TELANGANA STATE STATISTICAL ABSTRACT Government of Telangana For Official Use Only Telangana State Development Planning Society (TSDPS), Planning Department - 2021

Welcome message from author
This document is posted to help you gain knowledge. Please leave a comment to let me know what you think about it! Share it to your friends and learn new things together.
Transcript
TELANGANA STATE STATISTICAL ABSTRACT
Government of Telangana
For Official Use Only
Telangana State Development Planning Society (TSDPS), Planning Department - 2021
II | Telangana State Statistical Abstract, 2021
Telangana State Statistical Abstract, 2021 | III
Telangana State Statistical Abstract
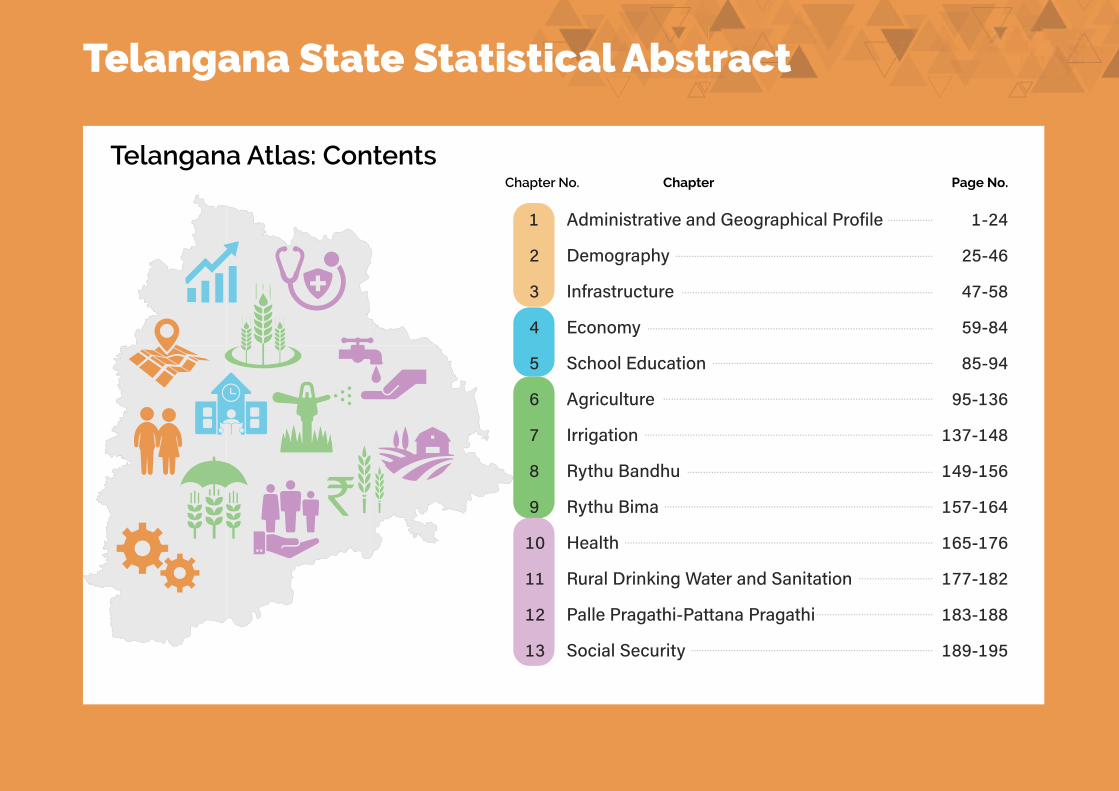
Telangana Atlas: ContentsPage No.ChapterChapter No.
�� ���������������������������� ���������� ������������
�� ����������� ����������
�� �������� ����� ����������
�� � ������ ����������
�� � �������� ������ ����������
�� ���� ������� ���������
�� ����������� ��������
�� ����������� ��������
�� ��������� ��������
��� ������� ��������
��� ����������������������������������� ��������
��� ������������������������������� ��������
��� �� ������ ������ ��������

IV | Telangana State Statistical Abstract, 2021
Telangana State Statistical Abstract, 2021 | 1
Administrative and Geographical Profile
Chapter 1
2 | Telangana State Statistical Abstract, 2021
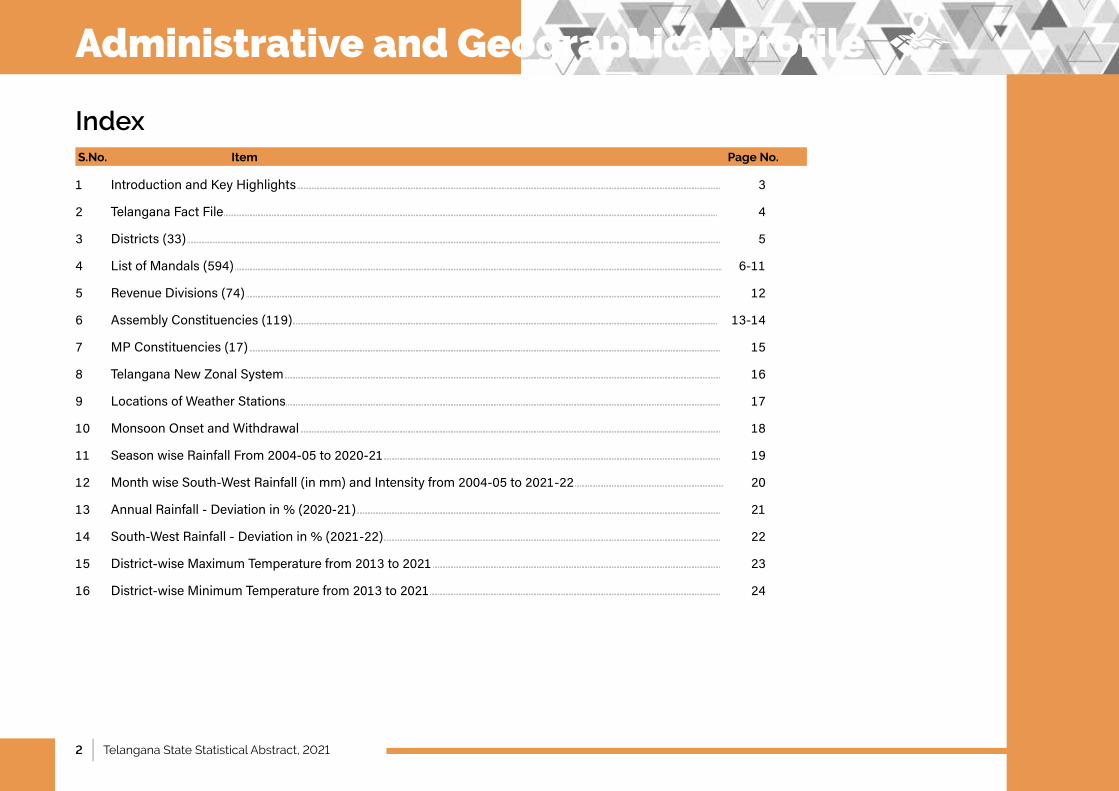
1 IntroductionandKeyHighlights..........................................................................................................................................................................................................................................................................3
2 TelanganaFactFile......................................................................................................................................................................................................................................................................................................................4
3 Districts(33)...............................................................................................................................................................................................................................................................................................................................................5
4 ListofMandals(594)..................................................................................................................................................................................................................................................................................................................6-11
5 RevenueDivisions(74)..........................................................................................................................................................................................................................................................................................................12
6 AssemblyConstituencies(119)...........................................................................................................................................................................................................................................................................13-14
7 MPConstituencies(17)........................................................................................................................................................................................................................................................................................................15
8 TelanganaNewZonalSystem..................................................................................................................................................................................................................................................................................16
9 LocationsofWeatherStations.................................................................................................................................................................................................................................................................................17
10 MonsoonOnsetandWithdrawal........................................................................................................................................................................................................................................................................18
11 SeasonwiseRainfallFrom2004-05to2020-21....................................................................................................................................................................................................................19
12 MonthwiseSouth-WestRainfall(inmm)andIntensityfrom2004-05to2021-22..............................................................................................20
13 AnnualRainfall-Deviationin%(2020-21).....................................................................................................................................................................................................................................21
14 South-WestRainfall-Deviationin%(2021-22)....................................................................................................................................................................................................................22
15 District-wiseMaximumTemperaturefrom2013to2021.....................................................................................................................................................................................23
16 District-wiseMinimumTemperaturefrom2013to2021.......................................................................................................................................................................................24
Index
Administrative and Geographical Profile
Page No.S.No. Item
Telangana State Statistical Abstract, 2021 | 3
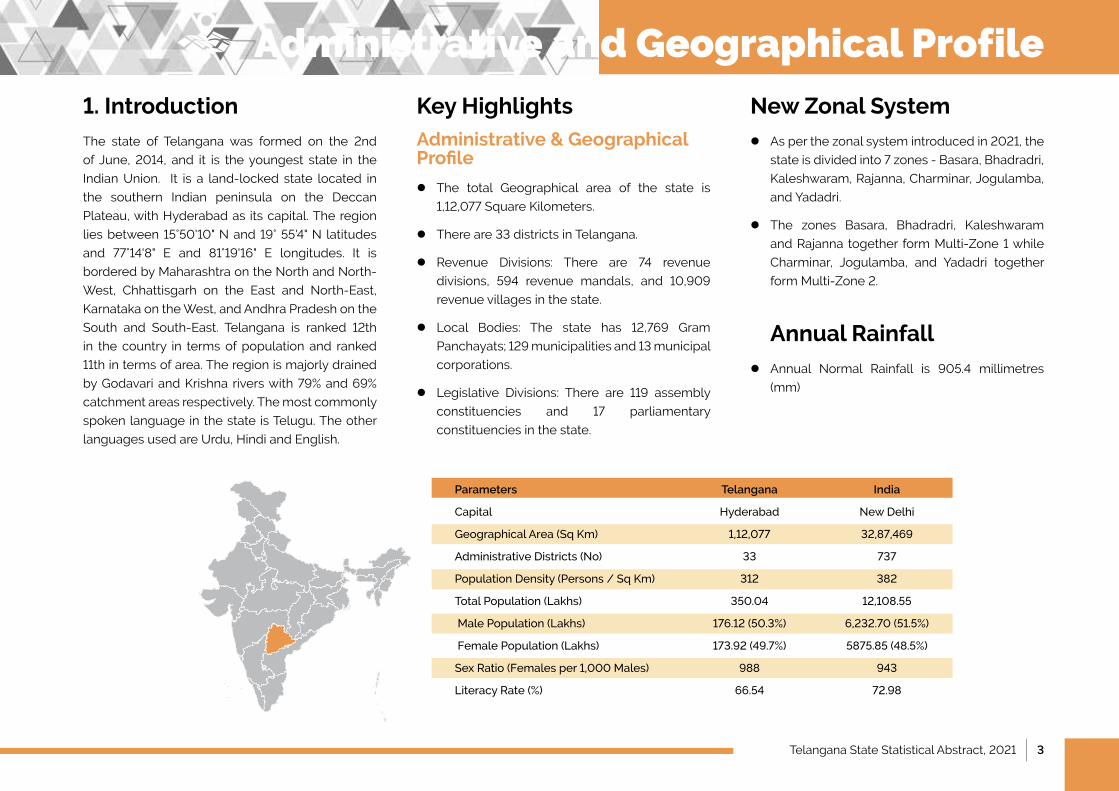
1. Introduction The state of Telangana was formed on the 2nd
of June, 2014, and it is the youngest state in the
Indian Union. It is a land-locked state located in
the southern Indian peninsula on the Deccan
Plateau, with Hyderabad as its capital. The region
lies between 15°50'10" N and 19° 55'4" N latitudes
and 77°14'8" E and 81°19'16" E longitudes. It is
bordered by Maharashtra on the North and North-
West, Chhattisgarh on the East and North-East,
Karnataka on the West, and Andhra Pradesh on the
South and South-East. Telangana is ranked 12th
in the country in terms of population and ranked
11th in terms of area. The region is majorly drained
by Godavari and Krishna rivers with 79% and 69%
catchment areas respectively. The most commonly
spoken language in the state is Telugu. The other
languages used are Urdu, Hindi and English.
Key HighlightsAdministrative & Geographical Profile
●lThe total Geographical area of the state is
1,12,077 Square Kilometers.
lThere are 33 districts in Telangana.
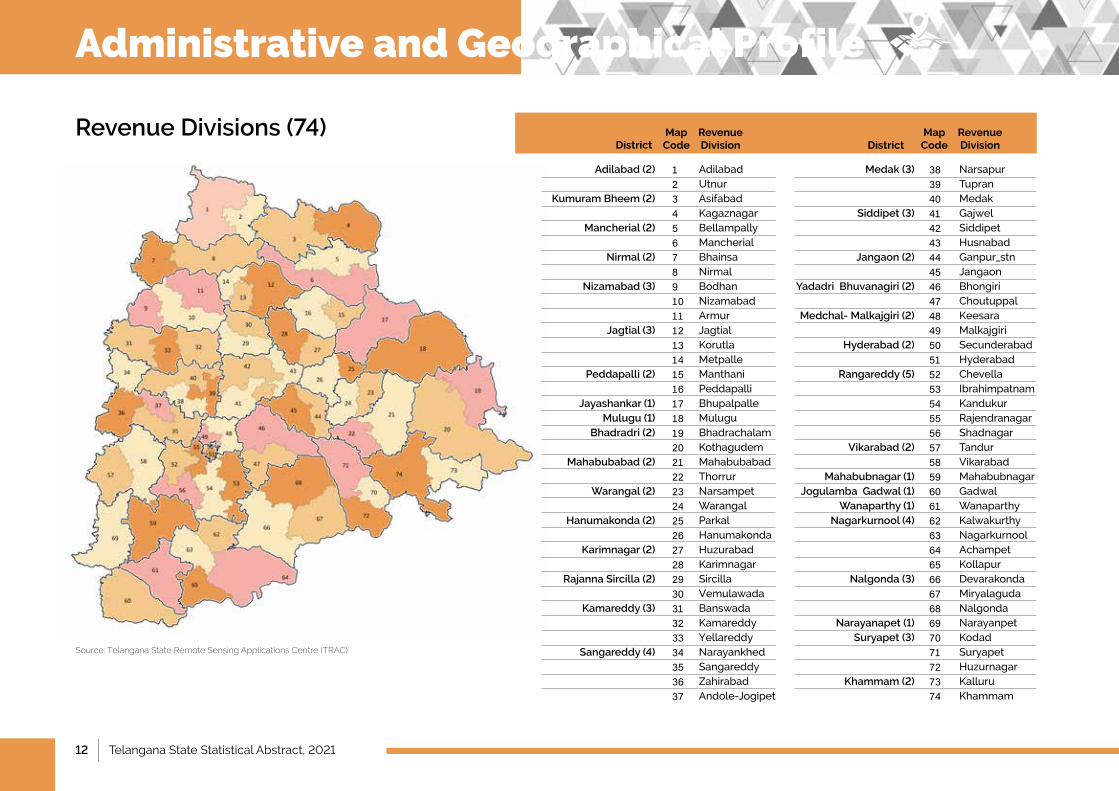
●lRevenue Divisions: There are 74 revenue
divisions, 594 revenue mandals, and 10,909
revenue villages in the state.
●lLocal Bodies: The state has 12,769 Gram
Panchayats; 129 municipalities and 13 municipal
corporations.
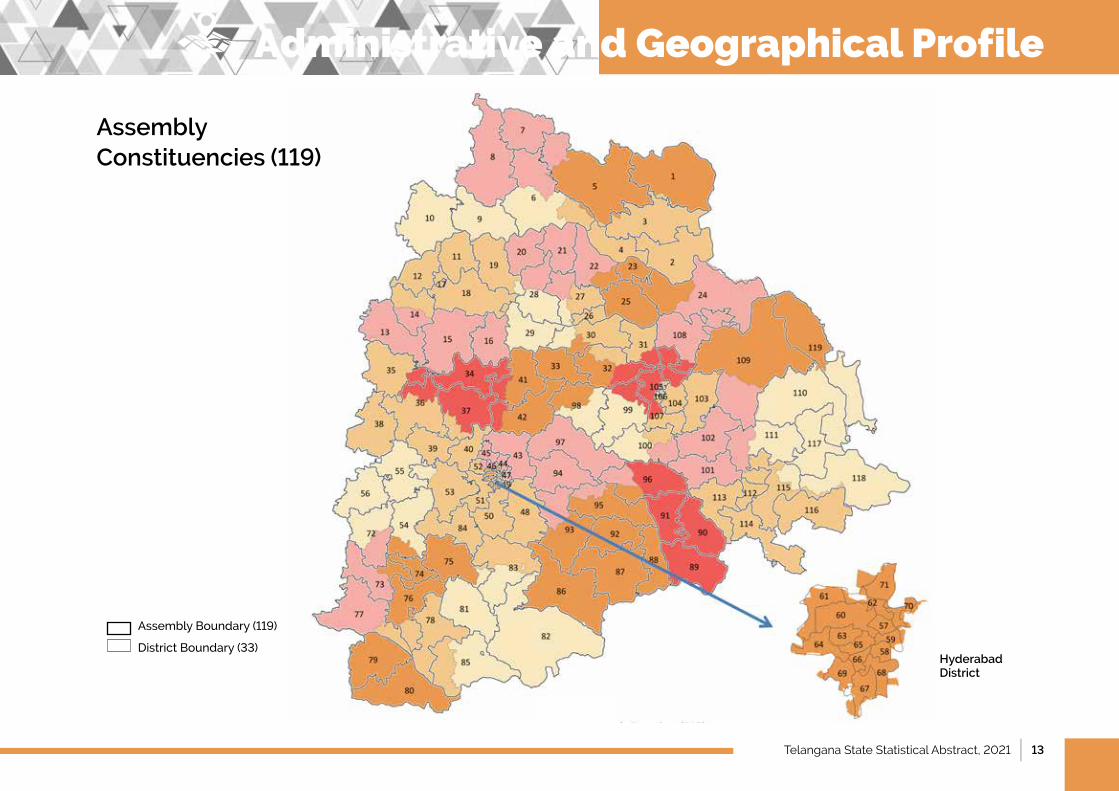
●lLegislative Divisions: There are 119 assembly
constituencies and 17 parliamentary
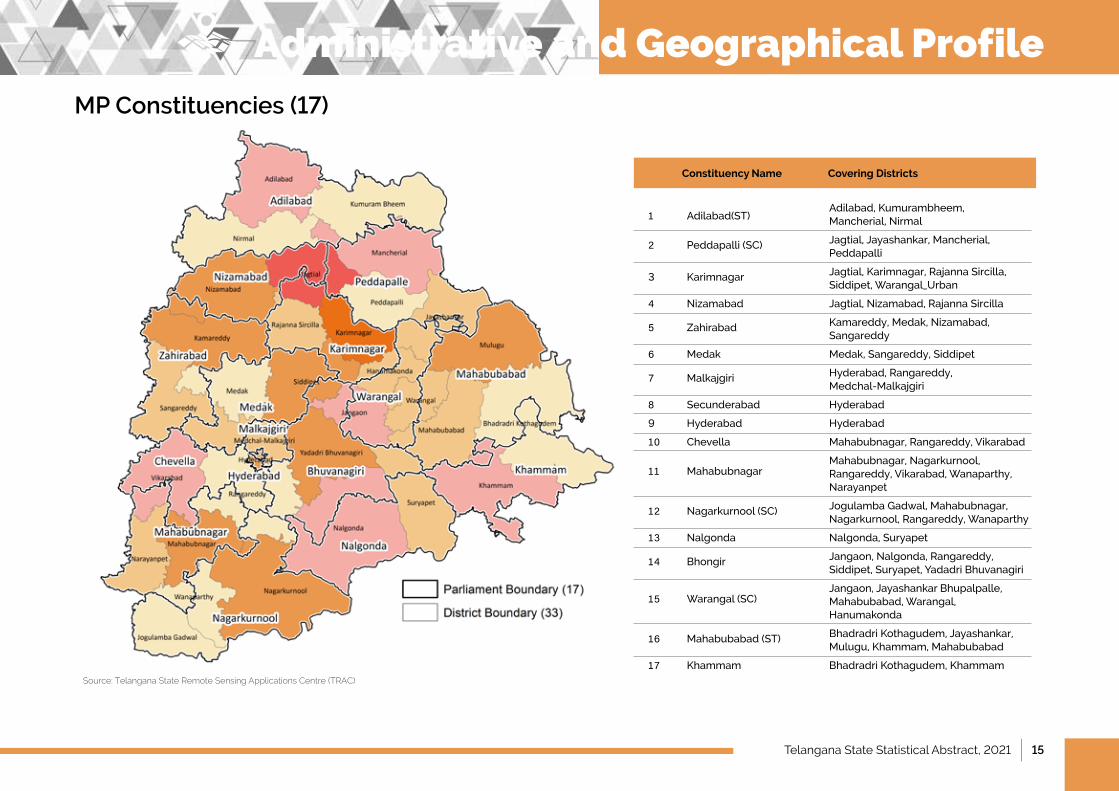
constituencies in the state.
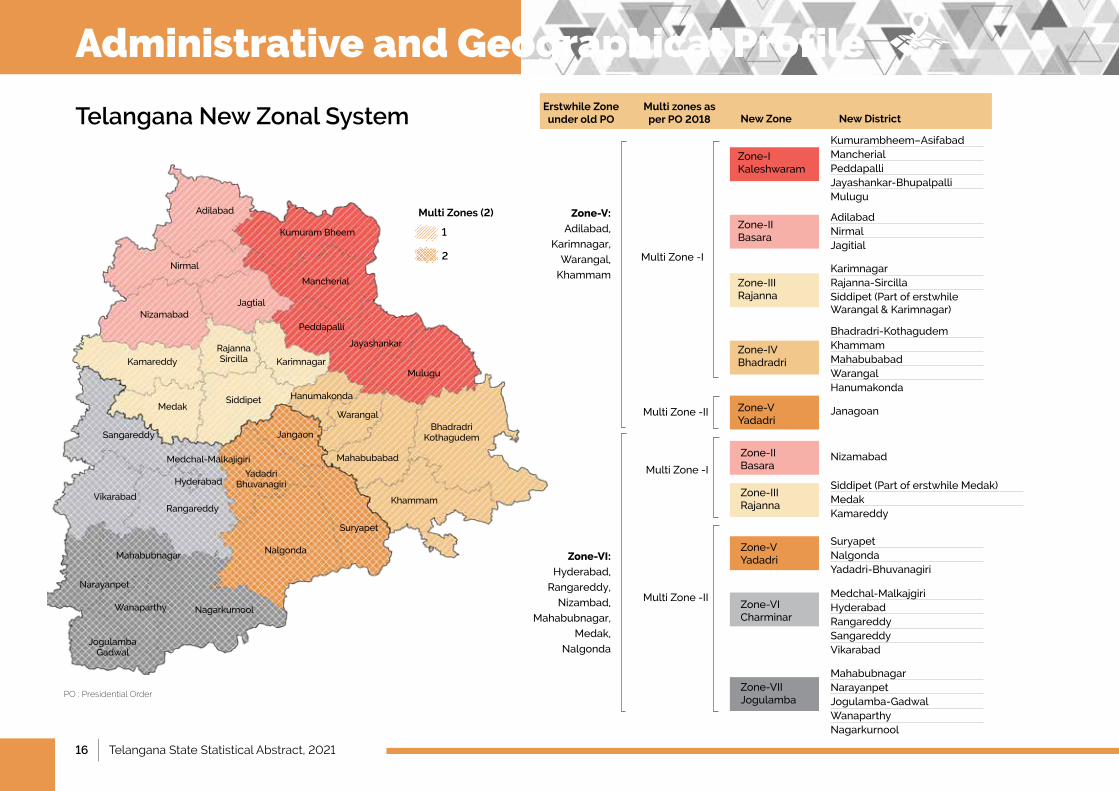
●New Zonal System●lAs per the zonal system introduced in 2021, the
state is divided into 7 zones - Basara, Bhadradri,
Kaleshwaram, Rajanna, Charminar, Jogulamba,
and Yadadri.
●lThe zones Basara, Bhadradri, Kaleshwaram
and Rajanna together form Multi-Zone 1 while
Charminar, Jogulamba, and Yadadri together
form Multi-Zone 2.
● Annual Rainfall
●lAnnual Normal Rainfall is 905.4 millimetres
(mm)
Parameters Telangana India
Capital Hyderabad New Delhi
Geographical Area (Sq Km) 1,12,077 32,87,469
AdministrativeDistricts(No) 33 737
PopulationDensity(Persons/SqKm) 312 382
TotalPopulation(Lakhs) 350.04 12,108.55
MalePopulation(Lakhs) 176.12(50.3%) 6,232.70(51.5%)
FemalePopulation(Lakhs) 173.92(49.7%) 5875.85(48.5%)
SexRatio(Femalesper1,000Males) 988 943
LiteracyRate(%) 66.54 72.98
Administrative and Geographical Profile
4 | Telangana State Statistical Abstract, 2021
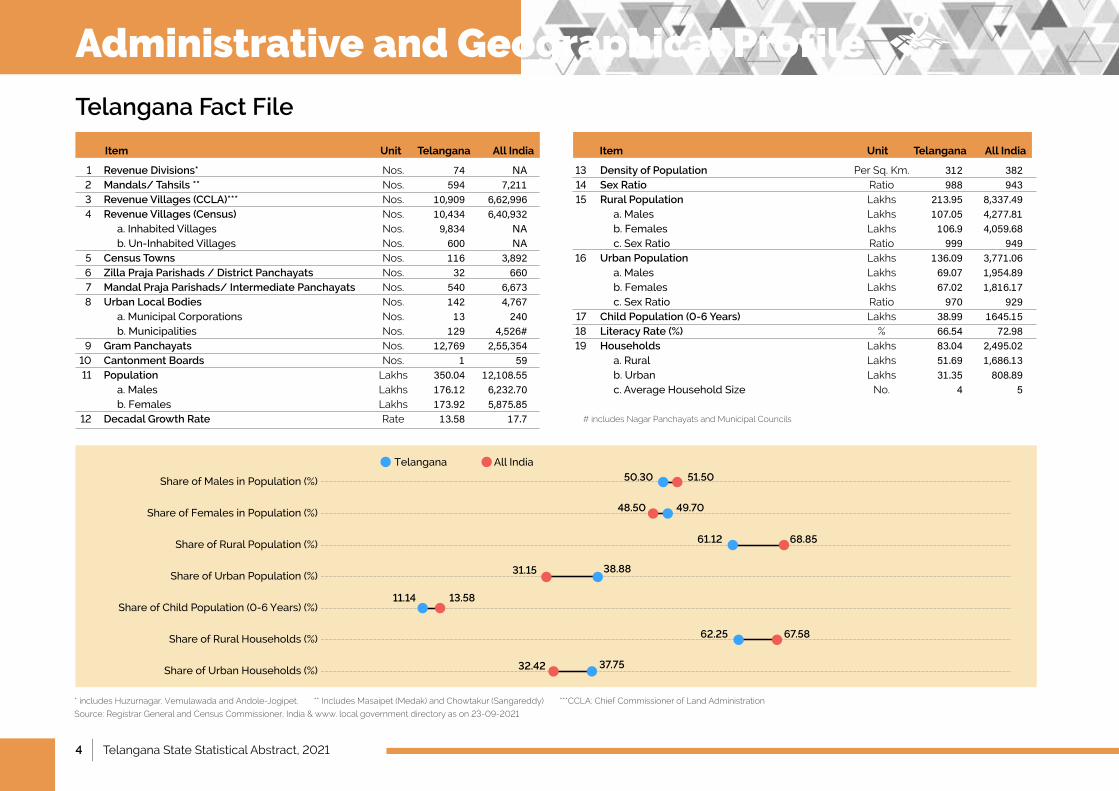
Telangana Fact File
Revenue Divisions*Mandals/ Tahsils **Revenue Villages (CCLA)***Revenue Villages (Census)a.InhabitedVillagesb.Un-InhabitedVillagesCensus TownsZilla Praja Parishads / District PanchayatsMandal Praja Parishads/ Intermediate PanchayatsUrban Local Bodiesa.MunicipalCorporationsb.MunicipalitiesGram PanchayatsCantonment BoardsPopulationa.Malesb.FemalesDecadal Growth Rate
Density of PopulationSex RatioRural Populationa.Malesb.Femalesc.SexRatioUrban Populationa.Malesb.Femalesc.SexRatioChild Population (0-6 Years)Literacy Rate (%)Householdsa.Ruralb.Urbanc.AverageHouseholdSize
1234
5678
91011
12
131415
16
171819
Nos.Nos.Nos.Nos.Nos.Nos.Nos.Nos.Nos.Nos.Nos.Nos.Nos.Nos.
LakhsLakhsLakhsRate
Per Sq. Km.RatioLakhsLakhsLakhsRatioLakhsLakhsLakhsRatioLakhs
%LakhsLakhsLakhs
No.
74594
10,90910,4349,83460011632
54014213
12912,769
1350.04176.12173.9213.58
312988
213.95107.05106.9999
136.0969.0767.02970
38.9966.5483.0451.6931.35
4
NA7,211
6,62,9966,40,932
NANA
3,892660
6,6734,767240
4,526#2,55,354
5912,108.556,232.705,875.85
17.7
382943
8,337.494,277.814,059.68
9493,771.061,954.891,816.17
9291645.15
72.982,495.021,686.13808.89
5
Item ItemUnit UnitTelangana TelanganaAll India All India
ShareofMalesinPopulation(%)
ShareofFemalesinPopulation(%)
ShareofRuralPopulation(%)
ShareofUrbanPopulation(%)
ShareofChildPopulation(0-6Years)(%)
ShareofRuralHouseholds(%)
ShareofUrbanHouseholds(%)
* includes Huzurnagar, Vemulawada and Andole-Jogipet. ** Includes Masaipet (Medak) and Chowtakur (Sangareddy) ***CCLA: Chief Commissioner of Land Administration
Source: Registrar General and Census Commissioner, India & www. local government directory as on 23-09-2021
Telangana AllIndia50.30
49.70
68.85
51.50
48.50
61.12
38.8831.15
62.25 67.58
32.42 37.75
11.14 13.58
# includes Nagar Panchayats and Municipal Councils
Administrative and Geographical Profile
Telangana State Statistical Abstract, 2021 | 5
Source: Telangana State Remote Sensing Applications Centre (TRAC)
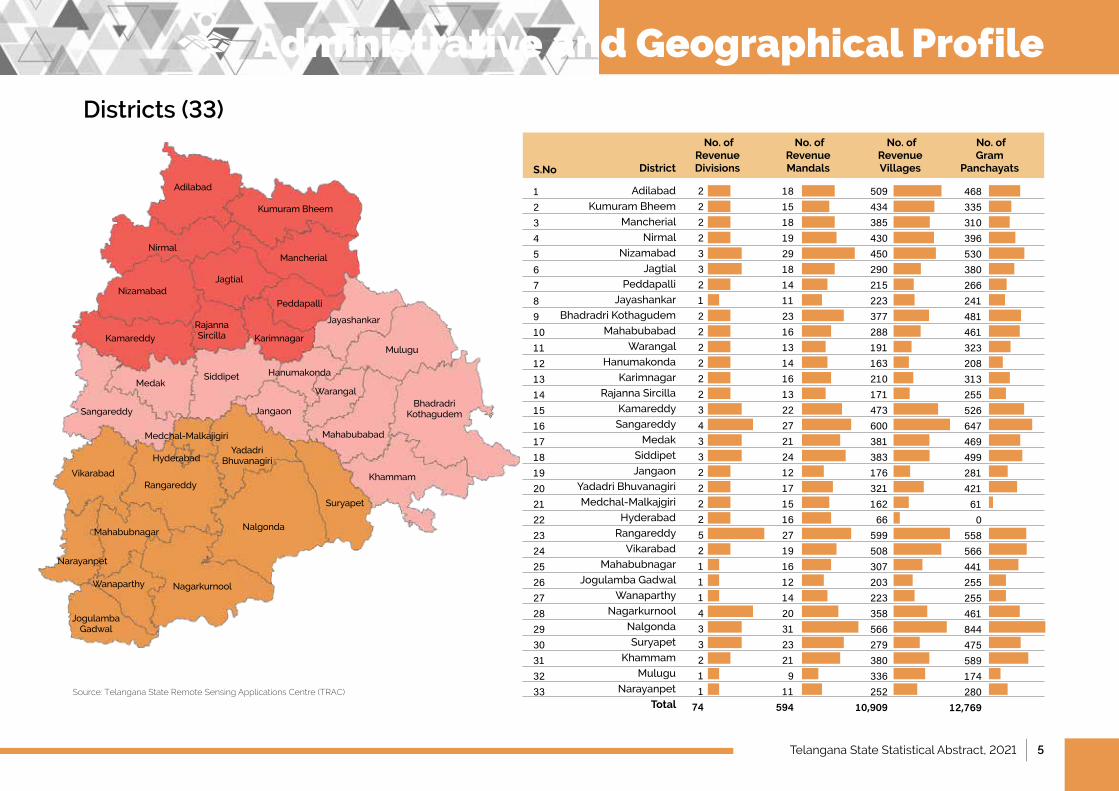
Districts (33)
Adilabad
Kumuram Bheem
Mancherial
Nirmal
Nizamabad
Jagtial
Peddapalli
Jayashankar
Bhadradri Kothagudem
Mahabubabad
Warangal
Hanumakonda
Karimnagar
Rajanna Sircilla
Kamareddy
Sangareddy
Medak
Siddipet
Jangaon
YadadriBhuvanagiri
Medchal-Malkajgiri
Hyderabad
Rangareddy
Vikarabad
Mahabubnagar
Jogulamba Gadwal
Wanaparthy
Nagarkurnool
Nalgonda
Suryapet
Khammam
Mulugu
Narayanpet
Total
222233212222223433222252111433211
74
181518192918141123161314161322272124121715162719161214203123219
11594
50943438543045029021522337728819116321017147360038138317632116266
599508307203223358566279380336252
10,909
468335310396530380266241481461323208313255526647469499281421610
558566441255255461844475589174280
12,769
123456789101112131415161718192021222324252627282930313233
No. of Revenue Divisions
No. of Revenue Mandals
No. of Revenue Villages
No. of Gram
PanchayatsDistrictS.No
Adilabad
Nirmal
Kumuram Bheem
Mancherial
Jagtial
Rajanna Sircilla
Peddapalli
Jayashankar
Mulugu
MedakSiddipet Hanumakonda
Warangal
JangaonSangareddy
Medchal-Malkajigiri
VikarabadRangareddy
Mahabubnagar
Narayanpet
Nalgonda
NagarkurnoolWanaparthy
Suryapet
Khammam
Karimnagar
Yadadri Bhuvanagiri
Mahabubabad
Jogulamba Gadwal
Bhadradri Kothagudem
Kamareddy
Nizamabad
Hyderabad
Administrative and Geographical Profile
6 | Telangana State Statistical Abstract, 2021
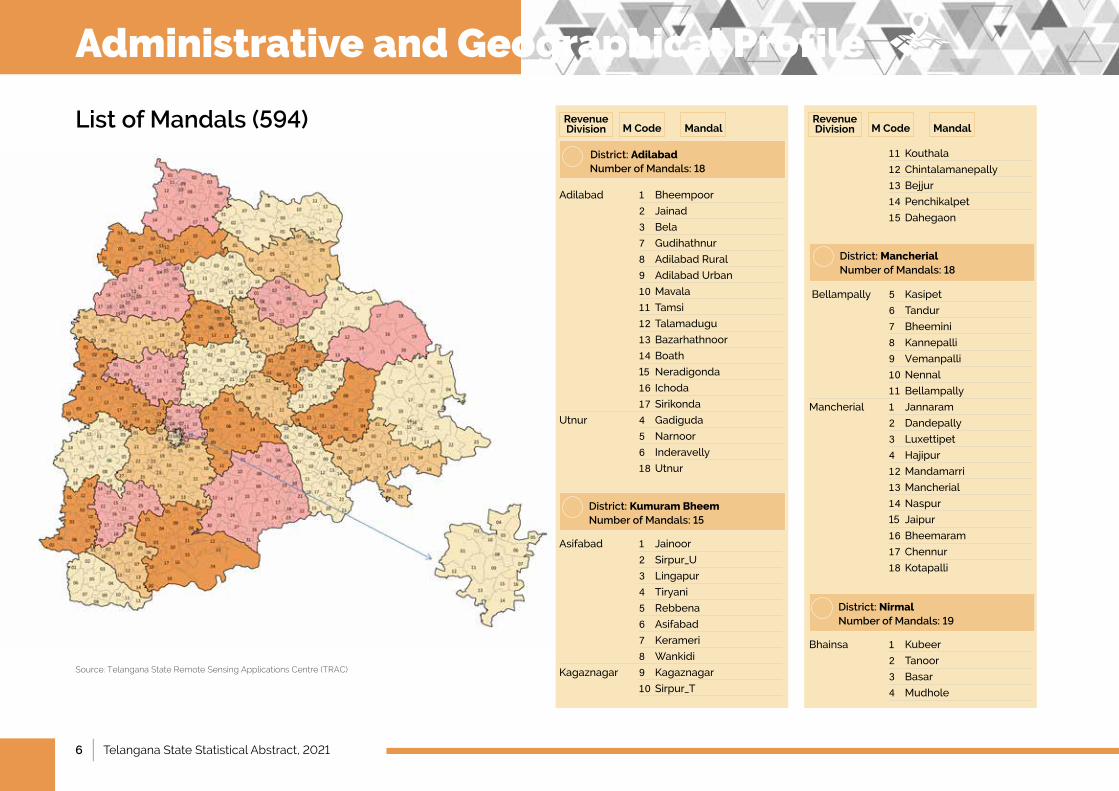
Source: Telangana State Remote Sensing Applications Centre (TRAC)
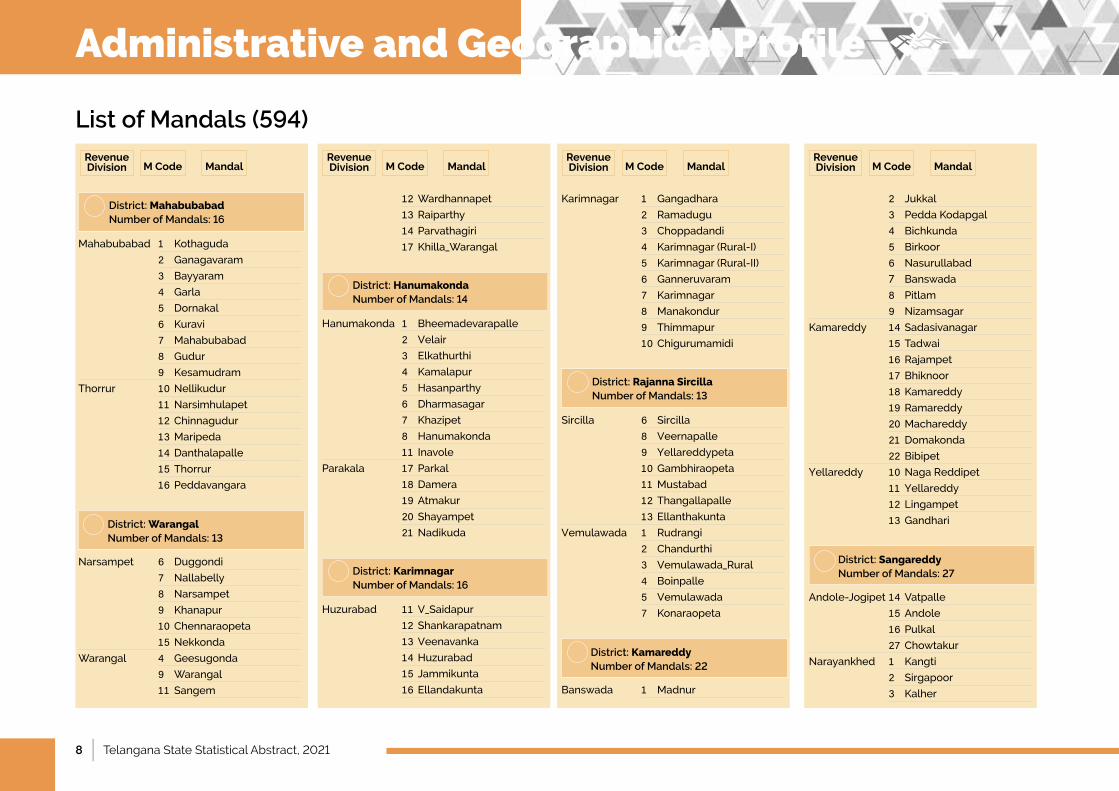
List of Mandals (594)
Adilabad 1 Bheempoor
2 Jainad
3 Bela
7 Gudihathnur
8 Adilabad Rural
9 AdilabadUrban 10Mavala 11 Tamsi
12 Talamadugu
13 Bazarhathnoor 14 Boath
15 Neradigonda
16 Ichoda 17 Sirikonda
Utnur 4 Gadiguda
5 Narnoor
6 Inderavelly 18 Utnur
2. District: Kumuram Bheem Number of Mandals: 15
Asifabad 1 Jainoor
2 Sirpur_U 3 Lingapur
4 Tiryani
5 Rebbena
6 Asifabad
7 Kerameri
8 Wankidi
Kagaznagar 9 Kagaznagar 10 Sirpur_T
11 Kouthala
12 Chintalamanepally
13 Bejjur
14 Penchikalpet
15 Dahegaon
3. District: Mancherial Number of Mandals: 18
Bellampally 5 Kasipet
6 Tandur
7 Bheemini
8 Kannepalli
9 Vemanpalli 10 Nennal
11 Bellampally
Mancherial 1 Jannaram
2 Dandepally
3 Luxettipet
4 Hajipur
12Mandamarri 13Mancherial 14 Naspur
15 Jaipur
16 Bheemaram
17 Chennur
18 Kotapalli
4. District: Nirmal Number of Mandals: 19
Bhainsa 1 Kubeer
2 Tanoor
3 Basar
4 Mudhole
1. District: Adilabad Number of Mandals: 18
Revenue Division M Code Mandal
Revenue Division M Code Mandal
Administrative and Geographical Profile
Telangana State Statistical Abstract, 2021 | 7
Revenue Division M Code Mandal
Revenue Division M Code Mandal
Revenue Division M Code Mandal
Revenue Division M Code Mandal
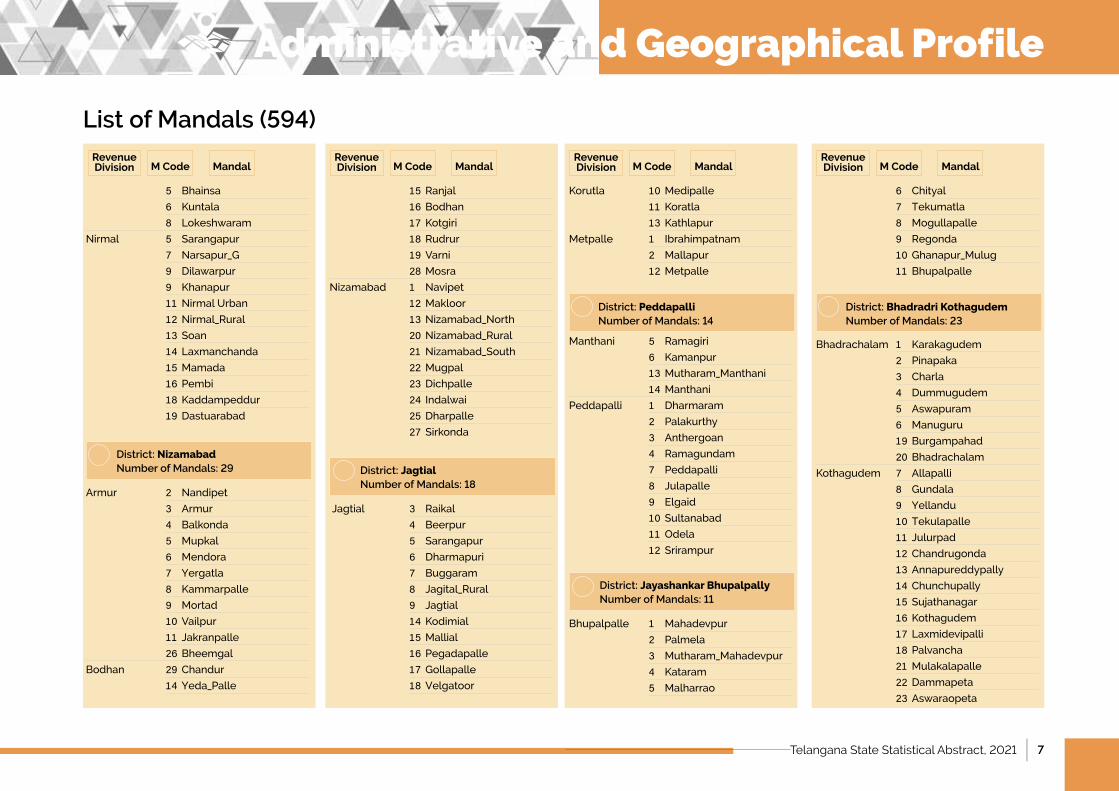
List of Mandals (594)
5 Bhainsa
6 Kuntala
8 Lokeshwaram
Nirmal 5 Sarangapur
7 Narsapur_G
9 Dilawarpur
9 Khanapur
11 NirmalUrban 12 Nirmal_Rural
13 Soan
14 Laxmanchanda
15Mamada 16 Pembi
18 Kaddampeddur
19 Dastuarabad
5. District: Nizamabad Number of Mandals: 29
Armur 2 Nandipet
3 Armur
4 Balkonda
5 Mupkal 6 Mendora 7 Yergatla 8 Kammarpalle
9 Mortad 10 Vailpur 11 Jakranpalle
26 Bheemgal
Bodhan 29 Chandur
14 Yeda_Palle
15 Ranjal
16 Bodhan
17 Kotgiri
18 Rudrur
19 Varni 28MosraNizamabad 1 Navipet
12Makloor 13 Nizamabad_North 20 Nizamabad_Rural 21 Nizamabad_South 22Mugpal 23Dichpalle
24 Indalwai 25 Dharpalle
27 Sirkonda
6. District: Jagtial Number of Mandals: 18
Jagtial 3 Raikal
4 Beerpur
5 Sarangapur
6 Dharmapuri
7 Buggaram
8 Jagital_Rural
9 Jagtial
14 Kodimial
15Mallial 16 Pegadapalle
17 Gollapalle
18 Velgatoor
Korutla 10Medipalle 11 Koratla
13 Kathlapur
Metpalle 1 Ibrahimpatnam 2 Mallapur 12Metpalle
7. District: Peddapalli Number of Mandals: 14
Manthani 5 Ramagiri
6 Kamanpur
13Mutharam_Manthani 14ManthaniPeddapalli 1 Dharmaram
2 Palakurthy
3 Anthergoan
4 Ramagundam
7 Peddapalli
8 Julapalle
9 Elgaid
10 Sultanabad
11 Odela
12 Srirampur
8. District: Jayashankar Bhupalpally Number of Mandals: 11
Bhupalpalle 1 Mahadevpur 2 Palmela
3 Mutharam_Mahadevpur 4 Kataram
5 Malharrao
6 Chityal
7 Tekumatla
8 Mogullapalle 9 Regonda
10 Ghanapur_Mulug 11 Bhupalpalle
9. District: Bhadradri Kothagudem Number of Mandals: 23
Bhadrachalam 1 Karakagudem
2 Pinapaka
3 Charla
4 Dummugudem
5 Aswapuram
6 Manuguru 19 Burgampahad
20 Bhadrachalam
Kothagudem 7 Allapalli
8 Gundala
9 Yellandu 10 Tekulapalle
11 Julurpad
12 Chandrugonda
13Annapureddypally
14 Chunchupally
15 Sujathanagar
16 Kothagudem
17 Laxmidevipalli
18 Palvancha
21Mulakalapalle 22 Dammapeta
23 Aswaraopeta
Administrative and Geographical Profile
8 | Telangana State Statistical Abstract, 2021
Revenue Division M Code Mandal
Revenue Division M Code Mandal
Revenue Division M Code Mandal
Revenue Division M Code Mandal
List of Mandals (594)
10. District: Mahabubabad Number of Mandals: 16
Mahabubabad 1 Kothaguda
2 Ganagavaram
3 Bayyaram
4 Garla
5 Dornakal
6 Kuravi
7 Mahabubabad 8 Gudur
9 Kesamudram
Thorrur 10 Nellikudur
11 Narsimhulapet
12 Chinnagudur
13Maripeda 14 Danthalapalle
15 Thorrur
16 Peddavangara
11. District: Warangal Number of Mandals: 13
Narsampet 6 Duggondi
7 Nallabelly
8 Narsampet
9 Khanapur
10 Chennaraopeta
15 Nekkonda
Warangal 4 Geesugonda
9 Warangal
11 Sangem
12 Wardhannapet
13 Raiparthy
14 Parvathagiri
17 Khilla_Warangal
12. District: Hanumakonda Number of Mandals: 14
Hanumakonda 1 Bheemadevarapalle
2 Velair 3 Elkathurthi
4 Kamalapur
5 Hasanparthy
6 Dharmasagar
7 Khazipet 8 Hanumakonda
11 InavoleParakala 17 Parkal
18 Damera
19 Atmakur
20 Shayampet
21 Nadikuda
13. District: Karimnagar Number of Mandals: 16
Huzurabad 11 V_Saidapur 12 Shankarapatnam
13 Veenavanka 14 Huzurabad 15 Jammikunta
16 Ellandakunta
Karimnagar 1 Gangadhara
2 Ramadugu
3 Choppadandi
4 Karimnagar(Rural-I) 5 Karimnagar(Rural-II) 6 Ganneruvaram
7 Karimnagar
8 Manakondur 9 Thimmapur
10 Chigurumamidi
14. District: Rajanna Sircilla Number of Mandals: 13
Sircilla 6 Sircilla
8 Veernapalle 9 Yellareddypeta 10 Gambhiraopeta
11Mustabad 12 Thangallapalle
13 Ellanthakunta
Vemulawada 1 Rudrangi
2 Chandurthi
3 Vemulawada_Rural 4 Boinpalle
5 Vemulawada 7 Konaraopeta
15. District: Kamareddy Number of Mandals: 22
Banswada 1 Madnur
2 Jukkal
3 Pedda Kodapgal
4 Bichkunda
5 Birkoor
6 Nasurullabad
7 Banswada
8 Pitlam
9 NizamsagarKamareddy 14Sadasivanagar
15 Tadwai
16 Rajampet
17 Bhiknoor
18 Kamareddy
19 Ramareddy
20Machareddy 21 Domakonda
22 Bibipet
Yellareddy 10 Naga Reddipet
11 Yellareddy 12 Lingampet
13 Gandhari
16. District: Sangareddy Number of Mandals: 27
Andole-Jogipet14 Vatpalle 15 Andole
16 Pulkal
27 Chowtakur
Narayankhed 1 Kangti
2 Sirgapoor
3 Kalher
Administrative and Geographical Profile
Telangana State Statistical Abstract, 2021 | 9
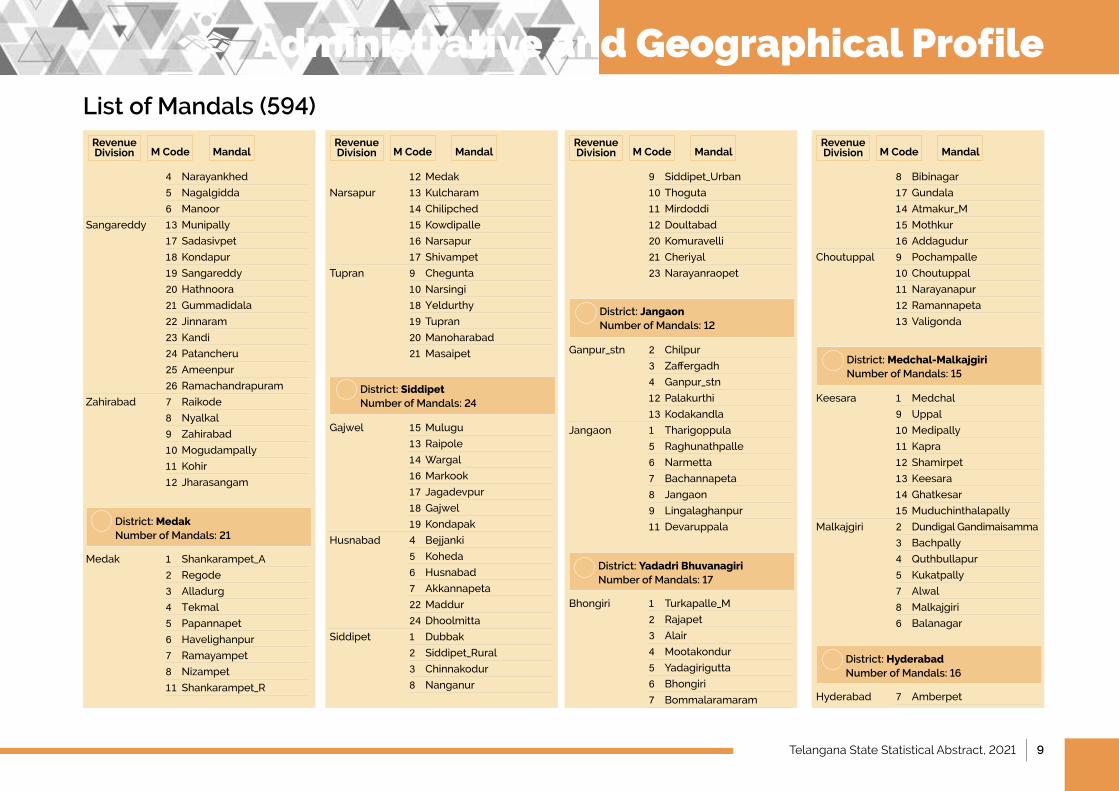
List of Mandals (594)
4 Narayankhed
5 Nagalgidda
6 ManoorSangareddy 13Munipally 17 Sadasivpet
18 Kondapur
19 Sangareddy
20 Hathnoora
21 Gummadidala
22 Jinnaram
23 Kandi
24 Patancheru
25 Ameenpur
26 Ramachandrapuram
Zahirabad 7 Raikode
8 Nyalkal
9 Zahirabad
10Mogudampally 11 Kohir
12 Jharasangam
17. District: Medak Number of Mandals: 21
Medak 1 Shankarampet_A
2 Regode
3 Alladurg
4 Tekmal
5 Papannapet
6 Havelighanpur
7 Ramayampet
8 Nizampet 11 Shankarampet_R
12MedakNarsapur 13 Kulcharam
14 Chilipched
15 Kowdipalle
16 Narsapur
17 Shivampet
Tupran 9 Chegunta
10 Narsingi
18 Yeldurthy 19 Tupran
20Manoharabad 21Masaipet
18. District: Siddipet Number of Mandals: 24
Gajwel 15Mulugu 13 Raipole
14 Wargal
16Markook 17 Jagadevpur
18 Gajwel
19 Kondapak
Husnabad 4 Bejjanki
5 Koheda
6 Husnabad
7 Akkannapeta
22Maddur 24 Dhoolmitta
Siddipet 1 Dubbak
2 Siddipet_Rural
3 Chinnakodur
8 Nanganur
9 Siddipet_Urban 10 Thoguta
11Mirdoddi 12 Doultabad
20 Komuravelli
21 Cheriyal
23 Narayanraopet
19. District: Jangaon Number of Mandals: 12
Ganpur_stn 2 Chilpur
3 Zaffergadh 4 Ganpur_stn
12 Palakurthi
13 Kodakandla
Jangaon 1 Tharigoppula
5 Raghunathpalle
6 Narmetta
7 Bachannapeta
8 Jangaon
9 Lingalaghanpur
11 Devaruppala
20. District: Yadadri Bhuvanagiri Number of Mandals: 17
Bhongiri 1 Turkapalle_M 2 Rajapet
3 Alair
4 Mootakondur 5 Yadagirigutta 6 Bhongiri
7 Bommalaramaram
8 Bibinagar
17 Gundala
14 Atmakur_M 15Mothkur 16 Addagudur
Choutuppal 9 Pochampalle
10 Choutuppal
11 Narayanapur
12 Ramannapeta
13 Valigonda
21. District: Medchal-Malkajgiri Number of Mandals: 15
Keesara 1 Medchal 9 Uppal 10Medipally 11 Kapra
12 Shamirpet
13 Keesara
14 Ghatkesar
15MuduchinthalapallyMalkajgiri 2 Dundigal Gandimaisamma
3 Bachpally
4 Quthbullapur
5 Kukatpally
7 Alwal
8 Malkajgiri 6 Balanagar
22. District: Hyderabad Number of Mandals: 16
Hyderabad 7 Amberpet
Revenue Division M Code Mandal
Revenue Division M Code Mandal
Revenue Division M Code Mandal
Revenue Division M Code Mandal
Administrative and Geographical Profile
10 | Telangana State Statistical Abstract, 2021
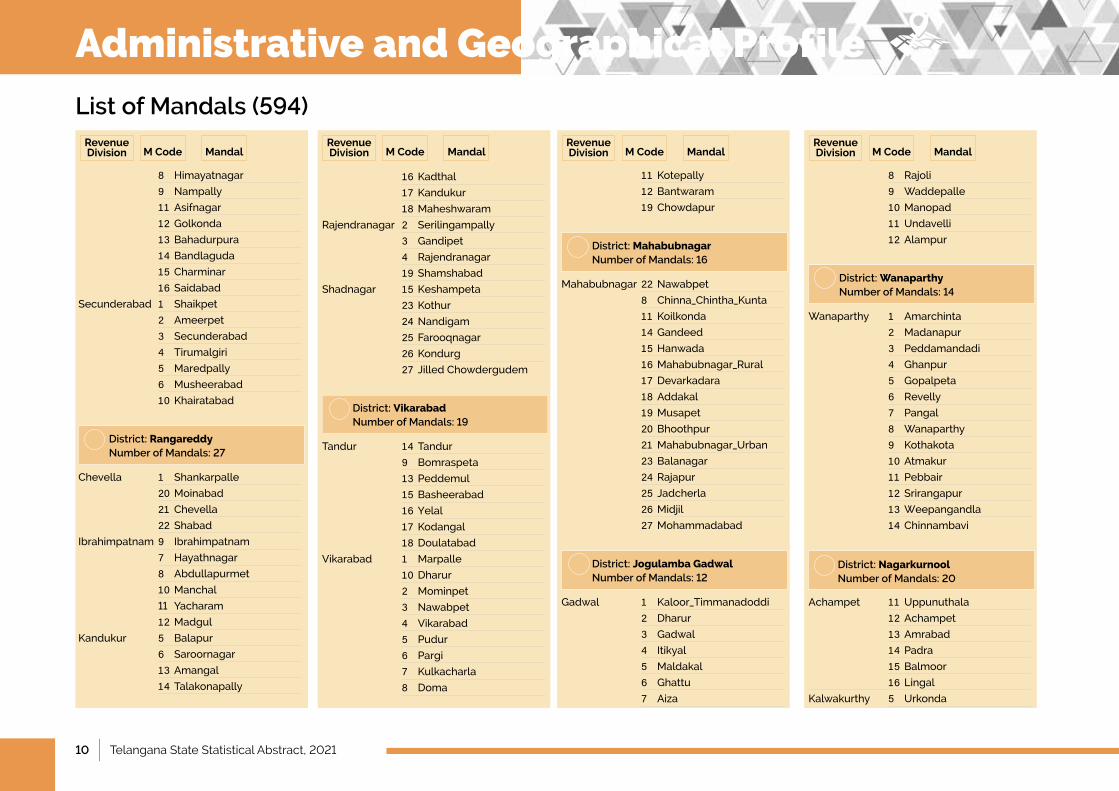
List of Mandals (594)
8 Himayatnagar
9 Nampally
11 Asifnagar
12 Golkonda
13 Bahadurpura
14 Bandlaguda
15 Charminar
16 Saidabad
Secunderabad 1 Shaikpet
2 Ameerpet
3 Secunderabad
4 Tirumalgiri
5 Maredpally 6 Musheerabad 10 Khairatabad
23. District: Rangareddy Number of Mandals: 27
Chevella 1 Shankarpalle
20Moinabad 21 Chevella
22 Shabad
Ibrahimpatnam9 Ibrahimpatnam 7 Hayathnagar
8 Abdullapurmet
10Manchal 11 Yacharam
12MadgulKandukur 5 Balapur
6 Saroornagar
13 Amangal
14 Talakonapally
16 Kadthal
17 Kandukur
18MaheshwaramRajendranagar 2 Serilingampally
3 Gandipet
4 Rajendranagar
19 Shamshabad
Shadnagar 15 Keshampeta
23 Kothur
24 Nandigam
25 Farooqnagar 26 Kondurg
27 Jilled Chowdergudem
24. District: Vikarabad Number of Mandals: 19
Tandur 14 Tandur
9 Bomraspeta
13 Peddemul
15 Basheerabad
16 Yelal 17 Kodangal
18 Doulatabad
Vikarabad 1 Marpalle 10 Dharur
2 Mominpet 3 Nawabpet
4 Vikarabad 5 Pudur
6 Pargi
7 Kulkacharla
8 Doma
11 Kotepally
12 Bantwaram
19 Chowdapur
25. District: Mahabubnagar Number of Mandals: 16
Mahabubnagar 22 Nawabpet
8 Chinna_Chintha_Kunta
11 Koilkonda
14 Gandeed
15 Hanwada
16Mahabubnagar_Rural 17 Devarkadara
18 Addakal
19Musapet 20 Bhoothpur
21Mahabubnagar_Urban 23 Balanagar
24 Rajapur
25 Jadcherla
26Midjil 27Mohammadabad
26. District: Jogulamba Gadwal Number of Mandals: 12
Gadwal 1 Kaloor_Timmanadoddi
2 Dharur
3 Gadwal
4 Itikyal 5 Maldakal 6 Ghattu
7 Aiza
8 Rajoli
9 Waddepalle
10Manopad 11 Undavelli 12 Alampur
27. District: Wanaparthy Number of Mandals: 14
Wanaparthy 1 Amarchinta
2 Madanapur 3 Peddamandadi
4 Ghanpur
5 Gopalpeta
6 Revelly
7 Pangal
8 Wanaparthy
9 Kothakota
10 Atmakur
11 Pebbair
12 Srirangapur
13 Weepangandla
14 Chinnambavi
28. District: Nagarkurnool Number of Mandals: 20
Achampet 11 Uppunuthala 12 Achampet
13 Amrabad
14 Padra
15 Balmoor
16 Lingal
Kalwakurthy 5 Urkonda
Revenue Division M Code Mandal
Revenue Division M Code Mandal
Revenue Division M Code Mandal
Revenue Division M Code Mandal
Administrative and Geographical Profile
Telangana State Statistical Abstract, 2021 | 11
Revenue Division M Code Mandal
Revenue Division M Code Mandal
Revenue Division M Code Mandal
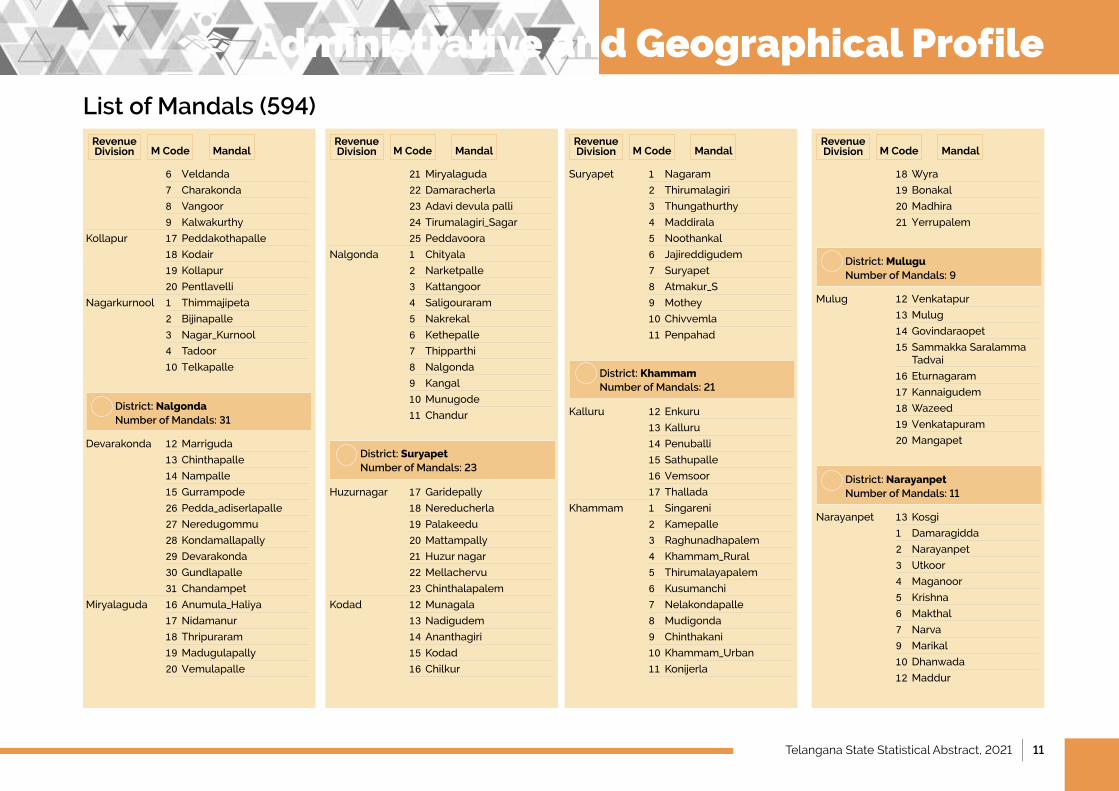
Revenue Division M Code Mandal
6 Veldanda 7 Charakonda
8 Vangoor 9 Kalwakurthy
Kollapur 17 Peddakothapalle
18 Kodair
19 Kollapur
20 Pentlavelli
Nagarkurnool 1 Thimmajipeta
2 Bijinapalle
3 Nagar_Kurnool
4 Tadoor
10 Telkapalle
29. District: Nalgonda Number of Mandals: 31
Devarakonda 12Marriguda 13 Chinthapalle
14 Nampalle
15 Gurrampode
26 Pedda_adiserlapalle
27 Neredugommu
28 Kondamallapally
29 Devarakonda
30 Gundlapalle
31 Chandampet
Miryalaguda 16 Anumula_Haliya
17 Nidamanur
18 Thripuraram
19Madugulapally 20 Vemulapalle
21Miryalaguda 22 Damaracherla
23 Adavi devula palli
24 Tirumalagiri_Sagar
25 Peddavoora
Nalgonda 1 Chityala
2 Narketpalle
3 Kattangoor
4 Saligouraram
5 Nakrekal
6 Kethepalle
7 Thipparthi
8 Nalgonda
9 Kangal
10Munugode 11 Chandur
30. District: Suryapet Number of Mandals: 23
Huzurnagar 17 Garidepally
18 Nereducherla
19 Palakeedu
20Mattampally 21 Huzurnagar 22Mellachervu 23 Chinthalapalem
Kodad 12Munagala 13 Nadigudem
14 Ananthagiri
15 Kodad
16 Chilkur
Suryapet 1 Nagaram
2 Thirumalagiri
3 Thungathurthy
4 Maddirala 5 Noothankal
6 Jajireddigudem
7 Suryapet
8 Atmakur_S
9 Mothey 10 Chivvemla
11 Penpahad
31. District: Khammam Number of Mandals: 21
Kalluru 12 Enkuru
13 Kalluru
14 Penuballi
15 Sathupalle
16 Vemsoor 17 Thallada
Khammam 1 Singareni
2 Kamepalle
3 Raghunadhapalem
4 Khammam_Rural
5 Thirumalayapalem
6 Kusumanchi
7 Nelakondapalle
8 Mudigonda 9 Chinthakani
10 Khammam_Urban 11 Konijerla
18 Wyra
19 Bonakal
20Madhira 21 Yerrupalem
32. District: Mulugu Number of Mandals: 9
Mulug 12 Venkatapur 13Mulug 14 Govindaraopet
15 Sammakka Saralamma Tadvai
16 Eturnagaram
17 Kannaigudem
18Wazeed 19 Venkatapuram 20Mangapet
33. District: Narayanpet Number of Mandals: 11
Narayanpet 13 Kosgi
1 Damaragidda
2 Narayanpet
3 Utkoor 4 Maganoor 5 Krishna
6 Makthal 7 Narva
9 Marikal 10 Dhanwada
12Maddur
List of Mandals (594)
Administrative and Geographical Profile
12 | Telangana State Statistical Abstract, 2021
Revenue Divisions (74)
Adilabad (2)
Kumuram Bheem (2)
Mancherial (2)
Nirmal (2)
Nizamabad (3)
Jagtial (3)
Peddapalli (2)
Jayashankar (1)Mulugu (1)
Bhadradri (2)
Mahabubabad (2)
Warangal (2)
Hanumakonda (2)
Karimnagar (2)
Rajanna Sircilla (2)
Kamareddy (3)
Sangareddy (4)
Medak (3)
Siddipet (3)
Jangaon (2)
Yadadri Bhuvanagiri (2)
Medchal- Malkajgiri (2)
Hyderabad (2)
Rangareddy (5)
Vikarabad (2)
Mahabubnagar (1)Jogulamba Gadwal (1)
Wanaparthy (1)Nagarkurnool (4)
Nalgonda (3)
Narayanapet (1)Suryapet (3)
Khammam (2)
AdilabadUtnurAsifabadKagaznagarBellampallyMancherialBhainsaNirmalBodhanNizamabadArmurJagtialKorutlaMetpalleManthaniPeddapalliBhupalpalleMuluguBhadrachalamKothagudemMahabubabadThorrurNarsampetWarangalParkalHanumakondaHuzurabadKarimnagarSircillaVemulawadaBanswadaKamareddyYellareddyNarayankhedSangareddyZahirabadAndole-Jogipet
NarsapurTupranMedakGajwelSiddipetHusnabadGanpur_stnJangaonBhongiriChoutuppalKeesaraMalkajgiriSecunderabadHyderabadChevellaIbrahimpatnamKandukurRajendranagarShadnagarTandurVikarabadMahabubnagarGadwalWanaparthyKalwakurthyNagarkurnoolAchampetKollapurDevarakondaMiryalagudaNalgondaNarayanpetKodadSuryapetHuzurnagarKalluruKhammam
12345678910111213141516171819202122232425262728293031323334353637
38394041424344454647484950515253545556575859606162636465666768697071727374
Revenue Division
Revenue DivisionDistrict District
Map Code
Map Code
Source: Telangana State Remote Sensing Applications Centre (TRAC)
Administrative and Geographical Profile
Telangana State Statistical Abstract, 2021 | 13
Hyderabad District
Assembly Constituencies (119)
AssemblyBoundary(119)
DistrictBoundary(33)
Administrative and Geographical Profile
14 | Telangana State Statistical Abstract, 2021
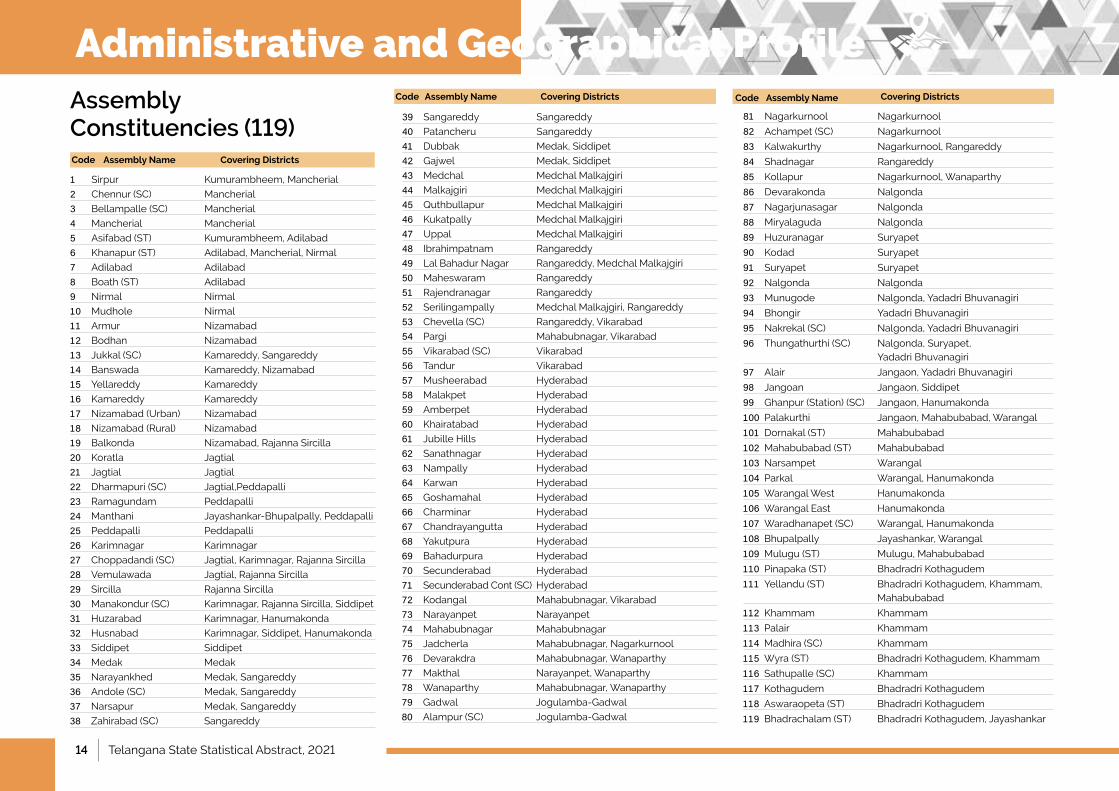
1 Sirpur Kumurambheem, Mancherial
2 Chennur (SC) Mancherial
3 Bellampalle (SC) Mancherial
4 Mancherial Mancherial
5 Asifabad (ST) Kumurambheem, Adilabad
6 Khanapur (ST) Adilabad, Mancherial, Nirmal
7 Adilabad Adilabad
8 Boath (ST) Adilabad
9 Nirmal Nirmal
10 Mudhole Nirmal
11 Armur Nizamabad
12 Bodhan Nizamabad
13 Jukkal (SC) Kamareddy, Sangareddy
14 Banswada Kamareddy, Nizamabad
15 Yellareddy Kamareddy
16 Kamareddy Kamareddy
17 Nizamabad (Urban) Nizamabad
18 Nizamabad (Rural) Nizamabad
19 Balkonda Nizamabad, Rajanna Sircilla
20 Koratla Jagtial
21 Jagtial Jagtial
22 Dharmapuri (SC) Jagtial,Peddapalli
23 Ramagundam Peddapalli
24 Manthani Jayashankar-Bhupalpally, Peddapalli
25 Peddapalli Peddapalli
26 Karimnagar Karimnagar
27 Choppadandi (SC) Jagtial, Karimnagar, Rajanna Sircilla
28 Vemulawada Jagtial, Rajanna Sircilla
29 Sircilla Rajanna Sircilla
30 Manakondur (SC) Karimnagar, Rajanna Sircilla, Siddipet
31 Huzarabad Karimnagar, Hanumakonda
32 Husnabad Karimnagar, Siddipet, Hanumakonda
33 Siddipet Siddipet
34 Medak Medak
35 Narayankhed Medak, Sangareddy
36 Andole (SC) Medak, Sangareddy
37 Narsapur Medak, Sangareddy
38 Zahirabad (SC) Sangareddy
Assembly NameCode Covering Districts
39 Sangareddy Sangareddy
40 Patancheru Sangareddy
41 Dubbak Medak, Siddipet
42 Gajwel Medak, Siddipet
43 Medchal Medchal Malkajgiri
44 Malkajgiri Medchal Malkajgiri
45 Quthbullapur Medchal Malkajgiri
46 Kukatpally Medchal Malkajgiri
47 Uppal Medchal Malkajgiri
48 Ibrahimpatnam Rangareddy
49 Lal Bahadur Nagar Rangareddy, Medchal Malkajgiri
50 Maheswaram Rangareddy
51 Rajendranagar Rangareddy
52 Serilingampally Medchal Malkajgiri, Rangareddy
53 Chevella (SC) Rangareddy, Vikarabad
54 Pargi Mahabubnagar, Vikarabad
55 Vikarabad (SC) Vikarabad
56 Tandur Vikarabad
57 Musheerabad Hyderabad
58 Malakpet Hyderabad
59 Amberpet Hyderabad
60 Khairatabad Hyderabad
61 Jubille Hills Hyderabad
62 Sanathnagar Hyderabad
63 Nampally Hyderabad
64 Karwan Hyderabad
65 Goshamahal Hyderabad
66 Charminar Hyderabad
67 Chandrayangutta Hyderabad
68 Yakutpura Hyderabad
69 Bahadurpura Hyderabad
70 Secunderabad Hyderabad
71 Secunderabad Cont (SC) Hyderabad
72 Kodangal Mahabubnagar, Vikarabad
73 Narayanpet Narayanpet
74 Mahabubnagar Mahabubnagar
75 Jadcherla Mahabubnagar, Nagarkurnool
76 Devarakdra Mahabubnagar, Wanaparthy
77 Makthal Narayanpet, Wanaparthy
78 Wanaparthy Mahabubnagar, Wanaparthy
79 Gadwal Jogulamba-Gadwal
80 Alampur (SC) Jogulamba-Gadwal
Assembly Name Covering Districts
81 Nagarkurnool Nagarkurnool
82 Achampet (SC) Nagarkurnool
83 Kalwakurthy Nagarkurnool, Rangareddy
84 Shadnagar Rangareddy
85 Kollapur Nagarkurnool, Wanaparthy
86 Devarakonda Nalgonda
87 Nagarjunasagar Nalgonda
88 Miryalaguda Nalgonda
89 Huzuranagar Suryapet
90 Kodad Suryapet
91 Suryapet Suryapet
92 Nalgonda Nalgonda
93 Munugode Nalgonda, Yadadri Bhuvanagiri
94 Bhongir Yadadri Bhuvanagiri
95 Nakrekal (SC) Nalgonda, Yadadri Bhuvanagiri
96 Thungathurthi (SC) Nalgonda, Suryapet, Yadadri Bhuvanagiri
97 Alair Jangaon, Yadadri Bhuvanagiri
98 Jangoan Jangaon, Siddipet
99 Ghanpur (Station) (SC) Jangaon, Hanumakonda
100 Palakurthi Jangaon, Mahabubabad, Warangal
101 Dornakal (ST) Mahabubabad
102 Mahabubabad (ST) Mahabubabad
103 Narsampet Warangal
104 Parkal Warangal, Hanumakonda
105 Warangal West Hanumakonda
106 Warangal East Hanumakonda
107 Waradhanapet (SC) Warangal, Hanumakonda
108 Bhupalpally Jayashankar, Warangal
109 Mulugu (ST) Mulugu, Mahabubabad
110 Pinapaka (ST) Bhadradri Kothagudem
111 Yellandu (ST) Bhadradri Kothagudem, Khammam, Mahabubabad
112 Khammam Khammam
113 Palair Khammam
114 Madhira (SC) Khammam
115 Wyra (ST) Bhadradri Kothagudem, Khammam
116 Sathupalle (SC) Khammam
117 Kothagudem Bhadradri Kothagudem
118 Aswaraopeta (ST) Bhadradri Kothagudem
119 Bhadrachalam (ST) Bhadradri Kothagudem, Jayashankar
Assembly Name Covering DistrictsCode CodeAssembly Constituencies (119)
Administrative and Geographical Profile
Telangana State Statistical Abstract, 2021 | 15
MP Constituencies (17)
Source: Telangana State Remote Sensing Applications Centre (TRAC)
1 Adilabad(ST) Adilabad,Kumurambheem,
Mancherial,Nirmal
2 Peddapalli (SC) Jagtial,Jayashankar,Mancherial,Peddapalli
3 Karimnagar Jagtial,Karimnagar,RajannaSircilla,Siddipet,Warangal_Urban
4 Nizamabad Jagtial,Nizamabad,RajannaSircilla
5 Zahirabad Kamareddy,Medak,Nizamabad,Sangareddy
6 Medak Medak,Sangareddy,Siddipet
7 Malkajgiri Hyderabad,Rangareddy, Medchal-Malkajgiri
8 Secunderabad Hyderabad
9 Hyderabad Hyderabad
10 Chevella Mahabubnagar,Rangareddy,Vikarabad
11 Mahabubnagar Mahabubnagar,Nagarkurnool,
Rangareddy,Vikarabad,Wanaparthy,Narayanpet
12 Nagarkurnool (SC) JogulambaGadwal,Mahabubnagar,Nagarkurnool,Rangareddy,Wanaparthy
13 Nalgonda Nalgonda,Suryapet
14 Bhongir Jangaon,Nalgonda,Rangareddy,Siddipet,Suryapet,YadadriBhuvanagiri
15 Warangal (SC) Jangaon,JayashankarBhupalpalle,
Mahabubabad,Warangal, Hanumakonda
16 Mahabubabad(ST) BhadradriKothagudem,Jayashankar,Mulugu,Khammam,Mahabubabad
17 Khammam BhadradriKothagudem,Khammam
Constituency Name Covering Districts
Administrative and Geographical Profile
16 | Telangana State Statistical Abstract, 2021
Telangana New Zonal System Kumurambheem–AsifabadMancherialPeddapalliJayashankar-BhupalpalliMulugu
AdilabadNirmalJagitial
KarimnagarRajanna-SircillaSiddipet (Part of erstwhile Warangal & Karimnagar)
Bhadradri-KothagudemKhammamMahabubabadWarangalHanumakonda
Janagoan
Nizamabad
Siddipet(PartoferstwhileMedak)MedakKamareddy
MahabubnagarNarayanpetJogulamba-GadwalWanaparthyNagarkurnool
Medchal-MalkajgiriHyderabadRangareddySangareddyVikarabad
SuryapetNalgondaYadadri-Bhuvanagiri
Zone-IKaleshwaram
Zone-II Basara
Zone-III Rajanna
Zone-IV Bhadradri
Zone-V Yadadri
Zone-II Basara
Zone-III Rajanna
Zone-V Yadadri
Zone-VI Charminar
Zone-VII Jogulamba
MultiZone-I
MultiZone-I
MultiZone-II
MultiZone-II
Zone-V:
Adilabad,
Karimnagar,
Warangal,
Khammam
Zone-VI:
Hyderabad,
Rangareddy,
Nizambad,
Mahabubnagar,
Medak,
Nalgonda
1
2
Multi Zones (2)Adilabad
Nirmal
Kumuram Bheem
Mancherial
Jagtial
Rajanna Sircilla
Peddapalli
Jayashankar
Mulugu
MedakSiddipet Hanumakonda
Warangal
JangaonSangareddy
Medchal-Malkajigiri
VikarabadRangareddy
Mahabubnagar
Narayanpet
Nalgonda
NagarkurnoolWanaparthy
Suryapet
Khammam
Karimnagar
Yadadri Bhuvanagiri
Mahabubabad
Jogulamba Gadwal
Bhadradri Kothagudem
Kamareddy
Nizamabad
Hyderabad
New DistrictNew ZoneMulti zones as per PO 2018
Erstwhile Zone under old PO
PO : Presidential Order
Administrative and Geographical Profile
Telangana State Statistical Abstract, 2021 | 17
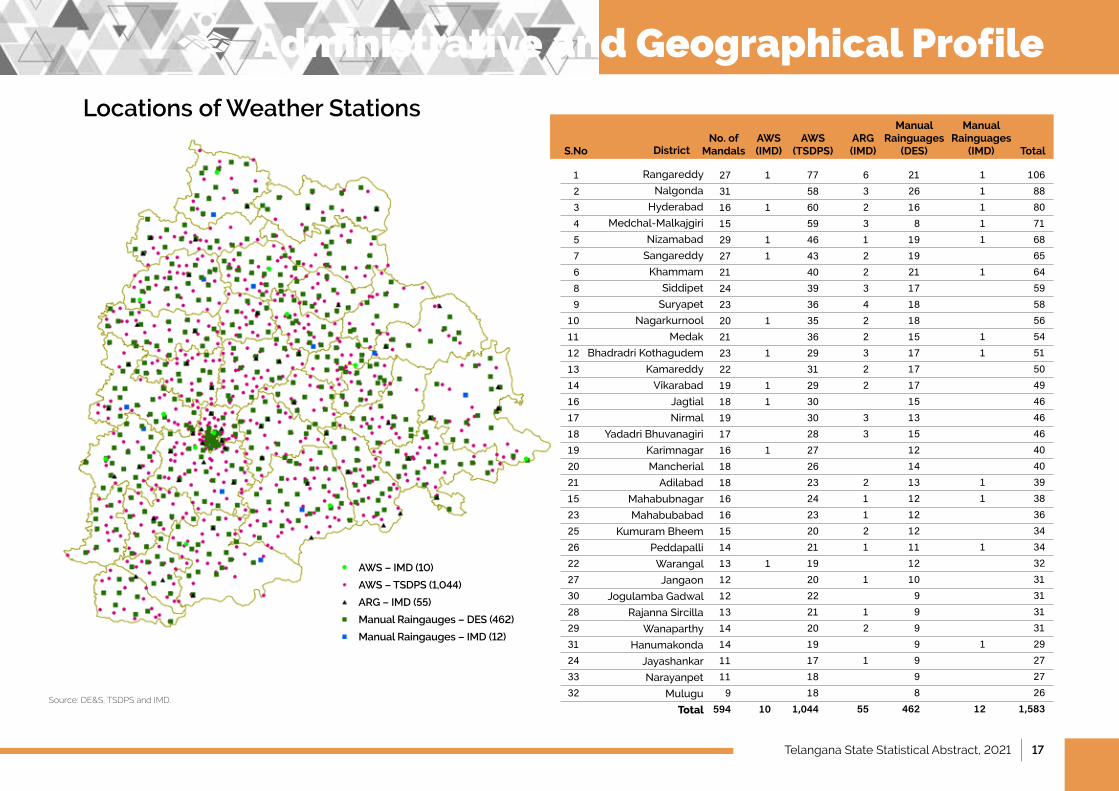
Locations of Weather Stations No. of
MandalsDistrictS.NoAWS (IMD)
AWS (TSDPS)
ARG (IMD)
Manual Rainguages
(DES)
Manual Rainguages
(IMD) Total
123457689
101112131416171819202115232526222730282931243332
Rangareddy
Nalgonda
Hyderabad
Medchal-Malkajgiri
Nizamabad
Sangareddy
Khammam
Siddipet
Suryapet
Nagarkurnool
Medak
Bhadradri Kothagudem
Kamareddy
Vikarabad
Jagtial
Nirmal
YadadriBhuvanagiri
Karimnagar
Mancherial
Adilabad
Mahabubnagar
Mahabubabad
Kumuram Bheem
Peddapalli
Warangal
Jangaon
Jogulamba Gadwal
Rajanna Sircilla
Wanaparthy
Hanumakonda
Jayashankar
Narayanpet
Mulugu
Total
27311615292721242320212322191819171618181616151413121213141411119
594
1
1
11
1
1
11
1
1
10
775860594643403936353629312930302827262324232021192022212019171818
1,044
63231223422322
33
21121
1
12
1
55
2126168
191921171818151717171513151214131212121112109999998
462
11111
1
11
11
1
1
12
1068880716865645958565451504946464640403938363434323131313129272726
1,583Source: DE&S, TSDPS and IMD.
AWS – IMD (10)
AWS – TSDPS (1,044)
ARG – IMD (55)
Manual Raingauges – DES (462)
Manual Raingauges – IMD (12)
Administrative and Geographical Profile
18 | Telangana State Statistical Abstract, 2021
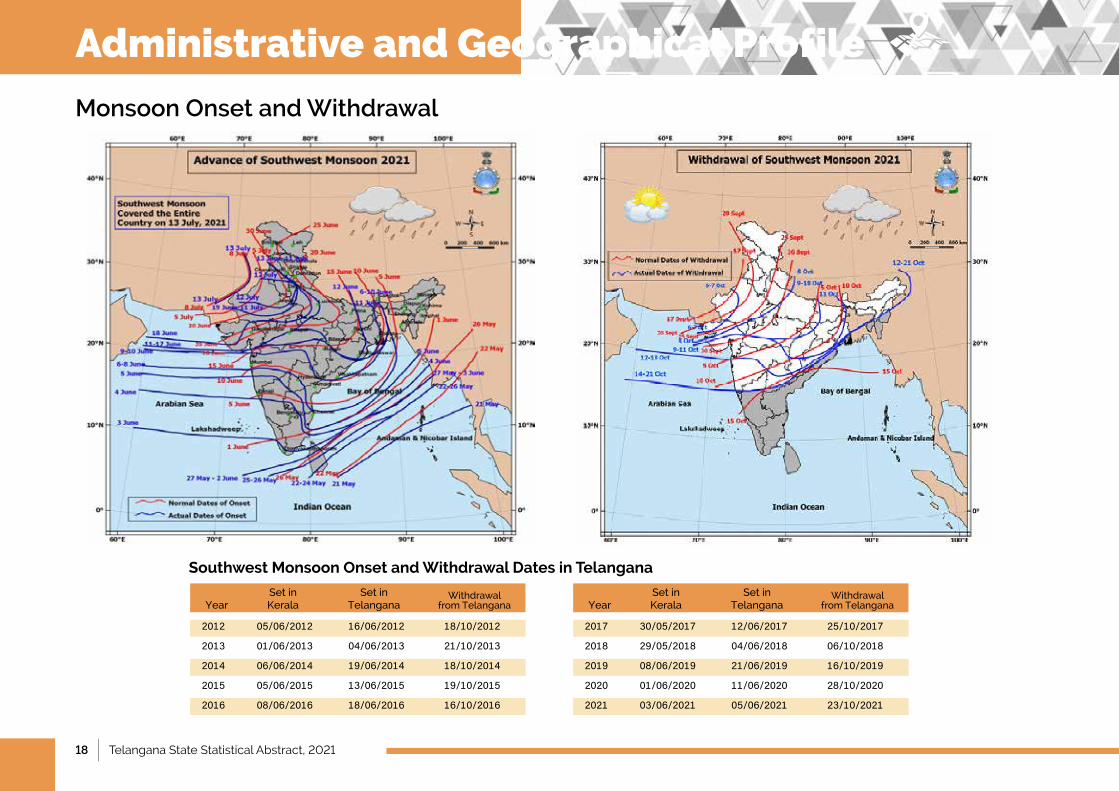
Monsoon Onset and Withdrawal
Monsoon Onset and WithdrawalOnly this image
2012 05/06/2012 16/06/2012 18/10/2012
2013 01/06/2013 04/06/2013 21/10/2013
2014 06/06/2014 19/06/2014 18/10/2014
2015 05/06/2015 13/06/2015 19/10/2015
2016 08/06/2016 18/06/2016 16/10/2016
Withdrawal from Telangana
Set in Telangana
Set in KeralaYear
2017 30/05/2017 12/06/2017 25/10/2017
2018 29/05/2018 04/06/2018 06/10/2018
2019 08/06/2019 21/06/2019 16/10/2019
2020 01/06/2020 11/06/2020 28/10/2020
2021 03/06/2021 05/06/2021 23/10/2021
Withdrawal from Telangana
Set in Telangana
Set in KeralaYear
Southwest Monsoon Onset and Withdrawal Dates in Telangana
Administrative and Geographical Profile
Telangana State Statistical Abstract, 2021 | 19
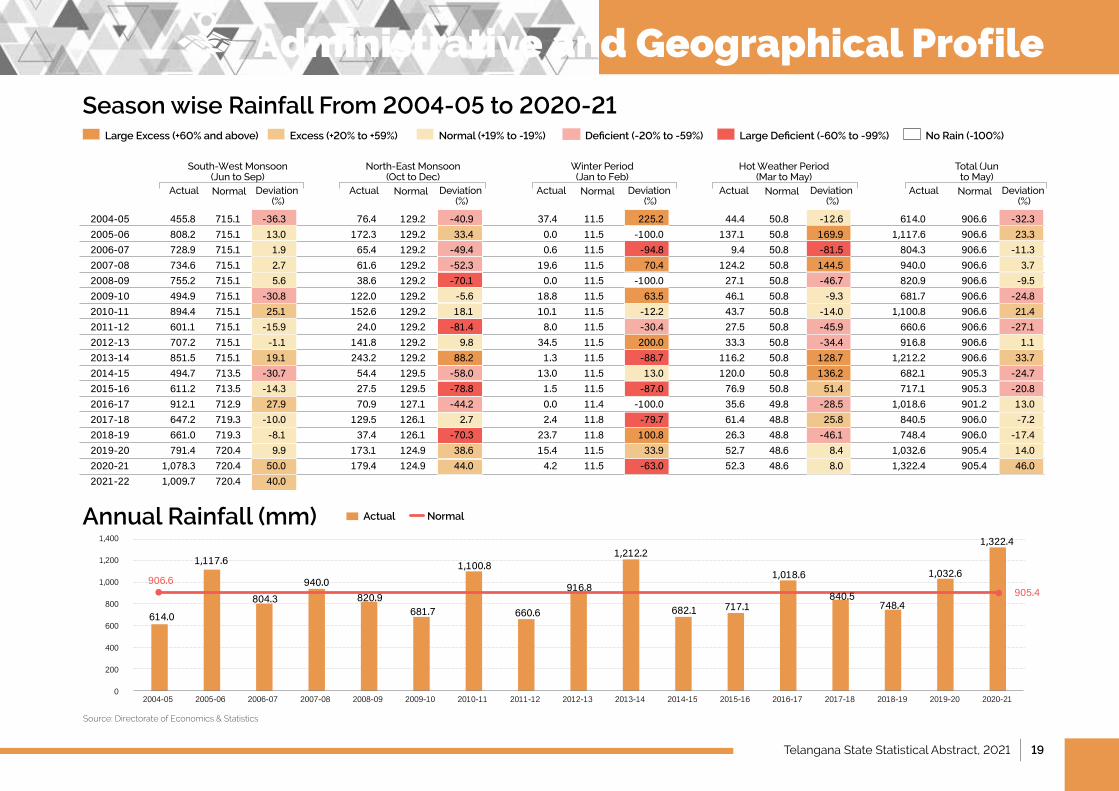
Season wise Rainfall From 2004-05 to 2020-21
Annual Rainfall (mm)
2004-05 455.8 715.1 -36.3 76.4 129.2 -40.9 37.4 11.5 225.2 44.4 50.8 -12.6 614.0 906.6 -32.32005-06 808.2 715.1 13.0 172.3 129.2 33.4 0.0 11.5 -100.0 137.1 50.8 169.9 1,117.6 906.6 23.32006-07 728.9 715.1 1.9 65.4 129.2 -49.4 0.6 11.5 -94.8 9.4 50.8 -81.5 804.3 906.6 -11.32007-08 734.6 715.1 2.7 61.6 129.2 -52.3 19.6 11.5 70.4 124.2 50.8 144.5 940.0 906.6 3.72008-09 755.2 715.1 5.6 38.6 129.2 -70.1 0.0 11.5 -100.0 27.1 50.8 -46.7 820.9 906.6 -9.52009-10 494.9 715.1 -30.8 122.0 129.2 -5.6 18.8 11.5 63.5 46.1 50.8 -9.3 681.7 906.6 -24.82010-11 894.4 715.1 25.1 152.6 129.2 18.1 10.1 11.5 -12.2 43.7 50.8 -14.0 1,100.8 906.6 21.42011-12 601.1 715.1 -15.9 24.0 129.2 -81.4 8.0 11.5 -30.4 27.5 50.8 -45.9 660.6 906.6 -27.12012-13 707.2 715.1 -1.1 141.8 129.2 9.8 34.5 11.5 200.0 33.3 50.8 -34.4 916.8 906.6 1.12013-14 851.5 715.1 19.1 243.2 129.2 88.2 1.3 11.5 -88.7 116.2 50.8 128.7 1,212.2 906.6 33.72014-15 494.7 713.5 -30.7 54.4 129.5 -58.0 13.0 11.5 13.0 120.0 50.8 136.2 682.1 905.3 -24.72015-16 611.2 713.5 -14.3 27.5 129.5 -78.8 1.5 11.5 -87.0 76.9 50.8 51.4 717.1 905.3 -20.82016-17 912.1 712.9 27.9 70.9 127.1 -44.2 0.0 11.4 -100.0 35.6 49.8 -28.5 1,018.6 901.2 13.02017-18 647.2 719.3 -10.0 129.5 126.1 2.7 2.4 11.8 -79.7 61.4 48.8 25.8 840.5 906.0 -7.22018-19 661.0 719.3 -8.1 37.4 126.1 -70.3 23.7 11.8 100.8 26.3 48.8 -46.1 748.4 906.0 -17.42019-20 791.4 720.4 9.9 173.1 124.9 38.6 15.4 11.5 33.9 52.7 48.6 8.4 1,032.6 905.4 14.02020-21 1,078.3 720.4 50.0 179.4 124.9 44.0 4.2 11.5 -63.0 52.3 48.6 8.0 1,322.4 905.4 46.02021-22 1,009.7 720.4 40.0
Excess (+20% to +59%) Normal (+19% to -19%) Deficient (-20% to -59%) Large Deficient (-60% to -99%) No Rain (-100%) Large Excess (+60% and above)
Actual Normal Deviation (%)
South-WestMonsoon(Jun to Sep)
Actual Normal Deviation (%)
North-EastMonsoon (Oct to Dec)
Actual Normal Deviation (%)
Winter Period (JantoFeb)
Actual Normal Deviation (%)
Hot Weather Period (MartoMay)
Actual Normal Deviation (%)
Total (Jun toMay)
2004-05 2005-06 2006-07 2007-08 2008-09 2009-10 2010-11 2011-12 2012-13 2013-14 2014-15 2015-16 2016-17 2017-18 2018-19 2019-20 2020-21
1,400
1,200
1,000
800
600
400
200
0
Actual Normal
Source: Directorate of Economics & Statistics
614.0
1,117.6
906.6905.4804.3
940.0820.9
681.7
1,100.8
660.6
916.8
1,212.2
682.1 717.1
1,018.6
840.5748.4
1,032.6
1,322.4
Administrative and Geographical Profile
20 | Telangana State Statistical Abstract, 2021
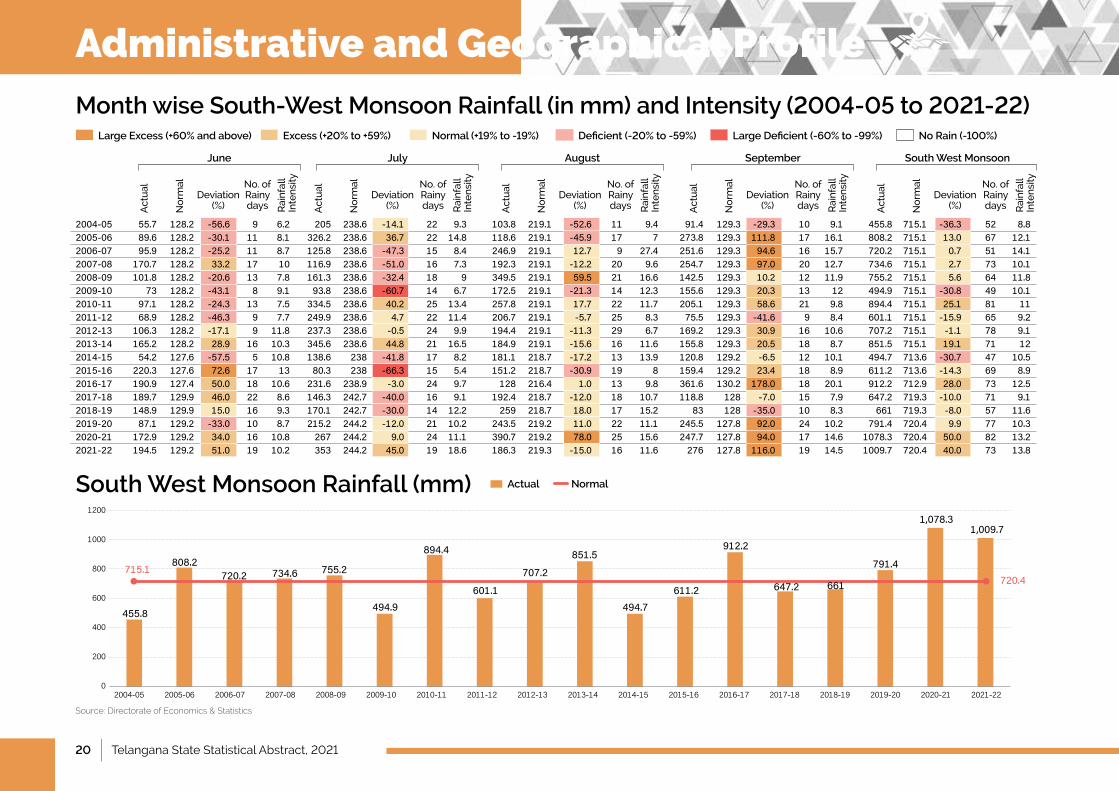
Month wise South-West Monsoon Rainfall (in mm) and Intensity (2004-05 to 2021-22)
Act
ual
No
rmal
Deviation (%)
No.ofRainy days R
ainf
all
Intensity
Act
ual
No
rmal
Deviation (%)
No.ofRainy days R
ainf
all
Intensity
Act
ual
No
rmal
Deviation (%)
No.ofRainy days R
ainf
all
Intensity
Act
ual
No
rmal
Deviation (%)
No.ofRainy days R
ainf
all
Intensity
Act
ual
No
rmal
Deviation (%)
No.ofRainy days R
ainf
all
Intensity
Excess (+20% to +59%) Normal (+19% to -19%) Deficient (-20% to -59%) Large Deficient (-60% to -99%) No Rain (-100%) Large Excess (+60% and above)
2004-05 55.7 128.2 -56.6 9 6.2 205 238.6 -14.1 22 9.3 103.8 219.1 -52.6 11 9.4 91.4 129.3 -29.3 10 9.1 455.8 715.1 -36.3 52 8.82005-06 89.6 128.2 -30.1 11 8.1 326.2 238.6 36.7 22 14.8 118.6 219.1 -45.9 17 7 273.8 129.3 111.8 17 16.1 808.2 715.1 13.0 67 12.12006-07 95.9 128.2 -25.2 11 8.7 125.8 238.6 -47.3 15 8.4 246.9 219.1 12.7 9 27.4 251.6 129.3 94.6 16 15.7 720.2 715.1 0.7 51 14.12007-08 170.7 128.2 33.2 17 10 116.9 238.6 -51.0 16 7.3 192.3 219.1 -12.2 20 9.6 254.7 129.3 97.0 20 12.7 734.6 715.1 2.7 73 10.12008-09 101.8 128.2 -20.6 13 7.8 161.3 238.6 -32.4 18 9 349.5 219.1 59.5 21 16.6 142.5 129.3 10.2 12 11.9 755.2 715.1 5.6 64 11.82009-10 73 128.2 -43.1 8 9.1 93.8 238.6 -60.7 14 6.7 172.5 219.1 -21.3 14 12.3 155.6 129.3 20.3 13 12 494.9 715.1 -30.8 49 10.12010-11 97.1 128.2 -24.3 13 7.5 334.5 238.6 40.2 25 13.4 257.8 219.1 17.7 22 11.7 205.1 129.3 58.6 21 9.8 894.4 715.1 25.1 81 112011-12 68.9 128.2 -46.3 9 7.7 249.9 238.6 4.7 22 11.4 206.7 219.1 -5.7 25 8.3 75.5 129.3 -41.6 9 8.4 601.1 715.1 -15.9 65 9.22012-13 106.3 128.2 -17.1 9 11.8 237.3 238.6 -0.5 24 9.9 194.4 219.1 -11.3 29 6.7 169.2 129.3 30.9 16 10.6 707.2 715.1 -1.1 78 9.12013-14 165.2 128.2 28.9 16 10.3 345.6 238.6 44.8 21 16.5 184.9 219.1 -15.6 16 11.6 155.8 129.3 20.5 18 8.7 851.5 715.1 19.1 71 122014-15 54.2 127.6 -57.5 5 10.8 138.6 238 -41.8 17 8.2 181.1 218.7 -17.2 13 13.9 120.8 129.2 -6.5 12 10.1 494.7 713.6 -30.7 47 10.52015-16 220.3 127.6 72.6 17 13 80.3 238 -66.3 15 5.4 151.2 218.7 -30.9 19 8 159.4 129.2 23.4 18 8.9 611.2 713.6 -14.3 69 8.92016-17 190.9 127.4 50.0 18 10.6 231.6 238.9 -3.0 24 9.7 128 216.4 1.0 13 9.8 361.6 130.2 178.0 18 20.1 912.2 712.9 28.0 73 12.52017-18 189.7 129.9 46.0 22 8.6 146.3 242.7 -40.0 16 9.1 192.4 218.7 -12.0 18 10.7 118.8 128 -7.0 15 7.9 647.2 719.3 -10.0 71 9.12018-19 148.9 129.9 15.0 16 9.3 170.1 242.7 -30.0 14 12.2 259 218.7 18.0 17 15.2 83 128 -35.0 10 8.3 661 719.3 -8.0 57 11.62019-20 87.1 129.2 -33.0 10 8.7 215.2 244.2 -12.0 21 10.2 243.5 219.2 11.0 22 11.1 245.5 127.8 92.0 24 10.2 791.4 720.4 9.9 77 10.32020-21 172.9 129.2 34.0 16 10.8 267 244.2 9.0 24 11.1 390.7 219.2 78.0 25 15.6 247.7 127.8 94.0 17 14.6 1078.3 720.4 50.0 82 13.22021-22 194.5 129.2 51.0 19 10.2 353 244.2 45.0 19 18.6 186.3 219.3 -15.0 16 11.6 276 127.8 116.0 19 14.5 1009.7 720.4 40.0 73 13.8
September South West MonsoonAugustJulyJune
South West Monsoon Rainfall (mm)
2004-05 2005-06 2006-07 2007-08 2008-09 2009-10 2010-11 2011-12 2012-13 2013-14 2014-15 2015-16 2016-17 2017-18 2018-19 2019-20 2020-21 2021-22
1200
1000
800
600
400
200
0
Actual Normal
Source: Directorate of Economics & Statistics
455.8
808.2715.1 720.2 734.6 755.2
494.9
894.4
601.1
707.2
851.5
494.7611.2
912.2
647.2 661
791.4
1,078.31,009.7
720.4
Administrative and Geographical Profile
Telangana State Statistical Abstract, 2021 | 21
Adilabad
Nirmal
Kumuram Bheem
Mancherial
Jagtial
Rajanna Sircilla
Peddapalli
Jayashankar
Mulugu
MedakSiddipet Hanumakonda
Warangal
JangaonSangareddy
Medchal-Malkajigiri
VikarabadRangareddy
Mahabubnagar
Narayanpet
Nalgonda
NagarkurnoolWanaparthy
Suryapet
Khammam
Karimnagar
Yadadri Bhuvanagiri
Mahabubabad
Jogulamba Gadwal
Bhadradri Kothagudem
Kamareddy
Nizamabad
Hyderabad
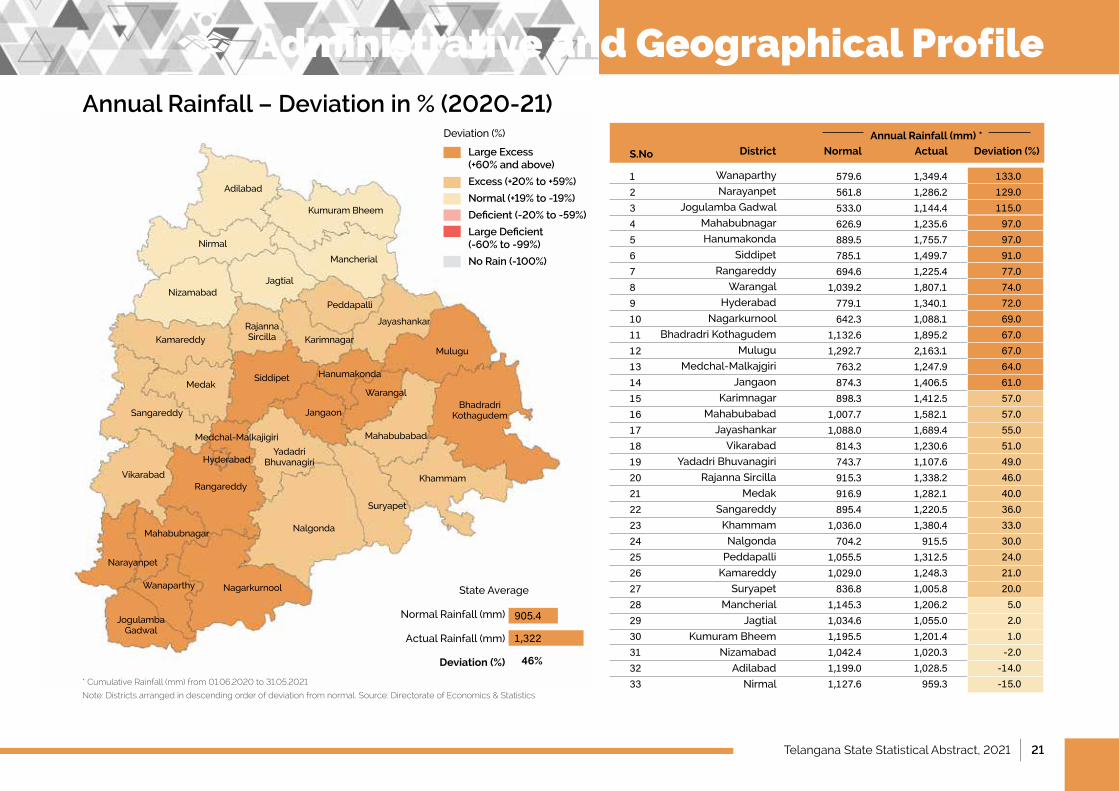
Annual Rainfall – Deviation in % (2020-21)
Wanaparthy
Narayanpet
Jogulamba Gadwal
Mahabubnagar
Hanumakonda
Siddipet
Rangareddy
Warangal
Hyderabad
Nagarkurnool
Bhadradri Kothagudem
Mulugu
Medchal-Malkajgiri
Jangaon
Karimnagar
Mahabubabad
Jayashankar
Vikarabad
YadadriBhuvanagiri
Rajanna Sircilla
Medak
Sangareddy
Khammam
Nalgonda
Peddapalli
Kamareddy
Suryapet
Mancherial
Jagtial
Kumuram Bheem
Nizamabad
Adilabad
Nirmal
579.6561.8533.0626.9889.5785.1694.6
1,039.2779.1642.3
1,132.61,292.7763.2874.3898.3
1,007.71,088.0814.3743.7915.3916.9895.4
1,036.0704.2
1,055.51,029.0836.8
1,145.31,034.61,195.51,042.41,199.01,127.6
123456789101112131415161718192021222324252627282930313233
1,349.41,286.21,144.41,235.61,755.71,499.71,225.41,807.11,340.11,088.11,895.22,163.11,247.91,406.51,412.51,582.11,689.41,230.61,107.61,338.21,282.11,220.51,380.4915.5
1,312.51,248.31,005.81,206.21,055.01,201.41,020.31,028.5959.3
Normal Actual Deviation (%)DistrictS.No
133.0129.0115.097.097.091.077.074.072.069.067.067.064.061.057.057.055.051.049.046.040.036.033.030.024.021.020.05.02.01.0-2.0
-14.0-15.0
Deviation(%)
* Cumulative Rainfall (mm) from 01.06.2020 to 31.05.2021
Note: Districts arranged in descending order of deviation from normal. Source: Directorate of Economics & Statistics
Large Excess (+60% and above)
Excess (+20% to +59%)
Normal (+19% to -19%)
Deficient (-20% to -59%)
Large Deficient (-60% to -99%)
No Rain (-100%)
Normal Rainfall (mm)
Actual Rainfall (mm)
State Average
Deviation (%) 46%
905.4
1,322
Annual Rainfall (mm) *
Administrative and Geographical Profile
22 | Telangana State Statistical Abstract, 2021
Adilabad
Nirmal
Kumuram Bheem
Mancherial
Jagtial
Rajanna Sircilla
Peddapalli
Jayashankar
Mulugu
MedakSiddipet Hanumakonda
Warangal
JangaonSangareddy
Medchal-Malkajigiri
VikarabadRangareddy
Mahabubnagar
Narayanpet
Nalgonda
NagarkurnoolWanaparthy
Suryapet
Khammam
Karimnagar
Yadadri Bhuvanagiri
Mahabubabad
Jogulamba Gadwal
Bhadradri Kothagudem
Kamareddy
Nizamabad
Hyderabad
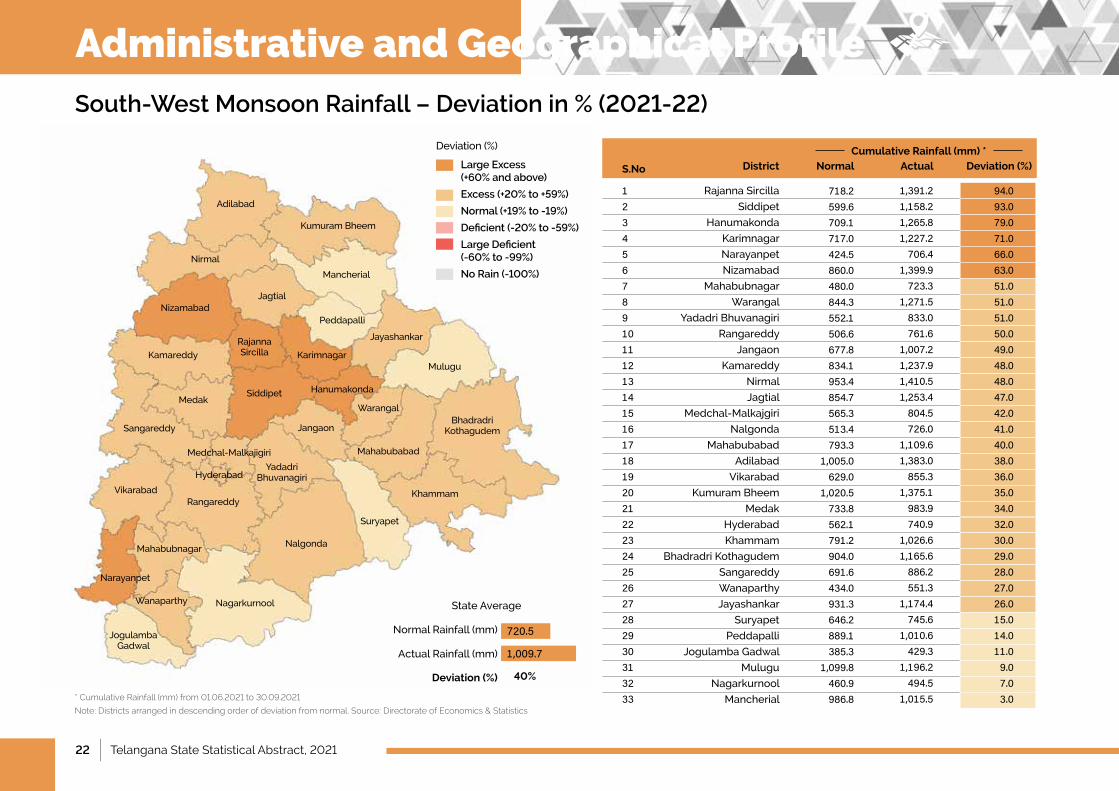
South-West Monsoon Rainfall – Deviation in % (2021-22)
Rajanna Sircilla
Siddipet
Hanumakonda
Karimnagar
Narayanpet
Nizamabad
Mahabubnagar
Warangal
YadadriBhuvanagiri
Rangareddy
Jangaon
Kamareddy
Nirmal
Jagtial
Medchal-Malkajgiri
Nalgonda
Mahabubabad
Adilabad
Vikarabad
Kumuram Bheem
Medak
Hyderabad
Khammam
Bhadradri Kothagudem
Sangareddy
Wanaparthy
Jayashankar
Suryapet
Peddapalli
Jogulamba Gadwal
Mulugu
Nagarkurnool
Mancherial
718.2599.6709.1717.0424.5860.0480.0844.3552.1506.6677.8834.1953.4854.7565.3513.4793.3
1,005.0629.0
1,020.5733.8562.1791.2904.0691.6434.0931.3646.2889.1385.3
1,099.8460.9986.8
123456789101112131415161718192021222324252627282930313233
1,391.21,158.21,265.81,227.2706.4
1,399.9723.3
1,271.5833.0761.6
1,007.21,237.91,410.51,253.4804.5726.0
1,109.61,383.0855.3
1,375.1983.9740.9
1,026.61,165.6886.2551.3
1,174.4745.6
1,010.6429.3
1,196.2494.5
1,015.5
Normal Actual Deviation (%)DistrictS.No
94.093.079.071.066.063.051.051.051.050.049.048.048.047.042.041.040.038.036.035.034.032.030.029.028.027.026.015.014.011.09.07.03.0
Deviation(%)
* Cumulative Rainfall (mm) from 01.06.2021 to 30.09.2021
Note: Districts arranged in descending order of deviation from normal. Source: Directorate of Economics & Statistics
Large Excess (+60% and above)
Excess (+20% to +59%)
Normal (+19% to -19%)
Deficient (-20% to -59%)
Large Deficient (-60% to -99%)
No Rain (-100%)
Normal Rainfall (mm)
Actual Rainfall (mm)
State Average
Deviation (%) 40%
720.5
1,009.7
Cumulative Rainfall (mm) *
Administrative and Geographical Profile
Telangana State Statistical Abstract, 2021 | 23
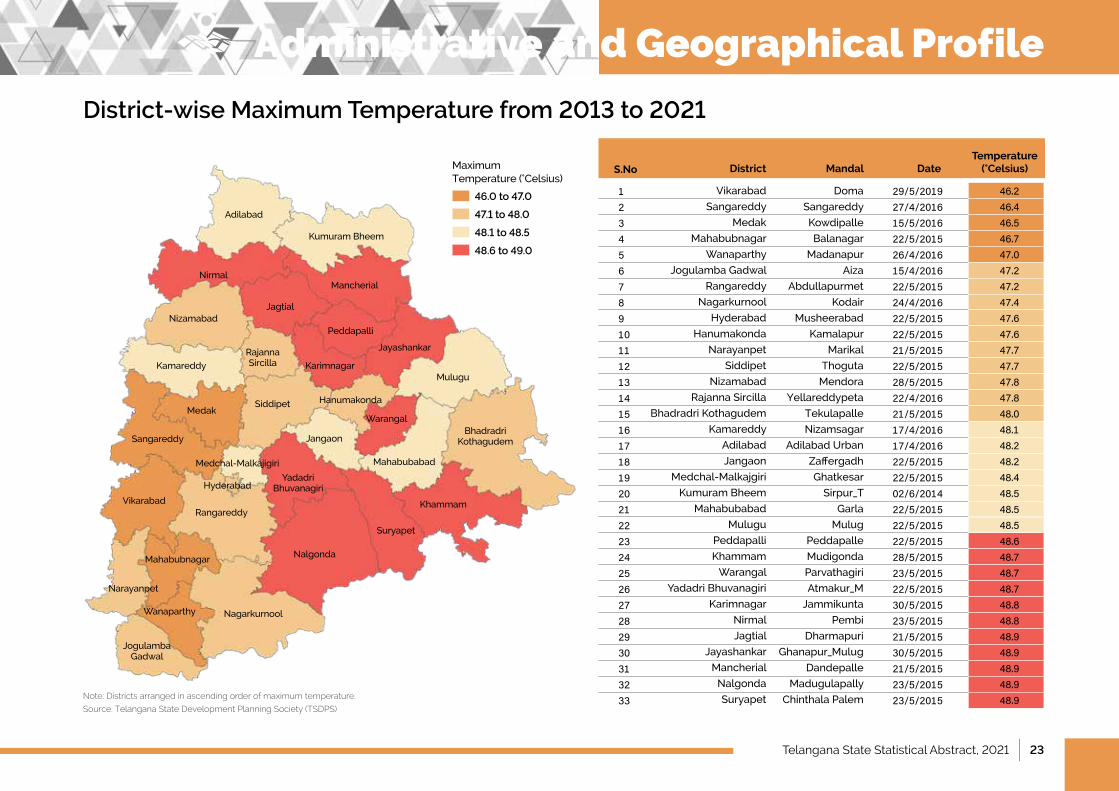
District-wise Maximum Temperature from 2013 to 2021
Vikarabad
Sangareddy
Medak
Mahabubnagar
Wanaparthy
Jogulamba Gadwal
Rangareddy
Nagarkurnool
Hyderabad
Hanumakonda
Narayanpet
Siddipet
Nizamabad
Rajanna Sircilla
Bhadradri Kothagudem
Kamareddy
Adilabad
Jangaon
Medchal-Malkajgiri
Kumuram Bheem
Mahabubabad
Mulugu
Peddapalli
Khammam
Warangal
YadadriBhuvanagiri
Karimnagar
Nirmal
Jagtial
Jayashankar
Mancherial
Nalgonda
Suryapet
Doma
Sangareddy
Kowdipalle
Balanagar
Madanapur
Aiza
Abdullapurmet
Kodair
Musheerabad
Kamalapur
Marikal
Thoguta
Mendora
Yellareddypeta
Tekulapalle
Nizamsagar
AdilabadUrban
Zaffergadh
Ghatkesar
Sirpur_T
Garla
Mulug
Peddapalle
Mudigonda
Parvathagiri
Atmakur_M
Jammikunta
Pembi
Dharmapuri
Ghanapur_Mulug
Dandepalle
Madugulapally
Chinthala Palem
123456789101112131415161718192021222324252627282930313233
29/5/201927/4/201615/5/201622/5/201526/4/201615/4/201622/5/201524/4/201622/5/201522/5/201521/5/201522/5/201528/5/201522/4/201621/5/201517/4/201617/4/201622/5/201522/5/201502/6/201422/5/201522/5/201522/5/201528/5/201523/5/201522/5/201530/5/201523/5/201521/5/201530/5/201521/5/201523/5/201523/5/2015
Mandal DateTemperature
(°Celsius)DistrictS.No
46.246.446.546.747.047.247.247.447.647.647.747.747.847.848.048.148.248.248.448.548.548.548.648.748.748.748.848.848.948.948.948.948.9
46.0 to 47.0
47.1 to 48.0
48.1 to 48.5
48.6 to 49.0
Maximum Temperature (°Celsius)
Note: Districts arranged in ascending order of maximum temperature.
Source: Telangana State Development Planning Society (TSDPS)
Adilabad
Nirmal
Kumuram Bheem
Mancherial
Jagtial
Rajanna Sircilla
Peddapalli
Jayashankar
Mulugu
MedakSiddipet Hanumakonda
Warangal
JangaonSangareddy
Medchal-Malkajigiri
VikarabadRangareddy
Mahabubnagar
Narayanpet
Nalgonda
NagarkurnoolWanaparthy
Suryapet
Khammam
Karimnagar
Yadadri Bhuvanagiri
Mahabubabad
Jogulamba Gadwal
Bhadradri Kothagudem
Kamareddy
Nizamabad
Hyderabad
Administrative and Geographical Profile
24 | Telangana State Statistical Abstract, 2021
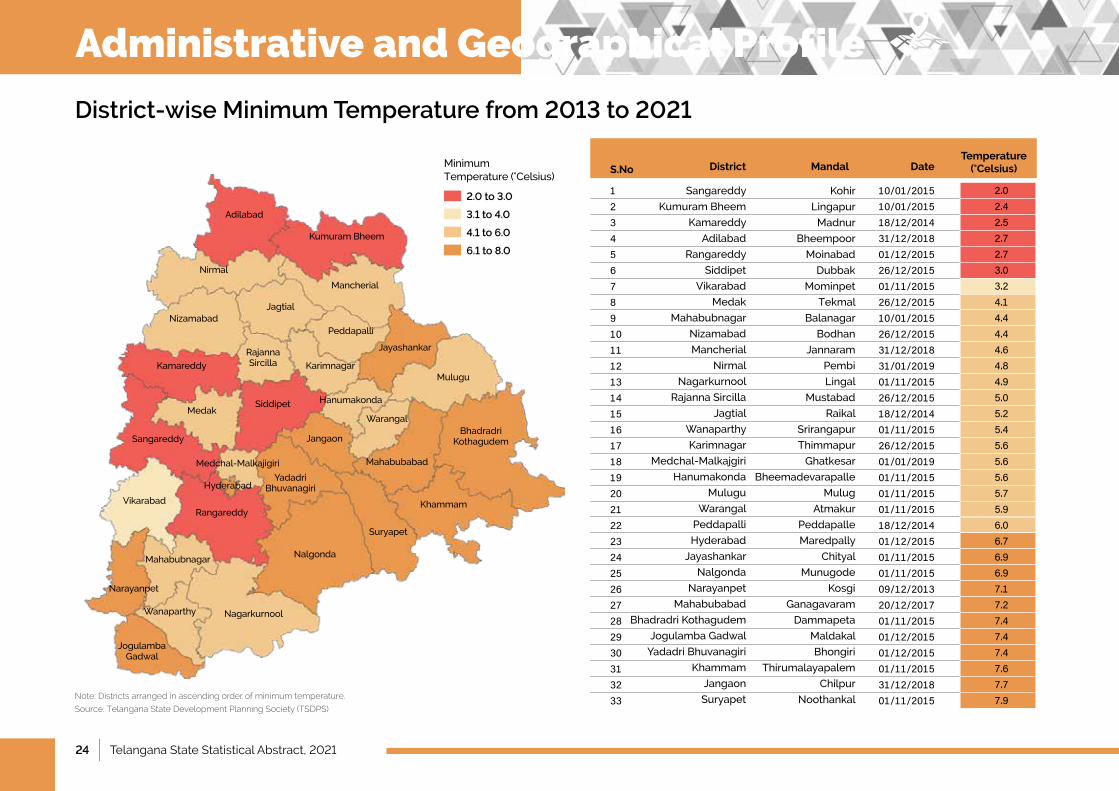
District-wise Minimum Temperature from 2013 to 2021
Sangareddy
Kumuram Bheem
Kamareddy
Adilabad
Rangareddy
Siddipet
Vikarabad
Medak
Mahabubnagar
Nizamabad
Mancherial
Nirmal
Nagarkurnool
Rajanna Sircilla
Jagtial
Wanaparthy
Karimnagar
Medchal-Malkajgiri
Hanumakonda
Mulugu
Warangal
Peddapalli
Hyderabad
Jayashankar
Nalgonda
Narayanpet
Mahabubabad
Bhadradri Kothagudem
Jogulamba Gadwal
YadadriBhuvanagiri
Khammam
Jangaon
Suryapet
Kohir
Lingapur
Madnur
Bheempoor
Moinabad
Dubbak
Mominpet
Tekmal
Balanagar
Bodhan
Jannaram
Pembi
Lingal
Mustabad
Raikal
Srirangapur
Thimmapur
Ghatkesar
Bheemadevarapalle
Mulug
Atmakur
Peddapalle
Maredpally
Chityal
Munugode
Kosgi
Ganagavaram
Dammapeta
Maldakal
Bhongiri
Thirumalayapalem
Chilpur
Noothankal
123456789101112131415161718192021222324252627282930313233
10/01/201510/01/201518/12/201431/12/201801/12/201526/12/201501/11/201526/12/201510/01/201526/12/201531/12/201831/01/201901/11/201526/12/201518/12/201401/11/201526/12/201501/01/201901/11/201501/11/201501/11/201518/12/201401/12/201501/11/201501/11/201509/12/201320/12/201701/11/201501/12/201501/12/201501/11/201531/12/201801/11/2015
Mandal DateTemperature
(°Celsius)DistrictS.No
2.02.42.52.72.73.03.24.14.44.44.64.84.95.05.25.45.65.65.65.75.96.06.76.96.97.17.27.47.47.47.67.77.9
2.0 to 3.0
3.1 to 4.0
4.1 to 6.0
6.1 to 8.0
Minimum Temperature (°Celsius)
Note: Districts arranged in ascending order of minimum temperature.
Source: Telangana State Development Planning Society (TSDPS)
Adilabad
Nirmal
Kumuram Bheem
Mancherial
Jagtial
Rajanna Sircilla
Peddapalli
Jayashankar
Mulugu
MedakSiddipet Hanumakonda
Warangal
JangaonSangareddy
Medchal-Malkajigiri
VikarabadRangareddy
Mahabubnagar
Narayanpet
Nalgonda
NagarkurnoolWanaparthy
Suryapet
Khammam
Karimnagar
Yadadri Bhuvanagiri
Mahabubabad
Jogulamba Gadwal
Bhadradri Kothagudem
Kamareddy
Nizamabad
Hyderabad
Administrative and Geographical Profile
Telangana State Statistical Abstract, 2021 | 25Telangana State Statistical Abstract, 2021 | 5
DemographyChapter 2
26 | Telangana State Statistical Abstract, 2021
Demography
1 IntroductionandKeyHighlights..................................................................................................................................................................................................................................................................................27
2 PopulationDensity.................................................................................................................................................................................................................................................................................................................................28
3 RuralPopulation..........................................................................................................................................................................................................................................................................................................................................29
4 UrbanPopulation......................................................................................................................................................................................................................................................................................................................................30
5 Child(0-6Years)Population................................................................................................................................................................................................................................................................................................31
6 LiteracyRate......................................................................................................................................................................................................................................................................................................................................................32
7 MaleLiteracyRate..................................................................................................................................................................................................................................................................................................................................33
8 FemaleLiteracyRate.........................................................................................................................................................................................................................................................................................................................34
9 SexRatio....................................................................................................................................................................................................................................................................................................................................................................35
10 Child(0-6Years)SexRatio.....................................................................................................................................................................................................................................................................................................36
11 ScheduledCastes–Population.....................................................................................................................................................................................................................................................................................37
12 ScheduledCastes-SexRatio...........................................................................................................................................................................................................................................................................................38
13 ScheduledTribes—Population.....................................................................................................................................................................................................................................................................................39
14 ScheduledTribes-SexRatio..............................................................................................................................................................................................................................................................................................40
15 SC-STSexRatio&LiteracyRate................................................................................................................................................................................................................................................................................41
16 MainWorkers....................................................................................................................................................................................................................................................................................................................................................42
17 MarginalWorkers......................................................................................................................................................................................................................................................................................................................................43
18 Cultivators...............................................................................................................................................................................................................................................................................................................................................................44
19 AgriculturalLabourers.....................................................................................................................................................................................................................................................................................................................45
20 ProjectedPopulationbyAgeandGender,2011to2036..............................................................................................................................................................................................46
IndexPage No.S.No. Item
Telangana State Statistical Abstract, 2021 | 27
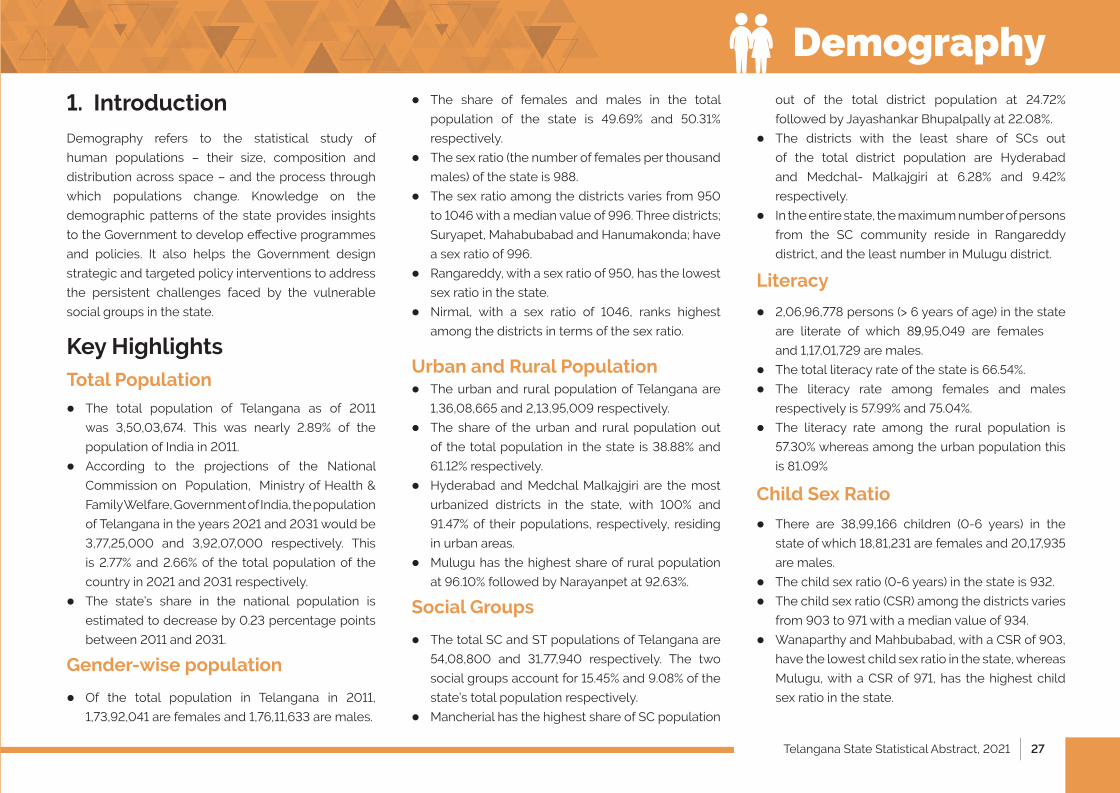
1. Introduction Demography refers to the statistical study of
human populations – their size, composition and
distribution across space – and the process through
which populations change. Knowledge on the
demographic patterns of the state provides insights
to the Government to develop eff ective programmes
and policies. It also helps the Government design
strategic and targeted policy interventions to address
the persistent challenges faced by the vulnerable
social groups in the state.
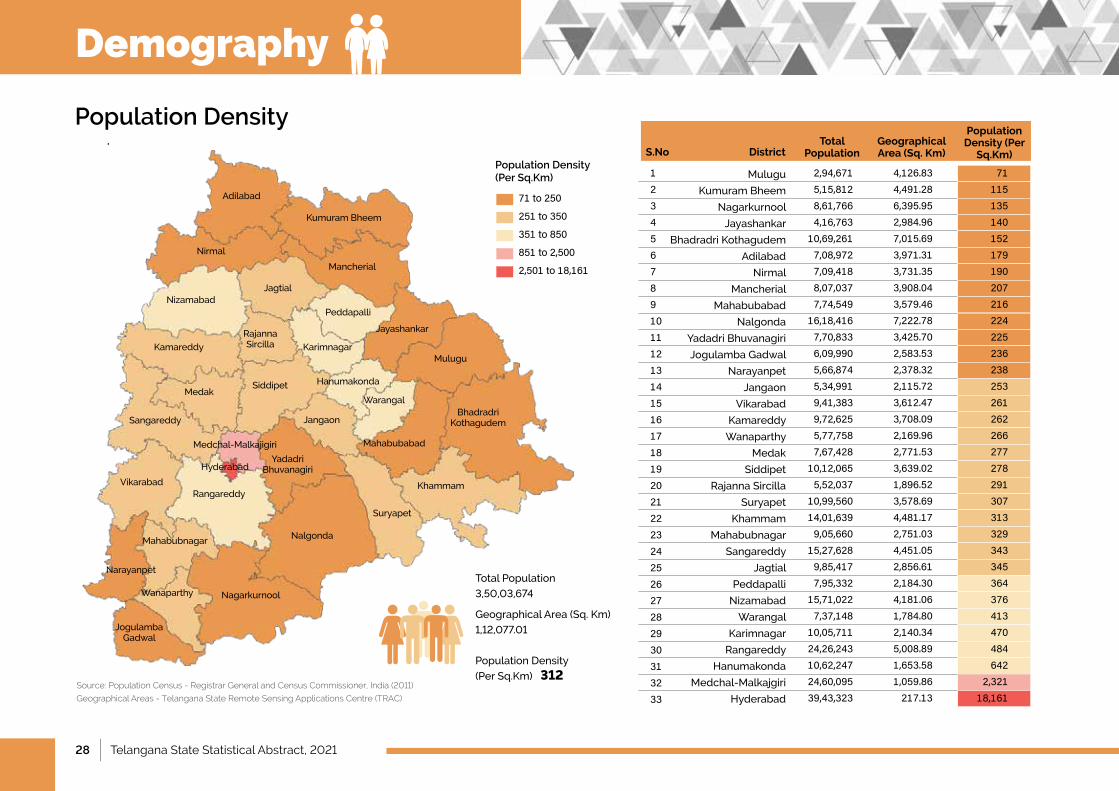
Key HighlightsTotal Population The total population of Telangana as of 2011
was 3,50,03,674. This was nearly 2.89% of the
population of India in 2011.
According to the projections of the National
Commission on Population, Ministry of Health &
Family Welfare, Government of India, the population
of Telangana in the years 2021 and 2031 would be
3,77,25,000 and 3,92,07,000 respectively. This
is 2.77% and 2.66% of the total population of the
country in 2021 and 2031 respectively.
The state’s share in the national population is
estimated to decrease by 0.23 percentage points
between 2011 and 2031.
Gender-wise population
Of the total population in Telangana in 2011,
1,73,92,041 are females and 1,76,11,633 are males.
The share of females and males in the total
population of the state is 49.69% and 50.31%
respectively.
The sex ratio (the number of females per thousand
males) of the state is 988.
The sex ratio among the districts varies from 950
to 1046 with a median value of 996. Three districts;
Suryapet, Mahabubabad and Hanumakonda; have
a sex ratio of 996.
Rangareddy, with a sex ratio of 950, has the lowest
sex ratio in the state.
Nirmal, with a sex ratio of 1046, ranks highest
among the districts in terms of the sex ratio.
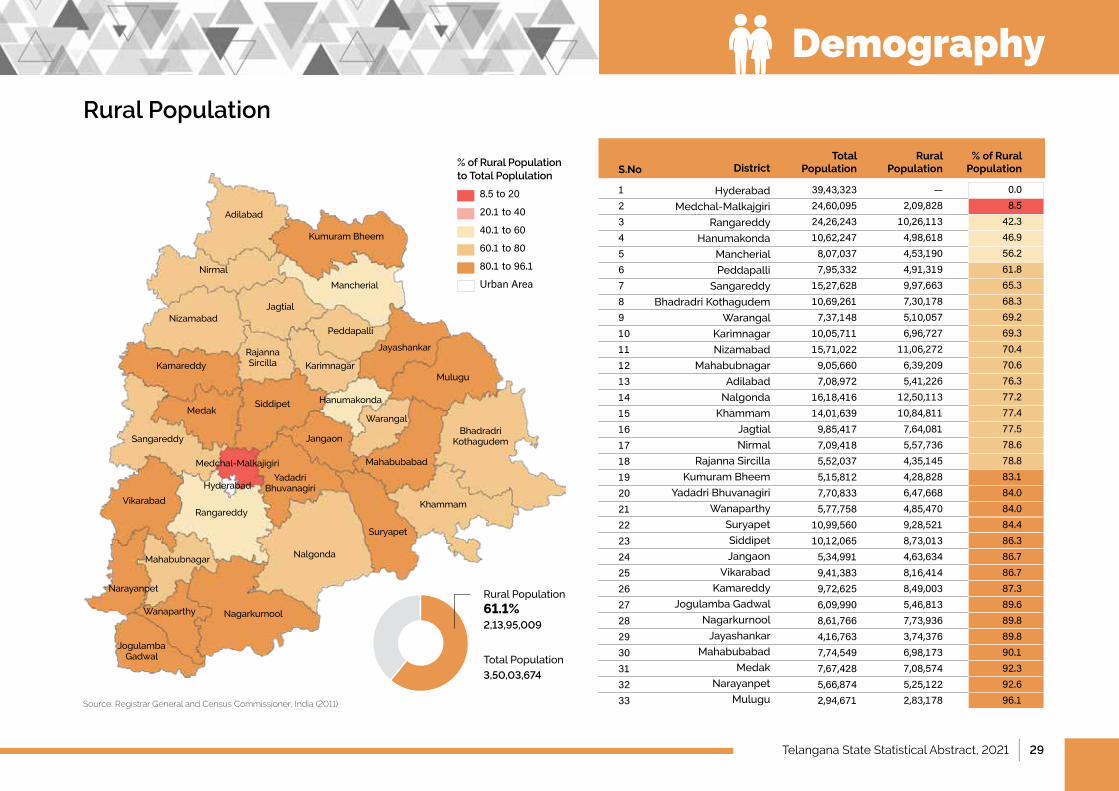
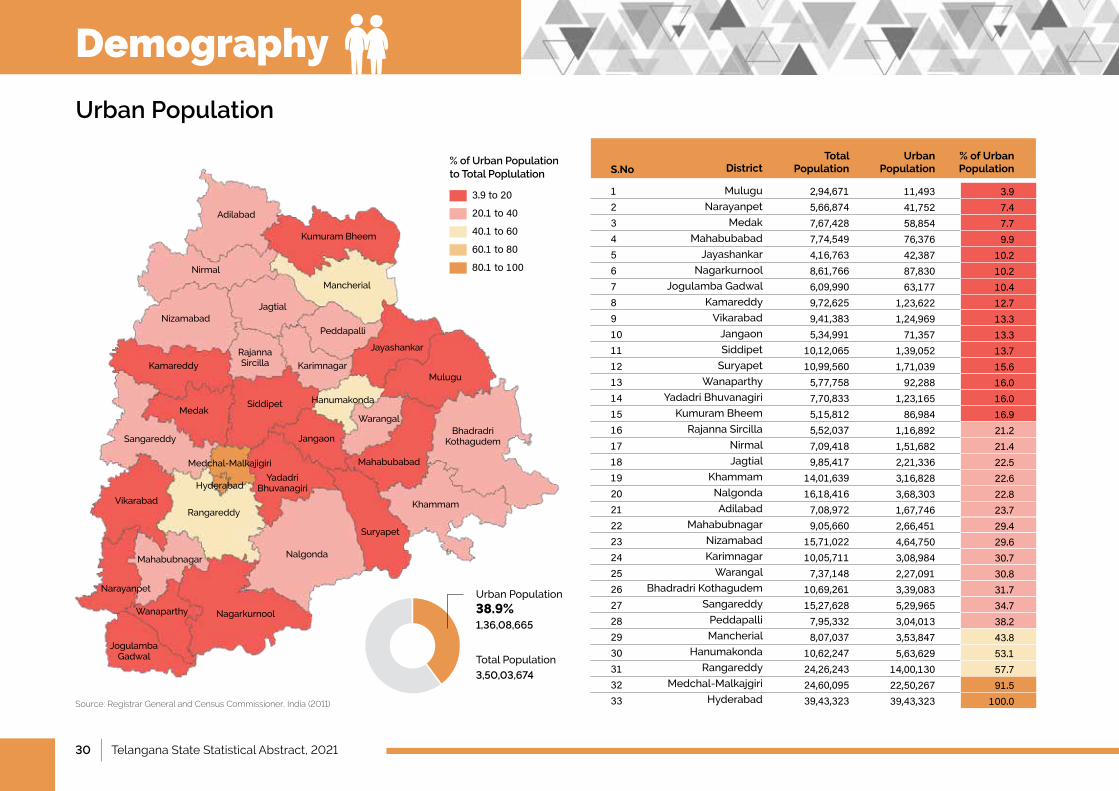
Urban and Rural Population The urban and rural population of Telangana are
1,36,08,665 and 2,13,95,009 respectively.
The share of the urban and rural population out
of the total population in the state is 38.88% and
61.12% respectively.
Hyderabad and Medchal Malkajgiri are the most
urbanized districts in the state, with 100% and
91.47% of their populations, respectively, residing
in urban areas.
Mulugu has the highest share of rural population
at 96.10% followed by Narayanpet at 92.63%.
Social Groups
The total SC and ST populations of Telangana are
54,08,800 and 31,77,940 respectively. The two
social groups account for 15.45% and 9.08% of the
state’s total population respectively.
Mancherial has the highest share of SC population
out of the total district population at 24.72%
followed by Jayashankar Bhupalpally at 22.08%.
The districts with the least share of SCs out
of the total district population are Hyderabad
and Medchal- Malkajgiri at 6.28% and 9.42%
respectively.
In the entire state, the maximum number of persons
from the SC community reside in Rangareddy
district, and the least number in Mulugu district.
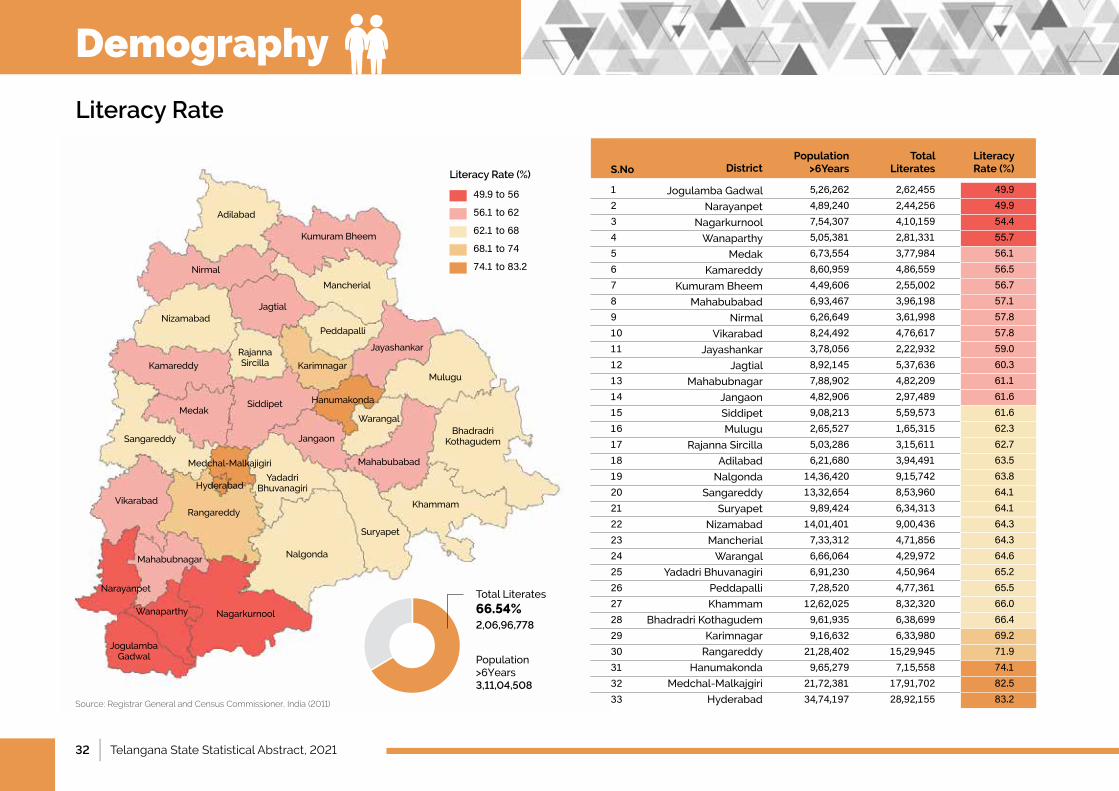
Literacy
The total literacy rate of the state is 66.54%.
The literacy rate among females and males
respectively is 57.99% and 75.04%.
The literacy rate among the rural population is
57.30% whereas among the urban population this
is 81.09%
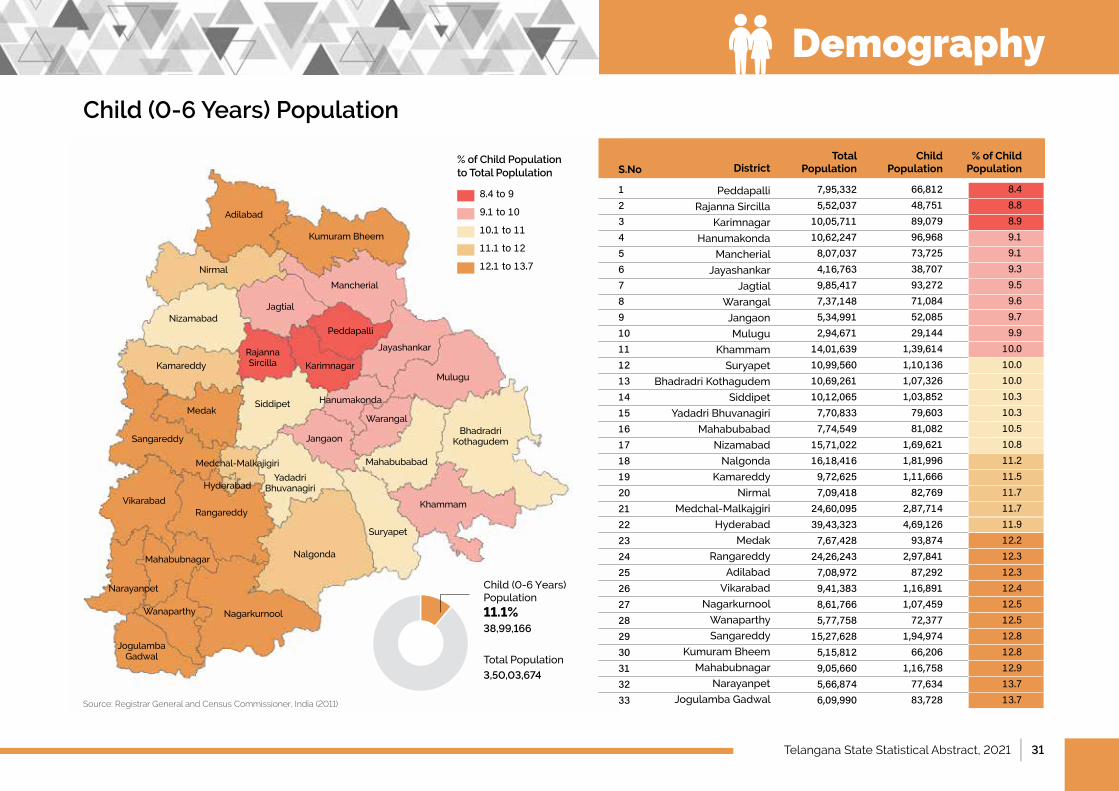
Child Sex Ratio
There are 38,99,166 children (0-6 years) in the
state of which 18,81,231 are females and 20,17,935
are males.
The child sex ratio (0-6 years) in the state is 932.
The child sex ratio (CSR) among the districts varies
from 903 to 971 with a median value of 934.
Wanaparthy and Mahbubabad, with a CSR of 903,
have the lowest child sex ratio in the state, whereas
Mulugu, with a CSR of 971, has the highest child
sex ratio in the state.
Demography
2,06,96,778 persons (> 6 years of age) in the state
are literate of which 89,95,049 are females
and 1,17,01,729 are males.
28 | Telangana State Statistical Abstract, 2021
Population Density
Mulugu
Kumuram Bheem
Nagarkurnool
Jayashankar
Bhadradri Kothagudem
Adilabad
Nirmal
Mancherial
Mahabubabad
Nalgonda
YadadriBhuvanagiri
Jogulamba Gadwal
Narayanpet
Jangaon
Vikarabad
Kamareddy
Wanaparthy
Medak
Siddipet
Rajanna Sircilla
Suryapet
Khammam
Mahabubnagar
Sangareddy
Jagtial
Peddapalli
Nizamabad
Warangal
Karimnagar
Rangareddy
Hanumakonda
Medchal-Malkajgiri
Hyderabad
Population Density (Per
Sq.Km)Geographical Area (Sq. Km)
Total PopulationDistrictS.No
123456789101112131415161718192021222324252627282930313233
71115135140152179190207216224225236238253261262266277278291307313329343345364376413470484642
2,32118,161
2,94,6715,15,8128,61,7664,16,763
10,69,2617,08,9727,09,4188,07,0377,74,549
16,18,4167,70,8336,09,9905,66,8745,34,9919,41,3839,72,6255,77,7587,67,428
10,12,0655,52,037
10,99,56014,01,6399,05,660
15,27,6289,85,4177,95,332
15,71,0227,37,148
10,05,71124,26,24310,62,24724,60,09539,43,323
4,126.834,491.286,395.952,984.967,015.693,971.313,731.353,908.043,579.467,222.783,425.702,583.532,378.322,115.723,612.473,708.092,169.962,771.533,639.021,896.523,578.694,481.172,751.034,451.052,856.612,184.304,181.061,784.802,140.345,008.891,653.581,059.86217.13
71to250
251to350
351to850
851to2,500
2,501to18,161
Population Density (Per Sq.Km)
Source: Population Census - Registrar General and Census Commissioner, India (2011)
Geographical Areas - Telangana State Remote Sensing Applications Centre (TRAC)
Adilabad
Nirmal
Kumuram Bheem
Mancherial
Jagtial
Rajanna Sircilla
Peddapalli
Jayashankar
Mulugu
MedakSiddipet Hanumakonda
Warangal
JangaonSangareddy
Medchal-Malkajigiri
VikarabadRangareddy
Mahabubnagar
Narayanpet
Nalgonda
NagarkurnoolWanaparthy
Suryapet
Khammam
Karimnagar
Yadadri Bhuvanagiri
Mahabubabad
Jogulamba Gadwal
Bhadradri Kothagudem
Kamareddy
Nizamabad
Hyderabad
Total Population
3,50,03,674
GeographicalArea(Sq.Km)
1,12,077.01
Population Density
(PerSq.Km)312
Demography
Telangana State Statistical Abstract, 2021 | 29
Rural Population
Hyderabad
Medchal-Malkajgiri
Rangareddy
Hanumakonda
Mancherial
Peddapalli
Sangareddy
Bhadradri Kothagudem
Warangal
Karimnagar
Nizamabad
Mahabubnagar
Adilabad
Nalgonda
Khammam
Jagtial
Nirmal
Rajanna Sircilla
Kumuram Bheem
YadadriBhuvanagiri
Wanaparthy
Suryapet
Siddipet
Jangaon
Vikarabad
Kamareddy
Jogulamba Gadwal
Nagarkurnool
Jayashankar
Mahabubabad
Medak
Narayanpet
Mulugu
Total Population
Rural Population
% of Rural PopulationDistrictS.No
123456789101112131415161718192021222324252627282930313233
39,43,32324,60,09524,26,24310,62,2478,07,0377,95,332
15,27,62810,69,2617,37,148
10,05,71115,71,0229,05,6607,08,972
16,18,41614,01,6399,85,4177,09,4185,52,0375,15,8127,70,8335,77,758
10,99,56010,12,0655,34,9919,41,3839,72,6256,09,9908,61,7664,16,7637,74,5497,67,4285,66,8742,94,671
—2,09,828
10,26,1134,98,6184,53,1904,91,3199,97,6637,30,1785,10,0576,96,727
11,06,2726,39,2095,41,226
12,50,11310,84,8117,64,0815,57,7364,35,1454,28,8286,47,6684,85,4709,28,5218,73,0134,63,6348,16,4148,49,0035,46,8137,73,9363,74,3766,98,1737,08,5745,25,1222,83,178
0.08.5
42.346.956.261.865.368.369.269.370.470.676.377.277.477.578.678.883.184.084.084.486.386.786.787.389.689.889.890.192.392.696.1
8.5to20
20.1to40
40.1to60
60.1to80
80.1to96.1
UrbanArea
Rural Population
61.1%2,13,95,009
Total Population
3,50,03,674
Source: Registrar General and Census Commissioner, India (2011)
Adilabad
Nirmal
Kumuram Bheem
Mancherial
Jagtial
Rajanna Sircilla
Peddapalli
Jayashankar
Mulugu
MedakSiddipet Hanumakonda
Warangal
JangaonSangareddy
Medchal-Malkajigiri
VikarabadRangareddy
Mahabubnagar
Narayanpet
Nalgonda
NagarkurnoolWanaparthy
Suryapet
Khammam
Karimnagar
Yadadri Bhuvanagiri
Mahabubabad
Jogulamba Gadwal
Bhadradri Kothagudem
Kamareddy
Nizamabad
Hyderabad
% of Rural Population to Total Poplulation
Demography
30 | Telangana State Statistical Abstract, 2021
Urban Population
Mulugu
Narayanpet
Medak
Mahabubabad
Jayashankar
Nagarkurnool
Jogulamba Gadwal
Kamareddy
Vikarabad
Jangaon
Siddipet
Suryapet
Wanaparthy
YadadriBhuvanagiri
Kumuram Bheem
Rajanna Sircilla
Nirmal
Jagtial
Khammam
Nalgonda
Adilabad
Mahabubnagar
Nizamabad
Karimnagar
Warangal
Bhadradri Kothagudem
Sangareddy
Peddapalli
Mancherial
Hanumakonda
Rangareddy
Medchal-Malkajgiri
Hyderabad
Total Population
Urban Population
% of Urban PopulationDistrictS.No
123456789101112131415161718192021222324252627282930313233
2,94,6715,66,8747,67,4287,74,5494,16,7638,61,7666,09,9909,72,6259,41,3835,34,991
10,12,06510,99,5605,77,7587,70,8335,15,8125,52,0377,09,4189,85,417
14,01,63916,18,4167,08,9729,05,660
15,71,02210,05,7117,37,148
10,69,26115,27,6287,95,3328,07,037
10,62,24724,26,24324,60,09539,43,323
11,49341,75258,85476,37642,38787,83063,177
1,23,6221,24,96971,357
1,39,0521,71,03992,288
1,23,16586,984
1,16,8921,51,6822,21,3363,16,8283,68,3031,67,7462,66,4514,64,7503,08,9842,27,0913,39,0835,29,9653,04,0133,53,8475,63,629
14,00,13022,50,26739,43,323
3.97.47.79.9
10.210.210.412.713.313.313.715.616.016.016.921.221.422.522.622.823.729.429.630.730.831.734.738.243.853.157.791.5
100.0
3.9to20
20.1to40
40.1to60
60.1to80
80.1to100
% of Urban Population to Total Poplulation
UrbanPopulation
38.9%1,36,08,665
Total Population
3,50,03,674
Source: Registrar General and Census Commissioner, India (2011)
Adilabad
Nirmal
Kumuram Bheem
Mancherial
Jagtial
Rajanna Sircilla
Peddapalli
Jayashankar
Mulugu
MedakSiddipet Hanumakonda
Warangal
JangaonSangareddy
Medchal-Malkajigiri
VikarabadRangareddy
Mahabubnagar
Narayanpet
Nalgonda
NagarkurnoolWanaparthy
Suryapet
Khammam
Karimnagar
Yadadri Bhuvanagiri
Mahabubabad
Jogulamba Gadwal
Bhadradri Kothagudem
Kamareddy
Nizamabad
Hyderabad
Demography
Telangana State Statistical Abstract, 2021 | 31
Child (0-6 Years) Population
Peddapalli
Rajanna Sircilla
Karimnagar
Hanumakonda
Mancherial
Jayashankar
Jagtial
Warangal
Jangaon
Mulugu
Khammam
Suryapet
Bhadradri Kothagudem
Siddipet
YadadriBhuvanagiri
Mahabubabad
Nizamabad
Nalgonda
Kamareddy
Nirmal
Medchal-Malkajgiri
Hyderabad
Medak
Rangareddy
Adilabad
Vikarabad
Nagarkurnool
Wanaparthy
Sangareddy
Kumuram Bheem
Mahabubnagar
Narayanpet
Jogulamba Gadwal
Total Population
Child Population
% of Child PopulationDistrictS.No
123456789101112131415161718192021222324252627282930313233
7,95,3325,52,037
10,05,71110,62,2478,07,0374,16,7639,85,4177,37,1485,34,9912,94,671
14,01,63910,99,56010,69,26110,12,0657,70,8337,74,549
15,71,02216,18,4169,72,6257,09,418
24,60,09539,43,3237,67,428
24,26,2437,08,9729,41,3838,61,7665,77,758
15,27,6285,15,8129,05,6605,66,8746,09,990
66,81248,75189,07996,96873,72538,70793,27271,08452,08529,144
1,39,6141,10,1361,07,3261,03,85279,60381,082
1,69,6211,81,9961,11,66682,769
2,87,7144,69,12693,874
2,97,84187,292
1,16,8911,07,45972,377
1,94,97466,206
1,16,75877,63483,728
8.48.88.99.19.19.39.59.69.79.9
10.010.010.010.310.310.510.811.211.511.711.711.912.212.312.312.412.512.512.812.812.913.713.7
8.4to9
9.1to10
10.1to11
11.1to12
12.1to13.7
% of Child Population to Total Poplulation
Child(0-6Years)Population
11.1%38,99,166
Total Population
3,50,03,674
Source: Registrar General and Census Commissioner, India (2011)
Adilabad
Nirmal
Kumuram Bheem
Mancherial
Jagtial
Rajanna Sircilla
Peddapalli
Jayashankar
Mulugu
MedakSiddipet Hanumakonda
Warangal
JangaonSangareddy
Medchal-Malkajigiri
VikarabadRangareddy
Mahabubnagar
Narayanpet
Nalgonda
NagarkurnoolWanaparthy
Suryapet
Khammam
Karimnagar
Yadadri Bhuvanagiri
Mahabubabad
Jogulamba Gadwal
Bhadradri Kothagudem
Kamareddy
Nizamabad
Hyderabad
Demography
32 | Telangana State Statistical Abstract, 2021
Literacy Rate
Jogulamba Gadwal
Narayanpet
Nagarkurnool
Wanaparthy
Medak
Kamareddy
Kumuram Bheem
Mahabubabad
Nirmal
Vikarabad
Jayashankar
Jagtial
Mahabubnagar
Jangaon
Siddipet
Mulugu
Rajanna Sircilla
Adilabad
Nalgonda
Sangareddy
Suryapet
Nizamabad
Mancherial
Warangal
YadadriBhuvanagiri
Peddapalli
Khammam
Bhadradri Kothagudem
Karimnagar
Rangareddy
Hanumakonda
Medchal-Malkajgiri
Hyderabad
Population >6Years
Total Literates
Literacy Rate (%)DistrictS.No
123456789101112131415161718192021222324252627282930313233
5,26,2624,89,2407,54,3075,05,3816,73,5548,60,9594,49,6066,93,4676,26,6498,24,4923,78,0568,92,1457,88,9024,82,9069,08,2132,65,5275,03,2866,21,680
14,36,42013,32,6549,89,424
14,01,4017,33,3126,66,0646,91,2307,28,520
12,62,0259,61,9359,16,632
21,28,4029,65,279
21,72,38134,74,197
2,62,4552,44,2564,10,1592,81,3313,77,9844,86,5592,55,0023,96,1983,61,9984,76,6172,22,9325,37,6364,82,2092,97,4895,59,5731,65,3153,15,6113,94,4919,15,7428,53,9606,34,3139,00,4364,71,8564,29,9724,50,9644,77,3618,32,3206,38,6996,33,980
15,29,9457,15,558
17,91,70228,92,155
49.949.954.455.756.156.556.757.157.857.859.060.361.161.661.662.362.763.563.864.164.164.364.364.665.265.566.066.469.271.974.182.583.2
49.9to56
56.1to62
62.1to68
68.1to74
74.1to83.2
Literacy Rate (%)
Total Literates
66.54%2,06,96,778
Population >6Years3,11,04,508
Source: Registrar General and Census Commissioner, India (2011)
Adilabad
Nirmal
Kumuram Bheem
Mancherial
Jagtial
Rajanna Sircilla
Peddapalli
Jayashankar
Mulugu
MedakSiddipet Hanumakonda
Warangal
JangaonSangareddy
Medchal-Malkajigiri
VikarabadRangareddy
Mahabubnagar
Narayanpet
Nalgonda
NagarkurnoolWanaparthy
Suryapet
Khammam
Karimnagar
Yadadri Bhuvanagiri
Mahabubabad
Jogulamba Gadwal
Bhadradri Kothagudem
Kamareddy
Nizamabad
Hyderabad
Demography
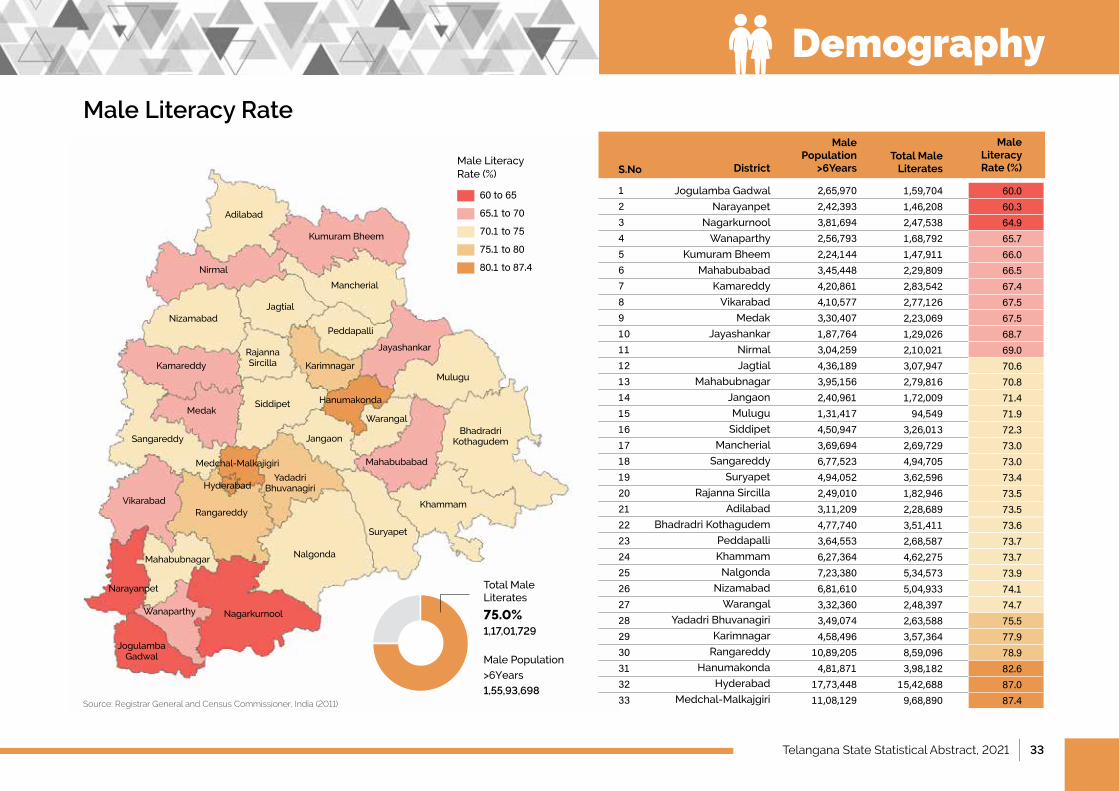
Telangana State Statistical Abstract, 2021 | 33
Male Literacy Rate
Jogulamba Gadwal
Narayanpet
Nagarkurnool
Wanaparthy
Kumuram Bheem
Mahabubabad
Kamareddy
Vikarabad
Medak
Jayashankar
Nirmal
Jagtial
Mahabubnagar
Jangaon
Mulugu
Siddipet
Mancherial
Sangareddy
Suryapet
Rajanna Sircilla
Adilabad
Bhadradri Kothagudem
Peddapalli
Khammam
Nalgonda
Nizamabad
Warangal
YadadriBhuvanagiri
Karimnagar
Rangareddy
Hanumakonda
Hyderabad
Medchal-Malkajgiri
Male Population
>6YearsTotal Male
Literates
Male Literacy Rate (%)DistrictS.No
123456789101112131415161718192021222324252627282930313233
2,65,9702,42,3933,81,6942,56,7932,24,1443,45,4484,20,8614,10,5773,30,4071,87,7643,04,2594,36,1893,95,1562,40,9611,31,4174,50,9473,69,6946,77,5234,94,0522,49,0103,11,2094,77,7403,64,5536,27,3647,23,3806,81,6103,32,3603,49,0744,58,496
10,89,2054,81,871
17,73,44811,08,129
1,59,7041,46,2082,47,5381,68,7921,47,9112,29,8092,83,5422,77,1262,23,0691,29,0262,10,0213,07,9472,79,8161,72,00994,549
3,26,0132,69,7294,94,7053,62,5961,82,9462,28,6893,51,4112,68,5874,62,2755,34,5735,04,9332,48,3972,63,5883,57,3648,59,0963,98,182
15,42,6889,68,890
60.060.364.965.766.066.567.467.567.568.769.070.670.871.471.972.373.073.073.473.573.573.673.773.773.974.174.775.577.978.982.687.087.4
60to65
65.1to70
70.1to75
75.1to80
80.1to87.4
MaleLiteracy Rate(%)
TotalMale Literates
75.0%1,17,01,729
MalePopulation
>6Years
1,55,93,698Source: Registrar General and Census Commissioner, India (2011)
Adilabad
Nirmal
Kumuram Bheem
Mancherial
Jagtial
Rajanna Sircilla
Peddapalli
Jayashankar
Mulugu
MedakSiddipet Hanumakonda
Warangal
JangaonSangareddy
Medchal-Malkajigiri
VikarabadRangareddy
Mahabubnagar
Narayanpet
Nalgonda
NagarkurnoolWanaparthy
Suryapet
Khammam
Karimnagar
Yadadri Bhuvanagiri
Mahabubabad
Jogulamba Gadwal
Bhadradri Kothagudem
Kamareddy
Nizamabad
Hyderabad
Demography
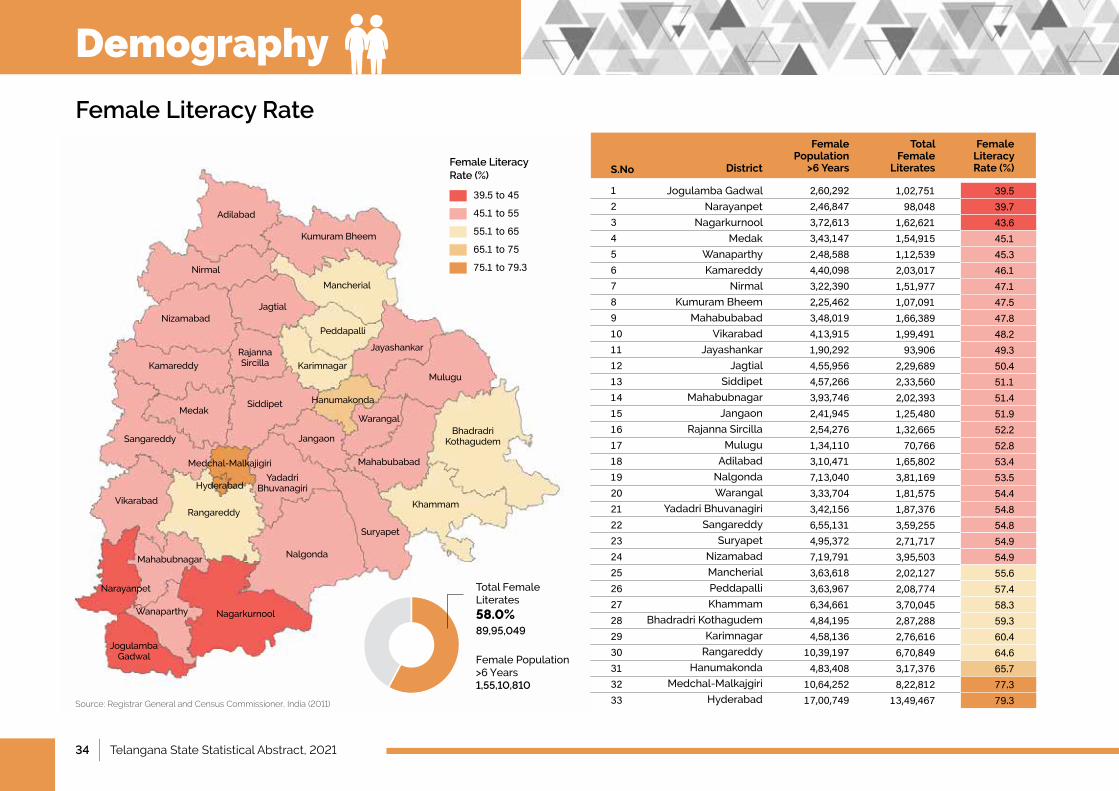
34 | Telangana State Statistical Abstract, 2021
Female Literacy Rate
Jogulamba Gadwal
Narayanpet
Nagarkurnool
Medak
Wanaparthy
Kamareddy
Nirmal
Kumuram Bheem
Mahabubabad
Vikarabad
Jayashankar
Jagtial
Siddipet
Mahabubnagar
Jangaon
Rajanna Sircilla
Mulugu
Adilabad
Nalgonda
Warangal
YadadriBhuvanagiri
Sangareddy
Suryapet
Nizamabad
Mancherial
Peddapalli
Khammam
Bhadradri Kothagudem
Karimnagar
Rangareddy
Hanumakonda
Medchal-Malkajgiri
Hyderabad
Female Population
>6 Years
Total Female
Literates
Female Literacy Rate (%)DistrictS.No
123456789101112131415161718192021222324252627282930313233
2,60,2922,46,8473,72,6133,43,1472,48,5884,40,0983,22,3902,25,4623,48,0194,13,9151,90,2924,55,9564,57,2663,93,7462,41,9452,54,2761,34,1103,10,4717,13,0403,33,7043,42,1566,55,1314,95,3727,19,7913,63,6183,63,9676,34,6614,84,1954,58,136
10,39,1974,83,408
10,64,25217,00,749
1,02,75198,048
1,62,6211,54,9151,12,5392,03,0171,51,9771,07,0911,66,3891,99,49193,906
2,29,6892,33,5602,02,3931,25,4801,32,66570,766
1,65,8023,81,1691,81,5751,87,3763,59,2552,71,7173,95,5032,02,1272,08,7743,70,0452,87,2882,76,6166,70,8493,17,3768,22,812
13,49,467
39.539.743.645.145.346.147.147.547.848.249.350.451.151.451.952.252.853.453.554.454.854.854.954.955.657.458.359.360.464.665.777.379.3
39.5to45
45.1to55
55.1to65
65.1to75
75.1to79.3
Female Literacy Rate (%)
TotalFemale Literates
58.0%89,95,049
FemalePopulation>6Years1,55,10,810
Source: Registrar General and Census Commissioner, India (2011)
Adilabad
Nirmal
Kumuram Bheem
Mancherial
Jagtial
Rajanna Sircilla
Peddapalli
Jayashankar
Mulugu
MedakSiddipet Hanumakonda
Warangal
JangaonSangareddy
Medchal-Malkajigiri
VikarabadRangareddy
Mahabubnagar
Narayanpet
Nalgonda
NagarkurnoolWanaparthy
Suryapet
Khammam
Karimnagar
Yadadri Bhuvanagiri
Mahabubabad
Jogulamba Gadwal
Bhadradri Kothagudem
Kamareddy
Nizamabad
Hyderabad
Demography
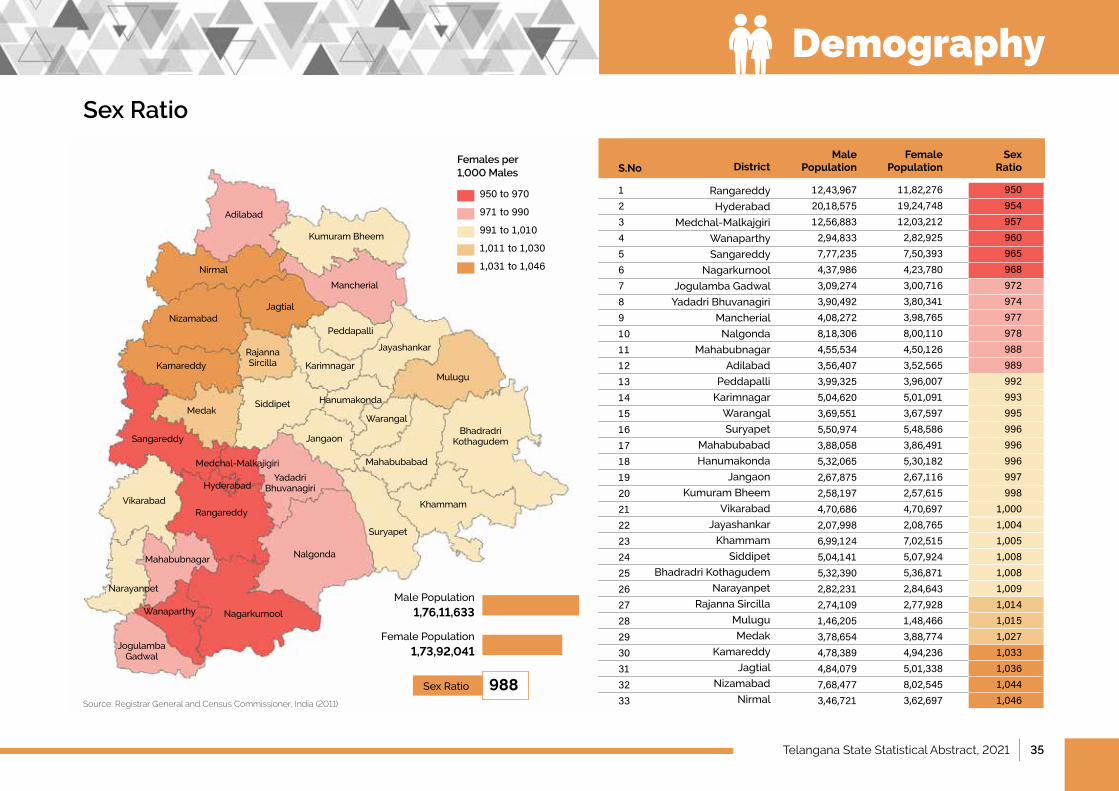
Telangana State Statistical Abstract, 2021 | 35
Sex Ratio
Rangareddy
Hyderabad
Medchal-Malkajgiri
Wanaparthy
Sangareddy
Nagarkurnool
Jogulamba Gadwal
YadadriBhuvanagiri
Mancherial
Nalgonda
Mahabubnagar
Adilabad
Peddapalli
Karimnagar
Warangal
Suryapet
Mahabubabad
Hanumakonda
Jangaon
Kumuram Bheem
Vikarabad
Jayashankar
Khammam
Siddipet
Bhadradri Kothagudem
Narayanpet
Rajanna Sircilla
Mulugu
Medak
Kamareddy
Jagtial
Nizamabad
Nirmal
Male Population
Female Population
Sex RatioDistrictS.No
123456789101112131415161718192021222324252627282930313233
12,43,96720,18,57512,56,8832,94,8337,77,2354,37,9863,09,2743,90,4924,08,2728,18,3064,55,5343,56,4073,99,3255,04,6203,69,5515,50,9743,88,0585,32,0652,67,8752,58,1974,70,6862,07,9986,99,1245,04,1415,32,3902,82,2312,74,1091,46,2053,78,6544,78,3894,84,0797,68,4773,46,721
11,82,27619,24,74812,03,2122,82,9257,50,3934,23,7803,00,7163,80,3413,98,7658,00,1104,50,1263,52,5653,96,0075,01,0913,67,5975,48,5863,86,4915,30,1822,67,1162,57,6154,70,6972,08,7657,02,5155,07,9245,36,8712,84,6432,77,9281,48,4663,88,7744,94,2365,01,3388,02,5453,62,697
950954957960965968972974977978988989992993995996996996997998
1,0001,0041,0051,0081,0081,0091,0141,0151,0271,0331,0361,0441,046
950to970
971to990
991to1,010
1,011to1,030
1,031to1,046
Females per 1,000 Males
MalePopulation
1,76,11,633
FemalePopulation
1,73,92,041
Source: Registrar General and Census Commissioner, India (2011)
Adilabad
Nirmal
Kumuram Bheem
Mancherial
Jagtial
Rajanna Sircilla
Peddapalli
Jayashankar
Mulugu
MedakSiddipet Hanumakonda
Warangal
JangaonSangareddy
Medchal-Malkajigiri
VikarabadRangareddy
Mahabubnagar
Narayanpet
Nalgonda
NagarkurnoolWanaparthy
Suryapet
Khammam
Karimnagar
Yadadri Bhuvanagiri
Mahabubabad
Jogulamba Gadwal
Bhadradri Kothagudem
Kamareddy
Nizamabad
Hyderabad
Sex Ratio 988
Demography
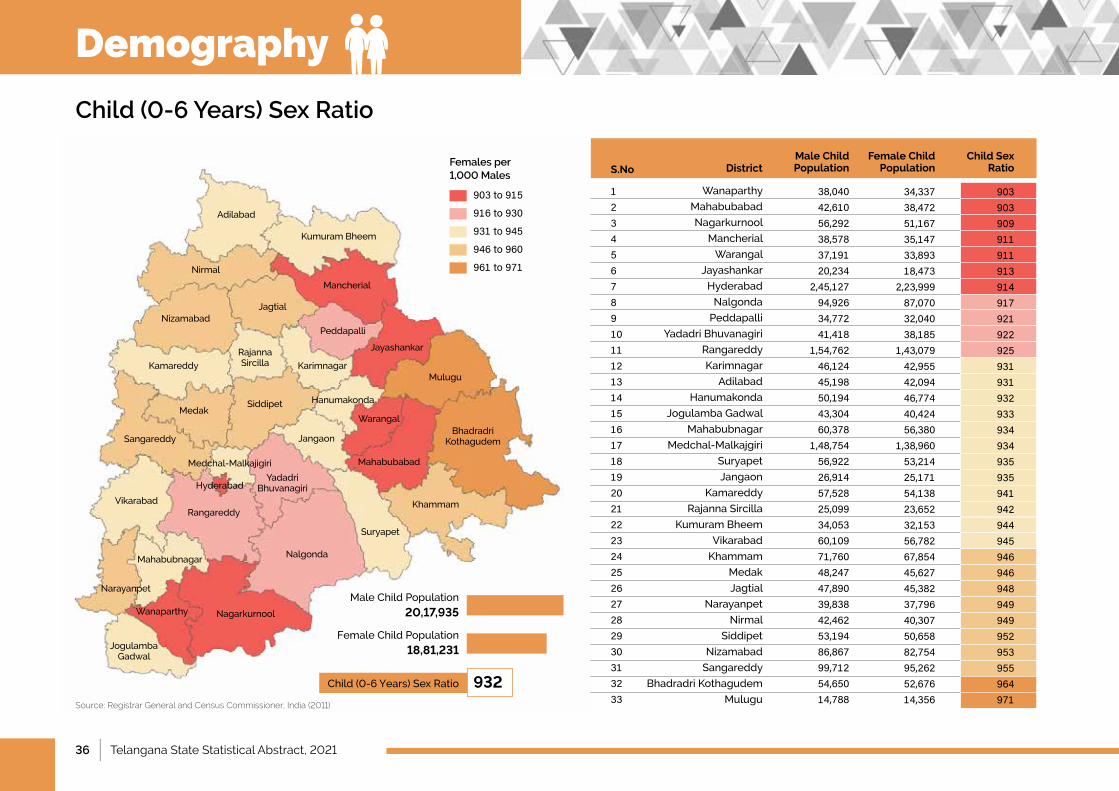
36 | Telangana State Statistical Abstract, 2021
Child (0-6 Years) Sex Ratio
Wanaparthy
Mahabubabad
Nagarkurnool
Mancherial
Warangal
Jayashankar
Hyderabad
Nalgonda
Peddapalli
YadadriBhuvanagiri
Rangareddy
Karimnagar
Adilabad
Hanumakonda
Jogulamba Gadwal
Mahabubnagar
Medchal-Malkajgiri
Suryapet
Jangaon
Kamareddy
Rajanna Sircilla
Kumuram Bheem
Vikarabad
Khammam
Medak
Jagtial
Narayanpet
Nirmal
Siddipet
Nizamabad
Sangareddy
Bhadradri Kothagudem
Mulugu
Male Child Population
Female Child Population
Child Sex RatioDistrictS.No
123456789101112131415161718192021222324252627282930313233
38,04042,61056,29238,57837,19120,234
2,45,12794,92634,77241,418
1,54,76246,12445,19850,19443,30460,378
1,48,75456,92226,91457,52825,09934,05360,10971,76048,24747,89039,83842,46253,19486,86799,71254,65014,788
34,33738,47251,16735,14733,89318,473
2,23,99987,07032,04038,185
1,43,07942,95542,09446,77440,42456,380
1,38,96053,21425,17154,13823,65232,15356,78267,85445,62745,38237,79640,30750,65882,75495,26252,67614,356
903903909911911913914917921922925931931932933934934935935941942944945946946948949949952953955964971
903to915
916to930
931to945
946to960
961to971
Females per 1,000 Males
MaleChildPopulation
20,17,935
FemaleChildPopulation
18,81,231
Source: Registrar General and Census Commissioner, India (2011)
Adilabad
Nirmal
Kumuram Bheem
Mancherial
Jagtial
Rajanna Sircilla
Peddapalli
Jayashankar
Mulugu
MedakSiddipet Hanumakonda
Warangal
JangaonSangareddy
Medchal-Malkajigiri
VikarabadRangareddy
Mahabubnagar
Narayanpet
Nalgonda
NagarkurnoolWanaparthy
Suryapet
Khammam
Karimnagar
Yadadri Bhuvanagiri
Mahabubabad
Jogulamba Gadwal
Bhadradri Kothagudem
Kamareddy
Nizamabad
Hyderabad
Child(0-6Years)SexRatio 932
Demography
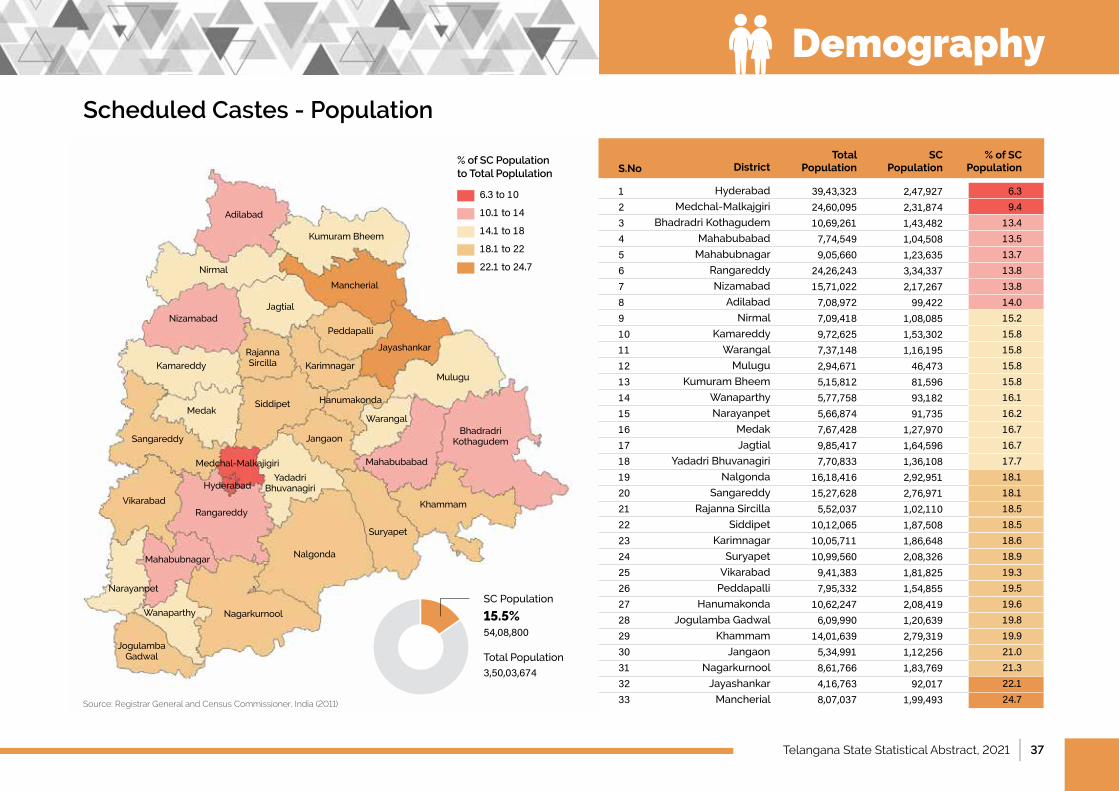
Telangana State Statistical Abstract, 2021 | 37
Scheduled Castes - Population
Hyderabad
Medchal-Malkajgiri
Bhadradri Kothagudem
Mahabubabad
Mahabubnagar
Rangareddy
Nizamabad
Adilabad
Nirmal
Kamareddy
Warangal
Mulugu
Kumuram Bheem
Wanaparthy
Narayanpet
Medak
Jagtial
YadadriBhuvanagiri
Nalgonda
Sangareddy
Rajanna Sircilla
Siddipet
Karimnagar
Suryapet
Vikarabad
Peddapalli
Hanumakonda
Jogulamba Gadwal
Khammam
Jangaon
Nagarkurnool
Jayashankar
Mancherial
123456789101112131415161718192021222324252627282930313233
39,43,32324,60,09510,69,2617,74,5499,05,660
24,26,24315,71,0227,08,9727,09,4189,72,6257,37,1482,94,6715,15,8125,77,7585,66,8747,67,4289,85,4177,70,833
16,18,41615,27,6285,52,037
10,12,06510,05,71110,99,5609,41,3837,95,332
10,62,2476,09,990
14,01,6395,34,9918,61,7664,16,7638,07,037
2,47,9272,31,8741,43,4821,04,5081,23,6353,34,3372,17,26799,422
1,08,0851,53,3021,16,19546,47381,59693,18291,735
1,27,9701,64,5961,36,1082,92,9512,76,9711,02,1101,87,5081,86,6482,08,3261,81,8251,54,8552,08,4191,20,6392,79,3191,12,2561,83,76992,017
1,99,493
Total Population
SC Population
% of SC PopulationDistrictS.No
6.39.4
13.413.513.713.813.814.015.215.815.815.815.816.116.216.716.717.718.118.118.518.518.618.919.319.519.619.819.921.021.322.124.7
6.3to10
10.1to14
14.1to18
18.1to22
22.1to24.7
% of SC Population to Total Poplulation
Source: Registrar General and Census Commissioner, India (2011)
Adilabad
Nirmal
Kumuram Bheem
Mancherial
Jagtial
Rajanna Sircilla
Peddapalli
Jayashankar
Mulugu
MedakSiddipet Hanumakonda
Warangal
JangaonSangareddy
Medchal-Malkajigiri
VikarabadRangareddy
Mahabubnagar
Narayanpet
Nalgonda
NagarkurnoolWanaparthy
Suryapet
Khammam
Karimnagar
Yadadri Bhuvanagiri
Mahabubabad
Jogulamba Gadwal
Bhadradri Kothagudem
Kamareddy
Nizamabad
Hyderabad
SC Population
15.5%54,08,800
Total Population
3,50,03,674
Demography
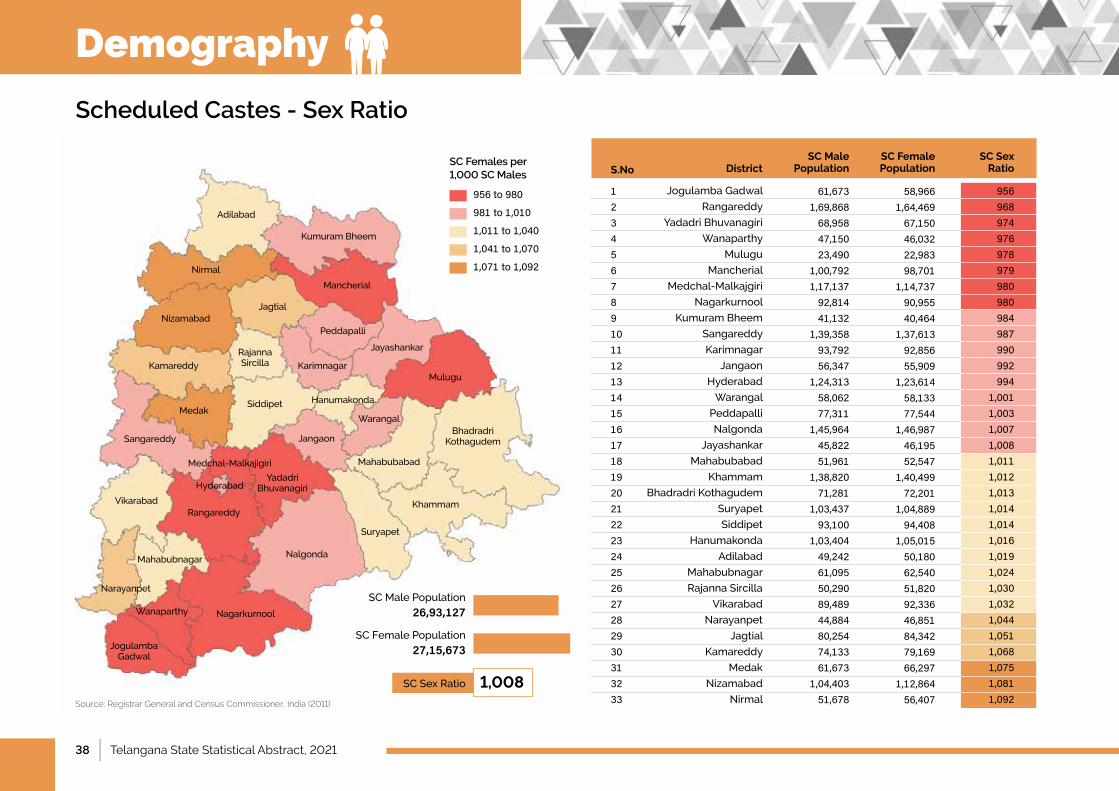
38 | Telangana State Statistical Abstract, 2021
Scheduled Castes - Sex Ratio
Jogulamba Gadwal
Rangareddy
YadadriBhuvanagiri
Wanaparthy
Mulugu
Mancherial
Medchal-Malkajgiri
Nagarkurnool
Kumuram Bheem
Sangareddy
Karimnagar
Jangaon
Hyderabad
Warangal
Peddapalli
Nalgonda
Jayashankar
Mahabubabad
Khammam
Bhadradri Kothagudem
Suryapet
Siddipet
Hanumakonda
Adilabad
Mahabubnagar
Rajanna Sircilla
Vikarabad
Narayanpet
Jagtial
Kamareddy
Medak
Nizamabad
Nirmal
123456789101112131415161718192021222324252627282930313233
61,6731,69,86868,95847,15023,490
1,00,7921,17,13792,81441,132
1,39,35893,79256,347
1,24,31358,06277,311
1,45,96445,82251,961
1,38,82071,281
1,03,43793,100
1,03,40449,24261,09550,29089,48944,88480,25474,13361,673
1,04,40351,678
58,9661,64,46967,15046,03222,98398,701
1,14,73790,95540,464
1,37,61392,85655,909
1,23,61458,13377,544
1,46,98746,19552,547
1,40,49972,201
1,04,88994,408
1,05,01550,18062,54051,82092,33646,85184,34279,16966,297
1,12,86456,407
SC Male Population
SC Female Population
SC Sex RatioDistrictS.No
956968974976978979980980984987990992994
1,0011,0031,0071,0081,0111,0121,0131,0141,0141,0161,0191,0241,0301,0321,0441,0511,0681,0751,0811,092
956to980
981to1,010
1,011to1,040
1,041to1,070
1,071to1,092
SC Females per 1,000 SC Males
Source: Registrar General and Census Commissioner, India (2011)
Adilabad
Nirmal
Kumuram Bheem
Mancherial
Jagtial
Rajanna Sircilla
Peddapalli
Jayashankar
Mulugu
MedakSiddipet Hanumakonda
Warangal
JangaonSangareddy
Medchal-Malkajigiri
VikarabadRangareddy
Mahabubnagar
Narayanpet
Nalgonda
NagarkurnoolWanaparthy
Suryapet
Khammam
Karimnagar
Yadadri Bhuvanagiri
Mahabubabad
Jogulamba Gadwal
Bhadradri Kothagudem
Kamareddy
Nizamabad
Hyderabad
SCMalePopulation
26,93,127
SCFemalePopulation
27,15,673
SC Sex Ratio 1,008
Demography
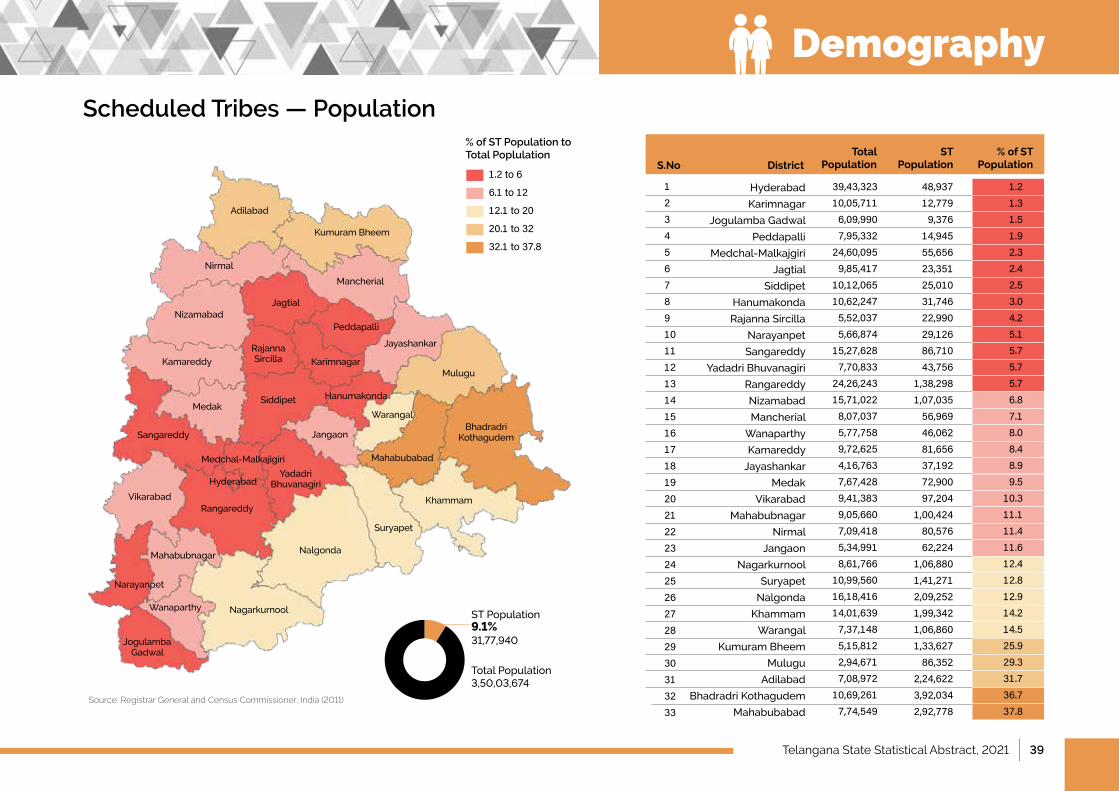
Telangana State Statistical Abstract, 2021 | 39
Scheduled Tribes — Population
Hyderabad
Karimnagar
Jogulamba Gadwal
Peddapalli
Medchal-Malkajgiri
Jagtial
Siddipet
Hanumakonda
Rajanna Sircilla
Narayanpet
Sangareddy
YadadriBhuvanagiri
Rangareddy
Nizamabad
Mancherial
Wanaparthy
Kamareddy
Jayashankar
Medak
Vikarabad
Mahabubnagar
Nirmal
Jangaon
Nagarkurnool
Suryapet
Nalgonda
Khammam
Warangal
Kumuram Bheem
Mulugu
Adilabad
Bhadradri Kothagudem
Mahabubabad
ST Population
Total PopulationDistrictS.No
% of ST Population
123456789101112131415161718192021222324252627282930313233
39,43,32310,05,7116,09,9907,95,332
24,60,0959,85,417
10,12,06510,62,2475,52,0375,66,874
15,27,6287,70,833
24,26,24315,71,0228,07,0375,77,7589,72,6254,16,7637,67,4289,41,3839,05,6607,09,4185,34,9918,61,766
10,99,56016,18,41614,01,6397,37,1485,15,8122,94,6717,08,972
10,69,2617,74,549
48,93712,7799,376
14,94555,65623,35125,01031,74622,99029,12686,71043,756
1,38,2981,07,03556,96946,06281,65637,19272,90097,204
1,00,42480,57662,224
1,06,8801,41,2712,09,2521,99,3421,06,8601,33,62786,352
2,24,6223,92,0342,92,778
1.21.31.51.92.32.42.53.04.25.15.75.75.76.87.18.08.48.99.5
10.311.111.411.612.412.812.914.214.525.929.331.736.737.8
1.2to6
6.1to12
12.1to20
20.1to32
32.1to37.8
% of ST Population to Total Poplulation
Source: Registrar General and Census Commissioner, India (2011)
Adilabad
Nirmal
Kumuram Bheem
Mancherial
Jagtial
Rajanna Sircilla
Peddapalli
Jayashankar
Mulugu
MedakSiddipet Hanumakonda
Warangal
JangaonSangareddy
Medchal-Malkajigiri
VikarabadRangareddy
Mahabubnagar
Narayanpet
Nalgonda
NagarkurnoolWanaparthy
Suryapet
Khammam
Karimnagar
Yadadri Bhuvanagiri
Mahabubabad
Jogulamba Gadwal
Bhadradri Kothagudem
Kamareddy
Nizamabad
Hyderabad
ST Population9.1%31,77,940
Total Population3,50,03,674
Demography
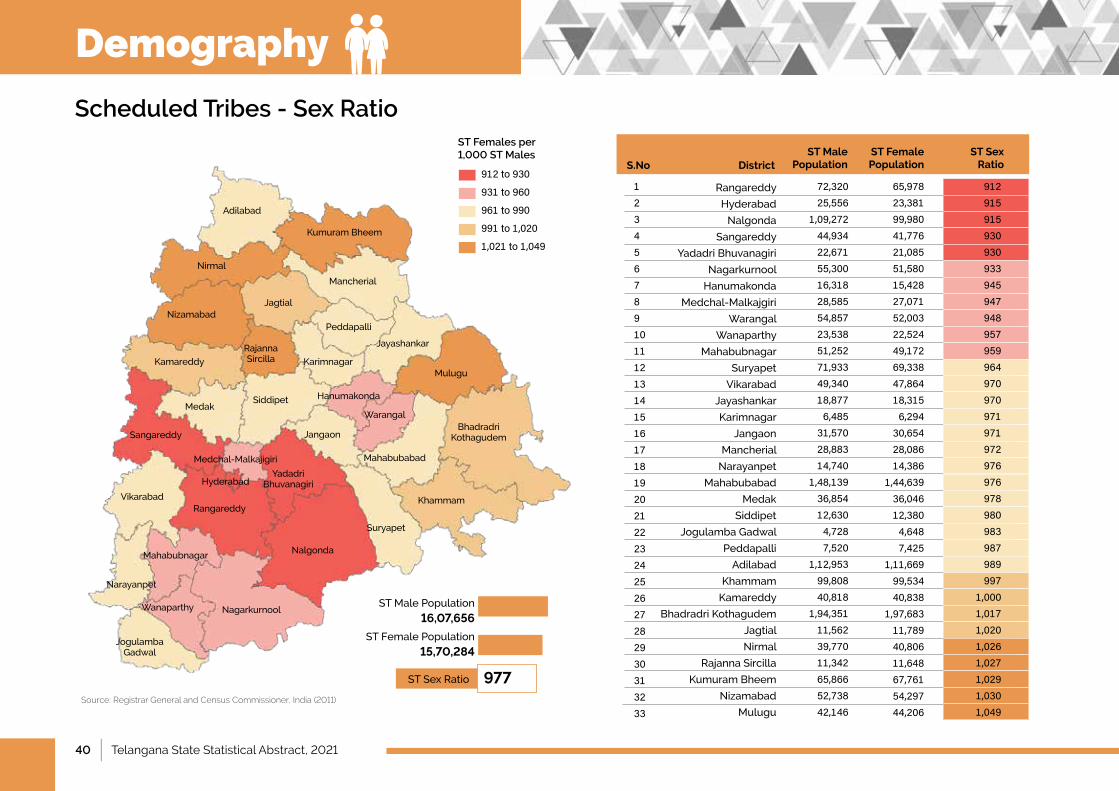
40 | Telangana State Statistical Abstract, 2021
Scheduled Tribes - Sex Ratio
Rangareddy
Hyderabad
Nalgonda
Sangareddy
YadadriBhuvanagiri
Nagarkurnool
Hanumakonda
Medchal-Malkajgiri
Warangal
Wanaparthy
Mahabubnagar
Suryapet
Vikarabad
Jayashankar
Karimnagar
Jangaon
Mancherial
Narayanpet
Mahabubabad
Medak
Siddipet
Jogulamba Gadwal
Peddapalli
Adilabad
Khammam
Kamareddy
Bhadradri Kothagudem
Jagtial
Nirmal
Rajanna Sircilla
Kumuram Bheem
Nizamabad
Mulugu
ST Female Population
ST Male PopulationDistrictS.No
ST Sex Ratio
123456789101112131415161718192021222324252627282930313233
72,32025,556
1,09,27244,93422,67155,30016,31828,58554,85723,53851,25271,93349,34018,8776,485
31,57028,88314,740
1,48,13936,85412,6304,7287,520
1,12,95399,80840,818
1,94,35111,56239,77011,34265,86652,73842,146
65,97823,38199,98041,77621,08551,58015,42827,07152,00322,52449,17269,33847,86418,3156,294
30,65428,08614,386
1,44,63936,04612,3804,6487,425
1,11,66999,53440,838
1,97,68311,78940,80611,64867,76154,29744,206
912915915930930933945947948957959964970970971971972976976978980983987989997
1,0001,0171,0201,0261,0271,0291,0301,049
912to930
931to960
961to990
991to1,020
1,021to1,049
ST Females per 1,000 ST Males
Source: Registrar General and Census Commissioner, India (2011)
Adilabad
Nirmal
Kumuram Bheem
Mancherial
Jagtial
Rajanna Sircilla
Peddapalli
Jayashankar
Mulugu
MedakSiddipet Hanumakonda
Warangal
JangaonSangareddy
Medchal-Malkajigiri
VikarabadRangareddy
Mahabubnagar
Narayanpet
Nalgonda
NagarkurnoolWanaparthy
Suryapet
Khammam
Karimnagar
Yadadri Bhuvanagiri
Mahabubabad
Jogulamba Gadwal
Bhadradri Kothagudem
Kamareddy
Nizamabad
Hyderabad
STMalePopulation
16,07,656
STFemalePopulation
15,70,284
ST Sex Ratio 977
Demography
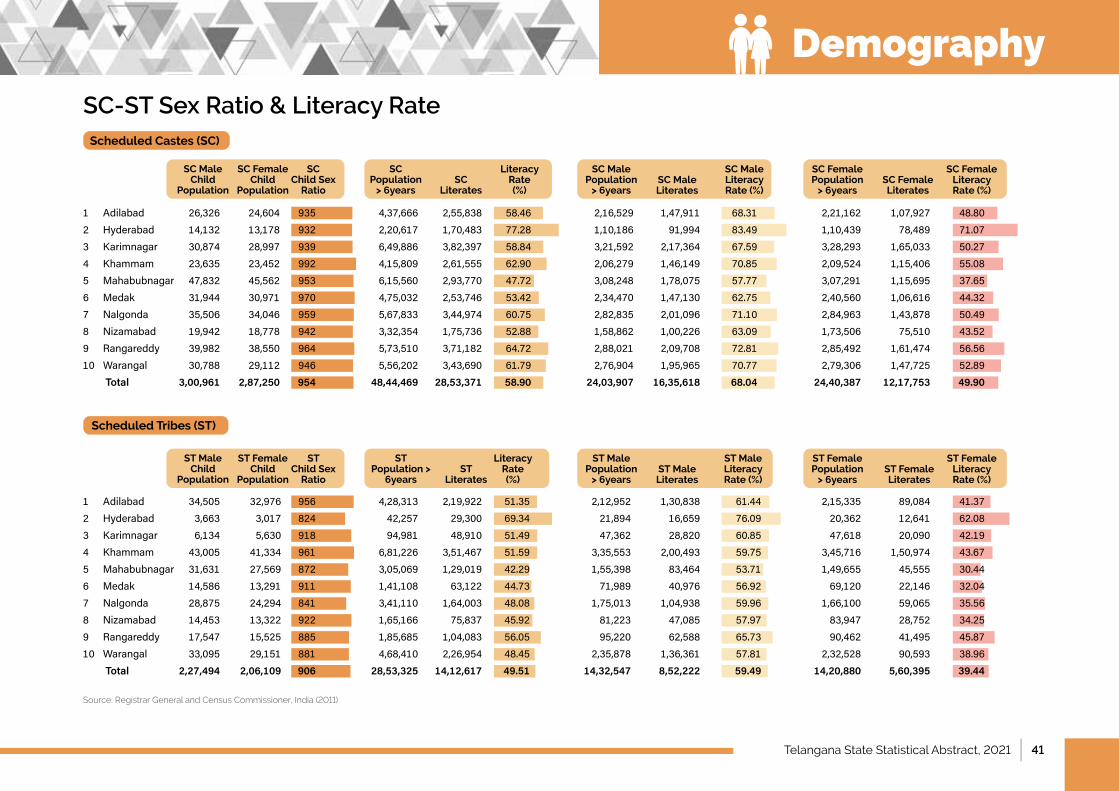
Telangana State Statistical Abstract, 2021 | 41
1 Adilabad 26,326 24,604 935 4,37,666 2,55,838 58.46 2,16,529 1,47,911 68.31 2,21,162 1,07,927 48.802 Hyderabad 14,132 13,178 932 2,20,617 1,70,483 77.28 1,10,186 91,994 83.49 1,10,439 78,489 71.073 Karimnagar 30,874 28,997 939 6,49,886 3,82,397 58.84 3,21,592 2,17,364 67.59 3,28,293 1,65,033 50.274 Khammam 23,635 23,452 992 4,15,809 2,61,555 62.90 2,06,279 1,46,149 70.85 2,09,524 1,15,406 55.085 Mahabubnagar 47,832 45,562 953 6,15,560 2,93,770 47.72 3,08,248 1,78,075 57.77 3,07,291 1,15,695 37.656 Medak 31,944 30,971 970 4,75,032 2,53,746 53.42 2,34,470 1,47,130 62.75 2,40,560 1,06,616 44.327 Nalgonda 35,506 34,046 959 5,67,833 3,44,974 60.75 2,82,835 2,01,096 71.10 2,84,963 1,43,878 50.498 Nizamabad 19,942 18,778 942 3,32,354 1,75,736 52.88 1,58,862 1,00,226 63.09 1,73,506 75,510 43.529 Rangareddy 39,982 38,550 964 5,73,510 3,71,182 64.72 2,88,021 2,09,708 72.81 2,85,492 1,61,474 56.5610 Warangal 30,788 29,112 946 5,56,202 3,43,690 61.79 2,76,904 1,95,965 70.77 2,79,306 1,47,725 52.89 Total 3,00,961 2,87,250 954 48,44,469 28,53,371 58.90 24,03,907 16,35,618 68.04 24,40,387 12,17,753 49.90
1 Adilabad 34,505 32,976 956 4,28,313 2,19,922 51.35 2,12,952 1,30,838 61.44 2,15,335 89,084 41.372 Hyderabad 3,663 3,017 824 42,257 29,300 69.34 21,894 16,659 76.09 20,362 12,641 62.083 Karimnagar 6,134 5,630 918 94,981 48,910 51.49 47,362 28,820 60.85 47,618 20,090 42.194 Khammam 43,005 41,334 961 6,81,226 3,51,467 51.59 3,35,553 2,00,493 59.75 3,45,716 1,50,974 43.675 Mahabubnagar 31,631 27,569 872 3,05,069 1,29,019 42.29 1,55,398 83,464 53.71 1,49,655 45,555 30.446 Medak 14,586 13,291 911 1,41,108 63,122 44.73 71,989 40,976 56.92 69,120 22,146 32.047 Nalgonda 28,875 24,294 841 3,41,110 1,64,003 48.08 1,75,013 1,04,938 59.96 1,66,100 59,065 35.568 Nizamabad 14,453 13,322 922 1,65,166 75,837 45.92 81,223 47,085 57.97 83,947 28,752 34.259 Rangareddy 17,547 15,525 885 1,85,685 1,04,083 56.05 95,220 62,588 65.73 90,462 41,495 45.8710 Warangal 33,095 29,151 881 4,68,410 2,26,954 48.45 2,35,878 1,36,361 57.81 2,32,528 90,593 38.96 Total 2,27,494 2,06,109 906 28,53,325 14,12,617 49.51 14,32,547 8,52,222 59.49 14,20,880 5,60,395 39.44
ST Male Child
Population
SC Male Child
Population
ST Population >
6years
SC Population
> 6years
ST Female Child
Population
SC Female Child
Population
ST Literates
SC Literates
ST Child Sex
Ratio
SC Child Sex
Ratio
Literacy Rate (%)
Literacy Rate (%)
ST Male Population
> 6years
SC Male Population
> 6years
ST Male Literacy Rate (%)
SC Male Literacy Rate (%)
ST Female Population
> 6years
SC Female Population
> 6years
ST Female Literates
SC Female Literates
ST Female Literacy Rate (%)
SC Female Literacy Rate (%)
ST Male Literates
SC Male Literates
Source: Registrar General and Census Commissioner, India (2011)
SC-ST Sex Ratio & Literacy Rate Scheduled Castes (SC)
Scheduled Tribes (ST)
Demography
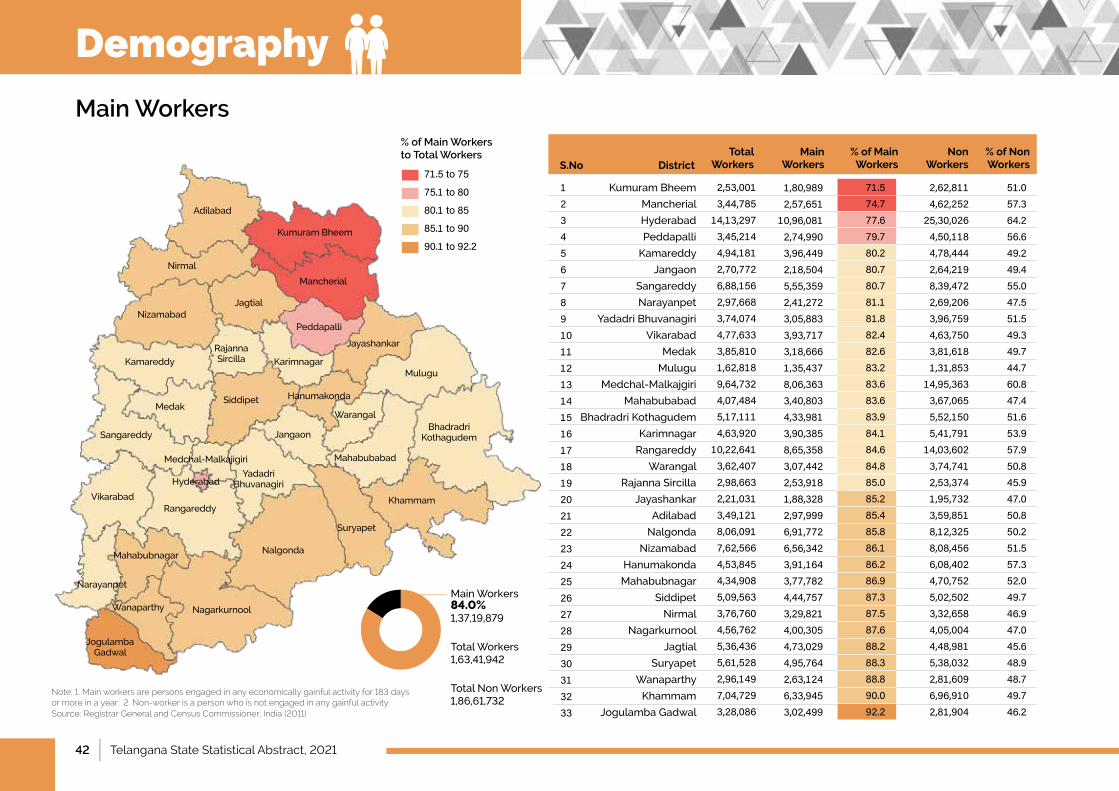
42 | Telangana State Statistical Abstract, 2021
Main Workers
Kumuram Bheem
Mancherial
Hyderabad
Peddapalli
Kamareddy
Jangaon
Sangareddy
Narayanpet
YadadriBhuvanagiri
Vikarabad
Medak
Mulugu
Medchal-Malkajgiri
Mahabubabad
Bhadradri Kothagudem
Karimnagar
Rangareddy
Warangal
Rajanna Sircilla
Jayashankar
Adilabad
Nalgonda
Nizamabad
Hanumakonda
Mahabubnagar
Siddipet
Nirmal
Nagarkurnool
Jagtial
Suryapet
Wanaparthy
Khammam
Jogulamba Gadwal
Main Workers
Total WorkersDistrictS.No
% of Main Workers
Non Workers
% of Non Workers
123456789101112131415161718192021222324252627282930313233
2,53,0013,44,785
14,13,2973,45,2144,94,1812,70,7726,88,1562,97,6683,74,0744,77,6333,85,8101,62,8189,64,7324,07,4845,17,1114,63,920
10,22,6413,62,4072,98,6632,21,0313,49,1218,06,0917,62,5664,53,8454,34,9085,09,5633,76,7604,56,7625,36,4365,61,5282,96,1497,04,7293,28,086
2,62,8114,62,252
25,30,0264,50,1184,78,4442,64,2198,39,4722,69,2063,96,7594,63,7503,81,6181,31,853
14,95,3633,67,0655,52,1505,41,791
14,03,6023,74,7412,53,3741,95,7323,59,8518,12,3258,08,4566,08,4024,70,7525,02,5023,32,6584,05,0044,48,9815,38,0322,81,6096,96,9102,81,904
1,80,9892,57,651
10,96,0812,74,9903,96,4492,18,5045,55,3592,41,2723,05,8833,93,7173,18,6661,35,4378,06,3633,40,8034,33,9813,90,3858,65,3583,07,4422,53,9181,88,3282,97,9996,91,7726,56,3423,91,1643,77,7824,44,7573,29,8214,00,3054,73,0294,95,7642,63,1246,33,9453,02,499
51.057.364.256.649.249.455.047.551.549.349.744.760.847.451.653.957.950.845.947.050.850.251.557.352.049.746.947.045.648.948.749.746.2
71.574.777.679.780.280.780.781.181.882.482.683.283.683.683.984.184.684.885.085.285.485.886.186.286.987.387.587.688.288.388.890.092.2
71.5to75
75.1to80
80.1to85
85.1to90
90.1to92.2
% of Main Workers to Total Workers
Note: 1. Main workers are persons engaged in any economically gainful activity for 183 days or more in a year. 2. Non-worker is a person who is not engaged in any gainful activity. Source: Registrar General and Census Commissioner, India (2011)
Adilabad
Nirmal
Kumuram Bheem
Mancherial
Jagtial
Rajanna Sircilla
Peddapalli
Jayashankar
Mulugu
MedakSiddipet Hanumakonda
Warangal
JangaonSangareddy
Medchal-Malkajigiri
VikarabadRangareddy
Mahabubnagar
Narayanpet
Nalgonda
NagarkurnoolWanaparthy
Suryapet
Khammam
Karimnagar
Yadadri Bhuvanagiri
Mahabubabad
Jogulamba Gadwal
Bhadradri Kothagudem
Kamareddy
Nizamabad
Hyderabad
MainWorkers84.0%1,37,19,879
Total Workers1,63,41,942
Total Non Workers1,86,61,732
Demography
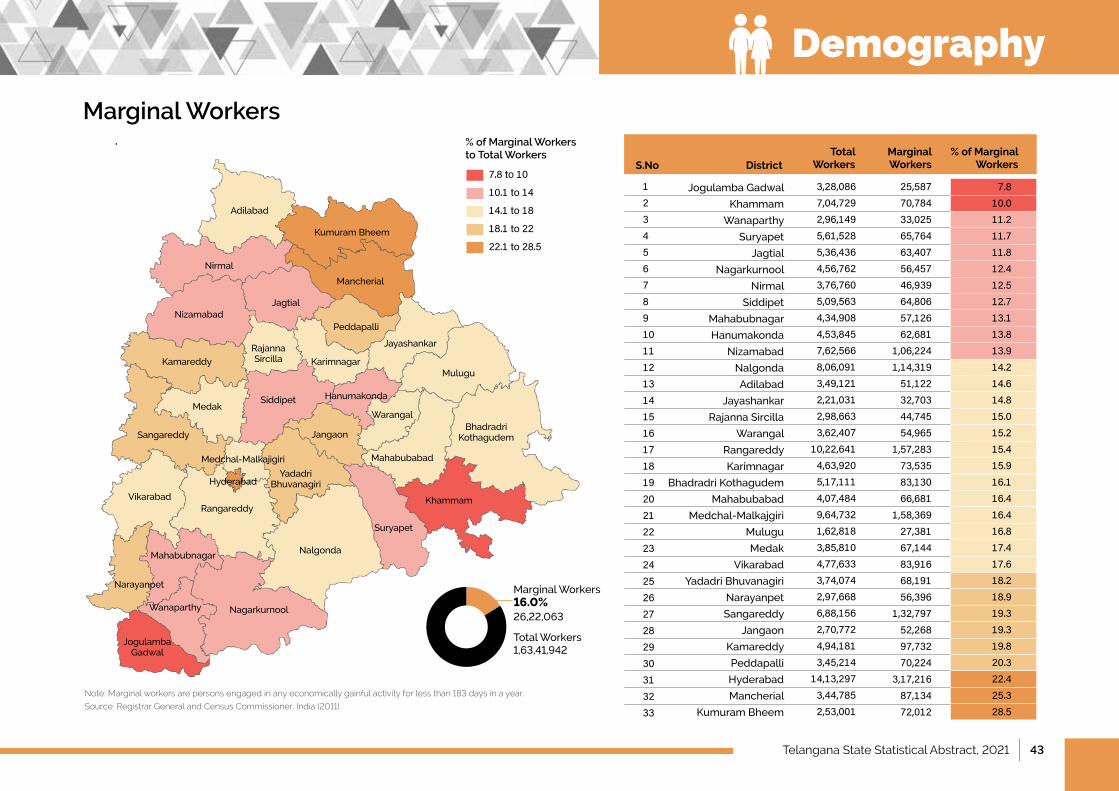
Telangana State Statistical Abstract, 2021 | 43
Marginal Workers
Jogulamba Gadwal
Khammam
Wanaparthy
Suryapet
Jagtial
Nagarkurnool
Nirmal
Siddipet
Mahabubnagar
Hanumakonda
Nizamabad
Nalgonda
Adilabad
Jayashankar
Rajanna Sircilla
Warangal
Rangareddy
Karimnagar
Bhadradri Kothagudem
Mahabubabad
Medchal-Malkajgiri
Mulugu
Medak
Vikarabad
YadadriBhuvanagiri
Narayanpet
Sangareddy
Jangaon
Kamareddy
Peddapalli
Hyderabad
Mancherial
Kumuram Bheem
Marginal Workers
Total WorkersDistrictS.No
% of Marginal Workers
123456789101112131415161718192021222324252627282930313233
3,28,0867,04,7292,96,1495,61,5285,36,4364,56,7623,76,7605,09,5634,34,9084,53,8457,62,5668,06,0913,49,1212,21,0312,98,6633,62,407
10,22,6414,63,9205,17,1114,07,4849,64,7321,62,8183,85,8104,77,6333,74,0742,97,6686,88,1562,70,7724,94,1813,45,214
14,13,2973,44,7852,53,001
25,58770,78433,02565,76463,40756,45746,93964,80657,12662,681
1,06,2241,14,31951,12232,70344,74554,965
1,57,28373,53583,13066,681
1,58,36927,38167,14483,91668,19156,396
1,32,79752,26897,73270,224
3,17,21687,13472,012
7.810.011.211.711.812.412.512.713.113.813.914.214.614.815.015.215.415.916.116.416.416.817.417.618.218.919.319.319.820.322.425.328.5
7.8to10
10.1to14
14.1to18
18.1to22
22.1to28.5
% of Marginal Workers to Total Workers
Note: Marginal workers are persons engaged in any economically gainful activity for less than 183 days in a year.
Source: Registrar General and Census Commissioner, India (2011)
Adilabad
Nirmal
Kumuram Bheem
Mancherial
Jagtial
Rajanna Sircilla
Peddapalli
Jayashankar
Mulugu
MedakSiddipet Hanumakonda
Warangal
JangaonSangareddy
Medchal-Malkajigiri
VikarabadRangareddy
Mahabubnagar
Narayanpet
Nalgonda
NagarkurnoolWanaparthy
Suryapet
Khammam
Karimnagar
Yadadri Bhuvanagiri
Mahabubabad
Jogulamba Gadwal
Bhadradri Kothagudem
Kamareddy
Nizamabad
Hyderabad
MarginalWorkers16.0%26,22,063
Total Workers1,63,41,942
Demography
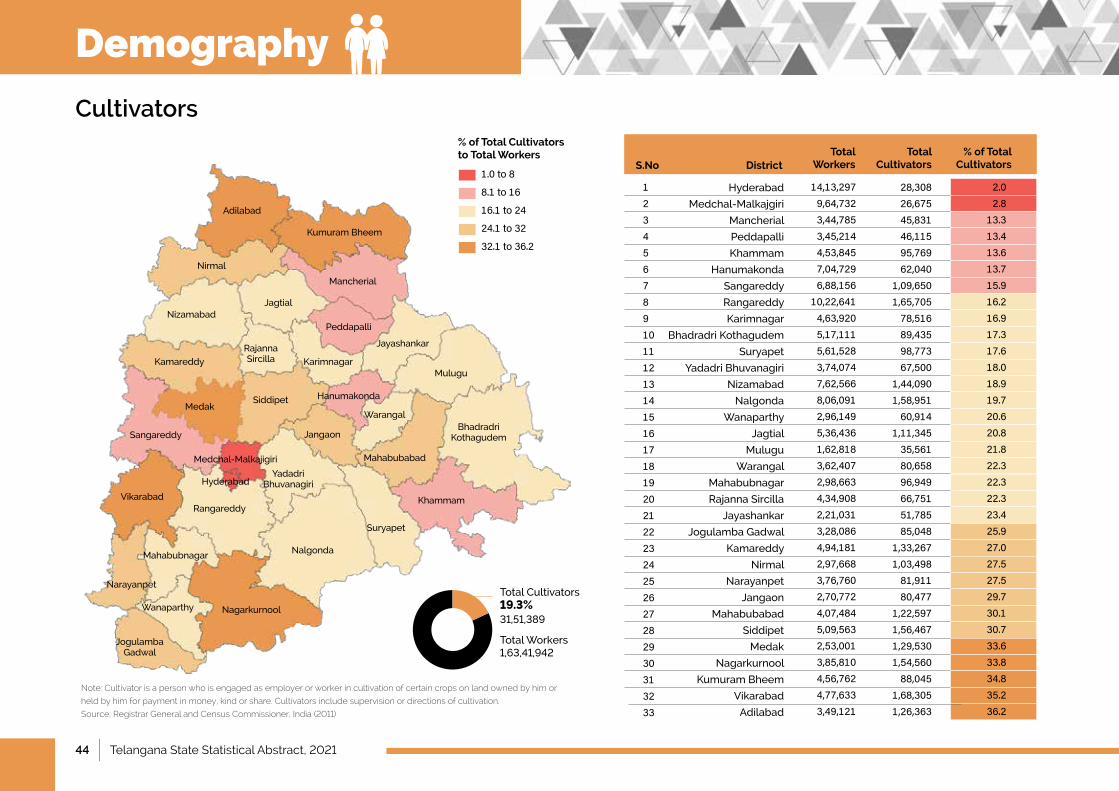
44 | Telangana State Statistical Abstract, 2021
Adilabad
Nirmal
Kumuram Bheem
Mancherial
Jagtial
Rajanna Sircilla
Peddapalli
Jayashankar
Mulugu
MedakSiddipet Hanumakonda
Warangal
JangaonSangareddy
Medchal-Malkajigiri
VikarabadRangareddy
Mahabubnagar
Narayanpet
Nalgonda
NagarkurnoolWanaparthy
Suryapet
Khammam
Karimnagar
Yadadri Bhuvanagiri
Mahabubabad
Jogulamba Gadwal
Bhadradri Kothagudem
Kamareddy
Nizamabad
Hyderabad
Cultivators
Hyderabad
Medchal-Malkajgiri
Mancherial
Peddapalli
Khammam
Hanumakonda
Sangareddy
Rangareddy
Karimnagar
Bhadradri Kothagudem
Suryapet
YadadriBhuvanagiri
Nizamabad
Nalgonda
Wanaparthy
Jagtial
Mulugu
Warangal
Mahabubnagar
Rajanna Sircilla
Jayashankar
Jogulamba Gadwal
Kamareddy
Nirmal
Narayanpet
Jangaon
Mahabubabad
Siddipet
Medak
Nagarkurnool
Kumuram Bheem
Vikarabad
Adilabad
Total Cultivators
Total WorkersDistrictS.No
% of Total Cultivators
123456789101112131415161718192021222324252627282930313233
14,13,2979,64,7323,44,7853,45,2144,53,8457,04,7296,88,156
10,22,6414,63,9205,17,1115,61,5283,74,0747,62,5668,06,0912,96,1495,36,4361,62,8183,62,4072,98,6634,34,9082,21,0313,28,0864,94,1812,97,6683,76,7602,70,7724,07,4845,09,5632,53,0013,85,8104,56,7624,77,6333,49,121
28,30826,67545,83146,11595,76962,040
1,09,6501,65,70578,51689,43598,77367,500
1,44,0901,58,95160,914
1,11,34535,56180,65896,94966,75151,78585,048
1,33,2671,03,49881,91180,477
1,22,5971,56,4671,29,5301,54,56088,045
1,68,3051,26,363
2.02.8
13.313.413.613.715.916.216.917.317.618.018.919.720.620.821.822.322.322.323.425.927.027.527.529.730.130.733.633.834.835.236.2
1.0to8
8.1to16
16.1to24
24.1to32
32.1to36.2
% of Total Cultivators to Total Workers
Note: Cultivator is a person who is engaged as employer or worker in cultivation of certain crops on land owned by him or
held by him for payment in money, kind or share. Cultivators include supervision or directions of cultivation.
Source: Registrar General and Census Commissioner, India (2011)
Total Cultivators19.3%31,51,389
Total Workers1,63,41,942
Demography
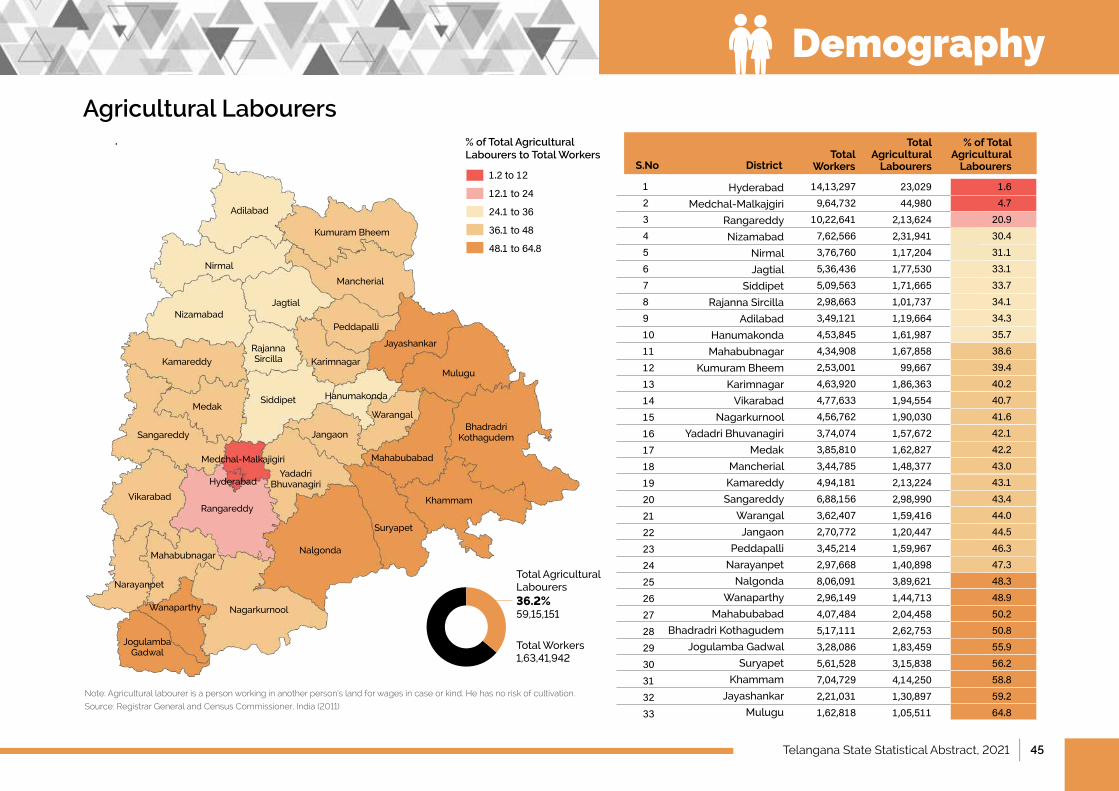
Telangana State Statistical Abstract, 2021 | 45
Agricultural Labourers
Hyderabad
Medchal-Malkajgiri
Rangareddy
Nizamabad
Nirmal
Jagtial
Siddipet
Rajanna Sircilla
Adilabad
Hanumakonda
Mahabubnagar
Kumuram Bheem
Karimnagar
Vikarabad
Nagarkurnool
YadadriBhuvanagiri
Medak
Mancherial
Kamareddy
Sangareddy
Warangal
Jangaon
Peddapalli
Narayanpet
Nalgonda
Wanaparthy
Mahabubabad
Bhadradri Kothagudem
Jogulamba Gadwal
Suryapet
Khammam
Jayashankar
Mulugu
Total Agricultural
LabourersTotal
WorkersDistrictS.No
% of Total Agricultural
Labourers
123456789101112131415161718192021222324252627282930313233
14,13,2979,64,732
10,22,6417,62,5663,76,7605,36,4365,09,5632,98,6633,49,1214,53,8454,34,9082,53,0014,63,9204,77,6334,56,7623,74,0743,85,8103,44,7854,94,1816,88,1563,62,4072,70,7723,45,2142,97,6688,06,0912,96,1494,07,4845,17,1113,28,0865,61,5287,04,7292,21,0311,62,818
23,02944,980
2,13,6242,31,9411,17,2041,77,5301,71,6651,01,7371,19,6641,61,9871,67,85899,667
1,86,3631,94,5541,90,0301,57,6721,62,8271,48,3772,13,2242,98,9901,59,4161,20,4471,59,9671,40,8983,89,6211,44,7132,04,4582,62,7531,83,4593,15,8384,14,2501,30,8971,05,511
1.64.7
20.930.431.133.133.734.134.335.738.639.440.240.741.642.142.243.043.143.444.044.546.347.348.348.950.250.855.956.258.859.264.8
1.2to12
12.1to24
24.1to36
36.1to48
48.1to64.8
% of Total Agricultural Labourers to Total Workers
Note: Agricultural labourer is a person working in another person’s land for wages in case or kind. He has no risk of cultivation.
Source: Registrar General and Census Commissioner, India (2011)
Adilabad
Nirmal
Kumuram Bheem
Mancherial
Jagtial
Rajanna Sircilla
Peddapalli
Jayashankar
Mulugu
MedakSiddipet Hanumakonda
Warangal
JangaonSangareddy
Medchal-Malkajigiri
VikarabadRangareddy
Mahabubnagar
Narayanpet
Nalgonda
NagarkurnoolWanaparthy
Suryapet
Khammam
Karimnagar
Yadadri Bhuvanagiri
Mahabubabad
Jogulamba Gadwal
Bhadradri Kothagudem
Kamareddy
Nizamabad
Hyderabad
Total Agricultural Labourers36.2%59,15,151
Total Workers1,63,41,942
Demography
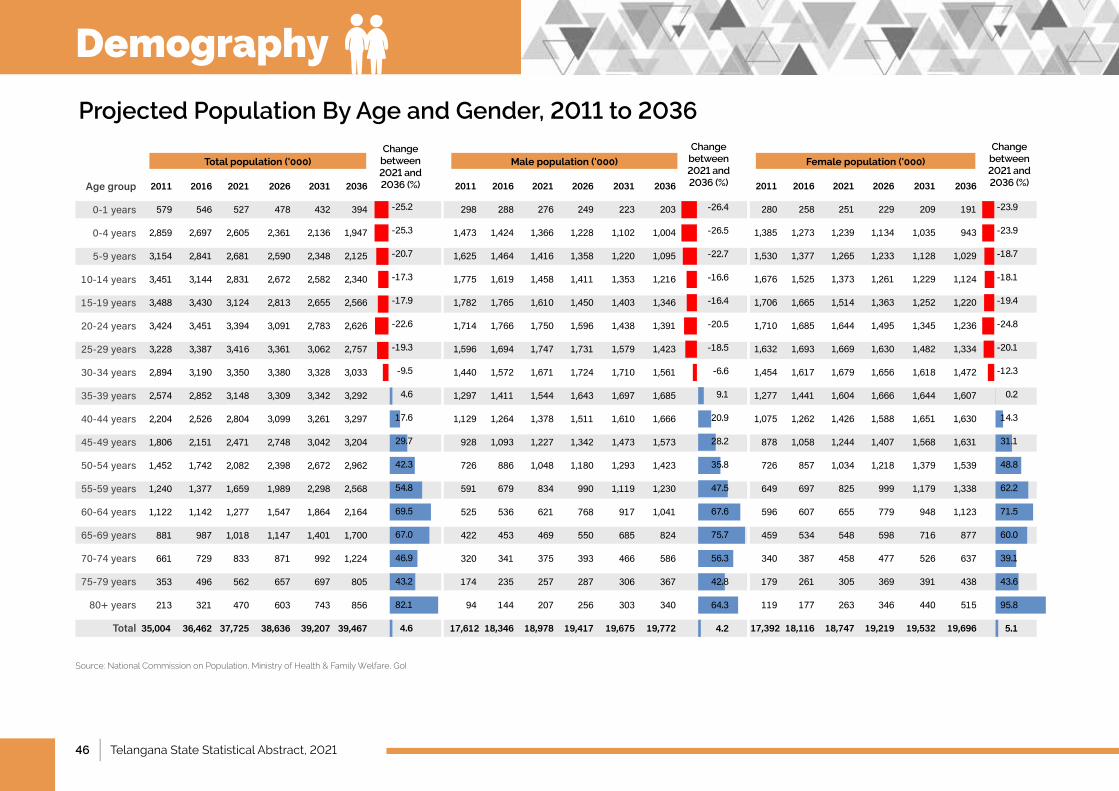
46 | Telangana State Statistical Abstract, 2021
Projected Population By Age and Gender, 2011 to 2036
Total population ('000) Male population ('000) Female population ('000)
Source: National Commission on Population, Ministry of Health & Family Welfare, GoI
Agegroup
0-1years
0-4years
5-9years
10-14years
15-19years
20-24years
25-29years
30-34years
35-39years
40-44years
45-49years
50-54years
55-59years
60-64years
65-69years
70-74years
75-79years
80+years
Total
2011 2016 2021 2026 2031 2036
579 546 527 478 432 394
2,859 2,697 2,605 2,361 2,136 1,947
3,154 2,841 2,681 2,590 2,348 2,125
3,451 3,144 2,831 2,672 2,582 2,340
3,488 3,430 3,124 2,813 2,655 2,566
3,424 3,451 3,394 3,091 2,783 2,626
3,228 3,387 3,416 3,361 3,062 2,757
2,894 3,190 3,350 3,380 3,328 3,033
2,574 2,852 3,148 3,309 3,342 3,292
2,204 2,526 2,804 3,099 3,261 3,297
1,806 2,151 2,471 2,748 3,042 3,204
1,452 1,742 2,082 2,398 2,672 2,962
1,240 1,377 1,659 1,989 2,298 2,568
1,122 1,142 1,277 1,547 1,864 2,164
881 987 1,018 1,147 1,401 1,700
661 729 833 871 992 1,224
353 496 562 657 697 805
213 321 470 603 743 856
35,004 36,46237,725 38,636 39,20739,467
2011 2016 2021 2026 2031 2036
298 288 276 249 223 203
1,473 1,424 1,366 1,228 1,102 1,004
1,625 1,464 1,416 1,358 1,220 1,095
1,775 1,619 1,458 1,411 1,353 1,216
1,782 1,765 1,610 1,450 1,403 1,346
1,714 1,766 1,750 1,596 1,438 1,391
1,596 1,694 1,747 1,731 1,579 1,423
1,440 1,572 1,671 1,724 1,710 1,561
1,297 1,411 1,544 1,643 1,697 1,685
1,129 1,264 1,378 1,511 1,610 1,666
928 1,093 1,227 1,342 1,473 1,573
726 886 1,048 1,180 1,293 1,423
591 679 834 990 1,119 1,230
525 536 621 768 917 1,041
422 453 469 550 685 824
320 341 375 393 466 586
174 235 257 287 306 367
94 144 207 256 303 340
17,612 18,346 18,978 19,417 19,675 19,772
2011 2016 2021 2026 2031 2036
280 258 251 229 209 191
1,385 1,273 1,239 1,134 1,035 943
1,530 1,377 1,265 1,233 1,128 1,029
1,676 1,525 1,373 1,261 1,229 1,124
1,706 1,665 1,514 1,363 1,252 1,220
1,710 1,685 1,644 1,495 1,345 1,236
1,632 1,693 1,669 1,630 1,482 1,334
1,454 1,617 1,679 1,656 1,618 1,472
1,277 1,441 1,604 1,666 1,644 1,607
1,075 1,262 1,426 1,588 1,651 1,630
878 1,058 1,244 1,407 1,568 1,631
726 857 1,034 1,218 1,379 1,539
649 697 825 999 1,179 1,338
596 607 655 779 948 1,123
459 534 548 598 716 877
340 387 458 477 526 637
179 261 305 369 391 438
119 177 263 346 440 515
17,392 18,116 18,747 19,219 19,532 19,696
-25.2
-25.3
-20.7
-17.3
-17.9
-22.6
-19.3
-9.5
4.6
17.6
29.7
42.3
54.8
69.5
67.0
46.9
43.2
82.1
4.6
Change between 2021 and 2036 (%)
Change between 2021 and 2036 (%)
Change between 2021 and 2036 (%)
-26.4
-26.5
-22.7
-16.6
-16.4
-20.5
-18.5
-6.6
9.1
20.9
28.2
35.8
47.5
67.6
75.7
56.3
42.8
64.3
4.2
-23.9
-23.9
-18.7
-18.1
-19.4
-24.8
-20.1
-12.3
0.2
14.3
31.1
48.8
62.2
71.5
60.0
39.1
43.6
95.8
5.1
Demography
Telangana State Statistical Abstract, 2021 | 47
InfrastructureChapter 3
48 | Telangana State Statistical Abstract, 2021
Infrastructure
1 IntroductionandKeyHighlights..................................................................................................................................................................................................................................................................................49
2 Energy-ContractedCapacity(MW)...................................................................................................................................................................................................................................................................50
3 Electrification-Agriculture/Domestic/IndustrialConnections................................................................................................................................................................51
4 DistrictwiseRoadsLength(Km)-2020-21..........................................................................................................................................................................................................................................52
5 Roads-R&B(Kilometers)-2020-21..............................................................................................................................................................................................................................................................53
6 Roads-PanchayatRaj(Kilometers)-2020-21...............................................................................................................................................................................................................................54
7 CategorywiseRoads–Total(Km)-2020-21.....................................................................................................................................................................................................................................55
8 MotorVehiclesRegistered......................................................................................................................................................................................................................................................................................................56
9 MotorVehiclesRegisteredduring2020-21............................................................................................................................................................................................................................................57
10 AllScheduledBanks,2021-22(Q1)......................................................................................................................................................................................................................................................................58
IndexPage No.S.No. Item
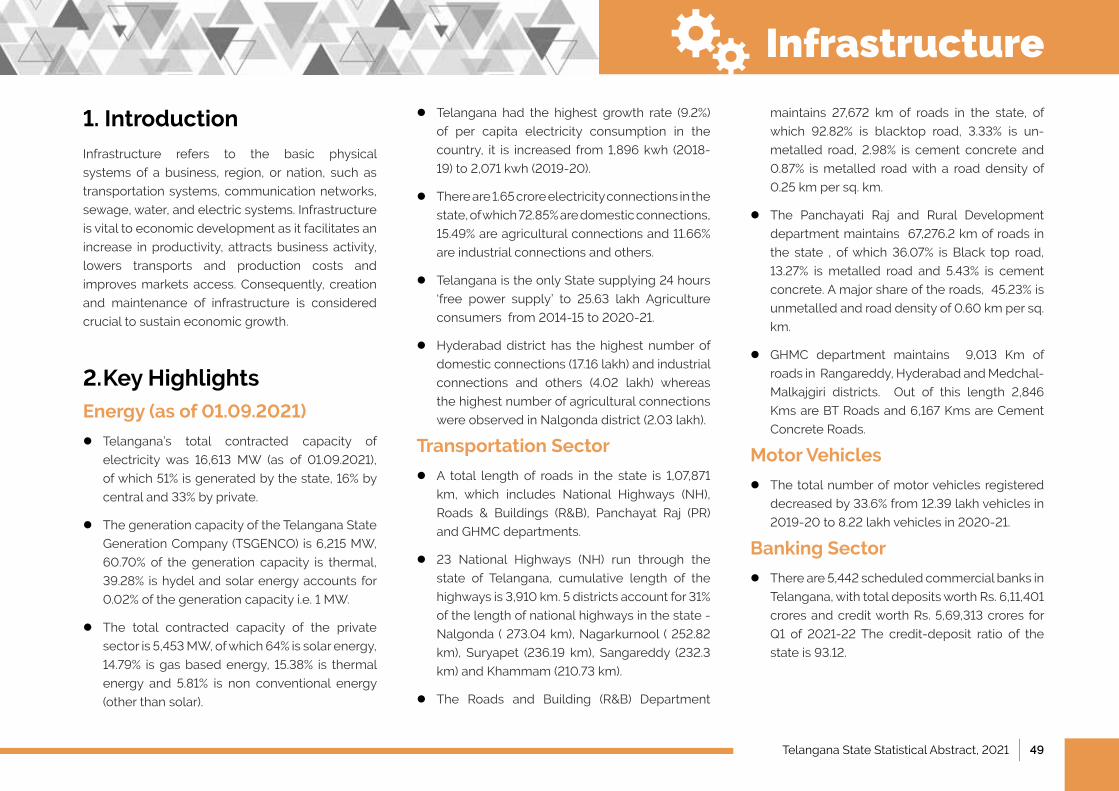
Telangana State Statistical Abstract, 2021 | 49
1. Introduction Infrastructure refers to the basic physical
systems of a business, region, or nation, such as
transportation systems, communication networks,
sewage, water, and electric systems. Infrastructure
is vital to economic development as it facilitates an
increase in productivity, attracts business activity,
lowers transports and production costs and
improves markets access. Consequently, creation
and maintenance of infrastructure is considered
crucial to sustain economic growth.
2. Key Highlights Energy (as of 01.09.2021)
●lTelangana’s total contracted capacity of
electricity was 16,613 MW (as of 01.09.2021),
of which 51% is generated by the state, 16% by
central and 33% by private.
●lThe generation capacity of the Telangana State
Generation Company (TSGENCO) is 6,215 MW,
60.70% of the generation capacity is thermal,
39.28% is hydel and solar energy accounts for
0.02% of the generation capacity i.e. 1 MW.
●lThe total contracted capacity of the private
sector is 5,453 MW, of which 64% is solar energy,
14.79% is gas based energy, 15.38% is thermal
energy and 5.81% is non conventional energy
(other than solar).
●lTelangana had the highest growth rate (9.2%)
of per capita electricity consumption in the
country, it is increased from 1,896 kwh (2018-
19) to 2,071 kwh (2019-20).
●lThere are 1.65 crore electricity connections in the
state, of which 72.85% are domestic connections,
15.49% are agricultural connections and 11.66%
are industrial connections and others.
●lTelangana is the only State supplying 24 hours
‘free power supply’ to 25.63 lakh Agriculture
consumers from 2014-15 to 2020-21.
●lHyderabad district has the highest number of
domestic connections (17.16 lakh) and industrial
connections and others (4.02 lakh) whereas
the highest number of agricultural connections
were observed in Nalgonda district (2.03 lakh).
Transportation Sector
●lA total length of roads in the state is 1,07,871
km, which includes National Highways (NH),
Roads & Buildings (R&B), Panchayat Raj (PR)
and GHMC departments.
●l23 National Highways (NH) run through the
state of Telangana, cumulative length of the
highways is 3,910 km. 5 districts account for 31%
of the length of national highways in the state -
Nalgonda ( 273.04 km), Nagarkurnool ( 252.82
km), Suryapet (236.19 km), Sangareddy (232.3
km) and Khammam (210.73 km).
●lThe Roads and Building (R&B) Department
maintains 27,672 km of roads in the state, of
which 92.82% is blacktop road, 3.33% is un-
metalled road, 2.98% is cement concrete and
0.87% is metalled road with a road density of
0.25 km per sq. km.
●lThe Panchayati Raj and Rural Development
department maintains 67,276.2 km of roads in
the state , of which 36.07% is Black top road,
13.27% is metalled road and 5.43% is cement
concrete. A major share of the roads, 45.23% is
unmetalled and road density of 0.60 km per sq.
km.
●lGHMC department maintains 9,013 Km of
roads in Rangareddy, Hyderabad and Medchal-
Malkajgiri districts. Out of this length 2,846
Kms are BT Roads and 6,167 Kms are Cement
Concrete Roads.
Motor Vehicles
●lThe total number of motor vehicles registered
decreased by 33.6% from 12.39 lakh vehicles in
2019-20 to 8.22 lakh vehicles in 2020-21.
Banking Sector
●lThere are 5,442 scheduled commercial banks in
Telangana, with total deposits worth Rs. 6,11,401
crores and credit worth Rs. 5,69,313 crores for
Q1 of 2021-22 The credit-deposit ratio of the
state is 93.12.
Infrastructure
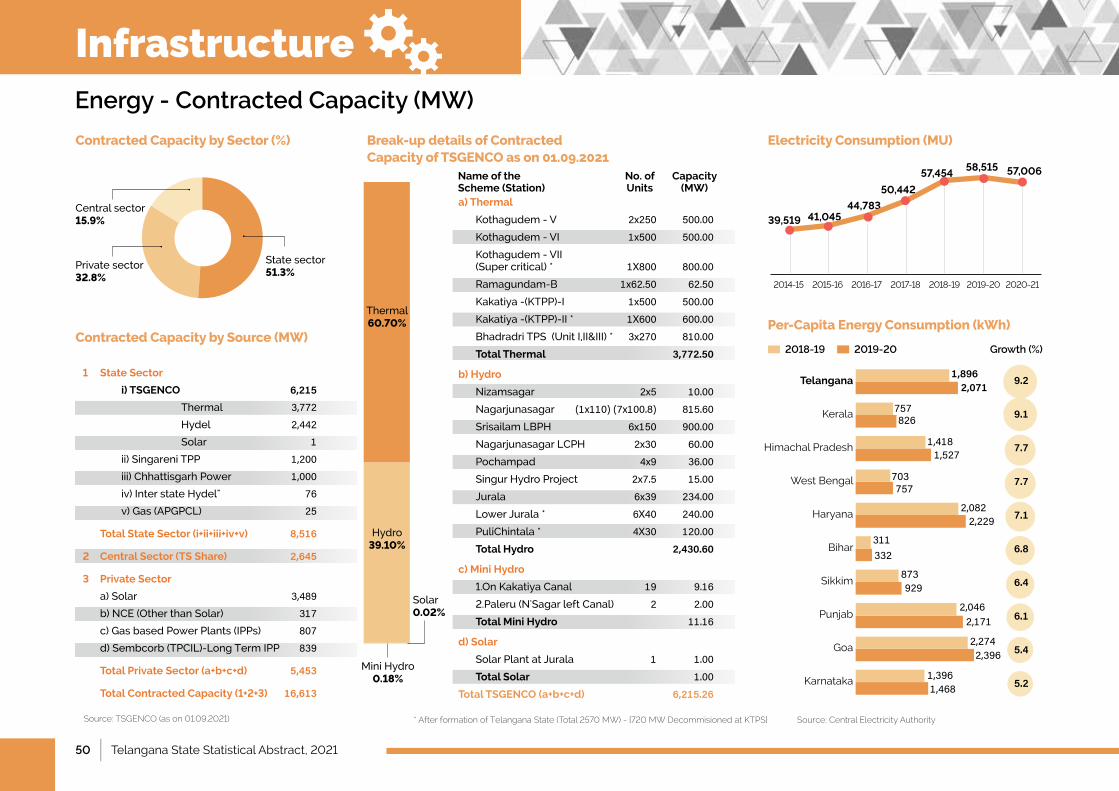
50 | Telangana State Statistical Abstract, 2021
Break-up details of ContractedCapacity of TSGENCO as on 01.09.2021
Electricity Consumption (MU)
Per-Capita Energy Consumption (kWh)
Contracted Capacity by Sector (%)
Contracted Capacity by Source (MW)
Energy - Contracted Capacity (MW)
* After formation of Telangana State (Total 2570 MW) - {720 MW Decommisioned at KTPS} Source: Central Electricity Authority
a) Thermal
Kothagudem-V 2x250 500.00
Kothagudem-VI 1x500 500.00
Kothagudem-VII (Super critical) * 1X800 800.00
Ramagundam-B 1x62.50 62.50
Kakatiya-(KTPP)-I 1x500 500.00
Kakatiya-(KTPP)-II* 1X600 600.00
BhadradriTPS(UnitI,II&III)* 3x270 810.00
Total Thermal 3,772.50
b) Hydro
Nizamsagar 2x5 10.00
Nagarjunasagar (1x110)(7x100.8) 815.60
Srisailam LBPH 6x150 900.00
Nagarjunasagar LCPH 2x30 60.00
Pochampad 4x9 36.00
Singur Hydro Project 2x7.5 15.00
Jurala 6x39 234.00
Lower Jurala * 6X40 240.00
PuliChintala * 4X30 120.00
Total Hydro 2,430.60
c) Mini Hydro
1.OnKakatiyaCanal 19 9.16
2.Paleru(N'SagarleftCanal) 2 2.00
Total Mini Hydro 11.16
d) Solar
Solar Plant at Jurala 1 1.00
Total Solar 1.00
Total TSGENCO (a+b+c+d) 6,215.26
Thermal60.70%
Hydro39.10%
MiniHydro0.18%
Solar0.02%
Source: TSGENCO (as on 01.09.2021)
1 State Sector
i) TSGENCO 6,215
Thermal 3,772
Hydel 2,442
Solar 1
ii) Singareni TPP 1,200
iii) Chhattisgarh Power 1,000
iv)InterstateHydel" 76
v) Gas (APGPCL) 25
Total State Sector (i+ii+iii+iv+v) 8,516
2 Central Sector (TS Share) 2,645
3 Private Sector
a) Solar 3,489
b) NCE (Other than Solar) 317
c)GasbasedPowerPlants(IPPs) 807
d)Sembcorb(TPCIL)-LongTermIPP 839
Total Private Sector (a+b+c+d) 5,453
Total Contracted Capacity (1+2+3) 16,613
State sector51.3%
Private sector32.8%
Central sector15.9%
Name of the Scheme (Station)
No. of Units
Capacity (MW)
2014-15 2015-16 2016-17 2017-18 2018-19 2019-20 2020-21
39,519 41,04544,783
50,442
57,45458,515 57,006
2018-19 2019-20 Growth (%)
Telangana
Kerala
Himachal Pradesh
West Bengal
Haryana
Bihar
Sikkim
Punjab
Goa
Karnataka
1,8962,071
757826
1,4181,527
757703
2,0822,229
332311
873929
2,0462,171
2,2742,396
1,4681,396
9.2
9.1
7.7
7.7
7.1
6.8
6.4
6.1
5.4
5.2
Infrastructure
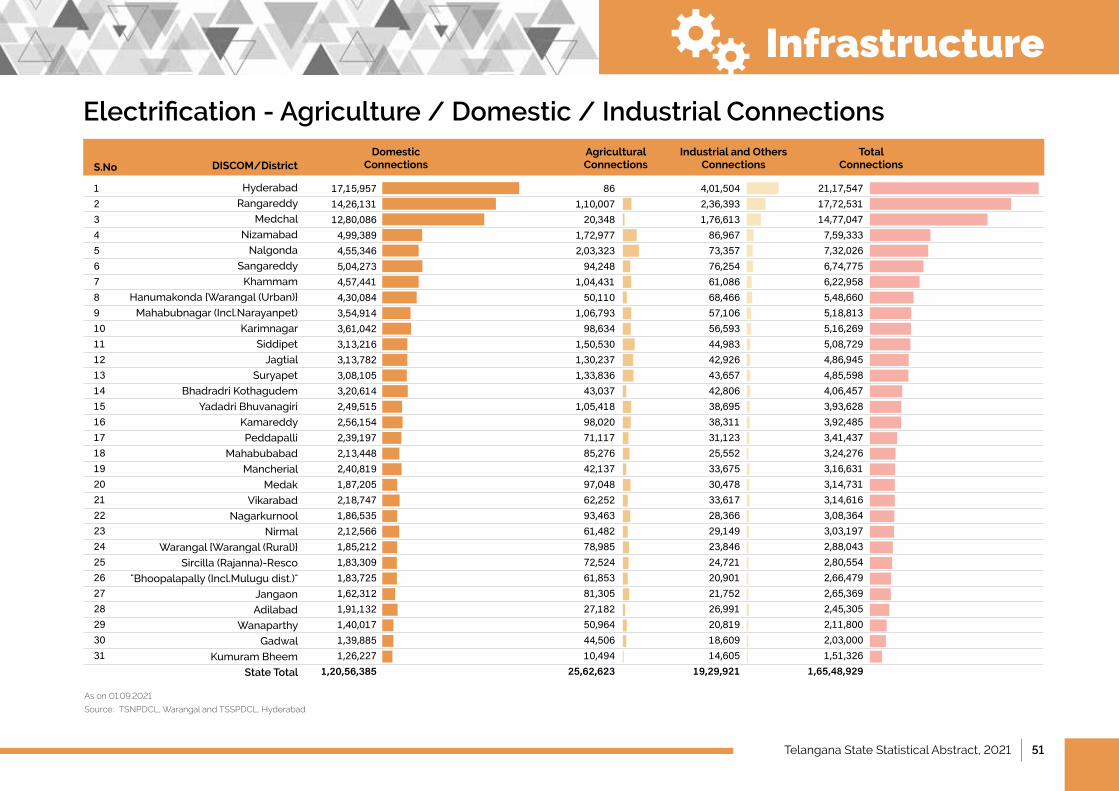
Telangana State Statistical Abstract, 2021 | 51
As on 01.09.2021
Source: TSNPDCL, Warangal and TSSPDCL, Hyderabad
Electrification - Agriculture / Domestic / Industrial Connections
Hyderabad
Rangareddy
Medchal
Nizamabad
Nalgonda
Sangareddy
Khammam
Hanumakonda{Warangal(Urban)}
Mahabubnagar(Incl.Narayanpet)
Karimnagar
Siddipet
Jagtial
Suryapet
Bhadradri Kothagudem
YadadriBhuvanagiri
Kamareddy
Peddapalli
Mahabubabad
Mancherial
Medak
Vikarabad
Nagarkurnool
Nirmal
Warangal{Warangal(Rural)}
Sircilla(Rajanna)-Resco
"Bhoopalapally(Incl.Mulugudist.)"
Jangaon
Adilabad
Wanaparthy
Gadwal
Kumuram Bheem
State Total
17,15,95714,26,13112,80,0864,99,3894,55,3465,04,2734,57,4414,30,0843,54,9143,61,0423,13,2163,13,7823,08,1053,20,6142,49,5152,56,1542,39,1972,13,4482,40,8191,87,2052,18,7471,86,5352,12,5661,85,2121,83,3091,83,7251,62,3121,91,1321,40,0171,39,8851,26,227
1,20,56,385
861,10,00720,348
1,72,9772,03,32394,248
1,04,43150,110
1,06,79398,634
1,50,5301,30,2371,33,83643,037
1,05,41898,02071,11785,27642,13797,04862,25293,46361,48278,98572,52461,85381,30527,18250,96444,50610,494
25,62,623
4,01,5042,36,3931,76,61386,96773,35776,25461,08668,46657,10656,59344,98342,92643,65742,80638,69538,31131,12325,55233,67530,47833,61728,36629,14923,84624,72120,90121,75226,99120,81918,60914,605
19,29,921
21,17,54717,72,53114,77,0477,59,3337,32,0266,74,7756,22,9585,48,6605,18,8135,16,2695,08,7294,86,9454,85,5984,06,4573,93,6283,92,4853,41,4373,24,2763,16,6313,14,7313,14,6163,08,3643,03,1972,88,0432,80,5542,66,4792,65,3692,45,3052,11,8002,03,0001,51,326
1,65,48,929
12345678910111213141516171819202122232425262728293031
DISCOM/DistrictDomestic
ConnectionsAgricultural Connections
Industrial and Others Connections
Total ConnectionsS.No
Infrastructure

52 | Telangana State Statistical Abstract, 2021
Length of Roads
District wise Roads Length (Km) - 2020-21
1 GHMC 9,013.0 2 Nalgonda 273.0 5,416.5 1,821.5 7,511.0 1.043 Khammam 210.7 2,680.4 2,216.3 5,107.5 1.144 Rangareddy 167.3 3,790.9 1,103.5 5,061.7 1.015 Nagarkurnool 252.8 2,834.1 999.1 4,086.1 0.646 Siddipet 85.3 2,663.7 1,331.9 4,080.9 1.127 Nizamabad 178.8 2,366.9 1,405.9 3,951.6 0.958 Sangareddy 232.3 2,624.8 1,076.8 3,933.9 0.889 Vikarabad 40.0 2,871.0 995.9 3,906.9 1.0810 YadadriBhuvanagiri 129.7 2,794.2 895.9 3,819.7 1.1111 Bhadradri Kothagudem 105.5 2,373.6 1,239.1 3,718.2 0.5312 Suryapet 236.2 2,562.7 902.1 3,701.0 1.0313 Mahabubabad 147.3 2,336.5 925.9 3,409.6 0.9514 Kamareddy 125.2 2,277.6 973.2 3,376.0 0.9115 Jagtial 155.2 1,577.1 1,189.9 2,922.1 1.0216 Adilabad 117.8 2,065.9 655.3 2,838.9 0.7117 Warangal Rural 96.2 2,058.8 640.2 2,795.1 1.3018 Mahabubnagar 135.1 2,065.0 566.6 2,766.7 1.0119 Kumuram Bheem 52.6 2,099.1 594.5 2,746.2 0.6120 Medak 162.4 1,825.4 699.2 2,686.9 0.9721 Karimnagar 76.0 1,596.1 920.7 2,592.8 1.2122 Nirmal 121.9 1,628.1 817.9 2,567.9 0.6923 Mancherial 132.5 1,826.6 570.3 2,529.4 0.6524 Jangaon 118.3 1,801.5 453.8 2,373.6 1.1225 Jogulamba Gadwal 39.3 1,726.3 446.6 2,212.2 0.8626 Narayanpet 104.8 1,551.5 477.6 2,133.9 0.9027 Rajanna Sircilla 18.1 1,475.4 595.9 2,089.4 1.1028 Jayashankar 82.0 1,461.1 546.2 2,089.4 0.7029 Peddapalli 0.0 1,265.3 800.2 2,065.5 0.9530 Wanaparthy 41.1 1,361.5 525.6 1,928.2 0.8931 Mulugu 136.6 967.5 457.5 1,561.7 0.3832 WarangalUrban 79.0 834.0 436.0 1,348.9 1.0433 Medchal-Malkajgiri 50.3 497.2 391.1 938.6 0.8934 Hyderabad 6.9 0.0 0.0 6.9 0.03 State 3,910.0 67,276.2 27,672.1 1,07,871.2 0.96
Note: Districts arranged in descending order of total road length. Different scale used for each category of road. Source: National Highways Authority, Engineer-in-Chief (R&B), Hyderabad, Engineer-in-Chief, (PR), Hyderabad
National Highways
3.6%(3,910.0Km)
Panchayat Raj Roads
62.4%(67,276.2Km)
R&B Roads
25.7%(27,672.1Km)
GHMCRoads
8.4%(9,013.0km)
National Highways (Km)
Panchayat Raj Roads (Km) R&B Roads (Km) Total Roads
Road Density (Km/Sq.Km)
Infrastructure
DistrictS.No
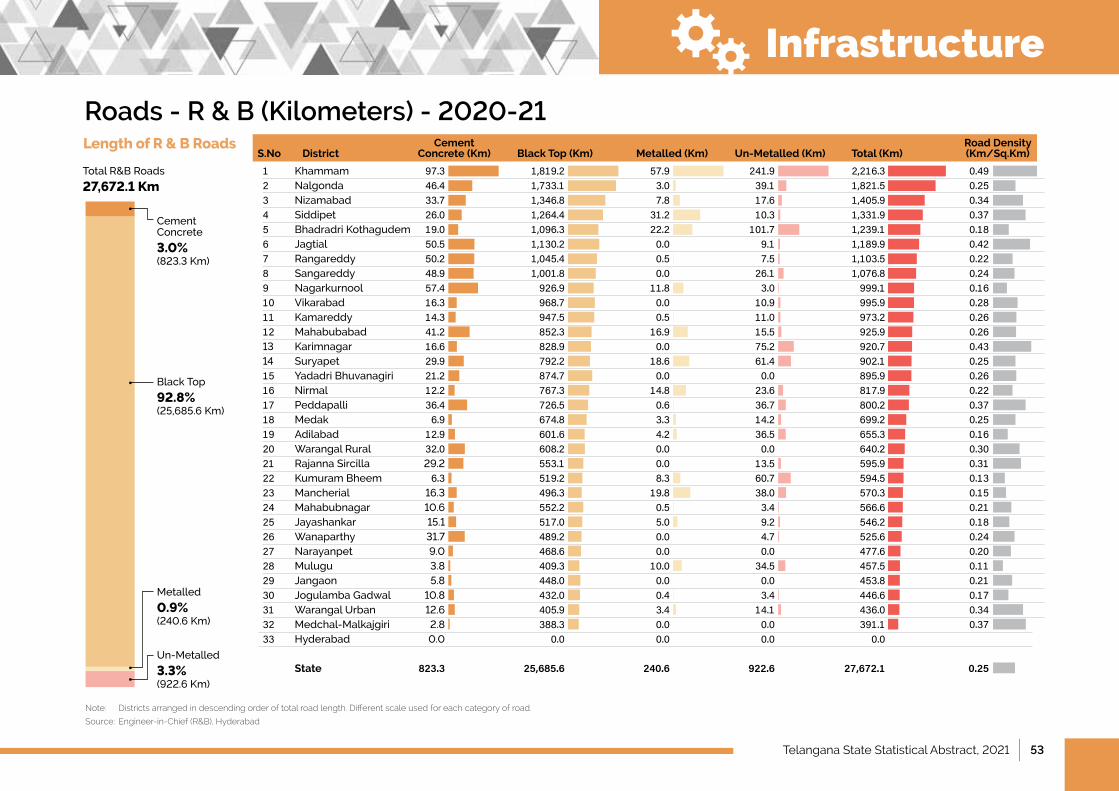
Telangana State Statistical Abstract, 2021 | 53
1 Khammam 97.3 1,819.2 57.9 241.9 2,216.3 0.492 Nalgonda 46.4 1,733.1 3.0 39.1 1,821.5 0.253 Nizamabad 33.7 1,346.8 7.8 17.6 1,405.9 0.344 Siddipet 26.0 1,264.4 31.2 10.3 1,331.9 0.375 Bhadradri Kothagudem 19.0 1,096.3 22.2 101.7 1,239.1 0.186 Jagtial 50.5 1,130.2 0.0 9.1 1,189.9 0.427 Rangareddy 50.2 1,045.4 0.5 7.5 1,103.5 0.228 Sangareddy 48.9 1,001.8 0.0 26.1 1,076.8 0.249 Nagarkurnool 57.4 926.9 11.8 3.0 999.1 0.1610 Vikarabad 16.3 968.7 0.0 10.9 995.9 0.2811 Kamareddy 14.3 947.5 0.5 11.0 973.2 0.2612 Mahabubabad 41.2 852.3 16.9 15.5 925.9 0.2613 Karimnagar 16.6 828.9 0.0 75.2 920.7 0.4314 Suryapet 29.9 792.2 18.6 61.4 902.1 0.2515 YadadriBhuvanagiri 21.2 874.7 0.0 0.0 895.9 0.2616 Nirmal 12.2 767.3 14.8 23.6 817.9 0.2217 Peddapalli 36.4 726.5 0.6 36.7 800.2 0.3718 Medak 6.9 674.8 3.3 14.2 699.2 0.2519 Adilabad 12.9 601.6 4.2 36.5 655.3 0.1620 Warangal Rural 32.0 608.2 0.0 0.0 640.2 0.3021 RajannaSircilla 29.2 553.1 0.0 13.5 595.9 0.3122 Kumuram Bheem 6.3 519.2 8.3 60.7 594.5 0.1323 Mancherial 16.3 496.3 19.8 38.0 570.3 0.1524 Mahabubnagar 10.6 552.2 0.5 3.4 566.6 0.2125 Jayashankar 15.1 517.0 5.0 9.2 546.2 0.1826 Wanaparthy 31.7 489.2 0.0 4.7 525.6 0.2427 Narayanpet 9.0 468.6 0.0 0.0 477.6 0.2028 Mulugu 3.8 409.3 10.0 34.5 457.5 0.1129 Jangaon 5.8 448.0 0.0 0.0 453.8 0.2130 JogulambaGadwal 10.8 432.0 0.4 3.4 446.6 0.1731 WarangalUrban 12.6 405.9 3.4 14.1 436.0 0.3432 Medchal-Malkajgiri 2.8 388.3 0.0 0.0 391.1 0.3733 Hyderabad 0.0 0.0 0.0 0.0 0.0 State 823.3 25,685.6 240.6 922.6 27,672.1 0.25
Length of R & B Roads
Roads - R & B (Kilometers) - 2020-21
Note: Districts arranged in descending order of total road length. Different scale used for each category of road.
Source: Engineer-in-Chief (R&B), Hyderabad
Cement Concrete
3.0%(823.3Km)
Black Top
92.8%(25,685.6Km)
Metalled
0.9%(240.6Km)
Un-Metalled
3.3%(922.6Km)
Cement Concrete (Km) Black Top (Km) Metalled (Km) Un-Metalled (Km) Total (Km)
Road Density (Km/Sq.Km)
Total R&B Roads
27,672.1 Km
Infrastructure
DistrictS.No
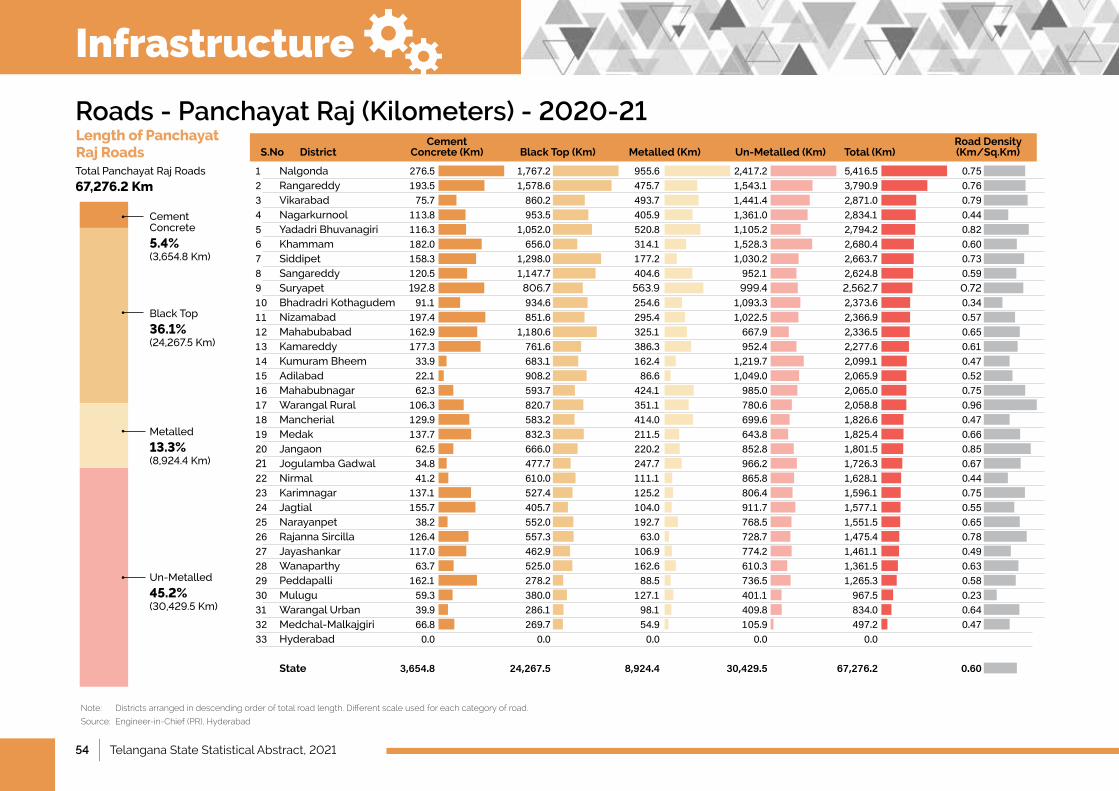
54 | Telangana State Statistical Abstract, 2021
DistrictS.No
Length of Panchayat Raj Roads
Roads - Panchayat Raj (Kilometers) - 2020-21
1 Nalgonda 276.5 1,767.2 955.6 2,417.2 5,416.5 0.752 Rangareddy 193.5 1,578.6 475.7 1,543.1 3,790.9 0.763 Vikarabad 75.7 860.2 493.7 1,441.4 2,871.0 0.794 Nagarkurnool 113.8 953.5 405.9 1,361.0 2,834.1 0.445 YadadriBhuvanagiri 116.3 1,052.0 520.8 1,105.2 2,794.2 0.826 Khammam 182.0 656.0 314.1 1,528.3 2,680.4 0.607 Siddipet 158.3 1,298.0 177.2 1,030.2 2,663.7 0.738 Sangareddy 120.5 1,147.7 404.6 952.1 2,624.8 0.599 Suryapet 192.8 806.7 563.9 999.4 2,562.7 0.7210 Bhadradri Kothagudem 91.1 934.6 254.6 1,093.3 2,373.6 0.3411 Nizamabad 197.4 851.6 295.4 1,022.5 2,366.9 0.5712 Mahabubabad 162.9 1,180.6 325.1 667.9 2,336.5 0.6513 Kamareddy 177.3 761.6 386.3 952.4 2,277.6 0.6114 Kumuram Bheem 33.9 683.1 162.4 1,219.7 2,099.1 0.4715 Adilabad 22.1 908.2 86.6 1,049.0 2,065.9 0.5216 Mahabubnagar 62.3 593.7 424.1 985.0 2,065.0 0.7517 Warangal Rural 106.3 820.7 351.1 780.6 2,058.8 0.9618 Mancherial 129.9 583.2 414.0 699.6 1,826.6 0.4719 Medak 137.7 832.3 211.5 643.8 1,825.4 0.6620 Jangaon 62.5 666.0 220.2 852.8 1,801.5 0.8521 JogulambaGadwal 34.8 477.7 247.7 966.2 1,726.3 0.6722 Nirmal 41.2 610.0 111.1 865.8 1,628.1 0.4423 Karimnagar 137.1 527.4 125.2 806.4 1,596.1 0.7524 Jagtial 155.7 405.7 104.0 911.7 1,577.1 0.5525 Narayanpet 38.2 552.0 192.7 768.5 1,551.5 0.6526 Rajanna Sircilla 126.4 557.3 63.0 728.7 1,475.4 0.7827 Jayashankar 117.0 462.9 106.9 774.2 1,461.1 0.4928 Wanaparthy 63.7 525.0 162.6 610.3 1,361.5 0.6329 Peddapalli 162.1 278.2 88.5 736.5 1,265.3 0.5830 Mulugu 59.3 380.0 127.1 401.1 967.5 0.2331 WarangalUrban 39.9 286.1 98.1 409.8 834.0 0.6432 Medchal-Malkajgiri 66.8 269.7 54.9 105.9 497.2 0.4733 Hyderabad 0.0 0.0 0.0 0.0 0.0 State 3,654.8 24,267.5 8,924.4 30,429.5 67,276.2 0.60
Note: Districts arranged in descending order of total road length. Different scale used for each category of road.
Source: Engineer-in-Chief (PR), Hyderabad
Cement Concrete
5.4%(3,654.8Km)
Black Top
36.1%(24,267.5Km)
Metalled
13.3%(8,924.4Km)
Un-Metalled
45.2%(30,429.5Km)
Cement Concrete (Km) Black Top (Km) Metalled (Km) Un-Metalled (Km) Total (Km)
Road Density (Km/Sq.Km)
Total Panchayat Raj Roads
67,276.2 Km
Infrastructure
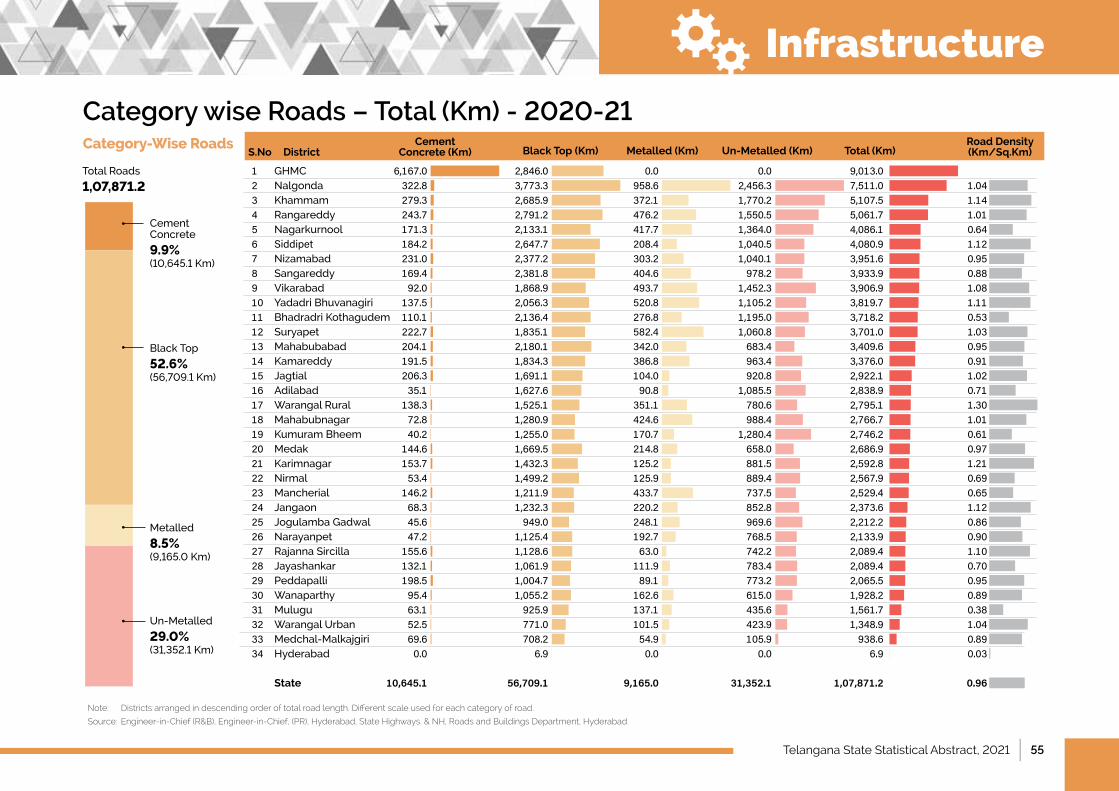
Telangana State Statistical Abstract, 2021 | 55
DistrictS.NoCategory-Wise Roads
Category wise Roads – Total (Km) - 2020-21
1 GHMC 6,167.0 2,846.0 0.0 0.0 9,013.02 Nalgonda 322.8 3,773.3 958.6 2,456.3 7,511.0 1.043 Khammam 279.3 2,685.9 372.1 1,770.2 5,107.5 1.144 Rangareddy 243.7 2,791.2 476.2 1,550.5 5,061.7 1.015 Nagarkurnool 171.3 2,133.1 417.7 1,364.0 4,086.1 0.646 Siddipet 184.2 2,647.7 208.4 1,040.5 4,080.9 1.127 Nizamabad 231.0 2,377.2 303.2 1,040.1 3,951.6 0.958 Sangareddy 169.4 2,381.8 404.6 978.2 3,933.9 0.889 Vikarabad 92.0 1,868.9 493.7 1,452.3 3,906.9 1.0810 YadadriBhuvanagiri 137.5 2,056.3 520.8 1,105.2 3,819.7 1.1111 Bhadradri Kothagudem 110.1 2,136.4 276.8 1,195.0 3,718.2 0.5312 Suryapet 222.7 1,835.1 582.4 1,060.8 3,701.0 1.0313 Mahabubabad 204.1 2,180.1 342.0 683.4 3,409.6 0.9514 Kamareddy 191.5 1,834.3 386.8 963.4 3,376.0 0.9115 Jagtial 206.3 1,691.1 104.0 920.8 2,922.1 1.0216 Adilabad 35.1 1,627.6 90.8 1,085.5 2,838.9 0.7117 Warangal Rural 138.3 1,525.1 351.1 780.6 2,795.1 1.3018 Mahabubnagar 72.8 1,280.9 424.6 988.4 2,766.7 1.0119 Kumuram Bheem 40.2 1,255.0 170.7 1,280.4 2,746.2 0.6120 Medak 144.6 1,669.5 214.8 658.0 2,686.9 0.9721 Karimnagar 153.7 1,432.3 125.2 881.5 2,592.8 1.2122 Nirmal 53.4 1,499.2 125.9 889.4 2,567.9 0.6923 Mancherial 146.2 1,211.9 433.7 737.5 2,529.4 0.6524 Jangaon 68.3 1,232.3 220.2 852.8 2,373.6 1.1225 Jogulamba Gadwal 45.6 949.0 248.1 969.6 2,212.2 0.8626 Narayanpet 47.2 1,125.4 192.7 768.5 2,133.9 0.9027 Rajanna Sircilla 155.6 1,128.6 63.0 742.2 2,089.4 1.1028 Jayashankar 132.1 1,061.9 111.9 783.4 2,089.4 0.7029 Peddapalli 198.5 1,004.7 89.1 773.2 2,065.5 0.9530 Wanaparthy 95.4 1,055.2 162.6 615.0 1,928.2 0.8931 Mulugu 63.1 925.9 137.1 435.6 1,561.7 0.3832 WarangalUrban 52.5 771.0 101.5 423.9 1,348.9 1.0433 Medchal-Malkajgiri 69.6 708.2 54.9 105.9 938.6 0.8934 Hyderabad 0.0 6.9 0.0 0.0 6.9 0.03 State 10,645.1 56,709.1 9,165.0 31,352.1 1,07,871.2 0.96
Note: Districts arranged in descending order of total road length. Different scale used for each category of road.
Source: Engineer-in-Chief (R&B), Engineer-in-Chief, (PR), Hyderabad, State Highways. & NH, Roads and Buildings Department, Hyderabad
Cement Concrete (Km) Black Top (Km) Metalled (Km) Un-Metalled (Km) Total (Km)
Road Density (Km/Sq.Km)
Total Roads
1,07,871.2
Cement Concrete
9.9%(10,645.1Km)
Black Top
52.6%(56,709.1Km)
Metalled
8.5%(9,165.0Km)
Un-Metalled
29.0%(31,352.1Km)
Infrastructure
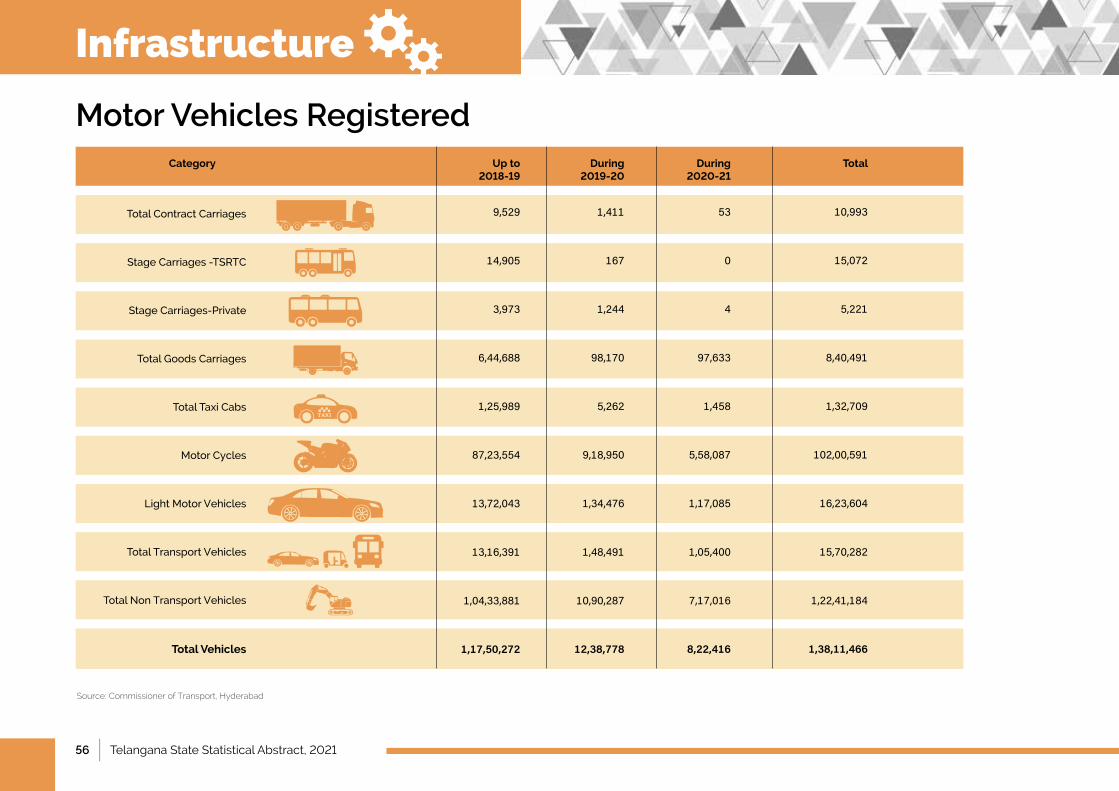
56 | Telangana State Statistical Abstract, 2021
Motor Vehicles Registered
Source: Commissioner of Transport, Hyderabad
Total Contract Carriages
StageCarriages-TSRTC
StageCarriages-Private
Total Goods Carriages
Total Taxi Cabs
MotorCycles
LightMotorVehicles
TotalTransportVehicles
TotalNonTransportVehicles
Total Vehicles
9,529
14,905
3,973
6,44,688
1,25,989
87,23,554
13,72,043
13,16,391
1,04,33,881
1,17,50,272
1,411
167
1,244
98,170
5,262
9,18,950
1,34,476
1,48,491
10,90,287
12,38,778
53
0
4
97,633
1,458
5,58,087
1,17,085
1,05,400
7,17,016
8,22,416
10,993
15,072
5,221
8,40,491
1,32,709
102,00,591
16,23,604
15,70,282
1,22,41,184
1,38,11,466
Category Up to 2018-19
During 2019-20
During 2020-21
Total
Infrastructure
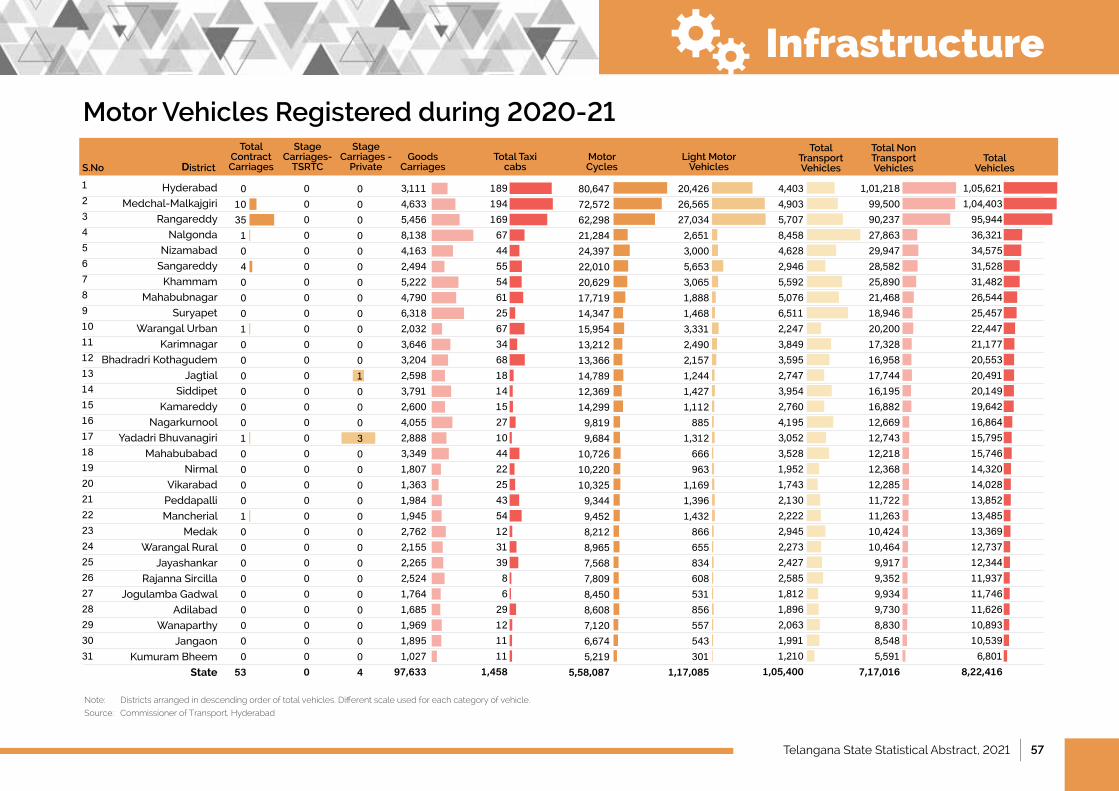
Telangana State Statistical Abstract, 2021 | 57
Motor Vehicles Registered during 2020-21
Note: Districts arranged in descending order of total vehicles. Different scale used for each category of vehicle.
Source: Commissioner of Transport, Hyderabad
Hyderabad
Medchal-Malkajgiri
Rangareddy
Nalgonda
Nizamabad
Sangareddy
Khammam
Mahabubnagar
Suryapet
WarangalUrban
Karimnagar
Bhadradri Kothagudem
Jagtial
Siddipet
Kamareddy
Nagarkurnool
YadadriBhuvanagiri
Mahabubabad
Nirmal
Vikarabad
Peddapalli
Mancherial
Medak
Warangal Rural
Jayashankar
Rajanna Sircilla
Jogulamba Gadwal
Adilabad
Wanaparthy
Jangaon
Kumuram Bheem
State
010351040001000000100001000000000
53
00000000000000000000000000000000
3,1114,6335,4568,1384,1632,4945,2224,7906,3182,0323,6463,2042,5983,7912,6004,0552,8883,3491,8071,3631,9841,9452,7622,1552,2652,5241,7641,6851,9691,8951,027
97,633
1891941696744555461256734681814152710442225435412313986
29121111
1,458
12345678910111213141516171819202122232425262728293031
District
Total Contract Carriages
Stage Carriages-
TSRTC
Stage Carriages -
PrivateGoods
CarriagesTotal Taxi
cabsS.No
00000000000010003000000000000004
80,64772,57262,29821,28424,39722,01020,62917,71914,34715,95413,21213,36614,78912,36914,2999,8199,684
10,72610,22010,3259,3449,4528,2128,9657,5687,8098,4508,6087,1206,6745,219
5,58,087
20,42626,56527,0342,6513,0005,6533,0651,8881,4683,3312,4902,1571,2441,4271,112885
1,312666963
1,1691,3961,432866655834608531856557543301
1,17,085
4,4034,9035,7078,4584,6282,9465,5925,0766,5112,2473,8493,5952,7473,9542,7604,1953,0523,5281,9521,7432,1302,2222,9452,2732,4272,5851,8121,8962,0631,9911,210
1,05,400
1,01,21899,50090,23727,86329,94728,58225,89021,46818,94620,20017,32816,95817,74416,19516,88212,66912,74312,21812,36812,28511,72211,26310,42410,4649,9179,3529,9349,7308,8308,5485,591
7,17,016
1,05,6211,04,40395,94436,32134,57531,52831,48226,54425,45722,44721,17720,55320,49120,14919,64216,86415,79515,74614,32014,02813,85213,48513,36912,73712,34411,93711,74611,62610,89310,5396,801
8,22,416
Motor Cycles
Light Motor Vehicles
Total Transport Vehicles
Total Non Transport Vehicles
Total Vehicles
Infrastructure

58 | Telangana State Statistical Abstract, 2021
All Scheduled Banks, 2021-22 (Q1)
Note: Districts arranged in descending order of credit-deposit ratio. Different scale used for each metric.
Source: Quarterly Statistics on Deposits and Credits of Scheduled Commercial Banks, Q1 2021-22 RBI, Mumbai.
SuryapetJangaonMedak
NalgondaWarangal Rural
NarayanpetMahabubabad
Jogulamba GadwalNagarkurnool
WanaparthyNirmal
KhammamMahabubnagar
VikarabadKamareddyNizamabad
YadadriBhuvanagiriAdilabad
SangareddySiddipet
Jayashankar Hyderabad
MuluguBhadradri Kothagudem
WarangalUrbanJagtial
KarimnagarRajanna Sircilla
MancherialRangareddy
Medchal-MalkajgiriKumuram Bheem
Peddapalli
Telangana 5,442
AllIndia 1,50,182
Telangana 6,11,401
AllIndia 1,55,39,309
Telangana 5,69,313
AllIndia 1,09,48,614
Telangana 93.1
AllIndia70.5
Number of Reporting Offices
Deposits (Rs. Crores)
Credits (Rs. Crores)
Credit-Deposit Ratio
1395097
21064426049785180
2031349398
25392
10320311835
1,20226
1361921051955294
4056574185
3,5561,4712,4786,6911,5141,0881,6891,4842,2221,6202,5277,6254,7382,3722,9258,1702,8033,945
10,7644,5131,334
3,61,115935
6,02614,9244,045
10,3372,3445,675
30,17993,0391,7195,532
6,7432,6054,060
10,9472,4581,7622,7212,1723,1742,2163,456
10,2146,1993,0433,732
10,1193,4134,409
12,0114,8921,309
3,49,118857
5,41412,8613,4428,5201,7733,861
19,31058,1761,0373,288
189.6177.1163.8163.6162.4161.9161.1146.4142.8136.8136.8134.0130.8128.3127.6123.9121.8111.8111.6108.498.196.791.789.886.285.182.475.668.064.062.560.359.4
123456789101112131415161718192021222324252627282930313233
DistrictNumber of
Reporting OfficesDeposits
(Rs. Crores)Credit
(Rs. Crores)Credit-Deposit
RatioS.No
Infrastructure
Telangana State Statistical Abstract, 2021 | 59
EconomyChapter 4
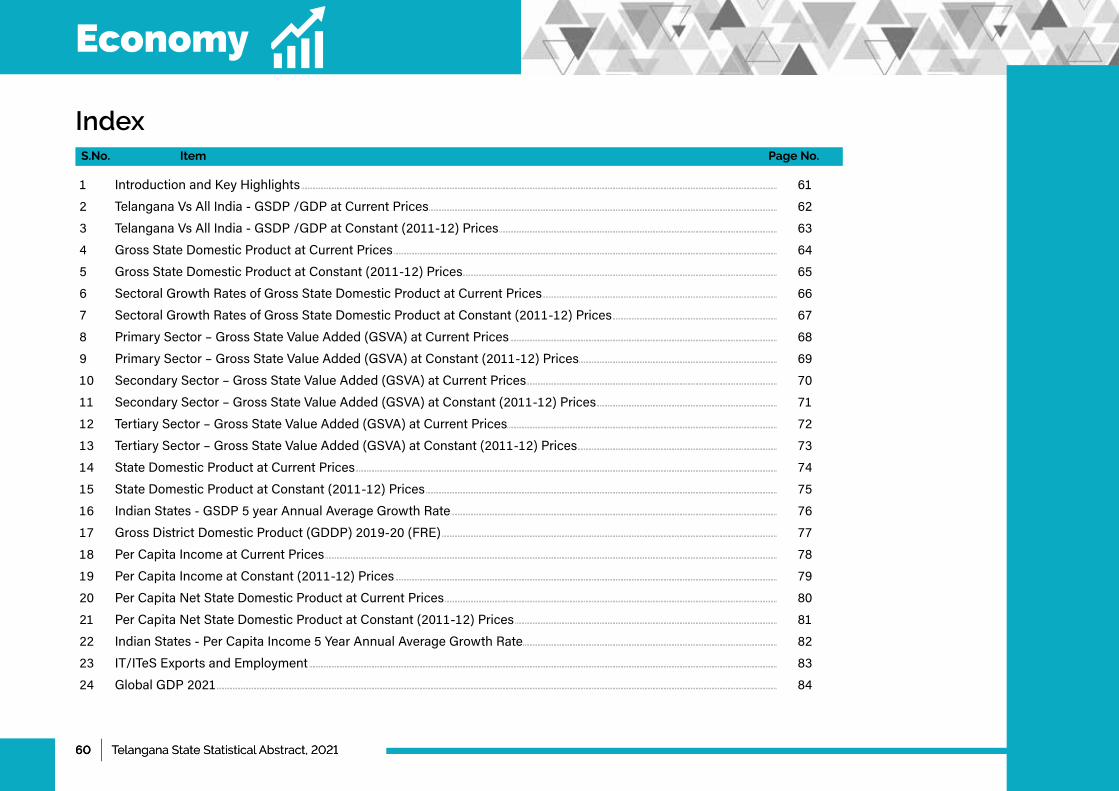
60 | Telangana State Statistical Abstract, 202160 | Telangana State Statistical Abstract, 2021
Economy
1 IntroductionandKeyHighlights...........................................................................................................................................................................................................................................................................................................61
2 TelanganaVsAllIndia-GSDP/GDPatCurrentPrices...........................................................................................................................................................................................................................62
3 TelanganaVsAllIndia-GSDP/GDPatConstant(2011-12)Prices...............................................................................................................................................................................63
4 GrossStateDomesticProductatCurrentPrices.................................................................................................................................................................................................................................................64
5 GrossStateDomesticProductatConstant(2011-12)Prices.....................................................................................................................................................................................................65
6 SectoralGrowthRatesofGrossStateDomesticProductatCurrentPrices....................................................................................................................................................66
7 SectoralGrowthRatesofGrossStateDomesticProductatConstant(2011-12)Prices........................................................................................................67
8 PrimarySector–GrossStateValueAdded(GSVA)atCurrentPrices........................................................................................................................................................................68
9 PrimarySector–GrossStateValueAdded(GSVA)atConstant(2011-12)Prices.............................................................................................................................69
10 SecondarySector–GrossStateValueAdded(GSVA)atCurrentPrices..............................................................................................................................................................70
11 SecondarySector–GrossStateValueAdded(GSVA)atConstant(2011-12)Prices..................................................................................................................71
12 TertiarySector–GrossStateValueAdded(GSVA)atCurrentPrices.........................................................................................................................................................................72
13 TertiarySector–GrossStateValueAdded(GSVA)atConstant(2011-12)Prices..............................................................................................................................73
14 StateDomesticProductatCurrentPrices.........................................................................................................................................................................................................................................................................74
15 StateDomesticProductatConstant(2011-12)Prices.............................................................................................................................................................................................................................75
16 IndianStates-GSDP5yearAnnualAverageGrowthRate.............................................................................................................................................................................................................76
17 GrossDistrictDomesticProduct(GDDP)2019-20(FRE)...................................................................................................................................................................................................................77
18 PerCapitaIncomeatCurrentPrices............................................................................................................................................................................................................................................................................................78
19 PerCapitaIncomeatConstant(2011-12)Prices................................................................................................................................................................................................................................................79
20 PerCapitaNetStateDomesticProductatCurrentPrices.................................................................................................................................................................................................................80
21 PerCapitaNetStateDomesticProductatConstant(2011-12)Prices.....................................................................................................................................................................81
22 IndianStates-PerCapitaIncome5YearAnnualAverageGrowthRate................................................................................................................................................................82
23 IT/ITeSExportsandEmployment......................................................................................................................................................................................................................................................................................................83
24 GlobalGDP2021................................................................................................................................................................................................................................................................................................................................................................84
IndexPage No.S.No. Item
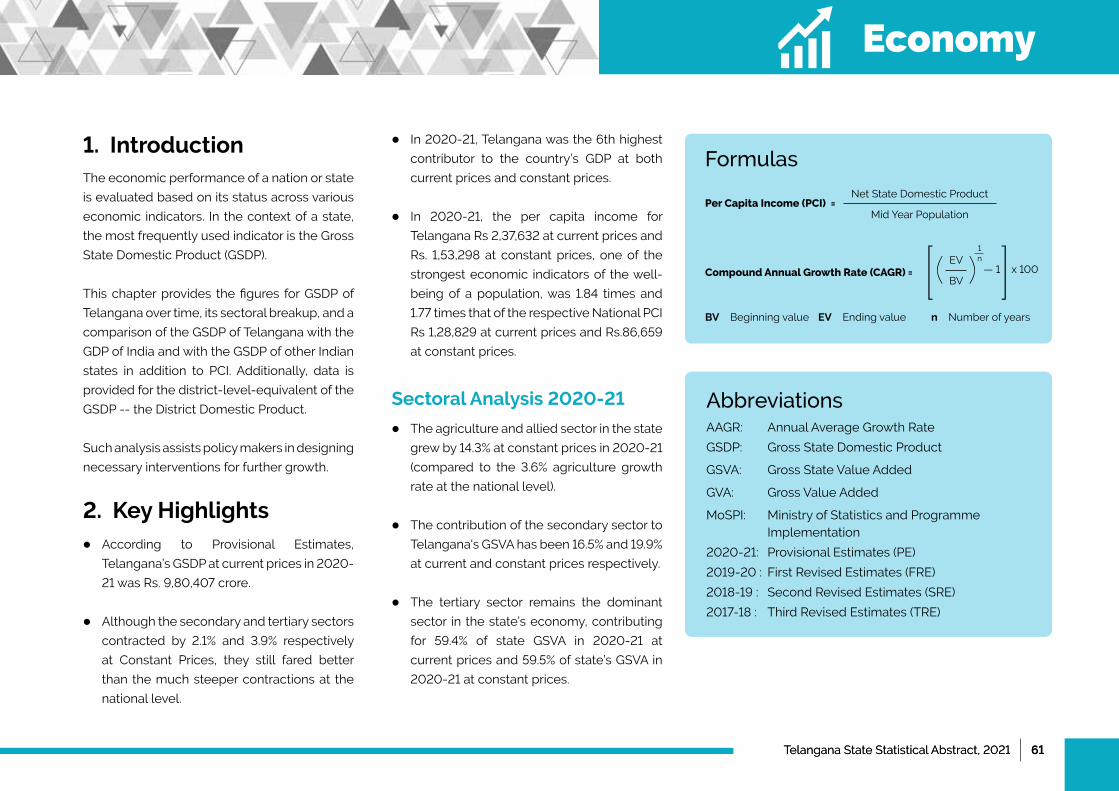
Telangana State Statistical Abstract, 2021 | 61Telangana State Statistical Abstract, 2021 | 61
1. Introduction The economic performance of a nation or state
is evaluated based on its status across various
economic indicators. In the context of a state,
the most frequently used indicator is the Gross
State Domestic Product (GSDP).
This chapter provides the figures for GSDP of
Telangana over time, its sectoral breakup, and a
comparison of the GSDP of Telangana with the
GDP of India and with the GSDP of other Indian
states in addition to PCI. Additionally, data is
provided for the district-level-equivalent of the
GSDP -- the District Domestic Product.
Such analysis assists policy makers in designing
necessary interventions for further growth.
2. Key Highlights ●l According to Provisional Estimates,
Telangana’s GSDP at current prices in 2020-
21 was Rs. 9,80,407 crore.
●l Although the secondary and tertiary sectors
contracted by 2.1% and 3.9% respectively
at Constant Prices, they still fared better
than the much steeper contractions at the
national level.
●l In 2020-21, Telangana was the 6th highest
contributor to the country’s GDP at both
current prices and constant prices.
●l In 2020-21, the per capita income for
Telangana Rs 2,37,632 at current prices and
Rs. 1,53,298 at constant prices, one of the
strongest economic indicators of the well-
being of a population, was 1.84 times and
1.77 times that of the respective National PCI
Rs 1,28,829 at current prices and Rs.86,659
at constant prices.
Sectoral Analysis 2020-21
●l The agriculture and allied sector in the state
grew by 14.3% at constant prices in 2020-21
(compared to the 3.6% agriculture growth
rate at the national level).
●l The contribution of the secondary sector to
Telangana's GSVA has been 16.5% and 19.9%
at current and constant prices respectively.
●l The tertiary sector remains the dominant
sector in the state’s economy, contributing
for 59.4% of state GSVA in 2020-21 at
current prices and 59.5% of state’s GSVA in
2020-21 at constant prices.
Per Capita Income (PCI) =Net State Domestic Product
Mid Year Population
BV Beginning value EV Ending value n Number of years
EV
BV— 1 x 100Compound Annual Growth Rate (CAGR) =
1n
Formulas
AbbreviationsAAGR: Annual Average Growth Rate
GSDP: Gross State Domestic Product
GSVA: Gross State Value Added
GVA: Gross Value Added
MoSPI: Ministry of Statistics and Programme Implementation
2020-21: Provisional Estimates (PE)
2019-20 : First Revised Estimates (FRE)
2018-19 : Second Revised Estimates (SRE)
2017-18 : Third Revised Estimates (TRE)
Economy
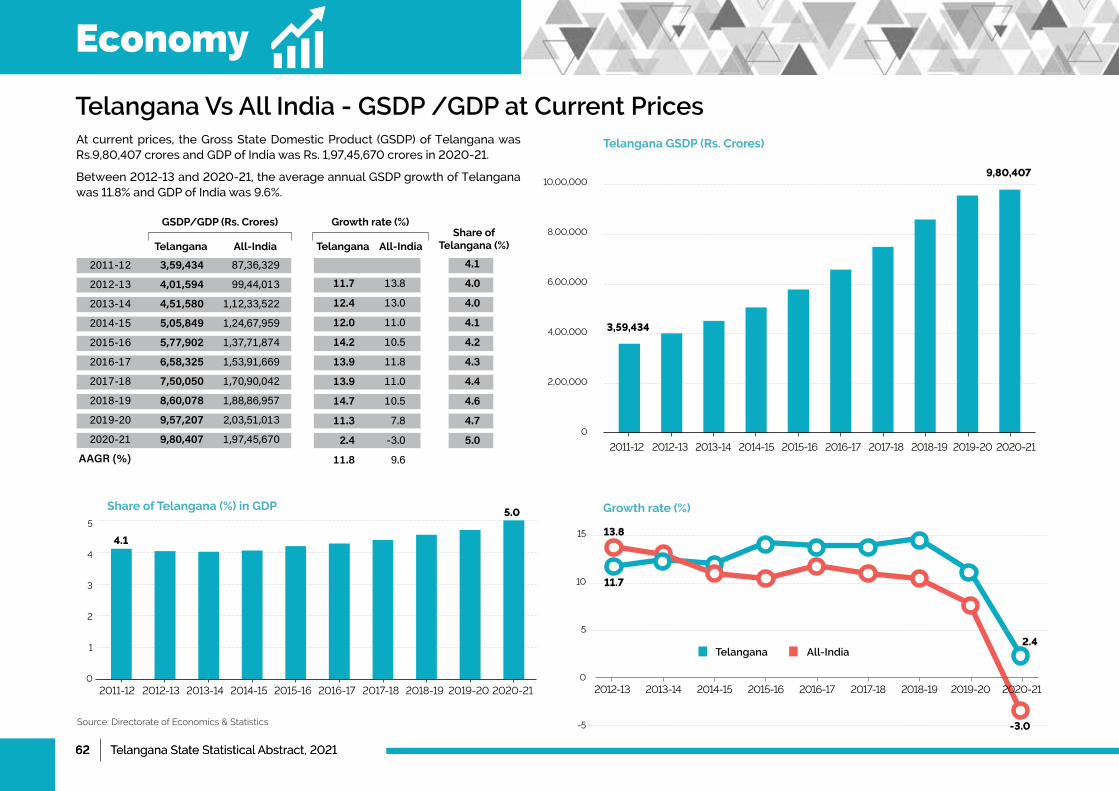
62 | Telangana State Statistical Abstract, 202162 | Telangana State Statistical Abstract, 2021
Telangana Vs All India - GSDP /GDP at Current Prices
GSDP/GDP (Rs. Crores) Growth rate (%)
2011-12
2012-13
2013-14
2014-15
2015-16
2016-17
2017-18
2018-19
2019-20
2020-21
AAGR(%)
3,59,434
4,01,594
4,51,580
5,05,849
5,77,902
6,58,325
7,50,050
8,60,078
9,57,207
9,80,407
87,36,329
99,44,013
1,12,33,522
1,24,67,959
1,37,71,874
1,53,91,669
1,70,90,042
1,88,86,957
2,03,51,013
1,97,45,670
11.7
12.4
12.0
14.2
13.9
13.9
14.7
11.3
2.4
11.8
13.8
13.0
11.0
10.5
11.8
11.0
10.5
7.8
-3.0
9.6
Telangana All-India Telangana All-IndiaShare of
Telangana (%)
4.1
4.0
4.0
4.1
4.2
4.3
4.4
4.6
4.7
5.0
Atcurrentprices, theGrossStateDomesticProduct (GSDP)ofTelanganawasRs.9,80,407croresandGDPofIndiawasRs.1,97,45,670croresin2020-21.
Between2012-13and2020-21,theaverageannualGSDPgrowthofTelanganawas11.8%andGDPofIndiawas9.6%.
Source: Directorate of Economics & Statistics
Share of Telangana (%) in GDP
2011-12 2012-13 2013-14 2014-15 2015-16 2016-17 2017-18 2018-19 2019-20 2020-21
4.1
5.05
4
3
2
1
0
Growth rate (%)
11.7
-3.0
2.4
13.8
2012-13 2013-14 2014-15 2015-16 2016-17 2017-18 2018-19 2019-20 2020-21
15
10
5
0
-5
Telangana GSDP (Rs. Crores)
10,00,000
8,00,000
6,00,000
4,00,000
2,00,000
0
2011-12 2012-13 2013-14 2014-15 2015-16 2016-17 2017-18 2018-19 2019-20 2020-21
3,59,434
9,80,407
Telangana All-India
Economy
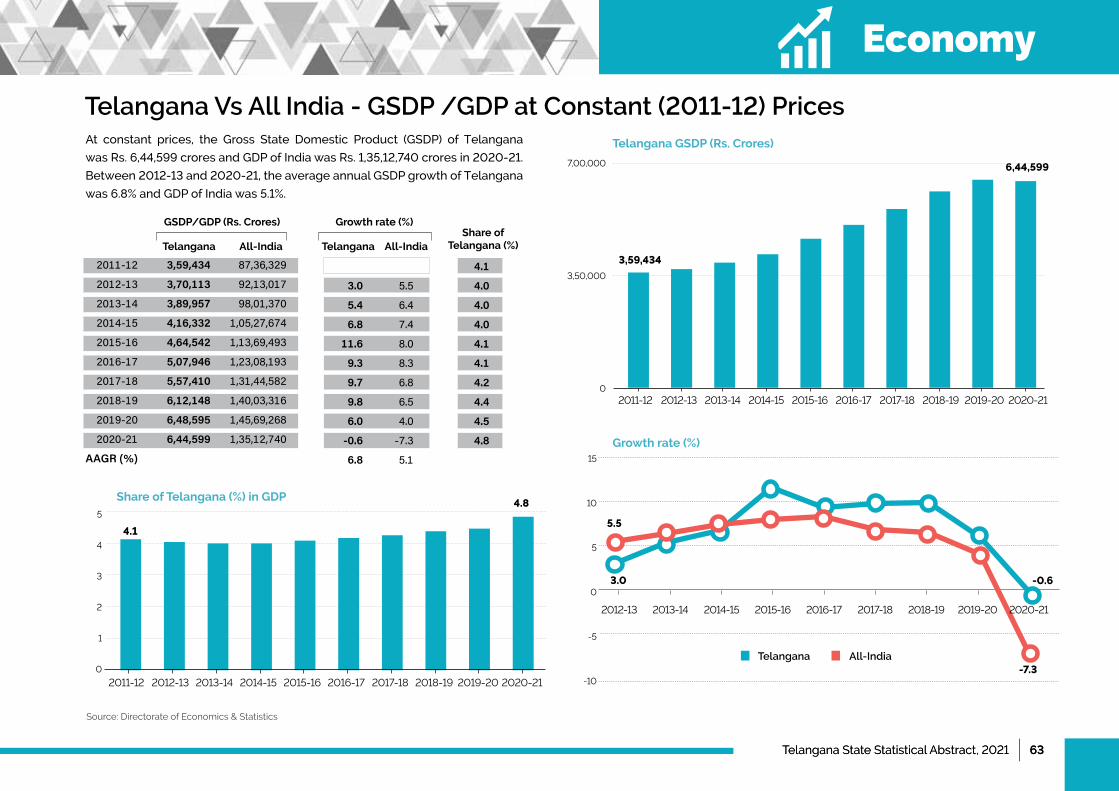
Telangana State Statistical Abstract, 2021 | 63Telangana State Statistical Abstract, 2021 | 63
Telangana Vs All India - GSDP /GDP at Constant (2011-12) Prices
GSDP/GDP (Rs. Crores) Growth rate (%)Share of
Telangana (%)
2011-12
2012-13
2013-14
2014-15
2015-16
2016-17
2017-18
2018-19
2019-20
2020-21
AAGR(%)
3,59,434
3,70,113
3,89,957
4,16,332
4,64,542
5,07,946
5,57,410
6,12,148
6,48,595
6,44,599
87,36,329
92,13,017
98,01,370
1,05,27,674
1,13,69,493
1,23,08,193
1,31,44,582
1,40,03,316
1,45,69,268
1,35,12,740
3.0
5.4
6.8
11.6
9.3
9.7
9.8
6.0
-0.6
6.8
5.5
6.4
7.4
8.0
8.3
6.8
6.5
4.0
-7.3
5.1
4.1
4.0
4.0
4.0
4.1
4.1
4.2
4.4
4.5
4.8
Telangana All-India Telangana All-India
At constant prices, the Gross State Domestic Product (GSDP) of Telangana
wasRs.6,44,599croresandGDPofIndiawasRs.1,35,12,740croresin2020-21.
Between2012-13and2020-21,theaverageannualGSDPgrowthofTelangana
was6.8%andGDPofIndiawas5.1%.
Source: Directorate of Economics & Statistics
Share of Telangana (%) in GDP
2011-12 2012-13 2013-14 2014-15 2015-16 2016-17 2017-18 2018-19 2019-20 2020-21
4.1
4.85
4
3
2
1
0
Telangana GSDP (Rs. Crores)
7,00,000
3,50,000
02011-12 2012-13 2013-14 2014-15 2015-16 2016-17 2017-18 2018-19 2019-20 2020-21
3,59,434
6,44,599
15
10
5
0
-5
-10
Growth rate (%)
5.5
3.0 -0.6
-7.3
2012-13 2013-14 2014-15 2015-16 2016-17 2017-18 2018-19 2019-20 2020-21
Telangana All-India
Economy
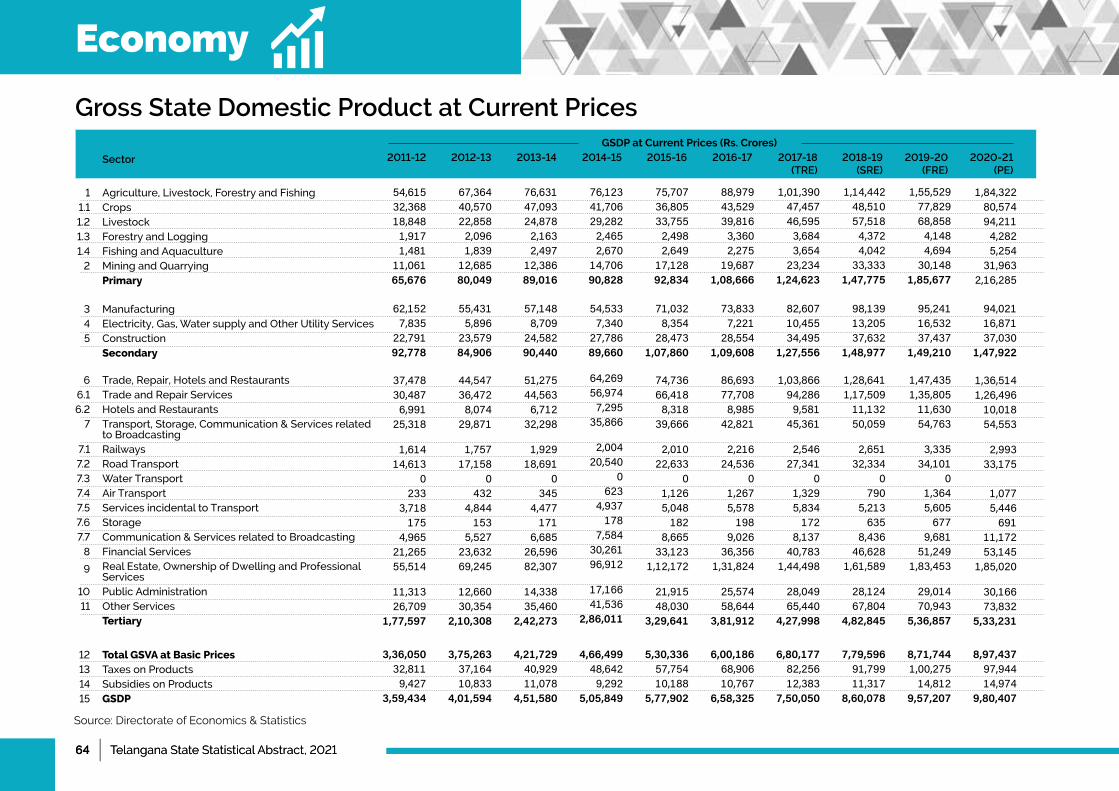
64 | Telangana State Statistical Abstract, 202164 | Telangana State Statistical Abstract, 2021
Gross State Domestic Product at Current Prices
Agriculture,Livestock,ForestryandFishingCropsLivestockForestryandLoggingFishingandAquacultureMiningandQuarryingPrimary
Trade,Repair,HotelsandRestaurantsTrade and Repair ServicesHotels and RestaurantsTransport,Storage,Communication&Servicesrelatedto BroadcastingRailwaysRoad TransportWater TransportAir TransportServices incidental to TransportStorageCommunication & Services related to BroadcastingFinancialServicesRealEstate,OwnershipofDwellingandProfessionalServicesPublic AdministrationOther ServicesTertiary
1,84,32280,57494,2114,2825,254
31,9632,16,285
1,36,5141,26,49610,01854,553
2,99333,175
1,0775,446691
11,17253,145
1,85,020
30,16673,832
5,33,231
54,61532,36818,8481,9171,481
11,06165,676
37,47830,4876,991
25,318
1,61414,613
0233
3,718175
4,96521,26555,514
11,31326,709
1,77,597
67,36440,57022,8582,0961,839
12,68580,049
44,54736,4728,074
29,871
1,75717,158
0432
4,844153
5,52723,63269,245
12,66030,354
2,10,308
76,63147,09324,8782,1632,497
12,38689,016
51,27544,5636,712
32,298
1,92918,691
0345
4,477171
6,68526,59682,307
14,33835,460
2,42,273
76,12341,70629,2822,4652,670
14,70690,828
64,26956,9747,295
35,866
2,00420,540
0623
4,937178
7,58430,26196,912
17,16641,536
2,86,011
75,70736,80533,7552,4982,649
17,12892,834
74,73666,4188,318
39,666
2,01022,633
01,1265,048182
8,66533,123
1,12,172
21,91548,030
3,29,641
88,97943,52939,8163,3602,275
19,6871,08,666
86,69377,7088,985
42,821
2,21624,536
01,2675,578198
9,02636,356
1,31,824
25,57458,644
3,81,912
1,01,39047,45746,5953,6843,654
23,2341,24,623
1,03,86694,2869,581
45,361
2,54627,341
01,3295,834172
8,13740,783
1,44,498
28,04965,440
4,27,998
1,14,44248,51057,5184,3724,042
33,3331,47,775
1,28,6411,17,50911,13250,059
2,65132,334
0790
5,213635
8,43646,628
1,61,589
28,12467,804
4,82,845
1,55,52977,82968,8584,1484,694
30,1481,85,677
1,47,4351,35,80511,63054,763
3,33534,101
01,3645,605677
9,68151,249
1,83,453
29,01470,943
5,36,857
2011-12 2012-13 2013-14 2014-15 2015-16 2016-17 2017-18 (TRE)
2018-19 (SRE)
2019-20 (FRE)
2020-21 (PE)
Sector
GSDP at Current Prices (Rs. Crores)
ManufacturingElectricity,Gas,WatersupplyandOtherUtilityServicesConstructionSecondary
94,02116,87137,030
1,47,922
62,1527,835
22,79192,778
55,4315,896
23,57984,906
57,1488,709
24,58290,440
54,5337,340
27,78689,660
71,0328,354
28,4731,07,860
73,8337,221
28,5541,09,608
82,60710,45534,495
1,27,556
98,13913,20537,632
1,48,977
95,24116,53237,437
1,49,210
Total GSVA at Basic PricesTaxes on ProductsSubsidies on ProductsGSDP
8,97,43797,94414,974
9,80,407
11.11.21.31.42
66.16.27
7.17.27.37.47.57.67.78
9
1011
345
12131415
3,36,05032,8119,427
3,59,434
3,75,26337,16410,833
4,01,594
4,21,72940,92911,078
4,51,580
4,66,49948,6429,292
5,05,849
5,30,33657,75410,188
5,77,902
6,00,18668,90610,767
6,58,325
6,80,17782,25612,383
7,50,050
7,79,59691,79911,317
8,60,078
8,71,7441,00,27514,812
9,57,207
Source: Directorate of Economics & Statistics
Economy
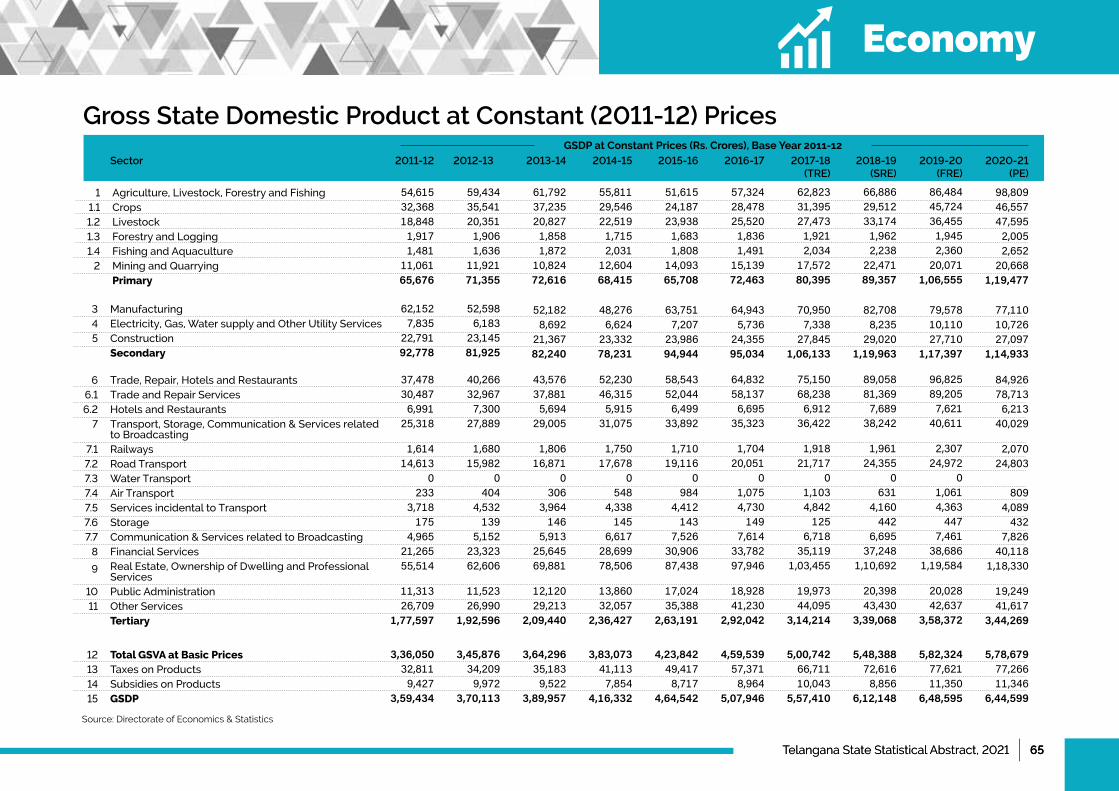
Telangana State Statistical Abstract, 2021 | 65Telangana State Statistical Abstract, 2021 | 65
Gross State Domestic Product at Constant (2011-12) Prices
Agriculture,Livestock,ForestryandFishingCropsLivestockForestryandLoggingFishingandAquacultureMiningandQuarryingPrimary
Trade,Repair,HotelsandRestaurantsTrade and Repair ServicesHotels and RestaurantsTransport,Storage,Communication&Servicesrelatedto BroadcastingRailwaysRoad TransportWater TransportAir TransportServices incidental to TransportStorageCommunication & Services related to BroadcastingFinancialServicesRealEstate,OwnershipofDwellingandProfessionalServicesPublic AdministrationOther ServicesTertiary
98,80946,55747,5952,0052,652
20,6681,19,477
84,92678,7136,213
40,029
2,07024,803
8094,089432
7,82640,118
1,18,330
19,24941,617
3,44,269
54,61532,36818,8481,9171,481
11,06165,676
37,47830,4876,991
25,318
1,61414,613
0233
3,718175
4,96521,26555,514
11,31326,709
1,77,597
59,43435,54120,3511,9061,636
11,92171,355
40,26632,9677,300
27,889
1,68015,982
0404
4,532139
5,15223,32362,606
11,52326,990
1,92,596
61,79237,23520,8271,8581,872
10,82472,616
43,57637,8815,694
29,005
1,80616,871
0306
3,964146
5,91325,64569,881
12,12029,213
2,09,440
55,81129,54622,5191,7152,031
12,60468,415
52,23046,3155,915
31,075
1,75017,678
0548
4,338145
6,61728,69978,506
13,86032,057
2,36,427
51,61524,18723,9381,6831,808
14,09365,708
58,54352,0446,499
33,892
1,71019,116
0984
4,412143
7,52630,90687,438
17,02435,388
2,63,191
57,32428,47825,5201,8361,491
15,13972,463
64,83258,1376,695
35,323
1,70420,051
01,0754,730149
7,61433,78297,946
18,92841,230
2,92,042
62,82331,39527,4731,9212,034
17,57280,395
75,15068,2386,912
36,422
1,91821,717
01,1034,842125
6,71835,119
1,03,455
19,97344,095
3,14,214
66,88629,51233,1741,9622,238
22,47189,357
89,05881,3697,689
38,242
1,96124,355
0631
4,160442
6,69537,248
1,10,692
20,39843,430
3,39,068
86,48445,72436,4551,9452,360
20,0711,06,555
96,82589,2057,621
40,611
2,30724,972
01,0614,363447
7,46138,686
1,19,584
20,02842,637
3,58,372
2011-12 2012-13 2013-14 2014-15 2015-16 2016-17 2017-18 (TRE)
2018-19 (SRE)
2019-20 (FRE)
2020-21 (PE)
SectorGSDP at Constant Prices (Rs. Crores), Base Year 2011-12
ManufacturingElectricity,Gas,WatersupplyandOtherUtilityServicesConstructionSecondary
77,11010,72627,097
1,14,933
62,1527,835
22,79192,778
52,5986,183
23,14581,925
52,1828,692
21,36782,240
48,2766,624
23,33278,231
63,7517,207
23,98694,944
64,9435,736
24,35595,034
70,9507,338
27,8451,06,133
82,7088,235
29,0201,19,963
79,57810,11027,710
1,17,397
Total GSVA at Basic PricesTaxes on ProductsSubsidies on ProductsGSDP
5,78,67977,26611,346
6,44,599
11.11.21.31.42
66.16.27
7.17.27.37.47.57.67.78
9
1011
345
12131415
3,36,05032,8119,427
3,59,434
3,45,87634,2099,972
3,70,113
3,64,29635,1839,522
3,89,957
3,83,07341,1137,854
4,16,332
4,23,84249,4178,717
4,64,542
4,59,53957,3718,964
5,07,946
5,00,74266,71110,043
5,57,410
5,48,38872,6168,856
6,12,148
5,82,32477,62111,350
6,48,595
Source: Directorate of Economics & Statistics
Economy
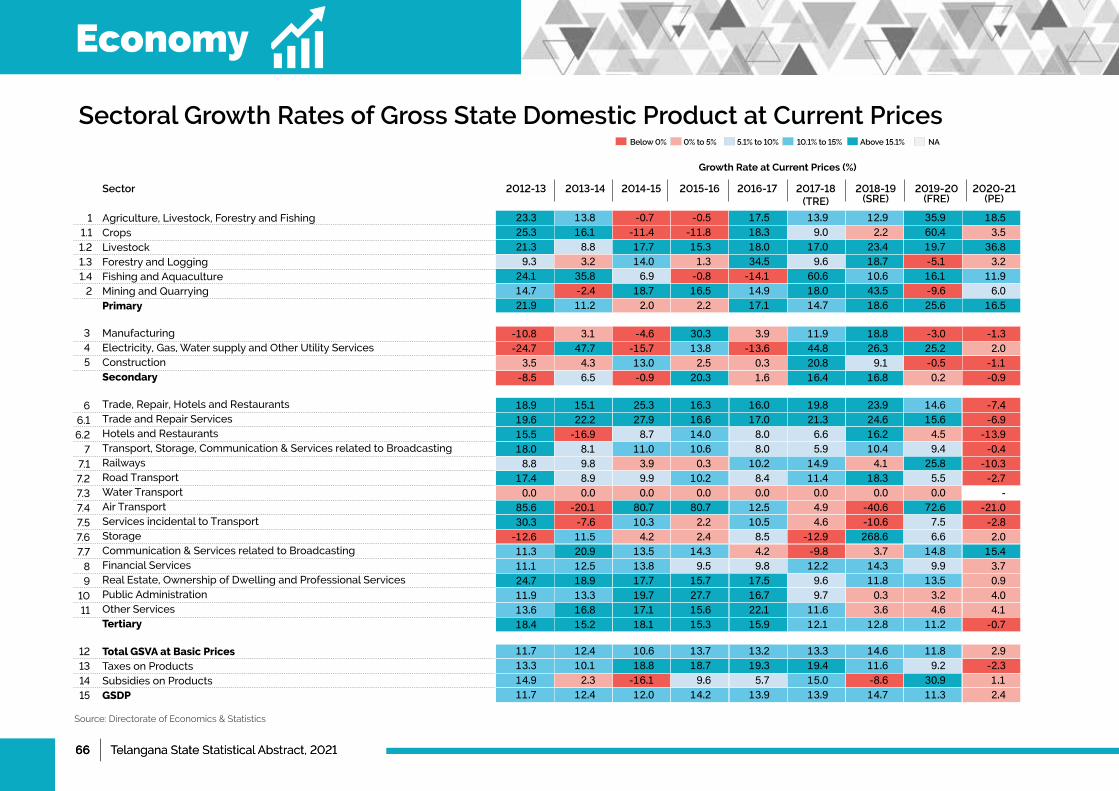
66 | Telangana State Statistical Abstract, 202166 | Telangana State Statistical Abstract, 2021
Sector
ManufacturingElectricity,Gas,WatersupplyandOtherUtilityServicesConstructionSecondary
11.11.21.31.42
Trade,Repair,HotelsandRestaurantsTrade and Repair ServicesHotels and RestaurantsTransport,Storage,Communication&ServicesrelatedtoBroadcastingRailwaysRoad TransportWater TransportAir TransportServices incidental to TransportStorageCommunication & Services related to BroadcastingFinancialServicesRealEstate,OwnershipofDwellingandProfessionalServicesPublic AdministrationOther ServicesTertiary
66.16.277.17.27.37.47.57.67.7891011
345
12131415
Agriculture,Livestock,ForestryandFishingCropsLivestockForestryandLoggingFishingandAquacultureMiningandQuarryingPrimary
Total GSVA at Basic PricesTaxes on ProductsSubsidies on ProductsGSDP
Source: Directorate of Economics & Statistics
Sectoral Growth Rates of Gross State Domestic Product at Current Prices
Growth Rate at Current Prices (%)
NABelow 0% 0% to 5% 5.1% to 10% 10.1% to 15% Above 15.1%
2012-13 2013-14 2014-15 2015-16 2016-17 2017-18 (TRE)
2018-19 (SRE)
2019-20 (FRE)
2020-21 (PE)
18.53.5
36.83.2
11.96.0
16.5
23.325.321.39.3
24.114.721.9
13.816.18.83.2
35.8-2.411.2
-0.7-11.417.714.06.9
18.72.0
-0.5-11.815.31.3-0.816.52.2
17.518.318.034.5-14.114.917.1
13.99.0
17.09.6
60.618.014.7
12.92.2
23.418.710.643.518.6
35.960.419.7-5.116.1-9.625.6
-1.32.0-1.1-0.9
-10.8-24.73.5-8.5
3.147.74.36.5
-4.6-15.713.0-0.9
30.313.82.5
20.3
3.9-13.60.31.6
11.944.820.816.4
18.826.39.1
16.8
-3.025.2-0.50.2
-7.4-6.9
-13.9-0.4
-10.3-2.7
--21.0-2.82.0
15.43.70.94.04.1-0.7
15.122.2-16.98.19.88.90.0
-20.1-7.611.520.912.518.913.316.815.2
25.327.98.7
11.03.99.90.0
80.710.34.2
13.513.817.719.717.118.1
16.316.614.010.60.3
10.20.0
80.72.22.4
14.39.5
15.727.715.615.3
16.017.08.08.0
10.28.40.0
12.510.58.54.29.8
17.516.722.115.9
19.821.36.65.9
14.911.40.04.94.6
-12.9-9.812.29.69.7
11.612.1
23.924.616.210.44.1
18.30.0
-40.6-10.6268.6
3.714.311.80.33.6
12.8
14.615.64.59.4
25.85.50.0
72.67.56.6
14.89.9
13.53.24.6
11.2
18.919.615.518.08.8
17.40.0
85.630.3-12.611.311.124.711.913.618.4
2.9-2.31.12.4
11.713.314.911.7
12.410.12.3
12.4
10.618.8-16.112.0
13.718.79.6
14.2
13.219.35.7
13.9
13.319.415.013.9
14.611.6-8.614.7
11.89.2
30.911.3
Economy

Telangana State Statistical Abstract, 2021 | 67Telangana State Statistical Abstract, 2021 | 67
Sector
ManufacturingElectricity,Gas,WatersupplyandOtherUtilityServicesConstructionSecondary
11.11.21.31.42
Trade,Repair,HotelsandRestaurantsTrade and Repair ServicesHotels and RestaurantsTransport,Storage,Communication&ServicesrelatedtoBroadcastingRailwaysRoad TransportWater TransportAir TransportServices incidental to TransportStorageCommunication & Services related to BroadcastingFinancialServicesRealEstate,OwnershipofDwellingandProfessionalServicesPublic AdministrationOther ServicesTertiary
66.16.277.17.27.37.47.57.67.7891011
345
12131415
Agriculture,Livestock,ForestryandFishingCropsLivestockForestryandLoggingFishingandAquacultureMiningandQuarryingPrimary
Total GSVA at Basic PricesTaxes on ProductsSubsidies on ProductsGSDP
Source: Directorate of Economics & Statistics
Sectoral Growth Rates of Gross State Domestic Product at Constant (2011-12) Prices
Growth Rate at Constant Prices (%), Base Year 2011-12
NABelow 0% 0% to 5% 5.1% to 10% 10.1% to 15% Above 15.1%
2012-13 2013-14 2014-15 2015-16 2016-17 2017-18 (TRE)
2018-19 (SRE)
2019-20 (FRE)
2020-21 (PE)
14.31.8
30.63.1
12.43.0
12.1
8.89.88.0-0.610.47.88.6
4.04.82.3-2.514.4-9.21.8
-9.7-20.68.1-7.78.5
16.4-5.8
-7.5-18.16.3-1.9
-11.011.8-4.0
11.117.76.69.1
-17.67.4
10.3
9.610.27.74.6
36.516.110.9
6.5-6.020.82.2
10.027.911.1
29.354.99.9-0.95.4
-10.719.2
-3.16.1-2.2-2.1
-15.4-21.11.6
-11.7
-0.840.6-7.70.4
-7.5-23.89.2-4.9
32.18.82.8
21.4
1.9-20.41.50.1
9.327.914.311.7
16.612.24.2
13.0
-3.822.8-4.5-2.1
-12.3-11.8-18.5-1.4
-10.3-0.70.0
-23.8-6.3-3.24.93.7-1.0-3.9-2.4-3.9
8.214.9-22.04.07.45.60.0
-24.3-12.54.9
14.810.011.65.28.28.7
19.922.33.97.1-3.14.80.0
79.39.4-0.311.911.912.314.49.7
12.9
12.112.49.99.1-2.28.10.0
79.71.7-1.213.77.7
11.422.810.411.3
10.711.73.04.2-0.44.90.09.27.23.81.29.3
12.011.216.511.0
15.917.43.23.1
12.58.30.02.72.4
-15.8-11.84.05.65.56.97.6
18.519.211.25.02.3
12.10.0
-42.9-14.1252.3-0.36.17.02.1-1.57.9
8.79.6-0.96.2
17.72.50.0
68.34.91.2
11.43.98.0-1.8-1.85.7
7.48.14.4
10.24.19.40.0
73.621.9-20.83.79.7
12.81.91.08.4
-0.6-0.50.0-0.6
2.94.35.83.0
5.32.8-4.55.4
5.216.9-17.56.8
10.620.211.011.6
8.416.12.89.3
9.016.312.09.7
9.58.9
-11.89.8
6.26.9
28.26.0
Economy
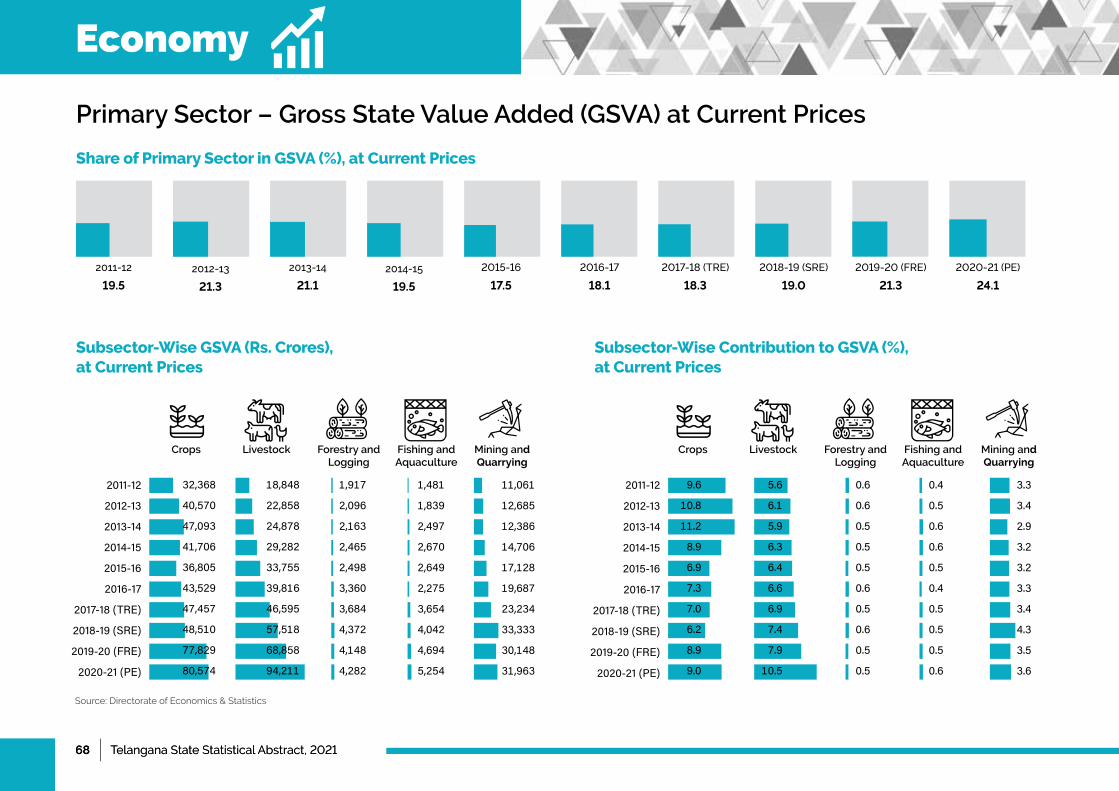
68 | Telangana State Statistical Abstract, 202168 | Telangana State Statistical Abstract, 2021
Primary Sector – Gross State Value Added (GSVA) at Current Prices
Share of Primary Sector in GSVA (%), at Current Prices
Subsector-Wise GSVA (Rs. Crores), at Current Prices
Subsector-Wise Contribution to GSVA (%), at Current Prices
2011-12
2012-13
2013-14
2014-15
2015-16
2016-17
2017-18(TRE)
2018-19(SRE)
2019-20(FRE)
2020-21(PE)
2011-12
2012-13
2013-14
2014-15
2015-16
2016-17
2017-18(TRE)
2018-19(SRE)
2019-20(FRE)
2020-21(PE)
Crops CropsLivestock LivestockForestry and Logging
Forestry and Logging
Fishing and Aquaculture
Fishing and Aquaculture
Mining and Quarrying
Mining and Quarrying
32,368
40,570
47,093
41,706
36,805
43,529
47,457
48,510
77,829
80,574
18,848
22,858
24,878
29,282
33,755
39,816
46,595
57,518
68,858
94,211
1,917
2,096
2,163
2,465
2,498
3,360
3,684
4,372
4,148
4,282
1,481
1,839
2,497
2,670
2,649
2,275
3,654
4,042
4,694
5,254
11,061
12,685
12,386
14,706
17,128
19,687
23,234
33,333
30,148
31,963
9.6
10.8
11.2
8.9
6.9
7.3
7.0
6.2
8.9
9.0
5.6
6.1
5.9
6.3
6.4
6.6
6.9
7.4
7.9
10.5
0.6
0.6
0.5
0.5
0.5
0.6
0.5
0.6
0.5
0.5
0.4
0.5
0.6
0.6
0.5
0.4
0.5
0.5
0.5
0.6
3.3
3.4
2.9
3.2
3.2
3.3
3.4
4.3
3.5
3.6
Source: Directorate of Economics & Statistics
2011-12
19.5
2012-13
21.3
2013-14
21.1
2014-15
19.5
2015-16
17.5
2016-17
18.1
2017-18(TRE)
18.3
2018-19(SRE)
19.0
2019-20(FRE)
21.3
2020-21(PE)
24.1
Economy
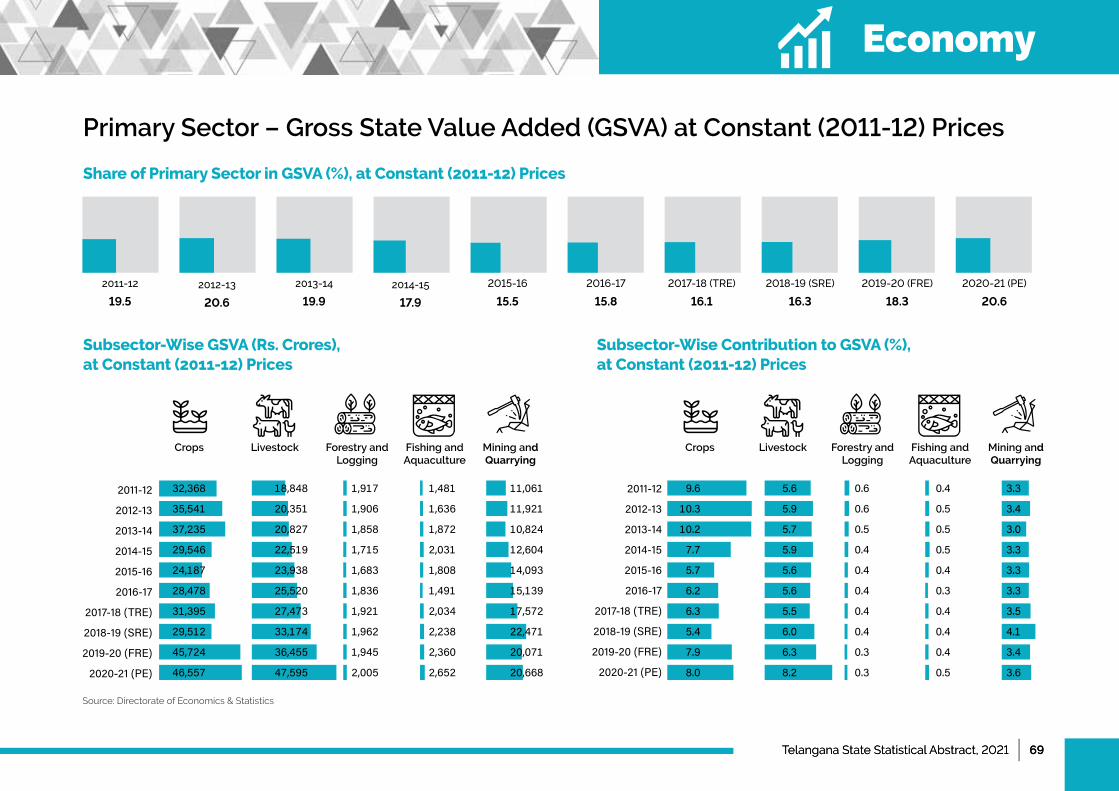
Telangana State Statistical Abstract, 2021 | 69Telangana State Statistical Abstract, 2021 | 69
Primary Sector – Gross State Value Added (GSVA) at Constant (2011-12) Prices
Share of Primary Sector in GSVA (%), at Constant (2011-12) Prices
Subsector-Wise GSVA (Rs. Crores), at Constant (2011-12) Prices
Subsector-Wise Contribution to GSVA (%), at Constant (2011-12) Prices
2011-12
2012-13
2013-14
2014-15
2015-16
2016-17
2017-18(TRE)
2018-19(SRE)
2019-20(FRE)
2020-21(PE)
2011-12
2012-13
2013-14
2014-15
2015-16
2016-17
2017-18(TRE)
2018-19(SRE)
2019-20(FRE)
2020-21(PE)
Crops CropsLivestock LivestockForestry and Logging
Forestry and Logging
Fishing and Aquaculture
Fishing and Aquaculture
Mining and Quarrying
Mining and Quarrying
32,368
35,541
37,235
29,546
24,187
28,478
31,395
29,512
45,724
46,557
18,848
20,351
20,827
22,519
23,938
25,520
27,473
33,174
36,455
47,595
1,917
1,906
1,858
1,715
1,683
1,836
1,921
1,962
1,945
2,005
1,481
1,636
1,872
2,031
1,808
1,491
2,034
2,238
2,360
2,652
11,061
11,921
10,824
12,604
14,093
15,139
17,572
22,471
20,071
20,668
9.6
10.3
10.2
7.7
5.7
6.2
6.3
5.4
7.9
8.0
5.6
5.9
5.7
5.9
5.6
5.6
5.5
6.0
6.3
8.2
0.6
0.6
0.5
0.4
0.4
0.4
0.4
0.4
0.3
0.3
0.4
0.5
0.5
0.5
0.4
0.3
0.4
0.4
0.4
0.5
3.3
3.4
3.0
3.3
3.3
3.3
3.5
4.1
3.4
3.6
Source: Directorate of Economics & Statistics
2011-12
19.5
2012-13
20.6
2013-14
19.9
2014-15
17.9
2015-16
15.5
2016-17
15.8
2017-18(TRE)
16.1
2018-19(SRE)
16.3
2019-20(FRE)
18.3
2020-21(PE)
20.6
Economy
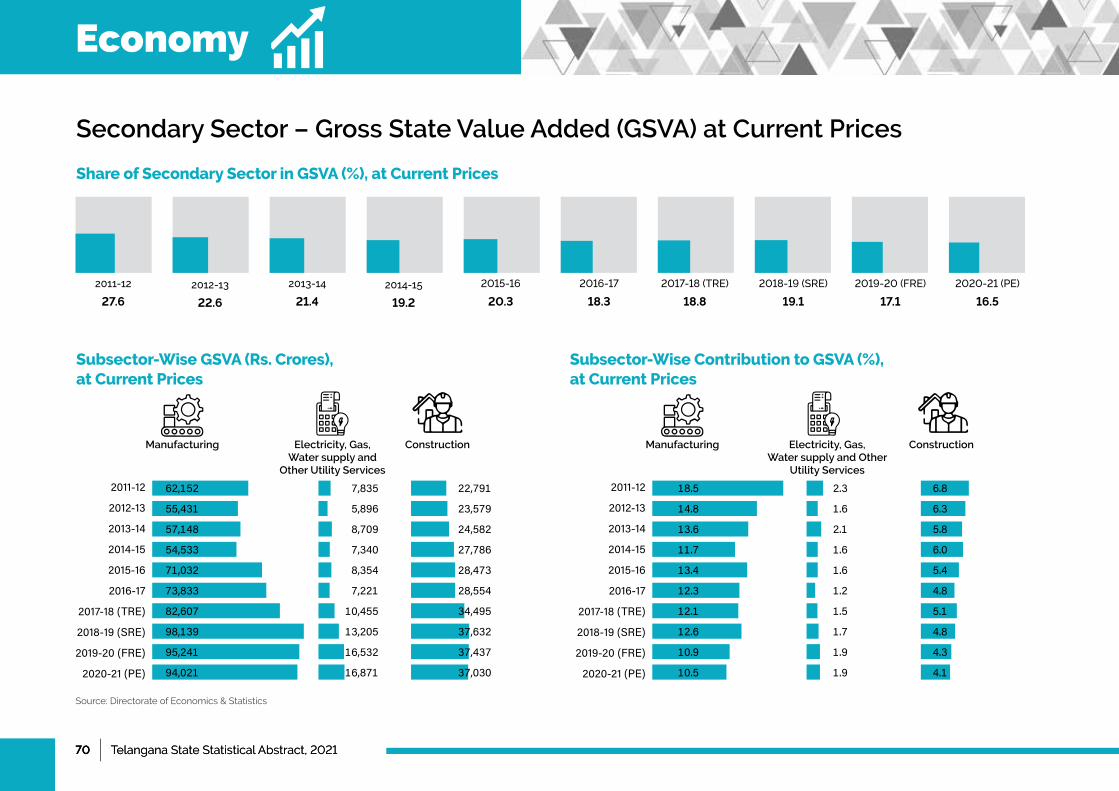
70 | Telangana State Statistical Abstract, 202170 | Telangana State Statistical Abstract, 2021
Secondary Sector – Gross State Value Added (GSVA) at Current Prices
Share of Secondary Sector in GSVA (%), at Current Prices
Subsector-Wise GSVA (Rs. Crores), at Current Prices
Subsector-Wise Contribution to GSVA (%), at Current Prices
2011-12
2012-13
2013-14
2014-15
2015-16
2016-17
2017-18(TRE)
2018-19(SRE)
2019-20(FRE)
2020-21(PE)
2011-12
2012-13
2013-14
2014-15
2015-16
2016-17
2017-18(TRE)
2018-19(SRE)
2019-20(FRE)
2020-21(PE)
Manufacturing ManufacturingConstruction ConstructionElectricity, Gas, Water supply and
Other Utility Services
Electricity, Gas, Water supply and Other
Utility Services
62,152
55,431
57,148
54,533
71,032
73,833
82,607
98,139
95,241
94,021
18.5
14.8
13.6
11.7
13.4
12.3
12.1
12.6
10.9
10.5
7,835
5,896
8,709
7,340
8,354
7,221
10,455
13,205
16,532
16,871
2.3
1.6
2.1
1.6
1.6
1.2
1.5
1.7
1.9
1.9
22,791
23,579
24,582
27,786
28,473
28,554
34,495
37,632
37,437
37,030
6.8
6.3
5.8
6.0
5.4
4.8
5.1
4.8
4.3
4.1
Source: Directorate of Economics & Statistics
2011-12
27.6
2012-13
22.6
2013-14
21.4
2014-15
19.2
2015-16
20.3
2016-17
18.3
2017-18(TRE)
18.8
2018-19(SRE)
19.1
2019-20(FRE)
17.1
2020-21(PE)
16.5
Economy
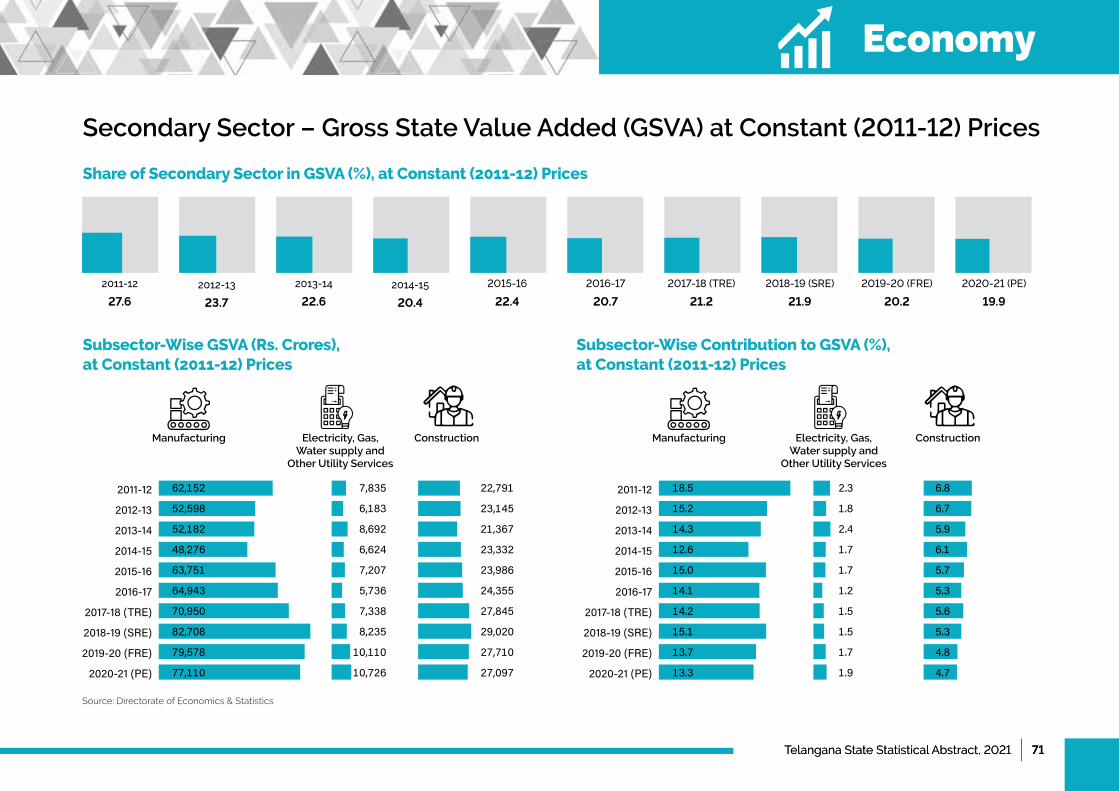
Telangana State Statistical Abstract, 2021 | 71Telangana State Statistical Abstract, 2021 | 71
Secondary Sector – Gross State Value Added (GSVA) at Constant (2011-12) Prices
Share of Secondary Sector in GSVA (%), at Constant (2011-12) Prices
Subsector-Wise GSVA (Rs. Crores), at Constant (2011-12) Prices
Subsector-Wise Contribution to GSVA (%), at Constant (2011-12) Prices
2011-12
2012-13
2013-14
2014-15
2015-16
2016-17
2017-18(TRE)
2018-19(SRE)
2019-20(FRE)
2020-21(PE)
2011-12
2012-13
2013-14
2014-15
2015-16
2016-17
2017-18(TRE)
2018-19(SRE)
2019-20(FRE)
2020-21(PE)
Manufacturing ManufacturingConstruction ConstructionElectricity, Gas, Water supply and
Other Utility Services
Electricity, Gas, Water supply and
Other Utility Services
62,152
52,598
52,182
48,276
63,751
64,943
70,950
82,708
79,578
77,110
18.5
15.2
14.3
12.6
15.0
14.1
14.2
15.1
13.7
13.3
7,835
6,183
8,692
6,624
7,207
5,736
7,338
8,235
10,110
10,726
2.3
1.8
2.4
1.7
1.7
1.2
1.5
1.5
1.7
1.9
22,791
23,145
21,367
23,332
23,986
24,355
27,845
29,020
27,710
27,097
6.8
6.7
5.9
6.1
5.7
5.3
5.6
5.3
4.8
4.7
Source: Directorate of Economics & Statistics
2011-12
27.6
2012-13
23.7
2013-14
22.6
2014-15
20.4
2015-16
22.4
2016-17
20.7
2017-18(TRE)
21.2
2018-19(SRE)
21.9
2019-20(FRE)
20.2
2020-21(PE)
19.9
Economy
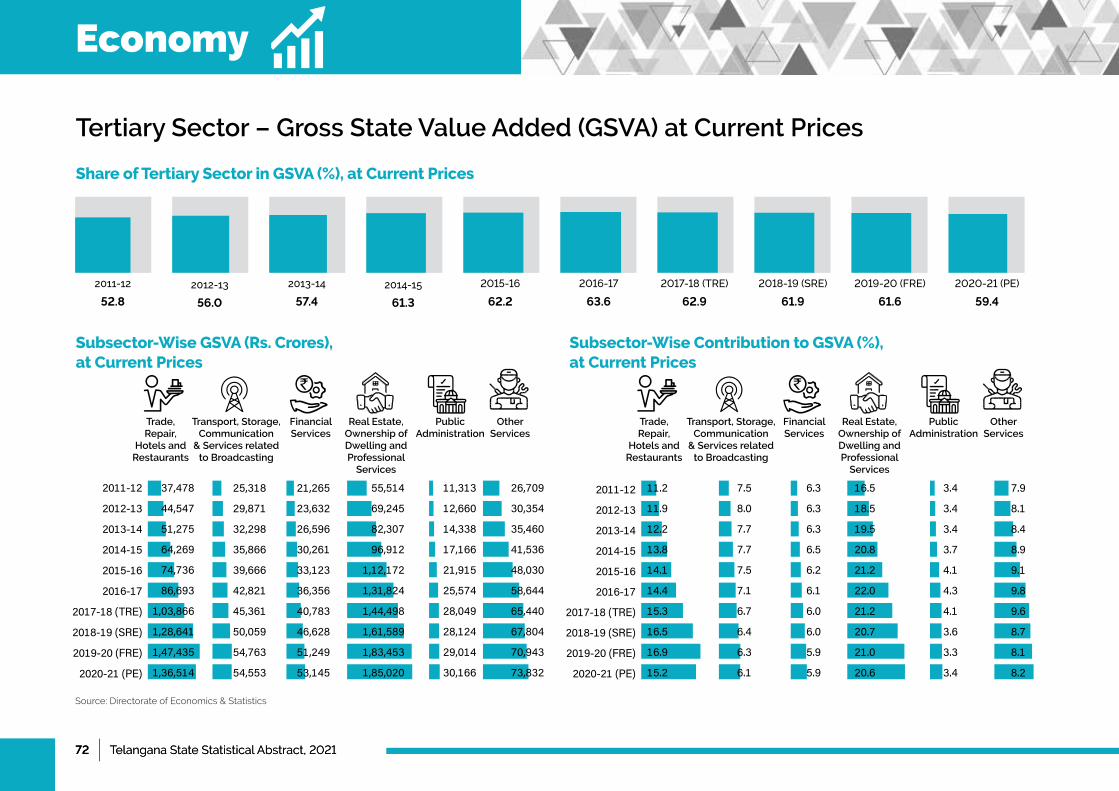
72 | Telangana State Statistical Abstract, 202172 | Telangana State Statistical Abstract, 2021
Tertiary Sector – Gross State Value Added (GSVA) at Current Prices
Share of Tertiary Sector in GSVA (%), at Current Prices
Subsector-Wise GSVA (Rs. Crores), at Current Prices
Subsector-Wise Contribution to GSVA (%), at Current Prices
2011-12
2012-13
2013-14
2014-15
2015-16
2016-17
2017-18(TRE)
2018-19(SRE)
2019-20(FRE)
2020-21(PE)
2011-12
2012-13
2013-14
2014-15
2015-16
2016-17
2017-18(TRE)
2018-19(SRE)
2019-20(FRE)
2020-21(PE)
Trade, Repair,
Hotels and Restaurants
Trade, Repair,
Hotels and Restaurants
Transport, Storage, Communication
& Services related to Broadcasting
Transport, Storage, Communication
& Services related to Broadcasting
Financial Services
Financial Services
Real Estate, Ownership of Dwelling and Professional
Services
Real Estate, Ownership of Dwelling and Professional
Services
Public Administration
Public Administration
Other Services
Other Services
37,478
44,547
51,275
64,269
74,736
86,693
1,03,866
1,28,641
1,47,435
1,36,514
11.2
11.9
12.2
13.8
14.1
14.4
15.3
16.5
16.9
15.2
7.5
8.0
7.7
7.7
7.5
7.1
6.7
6.4
6.3
6.1
6.3
6.3
6.3
6.5
6.2
6.1
6.0
6.0
5.9
5.9
16.5
18.5
19.5
20.8
21.2
22.0
21.2
20.7
21.0
20.6
3.4
3.4
3.4
3.7
4.1
4.3
4.1
3.6
3.3
3.4
7.9
8.1
8.4
8.9
9.1
9.8
9.6
8.7
8.1
8.2
25,318
29,871
32,298
35,866
39,666
42,821
45,361
50,059
54,763
54,553
21,265
23,632
26,596
30,261
33,123
36,356
40,783
46,628
51,249
53,145
Source: Directorate of Economics & Statistics
2011-12
52.8
2012-13
56.0
2013-14
57.4
2014-15
61.3
2015-16
62.2
2016-17
63.6
2017-18(TRE)
62.9
2018-19(SRE)
61.9
2019-20(FRE)
61.6
2020-21(PE)
59.4
26,709
30,354
35,460
41,536
48,030
58,644
65,440
67,804
70,943
73,832
11,313
12,660
14,338
17,166
21,915
25,574
28,049
28,124
29,014
30,166
55,514
69,245
82,307
96,912
1,12,172
1,31,824
1,44,498
1,61,589
1,83,453
1,85,020
Economy
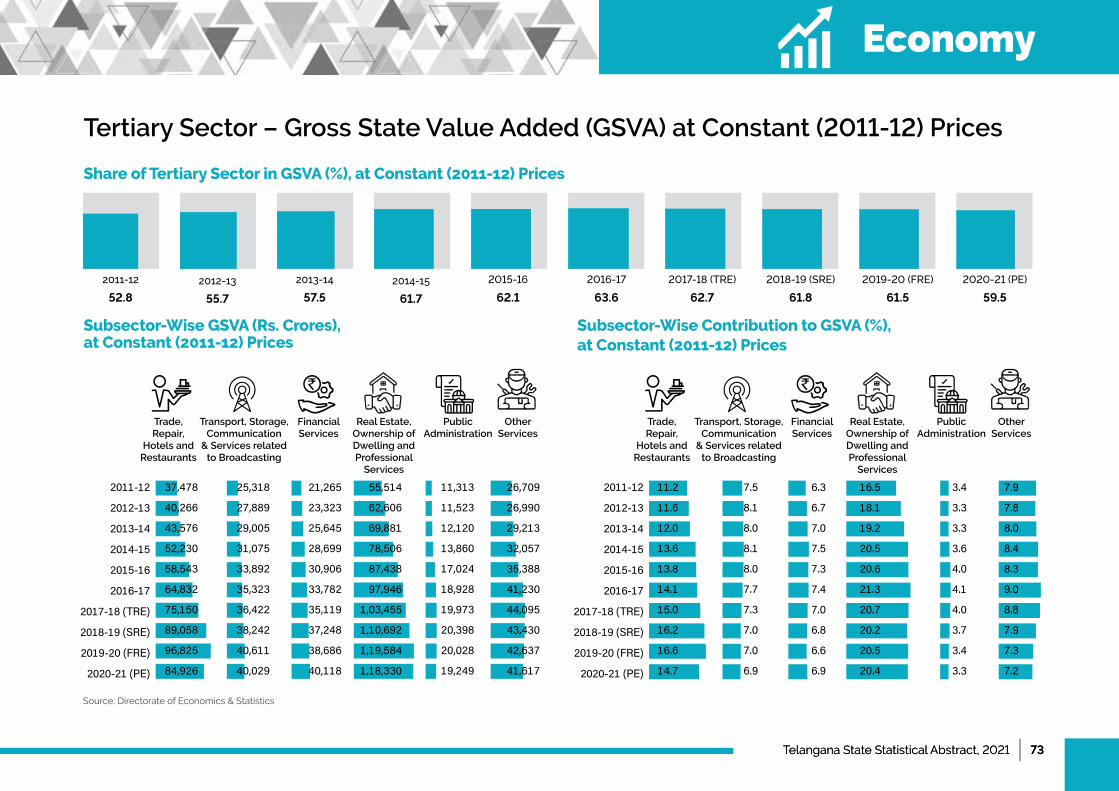
Telangana State Statistical Abstract, 2021 | 73Telangana State Statistical Abstract, 2021 | 73
Tertiary Sector – Gross State Value Added (GSVA) at Constant (2011-12) Prices
Share of Tertiary Sector in GSVA (%), at Constant (2011-12) Prices
Subsector-Wise GSVA (Rs. Crores), at Constant (2011-12) Prices
Subsector-Wise Contribution to GSVA (%), at Constant (2011-12) Prices
2011-12
2012-13
2013-14
2014-15
2015-16
2016-17
2017-18(TRE)
2018-19(SRE)
2019-20(FRE)
2020-21(PE)
2011-12
2012-13
2013-14
2014-15
2015-16
2016-17
2017-18(TRE)
2018-19(SRE)
2019-20(FRE)
2020-21(PE)
Trade, Repair,
Hotels and Restaurants
Trade, Repair,
Hotels and Restaurants
Transport, Storage, Communication
& Services related to Broadcasting
Transport, Storage, Communication
& Services related to Broadcasting
Financial Services
Financial Services
Real Estate, Ownership of Dwelling and Professional
Services
Real Estate, Ownership of Dwelling and Professional
Services
Public Administration
Public Administration
Other Services
Other Services
Source: Directorate of Economics & Statistics
2011-12
52.8
2012-13
55.7
2013-14
57.5
2014-15
61.7
2015-16
62.1
2016-17
63.6
2017-18(TRE)
62.7
2018-19(SRE)
61.8
2019-20(FRE)
61.5
2020-21(PE)
59.5
37,478
40,266
43,576
52,230
58,543
64,832
75,150
89,058
96,825
84,926
25,318
27,889
29,005
31,075
33,892
35,323
36,422
38,242
40,611
40,029
21,265
23,323
25,645
28,699
30,906
33,782
35,119
37,248
38,686
40,118
26,709
26,990
29,213
32,057
35,388
41,230
44,095
43,430
42,637
41,617
11,313
11,523
12,120
13,860
17,024
18,928
19,973
20,398
20,028
19,249
55,514
62,606
69,881
78,506
87,438
97,946
1,03,455
1,10,692
1,19,584
1,18,330
11.2
11.6
12.0
13.6
13.8
14.1
15.0
16.2
16.6
14.7
7.5
8.1
8.0
8.1
8.0
7.7
7.3
7.0
7.0
6.9
6.3
6.7
7.0
7.5
7.3
7.4
7.0
6.8
6.6
6.9
7.9
7.8
8.0
8.4
8.3
9.0
8.8
7.9
7.3
7.2
3.4
3.3
3.3
3.6
4.0
4.1
4.0
3.7
3.4
3.3
16.5
18.1
19.2
20.5
20.6
21.3
20.7
20.2
20.5
20.4
Economy
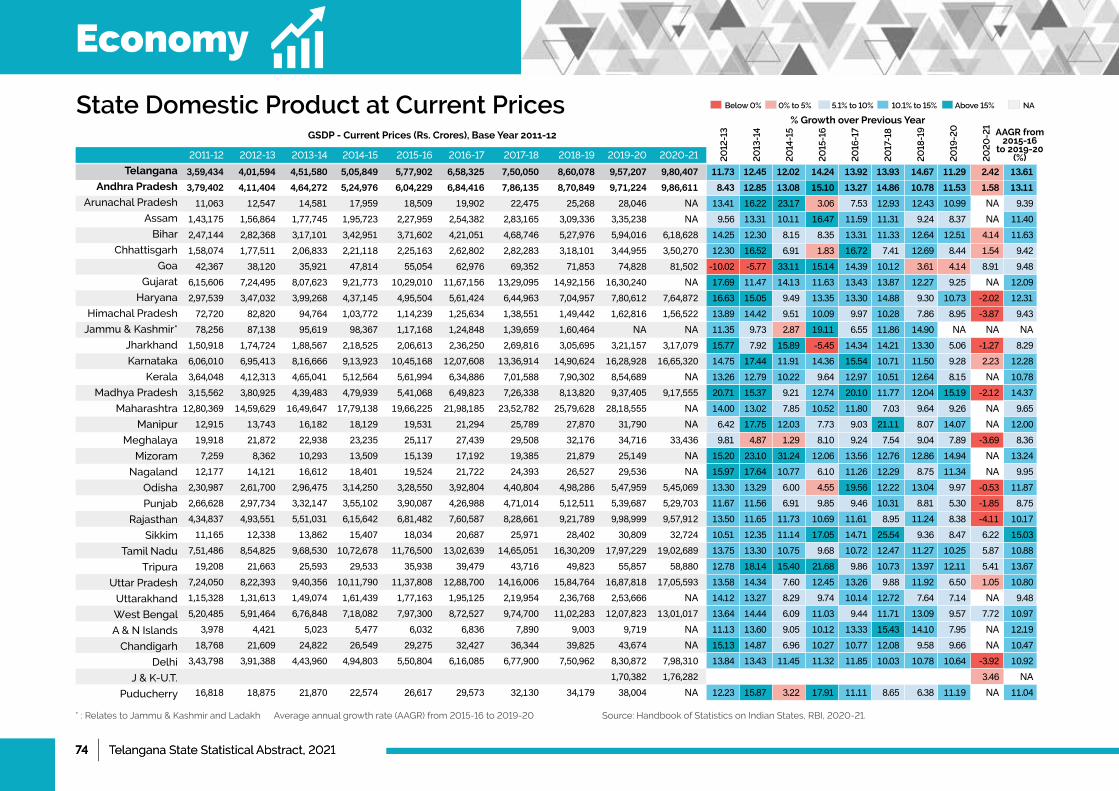
74 | Telangana State Statistical Abstract, 202174 | Telangana State Statistical Abstract, 2021
State Domestic Product at Current Prices
Telangana
Andhra Pradesh
Arunachal Pradesh
Assam
Bihar
Chhattisgarh
Goa
Gujarat
Haryana
Himachal Pradesh
Jammu & Kashmir*
Jharkhand
Karnataka
Kerala
MadhyaPradesh
Maharashtra
Manipur
Meghalaya
Mizoram
Nagaland
Odisha
Punjab
Rajasthan
Sikkim
Tamil Nadu
Tripura
UttarPradesh
Uttarakhand
West Bengal
A&NIslands
Chandigarh
Delhi
J&K-U.T.
Puducherry
2011-12 2012-13 2013-14 2014-15 2015-16 2016-17 2017-18 2018-19 2019-20 2020-21 20
12-1
3
20
13-1
4
20
14-1
5
20
15-1
6
20
16-1
7
20
17-1
8
20
18-1
9
20
19-2
0
20
20
-21
AAGR from 2015-16
to 2019-20 (%)
GSDP - Current Prices (Rs. Crores), Base Year 2011-12
% Growth over Previous Year
* : Relates to Jammu & Kashmir and Ladakh Average annual growth rate (AAGR) from 2015-16 to 2019-20 Source: Handbook of Statistics on Indian States, RBI, 2020-21.
3,59,434 4,01,594 4,51,580 5,05,849 5,77,902 6,58,325 7,50,050 8,60,078 9,57,207 9,80,407 3,79,402 4,11,404 4,64,272 5,24,976 6,04,229 6,84,416 7,86,135 8,70,849 9,71,224 9,86,611 11,063 12,547 14,581 17,959 18,509 19,902 22,475 25,268 28,046 NA 1,43,175 1,56,864 1,77,745 1,95,723 2,27,959 2,54,382 2,83,165 3,09,336 3,35,238 NA 2,47,144 2,82,368 3,17,101 3,42,951 3,71,602 4,21,051 4,68,746 5,27,976 5,94,016 6,18,628 1,58,074 1,77,511 2,06,833 2,21,118 2,25,163 2,62,802 2,82,283 3,18,101 3,44,955 3,50,270 42,367 38,120 35,921 47,814 55,054 62,976 69,352 71,853 74,828 81,502 6,15,606 7,24,495 8,07,623 9,21,773 10,29,010 11,67,156 13,29,095 14,92,156 16,30,240 NA 2,97,539 3,47,032 3,99,268 4,37,145 4,95,504 5,61,424 6,44,963 7,04,957 7,80,612 7,64,872 72,720 82,820 94,764 1,03,772 1,14,239 1,25,634 1,38,551 1,49,442 1,62,816 1,56,522 78,256 87,138 95,619 98,367 1,17,168 1,24,848 1,39,659 1,60,464 NA NA 1,50,918 1,74,724 1,88,567 2,18,525 2,06,613 2,36,250 2,69,816 3,05,695 3,21,157 3,17,079 6,06,010 6,95,413 8,16,666 9,13,923 10,45,168 12,07,608 13,36,914 14,90,624 16,28,928 16,65,320 3,64,048 4,12,313 4,65,041 5,12,564 5,61,994 6,34,886 7,01,588 7,90,302 8,54,689 NA 3,15,562 3,80,925 4,39,483 4,79,939 5,41,068 6,49,823 7,26,338 8,13,820 9,37,405 9,17,555 12,80,369 14,59,629 16,49,647 17,79,138 19,66,225 21,98,185 23,52,782 25,79,628 28,18,555 NA 12,915 13,743 16,182 18,129 19,531 21,294 25,789 27,870 31,790 NA 19,918 21,872 22,938 23,235 25,117 27,439 29,508 32,176 34,716 33,436 7,259 8,362 10,293 13,509 15,139 17,192 19,385 21,879 25,149 NA 12,177 14,121 16,612 18,401 19,524 21,722 24,393 26,527 29,536 NA 2,30,987 2,61,700 2,96,475 3,14,250 3,28,550 3,92,804 4,40,804 4,98,286 5,47,959 5,45,069 2,66,628 2,97,734 3,32,147 3,55,102 3,90,087 4,26,988 4,71,014 5,12,511 5,39,687 5,29,703 4,34,837 4,93,551 5,51,031 6,15,642 6,81,482 7,60,587 8,28,661 9,21,789 9,98,999 9,57,912 11,165 12,338 13,862 15,407 18,034 20,687 25,971 28,402 30,809 32,724 7,51,486 8,54,825 9,68,530 10,72,678 11,76,500 13,02,639 14,65,051 16,30,209 17,97,229 19,02,689 19,208 21,663 25,593 29,533 35,938 39,479 43,716 49,823 55,857 58,880 7,24,050 8,22,393 9,40,356 10,11,790 11,37,808 12,88,700 14,16,006 15,84,764 16,87,818 17,05,593 1,15,328 1,31,613 1,49,074 1,61,439 1,77,163 1,95,125 2,19,954 2,36,768 2,53,666 NA 5,20,485 5,91,464 6,76,848 7,18,082 7,97,300 8,72,527 9,74,700 11,02,283 12,07,823 13,01,017 3,978 4,421 5,023 5,477 6,032 6,836 7,890 9,003 9,719 NA 18,768 21,609 24,822 26,549 29,275 32,427 36,344 39,825 43,674 NA 3,43,798 3,91,388 4,43,960 4,94,803 5,50,804 6,16,085 6,77,900 7,50,962 8,30,872 7,98,310 1,70,382 1,76,282 16,818 18,875 21,870 22,574 26,617 29,573 32,130 34,179 38,004 NA
NABelow 0% 0% to 5% 5.1% to 10% 10.1% to 15% Above 15%
11.73 12.45 12.02 14.24 13.92 13.93 14.67 11.29 2.42 13.61 8.43 12.85 13.08 15.10 13.27 14.86 10.78 11.53 1.58 13.11 13.41 16.22 23.17 3.06 7.53 12.93 12.43 10.99 NA 9.39 9.56 13.31 10.11 16.47 11.59 11.31 9.24 8.37 NA 11.40 14.25 12.30 8.15 8.35 13.31 11.33 12.64 12.51 4.14 11.63 12.30 16.52 6.91 1.83 16.72 7.41 12.69 8.44 1.54 9.42 -10.02 -5.77 33.11 15.14 14.39 10.12 3.61 4.14 8.91 9.48 17.69 11.47 14.13 11.63 13.43 13.87 12.27 9.25 NA 12.09 16.63 15.05 9.49 13.35 13.30 14.88 9.30 10.73 -2.02 12.31 13.89 14.42 9.51 10.09 9.97 10.28 7.86 8.95 -3.87 9.43 11.35 9.73 2.87 19.11 6.55 11.86 14.90 NA NA NA 15.77 7.92 15.89 -5.45 14.34 14.21 13.30 5.06 -1.27 8.29 14.75 17.44 11.91 14.36 15.54 10.71 11.50 9.28 2.23 12.28 13.26 12.79 10.22 9.64 12.97 10.51 12.64 8.15 NA 10.78 20.71 15.37 9.21 12.74 20.10 11.77 12.04 15.19 -2.12 14.37 14.00 13.02 7.85 10.52 11.80 7.03 9.64 9.26 NA 9.65 6.42 17.75 12.03 7.73 9.03 21.11 8.07 14.07 NA 12.00 9.81 4.87 1.29 8.10 9.24 7.54 9.04 7.89 -3.69 8.36 15.20 23.10 31.24 12.06 13.56 12.76 12.86 14.94 NA 13.24 15.97 17.64 10.77 6.10 11.26 12.29 8.75 11.34 NA 9.95 13.30 13.29 6.00 4.55 19.56 12.22 13.04 9.97 -0.53 11.87 11.67 11.56 6.91 9.85 9.46 10.31 8.81 5.30 -1.85 8.75 13.50 11.65 11.73 10.69 11.61 8.95 11.24 8.38 -4.11 10.17 10.51 12.35 11.14 17.05 14.71 25.54 9.36 8.47 6.22 15.03 13.75 13.30 10.75 9.68 10.72 12.47 11.27 10.25 5.87 10.88 12.78 18.14 15.40 21.68 9.86 10.73 13.97 12.11 5.41 13.67 13.58 14.34 7.60 12.45 13.26 9.88 11.92 6.50 1.05 10.80 14.12 13.27 8.29 9.74 10.14 12.72 7.64 7.14 NA 9.48 13.64 14.44 6.09 11.03 9.44 11.71 13.09 9.57 7.72 10.97 11.13 13.60 9.05 10.12 13.33 15.43 14.10 7.95 NA 12.19 15.13 14.87 6.96 10.27 10.77 12.08 9.58 9.66 NA 10.47 13.84 13.43 11.45 11.32 11.85 10.03 10.78 10.64 -3.92 10.92 3.46 NA 12.23 15.87 3.22 17.91 11.11 8.65 6.38 11.19 NA 11.04
Economy
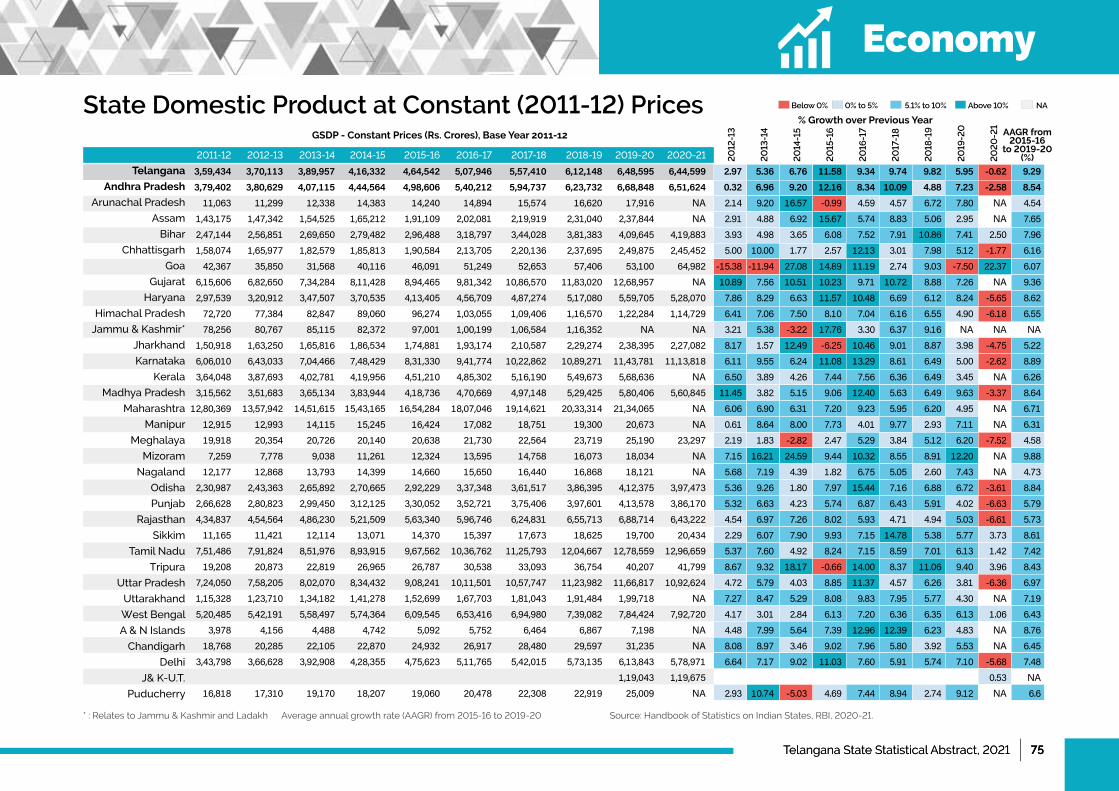
Telangana State Statistical Abstract, 2021 | 75Telangana State Statistical Abstract, 2021 | 75
State Domestic Product at Constant (2011-12) Prices
Telangana
Andhra Pradesh
Arunachal Pradesh
Assam
Bihar
Chhattisgarh
Goa
Gujarat
Haryana
Himachal Pradesh
Jammu & Kashmir*
Jharkhand
Karnataka
Kerala
MadhyaPradesh
Maharashtra
Manipur
Meghalaya
Mizoram
Nagaland
Odisha
Punjab
Rajasthan
Sikkim
Tamil Nadu
Tripura
UttarPradesh
Uttarakhand
West Bengal
A&NIslands
Chandigarh
Delhi
J&K-U.T.
Puducherry
2011-12 2012-13 2013-14 2014-15 2015-16 2016-17 2017-18 2018-19 2019-20 2020-21 20
12-1
3
20
13-1
4
20
14-1
5
20
15-1
6
20
16-1
7
20
17-1
8
20
18-1
9
20
19-2
0
20
20
-21
AAGR from 2015-16
to 2019-20 (%)
GSDP - Constant Prices (Rs. Crores), Base Year 2011-12
% Growth over Previous Year
* : Relates to Jammu & Kashmir and Ladakh Average annual growth rate (AAGR) from 2015-16 to 2019-20 Source: Handbook of Statistics on Indian States, RBI, 2020-21.
3,59,434 3,70,113 3,89,957 4,16,332 4,64,542 5,07,946 5,57,410 6,12,148 6,48,595 6,44,599 3,79,402 3,80,629 4,07,115 4,44,564 4,98,606 5,40,212 5,94,737 6,23,732 6,68,848 6,51,624 11,063 11,299 12,338 14,383 14,240 14,894 15,574 16,620 17,916 NA 1,43,175 1,47,342 1,54,525 1,65,212 1,91,109 2,02,081 2,19,919 2,31,040 2,37,844 NA 2,47,144 2,56,851 2,69,650 2,79,482 2,96,488 3,18,797 3,44,028 3,81,383 4,09,645 4,19,883 1,58,074 1,65,977 1,82,579 1,85,813 1,90,584 2,13,705 2,20,136 2,37,695 2,49,875 2,45,452 42,367 35,850 31,568 40,116 46,091 51,249 52,653 57,406 53,100 64,982 6,15,606 6,82,650 7,34,284 8,11,428 8,94,465 9,81,342 10,86,570 11,83,020 12,68,957 NA 2,97,539 3,20,912 3,47,507 3,70,535 4,13,405 4,56,709 4,87,274 5,17,080 5,59,705 5,28,070 72,720 77,384 82,847 89,060 96,274 1,03,055 1,09,406 1,16,570 1,22,284 1,14,729 78,256 80,767 85,115 82,372 97,001 1,00,199 1,06,584 1,16,352 NA NA 1,50,918 1,63,250 1,65,816 1,86,534 1,74,881 1,93,174 2,10,587 2,29,274 2,38,395 2,27,082 6,06,010 6,43,033 7,04,466 7,48,429 8,31,330 9,41,774 10,22,862 10,89,271 11,43,781 11,13,818 3,64,048 3,87,693 4,02,781 4,19,956 4,51,210 4,85,302 5,16,190 5,49,673 5,68,636 NA 3,15,562 3,51,683 3,65,134 3,83,944 4,18,736 4,70,669 4,97,148 5,29,425 5,80,406 5,60,845 12,80,369 13,57,942 14,51,615 15,43,165 16,54,284 18,07,046 19,14,621 20,33,314 21,34,065 NA 12,915 12,993 14,115 15,245 16,424 17,082 18,751 19,300 20,673 NA 19,918 20,354 20,726 20,140 20,638 21,730 22,564 23,719 25,190 23,297 7,259 7,778 9,038 11,261 12,324 13,595 14,758 16,073 18,034 NA 12,177 12,868 13,793 14,399 14,660 15,650 16,440 16,868 18,121 NA 2,30,987 2,43,363 2,65,892 2,70,665 2,92,229 3,37,348 3,61,517 3,86,395 4,12,375 3,97,473 2,66,628 2,80,823 2,99,450 3,12,125 3,30,052 3,52,721 3,75,406 3,97,601 4,13,578 3,86,170 4,34,837 4,54,564 4,86,230 5,21,509 5,63,340 5,96,746 6,24,831 6,55,713 6,88,714 6,43,222 11,165 11,421 12,114 13,071 14,370 15,397 17,673 18,625 19,700 20,434 7,51,486 7,91,824 8,51,976 8,93,915 9,67,562 10,36,762 11,25,793 12,04,667 12,78,559 12,96,659 19,208 20,873 22,819 26,965 26,787 30,538 33,093 36,754 40,207 41,799 7,24,050 7,58,205 8,02,070 8,34,432 9,08,241 10,11,501 10,57,747 11,23,982 11,66,817 10,92,624 1,15,328 1,23,710 1,34,182 1,41,278 1,52,699 1,67,703 1,81,043 1,91,484 1,99,718 NA 5,20,485 5,42,191 5,58,497 5,74,364 6,09,545 6,53,416 6,94,980 7,39,082 7,84,424 7,92,720 3,978 4,156 4,488 4,742 5,092 5,752 6,464 6,867 7,198 NA 18,768 20,285 22,105 22,870 24,932 26,917 28,480 29,597 31,235 NA 3,43,798 3,66,628 3,92,908 4,28,355 4,75,623 5,11,765 5,42,015 5,73,135 6,13,843 5,78,971 1,19,043 1,19,675 16,818 17,310 19,170 18,207 19,060 20,478 22,308 22,919 25,009 NA
NABelow 0% 0% to 5% 5.1% to 10% Above 10%
2.97 5.36 6.76 11.58 9.34 9.74 9.82 5.95 -0.62 9.29 0.32 6.96 9.20 12.16 8.34 10.09 4.88 7.23 -2.58 8.54 2.14 9.20 16.57 -0.99 4.59 4.57 6.72 7.80 NA 4.54 2.91 4.88 6.92 15.67 5.74 8.83 5.06 2.95 NA 7.65 3.93 4.98 3.65 6.08 7.52 7.91 10.86 7.41 2.50 7.96 5.00 10.00 1.77 2.57 12.13 3.01 7.98 5.12 -1.77 6.16 -15.38 -11.94 27.08 14.89 11.19 2.74 9.03 -7.50 22.37 6.07 10.89 7.56 10.51 10.23 9.71 10.72 8.88 7.26 NA 9.36 7.86 8.29 6.63 11.57 10.48 6.69 6.12 8.24 -5.65 8.62 6.41 7.06 7.50 8.10 7.04 6.16 6.55 4.90 -6.18 6.55 3.21 5.38 -3.22 17.76 3.30 6.37 9.16 NA NA NA 8.17 1.57 12.49 -6.25 10.46 9.01 8.87 3.98 -4.75 5.22 6.11 9.55 6.24 11.08 13.29 8.61 6.49 5.00 -2.62 8.89 6.50 3.89 4.26 7.44 7.56 6.36 6.49 3.45 NA 6.26 11.45 3.82 5.15 9.06 12.40 5.63 6.49 9.63 -3.37 8.64 6.06 6.90 6.31 7.20 9.23 5.95 6.20 4.95 NA 6.71 0.61 8.64 8.00 7.73 4.01 9.77 2.93 7.11 NA 6.31 2.19 1.83 -2.82 2.47 5.29 3.84 5.12 6.20 -7.52 4.58 7.15 16.21 24.59 9.44 10.32 8.55 8.91 12.20 NA 9.88 5.68 7.19 4.39 1.82 6.75 5.05 2.60 7.43 NA 4.73 5.36 9.26 1.80 7.97 15.44 7.16 6.88 6.72 -3.61 8.84 5.32 6.63 4.23 5.74 6.87 6.43 5.91 4.02 -6.63 5.79 4.54 6.97 7.26 8.02 5.93 4.71 4.94 5.03 -6.61 5.73 2.29 6.07 7.90 9.93 7.15 14.78 5.38 5.77 3.73 8.61 5.37 7.60 4.92 8.24 7.15 8.59 7.01 6.13 1.42 7.42 8.67 9.32 18.17 -0.66 14.00 8.37 11.06 9.40 3.96 8.43 4.72 5.79 4.03 8.85 11.37 4.57 6.26 3.81 -6.36 6.97 7.27 8.47 5.29 8.08 9.83 7.95 5.77 4.30 NA 7.19 4.17 3.01 2.84 6.13 7.20 6.36 6.35 6.13 1.06 6.43 4.48 7.99 5.64 7.39 12.96 12.39 6.23 4.83 NA 8.76 8.08 8.97 3.46 9.02 7.96 5.80 3.92 5.53 NA 6.45 6.64 7.17 9.02 11.03 7.60 5.91 5.74 7.10 -5.68 7.48 0.53 NA 2.93 10.74 -5.03 4.69 7.44 8.94 2.74 9.12 NA 6.6
Economy
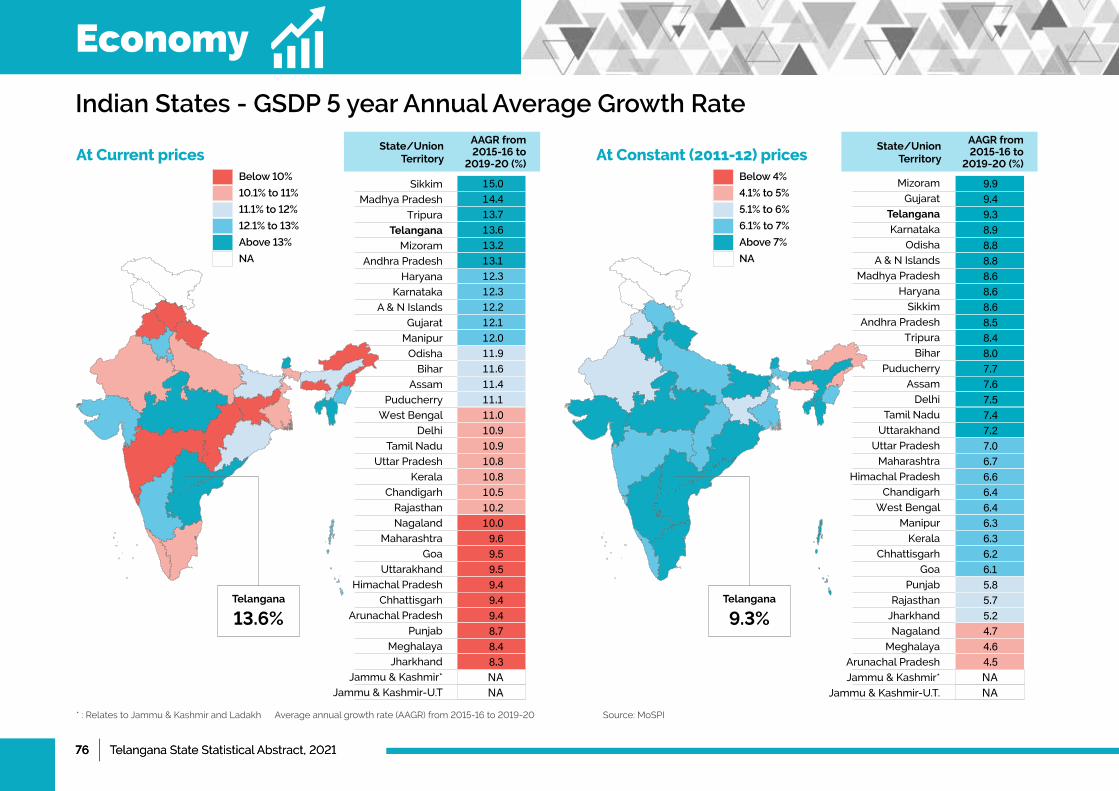
76 | Telangana State Statistical Abstract, 202176 | Telangana State Statistical Abstract, 2021
Mizoram
Gujarat
Telangana
Karnataka
Odisha
A&NIslands
MadhyaPradesh
Haryana
Sikkim
Andhra Pradesh
Tripura
Bihar
Puducherry
Assam
Delhi
Tamil Nadu
Uttarakhand
UttarPradesh
Maharashtra
Himachal Pradesh
Chandigarh
West Bengal
Manipur
Kerala
Chhattisgarh
Goa
Punjab
Rajasthan
Jharkhand
Nagaland
Meghalaya
Arunachal Pradesh
Jammu & Kashmir*
Jammu&Kashmir-U.T.
Indian States - GSDP 5 year Annual Average Growth Rate
Below 10%
10.1% to 11%
11.1% to 12%
12.1% to 13%
Above 13%
NA
Below 4%
4.1% to 5%
5.1% to 6%
6.1% to 7%
Above 7%
NA
Sikkim
MadhyaPradesh
Tripura
Telangana
Mizoram
Andhra Pradesh
Haryana
Karnataka
A&NIslands
Gujarat
Manipur
Odisha
Bihar
Assam
Puducherry
West Bengal
Delhi
Tamil Nadu
UttarPradesh
Kerala
Chandigarh
Rajasthan
Nagaland
Maharashtra
Goa
Uttarakhand
Himachal Pradesh
Chhattisgarh
Arunachal Pradesh
Punjab
Meghalaya
Jharkhand
Jammu & Kashmir*
Jammu&Kashmir-U.T
15.014.413.713.613.213.112.312.312.212.112.011.911.611.411.111.010.910.910.810.810.510.210.09.69.59.59.49.49.48.78.48.3NANA
9.99.49.38.98.88.88.68.68.68.58.48.07.77.67.57.47.27.06.76.66.46.46.36.36.26.15.85.75.24.74.64.5NANA
AAGR from 2015-16 to
2019-20 (%)
AAGR from 2015-16 to
2019-20 (%)
State/Union Territory
State/Union Territory
* : Relates to Jammu & Kashmir and Ladakh Average annual growth rate (AAGR) from 2015-16 to 2019-20 Source: MoSPI
At Current prices At Constant (2011-12) prices
Telangana
13.6%Telangana
9.3%
Economy
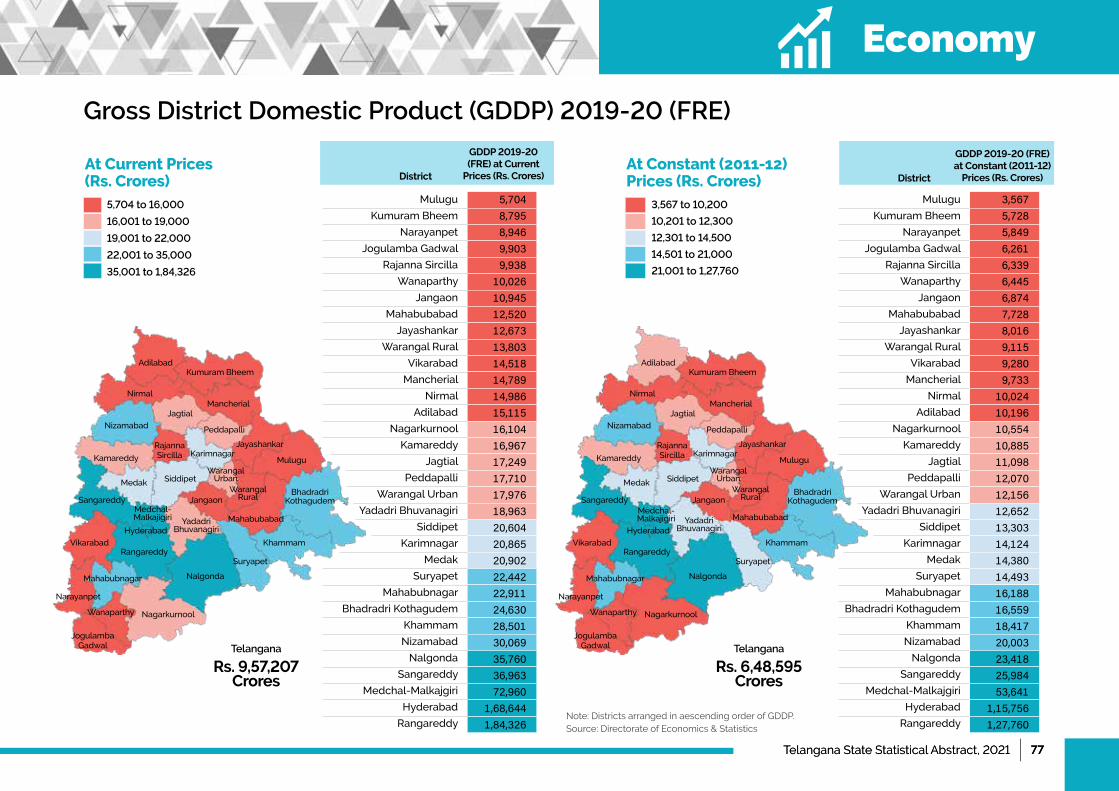
Telangana State Statistical Abstract, 2021 | 77Telangana State Statistical Abstract, 2021 | 77
Gross District Domestic Product (GDDP) 2019-20 (FRE)
5,704 to 16,000
16,001 to 19,000
19,001 to 22,000
22,001 to 35,000
35,001 to 1,84,326
At Current Prices (Rs. Crores)
At Constant (2011-12) Prices (Rs. Crores)
Note: Districts arranged in aescending order of GDDP. Source: Directorate of Economics & Statistics
Mulugu
Kumuram Bheem
Narayanpet
Jogulamba Gadwal
Rajanna Sircilla
Wanaparthy
Jangaon
Mahabubabad
Jayashankar
Warangal Rural
Vikarabad
Mancherial
Nirmal
Adilabad
Nagarkurnool
Kamareddy
Jagtial
Peddapalli
WarangalUrban
YadadriBhuvanagiri
Siddipet
Karimnagar
Medak
Suryapet
Mahabubnagar
Bhadradri Kothagudem
Khammam
Nizamabad
Nalgonda
Sangareddy
Medchal-Malkajgiri
Hyderabad
Rangareddy
District
5,7048,7958,9469,9039,938
10,02610,94512,52012,67313,80314,51814,78914,98615,11516,10416,96717,24917,71017,97618,96320,60420,86520,90222,44222,91124,63028,50130,06935,76036,96372,960
1,68,6441,84,326
GDDP 2019-20 (FRE) at Current
Prices (Rs. Crores)
Mulugu
Kumuram Bheem
Narayanpet
Jogulamba Gadwal
Rajanna Sircilla
Wanaparthy
Jangaon
Mahabubabad
Jayashankar
Warangal Rural
Vikarabad
Mancherial
Nirmal
Adilabad
Nagarkurnool
Kamareddy
Jagtial
Peddapalli
WarangalUrban
YadadriBhuvanagiri
Siddipet
Karimnagar
Medak
Suryapet
Mahabubnagar
Bhadradri Kothagudem
Khammam
Nizamabad
Nalgonda
Sangareddy
Medchal-Malkajgiri
Hyderabad
Rangareddy
District
3,5675,7285,8496,2616,3396,4456,8747,7288,0169,1159,2809,733
10,02410,19610,55410,88511,09812,07012,15612,65213,30314,12414,38014,49316,18816,55918,41720,00323,41825,98453,641
1,15,7561,27,760
GDDP 2019-20 (FRE) at Constant (2011-12)
Prices (Rs. Crores)
3,567 to 10,200
10,201 to 12,300
12,301 to 14,500
14,501 to 21,000
21,001 to 1,27,760
Adilabad
Nirmal
Kumuram Bheem
MancherialJagtial
Rajanna Sircilla
Peddapalli
Jayashankar
Mulugu
Medak Siddipet
JangaonSangareddyMedchal- Malkajigiri
VikarabadRangareddy
Mahabubnagar
Narayanpet
Nalgonda
NagarkurnoolWanaparthy
Suryapet
Khammam
Karimnagar
Yadadri Bhuvanagiri
Mahabubabad
Jogulamba Gadwal
Bhadradri Kothagudem
Kamareddy
Nizamabad
Hyderabad
Warangal Urban
Warangal Rural
Telangana
Rs. 6,48,595 Crores
Telangana
Rs. 9,57,207 Crores
Economy
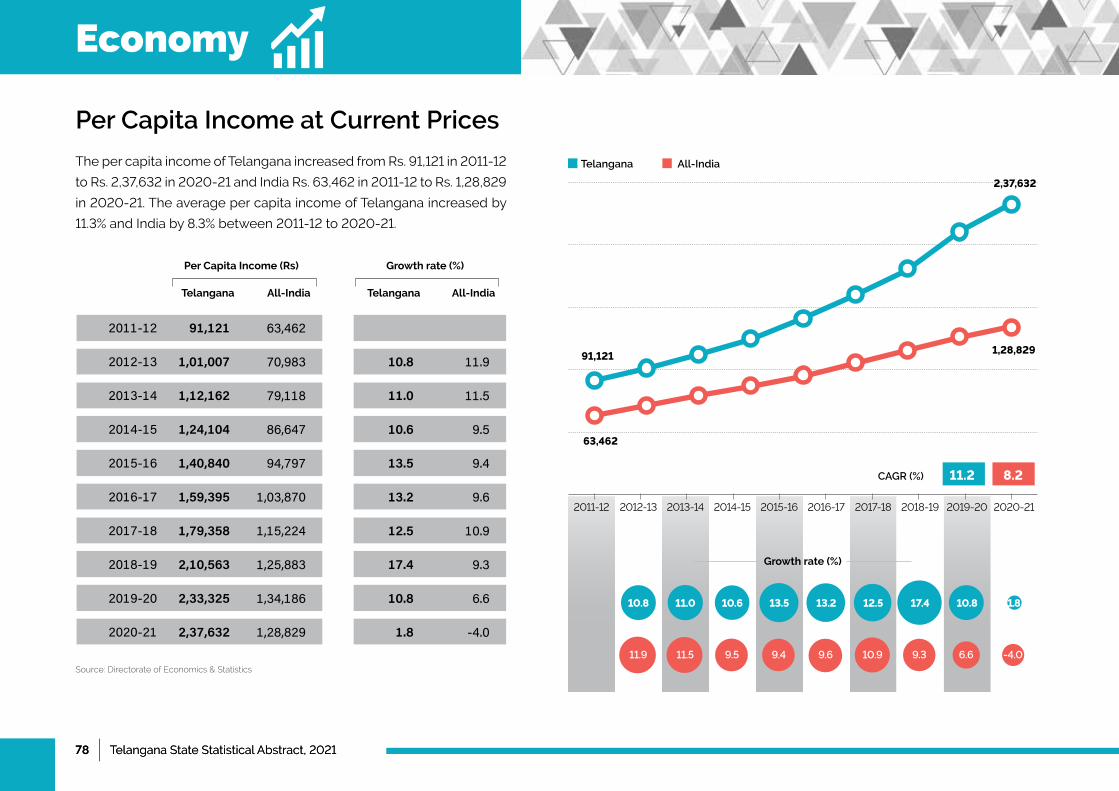
78 | Telangana State Statistical Abstract, 202178 | Telangana State Statistical Abstract, 2021
Per Capita Income at Current Prices
Source: Directorate of Economics & Statistics
2011-12
2012-13
2013-14
2014-15
2015-16
2016-17
2017-18
2018-19
2019-20
2020-21
91,121
1,01,007
1,12,162
1,24,104
1,40,840
1,59,395
1,79,358
2,10,563
2,33,325
2,37,632
10.8
11.0
10.6
13.5
13.2
12.5
17.4
10.8
1.8
63,462
70,983
79,118
86,647
94,797
1,03,870
1,15,224
1,25,883
1,34,186
1,28,829
11.9
11.5
9.5
9.4
9.6
10.9
9.3
6.6
-4.0
Per Capita Income (Rs) Growth rate (%)
Telangana TelanganaAll-India All-India
The per capita income of Telangana increased from Rs. 91,121 in 2011-12
to Rs. 2,37,632 in 2020-21 and India Rs. 63,462 in 2011-12 to Rs. 1,28,829
in 2020-21. The average per capita income of Telangana increased by
11.3% and India by 8.3% between 2011-12 to 2020-21.
Growth rate (%)
2011-12 2012-13 2013-14 2014-15 2015-16 2016-17 2017-18 2018-19 2019-20 2020-21
Telangana All-India
2,37,632
63,462
1,28,82991,121
CAGR (%) 11.2 8.2
10.8 11.0 10.6 13.5 13.2 12.5 17.4 10.8 1.8
11.9 11.5 9.5 9.4 9.6 10.9 9.3 6.6 -4.0
Economy
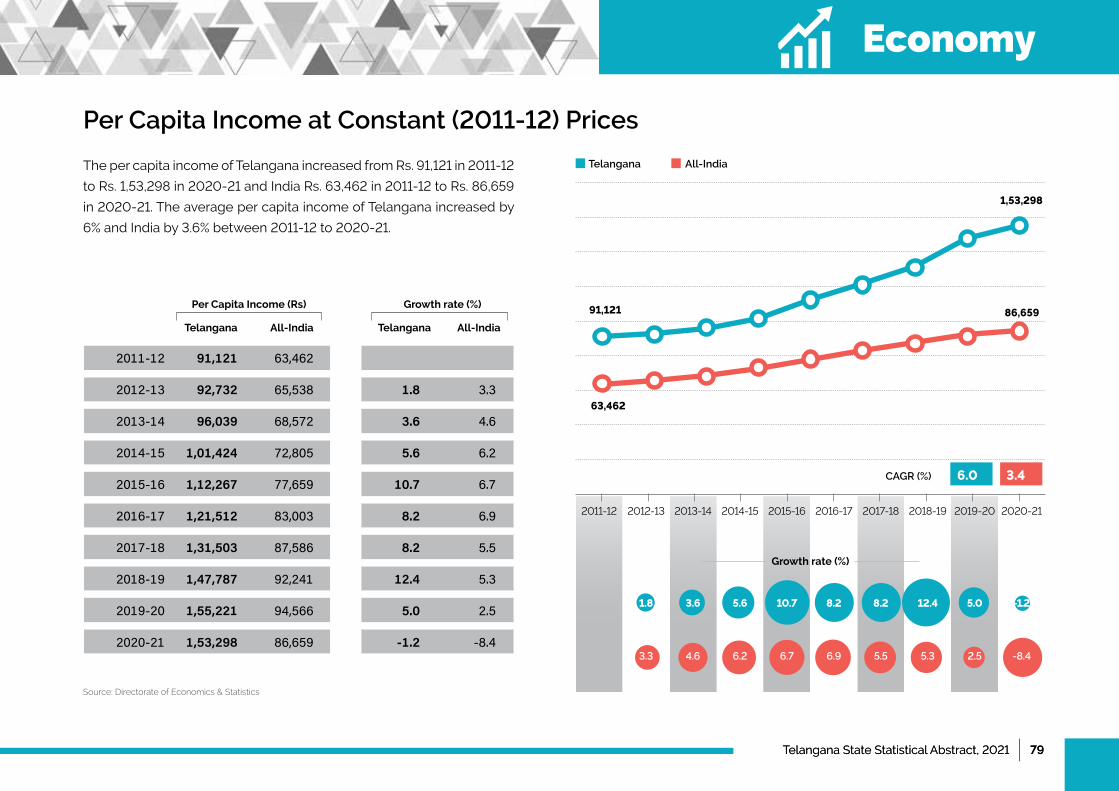
Telangana State Statistical Abstract, 2021 | 79Telangana State Statistical Abstract, 2021 | 79
Per Capita Income at Constant (2011-12) Prices
Source: Directorate of Economics & Statistics
2011-12
2012-13
2013-14
2014-15
2015-16
2016-17
2017-18
2018-19
2019-20
2020-21
91,121
92,732
96,039
1,01,424
1,12,267
1,21,512
1,31,503
1,47,787
1,55,221
1,53,298
1.8
3.6
5.6
10.7
8.2
8.2
12.4
5.0
-1.2
63,462
65,538
68,572
72,805
77,659
83,003
87,586
92,241
94,566
86,659
3.3
4.6
6.2
6.7
6.9
5.5
5.3
2.5
-8.4
Per Capita Income (Rs) Growth rate (%)
Telangana TelanganaAll-India All-India
The per capita income of Telangana increased from Rs. 91,121 in 2011-12
to Rs. 1,53,298 in 2020-21 and India Rs. 63,462 in 2011-12 to Rs. 86,659
in 2020-21. The average per capita income of Telangana increased by
6% and India by 3.6% between 2011-12 to 2020-21.
Growth rate (%)
2011-12 2012-13 2013-14 2014-15 2015-16 2016-17 2017-18 2018-19 2019-20 2020-21
Telangana All-India
1,53,298
63,462
86,65991,121
CAGR (%) 6.0 3.4
1.8 3.6 5.6 10.7 8.2 8.2 12.4 5.0 -1.2
3.3 4.6 6.2 6.7 6.9 5.5 5.3 2.5 -8.4
Economy
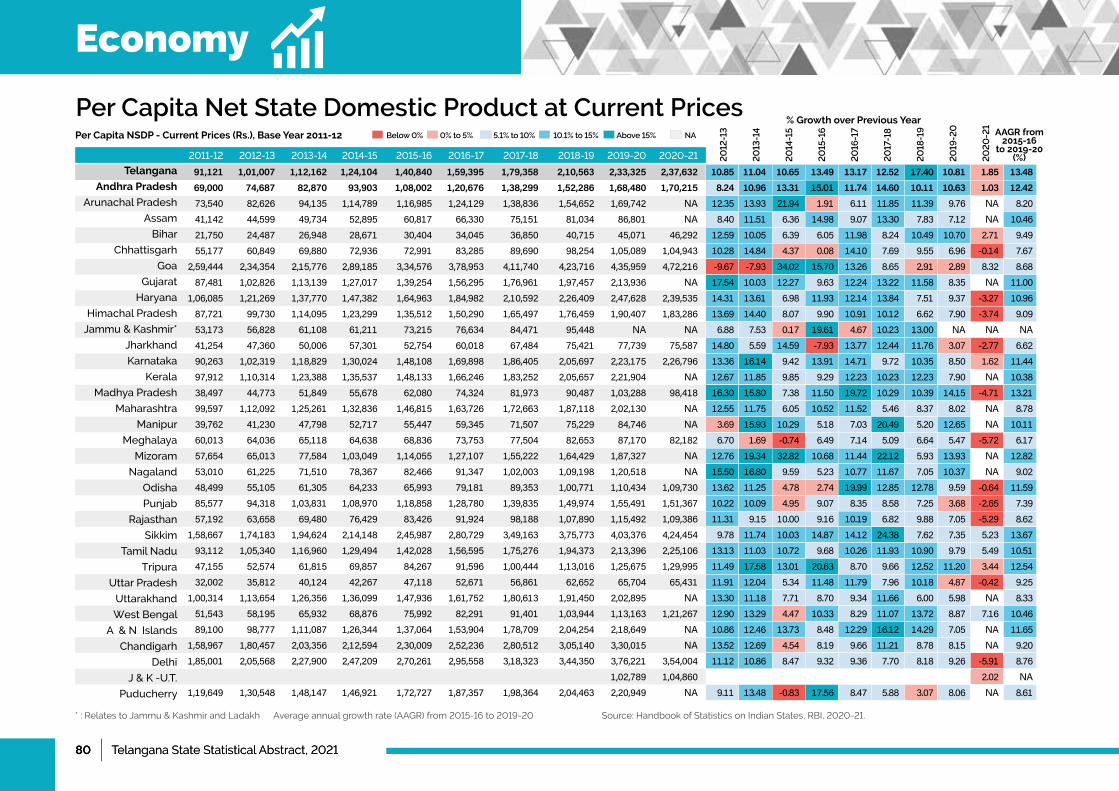
80 | Telangana State Statistical Abstract, 202180 | Telangana State Statistical Abstract, 2021
Per Capita Net State Domestic Product at Current Prices
Telangana
Andhra Pradesh
Arunachal Pradesh
Assam
Bihar
Chhattisgarh
Goa
Gujarat
Haryana
Himachal Pradesh
Jammu & Kashmir*
Jharkhand
Karnataka
Kerala
MadhyaPradesh
Maharashtra
Manipur
Meghalaya
Mizoram
Nagaland
Odisha
Punjab
Rajasthan
Sikkim
Tamil Nadu
Tripura
UttarPradesh
Uttarakhand
West Bengal
A&NIslands
Chandigarh
Delhi
J&K-U.T.
Puducherry
2011-12 2012-13 2013-14 2014-15 2015-16 2016-17 2017-18 2018-19 2019-20 2020-21 20
12-1
3
20
13-1
4
20
14-1
5
20
15-1
6
20
16-1
7
20
17-1
8
20
18-1
9
20
19-2
0
20
20
-21
AAGR from 2015-16
to 2019-20 (%)
Per Capita NSDP - Current Prices (Rs.), Base Year 2011-12
% Growth over Previous Year
* : Relates to Jammu & Kashmir and Ladakh Average annual growth rate (AAGR) from 2015-16 to 2019-20 Source: Handbook of Statistics on Indian States, RBI, 2020-21.
91,121 1,01,007 1,12,162 1,24,104 1,40,840 1,59,395 1,79,358 2,10,563 2,33,325 2,37,632 69,000 74,687 82,870 93,903 1,08,002 1,20,676 1,38,299 1,52,286 1,68,480 1,70,215 73,540 82,626 94,135 1,14,789 1,16,985 1,24,129 1,38,836 1,54,652 1,69,742 NA 41,142 44,599 49,734 52,895 60,817 66,330 75,151 81,034 86,801 NA 21,750 24,487 26,948 28,671 30,404 34,045 36,850 40,715 45,071 46,292 55,177 60,849 69,880 72,936 72,991 83,285 89,690 98,254 1,05,089 1,04,943 2,59,444 2,34,354 2,15,776 2,89,185 3,34,576 3,78,953 4,11,740 4,23,716 4,35,959 4,72,216 87,481 1,02,826 1,13,139 1,27,017 1,39,254 1,56,295 1,76,961 1,97,457 2,13,936 NA 1,06,085 1,21,269 1,37,770 1,47,382 1,64,963 1,84,982 2,10,592 2,26,409 2,47,628 2,39,535 87,721 99,730 1,14,095 1,23,299 1,35,512 1,50,290 1,65,497 1,76,459 1,90,407 1,83,286 53,173 56,828 61,108 61,211 73,215 76,634 84,471 95,448 NA NA 41,254 47,360 50,006 57,301 52,754 60,018 67,484 75,421 77,739 75,587 90,263 1,02,319 1,18,829 1,30,024 1,48,108 1,69,898 1,86,405 2,05,697 2,23,175 2,26,796 97,912 1,10,314 1,23,388 1,35,537 1,48,133 1,66,246 1,83,252 2,05,657 2,21,904 NA 38,497 44,773 51,849 55,678 62,080 74,324 81,973 90,487 1,03,288 98,418 99,597 1,12,092 1,25,261 1,32,836 1,46,815 1,63,726 1,72,663 1,87,118 2,02,130 NA 39,762 41,230 47,798 52,717 55,447 59,345 71,507 75,229 84,746 NA 60,013 64,036 65,118 64,638 68,836 73,753 77,504 82,653 87,170 82,182 57,654 65,013 77,584 1,03,049 1,14,055 1,27,107 1,55,222 1,64,429 1,87,327 NA 53,010 61,225 71,510 78,367 82,466 91,347 1,02,003 1,09,198 1,20,518 NA 48,499 55,105 61,305 64,233 65,993 79,181 89,353 1,00,771 1,10,434 1,09,730 85,577 94,318 1,03,831 1,08,970 1,18,858 1,28,780 1,39,835 1,49,974 1,55,491 1,51,367 57,192 63,658 69,480 76,429 83,426 91,924 98,188 1,07,890 1,15,492 1,09,386 1,58,667 1,74,183 1,94,624 2,14,148 2,45,987 2,80,729 3,49,163 3,75,773 4,03,376 4,24,454 93,112 1,05,340 1,16,960 1,29,494 1,42,028 1,56,595 1,75,276 1,94,373 2,13,396 2,25,106 47,155 52,574 61,815 69,857 84,267 91,596 1,00,444 1,13,016 1,25,675 1,29,995 32,002 35,812 40,124 42,267 47,118 52,671 56,861 62,652 65,704 65,431 1,00,314 1,13,654 1,26,356 1,36,099 1,47,936 1,61,752 1,80,613 1,91,450 2,02,895 NA 51,543 58,195 65,932 68,876 75,992 82,291 91,401 1,03,944 1,13,163 1,21,267 89,100 98,777 1,11,087 1,26,344 1,37,064 1,53,904 1,78,709 2,04,254 2,18,649 NA 1,58,967 1,80,457 2,03,356 2,12,594 2,30,009 2,52,236 2,80,512 3,05,140 3,30,015 NA 1,85,001 2,05,568 2,27,900 2,47,209 2,70,261 2,95,558 3,18,323 3,44,350 3,76,221 3,54,004 1,02,789 1,04,860 1,19,649 1,30,548 1,48,147 1,46,921 1,72,727 1,87,357 1,98,364 2,04,463 2,20,949 NA
NABelow 0% 0% to 5% 5.1% to 10% 10.1% to 15% Above 15%
10.85 11.04 10.65 13.49 13.17 12.52 17.40 10.81 1.85 13.48 8.24 10.96 13.31 15.01 11.74 14.60 10.11 10.63 1.03 12.42 12.35 13.93 21.94 1.91 6.11 11.85 11.39 9.76 NA 8.20 8.40 11.51 6.36 14.98 9.07 13.30 7.83 7.12 NA 10.46 12.59 10.05 6.39 6.05 11.98 8.24 10.49 10.70 2.71 9.49 10.28 14.84 4.37 0.08 14.10 7.69 9.55 6.96 -0.14 7.67 -9.67 -7.93 34.02 15.70 13.26 8.65 2.91 2.89 8.32 8.68 17.54 10.03 12.27 9.63 12.24 13.22 11.58 8.35 NA 11.00 14.31 13.61 6.98 11.93 12.14 13.84 7.51 9.37 -3.27 10.96 13.69 14.40 8.07 9.90 10.91 10.12 6.62 7.90 -3.74 9.09 6.88 7.53 0.17 19.61 4.67 10.23 13.00 NA NA NA 14.80 5.59 14.59 -7.93 13.77 12.44 11.76 3.07 -2.77 6.62 13.36 16.14 9.42 13.91 14.71 9.72 10.35 8.50 1.62 11.44 12.67 11.85 9.85 9.29 12.23 10.23 12.23 7.90 NA 10.38 16.30 15.80 7.38 11.50 19.72 10.29 10.39 14.15 -4.71 13.21 12.55 11.75 6.05 10.52 11.52 5.46 8.37 8.02 NA 8.78 3.69 15.93 10.29 5.18 7.03 20.49 5.20 12.65 NA 10.11 6.70 1.69 -0.74 6.49 7.14 5.09 6.64 5.47 -5.72 6.17 12.76 19.34 32.82 10.68 11.44 22.12 5.93 13.93 NA 12.82 15.50 16.80 9.59 5.23 10.77 11.67 7.05 10.37 NA 9.02 13.62 11.25 4.78 2.74 19.99 12.85 12.78 9.59 -0.64 11.59 10.22 10.09 4.95 9.07 8.35 8.58 7.25 3.68 -2.65 7.39 11.31 9.15 10.00 9.16 10.19 6.82 9.88 7.05 -5.29 8.62 9.78 11.74 10.03 14.87 14.12 24.38 7.62 7.35 5.23 13.67 13.13 11.03 10.72 9.68 10.26 11.93 10.90 9.79 5.49 10.51 11.49 17.58 13.01 20.63 8.70 9.66 12.52 11.20 3.44 12.54 11.91 12.04 5.34 11.48 11.79 7.96 10.18 4.87 -0.42 9.25 13.30 11.18 7.71 8.70 9.34 11.66 6.00 5.98 NA 8.33 12.90 13.29 4.47 10.33 8.29 11.07 13.72 8.87 7.16 10.46 10.86 12.46 13.73 8.48 12.29 16.12 14.29 7.05 NA 11.65 13.52 12.69 4.54 8.19 9.66 11.21 8.78 8.15 NA 9.20 11.12 10.86 8.47 9.32 9.36 7.70 8.18 9.26 -5.91 8.76 2.02 NA 9.11 13.48 -0.83 17.56 8.47 5.88 3.07 8.06 NA 8.61
Economy
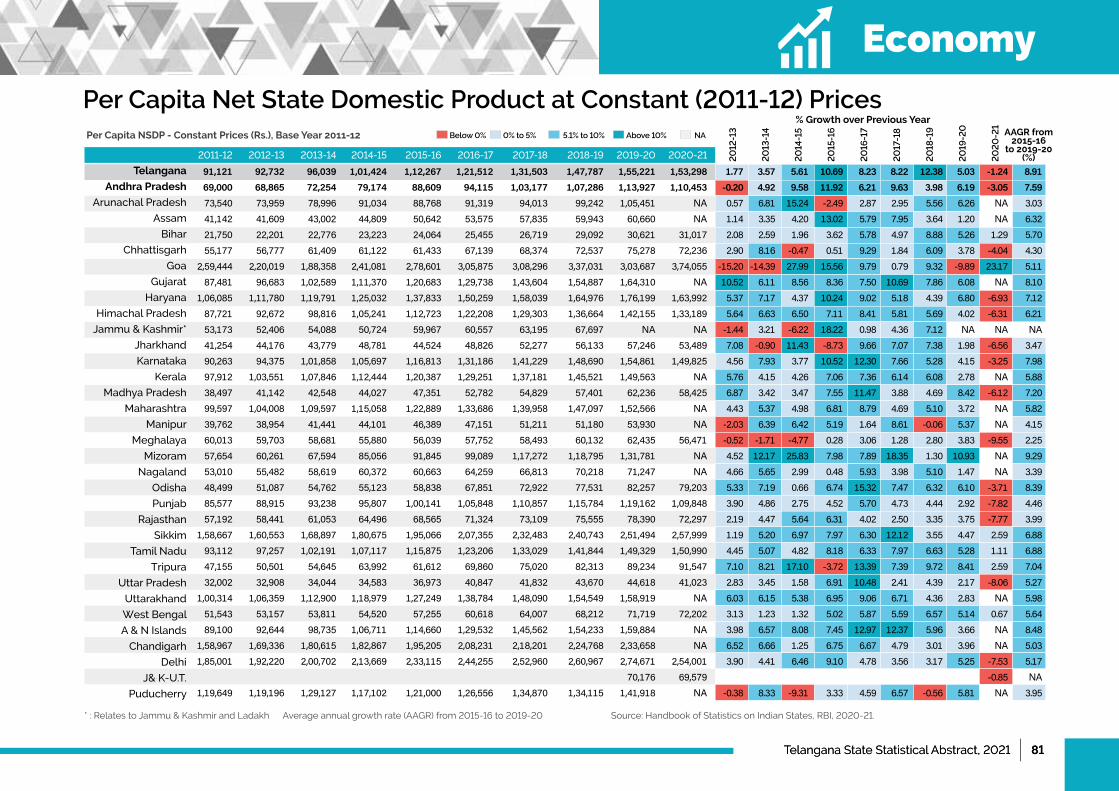
Telangana State Statistical Abstract, 2021 | 81Telangana State Statistical Abstract, 2021 | 81
Per Capita Net State Domestic Product at Constant (2011-12) Prices
Telangana
Andhra Pradesh
Arunachal Pradesh
Assam
Bihar
Chhattisgarh
Goa
Gujarat
Haryana
Himachal Pradesh
Jammu & Kashmir*
Jharkhand
Karnataka
Kerala
MadhyaPradesh
Maharashtra
Manipur
Meghalaya
Mizoram
Nagaland
Odisha
Punjab
Rajasthan
Sikkim
Tamil Nadu
Tripura
UttarPradesh
Uttarakhand
West Bengal
A&NIslands
Chandigarh
Delhi
J&K-U.T.
Puducherry
2011-12 2012-13 2013-14 2014-15 2015-16 2016-17 2017-18 2018-19 2019-20 2020-21 20
12-1
3
20
13-1
4
20
14-1
5
20
15-1
6
20
16-1
7
20
17-1
8
20
18-1
9
20
19-2
0
20
20
-21
AAGR from 2015-16
to 2019-20 (%)
Per Capita NSDP - Constant Prices (Rs.), Base Year 2011-12
% Growth over Previous Year
* : Relates to Jammu & Kashmir and Ladakh Average annual growth rate (AAGR) from 2015-16 to 2019-20 Source: Handbook of Statistics on Indian States, RBI, 2020-21.
91,121 92,732 96,039 1,01,424 1,12,267 1,21,512 1,31,503 1,47,787 1,55,221 1,53,298 69,000 68,865 72,254 79,174 88,609 94,115 1,03,177 1,07,286 1,13,927 1,10,453 73,540 73,959 78,996 91,034 88,768 91,319 94,013 99,242 1,05,451 NA 41,142 41,609 43,002 44,809 50,642 53,575 57,835 59,943 60,660 NA 21,750 22,201 22,776 23,223 24,064 25,455 26,719 29,092 30,621 31,017 55,177 56,777 61,409 61,122 61,433 67,139 68,374 72,537 75,278 72,236 2,59,444 2,20,019 1,88,358 2,41,081 2,78,601 3,05,875 3,08,296 3,37,031 3,03,687 3,74,055 87,481 96,683 1,02,589 1,11,370 1,20,683 1,29,738 1,43,604 1,54,887 1,64,310 NA 1,06,085 1,11,780 1,19,791 1,25,032 1,37,833 1,50,259 1,58,039 1,64,976 1,76,199 1,63,992 87,721 92,672 98,816 1,05,241 1,12,723 1,22,208 1,29,303 1,36,664 1,42,155 1,33,189 53,173 52,406 54,088 50,724 59,967 60,557 63,195 67,697 NA NA 41,254 44,176 43,779 48,781 44,524 48,826 52,277 56,133 57,246 53,489 90,263 94,375 1,01,858 1,05,697 1,16,813 1,31,186 1,41,229 1,48,690 1,54,861 1,49,825 97,912 1,03,551 1,07,846 1,12,444 1,20,387 1,29,251 1,37,181 1,45,521 1,49,563 NA 38,497 41,142 42,548 44,027 47,351 52,782 54,829 57,401 62,236 58,425 99,597 1,04,008 1,09,597 1,15,058 1,22,889 1,33,686 1,39,958 1,47,097 1,52,566 NA 39,762 38,954 41,441 44,101 46,389 47,151 51,211 51,180 53,930 NA 60,013 59,703 58,681 55,880 56,039 57,752 58,493 60,132 62,435 56,471 57,654 60,261 67,594 85,056 91,845 99,089 1,17,272 1,18,795 1,31,781 NA 53,010 55,482 58,619 60,372 60,663 64,259 66,813 70,218 71,247 NA 48,499 51,087 54,762 55,123 58,838 67,851 72,922 77,531 82,257 79,203 85,577 88,915 93,238 95,807 1,00,141 1,05,848 1,10,857 1,15,784 1,19,162 1,09,848 57,192 58,441 61,053 64,496 68,565 71,324 73,109 75,555 78,390 72,297 1,58,667 1,60,553 1,68,897 1,80,675 1,95,066 2,07,355 2,32,483 2,40,743 2,51,494 2,57,999 93,112 97,257 1,02,191 1,07,117 1,15,875 1,23,206 1,33,029 1,41,844 1,49,329 1,50,990 47,155 50,501 54,645 63,992 61,612 69,860 75,020 82,313 89,234 91,547 32,002 32,908 34,044 34,583 36,973 40,847 41,832 43,670 44,618 41,023 1,00,314 1,06,359 1,12,900 1,18,979 1,27,249 1,38,784 1,48,090 1,54,549 1,58,919 NA 51,543 53,157 53,811 54,520 57,255 60,618 64,007 68,212 71,719 72,202 89,100 92,644 98,735 1,06,711 1,14,660 1,29,532 1,45,562 1,54,233 1,59,884 NA 1,58,967 1,69,336 1,80,615 1,82,867 1,95,205 2,08,231 2,18,201 2,24,768 2,33,658 NA 1,85,001 1,92,220 2,00,702 2,13,669 2,33,115 2,44,255 2,52,960 2,60,967 2,74,671 2,54,001 70,176 69,579 1,19,649 1,19,196 1,29,127 1,17,102 1,21,000 1,26,556 1,34,870 1,34,115 1,41,918 NA
NABelow 0% 0% to 5% 5.1% to 10% Above 10%
1.77 3.57 5.61 10.69 8.23 8.22 12.38 5.03 -1.24 8.91 -0.20 4.92 9.58 11.92 6.21 9.63 3.98 6.19 -3.05 7.59 0.57 6.81 15.24 -2.49 2.87 2.95 5.56 6.26 NA 3.03 1.14 3.35 4.20 13.02 5.79 7.95 3.64 1.20 NA 6.32 2.08 2.59 1.96 3.62 5.78 4.97 8.88 5.26 1.29 5.70 2.90 8.16 -0.47 0.51 9.29 1.84 6.09 3.78 -4.04 4.30 -15.20 -14.39 27.99 15.56 9.79 0.79 9.32 -9.89 23.17 5.11 10.52 6.11 8.56 8.36 7.50 10.69 7.86 6.08 NA 8.10 5.37 7.17 4.37 10.24 9.02 5.18 4.39 6.80 -6.93 7.12 5.64 6.63 6.50 7.11 8.41 5.81 5.69 4.02 -6.31 6.21 -1.44 3.21 -6.22 18.22 0.98 4.36 7.12 NA NA NA 7.08 -0.90 11.43 -8.73 9.66 7.07 7.38 1.98 -6.56 3.47 4.56 7.93 3.77 10.52 12.30 7.66 5.28 4.15 -3.25 7.98 5.76 4.15 4.26 7.06 7.36 6.14 6.08 2.78 NA 5.88 6.87 3.42 3.47 7.55 11.47 3.88 4.69 8.42 -6.12 7.20 4.43 5.37 4.98 6.81 8.79 4.69 5.10 3.72 NA 5.82 -2.03 6.39 6.42 5.19 1.64 8.61 -0.06 5.37 NA 4.15 -0.52 -1.71 -4.77 0.28 3.06 1.28 2.80 3.83 -9.55 2.25 4.52 12.17 25.83 7.98 7.89 18.35 1.30 10.93 NA 9.29 4.66 5.65 2.99 0.48 5.93 3.98 5.10 1.47 NA 3.39 5.33 7.19 0.66 6.74 15.32 7.47 6.32 6.10 -3.71 8.39 3.90 4.86 2.75 4.52 5.70 4.73 4.44 2.92 -7.82 4.46 2.19 4.47 5.64 6.31 4.02 2.50 3.35 3.75 -7.77 3.99 1.19 5.20 6.97 7.97 6.30 12.12 3.55 4.47 2.59 6.88 4.45 5.07 4.82 8.18 6.33 7.97 6.63 5.28 1.11 6.88 7.10 8.21 17.10 -3.72 13.39 7.39 9.72 8.41 2.59 7.04 2.83 3.45 1.58 6.91 10.48 2.41 4.39 2.17 -8.06 5.27 6.03 6.15 5.38 6.95 9.06 6.71 4.36 2.83 NA 5.98 3.13 1.23 1.32 5.02 5.87 5.59 6.57 5.14 0.67 5.64 3.98 6.57 8.08 7.45 12.97 12.37 5.96 3.66 NA 8.48 6.52 6.66 1.25 6.75 6.67 4.79 3.01 3.96 NA 5.03 3.90 4.41 6.46 9.10 4.78 3.56 3.17 5.25 -7.53 5.17 -0.85 NA -0.38 8.33 -9.31 3.33 4.59 6.57 -0.56 5.81 NA 3.95
Economy
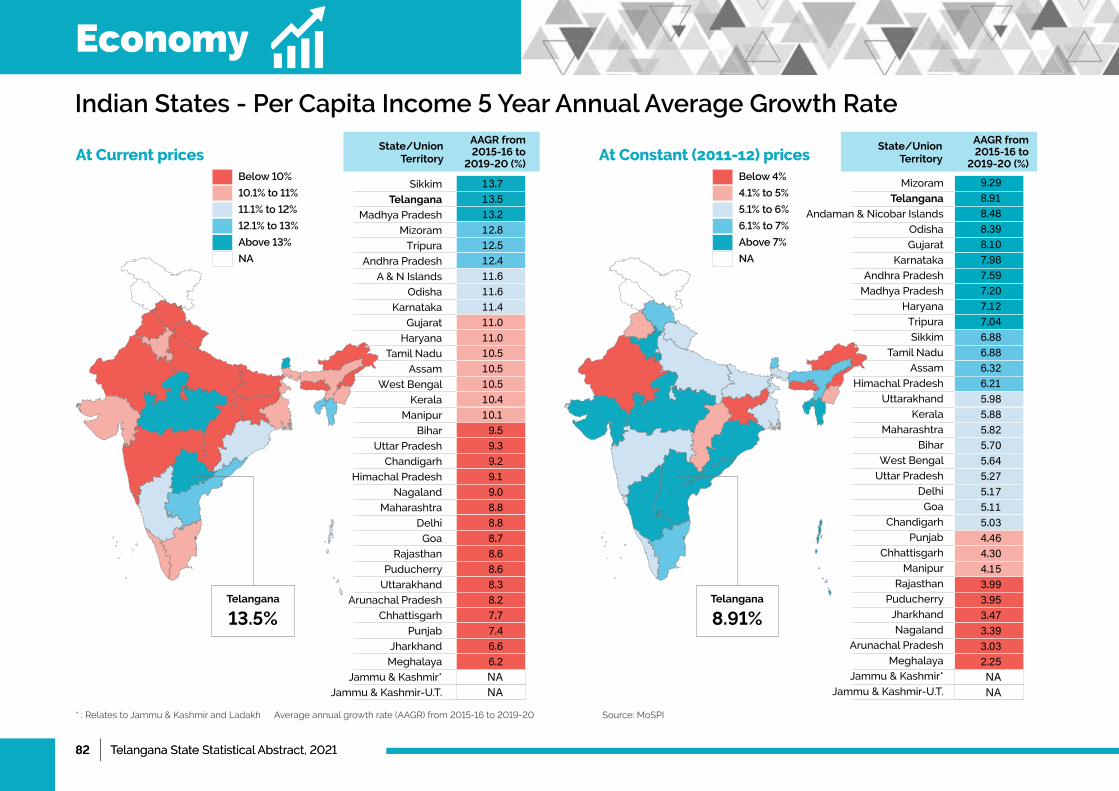
82 | Telangana State Statistical Abstract, 202182 | Telangana State Statistical Abstract, 2021
Mizoram
Telangana
Andaman&NicobarIslands
Odisha
Gujarat
Karnataka
Andhra Pradesh
MadhyaPradesh
Haryana
Tripura
Sikkim
Tamil Nadu
Assam
Himachal Pradesh
Uttarakhand
Kerala
Maharashtra
Bihar
West Bengal
UttarPradesh
Delhi
Goa
Chandigarh
Punjab
Chhattisgarh
Manipur
Rajasthan
Puducherry
Jharkhand
Nagaland
Arunachal Pradesh
Meghalaya
Jammu & Kashmir*
Jammu&Kashmir-U.T.
Indian States - Per Capita Income 5 Year Annual Average Growth Rate
Below 10%
10.1% to 11%
11.1% to 12%
12.1% to 13%
Above 13%
NA
Below 4%
4.1% to 5%
5.1% to 6%
6.1% to 7%
Above 7%
NA
Sikkim
Telangana
MadhyaPradesh
Mizoram
Tripura
Andhra Pradesh
A&NIslands
Odisha
Karnataka
Gujarat
Haryana
Tamil Nadu
Assam
West Bengal
Kerala
Manipur
Bihar
UttarPradesh
Chandigarh
Himachal Pradesh
Nagaland
Maharashtra
Delhi
Goa
Rajasthan
Puducherry
Uttarakhand
Arunachal Pradesh
Chhattisgarh
Punjab
Jharkhand
Meghalaya
Jammu & Kashmir*
Jammu&Kashmir-U.T.
13.713.513.212.812.512.411.611.611.411.011.010.510.510.510.410.19.59.39.29.19.08.88.88.78.68.68.38.27.77.46.66.2NANA
9.298.918.488.398.107.987.597.207.127.046.886.886.326.215.985.885.825.705.645.275.175.115.034.464.304.153.993.953.473.393.032.25NANA
AAGR from 2015-16 to
2019-20 (%)
AAGR from 2015-16 to
2019-20 (%)
State/Union Territory
State/Union Territory
* : Relates to Jammu & Kashmir and Ladakh Average annual growth rate (AAGR) from 2015-16 to 2019-20 Source: MoSPI
At Current prices At Constant (2011-12) prices
Telangana
13.5%Telangana
8.91%
Economy
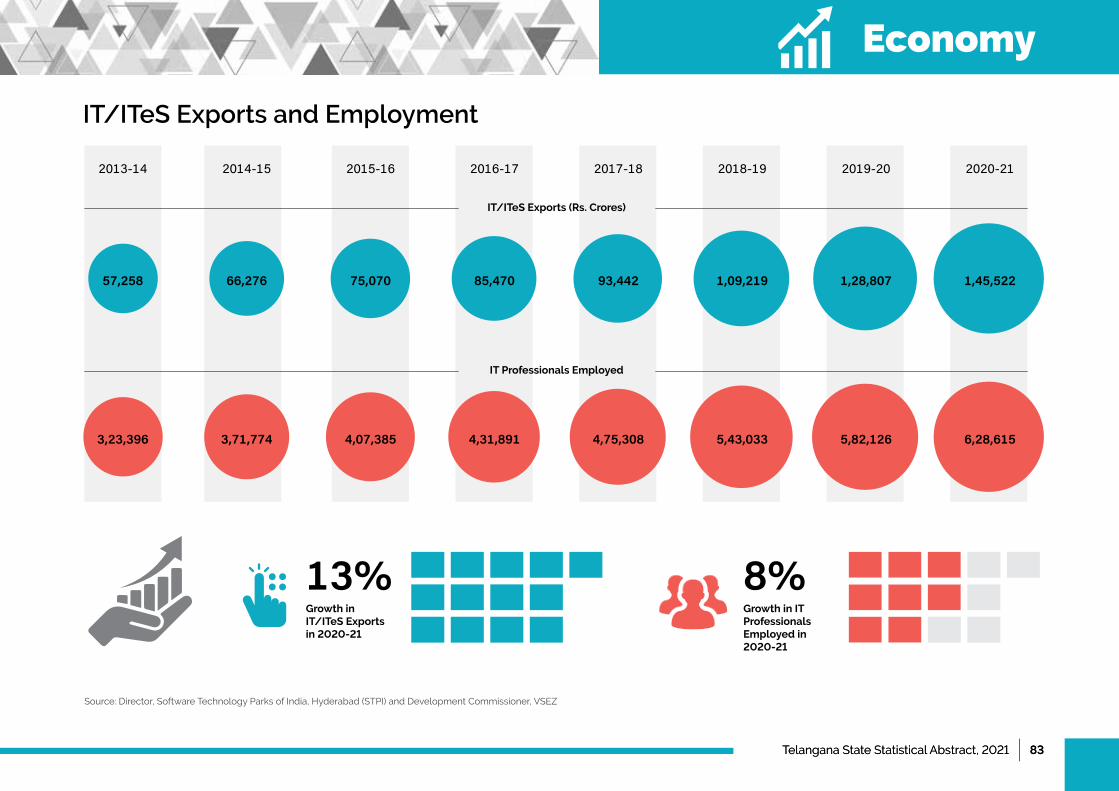
Telangana State Statistical Abstract, 2021 | 83Telangana State Statistical Abstract, 2021 | 83
IT/ITeS Exports and Employment
Source: Director, Software Technology Parks of India, Hyderabad (STPI) and Development Commissioner, VSEZ
2013-14 2014-15 2015-16 2016-17 2017-18 2018-19 2019-20 2020-21
IT/ITeS Exports (Rs. Crores)
Growth in IT/ITeS Exports in 2020-21
Growth in IT Professionals Employed in 2020-21
IT Professionals Employed
57,258 66,276 75,070 85,470 93,442 1,09,219 1,28,807 1,45,522
3,23,396 3,71,774 4,07,385 4,31,891 4,75,308 5,43,033 5,82,126 6,28,615
13% 8%
Economy
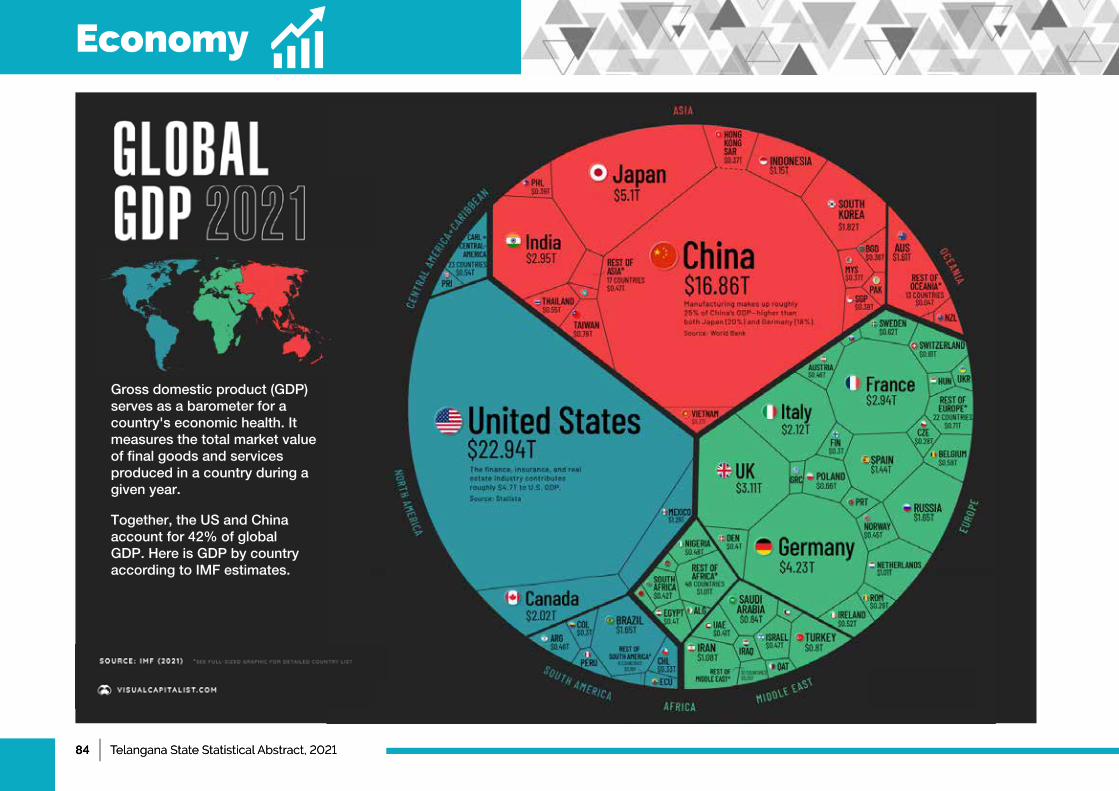
84 | Telangana State Statistical Abstract, 202184 | Telangana State Statistical Abstract, 2021
Gross domestic product (GDP) serves as a barometer for a country's economic health. It measures the total market value of final goods and services produced in a country during a given year.
Together, the US and China account for 42% of global GDP. Here is GDP by country according to IMF estimates.
Economy
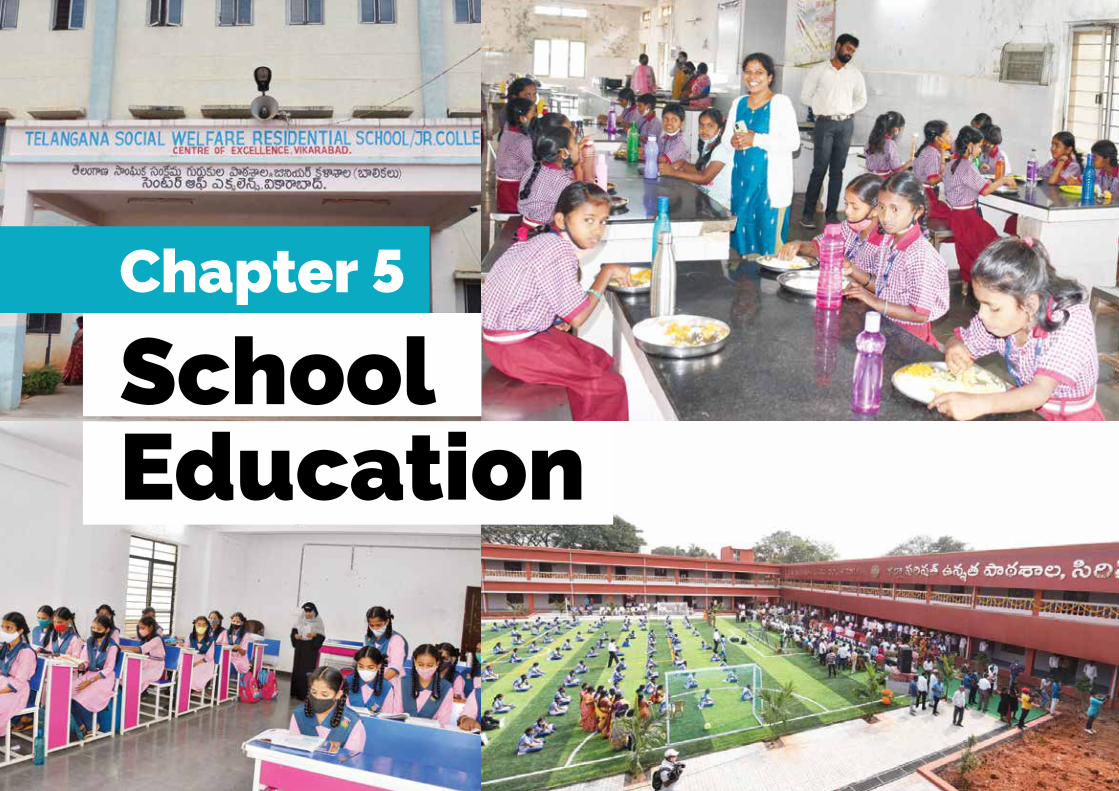
Telangana State Statistical Abstract, 2021 | 85Telangana State Statistical Abstract, 2021 | 85
School Education
Chapter 5
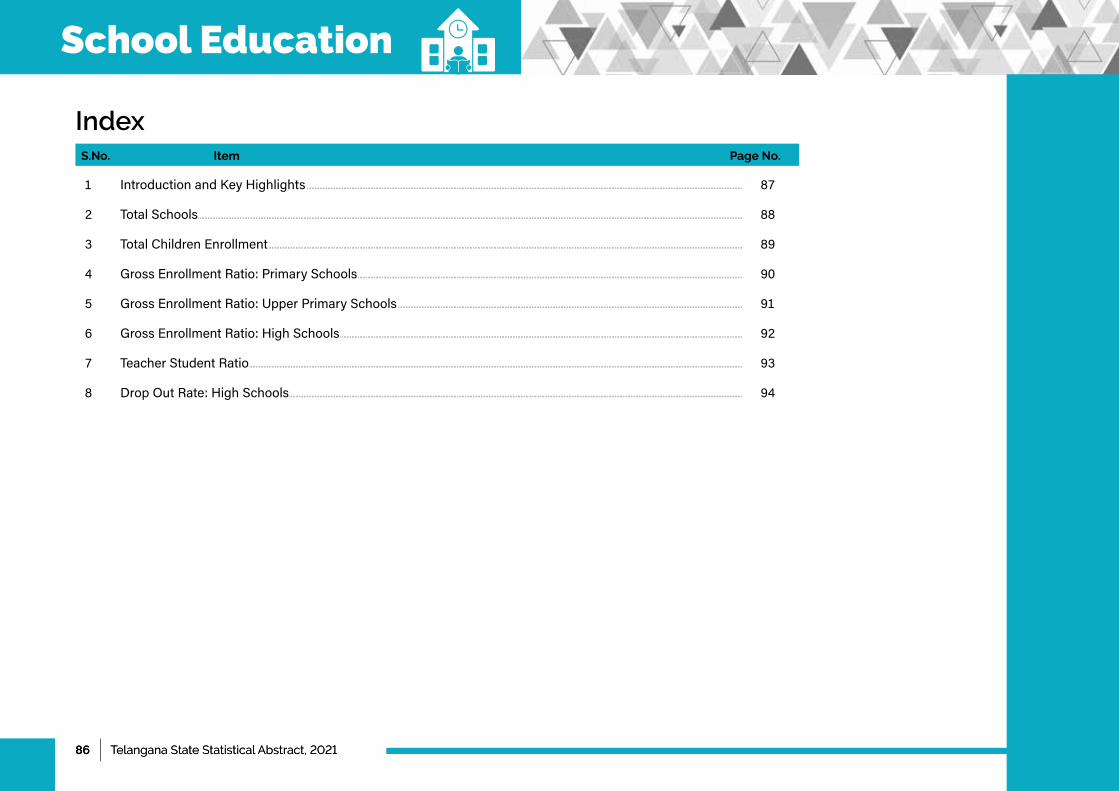
86 | Telangana State Statistical Abstract, 202186 | Telangana State Statistical Abstract, 2021
School Education
1 IntroductionandKeyHighlights..................................................................................................................................................................................................................................................................................87
2 TotalSchools......................................................................................................................................................................................................................................................................................................................................................88
3 TotalChildrenEnrollment..........................................................................................................................................................................................................................................................................................................89
4 GrossEnrollmentRatio:PrimarySchools..................................................................................................................................................................................................................................................90
5 GrossEnrollmentRatio:UpperPrimarySchools.........................................................................................................................................................................................................................91
6 GrossEnrollmentRatio:HighSchools.............................................................................................................................................................................................................................................................92
7 TeacherStudentRatio......................................................................................................................................................................................................................................................................................................................93
8 DropOutRate:HighSchools.............................................................................................................................................................................................................................................................................................94
IndexPage No.S.No. Item
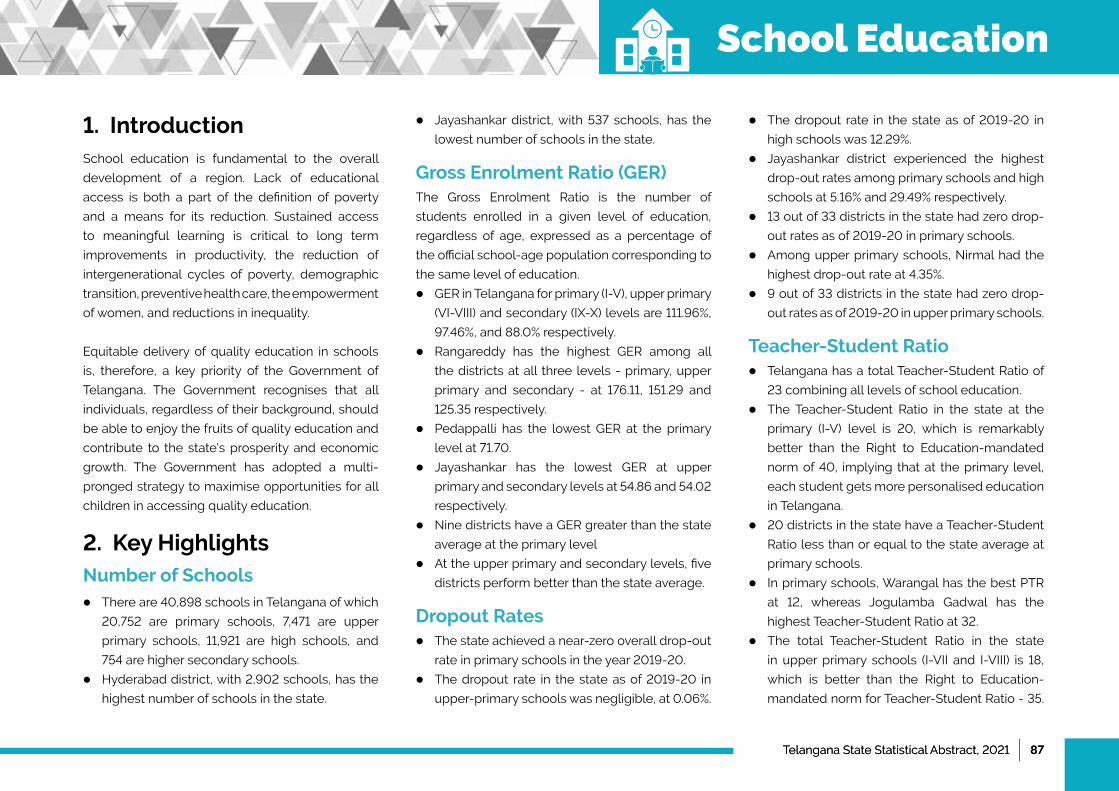
Telangana State Statistical Abstract, 2021 | 87Telangana State Statistical Abstract, 2021 | 87
1. Introduction School education is fundamental to the overall
development of a region. Lack of educational
access is both a part of the definition of poverty
and a means for its reduction. Sustained access
to meaningful learning is critical to long term
improvements in productivity, the reduction of
intergenerational cycles of poverty, demographic
transition, preventive health care, the empowerment
of women, and reductions in inequality.
Equitable delivery of quality education in schools
is, therefore, a key priority of the Government of
Telangana. The Government recognises that all
individuals, regardless of their background, should
be able to enjoy the fruits of quality education and
contribute to the state's prosperity and economic
growth. The Government has adopted a multi-
pronged strategy to maximise opportunities for all
children in accessing quality education.
2. Key Highlights Number of Schools●l There are 40,898 schools in Telangana of which
20,752 are primary schools, 7,471 are upper
primary schools, 11,921 are high schools, and
754 are higher secondary schools.
●l Hyderabad district, with 2,902 schools, has the
highest number of schools in the state.
●l Jayashankar district, with 537 schools, has the
lowest number of schools in the state.
Gross Enrolment Ratio (GER)The Gross Enrolment Ratio is the number of
students enrolled in a given level of education,
regardless of age, expressed as a percentage of
the official school-age population corresponding to
the same level of education.
●l GER in Telangana for primary (I-V), upper primary
(VI-VIII) and secondary (IX-X) levels are 111.96%,
97.46%, and 88.0% respectively.
●●l Rangareddy has the highest GER among all
the districts at all three levels - primary, upper
primary and secondary - at 176.11, 151.29 and
125.35 respectively.
●l Pedappalli has the lowest GER at the primary
level at 71.70.
●l Jayashankar has the lowest GER at upper
primary and secondary levels at 54.86 and 54.02
respectively.
●l Nine districts have a GER greater than the state
average at the primary level
●l At the upper primary and secondary levels, five
districts perform better than the state average.
Dropout Rates●l The state achieved a near-zero overall drop-out
rate in primary schools in the year 2019-20.
●l The dropout rate in the state as of 2019-20 in
upper-primary schools was negligible, at 0.06%.
●l The dropout rate in the state as of 2019-20 in
high schools was 12.29%.
●l Jayashankar district experienced the highest
drop-out rates among primary schools and high
schools at 5.16% and 29.49% respectively.
●l 13 out of 33 districts in the state had zero drop-
out rates as of 2019-20 in primary schools.
●l Among upper primary schools, Nirmal had the
highest drop-out rate at 4.35%.
●l 9 out of 33 districts in the state had zero drop-
out rates as of 2019-20 in upper primary schools.
Teacher-Student Ratio●●l Telangana has a total Teacher-Student Ratio of
23 combining all levels of school education.
●l The Teacher-Student Ratio in the state at the
primary (I-V) level is 20, which is remarkably
better than the Right to Education-mandated
norm of 40, implying that at the primary level,
each student gets more personalised education
in Telangana.
●l 20 districts in the state have a Teacher-Student
Ratio less than or equal to the state average at
primary schools.
●l In primary schools, Warangal has the best PTR
at 12, whereas Jogulamba Gadwal has the
highest Teacher-Student Ratio at 32.
●l The total Teacher-Student Ratio in the state
in upper primary schools (I-VII and I-VIII) is 18,
which is better than the Right to Education-
mandated norm for Teacher-Student Ratio - 35.●
School Education
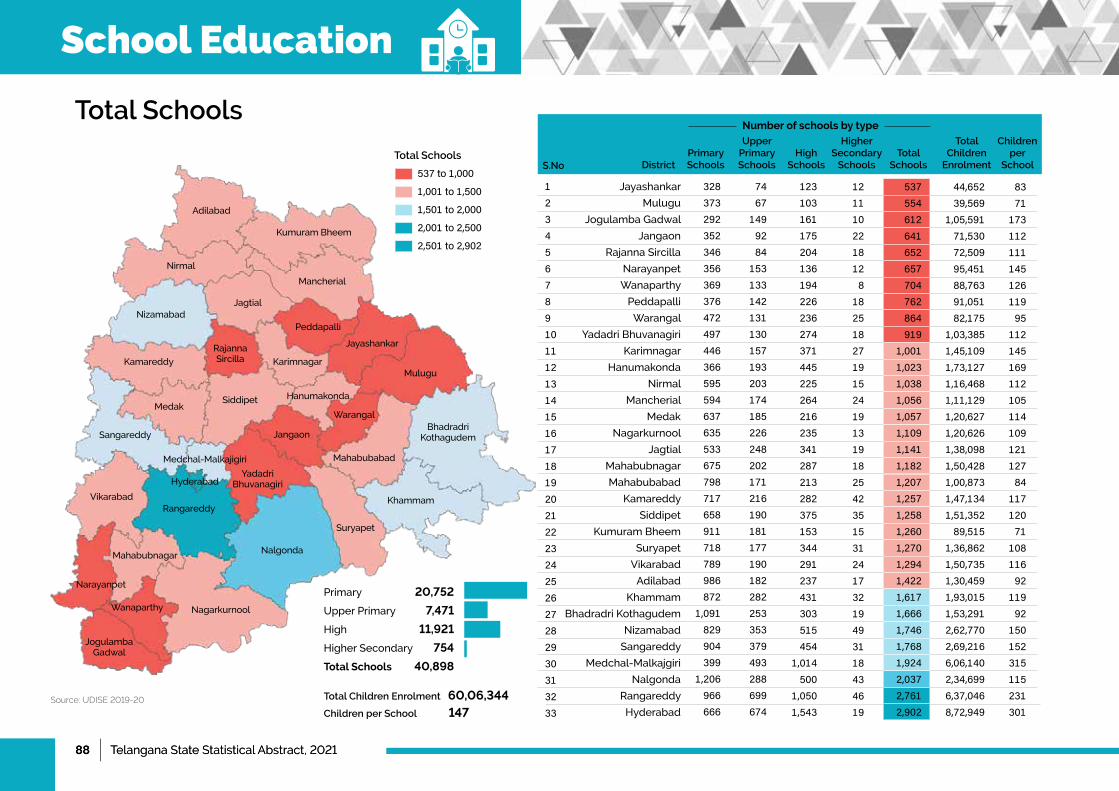
88 | Telangana State Statistical Abstract, 202188 | Telangana State Statistical Abstract, 2021
Total Schools
Jayashankar
Mulugu
Jogulamba Gadwal
Jangaon
Rajanna Sircilla
Narayanpet
Wanaparthy
Peddapalli
Warangal
YadadriBhuvanagiri
Karimnagar
Hanumakonda
Nirmal
Mancherial
Medak
Nagarkurnool
Jagtial
Mahabubnagar
Mahabubabad
Kamareddy
Siddipet
Kumuram Bheem
Suryapet
Vikarabad
Adilabad
Khammam
Bhadradri Kothagudem
Nizamabad
Sangareddy
Medchal-Malkajgiri
Nalgonda
Rangareddy
Hyderabad
High Schools
Higher Secondary
Schools
Upper Primary Schools
PrimarySchoolsDistrictS.No
Total Schools
Total Children
Enrolment
Children per
School
123456789101112131415161718192021222324252627282930313233
328373292352346356369376472497446366595594637635533675798717658911718789986872
1,091829904399
1,206966666
7467
1499284
153133142131130157193203174185226248202171216190181177190182282253353379493288699674
123103161175204136194226236274371445225264216235341287213282375153344291237431303515454
1,014500
1,0501,543
1211102218128
1825182719152419131918254235153124173219493118434619
537554612641652657704762864919
1,0011,0231,0381,0561,0571,1091,1411,1821,2071,2571,2581,2601,2701,2941,4221,6171,6661,7461,7681,9242,0372,7612,902
44,65239,569
1,05,59171,53072,50995,45188,76391,05182,175
1,03,3851,45,1091,73,1271,16,4681,11,1291,20,6271,20,6261,38,0981,50,4281,00,8731,47,1341,51,35289,515
1,36,8621,50,7351,30,4591,93,0151,53,2912,62,7702,69,2166,06,1402,34,6996,37,0468,72,949
8371
17311211114512611995
11214516911210511410912112784
11712071
10811692
11992
150152315115231301
537to1,000
1,001to1,500
1,501to2,000
2,001to2,500
2,501to2,902
Total Schools
Source: UDISE 2019-20
Adilabad
Nirmal
Kumuram Bheem
Mancherial
Jagtial
Rajanna Sircilla
Peddapalli
Jayashankar
Mulugu
MedakSiddipet Hanumakonda
Warangal
JangaonSangareddy
Medchal-Malkajigiri
VikarabadRangareddy
Mahabubnagar
Narayanpet
Nalgonda
NagarkurnoolWanaparthy
Suryapet
Khammam
Karimnagar
Yadadri Bhuvanagiri
Mahabubabad
Jogulamba Gadwal
Bhadradri Kothagudem
Kamareddy
Nizamabad
Hyderabad
Primary 20,752
UpperPrimary 7,471
High 11,921
Higher Secondary 754
Total Schools 40,898
Total Children Enrolment 60,06,344Children per School 147
Number of schools by type
School Education
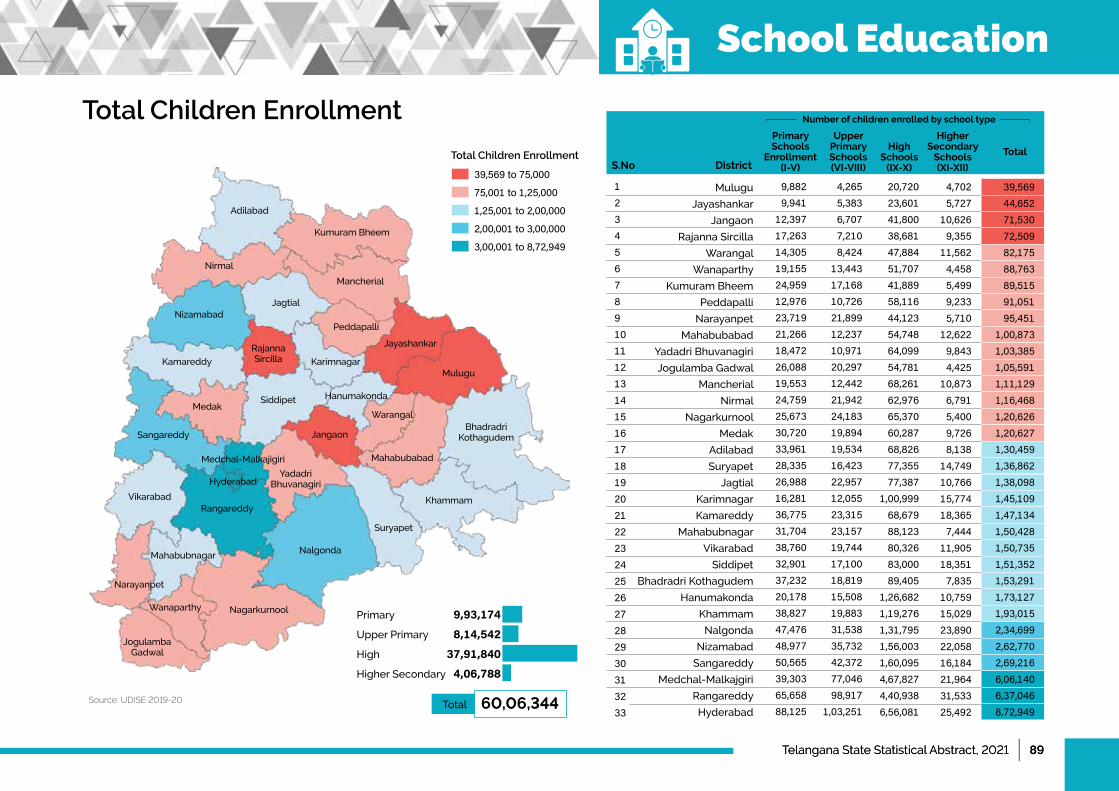
Telangana State Statistical Abstract, 2021 | 89Telangana State Statistical Abstract, 2021 | 89
Total Children Enrollment
Mulugu
Jayashankar
Jangaon
Rajanna Sircilla
Warangal
Wanaparthy
Kumuram Bheem
Peddapalli
Narayanpet
Mahabubabad
YadadriBhuvanagiri
Jogulamba Gadwal
Mancherial
Nirmal
Nagarkurnool
Medak
Adilabad
Suryapet
Jagtial
Karimnagar
Kamareddy
Mahabubnagar
Vikarabad
Siddipet
Bhadradri Kothagudem
Hanumakonda
Khammam
Nalgonda
Nizamabad
Sangareddy
Medchal-Malkajgiri
Rangareddy
Hyderabad
Primary Schools
Enrollment (I-V)
Upper Primary Schools (VI-VIII)
Higher Secondary
Schools (XI-XII)
High Schools
(IX-X)
TotalDistrictS.No
123456789101112131415161718192021222324252627282930313233
9,8829,941
12,39717,26314,30519,15524,95912,97623,71921,26618,47226,08819,55324,75925,67330,72033,96128,33526,98816,28136,77531,70438,76032,90137,23220,17838,82747,47648,97750,56539,30365,65888,125
4,2655,3836,7077,2108,424
13,44317,16810,72621,89912,23710,97120,29712,44221,94224,18319,89419,53416,42322,95712,05523,31523,15719,74417,10018,81915,50819,88331,53835,73242,37277,04698,917
1,03,251
20,72023,60141,80038,68147,88451,70741,88958,11644,12354,74864,09954,78168,26162,97665,37060,28768,82677,35577,387
1,00,99968,67988,12380,32683,00089,405
1,26,6821,19,2761,31,7951,56,0031,60,0954,67,8274,40,9386,56,081
4,7025,727
10,6269,355
11,5624,4585,4999,2335,710
12,6229,8434,425
10,8736,7915,4009,7268,138
14,74910,76615,77418,3657,444
11,90518,3517,835
10,75915,02923,89022,05816,18421,96431,53325,492
39,56944,65271,53072,50982,17588,76389,51591,05195,451
1,00,8731,03,3851,05,5911,11,1291,16,4681,20,6261,20,6271,30,4591,36,8621,38,0981,45,1091,47,1341,50,4281,50,7351,51,3521,53,2911,73,1271,93,0152,34,6992,62,7702,69,2166,06,1406,37,0468,72,949
39,569to75,000
75,001to1,25,000
1,25,001to2,00,000
2,00,001to3,00,000
3,00,001to8,72,949
Total Children Enrollment
Source: UDISE 2019-20
Adilabad
Nirmal
Kumuram Bheem
Mancherial
Jagtial
Rajanna Sircilla
Peddapalli
Jayashankar
Mulugu
MedakSiddipet Hanumakonda
Warangal
JangaonSangareddy
Medchal-Malkajigiri
VikarabadRangareddy
Mahabubnagar
Narayanpet
Nalgonda
NagarkurnoolWanaparthy
Suryapet
Khammam
Karimnagar
Yadadri Bhuvanagiri
Mahabubabad
Jogulamba Gadwal
Bhadradri Kothagudem
Kamareddy
Nizamabad
Hyderabad
Primary 9,93,174
UpperPrimary 8,14,542
High 37,91,840
Higher Secondary 4,06,788
Total 60,06,344
Number of children enrolled by school type
School Education
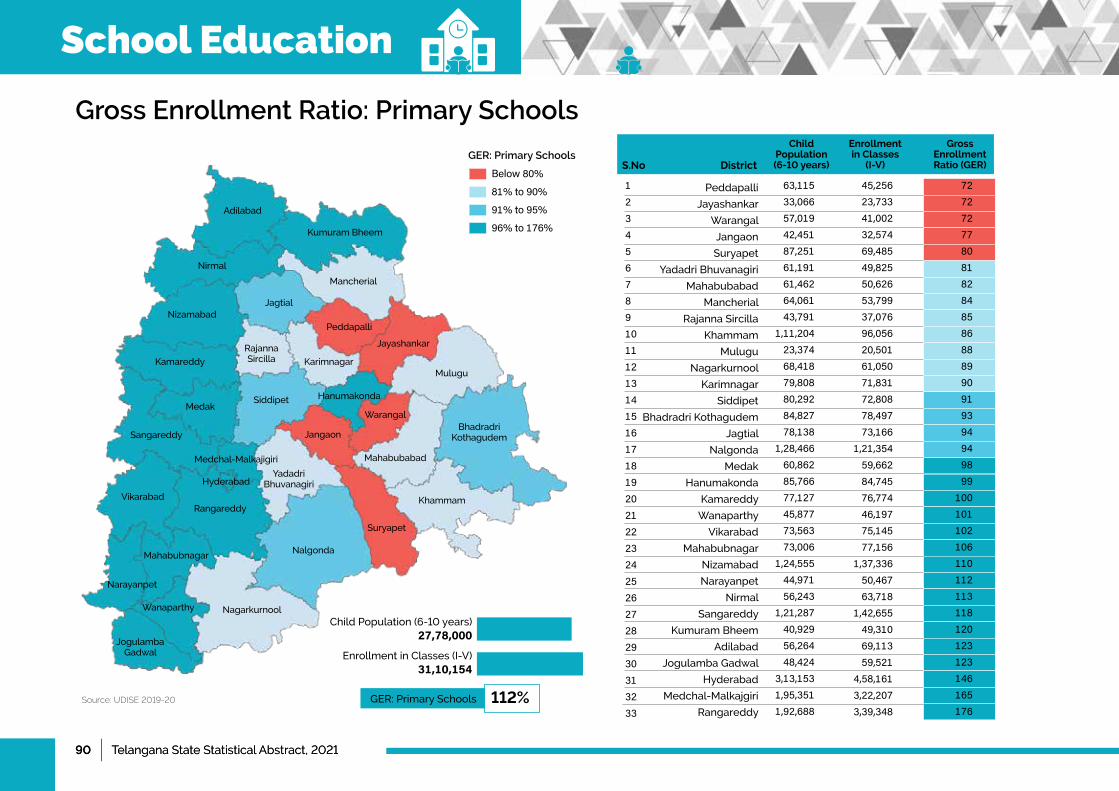
90 | Telangana State Statistical Abstract, 202190 | Telangana State Statistical Abstract, 2021
Gross Enrollment Ratio: Primary Schools
Peddapalli
Jayashankar
Warangal
Jangaon
Suryapet
YadadriBhuvanagiri
Mahabubabad
Mancherial
Rajanna Sircilla
Khammam
Mulugu
Nagarkurnool
Karimnagar
Siddipet
Bhadradri Kothagudem
Jagtial
Nalgonda
Medak
Hanumakonda
Kamareddy
Wanaparthy
Vikarabad
Mahabubnagar
Nizamabad
Narayanpet
Nirmal
Sangareddy
Kumuram Bheem
Adilabad
Jogulamba Gadwal
Hyderabad
Medchal-Malkajgiri
Rangareddy
Enrollment in Classes
(I-V)
Child Population (6-10 years)DistrictS.No
Gross Enrollment Ratio (GER)
123456789101112131415161718192021222324252627282930313233
63,11533,06657,01942,45187,25161,19161,46264,06143,791
1,11,20423,37468,41879,80880,29284,82778,138
1,28,46660,86285,76677,12745,87773,56373,006
1,24,55544,97156,243
1,21,28740,92956,26448,424
3,13,1531,95,3511,92,688
45,25623,73341,00232,57469,48549,82550,62653,79937,07696,05620,50161,05071,83172,80878,49773,166
1,21,35459,66284,74576,77446,19775,14577,156
1,37,33650,46763,718
1,42,65549,31069,11359,521
4,58,1613,22,2073,39,348
72727277808182848586888990919394949899
100101102106110112113118120123123146165176
Below80%
81%to90%
91%to95%
96%to176%
GER: Primary Schools
Source: UDISE 2019-20
Adilabad
Nirmal
Kumuram Bheem
Mancherial
Jagtial
Rajanna Sircilla
Peddapalli
Jayashankar
Mulugu
MedakSiddipet Hanumakonda
Warangal
JangaonSangareddy
Medchal-Malkajigiri
VikarabadRangareddy
Mahabubnagar
Narayanpet
Nalgonda
NagarkurnoolWanaparthy
Suryapet
Khammam
Karimnagar
Yadadri Bhuvanagiri
Mahabubabad
Jogulamba Gadwal
Bhadradri Kothagudem
Kamareddy
Nizamabad
Hyderabad
GER: Primary Schools 112%
ChildPopulation(6-10years)27,78,000
EnrollmentinClasses(I-V)31,10,154
School Education
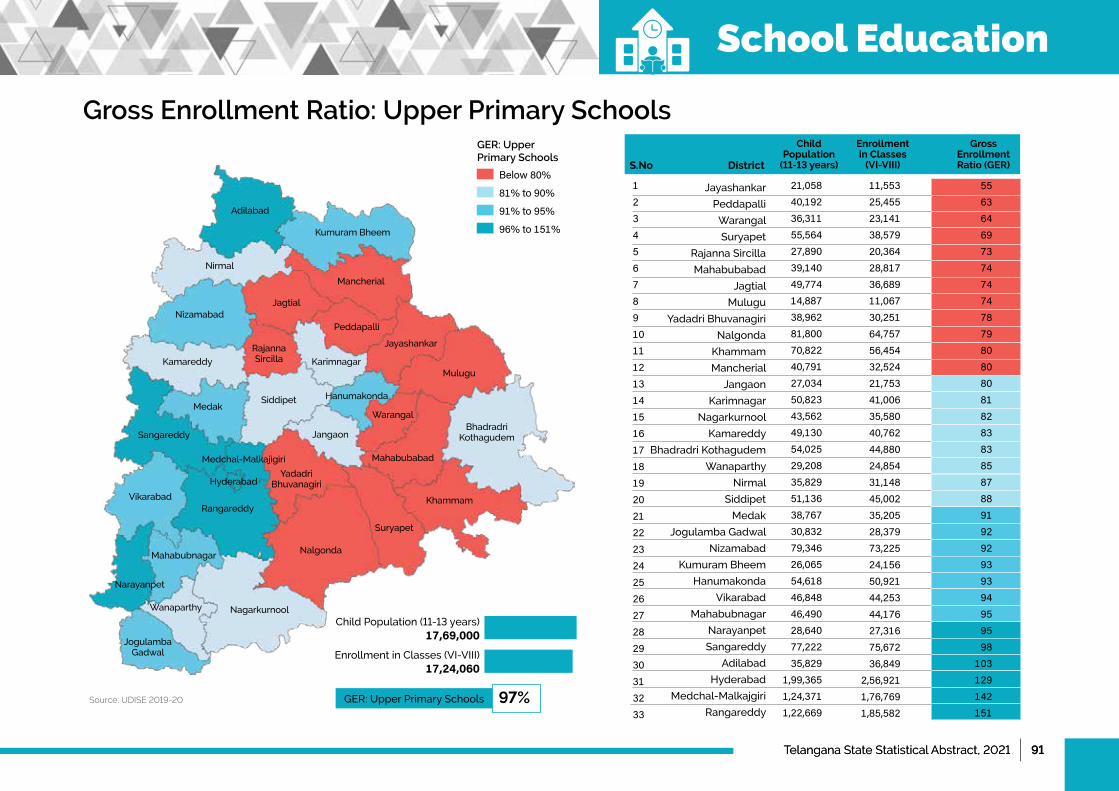
Telangana State Statistical Abstract, 2021 | 91Telangana State Statistical Abstract, 2021 | 91
Gross Enrollment Ratio: Upper Primary Schools
Jayashankar
Peddapalli
Warangal
Suryapet
Rajanna Sircilla
Mahabubabad
Jagtial
Mulugu
YadadriBhuvanagiri
Nalgonda
Khammam
Mancherial
Jangaon
Karimnagar
Nagarkurnool
Kamareddy
Bhadradri Kothagudem
Wanaparthy
Nirmal
Siddipet
Medak
Jogulamba Gadwal
Nizamabad
Kumuram Bheem
Hanumakonda
Vikarabad
Mahabubnagar
Narayanpet
Sangareddy
Adilabad
Hyderabad
Medchal-Malkajgiri
Rangareddy
Enrollment in Classes
(VI-VIII)
Child Population
(11-13 years)DistrictS.No
Gross Enrollment Ratio (GER)
123456789101112131415161718192021222324252627282930313233
21,05840,19236,31155,56427,89039,14049,77414,88738,96281,80070,82240,79127,03450,82343,56249,13054,02529,20835,82951,13638,76730,83279,34626,06554,61846,84846,49028,64077,22235,829
1,99,3651,24,3711,22,669
11,55325,45523,14138,57920,36428,81736,68911,06730,25164,75756,45432,52421,75341,00635,58040,76244,88024,85431,14845,00235,20528,37973,22524,15650,92144,25344,17627,31675,67236,849
2,56,9211,76,7691,85,582
5563646973747474787980808081828383858788919292939394959598
103129142151
Below80%
81%to90%
91%to95%
96%to151%
GER: Upper Primary Schools
Source: UDISE 2019-20
Adilabad
Nirmal
Kumuram Bheem
Mancherial
Jagtial
Rajanna Sircilla
Peddapalli
Jayashankar
Mulugu
MedakSiddipet Hanumakonda
Warangal
JangaonSangareddy
Medchal-Malkajigiri
VikarabadRangareddy
Mahabubnagar
Narayanpet
Nalgonda
NagarkurnoolWanaparthy
Suryapet
Khammam
Karimnagar
Yadadri Bhuvanagiri
Mahabubabad
Jogulamba Gadwal
Bhadradri Kothagudem
Kamareddy
Nizamabad
Hyderabad
GER:UpperPrimarySchools 97%
ChildPopulation(11-13years)17,69,000
EnrollmentinClasses(VI-VIII)17,24,060
School Education
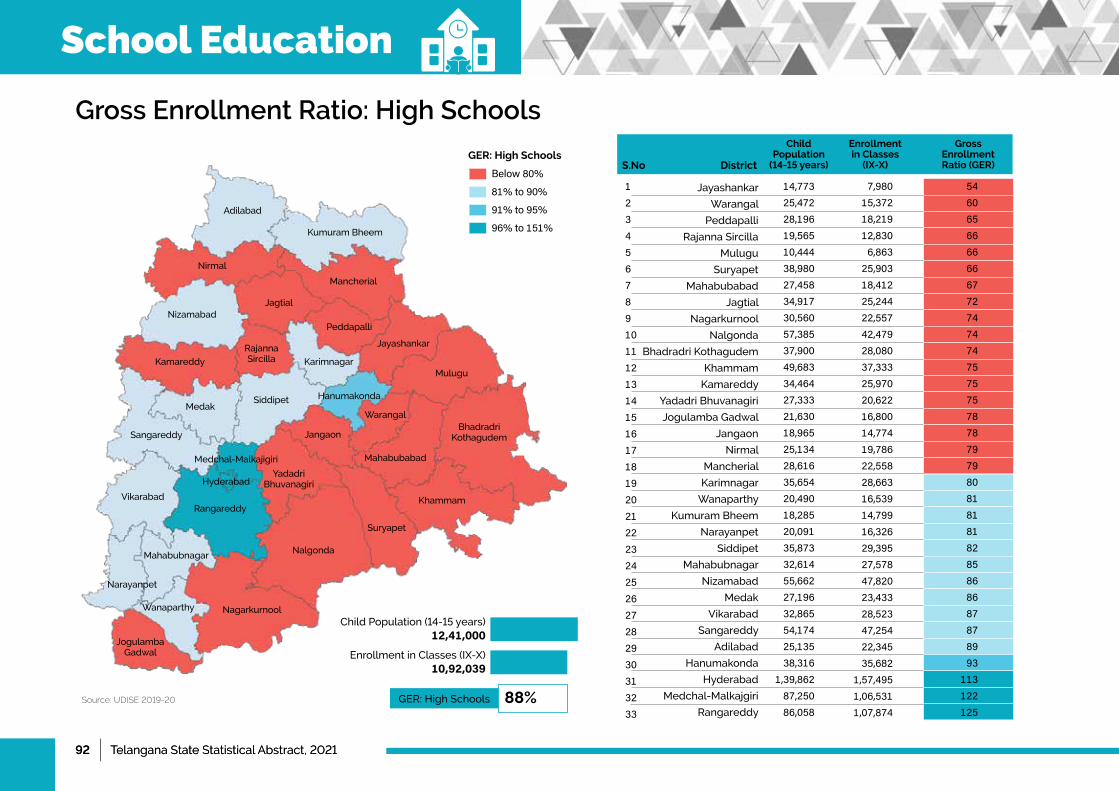
92 | Telangana State Statistical Abstract, 202192 | Telangana State Statistical Abstract, 2021
Gross Enrollment Ratio: High Schools
Jayashankar
Warangal
Peddapalli
Rajanna Sircilla
Mulugu
Suryapet
Mahabubabad
Jagtial
Nagarkurnool
Nalgonda
Bhadradri Kothagudem
Khammam
Kamareddy
YadadriBhuvanagiri
Jogulamba Gadwal
Jangaon
Nirmal
Mancherial
Karimnagar
Wanaparthy
Kumuram Bheem
Narayanpet
Siddipet
Mahabubnagar
Nizamabad
Medak
Vikarabad
Sangareddy
Adilabad
Hanumakonda
Hyderabad
Medchal-Malkajgiri
Rangareddy
Enrollment in Classes
(IX-X)
Child Population
(14-15 years)DistrictS.No
Gross Enrollment Ratio (GER)
123456789101112131415161718192021222324252627282930313233
14,77325,47228,19619,56510,44438,98027,45834,91730,56057,38537,90049,68334,46427,33321,63018,96525,13428,61635,65420,49018,28520,09135,87332,61455,66227,19632,86554,17425,13538,316
1,39,86287,25086,058
7,98015,37218,21912,8306,863
25,90318,41225,24422,55742,47928,08037,33325,97020,62216,80014,77419,78622,55828,66316,53914,79916,32629,39527,57847,82023,43328,52347,25422,34535,682
1,57,4951,06,5311,07,874
546065666666677274747475757578787979808181818285868687878993
113122125
Below80%
81%to90%
91%to95%
96%to151%
GER: High Schools
Source: UDISE 2019-20
Adilabad
Nirmal
Kumuram Bheem
Mancherial
Jagtial
Rajanna Sircilla
Peddapalli
Jayashankar
Mulugu
MedakSiddipet Hanumakonda
Warangal
JangaonSangareddy
Medchal-Malkajigiri
VikarabadRangareddy
Mahabubnagar
Narayanpet
Nalgonda
NagarkurnoolWanaparthy
Suryapet
Khammam
Karimnagar
Yadadri Bhuvanagiri
Mahabubabad
Jogulamba Gadwal
Bhadradri Kothagudem
Kamareddy
Nizamabad
Hyderabad
GER: High Schools 88%
ChildPopulation(14-15years)12,41,000
EnrollmentinClasses(IX-X)10,92,039
School Education
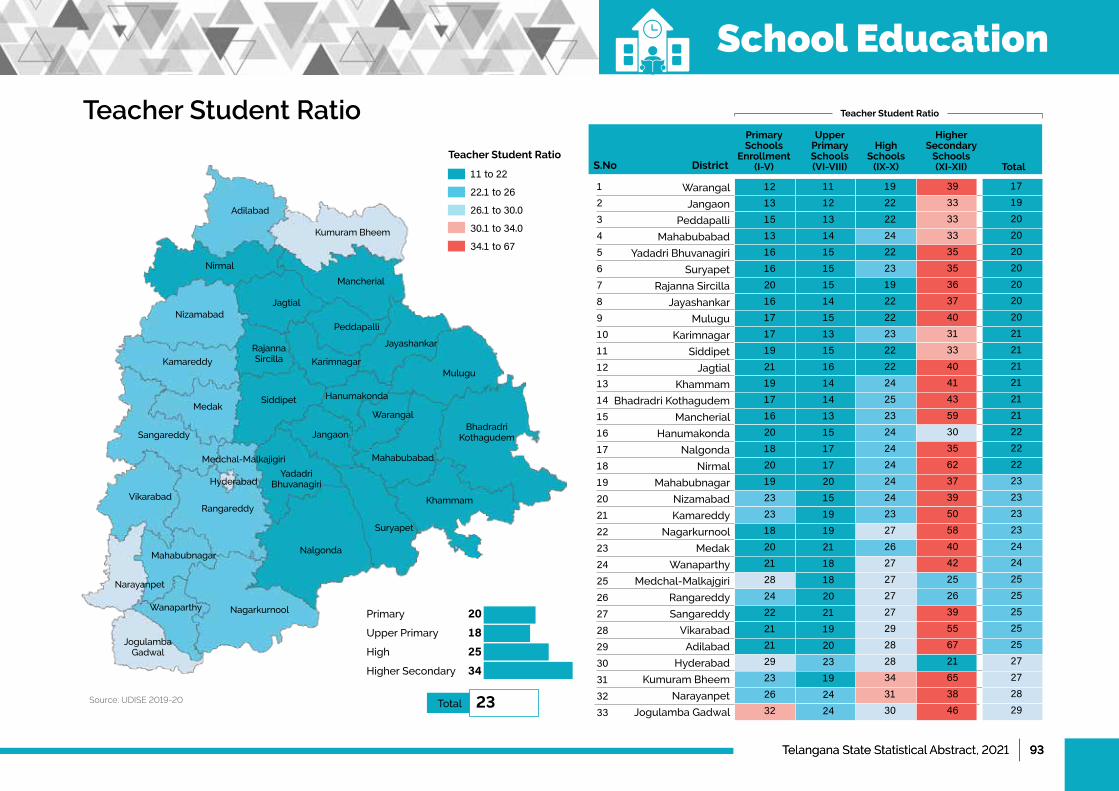
Telangana State Statistical Abstract, 2021 | 93Telangana State Statistical Abstract, 2021 | 93
Teacher Student Ratio
Warangal
Jangaon
Peddapalli
Mahabubabad
YadadriBhuvanagiri
Suryapet
Rajanna Sircilla
Jayashankar
Mulugu
Karimnagar
Siddipet
Jagtial
Khammam
Bhadradri Kothagudem
Mancherial
Hanumakonda
Nalgonda
Nirmal
Mahabubnagar
Nizamabad
Kamareddy
Nagarkurnool
Medak
Wanaparthy
Medchal-Malkajgiri
Rangareddy
Sangareddy
Vikarabad
Adilabad
Hyderabad
Kumuram Bheem
Narayanpet
Jogulamba Gadwal
Upper Primary Schools (VI-VIII)
Primary Schools
Enrollment (I-V)DistrictS.No
High Schools
(IX-X)
Higher Secondary
Schools (XI-XII) Total
123456789101112131415161718192021222324252627282930313233
121315131616201617171921191716201820192323182021282422212129232632
111213141515151415131516141413151717201519192118182021192023192424
192222242223192222232222242523242424242423272627272727292828343130
393333333535363740313340414359303562373950584042252639556721653846
171920202020202020212121212121222222232323232424252525252527272829
Source: UDISE 2019-20
Adilabad
Nirmal
Kumuram Bheem
Mancherial
Jagtial
Rajanna Sircilla
Peddapalli
Jayashankar
Mulugu
MedakSiddipet Hanumakonda
Warangal
JangaonSangareddy
Medchal-Malkajigiri
VikarabadRangareddy
Mahabubnagar
Narayanpet
Nalgonda
NagarkurnoolWanaparthy
Suryapet
Khammam
Karimnagar
Yadadri Bhuvanagiri
Mahabubabad
Jogulamba Gadwal
Bhadradri Kothagudem
Kamareddy
Nizamabad
Hyderabad
Total 23
Primary 20UpperPrimary 18High 25Higher Secondary 34
11to22
22.1to26
26.1to30.0
30.1to34.0
34.1to67
Teacher Student Ratio
Teacher Student Ratio
School Education
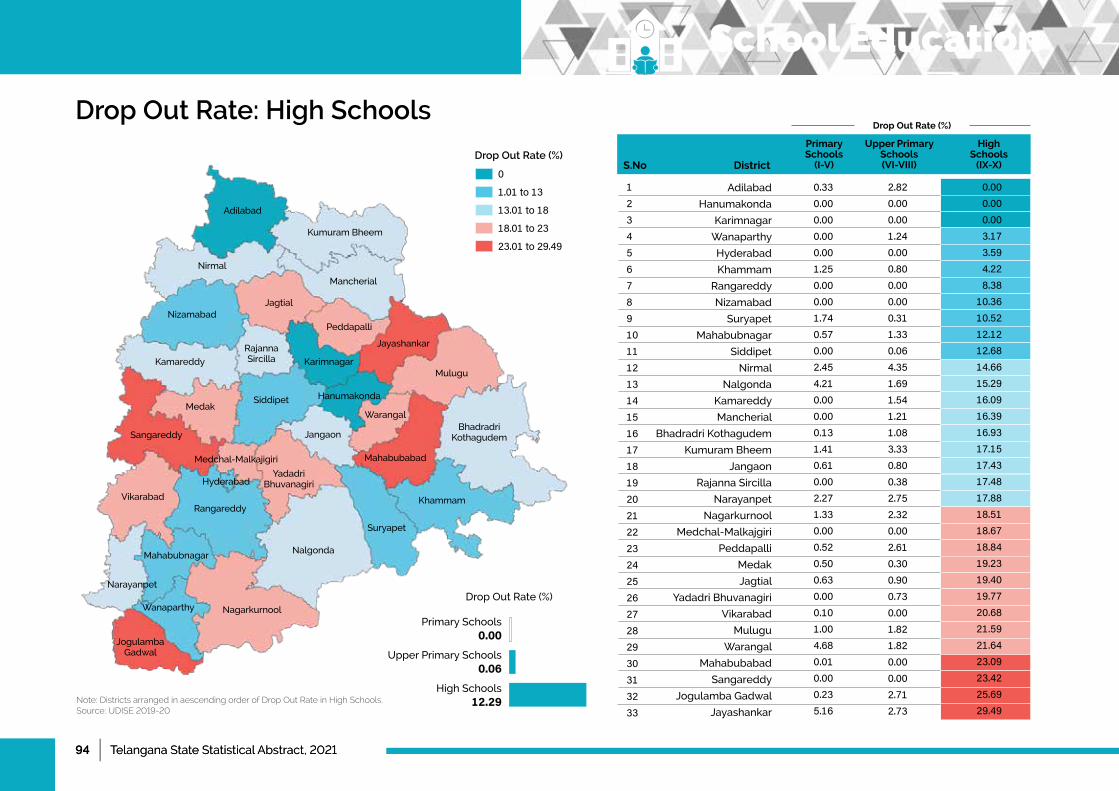
94 | Telangana State Statistical Abstract, 202194 | Telangana State Statistical Abstract, 2021
Drop Out Rate: High Schools
Adilabad
Hanumakonda
Karimnagar
Wanaparthy
Hyderabad
Khammam
Rangareddy
Nizamabad
Suryapet
Mahabubnagar
Siddipet
Nirmal
Nalgonda
Kamareddy
Mancherial
Bhadradri Kothagudem
Kumuram Bheem
Jangaon
Rajanna Sircilla
Narayanpet
Nagarkurnool
Medchal-Malkajgiri
Peddapalli
Medak
Jagtial
YadadriBhuvanagiri
Vikarabad
Mulugu
Warangal
Mahabubabad
Sangareddy
Jogulamba Gadwal
Jayashankar
Upper Primary Schools (VI-VIII)
Primary Schools
(I-V)DistrictS.No
High Schools
(IX-X)
123456789101112131415161718192021222324252627282930313233
0.330.000.000.000.001.250.000.001.740.570.002.454.210.000.000.131.410.610.002.271.330.000.520.500.630.000.101.004.680.010.000.235.16
2.820.000.001.240.000.800.000.000.311.330.064.351.691.541.211.083.330.800.382.752.320.002.610.300.900.730.001.821.820.000.002.712.73
0.000.000.003.173.594.228.38
10.3610.5212.1212.6814.6615.2916.0916.3916.9317.1517.4317.4817.8818.5118.6718.8419.2319.4019.7720.6821.5921.6423.0923.4225.6929.49
Note: Districts arranged in aescending order of Drop Out Rate in High Schools.Source: UDISE 2019-20
Adilabad
Nirmal
Kumuram Bheem
Mancherial
Jagtial
Rajanna Sircilla
Peddapalli
Jayashankar
Mulugu
MedakSiddipet Hanumakonda
Warangal
JangaonSangareddy
Medchal-Malkajigiri
VikarabadRangareddy
Mahabubnagar
Narayanpet
Nalgonda
NagarkurnoolWanaparthy
Suryapet
Khammam
Karimnagar
Yadadri Bhuvanagiri
Mahabubabad
Jogulamba Gadwal
Bhadradri Kothagudem
Kamareddy
Nizamabad
Hyderabad
Primary Schools0.00
UpperPrimarySchools 0.06
High Schools 12.29
DropOutRate(%)
0
1.01to13
13.01to18
18.01to23
23.01to29.49
Drop Out Rate (%)
Drop Out Rate (%)
School Education
AgricultureChapter 6
Telangana State Statistical Abstract, 2021 | 95
AgricultureChapter 6
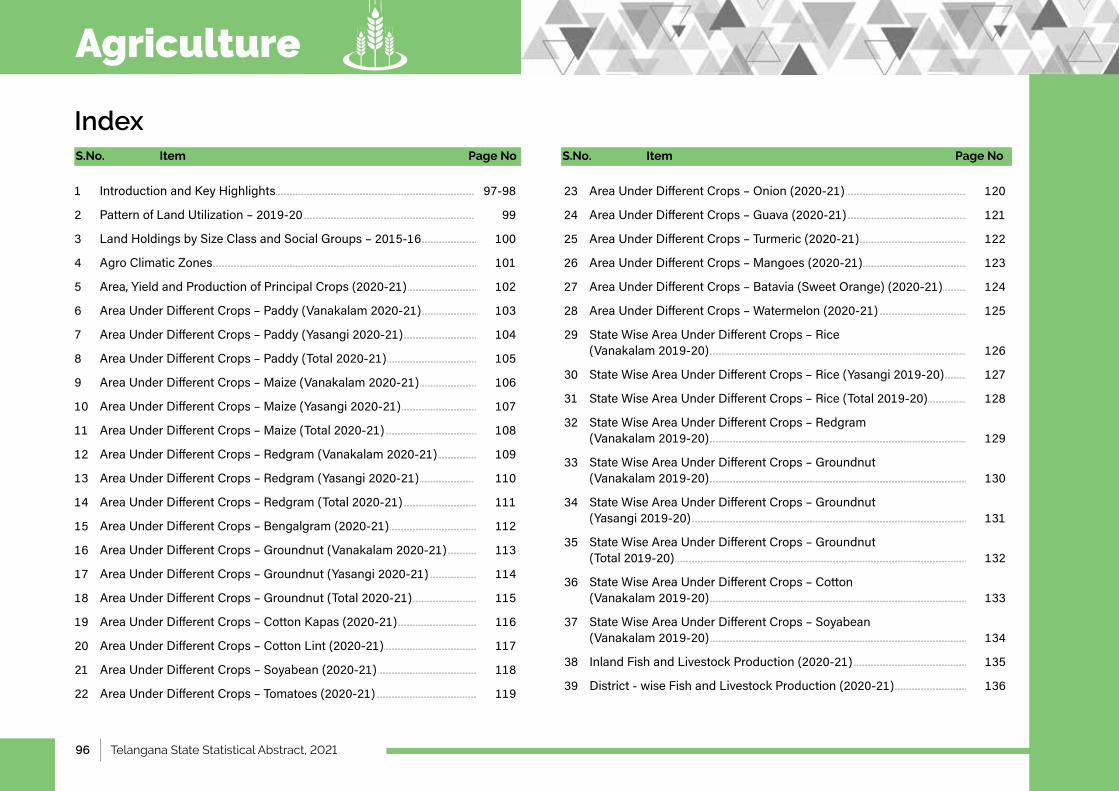
96 | Telangana State Statistical Abstract, 2021
Agriculture
1 IntroductionandKeyHighlights.......................................................................................................................................97-98
2 PatternofLandUtilization–2019-20...........................................................................................................................99
3 LandHoldingsbySizeClassandSocialGroups–2015-16...........................................100
4 AgroClimaticZones....................................................................................................................................................................................101
5 Area,YieldandProductionofPrincipalCrops(2020-21)....................................................102
6 AreaUnderDifferentCrops–Paddy(Vanakalam2020-21)...........................................103
7 AreaUnderDifferentCrops–Paddy(Yasangi2020-21).......................................................104
8 AreaUnderDifferentCrops–Paddy(Total2020-21)..................................................................105
9 AreaUnderDifferentCrops–Maize(Vanakalam2020-21)............................................106
10 AreaUnderDifferentCrops–Maize(Yasangi2020-21)........................................................107
11 AreaUnderDifferentCrops–Maize(Total2020-21)...................................................................108
12 AreaUnderDifferentCrops–Redgram(Vanakalam2020-21)................................109
13 AreaUnderDifferentCrops–Redgram(Yasangi2020-21)..........................................110
14 AreaUnderDifferentCrops–Redgram(Total2020-21).......................................................111
15 AreaUnderDifferentCrops–Bengalgram(2020-21)................................................................112
16 AreaUnderDifferentCrops–Groundnut(Vanakalam2020-21)..........................113
17 AreaUnderDifferentCrops–Groundnut(Yasangi2020-21)......................................114
18 AreaUnderDifferentCrops–Groundnut(Total2020-21).................................................115
19 AreaUnderDifferentCrops–CottonKapas(2020-21)...........................................................116
20 AreaUnderDifferentCrops–CottonLint(2020-21)....................................................................117
21 AreaUnderDifferentCrops–Soyabean(2020-21)........................................................................118
22 AreaUnderDifferentCrops–Tomatoes(2020-21).........................................................................119
23 AreaUnderDifferentCrops–Onion(2020-21)......................................................................................120
24 AreaUnderDifferentCrops–Guava(2020-21).....................................................................................121
25 AreaUnderDifferentCrops–Turmeric(2020-21).............................................................................122
26 AreaUnderDifferentCrops–Mangoes(2020-21)...........................................................................123
27 AreaUnderDifferentCrops–Batavia(SweetOrange)(2020-21)......................124
28 AreaUnderDifferentCrops–Watermelon(2020-21)................................................................125
29 StateWiseAreaUnderDifferentCrops–Rice(Vanakalam2019-20)................................................................................................................................................................................126
30 StateWiseAreaUnderDifferentCrops–Rice(Yasangi2019-20).....................127
31 StateWiseAreaUnderDifferentCrops–Rice(Total2019-20)................................128
32 StateWiseAreaUnderDifferentCrops–Redgram(Vanakalam2019-20)................................................................................................................................................................................129
33 StateWiseAreaUnderDifferentCrops–Groundnut(Vanakalam2019-20)................................................................................................................................................................................130
34 StateWiseAreaUnderDifferentCrops–Groundnut(Yasangi2019-20)............................................................................................................................................................................................131
35 StateWiseAreaUnderDifferentCrops–Groundnut(Total2019-20).......................................................................................................................................................................................................132
36 StateWiseAreaUnderDifferentCrops–Cotton (Vanakalam2019-20)................................................................................................................................................................................133
37 StateWiseAreaUnderDifferentCrops–Soyabean(Vanakalam2019-20)................................................................................................................................................................................134
38 InlandFishandLivestockProduction(2020-21).................................................................................135
39 District-wiseFishandLivestockProduction(2020-21)......................................................136
IndexPage No Page NoS.No. S.No.Item Item
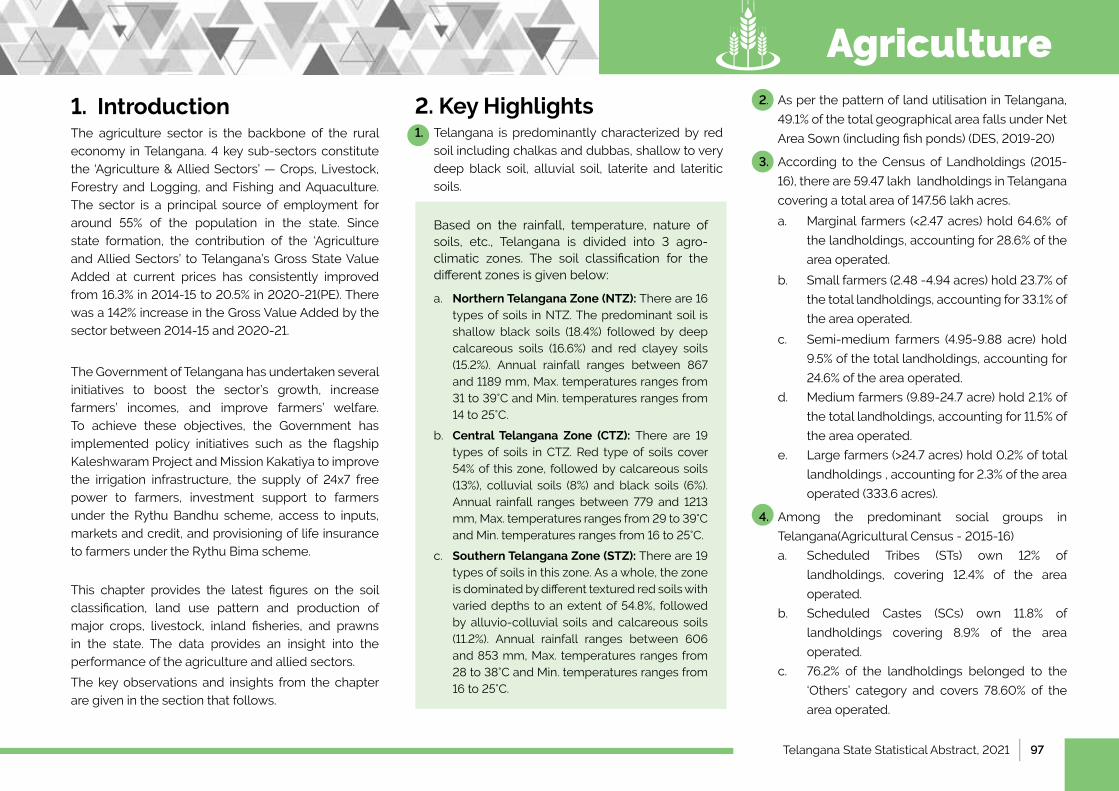
Telangana State Statistical Abstract, 2021 | 97
Based on the rainfall, temperature, nature of soils, etc., Telangana is divided into 3 agro-climatic zones. The soil classification for the different zones is given below:
a. Northern Telangana Zone (NTZ): There are 16 types of soils in NTZ. The predominant soil is shallow black soils (18.4%) followed by deep calcareous soils (16.6%) and red clayey soils (15.2%). Annual rainfall ranges between 867 and 1189 mm, Max. temperatures ranges from 31 to 39°C and Min. temperatures ranges from 14 to 25°C.
b. Central Telangana Zone (CTZ): There are 19 types of soils in CTZ. Red type of soils cover 54% of this zone, followed by calcareous soils (13%), colluvial soils (8%) and black soils (6%). Annual rainfall ranges between 779 and 1213 mm, Max. temperatures ranges from 29 to 39°C and Min. temperatures ranges from 16 to 25°C.
c. Southern Telangana Zone (STZ): There are 19 types of soils in this zone. As a whole, the zone is dominated by different textured red soils with varied depths to an extent of 54.8%, followed by alluvio-colluvial soils and calcareous soils (11.2%). Annual rainfall ranges between 606 and 853 mm, Max. temperatures ranges from 28 to 38°C and Min. temperatures ranges from 16 to 25°C.
1. Introduction The agriculture sector is the backbone of the rural economy in Telangana. 4 key sub-sectors constitute the ‘Agriculture & Allied Sectors’ — Crops, Livestock, Forestry and Logging, and Fishing and Aquaculture. The sector is a principal source of employment for around 55% of the population in the state. Since state formation, the contribution of the ‘Agriculture and Allied Sectors’ to Telangana’s Gross State Value Added at current prices has consistently improved from 16.3% in 2014-15 to 20.5% in 2020-21(PE). There was a 142% increase in the Gross Value Added by the sector between 2014-15 and 2020-21.
The Government of Telangana has undertaken several initiatives to boost the sector’s growth, increase farmers’ incomes, and improve farmers’ welfare. To achieve these objectives, the Government has implemented policy initiatives such as the flagship Kaleshwaram Project and Mission Kakatiya to improve the irrigation infrastructure, the supply of 24x7 free power to farmers, investment support to farmers under the Rythu Bandhu scheme, access to inputs, markets and credit, and provisioning of life insurance to farmers under the Rythu Bima scheme.
This chapter provides the latest figures on the soil classification, land use pattern and production of major crops, livestock, inland fisheries, and prawns in the state. The data provides an insight into the performance of the agriculture and allied sectors.
The key observations and insights from the chapter are given in the section that follows.
2. Key Highlights 1. Telangana is predominantly characterized by red
soil including chalkas and dubbas, shallow to very deep black soil, alluvial soil, laterite and lateritic soils.
2. As per the pattern of land utilisation in Telangana,
49.1% of the total geographical area falls under Net
Area Sown (including fish ponds) (DES, 2019-20)
3. According to the Census of Landholdings (2015-
16), there are 59.47 lakh landholdings in Telangana
covering a total area of 147.56 lakh acres.
a. Marginal farmers (<2.47 acres) hold 64.6% of
the landholdings, accounting for 28.6% of the
area operated.
b. Small farmers (2.48 -4.94 acres) hold 23.7% of
the total landholdings, accounting for 33.1% of
the area operated.
c. Semi-medium farmers (4.95-9.88 acre) hold
9.5% of the total landholdings, accounting for
24.6% of the area operated.
d. Medium farmers (9.89-24.7 acre) hold 2.1% of
the total landholdings, accounting for 11.5% of
the area operated.
e. Large farmers (>24.7 acres) hold 0.2% of total
landholdings , accounting for 2.3% of the area
operated (333.6 acres).
4. Among the predominant social groups in
Telangana(Agricultural Census - 2015-16)
a. Scheduled Tribes (STs) own 12% of
landholdings, covering 12.4% of the area
operated.
b. Scheduled Castes (SCs) own 11.8% of
landholdings covering 8.9% of the area
operated.
c. 76.2% of the landholdings belonged to the
‘Others’ category and covers 78.60% of the
area operated.
Agriculture

98 | Telangana State Statistical Abstract, 2021
5. The total production of rice in Telangana was
145.68 lakh tonnes in 2020-21. The districts of
Nalgonda and Nizamabad were the highest
contributors to the production of cereals
accounting for 8.4% and 8.3% of the total
production respectively.
6. The total production of millets (jowar, bajra,
maize, ragi, and korra) in Telangana was 19.22 lakh
tonnes in 2020-21. The district of Warangal Rural
and Khammam were the highest contributors to
the production of millets accounting for 15.9%
and 15% of the total production respectively.
7. The total production of pulses was 6.69 lakh
tonnes in 2020-21 in Telangana. Kamareddy and
Vikarabad districts were the highest contributors
to the production of pulses accounting for
13.8% and 12.7% of the total state production
respectively.
8. The total production of foodgrains (cereals,
millets, and pulses) in Telangana was 171.76 lakh
tonnes in 2020-21. Nizamabad and Nalgonda
districts were the highest contributors to the
production of pulses accounting for 7.6% and
7.1% of the total state production respectively
9. The two major spices produced in Telangana are
chillies and turmeric.
a. The total production of chillies in 2020-
21 was 5.37 lakh tonnes. Nearly one-third
of the total production came from the
Khammam district (32.4%).
b. The total production of turmeric in 2020-
21 was 2.26 lakh tonnes. Major contributors
to the production of turmeric were the
districts of Nizamabad (38.05%) and Jagtial
(18.71%).
10. Onion is the major vegetable produced in
Telangana. The total production of onion in the
state was 1.80 lakh tonnes in the year 2020-21.
Jogulamba Gadwal district alone accounted for
26.96% of the total onion production.
11. The dominant fibre crop produced in Telangana
is cotton. The total production of cotton kapas
in the state in the year 2020-21 was 30.4 lakh
tonnes, and that of cotton lint was 57.99 lakh
bales.
12. The total production of oilseeds in Telangana,
including Groundnut, Sesame, Safflower,
Sunflower, Rape Mustard, Soybean, Palmoil
and Castor, was 9.89 lakh tonnes in 2020-21.
A significant share of oilseed production came
from the Bhadradri district, which contributed
33.6% to the total production, followed by
Nagarkurnool, at 14.8% of the total production.
13. The Government of Telangana recently launched
the Oil Palm Mission to promote the cultivation
of oil palm in the state. The end goal of the
Mission is to improve the livelihood of farmers
and to bridge the edible oil deficit in the country.
The Mission provides for a Minimum Guarantee
Price (MGP) of Rs. 15,000 per MT of Fresh Fruit
Bunch (FFB). The total production of oil palm in
2020-21 was 4.12 lakh tonnes. Bhadradri district
accounted for 80% of the production of oil palm.
14. The total production of tobacco, which is
predominantly produced in 5 districts of
Telangana, was 2,731 tonnes in 2020-21. 37.5%
of the total tobacco production came from
Jogulamba district, followed by Jangaon district,
which accounted for 21.5% of the total production.
15. As per the livestock census 2019, the total
population of livestock in Telangana was 3.26
crore. Sheep accounted for 58.4% of the total
livestock population. Goat, cattle and buffalos
account for 15.1%, 13% and 12.9% of the population
respectively.
16. The production of milk in the state was 57.65
lakh tonnes, meat was 5.10 lakh tonnes, chicken
was 4.10 lakh tonnes, and eggs were 1,58,470.33
lakhs in the year 2020-21.
17. The total production of inland fish and prawns in
the year 2020-21 was 3.37 lakh tonnes and 11,734
tonnes respectively. The highest contributing
districts were Nalgonda (7.5%), and Nirmal (6.7%)
for inland fish, and Karimnagar (10.7%), and
Nizamabad (9.5%) for prawns.
Agriculture
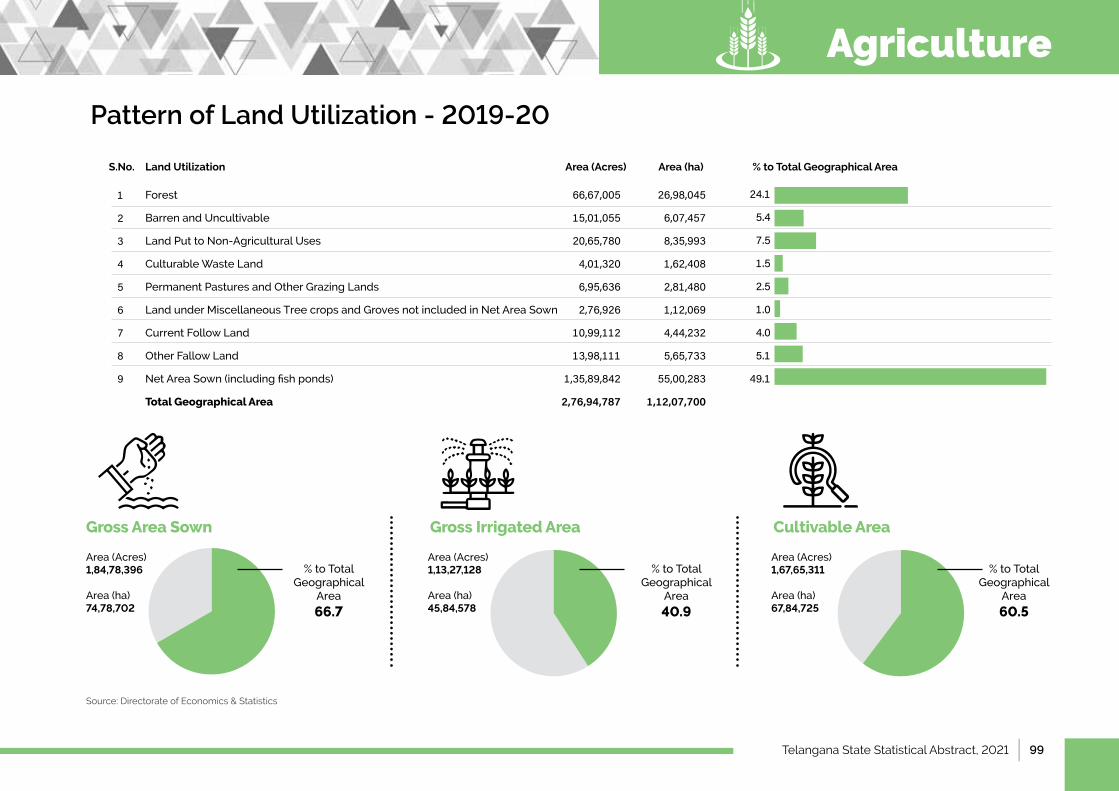
Telangana State Statistical Abstract, 2021 | 99
Pattern of Land Utilization - 2019-20
Land UtilizationS.No. Area (Acres) % to Total Geographical AreaArea (ha)
Forest 66,67,005 26,98,045
BarrenandUncultivable 15,01,055 6,07,457
LandPuttoNon-AgriculturalUses 20,65,780 8,35,993
Culturable Waste Land 4,01,320 1,62,408
PermanentPasturesandOtherGrazingLands 6,95,636 2,81,480
LandunderMiscellaneousTreecropsandGrovesnotincludedinNetAreaSown 2,76,926 1,12,069
CurrentFollowLand 10,99,112 4,44,232
OtherFallowLand 13,98,111 5,65,733
NetAreaSown(includingfishponds) 1,35,89,842 55,00,283
Total Geographical Area 2,76,94,787 1,12,07,700
24.1
5.4
7.5
1.5
2.5
1.0
4.0
5.1
49.1
Gross Area Sown
Area (Acres) 1,84,78,396
Area (ha) 74,78,702
%toTotal Geographical
Area
66.7
Gross Irrigated Area
Area (Acres) 1,13,27,128
Area (ha) 45,84,578
%toTotal Geographical
Area
40.9
Cultivable Area
Area (Acres) 1,67,65,311
Area (ha) 67,84,725
%toTotal Geographical
Area
60.5
1
2
3
4
5
6
7
8
9
Agriculture
Source: Directorate of Economics & Statistics
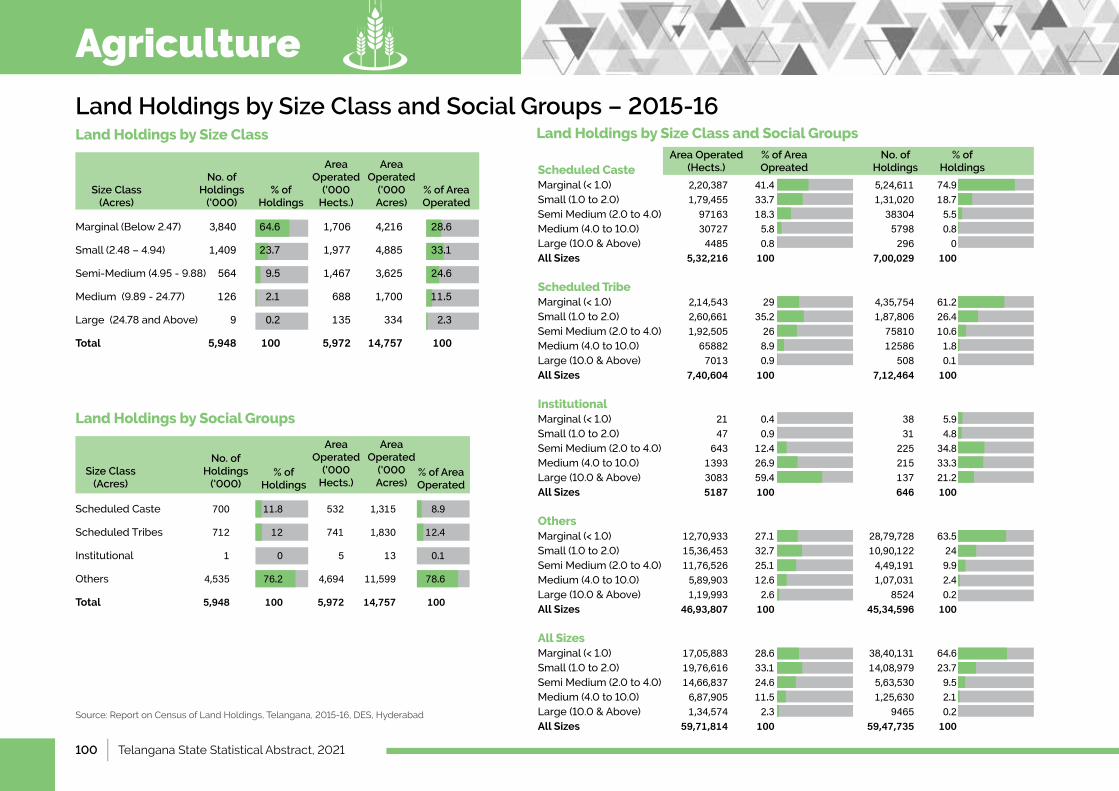
100 | Telangana State Statistical Abstract, 2021
Land Holdings by Size Class and Social Groups – 2015-16
Scheduled Caste Marginal(<1.0) 2,20,387 41.4 5,24,611 74.9Small(1.0to2.0) 1,79,455 33.7 1,31,020 18.7SemiMedium(2.0to4.0) 97163 18.3 38304 5.5Medium(4.0to10.0) 30727 5.8 5798 0.8Large(10.0&Above) 4485 0.8 296 0All Sizes 5,32,216 100 7,00,029 100 Scheduled Tribe Marginal(<1.0) 2,14,543 29 4,35,754 61.2Small(1.0to2.0) 2,60,661 35.2 1,87,806 26.4SemiMedium(2.0to4.0) 1,92,505 26 75810 10.6Medium(4.0to10.0) 65882 8.9 12586 1.8Large(10.0&Above) 7013 0.9 508 0.1All Sizes 7,40,604 100 7,12,464 100 Institutional Marginal(<1.0) 21 0.4 38 5.9Small(1.0to2.0) 47 0.9 31 4.8SemiMedium(2.0to4.0) 643 12.4 225 34.8Medium(4.0to10.0) 1393 26.9 215 33.3Large(10.0&Above) 3083 59.4 137 21.2All Sizes 5187 100 646 100 Others Marginal(<1.0) 12,70,933 27.1 28,79,728 63.5Small(1.0to2.0) 15,36,453 32.7 10,90,122 24SemiMedium(2.0to4.0) 11,76,526 25.1 4,49,191 9.9Medium(4.0to10.0) 5,89,903 12.6 1,07,031 2.4Large(10.0&Above) 1,19,993 2.6 8524 0.2All Sizes 46,93,807 100 45,34,596 100 All Sizes Marginal(<1.0) 17,05,883 28.6 38,40,131 64.6Small(1.0to2.0) 19,76,616 33.1 14,08,979 23.7SemiMedium(2.0to4.0) 14,66,837 24.6 5,63,530 9.5Medium(4.0to10.0) 6,87,905 11.5 1,25,630 2.1Large(10.0&Above) 1,34,574 2.3 9465 0.2All Sizes 59,71,814 100 59,47,735 100
Land Holdings by Size Class Land Holdings by Size Class and Social Groups Area Operated
(Hects.)% of Area Opreated
No. of Holdings
% of Holdings
Marginal(Below2.47) 3,840 64.6 1,706 4,216 28.6
Small(2.48–4.94) 1,409 23.7 1,977 4,885 33.1
Semi-Medium(4.95-9.88) 564 9.5 1,467 3,625 24.6
Medium(9.89-24.77) 126 2.1 688 1,700 11.5
Large(24.78andAbove) 9 0.2 135 334 2.3
Total 5,948 100 5,972 14,757 100
Scheduled Caste 700 11.8 532 1,315 8.9
Scheduled Tribes 712 12 741 1,830 12.4
Institutional 1 0 5 13 0.1
Others 4,535 76.2 4,694 11,599 78.6
Total 5,948 100 5,972 14,757 100
Land Holdings by Social Groups
No. of Holdings
('000)
No. of Holdings
('000)Size Class
(Acres)
Size Class (Acres)
Area Operated
('000 Hects.)
Area Operated
('000 Hects.)
Area Operated
('000 Acres)
Area Operated
('000 Acres)
% of Holdings
% of Holdings
% of Area Operated
% of Area Operated
Source: Report on Census of Land Holdings, Telangana, 2015-16, DES, Hyderabad
Agriculture
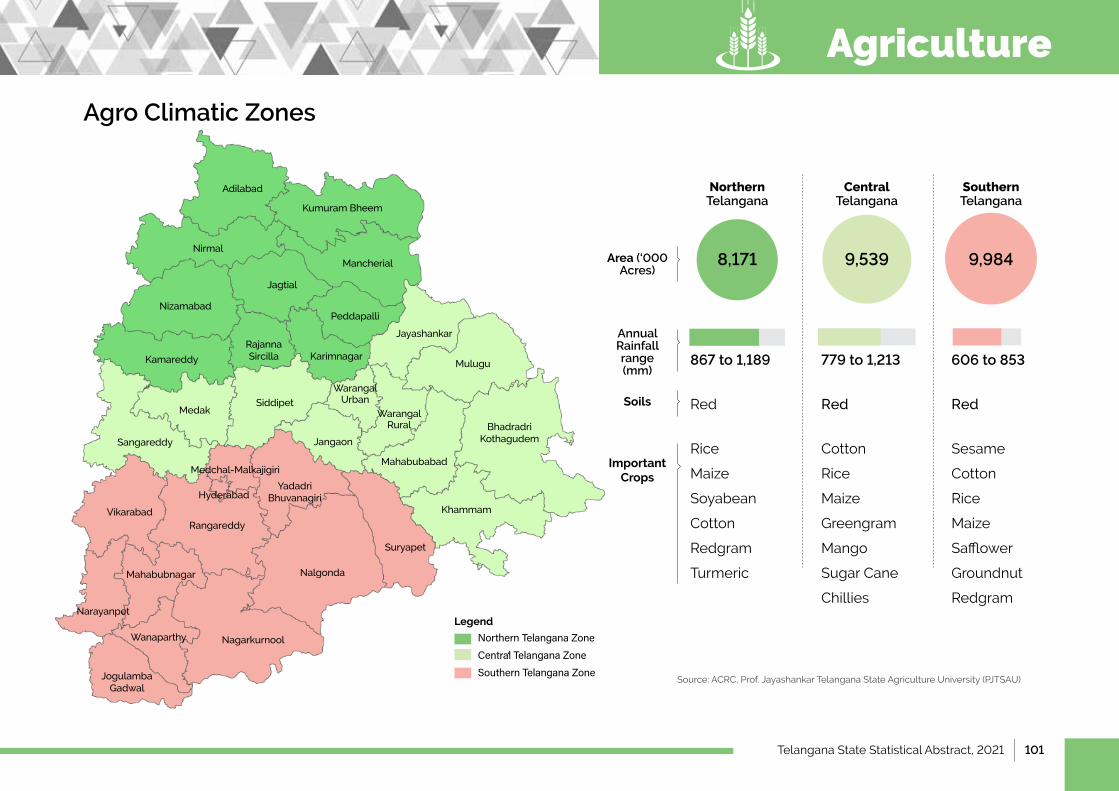
Telangana State Statistical Abstract, 2021 | 101
Agriculture
Agro Climatic Zones
Source: ACRC, Prof. Jayashankar Telangana State Agriculture University (PJTSAU)
867 to 1,189
Red
Rice
Maize
Soyabean
Cotton
Redgram
Turmeric
779 to 1,213
Red
Cotton
Rice
Maize
Greengram
Mango
Sugar Cane
Chillies
606 to 853
Red
Sesame
Cotton
Rice
Maize
Safflower
Groundnut
Redgram
Northern Telangana
Area (‘000 Acres)
Annual Rainfall range (mm)
Soils
Important Crops
Central Telangana
Southern Telangana
8,171 9,539 9,984
Adilabad
Nirmal
Kumuram Bheem
Mancherial
Jagtial
Rajanna Sircilla
Peddapalli
Jayashankar
Mulugu
MedakSiddipet
JangaonSangareddy
Medchal-Malkajigiri
VikarabadRangareddy
Mahabubnagar
Narayanpet
Nalgonda
NagarkurnoolWanaparthy
Suryapet
Khammam
Karimnagar
Yadadri Bhuvanagiri
Mahabubabad
Jogulamba Gadwal
Bhadradri Kothagudem
Kamareddy
Nizamabad
Hyderabad
Warangal Urban
Warangal Rural
Legend
NorthernTelanganaZone
CentralTelanganaZone
SouthernTelanganaZone
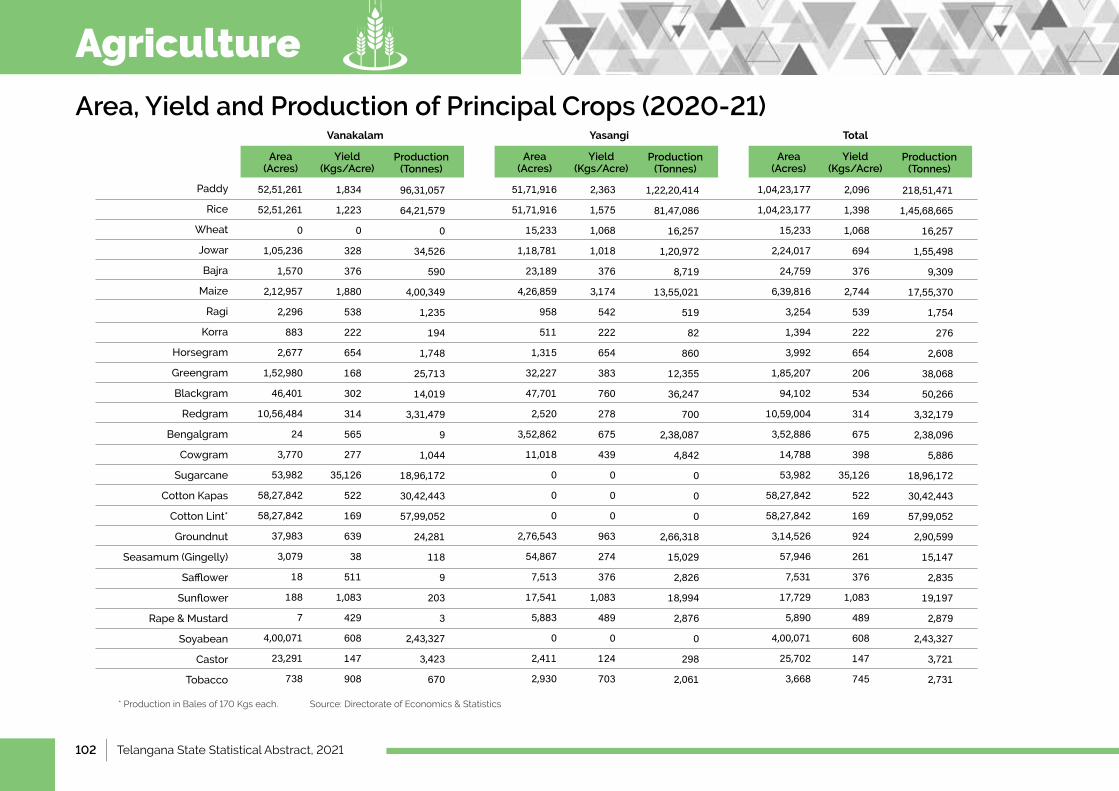
102 | Telangana State Statistical Abstract, 2021
Paddy
Rice
Wheat
Jowar
Bajra
Maize
Ragi
Korra
Horsegram
Greengram
Blackgram
Redgram
Bengalgram
Cowgram
Sugarcane
Cotton Kapas
Cotton Lint*
Groundnut
Seasamum (Gingelly)
Safflower
Sunflower
Rape&Mustard
Soyabean
Castor
Tobacco
52,51,261
52,51,261
0
1,05,236
1,570
2,12,957
2,296
883
2,677
1,52,980
46,401
10,56,484
24
3,770
53,982
58,27,842
58,27,842
37,983
3,079
18
188
7
4,00,071
23,291
738
51,71,916
51,71,916
15,233
1,18,781
23,189
4,26,859
958
511
1,315
32,227
47,701
2,520
3,52,862
11,018
0
0
0
2,76,543
54,867
7,513
17,541
5,883
0
2,411
2,930
1,04,23,177
1,04,23,177
15,233
2,24,017
24,759
6,39,816
3,254
1,394
3,992
1,85,207
94,102
10,59,004
3,52,886
14,788
53,982
58,27,842
58,27,842
3,14,526
57,946
7,531
17,729
5,890
4,00,071
25,702
3,668
1,834
1,223
0
328
376
1,880
538
222
654
168
302
314
565
277
35,126
522
169
639
38
511
1,083
429
608
147
908
2,363
1,575
1,068
1,018
376
3,174
542
222
654
383
760
278
675
439
0
0
0
963
274
376
1,083
489
0
124
703
2,096
1,398
1,068
694
376
2,744
539
222
654
206
534
314
675
398
35,126
522
169
924
261
376
1,083
489
608
147
745
96,31,057
64,21,579
0
34,526
590
4,00,349
1,235
194
1,748
25,713
14,019
3,31,479
9
1,044
18,96,172
30,42,443
57,99,052
24,281
118
9
203
3
2,43,327
3,423
670
1,22,20,414
81,47,086
16,257
1,20,972
8,719
13,55,021
519
82
860
12,355
36,247
700
2,38,087
4,842
0
0
0
2,66,318
15,029
2,826
18,994
2,876
0
298
2,061
218,51,471
1,45,68,665
16,257
1,55,498
9,309
17,55,370
1,754
276
2,608
38,068
50,266
3,32,179
2,38,096
5,886
18,96,172
30,42,443
57,99,052
2,90,599
15,147
2,835
19,197
2,879
2,43,327
3,721
2,731
Area, Yield and Production of Principal Crops (2020-21)
Area (Acres)
Area (Acres)
Area (Acres)
Yield (Kgs/Acre)
Yield (Kgs/Acre)
Yield (Kgs/Acre)
Production (Tonnes)
Production (Tonnes)
Production (Tonnes)
Vanakalam Yasangi Total
* Production in Bales of 170 Kgs each. Source: Directorate of Economics & Statistics
Agriculture
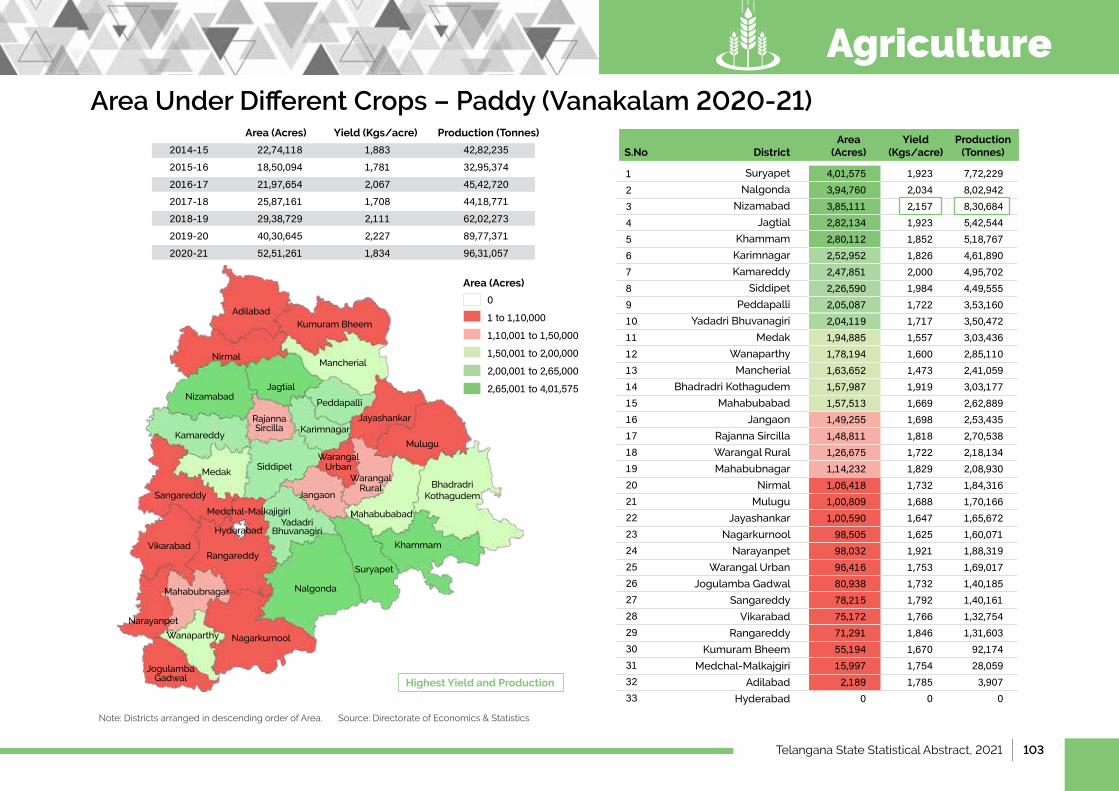
Telangana State Statistical Abstract, 2021 | 103
Area Under Different Crops – Paddy (Vanakalam 2020-21)
Note: Districts arranged in descending order of Area. Source: Directorate of Economics & Statistics
Area (Acres) Yield (Kgs/acre) Production (Tonnes)
2014-15 22,74,118 1,883 42,82,2352015-16 18,50,094 1,781 32,95,3742016-17 21,97,654 2,067 45,42,7202017-18 25,87,161 1,708 44,18,7712018-19 29,38,729 2,111 62,02,2732019-20 40,30,645 2,227 89,77,3712020-21 52,51,261 1,834 96,31,057
Highest Yield and Production
Adilabad
Nirmal
Kumuram Bheem
Mancherial
Jagtial
Rajanna Sircilla
Peddapalli
Jayashankar
Mulugu
MedakSiddipet
Warangal Urban
Warangal Rural
JangaonSangareddy
Medchal-Malkajigiri
VikarabadRangareddy
Mahabubnagar
Narayanpet
Nalgonda
NagarkurnoolWanaparthy
Suryapet
Khammam
Karimnagar
Yadadri Bhuvanagiri
Mahabubabad
Jogulamba Gadwal
Bhadradri Kothagudem
Kamareddy
Nizamabad
Hyderabad
0
1to1,10,000
1,10,001to1,50,000
1,50,001to2,00,000
2,00,001to2,65,000
2,65,001to4,01,575
Suryapet
Nalgonda
Nizamabad
Jagtial
Khammam
Karimnagar
Kamareddy
Siddipet
Peddapalli
YadadriBhuvanagiri
Medak
Wanaparthy
Mancherial
Bhadradri Kothagudem
Mahabubabad
Jangaon
Rajanna Sircilla
Warangal Rural
Mahabubnagar
Nirmal
Mulugu
Jayashankar
Nagarkurnool
Narayanpet
WarangalUrban
Jogulamba Gadwal
Sangareddy
Vikarabad
Rangareddy
Kumuram Bheem
Medchal-Malkajgiri
Adilabad
Hyderabad
123456789101112131415161718192021222324252627282930313233
DistrictS.NoArea
(Acres)Yield
(Kgs/acre)Production
(Tonnes)
4,01,5753,94,7603,85,1112,82,1342,80,1122,52,9522,47,8512,26,5902,05,0872,04,1191,94,8851,78,1941,63,6521,57,9871,57,5131,49,2551,48,8111,26,6751,14,2321,06,4181,00,8091,00,59098,50598,03296,41680,93878,21575,17271,29155,19415,9972,189
0
7,72,2298,02,9428,30,6845,42,5445,18,7674,61,8904,95,7024,49,5553,53,1603,50,4723,03,4362,85,1102,41,0593,03,1772,62,8892,53,4352,70,5382,18,1342,08,9301,84,3161,70,1661,65,6721,60,0711,88,3191,69,0171,40,1851,40,1611,32,7541,31,60392,17428,0593,907
0
Area (Acres)
1,9232,0342,1571,9231,8521,8262,0001,9841,7221,7171,5571,6001,4731,9191,6691,6981,8181,7221,8291,7321,6881,6471,6251,9211,7531,7321,7921,7661,8461,6701,7541,785
0
Agriculture
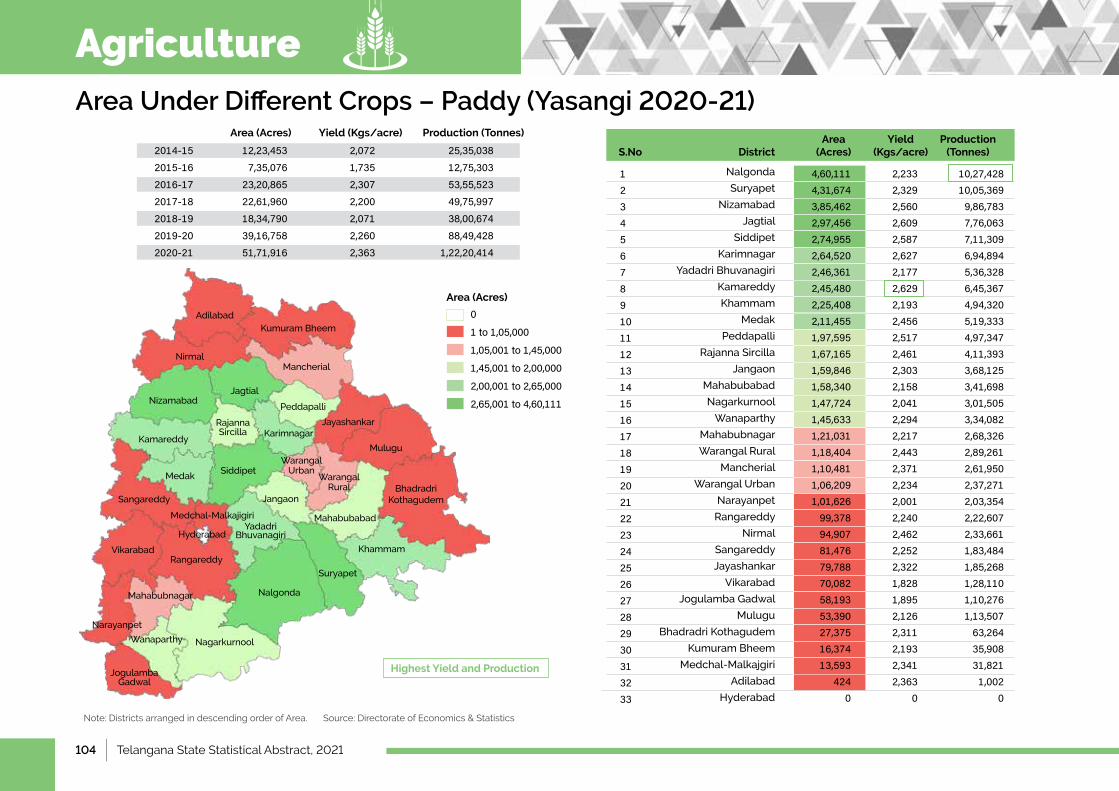
104 | Telangana State Statistical Abstract, 2021
Adilabad
Nirmal
Kumuram Bheem
Mancherial
Jagtial
Rajanna Sircilla
Peddapalli
Jayashankar
Mulugu
MedakSiddipet
JangaonSangareddy
Medchal-Malkajigiri
VikarabadRangareddy
Mahabubnagar
Narayanpet
Nalgonda
NagarkurnoolWanaparthy
Suryapet
Khammam
Karimnagar
Yadadri Bhuvanagiri
Mahabubabad
Jogulamba Gadwal
Bhadradri Kothagudem
Kamareddy
Nizamabad
Hyderabad
Area Under Different Crops – Paddy (Yasangi 2020-21)
Note: Districts arranged in descending order of Area. Source: Directorate of Economics & Statistics
Area (Acres) Yield (Kgs/acre) Production (Tonnes)
2014-15 12,23,453 2,072 25,35,0382015-16 7,35,076 1,735 12,75,3032016-17 23,20,865 2,307 53,55,5232017-18 22,61,960 2,200 49,75,9972018-19 18,34,790 2,071 38,00,6742019-20 39,16,758 2,260 88,49,4282020-21 51,71,916 2,363 1,22,20,414
Highest Yield and Production
Nalgonda
Suryapet
Nizamabad
Jagtial
Siddipet
Karimnagar
YadadriBhuvanagiri
Kamareddy
Khammam
Medak
Peddapalli
Rajanna Sircilla
Jangaon
Mahabubabad
Nagarkurnool
Wanaparthy
Mahabubnagar
Warangal Rural
Mancherial
WarangalUrban
Narayanpet
Rangareddy
Nirmal
Sangareddy
Jayashankar
Vikarabad
Jogulamba Gadwal
Mulugu
Bhadradri Kothagudem
Kumuram Bheem
Medchal-Malkajgiri
Adilabad
Hyderabad
123456789101112131415161718192021222324252627282930313233
DistrictS.NoArea
(Acres)Yield
(Kgs/acre)Production
(Tonnes)
4,60,1114,31,6743,85,4622,97,4562,74,9552,64,5202,46,3612,45,4802,25,4082,11,4551,97,5951,67,1651,59,8461,58,3401,47,7241,45,6331,21,0311,18,4041,10,4811,06,2091,01,62699,37894,90781,47679,78870,08258,19353,39027,37516,37413,593
4240
10,27,42810,05,3699,86,7837,76,0637,11,3096,94,8945,36,3286,45,3674,94,3205,19,3334,97,3474,11,3933,68,1253,41,6983,01,5053,34,0822,68,3262,89,2612,61,9502,37,2712,03,3542,22,6072,33,6611,83,4841,85,2681,28,1101,10,2761,13,50763,26435,90831,8211,002
0
2,2332,3292,5602,6092,5872,6272,1772,6292,1932,4562,5172,4612,3032,1582,0412,2942,2172,4432,3712,2342,0012,2402,4622,2522,3221,8281,8952,1262,3112,1932,3412,363
0
0
1to1,05,000
1,05,001to1,45,000
1,45,001to2,00,000
2,00,001to2,65,000
2,65,001to4,60,111
Area (Acres)
Warangal Urban
Warangal Rural
Agriculture
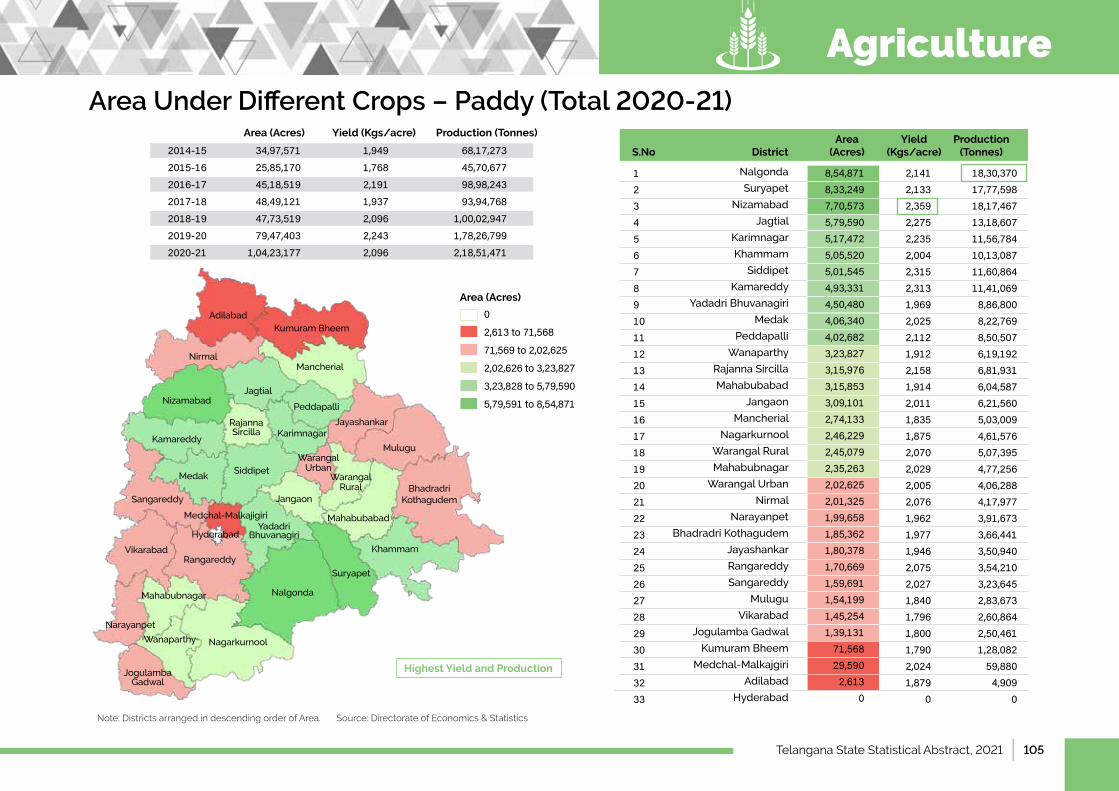
Telangana State Statistical Abstract, 2021 | 105
Adilabad
Nirmal
Kumuram Bheem
Mancherial
Jagtial
Rajanna Sircilla
Peddapalli
Jayashankar
Mulugu
MedakSiddipet
JangaonSangareddy
Medchal-Malkajigiri
VikarabadRangareddy
Mahabubnagar
Narayanpet
Nalgonda
NagarkurnoolWanaparthy
Suryapet
Khammam
Karimnagar
Yadadri Bhuvanagiri
Mahabubabad
Jogulamba Gadwal
Bhadradri Kothagudem
Kamareddy
Nizamabad
Hyderabad
Area Under Different Crops – Paddy (Total 2020-21)
Note: Districts arranged in descending order of Area. Source: Directorate of Economics & Statistics
Area (Acres) Yield (Kgs/acre) Production (Tonnes)
2014-15 34,97,571 1,949 68,17,2732015-16 25,85,170 1,768 45,70,6772016-17 45,18,519 2,191 98,98,2432017-18 48,49,121 1,937 93,94,7682018-19 47,73,519 2,096 1,00,02,9472019-20 79,47,403 2,243 1,78,26,7992020-21 1,04,23,177 2,096 2,18,51,471
Highest Yield and Production
Nalgonda
Suryapet
Nizamabad
Jagtial
Karimnagar
Khammam
Siddipet
Kamareddy
YadadriBhuvanagiri
Medak
Peddapalli
Wanaparthy
Rajanna Sircilla
Mahabubabad
Jangaon
Mancherial
Nagarkurnool
Warangal Rural
Mahabubnagar
WarangalUrban
Nirmal
Narayanpet
Bhadradri Kothagudem
Jayashankar
Rangareddy
Sangareddy
Mulugu
Vikarabad
Jogulamba Gadwal
Kumuram Bheem
Medchal-Malkajgiri
Adilabad
Hyderabad
123456789101112131415161718192021222324252627282930313233
DistrictS.NoArea
(Acres)Yield
(Kgs/acre)Production
(Tonnes)
8,54,8718,33,2497,70,5735,79,5905,17,4725,05,5205,01,5454,93,3314,50,4804,06,3404,02,6823,23,8273,15,9763,15,8533,09,1012,74,1332,46,2292,45,0792,35,2632,02,6252,01,3251,99,6581,85,3621,80,3781,70,6691,59,6911,54,1991,45,2541,39,13171,56829,5902,613
0
18,30,37017,77,59818,17,46713,18,60711,56,78410,13,08711,60,86411,41,0698,86,8008,22,7698,50,5076,19,1926,81,9316,04,5876,21,5605,03,0094,61,5765,07,3954,77,2564,06,2884,17,9773,91,6733,66,4413,50,9403,54,2103,23,6452,83,6732,60,8642,50,4611,28,08259,8804,909
0
2,1412,1332,3592,2752,2352,0042,3152,3131,9692,0252,1121,9122,1581,9142,0111,8351,8752,0702,0292,0052,0761,9621,9771,9462,0752,0271,8401,7961,8001,7902,0241,879
0
0
2,613to71,568
71,569to2,02,625
2,02,626to3,23,827
3,23,828to5,79,590
5,79,591to8,54,871
Area (Acres)
Warangal Urban
Warangal Rural
Agriculture
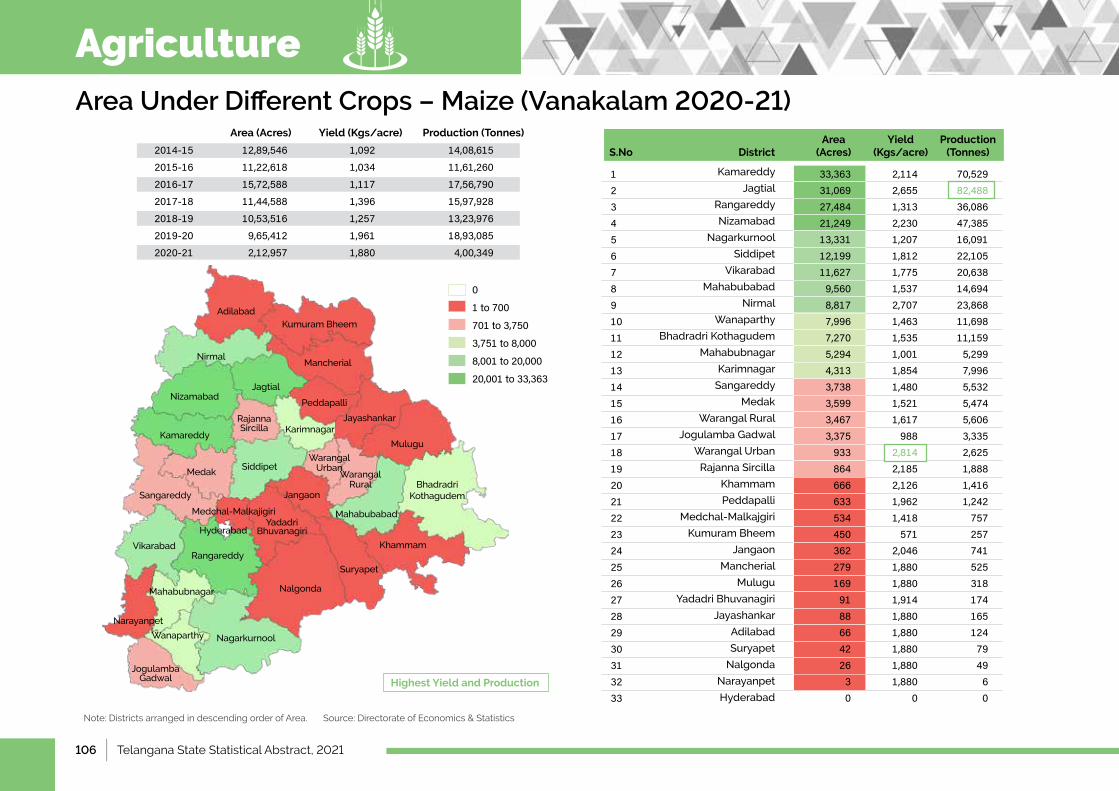
106 | Telangana State Statistical Abstract, 2021
Area Under Different Crops – Maize (Vanakalam 2020-21)
Note: Districts arranged in descending order of Area. Source: Directorate of Economics & Statistics
Area (Acres) Yield (Kgs/acre) Production (Tonnes)
2014-15 12,89,546 1,092 14,08,6152015-16 11,22,618 1,034 11,61,2602016-17 15,72,588 1,117 17,56,7902017-18 11,44,588 1,396 15,97,9282018-19 10,53,516 1,257 13,23,9762019-20 9,65,412 1,961 18,93,0852020-21 2,12,957 1,880 4,00,349
Highest Yield and Production
Adilabad
Nirmal
Kumuram Bheem
Mancherial
Jagtial
Rajanna Sircilla
Peddapalli
Jayashankar
Mulugu
MedakSiddipet
JangaonSangareddy
Medchal-Malkajigiri
VikarabadRangareddy
Mahabubnagar
Narayanpet
Nalgonda
NagarkurnoolWanaparthy
Suryapet
Khammam
Karimnagar
Yadadri Bhuvanagiri
Mahabubabad
Jogulamba Gadwal
Bhadradri Kothagudem
Kamareddy
Nizamabad
Hyderabad
0
1to700
701to3,750
3,751to8,000
8,001to20,000
20,001to33,363
Kamareddy
Jagtial
Rangareddy
Nizamabad
Nagarkurnool
Siddipet
Vikarabad
Mahabubabad
Nirmal
Wanaparthy
Bhadradri Kothagudem
Mahabubnagar
Karimnagar
Sangareddy
Medak
Warangal Rural
Jogulamba Gadwal
WarangalUrban
Rajanna Sircilla
Khammam
Peddapalli
Medchal-Malkajgiri
Kumuram Bheem
Jangaon
Mancherial
Mulugu
YadadriBhuvanagiri
Jayashankar
Adilabad
Suryapet
Nalgonda
Narayanpet
Hyderabad
123456789101112131415161718192021222324252627282930313233
DistrictS.NoArea
(Acres)Yield
(Kgs/acre)Production
(Tonnes)
33,36331,06927,48421,24913,33112,19911,6279,5608,8177,9967,2705,2944,3133,7383,5993,4673,375933864666633534450362279169918866422630
70,52982,48836,08647,38516,09122,10520,63814,69423,86811,69811,1595,2997,9965,5325,4745,6063,3352,6251,8881,4161,242757257741525318174165124794960
2,1142,6551,3132,2301,2071,8121,7751,5372,7071,4631,5351,0011,8541,4801,5211,617988
2,8142,1852,1261,9621,418571
2,0461,8801,8801,9141,8801,8801,8801,8801,880
0
Warangal Urban
Warangal Rural
Agriculture
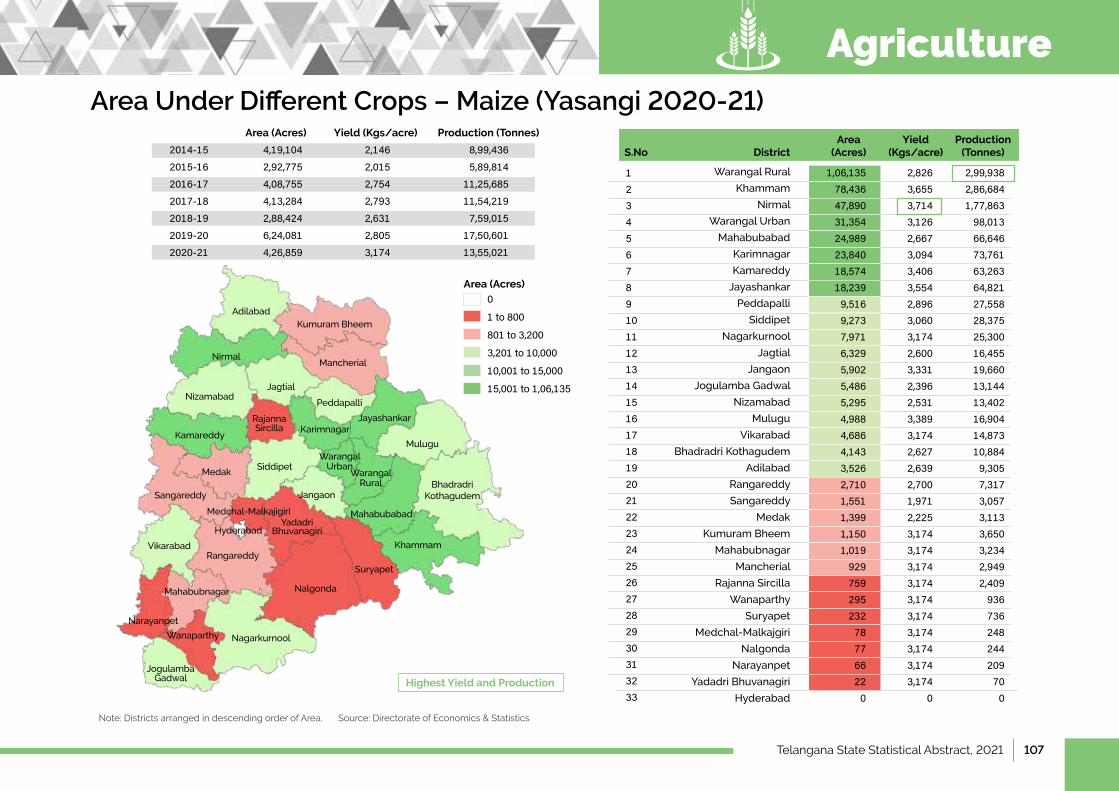
Telangana State Statistical Abstract, 2021 | 107
Area Under Different Crops – Maize (Yasangi 2020-21)
Note: Districts arranged in descending order of Area. Source: Directorate of Economics & Statistics
Area (Acres) Yield (Kgs/acre) Production (Tonnes)
2014-15 4,19,104 2,146 8,99,4362015-16 2,92,775 2,015 5,89,8142016-17 4,08,755 2,754 11,25,6852017-18 4,13,284 2,793 11,54,2192018-19 2,88,424 2,631 7,59,0152019-20 6,24,081 2,805 17,50,6012020-21 4,26,859 3,174 13,55,021
Highest Yield and Production
Adilabad
Nirmal
Kumuram Bheem
Mancherial
Jagtial
Rajanna Sircilla
Peddapalli
Jayashankar
Mulugu
MedakSiddipet
JangaonSangareddy
Medchal-Malkajigiri
VikarabadRangareddy
Mahabubnagar
Narayanpet
Nalgonda
NagarkurnoolWanaparthy
Suryapet
Khammam
Karimnagar
Yadadri Bhuvanagiri
Mahabubabad
Jogulamba Gadwal
Bhadradri Kothagudem
Kamareddy
Nizamabad
Hyderabad
0
1to800
801to3,200
3,201to10,000
10,001to15,000
15,001to1,06,135
Warangal Rural
Khammam
Nirmal
WarangalUrban
Mahabubabad
Karimnagar
Kamareddy
Jayashankar
Peddapalli
Siddipet
Nagarkurnool
Jagtial
Jangaon
Jogulamba Gadwal
Nizamabad
Mulugu
Vikarabad
Bhadradri Kothagudem
Adilabad
Rangareddy
Sangareddy
Medak
Kumuram Bheem
Mahabubnagar
Mancherial
Rajanna Sircilla
Wanaparthy
Suryapet
Medchal-Malkajgiri
Nalgonda
Narayanpet
YadadriBhuvanagiri
Hyderabad
123456789101112131415161718192021222324252627282930313233
DistrictS.NoArea
(Acres)Yield
(Kgs/acre)Production
(Tonnes)
1,06,13578,43647,89031,35424,98923,84018,57418,2399,5169,2737,9716,3295,9025,4865,2954,9884,6864,1433,5262,7101,5511,3991,1501,019929759295232787766220
2,99,9382,86,6841,77,86398,01366,64673,76163,26364,82127,55828,37525,30016,45519,66013,14413,40216,90414,87310,8849,3057,3173,0573,1133,6503,2342,9492,409936736248244209700
2,8263,6553,7143,1262,6673,0943,4063,5542,8963,0603,1742,6003,3312,3962,5313,3893,1742,6272,6392,7001,9712,2253,1743,1743,1743,1743,1743,1743,1743,1743,1743,174
0
Area (Acres)
Warangal Urban
Warangal Rural
Agriculture
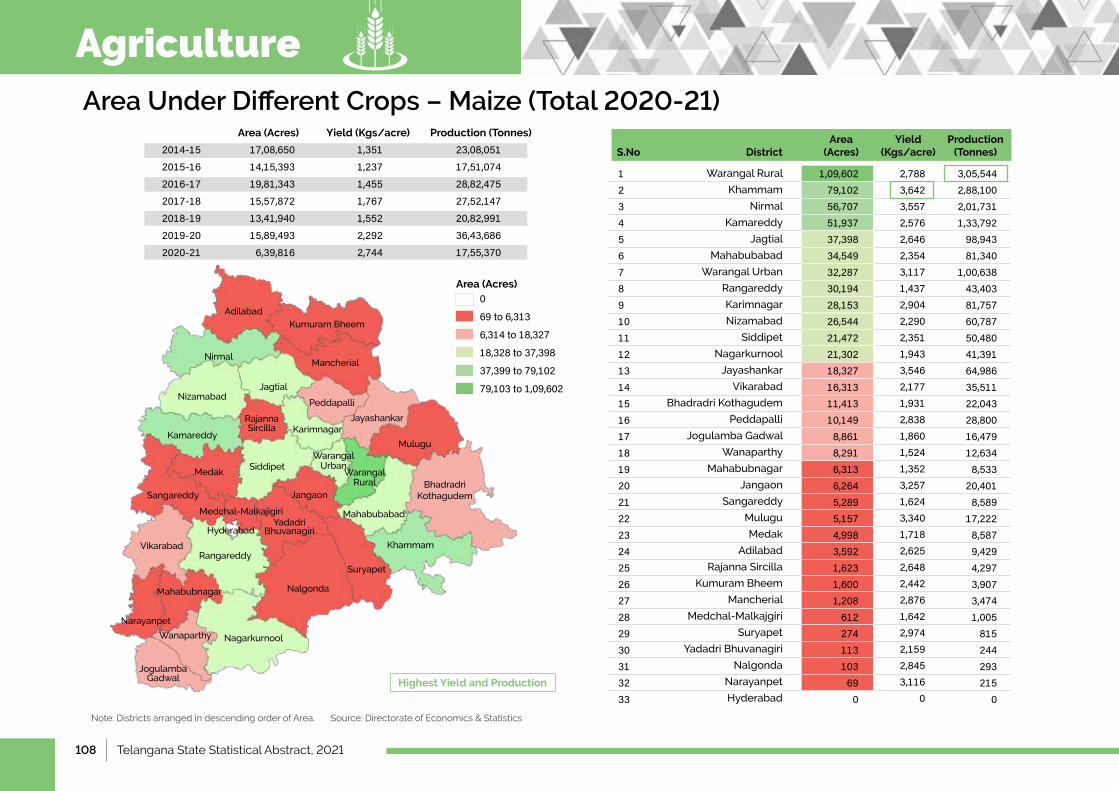
108 | Telangana State Statistical Abstract, 2021
Area Under Different Crops – Maize (Total 2020-21)
Note: Districts arranged in descending order of Area. Source: Directorate of Economics & Statistics
Area (Acres) Yield (Kgs/acre) Production (Tonnes)
2014-15 17,08,650 1,351 23,08,0512015-16 14,15,393 1,237 17,51,0742016-17 19,81,343 1,455 28,82,4752017-18 15,57,872 1,767 27,52,1472018-19 13,41,940 1,552 20,82,9912019-20 15,89,493 2,292 36,43,6862020-21 6,39,816 2,744 17,55,370
Highest Yield and Production
Adilabad
Nirmal
Kumuram Bheem
Mancherial
Jagtial
Rajanna Sircilla
Peddapalli
Jayashankar
Mulugu
MedakSiddipet
JangaonSangareddy
Medchal-Malkajigiri
VikarabadRangareddy
Mahabubnagar
Narayanpet
Nalgonda
NagarkurnoolWanaparthy
Suryapet
Khammam
Karimnagar
Yadadri Bhuvanagiri
Mahabubabad
Jogulamba Gadwal
Bhadradri Kothagudem
Kamareddy
Nizamabad
Hyderabad
0
69to6,313
6,314to18,327
18,328to37,398
37,399to79,102
79,103to1,09,602
Warangal Rural
Khammam
Nirmal
Kamareddy
Jagtial
Mahabubabad
WarangalUrban
Rangareddy
Karimnagar
Nizamabad
Siddipet
Nagarkurnool
Jayashankar
Vikarabad
Bhadradri Kothagudem
Peddapalli
Jogulamba Gadwal
Wanaparthy
Mahabubnagar
Jangaon
Sangareddy
Mulugu
Medak
Adilabad
Rajanna Sircilla
Kumuram Bheem
Mancherial
Medchal-Malkajgiri
Suryapet
YadadriBhuvanagiri
Nalgonda
Narayanpet
Hyderabad
123456789101112131415161718192021222324252627282930313233
DistrictS.NoArea
(Acres)Yield
(Kgs/acre)Production
(Tonnes)
1,09,60279,10256,70751,93737,39834,54932,28730,19428,15326,54421,47221,30218,32716,31311,41310,1498,8618,2916,3136,2645,2895,1574,9983,5921,6231,6001,208612274113103690
3,05,5442,88,1002,01,7311,33,79298,94381,340
1,00,63843,40381,75760,78750,48041,39164,98635,51122,04328,80016,47912,6348,533
20,4018,589
17,2228,5879,4294,2973,9073,4741,005815244293215
0
2,7883,6423,5572,5762,6462,3543,1171,4372,9042,2902,3511,9433,5462,1771,9312,8381,8601,5241,3523,2571,6243,3401,7182,6252,6482,4422,8761,6422,9742,1592,8453,116
0
Area (Acres)
Warangal Urban
Warangal Rural
Agriculture
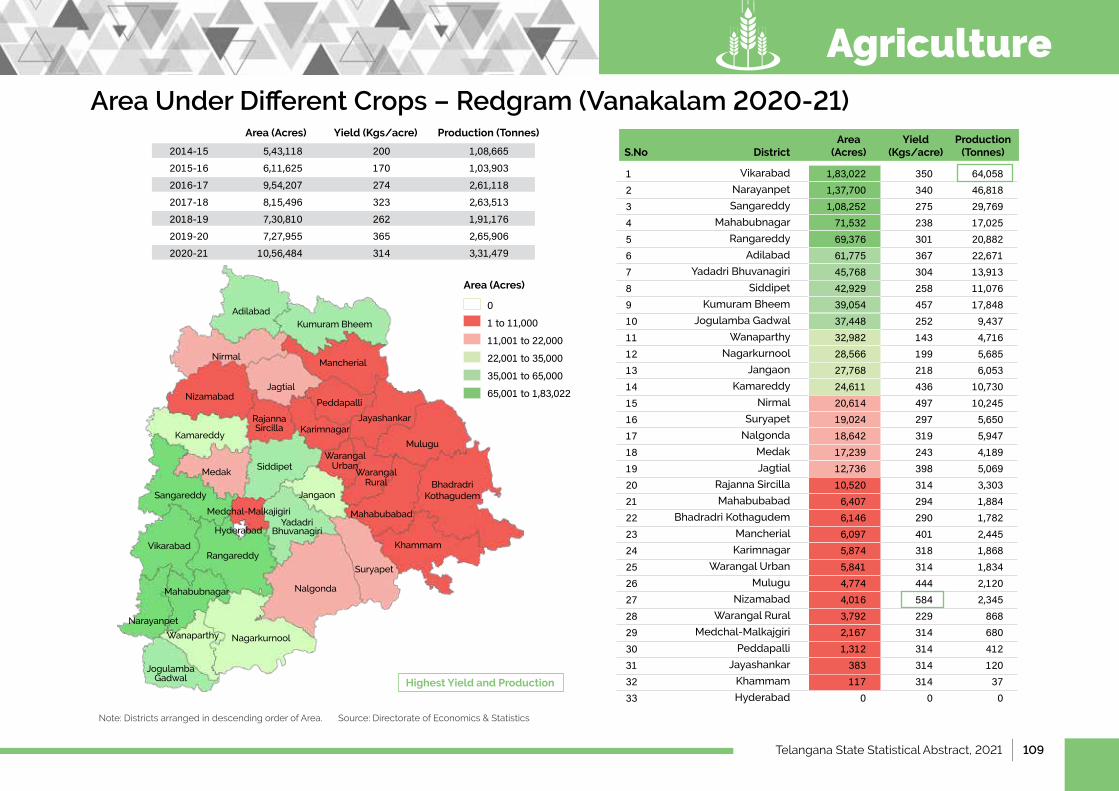
Telangana State Statistical Abstract, 2021 | 109
Area Under Different Crops – Redgram (Vanakalam 2020-21)
Note: Districts arranged in descending order of Area. Source: Directorate of Economics & Statistics
Area (Acres) Yield (Kgs/acre) Production (Tonnes)
2014-15 5,43,118 200 1,08,6652015-16 6,11,625 170 1,03,9032016-17 9,54,207 274 2,61,1182017-18 8,15,496 323 2,63,5132018-19 7,30,810 262 1,91,1762019-20 7,27,955 365 2,65,9062020-21 10,56,484 314 3,31,479
Highest Yield and Production
Adilabad
Nirmal
Kumuram Bheem
Mancherial
Jagtial
Rajanna Sircilla
Peddapalli
Jayashankar
Mulugu
MedakSiddipet
JangaonSangareddy
Medchal-Malkajigiri
VikarabadRangareddy
Mahabubnagar
Narayanpet
Nalgonda
NagarkurnoolWanaparthy
Suryapet
Khammam
Karimnagar
Yadadri Bhuvanagiri
Mahabubabad
Jogulamba Gadwal
Bhadradri Kothagudem
Kamareddy
Nizamabad
Hyderabad
0
1to11,000
11,001to22,000
22,001to35,000
35,001to65,000
65,001to1,83,022
Vikarabad
Narayanpet
Sangareddy
Mahabubnagar
Rangareddy
Adilabad
YadadriBhuvanagiri
Siddipet
Kumuram Bheem
Jogulamba Gadwal
Wanaparthy
Nagarkurnool
Jangaon
Kamareddy
Nirmal
Suryapet
Nalgonda
Medak
Jagtial
Rajanna Sircilla
Mahabubabad
Bhadradri Kothagudem
Mancherial
Karimnagar
WarangalUrban
Mulugu
Nizamabad
Warangal Rural
Medchal-Malkajgiri
Peddapalli
Jayashankar
Khammam
Hyderabad
123456789101112131415161718192021222324252627282930313233
DistrictS.NoArea
(Acres)Yield
(Kgs/acre)Production
(Tonnes)
1,83,0221,37,7001,08,25271,53269,37661,77545,76842,92939,05437,44832,98228,56627,76824,61120,61419,02418,64217,23912,73610,5206,4076,1466,0975,8745,8414,7744,0163,7922,1671,312383117
0
64,05846,81829,76917,02520,88222,67113,91311,07617,8489,4374,7165,6856,053
10,73010,2455,6505,9474,1895,0693,3031,8841,7822,4451,8681,8342,1202,345868680412120370
350340275238301367304258457252143199218436497297319243398314294290401318314444584229314314314314
0
Area (Acres)
Warangal Urban
Warangal Rural
Agriculture
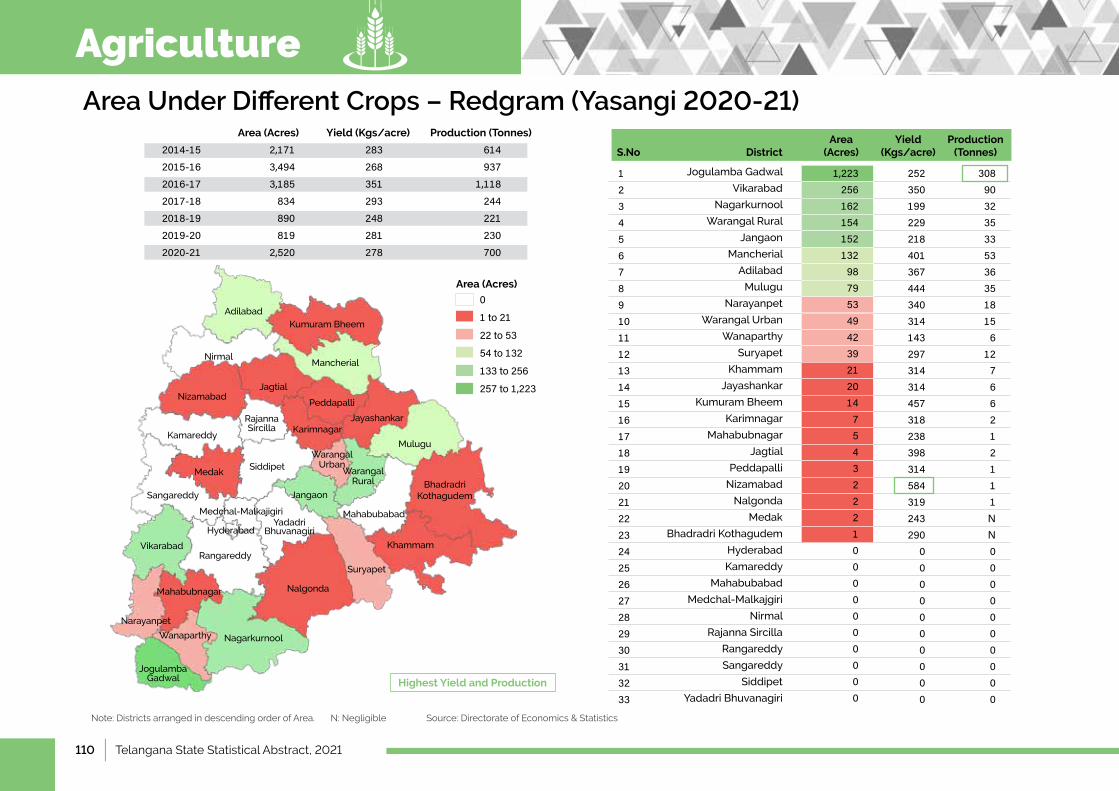
110 | Telangana State Statistical Abstract, 2021
Area Under Different Crops – Redgram (Yasangi 2020-21)
Note: Districts arranged in descending order of Area. N: Negligible Source: Directorate of Economics & Statistics
Area (Acres) Yield (Kgs/acre) Production (Tonnes)
2014-15 2,171 283 6142015-16 3,494 268 9372016-17 3,185 351 1,1182017-18 834 293 2442018-19 890 248 2212019-20 819 281 2302020-21 2,520 278 700
Highest Yield and Production
Adilabad
Nirmal
Kumuram Bheem
Mancherial
Jagtial
Rajanna Sircilla
Peddapalli
Jayashankar
Mulugu
MedakSiddipet
JangaonSangareddy
Medchal-Malkajigiri
VikarabadRangareddy
Mahabubnagar
Narayanpet
Nalgonda
NagarkurnoolWanaparthy
Suryapet
Khammam
Karimnagar
Yadadri Bhuvanagiri
Mahabubabad
Jogulamba Gadwal
Bhadradri Kothagudem
Kamareddy
Nizamabad
Hyderabad
0
1to21
22to53
54to132
133to256
257to1,223
Jogulamba Gadwal
Vikarabad
Nagarkurnool
Warangal Rural
Jangaon
Mancherial
Adilabad
Mulugu
Narayanpet
WarangalUrban
Wanaparthy
Suryapet
Khammam
Jayashankar
Kumuram Bheem
Karimnagar
Mahabubnagar
Jagtial
Peddapalli
Nizamabad
Nalgonda
Medak
Bhadradri Kothagudem
Hyderabad
Kamareddy
Mahabubabad
Medchal-Malkajgiri
Nirmal
Rajanna Sircilla
Rangareddy
Sangareddy
Siddipet
YadadriBhuvanagiri
123456789101112131415161718192021222324252627282930313233
DistrictS.NoArea
(Acres)Yield
(Kgs/acre)Production
(Tonnes)
1,223256162154152132987953494239212014754322210000000000
3089032353353363518156
12766212111NN0000000000
252350199229218401367444340314143297314314457318238398314584319243290
0000000000
Area (Acres)
Warangal Urban
Warangal Rural
Agriculture
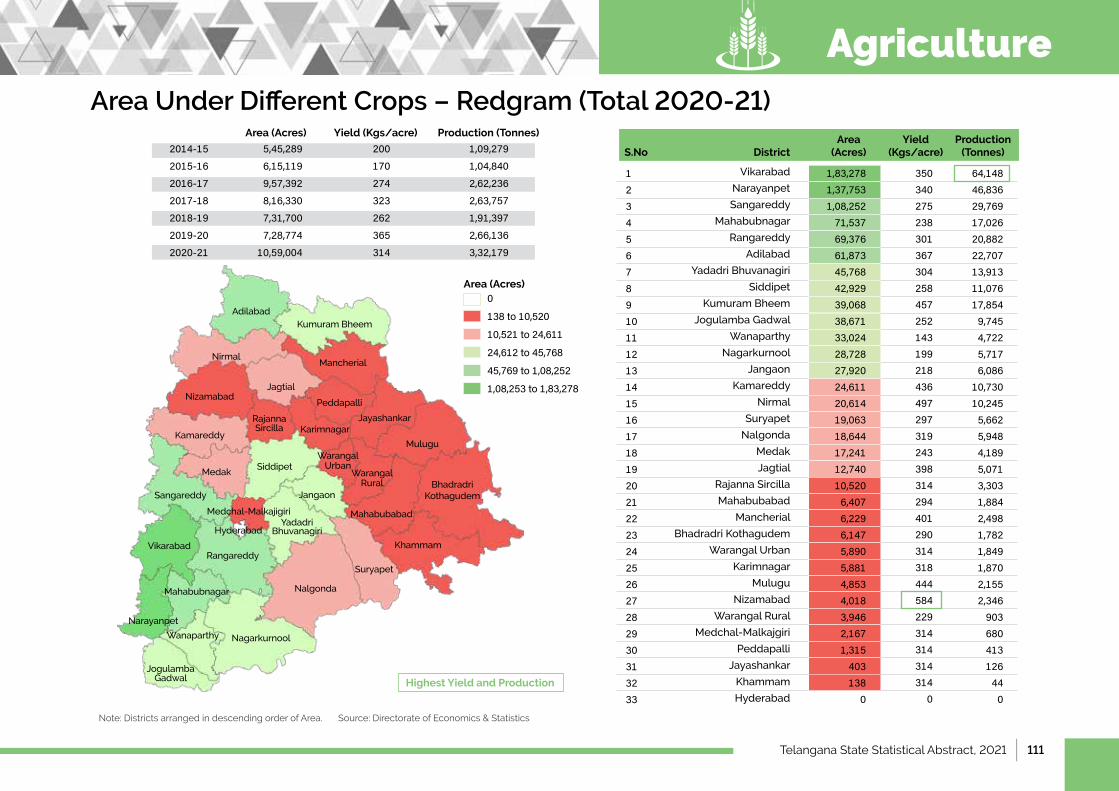
Telangana State Statistical Abstract, 2021 | 111
Area Under Different Crops – Redgram (Total 2020-21)
Note: Districts arranged in descending order of Area. Source: Directorate of Economics & Statistics
Area (Acres) Yield (Kgs/acre) Production (Tonnes)
2014-15 5,45,289 200 1,09,279
2015-16 6,15,119 170 1,04,840
2016-17 9,57,392 274 2,62,236
2017-18 8,16,330 323 2,63,757
2018-19 7,31,700 262 1,91,397
2019-20 7,28,774 365 2,66,136
2020-21 10,59,004 314 3,32,179
Highest Yield and Production
Adilabad
Nirmal
Kumuram Bheem
Mancherial
Jagtial
Rajanna Sircilla
Peddapalli
Jayashankar
Mulugu
MedakSiddipet
JangaonSangareddy
Medchal-Malkajigiri
VikarabadRangareddy
Mahabubnagar
Narayanpet
Nalgonda
NagarkurnoolWanaparthy
Suryapet
Khammam
Karimnagar
Yadadri Bhuvanagiri
Mahabubabad
Jogulamba Gadwal
Bhadradri Kothagudem
Kamareddy
Nizamabad
Hyderabad
0
138to10,520
10,521to24,611
24,612to45,768
45,769to1,08,252
1,08,253to1,83,278
Vikarabad
Narayanpet
Sangareddy
Mahabubnagar
Rangareddy
Adilabad
YadadriBhuvanagiri
Siddipet
Kumuram Bheem
Jogulamba Gadwal
Wanaparthy
Nagarkurnool
Jangaon
Kamareddy
Nirmal
Suryapet
Nalgonda
Medak
Jagtial
Rajanna Sircilla
Mahabubabad
Mancherial
Bhadradri Kothagudem
WarangalUrban
Karimnagar
Mulugu
Nizamabad
Warangal Rural
Medchal-Malkajgiri
Peddapalli
Jayashankar
Khammam
Hyderabad
123456789101112131415161718192021222324252627282930313233
DistrictS.NoArea
(Acres)Yield
(Kgs/acre)Production
(Tonnes)
1,83,2781,37,7531,08,25271,53769,37661,87345,76842,92939,06838,67133,02428,72827,92024,61120,61419,06318,64417,24112,74010,5206,4076,2296,1475,8905,8814,8534,0183,9462,1671,315403138
0
64,14846,83629,76917,02620,88222,70713,91311,07617,8549,7454,7225,7176,086
10,73010,2455,6625,9484,1895,0713,3031,8842,4981,7821,8491,8702,1552,346903680413126440
350340275238301367304258457252143199218436497297319243398314294401290314318444584229314314314314
0
Area (Acres)
Warangal Urban
Warangal Rural
Agriculture
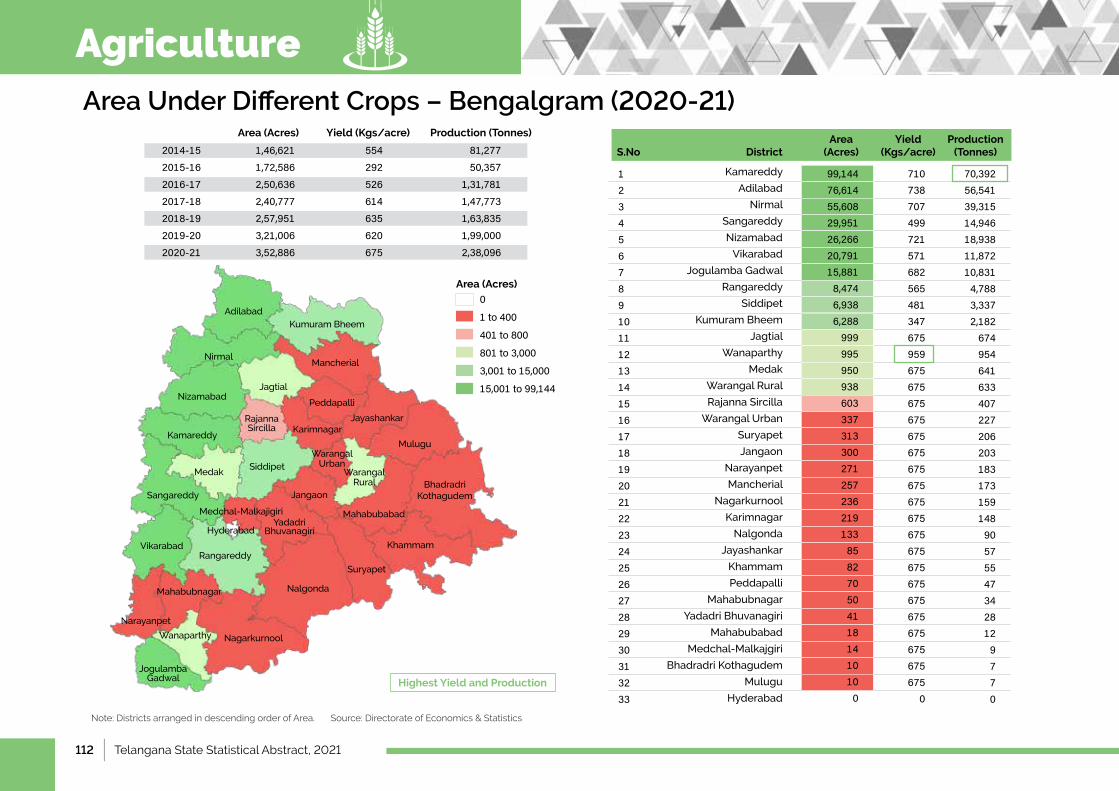
112 | Telangana State Statistical Abstract, 2021
Area Under Different Crops – Bengalgram (2020-21)
Note: Districts arranged in descending order of Area. Source: Directorate of Economics & Statistics
Area (Acres) Yield (Kgs/acre) Production (Tonnes)
2014-15 1,46,621 554 81,2772015-16 1,72,586 292 50,3572016-17 2,50,636 526 1,31,7812017-18 2,40,777 614 1,47,7732018-19 2,57,951 635 1,63,8352019-20 3,21,006 620 1,99,0002020-21 3,52,886 675 2,38,096
Highest Yield and Production
Adilabad
Nirmal
Kumuram Bheem
Mancherial
Jagtial
Rajanna Sircilla
Peddapalli
Jayashankar
Mulugu
MedakSiddipet
JangaonSangareddy
Medchal-Malkajigiri
VikarabadRangareddy
Mahabubnagar
Narayanpet
Nalgonda
NagarkurnoolWanaparthy
Suryapet
Khammam
Karimnagar
Yadadri Bhuvanagiri
Mahabubabad
Jogulamba Gadwal
Bhadradri Kothagudem
Kamareddy
Nizamabad
Hyderabad
0
1to400
401to800
801to3,000
3,001to15,000
15,001to99,144
Kamareddy
Adilabad
Nirmal
Sangareddy
Nizamabad
Vikarabad
Jogulamba Gadwal
Rangareddy
Siddipet
Kumuram Bheem
Jagtial
Wanaparthy
Medak
Warangal Rural
Rajanna Sircilla
WarangalUrban
Suryapet
Jangaon
Narayanpet
Mancherial
Nagarkurnool
Karimnagar
Nalgonda
Jayashankar
Khammam
Peddapalli
Mahabubnagar
YadadriBhuvanagiri
Mahabubabad
Medchal-Malkajgiri
Bhadradri Kothagudem
Mulugu
Hyderabad
123456789101112131415161718192021222324252627282930313233
DistrictS.NoArea
(Acres)Yield
(Kgs/acre)Production
(Tonnes)
99,14476,61455,60829,95126,26620,79115,8818,4746,9386,2889999959509386033373133002712572362191338582705041181410100
70,39256,54139,31514,94618,93811,87210,8314,7883,3372,182674954641633407227206203183173159148905755473428129770
710738707499721571682565481347675959675675675675675675675675675675675675675675675675675675675675
0
Area (Acres)
Warangal Urban
Warangal Rural
Agriculture
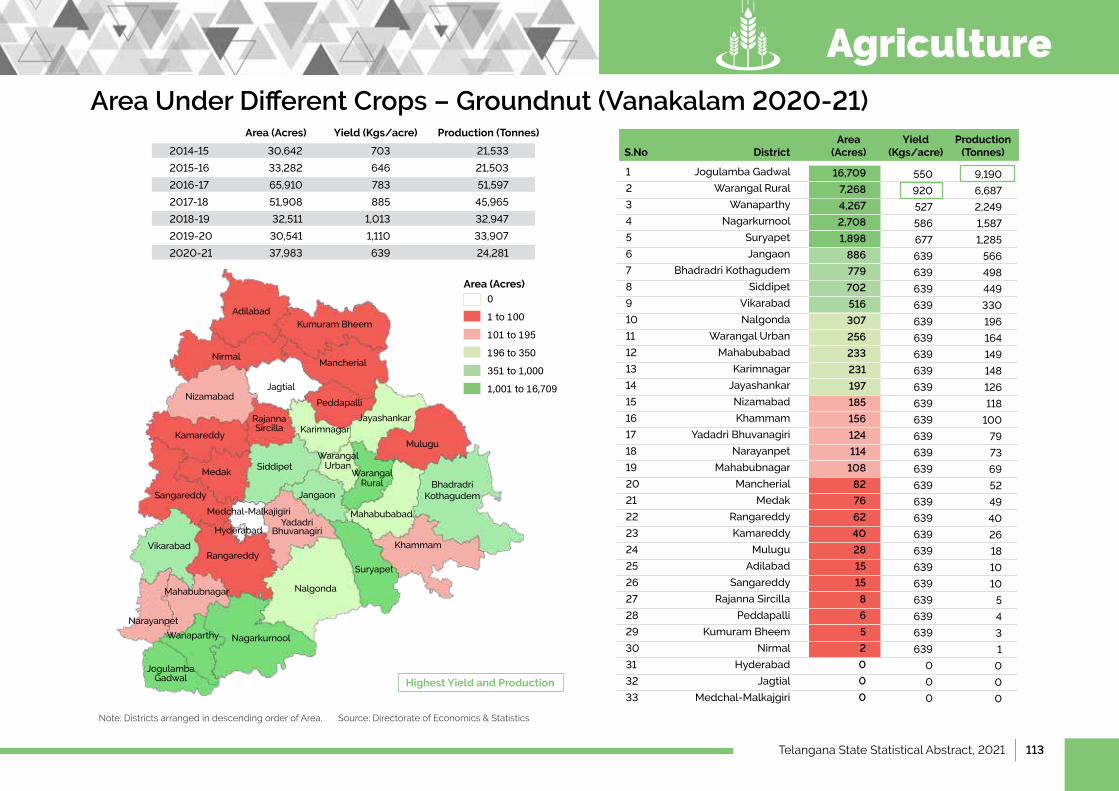
Telangana State Statistical Abstract, 2021 | 113
Area Under Different Crops – Groundnut (Vanakalam 2020-21)
Note: Districts arranged in descending order of Area. Source: Directorate of Economics & Statistics
Area (Acres) Yield (Kgs/acre) Production (Tonnes)
2014-15 30,642 703 21,533
2015-16 33,282 646 21,503
2016-17 65,910 783 51,597
2017-18 51,908 885 45,965
2018-19 32,511 1,013 32,947
2019-20 30,541 1,110 33,907
2020-21 37,983 639 24,281
Highest Yield and Production
Adilabad
Nirmal
Kumuram Bheem
Mancherial
Jagtial
Rajanna Sircilla
Peddapalli
Jayashankar
Mulugu
MedakSiddipet
JangaonSangareddy
Medchal-Malkajigiri
VikarabadRangareddy
Mahabubnagar
Narayanpet
Nalgonda
NagarkurnoolWanaparthy
Suryapet
Khammam
Karimnagar
Yadadri Bhuvanagiri
Mahabubabad
Jogulamba Gadwal
Bhadradri Kothagudem
Kamareddy
Nizamabad
Hyderabad
0
1to100
101to195
196to350
351to1,000
1,001to16,709
Jogulamba Gadwal
Warangal Rural
Wanaparthy
Nagarkurnool
Suryapet
Jangaon
Bhadradri Kothagudem
Siddipet
Vikarabad
Nalgonda
WarangalUrban
Mahabubabad
Karimnagar
Jayashankar
Nizamabad
Khammam
YadadriBhuvanagiri
Narayanpet
Mahabubnagar
Mancherial
Medak
Rangareddy
Kamareddy
Mulugu
Adilabad
Sangareddy
Rajanna Sircilla
Peddapalli
Kumuram Bheem
Nirmal
Hyderabad
Jagtial
Medchal-Malkajgiri
1
2
3
4
5
6
7
8
9
10
11
12
13
14
15
16
17
18
19
20
21
22
23
24
25
26
27
28
29
30
31
32
33
DistrictS.NoArea
(Acres)Yield
(Kgs/acre)Production
(Tonnes)
16,709
7,268
4,267
2,708
1,898
886
779
702
516
307
256
233
231
197
185
156
124
114
108
82
76
62
40
28
15
15
8
6
5
2
0
0
0
9,190
6,687
2,249
1,587
1,285
566
498
449
330
196
164
149
148
126
118
100
79
73
69
52
49
40
26
18
10
10
5
4
3
1
0
0
0
550
920
527
586
677
639
639
639
639
639
639
639
639
639
639
639
639
639
639
639
639
639
639
639
639
639
639
639
639
639
0
0
0
Area (Acres)
Warangal Urban
Warangal Rural
Agriculture
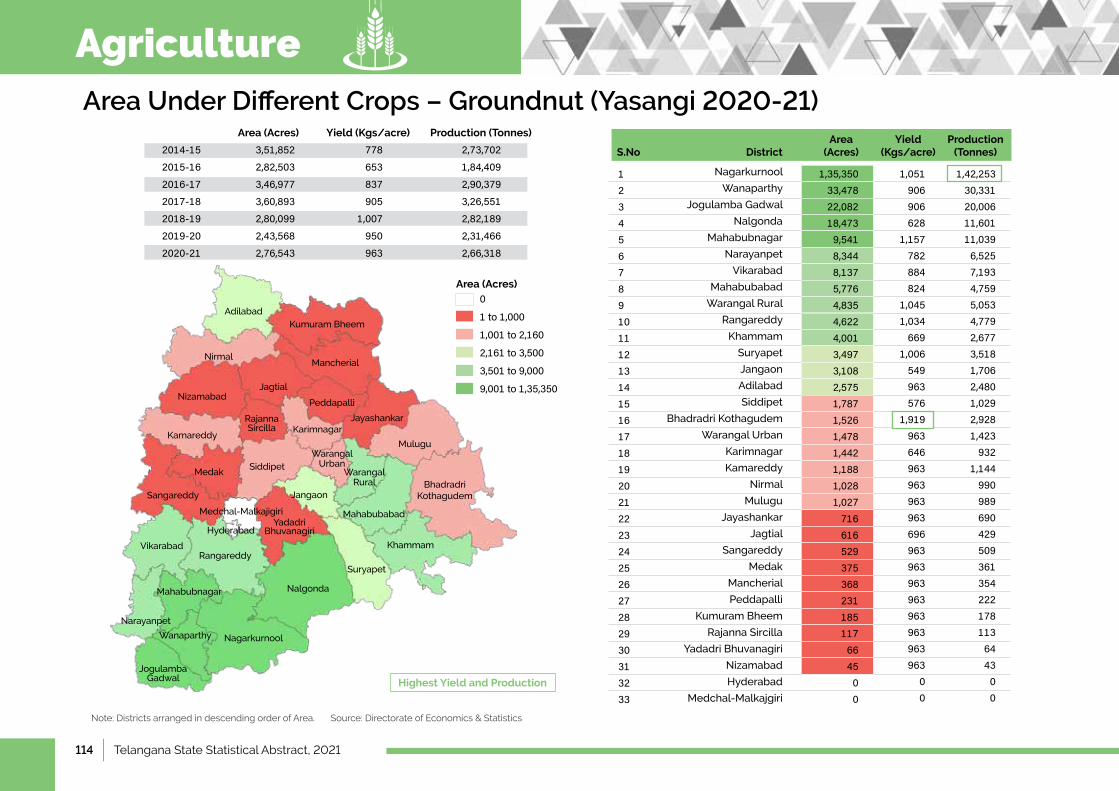
114 | Telangana State Statistical Abstract, 2021
Area Under Different Crops – Groundnut (Yasangi 2020-21)
Note: Districts arranged in descending order of Area. Source: Directorate of Economics & Statistics
Area (Acres) Yield (Kgs/acre) Production (Tonnes)
2014-15 3,51,852 778 2,73,7022015-16 2,82,503 653 1,84,4092016-17 3,46,977 837 2,90,3792017-18 3,60,893 905 3,26,5512018-19 2,80,099 1,007 2,82,1892019-20 2,43,568 950 2,31,4662020-21 2,76,543 963 2,66,318
Highest Yield and Production
Adilabad
Nirmal
Kumuram Bheem
Mancherial
Jagtial
Rajanna Sircilla
Peddapalli
Jayashankar
Mulugu
MedakSiddipet
JangaonSangareddy
Medchal-Malkajigiri
VikarabadRangareddy
Mahabubnagar
Narayanpet
Nalgonda
NagarkurnoolWanaparthy
Suryapet
Khammam
Karimnagar
Yadadri Bhuvanagiri
Mahabubabad
Jogulamba Gadwal
Bhadradri Kothagudem
Kamareddy
Nizamabad
Hyderabad
0
1to1,000
1,001to2,160
2,161to3,500
3,501to9,000
9,001to1,35,350
Nagarkurnool
Wanaparthy
Jogulamba Gadwal
Nalgonda
Mahabubnagar
Narayanpet
Vikarabad
Mahabubabad
Warangal Rural
Rangareddy
Khammam
Suryapet
Jangaon
Adilabad
Siddipet
Bhadradri Kothagudem
WarangalUrban
Karimnagar
Kamareddy
Nirmal
Mulugu
Jayashankar
Jagtial
Sangareddy
Medak
Mancherial
Peddapalli
Kumuram Bheem
Rajanna Sircilla
YadadriBhuvanagiri
Nizamabad
Hyderabad
Medchal-Malkajgiri
123456789101112131415161718192021222324252627282930313233
DistrictS.NoArea
(Acres)Yield
(Kgs/acre)Production
(Tonnes)
1,35,35033,47822,08218,4739,5418,3448,1375,7764,8354,6224,0013,4973,1082,5751,7871,5261,4781,4421,1881,0281,027716616529375368231185117664500
1,42,25330,33120,00611,60111,0396,5257,1934,7595,0534,7792,6773,5181,7062,4801,0292,9281,423932
1,144990989690429509361354222178113644300
1,051906906628
1,157782884824
1,0451,034669
1,006549963576
1,919963646963963963963696963963963963963963963963
00
Area (Acres)
Warangal Urban
Warangal Rural
Agriculture
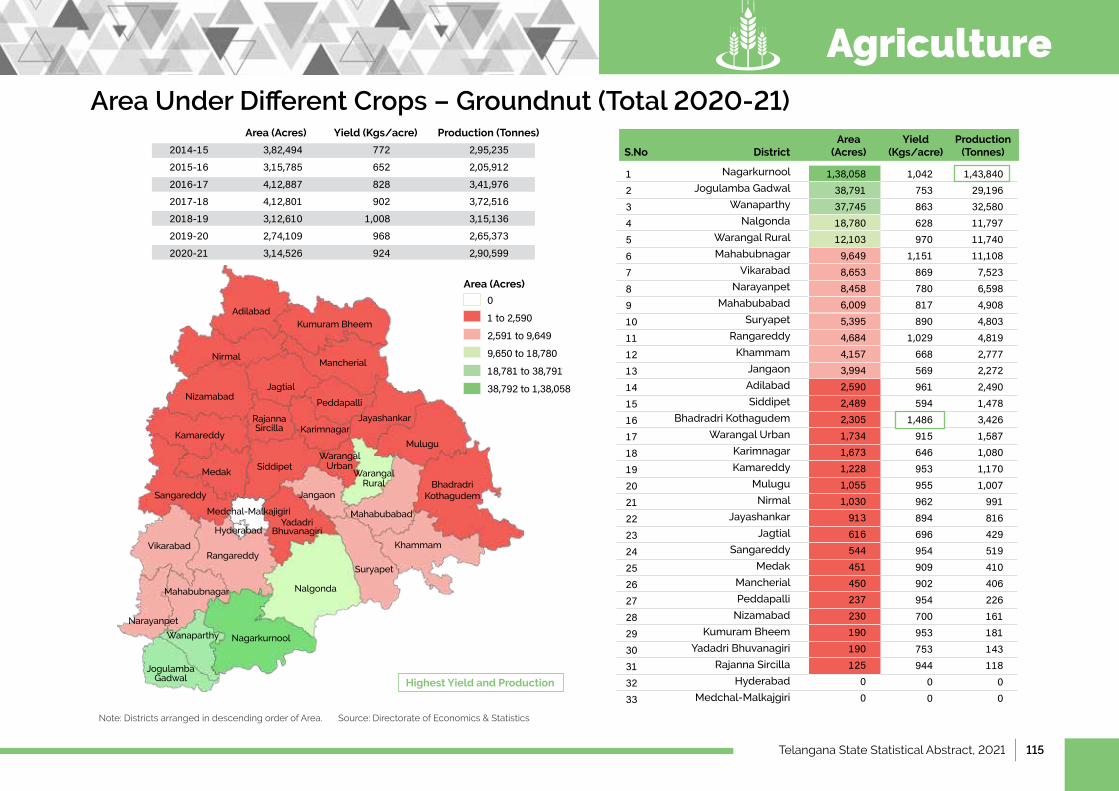
Telangana State Statistical Abstract, 2021 | 115
Area Under Different Crops – Groundnut (Total 2020-21)
Note: Districts arranged in descending order of Area. Source: Directorate of Economics & Statistics
Area (Acres) Yield (Kgs/acre) Production (Tonnes)
2014-15 3,82,494 772 2,95,2352015-16 3,15,785 652 2,05,9122016-17 4,12,887 828 3,41,9762017-18 4,12,801 902 3,72,5162018-19 3,12,610 1,008 3,15,1362019-20 2,74,109 968 2,65,3732020-21 3,14,526 924 2,90,599
Highest Yield and Production
Adilabad
Nirmal
Kumuram Bheem
Mancherial
Jagtial
Rajanna Sircilla
Peddapalli
Jayashankar
Mulugu
MedakSiddipet
JangaonSangareddy
Medchal-Malkajigiri
VikarabadRangareddy
Mahabubnagar
Narayanpet
Nalgonda
NagarkurnoolWanaparthy
Suryapet
Khammam
Karimnagar
Yadadri Bhuvanagiri
Mahabubabad
Jogulamba Gadwal
Bhadradri Kothagudem
Kamareddy
Nizamabad
Hyderabad
0
1to2,590
2,591to9,649
9,650to18,780
18,781to38,791
38,792to1,38,058
Nagarkurnool
Jogulamba Gadwal
Wanaparthy
Nalgonda
Warangal Rural
Mahabubnagar
Vikarabad
Narayanpet
Mahabubabad
Suryapet
Rangareddy
Khammam
Jangaon
Adilabad
Siddipet
Bhadradri Kothagudem
WarangalUrban
Karimnagar
Kamareddy
Mulugu
Nirmal
Jayashankar
Jagtial
Sangareddy
Medak
Mancherial
Peddapalli
Nizamabad
Kumuram Bheem
YadadriBhuvanagiri
Rajanna Sircilla
Hyderabad
Medchal-Malkajgiri
123456789101112131415161718192021222324252627282930313233
DistrictS.NoArea
(Acres)Yield
(Kgs/acre)Production
(Tonnes)
1,38,05838,79137,74518,78012,1039,6498,6538,4586,0095,3954,6844,1573,9942,5902,4892,3051,7341,6731,2281,0551,030913616544451450237230190190125
00
1,43,84029,19632,58011,79711,74011,1087,5236,5984,9084,8034,8192,7772,2722,4901,4783,4261,5871,0801,1701,007991816429519410406226161181143118
00
Area (Acres)
1,042753863628970
1,151869780817890
1,029668569961594
1,486915646953955962894696954909902954700953753944
00
Warangal Urban
Warangal Rural
Agriculture
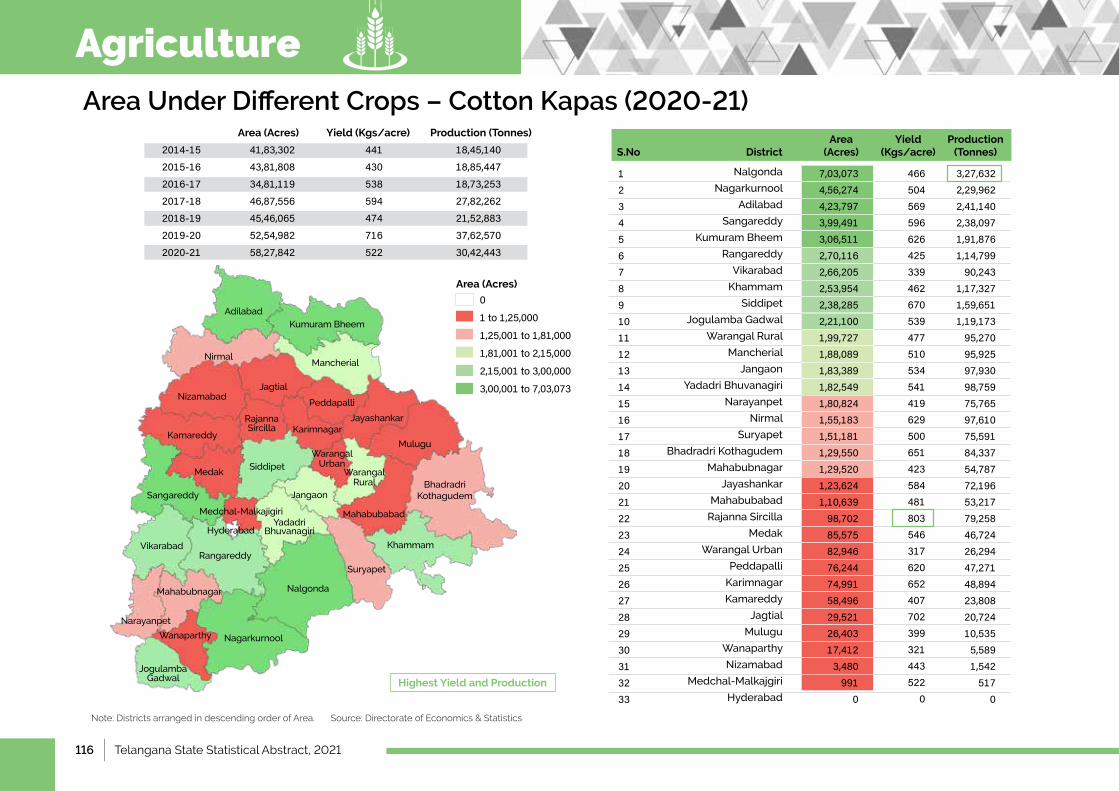
116 | Telangana State Statistical Abstract, 2021
Area Under Different Crops – Cotton Kapas (2020-21)
Note: Districts arranged in descending order of Area. Source: Directorate of Economics & Statistics
Area (Acres) Yield (Kgs/acre) Production (Tonnes)
2014-15 41,83,302 441 18,45,1402015-16 43,81,808 430 18,85,4472016-17 34,81,119 538 18,73,2532017-18 46,87,556 594 27,82,2622018-19 45,46,065 474 21,52,8832019-20 52,54,982 716 37,62,5702020-21 58,27,842 522 30,42,443
Highest Yield and Production
Adilabad
Nirmal
Kumuram Bheem
Mancherial
Jagtial
Rajanna Sircilla
Peddapalli
Jayashankar
Mulugu
MedakSiddipet
JangaonSangareddy
Medchal-Malkajigiri
VikarabadRangareddy
Mahabubnagar
Narayanpet
Nalgonda
NagarkurnoolWanaparthy
Suryapet
Khammam
Karimnagar
Yadadri Bhuvanagiri
Mahabubabad
Jogulamba Gadwal
Bhadradri Kothagudem
Kamareddy
Nizamabad
Hyderabad
0
1to1,25,000
1,25,001to1,81,000
1,81,001to2,15,000
2,15,001to3,00,000
3,00,001to7,03,073
Nalgonda
Nagarkurnool
Adilabad
Sangareddy
Kumuram Bheem
Rangareddy
Vikarabad
Khammam
Siddipet
Jogulamba Gadwal
Warangal Rural
Mancherial
Jangaon
YadadriBhuvanagiri
Narayanpet
Nirmal
Suryapet
Bhadradri Kothagudem
Mahabubnagar
Jayashankar
Mahabubabad
Rajanna Sircilla
Medak
WarangalUrban
Peddapalli
Karimnagar
Kamareddy
Jagtial
Mulugu
Wanaparthy
Nizamabad
Medchal-Malkajgiri
Hyderabad
123456789101112131415161718192021222324252627282930313233
DistrictS.NoArea
(Acres)Yield
(Kgs/acre)Production
(Tonnes)
7,03,0734,56,2744,23,7973,99,4913,06,5112,70,1162,66,2052,53,9542,38,2852,21,1001,99,7271,88,0891,83,3891,82,5491,80,8241,55,1831,51,1811,29,5501,29,5201,23,6241,10,63998,70285,57582,94676,24474,99158,49629,52126,40317,4123,480991
0
3,27,6322,29,9622,41,1402,38,0971,91,8761,14,79990,243
1,17,3271,59,6511,19,17395,27095,92597,93098,75975,76597,61075,59184,33754,78772,19653,21779,25846,72426,29447,27148,89423,80820,72410,5355,5891,542517
0
466504569596626425339462670539477510534541419629500651423584481803546317620652407702399321443522
0
Area (Acres)
Warangal Urban
Warangal Rural
Agriculture
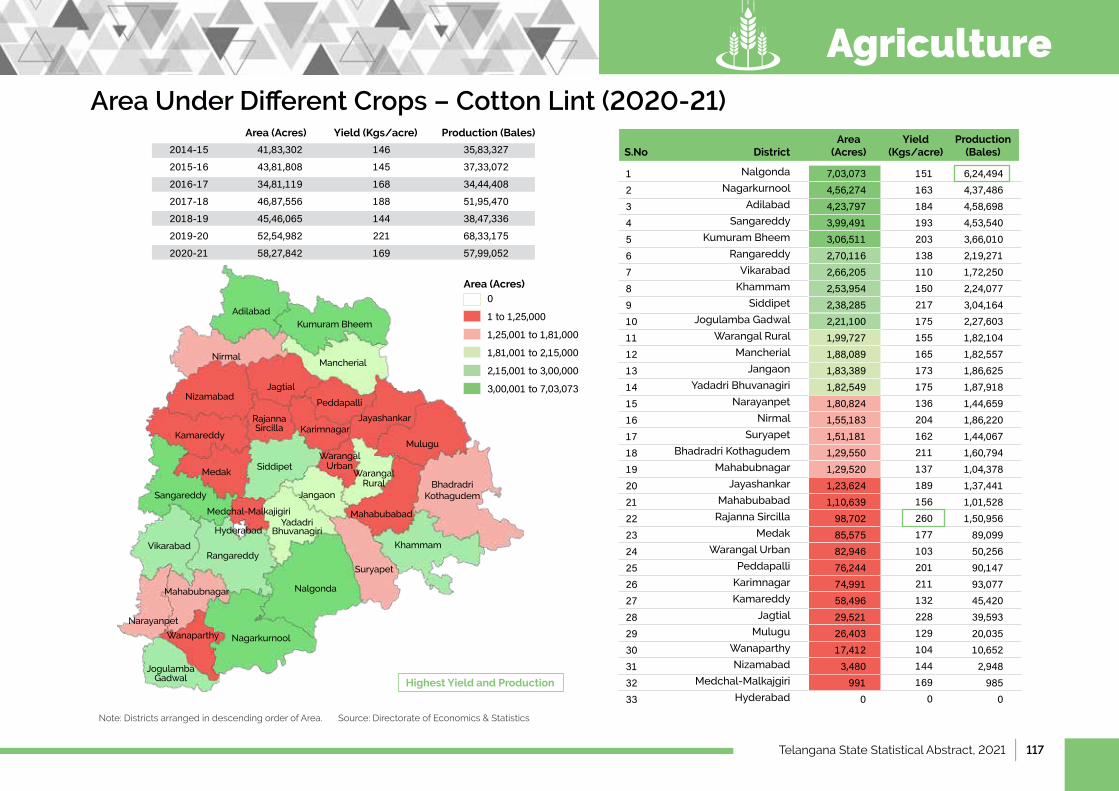
Telangana State Statistical Abstract, 2021 | 117
Area Under Different Crops – Cotton Lint (2020-21)
Note: Districts arranged in descending order of Area. Source: Directorate of Economics & Statistics
Area (Acres) Yield (Kgs/acre) Production (Bales)
2014-15 41,83,302 146 35,83,327
2015-16 43,81,808 145 37,33,072
2016-17 34,81,119 168 34,44,408
2017-18 46,87,556 188 51,95,470
2018-19 45,46,065 144 38,47,336
2019-20 52,54,982 221 68,33,175
2020-21 58,27,842 169 57,99,052
Highest Yield and Production
Adilabad
Nirmal
Kumuram Bheem
Mancherial
Jagtial
Rajanna Sircilla
Peddapalli
Jayashankar
Mulugu
MedakSiddipet
JangaonSangareddy
Medchal-Malkajigiri
VikarabadRangareddy
Mahabubnagar
Narayanpet
Nalgonda
NagarkurnoolWanaparthy
Suryapet
Khammam
Karimnagar
Yadadri Bhuvanagiri
Mahabubabad
Jogulamba Gadwal
Bhadradri Kothagudem
Kamareddy
Nizamabad
Hyderabad
0
1to1,25,000
1,25,001to1,81,000
1,81,001to2,15,000
2,15,001to3,00,000
3,00,001to7,03,073
Nalgonda
Nagarkurnool
Adilabad
Sangareddy
Kumuram Bheem
Rangareddy
Vikarabad
Khammam
Siddipet
Jogulamba Gadwal
Warangal Rural
Mancherial
Jangaon
YadadriBhuvanagiri
Narayanpet
Nirmal
Suryapet
Bhadradri Kothagudem
Mahabubnagar
Jayashankar
Mahabubabad
Rajanna Sircilla
Medak
WarangalUrban
Peddapalli
Karimnagar
Kamareddy
Jagtial
Mulugu
Wanaparthy
Nizamabad
Medchal-Malkajgiri
Hyderabad
123456789101112131415161718192021222324252627282930313233
DistrictS.NoArea
(Acres)Yield
(Kgs/acre)Production
(Bales)
7,03,0734,56,2744,23,7973,99,4913,06,5112,70,1162,66,2052,53,9542,38,2852,21,1001,99,7271,88,0891,83,3891,82,5491,80,8241,55,1831,51,1811,29,5501,29,5201,23,6241,10,63998,70285,57582,94676,24474,99158,49629,52126,40317,4123,480991
0
6,24,4944,37,4864,58,6984,53,5403,66,0102,19,2711,72,2502,24,0773,04,1642,27,6031,82,1041,82,5571,86,6251,87,9181,44,6591,86,2201,44,0671,60,7941,04,3781,37,4411,01,5281,50,95689,09950,25690,14793,07745,42039,59320,03510,6522,948985
0
151163184193203138110150217175155165173175136204162211137189156260177103201211132228129104144169
0
Area (Acres)
Warangal Urban
Warangal Rural
Agriculture
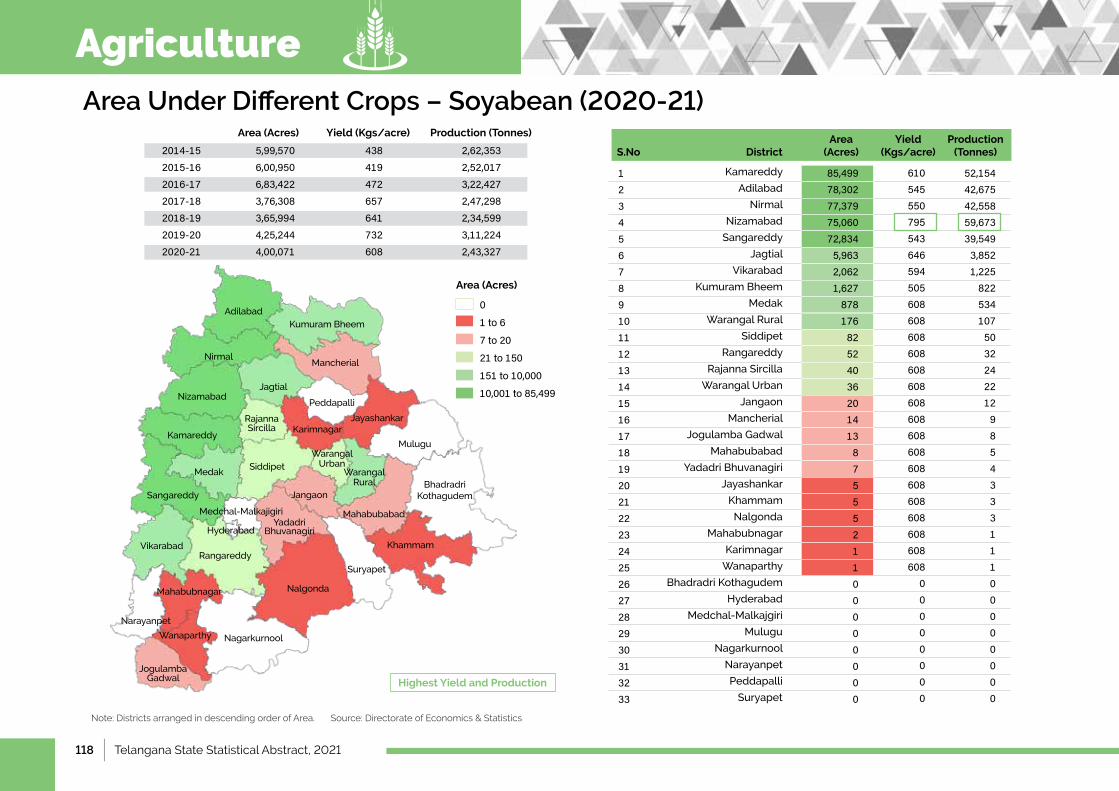
118 | Telangana State Statistical Abstract, 2021
Area Under Different Crops – Soyabean (2020-21)
Note: Districts arranged in descending order of Area. Source: Directorate of Economics & Statistics
Area (Acres) Yield (Kgs/acre) Production (Tonnes)
2014-15 5,99,570 438 2,62,3532015-16 6,00,950 419 2,52,0172016-17 6,83,422 472 3,22,4272017-18 3,76,308 657 2,47,2982018-19 3,65,994 641 2,34,5992019-20 4,25,244 732 3,11,2242020-21 4,00,071 608 2,43,327
Highest Yield and Production
Adilabad
Nirmal
Kumuram Bheem
Mancherial
Jagtial
Rajanna Sircilla
Peddapalli
Jayashankar
Mulugu
MedakSiddipet
JangaonSangareddy
Medchal-Malkajigiri
VikarabadRangareddy
Mahabubnagar
Narayanpet
Nalgonda
NagarkurnoolWanaparthy
Suryapet
Khammam
Karimnagar
Yadadri Bhuvanagiri
Mahabubabad
Jogulamba Gadwal
Bhadradri Kothagudem
Kamareddy
Nizamabad
Hyderabad
0
1to6
7to20
21to150
151to10,000
10,001to85,499
Kamareddy
Adilabad
Nirmal
Nizamabad
Sangareddy
Jagtial
Vikarabad
Kumuram Bheem
Medak
Warangal Rural
Siddipet
Rangareddy
Rajanna Sircilla
WarangalUrban
Jangaon
Mancherial
Jogulamba Gadwal
Mahabubabad
YadadriBhuvanagiri
Jayashankar
Khammam
Nalgonda
Mahabubnagar
Karimnagar
Wanaparthy
Bhadradri Kothagudem
Hyderabad
Medchal-Malkajgiri
Mulugu
Nagarkurnool
Narayanpet
Peddapalli
Suryapet
123456789101112131415161718192021222324252627282930313233
DistrictS.NoArea
(Acres)Yield
(Kgs/acre)Production
(Tonnes)
85,49978,30277,37975,06072,8345,9632,0621,627878176825240362014138755521100000000
52,15442,67542,55859,67339,5493,8521,2258225341075032242212985433311100000000
610545550795543646594505608608608608608608608608608608608608608608608608608
00000000
Area (Acres)
Warangal Urban
Warangal Rural
Agriculture
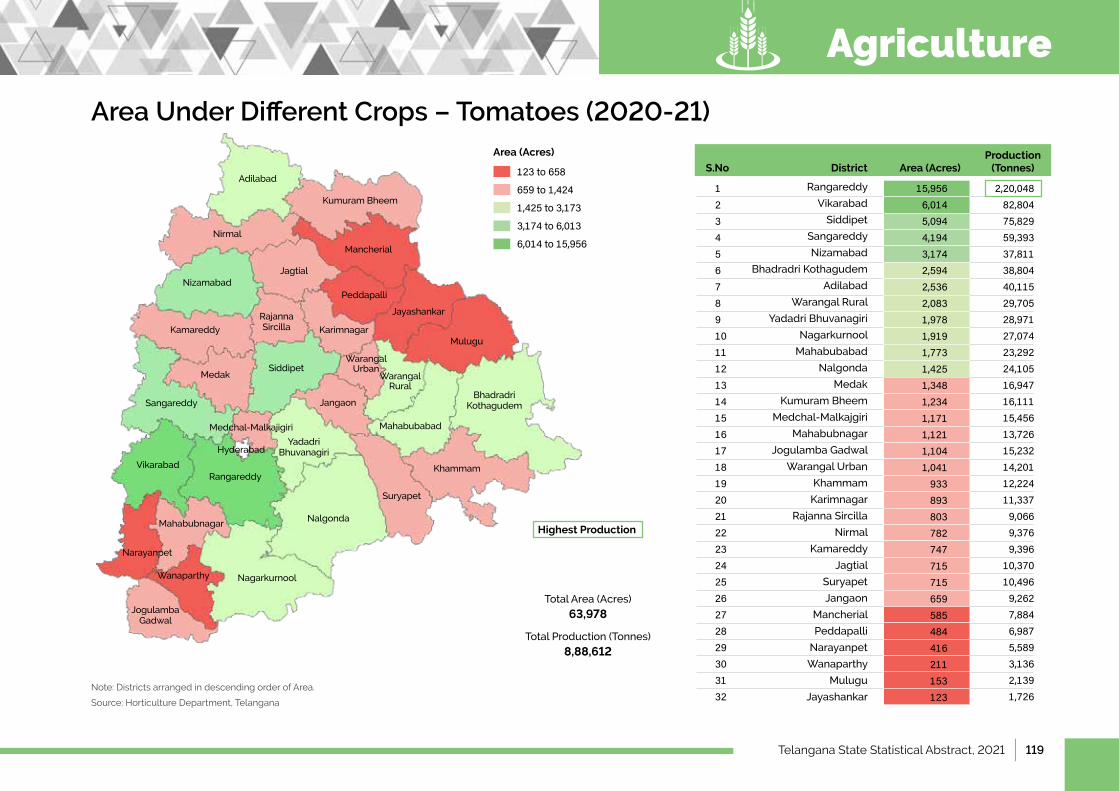
Telangana State Statistical Abstract, 2021 | 119
Area Under Different Crops – Tomatoes (2020-21)
Note: Districts arranged in descending order of Area.
Source: Horticulture Department, Telangana
123to658
659to1,424
1,425to3,173
3,174to6,013
6,014to15,956
Adilabad
Nirmal
Kumuram Bheem
Mancherial
Jagtial
Rajanna Sircilla
Peddapalli
Jayashankar
Mulugu
MedakSiddipet
JangaonSangareddy
Medchal-Malkajigiri
VikarabadRangareddy
Mahabubnagar
Narayanpet
Nalgonda
NagarkurnoolWanaparthy
Suryapet
Khammam
Karimnagar
Yadadri Bhuvanagiri
Mahabubabad
Jogulamba Gadwal
Bhadradri Kothagudem
Kamareddy
Nizamabad
Hyderabad
Area (Acres)
Rangareddy
Vikarabad
Siddipet
Sangareddy
Nizamabad
Bhadradri Kothagudem
Adilabad
Warangal Rural
YadadriBhuvanagiri
Nagarkurnool
Mahabubabad
Nalgonda
Medak
Kumuram Bheem
Medchal-Malkajgiri
Mahabubnagar
Jogulamba Gadwal
WarangalUrban
Khammam
Karimnagar
Rajanna Sircilla
Nirmal
Kamareddy
Jagtial
Suryapet
Jangaon
Mancherial
Peddapalli
Narayanpet
Wanaparthy
Mulugu
Jayashankar
1234567891011121314151617181920212223242526272829303132
DistrictS.No Area (Acres)
15,9566,0145,0944,1943,1742,5942,5362,0831,9781,9191,7731,4251,3481,2341,1711,1211,1041,041933893803782747715715659585484416211153123
2,20,04882,80475,82959,39337,81138,80440,11529,70528,97127,07423,29224,10516,94716,11115,45613,72615,23214,20112,22411,3379,0669,3769,396
10,37010,4969,2627,8846,9875,5893,1362,1391,726
Production (Tonnes)
Total Area (Acres)
63,978
Total Production (Tonnes)
8,88,612
Highest Production
Warangal Urban
Warangal Rural
Agriculture
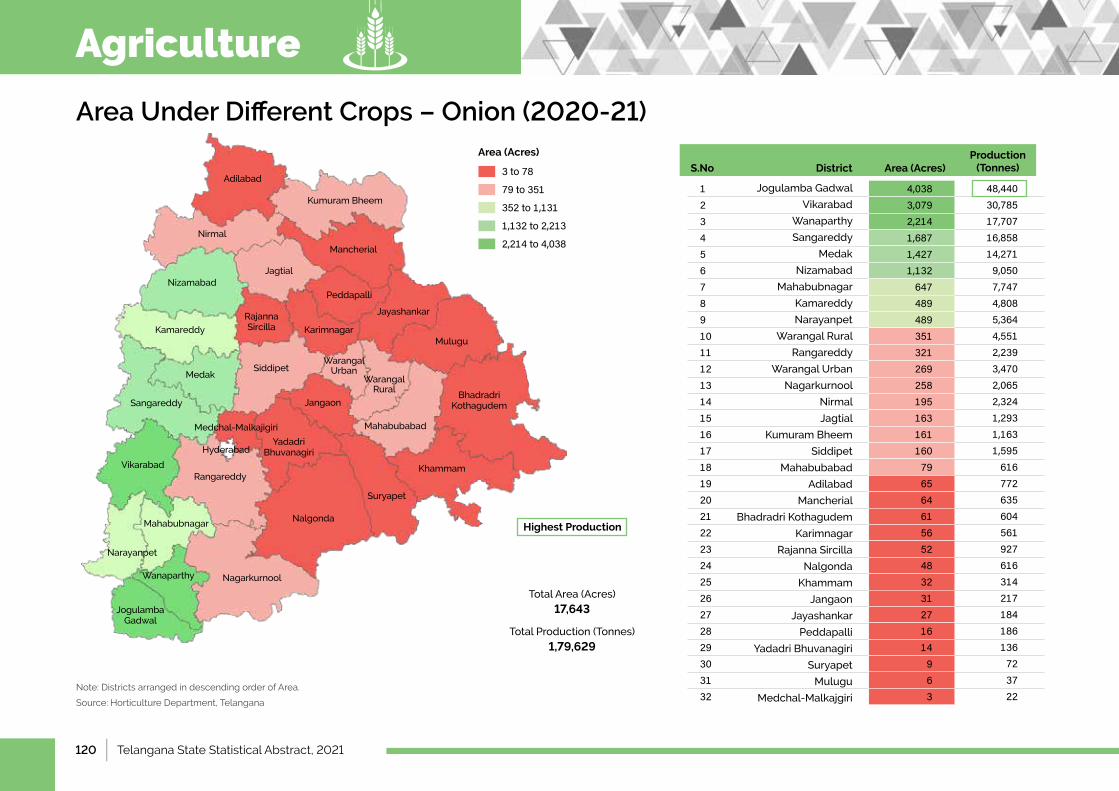
120 | Telangana State Statistical Abstract, 2021
Area Under Different Crops – Onion (2020-21)
Note: Districts arranged in descending order of Area.
Source: Horticulture Department, Telangana
3to78
79to351
352to1,131
1,132to2,213
2,214to4,038
Adilabad
Nirmal
Kumuram Bheem
Mancherial
Jagtial
Rajanna Sircilla
Peddapalli
Jayashankar
Mulugu
MedakSiddipet
JangaonSangareddy
Medchal-Malkajigiri
VikarabadRangareddy
Mahabubnagar
Narayanpet
Nalgonda
NagarkurnoolWanaparthy
Suryapet
Khammam
Karimnagar
Yadadri Bhuvanagiri
Mahabubabad
Jogulamba Gadwal
Bhadradri Kothagudem
Kamareddy
Nizamabad
Hyderabad
Area (Acres)
Jogulamba Gadwal
Vikarabad
Wanaparthy
Sangareddy
Medak
Nizamabad
Mahabubnagar
Kamareddy
Narayanpet
Warangal Rural
Rangareddy
WarangalUrban
Nagarkurnool
Nirmal
Jagtial
Kumuram Bheem
Siddipet
Mahabubabad
Adilabad
Mancherial
Bhadradri Kothagudem
Karimnagar
Rajanna Sircilla
Nalgonda
Khammam
Jangaon
Jayashankar
Peddapalli
YadadriBhuvanagiri
Suryapet
Mulugu
Medchal-Malkajgiri
1234567891011121314151617181920212223242526272829303132
DistrictS.No Area (Acres)
4,0383,0792,2141,6871,4271,132647489489351321269258195163161160796564615652483231271614963
48,44030,78517,70716,85814,2719,0507,7474,8085,3644,5512,2393,4702,0652,3241,2931,1631,595616772635604561927616314217184186136723722
Production (Tonnes)
Total Area (Acres)
17,643
Total Production (Tonnes)
1,79,629
Highest Production
Warangal Urban
Warangal Rural
Agriculture
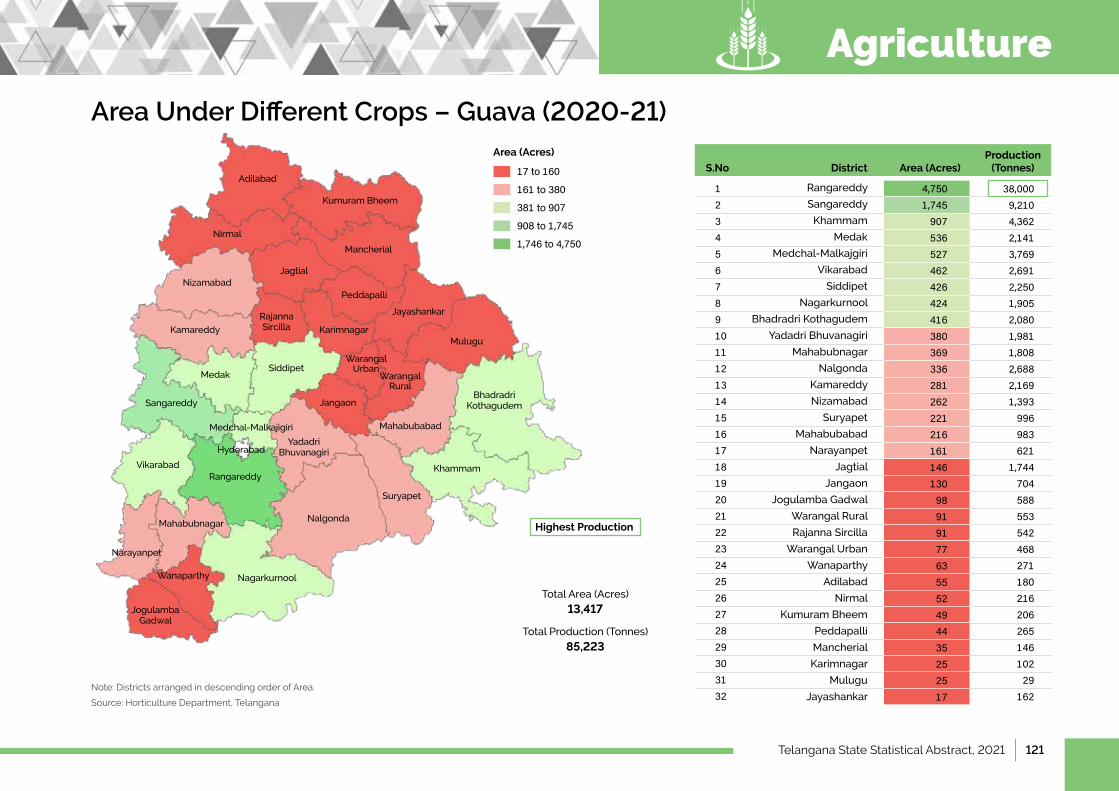
Telangana State Statistical Abstract, 2021 | 121
Area Under Different Crops – Guava (2020-21)
Note: Districts arranged in descending order of Area.
Source: Horticulture Department, Telangana
17to160
161to380
381to907
908to1,745
1,746to4,750
Adilabad
Nirmal
Kumuram Bheem
Mancherial
Jagtial
Rajanna Sircilla
Peddapalli
Jayashankar
Mulugu
MedakSiddipet
JangaonSangareddy
Medchal-Malkajigiri
VikarabadRangareddy
Mahabubnagar
Narayanpet
Nalgonda
NagarkurnoolWanaparthy
Suryapet
Khammam
Karimnagar
Yadadri Bhuvanagiri
Mahabubabad
Jogulamba Gadwal
Bhadradri Kothagudem
Kamareddy
Nizamabad
Hyderabad
Area (Acres)
Rangareddy
Sangareddy
Khammam
Medak
Medchal-Malkajgiri
Vikarabad
Siddipet
Nagarkurnool
Bhadradri Kothagudem
YadadriBhuvanagiri
Mahabubnagar
Nalgonda
Kamareddy
Nizamabad
Suryapet
Mahabubabad
Narayanpet
Jagtial
Jangaon
Jogulamba Gadwal
Warangal Rural
Rajanna Sircilla
WarangalUrban
Wanaparthy
Adilabad
Nirmal
Kumuram Bheem
Peddapalli
Mancherial
Karimnagar
Mulugu
Jayashankar
1234567891011121314151617181920212223242526272829303132
DistrictS.No Area (Acres)
4,7501,74590753652746242642441638036933628126222121616114613098919177635552494435252517
38,0009,2104,3622,1413,7692,6912,2501,9052,0801,9811,8082,6882,1691,393996983621
1,74470458855354246827118021620626514610229
162
Production (Tonnes)
Total Area (Acres)
13,417
Total Production (Tonnes)
85,223
Highest Production
Warangal Urban
Warangal Rural
Agriculture
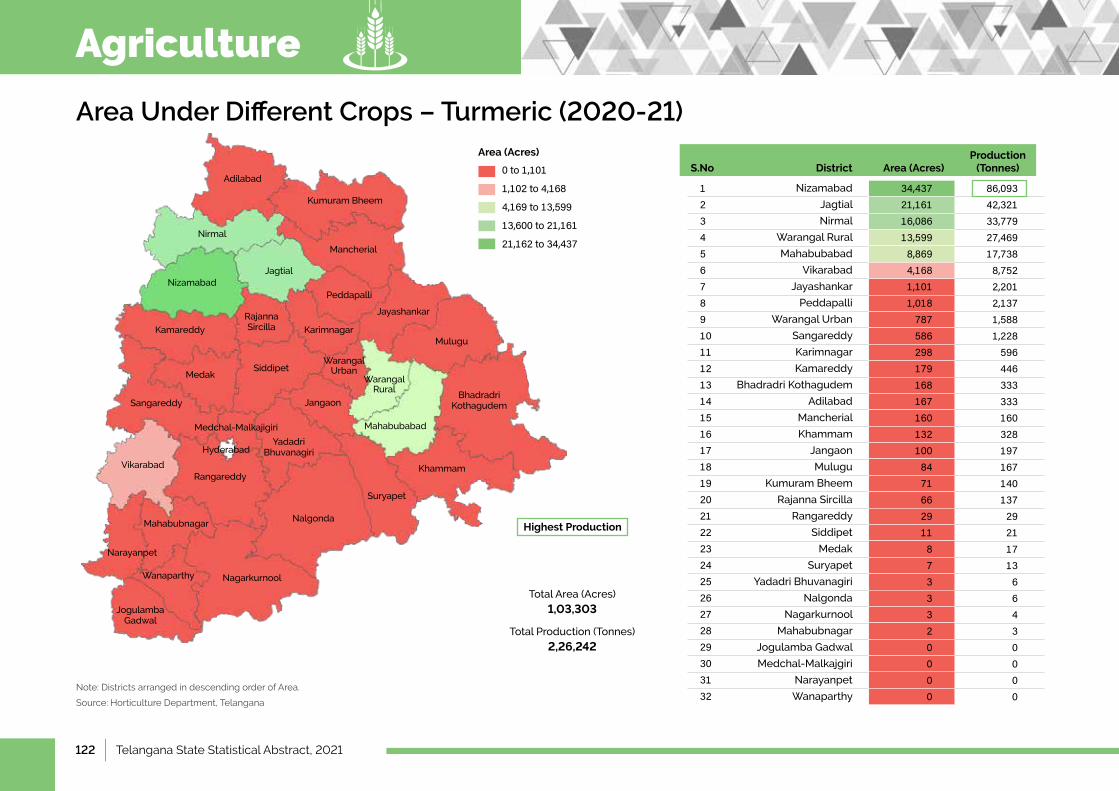
122 | Telangana State Statistical Abstract, 2021
Area Under Different Crops – Turmeric (2020-21)
Note: Districts arranged in descending order of Area.
Source: Horticulture Department, Telangana
0to1,101
1,102to4,168
4,169to13,599
13,600to21,161
21,162to34,437
Adilabad
Nirmal
Kumuram Bheem
Mancherial
Jagtial
Rajanna Sircilla
Peddapalli
Jayashankar
Mulugu
MedakSiddipet
JangaonSangareddy
Medchal-Malkajigiri
VikarabadRangareddy
Mahabubnagar
Narayanpet
Nalgonda
NagarkurnoolWanaparthy
Suryapet
Khammam
Karimnagar
Yadadri Bhuvanagiri
Mahabubabad
Jogulamba Gadwal
Bhadradri Kothagudem
Kamareddy
Nizamabad
Hyderabad
Area (Acres)
Nizamabad
Jagtial
Nirmal
Warangal Rural
Mahabubabad
Vikarabad
Jayashankar
Peddapalli
WarangalUrban
Sangareddy
Karimnagar
Kamareddy
Bhadradri Kothagudem
Adilabad
Mancherial
Khammam
Jangaon
Mulugu
Kumuram Bheem
Rajanna Sircilla
Rangareddy
Siddipet
Medak
Suryapet
YadadriBhuvanagiri
Nalgonda
Nagarkurnool
Mahabubnagar
Jogulamba Gadwal
Medchal-Malkajgiri
Narayanpet
Wanaparthy
1234567891011121314151617181920212223242526272829303132
DistrictS.No Area (Acres)
34,43721,16116,08613,5998,8694,1681,1011,01878758629817916816716013210084716629118733320000
86,09342,32133,77927,46917,7388,7522,2012,1371,5881,2285964463333331603281971671401372921171366430000
Production (Tonnes)
Total Area (Acres)
1,03,303
Total Production (Tonnes)
2,26,242
Highest Production
Warangal Urban
Warangal Rural
Agriculture
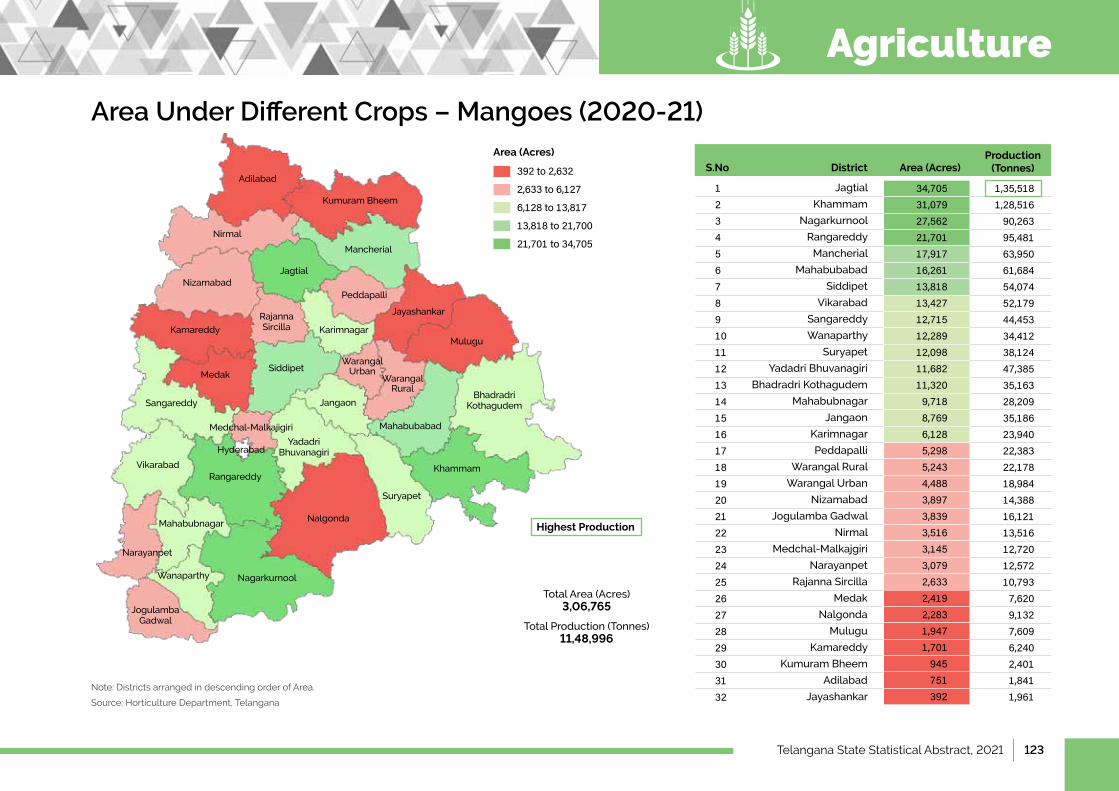
Telangana State Statistical Abstract, 2021 | 123
Area Under Different Crops – Mangoes (2020-21)
Note: Districts arranged in descending order of Area.
Source: Horticulture Department, Telangana
392to2,632
2,633to6,127
6,128to13,817
13,818to21,700
21,701to34,705
Adilabad
Nirmal
Kumuram Bheem
Mancherial
Jagtial
Rajanna Sircilla
Peddapalli
Jayashankar
Mulugu
MedakSiddipet
JangaonSangareddy
Medchal-Malkajigiri
VikarabadRangareddy
Mahabubnagar
Narayanpet
Nalgonda
NagarkurnoolWanaparthy
Suryapet
Khammam
Karimnagar
Yadadri Bhuvanagiri
Mahabubabad
Jogulamba Gadwal
Bhadradri Kothagudem
Kamareddy
Nizamabad
Hyderabad
Area (Acres)
Jagtial
Khammam
Nagarkurnool
Rangareddy
Mancherial
Mahabubabad
Siddipet
Vikarabad
Sangareddy
Wanaparthy
Suryapet
YadadriBhuvanagiri
Bhadradri Kothagudem
Mahabubnagar
Jangaon
Karimnagar
Peddapalli
Warangal Rural
WarangalUrban
Nizamabad
Jogulamba Gadwal
Nirmal
Medchal-Malkajgiri
Narayanpet
Rajanna Sircilla
Medak
Nalgonda
Mulugu
Kamareddy
Kumuram Bheem
Adilabad
Jayashankar
1234567891011121314151617181920212223242526272829303132
DistrictS.No Area (Acres)
34,70531,07927,56221,70117,91716,26113,81813,42712,71512,28912,09811,68211,3209,7188,7696,1285,2985,2434,4883,8973,8393,5163,1453,0792,6332,4192,2831,9471,701945751392
1,35,5181,28,51690,26395,48163,95061,68454,07452,17944,45334,41238,12447,38535,16328,20935,18623,94022,38322,17818,98414,38816,12113,51612,72012,57210,7937,6209,1327,6096,2402,4011,8411,961
Production (Tonnes)
Total Area (Acres) 3,06,765
Total Production (Tonnes) 11,48,996
Highest Production
Warangal Urban
Warangal Rural
Agriculture
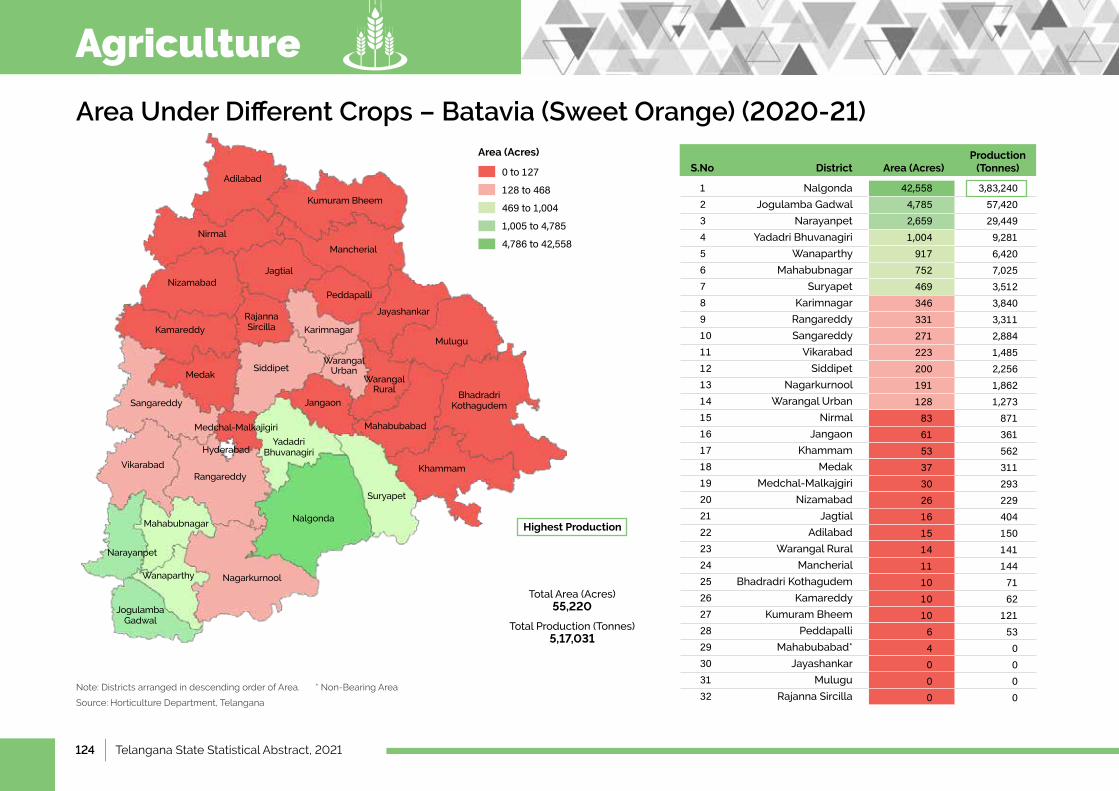
124 | Telangana State Statistical Abstract, 2021
Area Under Different Crops – Batavia (Sweet Orange) (2020-21)
Note: Districts arranged in descending order of Area. * Non-Bearing Area
Source: Horticulture Department, Telangana
0to127
128to468
469to1,004
1,005to4,785
4,786to42,558
Adilabad
Nirmal
Kumuram Bheem
Mancherial
Jagtial
Rajanna Sircilla
Peddapalli
Jayashankar
Mulugu
MedakSiddipet
JangaonSangareddy
Medchal-Malkajigiri
VikarabadRangareddy
Mahabubnagar
Narayanpet
Nalgonda
NagarkurnoolWanaparthy
Suryapet
Khammam
Karimnagar
Yadadri Bhuvanagiri
Mahabubabad
Jogulamba Gadwal
Bhadradri Kothagudem
Kamareddy
Nizamabad
Hyderabad
Area (Acres)
Nalgonda
Jogulamba Gadwal
Narayanpet
YadadriBhuvanagiri
Wanaparthy
Mahabubnagar
Suryapet
Karimnagar
Rangareddy
Sangareddy
Vikarabad
Siddipet
Nagarkurnool
WarangalUrban
Nirmal
Jangaon
Khammam
Medak
Medchal-Malkajgiri
Nizamabad
Jagtial
Adilabad
Warangal Rural
Mancherial
Bhadradri Kothagudem
Kamareddy
Kumuram Bheem
Peddapalli
Mahabubabad*
Jayashankar
Mulugu
Rajanna Sircilla
1234567891011121314151617181920212223242526272829303132
DistrictS.No Area (Acres)
42,5584,7852,6591,0049177524693463312712232001911288361533730261615141110101064000
3,83,24057,42029,4499,2816,4207,0253,5123,8403,3112,8841,4852,2561,8621,2738713615623112932294041501411447162
121530000
Production (Tonnes)
Total Area (Acres) 55,220
Total Production (Tonnes) 5,17,031
Highest Production
Warangal Urban
Warangal Rural
Agriculture

Telangana State Statistical Abstract, 2021 | 125
Area Under Different Crops – Watermelon (2020-21)
Note: Districts arranged in descending order of Area.
Source: Horticulture Department, Telangana
2to56
57to119
120to241
242to537
538to1,216
Area (Acres)
Warangal Rural
Khammam
Bhadradri Kothagudem
Nalgonda
Nagarkurnool
Nizamabad
Nirmal
Mahabubnagar
Mulugu
Jangaon
Jayashankar
Karimnagar
Siddipet
Mahabubabad
Narayanpet
Vikarabad
Rangareddy
Adilabad
Kamareddy
Sangareddy
Peddapalli
WarangalUrban
Mancherial
Jogulamba Gadwal
Jagtial
Suryapet
Wanaparthy
YadadriBhuvanagiri
Kumuram Bheem
Rajanna Sircilla
Medak
Medchal-Malkajgiri
1234567891011121314151617181920212223242526272829303132
DistrictS.No Area (Acres)
1,216538475406356241228227206199198175170160156119112111888581777757504442402724192
36,48010,73514,22810,1387,1087,1406,8175,6565,1305,9745,9414,9015,1034,6854,6583,3623,2883,1112,6152,5342,0072,3011,6791,6891,4831,2941,2391,19167672647933
Production (Tonnes)
Total Area (Acres) 6,007
Total Production (Tonnes) 1,64,400
Highest Production
Adilabad
Nirmal
Kumuram Bheem
Mancherial
Jagtial
Rajanna Sircilla
Peddapalli
Jayashankar
Mulugu
MedakSiddipet
JangaonSangareddy
Medchal-Malkajigiri
VikarabadRangareddy
Mahabubnagar
Narayanpet
Nalgonda
NagarkurnoolWanaparthy
Suryapet
Khammam
Karimnagar
Yadadri Bhuvanagiri
Mahabubabad
Jogulamba Gadwal
Bhadradri Kothagudem
Kamareddy
Nizamabad
Hyderabad
Warangal Urban
Warangal Rural
Agriculture
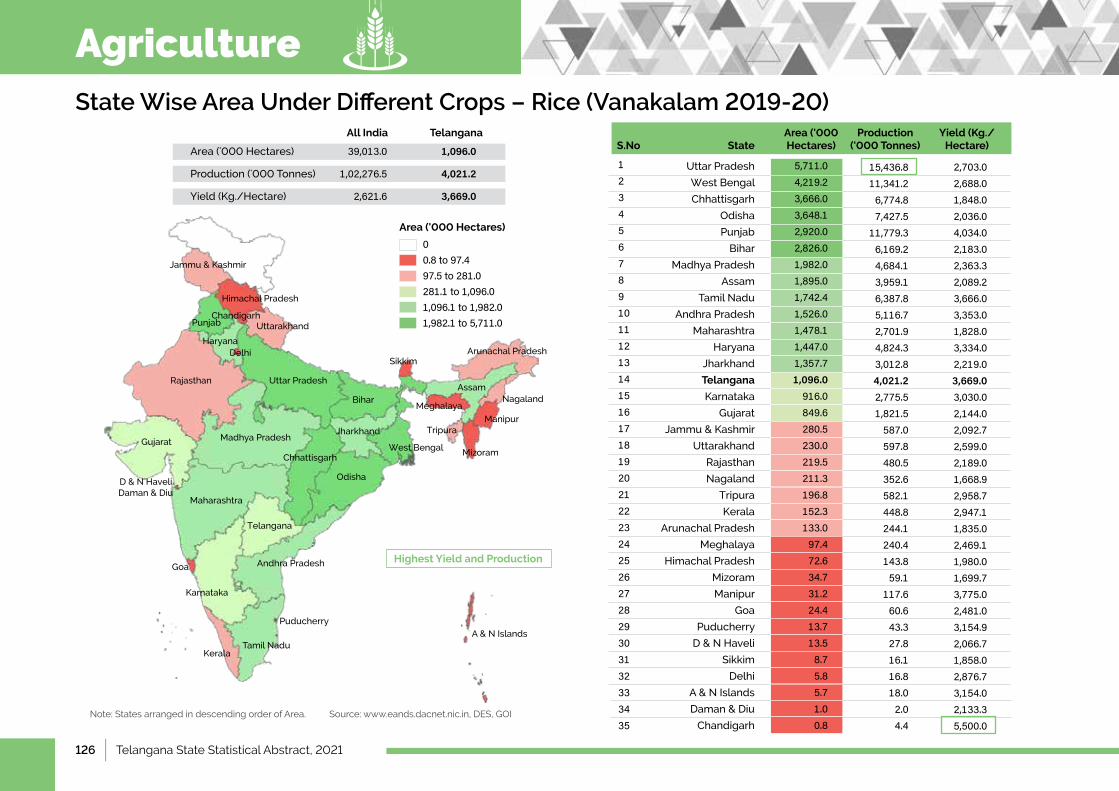
126 | Telangana State Statistical Abstract, 2021
State Wise Area Under Different Crops – Rice (Vanakalam 2019-20)
Note: States arranged in descending order of Area. Source: www.eands.dacnet.nic.in, DES, GOI
UttarPradesh
West Bengal
Chhattisgarh
Odisha
Punjab
Bihar
MadhyaPradesh
Assam
Tamil Nadu
Andhra Pradesh
Maharashtra
Haryana
Jharkhand
Telangana
Karnataka
Gujarat
Jammu & Kashmir
Uttarakhand
Rajasthan
Nagaland
Tripura
Kerala
Arunachal Pradesh
Meghalaya
Himachal Pradesh
Mizoram
Manipur
Goa
Puducherry
D & N Haveli
Sikkim
Delhi
A&NIslands
Daman & Diu
Chandigarh
1234567891011121314151617181920212223242526272829303132333435
StateS.NoArea ('000 Hectares)
Production ('000 Tonnes)
Yield (Kg./Hectare)
2,703.02,688.01,848.02,036.04,034.02,183.02,363.32,089.23,666.03,353.01,828.03,334.02,219.03,669.03,030.02,144.02,092.72,599.02,189.01,668.92,958.72,947.11,835.02,469.11,980.01,699.73,775.02,481.03,154.92,066.71,858.02,876.73,154.02,133.35,500.0
15,436.811,341.26,774.87,427.5
11,779.36,169.24,684.13,959.16,387.85,116.72,701.94,824.33,012.84,021.22,775.51,821.5587.0597.8480.5352.6582.1448.8244.1240.4143.859.1
117.660.643.327.816.116.818.02.04.4
5,711.04,219.23,666.03,648.12,920.02,826.01,982.01,895.01,742.41,526.01,478.11,447.01,357.71,096.0916.0849.6280.5230.0219.5211.3196.8152.3133.097.472.634.731.224.413.713.58.75.85.71.00.8
All India Telangana
Area('000Hectares) 39,013.0 1,096.0
Production('000Tonnes) 1,02,276.5 4,021.2
Yield(Kg./Hectare) 2,621.6 3,669.0
UttarPradesh
Bihar
Jharkhand
Telangana
West Bengal
Nagaland
Tripura
Mizoram
Sikkim
Manipur
Meghalaya
Kerala
Chhattisgarh
MadhyaPradesh
RajasthanAssam
Tamil Nadu
Arunachal Pradesh
Maharashtra
D & N HaveliDaman & Diu
Uttarakhand
Himachal Pradesh
Gujarat
HaryanaDelhi
Andhra Pradesh
A&NIslandsPuducherry
Karnataka
Goa
Jammu & Kashmir
Odisha
PunjabChandigarh
Area ('000 Hectares)
00.8to97.497.5to281.0281.1to1,096.01,096.1to1,982.01,982.1to5,711.0
Highest Yield and Production
Agriculture
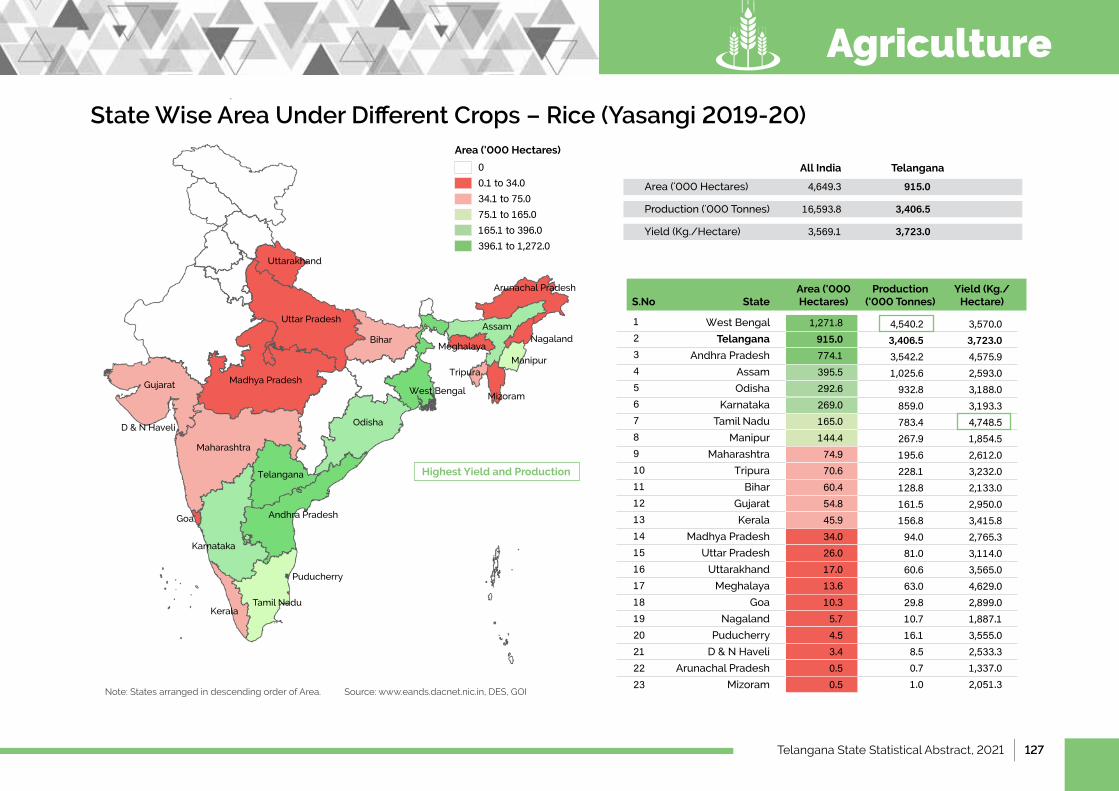
Telangana State Statistical Abstract, 2021 | 127
State Wise Area Under Different Crops – Rice (Yasangi 2019-20)
Note: States arranged in descending order of Area. Source: www.eands.dacnet.nic.in, DES, GOI
All India Telangana
Area('000Hectares) 4,649.3 915.0
Production('000Tonnes) 16,593.8 3,406.5
Yield(Kg./Hectare) 3,569.1 3,723.0
UttarPradesh
Bihar
Telangana
West Bengal
Nagaland
Tripura
Mizoram
Manipur
Meghalaya
Kerala
MadhyaPradesh
Assam
Tamil Nadu
Arunachal Pradesh
Maharashtra
D & N Haveli
Uttarakhand
Gujarat
Andhra Pradesh
Puducherry
Karnataka
Goa
Odisha
Highest Yield and Production
Area ('000 Hectares)
00.1to34.034.1to75.075.1to165.0165.1to396.0396.1to1,272.0
West Bengal
Telangana
Andhra Pradesh
Assam
Odisha
Karnataka
Tamil Nadu
Manipur
Maharashtra
Tripura
Bihar
Gujarat
Kerala
MadhyaPradesh
UttarPradesh
Uttarakhand
Meghalaya
Goa
Nagaland
Puducherry
D & N Haveli
Arunachal Pradesh
Mizoram
1234567891011121314151617181920212223
StateS.NoArea ('000 Hectares)
Production ('000 Tonnes)
Yield (Kg./Hectare)
3,570.03,723.04,575.92,593.03,188.03,193.34,748.51,854.52,612.03,232.02,133.02,950.03,415.82,765.33,114.03,565.04,629.02,899.01,887.13,555.02,533.31,337.02,051.3
4,540.23,406.53,542.21,025.6932.8859.0783.4267.9195.6228.1128.8161.5156.894.081.060.663.029.810.716.18.50.71.0
1,271.8915.0774.1395.5292.6269.0165.0144.474.970.660.454.845.934.026.017.013.610.35.74.53.40.50.5
Agriculture
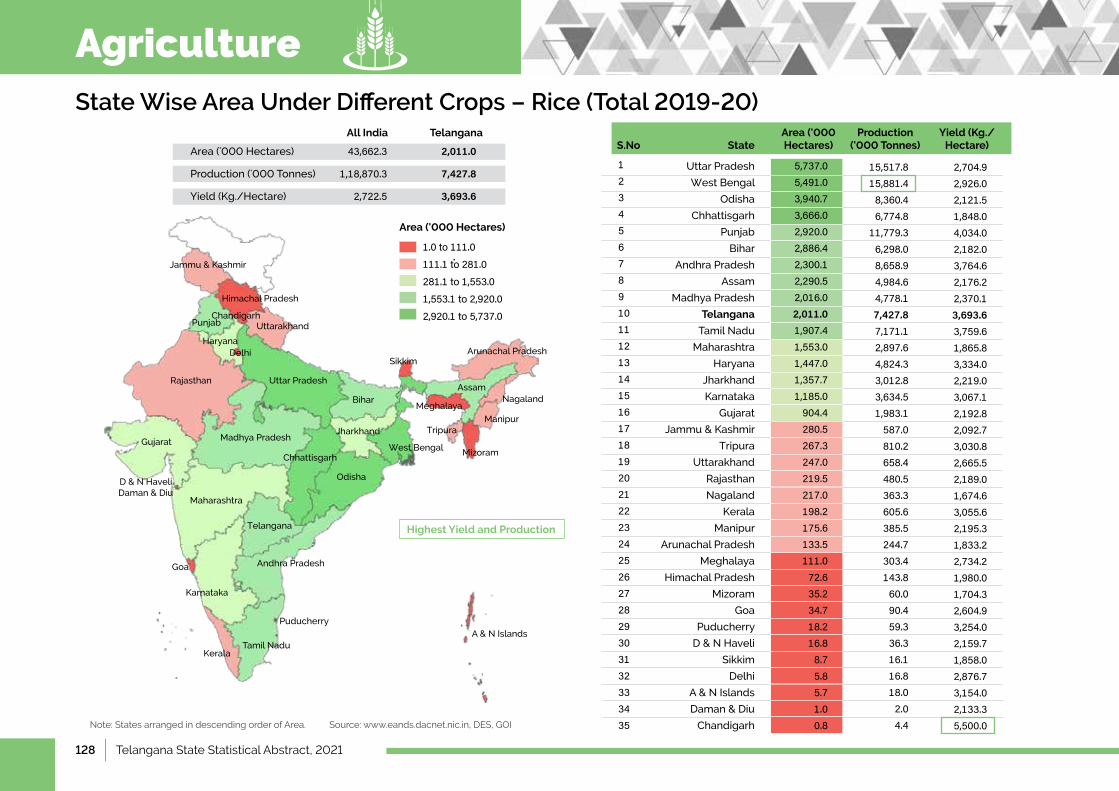
128 | Telangana State Statistical Abstract, 2021
State Wise Area Under Different Crops – Rice (Total 2019-20)
Note: States arranged in descending order of Area. Source: www.eands.dacnet.nic.in, DES, GOI
1.0to111.0
111.1to281.0
281.1to1,553.0
1,553.1to2,920.0
2,920.1to5,737.0
Area ('000 Hectares)
UttarPradesh
West Bengal
Odisha
Chhattisgarh
Punjab
Bihar
Andhra Pradesh
Assam
MadhyaPradesh
Telangana
Tamil Nadu
Maharashtra
Haryana
Jharkhand
Karnataka
Gujarat
Jammu & Kashmir
Tripura
Uttarakhand
Rajasthan
Nagaland
Kerala
Manipur
Arunachal Pradesh
Meghalaya
Himachal Pradesh
Mizoram
Goa
Puducherry
D & N Haveli
Sikkim
Delhi
A&NIslands
Daman & Diu
Chandigarh
1234567891011121314151617181920212223242526272829303132333435
StateS.NoArea ('000 Hectares)
Production ('000 Tonnes)
Yield (Kg./Hectare)
2,704.92,926.02,121.51,848.04,034.02,182.03,764.62,176.22,370.13,693.63,759.61,865.83,334.02,219.03,067.12,192.82,092.73,030.82,665.52,189.01,674.63,055.62,195.31,833.22,734.21,980.01,704.32,604.93,254.02,159.71,858.02,876.73,154.02,133.35,500.0
15,517.815,881.48,360.46,774.8
11,779.36,298.08,658.94,984.64,778.17,427.87,171.12,897.64,824.33,012.83,634.51,983.1587.0810.2658.4480.5363.3605.6385.5244.7303.4143.860.090.459.336.316.116.818.02.04.4
5,737.05,491.03,940.73,666.02,920.02,886.42,300.12,290.52,016.02,011.01,907.41,553.01,447.01,357.71,185.0904.4280.5267.3247.0219.5217.0198.2175.6133.5111.072.635.234.718.216.88.75.85.71.00.8
All India Telangana
Area('000Hectares) 43,662.3 2,011.0
Production('000Tonnes) 1,18,870.3 7,427.8
Yield(Kg./Hectare) 2,722.5 3,693.6
UttarPradesh
Bihar
Jharkhand
Telangana
West Bengal
Nagaland
Tripura
Mizoram
Sikkim
Manipur
Meghalaya
Kerala
Chhattisgarh
MadhyaPradesh
RajasthanAssam
Tamil Nadu
Arunachal Pradesh
Maharashtra
D & N HaveliDaman & Diu
Uttarakhand
Himachal Pradesh
Gujarat
HaryanaDelhi
Andhra Pradesh
A&NIslandsPuducherry
Karnataka
Goa
Jammu & Kashmir
Odisha
PunjabChandigarh
Highest Yield and Production
Agriculture
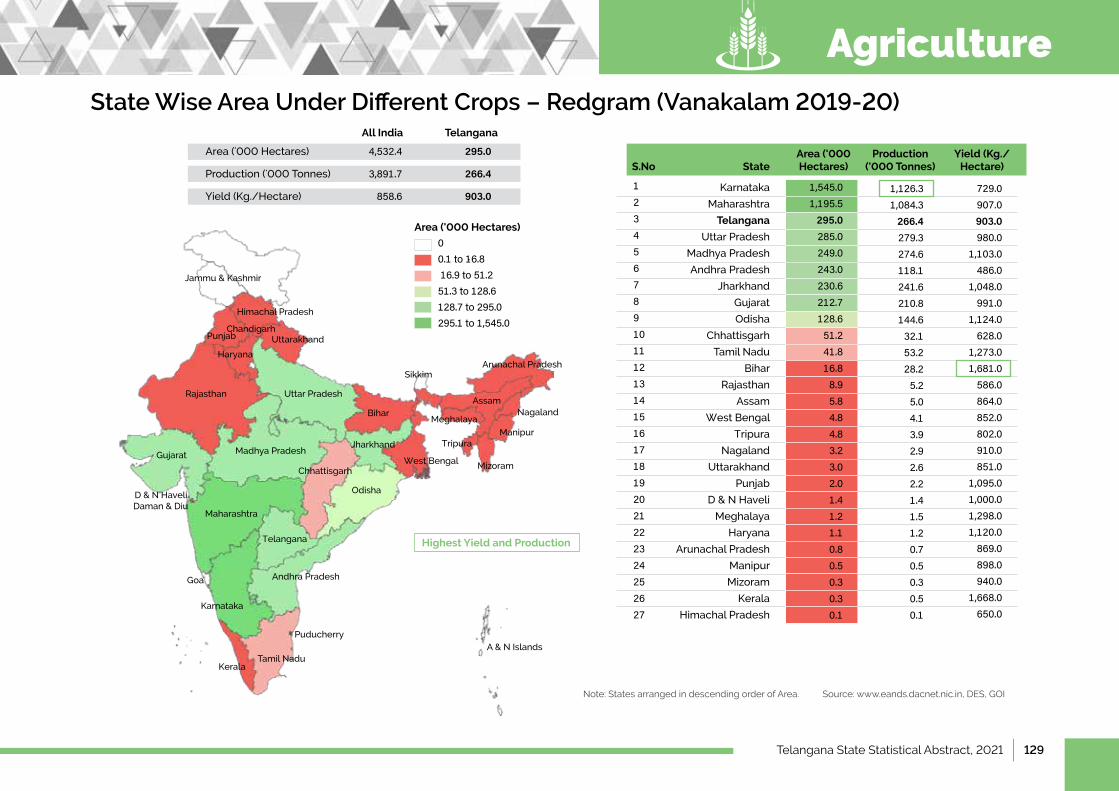
Telangana State Statistical Abstract, 2021 | 129
State Wise Area Under Different Crops – Redgram (Vanakalam 2019-20)
Note: States arranged in descending order of Area. Source: www.eands.dacnet.nic.in, DES, GOI
Area ('000 Hectares)
All India Telangana
Area('000Hectares) 4,532.4 295.0
Production('000Tonnes) 3,891.7 266.4
Yield(Kg./Hectare) 858.6 903.0
UttarPradesh
Bihar
Jharkhand
Telangana
West Bengal
Nagaland
Tripura
Mizoram
Sikkim
Manipur
Meghalaya
Kerala
Chhattisgarh
MadhyaPradesh
RajasthanAssam
Tamil Nadu
Arunachal Pradesh
Maharashtra
D & N HaveliDaman & Diu
Uttarakhand
Himachal Pradesh
Gujarat
Haryana
Andhra Pradesh
A & N IslandsPuducherry
Karnataka
Goa
Jammu & Kashmir
Odisha
PunjabChandigarh
00.1to16.816.9to51.251.3to128.6128.7to295.0295.1to1,545.0
Karnataka
Maharashtra
Telangana
UttarPradesh
MadhyaPradesh
Andhra Pradesh
Jharkhand
Gujarat
Odisha
Chhattisgarh
Tamil Nadu
Bihar
Rajasthan
Assam
West Bengal
Tripura
Nagaland
Uttarakhand
Punjab
D & N Haveli
Meghalaya
Haryana
Arunachal Pradesh
Manipur
Mizoram
Kerala
Himachal Pradesh
123456789101112131415161718192021222324252627
StateS.NoArea ('000 Hectares)
Production ('000 Tonnes)
Yield (Kg./Hectare)
729.0907.0903.0980.0
1,103.0486.0
1,048.0991.0
1,124.0628.0
1,273.01,681.0586.0864.0852.0802.0910.0851.0
1,095.01,000.01,298.01,120.0869.0898.0940.0
1,668.0650.0
1,126.31,084.3266.4279.3274.6118.1241.6210.8144.632.153.228.25.25.04.13.92.92.62.21.41.51.20.70.50.30.50.1
1,545.01,195.5295.0285.0249.0243.0230.6212.7128.651.241.816.88.95.84.84.83.23.02.01.41.21.10.80.50.30.30.1
Highest Yield and Production
Agriculture
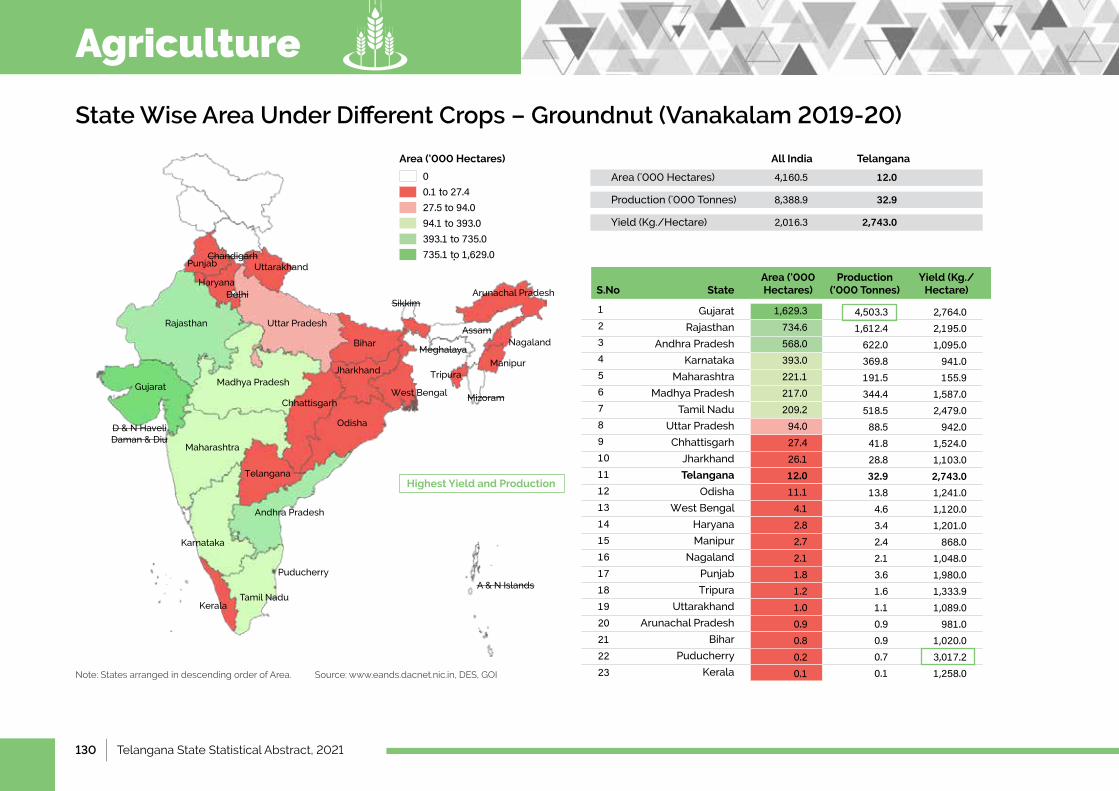
130 | Telangana State Statistical Abstract, 2021
State Wise Area Under Different Crops – Groundnut (Vanakalam 2019-20)
Note: States arranged in descending order of Area. Source: www.eands.dacnet.nic.in, DES, GOI
All India Telangana
Area('000Hectares) 4,160.5 12.0
Production('000Tonnes) 8,388.9 32.9
Yield(Kg./Hectare) 2,016.3 2,743.0
UttarPradesh
Bihar
Jharkhand
Telangana
West Bengal
Nagaland
Tripura
Mizoram
Sikkim
Manipur
Meghalaya
Kerala
Chhattisgarh
MadhyaPradesh
RajasthanAssam
Tamil Nadu
Arunachal Pradesh
Maharashtra
D & N HaveliDaman & Diu
Uttarakhand
Gujarat
HaryanaDelhi
Andhra Pradesh
A & N IslandsPuducherry
Karnataka
Odisha
PunjabChandigarh
Highest Yield and Production
Gujarat
Rajasthan
Andhra Pradesh
Karnataka
Maharashtra
MadhyaPradesh
Tamil Nadu
UttarPradesh
Chhattisgarh
Jharkhand
Telangana
Odisha
West Bengal
Haryana
Manipur
Nagaland
Punjab
Tripura
Uttarakhand
Arunachal Pradesh
Bihar
Puducherry
Kerala
1234567891011121314151617181920212223
StateS.NoArea ('000 Hectares)
Production ('000 Tonnes)
Yield (Kg./Hectare)
2,764.02,195.01,095.0941.0155.9
1,587.02,479.0942.0
1,524.01,103.02,743.01,241.01,120.01,201.0868.0
1,048.01,980.01,333.91,089.0981.0
1,020.03,017.21,258.0
4,503.31,612.4622.0369.8191.5344.4518.588.541.828.832.913.84.63.42.42.13.61.61.10.90.90.70.1
1,629.3734.6568.0393.0221.1217.0209.294.027.426.112.011.14.12.82.72.11.81.21.00.90.80.20.1
Area ('000 Hectares)
00.1to27.427.5to94.094.1to393.0393.1to735.0735.1to1,629.0
Agriculture
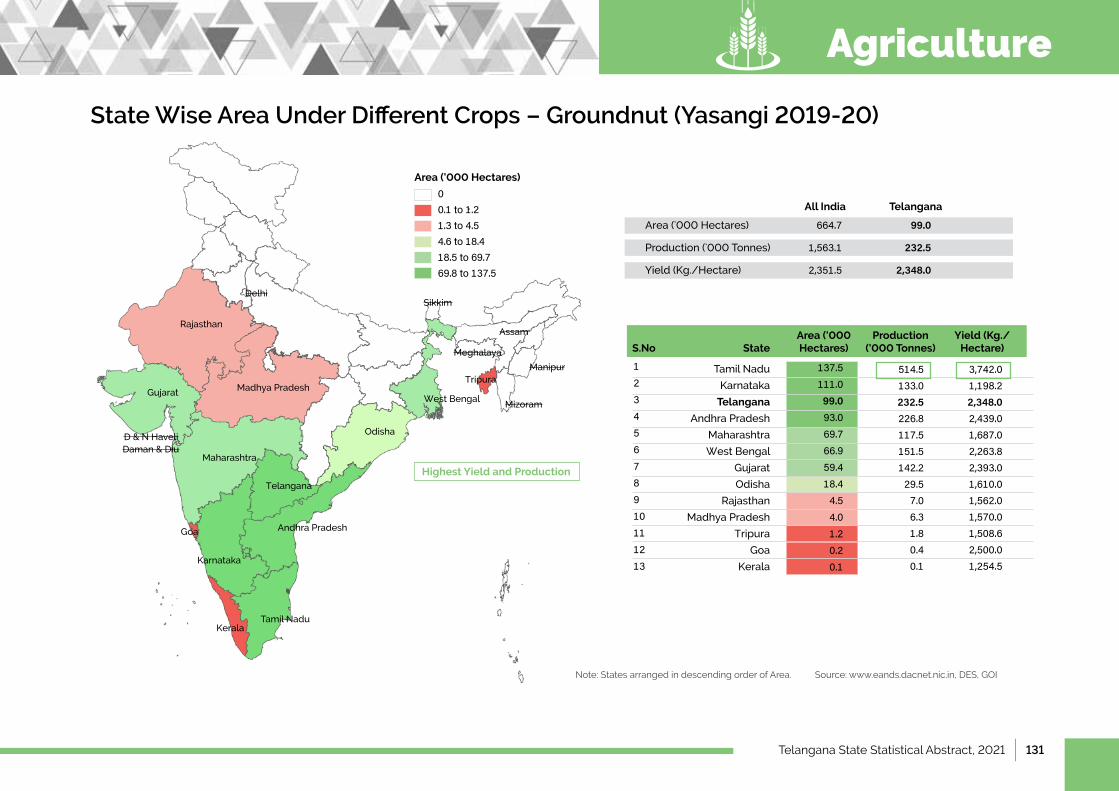
Telangana State Statistical Abstract, 2021 | 131
State Wise Area Under Different Crops – Groundnut (Yasangi 2019-20)
Note: States arranged in descending order of Area. Source: www.eands.dacnet.nic.in, DES, GOI
All India Telangana
Area('000Hectares) 664.7 99.0
Production('000Tonnes) 1,563.1 232.5
Yield(Kg./Hectare) 2,351.5 2,348.0
Chandigarh
Area ('000 Hectares)
00.1to1.21.3to4.54.6to18.418.5to69.769.8to137.5
Telangana
West Bengal
Tripura
Mizoram
Sikkim
Manipur
Meghalaya
Kerala
MadhyaPradesh
RajasthanAssam
Tamil Nadu
Maharashtra
D & N HaveliDaman & Diu
Gujarat
Delhi
Andhra Pradesh
Karnataka
Goa
Odisha
Highest Yield and Production
Tamil Nadu
Karnataka
Telangana
Andhra Pradesh
Maharashtra
West Bengal
Gujarat
Odisha
Rajasthan
MadhyaPradesh
Tripura
Goa
Kerala
12345678910111213
StateS.NoArea ('000 Hectares)
Production ('000 Tonnes)
Yield (Kg./Hectare)
3,742.01,198.22,348.02,439.01,687.02,263.82,393.01,610.01,562.01,570.01,508.62,500.01,254.5
514.5133.0232.5226.8117.5151.5142.229.57.06.31.80.40.1
137.5111.099.093.069.766.959.418.44.54.01.20.20.1
Agriculture
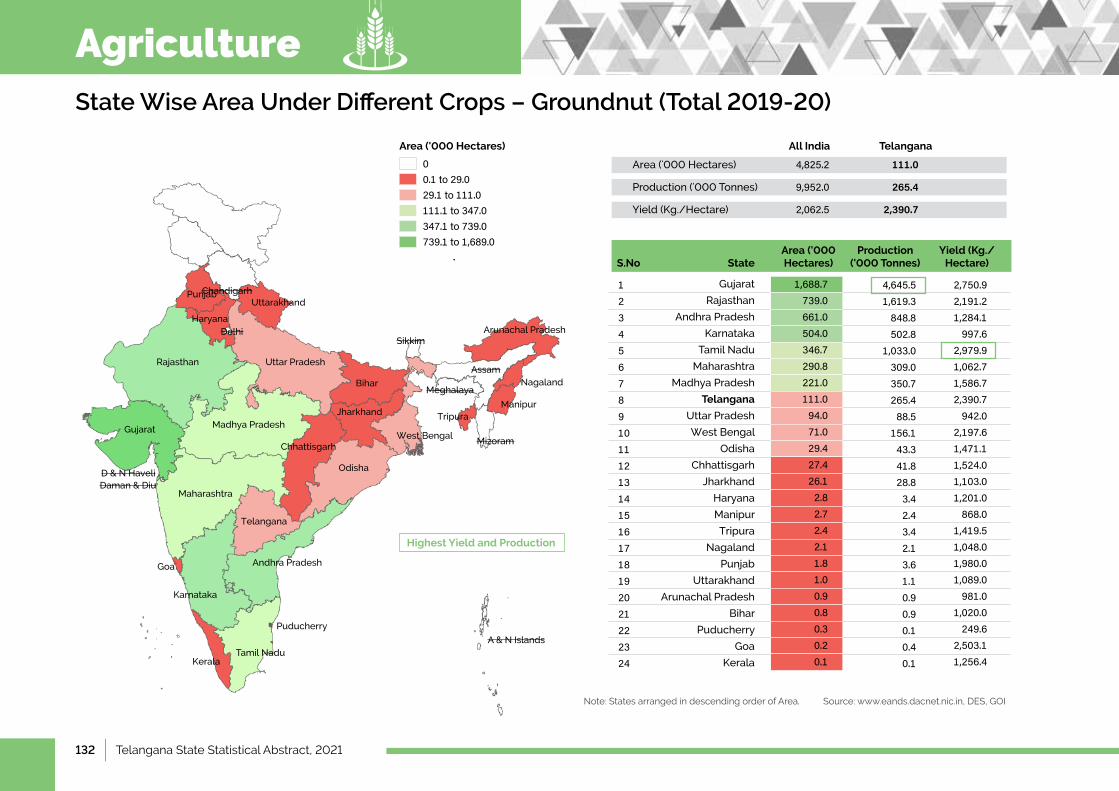
132 | Telangana State Statistical Abstract, 2021
State Wise Area Under Different Crops – Groundnut (Total 2019-20)
Note: States arranged in descending order of Area. Source: www.eands.dacnet.nic.in, DES, GOI
All India Telangana
Area('000Hectares) 4,825.2 111.0
Production('000Tonnes) 9,952.0 265.4
Yield(Kg./Hectare) 2,062.5 2,390.7
UttarPradesh
Bihar
Jharkhand
Telangana
West Bengal
Nagaland
Tripura
Mizoram
Sikkim
Manipur
Meghalaya
Kerala
Chhattisgarh
MadhyaPradesh
RajasthanAssam
Tamil Nadu
Arunachal Pradesh
Maharashtra
D & N HaveliDaman & Diu
Uttarakhand
Gujarat
HaryanaDelhi
Andhra Pradesh
A & N Islands
Puducherry
Karnataka
Goa
Odisha
PunjabChandigarh
Area ('000 Hectares)
00.1to29.029.1to111.0111.1to347.0347.1to739.0739.1to1,689.0
Highest Yield and Production
Gujarat
Rajasthan
Andhra Pradesh
Karnataka
Tamil Nadu
Maharashtra
MadhyaPradesh
Telangana
UttarPradesh
West Bengal
Odisha
Chhattisgarh
Jharkhand
Haryana
Manipur
Tripura
Nagaland
Punjab
Uttarakhand
Arunachal Pradesh
Bihar
Puducherry
Goa
Kerala
123456789101112131415161718192021222324
StateS.NoArea ('000 Hectares)
Production ('000 Tonnes)
Yield (Kg./Hectare)
2,750.92,191.21,284.1997.6
2,979.91,062.71,586.72,390.7942.0
2,197.61,471.11,524.01,103.01,201.0868.0
1,419.51,048.01,980.01,089.0981.0
1,020.0249.6
2,503.11,256.4
4,645.51,619.3848.8502.8
1,033.0309.0350.7265.488.5
156.143.341.828.83.42.43.42.13.61.10.90.90.10.40.1
1,688.7739.0661.0504.0346.7290.8221.0111.094.071.029.427.426.12.82.72.42.11.81.00.90.80.30.20.1
Agriculture
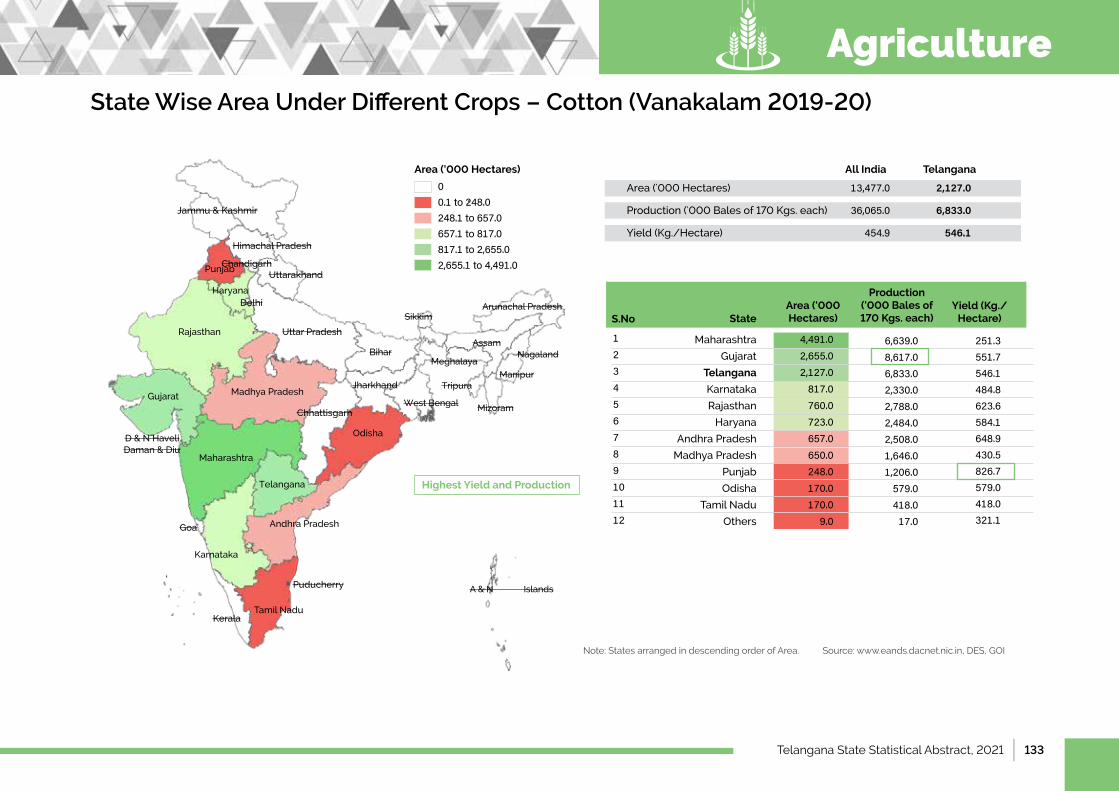
Telangana State Statistical Abstract, 2021 | 133
State Wise Area Under Different Crops – Cotton (Vanakalam 2019-20)
Note: States arranged in descending order of Area. Source: www.eands.dacnet.nic.in, DES, GOI
All India Telangana
Area('000Hectares) 13,477.0 2,127.0
Production('000Balesof170Kgs.each) 36,065.0 6,833.0
Yield(Kg./Hectare) 454.9 546.1
Uttar Pradesh
Bihar
Jharkhand
Telangana
West Bengal
Nagaland
Tripura
Mizoram
Sikkim
Manipur
Meghalaya
Kerala
Chhattisgarh
MadhyaPradesh
RajasthanAssam
Tamil Nadu
Arunachal Pradesh
Maharashtra
D & N HaveliDaman & Diu
Uttarakhand
Himachal Pradesh
Gujarat
HaryanaDelhi
Andhra Pradesh
A & N IslandsPuducherry
Karnataka
Goa
Jammu & Kashmir
Odisha
PunjabChandigarh
Area ('000 Hectares)
00.1to248.0248.1to657.0657.1to817.0817.1to2,655.02,655.1to4,491.0
Highest Yield and Production
Maharashtra
Gujarat
Telangana
Karnataka
Rajasthan
Haryana
Andhra Pradesh
MadhyaPradesh
Punjab
Odisha
Tamil Nadu
Others
123456789101112
StateS.NoArea ('000 Hectares)
Production ('000 Bales of 170 Kgs. each)
Yield (Kg./Hectare)
251.3551.7546.1484.8623.6584.1648.9430.5826.7579.0418.0321.1
6,639.08,617.06,833.02,330.02,788.02,484.02,508.01,646.01,206.0579.0418.017.0
4,491.02,655.02,127.0817.0760.0723.0657.0650.0248.0170.0170.0
9.0
Agriculture
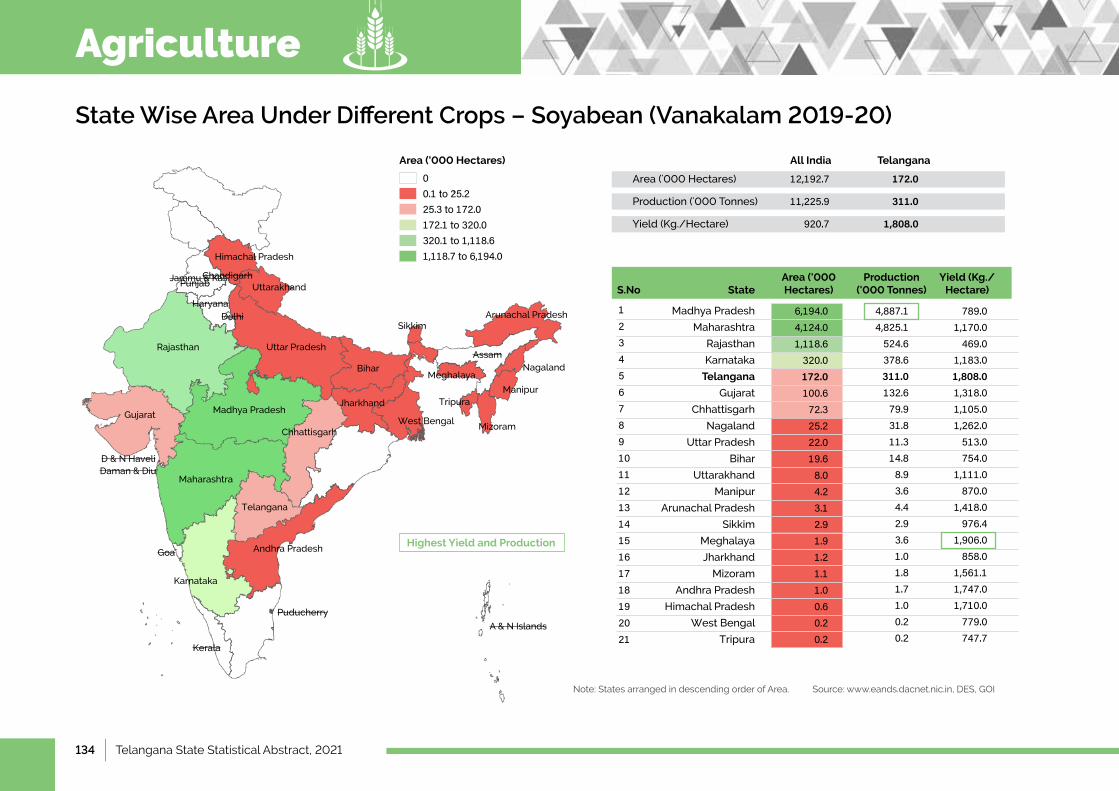
134 | Telangana State Statistical Abstract, 2021
State Wise Area Under Different Crops – Soyabean (Vanakalam 2019-20)
Note: States arranged in descending order of Area. Source: www.eands.dacnet.nic.in, DES, GOI
All India Telangana
Area('000Hectares) 12,192.7 172.0
Production('000Tonnes) 11,225.9 311.0
Yield(Kg./Hectare) 920.7 1,808.0
Jammu & Kashmir
UttarPradesh
Bihar
Jharkhand
Telangana
West Bengal
Nagaland
Tripura
Mizoram
Sikkim
Manipur
Meghalaya
Kerala
Chhattisgarh
MadhyaPradesh
RajasthanAssam
Arunachal Pradesh
Maharashtra
D & N HaveliDaman & Diu
Uttarakhand
Himachal Pradesh
Gujarat
HaryanaDelhi
Andhra Pradesh
A & N Islands
Puducherry
Karnataka
Goa
PunjabChandigarh
Area ('000 Hectares)
00.1to25.225.3to172.0172.1to320.0320.1to1,118.61,118.7to6,194.0
Highest Yield and Production
123456789101112131415161718192021
StateS.NoArea ('000 Hectares)
Production ('000 Tonnes)
Yield (Kg./Hectare)
789.01,170.0469.0
1,183.01,808.01,318.01,105.01,262.0513.0754.0
1,111.0870.0
1,418.0976.4
1,906.0858.0
1,561.11,747.01,710.0779.0747.7
4,887.14,825.1524.6378.6311.0132.679.931.811.314.88.93.64.42.93.61.01.81.71.00.20.2
6,194.04,124.01,118.6320.0172.0100.672.325.222.019.68.04.23.12.91.91.21.11.00.60.20.2
MadhyaPradesh
Maharashtra
Rajasthan
Karnataka
Telangana
Gujarat
Chhattisgarh
Nagaland
UttarPradesh
Bihar
Uttarakhand
Manipur
Arunachal Pradesh
Sikkim
Meghalaya
Jharkhand
Mizoram
Andhra Pradesh
Himachal Pradesh
West Bengal
Tripura
Agriculture
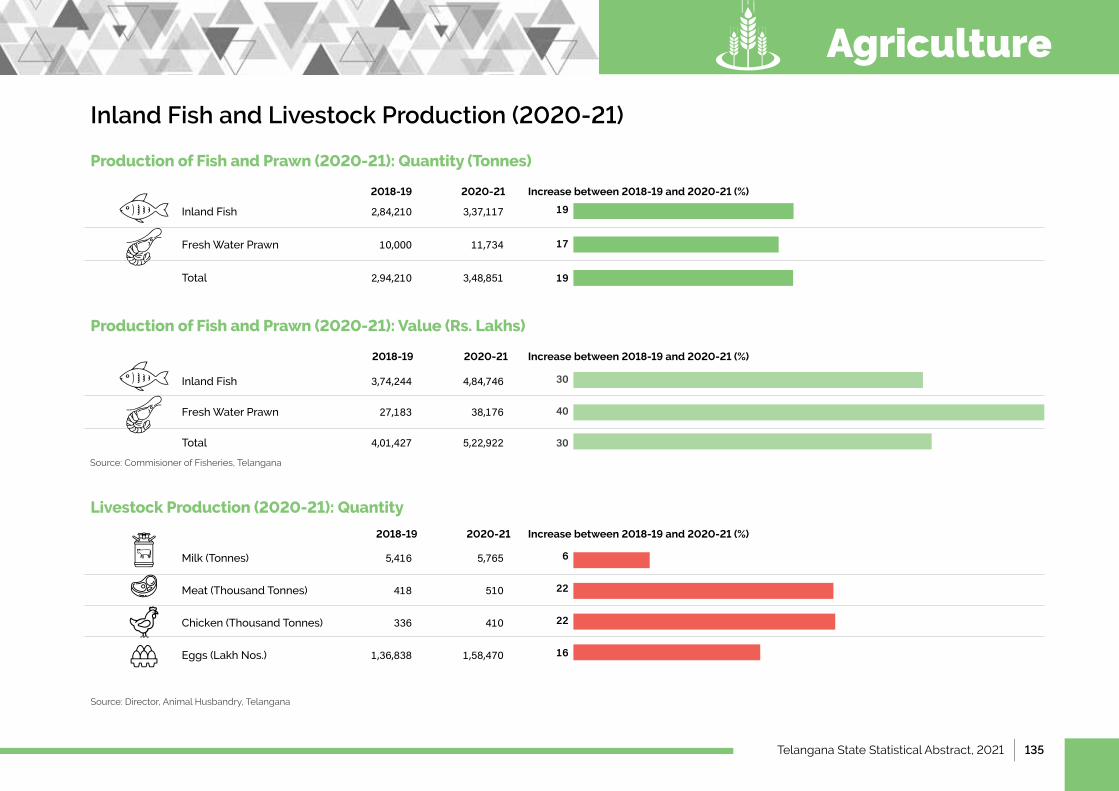
Telangana State Statistical Abstract, 2021 | 135
Inland Fish and Livestock Production (2020-21)
2018-19
2018-19
2018-19
2020-21
2020-21
2020-21
Increase between 2018-19 and 2020-21 (%)
Increase between 2018-19 and 2020-21 (%)
Increase between 2018-19 and 2020-21 (%)
InlandFish 2,84,210 3,37,117
FreshWaterPrawn 10,000 11,734
Total 2,94,210 3,48,851
InlandFish 3,74,244 4,84,746
FreshWaterPrawn 27,183 38,176
Total 4,01,427 5,22,922
Milk(Tonnes) 5,416 5,765
Meat(ThousandTonnes) 418 510
Chicken (Thousand Tonnes) 336 410
Eggs(LakhNos.) 1,36,838 1,58,470
Source: Commisioner of Fisheries, Telangana
Source: Director, Animal Husbandry, Telangana
19
17
19
30
40
30
6
22
22
16
Production of Fish and Prawn (2020-21): Quantity (Tonnes)
Production of Fish and Prawn (2020-21): Value (Rs. Lakhs)
Livestock Production (2020-21): Quantity
Agriculture
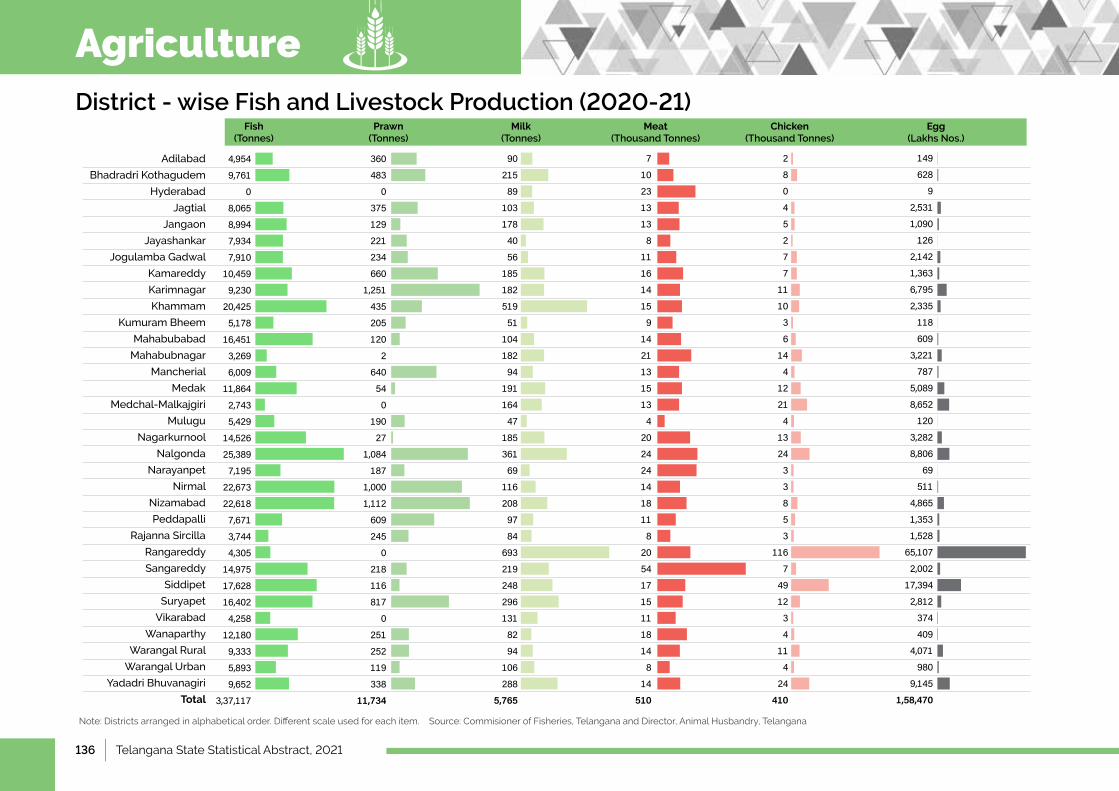
136 | Telangana State Statistical Abstract, 2021
District - wise Fish and Livestock Production (2020-21)
Adilabad
Bhadradri Kothagudem
Hyderabad
Jagtial
Jangaon
Jayashankar
Jogulamba Gadwal
Kamareddy
Karimnagar
Khammam
Kumuram Bheem
Mahabubabad
Mahabubnagar
Mancherial
Medak
Medchal-Malkajgiri
Mulugu
Nagarkurnool
Nalgonda
Narayanpet
Nirmal
Nizamabad
Peddapalli
Rajanna Sircilla
Rangareddy
Sangareddy
Siddipet
Suryapet
Vikarabad
Wanaparthy
Warangal Rural
WarangalUrban
YadadriBhuvanagiri
Total
Fish (Tonnes)
Prawn (Tonnes)
Milk (Tonnes)
Meat (Thousand Tonnes)
Chicken (Thousand Tonnes)
Egg (Lakhs Nos.)
4,954
9,761
0
8,065
8,994
7,934
7,910
10,459
9,230
20,425
5,178
16,451
3,269
6,009
11,864
2,743
5,429
14,526
25,389
7,195
22,673
22,618
7,671
3,744
4,305
14,975
17,628
16,402
4,258
12,180
9,333
5,893
9,652
3,37,117
360
483
0
375
129
221
234
660
1,251
435
205
120
2
640
54
0
190
27
1,084
187
1,000
1,112
609
245
0
218
116
817
0
251
252
119
338
11,734
90
215
89
103
178
40
56
185
182
519
51
104
182
94
191
164
47
185
361
69
116
208
97
84
693
219
248
296
131
82
94
106
288
5,765
7
10
23
13
13
8
11
16
14
15
9
14
21
13
15
13
4
20
24
24
14
18
11
8
20
54
17
15
11
18
14
8
14
510
2
8
0
4
5
2
7
7
11
10
3
6
14
4
12
21
4
13
24
3
3
8
5
3
116
7
49
12
3
4
11
4
24
410
149
628
9
2,531
1,090
126
2,142
1,363
6,795
2,335
118
609
3,221
787
5,089
8,652
120
3,282
8,806
69
511
4,865
1,353
1,528
65,107
2,002
17,394
2,812
374
409
4,071
980
9,145
1,58,470
Note: Districts arranged in alphabetical order. Different scale used for each item. Source: Commisioner of Fisheries, Telangana and Director, Animal Husbandry, Telangana
Agriculture
Telangana State Statistical Abstract, 2021 | 137
IrrigationChapter 7
138 | Telangana State Statistical Abstract, 2021
Irrigation
1 IntroductionandKeyHighlights..............................................................................................................................................................................................................................................................................................................139
2 DistrictwiseWaterlevelsandPiezometricStations..........................................................................................................................................................................................................................................140
3 AveragePre&PostMonsoonGroundwaterleveldatafrom2015to2021(mbgl)...............................................................................................................................141
4 District-wisenumberofMandalsofGroundwaterresourcesindifferentcategories.......................................................................................................................142
5 District-wiseGroundWaterSchemes...........................................................................................................................................................................................................................................................................................143
6 MajorIrrigationProjects..........................................................................................................................................................................................................................................................................................................................................144
7 MediumIrrigationProjects.................................................................................................................................................................................................................................................................................................................................145
8 DistrictWiseMinorIrrigationSources..........................................................................................................................................................................................................................................................................................146
9 BeneficiariesandArea(Acres)underMicroIrrigation..................................................................................................................................................................................................................................147
10 DistrictwiseCommissionedLiftIrrigationSchemes........................................................................................................................................................................................................................................148
IndexPage No.S.No. Item
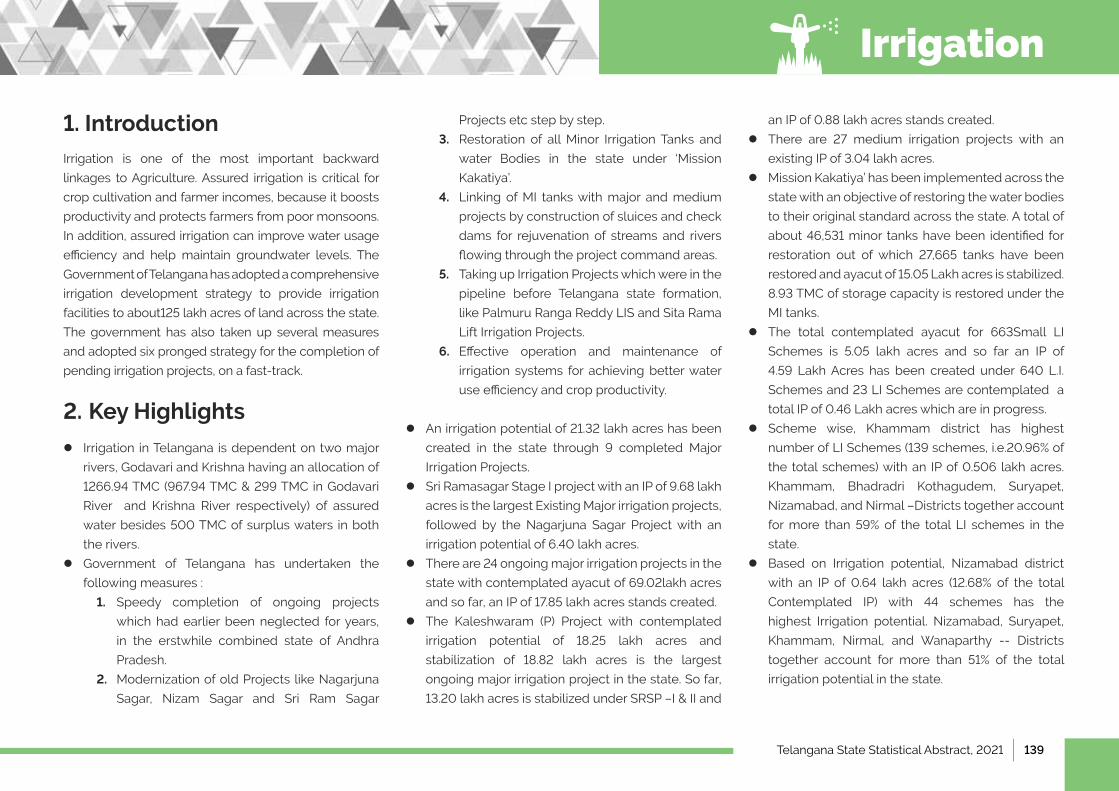
Telangana State Statistical Abstract, 2021 | 139
1. Introduction Irrigation is one of the most important backward
linkages to Agriculture. Assured irrigation is critical for
crop cultivation and farmer incomes, because it boosts
productivity and protects farmers from poor monsoons.
In addition, assured irrigation can improve water usage
efficiency and help maintain groundwater levels. The
Government of Telangana has adopted a comprehensive
irrigation development strategy to provide irrigation
facilities to about125 lakh acres of land across the state.
The government has also taken up several measures
and adopted six pronged strategy for the completion of
pending irrigation projects, on a fast-track.
2. Key Highlights
lIrrigation in Telangana is dependent on two major
rivers, Godavari and Krishna having an allocation of
1266.94 TMC (967.94 TMC & 299 TMC in Godavari
River and Krishna River respectively) of assured
water besides 500 TMC of surplus waters in both
the rivers.
lGovernment of Telangana has undertaken the
following measures :
1. Speedy completion of ongoing projects
which had earlier been neglected for years,
in the erstwhile combined state of Andhra
Pradesh.
2. Modernization of old Projects like Nagarjuna
Sagar, Nizam Sagar and Sri Ram Sagar
Projects etc step by step.
3. Restoration of all Minor Irrigation Tanks and
water Bodies in the state under ‘Mission
Kakatiya’.
4. Linking of MI tanks with major and medium
projects by construction of sluices and check
dams for rejuvenation of streams and rivers
flowing through the project command areas.
5. Taking up Irrigation Projects which were in the
pipeline before Telangana state formation,
like Palmuru Ranga Reddy LIS and Sita Rama
Lift Irrigation Projects.
6. Effective operation and maintenance of
irrigation systems for achieving better water
use efficiency and crop productivity.
lAn irrigation potential of 21.32 lakh acres has been
created in the state through 9 completed Major
Irrigation Projects.
lSri Ramasagar Stage I project with an IP of 9.68 lakh
acres is the largest Existing Major irrigation projects,
followed by the Nagarjuna Sagar Project with an
irrigation potential of 6.40 lakh acres.
lThere are 24 ongoing major irrigation projects in the
state with contemplated ayacut of 69.02lakh acres
and so far, an IP of 17.85 lakh acres stands created.
lThe Kaleshwaram (P) Project with contemplated
irrigation potential of 18.25 lakh acres and
stabilization of 18.82 lakh acres is the largest
ongoing major irrigation project in the state. So far,
13.20 lakh acres is stabilized under SRSP –I & II and
an IP of 0.88 lakh acres stands created.
lThere are 27 medium irrigation projects with an
existing IP of 3.04 lakh acres.
lMission Kakatiya’ has been implemented across the
state with an objective of restoring the water bodies
to their original standard across the state. A total of
about 46,531 minor tanks have been identified for
restoration out of which 27,665 tanks have been
restored and ayacut of 15.05 Lakh acres is stabilized.
8.93 TMC of storage capacity is restored under the
MI tanks.
lThe total contemplated ayacut for 663Small LI
Schemes is 5.05 lakh acres and so far an IP of
4.59 Lakh Acres has been created under 640 L.I.
Schemes and 23 LI Schemes are contemplated a
total IP of 0.46 Lakh acres which are in progress.
lScheme wise, Khammam district has highest
number of LI Schemes (139 schemes, i.e.20.96% of
the total schemes) with an IP of 0.506 lakh acres.
Khammam, Bhadradri Kothagudem, Suryapet,
Nizamabad, and Nirmal –Districts together account
for more than 59% of the total LI schemes in the
state.
●lBased on Irrigation potential, Nizamabad district
with an IP of 0.64 lakh acres (12.68% of the total
Contemplated IP) with 44 schemes has the
highest Irrigation potential. Nizamabad, Suryapet,
Khammam, Nirmal, and Wanaparthy -- Districts
together account for more than 51% of the total
irrigation potential in the state.
Irrigation
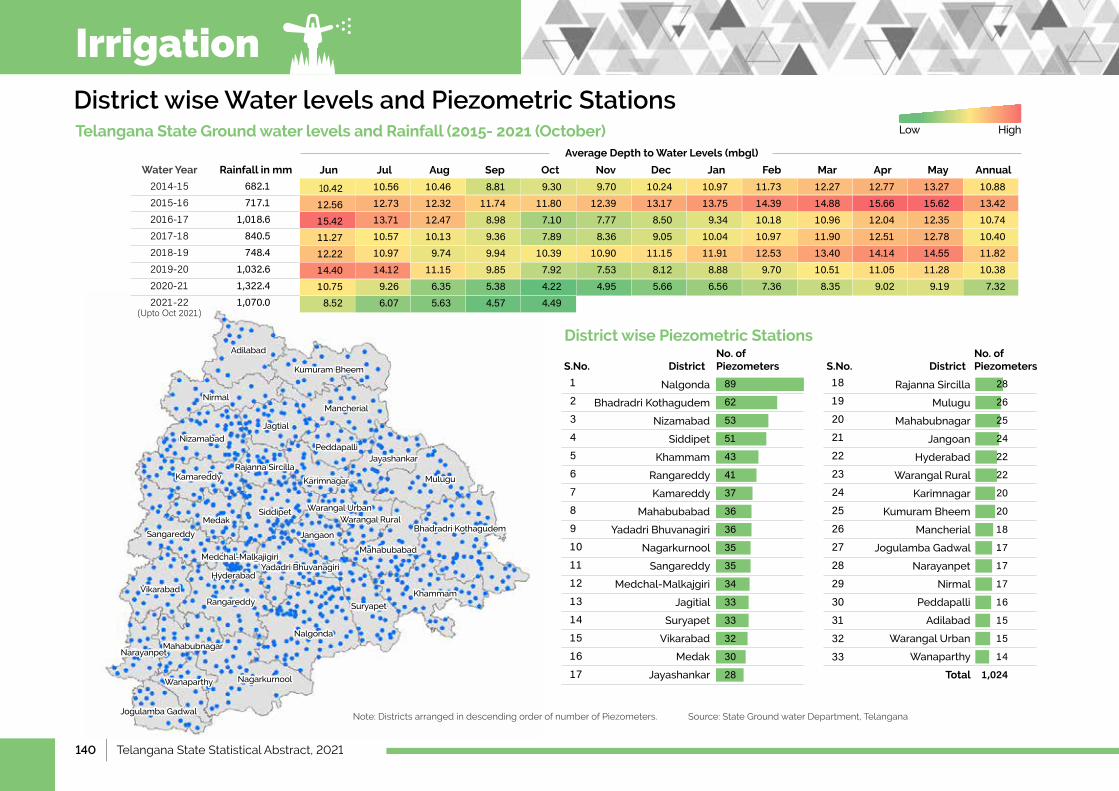
140 | Telangana State Statistical Abstract, 2021
District wise Water levels and Piezometric StationsLow HighTelangana State Ground water levels and Rainfall (2015- 2021 (October)
District wise Piezometric Stations
18192021222324252627282930313233
No. of PiezometersDistrict DistrictS.No. S.No.
No. of Piezometers
AdilabadAdilabad
NirmalNirmal
Kumuram BheemKumuram Bheem
MancherialMancherial
JagtialJagtial
Rajanna SircillaRajanna Sircilla
PeddapalliPeddapalliJayashankarJayashankar
MuluguMulugu
MedakMedakSiddipetSiddipet WarangalUrbanWarangalUrban
Warangal RuralWarangal Rural
JangaonJangaonSangareddySangareddy
Medchal-MalkajigiriMedchal-Malkajigiri
VikarabadVikarabad
RangareddyRangareddy
MahabubnagarMahabubnagarNarayanpetNarayanpet
NalgondaNalgonda
NagarkurnoolNagarkurnoolWanaparthyWanaparthy
SuryapetSuryapet
KhammamKhammam
KarimnagarKarimnagar
YadadriBhuvanagiriYadadriBhuvanagiri
MahabubabadMahabubabad
Jogulamba GadwalJogulamba Gadwal
Bhadradri KothagudemBhadradri Kothagudem
KamareddyKamareddy
NizamabadNizamabad
HyderabadHyderabad
Nalgonda
Bhadradri Kothagudem
Nizamabad
Siddipet
Khammam
Rangareddy
Kamareddy
Mahabubabad
YadadriBhuvanagiri
Nagarkurnool
Sangareddy
Medchal-Malkajgiri
Jagitial
Suryapet
Vikarabad
Medak
Jayashankar
Rajanna Sircilla
Mulugu
Mahabubnagar
Jangoan
Hyderabad
Warangal Rural
Karimnagar
Kumuram Bheem
Mancherial
Jogulamba Gadwal
Narayanpet
Nirmal
Peddapalli
Adilabad
WarangalUrban
Wanaparthy
Total
Note: Districts arranged in descending order of number of Piezometers. Source: State Ground water Department, Telangana
2014-15 2015-16 2016-17 2017-18 2018-19 2019-20 2020-212021-22
682.1717.1
1,018.6840.5748.4
1,032.61,322.41,070.0
10.4212.5615.4211.2712.2214.4010.758.52
10.5612.7313.7110.5710.9714.129.266.07
10.4612.3212.4710.139.74
11.156.355.63
8.8111.748.989.369.949.855.384.57
9.3011.807.107.89
10.397.924.224.49
9.7012.397.778.36
10.907.534.95
10.2413.178.509.05
11.158.125.66
10.9713.759.34
10.0411.918.886.56
11.7314.3910.1810.9712.539.707.36
12.2714.8810.9611.9013.4010.518.35
12.7715.6612.0412.5114.1411.059.02
13.2715.6212.3512.7814.5511.289.19
10.8813.4210.7410.4011.8210.387.32
Rainfall in mm Jun Jul Aug Sep Oct Nov Dec Jan Feb Mar Apr May AnnualWater Year
(Upto Oct 2021)
Average Depth to Water Levels (mbgl)
89
62
53
51
43
41
37
36
36
35
35
34
33
33
32
30
28
28
26
25
24
22
22
20
20
18
17
17
17
16
15
15
14
1,024
1234567891011121314151617
Irrigation
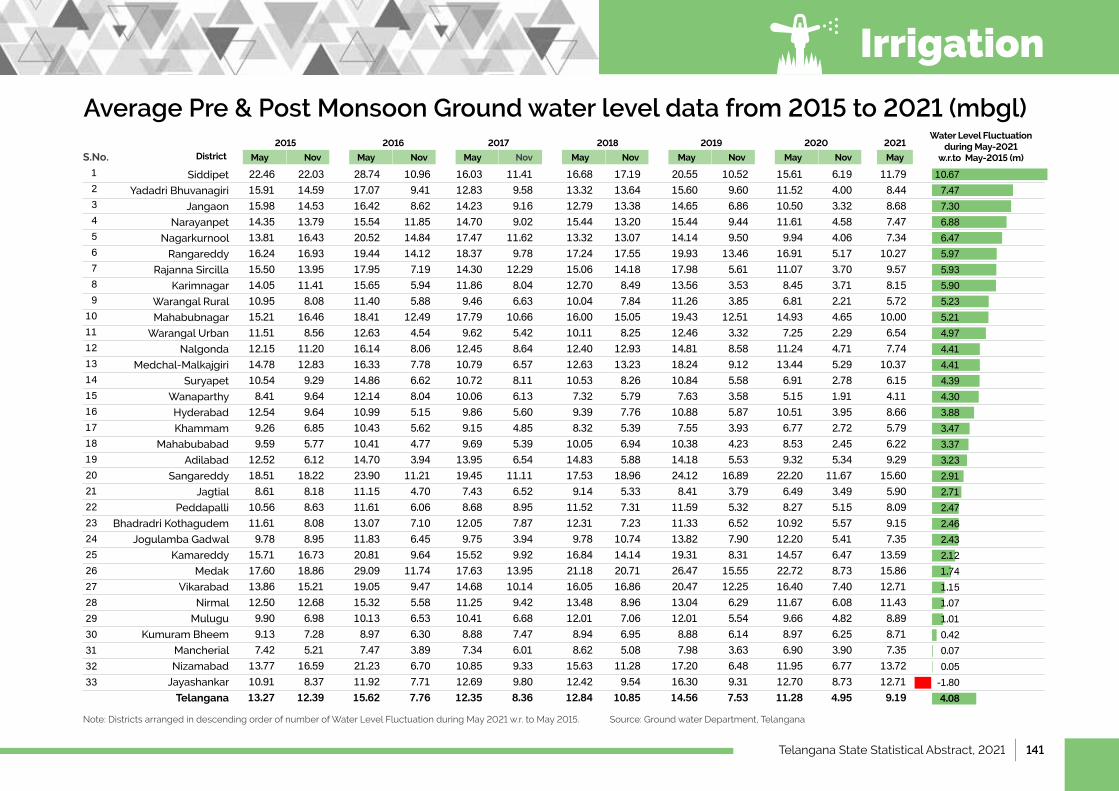
Telangana State Statistical Abstract, 2021 | 141
Average Pre & Post Monsoon Ground water level data from 2015 to 2021 (mbgl)
Siddipet
YadadriBhuvanagiri
Jangaon
Narayanpet
Nagarkurnool
Rangareddy
Rajanna Sircilla
Karimnagar
Warangal Rural
Mahabubnagar
WarangalUrban
Nalgonda
Medchal-Malkajgiri
Suryapet
Wanaparthy
Hyderabad
Khammam
Mahabubabad
Adilabad
Sangareddy
Jagtial
Peddapalli
Bhadradri Kothagudem
Jogulamba Gadwal
Kamareddy
Medak
Vikarabad
Nirmal
Mulugu
Kumuram Bheem
Mancherial
Nizamabad
Jayashankar
Telangana
123456789
101112131415161718192021222324252627282930313233
22.46 22.03 28.74 10.96 16.03 11.41 16.68 17.19 20.55 10.52 15.61 6.19 11.7915.91 14.59 17.07 9.41 12.83 9.58 13.32 13.64 15.60 9.60 11.52 4.00 8.4415.98 14.53 16.42 8.62 14.23 9.16 12.79 13.38 14.65 6.86 10.50 3.32 8.6814.35 13.79 15.54 11.85 14.70 9.02 15.44 13.20 15.44 9.44 11.61 4.58 7.4713.81 16.43 20.52 14.84 17.47 11.62 13.32 13.07 14.14 9.50 9.94 4.06 7.3416.24 16.93 19.44 14.12 18.37 9.78 17.24 17.55 19.93 13.46 16.91 5.17 10.2715.50 13.95 17.95 7.19 14.30 12.29 15.06 14.18 17.98 5.61 11.07 3.70 9.5714.05 11.41 15.65 5.94 11.86 8.04 12.70 8.49 13.56 3.53 8.45 3.71 8.1510.95 8.08 11.40 5.88 9.46 6.63 10.04 7.84 11.26 3.85 6.81 2.21 5.7215.21 16.46 18.41 12.49 17.79 10.66 16.00 15.05 19.43 12.51 14.93 4.65 10.0011.51 8.56 12.63 4.54 9.62 5.42 10.11 8.25 12.46 3.32 7.25 2.29 6.5412.15 11.20 16.14 8.06 12.45 8.64 12.40 12.93 14.81 8.58 11.24 4.71 7.7414.78 12.83 16.33 7.78 10.79 6.57 12.63 13.23 18.24 9.12 13.44 5.29 10.3710.54 9.29 14.86 6.62 10.72 8.11 10.53 8.26 10.84 5.58 6.91 2.78 6.15 8.41 9.64 12.14 8.04 10.06 6.13 7.32 5.79 7.63 3.58 5.15 1.91 4.1112.54 9.64 10.99 5.15 9.86 5.60 9.39 7.76 10.88 5.87 10.51 3.95 8.66 9.26 6.85 10.43 5.62 9.15 4.85 8.32 5.39 7.55 3.93 6.77 2.72 5.79 9.59 5.77 10.41 4.77 9.69 5.39 10.05 6.94 10.38 4.23 8.53 2.45 6.2212.52 6.12 14.70 3.94 13.95 6.54 14.83 5.88 14.18 5.53 9.32 5.34 9.2918.51 18.22 23.90 11.21 19.45 11.11 17.53 18.96 24.12 16.89 22.20 11.67 15.60 8.61 8.18 11.15 4.70 7.43 6.52 9.14 5.33 8.41 3.79 6.49 3.49 5.9010.56 8.63 11.61 6.06 8.68 8.95 11.52 7.31 11.59 5.32 8.27 5.15 8.0911.61 8.08 13.07 7.10 12.05 7.87 12.31 7.23 11.33 6.52 10.92 5.57 9.15 9.78 8.95 11.83 6.45 9.75 3.94 9.78 10.74 13.82 7.90 12.20 5.41 7.3515.71 16.73 20.81 9.64 15.52 9.92 16.84 14.14 19.31 8.31 14.57 6.47 13.5917.60 18.86 29.09 11.74 17.63 13.95 21.18 20.71 26.47 15.55 22.72 8.73 15.8613.86 15.21 19.05 9.47 14.68 10.14 16.05 16.86 20.47 12.25 16.40 7.40 12.7112.50 12.68 15.32 5.58 11.25 9.42 13.48 8.96 13.04 6.29 11.67 6.08 11.43 9.90 6.98 10.13 6.53 10.41 6.68 12.01 7.06 12.01 5.54 9.66 4.82 8.89 9.13 7.28 8.97 6.30 8.88 7.47 8.94 6.95 8.88 6.14 8.97 6.25 8.71 7.42 5.21 7.47 3.89 7.34 6.01 8.62 5.08 7.98 3.63 6.90 3.90 7.3513.77 16.59 21.23 6.70 10.85 9.33 15.63 11.28 17.20 6.48 11.95 6.77 13.7210.91 8.37 11.92 7.71 12.69 9.80 12.42 9.54 16.30 9.31 12.70 8.73 12.7113.27 12.39 15.62 7.76 12.35 8.36 12.84 10.85 14.56 7.53 11.28 4.95 9.19
May
2015District
2016 2017 2018 2019 2020 2021Water Level Fluctuation
during May-2021 w.r.to May-2015 (m)
10.677.477.306.886.475.975.935.905.235.214.974.414.414.394.303.883.473.373.232.912.712.472.462.432.121.741.151.071.010.420.070.05-1.804.08
Note: Districts arranged in descending order of number of Water Level Fluctuation during May 2021 w.r. to May 2015. Source: Ground water Department, Telangana
May Nov May Nov May Nov May Nov May Nov May NovS.No.
Irrigation
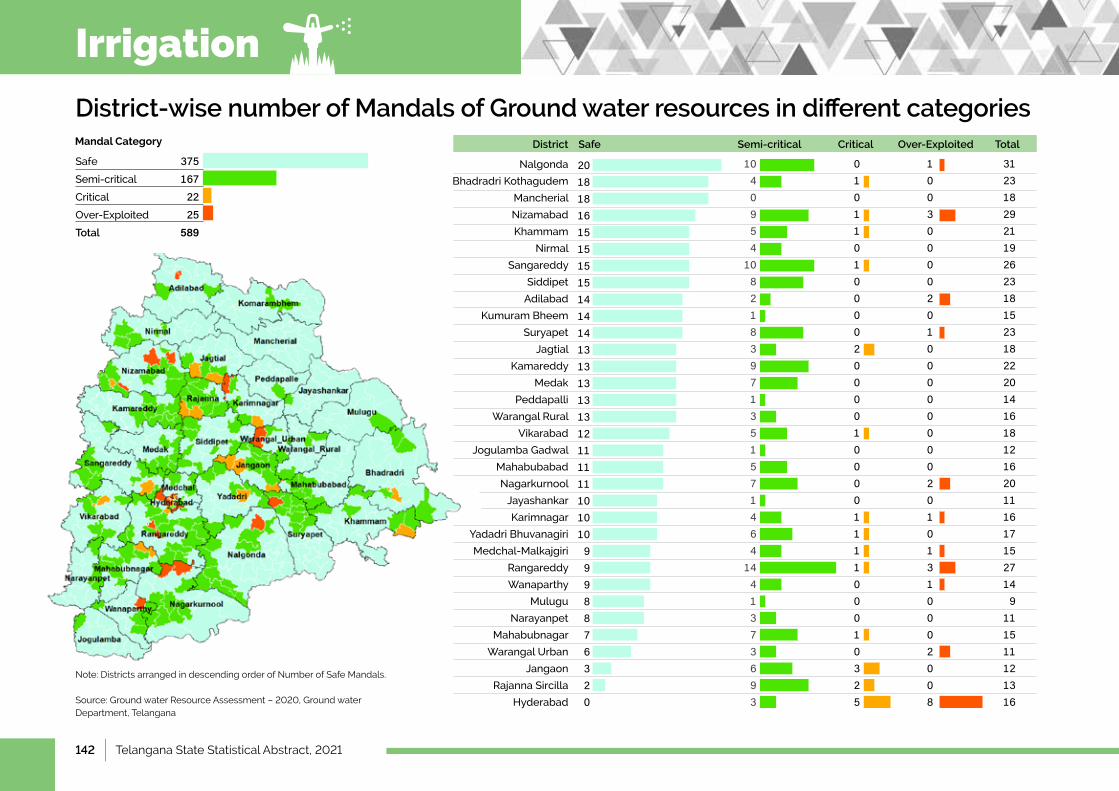
142 | Telangana State Statistical Abstract, 2021
District-wise number of Mandals of Ground water resources in different categories
Nalgonda
Bhadradri Kothagudem
Mancherial
Nizamabad
Khammam
Nirmal
Sangareddy
Siddipet
Adilabad
Kumuram Bheem
Suryapet
Jagtial
Kamareddy
Medak
Peddapalli
Warangal Rural
Vikarabad
Jogulamba Gadwal
Mahabubabad
Nagarkurnool
Jayashankar
Karimnagar
YadadriBhuvanagiri
Medchal-Malkajgiri
Rangareddy
Wanaparthy
Mulugu
Narayanpet
Mahabubnagar
WarangalUrban
Jangaon
Rajanna Sircilla
Hyderabad
Note: Districts arranged in descending order of Number of Safe Mandals. Source: Ground water Resource Assessment – 2020, Ground water Department, Telangana
Safe 375Semi-critical 167Critical 22Over-Exploited 25Total 589
Mandal Category SafeDistrict Semi-critical Over-Exploited TotalCritical
20181816151515151414141313131313121111111010109998876320
1040954
1082183971351571464
1441373693
010110100002000010000111100010325
100300002010000000020101310002008
31231829211926231815231822201416181216201116171527149
111511121316
Irrigation
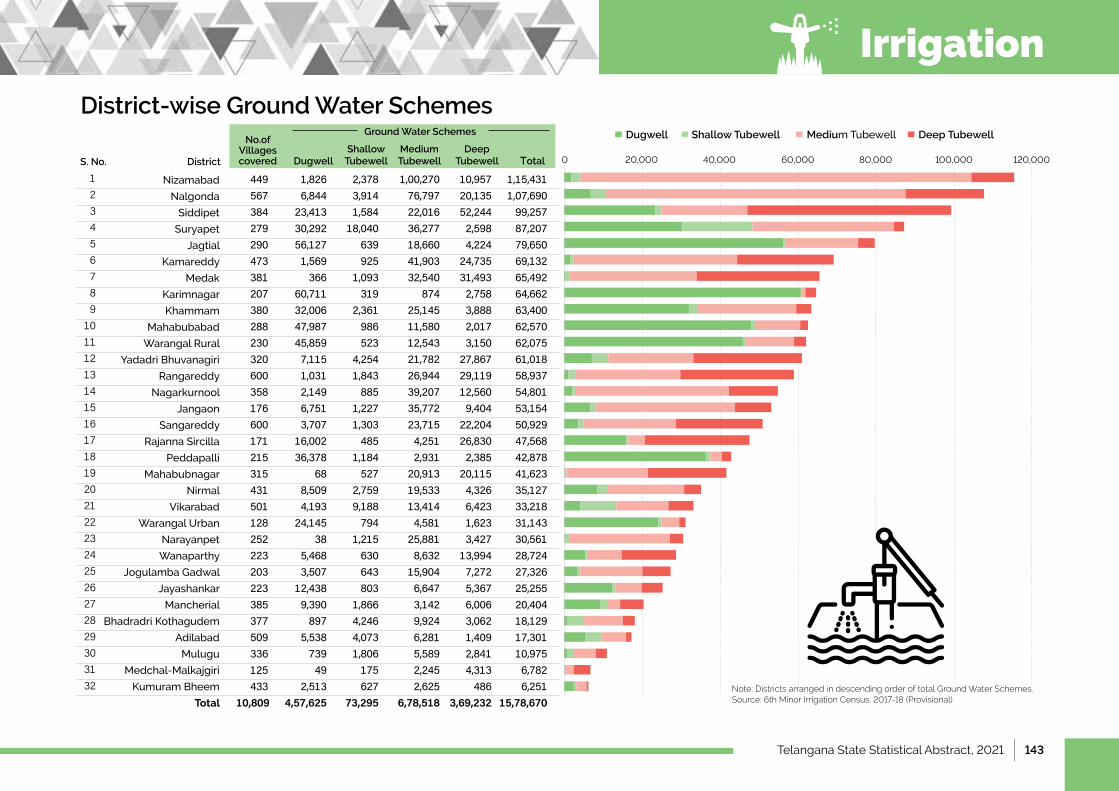
Telangana State Statistical Abstract, 2021 | 143
District-wise Ground Water Schemes
Nizamabad
Nalgonda
Siddipet
Suryapet
Jagtial
Kamareddy
Medak
Karimnagar
Khammam
Mahabubabad
Warangal Rural
YadadriBhuvanagiri
Rangareddy
Nagarkurnool
Jangaon
Sangareddy
Rajanna Sircilla
Peddapalli
Mahabubnagar
Nirmal
Vikarabad
WarangalUrban
Narayanpet
Wanaparthy
Jogulamba Gadwal
Jayashankar
Mancherial
Bhadradri Kothagudem
Adilabad
Mulugu
Medchal-Malkajgiri
Kumuram Bheem
Total
123456789
1011121314151617181920212223242526272829303132
449 1,826 2,378 1,00,270 10,957 1,15,431 567 6,844 3,914 76,797 20,135 1,07,690 384 23,413 1,584 22,016 52,244 99,257 279 30,292 18,040 36,277 2,598 87,207 290 56,127 639 18,660 4,224 79,650 473 1,569 925 41,903 24,735 69,132 381 366 1,093 32,540 31,493 65,492 207 60,711 319 874 2,758 64,662 380 32,006 2,361 25,145 3,888 63,400 288 47,987 986 11,580 2,017 62,570 230 45,859 523 12,543 3,150 62,075 320 7,115 4,254 21,782 27,867 61,018 600 1,031 1,843 26,944 29,119 58,937 358 2,149 885 39,207 12,560 54,801 176 6,751 1,227 35,772 9,404 53,154 600 3,707 1,303 23,715 22,204 50,929 171 16,002 485 4,251 26,830 47,568 215 36,378 1,184 2,931 2,385 42,878 315 68 527 20,913 20,115 41,623 431 8,509 2,759 19,533 4,326 35,127 501 4,193 9,188 13,414 6,423 33,218 128 24,145 794 4,581 1,623 31,143 252 38 1,215 25,881 3,427 30,561 223 5,468 630 8,632 13,994 28,724 203 3,507 643 15,904 7,272 27,326 223 12,438 803 6,647 5,367 25,255 385 9,390 1,866 3,142 6,006 20,404 377 897 4,246 9,924 3,062 18,129 509 5,538 4,073 6,281 1,409 17,301 336 739 1,806 5,589 2,841 10,975 125 49 175 2,245 4,313 6,782 433 2,513 627 2,625 486 6,25110,809 4,57,625 73,295 6,78,518 3,69,232 15,78,670
No.of Villages coveredDistrictS. No. Dugwell
Shallow Tubewell
Medium Tubewell
Deep Tubewell Total
Ground Water Schemes Dugwell Shallow Tubewell Medium Tubewell Deep Tubewell
0 20,000 40,000 60,000 80,000 100,000 120,000
Note: Districts arranged in descending order of total Ground Water Schemes.Source: 6th Minor Irrigation Census, 2017-18 (Provisional)
Irrigation
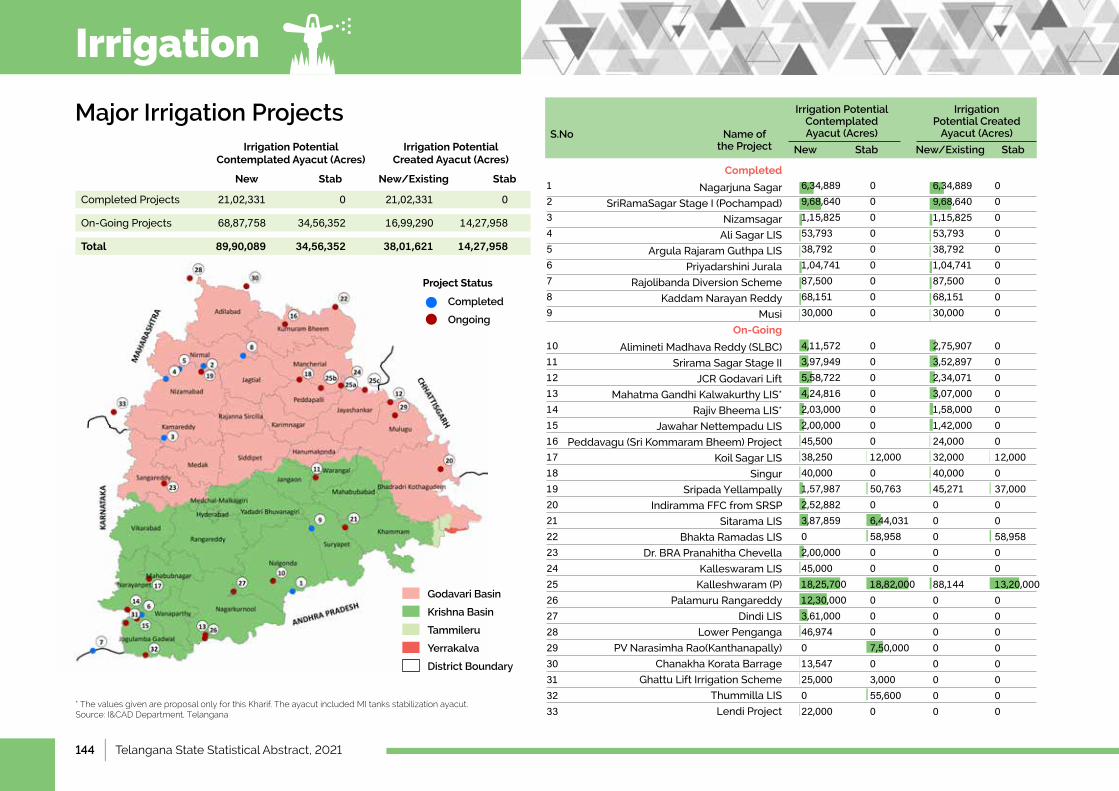
144 | Telangana State Statistical Abstract, 2021
Major Irrigation Projects
Godavari Basin
Krishna Basin
Tammileru
Yerrakalva
District Boundary
Completed
Ongoing
Project Status
Irrigation Potential Contemplated Ayacut (Acres)
Irrigation Potential Created Ayacut (Acres)
New New/ExistingStab Stab
Completed Projects 21,02,331 0 21,02,331 0
On-GoingProjects 68,87,758 34,56,352 16,99,290 14,27,958
Total 89,90,089 34,56,352 38,01,621 14,27,958
Completed
Nagarjuna Sagar
SriRamaSagarStageI(Pochampad)
Nizamsagar
AliSagarLIS
ArgulaRajaramGuthpaLIS
Priyadarshini Jurala
Rajolibanda Diversion Scheme
Kaddam Narayan Reddy
Musi
On-Going
AliminetiMadhavaReddy(SLBC)
SriramaSagarStageII
JCR Godavari Lift
MahatmaGandhiKalwakurthyLIS*
RajivBheemaLIS*
JawaharNettempaduLIS
Peddavagu (Sri Kommaram Bheem) Project
KoilSagarLIS
Singur
SripadaYellampally
IndirammaFFCfromSRSP
SitaramaLIS
BhaktaRamadasLIS
Dr.BRAPranahithaChevella
KalleswaramLIS
Kalleshwaram (P)
Palamuru Rangareddy
DindiLIS
Lower Penganga
PVNarasimhaRao(Kanthanapally)
Chanakha Korata Barrage
GhattuLiftIrrigationScheme
ThummillaLIS
Lendi Project
123456789
101112131415161718192021222324252627282930313233
Name of the Project
Irrigation Potential Contemplated Ayacut (Acres)
Irrigation Potential Created
Ayacut (Acres)
New New/ExistingStab Stab
S.No
* The values given are proposal only for this Kharif. The ayacut included MI tanks stabilization ayacut. Source: I&CAD Department, Telangana
6,34,8899,68,6401,15,82553,79338,7921,04,74187,50068,15130,000
4,11,5723,97,9495,58,7224,24,8162,03,0002,00,00045,50038,25040,0001,57,9872,52,8823,87,85902,00,00045,00018,25,70012,30,0003,61,00046,974013,54725,000022,000
000000000
000000012,000050,76306,44,03158,9580018,82,0000007,50,00003,00055,6000
6,34,8899,68,6401,15,82553,79338,7921,04,74187,50068,15130,000
2,75,9073,52,8972,34,0713,07,0001,58,0001,42,00024,00032,00040,00045,2710000088,14400000000
000000000
000000012,000037,0000058,9580013,20,00000000000
Irrigation
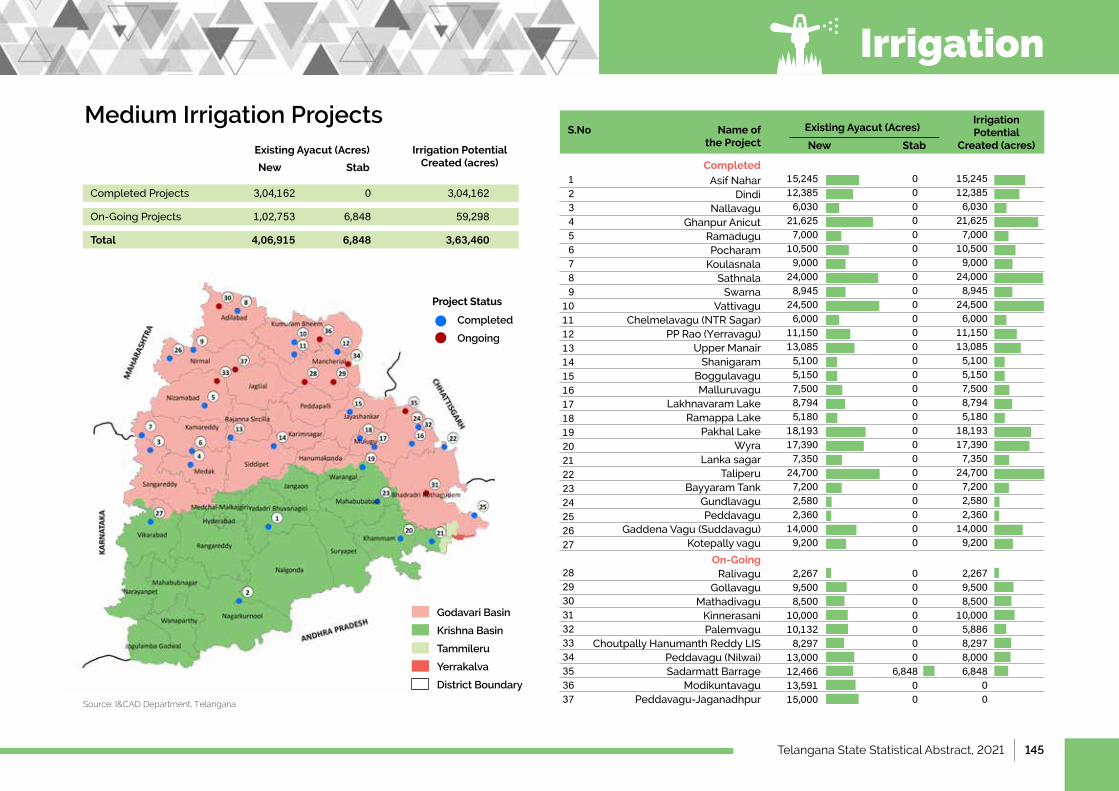
Telangana State Statistical Abstract, 2021 | 145
Medium Irrigation Projects
Godavari Basin
Krishna Basin
Tammileru
Yerrakalva
District Boundary
Completed
Ongoing
Project Status
Existing Ayacut (Acres)
New Stab
Irrigation Potential Created (acres)
Completed Projects 3,04,162 0 3,04,162
On-GoingProjects 1,02,753 6,848 59,298
Total 4,06,915 6,848 3,63,460
CompletedAsif Nahar
DindiNallavagu
Ghanpur AnicutRamaduguPocharam
KoulasnalaSathnala
SwarnaVattivagu
Chelmelavagu (NTR Sagar)PPRao(Yerravagu)
UpperManairShanigaram
BoggulavaguMalluruvagu
Lakhnavaram LakeRamappa Lake
Pakhal LakeWyra
Lanka sagarTaliperu
Bayyaram TankGundlavaguPeddavagu
GaddenaVagu(Suddavagu)Kotepally vagu
On-GoingRalivagu
GollavaguMathadivagu
KinnerasaniPalemvagu
ChoutpallyHanumanthReddyLISPeddavagu (Nilwai)Sadarmatt Barrage
ModikuntavaguPeddavagu-Jaganadhpur
15,24512,3856,030
21,6257,000
10,5009,000
24,0008,945
24,5006,000
11,15013,0855,1005,1507,5008,7945,180
18,19317,3907,350
24,7007,2002,5802,360
14,0009,200
2,2679,5008,500
10,00010,1328,297
13,00012,46613,59115,000
000000000000000000000000000
0000000
6,84800
15,24512,3856,030
21,6257,000
10,5009,000
24,0008,945
24,5006,000
11,15013,0855,1005,1507,5008,7945,180
18,19317,3907,350
24,7007,2002,5802,360
14,0009,200
2,2679,5008,500
10,0005,8868,2978,0006,848
00
123456789
101112131415161718192021222324252627
28293031323334353637
Name of the Project
Irrigation Potential
Created (acres)
Existing Ayacut (Acres)
New Stab
S.No
Source: I&CAD Department, Telangana
Irrigation
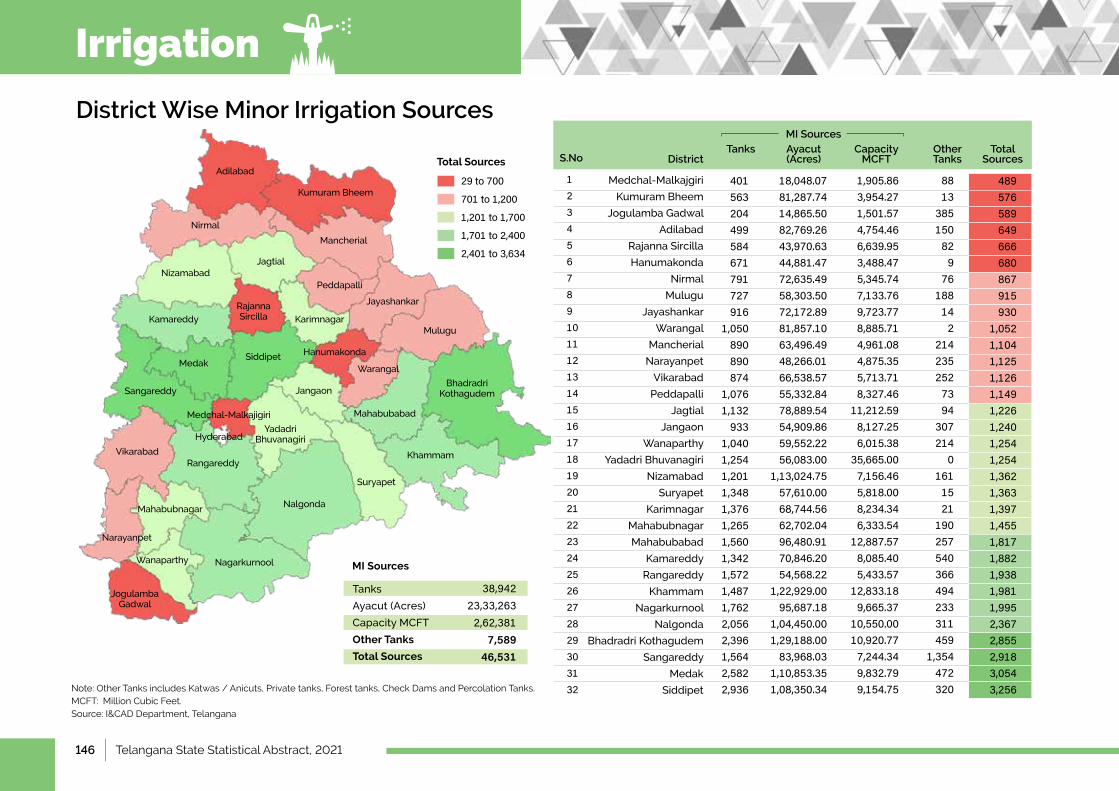
146 | Telangana State Statistical Abstract, 2021
District Wise Minor Irrigation Sources
Note: Other Tanks includes Katwas / Anicuts, Private tanks, Forest tanks, Check Dams and Percolation Tanks. MCFT: Million Cubic Feet. Source: I&CAD Department, Telangana
1234567891011121314151617181920212223242526272829303132
S.No DistrictTanks Ayacut
(Acres)Other Tanks
Capacity MCFT
Total Sources
Medchal-Malkajgiri
Kumuram Bheem
Jogulamba Gadwal
Adilabad
Rajanna Sircilla
Hanumakonda
Nirmal
Mulugu
Jayashankar
Warangal
Mancherial
Narayanpet
Vikarabad
Peddapalli
Jagtial
Jangaon
Wanaparthy
YadadriBhuvanagiri
Nizamabad
Suryapet
Karimnagar
Mahabubnagar
Mahabubabad
Kamareddy
Rangareddy
Khammam
Nagarkurnool
Nalgonda
Bhadradri Kothagudem
Sangareddy
Medak
Siddipet
489576589649666680867915930
1,0521,1041,1251,1261,1491,2261,2401,2541,2541,3621,3631,3971,4551,8171,8821,9381,9811,9952,3672,8552,9183,0543,256
401563204499584671791727916
1,050890890874
1,0761,132933
1,0401,2541,2011,3481,3761,2651,5601,3421,5721,4871,7622,0562,3961,5642,5822,936
18,048.0781,287.7414,865.5082,769.2643,970.6344,881.4772,635.4958,303.5072,172.8981,857.1063,496.4948,266.0166,538.5755,332.8478,889.5454,909.8659,552.2256,083.00
1,13,024.7557,610.0068,744.5662,702.0496,480.9170,846.2054,568.22
1,22,929.0095,687.18
1,04,450.001,29,188.0083,968.03
1,10,853.351,08,350.34
1,905.863,954.271,501.574,754.466,639.953,488.475,345.747,133.769,723.778,885.714,961.084,875.355,713.718,327.46
11,212.598,127.256,015.38
35,665.007,156.465,818.008,234.346,333.54
12,887.578,085.405,433.57
12,833.189,665.37
10,550.0010,920.777,244.349,832.799,154.75
8813
385150829
76188142
2142352527394
307214
01611521
190257540366494233311459
1,354472320
29to700
701to1,200
1,201to1,700
1,701to2,400
2,401to3,634
Total Sources
Tanks
Ayacut (Acres)
CapacityMCFT
Other Tanks
Total Sources
MI Sources
38,94223,33,2632,62,381
7,58946,531
MI Sources
Adilabad
Nirmal
Kumuram Bheem
Mancherial
Jagtial
Rajanna Sircilla
Peddapalli
Jayashankar
Mulugu
MedakSiddipet Hanumakonda
Warangal
JangaonSangareddy
Medchal-Malkajigiri
VikarabadRangareddy
Mahabubnagar
Narayanpet
Nalgonda
NagarkurnoolWanaparthy
Suryapet
Khammam
Karimnagar
Yadadri Bhuvanagiri
Mahabubabad
Jogulamba Gadwal
Bhadradri Kothagudem
Kamareddy
Nizamabad
Hyderabad
Irrigation
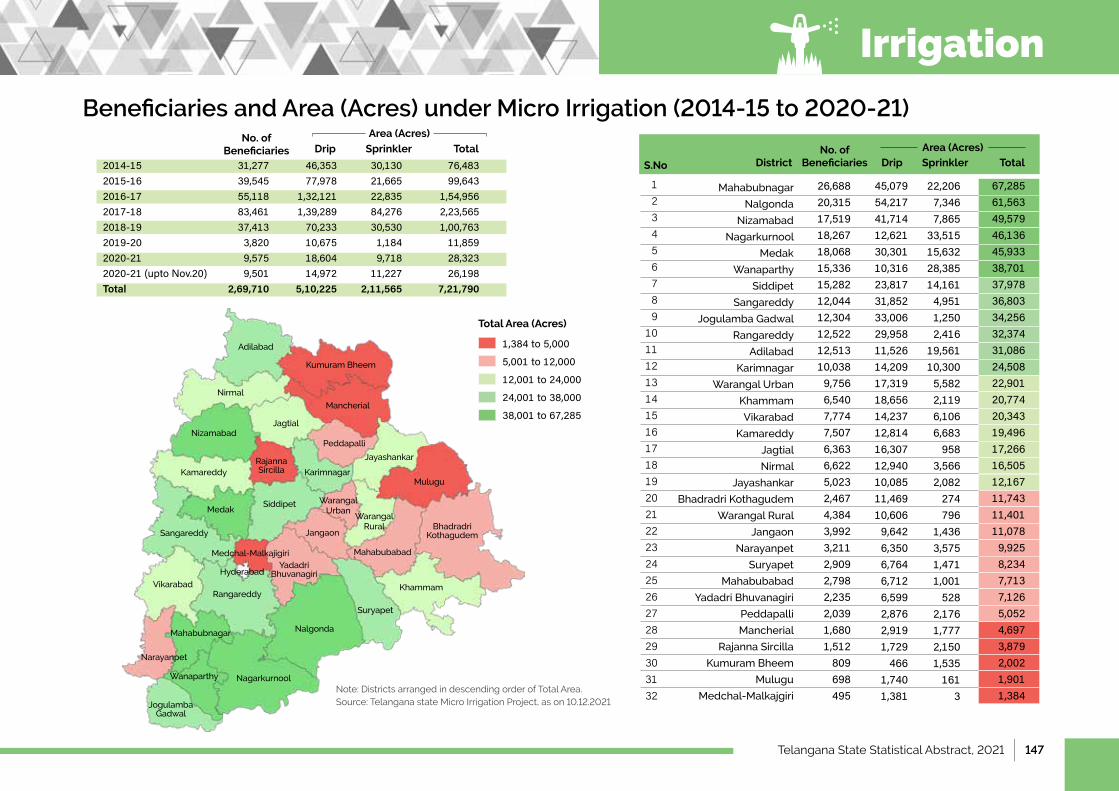
Telangana State Statistical Abstract, 2021 | 147
Note: Districts arranged in descending order of Total Area. Source: Telangana state Micro Irrigation Project, as on 10.12.2021
1,384to5,000
5,001to12,000
12,001to24,000
24,001to38,000
38,001to67,285
Total Area (Acres)
Beneficiaries and Area (Acres) under Micro Irrigation (2014-15 to 2020-21)No. of
Beneficiaries Drip Sprinkler Total
2014-15 31,277 46,353 30,130 76,4832015-16 39,545 77,978 21,665 99,6432016-17 55,118 1,32,121 22,835 1,54,9562017-18 83,461 1,39,289 84,276 2,23,5652018-19 37,413 70,233 30,530 1,00,7632019-20 3,820 10,675 1,184 11,8592020-21 9,575 18,604 9,718 28,3232020-21(uptoNov.20) 9,501 14,972 11,227 26,198Total 2,69,710 5,10,225 2,11,565 7,21,790
Area (Acres)
Mahabubnagar
Nalgonda
Nizamabad
Nagarkurnool
Medak
Wanaparthy
Siddipet
Sangareddy
Jogulamba Gadwal
Rangareddy
Adilabad
Karimnagar
WarangalUrban
Khammam
Vikarabad
Kamareddy
Jagtial
Nirmal
Jayashankar
Bhadradri Kothagudem
Warangal Rural
Jangaon
Narayanpet
Suryapet
Mahabubabad
YadadriBhuvanagiri
Peddapalli
Mancherial
Rajanna Sircilla
Kumuram Bheem
Mulugu
Medchal-Malkajgiri
123456789
1011121314151617181920212223242526272829303132
26,68820,31517,51918,26718,06815,33615,28212,04412,30412,52212,51310,0389,7566,5407,7747,5076,3636,6225,0232,4674,3843,9923,2112,9092,7982,2352,0391,6801,512809698495
45,07954,21741,71412,62130,30110,31623,81731,85233,00629,95811,52614,20917,31918,65614,23712,81416,30712,94010,08511,46910,6069,6426,3506,7646,7126,5992,8762,9191,729466
1,7401,381
22,2067,3467,865
33,51515,63228,38514,1614,9511,2502,416
19,56110,3005,5822,1196,1066,683958
3,5662,082274796
1,4363,5751,4711,001528
2,1761,7772,1501,535161
3
DistrictS.No TotalSprinklerDripNo. of
Beneficiaries
67,28561,56349,57946,13645,93338,70137,97836,80334,25632,37431,08624,50822,90120,77420,34319,49617,26616,50512,16711,74311,40111,0789,9258,2347,7137,1265,0524,6973,8792,0021,9011,384
Adilabad
Nirmal
Kumuram Bheem
Mancherial
Jagtial
Rajanna Sircilla
Peddapalli
Jayashankar
Mulugu
MedakSiddipet Warangal
UrbanWarangal
RuralJangaonSangareddy
Medchal-Malkajigiri
VikarabadRangareddy
Mahabubnagar
Narayanpet
Nalgonda
NagarkurnoolWanaparthy
Suryapet
Khammam
Karimnagar
Yadadri Bhuvanagiri
Mahabubabad
Jogulamba Gadwal
Bhadradri Kothagudem
Kamareddy
Nizamabad
Hyderabad
Irrigation
Area (Acres)
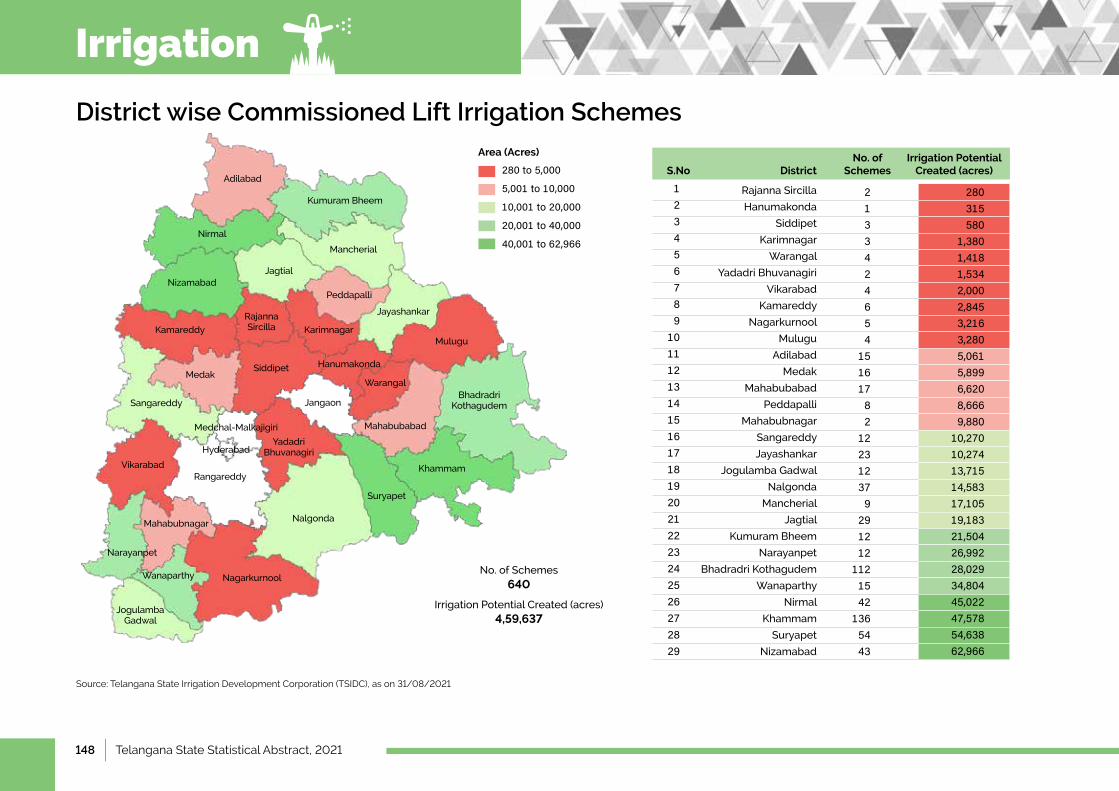
148 | Telangana State Statistical Abstract, 2021
District wise Commissioned Lift Irrigation Schemes
Source: Telangana State Irrigation Development Corporation (TSIDC), as on 31/08/2021
280to5,000
5,001to10,000
10,001to20,000
20,001to40,000
40,001to62,966
Rajanna Sircilla
Hanumakonda
Siddipet
Karimnagar
Warangal
YadadriBhuvanagiri
Vikarabad
Kamareddy
Nagarkurnool
Mulugu
Adilabad
Medak
Mahabubabad
Peddapalli
Mahabubnagar
Sangareddy
Jayashankar
Jogulamba Gadwal
Nalgonda
Mancherial
Jagtial
Kumuram Bheem
Narayanpet
Bhadradri Kothagudem
Wanaparthy
Nirmal
Khammam
Suryapet
Nizamabad
123456789
1011121314151617181920212223242526272829
DistrictS.NoNo. of
SchemesIrrigation Potential
Created (acres)
280315580
1,3801,4181,5342,0002,8453,2163,2805,0615,8996,6208,6669,880
10,27010,27413,71514,58317,10519,18321,50426,99228,02934,80445,02247,57854,63862,966
2133424654
15161782
122312379
291212
1121542
1365443
Adilabad
Nirmal
Kumuram Bheem
Mancherial
Jagtial
Rajanna Sircilla
Peddapalli
Jayashankar
Mulugu
MedakSiddipet Hanumakonda
Warangal
JangaonSangareddy
Medchal-Malkajigiri
VikarabadRangareddy
Mahabubnagar
Narayanpet
Nalgonda
NagarkurnoolWanaparthy
Suryapet
Khammam
Karimnagar
Yadadri Bhuvanagiri
Mahabubabad
Jogulamba Gadwal
Bhadradri Kothagudem
Kamareddy
Nizamabad
Hyderabad
No.ofSchemes 640
IrrigationPotentialCreated(acres)4,59,637
Area (Acres)
Irrigation
Telangana State Statistical Abstract, 2021 | 149
Rythu Bandhu
Chapter 8
150 | Telangana State Statistical Abstract, 2021
Rythu Bandhu
1 IntroductionandKeyHighlights..............................................................................................................................................................................................................................................................................................................151
2 RythuBandhu:2018to2021..........................................................................................................................................................................................................................................................................................................................152
3 SocialCategorywiseBeneficiaries,TotalExtent.....................................................................................................................................................................................................................................................153
4 RythuBandhu-Beneficiaries-Vanakalam(2021)..............................................................................................................................................................................................................................................154
5 RythuBandhu-TotalExtent(Acres)-Vanakalam(2021).....................................................................................................................................................................................................................155
6 RythuBandhu-TotalAmount(Rs.Lakhs)-Vanakalam(2021).................................................................................................................................................................................................156
IndexPage No.S.No. Item
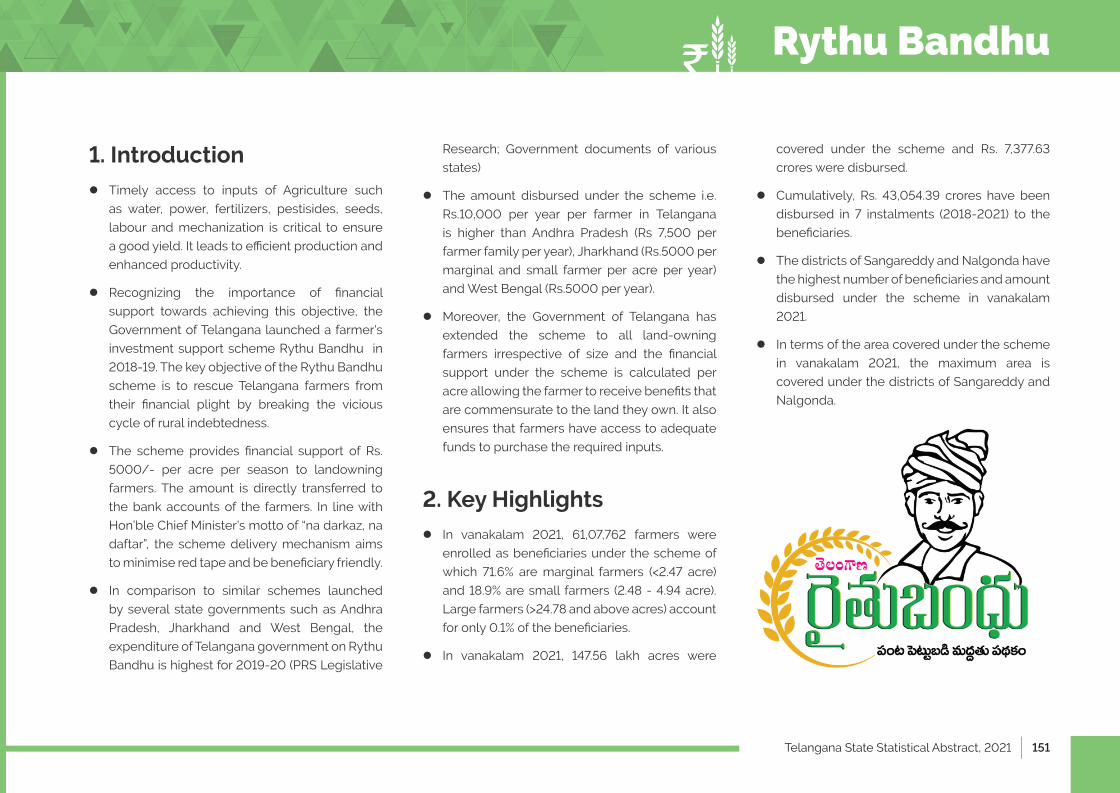
Telangana State Statistical Abstract, 2021 | 151
Rythu Bandhu
1. Introduction �Timely access to inputs of Agriculture such
as water, power, fertilizers, pestisides, seeds,
labour and mechanization is critical to ensure
a good yield. It leads to effi cient production and
enhanced productivity.
Recognizing the importance of fi nancial
support towards achieving this objective, the
Government of Telangana launched a farmer's
investment support scheme Rythu Bandhu in
2018-19. The key objective of the Rythu Bandhu
scheme is to rescue Telangana farmers from
their fi nancial plight by breaking the vicious
cycle of rural indebtedness.
The scheme provides fi nancial support of Rs.
5000/- per acre per season to landowning
farmers. The amount is directly transferred to
the bank accounts of the farmers. In line with
Hon’ble Chief Minister’s motto of “na darkaz, na
daftar”, the scheme delivery mechanism aims
to minimise red tape and be benefi ciary friendly.
In comparison to similar schemes launched
by several state governments such as Andhra
Pradesh, Jharkhand and West Bengal, the
expenditure of Telangana government on Rythu
Bandhu is highest for 2019-20 (PRS Legislative
Research; Government documents of various
states)
The amount disbursed under the scheme i.e.
Rs.10,000 per year per farmer in Telangana
is higher than Andhra Pradesh (Rs 7,500 per
farmer family per year), Jharkhand (Rs.5000 per
marginal and small farmer per acre per year)
and West Bengal (Rs.5000 per year).
Moreover, the Government of Telangana has
extended the scheme to all land-owning
farmers irrespective of size and the fi nancial
support under the scheme is calculated per
acre allowing the farmer to receive benefi ts that
are commensurate to the land they own. It also
ensures that farmers have access to adequate
funds to purchase the required inputs.
2. Key Highlights In vanakalam 2021, 61,07,762 farmers were
enrolled as benefi ciaries under the scheme of
which 71.6% are marginal farmers (<2.47 acre)
and 18.9% are small farmers (2.48 - 4.94 acre).
Large farmers (>24.78 and above acres) account
for only 0.1% of the benefi ciaries.
In vanakalam 2021, 147.56 lakh acres were
covered under the scheme and Rs. 7,377.63
crores were disbursed.
Cumulatively, Rs. 43,054.39 crores have been
disbursed in 7 instalments (2018-2021) to the
benefi ciaries.
The districts of Sangareddy and Nalgonda have
the highest number of benefi ciaries and amount
disbursed under the scheme in vanakalam
2021.
In terms of the area covered under the scheme
in vanakalam 2021, the maximum area is
covered under the districts of Sangareddy and
Nalgonda.
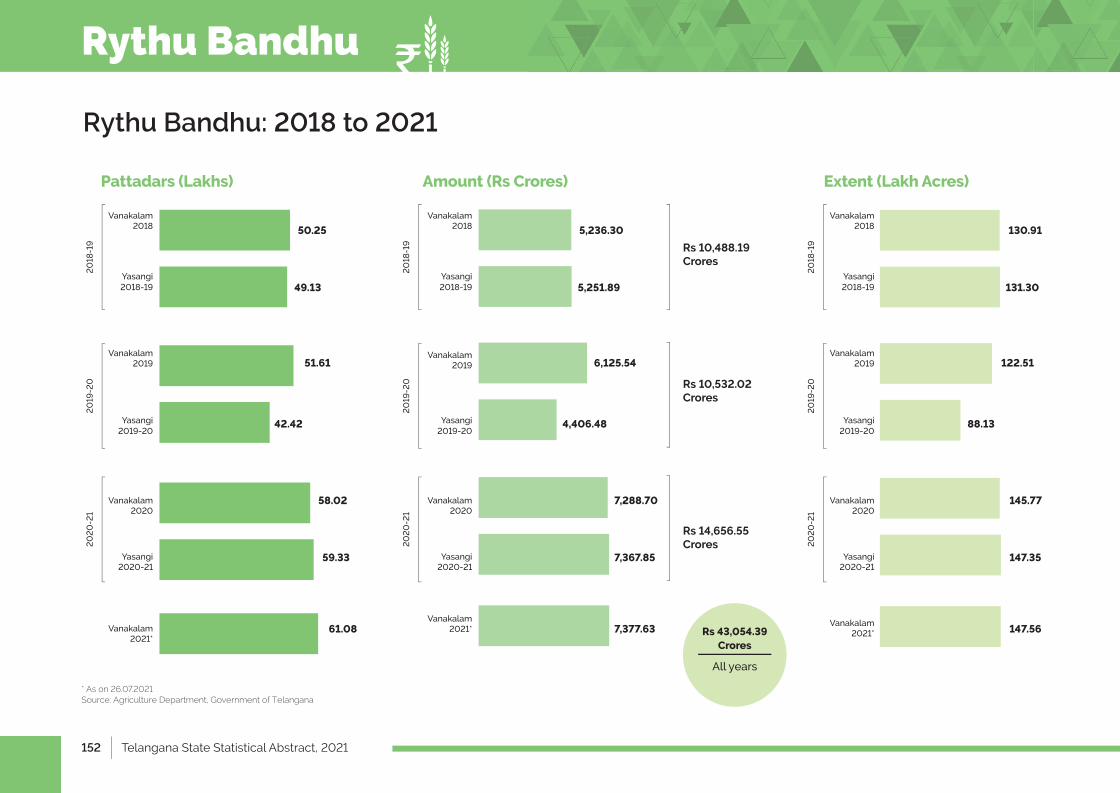
152 | Telangana State Statistical Abstract, 2021
All years
Rs 43,054.39 Crores
Pattadars (Lakhs) Extent (Lakh Acres)Amount (Rs Crores)
Vanakalam 2018
Vanakalam 2019
Vanakalam 2020
Yasangi2018-19
Yasangi2019-20
Yasangi 2020-21
Vanakalam 2021*
50.25
49.13
51.61
42.42
58.02
59.33
61.08
20
18-1
92
019
-20
20
20
-21
Vanakalam 2018
Vanakalam 2019
Vanakalam 2020
Yasangi2018-19
Yasangi2019-20
Yasangi 2020-21
Vanakalam 2021*
130.91
131.30
122.51
88.13
145.77
147.35
147.56
20
18-1
92
019
-20
20
20
-21
Vanakalam 2018
Rs 10,488.19 Crores
Rs 10,532.02 Crores
Rs 14,656.55 Crores
Vanakalam 2019
Vanakalam 2020
Yasangi2018-19
Yasangi2019-20
Yasangi 2020-21
Vanakalam 2021*
5,236.30
5,251.89
6,125.54
4,406.48
7,288.70
7,367.85
7,377.63
20
18-1
92
019
-20
2
02
0-2
1
* As on 26.07.2021Source: Agriculture Department, Government of Telangana
Rythu Bandhu: 2018 to 2021
Rythu Bandhu
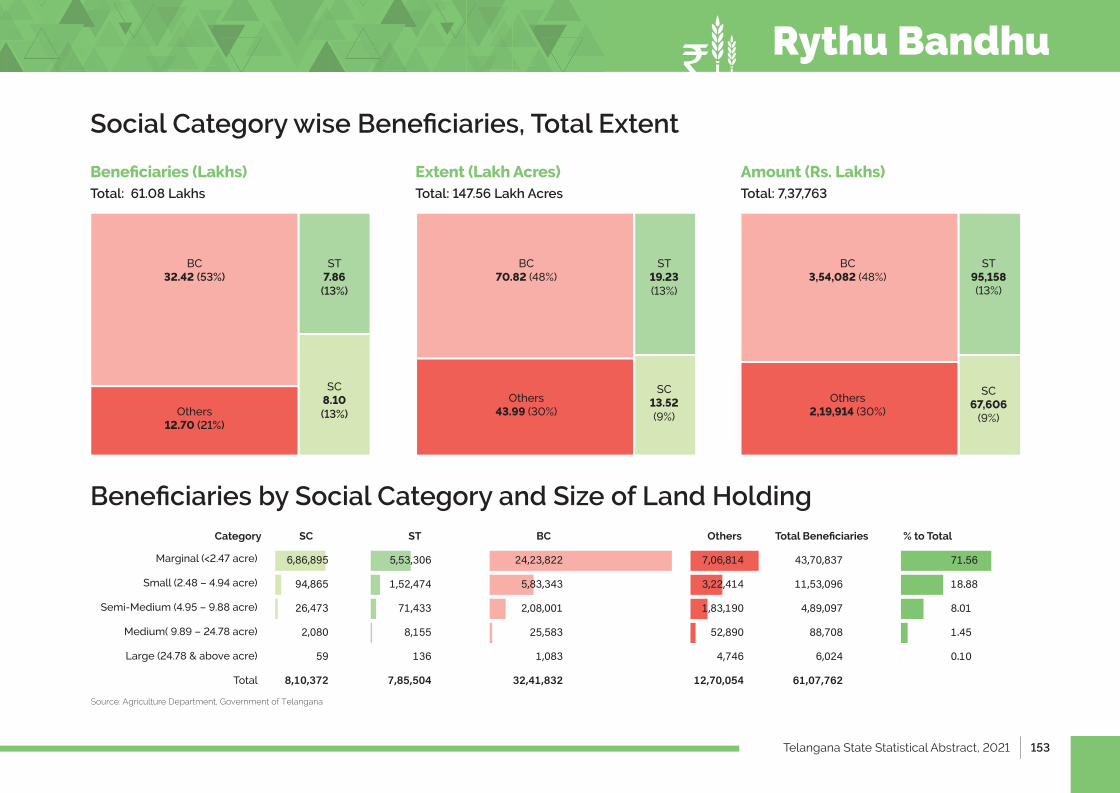
Telangana State Statistical Abstract, 2021 | 153
Rythu Bandhu
Social Category wise Benefi ciaries, Total Extent
Benefi ciaries by Social Category and Size of Land Holding
Benefi ciaries (Lakhs) Extent (Lakh Acres) Amount (Rs. Lakhs)Total: 61.08 Lakhs Total: 147.56 Lakh Acres Total: 7,37,763
ST 7.86(13%)
ST 19.23(13%)
ST 95,158(13%)
SC 8.10(13%)
SC 13.52(9%)
SC 67,606
(9%)
BC 32.42 (53%)
BC 70.82 (48%)
BC 3,54,082 (48%)
Others 12.70 (21%)
Others 43.99 (30%)
Others 2,19,914 (30%)
Category SC ST BC Others % to TotalTotal Benefi ciaries
Marginal (<2.47 acre)
Small (2.48 – 4.94 acre)
Semi-Medium (4.95 – 9.88 acre)
Medium( 9.89 – 24.78 acre)
Large (24.78 & above acre)
Total
��������
������
�����
����
��
��������
��������
�������
������
�����
���
��������
�����
��������
�������
�����
�����
���������
��������
������
��������
�����
�����
���������
���������
���������
��������
������
����
���������
�����
�����
����
����
����
Source: Agriculture Department, Government of Telangana
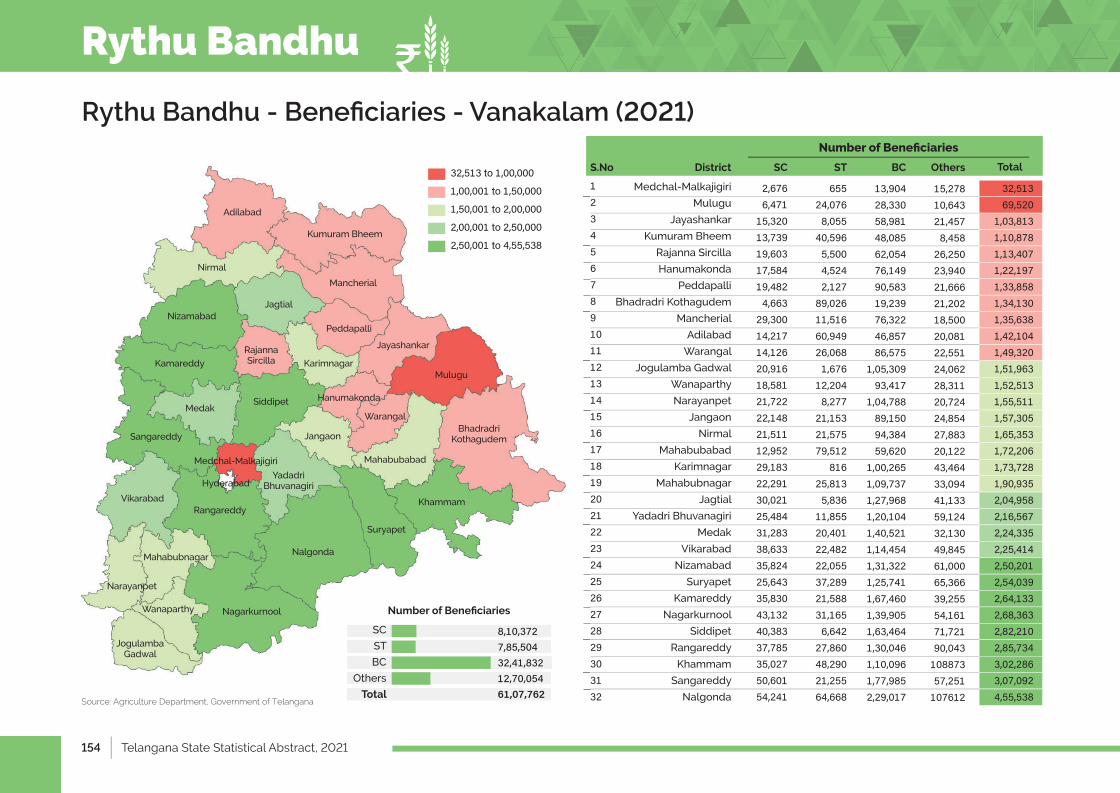
154 | Telangana State Statistical Abstract, 2021
Rythu Bandhu
Rythu Bandhu - Benefi ciaries - Vanakalam (2021)
Medchal-Malkajigiri
Mulugu
Jayashankar
Kumuram Bheem
Rajanna Sircilla
Hanumakonda
Peddapalli
Bhadradri Kothagudem
Mancherial
Adilabad
Warangal
Jogulamba Gadwal
Wanaparthy
Narayanpet
Jangaon
Nirmal
Mahabubabad
Karimnagar
Mahabubnagar
Jagtial
Yadadri Bhuvanagiri
Medak
Vikarabad
Nizamabad
Suryapet
Kamareddy
Nagarkurnool
Siddipet
Rangareddy
Khammam
Sangareddy
Nalgonda
�����������������������������������������
���������
���������������������������������
������������������������������������������������������������������������������������������������������������������������
�������������
������������������
���������������������������
��������
���������������
�������������
��������������������������������������
��������������������
�������������������������������������������������������������
��������������
�������������������������
���������������������������������������������������������������������������������������������������������������
���������������������
����������������������������������������������������������������������������������������������������������������������������������������������
SC ST BC OthersDistrictS.No Total
Number of Benefi ciaries
����������
����������������������������������������������������������������������������������������������������������������������������������������������������������������������������������������������������������������������
�����������������
��������������������
�������������������
������������������
�������������������
Source: Agriculture Department, Government of Telangana
Adilabad
Nirmal
Kumuram Bheem
Mancherial
Jagtial
Rajanna Sircilla
Peddapalli
Jayashankar
Mulugu
MedakSiddipet Hanumakonda
Warangal
JangaonSangareddy
Medchal-Malkajigiri
VikarabadRangareddy
Mahabubnagar
Narayanpet
Nalgonda
NagarkurnoolWanaparthy
Suryapet
Khammam
Karimnagar
Yadadri Bhuvanagiri
Mahabubabad
Jogulamba Gadwal
Bhadradri Kothagudem
Kamareddy
Nizamabad
Hyderabad
Number of Benefi ciaries
SC
ST
BC
Others
Total
�������������������������������������������
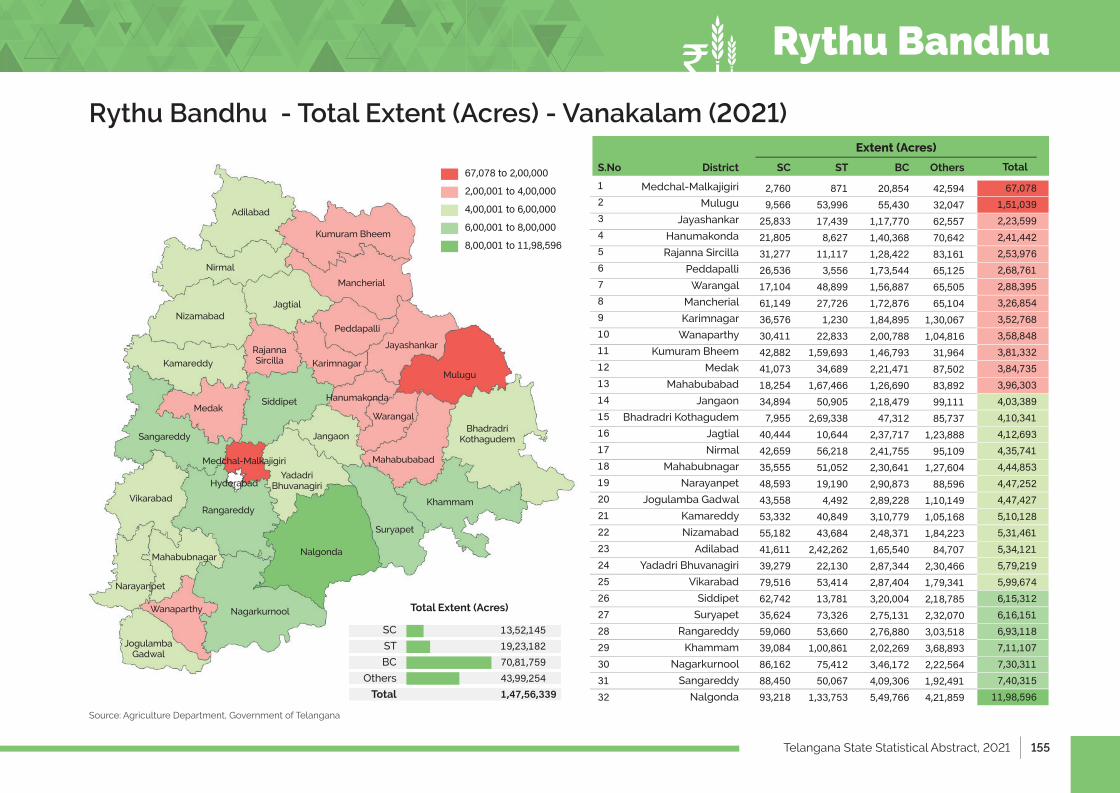
Telangana State Statistical Abstract, 2021 | 155
Rythu Bandhu
Rythu Bandhu - Total Extent (Acres) - Vanakalam (2021)
Source: Agriculture Department, Government of Telangana
Medchal-Malkajigiri
Mulugu
Jayashankar
Hanumakonda
Rajanna Sircilla
Peddapalli
Warangal
Mancherial
Karimnagar
Wanaparthy
Kumuram Bheem
Medak
Mahabubabad
Jangaon
Bhadradri Kothagudem
Jagtial
Nirmal
Mahabubnagar
Narayanpet
Jogulamba Gadwal
Kamareddy
Nizamabad
Adilabad
Yadadri Bhuvanagiri
Vikarabad
Siddipet
Suryapet
Rangareddy
Khammam
Nagarkurnool
Sangareddy
Nalgonda
�����������������������������������������
���������
����������������������������������������������������������������������
���������������������������������������������������������������������������������������������
�������������������
�����������
��������������
������������������
��������������
���������������������������������
������������
�������������������������������
�������������������
��������
�����������
��������������������������������������������������������������������������������������������
�����������������������������������������������������������������������������������������������������������������������
�������������������������������������������
��������������������������������������������
�������������
�������������
����������������������������
���������������������������������������������������������������
SC ST BC OthersDistrictS.No Total
Extent (Acres)
������������������������������������������������������������������������������������������������������������������������������������������������������������������������������������������������������������������������������������
���������
�����������������
�������������������
��������������������
��������������������
���������������������
Total Extent (Acres)
SC
ST
BC
Others
Total
�������������������������������������������
Adilabad
Nirmal
Kumuram Bheem
Mancherial
Jagtial
Rajanna Sircilla
Peddapalli
Jayashankar
Mulugu
MedakSiddipet Hanumakonda
Warangal
JangaonSangareddy
Medchal-Malkajigiri
VikarabadRangareddy
Mahabubnagar
Narayanpet
Nalgonda
NagarkurnoolWanaparthy
Suryapet
Khammam
Karimnagar
Yadadri Bhuvanagiri
Mahabubabad
Jogulamba Gadwal
Bhadradri Kothagudem
Kamareddy
Nizamabad
Hyderabad
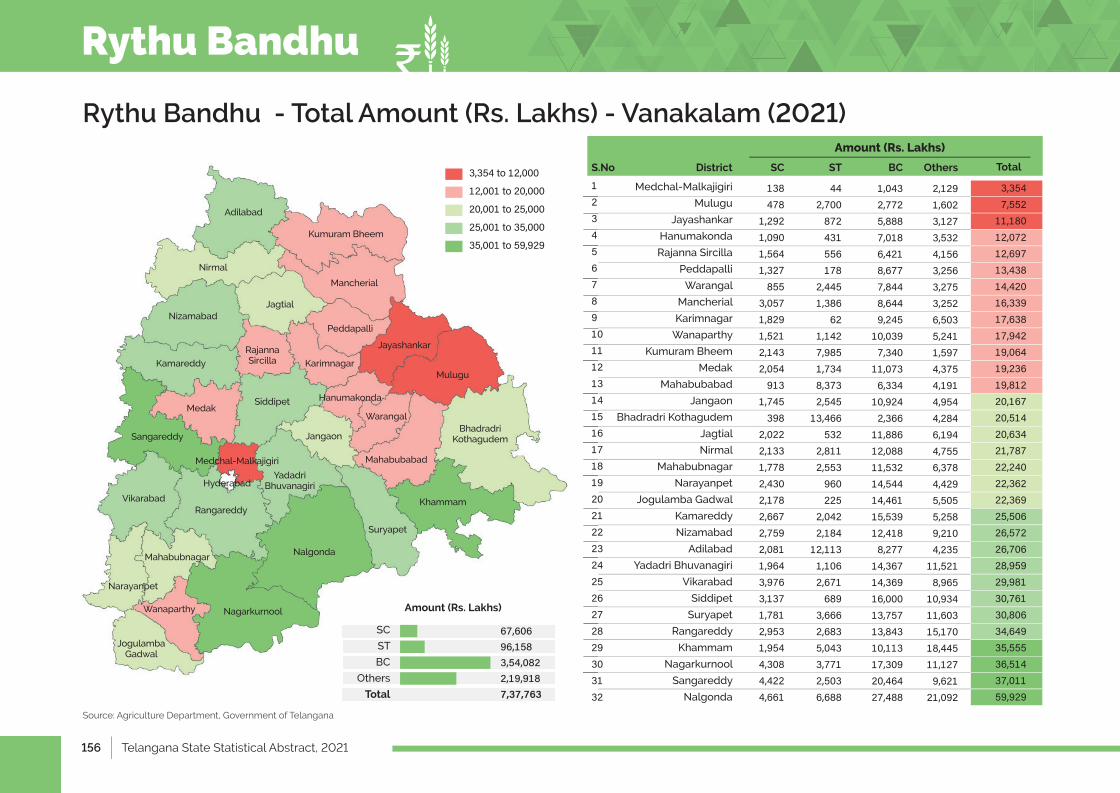
156 | Telangana State Statistical Abstract, 2021
Rythu Bandhu - Total Amount (Rs. Lakhs) - Vanakalam (2021)
Source: Agriculture Department, Government of Telangana
Medchal-Malkajigiri
Mulugu
Jayashankar
Hanumakonda
Rajanna Sircilla
Peddapalli
Warangal
Mancherial
Karimnagar
Wanaparthy
Kumuram Bheem
Medak
Mahabubabad
Jangaon
Bhadradri Kothagudem
Jagtial
Nirmal
Mahabubnagar
Narayanpet
Jogulamba Gadwal
Kamareddy
Nizamabad
Adilabad
Yadadri Bhuvanagiri
Vikarabad
Siddipet
Suryapet
Rangareddy
Khammam
Nagarkurnool
Sangareddy
Nalgonda
�����������������������������������������
������
��������������������
������������������������
��������
�������������������������������������������������������������������������
�����������������
���������
������������������������
��������
������������
�������
�����������������
����������������������������
�����������������������������������������
�����������
�����������
���������
�������������������������������������������
����������������������������������������������������
����������������������������������������������������������������������������������������������������
����������
���������������������������������
����
SC ST BC OthersDistrictS.No Total
Amount (Rs. Lakhs)
���������
����������������������������������������������������������������������������������������������������������������������������������������������������������
��������������
��������������
��������������
���������������
���������������
Amount (Rs. Lakhs)
SC
ST
BC
Others
Total
������������������������������������
Rythu Bandhu
Adilabad
Nirmal
Kumuram Bheem
Mancherial
Jagtial
Rajanna Sircilla
Peddapalli
Jayashankar
Mulugu
MedakSiddipet Hanumakonda
Warangal
JangaonSangareddy
Medchal-Malkajigiri
VikarabadRangareddy
Mahabubnagar
Narayanpet
Nalgonda
NagarkurnoolWanaparthy
Suryapet
Khammam
Karimnagar
Yadadri Bhuvanagiri
Mahabubabad
Jogulamba Gadwal
Bhadradri Kothagudem
Kamareddy
Nizamabad
Hyderabad
Telangana State Statistical Abstract, 2021 | 157
Rythu BimaChapter 9
158 | Telangana State Statistical Abstract, 2021
Rythu Bima
1 IntroductionandKeyHighlights..............................................................................................................................................................................................................................................................................................................159
2 RythuBima:2018-19to2020-21...........................................................................................................................................................................................................................................................................................................160
3 RythuBima–YearwiseFarmersEnrolled............................................................................................................................................................................................................................................................................161
4 Yearwise-EnrolledVsClaimsSettled(2018-19to2020-21)........................................................................................................................................................................................................162
5 RythuBima-DistrictwiseClaimsSettled2018-19to2020-21..................................................................................................................................................................................................163
6 RythuBima-District,AgeGroupwise-ClaimsSettled(2018-19to2020-21)...........................................................................................................................................164
IndexPage No.S.No. Item
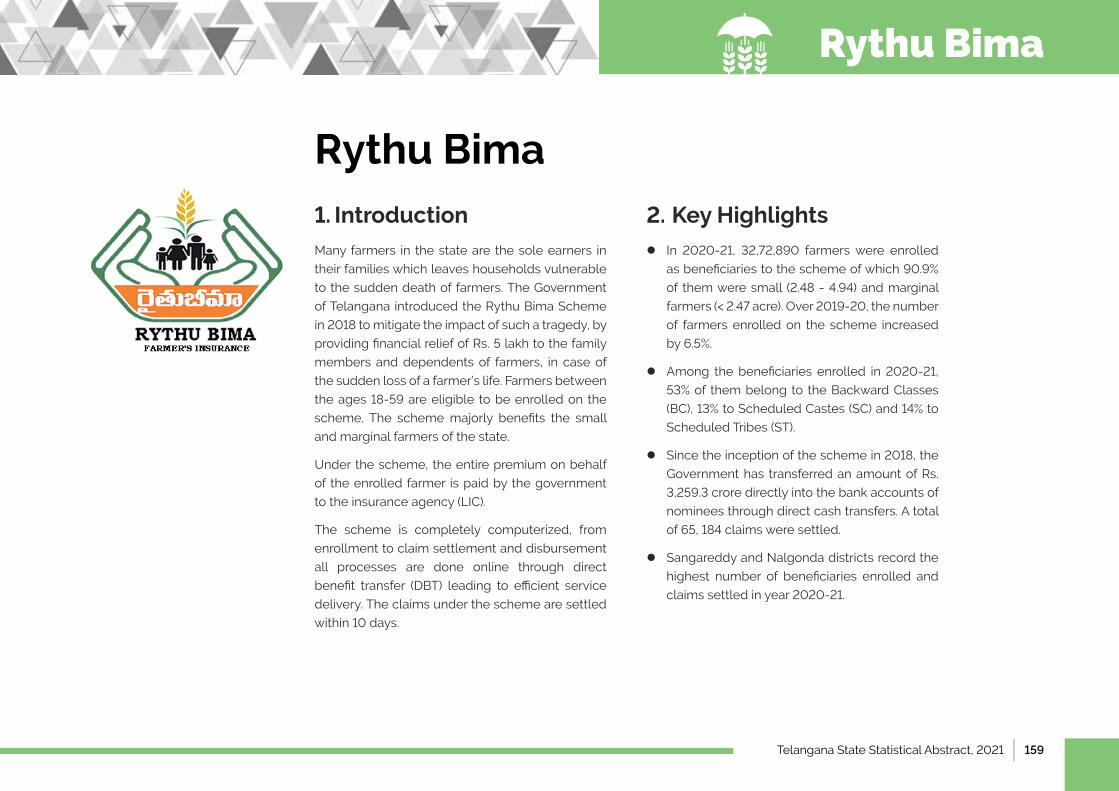
Telangana State Statistical Abstract, 2021 | 159
Rythu Bima
1. Introduction Many farmers in the state are the sole earners in
their families which leaves households vulnerable
to the sudden death of farmers. The Government
of Telangana introduced the Rythu Bima Scheme
in 2018 to mitigate the impact of such a tragedy, by
providing financial relief of Rs. 5 lakh to the family
members and dependents of farmers, in case of
the sudden loss of a farmer’s life. Farmers between
the ages 18-59 are eligible to be enrolled on the
scheme. The scheme majorly benefits the small
and marginal farmers of the state.
●Under the scheme, the entire premium on behalf
of the enrolled farmer is paid by the government
to the insurance agency (LIC).
●The scheme is completely computerized, from
enrollment to claim settlement and disbursement
all processes are done online through direct
benefit transfer (DBT) leading to efficient service
delivery. The claims under the scheme are settled
within 10 days.
2. Key Highlights l In 2020-21, 32,72,890 farmers were enrolled
as beneficiaries to the scheme of which 90.9%
of them were small (2.48 - 4.94) and marginal
farmers (< 2.47 acre). Over 2019-20, the number
of farmers enrolled on the scheme increased
by 6.5%.
l Among the beneficiaries enrolled in 2020-21,
53% of them belong to the Backward Classes
(BC), 13% to Scheduled Castes (SC) and 14% to
Scheduled Tribes (ST).
l Since the inception of the scheme in 2018, the
Government has transferred an amount of Rs.
3,259.3 crore directly into the bank accounts of
nominees through direct cash transfers. A total
of 65, 184 claims were settled.
l Sangareddy and Nalgonda districts record the
highest number of beneficiaries enrolled and
claims settled in year 2020-21.
Rythu Bima
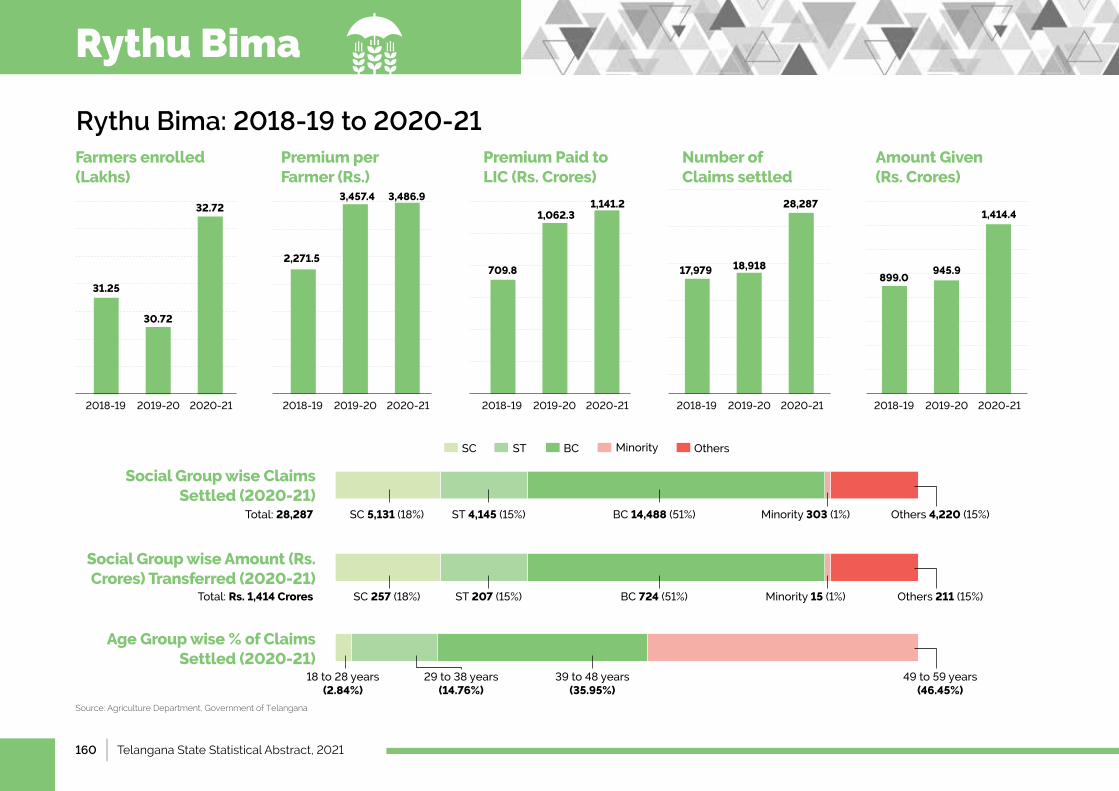
160 | Telangana State Statistical Abstract, 2021
Rythu Bima
Rythu Bima: 2018-19 to 2020-21Premium Paid to LIC (Rs. Crores)
2018-19 2019-20 2020-21
Number of Claims settled
2018-19 2019-20 2020-21
Amount Given (Rs. Crores)
2018-19 2019-20 2020-21
Farmers enrolled (Lakhs)
2018-19 2019-20 2020-21
Premium per Farmer (Rs.)
2018-19 2019-20 2020-21
31.25
30.72
2,271.5
3,457.4 3,486.9
709.8
1,062.31,141.2
17,979 18,918
28,287
899.0945.9
1,414.432.72
Social Group wise Claims Settled (2020-21)
Social Group wise Amount (Rs. Crores) Transferred (2020-21)
Age Group wise % of Claims Settled (2020-21)
Total: 28,287
Total: Rs. 1,414 Crores
SC 5,131 (18%)
SC 257(18%)
18to28years(2.84%)
ST 4,145(15%)
ST 207(15%)
29to38years(14.76%)
BC 14,488(51%)
BC 724(51%)
Minority303(1%)
Minority15(1%)
39to48years (35.95%)
Others 4,220(15%)
Others 211(15%)
49to59years (46.45%)
OthersMinorityBCSTSC
Source: Agriculture Department, Government of Telangana
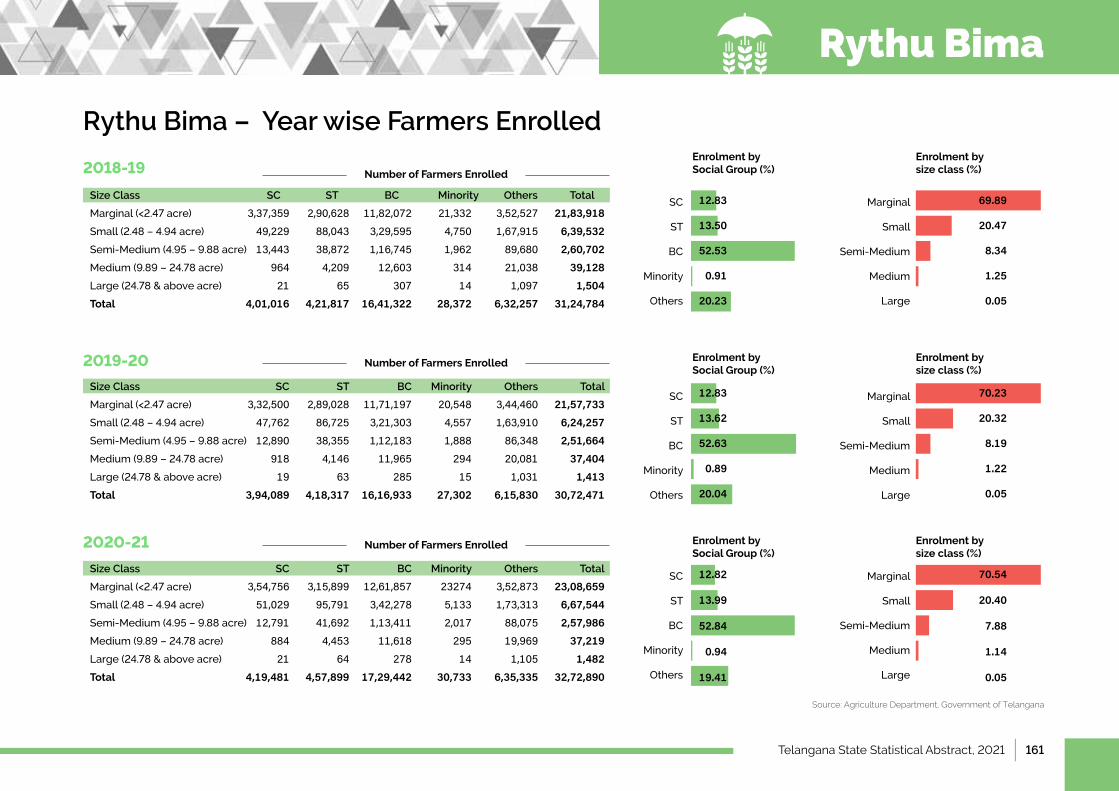
Telangana State Statistical Abstract, 2021 | 161
Rythu Bima
Rythu Bima – Year wise Farmers Enrolled
Size Class SC ST BC Minority Others Total
Marginal(<2.47acre) 3,37,359 2,90,628 11,82,072 21,332 3,52,527 21,83,918Small(2.48–4.94acre) 49,229 88,043 3,29,595 4,750 1,67,915 6,39,532Semi-Medium(4.95–9.88acre) 13,443 38,872 1,16,745 1,962 89,680 2,60,702Medium(9.89–24.78acre) 964 4,209 12,603 314 21,038 39,128Large(24.78&aboveacre) 21 65 307 14 1,097 1,504Total 4,01,016 4,21,817 16,41,322 28,372 6,32,257 31,24,784
SC
ST
BC
Minority
Others
Marginal
Small
Semi-Medium
Medium
Large
Size Class SC ST BC Minority Others Total
Marginal(<2.47acre) 3,32,500 2,89,028 11,71,197 20,548 3,44,460 21,57,733Small(2.48–4.94acre) 47,762 86,725 3,21,303 4,557 1,63,910 6,24,257Semi-Medium(4.95–9.88acre) 12,890 38,355 1,12,183 1,888 86,348 2,51,664Medium(9.89–24.78acre) 918 4,146 11,965 294 20,081 37,404Large(24.78&aboveacre) 19 63 285 15 1,031 1,413Total 3,94,089 4,18,317 16,16,933 27,302 6,15,830 30,72,471
SC
ST
BC
Minority
Others
SC
ST
BC
Minority
Others
Marginal
Small
Semi-Medium
Medium
Large
Marginal
Small
Semi-Medium
Medium
Large
Size Class SC ST BC Minority Others Total
Marginal(<2.47acre) 3,54,756 3,15,899 12,61,857 23274 3,52,873 23,08,659Small(2.48–4.94acre) 51,029 95,791 3,42,278 5,133 1,73,313 6,67,544Semi-Medium(4.95–9.88acre) 12,791 41,692 1,13,411 2,017 88,075 2,57,986Medium(9.89–24.78acre) 884 4,453 11,618 295 19,969 37,219Large(24.78&aboveacre) 21 64 278 14 1,105 1,482Total 4,19,481 4,57,899 17,29,442 30,733 6,35,335 32,72,890
2018-19
2019-20
2020-21
Enrolment by Social Group (%)
Enrolment by Social Group (%)
Enrolment by Social Group (%)
Enrolment by size class (%)
Enrolment by size class (%)
Enrolment by size class (%)
12.83
13.50
52.53
0.91
20.23
12.83
13.62
52.63
0.89
20.04
12.82
13.99
52.84
0.94
19.41
70.23
20.32
8.19
1.22
0.05
70.54
20.40
7.88
1.14
0.05
69.89
20.47
8.34
1.25
0.05
Number of Farmers Enrolled
Number of Farmers Enrolled
Number of Farmers Enrolled
Source: Agriculture Department, Government of Telangana
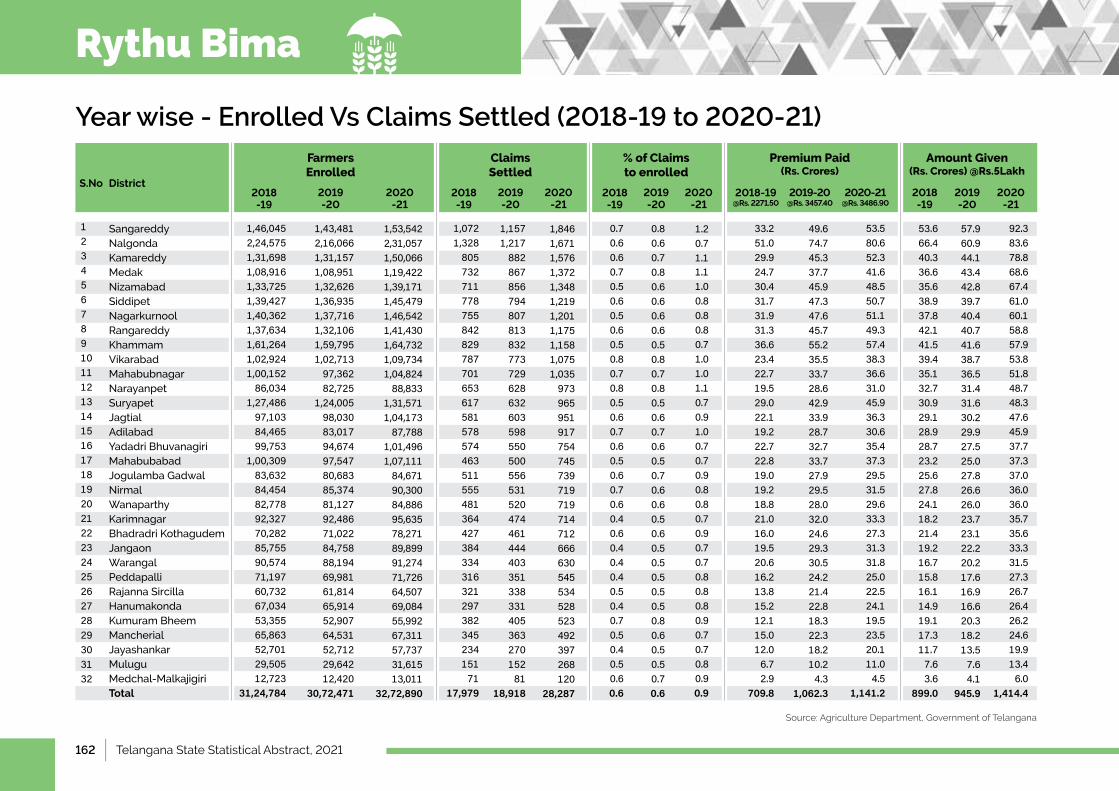
162 | Telangana State Statistical Abstract, 2021
Rythu Bima
Year wise - Enrolled Vs Claims Settled (2018-19 to 2020-21)
SangareddyNalgondaKamareddyMedakNizamabadSiddipetNagarkurnoolRangareddyKhammamVikarabadMahabubnagarNarayanpetSuryapetJagtialAdilabadYadadriBhuvanagiriMahabubabadJogulamba GadwalNirmalWanaparthyKarimnagarBhadradri KothagudemJangaonWarangalPeddapalliRajanna SircillaHanumakondaKumuram BheemMancherialJayashankarMuluguMedchal-MalkajigiriTotal
1234567891011121314151617181920212223242526272829303132
2018 -19
2018 -19
2018 -19
2018-19 @Rs. 2271.50
2018 -19
2019 -20
2019 -20
2019 -20
2019-20@Rs. 3457.40
2019 -20
2020 -21
2020 -21
2020 -21
2020-21@Rs. 3486.90
2020 -21
DistrictS.No
Farmers Enrolled
Claims Settled
% of Claims to enrolled
Premium Paid (Rs. Crores)
Amount Given (Rs. Crores) @Rs.5Lakh
1,46,0452,24,5751,31,6981,08,9161,33,7251,39,4271,40,3621,37,6341,61,2641,02,9241,00,15286,034
1,27,48697,10384,46599,753
1,00,30983,63284,45482,77892,32770,28285,75590,57471,19760,73267,03453,35565,86352,70129,50512,723
31,24,784
1,0721,32880573271177875584282978770165361758157857446351155548136442738433431632129738234523415171
17,979
0.70.60.60.70.50.60.50.60.50.80.70.80.50.60.70.60.50.60.70.60.40.60.40.40.40.50.40.70.50.40.50.60.6
33.251.029.924.730.431.731.931.336.623.422.719.529.022.119.222.722.819.019.218.821.016.019.520.616.213.815.212.115.012.06.72.9
709.8
53.666.440.336.635.638.937.842.141.539.435.132.730.929.128.928.723.225.627.824.118.221.419.216.715.816.114.919.117.311.77.63.6
899.0
1,43,4812,16,0661,31,1571,08,9511,32,6261,36,9351,37,7161,32,1061,59,7951,02,71397,36282,725
1,24,00598,03083,01794,67497,54780,68385,37481,12792,48671,02284,75888,19469,98161,81465,91452,90764,53152,71229,64212,420
30,72,471
1,1571,21788286785679480781383277372962863260359855050055653152047446144440335133833140536327015281
18,918
0.80.60.70.80.60.60.60.60.50.80.70.80.50.60.70.60.50.70.60.60.50.60.50.50.50.50.50.80.60.50.50.70.6
49.674.745.337.745.947.347.645.755.235.533.728.642.933.928.732.733.727.929.528.032.024.629.330.524.221.422.818.322.318.210.24.3
1,062.3
57.960.944.143.442.839.740.440.741.638.736.531.431.630.229.927.525.027.826.626.023.723.122.220.217.616.916.620.318.213.57.64.1
945.9
1,53,5422,31,0571,50,0661,19,4221,39,1711,45,4791,46,5421,41,4301,64,7321,09,7341,04,82488,833
1,31,5711,04,17387,788
1,01,4961,07,111
84,67190,30084,88695,63578,27189,89991,27471,72664,50769,08455,99267,31157,73731,61513,011
32,72,890
1,8461,6711,5761,3721,3481,2191,2011,1751,1581,0751,035973965951917754745739719719714712666630545534528523492397268120
28,287
1.20.71.11.11.00.80.80.80.71.01.01.10.70.91.00.70.70.90.80.80.70.90.70.70.80.80.80.90.70.70.80.90.9
53.580.652.341.648.550.751.149.357.438.336.631.045.936.330.635.437.329.531.529.633.327.331.331.825.022.524.119.523.520.111.04.5
1,141.2
92.383.678.868.667.461.060.158.857.953.851.848.748.347.645.937.737.337.036.036.035.735.633.331.527.326.726.426.224.619.913.46.0
1,414.4
Source: Agriculture Department, Government of Telangana
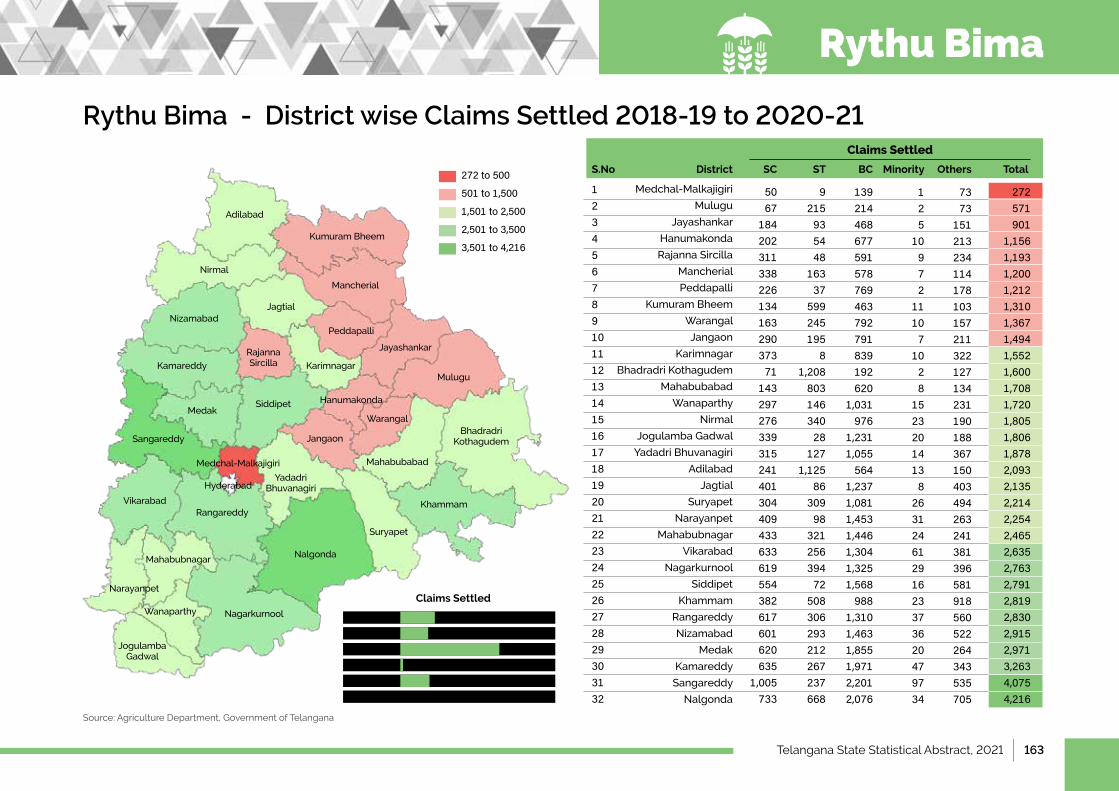
Telangana State Statistical Abstract, 2021 | 163
Rythu Bima
Rythu Bima - District wise Claims Settled 2018-19 to 2020-21
Source: Agriculture Department, Government of Telangana
Medchal-Malkajigiri
Mulugu
Jayashankar
Hanumakonda
Rajanna Sircilla
Mancherial
Peddapalli
Kumuram Bheem
Warangal
Jangaon
Karimnagar
Bhadradri Kothagudem
Mahabubabad
Wanaparthy
Nirmal
Jogulamba Gadwal
YadadriBhuvanagiri
Adilabad
Jagtial
Suryapet
Narayanpet
Mahabubnagar
Vikarabad
Nagarkurnool
Siddipet
Khammam
Rangareddy
Nizamabad
Medak
Kamareddy
Sangareddy
Nalgonda
1234567891011121314151617181920212223242526272829303132
5067
18420231133822613416329037371
143297276339315241401304409433633619554382617601620635
1,005733
9215935448
16337
599245195
81,20880314634028
1271,125
8630998
32125639472
508306293212267237668
139214468677591578769463792791839192620
1,031976
1,2311,055564
1,2371,0811,4531,4461,3041,3251,568988
1,3101,4631,8551,9712,2012,076
125
10972
11107
1028
15232014138
26312461291623373620479734
7373
151213234114178103157211322127134231190188367150403494263241381396581918560522264343535705
SC ST BC Minority OthersDistrictS.No Total
Claims Settled
272571901
1,1561,1931,2001,2121,3101,3671,4941,5521,6001,7081,7201,8051,8061,8782,0932,1352,2142,2542,4652,6352,7632,7912,8192,8302,9152,9713,2634,0754,216
272to500
501to1,500
1,501to2,500
2,501to3,500
3,501to4,216
Claims Settled
SC
ST
BC
Minority
Others
Total
11,966
9,470
33,268
658
9,822
65,184
Adilabad
Nirmal
Kumuram Bheem
Mancherial
Jagtial
Rajanna Sircilla
Peddapalli
Jayashankar
Mulugu
MedakSiddipet Hanumakonda
Warangal
JangaonSangareddy
Medchal-Malkajigiri
VikarabadRangareddy
Mahabubnagar
Narayanpet
Nalgonda
NagarkurnoolWanaparthy
Suryapet
Khammam
Karimnagar
Yadadri Bhuvanagiri
Mahabubabad
Jogulamba Gadwal
Bhadradri Kothagudem
Kamareddy
Nizamabad
Hyderabad
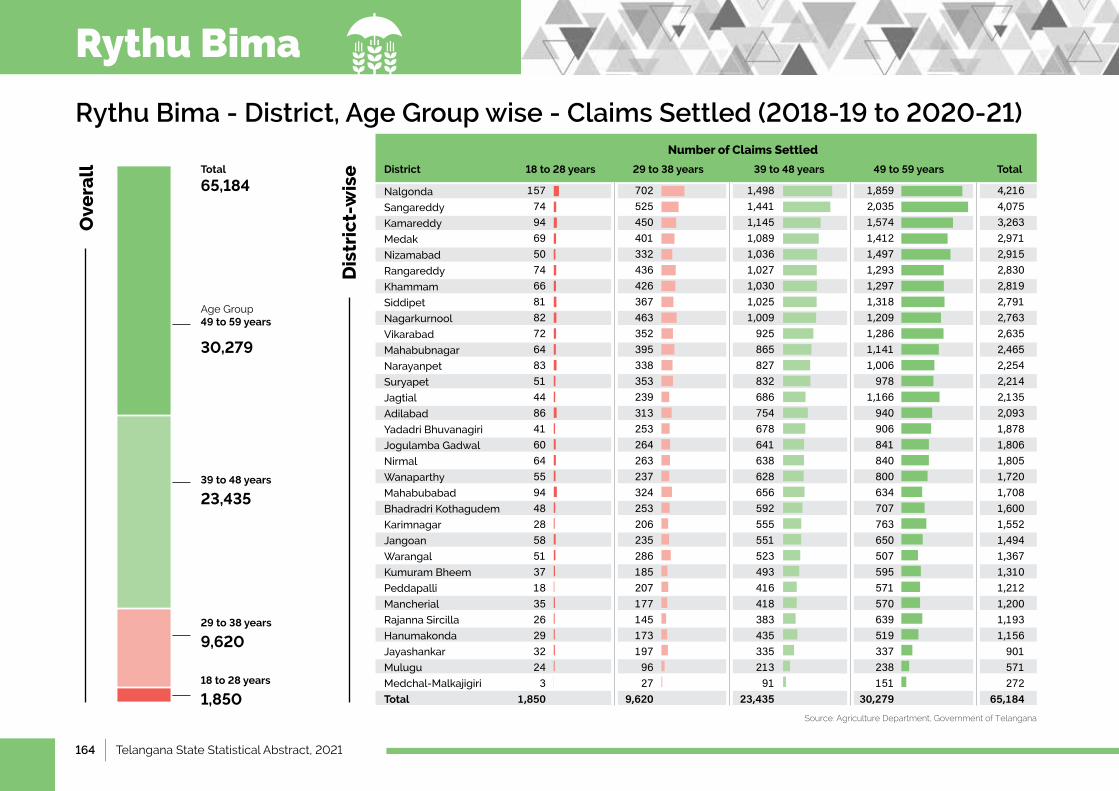
164 | Telangana State Statistical Abstract, 2021
Rythu Bima
Rythu Bima - District, Age Group wise - Claims Settled (2018-19 to 2020-21)
Nalgonda
Sangareddy
Kamareddy
Medak
Nizamabad
Rangareddy
Khammam
Siddipet
Nagarkurnool
Vikarabad
Mahabubnagar
Narayanpet
Suryapet
Jagtial
Adilabad
YadadriBhuvanagiri
Jogulamba Gadwal
Nirmal
Wanaparthy
Mahabubabad
Bhadradri Kothagudem
Karimnagar
Jangoan
Warangal
Kumuram Bheem
Peddapalli
Mancherial
Rajanna Sircilla
Hanumakonda
Jayashankar
Mulugu
Medchal-Malkajigiri
Total
1577494695074668182726483514486416064559448285851371835262932243
1,850
7025254504013324364263674633523953383532393132532642632373242532062352861852071771451731979627
9,620
1,4981,4411,1451,0891,0361,0271,0301,0251,00992586582783268675467864163862865659255555152349341641838343533521391
23,435
1,8592,0351,5741,4121,4971,2931,2971,3181,2091,2861,1411,006978
1,166940906841840800634707763650507595571570639519337238151
30,279
18 to 28 years 29 to 38 years 39 to 48 years 49 to 59 yearsDistrict
Age Group49 to 59 years
Total
65,184
39 to 48 years
23,435
29 to 38 years
9,620
18 to 28 years
1,850
30,279
Total
Number of Claims Settled
Ove
rall
Dis
tric
t-w
ise
4,2164,0753,2632,9712,9152,8302,8192,7912,7632,6352,4652,2542,2142,1352,0931,8781,8061,8051,7201,7081,6001,5521,4941,3671,3101,2121,2001,1931,156901571272
65,184
Source: Agriculture Department, Government of Telangana
Telangana State Statistical Abstract, 2021 | 165
HealthChapter 10
166 | Telangana State Statistical Abstract, 2021
1 IntroductionandKeyHighlights.....................................................................................................................................................................................................................................................................................................167
2 HealthIndices(TelanganaVsAll-India)....................................................................................................................................................................................................................................................................168-169
3 MedicalInfrastructure-Facilities(Number)............................................................................................................................................................................................................................................................170
4 AnganwadiCentres.................................................................................................................................................................................................................................................................................................................................................171
5 MotherCare-SupplementaryNutrition..........................................................................................................................................................................................................................................................................172
6 ChildCare-SupplementaryNutrition(7monthsto6years)..................................................................................................................................................................................................173
7 ChildMalnutritionStatus...............................................................................................................................................................................................................................................................................................................................174
8 No.ofKCRKITSDistributed(2020-21)...............................................................................................................................................................................................................................................................................175
9 ArogyasriBeneficiaries-2021-22...............................................................................................................................................................................................................................................................................................176
IndexPage No.S.No. Item
Health
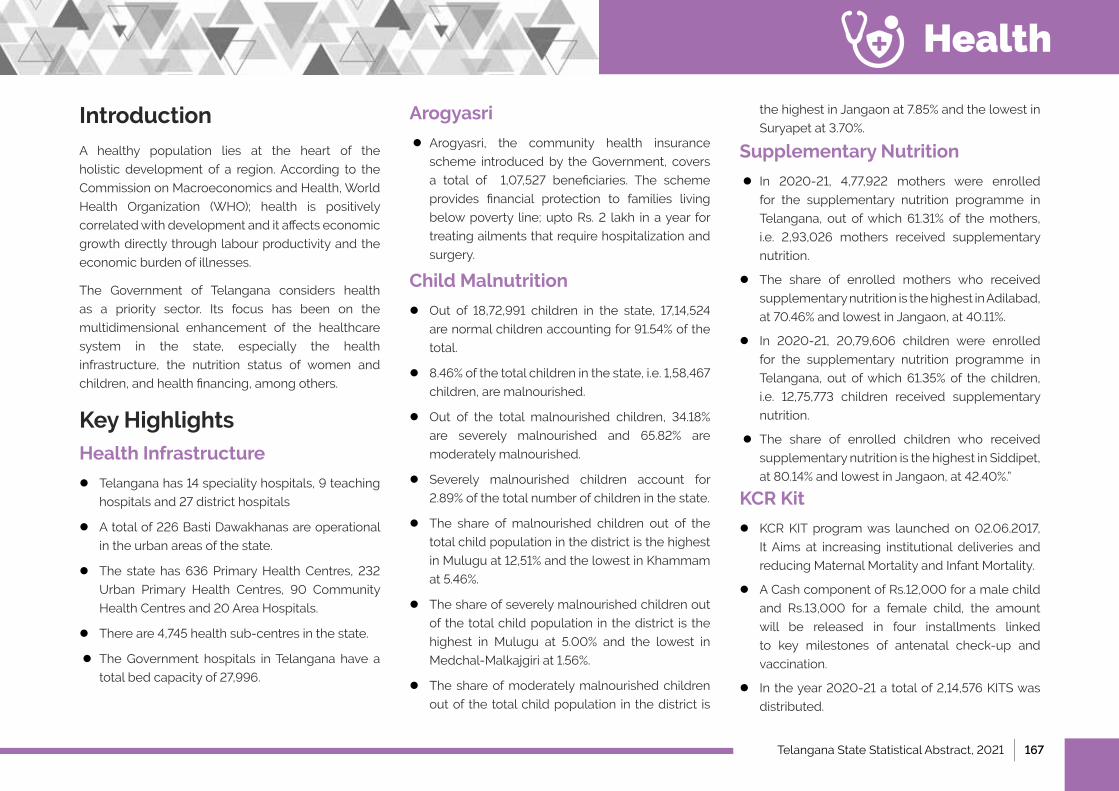
Telangana State Statistical Abstract, 2021 | 167
Health
IntroductionA healthy population lies at the heart of the
holistic development of a region. According to the
Commission on Macroeconomics and Health, World
Health Organization (WHO); health is positively
correlated with development and it affects economic
growth directly through labour productivity and the
economic burden of illnesses.
The Government of Telangana considers health
as a priority sector. Its focus has been on the
multidimensional enhancement of the healthcare
system in the state, especially the health
infrastructure, the nutrition status of women and
children, and health financing, among others.
Key HighlightsHealth Infrastructure
l Telangana has 14 speciality hospitals, 9 teaching
hospitals and 27 district hospitals
l A total of 226 Basti Dawakhanas are operational
in the urban areas of the state.
l The state has 636 Primary Health Centres, 232
Urban Primary Health Centres, 90 Community
Health Centres and 20 Area Hospitals.
l There are 4,745 health sub-centres in the state.
● l The Government hospitals in Telangana have a
total bed capacity of 27,996.
Arogyasri
● l Arogyasri, the community health insurance
scheme introduced by the Government, covers
a total of 1,07,527 beneficiaries. The scheme
provides financial protection to families living
below poverty line; upto Rs. 2 lakh in a year for
treating ailments that require hospitalization and
surgery.
Child Malnutrition
l Out of 18,72,991 children in the state, 17,14,524
are normal children accounting for 91.54% of the
total.
l 8.46% of the total children in the state, i.e. 1,58,467
children, are malnourished.
l Out of the total malnourished children, 34.18%
are severely malnourished and 65.82% are
moderately malnourished.
l Severely malnourished children account for
2.89% of the total number of children in the state.
l The share of malnourished children out of the
total child population in the district is the highest
in Mulugu at 12,51% and the lowest in Khammam
at 5.46%.
l The share of severely malnourished children out
of the total child population in the district is the
highest in Mulugu at 5.00% and the lowest in
Medchal-Malkajgiri at 1.56%.
l The share of moderately malnourished children
out of the total child population in the district is
the highest in Jangaon at 7.85% and the lowest in
Suryapet at 3.70%.
Supplementary Nutrition
● l In 2020-21, 4,77,922 mothers were enrolled
for the supplementary nutrition programme in
Telangana, out of which 61.31% of the mothers,
i.e. 2,93,026 mothers received supplementary
nutrition.
l The share of enrolled mothers who received
supplementary nutrition is the highest in Adilabad,
at 70.46% and lowest in Jangaon, at 40.11%.
l In 2020-21, 20,79,606 children were enrolled
for the supplementary nutrition programme in
Telangana, out of which 61.35% of the children,
i.e. 12,75,773 children received supplementary
nutrition.
● l The share of enrolled children who received
supplementary nutrition is the highest in Siddipet,
at 80.14% and lowest in Jangaon, at 42.40%.”
KCR Kit
l KCR KIT program was launched on 02.06.2017,
It Aims at increasing institutional deliveries and
reducing Maternal Mortality and Infant Mortality.
l A Cash component of Rs.12,000 for a male child
and Rs.13,000 for a female child, the amount
will be released in four installments linked
to key milestones of antenatal check-up and
vaccination.
l In the year 2020-21 a total of 2,14,576 KITS was
distributed.
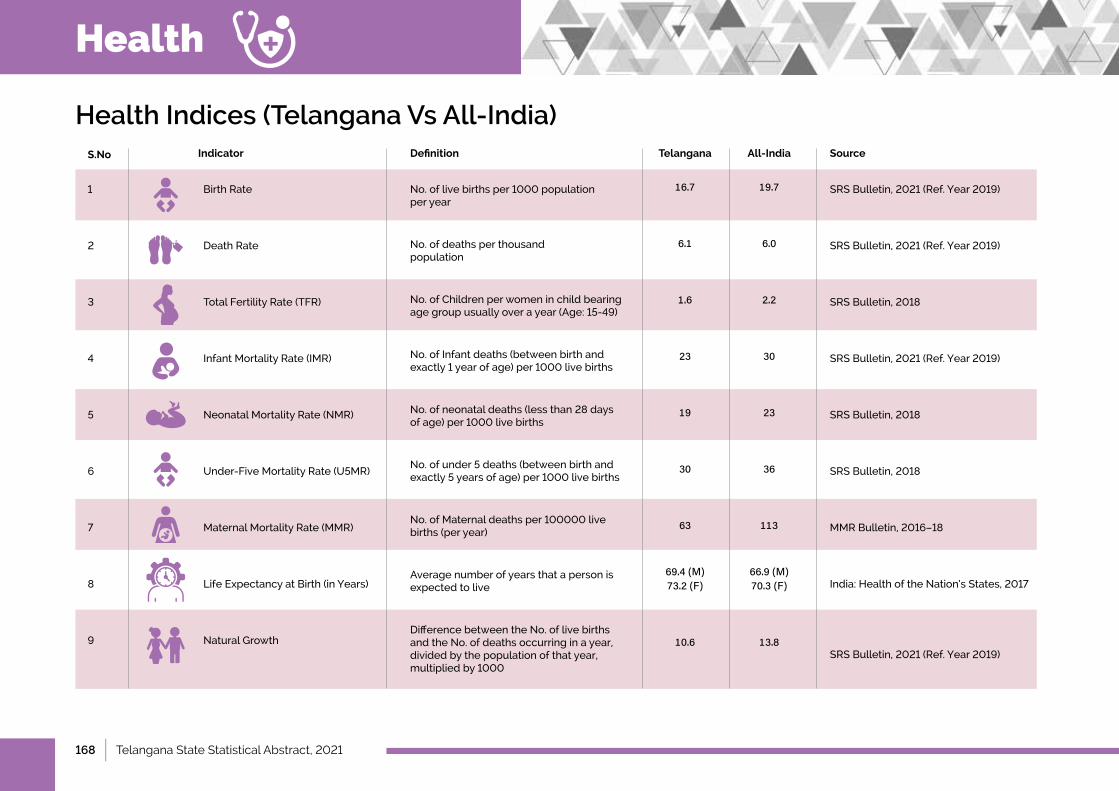
168 | Telangana State Statistical Abstract, 2021
Health
Health Indices (Telangana Vs All-India)
Birth Rate
Death Rate
TotalFertilityRate(TFR)
InfantMortalityRate(IMR)
NeonatalMortalityRate(NMR)
Under-FiveMortalityRate(U5MR)
MaternalMortalityRate(MMR)
LifeExpectancyatBirth(inYears)
Natural Growth
No.oflivebirthsper1000population per year
No.ofdeathsperthousand population
No.ofChildrenperwomeninchildbearingagegroupusuallyoverayear(Age:15-49)
No.ofInfantdeaths(betweenbirthandexactly1yearofage)per1000livebirths
No.ofneonataldeaths(lessthan28days ofage)per1000livebirths
No.ofunder5deaths(betweenbirthandexactly5yearsofage)per1000livebirths
No.ofMaternaldeathsper100000livebirths (per year)
Average number of years that a person is expected to live
DifferencebetweentheNo.oflivebirthsandtheNo.ofdeathsoccurringinayear,dividedbythepopulationofthatyear,multipliedby1000
16.7
6.1
1.6
23
19
30
63
69.4(M)73.2(F)
10.6
19.7
6.0
2.2
30
23
36
113
66.9(M)70.3(F)
13.8
SRSBulletin,2021(Ref.Year2019)
SRSBulletin,2021(Ref.Year2019)
SRSBulletin,2018
SRSBulletin,2021(Ref.Year2019)
SRSBulletin,2018
SRSBulletin,2018
MMRBulletin,2016–18
India:HealthoftheNation’sStates,2017
SRSBulletin,2021(Ref.Year2019)
1
2
3
4
5
6
7
8
9
Indicator Definition Telangana All-India SourceS.No
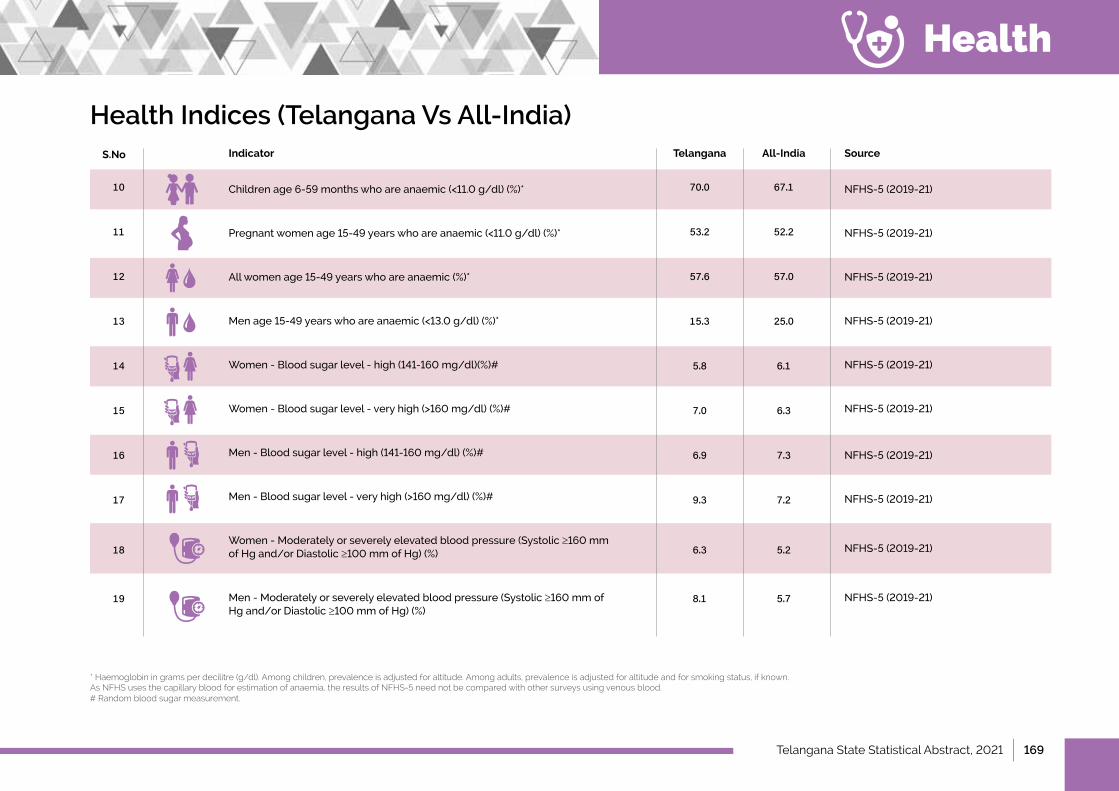
Telangana State Statistical Abstract, 2021 | 169
Health
Health Indices (Telangana Vs All-India)
Childrenage6-59monthswhoareanaemic(<11.0g/dl)(%)*
Pregnantwomenage15-49yearswhoareanaemic(<11.0g/dl)(%)*
Allwomenage15-49yearswhoareanaemic(%)*
Menage15-49yearswhoareanaemic(<13.0g/dl)(%)*
Women-Bloodsugarlevel-high(141-160mg/dl)(%)#
Women-Bloodsugarlevel-veryhigh(>160mg/dl)(%)#
Men-Bloodsugarlevel-high(141-160mg/dl)(%)#
Men-Bloodsugarlevel-veryhigh(>160mg/dl)(%)#
Women-Moderatelyorseverelyelevatedbloodpressure(Systolic≥160mmof Hg and/or Diastolic ≥100mmofHg)(%)
Men-Moderatelyorseverelyelevatedbloodpressure(Systolic≥160mmofHg and/or Diastolic ≥100mmofHg)(%)
70.0
53.2
57.6
15.3
5.8
7.0
6.9
9.3
6.3
8.1
67.1
52.2
57.0
25.0
6.1
6.3
7.3
7.2
5.2
5.7
NFHS-5(2019-21)
NFHS-5(2019-21)
NFHS-5(2019-21)
NFHS-5(2019-21)
NFHS-5(2019-21)
NFHS-5(2019-21)
NFHS-5(2019-21)
NFHS-5(2019-21)
NFHS-5(2019-21)
NFHS-5(2019-21)
10
11
12
13
14
15
16
17
18
19
Indicator Telangana All-India SourceS.No
* Haemoglobin in grams per decilitre (g/dl). Among children, prevalence is adjusted for altitude. Among adults, prevalence is adjusted for altitude and for smoking status, if known. As NFHS uses the capillary blood for estimation of anaemia, the results of NFHS-5 need not be compared with other surveys using venous blood. # Random blood sugar measurement.
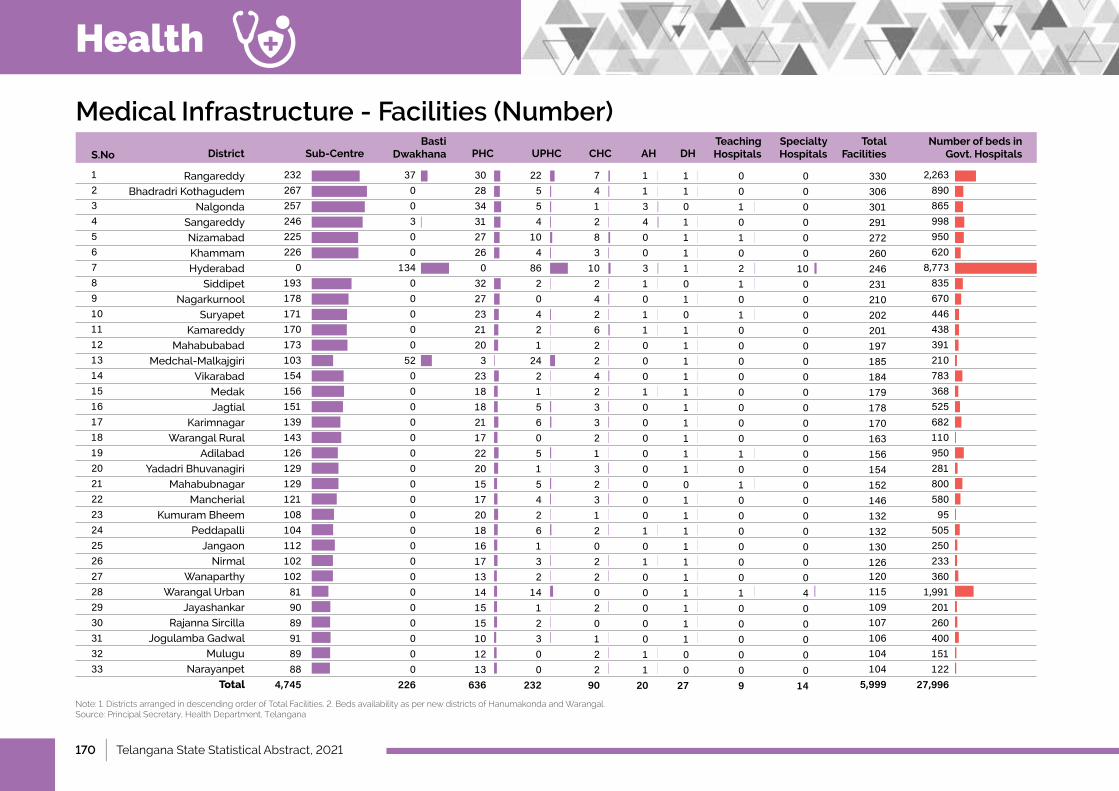
170 | Telangana State Statistical Abstract, 2021
Medical Infrastructure - Facilities (Number)
Rangareddy
Bhadradri Kothagudem
Nalgonda
Sangareddy
Nizamabad
Khammam
Hyderabad
Siddipet
Nagarkurnool
Suryapet
Kamareddy
Mahabubabad
Medchal-Malkajgiri
Vikarabad
Medak
Jagtial
Karimnagar
Warangal Rural
Adilabad
YadadriBhuvanagiri
Mahabubnagar
Mancherial
Kumuram Bheem
Peddapalli
Jangaon
Nirmal
Wanaparthy
WarangalUrban
Jayashankar
Rajanna Sircilla
Jogulamba Gadwal
Mulugu
Narayanpet
Total
123456789101112131415161718192021222324252627282930313233
232267257246225226
0193178171170173103154156151139143126129129121108104112102102819089918988
4,745
3700300
13400000
5200000000000000000000
226
3028343127260
32272321203
2318182117222015172018161713141515101213
636
22554
104
8620421
2421560515426132
1412300
232
741283
1024262242332132312022020122
90
113400310110001000000001010000011
20
110111101011111111110111111111100
27
0010102101000000001010000001000009
000000
1000000000000000000000400000
14
330306301291272260246231210202201197185184179178170163156154152146132132130126120115109107106104104
5,999
2,263890865998950620
8,77383567044643839121078336852568211095028180058095
505250233360
1,991201260400151122
27,996
Sub-Centre Basti
Dwakhana PHC UPHC CHC AH DH Teaching Hospitals
Specialty Hospitals
Total Facilities
Number of beds in Govt. HospitalsDistrictS.No
Note: 1. Districts arranged in descending order of Total Facilities. 2. Beds availability as per new districts of Hanumakonda and Warangal. Source: Principal Secretary, Health Department, Telangana
Health
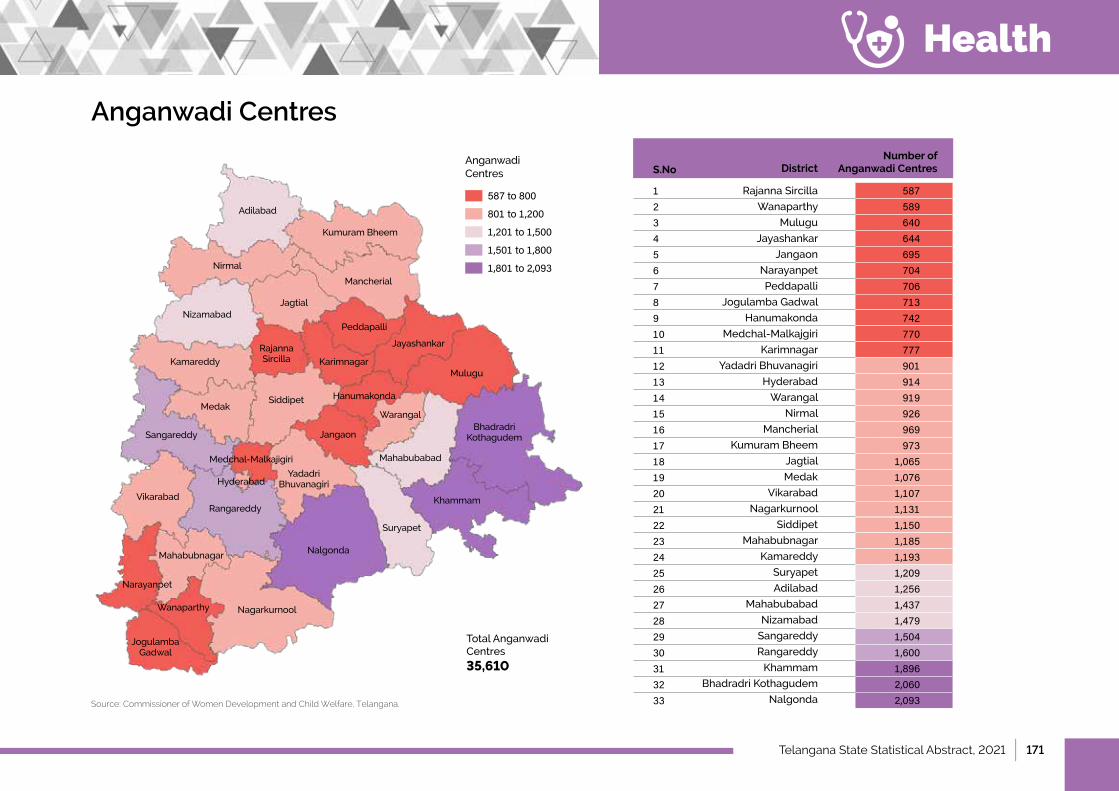
Telangana State Statistical Abstract, 2021 | 171
Anganwadi Centres
Rajanna Sircilla
Wanaparthy
Mulugu
Jayashankar
Jangaon
Narayanpet
Peddapalli
Jogulamba Gadwal
Hanumakonda
Medchal-Malkajgiri
Karimnagar
YadadriBhuvanagiri
Hyderabad
Warangal
Nirmal
Mancherial
Kumuram Bheem
Jagtial
Medak
Vikarabad
Nagarkurnool
Siddipet
Mahabubnagar
Kamareddy
Suryapet
Adilabad
Mahabubabad
Nizamabad
Sangareddy
Rangareddy
Khammam
Bhadradri Kothagudem
Nalgonda
123456789101112131415161718192021222324252627282930313233
Number of Anganwadi CentresDistrictS.No
587589640644695704706713742770777901914919926969973
1,0651,0761,1071,1311,1501,1851,1931,2091,2561,4371,4791,5041,6001,8962,0602,093
587to800
801to1,200
1,201to1,500
1,501to1,800
1,801to2,093
Anganwadi Centres
Source: Commissioner of Women Development and Child Welfare, Telangana.
Adilabad
Nirmal
Kumuram Bheem
Mancherial
Jagtial
Rajanna Sircilla
Peddapalli
Jayashankar
Mulugu
MedakSiddipet Hanumakonda
Warangal
JangaonSangareddy
Medchal-Malkajigiri
VikarabadRangareddy
Mahabubnagar
Narayanpet
Nalgonda
NagarkurnoolWanaparthy
Suryapet
Khammam
Karimnagar
Yadadri Bhuvanagiri
Mahabubabad
Jogulamba Gadwal
Bhadradri Kothagudem
Kamareddy
Nizamabad
Hyderabad
Total Anganwadi Centres
35,610
Health
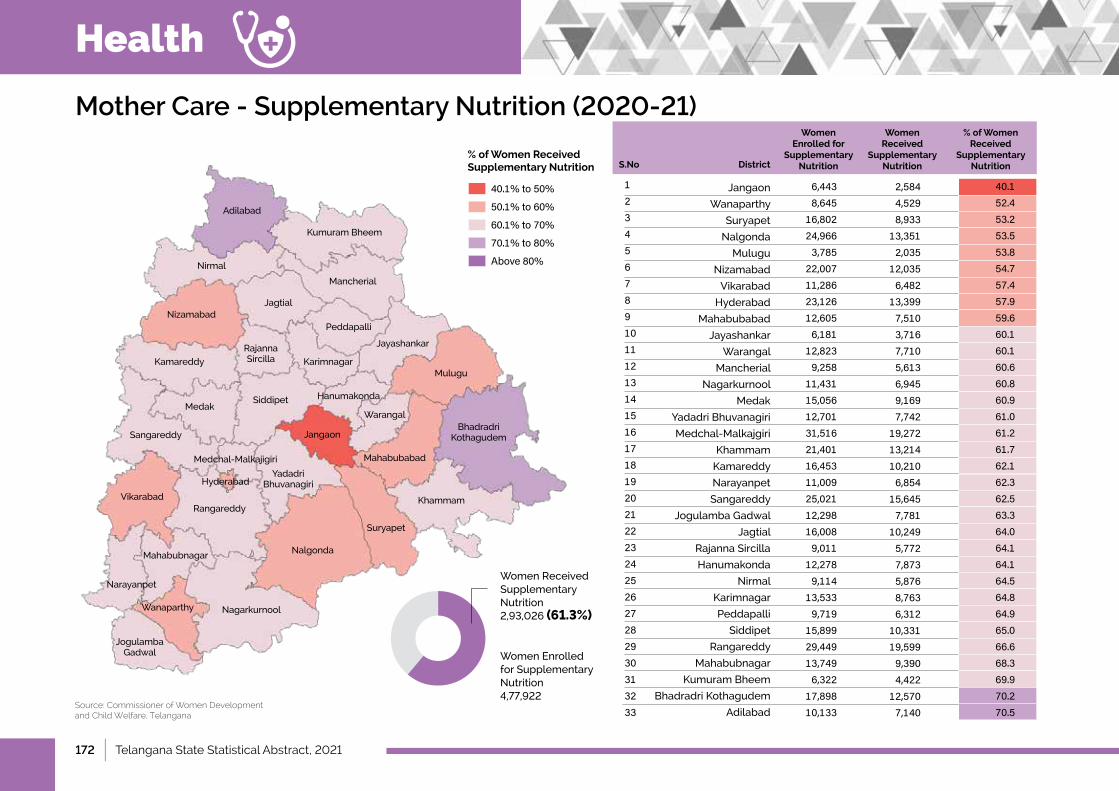
172 | Telangana State Statistical Abstract, 2021
Health
Mother Care - Supplementary Nutrition (2020-21)
Source: Commissioner of Women Development and Child Welfare, Telangana
Jangaon
Wanaparthy
Suryapet
Nalgonda
Mulugu
Nizamabad
Vikarabad
Hyderabad
Mahabubabad
Jayashankar
Warangal
Mancherial
Nagarkurnool
Medak
YadadriBhuvanagiri
Medchal-Malkajgiri
Khammam
Kamareddy
Narayanpet
Sangareddy
Jogulamba Gadwal
Jagtial
Rajanna Sircilla
Hanumakonda
Nirmal
Karimnagar
Peddapalli
Siddipet
Rangareddy
Mahabubnagar
Kumuram Bheem
Bhadradri Kothagudem
Adilabad
123456789101112131415161718192021222324252627282930313233
6,4438,645
16,80224,9663,785
22,00711,28623,12612,6056,181
12,8239,258
11,43115,05612,70131,51621,40116,45311,00925,02112,29816,0089,011
12,2789,114
13,5339,719
15,89929,44913,7496,322
17,89810,133
2,5844,5298,933
13,3512,035
12,0356,482
13,3997,5103,7167,7105,6136,9459,1697,742
19,27213,21410,2106,854
15,6457,781
10,2495,7727,8735,8768,7636,312
10,33119,5999,3904,422
12,5707,140
Women Enrolled for
Supplementary Nutrition
Women Received
Supplementary NutritionDistrictS.No
% of Women Received
Supplementary Nutrition
40.152.453.253.553.854.757.457.959.660.160.160.660.860.961.061.261.762.162.362.563.364.064.164.164.564.864.965.066.668.369.970.270.5
40.1%to50%
50.1%to60%
60.1%to70%
70.1%to80%
Above80%
% of Women Received Supplementary Nutrition
Adilabad
Nirmal
Kumuram Bheem
Mancherial
Jagtial
Rajanna Sircilla
Peddapalli
Jayashankar
Mulugu
MedakSiddipet Hanumakonda
Warangal
JangaonSangareddy
Medchal-Malkajigiri
VikarabadRangareddy
Mahabubnagar
Narayanpet
Nalgonda
NagarkurnoolWanaparthy
Suryapet
Khammam
Karimnagar
Yadadri Bhuvanagiri
Mahabubabad
Jogulamba Gadwal
Bhadradri Kothagudem
Kamareddy
Nizamabad
Hyderabad
Women Received Supplementary Nutrition 2,93,026(61.3%)
Women Enrolled for Supplementary Nutrition 4,77,922
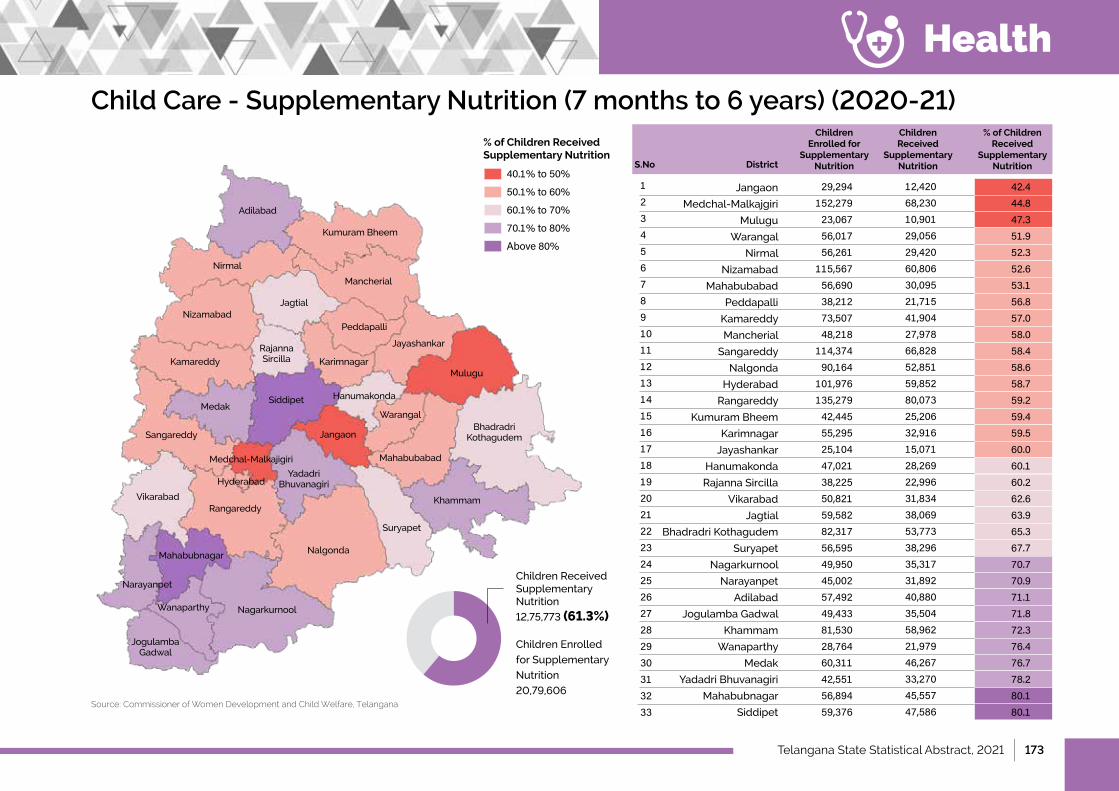
Telangana State Statistical Abstract, 2021 | 173
Health
Child Care - Supplementary Nutrition (7 months to 6 years) (2020-21)
Source: Commissioner of Women Development and Child Welfare, Telangana
Jangaon
Medchal-Malkajgiri
Mulugu
Warangal
Nirmal
Nizamabad
Mahabubabad
Peddapalli
Kamareddy
Mancherial
Sangareddy
Nalgonda
Hyderabad
Rangareddy
Kumuram Bheem
Karimnagar
Jayashankar
Hanumakonda
Rajanna Sircilla
Vikarabad
Jagtial
Bhadradri Kothagudem
Suryapet
Nagarkurnool
Narayanpet
Adilabad
Jogulamba Gadwal
Khammam
Wanaparthy
Medak
YadadriBhuvanagiri
Mahabubnagar
Siddipet
123456789101112131415161718192021222324252627282930313233
29,294152,27923,06756,01756,261
115,56756,69038,21273,50748,218
114,37490,164
101,976135,27942,44555,29525,10447,02138,22550,82159,58282,31756,59549,95045,00257,49249,43381,53028,76460,31142,55156,89459,376
12,42068,23010,90129,05629,42060,80630,09521,71541,90427,97866,82852,85159,85280,07325,20632,91615,07128,26922,99631,83438,06953,77338,29635,31731,89240,88035,50458,96221,97946,26733,27045,55747,586
Children Enrolled for
Supplementary Nutrition
Children Received
Supplementary NutritionDistrictS.No
% of Children Received
Supplementary Nutrition
42.444.847.351.952.352.653.156.857.058.058.458.658.759.259.459.560.060.160.262.663.965.367.770.770.971.171.872.376.476.778.280.180.1
40.1%to50%
50.1%to60%
60.1%to70%
70.1%to80%
Above80%
% of Children Received Supplementary Nutrition
Adilabad
Nirmal
Kumuram Bheem
Mancherial
Jagtial
Rajanna Sircilla
Peddapalli
Jayashankar
Mulugu
MedakSiddipet Hanumakonda
Warangal
JangaonSangareddy
Medchal-Malkajigiri
VikarabadRangareddy
Mahabubnagar
Narayanpet
Nalgonda
NagarkurnoolWanaparthy
Suryapet
Khammam
Karimnagar
Yadadri Bhuvanagiri
Mahabubabad
Jogulamba Gadwal
Bhadradri Kothagudem
Kamareddy
Nizamabad
Hyderabad
Children Received Supplementary Nutrition
12,75,773(61.3%)
Children Enrolled
for Supplementary
Nutrition
20,79,606
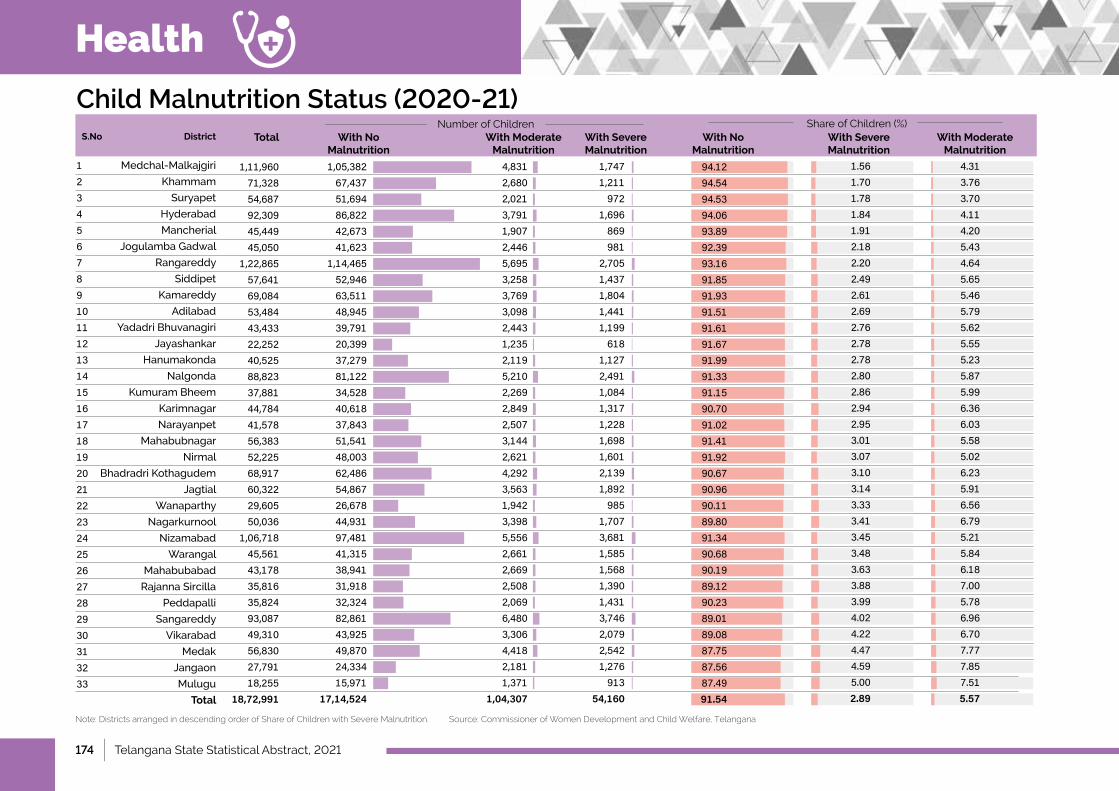
174 | Telangana State Statistical Abstract, 2021
Health
Child Malnutrition Status (2020-21)
Medchal-Malkajgiri
Khammam
Suryapet
Hyderabad
Mancherial
Jogulamba Gadwal
Rangareddy
Siddipet
Kamareddy
Adilabad
YadadriBhuvanagiri
Jayashankar
Hanumakonda
Nalgonda
Kumuram Bheem
Karimnagar
Narayanpet
Mahabubnagar
Nirmal
Bhadradri Kothagudem
Jagtial
Wanaparthy
Nagarkurnool
Nizamabad
Warangal
Mahabubabad
Rajanna Sircilla
Peddapalli
Sangareddy
Vikarabad
Medak
Jangaon
Mulugu
Total
Total With No Malnutrition
With Moderate Malnutrition
With Severe Malnutrition
With No Malnutrition
With Severe Malnutrition
With Moderate Malnutrition
123456789101112131415161718192021222324252627282930313233
Note: Districts arranged in descending order of Share of Children with Severe Malnutrition. Source: Commissioner of Women Development and Child Welfare, Telangana
1,11,96071,32854,68792,30945,44945,050
1,22,86557,64169,08453,48443,43322,25240,52588,82337,88144,78441,57856,38352,22568,91760,32229,60550,036
1,06,71845,56143,17835,81635,82493,08749,31056,83027,79118,255
18,72,991
1,05,38267,43751,69486,82242,67341,623
1,14,46552,94663,51148,94539,79120,39937,27981,12234,52840,61837,84351,54148,00362,48654,86726,67844,93197,48141,31538,94131,91832,32482,86143,92549,87024,33415,971
17,14,524
4,8312,6802,0213,7911,9072,4465,6953,2583,7693,0982,4431,2352,1195,2102,2692,8492,5073,1442,6214,2923,5631,9423,3985,5562,6612,6692,5082,0696,4803,3064,4182,1811,371
1,04,307
1,7471,211972
1,696869981
2,7051,4371,8041,4411,199618
1,1272,4911,0841,3171,2281,6981,6012,1391,892985
1,7073,6811,5851,5681,3901,4313,7462,0792,5421,276913
54,160
4.313.763.704.114.205.434.645.655.465.795.625.555.235.875.996.366.035.585.026.235.916.566.795.215.846.187.005.786.966.707.777.857.515.57
1.561.701.781.841.912.182.202.492.612.692.762.782.782.802.862.942.953.013.073.103.143.333.413.453.483.633.883.994.024.224.474.595.002.89
94.1294.5494.5394.0693.8992.3993.1691.8591.9391.5191.6191.6791.9991.3391.1590.7091.0291.4191.9290.6790.9690.1189.8091.3490.6890.1989.1290.2389.0189.0887.7587.5687.4991.54
Share of Children (%)Number of ChildrenDistrictS.No
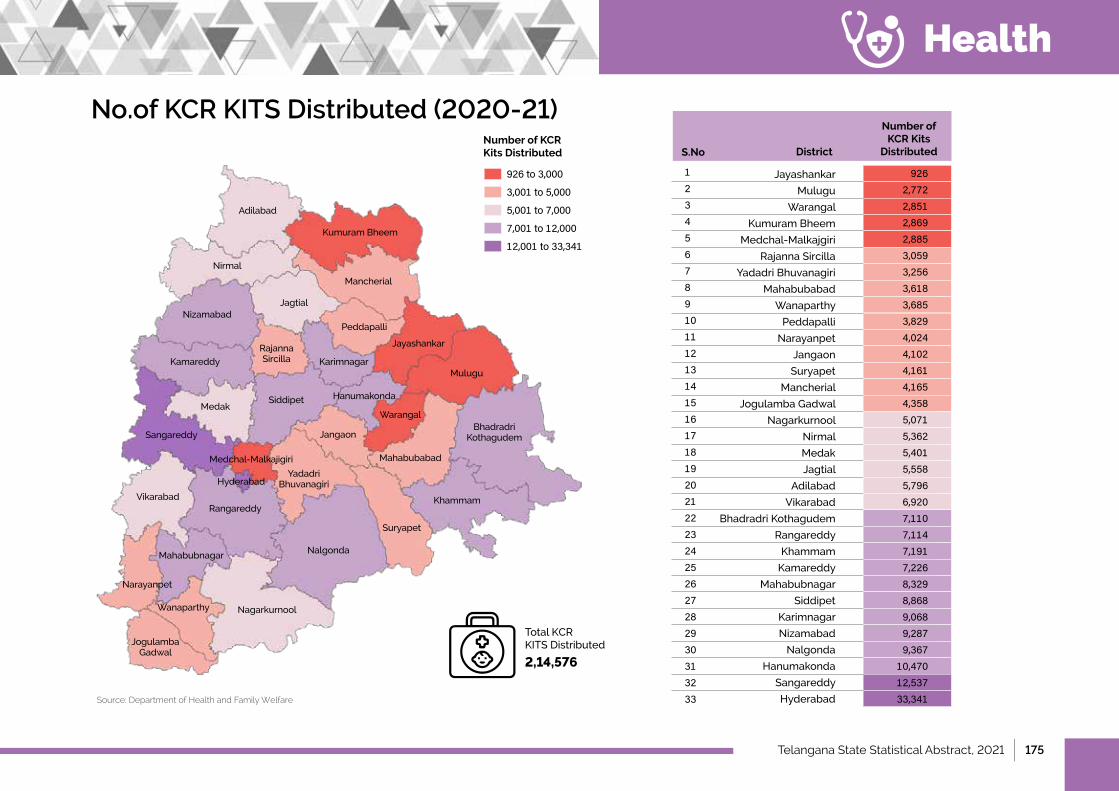
Telangana State Statistical Abstract, 2021 | 175
Health
No.of KCR KITS Distributed (2020-21)
Jayashankar
Mulugu
Warangal
Kumuram Bheem
Medchal-Malkajgiri
Rajanna Sircilla
YadadriBhuvanagiri
Mahabubabad
Wanaparthy
Peddapalli
Narayanpet
Jangaon
Suryapet
Mancherial
Jogulamba Gadwal
Nagarkurnool
Nirmal
Medak
Jagtial
Adilabad
Vikarabad
Bhadradri Kothagudem
Rangareddy
Khammam
Kamareddy
Mahabubnagar
Siddipet
Karimnagar
Nizamabad
Nalgonda
Hanumakonda
Sangareddy
Hyderabad
123456789101112131415161718192021222324252627282930313233
DistrictS.No
Number of KCR Kits
Distributed
9262,7722,8512,8692,8853,0593,2563,6183,6853,8294,0244,1024,1614,1654,3585,0715,3625,4015,5585,7966,9207,1107,1147,1917,2268,3298,8689,0689,2879,367
10,47012,53733,341
926to3,000
3,001to5,000
5,001to7,000
7,001to12,000
12,001to33,341
Number of KCR Kits Distributed
Source: Department of Health and Family Welfare
Adilabad
Nirmal
Kumuram Bheem
Mancherial
Jagtial
Rajanna Sircilla
Peddapalli
Jayashankar
Mulugu
MedakSiddipet Hanumakonda
Warangal
JangaonSangareddy
Medchal-Malkajigiri
VikarabadRangareddy
Mahabubnagar
Narayanpet
Nalgonda
NagarkurnoolWanaparthy
Suryapet
Khammam
Karimnagar
Yadadri Bhuvanagiri
Mahabubabad
Jogulamba Gadwal
Bhadradri Kothagudem
Kamareddy
Nizamabad
Hyderabad
Total KCR KITSDistributed
2,14,576
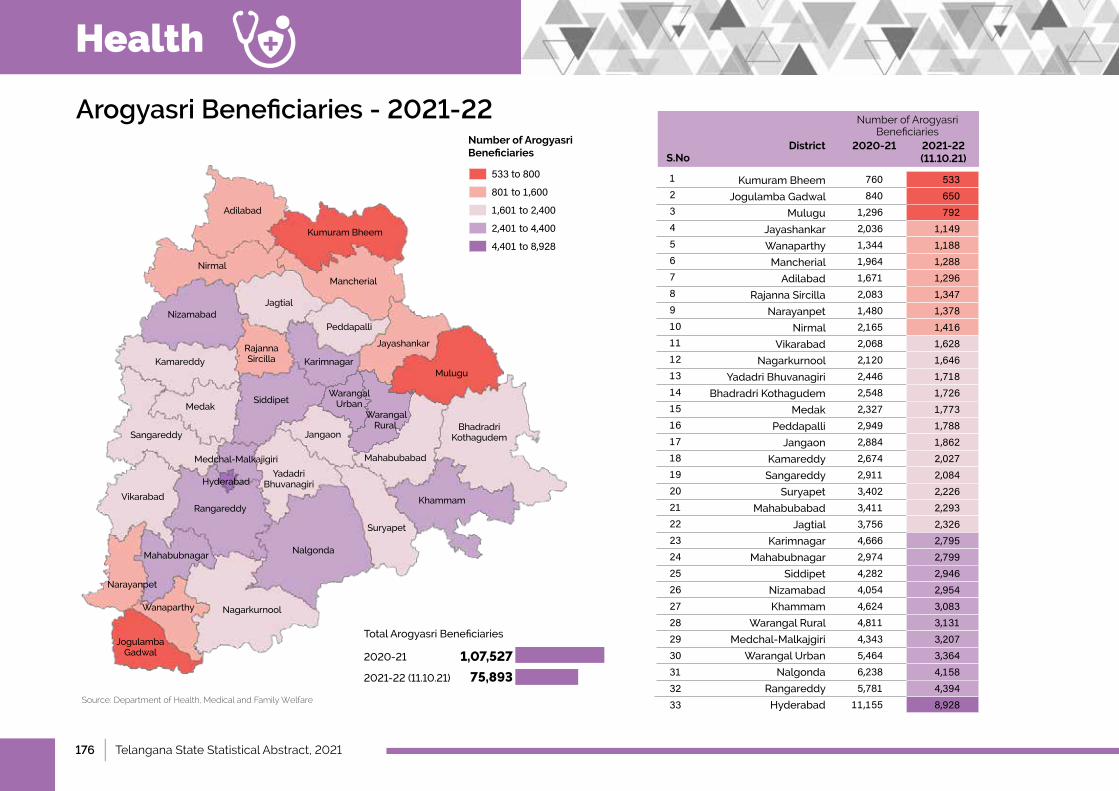
176 | Telangana State Statistical Abstract, 2021
Health
Arogyasri Beneficiaries - 2021-22
Source: Department of Health, Medical and Family Welfare
Kumuram Bheem
Jogulamba Gadwal
Mulugu
Jayashankar
Wanaparthy
Mancherial
Adilabad
Rajanna Sircilla
Narayanpet
Nirmal
Vikarabad
Nagarkurnool
YadadriBhuvanagiri
Bhadradri Kothagudem
Medak
Peddapalli
Jangaon
Kamareddy
Sangareddy
Suryapet
Mahabubabad
Jagtial
Karimnagar
Mahabubnagar
Siddipet
Nizamabad
Khammam
Warangal Rural
Medchal-Malkajgiri
WarangalUrban
Nalgonda
Rangareddy
Hyderabad
123456789101112131415161718192021222324252627282930313233
DistrictS.No
2020-21 2021-22 (11.10.21)
533650792
1,1491,1881,2881,2961,3471,3781,4161,6281,6461,7181,7261,7731,7881,8622,0272,0842,2262,2932,3262,7952,7992,9462,9543,0833,1313,2073,3644,1584,3948,928
760840
1,2962,0361,3441,9641,6712,0831,4802,1652,0682,1202,4462,5482,3272,9492,8842,6742,9113,4023,4113,7564,6662,9744,2824,0544,6244,8114,3435,4646,2385,781
11,155
Number of Arogyasri Beneficiaries
TotalArogyasriBeneficiaries
2020-21 1,07,527
2021-22(11.10.21) 75,893
Adilabad
Nirmal
Kumuram Bheem
Mancherial
Jagtial
Rajanna Sircilla
Peddapalli
Jayashankar
Mulugu
MedakSiddipet
Warangal Urban
Warangal Rural
JangaonSangareddy
Medchal-Malkajigiri
VikarabadRangareddy
Mahabubnagar
Narayanpet
Nalgonda
NagarkurnoolWanaparthy
Suryapet
Khammam
Karimnagar
Yadadri Bhuvanagiri
Mahabubabad
Jogulamba Gadwal
Bhadradri Kothagudem
Kamareddy
Nizamabad
Hyderabad
533to800
801to1,600
1,601to2,400
2,401to4,400
4,401to8,928
Number of Arogyasri Beneficiaries
Telangana State Statistical Abstract, 2021 | 177
Chapter 11
Rural Drinking Water and Sanitation
178 | Telangana State Statistical Abstract, 2021
Rural Drinking Water and Sanitation
1 IntroductionandKeyHighlights..............................................................................................................................................................................................................................................................................................................179
2 CoverageofMissionBhagirathaandSwachhBharatMission(2020-21)................................................................................................................................................................180
3 DrainageFacilitiesUnderSwacchBharatMissionbyDistricts...................................................................................................................................................................................................181
4 FunctionalHouseholdTapConnections(Ason13.12.2021)............................................................................................................................................................................................................182
IndexPage No.S.No. Item
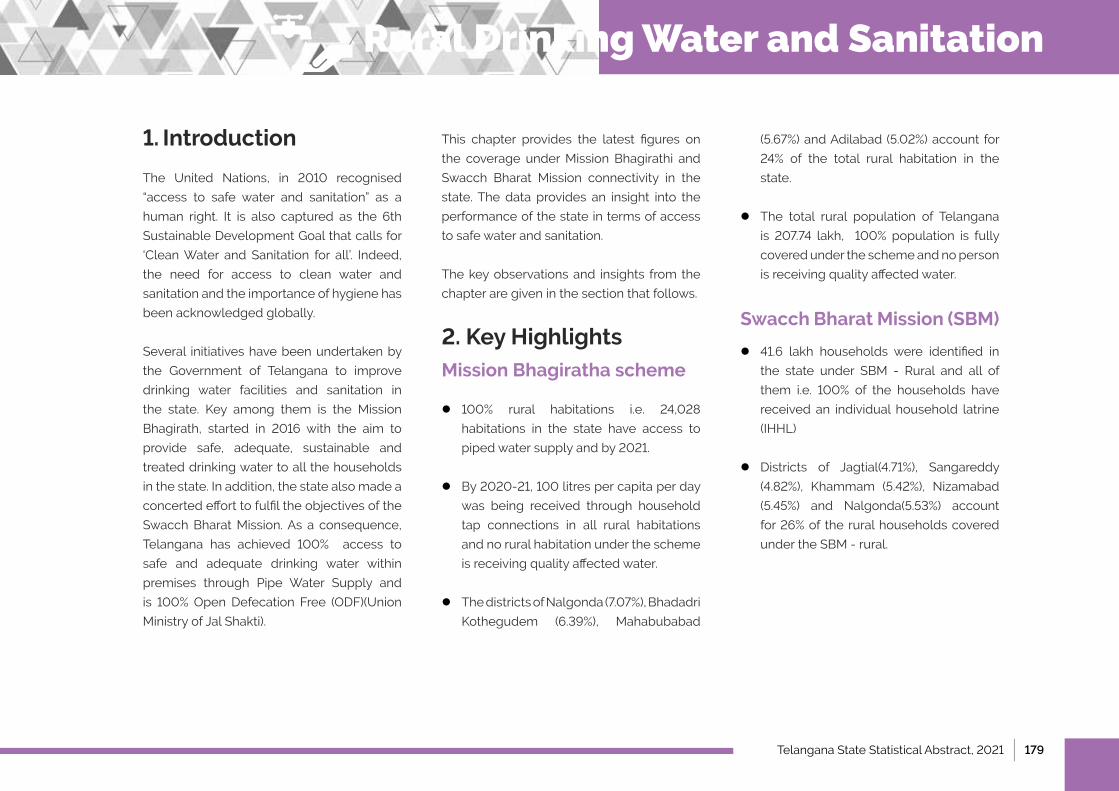
Telangana State Statistical Abstract, 2021 | 179
1. Introduction
The United Nations, in 2010 recognised
“access to safe water and sanitation” as a
human right. It is also captured as the 6th
Sustainable Development Goal that calls for
‘Clean Water and Sanitation for all’. Indeed,
the need for access to clean water and
sanitation and the importance of hygiene has
been acknowledged globally.
Several initiatives have been undertaken by
the Government of Telangana to improve
drinking water facilities and sanitation in
the state. Key among them is the Mission
Bhagirath, started in 2016 with the aim to
provide safe, adequate, sustainable and
treated drinking water to all the households
in the state. In addition, the state also made a
concerted effort to fulfil the objectives of the
Swacch Bharat Mission. As a consequence,
Telangana has achieved 100% access to
safe and adequate drinking water within
premises through Pipe Water Supply and
is 100% Open Defecation Free (ODF)(Union
Ministry of Jal Shakti).
This chapter provides the latest figures on
the coverage under Mission Bhagirathi and
Swacch Bharat Mission connectivity in the
state. The data provides an insight into the
performance of the state in terms of access
to safe water and sanitation.
The key observations and insights from the
chapter are given in the section that follows.
2. Key Highlights Mission Bhagiratha scheme
●l100% rural habitations i.e. 24,028
habitations in the state have access to
piped water supply and by 2021.
lBy 2020-21, 100 litres per capita per day
was being received through household
tap connections in all rural habitations
and no rural habitation under the scheme
is receiving quality affected water.
●lThe districts of Nalgonda (7.07%), Bhadadri
Kothegudem (6.39%), Mahabubabad
(5.67%) and Adilabad (5.02%) account for
24% of the total rural habitation in the
state.
l The total rural population of Telangana
is 207.74 lakh, 100% population is fully
covered under the scheme and no person
is receiving quality affected water.
Swacch Bharat Mission (SBM)
●l41.6 lakh households were identified in
the state under SBM - Rural and all of
them i.e. 100% of the households have
received an individual household latrine
(IHHL)
lDistricts of Jagtial(4.71%), Sangareddy
(4.82%), Khammam (5.42%), Nizamabad
(5.45%) and Nalgonda(5.53%) account
for 26% of the rural households covered
under the SBM - rural.
Rural Drinking Water and Sanitation
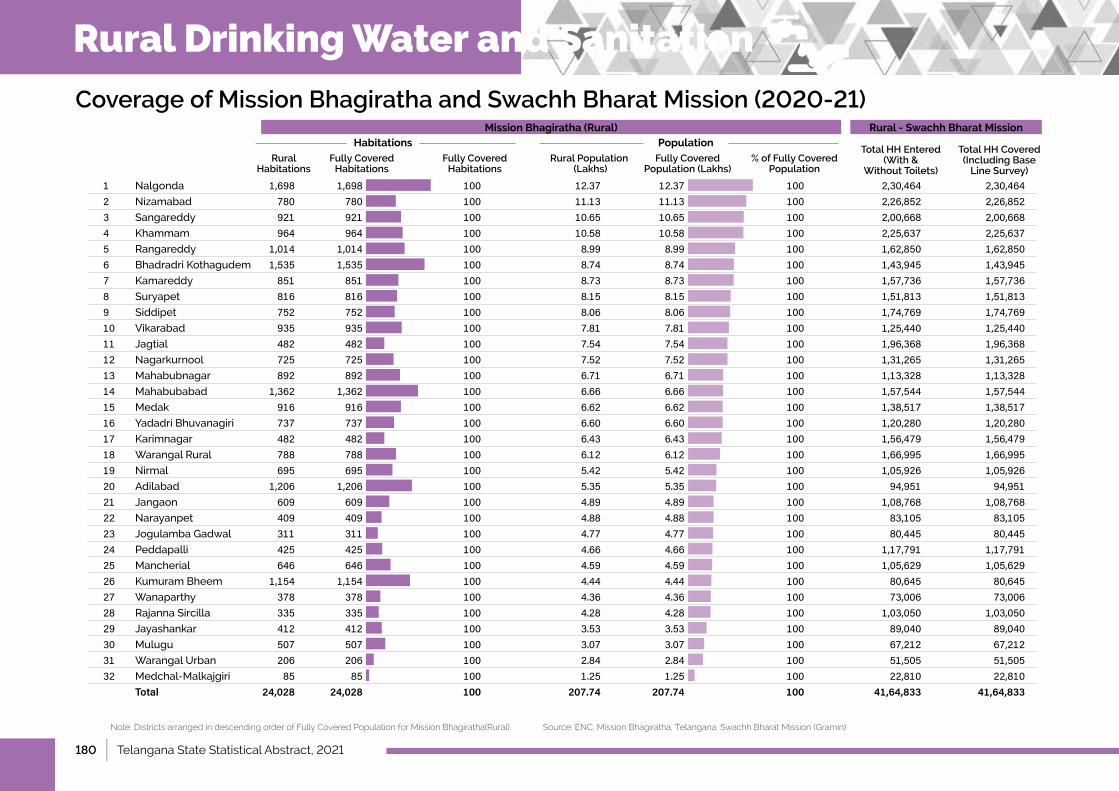
180 | Telangana State Statistical Abstract, 2021
Coverage of Mission Bhagiratha and Swachh Bharat Mission (2020-21)
Rural Habitations
Fully Covered Habitations
Fully Covered Habitations
Rural Population (Lakhs)
Fully Covered Population (Lakhs)
% of Fully Covered Population
Total HH Entered (With &
Without Toilets)
Total HH Covered (Including Base
Line Survey)
Mission Bhagiratha (Rural) Rural - Swachh Bharat MissionHabitations Population
1 Nalgonda 1,698 1,698 100 12.37 12.37 100 2,30,464 2,30,4642 Nizamabad 780 780 100 11.13 11.13 100 2,26,852 2,26,8523 Sangareddy 921 921 100 10.65 10.65 100 2,00,668 2,00,6684 Khammam 964 964 100 10.58 10.58 100 2,25,637 2,25,6375 Rangareddy 1,014 1,014 100 8.99 8.99 100 1,62,850 1,62,8506 Bhadradri Kothagudem 1,535 1,535 100 8.74 8.74 100 1,43,945 1,43,9457 Kamareddy 851 851 100 8.73 8.73 100 1,57,736 1,57,7368 Suryapet 816 816 100 8.15 8.15 100 1,51,813 1,51,8139 Siddipet 752 752 100 8.06 8.06 100 1,74,769 1,74,76910 Vikarabad 935 935 100 7.81 7.81 100 1,25,440 1,25,44011 Jagtial 482 482 100 7.54 7.54 100 1,96,368 1,96,36812 Nagarkurnool 725 725 100 7.52 7.52 100 1,31,265 1,31,26513 Mahabubnagar 892 892 100 6.71 6.71 100 1,13,328 1,13,32814 Mahabubabad 1,362 1,362 100 6.66 6.66 100 1,57,544 1,57,54415 Medak 916 916 100 6.62 6.62 100 1,38,517 1,38,51716 YadadriBhuvanagiri 737 737 100 6.60 6.60 100 1,20,280 1,20,28017 Karimnagar 482 482 100 6.43 6.43 100 1,56,479 1,56,47918 Warangal Rural 788 788 100 6.12 6.12 100 1,66,995 1,66,99519 Nirmal 695 695 100 5.42 5.42 100 1,05,926 1,05,92620 Adilabad 1,206 1,206 100 5.35 5.35 100 94,951 94,95121 Jangaon 609 609 100 4.89 4.89 100 1,08,768 1,08,76822 Narayanpet 409 409 100 4.88 4.88 100 83,105 83,10523 Jogulamba Gadwal 311 311 100 4.77 4.77 100 80,445 80,44524 Peddapalli 425 425 100 4.66 4.66 100 1,17,791 1,17,79125 Mancherial 646 646 100 4.59 4.59 100 1,05,629 1,05,62926 Kumuram Bheem 1,154 1,154 100 4.44 4.44 100 80,645 80,64527 Wanaparthy 378 378 100 4.36 4.36 100 73,006 73,00628 Rajanna Sircilla 335 335 100 4.28 4.28 100 1,03,050 1,03,05029 Jayashankar 412 412 100 3.53 3.53 100 89,040 89,04030 Mulugu 507 507 100 3.07 3.07 100 67,212 67,21231 WarangalUrban 206 206 100 2.84 2.84 100 51,505 51,50532 Medchal-Malkajgiri 85 85 100 1.25 1.25 100 22,810 22,810 Total 24,028 24,028 100 207.74 207.74 100 41,64,833 41,64,833
Note: Districts arranged in descending order of Fully Covered Population for Mission Bhagiratha(Rural). Source: ENC, Mission Bhagiratha, Telangana; Swachh Bharat Mission (Gramin)
Rural Drinking Water and Sanitation
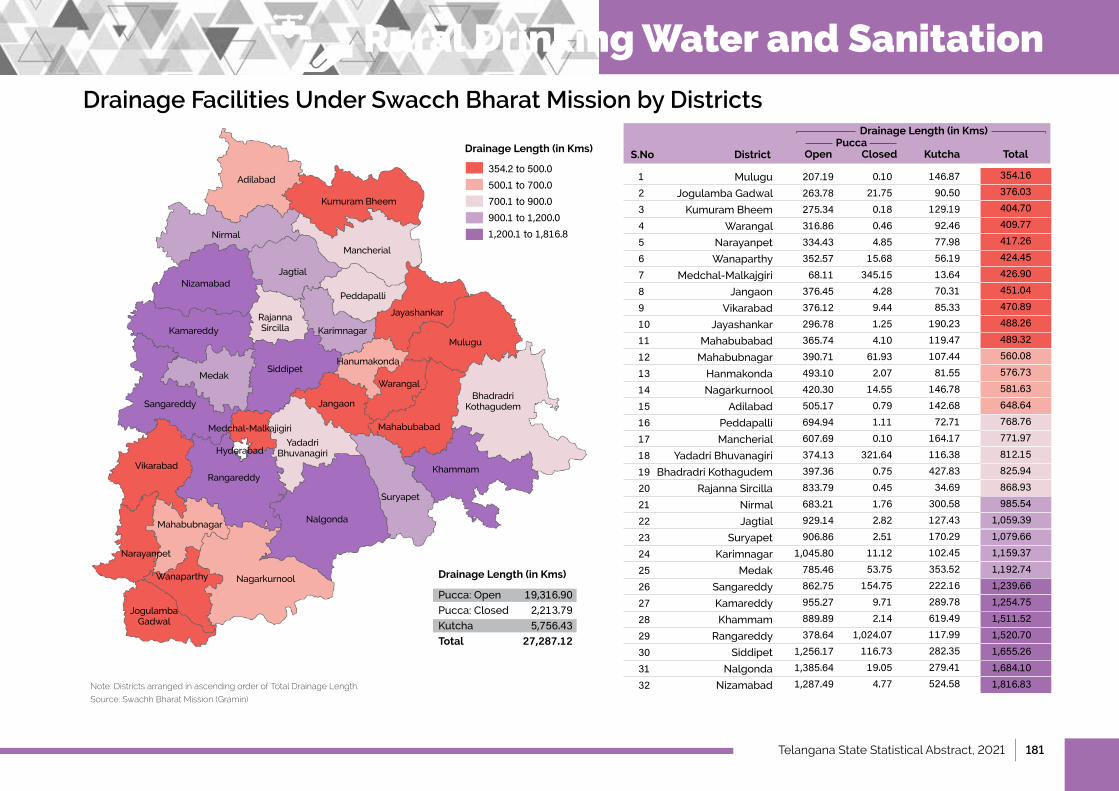
Telangana State Statistical Abstract, 2021 | 181
Rural Drinking Water and Sanitation Drainage Facilities Under Swacch Bharat Mission by Districts
Mulugu
Jogulamba Gadwal
Kumuram Bheem
Warangal
Narayanpet
Wanaparthy
Medchal-Malkajgiri
Jangaon
Vikarabad
Jayashankar
Mahabubabad
Mahabubnagar
Hanmakonda
Nagarkurnool
Adilabad
Peddapalli
Mancherial
YadadriBhuvanagiri
Bhadradri Kothagudem
Rajanna Sircilla
Nirmal
Jagtial
Suryapet
Karimnagar
Medak
Sangareddy
Kamareddy
Khammam
Rangareddy
Siddipet
Nalgonda
Nizamabad
1234567891011121314151617181920212223242526272829303132
OpenPucca
Closed Kutcha TotalS.No District
354.16376.03404.70409.77417.26424.45426.90451.04470.89488.26489.32560.08576.73581.63648.64768.76771.97812.15825.94868.93985.54
1,059.391,079.661,159.371,192.741,239.661,254.751,511.521,520.701,655.261,684.101,816.83
207.19263.78275.34316.86334.43352.5768.11
376.45376.12296.78365.74390.71493.10420.30505.17694.94607.69374.13397.36833.79683.21929.14906.86
1,045.80785.46862.75955.27889.89378.64
1,256.171,385.641,287.49
0.1021.750.180.464.85
15.68345.15
4.289.441.254.10
61.932.07
14.550.791.110.10
321.640.750.451.762.822.51
11.1253.75
154.759.712.14
1,024.07116.7319.054.77
146.8790.50
129.1992.4677.9856.1913.6470.3185.33
190.23119.47107.4481.55
146.78142.6872.71
164.17116.38427.8334.69
300.58127.43170.29102.45353.52222.16289.78619.49117.99282.35279.41524.58
354.2to500.0500.1to700.0700.1to900.0900.1to1,200.01,200.1to1,816.8
Drainage Length (in Kms)
Note: Districts arranged in ascending order of Total Drainage Length.
Source: Swachh Bharat Mission (Gramin)
Pucca: Open 19,316.90Pucca: Closed 2,213.79Kutcha 5,756.43Total 27,287.12
Drainage Length (in Kms)
Drainage Length (in Kms)
Adilabad
Nirmal
Kumuram Bheem
Mancherial
Jagtial
Rajanna Sircilla
Peddapalli
Jayashankar
Mulugu
MedakSiddipet
Hanumakonda
Warangal
JangaonSangareddy
Medchal-Malkajigiri
VikarabadRangareddy
Mahabubnagar
Narayanpet
Nalgonda
NagarkurnoolWanaparthy
Suryapet
Khammam
Karimnagar
Yadadri Bhuvanagiri
Mahabubabad
Jogulamba Gadwal
Bhadradri Kothagudem
Kamareddy
Nizamabad
Hyderabad
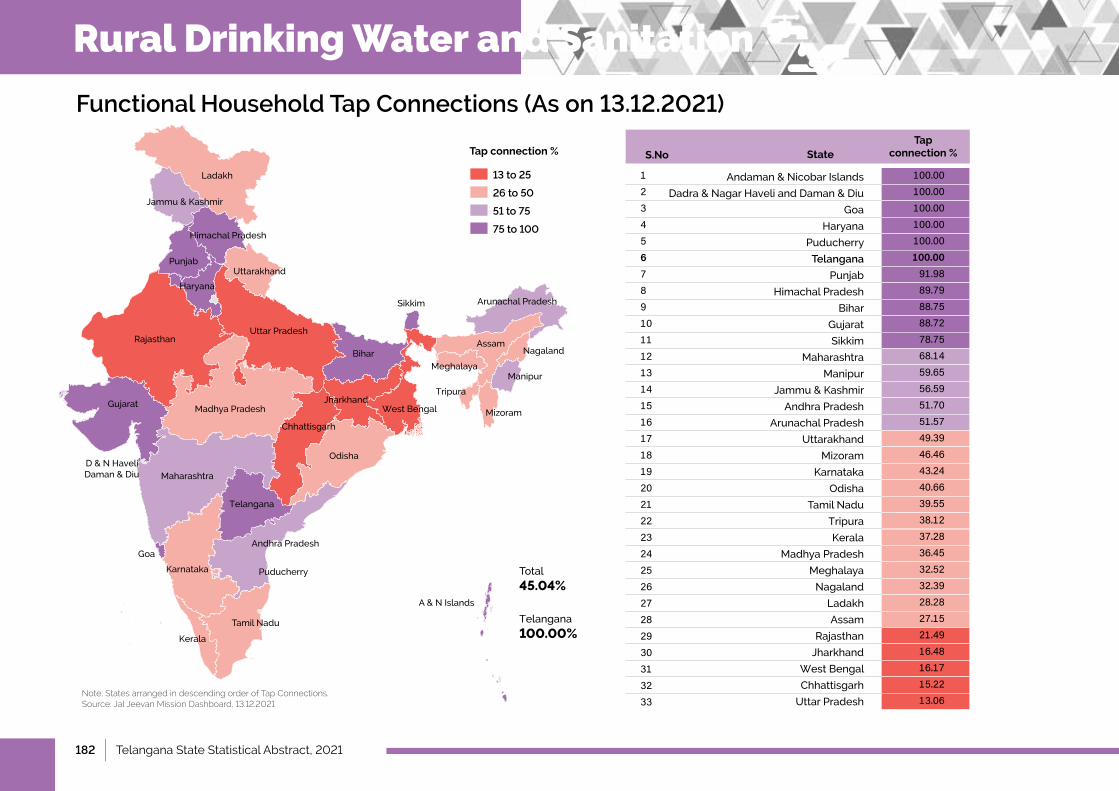
182 | Telangana State Statistical Abstract, 2021
Rural Drinking Water and Sanitation
Functional Household Tap Connections (As on 13.12.2021)
Total
45.04%
Telangana
100.00%
Andaman&NicobarIslands
Dadra & Nagar Haveli and Daman & Diu
Goa
Haryana
Puducherry
Telangana
Punjab
Himachal Pradesh
Bihar
Gujarat
Sikkim
Maharashtra
Manipur
Jammu & Kashmir
Andhra Pradesh
Arunachal Pradesh
Uttarakhand
Mizoram
Karnataka
Odisha
Tamil Nadu
Tripura
Kerala
MadhyaPradesh
Meghalaya
Nagaland
Ladakh
Assam
Rajasthan
Jharkhand
West Bengal
Chhattisgarh
UttarPradesh
123456789101112131415161718192021222324252627282930313233
StateS.NoTap
connection %
100.00100.00100.00100.00100.00100.0091.9889.7988.7588.7278.7568.1459.6556.5951.7051.5749.3946.4643.2440.6639.5538.1237.2836.4532.5232.3928.2827.1521.4916.4816.1715.2213.06
13 to 25
26 to 50
51 to 75
75 to 100
Tap connection %
Note: States arranged in descending order of Tap Connections.Source: Jal Jeevan Mission Dashboard, 13.12.2021
UttarPradesh
Bihar
Jharkhand
Telangana
West Bengal
Nagaland
Tripura
Mizoram
Sikkim
ManipurMeghalaya
Kerala
Chhattisgarh
MadhyaPradesh
Rajasthan Assam
Tamil Nadu
Arunachal Pradesh
MaharashtraD & N HaveliDaman & Diu
Uttarakhand
Himachal Pradesh
Gujarat
Haryana
Andhra Pradesh
A&NIslands
PuducherryKarnataka
Goa
Jammu & Kashmir
Ladakh
Odisha
Punjab
Telangana State Statistical Abstract, 2021 | 183
Palle Pragathi-Pattana Pragathi
Chapter 12
184 | Telangana State Statistical Abstract, 2021
Palle Pragathi-Pattana Pragathi
1 PallePragathi-PattanaPragathi:KeyHighlights.......................................................................................................................................................................................................................................185-186
2 TheAchievementsUnderSwachhSurvekshan-2021andSafaiMitraSurakshaChallenge..........................................................................................186
3 PallePragathi...........................................................................................................................................................................................................................................................................................................................................................................187
4 PattanaPragathi.................................................................................................................................................................................................................................................................................................................................................................188
IndexPage No.S.No. Item
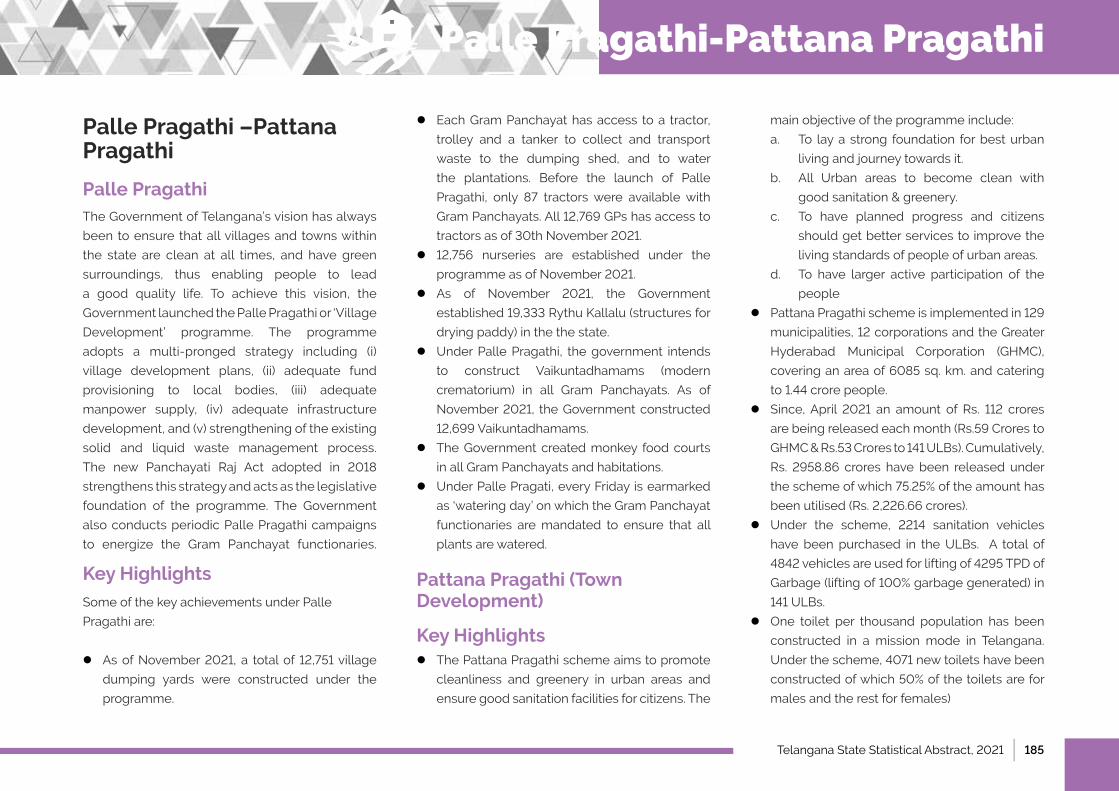
Telangana State Statistical Abstract, 2021 | 185
Palle Pragathi –Pattana Pragathi
Palle Pragathi
The Government of Telangana’s vision has always
been to ensure that all villages and towns within
the state are clean at all times, and have green
surroundings, thus enabling people to lead
a good quality life. To achieve this vision, the
Government launched the Palle Pragathi or ‘Village
Development’ programme. The programme
adopts a multi-pronged strategy including (i)
village development plans, (ii) adequate fund
provisioning to local bodies, (iii) adequate
manpower supply, (iv) adequate infrastructure
development, and (v) strengthening of the existing
solid and liquid waste management process.
The new Panchayati Raj Act adopted in 2018
strengthens this strategy and acts as the legislative
foundation of the programme. The Government
also conducts periodic Palle Pragathi campaigns
to energize the Gram Panchayat functionaries.
Key HighlightsSome of the key achievements under Palle
Pragathi are:
lAs of November 2021, a total of 12,751 village
dumping yards were constructed under the
programme.
lEach Gram Panchayat has access to a tractor,
trolley and a tanker to collect and transport
waste to the dumping shed, and to water
the plantations. Before the launch of Palle
Pragathi, only 87 tractors were available with
Gram Panchayats. All 12,769 GPs has access to
tractors as of 30th November 2021.
l12,756 nurseries are established under the
programme as of November 2021.
lAs of November 2021, the Government
established 19,333 Rythu Kallalu (structures for
drying paddy) in the the state.
lUnder Palle Pragathi, the government intends
to construct Vaikuntadhamams (modern
crematorium) in all Gram Panchayats. As of
November 2021, the Government constructed
12,699 Vaikuntadhamams.
lThe Government created monkey food courts
in all Gram Panchayats and habitations.
lUnder Palle Pragati, every Friday is earmarked
as ‘watering day’ on which the Gram Panchayat
functionaries are mandated to ensure that all
plants are watered.
Pattana Pragathi (Town Development) Key Highlightsl The Pattana Pragathi scheme aims to promote
cleanliness and greenery in urban areas and
ensure good sanitation facilities for citizens. The
main objective of the programme include:
a. To lay a strong foundation for best urban
living and journey towards it.
b. All Urban areas to become clean with
good sanitation & greenery.
c. To have planned progress and citizens
should get better services to improve the
living standards of people of urban areas.
d. To have larger active participation of the
people
l Pattana Pragathi scheme is implemented in 129
municipalities, 12 corporations and the Greater
Hyderabad Municipal Corporation (GHMC),
covering an area of 6085 sq. km. and catering
to 1.44 crore people.
l Since, April 2021 an amount of Rs. 112 crores
are being released each month (Rs.59 Crores to
GHMC & Rs.53 Crores to 141 ULBs). Cumulatively,
Rs. 2958.86 crores have been released under
the scheme of which 75.25% of the amount has
been utilised (Rs. 2,226.66 crores).
l Under the scheme, 2214 sanitation vehicles
have been purchased in the ULBs. A total of
4842 vehicles are used for lifting of 4295 TPD of
Garbage (lifting of 100% garbage generated) in
141 ULBs.
l One toilet per thousand population has been
constructed in a mission mode in Telangana.
Under the scheme, 4071 new toilets have been
constructed of which 50% of the toilets are for
males and the rest for females)
Palle Pragathi-Pattana Pragathi
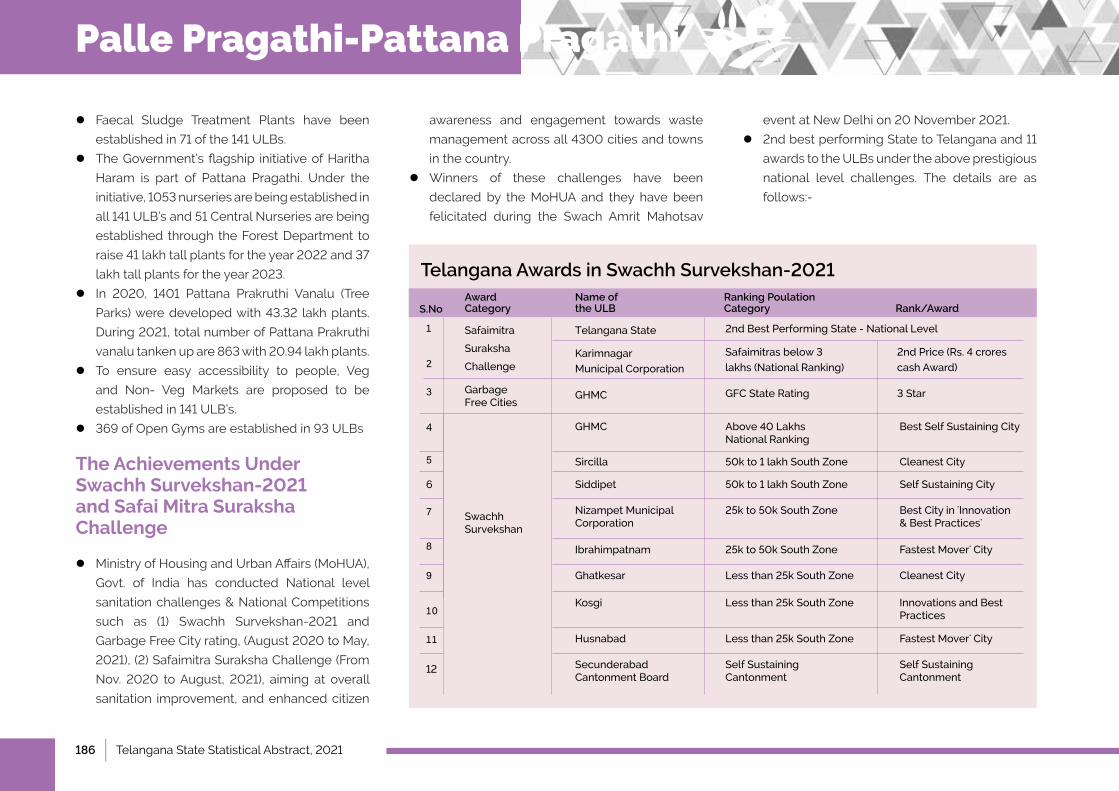
186 | Telangana State Statistical Abstract, 2021
l Faecal Sludge Treatment Plants have been
established in 71 of the 141 ULBs.
l The Government’s flagship initiative of Haritha
Haram is part of Pattana Pragathi. Under the
initiative, 1053 nurseries are being established in
all 141 ULB’s and 51 Central Nurseries are being
established through the Forest Department to
raise 41 lakh tall plants for the year 2022 and 37
lakh tall plants for the year 2023.
l In 2020, 1401 Pattana Prakruthi Vanalu (Tree
Parks) were developed with 43.32 lakh plants.
During 2021, total number of Pattana Prakruthi
vanalu tanken up are 863 with 20.94 lakh plants.
l To ensure easy accessibility to people, Veg
and Non- Veg Markets are proposed to be
established in 141 ULB’s.
l 369 of Open Gyms are established in 93 ULBs
The Achievements Under Swachh Survekshan-2021 and Safai Mitra Suraksha Challenge
lMinistry of Housing and Urban Affairs (MoHUA),
Govt. of India has conducted National level
sanitation challenges & National Competitions
such as (1) Swachh Survekshan-2021 and
Garbage Free City rating, (August 2020 to May,
2021), (2) Safaimitra Suraksha Challenge (From
Nov. 2020 to August, 2021), aiming at overall
sanitation improvement, and enhanced citizen
awareness and engagement towards waste
management across all 4300 cities and towns
in the country.
lWinners of these challenges have been
declared by the MoHUA and they have been
felicitated during the Swach Amrit Mahotsav
event at New Delhi on 20 November 2021.
l2nd best performing State to Telangana and 11
awards to the ULBs under the above prestigious
national level challenges. The details are as
follows:-
Safaimitra
Suraksha
Challenge
Telangana Awards in Swachh Survekshan-2021
Garbage FreeCities
Swachh Survekshan
1
2
3
4
5
6
7
12
11
10
9
8
Telangana State
GHMC
Karimnagar
MunicipalCorporation
GHMC
Sircilla
Siddipet
NizampetMunicipalCorporation
Ibrahimpatnam
Ghatkesar
Kosgi
Husnabad
Secunderabad Cantonment Board
Safaimitrasbelow3
lakhs (National Ranking)
Above40Lakhs National Ranking
50kto1lakhSouthZone
50kto1lakhSouthZone
25kto50kSouthZone
25kto50kSouthZone
Lessthan25kSouthZone
Lessthan25kSouthZone
Lessthan25kSouthZone
Self Sustaining Cantonment
Best Self Sustaining City
Cleanest City
Self Sustaining City
BestCityin'Innovation &BestPractices'
FastestMover'City
Cleanest City
InnovationsandBestPractices
FastestMover'City
Self Sustaining Cantonment
2ndPrice(Rs.4crores
cash Award)
2ndBestPerformingState-NationalLevel
GFCStateRating 3Star
Award CategoryS.No
Name of the ULB
Ranking Poulation Category Rank/Award
Palle Pragathi-Pattana Pragathi
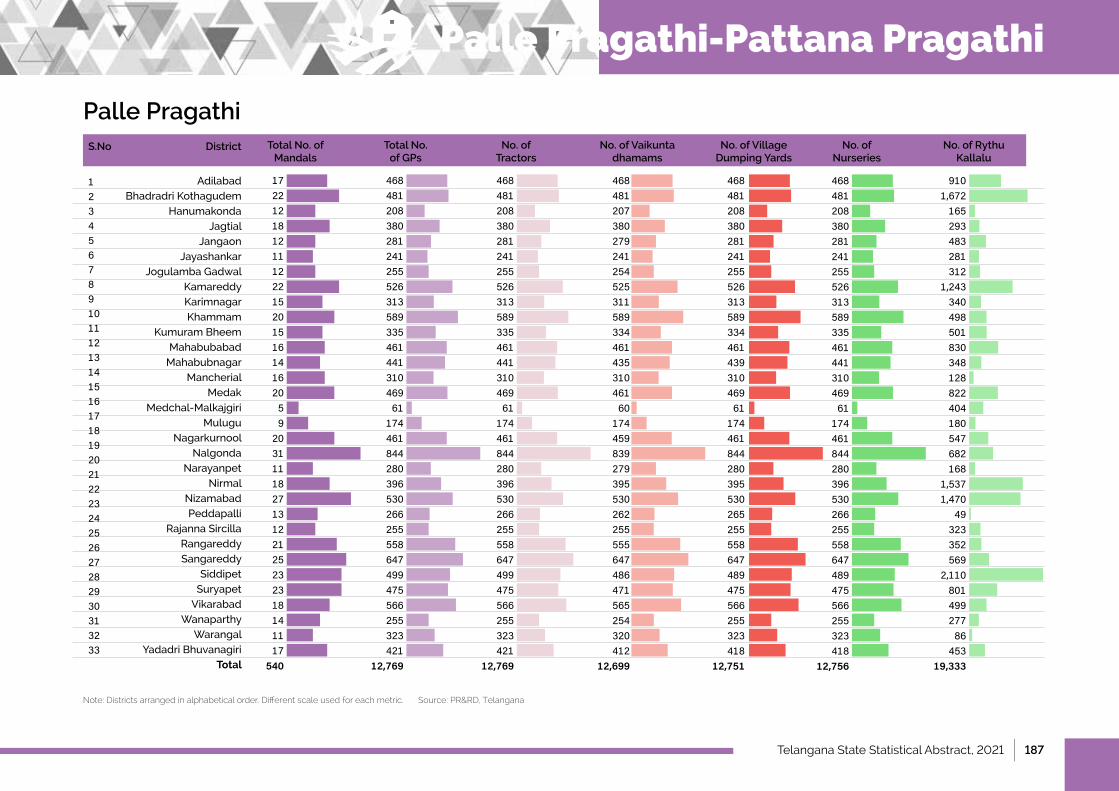
Telangana State Statistical Abstract, 2021 | 187
Palle Pragathi
Note: Districts arranged in alphabetical order. Different scale used for each metric. Source: PR&RD, Telangana
AdilabadBhadradri Kothagudem
HanumakondaJagtial
JangaonJayashankar
Jogulamba GadwalKamareddyKarimnagarKhammam
Kumuram BheemMahabubabadMahabubnagar
MancherialMedak
Medchal-MalkajgiriMulugu
NagarkurnoolNalgonda
NarayanpetNirmal
NizamabadPeddapalli
Rajanna SircillaRangareddySangareddy
SiddipetSuryapetVikarabad
WanaparthyWarangal
YadadriBhuvanagiriTotal
123456789101112131415161718192021222324252627282930313233
17221218121112221520151614162059
203111182713122125232318141117
540
46848120838028124125552631358933546144131046961
174461844280396530266255558647499475566255323421
12,769
46848120838028124125552631358933546144131046961
174461844280396530266255558647499475566255323421
12,769
46848120738027924125452531158933446143531046160
174459839279395530262255555647486471565254320412
12,699
46848120838028124125552631358933446143931046961
174461844280395530265255558647489475566255323418
12,751
9101,672165293483281312
1,243340498501830348128822404180547682168
1,5371,470
49323352569
2,11080149927786
45319,333
46848120838028124125552631358933546144131046961
174461844280396530266255558647489475566255323418
12,756
Total No. of Mandals
Total No. of GPs
No. of Tractors
No. of Vaikunta dhamams
No. of Rythu Kallalu
No. of Nurseries
No. of Village Dumping Yards
DistrictS.No
Palle Pragathi-Pattana Pragathi
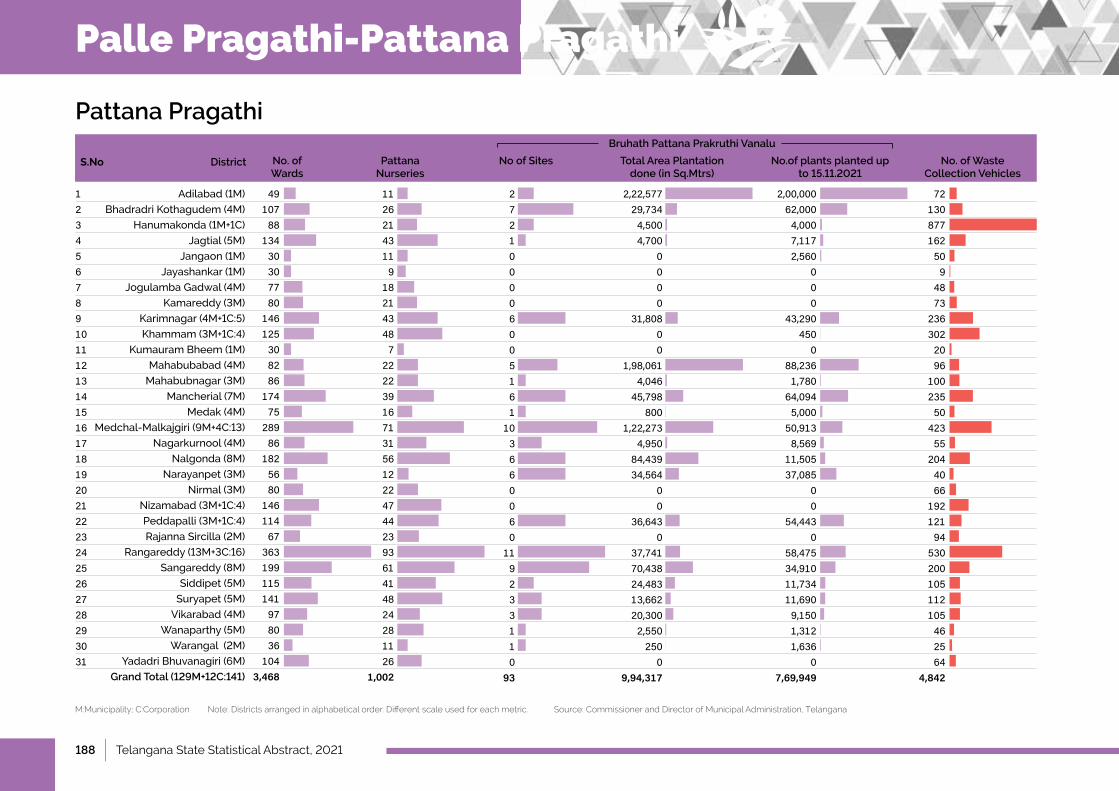
188 | Telangana State Statistical Abstract, 2021
Pattana Pragathi
M:Municipality; C:Corporation Note: Districts arranged in alphabetical order. Different scale used for each metric. Source: Commissioner and Director of Municipal Administration, Telangana
No. of Wards
Pattana Nurseries
No of Sites Total Area Plantation done (in Sq.Mtrs)
No. of Waste Collection Vehicles
No.of plants planted up to 15.11.2021
DistrictS.No
Adilabad(1M)
BhadradriKothagudem(4M)
Hanumakonda(1M+1C)
Jagtial(5M)
Jangaon(1M)
Jayashankar(1M)
JogulambaGadwal(4M)
Kamareddy(3M)
Karimnagar(4M+1C:5)
Khammam(3M+1C:4)
KumauramBheem(1M)
Mahabubabad(4M)
Mahabubnagar(3M)
Mancherial(7M)
Medak(4M)
Medchal-Malkajgiri(9M+4C:13)
Nagarkurnool(4M)
Nalgonda(8M)
Narayanpet(3M)
Nirmal(3M)
Nizamabad(3M+1C:4)
Peddapalli(3M+1C:4)
RajannaSircilla(2M)
Rangareddy(13M+3C:16)
Sangareddy(8M)
Siddipet(5M)
Suryapet(5M)
Vikarabad(4M)
Wanaparthy(5M)
Warangal(2M)
YadadriBhuvanagiri(6M)
Grand Total (129M+12C:141)
12345678910111213141516171819202122232425262728293031
4910788
13430307780
146125308286
17475
28986
1825680
14611467
363199115141978036
1043,468
11262143119
182143487
2222391671315612224744239361414824281126
1,002
272100006005161
103660060
119233110
93
2,22,57729,7344,5004,700
0000
31,80800
1,98,0614,046
45,798800
1,22,2734,950
84,43934,564
00
36,6430
37,74170,43824,48313,66220,3002,550250
09,94,317
72130877162509
4873
2363022096
10023550
42355
2044066
19212194
530200105112105462564
4,842
2,00,00062,0004,0007,1172,560
000
43,290450
088,2361,780
64,0945,000
50,9138,569
11,50537,085
00
54,4430
58,47534,91011,73411,6909,1501,3121,636
07,69,949
Bruhath Pattana Prakruthi Vanalu
Palle Pragathi-Pattana Pragathi
Chapter 13
Social Security
Telangana State Statistical Abstract, 2021 | 189
Chapter 13
Social Security

190 | Telangana State Statistical Abstract, 2021
Social Security
1 IntroductionandKeyHighlights..............................................................................................................................................................................................................................................................................................................191
2 Districtwise-PublicDistributionSystem(Number).........................................................................................................................................................................................................................................192
3 Districtwise-AasaraPensions(Number)–2020-21.....................................................................................................................................................................................................................................193
4 MGNREGA–Workers(2020-21).............................................................................................................................................................................................................................................................................................................194
5 SelfHelpGroups(SHGs)–2020-21.................................................................................................................................................................................................................................................................................................195
IndexPage No.S.No. Item
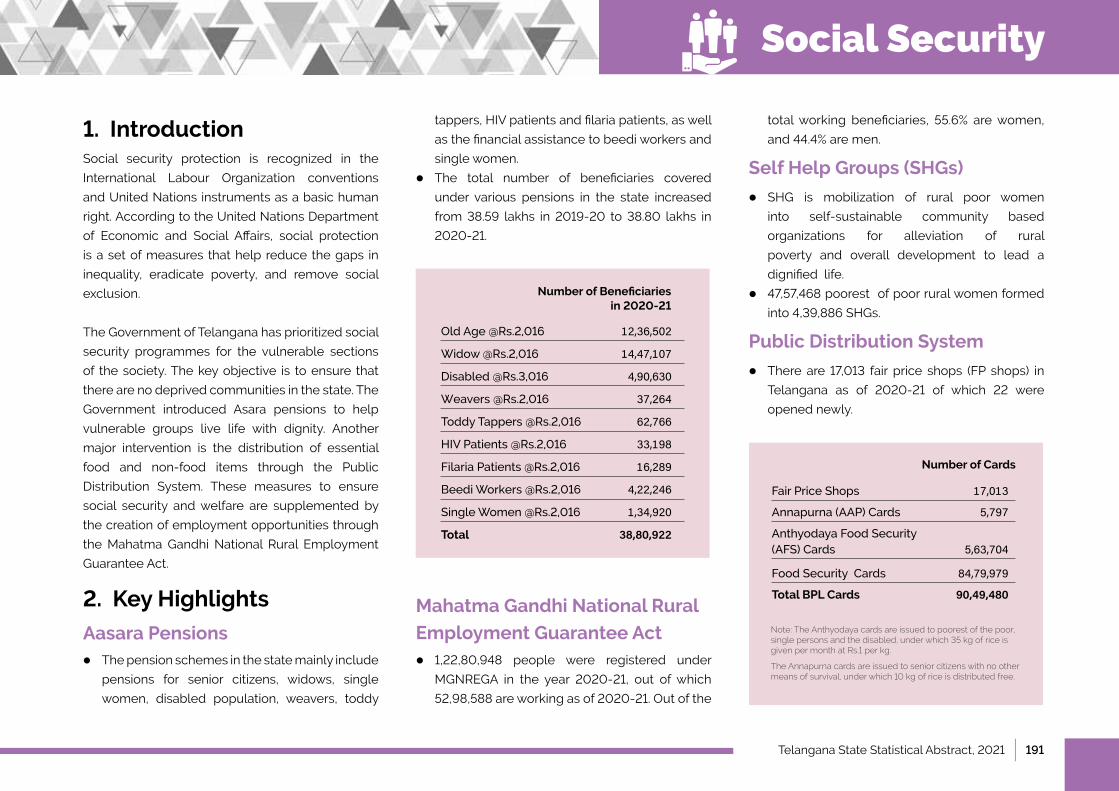
Telangana State Statistical Abstract, 2021 | 191
1. Introduction Social security protection is recognized in the
International Labour Organization conventions
and United Nations instruments as a basic human
right. According to the United Nations Department
of Economic and Social Affairs, social protection
is a set of measures that help reduce the gaps in
inequality, eradicate poverty, and remove social
exclusion.
The Government of Telangana has prioritized social
security programmes for the vulnerable sections
of the society. The key objective is to ensure that
there are no deprived communities in the state. The
Government introduced Asara pensions to help
vulnerable groups live life with dignity. Another
major intervention is the distribution of essential
food and non-food items through the Public
Distribution System. These measures to ensure
social security and welfare are supplemented by
the creation of employment opportunities through
the Mahatma Gandhi National Rural Employment
Guarantee Act.
2. Key Highlights
Aasara Pensions●l The pension schemes in the state mainly include
pensions for senior citizens, widows, single
women, disabled population, weavers, toddy
tappers, HIV patients and filaria patients, as well
as the financial assistance to beedi workers and
single women.
●l The total number of beneficiaries covered
under various pensions in the state increased
from 38.59 lakhs in 2019-20 to 38.80 lakhs in
2020-21.
Mahatma Gandhi National Rural
Employment Guarantee Act●l 1,22,80,948 people were registered under
MGNREGA in the year 2020-21, out of which
52,98,588 are working as of 2020-21. Out of the
total working beneficiaries, 55.6% are women,
and 44.4% are men.
Self Help Groups (SHGs)
●l SHG is mobilization of rural poor women
into self-sustainable community based
organizations for alleviation of rural
poverty and overall development to lead a
dignified life.
●l 47,57,468 poorest of poor rural women formed
into 4,39,886 SHGs.
Public Distribution System
●l There are 17,013 fair price shops (FP shops) in
Telangana as of 2020-21 of which 22 were
opened newly.
[email protected],016 12,36,502
[email protected],016 14,47,107
[email protected],016 4,90,630
[email protected],016 37,264
[email protected],016 62,766
[email protected],016 33,198
[email protected],016 16,289
[email protected],016 4,22,246
[email protected],016 1,34,920
Total 38,80,922
Number of Beneficiaries in 2020-21
FairPriceShops 17,013
Annapurna (AAP) Cards 5,797
AnthyodayaFoodSecurity (AFS)Cards 5,63,704
FoodSecurity Cards 84,79,979
Total BPL Cards 90,49,480
Number of Cards
Note: The Anthyodaya cards are issued to poorest of the poor, single persons and the disabled, under which 35 kg of rice is given per month at Rs.1 per kg. The Annapurna cards are issued to senior citizens with no other means of survival, under which 10 kg of rice is distributed free.
Social Security
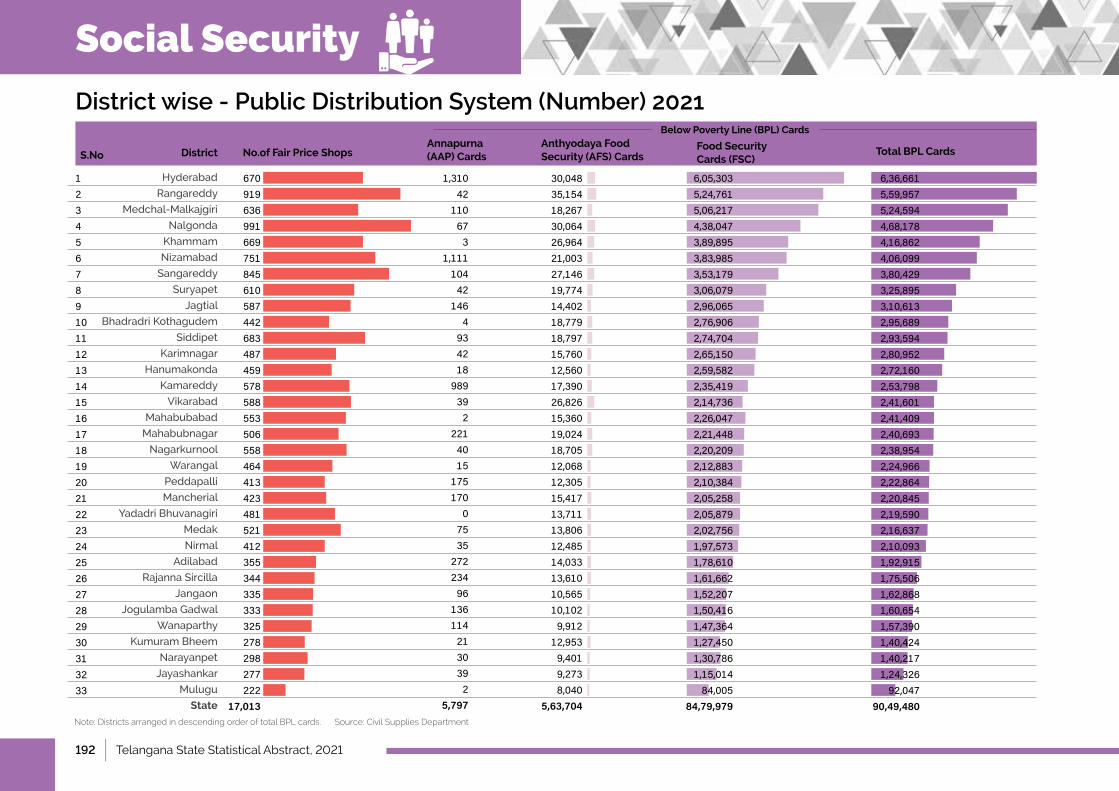
192 | Telangana State Statistical Abstract, 2021
District wise - Public Distribution System (Number) 2021
Hyderabad
Rangareddy
Medchal-Malkajgiri
Nalgonda
Khammam
Nizamabad
Sangareddy
Suryapet
Jagtial
Bhadradri Kothagudem
Siddipet
Karimnagar
Hanumakonda
Kamareddy
Vikarabad
Mahabubabad
Mahabubnagar
Nagarkurnool
Warangal
Peddapalli
Mancherial
YadadriBhuvanagiri
Medak
Nirmal
Adilabad
Rajanna Sircilla
Jangaon
Jogulamba Gadwal
Wanaparthy
Kumuram Bheem
Narayanpet
Jayashankar
Mulugu
State
No.of Fair Price ShopsAnnapurna (AAP) Cards
Anthyodaya Food Security (AFS) Cards
Food Security Cards (FSC)
Total BPL Cards
123456789101112131415161718192021222324252627282930313233
670919636991669751845610587442683487459578588553506558464413423481521412355344335333325278298277222
17,013
1,31042
110673
1,11110442
1464
934218
989392
2214015
175170
07535
27223496
1361142130392
5,797
30,04835,15418,26730,06426,96421,00327,14619,77414,40218,77918,79715,76012,56017,39026,82615,36019,02418,70512,06812,30515,41713,71113,80612,48514,03313,61010,56510,1029,912
12,9539,4019,2738,040
5,63,704
6,36,6615,59,9575,24,5944,68,1784,16,8624,06,0993,80,4293,25,8953,10,6132,95,6892,93,5942,80,9522,72,1602,53,7982,41,6012,41,4092,40,6932,38,9542,24,9662,22,8642,20,8452,19,5902,16,6372,10,0931,92,9151,75,5061,62,8681,60,6541,57,3901,40,4241,40,2171,24,32692,047
90,49,480
6,05,3035,24,7615,06,2174,38,0473,89,8953,83,9853,53,1793,06,0792,96,0652,76,9062,74,7042,65,1502,59,5822,35,4192,14,7362,26,0472,21,4482,20,2092,12,8832,10,3842,05,2582,05,8792,02,7561,97,5731,78,6101,61,6621,52,2071,50,4161,47,3641,27,4501,30,7861,15,01484,005
84,79,979
Below Poverty Line (BPL) Cards
Note: Districts arranged in descending order of total BPL cards. Source: Civil Supplies Department
DistrictS.No
Social Security
Telangana State Statistical Abstract, 2021 | 193
District wise - Aasara Pensions (Number) – 2020-21
Nizamabad
Jagtial
Hyderabad
Nalgonda
Siddipet
Rangareddy
Khammam
Kamareddy
Sangareddy
Nirmal
Hanumakonda
Suryapet
Karimnagar
Rajanna Sircilla
Medak
Medchal-Malkajgiri
Bhadradri Kothagudem
Nagarkurnool
Vikarabad
Mahabubabad
Mahabubnagar
YadadriBhuvanagiri
Mancherial
Peddapalli
Narayanpet
Jangaon
Wanaparthy
Adilabad
Warangal
Jogulamba Gadwal
Jayashankar
Kumuram Bheem
Mulugu
Total
Note: Districts arranged in descending order of total Aasara beneficiaries. Source: CEO, SERP, Department of Rural Development, Hyderabad
Old AgeDistrict Widow Disabled Weavers Toddy Tappers HIV Patients Filaria Patients Beedi Workers Single Women Total
123456789101112131415161718192021222324252627282930313233
55,51152,26158,39160,33757,13357,28157,75244,81052,05131,02943,37544,28045,64728,28934,80830,63036,36642,84433,83838,07830,47032,11132,20230,93327,48426,24726,10723,17626,20222,46721,42319,03813,931
12,36,502
70,98341,78398,87475,09154,68478,08264,88549,21368,51036,78552,38254,20434,24222,79545,64352,60147,48742,42148,54039,62742,23533,95938,52429,60930,86225,23727,32129,17825,12728,22820,96520,76316,267
14,47,107
19,43417,57428,59830,30615,36926,80726,44918,38215,70110,05018,60819,59821,04310,5519,188
20,28612,82113,19112,62115,14213,33413,47012,25413,1179,786
11,09811,3507,1699,988
10,9876,5965,8723,890
4,90,630
2022,221
62,9042,46177345864378146
3,569906
2,7873,87453514618
245164379504
3,221306767
2,8641,55667720
6332,054850499195
37,264
1,0633,527
07,4893,0632,0793,154716842278
3,2446,8753,7062,209909417146740461
2,931636
5,897928
2,229988
2,89044841
2,462387
1,642138231
62,766
1,615603
9,9011,774878
02,5641,2251,997
02,793828
2,252000
1,0800
1,0710
2,11400
1,1870
4240
89200000
33,198
4021,787
37771
2,65643
1,253529401224464
1,89357591549212915312
21423353
466270364136521
6586156
039
48425
16,289
96,29989,409
540
44,295161
37,02595
62,7988,483
09,378
43,53214,208
1693
234112
1,793896
2,341694
1,2332,021996
5,52863653428290
4,22,246
10,0464,6109,1927,3153,4455,9938,0164,4477,4592,1293,3036,6803,3011,8464,2955,2765,8153,7214,6342,8624,3152,5492,4612,4243,2021,5292,5692,2521,8962,0781,2172,5681,475
1,34,920
2,55,5552,13,7752,05,0531,85,9871,83,9841,71,0741,64,5321,56,9901,47,8371,43,3391,36,2211,35,2641,22,9311,14,0111,10,0781,09,6541,03,8891,03,1971,01,58499,26495,45492,56989,28681,32476,55571,52369,47468,84267,10066,25452,77449,44436,104
38,80,922
S.No
Social Security
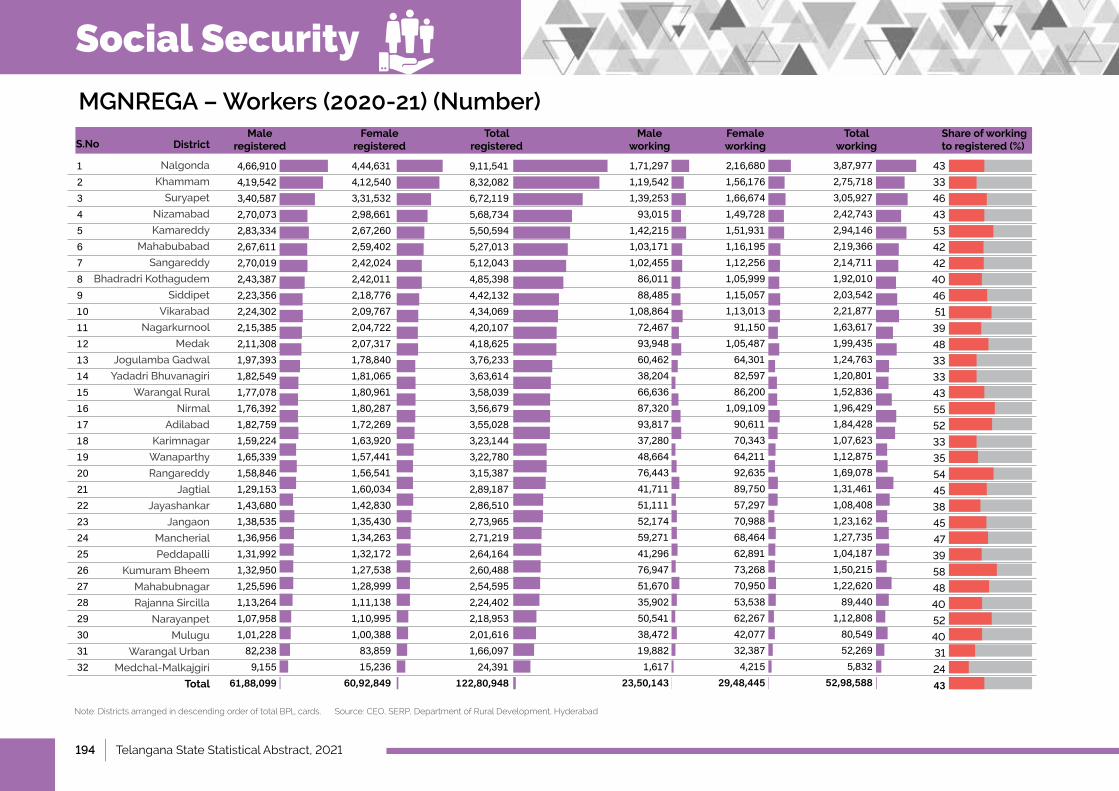
194 | Telangana State Statistical Abstract, 2021
MGNREGA – Workers (2020-21) (Number)
Nalgonda
Khammam
Suryapet
Nizamabad
Kamareddy
Mahabubabad
Sangareddy
Bhadradri Kothagudem
Siddipet
Vikarabad
Nagarkurnool
Medak
Jogulamba Gadwal
YadadriBhuvanagiri
Warangal Rural
Nirmal
Adilabad
Karimnagar
Wanaparthy
Rangareddy
Jagtial
Jayashankar
Jangaon
Mancherial
Peddapalli
Kumuram Bheem
Mahabubnagar
Rajanna Sircilla
Narayanpet
Mulugu
WarangalUrban
Medchal-Malkajgiri
Total
Male registered
Female registered
Total registered
Male working
Female working
Total working
Share of working to registered (%)
1234567891011121314151617181920212223242526272829303132
Note: Districts arranged in descending order of total BPL cards. Source: CEO, SERP, Department of Rural Development, Hyderabad
4,66,9104,19,5423,40,5872,70,0732,83,3342,67,6112,70,0192,43,3872,23,3562,24,3022,15,3852,11,3081,97,3931,82,5491,77,0781,76,3921,82,7591,59,2241,65,3391,58,8461,29,1531,43,6801,38,5351,36,9561,31,9921,32,9501,25,5961,13,2641,07,9581,01,22882,2389,155
61,88,099
4,44,6314,12,5403,31,5322,98,6612,67,2602,59,4022,42,0242,42,0112,18,7762,09,7672,04,7222,07,3171,78,8401,81,0651,80,9611,80,2871,72,2691,63,9201,57,4411,56,5411,60,0341,42,8301,35,4301,34,2631,32,1721,27,5381,28,9991,11,1381,10,9951,00,38883,85915,236
60,92,849
1,71,2971,19,5421,39,25393,015
1,42,2151,03,1711,02,45586,01188,485
1,08,86472,46793,94860,46238,20466,63687,32093,81737,28048,66476,44341,71151,11152,17459,27141,29676,94751,67035,90250,54138,47219,8821,617
23,50,143
2,16,6801,56,1761,66,6741,49,7281,51,9311,16,1951,12,2561,05,9991,15,0571,13,01391,150
1,05,48764,30182,59786,200
1,09,10990,61170,34364,21192,63589,75057,29770,98868,46462,89173,26870,95053,53862,26742,07732,3874,215
29,48,445
3,87,9772,75,7183,05,9272,42,7432,94,1462,19,3662,14,7111,92,0102,03,5422,21,8771,63,6171,99,4351,24,7631,20,8011,52,8361,96,4291,84,4281,07,6231,12,8751,69,0781,31,4611,08,4081,23,1621,27,7351,04,1871,50,2151,22,62089,440
1,12,80880,54952,2695,832
52,98,588
43
33
46
43
53
42
42
40
46
51
39
48
33
33
43
55
52
33
35
54
45
38
45
47
39
58
48
40
52
40
31
24
43
9,11,5418,32,0826,72,1195,68,7345,50,5945,27,0135,12,0434,85,3984,42,1324,34,0694,20,1074,18,6253,76,2333,63,6143,58,0393,56,6793,55,0283,23,1443,22,7803,15,3872,89,1872,86,5102,73,9652,71,2192,64,1642,60,4882,54,5952,24,4022,18,9532,01,6161,66,09724,391
122,80,948
DistrictS.No
Social Security
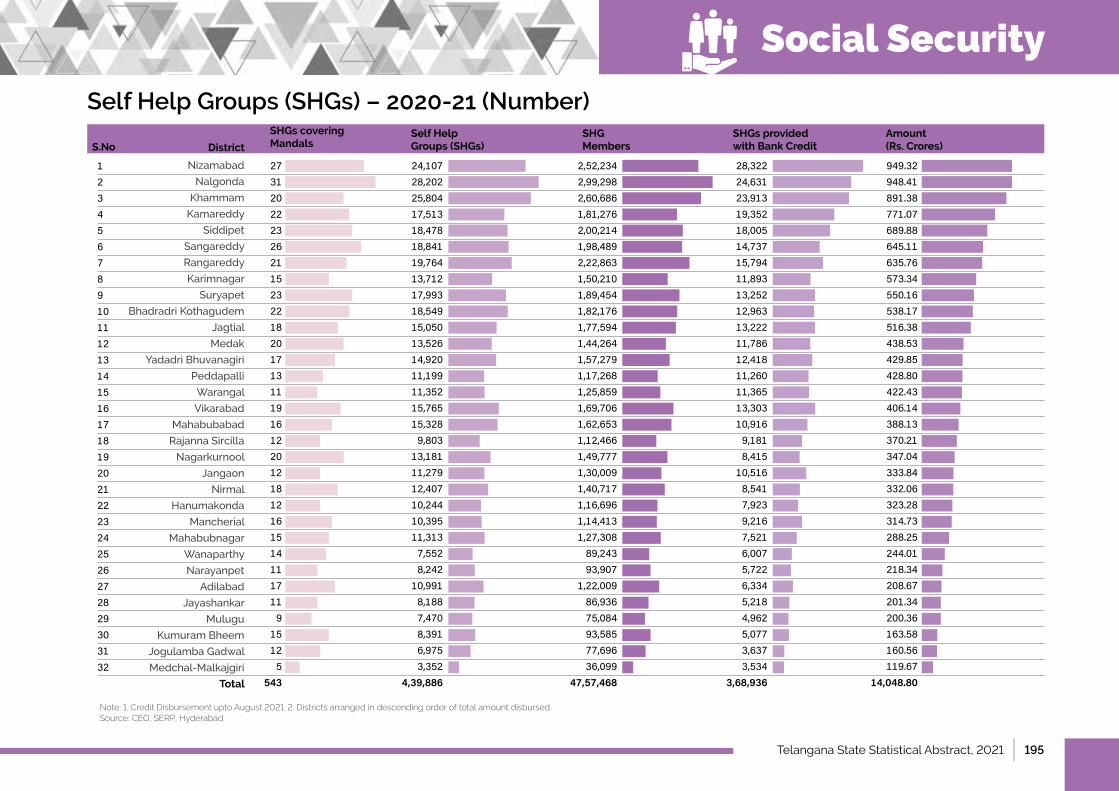
Telangana State Statistical Abstract, 2021 | 195
Self Help Groups (SHGs) – 2020-21 (Number)
Nizamabad
Nalgonda
Khammam
Kamareddy
Siddipet
Sangareddy
Rangareddy
Karimnagar
Suryapet
Bhadradri Kothagudem
Jagtial
Medak
YadadriBhuvanagiri
Peddapalli
Warangal
Vikarabad
Mahabubabad
Rajanna Sircilla
Nagarkurnool
Jangaon
Nirmal
Hanumakonda
Mancherial
Mahabubnagar
Wanaparthy
Narayanpet
Adilabad
Jayashankar
Mulugu
Kumuram Bheem
Jogulamba Gadwal
Medchal-Malkajgiri
Total
SHGs covering Mandals
Self Help Groups (SHGs)
SHG Members
SHGs provided with Bank Credit
Amount (Rs. Crores)
Note: 1. Credit Disbursement upto August 2021. 2. Districts arranged in descending order of total amount disbursed. Source: CEO, SERP, Hyderabad
1234567891011121314151617181920212223242526272829303132
273120222326211523221820171311191612201218121615141117119
15125
543
24,10728,20225,80417,51318,47818,84119,76413,71217,99318,54915,05013,52614,92011,19911,35215,76515,3289,803
13,18111,27912,40710,24410,39511,3137,5528,242
10,9918,1887,4708,3916,9753,352
4,39,886
2,52,2342,99,2982,60,6861,81,2762,00,2141,98,4892,22,8631,50,2101,89,4541,82,1761,77,5941,44,2641,57,2791,17,2681,25,8591,69,7061,62,6531,12,4661,49,7771,30,0091,40,7171,16,6961,14,4131,27,30889,24393,907
1,22,00986,93675,08493,58577,69636,099
47,57,468
28,32224,63123,91319,35218,00514,73715,79411,89313,25212,96313,22211,78612,41811,26011,36513,30310,9169,1818,415
10,5168,5417,9239,2167,5216,0075,7226,3345,2184,9625,0773,6373,534
3,68,936
949.32948.41891.38771.07689.88645.11635.76573.34550.16538.17516.38438.53429.85428.80422.43406.14388.13370.21347.04333.84332.06323.28314.73288.25244.01218.34208.67201.34200.36163.58160.56119.67
14,048.80
DistrictS.No
Social Security

196 | Telangana State Statistical Abstract, 2021

Telangana State Statistical Abstract, 2021 | 197
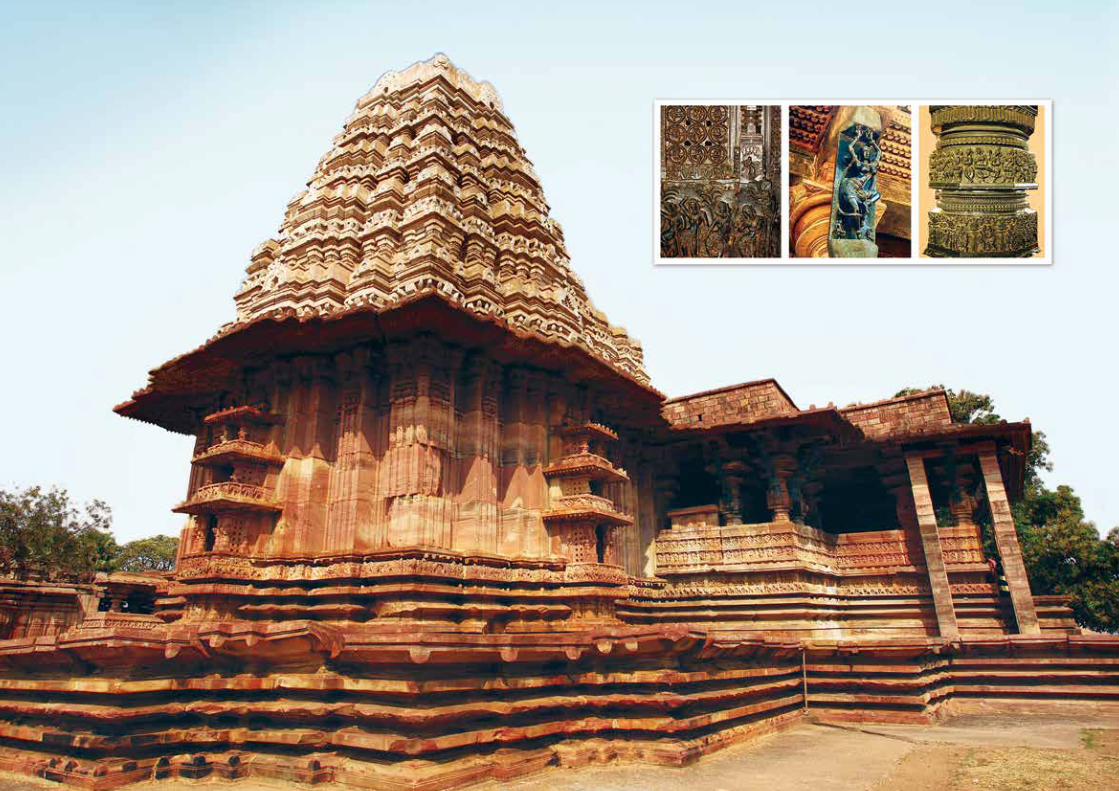
Related Documents