a Telangana Socio Economic Outlook 2022

Welcome message from author
This document is posted to help you gain knowledge. Please leave a comment to let me know what you think about it! Share it to your friends and learn new things together.
Transcript

a
TelanganaSocio Economic Outlook 2022


Government of Telangana
PLANNING DEPARTMENT
TelanganaSocio Economic Outlook 2022


1Preface
he Government of Telangana publishes the Socio Economic Outlook (SEO) annually and tables it in the State Legislature during the budget session. It presents
the socio-economic performance of the State across various sectors and recognises the specifi c gaps and challenges to initiate appropriate action. It also presents the information on Government policies and fl agship programmes, and analyses their performance. SEO 2022 highlights the major achievements of the State in relevant sections. Along with ensuring accountability and transparency, it also gives the Government an opportunity to refl ect holistically on the existing and future pathways towards achieving ‘Bangaru Telangana’.
SEO 2022 has been prepared based on the data from the State and Central Government departments, and has been supplemented by data from credible and autonomous sources, such as the Reserve Bank of India, NITI Aayog, Periodic Labour Force Survey, National Achievement Survey etc. Through the ‘box items’ a consistent effort has been made to either present a case study of a successful reform/innovation that has been implemented in the State or elsewhere.
All this would not have been possible without the meticulous support of various line departments of the Government in providing the necessary information on time. The effort led by the dedicated team from the Planning Department including Kakatiya Governance Fellows (KGF) and Centre for Effective Governance of Indian States (CEGIS) in the preparation of SEO 2022 is deeply appreciated.
Planning Department,Government of Telangana.
PrefaceT

Telangana Socio Economic Outlook 20222
TABLE OF CONTENTS1. Overview .................................................................................................................................... 6
2. Macroeconomic Trends .......................................................................................................... 12
2.1 Introduction ................................................................................................................................ 14
2.2 Gross State Domestic Product ........................................................................................... 14
2.3 Per-Capita Income .................................................................................................................. 17
2.4 Sectoral Analysis ..................................................................................................................... 19
2.5 District-Level Indicators ........................................................................................................ 22
2.6 Way Forward ............................................................................................................................ 25
3. Public Finance ......................................................................................................................... 26
3.1 Introduction ................................................................................................................................ 28
3.2 Comparative Fiscal Profi le of Telangana ........................................................................ 28
3.3 Comparative Fiscal Profi le - Expenditure ....................................................................... 32
3.4 Committed Expenditure ......................................................................................................... 36
3.5 Resource Mobilization ............................................................................................................ 38
3.6 Way Forward ............................................................................................................................ 39
4. Agriculture and Allied Activities ............................................................................................. 40
4.1 Agriculture and allied activities -Macro Trends ........................................................... 42
4.2 Land Use Pattern ..................................................................................................................... 44
4.3 Agriculture and Allied Activities: Trends in Output ..................................................... 45
4.4 Government Initiatives ........................................................................................................... 54
4.5 Way Forward ............................................................................................................................ 69
5. Industries ................................................................................................................................. 70
5.1. Role of Industry and its Contribution to the State Economy ................................... 72
5.2. Major Initiatives of the State to Promote Industrial Development ........................ 73
5.3. Sectoral Insights ...................................................................................................................... 81
5.4 Way Forward ............................................................................................................................ 87
3
6. Services .................................................................................................................................... 88
6.1 Introduction ................................................................................................................................ 90
6.2 Sectoral Insights ...................................................................................................................... 90
6.3 Sub-sectoral Insights ............................................................................................................. 92
6.4 Employment Trends in the Services Sector .................................................................. 104
6.5 Way Forward ......................................................................................................................... 105
7. Infrastructure ..........................................................................................................................106
7.1 Introduction ............................................................................................................................. 108
7.2 Transportation infrastructure ........................................................................................... 108
7.3 Water Supply and Sanitation .......................................................................................... 113
7.4 Energy ....................................................................................................................................... 115
7.5 Communication ..................................................................................................................... 121
7.6 Way Forward ......................................................................................................................... 123
8. Health ..................................................................................................................................... 124
8.1 Introduction ............................................................................................................................. 126
8.2 Performance of Telangana on the Health Index ....................................................... 126
8.3 Health Infrastructure ........................................................................................................... 128
8.4 Non-communicable and communicable diseases ................................................... 134
8.5 COVID - 19 .............................................................................................................................. 138
8.6 Way Forward ......................................................................................................................... 141
9. Maternal & Child Care ......................................................................................................... 142
9.1 Introduction ............................................................................................................................. 144
9.2 Maternal Health and Nutrition ........................................................................................ 144
9.3 Child Health and Nutrition ................................................................................................ 148
9.4 POSHAN Abhiyaan ............................................................................................................. 155
9.5 Giriposhana – an innovative approach towards improved nutrition ................ 155
9.6 Way Forward ......................................................................................................................... 155
Telangana Socio Economic Outlook 20224
10. Education & Skill Development ....................................................................................... 156
10.1 Education is Fundamental for Human Development .............................................. 158
10.2 Pre- School and School Education ................................................................................. 158
10.3 Foundational Literacy and Numeracy(FLN) ............................................................... 165
10.4 Status of Learning Outcomes in Telangana .............................................................. 167
10.5 Pupil-Teacher Ratio (PTR) ................................................................................................. 170
10.6 Initiatives for Students from the Marginalised Communities ............................... 170
10.7 Higher Education .................................................................................................................. 174
10.8 Collegiate Education ............................................................................................................ 175
10.9 Adult Education ..................................................................................................................... 176
10.10 Skill Development ................................................................................................................. 176
10.11 Way Forward ......................................................................................................................... 179
11. Welfare ................................................................................................................................. 180
11.1 Introduction ............................................................................................................................. 182
11.2 Welfare of Scheduled Castes, Scheduled Tribes, Backward ................................. 182 Classes and Minorities
11.3 Housing .................................................................................................................................... 185
11.4 Women Welfare ................................................................................................................... 186
11.5 Poverty Alleviation ............................................................................................................... 189
11.6 Economic Support Schemes ............................................................................................. 192
11.7 Development and Protection of Culture ....................................................................... 192
11.8 Welfare for Senior Citizens and the Disabled ............................................................ 193
11.9 Way Forward ......................................................................................................................... 195
12. Forestry & Environment .................................................................................................... 196
12.1 Introduction ............................................................................................................................. 198
12.2 Forest ........................................................................................................................................ 198
12.3 Biodiversity ............................................................................................................................. 203
12.4 Pollution Control ................................................................................................................. 206
12.5 Conservation and Climate Action .................................................................................. 209
12.6 Way Forward ......................................................................................................................... 209

5
13. Panchayat Raj & Palle Pragathi ...................................................................................... 210
13.1 Democratic Decentralisation and Development ....................................................... 212
13.2 Implementation Status: Telangana Panchayat Raj Act 2018 ............................. 212
13.3 Palle Pragathi ....................................................................................................................... 216
13.4 Qualitative Aspects Of Mahatma Gandhi National ............................................... 217 Rural Employment Guarantee Scheme (MGNREGS)
13.5 Society for Elimination of Rural Poverty (SERP) ....................................................... 220
13.6 Other Initiatives under Panchayat Raj ......................................................................... 224
13.7 Way Forward ........................................................................................................................ 225
14. Urban Development .......................................................................................................... 226
14.1 The Urban Landscape ....................................................................................................... 228
14.2 Urban Infrastructure ........................................................................................................... 229
14.3 Urban Areas and Jobs ....................................................................................................... 232
14.4 Urban Areas and Climate Change ................................................................................. 236
14.5 Urban Areas and Gender .................................................................................................. 239
14.6 Developing Hyderabad ...................................................................................................... 240
14.7 Urban Governance ............................................................................................................... 244
14.8 Financing Urban Development ........................................................................................ 246
14.9 Way Forward ......................................................................................................................... 248
15. Governance .......................................................................................................................... 250
15.1 Introduction ............................................................................................................................. 252
15.2 Decentralization for Good Governance ........................................................................ 252
15.3 Citizen-Centric Governance .............................................................................................. 253
15.4 Public Safety, Policing, and Prisoners’ Welfare ......................................................... 256
15.5 Institutions to support Governance ............................................................................... 259
15.6 Monitoring and Evaluation ................................................................................................ 261
15.7 Sustainable Development Goals and Governance .................................................. 262
15.8 Way Forward ......................................................................................................................... 263
Annexures .................................................................................................................................... 264

Telangana Socio Economic Outlook 20226
OVERVIEW
CHAPTER
01Adilabad
Nirmal
Kumuram Bheem
Mancherial
Jagtial
Rajanna Sircilla
Peddapalli
Jayashankar
Mulugu
MedakSiddipet Hanumakonda
Warangal
JangaonSangareddy
Medchal-Malkajigiri
VikarabadRangareddy
Mahabubnagar
Narayanpet
Nalgonda
NagarkurnoolWanaparthy
Suryapet
Khammam
Karimnagar
Yadadri Bhuvanagiri
Mahabubabad
Jogulamba Gadwal
Bhadradri Kothagudem
Kamareddy
Nizamabad
Hyderabad

7Overview
he past two years have been challenging for governments across the world. On account of the COVID-19 pandemic,
their core focus has been on saving lives and ensuring minimum sustenance support for various affected groups. The financial support extended towards ensuring the good health and well-being of the citizens has created upward pressures on expenditure, thus creating severe revenue constraints, leading to a poor fiscal situation across the board.
In this context, Telangana stands out as one of the few states that have successfully managed multiple challenges presented by the pandemic. Four themes underpin this achievement: resilient economy, prudent fiscal management, systemic improvements in universal service delivery, and focused welfare initiatives.
Resilient EconomyEven in the midst of the pandemic, Telangana’s Gross State Domestic Product (GSDP) at current prices achieved a positive growth rate (2.2%) in the year 2020-21. In contrast, the Gross Domestic Product (GDP) of the country declined by 1.4%. At constant (2011-12) prices, while the country’s GDP contracted by 6.6% in 2020-21, the decline in the state’s GSDP was limited to 3.5%.
The year 2021-22 was one of economic revival, with the state as well as the national economy rebounding, and achieving a ‘V-shaped’ recovery. The country’s GDP at constant (2011-12) prices grew by 8.9%, while that of the state grew by 11.2% – higher than the country’s by 3.6 percentage points. At current prices, Telangana’s GSDP grew by 19.1% in 2021-22. Thus, the state economy was resilient to the challenges imposed by the COVID-19 pandemic.
With a nominal Per Capita Income (Rs. 2.79 lakh) of 1.86 times the national figure (Rs.1.50 lakh) in 2021-22, Telangana is on a healthy growth trajectory that meets the aspirations of its residents. Based on the Compound Annual Growth Rate (CAGR) of Per Capita Income (PCI) at current prices between 2014-15 and 2021-22 at the state and national levels, the
time period in which an average citizen can expect his/her income to double is 5 to 6 years in Telangana compared to 8 to 9 years in India as a whole.
The agriculture and allied sectors in the state remained strong throughout the pandemic and after, achieving a robust growth in current price GVA of 12.24% and 9.09% in 2020-21 and 2021-22, respectively. Telangana’s agriculture and allied sector has been on an upward growth path for the past seven years, with its growth rate increasing by 9.75 percentage points between 2014-15 and 2021-22. This was made possible by Government policies such as cash transfers for investment support (Rythu Bandhu), infrastructural investments (e.g. Mission Kakatiya), in-kind input support and procurement.
The Rythu Bandhu scheme has crossed the milestone of Rs. 50,000 crores (Rs. 50,448 crores) in 8 seasons starting from Vanakalam, 2018 to Yasangi, 2021-22, reaching around 63 lakh beneficiaries under the scheme. On the procurement front, despite the lockdown restrictions, the Government procured 252.4 Lakh Metric Tonnes (LMT) of paddy and 39.5 LMT of cotton at Minimum Support Price (MSP) during 2019-20 and 2020-21. Notably, there was a growth of about 27% in paddy procurement in 2020-21 over 2019-20. With a livestock population growth of 22.21% between 19th and 20th Livestock Census (2012 and 2019 respectively), the state has been leading the growth in livestock population in the country.
Moving forward, in view of the excess paddy production in the state and to ensure that the farmers continue receiving remunerative prices in the future, the Government plans to support farmers in “demand-driven agriculture” for sustainable increase in agricultural incomes through crop diversification. An example of this is the ambitious Oil Palm Mission, where the Government is targeting the cultivation of oil palm in 20 lakh acres over the next few years.
While the industries sector in Telangana experienced a decline in GVA (growth rate of -1.73%) at current prices in 2020-21, the sector grew at a notable 20.23% in 2021-22 (AE). The services sector witnessed a remarkable growth of 18.32% in its
T
OVERVIEW

Telangana Socio Economic Outlook 20228
GVA at current prices in 2021-22, against a growth of 0.91% in 2020-21. Owing to the government’s investor friendly policies, the seamless system of approvals via TS-iPASS has stabilised, with 3,185 approvals accounting for investments worth Rs. 6,965 crore provided in 2021-22 (till January 2022).
Telangana is also the most favoured location for next generation sectors like Artificial Intelligence, Blockchain, Cloud Adoption, and Cybersecurity. This is driven by its investment promotion and policy support, which is also reflected in the doubling of exports (from Rs.66,276 crore to Rs.1,45,522 crore) and employment (from 3,71,774 to 6,28,615) in the IT sector between 2014-15 and 2020-21 respectively. This evidences the success of the first ICT policy launched in 2016. The second ICT Policy 2021-26 has set out ambitious aims of multiplying innovation, employment and exports.
Tourism is also a significant sub-sector under the services sector. The Ramappa temple and Pochampally village gained world-wide recognition as a UNESCO World Heritage Site and a UNWTO Best World Tourism Village in 2021, respectively. These recognitions are a fillip to the tourism sector in the state and the Government is actively promoting tourism with various initiatives to boost the economy and employment.
Prudent Fiscal ManagementOver the past few years, there has been increasing uncertainty, both in the manner and timing of fiscal transfers from the Government of India. While such trends do add to the fiscal stress, Telangana is better insulated from this due to a considerable share of ‘own tax revenue’ in the total revenue receipts. During 2017-20, the state’s own revenue (sum of state’s own tax and non-tax revenue) accounted for 73.8% of its revenue receipts on average, higher than that of the average of General States (57.7%). Telangana has also recorded the highest CAGR in the ‘own tax revenue’ (18.2%) post its formation amongst all General States (GS) between 2014 and 2020.
This has been possible through the facilitation of overall economic growth, and specific initiatives
such as strengthening of the Commercial Taxes Department, leveraging technology and analytics to enumerate various liabilities of taxpayers, and tracking the progress of work by the tax authorities. These initiatives have led to the doubling of the GST tax base (2.18 lakh to 4.89 lakh) compared to the earlier VAT regime. Further, a calibrated revision of market values of the land and revision of stamp duty rates in 2021-22, as recommended by the Cabinet Sub-Committee on Resource Mobilization, has led to the doubling of monthly revenue of stamps and registrations on an average, compared to 2019-20.
In addition to the above initiatives to enhance public revenues, the Government has also ensured quality expenditure from the public exchequer. Telangana’s share of development expenditure in the total expenditure in the 2017-20 period was 77.4%, the highest among all GS; the average of all GS was 68.2%. It is this developmental expenditure that has helped the state boost the incomes and address the welfare needs of the most vulnerable groups. Telangana stands second among GS in terms of the average per capita development expenditure incurred during the 2017-20 period. Such fiscal prudence also extends to the liabilities - for the 2017-20 period, the total outstanding liabilities to GSDP ratio stood at 22.33%, which is 5.4 percentage points less than the average of GS (27.73%).
The Government also decided to supplement the budgetary resources with extra budgetary resources to fasten development. From 2014-15 to 2021-22 (till 31.1.2022), apart from the expenditure incurred from the budget (Rs. 1.67 lakh crores), Rs. 1.14 lakh crores was spent for capital expenditure, leading to a total capital expenditure of nearly Rs. 2.82 lakh crores, which is more than 5 times the capital expenditure incurred in the 10 years before the bifurcation of the state. Such an increase in capital expenditure is unprecedented.
This extra budgetary spending has supported the construction of projects such as the Kaleshwaram project, the world’s largest lift irrigation system and Mission Bhagiratha. The results of this spending are already visible in the strong growth of the agricultural sector, which has a multiplier effect on other sectors.

9
Systemic Improvements in Universal Service DeliveryThrough improved emphasis on public goods (like health, safety, nutrition, education, water and sanitation), Telangana has ensured universal access to high-quality basic services. This is evidenced by the superior outcomes across multiple services.
In the crucial area of maternal and child health, there has been an improvement in both institutional births (from 91.5% to 97%) and births in government hospitals (from 30.5% to 49.7%) between 2015-16 and 2019-20 (NFHS 4 and NFHS 5 survey periods). In contrast to a population share of ~ 2.8%, Telangana’s share of overall COVID-19 cases in the country was nearly 1.8%, and its share of deaths was even smaller at about 0.8%. The robustness of the healthcare system is visible in the quick achievement of 105% coverage of the first dose of COVID-19 vaccine and 90% coverage of the second dose; including the migrant population.
To strengthen the healthcare system, the Government has proposed to improve health infrastructure in the state through new medical colleges and super speciality hospitals. Eight new medical colleges in different areas of the state have been sanctioned with a cumulative capacity of 1,200 MBBS seats. Four new Telangana Institute of Medical Sciences & Research (TIMS) super speciality hospitals are to be established with medical infrastructure standards at par with corporate hospitals and AIIMS, New Delhi. Warangal will be developed as a health city and medical tourism destination and Rs. 1,100 crores has been sanctioned for construction of a super speciality hospital.
Following the success of Basti Dawakhanas, the Government is upgrading the sub-centers in rural areas to Palle Dawakhanas so that the rural population has access to the same quality of healthcare services as their urban counterparts. With the larger objective of strengthening the health system, the Government is planning a holistic transformation of the health ecosystem across preventive and curative elements, to ensure its
resilience and effectiveness.
Sanitation and Waste Management are critical areas impacting health outcomes. Efforts of the government in this domain through Palle Pragathi and Pattana Pragathi flagship programs have led to the state’s ULBs and RLBs being felicitated across various Swachh Survekshan rounds as having some of the highest levels of cleanliness and sustainability scores (e.g. 100% of urban wards have door to door waste collection facilities) and Hyderabad retaining Open Defecation Free (ODF) ++ tag and also being declared as a ‘Water Plus’ city in 2021.
One of the targets under Goal 11 of the Sustainable Development Goals (SDG) focuses on providing access to safe public spaces. Making public spaces safe for women has been a priority of the Government. In this regard, ‘SHE teams’ has been a successful initiative in ensuring safety and security of women. According to the impact analysis study conducted by the Centre for Economic and Social Studies (CESS), in 2020, 96% of the respondents have rated the services as satisfactory and above.
On the environment front, continuous efforts being made under Telangana Ku Haritha Haram (TKHH) to increase the green cover in the state are bearing fruits. In rural areas, under Palle Prakruthi Vanams, dense forest type plantations have been established in 19,472 Gram Panchayats and habitations at an expenditure of Rs. 222.06 crore and 5 Bruhat Palle Prakruthi Vanams are being established in each mandal for which expenditure of Rs. 28.33 crore has been incurred. Under the Urban Forest Blocks initiative, 188 forest blocks spread over 1,60,660 acres within HMDA limits will be established. TKHH would receive further fillip as 10% of the budget of urban local bodies from 2022-23 is to be earmarked for improvement of greenery under Green Budget.
According to the United Nations, provision of quality education is at the heart of achieving the SDGs. As part of the efforts towards strengthening the education system, “Mana Ooru-Mana Badi/Mana Basti-Mana-Badi” initiative was launched in January 2022 to upgrade the infrastructure facilities
Overview

Telangana Socio Economic Outlook 202210
in the government schools within a period of three years with an approved budget of Rs. 7,289.54 crore. The objective of the initiative is to create a conducive learning environment which would lead to better retention and enrollment rates. In addition to infrastructural components, the program also includes initiatives to improve efficiency and accountability. Additionally, recognizing the impact of the pandemic on education, and to ensure that the students are not affected due to school closures, the State Institute of Education Technology (SIET) has been creating and transmitting digital lessons through Doordarshan and T-SAT Vidya classes.
In addition to improving services, the Government has been focusing on improving the social returns on its most valuable assets - the workforce. Initiatives on supportive supervision and better measurement of performance are being rolled out in the Panchayati Raj, Women & Child Development, and Agriculture departments. In addition, an Administrative Reforms Committee has been created to prioritise the filling of key positions across Departments, and to improve staff accessibility and productivity resulting in better citizen experience and outcomes.
Performance of the workforce is also improving as the creation of new districts and administrative divisions is bringing governance closer to citizens. Such improved availability of administration and service delivery is also a key factor contributing to the state’s superior service outcomes. Further, strengthening of personnel management systems for all the departments across the state through a robust Human Resource Management System (HRMS) is under active consideration.
Focused Welfare InitiativesIn addition to facilitating the overall economic growth, prudent fiscal management and improved universal service quality, the Government has consistently undertaken initiatives to improve socio-economic outcomes of the marginalized and vulnerable groups across caste, gender, occupational and other categories. In spite of the economic and administrative hurdles posed by the
successive lockdowns, the welfare schemes of the state remained uninterrupted. The success of the welfare agenda rests on ensuring that the schemes are properly implemented, with their outcomes aligning with the vision of the Government.
The Government has launched the Telangana Dalit Bandhu scheme for the SC families to enhance their economic condition. Under this scheme, each beneficiary household is provided financial assistance of Rs. 10 lakh as a complete grant without any bank dependencies. A remarkable feature is that it is a long-term income-generation focused support scheme compared to traditional consumption-oriented support. Till January 2022, Rs. 2,007.60 crore has been released to 17,626 beneficiaries in Huzurabad and Alair assembly constituencies. The Government has also decided to scale up the scheme to 118 Assembly Constituencies (AC) by selecting 100 SC families in each AC during this financial year itself and has released an amount of Rs. 300 crore to all 33 districts in the state. Over the coming years, this scheme has the potential to redefine the landscape of welfare spending in the country.
The Government has laid special emphasis on the educational needs of the disadvantaged communities by increasing and improving residential educational institutions for SCs, STs, BCs and Minorities since the formation of the state. The number of Social Welfare (134 to 268) and Tribal Welfare (96 to 188) residential institutions has doubled since 2014 and the number of BC Welfare residential institutions (19 to 281) and Minority Welfare residential institutions (12 to 204) has grown exponentially. The quality of teaching and physical environment in these schools is of the best standards and some of the students of these institutions have secured admissions in IITs, NITs, and other reputed institutions in the country.
In order to ensure the economic and social security of farmers, Rythu Bima is being implemented since 2018 with the objective of providing financial relief and social security to the dependents in case of loss of farmer’s life due to any reason. The entire premium is borne by the Government, without imposing any burden on the farmer and all farmers, irrespective

11
of their land holding size, are eligible for this. In the event of the death of the enrolled farmer due to any cause, the insured amount of Rs 5.00 lakh is deposited into the nominee account within 10 days. Since 2018-19, the Government has settled claims to an extent of Rs. 3,763.80 crore and transferred the amount to the 75,276 bereaved families.
Financial inclusion is a crucial mechanism to help formalise the informal economy. The Government has been pursuing policies that can help expand the reach of the financial system to the informal sector, which was the need-of-the-hour after COVID-19 lockdowns. Self Help Groups (SHG) play a crucial role in empowering women, creating livelihoods and thereby achieving financial inclusion. During 2021-22 till December, Rs. 8,922 crore was disbursed as loans to 1.89 lakh SHGs in rural areas and till November, Rs. 1,107 crores was disbursed as loans to 17,287 SHGs in urban areas. Street Vendors are also a priority category and in November 2021, under the PMSVANidhi scheme, Telangana became the first state in the country to achieve its target of distributing loans to 3.4 lakh street vendors.
The Government runs various schemes for women and children to address the gaps in dietary intake, medical care, hygiene, and sanitation. Under the KCR Kit scheme launched in 2017, mothers are provided with a financial assistance of Rs. 12,000 (Rs. 13,000 for a girl child) to compensate for the loss of wages during the pregnancy and post-natal period. After delivery, they receive a kit consisting of 15 items (clothes, baby soaps, baby oil, etc.) necessary to keep the newborn babies warm and hygienic. About 2.1 lakh KCR Kits were distributed in 2020-21 and nearly 1.5 lakh kits have been distributed in 2021-22 (till November 2021). The success of the scheme is evident from a rise in the percentage of institutional deliveries in public hospitals, and a significant reduction in the Infant Mortality Rate and Maternal Mortality Rate after the launch of the scheme.
Aarogya Lakshmi scheme provides nutritious and healthy meals to all pregnant and lactating mothers registered in all the Anganwadi Centres. The funding for this scheme as per Government of India norms is a 50:50 split between the Central and State
Government. However, in the interest of women’s health and welfare, the Government of Telangana has enhanced the rates by providing an additional allocation of Rs. 14 per beneficiary per day. In addition, the State Government has increased the number of days the beneficiaries receive milk and eggs from 25 to 30. The scheme benefited over 22 lakh beneficiaries in 2021-22. The pandemic year 2020-21 saw an enhanced coverage of 18.24% beneficiaries indicating effective outreach of the Government to the last mile mother and child in need.
The availability of adequate housing facilities with proper supply of potable water, sufficient sanitation facilities and clean surroundings is necessary to ensure decent public health. The 2 BHK Housing Programme was launched in October 2015, with an objective of providing affordable and quality housing to the poor. Out of the 2.91 lakh sanctioned houses, construction of 1.08 lakh houses has been completed and the construction of remaining houses is in various stages of completion.
The “Aasara’’ pension scheme was launched in November 2014 to extend welfare measures and social safety net to support the most vulnerable sections. It covers senior citizens, disabled persons, widows, people living with HIV, filaria effected persons, incapacitated weavers, toddy tappers, poor Beedi workers and single women. During 2021-22, upto January 2022, 37.34 lakh pensioners were disbursed an amount of Rs. 7,078 crore.
The economy of the state has been performing well since the formation of the state. Due to the strong foundations laid by the Government since 2014, the economy and the society was able to withstand the ill effects of COVID-19 pandemic to a significant extent. The revenues in 2021-22 have already recovered to pre-pandemic levels, and there is every possibility for economic growth to gain momentum. Telangana will continue to be one of the fastest growing states, thereby contributing to national growth. The Government’s initiative in pursuing progressive policies that supplement high economic growth with employment creation and broad-based distribution will ensure the prosperity of Telangana in the coming years.
Overview

Telangana Socio Economic Outlook 202212
MACROECONOMIC TRENDS
CHAPTER
02

13
l In 2021-221, Telangana’s Gross State Domestic Product (GSDP) at current prices (AE) is Rs. 11.55 lakh crore. Telangana’s GSDP at current prices increased by 19.1% in 2021-22.
l In 2021-22, the Per Capita Income (PCI) at current prices (AE) in Telangana is Rs. 2.8 lakh, which is Rs. 1.3 lakh higher than the National Per Capita Income in 2021-22 (SAE) (Rs.1.5 lakh).
l Based on the Compound Annual Growth Rate (CAGR) of PCI at current prices for Telangana and India for the period 2014-15 to 2021-22, the average citizen in Telangana can expect his/her income to double in roughly 5 to 6 years, whereas the average citizen in the country as a whole would have to wait for about 8 to 9 years for their income to double.
l The Agriculture and allied sectors in Telangana achieved a year-
on-year growth in Gross Value Added (GVA) (current prices) of 9.09% between 2020-21 and 2021-22. Since the sector employs 48.4% of the population of the state, its economic success is crucial to improving the living standards in Telangana.
l While the Industries sector in Telangana experienced a decline in GVA at current prices in 2020-21 (growth rate of the sector was -1.73% in 2020-21), the sector grew at a notable 20.23% in 2021-22 (AE).
l The Services sector witnessed a remarkable growth of 18.32% in its GVA at current prices in 2021-22, against a growth of 0.91% in 2020-21.
l The Services sector has been a primary contributor to the state’s economic growth in all years between 2014-15 and 2021-22, except 2020-21.
Key Highlights
Macroeconomic Trends
1 All GSDP, GSVA/GVA, and PCI figures reported for Telangana for the year 2021-22 represent the Advance Estimates (AE). All GDP, GVA and PCI figures reported for India for the year 2021-22 represent the Second Advance Estimates (SAE). Wherever interstate comparisons are carried out, figures reflect Provisional Estimates (PE) released in August, 2021, on account of non-availability of state-wise Advance Estimate data.

Telangana Socio Economic Outlook 202214
2.1. Introductionuite like its predecessor, the year 2021-22 was dominated by the disruptive effects of the COVID-19 pandemic. Globally,
more cases as well as deaths from the pandemic were reported in 2021, than in 2020. As the world economy started on the path of recovery in the third quarter of the year, new variants such as Delta and Omicron emerged, putting the economy under renewed pressure. The World Economic Outlook2 published by the International Monetary Fund (IMF) in January 2022 predicts that the global economy is likely to grow by 4.4% in the year 2021-22 - a slight downward revision from their previous forecasts for the year.
2.2 Gross State Domestic Product3 The Gross State Domestic Product (GSDP) measures the monetary value of all final goods and services produced in an economy during any given year. The GSDP is one of the most important economic indicators, as it provides information about the general economic health of the economy in terms of its size and growth.
While Telangana’s economy was not completely immune to the turmoil caused by the COVID-19 pandemic, the State still managed to achieve an increase in the GSDP at current prices in 2020-21 as compared to the previous year, and its growth rate of GSDP in 2020-21 was higher than the national growth rate of GDP.
The year 2021-22, however, has been one of tremendous recovery, and the State’s GSDP – both at current as well as constant prices – has shown enormous growth.
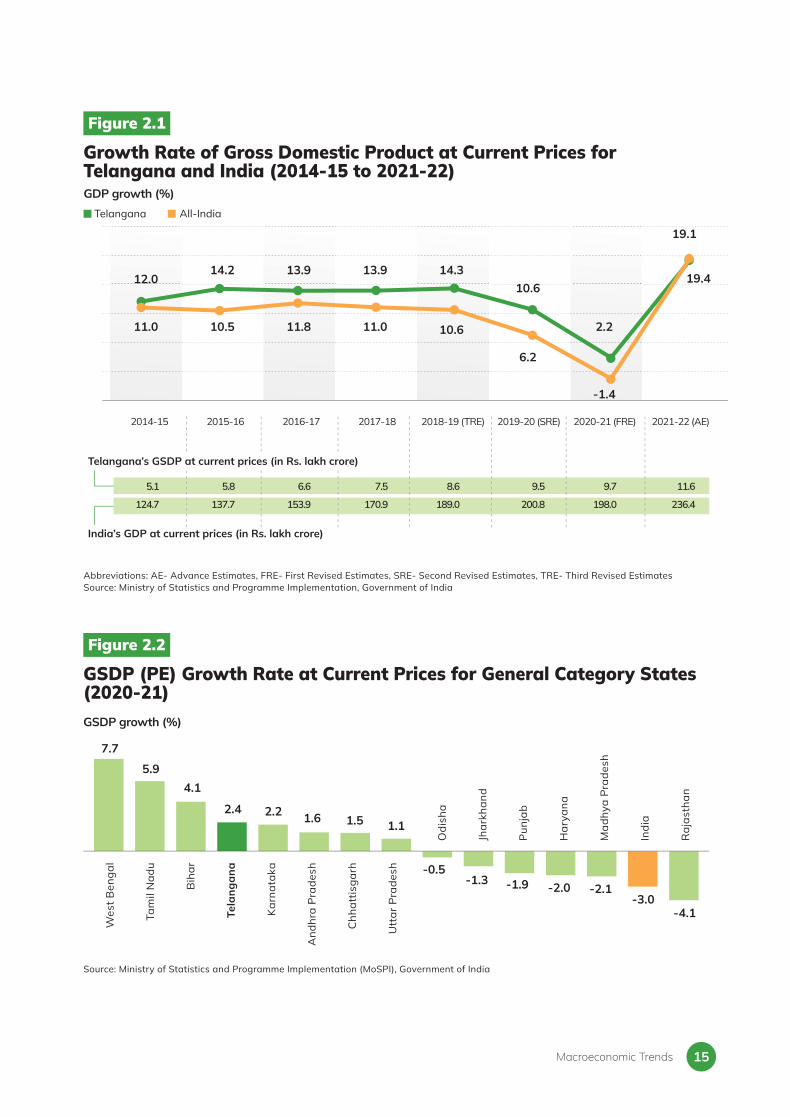
2.2.1 GSDP at Current PricesBased on the Advance Estimates (AE) released by the Ministry of Statistics and Programme Implementation, Government of India, in 2021-22, Telangana’s nominal GSDP was valued at Rs. 11.55 lakh crore, after achieving a growth rate of 19.1% over the previous year, showing strong signs of recovery from the shock of the COVID-19 pandemic.
Figure 2.1 depicts Telangana’s growth journey from the year of state formation. Telangana’s nominal growth rate exceeded that of India’s by 1.0 percentage points in 2014-15. The gap had increased to 3.6 percentage points by 2020-21, declining thereafter as the pan-Indian economy recovered from the pandemic in 2021-22 (The V-shaped recovery is evident from Figure 2.1, both in the case of Telangana and India). Compared to the pre-pandemic levels in 2019-20, Telangana’s nominal GSDP is 21.8% higher in 2021-22, while India’s nominal GDP has only increased by 17.8% in the two years.
In the midst of the pandemic in 2020-21, the State ranked fourth in terms of the growth rate of nominal GSDP (Provisional Estimates) among the fourteen General Category States4 for which data was released by the Ministry of Statistics & Programme Implementation (MoSPI)5 (see Figure 2.2).
Q
2 Source: International Monetary Fund. 2022. World Economic Outlook Update: Rising Caseloads, A Disrupted Recovery, and Higher Inflation. Washington, DC, January.
3 Gross State Domestic Product measures the size of the state’s economy. It is a commonly used indicator for the performance of the state’s economy. Generally a rapidly increasing GSDP is a sign of a healthy economy. GSDP is the value of all the final goods (e.g. cars, food, furniture) and services (e.g. services provided by barbers, taxi drivers, waiters) produced within the state during the year. Importantly, there are two measures of GSDP: nominal GSDP (GSDP at current prices) and real GSDP (GSDP at constant prices). While nominal GSDP is calculated by using the prices of the current year, real GSDP is calculated by using the prices of some other year designated as the ‘base year’ (in the context of this chapter, the base year is 2011-12). Therefore, changes in nominal GSDP between years reflect the change in both prices as well as quantity of final goods (e.g. number of cars) and services (e.g. number of haircuts) produced. In contrast, changes in real GSDP reflects only changes in the quantity of goods and services produced, since the same prices are used for all years.
4 General Category states include 18 Indian states of Andhra Pradesh, Bihar, Chhattisgarh, Goa, Gujarat, Haryana, Jharkhand, Karnataka, Kerala, Madhya Pradesh, Maharashtra, Odisha, Punjab, Rajasthan, Tamil Nadu, Telangana, Uttar Pradesh and West Bengal. These 18 states account for approximately 92% of India’s population.
5 Goa, Gujarat, Kerala, and Maharashtra are the 4 General Category states for which data for the year 2020-21 was not released by MoSPI. The same applies to all other indicators where MoSPI data for the year 2020-21 has been used.
15
Figure 2.1
Growth Rate of Gross Domestic Product at Current Prices for Telangana and India (2014-15 to 2021-22)
Abbreviations: AE- Advance Estimates, FRE- First Revised Estimates, SRE- Second Revised Estimates, TRE- Third Revised Estimates Source: Ministry of Statistics and Programme Implementation, Government of India
2014-15 2015-16 2016-17 2017-18 2018-19 (TRE) 2019-20 (SRE) 2020-21 (FRE) 2021-22 (AE)
Telangana All-India
12.0
11.0
14.2
10.5
13.9
11.8
13.9
11.0
14.3
10.6
10.6
6.2
2.2
-1.4
19.1
19.4
GDP growth (%)
5.1 5.8 6.6 7.5 8.6 9.5 9.7 11.6
124.7 137.7 153.9 170.9 189.0 200.8 198.0 236.4
India’s GDP at current prices (in Rs. lakh crore)
Telangana’s GSDP at current prices (in Rs. lakh crore)
Figure 2.2
GSDP (PE) Growth Rate at Current Prices for General Category States (2020-21) GSDP growth (%)
Wes
t Ben
gal
Tam
il N
adu
Bih
ar
Tela
ngan
a
Kar
nata
ka
And
hra
Pra
desh
Chh
attis
garh
Utt
ar P
rade
sh
Odi
sha
Jhar
khan
d
Pun
jab
Har
yana
Mad
hya
Pra
desh
Indi
a
Raj
asth
an
7.7
5.9
-0.5
4.1
-1.3
2.4
-1.9
2.2
-2.0
1.6
-2.1
1.5
-3.0
1.1
-4.1
Source: Ministry of Statistics and Programme Implementation (MoSPI), Government of India
Macroeconomic Trends
Telangana Socio Economic Outlook 202216
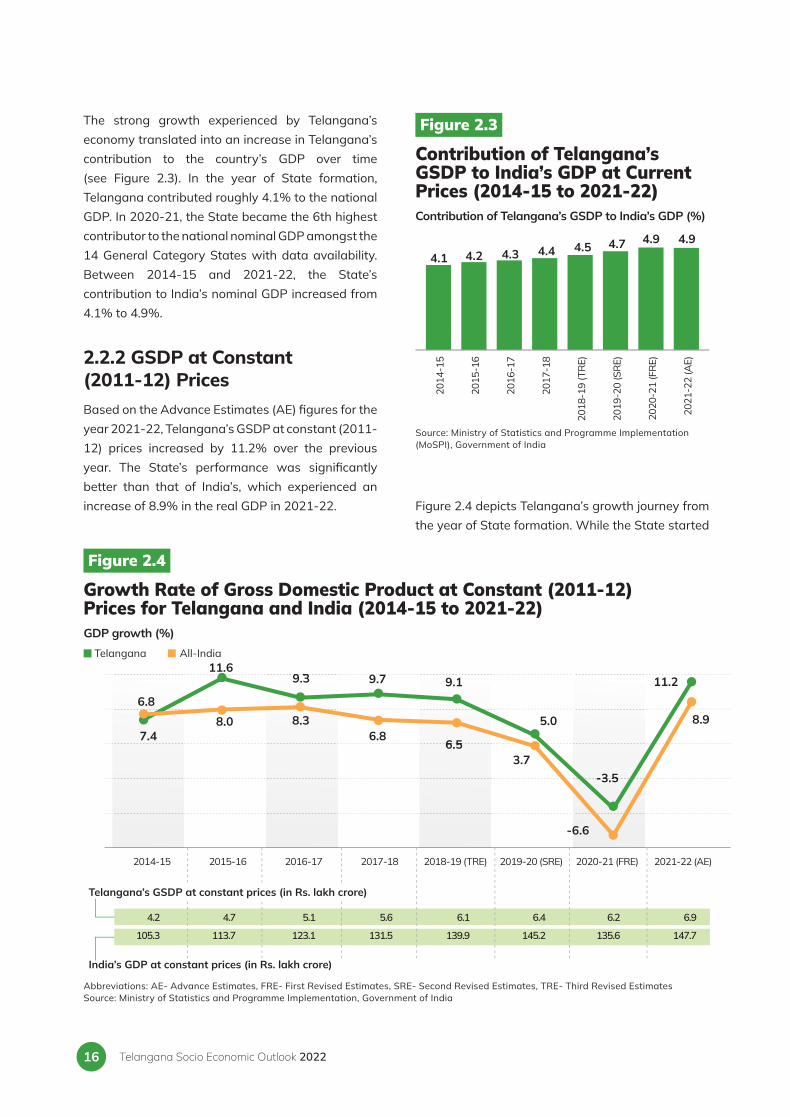
The strong growth experienced by Telangana’s economy translated into an increase in Telangana’s contribution to the country’s GDP over time (see Figure 2.3). In the year of State formation, Telangana contributed roughly 4.1% to the national GDP. In 2020-21, the State became the 6th highest contributor to the national nominal GDP amongst the 14 General Category States with data availability. Between 2014-15 and 2021-22, the State’s contribution to India’s nominal GDP increased from 4.1% to 4.9%.
2.2.2 GSDP at Constant (2011-12) PricesBased on the Advance Estimates (AE) fi gures for the year 2021-22, Telangana’s GSDP at constant (2011-12) prices increased by 11.2% over the previous year. The State’s performance was signifi cantly better than that of India’s, which experienced an increase of 8.9% in the real GDP in 2021-22. Figure 2.4 depicts Telangana’s growth journey from
the year of State formation. While the State started
Figure 2.3
Contribution of Telangana’s GSDP to India’s GDP at Current Prices (2014-15 to 2021-22)
Source: Ministry of Statistics and Programme Implementation (MoSPI), Government of India
Contribution of Telangana’s GSDP to India’s GDP (%)
2014
-15
2015
-16
2016
-17
2017
-18
2018
-19
(TR
E)
2019
-20
(SR
E)
2020
-21
(FR
E)
2021
-22
(AE)
4.1 4.2 4.3 4.4 4.5 4.7 4.9 4.9
Figure 2.4
Growth Rate of Gross Domestic Product at Constant (2011-12) Prices for Telangana and India (2014-15 to 2021-22)
Abbreviations: AE- Advance Estimates, FRE- First Revised Estimates, SRE- Second Revised Estimates, TRE- Third Revised Estimates Source: Ministry of Statistics and Programme Implementation, Government of India
2014-15 2015-16 2016-17 2017-18 2018-19 (TRE) 2019-20 (SRE) 2020-21 (FRE) 2021-22 (AE)
Telangana All-India
6.8
7.4
11.6
8.0
9.3
8.36.8
9.1
6.5
5.0
3.7-3.5
-6.6
11.2
8.9
GDP growth (%)
6.5
9.39.3
-3.5
9.7
4.2 4.7 5.1 5.6 6.1 6.4 6.2 6.9
105.3 113.7 123.1 131.5 139.9 145.2 135.6 147.7
India’s GDP at constant prices (in Rs. lakh crore)
Telangana’s GSDP at constant prices (in Rs. lakh crore)

17
out with a lower growth rate of real GSDP than the national average in the year of state formation, its growth rate exceeded that of India’s by 3.6 percentage points the very next year. The State’s real growth rate has been higher than the national growth rate in every year since 2015-16. In 2021-22, the gap between Telangana’s GSDP growth rate and India’s GDP growth rate was 2.3 percentage points.
In the midst of the pandemic in 2020-21, the State ranked fourth in terms of the growth rate of GSDP (Provisional Estimates) at constant (2011-12) prices, among the fourteen General Category States for which data was released by the Ministry of Statistics & Programme Implementation (MoSPI) (see Figure 2.5).
2.3 Per Capita Income6 While the Gross State Domestic Product reflects the size of an economy as a whole, a better measure
of economic growth accrued by an individual is the Per Capita Income (PCI). In the year 2020-21, Telangana’s nominal PCI (Rs.2,37,632 as per Provisional Estimates) was the second highest among the 14 General Category States for which data had been released by MoSPI.
In the year 2021-22, Telangana’s nominal PCI (AE) had increased to Rs. 2.79 lakh. Telangana’s PCI has consistently been higher than the average national PCI since the year of state formation, and the gap has widened with each successive year (see Figure 2.6). In 2014-15, the PCI of Telangana was 1.43 times the national PCI (Telangana’s PCI was Rs. 37,457 higher than the national PCI). As of 2021-22, the multiplier had increased to 1.86 (Telangana’s PCI was Rs. 1,28,985 higher than the national PCI).
Figure 2.5
GSDP (PE) Growth Rate at Constant (2011-12) Prices for General Category States (2020-21)GSDP growth (%)
Bih
ar
Tam
il N
adu
Wes
t Ben
gal
Tela
ngan
a
Chh
attis
garh
And
hra
Pra
desh
Kar
nata
ka
Mad
hya
Pra
desh
Odi
sha
Jhar
khan
d
Har
yana
Utt
ar P
rade
sh
Raj
asth
an
Pun
jab
Indi
a
2.51.4
-3.6
1.1
-4.8
-0.6
-5.7
-18
-6.4
-2.6
-6.6
-2.6
-6.6
-3.4
-7.3Source: Ministry of Statistics and Programme Implementation (MoSPI), Government of India
6 Per Capita Income (PCI) measures the amount of money that would be available per person if the total value of all goods and services produced in the economy were to be divided equally among all citizens. An important point to note is that capital goods (e.g. machines) depreciate in value with time. To adjust for this, depreciation is first subtracted from the GSDP before calculating the PCI.
Macroeconomic Trends

Telangana Socio Economic Outlook 202218
Figure 2.6
Per Capita Income at Current Prices for Telangana and India (2014-15 to 2021-22)
Abbreviations: AE- Advance Estimates, FRE- First Revised Estimates, SRE- Second Revised Estimates, TRE- Third Revised Estimates Source: Ministry of Statistics and Programme Implementation, Government of India
2014-15 2015-16 2016-17 2017-18 2018-19 (TRE) 2019-20 (SRE) 2020-21 (FRE) 2021-22 (AE)
Telangana All-India
1.4
1,24,104
86,647
1.5
1,40,840
94,797
1.5
1,59,395
1,04,880
1.6 1.7
2,09,848
1,25,946
1.8
2,30,955
1,32,115
1.9
2,34,751
1,26,855
1.9
2,78,833
1,49,848
Multiplier
1,79,358
1,15,224
Not only has Telangana’s PCI been higher than India’s for each year post state formation, but also, it has grown at a higher rate than India’s for each of those years.
A comparison of the growth rates of PCI for Telangana and India is presented in Figure 2.7. In
2020-21, while India experienced a drastic fall in its nominal PCI on account of the COVID-19 pandemic (-4.0%), Telangana’s PCI increased even in that year (1.6%). In 2021-22, the State witnessed the highest rise in nominal PCI, at 18.8%—around 0.7 percentage points higher than the national nominal PCI growth rate.
Figure 2.7
Growth Rate of Per Capita Income at Current Prices for Telangana and India (2014-15 to 2021-22)
Source: Ministry of Statistics and Programme Implementation, Government of India
Telangana All-IndiaGrowth in per capita income (%)
2014-15 2015-16 2016-17 2017-18 2018-19 (TRE) 2019-20 (SRE) 2020-21 (FRE) 2021-22 (AE)
10.6
9.5
13.5
9.4
13.2
10.6 9.9
17.0
9.3
10.1
4.91.6
-4.0
18.8
18.112.5
Per Capita Income (in Rs. lakh crore)

19
Based on the Compound Annual Growth Rate (CAGR) of PCI (at current prices) for Telangana and India from 2014-15 to 2021-22, the average citizen in Telangana can expect their income to double in roughly 5 to 6 years, whereas the average citizen in the country as a whole would have to wait for about 8 to 9 years for their income to double.
2.4 Sectoral Analysis2.4.1 Sectoral Contribution7 The GSDP of any state is measured in terms of the economic contributions made by three key sectors—Agriculture & Allied Sectors, Industries (including mining and quarrying) and Services. Since state formation, the Services sector has been the highest contributor to Telangana’s Gross State Value Added (GSVA), followed by the Industries and Agriculture and allied sectors. Based on the Advance Estimates of GSVA for Telangana, in 2021-22, the Services sector accounted for 61.3% of Telangana’s GSVA at current prices8, followed by the Industrial sector (20.4%) and the Agriculture and allied sector (18.3%).
The trend in the share of each sector towards the State’s GSVA is shown in Figure 2.8. Figure 2.9 shows the share of GVA coming from the three sectors for India.
The share of the Agriculture and allied sectors in the total GSVA of the State increased from 16.3% in 2014-15 to 18.3% in 2021-22, while its share in the national GVA remained largely constant (close to 18.5% in both years). The increase in the
Figure 2.8
Sectoral Composition of GSVA at Current Prices for Telangana (2014-15 to 2021-22)
Source: Ministry of Statistics & Programme Implementation, GoI
Contribution to GSVA (%)
Agriculture Industries Services
0% 20% 40% 60% 80% 100%
2014-15
2015-16
2016-17
2017-18
2018-19 (TRE)
2019-20 (SRE)
2020-21 (FRE)
2021-22 (AE)
16.3
14.3
14.8
14.9
14.7
17.9
19.6
18.3
22.4
23.6
21.5
22.2
23.5
20.7
19.8
20.4
61.3
62.2
63.6
62.9
61.8
61.5
60.6
61.3
7 Traditionally, the three sectors discussed are the primary, secondary and tertiary sectors, where the primary sector comprises the ‘Agriculture and Allied Sectors’, and ‘Mining & Quarrying’, the secondary sector comprises ‘Construction’, ‘Manufacturing’, and ‘Electricity, Gas, Water Supply & other Utility Services’, and the services sector comprises ‘Trade, Repair, Hotels and Restaurants’, ‘Transport, Storage, Communication & Services related to Broadcasting’, ‘Financial Services’, ‘Real Estate, Ownership of Dwelling, & Professional Services’, ‘Public Administration’, and ‘Other Services’.
In this chapter, we divide the economy into the agriculture and allied sectors (primary sector minus the mining and quarrying subsector), the industrial sector (secondary sector plus the mining and quarrying subsector), and the services sector (tertiary sector).
8 The Gross Value Added (GVA) of any unit (sector, sub-sector, firm, etc) measures the contribution of that unit to the overall output of a country or state. It is calculated by subtracting the value of all intermediate goods and services from the total value of units output. This is done to remove any ‘double counting’. For instance, assume that a firm buys oranges and sells orange juice. The value of the oranges should be subtracted while calculating the firm’s gross value added, as this is already included in the final value of the orange juice.
Figure 2.9
Sectoral Composition of GSVA at Current Prices for India (2014-15 to 2021-22)
Source: Ministry of Statistics and Programme Implementation, Government of India
Contribution to GSVA (%)
Agriculture Industries Services
0% 20% 40% 60% 80% 100%
2014-15
2015-16
2016-17
2017-18
2018-19 (TRE)
2019-20 (SRE)
2020-21 (FRE)
2021-22 (SAE)
18.2
17.7
18.0
18.3
17.6
18.3
20.0
18.6
30.0
30.0
29.3
29.2
29.1
26.9
26.9
28.6
51.8
52.3
52.6
52.5
53.3
54.8
53.1
52.8
Macroeconomic Trends

Telangana Socio Economic Outlook 202220
contribution of this sector in Telangana was driven by the signifi cant increase in its nominal growth rate – from negative 0.66% in 2014-15 to 9.09% in 2021-22 (see Figure 2.10).
As refl ected in Figures 2.8 and 2.9, the Industrial sector contributes less to Telangana’s economy than it does to India’s economy. However, the Industrial sector in the State is very vibrant. As the Government of Telangana recognizes that industrial development is crucial to job creation and increasing productivity in other sectors, it has taken up several measures to ensure sustained growth of the Industrial sector. This includes business reforms like TS-iPASS, schemes for entrepreneurship like T-IDEA and T-PRIDE, and multiple initiatives for the MSME sector including Industrial Health Clinics, TS-Globalinker, and partnerships with private companies like SAP and Sapio Analytics. The positive impact of the investments being made by the Government towards strengthening of the Industrial sector will start manifesting in the coming few years, and the benefi ts will continue to accrue for many years to come. Details of these schemes are discussed in the chapter on Industries.
The Services sector accounted for 61.3% of the State’s value added in 2021-22, and is therefore, one of the most important sectors in Telangana’s economy. Its share in the State’s nominal GSVA (61.3%) is larger than the share of this sector in India’s nominal GVA (52.8%).
2.4.2 Sectoral Growth RatesFigure 2.10 refl ects the sector-wise growth rates at current prices from 2014-15 to 2021-22 for Telangana and India.
While the Industries and Services sectors were badly hit by the pandemic, during the year 2021-22, the sectors experienced a sharp rebound over the previous year values in India, increasing from -1.63% and -4.65% respectively in 2020-21, to 25.93% and 17.57% in 2021-22. The Agriculture and allied sectors in India experienced a growth of
9.83% in 2021-22 (see Figure 2.10).
In Telangana, the Agriculture and allied sectors registered a robust growth in current price GVA, of 12.24% and 9.09% in 2020-21 and 2021-22, respectively (see Figure 2.10). It is noteworthy that the ‘Agriculture & Allied Sectors’, which are the backbone of rural Telangana, employ 48.4% of the population of the State. Therefore, its economic success is crucial to improving the living standards in Telangana.
Figure 2.10
Sector-wise Growth Rate of GVA at Current Prices for Telangana and India (2014-15 to 2021-22)
Source: Ministry of Statistics and Programme Implementation, Government of India
A. Telengana
B. India
Agriculture & Allied Sectors Industries Services
Agriculture & Allied Sectors Industries Services
2014-15
2015-16
2016-17
2017-18
2018-19 (TRE)
2019-20 (SRE)
2020-21 (FRE)
2021-22 (AE)
2014-15
2015-16
2016-17
2017-18
2018-19 (TRE)
2019-20 (SRE)
2020-21 (FRE)
2021-22 (SAE)
1.5
19.8
3.4
16.6
20.9
-1.6
-1.7
20.2
18.1
15.3
15.9
12.1
12.2
11.2
0.9
18.3
13.7
10.4
11.7
10.9
12.4
9.9
-4.7
17.6
-0.7
-0.5
17.5
13.9
12.7
35.6
12.2
9.1
8.7
6.4
13.1
12.4
7.1
10.8
7.5
9.8
Growth rate (%)
Growth rate (%)
8.1
9.2
8.8
10.5
10.2
-1.1
-1.6
25.9

21
Telangana’s Agriculture and allied sector has been on an upward growth path for the past seven years, with its current price growth rate increasing by 9.75 percentage points between 2014-15 and 2021-22. The growth rate of the sector was higher than that of India’s, even during the peak of the pandemic in 2020-21. While the country’s Agriculture and allied sector grew by 7.48% in 2020-21, Telangana’s Agriculture and allied sector experienced a 12.24% growth at current prices during that year. This has been achieved through a multitude of factors including new irrigation schemes such as the Kaleshwaram Lift Irrigation Project and Mission Kakatiya, and innovative agricultural support policies like the Rythu Bandhu Scheme, insurance policies (Rythu Bima), and 24*7 free power supply to the Agriculture and allied sector.
Policies like the Rythu Bandhu scheme have not only benefi ted the primary sector, but have also had spillover effects on the secondary and tertiary sectors. Direct Benefi t Transfers (DBTs) into the accounts of the farmers under Rythu Bandhu, for instance, have led to increased liquidity in the hands of the farming households. This in turn has been utilised by the farmers for buying goods produced by the industrial sector, and for availing services, thus creating knock-on effects for non-farming
sectors as well.
The Industrial sector in Telangana saw a robust recovery from the pandemic in 2021-22, growing at a notable 20.23% over the previous year (see Figure 2.10). Within the Industrial sector, the manufacturing sub-sector, which is critical to job creation in any economy, saw the steepest recovery in Telangana, witnessing an annual growth rate of 28.59% in 2021-22. In comparison, the growth rate of this sub-sector in India was 22.78% in 2021-22—5.81 percentage points lower than Telangana. In the same period, in Telangana, the mining and quarrying sub-sector witnessed a growth of 13.24%, followed by the construction sub-sector, which grew by 10.38%, and the electricity and utilities sub-sector, which grew by 7.38%.
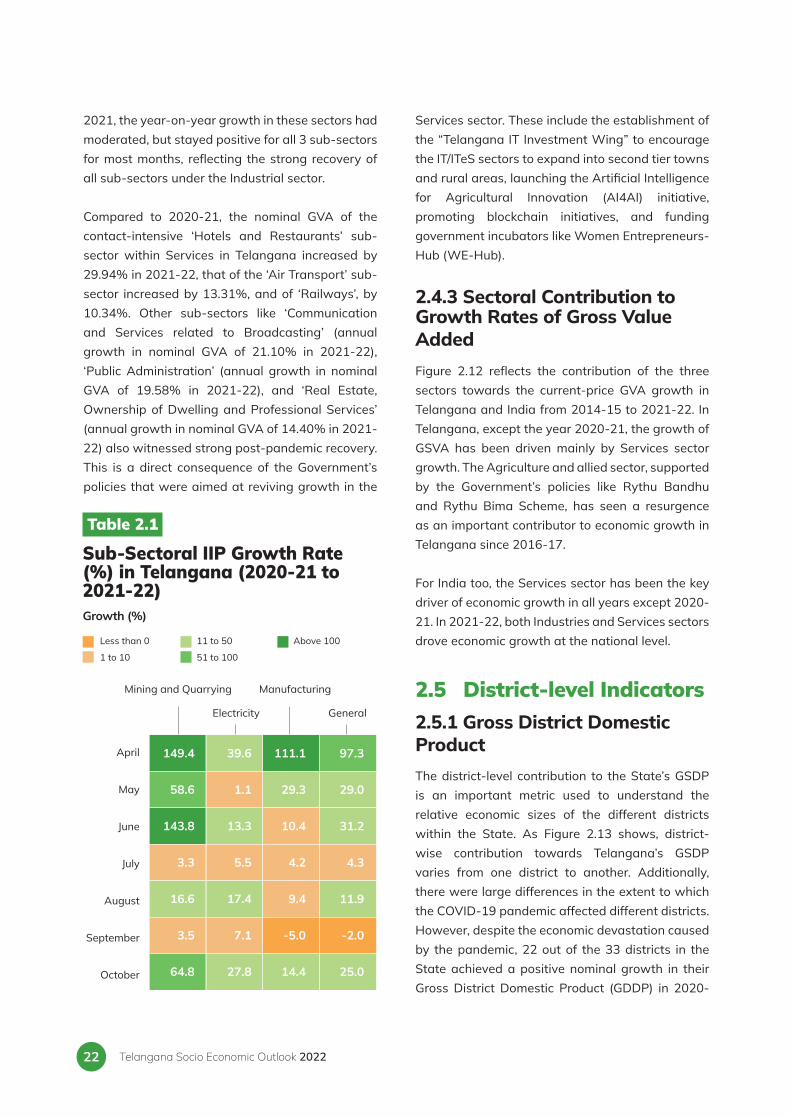
This rebound in industrial activity was also refl ected in the Index of Industrial Production9. The monthly Index of Industrial Production across all three sub-sectors (Mining, Manufacturing and Electricity utilities) experienced an upswing compared to the corresponding values across the same months in 2020 for most months of the fi nancial year (see Figure 2.11). In April 2021, the General Index of Industrial Production (IIP) was 97.4% higher than its value in April 2020. In the following months of
9 The Index of Industrial Production (IIP) is a composite indicator that measures the short-term changes in the volume of production of a basket of industrial products during a given period, with respect to that in a chosen base period. The index is computed and published by the Central Statistical Organisation (CSO) on a monthly basis.
Figure 2.11
General IIP (base year 2011-12) for Telangana (2020-21 and 2021-22)
Source: Directorate of Economics and Statistics, Government of Telangana
April May June July August September October November
General 2020-21 General 2021-22
153.3
77.7
154.0
119.4
181.9
138.6152.4
152.4
136.2156.0
159.2175.8
140.6155.4
163.6
IIP
158.9
Macroeconomic Trends
Telangana Socio Economic Outlook 202222
2021, the year-on-year growth in these sectors had moderated, but stayed positive for all 3 sub-sectors for most months, reflecting the strong recovery of all sub-sectors under the Industrial sector.
Compared to 2020-21, the nominal GVA of the contact-intensive ‘Hotels and Restaurants’ sub-sector within Services in Telangana increased by 29.94% in 2021-22, that of the ‘Air Transport’ sub-sector increased by 13.31%, and of ‘Railways’, by 10.34%. Other sub-sectors like ‘Communication and Services related to Broadcasting’ (annual growth in nominal GVA of 21.10% in 2021-22), ‘Public Administration’ (annual growth in nominal GVA of 19.58% in 2021-22), and ‘Real Estate, Ownership of Dwelling and Professional Services’ (annual growth in nominal GVA of 14.40% in 2021-22) also witnessed strong post-pandemic recovery. This is a direct consequence of the Government’s policies that were aimed at reviving growth in the
Services sector. These include the establishment of the “Telangana IT Investment Wing” to encourage the IT/ITeS sectors to expand into second tier towns and rural areas, launching the Artificial Intelligence for Agricultural Innovation (AI4AI) initiative, promoting blockchain initiatives, and funding government incubators like Women Entrepreneurs-Hub (WE-Hub).
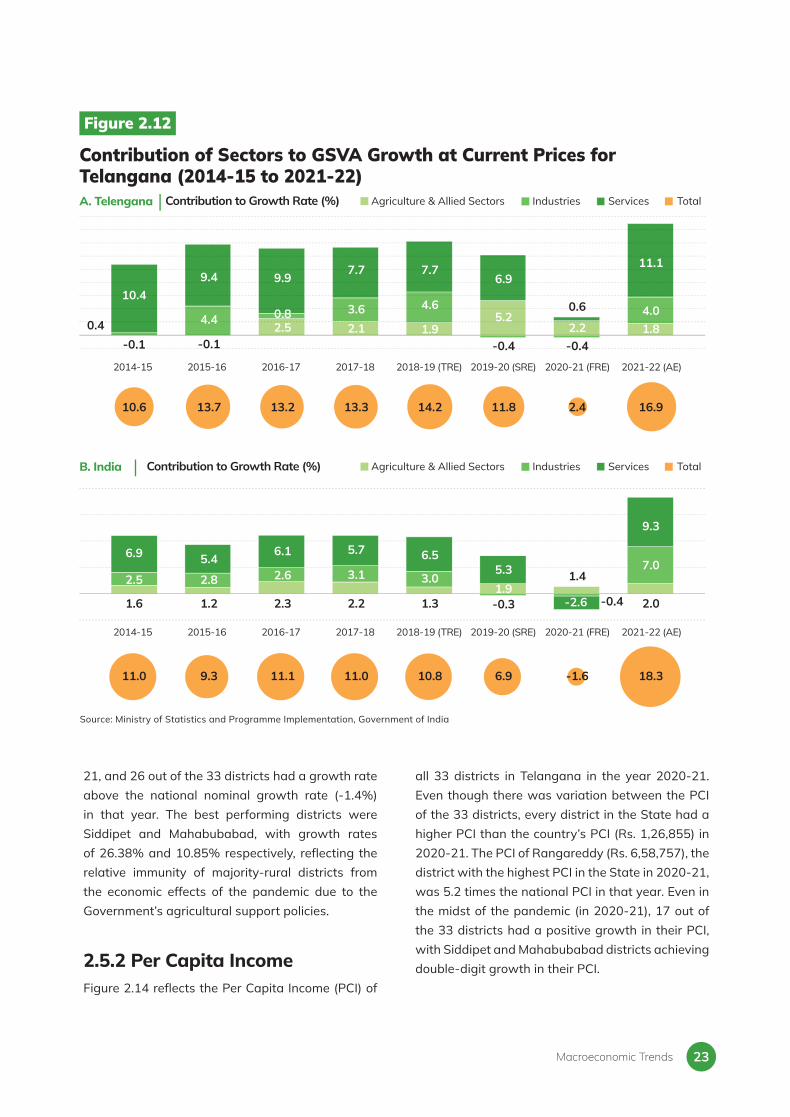
2.4.3 Sectoral Contribution to Growth Rates of Gross Value AddedFigure 2.12 reflects the contribution of the three sectors towards the current-price GVA growth in Telangana and India from 2014-15 to 2021-22. In Telangana, except the year 2020-21, the growth of GSVA has been driven mainly by Services sector growth. The Agriculture and allied sector, supported by the Government’s policies like Rythu Bandhu and Rythu Bima Scheme, has seen a resurgence as an important contributor to economic growth in Telangana since 2016-17.
For India too, the Services sector has been the key driver of economic growth in all years except 2020-21. In 2021-22, both Industries and Services sectors drove economic growth at the national level.
2.5 District-level Indicators2.5.1 Gross District Domestic ProductThe district-level contribution to the State’s GSDP is an important metric used to understand the relative economic sizes of the different districts within the State. As Figure 2.13 shows, district-wise contribution towards Telangana’s GSDP varies from one district to another. Additionally, there were large differences in the extent to which the COVID-19 pandemic affected different districts. However, despite the economic devastation caused by the pandemic, 22 out of the 33 districts in the State achieved a positive nominal growth in their Gross District Domestic Product (GDDP) in 2020-
Less than 0
1 to 10
11 to 50
51 to 100
Above 100
Table 2.1
Sub-Sectoral IIP Growth Rate (%) in Telangana (2020-21 to 2021-22) Growth (%)
April
May
June
July
August
September
October
Mining and Quarrying
Electricity
Manufacturing
General
149.4
58.6
143.8
3.3
16.6
3.5
64.8
39.6
1.1
13.3
5.5
17.4
7.1
27.8
111.1
29.3
10.4
4.2
9.4
-5.0
14.4
97.3
29.0
31.2
4.3
11.9
-2.0
25.0
23
21, and 26 out of the 33 districts had a growth rate above the national nominal growth rate (-1.4%) in that year. The best performing districts were Siddipet and Mahabubabad, with growth rates of 26.38% and 10.85% respectively, refl ecting the relative immunity of majority-rural districts from the economic effects of the pandemic due to the Government’s agricultural support policies.
2.5.2 Per Capita IncomeFigure 2.14 refl ects the Per Capita Income (PCI) of
all 33 districts in Telangana in the year 2020-21. Even though there was variation between the PCI of the 33 districts, every district in the State had a higher PCI than the country’s PCI (Rs. 1,26,855) in 2020-21. The PCI of Rangareddy (Rs. 6,58,757), the district with the highest PCI in the State in 2020-21, was 5.2 times the national PCI in that year. Even in the midst of the pandemic (in 2020-21), 17 out of the 33 districts had a positive growth in their PCI, with Siddipet and Mahabubabad districts achieving double-digit growth in their PCI.
Figure 2.12
Contribution of Sectors to GSVA Growth at Current Prices for Telangana (2014-15 to 2021-22) A. Telengana
B. India
Agriculture & Allied Sectors Industries Services Total
Agriculture & Allied Sectors Industries Services Total
Contribution to Growth Rate (%)
Contribution to Growth Rate (%)
Source: Ministry of Statistics and Programme Implementation, Government of India
2014-15 2015-16 2016-17 2017-18 2018-19 (TRE) 2019-20 (SRE) 2020-21 (FRE) 2021-22 (AE)
2014-15 2015-16 2016-17 2017-18 2018-19 (TRE) 2019-20 (SRE) 2020-21 (FRE) 2021-22 (AE)
-0.10.4
10.4
-0.1
4.4
9.4
2.50.8
9.9
2.13.6
7.7
1.9
4.6
7.7
5.2
-0.4
6.9
2.2-0.4
0.6
1.84.0
11.1
10.6
11.0
1.6
2.5
6.9
13.7
9.3
1.2
2.8
5.4
13.2
11.1
2.3
2.6
6.1
13.3
11.0
2.2
3.1
5.7
14.2
10.8
1.3
3.0
6.5
11.8
6.9
1.9-0.3
5.3
2.4
-1.6
1.4
-0.4-2.6
16.9
18.3
2.0
7.0
9.3
Macroeconomic Trends

Telangana Socio Economic Outlook 202224
Figure 2.13
Gross District Domestic Product at Current Prices for Telangana’s Districts in Rs. crore (2020-21)
Note: Districts arranged in descending order of GDDP. Source: Directorate of Economics and Statistics, Government of Telangana
GDDP (Rs. crore)
GDDP (Rs. crore)District District
1,93,507
1,62,877
70,870
37,948
36,951
30,498
29,806
25,912
24,332
23,471
23,223
22,625
20,830
19,936
17,457
17,455
17,138
16,483
16,230
14,802
14,739
14,676
14,599
14,279
13,673
10,751
10,648
10,521
10,082
10,073
9,308
8,211
5,746
Rangareddy
Hyderabad
Medchal-Malkajgiri
Nalgonda
Sangareddy
Nizamabad
Khammam
Siddipet
Mahabubnagar
Suryapet
Bhadradri
Karimnagar
Medak
Yadadri
Kamareddy
Warangal Urban
Jagtial
Peddapalli
Nagarkurnool
Nirmal
Mancherial
Warangal Rural
Adilabad
Vikarabad
Mahabubabad
Jangaon
Jayashankar
Jogulamba
Rajanna
Wanaparthy
Narayanpet
Kumuram Bheem
Mulugu
GDDP (Rs. crore)
5,746 to 1,075110,752 to 20,83020,831 to 37,94837,949 to 1,62,8771,62,878 to 1,93,507
Rangareddy
Hyderabad
Medchal-Malkajgiri
Medak
Mahabubnagar
Yadadri
Siddipet
Jayashankar
Sangareddy
Nalgonda
Karimnagar
Suryapet
Bhadradri
Khammam
Nirmal
Warangal Rural
Adilabad
Jangaon
Peddapalli
Mulugu
Nizamabad
Nagarkurnool
Rajanna
Kamareddy
Mancherial
Mahabubabad
Wanaparthy
Jagtial
Jogulamba
Narayanpet
Warangal Urban
Kumuram Bheem
Vikarabad
Figure 2.14
Per-Capita Income at Current Prices for Telangana’s Districts (2020-21)
Note: Districts arranged in descending order of per capita income. Source: Directorate of Economics and Statistics, Government of Telangana
Per-Capita Income (Rs.)
Per-Capita Income (Rs.)District District
Per-Capita Income (Rs.)
1,32,479 to 1,56,1501,56,151 to 1,79,1691,79,170 to 2,04,6922,04,693 to 3,51,3323,51,333 to 6,58,757
6,58,757
3,51,332
2,40,008
2,29,833
2,23,348
2,22,100
2,19,292
2,13,735
2,04,692
2,01,144
1,91,205
1,83,810
1,83,368
1,83,318
1,79,169
1,75,951
1,75,171
1,74,636
1,73,981
1,67,769
1,66,766
1,63,462
1,56,150
1,55,032
1,54,955
1,52,577
1,51,458
1,50,048
1,49,606
1,43,428
1,38,387
1,37,488
1,32,479
1,32,479 to 1,56,1501,56,151 to 1,79,1691,79,170 to 2,04,6922,04,693 to 3,51,3323,51,333 to 6,58,757

25
2.6 Way ForwardThe performance of Telangana’s economy in 2021-22 indicates that it withstood the social, health-related, and economic challenges of the pandemic in 2020-21, and recovered from the same at an accelerated pace. The economic resilience of the State is rooted in years of reforms undertaken across all sectors, which helped it weather the shocks of the pandemic and pursue a path of swift and lasting recovery.
Given the combination of innovative and broad-based policies that are being adopted by the State, its future growth trajectory also looks secure. The
irrigation potential created by projects such as the Kaleshwaram Lift Irrigation Project, augmented power supply, and industrial and administrative reforms would contribute to the strengthening of the economy’s foundation. In the long run, Telangana would reap the benefits of the investments in human capital that it is undertaking through initiatives such as the construction of new medical colleges, multi-speciality hospitals, and the recently launched Mana Ooru Mana Badi programme. At the same time, the State is also geared towards using welfare programs like the Dalit Bandhu scheme to bridge existing inequities and boost consumption in the State.
Macroeconomic Trends

Telangana Socio Economic Outlook 202226
PUBLIC FINANCE
CHAPTER
03

27
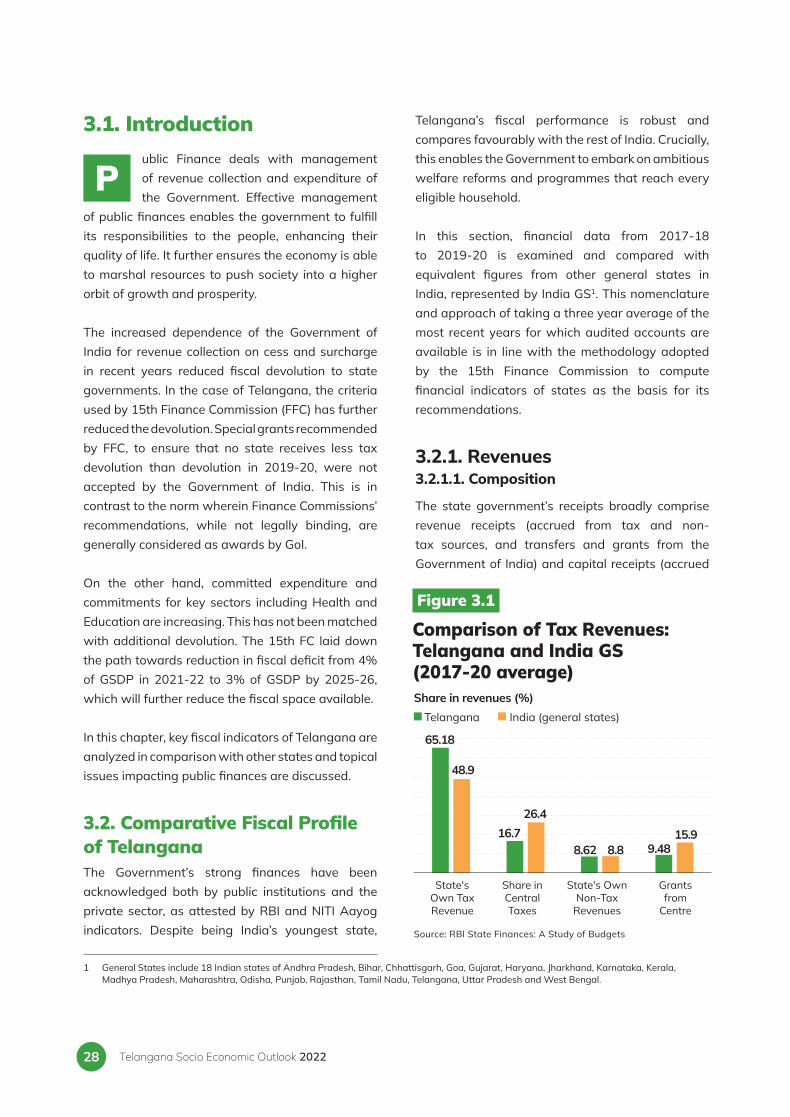
l During 2017-20, Telangana’s Own Tax Revenues as a proportion of GSDP was 7.4%, the highest among the 18 General States (India-GS) in the country.
l During 2017-20, the state’s own revenue accounted for 73.8% of its revenue receipts on average, higher than India GS at 57.7%.
l The second wave of the Covid-19 in April-June 2021 did not impact Telangana’s finances as much as the first wave did. Almost every revenue stream of the Government recorded higher numbers than the same month in 2019.
l The revision of market values of the lands and revision of stamp duty rates in 2021-22 (July-December) led to doubling of monthly revenue of stamps and registrations in comparison to
the monthly revenue during the corresponding time period in 2019-20.
l The share of Development Expenditure in Total Expenditure in the 2017-20 period for Telangana is 77.4%, which is the highest among India GS with the latter’s average share of Development Expenditure being 68.2%.
l In the 2017-20 period, Committed Expenditure (inclusive of salaries, wages and interest payments) is 48.7% of revenue receipts, slightly lower than the average committed expenditure of 49.1% of revenue receipts of India GS.
l For the 2017-20 period, the total outstanding liabilities to GSDP ratio stood at 22.33%, which is lesser than the 27.73% of India GS.
Key Highlights
Public Finance
Telangana Socio Economic Outlook 202228
3.1. Introductionublic Finance deals with management of revenue collection and expenditure of the Government. Effective management
of public finances enables the government to fulfill its responsibilities to the people, enhancing their quality of life. It further ensures the economy is able to marshal resources to push society into a higher orbit of growth and prosperity.
The increased dependence of the Government of India for revenue collection on cess and surcharge in recent years reduced fiscal devolution to state governments. In the case of Telangana, the criteria used by 15th Finance Commission (FFC) has further reduced the devolution. Special grants recommended by FFC, to ensure that no state receives less tax devolution than devolution in 2019-20, were not accepted by the Government of India. This is in contrast to the norm wherein Finance Commissions’ recommendations, while not legally binding, are generally considered as awards by GoI.
On the other hand, committed expenditure and commitments for key sectors including Health and Education are increasing. This has not been matched with additional devolution. The 15th FC laid down the path towards reduction in fiscal deficit from 4% of GSDP in 2021-22 to 3% of GSDP by 2025-26, which will further reduce the fiscal space available.
In this chapter, key fiscal indicators of Telangana are analyzed in comparison with other states and topical issues impacting public finances are discussed.
3.2. Comparative Fiscal Profile of TelanganaThe Government’s strong finances have been acknowledged both by public institutions and the private sector, as attested by RBI and NITI Aayog indicators. Despite being India’s youngest state,
Telangana’s fiscal performance is robust and compares favourably with the rest of India. Crucially, this enables the Government to embark on ambitious welfare reforms and programmes that reach every eligible household.
In this section, financial data from 2017-18 to 2019-20 is examined and compared with equivalent figures from other general states in India, represented by India GS1. This nomenclature and approach of taking a three year average of the most recent years for which audited accounts are available is in line with the methodology adopted by the 15th Finance Commission to compute financial indicators of states as the basis for its recommendations.
3.2.1. Revenues3.2.1.1. Composition
The state government’s receipts broadly comprise revenue receipts (accrued from tax and non-tax sources, and transfers and grants from the Government of India) and capital receipts (accrued
P
1 General States include 18 Indian states of Andhra Pradesh, Bihar, Chhattisgarh, Goa, Gujarat, Haryana, Jharkhand, Karnataka, Kerala, Madhya Pradesh, Maharashtra, Odisha, Punjab, Rajasthan, Tamil Nadu, Telangana, Uttar Pradesh and West Bengal.
Figure 3.1
Comparison of Tax Revenues: Telangana and India GS (2017-20 average)Share in revenues (%)
Source: RBI State Finances: A Study of Budgets
State's Own Tax Revenue
Share in Central Taxes
State's Own Non-Tax
Revenues
Grants from
Centre
Telangana India (general states)
65.18
48.9
16.726.4
8.815.9
8.62 9.48

29
from borrowings, debt repayments etc.). The state government budgeted revenue receipts of Rs. 1,76,127 crore and capital receipts of Rs. 45,560 crores in 2021-22 BE (Budget Estimates). During 2017-20, within revenue receipts, the state’s own revenue (sum of state’s own tax and non-tax revenue, Fig. 3.1), accounted for 73.8%, much higher than the average of India GS at 57.7%.
The State’s Own Tax Revenue (SOTR) constitutes 65.18% of revenue receipts, which is significantly higher than the India GS average of 48.9%, reflecting its tax collection efficiency in comparison with other states. Its average per capita revenue (Rs. 26,393) for 2017-20 is the second highest among India GS. Overall average for India GS for 2017-20 is Rs. 22,955. Within SOTR, the average Value Added Tax (VAT) and Excise revenue for 2017-20 are significantly higher than the India GS average (Fig. 3.2).
3.2.1.2. Tax Growth and Buoyancy The state witnessed remarkable revenue growth in Stamps and Registration Fees, Excise, and SGST (State Goods and Services Tax) and VAT. It topped or remained much higher than the India GS growth rate in these categories (Fig. 3.3). In the former two categories, it posted the highest growth rate among India GS. It is noteworthy that the state recorded the highest SOTR growth rate amongst the GS between 2014-20, at a Compounded Annual Growth Rate (CAGR) of 18.2%, more than twice that of the India GS average at 8.36%.
In the period of 2017-20, Telangana’s growth rate far exceeded the India GS growth rate in Stamps & Registration Fees, Excise, and SGST & VAT revenue streams as indicated in Figure 3.3.
One measure of tax collection is the share of SOTR in the state’s economic output (GSDP). The State
Figure 3.2
State's Own Tax Revenue Composition: Telangana & India GS (2017-20 average)Share in state's own tax revenues (%)
Source: RBI State Finances: A Study of Budgets
Telangana India (general states)
VAT SGST Excise Stamps and registration fees
Motor vehicles
tax
35.1
29.6
40.2
12.811.2
6.1
33.2
17.0
8.66.0
Figure 3.3
Tax Revenue Compounded Annual Growth Rate: Telangana and India GS (2017-20 average)CAGR (%)
Source: RBI State Finances: A Study of Budgets
Telangana India (general states)
SGST + VAT
Stamps & Registration Fees
Excise
Motor Vehicle Tax
11.94
2.36
3.48
8.00
6.38
7.79
12.82
4.70
Public Finance

Telangana Socio Economic Outlook 202230
with its SOTR at 7.4% is a top performer in SOTR to GSDP ratio (Figure 3.4).
As the economy grows, the state’s revenues should increase. The greater responsiveness of tax revenues to GSDP growth (known as tax buoyancy) allows the Government to finance expenditure from its own resources without resorting to debt. Tax buoyancy of SOTR, measured as a ratio of growth rate of SOTR to the growth rate of GSDP (in current prices), stood at 1.3 during 2017-20 period (Fig. 3.5), close to the India GS average of 1.4. The state outperformed India GS in tax buoyancy in the categories of Excise and Stamps and Registration Fees.
3.2.2. Impact of Covid-19 and Recovery in 2021 - Revenue
The Covid-19 pandemic left an adverse impact on all sectors of the Indian economy, especially on the unorganized sector. The State saw considerable revenue shortfalls in some months in 2020-21, compared to 2019-20. The question in 2021-22 was how well the state economy could bounce back. This was further complicated by the onset of the second wave of the pandemic between April-June 2021.
Figure 3.4
Tax to GSDP Ratio: Telangana and India GS, (2017-20 average)
SOTR SGST+ VAT Stamps and registration fees
Excise Tax on Vehicles
7.40
5.00
0.601.30
0.44 0.380.800.60
4.20
6.40
7.40
5.10
1.071.50
0.50
Tax buoyancy
Telangana India (general states)
Figure 3.5
Tax Buoyancy for Telangana and India GS (2017-20 average)
Source: RBI State Finances: A Study of Budgets
SOTR
SGST+ VAT
Stamps and registration fees
Excise
Tax on Vehicles
1.30
1.40
0.81
1.08
1.42
1.18
0.61
1.60
2.22
0.38
Tax to GSDP ratio (%) Telangana India (general states) Highest state
Source: RBI State Finances: A Study of Budgets

31
To arrive at a fuller picture of the state’s economic recovery, its 2021-22 revenues must be compared with a non-Covid year, i.e., 2019-20.
The State’s Own Tax Revenues in April-August 2021 grew by more than 55% over respective months in 2019, except in May 2021 which saw the peak of the second wave (Fig. 3.6). By August 2021, each revenue category, except Excise, was on the upswing in comparison to previous months in the same year and in previous years. The State collected Rs. 33,062 crores between April-August 2021, 52% higher than the corresponding period in 2019-20, and 92% higher than the same period in 2020-21.
Both VAT and SGST posted strong numbers throughout April-August 2021, higher than any month in the corresponding periods in 2019 and 2020.
Compared to May 2019, Stamps and Registration Fees took a major hit in May 2020 and May 2021, but it posted strong numbers in the aftermath of the second wave. However the collections from the Motor Vehicle Tax did not recover until August 2021. A comparison between 2020-21 and 2021-22 of various tax streams in April-August indicates 2021-22 being higher in every month in every category, except for Excise in May 2021.
The Government of Telangana’s remarkable growth in its revenues is reflected in the collection of tax revenues by its Commercial Taxes Department. They have nearly doubled between 2014-15 (Rs. 27,700 crore) and 2020-21 (Rs. 52,436 crore). To further improve its tax mobilization efforts, the government enabled the strengthening of the Commercial Taxes Department. Accordingly, 2 new divisions and 18 new circles have been formed. New cadre posts in higher bureaucracy were created within the Commissionerate of Commercial Taxes with 161 new posts in different categories.
On the technological front, the department has to its credit several apps (OIC App, 3BD App, Function Hall App, Refund IT Tool) and modules (Scrutiny, Legal Module) which are
first of their kind in the country. These tools not only enumerate various liabilities of taxpayers but also track the progress of work by the tax authorities. These were helpful to maintain revenue collections despite economic shocks due to COVID-19.
Further on, an Economic Intelligence Unit was established to curb tax evasion. Data analytics tools are also being used extensively to identify tax defaulters and generate individual reports for prompt departmental action. Under VAT, Telangana’s tax base was about 2.18 lakhs. Through above efforts in terms of administrative, technical, and government actions, this tax base has more than doubled. As of December 2021, the number of taxpayers in the State under GST is around 4.89 lakhs.
Box 3.1
Realising Higher Revenues : Telangana as a Model State
Public Finance

Telangana Socio Economic Outlook 202232
Figure 3.6
Month-on-month revenues (2019 to 2021) in Rs. Crore2019 2020 2021
Motor vehicles tax Excise Duty
500
400
300
200
100
0April May June July August April May June July August
1,800
1350
900
450
0
1,258
1,258
425
341
States Goods and Services Tax (SGST) Stamps and registration fees
3,000
2,000
1,000
0April May June July AugustApril May June July August
1,400
1,200
1,000
800
600
400
200
0
928
2,6192,697
628
State's Own Tax Revenue (SOTR) VAT
9,000
6,000
3,000
0
2,500
2,000
1,500
1,000
500
0April May June July AugustApril May June July August
2,398
1,9257,667
6,666
3,948
484
4,850
190
526
20
648
472
1,125
220
995
885
329 297
45 576
8
916
1,195
335
1,671
2,001
4,566 1,392
Source: RBI State Finances: A Study of Budgets

33
3.3. Comparative Fiscal Profile - Expenditure
The Budgeted Expenditure for Financial Year 2021-22 is Rs. 2,30,826 crores, which comprises Revenue Expenditure and Capital Expenditure. Revenue Expenditure includes expenditure which does not result in creation of assets and is largely recurring in nature. This includes expenditure incurred on salaries, wages, pensions, grants and operational expenditure and includes expenditure on Rythu Bandhu, Aasara Pensions and other key schemes.
The revenue expenditure for FY 2021-22 is estimated to be Rs. 1,69,383 crores, which is 73% of the total expenditure. Capital Expenditure on the other hand is usually non-recurring in nature and spread over a long-term. It either leads to asset creation (Capital Outlay) or reduction of liabilities (Loan Repayments). Capital expenditure for FY 2021-22 is estimated to be Rs. 61,443 crores, of which Capital Outlay is Rs. 29,047 crores (47%).
Higher allocation towards Capital Outlay has a multiplier effect which can boost the economy. During 2017-20, the share of Capital Outlay in Total Expenditure (taken as a sum of Revenue Expenditure and Capital Outlay) of Telangana is 17.9%, higher than India GS average (13.8%). In order to ensure faster development of Telangana, which was totally neglected in the combined state, the State Government decided to supplement the budgetary resources with extra budgetary resources. From 2014-15 to 2021-22 (till 31.1.2022), apart from expenditure incurred from the budget (Rs. 1.67 lakh crores), Rs. 1.14 lakh crores has been spent for capital expenditure, leading to a total capital expenditure of Rs. 2.82 lakh crores.
The capital expenditure in the undivided State from 2004-05 to 2013-14, i.e, a period of 10 years, is Rs. 1.29 lakh crores. If it is assumed that the share of population of Telangana in the undivided State (41.68%) is the share of Telangana in the undivided
State capital expenditure, the capital expenditure incurred in Telangana would be Rs. 54,052 crores. Taking into account the total capital expenditure since 2014-15, it is clear that the state has spent more than 5 times the capital expenditure incurred in the 10 years before bifurcation. Such an increase in capital expenditure is unprecedented.
This extra budgetary spending has supported the construction of projects such as the Kaleshwaram project, the world’s largest lift irrigation system and Mission Bhagiratha. The results of this spending are already visible in the strong growth of the Agricultural sector, which has a multiplier effect on other sectors.
To incentivize higher levels of capital expenditure, out of Net Borrowing Ceiling of 4% of projected GSDP set for states for FY 2021-22, 0.50% has been earmarked for incremental capital expenditure by the Government of India. To become eligible for this additional borrowing, expenditure incurred should be at least 70% of the targeted capital outlay for FY 2021-22 by the end of third quarter (December 2021).
The targeted capital outlay for Telangana for 2021-22 is Rs. 20,903 crores and therefore, by December 2021, the expenditure incurred should be Rs. 14,632 crores (70%). However, by December 2021, Telangana incurred expenditure of Rs. 22,073 crores, which is substantially higher than the target expenditure and became eligible for additional open market borrowing.
3.3.1. Development and Non-Development ExpenditureTotal Expenditure can also be classified into Development Expenditure and Non-Development Expenditure. Development Expenditure comprises expenditure on Social Services (Education, Health, Welfare, Housing etc.) and Economic Services (Agriculture, Forestry, Industry, Transport etc.). Non-
Public Finance

Telangana Socio Economic Outlook 202234
Development Expenditure comprises expenditure on General Services (Fiscal Services, Administrative Services etc.).
The share of Development Expenditure in Total Expenditure in the 2017-20 period for Telangana is 77.4%, which is the highest among India GS. The latter’s average share of Development Expenditure is 68.2%. Within Development Expenditure, the share of expenditure on Social Services is higher than Economic Services, mirroring the pattern in India GS average (Fig. 3.7).
3.3.2. Per Capita Development ExpenditureIn per capita terms, leaving out Goa which is an outlier, Telangana stood first in Development Expenditure incurred during the 2017-20 period. Telangana spent Rs. 24,758 per capita followed by Haryana (Rs. 23,088). For comparison with India GS, see figure 3.8.
3.3.3. Deficits and DebtA deficit occurs when expenditure exceeds receipts. The Telangana Fiscal Responsibility and Budget Management Act, 2005 has set the target for the Government to eliminate revenue deficit (revenue expenditure exceeding revenue receipts) and bring
Figure 3.7
Expenditure Composition for Telangana and India GS (2017-20 average)Composition of Total Expenditure (%)
Composition of Development Expenditure (%)
Development Expenditure
Social Services Expenditure
Non-Development Expenditure
Economic Services Expenditure
Telangana
India GS
Telangana
India GS
77.4
68.2
22.6
31.8
Source: RBI State Finances: A Study of Budgets
54.9
54.8
45.1
45.2
Figure 3.8
Inter-State Comparison of Average Per Capita Development Expenditure (2017-20 average)Average per capita development expenditure (Rs.)
Source: RBI State Finances: A Study of Budgets , Population Projections for India and States 2011-2036, Ministry of Health and Family Welfare
58,111
24,758
23,088
22,903
20,091
20,085
18,883
17,979
17,182
16,581
16,220
16,167
15,736
13,687
12,494
11,970
9,556
8,312
Goa
Telangana
Haryana
Karnataka
Andhra Pradesh
Chhattisgarh
Odisha
Tamil Nadu
Rajasthan
Gujarat
Kerala
Maharashtra
Madhya Pradesh
Punjab
Jharkhand
West Bengal
Uttar Pradesh
Bihar
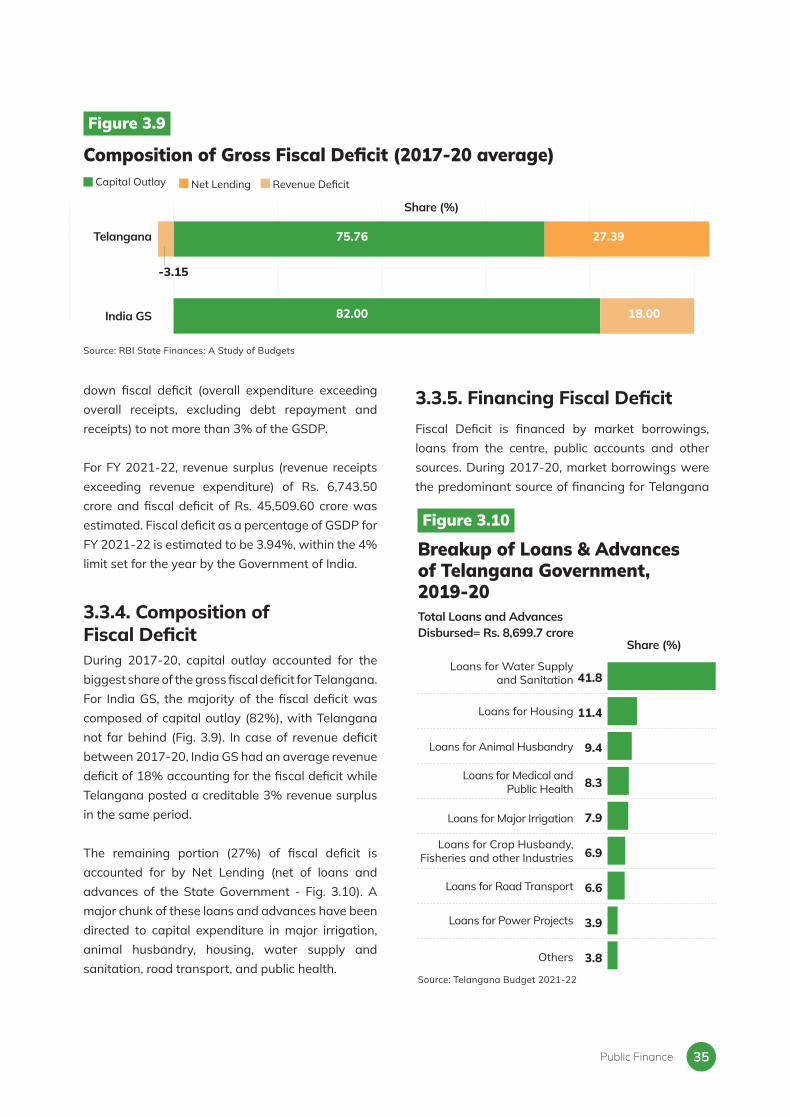
35
down fiscal deficit (overall expenditure exceeding overall receipts, excluding debt repayment and receipts) to not more than 3% of the GSDP.
For FY 2021-22, revenue surplus (revenue receipts exceeding revenue expenditure) of Rs. 6,743.50 crore and fiscal deficit of Rs. 45,509.60 crore was estimated. Fiscal deficit as a percentage of GSDP for FY 2021-22 is estimated to be 3.94%, within the 4% limit set for the year by the Government of India.
3.3.4. Composition of Fiscal DeficitDuring 2017-20, capital outlay accounted for the biggest share of the gross fiscal deficit for Telangana. For India GS, the majority of the fiscal deficit was composed of capital outlay (82%), with Telangana not far behind (Fig. 3.9). In case of revenue deficit between 2017-20, India GS had an average revenue deficit of 18% accounting for the fiscal deficit while Telangana posted a creditable 3% revenue surplus in the same period. The remaining portion (27%) of fiscal deficit is accounted for by Net Lending (net of loans and advances of the State Government - Fig. 3.10). A major chunk of these loans and advances have been directed to capital expenditure in major irrigation, animal husbandry, housing, water supply and sanitation, road transport, and public health.
3.3.5. Financing Fiscal DeficitFiscal Deficit is financed by market borrowings, loans from the centre, public accounts and other sources. During 2017-20, market borrowings were the predominant source of financing for Telangana
Capital Outlay Net Lending Revenue Deficit
Figure 3.9
Composition of Gross Fiscal Deficit (2017-20 average)
Source: RBI State Finances: A Study of Budgets
India GS
Telangana
-3.15
75.76
82.00
27.39
18.00
Share (%)
Public Finance
Source: Telangana Budget 2021-22
41.8
11.4
9.4
8.3
7.9
6.9
6.6
3.9
3.8
Figure 3.10
Breakup of Loans & Advances of Telangana Government, 2019-20
Share (%)
Total Loans and Advances Disbursed= Rs. 8,699.7 crore
Loans for Crop Husbandy, Fisheries and other Industries
Loans for Housing
Loans for Animal Husbandry
Loans for Major Irrigation
Loans for Road Transport
Loans for Power Projects
Loans for Medical and Public Health
Loans for Water Supply and Sanitation
Others

Telangana Socio Economic Outlook 202236
and India GS, making up 82.3% and 65.5% of their fi scal defi cits respectively. (Fig. 3.11).
3.3.6. Debt SustainabilityIt is important for debt to be sustainable to ensure that interest payments do not account for a signifi cant share of revenues. Debt Sustainability is tracked through two key parameters: Total Outstanding Liabilities to GSDP ratio and Interest Payments to Revenue Receipts ratio.
For the 2017-20 period, total outstanding liabilities to GSDP ratio stood at 22.33%, much less than the India GS average (27.73%, Fig. 3.12). In the
same period, interest payments to revenue receipts ratio stood at 12.88%, less than the India GS average (13.71%). Therefore, Telangana has done well compared to other states in terms of debt sustainability (Fig. 3.13).
3.4. Committed ExpenditureCommitted Expenditure for a government includes expenditure on payment of salaries and wages, pensions and interest payments. Higher allocation towards committed expenditure leads to reduced fi scal space for other developmental expenditure. In the 2017-20 period, Telangana’s committed expenditure as a percentage of revenue receipts
Source: RBI State Finances: A Study of Budgets Note: 1. Others include Special Securities issued to the National Small Savings Fund (NSSF), Reserve Funds, Deposits and Advances, Suspense and Miscellaneous, Remittances, and Overall Surplus (-)/ Defi cit (+). 2 Due to rounding off, the fi gures may not add up to exactly 100%.
Market Borrowings Public Accounts Loans from Centre Others
Figure 3.11
Financing of Fiscal Defi cit, India GS and Telangana (2017-20 average)
India GS
Telangana
Share (%)
82.29
-0.48
-0.71
-4.54
1.67
65.52
18.90
37.38
Figure 3.12
Outstanding Liabilities to GSDP ratio, India GS and Telangana (2014-20)
Figure 3.13
Interest Payments to Revenue Receipts Ratio, Telangana and India GS (2014-20)
Outstanding Liabilities to GSDP Ratio (%) Interest Payments to Revenue Receipts Ratio (%)
Telangana Telangana Average of General states Average of General states
2014-15 2015-16 2016-17 2017-18 2018-19 2019-20
28.414.6
23.5
23.212.4
14.4
25.5 12.2
15.7
26.9 12.9
12.4
27.4 13.5
21.4
27.4 13.1
22.1
Source: RBI State Finances: A Study of Budgets
13.113.113.513.5
2014-15 2015-16 2016-17 2017-18 2018-19 2019-20
Source: RBI State Finances: A Study of Budgets
30
20
10
0
15
10
5
0
14.0
10.2 9.9 10.412.2 12.4

37
As market borrowings are the predominant form of financing the fiscal deficit, it is important to ensure that borrowing costs are low. A recent RBI working paper titled ‘States’ Fiscal Performance and Yield Spreads on Market Borrowings in India’ using data from 2014-15 to 2018-19 shows that better fiscal and market performance is linked to lower yield spread (lower cost of borrowing).
This is shown through the development of States’ Performance Composite Index (SPCI) which is composed of fiscal, debt and market indicators. It examined the relationship between the index and yield spreads. The inter state variations in the yield spread across time were attributed to perceived state specific credit risk and liquidity. The paper highlights Telangana’s able financial management. Relevant points from the working paper are as follows:
1. In 2018-19, compared to other major states, Telangana could borrow at the lowest rates (30-40 basis points over the yield on central government securities of similar maturity). The average figure for all states was 55 basis points.
2. Telangana issued the longest tenor security of 30 years maturity, which indicates good performance in the management of maturity profile of debt. About 49% of the outstanding state government securities are going to mature only after 2036 as per the latest RBI State Finances report
3. In the 2014-15 to 2018-19 period, the lowest debt to GSDP ratio among India GS is of Telangana with the average debt to GSDP ratio of 17.2 percent (see Figure 3.14)
Box 3.2
Linking Fiscal Performance with Lower Borrowing Costs
Public Finance
Figure 3.14
Comparison of Debt to GSDP Ratio (2014-19 average) for India GS
Debt to GSDP ratio (%)
Source: RBI State Finances: A Study of Budgets
Telangana
Chhattisgarh
Maharashtra
Karnataka
Odisha
Tamil Nadu
Gujarat
Madhya Pradesh
Haryana
Jharkhand
Goa
Andhra Pradesh
Kerala
Rajasthan
Bihar
Uttar Pradesh
West Bengal
Punjab
17.19
17.84
17.87
18.04
19.79
21.08
21.10
23.62
25.07
26.47
28.03
28.91
29.75
31.25
31.79
34.80
38.32
38.32

Telangana Socio Economic Outlook 202238
was 48.7%, slightly lower than the India GS average (49.1%) for the same period. Comparison with other general states is shown in Figure 3.15.
In FY 2021-22, Committed Expenditure is estimated to be 36% of revenue receipts, which is lower than the average of 48.7% during 2017-20. The trend since 2015-16 is shown in Figure 3.16.
The lower committed expenditure as a percentage of revenue receipts is primarily due to higher estimated revenue receipts in FY 2021-22 (72% higher than FY 2019-20). However, committed expenditure is estimated to increase from Rs. 50,527 crores in 2019-20 to Rs. 63,024 crores in 2021-22. This increase in committed expenditure is primarily led by increased outgo on salaries, wages and pensions due to implementation of Revised Pay Scales, 2020.
The burden on the exchequer is expected to further increase with the expected fi lling of vacancies in the upcoming fi nancial year. Vacancies have
been identifi ed after completion of the process of allotment of existing employees to local cadres and districts based on the zonal system. Therefore, to ensure that committed expenditure as a percentage of revenue receipts does not increase substantially, resource mobilization is highly imperative.
3.5. Resource MobilizationMajor decisions were taken by the Government for resource mobilization in FY 2021-22. The Cabinet Sub-Committee on Resource Mobilization led by Hon’ble Finance Minister in June 2021 recommended revision of market values of lands and registration charges across the state. This revision was necessitated due to signifi cant increase in land
Figure 3.16
Committed Expenditure as % of Revenue Receipts, Telangana 2015-22
Source: RBI State Finances: A Study of Budgets
2015-16 2016-17 2017-18 2018-19 2019-20 2020-21 2021-22 (RE) (BE)
44.8 44.852.4
44.749.3
42.535.8
Figure 3.15
Comparison of Committed Expenditure as % of Revenue Receipts (2017-20 average) for India GS
Source: RBI State Finances: A Study of Budgets
37.0237.1138.4939.0840.1341.0242.2443.5948.3748.6649.1050.2651.4461.6763.3063.4365.5777.8685.96
Madhya PradeshBihar
Uttar PradeshKarnataka
MaharashtraJharkhand
ChhattisgarhOdisha
GoaTelanganaIndia (Avg.)
GujaratWest Bengal
Andhra PradeshHaryana
RajasthanTamil Nadu
KeralaPunjab
Figure 3.17
Stamp Duty and Registration Revenues in 2019 and 2021, Telangana Amount (Rs. crore)
Source: Registration and Stamps Department, Government of Telangana
2021-222019-20
Jul Aug Sep Oct Nov Dec
1400
1200
1000
800
600
400
200
0
1,2621,2021,091
575 498577

39
The Government of Telangana is committed to the welfare of its employees, including contract/outsourcing/honorarium personnel. In this regard, the Government constituted the 1st Pay Revision Commission (PRC) under the Chairmanship of Sri C.R.Biswal, IAS (Retd.) and two other members. The commission submitted its report to the Chief Secretary on 31.12.2020. Key recommendations include 7.5% fitment for all employee categories and a minimum pay of Rs. 19,000, higher than the basic pay (Rs. 18,000) for Union Government employees.
Based on the recommendations of the 1st PRC and considering the welfare of employees, the Hon’ble Chief Minister announced revision of pay scales on the floor of Legislative Assembly on 23.03.2021 and awarded 30% fitment against the PRC recommended fitment of 7.5%.
For the first time ever, this 30% fitment has also been made applicable for Full Time/Part Time Contingent, Daily Wage/Casual Labour/NMR, Time Scale Employees, Contract, Outsourcing, Home Guards, Anganwadi Workers, Village Revenue Assistants, ASHA workers, SERP/MEPMA Employees, Village Organization Assistants, ZPTC Members, MPTC Members, Sarpanches and all Residential
Schools employees including regular, contract, outsourcing and honorarium categories.
The total number of personnel benefited due to the implementation of revised pay scales is 9,48,125. The financial implication on exchequer is estimated to be around Rs. 12,595 crores per annum. Other measures taken by the Government include enhancement of the superannuation age from 58 years to 61 years instead of 60 years recommended by PRC, enhancement of retirement gratuity from Rs.12.00 lakhs to Rs.16.00 lakhs and additional quantum of pension for various age groups of pensioners, which will be very helpful to the senior citizens drawing government pension.
Recognizing the requirement of additional teaching faculty in medical colleges across the state and to ensure sufficient staffing for new medical colleges, the superannuation age has been enhanced from 58 years to 65 years for Professors, Associate Professors and Assistant Professors in Government Medical Colleges, Government Dental Colleges including Semi-Autonomous and Autonomous Medical Colleges. This is also applicable for faculty working in AYUSH medical colleges.
Box 3.3
Revised Pay Scales, 2020
Public Finance
values but no corresponding increase in registration charges for several years.
The revision of market values and revision of stamp duty rates came into effect from 22.07.2021, leading to doubling of monthly revenue from July to December 2021-22, on an average in comparison to monthly revenue in 2019-20 (July-December) (Fig. 3.17). The market values of agricultural lands, plots and apartments were hiked again on 31.01.2022 and the revised market values would come into effect from 01.02.2022. Levy of Special Excise Cess on Indian-made foreign liquor
and Foreign brands from May 2020 also led to a significant increase in revenue.
3.6 Way ForwardThe imminent stoppage of GST compensation, increase in committed expenditure, and decreased devolution of funds from the Fifteenth Finance Commission are challenges that require innovative financial solutions from the Government. With the signs of adverse impact of COVID-19 receding, the state is well-positioned to sustain its fiscal performance and overcome any impending challenges.

Telangana Socio Economic Outlook 202240
AGRICULTURE AND ALLIED ACTIVITIES
CHAPTER
04

41
l Agriculture plays a pivotal role in the economy of Telangana and the better performance of this sector is vital for inclusive growth. Agriculture is a way of life, a tradition that has shaped the culture and economic life of the people of the state, and continues to employ around half of the workforce. Therefore, it will continue to be central to all strategies for planned socio-economic development of the State.
l Agriculture, Forestry, Livestock and Fisheries sectors’ Gross Value added (Current Prices) to the state economy has seen a CAGR of 13.94% from Rs.76,123 crores in 2014-15 to Rs.189,826 crores in 2021-22 (AE) and during the same period the sector CAGR at all India level was 9.55%.
l A significant portion of this growth was driven by the livestock sub-sector, currently livestock accounts for 49.73% of the overall sector, followed by crops at 44.66%, fishing and aquaculture at 3.23%, forestry and logging sector stood at 2.38% in 2021-22.
l In the allied sector, between 2012 to 2019 the livestock population in the state has increased from 26.7 million to 32.6 million with a growth of 22.21%. Among the major states in India, Telangana is second to West Bengal in the growth of livestock population in the same period.
l As part of agriculture investment support, under the Rythu Bandhu scheme, cumulatively, state government disbursed Rs. 50,448 crores in 8 instalments (from Vanakalam 2018-Yasangi 2021-22) to
63 lakh beneficiaries (in Yasangi 2021-22). Under the Rythu Bima scheme, from 2018-19, the Government has settled claims to an extent of Rs. 3763.80 Cr and transferred the amount to the 75,276 bereaved families1.
l State government efforts to improve Irrigation by commissioning new projects and improving old irrigation infrastructure have begun to pay off. The overall gross irrigated area in Telangana increased by 119% between 2014-15 (from 62.48 lakh Acres) and 2020-21 (136.86 lakh Acres).
l Due to the construction of various irrigation projects, lifts, Restoration of minor irrigation tanks, check dams, the irrigation potential available has increased to 85.89 Lakh acres during 2020-21. The resultant impact of improved irrigation can be seen in production of major crops. Between 2015-16 to 2020-21, paddy production increased by a massive 378% and the cotton production increased by 61% in the same period and resulted in Telangana becoming a major Paddy production state.
l The State government has provided a safety net during the previous year by procuring total production of major crops (Paddy and Cotton) and given the unpredictability of the Government of India’s position on supporting procurement, the State is actively supporting a transition to demand driven and commercial agriculture which will provide sustainable income increase to farmers through initiatives like crop diversification and the oil palm mission etc.
Key Highlights
Agriculture and Allied Activities
1 As on 24.02.2022

Telangana Socio Economic Outlook 202242
4.1. Agriculture and Allied Activities -Macro Trends
griculture and its allied activities are integral to the lives and livelihoods of most of the people in the State. Besides the
fact that the sector helps in ensuring food security, it also provides livelihoods to more than half of the state’s workforce (Almost half of the workforce in the state are engaged in agriculture and its allied activities2). The recent NSS report3 depicts that in the state of Telangana, the agricultural households4 as the percentage of rural households has gone up from 51.5% (25,38,900 agricultural households out of 49,30,900 rural households) in 2013 to 54.2% (26,55,700 agricultural households out of 48,99,600 rural households) in 2019. In essence agriculture assumes more economic importance to households.
To achieve food and income security, the state government has given priority to the agriculture sector and has implemented several farmer welfare oriented schemes. Budget allocation for agriculture also improved markedly from Rs.6,611 crores in 2016-17 to Rs.26,822 in 2021-22. In the year 2021-22 budget, the state has allocated 13.5% of its total revenue expenditure towards agriculture and allied activities. This is significantly higher than the average allocation for agriculture by states (6.3%)5.
There has been a sustained growth of primary sector contribution to the state economy over the years. The contribution of the crops sector to Telangana’s Gross State Value Added (GSVA) at Current Prices has increased 103% from Rs.41,706 crores in 2014-15 to Rs.84,785 crores in 2021-22(AE). There is a marked improvement in GSVA of crops at current prices between 2018-19 and 2019-20 (from 48,366 crores in 2018-19 to 77,338 crores in 2019-20), which in part is attributed to increase in investment on agriculture through schemes such as Rythu Bandhu.
Fig 4.1 denotes the share of each sector in the state economy and trends between 2014-15 to 2021-22.
Between 2014-15 to 2021-22(AE), GSVA (at current prices) of Agriculture, forestry, livestock and fisheries has seen a CAGR of 13.94% in Telangana. Livestock sector was a major driver of this growth with a CAGR of 18.2%, the sector’s contribution to the GSVA of
A
2 As per Periodic Labour Force Survey, 2019-20, agriculture sector employs 48.4% of the population of the state.
3 Situation Assessment of Agricultural Households and Land and Holdings of Households in Rural India (NSS 77th Round, 2019)
4 An agricultural household was defined as a household having some production from agriculture activities (e.g., cultivation of field crops, horticultural crops, fodder crops, plantation, animal husbandry, poultry, fishery, piggery, bee-keeping, vermiculture, sericulture, etc.) during last 365 days and having at least one member self employed in agriculture during last 365 days.
5 Telangana Budget Analysis 2021-22 by PRS Legislative Research
Figure 4.1
Sectoral Contribution to Telangana GSVA from 2014-15 to 2021-22 (AE) (at Current Prices)
Source: Directorate of Economics and Statistics, GoTS
Contribution to GSVA (%)Agriculture Industries Services
0% 20% 40% 60% 80% 100%
2014-152015-162016-172017-18
2018-19 (TRE)2019-20 (SRE)2020-21 (FRE)2021-22 (AE)
16.314.314.814.914.717.919.618.3
22.423.621.522.223.520.719.820.4
61.362.263.662.961.861.560.661.3
0% 20% 40% 60% 80% 100%
Figure 4.2
Agriculture and Allied Activities Contribution to GSVA Between 2014-15 and 2021-22 (AE) at Current Prices
Crops Livestock Forestry & logging Fishing & aquaculture
2014-152015-162016-172017-18
2018-19 (TRE)2019-20 (SRE)2020-21 (FRE)2021-22 (AE)
Source: Directorate of Economics and Statistics, GoTS
3.53.52.63.63.53.03.03.2
3.23.33.83.63.82.72.52.4
38.544.644.746.050.344.445.949.7
54.848.648.946.842.349.948.644.7

43
Agriculture and Allied activities has improved from 38.47% in 2014-15 to 49.73% in 2021-22. The growth in part is attributed to the renewed efforts of the state government on this sector which include new schemes such as Sheep distribution scheme. Figure 4.3A shows comparison between percent
growth rate of Telangana and India over the years in current prices. Figure 4.3B depicts the sub-sector’s contribution to the agriculture growth rate between 2015-16 and 2021-22, in which the livestock sector has seen a sustained growth rate over the years.
Agriculture and Allied Activities
Figure 4.3
Contribution of the agriculture sector in Telangana’s economic development
Crops Livestock Forestry and logging Fishing and aquaculture
Source: Directorate of Economics and Statistics, GoTS
4.3A: Growth Rate of Agriculture to State Economy at Current Prices Between 2015-16 and 2021-22 (in %)
Telangana
India
4.3B: Sub Sectoral Growth Rate Contribution to Overall Sector Growth Rate at Current Prices Between 2015-16 and 2021-22 (in %)
2015-16
2015-16
-0.5
6.4
2016-17
2016-17
17.5
13.1
2017-18
2017-18
13.9
12.4
2018-19 (TRE)
2018-19 (TRE)
12.7
7.1
2019-20 (SRE)
2019-20 (SRE)
35.6
10.8
2020-21 (FRE)
2020-21 (FRE)
12.2
7.5
2021-22 (AE)
2021-22 (AE)
9.1
9.8
40%
35%
30%
25%
20%
15%
10%
5%
0%
-5%
-10%
-6.4
5.9
0.00.0
8.9
8.0
1.1
-0.5
4.4
7.60.4
1.6
0.9
10.8
0.70.4
25.3
9.9
-0.2
0.6
4.7
7.1
0.10.4
0.1
8.40.1
0.5

Telangana Socio Economic Outlook 202244
Scheduled Caste 700 11.8 532 1,315 8.9Scheduled Tribes 712 12 741 1,830 12.4Institutional 1 0 5 13 0.1Others 4,535 76.2 4,694 11,599 78.6Total 5,948 100 5,972 14,757 100
Marginal (Below 2.47) 3,840 64.6 1,706 4,216 28.6Small (2.48 – 4.94) 1,409 23.7 1,977 4,885 33.1Semi-Medium (4.95 - 9.88) 564 9.5 1,467 3,625 24.6Medium (9.89 - 24.77) 126 2.1 688 1,700 11.5Large (24.78 and Above) 9 0.2 135 334 2.3Total 5,948 100 5,972 14,757 100
Fig 4.4 depicts the trends in the CAGR of GSVA (Current Prices) of Agriculture between 2014-15 and 2021-22 across non special category states for which data is available. Among these states for which data is available, Telangana Stands at 2nd position with a CAGR of 11.60% next only to Madhya Pradesh.
4.2. Land Use PatternTelangana State is the 11th largest State in India with a geographical area of over 276.96 lakh acres (112.08 lakh Hectares). Out of the total area, 49.07 percent of area comes under Net Sown Area and around 24.07 percent is under forest coverage. Land put to non-agriculture uses is around 7.46 percent, fallow lands (9.02 percent), Barren and uncultivable land (5.42 percent) and the remaining is under permanent pastures and other grazing lands.
4.2.1 Land holding patternThe total number of operational holdings in the State are 59.48 lakhs covering an area of 59.72 lakh hectares. Percentage of each category of land holding pattern (as per 10th census of landholdings) is indicated in Fig 4.5.
Figure 4.4
Trends in CAGR of Agriculture GSVA (Current Prices) between 2014-15 and 2021-226
CAGR Between 2014-15 and 2021-22 (%)
Source: RBI Handbook of statistics on Indian Economy 2020-21
Madhya Pradesh
Telangana
Andhra Pradesh
Rajasthan
Chhattisgarh
West Bengal
Uttar Pradesh
Karnataka
Bihar
Jharkhand
Haryana
Punjab
Tamil Nadu
Odisha
13.6
11.6
10.0
8.9
8.5
8.5
8.5
8.5
7.2
6.9
6.7
6.6
6.4
5.5
6 Analysis was done among Non-Special Category States for which data is available.
Figure 4.5
Land Holding Pattern in Telangana
Source: Agriculture Census 2015-16, MoAFW, GoI
Land Holdings by Size Class
Land Holdings by Social Groups
No. of Holdings
('000)Size Class
(Acres)
Area Operated
('000 Hects.)
Area Operated
('000 Acres)% of
Holdings% of Area Operated

45
Marginal (<2.47 acres) and small landholdings (2.48 -4.94 acres) account for 88.3% of the total agricultural landholdings in the state. These account for 61.7% of the total operated agricultural area. The Scheduled Castes (SC) population own 11.8% of landholdings, covering 8.9% of the total area. The Scheduled Tribes (ST) population own 12.0%
of agricultural landholdings, covering 12.4% of the total area. 76.2% of the landholdings belong to the ‘Others’ category, and cover 78.60% of the area operated.
4.2.2 RainfallTelangana received 1322.4 millimetres (mm) of rainfall in 2020-21(from June to May), which is 46% in excess of normal rainfall of 905.4mm (Fig 4.6).
Telangana received normal rains in the years 2017-18, 2018-19, and 2019-20, and excess rains in the year 2020-21, which contributed to improvement in groundwater recharge. This in turn contributed positively to overall sown area and agricultural productivity of the state.
4.3. Agriculture and Allied Activities: Trends in Output 4.3.1 Sown AreaAs a result of the government’s efforts and focus, overall cropping area and irrigated area have
Agriculture and Allied Activities
7 During 2020-21, State normal rainfall during South-West monsoon (Jun-Sep) is 720.4 mm, during North-East monsoon (Oct-Dec) is 124.9, during winter period (Jan to Feb) is 11.5 mm and during Hot Weather period (Mar-May) is 48.6mm.
Source: Directorate of Economics and Statistics, GoTS
Figure 4.6
Annual Rainfall (Actual in mm) Between 2014-15 to 2020-217
Actual Rainfall (in mm)
2014-15
2015-16
2016-17
2017-18
2018-19
2019-20
2020-21
682
717
1,019
841
748
1,033
1,322
Fig 4.7A
% Of Gross Sown Area Under Top 5 Crops in Vanakaalam Between 2014-15 to 2020-21
Source: Directorate of Economics and Statistics, GoTS
Share of gross sown area (%)Total share of top
5 crops (%)Paddy Cotton Maize Redgram Soyabean
2014-15
2015-16
2016-17
2017-18
2018-19
2019-20
2020-21
22.0
18.3
20.3
23.2
26.4
31.2
37.1
40.6
43.4
32.1
42.0
40.9
40.7
41.2
86.2
84.8
82.1
86.1
86.7
88.3
90.1
12.5
11.1
14.5
10.3
9.5
7.5
1.5
5.8
5.9
6.3
3.4
3.3
3.3
2.8
5.3
6.1
8.8
7.3
6.6
5.6
7.5

Telangana Socio Economic Outlook 202246
increased significantly, the Gross Sown Area (GSA) has significantly increased from 131 lakh acres in 2014-15 to 210 lakh acres in 2020-21. During this period, more than 79 lakh acres were brought under cultivation. This increase can be attributed to the sustained investment in irrigation projects and paddy procurement by the Government, which has made it possible for farmers to cultivate paddy in both seasons of the year.
Paddy, Cotton, Maize and Red Gram are the major crops grown in Telangana. Cumulatively, the area under these crops constitutes nearly 85% of the total area under cultivation. Currently, cultivated area under Paddy (50%) and Cotton (28%) constitutes 78% of the total. In 2014-15, total area cultivated under Paddy was around 35 lakh acres and by the end of 2020-21, it increased nearly 197% to 104 lakh acres. The total area under cotton cultivation increased by 38% from 42 lakh acres to 58 lakh acres.
There was a significant decline in the coverage of
Maize—from 12.5% of overall gross area sown in Vanakalam 2014-15 to 1.5% of the gross area sown in 2020-21 Vanakalam. The coverage of Red gram and Soyabean did not vary significantly in this time span. Fig 4.7A depicts the trends in % area coverage of the top 5 crops out of gross sown area in Vanakalam between 2014-15 and 2020-21. Fig 4.7B reflects the year-on-year percentage of area for the top 5 crops out of gross sown area in Yasangi season.
While the % sown area for the top-ranking crop-paddy-increased from 43.42% in Yasangi 2014-15, to 76.0% in Yasangi 2020-21, the percentage sown area for all the other 4 crops declined between 2018-19 and 2020-21. The most drastic decrease in sown area was for groundnut, where the percentage sown area declined from 12.5% 2014-15 to 4.1% in 2020-21. It is pertinent to note that area % under top 5 crops out of sown area in Yasangi has increased from 77.6% in 2014-15 to 92.3% in 2020-21.
District level data also shows that there has been
Fig 4.7B
% of Gross Sown Area Under Top 5 Crops in Yasangi Between 2014-15 to 2020-21
Source: Directorate of Economics and Statistics, GoTS
Share of gross sown area (%)
Paddy Maize Groundnut Bengalgram Sesamum
2014-15
2015-16
2016-17
2017-18
2018-19
2019-20
2020-21
43.4
36.9
59.2
59.4
58.3
70.4
76.0
14.9 12.5 5.2
8.7
6.4
6.3
8.2
5.8
5.2
14.2
8.9
9.5
8.9
4.4
4.1
14.7
10.4
10.9
9.2
11.2
6.3
Total share of top 5
crops (%)
77.6
75.7
86.0
87.0
85.8
92.7
92.3
1.6
1.2
1.1
1.3
1.0
0.9
0.8

47
sustained improvement in Gross Sown Area (GSA) between 2019-20 and 2020-21 with nearly all districts recording positive growth and the overall growth in GSA across Telangana stood at 13.7%. Fig 4.8 depicts the district wise percentage increase in GSA between 2019-20 and 2020-21. There was a decrease in GSA in Nirmal district (-11.1%) due to crop diversifi cation and shifting away from sowing Maize crop in 2020-21.
4.3.2 Cropping IntensityThe ratio of gross cropped area to net cropped area, is an indicator useful for assessing effi ciency of the agriculture sector. Cropping intensity refers to the raising of a number of crops from the same fi eld during one agricultural year. Thus, higher cropping
intensity means that a higher proportion of the net sown area is being cropped more than once during one agricultural year. Fig 4.9 indicates the cropping intensity index across the districts. With an overall index of 136, the state has an opportunity in improving cropping intensity by utilising technology and improved agricultural practices.
4.3.3. Production of major cropsThe improvement in cropping area led to the overall agriculture production in the state which increased by 52% from 232 lakh MT in 2014-15 to 353 lakh MT in 2020-21. The 3 major crops grown in Telangana by production are Paddy, Cotton and Maize. These three crops together constitute nearly 75% of total produce in 2020. As per the agriculture statistics
Agriculture and Allied Activities
Figure 4.8
% Increase in Gross Sown Area Between 2019-20 and 2020-21 % Increase in Gross Sown Area Between 2019-20 and 2020-21 Across Districts Across Districts
Note: Districts arranged in descending order of increase in gross sown area. Source: Directorate of Economics and Statistics, GoTS
State average 13.7
Change in gross sown
area (%)
Change in gross sown
area (%)District District
57.2
31.6
30.5
30.4
25.8
22.9
20.9
20.8
20.5
17.7
17.2
16.9
15.0
13.4
13.1
12.8
12.8
11.4
11.4
10.5
10.3
9.5
8.9
8.4
7.3
6.4
6.0
5.1
4.0
2.9
1.0
-11.1
Medak
Vikarabad
Mahabubnagar
Jangaon
Yadadri
Sangareddy
Rangareddy
Nagarkurnool
Medchal-Malkajgiri
Siddipet
Wanaparthy
Rajanna
Mahabubabad
Suryapet
Nalgonda
Jogulamba
Warangal Urban
Adilabad
Jagtial
Kamareddy
Khammam
Narayanpet
Karimnagar
Jayashankar
Bhadradri
Mancherial
Mulugu
Warangal Rural
Nizamabad
Peddapalli
Kumuram Bheem
Nirmal
Increase in GSA (%)
Below 2.62.7 to 16.216.3 to 29.930.0 to 43.543.6 to 57.0
Below 2.62.7 to 16.216.3 to 29.930.0 to 43.543.6 to 57.0

Telangana Socio Economic Outlook 202248
2020 of Ministry of Agriculture and Farmer Welfare, GoI, Telangana stands at 2nd for cotton production (with an output of 6.83 million bales) and at 3rd position in Maize production (with an output of 3 Million tonnes)8. Fig 4.10A provides trends over the years.
Figure 4.9
District Level Cropping Intensity Index for 2019-20
106.83
Cropping Intensity
Index
135.50
178.50
Source: Directorate of Economics and Statistics, GoTS
Adilabad123.02
Nirmal161.45
Kumuram Bheem107.40
Mancherial126.63
Jagtial147.67
Rajanna Sircilla154.97
Peddapalli169.48 Jayashankar
135.75
Mulugu138.89
Medak128.94
Siddipet131.46
Warangal Urban167.69 Warangal
Rural158.12Jangaon
144.63Sangareddy
106.83Medchal-Malkajigiri
134.11
Vikarabad107.28 Rangareddy
112.51
Mahabubnagar113.05
Narayanpet113.54
Nalgonda128.60
Nagarkurnool121.68
Wanaparthy140.94
Suryapet168.90
Khammam144.50
Karimnagar160.25
Yadadri Bhuvanagiri
134.69
Mahabubabad150.33
Jogulamba Gadwal115.13
Bhadradri Kothagudem
121.55
Kamareddy163.58
Nizamabad 178.50
Figure 4.10A
Trends in Total Agriculture Production in Telangana (in Lakh MT)
Source: Directorate of Economics and Statistics, GoTS
Total Production (Lakh MTs)
2014-15 2015-16 2016-17 2017-18 2018-19 2019-20 2020-21
231.74188.85
210.48234.89 234.00
339.83 353.33
8 As per 4th advance estimates 2019-20.

49Agriculture and Allied Activities
Multiple levels of checks and verifications have been adopted by the government in the data collection process to ensure that the final data arrived at is error-free.
This includes 4 major aspects:
(1) Land Records Updation Programme: A programme initiated by the Government of Telangana to undertake the purification of land records across all villages in all Mandals of the state. Under the programme, 1 crore hectares of land was verified, and new Pattadar Passbooks-cum-Title Deeds were issued to 60.24 lakh khatas covering 0.6 crore hectares of agricultural land (92%). The programme has now been completed, thereby guaranteeing that land records data across the state is authentic.
(2) Crop Booking: A bi-seasonal census was undertaken to capture the details of the crop sown by farmers. Estimation is done by visiting each and every farmer field in the state, and data collected is verified by 4 different officials under the agriculture department. From this season (Yasangi 2021-22), the Department of Agriculture is commencing strengthened mobile applications under the ‘Crop Booking Enhancement’ module. In addition, the government has also recruited 472 Mandal Planning and Statistical Officers (MPSO) to verify the data.
(3) Survey CTO Application: The MPSOs have entrusted the job of verifying area enumeration done by the agriculture department by using a mobile-based data collection platform that allows for complex skip patterns, geo-tracing and tagging of crops, and ensures collection of authentic data during agricultural area enumeration surveys. Use of this application for data collection will provide another level of check with sophisticated real time data gathering to ensure that the data recorded is accurate. The state government did a pilot of this in Yasangi 2021 and is in the process of scaling up across the state. This also helps to identify correction factors in the area enumeration work.
(4) Crop Cutting Experiments (CCEs): For CCEs to enhance accuracy in yield estimates, an app was developed with NIC to capture data during harvest of crop (i.e. Form 2, 3), a web portal to capture data of plot selection (Form 1). New features include:l Near real-time availability of data for
scrutinyl Photo and GPS available for conducting
further checksl Divisional, District, State Statistical officers
and NSSO officials visit field in a samplel In order to improve the accuracy in measuring
yield of crops all the field functionaries are provided with the latest CCE kits.
Box 4.1
Efforts of State Government in Strengthening Agriculture Statistics

Telangana Socio Economic Outlook 202250
Production details of Paddy and Cotton are provided in Box 4.2.
Telangana’s contribution to the production of pulses at the national level was ranked in 10th place.
Box 4.2
Paddy and CottonThe effectiveness of the state’s agricultural policies and incentives can be directly seen in the growth of Paddy and Cotton.
l According to the estimates for 2019-20, Telangana produces around 19% of India’s Cotton and around 6% of the total rice produced in India.
l Area: In 2015-16, total area under Paddy and Cotton was 25 and 43 lakh acres respectively. By 2021, the area under them stood at 104 and 58 lakh acres respectively. Area under Paddy increased nearly 303% and Cotton saw a 33% increase.
l Production: In 2015-16, Paddy Production was around 45 lakh tonnes and Cotton Production was 18 lakh tonnes. By 2020-21 Paddy Production increased nearly 378% to 218.5 lakh tonnes and Cotton production increased 61% to 30.42 lakh tonnes.
l Comparison with India: Between 2015-16 to 2019-20, rice production saw a CAGR of 25% highest across the country (2nd highest is Odisha state with a CAGR of 9.2% and all India at 3.3%) and production of cotton saw CAGR of 16.9%, 4th highest in the country after Haryana (25.80%), Rajasthan (23.1%), Odisha (17.87%). In the same period all India production has seen a CAGR of 4.7%.
Source: Directorate of Economics and Statistics, GoTS and RBI Handbook of Statistics on Indian States 2020-21
Figure 4.11A
Area Under Paddy and Cotton (in Lakh Acres) Between 2015-16 and 2020-21
Figure 4.11B
Production of Paddy and Cotton (in Lakh MT) Between 2015-16 and 2020-21
Source: Directorate of Economics and Statistics, GoTS
2015-16
2016-17
2017-18
2018-19
2019-20
2020-21
2015-16
2016-17
2017-18
2018-19
2019-20
2020-21
43.81 18.85
34.82 18.73
46.88 27.82
45.46 21.53
52.55 37.63
58.28 30.42
Paddy CottonArea (in Lakh Acres) Paddy CottonProduction (in Lakh MT)
25.85 45.71
45.17 98.99
48.49 93.95
47.74 100.03
79.47 178.27
104.23 218.51

51
However, looking at the growth rate of production of pulses between 2018-19 and 2019-20, Telangana stood 4th at the national level. As compared to the national growth rate of 4.3%, Telangana’s growth rate was 20.49% points higher. Total output of the
Maize and Redgram over the years are depicted in Fig 4.10B.
4.3.4 Yield of major crops over the yearsThe state government’s consistent efforts in increasing the quality of agriculture inputs led to increase in acreage and yield of various crops. Fig 4.12 provides trends in yield of major crops between 2015-16 and 2020-21.
4.3.5 Consumption of Fertilisers
Consumption of fertilisers and pesticides is determined by multiple factors such as area of land under cultivation, the type of crop, cropping pattern and cropping intensity, soil type and its condition, agro-climatic conditions, the ability of farmers to purchase, irrigation, and others. The consumption of major fertilisers in the state increased from 28 lakh MT in 2018 to 39 lakh MT in 2020. Analysis of the % growth of fertiliser consumption among districts between 2019-20 and 2020-21 is presented in Fig 4.13. Among the districts, Warangal Urban has seen
Agriculture and Allied Activities
Fig 4.10B
Production of Maize and Redgram Between 2015-16 and 2020-21 (in Lakh MT)
Source: Directorate of Economics and Statistics, GoTS
Production (in Lakh MT)
2015-16 2016-17 2017-18 2018-19 2019-20 2020-21
1.05
17.51
2.62
28.82
2.64
27.52
1.91
20.83
2.66 3.32
17.55
Maize Redgram
36.44
Fig 4.12
Year-Wise Yield of Major Crops Between 2015-16 and 2020-21
Source: Directorate of Economics and Statistics, GoTS
Yield (Kg/Acre)
2015-16 2016-17 2017-18 2018-19 2019-20 2020-21
Paddy Maize Cotton Redgram
170
430
1,237
1,768
274
538
1,455
2,191
323
594
1,766
1,938
262
474
1,552
2,095
365
716
2,292
2,243
314
522
2,096
2,744

Telangana Socio Economic Outlook 202252
growth rate of -51.68%, whereas Mahabubabbad and Siddipet districts have seen exponential growth in fertiliser consumption (Fig 4.13).
4.3.6 HorticultureIn 2020-21, area under Horticulture crops in the state is 11.57 Lakh acres with a production of 59.03 Lakh MTs. The area under Horticulture in Telangana state is contributing 5.39% of the total Agriculture area (214.48 lakh acres), whereas the sector contributes 26% in terms of value of the produce (Agriculture crops value Rs.89,058 Cr, Horticulture crops value Rs.22,774 Cr). Between 2015-16 and 2020-21, area under horticulture crops has seen a growth of 304% (from 3.8 lakh acres in 2015-16 to 11.57 lakh acres in 2020-21). Mango, Sweet orange, Acid Lime, Guava, Pomegranate, Tomato, Brinjal, Oilpalm, Cashewnut, Chillies and Turmeric are the major horticulture crops in the state. In 2020-21, total horticulture production was 59.03 LMTs, an increase of 101% compared to 2015-16.
Figure 4.13
% Increase in Fertiliser Consumption Across Districts Between 2019-20 and 2020-21
Note: Districts arranged in descending order of increase in gross sown area. Source: Department of Agriculture, GoTS
State average 19.0
Change in fertiliser
consumption (%)
Change in fertiliser
consumption (%)District District
143.6123.2
92.692.289.075.868.760.549.547.746.143.436.436.231.629.2
25.224.421.720.116.210.610.5
5.7-3.4
-15.7-19.2-22.5-31.8-47.8-51.7-52.5
MahabubabadSiddipet
SangareddyNirmal
JayashankarWarangal Rural
Kumuram BheemJangaon
MancherialJagtial
YadadriRajanna
KamareddyNalgonda
WanaparthyVikarabad
MahabubnagarNagarkurnool
BhadradriSuryapet
PeddapalliKhammam
RangareddyJogulamba
NizamabadMedak
AdilabadMulugu
KarimnagarNarayanpet
Warangal UrbanMedchal-Malkajgiri
Change in fertiliser consumption (%)
-52.5 to -13.6-13.5 to 25.825.9 to 65.265.3 to 104.6104.7 to 144.0
Production in LMT
Figure 4.14
Production of Major Horticulture Crops in 2015-16 and 2020-21 (in LMT)
Source: Horticulture Department, GoTS
Fruits Vegetables Flowers Plantation Spices
2015-16 2020-21
23.89
12.15
22.03
12.67
0.080.5
0.02
3.864.4
8.51
Change in fertiliser consumption (%)
-52.5 to -13.6-13.5 to 25.825.9 to 65.265.3 to 104.6104.7 to 144.0

53
4.3.7 Livestock sector in TelanganaAbout 29 lakh families in Telangana State are engaged in livestock sector for their livelihood and livestock sector is emerging as one of the most potential and income generating sectors for rural and semi urban areas. Between 2012 to 2019 the livestock population in the state has increased from 26.7 million to 32.6 million with 22.09% growth between the years. Among the major states in India, Telangana is second to West Bengal in the growth of livestock population in the same period. Fig 4.15 projects the change in livestock population between 2012 and 2019 (between 19th and 20th livestock census).
Among livestock, Telangana ranks fi rst place in sheep population at 19.1 million. The sheep population has seen an increase of 48.51% between 2012 to 2019. As per 2019-20 (FRE), milk and meat almost covers 76% of the total Gross Value Added in the livestock sector. Fig 4.16 provides details of each sub-sector contribution to GVA
Agriculture and Allied Activities
Figure 4.15
% Change in Livestock Population Between 2012 and 2019
Source: 20th Livestock Census, GoI
Change (%)
West Bengal
Telangana
Andhra Pradesh
Madhya Pradesh
Bihar
Karnataka
Maharashtra
Gujarat
Uttar Pradesh
Rajasthan
23.43
22.10
15.65
11.85
10.94
4.69
1.54
-0.74
-1.31
-1.56
Figure 4.16
Breakup of Livestock GVO in Telangana (2019-20)Total Livestock GVO: Rs. 80,137 crore
Source: Animal Husbandry Department
Milk46.0%
(Rs. 36,862 crore)
Poultry Meat13.7%
(Rs. 10,941 crore)
Eggs6.8%
(Rs. 5,461 crore)
Others3.1%
(Rs. 2,517 crore)
Wool & Hair0.1% (Rs. 47 crore)
Meat (Excluding Poultry Meat)
30.3%(Rs. 24,309
crore)
Source: Animal Husbandry Department
Figure 4.17
Trends in GVO of Livestock Sector in Telangana Between 2014-15 to 2020-21
2014
-15
2015
-16
2016
-17
2017
-18
(TR
E)
2018
-19
(SR
E)
2019
-20
(FR
E)
2020
-21(
PE)
36,886
1,04,832
80,135
66,56758,262
49,308
42,147
Total Livestock GVO (in Rs. crore)

Telangana Socio Economic Outlook 202254
In the Telangana state, Gross Value of Output created by livestock has steadily increased over the years. It has seen a marked increase from Rs.36,886 crores in 2014-15 to Rs.1,04,832 crores by 2020-21(PE). Trends are depicted in Fig 4.17.
4.4. Government InitiativesTelangana has rapidly moved out of the past shadow of farmer suicides, extreme indebtedness and lack of irrigation facilities, and become a model for farmer friendly initiatives under agriculture sector. Schemes such as Rythu Bandhu and Rythu Bima won accolades at the United Nations and adopted by other states as well as the central government. The share of the primary sector in the GSVA has increased consistently since the formation of the state, which can be attributed to the initiatives of the state government such as the Rythu Bandhu scheme, construction of new (major and medium) irrigation projects besides strengthening and streamlining of the existing ones, 24x7 free power to Agriculture, Mission Kakatiya, promotion of livestock and fisheries, sheep distribution scheme, etc. resulted in the realisation of Green, White and Blue revolutions in the state.
The philosophy of the Government has been that, ‘Everything can wait but not agriculture’ and farmers need timely access to inputs such as funds (in terms of support for investment) and access to credit facilities. Moreover, streamlining availability of various farm inputs (such as seeds, fertilisers etc.) and providing optimal extension services is critical to ensure a good yield. As discussed in the earlier section, with the increase in production over the years, it is also important to create facilities for post-harvest management via appropriate market linkages. Most recently, the state government, to deal with the problem of plenty, has also initiated activities which are more oriented towards structural reforms such as promoting diversification through oil palm cultivation and more concentration towards
improving animal husbandry.
Access to finance is critical for the growth of the agriculture sector. With ever increasing demand for agriculture and allied products, it is necessary to create a risk free environment for farmers to get access to funds. The state government to reduce the burden of the farmers is providing support in two major ways. First, through Rythu Bandhu which provides financial support to all farmers and second, with an increase in lending through banks.
4.4.1 Rythu Bandhu (Investment Support)Recognizing the importance of financial support towards meeting the cost of the input needs of the farmers, the Government of Telangana launched the Rythu Bandhu Scheme in 2018. The scheme provides financial support of Rs. 10,000/- per acre per year to landowning farmers and is higher than that disbursed in Andhra Pradesh (Rs 7,500 per farmer family per year), Jharkhand (Rs.5,000 per marginal and small farmer per acre per year), and West Bengal (Rs.5,000 per year). Moreover, the Government of Telangana has extended the scheme to all land-owning farmers irrespective of the farm size. A brief prepared by the Indian Council for Research on International Economic Relations (ICRIER) has also recommended direct investment support initiated by the state of Telangana as it is better compared to other alternatives, simple to implement, more transparent and inclusive.9
Key Highlights In Yasangi 2021-22, around 63 lakh farmers received investment support under the scheme of which 72.58% are marginal farmers (<2.48 acre) and 18.30% are small farmers (2.48 - 4.94 acre). Large farmers (>24.78 and above acres) account for only 0.1% of the beneficiaries. In Yasangi 2021-22, 148 lakh acres were covered under
9 Gulati, A., Chatterjee, T., & Hussain, S. (2018). Supporting Indian farmers: Price support or direct income/investment support?.

55
the scheme and Rs. 7,412 crores was disbursed. Cumulatively, Rs. 50,448 crores have been disbursed in 8 seasons (from Vanakalam 2018-Yasangi 2021-22) to the beneficiaries (Fig 4.18C).
Out of the total 63 lakh beneficiaries in Yasangi 2021-22, 53% belong to BC category, around 13% each to SC and ST categories, and ‘Others’ constitute around 21% of the beneficiaries (Fig 4.18B).
Out of the total amount disbursed under Rythu Bandhu, 48% was disbursed to BCs, 30% to ‘Others’, 13% to STs and 9% to SCs. In 2021-22, out of the agriculture budget outlay, 55% of the agriculture and allied activities sector budget was earmarked for the Rythu Bandhu Scheme.
Agriculture and Allied Activities
Total Beneficiaries: 63,00,619
Source: Department of Agriculture, GoTS
Figure 4.18A
Beneficiaries of Rythu Bandhu as per land holding category in Yasangi 2021-22
Share of beneficiaries (%)
Marginal (<2.47 acre) 72.58%
(45,73,052)
Small (2.48 – 4.94 acre)18.30% (11,53,120)
Semi-Medium (4.95–9.88 acre)
7.64% (4,81,655)
Medium ( 9.89 – 24.78 acre)
1.38% (86,846)
Large (24.78 & above acre)
0.10% (5,946)
Source: Department of Agriculture, GoTS
Total Beneficiaries: 63 lakhs
Figure 4.18B
Beneficiaries of Rythu Bandhu as per social category in Yasangi 2021-22
Share of beneficiaries (%)
ST12.76%
(8.03 lakhs)
SC13.19%
(8.31 lakhs)BC
53.33% (33.60 lakhs)
Others20.72%
(13.05 lakhs)
Number of Beneficiaries
(in Lakhs)Season
Amount Disbursed (in
Rs. crore)
Source: Department of Agriculture, GoTS
Figure 4.18C
Status of Rythu Bandhu Scheme from Vanakalam 2018-19 to Yasangi 2021-22
Vanakalam 2018
Yasangi 2018-19
Vanakalam 2019
Yasangi 2019-20
Vanakalam 2020
Yasangi 2020-21
Vanakalam 2021
Yasangi 2021-22
50.25
49.13
51.61
42.42
58.02
59.32
60.84
63.00
5,236
5,252
6,126
4,406
7,289
7,367
7,360
7,412

Telangana Socio Economic Outlook 202256
4.4.2 Agriculture Credit
Credit is one of the most important inputs for promoting sustainable and equitable agriculture. The state government lays emphasis on timely and adequate credit support to the farmers with particular focus on small and marginal farmers to enable them to adopt latest technology and improve crop production and increase their income.
As per the Annual Credit Plan prepared by the State Level Bankers Committee of Telangana, the total annual credit plan for the agricultural sector during the year 2021-22 is Rs. 91,541 crore. Out of the total target, Rs. 75,977 crore was allocated for the crop loans, and Rs. 32,101 crore towards agriculture term loans and agriculture and allied activities. Out of the total target, Rs. 31,813 crore was disbursed towards the agriculture sector till September 2021, and further lending is under process.
Due to the importance given by the state government, credit to agriculture for scheduled commercial banks has increased by 92% between 2015 to 2021 (from Rs.41,300 Crore in 2015 to Rs.79,689 Crore in 2021).
Crop loan waiverTaking the plight of the farmers into consideration, the Government of Telangana, while giving priority to the Agriculture sector has waived off the outstanding loans of the farmers in the state. Accordingly, between 2014-15 to 2018-19, the Government has waived off Rs. 16,124 Crores for 35,29,944 farmers of their outstanding crop loans, in (4) annual instalments in the state. The state government has initiated a second crop loan waiver of up-to Rs. 1,00,000 and during 2020-21, Rs. 733 crore is credited to 4.07 lakh farmers towards crop loan waiver.
4.4.3 Risk Mitigation-Rythu BimaIn order to ensure the economic and social security
to the farmers, the Government of Telangana has conceptualised and implemented an innovative scheme named as Farmers Group Life Insurance Scheme (Rythu Bima) since 2018. The main objective of the Farmers Group Life Insurance Scheme (Rythu Bima), is to provide financial relief and social security to the family members / dependents, in case of loss of farmer’s life due to any reason. In the event of the death of the enrolled farmer due to any cause including natural death, the insured amount of Rs 5.00 Lakhs is deposited into the designated nominee account within (10) days. The entire premium is borne by the state government without imposing any burden on the farmer and irrespective of their land holding size. From 2018-19, the Government has settled claims to an extent of Rs.3,763.80 Crores and transferred the amount to the 75,276 bereaved families10.
In the year 2020-21, 32.7 lakh farmers are enrolled under Rythu Bima and Rs.1,435 crore was disbursed to 28,708 farmers under the scheme. Out of the total claims from the beginning of the scheme, the highest claims settled belonged to the age group of
10 As on 24.02.2022
Figure 4.19
Claims Settled and Amount Disbursed Under Rythu Bima Between 2018-19 and 2020-21
Source: Department of Agriculture, GoTS
2018-19 2019-20 2020-21
Number of Claims Settled Amount Disbursed (Rs. crore)
17,661 18,983 28,708
883 949
1,435

57
49-59 yrs at 46% (30,279) followed by 39-48 age group at 36% (23,435).
4.4.4. Inputs-Irrigation, Free Power, Seeds and Fertilisers Timely and adequate availability of inputs is vital for enhancing crop productivity. State government maintains strict vigil and tracks the supply of seeds, fertilisers and pesticides to the farmers in the state. To improve irrigation facilities, the state government has come up with multiple initiatives and supplying 24x7 free power for agriculture. Telangana government is the only state in India which provides uninterrupted power facility to all farmers at no cost.
4.4.4.1 Seeds and FertilisersSeed is the most important and vital input for agricultural production. In fact, it is the most cost efficient means of increasing agricultural production and productivity. With favorable climate conditions and fertile soil, the state has an opportunity to become “Seed Bowl of the World”. Towards this, the state government initiated supplying of quality seeds to the farmers at affordable prices. State government has planned to distribute 1.92 lakh qtl of Green Manure seed under subsidy during 2021-22. Given the importance of fertilisers in improving productivity, the state government has made efforts to supply them on time. Between 2014-15 to 2020-21 overall fertiliser supplies have increased by 45% from 25.36 Lakh tonnes to 36.87 lakh tonnes.
Besides distribution, the state government is also involved in seed production and certification. Telangana State Seeds Development Corporation (TSSDC) is the Nodal agency meeting the seed requirement of the Department of Agriculture in the state. Seed Production of 2.45 lakh qtl. of different crop varieties is taken up during Vanakalam-2021 and in view of crop diversification, seed production of 2.35 lakh qtl. of Pulses, Oilseeds and Millets is organised during Yasangi 2021-22. Moreover, the state supplies
seeds to Andhra Pradesh, Tamil Nadu, Uttar Pradesh, Maharashtra, Rajasthan, Karnataka, Chhattisgarh.
Seed certificationTelangana State Seed & Organic Certification Authority (TSSOCA) main task is to maintain and make available high-quality seeds of notified varieties to the farming community through Certification process. In 2020-21, 1.5 lakh acres are registered under TSSOCA for production of certified seeds in the state. From 2019 to 2021, 306 farmers have been registered for organic certification in the state with an area of 2,981 acres.
4.4.4.2 Free power for agricultureSince 1st January, 2018, the Government of Telangana has been providing 24 hours free and quality power supply to agricultural consumers in the state. About 40% of power supplied in the state is towards agriculture. 6.39 lakh new agriculture connections have been released after the formation of the state with an investment of Rs. 3,196 crore, taking the total number of agricultural electricity connections to 25.63 lakh. Since 2014-15, the government has incurred an expenditure of Rs. 39,200 crore on subsidies to the agriculture sector towards free power supply. At the all India level, Telangana consumes highest percentage (41.25%) of electricity for agriculture purposes (24077 GWh out of total energy sold of 58,365 GWh)11.
Agriculture and Allied Activities
Table 4.1
Interstate Supply of Seeds From 2018-19 to 2021-22
2018-19 Paddy, Bengal Gram 17,641
2019-20 Paddy 21,000
2020-21 Paddy 55,143
2021-22 Paddy, Blackgram 13,722
CropYear Qty. in Qtls
Source: Department of Agriculture
11 Agriculture Statistics at a Glance, 2020, MoAFW, GoI

Telangana Socio Economic Outlook 202258
4.4.4.3 Improving Irrigation FacilitiesAssured irrigation is critical for crop cultivation and farmer incomes, because it boosts productivity and protects farmers from poor monsoons. In addition, assured irrigation can improve water usage efficiency and help maintain groundwater level. After formation of the state, government has incurred an expenditure of Rs.1,28,596 Cr on Major & Medium Irrigation Projects because of which Gross Irrigated Area (GIA) has significantly increased by 119% between 2014-15 and 2020-21 and so far an Irrigation Potential (IP) of 72.70 lakh acres stands created. The increase has been driven by the Government’s efforts to augment water resources in the state on a priority basis. Various initiatives of the state government led to a marked increase in the gross irrigated area as shown in Fig 4.20.
Measures to improve irrigation
The Government adopted a multi-pronged approach to drastically scale up the irrigation coverage in the state. The strategy adopted includes the following:
l Taking up new irrigation projects and Lift Irrigation schemes such as the Kaleshwaram,
Palamuru-Rangareddy, SitaRama Lift Irrigation projects and the J. Chokka Rao Devadula Lift Irrigation Scheme (LIS).
l Restoration of all minor irrigation tanks and water bodies in the state under ‘Mission Kakatiya’.
l Modernization of old projects such as Nagarjuna Sagar, Nizam Sagar and Sri Ram Sagar Projects.
l Effective operation and maintenance of irrigation systems for achieving better water use efficiency and crop productivity.
Some of the flagship projects undertaken in the state such as Kaleshwaram lift irrigation project, Mahatma Gandhi Kalwakurthy Lift Irrigation Scheme (MGKLIS) and J Chokkarao Devadula Lift Irrigation Scheme (JCRDLIS) have drastically increased access to irrigation facilities in the state. Progress made under irrigation projects after formation of the state are detailed in Table 4.2.
Micro IrrigationMicro Irrigation is being encouraged on a large scale mainly for horticulture crops by providing drip and sprinkler systems with a unique subsidy pattern for enhanced water and fertiliser use efficiency thereby enhancing income of farmers. An impact assessment done by Professor Jayashankar Telangana Agricultural University on Telangana State Micro Irrigation Project (TSMIP) indicates that, in the demonstration plots there was 8.8 to 53.3% water savings, 30.1 to 110.6% enhancement in fertiliser use efficiency and 15.4 to 27.3% reduction in production costs in different fruits, vegetables and commercial field crops when compared to surface irrigation method12.
Through the project, an area of 7.17 lakh Ac has been brought under Micro Irrigation with an amount of Rs.
Figure 4.20
Trends in Gross Irrigated Area (All Sources) Between 2014-15 and 2020-21 (in Lakh Acres)
Source: Directorate of Economics and Statistics, GoTS
2014-15 2015-16 2016-17 2017-18 2018-19 2019-20 2020-21
62.4850.10
74.32 78.38 77.37
113.27
136.86Gross Irrigated area (Lakh Acres)
12 Rao, V. Praveen, and H. P. Singh. "Telangana State Microirrigation Project: A Special Purpose Vehicle to Avert Water Scarcity and Enhance Yield, Incomes and Environmental Sustainability." International Journal of Innovative Horticulture 8, no. 2 (2019): 82-91.

59
1,924.96 crore and benefitted 2.7 lakh farmers. To encourage the farmers to cultivate vegetables and flowers, the state government launched a flagship program in 2014-15 for setting up of Poly houses. Till date, an area of 1,324.47 acres covered under Polyhouses across the State reaching out to 1,190 farmers with expenditure of Rs 291.68 Cr. Further an additional area of 28,819 Acres was brought under Fruit crops like Mango, Citrus, Pomegranate, Guava etc.
4.4.4.4 Farm MechanisationThe main objective of Farm Mechanisation is to improve the Farm Power availability by supplying various farm machinery through Custom Hiring
Centres (CHCs) on subsidy to improve the productivity of the crops. With the aim to promote farm mechanisation, a new scheme is being implemented by Telangana government to provide farm equipment at subsidised rates to farmers. The state government aims to double the farm mechanisation from the existing 45 percent to 90 percent in the state over the next three to four years to tackle the problem of farm labourers. Since formation of the state, an amount of Rs. 951.28 crore was spent on farm mechanisation (providing farm implements such as tractors, harvesters and tarpaulins etc.), which benefitted 6.66 lakh farmers. The state government has provided 19,352 tractors after the formation of the state because of which
Agriculture and Allied Activities
Table 4.2
Achievement and status of irrigation schemes after formation of Telangana State
Source: Irrigation & CAD Department, GoTS
Construction of Projects
Restoration of MI Tanks
Construction of Check dams
IP Utilization
Improvement in Ground water
Fisheries
Small LI Schemes not functioning effectively.
Repairs were taken up as and when breaches occurred.
Very few.
Due to unassured water supply, IP utilised was very low about 20 lakh acres against 57.86 lakh acres created.
-
No specific interest shown
Major Projects commissioned.1) Kaleshwaram project (18.25 Lakh acres), 2) Sita Rama Lift Irrigation Scheme (3.87 Lakh acres), 3)J.Chokka Rao Devadula Lift Irrigation Scheme (5.58 Lakh acres), 4)Rajeev Bhima Lift Irrigation Scheme (2.03 Lakh acres), 5)Mahatma Gandhi Kalwakurthy lift irrigation scheme (4.24 Lakh acres), Jawahar Nettampadu Lift Irrigation Scheme (2.00 Lakh acres).
27,665 Tanks restored with an expenditure of Rs.5349 Cr, stabilizing an ayacut of 15.05 Lakh acres. 8.93 TMC of storage capacity is restored.
1,200 Checkdams sanctioned for Rs. 3850.00 Crs. In Phase-T, 638 checkdams are in progress and remaining 562 to be taken up under phase-II.
Due to construction of various projects, lifts, Restoration of MI tanks, Check dams, the IP utilized has increased to 85.89 Lakh acres during 2020-21 and our state became a major Paddy production state.
Ground water has increased 4.14 mt in the last 6 years.
The state is ranked 3rd in inland fishery resources and 8th in Fish production.
Description of Initiative
Before Formation of Telangana
Achievement after Formation of Telangana State

Telangana Socio Economic Outlook 202260
farm power availability (in terms of availability of tractor) of Telangana stands at 2.886kW/ha (1.075 kW/ acre) which is higher than the national average of 1.35 kW/ha (0.54 kW/ acre). As per estimates by NABCONS, the state is projected to achieve the farm power availability of 3.5 kW/ha (1.4 kW/ acre) by 2024 and 4.0 kW/ha (1.6 kW/ acre) by 2030, in the State.
4.4.5. Agriculture Extension through Rythu VedikaThe Government of Telangana has taken an initiative to bring farmers under one platform and help them attain higher returns by constructing RythuVedika (RV) in every Agriculture Extension Offi cer Cluster consisting of 1-3 villages. A total of 2601 RV’s were proposed and currently 2595 have already been constructed. Each RV has been constructed at a cost of Rs. 22 lakhs with a share of Rs. 12 lakhs from the Department of Agriculture and Rs. 10 lakhs from MGNREGA funds. These RVs Created to allow farmers to share information on the crops,
market in order to grow remunerative crops. Further Telangana Rythu Bhandu Samithi (TRBS) has formed committees at village, Mandal, District and state level with a force of 1,60,990 members who will act as bridge between farmers and Agriculture and Allied Departments for transfer of technology. Further, the State government initiated construction of multi-purpose cement ‘Kallams’ (drying platforms) across the State for farmers to dry their agricultural produce, particularly grains. Until now, 49,170 Drying Platforms have been grounded and 19,309 are completed with an expenditure of Rs. 124.00 crore.
4.4.6. Structural ReformsAs pointed out by the Committee on Doubling Farmers Income chaired by Dr. Ashok Dalwai, one of the weakest links in the agriculture value chain is getting access to markets as well as to receive information on which crops to grow. With the increase in production, there are chances of supply demand shocks which in turn result in
Figure 4.21
District Level Crop Diversifi cation Index for 2020-21
Note: Districts arranged in descending order of index value.Source: Department of Agriculture, GoTS
Crop Diversifi cation
Index
Crop Diversifi cation
Index District District
0.800.780.760.750.740.710.710.690.680.680.660.650.640.610.600.60
0.580.570.570.560.550.530.520.500.450.440.430.420.400.360.340.33
NirmalVikarabad
SangareddyRangareddy
JogulambaWarangal Rural
NarayanpetMahabubnagar
NagarkurnoolKhammam
KamareddyBhadradri
MahabubabadMedchal-Malkajgiri
AdilabadJayashankar
SiddipetJangaon
Warangal UrbanNalgonda
MancherialWanaparthy
YadadriKumuram Bheem
MuluguNizamabad
RajannaJagtialMedak
SuryapetKarimnagar
Peddapalli
Crop Diversifi cation Index
0.33 to 0.420.42 to 0.520.52 to 0.610.61 to 0.710.71 to 0.80
Crop Diversifi cation Index
0.33 to 0.420.42 to 0.520.52 to 0.610.61 to 0.710.71 to 0.80

61Agriculture and Allied Activities
Figure 4.22
Mandal Level Crop Diversification Index for 2020-21
Source: Department of Agriculture, GoTS
CDI0.01 -0.190.20 - 0.370.38-0.540.55-0.720.73-0.90District Boundary
less remuneration for farmers. Towards this state government has initiated multiple strategies in terms of pushing for crop diversification (through support for Oil Palm and other horticulture crops) and has given importance to allied sectors to diversify the income of farmers.
4.4.6.1. Crop DiversificationSustainable agricultural growth in the state requires crop diversification. This will make farmer incomes more resilient to fluctuating prices and help them realise higher farm incomes. State government has emphasised on the importance of crop diversification, in order to avoid glut in production
and recommended crops like Ground nut, Sun flower, Sesamum, Bengal gram, Black gram, Green gram, Castor, Mustard, Kusuma, Oilpalm and Jowar. In 2020-21, there was significantly greater crop diversification (as measured by a crop diversification index13) in Nirmal, Vikarabad and Sangareddy (the three most diversified districts), compared to Peddapalli, Karimnagar and Suryapet (the three least diversified).
Mandal level index has also been prepared across the districts of the state. Fig 4.22 projects the mandal level crop diversification Index for the year 2020-21.
13 The Index of Crop Diversification (CDI) value ranges between 0 and 1 and higher the value, greater the diversification. Gibbs and Martin’s Method for Demarcating Crop Diversification has been used to compute Index of Crop Diversification. Index of Crop Diversification = 1 - [ Σx2 / (Σx)2 ] where X is the percentage of total cropped area under an individual crop.

Telangana Socio Economic Outlook 202262
4.4.6.2. Oil palm cultivation
Oil palm cultivation assumes signifi cance for augmenting the indigenous availability of edible oil as it is the highest oil yielding perennial crop. With good planting material, irrigation and proper management, oil palm has the potential to increase income of the farmers. Also oil palm produces 10 to 46 times more oil per hectare compared to other oilseed crops and has yield of around 4 tons oil per ha. Thus, it has enormous potential for cultivation.
Opportunity for the stateThe consumption of edible oil in India is at 22 Million MTs per annum with a per capita consumption of 16 kg/ person whereas the production is only 7 million MTs. The defi cit of 15 Million MTs of edible oil is being met through imports from Indonesia and Malaysia spending huge foreign exchange. Out of the total edible oil imports, Palm oil accounts to 60% i.e., 9-10 Million MTs of the total imports worth of Rs.60,000 to Rs.70,000 crores per annum.
At present, Oil Palm cultivation is taken up in 3.30 lakh Ha (8.25 lakh acres) with an annual Fresh Fruit Bunches (FFB) production of 16.85 Lakh MTs and Crude Palm Oil (CPO) production of 2.81 Lakh MTs in India. To attain self-suffi ciency under oil palm in India, an additional area of 28 lakh Ha (70 lakh acres) is required.
Telangana Stands 6th in Oil palm area with 21,382 Ha (53,455 acres), 1st in productivity (8 MT of FFB per acre) and 1st in Oil Extraction Rate (OER) with 19.22 % (2020-21) in the country. The State production of Crude Palm Oil is around 0.45 Lakh MT against the requirement of 3.66 Lakh MT.
Considering the potentiality for Oil Palm cultivation in Telangana, the state government is planning to take up 20 lakh acres under Oil Palm in a mission mode as part of crop diversifi cation and has notifi ed
26 districts for oil palm cultivation and during 2022-23, state government is planning to cover 1.00 lakh ha (2.5 lakh acres) with an outlay of Rs.471.93 crores (GoI share: Rs.283.16 crores & State share: Rs.188.77 crores) and rest of the area in the subsequent years. Around 11 Oil processing units are operating in the state at present. To augment the Oil Palm cultivation in the state, the Government of Telangana is providing a subsidy of Rs. 26,000 per acre to oil palm farmers in the fi rst year, Rs. 5000 per acre each in second, third and fourth year as a crop investment incentive and also can avail assistance on Micro/drip Irrigation (at Rs. 23,000/Hectare). The main objective of extending subsidies to the farmers is to attract farmers to shift to oil palm cultivation.
14 Provisional
Figure 4.23
Oil Palm Production in Telangana Between 2014-15 and 2019-20(P)14 Production in Telangana (in MT)
Source: Agriculture Statistics at a Glance, MoAFW, GoI
2014-15 2015-16 2016-17 2017-18 2018-19 2019-20 (P)
5.10 5.81 6.82 8.99 12.03 13.52
57,87375,447
88,119
1,47,516
1,97,632
2,08,826
Share of Telangana in India production (%)

63
To ensure the availability of the oil palm seedlings at the village level, the government decided to set up palm nurseries in coordination with the Forest Development Corporation, Panchayat Raj and Rural Development departments.
Organic Farming With an aim to promote sustainable agriculture, the state government initiated promotion of organic agriculture. There are two significant areas where organic systems have higher yields compared to conventional systems. Under conditions of climate extremes and in smallholder systems15. With around 88% farmers in the smallholder category, Telangana state has the potential to be a model for others to follow. Organic farming has advantages in terms of keeping the Organic farming has the potential to produce high quality food, enhance natural resource base and environment, increase income (coming from premium price on the produce, even in the face of a slight dip in the yields) and contribute to the wellbeing of the farmers.
4.4.6.3. Enhancing farmers income
through Animal HusbandryThe Doubling Farmers Income strategy of Government of India has recommended that, to increase farmers income, it is necessary for farmers to diversify into non-farm income as well as stress upon improving the necessity of livestock productivity. Animal Husbandry provides an additional income and employment to the farmers, especially during unpredictable weather patterns. Telangana state has given importance to the livestock sector and come up with schemes to support farmers with various schemes. This led to growth in milk, eggs and meat production over the years and at all India level for the year 2019-20, Telangana stands at 5th in meat production (9.86% contribution to national production), 3rd in egg production (12.94% contribution to national production) and 13th in milk production (2.82% contribution to national production).
The sustained growth in the livestock sector can be attributed to various schemes of the state government. Over the years, the state government introduced schemes with an integrated outlook to develop the sector. Fig 4.24 shows the trends in
Agriculture and Allied Activities
Farmers in Nagasamudram village of Dandepally mandla in Mancherial district have adapted to organic farming for the last three years and grown black and Red rice in their farms. With a yield of 21 Kwt/acre, farmers who adopted Black and Brown rice had an income around Rs3.5 lakh/acre in the Kharif 2021, compared with an income of Rs 50-60 thousand/Acre in traditional means of agriculture. This shows the way for other farmers to follow in the state and get more
remuneration from agriculture. Recently, a couple of farmers in Siddipet and Bhadradri kothagudem district have also successfully grown black and red rice.
Apart from economic benefits, Black and Brown rice have health benefits too as they have many nutrients (protein, fats, carbohydrates, natural fibre, iron and calories). Being rich in antioxidants, they can prevent cardio-vascular diseases, diabetes and even cancer.
Box 4.3
Innovative Farming: A Case study
15 Volume VI, “Strategies For Sustainability in Agriculture”, Report of the Committee on Doubling Farmers Income.

Telangana Socio Economic Outlook 202264
production of Meat, Milk and Eggs between 2014-15 to 2020-21.
Sheep Rearing and Development Programme (SRDP)SRDP was introduced by the state government to develop the economic standards of the shepherd communities by supporting the traditional shepherd families with supply of (20+1) sheep with a unit cost of Rs.1.25 lakh with a subsidy component of 75% and a total project outlay of Rs.5,000 crores. From introduction of the program (2017) to till date, a total of 79.98 lakh sheep have been distributed to 3,80,878 members of Primary Sheep Breeder Cooperative Societies. Keeping the rise in cost of Sheep in the open market and also increase in transportation prices, in the Phase II of the SRDP program (2021-22 and 2022-23), the Government has enhanced the Unit cost from Rs.1,25,000/- to Rs.1,75,000/- with a beneficiary target of 3.5 lakhs. After the implementation of the scheme, the meat production in the state has seen a growth rate of 43.5% (in between 2016-17 to 2019-20) from 5.9 lakh tonnes to 8.5 lakh tonnes only behind Karnataka (with a growth rate of 45% in the same period).
Dairy sectorDairy sector is an important way for farmers to increase their earnings and access to more nutritious food for their families. To encourage farmers to take up dairying, the state government has introduced a scheme to provide Rs.4/- as incentive per litre of milk collected to the members of Cooperative dairies by directly crediting the amount to their bank accounts every month. An amount of Rs.100.00 Crore is spent per annum. About 2.93 Lakh Milk pourers have been benefited every year. An amount of Rs.343.00 Crore is spent on this Programme in between 2014-15 and 2020-21. Between 2014-15 and 2020-21, milk production has seen a growth of 37% (from 42 lakh tons in 2014-15 to 57.6 lakh tons in 2020-21. This has also led to an increase in per capita availability of milk from 321gm/day in 2015 to 410gms/day in 2020.
FodderWith 138.92 Lakh livestock units across the state, fodder plays a vital role in the production and green fodder is essential for high yielding dairy animals to enhance productivity. State government has stressed upon supply of fodder seed to motivate the farmers to cultivate and make available fodder locally. Accordingly 797 MTs of fodder seed were supplied in 2020-21 with an output of approximately
Figure 4.24
Production of Meat, Milk and Eggs in Telangana Between 2014-15 and 2020-21
Milk (Hundred Tonnes)
4,20,726
4,44,245
4,68,109
4,96,537
5,41,613
5,59,021
5,76,500
1,06,185
1,12,058
1,18,186
1,26,700
1,36,868
1,48,055
1,58,470
5,05,050
5,42,050
5,91,040
6,45,030
7,54,060
8,48,156
9,20,250
Eggs (Million Numbers) Meat (Tonnes)
Source: Animal Husbandry Department
2014-15
2015-16
2016-17
2017-18
2018-19
2019-20
2020-21

65
1.60 Lakh MT of dry fodder. An amount of Rs. 442.52 lakhs budget is indicated under Feed and Fodder Development programme during the year 2021-22.
PoultryWith an annual output of 1,586 crore eggs in 2020-21, Telangana stands 3rd in egg production in the country. To incentivise the sector, the state government is providing free power upto 200/unit to 5,894 poultry farms from 2015 onwards. As per the latest data from RBI, in the year 2019-20, with a contribution of 12.94%, to total egg production in the country, Telangana state is 3rd top contributor to the production of eggs.
AquacultureFisheries is one of the fast growing sectors generating income and employment in the state of Telangana. The sector plays an important role in the overall socio-economic development of fisher families in Telangana by providing nutrition & food security. Telangana is the only state where all suitable water bodies are stocked with adequate numbers of quality fish seed by providing 100% grant. To provide employment opportunities to women groups, 150 numbers of customised vehicles, designed for dual usage of raw fish sales and Ready-to-Eat fish food are being provided in GHMC limits and in the districts with an outlay of Rs. 15.00 crores. For the welfare of the fisheries community, a group accident insurance scheme has also been launched by the state government from 2014-15. The incentives along with the support led to an increase in Fish and Prawns production over the years. Fish and Prawns production increased from 2.68 lakh tonnes (2.6 lakh tons of Fish and 8.3 thousand tons of Prawns) in 2014-15 to 3.48 lakh tonnes (3.4 lakh tons of Fish and 11.7 thousand tons of Prawns) in 2020-21. The value of the production also increased from ₹2,637 Cr to ₹5,229 Cr in the same period.
4.4.7. Market LinkagesWhile increased productivity is an essential component of a vibrant agricultural sector, improved marketing connectivity, post harvest handling and processing is essential to ensure high quality products reach the market. Effective post harvest management allows not only the minimisation of losses but also increases the value of marketed agriculture products. Below are details of state government initiates in this regard.
4.4.7.1. ProcurementWell-organised, efficient, and timely procurement of paddy and rice by the government from the farmers has reduced their dependence on middle-men for selling of their produce. This has further nudged farmers in the direction of increased cultivation. To
Agriculture and Allied Activities
Figure 4.25
% Contribution of Non Special Category States to National Egg Production in 2019-20
Source: RBI Handbook of statistics on Indian Economy 2020-21
Share (%)
Andhra Pradesh
Tamil Nadu
Telangana
West Bengal
Karnataka
Haryana
Maharashtra
Punjab
Uttar Pradesh
Bihar
Rajasthan
Odisha
Madhya Pradesh
Kerala
Chhattisgarh
Gujarat
Jharkhand
Goa
19.17
17.50
12.94
8.51
5.81
5.78
5.57
4.93
2.98
2.40
2.36
2.08
2.08
1.91
1.77
1.69
0.61
0.03
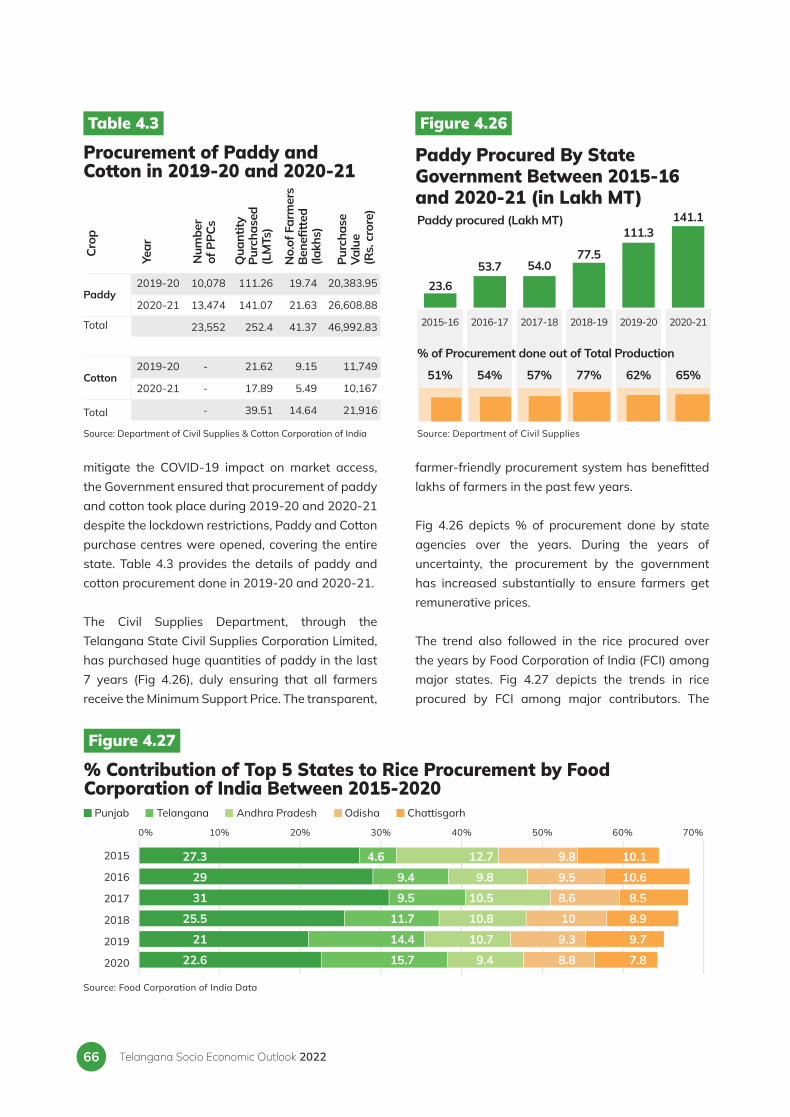
Telangana Socio Economic Outlook 202266
mitigate the COVID-19 impact on market access, the Government ensured that procurement of paddy and cotton took place during 2019-20 and 2020-21 despite the lockdown restrictions, Paddy and Cotton purchase centres were opened, covering the entire state. Table 4.3 provides the details of paddy and cotton procurement done in 2019-20 and 2020-21.
The Civil Supplies Department, through the Telangana State Civil Supplies Corporation Limited, has purchased huge quantities of paddy in the last 7 years (Fig 4.26), duly ensuring that all farmers receive the Minimum Support Price. The transparent,
farmer-friendly procurement system has benefi tted lakhs of farmers in the past few years.
Fig 4.26 depicts % of procurement done by state agencies over the years. During the years of uncertainty, the procurement by the government has increased substantially to ensure farmers get remunerative prices.
The trend also followed in the rice procured over the years by Food Corporation of India (FCI) among major states. Fig 4.27 depicts the trends in rice procured by FCI among major contributors. The
Table 4.3
Procurement of Paddy and Cotton in 2019-20 and 2020-21
Cro
p
Paddy
Total
Total
Cotton
2019-20
2020-21
2019-20
2020-21
10,078
13,474
23,552
-
-
-
111.26
141.07
252.4
21.62
17.89
39.51
19.74
21.63
41.37
9.15
5.49
14.64
20,383.95
26,608.88
46,992.83
11,749
10,167
21,916
Year
Num
ber
of P
PCs
Qua
ntity
Pu
rcha
sed
(LM
Ts)
No.
of F
arm
ers
Ben
efi tt
ed
(lakh
s)
Purc
hase
Va
lue
(Rs.
cro
re)
Source: Department of Civil Supplies & Cotton Corporation of India Source: Department of Civil Supplies
2015-16 2016-17 2017-18 2018-19 2019-20 2020-21
51% 54% 57% 77% 62% 65%
% of Procurement done out of Total Production
Figure 4.26
Paddy Procured By State Government Between 2015-16 and 2020-21 (in Lakh MT)Paddy procured (Lakh MT)
23.653.7 54.0
77.5
111.3141.1
0% 10% 20% 30% 40% 50% 60% 70%
Figure 4.27
% Contribution of Top 5 States to Rice Procurement by Food Corporation of India Between 2015-2020
Punjab Telangana Andhra Pradesh Odisha Chattisgarh
2015
2016
2017
2018
2019
2020
Source: Food Corporation of India Data
27.3
29
31
25.5
21
22.6
4.6
9.4
9.5
11.7
14.4
15.7
12.7
9.8
10.5
10.8
10.7
9.4
9.8
9.5
8.6
10
9.3
8.8
10.1
10.6
8.5
8.9
9.7
7.8

67
share of Telangana state has seen a sustained increase over the years and despite the recent vagaries from the central government, out of total procurement Telangana state has contributed around 16%. Further the state government has requested clarification from the central government on procurement, so that farmers get guidance on which crops to grow and get remunerative prices.
Coming to the procurement of cotton, Fig 4.28 provides the details of cotton procured by Cotton Corporation of India in 2019-20. It is important to note that almost 50% of total procurement done by CCI in India comes from Telangana state.
4.4.7.2 Milling and warehouse capacity in the stateSince the formation of Telangana, the state has consciously worked towards building agricultural infrastructure capacity. There are 2200 Rice Mills all over the State with a capacity to mill one crore tonnes of rice per year.16 In the past, these mills could not get the Paddy to their capacity. Due to the state’s progressive agriculture focused policies, the situation has changed and there is an abundant
supply of Paddy. Further, with 24-hour uninterrupted power supply, Rice Mills have the ability to mill more rice. However, given the drastic increase in Paddy production there is a need to build more new Mills. The government plans to facilitate this by creating a conducive environment for rice millers.
Further, Telangana State Warehousing Corporation was set up by the State Government to build out the state’s warehousing capacity. Since 2014 this statutory body has successfully increased the state’s average warehouse capacity by nearly 140% from 9 lakh MT to 23 lakh MT, the total number of warehouses increased from 70 to 313 since the formation of the state. Moreover, an additional 3 lakh MT capacity is being built in the state, funded by TS Warehousing Corporation’s profitable operations.
4.4.7.3. Agriculture exportsAgricultural exports are expected to play a pivotal role in doubling farmers income and linking agriculture production to the export market is a critical step in achieving the same. State government has been working towards strengthening these linkages. Among the exports from the agriculture
Agriculture and Allied Activities
16 https://cm.telangana.gov.in/2020/03/integrated-grain-and-rice-policy-in-telangana/
Figure 4.28
Details of Procurement of Cotton by Cotton Corporation of India in 2019-20 (in Lakh Qtls)
Source: Ministry of Agriculture and Farmers Welfare, GoI
Cotton procured (Lakh Qtls)
Telangana
Maharashtra
Gujarat
Haryana
Madhya Pradesh
Punjab
Rajasthan
Karnataka
Andhra Pradesh
Orissa
205.6190.38
31.116.1215.2414.7213.8811.3411.18
7.75
Figure 4.29
Year-wise Average Warehouse Capacity in Telangana between 2014-15 to 2020-21 (in Lakh MT)
Source: Department of Agriculture, GoTS
Total Avg. Capacity (in MTs)
2014-15 2015-16 2016-17 2017-18 2018-19 2019-20 2020-21
9.79 10.747.60
10.68
21.59
25.74 26.25

Telangana Socio Economic Outlook 202268
and allied sectors in the state, cereals, spices, meat and cotton make up the top commodities. The state also exports seeds to 18 countries in the world 65% seed requirement of the country is met by the state.
4.4.7.4. Food ProcessingThe State has come up with Telangana State Food Processing policy with an objective to set up food processing units, in view of rising food production in the State. Telangana accounts for substantial agricultural produce ranging from rice, maize, lemon, grapes, mango and soybean. In particular, the State accounted for the highest production of turmeric and sweet orange, third highest production of tea and coffee, and the fourth highest production of marine fish. Under the new policy, Rice mill industries, pulses, oilseeds, fruits, flowers, vegetables, meat, chicken, fish, milk, and dairy products food processing units would be set up.
The policy aims to create 10,000 acres of special food processing zones across the State to support
the additional 53 lakh acres area brought under irrigation till 2024-25 and to attract a total of Rs.25,000 Crores of capital investment to establish food processing enterprises and generate direct employment for approx 70,000 personnel.
Further, the state government is working with GoI in “Formalisation of Micro Food Processing Enterprises” with an outlay of Rs.10,000 Crore to be implemented over a period of five years from 2020-21 to 2024-25. Under the proposed scheme, micro food enterprises will be supported with a package of services including a credit linked subsidy @ 35% of the eligible project cost with a ceiling of Rs.10 Lakhs for expansion and modernization of their units. The scheme focuses on One district One product (ODOP) approach which will be applicable for all new units being set up. The target for Telangana for grounding of units for FY22 is 1,168. The total applications registered in the portal is 1,510 out of which 1122 applications have been submitted as on 31st December, 2021. The applications are at various stages of the sanction process and 78 loans are sanctioned as on 31-Dec-21. In FY22, Seed Capital amount of Rs.24.84 Crores has been sanctioned and disbursed to 6,307 SHG members from SERP.
e-NAMNational Agriculture Market (e- NAM) was launched with a vision to promote uniformity in agriculture marketing, integrate markets across the country and to eliminate information asymmetry. Around 175 commodities which include food grains, Oil seeds, Fruits and Vegetables are traded on e-NAM. Currently, e-NAM is implemented in 57 Agricultural Market Committees (AMC) across the state. The AMC, Nizamabad has been awarded the Prime Minister’s Excellence award for successful implementation of e-NAM. The state is the first in
Figure 4.30
Agriculture and Allied Exports in 2020-21-Telangana (in Rs. Cr)
Source: State Export Commissioner, Commerce & Export Promotion Dept GoTS
Exports in 2020-21 (in Rs. crore)
Cotton1,268
Spices, Coffee, Tea & Mate 1,124
Cereals1,137
Meat and Edible Meat Offal
508

69
the country to implement Weighing Integration and Payments under e-NAM. A brief account of achievements under e-NAM and year wise data on transactions under e-NAM are provided in Table 4.4.
4.5. Way ForwardSince the formation of the state, Telangana has made major strides in the Agriculture and Allied Sectors. To reduce the burden on farmers in engaging labour for agriculture activities, the state legislature has passed a resolution to integrate MGNREGA with agriculture activity so that cost of labour is partially borne by the governments along with farmers. Sustainable agriculture growth in the state requires
crop diversification including the adoption of oilseed production and shifting towards more profitable. This would ensure farmers’ income to become more resilient to price fluctuations and might also help them. The state government has drawn up plans for a large scale diversification initiative to wean away farmers from paddy and migrate to multi cropping which would increase farmers’ incomes and also help them to export the surplus.
To improve accuracy of area and yield estimations, the Government of Telangana is implementing ‘Crop Booking Enhancement’ and is planning to pilot Improved Area Estimation through Remote Sensing in Yasangi 2021-22. The Government also plans to put advanced personnel management and supportive supervisory practises to improve beneficiary (farmer) experience. Commensurate with the increased agricultural production, the Government has introduced a ‘Food Processing Policy’ that focuses on innovation, agri-tech startups and the supply of good quality seeds and technology practises to the farmers that enable them to compete at a global platform. Furthermore, through this policy, the Government intends to increase the capacity to process the surplus produce from the agriculture, horticulture, animal husbandry, milk, and fisheries sectors.
Agriculture and Allied Activities
Quantity Traded 41,76,606 MT
Volume 13,587 Crores
Number of traders registered 5,730
Number of commission agents registered 4,682
Number of farmers registered 18,23,522
Table 4.4
Achievements Under e-NAM (as of 31st October 2021)
Source: Agriculture Marketing Department

Telangana Socio Economic Outlook 202270
INDUSTRIES
CHAPTER
05

71
l The development and promotion of industries is an important policy priority of the Government and in the year 2021-22, the sector contributed 20.40% to the state’s Gross Value Added (GSVA) at current prices, besides providing employment to 18.23% of the working population in the state (2019-20). Between 2020-21 and 2021-22, the GVA of the Industrial sector increased by 20.23%.
l During 2014-15 to 2021-22, the Compounded Annual Growth Rate (CAGR) for Gross Value Added at current prices of 3 out of 4 sub-sectors under the industries was higher than the CAGR at the national level. The Mining and Quarrying CAGR in Telangana was roughly 1.5 times that at the national level, while the Manufacturing CAGR was 1.4 times the national level, and the Electricity and Utilities CAGR was roughly 1.3 times the national CAGR.
l According to the Periodic Labour Force Survey 2019-20, ‘Manufacturing’ and ‘Construction’ are two major sub-sectors of employment generation in the state, employing 10.69% and 6.62% of the total working population respectively.
l In the year 2021-22 (until January 2022), 3,185 approvals have been given through the TS-iPASS, bringing in new investments worth Rs.6,965 crore.
l As per the Export Preparedness Index 2020 published by NITI Aayog,
Telangana ranked second among the land-locked states and sixth overall in terms of Export Preparedness.
l During 2020-21, Telangana exported merchandise goods worth Rs.64,539 crore. Pharmaceutical goods and Organic Chemicals constituted 65% of the total goods exported. The USA was the largest importer of goods from Telangana, importing over 26.3% of all exports by value.
l Since 2016, Telangana has consistently ranked among the top 3 states in India in the Ease of Doing Business ranking since its introduction. This is also reflected from the state’s efforts through initiatives such as TS iPASS, T-PRIDE, and support by establishing a land bank of 1.5 lakh acres and 63 Special Economic Zones.
l Telangana has evolved from being a power deficit state in 2014 to a power surplus state, with a contracted capacity of 16.6 GW by August 2021, supplying uninterrupted electricity to more than 16 lakh industrial units in the state.
l Facilitating the growth of the textiles sector in the state, the Government has attracted over Rs. 2,000 crore in investment from companies like Kitex, Youngone Corporation, and Ganesha Ecosphere at the Kakatiya Mega Textile Park. Taken together, the major industrial parks are expected to generate 5 lakhs new jobs.
Key Highlights
Industries

Telangana Socio Economic Outlook 202272
5.1. Role of Industry and its Contribution to the State Economy
lobally, industrial sector has driven economic growth and increased labour productivity since the Industrial Revolution
in the 16th century. Several new industrialised nations, like South Korea, Singapore, Taiwan, relied on industrial policy and promotion of manufacturing to achieve high growth rates, and are now amongst the richest nations in the world. The productivity-enhancing and labour-absorbing effects of the sector are primary reasons behind the success of an industry-led growth strategy in these countries. Thus, an enabling environment that expands the industrial sector is crucial to the prosperity of any society.
In Telangana too, the Industry sector plays a pivotal role in strengthening the state economy and in creating significant livelihood opportunities. During 2021-22, the total GVA (current prices) from the industrial sector (including ‘Mining and Quarrying’) stood at Rs. 2,12,069 crore. This is 20.4% of Telangana’s Gross State Value Added (GSVA).
In 2021-22, the GVA of the Industrial sector in Telangana grew by 20.23%. For the same period, at the national level, the industrial sector GVA grew by 25.93% in nominal terms. The accelerated increase in the industrial sector GVA of Telangana suggests that the shocks from the COVID-19 pandemic were transitory, and reflects the resilience of the sector, supported by growth-focused industrial policies pursued by the Government.
5.1.1. Sub-sectoral Analysis5.1.1.1. Sub-sectoral Contribution
Of the total value added by the industrial sector, 56.90% of the nominal GVA contribution comes from the ‘Manufacturing’ sub-sector, while the rest is from the ‘Construction’, ‘Mining and Quarrying’, and ‘Electricity and other Utilities’ sub-sectors (see Figure 5.1).
5.1.1.2. Sub-sectoral Growth
Three out of four key sub-sectors achieved a higher Compound Annual Growth Rate (CAGR) of sub-sectoral GVA than the national counterparts between 2014-15 and 2021-22 (see Figure 5.2), reflecting Telangana’s rapid economic advancement, and its ability to attract investment through initiatives such as the Ease of Doing Business Reforms, the provisioning of world-class infrastructure, and the furnishing of competitive financial concessions to potential investors. Of the four key sub-sectors within Industries, Electricity and other Utilities has
G
Figure 5.1
Contribution of the sub-sectors to Industry GSVA at current prices in Telangana (2021-22)Total GSVA From Industries (2021-22): Rs. 2,12,069 crore
Source: Ministry of Statistics and Programme Implementation, Government of India, 2022
Manufacturing56.9%
(Rs. 1,20,665 crore)
Construction19.9%
(Rs. 42,229 crore)
Mining & Quarrying14.7%
(Rs.31,208 crore)
Electricity & Utilities8.5%
(Rs. 17,967 crore)

73
seen the highest growth between 2014 and 2022. As shown in Fig. 5.2, the nominal GVA of Electricity and other utilities witnessed a 13.64% Compound Annual Growth Rate (CAGR) between 2014-15 and 2021-22, roughly 1.3 times the national CAGR for the sub-sector. This is followed by Manufacturing, with a CAGR of 12.01%, roughly 1.41 times the national CAGR for the sub-sector. The CAGR of the Mining and Quarrying sub-sector, at 11.35%, was 1.48 times that at the national level during this period. 5.1.1.3. Employment ContributionThe Periodic Labour Force Survey 2019-20 reports that 18.23% of all working adults in the state are employed by the industries sector. This is approximately 25,69,134 working adults in the state engaged in industry sector1. Within the sector, Construction and Manufacturing are sub-sectors that provide the largest share of employment to the
workforce in the state, employing 6.6% and 10.7% of the state’s working adults respectively (Figure 5.3). The other two sub-sectors together employ 0.93% of the state’s workforce.
5.2. Major Initiatives of the State to Promote Industrial Development5.2.1. Telangana State-Industrial Project Approval and Self-Certification System (TS-iPASS)TS-iPASS was enacted in 2014 to ease the administrative burden of setting up industries in the state. The system enabled by TS-iPASS provides clearances to all projects within 30 days, which is one of the shortest periods across the country.
1 All absolute figures on employment in industries are estimated figures calculated based on PLFS data, and may vary slightly from the actual figures.
2 All figures are estimated from PLFS 2019-20, and might differ slightly from actual figures.
Figure 5.2
Sub-sector wise CAGR of GVA at current prices within Industries for Telangana and India (2014-15 to 2021-22)
TelanganaGrowth (%) India
Source: Ministry of Statistics and Programme Implementation, Government of India, 2022
Mining and quarrying
Manufacturing Electricity, gas, water supply & other utility
services
Construction
7.69 8.51
10.57
8.22
11.35 12.0113.64
6.16
Figure 5.3
Percentage of Workers (15-59 years) Employed in different Sub-sectors in the Industry Sector in Telangana (2019-20)2
Number of People working in the Industries Sector, Telangana: 25,69,134
Source: Ministry of Statistics and Programme Implementation, GoI; Periodic Labour Force Survey, 2019-20
Manufacturing58.6%
Mining & Quarrying3.4%
Construction36.3%
Electricity & Utilities1.7%
Industries

Telangana Socio Economic Outlook 202274
This system is crucial to implementing the ‘Right to Clearance’ guaranteed to industrialists by the state. This guarantee is unique to Telangana and has been instrumental in Telangana’s consistently high ranking in Ease of Doing Business (EoDB), compiled by the Department of Promotion of Industry and Internal Trade (DPIIT), since 2016. Figure 5.4 shows the number of approvals given, under TS-iPASS, since 2015.
A total of 18,761 proposals were approved between 2014-15 and 2021-22 (up to January
2022) with an investment of Rs.2,26,806 crore. These investments have provided employment to 16.32 lakh people in the state.
Compared to 2015-16, the first full financial year when the TS-iPASS was in force, the number of approvals made through TS-iPASS have more than doubled by 2021-22, with a CAGR of 12.9%. While the number of approvals in the years 2020-21 and 2021-22 was higher than the number of approvals in 2019-20 (approvals grew by 13.5% from 2019-20 to 2021-22), the total investments and total potential employment reduced by 60.27% and 48.27% respectively in this duration. One of the reasons for this stems from the total micro-units approvals granted, for this duration, which was upwards of 70% of all approvals in 2020-21 and 2021-22 as compared to 56.2% in 2019-20. Of all the units approved since 2015, 95.6% are MSME units while only 4.4% are large or mega enterprises. (Figure 5.5).
5.2.1.1. District-wise PerformanceBetween 2015 and January, 2022:l Medchal Malkajgiri (22.2%), Sangareddy
(8.25%), and Karimnagar (7.4%) were the top three districts in terms of approvals received for setting up of business units (see Figure 5.6A).
Figure 5.4
Number of Approvals Given under TS-iPASS (2015 to January 2022)Number of Approvals
Source: TS-iPASS, 2022
174
1,5341,709
2,809 2,8053,065
3,4793,185
2014
-15
2015
-16
2016
-17
2017
-18
2018
-19
2019
-20
2020
-21
2021
-22
(31
Jan
2022
)
Figure 5.5
Percentage of Total Approvals under TS-iPASS by Industry Size for Manufacturing Sector (2015-January 2022)Share by Size of industries (%)
Micro Enterprises Small Enterprises Medium Enterprises Large Enterprises Mega Enterprises
Source: TS-iPASS, 2022
Share of Approvals
Share of Employment
63.1 29.9
2.6
3.4
1.0
14.0 18.7 6.9 11.9 48.4
Share of Investment
2.5
9.9 6.2 22.2 59.2

75
Figure 5.6 District wise units approved, investments and employment from District wise units approved, investments and employment from 2015 to January 2022 as per TS-iPASS2015 to January 2022 as per TS-iPASS
3,805
1,410
1,273
1,137
790
650
624
594
556
553
519
453
420
361
360
358
344
341
319
319
295
274
235
184
174
167
153
123
91
77
57
49
32
Medchal-Malkajgiri
Sangareddy
Karimnagar
Rangareddy
Jagtial
Warangal Urban
Khammam
Rajanna
Yadadri
Nizamabad
Nalgonda
Medak
Vikarabad
Mahabubabad
Warangal Rural
Siddipet
Mancherial
Peddapalli
Kamareddy
Bhadradri
Mahabubnagar
Jangaon
Suryapet
Adilabad
Nirmal
Kumuram Bheem
Nagarkurnool
Jayashankar
Jogulamba
Wanaparthy
Mulugu
Narayanpet
Hyderabad
16,910
16,240
14,640
13,320
12,283
6,417
5,858
5,127
3,991
3,927
3,562
3,226
2,799
2,409
2,239
2,219
1,509
1,416
992
979
965
670
665
627
601
586
551
352
195
128
90
89
41
Sangareddy
Rangareddy
Bhadradri
Peddapalli
Medchal-Malkajgiri
Mahabubnagar
Mancherial
Yadadri
Karimnagar
Medak
Jangaon
Suryapet
Nalgonda
Kamareddy
Siddipet
Jogulamba
Nagarkurnool
Wanaparthy
Khammam
Narayanpet
Vikarabad
Warangal Urban
Rajanna
Nizamabad
Nirmal
Warangal Rural
Mahabubabad
Jagtial
Hyderabad
Kumuram Bheem
Jayashankar
Adilabad
Mulugu
1,90,884
1,60,382
1,07,716
96,624
22,732
22,587
18,393
14,951
13,540
9,920
9,584
9,283
7,932
7,615
7,237
6,047
5,511
5,277
5,012
4,270
4,139
4,033
3,496
3,224
2,838
1,834
1,826
1,718
1,663
1,438
1,435
1,138
466
Warangal Rural
Rangareddy
Sangareddy
Medchal-Malkajgiri
Yadadri
Mahabubnagar
Medak
Karimnagar
Nalgonda
Siddipet
Nizamabad
Bhadradri
Khammam
Warangal Urban
Suryapet
Rajanna
Kamareddy
Jagtial
Vikarabad
Peddapalli
Mancherial
Jangaon
Mahabubabad
Nagarkurnool
Wanaparthy
Jayashankar
Jogulamba
Kumuram Bheem
Adilabad
Nirmal
Narayanpet
Hyderabad
Mulugu
5.6A. Number of Units
5.6B: Investment (in Rs. crore)
5.6C. Employment
32 to 159
41 to 565
466 to 1,829
160 to 314
566 to 976
1,830 to 4,244
315 to 373
977 to 2,487
4,245 to 7,678
374 to 612
2,488 to 5,566
7,679 to 17,016
613 to 3,805
5,567 to 16,910
17,017 to 1,90,884
Note: Districts arranged in descending order with respect to relevant indicator. Source: TS-iPASS, 2022
Industries
Medchal-Malkajgiri
Medchal-Malkajgiri

Telangana Socio Economic Outlook 202276
l Sangareddy (7.59%), Rangareddy (7.29%), and Bhadradri Kothagudem (6.57%) districts received the highest investments in the state (see Figure 5.6B).
l The highest employment generation through the investments received under TS-iPASS happened in Warangal Rural district, accounting for 11.68% of the total employment
generated under TS-iPASS across the state (see Figure 5.6C).
5.2.1.2. Sector-wise PerformanceThe sectoral distribution of the units approved under TS-iPASS is shown in Figure 5.7.l There has been a steady rise in the number
of approvals given to food processing and
Figure 5.7
Sector wise TS-iPASS number of units, investment, and employment (2015-January 2022)5.7A. Number of Units
5.7B. Investment (in Rs. crore)
5.7C. Employment
Engineering
Food Processing
Agro Based Including Cold Storages
Cement.Cement & Concrete Products
Granite And Stone Crushing
Others
Total
Thermal Power Plants
Real Estate Industrial Parks and IT Buildings
Solar And Other Renewable Energy
Pharmaceuticals And Chemicals
Fertilizers
Others
Total
Real Estate Industrial Parks and IT Buildings
Textiles
Pharmaceuticals And Chemicals
Food Processing
Engineering
Others
Total
2015-16 2016-17 2017-18 2018-19 2019-20 2020-21 2021-22
2015-16 2016-17 2017-18 2018-19 2019-20 2020-21 2021-22
2015-16 2016-17 2017-18 2018-19 2019-20 2020-21 2021-22
Source: TS-iPASS, 2022
161
240
160
84
83
513
1,241
337
241
117
119
162
574
1,550
619
372
250
226
261
1,040
2,768
603
468
314
260
204
931
2,780
618
450
420
278
224
934
2,924
570
662
580
503
235
924
3,474
503
838
447
230
186
1,091
3,295
10,098
133
2,187
2,304
0
7,331
22,053
7,846
4,818
2,201
2,297
3,161
5,848
26,171
41,066
1,378
13,654
10,941
4,952
36,267
1,08,258
37,934
4,432
11,599
1,644
109
10,935
66,653
1,08,170
2,543
15,094
8,293
11,885
61,604
2,07,589
5,628
22,472
807
2,203
65
8,572
39,747
3,95,964
1,88,972
11,916
14,074
10,831
41,608
6,63,365
140
5,122
363
2,125
5,269
9,038
22,057
1,64,023
3,262
11,462
8,456
12,804
38,050
2,38,057
0
1,152
3,039
4,694
72
7,148
16,105
98,958
3,963
14,215
10,417
8,192
27,695
1,63,440
0
152
1,341
6,115
19
5,497
13,124
40
1,345
33,537
9,634
8,610
24,990
78,156
0
824
12,123
7,710
3,690
37,622
61,969

77
agro industries between 2015-16 and 2021-22, achieving a CAGR of 23.2% in this period. This reflects the progress of Telangana’s Food Policy instituted by the state (see Figure 5.7A).
l Pharmaceuticals and Chemicals have attracted an increasing share of total investment, going from under 10% of total investment in 2015-16 to 46% of all investments in 2021-22. Renewable energy has seen a doubling in its share of investment, from 10.4% in 2015-16 to 19% by 2020-21 (see Figure 5.7B).
l Between 2016-17 and 2020-21, the IT sector remained the dominant sector producing new employment, contributing upwards of 50% of all new employment generated by firms approved through TS-iPASS. However, in 2021-22, the bulk of new employment (42.9%) came from the pharmaceutical sector. This reflects the success of the Government in attracting new investment and employment through development of Medical Devices Park in Sultanpur and the Pharma City in Hyderabad (see Figure 5.7C).
5.2.2. Incentives for Industrial DevelopmentT-IDEA (Telangana State Industrial Development and Entrepreneur Advancement) and T-PRIDE (Telangana State Program for Rapid Incubation Dalit Entrepreneurs incentive scheme) are important components of the state’s industrial policy. While TS-IDEA is aimed at using subsidies to promote industrial development in Telangana, T-PRIDE is the state’s flagship programme to encourage entrepreneurship among historically marginalised groups like the SC and ST community, women, and specially abled persons.
5.2.2.1. Telangana State Industrial Development and Entrepreneur Advancement (T-IDEA)Under T-IDEA, the state offers incentives to entrepreneurs for setting up industries by reimbursing stamp duty, power cost, offering
interest and investment subsidies, capital assistance, and other support with Quality Control and Patent Registration. The number of claims sanctioned under T-IDEA has grown by 47.3% since its launch in 2014-15 (see Figure 5.8). Cumulatively, the Government has sanctioned Rs.2,965.10 crore under this scheme up to January, 2022.
5.2.2.2 Telangana State Program for Rapid Incubation Dalit Entrepreneurs (T-PRIDE)
T-PRIDE is targeted specifically towards making the industrial sector more equitable by increasing the representation of entrepreneurs from the Scheduled Castes, Scheduled Tribes, and Specially-abled Persons (SAP). Similar to T-IDEA, the scheme offers various incentives, subsidies and reimbursements.
Figure 5.9. shows the total amount released under TS-PRIDE to eligible social groups. Between 2016-17 and 2020-21, the disbursements had increased almost 234%. 12,602 SC applicants, and 11,694 ST applicants have received subsidies to the tune of Rs.1,150.5 crore till January 2022.
Figure 5.8
Total Number of Claims and Amount (in Rs. crore) sanctioned under T-IDEA (2014-15 to 2021-22)
2,180 1,561 2,784 3,135 3,426 3,383 2,659 3,212
Source: T-IDEA, 2022
2014
-15
2015
-16
2016
-17
2017
-18
2018
-19
2019
-20
2020
-21
2021
-22
(31
Jan
2022
)
Claims Sanctioned Amount (Rs. crore)
297.77
442.44
410.98
504.06
369.47
417.46
251.32
271.60
Industries

Telangana Socio Economic Outlook 202278
5.2.3. Telangana State Industrial Infrastructure Corporation (TSIIC)TSIIC is the nodal agency for developing industrial parks in Telangana. It has been allotted over 1.5 lakh acres of government land for this purpose. Between 2014 and 2021, the corporation has identified and acquired 19,961 acres of the said land, generating over 1.09 lakh jobs and investing Rs. 31,439 crore. This land has gone towards the development of the industrial park at Zaheerabad, Kakatiya Mega Textile Park, Electronics Manufacturing Clusters, Fibreglass composite cluster, Sultanpur’s Medical Devices Park, apparel weaving park at Sircilla and industrial parks at Chandanvelly and Dandumalkapur. A total of 28 industrial parks have already been developed, while 80 are underway.
5.2.4. Micro, Small and Medium Enterprises (MSMEs)According to the Invest India portal maintained by the Government of India, MSMEs account for 95% of all industrial units and employ over 100 million
people across the country, second only to the agricultural sector. The growth of the MSME sector is crucial to widening the industrial base of the state, enhancing livelihood opportunities, and fostering entrepreneurship and productivity in upstream and downstream sectors. As per TS iPASS, nearly 16,365 MSME units have started operations between January 2015 and January 2022, generating employment for 2.44 lakh people.
Data available on the UDYAM portal of the Ministry of Micro, Small, and Medium Enterprises reflects that the MSMEs are majorly concentrated in Hyderabad, Medchal-Malkajgiri, Sangareddy, Rangareddy, and Karimnagar districts, with Hyderabad accounting for the highest share of MSMEs among all the districts (Figure 5.10). The majority of new units established since 2015 are micro-units (60.4%), with less than Rs. 1 crore in investment and less than Rs. 5 crores in turnover. To tap the growth potential and employment-generation potential of the MSME sector, the Government has launched several initiatives for a targeted growth of this sector.
5.2.4.1. Telangana State Industrial Development Corporation (TSIDC)TSIDC aims to identify and promote entrepreneurship within the state, extend financial services, extend support to startup companies, and ensure the economic viability of the basket of projects adopted by the corporation. Currently, it has over 95 units in its portfolio, totaling an investment of Rs. 42.95 crore. Of these, 23 units are listed and traded on the stock market. 5.2.4.2. Industrial Health ClinicsTelangana Industrial Health Clinic Limited (TIHCL) is a Non-Banking Financial Company set up by the Government of Telangana in 2017 for the revival and rehabilitation of sick MSEs. The TIHCL focuses on providing ex-post diagnostics to non-wilful defaulters, extending financial support to pay off the ‘critical amount’ necessary to prevent assets from turning into NPAs, and providing special assistance to female-led firms and businesses in Telangana. In July 2021, TIHCL entered into an MoU with the
Figure 5.9
Year-wise Amounts Released Under TS-PRIDE in Rs. crore (2014-15 to 2020-21)
Source: T-PRIDE, 2022
Amount (in Rs. crore)
2014-15 2015-16 2016-17 2017-18 2018-19 2019-20 2020-21
SC ST
58.17 48.76 25.52 69.84 112.79 183.48 113.76
36.8322.8
32.43
106.59
135.57
124.18
79.44

79
Federation of Telangana Chambers of Commerce and Industry (FTCCI) to assist MSEs in stress through awareness programs, resource sharing and helping improve the fi nancial discipline of the MSEs. TIHCL’s key engagements included consulting, advising, lending and providing bridge and margin fi nancing to sanctioned initiatives. Until October 2021, it had resolved 356 enquiries of which 34 were provided with funding amounting to Rs. 407.28 lakhs.
5.2.4.3. Partnerships with Private PlayersThe Government has signed MoUs and partnered with private players such as SAP, Sapio Analytics, and Bombay Stock Exchange to help MSMEs receive access to cutting-edge technology and analytics. . In collaboration with SAP, the Government is providing access to ERP solutions, the Ariba Network, and over 240 courses on digital, fi nancial and soft skills to MSMEs. The partnership with Sapio Analytics,
announced in November 2020, provides licences for their software to assist SMEs with accounting and automation. Finally, the collaboration with the Bombay Stock Exchange aims to provide information and manpower support to MSMEs for listing on the stock market.
5.2.4.4. TS GloballinkerIn 2019, the Government launched TS Globallinker - a digital networking platform that helps MSMEs contact global buyers and sellers, and get appraised about opportunities in the sector. Currently, 3 lakh SMEs globally, with over 7,000 SMEs from Telangana have registered on the platform. The platform is collaborating with the Confederation of All India Traders (CAIT) to launch the “SMEs of Digital India” program. As a part of this program, Kiranalinker – an online grocery platform – was launched for the grocery stores during the COVID-19 pandemic.
Figure 5.10 District-wise number of MSMEs, Telangana (According to District-wise number of MSMEs, Telangana (According to Registrations on UDYAM Portal as on 13 January 2022)Registrations on UDYAM Portal as on 13 January 2022)
Districts arranged in descending order of the number of registered MSMEs on UDYAM PortalMinistry of Micro, Small and Medium Enterprises, Government of India
Number of MSMEs
Number of MSMEsDistrict District
48,224
26,520
25,752
11,177
9,777
8,989
7,972
6,434
6,323
5,725
5,559
3,948
3,526
3,504
3,377
3,099
3,031
3,017
2,884
2,730
2,716
2,463
2,415
2,401
2,384
1,730
1,615
1,590
1,365
1,352
755
511
497
Hyderabad
Rangareddy
Medchal-Malkajgiri
Nalgonda
Karimnagar
Nizamabad
Warangal Urban
Mahabubnagar
Sangareddy
Khammam
Suryapet
Yadadri
Peddapalli
Medak
Siddipet
Warangal Rural
Jagtial
Mancherial
Bhadradri
Adilabad
Kamareddy
Mahabubabad
Rajanna
Vikarabad
Nagarkurnool
Jangaon
Wanaparthy
Nirmal
Jogulamba
Jayashankar
Kumuram Bheem
Narayanpet
Mulugu
Number of MSMEs
497 to 1,6611,662 to 2,7272,728 to 3,5083,509 to 7,3577,358 to 48,223
Industries
Number of MSMEs
497 to 1,6611,662 to 2,7272,728 to 3,5083,509 to 7,3577,358 to 48,223

Telangana Socio Economic Outlook 202280
5.2.4.5. Emergency Credit Line Guarantee Scheme (ECLGS)The Government of India launched the ECGLS for MSMEs during the first wave of the COVID-19 pandemic. Under this scheme, the Government provided 100% guarantees to banks and NBFCs that extended emergency credit lines to MSMEs in the country. The report by the State Bank of India (SBI)3 suggests that over 13.5 lakh MSMEs were saved from going under by this scheme. Telangana’s companies also benefited from this scheme. Out of the total loans that were prevented from turning into NPAs, 5.9% originated from Telangana, and the state was among the top 5 beneficiaries of the program. 5.2.4.6. Prime Minister’s Employment Generation Programme (PMEGP)
Funded by the Central Government and administered by the Telangana State Khadi Village Industries Board (TSKVIB), this scheme provides margin money to khadi enterprises in rural Telangana. It is a credit-linked subsidy program for newly established micro-enterprises. The TSKVIB disbursed Rs.1,484.95 lakh under this scheme in 2021-22 (till December 2021), providing support to 383 units. Khammam, Rangareddy and Adilabad accounted for over 37.8% of all units that received margin money under this scheme.
5.2.4.7. Women Entrepreneurs Hub (We-Hub)We-Hub is a state-led incubator established in 2017 to help foster women entrepreneurship in Telangana. It provides incubation facilities, access to the Government, and a global network of collaborators to new women entrepreneurs in the state. It plays an especially important role in promoting entrepreneurial skills in Tier-2 and Tier-3 cities, and running programs that increase the interest of young women in pursuing Science, Technology, Engineering, and Mathematics education.
In three years since its establishment, We-Hub has incubated over 1,495 startups, raised Rs. 56.8 crore in funding, and created 2,800 jobs. Upwards of 86% these startups have a survival rate of more than 2 years.
5.2.4.8. Technology-Hub (T-Hub)T-Hub was established in 2015 to enable and empower the innovation ecosystem in the state, and to create impact for startups, corporations and other stakeholders. Its flagship innovation program, Lab32, completed its sixth cohort by providing consulting sessions to 22 startups from across the state. T-Fund, associated with T-Hub was allocated Rs. 15 crore in the 2021-22 state budget. T-Hub has also taken the lead in working with TSIIC and other ecosystem partners to provide incentives to start-ups in Telangana under the Telangana Innovation Policy. Three cycles of incentives impacting 52 startups resulted in Rs.1.8 crore worth of funding.
5.2.5. One-District One-Product (ODOP)One-District One-Product is a joint initiative by the state and Central Governments to identify district-specific products that can be marketed overseas, and to then help the districts produce and market those products. The scheme was launched in February, 2021 and subsumed the prior Central Government initiative, “Districts as Export Hubs (DEH)”. The State Government has set up District Level Export Promotion Committees (DLEPCs) in every district. These committees would design and implement District Specific Action Plans, with the support of the district, state and central officials.
The scheme is intended to bolster rural entrepreneurship, produce internationally competitive products, help the MSMEs in addressing bottlenecks in production and export, and increase employment and investment in the manufacturing sector in the state.
3 SBI Research, (2022), “The ECLGS that saved 13.5 lakh MSME units, 1.5 crore jobs & 14% of Outstanding MSME loans turning into NPA”, State Bank of India (SBI)

81
Governments encourage local producers to export their goods by supporting them with market linkages and investments. One key advantage of exporting goods is the access to a larger international market that enhances the available customers for any industry. This allows the producers to produce at scale and earn greater profits. International trade is also associated with another benefit - the transfer of knowledge and technology. By indulging in the international markets, producers can identify gaps in their knowledge of the production process, receive feedback on their products, improve their productivity and operating processes, and thereby produce better outputs. Such benefits enable tremendous potential to improve the economic conditions of the exporters. Hence, the governments encourage the export of goods to improve the productivity of their producers.
A prime example of growth by promoting exports is South Korea. Touted as one of the East Asian Tigers, the country doubled its real per-capita income in a decade (1962 to 1972). In the 1950s, when South Korea became independent, it was one of the poorest
countries in the world. Today, the country ranks in the top 15 richest countries globally. The country directed its growth efforts towards an exporting model, where their Government provided huge incentives and easy loans to the local manufacturers in lieu of meeting certain export targets. The Government also invested money in developing infrastructures like roads, ports, telecommunications, and other inputs that were central to the promotion efforts. The share of manufacturing in GNP rose from less than 10% to 35% within two decades, which translated into higher wages for their citizens.
A primary component of schemes like One District One Product (ODOP) is to build momentum around exports of certain goods and foster a market for them. Hence, in 2021, some of the key events carried out under ODOP included export promotion events and exhibitions in Hyderabad and other cities.
Reference:Hong, W. (2007). 8. Export Promotion and Employment Growth in South Korea. In Trade and Employment in Developing Countries, Volume 1 (pp. 341-392). University of Chicago Press.
Box 5.1
Why do governments encourage export?
5.3. Sectoral Insights 5.3.1.Handlooms, Textiles, and Handicrafts5.3.1.1. HandloomsHandlooms are the largest cottage industry in the state. The Government has launched several flagship programs to help the handloom weavers
of the state. Among them, the prominent schemes include:l Nethannaku Cheyutha (Thrift Fund Scheme)-
In order to inculcate saving habit among the handloom weavers, the Government launched a Thrift Fund Scheme for the farmers in June 2017, where the weaver contributes 8% of his wage into the savings account, and the state
Industries
Telangana Socio Economic Outlook 202282
supplements that amount by contributing 16% of weaver’s wage to each of the weaver’s account. The scheme also provides social security to the weavers. As COVID-19 disrupted work in 2020-21, the Government exempted the three-year lock-in period and allowed weavers to withdraw amounts from their accounts. The Scheme has been successfully implemented and an amount of Rs.32.14 crore under RD1 accounts (beneficiary’s share) and Rs.64.28 crore under RD2 (Government’s share) accounts totalling to Rs.96.43 crore have been released benefitting (20,537) Handloom Weavers.
l Chenetha Mitra (Input Subsidy Linked wage compensation Scheme) - Since it was necessary to increase the wages accruing to the weavers without hurting the profit margins in a competitive market, the Government introduced an input subsidy scheme that provided 40% subsidy for yarn, dyes and chemicals. The scheme won the nationally renowned SKOCH Award at the 73rd SKOCH Summit in 2021.
l Credit Support: The District Co-Cooperative Central Banks issue cash credit to primary handloom weavers to help with the day-to-day running of their looms. In 2020-21, Rs.1,200.50 lakh was distributed as loans to 86 Weavers Societies.
l Pavala Vaddi Scheme: In order to reduce the burden of interest on Handloom Weavers Cooperative Societies, APEX Society, Individual Weavers covered under Artisan Credit Cards and Handloom weaver Groups (HWGS), the Government disbursed over Rs. 152.16 lakh under this scheme in 2020-21 to cover interest payments of weaver loans.
l Telangana State Handloom Weavers Cooperative (TSCO): TSCO was registered as an Apex Handloom Cooperative Society in 2017 to represent the interests and market the products created by the weavers of Telangana. Currently, the society owns 29 showrooms around the country. In 2020-21, the sales from
these stores totalled Rs. 498 crore, despite the stalling of economic activity brought about by the pandemic. In addition, the society also launched an e-commerce store on Shopify in 2019. The society earned over Rs. 55.14 lakh from online sales in 2020-21, up from Rs. 10 lakh in 2019-20. Finally, the society also earned Rs. 453.37 crore from the Government supplies for programs like distribution of Bathukamma sarees, sale of uniforms, etc.
5.3.1.2. TextilesIndustrial and textile parks feature prominently in the state’s policies to encourage new investment in textile manufacturing in the state. In 2017, the Government established the Kakatiya Mega Textile Park in Warangal, the highest cotton-growing district in the state. spread over 2,000 acres, the park has an investment potential of Rs.11,586 crore. It is being developed as a vertically integrated model that can cover the complete textile value chain. Major national textile companies like Ganesha Ecosphere, Youngone corporation and Kitex have proposed investments of Rs.2,000 crore in the park.
In addition to these policies, the state has also set up a new Apparel Park in Rajanna Sircilla District in 2021. The primary objective of the park is to divert women’s employment towards manufacturing of clothes and apparel. The projected cost of Rs.174.86 crore. Several firms like Gokaldas Images Pvt. Ltd. and Texport Industries Pvt. Ltd. have committed to opening plants in the park.
5.3.1.3. HandicraftsTelangana is home to several artisans that produce exquisite toys, furniture, silver filigree and brass bangles, etc. For example, the Adilabad district is known for its Nirmal Furniture, which received Geographical Indication Rights in 2009. Similarly, Adilabad’s Ushegaon village is known for Dokra metal artefacts, made by employing the lost-wax method. Pembarthi village in Jangaon district produces Pembarthi metal crafts. The craftsmen decorate individual items like perfume bottles and

83
betel-nut cases, and even vases and mementoes. Hyderabad is home to artists that make the Cheriyal paintings that depict narratives and stories across long scrolls.
Telangana State Handicrafts Development Corporation (TSHDC) bears the primary responsibility of marketing the state’s handicrafts and providing welfare support to the artisans in the state. It has owned the ‘Golkonda’ trademark since 2015 and is tasked with publicising the state’s handicrafts under this trademark. It also owns ten
emporia in India, two of which are located outside Telangana. During 2020-21, the sales at these emporia totalled Rs. 1,617.00 lakh. In 2021-22, the sales crossed Rs.3,400.00 lakh by November 2021. In order to aid the functioning of the corporation, the Government allocated Rs. 1 crore budget support to TSHDC in 2021-22.
5.3.2. Life Sciences and Pharmaceuticals Pharmaceuticals comprise the largest commodity export of the state, averaging over 30% of the
Industries
Box 5.2
The Pharma Industry in HyderabadA key feature of most globally competitive industries is that they exist in clusters. That is, they are geographically concentrated in small areas, and are surrounded by firms exclusively producing similar products or providing services upstream to the production. These clusters build their competitive advantage in two ways. First, they develop a collective reputation for all firms within a cluster. Having a reputation for producing world-class products is essential to taking part in the global value chains. Another mechanism by which clusters prosper is by sharing information, innovation, and knowledge. When industries locate together, they can benefit from learning the best practices of other firms. At the same time, governments might set up universities, accreditation organisations, laboratories, or other institutions to facilitate the growth and success of the clusters.
Hyderabad’s Pharma Industry is no exception in reaping the benefits of clusters. The Genome Valley, established in 1999 and spread over just 600 square kilometres, is home to a third of
the global vaccine production facilities. As the COVID-19 pandemic spread through the world, multiple Hyderabad-based companies were at the forefront of the R&D and manufacturing of the global vaccine stocks. Two of these - Bharat BioTech and Biological E - have produced vaccines against COVID-19 that have helped both India and other low and middle-income countries (LMICs). A third Hyderabad-based firm, Dr. Reddy’s Laboratories, is at the forefront of manufacturing the Sputnik V vaccine, which was created in Russia. Bharat Biotech expects to export over 108 lakh doses of its vaccine in a bid to bridge the global vaccine divide. Clearly, the success of Hyderabad’s pharmaceutical cluster is evident in the speed and dexterity with which they could produce and supply the COVID-19 vaccine around the world.
The Government has been at the forefront of developing and promoting industrial clusters. Genome Valley, where Bharat Biotech is headquartered, was the first R&D Industrial company dedicated to life sciences. The state has now pioneered a Medical Devices Park in Sultanpur, and Pharma City in Hyderabad. If the success of Genome Valley is any indicator, these industrial clusters could also flourish into global suppliers of prime-quality medical goods.

Telangana Socio Economic Outlook 202284
total merchandise exports since 2015-16. In order to support the sector, the Government has sanctioned the Hyderabad Pharma City Project. On completion, it is expected to be the world’s largest pharmaceutical cluster, with a potential investment of Rs.64,000 crore and employment to over 4.2 lakh individuals.
5.3.2.1. Medical Devices ParkThe Government of Telangana has identified medical devices as a strategic area for growth. As of 2021, around 80% of India’s requirements in the sector were met through imports from other countries. Hence, building a local industrial base in medical devices has great potential for growth. The Government established the country’s largest medical devices park in Sultanpur, Hyderabad in 2017. The establishment is spread over 302 acres and has over 50 companies with manufacturing/R&D capacity. The total investment in the park is close to Rs.1,424 crore, and it has generated over 7,000 jobs. Hyderabad offers locational advantages to the industry, as the city is home to several SMEs that specialise in precision engineering and the manufacturing of plastics. In addition, the park provides an uninterrupted power supply, effluent treatment plants, rapid testing centres, facilities for testing medical devices, and warehouses.
5.3.3. Food Processing Food Processing has been recognized as one of the 14 thrust sectors of the state in the industrial policy framework of 2014. The food processing industry in Telangana processes 25% of the output from the agriculture and allied sectors, and adds 12.5% in value to marketed agricultural products.
The Food Processing industries have unique opportunities to link the agricultural sector with the more productive industries. The state has 4 major Food Processing Parks, located in Nizamabad, Khammam, Jogulamba Gadwal, and Zahirabad districts – projects worth Rs. 492 crore, and 7 integrated cold chain projects worth Rs. 208 crore. Nizamabad’s agro park has a warehouse capacity
of 5,000 MT, alongside cold storage capacity, food testing labs, farmer training centres, and water and power supply. Zahirabad possesses 10,000 MT of dry warehouse capacity, alongside cold storage, deep freezer storage, tetra pack lines, and gamma irradiation plant. Similarly, the Raagmayuri Mega Food Park in Jogulamba Gadwal possesses 5,000 MT of cold storage, spices processing plants, refer vans, and testing labs. The state intends to expand the presence of such parks across other districts in the state.
To extend the scope and growth of food processing industries in the state, the Telangana Government introduced a Food Processing and Preservation Policy in 2021. The primary aim of the policy is to create Special Food Processing Zones (SPFZs) in the state. In order to attract food processing industries, the state has offered power rebates, reimbursements to Agriculture Produce Marketing Committees (APMCs), capital grants, land cost rebates, and other benefits to the establishments within the SPFZs. It aims to attract Rs.25,000 crore in capital investment and provide a livelihood to over 70,000 people. 5.3.4. MiningTelangana has varied geology, endowed with a rich and wide variety of minerals suitable for specific mineral industries. The Government has leased 88,809 hectares of land for mining and quarrying activities. The state has over 1,904 mineral industries, with Jogulamba-Gadwel (723), Khammam (463), Vikarabad (234), and Komara Bheem (183) having the maximum share of units. In 2019-20, the state earned a total revenue of Rs. 3,715.78 crore from mineral production in the state. Mineral revenue collections worth Rs. 19,776 crore has been achieved between 2014-15 to 2019-20. (see Figure 5.11)
The Telangana State Mineral Development Corporation (TSMDC) is responsible for developing mineral resources through exploration and mining activities. TSMDC was declared a National

85
Exploration Agency (NEA) by the Ministry of Mines in 2016 and has taken up exploration of minerals within and outside the state.
5.3.4.1. Sand Mining
As per the Sand Mining Policy, 2014, sand from certain streams is entrusted to TSMDC for extraction and supply. TSMDC has environmental clearances to operate in 70 sand bearing areas (as of November 2021), with another 100 sand bearing areas to become operational by the end of 2021-22. The corporation supplies sand to state Government programs in the housing and irrigation sectors.
During the year 2020-21, sand mining contributed revenue worth Rs. 783.75 crore to the state exchequer. It directly employed over 5,250 people. For 2021-22, until November, the contribution to the state exchequer has been Rs. 546 crore. Close to a third of the revenue generated goes to the District Mineral Foundation, used exclusively to benefi t the local population, and provide funds for improving the quality of infrastructure, schools, health facilities and toilets.
In order to monitor and curb illegal sand mining in the state, the TSMDC has set up an integrated call centre to inform the buyers of sand prices and prevent illegal transportation of sand. Additionally, monitoring tools like CCTV cameras and weighting bridges have been installed. The online Sand Sales Management and Monitoring System received the Digital India Gold Award from the SKOCH group in 2020.
5.3.4.2. Coal
Telangana has the largest deposits of coal among all South Indian states. It has proven deposits of 11,394.76 million tonnes, accounting for 7.04% of all proven deposits in the country. Mancherial, Peddapalli and Bhadradri Kothagudem districts account for 75% of these reserves.
M/s Singareni Collieries Company Ltd (SCCL), a State Public Sector Undertaking, is the primary coal mining corporation in Telangana. It is the second-largest coal producer in India. The total coal production for the Singareni Collieries Company Ltd. grew over 42.5% for the current fi scal year, from 32.65 million tonnes in 2020-21 to 46.52 million tonnes until December 2021-22.
In 2021 the Singareni Thermal Plant was awarded by the Mission Energy Foundation for its effective utilisation of fl y ash. In the same year, the thermal plant was also declared the best power plant in the country in terms of Plant Load Factor (PLF)4. The company also received the Solar Excellency Award 2021 for its 219 MW Solar Plant. The company had a turnover of Rs.18,907 crore in the fi rst three quarters of 2021-22 and recorded a profi t of Rs.1,070 crore, achieving a 227% rise in profi t compared to the same quarters in the previous fi nancial year.
5.3.5. Exports SectorExports of goods and services are a crucial source of revenue, employment, and investment
Figure 5.11
Year-wise Revenue generated from Mineral Resources for Telangana (2014-15 to 2019-20)
Source: Department of Mines and Geology, Government of Telangana, 2022
Revenue (in Rs. Crore)
2014-15 2015-16 2016-17 2017-18 2018-19 2019-20
1,968.27
2,369.72
3,169.00 3,704.38 3,715.78
4,848.854,848.854,848.854,848.854,848.854,848.85
4 PLF is a measure of the ratio between the actual produced energy at a power plant and the maximum possible energy that a power plant can produce. Singareni Thermal Power Plant achieved a PLF of 87.18%. In the second place, Telangana State’s GENCO had a PLF of 73.98%
Industries
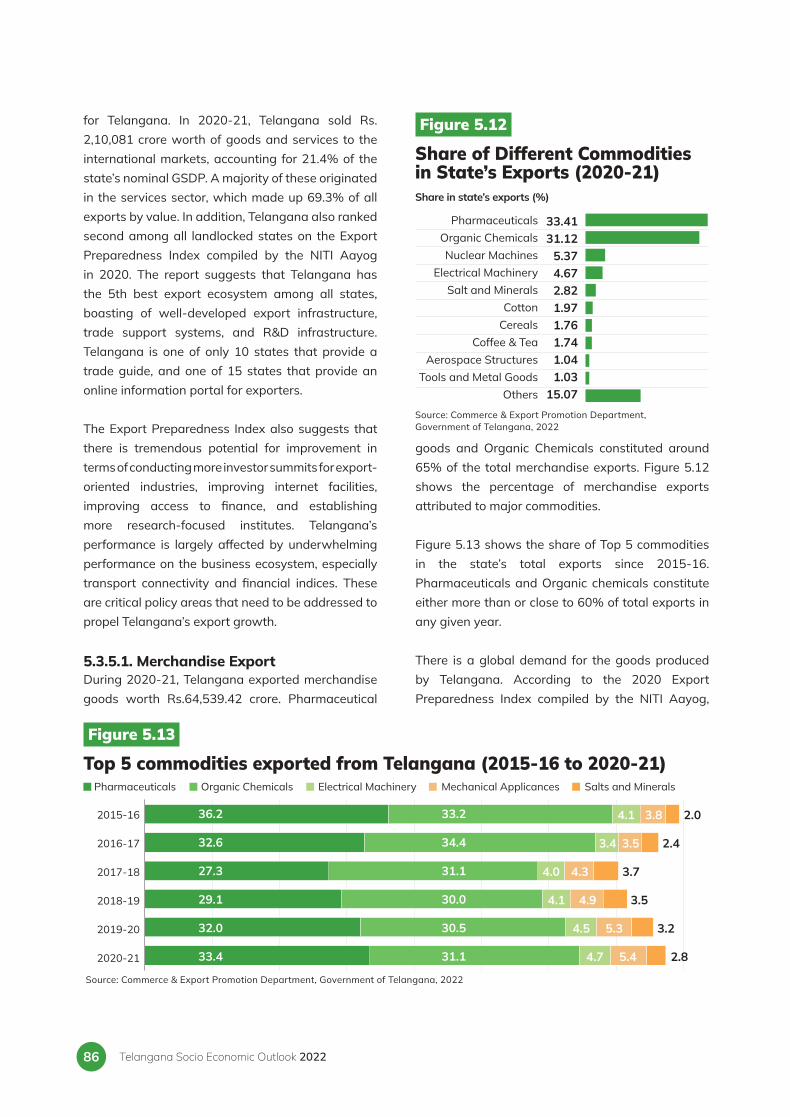
Telangana Socio Economic Outlook 202286
for Telangana. In 2020-21, Telangana sold Rs. 2,10,081 crore worth of goods and services to the international markets, accounting for 21.4% of the state’s nominal GSDP. A majority of these originated in the services sector, which made up 69.3% of all exports by value. In addition, Telangana also ranked second among all landlocked states on the Export Preparedness Index compiled by the NITI Aayog in 2020. The report suggests that Telangana has the 5th best export ecosystem among all states, boasting of well-developed export infrastructure, trade support systems, and R&D infrastructure. Telangana is one of only 10 states that provide a trade guide, and one of 15 states that provide an online information portal for exporters. The Export Preparedness Index also suggests that there is tremendous potential for improvement in terms of conducting more investor summits for export-oriented industries, improving internet facilities, improving access to finance, and establishing more research-focused institutes. Telangana’s performance is largely affected by underwhelming performance on the business ecosystem, especially transport connectivity and financial indices. These are critical policy areas that need to be addressed to propel Telangana’s export growth.
5.3.5.1. Merchandise ExportDuring 2020-21, Telangana exported merchandise goods worth Rs.64,539.42 crore. Pharmaceutical
goods and Organic Chemicals constituted around 65% of the total merchandise exports. Figure 5.12 shows the percentage of merchandise exports attributed to major commodities.
Figure 5.13 shows the share of Top 5 commodities in the state’s total exports since 2015-16. Pharmaceuticals and Organic chemicals constitute either more than or close to 60% of total exports in any given year.
There is a global demand for the goods produced by Telangana. According to the 2020 Export Preparedness Index compiled by the NITI Aayog,
Figure 5.12
Share of Different Commodities in State’s Exports (2020-21)
Source: Commerce & Export Promotion Department, Government of Telangana, 2022
Share in state’s exports (%)
PharmaceuticalsOrganic ChemicalsNuclear Machines
Electrical MachinerySalt and Minerals
CottonCereals
Coffee & TeaAerospace Structures
Tools and Metal GoodsOthers
33.4131.12
5.374.672.821.971.761.741.041.03
15.07
Figure 5.13
Top 5 commodities exported from Telangana (2015-16 to 2020-21)Pharmaceuticals Organic Chemicals Electrical Machinery Mechanical Applicances Salts and Minerals
2015-16
2016-17
2017-18
2018-19
2019-20
2020-21
36.2
32.6
27.3
29.1
32.0
33.4
33.2
34.4
31.1
30.0
30.5
31.1
4.1 3.8 2.0
3.4 3.5 2.4
4.0 4.3 3.7
4.1 4.9 3.5
4.5 5.3 3.2
4.7 5.4 2.8
Source: Commerce & Export Promotion Department, Government of Telangana, 2022

87
Telangana’s exports command high value across 80 different countries. Hence, Telangana has the fourth highest international market penetration among all states in India. Figure 5.14 shows the major importers of Telangana’s products. Among them, a large section of Telangana’s export merchandise is directed towards the USA (26.3%), China (6.8%), and Russia (4.0%).
The exported goods are produced across Telangana, though, between April and September 2021, roughly 5 districts (Medchal-Malkajgiri, Hyderabad, Sangareddy, Ranga Reddy and Medak) accounted for over 75% of all exports from the state (Figure 5.15). Other major contributors include Nalgonda (3.0%), Khammam (2.6%), and Yadadri Bhuvanagiri (1.7%). With the launch of policies like One-District-One-Product, the Government has directed its focus on expanding the export potential of all 33 districts of Telangana.
5.4. Way ForwardTelangana was declared the 3rd most attractive destination for Doing Business in India by the World
Bank in 2019-20. The state has built itself as a pioneer in the export and manufacturing sector. The Government intends to further strengthen its industry ecosystem through its manufacturing and employment centric approach to industrial development. Since the formation of Telangana in 2014, several steps have been taken to foster an investor-friendly climate. The introduction of TS-iPASS, the creation of industrial parks with plug and play facilities, provision of competitive concessions to attract and retain investments, and the development of a skilled workforce have been accomplished by pursuance of the industrial policy by the Government.
The Government intends to further strengthen its efforts with an increased rigour to mitigate the impact of COVID-19 on the industry sector. The Government is focused on creating new industrial parks across Telangana, providing competitive infrastructure facilities and financial incentives to potential investors, attracting investments in high-value industries like R&D and life sciences, and promoting the entrepreneurial talent of women and members of the marginalised community. Expanding its support to high growth potential sectors such as food processing, and textiles, the Government envisages to make the state an export hub in these sectors.
Figure 5.14
Top 10 countries to which Telangana exported goods (2020-21)
Source: Commerce & Export Promotion Department, Government of Telangana
Share in state’s exports (%)
USA
China
Russia
United Arab Emirates
Bangladesh
Turkey
Germany
United Kingdom(UK)
Singapore
Japan
26.266.784.013.262.902.572.292.262.242.06
Figure 5.15
Top 5 Districts in Merchandise Exports from Telangana (April-September 2021)
Source: Commerce & Export Promotion Department, Government of Telangana, 2022
25.5220.1117.8516.97
4.05
Share of exports (%)DistrictMedchal-Malkajgiri
HyderabadSangareddyRangareddy
Medak
Industries

Telangana Socio Economic Outlook 202288
SERVICES
CHAPTER
06

89
l More advanced economies around the world have a more dominant services sector in terms of their contribution to the value added. The services sector remains the dominant sector in Telangana’s economy with a share of 61.33% in the Gross State Value Added (GSVA) at current prices in 2021-22.
l The Compounded Annual Growth Rate (CAGR) of Gross Value Added (GVA) at current prices by the services sector in Telangana (12.13%) between 2014-15 and 2021-22 was nearly 2.3 percentage points higher than the All-India average (9.53%).
l The ‘Real Estate, Ownership of Dwelling and Professional Services’ is the most dominant sub-sector of the services sector in the state, which contributed more than one-third (33.79%) of the GVA at current prices by the sector in 2021-22. It is also the single largest sub-sector of the state’s GVA (20.73%).
l Despite the unprecedented disruption caused by the pandemic to the services sector due to the contact-intensive nature of its component sub-sectors, Telangana’s services sector GVA experienced a positive growth rate at current prices (0.91%) in 2020-21 as compared to the negative growth rate at the national level (-4.65%).
l Approximately one-third (33.32%) of the total workers in Telangana are employed in the services sector. Among the total workers in the service sector, more than one-third (37.75%) work in the ‘trade, hotels and restaurants’ sub-sector.
l The services sector in urban Telangana employs a greater share of persons (68.07%) than those employed in urban India (61.48%), whereas in rural
Telangana, the sector employs a smaller share (15.66%) of persons than rural India (18.47%).
l Between 2014-15 and 2020-21, IT exports from Telangana experienced a Compounded Annual Growth Rate of 14.01%. The total employment in the IT sector increased from nearly 3.7 lakhs to 6.28 lakhs during this period. This reflects the success of the first ICT Policy (2016) that aimed to augment the IT sector growth. The Government has introduced its second ICT Policy (2021-26) to further scale the sector.
l Telangana received two global recognitions in 2021 in the tourism sector:
nThe Ramappa Temple in Mulugu District was declared as a World Heritage Site by the United Nations Educational, Scientific and Cultural Organization (UNESCO).
nPochampally village in Yadadri Bhuvanagiri district was awarded the title ‘Best Tourism Village’ by the United Nations World Tourism Organisation (UNWTO).
l To ease the administrative burdens in the development of new buildings, the Government introduced the Telangana State Building Permission Approval and Self Certification System (TS-bPASS), a single-window system that expedites the approval of building designs.
l The Government introduced Dharani Portal in 2020, a service sector innovation for agricultural land transactions, that offers 100% advance slot bookings and instantaneous mutations and registrations. Within a span of one year, the portal completed more than 8 lakhs transactions.
Key Highlights
Services

Telangana Socio Economic Outlook 202290
6.1. Introductionhe services sector, also known as the tertiary sector, includes the intangible services bought or sold in an economy.
It is the largest sector of the global economy in terms of value-added, accounting for 59.94% of the global GDP in 20201. The services sector covers a wide range of services, including trade, hotels and restaurants, transport, storage and communication, financing, insurance, real estate, business services, community, social, and personal services.
The services sector is also critical to the growth of the industrial and agriculture sectors through improvements in electrification, communication, transportation, banking, etc. services, for improvements in the overall quality of life through access to improved healthcare and education services, and for expeditious economic growth through increased productivity and expansion of trade.
Nobel-prize winning economist, Simon Kuznets points out that economic growth is associated with structural shifts from the agricultural sector to the industrial sector to the services sector. Thus, more advanced economies around the world have a more dominant services sector in terms of its contribution to the value added and employment.
In the context of Telangana, the services sector was the highest contributor to the state’s economy, with 61.3% of the total Gross State Value Added (GSVA) coming from this sector in the year 2021-22. Additionally, the sector provided employment to more than one-third of the total workforce. The services sector has been a vital source of output, growth, and jobs in the state, and has also brought in significant amounts of foreign capital into the state’s economy. In the last seven years, investments in knowledge and data, and rapid technological advances have fueled the swift growth of the services sector as well
as other related sectors in Telangana.
6.2. Sectoral Insights6.2.1. Sectoral ContributionIn the year 2021-22, 61.3% (Rs. 6,37,476 crore) of Telangana’s Gross State Value Added at current prices was accounted for by the services sector, making it the most dominant sector in the state’s economy (see Figure 6.1).
For the last three years, Telangana stood third among the 18 Non-Special Category (NSC) states in terms of the share of the services sector in the total state economy. Moreover, the state’s service sector share was higher than the national average in all these years (see Figure 6.2). This is reflective of the advanced nature of the economy of the state in comparison with the other NSC states in the country.
6.2.2. Sectoral Growth RateThe Gross Value Added (GVA) by the services
T
1 World Bank National Accounts Data and OECD National Accounts Data. https://data.worldbank.org/indicator/NV.SRV.TOTL.ZS
Figure 6.1
Contribution of economic sectors to the GSVA at current prices of Telangana (2021-22)
Source: Ministry of Statistics and Programme Implementation, Government of India
Industries (including Mining & Quarrying)Rs. 2,12,069 crore
(20.4%)
ServicesRs. 6,37,476
crore (61.3%)
Share in GSVA (%)
Total GSVA (at Current Prices) = Rs 10,39,371 crore
Agriculture and Allied sectorsRs. 1,89,826
crore (18.3%)

91
sector at current prices in Telangana grew from Rs. 2,86,011 crore in 2014-15 to Rs. 6,37,476crore in 2021-22 – an increase of 122.89% over a span of 7 years (see Figure 6.3). In the same duration, the GVA by the services sector in India grew from Rs. 59,62,478 crore to Rs. 1,12,75,865 crore – an increase of 89.11%. Thus, between 2014-15 and
2021-22, Telangana’s service sector grew by 33.78 percentage points more than the nation’s.
Between 2014-15 and 2021-22, the GVA by the services sector at current prices in the state experienced a Compounded Annual Growth Rate (CAGR) of 12.13%, nearly 2.3 percentage points
Figure 6.2
Share of services sector in the GVA/GSVA at current prices (2018-19 to 2020-21)
* 14 out of the 18 Non-Special Category states with data available in 2020-21 Source: Ministry of Statistics and Programme Implementation, Government of India
Highest value among 18 NSC states
Telangana India
Median of 18 NSC states Lowest Value among 18 NSC states
2018-19 (SRE) 2019-20 (FRE) 2020-21(PE) *
Share of services sector in GVA/GSVA (%)
61.9 61.655.0
66.2
48.636.1
59.453.9
66.5
47.337.7
53.465.0
47.735.7
Figure 6.3
GVA by services sector at current prices (2014-15 to 2021-22)
Telangana India
GVA-Services (Rs. crore)
Abbreviations: AE- Advance Estimates, FRE- First Revised Estimates, SRE- Second Revised Estimates, TRE- Third Revised Estimates Source: Ministry of Statistics and Programme Implementation, Government of India
7,00,000
6,00,000
5,00,000
4,00,000
3,00,000
2,00,000
1,00,000
0
1,20,00,000
1,00,00,000
80,00,000
60,00,000
40,00,000
20,00,000
0
2014
-15
2015
-16
2016
-17
2017
-18
2018
-19
(TRE
)
2019
-20
(SRE
)
2020
-21
(FRE
)
2021
-22
(AE)
2014
-15
2015
-16
2016
-17
2017
-18
2018
-19
(TRE
)
2019
-20
(SRE
)
2020
-21
(FRE
)
2021
-22
(AE)
6,37,476
5,38,757
5,33,910
2,86,011
1,12,75,865
95,90,940
1,00,59,042
59,62,478
Services

Telangana Socio Economic Outlook 202292
higher than the all-India CAGR value (9.53%). During this span, the growth rate of the services sector in Telangana was higher than that of India’s for all years except 2018-19 (see Figure 6.4).
The services sector in Telangana, as well as India was affected due to the contact-intensive nature of its component sub-sectors. However, despite the unprecedented disruption caused by the pandemic to this sector, Telangana’s services sector GVA (at current prices) experienced a positive growth rate (0.91%) in 2020-21 whereas at the national level this experienced a decline of 4.65%.
Moreover, the state’s service sector grew better than the nation’s during its recovery from the pandemic-induced economic stress. The services sector in the state grew by 18.32% against the All-India value of 17.57% in 2021-22.
6.3. Sub-sectoral Insights6.3.1. Contribution of sub-sectorsThe ‘Real Estate, Ownership and Other Professional Services’ sub-sector was the largest contributor to the service sector GVA at current prices, with a
Figure 6.4
Year-on-Year Growth Rate of GVA at current prices by the services sector (2015-16 to 2021-22): India vs. TelanganaYear-on-year growth of GVA (%) CAGR between 2014-15 and 2021-22 (%)
Abbreviations: AE- Advance Estimates, FRE- First Revised Estimates, SRE- Second Revised Estimates, TRE- Third Revised Estimates Source: Ministry of Statistics and Programme Implementation, Government of India
15.25
10.3711.68
15.86
12.07 12.22 11.17
0.91
18.32 17.57
12.13
9.53
-4.65
9.89
12.35
Telangana India CAGR (Telangana) CAGR (India)
10.85
2015-16 2016-17 2017-18 2018-19 2019-20) 2020-21 2021-22 (TRE) (SRE) (FRE) (AE)
11.32
1) Trade, repair, hotels and restaurantsa) Trade & repair servicesb) Hotels & restaurants
2) Transport, storage, communication
& services related to broadcasting a) Railways b) Road transport c) Water transport d) Air transport e) Services incidental to transport f) Storage g) Communication & services related
to broadcasting 3) Financial services
4) Real estate, ownership of dwelling & professional services
5) Public administration
6) Other services
What constitutes the services sector?

93
share of 33.79% in 2021-22, followed by the ‘Trade, Repairs, Hotels and Restaurants’, with a share of 27.40% (see Figure 6.5).
Between 2014-15 and 2021-22, there was a net increase in the share of the ‘Trade, Repair, Hotels and Restaurants’. In all years during this period, the ‘Real Estate, Ownership of Dwelling and Professional Services’ sub-sector held more than one-third of the GVA by the services sector (see Figure 6.5). The initiatives taken by the Government have helped these sectors to flourish. The first ICT policy (2016) and Telangana State Innovation Cell (TSIC) significantly helped in the capacity and infrastructure building of IT/ITeS sectors. On the other hand, approvals and clearances were made easy through single window systems like Telangana State Industrial Project Approval and Self-Certification System (TS-iPASS) and Telangana State Building Permission Approval and Self Certification System (TS-bPASS).
6.3.2. Growth of sub-sectorsThe ‘Trade, Repair, Hotels and Restaurants’ sub-sector experienced the maximum Compound Annual Growth Rate (CAGR) between 2014-15 and 2021-22 (at current prices), at 15.35%. The ‘Real Estate,
Ownership of Dwelling and Other Professional Services’ sub-sector experienced a CAGR of 12.09% (see Figure 6.6).
The sub-sectors most affected by the pandemic were the ‘trade and repair, hotels and restaurants’ and road the ‘transport, storage and communication’ sub-sectors. Between 2019-20 and 2020-21, the GVA by the former saw a decline of 8.54% compared to a 1.89% decline in the GVA by the latter.
Share of sub-sector (%)
Figure 6.5
Sub-sector wise shares in the services Sector GSVA at current prices in Telangana (2014-15 to 2021-22)
Trade, Repair, Hotels and Restaurants
Transport, Storage, Communication & Services related to Broadcasting
Financial Services Real Estate, Ownership of Dwelling and Professional Services
Public Administration
Other Services
Abbreviations: AE- Advance Estimates, FRE- First Revised Estimates, SRE- Second Revised Estimates, TRE- Third Revised Estimates Source: Ministry of Statistics and Programme Implementation, Government of India
2014-15
2015-16
2016-17
2017-18
2018-19 (TRE)
2019-20 (SRE)
2020-21 (FRE)
2021-22 (AE)
22.47
22.67
22.70
24.27
26.81
27.66
25.07
27.40
12.54
12.03
11.21
10.60
10.43
10.27
9.98
9.15
10.58
10.05
9.52
9.53
9.13
8.78
9.10
8.57
33.88
34.03
34.52
33.76
33.65
34.37
34.95
33.79
6.00
6.65
6.70
6.55
5.86
4.92
5.50
5.56
14.52
14.57
15.36
15.29
14.12
14.01
15.40
15.52
Figure 6.6
Compound Annual Growth Rate (CAGR) of sub-sectors under services between 2014-15 and 2021-22 at current prices
Source: Ministry of Statistics and Programme Implementation, Government of India
Trade, Repair, Hotels and Restaurants
Other Services
Real Estate, Ownership of Dwelling and Professional Services
Public Administration
Financial ServicesTransport, Storage, Communication &
Services related to Broadcasting
15.35
13.20
12.09
10.92
8.81
7.19
CAGR (%)
Services

Telangana Socio Economic Outlook 202294
6.3.3. Real Estate, Trade and Professional Services
The gross value added by the real estate, trade and professional services sector at current prices in Telangana grew from Rs. 96,912 crore in 2014-15 to Rs. 2,15,426 crore in 2021-22 – an increase of 122.29% over a span of 7 years (see Figure 6.7).
Within the ‘Real Estate, Trade and Professional Services’ sector, the IT and ITeS subsectors in particular experienced signifi cant and sustained growth post-state formation owing to the special focus of the government on this sub-sector.
6.3.3.1. Information Technology and IT Enabled ServicesInformation Technology (IT) is one of the fastest-growing sectors in Telangana. In particular, Hyderabad city has played a crucial role in putting the Indian IT sector on the global map. In 2014-15, the IT exports from Telangana were worth Rs. 66,276 crore. This more than doubled to Rs. 1,45,522 crore by 2020-21. The Compound Annual Growth Rate in IT exports during this period was 14.01%.
IT exports experienced a growth rate of 17.93% between 2018-19 and 2019-20. But this decreased to 12.98% in 2020-21. However, there is an absolute increase of Rs. 79,246 crore in the IT Exports from the state as most of the IT companies went into a
‘Work-from Home’ model during the pandemic.
In 2014-15 a total of 3,71,774 persons were employed directly in the IT/ ITeS sector. This fi gure increased to 6,28,615 by 2020-21. During this period, 2,56,841 jobs were created. In 2020-21 alone, the IT sector created 46,489 new jobs (see Figure 6.8).
Source: Information Technology, Electronics and Communications Department, Government of Telangana
Figure 6.8
IT Exports and Employment in ITeS in Telangana (2014-15 to 2020-21)IT exports (Rs. crore)
IT e
xpor
ts (R
s. c
rore
)
IT e
mpl
oym
ent
IT employment
1,60,000
1,40,000
1,20,000
1,00,000
80,000
60,000
40,000
20,000
0
7,00,000
6,00,000
5,00,000
4,00,000
3,00,000
2,00,000
1,00,000
02014-15 2015-16 2016-17 2017-18 2018-19 2019-20 2020-21
66,276
3,71,7744,07,385 4,31,891
4,75,3085,43,033
5,82,1266,28,615
75,070 85,470 93,442 1,09,219 1,28,807 1,45,522
GVA by Real Estate, Ownership of Dwelling and Professional Services (Rs. crore)
Figure 6.7
GVA by the Real Estate and Professional Services at current prices in Telangana (2014-15 to 2021-22)
Source: Ministry of Statistics and Programme Implementation, Government of India
2014
-15
2015
-16
2016
-17
2017
-18
2018
-19
(TR
E)
2019
-20
(SR
E)
2020
-21
(FR
E)
2021
-22
(AE)
1,12,17296,912
1,31,8241,44,498
1,61,6351,83,529
1,88,3052,15,426

95
6.3.3.2. Initiatives to promote IT/ITeS
6.3.3.2.1. Success of the Telangana ICT Policy, 2016
The Government of Telangana introduced its first Information and Communications Technology (ICT) Policy in 2016. The policy proposed to transform Telangana into the most preferred destination for IT companies and thereby enable the state to be a hub for technology entrepreneurship and innovation in the country. To augment the IT sector growth rate, the Government also brought in sectoral policy frameworks in 2016 for Electronics, Innovation and Rural Technology, Data Centres, Open Data, Cyber Security, Data Analytics, Internet of Things (IoT), and eWaste.
The success of the first ICT policy is reflected in the exports and employment trends of the IT/ITeS sector in the state.
6.3.3.2.2. Second ICT Policy (2021-2026)
The Second ICT Policy of Telangana focuses on digital empowerment of citizens, innovation, and entrepreneurship as drivers of the sector’s growth. It aims to scale the exports from this sector from Rs.1.45 lakh crore in 2020-21 to Rs. 3 lakh crore by 2026. In doing so, it targets increasing the employment in the sector from 6.3 lakh to 10 lakh by the year 2026.
6.3.3.2.3. Distributed Growth- GRID Policy and Special IT-SEZThe Government of Telangana recognizes the need to distribute growth across Hyderabad in order to spread the gains from growth to the semi-urban areas around Hyderabad as well.
Through the Growth in Dispersion (GRID) policy, the Government provides special incentives to the companies that expand or set up their units beyond the western part of Hyderabad. IT parks in Uppal, Pocharam, Kompally, Kollapur, Shamshabad are under development and two electronic manufacturing clusters are under development at Maheshwaram and Raviryal.
The Government also plans to develop 53 IT Special Economic Zones (IT-SEZ) across the state with an emphasis on developing clusters in Tier - II and Tier - III towns including Warangal, Karimnagar, Mahbubnagar, Siddipet, Nalgonda, and Nizamabad. The IT towers in Warangal, Karimnagar, and Khammam are already operational whereas those in Mahabubnagar, Nizamabad and Siddipet are under construction.
6.3.3.3. Initiatives to promote Real Estate Services6.3.3.3.1. Dharani
Dharani web-portal is a service sector-innovation for the agricultural land transactions in the state that offers a one-stop solution for agricultural land transactions. The portal offers 100% advance slot bookings and instantaneous mutation and registration, and brings registrations to the doorsteps of the citizens. Stamp duty fee is calculated by the system without human intervention which ensures that there is no discretion to any official. 8,52,874 transactions had been completed through the portal as of October 2021.
6.3.3.3.2. TS-bPASSTo ease the administrative burdens in the development of new buildings, the Government introduced the Telangana State Building Permission Approval and Self Certification System (TS-bPASS), a single-window system that expedites approval of building designs.
The new rules under TS-bPASS have eliminated the need to obtain building permission for ground floor and ground plus one floor residential buildings along with providing tentative layout approval through online application. It also provides for the processing of land use certificates and land conversion certificates. 6.3.3.4. Initiatives to promote Skill and Innovation6.3.3.4.1. Telangana Academy for Skill and Knowledge (TASK)The Telangana Academy for Skill and Knowledge (TASK) envisages enhancing skilling synergy among
Services

Telangana Socio Economic Outlook 202296
the institutions of the Government, industry and academia. The services offered by TASK belong to three major categories- skill development, entrepreneurship, and capacity building for government machinery.
Since its inception, TASK has facilitated training to 3,07,847 students and about 700 colleges are empanelled for the programmes offered by TASK. 2,918 engineering students are enrolled under Technology Entrepreneurship Programme (TEP) which aims to foster entrepreneurship by guiding engineering students in creating technology-enabled products and services. 1,329 healthcare employees under Telangana Vaidya Vidhana Parishad (TVVP) have been trained by TASK to date.
TASK received the Outstanding Youth Transformation Initiative Award in the India Global Education and Skills Summit 2021 and the Global Ignite Excellence Award in 2021. TASK achieved a place in the Asia Book of Records for simultaneously training the maximum number of students across the state through the F-Tech 2.0 programme.
6.3.3.4.2. Telangana State Innovation Cell The Telangana State Innovation Cell (TSIC) set up in 2017 under the State Innovation Policy promotes the culture of innovation and entrepreneurship among the government departments, other organizations, and schools. TSIC works under the areas of innovation in schools, social innovation, innovation diffusion, startup support, and grassroots innovation.
Through Telangana Social Innovation Challenge- in collaboration with UNICEF and the Inqui-Lab Foundation - introduces the schools and children to the basics of design thinking and social innovation. Top 25 out of 7,092 ideas from school students were exhibited in its first edition in 2020. Telangana Social Startup Network (TSSN) - a network of 297 social startups, 35 incubators, 30 NGOs, 77 mentors and 23 investors- organized monthly networking sessions to bring together the social start-up community onto a single platform and enable resource sharing and opportunities scaling.
6.3.3.4.3. Technology Hub (T-Hub)T-Hub is an innovation intermediary and business incubator based in Hyderabad set up to promote entrepreneurship in Telangana with the first phase launched in 2015. Since its inception, the T-Hub has provided over 1,800 national and international startups with access to better technology, talent, mentors, customers, corporates, investors and government agencies.
6.3.3.4.4. Women Entrepreneurs Hub (WE-Hub)Women Entrepreneurs Hub (WE-Hub), launched in 2017, is a state-led incubator to promote and foster women entrepreneurship. Since 2018, WE-Hub has incubated 1,495 startups and small/medium entrepreneurs and engaged 4,527 women entrepreneurs.
6.3.4. Financial ServicesThe gross value added (at current prices) by the financial services sector in Telangana grew from Rs. 30,261 crore in 2014-15 to Rs. 54,659 crore in 2021-22 – an increase of 80.62% over a span of 7 years (see Figure 6.9).
GVA by Financial Services (Rs. crore)
Figure 6.9
GVA by 'Financial Services' at current prices in Telangana (2014-15 to 2021-22)
Abbreviations: AE- Advance Estimates, FRE- First Revised Estimates, SRE- Second Revised Estimates, TRE- Third Revised Estimates Source: Ministry of Statistics and Programme Implementation, Government of India
2014
-15
2015
-16
2016
-17
2017
-18
2018
-19
(TR
E)
2019
-20
(SR
E)
2020
-21
(FR
E)
2021
-22
(AE)
33,12330,261
36,35640,783
43,84146,866
49,02254,659

97
6.3.4.1. Banking and Insurance
Banking and Insurance forms a major part of the financial services along with professional advisory, insurance, wealth management, mutual funds, stock markets, treasuries and debt instruments, tax and audit consultancy, capital restructuring and portfolio management.
There is a strong, bi-directional relationship between banking and insurance, and economic growth. 15.24 bank branches are available per 1 Lakh population in Telangana, as of 2020-21. Out of the total 5,750 bank branches across the state, 3,079 are public sector banks, 1,271 are private sector banks, 456 are co-operative banks, 918 are regional rural banks, 14 are small finance banks and 12 are other banks. Nearly one-third (31.0%) of the total bank branches in the state are in rural areas and another one-third (33.7%) are metropolitan branches (see Figure 6.10).
Contribution of banking and insurance to the economy
The share of Banking and Insurance in the GSVA of Telangana (at current prices) was 5.92% in 2020-
21, the second-highest among the 14 Non-Special Category States with data availability2. In 2019-20, Telangana had the second-highest share of Banking and Insurance in GSVA (at current prices) at 5.88% among all Non-Special Category States (see Figure 6.11).
Growth Rate of Banking and Insurance sectorThe Compound Annual Growth Rate (CAGR) of GVA by the banking and insurance sector (at current prices) in Telangana between 2014-15 and 2020-21 was 9.84%.
Between 2019-20 and 2020-21, the GVA by
Total number of bank branches: 5,750
Figure 6.10
Region-wise distribution of bank branches in Telangana (As of 30th September 2021)
Source: State Level Bankers Committee, Telangana
Metro33.7% (1,937)
Rural areas31.0% (1,781)
Semi-urban areas 22.4% (1,290)
Urban Areas12.9% (742)
Figure 6.11
Share of Banking and Insurance in GSVA at current prices: Non-Special Category States
MaharashtraTelanganaTamil Nadu
GujaratHaryana
KarnatakaWest Bengal
PunjabBihar
KeralaGoa
Andhra PradeshOdisha
Uttar PradeshChhattisgarh
RajasthanMadhya Pradesh
Jharkhand
Note: States arranged in descending values for 2019-20.Source: RBI Handbook of Statistics on Indian States
Below 3
4.51 to 5.00
3.01 to 4.00
Above 5.00
4.01 to 4.50
Share in GSVA (%)2019-20 2020-21
9.925.885.695.355.045.005.004.934.414.063.903.623.613.353.293.233.203.04
NA5.925.96NA-5.714.894.885.154.81NA-NA-3.994.083.593.533.423.293.10
2 Non-Special Category States with no data available for 2020-21 are Goa, Gujarat, Kerala and Maharashtra. However, in 2019-20, the share of Banking and Insurance in the GSVA (at constant prices) in Telangana was higher than that for all these 4 states.
Services

Telangana Socio Economic Outlook 202298
banking and insurance (at current prices) grew from Rs. 51,24,901 crore to Rs. 53,14,522 crore an increase of 3.70%. In this sub-sector, Telangana had the sixth-highest CAGR of GVA by banking and insurance at current prices) between 2014-15 and 2020-21 among 14 Non-Special category states with data availability3 (see Figure 6.12).
6.3.5. Trade, Repair, Hotels and Restaurants
This sub-sector is further split into 2 component sub-sectors: Trade and Repair Services – which (at current prices) accounted for 92.75% of this sub-sector’s GVA in 2021-22 and Hotels and
Restaurants – which accounted for 7.25% of this sub-sector’s GVA in 2021-22.The gross value added by ‘trade and repair’ at current prices in Telangana grew from Rs. 56,974 crore in 2014-15 to Rs. 1,61,991 crore in 2020-21 – an increase of 184.32% over a span of 7 years. On the other hand, during this span, the gross value added by the hotels and restaurants at current prices in Telangana grew from Rs. 7,295 crore in 2014-15 to Rs. 12,662 crore in 2020-21 – an increase of 73.58% (see Figure 6.13).
Trade and repair’ experienced a signifi cant increase in its GVA in all pre-pandemic years. But this was not the case with ‘hotels and restaurants’. Though
Note: Data not available for Goa, Gujarat, Kerala and Maharashtra. Source: Ministry of Statistics and Programme Implementation, Government of India
Figure 6.12
Compound Annual Growth rate of GVA (at current prices) by Banking and Insurance between 2014-15 and 2020-21: Non-Special Category States
Bihar
Haryana
Andhra Pradesh
Tamil Nadu
Odisha
Telangana
Karnataka
Rajasthan
Chhattisgarh
West Bengal
Jharkhand
Uttar Pradesh
Punjab
Madhya Pradesh
14.86
14.48
11.23
10.34
9.96
9.84
9.71
8.24
8.17
8.15
7.96
7.83
6.52
6.06
CAGR of GVA by banking and insurance (%) Share in GSVA (%)
6.00 to 8.008.01 to 10.0010.01 to 12.0012.01 to 14.00Above 14NA
3 The data for Goa, Gujarat, Kerala and Maharashtra was not available for 2020-21.
Telangana9.84%

99
there was a year-on-year increase in the GVA added by ‘hotels and restaurants’ till the COVID-19 pandemic, the growth rate is less compared to ‘trade and repair’.
Both the components under this sub-sector - ‘trade and repair’ as well as ‘hotels and restaurants’ - are contact-intensive sectors. The impact of COVID-19 is visible in the patterns of growth of these sectors where physical human interaction is inevitable.
Many of the retail outlets and restaurants switched to ‘home delivery’ mode during the pandemic. Also, large food and grocery home delivery chains in the cities managed the situation by strengthening their existing system. However, this was largely limited to the urban areas.
However, in 2021-22, the GVA (current prices) by the overall ‘Trade, Repair, Hotels and Restaurants’ exceeded the pre-pandemic level (2019-20) by Rs.
26,990 crore (see Figure 6.13). The GVA (current prices) by the ‘Trade and Repair’ sub-sector experienced a fall of 7.87% between 2019-20 and 2020-21- from Rs. 1,36,009 crore to Rs. 1,25,308 crore. During this period, the GVA (current prices) by the hotels and restaurants fell by 16.39% - from Rs. 11,655 crore to Rs. 9,745 crore.
The share of trade and repair services to the GVA by the services sector (at current prices) in 2021-22 was 25.41% whereas this for ‘hotels and restaurants’ was 1.99%.
6.3.6. Transportation, Storage, Broadcasting and CommunicationThis sub-sector is further split into 7 components, whose contributions to this sub-sector at current prices in the year 2021-22 were as follows:l Railways, Road Transport and Air Transport
Figure 6.13
GVA (contribution and growth rate) of Trade, Repair, Hotels and Restaurants (2014-15 to 2021-22): Telangana
Abbreviations: AE- Advance Estimates, FRE- First Revised Estimates, SRE- Second Revised Estimates, TRE- Third Revised Estimates Source: Ministry of Statistics and Programme Implementation, Government of India
Trade and Repair Services Hotels and Restaurants
A. GVA (Rs. crore) B. GVA growth (%)
2014
-15
2015
-16
2016
-17
2017
-18
2018
-19
(TR
E)
2019
-20
(SR
E)
2020
-21
(FR
E)
2021
-22
(AE)
1,61,991
1,25,308
56,97466,418
77,708
1,17,600
94,286
12,6629,74511,655
7,295 8,318 8,985 9,581 11,145
1,36,009
Trade and Repair Services
Hotels and Restaurants
30
20
10
0
-10
-20
16.617.0
21.324.7
29.3
14.016.3
8.06.6
29.9
2015
-16
2016
-17
2017
-18
2018
-19
(TR
E)
2019
-20
(SR
E)
2020
-21
(FR
E)
2021
-22
(AE)
Services
-7.9
15.7
4.6
-16.4

Telangana Socio Economic Outlook 2022100
accounted for 5.94%, 59.78% and 2.09% of this sub-sector respectively
l Services incidental to transport - accounted for 9.43% of this sub-sector
l Storage – accounted for 1.28% of this sub-sector
l Communication and services related to broadcasting is the second largest
contributor to the sub sector which accounted for 21.49% of this sub-sector.
The gross value added by the transport sub-sector at current prices in Telangana grew from Rs. 35,866 crore in 2014-15 to Rs. 58,324 crore in 2021-22 – an increase of 62.62% over a span of 6 years (see Figure 6.14).
Air, Railways and Road transport are the contact-intensive components of this sub-sector. Between
Abbreviations: AE- Advance Estimates, FRE- First Revised Estimates, SRE- Second Revised Estimates, TRE- Third Revised Estimates Source: Ministry of Statistics and Programme Implementation, Government of India
B. GVA growth (%)
2015-16 2016-17 2017-18 2018-19 (TRE) 2019-20 (SRE) 2020-21 (FRE) 2021-22 (AE)
Figure 6.14
GVA (contribution and growth rate) of Transportation Sector (2015-16 to 2021-22) at current prices: TelanganaA. GVA (Rs. crore)
2014-15
2015-16
2016-17
2017-18
2018-19 (TRE)
2019-20 (SRE)
2020-21 (FRE)
2021-22 (AE)
Railways Road Transport Air Transport Incidental Services
2,004
2,010
2,216
2,546
2,640
3,361
3,139
3,463
20,540
22,633
24,536
27,341
32,354
34,133
33,087
34,864
623 4,937
5,048
5,578
5,834
5,213
5,611
5,431
5,501
1,126
1,267
1,329
791
1,365
1,074
1,217
Railways Road Transport Air Transport
0.310.2
14.927.3
-6.6
10.3 10.2 8.4 11.418.3
5.5
-3.1
5.4
80.7
12.54.9
-40.5
-21.3
72.6
13.33.7

101
2019-20 and 2020-21, the air transport sub-sector experienced a decrease of Rs. 291 crore in the GVA (at current prices), a fall of 21.30%. During this period, the absolute decrease in GVA of railways was Rs. 222 crore, a fall of 6.61%; road transport experienced a fall of 3.06%, an absolute decrease of Rs.1,046 crore (see Figure 6.14).
While all sub-sectors herein experienced a decline in the growth rates on account of the pandemic, the road transport sub-sector experienced a more significant decline. One of the possible reasons for road transport experiencing a higher fall rate is the relatively higher instances of interaction with other contact-intensive outlets such as trade, retail, hotel, restaurants. The trade, repair, hotels and restaurants together experienced a decline of 10.26 percentage points in their growth rate between 2019-20 and 2020-21.
Another reason for this trend could be the relatively lower impact of the pandemic on the non-contact-intensive income generation activities that the Railways and Air Transport sectors carry out.
6.3.7. TourismTelangana’s history and topography have endowed the state with a variety of tourist destinations, from waterfalls and hills to temples and forts. The region has a rich cultural heritage and possesses all the qualities required to emerge as a potent tourist destination in India.
6.3.7.1. Tourist FootfallThe state witnessed an increase in the domestic tourist footfall from 7,23,99,113 in 2014-15 to 8,30,35,894 in 2019-20, an increase of 14.69%. During this period, the foreign tourist footfall increased from 75,171 to 3,23,326, a 4.3 times increase.
However, due to the travel restrictions, lockdowns, and border closures during the pandemic, there was a steep decline of 4,29,80,313 in the domestic tourist arrivals between 2019-20 and 2020-21. In
this span, the foreign tourist footfall declined by 2,76,626 (see Figure 6.15).
6.3.7.2. Global Recognitions and Awards6.3.7.2.1. Ramappa Temple Ramappa Temple in Mulugu District was declared as a World Heritage Site by the United Nations Educational, Scientific and Cultural Organization (UNESCO) in 2021. The temple, also known as Rudreshwara Temple, in a walled complex was built during the Kakatiyan period (1123–1323 CE) under rulers Rudradeva and Recharla Rudra. The building features decorated beams and pillars of carved granite and dolerite with a distinctive and pyramidal Vimana (horizontally stepped tower) made of lightweight porous bricks, so-called ‘floating bricks’, which reduced the weight of the roof structures.
6.3.7.2.2. Pochampally VillagePochampally village, a 28 square km-wide weavers’ hamlet on the outskirts of Hyderabad was awarded the title ‘Best Tourism Village’ by the United Nations World Tourism Organisation (UNWTO) in 2021 for its commitment towards the promotion and preservation of cultural heritage and sustainable
Figure 6.15
Total Tourist Arrivals in Telangana (2014-15 to 2021-22)
Source: Department of Tourism, Government of Telangana
2014-15
2015-16
2016-17
2017-18
2018-19
2019-20
2020-21
2021-22
7.24
9.45
9.52
8.53
9.29
8.30
4.01
2.48
0.75
1.27
1.67
2.52
3.18
3.23
0.47
0.03
Domestic Tourist Arrivals (Crores)
Foreign Tourist Arrivals (Lakhs)
Services

Telangana Socio Economic Outlook 2022102
development through tourism. The weavers in the village are engaged in the production and marketing of hand-woven sarees, dress materials, bed sheets, furnishing fabrics - in silk and cotton. Pochampally Ikat designs already hold the Geographical Indications tag. 6.3.7.2.3. Awards
Renowned Gussadi Dancer, Sri. Kanakaraju was facilitated with the Padma Shri award on 10.11.2021 in recognition of his contributions to art and culture. Recently Sri. Darshanam Moglaiah, who has kept alive the 12-step stringed musical instrument Kinnera, Kuchipudi dancer Smt. Gaddam Padmaja Reddy and tribal folk singer Sri. Ramachandraiah were awarded Padma Shri on 26.01.2022. 6.3.7.3. Government Initiatives to promote tourism
The Government promotes tourism in the state through supporting festivals and pilgrimages, building safe and hygienic hospitality infrastructure, creating livelihood opportunities and through reach-out activities in India and abroad. 6.3.7.3.1. Tourism Circuits
Tourism circuits help highlight the inter-relationships and common tourism opportunities among the cities and villages that are part of the same destination. The major tourism circuits in the state are:-
lTribal Circuit: Mulugu - Laknavaram - Medaram - Tadvai - Damaravai - Mallur - Bogatha Waterfalls.
l Heritage Circuit: Qutub Shahi Heritage Park - Paigah tombs - Hayath Bakshi Mosque - Raymond’s tomb
lEco-Tourism Circuit: Somasila Reservoir - Singotam Reservoir - Akka Mahadevi Caves - Srisailam - Mannanur - Malleelatheertham - Uma Maheshwaram Temple
6.3.7.3.2. Festivals, Pilgrimages and Heritage Walks
The biennial Medaram Jathara or Sammakka Saralamma Jathara, honouring the twin goddesses of Sammakka and Saralamma, is the biggest tribal festival in Asia, attracting nearly 1 crore devotees. During every jathara, the Government makes elaborate arrangements for providing logistics, drinking water, sanitation and emergency healthcare facilities. Since the pandemic, the Government has also been setting up covid testing and vaccination centres in Medaram during the festival. The 2022 celebrations took place from February 14th to 20th.
Bathukamma is a colourful floral festival of Telangana that is celebrated by women with exotic flowers of the region. The Government distributes Bathukamma Sarees to all adult women enrolled under the Food Security Scheme during the festival season every year from 2017.
The yearly kite festival is another state-sponsored tourist initiative. Nearly 13 lakh people visited the 2020 kite festival at Parade grounds, Hyderabad. The Government organized 6 exhibitions, 3 celebration events and a roadshow in the last two years.
The Government organizes heritage walks every second Saturday and Sunday where the public, students, researchers, architects, historians and enthusiasts can explore the rich heritage and architecture of the monuments located around the old city. 6.3.7.3.3. TS-iPASS for tourism
To facilitate the speedy approvals and clearances for tourism-related services, the Government has developed an application in the Telangana State Industrial Project Approval and Self-Certification System (TS-iPASS) portal for the registration of hotels, resorts, service apartments, lodges, wayside amenities, convention center and travel agencies as well as the performance licenses for tourism events. 6.3.7.3.4. Hospitality and Transport Services
The Telangana State Tourism Development

103
MICE stands for Meetings, Incentives, Conferencing and Exhibitions. Hyderabad has emerged as a major IT hub in the country. The city’s infrastructure can be advertised to attract Multi-National Companies, international organisations, and commerce bodies to host their events. By combining its rich heritage with a bustling economy, it offers a great combination for MICE travellers to work and vacation here. Thanks to its strengths in multiple sectors, it is fast developing into a business hub and a prime MICE destination. Every year, nearly 20 big international meets and 30-40 national level events are hosted by Hyderabad thanks to the world-class infrastructure that the city provides.
In its annual survey in 2014, the ICCA (International Congress and Convention Association) recognized Hyderabad as the 2nd best MICE (Meetings, Incentives, Conferencing and Entertainment) destination in India. Since
then, Hyderabad has only grown from strength to strength. Under the Government of India’s National Tourism Awards, the Hyderabad International Convention Centre and Leonia won the Best Standalone Convention Centre awards in 2014 and 2015 respectively.
In 2016, Hyderabad International Convention Centre (HICC) and Hitex Exhibition Centre together hosted about 100 meetings, conferences and exhibitions. Other events attracting many delegates were the NASSCOM Gaming and Developers Conference, Poultry Exhibition, Geospatial World Forum, World Endoscopy Conference, International Conference on Drought Tolerance and the National Congress of Indian Association of Gastrointestinal Endo-Surgeons. By 2019, nearly 85-90% of premium hotel demand came from visitors coming for business purposes led by MICE activities.4
Box 6.1
MICE Tourism
Corporation (TSFDC) operates a chain of 45 ‘Haritha’ hotels in the state. These hotels provide quality accommodation and hygienic food for tourists at major destinations. ‘Haritha’ hotels are equipped with bars, banquet halls, conference halls, board rooms, auditoriums, gymnasiums, children’s play area and swimming pools. TSFDC also operates tour packages to major tourist destinations. These tour packages also include darshan facilities at pilgrim centres, accommodation, food and guide services.
6.3.8. Sub-sectoral Contribution to the Sectoral Growth RateThe biggest drivers of the services sector growth (current prices) in the state were the ‘Financial,
Real Estate, and other Professional Services’ sub-sector in 2015-16 and 2016-17, and the ‘Trade, Repair, Hotels & Restaurants, Transport, Storage, Communication, and Services related to Broadcasting’ sub-sector in 2017-18 and 2018-19 (see Figure 6.16). In 2019-20, both of the above sub-sectors drove the growth of the services sector almost equally, with the former contributing slightly higher to the sectoral growth rate.
In 2021-22, during the recovery from the pandemic, the ‘Trade, Repair, Hotels & Restaurants, Transport, Storage, Communication, and Services related to Broadcasting’ sub-sector drove the sector, accounting for 8.20 percentage points of the sectoral growth rate (18.32%).
4 2019. Care Ratings, Indian Hotel Industry - Review FY19 and Outlook, October 31.
Services

Telangana Socio Economic Outlook 2022104
At the national level, it was the ‘Financial, Real Estate, and other Professional Services’ sub-sector that drove the growth of the services sector (current prices)) for most years between 2015-16 and 2019-20. However, in the post-pandemic period (2021-22), the ‘Trade, Repair, Hotels & Restaurants, Transport, Storage, Communication, and Services related to Broadcasting’ sub-sector was the largest contributor to the sectoral growth rate.
In the year 2020-21, when the impact of the pandemic on the services sector was the most severe, it was the contact intensive ‘Trade, Repair, Hotels & Restaurants, Transport, Storage, Communication, and Services related to Broadcasting’ sub-sector that drove the decline in the GVA of the services sector, both in India, as well as Telangana. The decline, however, was significantly smaller in the case of Telangana. Overall, in the year 2020-21, India’s services sector fell by 4.65% whereas in Telangana this grew by 0.91%.
6.4. Employment Trends in the Services SectorMore than one-third (33.32%) of all workers in
Telangana are employed in the services sector. At the all-India level, this is 30.77%.
In urban areas, the share of service sector workers in Telangana has been higher than India since 2017-18. On the other hand, in rural areas, this is lower than the national average (see Figure 6.17).
The services sector’s contribution to employment is higher in the urban areas of Telangana compared to rural areas. According to the Periodic Labour Force Survey 2018-19, 68.07% of the urban workers in the state fall under the service sector whereas this is only around 15.6% in the rural areas (see Figure 6.18). This is due to the diverse opportunities in trade, repair, hotels, real estate and other professional services available in urban areas.
Within the services sector, more than one-third of all workers (37.75%) are employed in the ‘Trade, Hotels and Restaurants’ sub-sector, whereas 21.48% of the workers are employed in the ‘Transport, Storage and Communication’ sub-sector, together accounting for 59.23% of the employment in the services sector. In rural areas, the former employs a greater percentage of the persons (31.01%) in comparison to the latter
Figure 6.16
Sub-sectoral Contribution to the Growth in GVA by the Services Sector: Telangana (at current prices)
Source: Ministry of Statistics and Programme Implementation, Government of India
Contribution to growth in services (%)
Trade, Repair, Hotels and Restaurants, Transport, Storage, Communication & Services related to Broadcasting
Public Administration and Other Services
Financial Services, Real Estate, Ownership of Dwelling and Professional Services
2015-16 2016-17 2017-18 2018-19 (TRE)
2019-20 (SRE)
2020-21 (FRE)
2021-22 (AE)
Telangana India
2015-16 2016-17 2017-18 2018-19 (TRE)
2019-20 (SRE)
2020-21 (FRE)
2021-22 (AE)
--2.56
1.30
2.174.92
5.19
1.06
6.92
4.72
0.58
5.16
4.48
2.43
4.58
6.94
4.33
4.99
6.34
3.93
8.20
6.08
4.05
11.362.79
8.75
8.15
2.83
3.13 5.70 4.10 5.43 4.62
-10.27-0.38
3.62 4.786.75
5.874.06 4.00
4.70 4.70
4.41

105
(21.00%), together employing 52.01% of all service sector workers. The trend is similar in urban areas too, where the former sector employs 40.46% of all workers, while the latter employs 21.51% of all workers, together accounting for 61.97% of the service sector employment in urban areas (see Figure 6.18).
6.5. Way ForwardAdvanced economies around the world have a relatively dominant services sector - both in terms of its contribution to the value added, as well as the share of employment held. The Government envisions enabling a service-oriented economic transformation in the state.
Recognizing the central role of technology in service-sector growth, the Government is trying to supplement the existing potential through institutional support to the firms, especially start-ups, via initiatives such as T-Hub, WE-Hub, TSIC and T-works. The Government is also actively promoting the use of Artificial Intelligence (AI), Blockchain technology and drone technologies. This is combined with efforts that target skill enhancement through institutions such as the Telangana Academy for Skill and Knowledge (TASK). This would train and gear up the workforce to adapt to technological changes.
In addition, the Government is also keen on
integrating the innovations in the service sector with other sectors like agriculture, which are dominant in rural areas, and would be able to benefit from the innovations in IT/ITeS currently focused in urban areas. Most prominently, the Government has shown initiative to increase the rural penetration of the IT sector through initiatives like the Dharani portal and the use of technology to prevent leakages in the Public Distribution System. To foster greater cross-sectoral integration, the Government is providing enabling infrastructures such as T-Fiber and a high-quality road network. Taken together, these initiatives would help foster economic growth, enhance productivity across sectors, and generate robust employment.
Figure 6.17
Share of services sector workers in the total workers: Telangana vs India (2017-18, 2018-19 and 2019-20)
Source: Periodic Labour Force Surveys 2017-18, 2018-19 and 2019-20
Share of services sector workers (%)
Rural Urban
IndiaTelangana
65.95
59.08
60.4361.48
65.40
68.07
15.52
19.8720.71
18.4716.10
15.66
Figure 6.18
Sub-sector-wise employment in Telangana: Rural vs Urban Areas5 (2019-20)
Rural Urban Total
Trade, Hotels & Restaurants
Transport, Storage & Communications
Other Services
Share (%)
31.01
40.46
21.51
38.03
21.00 21.48
37.7540.77
47.99
Source: Directorate of Economics and Statistics, Government of Telangana
Services
5 Other services include (i) Accommodation and Food service activities, (ii) Information and communication, (iii) Financial and insurance activities, (iv) Real estate activities, Professional, scientific and technical activities, (v) Administrative and support service activities, (vi) Public administration and defence; compulsory social security, (vii) Education, (viii) Human health and social work activities; (ix) Arts, entertainment and recreation; (x) Other service activities; (xi) Activities of households as employers; undifferentiated goods- and services-producing activities of households for own use.
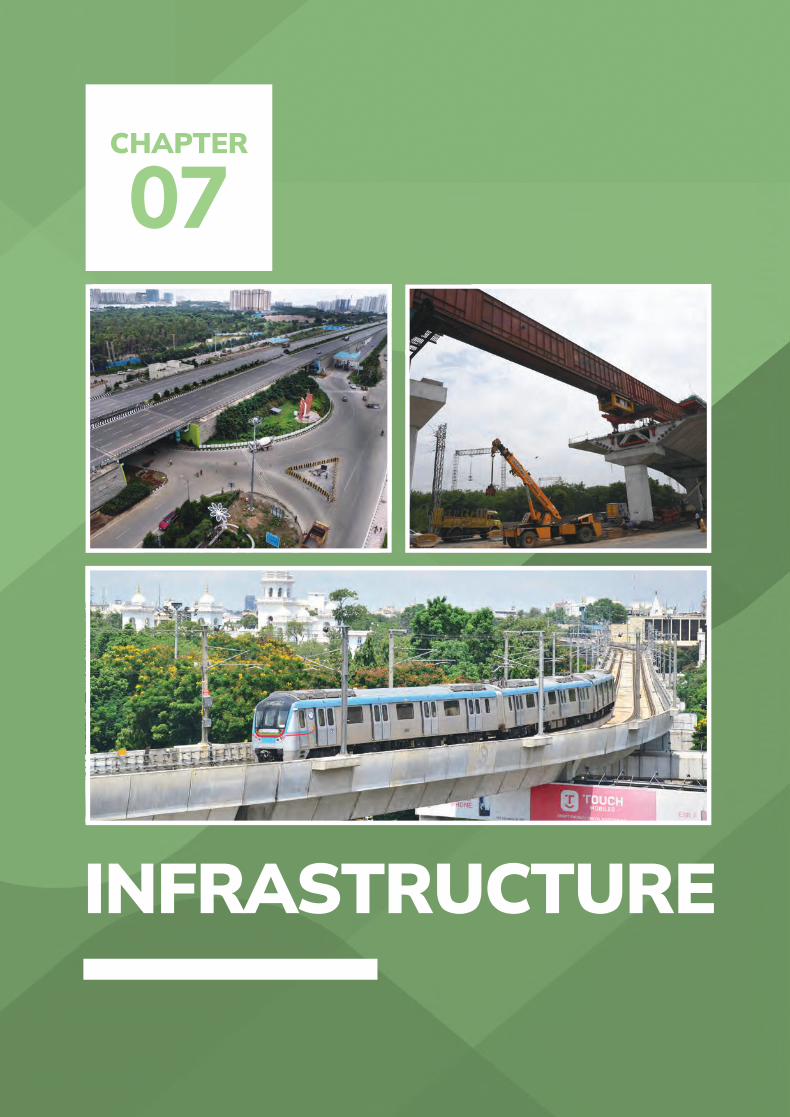
Telangana Socio Economic Outlook 2022106
INFRASTRUCTURE
CHAPTER
07

107
l Telangana is criss-crossed with a total road network of 1,07,871 km of which 67,276 km are rural roads, 3,910 km are National Highways, 9,013 km are GHMC roads, and the remaining 27,672 km are state highways and district roads.
l The The total number of vehicles in Telangana as of 1st December 2021 is 1,42,73,565, of which nearly 74.2% are two-wheelers, 13.2% are motor cars/cabs, and 3.1% are auto-rickshaws and the remaining 9.5% are other types of vehicles.
l Through Mission Bhagiratha, treated surface water is ensured to
n23,890 rural habitations (outside Outer Ring Road), 653 rural habitations that are merged with Urban Local Bodies (ULBs), and 121 ULBs
n22,882 schools, 27,310 Anganwadi Centers and other government institutions
l Telangana achieved 100% coverage of Functional Household Tap Connections (FHTC) in all rural habitations, along with Haryana and Goa.
l The installed capacity of power in Telangana experienced an increase from 9,470 MW in 2014-15 to 17,218 MW in 2020-21, an increase of more than 80%.
l 3,806 MW of power in the state is from renewable energy sources in 2021, of which 3,489 MW is Solar Energy, 128 MW from Wind Energy, 74 MW from Bagasse Cogeneration, 63 MW from Waste-to-Energy, 45 MW from Biomass and 7 MW from small Hydropower units.
l Telangana has the 3rd lowest transmission losses among all states in the country as of 2018-19, at 14.85%, compared to the all-India value of 20.66%.
Key Highlights
Infrastructure

Telangana Socio Economic Outlook 2022108
7.1. Introductionnfrastructure–the basic physical systems of a region, including a well-functioning transportation system, communication
networks, sewage, water, and electric system are vital to the economic development and prosperity of any region. The Government of Telangana has been promoting basic infrastructural development since its formation. For instance, Telangana has achieved 100% saturation in household electrification by 2018.
Five key sectors—Transportation, Water, Sanitation, Energy and Communications have been detailed in this chapter. The physical infrastructure aspects of public services, industries, health and education have been detailed in chapters 4, 5, 8 and 10.
7.2. Transportation infrastructureTelangana is a landlocked state, hence, land transportation infrastructure is essential to spatially connect the resources across this wide area span in the state. Additionally, it is also an important component of the state’s total economic product. Roads, railways and airways are the three major modes of transport in the state. In addition, Hyderabad has a well-functioning elevated metro rail corridor supplementing the city roads.
7.2.1. Road NetworkThe road network in Telangana comprises (i) National Highways (NH), (ii) roads managed by the Roads and Buildings Department (R&B), (iii) rural roads managed by the Panchayat Raj Engineering Department (PRED) and (iv) roads managed by the Greater Hyderabad Municipal Corporation (GHMC).
The state has a 1,07,871 km-long road network of which 62.37% are rural roads, 25.65% are state highways and district roads, 3.62% are National
Highways and 8.36% are GHMC roads (see Table 7.1).
The total road network in the state other than NHs is 1,03,961 km in length of which more than half are blacktop roads. Nearly one-tenth of the total state roads (except NHs) are cement-concrete roads. Around 9% of the total state roads (except NHs) are metalled (see Figure 7.1).
Among the districts, being a metropolitan area, Hyderabad has the longest road network in the
I
Table 7.1
Road Network in Telangana (2020-21)
Source: (1) Roads & Buildings Department, (2) Panchayat Raj Engineering Department
3,910
27,672
67,276
9,013
1,07,871
Length (km)Type of Road
1 National Highways
2 R&B Roads
3 PRED Roads (Rural Roads)
4 GHMC Roads
5 Total Road Network (1+2+3+4)
Figure 7.1
Road Network in Telangana (except NHs) by construction material (2020-21)
Note: R&B- Roads and Buildings Roads, PRED- Rural Roads, GHMC- Hyderabad Roads Source: (1) Roads & Buildings Department, (2) Panchayat Raj Engineering Department
Length (km) R&B PRED GHMC
CC Top Black Top Metalled Un-metalled
8233,655
6,167
25,686 24,267
2,846241
8,924
923
30,429
0 0
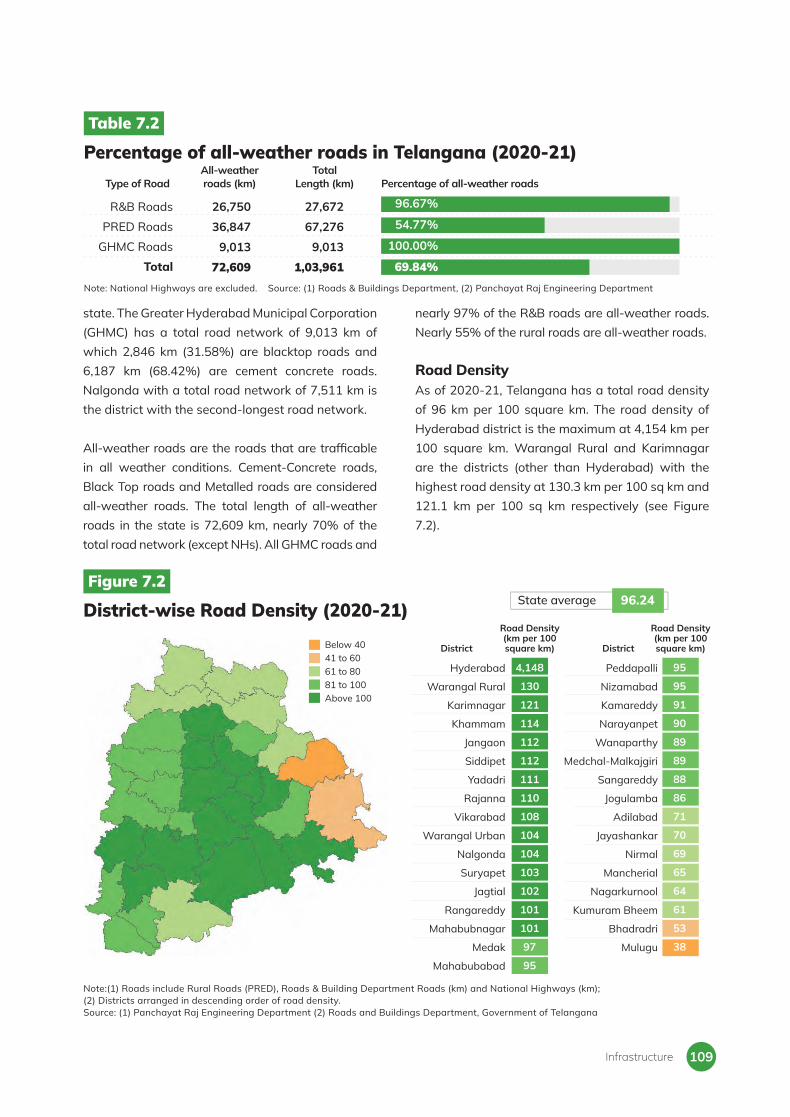
109
state. The Greater Hyderabad Municipal Corporation (GHMC) has a total road network of 9,013 km of which 2,846 km (31.58%) are blacktop roads and 6,187 km (68.42%) are cement concrete roads. Nalgonda with a total road network of 7,511 km is the district with the second-longest road network.
All-weather roads are the roads that are traffi cable in all weather conditions. Cement-Concrete roads, Black Top roads and Metalled roads are considered all-weather roads. The total length of all-weather roads in the state is 72,609 km, nearly 70% of the total road network (except NHs). All GHMC roads and
nearly 97% of the R&B roads are all-weather roads. Nearly 55% of the rural roads are all-weather roads.
Road DensityAs of 2020-21, Telangana has a total road density of 96 km per 100 square km. The road density of Hyderabad district is the maximum at 4,154 km per 100 square km. Warangal Rural and Karimnagar are the districts (other than Hyderabad) with the highest road density at 130.3 km per 100 sq km and 121.1 km per 100 sq km respectively (see Figure 7.2).
Infrastructure
Table 7.2
Percentage of all-weather roads in Telangana (2020-21)
Note: National Highways are excluded. Source: (1) Roads & Buildings Department, (2) Panchayat Raj Engineering Department
Type of RoadTotal
Length (km)All-weather roads (km) Percentage of all-weather roads
R&B Roads
PRED Roads
GHMC Roads
Total
26,750
36,847
9,013
72,609
27,672
67,276
9,013
1,03,961
96.67%
54.77%
100.00%
69.84%
Figure 7.2
District-wise Road Density (2020-21)Road Density (km per 100 square km)
Road Density (km per 100 square km)District District
4,148
130
121
114
112
112
111
110
108
104
104
103
102
101
101
97
95
95
95
91
90
89
89
88
86
71
70
69
65
64
61
53
38
Hyderabad
Warangal Rural
Karimnagar
Khammam
Jangaon
Siddipet
Yadadri
Rajanna
Vikarabad
Warangal Urban
Nalgonda
Suryapet
Jagtial
Rangareddy
Mahabubnagar
Medak
Mahabubabad
Peddapalli
Nizamabad
Kamareddy
Narayanpet
Wanaparthy
Medchal-Malkajgiri
Sangareddy
Jogulamba
Adilabad
Jayashankar
Nirmal
Mancherial
Nagarkurnool
Kumuram Bheem
Bhadradri
Mulugu
Below 4041 to 6061 to 8081 to 100Above 100
Note:(1) Roads include Rural Roads (PRED), Roads & Building Department Roads (km) and National Highways (km); (2) Districts arranged in descending order of road density. Source: (1) Panchayat Raj Engineering Department (2) Roads and Buildings Department, Government of Telangana
State average 96.24

Telangana Socio Economic Outlook 2022110
7.2.2. Vehicle Strength in the stateThe total number of vehicles in Telangana as of 2021 is 1,42,73,565 of which nearly 74.2% are motorcycles and 3.1% are auto-rickshaws. Motor cars and cabs together account for nearly 13.2% of the total vehicle strength (see Table 7.3).
7.2.2.1. Anywhere-Anytime InitiativeTo increase transparency in service delivery, the Government introduced the mobile-Governance initiative ‘Anywhere-Anytime’. This enables the citizens to avail necessary services from the Regional Transport Authorities (RTA) online.
The RTA application is integrated with T-App folio, the mobile application for citizen services. ‘Anytime Anywhere’ offers Artificial Intelligence-based liveness detection and Deep-Learning based comparison to check the authenticity of the
photo received through the smartphone. This is supplemented by a Machine Learning based entry resolution to check the demographic attributes of the applicant.
7.2.3. BuildingsBuildings for public services and utilities play a key role in infrastructure. Some of the major public building works under progress are the new Secretariat Building and City Police Commissionerate Headquarters in Hyderabad, and Integrated District Office Complexes in 26 districts.
7.2.4. Telangana State Road Transport Corporation (TSRTC)The Telangana State Road Transport Corporation (TSRTC) provides timely, affordable, and efficient bus services to the public. It operates 9,675 buses, including 6,631 owned and 3,044 hired buses. TSRTC has 3,549 routes connecting intra-state and inter-state destinations.
Nearly 68% of the TSRTC buses serve rural areas and around 32% of buses serve the urban population. TSRTC has an employee strength of 47,592 under various cadres. There are 97 bus depots across 21 divisions.
Nearly 54.52 lakh persons travel in TSRTC buses every day with an occupancy ratio of 60.80%. The average daily earning of TSRTC in November 2021 was Rs. 11.53 crore. To augment commercial revenues, TSRTC also introduced parcel and cargo services that move consignments of Government and private establishments. The corporation earned a revenue of Rs. 75.15 crore by delivering nearly 52.51 lakh parcels up to 30th November 2021. Eco-friendly initiativesTSRTC introduced 40 electric vehicles under the Faster Adoption of Hybrid and Electric Vehicles (FAME) scheme to mitigate air pollution and make Hyderabad a ‘green city’. It has already entered into agreements with three empanelled agencies
Table 7.3
Vehicles registered in Telangana as of 1st December 2021
1 Auto-rickshaws
2 Contract carriage vehicles
3 e-Rickshaw/e-Cart
4 Educational institution vehicles
5 Goods Carriage Vehicles
6 Maxi Cabs
7 Motor Cycles
8 Motor Cars
9 Motor Cabs
10 Private service vehicles
11 Stage carriage vehicles
12 Tractor and trailers
13 Others
Total
4,38,867
5,121
221
27,840
5,64,155
30,577
1,05,90,094
17,78,225
1,10,455
2,981
9,400
6,32,973
82,656
1,42,73,565
Type Number
Source: Transport Department, Government of Telangana

111
1 The two road stretches are: (i) Northern part with a design length of 158.4 km:- Sangareddy (on NH 161)-Narsapur-Toopran-Gajwel-Jagdevpur-Bhongir-Choutuppal (on NH 65) and (ii) Southern part with a design length of 181.87 km:- Choutuppal(on NH 65)-Shadnagar-Sangareddy (on NH 65).
for the production of 4,488 kW solar power with an average generated power of 65 lakh units. The savings in expenditure after installing solar PV roof-top projects is Rs. 2.26 crore per annum. The initiative also avoided 7300 tons of CO2 emissions per annum.
7.2.5. Urban Transport Infrastructure in HyderabadRoad Development
Hyderabad accounts for 28.97%, i.e. nearly one-third, of the state’s urban population, and has become a growth centre for the state. The increasing
number of industries, educational institutions, employment opportunities and healthcare facilities attract people for short or long term stay in Hyderabad. The consequent increase in the demand for advanced transport infrastructure in the city led the Government to devise focused strategies for easy mobility in Hyderabad.
The Government, through the Strategic Road Development Programme (SRDP), constructed 22 transit infrastructures including flyovers, over bridges and underpasses. The Comprehensive Road Maintenance Programme (CRMP) was introduced for the maintenance works of around 710 km main roads (3 lanes and above) in the GHMC area. The Government also decided to identify and develop the ‘Missing Link Corridors’ and ‘Slip Roads’ that would address the growing traffic congestion. They are intended to provide the missing connections in the effective distribution of traffic over the road network in Hyderabad.
The Proposed Regional Ring Road (RRR) encircles Hyderabad city with an average radial distance of 50-60 km. The Government of India, in principle, approved two road stretches1 connecting Sangareddy and Choutuppal as new NHs in 2016. Hyderabad Metro Rail The Hyderabad Metro Rail (HMR) project is an elevated 69 km-long mass transit solution to address the increasing traffic congestion and pollution levels in Hyderabad city. HMR serves nearly 4 lakh passengers per day before COVID lockdown. It operates on three distinct lines.
Phase-II of HMR includes a 31 km-long Airport Express Metro Rail from Raidurgam to Rajiv Gandhi International Airport, Shamshabad with an estimated cost of Rs. 5,100 crore is at the Detailed Project Report (DPR) stage.
lTSRTC received the national award from the Petroleum Conservation Research Association (PCRA) for the second-best State Transport Unit (STU) in the country for ‘kilometre per litre’ (KMPL) improvement between October 2019 and September 2020 under the category of ‘STUs with more than 4001 buses in operation’.
lAt the state level, Hayathnagar-1, Uppal and Dilsukhnagar depots received the best depot awards from the Honourable Governor of Telangana for KMPL improvement during the period from October 2019 to September 2020.
lThe Telangana State Renewable Energy Development Corporation Limited has instituted Telangana State Energy Conservation Awards. In 2021, Sathupally depot received the Gold Award’ for fuel conservation.
Awards and Recognitions
Infrastructure

Telangana Socio Economic Outlook 2022112
Air Traffic Patterns in Hyderabad AirportThe Rajiv Gandhi International Airport (RGIA), Hyderabad is connected to 60 domestic destinations and 12 international destinations. It also has an integrated cargo facility with a handling capacity of 1,50,000 MT per annum and a dedicated pharma zone.
Between April 2021 and November 2021, the passenger traffic at RGIA was 70.8 lakh, a 95% increase from the same period the previous year; 36.1 lakh in 2020 (see Figure 7.3). Between the same periods in 2020 and 2021, the total number of Air Traffic Movements (ATM) grew from 43,156 to 70,326, a rise of around 63%. The airport experienced a cargo traffic growth from 68,452 MT to 92,013 MT between the same periods in 2020 and 2021, an increase of about 34% (see Figure 7.4).
The Hyderabad Airport Cargo Terminal has been certified with the World Health Organization’s Good Storage and Distribution Practices (WHO-GSDP). RGIA also became the best airport in the Asia-Pacific region in the “15-25 million passengers per annum” category by the Airports Council International’s annual Airport Service Quality (ASQ) survey in 2020.
7.2.6. LogisticsLogistics infrastructure is a prerequisite for sustainable economic growth. A strong and affordable logistics ecosystem improves supply chain efficiencies and thereby enhances the competitiveness of the economy.
Figure 7.3
Passenger Traffic in Hyderabad Airport, 2020-21 and 2021-22Passenger Traffic (Millions)
Source: GMR Hyderabad International Airport Limited
3.39
6.35
0.220.73
3.61
7.08
April 2020-November 2020 April 2021-November 2021
Domestic International Total
Figure 7.4
Cargo and Air Traffic Movement in Hyderabad Airport, 2020-21 and 2021-22
27,208
41,243
49,72642,287
68,452
92,013
39,162
3,9947,114
43,156
70,326
63,212
Source: GMR Hyderabad International Airport Limited
Domestic DomesticInternational InternationalTotal Total
April 2020-November 2020 April 2021-November 2021
Air Traffic Movement (Number)Cargo (MT)

113
Logistics is one of the 14 thrust sectors under the Industrial Policy Framework for the state, 2014. Mangalapally logistics park in Ibrahimpatnam, Rangareddy district which spreads over 22 acres was the fi rst integrated logistics park in India to be developed in Public-Private-Partnership (PPP) mode.
The Government is also developing a fi rst-of-its-kind logistics park with warehousing, parking, and retail facilities at Batasingaram in Hyderabad across 40 acres at an investment of Rs 50 crore.
7.3. Water Supply and SanitationAccess to water is critical for human development and economic growth. Augmenting water resources has been a policy priority of the state right from its formation. The Government focuses on ensuring timely access to water for agriculture, potable water to the households and adequate water supply to the industrial sector.
Sanitation services are as important as water supply given its multiple implications on health, environment and safety. The Government of Telangana considers sanitation as a priority area through the sanitation components of Palle Pragathi and Pattana Pragathi. The Government also implements Swachh Telangana in line with the Swachh Bharat Mission.
7.3.1. Mission BhagirathaMission Bhagiratha is the fl agship programme of the Government of Telangana to provide safe, adequate, sustainable and treated drinking water to the entire state (except Hyderabad urban agglomeration where a separate water supply system is already functional).
Through its 26 segments, Mission Bhagiratha supplies surface-treated water to all rural habitations through functional tap connections. On the other hand, the Urban Local Bodies (ULBs) receive bulk water supply. The project provides treated drinking water at the rate of 100 Litres Per Capita Per Day (LPCD) in rural areas, 135 LPCD in
Figure 7.5
Percentage of Households with Functional Tap Connection (2022)
Note: 1. All values are as of 15th January 2022. 2. States arranged in descending order of coverage. Source: Jal Jeevan Mission Dashboard, Ministry of Jal Shakti, Government of India
Telangana
100.0
Households with functional tap
connection (%)
Households with functional tap
connection (%)State/ UT�����
�����
�����
�����
�����
�����
����
����
����
����
����
����
����
����
����
����
����
����
����
����
����
����
����
����
����
����
����
����
����
����
����
����
����
Telangana
Goa
Andaman and Nicobar Islands
Puducherry
Dadra & Nagar Haveli and Daman & Diu
Haryana
Punjab
Himachal Pradesh
Gujarat
Bihar
Sikkim
Maharashtra
Manipur
Jammu & Kashmir
Arunachal Pradesh
Andhra Pradesh
Uttarakhand
Mizoram
Karnataka
Odisha
Tripura
Tamil Nadu
Nagaland
Kerala
Madhya Pradesh
Meghalaya
Ladakh
Assam
Rajasthan
West Bengal
Jharkhand
Chhattisgarh
Uttar Pradesh
Infrastructure
Below 20.020.1 to 40.040.1 to 60.060.1 to 80.080.1 to 100.0

Telangana Socio Economic Outlook 2022114
municipalities/Nagar panchayats and 150 LPCD in municipal corporations. 10% of the total water is earmarked to meet industrial needs.
Mission Bhagiratha covers all the 23,890 rural habitations (outside Outer Ring Road), 653 rural habitations that are merged with ULBs, and 121 ULBs. It targets nearly 272.36 lakh population of which 75.52% is rural and the rest is urban. Moreover, 22,882 schools and 27,310 Anganwadi Centers along with other government institutions are provided with functional tap connections under this project.
According to the Ministry of Jal Shakti, Government of India, Telangana is one of the fi rst states in the country to achieve 100% coverage of Functional Household Tap Connections (FHTC) in all rural habitations through sustainable surface resources, along with Haryana and Goa (see Figure 7.5). A total expenditure of around Rs. 35,836 crore has been incurred on drinking water schemes under Mission Bhagiratha up to December 2021.
7.3.2. Swachh Telangana in line with Swachh Bharat MissionThe Swachh Bharat Mission was launched by the
Government of India in 2014 with an objective to bring improvement in the cleanliness, hygiene and the general quality of life in rural areas.
In 2014, the sanitation coverage in Telangana was only 27.32%. Within the 5 years thereafter, the State constructed over 30 lakh toilets, out of which more than 19 Lakh2 toilets were constructed under Swachh Bharat Mission-Gramin (SBM-G) (see Figure 7.6). Resultantly, Telangana was declared Open Defecation Free (ODF) in 2019.
Siddipet and Peddapalli districts received the ‘Best Districts in the country’ award as part of the World Toilet Day in 2020. Under the Gandagi Mukt Bharat programme, Telangana achieved the 1st position for maximum ‘shramdaan’ (effort).
SBM-G in the state now focuses on sustaining the outcomes achieved through the mission and climbing the sanitation ladder by managing solid and liquid wastes in line with Palle Pragathi, the state fl agship program for the overall progress and prosperity of rural areas. The Government of Telangana has developed a robust and inclusive ODF Plus strategy involving District Administrations and Panchayat Raj Institutions under SBM Phase II.
2014-15 2015-16 2016-17 2017-18 2018-19 2019-20
30,00,000
25,00,000
20,00,000
15,00,000
10,00,000
5,00,000
0
100.00
75.00
50.00
25.00
0.00
Figure 7.6
Performance of Telangana under Swachh Bharat- Gramin Household toilets constructed
Hou
seho
ld to
ilets
con
stru
cted
Cove
rage
(%)
Coverage (%)
81,6353,13,349
28.83%
100.00%
8,11,186
18,14,244
24,31,000
4,88,715
Source: Swachh Bharat- Gramin Dashboard
47.19%
87.69%
72.45%
2 As of 31 December 2020
34.66%

115
ODF Plus StrategyODF Sustainability (ODF-S), Solid and Liquid Waste Management (SLWM) and Visible Cleanliness (VC) are the key components of ODF Plus. The Government of Telangana recognizes the vital role of Information, Education and Communications (IEC) interventions for ODF-S and SLWM to create a felt need for these activities among rural communities.
7.4. EnergyBeing a basic input in the processes of production and consumption, energy is vital for economic growth. The major sources of power in Telangana are thermal power plants, hydel power stations and renewable energy sources. The Government of Telangana is committed to ensuring 24x7 uninterrupted power supply to all domestic, agricultural and industrial consumers.
7.4.1. Access to Power and Patterns of SupplyTelangana used to experience a peak demand shortage of 2,700 MW and a load relief of 4-8 hours to domestic and other categories at the time of its formation in 2014. Moreover, the industries in the state had to experience two power holidays a week. The erratic power supply of 4-6 hours to the agricultural sector led to crop failures and consequent farmer suicides. Furthermore, the farmers suffered from accidents and snake bites as supply was restricted to night hours.
With the persistent and systematic interventions from the Government, the power sector in the state experienced an overhaul in the last seven years. All consumers in all sectors (domestic, agriculture and industries) now receive a 24x7 reliable quality power supply. Interestingly, Telangana is the only state to supply 24x7 free power to 25.92 lakh agricultural consumers.
The Government allocated a subsidy of Rs. 10,500 crores to the power sector to provide free power to the agriculture and other subsidized categories under the 2021-22 budget. Most importantly, there has been no tariff hike to any category of consumers for the last five years.
Installed Capacity of PowerAt the time of its formation in 2014, Telangana was reeling under a power crisis with an installed capacity3 of 9,470 MW.
Through the persistent efforts by the Government, the installed capacity of power in Telangana increased from 9,470 MW in 2014-15 to 17,218 MW in 2020-21, at a Compound Annual Growth Rate (CAGR) of 10.48% (see Figure 7.7 and Figure 7.8), nearly 7 percentage points higher than the national average of 3.25%.
Telangana stands third among the non-special category states in the country and first among the
Figure 7.7
Installed Capacity of Power in Telangana (2014-15 to 2020-21)Installed Capacity of Power (MW)
2014
-15
2015
-16
2016
-17
2017
-18
2018
-19
2019
-20
2020
-21
9,47010,892 11,501
15,139 15,826 16,02417,218
Source: Central Electricity Authority, Ministry of Power, Government of India
3 Installed Capacity means the summation of the guaranteed rated capacity of the generating units at the rated head, or the capacity as decided in consultation with the Central Electricity Authority from time to time considering the uprating, de-rating etc.
Infrastructure

Telangana Socio Economic Outlook 2022116
south Indian states in terms of the growth rate in installed capacity between 2019-20 and 2020-21. The installed capacity of power in the state grew by 7.45% during this period.
Per Capita Availability of PowerTelangana experienced an increase in the per capita availability of power by 1.6 times between 2014-15 and 2020-21. The state has the fourth-highest per
capita availability of power in the country at 1,905 kWh as of 2020-21 (see Figure 7.9). This is nearly 1.8 times the all-India value of 1,031 kWh.
Telangana, among all states, has the second-highest growth in the per capita availability of power between 2014-15 and 2020-21, at a CAGR of 8.74%; the all-India value is just 3.24%.
Figure 7.8
Installed Capacity Growth Rate: Non Special Category States
Growth rate between 2019-20 and
2020-21 (%)
CAGR between 2014-15 and 2020-21 (%)
Note: States arranged in descending order of growth rate between 2019-20 and 2020-21.
Source: Central Electricity Authority, Ministry of Power, Government of India
Bihar
Gujarat
Telangana
Uttar Pradesh
Rajasthan
Madhya Pradesh
Tamil Nadu
Goa
Andhra Pradesh
Kerala
Chhattisgarh
Haryana
Maharashtra
Jharkhand
Punjab
Karnataka
Odisha
West Bengal
All India
9.13
7.62
7.45
6.63
2.70
2.69
2.60
2.58
2.53
2.48
1.88
1.55
1.54
1.35
1.30
0.89
0.32
0.09
3.25
14.81
4.58
10.48
10.79
8.20
8.25
6.66
6.87
14.56
6.03
-0.01
6.09
2.38
-0.50
5.35
12.12
-0.83
2.39
5.85
Figure 7.9
CAGR in Per Capita Availability Power in Non-Special Category States (2014-15 to 2020-21)
CAGR of Per Capita Availablity of Power between
2014-15 and 2020-21 (%)
Source: Central Electricity Authority, Ministry of Power, Government of India
Bihar
Telangana
Madhya Pradesh
Uttar Pradesh
Chhattisgarh
Rajasthan
Jharkhand
Punjab
All India
Gujarat
Karnataka
Haryana
Kerala
Odisha
Maharashtra
West Bengal
Andhra Pradesh
Tamil Nadu
Goa
10.43
8.74
7.74
5.98
5.97
4.54
4.53
3.25
3.24
2.54
2.33
2.26
2.14
2.11
2.09
1.87
1.60
1.45
0.58

117
In 2014-15, the per capita availability of power in Telangana was 1,152 kWh whereas the national average was 852 kWh (see Figure 7.10). The per capita availability of power in the state increased by nearly 1.65 times by 2020-21 to 1,905 kWh,
whereas the per capita availability of power in the country only increased to 1.21 times its 2014-15 value.
Energy SourcesThe total contracted capacity of Telangana more than doubled between 2014-15 and 2020-21 from 7,872 MW to 16,614 MW (see Figure 7.11).
The renewable sources held nearly one-fi fth (23%) of the total contracted capacity in the state in 2020-21. This includes solar, wind, bagasse, biomass, municipal/industrial waste & mini-hydel.
More than half of the total contracted capacity in the state was contributed by the thermal sector whereas hydel sources contributed 15% (see Figure 7.12A). More than half of the total contracted capacity in 2020-21 is from the state sector whereas the central sector contributed nearly 16%. Nearly one-third of the total contracted capacity in the state are held by the private sector (see Figure 7.12B).
2014-15 2015-16 2016-17 2017-18 2018-19 2019-20 2020-21
Figure 7.10
Year-on-year Per Capita Availability of Power: Telangana vs. India (2014-15 to 2020-21)
Source: Central Electricity Authority, Ministry of Power, Government of India
Telangana All India
852
1,5031,707
901 938 978 1,029 1,043 1,031
Per Capita Availability of Power (kWh)
1,888 1,942 1,905
1,416
1,152
Figure 7.11
Year-on-year contracted capacity of power (2014-15 to 2020-21)
Source: Energy Department, Government of Telangana
2014-15 2015-16 2016-17 2017-18 2018-19 2019-20 2020-21
7,8728,854
12,006
15,321 16,203 15,86416,614
Contracted Capacity (MW)
Infrastructure
Figure 7.12
Contracted Capacity in Telangana (as of 1st September 2021)
*Renewable sources inlcude Solar, Wind, Bagasse, Bio-mass, Municipal/Industrial Waste & Mini-Hydel
Total Contracted Capacity ~16,614 MW
A. By sources Capacity (MW)
Hydel15.1%
(2,506.91 MW)
Renewable23.0%
(3,818.16 MW)
Source: Energy Department, Government of Telangana
B. By sectors Capacity (MW)
State Sector51.3%
(8,516 MW)
Private Sector32.8%
(5,453 MW)
Central Sector15.9%
(2,645 MW)
Thermal55.6%
(9,241.81 MW)
Nuclear 1.3% (215.63 MW)
Gas5.0%
(831.82 MW)

Telangana Socio Economic Outlook 2022118
7.4.2. Transmission and Distribution‘Electricity Transmission’ in the state is managed by the Transmission Corporation of Telangana Limited (TRANSCO). On the other hand, the energy distribution is taken care of by the Telangana State Southern Power Distribution Company Limited (TSSPDCL) and the Telangana State Northern Power Distribution Company Limited (TSNPDCL).
Telangana has the 3rd lowest transmission loss as of 2018-19 among the 28 states in the country. According to the Central Electricity Authority, the electricity transmission and distribution loss of the state in 2018-19 was 14.85% compared to the all-India value of 20.66%. The only states with lower transmission losses than Telangana are Himachal Pradesh and Punjab, at 14.29% and 14.73% respectively.
7.4.3. Consumption PatternsThe year-on-year trend in the per capita consumption of electricity in Telangana is similar to the trend in the per capita availability of power. Both the parameters were on a consistent increase from 2014-15 to 2019-20 and then on a slight decrease in 2020-21, the pandemic year. Between 2019-20 and 2020-21, the per capita consumption decreased by 0.78%.
For instance, the per capita consumption of electricity in Telangana was 39,519 Million Units (MU) in 2014-15. By 2020-21, this increased by 17,488 units to 57,007 MU at a CAGR of 7.6%.
The CAGR from 2014-15 to 2019-20 is greater than that between 2014-15 and 2020-21. Given the population is projected to increase by 2.5 lakhs in this period, this refl ects a decrease in the consumption of electricity due to the COVID-19 (see Figure 7.13).
The consumer base of electrical connections in Telangana comprises domestic, agricultural and industrial consumers (see Figure 7.14).
As of 2020-21, there are 1,65,48,929 electrical connections in the state of which 25,62,623 (15.49%) are agricultural, 1,20,56,385 (72.85%) are domestic and 19,29,921 (11.66%) are industrial connections.
Hyderabad with 21,17,547 connections has the highest consumer base in the state whereas Komaram Bheem has only 1,51,326 connections, the lowest among all districts.
The percentage of agricultural connections is the highest in Medak where 30.84% of the total 3,14,731 connections are held by agricultural consumers. The maximum share of domestic consumers is in Medchal where 86.67% of the total 14,77,047 connections are domestic. Hyderabad is the district with the highest percentage of industrial connections at 18.96% of the total 21,17,547 connections.
Figure 7.13
Electricity Consumption in Telangana (2014-15 to 2020-21)
Source: Central Electricity Authority, Ministry of Power, Government of India
2014-15 2015-16 2016-17 2017-18 2018-19 2019-20 2020-21
Electricity Consumption (Million Units)
39,51941,045
44,783 50,442
57,45458,515
57,007

119
Figure 7.14
Distribution of electrical connections across the state (2020-21)
Total electrical connectionsDomestic Agricultural Industrial and other
Share of electrical connections (%)
* Including Narayanpet ** Including Mulugu Note: Districts arranged in descending order of total electrical connections. Source: Directorate of Economics and Statistics (as of 1st September 2021)
Hyderabad
Rangareddy
Medchal
Nizamabad
Nalgonda
Sangareddy
Khammam
Hanumakonda
Mahabubnagar*
Karimnagar
Siddipet
Jagityal
Suryapet
Badradri Kothagudem
Yadadri
Kamareddy
Peddapally
Mahbubabad
Mancherial
Medak
Vikarabad
Nagarkurnool
Nirmal
Warangal Rural
Rajanna Sircilla -Resco
Jayshankar Bhupalappally**
Jangaon
Adilabad
Wanaparthy
Jogulamba Gadwal
Komaram Bheem
Total
21,17,547
17,72,531
14,77,047
7,59,333
7,32,026
6,74,775
6,22,958
5,48,660
5,18,813
5,16,269
5,08,729
4,86,945
4,85,598
4,06,457
3,93,628
3,92,485
3,41,437
3,24,276
3,16,631
3,14,731
3,14,616
3,08,364
3,03,197
2,88,043
2,80,554
2,66,479
2,65,369
2,45,305
2,11,800
2,03,000
1,51,326
1,65,48,929
81.04
80.46
86.67
65.77
62.20
74.73
73.43
78.39
68.41
69.93
61.57
64.44
63.45
78.88
63.39
65.26
70.06
65.82
76.06
59.48
69.53
60.49
70.11
64.30
65.34
68.95
61.16
77.92
66.11
68.91
83.41
72.85
0.00
6.21
1.38
22.78
27.78
13.97
16.76
9.13
20.58
19.11
29.59
26.75
27.56
10.59
26.78
24.97
20.83
26.30
13.31
30.84
19.79
30.31
20.28
27.42
25.85
23.21
30.64
11.08
24.06
21.92
6.93
15.49
18.96
13.34
11.96
11.45
10.02
11.30
9.81
12.48
11.01
10.96
8.84
8.82
8.99
10.53
9.83
9.76
9.12
7.88
10.64
9.68
10.69
9.20
9.61
8.28
8.81
7.84
8.20
11.00
9.83
9.17
9.65
11.66
Infrastructure

Telangana Socio Economic Outlook 2022120
7.4.4. Renewable Energy
The United Nations Environment Programme (UNEP) finds that around 80% of global energy and 66% of electrical generation are from fossil fuels, contributing approximately 60% of the greenhouse gas (GHG) emissions responsible for climate change.
Compared to other states in the southern region, Telangana has a lower share of renewable energy sources in its total installed capacity, around 22% (see Table 7.4). The state needs nearly 5,000 MW of solar energy by 2022 to achieve 7.5% Renewable Purchase Obligation (RPO) compliance. To comply with the RPO mandates, the Government devised the Renewable Energy Plan for 2030 with generation targets for various renewable sources (see Table 7.4).
Telangana generates nearly one-fifth (3806 MW) of its total energy (17,218 MW) from renewable sources as of 2020. The composition of the renewable energy generated is from Solar Energy (3,489 MW) with a contribution of more than 90%, Wind Energy (128 MW), Waste-to-Energy (63 MW), Bagasse Cogeneration (74 MW), Biomass (45 MW), and small Hydropower units (7 MW).
The Government of Telangana has been taking steps to facilitate more private sector investments
in renewable energy. The cumulative investment to solar and other renewable energy sources (wind, small hydro-power, biomass, bagasse and waste-to-energy) in the state between 2015-16 and 2020-21 amounts to Rs.19,582 crore. There are 86 solar energy companies in the state of which 12 companies have an investment size greater than Rs.100 crore.
The Telangana State Solar Policy 2015 provided various incentives to prospective solar power developers. The success of the policy is evident from a rise in the installed capacity of solar power from 74 MW in 2014-15 to 3,489 MW in 2020-21, an increase of around 54 times. The state successfully implemented a distributed generation model for adding solar capacity. This model helped the Government to save Rs.533 crore at Extra High Tension (EHT)-level in the transmission network. As the generation is close to the demand, the Government saved about 122 MU energy and an amount of Rs. 49 crore in the public exchequer.
7.4.5. Telangana Electric Vehicle Policy (2020-2030)The Government recognizes that Electric Vehicles (EVs) are a promising alternative to ICE (Internal Combustion Engine) vehicles. The Telangana Electric Vehicle & Energy Storage Policy 2020-2030
Table 7.4
Share of Renewable Energy in the total Installed Capacity (2021)
4 For more details, please see: https://tsredco.telangana.gov.in/Updates_2020/Telangana_EVES_policy_2020_30.pdf
5 Faster Adoption of Hybrid and Electric Vehicles (FAME)- II scheme is being implemented since April 2019 by Department of Heavy Industries, Government of India. The scheme suggested states to offer fiscal and non-fiscal incentives to improve the use case for adoption of Electric Vehicles.
Installed Capacity of Renewable Energy (MW)State
Total Installed Capacity (MW)
Share of Renewable Energy
Source: (1) Central Electricity Authority (2) Ministry of New and Renewable Energy, Government of India
Karnataka
Tamil Nadu
Kerala
Andhra Pradesh
Telangana
All-India
19,427
18,142
2,509
10,870
3,806
1,52,366
30,091
33,695
5,837
25,484
17,218
3,82,151
64.56%
53.84%
42.99%
42.65%
22.10%
39.87%

121
6 TEVP 2020-2030 considers an investment of more than Rs.200 crores in plant and machinery or providing employment to more than 1000 persons as a ‘mega project’.
(TEVP 2020-2030)4 builds upon the extant FAME-II scheme5. The policy envisions to make Telangana a hub for Electric Vehicles & Energy Storage Systems (EV&ESS) by attracting private investment, promoting Research & Development (R&D) and manufacturing. The broader objective of the policy also includes a substantial reduction in the total cost of personal and commercial transportation.
TEVP 2020-30 has devised a strategy with robust incentive structures on both the supply and demand sides. On the supply side, EV & ESS sectors would be incentivized through the subsidies and incentives available under the Electronics Policy 2016. Moreover, the Government would extend tailor-made benefits to mega6 and strategic projects on a case to case basis. It has identified Electronics Manufacturing Clusters (EMC) and Industrial Parks are identified to promote EV & ESS manufacturing companies.
On the demand side, the policy prescribes an attractive incentive structure for electric two-wheelers, three-seater auto-rickshaws, electric 4-wheelers, buses and tractors. Recognizing the availability and accessibility of EV-charging infrastructure as a prerequisite for the penetration of EVs, the policy ensures support for charging infrastructure.
The Government would constitute a steering committee of senior officials for the time-bound demand creation of EVs, the development of a charging network in Hyderabad followed by other urban areas, and the periodic review of the policy.
7.5. CommunicationCommunication infrastructure is the backbone of the communications system upon which various digital, broadcasting, printed and telecommunication services are operated. This includes a range of modes of communication such as the internet, telephones, television, cable televisions, radio, newspapers and
other periodicals.
7.5.1. Digital InfrastructureA sustainable and inclusive digital infrastructure system is essential for the overall growth and development of the state. The Government of Telangana has devised Digital Telangana in line with Digital India. Digital Telangana stands on two pivots - one on the supply side and another on the demand side.
On the supply side, the Government aims to ensure the universal availability of digital facilities through laying Optic Fiber Cable (OFC) to each household using the water grid trenches, providing 4G services in the entire state and Wi-Fi access in major cities and towns, and, installing a one-stop kiosk in each Panchayat under the e-Panchayat scheme. On the demand side, a household-level digital literacy programme, school computer literacy programme, expansion of Mee-Seva services and identifying technological solutions for citizen services at government offices are implemented.
T-Fiber GridThe T-Fiber project aims to connect all households, public institutions and private enterprises across the
Infrastructure
Figure 7.15
Progress Status of T-Fiber (2022)T-Fiber progress (km)
Note: (1) Status as of January 2022, (2) Abbreviations: T&D - Transmission and Distribution, DRT- Plastic range and dryer cord Source: Information Technology, Electronics & Communications Department, Government of Telangana
New T&D DRT OFC Blowing
18,31615,004 14,981
10,708
35,031
16,227
OFC Blowing Achievement

Telangana Socio Economic Outlook 2022122
rural areas of the state through OFC, and provide them with high-speed internet connectivity. It involves laying a carrier-grade telecom OFC network from the state headquarters (SHQ), as cascades, to the district headquarters (DHQ), Mandal headquarters (MHQ) and the Gram Panchayats (GP). The network would be capable of delivering 4-100 Mbps to households and on-demand 20-100 Mbps to institutions and enterprises. T-Fiber will
leverage the existing trenches and ducts created under Mission Bhagiratha.
The Government incorporated a Special Purpose Vehicle (SPV), the Telangana Fiber Grid Corporation Limited as the implementing agency for T-Fiber in the state, and it targets completing the project by 31st March 2022. The status of the project as of January 2022 is refl ected in Figure 7.15. Nearly 82% of the Transmission & Distribution channels laying and 71% of the plastic range and dryer code laying has been completed as of January 2022.
7.5.2. Telephone ServicesTelangana has around 4.22 crores of telephone subscribers, of which 98% are wireless subscribers. In rural areas, there are 1.79 crores (99.8%) wireless subscribers and nearly 40,000 wireline subscribers. Of the total 2.42 crore urban subscribers, around 97% use wireless telephones (see Figure 7.16).
Telangana has the second-highest teledensity (number of mobile connections per 100 population) among the southern states as of June 2020 (see Figure 7.17) at 110. This is the 7th highest value
Note: States arranged in descending order of mobile tele-density. Source: Department of Telecommunications, Government of India
Figure 7.17
Mobile Tele-Density across the Indian States (June 2020) Number of
mobile phones per 100 persons
Number of mobile phones per
100 persons177146123122114113110110102101100
999586
8482817675747370686868655851
GoaHimachal Pradesh
KeralaPunjab
UttarakhandHaryana
TelanganaMizoram
Tamil NaduMaharashtra
KarnatakaSikkim
GujaratAndhra Pradesh
Arunachal PradeshRajasthan
West BengalTripuraOdisha
NagalandManipur
MeghalayaChhattisgarh
Uttar PradeshAssam
Madhya PradeshJharkhand
Bihar
Below 7070 to 9090 to 110110 to 120Above 120
Figure 7.16
Total Telephone Subscriptions in Telangana (2022)
Note: Data as of 10th January 2022. Source: The Indian Telecom Services Performance Indicators July-September, 2021, Telecom Regulatory Authority of India
Number of telephone subscribers (in lakhs)
Wireless Wireline
Total
Rural
Urban
413.8 8.1
0.4179.7
7.8234.1
Total
421.9
180.1
241.9

123
among all states.
7.5.3. PostsTelangana Postal Circle under India Posts has 47 Head Post Offices, 1,724 Sub Post Offices, 7,308 Branch Post Offices, and 27,031 letterboxes as of 31st March 2021. The circle also offers savings schemes, passport services, Aadhar services, and philately services.
7.5.4. Radio StationsAs of 26th May 2020, there are 15 All India Radio (AIR) stations in Telangana- 12 FM, 2 MW and 1 SW. There are 11 operational private FM Radio stations in Telangana, 8 based in Hyderabad, and 3 in Warangal.
7.5.5. Television and Community RadioThe state has two Doordarshan studio centres - Hyderabad and Warangal, and a digital High Power TV Transmitter (HPT) project in Hyderabad. According to the Ministry of Information and Broadcasting, Government of India, 11 community radio stations are registered in Telangana of which 10 are private. The community radio managed by the University of Hyderabad is public. There are 127 Multiple System Operators (MSO) registered in Telangana.
7.5.6. Periodicals and Newspapers
A total of 1,015 registered periodicals including daily newspapers, weekly and monthly magazines, and other periodicals are published from Telangana as of January 2022 (see Figure 7.18). This also includes the newspapers with multiple editions across the country.
More than half of the total registered publications are in Telugu, while Urdu and English hold a share of 17.6% and 13.1% respectively. The daily publications (mostly newspapers) account for 37.4% of the registered publications. Nearly 38% of the total registered publications are released once a month and 12.3% are published weekly.
7.6. Way ForwardThe Government aims to enhance the infrastructural capabilities in all the key areas including transportation, energy, water supply and sanitation, and communication. Pursuing this endeavour, policy initiatives such as the Strategic Road Development Plan, Crucial Road Maintenance Project, Renewable Energy Plan 2030, Telangana Electric Vehicle Policy (2020-2030) and the ODF Plus Strategy under SBM-G ensure a sustainable and inclusive physical infrastructure system in the state.
Infrastructure
Figure 7.18
Registered Printed Publications in TelanganaTotal number of registered publications = 1,015
By Language Share of publications (%)
Others4.5
Source: Office of Registrar of Newspapers for India, Government of India
By Periodicity Share of publications (%)
Monthly38.1
Daily37.4
Weekly12.3
Others12.1
Telugu58.2
Urdu17.6
Bilingual6.5
English13.1
Telangana Socio Economic Outlook 2022124
HEALTH
CHAPTER
08

125
l Telangana was the only state among the 19 larger states to have demonstrated a strong overall performance, as well as a marked incremental performance on NITI Aayog’s Annual Health Index 2019-20, ranking 3rd on both aspects.
l On account of its efforts towards strengthening the health systems in the state, Telangana and Andhra Pradesh were declared as the only larger states where all Primary Health Centers (PHCs) and Urban PHCs are now functioning as Health and Wellness Centres (HWCs).
l In 2019-20, Telangana had no shortfall in the number of Auxiliary Nurse Midwives (ANMs) at Health Sub Centers (HSCs), and of Medical Officers (MOs) at PHCs and UPHCs, and one of the lowest shortfalls in the number of specialist doctors at District Hospitals as per the IPHS (2012) norms for staffing.
l In 2021, the Government of Telangana announced plans to establish four Telangana Institute of Medical Sciences & Research (TIMS) hospitals with infrastructure at par with corporate hospitals – at Gachibowli, Sanath Nagar, Alwal, and Dilsukhnagar.
l To strengthen the medical education in the state, the Government sanctioned 8 new Government Medical Colleges at Sangareddy, Mahabubabad, Mancherial, Wanaparthy, Kothagudem, Jagityal, Nagarkurnool and Ramagundam with a cumulative intake capacity of 1,200 MBBS students.
l To bring healthcare services close to the urban poor, the Government has established 256 Basti Dawakhanas in urban slums that offer 53 different health
services free of cost including outpatient consultation, medicines, basic lab diagnosis, antenatal/postnatal care, and screening for non-communicable diseases. Basti Dawakhanas also provide specialist consultation through Telemedicine.
l After the success of the Basti Dawakhanas, the model is being replicated in rural areas to deliver comprehensive primary healthcare service by upgrading the sub-centres to “Palle Dawakhanas”. 573 sub-centres have been upgraded to Palle Dawakhanas so far.
l To increase the reach and benefits of its flagship health insurance scheme, Aarogyasri, the Government of Telangana has converged the scheme with the Government of India’s Ayushman Bharat scheme as “Ayushman Bharat - Pradhan Mantri Jan Arogya Yojana (AB PM-JAY) - Aarogyasri’’.
l Recognizing the importance of emotional, psychological, and social well-being of its citizens, especially in the wake of the COVID-19 pandemic, the Government of Telangana has rolled out the National Mental Health Program in all districts.
l Telangana has successfully achieved 100% coverage of the first dose of COVID-19 vaccination and 89% coverage of the second dose of vaccination in the 18+ age group. (as of 09.2.2022)
l As of 9th February, 2022, 76% coverage has been achieved in the case of the first dose of vaccination in the age group 15-18 years.
l 3.60 lakh precautionary (booster) doses have been given to frontline workers and persons aged 60+ years (as of 09.2.2022).
Key Highlights
Health

Telangana Socio Economic Outlook 2022126
8.1. Introductionhe World Health Organisation (WHO) defines ‘health’ as a state of complete physical, mental, and social well-being,
and not merely the absence of disease or infirmity. It emphasizes that enjoyment of the highest attainable standard of health is one of the fundamental rights of every human being. It is well recognized across the world that a healthy population is at the heart of sustainable development, and for the creation of an equitable society with stable economic growth and prosperity.
The Government of Telangana has recognized the role of state intervention in keeping the population healthy right from the state’s formation in 2014. In line with the WHO’s definition, it focuses on the preventive as well as curative aspects of health, with the aim of prolonging the life and promoting the well-being of its citizens. Since the state’s formation, the Government has invested significantly in strengthening its public health system, and has further sharpened its focus towards quality healthcare provisioning in light of the COVID-19 pandemic. The state has also constituted a Cabinet sub-committee to review the conditions of government hospitals as well as to study the best practices in other well-performing states and countries.
In order to improve health outcomes in the state, specifically for persons belonging to marginalized communities, the Government has launched several schemes that focus on improving the availability, accessibility, and affordability of quality healthcare. Further, in alignment with the Government’s objective of “Aarogya Telangana”, and to instill new confidence in the government healthcare system, the Government made a budgetary allocation of Rs. 6,295 crores for health in 2021-22, of which
Rs. 1,010 crore was allocated towards the National Health Mission for improving healthcare service delivery.
Over the last two years, the Government has taken several measures to minimize the impact of the COVID-19 pandemic. As of January 2022, Telangana is the first larger state in the country to achieve 100 percent coverage of first dose vaccination against COVID-19 in the 18+ age group. 89 percent of persons in this age group have also received their second dose of vaccination (as of 9th February, 2022). 3,500 Government centers and 264 private centers are offering vaccinations across the state, and a total of 10,000 vaccinators and 35,000 staff are involved in the vaccination process.
8.2. Performance of Telangana on the Health Index
Since the formation of the state, the Government has been making concerted efforts towards improving the health status of Telangana. The result of its efforts is reflected in the noteworthy performance of the state in the recent NITI Aayog Annual Health Index, 2019-20. The index is a weighted composite score incorporating 24 indicators covering key aspects of health performance across three critical domains:a) Health Outcomesb) Governance and Informationc) Key Inputs and Processes
Thus, the Annual Health Index is a holistic measure of the health systems performance as well as progress on health outcomes over time. Telangana ranked 11th amongst the 19 larger states1 in terms of the overall performance in the year 2015-16. Its rank improved to 10th in 2017-18, to 8th in 2018-19,
T
1 Larger states category has 19 states namely Andhra Pradesh, Assam, Bihar, Chhattisgarh, Gujarat, Haryana, Himachal Pradesh, Jharkhand, Karnataka, Kerala, Madhya Pradesh, Maharashtra, Odisha, Punjab, Rajasthan, Tamil Nadu, Telangana, Uttar Pradesh, Uttarakhand.

127
jumping to 3rd in 2019-20 (see Figure 8.1a). Further, it was the only larger state to have demonstrated a strong overall performance in 2019-20, as well as a marked incremental performance in comparison to its 2018-19 status. The state ranked 3rd among the 19 large states in terms of its incremental performance as well (see Figure 8.1b).
On the 3 domains of the index too, Telangana’s performance has been remarkable.
a) Health Outcomes: The category ‘Health Outcomes’ carries a weight of 70% in the
case of Larger states, out of the 3 categories in the index, making it the most important of the 3 categories. It comprises 4 key outcome indicators and 7 intermediate outcome indicators, capturing different aspects of maternal and child health, Tuberculosis, and HIV.
Telangana was classified as a ‘Front-runner’ on 7 of the indicators, and an ‘Achiever’ on 4 of the indicators, thereby ranking third in terms of the overall ‘Health Outcomes Index score’ amongst the 19 larger states.
Figure 8.1a
Larger States: State-wise Ranking on NITI Aayog's Health Index Score (2019-20)
Figure 8.1b
State-wise Ranking on Incremental Change in NITI Aayog's Health Index Score (2018-19 to 2019-20)
Source: Annual State Health Index Round IV, NITI Aayog (2019-20)
Overall Performance Index Score (Reference Year 2019-20)
Incremental Change in performance (Base Year 2018-19)
82.20
72.42
69.96
69.95
69.14
63.59
63.17
58.08
57.93
50.70
49.26
47.74
47.55
44.31
44.21
41.33
36.72
31.00
30.57
5.52
4.34
4.22
3.60
3.38
3.35
1.74
1.62
1.14
1.07
0.76
0.60
0.58
0.13
-0.06
-0.09
-0.25
-0.55
-1.37
Kerala
Tamil Nadu
Telangana
Andhra Pradesh
Maharashtra
Gujarat
Himachal Pradesh
Punjab
Karnataka
Chhattisgarh
Haryana
Assam
Jharkhand
Odisha
Uttarakhand
Rajasthan
Madhya Pradesh
Bihar
Uttar Pradesh
Uttar Pradesh
Assam
Telangana
Maharashtra
Jharkhand
Madhya Pradesh
Punjab
Tamil Nadu
Gujarat
Andhra Pradesh
Bihar
Kerala
Uttarakhand
Odisha
Himachal Pradesh
Chhattisgarh
Rajasthan
Haryana
Karnataka
Health

Telangana Socio Economic Outlook 2022128
2 HWC are envisaged to deliver expanded range services that go beyond Maternal and child health care services to include care for non -communicable diseases, palliative and rehabilitative care, oral, eye and ENT care, mental health and first level care for emergencies and trauma, including free essential drugs and diagnostic services as a component of Ayushman Bharat.
3 A functional FRU is essential to provide specialized services close to the community and can help in improving access and decongesting the patient load at higher level facilities.
b) Key Inputs and Processes: With a weight of 17% in the overall index for Larger states, this category is second in importance out of the 3 categories. It comprises 9 indicators (further divided into 27 sub-indicators) pertaining to health systems and service delivery, such as Human Resource availability, functionality and certification of health facilities, birth and death registrations, and the overall expenditure on health out of the total state expenditure.
Telangana was classified as a ‘Front-runner’ on 17 of the sub-indicators, an ‘Achiever’ on 3 of the sub-indicators, and an ‘Aspirant’ on 6 of the sub-indicators, with data missing for 1 indicator, thereby ranking fifth in terms of the ‘Key Inputs and Processes Index score’ amongst the 19 larger states.
c) Governance and Information: With a weight of 13% in the overall index, the ‘Governance and Information’ category is the least important of the 3 categories. This category includes 1 indicator capturing the status of health monitoring and data integrity, and 3 indicators pertaining to governance.
Telangana was classified as a ‘Front-runner’ on 1 of the indicators, and an ‘Achiever’ on 3 of the indicators, thereby ranking eighth on the ‘Governance and Information Index score’ among the 19 larger states.
8.3. Health Infrastructure Health infrastructure is often referred to as “the nerve center of the health system”. Broadly, it comprises a capable and qualified workforce, up-to-date data and information systems, and agencies capable of assessing and responding to
public health needs, and it provides the necessary foundation for undertaking the basic responsibilities of public health. The Government of Telangana has been making significant investments towards strengthening the Health Infrastructure in the state since 2014-15.
8.3.1 Performance of the State on Key Indicators
Telangana’s performance on all three key aspects of health infrastructure described above has been outstanding. As of 2019-20:lAs per state data and IPHS (2012) norms for
staffing, Telangana had no shortfall in the number of Auxiliary Nurse Midwives (ANMs) at Health Sub Centers (HSCs), and of Medical Officers (MOs) at PHCs and UPHCs.
lAs per state data, among the larger states, Telangana had one of the lowest shortfalls in the number of staff nurses at Primary Health Centres (PHCs), Urban PHCs (UPHCs), Community Health Centres (CHCs), and Urban CHCs (UCHCs), at 19.46%.
lAmong the larger states, Telangana had one of the lowest shortfalls in the number of specialist doctors at District Hospitals, at 10.69% as per state data.
lAs per data released by the Ministry of Health and Family Welfare (MoHFW), GoI, along with Andhra Pradesh, Telangana was the only larger state where all PHCs and Urban PHCs had been converted to Health and Wellness Centres2 (HWCs).
lAs per state data, and MoHFW norms on FRU requirement, Telangana was one of the only five larger states (along with Karnataka, Kerala, Punjab, and Tamil Nadu) that had 100% or higher availability of the required number of functional First Referral Units (FRUs)3.
129
4 Kayakalp scheme promotes cleanliness, hygiene and infection control practices in public healthcare facilities, through incentivising and recognising such public healthcare facilities that show exemplary performance in adhering to standard protocols of cleanliness and infection control.
5 LaQshya’- quality improvement initiative in labor room & maternity OT, aimed at improving quality of care for mothers and newborn during intrapartum and immediate postpartum period.
lAs per MoHFW, GoI, along with Karnataka, Telangana was the only state where all the District Hospitals had a Kayakalp4 score of >70%.
lAs per MoHFW, GoI, Telangana was the only state where all the District Hospitals (DHs) had been certified under LaQshya5 (for Labour Room and Maternity OT).
lAt 1.07%, Telangana had the least deviation among larger states, in the state-reported data for institutional deliveries (on the Health Management Information System (HMIS) portal vs. data released by the Office of the Registrar General, India (Sample Registration System (SRS))) for institutional deliveries.
lTelangana had the highest level of birth registration (100.00%) and the second highest level of death registration (98.60%) among the larger states as per data from the Civil Registration System (CRS).
8.3.2 Physical Health Infrastructure in TelanganaPhysical health infrastructure is critical for delivery of services that can only be offered at health facilities. It is important for emergency situations where proximity to a physical health facility contributes greatly to the promptness with which a patient is attended to. Lack of physical health infrastructure can also be a limiting factor in scaling up of services that require long term treatment.
To provide universal health coverage and ensure optimal service delivery to patients across the state, the Government operates a network of primary, secondary, and tertiary healthcare facilities. The patients in the state are catered to through 4 Civil Dispensaries, 2 Eye Hospitals, 4 Maternity Hospitals, 1 Child Hospital, 1 ENT Hospital, 1 Fever Hospital,
2 Chest Disease Hospitals, 21 District Hospitals, 44 Sub District Hospitals, 82 Community Health Centres, 604 Primary Health Centres, 232 Urban Primary Health Centres, 4,693 Health Sub Centres, 2,250 Health and Wellness Centres, and 256 Basti Dawakhanas.
8.3.3 Major Health Institutions and Destinations in TelanganaIn order to augment the capacity of the state to cater to patients from within and outside the state, and with the aim of making Telangana the “go-to healthcare destination”, the Government of Telangana has made significant investments towards establishing new health institutions in the state. Some of these institutions have already become functional, while others are expected to start functioning within the coming few years. All of them have been constructed with state-of-the-art facilities, comparable with some of the best institutions across the world. Details of these institutions are provided in this section.
8.3.3.1 All India Institute of Medical Sciences (AIIMS), TelanganaThe Pradhan Mantri Swasthya Suraksha Yojana (PMSSY) was announced in 2003 with the objective of correcting regional imbalances in the availability of affordable and reliable tertiary healthcare services, and also to augment facilities for quality medical education in the country.
AIIMS, Bibinagar in Yadadri Bhuvanagiri district is one of the apex healthcare institutes established under Phase VII of PMSSY. The institute became functional in the year 2019, and has been providing out-patient, in-patient, telemedicine, surgeries, Intensive Care Units (ICU), and investigative services to patients since then. Additionally, AIIMS is
Health

Telangana Socio Economic Outlook 2022130
a premier institute for health education in the state, with its first batch of 50 students from the MBBS course due to pass out in the year 2024.
8.3.3.2 Telangana Institute of Medical Sciences & Research (TIMS)Telangana Institute of Medical Sciences & Research (TIMS), Gachibowli, Hyderabad is a state-of-the-art multi-specialty hospital, with a total bed strength of 1,261 beds, including 137 Intensive Care Units (ICU)/ ventilator beds, and 843 oxygen beds. The hospital has been recognized as an exclusive COVID hospital on account of the pandemic, and till January 2022, had handled 14,108 COVID-related out-patient cases.
In 2021, the Government of Telangana announced plans to establish four more TIMS hospitals for areas under GHMC and the peripheral regions, which would match the medical infrastructure standards set by corporate hospitals and All India Institute of Medical Sciences (AIIMS), New Delhi. The four super-specialty hospitals for the urban population in GHMC, dubbed as Telangana Institute of Medical Sciences (TIMS) will come up at Gachibowli, Sanath Nagar, Alwal, and Dilsukhnagar. The construction of these hospitals is due to start in the coming few months.
8.3.3.3 Warangal City -The Health City of TelanganaIn 2021, the Government laid the foundation stone and sanctioned Rs 1,100 crore for the construction of a super specialty hospital in Warangal as part of its plan to develop Warangal into a health city and a medical tourism destination. The 24-storeyed hospital will be constructed across a 15 acre area, and will have 2,000 beds including 800 beds for super specialty services. The hospital will have 36 super specialty divisions, around 500 doctors, more than 1,000 nurses, paramedics and other staff. The hospital will also have facilities for organ transplant, chemotherapy and radiation therapy, and a helipad for emergency airlifting of patients using helicopters, and would be fully equipped with specialized
medical units, a Medical and a Dental College.
8.3.3.4 Nizam’s Institute of Medical Sciences (NIMS)Nizam’s Institute of Medical Sciences has been established with the primary objective of creating a center of excellence for providing medical care, educational and research facilities of high quality, and to start Post Graduate and Paramedical Courses. There are 34 departments under the institute including Super Specialties and Broad Specialties. The Government intends to increase the bed capacity from 1,500 to 4,000 and to expand the infrastructure with additional facilities, specialties, and departments.
8.3.3.5 Mehdi Nawaj Jung (MNJ) Institute of OncologyMNJ Institute of Oncology is the sole referral hospital in Telangana offering free comprehensive cancer care to poor patients from the state. It is a 450-bedded apex cancer hospital and teaching hospital with new patient registrations of around 10,000 per year. About 2,500 major & minor surgeries are performed every year at the hospital. Every day, 400 patients receive radiotherapy, and 350 receive chemotherapy. More than 1.5 lakh cancer related diagnostic tests are being done at the hospital each year. Further, at any given point in time, there are 500 to 550 in-patients at the institute. The Institute also acts as a major medical tourism centre providing cancer care to patients from neighboring states such as Andhra Pradesh, Maharashtra, Madhya Pradesh, Karnataka, and Orissa.
8.3.3.6 Telangana Vaidya Vidhana Parishad (TVVP)The Telangana Vaidya Vidhana Parishad (TVVP) was set up in 2014-15 to manage the secondary level hospitals (comprising select District Hospitals, Area Hospitals, Community Health Centres, Maternal and Child Health Hospitals, Urban Community Health Centres, and Civil Dispensaries) in the state. There are 122 TVVP hospitals at present, with

131
a bed strength of 9,320. These hospitals mostly provide maternity & child health services, besides general medicine, general surgery, ophthalmology, pediatrics, orthopedics, dermatology, ENT, etc. services. Being the intermediary between PHCs and tertiary care hospitals (mostly Teaching Hospitals), the majority share of the patient-burden in the state is handled by the Telangana Vaidya Vidhana Parishad Hospitals.
Since the formation of the state, 17 Intensive Care Units and 36 Dialysis Centres have been established in District/Area Hospitals under TVVP. Further, 34 blood banks and 17 Blood Storage Centres are currently functioning under TVVP. Since the state’s formation, the Government has created 5,909 posts in TVVP hospitals, taking the total cadre strength of TVVP to 11,609 at present. Between 2014-15 and 2020-21, the number of beds in hospitals under TVVP has gone up by 3,898.
During the COVID-2019 pandemic, TVVP provided the hospitals under its control with 750 pulse oximeters, 97 ventilators, 299 oxygen cylinders, 78 bilevel positive air pressure units.
The performance of the hospitals under TVVP in the last 2 years is given in Table 8.1. In 2019-20, the
institutions have more than exceeded their targets under all but one category by significant quantities. In 2020-21 too, the institutions are well on their way to achieving their targets.
8.3.3.7 Medical Institutions under the Directorate of Medical Education, Telangana
9 Teaching Hospitals and 12 Specialty Hospitals are currently functioning under the Directorate of Medical Education, Telangana. The 9 Teaching Hospitals at their respective Government Medical Colleges have a bed strength of 11,215 beds. It is proposed that the bed strength would further be increased by 4,538 beds in the coming months.
8.3.3.8 Telemedicine52.16% of the state’s population resides in rural areas, many of whom stay in remote regions with lack of access to emergency and specialist doctor services. Since the state-of-the-art health institutions created by the state may still not cater to the citizens residing in remote regions, the Government of Telangana has taken the initiative to leverage technology to take healthcare services to them. The Government, in collaboration with Tata Trusts, came up with a Digital Health Transformation
Table 8.1
Performance of TVVP hospitals
Development Indicator
Target TargetAchievement Achievement
2019 - 20 2020 - 21
(as of November 2020)
% %
Out Patients
In Patients
Major Surgeries
Sterilisations
Deliveries
X-Rays
U.S.G
E.C.G
Lab tests
1,28,03,350
11,22,120
60,300
58,900
94,320
2,55,240
97,410
74,440
43,20,720
1,30,40,950
11,46,600
62,280
60,520
97,920
2,59,200
1,00,290
75,810
44,34,120
1,53,91,299
13,35,694
98,990
42,699
1,46,856
3,77,780
2,52,911
1,62,569
94,74,028
77,46,963
8,18,985
78,101
35,964
1,39,346
2,17,131
1,72,136
1,04,033
52,00,299
120
119
164
72
156
148
260
218
219
59
71
125
59
142
84
172
137
117
Source: Department of Health, Medical and Family Welfare, Government of Telangana
Health

Telangana Socio Economic Outlook 2022132
Programme in 2019 with the vision of:
lConnecting specialists in government medical colleges & tertiary care centers to primary healthcare facilities in rural areas through digital platforms.
lReducing overcrowding of tertiary care facilities by stepping up diagnostic capabilities and strengthening the supply chain of required medicines and consumables at the primary healthcare facilities.
A pool of 530+ specialists across 17 specialities have been designated on a roster to provide timely specialty advice under the programme. The initiative is being implemented in 29 districts of the state, with 55 Specialty Hubs catering to more than 500 spokes. More than 45,000 teleconsultations were conducted in 2020-2021 under this programme.
8.3.4 Status of Medical Education In addition to focusing on clinical services, the Government has given special importance to medical education in the last few years. The emphasis has been on opening and building of new medical colleges, adding more MBBS and postgraduate seats to the existing ones, and plugging the gaps in manpower and infrastructure where required.
At the time of state formation, there were five Medical Colleges in Telangana, with 850 MBBS seats. Subsequently, four new medical colleges were opened up, taking the total number of MBBS seats to 1450. Further, new seats were added to 6 out of the 9 medical colleges, taking the final count of MBBS seats from 1,450 to 1,650. Furthermore, this year, the number of postgraduate seats in government medical colleges was increased from 838 to 866, and the final count of super specialty seats in the state stands at 92.
8.3.4.1 New Medical CollegesIn 2021, the Government sanctioned 8 new Government Medical Colleges at Sangareddy, Mahabubabad, Mancherial, Wanaparthy, Kothagudem, Jagityal, Nagarkurnool, and Ramagundam with a cumulative capacity of 1,200 MBBS seats.
8.3.4.2 Dental CollegesIn addition to the medical colleges, the Government operates a Government Dental College and Hospital in Hyderabad with an annual intake of 100 graduates and 27 postgraduate students.
8.3.4.3 Nursing Colleges and SchoolsTo maintain the quality of medical services in the state, the Government runs 6 nursing colleges
The Health Survey and Planning Committee (Mudaliar Committee) constituted by the Government of India in 1959 while stating ‘that the personnel dealing with problems of health and welfare should have a comprehensive and wide outlook and have rich experience of administration at the State level’ had
recommended a dedicated Health Service Cadre.
Among few other states, the State of Tamil Nadu has had a dedicated Public Health Cadre under the Department of Public Health and Preventive Medicine. A dedicated non-
Box 8.1
Public Health Cadre: A cost-effective solution for strengthening the Public Healthcare System
Continued on next page...
133Health
practicing cadre of Public Health Officials with Post Graduate Diploma in Public Health administer this Department. From 1980 onwards, the Government implemented the Multipurpose Workers scheme intensively along with expansion of critical health infrastructure across the state, further strengthening its public health structure and effectively transforming its health system. The public health cadre comprises the workforce qualified in Public Health and their job description consists of largely organizing public interventions, addressing social and environmental determinants of health as well as undertaking managerial roles in the delivery of healthcare services, especially primary healthcare.
Public Health Cadre Structure in Tamil NaduThe Public Health Cadre exists independently of the cadre of the medical/clinical service, operating under a Public Health Directorate with dedicated funding and is underpinned by a legislative framework - the Tamil Nadu Public Health Act, 1939. The 162-member public health cadre is responsible for managing the primary health services and the administrative work and positions associated with it. Field-level staff comprise Municipal Health Officers (MHOs) at the Municipality Level and Medical Officer (MO-PHC) at the PHC level who are responsible for a variety of public health-related activities such as surveillance and information campaigns. In this cadre, personnel in every district are managed by a Deputy Director rank officer.
Benefits of Public Health (PH) Cadre1. Creates a dedicated cadre of experienced
public health professionals2. Assures managerial continuity at the
primary, secondary and tertiary health care 3. Supports data and research driven
formulation, implementation and adoption of various health policies
4. Facilitates speedier allocation and more effective usage of resources at the facility level
5. Strengthens intersectoral coordination and support to local bodies
The Monthly Per Capita Out-of-Pocket expenditure on health as a share of Monthly Per Capita Consumption Expenditure (MPCE) is 9.1% for Tamil Nadu, ranking third (after Nagaland and Goa) among the Indian states5. The percentage of government health expenditure is 0.8% of GSDP in Tamil Nadu, lower than the expenditure of 1.3% of the GDP at the national level. This low expenditure combined with the exemplary performance of Tamil Nadu on health indicates that the Public Health Cadre driven health system in the state is highly cost-effective, both for the citizens and the state.
References:1. Muraleedharan, Vr & Dash, Umakant & Gilson,
Lucy. (2011). T.N. 1980s-2005: A success story in India
2. NITI Aayog (Health and Nutrition Division). (2018). Consultation on Developing a Public Health Cadre in India ., (pp. 10-12). New Delhi.
3. Gupta, M. D., Desikachari, B. R., Somanathan, T. V., & Padmanaban, P. (2009). How to Improve Public Health Systems - Lesson from Tamil Nadu. The World Bank, Development Research Group.
4. National Health Accounts 2017-18, Ministry of Health and Family Welfare, Government of India.
5. Adapted from “How to Improve Public Health Systems, Lessons from Tamil Nadu”, Monica Das Gupta et al 2009
6. Report of the Health Survey and Planning Committee (August 1969- October 1961), Ministry of Health

Telangana Socio Economic Outlook 2022134
with 380 graduate and 30 post-graduate seats. Additionally, 6 nursing schools with an intake capacity of 287 General Nursing and Midwifery (GNM) students are operational in Telangana.
To extend the quality of medical services, the Government has sanctioned 14 new Government Nursing Colleges with an additional intake capacity of 730 students, and recently inaugurated a new Government Nursing College at Rajanna Siricilla. The government has also recruited 1,108 staff nurses in Teaching Hospitals through the Telangana State Public Service Commission.
8.4. Non-communicable and communicable diseases 8.4.1 Status of diseases
The Global Burden of Diseases Study (GBDS), performed in coordination with the Indian Council of Medical Research, observes that there has been an epidemiological transition from communicable diseases to non-communicable diseases across the globe. Data from the Department of Health and Family Welfare, Government of Telangana indicates that in terms of mortality, 27.6% of the total disease burden in the state is due to communicable, maternal, neonatal and nutritional diseases. On the other hand, non-communicable diseases (NCDs) and injuries account for 59.2% and 13.2% of the total disease burden respectively. Among the non-communicable diseases, cardiovascular disease, neonatal disorders, diarrhoea, and lower respiratory infections account for a majority of fatalities. Among communicable diseases, AIDS, tuberculosis (TB), mosquito-borne diseases (malaria, dengue and chikungunya), and most recently, COVID-19 are the most critical ones across the state. The Government is committed to reducing the disease burden in the state.
8.4.2 Key programmes to reduce disease burdenThe Government has been implementing both
Central schemes and flagship State schemes to reduce the burden of communicable and non-communicable diseases in the state. These schemes include:
8.4.2.1 National Programme for Prevention and Control of Cancer, Diabetes, Cardiovascular Diseases and Stroke (NPCDCS)
NPCDCS works towards early diagnosis and treatment of hypertension, diabetes, and oral, cervical, and breast cancers. Data from the NFHS-5 survey (2019-20) shows that the prevalence of diabetes and hypertension has been increasing in the state. To ensure early diagnosis of diseases, the Government of Telangana has been running a state-wide screening programme for the adult population through its 7 district-level NCD clinics and 47 CHC NCD clinics.
As a result of its efforts, Telangana came in second for conducting screenings of NCDs such as high blood pressure, sugar, heart attacks, paralysis, and cancer at the sub-centre level during the ‘Healthy and Fit Nation’ campaign conducted on the occasion of Universal Health Coverage Day-2021.
8.4.2.2 HIV/AIDS and Telangana State AIDS Control Society (TSACS)
In order to provide treatment services to the 1.58 lakh persons affected with AIDS in the state, and to prevent further spread of the disease, the Government, through the Telangana State AIDS Control Society (TSACS), has established 1,194 Integrated Counseling and Testing Centres, and 99 treatment centers in the state, which provide Antiretroviral Therapy (ART), other related treatments, and counseling services. Further, 50 Suraksha Clinics have been established to provide information and create awareness about Sexually Transmitted Infections (STI)/ Reproductive Tract Infections (RTI) in order to support prevention efforts. 194 blood banks have been established in the state which provide support services to the HIV patients in need.

135
8.4.2.3 Health Profile SchemeThe ‘Health Profile Scheme’, which is currently being piloted in Mulugu and Rajanna Sircilla districts of the state, has a twofold objective – (i) to create a digitized database of the vital health parameters of all individuals in the region that can be accessed by all government hospitals in the state, thus facilitating proper course of treatment in case of emergencies and other illnesses, and (ii) to understand the unique disease profiles of different areas within the state, take necessary preventive measures, and implement localized solutions for the area-specific health problems. The pilot involves door-to-door sample collection followed by the issuing of a health card to each individual, for holding all their health information at one place.
8.4.2.4 Basti Dawakhanas
‘Basti Dawakhanas’ are an innovative initiative of the Government of Telangana to bring healthcare services close to the urban poor. 256 Basti Dawakhanas have been established by the state in urban slums so far, with one Basti Dawakhana serving 5,000 to 10,000 persons. These centers provide 53 different kinds of free health services including outpatient consultation, medicines, basic lab diagnosis, antenatal/postnatal care, and screening for non-communicable diseases. Specialist consultation is also provided at Basti Dawakhanas through Telemedicine. Basti Dawakhanas reduce travel and waiting time for patients, reduce out-of-pocket-expenditure for patients by serving as an efficient platform for convergence with other NHM programmes, and reduce the burden on secondary and tertiary health care facilities.
Since the launch of the scheme in 2018, 69.18 lakh people have availed services of 256 Basti Dawakhanas in the Greater Hyderabad Municipal Corporation (GHMC) area, at an expense of Rs. 80.82 crores to the Government. This initiative is set to be extended to other urban areas of the state with the launch of 288 new Basti Dawakhanas across 141 towns by June 2022.
8.4.2.5 Palle DawakhanasTo ensure that people residing in rural areas have access to the same quality healthcare services as their urban counterparts, including round-the-clock access to doctors, the Government has started the process of converting sub-centres to “Palle Dawakhanas”. The Palle Dawakhanas will deliver comprehensive primary healthcare services to the local population, will stock medicines for common ailments, and have a fully-equipped laboratory to conduct basic diagnostic tests. Specialist consultations would be available through telemedicine facilities. Till date, 573 sub-centres have been upgraded to Palle Dawakhanas.
8.4.2.6 Telangana Diagnostics Scheme
Even though the costs associated with getting diagnostic tests done for medical examinations are very high, most government hospitals do not have facilities for inexpensive diagnostic testing. To bridge this gap, the Government of Telangana launched the ‘Telangana Diagnostic Scheme’ in 2018, as a hub-and-spoke model, to provide low-cost pathological diagnostic services and imaging services to the people, with an apex laboratory acting as the hub, and the Urban Primary Health Centres (UPHCs), Community Health Centres (CHCs), Area Hospitals (AHs), etc. serving as the spokes. This model was developed in Hyderabad district, and was subsequently expanded to the entire state. Currently, 20 district-level diagnostic hubs and 300 spoke centers are operational in the state. The district hubs conduct 60+ types of tests with high-end diagnostic equipment, including auto-analyzers, digital X-rays, ultrasound scan machines, mammograms etc. Imaging services are provided through 8 mini-hubs. Going forward, 13 new district hubs are proposed to be established in the coming months, and imaging services are proposed to be established at 19 district hubs. Further, it is planned that in the future, RT-PCR labs will be co-located with these diagnostic hubs in all districts.
Health
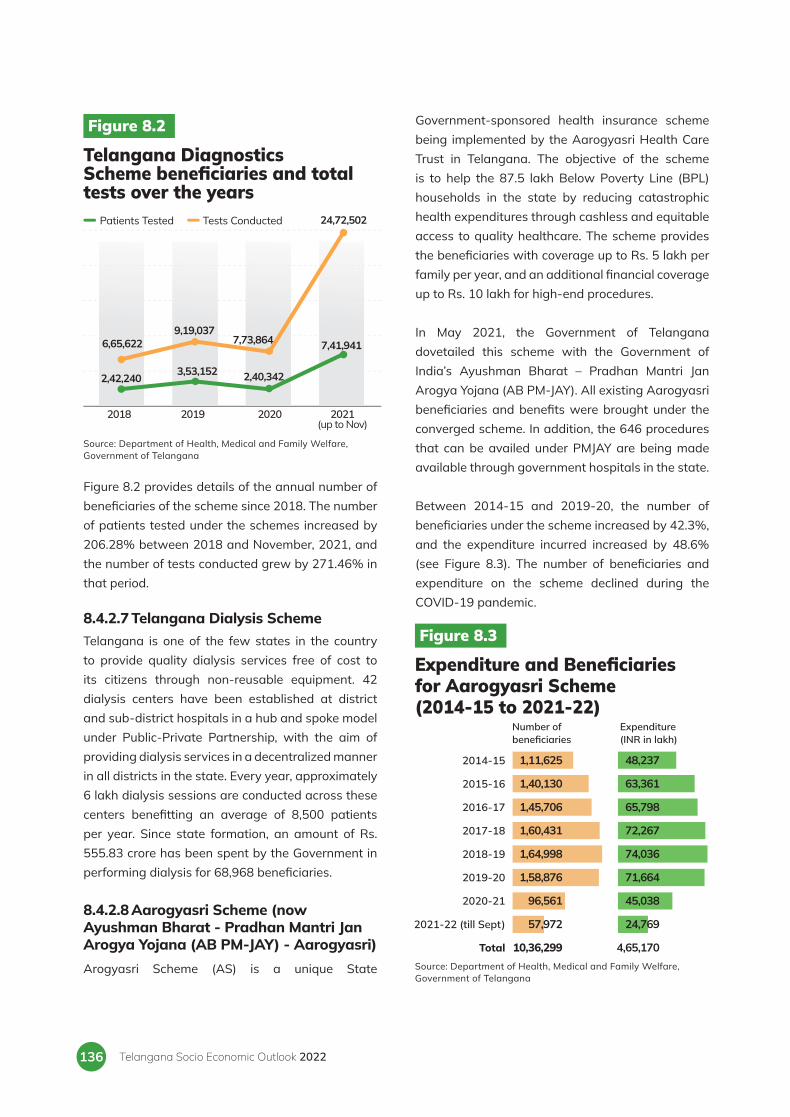
Telangana Socio Economic Outlook 2022136
Figure 8.2 provides details of the annual number of benefi ciaries of the scheme since 2018. The number of patients tested under the schemes increased by 206.28% between 2018 and November, 2021, and the number of tests conducted grew by 271.46% in that period.
8.4.2.7 Telangana Dialysis SchemeTelangana is one of the few states in the country to provide quality dialysis services free of cost to its citizens through non-reusable equipment. 42 dialysis centers have been established at district and sub-district hospitals in a hub and spoke model under Public-Private Partnership, with the aim of providing dialysis services in a decentralized manner in all districts in the state. Every year, approximately 6 lakh dialysis sessions are conducted across these centers benefi tting an average of 8,500 patients per year. Since state formation, an amount of Rs. 555.83 crore has been spent by the Government in performing dialysis for 68,968 benefi ciaries.
8.4.2.8 Aarogyasri Scheme (now Ayushman Bharat - Pradhan Mantri Jan Arogya Yojana (AB PM-JAY) - Aarogyasri)Arogyasri Scheme (AS) is a unique State
Government-sponsored health insurance scheme being implemented by the Aarogyasri Health Care Trust in Telangana. The objective of the scheme is to help the 87.5 lakh Below Poverty Line (BPL) households in the state by reducing catastrophic health expenditures through cashless and equitable access to quality healthcare. The scheme provides the benefi ciaries with coverage up to Rs. 5 lakh per family per year, and an additional fi nancial coverage up to Rs. 10 lakh for high-end procedures.
In May 2021, the Government of Telangana dovetailed this scheme with the Government of India’s Ayushman Bharat – Pradhan Mantri Jan Arogya Yojana (AB PM-JAY). All existing Aarogyasri benefi ciaries and benefi ts were brought under the converged scheme. In addition, the 646 procedures that can be availed under PMJAY are being made available through government hospitals in the state.
Between 2014-15 and 2019-20, the number of benefi ciaries under the scheme increased by 42.3%, and the expenditure incurred increased by 48.6% (see Figure 8.3). The number of benefi ciaries and expenditure on the scheme declined during the COVID-19 pandemic.
Figure 8.2
Telangana Diagnostics Scheme benefi ciaries and total tests over the years
Source: Department of Health, Medical and Family Welfare, Government of Telangana
Patients Tested Tests Conducted
6,65,622
2,42,240
9,19,037
24,72,502
3,53,152 2,40,342
7,41,9417,73,864
2018 2019 2020 2021(up to Nov)
Figure 8.3
Expenditure and Benefi ciaries for Aarogyasri Scheme (2014-15 to 2021-22)
Number of benefi ciaries
Expenditure (INR in lakh)
Source: Department of Health, Medical and Family Welfare, Government of Telangana
2014-15
2015-16
2016-17
2017-18
2018-19
2019-20
2020-21
2021-22 (till Sept)
Total
1,11,625
1,40,130
1,45,706
1,60,431
1,64,998
1,58,876
96,561
57,972
10,36,299
48,237
63,361
65,798
72,267
74,036
71,664
45,038
24,769
4,65,170
137
8.4.2.9 AYUSH (Ayurveda, Yoga & Naturopathy, Unani, Siddha and Homeopathy)The Telangana Government, along with the National AYUSH Mission (NAM), has been encouraging the AYUSH systems of medicine since the state’s formation. Currently, there are 860 dispensaries, hospitals, and institutions functioning under the AYUSH Department. Telangana is the only state with pharmacies in 3 systems of AYUSH – Ayurveda, Unani, and Homoeopathy – and has taken up several upgradation programmes for AYUSH dispensaries/Hospitals. At present, AYUSH Wellness Centers are functioning in Hyderabad and Warangal districts, whereas AYUSH wings are being strengthened in other district hospitals. To provide greater push to its AYUSH initiatives, the Government has taken up proposals for upgrading 421 AYUSH dispensaries as Health and Wellness Centers, and establishing 50-bedded integrated AYUSH hospitals at Ananthagiri Hills, Vikarabad, Siddipet and Jayashankar Bhupalpally districts.
8.4.2.10 Employee And Journalist Health SchemeTo provide cashless treatment to all state government employees, pensioners, journalists, and their dependent family members, the ‘Employees and Journalist Health Scheme’ has been implemented by the Government. Out-patient treatments are provided through wellness centers, and in-patient treatment through the 344 empaneled hospitals to the 12,04,654 beneficiaries enrolled under the scheme. Since state formation, approximately 3 lakh persons have benefitted through this scheme, at an expense of Rs.1,245.3 crores to the state exchequer.
8.4.2.11 Emergency Health Transportation Services (Emergency (108), MCH (102), Fixed Day Health Services (104) and Free Hearse ServicesThe Government of Telangana provides the following free transportation services for health-related needs to different categories of beneficiaries:l108 Service: 24-hour free transportation, 365
days a year through 394 ambulances to aid patients during emergencies.
l102 Service: Free transportation to pregnant women for ANC check-ups and delivery through the 300 Amma Vodi vehicles. This service caters to an average of 98,648 women each month.
l104 Service: Once-a-month fixed day service at rural habitations located beyond 3 km from a PHC or CHC according to a predetermined calendar, to provide pregnancy monitoring, treatment for infants and children, and for patients suffering from chronic ailments. This is done through the 198 mobile vehicles equipped with medical and laboratory equipment to perform basic diagnostic tests, as well as a cold chain unit to store vaccines and blood samples.
l Free Hearse Service: The 41 vehicles operated under this service transport dead bodies from hospitals to the choice of location of the deceased family.
8.4.2.12 National Programme for Palliative Care Patients with end stage diseases like cancer, organ failure, paralysis, cardio-vascular diseases, etc. need proper end-of-life care. In view of this, the state has rolled out a comprehensive palliative health care programme under the National Programme for Palliative Care (NPPC). The programme has a three pronged strategy, viz., (i) in-patient care, (ii) home-based care, and (iii) out-patient care. 18 palliative health care centers have been established for in-patient care, palliative home care is planned to be taken up in 110 Sub Centres-Health and Wellness Centres (SC-HWCs), and 30 mobile home care service units are being established for out-patient care.
8.4.2.12.1 Geriatric CareWith increasing life expectancy, the population of elderly in the state has been growing. Withdrawn from the decision-making role in their families, the elderly feel left out and alone. They often also suffer from depression due to loneliness. A two-pronged strategy has been adopted by the State to treat the
Health

Telangana Socio Economic Outlook 2022138
elderly and address their problems – weekly special elderly clinics are organized every Tuesday at the sub-centre and the PHC levels, and counseling is provided to the elderly on lifestyle modifications.
8.4.2.13 National Tobacco Control ProgrammeThe National Tobacco Control Programme (NTCP) is being implemented in all 33 districts with the objective of monitoring of tobacco control laws and setting-up and strengthening of cessation facilities including provisioning of pharmacological treatment facilities at the district level. District Level Coordination Committees (DLCC) have been formed in each district for its implementation. Enforcement Squads have been identified at the district level to conduct raids in coordination with the Police department. Since 2014 till date, a total of 90,000 challans have been issued.
8.4.2.14 National Mental Health ProgramRecognizing the importance of emotional, psychological, and social well-being of its citizens, the Government of Telangana has rolled out the National Mental Health Program in all districts, and has undertaken the recruitment of District Mental Health Professional (DMHP) teams under the National Health Mission. Additionally, a Mental Health Screening application has been developed in the state for the identification of Common Mental Health Disorders (CMD). The app is currently being piloted in select PHCs of 9 districts, covering a total population of 1.8 crore persons, out of which 6.2 lakh have been identified as risk-prone. Identification of persons as risk-prone is followed by referrals to psychiatrists, follow-up services by Medical Officers (MO), and if required, inpatient services through the District Non-Communicable Diseases (NCD) Clinics where Mental Health wards have been identified for the treatment of patients.
8.5. COVID - 19 COVID-19, which emerged as the most catastrophic global health crisis since the era of the influenza pandemic, continued to wreak havoc on health systems across the world even in the year 2021-22
on account of the emergence of new variants of the disease.
The state witnessed two surges in COVID-19 cases in the year 2021-22 – one in May 2021, and the other in January 2022. The Government responded swiftly to the rise in cases by taking short-term measures such as provisioning of testing facilities and conducting fever surveys, and long-term measures, such as (i) ramping up the number of COVID hospital beds, the supply of oxygen, and diagnostic facilities through the T-Diagnostics Initiative, (ii) undertaking large-scale vaccination drives, and (iii) creating new health infrastructure and improving the existing medical systems in government hospitals.
Further, to ensure precaution and to contain the spread of COVID-19, the Government has made it mandatory to follow COVID-appropriate behavior such as the use of masks, frequent hand washing, and observing social distancing in public places.
8.5.1 COVID - 19 CasesAs of 10th February 2022, the cumulative number of COVID-19 cases in the state was 7.81 lakh, out of which 19,850 cases were active and under treatment/isolation, and 7.57 lakh had recovered (Recovery rate in Telangana was 96.9%). Cumulatively, Telangana has accounted for 1.84% of the total cases in the country (see Table 8.2).
The state recorded a death ratio of 0.53% – the lowest among the major states in India, and nearly
Table 8.2
COVID -19 Cases in Telangana and India (as of 10.2.2022)
Telangana
India
Telangana % out of India
7,80,836
4,24,78,060
1.84%
4,103
5,06,520
0.81%
Total cases Deaths
Source: MyGov Portal, GoI

139Health
half the national average death ratio of 1.19%. Overall, the state performed particularly well in minimizing the loss of life due to COVID-19.
8.5.2 COVID - 19 TestingThe World Health Organisation (WHO) recommends that a country/state needs to conduct 140 tests per day per 1 million population for comprehensive surveillance of suspected COVID-19 cases. Based on this fi gure, it is recommended that Telangana conduct 5,600 COVID-19 tests per day.
3.27 crore tests have been conducted in the state since the outbreak of the pandemic, with daily testing in the state recorded at 61,573 as of 9.02.2022 – approximately 11 times the recommended daily value as per WHO. This has ensured early detection and timely treatment of COVID-19 patients in the state.
8.5.3 COVID - 19 VaccinationThe COVID-19 vaccination programme was rolled
out in a phased manner for persons belonging to different age groups:lfrom January, 2021 for persons over the age of
60,lfrom May, 2021 for persons above the age of
18, andlfrom January 3, 2022, for persons belonging to
the age group 15-18.
The Government adopted a mission mode approach towards achieving maximum vaccination coverage in the state. Based on the Media Bulletin released by the Government of Telangana on the 9th of February, 2022, the key achievements of the state in the area of COVID vaccination are mentioned below:lTelangana became the fi rst larger state in the
country to achieve 100% coverage of fi rst dose vaccination against COVID-19 in December 2021 for the age group of 18+
lAs of February 2022, 89% of the state’s population in the age group of 18+ had taken the second dose of vaccination.
Karimnagar
Warangal Urban
Jangaon
Khammam
Yadadri
Medak
Rangareddy
Mahabubabad
Rajanna
Siddipet
Mulugu
Adilabad
Jagtial
Bhadradri
Mahabubnagar
Nalgonda
Mancherial
Warangal Rural
Jayashankar
Peddapalli
Nirmal
Nagarkurnool
Suryapet
Hyderabad
Nizamabad
Sangareddy
Kamareddy
Medchal-Malkajgiri
Narayanpet
Jogulamba
Wanaparthy
Vikarabad
Kumuram Bheem
Figure 8.4
District-wise second dose vaccination coverage for the 18+ age group
Note: Districts arranged in descending order of coverage. Source: Department of Health, Medical and Family Welfare, Government of Telangana
Second dose coverage
(%)
Second dose coverage
(%)District District
Second dose coverage (%)
60 to 7070 to 8080 to 9090 to 100Above 100
102
102
100
100
100
99
98
97
97
95
94
93
93
92
92
92
91
91
89
87
86
85
85
83
82
82
81
81
80
77
74
69
66
89% of the state’s population in the 18+age group has received the second dose of vaccination coverage
The districts of Karimanagar, Hanamkonda, Khammam, Yadadri Bhuvangiri and Jangaon have achieved 100% vaccination of both the doses.

Telangana Socio Economic Outlook 2022140
lFor the age group – 15-17 years, 76% vaccination coverage had been achieved within the fi rst month itself (03.01.22 to 9.02.22).
lWithin a month from the start of administering precautionary/booster doses to frontline workers and persons aged 60+years (10th January, 2022-9th February, 2022), 3.60 lakh doses had been administered in the state.
8.5.4 COVID-19 related initiatives/welfare measuresThe State government adopted the syndromic approach to contain COVID-19 infections which involved making clinical decisions based on patients’ symptoms, rather than waiting for their test results. This approach ensured that all persons in the state with COVID symptoms got access to early treatment, on account of which the need for hospitalization and oxygen dependency was reduced across the state. In addition to syndromic
treatment, the Government implemented multiple measures to strengthen the health system, and to ensure access to basic nutritional services for all citizens during the pandemic, details of which are provided in this section.
8.5.4.1 Measures taken to strengthen the health system during the pandemic8.5.4.1.1 Fever Surveys
In view of the rising COVID cases in both May, 2021 and January, 2022, fever surveys were conducted by 21,150 medical teams comprising members from the Health, Panchayat Raj/Municipal Administration, and other departments. 1 crore households were covered as part of the surveys, and home isolation kits were provided to symptomatic persons.
8.5.4.1.2 Enhancement of Testing CapabilitiesThe number of functional RT-PCR labs in the state increased from 1 before the COVID outbreak to 27
Figure 8.5
District-wise fi rst dose vaccination coverage for the 15-17 age group
Note: Districts arranged in descending order of coverage. Source: Department of Health, Medical and Family Welfare, Government of Telangana
First dose coverage (%)
50 to 6060 to 7070 to 8080 to 90Above 90
Hanamkonda
Bhadradri
Mahabubnagar
Khammam
Rajanna
Narayanpet
Wanaparthy
Adilabad
Sangareddy
Jogulamba
Nirmal
Jangaon
Mulugu
Suryapet
Peddapalli
Kamareddy
Nagarkurnool
Jayashankar
Siddipet
Karimnagar
Yadadri
Medak
Mahabubabad
Mancherial
Nizamabad
Nalgonda
Warangal Rural
Medchal-Malkajgiri
Jagtial
Vikarabad
Hyderabad
Rangareddy
Kumuram Bheem
First dose coverage
(%)
First dose coverage
(%)District District
107
103
101
101
98
98
97
94
93
92
90
90
89
83
83
82
80
77
76
76
75
73
73
72
70
67
63
63
63
58
57
56
54
76% of the population in the age group of 15-17 years has received the fi rst dose of the vaccination The districts of Hanamkonda, Bhadradri Kothagudem, Mahabubnagar and Khammam have achieved 100% of the fi rst dose of COVID-19 vaccine among the age group of 15-17.
Note: Districts arranged in descending order of coverage.

141
as of September, 2021. The Government plans to establish 8 more RT-PCR labs, so that each district in the state would have at least one RT-PCR lab. The government also procured state-of-the-art CATH LABs, CT scanning machines, and a COBAS machine for improved efficiency of testing in the state.
8.5.4.1.3 Increased Hospital Bed Capacity for COVID-19 PatientsThe hospital bed capacity for COVID-19 patients in the state has more than tripled between February, 2021 and January, 2022 – from 16,210 to 56,206 (see Table 8.3). 27.9% of the total hospital beds in the state are accounted for by Government hospitals, whereas private hospitals account for 72.1% the total hospital beds. 39.3% of the total hospital beds in the state are regular beds, 39.3% are oxygen beds, and 21.3% are ICU beds.
8.5.4.1.4 Augmentation of Oxygen FacilitiesThe second wave of COVID brought forth the challenge of oxygen shortage in state hospitals. To remedy this limitation, the Government decided to provide 25,390 beds in Government hospitals with oxygen supply, establish liquid oxygen tanks in 24 major hospitals for oxygen storage, and secure 27 ISO oxygen tankers for oxygen transport. Oxygen generation capacity in the state was increased from 135 MT (million tonnes) to 327 MT per day. It is proposed to further increase it to 545 MT per day. For pediatric patients, 5,200 ICU/oxygen beds have been specially set aside. In addition to this, 26 Pressure Swing Absorption (PSA) oxygen generation plants have been established under
CSR, and 50 plants are being established under PM CARES. All private hospitals have also been directed to set up PSA plants, and so far, 98 of them are in the process of establishing them.
8.5.4.2 Measures taken to provide support and redressal to citizensAll COVID-19 patients admitted to government hospitals were given the highest quality of treatment, free medicines, and a special nutritious diet.Furthermore, in response to the second wave of COVID, 10 kg. rice was distributed to every white ration card holder each month between May, 2021 and November, 2021, at an expense of Rs. 324 crore to the state treasury. Further, 2,03,473 teaching and non-teaching staff of recognized private schools in the state were given 25 kg. per person free rice every month from April, 2021 to June, 2021, at an expense of Rs.52.26 crore to the state treasury.
8.6. Way ForwardThe past year has seen a substantive increase in the investments towards the expansion and improvement of health infrastructure in the state. The health ecosystem has remained resilient in the face of the pandemic and has ensured maximum care and minimum loss of life. Going forward, the Government would continue to strive to provide high-quality healthcare services to all as envisioned in the Sustainable Development Goals (Goal 3 - Good Health and Well Being), and would work towards eradicating diseases, and strengthening the health system in the state, with a special focus on personnel development and addressing new and emerging health challenges.
Table 8.3
Status of Hospital Beds exclusively for COVID-19 (on January, 2022)
Government
Private
Total
110
1,214
1,324
5,501
16,614
22,115
7,857
14,239
22,096
2,340
9,655
11,995
15,698
40,508
56,206
Number of Hospitals Regular Beds Oxygen Beds ICU Beds Total Beds
Source: Media Bulletin, 9 Feb 2022, Government of Telangana (https://covid19.telangana.gov.in/)
Health

Telangana Socio Economic Outlook 2022142
MATERNAL & CHILD CARE
CHAPTER
09

143
l Over the last decade, the MMR in Telangana has fallen by 43%, from 110 in 2010-12 to 63 in 2016-18.
l Infant mortality rate (IMR) dropped from 27.7 to 26.4 (per 1000 live births) between National Family Health Surveys NFHS-4 (2015-16) and NFHS-5 (2019-20) respectively.
l Institutional births improved from 91.5% to 97% between NFHS 4 and NFHS 5, and births in government hospitals improved from 30.5% to 49.7% between the two survey periods.
l Vaccination rates of children in the age group of 12-23 months
also improved from 79.1% in 2015-16 to 87.4% in 2019-20.
l A 24/7 helpline (181) for women in distress or women facing gender based violence is functional in collaboration with GVK-EMRI. Similarly, an exclusive Helpline for Anganwadi Services- 155209 is also available.
l Additional state funding has been allocated towards the Supplementary Nutrition Program for women and children registered at Anganwadi centers, resulting in an increase in the number of days of supplementary nutrition provisioning to beneficiaries from 25 days to 30 days for which the beneficiary receives food.
Key Highlights
Maternal & Child Care

Telangana Socio Economic Outlook 2022144
9.1. Introductionhe population of Telangana is 350.04 lakhs (Census of India 2011), out of which the total number of women in
the reproductive age group1 account to over 107.8 lakhs. Children between the ages of 0-4 years total to 31.32 lakhs (Ministry of Health and Family Welfare, Govt. Of India, 2021). A report published by NITI Aayog in 2021 finds that 13.74% of the population in Telangana is living in multidimensional poverty. Evidence shows that poverty is a proximate determinant of malnutrition through inadequate dietary intake, lack of medical care, lack of access to hygiene and sanitation, and poor environment (Panda et al., 2020,). Therefore, a key public health goal of Telangana is to improve maternal and child health & nutrition given the volume of people who require adequate health and nutrition services among women and children.
The Government runs various welfare programs and schemes to safeguard the basic health and nutrition needs of children, adolescent girls, and women. Maternal and Child Health programs are considered to be most effective when adopted a life cycle approach due to the intergenerational effects of health and nutrition. This includes access to good nutrition, detection and prevention of malnourishment and offering timely institutional support and access to all citizens. The health of a mother reflects the health of a child, where the health of the mother is often determined by the health prior to her pregnancy, during her pregnancy and after the pregnancy. Thus, the scope of health and nutrition programs cover children up to the age of 6 years, adolescent girls, pregnant and lactating women to take care of prenatal, antenatal and postnatal needs.
There are 35,700 Anganwadi Centers (AWCs)
across all districts in the State under 149 ICDS projects. Presently, the coverage of beneficiaries of the AWCs stands over 22.00 lakhs. The interventions cater to the needs of the children from the time of birth to six years of age, adolescent girls and pregnant women and lactating mothers through supply and distribution of food and micronutrients, early childhood development and education and counseling services. Similarly on the health front, during 2021-22 upto November 2021, over 7.95 lakh women benefited from the Amma Vodi scheme and around 1.5 lakh pregnant women benefited from KCR Kits, two flagship schemes targeting maternal health and wellbeing by offering institutional support.
Apart from these, there are other programs targeting various aspects of health and nutrition among the different beneficiary groups and are discussed in this chapter. This chapter also reviews the outcomes of various health and nutrition indicators and corresponds the achievements to initiatives and programs implemented by the state government. It also mentions a few innovative approaches adopted by the state government to solve some of the challenges pertaining to optimal health and nutrition of the relevant population.
9.2. Maternal Health and NutritionAccess to institutional and quality maternal healthcare is extremely important to prevent diseases, morbidity, mortality and reduce high risk pregnancies which lead to preterm births (Addisse, 2003). Nutritional problems of pregnant women are also a concern area as nutritional deficiencies often lead to complications in pregnancy. Research also indicates that deficiencies carry forward to the child that is to be born. For example, maternal anaemia along with other factors such as educational
T
1 Women of reproductive age are considered to be women between the ages of 15-49 years according to the World Health Organisation. For all official purposes, interventions and measurements, this is the age group that is considered. FHS data also considers the same age group for its classifications and statistics on women.

145
status and household wealth is said to be strongly correlated to child anaemia where severe anemia in mothers also impacts negatively on breast milk iron content leading to nutritional deficiency in the child (Onyenheo et al., 2019), and antenatal anemia impacts on weight at birth and premature deliveries, a major risk factor in childhood anemia (Wharton, 2002). Recognising the importance of maternal health and nutrition, the Government of Telangana strives towards providing comprehensive, promotive, preventive, curative and rehabilitative services for mothers and children all led to improved maternal outcomes.
9.2.1 Maternal Health OutcomesThe state has witnessed considerable improvement across major determinants of maternal health such as access to antenatal, postnatal services, nutritional services, immunization, transportation services, etc. Three key outcomes that have improved as a result of improvement in these major determinants are discussed below.
9.2.1.1. Maternal Mortality Ratio (MMR)The Maternal Mortality Ratio in the state has been consistently declining as evidenced by NFHS reports. MMR measures the number of maternal deaths that happen during childbirth or within 42 days of the same, for every 1,00,000 live births in the population. Over the last decade, the MMR has fallen by 43%, from 110 in 2010-12 to 63 in 2016-18 (Fig 9.1.). Telangana has already achieved the Sustainable Development Goal (SDG) target of reaching an MMR below 70 by 2030. Telangana has the fourth lowest MMR among the 18 Non-Special Category states of the country and it has the third lowest MMR among the states (highlighted in green color in Fig. 9.2) whose Per Capita Income(PCI) is comparable to that of Telangana.
9.2.1.2. Institutional Care Improving access to institutional care is vital in reducing infant and maternal mortality, and in treating complications that may arise during delivery. During 2019-20, over 88.5% mothers received an ante-natal checkup within the first trimester of their pregnancy. According to the NFHS-5 (2019-20),
Maternal & Child Care
Figure 9.1
Maternal Mortality Ratio of Telangana and India (2010-12 to 2016-18)Maternal mortality ratio in Telangana has decreased significantly in recent years
Source: Special Bulletin on Maternal Mortality in India of various years - Sample Registration System
2010-12
2011-13
2014-16
2015-17
2016-18
MMR- Telangana MMR- India SDG- Target
70 110
92
81
76
63 113
122
130
167
178

Telangana Socio Economic Outlook 2022146
almost 97% of children had an institutional birth, up from 91.5% as against NFHS-4 (2015-16). 96.7% of mothers received a Mother and Child Protection Card during pregnancy as per NFHS-5. The out-of-pocket expenditure on pregnancy has gone down in the state, from Rs.4,218 in 2015-16 to Rs.3,846 in 2019-20 implying a reduction in the fi nancial burden of benefi ciaries accessing the delivery services. A combination of government schemes like Amma Vodi and KCR Kits along with post natal
support at hospitals have led to the improvement of institutional parameters of child delivery in Telangana.
9.2.1.3. Anaemia LevelsAs per NFHS-5 over 57% of Indian women are anaemic. Telangana stands at the national average where 57.6% of women between 15-49 years were anaemic at the time of survey for NFHS-5. Among pregnant women, 53.2% women were anaemic in the state. Anaemia decreases the woman’s reserve to tolerate bleeding either during or after child birth and makes her prone to infections. Anaemia during pregnancy also has been associated with increased risk of intrauterine growth restriction, premature delivery, low birth weight (LBW), and maternal and child mortality. There are many causes of anaemia, out of which iron defi ciency accounts for about 50 percent cases of anaemia in school children and among women of reproductive age-group. Thus, the government has introduced measures and schemes to address the issue of anemia among women that are caused by iron defi ciency by supplying Iron Folic Acid tablets and running various awareness campaigns under Anaemia Mukt Bharat and POSHAN Abhiyaan. Over 63% of women in Telangana consumed IFA tablets for more than 100 days during their pregnancy in 2020-21. This is a signifi cant improvement from 2015-16, when only 52.7% women consumed these tablets.
9.2.2. Initiatives infl uencing Maternal Health and Nutritional OutcomesAs maternal health is a multi-faceted concern, various schemes and programs are being implemented in the State to improve maternal health and nutritional outcomes.
9.2.2.1. Amma VodiAmma Vodi, is an exclusive ambulance service launched by the State Government in 2018. It provides free to-and-fro transport facilities to pregnant women for regular checkups, for delivery,
Figure 9.2
Maternal Mortality Ratio of Telangana and Other Non-Special Category States- (2016-17 to 2018-19)Maternal mortality ratio in Telangana is 4th lowest among the 18 major states
States within +/-10% PCI of Telangana
Source: Special Bulletin on Maternal Mortality in India (2016-18)-Sample Registration System
Kerala
Maharashtra
Tamil Nadu
Telangana
Andhra Pradesh
Jharkhand
Gujarat
Haryana
Karnataka
West Bengal
Uttarakhand
Punjab
Bihar
Odisha
Chhattisgarh
Rajasthan
Madhya Pradesh
Uttar Pradesh
43
46
60
63
65
71
75
91
92
98
99
129
149
150
159
164
173
197

147
and post delivery for immunisation and other healthcare needs of the newborn and lactating mothers. 300 vehicles are operating across 33 districts under the scheme through the 102-Helpline. During 2020-21, about 10.85 lakh beneficiaries have availed the service and about 7.95 lakh beneficiaries have availed the service till November 2021.
9.2.2.2. KCR KitKCR Kit is one of the most successful schemes launched by the state Government in 2017 to ensure maternal and child health by promoting institutional deliveries. Under the scheme the mother is provided with financial assistance of ₹12,000 (₹13,000 for a girl child) to compensate for the loss of wages by the women during the pregnancy and postnatal period. After delivery, the mother is provided with a kit consisting of 15 items (clothes, quality baby soaps, baby oil, baby powder, mosquito nets, toys, napkins, and diapers) necessary to keep newborn babies (neonates) warm and hygienic. Between April ‘20 and March’21, about 2.1 lakh KCR Kits were distributed to beneficiaries and in 2021-22 about 1.5 lakh kits have been distributed between April’21 - Nov ‘21.
Since the launch of the scheme in 2017, the percentage of institutional deliveries in public hospitals have increased. Between 2015-16 and 2019-20, there was a near doubling of pregnancies being delivered at public facilities, from 30.5% to 49.7%. These deliveries were less likely to be caesarean deliveries, lowering the health risks and the costs of carrying out the operation. The state also witnessed a reduction in IMR and MMR post launch of the scheme.
9.2.2.3. ANC VisitsAs per the National Health Mission’s maternal health guidelines, at least 4 antenatal check-ups are essential for pregnant women during the entire pregnancy period. The 102 Referral Transport Service (Amma Vodi-free ambulance transport service) is catering towards the transportational needs of pregnant women for availing ANC services.
The Percentage of mothers who had an antenatal check-up in the first trimester increased from 83% as per NFHS-4 to 88.5% as per NFHS-5. In the same period, the percentage of registered pregnancies for which the mothers received a Mother and Child Protection Card also increased from 89% to 96.7%.
9.2.2.4. Anaemia Mukt BharatGovernment of India launched a program to tackle anaemia called Anaemia Mukt Bharat (AMB) which targets to reduce anaemia in women, children and adolescents through a lifecycle approach. In terms of maternal health, the number of ante-natal visits play an important role in anaemia detection and treatment. As per the quarterly report in Anaemia Mukt Bharat’s dashboard for Q4 of 2021, the state ranks 5th in the country with 95% of pregnant women (PW) receiving 180 Iron and Folic Acid (IFA) tablets. Among the 33 districts, except 5 (Warangal Urban (88.5%), Mahabubabad (87.9%), Sangareddy (84%), Rangareddy (81.2%) and Warangal Rural (63%)) over 90% of pregnant women (PW) in the state have been given 180 Iron and Folic Acid (IFA) tablets.
9.2.2.5. Aarogya LakshmiAarogya Lakshmi scheme provides nutritious and healthy meals to all pregnant and lactating mothers registered in Anganwadi Centres. The funding for this scheme as per Government of India norms is a 50:50 split between the Central and State Government. However, in the interest of womens’ health and welfare, the Government of Telangana has enhanced the rates by providing an additional allocation of Rs. 14 per beneficiary per day to the existing GOI cost norms. This has increased the number of days the beneficiaries receive milk and eggs from 25 to 30. Under this scheme, all pregnant and lactating mothers get one full nutritious meal (containing rice, dal, green leafy vegetables) for 25 days and 200 ml milk and one egg for 30 days each month. Along with this, they are also administered Iron and Folic Acid tablets for 100 days during pregnancy. As the Anganwadi centres were closed during the lockdown due to COVID-19, supplementary nutrition was given through take home ration (THR), ensuring
Maternal & Child Care

Telangana Socio Economic Outlook 2022148
benefi ciaries’ nutrition is not compromised. In addition to the meal, the pregnant mothers are also administered IFA supplementation every day. The IFA tablets are offered on-site, so that the mothers do not forget to take them alongside their meals. In 2021-22 the scheme benefi ted over 22,00,346 pregnant, lactating women and children in the age group of 7 months to 6 years (covered under Balamrutham and Supplementary Nutrition Programme). The pandemic year 2020-21 witnessed an enhanced coverage of 18.24% benefi ciaries indicating effective outreach of the Government to the last mile mother and child in need (Fig. 9.3).
9.2.2.6 Home Visits and Counseling (Intintiki Anganwadi)
Home visits for counseling benefi ciaries are a part of the ICDS services. The Intintiki Anganwadi Book serves as a guide and an educational resource for nutritional counseling on topics such as dietary practices, household practices, health precautions and actions, and hygiene and sanitation.
During the lockdown, Anganwadi Teachers counseled pregnant and lactating women over phone or during the time when they came to collect
Take-Home-Ration (THR). In emergency cases, Anganwadi Teachers visited the homes of pregnant women.
9.3. Child Health and Nutrition
Children aged between 0-6 years constitute around 11.14% of Telangana’s population. This demographic is vital and of great importance to the state, as securing access to essential health, nutrition and education to all children enables a more equitable future wherein the citizens’ participation in the economy and their productivity are maximised as an outcome of good health, nutrition and education. In cognisance, the Government of Telangana has strategically focused on child-centric investments in health, nutrition and early childhood education. An assessment of these public provisions indicate a positive trend towards improved child health outcomes, reduction in malnutrition and improved access to early childhood education.
9.3.1 Child Health and Nutritional Outcomes 9.4.1.1 Health Outcomes
The state has witnessed considerable improvement across major determinants of Child Health such as access to neonatal services, nutritional services, immunization, IFA supplementation etc. The Government is also making efforts towards institutionalising convergence and digital governance to improve outcomes. As a result, child health outcomes in the areas of Infant Mortality Rate (IMR), Neonatal Mortality Rate (NMR), Under Five Mortality Rate (U5MR) and Immunisation coverage have all shown improvements.
9.3.1.2. Child Mortality RateTelangana has witnessed substantial reductions in all indicators of child mortality. The Under-5 Mortality Rate (U5MR)—defi ned as the number of deaths of children aged 5 or below per 1000
2016-17 2017-18 2018-19 2019-20 2020-21 2021-22
19,07,91218,23,340
17,13,813 17,01,445
20,11,78922,00,346
Figure 9.3
Number of benefi ciaries (mothers and children) under Arogya Lakshmi Scheme (2016-17 to 2021-22)
Source: Women Development & Child Welfare Department
Ben
efi c
iarie
s
149Maternal & Child Care
Early childhood education and development has a huge bearing on a child’s overall development with implications on their overall life outcomes. Keeping this at the core, the ICDS intervention addresses nutrition, preschool education and counseling, among other services. However, between NFHS-4 (2015-16) and NFHS-5 (2019-20), 22 states & UTs reported an increase in child malnutrition. In addition, India’s position in the Global Hunger Index 2021 slipped from 101, to 116 of 135 countries. On early childhood learning outcomes, ASER 2019’s study reveals that only 21% of first-grade children are at the word level.
An Anganwadi typically has a staff of two- Anganwadi Worker and Anganwadi Helper. The worker is responsible for managing all services provided at the center, spanning early childhood health, nutrition, preschool education, and administrative duties, with duties in both the center and in the broader community. Center-level tasks include early childhood education, overseeing the mid day meal program, and providing nutritional supplements. Community-level duties include conducting home visits to raise awareness of appropriate nutritional and health practices; monitoring children’s nutritional status and providing supplemental nutrition packets to undernourished children; and coordinating with the ASHA and ANM to organize immunization camps and health check-ups for children enrolled in AWCs. In addition, the workers have a considerable amount of administrative work and are expected to maintain as many as 14 different paper registers (PEO, 2011). Finally, they are also frequently asked to assist with other government activities, such as surveying, managing electoral
booths, and conducting awareness on public schemes in their community. Recognising this, a large scale randomized controlled experiment was conducted in Tamil Nadu which studied the impact of hiring an extra worker at the Anganwadi Centre (Ganimian et al., 2021). The intent behind this experiment was to alleviate the burden of the AWW to perform a vast scope of work under her purview and optimize the time spent on performing different tasks. In Tamil Nadu’s case, the experiment primarily focused on increasing the instructional time. The existing Angnawadi Worker was relieved from teaching, giving her adequate time to focus on other health and nutrition activities.
This experiment in Tamil Nadu has demonstrated high returns on investment in terms of early childhood development outcomes on placing an additional worker at AWCs. The intervention led to (a) doubling of the overall time spent on pre-school education; (b) near-tripling of time spent on health and nutrition related tasks; (c) significant increases in the children’s math and language learning levels; (d) a 34% reduction in severe malnutrition; (e) 16% reduction in the fraction of children who were stunted from a base of 29.1% over a span of 18 months. Most importantly, the intervention proved to be highly cost-effective. The present discounted value of the gains that would likely accrue to the beneficiaries from the increased learning outcomes would be 13 times the cost incurred by the government on the intervention. If the impact of nutritional improvement were to be factored in, this gain would go up to 17 to 22 times the cost of the intervention.
Box 1
Two-Worker Model for increasing child development outcomes

Telangana Socio Economic Outlook 2022150
children—has improved from 31.7 in 2015-16 to 29.4 in 2019-20. The Neonatal Mortality Rate for the State has also declined from 20 in 2015-16 to 16.8 in 2019-20 (Fig. 9.4). Since the formation of the state, Telangana’s Infant Mortality Rate (IMR) has declined signifi cantly from 35 in 2014 to 23 in 2019, and remains below the national IMR of 30 (Fig. 9.5).
Telangana has witnessed a strong correlation between Institutional Births and Neonatal Mortality Rate (Fig. 9.6). As the percentage of Institutional Births improved from 91.5% in 2015-16 to 97% in 2019-20, the Neonatal Mortality Rate saw a signifi cant decline from 20% in 2015-16 to 16.8% in 2019-20. Better care at public hospitals and provision of KCR kits are associated with decline in NMR. It remains way below the national NMR of 24.9.
9.3.1.3. ImmunizationThe state has seen a large increase in immunization rates. In 2015-16, 79.1% of children under the age of 2
Figure 9.4
Child Mortality Rates in Telangana
2015-16 2019-20
Neonatal Mortality Rate
(NMR)
No. of neonatal deaths per 1,000
live births
Infant Mortality Rate
(IMR)
No. of infant deaths per 1,000
live births
Under 5 Mortality Rate
(U5MR)
No. of under 5 deaths per 1,000
live births
20.016.8
27.7 26.4
31.729.4
Source: National Family Health Survey- Round 4 and 5
Source: Sample Registration System
Figure 9.5
Infant Mortality Rate- India and Telangana (2014 to 2019) Infant Mortality Rate
Telangana India
3937
34 3332
30
23
2729
31
3435
2014 2015 2016 2017 2018 2019
Figure 9.6
Institutional Births vs Neonatal Mortality Rate in Telangana (2015-16 to 2019-20)
Source: National Family Health Survey-Round 4 and 5
Institutional births (%)
Neonatal Mortality rate (NMR)
NFHS-4
NFHS-4
NFHS-5
NFHS-5
91.5
20.0
97.0
16.8
+ 5.5
-3.2

151
years were fully immunized (Fig. 9.7). By 2019-20 and 2020-21, the percentage of children under the age of 2 years fully immunized improved to 87.4% and 96% respectively. This has been enabled by counseling and campaigning by ASHA and Anganwadi workers to encourage parents to get their children vaccinated.From the above fi gure, it is clear that the State is signifi cantly faring well in child immunisation as compared to the national performance.
9.3.2. Child Nutritional OutcomesDocumented evidence indicates that undernutrition affects physical and cognitive development of
children, their quality of schooling and productivity as young adults. Telangana faces a problem called the ‘triple burden’ of nutrition—which is under nutrition, over nutrition (obesity) and anaemia. Government interventions have focused largely on addressing problems of under-nutrition. Globally, there are four outcome indicators to measure undernutrition: underweight, stunting, wasting and anaemia. In addition to these, breastfeeding practices are also a key determinant of undernutrition and child health. Keeping in view the challenges COVID-19 have posed on the nutritional status of children since 2020, the government has made signifi cant strides in ensuring the consistency in nutritional service delivery such that child nutrition outcomes are not worsened. In the current fi nancial year, ICDS program is serving 22,00,346 benefi ciaries in Telangana. They include pregnant and lactating women and children up to the age of 5 years.
Low birth weight, as a signifi cant factor affecting the infants morbidity and mortality, is a critical determinant which has both short term and long term implications on a childs’ health. The State has performed better than the national average in Stunting, Underweight, and Exclusive Breastfeeding Practices. It is just under the margin of the national average when it comes to Wasting, Anaemia and Early Initiation of Breastfeeding (Fig 9.8).
Maternal & Child Care
Figure 9.7
Status of Immunization - India and Telangana Children age 12-23 months fully vaccinated (%)
Source: National Family Health Survey- Round 4 and 5
Telangana India
NFHS-4 NFHS-5
79.1
87.4
77.9
83.8
Figure 9.8
Key Nutritional Outcomes of Children (Under 5 years): India vs Telangana
Source: National Family Health Survey-5
Share of children (%)
Stunting (< 5 years)
Wasting (<5 years)
Underweight (<5 years)
Anaemia (<5 years)
Breastfed within one hour after birth
Exclusively Breastfed for 6 months
Telangana India
35.533.1
19.3 21.7
32.1
67.1
37.1 41.8
68.263.7
31.8
70.0

Telangana Socio Economic Outlook 2022152
In terms of low birth weight, Telangana ranks above the national average, ranking 3rd among the Non-Special Category States and 2nd among the Southern States with 7.14% of the total children being born with a low birth weight (Fig.9.9).
9.3.3. Initiatives influencing Child Health Outcomes9.3.3.1 Child Healthcare Services
There are 314 PHCs in the state that are notified as round the clock Mother and Child Health Care Centres to promote institutional deliveries to reduce child mortality. In addition to this, there are 29 special newborn care units, 46 special newborn stabilisation units, and 562 newborn care corners in various government hospitals in the state to reduce infant mortality and improve neonatal care. These units provide care at birth, help in managing sick newborns, resuscitate asphyxiated newborns, follow up on high risk newborns and offer immunization services.
9.3.3.2 Nutrition Rehabilitation Centres (NRC’s)Undernutrition is an invisible problem. It can jeopardize a child’s survival, health, growth and development. To prevent deaths among severely malnourished children under five years of age (0-5), the government has established the NRC under the National Rural Health Mission. They provide nutritional and clinical management services to children with Severe Acute Malnutrition (SAM). There are 12 NRCs functioning in the state, out of which 10 are 20-bedded and 2 are 10-bedded focussing primarily on the tribal areas of the state.
9.3.3.3. Kangaroo Mother Care CentresThere are 22 Kangaroo Mother Care (KMC) Centres in the state which offer simple, cost-effective and preventive care to mothers and newborns. This care includes services such as breastfeeding and continuous skin-to-skin contact between mother and newborn, for low birth weight infants. The care improves the overall duration of breastfeeding, and reduces the risk of infections in newborns. It promotes growth and development of the child, increases mother-child bonding, and reduces stress in both mother and child. Out of 1,81,157 admissions in SNCUs, 27,103 newborns were provided care in KMCs between 2015 and December 2020.
Figure 9.9
Low birth weight babies (%): Comparison of Telangana and other Non-Special Category States of India
Among all States:
7/28
Among Non- special Category
States: 3/18
Among Southern
States: 2/5
Telangana's rank
Low Birth Weight Babies (%)
Andhra Pradesh
Jharkhand
Telangana
Punjab
Haryana
Bihar
Karnataka
Chhattisgarh
Uttar Pradesh
Kerala
Maharashtra
Gujarat
Rajasthan
Madhya Pradesh
Tamil Nadu
Goa
West Bengal
Odisha
5.58
7.12
7.14
8.41
8.47
9.23
10.01
10.05
11.18
11.42
12.06
12.33
14.01
14.30
15.49
15.56
16.45
18.25
Source: National Family Health Survey-5
153Maternal & Child Care
The Government of Kerala has adopted a decentralized model for production and distribution of Take Home Ration in collaboration with Kudumbashree State Poverty Eradication Mission. Fortification of THR in Kerala was initiated in the year 2016 under Integrated Child Development Services (ICDS) by Women and Child Department (WCD) of Kerala and the United Nations World Food Programme (UNWFP), in collaboration with the Kudumbashree Mission to alleviate high prevalence of anemia and micronutrient deficiencies. A blended food called ‘Amrutham Nutrimix’, like balamrutham in Telangana, is produced by Kudumbashree groups and is provided to children between the ages of 6 to 36 months.
The modus operandi of Kudumbashree relies on the community, where Community Based Organizations (CBOs) are set up either at the Panchayat, Municipal or Corporation level, with a base unit having Neighborhood Groups (NGHs). The micro enterprises established by Kudumbashree produce Amrutham Nutrimix at the neighborhood group level which has about 5-10 trained members who are local women. With a total of 241 units, these micro enterprises are able to supply the nutrimix to over 5 lakh children enrolled in all 33,115 anganwadi across Kerala. Each child is provided with 3.5 kgs of nutrimix per month. The ingredients in 100 grams of Nutrimix are wheat (45 grams), soya chunks (10 grams), Bengal gram (15 grams), groundnut (10 grams) and sugar (20 grams).
In 2019, the Department of Women and Child Development, Government of Kerala, United Nations World Food Programme (UNWFP) and Kudumbashree Mission went for fortification of Nutrimix by adding 11 micro-nutrients Iron, Vitamin C, Calcium, Zinc, Vitamin A, Thiamine, Riboflavin, Niacin, Vitamin B6, Folic Acid and Vitamin B 12.
In addition to meeting the nutritional needs of children, this program has also been successful in empowering women from the local communities by enabling them to become economically independent through the microenterprise model. There has also been a positive reception of the product from mothers and caregivers, noticed by an increase in demand. This decentralised model from Kerala has been demonstrated to be replicable, scalable and sustainable towards achieving the twin goals of tackling malnutrition and empowering women from low socioeconomic groups.
ReferencesJoseph, M., Mayurdhar, Sumanth, P., & Indus Action. (2021). Best Practices from Kerala.M, A. (2021). How two Kudumbashree units in Kerala scripted history. The Hindu.Yunus, S., Dhawan, S., & P, R. (2020). A Cluster Model in Kerala: Experience of Kudumbashree. https://sightandlife.org/wp-content /uploads/2020/09/THR-Compendium_A-Cluster-Model-in-Kerala.pdf
Box 2
Decentralized model for production and distribution of Take Home Ration

Telangana Socio Economic Outlook 2022154
9.3.4. Initiatives influencing Child Nutrition Outcomes
The Government has taken up several initiatives to positively impact the Child Nutrition Outcomes which are reflective in the reduction of the Child Nutrition Outcome as measured by NFHS-5. Recently, Bhadradri Kothgudem, one of the identified Aspirational Districts conducted a pilot around inclusion of millet based recipes as hot cooked meals through the ICDS Scheme. During November 2021, the district achieved a rank of 9 out of 112 identified Aspirational Districts for its performance in the thematic area of Health and Nutrition, in the country. The initiatives taken by the district towards reducing malnutrition were appreciated by the Honorable Prime Minister during the virtual review of Government of India’s Transformation of Aspirational Districts Programme.
9.3.4.1 Supplementary Nutrition ProgramSupplementary Nutrition Program or SNP is an important component of the ICDS to tackle malnutrition. This program provides supplementary nutrition to children who visit the Anganwadi Centres between the ages of 3-6 years by providing them hot cooked meals and a snack. Out of the total released amount of Rs. 13,923.44 Crore during 2021-22, until November 2021 around 81% (Rs. 11,276.91 Crore) has already been utilised. Over and above its 50% share in the programmatic budget allocation, the Government for children between 7 months to 3 years there is an additional allocation of Rs. 1.79 per child per day; for children between 3 years to 6 years there is an additional allocation of Rs. 1.96 per child per day; and for malnourished children an additional amount of Rs. 5.75 per child.
In Telangana the kilocalories (kCal) of the food provided, marginally exceeds the minimum requirement of kCal to be provided to children under the SNP program between the ages of 3-6 years as per Government of India’s National Food Security Bill, 2013 guidelines. For children who are severely underweight or malnourished (SUW,SAM,MAM
categories), the food supplied to children is supplemented by an additional serving, doubling the kCal intake at the centre level. Under this, one hot cooked meal & snack food for 25 days and eggs for 30 days is provided to children between 3-6 years.
9.3.4.2 BalamruthamFor children under the age of three and over 7 months, a calorie-dense weaning food is provided by the Government called Balamrutham, containing wheat, chana dal, milk powder, oil and sugar with fortification of iron, calcium, vitamins and other recommended dietary allowance that children require per day. The recommended quantity is 100 gms which is to be given to children 3-5 times every day. Balamrutham is distributed in packets of 2.5 Kg per child per month. It is distributed on the first day of every month on Nutrition Health Day-1, along with the Balamrutham packet, 16 eggs are provided to children in the age group of 7 months to 3 years per month, and 30 eggs are provided to children in the age group of 3 - 6 years, per month.
The Government has also introduced Balamrutham Plus in the state, which is an enhanced nutrition food fortified with additional carbohydrates, proteins and micronutrients for SAM (Severe Acute Malnutrition) and MAM (Moderate Acute Malnutrition) infants. Supervised Supplementary Feeding Program.
Supervised Supplementary Feeding Program is a result-oriented community-based program for management of acute malnutrition. As per NFHS-5, 21.7% of children are wasted in the State, out of which 8.4% of children are severely wasted. The Government, with technical and knowledge support from ICMR- National Institute of Nutrition and UNICEF jointly, launched the SSFP program in December 2020. It has been piloted in two districts: Komaram Bheem Asifabad and Jogulamba Gadwal and acts as a cost effective alternative to facility based care.
Other services under Supervised Supplementary Feeding Program include the following: anthropometric assessment, medical assessment,

155
appetite test, nutritional treatment, medicines for SAM children, nutrition and health education, fortnightly SSFP visits AWC, providing Balamrutham Plus based on the weight of the child, and follow up after discharge from SSFP till the end of six months.
9.4. POSHAN AbhiyaanLaunched in March, 2018 POSHAN Abhiyaan is a flagship program of the Government of India to improve nutritional outcomes for children, pregnant women and lactating mothers. It directs the attention to address the issue of malnutrition, specially to reduce the level of stunting, under-nutrition, anaemia and low birth weight in a mission mode. The program is implemented through inter-sectoral convergence for better service delivery, use of technology (ICT) for real time growth monitoring and tracking of children and women respectively, intensified health and nutrition services for the first 1000 days of the program and mobilisation of people.
All the Anganwadi Teachers in the state have been provided smartphones which they use as a job aid and recording of the information of the beneficiaries on Poshan Tracker.
9.5. Giriposhana – an innovative approach towards improved nutritionTo improve the nutritional status of the tribal population in Telangana, the Tribal Welfare Department (TWD) in collaboration with Agribusiness and Innovation Platform (AIP), ICRISAT has initiated a project called Giri Poshana, an innovative approach to improve dietary diversity among tribal children and women. The objective of this initiative is to sensitize and provide the tribal
communities with affordable and nutritious food products to supplement their existing diet. Improved dietary diversity and overall nutritional intake for children in the age group of 3 to 6 years, and maternal and lactating mothers.
The target beneficiaries are being provided with nutritional food products: (1) Three Ready-to-Cook (RTC) food products - Multigrain meal, Jowar Meal, Multigrain sweet meal; (2) Three Ready-to-Eat (RTE) food products - Peanut- Sesame Chikki, Peanut-Fried gram Chikki, and Jowar Bytes. The products have been developed and validated by ICRISAT and are being produced in Tribal women run FSSAI licensed MSME units. The food products are provided in a combination of two products (breakfast and snack) per day for 6 days in a week at the Anganwadi Centers.
9.6. Way ForwardThe Government is committed towards improving the nutrition and health outcomes of women and children through policy reforms, and through innovative and targeted approaches. As part of this commitment, focussed efforts are being made towards addressing health and nutritional issues of adolescents. In this regard, the State has committed to supplying health and nutrition kits to adolescent girls in the coming year. In addition to these, various departments are focusing on convergence to target specific issues plaguing health and nutrition, such as anaemia; improving the e-governance architecture through incorporating changes in the m-anganwadi application to make it more citizen centric, and through effective beneficiary monitoring and feedback to improve the access and quality of service delivery. Parallelly, the State Government is also undertaking various activities to improve the capacity building of the existing workforce across levels.
Maternal & Child Care

Telangana Socio Economic Outlook 2022156
EDUCATION & SKILL DEVELOPMENT
CHAPTER
10

157
Education plays an instrumental role in transforming the current generation into a skilled and able future workforce and in boosting their earning capacities. Investment in education can break intergenerational poverty and promote human development.
l The total number of the schools in the state increased from 40,900 in 2019-20 to 41,220 2020-21.
l In 2021-22, due to the economic impact of COVID 19, 2,35,439 students of private schools transitioned to government schools.
l The transition rates in Telangana in 2019-20 at all three levels— from primary to upper primary (98.75%), upper primary to secondary (99.25%), and, secondary to higher secondary (74.15%)—were higher than the respective national averages (92.8%, 91.4%, and 71.6%).
l The Government launched its flagship initiative “Mana Ooru-Mana Badi/Mana Basti-Mana Badi” in January 2022 to upgrade the infrastructure facilities in the government schools for a period of three years with an approved budget of Rs.7,289.54 crore.
26,067 government and local body schools and 19,84,167 students are covered under this programme.
l To expand the learning opportunities for children beyond classrooms, during the academic year 2020-21, the State Institute of Educational Technology (SIET) had developed and transmitted 2180 digitals lessons through T-SAT and DDK channels in Telugu, English and Urdu media covering students in Grade III to X. On an average of 85% students viewed these digital lessons.
l The Government has set up residential education institutions across the state to impart quality education to the students belonging to the marginalised communities. The number of residential educational institutions increased from 298 in 2014 to 978 in 2022.
l Between 2014 and February 2022, 713 colleges registered for skill development partnership with Telangana Academy for Skill and Knowledge (TASK). 13,087 faculty members were trained through 450 Faculty Development Programmes (FDP) and 5,77,148 students were successfully trained.
Key Highlights
Education & Skill Development

Telangana Socio Economic Outlook 2022158
10.1. Education is Fundamental for Human Development
he 86th amendment to the Indian Constitution inserted Article 21A which states “The State shall provide free
and compulsory education to all children of 6 to 14 years in such manner as the State, may by law determine.” The Right of Children to Free and Compulsory Education (RTE) Act, 2009, mandates free and compulsory education for the children till the completion of their elementary education.
In order to ensure universal access to education, the Government focused on building Anganwadi Centres, schools and colleges across the state. Brief of educational profile of Telangana 2020-21 (Figure 10.1.). In addition to the above institutional facilities, Hyderabad alone boasts of 40 major research educational institutions along diverse fields like pharma, defence research, rural development etc. These institutions contribute not only to the research needs of various sectors, but also develop high impact professionals for the relevant sectors.
Along with establishing the educational institutions across the state, the Government is at the forefront of building industry-education partnerships to build
skilled talent to create talented employable youth and entrepreneurs. Various skilling institutions like Telangana Skill and Knowledge Centres (TSKC), Telangana Academy for Skill and Knowledge (TASK) and Industrial Training Institutes have been established to develop industry relevant skills.
10.2. Pre- School and School Education10.2.1. Early Childhood EducationPre-school education lays a solid foundation for a child’s learning and prepares children entering formal schooling. It plays an important role in the emotional, social and personal growth of a child. The focus of the state government has been to improve the pre - school education across the state. The Government has decided to run Anganwadi Centres (AWC) within the primary schools to ensure effective functioning of AWCs and for smoothly integrating the child into Grade 1 enrolment. Out of 35,700 Anganwadi Centres (AWC) in the state, 15,167 AWCs are functioning in government school premises. The Government has also decided to launch a special drive to provide its own buildings to the AWCs running in rented premises.
T
1 Enrolment figure pertains to enrolment through Degree Online Services Telangana (DOST) portal
Source: Department of Women Development & Child Welfare, Department of School Education, and Department of Higher Education, Government of Telangana
Figure 10.1
Snapshot of Educational Institutions and Student Enrolment, 2020-21
35,700
41,220
3,712
1,086
1,410
7,92,611
60,47,932
9,53,667
2,50,3911
1,39,485
Number of Institutions Total Enrolments
Anganwadi Centres (AWC)
Schools - All Management
Junior Colleges
Degree Colleges
Technical Colleges
Type of Educational Institution

159
The state government has revised the pre-school curriculum in the year 2018 -19 within the scope envisaged under the National Curriculum Framework of Early Childhood Care and Education (ECCE). The framework is focused on appropriate pedagogical practices for fostering various dimensions of child development - cognitive, physical, visual, emotional, and linguistic. These practices equip children from 3-6 years of age with the necessary skills so that they can be school ready. In an AWC the Anganwadi Worker, along with responsibilities pertaining to Early Childhood Education (ECE), also has signifi cant responsibilities related to Nutrition and Health, which reduces the overall total time invested on ECE leading to learning loss for the children. To ease the burden on a single Anganwadi Worker and mitigate the learning loss among children attending AWCs, the Telangana government is planning to pilot an initiative to place an additional worker to focus exclusively on imparting Early Childhood Education. This is expected to boost learning outcomes and school readiness among children aged 3-6 years.
10.2.2. School Education “Schools are institutional spaces for communities of learners, including both students and teachers. Play and scuffl e with one’s friends on the school
grounds, free time to sit on the benches and chat with one’s friends during breaks, gathering together for morning assembly, other festive and signifi cant occasions in the school, studies carried out in the classroom, anxious turning of pages before a class test and trips made with one’s classmates and teachers to places outside the school—all these are activities bringing the community together, giving it the character of a learning community” (NCF, 2005). The Covid-19 pandemic had induced school closures and disrupted the functioning of the schools. During the academic year 2020-21, the State Institute of Educational Technology (SIET) had developed and transmitted 2,180 digitals lessons through T-SAT and DDK channels in Telugu, English and Urdu media covering students in Grade III to X. On an average of 85% students viewed these digital lessons. The Government has reopened the schools since July 2021.
As of 2020-21, there are 41,220 schools in the state out of which 71% of the schools are run by the state government and local bodies, 26.6% of schools are run by the private management, 1.6% of the total schools are aided and less than 1% schools are run by the Central Government (Fig. 10.2). Brief of classifi cation of schools by grade and management (Table 10.1).
Figure 10.2
Classifi cation of Schools by Management, 2020-21
Source: Department of School Education
Total Schools : 41,220
Govt. & Local body63.2%
Private26.6%
Aided1.6%
Central Govt.0.2%
Govt. Welfare/ Residential Schools and other State Govt.8.3%
Table 10.1
Number of Schools by Management, 2020-21
Source: Department of School Education, Government of Telangana
PrimaryType of School UPS HS Total
Central Govt.
Govt. & Local body
Govt. Welfare/ Residential Schools & other State Govt.
Aided
Private
Total
0
18,233
1,557
289
646
20,725
2
3,154
113
125
4,244
7,638
70
4,680
1,756
256
6,095
12,857
72
26,067
3,426
670
10,985
41,220
Education & Skill Development

Telangana Socio Economic Outlook 2022160
Figure 10.3
District-wise availability of State Government & Local Body Schools per 1,00,000 Projected Population, 2020-21
Note: Districts arranged in descending order of schools per lakh population.
Source: Department of School Education, Government of Telangana
0 to 50 51 to 88 89 to 105 106 to 117 118 to 160
160133133130129117117114111109109107105104103103102
720353898
1,054898735
1,011430
1,064677825976508835712
1,483500
102999797969695888882757162502320
518645489714950
1,2151,262
461783
1,156548651
1,309492505690
Kumuram BheemMuluguMedak
VikarabadMahabubabad
NirmalKamareddy
JayashankarBhadradriAdilabad
NagarkurnoolSiddipetJangaon
MahabubnagarYadadri
NalgondaNarayanpet
WanaparthyWarangal Rural
RajannaMancherial
SuryapetKhammam
SangareddyJogulamba
JagtialNizamabadPeddapalli
KarimnagarRangareddy
Warangal UrbanMedchal-Malkajgiri
Hyderabad
State average 84
Schools per lakh
population
Schools per lakh
populationDistrict
Number of state
government & local body
schools
Number of state
government & local body
schools
Schools per lakh population
324125228166196151128178212177
95175
70132
47109
Figure 10.4
District-wise availability of Private Schools (Aided & Unaided) per 1,00,000 Projected Population, 2020-21
16 to 20 21 to 26 27 to 29 30 to 36 37 to 66
6664614936343433333333313131292727
1,4431,3642,131
318507336307301206266443442156227140266123
Medchal-MalkajgiriRangareddyHyderabad
Warangal RuralNizamabad
Warangal UrbanJagtial
KarimnagarNirmal
MahabubnagarSangareddy
NalgondaWanaparthy
MancherialNarayanpet
SuryapetKumuram Bheem
KhammamRajanna
BhadradriYadadri
VikarabadAdilabad
JogulambaPeddapalli
SiddipetNagarkurnool
JangaonKamareddy
JayashankarMahabubabad
MuluguMedak
State average 37
Private schools per lakh
population
Private schools per lakh
populationDistrict
Number of private schools
Number of private schools
Private schools per lakh population
Note: Districts arranged in descending order of schools per lakh population.
Source: Department of School Education, Government of Telangana
26252424242424242323202019191816

161
The state has a total of 26,067 state government and local body schools (Fig. 10.3) and 11,655 private aided and unaided schools (Fig. 10.4)
10.2.2.1 School Enrolment
During 2021-22, a total number of 60.47 lakh children are enrolled in all types of schools in the state. Out of these, 53.71% are enrolled in private schools and 46.29% are enrolled in government schools. In the year 2021-22, due to Covid-19 induced financial
stress several students couldn’t afford private schools. As of November 2021, 2,35,439 students of private schools have transitioned to Government schools in the state. In the year 2021-22, the total enrolment in the Government Schools has increased from 44.9% in 2020-21 to 46.29% in 2021-22 (Fig. 10.5).
To improve the enrolment in government schools, the state has taken up several initiatives, which include the improvement of infrastructure, the introduction of English as a medium of instruction in Government schools, introduction of soft-skills such as communication etc.
Out of the total enrolment across all the levels of school education, the enrolment of boys is higher than that of girls by 1,79,322. Except at the primary level, the Enrolment Ratio is skewed against the girls. Details of gender wise enrolment across different levels of education (Table 10.2).
In the year 2020-21, out of the total enrolled boys in Grade 1-10 across all types of schools, 48.9% were boys from Backward Castes (BC), 23.4% from General Category, 16.78% from Scheduled Castes and 10.98% from Scheduled Tribes. For the same year, out of the total girls enrolled, girls from Backward Castes (BC) constitute 48.9%, General Category constitute 23.2%, Schedule Caste
Table 10.2
Gender - Wise Enrolment by Level of Education Across all Schools in Telangana, 2020-21
Primary 4,75,831 490,587 9,66,418
Upper Primary 4,31,699 389,488 8,21,187
High Schools 22,06,097 20,54,230 42,60,327
Total 31,13,627 29,34,305 60,47,932
Enrolment of Boys
Enrolment of Girls
Total Enrolment
Share of Girls Enrolment compared to Boys (%)
50.76
47.43
48.22
48.52
Source: Department of School Education, Government of Telangana
Figure 10.5
Year-wise Percentage Enrolment in Government and Private SchoolsShare of enrolment (%) Government Private
Source: Department of School Education, Government of Telangana
2015-16
2016-17
2017-18
2018-19
2019-20
2020-21
2021-22
46.06
48.29
47.30
46.28
46.14
44.90
46.29
53.94
51.71
52.70
53.72
53.86
55.10
53.71
Education & Skill Development

Telangana Socio Economic Outlook 2022162
constitute 17.1%, and Scheduled Tribe constitute 10.7% (Fig. 10.6).
10.2.2.2. Gross Enrolment Ratio (GER)During the academic year 2020-21, the GER for Primary Schools is 110.20 for Boys and 111.08 for Girls. Similarly, for Upper Primary Schools, it is 104.35
for Boys and 103.07 for Girls. GER can be over 100 as it denotes that the state is able to accommodate students from all age groups based on their learning level when the denominator comprises only the age appropriate population for that grade. As per UDISE-2019-20 the GER for primary schools in Telangana (111.9) is significantly higher than the national average (102.7). Among the Non-Special Category States in the country, the state’s GER for primary schools stands second after West Bengal with a GER of 113.3. In southern states, Telangana has the highest GER for primary level (Fig. 10.7). The GER for Upper-Primary schools in Telangana at 97.4 is higher than that of the national average at 89.7. Among the Non-Special category states in the country, Telangana ranks fifth, and among the southern states it ranks second (Fig. 10.8)
10.2.2.3. Infrastructure in schoolsQuality Infrastructure contributes to the improvement in the overall learning environment
Figure 10.7
GER in Primary Schools across Non-Special Category States (2019-20)
Source: UDISE 2019-20
Gross enrolment ratio in primary schools
West BengalTelangana
PunjabKarnataka
MaharashtraRajasthan
HaryanaUttar Pradesh
IndiaJharkhand
Andhra PradeshKerala
GoaTamil Nadu
ChhattisgarhOdishaGujarat
BiharMadhya Pradesh
113.3111.9111.2107.4106.3106.1105.2102.9102.7102.6101.4100.2
99.298.997.196.896.493.592.9
Figure 10.8
GER in Upper-Primary Schools across Non-Special Category States (2019-20)
Source: UDISE 2019-20
Gross enrolment ratio in upper-primary schools
PunjabKarnataka
MaharashtraHaryana
TelanganaKerala
Tamil NaduChhattisgarh
GoaAndhra Pradesh
Madhya PradeshIndia
OdishaGujarat
RajasthanWest Bengal
JharkhandUttar Pradesh
Bihar
106.3101.1
99.098.797.497.296.592.691.891.391.389.789.689.588.988.683.281.779.2
Figure 10.6
Community-wise Enrolment of Boys and Girls from Class 1-10 in all schools in 2020-21Share of community in enrolment (%)
Boys
Girls
23.4 16.5 11.2 48.9
23.2 17.1 10.7 48.9
General SC ST BC
Source: Department of School Education , Government of Telangana

163
and adds to the sense of safety, which has a positive impact on student retention and learning outcomes. As per UDISE (2019-20), Telangana is performing better than the all India average on indicators such as schools with functional electricity connection, functional toilet facility, libraries and ramps for Children with Special Needs for the year 2019-20 (Fig. 10.9).
In the state, during 2020-21, Schools with Functional Drinking Water Facility, Schools with Computer facilities, and Schools with Functional Toilets for Children with Special Needs (CwSN) improved to 95.6%, 34.3%, and 6.25% respectively, from 92.45%, 20.81%, and 2.44% respectively in 2019-20.
10.2.2.4. Financial Assistance to Private School Teachers during COVID 19In view of the unprecedented Covid-19 pandemic, the Government of Telangana has provided financial assistance of Rs.2,000 and 25 kg super fine rice per month to all eligible teaching and non-teaching staff working in private recognized schools in the state from 1st April to June 2021.
10.2.2.5. Transition RateTransition Rate is the percentage of students out of
the total enrolled advancing from one grade to the next. During 2019-20, the state’s transition rates across all transition levels were significantly higher than the national average. The state’s transition rate from primary to upper primary is 5.95% points higher than the national average, transition rate from upper primary to secondary is 7.85% points higher than the national average and the transition rate from secondary to intermediate is 2.55% higher than the national average (Fig. 10.10).
Figure 10.10
Transition Rates in schools across grade levels in 2019-20
98.75 99.25
74.15
Primary to Upper Primary
Upper Primary to Secondary
Secondary to Higher
Secondary
Transition rate (%) Telangana India
92.80 91.40
71.60
Source: UDISE 2019-20
Figure 10.9
Percentage of Schools with Available Infrastructure, 2019-20Share of schools (%)
Functional Electricity Connection
Functional Drinking Water facility
Functional Toilet Facility
Hand Wash facility
Library Facility
Functional Computer Facility
Internet Facility
Functional toilets for CWSN
Ramps for CWSN
Telangana India
93.7792.45
94.93 95.63
90.2488.13
84.08 92.50
37.1335.34
22.2820.81
20.662.44
67.65 86.51
Source: UDISE 2019-20
80.16 92.55
Education & Skill Development

Telangana Socio Economic Outlook 2022164
Research on the impact of school’s physical environment on learning outcomes has shown a positive correlation. Studies done in Latin America showed that lack of basic services like potable water, electricity, toilets, sanitary drains has been linked to violence, discrimination and limited opportunities to learn. Apart from improving learning outcomes, improving physical learning environments can promote enrolment, student-retention and equity.
Access to educational facilities with child friendly and well ventilated classrooms, and recreational spaces can instil confidence in children. Moreover, it also shows students the value that their institutions and its representatives place on their education.
The Government of Telangana has announced a new programme “Mana Ooru-Mana Badi/Mana Basti-Mana Badi” for comprehensive development of school infrastructure covering all Government and Local body schools by providing additional class rooms, repairs, necessary furniture, toilets and other facilities including digital classrooms over a period of three years starting from 2021-22. This programme covers 26,067 government and local - body schools with 19,84,167 students. The
Government has allocated Rs.7,289.54 crore for this programme. The execution of all works shall be done through the School Management Committees (SMCs), up to the existing prescribed financial limit, to ensure people’s participation, transparency and quick execution. Any work above the prescribed limit shall be undertaken by the district collector by following the due process.
Additionally, under the Constituency Development Programme, Rs.2.00 Crore per MLA/MLC Constituency will be used towards works under Mana Ooru-Mana Badi/Mana Basti-Mana Badi to improve infrastructure facilities in local Government Schools/Anganwadi Centres.
From 2021-22 onwards, in the first phase 35% schools (9,123) across all categories, with the highest enrolment have been shortlisted considering mandal as a unit with an estimated budget of Rs. 3,497 crore.
ReferencePeter Barett, Alberto Trevas et al, The Impact of School Infrastructure on Learning 2019 and the G.O.Ms.No. 4, dated 3-2-2022, School Education Department, GoTS
Box 10.1
Mana Ooru-Mana Badi/Mana Basti-Mana Badi
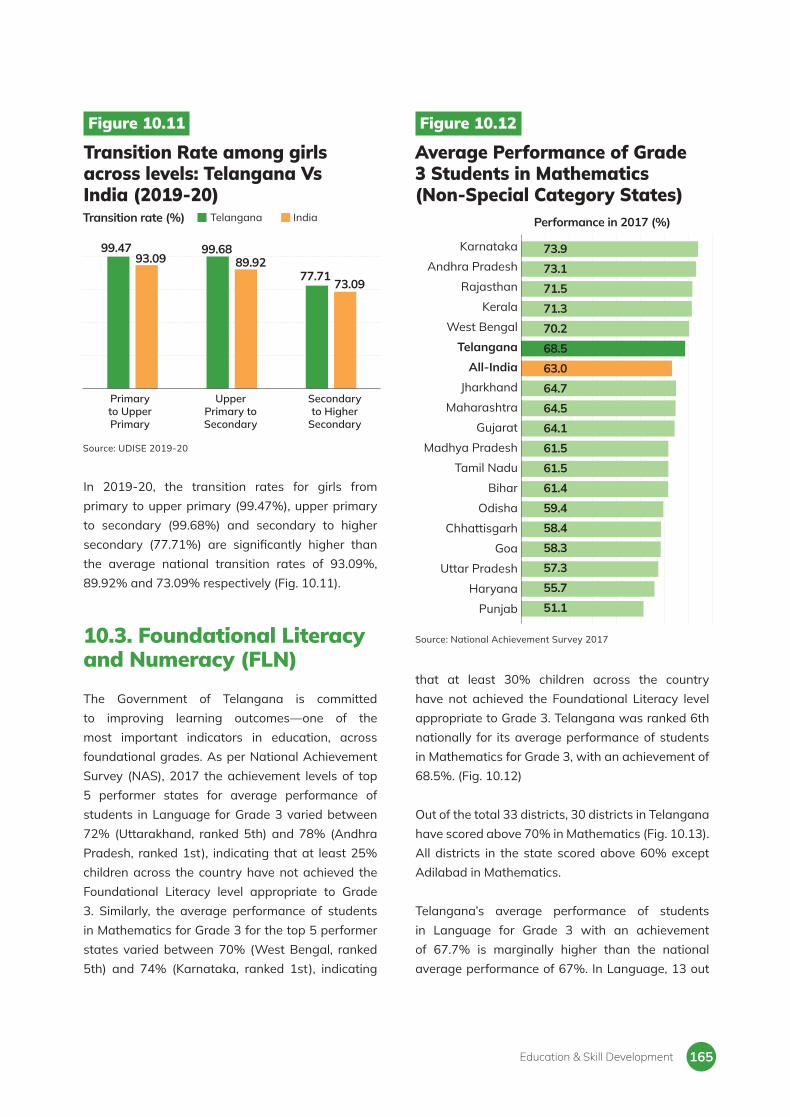
165
In 2019-20, the transition rates for girls from primary to upper primary (99.47%), upper primary to secondary (99.68%) and secondary to higher secondary (77.71%) are significantly higher than the average national transition rates of 93.09%, 89.92% and 73.09% respectively (Fig. 10.11).
10.3. Foundational Literacy and Numeracy (FLN)
The Government of Telangana is committed to improving learning outcomes—one of the most important indicators in education, across foundational grades. As per National Achievement Survey (NAS), 2017 the achievement levels of top 5 performer states for average performance of students in Language for Grade 3 varied between 72% (Uttarakhand, ranked 5th) and 78% (Andhra Pradesh, ranked 1st), indicating that at least 25% children across the country have not achieved the Foundational Literacy level appropriate to Grade 3. Similarly, the average performance of students in Mathematics for Grade 3 for the top 5 performer states varied between 70% (West Bengal, ranked 5th) and 74% (Karnataka, ranked 1st), indicating
that at least 30% children across the country have not achieved the Foundational Literacy level appropriate to Grade 3. Telangana was ranked 6th nationally for its average performance of students in Mathematics for Grade 3, with an achievement of 68.5%. (Fig. 10.12)
Out of the total 33 districts, 30 districts in Telangana have scored above 70% in Mathematics (Fig. 10.13). All districts in the state scored above 60% except Adilabad in Mathematics.
Telangana’s average performance of students in Language for Grade 3 with an achievement of 67.7% is marginally higher than the national average performance of 67%. In Language, 13 out
Figure 10.11
Transition Rate among girls across levels: Telangana Vs India (2019-20)
Source: UDISE 2019-20
Secondary to Higher
Secondary
Upper Primary to Secondary
Primary to Upper Primary
Transition rate (%) Telangana India
73.0977.71
89.9299.6899.47
93.09
Figure 10.12
Average Performance of Grade 3 Students in Mathematics (Non-Special Category States)
Source: National Achievement Survey 2017
Performance in 2017 (%)
Karnataka
Andhra Pradesh
Rajasthan
Kerala
West Bengal
Telangana
All-India
Jharkhand
Maharashtra
Gujarat
Madhya Pradesh
Tamil Nadu
Bihar
Odisha
Chhattisgarh
Goa
Uttar Pradesh
Haryana
Punjab
73.9
73.1
71.5
71.3
70.2
68.5
63.0
64.7
64.5
64.1
61.5
61.5
61.4
59.4
58.4
58.3
57.3
55.7
51.1
Education & Skill Development

Telangana Socio Economic Outlook 2022166
Figure 10.13
District-wise Average Performance of Students in Mathematics for Grade 3 Telangana, NAS 2017
Note: 1. Districts arranged in descending order of average performance. 2. NAS 2017 was conducted before Mulugu and Narayanpet districts were formed. Here, they are shown as part of the districts they were created from (Jayashankar and Mahabubnagar, respectively).
Source: National Achievement Survey, 2017
State average 68.3%
Average performance
(%)
Average performance
(%)District District
76.075.675.575.174.173.673.372.571.871.471.270.770.470.368.567.7
66.866.866.566.366.166.066.065.765.364.963.963.760.860.551.1
SiddipetWanaparthy
JangaonKhammam
Medchal-MalkajgiriMancherial
Warangal UrbanRangareddy
RajannaNalgonda
HyderabadSangareddy
NirmalVikarabad
JagtialMahabubabad
PeddapalliBhadradri
MahabubnagarKamareddyNizamabad
Warangal RuralSuryapet
JayashankarYadadri
JogulambaKarimnagar
MedakKumuram Bheem
NagarkurnoolAdilabad
Average performance (%)
Figure 10.14
District-wise Average Performance of Students in Language in Grade 3
Note: 1. Districts arranged in descending order of average performance. 2. NAS 2017 was conducted before Mulugu and Narayanpet districts were formed. Here, they are shown as part of the districts they were created from (Jayashankar and Mahabubnagar, respectively).
Source: National Achievement Survey, 2017
State average 67.3%
Average performance
(%)
Average performance
(%)District District
76.7
75.6
75.3
74.5
74.1
73.5
73.4
73.4
71.6
71.6
71.4
70.1
70.0
69.9
69.0
68.1
67.3
66.2
65.7
64.4
64.2
63.4
63.1
62.7
62.1
61.4
60.7
60.5
59.2
59.0
50.5
Siddipet
Wanaparthy
Rangareddy
Mancherial
Khammam
Hyderabad
Sangareddy
Jangaon
Nalgonda
Warangal Urban
Nirmal
Kamareddy
Rajanna
Medchal-Malkajgiri
Nizamabad
Vikarabad
Mahabubabad
Bhadradri
Suryapet
Jayashankar
Mahabubnagar
Medak
Karimnagar
Nagarkurnool
Jagtial
Jogulamba
Yadadri
Peddapalli
Kumuram Bheem
Warangal Rural
Adilabad
Average performance (%)
0 to 55.055.1 to 60.060.1 to 65.065.1 to 70.070.1 to 100.0
0 to 55.055.1 to 60.060.1 to 65.065.1 to 70.070.1 to 100.0

167
of 30 districts have scored above 70% (Fig. 10.14). Siddipet is the highest performing district both in Language and Mathematics.
Cognizant of the need of instilling FLN skills in children, the Government of Telangana has instituted a statewide Assessment and Remedial Programme to improve FLN. ABC (Attainment of Basic Competencies) assessments are conducted, for children up to Grade 8, twice a year in all government schools. This is done to understand and evaluate the FLN skills in children up to grade 8. On the basis of the performance of the children in these assessments, a 45 to 60 days program is conducted to improve basic competencies in Literacy and Numeracy in students who require additional support in achieving these competencies. As a part of FLN Programme, Reading Challenge has been started from September 2021 to improve
reading skills among children. With an objective to inculcate reading habit along with increasing basic competencies of reading among children and make them independent readers, the Government is kick-started a 100-day programme called READ (Read, Enjoy and Develop), a Reading Campaign for students of Classes 1 to 9 in all schools from February 2022 onwards. Additionally, curriculum frameworks for Language and Numeracy have been fi nalised to identify critical learning outcomes and the respective indicators to measure them.
10.4. Status of Learning Outcomes in Telangana
The National Achievement Survey is conducted by the Government of India to assess the learning outcomes of students across the country. The
Figure 10.15
District-wise Average Performance of Students in Mathematics in Grade 5
Note: 1. Districts arranged in descending order of average performance. 2. NAS 2017 was conducted before Mulugu and Narayanpet districts were formed. Here, they are shown as part of the districts they were created from (Jayashankar and Mahabubnagar, respectively).
Source: National Achievement Survey, 2017
State average 56.3%
Average performance
(%)
Average performance
(%)District District
66.0
64.1
63.7
63.3
63.1
62.5
60.6
60.3
59.7
59.6
59.4
59.2
58.4
57.0
56.8
56.8
56.6
55.9
55.0
55.0
53.7
53.4
52.5
51.8
51.0
51.0
50.9
50.5
49.9
48.5
40.9
Khammam
Mancherial
Medchal-Malkajgiri
Jangaon
Sangareddy
Siddipet
Rangareddy
Hyderabad
Wanaparthy
Peddapalli
Rajanna
Nizamabad
Mahabubnagar
Suryapet
Nalgonda
Warangal Urban
Karimnagar
Vikarabad
Jagtial
Warangal Rural
Nagarkurnool
Bhadradri
Yadadri
Nirmal
Kamareddy
Medak
Jayashankar
Jogulamba
Mahabubabad
Kumuram Bheem
Adilabad
Average performance (%)
0 to 45.045.1 to 50.050.1 to 55.055.1 to 60.060.1 to 100.0
Education & Skill Development
0 to 45.045.1 to 50.050.1 to 55.055.1 to 60.060.1 to 100.0

Telangana Socio Economic Outlook 2022168
Figure 10.16
District-wise Average Performance of Students in Language in Grade 5
Note: 1. Districts arranged in descending order of average performance. 2. NAS 2017 was conducted before Mulugu and Narayanpet districts were formed. Here, they are shown as part of the districts they were created from (Jayashankar and Mahabubnagar, respectively).
Source: National Achievement Survey, 2017
State average 56.6%
Average performance
(%)
Average performance
(%)District District
66.865.464.361.661.560.860.560.460.060.058.658.458.057.856.756.0
55.855.855.355.254.453.953.253.253.152.451.750.750.349.843.0
Medchal-MalkajgiriMancherial
JangaonSangareddyHyderabadKhammam
RangareddyNizamabad
SiddipetWanaparthy
Warangal UrbanRajanna
MahabubnagarKarimnagar
NagarkurnoolSuryapet
PeddapalliVikarabadNalgondaBhadradri
NirmalKamareddy
JagtialJogulamba
JayashankarWarangal Rural
MahabubabadMedak
YadadriKumuram Bheem
Adilabad
Average performance (%)
0 to 47.0 47.1 to 52.0 52.1 to 57.0 57.1 to 62.0 62.1 to 100.0
Figure 10.17
District-wise Average Performance of Students in Mathematics in Grade 8
Note: 1. Districts arranged in descending order of average performance. 2. NAS 2017 was conducted before Mulugu and Narayanpet districts were formed. Here, they are shown as part of the districts they were created from (Jayashankar and Mahabubnagar, respectively).
Source: National Achievement Survey, 2017
State average 37.1%
Average performance
(%)
Average performance
(%)District District
31.031.332.333.233.533.935.135.235.335.435.935.936.036.136.436.6
37.637.738.138.238.638.738.938.940.040.740.741.241.542.146.5
AdilabadJayashankar
BhadradriMahabubabad
Warangal RuralSuryapet
NalgondaKumuram Bheem
JagtialYadadri
KarimnagarNagarkurnool
MedakVikarabad
Medchal-MalkajgiriWanaparthy
JangaonJogulamba
MahabubnagarRajanna
PeddapalliHyderabadKhammam
Warangal UrbanNirmal
MancherialRangareddyKamareddyNizamabad
SangareddySiddipet
Average performance (%)
0 to 35.035.1 to 38.038.1 to 41.041.1 to 44.044.1 to 100.0
Average performance (%)
0 to 47.0 47.1 to 52.0 52.1 to 57.0 57.1 to 62.0 62.1 to 100.0
Average performance (%)
0 to 35.035.1 to 38.038.1 to 41.041.1 to 44.044.1 to 100.0

169
survey measures performance of the students in different subjects such Language, Mathematics and Environmental Science (EVS) depending on the level at which the child is being assessed. Beyond measuring the Foundational Literacy and Numeracy in Grade 3, performance of the students in Grade 5 and 8 are crucial, Grade 5 & 8 being important transition points from both curricular and transition point of view.
Average performance of Grade 5 Mathematics for students in Telangana at 57% is higher than the National average of 53%. In district wise performance in the state, Adilabad has the lowest average achievement of 40.9%, whereas Medchal - Malkajgiri has the highest percentage achievement of 63.7%. Except for Adilabad, Kumuram Bheem
and Mahabubabad, all the districts recorded scores above 50% (Fig. 10.15).
The performance of Grade 5 students in Language is lowest in Adilabad (43%) and highest in Medchal- Malkajgiri district (67%). Except for Adilabad and Kumuram Bheem districts, all the other districts in the state recorded scores above 50% (Fig. 10.16).
The performance of Grade 8 students in Mathematics and Language is lowest in Adilabad (31% and 43.6% respectively) and highest in Siddipet (46.5%) and Hyderabad (56.9%) respectively (Fig. 10.17 and 10.18). Except for Adilabad, Nalgonda and Medak districts, all the other districts in the state recorded an achievement of more than 50%.
Mancherial
Hyderabad
Siddipet
Warangal Urban
Karimnagar
Nirmal
Peddapalli
Sangareddy
Nizamabad
Wanaparthy
Rangareddy
Khammam
Medchal-Malkajgiri
Jagtial
Jangaon
Bhadradri
Kumuram Bheem
Jayashankar
Rajanna
Kamareddy
Mahabubnagar
Warangal Rural
Vikarabad
Nagarkurnool
Jogulamba
Suryapet
Nalgonda
Yadadri
Mahabubabad
Medak
Adilabad
Figure 10.18
District-wise Average Performance of Students in Language in Grade 8
Note: 1. Districts arranged in descending order of average performance. 2. NAS 2017 was conducted before Mulugu and Narayanpet districts were formed. Here, they are shown as part of the districts they were created from (Jayashankar and Mahabubnagar, respectively).
Source: National Achievement Survey, 2017
State average 52.6%
Average performance
(%)
Average performance
(%)District District
Average performance (%)
0 to 47.047.1 to 50.050.1 to 53.053.1 to 56.056.1 to 100.0
58.1
56.9
56.5
55.7
55.2
54.9
54.8
54.6
54.6
54.5
54.1
54.1
53.5
53.4
53.3
53.2
53.1
52.6
52.5
52.2
52.2
51.5
51.5
50.8
50.6
50.4
49.6
48.1
47.6
47.3
43.6
Education & Skill Development
Average performance (%)
0 to 47.047.1 to 50.050.1 to 53.053.1 to 56.056.1 to 100.0

Telangana Socio Economic Outlook 2022170
10.5. Pupil-Teacher Ratio (PTR)The state has total 3,05,597 teachers in all the schools, out of which 1,52,298 are working in government schools, 4,006 in government aided, 1,48,814 in private unaided recognised and 479 in other schools (Table 10.3).
Pupil Teacher Ratio is critical for equitable learning access at the grade level. As per RTE 2009, the PTR norm for primary level is 30:1 and for upper primary it is 35:1. In Telangana, during 2020-21 the PTR for Primary was 20:1, for Upper Primary it was 16:1 and for Secondary it was 19:1. (Fig. 10.19).
According to UDISE 2019-20, at primary level, the state with a PTR of 22.7 ranks fourth among the Non-Special category states. For upper primary and secondary levels, Telangana with a PTR of 13.1 and 9.9 respectively, ranks second among the Non-Special category states. (Fig. 10.20).
10.6. Initiatives for Students from the Marginalised CommunitiesIn terms of social groups, the largest share of students are from backward classes (BC) at 49%. This is followed by the general category (23.2%), SC (16.9%) and ST (10.9%). The gender ratio among each community is consistent with the national average (~48%). The Government is committed
Table 10.3
Number of Teachers by Gender and Class across Schools (All Management)
Male Female Total
Total
Pre Primary only
Pre Primary & Primary
Primary Only
Primary & Upper Primary
Upper Primary only
Upper Primary & Secondary
Secondary only
Secondary & Higher Secondary
Higher Secondary Only
1,31,671
108
1,305
35,554
10,217
9,449
37,507
15,633
1,678
20,220
1,73,926
1,120
4,798
62,256
22,921
17,158
33,864
19,818
1,698
10,293
3,05,597
1,228
6,103
97,810
33,138
26,607
71,317
35,451
3,376
30,513
Source: UDISE Data 2019-20
Figure 10.19
PTR in Government and Local Body Schools, 2020-21
Source: Department of School Education, Telangana
2014-15 2015-16 2016-17 2017-18 2018-19 2019-20 2020-21
Primary Upper Primary Secondary
20.64
17.86
14.87
17.68
19.47 20.10
18.98
16.04
19.15

171
to improving access to and quality of education for students from marginalised and minority communities, and is implementing several initiatives to achieve that.
10.6.1. Residential Schools for Students belonging to the Marginalised Communities
As of academic year 2021-22, the Government runs over 978 residential schools focused on delivering quality education to children belonging to SC, ST,
BC and Minority communities. Since the formation of the State there has been almost a three fold increase from 298 schools in 2014-15 to 978 schools in 2021-22 (Fig. 10.21)
10.6.2. Types of Residential Schools10.6.2.1. Telangana Residential Educational Institutions Society (TREIS)
TREIS was established to provide quality Education in GURUKUL method to the socially and economically
Figure 10.20
PTR in Telangana Vs Non - Special Category States 2019-20
Goa 27.3 17.6 9.9
Telangana 22.7 13.1 9.9
Rajasthan 24.8 12.0 11.4
Haryana 23.3 16.9 12.2
Tamil Nadu 20.1 15.1 12.6
Punjab 25.0 22.3 13.9
Kerala 25.9 20.3 14.8
Andhra Pradesh 24.4 16.8 15.9
Karnataka 20.9 16.3 16.1
Chhattisgarh 19.3 17.8 17.2
Odisha 16.0 14.9 17.6
West Bengal 29.5 27.6 18.3
Maharashtra 25.7 26.2 20.3
Uttar Pradesh 30.6 24.4 28.7
Madhya Pradesh 27.5 17.2 29.2
Gujarat 29.8 23.3 32.6
Jharkhand 30.6 22.0 33.7
Bihar 55.4 19.4 51.8
India 26.5 18.5 18.5
12
5
8
6
3
9
11
7
4
2
1
14
10
16
13
15
17
18
9
2
1
7
4
14
12
6
5
10
3
18
17
16
8
15
13
11
1
2
3
4
5
6
7
8
9
10
11
12
13
14
15
16
17
18
Note: States arranged in order of PTR rank for secondary schools. Source: UDISE 2019-20
Primary level
Primary level
PTR RankState Upper-Primary
levelUpper-Primary
levelSecondary
levelSecondary
level
1 to 5 6 to 10 11 to 15 16 to 18
Education & Skill Development

Telangana Socio Economic Outlook 2022172
backward rural talented children by establishing Residential Schools and Colleges. As of 2021-22, TREI Society is managing a total of 37 educational institutions. Against the sanctioned strength of 22,960 in 2020-21, the enrolment of students for the same year is 21,789. During 2020-21, the pass percentage of students studying for the Secondary School Certificate from the Residential Schools was 100% and for Intermediate students it was 95.3%. In addition to this, about 50 students were selected to study professional courses in prestigious institutions across the country such as IIT, IIIT and NIT.
10.6.2.2. Telangana Social Welfare Residential Educational Institutions Society (TSWREIS)
The Government, through the TSWREIS, manages 268 residential educational institutions (of which 173 are only for girls) with nearly 1.5 lakh students. Admissions into these schools are based on the reservations ( SC -75%, SCC- 2%, ST- 6%; BC- 12%; Minorities - 3% & OC/ EBC - 2%), and include institutions such as the School of Fine Arts & Film Technology, Sainik School in Rukmapur, Armed Forces Preparatory Degree College for Women,
Bhongir, 26 Sports Academies and 87 Freedom Schools. In addition to this, the society also runs 872 SC hostels across the state, accommodating 74,000 students from elementary to postgraduate levels. The students from these institutions have performed exceptionally well. In Secondary School examinations, these institutions have achieved 100% results, in Intermediate examinations the achievement has been 89.38% and in Degree Colleges that achievement has been 88.79. More than 400 students got admissions in prestigious institutions such as Azim Premji University, Indian Institute of Technology, University of Delhi, Ashoka University, JNTU and TISS.
10.6.2.3. Telangana Tribal Welfare Residential Educational Institutions Society (TTWREIS)
The Society is currently operating 188 residential educational institutions with English as a medium of instruction in Grades 1 to 10, Intermediate and Degree Colleges. Out of this, 69 institutions are for only boys, 103 institutions are for only girls and 16 are co-education institutions. A separate society of Telangana State Eklavya Model Residential Schools
Figure 10.21
Exclusive Residential Educational Institutions Society for BC/SC/ST and other minority students
2021-222014-15
Num
ber o
f ins
titut
ions
Residential Institutions under School Education
Social Welfare Institutions
Tribal Welfare Residential Institutions
Minority Welfare Residential Institutions
BC Welfare (Mahatma Jyotiba Phule Residential
Educational Institutions)
37 37
134
268
188204
281
96
12 19
Source: Departments concerned

173
Society (EMRS) was established in July 2020 to provide quality education to tribal children. A total of 23 EMRS institutions are functional in Telangana.
10.6.2.4. Telangana Minority Residential Educational Institutions Society (TMREIS)
In order to impart quality education to economically weak students belonging to the minority communities, residential schools were set up by TMREIS. Currently, the society runs 204 schools across 31 districts in the state with 67,234 students enrolled.
10.6.2.5. Mahatma Jyotiba Phule Telangana Backward Classes Welfare Residential Educational Institutions Society (MJPTBCWREIS)
This society was established in 2014 for the administration of BC Welfare Residential Schools. Currently it operates 261 schools, 19 junior colleges and one degree college with a sanctioned strength of 1,32,440. In 2021-22, 119 BC residential schools were upgraded to Junior Colleges, with a sanctioned strength of 9,650. It has evolved into one of the most important educational institutions for BC students. With further initiatives like Super-100 and School of Excellence- to coach meritorious students aspiring to succeed in NEET, EAMCET and JEE, the society has extended its services for the students to perform well in all major competitive exams.
10.6.2.6. Kasturba Gandhi Balika Vidyalayas (KGBV)
Kasturba Gandhi Balika Vidyalayas (KGBV) are the residential schools for girls. The objective of these schools is to ensure access to quality education for girls belonging to disadvantaged and underprivileged sections of the society. The scheme is implemented in educationally backward blocks (EBB)/mandals of the country where the female literacy level is below the national average and gender gap above national average. KGBVs operate
with Grades VI to XII (Intermediate). Currently there are 475 KGBVs functioning in the state, out of which 267 KGBVs have Grades VI – X & 208 KGBVs are functioning up to the Intermediate level. There are 91,617 girls enrolled up to class X and 22,453 girls enrolled in Intermediate sections.
10.6.2.7. Model Schools
The Government of India had launched the scheme of setting up of 6,000 Model Schools in Educationally Backward Blocks (EBBs) in the country in a phased manner. These schools operate with Grades VI to Intermediate based on state curriculum with English as medium of instruction. In 2013-14, 194 model schools were set up in the state.
The Government of Telangana has taken the complete responsibility of running the schools as the Government of India has delinked the scheme and stopped providing financial support from 2015-16.
10.6.3. Assistance for Students from the Marginalized CommunitiesThe Government of Telangana has been extending financial assistance to deserving and meritorious students from SC, ST, BC, and Minority communities for their educational advancement through various programmes. Financial assistance is also being given to school going children in the form of pre-matric scholarships.
10.6.3.1. Pre - Matric & Post - Matric Scholarships
The Government of Telangana has been providing pre-matric, post-matric scholarships and fee reimbursement to students in order to reduce the dropout rate. Between 2014-22, the government spent Rs. 402.54 crore on providing pre-matric scholarships and Rs. 7,153.11 crore on providing post-matric scholarships for SC, ST and BC students. In 2021-22, the Government has spent
Education & Skill Development

Telangana Socio Economic Outlook 2022174
Rs.25.22 crore on providing post -matric scholarship and spent Rs. 79.76 crore on fee reimbursement, for minority students.
10.6.3.2. Assistance for Overseas Education (Mahatma Jyotiba Phule Overseas Vidya Nidhi for BCs, Dr. Ambedkar Overseas Vidya Nidhi Scheme for SC and STs and Chief Minister Overseas Scholarship for Minorities)
Government is providing scholarships for overseas education of SC, ST, BC and Minority students for those students whose family annual income does not exceed Rs.5 Lakh. Since the launch of the programme over 1,790 BC, 699 SC, 204 ST and 2,235 Minority students have been benefited and the government has incurred an expenditure of more than Rs. 385.87 crore.
10.7. Higher Education
Through its various educational initiatives at the school level, the government has created a diverse pool of students who enter higher education institutions in the state. For higher education there are over 3,712 junior colleges and 1,086 degree colleges. In the state, there are two Universities of Potential Excellence namely University of Hyderabad and Osmania University as selected by the UGC. 9 colleges have been selected in the state under the Centre for Potential Excellence scheme.
As per Periodic Labour Force Survey 2019-20, out of the total adult population (15 yrs and above) 17.9% have completed secondary education, 15.9% completed higher secondary, 18.3% are graduates, 7.8% are postgraduates. All of these figures are higher than the corresponding national average.
In the state, Higher education is subdivided into Board of Intermediate Education, Department of Collegiate Education and Department of Technical Education.
10.7.1 Intermediate Education
Telangana State Board of Intermediate Education regulates and supervises the system of Intermediate education (10+2). In 2020-21, the total number of Junior colleges in the state are 3,712. The total student strength in the first year is 9,53,667 (includes both 1st and 2nd year).
10.7.1.1 Enrolment at the Intermediate Level
The Government has introduced free education and free textbooks to all the students studying in Government Junior Colleges (GJC) from the academic year 2015-16.
As per the RBI Handbook of Indian States 2020-21, the Gross enrolment for intermediate education in the state is 53% for boys and 61% for girls (Fig. 10.22). This is higher than the national average of 50.5% for boys and 52.4% for girls.
Figure 10.22
Gross Enrolment Rate (by gender) for Intermediate Education
Source: RBI Handbook of Indian States 2020-21
Telangana India
Gross Enrolment Rate (GER), 2020-21
Boys Girls Total
53.150.5 52.4 51.4
57.261.5
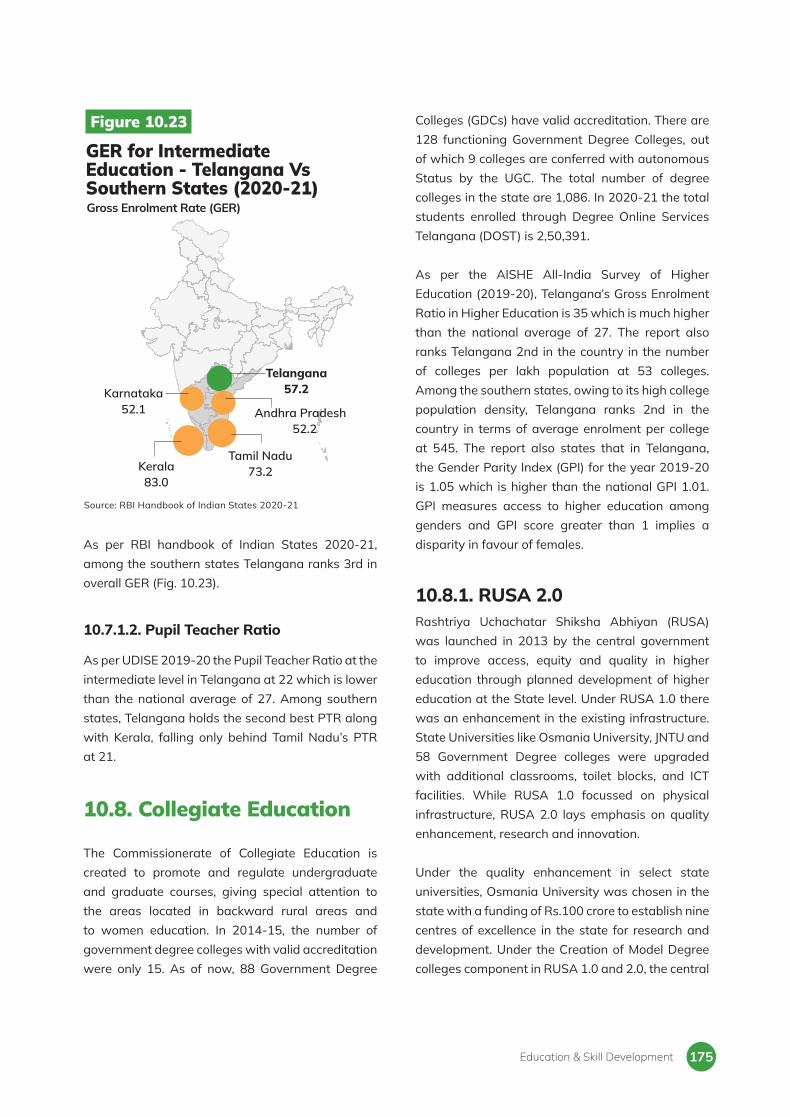
175
As per RBI handbook of Indian States 2020-21, among the southern states Telangana ranks 3rd in overall GER (Fig. 10.23).
10.7.1.2. Pupil Teacher Ratio
As per UDISE 2019-20 the Pupil Teacher Ratio at the intermediate level in Telangana at 22 which is lower than the national average of 27. Among southern states, Telangana holds the second best PTR along with Kerala, falling only behind Tamil Nadu’s PTR at 21.
10.8. Collegiate Education
The Commissionerate of Collegiate Education is created to promote and regulate undergraduate and graduate courses, giving special attention to the areas located in backward rural areas and to women education. In 2014-15, the number of government degree colleges with valid accreditation were only 15. As of now, 88 Government Degree
Colleges (GDCs) have valid accreditation. There are 128 functioning Government Degree Colleges, out of which 9 colleges are conferred with autonomous Status by the UGC. The total number of degree colleges in the state are 1,086. In 2020-21 the total students enrolled through Degree Online Services Telangana (DOST) is 2,50,391.
As per the AISHE All-India Survey of Higher Education (2019-20), Telangana’s Gross Enrolment Ratio in Higher Education is 35 which is much higher than the national average of 27. The report also ranks Telangana 2nd in the country in the number of colleges per lakh population at 53 colleges. Among the southern states, owing to its high college population density, Telangana ranks 2nd in the country in terms of average enrolment per college at 545. The report also states that in Telangana, the Gender Parity Index (GPI) for the year 2019-20 is 1.05 which is higher than the national GPI 1.01. GPI measures access to higher education among genders and GPI score greater than 1 implies a disparity in favour of females.
10.8.1. RUSA 2.0 Rashtriya Uchachatar Shiksha Abhiyan (RUSA) was launched in 2013 by the central government to improve access, equity and quality in higher education through planned development of higher education at the State level. Under RUSA 1.0 there was an enhancement in the existing infrastructure. State Universities like Osmania University, JNTU and 58 Government Degree colleges were upgraded with additional classrooms, toilet blocks, and ICT facilities. While RUSA 1.0 focussed on physical infrastructure, RUSA 2.0 lays emphasis on quality enhancement, research and innovation.
Under the quality enhancement in select state universities, Osmania University was chosen in the state with a funding of Rs.100 crore to establish nine centres of excellence in the state for research and development. Under the Creation of Model Degree colleges component in RUSA 1.0 and 2.0, the central
Figure 10.23
GER for Intermediate Education - Telangana Vs Southern States (2020-21)
Source: RBI Handbook of Indian States 2020-21
Gross Enrolment Rate (GER)
Kerala83.0
Tamil Nadu73.2
Telangana57.2
Andhra Pradesh 52.2
Karnataka52.1
Education & Skill Development

Telangana Socio Economic Outlook 2022176
government has provided support for creation of 4 and 3 Model degree colleges respectively in the aspirational districts of the state.
10.9. Adult EducationAttainment of 100% literacy among youth and the adults is part of a Sustainable Development Goals. As per Census 2011, the male and female literacy rates were 75.04% and 57.99% respectively.
10.9.1. Padhana Likhana AbhiyanThe primary objective of Padhna Likhna Abhiyan is to implement functional literacy to 2.20 lakh adult illiterates in the aged 15 and above under a basic literacy programme for a period of one year 2020-21. The Project Approval Board (PAB), Government of India has approved the “Padhna Likhna Abhiyan ‘’ programme to the State of Telangana to cover 2.20 lakh non-literates with a total cost of Rs.5.18 crores. It is proposed to implement the programme in the (3) Aspirational districts of Bhadradri-Kothagudem, Jayashankar -Bhoopalapalli and Kumaram Bheem-Asifabad.
Apart from this, Government of Telangana had launched the programme of ‘Each One Teach One’ to achieve 100% literacy in the state. The government urged every educated member of the society to participate in this initiative to educate at least 1 illiterate person.
Telangana Open School Society (TOSS) also provides opportunities for people who have missed opportunities to complete their education and are desirous of seeking it through open and distance learning. They offer secondary and Intermediate courses. The admission in TOSS has increased from 49,354 in 2014-15 to 50,502 in 2020-21.
10.10. Skill Development
The National Skill Development Policy (NSDP) 2015 identifies the framework, objectives and outputs needed to make India highly skilled. NSDP reports that by 2022, 10,973 million workers will be required across 24 sectors in the country. To meet this demand, the government seeks to focus on making vocational training aspirational to youth and to align the national skilling standard with the industry and employer requirements.
Cognizant of this, Telangana ICT policy of 2021-26 seeks to upskill, reskill and train the citizens of Telangana with a target to achieve 80% of the workforce requirement being met through local talent. For this, the government seeks to train more than 5 lakh students every year.
According to the India Skills Report of 2022, Telangana has the highest female employable talent. Telangana also scored 3rd in the country with respect to Computer skills availability. This shows a positive hiring trend in the state which offers equal opportunity and representation in job opportunities. Major avenues for skill development in the state include undertaking vocational education, technical education in professional colleges and Industrial training.
10.10.1 Vocational EducationVocational education seeks to promote employment among youth by providing them with specialised knowledge, employable skills and relevant occupational awareness. The National Skill Qualification Framework (NSQF) has identified clear pathways to vocational education from secondary school level onwards. For the academic year 2021-22, vocational education is being implemented in all 194 Telangana Model schools in the state with 2 trades being imparted in each school. They are a total of 10 trades being implemented in the

177
state through 384 Vocational trainers. In the year 2019-20, 52,870 students have received vocational training. Other vocational institutes in the state provide training for students who have passed their 10th grade such as TASK, TSKC etc.
10.10.1.1. Telangana Academy for Skill and Knowledge (TASK)
The Government of Telangana has set up TASK in 2014 for skill development among youth and creating synergy between institutions of government, industry and academia. In order to improve people’s access to the skill development institutions, the government has set up five regional centres at Warangal, Karimnagar, Khammam, Hyderabad and Siricilla.
TASK provides more than 80 types of technical, non-technical & essential skill programmes for the youth. Since its inception in 2014 till February 2022, a total of 713 colleges were registered for skill development partnership with TASK. 13,087 faculty were trained through 450 Faculty Development Programmes (FDP), 5,77,148 students were successfully trained and 608 youth were prepared to join the defence forces.
TASK under its finishing-school-programmes between 2014 - February 2022 has trained a total of 5,200 youth. Similarly, under its Technology Entrepreneurship programme (TEP) since 2014, a total of 2,918 students have received training. As part of the ‘i4TS - Innovating for Telangana State’ an entrepreneurship development programme to promote social innovation and rural entrepreneurship among the youth, more than 7000 youth across the state.
10.10.2. Technical EducationThe Government not only aims to make technical education accessible and affordable to the people but also to ensure to provide skilled workmen to the job market. As of 2021, the state has a total of 1,410 technical education institutions across all managements with an enrolment of 1,39,485 students.
The major professional colleges include MBA, MCA, Engineering, Medical, Polytechnic and B pharmacy. Brief Details of the major number of professional colleges and intake (Fig. 10.24).
There are 54 Government Polytechnic institutes
Source: Department of Technical Education, Telangana
Figure 10.24
Major Number of Professional Colleges and their Intake (2020-21)
Poly-Technic
MBA
MCA
Engineering
B.Pharmacy
Medical
Total
132
276
38
182
122
33
783
33,292
33,030
2,596
98,988
10,030
7,199
1,85,135
Number of CollegesType of College Intake
Education & Skill Development

Telangana Socio Economic Outlook 2022178
across the state. The State Board of Technical Education and Training (SBTET), Telangana, Hyderabad conducts “Polytechnic Common Entrance Test (POLYCET)” for the candidates seeking admission into all Diploma Courses in Engineering /Non Engineering/Technology offered at Polytechnics /Institutions.
The admissions to diploma courses for the academic year 2021-22 in the government polytechnic colleges have witnessed huge demand in seats with 43 out of 54 colleges recording 100 percent seat allotment. The total number of students enrolled in Government technical colleges amounts to 21,258, out of which 13,901 are boys and 7,357 are girls. The total number of students enrolled in Private technical colleges are 51,014, out of which 40,858 are boys and 10,156 are girls as shown in (Fig. 10.25).
Significant Initiatives undertaken by the Department of Technical education in the year 2021-22 include upgradation and construction of polytechnic institutions, signing MOU with Indian School of Business (ISB) for skilling programmes for undergraduate students.
10.10.3. Industrial TrainingThe Government is providing long term and short term training to youth in the state to help build employable skills through the Department of Employment and Training. There are 289 ITIs (Industrial Training Institutes) functioning in the state. Of these, 225 are private and 64 are government institutes, and the total intake capacity is 73,300. There are around 33 trades to which the training is provided. Since 2014, total 1,83,538 trainees have been trained, out of which 46,145 have been placed.
6 Govt I.T.I’s at Sircilla, Wanaparthy, Khammam, Nizamabad, Medchal and Karimnagar have been identified to establish incubation centres for promoting entrepreneurship as part of Ministry of Micro, Small & Medium Enterprises, Government of India (MSME, GoI) funded Livelihood Business Incubator Scheme.
Under GoI’s Skills Strengthening for Industrial Value Enhancement (STRIVE) 10 ITIs have been sanctioned in the state. Additionally to improve quality of training in I.T.Is industry linkages have been forged for providing on-job training to the
Figure 10.25
Enrolment in Technical Colleges 2021-22
Source: Department of Technical Education, Government of Telangana
Govt Colleges
Aided Colleges
Private Colleges
13,901
27
40,858
7,357
784
10,156
21,258
811
51,014
Management Type
Boys Enrolled
Girls Enrolled
Total

179
trainees and recruiting them as part of Corporate Social Responsibility. Presently, 48 ITIs have entered into an MOU with 48 industries for the same.
Digital Employment Exchange of Telangana (DEET)The Government has initiated Digital Employment Exchange of Telangana (DEET), for improving the employment ecosystem. The DEET acts as a network connecting the employers to prospective job-seekers on a platform provided by artificial intelligence. This application has been launched taking into consideration the technological boom witnessed in the State and the consequent growth in the requirement of manpower in numerous industries.
10.11. Way ForwardThe Government has made remarkable strides
in improving enrolment ratios across all levels of education. Improving infrastructure and ensuring quality education remains the top priority of the government. It also seeks to introduce a legislation for fee regulation in private schools, junior and degree colleges as well as to encourage English as language of instruction across all schools in the state. With the schools reopening, the Government is making sure that no child is left behind both in terms of enrolment and learning achievement by improving the infrastructure in schools and special focus on FLN to improve the learning outcomes. The new era requires knowledge of upcoming domains like Artificial Intelligence, nano technology etc, and it is critical for educational policies to factor in this transformational change. The Government is ready to embrace the same by introducing the digital classrooms and benefit from emerging technologies to transform the future of education and workforce in the state.
Education & Skill Development

Telangana Socio Economic Outlook 2022180
WELFARE
CHAPTER
11

181
l The Government introduced Dalit Bandhu in 2021 to assist SC households with a grant of Rs.10 Lakhs per household without any bank loan linkage, to establish a suitable income generating source.
l Under the 2-BHK Housing Scheme the Government constructed 1,07,612 houses by the end of November 2021 with an amount of Rs. 10,445 Crore.
l Since 2014-15, the Government has covered an average 38 lakh beneficiaries annually under Aasara Pension scheme with a total disbursement of Rs. 45,883 Crore (upto January 2022)
l To provide educational support to children from marginalised communities, the Government has doubled the number of Social Welfare Residential Institutions from 134 in 2014 to 268 in 2021. During this period, the number of Tribal Welfare Residential Institutions increased from 96 to 188, BC Residential Institutions from 19 to 281 and the Minority Welfare Institutions from 12 to 204.
l To ensure the health and well-being of women and children, the Government spent Rs. 118 crore in 2021-22 benefitting around
22 lakh beneficiaries under Arogya Lakshmi Scheme. Upto November 2021-22 around 1.51 lakh beneficiaries have received a Direct Benefit Transfer of Rs. 186 crore, along with KCR Kits.
l Under the Kalyana Lakshmi/Shaadi Mubarak scheme nearly 10 lakh marriages have been performed from its inception in 2014 till 2021. A total of 1.9 lakh SC, 1.1 lakh ST, 4.55 lakh BC and 1.97 lakh minority brides have benefited from the scheme.
l To empower women financially, a total number of 47.53 lakh women have been organised into 4.39 lakh SHGs and 17,886 Village Organisations in the State.
l SC/ST Special Development Fund Act was enacted in 2017 for proportionate allocation of funding to SCs and STs in the budget. Around Rs. 18,000 crore earmarked funds have been utilised for the exclusive benefit of SCs and STs during the year 2021-22 (until February 2022).
l Under the Sheep Distribution Scheme, the Government distributed 79.98 lakh sheep to 3.81 lakh beneficiaries comprising Yadava and Kurma communities.
Key Highlights
Welfare

Telangana Socio Economic Outlook 2022182
11.1. Introductionelfare lies at the heart of policy making in the State of Telangana. The Government has initiated several programs and
schemes with an objective of uplifting the poor and marginalised population in the state. The aim of these programs is to help align the economic success of Telangana with specific social goals such as creating a level playing field for the marginalised communities.
The Government is committed to improving the welfare of the socially and economically disadvantaged such as the Scheduled Castes (SCs), Scheduled Tribes (STs), Backward Classes (BCs), Minority Communities, Women, Children, Senior Citizens, and Specially-abled Persons and other disadvantaged communities. The success of the welfare agenda rests on ensuring that the schemes reflect the needs of the relevant communities and are meticulously implemented, with their deliverables aligning with proposed social goals of the government.
11.2 Welfare of Scheduled Castes, Scheduled Tribes, Backward Classes and MinoritiesTo achieve its aim of social justice and the creation of an equitable society, the Government is striving to build a sophisticated framework of welfare programs covering every oppressed caste or tribal group, every backward community and every religious minority. This framework aims to bring these targeted sections of the people socially, educationally and economically on par with other developed communities in the society.
11.2.1 Dalit BandhuOne of the major initiatives taken up by the Government during the financial year 2021-22 is the
launch of Dalit Bandhu Programme for the economic upliftment of the Scheduled Caste people in the State. Under this scheme, each beneficiary household will be provided with a financial assistance of Rs. 10 lakh as a complete grant without any bank dependencies to establish a suitable income generating source.
The scheme was launched on August 4, 2021 at Vasalamarri Village in the Alair Assembly Constituency (AC) of Yadadri-Bhuvanagiri district. Till January 2022, an amount of Rs.2,000 crore has been released to 17,554 dalit families and Rs. 7.60 crore has been released to 72 dalit families in Huzurabad and Alair ACs respectively.
Subsequently, the Government has taken a decision to implement the Dalit Bandhu scheme in 5 more ACs- Madhira (SC)1, Thungathurthi (SC), Jukkal (SC), Achampet (SC) and Kalwakurthy to better gauge the peculiarities and differences in the implementation modalities. An amount of Rs. 250 crore benefiting 2500 Dalit families has been released in these ACs.
After successfully gauging the alignment of the community’s need for social and economic upliftment, additionally the Government has proposed to implement the Dalit Bandhu Scheme in 118 ACs (including the 5 ACs mentioned above and except Huzurabad AC) in the state covering 100 dalit families in each constituency during this financial year itself and has released an amount of Rs. 300 crore to the 33 districts in the state.
11.2.2 Scheduled Castes/Scheduled Tribes Special Development Funds (SC/ST SDFs)The Government passed the “Scheduled Castes and Scheduled Tribes Special Development Fund (Planning, Allocation and Utilisation of Financial resources) Act in 2017” to secure earmarked funds for implementation of schemes that aim at ensuring accelerated development of SCs and STs with an emphasis on achieving equality, focussing on economic, educational and human development along with ensuring their security and social dignity
W
1 SC - Scheduled Caste

183
and promoting equity among SCs and STs. As a result, 15.45% of state scheme funds are directed solely towards the welfare and development of SC communities, and another 9.08% for the betterment of the ST communities proportionate to their population in the State. The Act also ensures that unused funds are carried forward into subsequent fi nancial years.
As of 2021-22, Telangana is one of the 4 states (the other three being Andhra Pradesh, Uttarakhand and Tamil Nadu) to provide legal guarantees for the welfare of and allocation of funds towards SC and ST communities. Around Rs. 18,000 crore earmarked funds have been utilised for the exclusive benefi t of SCs and STs during the year 2021-22 (upto February 2022).
All Scheduled Caste (SC) specifi c programmes are being listed under SCSDF and Scheduled Tribe (ST) specifi c programmes are being listed under STSDF. Some of the important on-going fl agship programmes such as Kalyana Laxmi, Aasara
Pensions, Drinking water to households, Sanna Biyyam to the students in the SC & ST hostels, KCR Kits etc., are linked with the Special Development Fund. Figures 11.1 & 11.2 show the expenditure under SC/ST Special Development funds since the implementation of the Act in 2017 till 2020-21.
11.2.3 Reservation for Scheduled Castes (SCs), Scheduled Tribes (STs), Backward Classes (BCs), Minorities, Economically Weaker Sections (EWS) in the State
The Government has a strong focus on undoing the historical injustices meted out to the SCs, STs and BCs in the state and making the minorities feel empowered by safeguarding their rights and entitlements. One way to address these concerns is by extending reservation to these communities. Currently, the STs, SCs, BCs, Minorities (BC-E) and Economically Weaker Sections (EWS) avail 6%, 15%, 25%, 4% and 10% reservation respectively for admissions in educational institutions and for state Government jobs.
Figure 11.1
Expenditure under SC Development Funds (2017-18 to 2020-21)
Figure 11.2
Expenditure under ST Development Funds (2017-18 to 2020-21)
Source: Scheduled Caste Development Department, Government of Telangana
Source: Scheduled Tribes Development Department, Government of Telangana
2017-18 2018-19 2019-20 2020-21
12,000
8,000
4,000
0
12,000
8,000
4,000
0
2017-18 2018-19 2019-20 2020-21
9,99010,989 10,745
Expenditure (in Rs. crore) Expenditure (in Rs. crore)
11,510
5,861 6,620 6,5277,185
Welfare

Telangana Socio Economic Outlook 2022184
In recognition of the need for better data for seamless implementation of these programs, the Telangana Legislative Assembly unanimously passed a resolution, urging the Government of India to undertake a caste-wise census of Backward Classes as part of Census 2021.
11.2.4 Land Rights to Scheduled Tribes (STs) & Giri VikasamUnder the ‘Scheduled Tribes and other Traditional Forest Dwellers (Recognition of Forest Rights) Act’ in 2006, the Government has granted the Scheduled Tribes and other traditional forest dwellers the right to hold and live in the forest land and the rights to “protect, regenerate or conserve or manage any community forest resource that they have been traditionally protecting and conserving for sustainable use”. As of January 2022, the Government has issued title certificates to 96,676 individuals involving 3,08,614 acres and 721 community titles involving 4,54,054 acres.
“GIRI VIKASAM” scheme is aimed to convert the uncultivable agricultural lands of small & marginal Scheduled tribe (ST) farmers into cultivable lands for the sustainable agriculture development. As of December 2021, An area of 18,228 acres of land belonging to 6,118 ST farmers has been converted to cultivable land with the cost of Rs 43.1 crore.
11.2.5 Educational Support to the SC, ST, BC and MinoritiesEducation being a key mechanism to break through poverty and enhance intergenerational mobility, the Government has laid special emphasis on programs that can make it easier for the disadvantaged communities to access and benefit from educational opportunities both at the State and Global level.
11.2.5.1 Residential Schools and CollegesSince the formation of Telangana in 2014, the Government has doubled the number of Social Welfare Residential Institutions, from 134 in 2014 to 268 in 2021. A similar increase has been witnessed
by the Tribal Welfare Institutions, which increased from 96 in 2014 to 188 in 2021. The BC welfare residential Institutions have seen a rise as well, from 19 in 2014 to 281 in 2021 and the minority Welfare residential Institutions have increased from 12 in 2014 to 204 in 2021. The new institutions were developed with increased focus on quality of teaching and physical environment in these schools and some of the students have gone on to graduate from IITs, NITs, and other reputed institutions in the country.
Further to encourage the women from the SC community to pursue higher education, 30 residential junior colleges have been created for them. Currently 17,014 women are studying in these colleges. Similarly, 22 new special residential degree colleges for ST women have been set up and 9,159 women are studying in these colleges.
In addition to these residential educational institutions, separate welfare hostels are also being established and maintained by the respective welfare departments.
11.2.5.2 ScholarshipsThe Government has extended financial assistance through scholarships and reimbursement of tuition fees to assist the education of SC, ST, BC and minority communities in the state.
Every academic year around 4.86 lakh SC students and 1.27 lakh ST students are assisted with pre-matric scholarships and around 2.5 lakh SC students, 1.4 lakh ST students, 1.2 lakh minority students and 10.1 lakh BC students are assisted with post-matric scholarships including the reimbursement of tuition fees.
11.2.5.2.1 Scholarships for Overseas EducationIn order to help children from disadvantaged communities in pursuing higher education abroad, the Government has introduced Overseas

185
Scholarship which provides Rs. 20 lakh to one child in a family (whose annual income less Rs. 5 lakh) who has secured admission in a foreign university from an eligible country. The Overseas Scholarship for SC and ST students is named as Dr. B.R. Ambedkar Overseas Vidya Nidhi, for BC and EBC students it is named as Mahatma Jyotiba Phule Overseas Vidya Nidhi and for Minority students it is named as Chief Minister’s Overseas Scholarship Scheme. Since the launch of the Overseas Scholarships for SCs, STs, BCs and Minorities till February 2022, a total of 699 SC, 204 ST, 1,790 BC and 2,235 Minority students have received these scholarships.
11.3 HousingAccess to safe housing plays an important role in the welfare of a family. Apart from providing shelter against various physical threats, both human-made and natural, the availability of adequate housing facilities with proper supply of potable water, sufficient sanitation facilities and clean surroundings is necessary to ensure a dignified life.
11.3.1 Two-BHK Housing ProgrammeWith the objective of providing affordable and quality housing to the poor, the Government launched a 2 BHK Housing Programme in October 2015. Under this programme, a total of 2,91,057 houses have been sanctioned between 2016 and 2021. Out of which construction of 1,07,612 houses has been completed until November 2021 (Fig. 11.3), while the construction of remaining houses is at various stages of completion. Around Rs. 10,445 crore has been utilised since the launch of the program till November 2021. The Greater Hyderabad Municipal Corporation (GHMC) is the implementing agency in its jurisdiction and for the rest of the state Telangana State Housing Corporation (TSHC) is the implementing agency.
Each house has a plinth area of 560 sq. ft., which includes a kitchen and two toilets. The construction cost of each house is Rs. 5.04 lakh in rural areas, Rs. 5.30 lakh in urban areas, and between Rs.
7.00 lakh and Rs. 7.90 lakh in the limits of Greater Hyderabad Municipal Corporation (GHMC). The 2BHK programme received the PMAY-U (Pradhan Mantri Awas Yojana - Urban) Award for excellent performance in e-governance in 2018-19.
Keeping the spatial distribution of population and social justice in mind, the Government has earmarked a share of these 2BHK houses for specific social groups. In rural areas, 50% houses are reserved for SCs and STs, 7% for Minorities and 43% for other communities. In urban areas this stands at 17% for SCs, 6% for STs, 12% for Minorities and 65% for other communities. Additionally, there is a blanket 2% reservation for ex-Service Personnel and widows of ex-Servicemen, and 5% is earmarked for Persons with Disabilities.
The State has made tremendous progress in providing pucca houses to its population. Telangana is one of the 18 Non-Special Category states where more households (66%) report receiving benefits from a state-specific housing scheme, when compared to a central housing scheme (34%). Telangana ranks 4th in terms of coverage by
Figure 11.3
Number of Houses built under 2-BHK Housing between 2016-17 to 2021-22
Source: Department of Housing, Government of Telangana
2016-17 2017-18 2018-19 2019-20 2020-21 2021-22 (up to 30.11.21)
Number of Houses built
1,5148,495
12,04317,470
14,791
53,299
Welfare

Telangana Socio Economic Outlook 2022186
state-specific housing scheme. Figure 11.4 shows the percentage of households who have received benefits under state-sponsored and centrally-sponsored (specifically PMAY-U) schemes across Non-Special Category States.
11.4 Women WelfareFor equitable development in the state across all domains, the Government is implementing a gamut of initiatives specially focussed at women’s welfare and empowerment. These initiatives focus on narrowing the gender divide in employment,
improving income and strengthening the bargaining power of women in a household. Initiatives like Aarogya Lakshmi and KCR Kits have been implemented to ensure adequate health and nutritional services to women. The Government has also taken initiatives to provide financial assistance during weddings and to enable a huge network of SHG groups to empower women.
In addition to the above programmes, the Government is also implementing the Centrally Sponsored Schemes such as the ICDS, Supplementary Nutrition Programme, Poshan Abhiyaan, construction and renovation of Anganwadi Centres, Integrated Child Protection Services, State Resource Centres for Women, Beti Padhao Beti Bachao, and Ujjwala for victims of trafficking and commercial sexual exploitation, among others.
Further, the State Government is providing 33.3% reservation for women in state Government jobs which are under direct recruitment and enrolment in educational institutions.
11.4.1 Kalyana Lakshmi / Shadi Mubarak (Marriage Assistance)/Aid for Inter-caste marriagesThe Government launched the ‘Kalyana Lakshmi/Shaadi Mubarak’ scheme to provide financial assistance in the form of a one-time grant of Rs.1,00,116 to unmarried girls2 (above 18 years of age) from SC, ST, BC and Minority families (with a combined income of both parents not exceeding Rs.2,00,000 per annum) at the time of their marriage. From mid 2019, The Government is also providing financial assistance of Rs.1,25,145 to unmarried disabled girls irrespective of their caste and religion.
Upto December 2021, a total of 1.9 lakh SC, 1.1 lakh ST, 4.3 lakh BC, 1.9 lakh Minority families have been benefited from the scheme and the Government has disbursed an amount of around Rs. 8085 crore. This initiative not only curbed child marriages to a significant extent but also greatly relieved the financial burden related to marriages.
Source: Mission Antyodaya 2020
Share of Beneficiaries (%)
Figure 11.4
Beneficiaries under state and centrally sponsored housing scheme in Non-Special Category States
State Scheme Central Scheme
Kerala
Goa
Andhra Pradesh
Telangana
Karnataka
Gujarat
Haryana
Maharashtra
Tamil Nadu
Rajasthan
Uttar Pradesh
Jharkhand
Punjab
Bihar
Madhya Pradesh
Chhattisgarh
Odisha
West Bengal
85
78
69
66
65
56
41
39
38
33
31
31
30
26
24
24
19
13
15
22
31
34
35
44
59
61
62
67
69
69
70
74
76
76
81
87
2 The Grant amount is transferred to the bank account of the unmarried girl’s mother

187
Table 11.1
Comparison of marriage assistance schemes across other states in India
Kalyana Lakshmi/ Shaadi Mubarak3
YSR Pelli Kanuka4
Mukhya Mantri Vivah Shagun Yojna5
Mukhya Mantri Kanya Vivah/ Nikah Yojana6
Bidaai (Shaadi Scheme)7
Telangana
Andhra Pradesh
Haryana
Madhya Pradesh
Karnataka
Bride belonging to SC, ST, BC and Minority families whose parents' annual income is not exceeding Rs. 2 lakh per annum
Unmarried BPL Bride belonging to SC/ST, BC, Minorities, Disabled and Children of Construction Labourers
BPL, Widows (with income less than Rs.1.00 lakh),, Orphans, BPL families, Daughters of Destitute Women, Sports women, Specially Abled, Girls from families having two and a half acres of agricultural land or whose annual family income from all sources is less than Rs 1.00 lakh.
Destitute,BPL Widow, BPL Divorced, Girls belonging to BPL families
Unmarried/Divorcee BPL Card Holder - belonging to Muslim, Christian, Jain, Buddhist and Parsi community of the State
Rs. 1,00,116
Varies between Rs. 20,000 - Rs. 1,00,000 depending upon the community of the bride and groom
Amount varies by category Rs. 31,000 - Rs. 71,000
Rs. 51,000 (with some variation for specially abled persons)
Rs. 50,000
Name of the Scheme State Eligibility Gift Amount
3 Source: https://yadadri.telangana.gov.in/scheme/kalyana-lakshmi-shaadi-mubarak/
4 Source - http://www.ysrpk.ap.gov.in/
5 Source - http://haryanascbc.gov.in/mukhya-mantri-vivah-shagun-yojna
6 Source - http://socialjustice.mp.gov.in/social-assistance
7 Source: https://dom.karnataka.gov.in/new-page/Bidaai%20(Shaadi%20Scheme)/en
Table 11.1 shows the comparison of schemes across states that provide fi nancial assistance during marriage. Telangana’s generous gift of Rs.1,00,116 of marriage assistance stands out as the most generous scheme among all states.
The Government in order to combat the evil of casteism in the society and to achieve the objective of social integration encourages inter-caste marriages between SC individuals and individuals from other castes by providing a cash incentive upto Rs.2.5 lakh to each inter-caste married couple. During the year 2021-22 an amount of Rs.29.28 crore has
been disbursed to 1,830 inter caste married couples. Since 2014, an amount of Rs.108.75 crore has been disbursed to 10,179 inter caste married couples.
11.4.2 Land Purchase Scheme Access to land is critical for poverty eradication and community development. The Land Purchase Scheme was launched in 2014 with an objective of the State purchasing and assigning 3.00 acres of agricultural land to the women of “Bhoomileni Nirupeda Dalita Vyavasaya Aadharitha Kutumbalu”. The Land Purchase Scheme is under implementation with 100% subsidy. The District Collectors were
Welfare
Telangana Socio Economic Outlook 2022188
given powers to purchase agricultural land for the above programme at a cost ranging from Rs. 2.00 lakhs to Rs. 7.00 lakhs per acre in the 30 Districts (excluding Hyderabad, Bhadradri Kothagudem and Medchal) of the State.
Under the Land Purchase Scheme an extent of 16,993.27 acres have been distributed to the 6,942 beneficiaries at a cost of Rs. 761.42 crores (from 2014 to December 2021). During 2021-22, 451.35 acres have been distributed to 261 beneficiaries with an amount of Rs. 25.32 crore.
11.4.3 Self-Help Groups (SHGs)The SHG movement has been widely acknowledged as a grassroots movement that brought transformative changes in the lives of women from marginalised and economically weaker families by empowering them financially. The Government is further facilitating this movement through “SERP (Society for Elimination of Rural Poverty)” by building and nurturing SHGs of women and their federations. A total number of 47.53 lakh women have been organised into 4.39 lakh SHGs and 17,886 Village Organisations in the State. Number of new SHGs formed in the year 2021-22 (till November 2021) is 15,865.
Telangana has pioneered the facilitation of bank linkages for all these SHGs. Since the formation of the State, the amount disbursed to the SHGs every year almost tripled from Rs.3,738.67 crore in 2014-15 to Rs.10,448.03 crore by 2020-21 (as the data for 2021-22 pertains to only until December).
“MEPMA” is the State Nodal Agency for implementing the Poverty Alleviation Programs in all urban areas of Telangana State. Till date 13,425 micro enterprises have been established through urban SHG women with a total cost of Rs.102.82 Crore. In 2021-22 an amount of Rs. 1,107.32 crore is provided to 17,287 SHGs under Self Help Group - Bank Linkage (SHG-BL) and Rs.113.92 Crore to 1,241 beneficiaries under Self Employment Program (SEP).
11.4.4 Arogya Lakshmi & KCR KitsAarogya Lakshmi scheme provides nutritious and healthy meals to all pregnant and lactating mothers registered in all the Anganwadi Centres. The core objectives of the scheme are to enhance the quality and acceptability of supplementary nutrition by the Pregnant and Lactating women, ensure that Pregnant and Lactating women consume 90+ IFA tablets, eliminate or decrease number of Pregnant and Lactating women with anaemia/ who are undernourished, improve the enrollment of mothers at Anganwadi Centers (AWCs), among others.
Over and above the norms mandated by the Government of India, in the interest of women’s health and welfare the Government of Telangana has enhanced the rates by providing an additional allocation of Rs. 14 per beneficiary per day. In addition, the State Government has increased the number of days the beneficiaries receive milk and eggs from 25 to 30.
In 2021-22 the scheme benefited over 22,00,346 pregnant, lactating women and children in the age group of 7 months to 6 years (covered under Balamrutham and Supplementary Nutrition Programme) with an expenditure of Rs.118 crore.
With an aim to reduce Maternal and Infant Mortality Rate through promotion of institutional deliveries, the ‘KCR Kit’ programme was launched in June 2017. Under the scheme, post-delivery mothers receive a kit containing 15 utility items. Under the scheme, post child delivery, the mother is provided with financial assistance of ₹12,000 (₹13,000 for a girl child) to compensate for the loss of wages by the women during the pregnancy and postnatal period. Upto November 2021-22 around 1.51 lakh beneficiaries have received a Direct Benefit Transfer of Rs. 186 crore, along with KCR Kits. The impact of the scheme can be seen in improved institutional deliveries in the state from 30.5% in 2015-16 (NFHS-4) to 49.7% in 2019-20 (NFHS-5).
11.4.5 Mahila Shakti Kendras (MSKs) Mahila Shakti Kendras (MSKs) is a Centrally
189
Sponsored Scheme with a Centre-State share of 60:40. The MSK Scheme is aimed at providing ‘one stop convergent support services for empowering rural women with opportunities for skill development, employment, digital literacy, health and nutrition’. MSKs create awareness on women-related schemes, programmes and laws implemented by the state, including awareness campaigns on various acts such as Sexual Harassment of Women at Workplace Act, 2013, Pre-Conception and Pre-Natal Diagnostic Techniques Act, 1994, The Prohibition of Child Marriage Act, 2006, Compulsory Registration of Marriage Act, 2002, RTE, 2009 etc.
11.4.6 One Stop Centres (Sakhi Centres)The One Stop Centres (also called Sakhi Centres) were set-up across all 33 districts in the State in December 2017 with an objective to provide integrated support to women affected by violence, in private and public spaces, within the family, community and at the workplace. Sakhi Centres handled 32,114 cases from 2017 to October 2021, which is evident from the growing reach of Sakhi centres. Around 66% of the total registered cases are under domestic violence.
A Women Helpline (WHL) 181 was launched in Telangana on 19th August, 2017 with a 6-seater Call Center. The Sakhi Centre is integrated with WHL to provide support to women/girls affected by violence.
11.4.7 BHAROSA CentresBHAROSA Centres are one-point help centres to provide integrated support to women and children who have been subjected to severe abuse, be it physical, sexual, financial or emotional. The first centre was established in Hyderabad in 2016, followed by Vikarabad in 2018. In 2020, new centres were also established in Sangareddy and Warangal. BHAROSACentres in Suryapet, Nalgonda, Medchal, Khammam, and Hyderabad’s Old City are underway.
11.4.8 Security, Health and Environment (SHE) TeamsSHE Teams were established as a division of
Telangana Police in 2014. The aim was to deal with offences against women like eve-teasing, stalking, harassment in public or at workplaces, educational institutions, residential areas or social media. At present, there are 331 SHE teams working in the state. Between October 2014 and September 2021, a total of 54,231 complaints were received under the initiative, leading to the arrest of over 19,411 perpetrators.
11.4.9 The Sexual Harassment Electronic Box (T-She Box)The Government established T-She Box (a mobile and web app) as an effort to provide a single window access to every woman, irrespective of her work status, whether working in organised or unorganised, private or public sector, to facilitate the registration of complaint related to sexual harassment.
In 2021-22, 4,376 Internal Complaints Committees (ICC) and 28 Local Complaints Committees (LCC) have been registered on the platform. In addition, the Government has also established a new home for the safety of trafficked victims in Hyderabad.
11.5 Poverty AlleviationAddressing poverty and its determinants has been one of the main focus areas of the Government. Since formation of the State, the Government has revamped the existing poverty alleviation programmes, especially the Public Distribution System (PDS) and Mahatma Gandhi National Rural Employment Guarantee Scheme (MGNREGS) and the 100% subsidised 2-BHK Housing Scheme.
Further, State level societies such as Society for Elimination of Rural Poverty (SERP) and Mission for Elimination of Poverty in Municipal Areas (MEPMA) are helping to build and nurture women led Self Help Groups (SHGs) and implementing poverty alleviation programmes in rural and urban areas.
Importantly, the Government broadened the focus of poverty alleviation by working to eradicate
Welfare

Telangana Socio Economic Outlook 2022190
multidimensional poverty. As per NITI Aayog’s Multidimensional Poverty Index (MPI) baseline report 2021, which has three equally weighted dimensions—Health, Education, and Living Standards, one in four individuals in India is multi-dimensionally poor, but in Telangana this is true for only one out of seven individuals.
Since the formation of the State, the Government has made targeted interventions in Health (KCR Kits, Aarogya Lakshmi, Giri Poshana, improving the Public Health Infrastructure etc.,), Education (revamping school infrastructure through Mana Ooru Mana Badi), and Living Standards (housing, skill development, asset creation, free electricity, etc.) covering specific marginalised groups in the State.
11.5.1 Aasara PensionAs part of its welfare and social safety net strategy, the Government has introduced the “Aasara’’ pension scheme in November 2014 in order to support the most vulnerable sections of the society. The scheme is meant to protect different sections of society in particular the old and infirm, disabled persons, Widows, people with HIV-AIDS, Filaria
effected persons (Grade-II & III), incapacitated weavers, toddy tappers, poor Beedi workers and Single Women. In 2021-22 (upto January 2022), around Rs. 7,078 crore has been disbursed to 37.34 lakh pensioners. Since 2014, an average around 38 lakh beneficiaries have been covered annually under this scheme (Fig. 11.5).
Since the launch of the scheme in Nov 2014 to January 2022, around Rs. 45,882 crore has been disbursed (Fig. 11.5). Since June 2019, the pension amount has been increased from Rs. 1500/- to Rs. 3016/- per month for disabled persons and for all other categories of pensioners from Rs. 1000/- to Rs. 2016/- per month.
11.5.2 Public Distribution System (PDS)The Government is distributing essential commodities and food grains to priority households at subsidised prices as per their eligibility. The Government has been proactively implementing the Public Distribution System (PDS), through a network of 17,013 Fair Price Shops (FPSs).
The Government of Telangana has extended the PDS coverage to an additional 96 lakh people
Figure 11.5
Number of Beneficiaries and Amount Disbursed (Rs. Crore) under Aasara Pension Scheme (2014-15 to 2021-22)
2014-15 2015-16 2016-17 2017-18 2018-19 2019-20 2020-21 2021-22 (Upto January 2022)
Am
ount
Rel
ease
d (R
s. c
rore
)
Num
ber o
f Ben
efici
arie
s
33,87,730 37,96,405 37,32,589 39,90,188 40,35,173 39,78,514 38,80,265 37,34,342
1,521
4,497 4,541 4,843 4,975
8,711
9,717
7,078
50,00,000
40,00,000
30,00,000
20,00,000
10,00,000
0
10,000
8,000
6,000
4,000
2,000
0
Number of Beneficiaries Amount Released (Rs. crore)
Source: Society for Elimination of Rural Poverty, Government of Telangana
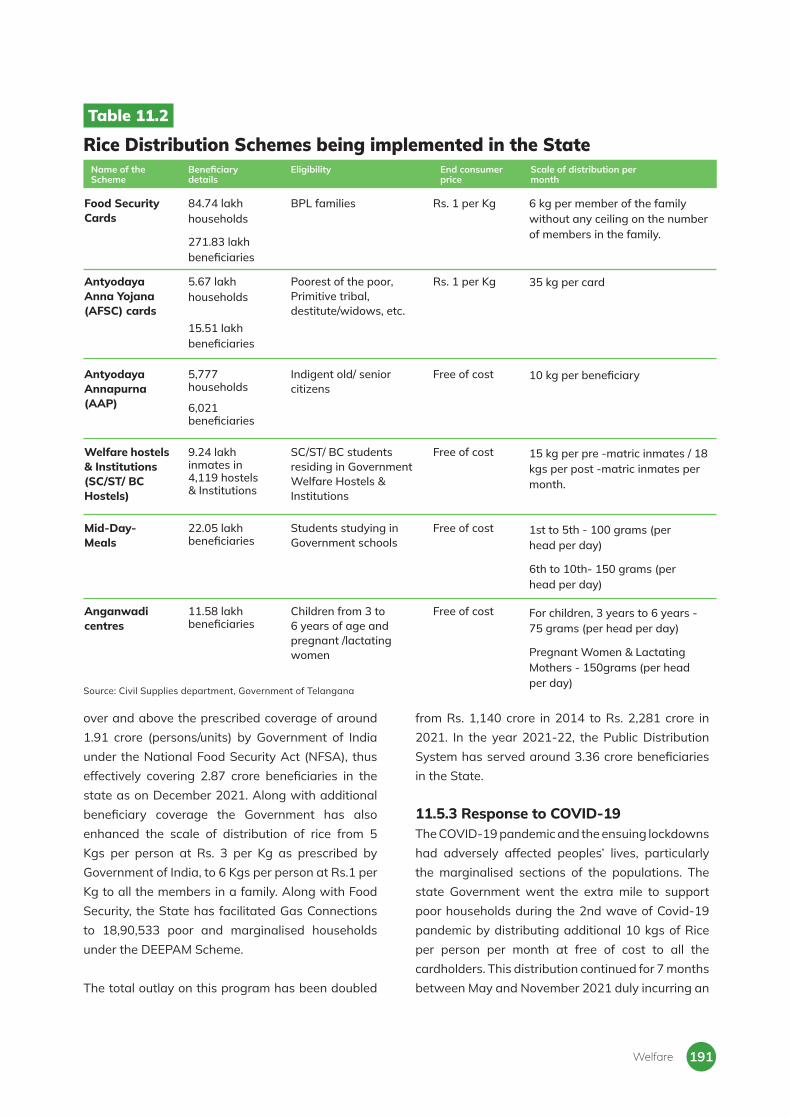
191
over and above the prescribed coverage of around 1.91 crore (persons/units) by Government of India under the National Food Security Act (NFSA), thus effectively covering 2.87 crore beneficiaries in the state as on December 2021. Along with additional beneficiary coverage the Government has also enhanced the scale of distribution of rice from 5 Kgs per person at Rs. 3 per Kg as prescribed by Government of India, to 6 Kgs per person at Rs.1 per Kg to all the members in a family. Along with Food Security, the State has facilitated Gas Connections to 18,90,533 poor and marginalised households under the DEEPAM Scheme.
The total outlay on this program has been doubled
from Rs. 1,140 crore in 2014 to Rs. 2,281 crore in 2021. In the year 2021-22, the Public Distribution System has served around 3.36 crore beneficiaries in the State.
11.5.3 Response to COVID-19 The COVID-19 pandemic and the ensuing lockdowns had adversely affected peoples’ lives, particularly the marginalised sections of the populations. The state Government went the extra mile to support poor households during the 2nd wave of Covid-19 pandemic by distributing additional 10 kgs of Rice per person per month at free of cost to all the cardholders. This distribution continued for 7 months between May and November 2021 duly incurring an
Table 11.2
Rice Distribution Schemes being implemented in the State
Food Security Cards
Antyodaya Anna Yojana (AFSC) cards
Antyodaya Annapurna (AAP)
Welfare hostels & Institutions (SC/ST/ BC Hostels)
Mid-Day-Meals
Anganwadi centres
84.74 lakh households
5.67 lakh households
5,777 households
9.24 lakh inmates in 4,119 hostels & Institutions
22.05 lakh beneficiaries
11.58 lakh beneficiaries
6,021 beneficiaries
6 kg per member of the family without any ceiling on the number of members in the family.
35 kg per card
10 kg per beneficiary
15 kg per pre -matric inmates / 18 kgs per post -matric inmates per month.
1st to 5th - 100 grams (per head per day)
For children, 3 years to 6 years - 75 grams (per head per day)
6th to 10th- 150 grams (per head per day)
Pregnant Women & Lactating Mothers - 150grams (per head per day)
271.83 lakh beneficiaries
15.51 lakh beneficiaries
BPL families
Poorest of the poor, Primitive tribal, destitute/widows, etc.
Indigent old/ senior citizens
SC/ST/ BC students residing in Government Welfare Hostels & Institutions
Students studying in Government schools
Children from 3 to 6 years of age and pregnant /lactating women
Rs. 1 per Kg
Rs. 1 per Kg
Free of cost
Free of cost
Free of cost
Free of cost
Name of the Scheme
Beneficiary details
Eligibility End consumer price
Scale of distribution per month
Source: Civil Supplies department, Government of Telangana
Welfare
Telangana Socio Economic Outlook 2022192
additional amount of Rs. 324 Crore.
To provide relief to the private school teachers, the State Government distributed Sannabiyyam to 2,03,473 teaching and non-teaching staff of recognized Private Schools @ 25kg each at free of cost from April to June, 2021 and incurred an expenditure of Rs. 52.26 Crs. Telangana state is the first State to provide such relief to private school staff.
11.6 Economic Support SchemesEconomic Support Schemes are introduced by the government, i) To provide financial assistance for creation of income generating assets, ii) To offer training programmes for Skill up-gradation leading to Self / Wage employment and iii) To plug critical gaps of finance in economic support schemes for the welfare of the SCs, STs and other weaker sections.
11.6.1 Sheep Distribution SchemeThe Government is implementing the Sheep Distribution Scheme for the Yadava and Kurma communities in the state. Since the inception of the program in 2017 to till date, a total of 79.98 lakh sheep have been distributed to 3.81 lakh beneficiaries. Between 2017 and October 2021 the State Government with a subsidy component of 75% has incurred expenditure of Rs. 3,572 crore. Keeping in view the rise in cost of Sheep in the open market and also increase in transportation prices, in the Phase II of the SRDP program (2021-22 and 2022-23), the Government has enhanced the Unit cost from Rs.1,25,000 to Rs.1,75,000.
11.6.2 Free Electricity supply to SC, ST and BC CommunitiesThe Government is providing free electricity supply to the families of the Scheduled Castes and Scheduled Tribes for domestic purposes up to 101 units, benefiting around 19.73 lakh SC Households and 1.47 lakh ST Households. The state Government has come up with a scheme of free electricity supply upto 250 units to laundries / dhobi ghats and saloons from 2021-22, benefitting 54,035 people
from Rajaka and Nayee Brahmin communities
11.6.3 Entrepreneurship Development (T-PRIDE)The Government has launched a special incentive package scheme called Telangana State Program for Rapid Incubation of Dalit Entrepreneurs (T-PRIDE) in 2014, to encourage entrepreneurship among the Scheduled Castes (SCs), Scheduled Tribes (STs) and eligible Physically Handicapped Citizens (PHCs). Apart from facilitating access to credit facilities, the policy envisions preferential allotment of plots in Industrial Parks and intensive entrepreneur and skilling programmes. Since the inception of the scheme in 2014 till January 2022, an amount of Rs. 1052 crore was sanctioned to 23,742 ST entrepreneurs, Rs. 1032 crore sanctioned to 22,955 SC entrepreneurs and Rs. 93 crore sanctioned to 1708 PHC entrepreneurs.
11.7 Development and Protection of CultureTelangana has long been a meeting place for diverse languages and cultures. It is easily the best example for India’s composite culture, pluralism and inclusiveness. It is thus no surprise that the region on the whole came to be known for its Ganga-Jamuna Tehzeeb and the capital Hyderabad as a ‘miniature India’.
The Government recognises the importance of preserving this composite culture of the state. In order to preserve the tribal culture the Government has constructed a tribal museum at Jodeghat in memory of Kumuram Bheem with a cost of Rs. 20 crore. Further, 12 Girijan Bhavans, Adivasi Bhavan, Banjara Bhavan are at various stages of construction with a sanctioned cost of Rs. 20 crore each.
The Government sponsors and celebrates major fairs and festivals of the tribal community like Santh Sevalal Jayanthi, Kumuram Bheem Vardhanthi, Nagoba Jathara, Bourapur Jathara, Jangubai Jathara, Nacharamma Jathara etc., every year.

193
Among the tribal festivals Sammakka Sarakka Jathara or Medaram Jathara is being celebrated biennially in Tadvai Mandal, Mulugu district, which is the largest tribal religious congregation in the world. The Sammakka Sarakka Jathara or Medaram Jathara is a State Festival of Telangana. During every jathara, the Government makes elaborate arrangements for providing logistics, drinking water, sanitation and emergency healthcare facilities. The celebrations for the year 2022 took place from February 14th to 20th, with nearly 1 crore pilgrims participating in the festival.
Bathukamma is an annual flower festival celebrated predominantly in Telangana, and is grandly celebrated by young girls. It is celebrated towards the end of monsoon and heralds the abundance that nature has to offer. The festival begins on the day of Mahalaya Amavasya, and is celebrated with much fanfare for nine days. The main purpose of this particular festival is to pray with devotion to the
Goddess - Maha Gauri. The Government distributes Bathukamma Sarees to all adult women enrolled under the Food Security Scheme during the festival season every year from 2017 onwards.
Similarly, the Government also supports the celebration of festivals of minority communities in Telangana. The Government is organising Dawat-e-Iftar and Christmas feast during the Ramzan and Christmas celebrations respectively every year across the state.
11.8 Welfare for Senior Citizens and the Disabled According to the 2021 report of the Ministry of Statistics and Programme Implementation (MoSPI), 11% of the total population in the State is above 60 years of age. The state is projected to have 14.5 % of its population in the Elderly category by 2031. Hence, the Government is constantly innovating
A recent report ‘Elderly in India’, published by the MoSPI (Government of India), captured how South Indian states have higher proportions of elderly population than the rest of the country. As one of India’s 10 ‘aged-states’ (states with at least 5 million population of those aged above 60), Telangana scored 38.9 on the Quality of Life for Elderly Index 2021, highlighting the need for improvement.8
The state Government can focus on policies, measures, and schemes centred on elders. These include having geriatric care in medical colleges and Government hospitals. In terms of social security, Revamping of Shelters for homeless elders. Subsidised insurance and medical
expenses, public and private transportation. To enable financial self-sufficiency, the idea of Elderly Self-Help Group (ESHG) can be explored.
Of immediate importance is the establishment of robust healthcare infrastructure to tackle widespread Non-Communicable Diseases (NCD). A research paper9 studying 1,821 participants aged above 60 (with 54% women) surmised that every third person in the districts of Khammam and Warangal had at least one NCD. Even if this doesn’t reflect state-wide trends, there is definitely a pressing need to face this issue before it becomes a systemic stress-point for existing healthcare facilities.
Box 11.1
Elderly in Telangana - Supporting our building blocks
8 The Index was created by the Institute for Competitiveness at the request of the Economic Advisory Council to the Prime Minister (EAC-PM).
9 Marmamula, Srinivas & Modepalli, Satya & Kumbham, Thirupathi & Challa, Rajesh & Keeffe, Jill. (2021). Prevalence of disabilities and non-communicable diseases in an elderly population in the Telangana state, India: a population-based cross-sectional study. BMJ Open. 11. e041755. 10.1136/bmjopen-2020-041755.
Welfare

Telangana Socio Economic Outlook 2022194
10 https://pqars.nic.in/annex/256/AU909.pdf
on policies and programs that can support the ageing population of Telangana. With the intention of serving the relevant needs of elderly, the state Government has provided a call centre-Helpline for Senior Citizens (Elder line-14567).
According to the “Persons with Disabilities in India” 2018, conducted by MoSPI, Differently-Abled Persons comprise roughly 2% of Telangana’s population. Most of them suffer from locomotor disability (65% of the specially-abled population). The literacy rate among the population is 40.7%. Hence, extending the welfare to this population is crucial for the dignity of life of the specially-abled population. Some of the initiatives taken up by the
Government are listed below.
lThere are 5 residential schools for 151 persons with disabilities, 2 schools for visually impaired and 3 schools for hearing impaired. The total sanctioned strength for these schools is 830 students and 25 teachers.
lThe Unique Disability ID cards (UDID) scheme was launched to encourage ease of governance and implementation for eligible PwDs. Over 4.76 lakh cards were issued in Telangana.
lNearly 5 lakh PwD benefi ciaries are covered under Aasara pensions of Rs. 3,016 per month.
Source: Ministry of Rural Development, Government of India10
Figure 11.6
State-wise Pension provided within Non-Special Category States under respective State Disability Pension SchemesAmount per person per month (in Rs.)
Tela
ngan
a
And
hra
Prad
esh
Har
yana
Goa
Raj
asth
an
Kera
la
Punj
ab
Karn
atak
a
Guj
arat
Tam
il N
adu
Utt
ar P
rade
sh
Jhar
khan
d
Wes
t Ben
gal
Bih
ar
Mad
hya
Prad
esh
Mah
aras
htra
Chh
attis
garh
Odi
sha
3,016 3,000
2,500
1,7001,500
1,3001,200 1,100 1,000 1,000 1,000
700 700
400 300 300 200 200

195
Apart from the reservation of 4% for PwD candidates in the recruitment of Government jobs, the reservation for PwDs was enhanced from 3% to 5% in all Poverty Alleviation programs.
lTo reach the needy Persons with Disabilities the department has established Toll-free Help Line Number 1800-572-8980 for persons with disabilities.
Figure 11.6 shows per month pension amounts for disabled people provided by the 18 Non-Special Category States. The pension amount provided to the disabled people by the Government of
Telangana, Rs. 3,016 per month, is the highest in the country.
11.9 Way ForwardThe Government’s sustained commitment to the welfare of the citizens is evidenced by the schemes and programmes it has continued to run in 2021-22 such as, Dalit Bandhu and SC and ST Special Development Funds. The pioneering initiatives of the Government are important building blocks in alleviating poverty and developing a futuristic developmental state that combines economic growth with equitable distribution of its benefits and thus provides social protection.
Welfare
Telangana Socio Economic Outlook 2022196
FORESTRY AND ENVIRONMENT
CHAPTER
12

197
l Telangana has a total forest cover (TFC) of 26,969.54 square kilometres, accounting for 24.05% of the total geographical area of the state.
l Five districts — Bhadradri Kothagudem, Mulugu, Nagarkurnool, Komaram Bheem and Mancherial — together account for more than 50% of the total forest area in the state. Bhadradri Kothagudem accounts for nearly 16% of the total forest area in the state.
l Telangana is endowed with a rich diversity of flora and fauna with over 2,939 plant species, 365 bird species, 103 mammal species, 28 reptile species, and a large number of invertebrate species.
l In 2021-22, the forestry and logging sub-sector added Rs. 1,944 crore that accounted for 1.77% of the Gross Value Added by the primary sector and 0.32% of the total Gross State Value Added at constant (2011-12) prices.
l Between 2014-15 and 2021-22, the GVA at constant (2011-12) prices by the forestry and logging grew from Rs. 1,715 crore in 2014-15 to Rs. 1,944 crore in 2021-22; an absolute increase of 13.35% at a Compound Annual Growth Rate of 1.81%.
l The Government set a target of planting 23,000 lakh seedlings across the state from 2015-16 to 2021-22. By January, 2022, 23,599.5 lakh seedlings had been planted—an achievement of 102.6% against the target.
l There are 12 protected areas in Telangana that includes 9 wildlife sanctuaries and 3 national parks covering a total of 5,692 sq.km. This also includes the Amrabad and Kawal Tiger Reserves.
l 29 Sewage Treatment Plants (STP) are operational in the state accounting for a total capacity of 885.5 million litres per day (MLD) and utilization of 735.8 MLD.
l The `Disability-Adjusted Life Years’ (DALY) Rate attributable to air pollution (per 1 lakh population) is 2,710 in Telangana compared to the national average of 3,469, implying that per 1 lakh population, 759 fewer persons suffered from deaths and diseases on account of air pollution in Telangana than in the country as a whole.
l In all years from 2016-17 to 2020-21, the Government has ensured that 100% of the Bio-Medical Waste (BMW) generated in the state is treated either through incineration or autoclaved.
Key Highlights
Forestry and Environment

Telangana Socio Economic Outlook 2022198
12.1. Introductionith a total forest area of 26,969.54 square kilometers, Telangana is endowed with a rich diversity of flora and fauna with over
2,939 plant species, 365 bird species, 103 mammal species, 28 reptile species and a large number of invertebrate species.
The Constitution of India, through Article 48A, directs the governments at all levels to ‘endeavour to protect and improve the environment, and to safeguard the forests and wild life of the country’. Article 51A(g) of the Constitution imposes the duty on every citizen to ‘protect and improve the natural environment including forests, lakes, rivers, wildlife and to have compassion for living creatures’.
Embracing the spirit of environment protection under the Constitutional framework, the Government of Telangana has been taking several initiatives to protect its forests and biodiversity, and minimize the harms done to the environment. In this effort, the Government focuses on striking a balance between the conservation of ecosystems and safeguarding the livelihood of the people.
This chapter is divided into four themes: forests, biodiversity, pollution and climate change. The present status of the state, major initiatives taken by the government and the performance under various indicators are discussed under each theme.
12.2. Forest Forest is a complex ecosystem consisting mainly of trees that buffer the earth and support a myriad of life forms. Nearly one-third of the world’s land surface are forests and they are determined both by the presence of trees and the absence of other predominant land uses. According to the Food and Agricultural Organization, ‘forest’ (including natural forests and forest plantations) is a land with a tree canopy cover of more than 10% and area of more than 0.5 hectares.
The Government of Telangana recognizes the role of forests in supporting livelihood, contributing to the economy, mitigating climate change as carbon sinks, protecting soil, providing a cultural ecosystem to tribal communities and conserving vulnerable wildlife. The core objective of the forest sector development strategy of the Government is to enhance green cover by integrating it with livelihood opportunities.
12.2.1. Forest cover in TelanganaTelangana has a total forest cover (TFC) of 26,969.54 square kilometers (sq.km) that accounts for 24.05% of the total geographical area of the state. Nearly one-third of TFC is open forests extending to 8,484 sq.km and 7,896 sq.km of moderately dense forests hold another one-third of TFC. 286 sq.km are very dense forests holding a share of 1.1% of TFC. Scrub forests that hold a share of 16.4% of TFC extends to 4,420 sq.km whereas 157 sq.km of water bodies hold 0.6% of TFC (see Figure 12.1).
W
Figure 12.1
Forest Cover in Telangana Total forest cover: 26,969.54 sq.km
Share of category (%)
Source: Department of Environment, Forests, Science and Technology, Government of Telangana
Open Forest31.46
Blanks/ Others21.23
Scrub Forest16.39
Very Dense Forest1.06
Water Body0.58
Moderately Dense Forest
29.28

199
The forests in Telangana belong to three forest groups: Tropical Dry Deciduous Forests, Tropical Thorn Forests and Tropical Moist Deciduous Forests (see Table 12.1).
According to the India State of Forest Report 2021, Mango Tree (Mangifera indica) is the most abundant tree species in the rural areas of the state with a relative abundance of 38.93%. In urban areas, this is Neem Tree (Azadirachta indica) with a relative abundance of 18.35%.
With a forest cover of 15.98%, 10.89%, and 9.25%, Bhadradri Kothagudem, Mulugu and Nagarkurnool districts respectively are the top contributors in the total forest cover of the State. At the district level Mulugu, at 71.81%, has the highest percentage share of forest area to the district’s total geographical area, followed by Bhadradri Kothagudem and Komaram Bheem with their percentage share at 60.95% and 54.41% respectively (see Figure 12.2).
Figure 12.2
District-wise forest cover in Telangana (%)
0%
Forest cover in total
geographical area (%)
36%
72%
Source: Department of Environment, Forests, Science and Technology, Government of Telangana
Forestry and Environment
Adilabad42.81
Nirmal32.58
Kumuram Bheem54.41
Mancherial45.17
Jagtial19.61
Rajanna Sircilla20.13
Peddapalli15.31 Jayashankar
51.57
Mulugu71.81
Medak21.17
Siddipet7.09
Warangal Urban2.35 Warangal
Rural6.81Jangaon
1.22Sangareddy
4.70Medchal-Malkajigiri
7.66
Vikarabad12.33 Rangareddy
5.93
Mahabubnagar10.42
Narayanpet3.33
Nalgonda9.00
Nagarkurnool38.99
Wanaparthy5.31
Suryapet3.50
Khammam13.78
Karimnagar0.15
Yadadri Bhuvanagiri
3.63
Mahabubabad39.51
Jogulamba Gadwal
0.29
Bhadradri Kothagudem
60.95
Kamareddy23.70
Nizamabad 20.79
Hyderabad0.80
Source: India State of Forest Report, 2021
Table 12.1
Forest Types in Telangana Forests GroupTropical Dry Deciduous Forests
1 Southern Dry Mixed Deciduous Forests2 Dry Deciduous Scrubs3 Dry Teak Forests4 Secondary Dry Deciduous Forests5 Dry Bamboo Brakes6 Hardwickia Forests7 Boswellia Forests8 Dry Savannah Forests9 Dry Grass Lands
Forests Group
Tropical Thorn Forests
1 Southern Thorn Scrubs2 Southern Thorn Forests
Forests Group
Tropical Moist Deciduous Forests
1 Southern Moist Mixed Deciduous Forests

Telangana Socio Economic Outlook 2022200
The northern and eastern parts of the state have a relatively higher share of forest areas. Five districts— Bhadradri Kothagudem, Mulugu, Nagarkurnool, Komaram Bheem and Mancherial—together account for 51.75% of the total forest area in the state.
12.2.2. Ecosystem services and LivelihoodEcosystem services are the direct or indirect positive benefits that ecosystems provide to human beings. Carbon storage, nutrient cycling, water and air purification, and maintenance of wildlife habitat are the major environmental benefits provided by forests. Another major ecosystem service from forests is the provision of goods such as timber, food, medicine, fuel and bioproducts. Timber and non-timber forest produce in turn creates livelihood opportunities particularly in rural areas. The forest produces in Telangana include timber, bamboo, firewood and charcoal, and beedi leaves1.
In 2021-22, the forestry and logging sub-sector added Rs. 1,944 crore that accounted for 1.77% of the Gross Value Added (GVA) by the primary sector and 0.32% of the total Gross State Value Added (GSVA) in the state [all at constant (2011-12) prices] (see Figure 12.3).
The share of forestry and logging in the GVA by the primary sector as well as in the total GSVA experienced an absolute decrease between 2014-15 and 2021-22 [all at constant (2011-12) prices]. The share of this sub-sector in the primary sector GVA slightly increased between 2014-15 and 2015-16, and thereafter was on a downward trend till 2019-20. This experienced a slight increase by 0.05 percentage points between 2019-20 and 2020-21 but declined by 0.09 percentage points by 2021-22 [all at constant (2011-12) prices]. A similar trend is observed during this period in the share of forestry and logging in the total GSVA also [all at constant (2011-12) prices] (see Figure 12.3).
Figure 12.3
Contribution and Growth of Forestry and Logging in Telangana (2014-15 to 2021-22)
GVA by Forestry and Logging at constant (2011-12)
prices (Rs. crore)
Share of ‘Forestry and Logging’ in the GVA by the primary sector at constant
(2011-12) prices (%)
Share of ‘Forestry and Logging’ in the GSVA
at constant (2011-12) prices (%)
Abbreviations: AE - Advanced Estimates, FRE- First Revised Estimates, SRE- Second Revised Estimates, TRE- Third Revised Estimates Source: Directorate of Economics and Statistics, Government of Telangana
1 Beedi Leaf: Leaves of the tendu tree (Diospyros melanoxylon) are used to wrap beedi, a thin cigarette or mini-cigar filled with tobacco flake.
2014-15
2015-16
2016-17
2017-18
2018-19 (TRE)
2019-20 (SRE)
2020-21 (FRE)
2021-22 (AE)
1,715
1,683
1,836
1,921
1,942
1,921
1,978
1,944
2.51
2.56
2.53
2.39
2.18
1.81
1.86
1.77
0.45
0.40
0.40
0.38
0.36
0.33
0.36
0.32

201
The GVA at constant (2011-12) prices by the forestry and logging grew from Rs. 1,715 crore in 2014-15 to Rs. 1,944 crore in 2021-22, an absolute increase of 13.35%. During this period, the GVA at constant (2011-12) prices by the sub-sector experienced a Compound Annual Growth Rate of 1.81% (see Figure 12.3).
12.2.3. Initiatives for Forest Health and Vitality
12.2.3.1. Telanganaku Haritha Haram
The Government of Telangana introduced Telangana Ku Haritha Haaram (TKHH, Green Garland for Telangana) that aims to increase the tree cover in the state from 24% to 33% of the total geographical area (see Figure 12.4). The strategy to achieve this is two-fold:
lTake up extensive planting activities outside the notifi ed forest areas like roadside, barren hills, institutional premises, housing colonies and community lands.
lTake up large-scale planting activities inside the notifi ed forests to increase density and assist natural regeneration through intensive water harvesting structures in forests.
The sixth phase of TKHH started in June 2020 from Medak district. In 2020-21, around 3,346 lakhs were planted by 2020-21 (see Table 12.2).
To supplement and sustain the massive plantation activities by Telanganaku Haritha Haram, the Government has established Telangana Haritha Nidhi, or Telangana Green Fund that receives contributions from public representatives, government employees and civil society.
12.2.3.2. Urban Forest BlocksThe ‘urban forest blocks’ are designed to provide adequate lung space to the Hyderabad Metropolitan Development Authority (HMDA) limits. These forest blocks would be protected from anthropogenic disturbances.
Forestry and Environment
Figure 12.4
Status of TKHH from 2015-16 to 2020-21
*Till September 2021 Source: Department of Environment, Forests, Science and Technology
Number of seedlings - Yearly total (in Lakhs)
Number of seedlings - Cumulative Total (in Lakhs)
2015
-16
2016
-17
2017
-18
2018
-19
2019
-20
2020
-21
2021
-22*
Tota
l Ta
rget
Tota
l A
chie
vem
ent
1,586
4,754
10,758
14,414
18,704
22,05023,600
4,2913,655
6,005
3,167
1,5861,549
3,346
23,0
00
23,6
00
Table 12.2
Seedlings planted under Telangana Ku Haritha Haaram (2020-21)
Description
Number of seedlings (in Lakhs)
Inside forests (by Artifi cial Regeneration)
Inside forests (by Rejuvenation)
Outside Forests
GHMC
HMDA
Total
205.4
615.0
1,980.1
211.9
333.8
3,346.2
Source:Department of Environment, Forests, Science and Technology, Government of Telangana

Telangana Socio Economic Outlook 2022202
The Government has decided to establish 188 forest blocks spread over 1,60,660 acres in 129 locations of which 99 blocks are stand-alone whereas the remaining 89 fall under 30 clusters. 59 of the total 129 locations would be developed as ‘urban forest parks’ owing to their proximity to residential areas. This would provide healthy opportunities for recreation and entertainment to the residents. The remaining 70 that are away from habitations would be conservation blocks. 19 out of 129 locations are already developed in 7 different districts falling in the HMDA limits.
12.2.3.3. GeomaticsGeomatics refers to the methods and technologies used to collect, distribute, store, analyze, process, and present geographic data. It encompasses Geographic Information Systems (GIS), Global Positioning Systems (GPS), Cartography, Remote Sensing, and Surveying.
The forest department uses Geomatics-based tools for the efficient management of its forests along
with Information and Communication Technology (ICT) tools. The department has developed a modular based web-enabled Forest Management Information System (FMIS) for the public servants and other stakeholders. 20 modules have been developed and operationalized and 5 modules are at different stages of development. These systems have also helped during the COVID-19 pandemic to cope with emergencies.
12.2.3.4. Implementation of FRA 2006The Government of India enacted the ‘Scheduled Tribes and other Traditional Forest Dwellers (Recognition of Forest Rights) Act’ in 2006, also known as FRA, 2006, and subsequently in 2008 the ‘Scheduled Tribes and other Traditional Forest Dwellers (Recognition of Forest Rights) Rules’ were introduced.
FRA, 2006 granted the Scheduled Tribes and other traditional forest dwellers the right to hold and live in the forest land and the rights to “protect, regenerate or conserve or manage any community forest
Table 12.3
Progress on Compensatory Afforestation under the Forest Conservation Act, 1980 as on 31st March 2021
Source: Department of Environment, Forests, Science and Technology, Government of Telangana
SN Item Value as of 31st March 2021
1 Area diverted 41,575 ha
2 Area diverted in forest land 13,874 ha
3 Area diverted in non-forest land 15,227 ha
4 Compensatory Afforestation Stipulation (Total) 29,101 ha
5 Additional and penal compensatory afforestation, and, safety zones 3,508 ha
6 Implementation of stipulated area afforested on forest land 10,787 ha
7 Implementation of stipulated area afforested on non-forest land 12,334 ha
8 Implementation of stipulation area afforested (Total) 23,121 ha
9 Balance area to be afforested on forest land (including additional and 6,771 ha penal compensatory afforestation and safety zone area)
10 Balance area to be afforested on non-forest land 2,892 ha
11 Balance area to be afforested (Total) 9,663 ha

203
resource that they have been traditionally protecting and conserving for sustainable use”. As of January 2022, the Government has issued title certificates to 96,676 individuals involving 3,08,614 acres and 721 community titles involving 4,54,054 acres. 12.2.3.5. Implementation of CAMPAComplying to the guidelines by the Government of India, the Government of Telangana established the Telangana State Compensatory Afforestation Fund Management and Planning Authority (TSCAMPA) in 2014.
TSCAMPA is entrusted with the responsibility of managing the money received from the user agencies towards compensatory afforestation, additional compensatory afforestation, penal compensatory afforestation and Net Present Value to compensate for the diversion of forest land to non-forest use.
The components under CAMPA include Compensatory Afforestation (CA), Catchment Area Treatment (CAT), Integrated Wildlife Management Plan (IWMP), Net Present Value (NPV), interest and others. Table 12.3 shows the progress of CAMPA in Telangana as on 31st March 2021.
12.2.4. Institutions for Forest Management, Research and Training 12.2.4.1. TSFDCThe Telangana State Forest Development Corporation was established with the objective of raising plantations to meet the demand of wood-based industries. The corporation has been raising various species such as eucalyptus and bamboo to meet the pulpwood demand of various paper mills in the state, thus relieving the natural forests from the burden of supplying the raw materials to them. TSFDC is spread across 12 districts in the state with a net area of 33,743 hectares (see Table 12.4). 12.2.4.2. Telangana State Forest Academy
The Telangana State Forest Academy (TSFA) was formed with the objective of conducting training programmes for public service officers working in the forest and wildlife sectors. In 2020-21, TSFA organized 62 division-level and 9 state-level refresher training programmes covering 6,150 and 1,625 participants respectively. It conducted 8 division-level and 7 state-level refresher training programmes covering 2,389 and 533 participants respectively in 2021-22 (till August 2021).
12.2.4.3. FCRI MuluguThe Government established a Forest College and Research Institute (FCRI) in 2016 in Mulugu of Siddipet district. FCRI aims to bring out qualified forestry professionals for the conservation and sustainable management of forest resources. FCRI offers bachelors-level, masters-level and doctoral degree programmes in forestry.
It also develops appropriate methods through rigorous research to propagate plantation crops to meet the domestic and industrial needs. Furthermore, FCRI provides extension training to farmers and develop agro-forestry models suitable for different agro-ecological systems.
12.3. Biodiversity According to the Biological Diversity Act, 2002, ‘biological diversity’ means the variability among living organisms from all sources and the ecological
Forestry and Environment
Table 12.4
Area managed by TSFDC (as of January 2022)
Type of Plantation
Total Area (In Ha)
1 Eucalyptus 22,279
2 Teak 275
3 Bamboo 7,077
4 Miscellaneous 4,112
Total 33,743
Source: Department of Environment, Forests, Science and Technology, Government of Telangana

Telangana Socio Economic Outlook 2022204
complexes of which they are part and includes diversity within species or between species and of eco-systems.
The Government of Telangana has adopted both in-situ and ex-situ conservation of biodiversity in the state. In-situ conservation is the way of conserving living species, especially wild and endangered species in their natural habitats and environment. This includes biosphere reserves, national parks, wildlife sanctuaries, etc. On the other hand, ex-situ methods involve conserving living species in artful habitats that refl ect their natural living habitats. Examples of ex-situ conservation are zoological parks, aquariums, botanical gardens, cryopreservation, DNA banks etc.
12.3.1. In-situ Conservation: Protected Areas in TelanganaTo protect its rich biodiversity, the Government of Telangana declared a network of 12 protected areas that includes 9 wildlife sanctuaries (see Table 12.5) and 3 national parks (see Table 12.6) covering an area of 5,692 sq.km.
All the three national parks fall within the Hyderabad Metropolitan Development Authority (HMDA) area and ensure that the city stays habitable for the people.
12.3.1.1. Project TigerTelangana has two tiger reserves with the objective to ensure the survival and propagation of tigers (see Table 12.7). The Amrabad Tiger Reserve located in the Nallamala hill tracts and spreads over
Table 12.5
Wildlife Sanctuaries in Telangana
* Core area of Kawal Tiger Reserve ** Core area of Amrabad Tiger Reserve Source: Department of Environment, Forests, Science and Technology, Government of Telangana
Name of the sanctuary District Area (sq.km)
Kawal *
Pranahita
Siwaram
Eturunagaram
Pakhal
Kinnerasani
Manjira
Pocharam
Amrabad Tiger Reserve **
Total Area
Mancherial
Mancherial
Mancherial
Mulugu
Warangal
Bhadradri Kothagudem
Sangareddy
Medak
Nagarkurnool and Nalgonda
892
136
30
803
860
635
20
130
2,166
5,672
Table 12.6
National Parks in Telangana
Kasu Brahmananda Reddy National Park
Mrugavani National Park
Mahavir Harina Vanasthali National Park
Total Area
Hyderabad
Rangareddy
Rangareddy
1
4
15
20
Name of the National Park District
Area (sq. km)
Source: Department of Environment, Forests, Science and Technology, Government of Telangana
Table 12.7
Tiger Reserves in Telangana
Kawal Tiger Reserve
Amrabad Tiger Reserve
892
2,166
1,123
445
2,015
2,611
Core Area
(sq. km)
Buffer Area
(sq. km)
Total Area
(sq. km)
Source: Department of Environment, Forests, Science and Technology, Government of Telangana

205
Mahabubnagar and Nalgonda districts to a total area of 2,611 sq.km. The Kawal Tiger Reserve with a total area of 2,015 sq.km has forest areas which are contiguous to Tadoba-Andheri Tiger Reserve in Maharashtra and Indravati Tiger Reserve in Chhattisgarh. Tigers are observed to migrate between Kawal and the other two reserves. The All-India tiger estimation carried out in 2018 indicated the presence of 16 tigers in Amrabad and 10 in Kawal.
Under the Swadesh Darshan initiative of Government of India an eco-tourism circuit in Mahbubnagar district has been developed. Encompassing the Nallamala Hills and the Eastern Ghats, this circuit covers rivers and waterfalls, temples, and natural caves, with the Srisailam temple anchoring the whole package. The revenue generated through the eco-tourism projects in Mannanur, Farhabad, Mallelatheertham and Domalapenta with the
involvement of local communities is deposited in the Tiger Conservation Foundation and utilized for the development and conservation of wildlife, particularly tigers.
12.3.2. Ex-situ ConservationThe Government of Telangana has adopted ex-situ conservation methods to facilitate the breeding of endangered species and their rehabilitation in the natural habitat. For this purpose, the Government manages two zoos in the state—in Hyderabad and Warangal (see Table 12.8).
The Government has also set up deer parks to conserve antelopes including black buck (Antilope cervicapra), Sambhar deer (Rusa unicolor), Chousingha deer (Tetracerus quadricornis) and Spotted deer (Axis axis) at four locations. In addition, there are two private deer parks in the state (see Table 12.8).
Table 12.8
Zoological Parks and Deer Parks in Telangana
Source: Department of Environment, Forests, Science and Technology, Government of Telangana
1 Nehru Zoological Park2 Kakatiya Zoological Park3 Total area under zoological parks Government-owned Deer Parks4 Jawaharlal Nehru Tourist Complex (JLTC) 5 Pillalamarri Deer Park6 Kinnerasani Deer Park7 LMD Deer Park8 Total area under Government-owned deer parks Private Deer Parks9 Deer Park - Kesoram Cement10 Sanghi Deer Park11 Total area under private deer parks 12 Total area under deer parks [ 8 + 11 ] 13 Total area under zoological parks and deer parks [ 3 +12 ]
152.019.2
171.2
26.05.8
14.512.558.8
5.3-
5.3
64.1235.3
HyderabadWarangal Urban
MedchalMahabubnagarKothagudemKarimnagar
PeddapallyRangareddy
Zoological ParksDistrictNameSN Area (hectares)
Forestry and Environment

Telangana Socio Economic Outlook 2022206
12.3.3. BIOSOT The Government of Telangana constituted the Biodiversity Conservation Society of Telangana (BIOSOT) as per the orders of the Honourable Supreme Court of India to implement the conservation measures in the wildlife sanctuaries. An amount of Rs. 25.36 crore is deposited in the BIOSOT account pertaining to the Srisailam Left Bank Canal Project. The interest accrued to the principal amount is utilized for the protection and management of sanctuaries and tiger reserves. This includes initiatives such as habitat improvement, installation of solar pump-equipped bore wells and purchase of camera traps to monitor the movement of wild animals etc.
12.3.4. Implementation of Biodiversity Act, 2002The Government of India enacted the Biological Diversity Act, 2002 (BDA, 2002) to provide for the conservation of biological diversity, sustainable use of its components and fair and equitable sharing of the benefits arising out of the use of biological resources and knowledge. To implement this in the state, the Government of Telangana created the Telangana State Biodiversity Board (TSBB) as a statutory and autonomous body corporate under section 22 of the BDA, 2002.
TSBB is entrusted with the responsibility to advise the Government on matters relating to the conservation of biodiversity, sustainable use of its components and equitable sharing of the benefits arising out of the utilization of biological resources. TSBB also performs the regulatory functions like managing the requests for commercial utilization of biological resources.
Biodiversity Management Committees: TSBB constituted Biodiversity Management Committees (BMCs) in the state under Section 41 of the Biological Diversity Act, 2002. The major functions of BMCs are (i) promoting the conservation of biological diversity, (ii) documentation of biological diversity,
(iii) preservation of habitats, (iv) conservation of land-races, folk varieties and cultivars, domesticated stocks and breeds of animals, and microorganisms, (v) chronicling of knowledge relating to biodiversity and (vi) facilitating the preparation of people’s biodiversity registers. Currently, there are 13,426 BMCs in the state covering 538 out of 540 mandals.
People’s Biodiversity Register: People’s Biodiversity Register (PBR) is a legal document that contains the details of the biological resources occurring within a BMC. It has comprehensive information on the availability and knowledge of local biological resources, medicinal or any other use or traditional knowledge associated with them. It also acts as a legal evidence of prior knowledge and a useful tool in the management and sustainable use of bioresources. 213 PBRs have been prepared to date. Ameenpur lake is recognized as a Biodiversity Heritage Site.
12.4. Pollution Control12.4.1. Air Quality Air Quality Index (AQI) is a composite measure of air pollution. Based on the ambient concentration values of air pollutants and their likely health impacts, AQI categorizes pollution levels into Good, Satisfactory, Moderate, Poor, Very Poor, and Severe. No monitoring station in the state recorded AQI level worse than ‘moderate’ between 2016 and 2021.
The Government established an Air Quality Monitoring Committee to prepare an action plan for Air Quality. The Telangana State Pollution Control Board (TSPCB) targets a 30% reduction in Particulate Matter of size less than 10 microns (PM 10) by 2025-26.
The Government has also decided to increase the number of Continuous Ambient Air Quality Monitoring Stations (CAAQMS) from 5 to 13. TSPCB has also introduced the TSAIR mobile application through which the public can register complaints related to air pollution in the cities in the state.

207
According to the ‘India: Health of the Nation’s States’ Report 2017, the Disability Adjusted Life Years (DALY) Rate2 attributable to air pollution (per 1 lakh population) is 2,710 in Telangana compared to the national average of 3,469. This implies that markedly fewer persons suffered from deaths and diseases on account of air pollution in Telangana than in the country as a whole. 12.4.2. Water QualityTSPCB monitors water quality under the National Water Quality Monitoring Programme (NWMP) in the water bodies in the state using 244 stations covering rivers, lakes, groundwater and sewage treatment plants.
29 Sewage Treatment Plants (STP) are operational in the state accounting for a total capacity of 885.5 million litres per day (MLD) and utilization of 735.8 MLD. Two Real-Time Water Quality Monitoring Stations (RTWQMS) are installed in Hussain Sagar Lake and Fatehnagar in Hyderabad. There are 4 Common Effluent Treatment Plants in Telangana under operation with a total capacity of around 6,850 kilolitres per day (see Table 12.9)
TSPCB has developed a GPS-based automatic effluent tanker tracking and reporting system
in collaboration with the Centre for Good Governance, Hyderabad. This is implemented in 167 vehicles transporting effluents to the Common Effluent Treatment Plants (CETPs).
12.4.3. Waste Management in Telangana
Solid Waste: In 2016-17, the collection rate of solid waste in the state was only 89.9%. With the persistent efforts of the Government, the collection rate of solid wastes has reached 100% by 2020-21. The percentage of waste treated out of the total waste generated also increased during this period (from 61.4% in 2016-17 to 75.56% in 2020-21) (see Figure 12.5).
Table 12.9
Common Effluent Treatment Plants in Telangana
Legend: LTDS- Low Total Dissolved Solids Wastewater, HTDS- High Total Dissolved Solids Wastewater, KLD- kilolitres per day Source: Telangana State Pollution Control Board
CapacityLocation
Jeedimetla
Patancheru
Balanagar
Mallapuram (Uppal)
LTDS-1500 KLD, HTDS-200 KLD
LTDS-3000 KLD
LTDS- 150 KLD
LTDS- 2000 KLD
2 DALY stands for ‘Disability Adjusted Life Years’, and is a time-based measure that combines years of life lost due to premature mortality (YLLs) and years of life lost due to time lived in states of less than full health, or years of healthy life lost due to disability (YLDs). One DALY represents the loss of the equivalent of one year of full health.
Figure 12.5
Solid Waste Management in Telangana (2016-17 to 2020-21)
Percentage of waste collected out of the total waste generated
Percentage of waste treated out of the total waste generated
Source: Telangana State Pollution Control Board
2016-17 2017-18 2018-19 2019-20 2020-21
89.99
61.44 62.19 67.64
7,804 7,871 8,497 9,785 9,965
62.03
75.56
99.28 98.39 94.74100.00
Waste Generated (Tonnes per day)
Forestry and Environment

Telangana Socio Economic Outlook 2022208
There are 5 waste-to-energy plants in Telangana; four with a capacity of 35.6 MW each and one with a capacity of 19.8 MW.
An Integrated Municipal Solid Waste Management project with a capacity of 6,275 Tonnes Per Day is established in Jawaharnagar, Hyderabad. This location also has an electricity generation plant using solid waste, established by GHMC.
140 Urban Local Bodies (ULB) in the state have identified lands for establishing processing facilities. 113 ULBs have established 279 dry resource collection centres to process dry waste. 102 ULBs have established wet processing facilities like vermicomposting yards.
Bio-Medical Waste: The Government ensures that 100% of the Bio-Medical Waste generated in the state is treated either through incineration or auto-clave. In all years from 2016-17 to 2020-21, the ratio of BMW incinerated to that processed in auto-claves remained around 3:1 (see Table 12.10).
The treated BMWs are also disposed of, through authorized recyclers. TSPCB has permitted 11 Common Bio-Medical Waste Treatment Facilities (CBWTFs) in Telangana State for collection and safe disposal of the Bio-Medical Waste. 51 Bio-medical waste-carrying vehicles are equipped with GPS-tracking.
e-Waste Management Policy in 2017The policy envisions creating an aware society that plays an active role in managing e-Waste by segregating and channelizing end-of-life products to the right avenues. The Government earmarks industrial space or shed for dismantling or recycling e-waste in the upcoming industrial parks, estates and clusters. Personnel working on-ground with the dismantling and recycling of e-waste would undergo this registration process so that they would not experience lack of personal protective equipment or unethical work practices. e-waste workers would be provided with the necessary skills through the Telangana Academy for Skill and Knowledge (TASK) and the Skill Council for Green Jobs.
Other Measures taken to prevent pollution Steps taken by the Government to combat other kinds of pollution in the state include:l 54 vehicles that carry hazardous waste to
the Hyderabad Waste Management Project, Dundigal and 11 vehicles to GEPIL, a hazardous waste processing facility, are equipped with GPS-tracking.
l Two Construction and Demolition waste processing plants are commissioned at Jeedimetla and Fathullaguda, with a capacity of 500 TPD each.
Table 12.10
Bio-medical Waste in Telangana: Generated Vs Treated
Source: Telangana State Pollution Control Board
Quantity (in kilograms) 2016 2017 2018 2019 2020
Total BMW generated 13,220 15,719 16,243 20,472 23,810
Incineration per day 9,858 11,317 11,841 16,082 17,819
Auto clave per day 3,362 4,402 4,402 4,390 5,991
BMW treated out of generated 100% 100% 100% 100% 100%

209
12.5. Conservation and Climate ActionTelangana is vulnerable to climate-induced natural disasters, predominantly, droughts, heat waves and flash floods. The frequency, intensity, and patterns of these disasters has been changing on account of climate change, and leading to unprecedented loss of human life as well as wealth.
The Telangana State Heatwave Action Plan, 2020 provides a framework to the state administration for heatwave response.
The Government also developed the Telangana State Action Plan for Climate Change (TSAPCC) in 2015. TSAPCC provides a framework to undertake actions that deliver benefits for growth and development while mitigating and adapting to climate change.
12.6. Way ForwardThe Government of Telangana is led by the constitutional vision to protect its natural environment. It has also aligned its programmes on forest, environment, biodiversity and climate change with four interconnected goals under the 2030 Sustainable Development Goals (SDG) Agenda- Clean Water and Sanitation (SDG 6), Responsible Production and Consumption (SDG 12), Climate Action (SDG 13) and Life on Land (SDG 15). In pursuing this, the policy frameworks such as the Telangana State Climate Action Plan, 2015, and initiatives such as Telangana Ku Haritha Haram would take the lead on achieving the target of 33% forest cover in the state even in the coming years. This would be supplemented with the ongoing initiatives of the Telangana State Pollution Control Board, rural and urban local bodies and the Telangana State Biodiversity Board.
Forestry and Environment
Telangana Socio Economic Outlook 2022210
PANCHAYAT RAJ & PALLE PRAGATHI
CHAPTER
13

211
l For spatial and administrative decentralisation, and to bring in transparency, accountability and people-centredness to governance, the Government of Telangana, since its formation, has reorganised the 10 districts, 459 mandals and 8,368 gram panchayats into 33 districts, 594 mandals, and 12,769 gram panchayats.
l The Palle Pragathi programme was launched in 2019 with the twin objectives of enhancing the quality of life in the rural areas and improving the governance of Gram Panchayats (GPs). The programme has completed four campaign rounds until July 2021 with a total expenditure of Rs. 8,617.45 crore. Key achievements include the construction of 12,714 crematoria, 12,751 dumping yards, and plantation of 9.30 crore seedlings across all GPs.
l The state has witnessed a transformation in rural governance, with improvements in Gram Panchayat (GP) infrastructure as well as better service delivery relating to sanitation, street lighting, water
supply, green cover, and financial management.
l The Government promulgated ‘The Telangana Panchayat Raj Act 2018’ clearly defining powers available to GPs, outlining roles and responsibilities of their functionaries, and introducing a monitoring system for Mandal Panchayat Officers to inspect the functioning of GPs once every 3 months. In line with the Panchayat Raj Act, the declaration of many tribal thandas as independent GPs has helped empower marginalised sections of society.
l The state has ensured capacity building of newly recruited 9,355 Junior Panchayat Secretaries. The capacity building initiatives have been expanded to train functionaries across the state. With the objective of promoting progress of Panchayat Raj Institutions, a data-driven GP-level performance measurement and management framework has been launched with clear supportive supervisory systems across all levels of Panchayat Raj institutions.
Key Highlights
Panchayat Raj & Palle Pragathi

Telangana Socio Economic Outlook 2022212
13.1. Democratic Decentralisation and Development
ctive participation and effective governance of the people, by the people and for the people is central to
a functioning democracy. Such participation and effectiveness is possible only when the functions and resources of the state are devolved to the elected representatives at the district, mandal, panchayat and ward levels. This devolution is aimed at empowering all sections of the people to come together, identify their strengths and problems, and suggest as well as demand solutions and monitor their implementation. This forms the crux of democratic decentralisation.
Taking the concept of decentralisation forward in letter and spirit, the Telangana Government, since the inception of the state, has been involved in changing the paradigm of the planning process so as to reflect the felt needs of the people in the policies and programmes. Through the introduction of the new Panchayat Raj Act, 2018 and its implementation through Palle Pragathi (Telangana Rural Inclusive Growth Project), the Telangana Government continues to focus on solving grassroot issues. Further, under the Fifth Schedule of the Constitution, special provisions are made for the Scheduled Areas. Currently, the Scheduled Areas in the state consist of 1,180 scheduled villages spread over 85 mandals in nine districts—Adilabad, Kumuram Bheem, Mancherial, Mulugu, Warangal (Rural), Mahabubabad, Bhadradri-Kothagudem, Khammam, and Nagarkurnool districts.
By the 73rd constitutional amendment, the Indian government empowered the Panchayat Raj Institutions (PRIs) to create their own development plans, generate taxes, administer schools, health facilities, development infrastructure etc.
The 3-tiered structure of PRIs recognises the layered nature of welfare, development and public policy
delivery. The roles and responsibilities of the elected representatives and government officials are well defined under the structure and they are expected to function in harmony and close cooperation for executing public work.
13.2. Implementation Status: Telangana Panchayat Raj Act 2018According to the Panchayat Raj Act, 2018 only the State legislature is competent to notify or de-notify a village. The Gram Panchayat is primarily responsible for maintenance of sanitation, plantations, streetlights and collection of taxes and non-taxes. For this, each GP must prepare a Gram Panchayat Development Plan (GPDP) and also take up activities connected with planning. In order to ensure the implementation of the plans and accountability of the village level functionaries, Gram Sabha must meet once in two months (6 times in a year). Several reports including annual development report, audit report and administration report need to be placed before the Gram Sabha which has four Standing Committees in the Gram Panchayat viz. Sanitation, Street Lights, Plantation and Works. Sarpanch and Panchayat Secretary stand to be removed from their positions for non-conduct of Audit in their Panchayat. Further, powers are delegated to the District Collectors to initiate disciplinary action against Panchayat officials. Additionally, a Gram Panchayat Tribunal is constituted to appeal on the removal of Sarpanchs.
Reservations to each category are extended for 2 terms with 100% ST population villages reserved for ST category in plain areas.
Accordingly elections to all the rural local bodies were conducted in 2019.
13.2.1. Reporting System for Panchayat SecretariesOver the last two years, a foundation has been
A

213
established for technology based, verifiable data based reporting by field level Panchayat Raj officials. A mobile application has been developed for Panchayat Secretaries (PSs) to report on daily, as well as, monthly indicators that have a strong outcome focus. Indicators reported are aligned with the responsibilities of the PSs as per the Telangana Panchayat Raj Act 2018.
13.2.2. Supervision of Gram Panchayats The Mandal Panchayat Officer (MPO) plays an important role in the supervision of Gram Panchayat performance. With the smallest average mandal population of any state, Telangana is at an advantage as MPOs can cater to a manageable population and get the pulse of citizens to improve service delivery (Fig. 13.1).
A second mobile application has been developed for use by Mandal Panchayat Officers as well as other supervising officers tasked with conducting inspections (Divisional Panchayat Officers, District Panchayat Officers, Deputy Chief Executive Officers of Zilla Praja Parishads and Chief Executive Officers of Zilla Praja Parishads).
Care has been taken to ensure compatibility between Gram Panchayat level reporting and data collected by the inspecting officers from mandal, revenue division, district and state level. This supervisory approach being deployed by the Panchayat Raj and Rural Development Department, can allow managerial officers at each level to efficiently oversee and support the progress of those under their charge, and as such holds potential to be replicated across multiple service delivery departments.
13.2.3. Citizen Feedback on Service DeliveryThe Department has also implemented innovative measures to improve GP management. To obtain a citizen-centric view on Gram Panchayat performance,
the Department has piloted an outbound call centre to get feedback on service delivery. An interactive voice response (IVR) automated calling system has also been tested as a means to capture citizen feedback at scale. To improve accuracy in data collection, the Department has also tagged all GP roads and GP office buildings. A GPS coordinate based attendance system has also been developed, allowing Panchayat Secretaries to fill their activity reports only once they report to the GP office.
13.2.4. Guidance From District AdministrationAccording to the Panchayat Raj Act, powers are delegated to the District Collectors to guide and monitor the performance of Panchayat Raj officials. To strengthen supervisory capacity at the district level, the state Government has created a new post
Figure 13.1
Average Mandal Population in States (2021)
Source: Local Governance Directory and National Commission on Population
Average Mandal Population
Telangana
Andhra Pradesh
Goa
Odisha
Jharkhand
Tamil Nadu
Punjab
Chhattisgarh
Haryana
Rajasthan
Bihar
Kerala
Madhya Pradesh
Uttar Pradesh
Gujarat
West Bengal
Karnataka
Maharashtra
64,050
79,023
1,26,000
1,40,233
1,45,724
1,96,913
2,01,318
2,02,007
2,07,627
2,25,231
2,30,493
2,33,481
2,70,020
2,78,874
2,79,152
2,85,248
2,94,472
3,53,515
Panchayat Raj & Palle Pragathi

Telangana Socio Economic Outlook 2022214
of ‘Additional Collector, Local Bodies’ to look after the administration of Gram Panchayats, Mandal Praja Parishads and Zilla Praja Parishads and Urban Local Bodies in the district.
13.2.5. Financial SupportThe state plays an important role in financing GPs by matching the Union Finance Commission grants. Allocation and release of funds are proportionate to the population with additional fund support being provided to vulnerable groups. During 2021-22, Rs. 1,365 crore was allocated under the 15th Finance Commission grant and a matching amount of Rs. 1,365 crore was allocated under the State Finance Commission grant.
Efforts have also been made to improve financial planning at the Gram Panchayat level. All Gram Panchayats in the state have prepared their annual budget till 2023-24, keeping 10% of funds reserved for green activities. A system of expenditure codes has also been launched in GPs to track and analyse expenses of different focus areas of the Panchayat Raj Act.
13.2.6. Service Delivery To CitizensSanitation: Gram Panchayats play a crucial role in sanitation of rural areas, from household waste collection and segregation to daily cleaning of village roads and institutions. The state finances various initiatives to promote waste management practices.
Green cover: Telangana ku Haritha Haram (Green Garland for Telangana) is a flagship programme of the Govt. of Telangana to increase the Green Cover from 24% to 33%. At the village level, a standing committee on plantation must be created to promote plantation activities.
Streetlights: Streetlights are integral to promoting public safety and reducing road accidents.
Panchayat Secretaries are responsible for daily quality checks of streetlights, and the Department monitors the timely payment of power consumption bills for streetlights every month. Initiatives have also been taken to improve the quality of streetlight infrastructure in remote areas.
Water supply: Gram Panchayats play an important role in ensuring last mile access to drinking water as part of the state’s flagship Mission Bhagiratha scheme. GPs are required to certify that there are no leftover households to provide tap water connections. They are also required to report any problems related to supply of drinking water to the concerned Mission Bhagiratha officer and coordinate to ensure timely resolution of issues. Testament to the effective implementation of the scheme, Telangana is India’s first large state which has achieved 100% coverage of functional household tap connections in all rural habitations through sustainable surface sources (as per Ministry of Jal Sakthi, GoI).
COVID-19 duties: To drive the state’s COVID-19 containment activities to the grassroots level, Panchayat Secretaries have played an active role in village disinfection, coordinating with frontline healthcare workers to supply masks, building awareness about vaccination, testing, and educating citizens about social distancing.
13.2.7. Capacity Building Initiatives Telangana State Institute for Rural Development (TSIRD) is the apex institute for training the Panchayat Raj and Rural Development Department (PRRD) functionaries including the elected representatives. From January to November 2021, TSIRD through its Hyderabad campus, as well as 2 extension centres (Rajendranagar, Rangareddy district and Hasanparthy, Warangal district) conducted 218 training programs with a total of 6,768 participants. Core areas of training include: Implementation of Panchayat Raj Act, IT and e-governance, MGNREGS implementation, social audit, and thematic training

215
With the launch of mobile applications for Panchayat Secretaries, it has become easier to collect, aggregate and analyse data reported by field functionaries and use it to drive improvements in outcomes. Table 13.1 summarises the share of GPs in each district that have scored more than 80% on ‘sanitation’ and ‘streetlight’ indicators that are collected as part of the daily and monthly reporting of the Panchayat Secretary. The sanitation indicator includes data on cleanliness of roads, drains and institutions as well as waste management practices of Gram Panchayats. The streetlights indicator captures the share of functioning streetlights during daily random road inspections by the Panchayat Secretary. For the GPs having sub-optimal performance as per the PS’App, the district administration has taken relevant steps to strengthen their performance.
Box 13.1
Monitoring District Level Outcomes Using ‘Palle Pragathi for PS’ App
Table 13.1
District-wise Share of GPs with Score Above 80% in PS’ AppShare of GPs with Score Above 80%
1 Adilabad2 Bhadradri Kothagudem3 Hanumakonda4 Jagtial5 Jangaon6 Jayashankar Bhupalapally7 Jogulamba Gadwal8 Kamareddy9 Karimnagar10 Khammam11 Kumuram Bheem12 Mahabubabad13 Mahabubnagar14 Mancherial15 Medak16 Medchal Malkajgiri17 Mulugu18 Nagarkurnool19 Nalgonda20 Narayanpet21 Nirmal22 Nizamabad23 Peddapalli24 Rajanna Sircilla25 Rangareddy26 Sangareddy27 Siddipet28 Suryapet29 Vikarabad30 Wanaparthy31 Warangal32 Yadadri Bhuvanagiri
Source: Panchayat Raj & Rural Development Department, Government of Telangana
Sanitation StreetlightsAbove 80% Below 80%
90.2%91.5%86.5%91.3%84.0%91.3%86.3%88.0%89.5%87.3%54.0%92.0%87.3%79.7%83.8%44.3%90.8%83.9%73.6%93.9%92.9%84.7%88.7%89.0%67.9%91.3%82.8%89.9%86.4%88.2%87.0%70.5%
85.3%80.7%82.2%83.7%79.4%82.2%74.1%74.1%84.3%83.7%57.9%81.3%89.1%83.6%79.5%86.9%83.3%71.8%74.5%70.0%89.6%82.5%91.4%85.9%82.8%79.3%82.4%77.5%70.5%74.9%73.4%86.7%
on topics such as water and sanitation, and women and child welfare. TSIRD has also embraced digital tools for capacity building, using Society for Telangana State Network (SoFTNET) in 2017-18 to conduct 42 training programs for Panchayat Raj
functionaries and elected representatives.
The Panchayat Raj and Rural Development Department continues to use a data driven approach for capacity building. Surveys have been conducted
Panchayat Raj & Palle Pragathi
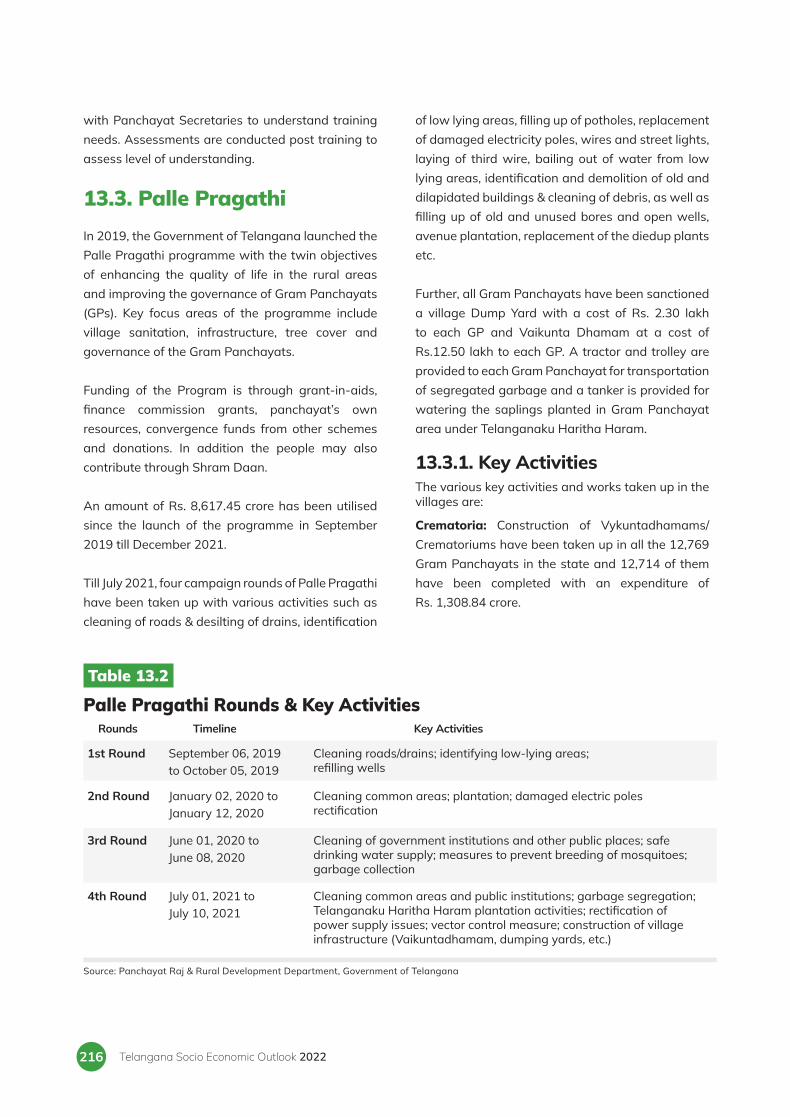
Telangana Socio Economic Outlook 2022216
with Panchayat Secretaries to understand training needs. Assessments are conducted post training to assess level of understanding.
13.3. Palle Pragathi In 2019, the Government of Telangana launched the Palle Pragathi programme with the twin objectives of enhancing the quality of life in the rural areas and improving the governance of Gram Panchayats (GPs). Key focus areas of the programme include village sanitation, infrastructure, tree cover and governance of the Gram Panchayats.
Funding of the Program is through grant-in-aids, finance commission grants, panchayat’s own resources, convergence funds from other schemes and donations. In addition the people may also contribute through Shram Daan.
An amount of Rs. 8,617.45 crore has been utilised since the launch of the programme in September 2019 till December 2021.
Till July 2021, four campaign rounds of Palle Pragathi have been taken up with various activities such as cleaning of roads & desilting of drains, identification
of low lying areas, filling up of potholes, replacement of damaged electricity poles, wires and street lights, laying of third wire, bailing out of water from low lying areas, identification and demolition of old and dilapidated buildings & cleaning of debris, as well as filling up of old and unused bores and open wells, avenue plantation, replacement of the diedup plants etc.
Further, all Gram Panchayats have been sanctioned a village Dump Yard with a cost of Rs. 2.30 lakh to each GP and Vaikunta Dhamam at a cost of Rs.12.50 lakh to each GP. A tractor and trolley are provided to each Gram Panchayat for transportation of segregated garbage and a tanker is provided for watering the saplings planted in Gram Panchayat area under Telanganaku Haritha Haram.
13.3.1. Key ActivitiesThe various key activities and works taken up in the villages are:
Crematoria: Construction of Vykuntadhamams/Crematoriums have been taken up in all the 12,769 Gram Panchayats in the state and 12,714 of them have been completed with an expenditure of Rs. 1,308.84 crore.
Table 13.2
Palle Pragathi Rounds & Key Activities
1st Round
2nd Round
3rd Round
4th Round
September 06, 2019 to October 05, 2019
January 02, 2020 to January 12, 2020
June 01, 2020 to June 08, 2020
July 01, 2021 to July 10, 2021
Cleaning roads/drains; identifying low-lying areas; refilling wells
Cleaning common areas; plantation; damaged electric poles rectification
Cleaning of government institutions and other public places; safe drinking water supply; measures to prevent breeding of mosquitoes; garbage collection
Cleaning common areas and public institutions; garbage segregation; Telanganaku Haritha Haram plantation activities; rectification of power supply issues; vector control measure; construction of village infrastructure (Vaikuntadhamam, dumping yards, etc.)
Source: Panchayat Raj & Rural Development Department, Government of Telangana
Timeline Key ActivitiesRounds

217
Dumping Yards: Construction of Dumping Yards has been taken up in all 12,769 Gram Panchayats and 12,751 of them have been completed by incurring an expenditure of Rs. 277.84 crore.
Greenery:Functional nurseries have been established in 12,759 Gram Panchayats and during 2020-21, 18.84 crore seedlings have been raised by incurring an amount of Rs. 271.23 crore.
For 2021-22, the PR&RD department surpassed its plantation target of 8.76 crore by planting 9.30 crore seedlings (106% achievement) with an expenditure of Rs. 436.02 crore.
Palle Prakruthi Vanam (Village Nature Park): PPVs constituting dense forest type plantations with an expenditure of Rs. 222.06 crore have been established in 19,472 Gram Panchayats and habitations which are serving as village nature parks and rural lung spaces.
Bruhat Palle Prakruthi Vanam (Village Nature Park for Mandal Headquarters): 5 BPPVs are being established in each mandal. Further, land identification has been completed at 785 sites against a target of 2,725. Plantation works have been completed in 98 sites and expenditure of Rs. 28.33 crore has been incurred.
Multi-Layer Avenue Plantation: MLAP plantation target of 8000 km (250 Km in each district) has been exceeded with 8305 km being covered at an expenditure of Rs. 26.42 crore.
Soak Pits: 11,64,643 individual and 32,941 community magic soak pits have been constructed in all the GPs of the State at a cost of Rs. 416.87 crore.
Rythu Vedikas: 2,597 Rythu Vedikas have been constructed in the State, for which an expenditure of Rs. 515.18 crore has been incurred.
Drying platforms: 49,170 Drying Platforms have been grounded and 19,309 are completed with an expenditure of Rs. 124.00 crore.
13.3.2. Resourcing for Palle Pragathi
During 2021-22, under State Finance Commission Grants, the Government of Telangana has allocated Rs. 1,365.00 Crore on par with 15th Finance Commission grant of Rs. 1,365.00 Crore. Further, the state Government is releasing Rs. 227.50 Crores to all the PRIs every month w.e.f. April 2021. Additionally, to fill resourcing gaps, Ministers are given Rs. 2 crores each, District Collectors are given Rs. 1 crore each and Additional Collectors (Local Bodies) are given Rs. 25 lakhs each, amounting to an overall total of Rs. 72 crores for meeting incidental expenditures during the implementation of Palle Pragathi.
Till December 2021, under State and Fifteenth Finance Commission grants, an amount of Rs. 1,820.00 crores has been released to the Gram Panchayats, Mandal Parishads and Zilla Parishads.
To ensure that the Gram Panchayats get a minimum of Rs. 5.00 lakh annual income, the Government has released Rs. 2.84 Crores to 332 Gram Panchayats under Assistance to Gram Panchayats for 2021-22. Further, the Government has allocated Rs. 500.00 Crores to Zilla Praja Parishads and Mandal Praja Parishads under State Finance Commission Grants.
13.4. Qualitative Aspects of Mahatma Gandhi National Rural Employment Guarantee Scheme (MGNREGS)
Telangana has channelized the MGNREGS for implementing several works under the Palle Pragathi programme to provide not only employment to
Panchayat Raj & Palle Pragathi

Telangana Socio Economic Outlook 2022218
citizens but also create indispensable permanent and quality assets in the rural areas.
13.4.1. Key Highlights of Telangana’s Performance (2021-22)1
l Wage seekers: 47.05 lakh wageseekers belonging to 28.13 lakh households have been provided wage employment.
l Person Days: 13.45 crore person days have
been generated with an average wage rate of Rs. 172.8 per day.
n Demographics: Out of total person days generated, nearly 22% has been for Scheduled Caste (SC) households, 21% for Scheduled Tribes (ST) households and remaining 57% for Others.
nAverage Person Days: 47.83 average person days were provided to reported households during the year.
nPerformance of districts: For the year 2021-22, until December, 15 districts in
13.3.3. Awards
Table 13.3
Best Performing Panchayats under Nation Panchayat Awards for the year 2021, under various categories for the Appraisal Year 2019-20
Deen Dayal Upadhyay Panchayat Sashaktikaran Puraskar (DDUPSP)
Nanaji Deshmukh Rashtriya Gaurav Gram Sabha Puraskar (NDRGGSP)
Child Friendly Gram Panchayat Award
Gram Panchayat Development Plan (GPDP) Award
7 Villages out of top 10 villages in the country under Saansad Adarsh Gram Yojana are from Telangana, as per the rankings released in 2021-22.
1
2
3
4
5
6
7
8
9
10
11
12
13
Zilla Praja Parishad Medak at Sangareddy
Korutla Mandal Parishad, Jagtial District
Dharmaram Mandal Parishad, Peddapalli District
Chakrapoor Gram Panchayat, Moosapet Mandal, Mahabubnagar District
Mittapalli Gram Panchayat, Siddipet (Urban) Mandal, Siddipet District
Ruyyadi Gram Panchayat, Talamadugu Mandal, Adilabad District
Malyala Gram Panchayat, Narayanraopet Mandal, Siddipet District
Parlapally Gram Panchayat, Thimmapur (L.M.D) Mandal, Karimnagar District
Haridasnagar Gram Panchayat, Yellareddipet Mandal, Rajanna Sircilla District
Sundilla Gram Panchayat, Ramagiri Mandal, Peddapalli District
Mohinikunta Gram Panchayat, Rajanna Sircilla District
Sundilla Gram Panchayat, Ramagiri Mandal, Peddapalli District
1. Vennampally (Karimnagar); 2. Kowlas (Nizamabad); 4.Ganneruvaram (Karimnagar); 5.Kandakurthi (Nizamabad); 6.Veeranapally (Karimnagar); 9.Ramakrishnapur (Karimnagar); 10.Thana Kurd (Nizamabad).
Source: Panchayat Raj & Rural Development Department, Government of Telangana
Category Mandal Parishad/ Gram Panchayat Name
1 Till January 28, 2022

219
Table 13.4
Year-wise MGNREGS physical targets, achievements and expenditureFinancial
YearSl.No.Target Person Days
(in Crore)Person-days generated
(in Crore)Percentage
AchievementFiscal Expenditure
(Rs. in Crore)
2014-152015-162016-172017-182018-192019-202020-212021-22*
Total
13.0813.5610.0012.0013.0012.0015.5013.00
102.14
10.3914.1810.8711.5011.7210.7215.7912.5697.73
79.0%101.0%107.0%96.0%90.0%89.0%
102.0%96.6%
95.1% (average)
2,0382,4102,6262,9303,0272,7344,5453,171
23,481
12345678
*(as on 20.12.2021) Source: Panchayat Raj & Rural Development Department, Government of Telangana
Figure 13.2
Achievement of districts based on physical performance in terms of person days (2021-22)
Note: Districts arranged in descending order of physical performance. Source: Panchayat Raj & Rural Development Department, Government of Telangana
Physical performance
(%)
Physical performance
(%)District District
125
122
121
117
113
111
110
108
107
107
106
104
102
101
101
98
97
97
97
93
92
92
90
89
88
87
86
82
78
73
72
64
Jogulamba
Mulugu
Hanumakonda
Suryapet
Medchal-Malkajgiri
Adilabad
Kumuram Bheem
Jayashankar
Nalgonda
Vikarabad
Narayanpet
Mancherial
Kamareddy
Mahabubnagar
Medak
Bhadradri
Jangaon
Siddipet
Yadadri
Mahabubabad
Sangareddy
Wanaparthy
Nirmal
Khammam
Nizamabad
Karimnagar
Nagarkurnool
Rajanna
Rangareddy
Peddapalli
Jagtial
Warangal
Average performance (%)
Up to 7071 to 8081 to 9091 to 100Above 100NA
Telangana have surpassed their targets of person days and nearly all districts have achieved more than 80% of their target (Fig. 13.2).
nExpenditure: An amount of Rs 3,478.25
crore has been incurred as expenditure during the year, of which 66.3% (Rs. 23,06.07 crore) has been utilised for wages, 30.3% (Rs. 1,053.9 crore) for creation of material assets and 3.4% (Rs. 118.26 crore) for administration
Panchayat Raj & Palle Pragathi
State average 97%
Up to 7071 to 8081 to 9091 to 100Above 100NA

Telangana Socio Economic Outlook 2022220
purposes (Fig. 13.3). According to the MGNREGA, 2005, states are mandated to maintain a wage-material ratio of 60:40.
13.4.2. Key aspects of implementation of MGNREGS
l Job Cards: MGNREGS Job Cards are valid for at least 5 years, after which they are reissued with due verification. 35 lakh job cards with QR Codes were printed and distributed in 2021-22.
l Use of ICT: n Mobile Monitoring System: e-MMS is a
mobile phone based technology customised for the MGNREGS field staff which includes mobile applications like Demand Capture, Work Allocation, e-Muster, e-Measurement, e-Check Measurement and e-Muster Verification. The Panchayat Secretary captures this data accessible through the web reports, which results in enhanced transparency and accountability.
n Public Finance Management System (PFMS): Payment of wages in the State made centrally by GoI has migrated from Electronic Fund Transfer system (eFMS) to National electronic Fund Management System (NeFMS) platform. Material and administrative expenditure will be paid by the State Government through eFMS.
l Quality Control Wing: An exclusive Quality Control Wing has been established under the Chief Quality Control Officer.
l Grievance Redressal / Call Centre: Grievance redressal rules were notified and a full-fledged complaint cell was established. Applicants can file complaints by calling a toll free number or by lodging their complaints on the website.
l Social Audit and Follow-up of Social Audit findings by the Vigilance Wing: Independent directorate of Society for Social Audit Accountability & Transparency (SSAAT) is a collaboration of Government and social activists and has been functioning since 2009. SSAAT’s mission is to promote the empowerment of rural communities directly benefiting from welfare schemes, minimization of leakages and wastage of public funds. Findings of the Social Audit are presented before the Gram Sabha and Block Public Hearing. A Special Vigilance Wing is formed at the State level and at each district for the follow-up of social audit findings.
13.5. Society for Elimination of Rural Poverty (SERP)SERP is a sensitive and supportive structure to facilitate social mobilisation of poor rural women in the rural areas of the 32 districts in the state, except in the urban district of Hyderabad. Focusing on the demand side of the problem, it works by building
Figure 13.3
Expenditure distribution during 2021-22
Source: Panchayat Raj & Rural Development Department, Government of Telangana
Wage66.3
Material30.3
Admin3.4
Share of expenditure
(%)

221
and nurturing Self Help Groups (SHGs) of women and their federations, by focusing on the following:
13.5.1. Institution & Capacity Buildingl Community Based Organisations Status (CBO):
A total number of 47.53 lakh SHG members have been organised into 4.39 lakhs SHGs, 46,423 Persons with Disability into 6,643 PwD Groups, and 17,886 Village Organisations.
l Social Category wise coverage: Since the formation of the State till November 2021,
In a bid to curb misuse of funds, and ensure transparency and accountability in fund utilisation in the local bodies, the Government of India had introduced the online audit of Gram Panchayats in 2020 using Audit Online—an open-source application developed as part of Panchayat Enterprise Suite (PES) under e-panchayat Mission Mode Project (MMP) initiated by the Ministry of Panchayati Raj. Online auditing in at least 20% of Gram Panchayats in each state was made mandatory by the 15th Finance Commission to receive further funds for development activities in rural local bodies.
For the audit period 2020-21, Telangana was declared as the National Lead State for the second consecutive year by the Government of India for being the first State to achieve the target of mandatory 100% audit of Gram Panchayats.
Key highlights of the audit:
l Number of institutions audited: The State Audit Department, Telangana has successfully completed 100% online auditing of 12,769 Gram Panchayats, 540 Mandal Parishads
and 32 Zilla Parishads.
l Recoveries effected: State Audit department has made recoveries for an amount of Rs.8.78 crores for auditable institutions and enabled remittances of Rs.3.96 crores for items such as seigniorage charges, I.T., library cess, GST, etc. to different departments.
l Extensive virtual training process and issuance of guidelines for panchayat secretaries, district-level auditors and audit officers during the course of the pandemic ensured quality of audit and timely outcomes
l Use of Audit Online platform streamlined the audit process due to time-bound schedules being assigned to officials and ease of monitoring of progress of work
l Training other State Governments: The State Audit team has also imparted training on usage of Audit Online to officials from states such as Karnataka, Chhattisgarh, Maharashtra, Gujarat and Rajasthan and also on the best practices in Telangana.
Box 13.2
The Government of India has appreciated Telangana for being the National Lead State i.e. being the first to achieve the target of mandatory 100% audit of Gram Panchayats for the audit period 2020-21
Panchayat Raj & Palle Pragathi

Telangana Socio Economic Outlook 2022222
SERP has formed 92,634 SHGs by mobilising 10.24 lakhs people from the Scheduled Castes, 6.6 lakhs from the Scheduled Tribes, 25.7 lakhs from Backward Castes and 1.5 lakh minorities (Fig. 13.4).
l A Community Investment Fund/ Revolving Fund Grant of Rs. 81.60 crore has been disbursed to Community Based Organisations from 2015 to November 2021.
13.5.2. Financial AccessSERP is facilitating bank linkages for SHG members and promoting diversified livelihoods to augment the income of the poor under the SHG-Bank linkage programme.
Since the formation of the State, the amount disbursed to the SHGs every year almost tripled from Rs.3,738.67 crore in 2014-15 to Rs.10,448.03 crore by 2020-21.
State Government in association with the Mandal
Samakhyas promoted by SERP, and Town Level Federations have promoted Stree Nidhi Credit Co-operative Federation Ltd. (Stree Nidhi) as an apex cooperative society for financing SHGs. In 2020-21, Rs. 2,381.51 crore loan has been disbursed to 1,61,010 SHGs with a recovery rate of 96%.
13.5.3. Farm LivelihoodsAs part of Sustainable Livelihoods initiatives, Farmer Producer Groups (FPGs) and Livestock Farmer Producer Groups with women have been formed to enable farmers to create additional income through productivity enhancement and improved market accessibility.
With regard to social category, nearly 49.0% of the FPG members belong to the Backward Castes, 23.5% to Scheduled Castes, 17.5% to Scheduled Tribes, 8.4% to Open Category, and 1.4% to Minority (Fig. 13.5).
Figure 13.4
Yearly number of SHGs formed (2014-15 to November 2021-22)
Source: Panchayat Raj & Rural Development Department, Government of Telangana
2014
-15
2015
-16
2016
-17
2017
-18
2018
-19
2019
-20
2020
-21
2021
-22
9,9667,750
4,722 4,4586,983
3,921
38,969
15,865
No. of New SHGs formed
Figure 13.5
Social Category-wise Member Count of FPGs in Telangana
Backward Castes49.0
Scheduled Tribes17.5
Open Category8.4
Minority1.4
Others0.1
Scheduled Castes23.5
Source: Panchayat Raj and Rural Development Department, GoTS.
(Total 1,06,313 members in 6,728 registered FPGs)
Share of FPGs (%)

223
Further, state-level federations which started operations in September 2019 have traded 3,041.2 MTs (vegetables and fruits) produce worth more than 6.04 crore till December 2021. Major marketing tie-ups have been made with Metro, Polimeras, Y&Gs, Ratnadeep, Reliance and e-platforms like Bigbasket.
13.5.4. Livestock Livelihoods
Under Livestock-based livelihoods, 2,913 Small Ruminant Livestock Farmer Producer Groups have been formed, covering 48,371 members. A separate cadre of 2,359 SHG women have been trained in First-aid Veterinary Services as Pashumithras to render door-step services.
SERP has conceptualised the “Custom Hiring Centre” (CHC) model executed by the Farmer Producer Organisation (FPO) to make farm machines accessible to those individuals who cannot afford them, primarily to small and marginal farmers, on a rental basis.
Under National Rural Livelihood Mission (NRLM), Rs. 25.00 lakh was sanctioned for the establishment of Annadata Custom Hiring Centre in Singareni mandal of Khammam district. The procurement of equipment was done at district level through the District Procurement Committee (DPC) which is chaired by the District Collector / Addl. Collector with the District Agriculture Officer, District Horticulture Officer and FPO Board of Directors as members and the District Rural Development Officer (DRDO).
Procurement of necessary machinery (based on a needs assessment) was done and CHC premises were identified on the main road for ease of access to farmers. Regular training is being given
to the CHC manager and driver on the usage of equipment and accounting.
The CHC is accessible to the farmers from 11 villages and nearly 400 farmers are utilising the equipment. The CHC aims to cover 1,300 acres. Higher productivity and greater output are the two major contributions of CHC. The productivity of major crops increased due to timely availability of machinery for critical farm operations such as sowing/planting and harvesting/threshing. In a span of 8 months and 114 business days, the gross revenue generated by the CHC is Rs. 3,75,000 and the net profit earned after meeting the expenditure amount of Rs. 1,50,000 is Rs. 2,25,000.
52 such CHCs have been established across 31 districts during 2020-21. Further, SERP plans to establish 100 more CHCs in 2021-22, for which 78 mandals have been mapped so far and 30 proposals sanctioned.
Box 13.3
Case Study of Annadata Custom Hiring Centre in Singareni mandal of Khammam district
Source: Panchayat Raj & Rural Development Department, Government of Telangana
Panchayat Raj & Palle Pragathi

Telangana Socio Economic Outlook 2022224
13.5.5. Non-Farm Livelihoods
To encourage additional livelihoods for poor SHG families, SERP has promoted the establishment of Non-farm Enterprises by SHG women. For the creation of Sustainable Livelihoods to Rural poorest of the poor beneficiaries, Rural Self Employment Training Institutes (RSETIs) have been established by Lead Banks in each district.
To overcome exploitation by middlemen, the farmer community demanded a system of collective procurement and marketing interventions of agriculture and Non Timber Forest Produce. To meet this demand, till 2020-21, a total of 10,795 Procurement Centres have been established in the state to aggregate the produce at VO level so that farmers benefit by receiving a remunerative price (MSP at doorstep).
13.6. Other Initiatives under Panchayat Raj 13.6.1. Swachh Bharat Mission (Gramin)
Swachh Bharat Mission (SBM) was launched on 2nd October 2014 to accelerate the efforts to achieve universal sanitation coverage and to put the focus on sanitation. Under the mission, all villages, Gram Panchayats, Districts, States and Union Territories in India declared themselves “open-defecation free” (ODF) by 2 October 2019, the 150th birth anniversary of Mahatma Gandhi, by constructing over 100 million toilets in rural India.
To ensure that the open defecation free behaviours are sustained, no one is left behind, and that solid and liquid waste management facilities are accessible, the Mission is moving towards the next Phase II of Swachh Bharat Mission (Gramin)/SBMG i.e ODF-Plus. ODF Plus activities under Phase II of SBMG will reinforce ODF behaviours and focus on providing interventions for the safe management of solid and liquid waste in villages.
The Telangana Government has given emphasis for providing sanitation facilities to the rural community of the state in line with SBMG. The efforts have resulted in Telangana topping the list of highest number of open defecation free (ODF Plus) villages under SBMG Phase-II programme in the country with nearly 73.39% of its villages declared as ODF Plus Aspiring villages, 24.23% as ODF Plus Model villages and the rest 0.23% as ODF Plus Rising villages. In several key indicators of SBMG which overlap with the Palle Pragathi’s indicators, specifically those related to sanitation, Telangana has outperformed the other states.
Other awards received by Telangana:1. National-level Swachhata Award, 2020:
Siddipet and Peddapalli districts from Telangana were among the 20 districts selected across the nation for this award on the occasion of ‘World Toilet Day’ for creating awareness on use of toilets, segregation of wet and dry garbage and their maintenance and campaign on Swachh Bharath in rural areas.
2. Gandagi Mukt Bharath (GMB) 2020: In Telangana, shramdaan, collection of single-
Table 13.5
Performance of Telangana's villages on key indicators of SBM(G)
Note: Data as on 23rd February, 2022 Source: Ministry of Jal Shakti, Department of Drinking Water & Sanitation, Government of India
Villages having arrangement of Solid Waste Management (SWM)
Villages with Minimal Litter
Villages with Minimal Stagnant water
Villages with no Plastic Dump in Public Places
99.88
99.77
99.68
99.87
% of villages
Number of
villagesKey Indicators
14,183
14,168
14,155
14,182
Total Villages 14,200

225
use plastics (SUP), plantation drives, among others, marked the week-long behaviour change campaign – Gandagi Mukt Bharat. As a result, Telangana received the top award for State with maximum Shramdaan, followed by Uttar Pradesh and Maharashtra. Karimnagar district of Telangana received National 3rd place for District with maximum villages with all information, education and communication (IEC) messages painted.
3. Saansad Adarsh Gram Yojana, 2022: Under the Saansad Adarsh Gram Yojana (SAGY), out of the top ten performing villages, seven are from Karimnagar and Nizamabad districts of Telangana. These villages were Vennampally in Saidapur mandal, Kowlas in Jukkal mandal, Ganneruvaram in Bejjanki mandal, Kandakurthi in Renjal mandal, Veernapalli in Yellareddypeta mandal, Ramakrishnapur in Veenavanka mandal and Tanakurdh in Nizamabad. As part of SAGY, villages are ranked based on 12 different parameters including Gram Panchayat conducting Environment Creation activities, completing baseline survey and uploading the survey details, whether the draft Village Development Plan got clearance of Gram Sabha, number of non-infrastructure projects completed, number of economic and livelihood activities etc.
13.6.2. Shyama Prasad Mukherjee Rurban Mission (National Rurban Mission)Shyama Prasad Mukherji Rurban Mission (SPMRM) was launched in 2016 by the Government of India with the mission of stimulating local economic development, enhancing basic services by creating
well planned clusters. Integrated Cluster Action Plans (ICAPS) and Detailed Project Reports (DPRs) have been prepared for all the 17 clusters.
An amount of Rs. 1,574.21 crore has been utilised for the execution of various works in these Rurban clusters which include convergence funds of Rs. 1,373.75 crore and Critical Gap Fund of Rs. 200.46 crore.
In December 2021, Telangana was ranked first in the implementation of Shyama Prasad Mukherji Rurban Mission (SPMRM) among the states. The Ryakal cluster in Sangareddy district and Jukkal cluster in Kamareddy districts of the state stood first and second respectively among the total 300 clusters in the country.
13.7. Way ForwardThe Government of Telangana is forging ahead for the realisation of ‘Bangaru Telangana’ by balancing the wheels of development through strengthening of service delivery, accountability, and demand in rural areas. The Government aims to leverage technology in building strong supervision and citizen accountability measures in light of the Telangana Panchayat Raj Act, 2018.
The Government is committed to accentuating its efforts to scale its legacy of bringing landmark reforms across all the key areas pertaining to the development of the rural masses. These would include greater access to credit, deepening of forward and backward linkages, and adoption of sector-appropriate technologies, leading to strengthening of the community level institutions and the institutions of governance that are key to achieving the desired development outcomes.
Panchayat Raj & Palle Pragathi

Telangana Socio Economic Outlook 2022226
URBAN DEVELOPMENT
CHAPTER
14

227
l As of 2022, the estimated share of Telangana’s population living in urban areas is 46.8%. Telangana is more urbanised than India as a whole, where only 34.7% of the total population lives in urban areas. Based on the population projections published by the Ministry of Health and Family Welfare, Telangana is also urbanising faster than the rest of India combined, and the share of urban residents in the state’s population is expected to reach 57.3% by 2036.
l Telangana’s urban areas had a Labour Force Participation Rate (LFPR) and Worker Population Ratio (WPR) of 57.2% and 51.0% in 2019-20 respectively, higher than the national level LFPR and WPR of 53.5% and 49.6% respectively.
l A majority of urban workers in Telangana (55.1%) have a regular or salaried job.
l In November 2021, Telangana became the first state in the country to achieve its target of distributing loans to 3.4 lakh street vendors under the PM SVANidhi Scheme.
l Hyderabad was honoured with the title, ‘Tree City of the World’, by the Food and Agriculture Organization in 2020.
l In order to deal with global warming and climate change, the Urban Local Bodies (ULBs) of Telangana have kept aside 10% of their expenditure for a ‘Green Budget’.
l In order to reduce the harms from heavy rainfall in Hyderabad, the
Greater Hyderabad Municipal Corporation (GHMC) has initiated a Strategic Nala Development Programme (SNDP), at a cost of Rs. 858 crore sanctioned for phase-I of the programme.
l Telangana’s ULBs were recognised and felicitated during the Swachh Survekshan 2021 conducted by MoHUA-GoI under different categories. In total, Telangana ULBs received 9 awards including awards for the ‘Best Self Sustaining City’, the ‘Cleanest City’ the ‘Best City in Innovation & Best Practices’, the ‘Fastest Mover City’, and the ‘Self-Sustaining Cantonment’.
l In order to ease administrative burdens, the Government introduced the Telangana State Building Permission and Self-Certification System (TS-bPASS) for approving the layouts of buildings—the first in the country to provide fully online services in this regard with no touchpoint.
l The Government of Telangana has commissioned South India’s largest Waste-to-Energy (WtE) plant in Jawaharnagar in 2021 to generate 63 MW of electricity from municipal solid waste in Hyderabad.
l As of 2020-21, 100% of Telangana’s urban wards have door-to-door waste collection facilities.
l To support women-led enterprises during COVID-19, the Government provided credit support of Rs. 36.83 crore to 6,603 urban SHGs during the pandemic.
Key Highlights
Urban Development

Telangana Socio Economic Outlook 2022228
14.1. The Urban Landscapeor centuries, urban areas have served as the epicentre of political and economic power, fostering economic growth and
innovation. As they attract people and skills from all around, urban areas benefi t from a robust spatial concentration of talent, knowledge, and wealth. While urban areas gain from such agglomeration of human and fi nancial capital, high density often comes with associated costs. Traffi c congestion, pollution, domestic and industrial waste production, concerns around affordable housing, and crime are a few examples of such costs. Urban policies strive to minimise these costs while maximising the benefi ts of the urban landscape, and ensuring that the gains accrue equitably across genders and social groups.
Since its formation in 2014, Telangana has strived to
create a sustainable and equitable urban biosphere within the state. As per population projections released by the National Commission on Population (Ministry of Health & Family Welfare, Government of India), 46.84% of the state’s population (1.79 crore) is expected to reside in urban areas in the year 2022. This is projected to further increase to 57.32% (2.2 crore) by 2036 (see Figure 14.1)—an increase of 10.5 percentage points between the two years. In the same period, at the national level, the percentage of urban residents is expected to increase from 34.75% in 2022 to 39.06% by 2036. This refl ects a 4.31 percentage point rise in the share of urban population in the country as a whole.
This implies that in the year 2022, the urban population of Telangana is projected to be 12.1 percentage points higher than that of the country, and this gap is expected to increase to
F
Figure 14.1
Projected Share of Urban Population for Telangana and India, 2011-2036
Share of urban population (%)
39.06
31.14
38.88
70
60
50
40
30
20
10
0
2011
2012
2013
2014
2015
2016
2017
2018
2019
2020
2021
2022
2023
2024
2025
2026
2027
2028
2029
2030
2031
2032
2033
2034
2035
2036
57.32
46.84
34.75
Telangana India
Source: Population Projections for India and States 2011-2036 (National Commission on Population, Ministry of Health and Family Welfare, Government of India; 2020)

229
18.3 percentage points by 2036. Thus, not only is Telangana more urbanised than India, but also, it is urbanising at a faster pace than the country as a whole.
Figure 14.2 shows the district-wise share of the urban population in Telangana as per Census 2011. 29 out of the 33 districts in the state have fewer than 50% of their populations residing in urban areas. More people live in urban areas than in the rural areas in 4 districts in the state—Hyderabad, Medchal-Malkajgiri, Warangal-Urban and Rangareddy.
The largest urban area in the state is Hyderabad, which occupies only 0.6% of Telangana’s total land area, but houses over 20% of the total population
of the state. In spite of its high population density, Hyderabad has strived to maintain its green cover. As a result, in 2020, the Food and Agriculture Organization honoured Hyderabad with the title of the “Tree City of the World”.
The development of more prosperous urban areas is a primary policy goal of the Government of Telangana, and the goal is being achieved through the 142 Urban Local Bodies present across the state.
14.2. Urban InfrastructureInvestments in infrastructure are an essential component of urban development. These investments increase the productivity of urban
Figure 14.2
District-wise Share of Population Living in Urban Areas, 2011
Source: Census 2011
100.0
91.5
68.5
57.7
43.9
38.2
34.7
31.7
30.7
29.6
29.0
23.7
22.8
22.6
22.5
21.4
21.2
16.9
16.0
16.0
15.6
13.7
13.5
13.3
13.3
10.4
10.2
10.2
9.9
7.7
7.4
7.0
3.9
Hyderabad
Medchal-Malkajgiri
Warangal Urban
Rangareddy
Mancherial
Peddapalli
Sangareddy
Bhadradri
Karimnagar
Nizamabad
Mahabubnagar
Adilabad
Nalgonda
Khammam
Jagtial
Nirmal
Rajanna
Kumuram Bheem
Wanaparthy
Yadadri
Suryapet
Siddipet
Vikarabad
Jangaon
Kamareddy
Jogulamba
Jayashankar
Nagarkurnool
Mahabubabad
Medak
Narayanpet
Warangal Rural
Mulugu
3.9 to 10.310.3 to 15.915.9 to 22.622.6 to 33.533.5 to 100.0
Adilabad
KhammamNalgonda
Hyderabad
Warangal
Karimnagar
Ramagundam
Jagtial
Nizamabad
MahabubnagarMiryalaguda
Suryapet
2,00,000
4,00,000
6,00,000
Major cities' population
Siddipet
Urban Development
State average 38.9%

Telangana Socio Economic Outlook 2022230
economic activities, thereby paying for themselves several times over. The Government has undertaken significant investments to build and maintain the infrastructure in the urban areas.
14.2.1. Pattana PragathiPattana Pragathi was launched by the Government in February 2020 to provide a strong foundation for better standards of living for the urban population, to make urban areas clean and green, and to provide better services to the urban public at large.
Pattana Pragathi was executed in three phases—the first of which focussed on developing urban utility infrastructure, the second on sanitation, and the third on both urban utility infrastructure as well as sanitation. Phases I and II of Pattana Pragathi were implemented in 2020-21, while the third phase was completed in 2021-22.
Under Pattana Pragathi, during 2020-21, the Government released Rs. 148 crore each month, of which Rs. 78 crore were allocated to GHMC, while the rest was shared among the 141 remaining ULBs. In 2021-22, the Government has been releasing Rs. 59 crore to GHMC and Rs. 53 crore to other municipalities in the state each month.
These funds have been used to address infrastructural gaps to meet the goals of citizen-centric service delivery by the ULBs. Prominent projects address the felt needs in the areas of sanitation and waste management, provision of public toilets, designing public spaces like gardens, markets, graveyards and animal shelters, and making concerted efforts towards greenifying the urban areas.
To improve the sanitation facilities, the ULBs purchased over 2,214 new sanitation vehicles, adding to the existing stock of 2,628 garbage-lifting vehicles in the state. Taken together, the fleet can collect 100% of the urban garbage produced by these ULBs on any given day. In the same vein, over
37.19 lakh bins were also purchased from these funds.
While garbage collection is essential, the funds were also devoted towards processing of this garbage. In 29 ULBs, the money was used to create new dumpyards. Additionally, 224 new compost sheds and 206 new Dry Resource Collection Centres (DRCC) have been constructed. Over Rs. 250 crore were utilised for the construction of Faecal Sludge Treatment Plants (FSTPs) in 71 ULBs. The FSTPs have generated capacity to process 1,565 kilo litres of sludge each day.
In addition to the garbage collection infrastructure, the Pattana Pragathi funds were also used to build public toilets. The Government accomplished the aim of constructing one public toilet per thousand people in urban areas by building 4,071 new toilets using funds from this scheme.
The ULBs also utilised these funds to meet the targets for Telaganaku Haritha Haram (TKHH)—a government policy to improve urban forestry and increase forest land cover in Telangana from 24% to 33%. Under this scheme, the ULBs established 1,053 nurseries, including 51 Central Nurseries, and added an additional 34.69 lakh tall plants in 2021-22. They also developed 2,265 Pattana Prakruthi Vanalu (Tree Parks) with 64.27 lakh plants. Additionally, funds were also used to make the Multi Layer Avenue Plantation along 723.76 kilometres of road. The new plants added under TKHH are regularly watered, weeded, and maintained to ensure a target survival rate of 90%.
Finally, the funds were used to develop utility infrastructure. This includes the construction of 369 open gyms, 1,037 sheds in street vending zones, animal care shelters in 16 districts, 265 Vaikuntha Dhamams, and integrated veg and non-veg markets (IVNMCs)
The efforts under this scheme have borne fruit, as Telangana ranked second among all states

231
in the Safaimitra Suraksha Challenge conducted by the Ministry of Housing and Urban Affairs , Government of India (MoHUA-GoI). Karimnagar Municipal Corporation received the second prize in this challenge among all cities in India with less than 3 lakh citizens.
Telangana’s ULBs were also recognised and felicitated during the Swachh Survekshan 2021 conducted by MoHUA-GoI. Table 14.1 presents the awards and titles won by the state in various categories.
14.2.2. Telangana State Building Permission and Self-Certifi cation System (TS-bPASS)The Government’s commitment to easing administrative burdens extends to the development of new buildings as well. In 2020, the Government introduced the TS-bPASS for approving the layouts of buildings.The process is the fi rst in the country to provide fully online services with no touchpoint. It is a single-window system that expedites approval of building designs, depending on their classifi cation into broad categories. The TS-bPASS was brought in to replace the Development Permission Management System (DPMS). The new rules have eliminated the need to obtain building permission for ground fl oor
and ground plus one fl oor residential buildings. It provides tentative layout approval through online application. It also provides for the processing of land use certifi cates and land conversion certifi cates.
14.2.3. Property Tax WaiverRecognising the fi nancial costs of COVID-19, the Government provided relaxation on property tax during 2020-21 to reduce the burden on people in major urban centres. Under various relaxations, over 58.6 lakh families received waivers to the tune of Rs 671.58 crore.
14.2.4. Vaikunthadhamams265 graveyards (Vaikunthadhamams) have been developed by providing infrastructure facilities like parking, toilets, rainwater harvesting structures, lighting, greenery and CCTV cameras. The government has made a provision for Rs. 200 crore for this scheme during 2021-22.
14.2.5. Innovative Waste Management PracticesA 2018 study by the National Environment Engineering Research Institute (NEERI) found that Hyderabad has the highest per-capita urban waste
Table 14.1
Major Awards won by the Urban Local Bodies of Telangana during Swachh Survekshan 2021
1 GHMC Above 40 Lakh National Best Self Sustaining city
2 Sircilla 50 thousand to 1 Lakh, South Zone Cleanest city
3 Siddipet 50 thousand to 1 Lakh, South Zone Self Sustaining city
4 Nizampet 25 thousand to 50 thousand, South Zone "Best City in 'Innovation & Best Practices'"
5 Ibrahimpatnam 25 thousand to 50 thousand, South Zone Fastest Mover City
6 Ghatkesar Less than 25 thousand, South Zone Cleanest City
7 Kosgi Less than 25 thousand, South Zone Innovation and Best Practices
8 Husnabad Less than 25 thousand, South Zone Fastest Mover City
9 Secunderabad Cantonment Board Self-Sustaining cantonment Self-Sustaining cantonment
Urban Development
S.No. Name of the ULB Award Category Award
Source: Swachh Survekshan Awards, 2021

Telangana Socio Economic Outlook 2022232
generation in the country, producing roughly 0.57 kilograms of urban waste per person per day. In order to reduce the burden of waste on urban landfills and the ecosystem, the Government has adopted innovative measures to address the problem.
The Government of Telangana has commissioned South India’s largest Waste-to-Energy (WtE) plant in Jawaharnagar in 2021. The target is to generate 63 MW of electricity from municipal solid waste in Hyderabad. In Phase I, a 19.8 MW plant has been made operational. It is expected to consume 1,200 tonnes of waste each day. Another 15 MW waste-to-energy plant is being planned in Dundigal. The WtE plant has the potential to reduce pressure on the landfill, lower the foul odour in the area, and prevent ground, soil and water pollution.
In another instance, GHMC partnered with Ramky Enviro to set up facilities that recycle waste generated by construction and demolition (C&D) in urban areas. 2 plants have been set up in the GHMC area in Public Private Partnership mode so far—at Jeedimetla and Fathullaguda, Hayathnagar—and 2 more are in the pipeline. The plant at Fathullaguda is among the largest C&D recycling facilities in South India. Both plants have the capacity to handle over 500 tonnes of waste per day, and can recycle and recover 90% of the material from construction waste. This is a huge achievement for the state, as the national estimates by the Centre for Science and Environment (CSE) suggest that currently, only 1% of the construction waste across India is recycled. Since April, 2018, 15.26 lakh MT of C&D waste has been collected in these plants, with 7.97 lakh MT collected at the Jeedimetla facility, and 5.38 lakh MT collected at the Fathullaguda facility. C&D waste from these facilities is being utilised for various non-structural purposes such as to create footpaths, road sub-bases, etc.
A third innovation in this sector comes from Telangana State Agricultural Industries Development Corporation Limited (TS AGROS). Recognising that urban Telangana produces over 7,000 MT of waste
on a daily basis, TS AGROS has entered into an MoU with M/s Bhavani Bio organics Pvt. Ltd. & HiMSW Ltd. for the supply of city compost to be used as fertiliser to improve the fertility of Telangana’s soils. The Government has instructed all fertiliser companies to supply city compost through TS AGROS alone.
The state’s efforts in improving garbage collection have borne fruit, as of 2020-21, data from MoHUA suggests that 100% of Telangana’s urban wards have door-to-door waste collection facilities.
14.2.6. Integrated MarketsIn order to address the infrastructural deficiencies in the ULBs, the Government has earmarked Rs.500 crore to construct Integrated Veg and Non-veg Markets in all 142 ULBs. Under this allocation, ULBs with population less than 25,000 would receive one integrated market spread over 1 acre, whereas larger ULBs would receive integrated markets spread over upto 2 acres. 5 ULBs (Gajwel, Siddipet, Siricilla, Khammam and Ieeja) have already constructed these markets, whereas the work is underway in 6 more ULBs. Sites for the construction have been identified in the remaining ULBs.
14.3. Urban Areas and JobsAs more and more people migrate to urban areas, there is an increasing demand for goods and services in urban areas, which necessitates the development of new enterprises, thus creating a virtuous cycle of more jobs and prosperity. While this virtuous cycle is created by individual demands, it can only be realised and expedited through supportive government policies that ease the process of establishing and running new businesses.
14.3.1. Employment in Urban TelanganaAccording to the World Bank, 80% of the global GDP is generated in the cities. They are hubs for businesses, services, and firms that generate new

233
employment in the economy. The two key indicators that capture the status of employment in urban areas are - Labour Force Participation Rate (LFPR)1
and Worker Population Ratio (WPR)2. According to Periodic Labour Force Surveys (PLFS), 2018-19 & 2019-20, the LFPR of the working age population in urban Telangana increased from 53.2% in 2018-19 to 57.2% in 2019-20—an increase of 4 percentage points. Additionally, the urban LFPR in the state was higher than the national urban LFPR in 2018-19 (51.6%) as well as 2019-20 (53.5%). Telangana had the second highest urban LFPR among the fi ve southern states in the year 2019-20.
Urban Telangana witnessed an increase in WPR from 47.1% in 2018-19 to 51% in 2019-20. This accounts for a 3.9 percentage point rise in WPR. Telangana’s urban WPR is also higher than the national urban WPR in 2019-20 (49.6%).
14.3.1.1. Status of Employment in Urban Telangana
A comparison of the overall employment status in rural versus the urban areas refl ects the stark difference in the employment statuses across the two areas in the state (see Figures 14.3 & 14.4). Data
Female Person
Figure 14.3
Percentage of working adults by broad employment status, Urban Telangana (2019-20)
Self-Employed Salaried Casual Labour
Employment status of working adults (%)
Source: PLFS 2019-20
Male Female Person
Figure 14.4
Percentage of working adults by broad employment status, Rural Telangana (2019-20)
Self-Employed Salaried Casual Labour
Employment status of working adults (%)
Source: PLFS 2019-20
Male
33.0
55.2
11.8
32.3
54.9
12.8
32.8
55.1
12.0
59.5
11.9
28.6
48.5
8.4
43.1
54.7
10.4
34.9
1 LFPR is defi ned as the percentage of population in the labour force. Labour force comprises persons who are either working (employed) or actively seeking work (unemployed).
2 WPR is defi ned as the percentage of employed persons in the total population.
Urban Development

Telangana Socio Economic Outlook 2022234
from PLFS 2019-20 suggests that in Telangana, urban workers across genders are more likely to have regular salaried jobs, whereas rural workers across genders are more likely to be self-employed or working as casual labourers. Among the urban working males in Telangana, 55.2% have a regular salaried job, compared to only 11.9% in rural areas. On similar lines, while 54.9% of urban working women are likely to have salaried jobs, only 8.4% of their rural counterparts are likely to be employed with salaried work.
14.3.1.2. Sectoral Distribution of Employment in Urban Telangana3
Figure 14.5 shows the industry-wise employment status of urban workers in Telangana according to PLFS 2019-20. ‘Trade and automobile repair’ is the largest employment generating sector, employing over 25% of all working adults in urban Telangana. The next highest employment is generated by the manufacturing sector (16.13%), followed by the construction sector (9.06%), and transportation & storage (8.45%).
Around 66% of all urban jobs in Telangana come from the services sector. In contrast, 70.76% of working adults in rural Telangana are employed in agriculture, forestry and fi shing (see Figure 14.6).
3 PLFS classifi es industries of work based on the following NIC-2008 classifi cation:Section A: Agriculture, forestry and fi shing, Section B: Mining and quarrying, Section C: Manufacturing, Section D: Electricity, gas, steam and air conditioning supply, Section E: Water supply; sewerage, waste management and remediation activities, Section F: Construction, Section G: Wholesale and retail trade; repair of motor vehicles and motorcycles, Section H: Transportation and storage, Section I: Accommodation and Food service activities, Section J: Information and communication, Section K: Financial and insurance activities, Section L: Real estate activities, Section M: Professional, scientifi c and technical activities, Section N: Administrative and support service activities, Section O: Public administration and defence; compulsory social security, Section P: Education, Section Q: Human health and social work activities, Section R: Arts, entertainment and recreation, Section S: Other service activities .Section T: Activities of households as employers; undifferentiated goods and services producing activities of households for own use, Section U: Activities of extraterritorial organizations and bodies.
For the purpose of this chapter, in the case of urban areas, Trade and automobile repair includes Wholesale and retail trade; repair of motor vehicles and motorcycles, Administration includes Public administration and defence; compulsory social security, Health & social work includes Human health and social work activities, Professional, scientifi c and technical activities includes Professional, scientifi c and technical activities, and all other sectors are as per NIC classifi cation. All NIC sectors other than those with slices on the graph are included within ‘Other Services’
For the purpose of this chapter, in the case of rural areas, Trade and automobile repair includes Wholesale and retail trade; repair of motor vehicles and motorcycles, and all other sectors are as per NIC classifi cation. All NIC sectors other than those with slices on the graph are included within ‘Other Services’
Figure 14.5
Share of Employment by Industry of Work in Urban Telangana (2019-20)Share of employment (%)
Source: PLFS 2019-20
Trade and automobile repair
Manufacturing
Construction
Transportation and storage
Information and communication
Education
Agriculture, forestry and fi shing
Administration
Health & social work
Professional, scientifi c & technical activities
Others
25.47
16.13
9.06
8.45
6.31
5.67
4.53
3.29
3.21
2.95
14.93

235
14.3.1.3. Earnings and Wages in Urban vs. Rural Telangana
Figure 14.7 compares the average reported monthly earnings among the salaried population in rural and urban Telangana. Salaried workers make up the largest worker category in urban areas, at 55.1%, and account for 10.4% of rural workers in the state. Data from PLFS 2019-20 suggests that the average salaried person earns 58.3% more in urban areas than in rural areas, with women in urban areas earning more than double their rural counterparts in a month.
Similarly, the average earnings of self-employed persons in urban Telangana (who comprise 32.8% of all urban workers) were 33% higher than that of self-employed persons in rural areas of the state (where self-employed persons are the largest
worker category, at 54.7% of all workers) (see Figure 14.8). Urban self-employed women were, on average, earning more than double the amount earned by rural women in this category.
Casual workers comprise 34.9% of the workforce in rural areas, and 12.0% in the urban areas. During July-September 2019, the daily earnings of casual workers in Telangana were estimated to be Rs.281.5/day in rural areas, compared to Rs.446.4/day in urban areas, mirroring the urban earnings premium observed among the self-employed and salaried workers (see Figure 14.9).
Figure 14.7
Reported Monthly Earnings among the salaried for July-Sept 2019, Rural and Urban TelanganaMonthly earnings (in Rs.)
Source: PLFS 2019-20
Male Female Person
12,909
5,512
12,71911,608
18,380
20,164
Rural Urban
Urban Development
Figure 14.6
Share of Employment by Industry of Work in Rural Telangana (2019-20)Share of employment (%)
Source: PLFS 2019-20
Agriculture, forestry & fi shing
Manufacturing
Construction
Trade and automobile repair
Education
Transportation and storage
Others
70.76
7.93
5.38
4.62
3.67
3.08
4.56

Telangana Socio Economic Outlook 2022236
14.3.2. Government InitiativesThe Government is committed to pursuing policies that create new jobs and upskill people to match the needs of new jobs required particularly in the urban areas. In this regard, the Government has undertaken several initiatives that impart skills and provide employment opportunities to the people, such as the employment through Employment through Skills Training & Placement (EST&P) program. The skills provided under this program help the urban poor gain salaried employment in the private sector. Of the 37,422 candidates trained under this program till December 2021, 17,233 have been provided employment.
14.4. Urban Areas and Climate ChangeIn 2020, the Government of India published its fi rst
assessment of Climate Change and its possible consequences for India. It states that between 1901 and 2018, India’s average temperature has risen by around 0.7 degrees celsius. Further, it projects that, under different assumptions, the surface temperature would increase by 2 to 3 degrees celsius between 2040 and 2070. Hence, by the end of the 21st century, the projected rise in temperature over India is roughly 4.4 degrees celsius. At the same time, the report projects lower rainfalls, more droughts, and rising sea levels.
While climate change is a global challenge, urban areas worldwide have a signifi cant role to play in combating climate change. It is estimated that over 75% of global carbon dioxide emissions arise in the cities. Thus, creating and maintaining sustainable cities is the key to reducing future carbon emissions and limiting earth’s warming.
Figure 14.8
Reported Monthly Earnings among the Self-Employed for July-Sept 2019, Rural and Urban TelanganaMonthly earnings (in Rs.)
Source: PLFS 2019-20
Male Female Person
13,172
2,501
5,741
10,251
15,632
18,670
Rural Urban
Figure 14.9
Reported Wages for Casual Labour for July-Sept 2019, Rural and Urban Telangana Daily wages (in Rs.)
Source: PLFS 2019-20
Male Female Person
307
258
337
282
447475
Rural Urban

237
Street vendors play a vital role in the urban areas, providing affordable goods and services to the urban residents. Recent surveys conducted by Telangana State Mission For Elimination of Poverty in Municipal Areas (TSMEPMA) in 2020 and 2021 suggest that the state has over 6.04 lakh street vendors across 33 districts. Out of the 85,289 vendors for which details were available, Hyderabad had the highest number of street vendors (25,855), followed by Khammam (4,428) and Nizamabad (4,351). These 3 districts together account for over 41% of all street vendors in the state.
According to the details available on the street vendors in the state till 2020, 56.2% of vendors are males, 43.8% are females, and 100% of vendors have an Aadhar card.Most vendors sell fruits and vegetables (over 33%), followed by tailoring (4.6%), and fastfood (4%).
50% of the street vendors in the state have a bank account. In Rajanna Sircilla, Warangal Rural, Suryapet, Narayanpet, and Jayashankar Bhupalpally districts, over 85% of vendors have a bank account. Female street vendors are more likely to have a bank account, with 54.2% reporting an account.
3% of the street vendors in the state are members of some Self-Help Group (SHG), with Bhadradri Kothagudem having the maximum number of vendors associated
with an SHG (23%). Hawkers and street vendors often find it tough to access formal loans as they are working in the informal economy.
The data collection on street vendors was undertaken by the Government to bring them within the ambit of formal credit under the PM Street Vendor’s Atma Nirbhar Nidhi (PMSVANidhi)—a special micro credit facility for street vendors. Since credit constraints might bind street vendors’ ability to expand and improve incomes, the program aimed to help provide funding to the street vendors to upgrade their equipment, transition into new careers, and diversify their products, etc.
Recognizing the criticality of financial inclusion as a crucial mechanism to help formalise the large informal economy of the state, the Government of Telangana is pursuing policies that can help expand the reach and benefits of the financial system to the informal sector and associated establishments in the state.
In June 2020, Telangana set a target of distributing loans to 3.4 lakh street vendors. In November 2021, Telangana was the first state in the country to reach (and exceed) the said target. GHMC attained the first position among all megacities, whereas GWMC held the first position in the ‘major cities’ category for loan disbursals to street vendors.
Box 14.1
Transitioning to the Mainstream
Urban Development

Telangana Socio Economic Outlook 2022238
14.4.1. Government Initiatives14.4.1.1. Strategic Nala Development Programme
On 8 October 2021, Hyderabad and surrounding districts witnessed over 100 mm of rainfall within a couple of hours. The October 2021 rainfall was not an isolated event—two major high rainfall events were observed in Hyderabad in 2020 as well. In fact, according to a 2021 report by Telangana State Development Planning Society (TSDPS) and the Directorate of Economics and Statistics (DES), four out of five highest 24-hour rainfall days for Hyderabad from the last century were witnessed in the previous two decades.
In order to reduce the possibility of flooding in the future, it is essential that the drainage infrastructure across urban areas in the state is expanded and improved upon. The stormwater drainage systems should be designed to accommodate the expected changes in precipitation in the future. Hence, the Government has taken up the Strategic Nala Development Programme (SNDP) in Hyderabad and 26 other Municipalities/Municipal Corporations to supplement the existing 1,296 kilometres of stormwater drains of the city.
The goal is to improve the city drainage systems so that unusual volumes of rainfall in the future do not lead to flooding. The Government has sanctioned an amount of Rs. 858 crore for the development of ‘Nala Network’ across identified high-priority areas in phase-I of the programme. 55 projects under this scheme.
14.4.1.2. Green BudgetIn addition to mitigation strategies, the Government has also taken up proactive measures. Since 2020, all ULBs in the state have earmarked 10% of their budget as ‘Green Budget’. The goal of ‘Green Budget’ is to address urban forestry and development of green cover in urban areas on a priority basis. This is done by establishing nurseries and plantations, and carrying out awareness programmes in the
urban areas. Taken together, all 142 ULBs in Telangana have set aside Rs. 590.39 crores for the Green Budget in 2021-22. GHMC allocated Rs. 306.67 crore towards the Green Budget in 2021-22. The proposed expenditure for GHMC under broad heads is shown in Figure 14.10. A large share of the Green Budget (47%) is devoted to developing colony parks, followed by upkeep and maintenance of city parks (44%). Development and maintenance of public parks serves many purposes. It provides recreational spaces for the residents, especially the children, and increases the green cover of the city.
14.4.1.3. Telangana State Heatwave Action PlanHeat waves act like a “silent disaster” that adversely affects the health of the people and animals of the state. According to a recent report by the Revenue (Disaster Management) Department (Government of Telangana), 568 out of 589 mandals of Telangana are susceptible to heatwaves. Hence, Telangana maintains the State Heatwave Action Plan to guide the line departments on how to alter their roles and functioning in the event of a heatwave in the state. The plan recognises that the burden of heatwaves is borne disproportionately by construction workers,
Figure 14.10
Distribution of Expenditure under Green Budget, GHMC (2021-22)
Colony Parks47.1%
(Rs. 144.40 crore)
City Level Parks44.3%
(Rs. 135.75 crore)
Nurseries8.2%
(Rs. 25.00 crore)
Purchase of Plants0.5%
(Rs. 1.50 crore)
Total outlay:
Rs. 306.65 crore
Source: GHMC Budget 2021-22

239
children, women, street vendors and the poor and the marginalised, and suggests measures to minimise the impact of heatwaves on all citizens in general, and on these vulnerable groups in particular It suggests altering the working hours in major cities to avoid peak hours, distributing information on how to deal with heatwaves, ensuring shelter facilities for livestock, deploying health teams at major bus stops, and rescheduling load shedding to avoid peak hours.
14.4.1.4. Early Warning System for Flood PredictionInformation from national monitoring networks is often insufficient for local authorities to evaluate flood risk at the local scale, particularly in urban areas. Often, the network density is insufficient and national network stations are situated according to hydrological and meteorological needs.
At the time of state formation, the area under the Greater Hyderabad Municipal Corporation had 33 Automatic Weather Stations (AWS), with a resolution of 10x10 km. In order to improve the accuracy and efficiency of the early warning system for flood prediction in Hyderabad, the Department of Planning, Government of Telangana, as per recommendations made by Dr. Kapil Gupta from Indian Institute of Technology (IIT) - Bombay, installed 99 new Automatic Weather Stations (AWS) in the GHMC area, taking the total count of AWS to 132.
The resolution of AWS in Telangana has now improved to 2x2 km, and they provide hourly data on rainfall (mm), temperature (degree Celsius), humidity (%), wind direction, and speed of wind. The data from these stations is transmitted to the main server located at the Telangana State Development Planning Society (TSDPS), Hyderabad through GSM technology. After quality control, the real-time data and products are disseminated to various users, who use this data to make timely decisions for disaster management.
14.5. Urban Areas and Gender
It is well established that across the country, there exists a disparity between the social and economic outcomes of men and women. Even though the increased mobility and access to greater and better quality employment opportunities in urban areas should lead to greater engagement of women in the economy, the actual status is the contrary. While employed women in urban areas earn better than their rural counterparts, and are also employed to a greater degree in regular, salaried positions, access to employment itself is more restricted for women in urban areas, than in rural areas.
Urban Development
Figure 14.11
Participation Rate and Time Spent by Persons on employment in Telangana (2019)
Participation rate Share of adults reporting spending time
on employment (%)
Source: Time Use in India Survey 2019, National Statistical Office, Ministry of Statistics and Programme Implementation
Time spentTime spent (in minutes) on Employment Related
Activities by adults
Urban
Rural
Male Female
Telangana
Telangana
India
India
Urban
Rural
Urban
Rural
Urban
Rural
81.7
30.5
73.1
69.8
571
486
385
430
394
521
445326
56.9
75.4
20.0
22.6

Telangana Socio Economic Outlook 2022240
Since projections suggest that women form 49.7% of the total urban population of the state in 2022, the Government has taken multiple initiatives to make outcomes in the state more equitable.
Gender dynamics in urban areas manifest in different ways. A ‘Time Use in India Survey’ conducted by NSO in 2019 shows that while fewer women engage in employment in both urban as well as rural areas, the employment gap between men and women in urban areas (44.9 % points) is drastically higher than that in rural areas (24.8 % points) (see Figure 14.11). A similar, but even more aggravated trend is observed in the case of India. Furthermore, as Figure 14.11 also reflects, urban women spend on average 25% less time than men on employment activities, while the time-gap in rural areas is only 18%.
14.5.1. Government InitiativesIn view of the fact that increased urbanisation may lead to increasingly skewed economic outcomes for women, the Government has launched programs and initiatives that enhance women’s participation in urbanisation and the economic growth of Telangana. Some of the key initiatives are highlighted below.
l The Government provided credit support of Rs. 36.83 crore to 6,603 urban SHGs during the pandemic.
l Recognising that households are less willing to spend resources on the health and nutrition of the female members, the Government, under National Urban Health Mission, has set up 7,531 Mahila Arogya Samitis (MAS) in the Slum Level Federations of 42 Municipal bodies. Roughly, Rs. 1.4 crore were released for 2,929 MAS in 2020-21.
l The Telangana Police has taken several initiatives to ensure greater safety of women in public spaces. For example, 331 SHE (Safety, Health and Environment) Teams in the state’s police departments monitor women safety in
the ‘hotspot’ public areas.
l The police has also taken a counselling approach towards those who harass women in public, and had offered counselling services to 27,396 culprits till December 2021.
l Bharosa Support Centres have been established in most districts of the state to assist women who have faced violence within or outside their homes.
l In July 2021, the Telangana State Road Transport Corporation (TSRTC) introduced a system of request stops for women and children. This facilitates the women travelling in buses after 7:30 pm to stop the bus at any point in the journey, instead of only at the bus stops designated for boarding and alighting from the bus. The system has been launched on a pilot basis on GHMC routes.
14.6. Developing HyderabadHyderabad is the largest city in Telangana and the fourth most populous city in the country. The Greater Hyderabad Municipal Corporation (GHMC) performs the primary task of delivering urban services. Several other agencies, such as the Hyderabad Metro Rail Limited (HMRL), the Hyderabad Metro Water Supply and Sewerage Board (HMWSSB), the Hyderabad Integrated Municipal Solid Waste Limited (HiMSW), and the Hyderabad Metro Development Authority (HMDA) also provide vital services that keep the city running.
14.6.1. Permanent and Temporary HousingThe high population density in urban areas puts considerable pressure on land and housing resources. Hence, the provision of safe and affordable housing is a key goal of urban policy. Recognising this, the Two Bedroom (2BHK) Housing programme, a unique ‘Dignity Housing

241
Programme’ has been initiated by the Government of Telangana. Under this programme, 2 BHK houses are constructed and given away free of cost to the shelter-less poor people living below the Poverty Line (BPL). Since the launch of the scheme in 2015, GHMC has been given a target of constructing 1 lakh houses under this scheme at a financial outlay of Rs. 8,598.58 crore. Out of the total target, construction of 64,628 2BHK houses has been completed, and the remaining 35,372 houses will be completed by March 2022.
Recently, the Government completed a mega 2 BHK project in Kollur, Sangareddy. It was built at a cost of Rs. 1,422.15 crore, and has 15,660 units in a single place. The project won the Housing and Urban Development Corporation Limited (HUDCO) award for best practices 2019-20 under the Housing, Urban Poverty and Infrastructure theme. The housing has Sewage Treatment Plants (STPs), power backup for lifts, playgrounds and gyms, rainwater harvesting pits, electrical appliances, commercial complexes, parking space, external electrification with underground cabling, water supply through potable pipes and underground drainage system, making it at par with private housing societies. It is expected to house 80,000 people in the near future.
In addition to funding permanent housing programs, GHMC has also made arrangements for the temporary housing of the people who visit the city to benefit from its medical and economic prowess.The GHMC constructs and maintains night shelters for the economically backward patients and their attendants coming to the hospitals in the city. As of 2021-22, the construction of night shelters has been completed at seven hospitals, with a total capacity of 862 persons.
14.6.2. Sewerage and Drainage FacilitiesUrban areas generate a large amount of sewage and waste. According to the 2020 figures from International Institute of Health and Hygiene
(Ministry of Environment and Forests, Government of India), urban Telangana alone generates 2,660 Million Litres of sewage per day. Hence, the handling of sewage is a major urban policy concern.
The HMWSSB provides water and sewerage services covering an area of 1,492 sq. kms. within the outer ring road area of Hyderabad city. The HMWSSB also formulated the Sewerage Master Plan, covering 62 Sewerage Treatment Plants (STPs) covering the core city, the peripheral villages and the Outer Ring Road (ORR). During 2021-22, the Government sanctioned the construction of 8 STPs to the north of Musi river at the cost of Rs.1,230.21 crore. Another 6 STPs have been sanctioned for construction to the south of Musi river at Rs. 1,355.13 crore. HMWSSB also took up the construction of three Fecal Sludge Treatment Plants in the villages near the ORR.
The efforts of HMWSSB ensured that GHMC was the first ULB in Telangana to receive the ‘Water Plus’ city tag from the Ministry of Housing and Urban Affairs (Government of India) in August 2021. The city also retained its Open Defecation Free (ODF) ++ tag, which it had received the previous year. This tag recognised that no unsafe or untreated water is discharged into the water bodies of the city, alongside the possession of adequate capacity of desludging vehicles and jetting machines to clean septic tanks.
In addition, the GHMC maintains over 1,300 kilometres of stormwater drains. During 2021-22, the corporation sanctioned over 803 construction or remodelling projects, of which over 247 projects have been completed. GHMC also carries out the de-silting of these drains.
14.6.3. Urban MobilityUrban areas, including Hyderabad, are often pressed to accommodate varied mobility concerns. Broadly, these concerns might be addressed under two categories—improving roads to facilitate smoother
Urban Development

Telangana Socio Economic Outlook 2022242
private transport experience, and expanding public transport networks for everyone.
14.6.3.1. Roads, Bridges and FlyoversThe Strategic Road Development Programme (SRDP) was formulated and implemented by GHMC as a high priority project with the goal of designing road networks that would reduce traffic fatalities and vehicular pollution across the major traffic corridors and activity centers in Hyderabad. The Plan includes the construction of flyovers, underpasses, and bridges. So far, 22 works have been completed, and another 25 works under the plan are in progress.
In addition, the Government has also sanctioned Rs.1,839 crore under the Comprehensive Road Maintenance Programme (CRMP) for maintenance of main roads (roads with more than 3 lanes). The funds under the scheme would be released in instalments over a period of 5 years. The programme covers 401 stretches and 7 packages. Till December, 2021, GHMC has spent Rs. 594.1 crore out of the total funds allocated to this scheme to recarpet a total length of 496.8 km, and to maintain footpaths, kerbs, central median, lane markings, sweeping (by m/c) and greenery maintenance along these roads.
GHMC also conducts repair and maintenance work on roads other than main roads. GHMC maintains over 9,013 kilometres of roads. During 2020-21, the GHMC filled over 13000 potholes, with another 15,230 potholes filled in 2021-22. In addition, roughly 4,560 additional roadworks were sanctioned, at a total outlay of Rs. 1,123.8 crore.
In addition to the GHMC, the Hyderabad Road Development Corporation Limited (HRDCL) also manages the building and maintenance of roads. During 2021-22, the corporation worked on the Missing Link Roads Project for Hyderabad city. The project has a financial outlay of Rs.2,984 crore across three phases, and aims to identify and construct roads that serve as missing connections
in the distribution of traffic over Hyderabad’s roads. These road links will act as shortest alternative routes that would improve mobility, shorten travel times, facilitate quick movement of essential services like ambulances and fire forces, improve road safety, reduce vehicular exhaust pollution, and connect the abandoned areas of the city, thereby controlling anti-social activities.
Finally, the HGCL is responsible for the construction and maintenance of the Outer Ring Road (ORR) to Hyderabad city. The entire corridor of 158 kilometres has been completed at a total cost of Rs. 8,828 crore. Since January 2021, HGCL has also taken up the management of the toll plazas on the ORR, and is also responsible for operating the Highway Traffic Management System on the road. In addition, HGCL has taken up the beautification of junctions and the LED lighting along the ORR.
14.6.3.2. Metro RailThe HMRL runs and maintains the Hyderabad Metro, providing a convenient, comfortable and state-of-the-art transport system covering 69 kms. The metro system is being developed under PPP mode at a cost of Rs. 22,000 crore.
In order to improve the urban milieu, the HMRL has taken up urban rejuvenation works along the 57 metro stations, which includes the construction of sidewalks, adding greenery and public-utility furniture near the metro stations, and developing service lanes.
The new Multi-Level Parking at Nampally taken up by HMRL is expected to be completed by March 2022. In addition, plans are on for the construction of 31 km. long ‘Airport Express Metro Rail’ from Raidurg Terminal Station to Shamshabad International Airport at an estimated cost of Rs. 5,100 crore, and a cost effective elevated Bus Rapid Transit System (BRTS)/Metro Neo from KPHB Metro Station to Financial District.

243
14.6.4. Health and Nutrition
A key goal of urban policy is to improve the health and nutritional status of the urban residents, so that they can serve as productive members of the society. In Telangana, urban initiatives like Annapurna Meals and Basti Dawakhanas have been designed to supplement the health infrastructure in the city.
14.6.4.1. Basti DawakhanasThe GHMC constructed over 256 Basti Dawakhanas to provide health care services including diagnostic tests and medicines free of cost to the urban poor. Each dawakhana has a doctor, a staff nurse, supporting staff, and a separate pathology lab. They provide services such as out patient, antenatal care, COVID-19 vaccination, child immunisation, tests for non-communicable diseases like diabetes and blood pressure, liver function test, renal function test, blood test, lipid profile, thyroid, complete blood picture, etc.
14.6.4.2. Annapurna MealsSince 2014, GHMC has been providing nutritious and affordable Annapurna meals at Rs. 5 per meal to people across the city, serving over 45,000 lunches each day.
During the first lockdown, Annapurna Meals were supplied totally free of cost. At present, Annapurna meals are being provided through 373 centres, including mobile Annapurna centers during lunch, and through 259 centres during dinner time. Since the launch of the scheme, 7,36,69,487 meals have been served, out of which 2,29,46,080 meals were served during 2020-21. GHMC has also identified 32 locations to establish “Seating Annapurna Canteens” for public convenience.
14.6.5. Waste ManagementAccording to the Telangana State Pollution Control Board (TSPCB), Telangana generated 9,965 tonnes of solid waste per day during 2020-21. 100% of this waste was collected, while over 75.6% of this waste
was treated. The GHMC and HiMSW together handle the city’s municipal solid waste under a Public-Private Partnership (PPP). In November 2020, the Government introduced 55 advanced compactors for waste collection in Hyderabad and also launched new transfer stations for handling the garbage. These stations were designed as closed sheds to reduce the hassle caused by the stink of the garbage. This was combined with a new fleet of garbage collection vehicles that call centres could track remotely. These upgrades will also help improve the city’s performance on the Swachh Survekshan rankings, which currently ranks Hyderabad at the 13th place among the 48 cities with a population above 10 lakh.
14.6.6. Greenery and BiodiversityThe GHMC and the Urban Forestry arm of the HMDA are responsible for implementing the Telanganaku Haritha Haram (TKHH). The aim of TKHH is to enhance the state’s forest cover from 24% to 33% by planting over 230 crore plants. The HMDA planted over 132.24 lakh seedlings and distributed another 113.96 lakh seedlings among the people. Under TKHH, the HMDA has also developed Green Corridors along the Outer Ring Road (ORR), projected and developed “Urban Lungs Spaces” in 16 forest blocks, maintained over 39 urban parks (including NTR Garden, Sanjeevaiah Park, and greenery along the Necklace Road in Hyderabad)and developed 41 nurseries.
The efforts of the Government have led to the recognition of Hyderabad as “Tree City of the World” by the FAO in 2020. Begumpet Rain Garden also received an award in the 2021 International Exhibition and 6th Smart Cities India Expo under the Green and Clean City category.
14.6.7. Urban PlanningThe Government has laid considerable focus on ensuring that the development of urban areas occurs in a planned manner. This is done to ensure
Urban Development

Telangana Socio Economic Outlook 2022244
that urban growth keeps pace with the growth in the size and the needs of the population. HMDA is the urban planning agency of Hyderabad. It is responsible for planning, coordinating, supervising, and securing the planned development of the Hyderabad Metropolitan Region. During 2021-22, it undertook several projects, including the layout development for Kokapet, construction of Osman Sagar’s Landscape Park, constructing skywalks at Mehdipatnam and Uppal, construction of a Logistics Park at Mangalpally and Batasingaram, development, operation and maintenance of Lake Front Night Bazar between Sanjeevaiah Park & Buddha Bhavan, development of Rock Garden at Jalpally Lake, beautification of 20 lakes, and restoration and maintenance of heritage sights, etc.
14.6.8. Leisure and RecreationHyderabad combines its strengths as an IT Hub with stellar recreational facilities. These facilities are necessary to develop Hyderabad as a ‘consumer city’, on the lines of other metropolitan cities in the developed countries. The Government has developed gardens and urban public spaces to meet the leisure needs of the residents. The Buddha Purnima Project, launched in 2000, was a concerted effort to develop the areas around the Hussain Sagar Lake as public recreational spots. The aim of the project was to help the growth of the lake, upgrade the surrounding environment, promote tourism, and encourage eco-tourism in the area. Under this project, the Government developed the Lumbini Park, NTR Gardens, Necklace Road, People’s Plaza, Sanjeevaiah Park, Hussain Sagar Lake, and Lake View Park. These areas provide ideal destinations for the citizens to relax, while also serving as a source of livelihood for small businesses and revenue for the government.
In 2021, the GHMC started organizing ‘Sunday-Funday’ events at Tank Bund in Hyderabad, which combines market areas with fun activities, bands
and orchestras, fireworks, folk performances, and eating joints. This was done after the lakeside stretch in the area was developed and renovated for public use. The event has garnered considerable appeal among the families in Hyderabad, while providing small businesses and vendors a chance to boost their earnings by catering to the crowds that flock to Tank Bund for the night events.
14.7. Urban GovernanceThe 74th Amendment Act 1992 stipulated that the responsibilities of providing citizen services in the urban areas and performing administrative tasks like urban planning and land use regulation, should fall under the purview of Urban Local Bodies. The Amendment left it to the respective states to enact laws that govern the structure and status of ULBs in their territory.
Accordingly, the Government enacted the Telangana Municipalities Act 2019 to guide the administration of ULBs other than GHMC. The Act pushes the ULBs to be more transparent, accountable, and efficient. In tune with the act, some of the identified focus areas are:
l Promoting Greenery in the urban areas, by demarcating funds towards the ‘Green Budget’.
l Encouraging citizen-centric governance by establishing Citizen Service Centres in the Municipalities.
l Saving water, improving sanitation and upgrading the sewerage systems to ensure that water resources are well-utilised.
l Introduction of a single-window online system, called Telangana State Building Permission and Self Certification System (TS-bPASS) to process building certifications in a timely and hassle-free manner.

245
Table 14.2
District-wise Urban Local Bodies in TelanganaName of Municipality/Municipal Corporation
Municipal corporations
No. of ULBsDistrictS.No.
4. Dharmapuri 5. Jagityal 6. Koratla 7. Metpalli 8. Raikal
11. Alampur 12. Gadwal 13. Leeja 14. Waddepalle
10. Bhupalpally
15. Banswada, 16. Kamareddy 17. Yellareddy
18. Choppandandi 19. Huzurabad 20. Jammikunta 21. Karimnagar 22. Kothapalli
23. Khammam 24. Madhira 25. Sattupalli 26. Wyra27. Kothagudem 28. Manuguru 29. Palvancha 30. Yellandu
31. Dornakal 32. Mahabubabad 33. Maripeda 34. Thorrur
35. Bhoothpur 36. Jadcherla 37. Mahabubnagar
45. Medak 46. Narsapur 47. Ramayampet 48. Thoopran
49. Boduppal 50. Dhammaiguda 51. Dundigal 52. Ghatkesar 53. Gundlapochampally 54. Jawaharnagar 55. Kompally 56. Medchal 57. Nagaram 58. Nizampet 59. Peerzadiguda 60. Pocharam 61.Thumkunta
62. Achampet 63. Kalwakurthy 64. Khollapur 65. Nagarkurnool
66. Chandur 67. Chityal 68. Devarakonda 69. Haliya 70. Miryalaguda 71. Nakrekal 72. Nalgonda 73. Nandikonda
104. Ameenpur 105. Andol-Jogipet 106. Bollaram 107. Narayankhed 108. Sadasivapet 109. Sangareddy 110. Tellapur 111. Zaheerabad
112. Cherial 113. Dubbaka 114. Gajwel 115. Husnabad 116. Siddipet
117.Sircilla 118. Vemulavada
119. Huzurnagar 120. Kodada 121. Neredcherla 122. Suryapet 123. Tirumalagiri
124. Kodangal 125. Parigi 126. Tandur 127. Vicarabad
128. Amarchinta 129. Atmakur 130. Kothakota 131. Pebbair 132. Wanaparthy
133. Narsampet 134. Parakala 135. Wardhannapet
136. GWMC
137. Alair 138. Bhongir 139. Choutuppal 140. Mothkur 141. Pochampally 142. Yadagirigutta
No ULBs
74. Kosgi 75. Makthal 76. Narayanpet
77. Bhainsa 78. Khanapur 79. Nirmal
80. Armoor 81. Bheemgal 82. Bodhan 83. Nizamabad
84. Manthani 85. Peddapalli 86. Ramagundam 87. Sulthanabad
88. Adibatla 89. Amangal 90. Badangpet 91. Bandlagudajagir 92. Ibrahimpatnam 93. Jalpally 94. Kothur 95. Manikonda 96. Meerpet 97. Narsingi 98. Pedda-Amberpet 99. Shadnagar 100. Shamshabad 101. Shankarpally 102. Thukkuguda 103. Turkayamjal
Jagitial
Jogulamba Gadwal
Jayashankar
Kamareddy
Karimnagar
Khammam
Kothagudem
MahabubabadMahbubnagar
Medak
Medchal-Malkajgiri
Nagarkurnool
Nalgonda
Sangareddy
Siddipet
Sircilla
Suryapet
Vikarabad
Wanaparthy
Warangal-Rural
Warangal-Urban
Yadadri Bhuvanagiri
Mulugu
Narayanpet
Nirmal
Nizamabad
Peddapalli
Rangareddy
4
7
6
8
9
10
11
1213
15
16
17
18
24
25
26
27
28
29
30
31
32
33
19
20
21
22
23
1. Adilabad
2. Kagaznagar
3. GHMC
9. Jangaon
Adilabad
Asifabad
Hyderabad
Jangaon
1
2
3
5
38. Bellampally 39. Cheenur 40. Kyathanpally 41. Luxettipet 42. Mancherial 43. Mandammari 44. Naspur
Mancherial14
1
1
1
1
5
5
44
4
3
4
13
4
8
8
5
2
5
4
5
3
1
6
0
3
3
4
4
16
4
1
3
7
Source: Municipal Administration & Urban Development Department, GoTS

Telangana Socio Economic Outlook 2022246
There are 142 ULBs in Telangana, spread across the districts of the state. Table 14.2 shows the number of ULBs located in each district.
In addition to the ULBs, the Government notifies the creation of Urban Development Authorities (UDAs) from time to time. The objective of UDAs is to ensure that the process of urbanisation does not occur in an unplanned manner, and to therefore provide adequate planning support during the urbanisation process. This involves the creation of master plans and layouts for land-use, water-use and sanitation facilities, and road networks in newly urbanising areas. Before 2014-15, the only UDAs in Telangana were Hyderabad’s HMDA and Warangal’s Kakatiya Urban Development Authority (KUDA). The following 8 UDAs were created in the state between 2014-15 and February, 2022, taking the total number of UDAs in the state to 10:
l Yadadrigutta Temple Development Authority in Yadadri Bhuvanagiri,
l Vemulawada Temple Development Authority in Rajanna Sircilla,
l Satavahana Urban Development Authority in Karimnagar,
l Nizamabad Urban Development Authority in Nizamabad,
l Stambhadri Urban Development Authority in Khammam,
l Siddipet Urban Development Authority in Siddipet,
l Mahabubnagar Urban Development Authority in Mahabubnagar, and
l Neelgiri Urban Development Authority in Nalgonda
14.8. Financing Urban DevelopmentUrban development requires considerable upfront public investment. While development of infrastructure such as flyovers and metro services provides a considerable boost to the productivity of the local economy, financing their construction remains a key concern globally. Telangana’s Urban Local Bodies (ULBs) benefit from a significant tax base that helps finance the development of its cities.
In January 2021, Telangana joined five other states (Rajasthan, Goa, Kerala, Andhra Pradesh, and Madhya Pradesh) in completing Urban Local Body (ULB) reforms stipulated by the Department of Expenditure (Ministry of Finance, Government of India). This entailed changing the floor rates of property tax rates to reflect the prevailing circle rates in the nearby areas, and update the user charges as well. This allowed the ULBs to raise resources that could help improve the health and sanitation in the areas that they cover. In addition, the Government would also introduce a mechanism to increase these rates periodically.
14.8.1. Greater Hyderabad Municipal CorporationGHMC is the largest Municipal corporation in the state, covering a population of 79 lakh. In 2021-22, the GHMC proposed a budget of Rs. 5,600 crore. GHMC gets its funds from 3 sources—tax revenues, non-tax revenues and capital grants.
Tax revenue comprises all the taxes collected by the GHMC, contributing 37% to the total revenues

247Urban Development
A drone is a small-sized Unmanned Aerial Vehicle (UAV) which can fly at low heights and capture its surroundings through the sensors attached to it. Drones have huge potential to alter the urban space. Recognising the potential of drones, the Government released the Telangana State Drone Policy in 2019. The stated goal of the policy was to strike a balance between regulation and growth-enhancing potential of drones for Telangana.
One area where these drones can provide significant advantage is cadastral activities. Specifically, drones can improve the property tax collection in urban areas, circumventing commonly-faced issues in the domain. While property taxes are a promising source of revenue for local governments (for example, GHMC collects 90% of all tax revenues through property taxes), they are associated with large administrative burdens. Collecting property taxes entails maintaining and updating spatially complete databases of property records. Failure to deal with these challenges reduces the potential revenue from property taxes.
Drones can significantly reduce the hurdles to maintaining and updating the maps in urban areas. They provide a low-cost solution to surveying techniques, and can supplement data on land use with
detailed information on the size, capacity, and use cases of different buildings in the city. Consequently, local governments can leverage this data to improve their property tax collections considerably.
Pilots to assess the costs and benefits of using drones in property tax collection have been launched in Bangalore and Hyderabad.
Chhattisgarh’s Raipur Municipal Corporation (RMC) has used this technology, alongside other GIS tools, to enhance its revenue base. In this process, the RMC combined their door-to-door surveys to assess property ownership with digital maps and aerial shots taken by drones from across the city. They also partnered with a bank to provide them with mobile apps that can digitise the process of property tax collection. Their efforts yielded positive results—the number of assessed properties increased 1.5 times and the total property tax demand jumped from Rs. 83 crore to Rs.139 crore.
ReferenceAwasthi, R., Nagarajan, M., & Deininger, K. W. (2021). Property taxation in India: Issues impacting revenue performance and suggestions for reform. Land Use Policy, 110, 104539.
Box 14.2
Drones for Development

Telangana Socio Economic Outlook 2022248
(see Figure 14.12). Over 90% of this collection comes from the property tax levied by the corporation. Till December 2021, GHMC had collected Rs.1,047.45 crore in property taxes in 2021-22.
Non-tax revenue primarily comprises Trade Licence Fees and Advertising Fees levied by the GHMC within its boundaries. Taken together, the non-tax revenues comprise 15.8% of the GHMC budget. In 2021-22, GHMC expects 12.59 crore in advertisement fees and 70 crore in licence fees.
Finally, GHMC also receives money from the capital grants provided by the state and central governments. These constitute over 11.4% of its budget. During 2021-22, GHMC would receive over Rs. 2,012 crore in capital grants. A large share of
this money is earmarked for specific schemes or projects. For example, in 2021-22, roughly 62% of the grant was earmarked for the 2-BHK Housing Project. 14.8.2. Other Municipal Corporations
There are 12 other Municipal Corporations in the state. The Greater Warangal Municipal Corporation (GWMC) is the second largest Municipal Corporation, with a population of 8.19 lakh. In 2021-22, the GWMC proposed a budget of Rs. 559.8 crore. The primary sources of revenues for GWMC were tax revenues (14.3%), non-tax revenues (18.4%) and capital grants (67%).
This is followed by Nizamabad Municipal Corporation, with a population of 3.1 lakh. During 2020-21, the corporation proposed a budget of Rs. 341.79 crore. The budget was primarily financed through four sources—tax revenues (15.5%), non-tax revenues (11.6%), capital grants (61.5%), and deposits and loans (11.4%).
Karimnagar Municipal Corporation has a population of 2.61 lakh. For 2020-21, the Karimnagar Municipal corporation proposed a budget of Rs. 220.1 crore. They had three primary sources of revenue—tax receipts (18.8%), non-tax receipts (19.66%), and capital grants (57.9%).
14.9. Way ForwardAs of 2022, over 47% of Telangana’s population is expected to be living in urban areas. By 2027, more residents of Telangana would be living in its urban areas than in rural areas.
The future of urban development in Telangana is full of opportunities, with a perfect ecosystem in place for experimenting with new technologies and policy proposals. For example, several economists
Figure 14.12
Share of different sources of revenue in total budget, GHMC (2021-22)
Source: GHMC Budget 2021-22
Total revenues : Rs. 6,757 crore
Tax Revenues37.0%
(Rs. 2,502.1 crore) Non-Tax Revenue15.8%
(Rs. 1,068.9 crore)
Revenue Surplus14.5%
(Rs. 978.5 crore)
Grants11.4%
(Rs. 770 crore)
Others21.3%
(Rs. 1,437.6 crore)

249
have recently endorsed the idea of creating an urban employment guarantee programme, and using the person days generated under the scheme to rejuvenate the urban public spaces. On the technological front, the experience of municipalities like Raipur and larger municipal corporations like Bengaluru show the immense potential of Geographic Information Systems (GIS) in improving property tax collections. Similarly,
the use of smart traffic management systems to reduce road congestion, and on-demand services to improve urban mobility are areas with ample potential for exploration. Telangana’s IT-hubs and technologists are well-suited to act as pioneers in deploying meaningful technologies to improve the urban experience. The citizen-centric focus of urban development in Telangana is poised for a future of greater and more inclusive urbanisation.
Urban Development
Telangana Socio Economic Outlook 2022250
GOVERNANCE
CHAPTER
15

251
l Telangana has the highest number of e-transactions per 1,000 population among all states in the country between 2014 and 2022. The state has been at the third position in the country in terms of the number of e-transactions per 1,000 population consecutively for three years from 2019.
l The Government introduced the Telangana State Building Permission Approval and Self Certification System (TS-bPASS) in 2020, as a single window system that processes the various permissions required during the land development and building construction in the Urban Local Bodies (ULBs) through a self-certification system in a time-bound manner. As of 25th February 2022, 90,412 applications have been received under TS-bPASS, out of which 69.1% applications have been approved. The remaining have either been rejected due to non-fulfilment of mandatory requirements, or are being processed.
l The Government introduced Dharani Portal in 2020, a service-sector innovation for agricultural land transactions, that offers 100% advance slot bookings, and instantaneous mutations and registrations. Within a span of one year, the portal completed more than 8 lakhs transactions.
l Currently, the state has 8,51,644 CCTV cameras installed under various schemes in sensitive locations, community spaces, and establishments. The Community CCTV surveillance project encourages the communities to invest in a CCTV project and integrate it with the nearby police stations for enhancing their safety and security.
l The Government created the Administrative Reforms Panel in 2022, a four-member body to study the roles and functioning of employees in different departments, and appropriate resourcing requirements.
Key Highlights
Governance

Telangana Socio Economic Outlook 2022252
15.1. Introductionhe United Nations Development Programme (UNDP) defines governance as “the exercise of economic, political,
and administrative authority to manage a country’s affairs at all levels. It comprises mechanisms, processes, and institutions through which citizens and groups articulate their interests, exercise their legal rights, meet their obligations, and mediate their differences.” Governance can be subtle, and may not be easily observable. It extends beyond the organs of the government, and includes citizens and institutions as well.
Among other things, “Good Governance” is most importantly participatory, transparent, and accountable.
To uphold these pillars of “Good Governance”, the Government of Telangana has taken a multitude of measures and initiatives, centered around the following: 1) Decentralization 2) Citizen Centric Governance 3) Public Safety, Policing & Prisoners’ Welfare
Various institutions have been established to support good governance, and the state is in the process of initiating ‘Monitoring & Evaluation’ studies in order to test the effectiveness of the initiatives implemented so far, to identify initiatives with high benefit-to-cost ratios, and to scale up initiatives that have the potential to bring about the biggest change.
15.2. Decentralization for Good Governance
One of the foundational features of good governance is decentralization. Decentralization ensures delegation of power and authority to the remote level administration, and thereby increases the access of citizens to government officials, enhancing the opportunity for active public participation. It makes
decision-making more contextual to local issues, and accelerates the speed of policy implementation.
Since 2014, the Government of Telangana has taken several measures to promote decentralization and empower the local governance institutions in the state as a step towards strengthening the governance structures in Telangana. Accordingly, the number of districts were increased from 10 to 31 in 2016, and further to 33 in 2019 (see Table 15.1.).
The Government of Telangana, through its decentralized citizen-centric model of governance, is not only utilizing the institutions of local governance as a direct interface between the government and the people, but is also empowering them to make their own decisions. This model is driven by a strong system of e-governance, wherein all departments are equipped with Information and Communication Technology facilities for fulfilling day-to-day work requirements, grievance redressal, and public communication.
The Government has also enacted several legislations and constituted local governance institutions to promote decentralization in the state.
T
Table 15.1
Growth in the administrative divisions in the state (2015-2021)
Source: Directorate of Economics and Statistics, Government of Telangana
Administrative Division 2015 2021 Change
Districts
Revenue Divisions
Mandals
Zilla Praja Parishad
Mandal Praja Parishad
Gram Panchayat
Municipal Corporations
Municipalities
Cantonment Board
10
42
464
9
438
8,691
6
67
1
33
74
594
32
540
12,769
13
129
1
23
32
130
23
102
4,078
7
62
0

253
The major legislation for rural governance is the Telangana Panchayat Raj Act, 2018 (amended in 2021), aligned to the Constitution (73rd Amendment) Act, 1992. The key objective of this legislation is the democratic decentralization of power and resources to elected representatives, and thereby, facilitation of participatory governance at the grassroots level. The Act provides for the constitution and management of Gram Panchayats, Mandal Praja Parishads, and Zilla Praja Parishads in the state.
Similarly, the 74th Constitutional Amendment Act mandated the setting up and devolution of powers to Urban Local Bodies (ULBs) or city governments as the lowest unit of governance in cities and towns. At present, there are 142 ULBs and 10 Urban Development Authorities (UDA) across the state. Out of the total 142 ULBs, 97 come under the ambit of the Telangana Town Planning Act, 1920. The Government enacted the Telangana Municipalities Act, 2019 to govern the municipalities and municipal corporations in the state. The Greater Hyderabad Municipal Corporation Act, 1955 (amended in 2020) governs the Hyderabad urban agglomeration.
15.3. Citizen-Centric GovernanceCitizen centricity, with the aim of ensuring citizens’ welfare and citizens’ satisfaction, is critical for any government – local, state, or national – which aims to provide good governance. Telangana has instituted multiple mechanisms and undertaken various initiatives to make governance citizen-oriented.
The Government of Telangana has leveraged technology through adopting e-governance across the system to improve access to services for citizens and to ensure that services are delivered in a more timely manner, while also increasing the transparency and accountability in service delivery. The Direct Benefit Transfer of the amounts to the beneficiaries of Rythu Bandhu is a case in point.
Telangana has the highest cumulative number of e-transactions per 1,000 population among all states in the country between 2014 and 2022 (see Figure 15.1). The state has consistently been at the third position in the country in terms of the yearly number of e-transactions per 1,000 population in the last three years (2019, 2020 and 2021).
Governance
Figure 15.1
e-Transactions per 1,000 population (June 2014 to January 2022)
Source: e-Taal Portal, Government of India
e-Transaction Per 1,000 Population
Telangana
Andhra Pradesh
Kerala
Gujarat
Himachal Pradesh
Tamil Nadu
Chhattisgarh
West Bengal
Haryana
Madhya Pradesh
Rajasthan
Punjab
Uttarakhand
Karnataka
Uttar Pradesh
Odisha
Goa
Meghalaya
Mizoram
Maharashtra
Sikkim
Bihar
Jharkhand
Assam
Jammu & Kashmir
Nagaland
Tripura
Manipur
1,38,266
1,37,264
1,31,016
72,935
43,133
43,002
40,422
37,182
35,816
26,020
24,157
22,839
20,266
19,437
18,199
15,955
15,620
12,885
12,251
12,186
9,797
8,753
8,484
8,209
7,609
7,346
7,263
5,703

Telangana Socio Economic Outlook 2022254
15.3.1. Mee SevaMee Seva was launched to bring public services closer to the citizens and to enable them to access government services anywhere, anytime through Mee Seva centres and online mode. The platform uses Information and Communications Technology (ICT) in an innovative manner that enables electronic delivery of 800-plus services from 90-plus departments.
At present, more than 4,500 Mee Seva centres are operating across the state. On an average, Mee Seva handles 1 lakh to 1.5 lakh transactions per day, with electricity and telephone bill payments, police complaints, and tax payments being the most popular services accessed by citizens through the application. In the year 2021-22, the app had served 1.11 crore citizens till September 2021 (see Figure 15.2).
The decline in the number of citizens served through Mee Seva since 2015-16 can be attributed to the increasing number of digital payment apps, and the increased penetration of internet facilities across the state. These popular digital wallets that facilitate
transactions through mobile phones have attracted the existing Mee Seva users, as well as new payees. However, the Mee Seva application continues to service a significant number of citizens across the state, especially those in remote areas with little or no access to internet facilities.
15.3.1.1. T App FolioThe Government launched its m-governance (mobile governance) initiative, the T App Folio application, as part of Mee Seva 2.0 in 2018. It is an integrated app that leverages the deep penetration of mobile usage in the state to deliver services such as Mee-Seva, Regional Transport Authority services, fee payments, and bill payments to the citizens.
Currently, the app has 14.75 lakh downloads and records close to 2 lakh transactions per month. T-App Folio experienced a 42.04% increase in the number of citizens served between 2019-20 and 2020-21 (see Figure 15.3).
15.3.2. Improved Land Records Management15.3.2.1. Dharani PortalThe Government launched the Dharani portal
Figure 15.2
Year-wise number of citizens served through Mee SevaNo of Citizens served (in Crores)
*Up to Sept. 2021Source: Department of Information Technology, Electronics & Communication, Government of Telangana
2014
-15
2015
-16
2016
-17
2017
-18
2018
-19
2019
-20
2020
-21
2021
-22*
3.11
4.15 4.04 3.91 3.723.41
2.81
1.11
Figure 15.3
Number of citizens served through T App Folio
Source: Department of Information Technology, Electronics & Communication, Government of Telangana
No of Citizens served
2017-18 2018-19 2019-20 2020-21
6,819 41,258
14,79,962
21,02,211

255
in 2020 with the vision of making the revenue administration process more transparent, citizen-friendly, and discretion-free. Dharani is a simple and user-friendly web portal that offers a one-stop solution for the registrations and mutations of agricultural lands. As of November 2021, 31 transaction modules and 10 information modules have been made available in Dharani portal.
The portal brings registrations to the doorsteps of the citizens, and offers 100% advance slot booking, and instantaneous mutation and registration. Stamp duty fee is auto calculated by the system. 8,52,874 transactions were completed through the portal in a span of one year—between October, 2020 and October, 2021 (see Figure 15.4). The largest transaction categories were ‘sales’ and ‘gifts’, with sales of land accounting for 58.9% of the total transactions on the portal, and ‘gifts’ making up 18.6% of the total transactions.
15.3.2.2. Telangana State Building Permission Approval and Self-Certification System (TS-bPASS)TS-bPASS is an integrated platform launched by the Government in line with the Telangana Municipalities Act, 2019 to process various permissions required during the land development and building construction in the Urban Local Bodies (ULBs) process through a self-certification system in a time-bound manner.
As of 25th February 2022, 92,945 applications were received under TS-bPASS of which 68.64% (63,797) has been approved. The remaining were either rejected due to non-fulfilment of mandatory requirements, or are being processed. Nearly half (49.18%) of the total applications received through TS-bPASS were to the Directorate of Town and Country Planning (DT &CP). The Hyderabad Metropolitan Development Authority (HMDA) and the Greater Hyderabad Metropolitan Corporation (GHMC) received 29,161 (31.37% of the total) and 18,078 (19.45% of the total) applications respectively.
HMDA witnessed the highest approval rate - percentage of applications approved out of the total applications received - at 70.65% followed by GHMC and DT&CP at 68.34% and 67.47% respectively.
15.3.3. T WalletT Wallet, launched in 2017, is a first-of-its-kind state-owned digital wallet. It can be accessed through online browsers, smart phones, feature phones, as well as in ‘no phone’ mode. T-Wallet can be used for both government and private transactions. The users can avail 1,032 services across 73 departments including the payment of tolls, utilities, and government benefits/subsidies wherever possible.
As of February 2022, a total of 1,29,4085 users and 15,827 merchants were registered for T Wallet, and 11,59,179 government and 1,55,27,521 non-government transactions were carried out.
Governance
Total transactions: 8,52,874
Note: Others (Number of transactions= 6,183) include partition, General Power of Attorney, Development Agreement-cum-General Power of Attorney (DAGPA), Agreement of sale cum GPA and leases Source: Revenue Department, Government of Telangana
Figure 15.4
Completed Transactions through Dharani portal (October 2020 to October 2021)
Share of transactions (%)
Sale58.9%
(5,02,281)
Gift18.6%
(1,58,215)
Succession8.5%
(72,085)
Mortgage6.8%
(58,285)
Registration (Institution)*
3.1% (26,372)
Others**0.7% (6,183)
NALA3.5%
(29,453)

Telangana Socio Economic Outlook 2022256
15.3.4. Portability of PDSTelangana is equipped with the intra-state (or inter-district) portability of PDS services from 2018. To ensure the smooth functioning of this facility, the Government allots 120% essential commodities in advance to each Fair Price Shop and curtails the subsequent allocation.
PDS portability is extremely convenient to the cardholders as they can avail the PDS services from the nearest FPS irrespective of the FPS where their cards are registered. Thus, essential commodities are ensured to all cardholders even if they move to a new location (no need of a new registration), any FPS gets closed or suspended, or faces technical difficulties to provide the supply. Portability also develops healthy competition practices among the dealers like the maintenance of adequate stocks and good behaviour as the cardholders prefer to avail the services of the better performing FPS.
Inter-state Portability: Telangana and Andhra Pradesh were the two states where the Integrated Management of Public Distribution System (IMPS) Scheme (One Nation-One Ration scheme) was launched on pilot-basis in 2019. Through this scheme the National Food Security Act cardholders can receive the entitled food grains from any Fair Price Shop in the states under IMPS.
15.3.5. Anywhere-Anytime services in Regional Transport Authority (RTA)The Government has introduced ‘Anytime Anywhere’, an m-governance project through which the citizens can avail basic RTA services without visiting the Regional Transport Offices. 71,072 transactions related to licenses and registrations have been recorded under this project.
15.3.6. Prajavani‘Prajavani’ is a centralized public grievance redressal system, as part of which, all districts conduct grievance redressal meetings every Monday. The
citizens can raise their grievances either through phone or on paper, that are redressed in specific time frames. Cumulatively, 3,68,583 issues have been raised as of 1st February 2022, out of which 2,97,251 issues have been disposed of.
15.4. Public Safety, Policing, and Prisoners’ WelfarePolice forces play a vital role in maintaining law and order, as well as ensuring public safety. The Government of Telangana has augmented the police forces in the state- in terms of its strength in numbers and service environment.
Modernizing the Police Stations: The Government modernised the existing Police Stations in the State through technology into ‘Smart and Responsive Police Stations’ that act as ‘citizen-centric uniform service delivery units’. The objective of these Police Stations is to increase efficacy in surveillance and monitoring, and to hasten the investigation process. To increase mobility, each of these police stations has been provided with two 4-wheeler patrol vehicles and four 2-wheeler patrol vehicles. Additional infrastructure such as fitness centres and health clinics has been established in these police stations. The police personnel also receive extensive professional training by domain experts and resource persons. Between 2014 and 2020, the Government imparted nine-month induction training to 22,347 Stipendiary Cadet Trainee Police Constables (SCTPC) of various police units across the state.
Police Administration: To improve citizens’ access to the police administration, the Government reorganised the Police Department by increasing the number of police districts from 10 to 20, and the number of commissionerates from 2 to 9. After the formation of new districts in the state (2016), a total of 103 police stations, 29 circles, 24 sub-divisions and 15 District Police Offices were created.

257
15.4.1. Digital Tools for Policing15.4.1.1. CCTV Surveillance SystemIn order to prevent, detect, and mitigate criminal activities in the state, the Government of Telangana has installed a strong network of CCTV cameras across the state. The state has the highest number of public CCTV cameras among all states in the country – a total of 8,51,644 CCTVs. More than 90% of them (a total of 7,76,284) are Government-funded (under the Nenu Saitham scheme and MP/MLA/MLC funds), and the remaining are community-funded. According to the Bureau of Police Research and Government (BPRD) Report 2020, Telangana state has 61.3% of the total CCTV cameras in the country. Through the ‘Community CCTV project’, the Government encourages communities to invest in a CCTV project and integrate it with the nearby police stations for enhancing their safety and security.
15.4.1.2. Hawk Eye AppThe Government launched the ‘Hawk Eye App’, a mobile application through which citizens can report traffic violations, crimes, criminal information, and violations by police personnel, and provide suggestions to improve policing. Currently, the app has above 5 lakh downloads on Google Play Store.
15.4.1.3. VERIFAST AppThe Government of Telangana has introduced this mobile application to reduce the turnaround time for verification and issue of passports. The applicants are continuously updated about the status of their application through SMS messaging services. The average time taken from the time of applying to the issue of Passport Verification Report in the state is 4 days, as against the national average of 21 days for police verification. 15.4.2. Policing Infrastructure 15.4.2.1. Command Control Centre
A state-of-the-art command and control centre equipped with modern Information and Communication Technology (ICT) has been set up in Hyderabad as part of the safe and smart city
project. This also acts as the state-level Disaster/Crisis Management Centre. The centre responds to emergency situations with actionable intelligence with the help of the ICT and information systems that are linked to the ground-level security infrastructure, video surveillance, transport and traffic system, geospatial technologies, emergency systems, citizen services applications and Radio-Frequency communication systems.
15.4.2.2. Integrated Traffic Management SystemThe Government established the Integrated Traffic Management System (ITMS) to improve traffic compliance, road safety, and public mobility. Information received from ITMS is used by the Traffic Police for regulation of waiting time at traffic signals in order to minimise traffic congestion. In addition, ITMS is also used for priority vehicle management, to ensure smooth clearance of emergency services such as ambulances, fire services and VIP vehicles near the traffic signals. The system also generates alerts for wanted, stolen, and abandoned vehicles through black list vehicle tracking mechanism.
ITMS fulfills the above-mentioned objectives through the following:lthe Automatic Number Plate Recognition (ANPR)
that captures the traffic violations and generates e-Challans automatically to the owners of the vehicles.
lLED Variable Message Boards (VMB) that publish live traffic alerts, which help commuters take alternative routes in case of traffic congestion.
lthe Digital Public Addressing system which creates traffic awareness and alerts the violators at the junctions.
lthe Automatic Traffic Counter and Classifier (ATCC) which counts the number of vehicles, thus helping with monitoring the corridor traffic level congestion using Adaptive Traffic Control System (ATCS).
Governance

Telangana Socio Economic Outlook 2022258
15.4.3. Women’s Safety15.4.3.1. SHE Teams
Safety, Health and Environment (SHE) Teams were launched by the Government to provide a safe and secure environment for women in the state. Women in distress can reach out to SHE Teams through different modes such as Whatsapp, Dial 100, Hawk Eye App, e-mail or through social media. 331 SHE Teams in the state together received 37,193 petitions1 between 2014 and 2021. Out of these, 22,574 cases (FIRs and petty cases) were booked under different sections. The team received 4,687 and 5,145 petitions in 2020 and 2021 (till November) respectively.
15.4.3.2. NRI Cells, Bharosa Centres, and Emergency ResponseTelangana Police has established an NRI Cell in its Women Safety Wing to address the matrimonial issues filed by women against the NRI/Overseas Indian husbands and their relatives.
Another key initiative of the police department is the establishment of Bharosa Centers, which are support and redressal centres for women and child survivors of violence. At present, 6 Bharosa centres are operational and the establishment of 7 centres are in progress. The Telangana Police also established SHE-Bharosa Cyber Lab in the Women Safety Wing, Hyderabad on 2nd November 2021 for dealing with cases related to cyber-crime against women and children.
Telangana Police has also modernised the Dial 112/100 emergency response system conforming to the Golden Hour Principle of “Reducing the Response Time”.
15.4.4. Prisoners’ WelfareThe Government of Telangana recognizes the role of correctional institutions in ensuring public safety and delivering social justice. The police and prisons departments in the state ensure that the offenders
are punished under law through competent judicial institutions. At the same time, the Government is well aware of the importance of upholding the constitutional rights of the convicts and bringing them back to dignified life through corrective training.
There are 51 prisons in Telangana of which 24 are sub-jails and 7 are district jails (see Figure 15.5).
The Government has taken up multiple initiatives to improve the prison infrastructure, and for skill development among prisoners. Key initiatives among these are elaborated below.
15.4.4.1. Prison environment and infrastructureE-Mulakath and Visitor’s Lounge
The Government of Telangana offers e-mulakath service to prisoners for interacting with their family members through video conferencing facility. The family or kin of the prisoners can register on the
Source: Department of Home Affairs, Government of Telangana
Figure 15.5
Category-wise Prisons in Telangana
Sub Jails 24
District Sub Jail Offices 9
District Jails 7
Special Sub Jails 4
Central Prisons 3
Prisoner's Agricultural Colony 1
SICA Hyderabad 1
Special Prison for Women, Hyderabad 1
Borstal School, Nizamabad 1
Institution Number of Prisons
1 October 2014 to September 2021
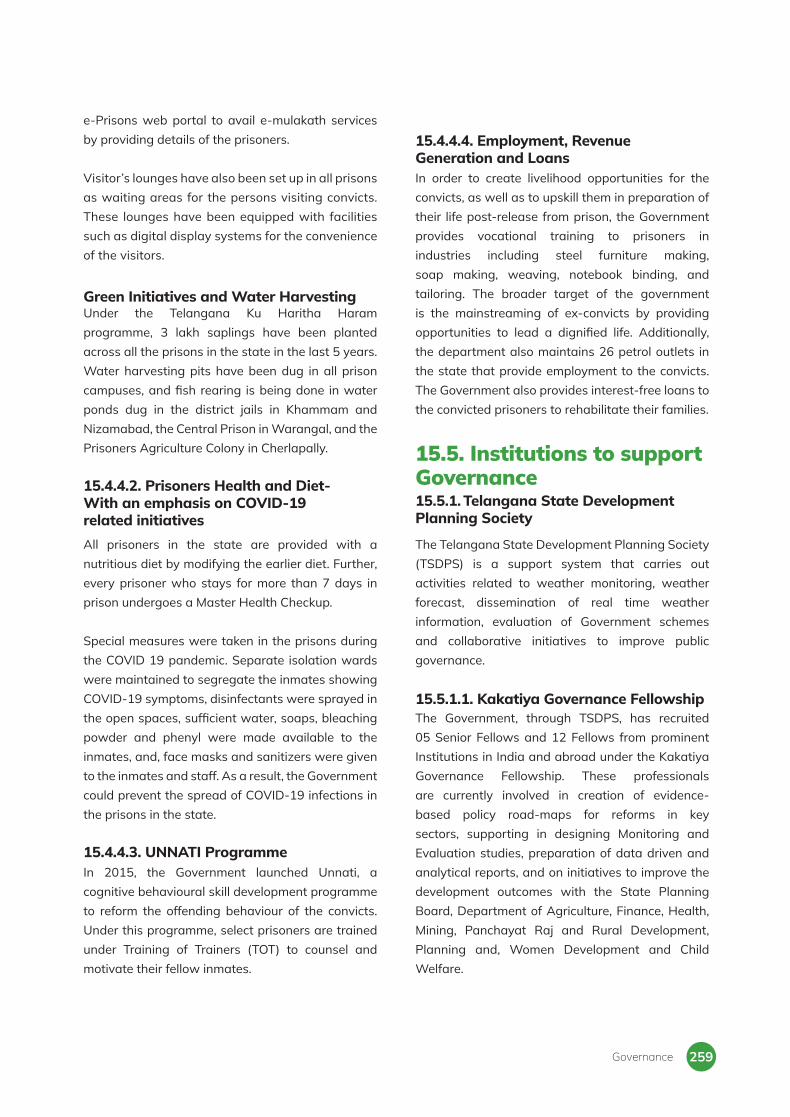
259
e-Prisons web portal to avail e-mulakath services by providing details of the prisoners.
Visitor’s lounges have also been set up in all prisons as waiting areas for the persons visiting convicts. These lounges have been equipped with facilities such as digital display systems for the convenience of the visitors.
Green Initiatives and Water HarvestingUnder the Telangana Ku Haritha Haram programme, 3 lakh saplings have been planted across all the prisons in the state in the last 5 years. Water harvesting pits have been dug in all prison campuses, and fish rearing is being done in water ponds dug in the district jails in Khammam and Nizamabad, the Central Prison in Warangal, and the Prisoners Agriculture Colony in Cherlapally.
15.4.4.2. Prisoners Health and Diet- With an emphasis on COVID-19 related initiativesAll prisoners in the state are provided with a nutritious diet by modifying the earlier diet. Further, every prisoner who stays for more than 7 days in prison undergoes a Master Health Checkup.
Special measures were taken in the prisons during the COVID 19 pandemic. Separate isolation wards were maintained to segregate the inmates showing COVID-19 symptoms, disinfectants were sprayed in the open spaces, sufficient water, soaps, bleaching powder and phenyl were made available to the inmates, and, face masks and sanitizers were given to the inmates and staff. As a result, the Government could prevent the spread of COVID-19 infections in the prisons in the state.
15.4.4.3. UNNATI ProgrammeIn 2015, the Government launched Unnati, a cognitive behavioural skill development programme to reform the offending behaviour of the convicts. Under this programme, select prisoners are trained under Training of Trainers (TOT) to counsel and motivate their fellow inmates.
15.4.4.4. Employment, Revenue Generation and LoansIn order to create livelihood opportunities for the convicts, as well as to upskill them in preparation of their life post-release from prison, the Government provides vocational training to prisoners in industries including steel furniture making, soap making, weaving, notebook binding, and tailoring. The broader target of the government is the mainstreaming of ex-convicts by providing opportunities to lead a dignified life. Additionally, the department also maintains 26 petrol outlets in the state that provide employment to the convicts. The Government also provides interest-free loans to the convicted prisoners to rehabilitate their families.
15.5. Institutions to support Governance15.5.1. Telangana State Development Planning Society
The Telangana State Development Planning Society (TSDPS) is a support system that carries out activities related to weather monitoring, weather forecast, dissemination of real time weather information, evaluation of Government schemes and collaborative initiatives to improve public governance.
15.5.1.1. Kakatiya Governance FellowshipThe Government, through TSDPS, has recruited 05 Senior Fellows and 12 Fellows from prominent Institutions in India and abroad under the Kakatiya Governance Fellowship. These professionals are currently involved in creation of evidence-based policy road-maps for reforms in key sectors, supporting in designing Monitoring and Evaluation studies, preparation of data driven and analytical reports, and on initiatives to improve the development outcomes with the State Planning Board, Department of Agriculture, Finance, Health, Mining, Panchayat Raj and Rural Development, Planning and, Women Development and Child Welfare.
Governance

Telangana Socio Economic Outlook 2022260
15.5.1.2. Weather Monitoring, Weather Forecasting and Disaster Management Support
TSDPS collects periodic weather-data on five parameters - rainfall, temperature, humidity, wind speed and wind direction through 1,044 Automatic Weather Stations (AWS) installed across the state
(see Figure 15.6). Rangareddy has the highest number of AWS (77) followed by Hyderabad (60).
The dynamic real-time weather data collected through AWSs is disseminated to the public through the TSDPS website, TS-Weather Mobile Application and 42 weather display boards across the state. The data is also used by various departments for
Figure 15.6
District-wise Automatic Weather Stations (AWS) in Telangana
Source: Telangana State Development Planning Society, Government of Telangana
Weather Stations
1,044

261
their daily operations and research as well as by the crop insurance companies to settle the claims of the beneficiaries.
TSDPS also supports the disaster management activities in the state by disseminating real-time weather alerts and ‘3-day advance’ weather forecasts that helps the administration in agricultural interventions and disaster mitigation.
15.5.1.3. Monitoring and EvaluationTSDPS is conducting the evaluation study of watershed projects in Telangana. Of the 274 watershed projects in five batches, the evaluation of 121 projects of the first two batches (47 in Batch 1 and 74 in Batch 2) are completed and 153 projects in the next three batches are in progress. It also publishes analytical reports on scheme monitoring, weather and climatology of the state.
15.5.2. TRACThe Telangana Remote Sensing Application Centre (TRAC), the nodal agency for providing the space technology application services in the state, utilizes remote sensing and Geographic Information System (GIS) to provide geo-spatial information to establish Decision Support Systems (DSS) in governance.
TRAC also maintains a centralized satellite data bank for Telangana that helps in mapping, monitoring and modeling the natural resources inventory. Various arms of the Government make use of this information to make governance decisions.
Some of the key activities that TRAC currently carries out are:l Geospatial database creation for all open cast
coal mines in the state. l Cadastral level mapping of land use and land
cover in the state.l Estimation of acreage and productivity of major
crops in the state. l Digitization of village-level cadastral maps in
the state. l Rural Road Information System management
for the state.l GIS based property surveys for estimating
property tax in Hyderabad.
15.5.3. MCRHRDITThe Marri Channa Reddy Human Resource Development Institute of Telangana (MCRHRDIT) is the premier administrative training institute of the Government of Telangana which was set up with the objective of creating and sustaining a dedicated workforce for the Government including the All-India Services officers. MCRHRDIT draws its faculty from premier institutes in the country including the Indian School of Business (ISB), Indian Institute of Information Technology (IIIT), Administrative Staff College of India (ASCI) and National Academy of Legal Studies and Research (NALSAR). MCRHRDIT has dedicated academic centres for public administration, financial management, Sustainable Development Goals, Information Technology, Urban Development Studies, Telangana Studies and Management Development.
15.5.4. External Partnership with CEGISThe Government of Telangana partnered (through a Memorandum of Understanding) with the Centre for Effective Governance of Indian States (CEGIS), an organization that aims to improve lives by helping state governments to deliver better development outcomes. CEGIS has a dedicated team supporting the Government on core sectors like Education and Nutrition as well as in the projects that focus on improving Outcome Measurement, Public Finance and Performance Management. A Technical Advisory Group (TAG) of researchers from renowned institutions in India and abroad supports the team to ensure the quality of output.
15.6. Monitoring and EvaluationWhile the Government works towards achieving its development goals, the Monitoring and Evaluation (M&E) mechanisms help the Government gauge the
Governance

Telangana Socio Economic Outlook 2022262
performance of the initiatives, assess their scope for improvement and identify ways to optimise them. Data collection and analysis is a vital component of Monitoring and Evaluation.
The Government’s administrative data doesn’t always capture household-level or citizen-level data. Other Government of India surveys, such as the National Sample Survey (NSS) or the National Family Health Survey (NFHS), provide credible data at the household level but they are not frequent or disaggregated enough.
To overcome these challenges, the Government of Telangana started the ‘Key Performance Indicator Survey’ (KPI Survey) as a supplementary data source. The first phase of the KPI survey would focus on health and nutrition; capture high-quality data from households and citizens, and generate district-level and select mandal-level estimates on the
key outcome indicators such as child malnutrition, maternal health, beneficiary experience, etc. This bi-annual digital survey would be made available to all stakeholders in the administrative system in a customised and easy-to-consume form. This in turn will help departments devise data-driven, localised solutions focussed on outcome improvement.
15.7. Sustainable Development Goals and GovernanceThe United Nations (UN) General Assembly in 2015 adopted a global development vision- ‘Transforming our World: The 2030 Agenda for Sustainable Development’. The 2030 Agenda is ‘a plan of action for people, planet and prosperity’ dimensions and built on the Millennium Development Goals (MDGs 2000-2015). The SDG agenda (2015-2030) lays out 17 Sustainable Development Goals (SDGs) and
* The score under each goal determines the status. The ranges of scores and the corresponding statuses are:- 100- Achiever; 65-99- Front Runner; 50-64- Performer; and 0-49- Aspirant. ** NITI Aayog assessment of SDG 14 in 2020-21 was limited to the coastal states. Source: SDG India Index, NITI Aayog
Ranks, scores and status of Telangana (TS) under the SDG India Index 2020-21
Goal Status* (TS)Rank among all
states (TS)Score out of
100 (TS)Score out of 100 (India)
Composite (Overall)
No Poverty
Zero Hunger
Good Health and Well-being
Quality Education
Gender Equality
Clean Water and Sanitation
Affordable and Clean Energy
Decent Work and Economic Growth
Industry, Innovation and Infrastructure
Reduced Inequalities
Sustainable Cities and Communities
Responsible Consumption and Production
Climate Action
Life below water**
Life on land
Peace, Justice and Strong institutions
Partnerships for the goals*
SDG 1
SDG 2
SDG 3
SDG 4
SDG 5
SDG 6
SDG 7
SDG 8
SDG 9
SDG 10
SDG 11
SDG 12
SDG 13
SDG 14
SDG 15
SDG 16
SDG 17
10
14
17
18
9
22
2
1
3
10
16
15
18
22
-
4
17
-
69
68
50
67
63
41
96
100
73
59
67
76
73
43
-
81
71
-
66
60
47
74
57
48
83
92
61
55
67
79
74
54
-
66
74
-
Front Runner
Front Runner
Performer
Front Runner
Performer
Aspirant
Front Runner
Achiever
Front Runner
Performer
Front Runner
Front Runner
Front Runner
Aspirant
-
Front Runner
Front Runner
-

263
169 targets to stimulate global action for the next 15 years on the issues critical to humanity and the planet. These issues range from reducing poverty, addressing the social needs on education, health, social protection and job opportunities, and tackling climate change. The SDGs are rooted in Governance initiatives centered around decentralization, citizen centredness, welfare, justice, public safety, and sustainability. The State has made considerable strides in moving forward in all SDGs:
lIn 2020-21, NITI Aayog considered 15 out of the 17 goals to build the SDG India Index. Out of the 15 goals assessed,
lTelangana with a composite overall score (across all SDGs) of 69 is identified as a ‘front runner’ state.
lThe state is an ‘achiever’ under SDG 7- Affordable and Clean Energy.
lTelangana came in the ‘front runner’ category in 9 goals: SDG 1-No Poverty, SDG 3- Good Health and Well-being, SDG 6- Clean Water and Sanitation, SDG 8- Decent Work and Economic Growth, SDG 10- Reduced Inequalities, SDG 11- Sustainable Cities and Communities, SDG 12- Responsible Consumption and Production, SDG 15- Life on land, SDG 16- Peace, Justice and Strong institutions
lThe state is a ‘performer’ in 3 goals: SDG 2- Zero Hunger, SDG 4- Quality Education, SDG 9- Industry, Innovation and Infrastructure.
lTelangana is under the ‘aspirant’ category in only 2 goals: SDG 5- Gender Equality and SDG 13- Climate Action
lFor 2020-21, Telangana’s normalized individual score was more than 90 out of 100 for 34 quantitative indicators considered by NITI Aayog.
l To implement its SDG strategy, the Government has devised an institutional arrangement involving inter-departmental coordination.
lTo localize SDGs at the state level, the Government has mapped SDGs to various
departments to implement target-oriented programmes.
15.8. Way ForwardThe Government envisions ‘good governance’ across all its vertical and horizontal arms grounded on transparent and corruption-free processes with minimum human interventions. Recognizing that it is primarily accountable to the citizens, the Government ensures consensus-oriented and responsive decision-making at all levels of the policy making process.
The Government is trying to improve the responsiveness and efficiency of public service staff through supportive supervisory models that are being rolled out at various levels of scale in the departments of Panchayat Raj and Rural Development, Women Development and Child Welfare, and Agriculture. Additionally, the Government envisages setting up a robust Human Resource Management System (HRMS) across Departments that would lead to better decision making across the personnel life cycle. To strengthen visibility of last mile beneficiary experience, several departments are setting up systems for the collection of outcome indicators data at household/citizen level through representative surveys and telephonic calls to understand the perceptions of service delivery.
The Government also envisions enhanced inter-departmental coordination by ensuring the convergence of organisational structures through structural and institutional reforms. The Administrative Reforms Panel created in January 2022 is a case in point. The four-member body studies the roles and functioning of employees in different departments, and appropriate resourcing. These studies, in turn, will help the Government strengthen the convergence between various departments for locally responsive citizen service delivery.
Governance
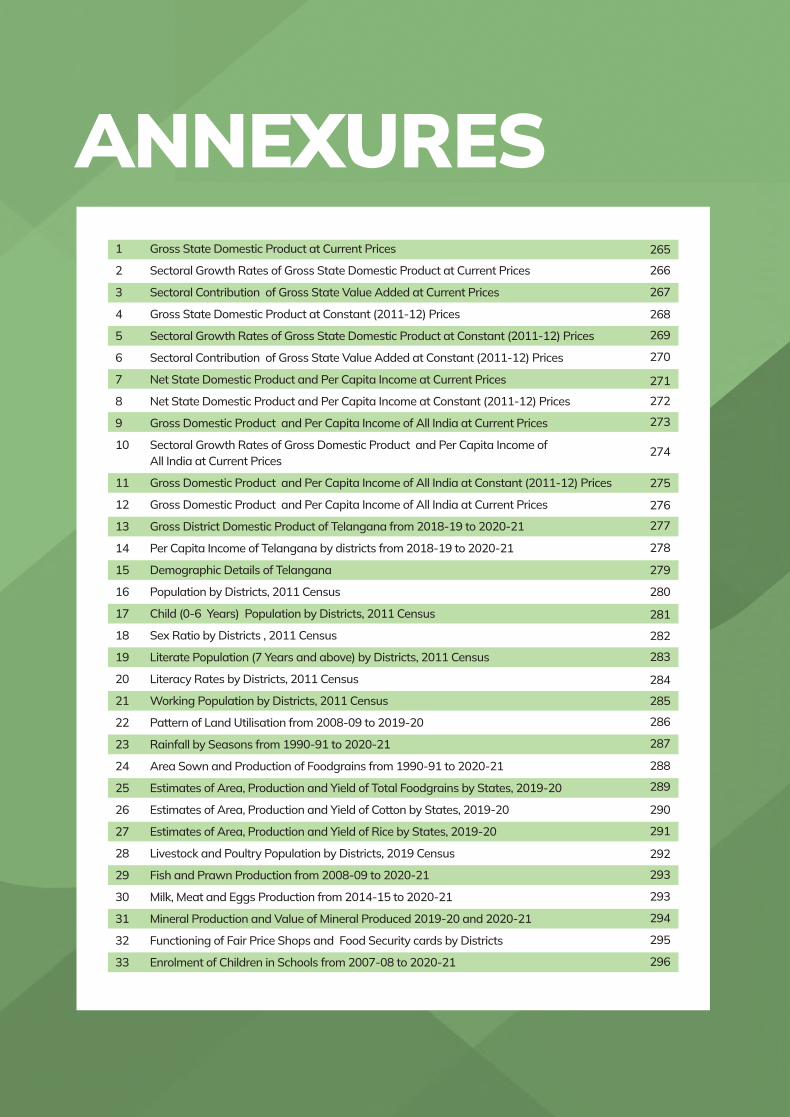
Telangana Socio Economic Outlook 2022264
1 Gross State Domestic Product at Current Prices
2 Sectoral Growth Rates of Gross State Domestic Product at Current Prices
3 Sectoral Contribution of Gross State Value Added at Current Prices
4 Gross State Domestic Product at Constant (2011-12) Prices
5 Sectoral Growth Rates of Gross State Domestic Product at Constant (2011-12) Prices
6 Sectoral Contribution of Gross State Value Added at Constant (2011-12) Prices
7 Net State Domestic Product and Per Capita Income at Current Prices
8 Net State Domestic Product and Per Capita Income at Constant (2011-12) Prices
9 Gross Domestic Product and Per Capita Income of All India at Current Prices
10 Sectoral Growth Rates of Gross Domestic Product and Per Capita Income of All India at Current Prices
11 Gross Domestic Product and Per Capita Income of All India at Constant (2011-12) Prices
12 Gross Domestic Product and Per Capita Income of All India at Current Prices
13 Gross District Domestic Product of Telangana from 2018-19 to 2020-21
14 Per Capita Income of Telangana by districts from 2018-19 to 2020-21
15 Demographic Details of Telangana
16 Population by Districts, 2011 Census
17 Child (0-6 Years) Population by Districts, 2011 Census
18 Sex Ratio by Districts , 2011 Census
19 Literate Population (7 Years and above) by Districts, 2011 Census
20 Literacy Rates by Districts, 2011 Census
21 Working Population by Districts, 2011 Census
22 Pattern of Land Utilisation from 2008-09 to 2019-20
23 Rainfall by Seasons from 1990-91 to 2020-21
24 Area Sown and Production of Foodgrains from 1990-91 to 2020-21
25 Estimates of Area, Production and Yield of Total Foodgrains by States, 2019-20
26 Estimates of Area, Production and Yield of Cotton by States, 2019-20
27 Estimates of Area, Production and Yield of Rice by States, 2019-20
28 Livestock and Poultry Population by Districts, 2019 Census
29 Fish and Prawn Production from 2008-09 to 2020-21
30 Milk, Meat and Eggs Production from 2014-15 to 2020-21
31 Mineral Production and Value of Mineral Produced 2019-20 and 2020-21
32 Functioning of Fair Price Shops and Food Security cards by Districts
33 Enrolment of Children in Schools from 2007-08 to 2020-21
ANNEXURES265
275
285
268
278
288
272
282
292
271
281
291
266
276
286
269
279
289
273
283
293
294
267
277
287
270
280
290
274
284
293
295
296

265
Annexure 1
Gross State Domestic Product at Current Prices
Agriculture, Livestock, Forestry and Fishing
Crops
Livestock
Forestry and Logging
Fishing and Aquaculture
Mining and Quarrying
Primary
Manufacturing
Electricity, Gas, Water supply and Other Utility Services
Construction
Secondary
Trade, Repair, Hotels and Restaurants
Trade and Repair Services
Hotels and Restaurants
Transport, Storage, Communication & Services related to Broadcasting
Railways
Road Transport
Water Transport
Air Transport
Services incidental to Transport
Storage
Communication & Services related to Broadcasting
Financial Services
Real Estate, Ownership of Dwelling and Professional Services
Public Administration
Other Services
Tertiary
Total GSVA at Basic Prices
Taxes on Products
Subsidies on Products
GSDP
1
1.1
1.2
1.3
1.4
2
3
4
5
6
6.1
6.2
7
7.1
7.2
7.37.4
7.5
7.6
7.7
8
9
10
11
1213
14
15
Sector
( Rs. in crore)
Sl. No.
76,123
41,706
29,282
2,465
2,670
14,706
90,828
54,533
7,340
27,786
89,660
64,269
56,974
7,295
35,866
2,004
20,540
0
623
4,937
178
7,584
30,261
96,912
17,166
41,536
2,86,011
4,66,499
48,642
9,292
5,05,849
75,707
36,805
33,755
2,498
2,649
17,128
92,834
71,032
8,354
28,473
1,07,860
74,736
66,418
8,318
39,666
2,010
22,633
0
1,126
5,048
182
8,665
33,123
1,12,172
21,915
48,030
3,29,641
5,30,336
57,754
10,188
5,77,902
88,979
43,529
39,816
3,360
2,275
19,687
1,08,666
73,833
7,221
28,554
1,09,608
86,693
77,708
8,985
42,821
2,216
24,536
0
1,267
5,578
198
9,026
36,356
1,31,824
25,574
58,644
3,81,912
6,00,186
68,906
10,767
6,58,325
1,01,390
47,457
46,595
3,684
3,654
23,234
1,24,623
82,607
10,455
34,495
1,27,556
1,03,866
94,286
9,581
45,361
2,546
27,341
0
1,329
5,834
172
8,137
40,783
1,44,498
28,049
65,440
4,27,998
6,80,177
82,256
12,383
7,50,050
1,14,292
48,366
57,513
4,372
4,042
33,337
1,47,629
98,148
13,201
37,687
1,49,036
1,28,745
1,17,600
11,145
50,105
2,640
32,354
0
791
5,213
635
8,472
43,841
1,61,635
28,124
67,831
4,80,280
7,76,946
91,799
11,317
8,57,427
1,55,032
77,338
68,853
4,148
4,694
30,162
1,85,195
95,231
16,654
37,449
1,49,334
1,47,664
1,36,009
11,655
54,806
3,361
34,133
0
1,365
5,611
677
9,661
46,866
1,83,529
26,250
74,795
5,33,910
8,68,439
94,283
14,365
9,48,356
1,74,012
84,613
79,859
4,286
5,254
27,559
2,01,572
93,833
16,732
38,259
1,48,824
1,35,052
1,25,308
9,745
53,770
3,139
33,087
0
1,074
5,431
689
10,351
49,022
1,88,305
29,655
82,953
5,38,757
8,89,153
1,02,196
21,693
9,69,656
1,89,826
1 2 3 4 5 6 7 8 9 10
84,785
94,400
4,512
6,128
31,208
2,21,034
1,20,665
17,967
42,229
1,80,861
1,74,654
1,61,991
12,662
58,324
3,463
34,864
0
1,217
5,501
745
12,535
54,659
2,15,426
35,461
98,952
6,37,476
10,39,371
1,31,280
15,791
11,54,860
2014-15 2015-16 2016-17 2017-18 2018-19 (TRE)
2019-20 (SRE)
2020-21 (FRE)
2021-22 (AE)
Annexures
AE- Advance Estimates, FRE- First Revised Estimates, SRE- Second Revised Estimates, TRE- Third Revised EstimatesSource: Ministry of Statistics and Programme Implementation, Government of India

Telangana Socio Economic Outlook 2022266
Annexure 2
Sectoral Growth Rates of Gross State Domestic Product at Current Prices
Agriculture, Livestock, Forestry and Fishing
Crops
Livestock
Forestry and Logging
Fishing and Aquaculture
Mining and Quarrying
Primary
Manufacturing
Electricity, Gas, Water supply and Other Utility Services
Construction
Secondary
Trade, Repair, Hotels and Restaurants
Trade and Repair Services
Hotels and Restaurants
Transport, Storage, Communication & Services related to Broadcasting
Railways
Road Transport
Water Transport
Air Transport
Services incidental to Transport
Storage
Communication and Services related to Broadcasting
Financial Services
Real Estate, Ownership of Dwelling and Professional Services
Public Administration
Other Services
Tertiary
Total GSVA at Basic Prices
Taxes on Products
Subsidies on Products
GSDP
1
1.1
1.2
1.3
1.4
2
3
4
5
6
6.1
6.2
7
7.1
7.2
7.37.4
7.5
7.6
7.7
8
8
10
11
1213
14
15
Sector
(Percent)
Sl. No.
-0.5
-11.8
15.3
1.3
-0.8
16.5
2.2
30.3
13.8
2.5
20.3
16.3
16.6
14.0
10.6
0.3
10.2
-
80.7
2.2
2.4
14.3
9.5
15.7
27.7
15.6
15.3
13.7
18.7
9.6
14.2
17.5
18.3
18.0
34.5
-14.1
14.9
17.1
3.9
-13.6
0.3
1.6
16.0
17.0
8.0
8.0
10.2
8.4
-
12.5
10.5
8.5
4.2
9.8
17.5
16.7
22.1
15.9
13.2
19.3
5.7
13.9
13.9
9.0
17.0
9.6
60.6
18.0
14.7
11.9
44.8
20.8
16.4
19.8
21.3
6.6
5.9
14.9
11.4
-
4.9
4.6
-12.9
-9.8
12.2
9.6
9.7
11.6
12.1
13.3
19.4
15.0
13.9
12.7
1.9
23.4
18.7
10.6
43.5
18.5
18.8
26.3
9.3
16.8
24.0
24.7
16.3
10.5
3.7
18.3
-
-40.5
-10.6
268.6
4.1
7.5
11.9
0.3
3.7
12.2
14.2
11.6
-8.6
14.3
35.6
59.9
19.7
-5.1
16.1
-9.5
25.4
-3.0
26.2
-0.6
0.2
14.7
15.7
4.6
9.4
27.3
5.5
-
72.6
7.6
6.6
14.0
6.9
13.5
-6.7
10.3
11.2
11.8
2.7
26.9
10.6
12.2
9.4
16.0
3.3
11.9
-8.6
8.8
-1.5
0.5
2.2
-0.3
-8.54
-7.9
-16.4
-1.9
-6.6
-3.1
-
-21.3
-3.2
1.8
7.1
4.6
2.6
13.0
10.9
0.9
2.4
8.4
51.0
2.2
9.1
0.20
18.2
5.3
16.6
13.2
9.7
28.6
7.4
10.4
21.5
29.32
29.3
29.9
8.5
10.3
5.4
-
13.3
1.3
8.1
21.1
11.5
14.4
19.6
19.3
18.3
16.9
28.5
-27.2
19.1
2015-16 2016-17 2017-18 2019-20 (SRE)
2020-21 (FRE)
2021-22 (AE)
2018-19 (TRE)
1 2 3 4 5 6 7 8 9
AE- Advance Estimates, FRE- First Revised Estimates, SRE- Second Revised Estimates, TRE- Third Revised EstimatesSource: Ministry of Statistics and Programme Implementation, Government of India

267
Annexure 3
Sectoral Contribution of Gross State Value Added at Current Prices
Agriculture, Livestock, Forestry and Fishing
Crops
Livestock
Forestry and Logging
Fishing and Aquaculture
Mining and Quarrying
Primary
Manufacturing
Electricity, Gas, Water supply and Other Utility Services
Construction
Secondary
Trade, Repair, Hotels and Restaurants
Trade and Repair Services
Hotels and Restaurants
Transport, Storage, Communication & Services related to Broadcasting
Railways
Road Transport
Water Transport
Air Transport
Services incidental to Transport
Storage
Communication and Services related to Broadcasting
Financial Services
Real Estate, Ownership of Dwelling and Professional Services
Public Administration
Other Services
Tertiary
Total GSVA at Basic Prices
1
1.1
1.2
1.3
1.4
2
3
4
5
6
6.1
6.2
7
7.1
7.2
7.37.4
7.5
7.6
7.7
8
8
10
11
12
Sector
(Percent)
Sl. No.
16.3
8.9
6.3
0.5
0.6
3.2
19.5
11.7
1.6
6.0
19.2
13.8
12.2
1.6
7.7
0.4
4.4
-
0.1
1.1
0.0
1.6
6.5
20.8
3.7
8.9
61.3
100
14.3
6.9
6.4
0.5
0.5
3.2
17.5
13.4
1.6
5.4
20.3
14.1
12.5
1.6
7.5
0.4
4.3
-
0.2
1.0
0.0
1.6
6.2
21.2
4.1
9.1
62.2
100
14.8
7.3
6.6
0.6
0.4
3.3
18.1
12.3
1.2
4.8
18.3
14.4
12.9
1.5
7.1
0.4
4.1
-
0.2
0.9
0.0
1.5
6.1
22.0
4.3
9.8
63.6
100
14.9
7.0
6.9
0.5
0.5
3.4
18.3
12.1
1.5
5.1
18.8
15.3
13.9
1.4
6.7
0.4
4.0
-
0.2
0.9
0.0
1.2
6.0
21.2
4.1
9.6
62.9
100
14.7
6.2
7.4
0.6
0.5
4.3
19.0
12.6
1.7
4.9
19.2
16.6
15.1
1.4
6.4
0.3
4.2
-
0.1
0.7
0.1
1.1
5.6
20.8
3.6
8.7
61.8
100
17.9
8.9
7.9
0.5
0.5
3.5
21.3
11.0
1.9
4.3
17.2
17.0
15.7
1.3
6.3
0.4
3.9
-
0.2
0.6
0.1
1.1
5.4
21.1
3.0
8.6
61.5
100
19.6
9.5
9.0
0.5
0.6
3.1
22.7
10.6
1.9
4.3
16.7
15.2
14.1
1.1
6.0
0.4
3.7
0.1
0.6
0.1
1.2
5.5
21.2
3.3
9.3
60.6
100
18.3
8.2
9.1
0.4
0.6
3.0
21.3
11.6
1.7
4.1
17.4
16.8
15.6
1.2
5.6
0.3
3.4
0.1
0.5
0.1
1.2
5.3
20.7
3.4
9.5
61.3
100
2014-15 2015-16 2016-17 2017-18 2018-19 (TRE)
2019-20 (SRE)
2020-21 (FRE)
2021-22 (AE)
Annexures
1 2 3 4 5 6 7 8 9 10
AE- Advance Estimates, FRE- First Revised Estimates, SRE- Second Revised Estimates, TRE- Third Revised EstimatesSource: Ministry of Statistics and Programme Implementation, Government of India

Telangana Socio Economic Outlook 2022268
Annexure 4
Gross State Domestic Product at Constant (2011-12) Prices
Agriculture, Livestock, Forestry and Fishing
Crops
Livestock
Forestry and Logging
Fishing and Aquaculture
Mining and Quarrying
Primary
Manufacturing
Electricity, Gas, Water supply and Other Utility Services
Construction
Secondary
Trade, Repair, Hotels and Restaurants
Trade and Repair Services
Hotels and Restaurants
Transport, Storage, Communication & Services related to Broadcasting
Railways
Road Transport
Water Transport
Air Transport
Services incidental to Transport
Storage
Communication and Services related to Broadcasting
Financial Services
Real Estate, Ownership of Dwelling and Professional Services
Public Administration
Other Services
Tertiary
Total GSVA at Basic Prices
Taxes on Products
Subsidies on Products
GSDP
1
1.1
1.2
1.3
1.4
2
3
4
5
6
6.1
6.2
7
7.1
7.2
7.37.4
7.5
7.6
7.7
8
8
10
11
1213
14
15
Sector
( Rs. in crore)
Sl. No.
55,811
29,546
22,519
1,715
2,031
12,604
68,415
48,276
6,624
23,332
78,231
52,230
46,315
5,915
31,075
1,750
17,678
0
548
4,338
145
6,617
28,699
78,506
13,860
32,057
2,36,427
3,83,073
41,113
7,854
4,16,332
51,615
24,187
23,938
1,683
1,808
14,093
65,708
63,751
7,207
23,986
94,944
58,543
52,044
6,499
33,892
1,710
19,116
0
984
4,412
143
7,526
30,906
87,438
17,024
35,388
2,63,191
4,23,842
49,417
8,717
4,64,542
57,324
28,478
25,520
1,836
1,491
15,139
72,463
64,943
5,736
24,355
95,034
64,832
58,137
6,695
35,323
1,704
20,051
0
1,075
4,730
149
7,614
33,782
97,946
18,928
41,230
2,92,042
4,59,539
57,371
8,964
5,07,946
62,823
31,395
27,473
1,921
2,034
17,572
80,395
70,950
7,338
27,845
1,06,133
75,150
68,238
6,912
36,422
1,918
21,717
0
1,103
4,842
125
6,718
35,119
1,03,455
19,973
44,095
3,14,214
5,00,742
66,711
10,043
5,57,410
66,725
29,375
33,170
1,942
2,238
22,472
89,197
82,686
8,223
29,053
1,19,962
89,114
81,417
7,697
38,271
1,951
24,367
0
631
4,159
442
6,721
35,294
1,10,724
19,418
43,441
3,36,262
5,45,421
71,836
8,856
6,08,401
86,107
45,375
36,451
1,921
2,360
20,078
1,06,185
79,530
10,180
26,672
1,16,381
96,955
89,320
7,635
40,353
2,042
24,991
0
1,062
4,366
447
7,446
35,795
1,19,583
17,396
44,835
3,54,917
5,77,484
72,199
11,001
6,38,682
89,209
46,225
38,353
1,978
2,652
17,175
1,06,384
76,978
10,297
27,847
1,15,122
80,442
74,688
5,754
37,482
1,541
24,054
0
731
3,695
415
7,048
37,152
1,14,690
18,155
46,617
3,34,538
5,56,044
76,580
16,255
6,16,369
88,202
42,459
40,747
1,944
3,051
21,569
1,09,770
88,869
10,781
29,496
1,29,146
98,154
91,116
7,038
40,109
2,199
25,300
0
770
3,480
424
7,936
41,425
1,20,199
20,357
52,976
3,73,219
6,12,135
85,551
12,136
6,85,550
2014-15 2015-16 2016-17 2017-18 2018-19 (TRE)
2019-20 (SRE)
2020-21 (FRE)
2021-22 (AE)
1 2 3 4 5 6 7 8 9 10
AE- Advance Estimates, FRE- First Revised Estimates, SRE- Second Revised Estimates, TRE- Third Revised EstimatesSource: Ministry of Statistics and Programme Implementation, Government of India

269
Annexure 5
Sectoral Growth Rates of Gross State Domestic Productat Constant (2011-12) Prices
Agriculture, Livestock, Forestry and Fishing
Crops
Livestock
Forestry and Logging
Fishing and Aquaculture
Mining and Quarrying
Primary
Manufacturing
Electricity, Gas, Water supply and Other Utility Services
Construction
Secondary
Trade, Repair, Hotels and Restaurants
Trade and Repair Services
Hotels and Restaurants
Transport, Storage, Communication & Services related to Broadcasting
Railways
Road Transport
Water Transport
Air Transport
Services incidental to Transport
Storage
Communication and Services related to Broadcasting
Financial Services
Real Estate, Ownership of Dwelling and Professional Services
Public Administration
Other Services
Tertiary
Total GSVA at Basic Prices
Taxes on Products
Subsidies on Products
Gross State Domestic Product
1
1.1
1.2
1.3
1.4
2
3
4
5
6
6.1
6.2
7
7.1
7.2
7.37.4
7.5
7.6
7.7
8
8
10
11
1213
14
15
Sector
(Percent)
Sl. No.
-7.5
-18.1
6.3
-1.9
-11.0
11.8
-4.0
32.1
8.8
2.8
21.4
12.1
12.4
9.9
9.1
-2.2
8.1
-
79.7
1.7
-1.2
13.7
7.7
11.4
22.8
10.4
11.3
10.6
20.2
11.0
11.6
11.1
17.7
6.6
9.1
-17.6
7.4
10.3
1.9
-20.4
1.5
0.1
10.7
11.7
3.0
4.2
-0.4
4.9
-
9.2
7.2
3.8
1.2
9.3
12.0
11.2
16.5
11.0
8.4
16.1
2.8
9.3
9.6
10.2
7.7
4.6
36.5
16.1
10.9
9.3
27.9
14.3
11.7
15.9
17.4
3.2
3.1
12.5
8.3
-
2.7
2.4
-15.8
-11.8
4.0
5.6
5.5
6.9
7.6
9.0
16.3
12.0
9.7
6.2
-6.4
20.7
1.1
10.0
27.9
10.9
16.5
12.1
4.3
13.0
18.6
19.3
11.3
5.1
1.8
12.2
-
-42.8
-14.1
252.3
0.0
0.5
7.0
-2.8
-1.5
7.0
8.9
7.7
-11.8
9.1
29.0
54.5
9.9
-1.1
5.4
-10.7
19.0
-3.8
23.8
-8.2
-3.0
8.8
9.7
-0.8
5.4
4.6
2.6
-
68.4
5.0
1.2
10.8
1.4
8.0
-10.4
3.2
5.5
5.9
0.5
24.2
5.0
3.6
1.9
5.2
2.9
12.4
-14.5
0.2
-3.2
1.2
4.4
-1.1
-17.0
-16.4
-24.6
-7.1
-24.5
-3.7
-
-31.2
-15.4
-7.2
-5.3
3.8
-4.1
4.4
4.0
-5.7
-3.7
6.1
47.76
-3.5
-1.1
-8.1
6.2
-1.7
15.0
25.6
3.2
15.4
4.7
5.9
12.2
22.0
22.0
22.3
7.0
42.7
5.2
-
5.4
-5.8
2.3
12.6
11.5
4.8
12.1
13.6
11.6
10.1
11.7
-25.34
11.2
2015-16 2016-17 2017-18 2019-20 (SRE)
2020-21 (FRE)
2021-22 (AE)
2018-19 (TRE)
1 2 3 4 5 6 7 8 9
AE- Advance Estimates, FRE- First Revised Estimates, SRE- Second Revised Estimates, TRE- Third Revised EstimatesSource: Ministry of Statistics and Programme Implementation, Government of India
Annexures
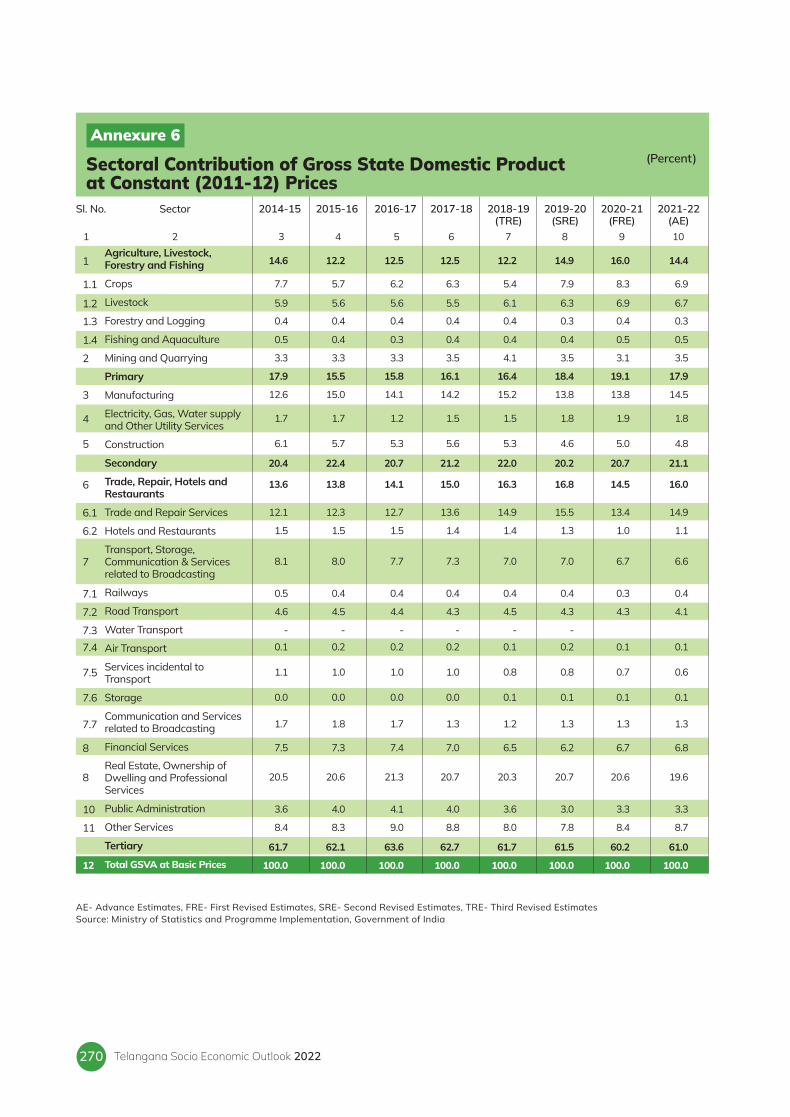
Telangana Socio Economic Outlook 2022270
Annexure 6
Sectoral Contribution of Gross State Domestic Product at Constant (2011-12) Prices
Agriculture, Livestock, Forestry and Fishing
Crops
Livestock
Forestry and Logging
Fishing and Aquaculture
Mining and Quarrying
Primary
Manufacturing
Electricity, Gas, Water supply and Other Utility Services
Construction
Secondary
Trade, Repair, Hotels and Restaurants
Trade and Repair Services
Hotels and Restaurants
Transport, Storage, Communication & Services related to Broadcasting
Railways
Road Transport
Water Transport
Air Transport
Services incidental to Transport
Storage
Communication and Services related to Broadcasting
Financial Services
Real Estate, Ownership of Dwelling and Professional Services
Public Administration
Other Services
Tertiary
Total GSVA at Basic Prices
1
1.1
1.2
1.3
1.4
2
3
4
5
6
6.1
6.2
7
7.1
7.2
7.37.4
7.5
7.6
7.7
8
8
10
11
12
Sector
(Percent)
Sl. No.
14.6
7.7
5.9
0.4
0.5
3.3
17.9
12.6
1.7
6.1
20.4
13.6
12.1
1.5
8.1
0.5
4.6
-
0.1
1.1
0.0
1.7
7.5
20.5
3.6
8.4
61.7
100.0
12.2
5.7
5.6
0.4
0.4
3.3
15.5
15.0
1.7
5.7
22.4
13.8
12.3
1.5
8.0
0.4
4.5
-
0.2
1.0
0.0
1.8
7.3
20.6
4.0
8.3
62.1
100.0
12.5
6.2
5.6
0.4
0.3
3.3
15.8
14.1
1.2
5.3
20.7
14.1
12.7
1.5
7.7
0.4
4.4
-
0.2
1.0
0.0
1.7
7.4
21.3
4.1
9.0
63.6
100.0
12.5
6.3
5.5
0.4
0.4
3.5
16.1
14.2
1.5
5.6
21.2
15.0
13.6
1.4
7.3
0.4
4.3
-
0.2
1.0
0.0
1.3
7.0
20.7
4.0
8.8
62.7
100.0
12.2
5.4
6.1
0.4
0.4
4.1
16.4
15.2
1.5
5.3
22.0
16.3
14.9
1.4
7.0
0.4
4.5
-
0.1
0.8
0.1
1.2
6.5
20.3
3.6
8.0
61.7
100.0
14.9
7.9
6.3
0.3
0.4
3.5
18.4
13.8
1.8
4.6
20.2
16.8
15.5
1.3
7.0
0.4
4.3
-
0.2
0.8
0.1
1.3
6.2
20.7
3.0
7.8
61.5
100.0
16.0
8.3
6.9
0.4
0.5
3.1
19.1
13.8
1.9
5.0
20.7
14.5
13.4
1.0
6.7
0.3
4.3
0.1
0.7
0.1
1.3
6.7
20.6
3.3
8.4
60.2
100.0
14.4
6.9
6.7
0.3
0.5
3.5
17.9
14.5
1.8
4.8
21.1
16.0
14.9
1.1
6.6
0.4
4.1
0.1
0.6
0.1
1.3
6.8
19.6
3.3
8.7
61.0
100.0
2014-15 2015-16 2016-17 2017-18 2018-19 (TRE)
2019-20 (SRE)
2020-21 (FRE)
2021-22 (AE)
1 2 3 4 5 6 7 8 9 10
AE- Advance Estimates, FRE- First Revised Estimates, SRE- Second Revised Estimates, TRE- Third Revised EstimatesSource: Ministry of Statistics and Programme Implementation, Government of India

271
Annexure 7
Net State Domestic Product and Per Capita Income at Current Prices
Agriculture, Livestock, Forestry and Fishing
Crops
Livestock
Forestry and Logging
Fishing and Aquaculture
Mining and Quarrying
Primary
Manufacturing
Electricity, Gas, Water supply and Other Utility Services
Construction
Secondary
Trade, Repair, Hotels and Restaurants
Trade and Repair Services
Hotels and Restaurants
Transport, Storage, Communication & Services related to Broadcasting
Railways
Road Transport
Water Transport
Air Transport
Services incidental to Transport
Storage
Communication & Services related to Broadcasting
Financial Services
Real Estate, Ownership of Dwelling and Professional Services
Public Administration
Other Services
Tertiary
Total NSVA at Basic Prices
Taxes on Products
Subsidies on Products
Net State Domestic Product
Population ('000)
Per Capita Income (Rs.)
1
1.1
1.2
1.3
1.4
2
3
4
5
6
6.1
6.2
7
7.1
7.2
7.37.4
7.5
7.6
7.7
8
9
10
11
1213
14
15
1617
Sector
( Rs. in crore)
Sl. No.
71,272
37,528
28,900
2,441
2,404
12,499
83,771
45,156
4,967
26,171
76,293
62,117
55,213
6,904
29,273
1,654
16,910
0
416
4,352
149
5,792
29,704
83,407
13,616
38,750
2,56,866
4,16,930
48,642
9,292
4,56,280
36,766
1,24,104
70,539
32,283
33,369
2,474
2,412
14,320
84,859
61,183
5,815
26,798
93,796
72,247
64,413
7,834
32,533
1,638
18,694
0
928
4,419
160
6,694
32,409
97,185
17,357
45,040
2,96,772
4,75,428
57,754
10,188
5,22,994
37,134
1,40,840
83,285
38,477
39,392
3,328
2,089
16,531
99,816
63,802
4,983
26,836
95,620
83,849
75,377
8,472
34,477
1,783
19,828
0
1,068
4,849
170
6,779
35,554
1,14,209
20,735
55,413
3,44,236
5,39,673
68,906
10,767
5,97,812
37,505
1,59,395
95,098
41,946
46,115
3,650
3,388
19,885
1,14,983
71,274
7,410
32,468
1,11,152
1,00,247
91,136
9,111
35,701
2,073
21,690
0
1,117
5,029
145
5,647
39,892
1,22,977
23,060
61,542
3,83,419
6,09,554
82,256
12,383
6,79,427
37,881
1,79,358
1,07,472
42,452
56,932
4,332
3,755
28,115
1,35,587
85,601
9,122
35,197
1,29,920
1,24,701
1,14,164
10,537
38,628
2,111
25,484
0
559
4,400
579
5,496
42,780
1,38,945
23,300
64,048
4,32,402
6,97,909
91,799
11,317
7,78,391
37,093
2,09,848
1,47,698
71,032
68,211
4,108
4,348
24,999
1,72,698
81,771
11,675
34,675
1,28,121
1,43,166
1,32,139
11,028
41,446
2,749
26,293
0
944
4,711
616
6,133
45,665
1,58,679
21,945
70,885
4,81,787
7,82,605
94,283
14,365
8,62,523
37,346
2,30,955
1,66,086
77,757
79,217
4,244
4,868
22,842
1,88,928
80,571
11,730
35,424
1,27,725
1,30,955
1,21,737
9,219
40,548
2,567
25,480
0
743
4,559
627
6,571
47,766
1,62,808
24,792
78,617
4,85,486
8,02,139
1,02,196
21,693
8,82,642
37,599
2,34,751
1,81,702
77,915
93,641
4,468
5,677
25,866
2,07,568
1,03,610
12,596
39,101
1,55,307
1,69,354
1,57,375
11,979
43,776
2,832
26,849
0
842
4,617
678
7,957
53,259
1,86,257
29,646
93,780
5,76,072
9,38,946
1,31,280
15,791
10,54,435
37,816
2,78,833
2014-15 2015-16 2016-17 2017-18 2018-19 (TRE)
2019-20 (SRE)
2020-21 (FRE)
2021-22 (AE)
1 2 3 4 5 6 7 8 9 10
AE- Advance Estimates, FRE- First Revised Estimates, SRE- Second Revised Estimates, TRE- Third Revised EstimatesSource: Ministry of Statistics and Programme Implementation, Government of India
Annexures

Telangana Socio Economic Outlook 2022272
Annexure 8
Net State Domestic Product and Per Capita Income at Constant (2011-12) Prices
Agriculture, Livestock, Forestry and Fishing
Crops
Livestock
Forestry and Logging
Fishing and Aquaculture
Mining and Quarrying
Primary
Manufacturing
Electricity, Gas, Water supply and Other Utility Services
Construction
Secondary
Trade, Repair, Hotels and Restaurants
Trade and Repair Services
Hotels and Restaurants
Transport, Storage, Communication & Services related to Broadcasting
Railways
Road Transport
Water Transport
Air Transport
Services incidental to Transport
Storage
Communication and Services related to Broadcasting
Financial Services
Real Estate, Ownership of Dwelling and Professional Services
Public Administration
Other Services
Tertiary
Total NSVA at Basic Prices
Taxes on Products
Subsidies on Products
Net State Domestic Product
Population ('000)
Per Capita Income (Rs.)
1
1.1
1.2
1.3
1.4
2
3
4
5
6
6.1
6.2
7
7.1
7.2
7.37.4
7.5
7.6
7.7
8
8
10
11
1213
14
15
1617
Sector
( Rs. in crore)
Sl. No.
51,883
26,191
22,190
1,694
1,808
10,704
62,586
39,854
4,502
21,833
66,189
50,341
44,769
5,572
25,095
1,445
14,298
0
354
3,821
120
5,058
28,204
66,962
10,648
29,612
2,10,862
3,39,638
41,113
7,854
3,72,897
36,766
1,01,424
47,578
20,723
23,592
1,662
1,601
11,743
59,321
54,924
4,933
22,462
82,319
56,317
50,250
6,067
27,468
1,387
15,441
0
801
3,859
123
5,856
30,286
74,858
12,874
32,749
2,34,552
3,76,192
49,417
8,717
4,16,892
37,134
1,12,267
53,042
24,759
25,148
1,809
1,325
12,541
65,582
55,949
3,731
22,715
82,395
62,313
56,071
6,241
27,874
1,333
15,733
0
893
4,095
124
5,696
33,080
83,156
14,532
38,393
2,59,347
4,07,324
57,371
8,964
4,55,731
37,505
1,21,512
58,220
27,454
27,077
1,893
1,797
14,885
73,105
61,027
4,676
25,920
91,623
72,080
65,564
6,515
27,970
1,524
16,658
0
915
4,158
102
4,613
34,359
85,972
15,571
40,797
2,76,749
4,41,477
66,711
10,043
4,98,145
37,881
1,31,503
61,889
25,269
32,720
1,911
1,989
18,416
80,304
72,079
4,769
26,756
1,03,604
85,840
78,633
7,207
28,452
1,530
18,322
0
430
3,494
397
4,278
34,423
93,137
15,314
40,385
2,97,552
4,81,461
71,836
8,856
5,44,441
37,093
1,46,777
81,071
41,156
35,956
1,891
2,068
16,177
97,248
68,259
5,969
24,076
98,304
93,346
86,213
7,133
29,249
1,554
18,428
0
709
3,633
399
4,526
34,812
1,00,131
13,797
41,689
3,13,024
5,08,576
72,199
11,001
5,69,774
37,346
1,52,566
84,090
41,960
37,859
1,946
2,325
13,837
97,928
66,069
6,037
25,137
97,243
77,462
72,087
5,375
27,121
1,173
17,732
0
488
3,074
370
4,285
36,132
96,033
14,398
43,346
2,94,493
4,89,664
76,580
16,255
5,49,989
37,599
1,46,278
83,351
38,541
40,222
1,914
2,675
17,377
1,00,728
76,275
6,321
26,626
1,09,222
94,517
87,943
6,574
28,937
1,674
18,651
0
514
2,895
379
4,825
40,288
1,00,646
16,145
49,259
3,29,791
5,39,741
85,551
12,136
6,13,156
37,816
1,62,142
2014-15 2015-16 2016-17 2017-18 2018-19 (TRE)
2019-20 (SRE)
2020-21 (FRE)
2021-22 (AE)
AE- Advance Estimates, FRE- First Revised Estimates, SRE- Second Revised Estimates, TRE- Third Revised EstimatesSource: Ministry of Statistics and Programme Implementation, Government of India
1 2 3 4 5 6 7 8 9 10

273
Annexure 9
Gross Domestic Product and Per Capita Income of All India at Current Prices from 2014-15 to 2020-21
Agriculture, Livestock, Forestry and Fishing
Crops
Livestock
Forestry and Logging
Fishing and Aquaculture
Mining and Quarrying
Primary
Manufacturing
Electricity, Gas, Water supply and Other Utility Services
Construction
Secondary
Trade, Repair, Hotels and Restaurants
Trade and Repair Services
Hotels and Restaurants
Transport, Storage, Communication & Services related to Broadcasting
Railways
Road Transport
Water Transport
Air Transport
Services incidental to Transport
Storage
Communication & Services related to Broadcasting
Financial Services
Real Estate, Ownership of Dwellings and Professional Services
Public Administration and Defence
Other Services
Tertiary
Total GSVA at Basic Prices
Taxes on Products
Subsidies on Products
Gross Domestic Product
Per Capita Income (Rs.)
1
1.1
1.2
1.3
1.4
2
3
4
5
6
6.1
6.2
7
7.1
7.2
7.3 7.4
7.5
7.6
7.7
8
9
10
11
12
13
14
15
16
SectorSl. No.
20,93,612
12,92,874
5,10,411
1,73,760
1,16,567
3,08,476
24,02,088
18,78,369
2,82,258
9,79,086
31,39,713
13,20,833
12,06,474
1,14,359
7,86,763
92,459
3,70,364
7,590
11,820
91,681
6,407
2,06,442
6,61,411
17,01,935
6,76,818
8,14,718
59,62,478
1,15,04,279
12,91,662
3,27,982
1,24,67,959
86,647
22,27,533
13,27,992
5,82,410
1,84,411
1,32,720
2,94,011
25,21,544
21,46,189
3,34,965
9,91,084
34,72,238
14,33,969
13,07,323
1,26,646
8,60,544
1,00,451
3,99,902
7,298
20,344
88,246
7,021
2,37,282
7,26,286
18,99,852
7,31,578
9,28,489
65,80,718
1,25,74,499
15,18,496
3,21,121
1,37,71,874
94,797
25,18,662
14,86,044
6,72,611
2,05,364
1,54,643
3,26,808
28,45,470
23,33,721
3,55,709
10,80,870
37,70,300
16,09,001
14,68,583
1,40,418
9,30,155
1,06,786
4,34,947
9,206
21,496
1,02,468
7,442
2,47,809
7,50,201
21,61,236
8,27,438
10,71,399
73,49,430
1,39,65,200
17,46,288
3,19,819
1,53,91,669
1,04,880
28,29,826
16,33,264
7,85,683
2,17,603
1,93,275
3,36,109
31,65,935
25,66,623
4,25,718
12,00,414
41,92,755
18,81,395
17,22,671
1,58,723
9,97,528
1,16,584
4,84,134
13,021
22,444
97,602
16,194
2,47,549
8,46,194
22,81,018
9,45,082
11,95,759
81,46,976
1,55,05,665
18,98,896
3,14,518
1,70,90,042
1,15,224
30,29,925
16,80,777
8,82,009
2,55,053
2,12,087
3,77,661
34,07,586
28,12,560
4,49,459
13,52,118
46,14,137
21,36,707
19,55,798
1,80,909
10,66,055
1,23,596
5,36,552
13,059
12,730
1,03,341
18,597
2,58,179
9,41,778
25,87,720
10,45,488
13,75,658
91,53,406
1,71,75,128
20,43,568
3,19,028
1,88,99,668
1,25,946
33,58,364
18,91,966
9,77,730
2,60,603
2,28,065
3,58,517
37,16,881
27,04,809
5,01,618
13,72,759
45,79,186
23,25,812
21,29,686
1,96,127
11,52,680
1,35,477
5,65,438
13,350
22,508
1,03,301
19,513
2,93,094
10,27,359
28,51,979
11,47,741
15,53,471
1,00,59,042
1,83,55,109
20,76,662
3,56,916
2,00,74,856
1,32,115
36,09,494
19,97,147
11,14,249
2,65,479
2,32,620
3,24,980
39,34,474
27,09,435
5,07,352
13,15,608
45,32,395
18,18,981
17,32,821
86,160
10,47,412
1,36,807
4,47,164
13,418
10,323
98,170
19,628
3,21,902
10,88,222
29,57,538
12,38,383
14,40,404
95,90,940
1,80,57,810
22,55,495
5,12,391
1,98,00,914
1,26,855
39,64,312
5,18,170
44,82,482
33,26,746
5,70,125
17,02,055
55,98,926
35,43,624
45,67,241
31,65,000
1,12,75,865
2,13,57,273
22,86,602
2,36,43,875
1,49,848
2014-15 2015-16 2016-17 2017-18 2018-19 (TRE)
2019-20 (SRE)
2020-21 (FRE)
2021-22 (SAE)
SAE-Second Advance Estimates, FRE- First Revised Estimates, SRE- Second Revised Estimates, TRE- Third Revised EstimatesSource: Ministry of Statistics and Programme Implementation, Government of India
(Rs. in crore)
Annexures
1 2 3 4 5 6 7 8 9 10

Telangana Socio Economic Outlook 2022274
SectorSl. No. 2015-16 2016-17 2017-18 2018-19 (TRE)
2019-20 (SRE)
2020-21 (FRE)
2021-22 (SAE)
Agriculture, Livestock, Forestry and Fishing
Crops
Livestock
Forestry and Logging
Fishing and Aquaculture
Mining and Quarrying
Primary
Manufacturing
Electricity, Gas, Water supply and Other Utility Services
Construction
Secondary
Trade, Repair, Hotels and Restaurants
Trade and Repair Services
Hotels and Restaurants
Transport, Storage, Communication & Services related to Broadcasting
Railways
Road Transport
Water Transport
Air Transport
Services incidental to Transport
Storage
Communication & Services related to Broadcasting
Financial Services
Real Estate, Ownership of Dwellings and Professional Services
Public Administration and Defence
Other Services
Tertiary
Total GSVA at Basic Prices
Taxes on Products
Subsidies on Products
Gross Domestic Product
Per Capita Income (Rs.)
1
1.1
1.2
1.3
1.4
2
3
4
5
6
6.1
6.2
7
7.1
7.2
7.3 7.4
7.5
7.6
7.7
8
9
10
11
12
13
14
15
16
6.4
2.7
14.1
6.1
13.9
-4.7
5.0
14.3
18.7
1.2
10.6
8.6
8.4
10.7
9.4
8.6
8.0
-3.8
72.1
-3.7
9.6
14.9
9.8
11.6
8.1
14.0
10.4
9.3
17.6
-2.1
10.5
9.4
13.1
11.9
15.5
11.4
16.5
11.2
12.8
8.7
6.2
9.1
8.6
12.2
12.3
10.9
8.1
6.3
8.8
26.1
5.7
16.1
6.0
4.4
3.3
13.8
13.1
15.4
11.7
11.1
15.0
-0.4
11.8
10.6
12.4
9.9
16.8
6.0
25.0
2.8
11.3
10.0
19.7
11.1
11.2
16.9
17.3
13.0
7.2
9.2
11.3
41.4
4.4
-4.7
117.6
-0.1
12.8
5.5
14.2
11.6
10.9
11.0
8.7
-1.7
11.0
9.9
7.1
2.9
12.3
17.2
9.7
12.4
7.6
9.6
5.6
12.6
10.1
13.6
13.5
14.0
6.9
6.0
10.8
0.3
-43.3
5.9
14.8
4.3
11.3
13.4
10.6
15.0
12.4
10.8
7.6
1.4
10.6
9.3
10.8
12.6
10.9
2.2
7.5
-5.1
9.1
-3.8
11.6
1.5
-0.8
8.9
8.9
8.4
8.1
9.6
5.4
2.2
76.8
0.0
4.9
13.5
9.1
10.2
9.8
12.9
9.9
6.9
1.6
11.9
6.2
4.9
7.5
5.6
14.0
1.9
2.0
-9.4
5.9
0.2
1.1
-4.2
-1.0
-21.8
-18.6
-56.1
-9.1
1.0
-20.9
0.5
-54.1
-5.0
0.6
9.8
5.9
3.7
7.9
-7.3
-4.7
-1.6
8.6
43.6
-1.4
-4.0
9.8
59.4
22.8
12.4
29.4
23.6
12.9
18.2
18.3
19.4
18.1
1 2 3 4 5 6 7 8 9
Annexure 10
Sectoral Growth Rates (%) of Gross Domestic Product and Per Capita Income of all India at Current Prices
(Percent)
SAE-Second Advance Estimates, FRE- First Revised Estimates, SRE- Second Revised Estimates, TRE- Third Revised EstimatesSource: Ministry of Statistics and Programme Implementation, Government of India
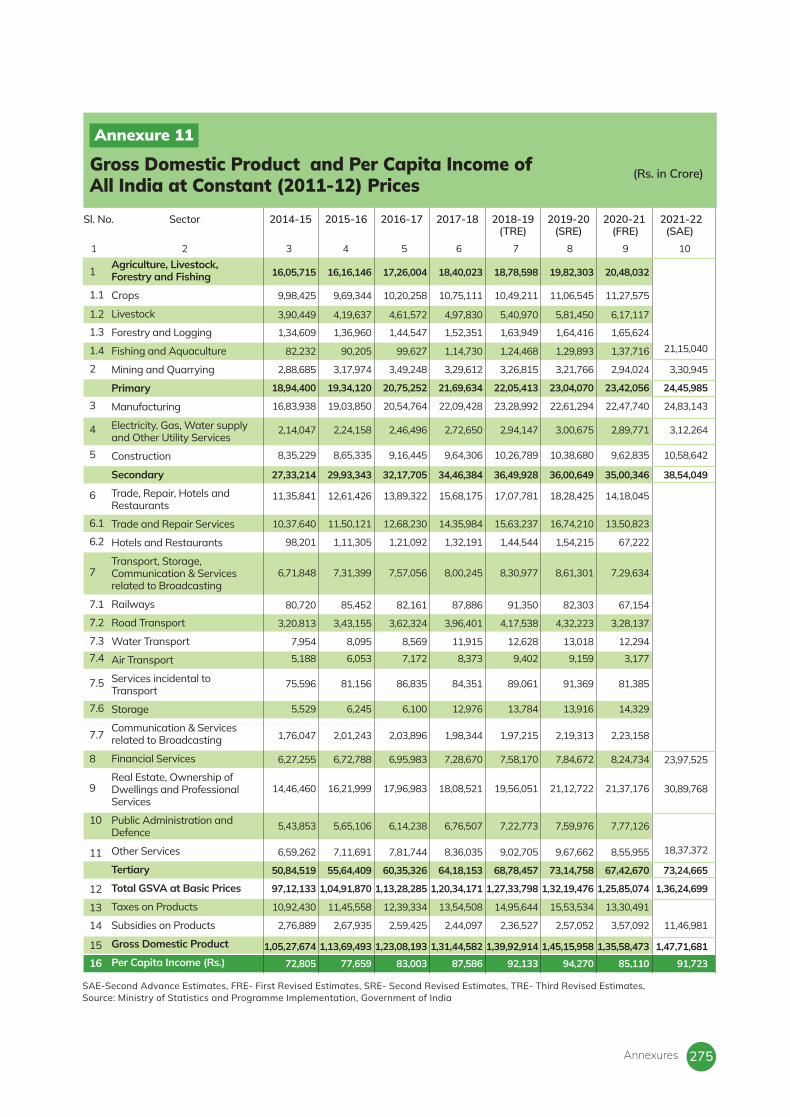
275
Agriculture, Livestock, Forestry and Fishing
Crops
Livestock
Forestry and Logging
Fishing and Aquaculture
Mining and Quarrying
Primary
Manufacturing
Electricity, Gas, Water supply and Other Utility Services
Construction
Secondary
Trade, Repair, Hotels and Restaurants
Trade and Repair Services
Hotels and Restaurants
Transport, Storage, Communication & Services related to Broadcasting
Railways
Road Transport
Water Transport
Air Transport
Services incidental to Transport
Storage
Communication & Services related to Broadcasting
Financial Services
Real Estate, Ownership of Dwellings and Professional Services
Public Administration and Defence
Other Services
Tertiary
Total GSVA at Basic Prices
Taxes on Products
Subsidies on Products
Gross Domestic Product
Per Capita Income (Rs.)
SectorSl. No.
16,05,715
9,98,425
3,90,449
1,34,609
82,232
2,88,685
18,94,400
16,83,938
2,14,047
8,35,229
27,33,214
11,35,841
10,37,640
98,201
6,71,848
80,720
3,20,813
7,954
5,188
75,596
5,529
1,76,047
6,27,255
14,46,460
5,43,853
6,59,262
50,84,519
97,12,133
10,92,430
2,76,889
1,05,27,674
72,805
16,16,146
9,69,344
4,19,637
1,36,960
90,205
3,17,974
19,34,120
19,03,850
2,24,158
8,65,335
29,93,343
12,61,426
11,50,121
1,11,305
7,31,399
85,452
3,43,155
8,095
6,053
81,156
6,245
2,01,243
6,72,788
16,21,999
5,65,106
7,11,691
55,64,409
1,04,91,870
11,45,558
2,67,935
1,13,69,493
77,659
17,26,004
10,20,258
4,61,572
1,44,547
99,627
3,49,248
20,75,252
20,54,764
2,46,496
9,16,445
32,17,705
13,89,322
12,68,230
1,21,092
7,57,056
82,161
3,62,324
8,569
7,172
86,835
6,100
2,03,896
6,95,983
17,96,983
6,14,238
7,81,744
60,35,326
1,13,28,285
12,39,334
2,59,425
1,23,08,193
83,003
18,40,023
10,75,111
4,97,830
1,52,351
1,14,730
3,29,612
21,69,634
22,09,428
2,72,650
9,64,306
34,46,384
15,68,175
14,35,984
1,32,191
8,00,245
87,886
3,96,401
11,915
8,373
84,351
12,976
1,98,344
7,28,670
18,08,521
6,76,507
8,36,035
64,18,153
1,20,34,171
13,54,508
2,44,097
1,31,44,582
87,586
18,78,598
10,49,211
5,40,970
1,63,949
1,24,468
3,26,815
22,05,413
23,28,992
2,94,147
10,26,789
36,49,928
17,07,781
15,63,237
1,44,544
8,30,977
91,350
4,17,538
12,628
9,402
89,061
13,784
1,97,215
7,58,170
19,56,051
7,22,773
9,02,705
68,78,457
1,27,33,798
14,95,644
2,36,527
1,39,92,914
92,133
19,82,303
11,06,545
5,81,450
1,64,416
1,29,893
3,21,766
23,04,070
22,61,294
3,00,675
10,38,680
36,00,649
18,28,425
16,74,210
1,54,215
8,61,301
82,303
4,32,223
13,018
9,159
91,369
13,916
2,19,313
7,84,672
21,12,722
7,59,976
9,67,662
73,14,758
1,32,19,476
15,53,534
2,57,052
1,45,15,958
94,270
20,48,032
11,27,575
6,17,117
1,65,624
1,37,716
2,94,024
23,42,056
22,47,740
2,89,771
9,62,835
35,00,346
14,18,045
13,50,823
67,222
7,29,634
67,154
3,28,137
12,294
3,177
81,385
14,329
2,23,158
8,24,734
21,37,176
7,77,126
8,55,955
67,42,670
1,25,85,074
13,30,491
3,57,092
1,35,58,473
85,110
21,15,040
3,30,945
24,45,985
24,83,143
3,12,264
10,58,642
38,54,049
23,97,525
30,89,768
18,37,372
73,24,665
1,36,24,699
11,46,981
1,47,71,681
91,723
2014-15 2015-16 2016-17 2017-18 2018-19 (TRE)
2019-20 (SRE)
2020-21 (FRE)
2021-22 (SAE)
1
1.1
1.2
1.3
1.4
2
3
4
5
6
6.1
6.2
7
7.1
7.2
7.37.4
7.5
7.6
7.7
8
9
10
11
12
13
14
15
16
1 2 3 4 5 6 7 8 9 10
Annexure 11
Gross Domestic Product and Per Capita Income of All India at Constant (2011-12) Prices
(Rs. in Crore)
SAE-Second Advance Estimates, FRE- First Revised Estimates, SRE- Second Revised Estimates, TRE- Third Revised Estimates, Source: Ministry of Statistics and Programme Implementation, Government of India
Annexures

Telangana Socio Economic Outlook 2022276
Annexure 12
Sectoral Growth Rates of Gross Domestic Product and Per Capita Income of All India at Constant (2011-12) Prices
Agriculture, Livestock, Forestry and Fishing
Crops
Livestock
Forestry and Logging
Fishing and Aquaculture
Mining and Quarrying
Primary
Manufacturing
Electricity, Gas, Water supply and Other Utility Services
Construction
Secondary
Trade, Repair, Hotels and Restaurants
Trade and Repair Services
Hotels and Restaurants
Transport, Storage, Communication & Services related to Broadcasting
Railways
Road Transport
Water Transport
Air Transport
Services incidental to Transport
Storage
Communication & Services related to Broadcasting
Financial Services
Real Estate, Ownership of Dwellings and Professional Services
Public Administration and Defence
Other Services
Tertiary
Total GSVA at Basic Prices
Taxes on Products
Subsidies on Products
Gross Domestic Product
Per Capita Income (Rs.)
SectorSl. No.
0.6
-2.9
7.5
1.7
9.7
10.1
2.1
13.1
4.7
3.6
9.5
11.1
10.8
13.3
8.9
5.9
7.0
1.8
16.7
7.4
12.9
14.3
7.3
12.1
3.9
8.0
9.4
8.0
4.9
-3.2
8.0
6.7
6.8
5.3
10.0
5.5
10.4
9.8
7.3
7.9
10.0
5.9
7.5
10.1
10.3
8.8
3.5
-3.9
5.6
5.9
18.5
7.0
-2.3
1.3
3.4
10.8
8.7
9.8
8.5
8.0
8.2
-3.2
8.3
6.9
6.6
5.4
7.9
5.4
15.2
-5.6
4.5
7.5
10.6
5.2
7.1
12.9
13.2
9.2
5.7
7.0
9.4
39.0
16.7
-2.9
112.7
-2.7
4.7
0.6
10.1
6.9
6.3
6.2
9.3
-5.9
6.8
5.5
2.1
-2.4
8.7
7.6
8.5
-0.8
1.6
5.4
7.9
6.5
5.9
8.9
8.9
9.3
3.8
3.9
5.3
6.0
12.3
5.6
6.2
-0.6
4.0
8.2
6.8
8.0
7.2
5.8
10.4
-3.1
6.5
5.2
5.5
5.5
7.5
0.3
4.4
-1.5
4.5
-2.9
2.2
1.2
-1.4
7.1
7.1
6.7
3.6
-9.9
3.5
3.1
-2.6
2.6
1.0
11.2
3.5
8.0
5.1
7.2
6.3
3.8
3.9
8.7
3.7
2.3
3.3
1.9
6.1
0.7
6.0
-8.6
1.6
-0.6
-3.6
-7.3
-2.8
-22.4
-19.3
-56.4
-15.3
-18.4
-24.1
-5.6
-65.3
-10.9
3.0
1.8
5.1
1.2
2.3
-11.5
-7.8
-4.8
-14.4
38.9
-6.6
-9.7
3.3
12.6
10.5
7.8
10.0
11.6
4.3
12.5
8.3
17.8
8.9
7.8
2015-16 2016-17 2017-18 2018-19 (TRE)
2019-20 (SRE)
2020-21 (FRE)
2021-22 (SAE)
1
1.1
1.2
1.3
1.4
2
3
4
5
6
6.1
6.2
7
7.1
7.2
7.37.4
7.5
7.6
7.7
8
9
10
11
12
13
14
15
16
(Percent)
1 2 3 4 5 6 7 8 9
SAE-Second Advance Estimates, FRE- First Revised Estimates, SRE- Second Revised Estimates, TRE- Third Revised Estimates, Source: Ministry of Statistics and Programme Implementation, Government of India

277
Annexure 13
Gross District Domestic Product of Telangana from 2018-19 to 2020-21
1 2 3 4 5 6 7 8
01 Adilabad 13,31,761 14,94,147 14,59,885 9,50,112 10,35,807 9,65,645
02 Kumuram Bheem 8,81,209 8,72,448 8,21,051 5,96,713 5,75,274 5,03,316
03 Mancherial 12,61,608 14,69,370 14,73,862 8,79,469 9,59,734 9,08,516
04 Nirmal 12,66,043 14,82,606 14,80,226 8,76,596 9,85,434 9,33,475
05 Nizamabad 24,87,037 29,70,079 30,49,764 17,33,193 19,61,100 19,14,873
06 Jagtial 12,77,878 16,96,513 17,13,847 8,53,607 10,83,397 10,17,333
07 Peddapalli 16,76,268 17,92,579 16,48,342 12,03,366 12,20,322 10,61,099
08 Jayashankar 11,68,259 12,66,758 10,64,808 7,29,461 7,68,703 6,15,745
09 Bhadradri Kothagudem 20,91,855 24,41,720 23,22,291 14,94,508 16,31,589 14,10,140
10 Mahabubabad 12,07,606 12,33,524 13,67,316 7,93,030 7,83,297 7,96,146
11 Warangal Rural 11,28,725 13,68,002 14,67,569 7,89,660 8,97,675 9,10,847
12 Warangal Urban 15,56,284 17,63,397 17,45,497 10,96,378 11,74,960 11,07,464
13 Karimnagar 19,90,488 20,78,954 22,62,531 14,02,840 13,97,196 14,55,891
14 Rajanna Siricilla 7,99,505 9,68,538 10,08,175 5,39,551 6,24,169 6,13,301
15 Kamareddy 13,68,778 16,76,180 17,45,651 9,17,471 10,67,009 10,53,818
16 Sangareddy 31,83,569 36,84,255 36,95,064 23,43,177 25,75,839 24,73,805
17 Medak 17,31,496 20,75,579 20,83,014 12,75,769 14,18,269 13,70,866
18 Siddipet 20,45,142 20,50,252 25,91,207 13,40,303 13,15,580 15,26,179
19 Jangaon 8,11,861 10,79,535 10,75,118 5,44,052 6,73,214 6,37,787
20 Yadadri Bhuvanagiri 16,06,496 18,83,101 19,93,603 11,28,194 12,48,377 12,50,657
21 Medchal-Malkajgiri 67,55,396 72,41,073 70,86,965 51,42,944 52,99,165 49,58,373
22 Hyderabad 162,00,201 165,45,060 162,87,737 117,12,775 112,80,351 105,95,867
23 Rangareddy 172,34,173 183,45,665 193,50,667 124,28,131 126,70,243 125,05,416
24 Vikarabad 15,31,079 14,41,762 14,27,867 9,88,282 9,13,151 8,57,781
25 Mahabubnagar 22,31,024 22,75,898 24,33,160 16,28,732 15,96,261 16,15,072
26 Jogulamba Gadwal 9,41,490 9,86,107 10,52,130 6,09,821 6,18,554 6,10,843
27 Wanaparthy 8,04,248 9,99,068 10,07,302 5,41,685 6,26,270 5,89,573
28 Nagarkurnool 11,94,242 16,07,462 16,23,008 7,90,602 10,10,248 9,69,686
29 Nalgonda 28,23,527 35,52,253 37,94,800 19,69,042 23,10,802 23,28,658
30 Suryapet 17,38,371 22,24,093 23,47,137 11,94,532 14,27,160 14,16,908
31 Khammam 23,41,701 28,14,615 29,80,559 16,34,827 18,02,724 17,85,454
32 Mulugu 4,80,646 5,72,355 5,74,619 3,11,269 3,55,443 3,30,039
33 Narayanpet 5,94,746 8,82,645 9,30,805 4,00,047 5,60,835 5,46,305
GSDP 8,57,42,707 9,48,35,591 9,69,65,578 6,08,40,138 6,38,68,151 6,16,36,877
Sl. No District
Constant (2011-12) prices
2018-19 (TRE)
2019-20 (SRE)
2020-21 (FRE)
Current prices
2018-19 (TRE)
2019-20 (SRE)
2020-21 (FRE)
(Rs. in Lakh)
FRE- First Revised Estimates, SRE- Second Revised Estimates, TRE- Third Revised EstimatesSource: Ministry of Statistics and Programme Implementation, Government of India
Annexures

Telangana Socio Economic Outlook 2022278
Annexure 14
Per Capita Income of Telangana by districts from 2018-19 to 2020-21
1 2 3 4 5 6 7 8
01 Adilabad 1,60,791 1,80,786 1,75,171 1,13,309 1,23,411 1,13,915
02 Kumuram Bheem 1,48,726 1,46,298 1,37,488 98,714 94,568 82,630
03 Mancherial 1,33,521 1,56,188 1,54,955 91,220 99,801 93,356
04 Nirmal 1,54,182 1,80,688 1,79,169 1,05,272 1,18,095 1,10,857
05 Nizamabad 1,36,333 1,63,274 1,66,766 93,644 1,05,820 1,02,711
06 Jagtial 1,12,032 1,49,769 1,50,048 73,674 94,049 87,338
07 Peddapalli 1,77,380 1,89,157 1,73,981 1,24,582 1,25,468 1,08,919
08 Jayashankar 2,36,051 2,52,692 2,13,735 1,44,906 1,50,455 1,21,059
09 Bhadradri Kothagudem 1,66,303 1,93,073 1,83,368 1,16,258 1,25,632 1,08,345
10 Mahabubabad 1,37,142 1,38,594 1,52,577 88,585 86,348 87,081
11 Warangal Rural 1,34,950 1,64,667 1,75,951 93,104 1,06,209 1,07,257
12 Warangal Urban 1,24,665 1,40,699 1,38,387 86,543 91,978 86,019
13 Karimnagar 1,70,862 1,76,506 1,91,205 1,18,605 1,16,367 1,20,329
14 Rajanna Siricilla 1,25,059 1,51,075 1,56,150 82,872 95,256 92,792
15 Kamareddy 1,23,043 1,50,385 1,55,032 81,220 94,057 91,817
16 Sangareddy 1,78,016 2,06,025 2,04,692 1,29,512 1,41,836 1,34,719
17 Medak 1,92,529 2,31,990 2,29,833 1,40,047 1,55,707 1,48,482
18 Siddipet 1,74,681 1,74,985 2,19,292 1,12,796 1,10,371 1,26,860
19 Jangaon 1,32,176 1,77,160 1,74,636 87,146 1,08,460 1,01,535
20 Yadadri Bhuvanagiri 1,79,702 2,10,460 2,22,100 1,24,352 1,37,105 1,36,771
21 Medchal-Malkajgiri 2,32,924 2,44,407 2,40,008 1,75,555 1,75,981 1,65,286
22 Hyderabad 3,56,910 3,62,116 3,51,332 2,55,096 2,42,798 2,24,834
23 Rangareddy 5,94,148 6,25,094 6,58,757 4,22,257 4,22,294 4,16,377
24 Vikarabad 1,45,327 1,35,005 1,32,479 92,489 83,926 78,020
25 Mahabubnagar 2,08,716 2,10,249 2,23,348 1,50,758 1,45,414 1,45,992
26 Jogulamba Gadwal 1,35,823 1,40,969 1,49,606 86,603 86,875 85,216
27 Wanaparthy 1,20,931 1,51,609 1,51,458 79,904 93,262 86,826
28 Nagarkurnool 1,19,358 1,62,670 1,63,462 77,714 1,00,468 95,790
29 Nalgonda 1,48,931 1,89,047 2,01,144 1,02,373 1,20,794 1,21,119
30 Suryapet 1,35,741 1,75,293 1,83,810 91,779 1,10,487 1,08,880
31 Khammam 1,44,754 1,74,030 1,83,318 99,281 1,09,091 1,07,439
32 Mulugu 1,43,461 1,69,239 1,67,769 91,478 1,03,171 94,108
33 Narayanpet 91,410 1,36,928 1,43,428 60,402 85,517 82,512
PCI 2,09,848 2,30,955 2,34,751 1,46,777 1,52,566 1,46,278
Sl. No District
Constant (2011-12) prices
2018-19 (TRE)
2019-20 (SRE)
2020-21 (FRE)
Current prices
2018-19 (TRE)
2019-20 (SRE)
2020-21 (FRE)
(in Rupees)
FRE- First Revised Estimates, SRE- Second Revised Estimates, TRE- Third Revised EstimatesSource: Ministry of Statistics and Programme Implementation, Government of India

279
Annexure 15
Demographic Details of Telangana
Telangana 1,27,11,785 1,58,17,895 2,01,81,085 2,60,89,074 3,09,87,271 3,50,03,674
India 43,92,34,771 54,81,59,652 68,33,29,097 84,64,21,039 1,02,86,10,328 1,21,08,54,977
Year 1961 1971 1981 1991 2001 2011
a. Population of Telangana State from 1961 to 2011 (in Nos.)
Telangana 19.27 20.99 25.27 30.18 31.79 38.88
India 17.97 17.98 19.51 22.87 25.49 31.15
Year 1961 1971 1981 1991 2001 2011
b. Percentage of Urban Population to total Population from 1961 to 2011
Telangana 16.48 24.60 27.59 29.27 18.77 13.58
India 21.51 24.80 24.66 23.85 21.54 17.70
Year 1951-61 1961-71 1971-81 1981-91 1991-01 2001-2011
c. Percentage of Decadal Growth Rates of Population from 1951-61 to 2001-2011
Telangana 111 138 176 227 270 312
India 144 177 216 273 325 382
Year 1961 1971 1981 1991 2001 2011
d. Density of Population from 1961 to 2011
Telangana 975 969 971 967 971 988
India 941 930 934 927 933 943
Year 1961 1971 1981 1991 2001 2011
e. Sex Ratio of Population from 1961 to 2011
Telangana 17.34 20.70 26.49 41.30 58.00 66.54
India 28.30 34.45 43.57 52.21 64.84 72.98
Year 1961 1971 1981 1991 2001 2011
f. Literacy Rate of Population from 1961 to 2011
Source: Registrar General and Census Commissioner, India.
Annexures

Telangana Socio Economic Outlook 2022280
Source: Registrar General and Census Commissioner, India.
Annexure 16
Population by Districts, 2011 Census
1 2 3 4 5 6 7 8 9 10 11
1 Adilabad 3,56,407 3,52,565 7,08,972 2,71,594 2,69,632 5,41,226 84,813 82,933 1,67,746
2 Kumuram Bheem 2,58,197 2,57,615 5,15,812 2,14,967 2,13,861 4,28,828 43,230 43,754 86,984
3 Mancherial 4,08,272 3,98,765 8,07,037 2,27,974 2,25,216 4,53,190 1,80,298 1,73,549 3,53,847
4 Nirmal 3,46,721 3,62,697 7,09,418 2,70,768 2,86,968 5,57,736 75,953 75,729 1,51,682
5 Nizamabad 7,68,477 8,02,545 15,71,022 5,37,574 5,68,698 11,06,272 2,30,903 2,33,847 4,64,750
6 Jagitial 4,84,079 5,01,338 9,85,417 3,73,526 3,90,555 7,64,081 1,10,553 1,10,783 2,21,336
7 Peddapalli 3,99,325 3,96,007 7,95,332 2,45,052 2,46,267 4,91,319 1,54,273 1,49,740 3,04,013
8 Jayashankar Bhupalapalli 2,07,998 2,08,765 4,16,763 1,86,188 1,88,188 3,74,376 21,810 20,577 42,387
9 Bhadradri Kothagudem 5,32,390 5,36,871 10,69,261 3,64,807 3,65,371 7,30,178 1,67,583 1,71,500 3,39,083
10 Mahabubabad 3,88,058 3,86,491 7,74,549 3,50,530 3,47,643 6,98,173 37,528 38,848 76,376
11 Warangal 3,69,551 3,67,597 7,37,148 2,55,622 2,54,435 5,10,057 1,13,929 1,13,162 2,27,091
12 Hanumakonda 5,32,065 5,30,182 10,62,247 2,48,907 2,49,711 4,98,618 2,83,158 2,80,471 5,63,629
13 Karimnagar 5,04,620 5,01,091 10,05,711 3,48,914 3,47,813 6,96,727 1,55,706 1,53,278 3,08,984
14 Rajanna Sircilla 2,74,109 2,77,928 5,52,037 2,15,791 2,19,354 4,35,145 58,318 58,574 1,16,892
15 Kamareddy 4,78,389 4,94,236 9,72,625 4,17,488 4,31,515 8,49,003 60,901 62,721 1,23,622
16 Sangareddy 7,77,235 7,50,393 15,27,628 5,04,840 4,92,823 9,97,663 2,72,395 2,57,570 5,29,965
17 Medak 3,78,654 3,88,774 7,67,428 3,50,091 3,58,483 7,08,574 28,563 30,291 58,854
18 Siddipet 5,04,141 5,07,924 10,12,065 4,34,875 4,38,138 8,73,013 69,266 69,786 1,39,052
19 Jangaon 2,67,875 2,67,116 5,34,991 2,31,389 2,32,245 4,63,634 36,486 34,871 71,357
20 Yadadri Bhuvanagiri 3,90,492 3,80,341 7,70,833 3,28,096 3,19,572 6,47,668 62,396 60,769 1,23,165
21 Medchal Malkajgiri 12,56,883 12,03,212 24,60,095 1,08,551 1,01,277 2,09,828 11,48,332 11,01,935 22,50,267
22 Hyderabad 20,18,575 19,24,748 39,43,323 - - - 20,18,575 19,24,748 39,43,323
23 Rangareddy 12,43,967 11,82,276 24,26,243 5,25,796 5,00,317 10,26,113 7,18,171 6,81,959 14,00,130
24 Vikarabad 4,70,686 4,70,697 9,41,383 4,08,231 4,08,183 8,16,414 62,455 62,514 1,24,969
25 Mahabubnagar 4,55,534 4,50,126 9,05,660 3,21,335 3,17,874 6,39,209 1,34,199 1,32,252 2,66,451
26 Jogulamba Gadwal 3,09,274 3,00,716 6,09,990 2,77,339 2,69,474 5,46,813 31,935 31,242 63,177
27 Wanaparthy 2,94,833 2,82,925 5,77,758 2,47,528 2,37,942 4,85,470 47,305 44,983 92,288
28 Nagarkurnool 4,37,986 4,23,780 8,61,766 3,93,137 3,80,799 7,73,936 44,849 42,981 87,830
29 Nalgonda 8,18,306 8,00,110 16,18,416 6,33,429 6,16,684 12,50,113 1,84,877 1,83,426 3,68,303
30 Suryapeta 5,50,974 5,48,586 10,99,560 4,66,191 4,62,330 9,28,521 84,783 86,256 1,71,039
31 Khammam 6,99,124 7,02,515 14,01,639 5,42,500 5,42,311 10,84,811 1,56,624 1,60,204 3,16,828
32 Mulug 1,46,205 1,48,466 2,94,671 1,40,429 1,42,749 2,83,178 5,776 5,717 11,493
33 Narayanpet 2,82,231 2,84,643 5,66,874 2,61,534 2,63,588 5,25,122 20,697 21,055 41,752
Grand Total 1,76,11,633 1,73,92,041 3,50,03,674 1,07,04,993 1,06,90,016 2,13,95,009 69,06,640 67,02,025 1,36,08,665
Sl. No District
Urban Population (Nos.)
Male Female Total
Rural Population (Nos.)
Male Female Total
Total Population (Nos.)
Male Female Total

281
Annexure 17
District wise Child(0-6 years) Population, 2011 Census
1 2 3 4 5 6 7 8 9 10 11
1 Adilabad 45,198 42,094 87,292 35,428 33,040 68,468 9,770 9,054 18,824
2 Kumuram Bheem 34,053 32,153 66,206 29,422 27,724 57,146 4,631 4,429 9,060
3 Mancherial 38,578 35,147 73,725 22,988 21,119 44,107 15,590 14,028 29,618
4 Nirmal 42,462 40,307 82,769 33,080 31,406 64,486 9,382 8,901 18,283
5 Nizamabad 86,867 82,754 1,69,621 59,559 56,475 1,16,034 27,308 26,279 53,587
6 Jagitial 47,890 45,382 93,272 35,685 33,849 69,534 12,205 11,533 23,738
7 Peddapalli 34,772 32,040 66,812 21,460 19,999 41,459 13,312 12,041 25,353
8 Jayashankar Bhupalapalli 20,234 18,473 38,707 18,318 16,821 35,139 1,916 1,652 3,568
9 Bhadradri Kothagudem 54,650 52,676 1,07,326 37,706 36,490 74,196 16,944 16,186 33,130
10 Mahabubabad 42,610 38,472 81,082 38,751 34,933 73,684 3,859 3,539 7,398
11 Warangal 37,191 33,893 71,084 25,443 23,005 48,448 11,748 10,888 22,636
12 Hanumakonda 50,194 46,774 96,968 23,015 21,031 44,046 27,179 25,743 52,922
13 Karimnagar 46,124 42,955 89,079 30,000 27,761 57,761 16,124 15,194 31,318
14 Rajanna Sircilla 25,099 23,652 48,751 19,315 18,235 37,550 5,784 5,417 11,201
15 Kamareddy 57,528 54,138 1,11,666 50,455 47,327 97,782 7,073 6,811 13,884
16 Sangareddy 99,712 95,262 1,94,974 65,424 62,546 1,27,970 34,288 32,716 67,004
17 Medak 48,247 45,627 93,874 44,946 42,407 87,353 3,301 3,220 6,521
18 Siddipet 53,194 50,658 1,03,852 45,709 43,542 89,251 7,485 7,116 14,601
19 Jangaon 26,914 25,171 52,085 23,435 21,768 45,203 3,479 3,403 6,882
20 Yadadri Bhuvanagiri 41,418 38,185 79,603 34,564 31,722 66,286 6,854 6,463 13,317
21 Medchal Malkajgiri 1,48,754 1,38,960 2,87,714 12,686 11,930 24,616 1,36,068 1,27,030 2,63,098
22 Hyderabad 2,45,127 2,23,999 4,69,126 - - - 2,45,127 2,23,999 4,69,126
23 Rangareddy 1,54,762 1,43,079 2,97,841 66,458 61,466 1,27,924 88,304 81,613 1,69,917
24 Vikarabad 60,109 56,782 1,16,891 52,563 49,632 1,02,195 7,546 7,150 14,696
25 Mahabubnagar 60,378 56,380 1,16,758 44,515 41,528 86,043 15,863 14,852 30,715
26 Jogulamba Gadwal 43,304 40,424 83,728 39,520 36,740 76,260 3,784 3,684 7,468
27 Wanaparthy 38,040 34,337 72,377 32,962 29,645 62,607 5,078 4,692 9,770
28 Nagarkurnool 56,292 51,167 1,07,459 51,101 46,261 97,362 5,191 4,906 10,097
29 Nalgonda 94,926 87,070 1,81,996 75,090 68,401 1,43,491 19,836 18,669 38,505
30 Suryapeta 56,922 53,214 1,10,136 48,504 45,255 93,759 8,418 7,959 16,377
31 Khammam 71,760 67,854 1,39,614 55,652 52,738 1,08,390 16,108 15,116 31,224
32 Mulug 14,788 14,356 29,144 14,314 13,873 28,187 474 483 957
33 Narayanpet 39,838 37,796 77,634 37,196 35,441 72,637 2,642 2,355 4,997
Grand Total 20,17,935 18,81,231 38,99,166 12,25,264 11,44,110 23,69,374 7,92,671 7,37,121 15,29,792
Sl. No District
Urban Child Population (Nos.)
Male Female Total
Rural Child Population (Nos.)
Male Female Total
Total Child Population (Nos.)
Male Female Total
Source: Registrar General and Census Commissioner, India
Annexures

Telangana Socio Economic Outlook 2022282
Annexure 18
District wise Sex Ratio, 2011 Census
1 2 3 4 5 6 7 8
1 Adilabad 993 978 989 933 927 931
2 Kumuram Bheem 995 1,012 998 942 956 944
3 Mancherial 988 963 977 919 900 911
4 Nirmal 1,060 997 1,046 949 949 949
5 Nizamabad 1,058 1,013 1,044 948 962 953
6 Jagitial 1,046 1,002 1,036 949 945 948
7 Peddapalli 1,005 971 992 932 905 921
8 Jayashankar Bhupalapalli 1,011 943 1,004 918 862 913
9 Bhadradri Kothagudem 1,002 1,023 1,008 968 955 964
10 Mahabubabad 992 1,035 996 901 917 903
11 Warangal 995 993 995 904 927 911
12 Hanumakonda 1,003 991 996 914 947 932
13 Karimnagar 997 984 993 925 942 931
14 Rajanna Sircilla 1,017 1,004 1,014 944 937 942
15 Kamareddy 1,034 1,030 1,033 938 963 941
16 Sangareddy 976 946 965 956 954 955
17 Medak 1,024 1,060 1,027 944 975 946
18 Siddipet 1,008 1,008 1,008 953 951 952
19 Jangaon 1,004 956 997 929 978 935
20 Yadadri Bhuvanagiri 974 974 974 918 943 922
21 Medchal Malkajgiri 933 960 957 940 934 934
22 Hyderabad - 954 954 914 914
23 Rangareddy 952 950 950 925 924 925
24 Vikarabad 1,000 1,001 1,000 944 948 945
25 Mahabubnagar 989 985 988 933 936 934
26 Jogulamba Gadwal 972 978 972 930 974 933
27 Wanaparthy 961 951 960 899 924 903
28 Nagarkurnool 969 958 968 905 945 909
29 Nalgonda 974 992 978 911 941 917
30 Suryapeta 992 1,017 996 933 945 935
31 Khammam 1,000 1,023 1,005 948 938 946
32 Mulug 1,017 990 1,015 969 1,019 971
33 Narayanpet 1,008 1,017 1,009 953 891 949
Grand Total 999 970 988 934 930 932
Sl. No District
Child (0-6 years) Sex Ratio
Rural Urban Total
Population Sex Ratio
Rural Urban Total
Source: Registrar General and Census Commissioner, India.

283
Annexure 19
District wise Literate Population (7 Years and above), 2011 Census
1 2 3 4 5 6 7 8 9 10 11
1 Adilabad 2,28,689 1,65,802 3,94,491 1,64,470 1,13,386 2,77,856 64,219 52,416 1,16,635
2 Kumuram Bheem 1,47,911 1,07,091 2,55,002 1,14,535 78,824 1,93,359 33,376 28,267 61,643
3 Mancherial 2,69,729 2,02,127 4,71,856 1,34,794 96,600 2,31,394 1,34,935 1,05,527 2,40,462
4 Nirmal 2,10,021 1,51,977 3,61,998 1,55,234 1,07,864 2,63,098 54,787 44,113 98,900
5 Nizamabad 5,04,933 3,95,503 9,00,436 3,34,248 2,49,189 5,83,437 1,70,685 1,46,314 3,16,999
6 Jagitial 3,07,947 2,29,689 5,37,636 2,24,824 1,62,559 3,87,383 83,123 67,130 1,50,253
7 Peddapalli 2,68,587 2,08,774 4,77,361 1,53,617 1,16,571 2,70,188 1,14,970 92,203 2,07,173
8 Jayashankar Bhupalapalli 1,29,026 93,906 2,22,932 1,12,539 80,672 1,93,211 16,487 13,234 29,721
9 Bhadradri Kothagudem 3,51,411 2,87,288 6,38,699 2,22,077 1,73,979 3,96,056 1,29,334 1,13,309 2,42,643
10 Mahabubabad 2,29,809 1,66,389 3,96,198 2,00,619 1,41,311 3,41,930 29,190 25,078 54,268
11 Warangal 2,48,397 1,81,575 4,29,972 1,60,659 1,12,676 2,73,335 87,738 68,899 1,56,637
12 Hanumakonda 3,98,182 3,17,376 7,15,558 1,66,533 1,21,418 2,87,951 2,31,649 1,95,958 4,27,607
13 Karimnagar 3,57,364 2,76,616 6,33,980 2,32,177 1,69,586 4,01,763 1,25,187 1,07,030 2,32,217
14 Rajanna Sircilla 1,82,946 1,32,665 3,15,611 1,38,476 98,230 2,36,706 44,470 34,435 78,905
15 Kamareddy 2,83,542 2,03,017 4,86,559 2,37,197 1,64,145 4,01,342 46,345 38,872 85,217
16 Sangareddy 4,94,705 3,59,255 8,53,960 2,90,649 1,97,425 4,88,074 2,04,056 1,61,830 3,65,886
17 Medak 2,23,069 1,54,915 3,77,984 2,01,803 1,36,621 3,38,424 21,266 18,294 39,560
18 Siddipet 3,26,013 2,33,560 5,59,573 2,72,345 1,90,026 4,62,371 53,668 43,534 97,202
19 Jangaon 1,72,009 1,25,480 2,97,489 1,42,923 1,02,772 2,45,695 29,086 22,708 51,794
20 Yadadri Bhuvanagiri 2,63,588 1,87,376 4,50,964 2,15,119 1,49,008 3,64,127 48,469 38,368 86,837
21 Medchal Malkajgiri 9,68,890 8,22,812 17,91,702 75,017 54,495 1,29,512 8,93,873 7,68,317 16,62,190
22 Hyderabad 15,42,688 13,49,467 28,92,155 - - - 15,42,688 13,49,467 28,92,155
23 Rangareddy 8,59,096 6,70,849 15,29,945 3,21,466 2,17,056 5,38,522 5,37,630 4,53,793 9,91,423
24 Vikarabad 2,77,126 1,99,491 4,76,617 2,31,464 1,60,765 3,92,229 45,662 38,726 84,388
25 Mahabubnagar 2,79,816 2,02,393 4,82,209 1,75,945 1,15,655 2,91,600 1,03,871 86,738 1,90,609
26 Jogulamba Gadwal 1,59,704 1,02,751 2,62,455 1,37,276 85,307 2,22,583 22,428 17,444 39,872
27 Wanaparthy 1,68,792 1,12,539 2,81,331 1,33,446 85,361 2,18,807 35,346 27,178 62,524
28 Nagarkurnool 2,47,538 1,62,621 4,10,159 2,13,365 1,36,622 3,49,987 34,173 25,999 60,172
29 Nalgonda 5,34,573 3,81,169 9,15,742 3,87,059 2,57,677 6,44,736 1,47,514 1,23,492 2,71,006
30 Suryapeta 3,62,596 2,71,717 6,34,313 2,94,818 2,11,866 5,06,684 67,778 59,851 1,27,629
31 Khammam 4,62,275 3,70,045 8,32,320 3,37,475 2,56,787 5,94,262 1,24,800 1,13,258 2,38,058
32 Mulug 94,549 70,766 1,65,315 90,326 67,401 1,57,727 4,223 3,365 7,588
33 Narayanpet 1,46,208 98,048 2,44,256 1,31,679 86,046 2,17,725 14,529 12,002 26,531
Grand Total 1,17,01,729 89,95,049 2,06,96,778 64,04,174 44,97,900 1,09,02,074 52,97,555 44,97,149 97,94,704
Sl. No District
Urban Literates (Nos.)
Male Female Total
Rural Literates (Nos.)
Male Female Total
Total Literates (Nos.)
Male Female Total
Source: Registrar General and Census Commissioner, India. Note: Literates exclude children in the age group of (0-6) years
Annexures

Telangana Socio Economic Outlook 2022284
Annexure 20
District wise Literacy Rates, 2011 Census
1 2 3 4 5 6 7 8 9 10 11
1 Adilabad 73.48 53.40 63.46 69.64 47.92 58.77 85.58 70.95 78.32
2 Kumuram Bheem 65.99 47.50 56.72 61.73 42.35 52.02 86.47 71.88 79.11
3 Mancherial 72.96 55.59 64.35 65.76 47.33 56.56 81.92 66.15 74.16
4 Nirmal 69.03 47.14 57.77 65.31 42.21 53.34 82.3 66.01 74.14
5 Nizamabad 74.08 54.95 64.25 69.92 48.65 58.92 83.84 70.49 77.1
6 Jagitial 70.6 50.38 60.26 66.55 45.57 55.77 84.52 67.64 76.04
7 Peddapalli 73.68 57.36 65.52 68.7 51.52 60.06 81.56 66.96 74.35
8 Jayashankar Bhupalapalli 68.72 49.35 58.97 67.04 47.08 56.95 82.87 69.93 76.56
9 Bhadradri Kothagudem 73.56 59.33 66.40 67.89 52.9 60.38 85.86 72.95 79.31
10 Mahabubabad 66.52 47.81 57.13 64.35 45.19 54.75 86.7 71.02 78.67
11 Warangal 74.74 54.41 64.55 69.8 48.69 59.21 85.87 67.37 76.61
12 Hanumakonda 82.63 65.65 74.13 73.72 53.1 63.35 90.5 76.93 83.73
13 Karimnagar 77.94 60.38 69.16 72.8 52.99 62.88 89.69 77.51 83.63
14 Rajanna Sircilla 73.47 52.17 62.71 70.48 48.84 59.53 84.65 64.78 74.66
15 Kamareddy 67.37 46.13 56.51 64.63 42.73 53.43 86.1 69.53 77.65
16 Sangareddy 73.02 54.84 64.08 66.14 45.88 56.12 85.7 71.97 79.03
17 Medak 67.51 45.15 56.12 66.13 43.22 54.48 84.18 67.58 75.59
18 Siddipet 72.3 51.08 61.61 69.98 48.16 58.99 86.87 69.47 78.1
19 Jangaon 71.38 51.86 61.60 68.73 48.83 58.72 88.12 72.16 80.33
20 Yadadri Bhuvanagiri 75.51 54.76 65.24 73.29 51.77 62.63 87.27 70.65 79.05
21 Medchal Malkajgiri 87.43 77.31 82.48 78.25 60.99 69.93 88.3 78.81 83.65
22 Hyderabad 86.99 79.35 83.25 - - - 86.99 79.35 83.25
23 Rangareddy 78.87 64.55 71.88 69.98 49.46 59.96 85.36 75.59 80.59
24 Vikarabad 67.5 48.2 57.81 65.08 44.84 54.92 83.16 69.95 76.53
25 Mahabubnagar 70.81 51.4 61.12 63.56 41.85 52.71 87.78 73.88 80.86
26 Jogulamba Gadwal 60.05 39.48 49.87 57.72 36.65 47.3 79.67 63.3 71.57
27 Wanaparthy 65.73 45.27 55.67 62.19 40.98 51.74 83.7 67.45 75.77
28 Nagarkurnool 64.85 43.64 54.38 62.38 40.84 51.73 86.17 68.28 77.41
29 Nalgonda 73.9 53.46 63.75 69.32 47 58.26 89.38 74.95 82.17
30 Suryapeta 73.39 54.85 64.11 70.58 50.8 60.7 88.76 76.44 82.52
31 Khammam 73.69 58.31 65.95 69.32 52.45 60.86 88.82 78.06 83.35
32 Mulug 71.95 52.77 62.26 71.62 52.3 61.86 79.65 64.29 72.02
33 Narayanpet 60.32 39.72 49.93 58.7 37.72 48.12 80.47 64.18 72.18
Grand Total 75.04 57.99 66.54 67.56 47.12 57.3 86.65 75.39 81.09
Sl. No District
Urban Literacy rate
Male Female Total
Rural Literacy Rate
Male Female Total
Total Literacy rate
Male Female Total
Source: Registrar General and Census Commissioner, India.

285
Annexure 21
Working Population by Districts, 2011 Census
1 2 3 4 5 6 7 8 9
1 Adilabad 7,08,972 1,26,363 1,19,664 10,313 92,781 3,49,121 49.24
2 Kumuram Bheem 5,15,812 88,045 99,667 7,490 57,799 2,53,001 49.05
3 Mancherial 8,07,037 45,831 1,48,377 8,423 1,42,154 3,44,785 42.72
4 Nirmal 7,09,418 1,03,498 1,17,204 58,435 97,623 3,76,760 53.11
5 Nizamabad 15,71,022 1,44,090 2,31,941 1,26,712 2,59,823 7,62,566 48.54
6 Jagtial 9,85,417 1,11,345 1,77,530 89,897 1,57,664 5,36,436 54.44
7 Peddapalli 7,95,332 46,115 1,59,967 8,207 1,30,925 3,45,214 43.41
8 Jayashankar 4,16,763 51,785 1,30,897 2,993 35,356 2,21,031 53.04
9 Bhadradri Kothagudem 10,69,261 89,435 2,62,753 8,446 1,56,477 5,17,111 48.36
10 Mahabubabad 7,74,549 1,22,597 2,04,458 7,427 73,002 4,07,484 52.61
11 Warangal Rural 7,18,537 98,880 2,00,721 7,612 69,399 3,76,612 52.41
12 Warangal Urban 10,80,858 43,818 1,20,682 16,094 2,59,046 4,39,640 40.68
13 Karimnagar 10,05,711 78,516 1,86,363 18,694 1,80,347 4,63,920 46.13
14 Rajanna Sircilla 5,52,037 66,751 1,01,737 46,647 83,528 2,98,663 54.10
15 Kamareddy 9,72,625 1,33,267 2,13,224 44,358 1,03,332 4,94,181 50.81
16 Sangareddy 15,27,628 1,09,650 2,98,990 17,234 2,62,282 6,88,156 45.05
17 Medak 7,67,428 1,29,530 1,62,827 15,811 77,642 3,85,810 50.27
18 Siddipet 10,12,065 1,56,467 1,71,665 40,520 1,40,911 5,09,563 50.35
19 Jangaon 5,34,991 80,477 1,20,447 7,462 62,386 2,70,772 50.61
20 Yadadri Bhuvanagiri 7,70,833 67,500 1,57,672 17,038 1,31,864 3,74,074 48.53
21 Medchal-Malkajgiri 24,60,095 26,675 44,980 38,872 8,54,205 9,64,732 39.22
22 Hyderabad 39,43,323 28,308 23,029 46,157 13,15,803 14,13,297 35.84
23 Rangareddy 24,26,243 1,65,705 2,13,624 29,544 6,13,768 10,22,641 42.15
24 Vikarabad 9,27,140 1,65,202 1,91,597 10,727 1,02,626 4,70,152 50.71
25 Mahabubnagar 9,19,903 1,00,052 1,70,815 14,901 1,56,621 4,42,389 48.09
26 Jogulamba Gadwal 6,09,990 85,048 1,83,459 8,441 51,138 3,28,086 53.79
27 Wanaparthy 5,77,758 60,914 1,44,713 8,749 81,773 2,96,149 51.26
28 Nagarkurnool 8,61,766 1,54,560 1,90,030 9,633 1,02,539 4,56,762 53.00
29 Nalgonda 16,18,416 1,58,951 3,89,621 19,633 2,37,886 8,06,091 49.81
30 Suryapet 10,99,560 98,773 3,15,838 8,453 1,38,464 5,61,528 51.07
31 Khammam 14,01,639 95,769 4,14,250 9,198 1,85,512 7,04,729 50.28
32 Mulugu 2,94,671 35,561 1,05,511 2,042 19,704 1,62,818 55.25
33 Narayanpet 5,66,874 81,911 1,40,898 10,366 64,493 2,97,668 52.51
Total 3,50,03,674 31,51,389 59,15,151 7,76,529 64,98,873 1,63,41,942 46.69
Sl. No District % Working Population
Household Industry
Other Workers
Total Workers
Total Population
Cultivators Agricultural Lobourers
Source: Registrar General and Census Commissioner, India.
(Nos.)
Annexures

Telangana Socio Economic Outlook 2022286
Annexure 22
Pattern of Land Utilisation from 2008-09 to 2019-20
1 2 3 4 5 6 7 8 9 10 11
2008-09 27.43 6.26 8.19 1.71 3.09 1.16 16.79 7.88 42.33 114.84
2009-10 27.43 6.18 8.24 1.7 3.08 1.16 19.38 8.08 39.59 114.84
2010-11 27.43 6.17 8.71 1.67 3.03 1.14 13.97 7.80 44.92 114.84
2011-12 27.43 6.17 8.82 1.65 3.02 1.14 12.36 8.26 45.99 114.84
2012-13 27.43 6.17 8.86 1.74 3.02 1.14 12.03 7.91 46.54 114.84
2013-14 25.40 6.07 8.81 1.77 3.00 1.12 9.51 7.17 49.23 112.08
2014-15 25.40 6.07 8.85 1.82 2.99 1.12 14.01 8.05 43.77 112.08
2015-16 25.40 6.07 8.92 1.82 2.99 1.12 15.79 8.22 41.75 112.08
2016-17 26.98 6.07 8.52 1.82 2.99 1.12 10.15 6.69 47.74 112.08
2017-18 26.98 6.07 8.34 1.82 2.99 1.12 9.16 6.62 48.98 112.08
2018-19 26.98 6.07 8.34 1.80 2.99 1.12 10.67 7.51 46.60 112.08
2019-20 26.98 6.07 8.36 1.63 2.82 1.12 5.66 4.44 55.00 112.08
Current Fallow Lands
Geographical Area
Culturable Waste
Permanent Pastures
and Grazing
Land
Other Fallow Lands
Land Under Misc. Tree Crops &
Groves not included in NAS
Net Area sown
Forest Area
Barren & Uncultivable
Land
Land put to Non-
Agricultural uses
(Area in Lakh Hectares)
Year
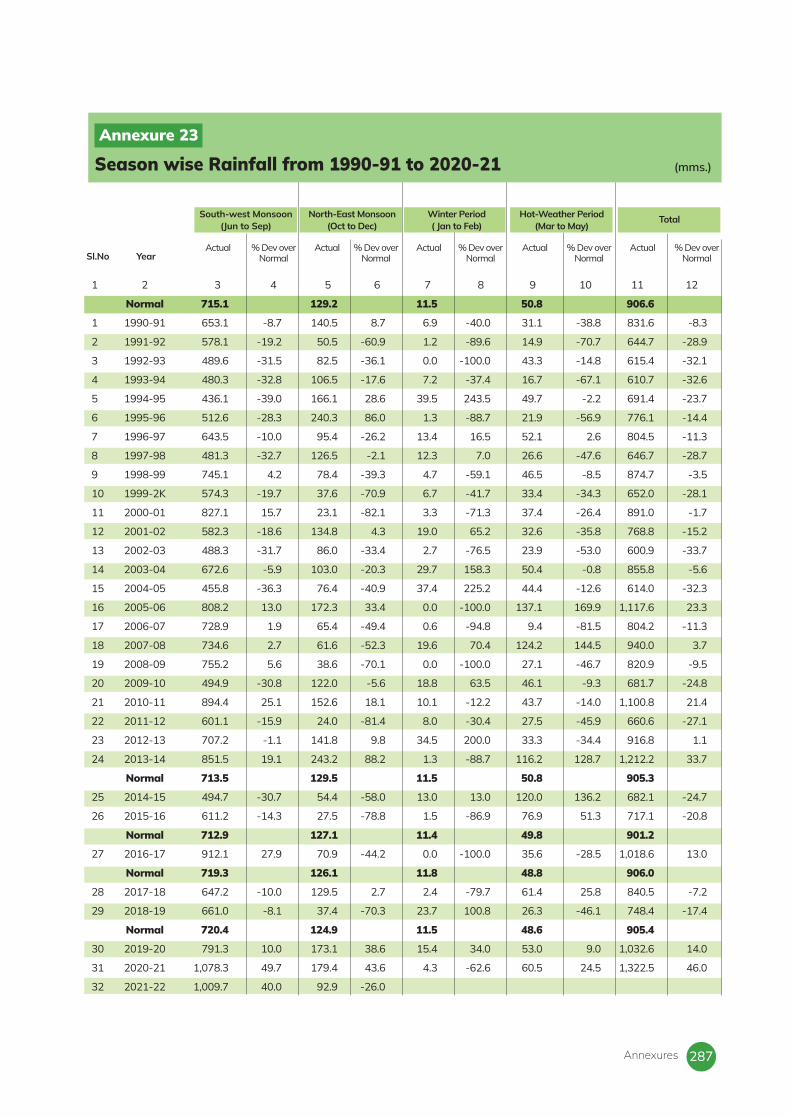
287
Annexure 23
Season wise Rainfall from 1990-91 to 2020-21 (mms.)
YearSl.NoActual % Dev over
Normal
South-west Monsoon (Jun to Sep)
Actual % Dev over Normal
North-East Monsoon (Oct to Dec)
Actual % Dev over Normal
Winter Period ( Jan to Feb)
Actual % Dev over Normal
Hot-Weather Period (Mar to May)
Actual % Dev over Normal
Total
1 2 3 4 5 6 7 8 9 10 11 12
Normal 715.1 129.2 11.5 50.8 906.6
1 1990-91 653.1 -8.7 140.5 8.7 6.9 -40.0 31.1 -38.8 831.6 -8.3
2 1991-92 578.1 -19.2 50.5 -60.9 1.2 -89.6 14.9 -70.7 644.7 -28.9
3 1992-93 489.6 -31.5 82.5 -36.1 0.0 -100.0 43.3 -14.8 615.4 -32.1
4 1993-94 480.3 -32.8 106.5 -17.6 7.2 -37.4 16.7 -67.1 610.7 -32.6
5 1994-95 436.1 -39.0 166.1 28.6 39.5 243.5 49.7 -2.2 691.4 -23.7
6 1995-96 512.6 -28.3 240.3 86.0 1.3 -88.7 21.9 -56.9 776.1 -14.4
7 1996-97 643.5 -10.0 95.4 -26.2 13.4 16.5 52.1 2.6 804.5 -11.3
8 1997-98 481.3 -32.7 126.5 -2.1 12.3 7.0 26.6 -47.6 646.7 -28.7
9 1998-99 745.1 4.2 78.4 -39.3 4.7 -59.1 46.5 -8.5 874.7 -3.5
10 1999-2K 574.3 -19.7 37.6 -70.9 6.7 -41.7 33.4 -34.3 652.0 -28.1
11 2000-01 827.1 15.7 23.1 -82.1 3.3 -71.3 37.4 -26.4 891.0 -1.7
12 2001-02 582.3 -18.6 134.8 4.3 19.0 65.2 32.6 -35.8 768.8 -15.2
13 2002-03 488.3 -31.7 86.0 -33.4 2.7 -76.5 23.9 -53.0 600.9 -33.7
14 2003-04 672.6 -5.9 103.0 -20.3 29.7 158.3 50.4 -0.8 855.8 -5.6
15 2004-05 455.8 -36.3 76.4 -40.9 37.4 225.2 44.4 -12.6 614.0 -32.3
16 2005-06 808.2 13.0 172.3 33.4 0.0 -100.0 137.1 169.9 1,117.6 23.3
17 2006-07 728.9 1.9 65.4 -49.4 0.6 -94.8 9.4 -81.5 804.2 -11.3
18 2007-08 734.6 2.7 61.6 -52.3 19.6 70.4 124.2 144.5 940.0 3.7
19 2008-09 755.2 5.6 38.6 -70.1 0.0 -100.0 27.1 -46.7 820.9 -9.5
20 2009-10 494.9 -30.8 122.0 -5.6 18.8 63.5 46.1 -9.3 681.7 -24.8
21 2010-11 894.4 25.1 152.6 18.1 10.1 -12.2 43.7 -14.0 1,100.8 21.4
22 2011-12 601.1 -15.9 24.0 -81.4 8.0 -30.4 27.5 -45.9 660.6 -27.1
23 2012-13 707.2 -1.1 141.8 9.8 34.5 200.0 33.3 -34.4 916.8 1.1
24 2013-14 851.5 19.1 243.2 88.2 1.3 -88.7 116.2 128.7 1,212.2 33.7
Normal 713.5 129.5 11.5 50.8 905.3
25 2014-15 494.7 -30.7 54.4 -58.0 13.0 13.0 120.0 136.2 682.1 -24.7
26 2015-16 611.2 -14.3 27.5 -78.8 1.5 -86.9 76.9 51.3 717.1 -20.8
Normal 712.9 127.1 11.4 49.8 901.2
27 2016-17 912.1 27.9 70.9 -44.2 0.0 -100.0 35.6 -28.5 1,018.6 13.0
Normal 719.3 126.1 11.8 48.8 906.0
28 2017-18 647.2 -10.0 129.5 2.7 2.4 -79.7 61.4 25.8 840.5 -7.2
29 2018-19 661.0 -8.1 37.4 -70.3 23.7 100.8 26.3 -46.1 748.4 -17.4
Normal 720.4 124.9 11.5 48.6 905.4
30 2019-20 791.3 10.0 173.1 38.6 15.4 34.0 53.0 9.0 1,032.6 14.0
31 2020-21 1,078.3 49.7 179.4 43.6 4.3 -62.6 60.5 24.5 1,322.5 46.0
32 2021-22 1,009.7 40.0 92.9 -26.0
Annexures

Telangana Socio Economic Outlook 2022288
Annexure 24
Area sown and Production of Foodgrains from 1990-91 to 2020-21
Year YearSl.No Sl.NoAREA
(Lakh Hect)AREA
(Lakh Hect)PRODUCTION ( Lakh Tonnes)
PRODUCTION ( Lakh Tonnes)
1 1990-91 34.10 48.19
2 1991-92 32.33 43.21
3 1992-93 28.39 39.08
4 1993-94 28.03 39.90
5 1994-95 27.76 41.60
6 1995-96 27.73 39.79
7 1996-97 30.56 53.06
8 1997-98 25.90 35.25
9 1998-99 32.47 60.94
10 1999-00 30.77 52.48
11 2000-01 33.39 64.63
12 2001-02 29.64 55.32
13 2002-03 26.67 39.48
14 2003-04 29.93 57.99
15 2004-05 24.97 41.68
16 2005-06 31.31 75.29
1 2 3 4 1 2 3 4
17 2006-07 30.81 65.22
18 2007-08 30.09 81.34
19 2008-09 31.72 82.48
20 2009-10 26.49 51.90
21 2010-11 34.44 92.60
22 2011-12 31.09 75.01
23 2012-13 28.36 82.42
24 2013-14 34.30 106.86
25 2014-15 26.13 72.18
26 2015-16 21.80 51.45
27 2016-17 34.39 101.29
28 2017-18 32.45 96.20
29 2018-19 30.56 92.75
30 2019-20 44.81 162.35
31 2020-21 52.79 171.75

289
1 2 3 4 5 6 7 8
1 Uttar Pradesh 19,949.00 1 56,169.14 1 2,816 12
2 Madhya Pradesh 15,246.09 3 33,523.13 2 2,199 18
3 Punjab 6,595.80 6 29,857.33 3 4,527 2
4 Rajasthan 15,809.60 2 23,227.06 4 1,469 34
5 West Bengal 6,471.57 7 18,794.33 5 2,904 11
6 Haryana 4,591.38 11 17,863.47 6 3,891 3
7 Bihar 6,183.15 8 14,233.00 7 2,302 17
8 Maharashtra 11,026.24 4 12,819.86 8 1,163 35
9 Karnataka 7,709.10 5 12,783.69 9 1,658 30
10 Andhra Pradesh 4,089.10 12 12,356.78 10 3,022 9
11 Tamil Nadu 3,692.41 14 11,269.78 11 3,052 7
12 Telangana 3,194.00 15 11,125.05 12 3,483 5
13 Odisha 4,829.13 9 9,030.05 13 1,870 25
14 Gujarat 3,759.15 13 8,153.43 14 2,169 20
15 Chhattisgarh 4,735.49 10 7,501.84 15 1,584 33
16 Assam 2,487.66 17 5,236.40 16 2,105 21
17 Jharkhand 2,637.43 16 4,792.30 17 1,817 26
18 Uttarakhand 805.00 19 1,886.01 18 2,343 16
19 Jammu & Kashmir 835.56 18 1,671.21 19 2,000 23
20 Himachal Pradesh 701.94 20 1,530.12 20 2,180 19
21 Tripura 308.03 22 853.31 21 2,770 13
22 Kerala 201.11 25 608.43 22 3,025 8
23 Nagaland 340.55 21 565.42 23 1,660 29
24 Manipur 207.57 24 421.38 24 2,030 22
25 Arunachal Pradesh 228.76 23 373.19 25 1,631 32
26 Meghalaya 140.82 26 360.82 26 2,562 14
27 Delhi 29.75 30 106.20 27 3,570 4
28 Goa 39.10 29 94.24 28 2,411 15
29 Sikkim 55.16 27 92.09 29 1,669 28
30 Mizoram 45.61 28 76.46 30 1,676 27
31 Puducherry 19.61 32 60.28 31 3,074 6
32 D & N Haveli 20.23 31 40.33 32 1,994 24
33 A & N Islands 6.22 33 18.28 33 2,939 10
34 Chandigarh 1.43 35 7.10 34 4,977 1
35 Daman & Diu 1.80 34 2.94 35 1,634 31
All India 1,26,994.53 2,97,504.46 2,343
Sl. No State/UT 000 Hectares
Rank 000 Tonnes
Rank Kg./ Hectare
Rank
(Nos.)
Production YieldArea
Annexure 25
Estimates of Area, Production and Yield of Total Foodgrains by States, 2019-20
Annexures

Telangana Socio Economic Outlook 2022290
1 2 3 4 5 6 7 8
Gujarat 2,655.0 2 8,617.00 1 552 6
Telangana 2,127.0 3 6,833.00 2 546 7
Maharashtra 4,491.0 1 6,639.00 3 251 12
Rajasthan 760.0 5 2,788.00 4 624 3
Andhra Pradesh 657.0 7 2,508.00 5 649 2
Haryana 723.0 6 2,484.00 6 584 4
Karnataka 817.0 4 2,330.00 7 485 8
Madhya Pradesh 650.0 8 1,646.00 8 430 9
Punjab 248.0 9 1,206.00 9 827 1
Odisha 170.0 10 579.00 10 579 5
Tamil Nadu 170.0 10 418.00 11 418 10
Others 9.0 11 17.00 12 321 11
All India 13,477.0 36,065.00 455
Sl. No State/UT 000 Hectares
Rank 000 Tonnes
Rank Kg./ Hectare
Rank
(Nos.)
Production YieldArea
Annexure 26
Estimates of Area, Production and Yield of Cotton by States, 2019-20

291
Annexure 27
Estimates of Area, Production and Yield of Rice by States, 2019-20
1 2 3 4 5 6 7 8
1 West Bengal 5,490.98 2 15,881.44 1 2,926 12
2 Uttar Pradesh 5,737.00 1 15,517.80 2 2,705 15
3 Punjab 2,920.00 5 11,779.28 3 4,034 2
4 Andhra Pradesh 2,300.10 7 8,658.88 4 3,765 3
5 Odisha 3,940.71 3 8,360.37 5 2,122 27
6 Telangana 2,011.00 10 7,427.77 6 3,694 5
7 Tamil Nadu 1,907.41 11 7,171.14 7 3,760 4
8 Chhattisgarh 3,666.00 4 6,774.77 8 1,848 32
9 Bihar 2,886.40 6 6,297.99 9 2,182 23
10 Assam 2,290.52 8 4,984.63 10 2,176 24
11 Haryana 1,447.00 13 4,824.30 13 3,334 6
12 Madhya Pradesh 2,016.00 9 4,778.15 14 2,370 18
13 Karnataka 1,185.00 15 3,634.48 15 3,067 9
14 Jharkhand 1,357.73 14 3,012.80 16 2,219 19
15 Maharashtra 1,552.99 12 2,897.59 17 1,866 30
16 Gujarat 904.35 16 1,983.05 18 2,193 21
17 Tripura 267.34 18 810.24 19 3,031 11
18 Uttarakhand 247.00 19 658.38 20 2,665 16
19 Kerala 198.18 22 605.57 21 3,056 10
20 Jammu & Kashmir 280.51 17 587.02 22 2,093 28
21 Rajasthan 219.52 20 480.53 23 2,189 22
22 Manipur 175.60 23 385.50 24 2,195 20
23 Nagaland 216.95 21 363.31 25 1,675 35
24 Meghalaya 110.98 25 303.44 26 2,734 14
25 Arunachal Pradesh 133.50 24 244.73 27 1,833 33
26 Himachal Pradesh 72.62 26 143.79 28 1,980 29
27 Goa 34.70 28 90.39 29 2,605 17
28 Mizoram 35.21 27 60.01 30 1,704 34
29 Puducherry 18.24 29 59.35 31 3,254 7
30 D & N Haveli 16.80 30 36.28 32 2,160 25
31 A & N Islands 5.70 33 17.98 33 3,154 8
32 Delhi 5.84 32 16.80 34 2,877 13
33 Sikkim 8.69 31 16.14 35 1,858 31
34 Chandigarh 0.80 35 4.40 36 5,500 1
35 Daman & Diu 0.95 34 2.03 39 2,133 26
All India 43,662.30 1,18,870.32 2,722
Sl. No
State/ UT 000 Hectares
Rank 000 Tonnes
Rank Kg./ Hectare
Rank
Source : www.eands.dacnet.nic.in
Area Production Yield
Annexures

Telangana Socio Economic Outlook 2022292
Sl.N
o.
Dis
tric
t
Cat
tle
Tota
l
Buf
falo
es
Tota
l
Shee
p
Goa
t
Pig
s
Oth
ers
Tota
l Li
vest
ock
Dog
s
Rab
bits
Poul
try
1 2 3 4 5 6 7 8 9 10 11 12
1 Adilabad 0.311 0.049 0.153 0.186 0.002 0.000 0.702 0.005 0.000 0.554
2 Kumuram Bheem Asifabad 0.264 0.049 0.161 0.260 0.001 0.000 0.735 0.001 0.001 0.456
3 Mancherial 0.180 0.106 0.521 0.184 0.002 0.000 0.992 0.008 0.000 0.868
4 Nirmal 0.179 0.121 0.503 0.132 0.003 0.000 0.938 0.009 0.000 0.501
5 Nizamabad 0.101 0.207 0.736 0.157 0.002 0.000 1.202 0.004 0.000 1.720
6 Jagitial 0.047 0.124 0.611 0.097 0.015 0.000 0.895 0.003 0.000 0.867
7 Peddapalli 0.056 0.091 0.549 0.096 0.004 0.000 0.796 0.004 0.000 1.070
8 Jayashankar Bhupalapally 0.069 0.063 0.292 0.081 0.001 0.000 0.506 0.002 0.000 0.422
9 Bhadradri Kothagudem 0.284 0.172 0.267 0.256 0.003 0.000 0.982 0.026 0.000 1.611
10 Mahabubabad 0.182 0.130 0.678 0.178 0.008 0.000 1.175 0.011 0.000 1.109
11 Warangal Rural 0.092 0.119 0.732 0.104 0.009 0.000 1.056 0.003 0.000 2.046
12 Warangal Urban 0.038 0.067 0.388 0.055 0.008 0.000 0.556 0.007 0.000 0.854
13 Karimnagar 0.082 0.095 0.639 0.093 0.007 0.000 0.916 0.007 0.003 2.168
14 Rajanna Sircilla 0.044 0.073 0.388 0.088 0.003 0.000 0.596 0.003 0.000 0.744
15 Kamareddy 0.112 0.181 0.574 0.168 0.006 0.001 1.041 0.007 0.000 1.375
16 Sangareddy 0.154 0.165 0.439 0.229 0.006 0.000 0.994 0.014 0.000 1.241
17 Medak 0.089 0.190 0.637 0.153 0.005 0.000 1.073 0.018 0.000 2.458
18 Siddipet 0.127 0.178 0.801 0.183 0.009 0.000 1.298 0.003 0.001 9.137
19 Jangoan 0.107 0.130 0.680 0.127 0.003 0.000 1.046 0.002 0.000 0.873
20 Yadadri Bhuvanagiri 0.105 0.158 0.650 0.148 0.002 0.000 1.064 0.007 0.001 4.389
21 Medchal Malkajgiri 0.027 0.060 0.149 0.040 0.002 0.000 0.279 0.052 0.000 3.958
22 Hyderabad 0.016 0.023 0.013 0.034 0.000 0.001 0.087 0.051 0.003 0.025
23 Rangareddi 0.241 0.167 0.767 0.257 0.006 0.001 1.439 0.027 0.003 24.070
24 Vikarabad 0.173 0.080 0.238 0.254 0.010 0.000 0.755 0.004 0.000 0.534
25 Mahbubnagar 0.139 0.099 1.008 0.155 0.009 0.000 1.411 0.010 0.000 2.535
26 Jogulamba Gadwal 0.075 0.058 0.577 0.068 0.005 0.000 0.783 0.002 0.000 1.480
27 Wanaparthy 0.075 0.073 0.977 0.081 0.009 0.000 1.214 0.008 0.000 0.766
28 Nagarkurnool 0.223 0.112 0.968 0.206 0.011 0.000 1.521 0.014 0.000 2.770
29 Nalgonda 0.203 0.309 1.098 0.336 0.007 0.000 1.954 0.012 0.000 4.435
30 Suryapet 0.095 0.290 0.779 0.140 0.003 0.000 1.307 0.008 0.000 2.003
31 Khammam 0.141 0.375 0.667 0.190 0.006 0.000 1.379 0.013 0.000 2.159
32 Mulug 0.099 0.061 0.129 0.075 0.001 0.000 0.365 0.004 0.000 0.514
33 Narayanpet 0.101 0.050 1.294 0.126 0.012 0.000 1.583 0.006 0.000 0.290
Total 4.233 4.226 19.063 4.935 0.178 0.003 32.641 0.355 0.015 79.999
Source : Director of Animal Husbandry, Hyderabad
(in Million Numbers)
Annexure 28
Livestock and Poultry Population by districts, 2019 Census
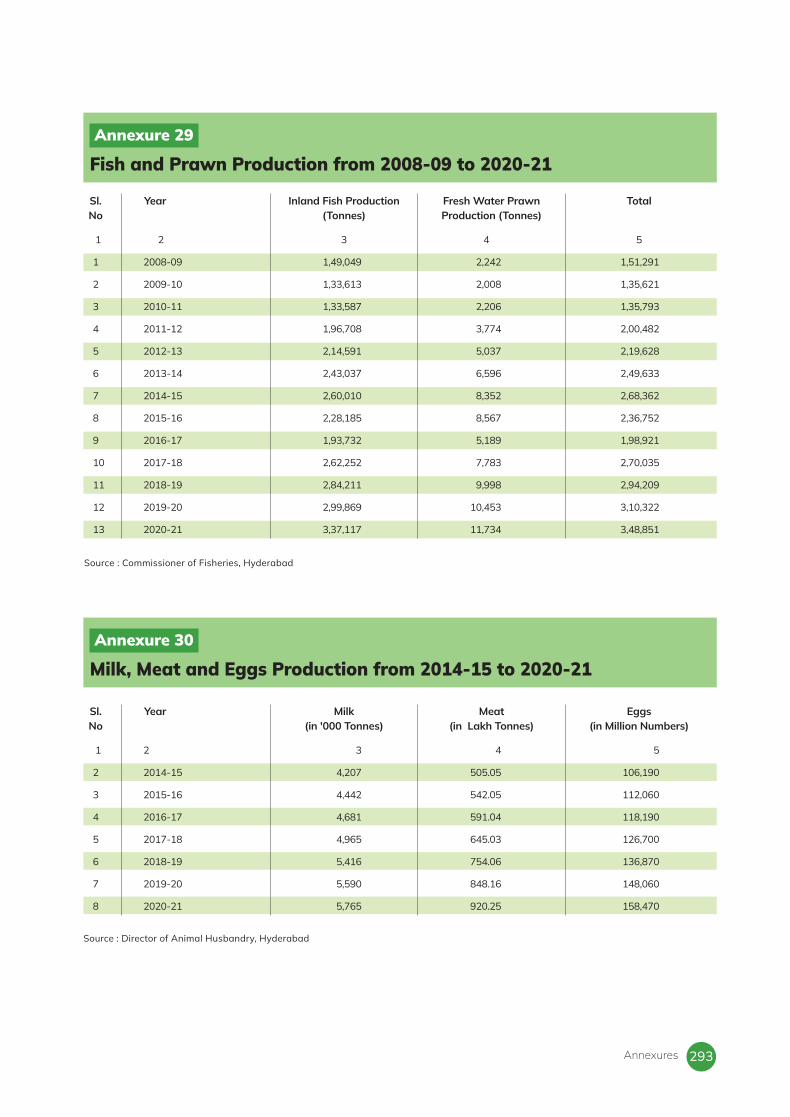
293
Annexure 29
Fish and Prawn Production from 2008-09 to 2020-21
Annexure 30
Milk, Meat and Eggs Production from 2014-15 to 2020-21
Source : Director of Animal Husbandry, Hyderabad
Source : Commissioner of Fisheries, Hyderabad
1 2 3 4 5
1 2008-09 1,49,049 2,242 1,51,291
2 2009-10 1,33,613 2,008 1,35,621
3 2010-11 1,33,587 2,206 1,35,793
4 2011-12 1,96,708 3,774 2,00,482
5 2012-13 2,14,591 5,037 2,19,628
6 2013-14 2,43,037 6,596 2,49,633
7 2014-15 2,60,010 8,352 2,68,362
8 2015-16 2,28,185 8,567 2,36,752
9 2016-17 1,93,732 5,189 1,98,921
10 2017-18 2,62,252 7,783 2,70,035
11 2018-19 2,84,211 9,998 2,94,209
12 2019-20 2,99,869 10,453 3,10,322
13 2020-21 3,37,117 11,734 3,48,851
1 2 3 4 5
2 2014-15 4,207 505.05 106,190
3 2015-16 4,442 542.05 112,060
4 2016-17 4,681 591.04 118,190
5 2017-18 4,965 645.03 126,700
6 2018-19 5,416 754.06 136,870
7 2019-20 5,590 848.16 148,060
8 2020-21 5,765 920.25 158,470
Sl. No
Sl. No
Year
Year
Inland Fish Production (Tonnes)
Milk (in '000 Tonnes)
Fresh Water Prawn Production (Tonnes)
Meat (in Lakh Tonnes)
Total
Eggs (in Million Numbers)
Annexures

Telangana Socio Economic Outlook 2022294
Annexure 31
Mineral Production and Value of Mineral Produced, 2019-20 and 2020-21
Sl. No
Mineral Unit Production ProductionValue (Rs. in '000)
Value (Rs. in '000)
2019-20 2020-21
1 2 3 4 5 6 7
I. Major Minerals
1 Coal Tonnes 6,20,27,976 15,19,68,541.20 4,85,17,153 11,88,670.25
2 Lime Stone Tonnes 2,56,89,207 86,31,573.52 2,39,93,360 80,617.69
3 Manganese Ore Tonnes 6,068 37,166.50 11,735 718.77
4 Stowing Sand Tonnes 25,63,847 3,56,374.77 8,38,494 1,165.51
6 Iron Ore Tonnes 0 0.00
Total 16,09,93,655.99 12,71,172.21
II. Minor Minerals
1 Amethyst Tonnes 0 0.00 0 0.00
2 Barytes Tonnes 150 748.69 500 24.96
3 Dolomite Tonnes 5,18,052 3,13,421.46 3,59,450 2,174.67
4 Feldspar Tonnes 7,80,653 3,73,542.69 6,70,106 3,206.46
5 Fire Clay Tonnes 0 0.00 0 0.00
6 Latarite Tonnes 46,60,797 16,40,600.54 36,02,917 12,682.27
7 Mica Tonnes 0 0.00 1,500 525.00
8 Quartz Tonnes 8,20,916 3,43,142.89 9,04,734 3,781.79
9 Silica Sand Tonnes 0 0.00 0 0.00
10 Shale Tonnes 18,323 3,325.62 21,350 38.75
11 White Clay Tonnes 44,410 13,434.03 37,215 112.58
12 Yellow Ochre Tonnes 0 0.00 0 0.00
Total 26,88,215.92 22,546.47
III. Other Minor Minerals
1 Black Granite M3 3,99,480 87,00,674.23 3,58,438 78,067.87
2 Colour Granite M3 7,44,153 1,89,08,930.54 8,38,963 2,13,180.40
3 Gravel / Earth M3 6,03,73,044 2,77,59,525.63 8,01,10,611 3,68,348.59
4 Fuller's Earth Tonnes 5,97,205 7,48,895.07 386,506 4,846.79
5 Lime Stone Slabs M2 29,26,619 9,20,714.46 21,92,763 6,898.43
6 Limekankar Tonnes 0.00 0.00
7 Mosaic Chips Tonnes 97,175 89,255.24 1,67,008 1,533.96
8 Marble Tonnes 0.00 0.00
9 Road Metal M3 6,72,79,441 7,70,41,687.89 8,35,93,649 9,57,230.87
10 Ordinary Sand M3 96,01,222 57,60,733.20 1,21,63,006 72,978.04
Total 13,99,30,416.26 17,03,084.95
Grand Total 30,36,12,288.17 29,96,803.63
Source: Director of Mines and Geology, Hyderabad.

295
Annexure 32
Functioning of Fair Price Shops and Food Security cards by Districts
1 2 3 4 5 6 7
1 Adilabad 355 272 14,033 1,78,610 1,92,915
2 Kumuram Bheem 278 21 12,953 1,27,450 1,40,424
3 Mancherial 423 170 15,417 2,05,258 2,20,845
4 Nirmal 412 35 12,485 1,97,573 2,10,093
5 Nizamabad 751 1,111 21,003 3,83,985 4,06,099
6 Jagtial 587 146 14,402 2,96,065 3,10,613
7 Peddapalli 413 175 12,305 2,10,384 2,22,864
8 Jayashankar 277 39 9,273 1,15,014 1,24,326
9 Bhadradri Kothagudem 442 4 18,779 2,76,906 2,95,689
10 Mahabubabad 553 2 15,360 2,26,047 2,41,409
11 Warangal Rural 464 15 12,068 2,12,883 2,24,966
12 Warangal Urban 459 18 12,560 2,59,582 2,72,160
13 Karimnagar 487 42 15,760 2,65,150 2,80,952
14 Rajanna Sircilla 344 234 13,610 1,61,662 1,75,506
15 Kamareddy 578 989 17,390 2,35,419 2,53,798
16 Sangareddy 845 104 27,146 3,53,179 3,80,429
17 Medak 521 75 13,806 2,02,756 2,16,637
18 Siddipet 683 93 18,797 2,74,704 2,93,594
19 Jangaon 335 96 10,565 1,52,207 1,62,868
20 Yadadri Bhuvanagiri 481 0 13,711 2,05,879 2,19,590
21 Medchal-Malkajgiri 636 110 18,267 5,06,217 5,24,594
22 Hyderabad 670 1,310 30,048 6,05,303 6,36,661
23 Rangareddy 919 42 35,154 5,24,761 5,59,957
24 Vikarabad 588 39 26,826 2,14,736 2,41,601
25 Mahabubnagar 506 221 19,024 2,21,448 2,40,693
26 Jogulamba Gadwal 333 136 10,102 1,50,416 1,60,654
27 Wanaparthy 325 114 9,912 1,47,364 1,57,390
28 Nagarkurnool 558 40 18,705 2,20,209 2,38,954
29 Nalgonda 991 67 30,064 4,38,047 4,68,178
30 Suryapet 610 42 19,774 3,06,079 3,25,895
31 Khammam 669 3 26,964 3,89,895 4,16,862
32 Mulugu 222 2 8,040 84,005 92,047
33 Narayanpet 298 30 9,401 1,30,786 1,40,217
Total 17,013 5,797 5,63,704 84,79,979 90,49,480
Sl. No
District Name
No. of FP Shops
Annapurna Cards (AAP)
Anthyodaya Food Security Cards ( AFSC )
Food Security Cards (FSC)
Total Cards
(As on September, 2021)
Sourse : Commissioner , Civil Supplies, Telangana
Annexures
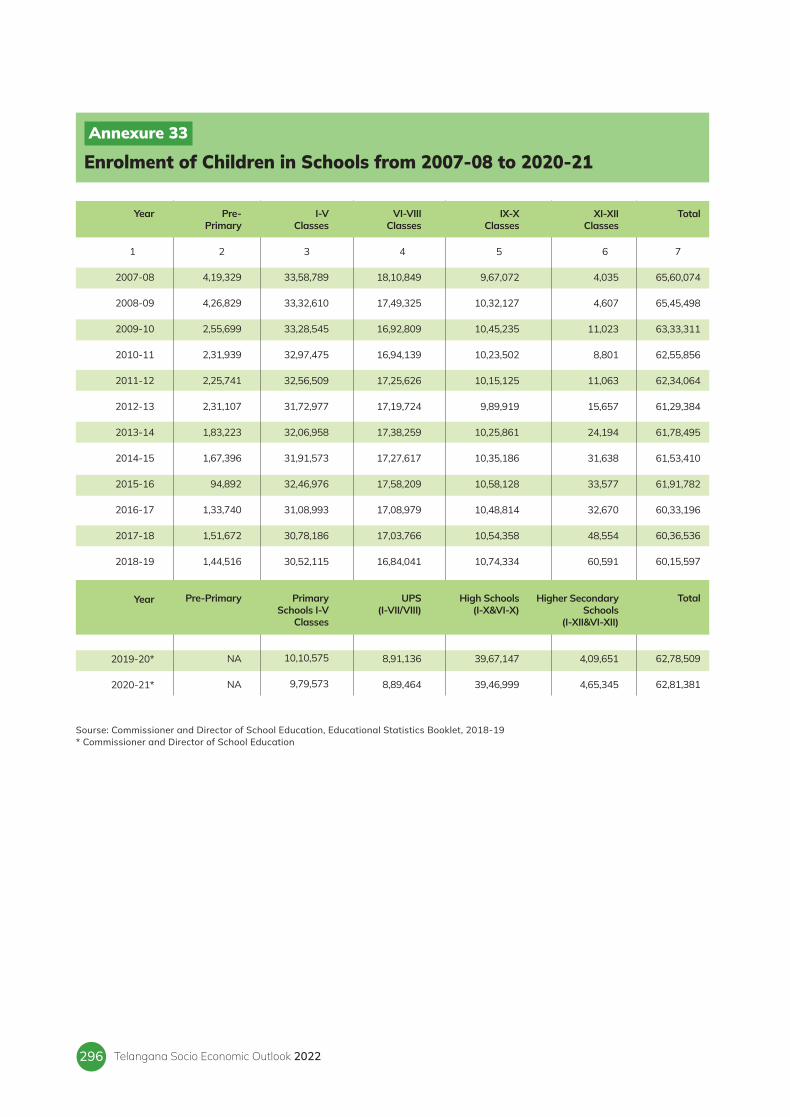
Telangana Socio Economic Outlook 2022296
Annexure 33
Enrolment of Children in Schools from 2007-08 to 2020-21
Pre- Primary
4,19,329
4,26,829
2,55,699
2,31,939
2,25,741
2,31,107
1,83,223
1,67,396
94,892
1,33,740
1,51,672
1,44,516
Pre-Primary
NA
NA
Year
2007-08
2008-09
2009-10
2010-11
2011-12
2012-13
2013-14
2014-15
2015-16
2016-17
2017-18
2018-19
Year
2019-20*
2020-21*
I-V Classes
33,58,789
33,32,610
33,28,545
32,97,475
32,56,509
31,72,977
32,06,958
31,91,573
32,46,976
31,08,993
30,78,186
30,52,115
Primary Schools I-V
Classes
10,10,575
9,79,573
VI-VIII Classes
18,10,849
17,49,325
16,92,809
16,94,139
17,25,626
17,19,724
17,38,259
17,27,617
17,58,209
17,08,979
17,03,766
16,84,041
UPS (I-VII/VIII)
8,91,136
8,89,464
IX-X Classes
9,67,072
10,32,127
10,45,235
10,23,502
10,15,125
9,89,919
10,25,861
10,35,186
10,58,128
10,48,814
10,54,358
10,74,334
High Schools (I-X&VI-X)
39,67,147
39,46,999
XI-XII Classes
4,035
4,607
11,023
8,801
11,063
15,657
24,194
31,638
33,577
32,670
48,554
60,591
Higher Secondary Schools
(I-XII&VI-XII)
4,09,651
4,65,345
Total
65,60,074
65,45,498
63,33,311
62,55,856
62,34,064
61,29,384
61,78,495
61,53,410
61,91,782
60,33,196
60,36,536
60,15,597
Total
62,78,509
62,81,381
Sourse: Commissioner and Director of School Education, Educational Statistics Booklet, 2018-19 * Commissioner and Director of School Education
1 2 3 4 5 6 7


Telangana Socio Economic Outlook 2022298
Government of TelanganaPlanning Departmentwww.telangana.gov.in
Related Documents