ted Pes Managemen ch Sympos

Welcome message from author
This document is posted to help you gain knowledge. Please leave a comment to let me know what you think about it! Share it to your friends and learn new things together.
Transcript
ted Pes Managemen ch Sympos
The editors of this volume wish to thank the following for their invaluable assistance in its preparation: Robert C. Biesterfeldt and Mar i lp kleeker, Southeastern Forest Experiment Station, for editing and preparation of indi- vidual papers; Howard W. Rffobley and Carol A. Lowe, Southern Forest Experiment Station, for editing and preparation of individual papers; David M. FVebb, Southern Region, for editing and preparation of individual papers; Itilarlene Hanna, Southern Forest Experiment Station, for design and printing services; and Julia G. Wilson, Southern Forest Experiment Station, for word processing services.
Integrated Pest Management
Research Symposium:
The Proceedings
Sponsored by: Southeastem Forest Expeiment Station Southern Forest Experiment Station Southern Region, State and P ~ v a t e Forestry USDA Cooperative Skate Research Service
Goopesating Qrganixa tions: Southem Region, National Association of Professional Forestry Schools
and Colleges Southern Inhstrial Forestry Research Council Southern State Agriculture Expe~ment Stations Association of Consdthg Foreshrs Southern Regional Planning Group 2,0
CONTENTS PREFACE . . . . . . . . . . . . . . . . . . . . . . . . . . . . . . . . . . . . . . . . . . . . . . . . . . . . . . . . . . . . . . . . . . . . . . . . . . . . . . . . v
. . . . . . . . . . . . . . . . . . . . . . . . . . . . . . . . . . . . . . . . . . . . . . . . . . . . . . . . . . . . . . . IKTRODUGTORY RERlARIKS 1 1 ntegrated Pest Management Research Symposi A, 6 . ~ a c e , e l r , . . . . . . . . . . . . . . . . . . . . . . . . . . 1
. . . . . . . . . . . . . . . . . . . . . . . . . . . . . . . . . . . . . . Integrated Pest Managenlent in the S o u l l ~ Ii. R. Shea 3
SPbXPLING AND IItaPACT ASSESSRIENT . . . . . . . . . . . . . . . . . . ..., . . . . a . . . . . . . . . . . 5
Sampling Pest Pc~puladicsns
Procedures for sampling six-spined ips populations in slash pine J. L. Foltz, J. A. Comeil, and R, M. Reick . . . . . . . . . . . . . . . . . . . . . . . . . . . . . . . . . . . . . . . . . . . . . . . . . . . . . . . . . . . . . . . . . . . . . . . . . . . 6
Z,ine intersect sampling technique for estimating Ips populations in logging residuc? . . . . . . . . . . . . . . . . . . . . . . . . . . . . C. IV. Berisford, It. F. Mizell, 111, and L. H, Kudon . . . . . ,... . . .. 13
Turpentine-baited traps capture black turpentine beetles and other forest Coleoptera but do not . . . . . . . . . . . . . . . . . . . . . . . . . . . . . . . . . . . . . . . . . . . . . . . prevent attacks on pines C . W. Fatzinger 26
Estimating Areawide Pest Population Ckrangeilfimber Lws
Estimating southem pine beetle-caused timber losses over extensive areas J. D. Ward, C. W. Dull, . . . . . . . . . . . . . . . . . . . . . . . . . . . . . . . . . . . . . . . . . . . . . . . . . . . . . . . . . . G. W. Ryan, and M. C. Remion 34
Objective prediction of climate-related changes in the distribution of southern pine beetle . . . . . . . . . . . . . . . . . . . . . . . . . . . . . . . . . . . . . . . . . . P. J. Michaels, D. E. Sappington, and P. J. Stenger 41
The large-scale prediction of southern pine beetle populations W. D. Mawby and F. P. Hain . . . . . . 53 Methods for estimating annosus root rot in loblolly pine stands S. A. Alexander, R. H. Hokans,
. . . . . . . . . . . . . . . . . . . . . . . . . . . . . . . . . . . . . . . . . . . . . . . . . . . . . . . . . E. S. Fanelli, and T. M. Kurdyla 56 Growth following thinning model for loblslly pine plantations indfeeted by annosus root rot
. . . . . . . . . . . . . . . . . . . . . . . . . . . . . . . . . . . . . . . . . . . . R. K. Hokans, E. S. Fanelli, and S. A. Alexander 59 Predicting survival and yield of unthinned slash and loblolly pine plantations with different levels of
. . . . . . . . . . . . . . . . . . . . . . . . . . . . . . . . . fusifom rust W. L. Nance, E. Shoulders, and T. R. Dell 62
. . . . . . . . . . . . . . . . . . . . . . . . . . . . . . . . . . PESTS AND kfOST/PES"r INTERACll'lBNS 73
Pests and Assoeiaded Organisms
Host preference behavior of insect parasites in the presence of southern pine beetle and one or more . . . . . . . . . . . . . . . . . . . . . . . . . . . . . . . . . . . . . . . . . . . . Ips species L. H. Kudon and C. W. Berisford 74
Strategies for cohabitation among the southem pine bark beetle species: comparisons for life process . . . . . . . . . . . . . . . . . . . . . . . . . . . . . . . . . . biologies T. L. Wagner, R. 0. Flamm, and R. N. Coulson 87
Effects of temperature and slash pine phloem thickness on i p s calligraphus life processes . . . . . . . . . . . . . . . . . . . . . . . . . . . . . . . . . . . . . . . . . . . . . . R. A. Haack, J. L. Foltz, and R. C. Wilkinson 102
Interactions of the southem pine beetle with competitor species and meteorological factors . . . . . . . . . . . . . . . . . . . . . . . . . . . . . . . . . . . . . . . . . . . . . . . . . . . . . . . . . . . . . . F. P. Hain and A. Ben Alya 114
. . . . . . . . . . Relationship of symbiotic fungi to southern pine beetle population trends J. R. Bridges 127 Population dynamics of initiation and growth of southern pine beetle infestations R. N. Coulson,
. . . . . . . . . . . . R. 0. Flamm, T. L. Wagner, E. J. Rykiel, P. J. H. Sharpe, T. L. Payne, and S. K. Lin 136
Factors contributing ta southem pine beetle host resistance F. P. Hain, S. P. Cook, P. A. hlatson, . . . . . . . . . . . . . . . . . . . . . . . . . . . . . . . . . . . . . . . . . . . . . . . . . . . . . . . . . . . . . . . . . . . . . . anda;&. GWilson 154
Hsstibeetle interactions: influence of associated micrsorgaazisms~ tree disturbance, and host vigor . . . . . . . . . . . . . . . . . . . . . . . . . . . . . . J. D. Kodges, T. E. Nebeker, J. D. DeAngelis, and C. A. Blanche 161
Induced defenses against Dendroctonus frontalis and associated fungi: variation in loblolly pine . . . . . . . . . . . . . . . . . . . . . . . . . . . . . . . . . . resistance T. D. Paine, F. M. Stephen, and R. O. Cates 169
Variation in the chemistry of lshloify pine in relation $0 infection by the blue-stairs. fungus . . . . . . . . . . . . . . . . . . . . . . . . . . . . . H. A. Gambliel, R. G. Cates, M. CaEey-Moquin, and T. D. Paine 177
iii
Descriptive and Predictive Models
A Dertdrcrctonus frontalis infestation growth model: organization, refinement, and utilization F.M,Stt;l?phenamdM,Lih . . . . . . . . . . . . . . . . . . . . . . . . . . . . . . . . . . . . . . . . . . . . . . . . . . . . . . . . . . . . . . . 186
A methodology for biophysical modeling using TAMBEETLE as an example R. hf, Feldman, . . . . . . . . . . . . . . . . . . . . . . . . . . . . . . T. L, Waper , 6. L. Curry, R. N. Coulson, and P. J. H. Shave 195
Evaluation. and application of the TAMBEETLE and Arkansas southern pine beetle spot growth . . . . . . . . . . . . . . . . . . . . . . . . modeis in the Gulf Coastal Plain W, A. Nettleton and M. D, Cstansr 28%
Energetics of pine defense systems to bark beetle attack P. J. K. Sharpe, H. Wu, R. C. Cates, and J.lg),Coesr=lk . . . . . . . . . . . . . . . . . . . . . . . . . . . . . . . . . . . . . . . . . . . . . . . . . . . . . . . . . . . . . . . . . . . . . . . . . . . 206
MANAGEBIENT APPROACHES AND IPM SYSTEMS . . . . . . . . . . . . . . . . . . . . . . . . . . . . 225
Hazard-Rating Systems
Development, implementation, and validation of a large area hazard- and risk-rating system for southern pine beetle R, F, BiUing~, @. M. Bryant, armd K, H, Wilson . . . . . . . . . . . .. .. . . . . . . . 226
Predicting susceptibiliky do southern pine beetle attack in the Coastal Plain, Piedmont, and southern . . . . . . . . . . . . . . . . . . . . . * . . . . . . . . * . . . . . * . . . Appalachians R. L. Hedden and R. P. Belanger .. 233
Pokntial use of soil maps to estimate southern pine beetle risk P. L. Lorio, Jr., and R.A.Ssmmers . . . . . . . . . . . . . . . . . . . . . . . . . . . . . . . . . . . . . . . . . . . . . . . . . . . . . . . . . . . . . . . . . . . . . . . . . 239
Adaptation of littleleaf disease hazard rating for use in forest mzanagemernd in South Carolina National. Forests S.FV,Oak . . . . . . . . . . . . . . . . . . . . . . . . . . . . . . . . . . . . . . . . . . . . . . . . . . . . . . . . . . . . . . . . . . . 246
Management Tactics
Fusifam rust: guidelines for selective cutting of rust-infmtcrd trees in merchantable slash pine . . . . . . . . . . . . . . . . . . . . . . . . . . . . plmtations R. P. Bdanger, T. Miller, and J. F. Codbee . ., .. .. 254
Pest assessments after sanitation-salvage cutting in fuslfsm rust-infected slash pine plantations . . . . . . . . . . . . . . . . . . . . . . . . . . . . . . . . . . . T. Miller, R, I?. Belanger, R. S. Webb, and J. F. Godbee 258
Thinning and harvesting practices to minimize site and stand disturbance and susceptibi"eity do bark . . . . . . . . . . . . . . . . . . . . . . . . . . . . . . . . beetle and disease attacks 7" E. Nebeker and J. D. Hodges 263
Field tests of inseetieides for control of black tuqentine be t l e J, C, Nord, A, S, Jones, and F, L. Hastings . . . . . . . . . . . . . . . . . . . . . . . . . . . . . . . . . . . . . . . . . . . . . . . . . . . . . . . . . . . . . . . . . . . . . . . . . 272
Effects of frontalure in. suppressing southern pine beetle spot growth under endemic and epidemic popuftetion levels T. %. Payne, E. H. Kudon, C. W. BePisfosd, Be F, 09DonneiiHp and D, M. Wdsh. . 281
IPM Systems
Simulation of soulhem pine beetle-associated timber loss using CLEMBEETLE R, L, Hedden . . + . 288 SPB-MTCROBEETLES: A simulation system for evaluating economic performance sf management
alternatives for shnds attacked by southern pine beetle W, A, Thompson . . . . . ... . . . . . . . . . . . 292 ITEMS: an integrated meLbod to project southern pine @Land development J, M, Vasievich and
W. A, Thompson. . . . . . . . . . . . . . . . . . . . . . . . . . . . . . . . . . . . . . . . . . ~ . . . - . . a ~ a m . ~ s - . . . . ~ . . . . . . . . . . 306 Risk assessment of investments iM loblolly pine plantations threatened by bark beetles
. . . . . . . . . . . . . . . . . . . . . . . . . . . . . . . . . . . . . . . . . . We C, Anderson, Re Mr. Gddin, and J. M, Vasievich 328 Development and implementation of the southern pine beetle decision support system
M. 6, Saunders, D. K. Lob, R. N, Codson, R. J. Rykiel, T, Lr Payneg Pa E. Pulley, and L, C, Hu . . . 335
Integrated Best &fanagemend in the South: An Overview R, C* Thatcher, G, ~89011)
md G, D, Hertel . . . . . . . . . . . . . . . . . . . . . . . . . . . . . . . . . . . . . . . . . . . . . . . . . . . . . . . . . . . . . . . . . . . . . . 364
PREFACE The Integrated Pest Managemmt Research, De-
velopment, and Applications Program for Bark Beetles of Southern Pines held a final Research Symposium at the Grove Park Inn in Ashevile, Nc on April 15-18, 1985. The purpose of the meeting was to summarize findings from research a d development work conducted in the South dur- ing the 5 years f 1 9 8 W 5 ) of the program"^ exis- tence, Results were presented in several subject areas, including sampling and impact assessment; bark beetle biology and ecology; pest, associated organism and host /pest interactions; hazard rating for bark beetles and diseases; management tactics, and integrated pest management systems. The texts for these presentations are included in these pro- ceedings along with an ovemiew of the Program's mission and aecsmplishments.
The steering committee for the symposium vJas composed sf Dr* Stanley J. Barras (USDA Forest Sewice), Dr. Asnett 6, Mace, Jr., (University of Florida), Dr. Jemy A, Seseo (USDA Forest Ser-
vice), Dr. John C. Meadows (Cooperative State Research Senice), and Dr. Harvey V- Toko ( USDA Forest Service), Moderators included James E. Neal (Cooperative Extension Service), Dr. Boyd W. Post (Cooperative State Research Service), Dr. Garland N, Mason (USDA Forest Service), Dr. Jerry A. Sescs (USDA Forest Service), Dr. Stanley J. Bar- ras (USDA Forest Service), Dr. Gerard D. Hertel (USDA Forest Service), Dr. 1;eRoj; Jones (USDA Forest Service), Dr. Barry F. Malac (Union Camp Corporation), Dr. Max W. McFadden (USDA Forest; Sewice), and Dr. Robert C. Thatcher (USDA Forest Serv'ice). Dr. Thomas H. Ellis, Director, Southern Forest Experiment Station, introduced the guest speakers, Dr. Arnett C . Mace, Jr., University of Flor- ida, and Dr. Keith R. Shea (IJSDA Forest Sewice).
The IPM Program management team is grateful to the many Federal, Stab, university, and indus&l.lial persons who contributed to the synnposium and to the management of the Grove Park Inn for facilita- t k g its planning and execution.
a;" ,,, U A G o 2 - 0 m 3 $ 3
4-J @ $ 8 g * n m 4 ~ 2 c g . rr(
a m " " " " ; m
3 2 * 8 g 8 3 3 g W I 1 , G c") g'O S'E > > a x $3 g m 5 g E g m %& S * ~ A m
* m z z 2 5 E $ 2 2 w a E g z g s
m a a a E 3 o E , ~ a a&-"-;" g 4
a - a*; % +$ 8 2 ga b, fj=4 k d 3 G a a c q STcaH El
u s - @ .E * .El g
0 .2 F-4 w-4
Z Z g aa;" cn 388 g . 3 $Do$ 3 -2 g 3 3 E: % Til .; 2 s3 r-4 03 42 '8 A m a -
72 gs 5 8 2 Q)
E &*& 8.9 %
r-4 b13 $ 2 3
a. a.2 2 Q R s a
4, Recommending changes in Program priorities and direc"l;ion.
5. Exposing program management to a wide range istrative perspectives and changing
The need for basic and applied studies was recog- M I Z ~ ~ , A planned technology trmsfer effort was undertaken to assure that better tools were provlided to pmetitioners and that research results were vali- dated and applied over a ~ d e range of management situations. A peer review process was also involved for the purposes of maintaining credibility, moni- torjing, and evaluation*
The planned coordinated technology transfer pro- gram resulted in continuous interaction d t h vsriou8 user groups, demonstration of new and/or &proved techuaolages, and packaging and transfer of a wide v a ~ e t y of wrjitten and visual mate~als. This infor- mation bas been used by vaeous segments of private forestry, S b t e forestry organizations, Cooperative Extension, National Forest Ahinistration, and others, This eBort has included: 1. The development and use of sampling tech-
niques md/or models for detemining the im- pacts of annosus root rot and fusifom- mst.
2. The development and use of simulation tech- niques for projecting the effects of stand man- agement practices and the economic returns fmm such practices in single or multiple stands in the presence or absence of southern pine beetle over a rotation.
3. The development and use of spot growth models for predicting timber and economic losses over the next 30-90 days.
4. The development and use of sa for determining the profitability of processing logs of sliaerent sizes and stages of deteriora- tion for lumber from green and beetle-killed timber,
5. validation and implementation of stand haz- asd-rating systems for southern pine beetle, annosus root rot, and Ettleleaf disease.
6- The development of salvage cutting guidelines for reducing fusiform rust-caused losses in slash and loblolly phe plantations.
7. The development of guidelines for thinning to prevent or reduce pest-caused losses,
8. Use of an attractant to suppress southern pine beetle spot growth in special management situations.
9. Development and use of alternative insecticides for preventive or remedial control a$ bark beetles in standing or felled trees, respectively.
10. Development of a pest management system for the southern pine beetle.
31. Demonstration and/or incorporation of new methods into management plans and opera- tions,
These achievements and others could not have been accomplished without the cooperative egorts of many people representing various organiiztiticsns. The acquisition of funding, program development and execution, transfer and utilization of infomation in management practices resulted because we worked together, We put organizational and personal goals and objectives aside to accomplish a difficult and complex task.
But our work is not finished because a sigmifiearmt amount still remains to be accomplished, mis in- cludes continuing transfer of information obtained and new research to be conducted on new and old pests that still significantly reduce the growth and/or survival sf southern forests.
Have we missed an opportunity to continue high priority parts of this program, to change the a- phasis to other priorities, and to cooperate as we have in the past? Each of us and our organizations have to respond to this question.
However, from my limited and biased perspective, reduced budgets a t the Federal, State, and industry levels have caused us to look more invvardly and to abandon an extremely valuable model for focusing on complex regional forestry problems. Let% hope we do not regret our decisions of yesleday and tn- day, for pest management is still a significant prob- lem for most forest resource managers in the South,
In concluding, on behalf of the Oversight arad ittee and many others, ,I ~ s h $0
extend our appreciation to Bob Thadcher, Garland Mason, and Gerry Hertel and their stafjf people for a job well done.
Integrated Forest Pest Management in the South Introductory C t4 by Keith R. Shea'
Historiwl background-Intensive, cooperative re- search on the southern pine beetle had its beginning in the fall of 1974 (fiscal year 1975), when the Con- gress appropriated funds for three major forest in-
southern pine beetle, gypsy moth, tussock moth. I had the honor of
leading i;he early planning effort in the 1973-74, obbining approval of the U.S. Department of Agriculture (USDA) and the Office of Manage- ment and Budget, testifying before the Congress, and ultimately serving as stag officer in the Office of the Secretarly, USDA. In addition to the Forest Service (FS), the Cooperative S t a b Research Service (CSRS), the Agriculture Research Service (ARS), and the Animal and Plant Health Inspection Service (APHIS) were heavily involved. Over $6 million was appropriated for this new and novel effort in ad&.tion to funds already available to the agencies, Ultimate- ly, over 38 universities, 9 State srganizatisms, and swerzl industries participated in the programs with a total Federd budget of about $9.5 million. The Ex- panded Southern Pine Beetle Research and Applica- tion Program (ESPBRAP) received over $2 million annually which was allocated through the FS and and GSIRS.
As you all know, Bob Thatcher was selected to be Program Manager for ESPBRAP. Bob assumed this position with essentially no guidelines or direction as to how to organize and manage such an interagency, multidisciplinary. effort. It never had been done before. There were many skeptics, Bob, the other two Program Managers, and I spent many long hours agonizing over organization, structures, recruitment of Research and Applimtion Coordinatom, plan- ning, budgeting, and processes for funding partici- pants. Each of the three programs evolved along s!ightly different paths. Each m s highly successful in achieving the orji~nal objectives. The Gypsy Moth and Douglas Fir Tussock Moth Psoparns were re- directed into the Canada/United States Spruce
1 Associate Deputy Chief for Research, U.S. D e p a w e n t of Agriculture, Forest Service, Washington, DC. Remarkhl to the Inlegrated Pest Management Research Smposiuan, Asl-revi'lle, NC, April 26, 1985.
Program ( b o r n as CANUSA) which
ESPBRAP and f PM-Hiiving been hvolvedl, either directly or hdjirectly, in accelerated insect research and development progrm8 for over a dee- ade, I would like to share some thought8 ~ L h yrsu with special emphasis on. ESPBRAP axrd its gue- cessor IPM Program.
First of all, such interagency, coapemtive pro- grams q u i r e a tremendous amuart of exeeu~ve energy from all participa organizations, T S s i8 not business as usual. C trment of top Ievef ad- finistrators to the pro is essential. We were fortunab to have Assistant Secretary Bob fully committed to ESPBRAP as were 1;1%e A istrators of the four Federal agencies. M a ~ y of Lgze organizational problem we: encountered would have defeated our efforts had it not been 1Esr this com- mitment a t high leveh,
Our experiences have shorn Lhere are m n y bene- fits from advanced planning, indu&ng definition of targets and outputs as end products d th in given time frames; involvement of the forestry ccr in planning and review ppiior to and dug.3ing the program; coordination of work \Nidhin and among disciplines, organizations, and the research and ac- tion communities; continuous monitsring and e~&%-. uation of ongoing work; and early (@%?en: infomd) release of results to various audiences,
Having a plan of work, budget, and a Program Manager doesn't assure success. Cooperation and/or support from many organizations are eseentia1 to accomplishing meaningful work, g&ning mrlg ac- ceptance of results and applying those 2esulL;s; do field operation. Such cooperation and support doesn't just happen. It is aePlieved only by highly pergonal interactions among all concerned parties, Here in the South, Bob matcher exemplifier~ the End of leadership essential for success. His leadership i s widely acknowledged both here and in the Depart- ment of Ag~culture PiRieh reeomized him in 5982 with a Superior Service Award for his work in the ESPBRAP.
F o l l o ~ n g up on the success of ESPBRAP, the 5-year Integrated Pest Management Program (IPM) for Bark Beetles of Southera Pines was staded in 1980. This program will be concluded in September
1986 having within its al%ocaded t h e frame achieved i t s mission of (I) completing and transferring the technolorn from ESPBRAP9 (; 2) beginning the devel- opment sf integrated forest pest management systems for the bark beetle and disease complex of southern pines, and 13) promoting the use of pest manage-merit as a park of eotai resource management oar all forest Bands, As you knows the IEOM Program has empha- sized the southern pine beetle, as it infiuenees or is influenced by the three southern Bps engraver beetles, the black turpentine beetle, and three major diseases sf southern pine fusiforrn rust, annosus root rot, and littleleaf disease,
h%ueh has been acesmplished~ There is, however, a continuing need far analyses, reporting, and transfer of kchnology in order to benefit fully from the in- fornation generated from 11 years of research and development and the over $22 million in expendi- tures, Research also must continue with emphasis on (1) host dynamics and hostjpest interactions, (2) southem pine beetle spat growth and pspuZaLion dynadcs models, and 43) diseases sf southern pines. TechnoXoa transfer must be strengthened and con- tinued,
Achievement of these tasks will require continued, coordinated work by the southern fsrestry eom- munity, The partnership among the Forest Service, universities9 State organiza"%is>ns, and forest indus- tries should be maintained to the extent that re- sources pernit, But new and innovative mys must be found to fund some of this work,
Due h the technnlogicraB advances fiat have been
made in hprsved management guidelines, tactics, and strakgies, geld or pilot tests must be conducted to verify m d expand the appIicabiIity of the results over a e d e range sf situations, This will. require close eolfaboratisn among researchers, pest control specialists, and fores"r,psactitioners in the planning and execution phases, It will also require a commit- ment to technology transfer, The whole process shoujld involve and utilize existing organizations, ex- perietnced people, and proven communication meth- ods.
Conclusions-In eonelusion, the ESPBRAP and the successor 1Pj.M RD&A Program are milestones sf great signiGcanee, Their accomplishments have sur- passed expectations, and the cooperative working relations established d t a ~ n g the last decade win, P am sure, continue for many years in the future,
You all should be proud 0% what you have achieved together. Yea have combined the best talent of all concerned organizationsSFecBeraBi State, universi- ties, and private industv-to address major pest problems limiting productivity of the southern pine resource. You have excelled in technology trans- fer. Such cooperation will need do continue as you address future needs and incorporate new knowledge into forest management practices, It has been per- ~oaaUy rewarding do have been involved in a minor way d l a~ng the 11 years of concentrated research and development. m e southern pine beetle problem is stilt ~ d h us, but this Program has provided many of the tools forest managem need to cope with it* Congratulations and well done!
SESSION AMPLING AND IMPACT ASSESSMENT
ing Pest Popu
Procedures for Sampling Six-Spined Ips Populations in Siash Pine
John L. Foltz, Jeffrey A. Comeil, and Robin M. Reich'
Abstract-The precisian of gallesy. length esti- mates for Ips calligraphus (fe), the primary bark beetle infesting Florida slash pine, is makedly af- fected by both shape and size of bark samples, Be- cause egg gallerim extend vertically in the trees, rectangular samples with the long axis oriented horii- zontally intersect more galleries and are less va~able than squares or vertically oriented rectangles of equal area. For estimating adult densities, sample unit size (but not shape) is an important considera- tion, Regressisn equations of sample unit variance as a function of population density can be used to calcu- late the number of sample units needed to estimate gallery length and brood densities a t specified error and confidence levels.
D a b collezted from 10 infested trees showed that the Ie population on a tree typically consisted of multipf e cohorts rather than a single, even-aged cohort. Ie broods frequently emerged from the mid- bole region before the extremes were cofonized. The magnitude and causes of brood morta1ilt;y often! ap- peared diBerent a t different heights and times. Ad- tack density tended to be lowest in the midbole region, increased slightly toward the base, and was greatest in the uppor bole up to the height where interspecific competition occurred. Egg density was least in the lower bole and tended to increase with height. Brood emergence was least- a t 4 m, increased to peaks a t 2 and 8 m, then diminished toward the extremes of the Ic-infested bole. Additional keywords: Bark beetle, Sccolytiidae, Ips calligraphus, Ips av ulsus, Ips grandicollis, Dendroc- tonus terebrans, Pinus elliat tii.
INTRODUCTION
Slash pine, Pinus elliottii Englem. var. elliottli, is one of the most important pines in the southeastern United States and one of the two southern pines worked for naval stores (Koeh 1912) * The natural range of slash pine extends frorn South Carolina to Louisiana, but has been extended into other adjacent States by planting, as in East Texas (FoweUs t965), Nearly 12 million acres are occupied by slash pine east of the Mississippi River, where the slash pine ecosystem is capable of producing an estimated it bil-
l Respmtively, Associate Professor, Research Associate, and Research Assistant, Department of Entomology and Nema- tology, University of Florida, Gainesville, FL, when this paper was prepared.
ition CU. ft. of net annual growth per year if carefully marraged in well-stocked natural stands and plants- Lions (EJoyce et al, 1975). In. FTcrridsr, over 5 million; acres have been planted
to stash pine since Wodd War 11. An equal area of land is occupied by natural pine stands, ~ t h slash pine occurring as the predominant species in many of them, Annual aerial surveys indicate that pine mortality increased four- Lo fivefold between 1959 and 1979, and the monetary value of killed standing timber increased horn a total of $8.7 ~ l l i o n du~wg the decade 1959-68 to $39 million during the decade 1969-79 (Cbellman 1980). Three Ips species, I. avulsus (Eichh.) , I. grandicollis (Eiehh,) , and 1, calligraphus (Germar), and the black turpen- tine beetle, Dendroc tonus terebrans Q OEvier ) , have been associated with this increased mortality, bud: relatively little is known about the population dy- namics of these beetles (Wilkinson and Folta 5980, Foktz et al, 1984)- The objectives of the research project initiated in 1981 ad the University of Florida were to develop sampling procedures for the primary pests in slash pine plantations and do in- vestigate their population dynamics- The infomation on sampling procedures is presented in this paper. Infomation about host Lme e6Fects on Ips calki- graphus reprodue'tion and survivorship is presented separately in Haack ed a%. (1985).
METHODS AND MATERIALS
The specific study objectives for the first year (1981) were to deternine the spatial and temporal pat&rns of colonization of sla& pine by bark beetles and how the size and configuration. sf bask samples interact do affect the confidence intervals for popu- lation. estimates. To accomplish these objectives, x-ray maps were made of 68- to 90-em long sections of infested stems frorn 15 slash pines, the procedures generally following those described by Stephen and Taha (1976) and Gorrlson et ab, (19E5, 1999). For each 2.5-em square in these maps, data were recorded on nuptial chambers, the amount sf egg galler~i, and the number of eaeh life stage for eaeh beetle species, Altogether, 99 sections were mapped with surface areas rmging from 300 do 618% em2. Comparisons of insect age distributions gave us information on s~here a given tree was first colonized and how rapidly csfsnizatican progressed to other portions, Specially written computer programs were then used to s b -
ulate sampling of 2% selected maps with sample mih of various sizes from 6.25 cm2 to 280 cru;;%and shapes from 2.5 to 20 em in height andlor width.
During 1982, the second sea er field season, 10 standing trees were sampled at 1. meter a t weekly intenals with the objective of cramparing insect den- sity st one time and he ighh i t l z densities a t a"t;er times and heights, Based on preli~nallgr anal- yses of the 1981 data, data gathering was limited to that portion 0% the tree infested by Ips cczbligraphus. The sample unit used was a bark rectangle 5 em high and 20 cm wide, Emerging brood were collected in 10 x l o cm emergence traps (MeCfelland et al, 1978). The bark samples were dissected in the lab- oratory where gallery length, egg niches, and numbers of each Ic life stage were recorded, Densities and tob l numbers for each I-meter frustum were calcu- lated from. the weighted mean of the top and bottom samples (Pulley et ab, 1977)- Data management and analyses were aczomplished using the Statistical Analysis System ( SAS) .
RESULTS
Spatiat attctck patterns, I-delta and the C1af.k and Evans statistics showed that Ips cattigraphus ( I c ) atbcks on a. tree tend to be regularly spaced, For Morisita" iindex, the I-delta value is zero for a 2-em quadrat. It is possible that l e males use a squtentiaf combination of pherornonc?s, bark topography, and sonic signals to space them- selves regularly on a given host*
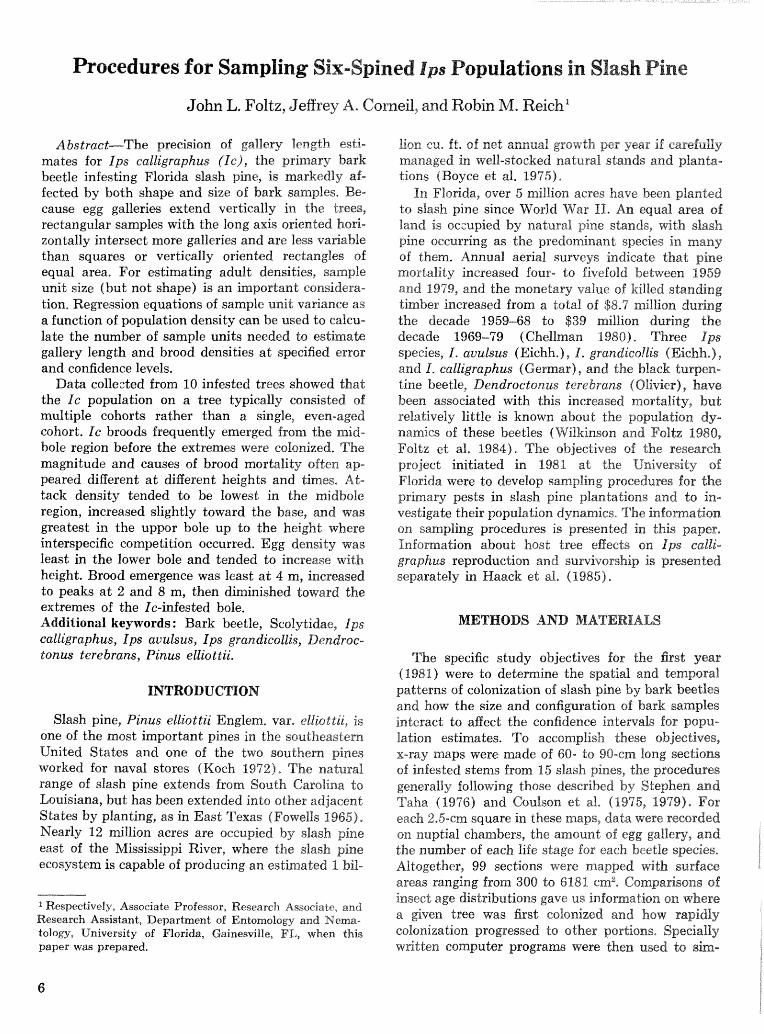
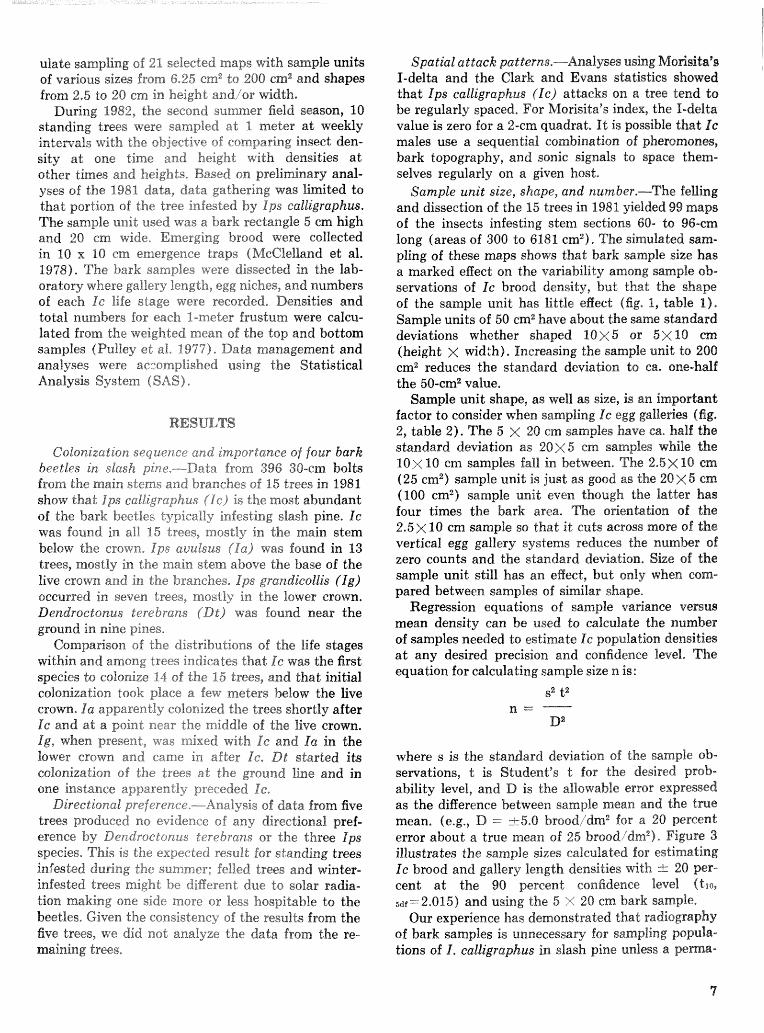
Sample unit size, shape, and number,-The felling and dissection of the 15 trees in 1981 yielded 99 maps of the insects infesting stem seetiions 60- to 96-m long (areas of 300 to 6181 em2) ). The simulated sam- pling of these maps shows that bark sample size has a marked effect on the variiabilidy among sample sb- sewatisms of Ic brood density, brat that the shape of the sanxlple unit bas little eJgFect (fig. I, table 1). Sample units of 50 cm2 have about the same standard deviations whether shaped 1 0 x 5 or 5x10 cm (height X width). Increasing the sample unit to 200 cm2 reduces the standard deviation to 68, one-half the 50-cm2 value.
Sample unit shape, as well as size, is 8x1 important factor to consider when sampling Ic egg galleries (fiig. 2, table 2). The 5 x 20 cm mmplies have ca, half the
Colonizatiorlsequcnceandimportanceoffourbark ~ t a " d a r d d e ~ i a t i ~ n a s 2 @ X 5 c m g a m ~ l e g w ~ ~ l e t ~ e beetles in slash pine.--Data from 396 3 0 - c ~ bolts 10X 10 cm samples fall in between. he 2 . 5 ~ 10 cm from the main stems and branches of 15 trees in 198 1 (25 em2) sample unit is just as good as the 20 X ern
show that i p s calligraphus ( I c ) is the most abundant cm2) sample unit even though the latter has of the bark beetles typically infesting slash pine. Ic times the bark area. me orientation of the was found in all 15 trees, mostly in the main stem 2.5 X 10 cm sample so that it cuts across more of the below the crown. Ips auulsus {la) was found in 13 vertical egg gallery systems reduces the number
trees, mostly in main stem above the base of the zero counts and the standard deviation. Size of the
live crown and in the branches. Ips grarzdicollis ( I g ) unit has an but only when 'Om-
occurred in seven trees, mostly in the lower crown. pared between samples of similar shape*
Dendroctonus terebsans jDd) was found near the Regression equations 0 6 sample va~ance versus
ground in nine pines, mean density can be used to calculate the number
c ~ ~ ~ ~ G ~ ~ ~ of the distributions of the stages of samples needed to estimate i c population densities
within and among trees indicates that Ie was the first a t any desired precision and confidenee level. The
species its colonize $4 of the 15 trees, and that initial equation for calculating sample size n is: colonization took place a few meters below the live crown, %a apparently colonized the trees sit-rorlly after IG and at a point near the middle sf the live crown. Ig , when present, was mixed with f c and l a in the lower crown and came in after 4c, Dd started its coIsnization of the trees at the ground line and in one instance apparently preceded l e .
Direct ioneel preference,---Anal ysis of data "Em five trees produced no evidence of any directional! gref- erence by Dendroctsnus terebrans or the three Pps species, This is the expected result for standing trees infested during the summer: fedled trees and winter- infested trees might be different due to solar radia- Lion making one side more or less hospitable to the beetles, Given the consistency of the results from the five trees, we did not analyze the data from the se- mairring trees,
where s is the standard deviation. sf the sample oh- sewations, .& is Student" t for the desired prob- ability level, and D is the allowable error expressed as the difference between sample mean and the tme mean, (e.g., D =- i.5.0 bmod/ 'dd for a 20 percent error about a true mean of 25 brosd/dm2). Figure 3 illustrates the smple sizes ealeultated for estirna$ing Ic brood and gallery length densities +th rlr: 20 per- cent a t the 90 percent confidence level ( t r a p 5diz2.015) and using the 5 >i 20 em bark sample,
Our experience has demonstrated that radiography of bark samples is unnecessary for sampling popula- tions of I, calligraphus in slash pine unless ea pema-
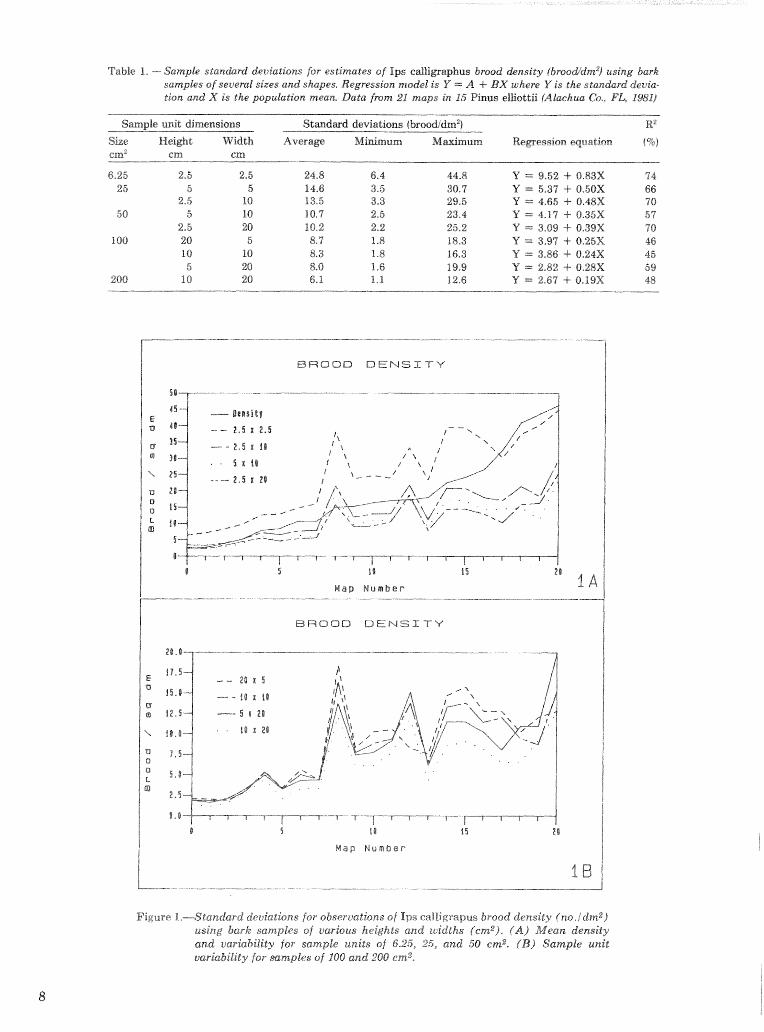
Table I. -- Sample sta:an&rd deuiatkns for estimates of Ips eallipaphus brood density (broo&dnz2) using bask sanzpks of several sizes and shapes. Regression model is V ~ = f A 4- L3X where Y is the s tanhrb devia- tion and X is the popukatia~z tra-ears. Data fmm 21 maps in 1'5 Pinus elKottii lillachua Go., FA9 2'%1/
-
SmpZe unit dimeasions Stanbmd deviations (broecLdm2)
Size Hei&C W-idth Average M u Mturimurn R e ~ e s s i n n eqnatirara cm" ern em
--- -- -
B R O O D D E N S I T Y
5 i t 15
Map N u m b e r
BROOD D E N S I T Y
L8 15
Map N u m b e r
Figure %.-Standard deviations for observations of Ips ealligrapus brood density f no./clmz) using bark samples of varbus heights and widths (cmz). (A) .Mean density and ~iarkbility for sample units of 6.25, 25, and 50 em2. {B) Sample unit varkbility for mmples of _208 and 280 cm2*
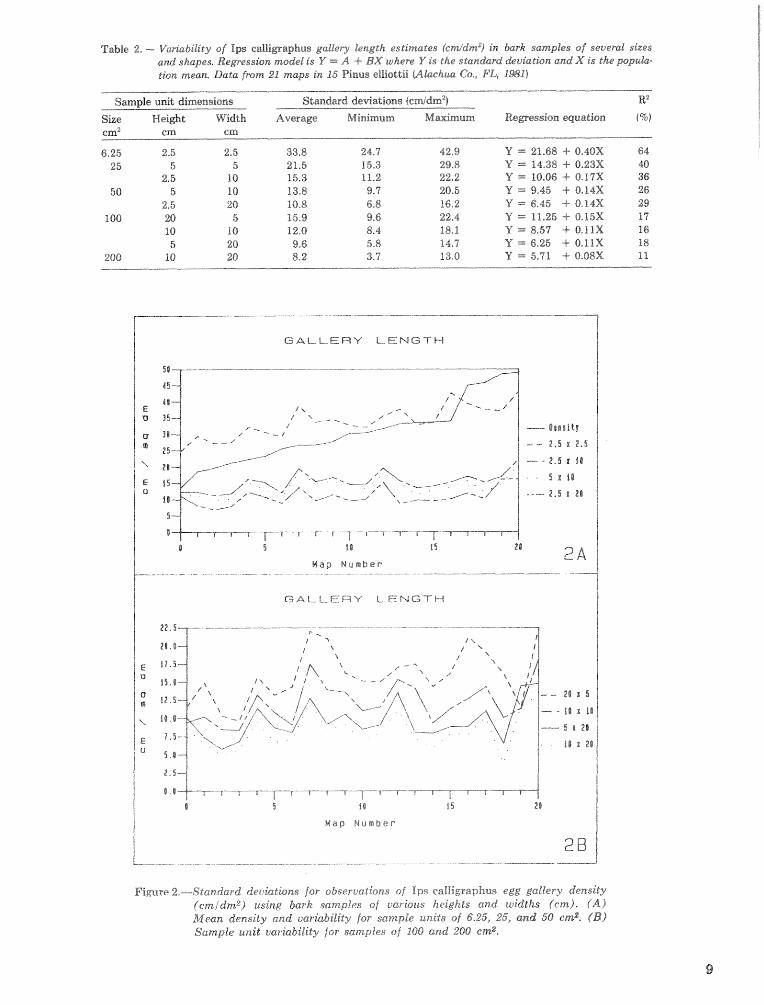
Table 2, -- Van'ability of Ips cdlimaphus gaklery Lngth esfimaks jcmldrn2) in bark samples of several sites a d shapes. Regression model is Y = A -4- BX where Y i s the standard &viation and X is the popuk- Lion mean, Data from 21 maps in 16 Pinus elliodt~ @lhcinua Co,, PL* I%Z)
Smple unit dimensions Standmd deviations icmidrn2) RZ Size E-S;ei&t Width Average Minimum M k m u n n Regeetsisnequa$ion (9%)
i ----
G A L L E R Y LENGTH
G A L L E R Y LENGTH
Map N u m b e r
Figure %.--Standard deviations for sbseruntions of Ips calIigraphus egg gallery density (cmidm2) using bark samples of ~~ar ious heights and widths 6cm). (A) ?&ilean density and vaskctbikity for sample ur~ita sf 6.25, 25, and 50 ern%. ( B ) Sample unit cariabikity for samples oj BOG- and 208 cmz.
- W i t h i n 10%
---. W i t h i n 2 0 %
G a l l e r y L e n g t h , cm / s q dm
3E3
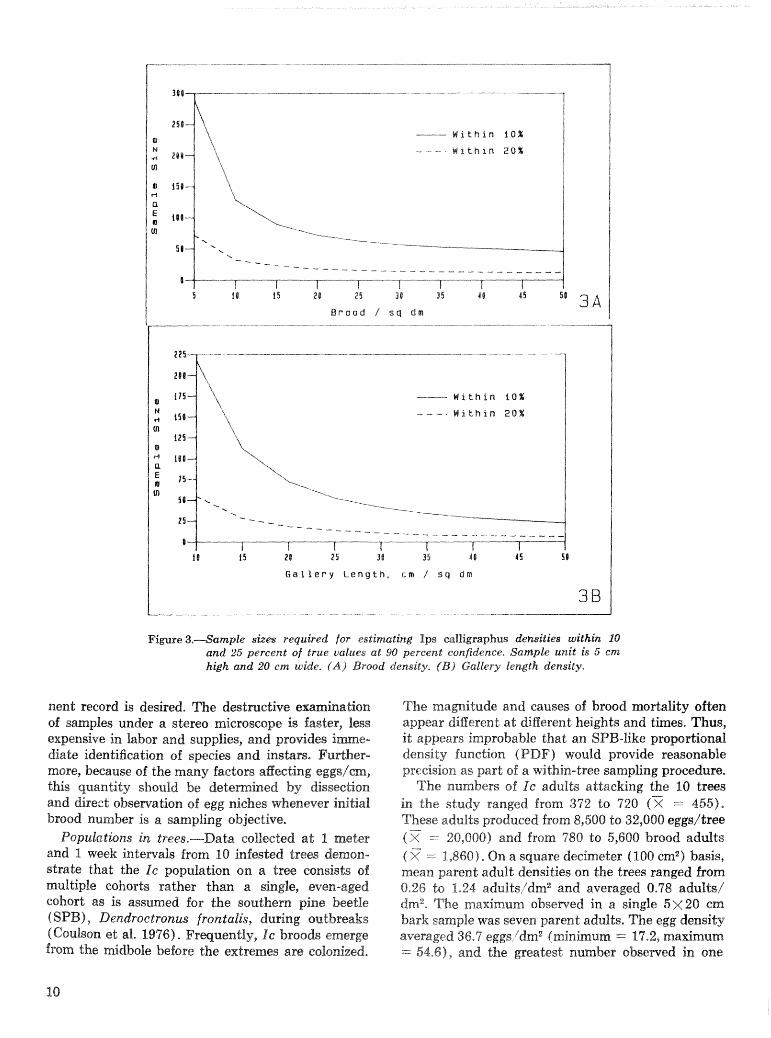
Figure 3.-Sample size8 required for estimating I p s ealljigraphus demities withk 10 and 25 percent of true values at 90 percent confidenee, Sample unit is 5 cnz high and 20 cm wide. (A) Brood density, (B ) GalZep.5: length density.
nent record is desired, m e destructive examination of samples under a stereo microscope is faster, less expensive in labor and supplies, and provides i diate identifieation of species and insblrs. Fur.kber- mare, because of the m a y factors affecting eggs/m, this quantity should be detemhed by &sseclion and direct obsemation of egg niGhes whenever S t ia l braod number is a sampling objective,
Populatkns in trees,-Data colleckd a t 1 meter and I week intervals from 10 infested trees demon- strate that the dc population on a tree coxasisb of multiple coho~ts rather than a single, even-aged cohort as is assumed for the southern pine beetle (SPB) , Dendroctronus frontalis, during outbreaks (Coulson e t al. 1976). Frequently, i c broods emerge from the midbole before the extremes are colonized.
The mamidude and causes 0% brood mortality often appear different ad different heights and times. Thus, i t appears improbable that an SPB-like proportianal density function ( PDF) would provide reasonable precision as past of a within-tree sampling procedure,
The numbers of l e adults attacking the 10 trees in the study ranged from 372 to 720 (2 = 455). These adults produced from 8,500 to 32,000 eggsltree ( X = 20,000) and from 780 to 5,600 brood adults ( 2 = 1,860). On a square decimeter (100 cm2) basis, mean parent adult densities on the trees ranged from 0,26 fs 1.24 adr%%ts /dm2 and averaged 0.78 adults/ dm" The maximum obsesved in a single 5~ 20 cm bask sample was seven parent adults, The egg density averaged 36,7 eggs /dm2 (minimum = 17.2, ma~imum = 54,6), and the greatest number obsemed in one
bark sample was 181, The emergence traps captured an average of 3.18 brood adulds/dm2 (minimum -- 0.93 and maximum = 4.33), and the greatest number in one trap was 25,
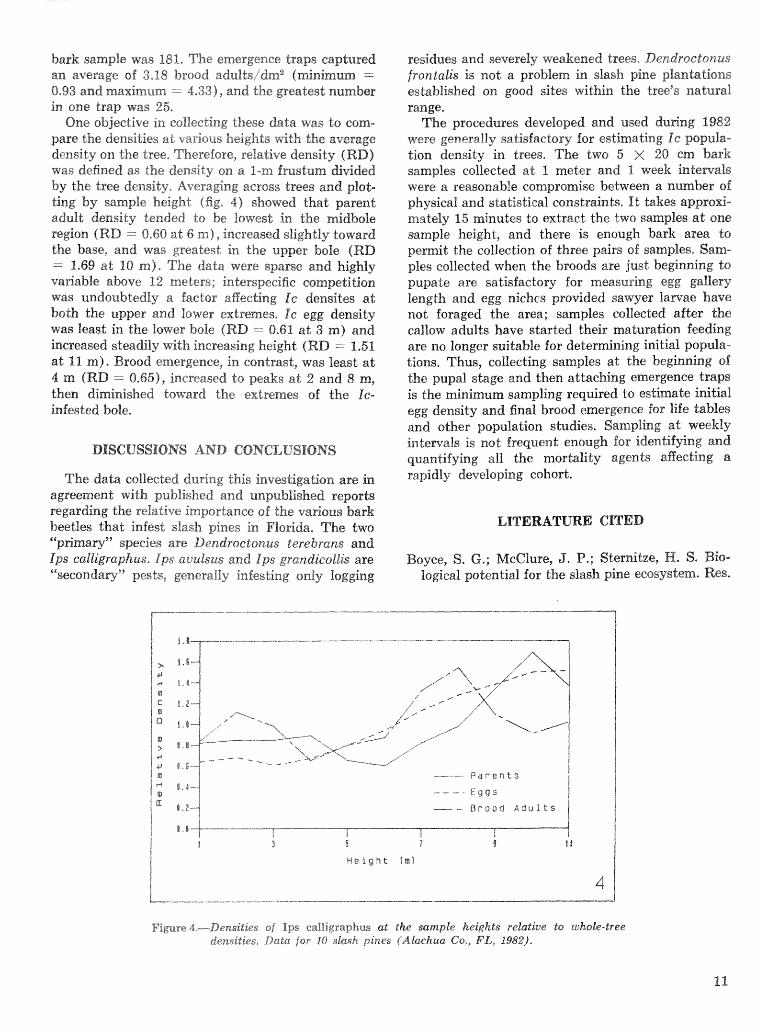
One objective in collecting these data was do corn- pare the densities at various heights with the average density on the tree, merefore, relative density (RE>) was defined as the density on a I-rn fmstum divided by the tree density, Averaging across trees and plot- ting by sample height (f ig, 4) showed that parent adult density tended to be Iowest in the midbole region (RD =. 0-60 a t 6 m), increased slightly toward the base, and was greatest in the upper bole (RD = 1-69 a t 10 m). The data were sparse and highly va~ab le above 12 meters; interspecific competition was undoubtedly a factor affecting Ic densites a t both the upper and lower extremes. Ic egg density was least in the lower bole (RD = 0.61 a t 3 m) and increased steadily with increasing heighf; (RD -- 1.51 a& 11 m). Brood emergence, in contrast, was least a t 4 rn fRD = 0.65), increased to peaks at 2 and 8 m, then diminished toward the extremes of the IG- infested bole.
DISCUSSEONS AND CONCLUSIONS
The data collected during this investigation are in agreement -Lvith published and unpublished reports regarding the relative importance of the various bark hee-t;les that infest slash pines in Florida, The two ""pimary" "species are Dendroctonus terebrans and Ips ealliigraphus. Ips avulsus and Ips grandicoilis are "weconriary" pesb, generarig; infesting only logging
residues and severely weakened trees, Dendroctonus frontalis is not a problem in slash pine planbtisns established on good sites tvitkin the tree" natural range.
lChe procedures developed and used duPirrg 2982 were generally satisfactory for estimating Be popula- tion density in trees. The two 5 X 20 cm bark samples coifeekd at, 1 meter and 1. week intewals were a reasonafiXe compromise between a number of physical and statistical constraints. I d takes appsfrg- msltely 15 m:lnuCes to extract the two samples a& one sample height, and there is enough bark area do permit the collection of three pairs of samples. S m - ples collected when the broods are just beginning to pupate are satishetory for measuring egg gallery length and egg niches provided sawyer lawsze have not foraged the area; samples collected aBer the callow adults have started their maturation feeding are no longer suitable for deteminillg initial popula- tions. Thus, collecting samples a t the beginning of the pupal stage and then attaching emergence traps is the minimum sampling required to estimate initial egg density and final brood emergence for life tables and other population studies. Sampling at weekly inf;spvaIs is n ~ & frequent enougb for identifying and quantifying all the mortality agents affecting a rapidly developing cohort.
LITERATURE CITED
Boyce, S. G.; McClure, J. P.; Sternitze, H. S. Bio- logical potential for the slash pine ecosystem. Res.
I r-4 1.44
1 , 2 - - B r o a d A d u l t s
D B
1
H e r g f i l . fml
Figuse 4.-Densities sf Ips eaIligsapjPus at the sample heights relatiue to whoks-kee densities, Data for 10 slash pines (Akchua Co,, FL, 1982).
Pap, SE-141, Asheville, KC; S* Department of Agriculture, Foreat Service, Southeastern Forest Experiment Station; 1975. 29 p,
Chellrnan, C. W. Tree mortality (pest) surveys in Florida from 1959 thru 1979, In:: Forest pest managenlent s-j-mpssiurn .: procecidings sf the Fiorida section o i dA&" 2 980 June 3-4; Gaines- ville, FL, Gaines~iile: School of Forest Resources and Csnservat ion, University of Florida; 1988: 8--12,
Coulson, R, H,; Hain, F, B,; Foltz, J, L, [and others], Techniques lor san:p&iit;g the dynamics of southern pine beetle populations* Texas Agr-ic, Exp* Sta, h3iscb PUB-%* f1f?5a College Station, TX: Texas A&&$ University; 1975, 29 p,
Coukson, R, N,; Pulleyp P, E,; Foltz, J, L, [and oth- ers] . Procedural guide for quantitatively sampling aithin-tree popularions of Dcndroctonus frontalis. Texas Agric. Gxp. Sta. ivlisc. Pub. 1267. Coiiege Statiofi, TX: Texas A&M University; 1976. 26 p.
Coulson, R. N.; Fargn, W. S.; Edson, L. J. [and others], Procedural guide fcr condncti~zg field in- vestigations on the popalatiorr dynamics of the southern pine beetle. Texas Agric. Exp. Sta. Misc. Pub, P427* College Station, TX: Texas Lhi- versity; 1979, 19 2
Foltz, J. L.; Rlerkei, E. F.; \fTiIkinson, R. C. Anno- tated bibliography of Deridroctgda~",~~ tesebrans ( Oli\+-r . Ips a:.ultiis i ElchhoR) , ips grandicoilis
bEiehRoff), and Ips calldgrayhus (Grtmar) in fie Southeastern U,S,A, Monograph No, 12, Gaines- vilfe, FL: University of Florida, Institute of Food and Agricultura~ Sciences, Agricultural Esperli- merit Station; 1984, 4 Q p ,
Foviells, H, A. Silvica of forest trees 0% the United States.. Agric, Handb, 271, Washington, DC: U,S. Department of AgrieuIture; 1965, "a2 pp,
Haack, R, He; Foltz, J, E.; iVi%kinson, R, 63, EBects of temperature and slash pine phBsem thickness on Ips ilalligraphus life processes, In: Proceedings, inbegrated pest management research symposium; 1985 April 15-18; Asheville, NC, Gen Tech. Rep, SO-56, New Orleans, LA: U.S, Department of Agriculture, Forest Service, Southern Forest Ex- perimenx Station; 1985 :: 102-1 13,
Koch, P, Utilization of the southern pines, Vof, 1, Th-e raw material. Agric. Handb. 420. Washington, DC: U.S. Department of Agriculture; 1972. 734 p.
MeClelland, W, T,; Hain, F, P.; DeMars, 6, J, [and othersj, Sampling bark beetle emergence: a review of rnethodoBogies, a proposal for standasdizatioa, and a new trap desinn. BuZL EntomsB, Sot, A m e ~ c a 24 ( 2 ) :: 137-140; 1978,
Pulley, P, E,; Foltz, J.. L,; kTayyaai, A. h4. [and others], Sampling procedures for within-tree at- tacking adult populations of the southern pine beetle, Dendriictonus frontalis (Coleoptera: Seoly- tidae) , Can* Entomol, 189: 39--48; 1977,
Line Intersect Sampling Technique for Estimating Ips P~pulations in Logging Residue
C. Wayne Berisford, Russell F. Mizell, 111, Louis H. Kudon, and Kenneth D. Ware'
A. bs trac t .---A mu2dis~age line intersect sampling (LIS) technique was developed and tested for esti- mating population of bps spp. bark beetles in logging stash, The technique utilized a series of grid points through which randomly directed sample lines 50 m. long were established. Slash exceeding 2 cm in &m- etes that was intersected by the line was measured and samples 06 every sixth infested piece were taken for dissection and beetle rearing, Estimates were calculated for slash volumes, bark surface areas, and numbers of beetles produced on 30 difplerewt sites,
Estimates sf beetle populalions were highly v a ~ - able among sites, ranging f ron~ zero to 880,000 beetles per hectare, with an average density of ca, 180,000 beetlesiha, Produetion of beetles relative to bark surface area was LOW, averaging only ea, 210 beetles/ m2 of bark surface.
This technique may be used to evaluate the poden- tial threat sf beetle populations in log@ng residue to residual or nearby stands, This information might also be incorporated into existing stand hazard-rating systems or bark beetle infestation dynamics models, Additional keywords: Dendroctonus frontalis Zim- mermanea, Ips grandicollis (EiehkzoB) , insect asso- ciates, population dynamics, prediction,
During the last decade, intensive research on bark beetles attacking southern pines has led to a better understanding af these pests and proGded a founda- tion for developing more eEeetive management prac- tices. &lost research has concentrated on the soulhem pine beetle, Dendroctonus f ron talts Zimmemann (SPB), However, research sponsored by the Inte- grated Pest Management R, 16) & A Program for Bark Beetles 06 Southern Fines was broadened to include other important bark beetle species, This effort recog- nized the bis%ogieal reality that these insects, which include five major pest species and t1-5.ro genera, must be studied as a complex rather than independently,
The population dynamics 06 bark beetle species that coinhabit the same trees is closely linked, For instance, trees attacked by the SPB are also usu- ally invaded by one to three species sf Ips and,'or the black turpentine beetle, Dendroctonus terebrans Olivier (BTB), In some cases, the population 0% Ips spp, foms a sipificant portion of the total bark beetle population -within a spot (Hain and MeClel- land 19791, Ips spp. and SPB may attack standing trees simu%daneous8y, and they eBectiveBy partition the resource until all habitable portions of the bole and limbs are occupied (Birch et al, 1988)- As SPB populations decline, Ips spp, occupy a higher per- centage of infested tree boles, Ips spp beetles are probably a significant factor in the maintenance of endemic SPB populations by initiating attacks and helping to overcome the resistance Lo attack (Hain and McClelland 1979)- Since I ps spp, may auwent SPB attacks, help maintain endemic SPB popula- tions, and/ or initiate infestations on their o m , it is important to identify and quanlif y sourcm of large Bps spp, populations, %Vhile both the SPB and Ips spp, attack standing trees, Ips also attack fallen trees, limbs, and logging slash, Ips spp, are quickly ad- tracted to logging slash or felled trees (Mason 1969, 19'70; Berisford and Franklin 19"11) or other damaged material (Hsdges and Pickard $97%), Ips spp, pepu- lations may increase dramatically following severe weather such as hurricanes, tornadoes or ice stoms (Speers 1971), In Australia, high populations sf Ips grandicsllis QEichhoR) from high vo%umes sf lagging slash often cause substantial mortality in nearby stands, including saplings ~ d g i 2-3 years old (bgorgan 1967, and others" b,
Logging slash generates the highest volumes of host material and the most consistent production of Ips spp, High beetle populations resulting from var- ious types of logging operations may be an imporhnd factor in the occurrence and/or severity of bark beetle attacks in nearby stands, Large beetle popufa- tions produced in lagging slash could increase the risk of initial infestation and also the potential for
Respectively, Professor, Department sf Entomology, Uni- spot expansion once infestations occur by augmen-
vereity of Georgia. Athens. CA; Assistant Professor, Uni- t ing attacking SPB and IPS populations- Nebeker rersity sf Florida. Agricultural Research Center, Pvrlionti- and Hodges ( 1983) and Nebeker 6 1985) showed that cellop FL; Research Associate, Department of Entomoiiogy, residual tree mor$aaity following thinning operations %i'nivc?ssidy of Georgia, Athens, GA; and Mensurationist. U.S. with &he volume ;and disdfibudion Forest Service, Southeastern Forest Experiment Station, Athens, GA, (The authors are grateful do William Harris, sf the slash, Psiteh hI:osgan. and Robert Watson for technical assistance and to Ray Souter for assistance with statistical analyses.) 2 Berisford, unpublished data,
The poten~al hazard imposed by sporadic and ofLen large Ips gopulations generated in logging slash should perhaps be integrated into hazard-rating sys- tems for bark beetles (Belanger et al. et al, 1980, Ku ek al- 1980, Lorio and So and SPB spat growth models (Hinm ef; al, l98Q; Feldman et al. 1981a, 1981b). With the exception of data achowled~ng al~eady established infesbtions or atand disturbances as factors in high-hazard stands, wo data on the presence of Ips spp in logging slash are included in current bark beetle risk-rating systems, There are several reasons for this, but it is prirna~ly because beetle populations in slash are transitory, as alasb is habitable for only a short time. No data are available on beetle numbers that might constitute w sicificant threat to stands in specific hazard categories, and until now, there were no tech- niques for ctstimating populations of Ips produced in 1ogg;ing slash, A reliable method based on line inter- sect sampling is pwsented here for making estimates of Ips sgp, populations in logging slash. The method is easy to use by field personnel; i.e., the procedure is simple and requires no highly specialized equip- ment, and it yields population estbates d t h a ream sonable investment of time.
MATERIALS AND METHODS
The minimum criteria in this study for a site to be sdeckd were f i a t logging operations had been recently completed or were in progress and that at; least 10 acres of logged area was available for Sam- pling. Sampling was initiated if preliminary checks showed that the slash contained late instar larvae and/or pupae of one or more ips spp. Sites with different types of logging operations were selected, includhg tkinn.ings, ele~rcuts (with or d thout tree- length skidding and limbing gates) and clearcut areas with log skidding only. Sites in both the Coastal Plain and Piedmont were sampled.
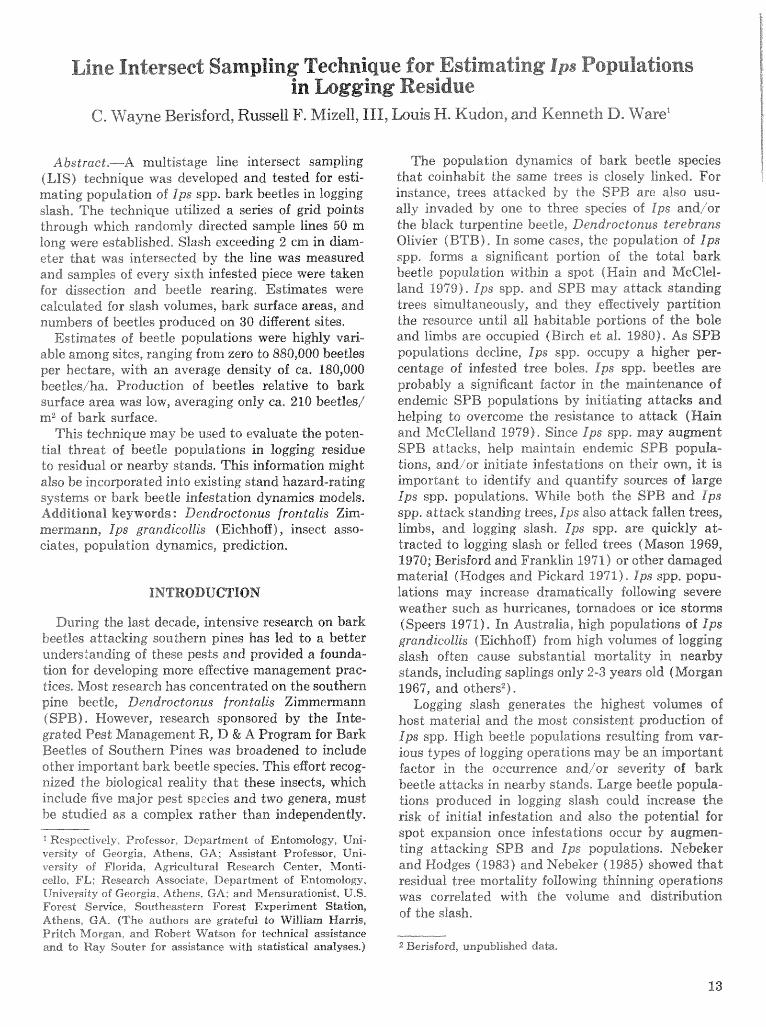
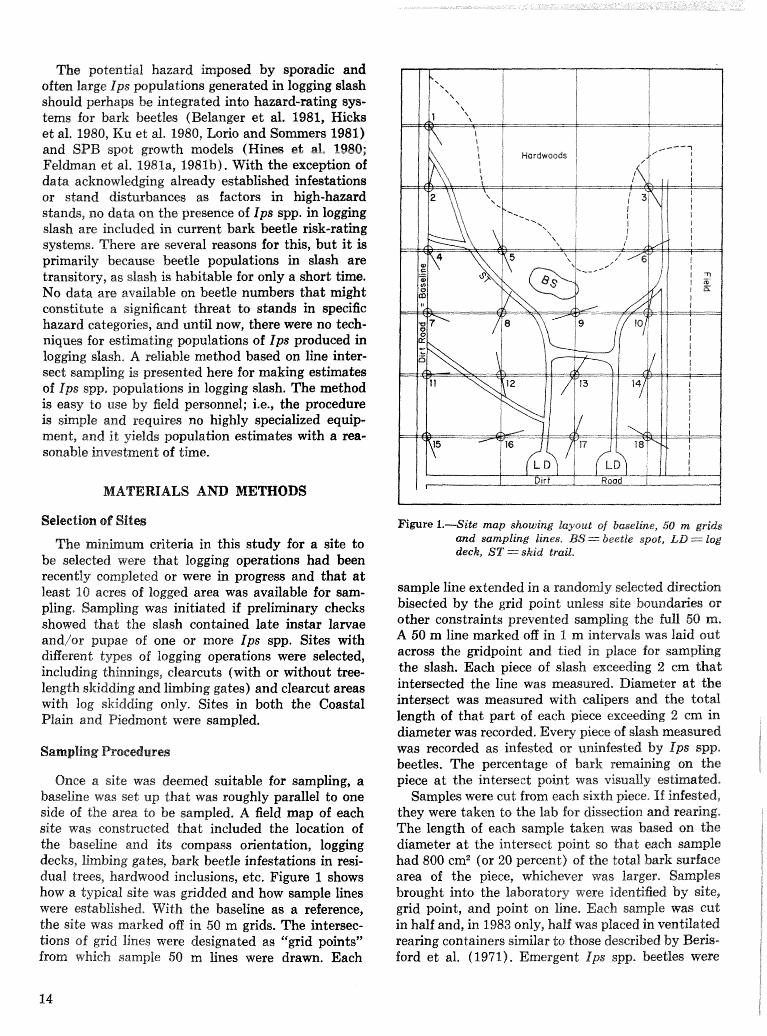
Once a site was deemed suitable for sampling, a baseline was set up that was roughly parallel to one side of the area to be sampled. A field map of each site was constructed that included the location of the baseline and its compass orientation, logging decks, limbing gates, bark beetle infestations in resi- dual trees, hardwood inclusions, etc. Figure 1 shows how a typical site was gridded and how sample lines were established. With the baseline as a reference, the site was marked off in 50 rn grids. The intersec- tions of grid lines were designated as "grid points" f r m which sample 50 m lines were drawn. Each
Figure 1.-Site map showing layout of baseline, 50 rn grids and sampling lines. L;CS =Z Jeetke spot, LD = log deck, ST == skid Irail,
sample line extended in a randomly selected Ikirectim bisected by the grid point unless site bounda~es or other constraints prevented sampling the full 60 m, A 50 m line marked off in 1 m intervals was laid out across the gridpoint and tied in place for sampling the slash. Each piece of slash exceeding 2 an that intersected the line was measured, Diameter a t the intersect was measured wid.h. calipers and the total length of that part of each piece exceeding 2 crrp in diameter was recorded. Every piece crf slash measured was recorded as infested or ~rninfesked I;uy Zlps spp. beetles. The percentage of bark remaining sn the piece at the intersect point was visually estimated.
Samples were cut from each siskh piwe. If infested, they were taken to the lab for dissection and r e n ~ n g - The length of eaeh sample taleen waa based on the diameter a t the intersect point sa that. eaeh sample had 800 cm2 (or 20 percent) of the total bark surface area of the piece, wkrichever was larger. Samples brought into the laboratory wesr; identified by site, grid point, and point on line. Each sample was cut in half and, in 1983 only, half was placed in ventilated rearing containers similar to those described by B e ~ s - ford et al. (1971). Emergent i p s spp. beetles were

counted and identified by species an alternate days for 3 weeks. The remaining half of each sample was dissected and numbers of' Ips spp. nuptial chambers, length of egg gallerries, and numbers of &Berent Ips l i fe stages (lawae, pupae, parent and/or callow adulh) were recorded (1982 and 19831,
The basic sampling procedures and appropriate theory are all based on extensions of multistage line intersect sampling, Line intersect sampling (LIS) has been studied by e)evsies (19B3, 1974), Van Wagner (X968), and others (Warren and Olsen, 1964, Hazard and Pickford 1983), and there is sub- stantial literature about the use sf id for estimating forest residues,
The sample selection procedures previously de- scribed are a three-stage line inkmeet sample gp-ilh stratification and with n~ultiple lines* The first stage selects primary wits, which are pieces sf slash (above 2 em diameter) with probability proportional to length of the piece. On these selected pieees, the diameters at the point of interseedion, d, and the length, 1, are obserrred and recorded. The pieees are stratified into small and large diameter classes, From each stratum, a second-stage subsample sf bolts is drawn with equal probability fss dissection a d rear- ing as described previously. Each secsnd-stage sub- sample is further subsampled with equal. probability, yielding third-stage elements that are bark surface areas on which the dissection counts and rearjing counts are made in the laboratory,
The sample sejteetisn and obsemation pmeedures are relatively easy do describe, The estimation pro- cedures are, however, necessrldly complex and involve re%a tiveTi y camplica ted f srmulae. In future applica- tions, these algebraic formulae will be written into a standard compeakr language and automated software so that users of the technique can have the estimates easily and directly produced. It is necessary, how- ever, to document the estimators in standard statis- tical sampling terminslogy and symbology.
For this purpose, we desig~nate the sbsewed sample quantities as B"o%%ows:
Lh = length of sample line for line h; h --- 1, 2 . . ., k
dihs ---. observed diameter 06 i-dh pieee of slash on h-th line belonging to the ""small" "(s) diam- eter class
d ~ , = 8s above, for ""large" "diameter crass nns .= number of pieces sf "mall" "slash measured
for diameter and length on. line h n h ~ = number of pieees sf ""large" "slash measured
for diameter and length oar line h
fibs '= length as above for d ~ ? ~ l*, = length as above for d ik l
f, .= sampling fraction for selecting pieces of slash to be measured En the "mall" "class [lizsrahaffy I i 3 )
f~ - analogous sampling fraction for ""large" eelass (usually 1 of each I; ail)
DB = diameter of slash ad starraturn boundary be- tween ""small" and ""rarge" "(tasuaily 5 ern)
Dm -- minimum diameter sf sitash in small stratum (for small plats Dm --- i em, For sthers, Dm = 2 em)
nrhs = number of "mall" "pieces of slash selected for dissection on the h-th line from the ra,, measured far dimeter and length
n'h~ ---- number of pieees of ""large" "slash selected for dissection from the n h ~ measured on line h
Mihs = number sf sub-elements (bark samples for dissection) in the i-th pieee 0% slashon bdh line in the "mall" "hiliameder elass
Mih~ ---- analogous to Mihs but for "~arge9' slash (numbered j = I, 2, . . ., Mi)
mih, = number sf sub-elements selected for dissee- tion from i-th piece, h-tb line and small diameter class (numbered j -- I, 2, . . ., mi)
mihL =. analogous number, large class Bihs = bark surface area sf i-d& piece of slash, h-dh
line, small diameter class B ~ L = (TI (dihs) (lihs)
bijjs = bark area of j-th subsample dissected "'small" "class i;-th pieee of slash, k-th line
bmj~ = analogous area, large class Mihs ='. Bihs/bihs
Now, if there is one line of length L and no sub- sampling and we observe a characteristic of interest, Xi, and length, 11, of each element selected by LIS, the mean quantity of X per unit area is estimated by:
Consequently, for all characteristics of the slash we have for fine h:
Since for: volume:
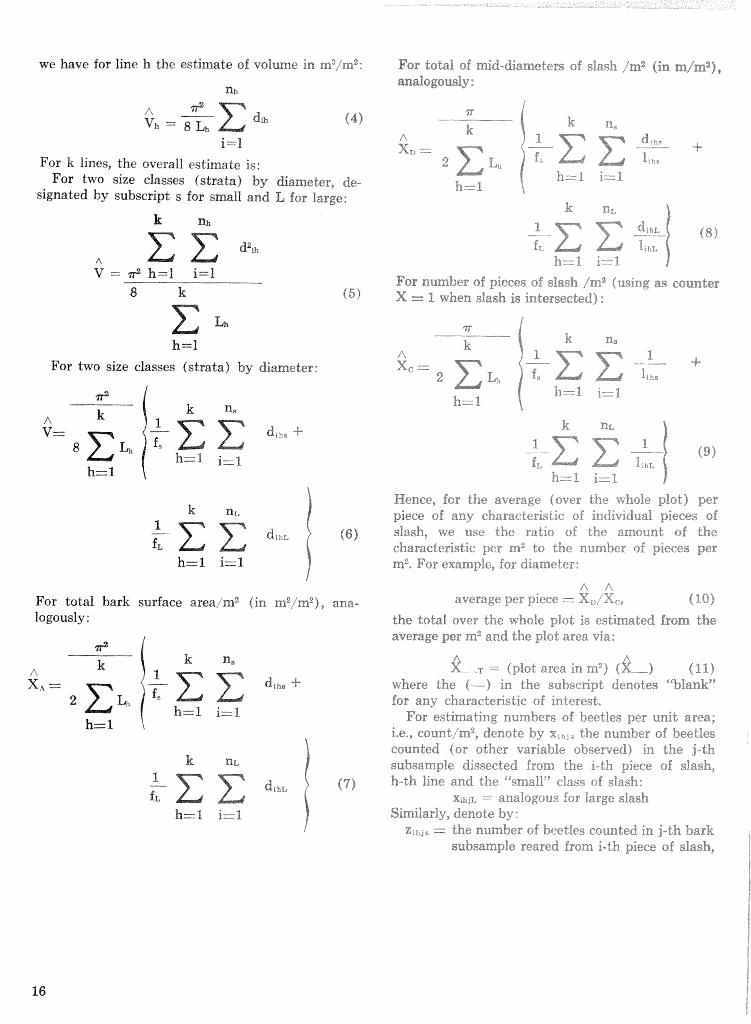
we have for line h the estimate of volume in rn3/rn2:
i=l For k lines, the overall estimate is:
For two size classes (strata) by diameter, de- signated by subscript s for small and L for large:
For two size classes (strata) by diameter:
For total bark surface area,lm2 (in m2/mz), ana- logously :
For total of mid-diameters of slash /ma (in xn/m2), andogsusly :
For number of pieces of slash ./xlViusiiig as counter X = I when slash is intersected) :
k fie
- fL -r-_ x $9)
h z b i&j, I
Hence, for the average (over the whole plot) per piece of any characteristic of iiidividual pieces of slash, we use ibe ratio of the amount of the characteristic per mq to the number of pieces per rn? Fw example, for diameter:
n A werage per piece r= X, /XX,., (10)
the total over the whole plot i s estimated from the average per m2 and the plot area via:
k ns P\ $..-1 = (plot area in m2) (X-_) (I I)
~ I I I S + where the - - - in the subscript denotes "blank" for any characteristic of interes~,
h==l i=I For estimating numbers of beeties per unit area: i.e., count/rn2, denote by xih,. the number of heeties counted (or other variable ohserv?ed) in the j-th
2% nt subsample dissected from the i-th piece of slash,
( 7 ) h-th line and the "'srnali" class of slash: x-hi:. --- analogou~ for large slash
h=$. i= l Similarly, denote by : z.,,, = the number of beeties counted in j-th hark
subsample reared from i-th piece of slash,
h-th line and small class of slash ztWL ---- analogous, for brge slash
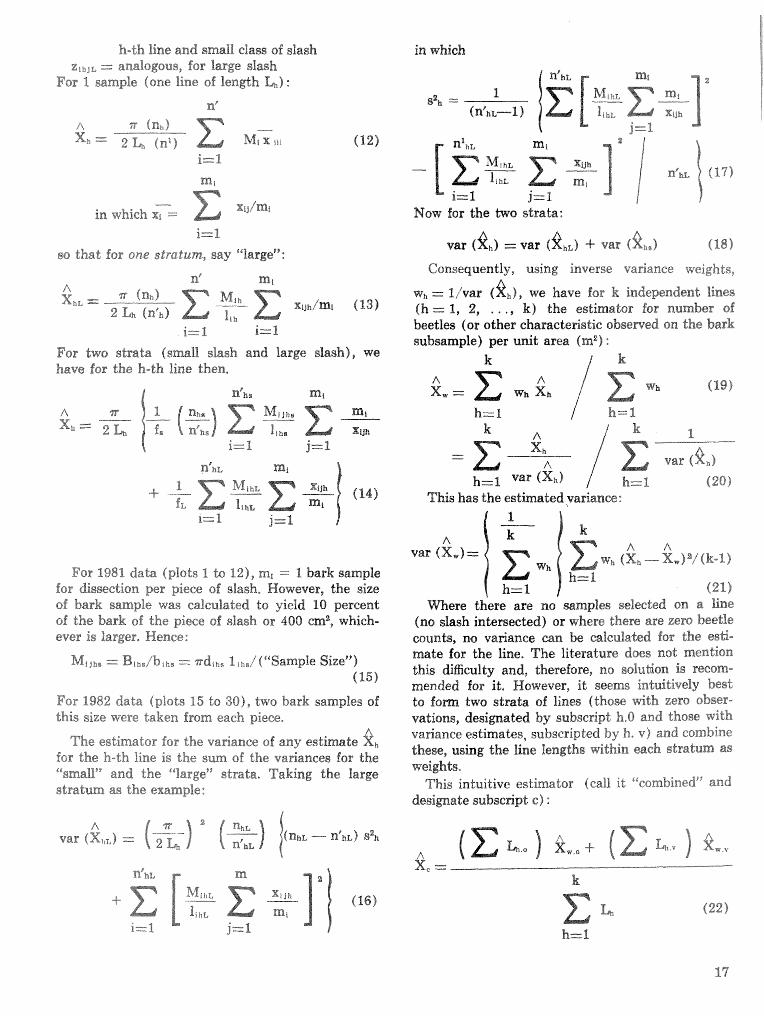
For 1 sample (one line of length L) :
so that for one stratum, say ""Barge"':
For two strata (smal slash and largo slash), we have for the kn-th line then,
For 1981 data (plots 1 4x1 12), rnl .= 1 bark sample for dissection per piece of slash, However, the size of bark sample was calculated do yield PO percent of the bark of the piece sf slash 01: 400 cm2, which- ever i s larger, Hence:
For 1982 data (plots 15 to 30), two bark samples sf this size were taken from each piece.
The estimator for the variance of any estimate fi, fcr the h-th Sine i s the sum of the va~ernees for the ''mnal19' and the "large" strata, Taking the large stratum as the example:
Now for the Lwo strada:
Consequently, using inverse variance weights,
w, = l/'var (fth), we have for k independent lines (h = 1, 2, . . ., k) the estimator for number of beetles (or other characteristic observed on the bark subsample) per unit area (m2) :
k
This has the estimated yariance:
Where tgere are no. samples selected on a line (no slash intersected) or where there are zero beetle counts, no variance can be calculated for the esti- mate for the line. The literature does not mention this difficulty and, therefore, no soluGon is recom- mended for it. However, it seems inkuitively best to f&lm two strab of lines (those with zero obser- vations, designated by subscript h.0 and those with variance estimates, subscripted by h. v) and combine these, using the line lengths within each stratum as weights.
This intuitive estimator (call it ""csmbined" rand desiprrte subscdpt c) :

where Z Lh c; = suan of line lengths of all lines con- t a i ~ n g zero observations for which no variance can be calculated, etc.,
--- sum of lengths of all lines over bath strata. We have made estimates based on two approaches:
the one described, and another that is analogous in all respects except- that we aggregated the obser- vations (lines) where possible until the counts were 2 or larger, Where this was not possible, the ob- semations sti81 went into the ""zero" "raturn.
This surnmafizes the procedure for direct esti- mation; that is, estimation for characteristics direct- ly obsewed in the sampling, Direct estimation would always be done for attributes of the slash itself, such as volume and surface area, which are based on &served dimensions, Analogously, for the subsample units, any characteristic actually observed can be directly estimated, including the counts of nuptial chambers, beetles by life stages from dissection or Pmm maring, gallery length, etc,
However, because the laboratory phase of count- ing beetles from the dissectisn srrhsamp'lcs or of actualy rearing from the samples is extremely costly, approaches must be considered that are based on estimating indirectly by regression from observa- tions of the easier-to-observe characteristics such as count of nuptial chambers and measure of piece size such as ~urface area. For this purpose, appropriate regressions have been investigated from our exten- sive data and reported for possible use by others in tho indirect approach.
For each of these plots, we have also estimated beetle count (dissection) by approaches involving three estimators each applied to unaggregated lines (hence six estimates) :
For unaggregated, then repeat for aggregated: 1) U'se our standard LIS estimator for the direet-
ly observed dissection count from subsampling (i.e., equation carrying through and combining the estimates from ""zero"9imes and '6non-zera'' lines) :
2) Use obsemed nuptial count, X,, and surface area of the slash, XI, in the regress-inn relating dissection count to these variables, i,e,, in:
to estimate the dissection count for each bolt, Now use this estimate mther than the obsewed dissection count in the same estimators as used in approach 1, above,
3) Estimate the average for tho plot of total surace area of slash lnahand, similarly, of nuptial count/'m? Then estimate these quara- tities on a ""per piece of slash" "basis, yielding average values of the X, and X, defined in 2) above. Now, use the same regression used In 2) to estimate average disscetion count on a '"per piece of slash" basis. On the basis of that, estimate the dissection eount/rn? ,The akps are :
a ) Estimate bark surface area./m2 for plot b) Estimate number of pieces of slash per rn2
using equation with comt variable of Xlih = 1 for each piece of slash intersected, no subsampling
e) Divide a) by b) do estimate bark surface area per piece of slash; convert to per bolt basis to get XI for the regression
d) Estimate nuptial count/m2 for plot e) Divide d) by b) to estimate nuptial count
per piece of slash; convert to bolt basis do
. L get f f i for the regression f ) Use regression from 2) above, with Xn --
x2 = fi2 from (c) and ( e ) as independent variables to estimate dissection count on per bolt basis, Y ,
g ) Estimate dissection esuntim2 for plot from: Y, (number pieces per unit area) (average number bolts per piece)
where Yb is from (f), number sf pieces is from (b), and average number of bolts per piece is from 2 BIhs"C b:hs, for small, for example,
RESULTS AND DISCUSSION
Estimates Pr~dueed
Measures of ha bits ble residue,-The amount of residue habitable by beetles may be measured in several ways, each possibly usehI for &Berend pur- poses. The most obvious measure of forestry interest is the volume af sfash left on the site, and much has been written about this. From the viewpoint of
habitat for bark bee"cies, however, the most relevant measure is surface area of the bark of the slash. Other indices that may be useful, especially as "rule of thumbR' indicators, are the average size (dianaeittr, length) of the pieces and the number of pieces of slash on the site,
When diameter and length of intersected pieces are observed, the &IS procedure readily provides estimates sf all these measures, on a per unit area basis. R'e have (via equations 9, 8, 10, 7 and 6) estimated, respectively, the number oi pieces, the to"%al of midsection diameters, the average diameter of pieces of slash, the surface area of bark, and the volume of the slash (refer do table 7).
Perhaps most remarkable is how little slash was actual%y- present on any of the sites and how rela- tively small were the differences between averages for tracts harvested in different ways.
Relationships among measures of beet Ee pres- ence,----Recalf that data are available for reared beetle counts only for plots 15-30. (For plots 1-12, all other data are available,) It is informative to consider the average relationships m o n g the mea- sures of beetle presence (beetle counts from dis- section, beetle counts from rearing, c~ilints of nuptial chambers from dissection, and measurements of length of galleries) based on all the observations (plots 15-30),
'We began with the assumption that there should be a relatively stable ratio of reared count to dis- sected count. However, zero counts were so often found either for dissection or reared that ratios were undefined s r othewise ill-behaved. To overcome this problem, 1 was added to all counts, both dissected and reared, and then the ratio of these adjusted counts was ealcultated for each sample bolt. These proved to be extremely variable. Counts were then plotted over diameter by size stratum and plot in an attempt to find a basis that would yield ratios stable enough for use in indirect estimation or in some way kdieative of underlying relationships. None of these; attempts were successful; hence, it was necessary do deternine whether more complex relationships involving ulzivariate--or, untimately, multivaria te-regressions mlgh t be informative and useful for estimation,
we f i t ted ordinary univariate linear regressions of the form:
%" ---i B, -+ B,X, Two dependent variables were considered: Y, which were reared counts (""reared" ")or dissection counts ( ""dassected" ")and the independent variables either nuptial chamber count (""muptials"")ar galleries length (""galleries" ") The erefationship of "gaIleries9' (Y) to i i n~p t i a f~ ' 9 (X) and "=earedH "(V) to ""ds- seeded" ( X i Nwerc: also examined.
The measure of linear association for which most have an intuitive appreciation is the eoeEcierad of detemination, R" which is the proportion of the total variation of k" that is accounted for by the linear relationship with the independent variable, X, Although all the refationships are statistically sig- nificant, there is no case where more: than half of the variation in either reared count or dissected count is accounted for by the regression (table 1)- The re- lationships to dissected counts are always substan-. tially stronger (two to three times as measured by R2) than for reared counts. There is a strong associa- tion (R2 --- ,965, table 1) between gallery length, and nuptials.
From the viewpoint of estimation, which is our ultimate objective here, the more relevant statistics are those that may be used to measure precision sf estimates from the relationship. Hence, several refe- vant summary statistics are presented in table 1) : - U = arithmetic mean of the dependent variable MSE t=: ".y = square root of the mean square error
from error row of ANOVA of linear re- gression
n n B,, B, = estimates of regression coeEeients std, error of B,,, B, =I square soot of the estimated
variance of each regression coeficient
These results make it evident that for estimatior~ purposes the relationship of dissection to nuptials is most promising. The nuptial chamber count is much less time-consuming and can be mare objec- tively observed than can gallery leligth,
Relationships of measure of beetle presence to size of slash.-We hypothesized a prlosi that the size of the slash would be related to the level of beetle popu- lations. However, i t was not known just what mea- sures of size of slash would be most useful sr how strong this relationship might be in the presence of other influencing factors.
In the explorations of relationships to size of slash, linear regressions were fitted of each of the four measures of beetle presence (nuptiaBs, galleries, dis- sected, and reared) upsn both diameter and surface area of the slash samples. The regressions were all statistically significant. However, their predictive power was disappointing (table I); in no case was more than. 40 percent of the variation in measures of beetle presence accounted for by the irefationship to slash diameter or surface area,
Nuptial chamber counts and length sf galleries are highly correlated (R2 = -96, table I ) , and the rela- tionships of both these measures do surface area are almost equivalent (table 1)- The relationship of disseeted counts to surface area is best in terms of relative mean square error (table 11, and (recall the previous discussion) the relationship 06 dissected to
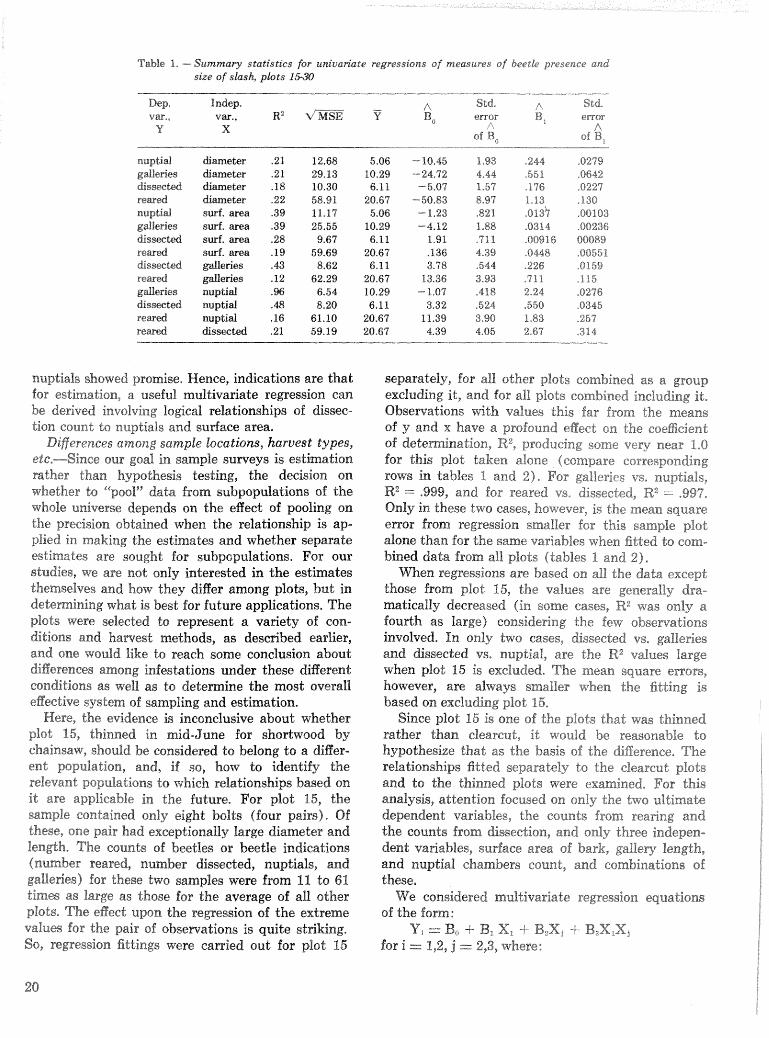
Table 1. - Summary statistics for un iva~a te regressions of Pnemuws of beetk presence and size of slash, pb t s 15-20
Dep. IarPep, - A Std. n Std. vm.%., VW., R2 U BO emor i- Bl error
Y X A of B, of B,
diiarnekr diiarnebr d-imekr & a e 9 r surf. area swf. m a surf. arc?& swf. mea Neries gderies nuptial nuptial nuptid dissee&
nuptials showed promise, Hence, indications are that for estimation, a useful multivariate regression can be derived involving l o ~ c a l relationships of dissec- tion count to nuptials and surface area.
Diflerences among sample %cteatiom, harvest types, etc,-Since our god in sample surtreys is esthation rather than hypothesis testing, the decision on whether to "poolfVa$a from subpopulations sf the whole universe depends on the effect of pooling on the precision obtained when the relationship is ap- plied in making the estimates and whether separate estimates are sought for subpopulations. For our standies, we are not ~ ~ l l y interested in the estimates themselves and how they differ among plots, but in detemining what is best for future applications. The plots were selected to rc?presenl a variety of con- ditions and harvest methods, as desGribed easlier, and one would like Lro reach some conclusion &out digesences among infestations under these difEc3rent conditions as well as to delemine the most overall egeetive system of sampling and eslimation.
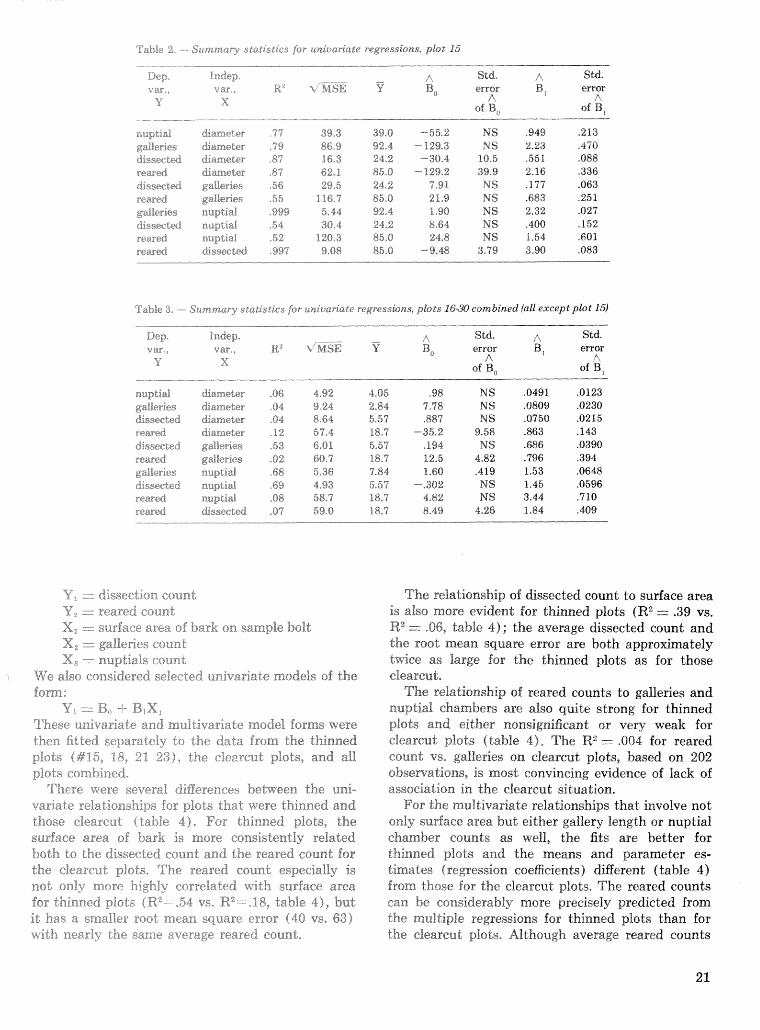
Here, the evidence is inconclusive about whether plot 15, thinned in mid-June for shorb;wosd by chdnsaw, should be considered to belong La a diger- end population, and, if as, how to identify the relevant populations to rx~kich relationships based on it are applicable in the future. For plot 15, the sample contained s d y eight bolts (four pairs). Of these, one pair had exceptinnally Barge diameter and len@h, The court& of beetles or beet;le indications (number reared, number dissected, nuptials, and galleGes) for these two amples were ham 11 to 61 times as large as those h r thC? average of all 0 t h ~ plots. The eEect upn the resession of the &reme values for the pair of observations is quite striking. So, regression fittings were carried out for plot 15
separately, for all other plots combined as a group excluding it, and for all plots combined including it. Obsewad-ions ~ t l r values this far from the means of y and x have a profound effect on the coefficient of deteminatioiiz, R" producing some very near I,O for this plot taken alone (compare corresponding rows in tabks 1 and 2). For galleries vs, nuptials, Eta - -999, and for reared vs, dissected, R G =1.997, Only in these two cases, however, is the mean square error from regression smaller for this sample plot alone than for the same variables when fitted to corn- bined data from 2711 plots (tab1 es 1 and 2).
m e n regressions are based can all the data except those from plot 15, the values are generally dra- matically decreased (in some eases, R2 was only a fourth as large) considering the few obsen"va8;ioxas involved, In only two cases, dissected w, galleries and dissected w, nuptial, are the RValues large when plot 15 is excluded, The mean aquare errors, ho~rever, are always smaller when the fitting is based on excluding plot $5,
Since plot 15 is one of the plots that was thinned rather than clearcut, it would be reasonable to hypothesize that as the basis sf the difference, The rehtionships f i t ted separately to the clearcut plots and to the thinned plots were examined, For this analysis, attention focused on only the two ultimate
I
dependent variables, the counts from rearing and the counts $ram assection, and only three indepen- dent variables, surface area of bark, gaH%ery Hen@h, and nuptial chambers count, and combinations of these,
We considered multivariate regression equations of the form:
M, f= B, i- B, XI -I- B2X, -i- B,X,Xj for i = l,2, j =r: 243, where:
Dep Xndep, - i A 1 Std. A Std. " 'iL id.9 ~aur.~ R" \ X i Y emor 1 error
V X ,2 A of B, of B,
;~l;ap",s galleries dissect-& reared di.isectdL reared gdleries dissected reared reared
~ ~ ~ e t ~ t " diameter diameter diameter galleries galleries nuptial n u ? t ~ d nuptial dissected
Table 3, --- Summary statisties for univariate regresskcins, plots 26-M combined (all except plot 15)
nuptid galleries dissected reaxed dissected reared gdigeries dis~ected reared rewed
- -
diameter diameter diiameter diameter gallerias gdleries n.dptiaJ nuptial nuptid dissected
Y, = dissection eount T.7 - r - reare& count XI = surface area of bark on sarnple bolt X, = gajieries eount X , = nuptials count
We also considered selected uni-fs-ariate models of the form :
U, = B, -I- B,X, These univariate and multivariate model forms were then f i t t ed sepa~ately t~ the data from the thinned plots (#Is, 18, 21 23 j; the clearcut plots, and aU plots combined,
r- 1 here were several differences between the uni- .;~aria-B;e relationships for plots that were thinned and those cieareut (table 4 ) - For thinned plots, the surface area sf bark i s more consistently related both to the dissected count and the reared count for the clearcut plots* The reared count especially i s not ~ n l y more highly correlated viith surface area for thinned plots (R" 54 VS, R2== ,IS, table 4), but it has a smaller r o ~ t mean square error (40 VS, 63) wish n e d y the same average reared count,
The relationship of dissected count to surface area is also more evident for thinned plots (RZ = .39 vs. R2 = -06, table 4); the average dissected eount and %%"I@- root mean square ermr are both approximately twice as large for the thinned plots as for those clearcut,
The relationship of reamd eounts to galleries and nuptial chambers are also qui te strong far thinned plots and either nonsignificant or very weak for clearcut plots (table 4) - The R2 = .004 for reared count vs, galleries on clearcut plots, based on 202 obsemations, is most esxlviincing evidence of lack of association in the clearcut situation.
For the multivariate relationships that involve not only surface area but either gallery length or nuptial chamber eounts as well, the fits are better for thinned plots and the means and parameter es- timates (regression coeficients) different (table 4)- from these for the clearcut plots. The reared counts can be considerably more precisely predicted from the multiple regressions for thinned plots than for the cieareut plots, Although average reared counts
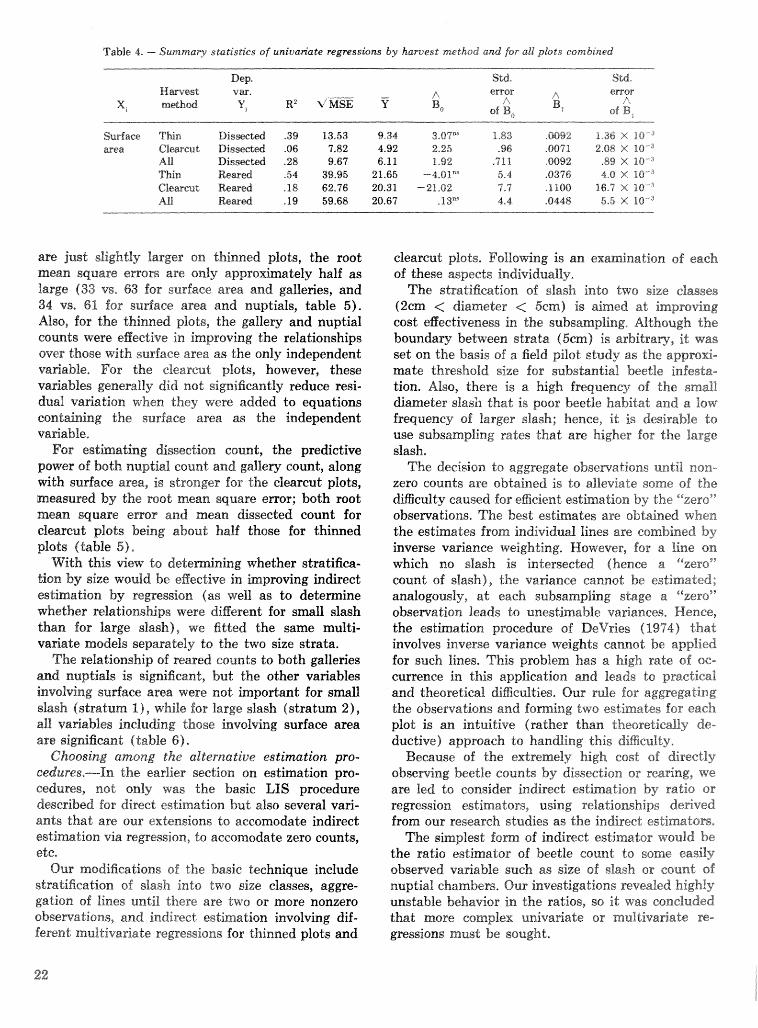
Table 4. - Summary statisties of uniuan'ate regresskm &by haruest m t h s d and for all plots combined
Surface T b Dis=t(?d .39 13.53 934 3.87"" 1-83 .W32 1.36 X 20-" area GZ-cut Dis -06 7.82 4.92 2.25 .96 .BQ71 2.08 X 101'
AU DiswM -28 9-67 6.11 1.92 -911 ,0092 .89 X f 0-3 T b Re=& -54 39.95 21.65 -4.01"" 5.4 .0376 4.Q X So-3 Clewcut ha& .I8 62.76 20.31 -21-02 7.7 *%I00 36-7 X AB &w& .19 59.68 20.67 .a 3rnS 4.4 .0448 5.5 x lo-"
are just slightly larger on thinned plots, the root mean square errass are only appro~rnately half as large (33 VS, 63 far surface area and galleries, and 34 vs, 61 for surface area and nuptials, table 5). Also, for the thinned plots, the gallerry and nuptial counts were efffeclive in improving the relationships over those with surface area as the only independent vafirrble. For the clearcut plots, however, these vadabfes generally did not sig~lificantly reduce resi- dual vaGation when they were added to equations containing the surface area as the independent vadable.
For estimating dissection count, the predictive power of both nuptial count and gallery count, along with surface area, is stranger for the clearnut plots, measured by the root mean square error; both root mean square error and mean dissected count for elearcut plots being about half those for thinned plots (table 5),
With this Gew to dete ning whether stratifica- tion by size would be eRective in hproving indirect estimation by regression (as well as to determine whether relationships were different for small slash than for large slash), we f i t ted the same multi- va~lzte models separately to the two size strata.
The relationship of reared counts to bath galleries and nuptials is signiscant, but the other variables irmvo2Gng surface area were not important for small slash (stratum 11, while for large slash (stratum 2), all va~ables including those involving surface area are significant (table 6),
Choosing among the alderaatiue estimation pro- cedures.-In the earlier seetion on estimation pro- cedures, not only was the basic LTS procedure described for direct estimation bud also seved vari- ants that are our extensions do aceonnodate indirect estimation via regression, to aceornodate zero counts, etc.
Our modifications of the basic technique include stratification of slash into two size classes, aggre- gadion 0% lines until there are two or more nonzero obsewatisns, and i.ndirect estimation involving dif- ferent multivariate regressions for thinned plots and
cleareut ploks, FoBI&twing is an exadailtion sf each of these aspects individually,
The stratification of tislash into two size classes (2cm < aameter < Sern) is aimed at improving cost effectiveness in the subsampling, Although the boundary between strata (5cm) is arbitram, it was set on the basis of a field pilot study as the approxi- mate threshold size for substantial beetle infesta- tion. Also, them is a high frequency of the small diameter slasir that is poor beetle habitat rand a Icrw frequency of larger slash; hence, id is desirable to use subsampling rates that are higher for the Barge slash.
The decision do aggregate obsemations until non- zero counts are obtained is to alleviate some of the dificulty caused for eacient estimation by the "zero" obsemadions. The best estimates are obtained when the estimates from individual lines are combined by inverse variance weighting. However, for a line on which no slash is intersected (hence a "zero" count of slash), the variance cannot be estimated; analogously, at each subsampling stage a tgzero'' observation leads do unesdimabile variances, Hence, the estimation procedure sf DeVfies (19'74 3 that involves inverse variance weights cannot be applied for such fines. This problem has a high rate of csc- currenee in this application and leads to practical and theoretical dilfieulties. Bur mte for aggregating the obserwtions and foming two estimates for each plot is an intuitive (rather than theoretically de- ductive) approach to hartcUing this diEculdy,
Because of the extremely high cost of directly obseming beetle counts by dissection or rearing, we are led to consider indirect estimation by radio 6P regression estimators, using relationships derived from our research studies as the indirect estimators,
simplest fom of kdirect estimator would be the ratio estimator of beetle count to some easily obsencved vafiable such as size of slash or count of nuptial chambers, Our ]investigations revealed highly unstable b e k a ~ o r in the ratios, so it was csncluded that more complex univariate or rnulkivadake re- gressions must be sought.
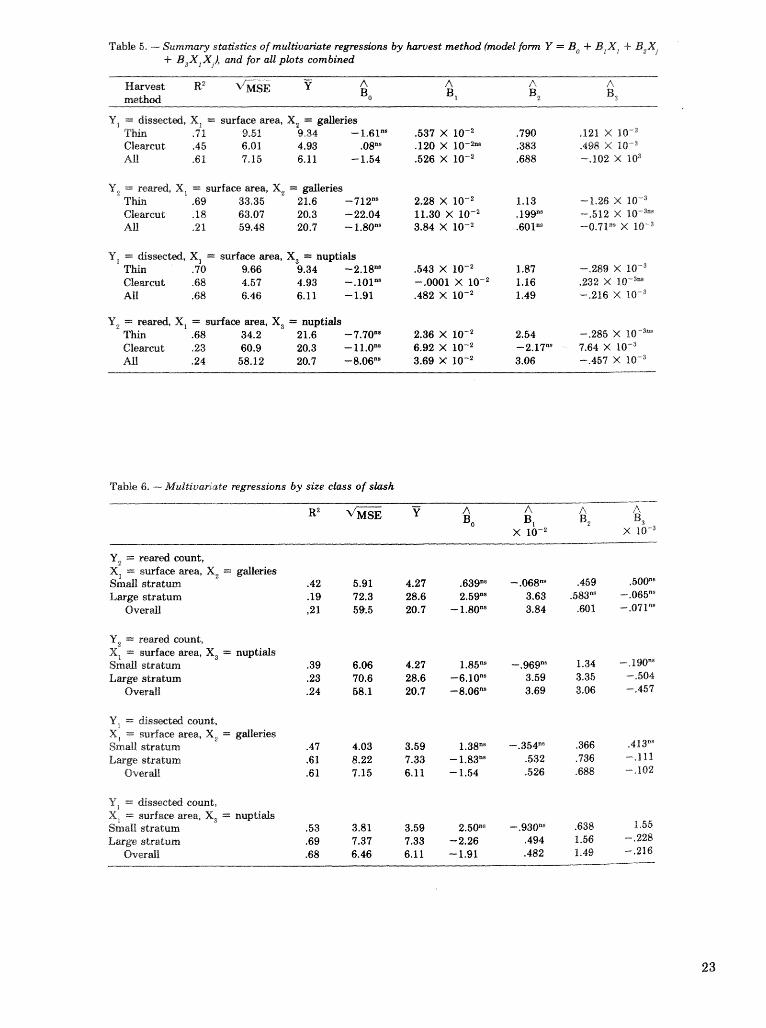
Tabb 5. - Summary stattstics of multivahte mgressians by est method (model form Y = B, + B,X; + + B,X,XS)s and for all plots combined
UZ -- remd, XI = surface m a , X, = weries Tkin '69 33.35 21.6 -71ZM 2.28 X lo-' 1.13 -1.26 x Clearcut . f 8 63.07 20.3 -22.04 11.30 X low2 .19P9"" -.512 X 10-""l All .21 59.48 20.7 -1.80"" 3-84 X loe2 .601" -0.71"" X
Y, = &ssectd, X, = surface m a , X, = nuptids Thh .7B 9.66 9.34 -2.18"' .543 X 1.87 -.2&9 X loe3 Clewcut .68 4.57 4.93 --.lOlne -.OOOl X 1 0 - V . 1 6 .232 X All .68 6.46 6.11 -1.91 .482 X 1W2 1.49 --,216 X
U, =: rear&, X, = surfam area, X, = nuptials Thin .68 34.2 21.6 -7.70"' 2.36 X 2.54 -.285 x 1.0~~"~ Cleascu t .23 60.9 20.3 - 11.0"' 6.92 X lo-' -2.17"" 7.64 X AU .24 58.12 20.7 -8.06"" 3.69 X 3.06 ---457 x
Table 6. - Multivanake rwressiotas by size class of slash
Y2 = remed count, X, = surface area, X, = galleries Small ~ t r a tum Large stratum
Overdl
V, = re=& eount, X, = surface areat X, = nuptids S m d stratum Lmge stratum
Overdl
V, =. dissecM count, X, -- surface asea, X , = galleries SmllEl stratum Lwge stratum
Over dl
"9, = dissecj.ettJd count, X, = surface mea, X, = nuptials Smdl stratum Large stratum
Ovctsdi
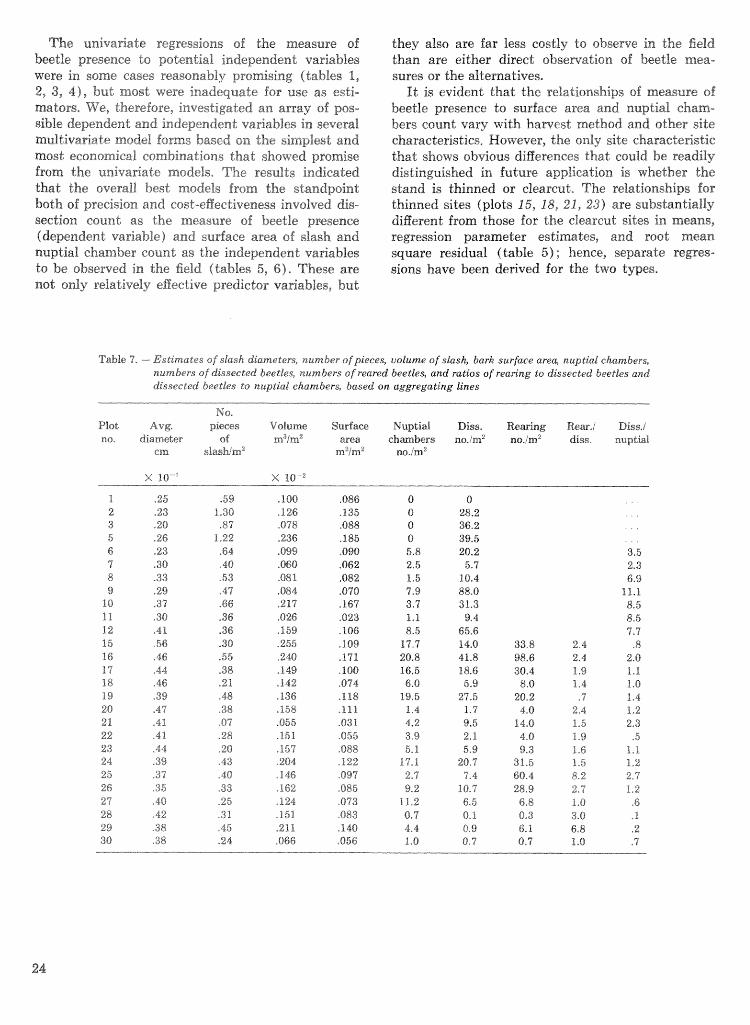
The univa~ate regressions of the measure of beetle presence do potential independent variables were in some cases "6e;lsonably promising (tables 1, 2, 3, $), but most were inadequate for use as esti- mators, We, therefore9 investigated an array of pos- sible dependent sand independent variables in several multivarisk~ mode1 forms based on the si~nplest and most economical combinations that showed promise from the univariate models, The results indicated thad; the overall best models from dbe standpoint both sf precision and cos"t-e~ectiveness involved dis- seetion count as the measure of beetle pmsence (dependent variable) and surface area of slash and nuptial chamber count as the independent variables La be obsemed in the field (tables 5, 6)- The- be are not only relatively egective predictor vaGabtes, bud
they also are far less costly to obsewe in the field than are either direct obsen-adion of beetle mea- sures or the a'lternstdives,
I d is evident that the relationships of measure of beetle presence to surface area and nuptial cham- bers count vary with kamest method and other site characteristics, However, the only site characte~stic that shows obvious digerences that could be readily disdinwished in future application is whether the stand is thinned or clearcut, The relationships for thinned sites (plots 15, 28, 21, 23) are substantially ditFerend from those for the elearcut sites in means, regression parameter estimates, and root mean square residual (table 5) ; henee, separate repes- sions have been defived for the two dses.
Table 7. --- Estimates of slash diameters, number ofpieceq volume of slash, bark surfice area, nuptial chambers, numbers of dissected becpdbs9 numbers of reared beetles, and ratios of rearing do dissected beetles and dissected beeties to nuptiai chambers based on aggregating lines
No, Plot Avg. pieces Volume Surface Pu'uptir-rl Diss. Rezing Re=./ I3iss.i no. diameter of rn3irn2 area chmbers n0./m2 no./m2 digs. nuptial
cm slashim" m2irnz m.irn2
LITERATURE CITED
Belanger, R. P.; Porterfieid, R. L.; Rowell, C, E. Development and validation of systems for rating the susceptibility of natural stands in the pied- mont of Georgia to attack by the ~ ~ ~ L l i e i ~ i jiht beetle, In: Hedden, R, L,; Barras, S. 3.; Costfar, J. E., eds. Hazard-rating systems in forest pest management: symposium proceedings; 1951 July 31-August 1; Athens, GA. Gen. Tech. Rep. WO-27. Washington. D. 6.: U.S. Department of Agriculture, Forest Service; 198 1 : 79-86.
Berisford, C. W.; Kulrnan, H. &id; Pienkowski, R. L.; Heikkenen, H, J. Factors affecting distribution and abundance of hyrnenopterous parasites of i p s spp. hark beetles in Virginia (Coleoptera: Seoly- tidae). Canad. Entornol. 103: 235-239; 1971.
Berisford C. W.; Franklin, R. T. Attack patterns of Ips avulsus and I. grandicollis (Coleoptera: Scoly- tidae) on four species of southern pines. Ann. EntomoI. SOC, 8hn, 64: 894-897; 1971,
Birch, M. C.; Svihra, P.; Paine, T. D.; Miller, J. C. Influence of chemically mediated behavior on host tree colonization by four species of bark beetles. J, Ghem. Ecsi, 6: 395-414; $980,
DeVries, P. G. A general theory on line intersect sampling. Bulletin 73-11. Wagmingen, Nether- lands: Mededelingen Landouw Hogeschool; 1973. 23 p.
DeVries, P. G. Multi-stage line intersect sampling. For. Sci, 20: 129-133; 1974.
DeVries, P. G. Line intersect sampling-statistical theory, applications and suggestions for extended use in ecological inventory. In: Corrnack, R. 39,; Patis, G. P.; Robson, D. S., eds. Statistical ecology 6: sampling biological populations. Bur- tonsville, MD: International Co-operator Publish- ing House; 19'99: 1-70,
Feldman, R. M.; Wagner, T. L.; Sharpe, P. J. H.; Gagne, J. A*; Coulson, R. N. TVithin-tree l i fe process models of the southern pine beetle, Den- droctonus frontalis. Ecol. Model. 13: 247-259; 1981a.
Feldman, R. M.; Curry, G. L.; Coulson, R. K. A mathematleal model of field population dynamics of the southern pine beetle, D~ndroctonus jron t- ails. Ecof, Model, 13: 261-281; 1981b-
Hain, F. P.; McCeiland, W. T* Studies of declining and Isw Iwel popufations of the southern pine beetle in North Carolina, In: Hain, F, P,, ed, Wcrk conference on population dynamics of forest insects, 1979 August 9-10; North Carolina State University, Raleigh, N%I ; 1979 : 9-26,
Hazard, J. W.; Pickford, S. G. Cost functions for the line intersect method of sampling forest resi-
due in the Pacific Xorth.&est, Cacad, J- Far, Res, $4: 57-62: 1984,
Hicks, R. R.? Jr.: Howard, .J. E.; Watierson, K. 6.; Caster, J, E, Rating forest stand susceptibility to southern pine beetle in east Texas. For. Ecoi. %fanage. F 226-283; 1980.
Hines, G. S.; '1 aha, f i . A.: Srtphen, F, &I. TV:sdcl fsr predicting southern pine beetie population growth and tree mortality, in: Stephen, F. &I.; Searcy, J. L.; Hertel, G. 13, eds. lilodrling scuthern pine beetle populations: symposium proceedings; ISSO February 20-22; Ashi~ll ie, KC. Tech, Bull. No. 1630: iyashington, DC: U.S. Department of Agri- culture; 1980: 4-12.
Hodges, J. D.: Pickaid, L. S. Lightning in the ecol- ogy of the southern pine beetle, Dcndroctonus fron talis (Coieoptera: Scalyi;dae). Ganad. En- tomol, 103: 44-51; 1971.
Ku, T. T.; Sweeney, J. M.; Shelburne, V. B. Site and stand conditions associated witla southern pine beetle outbreaks in Arkansas---a hazard rating system. South. J. Applied For. 4: 103-106; 1980,
Lorio? P. L.; Sornrners. R. A. Use of available re- source data tea rate stands for southern pine beetle risk, In: Hedden, 8, L,; Barras, S, J.; Cosier, 3. E., eds. Hazard-rating systems in forest pest management: symposiuni proceedings, 1981 July 31--August 1; Athem: CA* Gen. Tech. Rep. WO-27. \Vashington: D.C. : U.S. Department of Agriculture, Forest Service; 1981 : 75-86.
Rforgan, R. R. Behavior of i p s populations after summer thinning in a iobloily pine plantation. For. Sei, 15- 390-398; 1969,
IvIorgan, R. R. Comparison of flight aggregation in two species 9f southern ips (Coieoptera: Scolyti- dae) . Canad. Entornol. 102: 1036-1 041; 1970.
hlorgan, F. D. Ips grnrtdiroilis in South Australia. Austra%ian Fores~ry 31 : 134-155; 1967,
Nebeker, T. E. Forestry practices and bark beetles, a perspective. In: Insects and diseases of south- ern forests: proceedings. 31th Annual LSU For- estry Symposium. 1985 &larch 26-27; Baton Rouge, LA: 1985, ( I n press.)
Xebeker, 7. E,; Nndges, J. D. Influence of forestry practices on host susceptibility to bark beeries. Zeit. angeu;. Eniarnol. 96: 134-208; 1953,
Speers, C. F. Ips bark beetles in the South, For. Pest Lerlfl* 129. IYashicgtcn, DC: U S Depart- ment of Agriraliure, Fortst Service: 1971.
Van Wagner, G. E. The line intersect method in forest fuel sampling. For. Sci. 1-41 20-26; 1968.
Warren, W. G.; OIsen, P. 2;'. A i ine intersect tech- nique for nssessiiig logging waste. For. Sci. 10: 267-276; 196.4,
Turpentine-Baited Traps Capture Black Turpentine Beetles and Other Forest Coleoptera but do not Prevent Attacks on Pines
Carl W. Fatzinger'
A bs; trae t.-Turpen tineebaited traps captured sev- eral species af forest Coleoptera and were particularly egectivr? for monitoring blaek turpentine beetles, palies weevils, pitch-eating weevas, southern pine sawyers, and Carolina pine sawyers, The traps were not eEective for preventing attacks by blaek durpern- dine beetles on 1.7 ha plots containing slash pines artificially stressed with either a bark wound or zr hark wound treated with paraquat, or OM check plots with unwounded trees. Captures of black turpentine beetles were increased 59 percent by the addition sf ethanol t o the turpentine bait, but the improved bait has not been evaluated for preventive control. Additional keywords : Pinus elkio t t i& var. elllo t tii, lrost attraction, Dendractonus terebrans, paraquat- treated trees,
The black turpentine beetle (BTB) endro roc to- nus dere brans Q Biivier ) usual1 y causes only minor dawrtrge in southern forests, but during sporadic major outbreaks ids damage is quite serious. The in- sect shows a preference for bark of freshly cut stems or the bases and roots of living and dying trees ( S ~ d h and Kowal 1968). I d is attracted to trees disturbed by logging, naval stores operations, lightning, or drought (Srr;liidh and Lee 1957), During the early 1%0's, the BTB virtually f orced many turperatine Earners out of business (Merkel 1981) and destroyed an estimated 3"i"zniZlisva board feet of timbes in the southeastern United States. The BTB again became a serious problem during the late 1970%s, attacking up to 50 percent of the faced trees in gum naval stores stands in Georgia and Florida and damaging ornamental pines in urban and forested recreationam Elreas,
Preventative and remedial controls for the BTB are currently l h i t e d to spraying the bark of trees
1 Research Entomologist, U.S, Depadment of Agriculture Forest Service, Southeastern Forest Experiment Station, Olustee, FL, (This work was partially funded by the Trrte- grated Pest Management Program, U.S. Department of A g ~ - culture, Forest Service, Southern Forest jexperiment Station, and the @iecbr$a Forestry Go ission. Appreciation is ex- pressed to David hfuse, U.S. Department of Agriculture, Forest Service, Southeast-ern Forest Experhent Station, for kelp in analyzing tbe study results.)
with lindane or chforpyrifos insecticides. A trapping technique could be useful for monitoring field popu- lations of the insect to predict needs for preventive control during sporadic outbreaks* Traps might also be useful for- preventing BTB attacks in small stands of susceptible pines or for reducing attacks on orna- mental trees in residential areas,
Hspkins (1909) obsemed swarms of BTB near freshly painted buildings rvhere there was a strong odor of turpentine; he also reported the speeicss3hab- ii; of flying into, and bouncing from windows and doors, Hughes (1975) reported trapping BTB adults in field ~1Eactometers baited with resin of loblolly pine (Pinus taeda L,), and CZernents and Williams (1981) captured numerous BTB in stove pipe traps baited with turpentine freshly distilled from the oleo- resin of slash (Pa elliottii Engelme var, elliottit) and lorlgleaf pines (P, palaastrks MiBI,),
The study described here was initiated in 1980 to : (I ) evaluate diEeren t techniques for trapping the BTB; (2) determine optimal periods for trap- ping by investigating peak seasonal and daily times of BTB flight activities, and the influenee sf weather on daily flight periods; and 43) evaluate the use of BTB traps for preventing attacks on pines in small tracts such as naval stores or lightwood production areas,
Several trap designs, bait dispensers, and trap cof- ors were evaluated for capturing BTB, A modification of f i e stove pipe trap designed by Clements and Wil- liams ( 1981 ) baited with freshly distilled turpentine2 was selected as a standard trap for experirncmts (fig* I ) , Details of studies on the designs of traps and bait dispensers, improvements of the turpentine bait, daily and seasonal periods of peak trap captures, and the effects of lacar weather conditions on BTB flight activity are described in a paper submitted elsewhere for pubIieation,
Four studies were installed in north Florida be- tween June 1980 and March 3982 to evaluate the use
2 Turpentine distilled from the clecsresim of slash and long- leaf pines was obtahed from the Shelion Naval Stores Proc- essing Company, VaIdosda, GA,
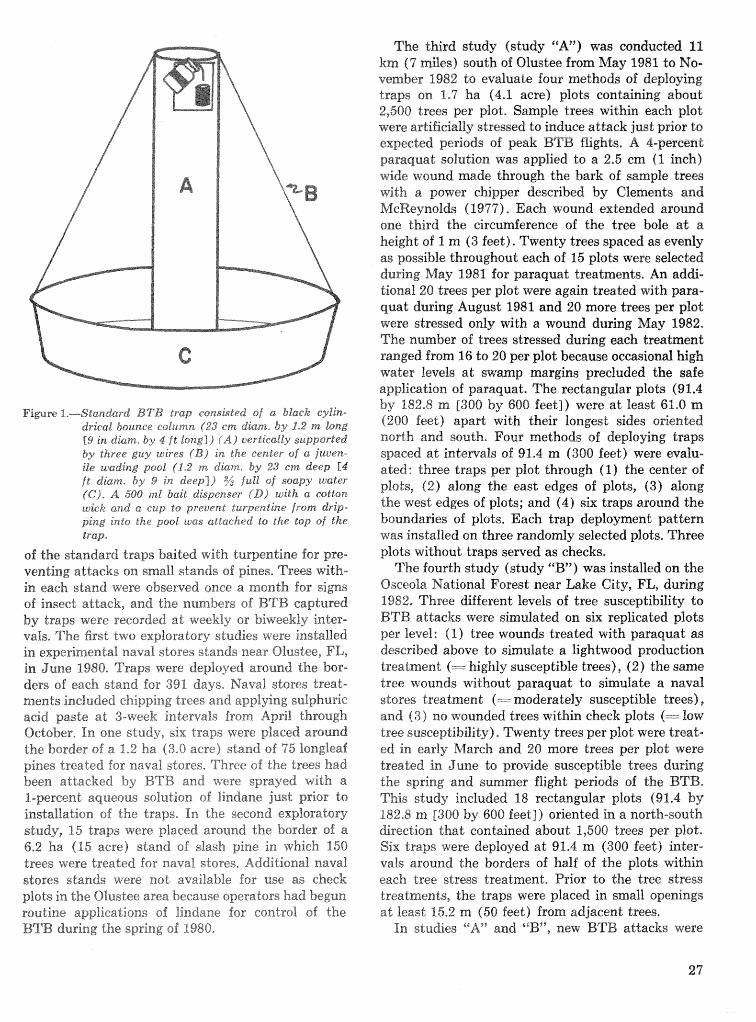
Fiwre 1.---Standard BTB trap cepnskted of a black eykin- drical bounce column (23 crn diam, by 1.2 m %on$ E9 in diam. by 4 f t loargl) (A ) vertically supported by three guy wires (B) in the center of a juuen- ile u*adii-,$ pool (1.2 rn d k m , by 23 crn deep Id f t diam. by 9 in d e e p ] ) :,s full of soapy water (C). A 5130 ml bait dispenser (Dl with a cotton wick and a cup to pseveltt turpentine from drip- ping into the pooE was attached to the top sf the trap.
of the standard traps baited with turpentine for pre- venting attacks on small stands of pines, Trees with- in each stand were observed once a month for signs sf insect attack, and the numbers of BTB captured by traps were recorded at weekly or biweekly inter- vals. The first two exploratory studies were installed in experimental naval stares stands near Oiustee, FE, in. June 4980. Traps were deployed around the bor- ders of each stand far 391 days, Naval ston;s treat- nraents included chipping trees and applying su~plrrrrric acid paste at 3-week intervals from April through October, In one study, six traps were placed around the border of a 9-22 ha (3.0 acre) stand of 75 longleaf pines treated. for naval stores, Three of the trees had been attacked by BTB and were sprayed with a 1-percent aqueous sohution of lindane just prior to installation of the traps. In the second exploratory study, 15 traps were placed around the border of a 6.2 ha (15 acre) stand sf slash pine in which 150 trees were treated for naval stores, Additionahnaval stares stands were not available for use as check plots in the O%uskee area because operators had begun routine applications of ligadane for control 06 the BTB during the spring of 1980,
The third study (study ""A") was conducted 2.1 km ( b i l e s ) south of Olustee from May 1981 La NO- vember I982 to evaluate four methods of deploying traps on 13 ha (4.1. acre) plots containing about 2,500 trees per plot, Sample trees within each plot were artificia11y stressed to induce attack just prior to expected periods of peak BTB flights, A $-percent paraquat solution was applied to a 2.5 cm (1 inch) wide wound made through the bark of sarnpfe trees with 23 power chipper described by CIements and McReyrrolds (1977). Each wound extended around one third the circumference of the tree bole at a height of 1 m (3 feet). Twenty trees spaced as evenly as possible throughout each of 15 plots were selected during May 1981. font pamquat treatments. An addi- tional 20 trees per plot were again treated with para- quat during August I981 and 20 more trees per plat were stressed only with a wound during May 1982, The number of trees stressed during each treatment ranged from I6 to 20 per plot because occasional high water levels a t swamp margins precluded the safe application of paraquat. The rectangular plots (91.4 by 182,8 rn [300 by 600 feet]) were at least 61.0 m (200 feet) apa& witb their longest sides o~ersted north and south. Four methods of deploying traps spaced a t intervals of 91.4 m (300 feet) were evalax- aated: three traps per plot through ( I ) the center of plots, (2) along the east edges of plots, (3) along the west edges of plots; and (4) six traps aroraad the boundaries of ploh. Each trap deployment pattern was installed on three randomly selected plots, Three plots without traps c;erved as checks.
The fourth study (study ""By was installed on the Bseeola Na"cona1 Forest near Lake City, E'L, during 1982, Three different levels of tree susceptibility do BTB attacks were simulated on six redieated plots per level: (1) tree wounds treated witb paraquat as described above to simulate a lightwood production treatment (== highly susceptible trees), (2) the same tree wounds without paraquat to simulate a naval stores treatment (= moderately susceptible trees), and (33 no wounded trees within cheek plots (= low tree susceptibility), Twenty trees per plot were treat- ed in early hIareh and 20 more trees per plot were treated in June to provide susceptible trees during the spring and summer flight periods of tbe BTB, This study included 18 rectangular plots (91.4 by 182,8 m [300 by 600 feet]) oriented in a noztkr-south direction that contained about 1,500 trees per plat, Six traps were deployed a t 91.4 m (300 fee%) inter- vals around the borders of half of the plots within each tree stress treatment, Prior to the tree stress treatments, the traps were placed in small openings ad least 15,2 rn (50 feet) from adjacent trees. Zn studies ""A" aa~d "B'99 new BTB attacks were
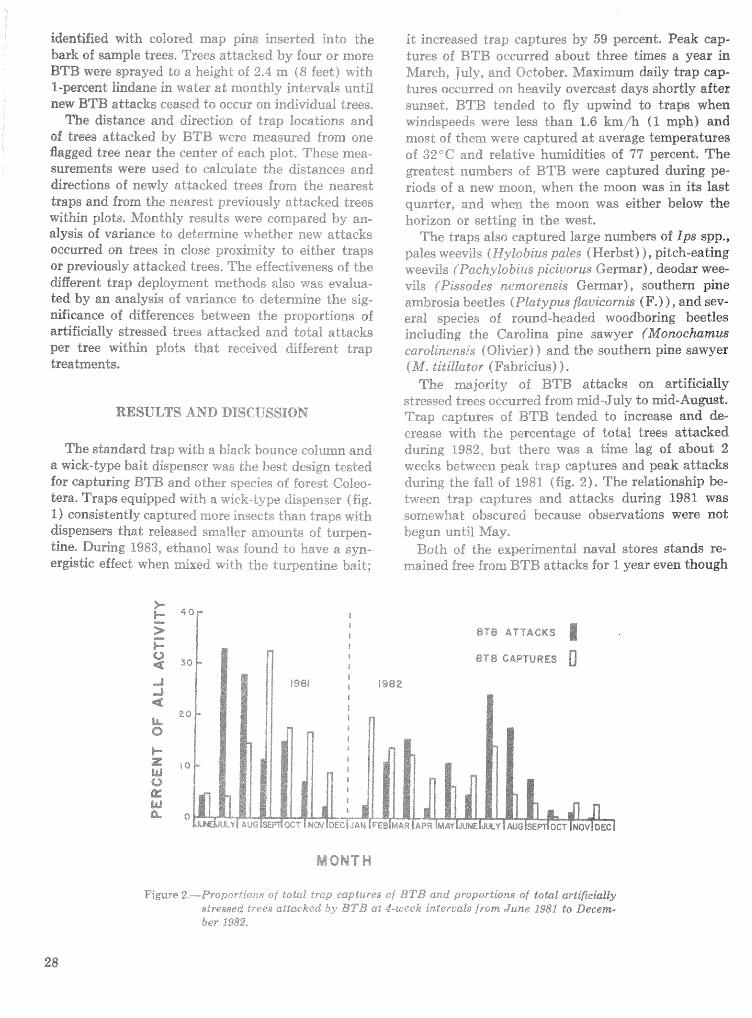
" * identified with colored map pins ~nserted mra the bark of sample trees, Trees attackcd by f ~ u r or more
* BTB were sprayed to a k&&t of 2,4 rn (8 deee r 91th
$-percent lindane in water at fi~onthly jnferyals uTltj:
new BTB attacks ceased to ocew 2n incjividaal trees* The distance and direction of trap I~catisns and
of tress attacked by BTB were ~ l e 8 5 ~ r e d trnxta 0ne flagged tree near the center o f each pkt* 'Tkesc mea- surements were usec to calculate the d i ~ s a n c r ~ and directions of newly atracked tzes from t he neared traps and from the ncsrest previously r-ztsclzed trees within plots, Monthly results .,.;ere r*cm.-,=.a~ ed by an- alysis of variance to determine \% heeher nen attacks occurred sn trees in close proximity to either traps or previously attacked trees, The eftectivesess o i the different trap deployrncnt n~etb;tl.Cs ds-, vva3 e~aIua- ted by an analysis sf variance to deterfi4nr: the 5ig- nificance of differences beheen tPle px oyt~i.tlons of artificially stressed trees attacked ac4 total httacks per tree within plots that lecei:~etl di:"Lrc.at trap treatments,
The standard trap with a black bounce cr~Iurfin and a wick-type bait dispenser vvras t i ;~~ dc-igfi tested for capturing BTB ;xnd 0:"rer species of forest Coleo-
, - a tera. Traps equipped wit"; v;i&dype dispenser (iig. * * 1) consistently capl~ured more insects than traps w,;iih
dispensers that released sn~&?:r amor:n!:-. of iu-pen- tine. During 1983, etiiar,oi f-iiind ti: A i;\yn-
ergistic effect when mixed with rurperl-ne bait;
it increased map captures by 59 percent, Peak cap- tures of ETB occurred about three times a year in h~iarch, gul?--, aa;;d October, Maximum daily trap cap- tures oer;ur~ed or", heavily overcast days shortly after sunset, BTB tended to fly upwind to traps when windspeeds were less than 1-43 km /h (1 mph) and m o s ~ of them were captured at average temperaturea sf 32 >C and relative humidities of 9npereen"a; The greatest umbers of BTB %vere captured during pe- risds of a new wmon, when the rmon was in its last quarter, and wk~efi the rnoon was either below %he h ~ x i z ~ n or setting in the viest,
The traps also captured large numbers of Ips spp., pales weevils r Hyk;: h u s pales [Herbst) ) , pitch-eating v;eevi!, { Pack> lo Ezus 2- ici~orus Germax?), deodar wee- vils BPissodes nenzorensis Cermar), southern pine a-mbroeia beetles (Platypus fb~uicornis (F,) ), and sev- eral species of rcrrsntl-headed woodboring beetles including the Carolina pine sawyer (Monoc&amus earoline~sis (961ivier) ) and the southern pine sawyer ( M , ~~ii21fitsr ( Fabricius) ) ,
Tbe rrajority 0% BTB attacks on adificially stressed trees o~;curred from mid-July to mid-Auwst, Trap eapt~pres cf BTB tended to increase and de- crease with the percentage of total trees attacked duri;a:g 1982 but there was a time lag of about 2 w e ~ k s between peek irap captures and peak attacks during t he "4'9 o i 198% (fig* 2 ) - The relationship be- .try-- L n e e ~ trap capfafes and attacks during 198% was
~.,on~evdli;at obscured 5ecause observations were not
Both crf the experirnentcl naval stores stands re- rnained irel';. from BTB attacks for 1 year even "r;hogh
the turpentine baited traps deployed around their boundaries captured ca. 14,000 BTB and 2,700 ips spp. (table 1). The trees apparently remained sus- ceptible to insect attack throughout the study as seven of the longleaf pjines were attack& by southern pine coneLvoms (Dioryctria anatella (Hulst) ) near the navd stores faces (Fatzinger and DeBarr 1969), The lack of BTB attacks in both navahtores stands could only be indirectly related to the presence of traps because check plots without traps were not avai'iable during the exploratory kests, About 10 per- cent of the trees in other naval stores stands in north Florida and south Georgia, however, continued to be attacked by the BTB despite preventive applications sf %indane3.
The 45 traps deployed in study "A" captured 18,928 BTB in 18 months (table 2). BTB initially began attacking trees that had been accidentally wounded by a mower, but these attacks decreased abruptly after the traps were installed. Attacks con- tinued LhrcrughouG the stla& on trees attacked prior to operation of the traps and on trees artificially stressed with paraquat. A total sf 39 percent (330 trees) of the 846 artificially stressed trees and about 1 percent (244 trees) of the unwounded and mower wounded trees were eventually at tacked,
Plods with six traps captured more BTB than plots with three traps, and the fewest BTB were captured by traps deployed alcrng the west edge of plots, There were no signifieank differences (P=0,85) in the per- centages of newly attacked trees per plot between trap deployment methods (table 2). Likewise, the number of BTB aliacks per tree dunrag each obser- vation period did not differ significantly by trapping methods,
A total of 6,270 BTB were captured in 7 months in the 54 traps deployed in study '23" (table 3 ) - BTB attacked 21 percent (101 trees) of the 417 artificialiy stressed trees and 7 unwounded trees on the 18 plots. The numbers of trees athaeked increased with the level of artificial stress imposed, Thus, 86-5 per- cent of the attacked trees were treated with a wound plus paraquat, 9 3 percent were stressed only hy a wound, and the remaining 3-6 percent were on the check plods. The percentages of sample trees attacked were significantly higher on the paraquat treated plots, but there were no significant differences in at- tack rates between plots with the wound only dread- merits and unwounded cheek plots. As in. study ""A9'", the presence sf traps did not significantly reduce the average number of BTB attacks per tree. Paraquat treated trees, however, received significantly more
Table 1. - Total number ofinsecds capdurczd by traps durz'ng expEor- atory studies in emR of two ezpen"mentd naval stores areas near Okres.tee> F L (July 3980-July 1981)
Pdes and Pine Ips pitch-eating Pine sgwiss Acres BTB spp wmrp2s sawyers
----m-*----s----------------------- Nuns &rer ----------------..--- ------
Longleaf 2.5 4746 1824 3845 779 Slash B3,0 9239 967 1809 939
Total 15.5 13985 2798 11645 1718
Table 2, --- Captures of BTB and attack rates on artimialiy stressed trees in plots with eitker three traps deployed on the east (3Ef or west (3W3 b o u n h ~ e s , three deployed through the center (36/; six positioned awund the bor&rs 16B19 or on cheek plots (CR) without t r a f ) ~ (Study '*A9: May 1982-November 2982)
Month Yem sbs.
198 1 June July Sept. act* Dee.
1982 Feb, M a . Apr . June July Bug. Cbed. NQV.
Proportions' of stressed trees
newly attacked by BTB ToLd BTB captured per plat
3E 3C 3 6B 3E 36 3W 623 GK
'The average number of skifieidly shessd trees per plot increas- ed from 20 after June t o 40 a&er Sptember 1981, llnd 8s 60 after June 1982. Mems were not sidficmtly &fferend (Pz0.05) ktween trap deployment treatments during my of the obsesvation perids,
attacks per tree during each obsemation period (range from 4.2 to 28-93 than did attacked trees on other plots (range from O to 5,0), There were no sig- nificant differences in the average number of attacks per tree between. check plots and plots receivin%g the wound only trestment, The level of artificial stress imposed on sample trees appeared to have little effect on the number of BTB captured in traps sur- rounding the plots (table 3 ) ,
In some of the plots in studies "A" and i6B"9 newly attacked trees appeared to be somewhat clustered about traps or about trees grev5ausly attacked by
Table 3. - BTB cuptured by traps and attaGk rates on am'ficially s w s s e d trees on pb ts with six traps (27 deplbyed amund the borders of each of three pbts per fret" stress treatment: parquat (P), wound (Wl, and untreated cheek (CK) (st&& "B", May to October, 1982)
hoportions1 of Total BTB captured stress& trms
per tree stress newly attacked by BTB Month tmakmnt per plot obs. P W CK P PtT) W W(Tf CK CK(T)
--*.,-*---- Number ----- --------..--me----- fircent ------------*----------------------------
May 576 658 472 4 4 3 4 2 6 June 449 63 1 463 16 26 2 0 0 0 Aug. 496 386 355 17 16 0 0 8 0 Sept. 215 307 182 3 1 0 0 8 0 Oct. 438 268 374 1 2 0 0 0 8
Total 2174 2250 1846
The average number of stressed trees per plot increased from 20 after March to 48 after June. Means were not significantly different (P=0.05) between plots with and without traps within a &ven tree stress treatment.
Table 4. -SuruiuuZ and continued susceptibility to BTB attack of trees treated with 2.0 percent lindune in water for remeda control during studies "A A" and "B'"
- - - -
Attacks per trw Surviving
Lindfine Total Tree Sunriving Dead trees treatment trees survival trees trees re-attacked
------------- Number ------------- p @ ~ @ n t ------------- Ntln her -------.----.. $?er@mt
lData include only those trees with more than four BTB attacks that were sprayed at least once with lindane.
BTB. An analysis of the distances and directions of newly attacked trees from the nearest traps or near- est trees attacked during the previous month, how- ever, indicated a unifom distribution of attacked trees throughout the plots.
About half of the attacked trees that were treated wit& a 1-percent solution of lindane were attacked a second time (table 4). The attack rates on previously attacked trees decreased with the number of lindane applications, and no further attacks occurred after the fourth applications. Tree mortality ranged from 25 percent following the first Endane application to 35 percent following the second and third applica- tions, The average numbers of BTB attacks per tree were about equal between trees that survived and trees that eventually died after the lindane applica- tions. Tree mortality was probably influenced by
unmeasured factors such as differences in bark thickness or texture and related sates of Bindame penetration through the bark,
CONCLUSIONS
The differences between attack rates as high as 10 percent on lindane treated trees in commercial na- val stores operations throughout Florida and Georgia and no BTB attacks on unsprayed trees in the two exploratory study areas protected with traps sug- gested that the traps might be effective in prevendhg BTB attacks* The presence of traps, however, did not decrease at;taek rates on plots with untreated trees or trees treated with either a wound pIus paraquat or only a wound during studies "Ap' or "BP'* The traps also appeased to be ineffective for preventing
&tacks on preeousEy attacked tree^^ Bn study "A9', for example, wounded tree6 that had been attacked prior to the installation of traps continued ta be at- tacked afkr the traps were psegent, First attacks 0x1 mower-wounded trees, however, decreased abmptly after the traps were insbned, The Llaqentine bait may have been more attractive to the BTB khan the oleoresin that exuded horn recently wounded trees, kcause %umen"eine had a higher concentration of volatile monoterpenes, The paraquat-treated trees, hosrever, appeared to be more attractive than the turpentine bait to BTB, Additional attractants may be produced by paraquat-treated trees or phemmones may be produced by a~aekixag BTB in combination d t h the oleoresin produced at the wound site,
Naval stores trees attacked by the BTB are knom to be twelve t h e s more prone ts attack than s h - iiarIy trmted trees that have nod; been attacked (Smith 1958), Both male and female BTB are be- lieved t~ produce secondary attractants (Godbee and Franklin 19"a), and the insect is capable of prodrae- iag the aggregation pheromone tram-verben01 (Hughes 1975)- Seigfried ($984) found that trans- verben01 increased captures of BTB by 38 percent when released from turpentine baited traps, Addi- tional research is needed to evaluate the use of trans-verben01 with a mixture of turpentine and ethanol as bait for trapping the BTB,
The twps have potential value for monitoring field pclpuifations of BTB as well as other destructive forest insects induding pales and pitch-eai;ing weevils, deo- dar weevils, Carolina and southern pirme sawyers, and southern pine ambrosia beetles, A Sircapping system might be developed for predicting tree rracorta1i"i; rdes and planning control measures, because txap captures tended to reflect BTB attack rates om trees, Traps with hproved baits also might be useful far prevent- ing BS"B attacks on ornamental pines and for reducing attach in naval stores or lightwood production op- erations. In view of the obsemed tendency for some attacks to occur near trapsl it is suggested "chat tr8p8 be located in small openings awray from trees, or that trees in close proximity to traps be sprayed 6 t h lindana, Maximum trap captures should occur three times a year iq early spring, early su fall, Daily captures should be m a ~ m u m near sunset on heavily overcast days when the ~ndspeed is less than 1-6 kmjh (I mph),
Ckemerrts, Re W.; M&eyaolds, R.D. A matodzed, rotary rsfmippiPzg ts~d for the gum navd ~;"crea indus- try. Res. Note SE-250. AsheviUe, NC: U.S. De- partment of Agriculture, Forest Service, South- eazskm Forest Expe enL Stsakion; 1977.4 p-
CIements, Ralph W.; Williams, Grady H. Attract- ants, techniques, and devices for trapping bark beeMes, Res, Note SE-369. Asheville, Me:: U.8, Department of Agriculture, Forest Sentice, South- eastern Forest Expe~ment Sbtion; 1981, 3 p.
Fatzinger, C. W.; DeBarr, G. L. How to distinguish attacks by the black turpentine beetle and Diorye- $ria amatella on southern p k s . Res. Note SE- 101. Asheville, NC: U.S. Department of Agricul- ture, Forest Service, Southeastern Forest Experi- ment Sdation; 1969, 4 p,
Godbee, J. F.; Franklin, R. T. Attraction, attack patterns and seasonal activity of the black turpen- tine beetle, Anra, Entomol, Soe. Am. 69:653-655; 1976,
Hopkins, A. D. Practical infamation on the scolytid beetles 06 North Aanre~ean fares les of the genus Dendroctonas. Bull. 83. Washing- ton, DC: U.S. Department of Agriculture, Bureau of EntomcrBogyr; 1909: p. 146153.
Hughes, Patrick R. Pheromones of Dendroctonus : origin of alpha-pinene oxidation products present in emergent adults. J. Insect Physiol. 21 : 687-691; 1915,
Merkel, E. P. Control of the black turpentine beetle. Res. Pap. 15. Macon, GA: Georgia Forestry Corn- rnis~ion; 1981.6 p,
Siegfried, B. D. Attraction of the black turpentine beetle, Dendroctonus terebram, to host- and in- sect-produced volatiles. Gainesville, FL : University of Florida; 1984, 59 p. [EEissertaLionf.
Smith, R. H. Control of the turpentine beetle in naval stores stands by spraying attacked trees with hen- zene hexachloride, J, For, 56: 190--594; 1968.
Smith, R. H.; Kowal, R. J. Attack of the black tur- pentine beetle on roots of slash pine. J. Econ. EntomoI* 61 : 1436---1432; 1968,
Smith, R.H.; Lee, R. E. Black turpentine beetle. For. Pest Lean. 12. Washington, DC: U.S. De- partment of Agriculture, Foest Service; 1957.7 p.
SESSION AMPLING AND IMPACT ASSESSMENT
Estimating Areawide Pest Popu ation ChangeITimber Loss
Estimating Southern Pine Beetle Caused Timber Losses Over Extensive Areas
J. D. Ward, C . We Dull, George W. Ryan and M. C. Remion'
A bs trae t,-A aerial photogmphic sampfhg method for assessing timber: losses caused by the southern pine beetle Dendroctonus frontalis Zimm, was de- veloped in &fississippi in 1979-80 and pilot ksted on 9 million acres in western South Carolina in 1981-82, A combination of aerial photographic sam- pling and timber volume estimates derived from Re- newable &sources Evaluation Sumtey d d a can be used to obtain statistieally reliable estimates of losses for extensive areas anywhere in the South, a t a reasonable cost, Additional keywords : Damage appraisal, survey, aerial photographic sampling.
Pest damage appraisal surveys are needed a t all levels of forest managemenlt to provide economic in- fomaidan %or making management decisions and evahating control tac"n;ics. In the past, there have been few attempts to assess the timber volume killed by the southern pine beetle over extensive areas, pri- marily because of the lack of a statistically reliable method to acquire the information. In 1978, under the Expanded Southern Pine Beetle Research and Applications Program, an evaluation of aerial photo- gr,.apkie sampling was initiated to assess the damage of a southern pine beetle outbreak in central Miss- issippi. Aerial photographic methods have been used since I967 far sclu"tern pine beetle biological evalu- ations ( Ciesla et al. 1967). Aerial photo sampling was considered a potentially good method for assessing the number of trees liilled by southern pine beetles on 3 million acres in &Iississippi because i t was (1) a rapjd way to collect data over a large area and (2) the aerial photographs provided a permanent rec- ord from which to locate and quantify tree mortality 9: Clerke and IVard 1979).
The evduation in %ifississippi utilized a modified random sampling plan with 45 sampling points rand- omly selected in seven counties. Plots were variable in size, but each contained at least 500 acres of host type. The plots began at the preselected sampling point and continued until 500 acres of host type were
photographed for each plot, Two coverages were used to get a periodic estimate
of the damage occurring in the area, The initial coverage established the baseline mortality and the final coverage established the damage oeeurring on the same plot a t the end of the evaluation.
The initial sampling showed 703,105 72,776 cubic feet (68 percent confidence level) of timber killed by the southern pine beetle in the spsng of 1978, and 3,135,640 r i ~ 203,284 cubic feet of timber during the winter of 1979-1980. By subtracting the initial sumey estimate from the final survey, a Ims of 2,432,535 cubic feet of timber occurred. No adjust- ment m s made for the timber salvaged do deternine the actual loss. The actual loss could have been esti- mated with a minimum of ground checking pro- vided through State salvage records,
This evaluation method provided a statistically acceptable estimate. I t also was the first successful test of an airborne Loran-6 navigation system which was the real key to completing this type of suwey (Dull 1980). The Loran-C navigation system pro- vided a means of locating loss assessment plots with- out visual prominent landmarks. The system also guided the aircraft back to the same plots for the resample. Another contribution from the Mississippi project was the development of an aerial photo vol- ume for trees killed by southern pine beetles in central Mississippi (Mead and Smith 1979).
Although the method was satisfactory for sam- pling losses, i t still required a considerable amount of ground checking. Also, the method required aerial photo volume tables, which were nonexistent for most of the South, Volume tables can be constructed from the aerial photos and ground sampling, but this process is extremely time consuming, Therefore, this method could not be very useful on an operational basis without some modification (Ghent and Ward 1980).
In 1981, the IPM program funded a piM test of the sampling method developed in Mississippi (Dull 1980). This project was conducted over 21 counties (8,154,827 acres) in South Carolina in cooperation with the Pest Control Branch of the South Carolina Commission of Forestry. The objective of the project was to deternine the operational feasibility 06 the
"espectiveI~-, Entomologists and Statistician, USDA Forest Service, Southern Region, Blasaville and Atlanta, GA, respec- aerial photographic sampling procedure developed
tiveIy, and Entomologist, South Carolina Forestrv Co in Mississippi with some modifications in the volume sisn, Columbia, SG, determination,
MATERIALS AND METHOD
Description of Study Area
The wesLern 21 counties of South Carolina cover- ing, 8,154,827 acres, were selected for the pilot pro- ject area, This area was the only one in the South considered to be in a southern pine beetle outbreak status as of November 1980, This area included Na- tional Forests, industrial, State and small, private ownerships. An 18-county area within the 21-county study site is considered one of the three survey units in South Carolina by the Forest Inventory Analysis- Southeastern Forest Experiment Station, formerly Renewable Resources Evaluation Group (Snyder 1978)- Within this Piedmont area of South Caro- lina, a considerable variation in forest composition occurs, Hardwood, mixed pineihardwood, pure pine stands with loblolly, Pinus taeda, and shortleaf pines, Pa echinata, are present. The western edge of the study area contains mountainous terrain with eleva- tions of up to 3,500 feet, while the eastern edge of the area is genLly rolling terrain with elevations around 500 feet above sea level.
pine beetles were distributed mainb in the extreme western portion of the survey area,
The entire (180 percent) area coverage provided data on the whole population (tree mortality) so that any estimates from sampling could be compared to the actual population dotal, Although the State aerial survey data was available, it was not used to stratify before the initial coverage in contrast to a normal operational situation. This data was not needed be- cause we obtained 100 percent coverage, As i t turned out, because of the drastic change in the southern pine beetle population, had the plots been selected on a nomal basis they would have been useless for the resample.
Before resampling the area was stratified by (1) using the locations and volume killed by south- ern pine beetle as shown on the 100-percent coverage and (2) the acres of host type per county as indi- cated by RRE survey reports. Fifty plots were selected for each method (fig. 2 and 3 ) a Because some of the plots could be used for either method only 83 had to be photographed.
A stratified random-sampling plan and analysis, using ratio estimation, was employed for both methods (Cochsan 1971).
Aequisitiion of Aelrial Photography Photo f nterpretaticbn
Color infrared aerial photography (film type 2443) was acquired by the Forest Pest Management Aerial Survey Team, Doraville, GA. Initial (baseline data) coverage was acquired in stereo for the entire 21- county area a t a scale of 1 : 24000 (fig. 1). The team flew 6,000 linear flight-line miles with two Aero Com- mander 500B aircraft, each equipped with an RC-10 aerial mapping camera and a Loran-C navigation system, This sytem provided flight line navigation (Dull and Clerke 1980, 1983). Geographic coordin- ate centered flight lines were flown. Plot boundaries were also defined in terms of geographic coordinates.
Complete coverage of the study area began &fay 4 and ended May 15, requiring only 8 days or 58.6 hours Aight time to cover the 8-million-acre area.
AeGal photographic resampling within the 21- county area began on September 16, 1982, and con- tinued through September 29. A total of 83 plots were photographed at a scale of 1 : 12000.
Sample Design
Bebre we selected the photo plots, the South Carolina State Commission of Forestry sketch- mapped the 21-county area in April 1481, and esti- mated the level of outbreak intensity in each county as low, moderate or high. Trees killed by southern
To facilitate the photo interpretation process on such a massive number of frames, initial monaseopic viewing to deternine the location and number of southern pine beetle spots was done on a Houston Instruments variscan film viewer, The viewer allowed the 1:2400 scale film to be magnified and viewed at a 1:4000 scale, After the 100-percent coverage had been interpreted to locate spots, the transgaw~ncies were viewed with a Bausch gi; Lomb 2443 Model zoom stereoscope mounted on a. Richards MIM-4 motor- ized light table. Each ~ o t was eakegorized by the number of red and fading trees within the spot as follows :
Categow I 10--25 trees Category 2 26-50 trees Category 3 51 --I00 trees Category 4 100 4- trees
Actual counts of the number of red and lading trees were made on the photography. Crown diam- eter was measured using da fine scale with incre- ments of '002 inches, Photography at a scale of 1 : 24000 enabled a minimum resolution with the -002 inch scale of Li feet, Stand height was es"i;iarpated with a representative sample of stands actually measured to allow for more accurate stand height estimates* The acreage of red and fading trees, black top trees, and total spot size wins measured using a 1 mm square
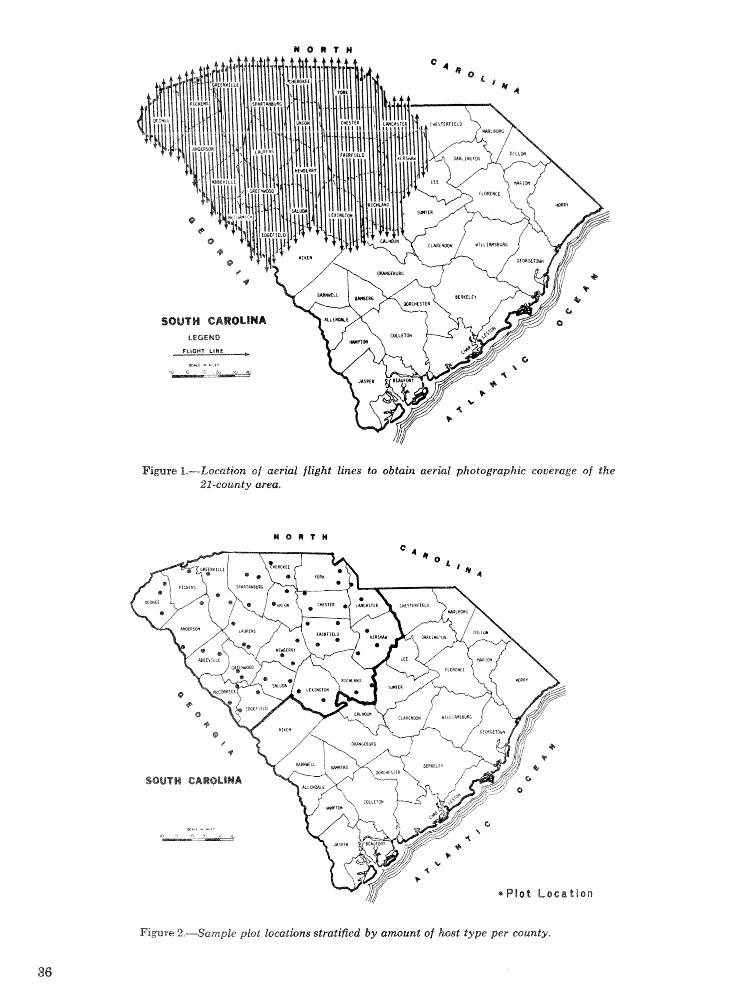
Figure 1.--tocation of aerial flight lines to obtain aerial photographic coverage of the 21-county area.
Figure 2 - S a m p l e plot locations stratified by amount of host type per county.
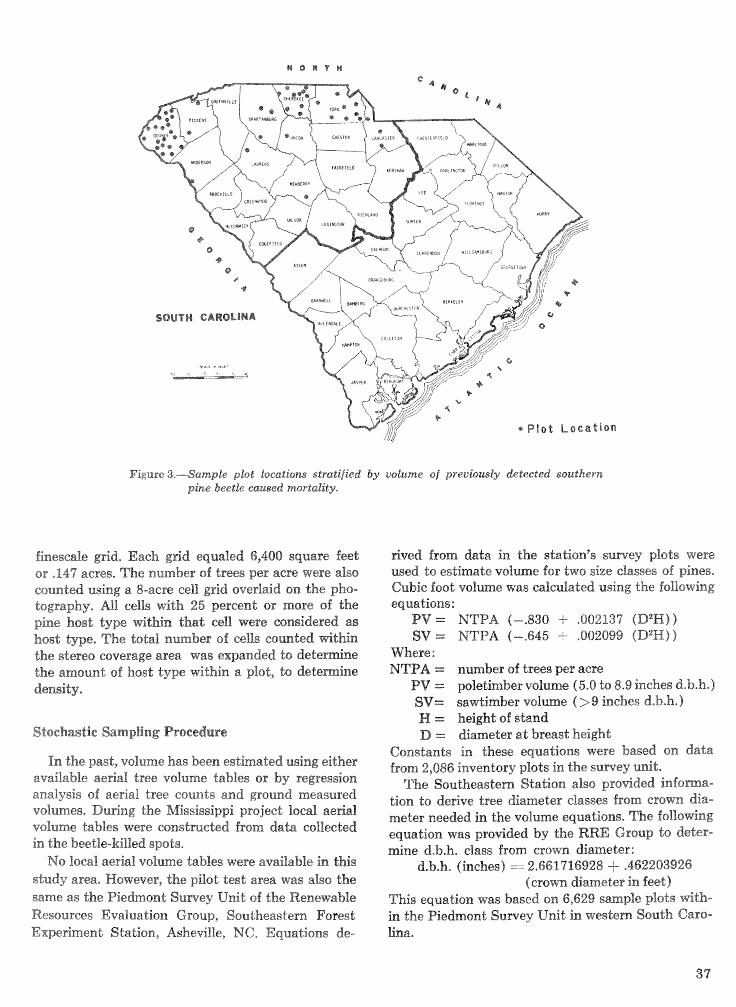
Figure 3.--Sample plot locatiom stratified by volume of previously detected southern pine beetle tamed mortality.
finescale grid. Each grid equaled 6,400 square feet or .I47 acres. The number of trees per acre were also counted using a 8-acre cell grid overlaid on the pho- tography. All cells with 25 percent or more of the pine host type within that cell were considered as host type. The total number of cells counted within the stereo coverage area was expanded to dete the amount of host type within a plot, to determine density,
Stochastic SampSing Proeedare
In the past, volume has been estimated using either available aerial tree volume tables or by regression analysis of aerial tree counts and ground measured volumes. During the Mississippi project local aerial volume tables were constructed from data collected in the beetle-killed spots, No local aerial volume tables were available in this
study area. However, the pilot test area was also the same as the Piedmont Survey Unit of the Renewable Resources EvaluaGion Group, Southeastern Forest Experiment Station, Asheville, NC. Equations de-
rived from data in the station's survey plots were used to estimate volume for two size classes of pines. Cubic foot volume was calculated using the following equations :
PV = NTPA (-.830 + .002137 (D2H)) sV = NTPA (--645 + .002099 (D2H) )
Where : MTPA .= number sf trees per acre
PV = poletimber volume (5.0 to 8.9 inches d.b.h.) SV= sawtimber volume (>9 inches d.b.h.) H = height of stand D = diameter at breast height
Constants in these equations were based on data from 2,086 inventory plots in the survey unit.
'I'he Southeastem Station also provided infoma- tion to derive tree diameter classes from crown dia- meter needed in the volume equations. The following equation was provided by the RRE Group to deter- mine d.b.h. class from crown diameter:
d.b.h. (inches) - 2.661716928 J- .462203926 (crown diameter in feet)
This equation was based on 6,629 sample plots with- in the Piedmont Survey Unit in western South Caro- Ena.
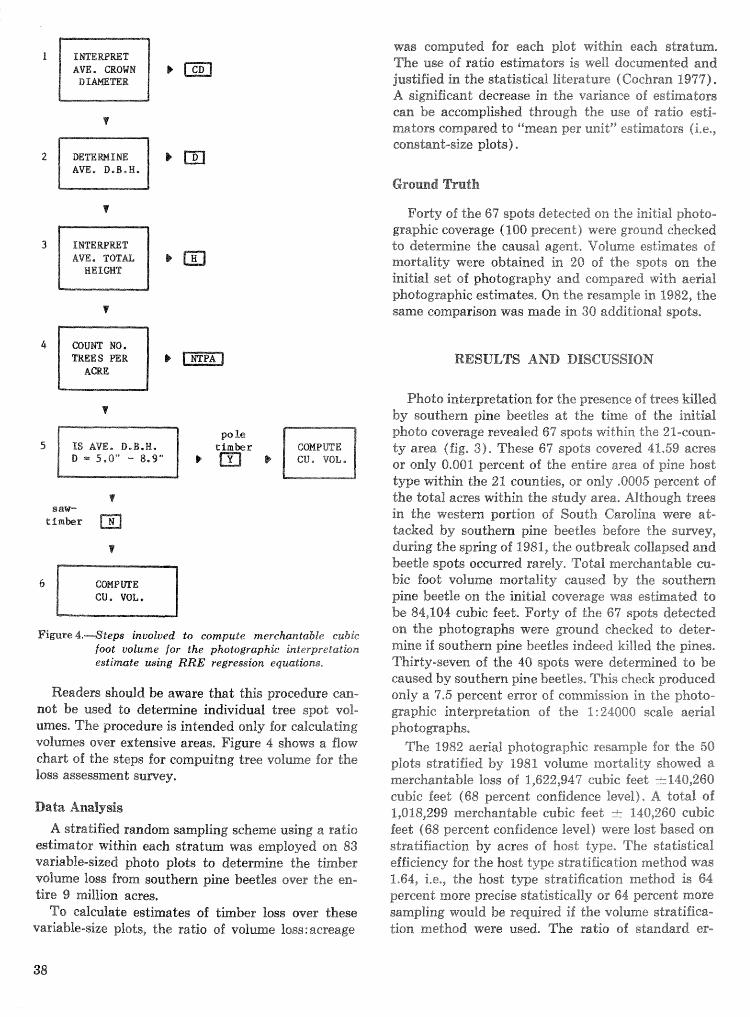
AVE, DliFQ,H,
Fiere 4 . 4 t e p s involued to compute merchantable cubic foot volume for the photographk iinterpretatbn estimate using RRE regression equatiam,
Readers should be aware that this procedure can- not be used ts deternine individual tree spot VOI- urrmes. The procedure is intended only for calculating volumes over exdensiate areas, R g u ~ 4 shows a asow chart of dbe steps for comp.;sitnag tree volume for the loss assessment sumey,
Data Anra?Iysis
A stratified sandoxn sampIirag scheme using a ratio estimator k th i a each shahurn was employed on 83 variable-sized photo plats to deternine the timber volume loss from southern pine beetles over the en- tire 9 ~lfiiora. acress
To eafeu%trte estimates of timber loss over these variable-size plots, the ratio of volume lass: acreage
was computed for eaeh plot vi4thin eaeh stratum, The use of radio estimators i s we28 documented rind justified in the statistical literature ( Cschran 1977), A significant decrease in khe variance of esthatsrs can be acecr-mpfished through the use of radio esti- m a t o r ~ compared to "mean per unit" estimators (i,e,, constant-size plots) .
Ground n a & h
Forty of the 6hspcrGs detected on the initial photo- graphic coverage (I00 precenk); were ground cheeked to deternine the causal agent, Volume estimates of mortality were obtained in 20 of the spots on the initial set sf photography and compared with aerial photographic estimates, On the resample in 1982, the same comparison was made in 30 additional spots,
RESULTS AND DISCUSSION
Photo interpretation for the presence sf trees killed by southern pine beetles at the time of the initial photo coverage revealed 67 spots within the 21-coun- %y area (fig, 3)- These 69 spots covered 41-59 acres or only 0,001 percent of the entire area of pine host type within the 21 counties, or only .&18005 percent of the total acres within the study area, Although trees in the western portion of South Carolina were at- tacked by southern pine beetles before the sumey, during the spring of 1981, the outbreak collapsed and beetle spots occurred rarely* Total merchantable cu- bic foot volume mortality caused by the southern pine beetle oar the initial coverage was estimated to be 84,104 eubie feed* Forty of the 6hspota detected on the photographs were ground checked to deter- mine if southern pine beetles indeed killed the pines. Thirty-seven sf the 40 spots were detemined to be caused by soufierun pine beetles, This check produced only 8 7,s percent error of commission in the photo- graphic interpretatioaai of the 1 : 24000 scale aerial photographs,
The 1982 aerial photographic resample for the 50 plots stratified by 1981 vokume rnsrtahity showed a merchantable loss of 1,622,947 cubic feet 2140,268 cubic feet (68 percent confidence levd8, A toea% of 1,018,299 merchantable cubic feet -i- 148,260 cubic feet (68 percent confidence level) were lost based on stratifiactisn by acres of host type, The statistical efficiency for the host type stratification method was 1.64, i,e,, the host type stratification method is 64 percent more precise s&akistical%y or 64 percent more sampling would be required if the volume stratifica- tion method were used, The ratio of standard er-
rov'mean (SE/n?ea82) equals .I8 for volume stratifi- cation whereas the SE 'mean ratio equals .I4 for the host type stratification method. The total number of samples used in this sampling design was more than adequate to conduct these analyses.
The volume stratification was based on the initial 100-percent photo coverage made in 1961,f6 months before the resample, The decrease in precision is related to the change in the location of beetle activ- ity, which was different for the resample, This change iltusdrates the need to accurately estimate popula- tion activity immediately before the stratified sample is obtained to more accurately estimate the volume loss and reduce survey costs, The southern pine beetle is SO dynamic that during periods of out- breaks the length of time to determine the stratifica- tion based on. .r?o1ume may be long enough for the population to change drastically and alter the val- idity of the survey results, The analysis also indicates that more intensive sampling would be needed dur- ing periods of low population activity to obtain a statistically reliable vs%ume loss estimate.
The disadvantage to stratifying by southern pine beetle outbreak intensity (vslu~xe killed) is that the amount 0% effort required to stratify is much greater than that required to stratify by distribution of acres of' host. type. &loreover, a preliminary survey is need- ed to obtain the information on the location of beetle infestations, Another disadvantage of using out- break intensity is that outbreak levels may change between two sumeys, If the information on outbreak intensity is available and a sne-point-in-time evalua- tion sf losses is being conducted or the interval be- tween surveys i s less than 1 year, stratify by out- break intensity. If the outbreak intensity infomation is not available or the interval between surveys is greater than O e a r then stmtify the distribution of acres by host type,
The comparison between the photo-interpreted volume loss versus the ground-determined volume in the 30 spots cheeked showed an underestimate of 26 percent for the photo method. The comparison be- tween photo-determid volume loss and gsound-de- dection vo%ume ~ O S S on 20 SPG$S oxz the 1982 resample showed again that the aerial photographic estimate gave a lo~ver estimate than did the ground truth inventory. The total percent error was -24.7 percent, Lee, the aerial photographic volume estimation was 24.7 percent less than the ground inventory volume estimations,
The underestimatisn o f 26-1 percent and 24.7 per- cent, 1981 and 1982 respectively, for photographic volume estimation compared to the ground truth inventory can. be explained after review of the data obtained from photographic memurements. Aerial
photographic estimates of cram diameter were con- sistently underestimated. The crown diameter mesa- surements were used as a variable in a regression equation to compute dbh which, in turn, was used in a regression equation to compute volume. Although a close correlation can be detemined between c r o w &ameter and dbh, small scale aerial photography al- lows the photo-interpreter to only view, in many cases a very closed canopy, the very top portion of the crown. The underestimation of crown diameter and observed crowns of some codominant trees prob- ably accounts for the difference in the volume esti- mates.
The periodic timber volume loss was computed by subtracting the volume estimate for the 100-per- cent aerial photographic coverage obtained in the spring of 1981 from the volume estimate obtained by the more statistically reliable host acre stratification sample obtained in the fall of 1982. During this 16- month period a total of 934,195 merchantable cubic feet were lost as a result of southern pine beetles,
The 100-percent aerial photographic coverage for the entire 21-county area cost $0.0032 cents per acre. The cost of acquiring the volume estimate of timber mortality over the 8,154,827 acres using the stratified random sampling design using 50 sample plots costs $0.0007 cents per acre. This figure in- cludes the costs of acquiring the imagery, as well as labor involved in the photointerpretation.
LITERATURE CITED
Ciesla, W. M.; Bell, J. C., Jr.; Curlin, J. W. Color photos and the southern pine beetle. Photogram- metric Engineering. 33 : 883-888; 1967.
Clerke, W. W.; Ward, J. D, Estimating tree mortality over extensive areas. In : Symposium proceedings : evaluating control tactics for the southern pine beetle. 1979 January 30-February 1; Many, LA. Tech. Bull. 1613. Washington, DC: U.S. Depart- ment of Agriculture; 1979: 75-85.
Cochran, W. Sampling techniques, 3d ed. New Uork: John Wiley and Sons, Inc.; 1977. 413 p.
Draper, N. R. : Smith, H. Applied regression analysis. New Uork: John Wiley and Sons, Inc.; 1966,407 p.
Dull, C. W. Pilot test of a sampling method to mea- sure timber mortality caused by the southern pine beetle in South Carolina. Atlanta, GA: U. S. De- partment of Agriculture, Forest Service, South- eastern Area State and Private Forestry; 1980, 73 p.
Dull, C. W.; Clerke, W. M. Loran-C navigation sys- t e m as an aid to southern pine beetle surveys. Agric. Handb. 567. Washington, DC.: U. S. De- partment of Agriculture; 1980. 15 p.

Dull, g?i* W,; Cierke, W. H, Loran-C navigation as an aid to aerial photographic operations, Photogram- metric Engineering and Remote Sensing 49 f 4 8 ) : 167"71584; 1983.
Ghent, J, H,; Ward, J. fa. Deteminatim of annual timber mortality: impact of the southern pine beetle, Final report to the Expanded Southern Pine Beetle Research and Applications Program, Pinevillep LA: U, S, Department of Agriculture, Southern Forwt Experiment Station; 1980, 39 p, [Unpublished report,
hfead, Roy A,; Smith, J m e s 'I;, Development. of an aerial photo voE e table for trees infested with southern pine beetles. Finat. Report No, 80-1, At- lanta, GA: U* S , Department of Agriculture, For- est Semiee, Southeastern Area State and Private Forestl.y; 1979, 33 p, [Unpublished report,]
Snyder, Nolan L, Porest shtisdies for the piehon-l; of Solath Carolina 197X Resource Bulletin SE-$5, Asheviffe, NG: U, S, Department of Agricutture, Forest Service, Southeastern Forest Experiment Station; 1978, 33 p,
Objective Prediction of Climate-Related Chanrges in the Distribution of Southern Pine Beetle
1 o--~P_ a i. -r
Patrick J. &lichaels. David E. Sappingrori, and ~iir i lp J . Stenger'
Abstract,-A statistical n~odel has been deve;orJed rnat{t- ~~r ih i , i i%&y dzci chaages in S9E coverage over to relate changes in areal coverage oi the sauthezn -.ir: ,rs.k..i.G ,,, c * ~ w e1--.:2 ,i-dZtA~l~*ii: .-, za:-ige9 am2 pine beetle (Dendroctonus front alis Z i 2 ) DevL.iop.ne.;:G of a management-oriented corn- multivariab combination of temperature and rcsis- p~j:.ea pa,z! STG "5 - $ c , ~ *;;..,ze 5: v=qlg"ga -~:,~cp for predictive ture status indices, It is applicable over the entire p * ~ q ; ; , ~ - ~ k ~ range of epidemic outSreaBs during the last quarter- century. The model properly hindcast the signs 9f 8% RESE_\RCE major coverage changes during LhaQ~eriod in a high- %y significant fashion, based upon an independent data set,
The study results have been adopted into an in- bractive computer program named SPBCMP* It re- quires only easily-accessed climatic deta and a mini- computer, The program i s par5icularly amenable f ~ r m a n a g e decisions based upon "lr~hat if?" mseenar- ios of future weather, Additional keywords : Dendroct~nug fro- tadis, larqe- area modeling, pine beetie 'ht3st relationehips,
The southern pine beetle QDer.tdroekcnz fror:.--,talts Zimm,) i s one of the most econsn2icafig iraporta~t brest pests in the United States, Several major out- breaks during the 20th century have darnaged exeez- give stands of southern pine specie., resulting ia multimillion dollar losses and also in ~ubetafitial alteration of both natural and managed stands,
The study detailed here describes a series of corn- puter models that qualify our knowledge of the rela- tionships between southern pine beetle ("WPB"') and
r 4 ' i t s gross environn~entd de~em1inants-----m~"3~1:1iy mean temperatures, totag precipitation, 2nd long-an i! short-term moisture stress indices,
Objectives included: 1) Determination of the r~lat- io~shir~ iwt:v~en ~ 5 i -
T ~ L ~ ns,, G g ,,4ii-: + - ar~ecatlise nn the so~thern pins beetle suggcxred tlikt "a- ..,, -- k ~ ~ ~ , l ~ e I- decexrinant of change in
* - infestrclan icvel i s :he moisture status sf the host tls..& $ r;Ggh~~.ij : 325, Beal 19S3), The literature a l s ~ saggestee 1,h;: i v~igatcr temperatures strongly in- flueme tbl, znIsstz t T;en levels in succeeding years,
Qwm ti: 8 :lye- i-. . ;,zrigi.+iofis of the influence of cli- matic f ~ ~ c t u a t i c ~ , ~ . on, large-area changes in SPB lev- els kga: ,!ti: the ir:!lt1g'c regresimn models of Kroll an& Reeuie.7 : ;gp;3 i dnd Camp bell and Smith (1980),
c b Q D a ~ ; ~ ~ a v ,,* ,* , r C ;:LA- +p~-s-k-3t-~ 2- ~ t _ an independent data. \luii-r:'i. reg~~s~jo. : ii:&J~j"s often become unstable
in the? -pr&:crdve rnsde because an inappropriate nt1m.$.g re&tjbl~'j deggees sf freedom is consumed in tile fittiag ;nodes Rt.r.ognizing this, Kaikateein 4 198.1 first fi],aFBered the temperature and preeipita- tinn data 3 ~:.-~ncipal composen: analysis (PCA) befcjre j:bei~i as p,tc,Lslors -r-m-- for SPB changes, ,-- .mat 1 vi;0rk VJ.S~S more stal>li;-. in the predictive mode
, *
fhun ewd:c!r a$ten--ipts, :.rij,i suffered from an ill- ti; produce -I,atisGi:a'lJy results over
an aggregaf,e tlf i2-deperndelld data, ;b,f';a.h->u;.z: tte La, /3YRd) . si;sr; a P ~ S r PcA
Z"$> w .-~ * .a s "A% ,. . . . . --.ire uilt arjd f:3ra:t-ywlta9.1g.,nv daba Predictive ea- -, -~ T)9p*";2<j-"' 14--,*c
+ , - ,,,,,i.,ii -.-- .iic2,., #~nga;~-ita:aed j;j the test mode by ~ubshn- J- . 'dk j j Lic*L+ ,*; ;,,, ,,,, h 5 d F s ,-, ,* nnurnl~es of residual degrees of fyc3edc:52 ;)lr6:algzh, use i-~f mul-jnle climatic Bistr icb r ~ ~ ~ q i c ~ , .tA* ;c 5 L8r-j. 2 : ~ I I V ~ ~ ! geographic model, That \ . tbiflL, "%*dl a - t i J ~ c - t . - ~ - ~ , .. ci i;ie rri I cirsstnl and Piedmont Virginia a n s ~ +hi I I,.; d b v \As .*is r ;;r-iilil; ...,,.,, -..pr sA ,$:9 nc3t sueeessfully extended RtB~~~U~;(%!;le l-egjckv-$e
<, - i i~<*
, (f File G1-J ~:.~zji;.:s a a ;cJ jli: an sppropriste unit for both , * he i s LTgro"5 rj:icr (-f (:iaicw t i c data and &ternination
- ~ - - [>f ";~sf. ~ ~ ~ s ; ; g ~ - ~ ~ j r . + , \ ,~J 'S ~ ~ ~ e r e cil.rjsen d8"; Qefinca&e rela-
- - + ; j r i . ~ L , i ej3d - - XI I l f i : L L L i l C S : B ~ ~ s-sQ-; :7r .s . I z-:i,;i~bs &:/a 1 6 > : 1 1 J ~ b , , ~ -i.,iiLpn6;: -k ~ , ~ e d ,ex1 both upon hy- tqpi>asyC~ --. -..<>- di vr* ,, p ~ ~ ~ r ~ J ~ p ; r g r p , r z ~ P - .A.As; -..-- ,, . 2 ' ~ .ae a,-..,ated tree spe-
6 ' 1 " L
Q : < ~ S ts 'fna<'in .-.rqnon<j i s ;jOth 1 GIPUs telad to agere-
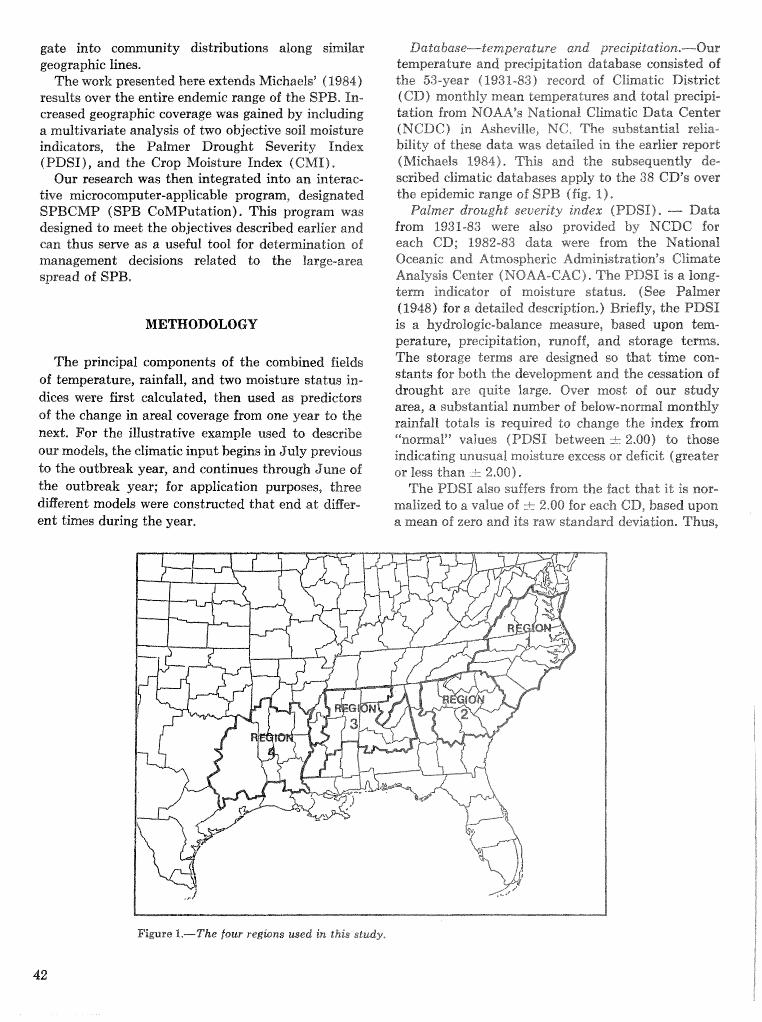
unity astributions along s i d a r geographic lines.
The work presented here extends Michaels" (1984) results over the entire endemic range of the SPB, In- creased geographic coverage was gained by irneftnding a multivaritate analysis of two objective soil moisture indicatom, the? Palmer DmugkG Severity f ndex (gZ)SI)t, and the Crop kfoisture Index (CMI),
Our research was then integrated into an interac- Give microwmputer-applicable program, designated SPBCMP (SPB CoMPutation) . This program was designed to meet the objectives descsibed earlier and can thus serve as a useful tool ifor detemiaation of management decisions relat-ed to the kasge-area spread of SPB,
METHODOLOGY
The principal components of the combined fields of temperature, rainfall, and t;vvo moisture status in- dices were first calculated, then used as predictors of the change in areal coverage from one year to the next. For the illustrative example used to describe our models, the climatic input begins in July previous to the outbreak year, and continues through June of the outbreak year; for application purposes, three different modells were constructed that end at; diEer- ent times during the year.
Datatrase-temperature and pre@iht&on*-eOur temperature and precipitation database consisted sf the 53-year ( f 93 1-83) record of Climatic District (CD> monthly mean temperatures and tot& preeipi- tation from NQI)AA9s Xatiornal Climatic Data Center (NCDC'fi in AskzeviXZ~, NC- The substantial relia- bility of these data was detailed in the eadier wport (hfickads 1984), This and the subsequently de- sefibed climatic databases apply do the 38 CDk over &be epidemic range of SPB (fig, 1 ) ,
Palmer drought severity index QPDSI), - Data from 1931-83 were also provided by NCDC for each CD; 1982-83 data were from the National Oceanic and Atmospheric Administratiosa"s Climate Analysis Center (NOAA-CAC), The PDSI i s B long- tern indicator of moisture status, (See Palmer (1948) for a detailed descriptim, ) Briefly, the PDSB i s a kzydm4ogic-k>a;lanct3. meamre, based upon tem- perature, precipitation, runoff, and storage terns, The storage terms are designed so that time con- stants for bod11 the deveZopmei'rk and the cessation of droglrgknt are quite large. Over most of our study area, a substantial number of below-nsmal mmtbIy rainfall totals is required do change the index horn ""nnesma19' values (PDSI: between zir 2,001 to those indicating unusual moisture excess or deficit (greater or less than -i- 2,gSB)),
The PDSI alas suffers from the fact that i t i s nos- malized to a value of * 2*00 for each CD, based upon a m e n of zero and i t s raw standard deviation, Thusl,
Figure 1,---The four regbns w e d in this 8Eudy,
it can be expected in 1 or 3 years, in each CD, that the PDSI will show excessive moisture surplus or shortfall, The underlying assumption is that agricui- tu rd economies are negatively impacted in the 1 - in4 years in tvhich it faits below -2.00 over each CP).
Another proJfl~m with the PDSZ concerns the time constants - agricultural droughts tare known to develop before the index reaches excessively negative values----presumabIy because topsoil and crop root depth levels dry out before the index does, The midwestern and mideastern agricultural droughts of 1980 and 1983, which occurred before the index reg- istered very low values, bear testimony to the PDSI's shortcomings,
It is perhaps most useful to consider the PDSI as a measure of deep-soil moisture, A modified index, called the Crop h4oisture Index (CblI) , is more re- flective of shallow-soil moisture status and is the remaining variable used in our model of SPB cover- age change.
Crop moisture index (ChII) .---The CMI is a modi- fied version of tho PDSI, based primarily on non- linear changes in the storage terms. Up to the time of this study, there was no long-term record of the Ch-IB that could be used far modeling purposes, The joint USDA/NOAA Agricultural Weather Facility supplied us with the program that calculates the PDSI and CMZ. FVe modified id, inputing CD tern- peradure and precipitation values from NCDG, and calculated a 51-year (1930-803; record of the CMT. Data for 1981-83 were obtained from NBAA-CAC.
The CBllI is a 'tveekly-based index, while PDSI is monthly, We generated surrogate weekly PDSI val- ues by fitting a smoo%h euwe through the monthly time series, We then calculated weekly values of the antemediate terms used in the PDST formulation- including storage terms, hydrological factors, and modifications to normalize the data, as described above, The weekly CMI values were then converted into monthly ones with simple averaging.
To ~~"Pknowledge, this represents the most earn- prehensive @&MI f i le currently available and thus should be useful $0 both forestry and agricultural researchers, Copies can be obtained either from the authors or through the USDA Forest Sewice" South- ern Forest Experiment Stations? Kew Orleans, LA, SPB couesage data,-Our dependent variable, SPB
coverage, was caBculated frorn the southwide eounty- presence data of Price and Doggett (1978) and Swain (198ef), The period sf record i s the 24 years extending from 1960 through 1983,"s noted earlier (Michaels 1984), the data only indicate the presence
2 Data for 1986-83 were supplied by personal eca
of spots in a county, and do not directly represen& the density or severity of an outbreak,
First, the area of each county was expressed as a percentage of the total area circumscribed by each CD. The annual record of county presence was then entered. SPB infestation intensity was then recorded as the percentage of CD area in which spots were reported, based upon county presence or absence.
Not all of the land within a CF) contains the cam- munity composition that can support SPB, Initial1 y, the total area of each CL) was adjusted for the amount of colonizable land, as determined by USDA forest inventory statistics. Subsequent results indi- cated no significant model improvement when this database modification was made, In fact, the final regression often indicated that more than 100 percent of the apparently colonizable land could be covered by SPB spots when referenced to the county data. Therefore, we chose to use our earlier, simple fomu- la tion in the subsequent models.
Input Data Analyses
The time series of temperature, precipitation, PDSP, and the CMI displays considerable temposd and spatial correlation. Thus, a principal component analysis (PCA) was performed on the monthly vari- ables in an attempt to combine them into groups of uncorrelated predictors. This technique resulted in a series of linear combinations of the data that effi- ciently explained most of the variance within and between original input variables.
While applications of this technique are relatively recent in the forestry literature (Michaels 1984, Newcomer and Meyers 1984, Kalkstein 1981), prin- cipal components, or some variant of them, are often used in the climatological and meteorological litera- ture (see Michaels and Gerzoff 1984, Cohen 1983, Hayden and Smith 1982, for typical recent examples). Over 60 recent articles in referred atmospheric eci- ence journals used this type of analysis (Richman 1983).
We subdivided the southeastern endemic SPB area into four distinct regions (fig. I). They are I) the same coastal and Piedmont regions of Krginia m d the Carolinas used in our earlier work (Michaels 1984), 2) upland and Piedmunt Georgia and South Carolina, 3) Piedmont Mississippi and Alabama, and 4) southern Arkansas, northern and central Lou- isiana, and a large area in east Texas. These regions were chosen to minimize the number of CD% that would enter into a lpredietive model, Larger areas last predictability in part because of seasonality changes through a southwestward transit of the re- gion, As an example, the onset of spring is over a
month earlier In Louisiana than in k"ir@nia. The design of our sta$;istic;a% models, dssc~bed below, makes them unable to compensate for this natural phenomenon*
The principal components of the climatic data were of the f o m :
where n refers do the order (first, second, etc, . . .). Each gear combination of the raw data is uncor- related with each o f the sthers, and successively ex- plains less of the variance-eovariansse sdmcture of the input data,
The summation (i=I to I%) i s over the 12 months ineluding and prior to midsummer when SPB be- comes economically important; note that we have developed applications models ending at other times, as detailed below, In the example here, the data ex- tend from July of the previous year through June of the current one. T, and P, refer to mean monthly temperature and total; precipitation, D, and M, are monthly average drought and moisture index values. The Creek letters are individual monthly coefficients (sometimes called ""weiglri;tirngs"~for each of the cli- matie terms*
The absolute values of the weighdings within each component determine the impordance of the climatic variables, Variables that have the most spatial and temporal correlation will tend to be the highest weighted on the Bower order (first, second, ete. . . .) components, Thus the PDST values, which have a long t ime constant, display month-to-month correla- Lions that are accounted for in the components sta- tistically most importan t,
Tab8e 1 details, in abbreviated form, the relative weighdings for each group of elianzatic terms in the first five principal components for Region 1 (see re- gional breakdown above), The "Righesf; values in the f ist component are un.ifctrmly &str-ibuted through the PDSI variables, They are apprsxi;mately the same for the 8 months not listed in the table. Thus, the most Common pattern of fluctuation in the eli- matic data is for the PDSIB to be either uniformly above or below normal for &he entire war, The same applies to temperature in the second principal com- ponent* In higher order components, expected cli- matic anomalies tend $0 become more seasonal in na- ture; by component #6, they tend to be monthly.
The statistical test of Overland and Preisendorfer (1982) can be used to deternine whether or not an individual high order component is primarily depend- ent only upon the variance of one variable, The null
* Table 1, - Weighting factors fir the climatic data for the first ifice
pPrncipal compown k"
TJUL 1"Om TJ AN TAPR PJUL POCT PJAN PAPR CMlJTJL GMIOCT GMlJAN CMIAPR PDSIJUL PDSIOCT PDSIJAN PDSIAPR
Gomp 12 Weight
.I070 -1154 .I1111 .1I)OO .0828
-,0190 ---.a138 - .a268
,0457 ' O l f 2
- ,0274 -. '0376
.03S4
.0146 *0062
-- ,0113
Gsmp W3 Weight
0763 ,0206 .0275 ,0072
-,0516 -,@I52
.8875 "0926
- ,8766 -.r391"9
.0614
.I127 -.0776 -.0828
.0185 -8925
a m p I 4 Weight
- .0628 .6403
- -80013 -.8676
-0629 -.w21 --.OIQfi - ,0208
+05-85 -- ,0241 -.8%13 -.(a025
,0445 --- ,0290 -- .0606
.0063
Gonap 4% Weight
-0693 .0100 ,0333 '0834
---- .0931 .I336
--,0052 - .1)-099 --.I457
.a309
.0315 - ,0830 - ,0964
,0371 .0416
- ,0452
'Ifncludes ody data for Jdy, C)&br, a d J m u q k a u i ~ $ of spec Limitations.
hypothesis used with this test is that the data are spatially uneorrelated.
The Overland and Preisendorfer ( 1982) test is based upon an extensive hfsmte Carlo analysis. The published table, which oxsly applies to the '05 level, gives the expected value of explained variance as a function of the number of raw variables, the number of observations, and principal component number. It atso extends only through the fifth principal com- ponent: i t was extended with a regression-based logarithmic extrapolation. Table 2 details some of the results of this test,
Cohen ( 1983) used another significance criterion, called the Scree Test, in which components whose eigc~nvalue i s less khan 1.0 are consihred insignifi- cant. In that ease, the principal component explains less variance than does an average raw input variable prior to the initiation of the PCA. While this may seem an appropniate ending point for the analysis, JolliBe (1982) argues; that higher order components that do nod pass the Scree Test may still be important predictors of some response variable,
Saulkrwiide Models for SPB and Climate
After the raw data were filtered to determine their most significant modes of variation with the principal component analysis, the derived variables were sub- jected to a multiple regression analysis to determine their relation to SPB coverage, The basic prediction model, for each a% the four regions, was 06 the form,
n n SPB = K -i- 2 f l (PC) 62)
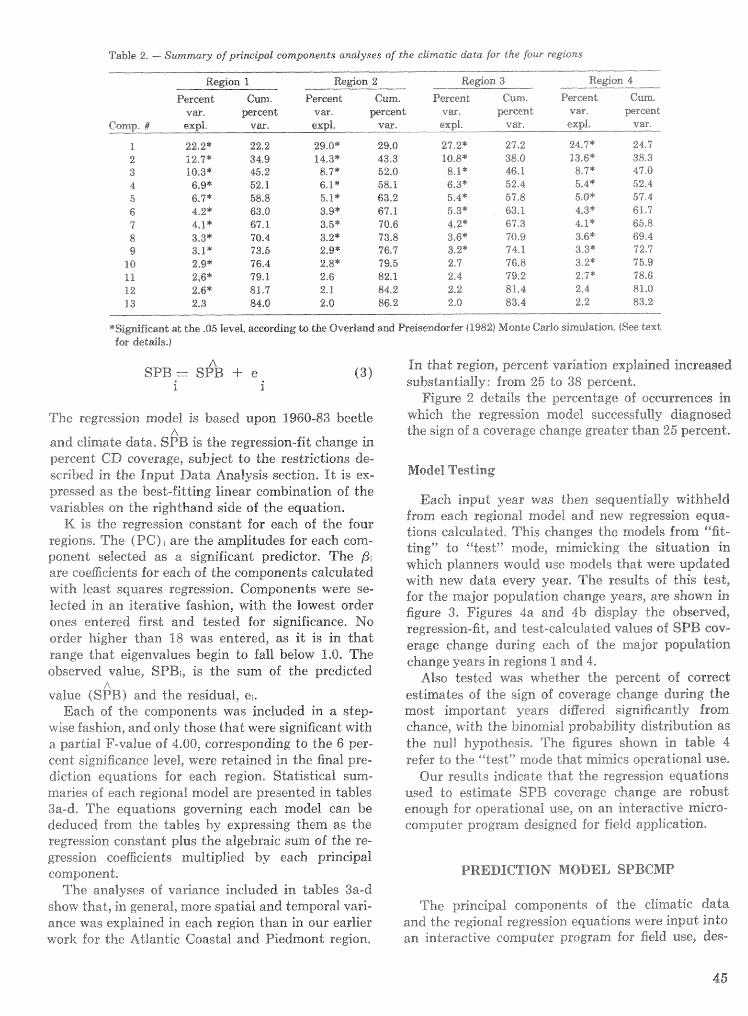
Table 2, - Summav of p~mipal' eompcanezzds analyses of the cfirnatie &ata for the four regions
&&on 1 b ~ o n 2
Percent C m . Percent Cum. vw, preen t var* preen t
etsr~b~ w P X P I , v%. E ? X ~ E . vat-. -- - -
P 2 2 2 22.2 29,O" 29-0 2 12-7" 39-9 f 4.3" 43.3 3 103' 45-2 8.7* 62.6 4 6.9" 52. P 6.1" 58.9 5 6 . P 58-8 &.IQ 63.2 6 42* 63.0 3.9" 6S,P 17 69.1 3.5" 70.6 8 3,3* 70.4 3.2* 73.8 9 3-1" 73.5 2.9" 76.7
a o 2,9* 76-4 2-13" '99.5 I L 2,6* as-n 2-6 821 12 2-6' 81,1 2,1. 84-2 13 2-23 84.0 2,O 86.2
Region 3 Region 4
Percent Cum- Percent Cum, VW* percent vm percent expl, vm, expl, 'bimi%, - -- - - --- 27-2" 27.2 24-7* 21.9 10.8" 38-0 13.6" 38-3 8.1" 46.1 8-7" 410 63" 52-4 5-4" 52.4 5.4" 57.8 5*0* 5x4 5 3 63.1 4-3" 61,7 4.2" 673 4-1" 65-8 3.6" 70-9 3.6" 69-4 3.2" 7.8-9 3-3" 72-7 2.7 76-8 3.2" "7,9 2.4 79,2 2-7" 78,6 2-2 81.4 2 4 81-0 2-0 83,4 2.2 83.2
--- -
*Siwifiemd at the .05 level, according do the Csverimd and Preisendorfer (1982) Monte Car10 simulation, {See tex t for details,)
A SPB = SPB 4- e
I 1
In that region, percent variation explained increased '3' substantially: from 25 to 38 percent.
Figure 2 details the percentage of occurrences in The regression model is based upon 1960-83 beetle which the regression model successfully diagnosed
A the sign 06 a coverage change greater than 25 percent* and climate data, SPB is the regression-fit change in percent CD coverage, subject to the restrictions de- scribed in the Input Data Analysis section. It is ex- Model Testing
pressed as the best-fitting linear combination of the on the righthand side of the equation,
K i s tho regression constant for each sf the four regions, The (PC), are the amplitudes for each com- ponent selected as a significant predictor, The 6, are coefficients for eaeh of the components calculated tvi$.h least squares regression. Components were se- lected in an iterative fashion, with the itowest order ones entered first and tested for significance, No order higher than 18 was entered, as it is in Ghat range that eigenvalues begin ta fall below l , O , The observed value, SPB,, is the sum of the predicted
value ( S ~ B ) and the residual. e,. Each of the compsnents was included in a step-
wise fashion, and only those that were significant with a partial F-value of 4,OCd, corresponding do the 6 per- cent significance level, were retained in the final pre- diction equations for each region, Statistical sum- maries of each regional model are presented in tables 3a-d, The equations governing each model can be deduced from the tables by expressing them as the regression constant plus the algebraic sum of the re- gression~ coeacients multiplied by eaeh principal component,
The analyses of variance included in tables 3a-d show that, in general, more spatial and temporal vari- ance was explained in each region than in our earlier work for the Atlantic Coastal and Piedmont region,
Each input year was then sequentially withheld from each regional model and new regression. equa- tions calculated, This changes the models from "fit$- ding" to '%destV mode, mimicking the situation in which planners svould use models that were updated with new data every year, The results of this test, for the major population change years9 are shown in figure 3, Figures 4a. and 4b display the observed, regression-fit, and test-calculated values of SPB cov- erage change during eaeh of the major population change years in regions 1 and 4,
Also tested was whether the percent of correct estimates of the sign of coverage change during the most important years differed significantly from chance, with the binomial probability distribution as the null hypothesis, The figures shown in table 4 refer to the ""test"' mode thatmimics operational use,
Bur results indicate that the regression equations used to estimate SPB coverage change are robust enough for operational use, on an interactive micro- computer program designed for field application,
PREDICTION MODEL SPBCBIP
The principal components of the climatic data and the regiona.8 regression equations were input into an interactive computer program far field usep des-
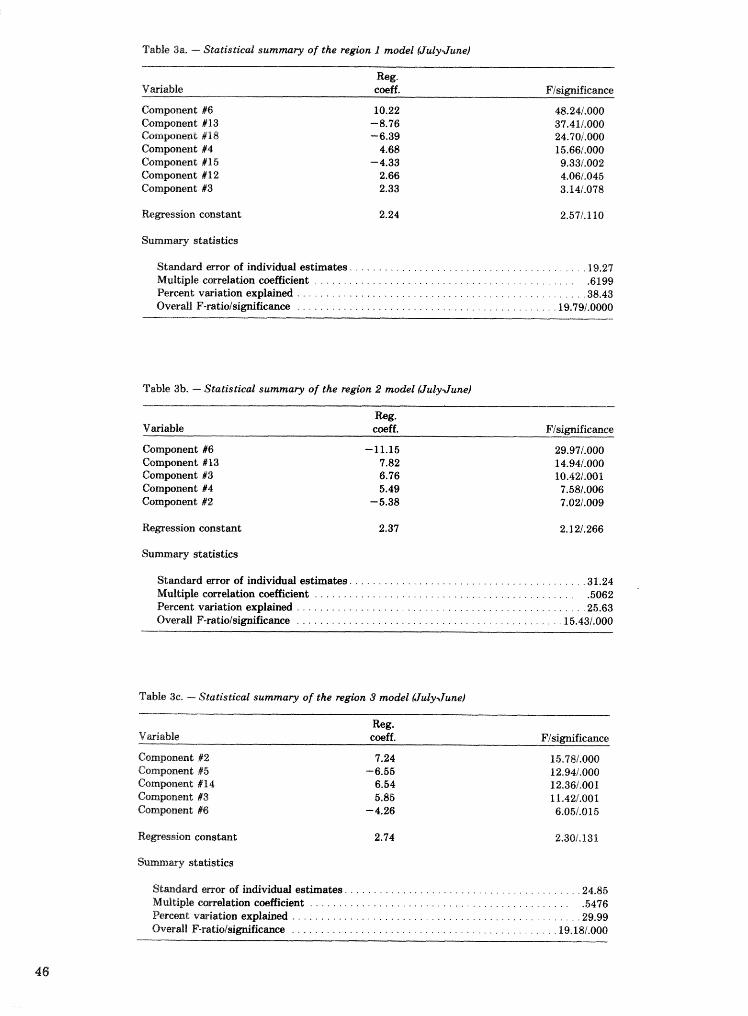
Table 3a. - Stati-sticd sumntary of the region 1 model (JulyJune)
Component ilr6 Component 113 Compnent # 18 Component 14 Component 11 5 Gompwnt, #I2 Component #3
Regression constant; 2.24 2.571.1 10
Standmrrd error of individual estimates. . . . . . . . . . . . . . . . . . . . . . . . . . . . . . . . . . . . . . . . ,1927 Multiple correlation coefficient . . . . . . . . . . . . . . . . . . . . . . . . . . . . . . . . . . . . . . . . . . . . . .6 199
. . . . . . . . . . . . . . . . . . . . . . . . . . . . . . . . . . . . . . . . . . . . . . . . . Percent variation explained .38.43 Overall F-ratio/si@;nificmce . . . . . . . . . . . . . . . . . . . . . . . . . . . . . . . . . . . . . . . . . . . . .19.791.01X)O
Table 3b. - Statistical summary of the region 2 model UulyJune)
Reg. Variable coeff. F/si@ficance
Component #6 -11.15 29.971.000 Component % 13 7.82 14.911.000 Compnen t %3 6.76 10.421.001 Component Ar4 5.49 7.581.006 Component 12 -5.38 7.021.009
Remession cons tan t 2.37 2.121.266
S u n m q statistics
Standard error of individual estimates. . . . . . . . . . . . . . . . . . . . . . . . . . . . . . . . . . . . . . . . .31.24 Multiple correlation coefficient . . . . . . . . . . . . . . . . . . . . . . . . . . . . . . . . . . . . . . . . . . . . .5062 Percentvariationexplaind . . . . . . . . . . . . . . . . . . . . . . . . . . . . . . . . . . . . . . . . . . . . . . . . . . 25.63 Over& F-ratiolsignificance . . . . . . . . . . . . . . . . . . . . . . . . . . . . . . . . . . . . . . . . . . . . . .15.43/.000
Tabje 36. - Statistical summary of the region 3 model (JulyJune) - -
Reg. Variable coeff. Flsi~ificance
eompnent 12 7.24 15.781.000 Coworrent 15 -6.55 12.941.000 Coanpsnent 114 6.54 12.361.001 ~ompc,nent f13 5.85 11.421.001 ~ o r r a ~ ~ ~ ~ n e n t R6 -4.26 6.05/.015
SLa~ldwd mor of individual esthates . . . . . . . . . . . . . . . . . . . . . . . . . . . . . . . . . . . . . . . . .24.85 ation coefficient . . . . . . . . . . . . . . . . . . . . . . . . . . . . . . . . . . . . . . . . . . . . . '5476
Percent vdatisn explained . . . . . . . . . . . . . . . . . . . . . . . . . . . . . . . . . . . . . . . . . . . . . . . . . .29,99 Overall F-nrtiolsignificance . . . . . . . . . . . . . . . . . . . . . . . . . . . . . . . . . . . . . . . . . . . . . .19.185.000
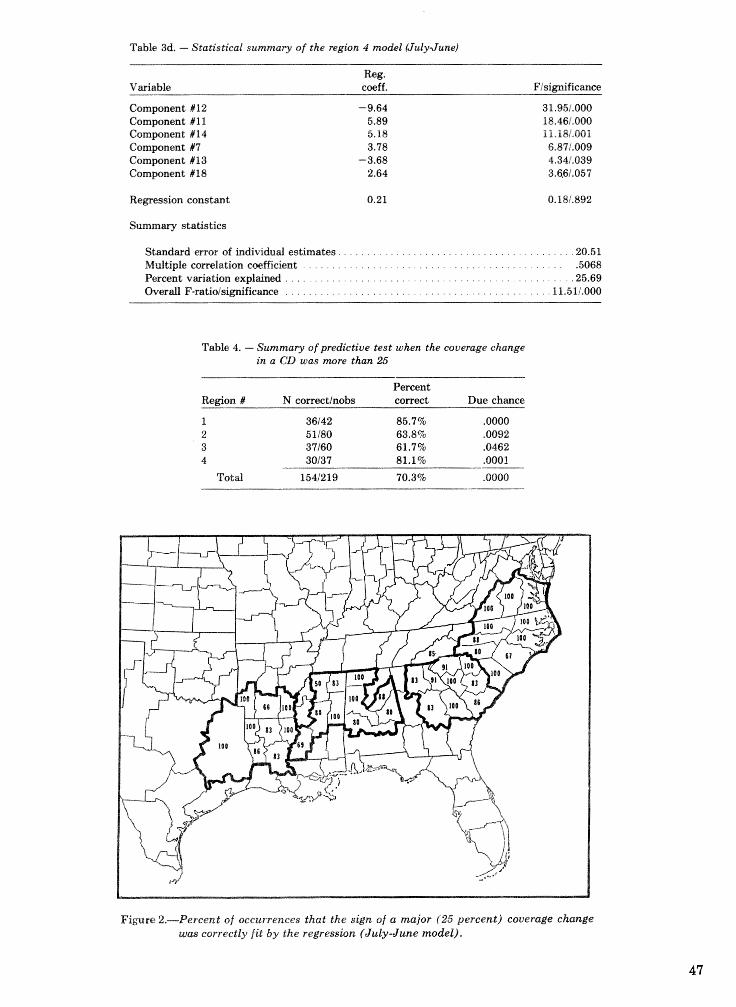
Table 3d. - Statisticai summary of the region 4 model (JalyJune)
Reg. Variable coeff. Fisignificmce
Component iV 12 Comgonent I1 f Component k"14 Compnent R I Component #I3 Component W 18
Summary statistics
. . . . . . . . . . . . . . . . . . . . . . . . . . . . . . . . . . . . . . . Steutdard error of Individual estimates. '20.51 . . . . . . . . . . . . . . . . . . . . . . . . . . . . . . . . . . . . . . . . . . . . . Multiple correlation coefficient -5068
Percentvariationexplained . . . . . . . . . . . . . . . . . . . . . . . . . . . . . . . . . . . . . . . . . . . . . . . . . . 5.69 . . . . . . . . . . . . . . . . . . . . . . . . . . . . . . . . . . . . . . . . . . . . . Overall F-ratioisi@ficance .11.5 1i.000
Table 4 . - Summary of predictive test ~uhen the coverage change in a CD was more than 25
Percent Redon I N correctlnobs correct Due chance
1 36142 85.7% .OOOO 2 5 1 i80 63.8% '0092 3 37/60 61.79% .0462 4 30137 81.1% .0001
Totd 1541219 70.3% .0000
Figure 2.-Percent of occurrences that the sign of a major (25 percent) coverage change utas correctly fit by the regression (July-June model),
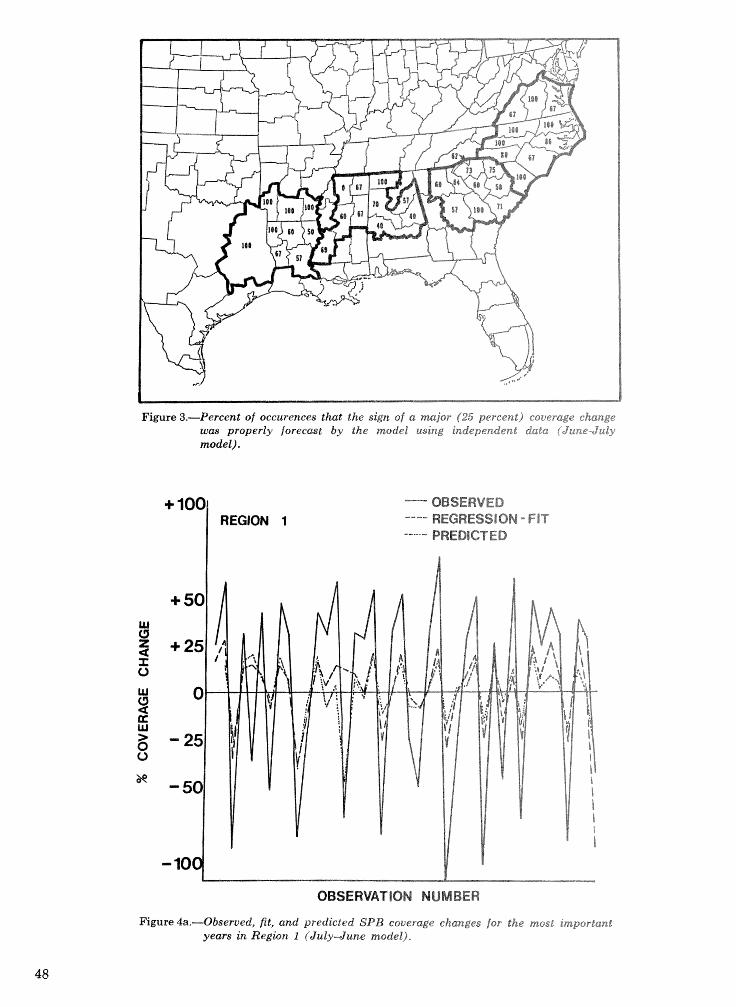
Figure 3.-Percent of occurences that the sign of a major (25 percent) eouerage change was properly forecast by the model using independent dcta (June-July model).
+ 100 REGION 1
OBSERVED ---- RECRESSBON - FIT ---.--* PREDTrCTED
OBSERVATlQN NUMBER
Figure 4a.-Obserued, fit, and predicted SPB coverage changes for the most important years in Region 1 (July-June model],
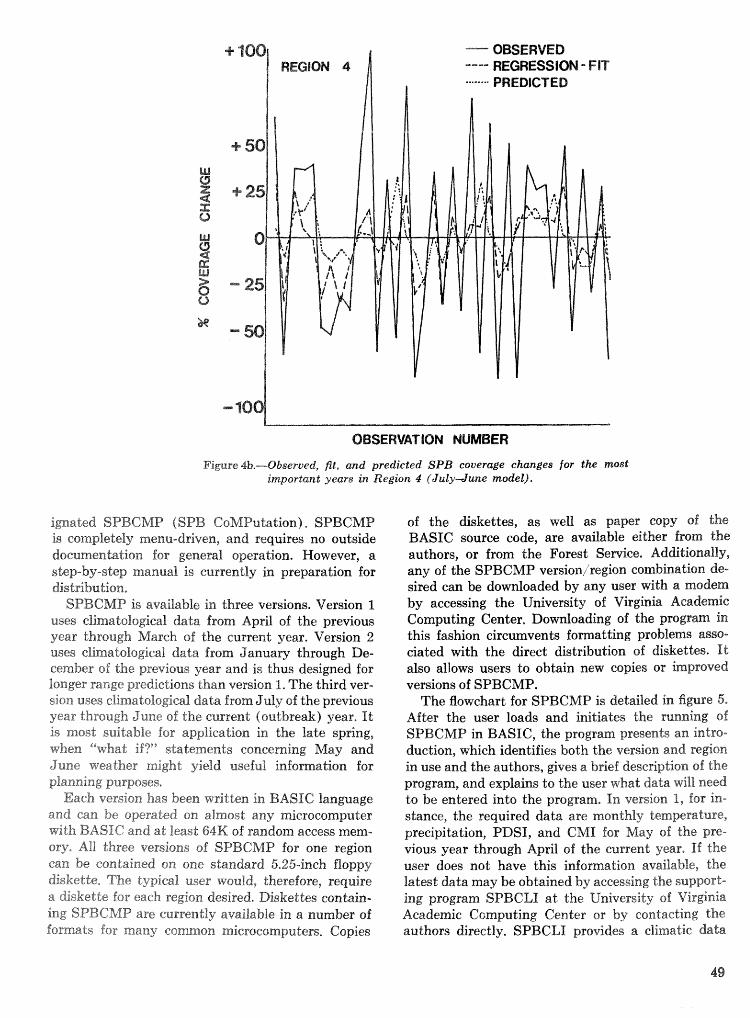
+ 100 OBSERVED ---- REGRESS !OM - F I"%
Fiere 4b.-Observed, fit, and predicted SPB coverage changes for the most inzportant years in Region P fJtelyz7une model).
ignated SPBCbql" (SPB CoMPuhtiomi). SPBCMP is compPekely menu-driven, and requires no outside documentation for general. operation. However, a step-by-step manual is currently in preparation for distribution,
SPBCMP is available in three versions. Version 1 uses climabslogical data from April of the previous year through March of the current year. Version 2 uses climatological data from January through De- cember sf the previous year and is thus designed for longer range predictions than version 1, The third ver- sion uses e%imadoXogiea2 data from July of the previous year through June of the current (outbreak) year. It is most suitable for application in the late spfing, when ""what if?" statements concerning May and June weather might yield useful infomatiern. for planning purposes,
Each version has been written in BASIC language and can be operated on almost any rniesoeomputer
BASIC and at least 64K of random access mem- ory. A11 three versions of SPBCMP for one region can be contained on one standard 5.25-inch floppy diskette, The typical user wi.ould, therefore, require a diskette for each region desired. Diskettes contain- ing SPB@&fP are currently available in a number of formats for many comrn~n micmeompaatem. Copies
of the diskettes, as well as paper copy of the BASIC source code, are available either from the authors, or from the Forest Service. Additionally, any of the SPBCMP version/region combination de- sired can be downloaded by any user with a modem by accessing the University of Virginia Academic Computing Center. Downloading of the program in this fashion circumvents fomatting problems asso- ciated with the direct distribution sf diskettes, It also allows users to obtain new copies or hproved versions of SPBCMP.
The flowchart for SPBCMP is detailed in figure 5, After the user loads and initiates the w n i a g 06 SPBCMP in BASIC, the program presents an intro- duction, which identifies both the version and region in use and the authors, gives a brief description of tke program, and explains to the uses what data will need to be entered into the progmm, In version I, for in- shnce, the required data are monthly temperature, precipitation, PDSI, and GMI for May sf the pre- vious year through April of the current year, If the user does not have this information available, the latest data may be obtained by accessing the support- ing program SPBCLI a t the University of Virgiwia Academic C~mputing Center or by conitacting the authors directly. SPBCLI provides a climatic data
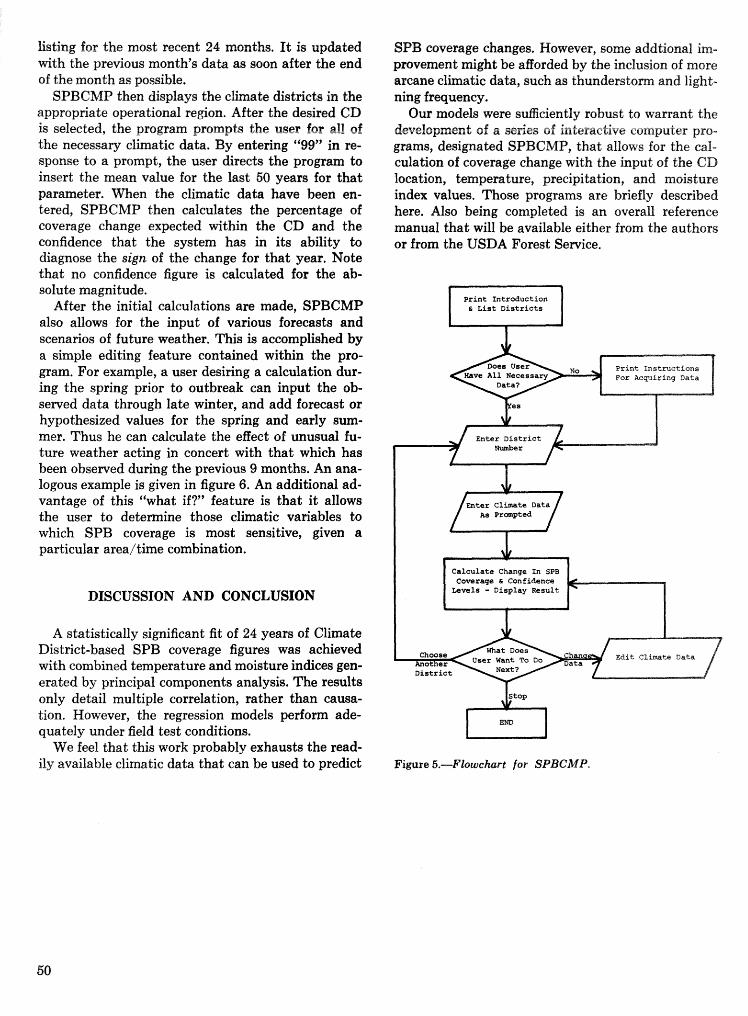
lislting for the most recent 24 months, It is updated with the previous month" data as soon after the end of the month as possible.
SPBCMP then displays the c b a h distr_icts in the appropriate operational re@on. After the desired CD is selected, the program prompts the user for all! of the necessary climatic data. By enter-ing "99" in re- SPOI~SC? to a prompt, the user direcb the progrm to insert the mean value for the last 50 years for that parmeter. m e n the climatic data have been en- tered, SPBCMP then calculates the percentage of coverage change expected within the CD and the confidence that the system has in its ability to diamose the sign of the change for that year. Note that no confictence figure is calculated for the ab- solute magnitude.
After the initial calculations are made, SPBCMP also allows for the input of various forecasts and scenarios of future weather. T%is is accomplished by a simple editing feature contained within the pro- gram. For example, a user desiring a calculation dur- ing the spring prior to outbreak can input the ob- served data through late winter, and add forecast or hypothesized values for the spring and early sum- mer. Thus he can cafcu1ate the effect of unusual fu- ture weather acting in concert with that which has been observed during the previous 9 months. An ana- logous example is given in figure 6. An additional ad- vantage of this "what if?" feature is that it allows the user to detemine those climatic variables to which SPB coverage is most sensitive, given a particular areaitime combination.
DISCUSSION AND CONCLUSION
A statistically significant fit of 24 years of Climate District-based SPB coverage figures was achieved with combined temperature and moisture indices gen- erated by principal components analysis. The results only detail multiple correlation, rather than causa- tion. However, the regression models perform ade- quately under field test conditions.
We feel that this work probably edausts the read- ily available climatic data that can be used to predict
SPB coverage changes. However, some addtianal im- provement might be afforded by the inclusion of more arcane elhatie data, such as thunderstorm and light- ning frequency.
Our models were suaicientIy robust to warrant the development csf a sepiea of interacMve computer pra- grams, designated SPBCMP, that allows for the cal- culation of coverage change with the input of the CD location, temperature, precipitation, and moisture index values. Those programs are briefly described here. Also being completed is an overall reference manual that will be availabIe either from the authors or from the USDA Forest Service.
I Calculate Change In SPB Cowrage 6 Confidence Levels - Display Result
Figure 5.-Flowchart for SPBCMP.
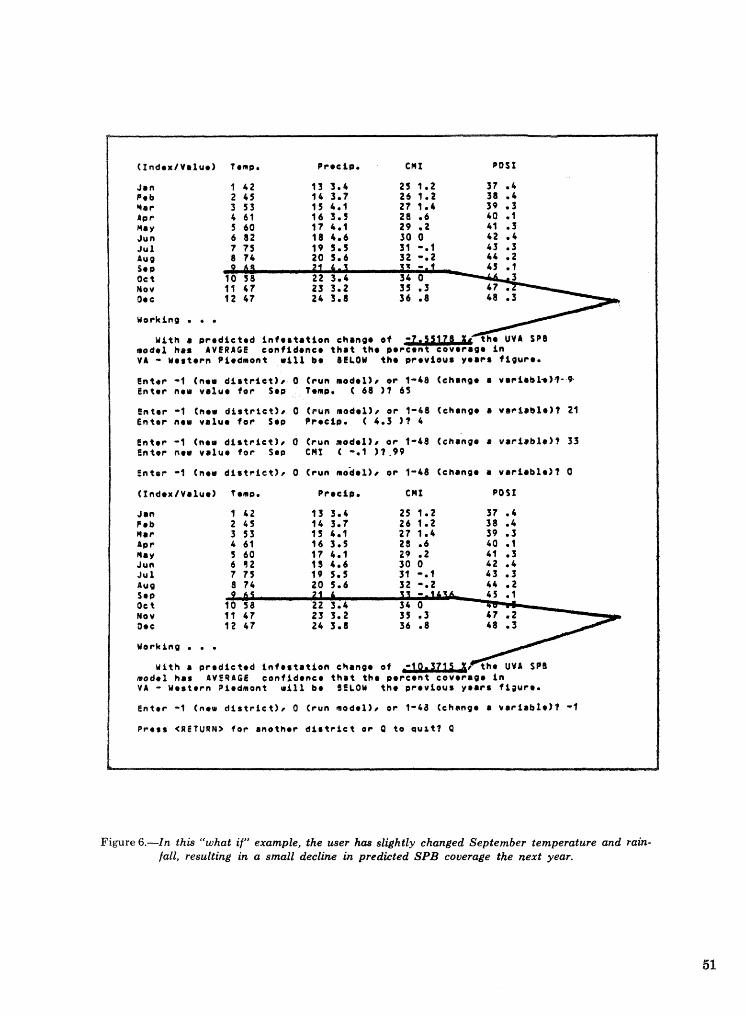
I f n d o x / V r l u e ) Temp.
wo rk ing . r . X i t h a p r o d t c t o d I n f o s t 8 t l o n change o f
e n t e r -1 ( n o r d i s t r i c t ) , 0 Crun nodo1)r o r 1-48 Cchanpe a vac i rb l * )9 -9 . Cn to r new v a l u e f o r Sop Temp. C 66 I ? 63
t n t o r -1 (now d i s t r i e t ) r 0 ( r u n nodo1) r o r 1-48 (change 8 v a r i & b t e ) ? 21 E n t e r n o r v a l u e f o r Sop P rec ip . < 4 .3 I ? 4
E n t o r -1 (new d t s t r i c t ) r O Crun node1) r o r 1-44 (change a v a r i a b l e ) ? 33 E n t e r n o r v r l u o f o r Sep C H I C -.1 ) ? .99
E n t e t -1 (nos d t h t r f e t ) r O ( r u n n e b a l ) r o r 5-46 Cchango o variable)? O
Cf ndoxlVa1uo) T *no.
Y o r k i n g . . .
E n t o r -1 ( n o r d t s t r i c t ) r O ( r u n aode2)r o r 1-4d (change a v a r i a b l e ) ? -1
Press <RETURN% f o r ano tho r d i s t r i c t o r 0 t o s u l t ? Q
Figure 6.-In this "what if"' example, the user has s l ~ h t l y changed September temperature and rain- fall, resuliiag in a small decline in predicted SPB couerage the next year.
LITERATURE CITED
Beal, Ljr* A, Temperature extremes as a factor in the ecology of the southern pine beetle. J. For, 31: 329-336; 1933.
Campbel, J, 23.; Smith, K. E, Climatological Eore- casts sf southern pine beetle infestations, South- east, Geog, 20: 16-30; 1980.
Gohen, $3. J, Classification of SOOmb height anoma- lies using obliquely rotated principal components. J* Clim, and Appl, Meteor, 22 : 1975--1990; 1983.
Craighead, F. C, Bark beetle epidemics and rainfall deficiency. J, Eeon. Entomol. 18: 557-586; 1925,
Hayden, B. P,; Smith, W. L. Season-to-season cyclone frequency prediction;. Mon. Wea. Rev. 10: 239- 253; 1982.
Joliffe, I* T, A note on the use of Principal Compo- nents in regression. Appl. Stat. 31: 300-308; 1982.
Kalkstein, L. $3. An improved technique to evaluate climate-souther pine beetle relationships. For. Sci, 27: 579-589; 1981,
Krsl , J, C.; Reeves, H. C.. A simple model for pre- dicting annual numbers of southern pine beetle kfeskations in East Texas. South. J. Appl. For. 2 : 62-64; 1478.
hlichaels, P. J. Climate and the southem pine beetle in Atlantic Coastal and Piedmont regions. For. Sci, 36): 143--156; 1984.
hfichaelis, P, J,; Gerzoff, R, B. Shtisdieal relations between summer thunderstorm patterns and con- tinental midtropospheric heights, Man, Wea, Rev, 112: 778-789; 1984.
Newcomer, J. A,; Meyers, L, Principal compo- nents analysis sf total tree farm in seven central Pennsylvania hardrvcrtod forests, For, Sci, 30: 64-70; 1984.
Overland, J, E.; Preisendofer, Ti, W, A significance test for principal components applied to a cyclone climatology. Mon, tYea. Rev, If 0: 1-4; 1982,
Palmer, W. E. hfeteorofogical drought, U, $3, Weather Bureau Research Paper #48, JVashington, DC: U.S. Department of Commerce; 1948, 58 pa
Price, T, 2%; Dsggett, C. A history of southern pine beetle outbreaks in the southeastern United States, Athens, GA: Georgia Forestry Commission; 31978. 31 p.
Richman, M. 13. Rotation of principal eompsnevats in clinnatologicall rsearch. Part I: Theoretical consid- erations, suitable applications and advantages over unrotated solutions, In: Proceedings of the 8th Conf. on Prob. and Stads,, American Meteors%sgical Society, Boston, hf A; 1983,
Swain, K, Me Forest insect and disease conditions in the South. For. Serv. Rep, SA-PR 4. Atianta, GA: U.S. Department of Agriculture, Forest Service, Southern Region State and Private Forestry; 1980. 25 p.
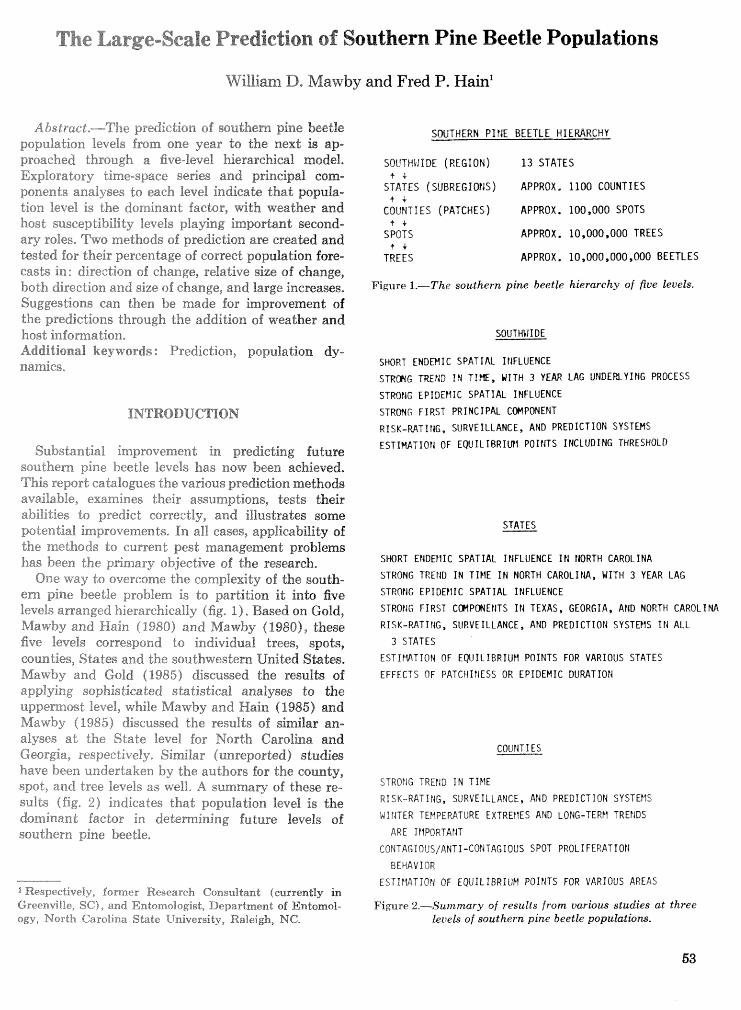
The Large-Scale Prediction of Southern Pine Beetle Populations
William D. Mawby and Fred P. H
Abstract.-The prediction of wuthen"~ pine beetle population levels from one yeas to the next is ap-
SOUTHERN P I H E BEETLE NIEWARCHY
proached through a five-%eve% hierarchical model, SOUTMI!II)E (REGION) 1 3 STATES
Exploratory time-space series and p~ncipal corn- 4- + ponents analyses to each level indicak that popuPa- STATES (SUBREGIONS) APPRDX, 1100 COUNT1 ES
A i z 7
tion level is the dominant factor, with weather and COUNTI ES I PATCHES) APPROX, 100,000 SPOTS host susceptibility levels playing important second- + + ary roles, Two methods sf prediction are ereakd and SPOTS
4 i
APPROX. 10,000,000 TREES 2 .
tested for their percentage of correct population fore- TREES APPROX. 10,000,000,800 BEETLES casts in: direction of change, relative size sf change, both direction and size of change, and large increases* Figure 1.-The southern pine beetle hierarchy of fiue leuels.
Suggestions can then be made for improvement of the predictions through the addition sf weather and host infomation, Additional keywords : Prediction, population dy- namics, SHORT ENDRi IC SPATIAL I tlFLUENCE
SRONG TREIID I N T I M , WITH 3 YEAR LAG UNDERYING PROCESS
STROtlG EPIDEMIC SPATIAL IMFLUENCE
STRONG FIRST PRINCIPAL CmPONEMT
RISK-R41 IIIG, SURVEILLANCE, AND PREDICTION SYSTENS
Substantial improvement in predicting f u t u ~ ESTINATIOt l OF EQUILIBRIUFl POIt iTS INCLUDIFIG THRESHOLD
southera pine beetle levels has now been achieved. This report catalogues the various predic"cisn methods available, examines their assumptions, teats their abilities to pttedick correctly, and illustrates some potential improvements. In all cases, applicability of the methods to current pest management problems has been the primary objective of the research,
One way to overcome the complexity of the south- e m pine beetle problem i s to partition it i n k five levels arranged hierarchically (fig. I), Based on Gold, Mawby and Hain 9 1980) and hfawby (1 9801, these five levels correspond to individebaa trees, spots, counties, States and the southwestern United SbLes. Mawby and Gold (9985) discussed the results of applying sophisticated statistical. analyses to the uppermost level., while h4awby and Hain (1985) and hfawby 61985) discussed the results sf skilas an- alyses at the State level for North Carolha and Georgia, respectively, Similar (mreported) strr&es have been undertaken by the authors for the eozmnty, spot, and tree levels as well, A summary of these re- sults (fig. 2) indicates that population level is the dominant factor in determining future levels of southern pine beetle,
1 Respective%y, former Research Consultant (currently in Greenville, SC) , and Entomologist, Department of Ent-omol- sgy, North Carolina State University, Raleigh, NC.
STATES
S W R T EHDEIIIC SPATIAL I HFLIJENCE I ti f4ORTH CAROLINA
STRONG TREIID I N TIFIE I N NORTH CAROLIIIA, WITH 3 YEAR LAG
STRtftiG EPIDEtI IC SPATIAL INFLUENCE
STROftG F IRST COMPONErlTS I N TEXAS, GEORGIA, AFiD NORTH CAROLINA
RISK-RATING, SURVEILLANCE, AND PREDICTION SYSTEtlS It4 ALL
3 STATES
E S T l r M T I O N OF EQLIILIBRIUI'I POIFITS FOR VARIOUS STATES
EFFECTS OF PATCMIftESS OR EPIDEMIC DURATION
COUNT l ES
STRONG TREIiB I # TIME
RI SK-RAT EFIG, SURVEILLANCE, AND PREDICTION SYSTEFtS
WINTER TEFIPERATURE EXT REllES AlJD LONG-TERf1 TRErlDS
ARE IFIPORIAtlT
CONTAGbOUS/ANTI-CONTAGIOUS SPOT PROL f FERAT I O N
BEHAVIGW
ESTIrlAflDPl OF E Q U I L I B R I U N POINTS FOR VARIOUS AREAS
Fimre 2.-Summary of results from various studies at three leuels of southern pine beetle popukticam.
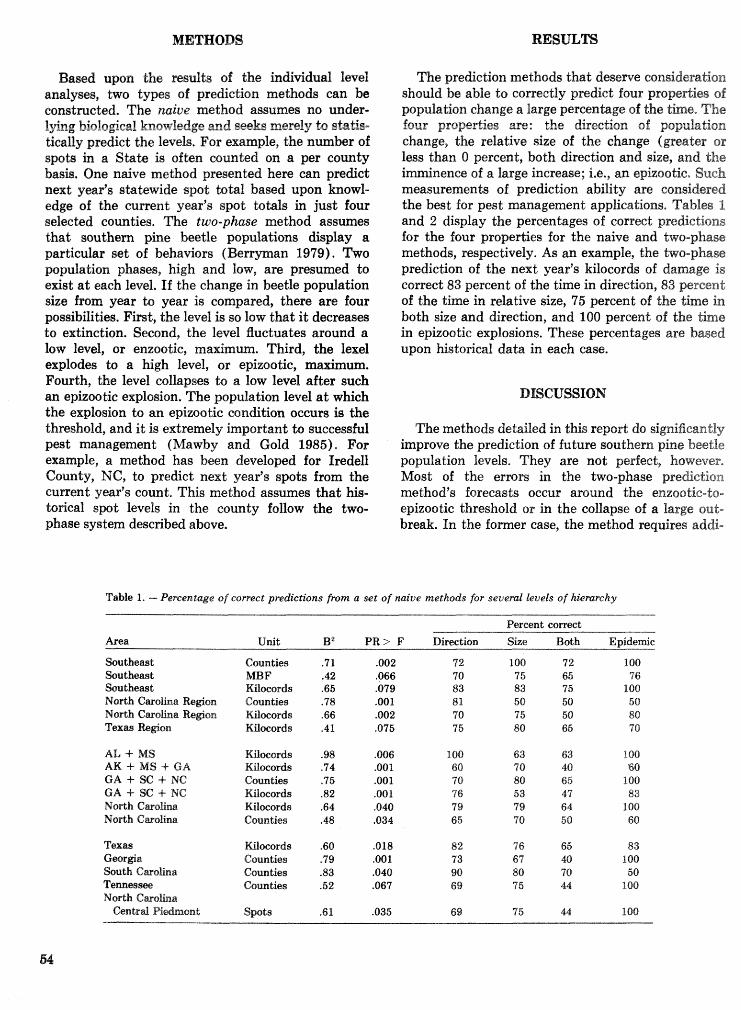
METHODS
Based upon Lbe resdts of the hdividual level analyses, two types of prediction methods can be constrztcted. The w i u e mr?thod assme8 no mder- l a g liriofo@cal knowledge and geekg merely !a etakig- tieaUy predict the levels, For examgle, Lhe n m b r of spsb in a S h b is ofkn eomted on a per county baa&, One naive method presented he= next yeafs sbtewide spot total based u edge of t b w m n t year's spot totals in just four lseleeted counties, The two-phase method assmes that southem p h e beetle populations display a particular set of behaviors (Be population phases, high and low, are presumed to errist a t each level, If the change in beetle population size from year to p a r is conapared, there are four possibilities. First, the level is so low that it decreaseis to extinction. Second, the level fluctuates around a low level, or enzootie, m a ~ m m . Third, the lexel explodes to a high level, or epizootic, m Fourth, the level collapses Lo a low level after such an epizootie explosion. The population level a t which the explosion to an epizootic mndition occurs is the threshold, and it is extremely important to successful pest management (MaPrby and Gold 1985). For example, a method has bmm developed for Iredell County, MC, to predict next year" spots from the current year" count. This method assumes that his- tofial spot levels in the counf;y follow the two- phase system described above.
The pre&cf;isn methods that deseme coa~ideralion should be able to comreetly plre&el four propehies of popula~on ehange a large percent-age of the *ea The Sour prope~ies are: the direction of popuhtion change, the relative size of the change (greater or less than 0 percent, both &rectiora and ~lize, md the * "nence sf a large increaee; i.e,, ara epksotk, Swh measurements of prediction ability are considered the best for pest management appEcatione, Tableg 1 and 2 display the percentages of commt pre&c=tions for the four properties for the naive and two-phase metho&, respectively, As an example, the ha-phase pre&ction of the next yeark kilocords of darnage is correct 83 percent of the time in direction, 83 percent of the t i m in relative size, 75 percent of the t h e h both she and direction, and 100 percent of the t h e in epizootic explosions. These percentages are based upon historical data in each case.
DISCUSSION
The methods detailed in this report do signieiicantly hprove the prediction of future southern pine beetle population levels. They are not perfect, however, Most of the errors in the two-phase preaction method's forecasts occur around the enzootic-to- epizootic threshold or in the collapse of a large out- break. In ttae fomer case, the method requires addi-
Table 1. - Percentage of correct predictions front a set of naive methods for several levels of hierarchy
Percent correct Area Unit BZ PR> F Bkwtion Size Both E p i d e ~ e
Southeast Counties .71 ,002 72 100 7 2 100 Southeast MBF .42 .066 70 7 5 65 76 ScYutheast Kiloeords .65 .079 83 83 75 100 North CaroEzaa h @ o n Cornties .78 ,001 8 1 60 59 50 North GmoEna %&on Wwctrds .66 .002 70 7% 50 80 Texas %&on Kilo~ords .41 .075 7 5 80 65 70
Ah, 4- MS mseods .98 .006 100 63 63 LOO AK 4- MS 4- GA Mascords .74 ,001 60 70 40 60 GA + SC -+ NC Counties .75 .001 70 80 65 100 GA -+ SC 4- lue K3ocords .82 -001 76 53 47 83 North GmoEna Rilacords .64 .040 79 79 64 100 North Cmolina Counties .48 ,034 65 70 50 60
Texas Mmords .60 -018 82 76 65 83 Gwr&a Counties .79 .001 73 67 40 100 South Cwolina Counties .83 .040 98 80 70 50 Tennesseci, Counties -52 .067 69 75 44 100 North Cgxgoha
SpLs .61 '035 69 75 44 100
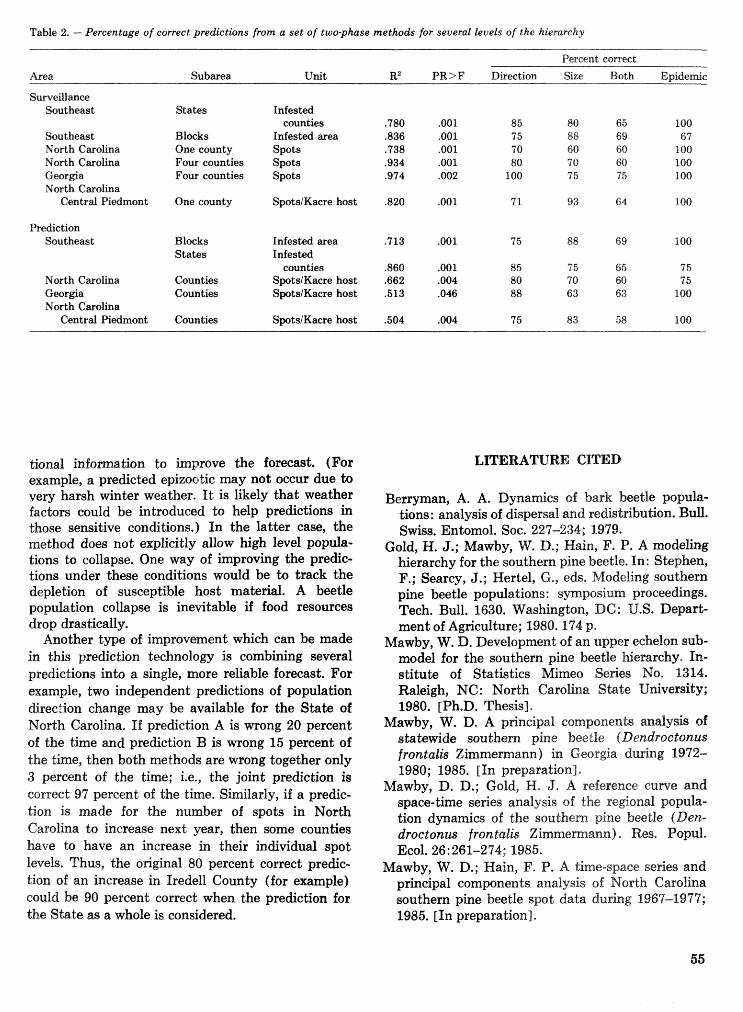
Table 2. - Percentage of correct predictions from a set of two-phase methods for severat leuels of the hierarchy
Percent correct
Area Submea Unit R2 Size Both Epidenzic
SmeiZIance Southeast Infested
counties lnfesLed area Spots Sgots Spots
Sout;heast North CaroEna North Carolina Gc30rgia North Carolina
Central Piedmont
Blocks One county Four counties Four counties
One county SpotsiKacre host
Prediction Southeast Blocks
States Infested area Infested
counties SpotslKacre host SpotsiKacre host
North CaroLina Georgia North Carolina
Central Pisdmont
Counties Counti~
Counties SpotsiKacre host
~ o n a l infomation to improve the forecast. (For example, a predicted epizootic may not occur due to very harsh winter weather. It is likely that weather factors could be introduced to help predictions in those sensitive conditions.) In the latter case, the method does not explicitly allow high level popula- tions to collapse. One way of improving the predic- tions under these conditions would be to track the depletion of susceptible host material. A beetle population collapse is inevitable if food resources drop drastically.
Another type of improvement which can be made in this prediction technology is combining several predictions into a single, more reliable forecast. For example, two independent predictions of population direction change may be available for the State of North Carolina. If prediction A is wrong 20 percent of the time and prediction B is mong 15 percent of the time, then both methods are .wrong together only 3 percent of the t i m ; i.e., the joint prediction i~ correct 97 percent of the time. Similarly, if a predic- tion is made for the number of spots in North Carolina Lo increase next year, then some counties ham to have an increase in their individual spot levels. Thus, the original 80 percent correct predic- tion of an increase in Iredell County (for eould be 90 percent c o m t when the prediction for the State as a whole is; considered,
LITERATURE CITED
Berryman, A. A. Dynamics of bark beetle popula- tions: analysis of dispersal and redistribution. Bull. Swiss. Entomol. Soc. 227-234; 1979.
Gold, H. J.; Mawby, W. D.; Hain, F. P. A modeling hierarchy for the southern pine beetle. In: Stephen, F.; Searcy, J.; Hertel, G., eds. Modeling southern pine beetle populations: symposium proceedings. Tech. Bull. 1630. Washington, DC: U.S. Depart- ment of Agriculture; 1980.174 p.
Mawby, W. D. Development of an upper echelon sub- model for the southern pine beetle hierarchy, h- stitute of Statistics Mimeo Series No. 1314. Raleigh, NC : North Carolina State University; 1980. [Ph.D. Thesis].
Mawby, W. D. A principal components analysis of shbwide southern pine beetle (Dendroctonus frontalis Zimmemann) in Georgia. &ring 1972- 1980; 1985. [In preparation]
Mawby, D. D.; Gold, H. J. A reference curve and space-time series analysis af the re&onal popula- tion dynamics of the southern pine beeLife (Den- droctonus frontalis Zi emam). Res. Papule Eco~. 26: 2631-274; 1985.
Mawby, W. D.; Hain, F. P, A time-space sesies and principal components analysis of North Carolina southern pine beetle spot data during 1967-1977; 1985. [In preparation].
Methods for Estimating Annosus Root Rot in Loblolly Pine Stands
S. A. Alexander, Re II. Hokans, E. S. Fanelli, and T. M. Kurdyla'
Abstract .-An Annosus Sampling Procedure (ASP) was developed for esti~nading the severity sf annosus root rot in thinned lrsbIo11y pine stands, The ASP i s based on the systematic establishment of 20 :plods with root samples co.ileeted at each plot evaluated for symptoms of annosus root rot. ASP is accurate to approximately 10 percent of the base- line annosus root rot severity, Two annosus predic- tion models have also been developed using regression techniques, These models were based pgmariiy on ahve-ground measurements; i-e,, site index, basal area, diameter breast height, radial growth, etc, The number of plots for the prediction models varim depending on the level of accuracy required, The percent annosus severity obtained from the ASP and prediction models may be used for the GY- ANKOSUS growth and yield model, Additionat keywords : He tero basidion annosum, Fomes annosus, Pinus taeda, disease severity, root rot, disease sampling,
INTRODUCTION
Annosus rsot rot is a major disease of Ioblolly pine (Ptnus taeda L.) and other southern. pines in the southeastern United States, The disease is most severe in thinned piantations and stands because thinning creates stump surfaces and root wounds Ghat act as points of entry for Heterobasidion annosum (Fr-) Bref,, the cause of annosus root rot. Severely affected trees grow at a slower rate and are more susceptible to bark beetle infestation, Tree nrorti%fi$y tends to occur in pocketsi although it may occur rmifaamly in severely affected stands, Annosus root rot tends to be more severe on well-drained soils with a sandy to sandy loam texture, 12 inches oar more in depth, and with a %ow seasonal wader table* Thus, these soil types are generally referred to as high-hazard soils,
Evaluating the presence and inrapact of annosus root rot %itas been difficult due to the lack sf effective methods for estimating the severity of the disease. It was the objective of this project to develop practical and effective methods for estimating an- nosus root rot in lcsblslly pine stands,
I Respectively, Associate Professor, Assistant Professor, and Graduate Research Assistants, Virginia Psiydeehnie Institute and State University, Blacksburg, VA,
STUDY B2ETHODS AND RESULTS
Forty-eight plots in 24 thinned %oblolly pine plaratatioas in Virginia, Alabama, and %ufississippi were used do develop the Annosus Sampling Proce- dure and annosus prediction models, Above-ground data colTeclCed included: crown e%ass, diameter at breast height (d,b,h,), height, height to live crown, basal area,;and site index. Stand history fac;tT)rs like age, thinning dates, and tree spacing miere also re- corded, Annual ineremenda8 growth of cores removed ad d.%b.h, was measured using an Addo-X dendro- chronograph, Baseline levels of annosus rsot rot were determined by excavating all trees in systematically placed twentieth-acre plots, and evaluatirag their rood systems for annosus root rod,
Annosus Sampling Procedure
The Annosus Sampling Procedure (ASP) provides a means of estimating annosus soot rot severity in a stand. Twenty sarrrple plots are systematically &s- tributed through the stand to be san~pled, Once a plot center has been located, the actual sampling poin"r,is moved to a position that maximizes the number of tree root systems sampled. SampEing begins with the removal sf the duff layer over 8x1 area I-food-square, A I-cubic-foot sample of soil is re- moved with a shovel and all pine root segments re- moved far evaluation, A11 pine root segments $4 inch in diameter or larger are separated, caausrted, and ex- amined for typical. annosus symptoms, resin-soaking and stringy, white rot. Roots with other symptoms (or symptomless) are ciiassified as noninfeeted, The sampling process is repeated at each of the 20 plods, and the results averaged to provide an estimate of the severity of annosus rood rot in the stand. Data collected from Virginia, Alabama, and M ~ B s ~ s s ~ ~ P ~ were used in developing the procedure, Baseline levels of annosus root rot severity were obtained from root system excavations and used for determin- ing the accuracy of the ASP, The ASP can estimate severity to within 10 percent of the baseline at P = 0.85,
Amosus Root Rot Prediction Bfodels
Tree and stand data were collected from loblolly pine stands in Virginia, Alabama, and Mississippi. The data were analyzed and a prediction model selected based on biological and satistical inferences. The models are described below,
The Virginia annosus prediction model consisted of the folloaaiing variables:
MCR5=mean, radial growth over the past 5 pears in inches
SIzs i te index in feet at base age 25 BA == basal area in square feet per acre Y S"r = years since first thinning Age Tan (h4DBH) =Smgewt of mean d.b.h, in inches QMDBHzquadratic mean d.b.h. in inches Cos (BA) = cosine of basa area &%ARES =mean annosus root rat severity
The kTirgiraia model is as follows: MARRS r-- 108,09- 162,04 (hiIGR5)-1.16
(SI) +8,21 (BA) -2.70 [Tan (MDBH) I -1- 4-69 (YST) --- 4.93 (Age) -t 11.25 (QMDEJH) 4- 9.69 [Gas (BA) 1-
The Virginia model had an regression R square value of 0-99, and a F) value of 0.0001.
The Alabama annosus preactian model eonsish of the f olfowing variables :
RSP=pereeazt roots symptomatic for H. anns- sum in X-eu-ft sail sample
SI:=site index in feet at base age 25 yrs MDBH =mean d,b.h, in inches Tan. MDBH) =- tangent of MDBH YST =years since first thinning QMESBH = quadratic 06 MDBH BAILG --- basal areaipercent live crown MARRS = mean annosus root rot sever;ity
The Alabama prediction model i s as follows: MARRS (cjr =,108,05+0.54 (RSP) -2.18 (SZ)
-53-24 (MDBH)-1.54 [Tan (MDBH) I - 6.56 (YST) Ji- 52.36 (QMDBH) -1- 15,34 (BAILC) .
The Alabama prediction model had a regression R square value of 0.96, and a p value of 0.0001.
Root diseases suck as annosus roo% rot are par- tieufarly diBcwIt to evaluate because tbey do not always reveal their presence with above-ground syrnptams even when growth i s impacted. The Anno- sus Sampling Procedure and the Virginia and Ala- b a r n prediction models developed during this pro- ject egectively address two important aspeels of annosus root rot management: (1) How to prac- tically sample for annosus root rot in the field; and ( 2 ) how to accurately estimate the severity of the disease in the atand, Annosus root rot severity, along
~ ~ 6 t h other infomation derived from the ASP and prediatt;ion models, can be used to obtain estimates from the GY-ANNOSUS growthand yield model, Estimaf;es of mortality and growth bss ~411 provide the forest manager with the inf ormadion necessary for making more effective decisions concerning annosus root rod.
SELECTED REFEREXCES
Alexander, S.A.; Skelly, J.M, A comparison s i isca8a- Lion methods for determining the incidence of Pomes annssus in living 1oblslly pine. European Journal Forest Pathology 4 : 33-38; 1944,
Alexander, S,A,; Skelfy, J,&I, The effect sf Fsrnes annosus infection on diameter growth of Pinus taeda: an initial. report, In Kuhlman, E,G, ed. Proceedings, fourth international conference on Fomes annosus, Asheville, NC : US. Department of Agriculture, Forest Service, Southeaskern Forest Experiment Station; $974: 30-34,
Alexander, S.A. ; Shelly, J,iS%B, ; Morris, C.L, Edaphic factors associated with the incidence and severity 06 disease caused by Fsmcs unnssus in loblolly pine plantations in Virginia. Phytnpathology 65: 585 -591; 1975.
Alexander, S.A; SkeBly, J,M,; FfTebb, R.S. (and others). Asso@iation of Heterobasidion annosum and the scrmthern pine beetle on lobloly pine, Phy- Lopathology 10: 510--523; 1980,
Alexander, S.A,; Ske'iBy, J.M.; Webb, R.S. EEeeb of Heterobasidion annosum on radial growth in south- ern pine beetle-infested loblolly pine. Phytopa- thology 713479-481; 1981,
Alerander, S.A.; Anderson, R.L. HOW to identify and control annosus root rot in the southeast. Forestry Bulletin SA-FB/P 4. Atlanta, GA: U.S. Department of Agriculture, Forest Service, South- eastern Forest Experiment Station; 1982, 2 p,
Bradford, B.; Alexander, S.A.; Skelly, J.M. Determi- nation of growth loss of Pinus taeda L. caused by Heteso basidion annotaus ( Fr. ) Bref. European Journal of Forest Pathology 8 : 429-134; 1978,
Bradford, B.; Skelly, J.hl.; Alexander, S.A. Incidence and severity of annosus root rot in loblolly pine plantations in Virginia. European Journal of Forest Pathology 8: 135---144; 19B8,
Froelich, R.C.; Cowling, E.B.; Collicot, L.V.; Del, T.R. F ~ m e s annosus reduces height and diameter growth of planted slash pine. Forest Science 23: 299-306; $977.
Kodges, C.S., Jr. Modes of infection and spread of Fomes annosus, Annual Review of Phytopatholsgy 7 : 247-266; 1969,

Hodges, C.S., Jr.; Kuhlman, E.G. Spread of Fomes Morris, CeL,; Frazier, D2-L Development sf a hazard annosus in roots of red cedar and loblolly pine. rating for Fomes annosus in Virginia. Plank; Disease Plant; Disease Reporter 58 : 282-284; 1974. Reporter 50: 510-5125 1966,
Kuhlman,E,C.Variationininfeet-ionofloblollypine ~Vebb,R.S.;AIexandes,S.A.;Skellys,J.~4,%~;eidence, roots on high and low hazard sites in the south- seve~ ty and growth eEecl;s of He tero basidion eastern United States. In Kuhlman, E.G,, ed. annosum in unthinned loblolly pine p1antatiean.i;- Proceedings, fourxh international conference on Phytopatholsgy 76 : 669--662; 1981. Fomes annosus. Ashevilre, NC: U.S. Department of Agriculture, Forest Service, Sou.theastern Forest; Experiment Station; 1974: 179-183.
Growth Following Thinning Model for Loblolly Pine Plantations Infected by Annosus Root Rot
Rickard H. Hokans, Eric S. Fanelli, and Samuel A. Alexander'
Abstract,----Thinning loblolly pine plantations ex- poses the residual stand lo infection by annosus root rot, Thinned stand gror,vth and yield models have been developed to account for reduced radial growth follo"i.ving the initial mortality resulting from annosus mot rot infection, Finallcia1 evaluation of growth impacts indicates t 2x3 t the cost of stump protection is fully justified to insure value-growth of the stand. -4ddiQiesnal keywords: Basal area growth, volume yield, Pinus taede, Hebero basidion annosum, Pcimes annosus.
Dr, Samuel Atewander and other forest paths- Xogists at Virginia BoTy"iechnic Iamstituk end State University have been collecting stand data on dis- eased pine plantations for many years. This study was undertaken to determine whether growth models might be fitted do these data, 5Vkaile extensive data nere not available in the normal growth and yield modeling sense, a remarkably good model was de- vised, This model i s specifically intended for use on 'HoblolHy pine (Pinus tnedaj plantations on high annosus hazard sites,
In the absence of remeasurement data, basal area growth data were approximated by using the radial growth data. Each tree's diameter was reduced by twice its radial growth over a given time periad. Period lengths were varied between plots to represent eliRerent areas in the growth curve. This assumed that trees present on the plots a t sampling time were the only ones present a t the beginning of the growth period ( 2 to 6 years prior to sampling). In essence, this amounted to the assumption of no mortaIiLgr during that period. While this may be inappropriate, Morris (1870) and others have shown the major wave of mortality to occur within the first 7 Lo 9 years subsequent to thinning.
The 33 sample plots averaged 29.6; years of age, site index 56.9 (base age 25), 113 sq. ft.facre basal area, and 10 years sinee thinning. The Alabama plots had suBered significant mortality, whereas mortality had been minimal in Virginia. For full life cycle mod- eling of the stand growth from the time of thinning, an appropriate mortality mcdel is required. In the ab- sence of such a model, the growth prediction equa- tions developed are intended for post-mortality use
DATA VOLUME: AND BASAL AREA
GROWTH MODELS Fi$teen plots were located in the Atlantic Coastal
Plain of Virginia and eighteen were from the Gulf Coastal Plain of Alabama, All were temporary 0,85- acre plots located in thinned loblolly pine planta- tions on moderate- to high-annosus-hazard sites, Above ground measurements included d.b,h,, total height, height-to-live crown, and radial growth in-- erement, Site index (base age 25) was calculated using two trees and DevanUs (19799) equation, The two trees were selected on the basis of total height, crown radio, and the absence of annosus infection, Burkhartk (1977) volume ratio was used to compute outside bark cubic-foot volumes to a 4-incl-1 top out- side bark for all trees greater than 4,s inches d,b.h, After these measurements were taken) the root SYS-
tems of a19 trees on the plot were excavated with bulldozers, and the percentage of roots infected was
Model forms presented by Sullivan and Clutter (1972) were used as a basis for the models. A term to include mean annosus root rot s eve~ ty level (kIARRS) was added with the quantity (1-Al/A2) 'to inswe that the modifying term would equal zero when no projection was involved. MARRS would be determined by the methods described by Alexander elsewhere in these proceedings. The final model forms are :
InY- b, - brS i- bz(Iita2) + ba(At/Az)lnB1 (1) + b* ( f-A,/A,) i- b5S (1-A,/A2)
f be MARES (I-AIJA,)
In&- (AI/A2) l n B ~ + a1 (I-AI/AZ) + aaS (I-Ai,.'Az) ( 2 )
+ai3 MARRS (I-AI/Az) determined for each tree. Selected roots were isslated ---- and later cultured in the laboratory, Where :
"Sd" = cubic-foot volume s,b, to a 4" bd.op 0.b. h I Respectively, Assistant Professor, former Graduate Assis- the 5" d.b,'E%, class and above at taxat, and Associate Professor, Virginia Polytechnic Institute projection age, A2 years. and State University, Blacksburg, VA, B, = basal area (sq. ft.,/acre) at projection
S = site index in feet (base age 25 years). B1 -- initial basal area (sq. ft*lacre). At = initial age (years) In = natural logafithm.
m i l e Fndividual models for Virginia and Alabama were explored, a single model based on the combined data performed well. Model foms (I) and (2) were simultaneously fitkd using a procedure developed by David Reed and presented by Burkhart and Sprinz (1984). The r-square shtistie, similar to the R2 used in or&nary least squares, was '98 for the combined data. The resu1l;ing coeficienb are presented in table 1.
These coeftieients have been implemented in the ~c roeompu ter program called GY -ANNOSUS. This program is a complete yield simulator with the follow- ing charactaristics :
OUTPUTS : 1) Site index (base age 25) 2) Current age (years) 3) Current basal area (square feet) 4) Annosus severity level 5) Ages for thinning and harvest 6) Residual basal area for thinning
OUTPUTS : 1) Cubic foot yields and basal area of infected
stand 2) Cubic foot yields and basal area of com-
parable healthy stand 3) Percent difference between infected and
healthy stands While the program stands alone as a yield sim-
ulator, the authors suggest that it be used as a percent reduction estimate for a diameter distribu- tion model such as PCWTHIN by Thomas Burk (1984). GY-ANNOSUS is written in BASIC lan- guage and implemented on the Apple I1 series rnicro- computer with 48K RAM, one disk drive, a mono- chrome display, and an optional 80-column printer. A program disk with complete documentation and source code is available from the authors2 a t a distribution charge of $20.
fMP3LICATIONS OF THE MODEL
The intensive management of loblolly pine in the southeastern U.S. involves cultural and financial de- cisions based on yield projections using any of several models. While the data used to build these models generally exclude areas of high annosus-induced
Contact Dr. S. A. Akxander, Associate Professor, Depart- ment of Plant PathoIogy and Physioio~ogy, Virginia Poly- technic Institute and State University, Blacksburg, VA 24061.
Table 1. - Coefficients of cubic-fool volume and basal area proj'ection models
Cubic-fmt volume equation Basd mea equation
b, = 2.41906 a, = 4,46386 b , = 0.00997 a, = O-Qf 901 b, = -22,90911 a3 = -0.00629 b, = 1.20439 b, - 5.37615 b, = 0.02289 b, = -0.00758
mortality, most data sets from Coastal Plain sites will contain some annosus infected stands, The signifi- cance of the mean infection level term in the above model implies that some of the variation in the standard growth models can be explained by an annosus growth effect. Further, the standard yield prediction models will be overly optimistic for stands where extensive annosus infection has been identified. The optimism can result in serious errors in analysis of thinning alternatives where treatment to prevent annosus infection is not done.
ILLUSTRATION OF POTENTIAL IMPACT ON FORESTRY INVESTMENT ANALYSIS
Consider a loblolly pine plantation on a high annosus hazard site with site index 60 and an original planting density of 1,000 trees per acre. A rotation age of 35 will be used. The forester wishes to evaluate the financial returns from a thinning at age 21 to 75 sq. ft. of basal area. Analyses for annosus-free and in- fected stands are compared in the following:
Financial assumptions : Discount rate== 6 percent (after tax) Ordinary tax rate = 40 percent Capital gains tax rate =: 16 percent Inflation == 3 percent ReforestationlplanLing costs = $ $2S/acre Annual management feeZ$5 per acre per yeas Pulp stumpage == $IO/cord Sawtimber stumpage - $100i"MBF Borax treatment= $,29/cord
The following table (table 2) is the result of an investment analysis using the above assumptions, yields from PCWTHIN (Burk P98$), yieId impacts from GS-ANNOSUS, and financial evaluation with QUICK-SILVER 2,OPC (Vasievieh 1984), A law mortality Virginia situation is assumed.
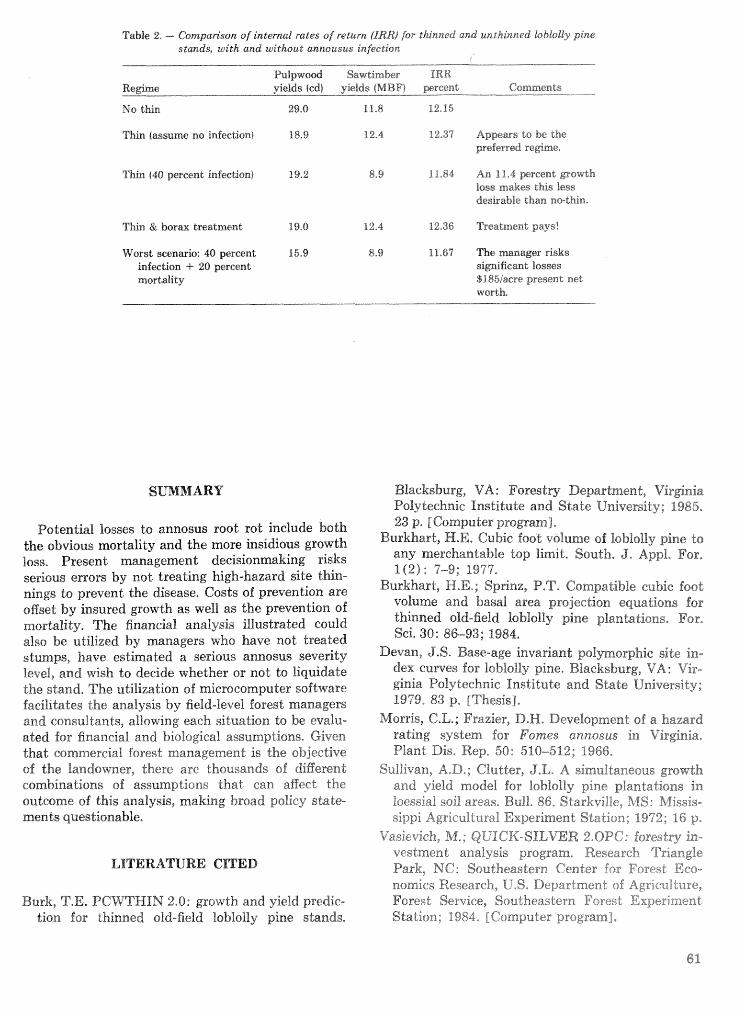
Table 2. - Comparison of internal rates of regum (IRR) for thinned and urrthinnsd koblocrtly pine sdands, with and without annousw infection
P u l p w d Sawtimkr IRR REidme yklds (cd) yields (MBF) percent Comments
NO thin 29.0 11.8 12.15
Thin [assume no infection) 18.9 12.4 12.37 Appears 60 be the preferred re@me.
T"Irin (40 -mrcent infection) 19.2 83 l f , 84 A n t l , 4 ~ r ~ e n t ~ s w d h loss m&es this less deskable than no-thin.
Thin & borax treatmeat 19.0 12.4 12.36 Treatment pays!
Worst scenario: 40 preent 15-9 8.9 11,6'9 The mamager risks infwtion 4- 26) preer,t si@ficmt losses mart &lily. $l85iacre present net
war th.
Potential losses to annosus root rot include both the obvious mortality and the more insidious growth Ioss. Present management decisionmaking risks serious errors by not treating high-hazard site thin- nings to prevent the disease. Costs of prevention are offset by insured growth as well as the prevention of mortality. The financial analysis illustrated could also be ~"clized by managers w h have not treated stumps, have eslinrakd a serious annosus severity level, and wish to decide whether or nod to liquidate the stand, The utilization of microcomputer software facilitates the analysis by field-level. forest managers and consultants, albwing each situation to be evalu- ated for financial and biological assumptions, Given
ereial forest management i s the objective sf the landswer, there are thousands of different combinations of rasscrmptions that can affect the outcome of this analysis, making bmad policy state- ments questionable.
Burk, T,E, PCbVTHfN 2.0: growth and yield predic- tion for thinned old-field loblolly pine sbnds.
Blacksburg, VA : Forestry Department, Virginia Polytechnic Institute and State University; 1985- 23 p. E Computer program],
Buskhart, H.E, Cubic foot volume 06 lobloliy pine to any merchantable top limit, South, J. Appl, For, 1(2) : 7-95 1977,
Burkhast, H.E,; Sprinz, P*T. Compatible cubic foot volume and basal area projection equations for thinned old-field loblolly pine ptantations, For, Sei. 30: 86-93; 1984.
Devan, %,S. Base-age invtakian-f; polmosphic site in- dex cuwes for Iobtslly pine, BIacksburg, VA: Vir- ginia Poly"ceehnir.: Institute and State University; 1979, 83 p. [Thesis].
h40rrhS, @.La; Fmzier, D.M. Dewlopmend sf a hazard rating system for Fomes annosus in \?i;rginia, Plant Dis, Rep, 50: 510--512; 1966,
Sullivan, A-D.; Clutter, J,L* A simultaneous growth and yield model for IoblolZgr pine plantations in toessial so61 areas. Bull. 86, Starkville, iMS: Xfissis- sippi Agricultural Experiment Station; 1972; 16 p,
Vasievich, &I.; QUICIC-SILVER 2,OPC: forestry in- vestment analysis program, Research Triangle Park, KG: Southeastern Center for Forest Eco- nomics Research, U,S, Department of Agricclture, Forest Service, Southeastern Pcrest Experiment Station; 1984, [Computer program],
Predicting Survival and Yield of Unthinned Slash and Loblolly Pine Plantations With Different Levels of Fusiform Rust
W. L. Nance, E. Shoulders, and T. R. Dell'
Abstract,-Modification of an existing slash pine growth and yield system to incorporate a rust-level parameter gave predictions that agree closely with observed data from mst-infected plantations planted in a variety of situations throughout the South. A major revision of a loblolly pine model has been initiated to correct basic deficiencies in the original growth and yield model, which, when applied to high density stands, had prevented the incorporation of a mst-level parameter. Additional keywords: Disease impact, rust man- agement strategies, growth simulation.
INTRODUCTION
Fusiform rust (Cronartium quereum Berk Miyabe ex Shirai f , sp fusiforme) is the most serious destruc- tive agent pet encountered in the management of slash pine (Pinus elliottii Engelm. var elliottii) and loblolly pine (Pinus taeda L.) plantations. In young stands, the dominant influence of the disease is the death of trees, which, can result in departure from desired stocking regimes. Effective application of control measures and the development of manage- ment strategies to minimize economic impacts are dependent on yield predictions that consider levels of the disease,
Basic concepts of disease loss assessment for kill- ing diseases in young forest stands were presented by Meineeke ( 1928). He emphasized considera- tion of stand dynamics and made a careful distinc- tion between disease effects on individual trees and those on stand developments. His formulation was essentially a call for what would today be designated a growth and yield modeling approach. Specifically, the caution was made that disease incidence, or even the death of an individual tree, may not necessarily constitute economic loss. Unfortunately, this guid- ance has been ignored. Holley and Veal (1977) con- cluded that reliable estimates of rust impact for man-
1 Respectively, Principal Plant Geneticist (Gulfport, MS), Principal Siivieutturist (Piaeville, LA), Mathematical Statis- tician i New Orleans, LA) I U.S. Department of Agriculture, Forest Service, Southern Forest Experiment Station. (Cur- rent developments are being supported by a grant from the Integrated Pest Management Program, 1J.S. Department of Agriculture, Forest Service, Pineville, LA.)
agement of a given stand or: for large area planning purposes were not available. They concluded tkat the limiting factor was quantitative information on how alternative levels of rust affect growth and yield,
One approach to provide this quantitative infoma- Lion was presented by Nance et ali, (19821, In tkat work and in an earlier paper (Nance et al. 1981), efforts were described in detail to: (1) hfodify an existing unthinned slash pine plantation yield sys- tem that had been developed by Dell et al, (2979) to forecast yields under digerent levels of rust., (2) validate the new system by comparing corre- sponding predicted and witnessed yields for plots under a wide range of situations throughout the South, and (3) involve potential users of the system by letting them provide feedback for further en- hancement to the system,
The main purpose of this paper is t o describe how the slash pine system was developed and $0 report on its reliability, with a discussion of how the slash pine system may be used to solve selected problems of the forest manager. The status of similar efforts to develop a loblolly pine model is also discussed,
MODELING BACKGROUND
The original form of the plantafiion yield system was described in Dell ei; al, (1979) and Feduecia et al. 1979). This mclclle~ing ~vsrkr, which involved both slash and lobloIly pine growing in planda- tiuns essentially free of fusiform rust, was impl e- mented in a computer program called USLYCOWG (Unthinned Slash and LobJoIly Yields for Cutover Sites in the Western Gulf 1,
The USLUGOWC prediction system can be b ~ e f l y described in functional form as follows, For an un- thinned plantation (slash or l ~ b i ~ l l y pine), it is assumed that predictions of current yield (Y) can be generated using only three parameters: the age sf the plantation in years QAp), the number sf living trees a t that age ( ' % E l 9 and the mean height of domi- nant and codominant trees in the plantation at that age (HD). Tn functional form, this appears as:
A Y = f (El,*, TI,, AP) (1)
This form is concerned with predicting current yields not with forecasting future yields since both Hu and Tt must be Imno~vn at &he age of interest, Ap.
However, if predicted values for HD and TI, (sym- A
bolized by (H, and TI,) a t age Ap are substituted in place of the known values, the resulting f o m :
A A A == f (]Eli,, T L 9 AF)) (2)
can be used to foreeast yields. In the ease of H,, predicted heights can he gene-
rated if one has an estimate of the site index (Sr) of the $anding sit Zstained either from soil-side relationships or the perfomanee of prior or neariisrgr stands, The predicted mean. dominant-codominant height for this case appears as:
In the case of survival, predicted values can be generated using a survival function that requires one to know site index (Sr), the number of trees initially planted on the site (T,), and the plantation age (Ap) :
A TL = f (SI, Tp, AP) (4)
Hence, in. the forecasting mode, the USLYGOB'G system simply replaces known values sf ED and TL with predicted values generated by appropriate pre- dietion equations, and the resulting functional form for forecasting yields appears as :
SLASH PINE MODEL MODIFICATIONS REQUlRETd FOR FUSIFORM RUST
The basic approach in incorporating fusif~rm mst into the 'USLUGOWG slash pine model was to: (1) Acquire a large data base generated by long-tern growth and yield type studies in which fusiform rust infection had been. closely monitored, (2 ) deternine which components of the original slash pine model required modification for fusifom rust, (3) ac- complish the required modifications, (4 ) integrate the new components into the USLYCOWG system, and (5) provide an errhaneed user interface do the new sysbm.
The Slash Pine Data Base
Two large, long-term expedmerats generated the data used in this modeling work. The first experi- ment, desimaded as set A, was or i~nal ly desived to compare the grow& and yield of Isblolly, slash, and longleaf pines on diverse sites (Shoulders 1916, Shoulders and Walker 1979, Nance e84 al, 1981), T"jkis study was measured pe~odically for rust infec- tion and growth for 20 years. The slash pine data from this study involved P O 0 plats f r m Mississippi and 87 from Louisiana, There were 64 plmted trees
in the interior of each Mississippi plot and 49 in each of the Louisiana plots, Site indexes at base age 25 (estimated from an equation presented by Dell et d, 1979), ranged from 25 to 80 feet, with a mean of 62 feet, Planting density (nurnber sf trees planted per acre) was 1,210 for all plots, with the n w b e s of trees sumiiving ad plantation age 5 (T,) r a n ~ n g from 600 to 1,210 trees per acre, with a mean of 996, The percentage of living trees with a stem canker at age 5 (S5) ranged frsm 8 to 32, with a mean of 4, and the eumu%ative percentage of trees that died with a stem canker by age 20 ranged from Ib Lo 44, with a mean oe 14,
The second expesiirnextt, desimated as set E3, was installed by a large industrial forestry fim to corn.- pare the growth and yield of slash and loblslly pine planted on a wide array csf sites. This study was measured periodically for rust infection and $rowt& for 19 years, The slash pine data from this expefi- ment involved 284 plots from Alabama, G e o r ~ a , Florida, and South Carolina. There were 25 measured trees in each plot, with site indexes ad base age 25 (estimated as in set A) ranging frsm 25 t o 78 feet, with a mean of 54 feet. Planting density ranged from 180 to 1,100 and establishment densities (T,) from 80 to 1,000 trees per acre, with a mean of 406, The percentage of living trees with a stem canker at age 5 (SIB) ranged from O to 76, with 8 mean of 18, The cumulative percentage of trees that died with a stem canker present by age 17 ranged from 0 do 78, with a mean of 2 8.
Previous work by Nance ed al, (1981) detailed some of the effects sf ifusifera91 rust on the growth and development 04 sfash pine plantations de- rived from the slash pine data base. BneBy, slash pines that developed frssifom rust stem cankers by age 5 were found to have a much higher probability of death in later wars than their rust-free neighbors, SurpiSlglgly, however, trees that sumived wi$;kb stem cankers to later ages appeared to compete sand grow as well over time as their noninfected neighbors.
These obsemations on individual-tree growth and survival \%.ere reinforced and confirmed by two fundamental modeling results (Hanee et al, 198"%;), The first was that the basic assumption underlying the USLYCOWG system-that current yield in an undhianned slash pine stand is simply a function of Tr:, and ElD---was also valid for rust-infected stands Ghat had undergone natural thinning from fusifom rust. Table 1 compares volumes and quadratic mean di- ameters in data sets A and B with those predicted by the original USLYCOWG system when used with the
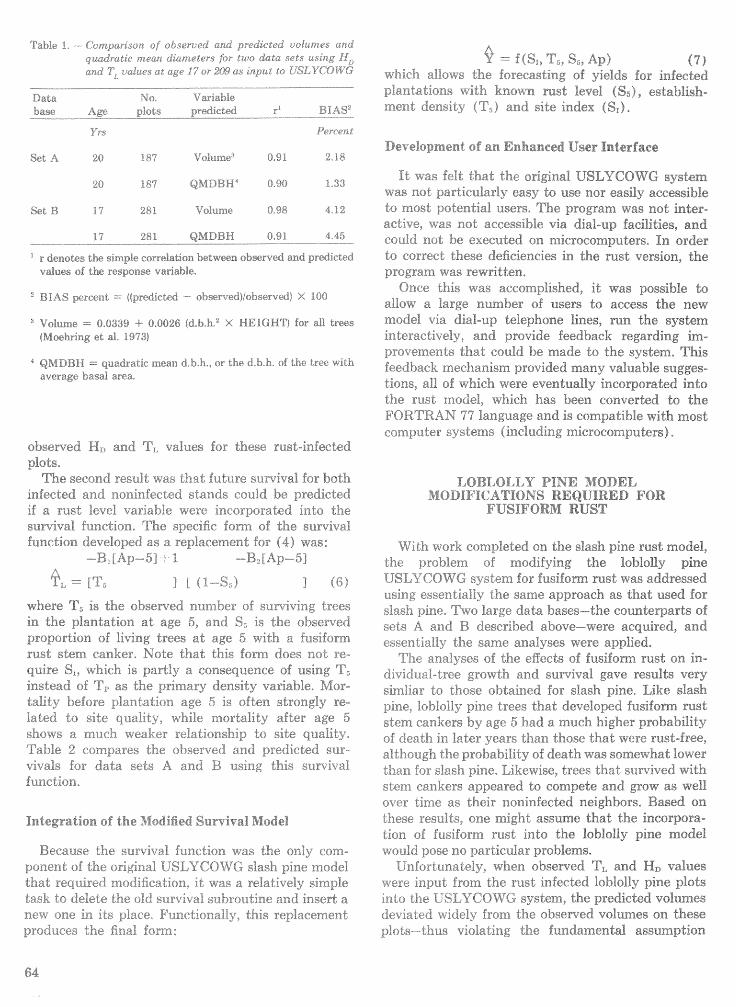
Table I . - Conzparlson of isbssriiied and predzctsd tolumrs and quadratzc mean diameters fir re: o data sets usi-ng -Ha C G ~ T, L dues at age 17 or 2@ as input to LrSL YCOKTG
Data No, Variable base Age plots predicted PP
8 B 1 AS-
Yrs Yercen t
Set A 20 187 Volume 0.91 2.18
17 281 QMDBH 0.9% 4.45
r denotes the simple esrrelskion between observed and predicted vdues of the response variable.
\'$VO~UMB = 0,0339 f 0,0026 (d,b.hSa X HEIGHT) for dl trees (Mmhring et da 1973)
QMDBN --- quadratic mean d.b,h,, or the d,b.h, of the tree wish average basd area.
observed HD and T, values for these rust-infected plots,
second r e s ~ l t was tha t future survival for botIi-1 infected and noninfected stands could be predicted if a rust level variable were incorporated into the survival function, The specific form of the survival function developed as a replacement for (4) was:
--B, [Ap--5]+ 1 --Bz, LAP----53
where T, i s the observed number of surviving trees in the plantation at age 5, and S, is the observed proportion of Eying trees at age 5 with a fusifsrrrm rust stem canker, Mote that this form does not re- quire Sr, which is partly a consequence sf using T, instead of Tp as the primary density variable, &Ior- LaliSy before plantation age 5 i s often strongly re- lated to site quality, while rnortahity after age 5 shows a much sveaka relationship to site quality, Table 2 compares the observed and predicted sur- vivals for data sets A and B using this survival function,
Integration sf the godified Survival Model
Because the survival f~nction was the only cam- ponent of the original CSLU68T~$rG slash pine rnodel that required modification, it was a relatively simple task to delete the old survi\,al subroutine and insert a new one in i t s place, FunctionaUj-, this replacement p r o d ~ c e s the final form:
= f(S,, T;, S,, Ap) (7) which allows the forecasting of yields for infected plantations with knov~n mst level $Ss), establish- ment density (T,) and site index (SI),
Development of an Enhaneed Vser Interface
It vvTas felt that the original USLlyCO~'@ system was not particularly easy to use nor easily accessible to most potential users, The program was not inter- active, was not accessible via dial-up facilities, and could not be executed OR r n i ~ r o ~ ~ r n p ~ . i ; e r ~ , In order to correct these deficiencies in the rust version, the program was revnitten,
Once this was accomplished, it was possible to allow a large number of users to access the new model via dial-up telephone lines, run the system interactively, and provide feedback regarding im- provements that could be made to the system, This feedback mechanism provided many valuable sugges- tions, all of which were eventually incorporated into the rust model, which has been ccnverted to the FORTRAN 79 language and is compatible with most computer systems (including microcomputers 1 *
LOBEOLLU PINE BZBDEL MODIFICATIONS REQUIRED FOR
FUSIFORRI RUST
W i ~ h work completed on the slash pine rust model, the problem 0% modifying the loblolly pine TJSLY COW6 system for fusiform rust was addressed using essentially the same approach as that used for slash pine, Two large data bases-the counterparts 0% sets A and B described above-were acquired, and essentially the same analyses were applied,
The analyses of the effects of fusi fom rust on in- dividual-tree growth and survival gave results very simliar to those obtained for slash pine, Like slash pine, Iobiolly pine trees that developed fusiform rust stem cankers by age 5 had a much higher probability of death in later years than those that were rust-free, although the probability of death w7as somewhat lower than for slash pine, Likewise, trees that survived with s tea cankers appeared to compete and grow as well over time as their noninfeeted neighbors, Based on these results, one might assume that the incorpora- tion of fusifsrrn rust into the XobPslly pine model would pose no particular probliems,
Ucfortunately, when observed T, and HD values were input from the rust infected Isblolly pine plots into the V SLUCOJYG system, the predicted volumes deviated nidely frorn the observed volumes on these plots--- t hus viola king the f undamendal assumption
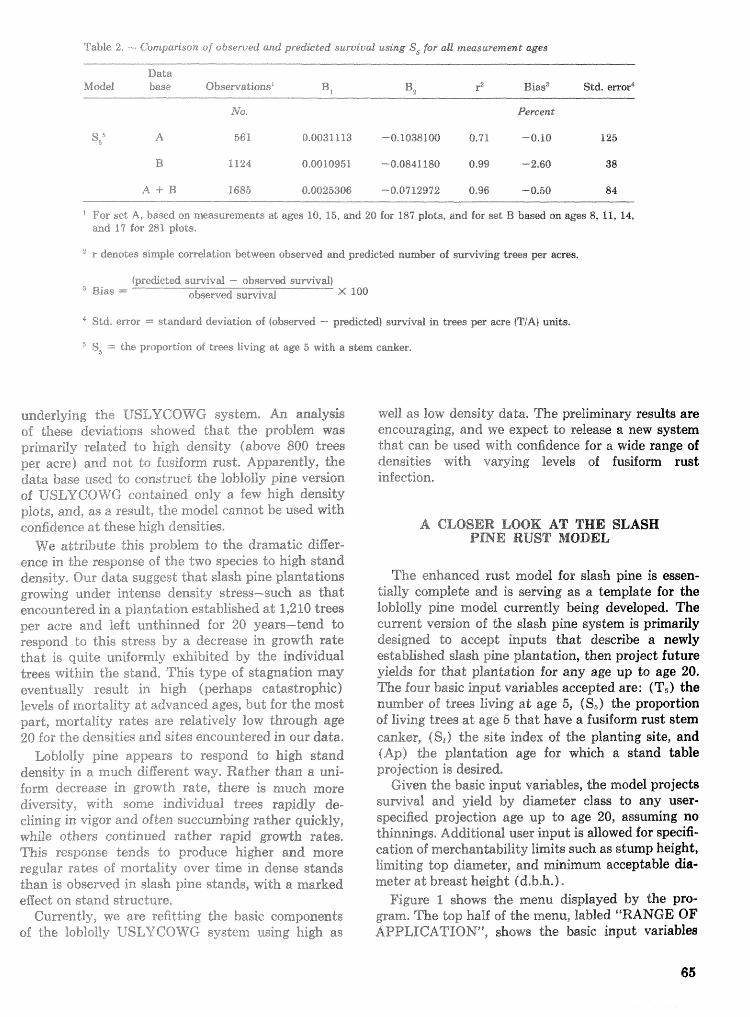
TgbEe 2 ---. Cornpriins6an of obserted and predkced survival using S5 for all measurement ages
Data ?vf&el base Obsewaeisns' B~ B2 r2 Biass Sdd. emor4
No Percent
23,; A 561% 0.0031 153 ---0,1038100 0.71 --ad,lO P 25
B 1124 0~00%0954. -0,0841180 0.99 -2-60 316
A + B 1685 0.04825386 -0,0712972 0.96 -0.50 84
For set A, b ~ s 6 d en measuremenes a$; ages 10, 15, and 20 for 187pBBoGs, md for set B based on ages 8, 11, 14, a d 14 for 281 plots.
' r denotes simple correi?aatf4;.n betasween observed md predicted number of sumivhnrg trees per acres.
tpre&sted sumha%: - sbsetved survivd;lsi 3 Bias ---
observed survival X SO0
" Std. error --- ~Lmdmd deviation of (observed --- p~di~ted;CB) survivd in trees per Bere (Tja) U ~ L S .
S5 I=I: the proportion d trees living at age 5 with a stern canker,
underlying the L7BLVCOWC system, An analysis of these deviations shs~ved that the problem was primarily related to high density (above 800 trees per acre) and nor: to i us i fom rust. Apparently, the data base used to construct the Ioblsliy pine version of LE3EUCOT24G contained scly a few high density plots. and, as a result, she nlodel cannot be used with confidence ht these high densities,
We astribute this problem to the dramatic &iEer- enee in the rerpmsr of the two species to high stand density* Olr data suggest that slash pine plantations growing under intense density stress-such as that encountered in a plantation established at 1,210 trees per acre and le f t unthinned for 20 years-tend to respond to this stress b y a decrease in growth rate that is quite uniformly exhibited by the individual trees within the stand, This type of stagnation may eventually resd;; i2 high (perhaps catastrophic) levels of Eortality at advanced ages, but for the most part, rniirtelity rates are relatively law through age 20 for the denshies and sites encountered in our data.
LoblolIy pine appears to respond $0 high stand density in a much different way. Rather than a uni- $om decrease in growth rate, there is r m ~ h diversity, with some individual trees rapidly de- clining in .tiger and often scccumbing rather quickly, while others continued rather rapid growth rates, This response tends to produce higher and more regular rates of aortalit-jd over time in dense stands than i s obse~ced in slash pine stands, with a marked effect on stand structure,
Currently, we are refitting the basic components of the lgabloily U,'SLYCOT8G system using hi& as
well as Isw density data, The preliminary results are encouraging, and we expect to release a new system that can be used with confidence for a wide range of densities with varying levels sf fusifom rust infection,
A CLOSER LOOK AT THE SLASH PINE RUST MODEL
The enhanced msd model for slash pine is essen- tially complete and is sewing as a template for the lobPolly pine mode8 currently being developed. The currend version of the slash pine system is primarily designed to accept inputs that describe a n e d y established slash pine plantation, then project future yields for that plantation for any age up to age 20. The four basic input variables accepted are: (T5) the number of trees living at age 5, (Ss) the proportion sf living trees ad age 5 that have a fusifsrm rust stem canker, (S,) the site index of the planting site, and (Ap) the plmtatisn age for which a stand taible projection is desired.
Given the basic input variables, the model projects survival and yield by d imetes class to any user- specified projection age up to age 20, assuming no tbinnings, Additional user input i~ allowed for specifi- cation of merchankb3ity l imi ts suGh as s t m p height, limiting top diameter, and minimurn acceptable &a- meter at breast height (d,b,h,).
Figure 1 shows the menu dispIayed by &e pro- gram. The top half of the menu, labled "RANGE OF APPLICATION", shows the basic input variables
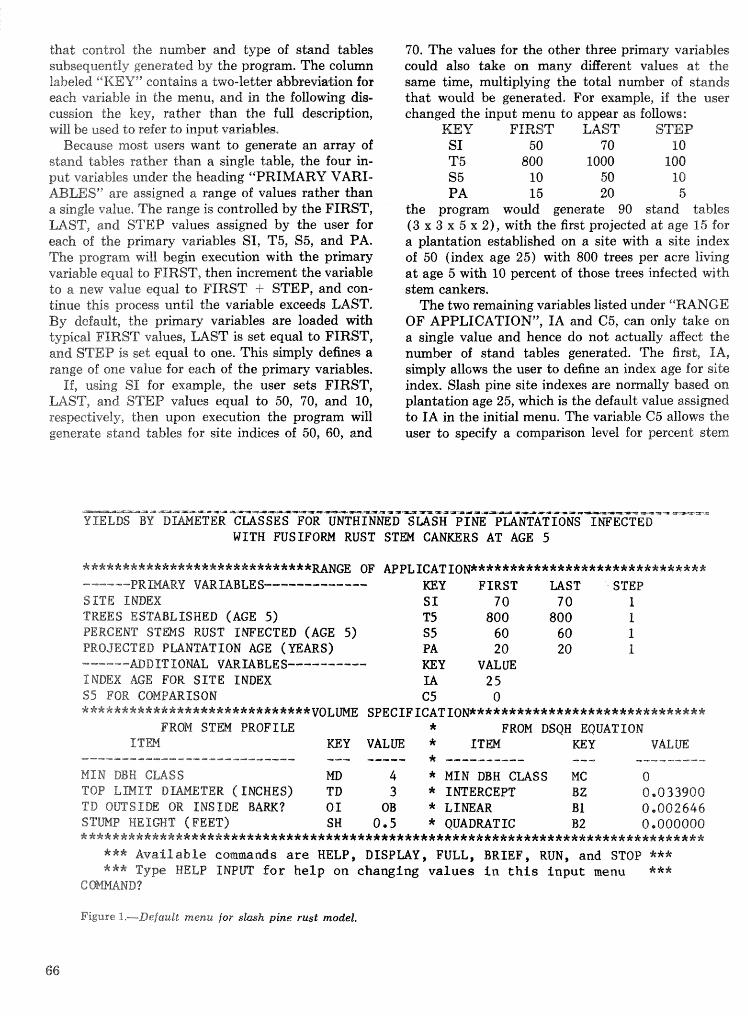
that control the number and type of stand tables subsequently generated by the? progmm. The colmn labefed "KEY" contains a -i;#o-letter abbreviation for each vaAable in the menu, and in the f o l l o ~ n g dig-
cussion the key, rather than the full description, will be used to refer to input variables,
Because most users want to generate an array of stand tables rather than a single table, the four in- put variables under the heading ""PRIMARY VARI- ABLES" are assimed a range of values rather than a sissgle valere. The range is controlled by the FIRST, LAST, and STEP values assigned by the user for each sf the primary va~ables SI, T5, 55, and PA, The program wil l begin execution with the primary wriahla equal to FIRST, then increment the variable to a new value equal to FIRST i- STEP, and eon- tinue thh process until the variable exceeds LAST. By default, the primary variables are loaded with typical FIRST values, LAST is set equal to FIRST, and STEP is set equal to one, This simply defines a range of one value for each of the primary variables.
If, using ST for example, the user sets FIRST, LAST, and STEP values equal to 50, 70, and 10, respectively, then upon execution the program will generate stand tables for site indices of 50, 60, and
70. The values for the other three primary vafiables could also take on many dlifirent values at the same time, multiplying the total nmber of stands that would be generated. For example, if the Laser changed the input menu to appear as fofliows:
KEY' FIRST LAST STEP SI 50 7 0 10 T5 800 1000 I00 55 10 50 10 PA 15 20 5
the progrm would generate 90 stand tables ( 3 x 3 x 5 x 2), with the first projected a t age 15 for a plantation established on a site vv.ith a site index of 50 (index age 25) with 800 trees per acre I ivbg at age 5 with 18 percent of those trees infected with stem cankers,
The two remaining va~ables listed under "RANGE OF APPLICATION", IA and C5, can only take on a single value and hence do not actually affect the number of stand tables generated. The first, IA, simply allows the user to define an index age for site index. Slash pine site indexes are nomally based on plantation age 25, which is the default value assifled to PA in the initial menu. The variable C5 allows the user to specify a comparison level for percent stem
-O;JLtSr~i=L~DasS; .r~tzl?~aL 9.-illlS'-i.--=pcJiltS L iCZ5S$9-.1xwS= -tZa?m?xS-CLaJ.al=
UNTHINNED SLASH PINE PLANTATIONS INFECTED WITH F U S I F O W RUST STEN CANKERS AT AGE 5
***&&****&****&*&&*tF;*********uNGE OF APPLICATION***********************&* RY VPIEbZABLE S------------- KEY F I R S T LAST STEP
S I 70 70 1 TWES ESTABLISHED (AGE 5) T 5 800 800 1 PERGEm STmS RUST IWECTED (AGE 5) S 5 60 60 1 PROJECTED PUNTATION AGE (YEARS) PA 20 20 f
mDITlOE%AL VARICABLES------em-- EtEY VALUE INDEX AGE FOR S I T E INDEX UI 25 S5 FOR COMPARISON C5 0 ****k*****k&&%*k&*&31:***JI:*JI:***vOL S~ECIFICATION*****************&.~JI:~~;~:&JI:&&**&
FROM f T W P R O F X U * FROM DSQB EQUATION ITW KEY VALUE * i T m my VALUE --------------------------- - - ----- * ---------- --- -em------
MBN BBH CUSS WD 4 * N Z N f l E Z H C M S S MC 0 TOP L ~ I T DWETER (INCHES) TD 3 * INTERCEPT BZ 0~033900 TD OmSIDE OR I N S I D E B 01 OB * L Z m A R B1 0,002646 STbXP HEIGHT (FEET) SM 0.5 * QUADRATIC I32 0 1000000 ************%&&*****tF;***tF;*******************************************.k&31:**&*****
*** kai labPe commands are HELP, DISPLAY, FULL, BRIEF, RUN, and STOP *** *** Type HELP INPUJI f o r help on changing values in this input m e n u ***
Figure 1.--Default menu for s h h pine rust model.
infection, For each set of SI, T5, S5, and PA values, the program automatically generates a comparison shand with dhe same SI, T5, and PA, but uses C5 instead sf S5 for the rust variable. The two stand tables are then compared automatically and the r~solts pn'nted along with the stand table. The process is repeated for all combinations of SI, T5, S5, and FA values defined by the menu. Initially, a default value of zero is assigned to C5 to provide comparisons with rust-free stands.
m e bottom half of figure 1, labeled ""VOLU1ME SPECIFICATION", allows the user strict control of volume computations for each stand table. The left half of the volume specification menu controls volumes that are computed by stem profile equations, and the right half controls volumes computed by equations based on the square of d.b.h. multiplied by total height (DSQH). The program computes mer- chantable volumes by diameter class using thr! stem profile model defined by Dell and others (1979).
The DSQH variables include MC, BZ, B1, and B2. The variable MC is equivalent to the stem profile variable MD, and simply defines the minimum acceptable d.b.h. The variables BZ, B1, and B2 de- fine the coeficients to be used in the following quad- ratic equation:
'V = BZ + Bl(DSQH) + BZ(DSQH*DSQH) where
V = volume (or perhaps dry weight), 132 = intercept term, 131 .= linear coefficient of DSQH, B2 = quadratic coefficient of DSQH, DSQH = d.b.h. X d.b.h. X total height.
By setting 132 equal to zero, the user can force a simple linear regression model for volume equations based on DSQH. Typical default values for slash pine are initialized in the menu, but most users prefer to use their o m local values instead.
The value for any variable in the menu can be changed essily by the user. In response to the "COM- MAND?" prompt, the user types the key letters and the new values:
SI = 50,70,10 This statement redefines FIRST, LAST, and
STEP values for site index to 50, 70, and 10 re- spectively. Typing "DISPLAY" in response to the COMMAND prompt will display (or print, if the terminal is a hardcopy device) a new menu contain- ing the current values for all input variables. When no more changes to the input menu are desired, typing "RUN" causes the program to generate stand tables prescribed by the menu. Typing "FULL" be- fore typing "RUN" directs the program to print the full s t a d table, If full output is not desired, typing ""BRIEF" "fore ""RUN" causes another menu to appear, from which the user can select the particular
stand summary infomation to be printed. BRIEF output is much more compact than FULL and is preferable when generating more than a few stand tables. The propam also allows a HELP earnmwnd that provides information regarding the operation of the program.
Figure 2 is a copy of the FGLL printout genera-ted by the menu shown in figure 1. Most of the output is self explanatory, but the following cryptic abbrevia- tions may not be obvious:
Abbreviation -Meaning
AV. D + C HT, average heigbt af dominant and codominant trees
CR average c r o w ratio AV HT. average height of all trees 0.13. outside bark I.B. inside bark A P plantation age, same as PA D2H d.b.h, x d.b.h, X total. height, same
as DSQH A, B, C the shape, scale, and location para-
meters of the Weibull distGbution function used to represent the dia- meter distribution 06 the eument stand table
The top section, labeled "STAND TABLE", con- tains predicted values for each I-inch diameter class. The lower half, labeled "MORE DETAILS ON RUST COMPARISON'" contains several stand s m - mary statistics, which are compared for the two stands with rust levels equal to S5 and C5. The comparison between C5 and S5 is highlighted throughout the output.
APPLICATION OF" THE SLASH PINE MODEL
The three primary variables (T5, S5, and SI) must be specified in order to generate predicted yields. For any plantation that can be observed at age 5, a suitable sampling scheme can be utilized to obtain estimates of the number of living trees per acre (T5) as well as the proportion of those trees with stem galls (55). However, the site index (SI) of the established site is more difficult to estimate. Exper- ience has shown that tree height at age 5 is a poor predictor of mean dominant-codominant height in future years, so it is recommended that estimates of site index be based on concomitant infomation, such as soil-site pwdictors or perhaps site index estimates for either prior or nearby slash pine stands. Once estimates of T5, S5, and SI are obtained, the program can be used to generate expected yields at any future
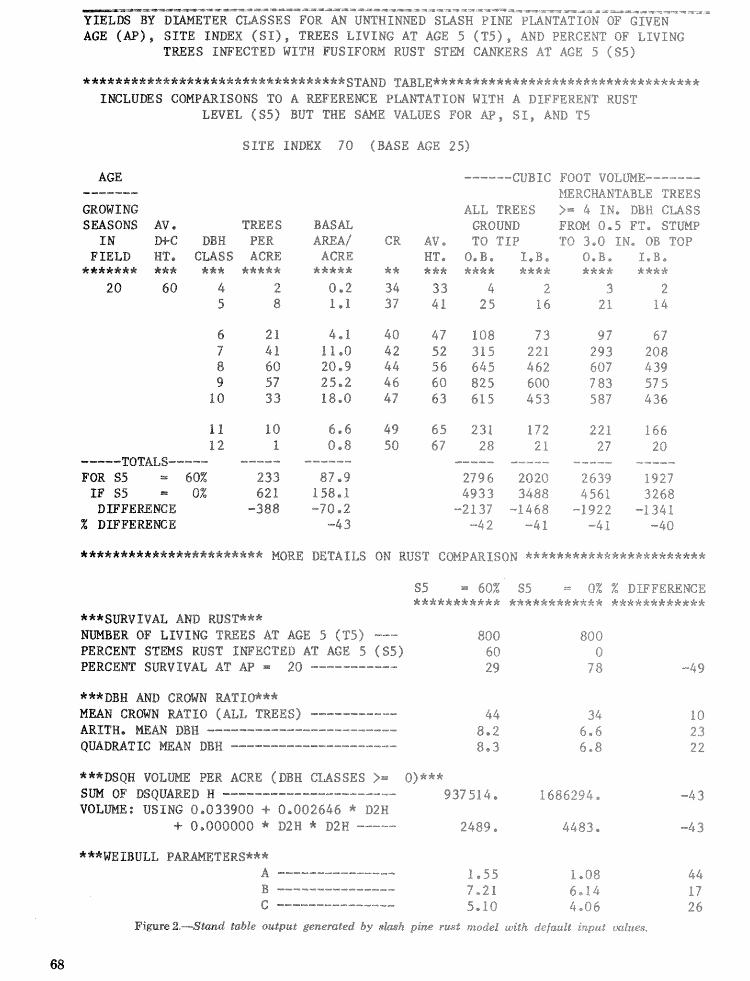
a ~ * ~ ~ ~ a a * = = S a a ~
FOR AH U W H SLASH PINE P U AGE ( M ) , SITE INDEX (SI), "%REES L I V I N G AT AGE 5 ( T 5 ) , AND PERCEPE OF LIVING
TREES IWECTED WITH FUSIFOW RUST STEM CA RS AT AGE 5 (35)
*****&&*&****&&&&****************STAED TABLE********************************** ZELUDES COHPmISONS TO A MFEREgCE PUWATION WITH A DIFFERENT RUST
LEVEL (S5) BUT THE SAHE VALUES FOR AP, S I , AND T5
SITE INDEX 78 (BASE AGE 25)
AGE ------a
GROMENG SmSOltSS AVa TWES
I N We" DBH PER FIELD HT, CUSS ACRE
&**f*f* * * Z * f ***** 20 60 4 2
5 8
-a-ee- CUBIC FOOT V8LlB4E-------
MERCPAKTABLE TREES ALL TREES >= 4 %fie DBH G"LASS
BASAL GROUND FROM 0,s PT, STUW AREA/ CR A T O T E P T9 3.0 IN* QB TOP ACRE HT, O,B, P,B, G ,B , I , B , ***** ** *** **** **** kkk* ****
0 * 2 34 33 4 2 3 2 1,1 37 tl 25 16 21 14
11 18 6e6 49 65 231 I72 221 166 12 1 8,8 50 67 28 2 1 27 20 ----- TOTALS----- -em-- a-e--- @---- ----- -----A .-----
FOR S5 .. 60% 233 87 ,9 2396 2826 2639 5927 I F S5 = OX 621 158,1 4933 3488 4561 3268
DLFFEmNCE -388 --70e2 -2137 -1468 -1922 -1341 % DPFE"EREHCE -4 3 -42 -41 -4 1 -40
$5 = 69% SS = 0;: X DIFFEPANCE *****k**k*k *********'A!** k*********k*
***SmVIVdaL AND RUST*** ER OF L I V I N G TWES AT AGE 5 (T5) --- 808 890
PERCEW S T ~ S WST IWECTED AT AGE 5 ($5) 60 e PERCEW SUEPVkVAL AT AP = 20 ----------- 29 1 d -49 7 b"
***DBH s4MD CRWN MT16*** MEAN CRWN RATLO (ALL TREES) ----------- 44 34 10 ARS;%H, DBH .--.----.-.-..--.----------------- S e a 2 5,6 23 QUADMTIC mAH BBg ..................... $ a 3 6,8 22
%&*BSQN VOLWE PER ACRE (DBH CUSSEs >= o>*** sm DSQUARED H -d------------------e- 937 $1 4 , 1$85234, -4 3
: U S I N G 0,033900 -4. 0,002646 * D2H + Oe000000 * D2H * D2H ----- 2489 , 4453, -4 3
Fimre a,-Stand table output generated by 8-hh pine model with default iaput cxzlue~,
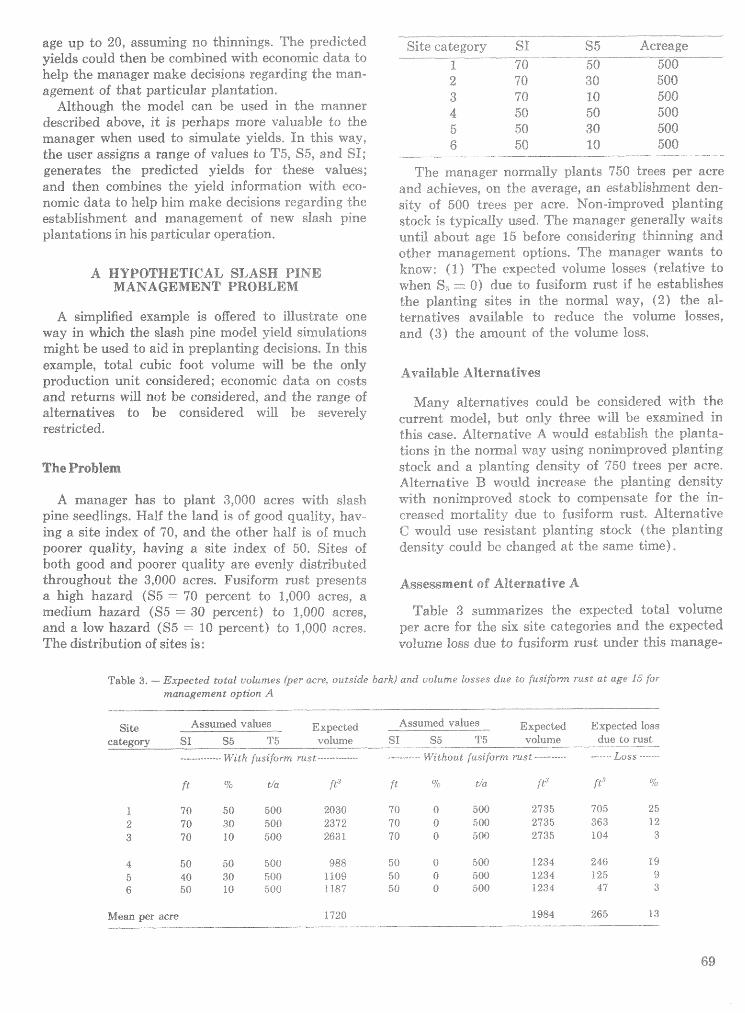
age up do 201 assuming no thinninge, The predicted yields could then be combined with economic data Lo help the manager make decisions regarding the rfian- agement sf that pamicular plantation,
Although the mode% can be used in the manner described above, i t is perhaps more valuable LO the manager when used to simulate yields, In this way, the user assigns a range sf values to T5, S5, and SI; generates the predicted yields for these values; and then combines the yield information with eco- nomic data to help him make decisions regardkg the establishment and management of new slash pize plantations in his particular operation,
A HYPOTHETICAL SLASH PlM3 MANAGEMENT PROBLEM
A simplified example is offered $0 illustrate one way in which the slash pine model yield simulations might be used to aid in preplanting decisions, Tn this example, total cubic foot volume will be the only production unit considered; economic data on costs and returns will nod be considered, and the range of alternatives do be considered will be severely restricted.
The Problem
A manager has to plant 3,000 acres with slash pine seedlings, Half the land i s of good quality, hav- ing a site index of WO, and the other half is of much poorer quality, having a site index of 50, Sites sf both good and poorer quality are evenly distributed ~hroughout the 3,000 acres- usi if om ruse presents a high hazard (S5 ---- 70 percent to 1,800 acres, a medium hazard (S5 = 30 percent) to 1,000 acres, and a Bow hazard (S5 -- LO percent) to 1,000 acres, The distribution sf sites is:
Site categar>- Sl 35 - - -
1 70 50 2 70 30 3 70 PO 4 50 50 K 5Q 30
6 50 f O
Acreage -- - - -
500
The manager normal& plants 758 trees per acre a ~ d achieves, on the average, an establishment den- sity of 500 treas per acre, Non-improved planting stock i s typically used, The manager gexaerally waits until about age %% before eensiderfng thinning a~rd other managemix& ogticns. The -manager wanta to know: ( 1 ) The expected volume lasses (relative to when S; = $1 due to $csiform rust i f he establishes the planting sites in the normal way, ( 2 ) the al- ternatives available to reduce the volume losses, and (3) the amount sf the volume Inss,
Available AT t ernatives
Many alternatives could be considered with the current model, but only three will be examined in this case, Alternative A establish the planta- tions in the normal way using norrimproved planting stock and a planting density of 750 trees per acre, Alternative B ivould increase the planting density with nonirnproved stock to compensate for the in- creased mortality due ts fusif orm rust, Alternative C would use resistant planting stock (rke planting density could he hanged at the same time).
Assessment of Alternative A
Table 3 summarizes the expected total volume per acre for the six site categories and the expected volume loss due to f us i f om rust under this manage-
Table 3, - Expected total volumes (per acre3 outside ba-K) and cspfurno roscer due to fug~fi-rrn rust at age 15 f i r rntzszagement op tiov A
Site Assumed vdues Assumed values Expected -- Expected Expected 403s category SI S5 $5 t o l w e 91 S5 T5 volume due to rust - --
------- ----- K t h fuiiiSfDmw ~ ~ k t -------------- -a*------ Wlchuut flrs:form rust - -------- - - --- Loss -----
Mean per acre i 720 4 984 265 13
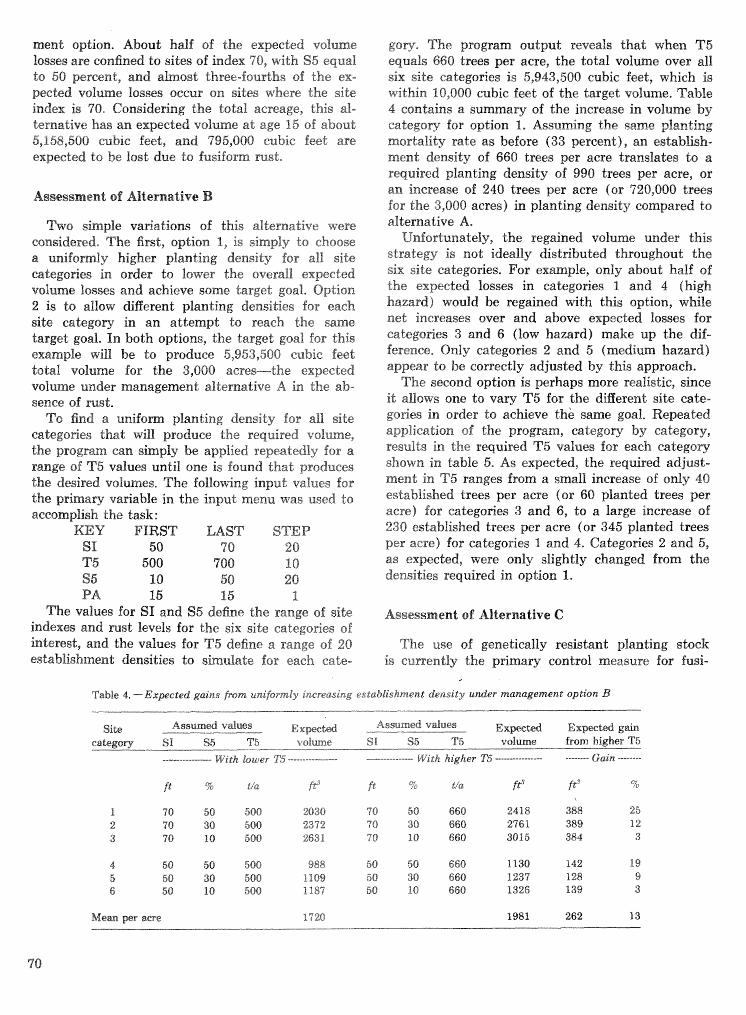
ment option. About half of the expeeted vo lme losses are confined to sites of index 70, with S5 equal to 50 percent, and ahos-t; three-f0ulrt.h~ of the ex- pected volume losses occur on sites where the site index is 70, Csnsidefing the total acreage, this al- hernative has an expected volume at age 15 sf about 5,158,500 cubie feet, and 795,000 cubic feet are expected to be lost due Lo ksiform rust.
Assessment of Alternatlve B
W o simple va~al ions 06 this alternative were considered, The first, option I, is simply LO choose a unifordy higher planting density for all side categodcs in order Lo lower the overall expected vo%ume losses and achieve some target goal. Option 2 is to allow diBerent planting densities for each site category in an attempt to reach the same target goal. In both options, the target goal for this example will be to produce 5,953,500 cubic feet total volume for the 3,000 acres-the expected volume under management alternative A in the ab- sence of mst,
To find a unifom planting density for all site catege~es Ghat will produce the required voEume, the progrm can simply be applied repeatedly for a range of T5 values until one is found that produces the desired volumes. The following input values for the primary variable in the input menu was used to accomplish the task:
m Y FIRST LAST STEP SI 50 70 20 T5 508 700 10 S6 18 50 20 PA 15 15 1
The values for SI and S5 define the range of site indexes and rust levels for the six site categories of interest, and the values for T5 define a range of 20 establishment densities to simulate for each cate-
g o v * The program output rewals that when T6 equals 668 tmes per acre, the total volume over all six site categories is 5,943,500 eubic feet, which is within 10,000 cubic of the target volume. TabIe 4 contains a summaw of the increase in volume by category for option 1. Assuming the same planting mortality rate as before (33 percent), an establish- ment density of 660 trees per acre translates Lo a required planting density of 990 trees per acre, or an increase of 240 trees per acre (or 720,000 trees for the 3,000 acres) in planting density compared to alternative A,
Unfortunately, the regained vo lwe under this strategy is not ideally distributed throughout the six site categories. For exampile, an'iy about half of the expected losses in categories 1 and 4 (high hazard) would be regained with this option, while net increases over and above expected losses lfop
ca tego~es 3 and 6 (low hazard) make up the dif- ference. Only catego~es 2 and 5 (medium hazard) appear to be correctly adjusted by this approach.
The second option is perhaps more realistic, since it allows one to vary T5 for the diBerent site eate- gories in order to achieve the same goal, Repeated application of the program, category by category, results in the required T5 values for each caitegory shown in table 5. As expected, the required adjust- ment in T5 ranges from a small increase of only 40 established trees per acre (or 60 planted trees per acre) for categories 3 and 6, to a large increase of 230 established trees per acre (or 345 planted trees per acre) for categories 1 and 4. Categories 2 m d 5, as expected, were only slightly changed from the densities required in option 1.
Assessment of Alternative C
The use sf genetically resistant planting stock is culrrently the p ~ m a r y control measure for fusi-
Table 4, ---Exmeted gaias fmm unifirmly increasing establishment density u d e r management qption 13
S i k Assumd vdues Exwctd Asmrned vdues Expet& Expected g&n eakgory SI S5 T5 v d m e SI S5 TS volume from higher T6
hwer Ts ----------------- ----------.,----., highef" 575 ---------------- -------- Gain --..-----
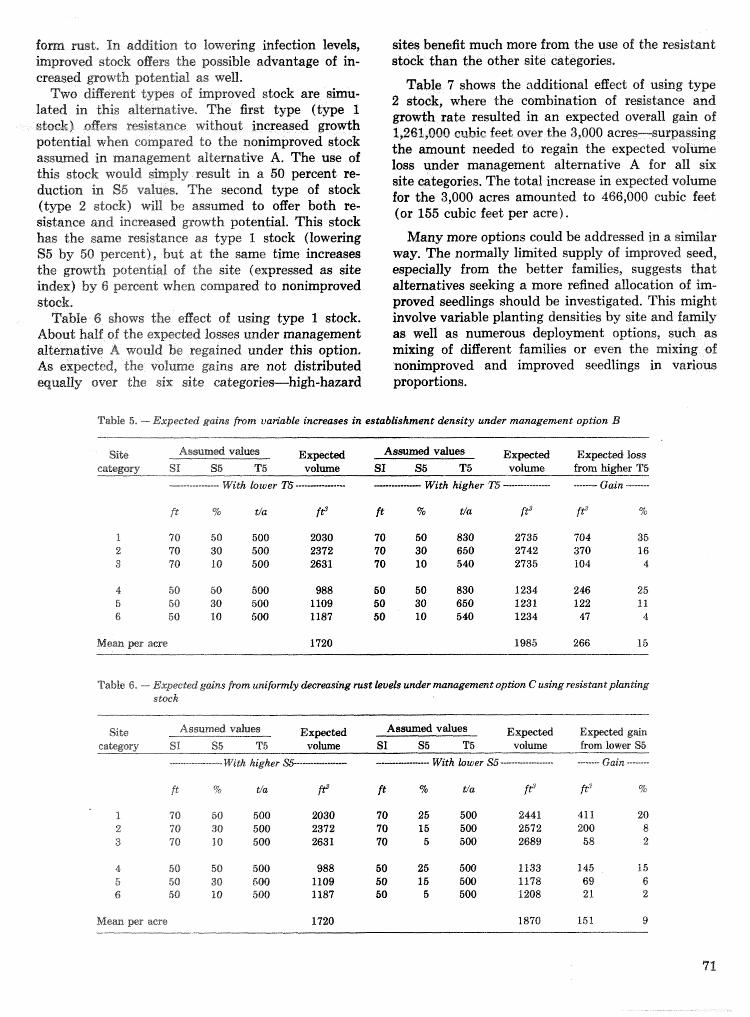
form rust. In addition to lowering infection levels, sites benefit much more from the use of the resistant improved stock otrers the possible advantage of in- stock than the other site categories. creased growth potential as well.
*o dserent tmes sf inrmpraved stock are sirnu- faded in. this dtemative* The first t y p f G p I stoek) oBem msidance ktbout increased sowth potential when compared to the nonimproved stock assmed in management alternative A, The use of this tstsck would simply =sulk in a 50 percent re- duCtio~l in S5 values, The second type of stock (type 2 stock) will be assumed to oger both re- sistance and increased growth potential. This stock has the same resistance as type 1 stock (lowering S5 by 50 percent), but at the same time increases the growth potential of the site (expressed as s i t e index) by 6 percent when compared to nonimproved stock,
Table 6 shows the eEect of using type 1 stock. About half of the expected losses under management aXtemative A would be regained under this option. As expected, the volume gains are not distributed equally over the six site cadegari
Table 7 show^ the ,ad&tional egect of using type 2 stock, where the combination of resistance and growth rate resulted in an expected overall gain of 1$61,000 cubic feet over the 3,000 acres-srargas&ng the amount needed to regain the expected vol loss under management dternalive A %sr alf. ~ i x site categories. The total increase in expected volume for the 3,000 acres amounted to 466,000 cubic feet (or 155 cubic feet per acre).
Many more opLions could be addresses in a s- i~lav way. The normally limited supply of improved seed, especially from the better families, suggests that dternat_ives seeking a more refined alloc&isn of im- proved seedlings should be investigated. This might involve variable planting densities by site and famay as well as n m w u s kployment options, meh as mixing of diBerent families or even the mixing of nonimproved and improved seedlings in various proportions.
Table 5, -Expected gaim hrn vu~uble increases in establisllsment density under management option B
Site Assum& vdues ExmtRd A s m d values E x p t e d IExpwted loss
categox~r %I S5 TB volume SI $5 1'5 volume from higher 7'5 ---*.%.----------- With la wer T5 --------------- -------- with higher Ts -,,,- ,,,,.-,,,,, -------- Gain --------
Mem per acre 1720 1985 266 15
---..-----..----..--- Wil-fL higher %---..--------- -----... with lower $6 -..------------... -- -------- Gain
Mean per acre 1720 1870 151 9
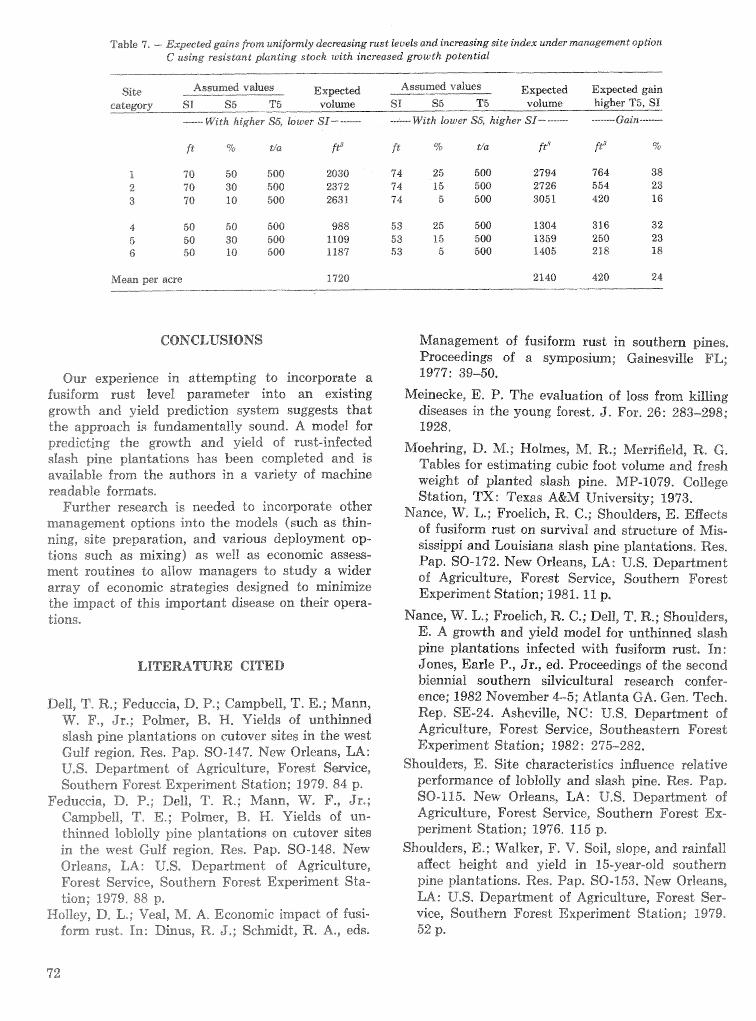
Table 7. - Expected gains fmn tknifomiy bemasing rust k v e b and itze~ming site in&x under nzanagenent o p ~ n @ using resistand planeireg smek with increased growth potential
Site Assram& vdues Expe.t;ed Assumed vdues E x p a E q w b d g&n category SI S5 TS vo1me ST S6 115 volume bigher T5, SI
------ t"Vt'th higher StiP bwer SI-- ------- ..------ with lower 3~~ highr Sl- .--...-- ...----..-Gain ---..----
Mean per acre B 720 2140 421) 24
CONCLUSIONS
Our experience in attempting to incorporate a fusiform mst level parameter into an existing growth and yield prediction system suggests that the approach is fundamenta%iy sound, A model for predicting the growth and yield of rust-infected slash pine plantations has been coapleted and is available from the authors in a variety of machine readable formats.
Further research is needed to incorporate stbear management options into the models (such as thin- ning, site preparation, and various deployment ap- tions such as mixing) as well as economic assess- ment routines to allov~ managers do study a wider array of economic strategies designed do minimize the impact of this important disease on their opera- tions.
LITERATURE CITED
Dell, T, R,; Fedueeia, D, P,; Campbell, T, E,; Mann, W+ Fa, Jr.; Pcalmer, B, H, Yields of ranthinned slash pine plantations on cutover sites in the west Gulf region, Res, Pap. SO-l4"3 New Orleans, LA: U,S, Department of Agriculture, Forest Sewice, Southern Forest Experiment Station; 4979, 84 p,
Peduccia, D, P,; Dell, T, R,; Mann, We F,, Jr.; Campbell, T. E,; Poimerag, B, H, Yields of tan- thinned Iobfoily pine planGaLigans OM cutover sites in the west Gulf region, Re%, Pap. SO-148. New Orleans, LA: U,S, Department 06 Agriculture, Forest Service, Southern Forest Experiment Sta- tion; 1979, 88 p,
Holley, D, L,; 'Veal, M, A, Economic impact of fusi- % o m rust- In: Dinus, R, J,; Schmidt, R, A,, eds*
Management of fusiform rust in southern pines. Proceedings of a symposium; Gainesville FL; 9979 : 39--50.
Meinecke, E. P. The evaluation of loss from killing diseases in the young forest. J. For. 26: 283-298; 1928,
Moehring, D. M.; Holmes, M. R.; Merrifield, R. G. Tables for estimating cubic foot w l u m and fresh weight of planted slash pine. MP-1079. College Station, TX: Texas A&M University; 1973.
Nance, W. L.; Froelich, R. C.; Shoulders, E. Effects of fusiform rust on survival and sdmedure of Mis- sissippi and Louisiana slash pine plantations. Res. Pap. SO-172. New Orleans, LA: U.S. Department of Agriculture, Forest Service, Southern Forest Experiment Station; 1981.11 p.
Nance, W. L.; Froelich, R. C.; Dell, T. R.; Shoulders, E, A growth and yield model for untbiganed slash pine plantations infected with fusifom mst, In: Jones, Earle P., Jr., ed. Proceedings of the second biemial southern silvieultrajral research confer- ence; 1982 November 4-5; Atlanta GA, Gen. Tech, Rep. SE-24. Asheville, NC: U.S. Department of Agkcul,ture, Forest Senice, Southeastern Forest Experiment Station; 1982: 27S282,
Shoulders, E. Site characteristics influence relative performance of loblolly and slash pine. Res. Pap. SO-115. New Orleans, LA: U.S. Department of 6%g-si;eu9ture9 Forest Service, Southern Forest Ex- periment Station; B96, f 15 p.
Shoulders, E.; Walker, F. V. Soil, slope, and rainfall affect height and yield in 15-year-old southern pine plantations. Res, Pap, SO-153. New Orleans, LA: 1J.S. Department of Agriculture, Forest Ser- vice, Southern Forest Expel-iment Station; 1979, 52 p.

ESTS AND HOST PmT INTERACTIONS
Pests and Associated Organisms
Host Preference Behavior of Insect Parasites in the Presence of Southern Pine Beetle and One or More Ips specie^
A bstract,-Gas liquid ehromatosaphy analysis of parasite lipid profiles was utilized to dekrf ine host origin of parasites infesting southern pine beetles (SPB) and Ips spp. in mpidy collapsing, transient stable, and expanding infestations. SPB population estimates and emergence and sticky trap catGhes 016 most SPB associates m r e also used in tfie sbdy siks,
In two adjacent concurrent infestatiozlis, SPB origin parasites tended do disperse rather than attack f p g spp. when SPB became scarce in the inll"estatioa, mere were indications of parasite dispersal from the rapidly collapsing infestation as i p s spp. became more abundant than SPB. A time fag between the parmites switching from host of origin to alternate hosts was attributed to parasite host preference and tenaci t y. Additional keywords : Denelroctonus frcrn talis Z h - memann, naturtil enemies, population dynamics, sampling.
INTRODUCTION
The southern pine beetle, Dendroctonus fronttllis Zirnmermann (SPB), is the most serious pest hPf southern pines and one of the most damaging of all eastern forest insects.
In 1982, an endemic year for the southern pine beetle in Georgia, combined losses for SPB and other pine bask beetles ( Ips spp.) exceeded $800,000 (Suber et. al. 1984)- From 19Cil-76, over 25 million dollars in damage was directly attributable to the SPIB in Georgia. The loss during the same period for the 12-State gouthern region meeeded $196 million, (Price and Doggett 1978).
The southern pine beetle has a large number of n3tural enemies. Predators, parasites, and csnapeG- tors may reduce SPB numbers or help prevent or delay population explosions. Natural enemies make up a simificant portion of the diverse arthropod community in a tree infested with SPB (Bixon and Payne 1979).
Most of the Hymesrropderous parasites attackhg the southern pine beetle are not host specific. Several Ips spp. and other bark beetle asmciates of SPB as well as bark beetles infesting nonpine hosts are rat- tacked by many of these parasites (Dixon and 0s- good 6 96 1 ) , The impaet of nonh~~t-speCj;fic parasites on SPB population dynamics is largely dependent on the nature of the interaction of parasites in selec"6ing betrveen SPB and non-SPB hosts, Kudon and Be~s- ford (1980) demonstrated the existence of host preferences sf some of these parasites, A esneeptua8 model was psopused for the interaction of the para- sites with SPB and Ips spp. (Besisfosd 19803, This model raises the possibility that endemic ips spp. populations may not function solely as a wsemoix for SPB parasites between epidemics, but may be eompeti-wg hosts; i.e., parasites may switch to the relatively abundant ips spp. a t endemic SPB pop- ulation levels thereby reducing SPB mortality.
This csncep.&;ual model also attempted to charac- t e ~ z e the relationship between host prefewnces sf parasites for endemic, epide~c, and intemeaab SPB pspu%atisms,
Both the validity of the proposed conceptual model and the relationship of parasite host preferenm to beetle population trends are vital to defining the collective role of natural enemies on i p s spp. and SPB populations. This study attempts to provide a factual basis for evaluation of the model and to further elucidate host-parasite interaction for south- ern pine bark beetles,
METHODS
Several southern pine beetle infestations having &Bering degrees of activity were selected, Sites were chosen with 15 $0 50 active trees and with expan- sion potential relative to tree host availability and beetle brood. SPB population estimates were made in each site utilizing a sampling and estimation pro- cedure based on Coulson et, al, (1976) and Pulley et, al, 919"97), A11 trees with d,b,h, of at least 17 cm and contahing Brood were sampled, Bask discs 10 em in diameter were removed from each sampled tree at two Reigfnts: 3 and 6 meters, Autoradiographs and
Respectively, Research Associate and Professor, Depart- dissection of these samples were used to determine merit of ~ n t o m o l o ~ , ~ n i v e n i t y of Georgia, Athens, GAS beetle density, presence of parasites, stage of devel- (Joseph S, Hamilton and Thomas A. CoRey both pro- vided invaluable tclehnieal assistance toward the compZetiisn
opment of infesting beetles, and primary beetle of this study. We are grateful to Drs. Gary L. DeBarr and species infesting the tree* On a'' trees past mass Gerold Morrison for re~ewing &e manuscript). beetle attack emergence traps were attached at the
same heights as those at which the bark discs were removed* These traps were checked three times per week. Numbers and species of bettles and parasites trapped were recorded. Sticky traps of 1000 cmZ were placed on infested trees a t locations infested primarily with 3rd and 4th instar beetle larvae of primarily one host. 'haps were also checked every 3 days and all parasites and beetles were removed, counted, and indentified.
Parasites ovipositing on trees or parts of trees infested uniformly with either SPB or i p s spp. were collected and analyzed for lipid profile (Kudon and Berisford 198118, These lipid profiles were matched with SPB and ips profiles to determine host of origin of the parasites,
Each selected SPB infestation was monitored for expansion during the study. Data collected were characteszed according to whether the SPB infesta- tion was expanding, rapidly collapsing, or transient stable, Since data were collected every 3 days, this period is referred to in this paper as 1 sampling day. Each site was observed for 21 sampling days, which equalled approximately 7 weeks.
RESULTS AED DISCUSSION
Seven southern pine beetle infesktions were sampled over a %year period. The sampled sites were classified for purposes of this study into four categories based on the behavior of the SPB popula- tions, These categories were: 1) Adjacent concur- sent infestations, 2 ) expanding infestations, 3) rap- idly collapsing infestations, and 4) transient stable infestations, Transient stable infestations were sites that had relatively stable populations d u ~ n g the 7 week study period but died out by the end of that time and (refer to figg, 2a), The sapidly collapsing infestation (see fig, 5a) started with a moderate population and steadily declined until only hialfwray through the study period no active SPBk sere left in the site, Both expanding infestations actually decreased in population over the study period, but due to late expansion ended with substantial gbotea-
tial for continued spot growth (see figs, 4a and 'la), The adjacent concurrent infesta$i&rn involved a rapidly collapsing infestation that developed a con- current satelite infestation nearby,
Over 1,800 individual live parasites were collected for lipid analysis, These were: Neydenia unim Cook and Davis ( PtersmaSidae) , Cselokdes pissodes (Ash- mead) (Braconidae) , Dendroso ter S U ~ C ~ ~ U S Muese- beck (Branconidae) , Roptrocerus xy lophagorum (Ratzeburg) (Tor~midae) and Spathius sp , (Bra- canidsae), Parasites were also collected in emergence traps and from sticky traps yielding the following genera : Spathius ,b Braconidae) , Blnotiscus (Ptero-
malidae), Neydenia (Pkrmdidae) , Coeloides (Bra- conidae), R o p t r o e e r u s (Torymidae), E u r y toma (Eurytornnidae ) , Blatygasder (Platygastridae) , Me- teorus (Braconidae) and Bendrclsoter (Braconidzae),
Primary bark beetle hosts trapped in emergence and sticky devices were Dendroctonw frontalis, Ips auubus (EichhoB), Ips calligrraphus (Germar), ip grandicollis (EichhoB) . The numbers and trap dates of the following SPB associates were also logged: A tany colus (Braconidae) , Cenocoelilrs (Braconidae) , Cossonus ( Curculionidae) , Cryp turgees ( Scdy tideas), Gnathotrichus (Scolytidae) , Nylasfes (Curculio~- dae) , Lascono tus ( Colydiidae) , Lep tacinus (Sta- phylinidae) , Leptacis (Platygastridae) , Lonchaea (Lonchaeidae) , Mesletera (Dolichopodidae) , Pity- ophthorus (Scolytidae), P l a t y soma (Histeridae), Plegaderus (Histeridae) , Ternnochila (Trogositidae) , Tene broides (Trogositidae) , Thanasimus ( Cleridae) and X y le boras (Scoly tidae) .
Adjacent Concurrent Infestationas The original infestation was located about 300 feet
from the western edge of a 10-acre loblolly planta- tion. A t the onset, there were five green infested trees and seven redtops, most of which were infested with late stage larvae or pupae. The spot rapidly declined with almost all activity ceasing by the end sf tho second week of the study p e ~ o d , At the be- ginning of the third week of monitoring, another infestation was established south of the initial one* This infestation was located about 1000 feet from the original and was bordered on the east by a cutover and on the south by a deep draw. This satellite in- feslation consisted of 15 trees that were infested with larvae and pupae when located. Because of expansion barriers (cutover, draw) and a predom- inance of surrounding hardwoods, the site had little opportunity for expansion. There were no new in- fested trees, and as all the other infested trees at this site were infested with SPB of the same appro^- mate life stage, the spot remained static until decline.
Initially, in the original infestation, bark disc sampling showed a relatively large population of late stage SPB (over 70,000 beetles) and concom- itant i p s spp. (fig. l a ) . Emergence trap catch for SPB peaked on sampling day 5 and thereafter rapidly dbinished so that a t the next sampling day emer.- gence was negligible. Site SPB population estimates also dropped to zero around sampling day 5 (fig. la). This is indicative of SPB dispersal from the original site and/or beetle mortality. There were no newly infested trees and sticky trap catches of both Ips spp. and SPB were minimal. Site evaluation on sampling days 5-7 showed little ips spp. activity. Site two was initiated through the sirnultaneorrs infestation of 15 trees. Emergence trap data (60
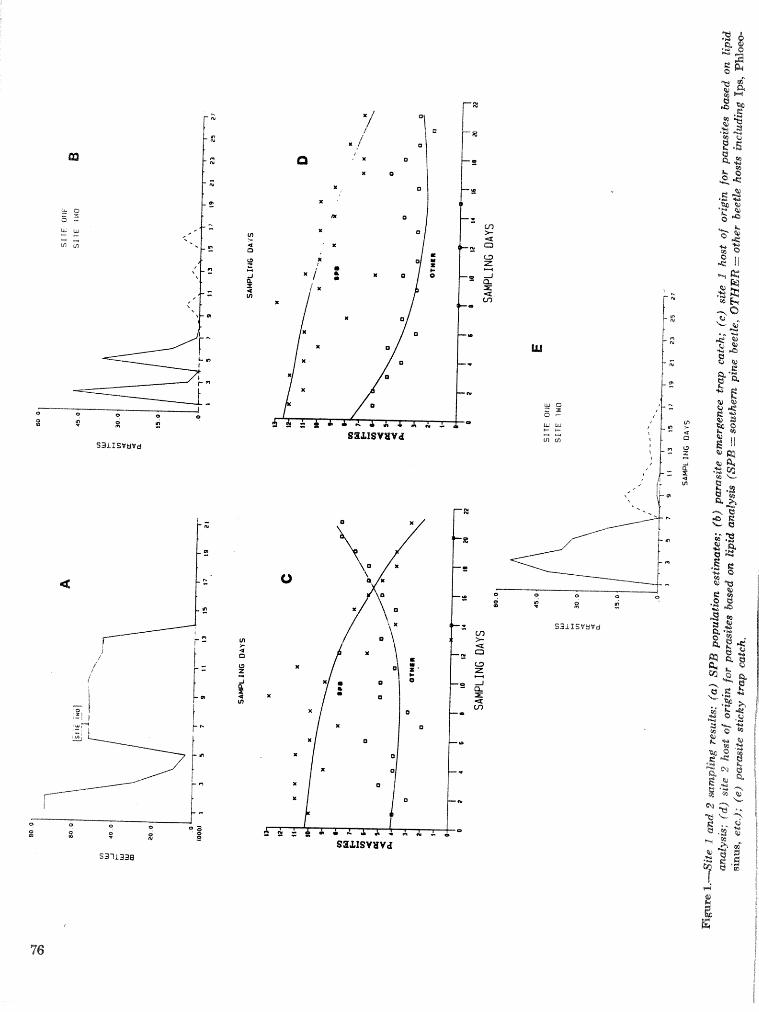
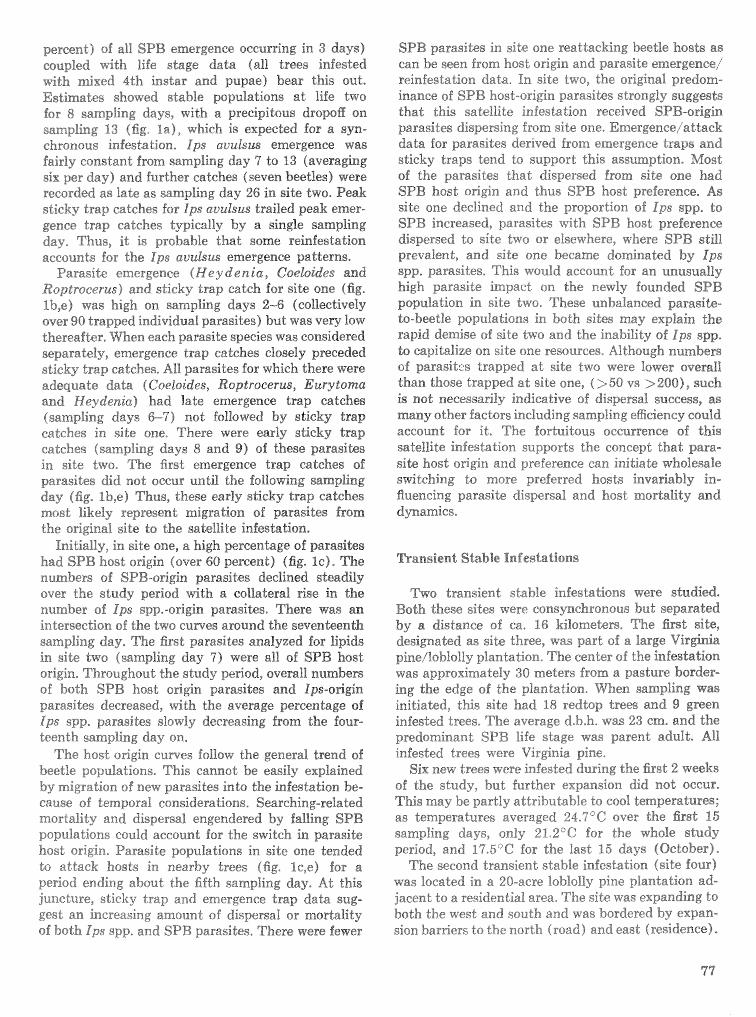
percent) of all SPB emergence occurring in 3 days) coupled with life stage data (all trees infested with mixed 4th instaa and pupae) bear this out, Estimates showed stable populations at l i fe two for 8 sampling days, with a precipitous dropoff on saapling 13 (fig. la), which is expected for a syn- ehmnsus infestation, IPS G;IUULSW emergence was fairly constant from sampling day 7 to 13 (averaging six per day) and further catches (seven beetles) were recorded as late as sampling day 26 in site two. Peak sticky trap catches for i p s avulsus trailed peak emer- gence trap catches typically by a single sampling day. Thus, it i s probable that some reinfestation accounts for the Ips aliubus emergence patterns.
Parasite emergence ( H e y d e n i a , Coeloides and Roptrocerus) and sticky trap catch for site one ( f ig. Ib,e) was high on sampling days 2-6 (collectively over 90 trapped individual parasites) but was very low thereafter. When each parasite species was considered separately, emergence trap catches close1 y preceded sticky trap catches. All parasites for which there were adequate data (Coeloides, Roptrocerus, Eurytoma and Heydenia) had late emergence trap catches (sampling days 6-71 not followed by sticky trap catches in site one, There were eiakiy sticky trap catches (sampling days 8 and 9) of these parasites in site two, The first emergence trap catches of parasites did not occur until the following sampling day (fig. Ib,e) Thus, these early sticky trap catches most likely represent migration of parasites from the original site to the satellite infestation.
Initially, in site one, a high percentage of parasites had SPB host origin (over 60 percent) (fig. Ic). The numbers of SPB-origin parasites declined steadily over the study period with a collateral rise in the number of ips spp.-origin parasites. There was an intersection of the two cuwes around the seventeenth sampling day. The first parasites analyzed for lipids in site two (sampling day 7 ) were all of SPB host origin. Throughout the study period, overall numbers of both SPB host origin parasites and ips-origin parasites decreased, with the average percentage of Ips spp. parasites slowly decreasing from the four- teenth sampling day on,
The host origin curves follow the general trend of beetle populations. This cannot be easily expiained by migration of new parasites into the infestation be- cause of temporal considerations. Searching-related mortality and dispersal engendered by falling SPB populations could account for the switch in parasite host origin. Parasite populations in site one tended to attack hosts in nearby trees (fig, k,e) for a period ending about the fifth sampling day. A t this juncture, sticky trap end emergence trap data sug- gest an increasing amount of dispersal or mortality of both Ips spp. and SPB parasites, There %?ere fewer
SPB parasites in site one reattacking beetle hosts as can be seen from host origin and parasite emergence; reinfestation data, In site two, the original predom- inance of SPB host-origin parasites strongly suggests that this satellite infestation received SPB-origin parasites dispersing from site one. Emergenceiattack data for parasites derived from emergence traps arid sticky traps tend to support this assumption. Most of the parasites that dispersed from site one had SPB host origin and thus SBB host preference, As site one declined and the proportion of I p s spp, to SPB increased, parasites with BPB host preference dispersed to site two or elsewhere, where SPB still prevalent, and site one became dominated by ips spp. parasites. This would account for an unusually high parasite impact on the newly founded SPB population in site two. These unbalanced parasite- do-beetle populations in both sites may explain tbe rapid demise of site two and the inability of Ips spp. to capitalize on site one resources. Although numbers of parasites trapped at site two were lower overall than those trapped at si te one, ( > 50 vs >20Q), such is not necessarily indicative of dispersal success, as many other factors including sampling efficiency could account for it, The fortuito~s occurrence of this satellite infestation supports &be concept that para- site host origin and preference can initiate wholesale switching to more preferred hosts invariably in- fluencing parasite dispersal and host mortality and dmamics,
Transient Stable Infestations
Two transient stable infestations were studied, Both these sites were consynchronous but separated by a distance of ca. 16 kilometers. The first site, designated as site three, was part of a large Virginia pine/loblolly plantation. The center of the infestation was approximately 30 meters from a pasture border- ing the edge of the plantation. When sampling was initiated, this site had 18 redtop trees and 9 green infested trees. The average d.b.h. was 23 cm. and the predominant SPB life stage was parent adult. All infested trees were Virginia pine,
Six new trees were infested during the first 2 weeks of the study. but further expansion did not occur. This may be partly attributable to cool temperatures; as temperatures averaged 24.T5C over the first 15 sampling days, only 21.2'C for the whole study period, and 17.5"C for the last 15 days (October).
The second transient stable inf esdation (site four) was located in a 20-acre loblolly pine plantation ad- jacent to a residential area. The site was expanding to both the west and south and was bordered by expan- sion barriers to the north (road) and east (residence).
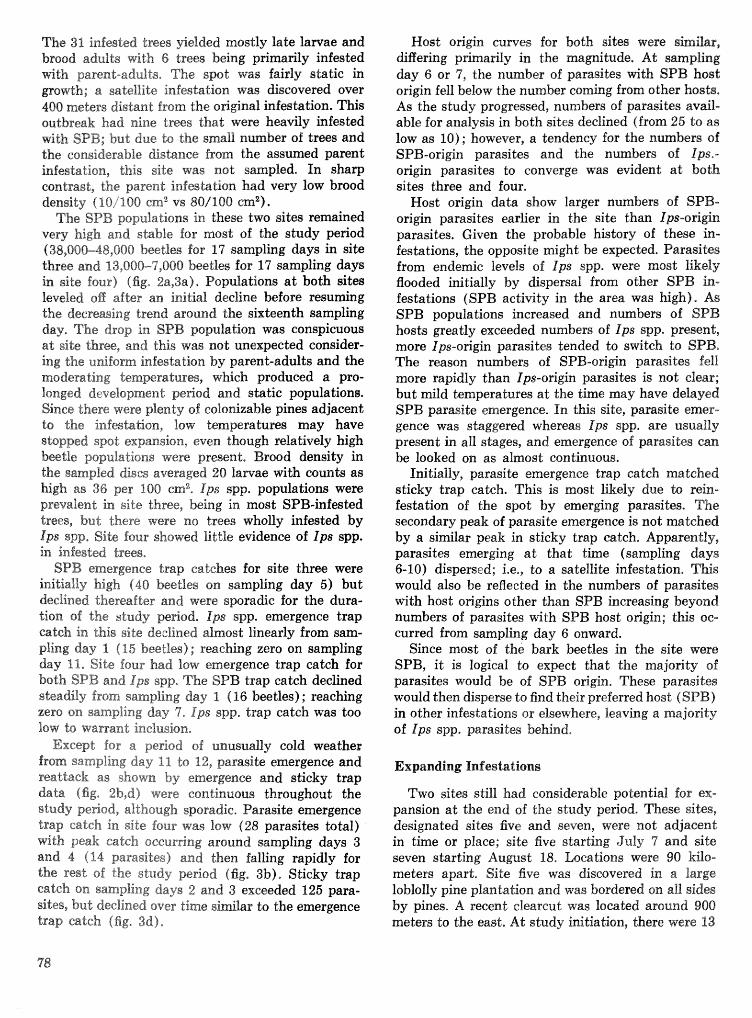
The 31 infested trees yielded mostly late larvae and bmsd adults d t h 6 trees bejivlg pr-lrmarily infeskd ~ t f f parent-addds, The apok was fairly sbtic in noPsth; a satellite infestatirm afas discovered over 400 meters disknt from the o ~ ~ n a l i infestation, This outbreak had nine trees that were heady infested with SPB; but due to the s m l l nwniber of trees and the considerable &shaee from the assmed parent infesbtionp this site was not sampled. In sharp contrast, the parent infestation had very low brood density (10/100 cm2 vs 80/100 mZ).
The SPB populations in these two sites remained very high and stable for most of the study period (38,000-48,000 beetles for 17 sampling days in site three and 13,000-7,000 beetles for 17 sampling days in site four) (fig, 2a,3a), Populations a t both sites leveled off after an initial decline before resuming the decreasing tread around the sixteenth sampling day, The drop in SPB population was conspicuous at Bite three, and this was not unexpected consider- ing the unifom infestation by parent-adults and the moderating demperadurm, which produced a pro- longed deve%capmend period and static populations. Since there were plenty of colsnizable pines adjacent do the infestation, law temperatures may have sbpped spot expamasion, even though relatively high beetle populations were present. Brood density in the sampled discs averaged 20 lenmae with counts as high as 36 per 100 em2, Ips spp. populations were prevalent in site three, being in most SPB-infested trees, but there were m s trees wholly infested by Ips spp, S i h four showed little evidence of Ips spp. in infested trem,
SPB emergence trap catches for site three were irmikiamy high (40 beetles on sampling day 5) but declined thereafter and were sporadic for the dura- tion of the study p e ~ o d - Ips spp. emergence trap catch in this site declined almost lineady from sam- pling day 1 (15 beetles) ; reaching zero on sampling day 11, Site four had low emergence trap catch for both SBB and Ips spp. The SPB trap catch declined steadily from sampling day I (1Ci beetles); r e a c b g zero on sampling day "7 Jps spp. trap catch was too %ow &.a warrant inclusion.
Except for a period sf unusuizUy cold weather from sampling day 11 to 12, prarasile emergence and sattack as s&ssm by emergenee and sticky trap data &fig. 2b,d) were continuous throughout the study period, although sporadic. Parasite emergence trap catch in site four was low (28 parasites total) with peak catch occurring around sampling days 3 and 4 (14 parasites) and then falling rapidly for the rest of the study period (fig. 3b). Sticky trap catch on sampling days 2 and 3 exceeded 125 para- sites, but declined over time similar to the emergence trap catch (fig, 3d),
Host origin curves for both sites were sbZilr, ariry in the magnibde. At s m p h g
day 6 or 7, the number of parasites with SPB hast origin fell below the number csraing from other hosts, As the study progressed, numbers of parasiks avail- able for analysis in both sites declined (from 25 to as low as 10); houlever, a tendency for the numbers sf SPB-origin parasides and the nunnbers of Ips.- origin parasites to converge was evident ad both sites three and four.
Host origin data show larger numbers of SPIES- ori@n parasites earlier in the site than Ips-orilz;ia parasites. Given the probable history of these 51- festations, the opposite might be expected. Parasibs from endemic levels of Ips spp. were most likely flooded initially by dispersal from other SPB in- festations (SPB activity in the area was high), As SPB populations increased and numbers of SPB hosts greatly exceeded numbers of lpls spp. present, more Ips-origin parasites tended to switch to SPB* The reason numbers of SPB-origin parasites fell more rapidly than Ips-origin parasites is not elear; but mild temperatures at the time may have delayed SPB parasite emergence. Ln this site, parasite erner- genee vvas staggered whereas Ips spp, are usually present in all stages, and emergence of parasites can be looked on as a h o s t continuous,
Initially, parasite emergence trap catch matched sticky trap catch. This is most likely due to rein- festation of the spot by emerging parasites. The secondary peak of parasite emergence is not matched by a similar peak in sticky trap catch. Apparently, parasites emerging a t that time (sampling days 6-10) dispersed; i.e., to a satellite infestation. "nria would also be reflected in the numbers of parasites with host o r i ~ n s other than SPB increasing beyond numbers of parasites with SPB host orjigin; this oe- curred from sampling day 6 onward,
Since most of the bark beetles in tho site weso SPB, it is logical to expect that the majority of parasites would be of SPB origin, These parasites would then disperse to find their preferred host (SPB) in other infestations crr elsewhere, leaving a runajsriky of Ips spp. parasites behind,
Two sites still had considerable potentid for ex- pansion at the end of the study period, These sites, designated sites five and seven, were not adjacent in time or place; site five starting July 7 and site seven starting August 18, Locations were 80 kilo- meters apart, Site 6ve was discovered in an large loblolly pine plantation and was bordemd on all side@ by pines, A recent elearcut was located around 900 metem to the east. At study hitiation, there were 13
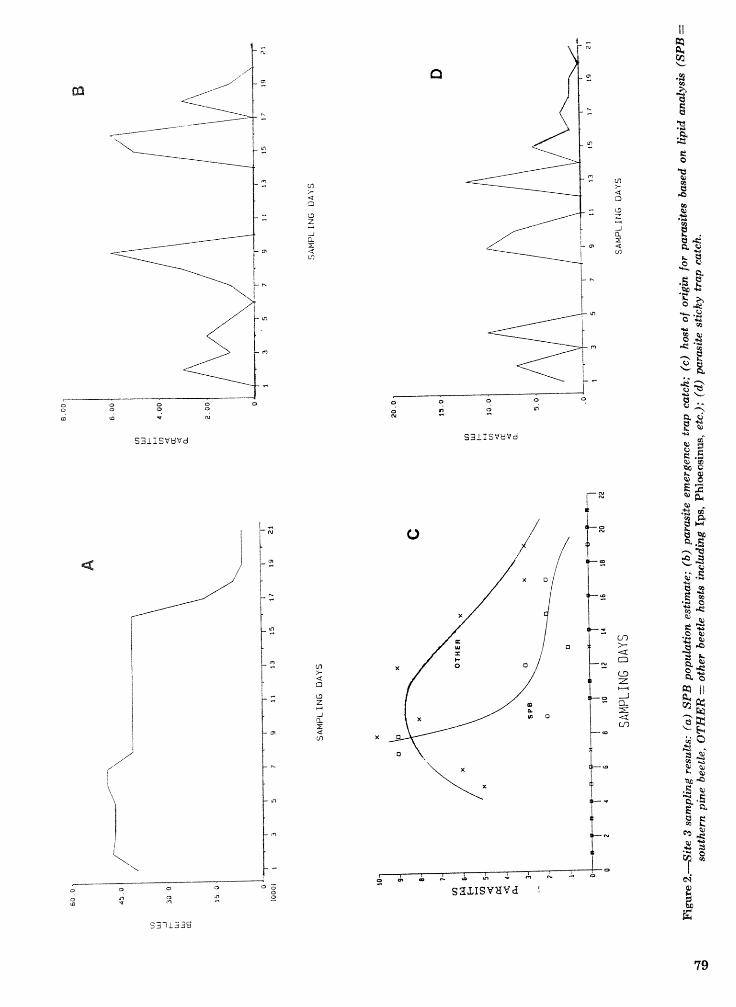
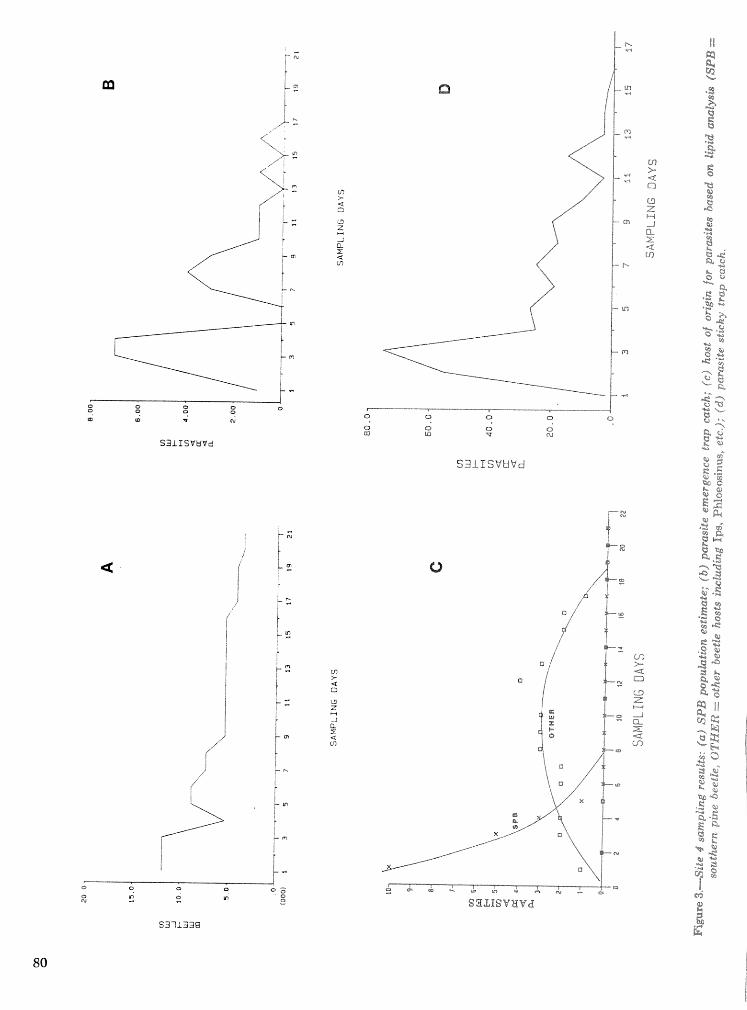
green infested trees, 17 faders, and 14 redtops* At termination, there were over "9 actively hfested trees. Al stages of SPB were present in. this sik, Site seven was located in a 20-acre natural pbe stand situated at the bottom of 8 c1earcut 810pe and bordered on the north by a hardwood s w a p and on the west by a hardwood ridge* The pines extended east for a cipnsiderable distance, At the outset, there were $4 green infested trees, 8 faders, and MO red.- tops, There were 35 newly infested trees while the site was being studied, At the end of the study period, enough green infested trees ( > 13) remained $0 insure spot growth (in the absence of coo1 weather inferferenee) ,
The SPB population at site five @;;"as very high (>iiaOQ,OOO beetles) (fig, .$a), and bmod density averaged 50 SPB/IOO cm2, There was sugcient activity in this site at the end of the study pedod to make further spot expansion likely. Emergence trap catch of SPB in this site ad outset averaged about 30 beetles with as many as 90 being trapped on sampling day 8, Catch decreased over t ~ e and then 6~al8y ended with a spurt sf emergenee (>I00 beetles over the last 3 sampling days), reflecting high terminal activity, Bps spp, were daidy prevalent in site five, with three trees being infested primarily with Ips spp, plus ad Isast some brood present in most other trees, la contrast9 very little Ips spp. brood were en-
countered in site seven, This site had such rapidlgr expanding SPB populations that Ips spp. populations had little chance to be established. SPB populations were even higher at site seven (up to 600,000 beetles) than at site firre but atill comparable (fig. Ba), Broad density in sampled trees was about &he same as in site five* Patterns of population increase and decrease were similar in both sites with a noticeable declhe in active beetles centered around sampling days 15 to 20 (from 308,000 down to 220,008, At the termi- nation of the study period, SPB populations in the site had begun to expand rapidly again. Emergence trap catch of SPB gradually increased from a sam- pling day 1 total of about 50 beetles to 600 on sam- pling day 8. The catch then fell rapidly to zero by sampling day 15, Expansion of this site occurred in three waves, the final involving 13 trees. This type of expansion results in brood development being synchronous and emergence data will typically be represented by peaks, The peak on sampling day 8 was the result of the second wave; development tines precluded observation of emergence from the last expacsion pulse. Sticky trap catch for beetles in this site was very low due to the rapid expansion of the site and resulting physical difficulty of keeping traps on trees under attack,
Parasite emergence and sticky trap catch in site
five folowed a pattern similar to the SPB population. Initially, large numbers of parasites were trapped (>400 parasites combined catch in th first 5 sam- pling days) followed by a period of low catches lasting from sampling day 7 to sampling day 16 (aver- aging less than nine parasites per sampling day). A t this point, trap catch began to increase. As in the SPB population, two major peaks of activity can be dis- tinguished, separated by about 9 sampling days. Peak emergence preceded peak sticky trap catch by 1 to 2 days. Again, this is evidence of reinfestation of the site by pajrasites.
In site seven, a diBerent pattern of parasite activ- ity was apparent: Trap catch c instead of concave, but still matched the SPB pep- ulation curve fairly closei y. The only discrepancy was the lack of any parasite trap catch after Sam- pling day 15. Parasite emergence and sticky trap catch synchronized fairly closely in this site, indi- cating parasite reinfestation. The lack of trap catch after sampling day 15 prevented a comparison of parasite trends with the terminal SPB population increase. The onset of cooler weather could have been a factor in the cessation sf tmp catch, but enough parasites were in the site to permit capture for lipid analyses. The parasites collected for lipid stu&es could have been the result of GspersaB into the site, and thus were not reflected in trap catch. A few parasites wem caught in sticky traps on wm- plhg day 20 .
The parasite trap calch reWecb the wave rrrahre of the infestation. Emergence of parasiks and re- infestation would not occur until sfightly afkr onset of SPB expansion; this expansion manifested itself at the termination of the study. These expected peaks of parasite activity were missed due to cessa- tion of sampling,
During most of the study period, the ratio of the numbers of parasites with host odgin other than SPB to the numbers of parasites from SPB stayed fairly constant (ca. 1 to 2). Only around sampling day 19 was there any variation in this trend. The same: trend can be seen in site seven with the excep- tion of a sharp fall in the overall number of parasites collected (from 25 down to 10). There was an in- crease in the number of parasites with host origins other than SPB relative to those with SPB host origias from sampling days 19 do 21 (36 peregn% to 58 percent). This change in ratio is undoubtedly due in part to clumping of points because of the low number of parasites collected (151, but it probably also reflects an actual change in the overall host ofig:n of the parasites, In both sites, high parasite populations showed a
conshnt ratio between SPB host-origin parasites and those with ho& orjigin other than SPB* gli";he?-
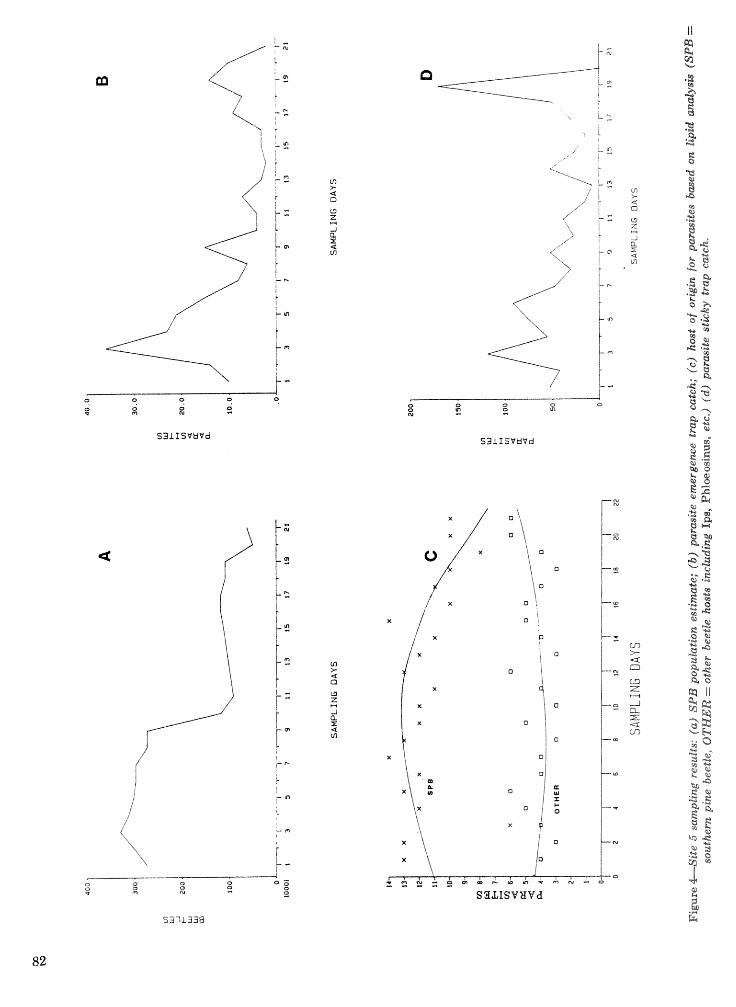
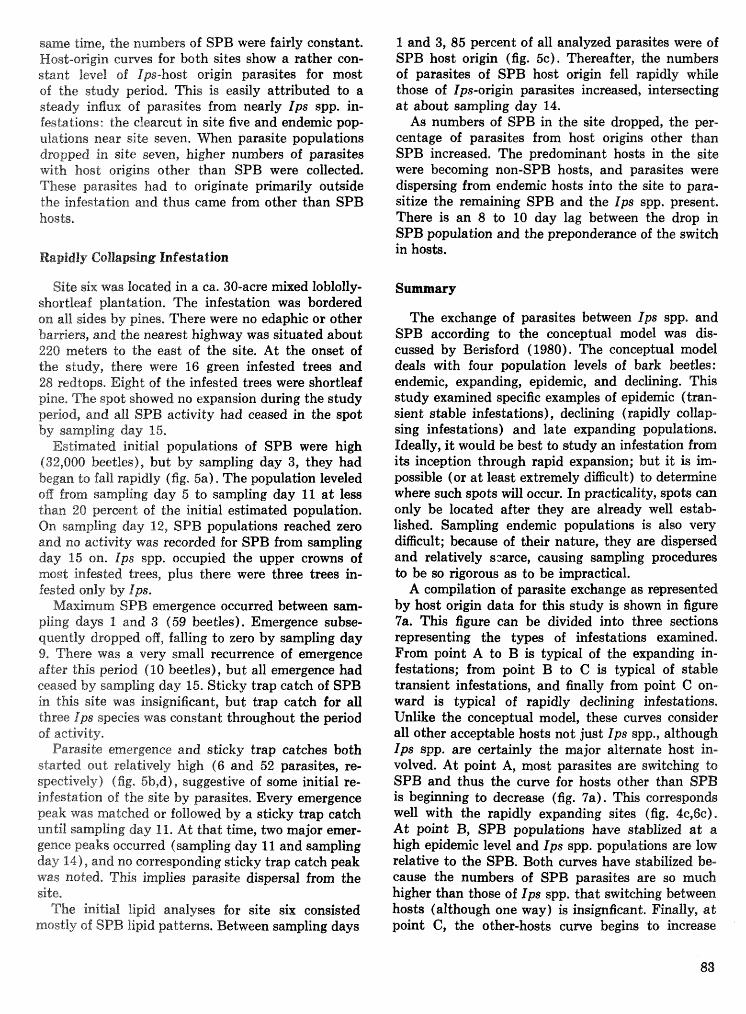
same time, the numbers of SPB were fairly constant. Host-o~gin curves for bath sites show a rather con- stant level of bps-host origin parasites for most of the study p e ~ o d , m i s is easily attributed to a skady inlfux of parasites frorn nearly fps spp. in- festations: the clearcut in site five and endemic pop- ulations near site seven. m e n parasite populations dropped in site seven, higher numbers of parasiks with host origins other than SPB were collected. These parasites had to originate primarily outside the infestation and thus came frorn other than SPB hosts.
Rapidly Callaping f nf estation
S i k six wa15 located in a ca. 30-acre mixed loblolly- shortleaf plantation, The infestation was bordered on a11 sides by pines, There were no edaphic or other bar~ers, and the nearest highway was situated about 220 meters to the east of the site. At the onset of the study, there were 16 green infested trees and 28 redtops. Eight of the infested trees were shortleaf pine, The spot showed no expansion during the study period, and all SPB activity had ceased in the spot by sampling day 15,
Estimated initial populations of SPB were high (32,000 beetles), but by sampling day 3, they had began to fall rapidly (fig. Sa). The population leveled off frorn sampling day 5 to sampling day 11 a t less than 20 percent of the initial estimated population. Orr: sampling day 12, SPB populations reached zero and no activity was recorded for SPB from sampling day I5 on. 1;Ds spp. occupied the upper crowns of most infested trees, plus there were three trees in- hsted only by Ips.
Maximum SPB emergence occurred between sam- pling days 1 and 3 (59 beetles). Emergence subse- quently dropped off, falling to zero by sampling day 9, There was a very small recurrence of emergence after this p e ~ o d (10 beetles), but all emergence had ceased by sampling day 15. Sticky trap catch of SPB in this site was insignificant, but trap catch for all three Ips species was constant throughout the period of activity,
Parasite emergence and sticky trap catches both started out relatively high (6 and 52 parasites, re- spectively) Q fig, 5b,d), suggestive of some initial re- infestation of the site by parasites. Every emergence peak was matched or followed by a sticky trap catch until ssrnpfing day 11. At that time, two major emer- geaee peaks occurred (sampling day 11 and sampling day f$) , and no corresponding sticky trap catch peak was noted* This implies parasite dispersal from the site,
The initial lipid analyses for site six consisted mostly of SPB lipid patterns. Between sampling days
1 and 3, 85 percent of all analyzed parasites were of SPB host origin (fig. 5c). Thereafkr, the numbers of parasibs of SPB host origin. fell ralpidfy while those of Ips-origin parasites increased, htemecting a t about sampling day 14.
As numbers of SPB in the site dropped, the per- centage of parasites from host origins other than SPB increased. The predominant hosts in the s ik were becoming non-SPB hosts, and parasites were dispersing from endemic hosts into the site to para- sitize the remaining SPB and the Ips spp, present, There is an 8 to 10 day lag between the drop in SPB population and the preponderance of the switch in hosts.
The exchange of parasites between Ips spp. and SPB according to the conceptual model was dis- cussed by Berisford (1980). The conceptual model deals with four population levels of bark beetles: endemic, expanding, epidemic, and declining. This study examined specific examples of epidehc (tran- sient stable infestations), declining (rapidly collap- sing infesbtions) and late expanding populations. Ideally, it would be best to study an infestation frorn its inception through rapid expansion; but it is im- possible (or a t least extremely difficult) to dete where such spots will occur. In practicality, spots can only be located after they are already well estab- lished. Sampling endemic populations is also very difficult; because of their nature, they are dispersed and relatively sctarce, causing sampling procedures to be so rigorous as to be impractical.
A compilation of parasite exchange as represented by host origin data for this study is shorn in figure 7a. This figure can be divided into three sections representing the types of infestations exahned. From point A to B is typical of the expanding in- festations; from point B to C is typical of stable transient infestations, and finally from point C on- ward is typical of rapidly declining infestations, Unlike the conceptual model, these curves consider all other acceptable hosts not just Ips spp., althougb Ips spp. are certainly the major alternate host in- volved. At point A, most parasites are sdtching to SPB and thus the curve for hosts other than SPB is beginning to decrease (fig. 7a). This corresponds well with the rapidly expanding sites (fig. .dc,fic)* At point B, SPB populations have stablized at a high epidemic level and Ips spp. populations are low relative to the SPB. Both curves have stabilized be- cause the numbers of SPB parasites are so much higher than those of Ips spp. that switching between hosts (although one way) is insignficant. Finally, a t point C , the other-hosts curve begins to increase
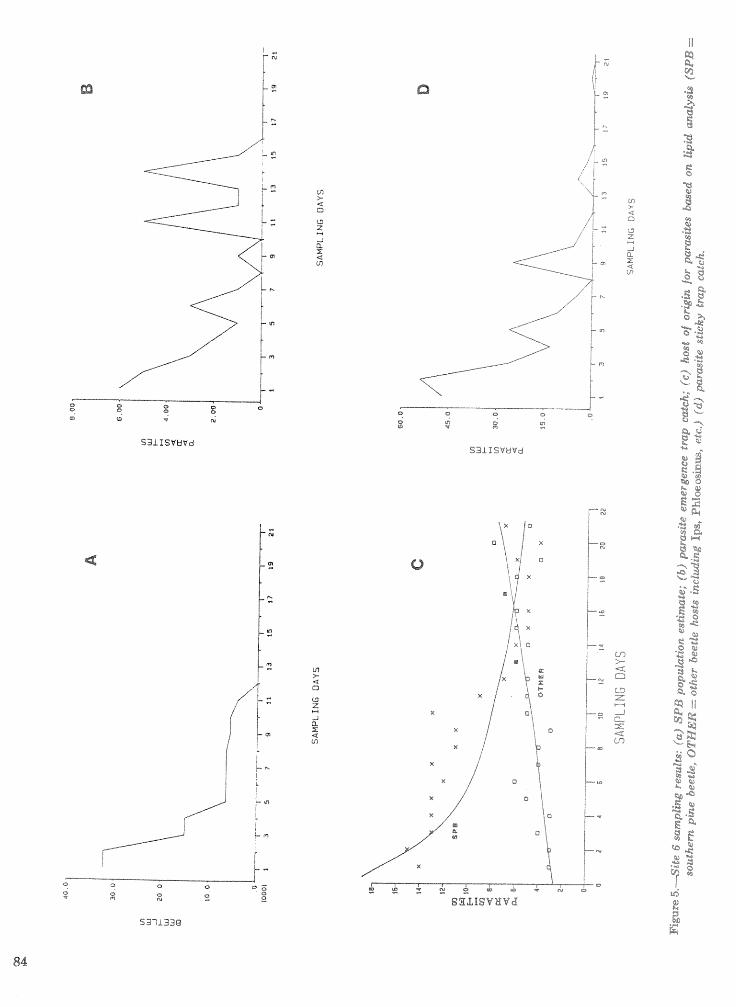
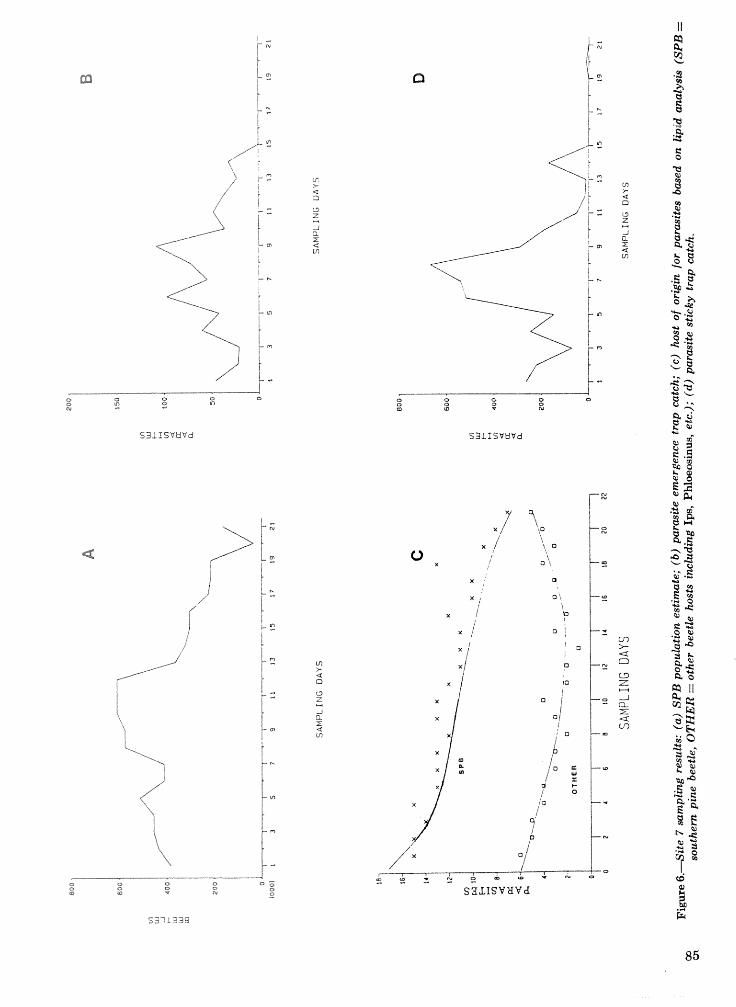
R ti' !? G .w
t3 as Q .g 2-8 '-ri; k; .ff U
g 2 'M .;s B P1 9) rr 0 9)
2i2 3; a "o
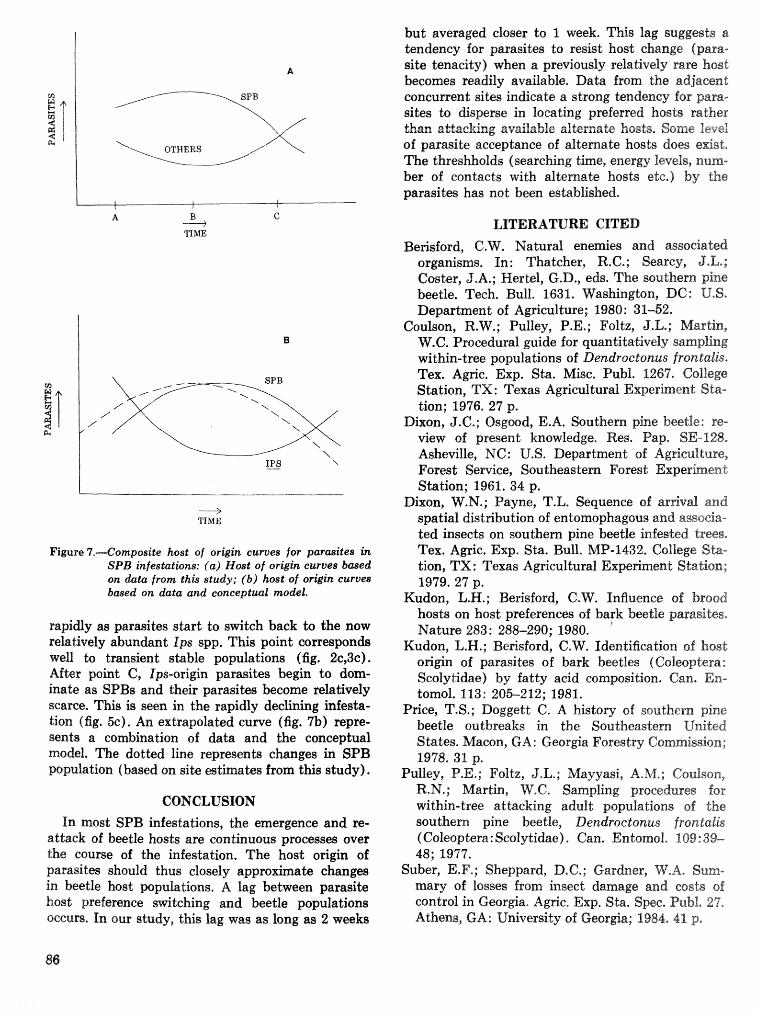
--+ TIME
Figure ?.*ompasite host of origin curves for parmitee in SPB infestations: (a) Host of origin curves baed on data from thk study; (b) host of origin curves based on data and conceptual model.
rapidy as parasites start to switch back to the now relatively abundant Ips spp. This point corresponds weH to transient stable populations (fig. 2c,3c). After point C, Ips-origin parasites begin to dom- inate as SPBs and their parasites become relatively scarce. This is seen in the rapidly declining infesta- tion (fig. k). An extrapolated curve (fig. 7b) repre- sents a codination of data and the conceptual model. The dotted line represents changes in SPB lpcspulation j based on site esthates from this study).
CONCLUSIOPJ In most SPB infestations, the mergence and re-
attack of beetle hosts are continuous processa over the course of the infestation. The host origin of parasites should thus closely appro in beetle host populations, A lag between parasite host preference switching and beetle populations occurs. In our study, this lag was as long as 2 weeks
but averaged closer to 1 week. This lag suggwts a tendency for parasites to resist host change (pam- site tenacity) when a previously relatively rare host becomes readily available. Data from the adjacent concurrent sibs indieate a strong tendency for para- sites Lo asperse in locating prefemed hwts rather than a&aekimg avazabte alhrnate hosts, Some level of parasite acceptance of alternate hosb does esst , The threshholds (searching time, energy levels, num- ber of contacts with alternate hosts ete.) by the parasitw has not been established.
LITERATURE CITED
Berisford, C.W. Natural enemies and associated organisms. In : Thatcher, R.C.; Searcy, J.L.; Cmter, J.A.; Hertel, G.D., eds. The southern phe beetle, Tech, Bull, 1631. WashingLon, DC: U.S. Department of Agriculture; 1980: 31-52.
Coulson, R.W.; Pulley, P.E.; Foltz, J.L.; Martin, W.C. Procedural guide for quantitatively sampling within-tree populations of Dendroetonus f rondakis* Tex. Agric. Exp. Sta. Misc, Publ. 1267. College Station, TX: Texas Agricultural Experiment Sda- tion; 1976. 27 p,
Dixon, J.C.; Osgmd, E.A. Southern pine beetle: re- view of present knowledge. Res, Pap. SE-128* Asheville, NC: U.S. Department of A~iculture, Forest Semice, Southeastern Forest Expearherat Station; 1961, 34 p.
Dixon, W.N.; Payne, T.L. Sequence of arrival and spatial dist~bution of entomophagous and associa- ted insects on southern pine beetle infle~ted trees. Tex. Agric. Exp. Sta. Bull. MP-1432. College Sta- tion, TX: Texas Agricultural Experiment Station; 1979. 27 p.
Kudon, L.H.; Berisford, C.W. Influence of brood hosts on host preferences of bark beetle parasites. Nature 283: 288-290; 1980. '
Kudon, L.H.; Berisford, C.W. Identification of host origin of parasites of bark beetles (Coleiclptem: Scofytidae) by fatty acid composition, Can. En- tomol, 113: 205-212; 1981.
Price, T.S.; Doggett C. A histor~r of southern pine beetle outbreaks in the Sou theastern United States. Macon, GA: Georgia Forestry dllom&ssio.ni; 1978. 31. p.
Pulley, B.Es; Foltz, J.L.; Mayyasi, A,M.; Goulson, R-N. ; Martin, CV.C, Sampling procedares far within-tree attacking adult populations of the southern pine beetle, Dendroctonzes frontalb (Coleoptera : Scolytidae) . Can. Entornol. 189: 39- 48; 11977,
Suber, E.F.; Sheppard, D.C.; Gardlaes, W,A. Sum- mary of losses from insect damage and c08L9 of control in Georgia. Agl-ic, Exp. Sta, Spec. PukbB. 27, Athens, CA: University of Georgia; 198.4.. 41 p,
Strategies for Cohabitation Among the Southern Pine Bark Beetle Species: Comparisons of Lif e-Process Biologies
Terence L. Wagner, R. 0. F , and R. N. Coulson'
A bstract,-Dendroctonufi frontalis Zi D. terebrans (Olivierl) , Ips auulsus (EichhoB), I. grandieollis (Eichhofi) , and I, ealliigraphus (Ger- mar) often inhabit the same southern pine trees, Pinus spp, Their spatial arrangement on these trees fretguenLly overlaps as arriving insects select breed- ing sites suitable for brood development. This material must be fresh (living or recently killed trees a t the time of attack), and for all species, the host must &e for the insects to complete develop- ment. These species are believed to increase their breeding opportunities through association, although this factor and their similar niche requirements increase the potential for competitive interactions. The nature of competition among the southern pine bark beetle species and the different structural, be- havioral, and physiological characteristics that reflect adaptive strategies for cohabitation are examined. The conclusion is that the beneficial effects of addi- tional resource made available to each species through association outweigh the negative effects of competition brought on by the association. The adaptive strategies of each species reduce competi- tion at all population densities, and evidence of severe exploitative competition among the speeies is minimal. Additional keywords: Dendroetonus frontalis Zim- mermann, Ips species, species competition, pest in- teractions, Dendroetonus terebrans (Olivier), insect associates
INTRODUCTION
tcelis Zi-wnnerrnann D, terebrures (Olivier) , Ips auaksub (EichhoR), I, grandicotlis (EiehhoB), and 1, caEli- g r a p h s (Germar), A guild ria a group of species (regardless of taxonomic relationship) that exploits the same resource in a similar way (Rood 1967), According to the concept, the niche requirements of the species must overlap significantly for them to be guild members, This criterion is certainly met by the southem pine bark beetle species, These insects are often found together in trees, and all require fresh phloem tissue for their desrelaspment,
The potential for competition naturally exists among guild members because of their similar habitat requirements and close association, Yet, it is obvious that interspecific competiticm is dele- terious, and that natural selection would tend to favor divergence among species leading to a reduc- tion in the level of competition (Root 196n ), Other- wise, the outcome of intense eompeti tian between species would be displacement as elimination of the weaker competitor from the habitat (competitive exclusion, principle) (Hardin 1960)- Although dis- placement could be an ongoing process with regard to some of the southern pine bark beetle species, all remain members of the guild, ThereiScare, adaptive strategies must exist that reduee competitive inter- actions among them,
This paper examines the nature of competitive interactions among southern pine bask beetle speeies and some of the physical, behavioral, and physiologi- cal adaptations for reducing the intensity of "Ghese interactions. This is mot an all-inclusive treatise on the subject, for there is much not known about in- dividual species and their interactions. Knowledge
~h~ major bark beetle species attacking south- is especially deficient on D. terebrans and I . grandi-
ern pines (pinus sppa) can be guild coltis; however, enough information is available to
members. These species are: Dendroetonus fron- provide insight into the ecslogica$: diversity among the species. This ecol~gieal perspective is necessary to the management of the bark beetle complex as a whole.
The reader is cautioned on two ~o in t s : First, this 1 Respectively, Assistant Research Scientist, Graduate Assis- is not a literature review although pertinent cita- tant, and Professor, Department of Entomology, Texas A&M University, College Station, TX, (We wish to thank our tions are given, Information is drawn horn a v a ~ e t y
colleagues at Texas A&M University who have contributed Sources, but relies most on original re- knowledge over the years to this work, especially R. W. search. Although some of this research i s wpub- Brown, A, &I. Bunting, S. P. Cook, P, S. Doraiswarny, W. S. lished, in most eases, manuscripts are in some stage - Fargo* R- M- Feldman, J- A- Gagne, P- B- Hennierv L. of preparation and are footnoted in the text* Second, Keeley, I?. J. H. Sharpe, 2". L. Payne, P. E. Pulley, and H. Wu. Speeiall thanks are extended to D. Watkins and L. Gattis
the hypotheses formulaled "&.roughout the paper
for technical and clerical assistance.) Texas Agricultural Ex- are based On the best available information* Alterna- periment Station Paper Number TA20551. tive hypotheses may be possible*
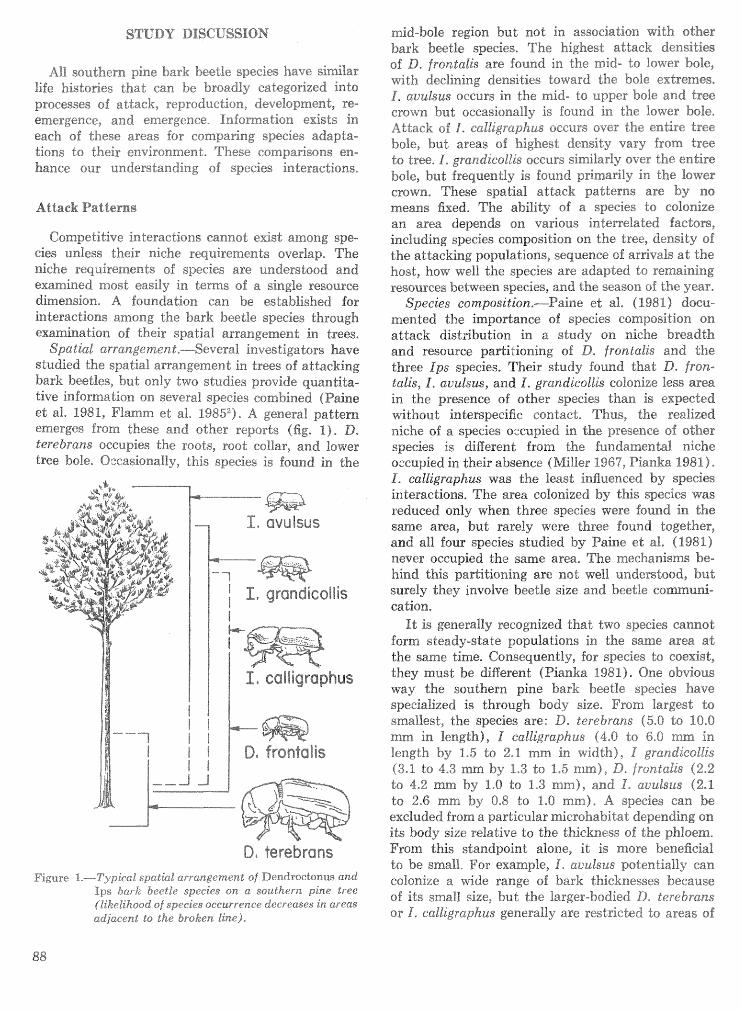
STUDY DISCUSSION
AIE southern pine bark beetle species have similar fife histories that can be broadly categorized into processes of attack, reproduction, devePopment, re- emergence, and emergence, Infomation exists in each of these areas for comparing species adapta- tions to their environment, These comparisons en- hance our understanding of species interactions,
Competitive interactions cannot exist among spe- cies %aun%ess their niche requirements overlap. The niche requirements of species are understood and examined most easily in terms of a single resource dimension, A foundation can be established for interachns among the bark beetle species through examinadisn of their spatial arrangement in trees,
Spatial arrangement,-Several investigators have studied the spatial arrangement in trees of attacking bark beetles, but only two studies provide quantita- tive infomadion on several species combined (Paine et al. 1981, Flamm et al. 1985?). A general pattern emerges from these and other reports (fig, 4-8, D, terebrans occupies the roots, root coilas, and lower tree bnie. Oscasionrslly, this species is found in the
D, terebrans Figure 1,-Typical spatial arrangement of Dendroctoaus and
I p s bark Beetle species on a sorkthern pine tree Qliketihood of species occurrence decr~ases in areas adjacent to the broken kine),
mid-bole =$isre but not in association with other bark beetle species, The highest attack densities of D. fronda~k are found in the mid- to lower bole, with declining densities toward the bole extremes. I , auulsus occurs in the mid- do upper bole and tree crown but occasionally i s found in the lower bole, Attack of I , ealktgraphbs occurs over the entire tree bole, but areas of higkes"cdensity vary from tree to tree, I , grandicsllis occurs similarly over the entire bole, but frequently is bound primarily in the lower cmwn, These spatial attack patterns are by no means fixed, The ability of a species to colonize an area depends on various interrelated factors, including species composition on. &he tree, density sf the attacking populations, sequence of arrivals at the host, how well the species are adapted to remaining resources between species, and the season of the year,
Species composition,-Painre et al, 6 1981) docu- mented the importance of speeies composition on attack dist;l.libution in a study on niche breadlks and resource partitioning of D, frontalis and the three Ips species, Their study found that D. fron- tatisis, 6, auulsus, and 1, grandEcoEkis colonize less area in the presence sf other species than i s expected without interspecific contact, Thus, the realized niche of a species occupied in the presence of other species is diBerent from the feandarnenGa1 niche occupied in their absence dh2iller 196% PPianka 1981). I , calligraphus was the least influenced by specim interactions. The area colonized by this species was reduced only when three species were found in the same area, but rarely were three found together, and all four speeies studied by Paine et al, (1981) never occupied the same area, The mechanisms be- hind this partitioning are mot well understood, but surely they involve beetle size and beetle eommuni- eation,
It is generally reespized that two species cannot form steady-state populations in the same area at the same time, Consequently, for species to coexist, they must be different (BJianka 1989), One obvious way the southern pine bark beetle species have specialized is through body size, From largest to smallest, the species are: D, tesebrans (5.0 to 10-8 mm in length), I ealligraphus (4-0 "c 66, mm in length by 1-5 to 2-1 mm in width), 1 grandicollis
b y 1-3 to 1-5 mm), D- frontalis (2-2 to 4.2 mm by 1,o to 1-3 mm), and I , auuksus (21 do 2.6 mm by 0,8 to 1-0 mm). A species can be excluded Dom a particular microhabitat depending on ids body size relative to the thickness of the phloem, From this standpaint alone, it is more beneficial to be small, FOE' example, 1, avulsus potentially can colonize a wide range of bark thicknesses because of its srnaI1 size, but the larger-bodied D, fewbrans or 1, cakligraphus generally are restricted to areas of
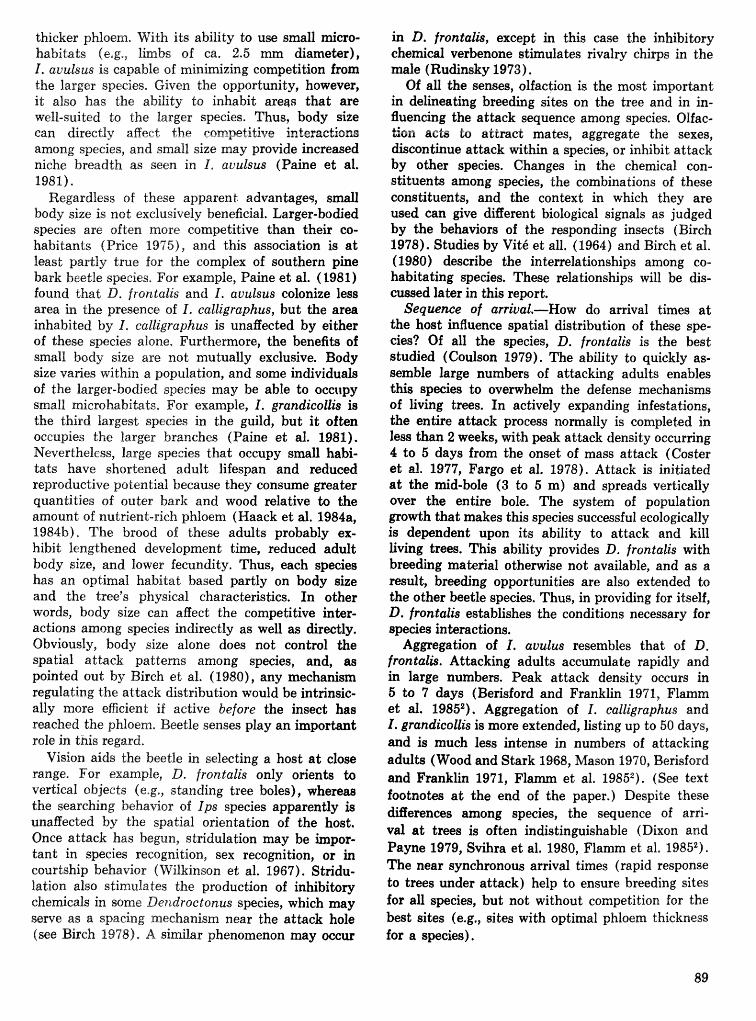
thicker phloem. With its ability to use small micro- habitats (e,g,, l k b s sf ca. 2.5 mm diameter), I. avutsus is capable of m i n ~ z i n g competition from the larger species. Given the opportunity, however, it also has the ability to inhabit areas that are mll-suited to the larger species. Thus, body size can directly affect the competitive irateractioncz~ among species, and srnatf size may provide increased niche breadth as seen in I, auulsus (Paine et al. 1981).
Regardless of these apparent advantageg, small body size is not exclusively beneficial. Larger-bodied species are often more competitive than their co- habitants (Price 1975), and this association is a t least partly true for the complex of southern pine bark beetle species. Far example, Paine et al. (1981) found that D, frontalis and I. avulsus colonize less area in the presence of I. cattigraphus, but the area inhabited by I , calligraphus is unaffected by either of these species alone. Furthermore, the benefits of small body size are not mutually exclusive. Body size varies within a population, and some individuals of the larger-bodied species may be able to occupy small microhiabitats, For example, 1. grandicollis is the third 1arges.t; species in the guild, but it often occupies the larger branches (Paine et a!. 1981). Nevertheless, large species that occupy small habi- tats have shortened adult lifespan and reduced reproductive potential because they consume greater quantities of outer bark and wood relative to the amount of nutrient-rich phloem (Waack et al. 1984a, 1984b). Tbe brood of these adults probably ex- hibit lengthened development time, reduced adult body size, and lower fecundity. Thus, each species has an optimal habitat based partly on body size and the tree's physical characteristics. In other words, body size can affect the competitive inter- actions among species indirectly as well as directly. Obviously, body size alone does not control the spatial attack patterns among species, and, as pointed out by Birch et al. (1980), any mechanism regulating the attack distribution would be intrinsic- ally more efficient if active before the insect has reached the pktllpem. Beetle senses play an important sale in this regard.
Vision aids -r;he beetle in selecting a host a t close sange* For example, LI. ifrontalis only orients to vertieal objects (e.g,, sbnding tree boles), whereas the searching behavior of ips species apparently is unaseeted by the spatial orientation of the host. Once attack has begun, stridulation may be impor- tant in species recognition, sex recognition, or in courtship behavior milkinson et al. 1967). Stridu- lation also stimulates the production of inhibitory chemicals in some Dendroctonus species, which may serve as a spacing mechanism near the attack hole (see Birch 1978). A similar phenomenon may occur
in D. frontalis, except in this case the inhibitory chemical verbenone stimulates rivalry chirps in the male (Rudinsky 1973).
Of all the sensa, olfaction is the most imporbnt in delineating breeding sites on the tree and in in- fiuencing the attack sequence among species. Offac- tion acts to attract mates, aggregate the sexes, discontinue attack within a species, or inhibit attack by other species. Changes in the chemical con- stituents among speeies, the combinations of the8e comstituents, and the context in which they are used ean give diirerent biological signals as judged by the behaviors of the responding insech (Birch 1978). Studies by Vith et all. (1964) and Birch et ml. (1980) describe the interrelationships among co- habitating species. These relationships will be dis- cussed later in this report.
Sequence of arriual--How do arrival times a t the host influence spatial distribution of these spe- cies? Of all the species, D. frontalis is the best studied (Coulson 1979). The ability to quickly as- semble large numbers of attacking adults enabbs this species to overwhelm the defense mechanisms of living trees. In actively expanding infestations, the entire attack process normally is completed in less than 2 weeks, with peak attack density occurring 4 to 5 days from the onset of mass attack (Coster et ral. 1977, Fargo et aI. 1978). Attack is initiated a t the mid-bole (3 to 5 m) and spreads vertically over the entire bole. The system of population growth that makes this species successful ecologically is dependent upon its ability to attack and kill living trees. This ability provides D. frontalis with breeding material otherwise not available, and as a result, breeding opportunities are also exbnded to the other beetle species. Thus, in providing for itself, D. frontalis establishes the conditions necessary for species interactions.
Aggregation of I. auulus resembles that of 13. frontalis. Attacking adults aecmulate rapidly and in hrge numbers. Peak attack density occurs in 5 to 7 days (Berisford and Franklin 1971, Ffamm et al. 19852). Aggregation of I . calligmphus and I . grandicollis is more extended, listing up to 59 days, and is much less intense in numbers of attacking adults (Wood and Stark 1968, Mason 1970, Berisf ord and Franklin 1971, Fla et al. 19852). (See text footnotes a t the end of the paper.) Despib these difIerences among species, the sequence of arri- val a t trees is often indistinguishable (Dixon and Payne 1979, Svihra et al. 1980, Flamm et al, 198G2). The near synchronous arrival times (rapid response to trees under attack) help to ensure breeding sites for all species, but not without competition for the best sites (e.g,, sites with optimal phloem thickness for a species) ,
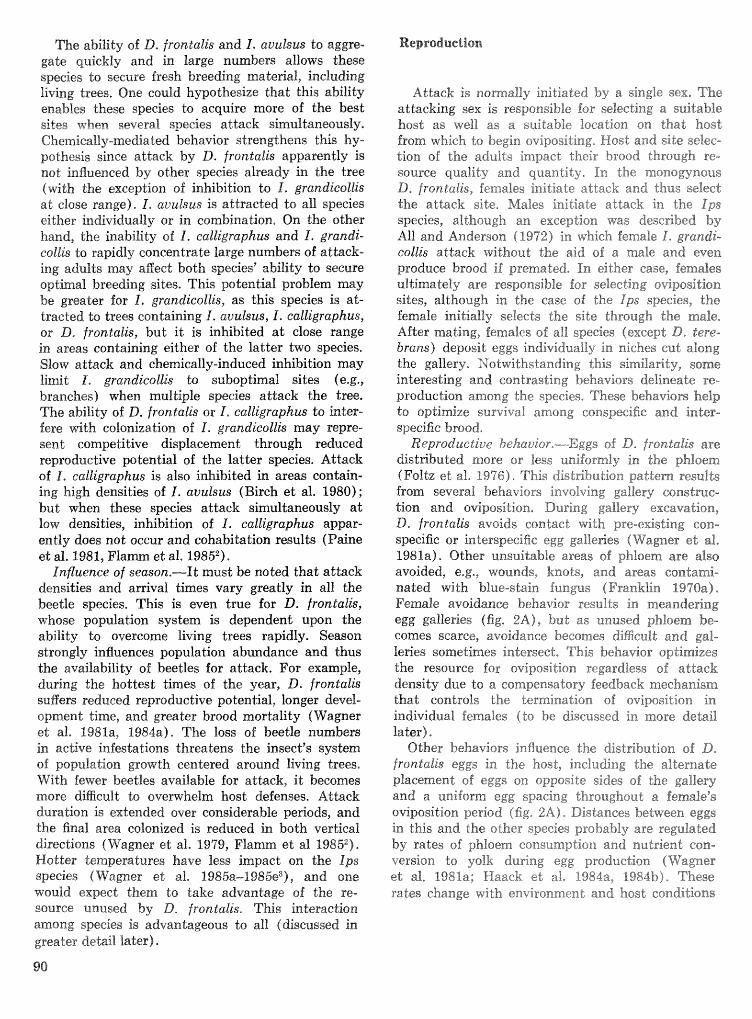
Tbe ability of D. frontal& and I. auufsrts to aggse- gate quickly and in large numbers allows these speeies to secure fresh breeding material, including living bees, One could hypothesize that thirj. ability enables these species to acquire more of the best sites when several species atbck simulf;aneously, Chemicafly-mediated behavior stsengfhens GIclis ky- pothesis since attack by D. frontatis apparently is nod influenced by other species already in the tree (with the exception of inhibition to I , grandieollis at close range). 1, attulsus is attracted to all species either individually or in combinat-ion, On the other hand, the inabiliLy of I, eallt'tqmphus and I , grandi- coklis to rapidly concentrate large numbers of a t be&- ing adulb may affect both species? ability to secure optimal breeding sites. This potential problem may be greater for I. grandicollis, as this species is at- tracted to trees containing I, avuksus, I . ealligraphus, or D. frontalis, but it is inhibited a t close range in areas containing either of the latter two species. Slow attack and chemically-induced inhibition may limit I , gwndicollk to suboptimal sites (e.g., branches) when multiple species attack the tree. The ability of B. frontalis or I , cakkigraphus to inter- fere with cslonization of 1. grandieollis may sepre- sent competitive displacement through reduced reproductive potential sf the latter speeies. Attack of 1. calligraphus is also inhibited in areas ccntain- ing high densities of I. auulsus (Birch et ale 1980) ; but &en these species attack simultaneously a t low densities, inhibition of 6. calligraphus appar- ently does not occur and cohabitation results (Paine
Influence o f season.-It must be nokd that attack densities and arrival times vary greatly in all the beetle speeies, This is even true for D. frontalis, whose population system is dependent u p n the ability to overcome living trees rapidly, Season strongly infiuenees population abundance and thus the availabifi-ty of beetles for attack, For -ample, during the hottest times of the year, D. frontalis suRer8 reduced reproductive potential, longer devel- opment time, and greater broad mortality (Wagner et ale 1981a, i1984a)- The loss of beetle rrumber~ in active infestations threatens the insect's system of population growth centered around living trees. With fewer beetles available for adlack, i d becames more diEcu2t to ovemhelm host defenses, Atdack duration is extended aver considerable peniods, and the final area colonized is reduced in both vertical direcgans f Wagner et af. 1979, Flilmm et at 19852). Hotter tenrr;perat;l7~sess have less impact on the Ips species (Warner et ale 1985a-1985e3), and one would expect them ts take advantage of the re- source unused by LI. frontalis, This interaction among species is aEfvan-8;ageous to all (discussed in greater dehil later).
Attack is no-mally initiated by a single sex, The attacking sex is responsible for selecting a suitable host as well as a suitable location on that host from which to begin ovipositing, Host and site selec- tion sf the adults impact their brood through re- source quality and quantity, In the rnatsn9agyn0~~ P), frontalis, females initiate attack and thus select the attack side, Males initiate attack in "che Ips speeies, although an exception was described by All! and Anderson (1972) in which female 6. grandi- eoltis attack without &he aid of a male and even produce brood if premated. Xa either case, females ultimately are responsible for selecting oviposition sites, although in the case of the Ips species, the fernale initially selects the site through the male, After mating, females of all species (except D, tere- brans) deposit eggs individually in niches cud along the gallery, ?Gotwithstanding this similarity, some interesting and contrasting behaviors delineate re- production among the species, These behaviors help to optimize survival arnsng conspecific and inter- specific brood.
Reproducti~ie behae.ior,-Eggs of D, frontalis are distributed more or less uniformly in the phloem (Foltz et ale 1976)- This distribution pattern results from several behaviors involving gallery construc- tion and oviposition, Duriw g gallery ex~avakion, D. frolzralis avoids contact with pre-existing con- specific or interspecific egg galleries (Wagner et al, 1981a). Other unsuitable areas of ptsloem are also avoided, e.g,, wounds, knots, and areas contami- nated with blue-stain fungus (Franklin 19%8a), Female avoidance behavior results in meandering egg galleries (fig. 2A), but as unused phloem be- comes scarce, avoidance becomes difficult and gal- leries sometimes intersect, This behavior optimizes the resource for crviposition regardless of attack density due to a compensatory feedback mechanism that controls the termination of ~vipo~idion in individual females (to be discussed in more detail later).
Other behaviors influence the distribution of B, frontalis eggs in the host, including %he alternate placement of eggs on opposite sides of the gallery and a uniform egg spacing throughout a female's avipositisn period (fig, %A), Distances between eggs in this and the other species probably are regulated by rates sf phloem consumption and nutrient con- version to yolk during egg production (Wagner et aZ, 198l.a; Haack et a%. 8984a, 1984b), These rates change with environment and hos"co9nditions
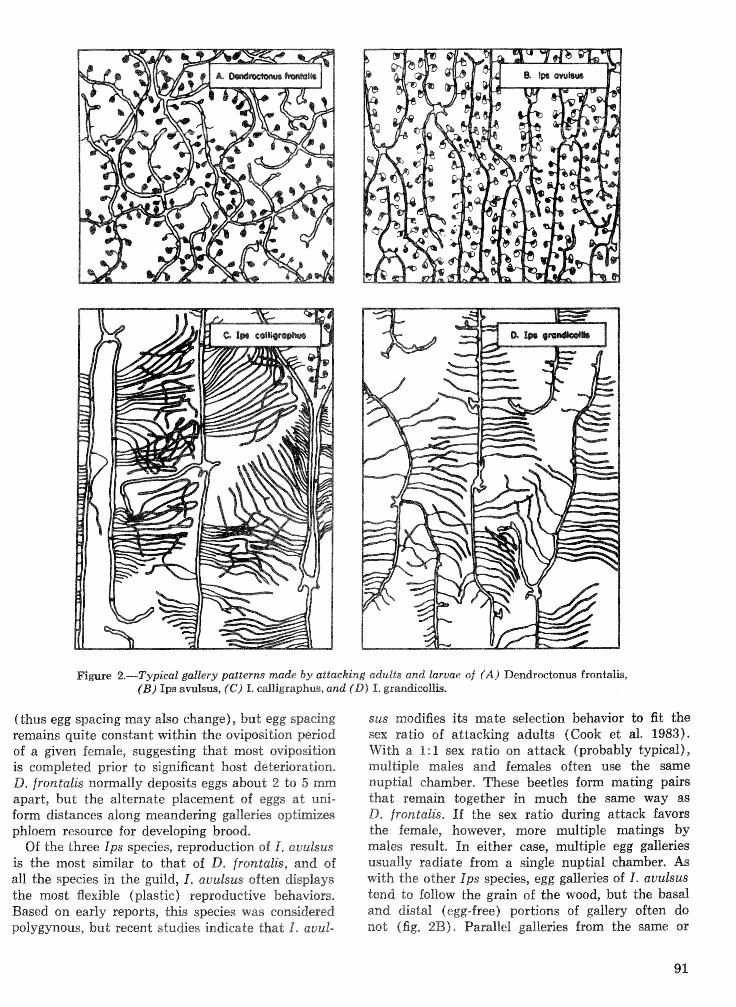
Figure 2.--Typical gallery patterns made by attacking adults and larvae of (A ) Dendroctonus frontalis, (B) Ips avulsus, ( C ) 1. ettlligraphus, and ( D ) 1, gsmdicollib.
(thus egg spacing may also change), but egg spacing remains quite constant within the oviposition period of a given female, suggesting that most oviposition is completed prior to significant host deterioration. D. frontalis normally deposits eggs about 2 to 5 mm apart, but the alternate placement of eggs at uni- form distances along meandering galleries optimizes phloem resource for developing brood.
Of the three ips species, reproduction of I. avulsus is the most similar to that of D. frontalis, and of all the species in the guild, I. avulsus often displays the most flexible (plastic) reproductive behaviors. Based on early reports, this species was considered polygynous, but recent studies indicate that I . auul-
sus modifies its made selection behavior to fit the sex ratio of attacking adults (Cook et al. 1983). With a 1:1 sex ratio on attack (probably typical), multiple males and females often use the same nuptial chamber. These beetles form mating pairs that remain together in much the same way as D. frontalis. If the sex ratio during attack favors the female, however, more multiple matings by males result. In either case, multiple egg galleries usually radiate from a single nuptial chamber. As with the other i p s species, egg galleries of I. avulsus tend to follow the grain of the wood, but the basal and distal (egg-free) portions of gallery often do not (fig. 2B). Parallel galleries from the same or
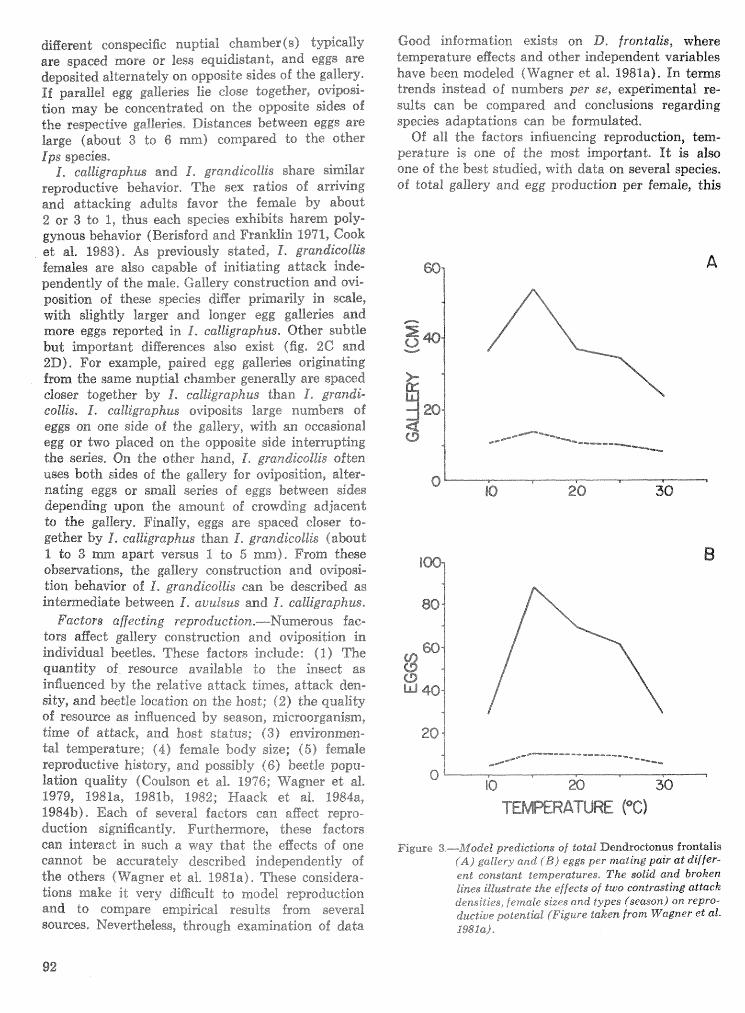
different conspecific nuptial chamber(s) typically are spaced more or less equidistant, and eggs are deposited alternately on opposite sides of the gallery. If parallel egg galleries lie close together, oviposi- tion may be concentrated on the opposite sides of the respective galleries Distances between eggs are large (about 3 to 6 mm) compared to the other Ips species,
I . calligraphus and I. grandicollis share similar reproductive behavior. The sex ratios of arriving and attacking adults favor the female by about 2 or 3 to 1, thus each species exhibits harem poIy- gynous behavior (Berisford and Franklin 1971, Cook et al. 1983). As previously stated, I . grandicollis femdes are also capable of initiating attack inde- pendently of the male. Gallery construction and ovi- position of these species diEer primarily in scale, with slightly larger and Xsngar egg galleries and more eggs reported in 1, calbigraphua. Other subtle but hportant digerences a%so exist (fig, 2C and 2D), For example, paired egg galleries originating fmm the same nuptial chamber generally are spaced closer together by I , cailigraphus than I , grandi- collis, 1, calligraphus oviposits large numbers of egg8 on one side of the gallery, with an occasional egg or two placed on the opposite side interrupting the se~es , On the other hand, 4, grandicotlis often uses both sides of the gallery for wipoaitian, alter- nating eggs or small series of eggs between sides depending upon the amount sf crmvding adjacent $0 the gaBlery, Finally, eggs are spaced closer to- gether by I , cakligrapkus than 9- grandicallis (about 1 to 3 apart versus I to 5 observations, the gallery eonstruetion and avipoai- tion behavior of 1. graredicol%is can be described as intermediate between 4, avulsus and I , ealligraph us*
Factors a#ec ting reprsduc t ion.---Numerous fac- tors a&c$ gallery construction and sviposition in in&vidual beetles, These factors include : ( 1 ) The quantity of resource available to the insect as influenced by the relative attack times, attack den- sity, and beetle loeation on the host; ( 2 ) the quality of resource as influenced by season, microorganism9 time of attack, and host status; 43) environmen- tal temperature; (4) female body size; (5) female reproductive history, m d possibly (6) bee& popu- lation quality (~oulson et a%, 1976; Wagner et ai- 1979, I981a, 1981b, 1982; Haaek et al, 1984a, B984b)- Each sf several factors can affect repro- duction significantly, ~urtherrnore, these factors can interact in such a way that the eBects of one cannot be accurately described independently sf the others (VVagner et aP, 1981a), These considera- "ions make it very diEcult $0 mode1 reproduction and to compare empirical results from several sources, Nevertheless, through examination of data
Good information exists on D. frontalis, where temperature effects and other independent variables have been modeled (!Vagnee: e"&L 1988a). In terns trends instead of numbers per se, expefimenlal re- sults can be compared and conclusions regarding species adaptations can be Oomulated.
Of all the factors infiuencing reproduction, tern- perature i s one of the most impsrhnd* It i s a190 one of the best studied, with data on several species, of total gallery and egg producdisss per female, this
&-----lsrs---rr----- -- ----- 88 20 30
TEMPERATURE PC,
Figure 3=---~Vodel predictions of total Dendroctonus frontalis A) gallery and ( B ) eggs per mating pair at ditfer-
en t constant temperatures. The solid and broken lines illustrate the effects of two contrasting attack densities, female si2c.s and types ( s eaon ) on repro- ductiue potential (Figure taken from Wagner eL a!. 1981~1,
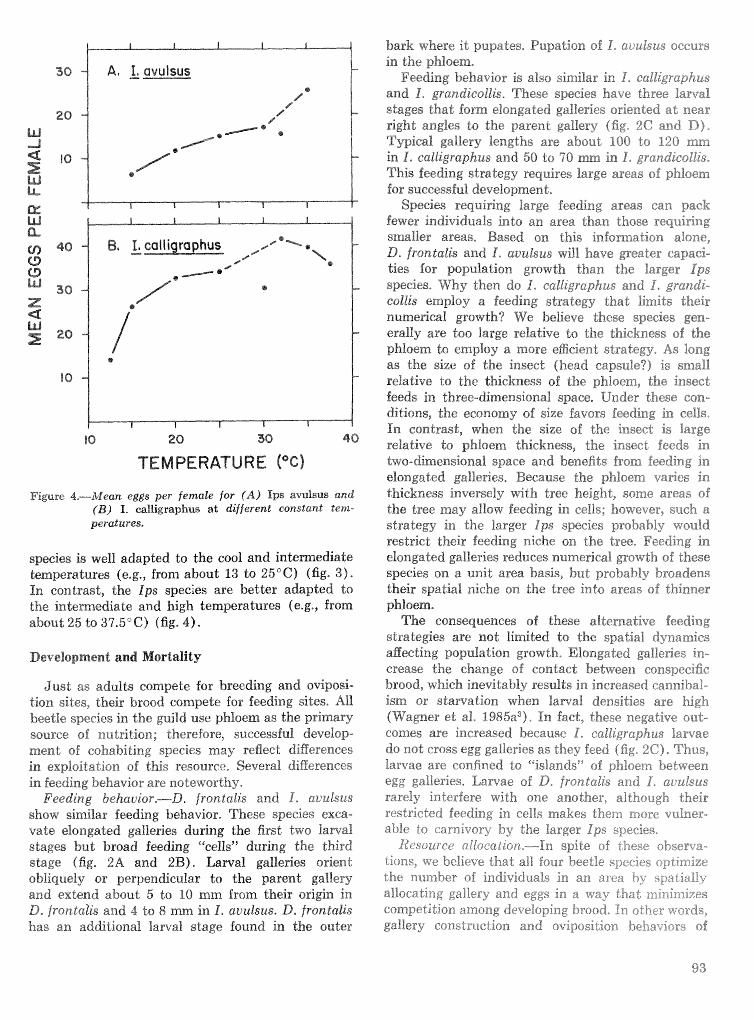
TEMPERATURE ( O c I
Fimre $.-Mean elCgs per female for (A) Ips avulsus and fB) I. calligrapkus at different constant tem- perat ures.
species is well adapted to the cool and intemediate temperatures (e,g., from about 13 to 25°C) (fig, 3 ) - In contrast, tho Ips species are better adapted to tho intermediate and high temperatures (e.g,, from about 25 to 37.5" 6) (fig. 4).
Just as adults compete flor breeding and oviposi- tion sites, their brood compete for feeding sites. ABfl beetle species in the guild use phloem as the primary source of nutrition; therefore, successful develop- ment of cohabiting species may reflect cl3Berences in exploitation of this resource, Several diEerences in feeding behavior are noteworthy,
Feeding behavior,-8, frontalis and I , akiulsus show similar feeding behavior, These species ewca- vate elanlfated galiesies during the first two Larva! stages hut broad feeding ""eelfs" "ring the third stage (fig, 2A and 2B). Larval galleries orient obliquely or perpendicular to the parent gallery and extend about 5 to 10 mrn from their origira in D. frontalis and 4 to 8 mm in I . auulsus. D. frontalis has an additional larval stage found in the outer
bark where it pupates. Pupation of 1, mvuLsus occurs in the phloem,
Feeding behavior is also similar in 6, rralligraphus and 1, grandiccrlki~~ These species have three larval stages that form elongated galleries oriented at near right angles to the parent gallery (fig. 2(? and n). 'r"wical gallery lengths are about 108 to 120 mm in I . calligraphus and 50 "r 70 1, grap.edi@oll&, This feeding strategy requires large areas of phloem for successful developmnt,
Species requiring large feeding areas can pack fewer individuals into an area than those requiring smaller areas. Based on this information alone, D. frontalis and I . auulsus will have greater capaci- ties for population growth than the larger ips species. Why then do I . calligraphus and I . gmndi- collis employ a feeding strategy that limits their numerical growth? We believe these species gen- erally are too Ilarge relative to the thickness of the phloem to employ a more ef ic ie l~ t strategy. As long as the size sf the insect (head capsule?) is small relative to the thickness of the phloem, the insect feeds in three-hlimensionaB space, Under these can- ditions, the economy of size favors feeding in cells. In contrast, when the size of the insect i s large relative to phloem thickness, the insect feeds in two-dimensional space and benefits from feeding in elongated galleries, Because the phloem varies in thickness inversely with tree height, some areas sf the tree may allow feeding in cells: however) such a strategy in the larger Ips species probably would restrict tbeir feeding niche on the tree. Feeding in elongated galleries reduces numerical growth of these species on a unit area basis: but probably broadens their spatial niche on the tree into areas of thinner phloem,
The consequences of these alternative feeding strategies are not limited to the spatial dynamics affecting population growth. Elongated galleries in- crease the change of contact between conspecific brood, which inevitably results in increased cannibal- ism or starvation when larval densities are high (UTagner et al. 1985a3). In fact, these negative out- comes are increased because 4, calligraphus larvae do not cross egg galleries as they feed (fig. 2C). Thus, larvae are confined to "islands" of phloem between egg galleries, Larvae of D, frontalis and 1- ~ C U ~ S U S
rarely interfere with one another, although their restricted feeding in cells makes them more vulner- able to cnrnivory hy the larger i p s species.
Kcsource n!location.--In spite of these observa- tions, we believe that all four beetle species i ~ t i a i ~ t the number of individuals in an area bl- qpalial!j- allocating gallery and eggs in a way that ir.;;iimizzs competition among developing brood. In other v crds, gallery conrtmciion and oviposition beha:-icrs of
the adult are compatible ~ t h larval feeding behavlior. Packing more indkiduals into an area than that area can support results in high cannibalism, car- nivory, or stawation, This hypothesis is developed in the discussion that follows,
On the one hand, 1. calliaraphus requires large feeding areas for successful development. Brood sumival in this spe&es is opthized by tightly pack- ing eggs into elongated elliptical areas centered around attack sites (fig. 26 ) . This strategy involves welt-spaced attack sites, each with four or fewer fe- males that construct egg galleries mnning with the grain of the wood, closely-spaced pairs of egg galleries originating from the same nuptial chamber, and tightly-packed eggs deposited along oppssing sides of the parallel gallerfes. Because foraging larvae do not cross egg galleries, the? area between paired gal- leries generally is not large enough to accommodate many brmd without high mortality. Although egg gallery s~entat ion generally follows the grain of the wood, 1, eakligraphus can alter the direction it travels. Instead of avoiding adjacent egg galleries, ovipositing females optimize the amount of phloem available to the brood by minimizing the distance between adjacent galleries and by placing all (or most) eggs on the resource-rich side. Parallel egg galleries originating from the same nuptial chamber often are found within 15 mm of each other, and
on for these galleries to virtually touch. This strategy of resource utilization tightly packs galleries and eggs into elongated areas there- by leaving more phloem between conspecific breed- ing sites. Thus, avoidance of conspecific egg galleries normally is absent in ovipositing I. calligraphus, and in fact, this species may be weakly attracted to its own galleries. Attraction to the galleries of other species does not appear to be the case, as we have observed I. calligraphus egg galleries avoiding the galleries of D. frontalis and I. auulsus (e.g., see figure 26, upper fight).
In contrast, ovipositing D. frontalis normally avoid conspecific and interspecific egg galleries, and any other obstruction they encounter. Eggs are widely spaced along the gallery and alternated side-do-side, These combined behaviors distribute gallery and eggs uniformly in the phloem, as opposed to the clumped distributions of I. calligraphus. Uni- form egg spacing in D. frontalis improves brood survival because the area required by foraging larvae is relaliveiy small,
The reproductive and development strategies of 1, Q B I L ~ I S U S are similar to those of D. frontalis. I* auul- sus excavates egg galleries running parallel to the aa in sf the wood, but these are spaced more or less equidistant, often thin 18 to 15 mm of each other. The distance between egg galleries decreases with
increasing attack density, This strategy suggests avoidance of conspecific egg galleries Lo distribute eggs uniformly. Eggs are w4de2y spaced and alter- nated side-to-side, and larvae require little area for development .
It should be evident from the preceding &scus- sion that resource afIocation within the host is can- trolled by the female through gallery eonstruetion and ovipo~tion. Proper placement of gaUery and eggs, including their controlled der~rrationa, espli- mizes available resource -to developing brood and thus creates optimum conditions for brood survival. Observations of reproductive biology, supplemented with infomation from the literature, provide insight into the mechanism controlling resource allocation and the termination of oviposidion among these spe- cies. (Warner et al. (1982) presents initial thoughts on this subject.)
We believe chemicals stmngly infiuence the eE- cient placement of gallery and eggs in the host in a manner not unlike the ehemical%y-mediated be- havior used to obtain breeding sites and mates, Chemical markers are eommonTny used to establish territories among animal species (A4illes 1967), and considering the cryptic habitat 06 the beetle species, chemicals can be a reliable means of co resource availability (or use) for several reasons. Unlike auditory signals Ghat change rapidry in time and space, chemicals are temporally constant, dur- able, and spatially precise, We believe chemicals originating from the beetle galle~es disperse rapidly into the phloem, thereby establishing a concentra- tion gradient adjacent do the galleries, mese elhemi- cals are perceived by oviposiding females (via contact chemoreceptors) pfior to encountering pre-existing galleries; thus they pslovide time for the insect to take evasive action. Frartkiterms~e, the coneentsa- tion gradient can be used by the Ips species to determine egg placement, The rapid dispersal of chemicals through the phloem opposes the slower physical changw accompanying galleg eonstructioua that also could elicit behavioral. responses through tactile means.
The complexity sf behaviors exhibited by all species suggests that the chemicals involved are beetle-derived compounds concentrated in the frass, but that chemicals from other sources (e,g., sym- biotic microorganisms or the host plant) may inter- act with beetle c~nrrpofands to elicit speci6c insect responses. Unlike chemicals from sther sources, beetle-derived csrnpslands transmit and elicit species- specific messages and Tcoeha~ors, As egg gaUeries fill the resource space (resulting in more ga2lew intersections), the frequency of contact ~ d k - 2 in- hibitory chemicals increases, Eventually, a thresh- old is surpassed and neharo-physido~cal ehangw
terminate reproduction in the female, which initiates reemergence. Thus, chemical compounds constitute an egcient means of interfering with a campetitor's access to needed resource. 'Flhrough te~mirnatiorr of oviposition, these chemicals also help assure pos- session of minimum space for brood development; i,e,, they help prevent avererarvdir-ag~
Reemergence occurs when an adult exits the host after reproducing, usually for the purpose of seeking out new breeding material. This behavior occurs in all southern pine hark beetle species (Franklin f9'iOb, ihll and Anderson 1972, Gouger et al, 1975, cook et al, 1983), but until recently, little quantita- tive informa-i;ion on it was available for any species except II. frontalis (Coulson et al. 1978, 1979; Schowalter et al. 1981). In this species, the re- distribution of adults through reemergence influence populations in some important ways, For example, reemerging beetles help to maintain a eoratinuous supply of adults for attack, which in turn provides new centers sf attraction a t the active front of the infestation. Reemerging D. frontalis also I) aid in overcoming host resistance, 2) secure new mates, thereby mixing the gene pool, and 3) produce ad&- Gioraal brood populations. The importance sf re- emergence to Ips papuEations has not been deter- mined, but certainly some of the factors mentioned above also pertain ts these species.
For example, the process by which beetles become available for attack involves reemergence of parent adults and emergence of brood adults, The blending of these populations----called allocation by Coulson (1979)-is important because it influences a species" ability to assemble adults to new hosts, Understand- ing the intensity and duration of these population events, as well as the degree of temporal overlap between them, will provide insight into the dynansics of attack among species.
Difienrnces among species were analyzed using vaiida ted simulation models of reemergence and emergence (Feldman et al. 1981, hvagner ei; a%. k984a, 19851s-e". These models integrate a temperahre- dependent rate function with a temperatme-in&- pendent distribution function (Wagner e t af f984b, 1984~; FVagaser 1985f"), The rate function deter- mines the "'speed" at which a popu'iatiou reemerges or emerges as a function of changing temperature, rvhereas the distribution function determines the cumulative fraction of the population reemerging ail" emerging through time as a function sf accumu- lating rates. These analyses reveal some interesting aspects of beetle biology,
Variability in times,
done can be used ts evalraatc? the relative variabnity in reemergenee and emergence times among indi- viduals in a population, Figarres 5A artd 5B iltustrate the cumu3atit.e distributions of normalized reemer- gence and enlergenee times for II. frontalis, I , auul- sus, m d I , cnlligrapfzus, By normalizing the time scale (X-axis), we are sble to exarnine these proe- esses independent sf temperature elFecGs (the wor- malization process represents chronological time in days divided by the mean or median time of the original temperature-dependent distributions). Note the dissimilar reemergence c m e s ( is* , their con- trasting deepmess) and the sinailas. emerger,ce curves, For all species, especially I. ealldgraphns, apparently there is greater variability in reproduc- tive activities influencing =emergence times than in development influencing emergence times. Given an identical attack time among individuals in a population, D. frontal& and I. avulsus reemerge over shorter periods than I. calligraphus. The greater synchrony in reemergence times among individuals of the former two species may aid them in rapidly assembling large numbers of beetles for attack. The protracted reemergence times of I. calligraphus sug- gest a digcrent strategy by which adults become available for at tack. Because this species normally does not attack living hosts (unless accompanied by other species), the need to rapidly assemble large numbers of adults does not exist. Thus, for this sca- venging species, it may be more egcient to have a few b~etles available for attack most of the time, instead of many available some of the time. The constant availability of a few "pioneer" beetles may allow I. calligraphus to rapidly respond to trees coming under mass adtack by D. frontalis and I , avulsus (which might explain the near synchronous attack often observed among the beetle species).
Effects of temperature.-The rate function can be used to evaluate the effects of temperature on reemergenee and emergence as illustrated in figures 6,4 and BB* These response curves indicate diflerent ten-aperature adaptations among the three beetle species, with the Ips species better suited to inter- mediate and high temperatures between 22 do 37°C and B, frontalis better suited to cool and inter- mediate temperatures between 18 do 22°C- These observations are based on the relative diaerences in rates at vafious ten~peratures along the curves, as well as differences in the optimum tempemtures for the three species. For example, note that the shortest residence times occurred a t 31 to 32°C for the I p s species, but at 26" for D. frontalis (fig, 66%)- Recall ibat the I p s species also aviposiked more eggs per female ad 32 to 35°C (fig, 4) , indicating that the greatest ovipssition rate per day occurs at these high temperatures, D, frontalis o\lipesited
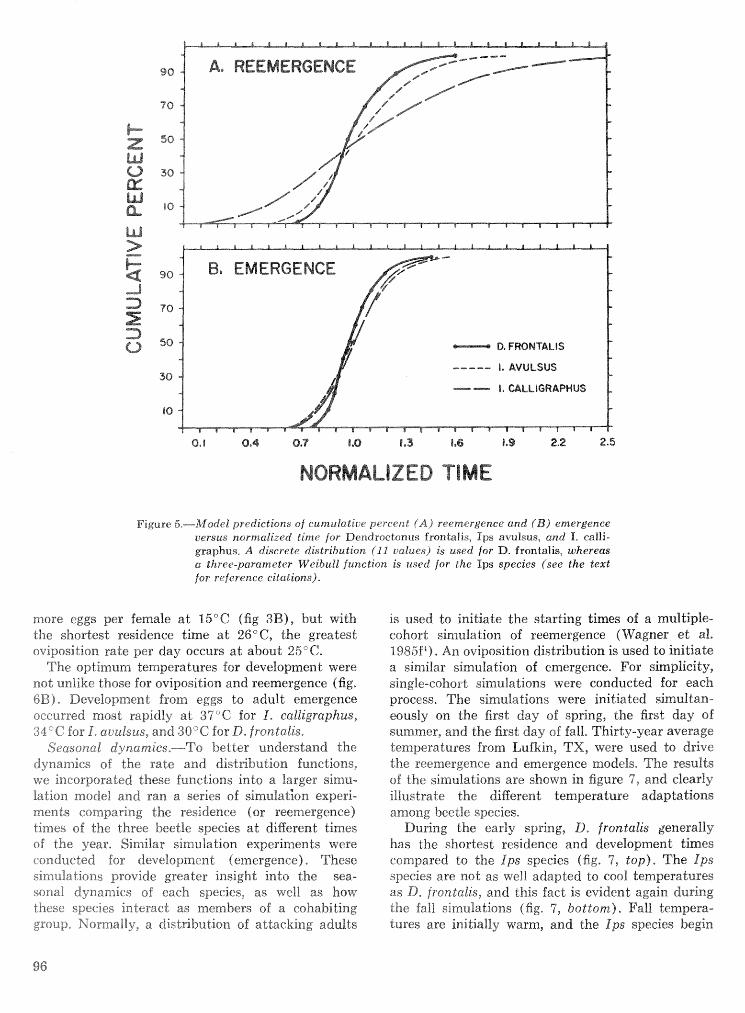
Figure 5,-Ailodet predictions of curnulatitie percent (A) reemergence and ( B ) emergence versus normalized time for Elendroctonus frontalis, I p s avulslas, and I, ca113.- graphus. A discrete distribution f l l r~alraesj is used for D. frontalis, whereas a three-parameter WeibuEl function is used for the Ips species (see the text for reference citations).
more eggs per female at 15°C (fig 3B), but with the shortest residence time a t 26"6, the greatest csvipssition rate per day occurs at about 25°C.
The optimum temperatures for development were not unlike those for ovipssition and reemergence (fig. 6B). Development from eggs to adult emergence occurred most rapid157 at 3'7°C for 1, ealligraphus, 33'C for 1, avulsus, and 303C for D, frontall's,
Seasonal d y numics,-To better understand the dynamics of the rate and distljbutiorr functions, we incorporated these functions into a larger simu- lation model and ran a series of simulation experi- men ts comparing the residence (or reemergence) timers of the three beetle species a t diserent times of the year, Similar simulation experiments were conducted for development (emergence), These si~~rrlatiol-a~ provide greater insight into the sea- sonal dynamics of each species, as well as how these species interact as members of a cohabiting group, Korn~alEgi, a d is t~but ion of attacking adults
is used to initiate the starting times of a multiple- cohort sirnufa.l;iom of reemergence (Wagner ed al. 1985f 9 ), An oviposition distribution is used to initiate a similar simulation of emergenee. For simplicity, single-cohort simulations were conducted for each process. The simulations were initiated simultan- musly on the first day of spring, the first day of summer, and the first day of fall, Thirty-year average temperatures from Lufkin, TX, were used to ddve the reemergenee and emergenee models. The results of the simulations are shown in figure 7, and clearly illustrate the diRerent temperature adaptations among beetle species.
During the early spring, 8, frodalis generafly has the shortest residence and development times compared do the Ips species (fig, 1, t op ) , The I p s species are not as well adapted to cool temperatures as D, frontalis, and this fact is evident again during the fall simu?iations (fig. 9, bottom). Faff tempera- tures are initially warm, and the Ips species begin
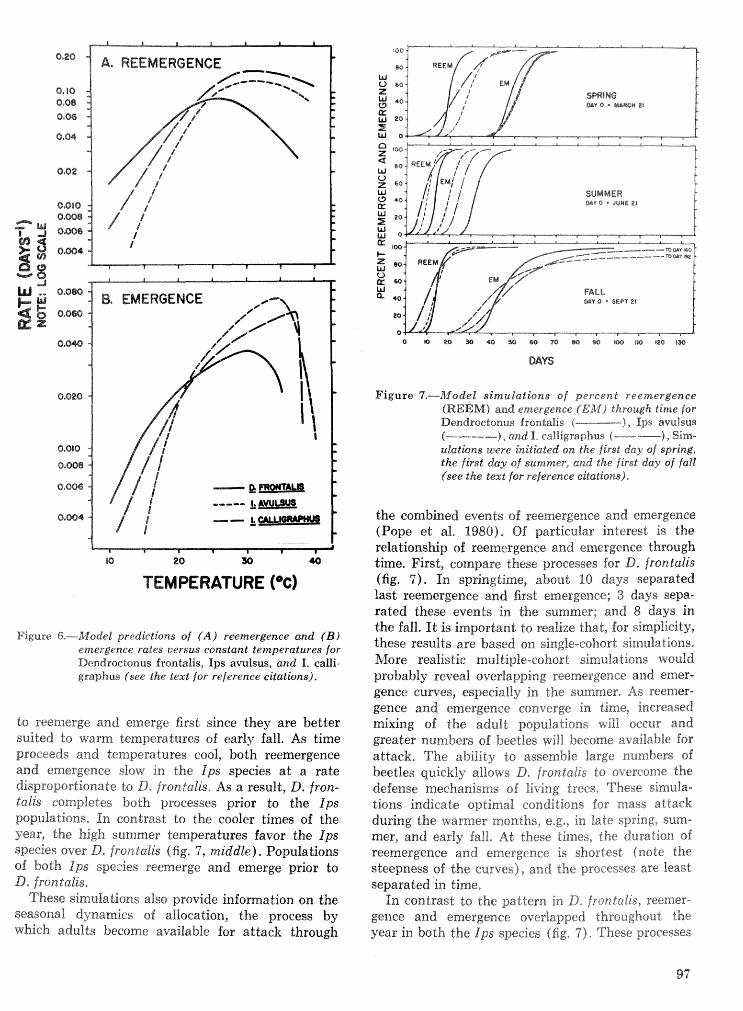
Be EMERGENCE
20 30 40
TEMPERATURE (OC)
Figure 6.--- model predictions of ( A ) reemergence and (23) emergence rates uersus constant temperatures for Dendroctonus frontalis, Ip s avulsus, and I . ealli- graphus (see the text for reference citations).
to reemerge and emerge first since they are better suited do warm temperatures of early fall. As time proceeds and temperatures cool, both reemergence and emergence sfow in the Ips species at a rate disproportionate to D. frontalis. As a result, D. fron- talk completes both processes prior to the Ips populations, In contrast to the cooler times sf the year, the? high summer temperatures favor the Ips species over D, frontalis (fig. 7, middle). Populations of both i p s spezies reemerge and emerge prior to D, frontalis,
These simulations also pmvide information on the seasonal dynamics of allocation, the process by which adults become available for attack through
~I 8 * SEPI 21
Figure "i"-Madek simulations of percen t reemergence (REEM) and emergence ("EM) through time for Dendroctonus frontalis ( ), Ips aw8sus ( -- --- - - ) , and I. ealligraphus (----- ) , Sim- ulations were initiated on the first day of spring, the first ckay of summer, and the first day of fall (see the text for referenee citations),
the combined events of reemergence and emergence (Pope et al. 9980). Of particular interes"liis the relationship of reemergence and emergence through time. First, compare these processes for D, frontatis (fig. 7). In springtime, about PO days sepasated fast reemergence and first emergence; 3 days sepa- rated these events in the summer; and 8 days in the fall. It is important to realize that, for simplicity, these results are based on single-cohort simu1a"r;ions. &lore realistic multiple-cohort simulations would probably reveal overlapping reemergence and emer- gence curves, especially in the summer, As reemer- gence a d emergence converge in time, increased mixing of the adult populations will occur and greater numbers of beetles wiS1 become available for attack. The ability to assemble large numbers of beetles quickly allows D. frontalis to overcome the defense mechanisms of living trees. These simula- tions indicate optimal conditions for mass attack dulring the warmer months, e*g., in late spring, ~ u m - mer, and early fall. A t these times, the duration of reemergence and emergence is shortest (note the steepness of the curves), sand the processes are least separated in dime, In contrast ko the pattern in D, frontalis, reerner-
gence and emergence overlapped throughout the year in both the Ips species (fig. '7). These processes
overlapped for longer periods in the spring and fall simulations compared to the summer. For example, the overlap for I. a~ulsus was about 9 days in the spring, 12 in the fall, and 8 in the su for I , callzgraphus the overlap was in the spring, 25 in the fall, and 10 More importantly, however, a greater percentage of the reemerging population was present during emergence in the summer compared to the spring and Sall, This result was especially true for I. atlul- sus, where about 25 percent of the parent adults reemerged with brood adults in the summer, but this value was only about 10 percent in the spring and fall. The higher percentage in the summer prob- ably provides more beetles for attack in shorter periods of time. This prescription is ideal for sup- porting the dwindling numbers of D. frontalis and their efi0r-i;~ t s overcome host resistance of living trees*
CONCLUSIONS
The potential for intense exploitative competition exists among the southern pine bark beetle species because these species often share a limited resource. This type of competition is not widespread, however. Several factors reduce niche overlap, and thus ex- ploitative competition among the species. Different body sizes among the species help regulate their spatial distributions on trees. Size can affect com- petitive irsteraetisns directly by preventing large beetles from colonizing small microhabitats, or i t can indirectly affect interactions by shortening adult life span, reducing reproductive potential, lengthen- ing development time, and increasing brood mor- tality when large beetles colonize areas of thin phloem, The latter instance influences adults as well their offspring.
The spatial arrangement of beetle species on trees is atso regulated by an elaborate system of beetle communications. Pheromones draw insects to a tree and aggregate them to specific areas on the host. These chemicals often attract other species to the tree, acting as allomones a t a distance. At close range, ho~vever, the chemicals may inhibit attack of the responding species. In this way, the tree is partitioned into areas dominated by one species, but several species attack, bringing about a more rapid decline and death to the host. The location of each species on the tree and the amount of area it occupies depend on the intensity and duration of a"Ltack as well as the timing of attaek relative to that by other species,
Chemically-mediated a t traction, cross-a ttraction, and interspecific inhihition reduce niche overlap on
trees, f nterspecific territories are established through interference competition when one species is denied access to a required resource, For example, inter- ference occurs a t the macrosite level when 1, grandi- collis attempts to acquire breeding sites in areas of the bole occupied by D. frontatis or I , calltgraphus, In this ease, 1, grandi~ollis is denied access to prime breeding sites characterized by thick phloem. Thus, i t often bezomes established in the crown where the phloem is thinner. Interference competitidn. also occurs a t the macrosite level when one species attempts to acquire oviposition sites in the phloem containing galleries of other species. In this ease, ovipositing females avoid galleries by detecting chemicals (or other stimuli) associated with these galleries.
Chemical communications inside and outside the host help to partition the resource among beetle species and reduce exploitative competition. How- ever, communication systems alone do not prevent species overlap, nor must they. Although niche over- lap is required for exploitative competition, overlap does not necessarily lead to competition unless resources are in short supply (Pianka 1981). Other reproductive and developmental strategies reduce competitive interactions among species. For example, D. frontalis and I . auulsus are often found together, but compatible lifestyles usual1 y prevent overuse sf the phloem and exploitative competition, In addition to avoiding each other's galleries during oviposition, these species alternate eggs on opposite sides of the gallery and space eggs widely apart, Larvd galfel-jes are short and terminate in feeding cells. D. frontalis also moves from the phloem to the outer bark to complete larval and pupal development. These be- haviors, combined with a density-dependent mechan- ism that influences the termination of oviposition, enable L) . frontalis and I , auulsus to coexist with little exploitation.
In contrast, I. ealligraphus packs eggs tightly along one side of the gallery, and larvae excavate elongated mines that extend considerable distances often in unison. This species commonly is found with D, frontalis and I . avulsus, but I . ealligraphus is a stronger competitor because of its size and aggressive feeding behavior. Nevertheless, when D. frontalis and I. auuLsus population densities are high, these species may reduce or displace I , calligraphus by rapidly accumulating adults and gallery in the tree. Under these conditions, competitive mutualism (Pianka 1981) may result between LI), frontal& and I , auulsus. Although high densities of L). frontatis and I. auukus may result in greater overlap between these species, the increased negative eeects between these weak competitors are offset by decreased con- tact with their stronger competitor, I. calligraphus,
Stated difirently, D. frontalis and I , avulsus have a beneficial net effect on one another (e.g., they actually act to increase one another's densities), even though their direct paimise interaction is somewhat detrimental.
Given a multidimensional perspective of resource use, rnmpetitiv~ mtttuaiism may not be limited ta D, frontalis and I. auulsus. Associations among the five bark beetle species vary widely. The number of species attacking a tree is not fixed, nor are the spatial and temporal attack patterns or the final attack densities. Furthermore, the species response to environrnen tal variables differs. For example, the Ips species are be"tter adapted to high temperatures, and D. frontalis is better adapted to cool temperatures. These diEerences may influence the seasonal dy- narnics of populations. In late winteriearly spring, the ips species and D. terebrans may support en- larging populations of D, frontalis (Coulson e t al. 1985" ), This support may be more prominent in the summer, when populations of D, frontalis are declin- ing. In both situations, all species act mutually to overcome host resistance by increasing the total number of beetles attacking the tree. Pairs of species with the potential for high niche overlap and strong competitive interactions (e.g., I?. frontalis and I , ealligraphus) may interact only weakly be- cause of the reduced population densities. We hypothesize that increased resource is made available to each species through their association, and that this beneficial effect outweighs the negative effects sf resulting competition.
A similar situation may also exist when beetle populations are a t endemic levels. At these times, cooperation among the beetle species probably in- creases their ability to secure breeding and ovi- position sites suitable for brood development. Cooperation among species when densities are low may he especially important to D. frontalis, a species that normally kills trees by rapidly assembling large numbers of beetles a t the host. This mass attack phenomenon has prescribed effects on the tree (Wag- ner e t al. 1979) that conditions i t for successful brood development. The condition of the host is particular1 y critical during the early larval stages when development is most vulnerable (Uragner e t al, 1979). Late-stage larvae apparently can tolerate a wider range of host conditions, as can the larvae of the bps species (based on our ability to rear late- stage &). frontalis and Ips species in the laboratory, and our inability to rear early-stage I). frontalis larvae). D, frontalis cannot overcome living trees a t low population densities, and given its narrow toler- ance of host conditions during larval development, suitable habitats may be more limiting to D. frontalis than to the i p s species. Association with the Ips
species may enable D. frontalis to secure host mate- rial suitable for development, The obvious benefib of this association are probably extended to all spe-ies, since competition would be minimal given the low beetle densities.
Finally, i t is apparent that many of the structural, behavioral, and physiological differences amoxig ifit: southern pine bark beetle species reflect adaptive strategies for cohabitation. These cfi8erenet.s enable the five species to reduce the intensity of competi- tion a t all population density levels and to cooperate in the exploitation of living southern pine trees.
LITERATURE CITED
All, J.N.; Anderson, R.F. Initial attack and brood production by females of i p s grandicollis (Cole- optera: Scolytidae) , Ann, Entomoi, Soc, Am, 65: 1293-1296; 1972.
Berisford, C.W.; Franklin, R.T. Attack patterns of Ips auulsus and I. grandicollis ( Coleoptera: Scoly- tidae) on four species of southern pines. Ann. Entomol. Soc. Am. 64: 894-897; 1971.
Birch, M.C. Chemical communication in pine bark beetles. Am. Sci. 66: 409-419; 1978.
Bircs, M.C.; Svihra, P.; Paine, T.D.; Miller, J.C. Influence of chemically mediated behavior on host tree colonization by four cohabiting species of bark beetles. J. Chern. Ecol. 6: 395-414; 1980.
Cook, S.P.; Wagner, T.L.; Flamm, R.O.; Dickens, J.C.; Coulson, R.N. Examination of sex ratios and mating habits of Ips aculsus and I. calligraphus ( Coleoptera : Scoly tidae) . Ann Entomol. Soc. Am. 76: 56-60; 1983.
Caster, J.E.; Payne, T.L.; Hart, E.R.; Edson, L.J. Aggregation of the southern pine beetle in re- sponse to attractive host trees. Environ, Entomol, 6: 725-731; 1977.
Coulson, R.N. Population dynamics of hark beetles. Ann. Rev. Entomol. 24: 417-447; 1979.
Coulson, R.N.; Mayyasi, A.M.; Foltz, J.L.; Hain, F.P.; Martin, W.C. Resource utilization by the southern pine beetle, Dendroctonus frontalis. Can. Entomol. 108: 353-362; 19"i.
Coulson, R.N. ; Fargo, W.S. ; Pulley, P.E. ; Foltz, J.L. ; Pope, D.N.; Richerson, J.V.; Pa>x?le, T.L. Evalua- tion of the re-emergence process of parent adult Dendroctonus fron talis ( Coleoptera : Scoly tidae) . Can. Entomol. 110: 475-486; 1978.
Coulson, R.N.; Fargo, W.S.; Pulley, P.E.; Pope, D.N.; Foltz, J.L.; Bunting, A.hK Spatial and temporal patterns of emergence for witlain-tree populations of Dendrocfonsls frontalis- Can. En- tomol. 111: 273-284; 1979,
Dixon, W.N.; Payne, T.L. Sequence of arrival and spatial distribution of enlomophagous and aSs(P.-
ciated insects on southern pine beetle-infested trees. Tex. Agric. Exp. Sta. Bull. MP-1432. Col- lege Station, TX: Texas A&M University; 1979. 27 p.
Fargo, W.S.; Coulson, R.N.; Pulley, P.E.; Pope, D.N.; Kelley, C.L. Spatial and temporal patterns of ~vithin-tree coloniza"i;ion by Dendroctonus fron- tabis 6@slenptesa: Scolytidae) Can, Entomal, 11.0: 1213--1232; 1978,
Feldman, R,hf,y IYagner, "re$.; Sharpe, P.S.H=; Gagrte, $,A,; CCDU~SOXI, R,N, %Vi&&in-tree life process models 0% the southern pine beetle, Dendroetonus frontalis. Ecol, Modelling $3 : 241-260; 198 1.
Faltz, J,L.; Mayyasi, A,M.; Hain, F*P.; Coulson, R.N.; %fartirap FV.C, Egg-gallery length relation- ships and within-tree analyses for the southern pine beetle, Dendrsctonus frontal&, Can, Entomol. 168: 341452; 1976,
Franklin, R.T, Observations on the blue stain- southern pine beetle relationship, J. Ga, Entornol, Sot* 5: 53-57; 19'TOa,
FraxakXin, R,T* Southern pine beetle population be- havior, 3, Ga, Entorno%, SQC. 5: 175-182; 1970b.
Gouger, R.J.; Uearian, Wac,; Wilkinson, R,C. Feed- ing and reproductive behavior of Ips avulsus. Fla. En%omo1,58: 221-229; 19'75,
Haack, R.A,; Wilkinson, R.C. ; Foltzz;, J.L. ; Corneil, S.A. Gallery construc-&isn and oviprnition by Ips ealligraphus ( Coneoptera : Scolytidae) in relation do slash pine phloem thickness and temperature. Can- Errtsmoli, 116: 4"2&63%; B984a.
Hrsaek, R.A,; Fofdz, 9,L.; Wilkinson, R,C. Longevity and fecundity of bps calligraphus ( Coleoptera : Scslytidae) in relation to slash pine phloem thick- ness, Ann, Entomo1, Soe, Am, 77:: 657-662: 1984b.
Hardin, G, The competitive exelusion principle, Science 131 : 1292-1297; 1960,
Mason, R.R, Comparison of Wight aggregation in two species of sou thesn bps ( Cofeoptera : Seol ytidae) . Can* Enkomcrl, 102: 103&1041; k9mCB,
Miller, R.S, Pattern and process in competition: In: Cragg, J.Bn9 ed, Adprances in ecological research, Vole 4. Xew York: Academic Press; 1962 1-74.
Paine, TD,; Birch, M a c ; Svihr;a, P, Niche breadth and resource par"ttisning by four sympadrie spe- cies of bark beetles ( Coleoptern : Sc-oly tidae) . Oecol- 48: 1-43; 1981,
Pianka, E.R. Competition and niche theory. In: May, R.M., ed. Theoretical ecology, principles and applications, 2nd Edition, Suaaderiand, MA: Si- mmer Associates, Pnc, 198 8 : 167-196,
Pope, D.N.; Coulson, R.N; Fargo, W.S.; Gagne, J.A.; Kelley, C.L. The allocation process and between-tree survival probabilities in Dendroc-
tonus frontalis infestations. Res. %"cap, Ecoli, 22: 197-210; 1980.
Price, P.W. Insect ecology. New York: John Wiley and Sons; 1975,
Rcot, R.B, The niche exploitation pattern of the blue-gray pateateher. Ecol, &Ionogre 37: 317- 349; 1967.
Rudinsky, J.A. Multiple function of the southern pine beetle pheromone verbenone. Environ. En- t om~l , :!: 511--514; f 973.
Scbowal ter, T.P. ; Pope, D.N.; C ~ k t l s ~ n , R,N,; Fargo, \V.S. Patterns of southem pine beetle (Bendroc- tonus frontatis Zirnm,) infestation enlargement. For. Sei. 27: 837-849; 1981,
Svihra, P.; Paine, T.D.; Birch, M.C. Interspecific unieations in southern pine beetles,
Naturwiss. 67: 518-519; 1980. Tbith, J.P.; Gara, 1R.I .; von Scheller, H.D. Field ob-
servations on the response to attractants of bark beetles infesting southern pines. Contr. Boyce Thompson Inst. PI, Res, 22: 461-470; 1964,
Wagner, T.L.; Gagne, J.A.; Doraiswamy, P,C.; Csul- son, R.N.; Brown, K.W. Development time and mortality of Dendroctonus frontalis in relation do changes in tree moisture and xylem water poten- tial. Environ, Entomoi, 8 : 1129-1 139; 1949,
Wagner, T.L.; Feldman, R.M.; Gagne, JA.; Cover, J.D.; Coulson, R.13,; SchcuofiReld, R,Mq Factors affecting gallery construction, oviposition, and reemergence by Dendroetonus frontalis in the laboratory. Ann. Entomol, Soe. Am. 74: 255--293; 1981a.
Wagner, T,L.; Gagne, J.A.; Cover, 5.D.; Cou'fssn, R.N.; Pulley, P.E. Comparison of gallery construc- tion, oviposition, and reemergence by Dendsoc- tonus frontalis females producing first and second broods. Am. Entomol, Ssc, Am. '94: 570-575; 1981b.
Wagner, T.L.; Fargo, W.S.; Keeley, LA,; Csulson, R.N.; Cover, J.D, Effects of sequential attack on gallery construction, oviposition, and reemergence by Dendroctonus frontails (@ oleoptera: Sesly- tidae) . Can. Entornol. 114 : 491-502; 1982,
TVagner, T.L; Gagne, J*A.; Sharpe, P,J.H,; COU%- son, R.N, A biophysical model sf southern pine beetle, Dendroctonus frorztakts Zimmerr~ann ( Coleclptera : Seoly tidae ) , development, Ecoi, hlod- elling 21 : $25---145; 1984a,
Wagner, 11,L.; Wu, EX,; Sharpe, P,J,H,; Schoolfield, R.l?iiB:.; Csulson, R.N, modeling insect; development rates: a literature revie~v and. appliea~ion of a his- physicial model. Ann, Entomol. Soe, Am* 77: 208-225; 1984b.
Wagner, T.L.; Wu, H.; Sharpe, P,J.H.; Coulson, R.N. Modeling distributions of insect develop- ment time: a literature se.iiew and application of
the Weibull function, Ann, En-tomctl, Soc. Ann, 77: 4"i-48? 11984~.
Kilkinson, R.C.; h$eCleltand, W,T,; kluriflo, R.M.; Ostmark, E.O. Stridulation and behavior in two sou theastern Ips bark beetles f Cotr?optepla : Scab - tiidae). Fla, Entomor. 50: 18s195; 1967,
iVuod, DL.; Stark, R.W. The I~ le history sf I p s calligraphus ( Csleoptera : Scoly tidae) with notes on its biology in California. Can, Endomst, 108: 145-151; 1968,
TEXTFOOTNOTES 2 Ffamm, R. 0.; Wagner, 2'. L.; Cook, S , P,; Puiley, P.E.; Coulson, R. N.; IlifcArdle, T. Host colonization by cohabitinq Dendrocitonus frontal&, Ips auulus, and I. calligraphus (Cole- optera: &olytidae) ; 1985. (In review). 3 Wagner, a". L.; Fargo, W. S.; Fla , R. 0.: coulson, El. N,; Pulley, It;". E. Aspects of development and mortality of I p s calllgraphus (Coleoptera: Scolytidae) a t constant tempera-
Lures; 1985a. (In review). R9agner, "6". L.; R. 0, Fla ; Wu, H,; Fargo, Wrf, 8.; Gou%son, R. N. A temperature-dependent model of life cycle develop- ment of Ips calligraphus (Coleoptera: ScoZy tidae) ; 1985"rp (Ira review) . 'CVagner, T. L.; Flamm. R. 0.; Coulson, R. N, A temperature- dependent model of reemergence of Bps eakligraphus (Cole- optrna, Scafy"liZlae) : 1985c, (In reviewj . Wagner, 1". L.; Hennier, P. B.; Flamm, R. 8.; Goutson, R. N. Aspects of development and mortality of Ip s ar-ulsus iColeop- tera : Scoiytidae) at constant temperatures; 1985~3, (In re- view). IVzagner, T, L,; FIamm, R, 0.; Hennier, P, B.; Couiison, R, X. A temperature dependent model of reemergence of I p s am%- srls f Coieoptera: Seoly tidae) ; L985e. i In preparation), dWagner, 7s" L.; Hu, W.; Feldman, R, %I.; Sharpe, P. J. H.; Coulson, R, N. A multiple-cohort approach for simulating de- velopment of insect populations under variable temperatures Ann, EntomoZ. Soe. Am.; 1985f. (In press), Woulson, R. N.; Flarnm, R. 0.; Pulley, P. E.; Payne, T, L.; Rykiel, E, J.; Wagner, T, L, Response of the southern pine beetle guild to host disturbance; 1985. (In review).
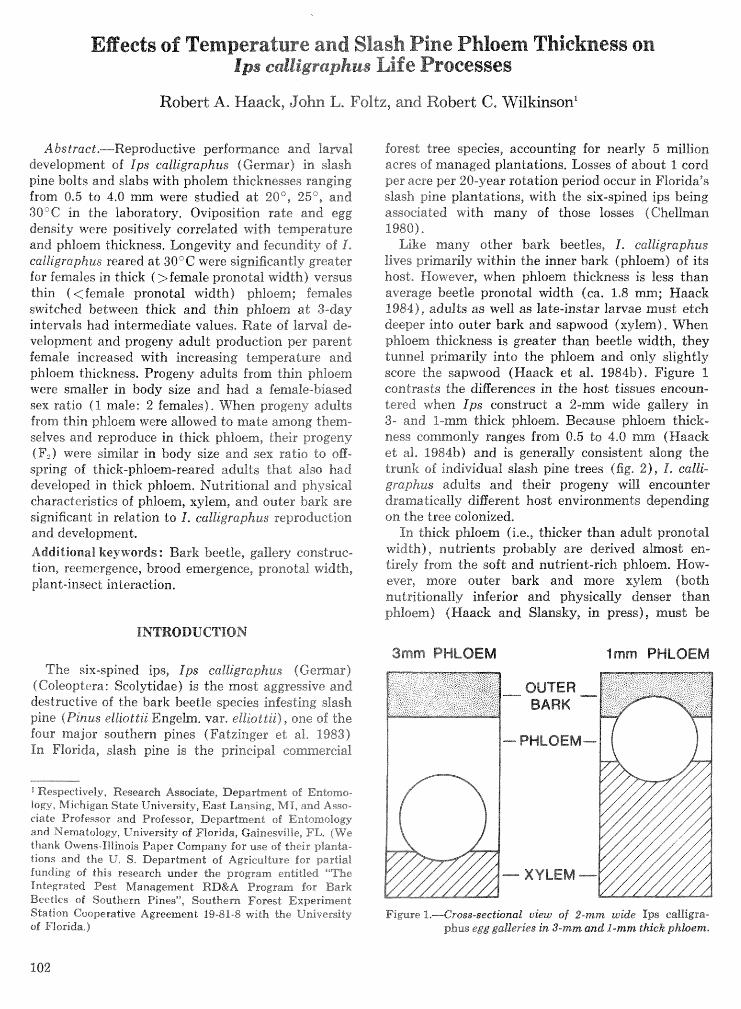
Effects of Temperature and Slash Pine Phloem Thickness on Ips calligraphus L i f e Processes
Robert A. Haack, John L. Foltz, and Robert C. Wilkinson'
A bstract,-Reproductive perfemanee and larval development of Ips ealtigraphus f Germar) in slash pine bolts and slabs with pholenrr thicknesses ranging from 0-5 to 4-0 were studied ad 20", %5", and 30°C in the laboratory, Ovipssition rate and egg density were positively correlated tviLh temperature and phloem thickness, Longevity and fecundity of 1, caltigraphus reared at 30°C were significantly greater for females in thick (>female proraotal width) versus thin ( < female pronotaf width) phloem; females switched between thick and thin phloem at 3-day intervals had intermediate values* Rate of larval de- veiiopment and progeny adult pssduction per parent fernale increased with increasing temperature and phloem thickness. Progeny aduf ts from thin phloem were smaller in body size and had a female-biased sex ratio (1 male: 2 females), N7kren progeny adults from thin phloem !%-ere allowed to mate among them- selves and reproduce in thick phloem, their progeny IF,) were similar in body size and sex ratio to off- spring sf thick-phloem-reared adults that also had developed in thick phloem, Nutritional and physical characteristics sf phloem, xylem, and outer bark are significant in relatian to I . culll'graphus reproduction and development.
forest tree species, aecourntirrg for nearly 5 million acres sf managed plantations, Losses of about 1 cord per acre per 28-year rotation period occur in Florida's slash pine plantations, with the six-spined ips being associated with many of those loses (Cheharr 1980),
Like many other bark beetles, I , catltgraphus lives primarily within the inner hark (phloem) of its host, However, when phloem thickness is less than average beetle pronohl ~ d t h (ea, 1,8 mm; Haack 19841, adults as well as late-insdar larvae must etch deeper into outer bark and sap~rood (xylem). When phloem thickness is g ra te r than beetle ~ d t h , they tunnel primarily into the phloem and only slightly score the sapwood (Haack et al. 1984b). Figure 1 contrasts the diAFerences in the host tissues eneoun- tercd when Ips eonstrued a 2-mm wide gallery in 3- and 1-mm thick phloem, Because phloem khick- ness commonly ranges from 0.5 to 4.0 (Haaek et al, 1984b) and is generally consistent along the trunk sf individual slash pine trees (fig, 2), 1, eaklt- graphus adufbs and their progeny &fl mcourtter: dramatically difierent host environments depending on the tree colonized.
In thick phloem (i.e,, thicker than adult prsnotal
Additional keywords: Bark beetle, gallery construe- width), nutrients probably are derived almost en- tion, reemergence, brood emergence, pronotal width, tirely from the soft and nutrient-rich ~hloern. HOW-
plant-insec t interaction. ever, more outer bark and more xylem (both nutritionally inferior and physically denser than phloem) (Haack and Slansky, in press), must be
f NTR0H)UCTIeB.N
3mm PHLOEM "1m PHLOEM The six-spined ips, Ips calkigraphus (Germar)
C Csleopdera : ScoZytidae) is the most aggressive and destructive sf the bark beetle species infesting slash pine (Pinus elbiotiii Engelm. var, elliottii), one sf the four major southern pines (Fatzinger et a"e 1983) In Florida, slash pine is the principal co
.------ t ..-.- OUTER 1 BARK ,/-+-- -- .
- PHLOEM-
' Respectively, Research Associate, Department sf Entorno- IoR.~~ Michigan Stale University, East Lansing, MI. and Asso- ciate Professor and Professor, Department of Entomo%sgy and Nematotogy, tiniversity of Florida, Gainesvilfe, PL. (We thank Owens-Illinois Paper Company for use of their plantza- tmns and the U. S, Department of Agriculture for partial funding 0% this research under the program entitled "The Integrated Pest &ilanagement RD&A Program for Bark Beetles of Southern Pines"", Southern Forest Experiment Slation Cooperative Agreement 19-81-8 with the University Figuse 1,-Gross-seedbnal view of 8-mm wide Ips ealligra- of Florida*) phus egg galierieg in 3-mnz and I-mm thick phbem*
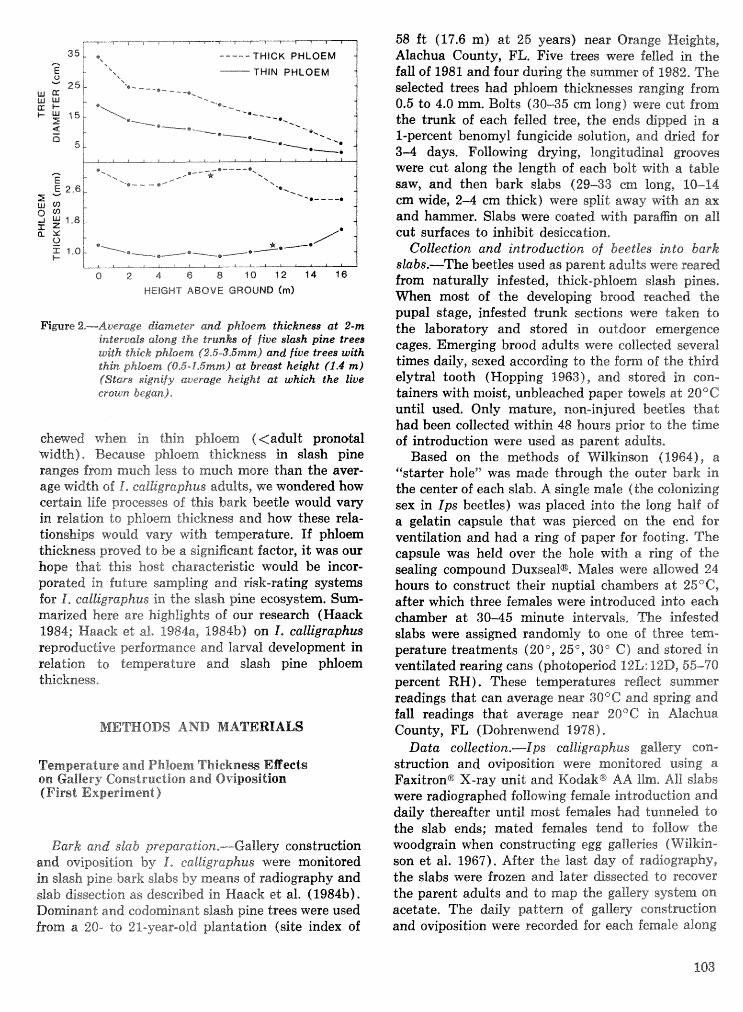
% \ - -.
%.
THiN PHLOEM
0 2 4 6 8 3 0 12 14 I6
HEtQHP ABOVE GROUND (rn)
1F"i~re 2,-Auerage dkmeter and phloem thkhness at 2-rn intervats along the trunks (sf five slmh pine trees with thick phloem (2,5-3.5mm) and five trees with thin phloem {0,5-1,6mm) at breahit height (1.4 rn) (Stars signify average height at which the live crown began),
chewed when in thin phlwm (<adult pronohl width), Because phloem thickness in slash pine ranges from mueh less to mueh more than the aver- age width of 1, calltgraphus adults, we wondered how certain life processes of this bark beetle would vary in. relation to phloem thkckness and how these rela- tionships would vary mrrith temperature. If phloem thickness proved do be a significant Ifactor, it was our hope that -$hiis host characteristic would be incor- porated in future sampling and risk-rating systems for 6, ealligsapkus in the slash pine ecosystem. Sum- mal.ized here are highlights of our research (Haack 1984; Haack et 81. 198.48, 19846) an I , calligraphm repmduetive performance and larval development in relation to temperature and slash pine phloem thickness,
METHODS AND MATERIALS
Temperature and Phloem Thicknem 'IEEects on Gallery Construction and Ovipssition (First Experiment)
Bark and slab preparationLi:-Gal1ery eonstrmdion and oviposition by 8, calligraphus were monitored in slash pine bark slabs by means of radiography and slab dissection as described in Haack et al. (1984'33). Dominant and codominant slash pine trees were used from a 20- to 21-year-old plantation (site index of
58 f t (17.6 m) a t 25 years) anear Orange Heights, Alachua County, FL, Five trees were .Eelled ia the fall of 1981 and four duriing the su seleckd trees had phitoem thickn
Bolts (30-35 cm long) were cut from ach felled tree, the ends &pped in a
I-percent benornyl fungicide solution, and dried for 3-44 days. Following drying, loragidudinall grooves were cut along the length of eaeh balk with a table saw, and then bark slabs (29-33 em long, 10-14
4 cm thick) were split away r;e;rth an ax er. S l a b were coafted e t h praEn on aU
cut surfaces to inhibit desiccation, Collection and introduction of beetles into bark
slabs.-The beetles used as parent adu%k were rear& from: naturally infested, thick-phloem slash pines. W e n most of the developing brood reached the pupal stage, infested trunk sections were taken to the laboratory and stored in outdoor emergence cages. Emerging brood adults were estlected several times daily, sexed according to the fsm of the third elytral tooth (Hopping 1963), and stored in con- tainers with moist, unbleached paper towels at 20°C until used. Only mature, nsn-injured beetles that had been collected within 48 hours prior to the time of introduction were used as parent adults,
Based on the methods o f Wilkinmn (1964), a "'starter hole" was made through the outer bark in the center of each slab. A single male (the eolonizing sex in Ips beetles) was placed into the long half sf a gelatin capsule that was pierced on the end for ventilation and had a rr;ng of paper for footing. The capsule was held over the hole with a ring sf the sealing compound DuxsealB. &$ales were allowed 24 hours to construct their nuptial chambers at 2SGC, after which three females were introduced into each chamber at 30-45 nninute intemals, The infested slabs were assigned randsmfy ta one of three tem- perature treatments (20", 25", 30" C) and stored in ventilated rearing cans (photoperiod 12L: I%D, 5S70 percent RH) , These temperatures reflect summer readings that can average near N°C and spring and fan readings that average near 20°C in Alachua County, FL (Dohrenwend 1978),
Data collection.-Ips calligrstpkus gallev con- struction and oviposition were monitored rasing a FaxitronB X-ray unit and Kodak@ AA Ilm, All slabs were radiographed following female indrodaaction and daily thereafter until most females had tunneled to the slab ends; mated females tend to follow the woodgrain when constructing egg galleries (Wilkira- son et al. 1967). After the last day of radiography, the slabs were frozen and later dissected to recover the parent adults and to map the galllev system on acetate. The daily pattern of gallery construetion and oviposition were recorded for eaeh female along
witb the average phloem thickness through which she tunneled and the average depth to which she etched the xylem,
Analyses,---Data analyses followed the general linear models procedures of the Statistical Analysis System (8AS): and were based on the first 8 days 05 gallery construction at 209C, first 6 days at 25'C, and first 4 days at 30°C, Regression of sviposidion rate (eggs /day), length of initial egg-free gallery dmm), egg density (egg 'cm of gallery starting at %he first e g g ) , and depth of xylem-etching (mm) were each performed over the entire data set, using phloem thickness as the independent variable and season and temperature as class variables, Because of the curvilinear relation between egg density and phloem thickness, these t.ii.s vasables were log-trans- formed prior do linear regression (Steel and Torsie 1980).
Phloem Thickness EBects on Female Longevity and Fecundity (Second Experiment)
Longevity and fecundity of 6, calligraphus were studied in relation to phloem thickness using slash pine bolts ad 30°C as described in Haack et al. 9 1984a1, This temperature was selected because re- productive performance of I . caltigraphus had varied the most between thick and thin phloem at 30°C in the previous study (Haaek et ali, 1984b). We were interested in learning whether or not greater repro- ductive rates in thick phloem eventually would lead to earlier female death in such phloem, in comparison witb longevity in thin phloem,
Bolt preparation,-Bolts (35 cm long) were sb- tained from 15 slash pine trees felled in the Orange Heights plantation between April and June 1982; phloem thickness was thin (1-0-1,s mm) on 7 trees and thick (25-3-5 mm) on 8, The bolts were dried and disinfected as before, after which the loose flakes of outer bark were removed tend the bolt ends pared back to unstained phloem and covered with paraffin,
Collection, introduction, and transfer sf beetles,- Beetles for this study were c011ected, sexed, and stored as described above. Only females coBZeeGed within 24 hours, and males within 48 hours prior $0 the time of beetle introduction were used, Fmm two do six starter holes were made around the midline of each bolt, with no two holes closes than BO ern, Males were introduced as described above and given 24 hours to constsuet their nuptial chambers at 30°C, after which one female was intmduced into each, Infested bolts were placed in verr&la$ed r e a ~ n g cans and maintained at 30°C, 60--70 percent RH, and a photoperiod of 12%: 12De
After 3 days, the time when females were nearing
the bolt ends, each gallew was easefully dissected with the female being removed and i troduced into another (then 24 hou chamber on a diEerent bolt, Similarly, 48 females were transferred again; and again every 3 days until their death, These wese four t;~eatrnents (Nl==lO females eaeh) with respect to how the females were transferred: (1) KK, from thick phloem do thick phloem only; (2) KN, alternating between thick and thin phloem, beginning on thick; (3) NK, alternating between thick and thin ptrlsem, b e ~ n - ning ow thin; rand (4) NN, from thin phloem do thin phloem only,
Data collec tion.-The ovipositional history. of each female was recorded by making tracings on acetate of all her egg galleries, including the nuptial cham= ber, gallery, and egg niches, For each felnale, total number of eggs, total gallery len&h (measured beginning a t the fimt egg in eaeh gallery), and Ion- gevity in days wese recorded, From those values, gallergr construction rate ( /day) ovipo~itiotll rate (eggslday), and egg density (eggsjcm) were caP- culated over each female" lifetime. For those females switched between thick and thin; phloem, numbers of eggs laid in the first 2 cm (beginning at the first egg) and last 2 ern of each gallery were recorded, Additionally, average water content 06 the phloem through which each female tunneled was es tbated (see Haack et al, 19848).
Analyses,-Data analyses followed the SAS psoce- dures. Mean female longevity, total gallelgr length ( cm) , gallesy construction rate, hcundity (eggs 1, gsvipssition raLe, and egg density were compared m o n g treatments with Dunean" multiple range test, For females switched between thick and thin phloem (KN & NK), t tests were used La compare (1 ) overall gallery constmaction rate, oviposition rate, and egg density while in tFniek phloem to that in thin phloem, and (2) egg density over the first 2 can of gallery to that over the last 2 em of gal%ew within each phloem Ghickness elass, In the latter analyses (KN & NK), only those? data from the 2nd-7th galleries (days 4-21 ) were used. Phloem water content was compared between phloem thick- ness classes with the t t a t .
Temperature and Phloem Thickness EEeets om Reemergenee and Brood Development (Third E xperimenrt)
Bolt and bark slab preparation,-Ips caEligraphus; parent adult reemergence and brood devdopment were studied using bolts and bark slabs of slash pine as described in Raack (1984)- Rearing materials were obtained from 16 slash pine trees felled in the Orange Heighh plankation between A p d and Sep-
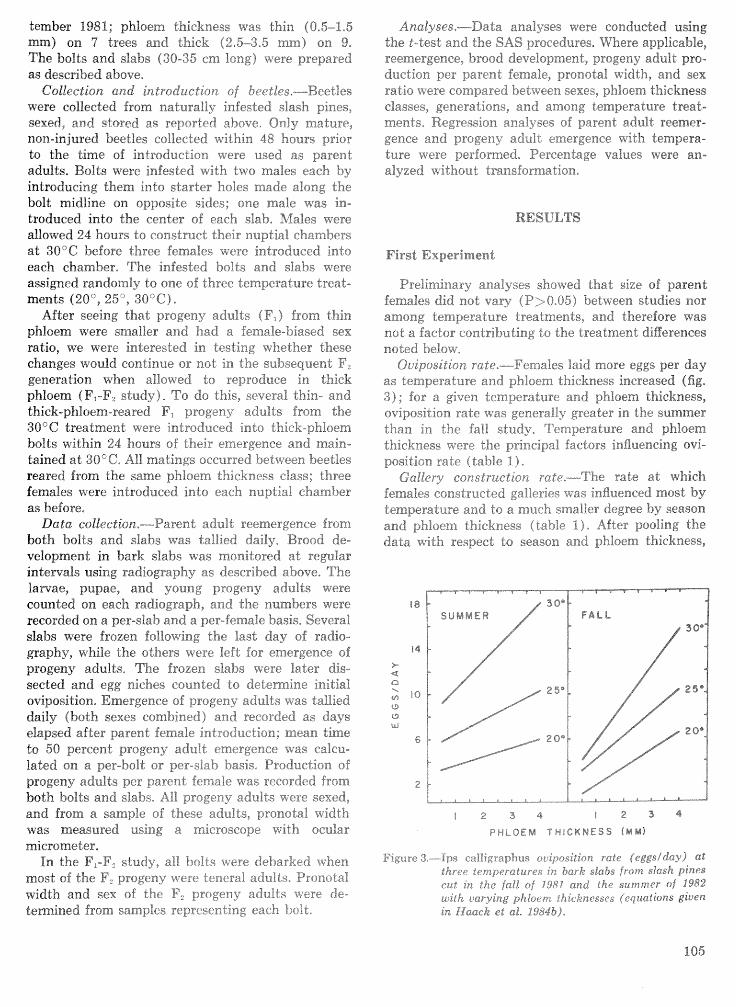
tember 1981; phloem thickness \vas thin (0,5--1-5 ) on 7 trees and thick (25--3,s mm) an 9,
The bolts and slabs (30-35 crn long) were prepared as described above,
GoEtection and introduction sf beetles.-Beetles were collected from naturally infested slash pines, sexed, and qfnred a s reported ~ b o v e Only mature, non-injured beetles coleeted within 48 hours prior Lo the time of introduction were used as parent adults, Bolts were infested with two males each by introducing them into starter holes made along the bolt midfine on opposite sides; one male was in- troduced into the center of each slab, Males were allowed 24 hours do construct their nuptial chambers at 30°C before three females were introduced into each chamber, The infested bolts and slabs were assigned randomly to one of three temperature treat- ments (20°, 25", 30°C)-
After seeing that progeny adults QF,) from thin phloem were smaller and had a female-biased sex ratio, we were interested in testing whether these changes would continue or not in the subsequent F L genera~on when allowed to reproduce in thick phloem IF,-F, study), To do this, several thin- and thick-phloem-reared F, progeny adults from the 30°C treatment were introduced into thick-phloem bolts within 24 hours sf their emergence and main- tained at 3QcC, All. matings occurred between beetles reared from the same phloem thickness class; three females bvere introduced into each nuptial chamber as before,
Data cstEeetion,--Parent adult reemergence from both bolts and slabs was tallied daily, Brood de- velopment in bark slabs was monitored at regular intervals using radiography as described above, The larvae, pupae, and young progeny adults were counted on each radiograph, and the numbers were recorded on a per-slab and a per-female basis, Several slabs were frozen Golltawing the last day sf radio- graphy, while the others were Left for emergence of progeny adults, The frozen slabs were later dis- sected and egg niches counted to determine initial oviposilisn, Emergence of progeny adults was tallied daily (both sexes combined) and recorded as days elapsed after parent female introduction; mean time do 50 percent progeny adult emergence was ealcu- tiated on a per-bolt or per-slab basis. Production of progeny adults per parent fen-;a%e was recorded from both bolts and slabs, A%$ progeny adults were sexed, and from a sample of these adults, pronstal width was measured using a microscope with ocular micrometer,
In the F,-F, study, all bolts .i;s7ere debarked when most sf the F, progeny were teneral adults, Pronotal width and sex of the I?, prcgeny adults were de- termined from samples representing each berit,
Analyses.-Data analyses were conducted using the t-test and the SAS procedures, Where applicable, reemergence, brood development, progeny adult pro- duction per parent female, pronotal and sex ratio were compared between sexes, phloem thickness classes, generations, and among temperature tread- ments Wegr~ssion analyses of parpnt adult rpemoar- gence and progeny adult emergence with tempera- ture were performed, Percentage values were an- alyzed without transformation,
RESULTS
First Experiment
Pre12rp%inary analyses showed that size of parent females did not vary (P>0,05) between studies nor among temperature treatments, and therefore was not a factor contributing to the treatment didlfesendses noted below,
Oviposition rate.----Females laid more eggs per day as temperature and phloem thickness increased (fig, 3); for a given temperature and phloem thickness, ovlpo~ition rate was generally greater in the summer than in the fall study, Temperature and phloem thickness were the principal factors infiuencing ovi- position rate (table I),
Gallery constsuctmn rate,---The rate ad which females constructed galleries was influenced most by temperature and to a much smaller degree by season and phloem PKieikness (table 11, After pooling that: data with respect to season and phloem thickness,
1 2 3 4 1 2 3 4
P H L O E M T H I C K N E S S ( M M )
3---Ips calligraphus ocipositiol.8- rate (eggsidagi) at three tenaperarfures in bark slabs frona slash pines cut rn the fall of 1981 and the szarnmer of 1982 uitk wry ing phloelpi- th ickn~sscs 8cqualions gir-ien kn Waack el al. 298Pb)-
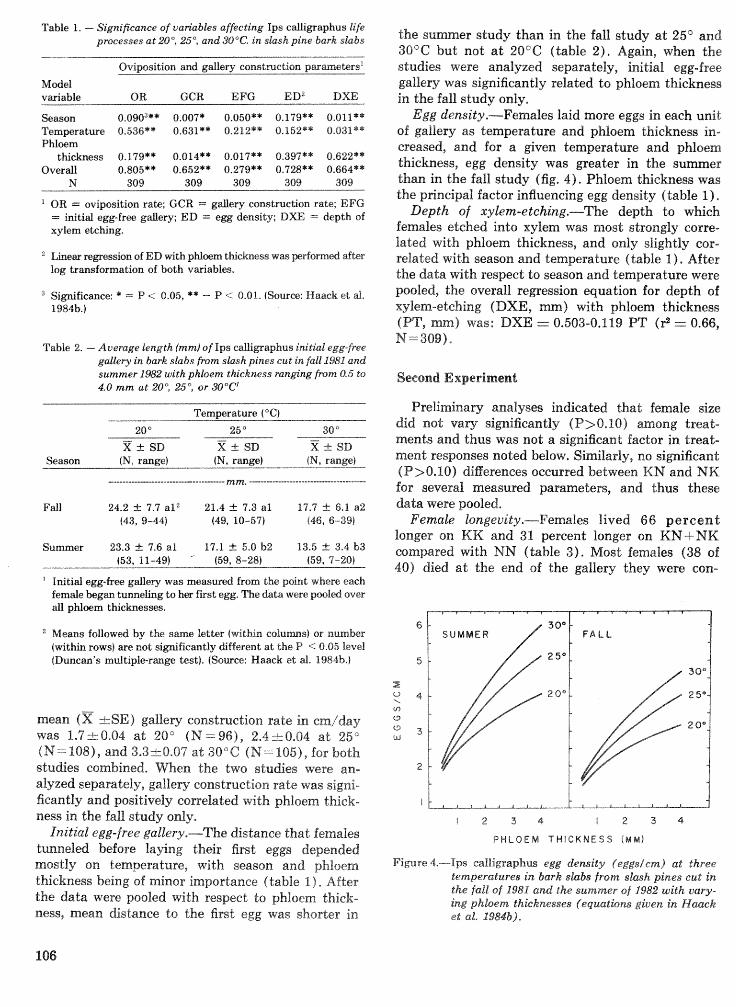
Table 1. - Signif eance of variables affie ting f ps cdlieaphus life pmcesses at XI5, 254 and 30°C. in stash pine bark slabs
Oviiposition d gallery eonstnvction pameters '
Mdef vwiable OR GCR EFG E D P X X I E
%ason 0.0903** 0.007* 0.050** O.179** 0,O1ll** Temperature 0.536** O,fi31** 0,212** 0. P52** 0.031** Phlmm
thickness 0,119** 0.014** 0.017'" 0.391"" 0.622** Overall 0,805** 0,652** 0.279** 0.728** 0,664**
Pu' 309 309 309 309 309
OR == oviposition rate; GCR -- gdery construction rate; EFG = initial egg-frw gallery; ED = egg density; D m = depth of xylem etching.
"hear ~gression of ED ~ t h phloem tEchess was p1-fomd d b r log transformation sf both vmiablw.
Significance: * --- P < 0.05, ** - P < 0-01. (Soure: Naack et d, 19845.)
Table 2. - Average bngth (mmt of Ips edlieaphus initial em-free galtery in bark slabs fin slash pines cud in fall LSag1 and summer f %2 with phben thickness ranging from 8.5 do 4.0 mm ad 20°, 25: or 30°C'
Temperature ( "6)
20 " 25" -
30" - - W -t- SD X -t- SD X -t- SD
Season (N, range) (N, r a g e ) (N, rangel
Fall 24.2 k 7.7 a lz 21.4 -t- 7.3 all 17.7 k 6.1 a2 (43, 9-44) (49, 10-51) 446, 6-39)
Summer 23.3 -t- 7.6 a1 17.1 -t 5.0 b2 13.5 r?r 3.4 b3 (53, 11-49) ' (59, 8-28) (59, 7-20)
Initial egg-frc?r? gdlesy was measured from the point; where each female began tunneling to her first egg. The data were p m l d over all phloem thicknesses.
Means followed by the s m e letter (within colums) or number (within rows) rare not significantly different at the P < 8.05 Level (Duncan's multiple-rmge kst) . (Source: Haack et Ell. 1984b.l
mean (x kSE) gallery construction rate in cm/day was P.7"i-0,04 ad 20" (N = 961, 2-4 -cO,Q4 at 25" (N=fQ8), and 3.3-6-0,07 a& 30°C (M=185), for both studies combined, m e n the two stu&es were an- alyzed separately, galley construction rate was signi- ficantly and positively cornelated with phloem thick- ness in the f a l study only,
Initial egg-free gallery.----The distance that females tunneled bdore laying their fist eggs depended mostly on temperature, with season and phloem thickness being of minor importance (table I ) , After the data were pooled with respect to pblo@m thick- ness, mean distance to the first egg was shorter in
er study than in the fall study a t 25' and not at 20CG (table 2). Again, when the
studies were analyzed ;separately, initial egg-free gallev was significantly related to phloem thickness in the fall study only,
Egg density.-Females laid more eggs it?, each unit of gallery as temperature and phloem thickness in- creased, and for a given temperature an thickness, egg density was peater in the than in the fall study (fig. 4). Phloem thick the principal factor influencing egg density (table I ) ,
Depth of xylem-etehltng.-The depth to which fenrales etched into xylem was most strongly corre- lated with phloem thickness, and only slightl3; car- related with season and temperature (table I), After the data with respect to season and temperature were pooled, the overall repession equation for depth of
) with phloem thickness 503-0.119 PT (I? tzt 0.66,
N=309).
Second Experiment
Preliminary aaalysa indicated that female size did not vary significantly ( P > 0.10 ) among treat- ments and thus was not a significant factor in treat- ment responses noted below. Similarly, no significant 4P>0.10) rfiBerences occurred between KN and NK for several measured parameters, and thus these data were pooled.
Female 2ongeuity.---Hr"emalw lived 66 pereernt longer on MK and 31. percent longer on KN+NK mmpared vvith NN (table 3). Most females (38 of 48) died a t the end of the galle~ly they were con-
FALL
P H L O E M T H I C K M E S S (ibllutl
Figbare .t,---lps ealiligraphw egg density (eggsicnt) at three temperatures in bark skbs from slash pines eat in the fall of 1981 and tke summer of 1982 with uaw- ing phloem thkknesses (equatiom given in Naack el ak. d984b).
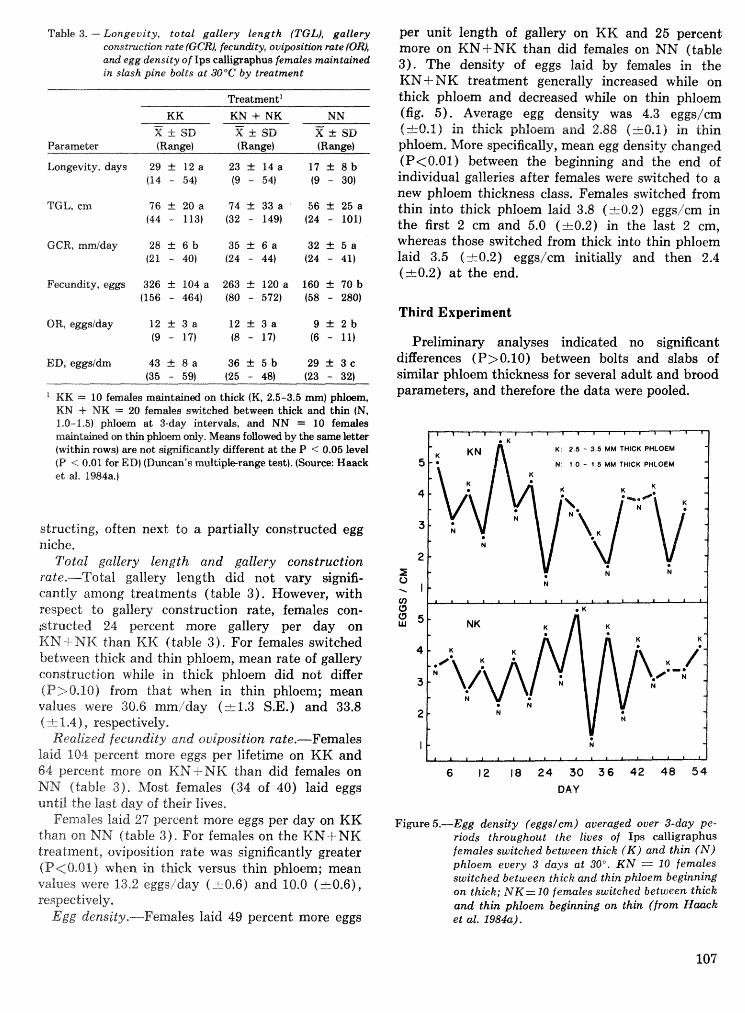
Table 3. - Lorzgevity totat gallery length (TGLI, gallery cclmtmt-ion mte ( G a l , feeun-ttity, o v i p s i ~ n rate (OBI, a d egg density af Ips calligraphus femaEes maintained in stash pine bolts at 30'C by treatment
Treatment "
TGL, em 76 k 20 a 74 -t. 33 a 56 f 25 a (44 - 113) (32 - 149) (24 - 101)
Fecundity, e g p 326 +. 104 a 263 k 120 a 160 f 70 b (156 - 464) (80 - 572) (58 - 280)
OR, eggsiday 12 f 3 a 12 f 3 a 9 + 2 b (9 - 17) (8 - 17) (6 - 11)
ED, eggsidm 4 3 k 8 a 3 6 f 5 b 2 9 s f r 3 c (35 - 59) (25 - 48) (23 - 32)
' KK -- 10 f a d e s maintained on thick (K, 2.5-3.5 m) phloem, KN C NR .= 20 females svri-itched between thick and thin (N, 1.0-1.5) phlmm at 3-day intervals, and NN = 10 females r n h t h d tm t b pMmm ody, Means followed. by the same letter (within rows) are not signifiear;rt;ly different at the P < 0.05 level (P < 0.01 for ED) (Dmcm's multiple-rmge test). (Source: Haack et raf. 1984a.j
strutting, often next to a partially constructed egg niche.
Total gallery length and gallery construction ra te.-To tal gallsry length did not vary signifi- cantly among treatments (table 3). However, with respect to gallery construction rate, females con- ;strutted 24 percent more gallery per day on K N + N K than KK (table 3 ) . For females switched between thick and thin phloem, mean rate of gallery construction while in thick phloem did not differ (P>O,IO) fmm that when in thin phloem; mean values were 30.6 mm/day (k1.3 S.E.) and 33.8 ( -i- 1.4 ) respectively,
Realized fecundity and oulposition rate.-Females laid 104 pereent more eggs per lifetime on KK and 64 percent more on MN+NK than did females on MN (table 3). %fast females (34 of 40) laid eggs until the fast day of their lives,
Females laid 27 percent more eggs per day on KK than on NN (table 3) . For females on the EN+- NK treatment, oviposition rate was significantly greater (P<O.Ol) when in thiek versus thin phloem; mean values were 13-2 eggsiday ( k 0 . 6 ) and 10.0 (sirr0.6), respee tively,
Egg density,---Females laid 49 percent mare eggs
per unit length of gallery on KK and 25 percent more on KN+NK than did females on NN (table 3). The density of eggs laid by females in the KN -i- NK treatment generally increased while on thick phloem and decreased while on thin phloem (fig. 5). Average egg density was 4.3 eggs/cm (k0.1) in thick phloem and 2.88 (k0.1) in thin phloem. More specifically, mean egg density changed (P<0.01) between the beginning and the end of individual galleries after females were switched to a new phloem thickness class, Females switched from thin into thick phloem laid 3.8 (20.2) eggsicm in the first 2 cm and 5.0 (rt0.2) in the last 2 cm, whereas those switched from thick into thin phloem laid 3.5 (k0.2) eggsJcm initially and then 2.4 (k8.2) a t the end.
Third Experiment
Preliminary analyses indicated no significant diflerences (P>O.10) between bolts and slabs of similar phloem thickness for several adult and brood parameters, and therefore the data were pooled,
. K K 2 5 - 3 5 MM THICK PHLOEM
N 1 0 - 1 5 MM THICK PHLOEM
K
4 3 0 )
N
N
I
6 12 18 24 30 36 42 48 5 4 DAY
Figure 5.-Egg density (eggsf cm) aueraged over 3-day pe- riods throughout the liues of Ips calligrlaphus females switched between thick ( K ) and thin (N) phloem every 3 days a t 30". ICN = 10 females switched between thich and thin phloem beginning on thick; N K I 10 females switched between thick and thin phloem beginning on thin (from Haaeh et a&. 1 9 8 4 ~ ) .
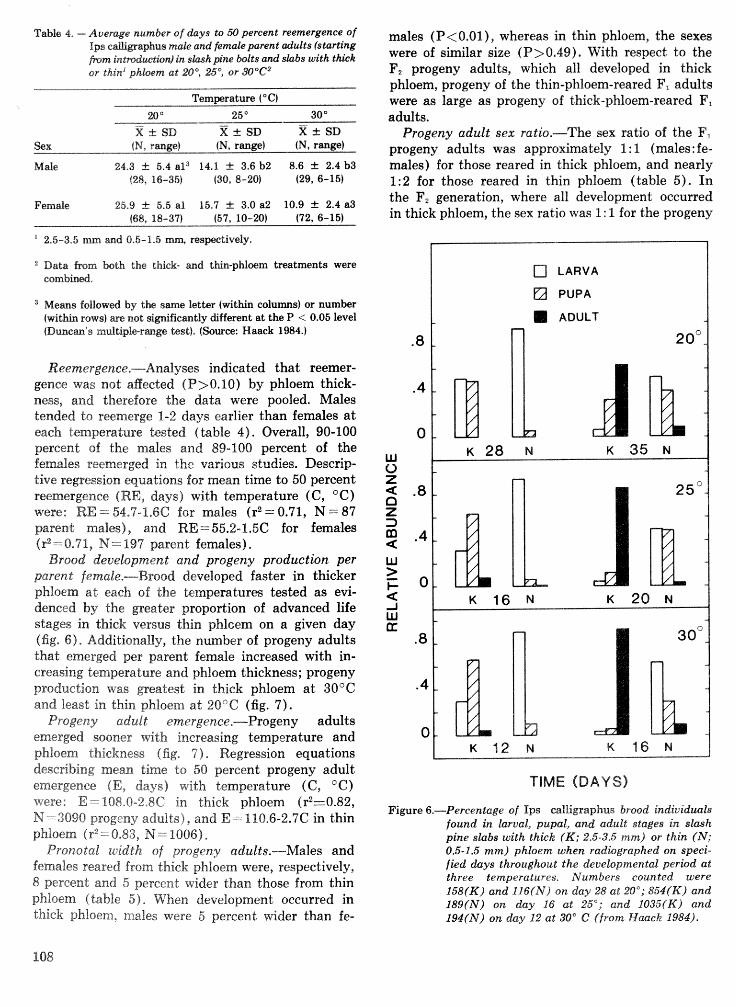
Table 4. - Average number of days to 50 percent reemergence of Ips cagsaphus m& and fern& parent adzllts (starting f i r n t'n&w&nf in s h h p i ~ e W t s a d slabs with thick or thia"pkiam at SOQ, 25', or 30°C'"
Data fmm b t b the thick- and t&n-phlmm treatments were cornbind,
Metms followed by the s m letter (within columns) or number (wiLhSn rows) are not silfnificmtliy different at the P < 0.05 level (Dunem" sdliplt-ran* test). (Source: Haack 1984.)
Reemergence.-Analyses indicated that reemer- gence was not aflected (P> 0,10) by phloem thick- ness, and therefore the data were pooled. Males tended to reemerge 1-2 days earlier than females a t each temperature tmted (bb le 4). Overall, 90-100 percent of the mles and 89-100 percent of the females reemerged in the various studies. Descrip- tive regression equations for mean time to 50 percent reemergence (RE, days) with temperature ( C , ' C ) were: RE = 54-7-1.66 for males (r2 = 0.71, RT = 87 parent malm), and RE=55.2-1.5C for females (r2==0.7l9 N== I97 parent females).
Brood development and progeny production per parent female.-----Brood developed faster in thicker phloem at each of the temperatures tested as evi- denced by the greater proportion of advanced life stages in thick versus thin phloem on a given day Q fig, 6)' Additionally, the number of progeny adults that emerged per parent female increased with in- creasing temperature and phloem thickness; progeny production was greatest in thick phloem a t sand least in thin phloem at 20CC (fig. 7) .
Progeny adult emevenee.-Progeny adults emerged sooner with increasing temperature and phloem thickness (Gg. 7)' Regression equations describing mean time to 50 percent progeny adult emergence (E, days) with temperature ( C , ' C ) were: E = 108-0-2,8C in thick phloem (r2=0.82, N - 3890 progeny adults), and E --- 110.6-2.7C in thin phloem (r2=0,83, N = 1006).
Pronodat width of progeay adults.--Males and females reared from t hi& phloem were, respectively , 8 percent and 5 percent wider than those from thin phloem (table 5). When development occurred in thick phloem, males were 5 percent wider than fe-
males (P<0.01), whereas in thin phlsem, the sexes were of similar size (P>0,49), With respect to the F, progeny adults, which all developed in thick phloem, progeny of the thin-phloem-reared F, adults were as large as progeny of thiek-pbloem-reared F, adults.
Progeny adult sex ratio.-The sex ratio of the It;", progeny adults was approximately 1 : 1 (males: fe- males) for those reared in thick phloem, and nearly 1:2 for those reared in thin phloern (table 5). In the F, generation, where all development occurred in thick phloem, the sex ratio was 1 : 1 for the progeny
LARVA
a PUPA
ADULT
Figure 6.-Percentage of Ips ~alligraphus brood indiuiduals found in hrval, pupal9 and adult stages in stash pine shbs with thick (K; 2.5-3.5 mm) or thin (N; 0.5-1.5 mm) phtoem when radiographed on speci- fied days throughout the developmental period al three temperatures. Numbers counted were 158fK) and 11difNj on day 28 at 20"; 854(K) and 189fN;) on day 16 at 25'; and 1035(K) and 194(N) @on day 12 at 30" C ( from Haaek 1984).
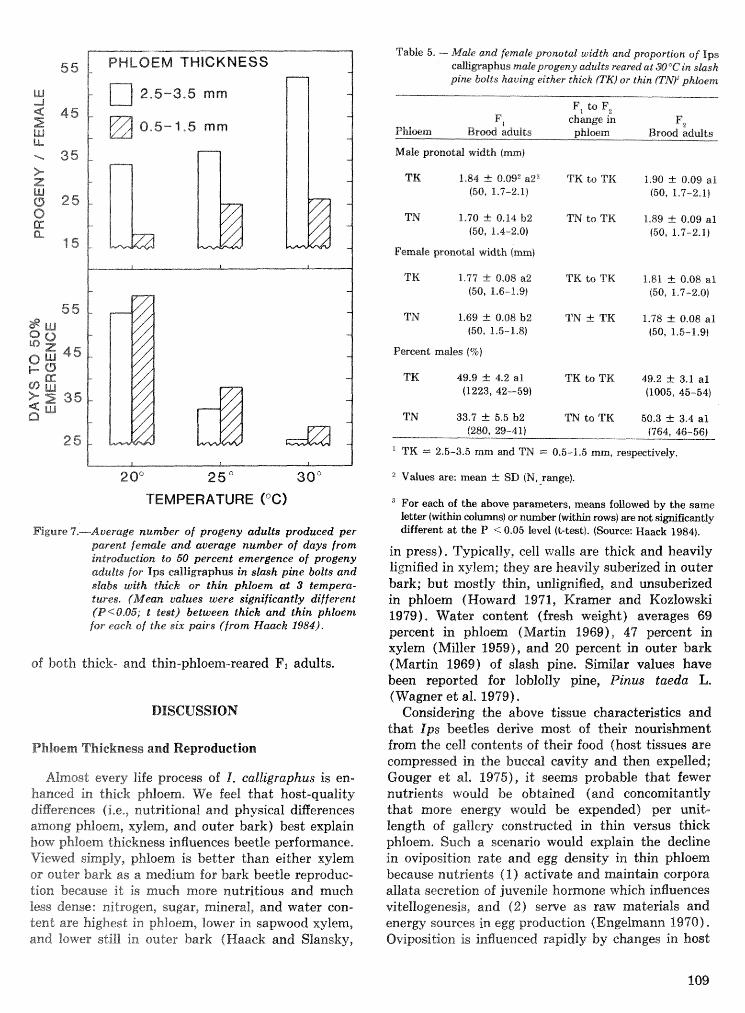
PHLOEM THICKNESS
2 0" 25" 30"
TEMPERATURE ('C)
Figure 7,-Average number of progeny adults produced per parent femak and average number of days from inbreduetion do 50 percent emergence of progeny adults for Ips cdfigraphus in slash pine bolts and slabs with thick or thin phloem at 3 tempera- tures. (Mean. ualues were significantly different (P90.05; t teat) between thick and thin phloent for each of the six p i r s (from Iiaack 1984).
of both thick- and thin-phloem-reared Ft adults.
Phloem Thiekraess and Reprodtletion
Almost every life process of 1. catligraphu~ is en- hanced in thick phloem. We feel that host-quality digercnces (i,e., nutritional and physical differences among phloem, xylem, and outer bark) best explain how phloem t hickraess influences beetle performance. Viewed simply, phloem is better than either xylem or outer bark as a medium far bark beetle reproduc- kisn because it i s much more nutritious and much less dense: nitrogen, sugar, mineral, and water con- -tent are highest in phloem, Iswer in sapwood xylem, and lower still in outer bark (Haaek and Slansky,
Table 5. - Male land female pronotat width and proportion of Ips cagapf ius mabeprogeny du l l s ?@@red at 3OQC irz stask pine b i t s having either thick (TK) or thin ~ T J V ~ phtoem
F, to F, F~ ehtmge in
$Klot?m B r d adults phloem F,
B r d i3dults
M d e gronotd width fmm)
Female ponotat width fmmf
Percent males (96)
"dues are: mi3n -t- Sf3 (N,,rmge).
For each of the above parmeters, means followed by tbe s m e S ) or amber (vviLhin rows) are not si@ficmtly
different at the P 0.05 level (t-twt). (Source: Maack 1984).
in press). Typically, cell ~x~alls are thick and heavily lignified in xylem; they are heavily suberized in outer bark; but mostly thin, unlignified, and unsuberized in phloem (Howard 2971, Kramer and Kozlowski 1979). Water content (fresh weight) averages 69 perca t in phloem (Martin 1969): 47 percent iin xylem (Miller 1959), and 20 percent in outer bark (Martin 1989) of slash pine. Similar values have been reported for loblolly phe, Pinus taeda L, (Wagner e% al. 1979),
Considering the above tissue charactesistics and that Ips beetles derive most sf their nourishment from the cell contents of their food (host tissues are compressed in the buccal cavity and then expelled; Gouger ed al, 19"75), it seems probable that fewer nutrients would be obtained (and concomitantly that mare energy would be expended) per uait- length of gallev constructed in thin versus thick phloem. Such a scenario would explain the decline in, oviposition sate and egg density in thin phloem because nutrients ( I) activate and maintain corpora allata secretion of juvenile hormone which influences vitellogenesis, and (2) sewe as raw materials and enerm sources in. egg production (Engelmann 19'90), Oviposition is influenced rapidly by changes in host
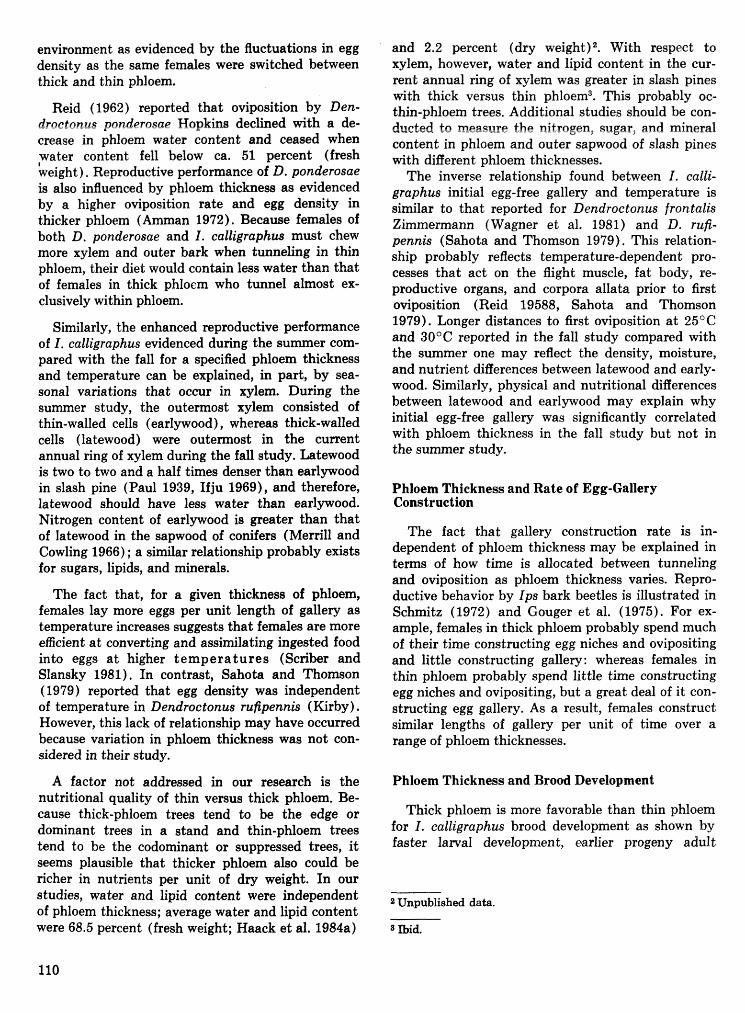
environment as evidenced by the fluctuations in egg density as the same females were switched between thick and thin phloem.
Reid (1962) reported that oviposition by Den- &actonus psnderosrte Hogkins declined with a de- crease in phloem water content and ceased when water content fell below ca. 51 percent (fresh &eight). Reproductive performance of D. ponderosae is also inBuenced by phloem thickness as evidenced by a higher oviposition rate and egg density in thicker phloem (A an 1972). Because females of both D. ponderosae and I. calligraphw must chew more xylem and outer bark when tunnefing in thin phloem, their diet would contain less water than that of females in thick phloem who tunnel almost ex- clusively within phloem.
Similarly, the enhanced reproductive performance of I. calligraphus evidenced during the summer com- pared with the fall for a specified phloem thickness and temperature can be explained, in part, by sea- sonal variations that occur in xylem. During the summer study, the outermost xylem consisted of thin-walled cells (earlywood) , whereas thick-walled cells (latewood) were outermost in the current annual ring of xylem during the fall study. Latewood is two to two and a half times denser than earlwood in slash pine (Paul 1939, Ifju 1969), and therefore, latewood should have less water than earlywood. Nitrogen content of earlywood is greater than that of fatewood in the sapwood of conifers (Merrill and Cowling 1966) ; a similar relationship probably exists for sugars, lipids, and minerals.
The fact that, for a given thickness of phloem, females lay more eggs per unit length of gallery as temperature increases suggests that females are more efficient at converting and assimilating ingested food into eggs a t higher temperatures (Scriber and Slansky 1981). In contrast, Sahota and Thornson (1979) reported that egg density was independent of temperature in Dendroctonus rufipennis (Kirby). However, this lack of relationship may have occurred because variation in phloem thickness was not con- sidered in their study.
A factor not addressed in our research is the nutritional quality of thin versus thick phloem. Be- cause thick-phloem trees tend to be the edge or dominant trees in a stand and thin-phloem trees tend to be the codominant or suppressed trees, it seems plausible that thicker phloem afso could be richer in nutrients per unit of dry weight. In our studies, water and lipid content were independent of phloem thickness; average water and lipid content were 68.5 percent (fresh weight; Haack et al. 1984a)
and 2.2 percent (dry weightI2. With mspect to xylem, however, water and lipid content in the cur- rent amual ring of xylem was greater in slash pines 'Gith thick versus thin phloem3. This probably oe- thin-phloem trees. Additional studies should be con- ducted to measure the nitrogen, sugar, and mineral content in phloem and outer sapwood of slash pines with diflerent phloem thicknesses.
The inverse relationship found between I, eatti- graphus initial egg-free gallery and temperature is similar to that reported for Dendroctonus frontalis Zirnmemann (Wagner et at. 1981) and I>. rufi- pennis (Sahota and Thomson 1979). This relation- ship probably reflects temperature-dependent pro- cesses that act on the flight muscle, fat body, re- productive organs, and corpora allata prior to first oviposition (Reid 19588, Sahota and Thomson 1979). Longer distances to first oviposition at 25'C and 30°C reported in the fall study compared with the summer one may reflect the density, moisture, and nutrient difl'erences between latewood and early- wood. Similarly, physical and nutritional differences between latewood and earlywood may explain why initial egg-free gallery was significantly correlated with phloem thickness in the fall study but not in the summer study.
Phloem Thickness and Rate of Egg-Gallery Construction
The fact that gallery construction rate is in- dependent of phloem thickness may be explained in terms of how time is allocated between tunneling and oviposition as phloem thickness varies. Repro- ductive behavior by Ips bark beetles is illustrated in Schmitz (1972) and Gouger et al. (1975). For ex- ample, females in thick phloem probably spend much of their time constructing egg niches and ovipositing and little constructing gallery: whereas females in thin phloem probably spend little time constructing egg niches and ovipositing, but a great deal of it con- structing egg gallery. As a result, females construct similar lengths of gallery per unit of time over a range of phloem thicknesses.
Phloem Thickness and Brood Development
Thick phloem is more favorable than thin phloem for I. calligraphus brood development as shown by faster larval development, earlier progeny adult
2 Unpublished data.
8 Ibid.
curred because the current increment of xylem in thick-phloem trees was wider and had a greater proplardion of earlpood to latewoad than that in emergence, greater body size, and w 1 to 1 sex ratio. The same physical and nutgtional advantages de- scribed shove for f , calligsaphus adults reproducing in thick phloem can be proposed as the principal factors for enhanced brood development in thick phloem, The fact that average time ta 50 percent emergenee and pronotal vvidth of I, calligraphus brood adults in Dale% study (1 967) were ea, 45 days and 1 , W m a t 25°C and 29 days and 1-6 mm at 30'6, respectively, suggests that host mateGal with thin phloem was used.
Fwd quaEty is k n o m to influence rate of larval development (Becker 1977) and adult body size (Anderson and Nilssea 1983) in many other species of bark- and woodboring Coleoptera. For D. pon- derosae developing in relatively thin phloem, larvae develop slower, progeny adults emerge later and are smaller in body size, and the sex ratio is female- biased (Amman and Pace 1976; Amman and Cole 1983),
The physical and nutritional constraints of the thin-phloem environment should most aBect the last (third) larval instar of I. calligraphus, simply because of its size; head capsule width averages ca, 1 mm in third instars (Wilkinson 1963). However, earlier larval instars of 1, ealligraphus apparently detect differences as evidenced by longer larval mines in thin versus thick phloem (Haack 1984). Early lawal instars of I>. ponderosae mined faster in thin compared to thick phloem (Amman and Cole 1983).
Given that I. calligraphus egg density inereages with both increasing phloem thickness and tempera- ture (Haack eat al. 1984b), the obsemred greater brood production in thick phloem probably is best explained in terns of greater original egg density rather than greater brood survival in thicker phloem. In fact, brood mortality was similar between phloem thickness classes, being ca. 3550 percent in bolts ( Haack 1984). TEs observation demonstrates f i e importance of reproductive performance being in part host-segirlated; i.e., females seem to lay the optimum nmber of eggs that can be supported by the host, Such behavior would allow females to maximize their fitness by laying an sptimum number of eggs in each hose they colonize,
Phloem Thickness and Other Southeastern Bark Beetles
In the southeastern U.S., four other majar bark beetle species infest pines: Dendroetsnus terebrans (Oliviier), D. f r o n t a l i ~ ~ Ips auulsus (Eichksgif), and
Ips grandicokkis (Eichhosf) (Wilkinson and Foltz 1980). F i p m 8 contrasts the relative size ole all five southeastern species (values estimated from data in Wood 1982) with 1-5- thick phloem, which is the average thickness found in most species of southern pines (LIoward 1971), Only one other large species (D, derebmns) would appear to be constrained by the relatively thin phloem of most southern pines, In fact, no correlation was found between D, f ron $@-[is reproduction and lohlolly pine (Pinus tneda L,) phfoem thickness in the study by Wagner et al, (1981). Although smaller adult size m y allow for greater host choice, it also may allaw for easier expulsion of such adults from resiractus trees like slash and longleaf pine (Pinus palustris Mill.) (Hedges et an, 1979),
SPECIES D t A
i c - Ig Df la - - - WIDTH 2.7 1.8 1,4 1.2 8,9
Figure 8.-Relative adult maze size based on pronotal width estimates ( f rom data in Wood 1982) of Dendroc- tonus terebrans (Dt ) , Ips calligraphus ( l e ) , Ips grandicollis ( I g ) , Dendroctsnus frontalis (Df), and Ips aw2sus ( l a ) with respect to typical host enuironment in southern pines (1.5-mm thick phloem) (Howard 9 . BB = outer bark, P =r: phloem, X = xylem.
SUMMARY
The three laboratory experiments reported in this paper demonstrate that phloem thickness is an jirn- portant variable in the biology sf I , caltigraphus, Therefore, i d should be considered in sampling and population dynamics studies of this beetle in. the slash pine eeosyslem, especially in su warmer temperatures accentuate phloem thickness eBeets on the beetle" life processes, Future research is needed do identify: (I) Why phloem thickness is correlated with Xongevit y, egg production, and larval. development; ( 2 ) what physical and chemical fac- toss cause the observed eEects; and (3) what other life processes might be correlated with phloem thickness.
LITERATURE CITED
an, Gene D, Some factors saEecting aavipssiticsrx behavior of the mountain pine beetle, Environ* Entomol, 1(6) : 691-695; 1972,
Amman, Gene Dl; Cole9 JVaBter Ei hlountain l.iine beetle dynarl-~ics in lodgepole pine foresf, Part 11. Population r]tr-namies, Gene Ti &, Rep, IxT- I 45" ogden, KT: U.S, Deyartn;ent of Ag~iculture, FCrest Service, ~ f i ~ e r ~ o u ~ t a ~ n ForeFt and Ra.rian a&"
E ~ p ~ r I r n e n t Sfatinn; 1983, 59 p, Amn~an, Gene -D,: Pace, Vincent E, Optimum egg
* gal%e.ai.l;- densities for the moe.dnt:~~n pine 'I-reetlc in rela"ro:n to j;trr%gepule pine phloe-m thiclcnc:;t;;i. Rrs, Note PF<T-"b$lS, Ogden, I.;'%": U.S. r>cpam.in:-t~nk of Agriculture, Forest Service, Jn$er-rgribuntn ~ ~ l * ; - ~ i ~
and Range Experirncnt Station; 19'76, 8 p, Anderson, Joh;ln : ~ < ~ ~ ~ s e l - B I C* Intr.4~!j<;;;ill:~~~<j3
A _/ ? * I v%~a~..latioc of free-livlng and tree-'ilo.:.ing c::(,aIe- optera* can, Entolnoi, 1% 56 11 ; . $45:3---14f$4; 19813,
Becker, Gunther, ~tr.ilogy and physiology of I V O C ~
destroying Coieopt era in structural timber-, ?*later, Org, 12S2) : 14"8---"860; 1977,
Chelln~an~ 6, Tree mortality surveys in Florida from 1959 thru 19,78. In : For0;- ~ ~ t p e s t mael-
* - 7
agen1ein.i: syn~yos~um, 1980 June 3-4; fhinesvl~le, FE, Rps , Rep, 7, Gainesvilke, FE: Sehoo% of Foi-(-st Resources and Cons~:yvation, T-,"njajiirsity sf FBcr-
1980; @--12, Dalep JoIln $xi , The infjuefiee rif te~yipey;~.kt~t"t? i, jgj tjx;
population grs\xv,th of species of c;fiutl:.tyrn pine, engr3-rscl-S. ~ i l r h a ~ ~ l , ?{(: : I)u]-re 1 ~n~x,::~r:::itr~, P* >i.houl of Fnrcstrv; - , 1967, 137 p, [$r"h~;eis.f
Dohrenviend, R, E, T h e (:]inlate of Alachu,cx C'otri.:ty, F]oa.ic.la. FIB, Agrig;., E x p = Bi?ll, 796, (%aincs- va!'&e, FL: Florida Agricultura] Esperi:nunt Sta- tion; 1 9 s 8 , 25 p,
Englemann, Franz, The I I ~ ~ S H G B I O ~ Y of ~ ~ ~ S C B I C ? rej)ro- duction, Oxford: Pergamon Press; 1970, 35(!":3 eJ -
Patzinger, C, IN,; JVilkinscn, R- C*; Bcri~ford.~ '$is Inscuts affecting the managed slash pipine ecosys- tem, In: The managed slash pine ecc~sy-ster~~: pro- ceedings of the qV;mpos;lium; 1981 J u r ~ e 9-11 : Gainesville, FL, Gainesville: School elf Forest Re-
" * sources and Con;.;ervation, University 01 k'lorida; $983 : 228-255,
% - T 1 - -- Gouger, R, 9,; Yelarian, VV, C,; V<ilkinssn, K, (1, Feeding ant77 rekj_;.rocjuctivp jss-.ha.ra.iop Ips gc:jlsu, Fla, Entorn;,], 5,s 14) : 221-229; 1975,
Haack, R;~fjert A, Attack, r c ; p r o d ~ ~ t i ~ n ~ and devc:lop- ~ n e n t of ljli;iir cU:"i;grGphU~ i ( " k ~ . o g t ~ ~ ~ : Sco]g,i-ti&e)
- -, in relation to tempc.ra"curr* slash pine phlocwi thickness, Gaincsvi%le I -wn~vc~r5i~~p. of Florida j 1984, 1 ";p. [Di++:;esta-lion,]
Hc.i,ack, Rcbert A,; po[tz, John E,; ~ ~ ~ l i ; ~ n ~ s o n , Eo!~e_..l-t c, IJ",cingevitj- and f p c l J : ~ ~ - ~ ~ ~ ~ ; * - L A j af I*:):; ~ ~ : ~ ~ ~ z ~ ~ ~ ~ ~ ~ ~~9
(Cofeoptera : &-~l>-%idae ) in relation to slash ~ i l ~ t :
phloem th%c:kness. Ann, Entiimfil, ~ { o c , -AArn, ';? (6) : 657-662; i984a,
Sahsda, T, S.; Thsmcpn, A, J. Temperature induced viadatisn in the rates of reproductive processes in Deazds-octonus rufipennis ( Colfeoptera : Seolytidae) : a new approach to detecting changes in population quality, Can, Emtomol. 111 (9) : f 069-1078; 1979.
Sehmitz, Richard F, Behavior of Ipg piai dufiiing mating, ovipssidion, and larval development (Cole- optera: SesSytlid~~,e), Can. Entomol. 104 (If) : l"323--1728; 1972.
Scriber, J, M.; Slansky, Fe, Jr. m e nut~t ional ecology of immature insects, Ann. Rev. Entomol. 26: 183-211; 1981,
Skeel, Roger G, D.; Tsrrie, James H. Principles and procedures of statistics. 2nd ed, New York: Mc- Grraw-Ha Book Go,; 1980, 633 p.
Wagner, Terence L. ; Gagne, James A*; Doraiswamy , Paul C.; Caulson, Robert N.; Brown, Kirk W. Development Lime and mortality of Llendroctonus frontalis in relation. to changes in tree moisture and xylem water potential, Environ.. Entomol. 8 (6) : 1129--1138; 1979.
'IrbPagner, T, L.; Feldman, R, h5.; Gape, J. A.; Cover, J. D*; C O U ~ S O ~ , R, N.; Schooldield, I%, M, Factors
aEeceing gallery construction, ovipositian, and reemergence of Dendroetonus frontalis in the: laboratory. Ann. Entomol, Soc. Am. 74 (3) : 25% 213; 1981.
Waifkinson, It. C. Larval: instar8 and head capsule ancrrpholnw in three ~outkleastern Ips bark beetles, Fla, Entomol, 46 (I) : 19-22; 1963.
Wgkhson, R. 6. Attraction and development of Ips bark beetle populaLions in adificially infftsted pine bolts t?xposed on firetowers and t-ktmtables in Florida. Fla. Entomol. 47 (1) : 5 7 4 4 ; 1964,
Wilkinson, R. C.; Foltz, J. L. A selected bibliography (1959-1979) of three southeastern species of Ips engraver beetles. Bull. Entomol. Soc, Am. 26(3) : 375-380; 1980.
Wilkinson, R. C.; McClelland, W. T.; Murillo, Ruth M.; Ostmark, E. 0. Stridulation and behavior in two southeastern Ips bark bedles (Coleoptera: Scolytidae) . Fla. Entomol. 50 (3) : 18S195; 1967.
Wood, Stephen L. The bark and ambrosia beetles of North and Central America (Caleoptera: Scoly- tidae), a taxonomic monograph. Great Basin Nat. Mem, 6; 1982. 1359 p.
Interactions of the Southern Pine Beetle With Competitor Species and Meteorological Factors
Fred P. Hain and Abelmajid Ben Alya '
A bstmct.-Evidence suggests that weather condi- tions (especially winter temperatures) and corn- petition with other insect species, especially Ips and Monochamus species, contribute to the patbrns of SPB activity in North Carolina. Monitoring of overwintering emergence during an average North Carolina winter showed that most emergence oc- curred in late April and early May. Very little occurred earlier, However, no additional trees were attacked within the spot infestations. Super cooling tests suggest that larvae are the most susceptible life stage to the lethal effects of cold temperatures. The mean freezing point for larvae was -13. lo0 t 1.8OC, while the pupal mean was -16.35°t2.20C. Precon- ditioning to colder temperatures improved the sur- vival of laboratory-reared pupae. The adult flight pe- riod of Monochamus carolinensis and M , titillator ex- tended over a period of approximately 4 months, from. late May to mid-October. Brood development within infested logs required approximately 12 months; hcwever, some individuals that infested a log by June completed development within 4 months. Cumulative mortalities from larvae establishment to adult emergence were 85.0 percent and 85.6 percent for M. carolinensis and M. titillator, respectively. Phloem moisture content of trees infested by Ips bark beetles or black turpentine beetles showed great fluctuation, However, i t appears that Ips infested trees can support SPB populations for up to 8 weeks after crown fade, but only a t low population levels. When SPB and I. calligraphus are infesting the same cut bolt, I. calligraphus survival from eggs to adults is comparable to or better than SPB survival. In a wind tunnel, SPB adults show no strong response to I. calligraphus males infesting loblolly pine bolts. Additional keywords: Ips auulsus, I. grandicollis, I. caltigrupkus, Dendroctonus frontalis, D. terebrans, i"lifonoeitlamus titillator, M. carolinensis, loblolly pine,
"espeetively, Professor and Research Assistant, Depart- ment of Entomology, North Carolina State University. Raleigh, NC, (We gratefully acknowledge W. Hobbs and E. Vounan for technical assistance with experimental proce- dures. This work was supported in part by the USDA-spon- sored LPM bark beetle progrm.)
Pinz~s taedn, wind tunnel, super csoting, overwinter- ing, pheromone response, phloem decomposition,
Periodic outbreaks of southern pine beetle Q SPB) , Dendroctonus frontalis Zimm., have been document- ed in North Carolina since 1960 (Price and Doggetd 1982). However, from 1973 through 1976, an un- precedented epidemic destroyed an estimated 996,- 000 cords and 420,000 MBF of timber. At least 2:4 times as much timber in cords and a t least 3.9 dimes more MBF were lost than during any other $-year period before or since. During the winter of 1974- '75 and the summer of 1975, respeel;ive%y2%2,000 and 20,000 SPB infestations vvere recorded by the North Carolina Forest Service.
An examination of the SPB survey maps (Price and Doggett 1982) suggests that the North Carolina- Virginia border is the northern limit of the SPB con- tinuous range. However, sporadic activity in Virgnia, especially during large outbreaks, does occur. A cli- mate with a hard winter freeze may limit the north- ern extension of the SPB range and may contribute to the outbreak patterns in North Carolina For ex- ample, during the 1973-76 epidemic, North Carolina was experiencing an unprecedented series of warm winters (fig. I ) , beginning during the w<nter of 1970- 71 and culminating during the winter of 1976-97 (the coldest winter recorded since 1959-69). Figure 2 shows the average temperatures sf the coldest winter month (either December, January or February) and confims that the winters of 19'90-78 through 1995-- 76 were unusually warm while 1976-79" rvas extremely cold.
During periods of low SPB activity in North Caro- lina, Wain and McClelland (19W9) reported that SPB were most frequenlly infesting trees in assseiaLion with Ips bark beetfcrs. I t appeared that I p s ae:uEsus (Eichoff ) infesting the tree crown were fseqtaen tly the primary attacking bark beetle and that SPB and
4, Doggett, personal, eommauzlieation,
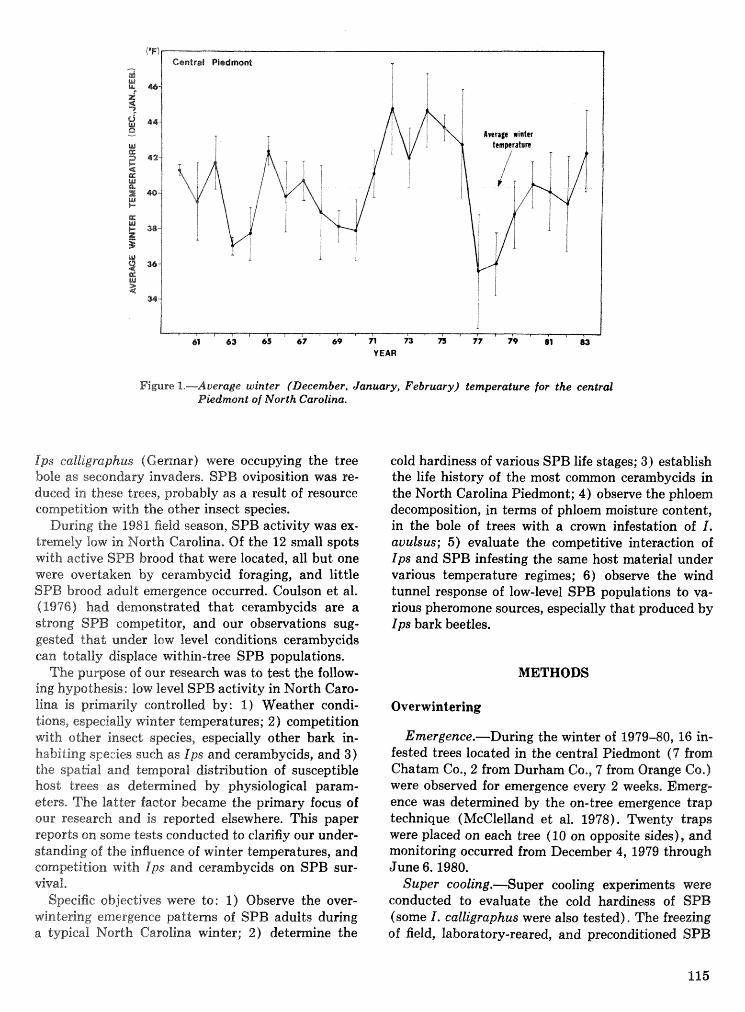
6s 63 65 $7 49 n 73 7s 77 79 81 YEAR
Fiwse 1.-Average winter (December, January, February) temperature for the eentrd Piedmont of North Carolina.
Ips eatligraphus (Germar) were occupying the tree bole as secondary invaders. SBB ovipositionn was re- duced in these trees, probably as a result of resource competition with the other insect species.
During the 1981 field season, SPB activity was ex- tremely low in North Carolina. Of the 12 small spots with active SPB brood that were located, all but one were overtaken by eerambycid foraging, and little SPB brood adult emergence occurred. Coulson et al. (19436) had demonstrated that cerambycids are a strong SPB competitor, and our observations sug- gested that under low level conditions cerambycids can totally displace within-tree SPB populations.
The purpctse of our research was to test the follow- ing hypothesis: low level SPB activity in North Caro- lina is primarily eontrol%ed by: 1) Weather condi- t ion~, especialtly winter temperatures; 2) competition with other insect species, especially other bark in- habiting s~ecies suck as Ips sand cerambycids, and 3) the sgrta~al and tmgoreal distibu6on of susceptible boat trees as dedemined by physiological param- eters* 9"e lattm factor became the primary foeus of our research and is reported elsewhere. This paper reports oar some tests conducted to clarifiy our under- standing of the influence of winter temperatures, and competition with Ips and eerambycids on SPB sur- vival,
Specific objectives were to: 1) Observe the over- wi lnk~ng emergence patterns of SPB adults during a typical North Carolina winter; 2) determine the
cold hardiness of various SPB life stages; 3) establish the life history of the most comrnon cerambycids in the North Carolina Piedmont; 4) observe the phloem decomposition, in terms of phloem moisture content, in the bole of trees with a crown infestation of I . auulsus; 5) evaluate the competitive interaction of Ips and SPB infesting the same host material under various temperature regimes; 6) observe the wind tunnel response of low-level SPB populations to va- rious pheromone sources, especially that produced by Ips bark beetles.
METHODS
Overwintering
Emergence.-During the winter of 1979-80,Ifj in- fested trees located in the central Piedmont (7 from Chatam Co., 2 from Durham Co., 7 from Orange Go.) were observed for emergence every 2 weeks. Emerg- ence was detemined by the on-tree emergence trap technique (McClelland et al. 1918). m e n t y traps were placed on each tree (10 on opposite sides), and monitoring occurred from December 4, 1979 through June 6.1980.
Super cooling.-Super cooling experiments wre conducted to evaluate the cold hardiness of SPB (some 1, ealtigraphus were also tested). The freezing of field, laboratory-rear&, and preconditioned SPB
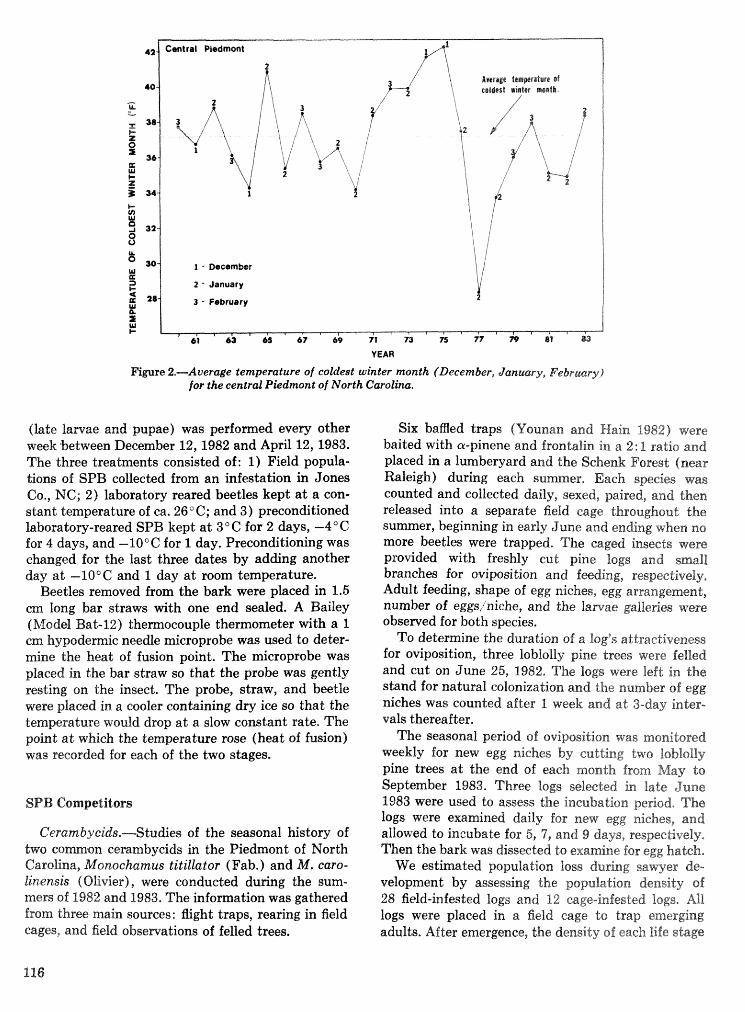
YEAR
Figure 2.-Average temperature of coldest winter month (December, hnuary, February) for the central Piedmont of North Carolina.
(late larvae and p u p e ) was performed every other week 'between December 12,1982 and April 12,1983. The three treatments consisted of: 1) Field popula- tions of SPB collected from an infestation in Jones Go., NC; 2) laboratory reared beetles kept a t a con- stant temperature of ca. 26" C; and 3) preconditioned laboratory-reared SPB kept a t 3" C for 2 days, -4 "C for 4 days, and -10°C for 1 day. Preconditioning was changed for the last three dates by adding another day a t -10°C and 1 day a t room temperature.
Beetles removed from the bark were placed in 1.5 em long bar straws with one end sealed. A Bailey (Model Bat-12) themocouple thermometer with a 1 em hypodemic needle microprobe was used to deter- mine the heat of fusion point. The microprobe was placed in the bar straw so that the probe was gently resting on the insect. The probe, straw, and beetle were placed in a cooler containing dry ice so that the temperature would drop a t a slow constant rate. The pokt a t which the teanperature rose (heat of fusion) was recorded for each of the two stages,
Geram by citz"s,-Studies of the seasonal history of on eerambycids in the Piedmont of North
Carolina, Monochamus ti tilla tor ( Fab. ) and 34, caro- It"nensi8 (BEvier), were conducted during the sum- mers of 1982 and 1983, The infomation was gathered from Ghree main sources: fight traps, rearing in field cages, and field obsewations of felled trees.
Six baffled traps (Younan and Hain 1982) were baited with a-pinene and frontailin in a 2: 1 ratio and placed in a lumberyard and the Schenk Forest (near Raleigh) during each summer. Each species was counted and collected daily, sexed, paired, and then released into a separate field cage throughout the summer, beginning in early June and ending when no more beetles were trapped. The caged insects were provided with freshly cut pine logs and small branches far oviposition and feeding, respectively. Adult feeding, shape of egg niches, egg arrangement, number of eggsiniche, and the larvae galleries were observed for both species.
To determine the duration of a log's altsncdl-deness for oviposition, three lobliolly pine trees were felled and cut on June 25, 1982. The logs were left in the stand for natural colonization and the number of egg niches was counted after 1 week and at 3-day inter- vals thereafter.
The seasonal period of ovipssition kvns manitcared weekly for new egg niches by cutting two loblolly pine trees a t the end of each month from May to September 1983. Three logs selected in late June 1983 were us& to assess the incarhaticin period* The logs were examined daily for new egg niches, and allowed to incubate for 5, 7, and 9 days, respectively. Then the bark was dissected to examine for egg Bwteh*
We estimated poplation loss during sawq.er de- velopment by assessing the population densitg of 28 field-infested logs and 12 cage-infested Bogs, All logs were placed in a field cage to trap emerging adults. After emergence, the density of each life sbge
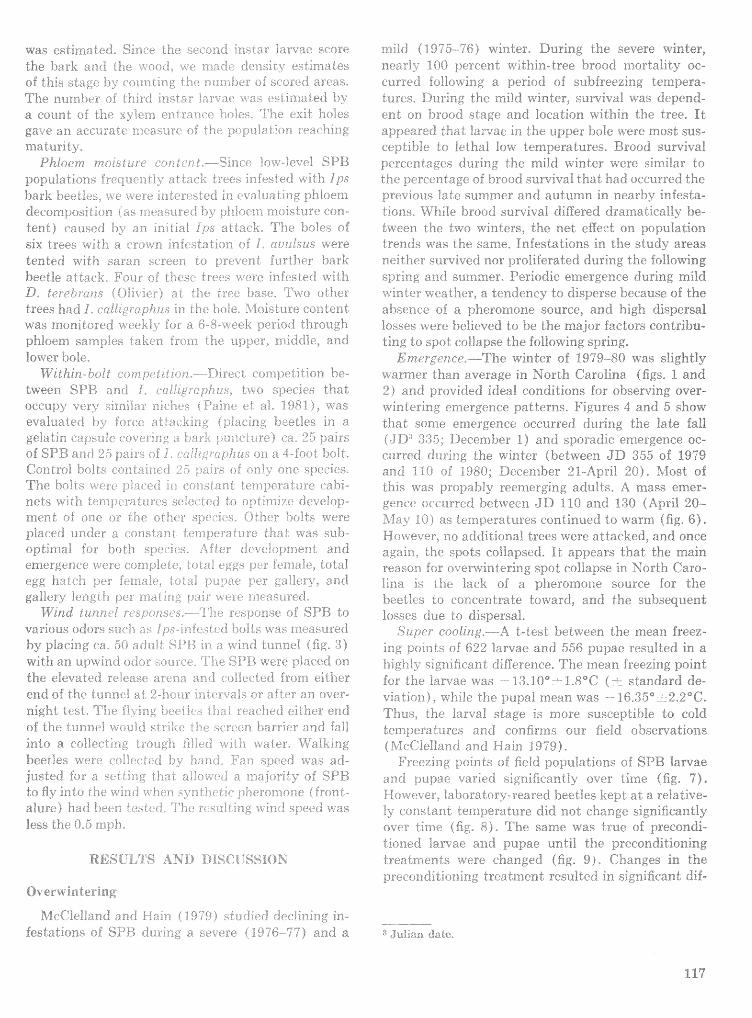
cli3d { 19"k-'"6 i 1% izter, During the severe winter, ntri.: i-- i SU pc.rici.at w~thln-tree Islood snorta!sty oc- ~ ~ i ~ 1 ~ e - f %oJ10=~ing a period of s~sbfreezing tempera- - ~ U P C S I ~ ~ l r ~ g the mi16 'vi~ter, survital was depend- enr on kianood sfage m d location within the tree, It ~ ; ~ , ~ l x r ~ d tki: ItAJ\ dil a~ppw bole xIv8;"e mosr SUS- cejrtil#lle re I r t h ~ & lo~v t~~nperatures, Brood survival p c h i ~ e r ~ t n g e ~ ~ j e l ~ * j ~ ~ I ~ C miid tvintet \*;ere similar lo :he pcrct::tre;r of i~rcod s u r ~ ~ v a l that had occurred the plt-diou~ la te Funlmer and aautumn in nearby infests-
* - fionr \;(nlie brtai;id survival differed dra1~1alica:ly be- riieeri the 't"~t'o wintzrs, t ! ~ net eflezt en pciprrlation f-.- rsl.n-a~?> was he same, Il-afcstations in the stud:: areas n4hhk.r ,-urvive~t nor proliferated during the fo!lowing c:il i tg :acd b..u~x;.~rmer, Periodic encergpnce durirrg mild - !ni_,-~ ~ ~ _ " s t ! ~ e r , a tendency $0 ciisperse iwrause sf the all~r~nc-u oi a pherouaernc source, and high dispersal Itsasex t4#6i,er~ kwli~ ved TO be the major factors contribu- tin$ to spc~; co%iapse ithe following spring,
Ernd~rgt stcc---The wrnCer of 1979-50 was slightly s,t1arrnae.r than s ~ e r a g e in Korth Cbr#>%-m"na (figs, 1 and 2 ) a1.d p~.svided ideal conditisn~ for observing over-- winrcrrng ;. mcrgence pattt3rns, Fig;"elres 4 and 5 show t219t sonic en"iergence occurred d:~ring the !ate fall 6 J D : i:3"t ~Tlecen~ber 1) anci sporadic emergence oc- edrded (iui lJlg the winter (between J D 355 of 1979
1 i s / ~f 1983: DecL-mber 21-April 40)- "Isst of thns vbbas pfi~;,abl:: rreefi~crgirig adl:ltb, A mass emer- gent P . P , t rxre d !letm cen J D 110 and 120 (Ai3.sril 20- s i, 1 7 1 ? ) / O < C :* _ I cnperatures eontinucd to warn; (fig, 6)- El~,l< ex r . ~ , ~ I O ai%:liticina% trees were at tacked, and once aq,.ai:l tb- q x ~ t s rao!Tap.~c;.d, 1; appears that the main rea~c:-~ fcr s~;erwin tering spot coliag~se in Sorbh Cam- Ilr~a :;- t h e o i a pheromofie source for the
l g 5 13 iiox~c er, tra te toward, snd the srlbsequent I b s i e ~ rlxe to di-gpersai,
Su;jr.lt r criolrng,---"4 t - fest bet~vcmt the: mean freez- 1 Orn t - PI 622 larvae and 556 pupae 1csu4ted in a
\.r>>ie ci,l,._* c;lgn~fi(*a~.,t d;iTel.-nc.e, The mean freezing point
for thcIarvat-~;a~as 13,1611" -1,8"6 ( standard de- v i b t i ~ ~ p 1 . v'hilt> f he p11pal mean waras -- 16,35"-- 2,2"6, Tkus, thc i2r;al stdge c - more susecptii~!e to cold d ~ ~ : p e r d " r ~ r e ~ and ci iarr f i~x~s sua- field observations (_".4dle&I:1nd a;;;;il Hain 19738,
=> - 7
F-;ds.tezifiX P(J : :~~F 3E f ieid cf SPB larvae - ?
prlof ;,lxq,at ~~gnlnc:intiy 4i_ver (fig, 71, If .iw,~r,-s, er, IP,~,orsztcJrj -feared bcp:lt!es hepr bl a relative-
( c;r,. fafit I t.nlg:era tuck dicJ ch3pge tlglr.,ifis?ar~tly oecr xiane r fig. 61, The sace was true of precondi- t,aJced bar-gae and pupae until &he preconditioning trest.trr;enls were changed (fig, 9'), Changes in the prcc ,il:ditic & ~ g treairnelll r-su:tli,d in &gnjfii.ag.a-t dif-
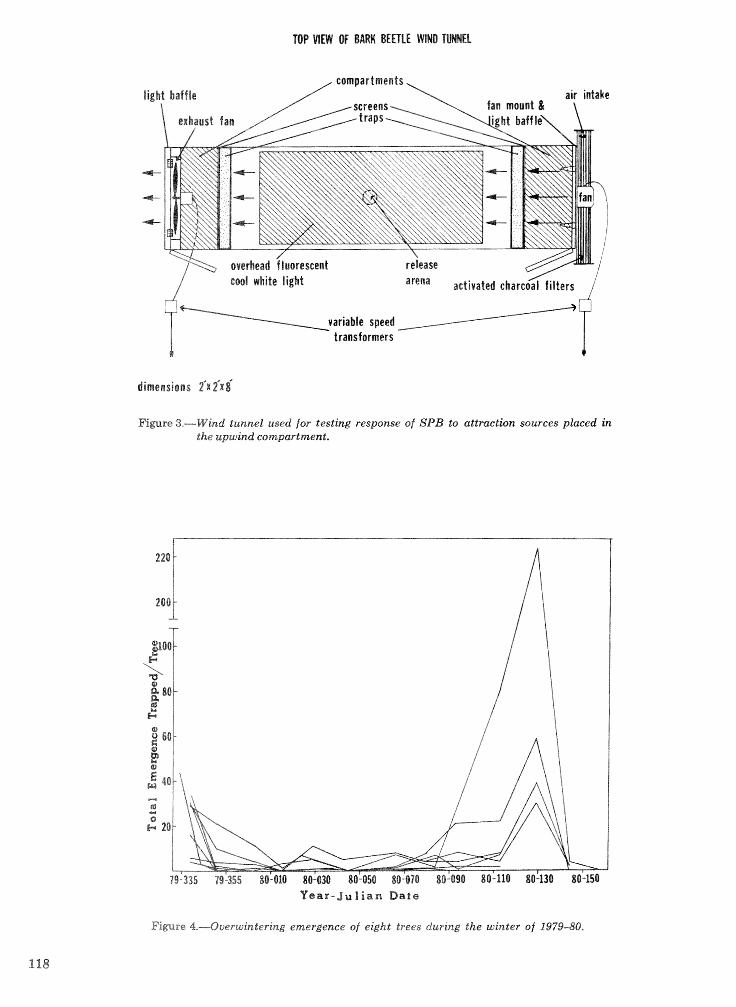
TOP MEW Of BARK BEETLE WIND TUNNEL
dimensions 2*x fx6
Figure 3.-Wind tunnel used for testing response of SPB to attraction sources placed in the upwind compartment.
Y e a r - ~ u l i a n Base
Figure 4.-Ouemintering emergence of eight trees during the winter of 197940.
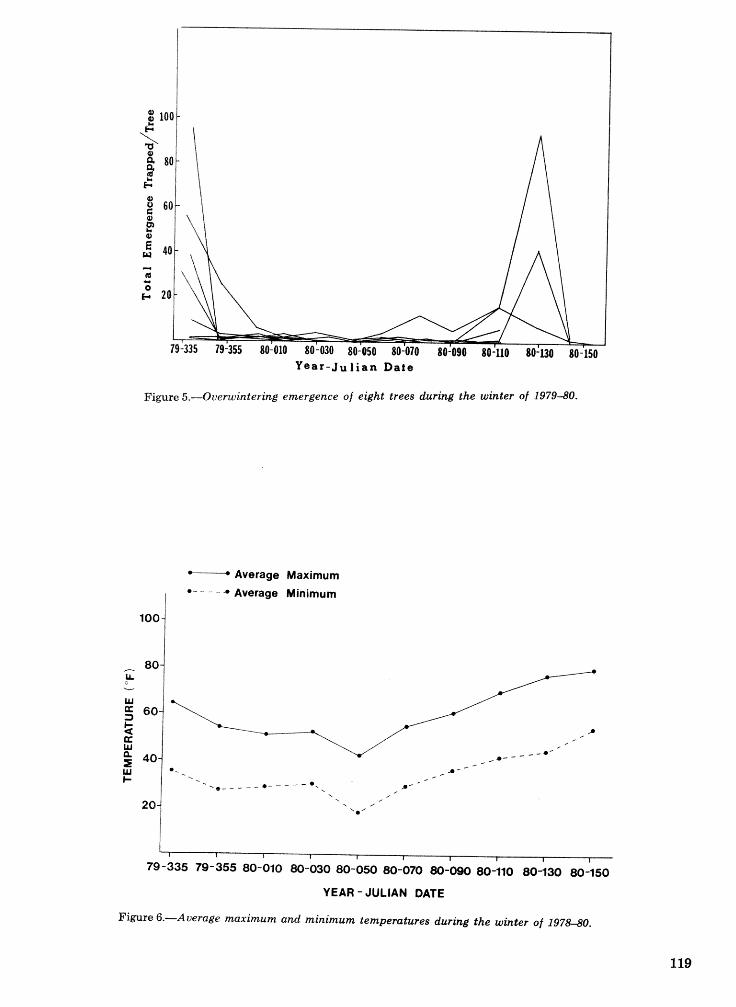
Year-Ju l i an Date
Figure 5.-Overwintering emergence o f eight trees during the winter of 1979-80.
o-----+ Average Maximum *- - - - Average Minimum
YEAR - JULIAN DATE
Figure 6.-Average maximum and minimum temperatures during the winter of 1978-80.
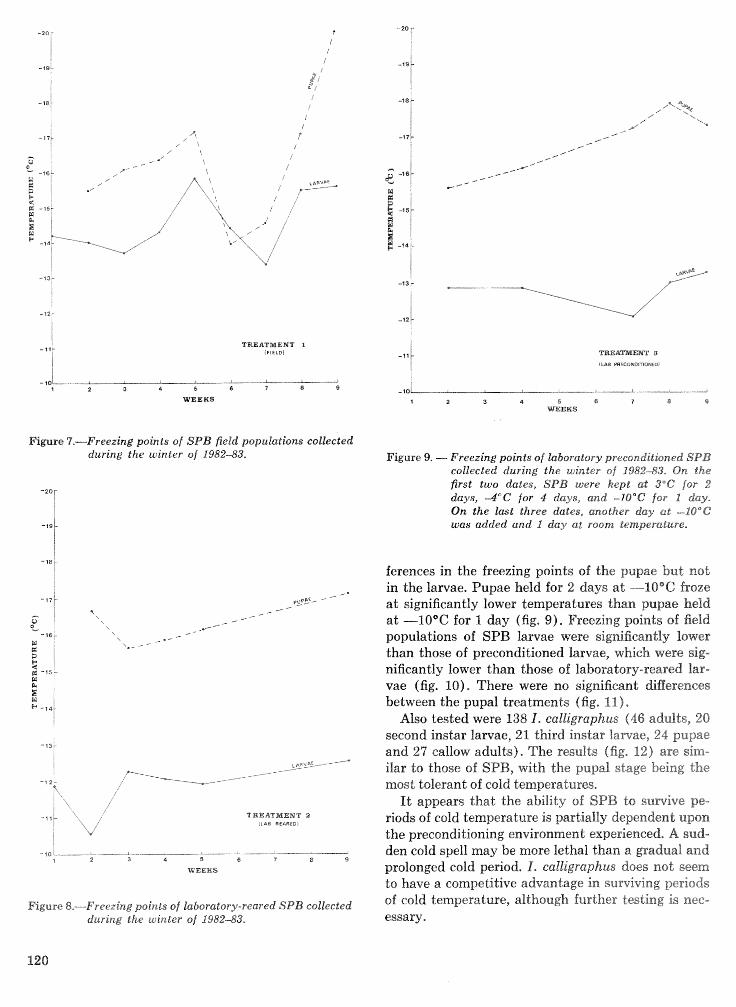
I I I
TREBTMENT I -?'I (FIELO, I . - t i t W A r n E r n 3
I I (LAB PRECONCrlYlOPiEOI
I - ,oi i
2 3 4 5 6 7 61 9 -10 j 1
--i
WEEKS 1 2 3 4 5 6% 7 B 9 WEEKS
Figure 7,---Freezing points of SPB fieid populations collected during the winter of: 1982-83, Figure 9. - Freezing points of laboratory preesnditioned SPB
collected during the winter of 6982-83. On the first two dates, SPB were kept at 3°C for 2
- 2 5 [
days, -4°C for 4 days, and -10°C for f day- On the last three dates, another day at ---%OQC was added and I day at room temperature.
- 10 L
1 2 3 4 5 G I 8 9 -
WEEKS
Figure 8.---Freezing pokds of laboramy-reared SPB collected during the winter sf 1982-83.
ferences in the freezing points of the pupae but not in the larvae. Pupae held for 2 days a t --10°C froze a t significantly lower temperatures than pupae held a t -10°C for 1 day (fig. 9). Freezing points of field populations of SPB larvae were significantly lower than those of preconditioned larvae, which were sig- nificantly lower than those of laboratory-reared lar- vae (fig. 10). There were no significant differences between the pupal treatments (fig, 11),
Also tested were 138 1. catlligi-aphus (46 adults, 20 second instar larvae, 21 third instar larvae, 24 pupae and 27 callow adults), The results (fig, 82) are sim- ilar to those of SPB, with the pupal stage being the most tolerant of cold temperatures,
It appears that the ability of SPB to survive pe- riods of cold temperature is partially dependent upon the preconditioning environment experienced. A sud- den cold spell may be more lethal than a gradual and prolonged cold period. I. calligraphus does not seem to have a competitive advantage in surviving periods of cold temperature, although further testing is nec- essary,
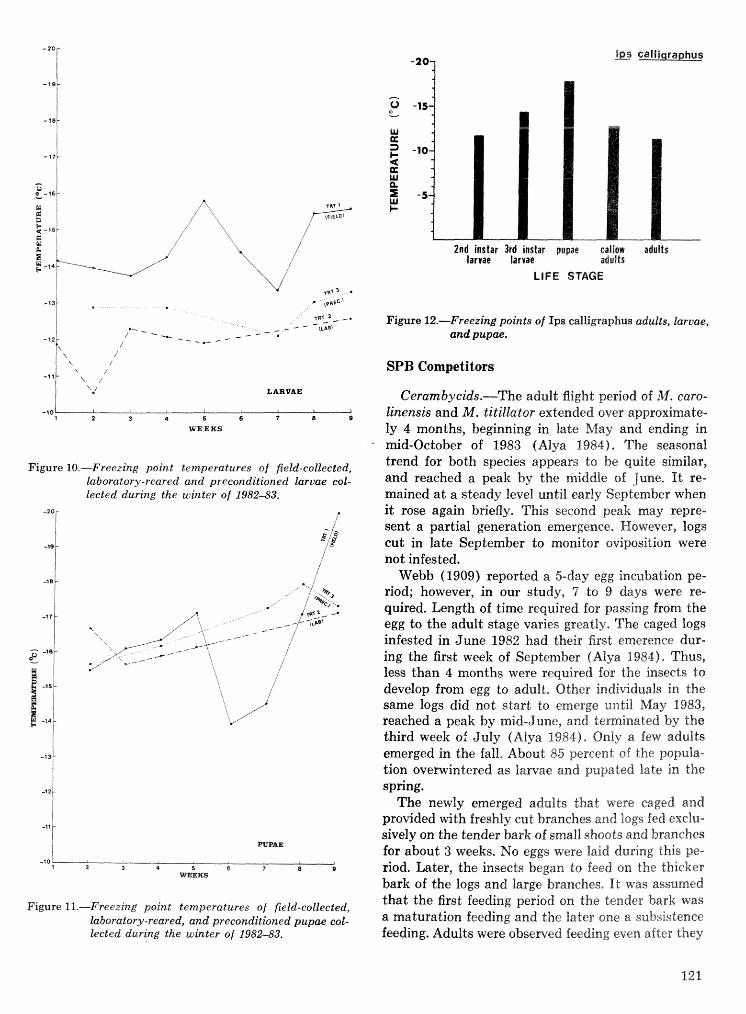
LARVAE
Figure 10.-Freezing point temperatures of field-collected, laboratory-reared and preconditioned larvae col- lected during the winter of 1982-83,
-20r I i
I
I PUPAE
-101 1 2 3 4 5 Ei 7 8 B
WEEKS
Figure 11.-Freezing point temperatures of field-collected, laboratory-reared, and preconditioned pupae cot- lected during the winter of 1982-83.
2nd instar 3rd instar pupae catlow adults larvae larvae adults
LlFE STAGE
Figure 12.-Freezing points o f I p s ealligraplhus adults, larvae, and pupae.
SPB Competitors
Cerambycids.-The adult Aigbt period of &f, caro- linensis and M. titillator extended over approximate- ly 4 months, beginning in late May and ending in mid-October of 1983 (Alya 1984). The seasonal trend for both species appears to be quite similar, and reached a peak 'Lay the middle of June. It re- mained a t a steady level until early September when i t rose again briefly. This second peak may repre- sent a partial generation emergence. However, logs cut in late September to monitor oviposition were not infested.
Webb (1909) reported a 5-day egg incubation pe- riod; however, in our study, 7 to 9 days were re- quired. Length of time required for passing from the egg to the adult stage varies greatly. The caged logs infested in June 1982 bad their first emerence dur- ing the first week of September (Alya 1984). Thus, less than 4 months were required for the Insects to develop from egg to adult, Other individuals in the same logs did not start to emerge until &lay 1983, reached a peak by mid-June, and terminated by the third week ot" July (Alya 8984), Only ia few adults emerged in the fall, About 85 percent of the popula- tion overwintered as larvae and pupated late in the spring.
The newly emerged adults that were caged and provided with freshly cut branches and logs bed exclu- sively on the tender bark of small shoots and branches for about 3 weeks. No eggs were laid during th is pe- riod. Later, the insects began to feed on the Gfiictges bark of the logs and large branches. It was assumed that the first feeding period sn the tender bark was a maturation feeding and the later one a subsistence feeding. Adults were observed feeding even after they
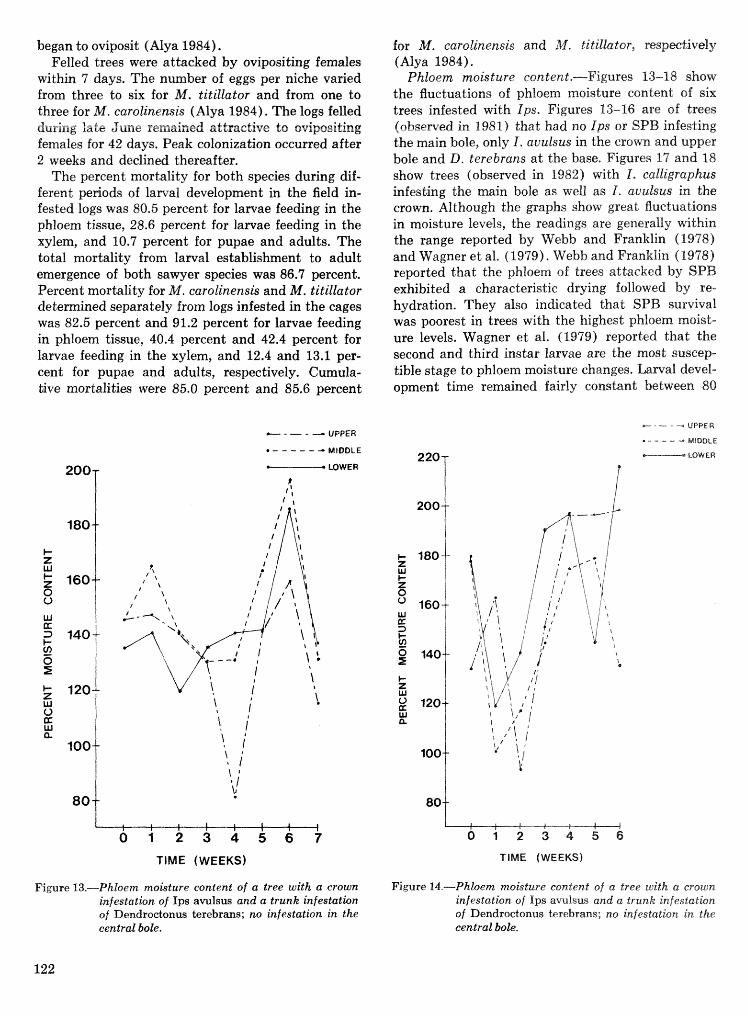
began to oviposit (Alya 1984). Felled trees were attacked by ovipositing females
withfn 7 days. The number of eggs per niche varied from three to six for M. titillator and from one to three for M. carolinensis (Alya 1984). The logs felled during late June remained attractive to avipositing females for 42 days. Peak colonization occurred after 2 weeks and ded ind thereafter.
The percent mortality for both species during dif- ferent periods of larval development in the field in- fested logs was 80.5 percent for larvae feeding in the phloem tissue, 28.6 percent for larvae feeding in the xylem, and 10.7 percent for pupae and adults. The total mortality from larval establishment to adult emergence of both sawyer species was 86.7 percent. Percent mortality for M. carolinensis and M. titillator detemined separately from logs infested in the cages was 82.5 percent and 91.2 percent for larvae feeding in phloem tissue, 40.4 percent and 42.4 percent for larvae feeding in the xylem, and 12.4 and 13.1 per- cent for pupae and adults, respectively. Curnula- hive mortalities were 85.0 percent and 85.6 percent
- - - --0 UPPER .----- -. MIDDLE
for M. carolinensis and M , titilla tor, rmpdively (Alya 1984).
Phloem moisture content,-Figures 13-98 show the fiuetuations of phloem moisture content of six trees infested with Ips. Figures 13-16 are of trees (ohsewed in 1981) that had no Ips or SPB infesking the main bole, only I . avtklsus in the crown and upper bole and 11). terebrans a t the base. Figures 17 and 118 show trees fobsemed in 1982) with 1, calligraphus infesting the main bole as well as I , auukus in the crown. Although the graphs show great fluctuations in moisture levels, the readings are generally within the range reported by Webb and Franklin (1978) and Wagner et al. (1979). Webb and Franklin (1978) reported that the phlaem of trees attacked by XPB exhibited a characteristic drying followed by re- hydration. They also indicated that SPB survival was poorest in trees with the highest &loem moist- ure levels. Wagner et al. (1979) reported that the second and third instar larvae are the most suscep- tible stage to phloem moisture changes. Larval devel- opment time remained fairly constant between 80
c- - - - - UPPER
* - - - - -4 MIDDLE - LOWER
TIME (WEEKS)
Figure 13.-Phloem moisture content of a tree with a crown infestation of Ips avulsus and a trunk infestation of Dendroctonus terebrans; no infestation in the central bole.
0 1 2 3 4 5 6
TIME (WEEKS)
Figure 14.-Phloem moisture content of a tree with a crown infestation of I p s avulsus and a trunk infestatkn of Dendroctonus terebrms; no infestation En the central bole.
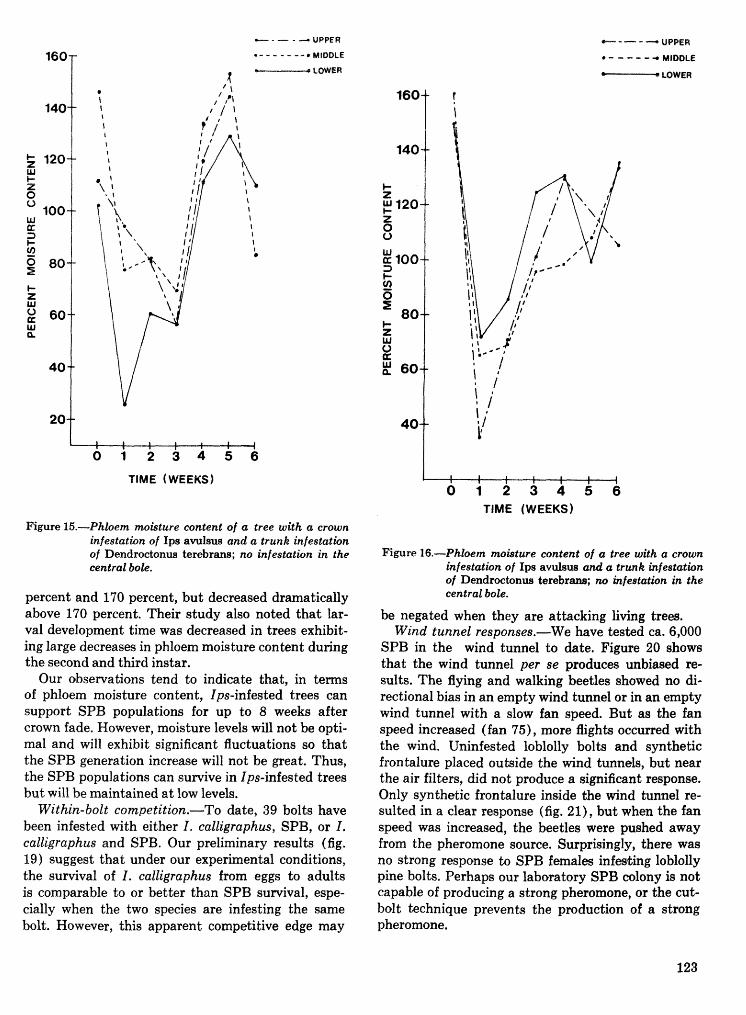
UPPER
MIDDLE
LOWER
0 1 2 3 4 5 6
TIME (WEEKS)
Figure 15.-Phloem mokture content of a tree with a crown infestation of Ips avulsus and a trunk infestation of Dendroctonus terebrans; no infestation in the central bole.
percent and 170 percent, but decreased dramatically above 170 percent. Their study also noted that lar- val development time was decreased in trees exhibit- ing large decreases in phloem moisture content during the second and third instar.
Our observations tend to indicate that, in terms of phloem moisture content, Ips-infested trees can support SPB populations for up to 8 weeks after crown fade, However, moisture levels will not be opti- mal and will exhibit significant fluctuations so that the SPB generation increase will not be great. Thus, the SPB populations can survive in Ips-infested trees but will. be maintained a t low levels,
Within-bolt competition.-To date, 39 bolts have been infested with either I. calligraphus, SPB, or I, calligraphus and SPB. Our preliminary results (fig. 19) suggest that under our experimental conditions, the survival of I. calligraphus from eggs to adults is comparable to or better than SPB survival, espe- cially when the two species are infesting the same bolt. However, this apparent competitive edge may
CI--- - . . UPPER
* - - - - - *MIDDLE - LOWER
TIME (WEEKS)
Figure 16.-Phloem moisture content of a tree with a crown infestation of Ips avuisus alad a trunk infestation of Dendroctonus terebrans; no linfestation in the central bole.
be negated when they are attacking living trees. Wind tunnel responses.-VVe have tested ca. 6,000
SPB in the wind tunnel to date. Figure 20 shows that the wind tunnel per se produces unbiwed re- sults. The flying and walking beetles showed no din rectional bias in an empty wind tunnel or in an empty wind tunnel with a slow fan speed. But as the fan speed increased (fan 75), more flights occurred with the wind. Uninfested loblolly bolts and synthetic frontalure placed outside the wind tunnels, but near the air filters, did not produce a significant response. Only synthetic frontalure inside the wind tunnef re- sulted in a clear response (fig. 21), but when the fan speed was increased, the beetles were pushed away from the pheromone source. SurprisingIy, there was no strong response to SPB females infwthg loblolly pine bolts. Perhaps our laboratory SPB colony is not capable of producing a strong pheromone, or the cut- bolt technique prevents the production of a strong pheromone.
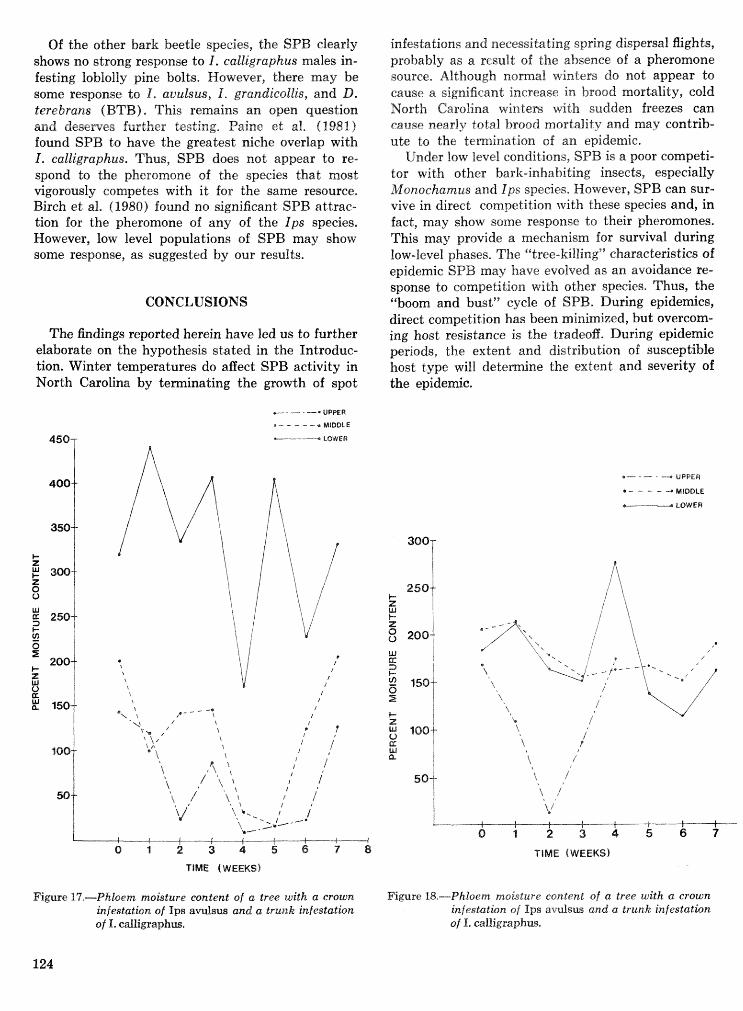
Of the other bark beetle species, the SPB clearly shows no strong response to 15, caltigraphus males in- festing loblolly pine bolts, However, there may be some response to I, atlubws, I, grandieoltis, and D. terebrans (BTB), This remains an open question and desemes further testing, Paine ed al. (1981) found SPB to have the greatest niche overlap with I. ealligraphuas. Thus, SPB does not appear to re- spond ts the pheromone of the species that most vigorously competes with it for the same resource. Birch et al. (I 980) found no significant SPB attrac- tion for the pheromone of any of the Ips species. However, low level populations of SPB may show some response, as suggested by our results.
CONCLUSIONS
The findings reported herein have led us to further elaborate on the hypothesis stated in the Introduc- tion. Winter temperatures do affect SPB activity in North Carolina by terminating the growth of spot
.-.---e UPPER
I - - - - - e MlDDLE
infestations and necessitating spring dispersal flights, probably as a result of %he absence of a pheromone source. Although nomal winters do not appear t s cause a significant increase in brood mortality, cold North Carolina windem Gtfi sudden freezw can cause nearly total hrnnd mortality and may contrib- ute to the ternination of an epidemic,
Under low level conditions, SPB is a poor competi- tor with other bark-inhabiting insects, especially Monochamus and f ps species, However, SPB can sur- vive in direct competition with these species and, in hct , may show some response lo their pheromones. This may provide a mechanism for survival during low-level phases. The "tree-killing" characteristics of epidemic SPB may have evolved as an avoidance re- sponse to competition with other species. Thus, the '%boom and bus19hcycle of SPB, During epidemics, direct competition has been minimized, but overcorn- ing host resistance is the tradeoff. During epidemic periods, the extent and distribution of susceptible host type will determine the extent and severity of the epidemic.
TIME (WEEKS)
*- - - - ---r UPPER
m - - - - --a MIDDLE
e r LOWER
TlME (WEEKS)
Figure 17,---Phloem moisture content of a tree with a crown Figure 18.-Phloem ntokture content of a tree with a crown infestation of Ip s avdaus and a! tru~tk infestatkn infestation of Ip s avulsus and a trunk infestatisn of I. calligraphw. of I. ealligraphm.
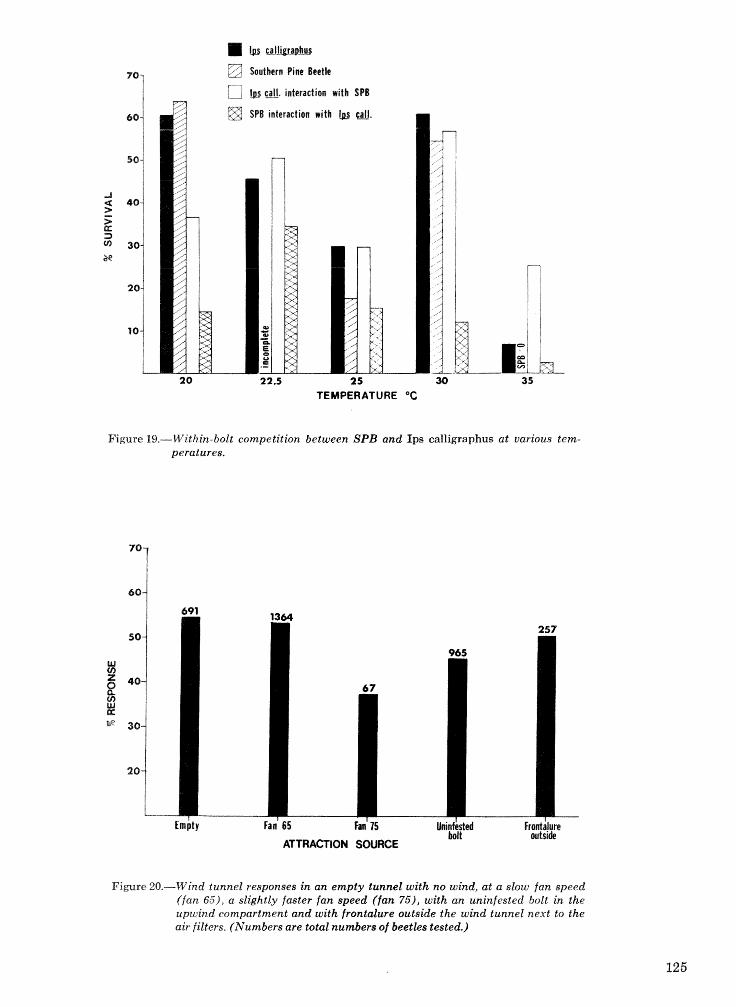
Dfps Southern Pine Beetle
11 @ c d . interaction witk SPB
@ SPB interactibn with ?Jts ca.
TEMPERATURE O C
Figure 19.-Within-bolt competition between SPB and Ips calligraphus at uarious tem- peratures.
ATTRACTION SOURCE bit
Figure 20.-Wind tunnel responses in. an empty tunnel with no wind, at a slow fan speed ( f an 65), a slightly faster fan speed ( f a n 751, with an uninfested bolt in the upwind compartment and with frontalure outside the wind tunnel next to the air filters. (Numbers are total numbers of beetles tested.)
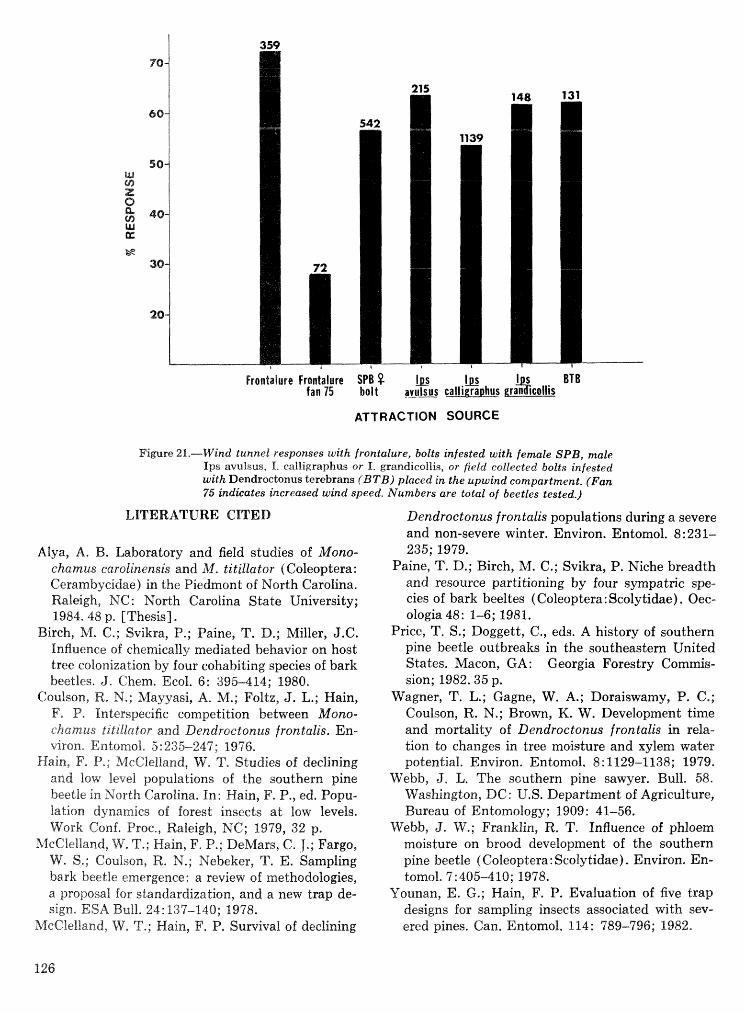
Fronlalure Frontalure SPB gr S c a j i i s
BT B fan75 bol t avuisus
ATTRACTION SOURCE
Fimre 21.-Wind tunnel responses with frontalure, bolts infested with female SPB, male I p s avulsus, 1. ealligrapkaus or I. grandicsl'lis, or field collected bolts infested with Dendroctonus terebrans (BTB) placed in the upwind compa~tment. (Fan 75 indicates increased wind speed. Numbers are total of beetles tested.)
LITERATURE CITED
A'tya, A. B. Laboratory and field studies of Mono- chamus carolinensis and 34. tititlator (Coleoptera: Gerambycidae) in the Piedmont of North Carolina. Raleigh, MC: North Carolina State University; 1984.48 p, [Thesis].
Birch, M, 6.; Svikra, P.; Baine, T. D,; Miller, J.G. Influence of chemically mediated behavior on host tree colonization by four cohabiting species of bark beetles. J, Chem. Ecol. 6: 395414; 1980.
Coulson, R, N.; hqayyasi, A. M.; Foltz, J. L.; I-fain, F, I?* Interspecific competition between Mono- chamrrs titillator and Dendroctonus frontalis. En- krone Entomol, 5:235-247: 1976,
Hain, P". P,; A~fcClelland, W, T. Studies of declining and low level populations of the southern pine beetle in North Carolina, In: Hain, F, P., ed. Popu- lation dynamics of forest insects a t low levels. t"iiork Conf. Proc., Raleigh, NC; 14W, 32 p.
McClelland, W. T.; Hain, F. P.; DeMars, C. 1.; Fargo, W. S.; Coulson, R, N.; Nebeker, T. E. Sampling bark beetle emergence: a review of methodoiiogies, a proposal for standardization, and a new trap de- sign. ESA Bull, 24: 13'7-140; 11378.
&aeCle2%and, W, T,; Hain, F. P. Sumtival of declining
Dendroctonus frontalis populations during a severe and non-severe winter. Environ. Entomol. 8:231- 235; 1979.
Paine, T. D.; Birch, M. C.; Svikra, P. Niche breadth and resource partitioning by four sympatric spe- cies of bark beeltes (Coleoptera : Scolytidae) . Oee- ologia 48: 1-6; 1981.
Price, T. S.; Doggett, C., eds. A history of southern pine beetle outbreaks in the southeastern United States. Macon, GA : Georgia Forestry Commis- sion; 1982.35 p,
Wagner, T. L.; Gagne, W. A.; Doraiswarny, P. C.; Coulson, R. N.; Brown, K. W. Development time and mortality of Dendroctonus frontalis in rela- tion Lo changes in tree moisture and xylem water potential, Environ. Entomol. 8 : 1129-1 138; 1979.
Webb, 6. L. The southern pine sawyer. Bull. 58. Waskington, DC: U,S, Department of Agriculture, Bureau of Entomology; 1909: 41-56.
Webb, J. IT.; Franklin, R. 'I" Influence of phloem moisture on brood development of the southern pine beetle ( Coleoptera: Scolytidae) . Environ. En- tomol. 7: 405410; 1978.
Uounan, E. 6.; Hain, F. P, Evaluation of five trap designs for sampling insects associated with sev- ered pines. Can. Entomol. 114: 789-796; 1982,
Relationship of Symbiotic Fungi to Southern Pine Beetle Population Trends
J. Robert Bridges'
A bs tract.-The sy~~b io t i c flangi assuciakd with the southern pine beetle (Dendroctonus frontalis
emann) vary widely among beetle infestations. Study Two mycangial fungi significantly affected beetle survival, brood production, and infestation grourth, but each aBected the beetle in different ways. Under- standing complex symbiotic interrelationships may be the key to understanding beetle population dynamics. Additional keywords : Dendroctonus f ron talis, Cera- tocystis minor, Sporothrix, bark beetle, symbiosis, blue-stain fungus.
INTRODUCTION
The evolutionary success of bark beetles can be attributed in part to symbiotic relationships with fungi (Berryman 1982). Although fungi are thought to be the major pathogens of beetle-infested trees, they may also be important in larvae nutrition, af- fecting the survival and development of beetle broods. Knowledge of this symbiosis is a key element in un- derstanding the population dynamics sf these in- sects (Berryman 1982).
The association of Dendroctonus frontalis Zimmer- mann (SPB) and fungi is an example of a highly evolved symbiosis. The adult female SPB has a high- ly developed mycangium, which is a cuticular pouch on the prothorax containing specialized gland cells (Happ et al. 1971, Barras and Perry 1972). This structure assures the transmission of fungi from tree to tree.
The SPB carries two species of fungi in its mycan- gium. One of the fungi is an unidentified basidiomy- cede, The other fungus is a Sporothrix sp. (Barras and Perry 1971). This nonstaining ascomycete is a va- riety of the blue-staining fungus, Cera tocy s tis minor Hedgcock (Hunt), also associated with SPB (Barras and Taylor 1973). The blue-staining form is not car- ried in the mycangium but is carried externally on SPB by phoretic mites (Bridges and Moser 19831,
This research examined the fungi associated with several SPB populations over a 2-year period. The purpose was to determine the frequency of occur- rence of the two mycangial fungi and the blue-stain- ing fungus, C. minor, in beetle infestations and to relate variations in fungal populations to SPB popu- lation changes.
Wesearch Entomologist, U.S. Department of Agriculture, Forest Service, Southern Forest Experiment Station, Pine- ville, LA.
METHODS
In 1983, SPB infestations kvere sampled in Texas, Louisiana, hfississippi, Alabama, and Georgia. Plots were located in seven geographic areas that ineluded the Sam Houston National Forest in Texas, the Sa- him, Davy Croekett, and AtlgePina Kational Forests in east Texas, the Kisatchie National Forest in cen- tral Louisiana, Calcasieta Parish in southwest Louisi- ana, the Homochitto National Forest in Mississippi, Pickens and Lamar Counties in Alabama, and the Fort Benning Military Reservation in Georgia. In 1984, SPB infestations were sampled on the Sam Houston and Sabine National Forests in Texas and on the Kisatchie National Forest in Louisiana,
Data Collection Procedures
f 983.-In most infestations (spots), f ve trees were sampled. Trees were selected in which SPB pupal/ callow adult stages were predominant. Ln each tree, four 100-cm2 bark disk samples were removed a t each of three heights (1.5, 3.5, and 6.5 m). After each barlc sample had been removed, the wood beneath the sam- ple was examined. If the blue-stain present was ebar- acteristic of that produced by 6.. minor, the area of stained wood was recorded by tracing the stain onto a piece of mylar (Bridges et al. 1985).
Bark samples were taken to the laboratory and placed in individual rearing containers. The number of attack sites was detemined by examining the bark s2mples (Linit and Stephen 1978). Measusemen t of the length sf gallery constructed by SPB considered only the parts of the sample not destroyed by sawyer beetle foraging (Coulson et al, 4976), Emerging brood adult beetles were collected daily, except for weekends, Live female beetles without missing parts were weighed using a Gahn electobalanee, then frozen until their mycangia could be examined, For identi- fication of the fungi, the mycangiurn sf each female was removed and mounted in lactsphenol,'eotdoM blue on a microscope slide (Bridges 1983).
Data were obtained on total emergenee sf brood adults (EMER) and the number of eggs laid (EGG). (See table I for definitions of abbreviations.) EGG
was estimated as 1.59 >-< GLEN (Folta et ale 1976). Population trend idexes included survival
(SURV) = EMER/ECG and ratio of increase (RI) = EMER/(2 X ATK) (Thatcher and Pickard 1964). Each sample tree was measured to det
'
diameter a t breast height (DBK), total (HGT), crown ratio (CR), and radial growth in the last 5 and PO years (G5 and Glf)) ,
Most of the spots were exa ed 2 weeks a h r the initial sampling do inf wtation enlargenzent. At each visit, the p nant lxood stage in each infested tree was recorded. Pine and hardwood basal areas of the stand were measured a t the advmcing head of each spot,
1984.-In 1984, sampling procedures were s to those used in 1983. Three t r w were sarnpled in most spots. Beetle collection procedures were the same as in 1983, except that beetles were not weighed.
Additional trees in each spot were examined by removing a strip of bark approximately 30 cm wide from around each tree a t 1.5 m and observing the wood for charwteristjc patches of C. minor stain. Only trees with SPB brood in late larva to adult stages were used for these blue-stain observations. Blue-stain in trees with brood in earlier stages may not be fully developed or recognizable.
Data Analyses
For analysis of the relationship of female weight and mycangial fungi, beetles were grouped accord- ing to whether they carried the basidiomycete alone, Sporothrix alone, both fungi, or no fungi. Mean weights of beetles in these groups were compared using a one-way analysis of variance.
Sbpvuise regression analyses were run to examine the relationship of symbiotic fungi to beetle popula- tion trend indexes, Regression analyses were run using BMDP2 computer programs. Dependent variables were SURV and RX (table 1). Independent variables included measurements of sample tree chara&eristjcs, variables describing the frequency of occurrence of mycangial fungi, and blue-stain variables (table 1 ) . Data were pooled for each tree. Data on 206 trees from both years were included in the analyses.
Stepwise regression analyses were also used to evaluate relationships between spot growth param- eters and other infestation paarmeters. Data were pealed for each plot, and data from both years were included in the analyses. The dependent variable was the number of dead trees in the spot at the second visit (a"% ) . Independent variables included the number of dead trees in the spot at the initial visit (TI), mycangial fungus variables, blue stain vari-
2 Produced by Software Development Inc., P.O. Box 675, Middlebury, VT 05753.
ables, EMER, SURV, RI, propr-t;isa of trees ~ i & h SPB in each brmd stage, proportion of infeskd trees of each species, mean d.b.h. of infested trees, sample tree characteristics, and basal area measurements,
Table 1. - List of abbreviations of ua&r"sEes measured fir e w h Cree sampled
Variable Definition
ATK B BA BOTH BSA BSZ CR DBH EGG EMER FUNGUS G5 G10 GLEN HGT RI S SA SURV
Number of attack sites per sarnple Percent of f e d e s with the basidiomyeete Percent of females *th the basidictmycek done Percent of fernales vvith both %n@ Percent of each smpEe steind by C'- minor Percent blue stain-fm samples in a tree Crown ratio Diatneter at breasg height of sample drm Eggs = GLEN X 1.59 Total numbr of brood emerged per sample Percent of fernales with either f u m e s Radial growth in last 5 yews Radial growth in last 10 years Length of SPB gdlery per smple Tree height Ratio of incmase .I= EMERI(2 X ATK) Percent of fenades with S p r o t h ~ x Percent of females with S p r o t h ~ x done Brood survivd =: EMERIEGG
RESULTS
Examination of emerging beetlw for the presence of mycangial fungi revealed that the basidiomycete was the predominant fungus in most SPB populatims* In 1983, Sporothrix occurred more frequently tban the basidiomycete in only three spots (table 2). In. 1984, the Sporothrix occurred more frequently than the basidiomycete in four spots (table 3)- Although emerging beetles almost always carried one or both fungi, a small proportion of the population in each spot emerged with empty mycangia. In 1983, the proportion of beetles that carried no mycangial fungi ranged from 0.6 percent to t3.6 percent (table: 2) ; in 1984, the values were 0.4 percent to 7.0 percent (table 3)
Beetles often emerged carrying both fungi (taPlles 2 and 3). The two fungi were seldom internixed in the mycangium. When a beetle carried both hngi, they were usually found on opposite sides of tbe my- can@um. Of 14,215 beetles examined in 1983, smfy 0.3 percent of the time were the two fungi inlemixed, In 1984, 1.8 percent of 9,914 beetles had inte fungi. In earlier studies, 0.3 prcent of SPB myeara~a were found to contain i n t e r ~ x e d fund (BE*-idges 1983).
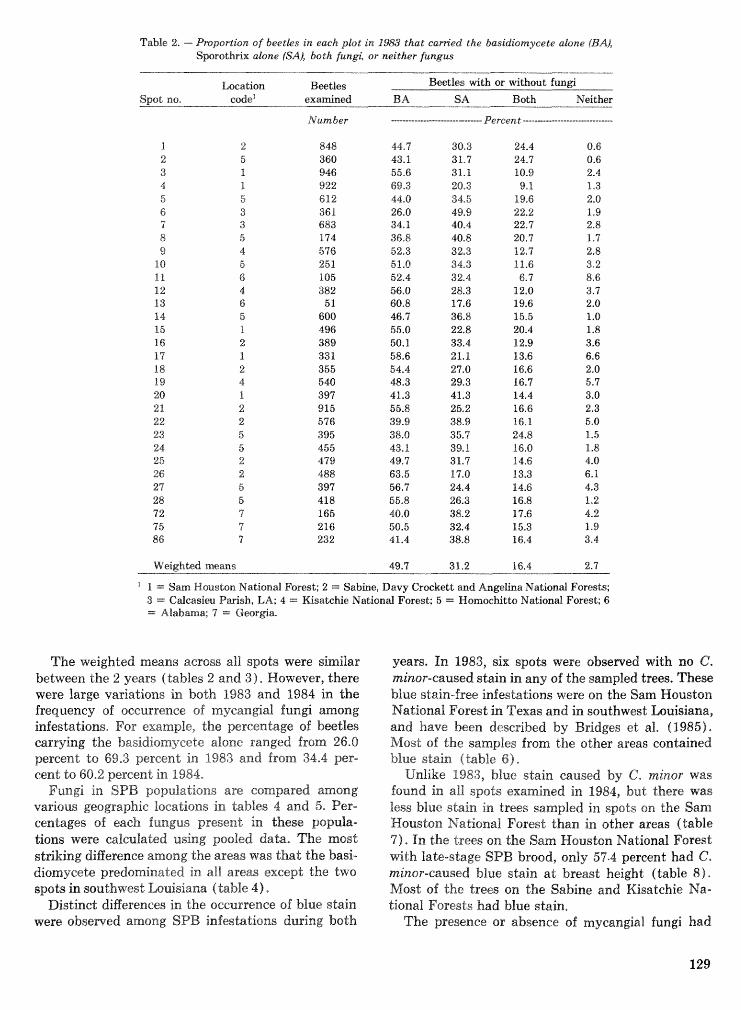
Table 2. - Prcgortion sf beetks in e w h igbt in PN that ca-r~ed the basic2iontycete alone tBAIp Sjporothrk atone TSAf, both fungi, or neither fungus
LoeatlIon Beetles Spat no. code" e x h n e d BA SA Both Neither
Weighted mans 49.7 31.2 16.4 2.7
" = S m Houston Nationrrl Forest; 2 = Sabine, Davy Crockett and Angelina National Forests; 3 = Cdeasicru Papish, LA; 4 -- Kisatcbie Nationd Forest; 5 = Mornochitto National Forest; 6 = Alabama; 7 =. Gear&a.
The weighted means across all spsts were similar between the 2 years (tables 2 and 3). However, there were large va~at ions in both 1983 and 1984 in t;lhe frequency of occurrence of mycsrngial fun& among infestations, For example, the percentage of beetles carwing the baasidismycete alone ranged from 26.0 percent to 69,3 percent in 1983 and from 34.4 per- cent Lo 60.2 percent in 198.6,
Fmr%g;i in SPB popu%a.&isns are compared among various geographic locations in tables 4 and 5, Per- centages 0% each funms present in these popula- .tlions were calculated using pooled data, The most stPiking &Berenee among the areas 'pirag that the basi- diomycete predominated in aBB areas except the two spots in southwest Louisiana (table 4).
Distinct differences in the occurrence of blue stain were obsewed among SPB infestations during both
years. In 1983, six spsts were observed with no 6. minor-caused stain in any of the sampled trees. These blue stain-free infestations were on the Sam Houston National Forest in Texas and in southwest huisiana, and have been described by Bridges ek al. f 1985). Most of the samples from the other areas contained blue stain (table 6 1,
Unlike 1983, blue sh in eaused by C. minor was found in aBX spots examined in 1984, but there was less blue stain inn trees sampled in spots can the Sam Houston National Forest than in other areas (table '7). In the trees on the Sam Houston. National Forest srritk late-stage SPB brood, only 5T4 percent had 6. minor-caused blue slain a& breast height (table 8 ) . Most sf the trees on the Sabine and Kisatchio Xa- tional Forests had blue stain,
The presence or absence of mycangial fungi had
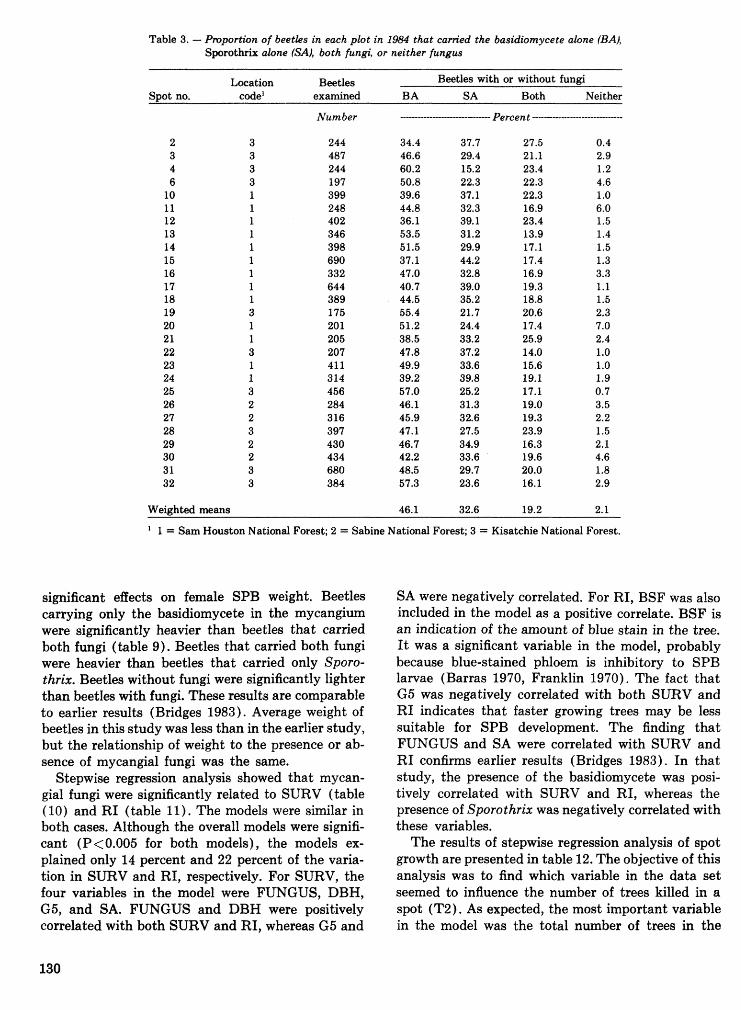
Table 3, - Pmportion of beetles in each plod in 19&P that cam*ed the bast'dionzycete &ne (6tA), Spotothrix alone (SA), both fungi, or neither fungtls
h a t i o n Beetles Beetles with or without fungi Smt no, code" BA SA Both Neither
Number .------------------------- Percent -------..-----------------
Weighted means 46.1 32.6 19.2 2.1
1 = Sam Houston National Forest; 2 = Sabine National Forest; 3 = Kisatchie National Forest.
significant effects on female SPB weight. Beetles carrying only the basidiomycete in the mycangium were sidficantly heavier than beetles that carried both fungi (table 9). Beetles that carried both fungi were heavier than beetles that carried only Sporo- thrix. Beetles without fungi were significantly lighter than beetles with fungi. These results are comparable to earlier results (Bridges 1983). Average weight of beetles in this study was less than in the earlier study, but the relationship of weight to the presence or ab- sence of mycangial fungi was the same.
Stepwise regression analysis showed that mycan- gial fungi were significantly related to SURV (table ( 10) and RI (table 11 ) . The models were similar in both cases. Although the overall models were signifi- cant (P<0.005 for both models), the models ex- plained only 14 percent and 22 percent of the varia- tion in SURV and RI, respectively. For SURV, the four variables in the model were FUNGUS, DBH, G5, and SA. FUNGUS and I3BH were positively correlated with both SURV and RI, whereas G5 and
SA were negatively correlated. For RI, BSF was also included in the model as a positive correlate. BSF is an indication, of the amount of blue stain in the tree. It was a significant variable in the model, probably because blue-stained phloem is inhibitory to SPB larvae (Barras 1970, Franklin 1970). The fact that G5 was negatively correlated with both SURV and RI indicates that faster growing trees may be less suitable for SPB development. The finding that FUNGUS and SA were correlated with SURV and RI confirms earlier results (Bridges 1983). In that study, the presence of the basidiomycete was posi- tively correlated with SURV and RI, whereas the presence of Sporothrix was negatively correlated with these variables.
The results of stepwise regression analysis of spot growth are presented in table 12. The objective of this analysis was to find which variable in the data set seemed to influence the number of trees killed in a spot (T2). As expected, the most important variable in the model was the total number of trees in the
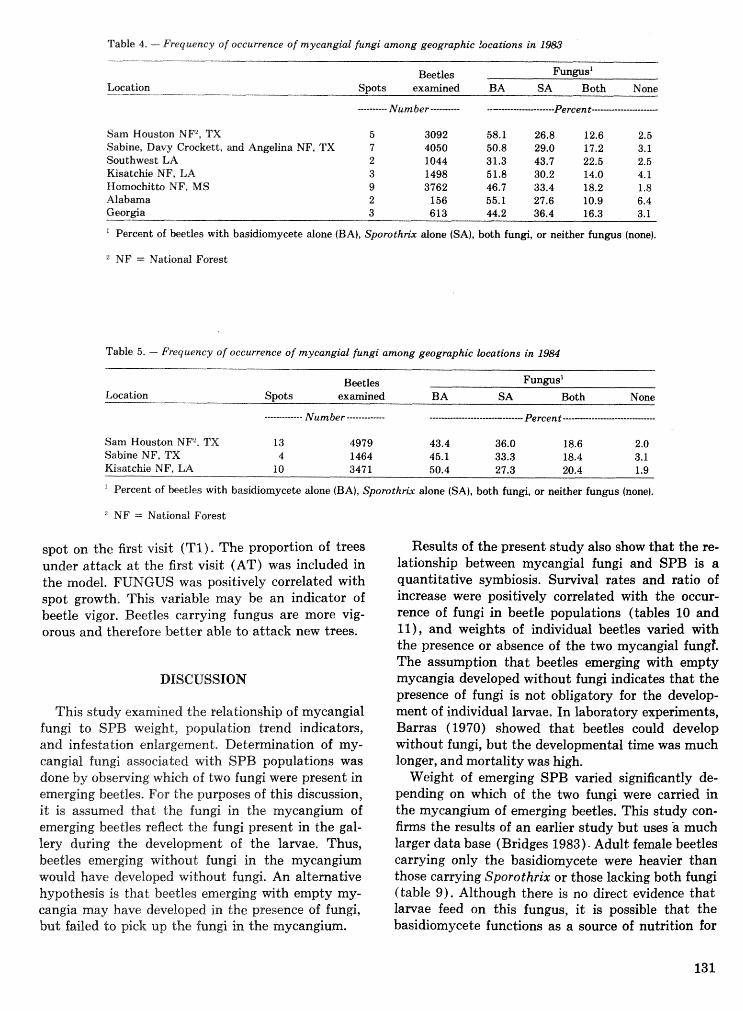
Table 4. -- Frequency of occurrence of myeangial fungi among geographic !oeations in 1983
Bmtles Lwation Spots e x m i n d BA SA Both Mone
S m Housmn NIP, TX 5 3092 58.1 26.8 12.6 2.5 Sabine, Davy Grwket;t, and Angelina NF, TX 7 4050 50.8 29.0 17.2 3.1 Southwest LA 2 1044 31.3 43.7 22.5 2.5 Kisatchie NF', LA 3 1498 51.8 130.2 14.0 4. I Wornwhitto NF, MS 9 3762 46.7 33.4 18.2 1.8 Alabarna 2 156 55.1 27.6 10.9 6.4 Geor@a 3 613 44.2 36.4 16.3 3.1
hrcent of hetles with basidiomycete done {BA), Sporothnjc alone (SA), both fungi, or neither fungus (none).
Table 5. - Frequency of occurrence o f mycangial fungi among geographic locations in 1984
Beetles Fungus1 Location Spots examined BA SA Both None
------------- Number ------------- ------------------------------- Percent ---- --- -------.------------.---
Sam Houston NF2, TX 13 4979 43.4 36.0 18.6 2.0 Sabine NF, TX 4 1464 45.1 33.3 18.4 3.1 Kisintchie NF, LA 10 3471 50.4 27.3 20.4 1.9
Percent of ketles with basidiomycete alone (BA), Sporoth* alone (SA), both fungi, or neither fungus (none).
WNF =. National Forest
spot on the first visit (TI ) . The proportion of trees under attack a t the first visit (AT) was included in the model. FUNGUS was positively correlated with spot growth. This variable may be an indicator of beetk vigor. Beetles carrying fungus are more vig- orous and therefore better able to attack new trees,
This study examined the relationship of mycangial fungi to SPB weight, population trend indicators, and infestation enlargement, Determination of my-
Results of the present study also show that the re- lationship between rnycangial fungi and SPB is a quantitative symbiosis. Survival rates and ratio of increase were positively correlated with the occur- rence of fungi in beetle populations (tables 10 and ll), and weights of individual beetles varied with the presence or absence of the two mycangial fungf. The assumption that beetles emerging with empty mycangia developed without fungi indicates that the presence of fungi is not obligatory for the develop- ment of individual larvae. In laboratory expe~ments, Barras (1970) showed that beetles could develop without fungi, but the developmental time was much
cangial fungi associated with SPB populations was longer, and rnortafity was high. done by observing which of two fun@ were present in Weight of emerging SPB varied significantly de- emerging beetles. For the purposes of this discussion, pending on which of the two fungi were carried in it is assumed that the fungi in the mycangium of the mycangium of emerging beetles. This study con- emerging beetles reflect the fungi present in the gal- firms the results of an earlier study but uses a much lery during the development of the lamae. Thus, larger data base (Bridges 1983). Adult female beetles beetles emerging ~ t h s u t fungi in the mycangiurn carrying only the basidiomycete were heavier than would have developed without fungi, An alternatiw those carrying Sporothrix or those lacking both fungi hypothesis is that beetles emerging with empty my- l table 9). Although there is no direct evidence that cangia may have developed in the presence of fungi, larvae feed on this fungus, it is possible that the but failed to pick up the fungi in the mycan~um. basidiornycete functions as a source of nutrition for
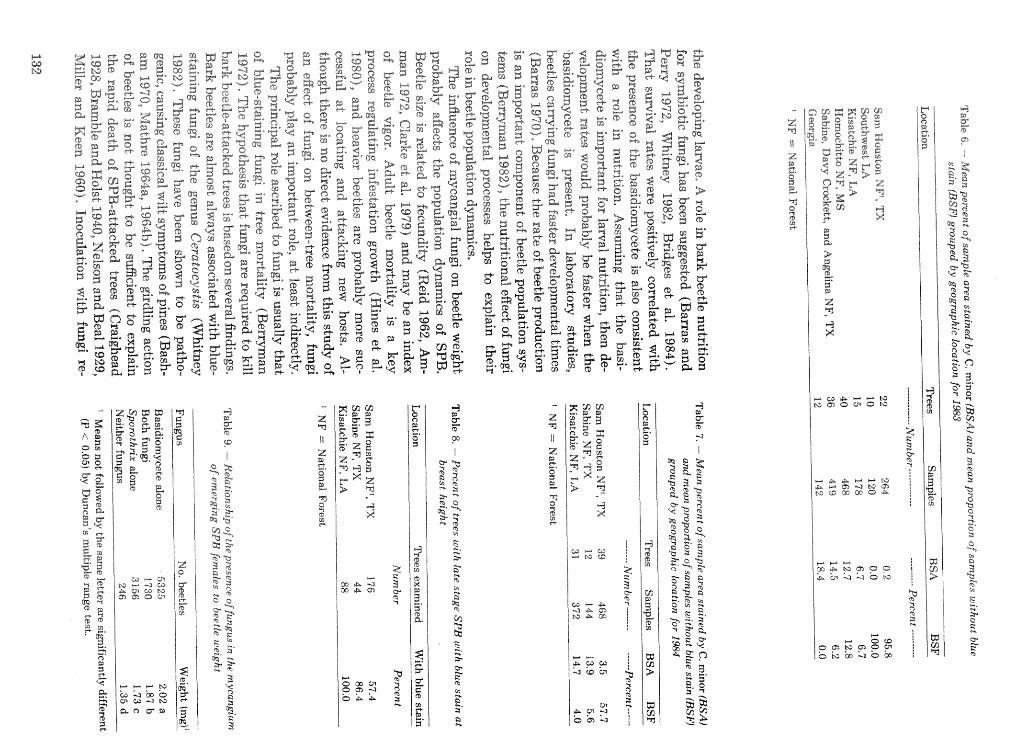
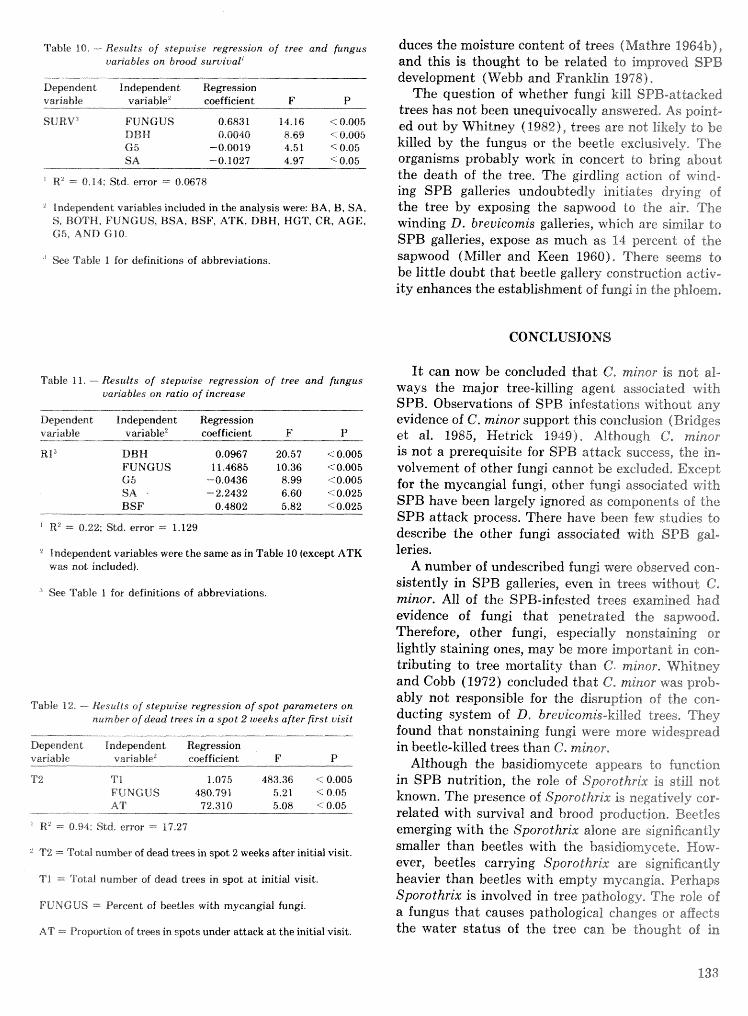
Table SO. -Results of sthapwise regression of tree and fungus uariables on brockd survival"
Dependent Independent Regression variable variableZ coefficient F P
SURVs FUNGUS 0.6831 14.16 < 0,005 DDEI 0,41040 8.69 r 0,005 6 5 -0,0019 4-51 < 0.05 SA -0.1027 4.97 < 0-05
R1 =. 0.14; Std. error = 0.M78
Vfndependent variables included in the analysis were: BA, B, SA, S , BOTH, FUNGUS, BSA, BSF, ATK, DBW, HCT, CR, AGE, G5, AND CIO,
See Table 1 for definitions of abbreviations.
Table I I . --- Results of stepwise regression of tree and fungus variables on ratio of increase
Dependent Independent Regression variable variable" cwfficiera t F P
R I ~ " DBH 0.0967 20.57 <0.005 FUNGUS 11.4685 10.36 <0.005 6 5 -0.0436 8.99 c0.005 SA - -2.2432 6.60 K0.025 BSF 0.4802 5.82 C=0.025
qR" .= 0.22; Sdd. error .= 1.129
Independent variables were the same as in Table 10 (except ATK was not included).
.' See Table I for definitions of abbreviations.
Table 12. -- Eesults of stepwise regression of spot parameters on number of dead trees in a spot 2 roeeks after first visit
Dependent Independent Regression variable variable2 cmfficient F P
T2 7-1 1.075 483.36 < 0.005 FUNGUS 480.791 5.21 < 0.05 AT 72.310 5.08 < 0.05
* RL = 0.94: Std. error =. 17.27
"2 = Total number of dead trees in spot 2 weeks after initial visit.
TI =. Total number of dead trees in spot a t initial visit.
FUKGUS =. Percent of beetles with mycangial fungi.
AT = Proportion of treres in spots under attack at the initial visit.
duees the moistuw content of t ~ e s (Mathre 1964b), and this is thought to be related to improved SPB development (Webb and Franklin f 9%).
The question of whether fungi kill SPB-attacked trees has not been unequivocally answered, As point- ed out by Whitney 0982), trees are not likely to be killed by the fungus or the beetle ex5usively, The organisms probably work in concert to bring about the death of the tree. The gircfling action of wind- ing SPB galleries undoubtedly initiates drying of the tree by exposing the sapwood to the air, The winding D. breuicomis galleries, which are similar to SPB galleries, expose as much as 14 percent of the sapwood (Miller and Keen 1960), There seems to be little doubt that beetle gallery construction activ- ity enhances the establishment of fungi in the phloem,
CONCLUSIONS
I t can now be concluded that 6, minor is not aP- ways the major tree-killing agent associated with SPB. Observations of SPB infestations without any evidence of C. minor support this conc8usion (Bridges et al. 1985, Hetrick 1949). Although @. minor is not a prerequisite for SPB attack success, the in- volvement of other fungi cannot be exciaadeta, Except for the mycangial fungi, other fungi associated with SPB have been largely ignored as corttpornents of the SPB attack process. There have been few studies to describe the other fungi associated with SPB gd- leries.
A number of undescribed fungi were observed con- sistently in SPB galleries, even in. trees without C, minor. All of the SPB-infested trees examined had evidence of fungi that penetrated the sapwood. Therefore, other fungi, especially nonstaining or lightly staining ones, may be more important in con.- tributing to tree mortality than C- minor. Whitney and Cobb (1972) ~oncluded tkat 42, minor was prob- ably not responsible for the disruption sf the con- ducting system of D. breuiconis-killed trees. They found that nonstaining fungi were more widespread in beetle-killed trees than C. minor,
Although the basidiomycete appears to function in SPB nutrition, the role of Sporsthr!'~ is s t i l l nrst known. The presence of Sporothrix i s nega%ively tor-
related with survival and brood production. Beetles emerging with the Sporothrix alone are significantly smaller than beetles with the basidioaraycete, How- ever, beetles carrying Spornfhrix are significantly heavier than beetles with empty mycangia, Perhaps Spomthrix is involved in tree pathcslogy, The role of a fungus that causes pathological changes or affects the water status of the tree can be "&hii.%agt of in
terms of a fungus-tree interaction. Although patho- logical changes might alter the nutritional quality of the tree, the effect would be more or less the same for all beetles in a tree, On the other hand, the role of the basidiomycete can be thought of in terms of a fungus. beetle interactian-an effect at the gallery level. Its presence or absence could affect each larva or small groups of larvae.
During the course of this study, the level of SPB activity increased in some areas over previous years. The activity was most apparent on the Sam Houston Xaltional Forest. hfost noteworthy was the Four n'oteh area of this Forest, where about 2,000 acres were destroyed by SPB in 1983. Trees in this area and in southwest Louisiana showed little or no blue- stain in 1983. Of all the areas sampled in 1983, these two locations had higher SPB infestation densities (Bridges et al. 1985). In 1984, there were also lesser amounts of blue stain in SPB-infested trees on the Sam Houston National Forest. These results suggest that the amount of blue stain and SPB popu- lation levels in an area may be related, It is possible that the absence of blue stain can be an indicator of SPB outbreaks (Bridges et al. 1985).
LITERATURE CITED
Amman, C. D. Some factors affecting oviposition be- havior of the mountain pine beetle. Environ. En- tomol. 1 : 691-695; 1972.
Barras, S. J. Antagonism between Dendroctonus frontalis and the fungus Ceratocystis minor. Ann. Entomol. Soc. Amer. 63: 1187-1190; 1970.
Barras, S. J.; Perry, T. Fungal symbionts in the pro- thoracic mycangium of Dendroctonus frontalis ( Goleopt. : Scolytidae) Zeit. angew. Entomol. 71 : 95-104; 1972.
Barras, S. J.; Perry, T. Gland cells and fungi associ- a ted with prothoracic mycangium of Dendroc tonus adjunct us ( Coleoptera : Scolytidae) . Ann. En- tomol. Soc. Amer. 64: 123-126; 1971.
Barras, S. J.; Taylor, J. J. Varietal Ceratocystis mi- nor identified from mycangium of Dendroctonus f rontalis. Mycopathol. Mycol. Appl. 50 : 293-305; 1973.
Basham, H. G. Wilt of loblolly pine inoculated with blue-shin fungi of the genus Ceratocystis, Phyto- path. 60: 750-754; 1970.
Berryman, A. A. Population dynamics of bark bee- tles. In: Mitton, J. B.; Sturgeon, K. B., eds. Bark beetles in North American conifers: a system for the study of evolutionary biolagy. Austin, TX: University of Texas Press; 1982: 264-314.
Berryman, A, A. Resistance of conifers to invasion by bark beetle-fungus associations, Bioscience 22: 598-602; 1972,
Bramble, W. C,; Halst, E. 6. Fungi associated ~ t h Dendroc tonus f ron talis in killing shortleaf pines and their effect aka conduction, Phytopatfi, 30 : 881- 899; 1940.
Bridges, S . R. Etifycangial fungi of Dendrocfonus front- alis (Coleoptera: Scoljrtidae) and their relatim- ship to beetle population trends. Environ. Ento- mol. 12: 858-861; 1983,
Bridges, J. R.; Marler, J. E.; bfcSparrin, B, EC, A quantitative study of the yeasts and bacteria as- sociated with laboratory-reared Dendroctclnus frontalis Zimm. (Coleoptera : Scolytidae) , Zeil;. angew. Entomol. 97: 261-267; 1984.
Bridges, J. R.; Moser, J, C . Role of two phoretic mites in transmission of blue-stain fungus, Ceratoeystis minor, Ecol, Entomol. 8: 9-12; 1983.
Bridges, J, R.; Nettleton, W. A,; Connor, M. D. Southern pine beetle (Coleoptera: Scolytidae) in- festations without the blue-stain fungus, Cerato- cystis minor. J. Econ. Entomol. 78: 325-327; 1985.
Clarke, A. L.; Webb, J. W.; Franklin, R, T, Fecund- ity of the southern pine beetle in laboratory pine bolts. Ann. Entomol. SOC, Am. 72: 229-231; 19'79.
Coulson, R. N.; Mayyasi, A. M.; Foltz, J. L.; Hain, F. P. Interspecific competition between Monochamus titillator and Dendroctonus frontalis. Environ, Entomol. 5: 235-247; 1976.
Craighead, C. F. Interrelation of tree-killing bark beetles (Dendroctonus) and blue stains. J. For. 26: 886-887; 1928.
Foltz, J. L.; Mayyasi, A. M.; Hain, F. P. (and others). Egg-gallery length relationship and within-tree analyses for the southern pine beetle, Dendroc- tonus frontalis (Coleoptera: Scolytidae). Can. Entomol. 108: 341-352; 1976.
Franklin, R. T. Observations on the blue stain- southern pine beetle relationship, 9. Ga. Entomol. SOC. 5: 53-57; 1970.
Happ, C. N.; Happ, 6. M.; Barras, S. J. Fine stsaac- ture of the prothoracic mycangium, a cbamber for the culture of symbiotic fungi, in the southern pine beetle, Dendroctonus frontalis, Tissue and GeU 3: 295-308; 19'71.
Hetrick, L. A. Some overlooked relationships of southern pine beetle. J. Econ. Entomol, 42: 466- 469; 1949.
Hines, G. S.; Taha, H. A,; Stephen, F. Me Model for predicting southern pine beetle population growth and tree mortality. In: Proceedings, symposium on modeling southern pine beetle populations; 1980 February 20-22; Asheville, NG. Tech, Bull,
1630. Washington, DC: U.S. Department of Agri- culture; 1980: 4-12.
Linit, Me Y,; Stephen, IF, M. Comparison of metho& for estimation of attacking adult populations of Dendmctonus frontalis. J. Econ. Elntomol. 71: 732-735; 1978.
Mathre, D, E. Sumey of Ceratoeystis spp. associ- ated with bark beetles in California. Contrib. Boyce Thompson Inst. 22: 353-362; 1964a.
-Mathre, L), E, Pathogenicity of Ceratocystis ips and Ceratocystk mkor to Pilaus ponderosa. Contrib. Boyce Thompson Inst. 22: 363-388; 1964b.
Miller, J, Me; Keen, F. P. Biology and control of the western pine beetle. Misc, Publ, 800. Washington, DC: CS. Department of Agriculture; 1960. 381 p.
Nelson, R. M.; Beal, J. A. Experiments with blue- stain fungi in southern pines. Phytopath. 19: 1101-1106; 1929.
Reid, R. W. Biology of the mountain pine beetle, Qendmc tanus monticolae Hopkins, in the east
Kaoternay Region of British Columbia. 11, Behav- iour in the host, fecundity and internal changes in the female. Can. Entomof, 94: 605-613; f 962,
Thatcher, EZ. C.; Pickard, I;, S. Seasonal variations in the activity of the SPB in east Texas, 5. Eeon. Entamol, 57: 840442; 1964,
Webb, J. W.; Franklin, R. T. Influence of phloem moisture on brood development of the southern pine beetle (Coleoptera: Scolytidae). Environ, En- Lomol. 7: 405-409; 1978.
Whitney, H. S. Relationships between hark beetles and symbiotic organisms, In: Mitton, J. B.; Stur- geon, LC. B., eds. Bark beetles in North American conifers: a system for the study of evolutionary biology. Austin, TX: University of Texas Press; 1982: 183-211.
Whitney, W. S.; Cobb, F. W., Jr. Non-staining fungi associated with the bark beetle Dendroctonus bre- vicomis (Coleoptera: Scolytidae) on Pinus ponde- rosa. Can. J. Bot. 50: 1943-1945; 1972.
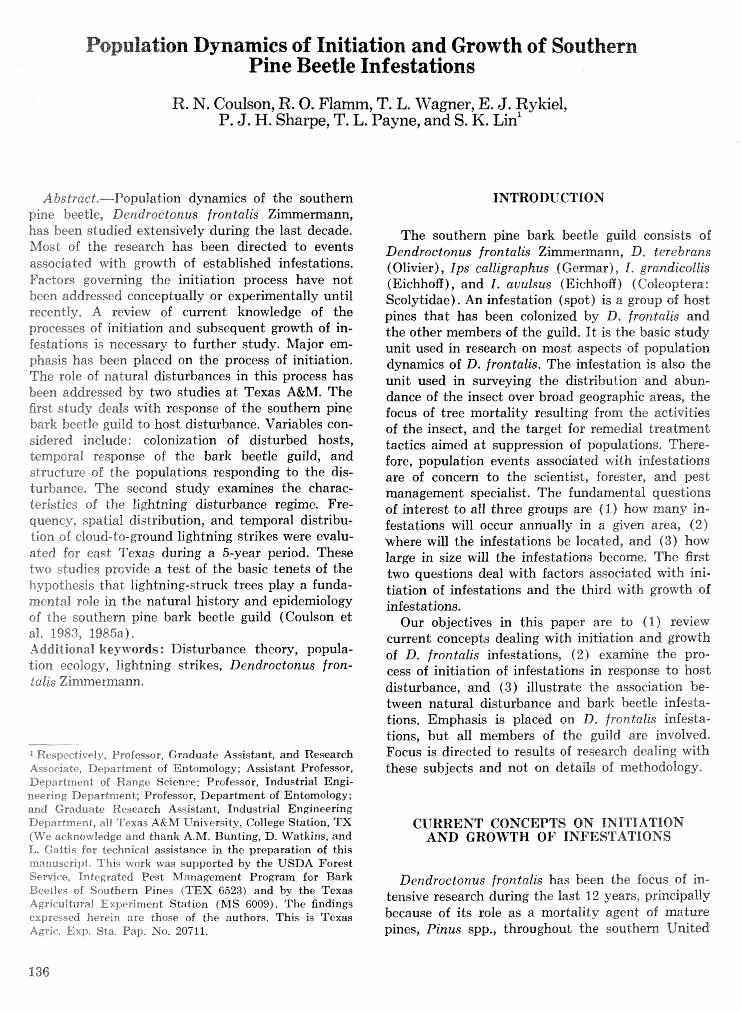
Population Dynamics of Initiation and Growth of Southern Pine Beetle Infestations
R. N. Coulson, R. 0. Fla , T. L. JF7agner, E. J. Rykiel, P. J. H. Sharpe, T. L. Payne, and S. K. in'
A bs tmct.---Population dynamics of the southern pine beetle, Dendro~onus f ran talis Zimmermann, has been studied extensively during the last decade. Most of the research bas been directed to events associated with growth of established infestations. Factors governing the initiation process have not been addressed conceptually or experimentally until recently, A review of current knowledge of the processes of initiation and subsequent growth of in- festations is necessary to further study. Major ern- phasis has been placed on the process of initiation. The role of natural disturbances in this process has been addressed by two studies a t Texas A&M. The first study deals with response of the southern pine bark beetle guild ta host disturbance. Variables con- sidered include: colonization of disturbed hosts, temporal response of the bark beetle guild, and structure of the populations responding to the dis- turbance, The second study examines the charac- teristics of the lightning disturbance regime. Fre- quency, spatial distribution, and temporal distribu- l i on of cloud-to-ground lightning strikes were evalu- ated for east Texas during a 5-year period. These two studies provide a test of the basic tenets of the hypothesis that lightning-struck trees play a funda- mental role in the natural history and epidemiology of the southern pine bark beetle guild (Coulson et al, 1983, 1985a). Additional keywords : Disturbance theory, popula- tion ecology, lightaing strikes, Dendroctonus fron- talis Zimmermann,
1 B'iespeckively, Professor, Graduate Assistant, and Research Arsociale, Department of Entomology; Assistant Professor, Department of Range Science; Professor, Industrial Engi- neering Department: Professor, Department of Entomology; and Graduate Research Assistant, Industrial Engineering Department, ail Texas A&M University, College Station, TX (We acknowledge and thank A.M. Bunting, D. Watkins, and %. Gattis for technical assistance in the preparation of this manuscript. This work was supported by the USDA Forest Service, Integrated Pest Management Program for Bark Beetles 06 Southern Pines (TEX 6523) and by the Texas Agricud t u r d Experiment Station (MS 6009). The findings expressed herein are those of the authors. This is Texas Agric- Exp. Sta. Pap, No. 20711.
The southern pine bark beetle guild consists of Dendroctonus frontalis Zimmemann, iD, terebrans (Olivier) , Ips calligraphus (Gcrmar), I, grandicollis (Eichhoff ) , and I. auulsus (EiehhoE ) ( Coleoflera: Scolytidae). An infestation (spot) is a group of host pines that has been colonized by D. frontalis and the other members of the guild. I t is the basic study unit used in research on most aspects of population dynamics of D. frontalis. The infestation is also the unit used in surveying the distribution and abun- dance of the insect over broad geographic areas, the focus of tree mortality resulting from the aetisiidies of the insect, and the target for remedial treatment tactics aimed a t suppression of populations. There- fore, population events associated with infestations are of concern to the scientist, forester, and pest management specialist. The fundamental questions of interest to all three groups are (1) how many in- festations will occur annually in a given area, (2) 'where will the infestations be located, and (3) how large in size will the infestations become. The first two questions deal with factors associated with ini- tiation of infestations and the third with growth of infestations.
Our objectives in this paper are to (1) review current concepts dealing with initiation and growth of D. frontalis infestations, (2) examine the pro- cess of initiation of infestations in response do host disturbance, and (3) illustrate the association be- tween natural disturbance and bark beetle infesta- tions. Emphasis is placed on D. frontalis infesta- tions, but all members of the guild are involved. Facus is directed to results of research dealing with these subjects and not on details of methodology.
CURRENT CONCEPTS ON BMITIATION AND GROWTH OF IMFESTAT169XS
Dendroctonus frontalis has been the focus of in- tensive research during the last 12 years, principally because of its role as a mortality agent of mature pines, Pinus spp., throughout the southern United
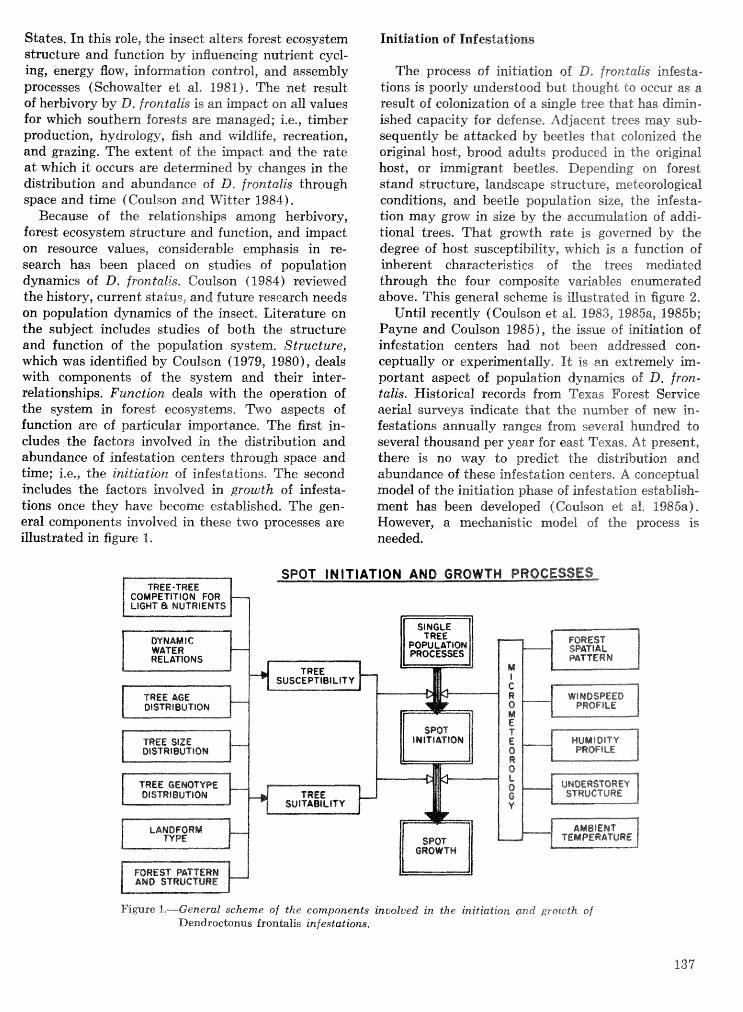
States. In this role, the insect altem forest ecosystem structure and function by irmauencing nutrient cycl- ing, energy flow, information control, and assembly processes (Schowalter et aZ, 1981). The net; result of herbivov by 8. frontalis is an. impact on all values for which southern forest rare managed; i.e., timber pmducdioa, hydrology, fish and wildlife, recreation, and grazing, The extent of the impact and the rate a t which it occurs are determined by changes in the &striiisutionrn and abundance of D. frontalis through space and time QCoulson and Witder 1984).
Because of the relationships among herbivory, forest ecosystem structure and function, and impact on resource values, considerable emphasis in re- search has been placed on studies of population dynamics of 23, f rontatis, Coulson ( 1984) reviewed the history, current status, and future research needs on population dynamics of the insect, Literature on the subject includes studies of both the structure and function of the population system. Structure, which was identified by Coulson (1979, 11980), deals with components of the system land their inter- rela tionships, Fune tion deals with the operation of the system in forest ecosystems, Two aspects of function are af particular importance, The first in- cludes the factors involved in the distribution and abundance of infestation centers through space and time; i,e., the initiation of infestations. The second includes the factors involved in growth of infesta- tions once they have become established. The gen- eral components involved in these two processes are illustrated in figure 1,
Initiation of Infestatism
The process of initiation of D= frontal& infesta- tions is poorly understood bur; thought to occur as a result of colonization of a single tree that has dimin- ished capacity for defense, Adjacent trees may sub- sequently be attacked by beetles that colonized the original host, brood adults produced in the original. host, or immigrant beetles, Depending on forest stand structure, landscape structure, meteorological conditions, and beetle population size, the infesta- tion may grow in size by the accumulation of addi- tional trees, That grotvth rate is governed by the degree of host susceptibility, which is a function of inherent characteristics of the trees mediated through the Sour composite variables enumerated above. This general scheme is illustrated in figure 2.
Until recently (Coufson et al, 1983, 1985a, 1985b; Payne and Coulson 19851, the issue of initiation of infestation centers had not been addressed eon- ceptually or experimentally, It is an extremely im- portant aspect of population dynamics of 63, Iron- talis. I3[istoricral records from Texas Forest Service aerial surveys indicate that the number of new in- festations annually ranges from several hundred to several thousand per year for east Texas, At present, there is no way to predict the distribution and abundance of these infestation centers, A conceptual model of the initiation phase of infestation establish- ment has been developed (Coulssn et ad, 5985a). However, a medskarnistie model of the process is needed.
TREE GEWTVBE
F i ~ r e 1.-General scheme of the components involved in the initiation and grou*th of Dendrocltonus frontalis tnjestatiom,
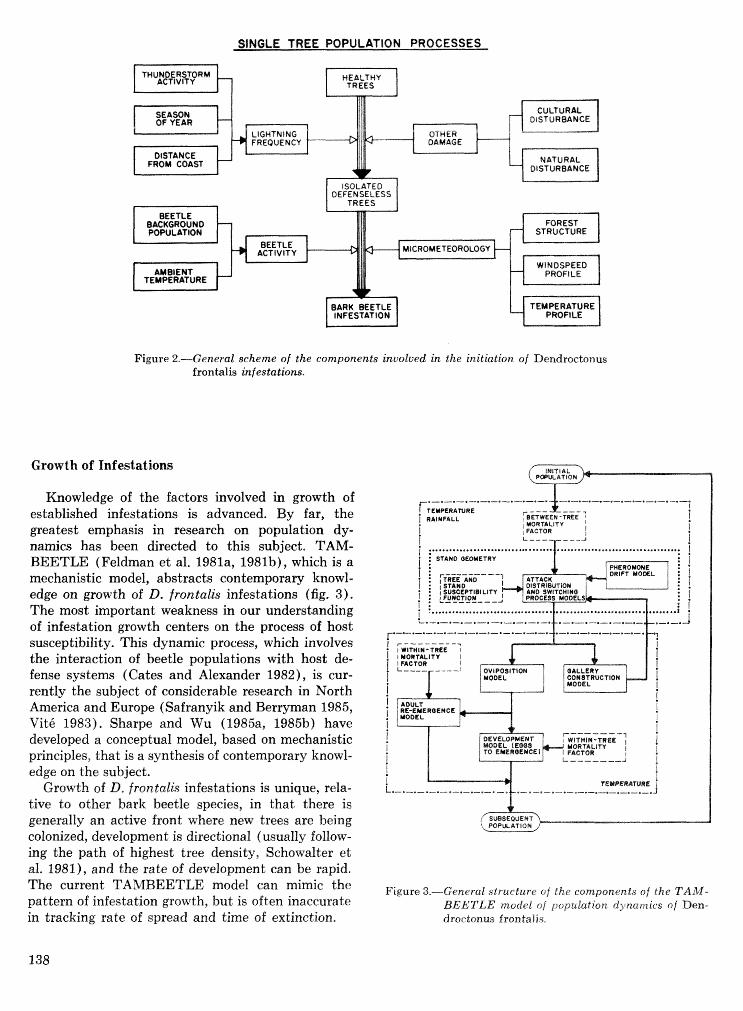
SINGLE TREE POPULATlON PROCESSES
Figure 2.-General scheme of the components involved in the initiation of Dendroctonus frontalis infestations.
Growth of Infestations
Knowledge of the factors involved in growth of established infestations is advanced. By far, the greatest emphasis in research on population dy- namics has been directed to this subject. TAM- BEETLE (Feldman et al. 1981a, 1981b), which is a mechanistic model, abstracts contemporary knowl- edge on growth of D. frontalis infestations (fig. 3). The most important weakness in our understanding of infestation growth centers on the process of host susceptibility. This dynamic process, which involves the interaction of beetle populations with host de- fense systems (Cates and Alexander 1982), is cur- rently the subject of considerable research in North America and Europe (Safranyik and Bervman 1985, Vit6 1983). Sharpe and Wu (1985a, 1985b) have developed a conceptual model, based on mechanistic principles, that is a synthesis of contemporary knowl- edge on the subject.
Growth sf D, frontalis infestations is unique, rela- tive to other bark beetle species, in that there is generally an active front where new trees are being colonized, development is directional (usually follow- ing the path of highest tree density, Schowalter et al. 1981), and the rate of development can be rapid. The current TAMBEETLE model can mimic the pattern of infestation growth, but is often inaccurate in tracking rate of spread and time of extinction.
b
1 TEMPERAWRE I I RAINFALL i
i
I ; FACTOR I I
i I
L---- --I i ; ................................... ye:.: ............................... i
I j I WITHIN-TREE I l MORTALITY I i i I FACTOR
i I
Figure 3.-General structure of the components of the TALV- BEETLE model of population dynamics of Den- droetonus frontalis.
In our view, accurate prediction of population dy- namics is contingent upon an understanding of both the processes of initiation and growth of infestations. The initiation process is poorly understood and se- search pertinent to the slabjeet has been organized but not interpreted. Understanding of the process of growth of infestations is advanced, HIowe-iier, the dy- namic component of host susceptibility has not been adequately addressed. Mechanistic models of these processes provide a means of efticiently abstractirrf: knowledge of the systems. The addition of these two components to TAlMBEIETLE would provide a holistic description of bark beetle/infestation dy- namics. Using TAhfBEETLE as a repository for all available scientific information regard.ing the bark beetle infestation process would provide a useful predictive tool as well as a synthesis that reflects basic knowledge and understanding of biological phenomena inv2lved.
INWIATION OF INFESTATIONS IN RESPONSE TO HOST DISTURBANCE
Historical records on the incidence of PI. froatalis indicate a remarkable variation in the number of in- festations detected on an annual basis within a particular geographic location. A number of studies have been designed to correlate incidence of infesta- tions with weather variables (e.g., Cagne et al. 1980, Kalkstein 1976, King 1972). These studies did not demonstra te how weather-related variables affect PI. frontalis distribution and abundance and, indeed, produced conflicting interpretations. For example, it has not been possible to predict with any con- sistency the number of new infestations that will occur in a year or their location using weather data from the preceding year. Also, historical information on past levels of infestation does not correlate well with f u t ~ ~ r e population trends.
Coulson e t al. (1983) hypothesized that initiation of D. frontalis infestations was a function of beetle response to host disturbance. Furthermore, we sug- gested that the lightning disturbance regime, because of its frequency and reliability in space and time, was the focus for initiation cf infestation, In this seetion, the basic tenets sf this hypothe," PIS are re- viewed, a conceptual model of the process illustrated, and experimental testing of the hypothesis reviewed briefly,
Association of Lightning and D. frontalis Infestations
Coulson et al. (1983) advanced the hypothesis that a fundamental relatiot~ship exists between the initiation of D. frontalis infestations and the pattern
of lightning strikes (e.g., frequency, spatial distribu- tion, and temporal distribution) occurring in pine ecosystems in the southern United States. Evidence to support the hypothesis was based on an examina- tion of literature documenting (1) the commonly observed association of barlc beetles with lightning- struck pines (Blanche e t al. 2983) ; (2 ) the effects produced by lightning striking a pine relative to colonization and brood dewelopment of L). frontalis (Hodges and Pickard 1971); and (3) the relation- ship of thunderstorms, incidence of lightning, and cloud-to-ground Iightning s'crilies. The empirical evi- dence on these three subjects was interpreted in the context of theory on (1) foraging strategies of bark beetles in relation to defense sZrategies of host trees, (2) climatic release of insect populations, and (3) ecological disturbances. Among the conclusions =ached, the following are of particular importance:
1, Lightning-struck pines are identified by adult bark beetles and are by far the most frequent dis- turbance associated with the initiation of infesta- tions (Hicks 1980, Bryant 3983, Payne and Coulson 1985) (table 1)- 2. Lightning striking a pine substantially dimin-
ished the function of the primary and hypersensi- tive defense systems of the tree (Cates and Alex- ander 1982), which gsezitly enhances colonization by D. frontalis and other members of the bark beetle guild. Consequently, it is likely tbat in contrast to non-lightning-struela trees: (1) Fewer beetles are required to kill the host, (2) beetle mortality re- sulting from the tree defense systems is leas, and (3) the relatively benign Ips spp. are capable of coloniz- ing the host as easily as D. frontalis (Hodges and Pickard 1971, Blanche et al. 19831,
3. Lightning-stmck pines provide particulady suitable habitat for brood development for all mem- bers of the bark hedle guild. Typical patterns of resource partitioning by members of the complex are not as apparent in lightning-struck trees.
4, The general climatic regime of an area estab- lishes the characteristic thunderstom pattern and hence determines the spatial and temporal d i s t ~ b u - Lion and frequency of lightning strikes. The lightning disturbance regime for east Texas is discussed in. the last sec"cion of this paper.
5. The strategies used by D. jrontalis for dispersal elearly have bearing on the ability of the inseets to utilize lightning-struck trees for colonization and subsequent brood development. Although poorly documented in the literature, it is likely that dis- persal is acmrnplished by both active and passive means and that lightning-struck trees are important in the insect persistence in both cases, Most of the literature on dispersal deals with D, frontalis and suggests that active dispersal, requiring use of meta-
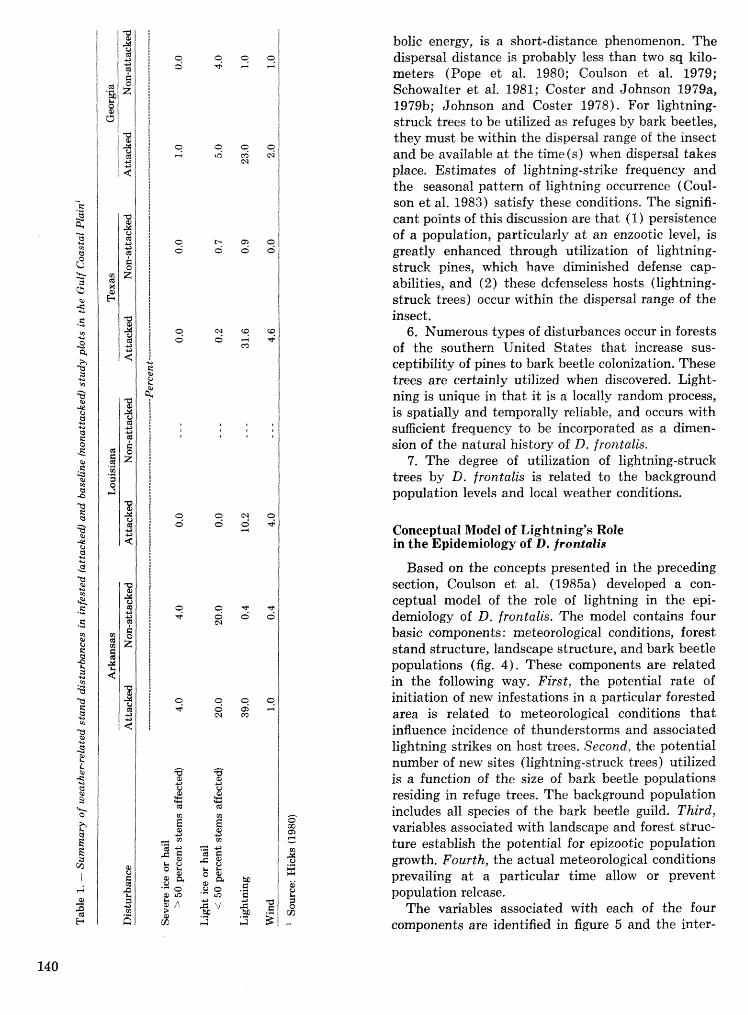
bolic energy, is a short-distance phenomenon, The dispersal distance is probably less than two sq kilo- meters (Pope et al. 1980; Coulson et al. 1979; Schowalter et at. 1981; Goster and Johnson 1979a, 197913; Johnson and Coster 1978). For lightning- struck trees to be utilized as refuges by bark beetles, they must be within the dispersal range of the insect and be available a t the time(s) when dispersal takes place, Estimates of lightning-stl.ike frequency and the seasonal pattern of lightning occurrence (Coul- son et al, 1983) satisfy these conditions. The signifi- cant points of this discussion are that ( I ) persistence of a population, particularly a t an enzootic level, is greatly enhanced through utilization of lightning- struck pines, which have diminished defense cap- abilities, and (2) these defenseless hosts (lightning- struck trees) occur within the dispersal range of the insect.
6. Numerous types of disturbances occur in forests of the southern 'United States that increase sus- ceptibility of pines to bark beetle colonization. These trees are certainly utilized when discovered. Light- ning is unique in that it is a locally random process, is spatially and temporally reliable, and occurs with sufficient frequency to be incorporated as a dimen- sion of the natural history of D. frontalis.
7. The degree of utilization of li&tning-struck trees by D. frontalis is related to the background population levels and local weather conditions.
Conceptual Model of Lightning's Role in the Epidemiology of D, frontalis
Based on the concepts presented in the preceding section, Coulson et al. (1985a) developed a con- ceptual model of the role of lightning in the epi- demiology of D, frontalis. The model contains four basic components: meteorological conditions, forest stand structure, landscape structure, and bark beetle populations (fig. 4). These components are related in the following way. First, the potential rate of initiation of new infestations in a particular forested area is related to meteorological conditions that influence incidence of thunderstorms and associated lightning strikes on host trees. Second, the potential number of new sites (lightning-struck trees) utilized is a function of the size of bark beetle populations residing in. refuge trees. The background population includes all species of the bark beetle guild, Third, variables associated with landscape and forest stmc- ture establish the potential for epizootic population growth. Fourth, the actual meteorological conditions prevailing a t a particular time allow or prevent population release.
The variables associated with each of the four components are identified in figure 5 and the inter-
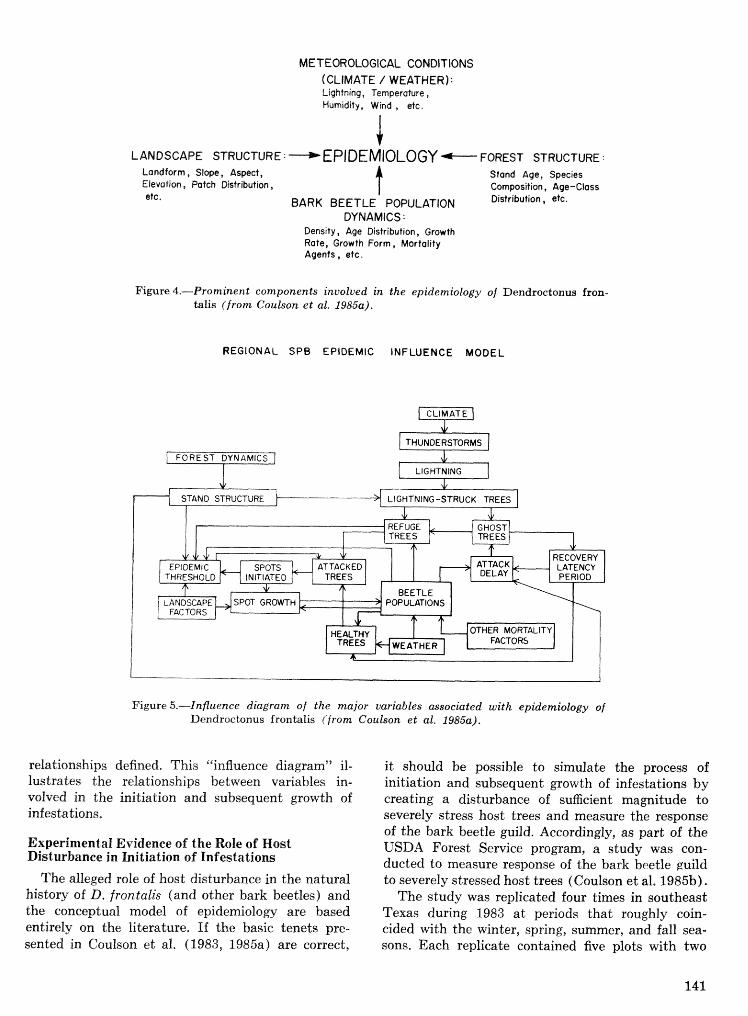
METEOROLOGICAL CONDITIONS f CLIMATE I WEATHER): Lightning, Temperature, Humidity, Wind , etc.
LANDSCAPE STRUCTURE : EPIDEMIOLOGY + FOREST STRUCTURE : Landform, Slope, Aspect, Stand Age, Species Elevation, Patch Distribution, Composition, Age-Class etc, BARK BEETLE POPULATION DiS'ribbU"~ * etc-
DYNAMICS : Density, Age Distribution, Growth Rate, Growth Farm, Mortality Agents, etc.
Figure 4.-Prominent components involved in the epidemiology of Dendroctonus fron- talis ( f rom Coulson et al. 1985a).
REGIONAL SPB EPIDEMIC INFLUENCE MODEL
[ FOREST DYNAMICS I
Figure 5.-Influence diagram oJ the major variables associated with epidemiology of Dendroetonus frontalis (from Coulson et al. 1985a).
relationships defined. This "influence diagram" il- lustrates the relationships between variables in- volved in the initiation and subsequent growth of infestations.
Experimental Evidence of the Role of Host Disturbance in Initiation of Infestations
The alleged role of host disturbance in the natural history of D. frontalis (and other bark beetles) and the conceptual model of epidemiology are based entirely on the literature. If the basic tenets pre- sented in Coulson et al. (1983, 1985a) are correct,
i t should be possible to simulate the process of initiation and subsequent growth of infestations by creating a disturbance of sufficient magnitude to severely stress host trees and measure the response of the bark beetle guild. Accordingly, as part of the USDA Forest Service program, a study was con- ducted to measure response of the bark beetle guild to severely stressed host trees (Coulson et al. 198533).
The study was replicated four times in southeast Texas during 1983 at periods that roughly coin- cided with the winter, spring, summer, and fall sea- sons. Each replicate contained five plots with two
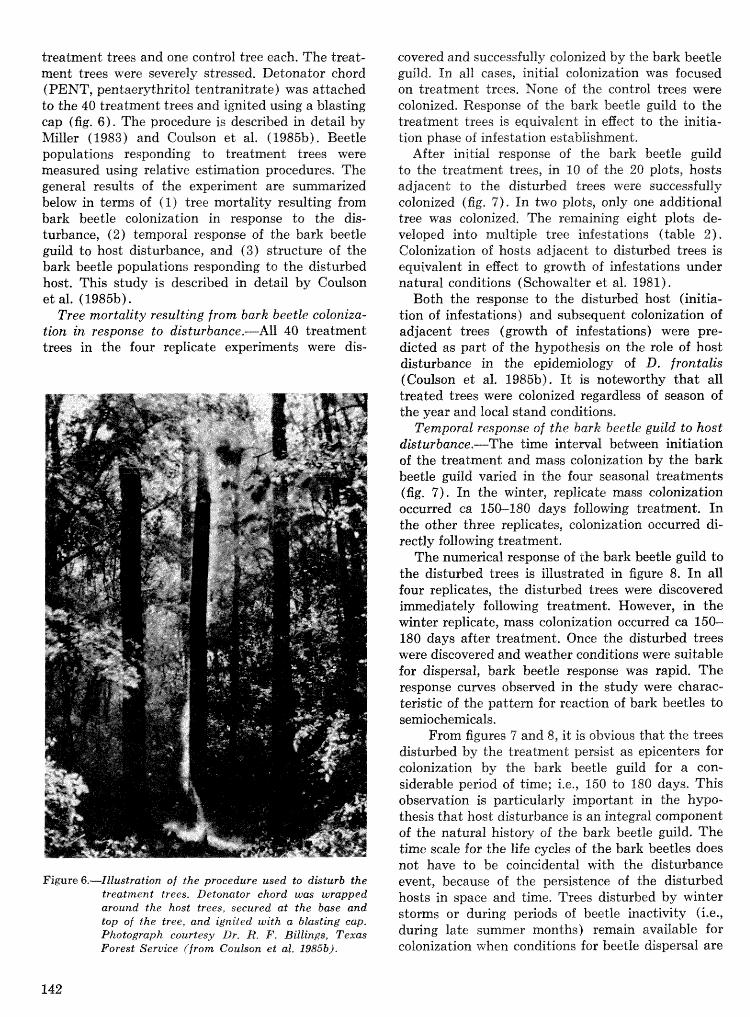
treatment trees and one control tree each. The treat- ment trees were severely stressed. Detonator chord (PENT, pentaerythritol tentranitrate) was attached to the 40 treatment trees and ignited using a blasting cap (fig, 6). The procedure is described in detail by Miller (1983) and Coulson et al, f 1985b). Beetle populations responding to treatment trees were measured using relative estimation procedures, The general results of the experiment are su below in terms of (1) tree mortality resulting from bark beetle colonization in response to the dis- turbance, (2) temporal response of the bark beetle guild to host disturbance, and (3) structure of the bark beetle populations responding to the disturbed host. This study is described in detail by Coulson et al. (1985b).
Tree mortality resulting from bark beetle coloniza- tion in response to disturbance.-All 40 treatment trees in the four replicate experiments were dis-
Figure 6.-Illustration of the procedure used to disturb the treatment trees. Detonator chord was wrapped around the host trees, secured at the base and Lop of the tree, and ignited with a blasting cap. Photograph courtesy Dr. R. F . Billings, Texas Forest Seruice ( f rom Coulson et aE. 19853).
covered and successfully colonized by the bark beetle mild. In all cases, initial colonization was focused on treatment trees, None of the control trees .pTere colonized. Response of the bark beetle wild to the treatment trees is equivalent in eEect to the initia- tion phase of infestation establishment.
After initial response of the hark beetle guild to the treatment trees, in 10 of the 20 plots, hosts adjacent to the disturbed trees were successfully colonized (fig, 7). In two plots, only one additional tree was colonized. The remaining eight plots de- veloped into multiple tree infestations (table 2). Colonization of hosts adjacent do disturbed trees is equivalent in @Beet to growth of infestations under natural conditions ( Schowalter et al. 1981).
Both the response to the disturbed host (initia- tion of infestations) and subsequent colonization of adjacent trees (growth of infestations) were pre- dicted as part of the hypothesis on the role of host disturbance in the epidemiology of L). f rontalis (Coulson et al. 1985b). It is noteworthy that all treated trees were colonized regardless of season of the year and local stand conditions,
Temporal response of the bark beetle guild to host disturbance.-The time interval between initiation of the treatment and mass colonization by the bark beetle guild varied in the four seasonal treatments (fig. 7). In the winter, replicate mass colonization occurred ca 150-180 days following treatment. In the other three replicates, colonization occurred di- rectly following treatment.
The numerical response of the bark beetle guild to the disturbed trees is illustrated in figure 8. In all four replicates, the disturbed trees were discovered immediately following treatment. However, in the winter replicate, mass colonization occurred ca 150- 180 days after treatment. Once the disturbed trees were discovered and weather conditions were suitable for dispersal, bark beetle response was rapid. The response curves observed in the study were charac- teristic of the pattern for reaction of bark beetles to semiochemicals.
From figures 7 and 8, it is obvious that the trees disturbed by the treatment persist as epicenters for colonization by the bark beetle guild for a con- siderable period of time; i,e,, 150 to 180 days. This observation is particularly important in the hypo- thesis that host disturbance is an integral component of the natural history of the bark beetle guild. The time scale for the life cycles of the bark beetles does not have to be coincidental with the disturbance event, because of the persistence of the disturbed hosts in space and time. Trees disturbed by winter storms or during periods of beetle inactivity (i'e., during late summer months) remain available for colonization when conditions for beetle dispersal are
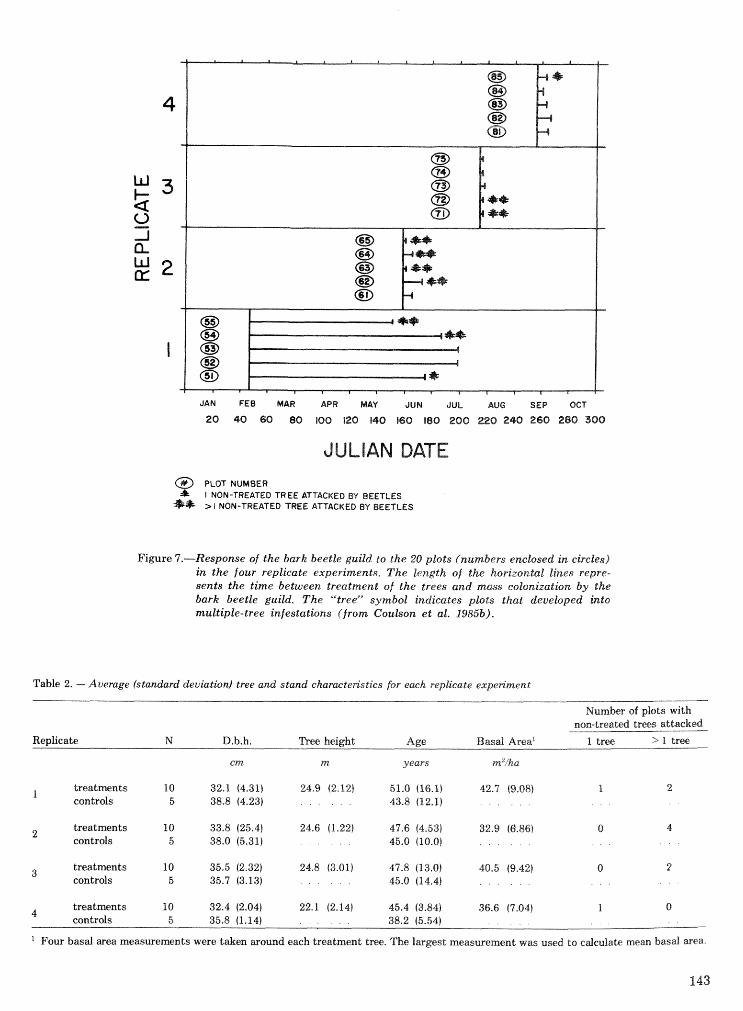
JAN FEE MAR APR MAY JUN JUL AUG SEP OCT
20 40 60 80 100 120 140 160 180 200 220 240 260 280 300
@ PLOT NUMBER f I NON-TREATED TREE ATTACKED BY BEETLES
*i)i > I NON-TREATED TREE ATTACKED BY BEETLES
Figure 7.-Response of: the bark beetle guild to the 20 plots (numbers enclosed in circles) in the four replicate experiments. The length sf the horizonta2 lines repre- sents the time between treatment of the trees and mass colonization by the bark beetle guild. T h e '"ree" symbol indicates plots that developed inlo multiple-tree infestations (from Coukon el al. 19858).
Table 2. - Average (standard deviation) tree and stand eharacte~stics for eaeh replicate expe~ment
Number of plots with non-treated trees attacked
Replicate N J3.b.h. Tree height Age Bas& Area' 1 tree > 1 tree
cm rn years m2&a
treatments 1
10 32.1 14.31) 24-9 12.12) 51-6 (56.1) 42.7 (9.08) 1 2 controls 5 38.8 (4.23) 43.8 (12.1)
treittrnents 10 33.8 (25.4) 24.6 (1.22) 41.6 (4.53) 32.9 (8.86) 0 4 controls 5 38.0 (5.31) . . . . . . 45.0 (10.01 . . . . . . . . . . .
treatments 10 35.5 (2.32) 24.8 (3.011 41.8 (13.01 40.5 (9.42) 0 2 controls 5 35.7 (3.13) . . . . . . 45.0 (14.4) . . . . . . . . . . .
treatments 10 32.4 (2.041 22.1 (2.14) 45.4 (3 .94 36.6 (1.04) 1 0 controls 5 35.8 (1.14) . . . . . . 38.2 (5.54) . . . . . . . . . . .
Four basal area measuremnts were taken around each treatment tree. The largest measurement was used to calculate mean bas& area.
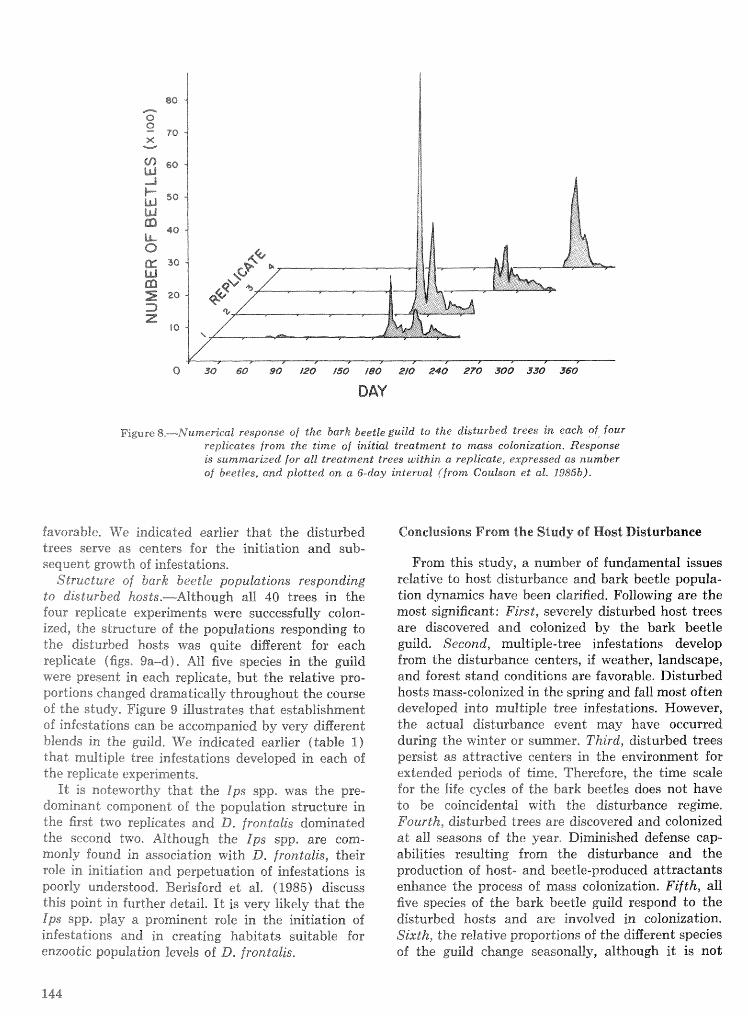
0 3Q 60 90 120 fb0 180 210 240 278 380 330 3m
DAY
Figure 8.---Numerical response of the bark beetle guild to the disturbed tress in each of four replicates from the time of initial treatment to mass colonization. Response Ids sumr~il-ari~ed for all treatment trees within a replieate, expressed as number of beetles, and plotted on a ti-day interval (from Coulsi-in et aE. 19853).
favorable, We indicaked earlier that the disturbed trees serve as centers for the initiation and sub- sequent growth of infestations,
Structure of bark beetle populations responding to disturbed hosts,----Although all 40 trees in the Sour replicate experiments were successfully colon- ized, the structure of the populations responding to the disturbed hosts was quite diifierent far each replicate (figs. 9a-d). All five species in the guild were present in each replicate, bud tho relative pro- portions changed dramatically throughout the course sf the study, Figure 9 iIIustrates that establishment of infestations can be accompanied by very different blends in the guild, We indicated earlier (table I ) that multipi;e tree -infestations developed in each sf the replicate experiments,
It i s noteavosthy "sat the Ips spp. was tho pre- dominant component of the population strracture in the first two replicates and D. frontalis dominaked the second two. Although the Ips spp, are eom- rnonly found in association with D, frontalis, their role in initiation asrd perpetuation of infestations is poorly understood, Berisford ed al. ( 1985) discuss this point in further detail. It is very likely that the Ips spp, play a prominent role in the initiation of infestations and in creating habitats suitable for enzootic population levels of D, f rontalis.
Conelusions From the Study of Host Disturbance
From this study, a number of hndamental issues relative to host disturbance and bark beetle popula- tion dynamics have been clarified. Following are the most significant: First, severely disturbed host trees are discovered and colonized by the bark beetle guild. Second, multiple-tree infestations develop from the disturbance centers, if weather, landscape, and forest stand conditicns are favorable. Disturbed hosts mass-colonized in the spring and fall most often developed into multiple tree infestations. However, the actual disturbance event may have occurred during the winter or summer, Third, disturbed trees persist as attractive centers in the environment for extended periods ofidirne, Therefore, the Lime scale for the life cycles of the bark beetles does not have to be coincidental with the disturbance regime, Fourth, disturbed trees are discovered and colonized at all seasons of the year, Diminished defense cap- abilities resulting from the disturbance and the production of host- and beetle-produced attractants enhance the process of mass colonization, Fifth, all five species of the bark beetle guild respond to the disturbed hosts and are involved in colonization. Skth , the relative proportions of the different species of the guild change seasonally, although it is not
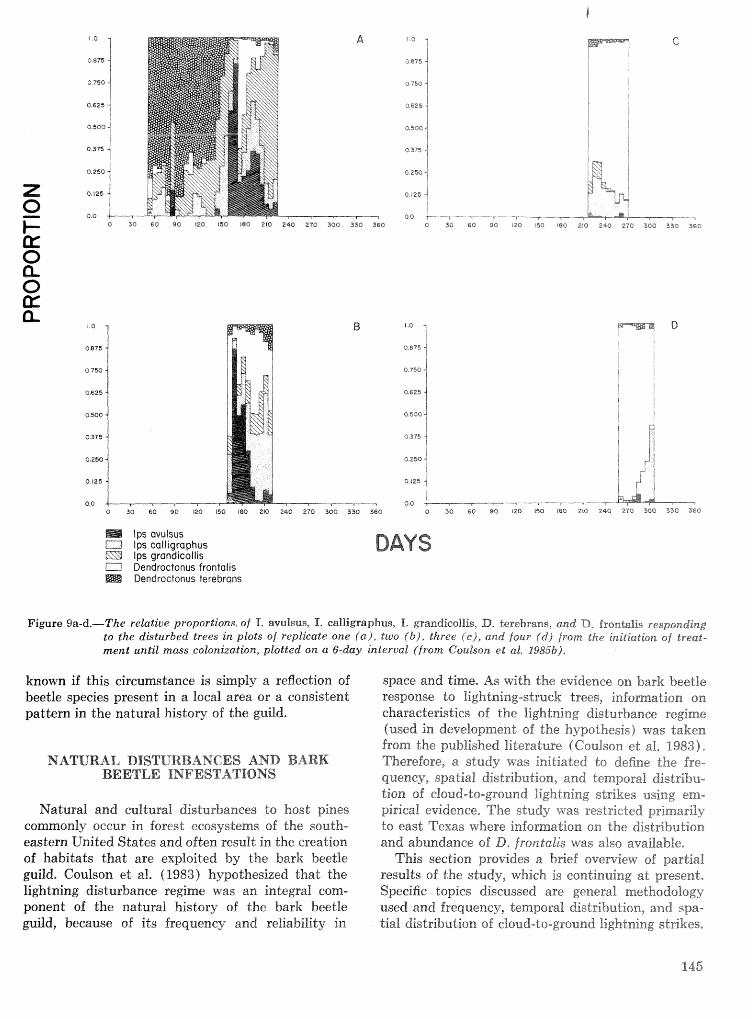
0 30 60 90 120 180 IW 210 240 270 300 330 360 o 30 60 rao rzo rso ieo 210 249 270 300 330 360
Ips avulsus CIJ Ips calligraphus ES3 Ips grandicollis i Dendroctonus frontalis
Dendroctonus terebrans
DAYS
Figure Sa-d.-The relative proportions, of 1. avulsus, I. calligraphus, I. grandicollis, 2). tesebram, and D. frontalis responding to the disturbed trees in plots o f replicate one ( a ) , two ( b ) , three je), and (our (d ) from the initiation of treat- ment until mass colonization, plotted on a 6-day interual ( f rom CouLon ef aE. 1985La).
known if this circumstance is simply a reflection of space and time, As with the evidence on bark beetle beetle species present in a local area or a consistent response Lo lightning-struck trees, inforna~ation on pattern in the natural history of the guild. ehnraeteristies of the lightning distuhaance regime
(used in developmen"c0-6 the hypothesis) was taken from the published literature (@oralson et af, 1983 1,
NATURAL DISTURBANCES AKTD BARK BEETLE INFESTATIONS
Natural and cultural: disturbances to host pines commonly occur in forest ecosystems of the south- eastern United States and often result in the creation of habitats that are exploited by the bark beetle guild. Coulson et al. (1983) hypothesized that the lightning disturbance regime was an integral eom- ponent of the natural history of the bark beetle guild, because of its frequency and reliability in
Therefore, a study was initiated to define the fre- quency, spatial distribution, and temporal distribu- tion of cIsud-to-ground lightning strikes using em- pirical evidence, The study mas restricted pdaarily do east Texas where information on the distribution and abundance of L), frontalis was also available,
This section provides a brief overview of partial results of the study, w"k.lieh is esntinuing at present, Specific topics discussed are general methodology used and frequency, temporal distribution, and spa- tial distribution of cloud-ts-ground lightning strikes,
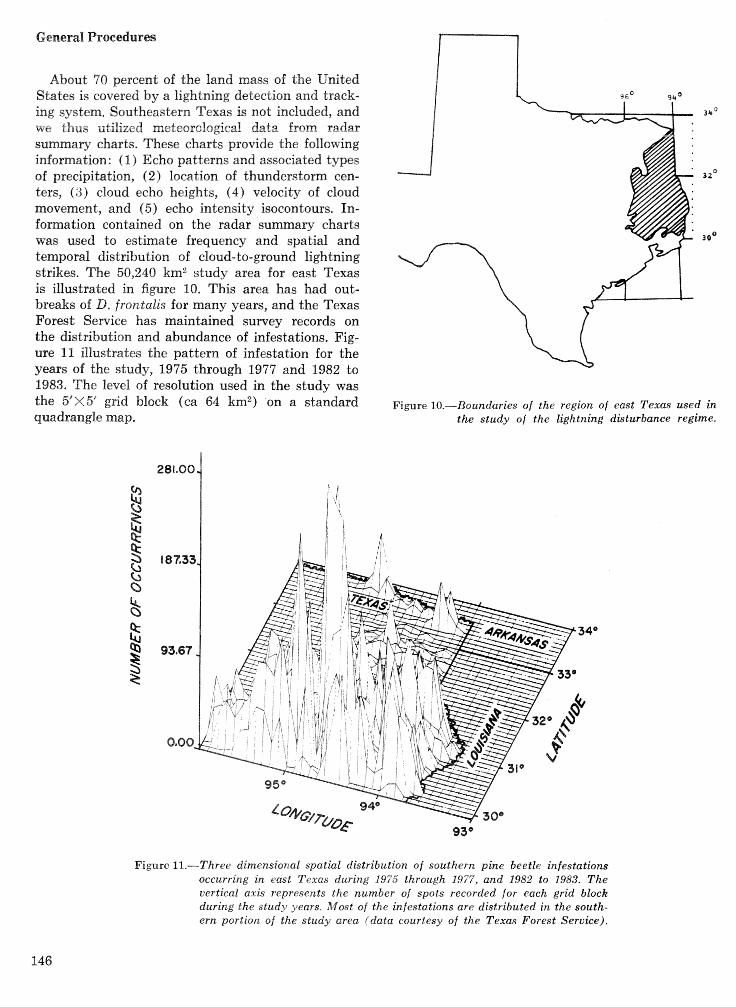
General Broeedures
About 70 percent of the land mass of the United States is covered by a lightning detection and track- ing system. Southeastern Texas is not included, and 34"
we thus utilized mcteorclogical data from radar summary charts. These charts provide the following information: (1 ) Echo patterns and associated types of precipitation, (2) location of thunderstorm cen- 32'
ters, (3) cloud echo heights, (4) velocity of cloud movement, and (5) echo intensity isocontours. In- formation contained on the radar summary charts was used to estimate frequency and spatial and 3e0
temporal distribution of cloud-to-ground lightning strikes. The 50,240 kmz study area for east Texas is illustrated in figure 10. This area has had out- breaks of D. frontalis for many years, and the Texas Forest Service has maintained sumvey records on the distribution and abundance of infestations, Fig- ure 11 illustrates the pattern of infestation for the years of the study, 1975 through 1977 and 1982 to 1983. The level of resolution used in the study was the 5 ' ~ 5 ' grid block (ca 64 km2) on a standard Fieure 10.-Boundaries o f the region of east Texas used in quadrangle map. the study of the lightning disturbance regime.
Figure 11.-Three dimensional spatial distribution of southern pine beetle infestations occurring in east Texos during 1975 through 1977, and 1982 to 1983. The vertical axis represents the number of spots recorded for each grid block during the study years. Most of the infestations are distributed in the south- ern portion of the study area (data courtesy o/ the Texas Forest Service).
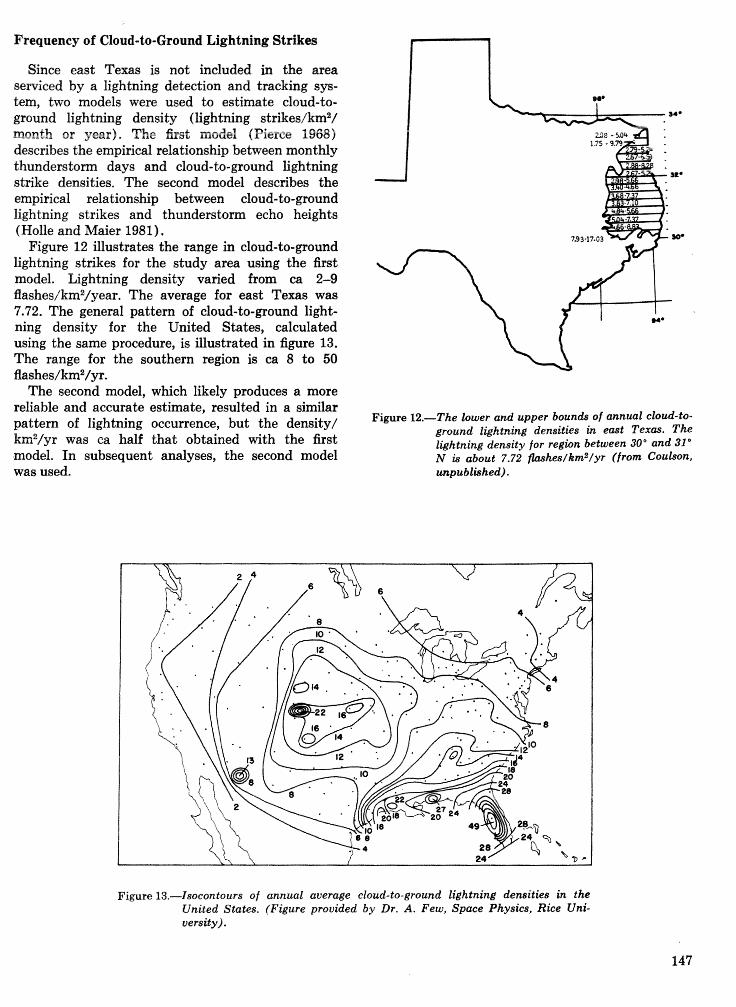
Frequency of Cloud-to-Ground Lightning Strikes
Since east Texas is not included in the area serviced by a lightning detection and tracking sys- tem, two models were used to estimate cloud-to- ground lightning density (ligh month or year). The first model (Pierce 1968) describes the empirical relationship between monthly thunderstom days and cloud-to-ground lightning strike densities. The second model describes the empirical relationship between cloud-to-ground lightning strikes and thunderstorm echo heights (Holle and Maier 198 1 ) .
Figure 12 illustrates the range in cloud-to-mound lightning strikes for the study area using the first model. Lightning density varied from ca 2-9 flashes/km2/year. The average for east Texas was '7.72. The general pattern of cloud-to-ground light- ning density for the United States, calculated using the same procedure, is illustrated in figure 13. The range for the southern region is ca 8 to 50 Aashes/km2/yr.
The second model, which likely produces a more reliable and accurate estimate, resulted in a similar
of lightning but density, Figure 12.-The lower and upper bounds of anawl cloud-to- ground l$htning densities in ewt Texas. The
km2/yr W ~ S ca half that obtained with the first lightning density for region between 30" and 31" model. In subsequent analyses, the second model N is about 7.72 mhes/km2/yr (from Coubon, was talrred. unpublished).
Figure 13.-Isocontours of annual average cloud-to-ground lightning densities in the United States. (Figure provided by Dr. A. Few, Space Physics, Rice Uni- versity).
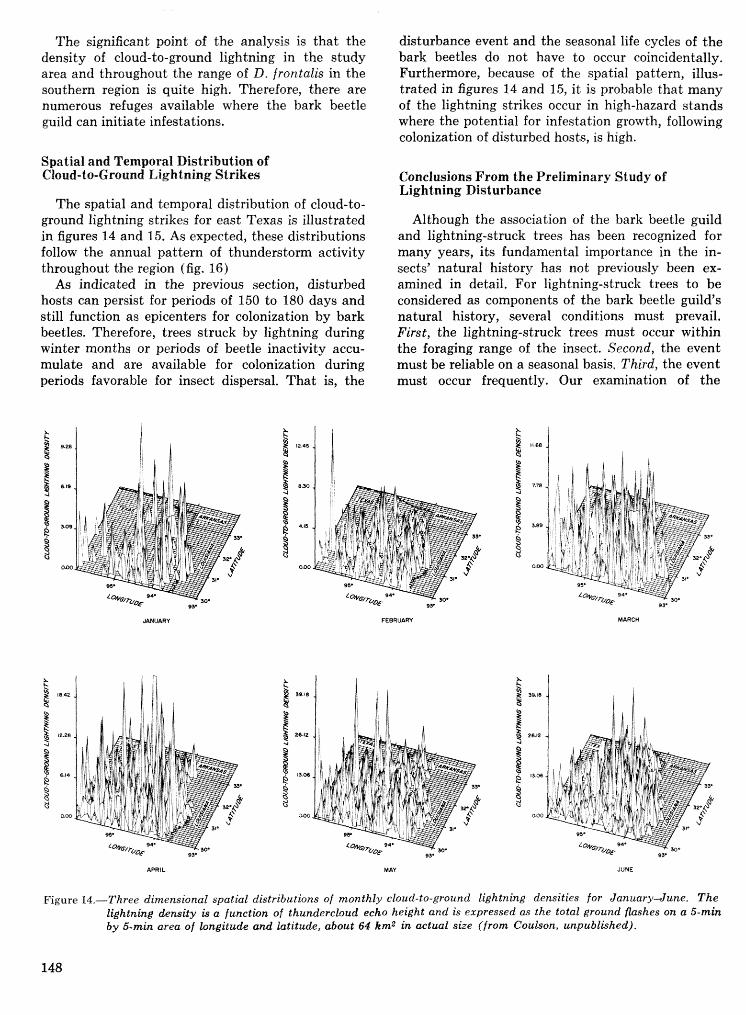
The s i ~ i f i c a n t point of the analysis is that the density of cloud-to-ground lightning in the study area and throughout the range of B, frontalis in the southern region is quite high. Therefore, there are numerous refuges available where the bark beetle guild can initiate infestations.
SpatiaI and Temporal Distribution of Cloud-to-Greund Lightning Strikes
The spatial and temporal distribution of cloud-to- ground lightning strikes for east Texas is illustrated in figures 14 and 15, As expected, these distributions follow the annual pattern of thunderstorm activity throughout the region (fig. 16)
As indicated in the previous section, disturbed hosts can persist for periods of 150 to 180 days and still function as epicenters for colonization by bark beetles. Therefore, trees struck by lightning during winter months or periods of beetle inactivity accu- mulate and are available for colonization during periods favorable for insect dispersal. That is, the
disturbance event and the seasonal life cycles of the bark beetles do not have to occur coincidentally. Furthermore, because of the spatial pattern, iI2us- trated in figures 14 and 15, i t is probable that many of the lightning strikes occur in high-hazard stands where the potential for infestation growth, following colonization of disturbed hosts, is high.
Conclusions From the Preliminary Study of Lightning Disturbance
Although the association of the bark beetle guild and lightning-struck trees has been recognized for many years, its fundamental importance in the in- sects' natural history has ~ o t previously been ex- amined in detail, For lightning-struck trees to be considered as components of the bark beetle guild's natural history, several conditions must prevail. First, the lightning-struck trees must occur within the foraging range of the insect. Second, the event must be reliable on a seasonal basis, Third, the event must occur frequently. Our examination of the
JANUARY FEBRUARY MARCH
APRIL MAY JUNE
Figure 14.-Three dimensional spatial distributions of monthly cloud-to-ground lightning demities for January-June. The lightning density is a function of thundercloud echo height and is expressed as the total ground fishes on a 5-mirz by 5-nin area of longitude and tatitude, about 64 km2 in actual size ( from Goutson, unpublkhed),
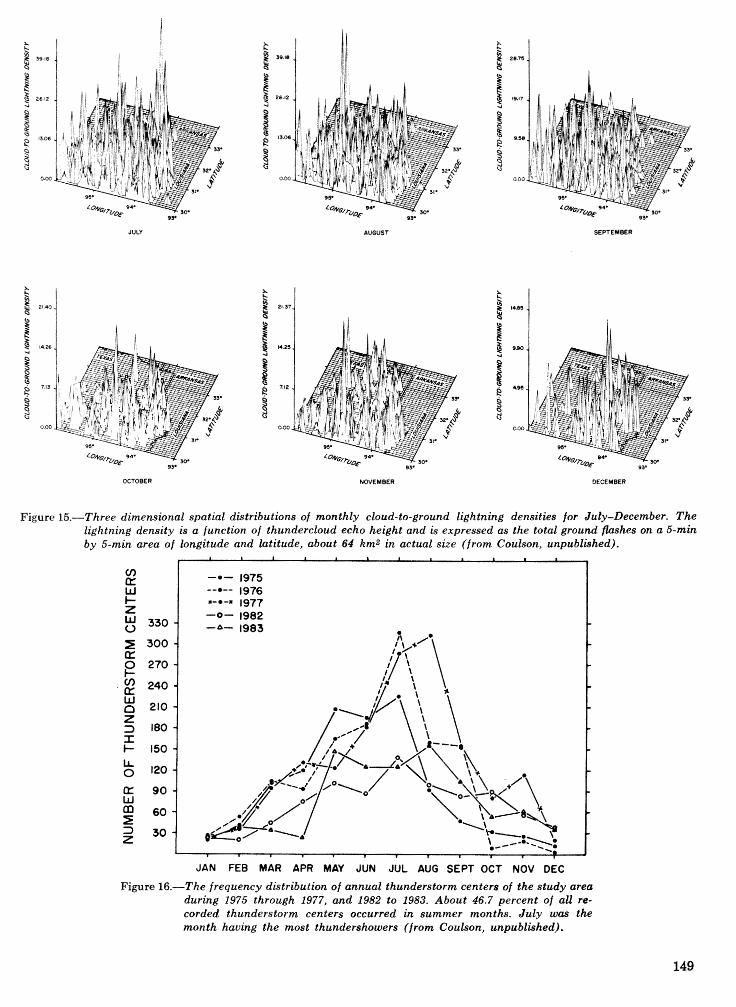
JULY AUGUST SEPTEMBER
OCTOBER NOVEMBER DECEMBER
Figure 15.-Three dimensional spatial distributions of monthly cloud-to-ground lightning densities for July-December. The lightning density is a function of thundercloud echo height and is expressed as the total ground flashes on a 8-min by 5-min area of longitude and latitude, about 64 hmz in actual size ( from Coulson, unpublished).
JAN FEB MAR APR MAY JUN JUL AUG SEPT OCT NOV DEC
Figure 16.-The frequency distribution of annual thunderstorm centers of the study area during I975 through 1977, and 1982 to 1983. About 46.7 percent of all re- corded thunderstorm centers occurred in summer months. July was the month having the most thundershowers ( from Coulson, unpublished).
characteristics of the lightning disturbance regime indicates that these conditions are met. This analy- sis, together with the study on response of the bark beet;le guild to host disturbance, strongly supports the basic tenets of the hypothesized role of lightning in the epidemiology of the bark beetle guild (Coul- son et al, 1983).
Most of the research conducted on population dynamics of D. frontulis and the other members of the bark beetle guild has centered on issues relating to growth of established infestations, e'g., the TAM- BEETLE model of population dynamics. Continued research on the initiation phase of infestation estab- lishment will eventually permit the development of a model that combines both components; i,e,, initia- tion and subsequent growth of infestations.
LITERATURE CITED
Berisford, C.W.; Mizell, R.F.; Kudon, L.H.; Ware, K.D. Line intersect sampling technique for esti- mating Ips populations in logging residue. In: Branham, Susan J.; Thatcher, Robert C.; eds. Proceedings, integrated pest management research symposium; 1985 April 15-18; Asheville, NC. Gen. Tech, Rep. SO-56. New Orleans, LA: U.S. De- partment of Agriculture, Forest Service, Southern Forest Experiment Station; 1985 : 13-25.
Blanche, C.A. ; Hodges, J.D. ; Nebeker, T.E. ; Moehr- ing, D.M. Southern pine beetle: the host dimen- sion, Miss. Agric. and For. Exp. Sta. Publ. 917. Mississippi State, MI: Mississippi State Uni- versity; 1983: 1-29.
Bryant, C.M. Pine engraver and black turpentine beetles associated with endemic populations of southern pine beetles in east Texas. Nacog- doches, TX: Stephen F. Austin State University; 1983. 81 p. [M.S. Thesis].
Cates, R,G.; Alexander, H. Host resistance and susceptibility, In: Mitton, J.B.; Sturgeon, K.B., eds* Bark beetles in North American conifers. Austin: University of Texas Press; 1982 : 212-263,
Csster, J,E.; Johnson, P.C. Dispersion patterns of Bendroctonus frontalis and its predator Than- asimus dubius: influence of behavioral chemicals. Mitt, Sehweiz, Entomol, Gesellsch. 52: 309-322; 1979a.
Goster, S .E, ; Johnson, I?. C. Characterizing Aight aggregation of the southern pine beetle. Environ. Entorn~I. 8: 381-387; f979b.
Coulsors, R-N. Population dynamics of bark beetles. Ann Rev, Entonnol, 24: 417447; 1979.
Coulson, R.N. Population dynamics of the southern pine beetle. In: Thatcher, R.C.; Searcy, J.L,; Coster, J.E.; Hertel, G.D., eds. The southern pine beetle. Tech. Bull. 1631. Washington, DC: U,S. Department of Agriculture; 1980: 71-105,
Coulson, R.N. History, status, and future needs for research on population dynamics of the southern pine beetle. In: Payne, T.L.; Billings, R.F.; Coul- son, R.N.; Kulhavy, D.L., eds. History, status, and future needs for research in southern forest en- tomology. Texas Agric, Exp. Sta. Misc. Publ. 1553. College Station, TX : Texas A&M University; 1984: 30-35.
Coulson, R.N.; Witter, J.A. Forest entomology: ecology and management. New Uork: John Wiley and Sons; 1984.669 p.
Coulson, R.N; Pulley, B.E. ; Pope, D.N.; Fargo, W,S. ; Gagne, J.A.; Kelley, C.L. Estimation of sumival and allocation of adult southern pine beetles between trees during the development of an in- festation. In: Berryman, A.A.; Safranyik, L., eds. Dispersal of forest insects: evaluation, theory, and management implications. Proceedings, IUFRO Symposium; Sandpoint, ID; 1979.
Couison, R.N. ; Hennier, 1P.B.; Flamm, R.O. ; Rykieil, E.J.; Hu, L.C.; Payne, T.L. The role of lightning in the epidemiology of the southern pine beetle, Ziet. angew. Entomol. 96: 182-193; 1983.
Coulson, R.N.; Rykiel, E.J.; Saunders, M.C.; Payne, T.L.; Flamm, R.O.; Wagner, T.L.; Hennier, P.B. A conceptual model of the role of lightning in the epidemiology of the southern pine beetle. In: Safranyik, L.; Berryman, A.A., eds. Insect-host in- teraction. Proceedings, IUFRO Symposium, Banff, Alberta, Canada; 1985a. [In press].
Coulson, R.N.; Flamm, R.O.; Pulley, P.E.; Payne, T.L.; Rykiel, E.J.; Wagner, T.L. Response of the southern pine bark beetle guild to host disturb- ance. 1985b. [In preparation].
Feldman, R.M.; Wagner, T.L.; Sharpe, P.J.H.; Gagne, J.A.; Coulson, R.N. Within-tree life pro- cess models of the southern pine beetle, Dendroe- tonus frontalis. Ecol. Model. 13: 247-259; 1981a.
Feldman, R.M. ; Curry, C.L. ; Coulson, R.N. A mathe- matical model of field population dl~namics of the southern pine beetle, Dendroc ton us f ron ta lk , Ecol. kfodel. 13: 261-281; 1981b.
Gagne, J.A.; Coulson, R.N.; Foltz, J.L.; Wagner, T.L.; Edson, L.J. Attack and survival of Gelzdroc- tonus frontalis in relation to weather during 3 years in east Texas. Environ. Entomol. 9: 222- 229; 1980.
Hicks, R.R., Jr . Climate, site, and stand factors. In: Thatcher, R.C.; Searcy, J.L.; Coster, J.E.; Hertel, G.D., eds. The southern pine beetle. Tech. Bull.
1631. Washington, DC: U.S. Department of Agri- culture; 1980: 55-68.
Hodges, J.B.; Pickard, L.S. Lightning in the ecology of the southern pine beetle, Dcndroetonus frontalis ( Coteoptera: Seolytidae) . Can, Entornol. 103: 44- 51; 7971.
Wolle, R.L.; Maier, M.W. Radar echo height related to cloud-to-ground lightning in South Florida. Preprints, 12th Severe Local Storms Conference; 1981 January 11-15; Sari Antonio, TX; 1981,
Johnson, P.E.; Coster, J.E. Probability of attack by southern pine beetle in relation to distance from an attractive host tree. For. Sci. 24: 574-580; 1978.
Malkstein, L.3. Effects of climatic stress upon out- breaks of the southern pine beetle. Environ. Entomol. 5: 653-658; 1976.
King, E.W. Rainfall and epidemics of the southern pine beetle. Environ. Entomol. 1: 279-285; 1972.
Miller, M.C. Lightning strike simulation for study- ing southern pine bark and engraved beetle attacks. Res. Pap. SO-296. New Orleans, LA: U.S. Department of Agriculture, Forest Service, South- ern Forest Experiment Station; 1983. 4 p.
Payne, T.L.; Ccaulson, R.N. Role of visual and olfac- tory stimuli in host selection and aggregation be- havior by Dendroe tonus frontatis. In : Safranyik, L.; Berryman, A.A., eds. Insect-host interactions. Proceedings, IUFRO Symposium; Banff, Alberta, Canada; 1985. [In press].
Pierce, E.T. A relationship between thunderstom
days and lightning Bash density, Trans, Am, Geophys. Un, 686; 1968,
Pope, D.N.; Coulson, R.N.; Fargo, W.S.; Gagne, J.A.; Kelly, C.L. The allocation process and be- tween-tree survival probabilities in Dendroctonus frorttatis infestations, Res. Pop. EcoT, 22: L9L-210; f 980,
Safranyik, L.; Berryman, A.A., eds. Insect-host in- teraction. Proceedings, IGTFRO Symposium; Banff, Alberta, Canada; 1985, u n press].
Sehowalter, T.D.; Pope, D.N.; Coulson, R.N.; Fargo, W.S, Patterns of southern pine beetle (Dendroe- tonus f ron tatis Zirnm. ) infestation enlargement, For. Sci, 27: 837-449; 1981,
Sharpe, P.J,H.; IVu, W. La, preliminary model of host susceptibility to bark beetle attack. In : Safrtnnyik, L.; Berryman, A.A., eds. Insect-host interactions. Proceedings, IUFRO Symposium7 Banff, Canada; 1985a. [In press].
Sharpe, P.J.H.; Wu, H. A preliminary model o f host susceptibility to bark beetle attack. In: Branham, Susan J. ; Tha tcher, Robert C., eds. Proceedings, integrated pest management research symposium; 1985 April 16-18; Asheville, NC. Gen. Tech. Rep, 50-56. New Orleans, LA: U.S, Department of Agriculture, Forest Service, Southern Forest Ex- periment Station; 1985b: 206-224.
Vit6, J.P., ed. Insect and host tree interactions, Symposium proceedings, Institute Forest Zoology, University of Freiburg, $Vest Germany, Zeit. angew. Entomol. 96: 105-265; 1983.
ION 11-PESTS AND HOSTIPEST INTERACTIONS
Host /Pest Interactions
Factors Contributing to Southern Pine Beetle Host Resistance
Fred I". , Stephen P. Cook, P A* Mabon md Karen G. Wilson'
Abstract,-me? wound-demsirrg response of the monslerpenes, induced molmstepenee, lesion length, preformed resin system and the con ment of the -pinene, P-pinene, camphene, fimonene, myrcene, infection by the hypersensitive reaction produced p-phelandrene, Pinus taeda, P. echinata, Dendroc- were studied in loblolly, Pinus taeda L., and short- tonus frontalis, Ceratocystis minor, C. minor var. leaf, P, eehinata Mill., pines responding to attacks barrassi. by southern pine beetles (SPB) , Dendroetonus fron talk Zimm., and their associated Ceratocystis INTRODUCTION fungi. The lesion length varied with the vidence of the attacking fungus and the season of the year. However, the monoterpene composition showed no difference based upon the virulence of the attacker. There was a significant difference in monoterpene composition and content between the hypersensitive reaction zone and unwounded tissue. Soluble sugar content decreased in the hypersensitive reaction and appeared to decrease more rapidly in loblolly pine. Comparison of loblolly and shortleaf pines showed no significant differences in the length of the hyper- sensitive reaction or the total decrease in its soluble sugar content. Although the total preformed mono- terpznes were in higher concentrations in loblolly, the induced response of shortleaf produced higher con- centrations of P-pinene and P-phelandrene. Bark thickness was significantly greater in the loblolly pines. Of the 22 loblolly and 16 shortleaf pines ex- posed to an attack of 2,000 or more SPB, 76 percent would have been correctly classified as resisting or succumbing to the attack based upon a threshold resin flow rate of 0.20 ml/hr. While resin flow ap- pears to be of primary importance in evaluating a tree's resistance properties, other factors are of some importance such as bark thickness, quantity and quality of the induced monoterpenes within the hy- persensitive response, and the withdrawal of essential nutrients from the wound tissue. The defensive strategies of loblolly and shortleaf pine are discussed. SPB brood survival within shortleaf or loblolly pine bolts was not significantly diflerent under laboratory conditions. The between-tree variation in defensive characteristics represents a wide arsenal for SPB to overcome when establishing outbreak conditions. Additional keywords : Resin flow, hypersensitive re- action, soluble sugars, bark thickness, preformed
Wespectively, Professor, Research Assistant, and Research Associates, North Carolina State University, Raleigh, NC. (We gratefu'tly acknowledge VV. Hobbs, P. Nappen, and E. Younan for technical assistance with experimental proce- dures. We also thank J. R. Bridges, who furnished the fungal cultures used in this study, and F. L. Hastings for the use of a coiorimeter and gas chromatograph. This work was sup- ported by the USDA-sponsored bark beetle IPM Program).
In 1972, Berryman hypothesized that the response of a conifer to an invading organism, such as Den- droctonus bark beetles and their associated fun&, is generalized and consists of three components: 1) The wound-cleansing response of the prefomed resin system, 2) the containment of the infection by the hypersensitive reaction, and 3) wound healing by wound periderm fornation.
Wound-cleansing by preformed resin is the first line of defense (Berryman 1972). Hodges et al. ( 1979) studied the physical properties of oleoresin and its composition in terms of preformed monoter- penes and resin acids for the four major southern pine species. Of course, loblolly (Pinus taeda L.) and shortleaf (P. echinata Mill.) pines are consid- ered more susceptible to successful southern pine beetle (SPB) , Dendroetonus frontalis Zimm., attack than slash pine (P. elliotti Engelm.) and longleaf (P. palustris Mill.). Their study concluded that the best characteristics for classifying a tree's resistance were physical properties (total flow, flow rate, vis- cosity, and time to crystallization), but not the com- position of the prefomed resin.
However, some work has indicated that resin. com- position may have some importance in resisting SPB attacks. In laboratory bioassays of monoter- penes found in shortleaf and loblolly pines, C o p e and Lott (1976) found that limonene was usually the substance most toxic to SPR. In fact, Smith (1965 and 1966) arrived a t the same conclusion for western pine beetle (WPR) , Dendroctonus brevi- comis LeConte. Smith (1975) presented a fornula for describing the effect of insect and host tree he- tors on resistance to WPB. I t infers that the favor- able effect of resin quality may be negated by poor quantity and, likewise, poor quality may be ogset by good quantity.
The hypersensitive reaction is the second line of an 1972). It is an active metabolic
process involving the degeneration of cells surround- ing the attack site and the induced release of ter- penes, polyphenols, and perhaps other toxic or in- hibitory compounds. Thus, the beetle and associated
fungi become surrounded by a feslon of dead, resin- impregnated tissue. Bemyman ( 1912 ) suggested that the intense metabolism in parer-iehpii cells sur- roullding the infection site and,'or the synthesis of toxic compounds restsfat in cell death and the release of these rcdmpraunds into the nerrntic area, Thus, nutrients essential! to the pathogen are converted to toxis or inhibitory compounds andi'or materials that cannot be metabolized by the pathogens (Wong and Berryman. 1977)- The intensity and extent of the reaction are probably functions of the sensitivity of the host cells, physiological condition of the host, and virulence sf the pathogen, Russell and Berryman (1976) concluded that lesion formation and terpene synthesis are two independent activities during wound rLsponse, Necrosis proceeds more rapidly than does terpene synthesis. Thus, the fungus is first confined by removal of essential nutrients, and secondly, by resinosis,
Russell and Berryman (1976) investigated the interaca;ion of Suotytus ventrnlis LeConte, a species that normally attacks only weakened trees, and grand fir f A bies grandis (Dougl.) ) . They found that the prefarmed rand indkreed monoterpenes digered both quantitatively and qualitatively. This suggests that grand fir responds to a fungus infection by producing monoterpenes that are more toxic, repel- lent, or inhibitory to bark beetles and their asso- ciated hngi at the expense of attractive or less biologically active compounds. On the other hand, RaEa and Berrgmar? (19823; evaluated the traits of lodgepole pine, P. con torta var. latifolia Engelm., for resistance to mountain pine beetle (MPB), D. pon- derosae. Although they found quantitative differ- ences in induced monoterpene production between resistant and susceptible trees, only slight qualita- tive differences were observed between the preformed and induced monotelpenes. In this case, the induced response appears to srraply supplement the preformed monoteqenes, It is interesting to note that MPlB is capable of periodic outbreaks that infest apparently healthy trees,
&fatson and Hain (1 985) hypothesized that the relative importance of wsmnd-cleansing by prefamed resin and containment of the infection by the hy- persensitive response can be related to differences in insect pressure (as well as other invading organisms). Pines, such as southern yellow pines, which are sub- ject t o many asynchronus beetle generations annually may rely more heavily on the preformed resin system as a first line sf defense, On the other hand, species such as lodgepole pine that defend against few and synchronous beetle generations each year may rely more on an inducible and localized hypersensitive response, The maintenance of a large reservoir of preformed resin, while energetically expensive, i s less
costly than the hypersensitive response would be, if continuously induced. In other words, southern yel- low pines may rely on the preformed resin system Lo physically resist beetle attack and "buy time" far the hypersensitive response to withdraw essential nutrients horn the attack zone and produce che&- eals that repel, inhibit, or poison the invading or- ganism. I% attacking populations are low, the first line of defense may be all that is necessary.
In order to test the above hypothesis on loblolfy and shortleaf pines, the following questions were investigated :
1) Does the hypersensitive reaction described for the western conifers occur in loblolly pine?
2) Is there a change over time in monoterpene and soluble sugar content of phloem tissue in the hypersensitive reaction zone compared with tissue outside the zone?
3) Are there differences in the intensity of the active response (measured by lesion length) between treatments involving simple rnechan- ical wounding and those with wounding plus fungal inoculation?
4) Are there quantitative differences in resin flow and the hypersensitive reaction of loblolly and shortleaf pine located on a single study site in the North Carolina Piedmont?
5) Do the loblolly and shortleaf pines differ in their relative abilities to resist attacking SPB?
6) what are the within-species characteristics of shortleaf pine that distinguish those trees that successfully resisted an SPB attack from those that succumbed?
7) What are the within-species characteristics of loblolly pine located on a single study site in the Virginia Coastal Plain that distinguish those trees that successfully resisted an SPB attack from those that succumbed?
8 ) Are there differences in brood development be- tween SPB reared on loblolly or shortleaf pine bol ts?
METHODS All the experimental work was conducted a t one
of three study sites: 1) A loblolly pine stand near West Point, VA (Coastal Plain) that had been sub- jected to four silvicultural treatments in 1978 (plots were either thinned, fertilized, fertilized and thinned, or untreated controls) ; 2) adjacent loblolly and sbort- leaf pine stands in the Hill Forest (Piedmont) near Durham, NC; and 3) a loblolly pine stand overlook- ing Jordan Lake Reservoir, NC (on the Coastal Plain side of the fall line dividing Piedmont and Coastal Plain),
Resin flow was measured 4-5 hours after a resin Aow "cube 19 was inserted into a tree a t d.b,b,
The measurement was -dEren converkd to nnlbr. I"he hypersensitive response was measured by wounding a tree to the xylem with a f4 cork borcjr (13 eter) and soaking exposed tissue with a 1 ml fungal solution. Usually, the fungus was Cera tocys tis minor (Hedgcock) Hunt (Rumbold 1931), but we also tested C, ~ E M O ~ var. batrassi Taylor (Barraa and Taylor 1973). Samples of the hypenensitive re- action zone were removed from I day t;o 2 weeks later, Measurements included zone Ienl;ft and ~ c l t h , so%uble sugar contend, and monateripene content. The samples were $aced in a via% of pentane and frozen for GC analysis using p-cymene as an internal stan- dard, M o n o e ~ e n e concentrations aPo reported in p-cymene equivalents. A before-wounding sample was also taken, Soluble sugar content was analyzed according to an Anthrone Colorimetric teclmique. In order do test a tree" ability resist an SPB
attack, a field bioassay was developed, The boles of selected trees were tented with saran screening, and infested bolts with. ready-to-emerge SPB were intro- duced underneath the tent, Emergence was esthaded by two methods: firs& by bark subsampling ts roughly control the number of beetles within each dent; and secondly, by counting emergence and ven- tilation hoIa before and after mass emergence, m e difference gave a more precise estimate of actual emergence, We took numerous measurements on alB trees tented; the most important of which were primary resin Aow, length rand area of the hypersen- sitive zone; soluble sugar content; and preformed and induced msnoteqene content.
Beetles for the bioassay were laboratory-reared according to the technique sf Bridges and Moser (1984). A modification of that technique was used $0 compared the suitability sf lobloilly or shortleaf pine beaks $04. brood development. After a bolt was punctured with a #4 cork borer, a gelatin capsule containing one female SPB was placed over each puncture, After the? female had begun boring into the log, a male was placed rrndemeath the capsule. t%r"hen a brood was established, the logs wem main- tained under similar eusvironmenta1 con&tions for 28 $0 29 days. Thereafter, brood emergence was monitored daily and when it ceased, the bolts were dissected, The f o l l o ~ n g measurements were made: total egg gallery length, distance between egg niches, total number of egg niches per gallev, total egg hatch, and total. number of larvae that migrated to the outer bark,
RESULTS AND DISCUSSION
Length o f the Hypersensitive Reaction in Loblolly Pine
Of 20 loblolly pines that were either wounded, wounded and inoculated with C, minor, wounded
and inoeufated with C. ~ Z L ~ B O P var. barrassi, a hyper- sensi.tjive =action was produced by all wounds (Coob and Hain 1985a). The lesion. length was longest when wounang was accompanied by EUI inoculation af C. micor and shczrbst when the wound was not accorn- panied by a fungal inoculation (Cook and Hain f 98Sa), The &Beren$i;~a$ion in reaction size based upon the virulence of the atheker suggesb that d;3re tree expends less energy in defen&ng itself upon hfwtion by a less vimlent amcker,
The reaction length incrmses during the wason, reaching ta peak in late summer and eady fall accord- ing to Cook and Hain (19858) and other studies2, This is probably a reffecdion sf temperature; cold tempera- tures may slow the Lseeshctive response as well as dow the invasion 0% the hngus.
Monoterpene Content of the Hyperserasidiw Reaction in Loblolly Pine
m e pepcent msnsteqene content betmen pre- fomed and induced msnoterpem diEered signifi- cantly (Cook and Hain 1985a)- However, there were no significant differences between the C, minor heat- men.& and the 6, minor var barrassi treatment (Cook aid Hain 198Sa). Thus, the monotemene composi- tion, unlike the reaction length, showed no difference based ulpc~ar the viruZenee sf the attacker.
There was an increase in the percentage 0% a m - phene, p-pinene, mJrreene, and limnonene in the hy- persensitive reaction zone of wounded tissue com- pared with rrnwomded tissue (Cook and Hain P985a). Coyne and Lot% (1976) reported that 1 b - onene, a-pinene, P-pinene, and myrceure are toxic to SPB in that order,
Soluble Sugar Content of the Hypersensitive Reaction in LobHolly Pine
The percearhge of total dry weight of phloem eom- posed sf soluble sugars was significantly greater in uninfwted phloem in. eompaGsorsas with the reaction zones of either fungal inmulatioras, brat there m s no diaemnee between the fungal treatments (Cook and Hah 1985a)- As with monoterpetse cornpsition, there was no digesence in the extent of the active response of the tree based upon the vimlenele of the invading organism, Thus, the trws appear to be decreasing the potential food available to the invad- ing organism while increasing the amounts of toxic mateGial present near the wotmt%/hfecticsn sibC
Resin flow,-me resin flow measuremen& were no& significantly diflerent between the 36 IobloUy
2 Hain, unpublished data*
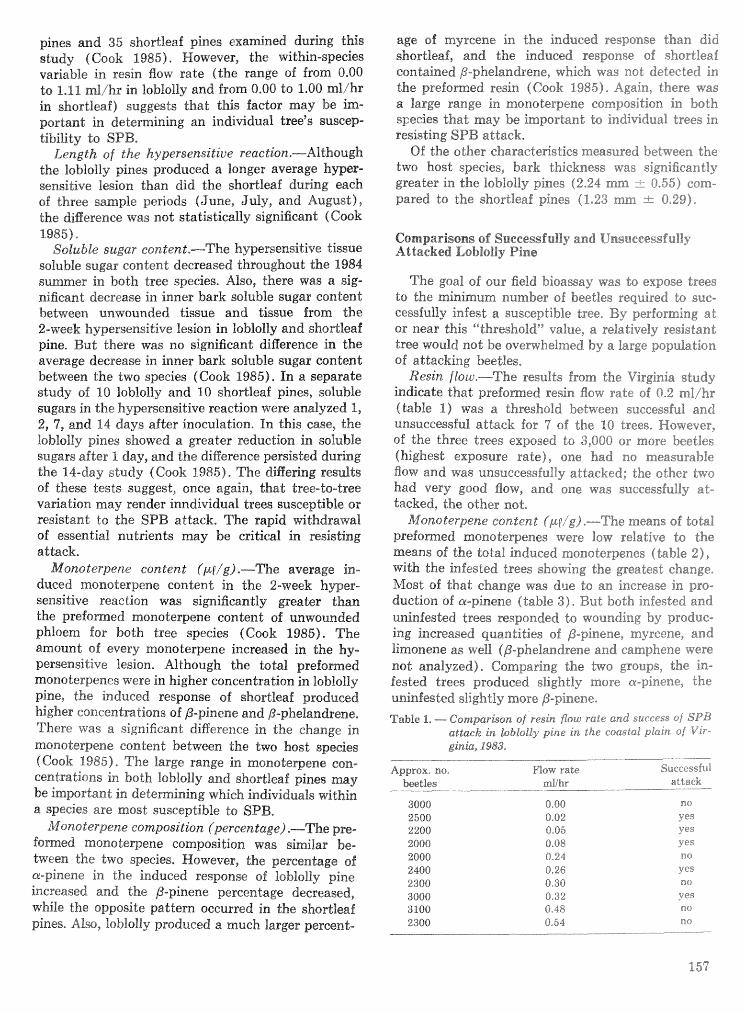
pines and 35 shortleaf pines examined during this study (Cook 1985). However, the within-species variable in resin. Bow rate (the range: of from 0.00 to 1.11 nnjjhr in loblolly and from 0.08 to 1-00 mfihr in shortleaf) suggests that this factor may be h- porbant in determining an individud dsee3s ssuscep- tibiility to SPB,
Length of the hypersensitive reaction.--Although the loblolly pines produced a l one r average hgrper- sensitive lesion than did the shortleaf duriarg each of three sample periods (June, July, and August), the digerence was not statistically significant (Cook 1985).
Sslub ke sugar eon ten t.-The hypersensitive tissue solubfe sugar content decreased throughout d')ne 1984 summer in both tree species. Also, there was a sig- nificant decrease in inner bark soluble sugar contend between unwounded tissue and tissue from the 2-week hypersensitive lesion in toblolly and shos.C;Bea% pine, But there was no significant dieererace ira the average decrease in inner bark soluble sugar content between the two species (Cook 1985). In a separate study of 16) loblolly and 10 shortleaf pines, soluble sugars in the hypersensitive reaction were analyzed 1, 2, 7, and 14 days after inoculation. In this case, the Isblolly pines showed a greater reduction in soluble sugars after i day, and the difference persisted during the 14-day study ( Cssk 19851, The difie~ng iresdts of these tests suggest, once again, that tree-do-tree variation may render inndividual trees susceptible or resistant to the SPB attack. The rapid withdrawal of essential nut&ents may be critical in resistkg attack.
Monoterpene eontent (pt:/g) *--The average ism- h e e d rncrnoterpene emten"e; in the %-week hyp;\er- sensitive reaction was significantly greater than the preformed mounolerpene content sf unwounded phloem for both tree species (cook 1985). The amount of every monoterpene increased in. the hy- persensitive lesion. Although the total preformed msatalerpenes were in higher concentration in tobloUy pine, the induced response of shortleaf produced higher concentrations of P-pinene and P-phelandrene. There was a significant difference in the change in monoterpene content between the two host species (Cook 1985). The large range in monoterpene con- centrations in both loblolly and shortleaf pines may be important in determining which individuals within a species are most susceptible to SPB,
Mono terpene composition (percentage) .--The pre- formed monoterpene composition was similar be- tween the two species. However, the percentage of a-pinene in the induced response of loblolly pine increased and the P-pinene percentage decreased, while the opposite pattern occurred in the shortleaf pines. Also, loblolly produced a much larger percent-
age of myreerse in the induced response than did shortleaf, and the induced response of shortleaf contained p-phelandrene, which was not detected in the prefsmed resin (Cook 1985)- Again, there was a large range in msnoterpene composition in both species that may be impsdant to individual trees in resisting SPB attack,
Of the other characte~sties measured between the two host species, bark thickness xae significantly greater in the Bsblslfy pines (224 pared to the shortleaf pines (1.23 ma -.. 0.29).
Comgarisl~ns of Snceessf uialy and Unsueeessfull y Attacked EoblrslBy Pine
The goal of our M d bioassay was to expose trees do the ~ n i m u m number of beetles required to suc- cessfully infest a susceptible tree, By perf oming at or near this ""dreshofd" valise, a relatively resistant tree would not be overwhelmed "6;. a large population 06 attacking beetles,
Resin flow.----The results from the Virginia study indicate that prefomed resin BOW rate of 0.2 ml/hr (table 1) was a threshold between successful and unsuccessfuB attack for hof the 18 trees, However, of the three trees exposed to 3,000 or mare beetles (highest exposure rate), one had no measurable flow and was unsuccessfully attacked; the other two had very good flow, and one was successfully st- tacked, the other not,
Monsderpene con tent (pp,"g) .---The means of total prefomed monoterpenes were low relative to the means of the total induced monoterpenes (table %), with the infested trees showing the greatest change. Mos"rof &at change was due to an increase in pro- duction of a-pinene (table 3 ) - But both infested and uninfested trees responded to wounding by produe- ing increased quantities of P-pinene, rnyrcene, and limonene as well (p-phehndrene and campkene were not analyzed), Compa~rag the two groupsi the in- fested trees produced slightly more a-pinene, the uninfested slightly more f3-p. ~nene.
Table I, --.--- Cornparkon of resin flow rate and success 0% SPB attack in Isbtokiy pine in the coastal plam 0% Vrr- gink, 1983,
Approx, no, Row rate Successful beetles d i h r atttick
3000 0,OO no 2500 0,02 yes 2200 0'05 yes 2000 0.08 yes 20065 0.24 ~ C I
2480 0.26 ves 2300 036) no 3000 0.32 v es 3100 0.48 no 2300 0.54 no
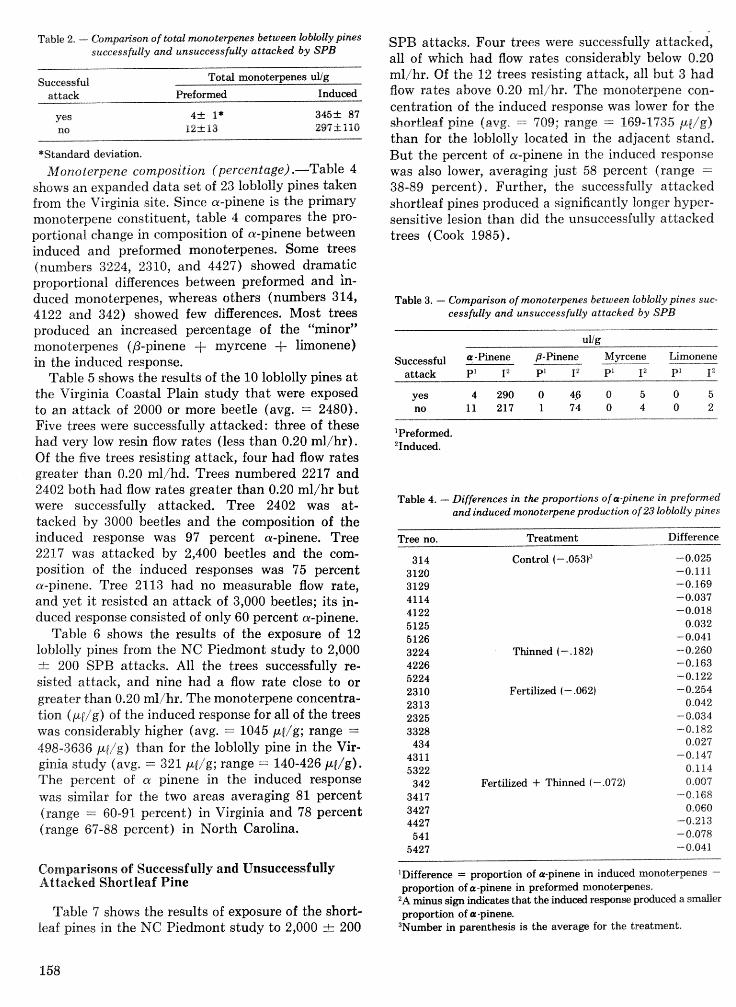
Table 2, ---- Comparison of total monotepenes between kobbGfy pines successfully and unsuccessfully attacked by SPB
Successful Total monoterpenes uUg
attack Preformed I n d u d
Yf?S 4 f 1* 345IfI: 87 no 1 2 f 1 3 297k110
*Stmdard deviation.
Monoterpene composition (percentage) .-Table 4 shows an expanded data set of 23 loblolly pines taken from the Virginia site. Since a-pinene is the primary monoterpene constituent, table 4 compares the pro- portional change in composition of a-pinene between induced and preformed monoterpenes. Some trees (numbers 3224, 2310, and 4427) showed dramatic proportional differences between preformed and in- duced monoterpenes, whereas others (numbers 314, 4122 and 342) showed few differences. Most trees produced an increased percentage of the "minor" monoterpenes (P-pinene + myrcene + limonene) in the induced response.
Table 5 shows the results of the 10 loblolly pines a t the Virginia Coastal Plain study that were exposed to an attack of 2000 or more beetle (avg. = 2480). Five trees were successf~1Iy attacked : three of these had very low resin flow rates (less than 0.20 ml/hr). Of the five trees resisting attack, four had flow rates greater than 0.20 rnl/hd. Trees numbered 2217 and 2402 both had flow rates greater than 0.20 ml/hr but were successfully attacked. Tree 2402 was at- tacked by 3000 beetles and the composition of the induced response was 97 percent a-pinene. Tree 2217 was attacked by 2,400 beetles and the com- position of the induced responses was 75 percent a-pinene. Tree 2113 had no measurable flow rate, and yet it resisted an attack of 3,000 beetles; its in- duced response consisted of only 60 percent a-pinene.
Table 6 shows the results of the exposure of 12 loblolly pines from the NC Piedmont study to 2,000 riz 200 SPB attacks. All the trees successfully re- sisted attack, and nine had a flow rate close to or greater than 0.20 ml/hr. The monoterpene concentra- Lion ( p [ / g ) of the induced response for all of the trees 'f-vas considerably higher (avg. = 1045 pp/g; range = 498-3636 p ~ / g ) than for the loblolly pine in the Vir- ginia study (avg, = 321 pf/g; range =. 140-426 pfjg). The percent of cr pinene in the induced response was similar for the two areas averaging 81 percent (range =I 60-91 percent) in Virginia and 78 percent (range 67-88 percent) in North Carolina.
Comparisons of Successfully and Unsuecessf ully Attacked Shortleaf Pine
Table 7 shows the results of exposure of the short- leaf pines in the NC Piedmont study to 2,000 -+ 200
SPB attacks. Four trees were successfully attacked, all of which had flow rates considerably below 0.20 ml/hr. Of the 12 trees resisting attack, all but 3 had flow rates above 0.20 ml/hr. The mono-terpene con- centration of the induced response was lower for the shortleaf pine (avg, -- 709; range == 169-1 735 y~ /g ) than for the ldlofly located in the adjacent stand, But the percent of a-pinene in the induced response was also lower, averaging just 58 percent (range - 38-89 percent). Further, the suecessfufly attacked shortleaf pines produced a significan tly longer hyper- sensitive lesion than did the unsuccessfuliy attacked trees (Cooli; 1985).
Table 3. - Comparison of monoterpenes between Zoblolly pines sue- eessfully and unsuccessfully attacked by SPB
ulig
~ ~ ~ ~ ~ ~ ~ ~ f ~ j q -Pinene /3-Pinene Myrcene Limonene
attack PI 12 PI 12 P' I' PI I'
Yes 4 290 0 45 0 5 0 5 no 11 217 1 74 0 4 0 2
' Preformed. 21nduced.
Table 4. - Differences in the proportions of a-pinene in preformed and induced monoterpene produetion of 23 loblolty pines
Thinned ( - ,182)
Fertilized (- .062)
Tree no. Treatment Difference
314 Control ( - .053)3 -0.025 3120 -0.111 3129 -0.169 4114 -0.037 4122 -0,018 5125 0.032 5126 -0.041 3224 -0.260 4226 -0.163 5224 -0.122 2310 -0.254 2313 0.042 2325 -0,034 3328 -0.182
434 0.027 4311 -0,141 5322 0,114
342 Fertilized + Thinned ( - .072) 0.007 3417 -0.168 3427 0,060 4427 -0.213 54 1 -0.018
5427 -0.041
'Difference = proportion of a-pinene in induwd moaoterpenes -- proportion of a-pinene in preform4 monotewnes.
ZA minus sign indicates that the i n d u d responsr? prducd a smaller proportion of a -pinene.
3Number in pmenthesis is the averae for the treatment.
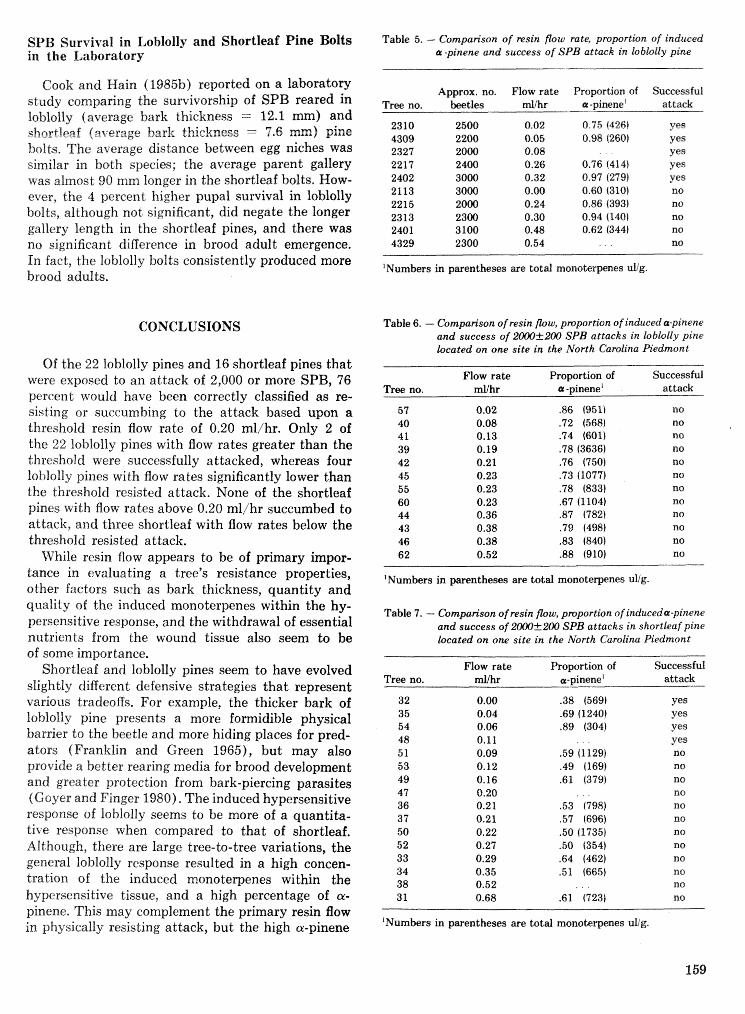
SPB Survival in Loblolly and Shortleaf Pine Bolts in the Laboratory
Table 5. - Comparison of resin flow rate, proportion sf induced a -pinene and success of SPB attaek in lobtcllly pine
Cook and Hain (1985b) reported on a laboratory study comparing the survivorship of SPB reared in loblolly (average bark thickness == 12.1 shortleaf (average hark thickness .- 7.6 bolts. The average distance between egg niches was similar in both species; the average parent gallery was almost 90 rnrn longer in the shortleaf bolts* How- ever, the 4 percent higher pupal survival in loblolly bolts, although not significant, did negate the longer gallery length in the shortleaf pines, and there was no significant difference in brood adult emergence. In fact, the loblolly bolts consistently produced more brood adults.
CONCLUSIONS
Of the 22 loblolly pines and 16 shortleaf pines that were exposed to an attack of 2,000 or more SPB, 76 percent would have been correctly classified as re- sisting or succumbing to the attack based upon a threshold resin flow rate of 0.20 ml/hr. Only 2 of the 22 loblolly pines with flow rates greater than the threshold were successfully attacked, whereas four lohlolly pines with flow rates significantly lower than the threshold resisted attack. None of the shortleaf pines with flow rates above 0.20 ml/hr succumbed to attack, and three shortleaf with flow rates below the threshold resisted attack.
While resin flow appears to be of primary impor- tance in evaluating a tree's resistance properties, other factors such as bark thickness, quantity and quality of the induced monoterpenes within the hy- persensitive response, and the withdrawal of essentiaI nutrients from the wound tissue also seem to be of some importance.
Shortleaf and loblolly pines seem to have evolved slightly different defensive strategies that represent various tradeoffs. For example, the thicker bark of lohlolly pine presents a more fomidible physical barrier to the beetle and more hiding places for pred- ators (Franklin and Green 1965), but may also provide a better rearing media for brood development and greater protection from bark-piercing parasites (Goyer and Finger 1980). The induced hypersensitive response of loblolly seems to be more of a quantita- tive response trrhen compared to that of shortleaf. Although, there are large tree-to-tree variations, the general loblolly response resulted in a high concen- tration of the induced monoterpenes within the hwcrsensitive tissue, and a high percentage of a- pinene, This may complement the primary resin flow in physically resisting attack, but the high a-pinene
Tree no. Approx. no.
beetles Flow rate
mlihr
"umbers in paentheses ape tot& monotepnes ufig.
Table 6. - Comparison of resin &w, proportion of induceda-pinene and success of 2W-t-2a) SPB attacks in loblolly pine located on one site in the North Carolina Piedmont
Flow rate Proportion of Successful Tree no. mllhr (Y -pineneB attack
57 0.02 .86 (951) no 40 0.08 .72 (568) no 41 0.13 .74 (601) no 39 0.19 .78 (3636) no 42 0.21 .76 (750) no 45 0.23 .73 (1077) no 55 0.23 .78 (833) no 60 0.23 $7 (1104) no 44 0.36 .87 (782) no 43 0.38 .79 (498) no 46 0.38 .83 (840) no 62 0.52 .88 (910) no
'Numbers in parentheses are total monoterpenes ulig.
Table 7. - Compan'son of resin &w, proportion of induceda-pinene and success of 2 0 5 200 SPB attacks in shortleaf pine located on o m site in the North Carolina Piedmont
Flow rate Proportion of Tree no. rnl/h r a-pinene"
3 2 0.00 .38 (569) 35 0.04 -69 (1240) 54 0.06 .89 (304) 48 0.11 . . 5 1 0.09 .59 (1129) 53 0.12 .49 (169) 49 0.16 .61 1379) 47 0.20 . . 36 0.21 .53 (798) 3 7 0.21 .57 (696) 50 0.22 .50 (1735) 52 0.27 .50 (354) 33 0.29 -64 (462) 34 0.35 .51 (665) 38 0.52 31 0.68 .6l (723)
Successful attack
"umbers in parentheses are total monotepenes ulig.
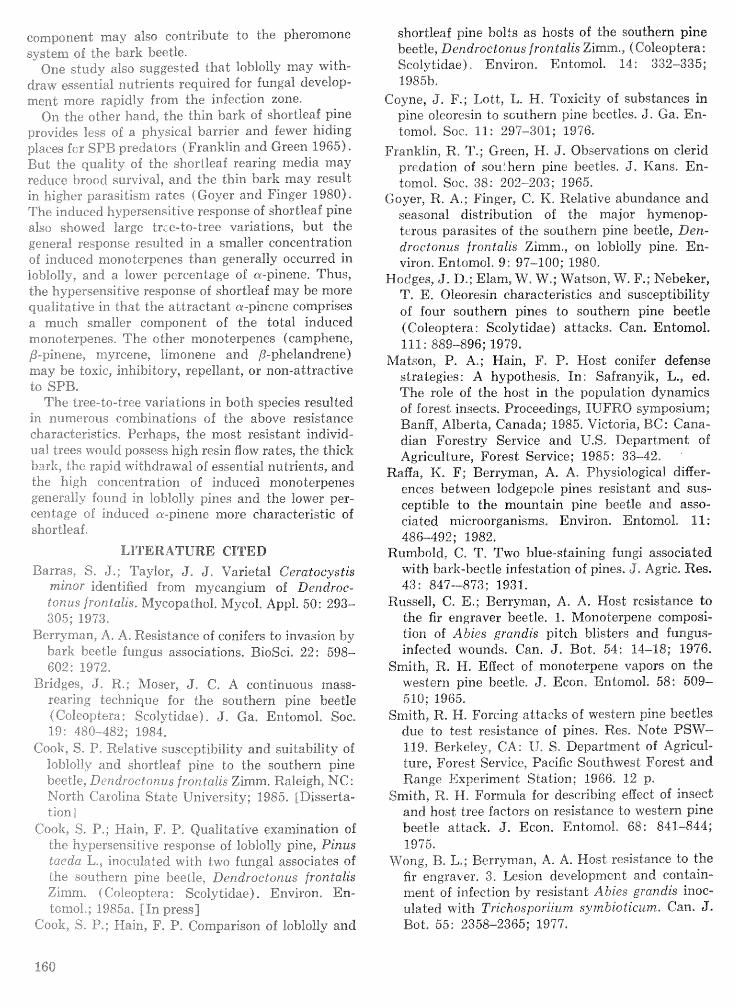
component may also contribute to the pheromone system of the bark beetle,
One study also suggested that lohloll3- may with- draw essential nutrients required for fungal derelop- men$ mme rapidly from the infection zone* On rhe other hand, the thin bark of shortleaf pine
provid~-s less of a physical barrier and fewer hiding piaces fcr SPPJ predarors (Franklin and Green 1965). But the quality of the shortleaf rearing media may reduce brood sur~vivaI, and the thin bark may result in higher parasitism rates (Goyer and Finger 1980). The induced hypersensitive response of shortleaf pine also showed large trce-to-tree variations, but the general 1 espsnse resulted in a smatter eoncentra tion of induced msnoterpenes than generally occurred in Iokriiiilly, and a lower percentage of a-pinene, Thus, the TPyg:ersenshb;ive response of shortleaf may be more quahitative in that the attractanha-pinene eomph.ises a much smaller component 06 the total induced maanoterpenes, The other msnoderpenes (eamphene, p-pinene, myrcene, limonene and P-phelandrene) may be toxic, inhibitory, repellant, or non-attractive to SPB,
The tree- to-.i ree variations in both species resulted in numerous co-xn~binations of the above resistance characteristics. Perhaps, the most resistant individ- ual trees ivould possess high resin flow rates, the thick b ~ k ; ; , the rapid withdrawal of essential nutrients, and the high concentration of induced monoterpenes generally found in loblolly pines and the Bower per- centage e p i induced a-pinene more chasacteris"cle of short8eaf,
LITERATURE CITED Barrasp S, Jl: Taylor, J. J. Varietal Cerntneystis
minor identified from mycangium of Dendroc- tonus fron talks* Mycopathol. Mycol, Appl. 50: 293- 3955 1973,
Berryman, A. A. Resistance of coniferr; to invasion by bark kc-ekle fungus associations, BioSei, 22: 598- 602: 1972,
Bridges, J, W*; %Toseat, J, 42, A continuous mass- rearing technique for the southern pine beetle (Co%eoi=tera: Scolytidae) , J, Ga, Enbmol, Soe, 89: 480-482; 1983,
Cook, S* P, Relative susceptibility and suitability of loblolly and shortleaf pine to the southern pine beetle, Bt-ndroctorsus Jron talk Zimm, Raleigh, NC : S'orth Carol$na State University; 1985, [Disserta- tion{
COGF;, S, P,; Main, I?, 911, Qualitative examination of the hypersensitive response of lobgolly pine, Pinus tacdci L,: inoculated with two fungal associates of the southern pine beedje, Dendroctonus frontalis Zimrn, (Coleoptera: Seolytidae) , Environ, En- toz~oh,; 1985a, [In press]
Cook9 Sm Pa: Hain, F, P, Comparison of Ioblolly and
shortleaf pine bolts as hosts of the southem pine beetle, Dendroctonus Jron tatis Zimm., ( Coleopteri : Scolytidae). Environ, Endomol. IS: 332-335; X985b.
Coyne, J, F.; Lott, Xi, H. T"oxicity of substances in pine oleoresin to scuthem pine beetles. J, Ga. En- torno%. Soc, 11: 297-309; 1976.
Frankfin, R, T,; Green, H. J, Observations on elerid predation of sou:hern pine beetles. J. Kans. En- tcrmol, Soe, 38: 202-203; 1965,
Goyer, R. A,; Finger, 6, K. Relative abundance and seasonal distribution of t be major h ymenop- tertlus parasites of the southern pine beet;le, Den- droctonus frontatis Zimm., on loblslity pine, En- virsn, EntomoI. 9: 97-400; 1980,
Hodges, 6. D.; Elam, \V, W,; !Vatson, W, I?.; Nebeker, 7'. E. Oleoresin. charaeteristies and susceptibility of four southern pines to southern pine beetle ( Coleopdera : Scoly tidae) attacks. Can, Entomol, 111 : 889-896; 1999.
Matson, P. A,; Wain, I?. I?, Host conifer defense strategies: A hypothesis. In : Safranyilr, L., ed, The role of the host in the population dynamics of forest insects, Proceedings, IUFRO symposium; Banfjf, Alberta, Canada; f 985. Victoria, BC: Cana- dian Forestry Service and U.S. Department of Agriculture, Forest Service; 1985 : 33--42.
Raga, K. F; Berryman, A. A. Physiological diEer- enees between lodgepale pines resistant and sus- ceptible to the mountain pine beetle and asss- ciated microorganisms, Environ. Entomol, 11: 486-492; 1982.
Rumbold, C, T, Two blue-staining fungi associated with bark-beetle infestation of pines, J, Agric, Res. 43: 847--873; 1931.
Russell, C. E.; Berryman, A. A. Host resistance to the fir engraver beetle, 1, Monoderpene eomposi- tion of Abies grandis pitch blisters and fungus- infected wounds, Can, J. Bot, 54: 14--18; 1976.
Smith, R. H. Eirect of monolevene vapors on the western pine beetle. J, Econ, Entomol. 58: 509- 510; 1965.
Smith, R. W. Forcing at txfrs of western pine beetles due to test resistance of pines, Res. Note PSNT- 119. Berkeley, CA: U. S. Department of Agricul- ture, Forest Service, Pacific. Southwest Forest; and Range Experiment Station; 1966, lQp.
Smith, R.. H, Fornula for describing eEect of insect and host tree factors on resistance to western pine beetle attack, J. Econ. Eratomof, 68: 841-844; 197-5.
ivong, B. L.; Berryman, A. A. Host resistance to the fir engraver. 3. Lesion development and contain- ment of infection by resishnt Abies g r a d i s inoc- ulated with Trichosporiium symbio tieurn, Can* J. Bat, 55: 2358-2365; 1917,
Host/Beetle Interactions: Influence of Associated Microorganisms, Tree Disturbance, and Host Vigor
J. D. Hodges, T. E. Nebeker, J. D. DeAngelis, and C. A. Blanche'
Ahsafrnct--Results of three separate but related investigations have shown that a number of factors influence host resistance to southern pine beetle, Tar one study, phenolic metabolites of 6, minor stimu- lated transpiration in toblolly pine seedlings when administered through the cut stem. Rates of water loss were doubled within 24 hours after treatment with isocoumarin solutions. A second study showed that physical. and chemical properties of the oleo- resin system may be altered due to cvounding of the stem and root system such as may occur during a thinning operation, A third set of investigations resulted in development of techniques for distin- guishing bet~veen sapwood and heartcvood of loblolly pine and disclosed that stern electrical resistance (SER) can be used to rate the vigor of individual trees within a stand. Other indicators of tree vigor in loblolly pine were: (1) Grams of stemwood pro- duced per sq. m of leaf surface, and (2) last year increment as a percentage of total cross-sectional sapwood area. Additional keyavords: Transpiration, fungal toxins, sapwood area, electrical resistance.
Mississippi State's cooperative work under the Integrated Pest hfanagennent Program has dealt primarily with hostlpest interactions. MTe have been most interested in the host and factors that might influence its resistance to the southern pine beetle (SPB). Specifically, we have looked at : (1) The role of microorganisms associated ~ - i t h the beetle in over- coming tree resistance; 12) the influence of tree disturbances, such as those causecl by logging opera- tions, on tree resistance, and (3) host vigor and methods for evaluating id.
From the earliest work OM the SPB, it was as- sumed that the oleoresin system of the southern pines was responsible for differences in tree resistance (Thatcher 19606, Resistarnce r,aaae hypothesized to be related to the chemical composition of the oleoresin (Coyne 1973; Hodges and Lorio 1993, 1375; Ctsyne
"espectivety, Professor, Del~artmenl of Forestry; and Pro- fessor and Assistant Entomi:logisl-s, Department of Entomol- ogy, Mississil->pi St;itc. University, hlississippi State, hIS. (This paper is Contribution No, 61483 of the 5iississippi AgricuIGural and Forestry Experiment; Station.)
and Lett 1976) or Lo pkzysica% properties sf the system such as Bow rate and vis~osjity (Anderson and Anderson 1968; Hodges and Loris 1968; Lorio and Hodges 1968a, $96853,1974, 1971; Mason 197%), Recent work (Hodges e.$ al, 1977, 1979) has defi- nitely established that there is a very strong rela- tionship between physical properties of the oleo- resin system, such as total flow of oleoresin, and the success of SPB attacks, %4ore beetles are needed to overcome a tree with a copious resin Aow than one with a low Aow; i.e,, the one with copious flow is more attack resistant,
Even though the importance of the oleoresin sys- tem in tree resistance is now well established, the (mechanism (s) whereby high oleoresin Wow can im- part greater resistance to the tree are not entirely understood M G ~ are the ways that beetles may eventually be able Lo overcome tree resistance and kill the tree, In a recent article, Hodges ed al. (1985) speculated that the function of oleoresin in tree resistance is to prevent inoeulatisn of the tree with microorganisms associated with the SPB, The hyper- thesis was: "The success of beetle attack, and thus the death of the tree, is directly related to the corn- plete circumferential introduction of fungal inoculum into the living tree, and the subsequent production of toxic substances which in turn alter physiological processes Ce.g., wader relations) in the tree, and thus make the tree far more susceptible do subsequent attacks. Relative resistance is therefore a function of the ease with "cvhich inoculurn can be introduced and successfully established."
One phase of this research has dealt with the role sf microorganisms associated with the SPB in aver- coming tree resistance do beetle attack* Specifically, we have examined the inAuenee of compounds pro- duced by Cerutoeysiis minor QHerFgcock) on tree water relations, Results of -this work have provided a plausible explanation of the sequence of events in attacked trees leading to a rapid reduction in oleo- resin Wowe9 successful beetle attack, and tree deathh,
A second phase of the work exanxined the influence of tree disturbances (simulated thlnning injuries) OM tree vigor and properties of the oleorresin syat em, The intent was to determine changes caused by in- juries that could increase suseeptik;lility to beetle attack. A third part of the research was concerned with host vigor and the developn~ent of a vigor in- dexing system for lobloIiy pine,
A description of the study on h~s t ipes t interac-
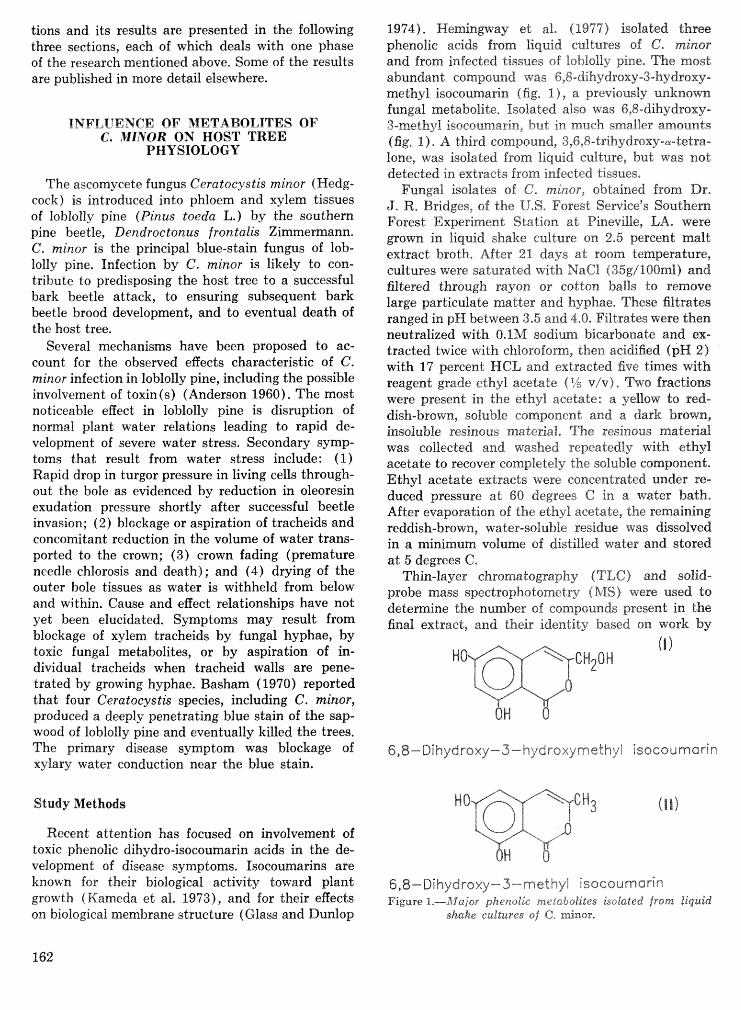
tions and its results are presented in the following three sections, each of which deals with one phase of the research mentioned above, Some of the results are published in more detail elsewhere.
INFLUENCE OF METABOLITES OF 6, MINOR OX HOST TREE
PHYSf OLOGU
The ascomyeete fungus Ceratocystis minor (Hedg- cock) is introduced into phloem and xylem tissues of loblolly pine ( P k u s toeda L,) by the southern pine beetle, Dendroetonus frontalis Zimmermann. C. minor is the principal blue-stain fungus of lob- lolly pine. Infection by 6, minor is likely to csn- tribute to predisposing the host tree to a successful bark beetle attack, to ensuring subsequent bark beetle brood development, and to eventual death of the host tree.
Several mechanisms have been proposed to ac- count for the observed effects characteristic of C. minor infection in loblolly pine, including the possible involvement of toxin (s) (Anderson 1960). The most noticeable effect in loblolly pine is disruption of normal plant water relations leading to rapid de- velopment of severe water stress. Secondary symp- toms that result from water stress include: (1) Rapid drop in turgor pressure in living cells through- out the bole as evidenced by reduction in oleoresin exudation pressure shortly after successful beetle invasion; (2) blockage or aspiration of tracheids and concomitant reduction in the volume of water trans- ported to the crown; (3) crown fading (premature needle chlorosis and death) ; and (4) drying of the outer bole tissues as water is withheld from below and within. Cause and effect relationships have nod yet been elucidated. Symptoms may result from blockage of xylem tracheids by fungal hyphae, by toxic fungal metabolites, or by aspiration of in- dividual tracheids when tracheid walls are pene- trated by growing hyphae. Basham (1970) reported that four Ceratocystis species, including C. minor, produced a deeply penetrating blue stain of the sap- wood of loblolly pine and eventually killed the trees. The primary disease symptom was blockage of xylary water conduction near the blue stain,
Study &jethods
Recent attention has focused on involvement; of toxic phenolic dihydro-isocoumarin acids in the de- velopment of disease symptoms. Isocoumarins are known for their biological activity toward plant growth (Kameda et al. 1973), and for their egects on biological membrane structure (Class and Dunlop
1974). Heminway et al. (19"37) isolated three phenolic acids from liquid cultures of 6. minor and from infected tissues of fisblsffy pine, The most abundant compound was 6,8-dihydroxy-3-fiydroxyS" methyl isoeoumarirrr (fig, I) , a previously unknown fungat metabolite, Isolated also was 6,8*dihydroxy- 3-methyl! icocoumariq hut in much smaller amounb-,c; (fig, 11, A third compound, 3,6,8-tfilrrydroxy-~-.I;etra- lone, was isolated from liquid culture, but was not detected in extracts from inf ecded tissues,
Fungal isolates of 6. miaor, obtained from Dr, J. R, Bridges, of the U.S. Forest Service" S~outherm Forest Experiment Station at Pineville, LA, were grown in liquid shake culture on 2-5 percent malt extract broth, After 21 days at roam temperature, cultures were saturated with NaCi (35gi100ml) and filtered through rayon sr cotton balls to remove large particulate matter and hyphae. These filtrates ranged in pH between 3.5 and 4.8. Filtrates were then neutralized with O.lM sodium bicarbonate and ex- tracted twice with chloroform, then acidified (pH 2) with 17 percent HCL and extracted five times with reagent grade ethyl acetate ($5 v/v), Two fractions were present in the ethyl acetate: a yellow to red- dish-brown, soluble component and a dark brom, insoluble resinous material, The resinous material. was collected and washed repeatedly with ethyl acetate to recover completely the soluble component. Ethyl acetate extracts were concentrated under se- duced pressure at 60 degrees Q_: in a water bath, After evaporation of the ethyl acetate, the remaining reddish-brown, water-soluble residue was dissolved in a minimum volume of distilled water and stored at 5 degrees 6.
Thin-layer ebPlomtogsaph y 4 TL6) and solid- probe mass speetropkotometrgi (MS) were used to determine the number of compounds present in the final extract, and their identity based on work by
6,8-Dihydroxy-3-hydroxymethyI isocoumarin
6,8-Dihydroxy-3-methyl isocoumarin Figure 1.-.Major phenolic metabolites b o k t e d from liquid
shake cedEtures of C, minor.
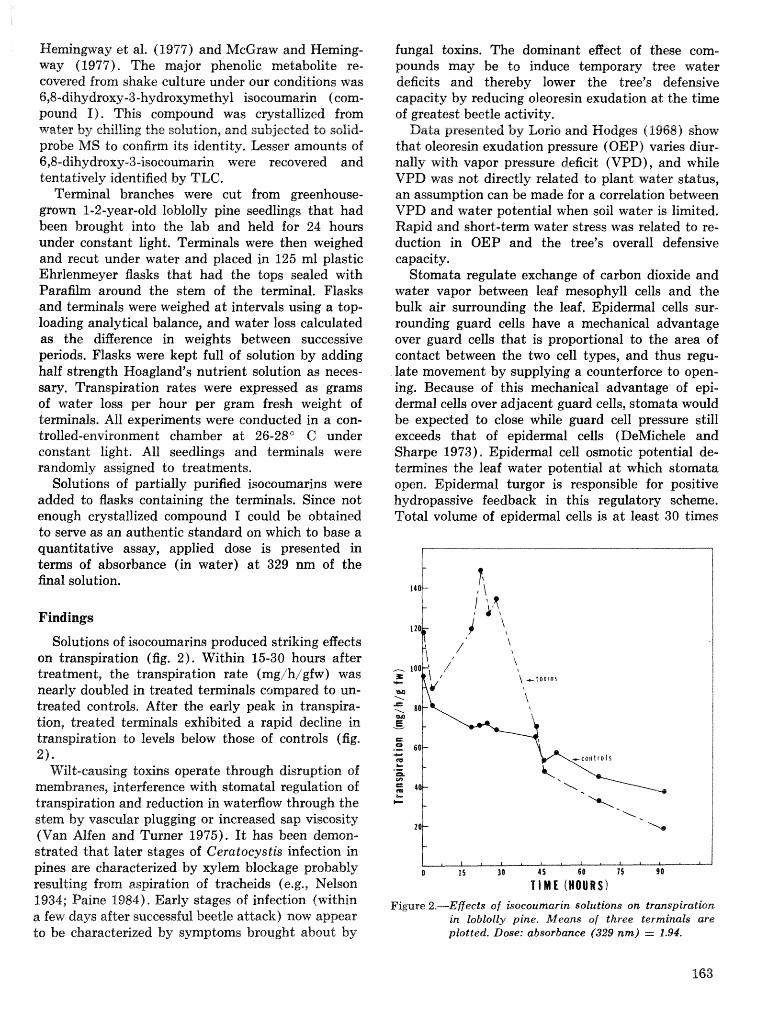
Heminmay et al. (1977) and McGraw and Heming- way (1977). The major phenolic metabolite re- covered from shake culture under our conditions was 6,8-dihydroxy-3-hydroxymethyl isocournarin (com- pound I) . This compound was c~ystallized from water by chiling the solution, and subjected t0 solid- probe MS to confirm its identity. Lesser amounts of 618-dihydroxy-3-is~coumarin were recovered and tentatively identified by TLC.
Terminal branches were cut from greenhouse- grown I-2-year-old loblolly pine seedlings that had been brought into the lab and held for 24 hours under constant light. Terminals were then weighed and recut under water and placed in 125 ml plastic Ehrlenrneyer Basks that had the tops sealed with
around the stem of the terminal, Flasks and terminals were weighed a t intemals using a top- loading analytical balance, and water loss calculated as the difference in weights between successive periods. Flasks were kept full of solution by adding half strength Woagland's nutrient solution as neces- sary. Transpiration rates were expressed as grams of water loss per hour per gram fresh weight of terminals. All experiments were conducted in a con- trolled-environment chamber at 26-28" &: under constant light. All seedlings and terminals were randomly assigned to treatments.
Solutions of partially purified isocoumarins were added to flasks containing the terminals. Since not enough crystallized compound I could be obtained to serve as an authentic standard on which to base a quantitative assay, applied dose is presented in terns of absorbance (in water) a t 329 nm of the final solution.
Findings
Solutions of isocoumarins produced striking eaects on transpiration (fig. 2). Within 15-30 hours after treatment, the transpiration rate (mg/h/gfPr) was nearly doubled in treated teminals compared to un- treated controls, After the early peak in transpira- tion, treated terminals exhibited a rapid decline in transpiration to levels below those of controls (fig. 2) *
Wilt-causing toxlins operate through disruption sf membranes, interference with stomata1 regulation of transpiration and reduction in waterfiow through the stem by vascular plugging or increased sap viscosity (Van Alfen and Turner 1975). It has been demon- strated that later stages of Ceratocystis infection in pines are characterized by xylem blockage probably resulting from aspiration of tracheids (e.g., Nelson 1934; Paine 1984). Early stages of infection (within a few days after successful beetle attack) now appear to be characterized by symptoms brought about by
fungal t o ~ n s . The dominant effect of these com- pounds may be to induce temporary tree water deficits and thereby lower the tree" defensive capacity by reducing oleoresin exudation at the time of greatest beetle activity.
Data presented by Lorio and Hsdges (4968) show that oleoresin exudation pressure (OEP) varies diur- nally with vapor pressure deficit (VPD), and while VPD was not directly related to plant water status, an assumption can be made for a correlation between VPD and water potential when soil water is limited, Rapid and short-tern water stress was related to re- duction in OEP and the tree's overall defensive capacity.
Stomata regulate exchange of carbon dioxide and water vapor between leaf mesophyll cells and the bulk air surrounding the leaf. Epidemal cells sur- rounding guard cells have a mechanical advantage over guard cells that is proportional to the area of contact between the two cell types, and thus regu- late movement by supplying a counterforce to open- ing. Because of this mechanical advantage of epi- demal cells over adjacent guard cells, stomata would be expected to close while guard cell pressure still exceeds that of epidemal cells (DeMichele and Sharpe 1973). Epidermal cell osmotic potential de- termines the leaf water potential a t which stomata open. Epidemal turgor is responsible for positive hydropassive feedback in this regulatory scheme. Total volume of epidermal cells is a t least 30 times
15 38 4 5 QB 75
T I M E (HOURS) Figure 2.-Ef ects of ifocoumarin solutions on transpiration
in loblotly pine. Means of three terminals are plotted. Dose: absorbance (329 nm) = 1.94.
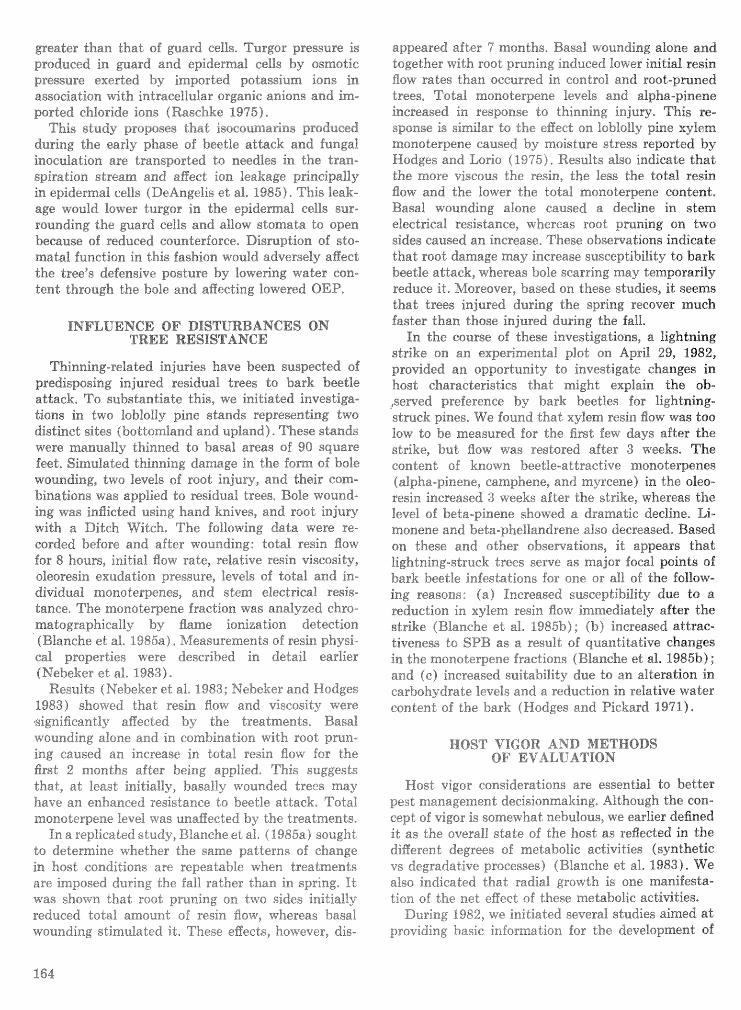
greater than that of guard cells, Turgor pressure is produced in guard and epidermal cells by osmotic pressure exerted by imported potassium ions in association with intraee%lular organic anions and im- ported chjsride ions CRaschke %995),
This study propuses that i a u c o u x x ~ ~ ~ i ~ ~ s produced during the early phase of beetle attack and fungal inoculation are transported to needles in the tran- spiration stream and affection leakage principally in epidermal cells (DeAngelis et a%, 1985)- This leak- age would lower turgor in the epidermal cells sur- rounding the guard cells and allow stomata to open because of reduced counterforce, Disruption of sto- mataf function in this fashion would adversely aEect the tree" defensive pasture by 1owering water con- tent through the bole and wgecting lowered OEP,
INFLUENCE OF DPSTURBAHCES ON TREE RESISTANCE
Thinning-related injuries have been suspected of predisposing injured residual trees do bark beetle attack, T o substantiate this, we initiated investiga- tions in two 'SoMolly pine stands representing two distinct sites Q bottomland and upland). These stands were manually thinned to basal areas of 90 square feed, Simulated thinning damage in the form of bole wounding, two levels of root injury, and their cam- binations was applied $0 residual trees, Bole wound- ing was infiicted using hand knives, and root injury with a Ditch Witch, The following data arere re- corded before and after wounding: total resin fisw for 8 hours, initial BOW rate, relative resin viscosity, oleoresin exudation pressure, levels of total and in- dividual n~onoterpenes, and stem electrical resis- tance, The monoterpene fraction was analyzed chro- matographically by flame ionization detection (Blanche et al, 1985a), Measurements of resin physi- cal properties were described in detail earlier (Nebeker et aB, 1983)-
Results (Nebeker et a%. 1983; Nebekes and Hodges 1983) showed that resin Aow and viscosity were significantly aBected by the treatments, Basal wounding alone and in combination with root prun- ing caused an increase in total resin flow for the first 2 months after being applied, This suggests that, at least initially, basally wounded trees may have an enhanced resistance to beetle attack, Total monotcrpene level was unaffected by the treatments, In a replicated study, Blanche et al, ( 1985a) sought
to determine whether the same patterns of change in host conditions are repeatable when dreatsents are imposed during the fall rather than in spring. It was shown .$;hat roo$ pruning on two sides initially reduced total amount of resin flow, whereas basal wounding stimulated it, These effects, however, dis-
appeared after 7 months, Basal wounding alone and together with root pruning induced lower initial resin fiow rates "&hart occurred in control and root-pruned trees, Total msnoterpene levels and alpha-pinene increased in response to thinning injury. This re- sponse i s similar ts the effect on loblolly pine xylem msnoderpene caused by moisture stress reported by Hcodges and Lori0 ( $975). Results also indicate that the mere viscous the resin, $he less the total resin flow and the %owes the total monoderpene content, Basan wounding alone caused a decline in stern electrical resistance, whereas root pmning on two sides caused an increase, These absemations indicate that root damage may increase susceptibility do bark beetle attack, whereas bole scarring may temporarily reduce it. Moreover, based on these studies, it seems that trees injured during the spring recover much faster than those injured during the fall, In the course of these investigations, a lightning
strike on an experimental plot on April 29, 191312, provided an opportunity to investigate changes in host characteristics that might explain the sb- ,served preference by bark beetles for lightning- struck pines, We found Ghat xylem resin Bow was too low to be measured for the first few days after the strike, but fiow was restored after 3 weeks, The content of known beetle-attract ive msnoterpenes (alpha-pinene, eamphene, and myrcene) in the oleo- resin increased 3 weeks after the strike, whereas the level of beta-pinene showed a dramatic decline, Li- monene and beta-phellandrene also decreased, Based on these and other observations, it appears that lightning-struck trees serve as major focal points sf bark beetle infestations fer one or all of the follow- ing reasons: (a) Increased suscepdf"gaili&y due to a reduction in xylem resin flow immediately after the strike (Blanche e% al, 1985b) ; (b) increased attrae- tivenesb to SPB as a result of quantitative changes in the monoterpene fractions (Blanche ed al, 1985b) ; and (e) increased suitability due to an alteration in carbohydrate levels sand a reduction in relative water content of the bark (Hsdges and Pickard 8971),
HOST VIGOR AED METHODS OF EVAEUATIOS
Host vigor considera.eions are essential to better pest management decisionmaking, Although the con- cept of vigor i s somewhat nebulous, we earlier defined it as the overall state of the host as reflected in the different degrees of metabolic activities bynthetis: vs deardative processes) (Blanche etaal, f 983). We also indicated that radial grori~~th is one manifesta- tion of the net effect of these metabolic activities.
During 1982, we initiated several studies aimed at providing basic information for the development of
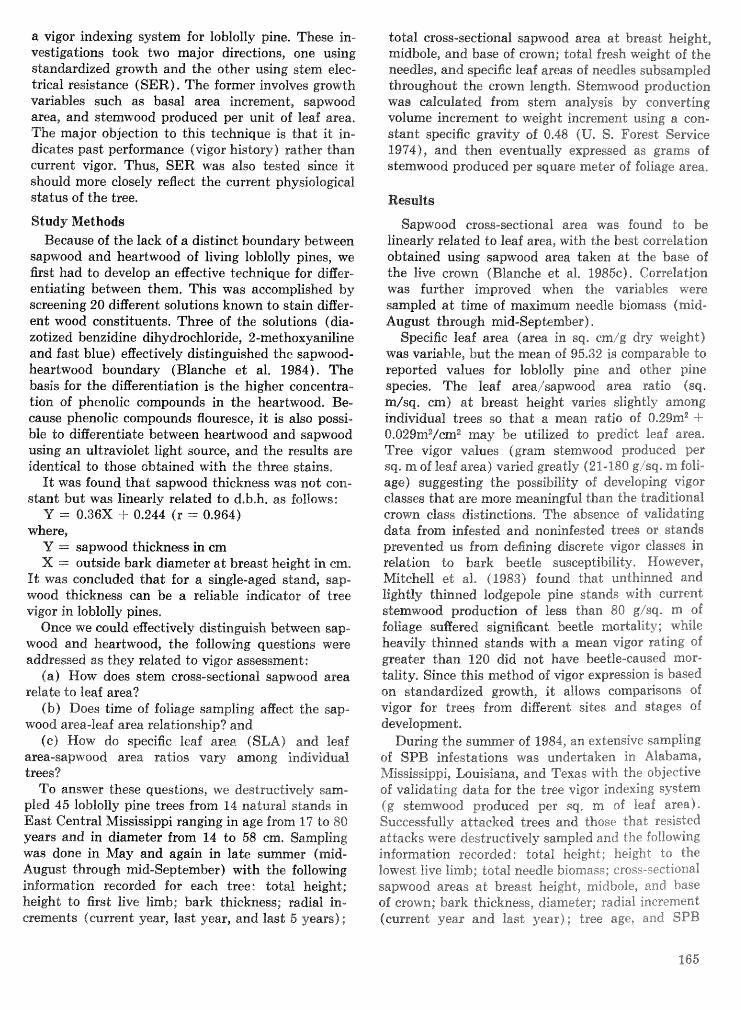
a vigor indexing system for loblolliy pine. These in- vestigations took two major directions, one using standardized growth and the other using stern elec- trical resistance (SER), The fomer involves growth variables such as basal area increment, sapwood area, and stemwood produced per unit of leaf area, The major objection to this technique is that it in- dicates past performance (vigor b i s t o ~ ) rather than current v-igor. Thus, SER was also tested since id should more closely reflect the current physiolagieal status of the tree,
Study Methods Because of the lack of a distinct boundary between
sapwood and heartwood of living loblolly pines, tve first had to develop an effective technique for differ- entiating between them, This was accomplished by screening 20 different solutions known to stain diaer- ent wood constituents. Three of the solutions (dia- zotized benzidine dihydroehloride, 2-methoxyaniline and fast blue) egectively distinguished the sapwood- heartwood boundary (Blanche et al. 1984). The basis for the differentiation is the higher coneentra- tion of phenolic compounds in the heartwood. Be- cause phenolic compounds flouresce, it is also possi- ble to diBerentiate between heartwood and sapwood using an ultraviolet light source, and the results are identical to those obtained with the three stains.
It was found that sapwood thickness was not eon- stant but was linearly related to d,b.h. as follows:
Y .= 0.36X -i- 0.244 (r = 0.964) where,
Y = sapwood thicknas in cm X = outside bark diameter a t breast height in em,
It was concluded that for a single-aged stand, sap- wood thickness can be a retiable indicator of tree vigor in loblolly pines.
Once we could effectively distinguish between sap- wood and heartwood, the following questions were addressed as they related to ~ g s r assessment:
(a) How does stem cross-sectional sapwood area relate do leaf area?
Qb) Does time of foliage sampling affect the sap- wood area-leaf area relationship? and
(c) HOW do speeif c leaf area (SLA) and leaf area-sapwood area ratios vary among individual trees?
To answer these questions, we destructively sam- pled 45 loblolly pine trees from 14 natural stands in East Central Mississippi ranging in age from 17 to 88 years and in diameter fram 64 to 58 can, Sampling was done in May and again in late summer (mid- August through mid-September) with the followkg information recorded for each tree: totab height; height to first live limb; bark thickness; radial in- crements (currerat year, last year, and last 5 years) ;
total ems-sectional sapwood area at breast height, midbole, and base sf crown; total fresh weight of the needles, and specific leaf areas of needles subsampled thrsughorsd the erown length* Stemwoad production was calculated from stem analysis by converting volume increment do weight increment using a con- stant specific graGdy of 0,48 QU, S, Forest Service 1974), and then eventually expressed as grams of stemwood produced per square meter of foliage area,
Sapwood cross-sectional area was found to be lineady related to leaf area, with the best correlation obtained using sapwood area taken at the base sf the dive erown (Blanche et a1, 1985~)~ Correlation was further improved when the variables were sampled at time of maximum needle biomass (mid- August through mid-September) .
Specific leaf area (area in sq, cm/g dry weight) was variable, beat the mean of 95-32 is comparable to reported values for ZobloEfy pine and other pine species, The leaf aseaisapwood area radio (sq* mlsq, ern) at breast height varies slightly among individual trees so that a mean ratio of 0,29narr" 6~029m2/em~rway be utilized do predict leaf area. Tree vigor values (gram stemwood produced per sg, m of leaf area) varied greatly (21-180 g/sq, m M i - age) suggestim~g the pos9ibility of developing vigor classes that are more meaningful than the traditional crown elass di~d.inetions, The absence of validating data from infested and noninfested trees or stands pmvented us from defining discrete vigor classes in relation Lo bark beetle susceptibility, However, Mitchell et aB, (1983) found that unthinned and lightly thinned lodgegs%e pine stands with current stemwood production of less than 80 g/sq. rn of foliage suAfered si&niff@ant beetle mortality; while heavily thinned stands with a mean vigor rating of greater than 128 did not have beetle-caused mop tality. Since this method of vigor expression is based on standardized growth, it allows comparisons of vigor for trees from different sites and stages of development,
Dudng the summer of 1984, an extensive sampling of SPB infestations was undertaken in Alabama, h%ississippi, Louisiana, and Texas with the objective of validating data for the tree vigor indexing system (g stemwood produced per sq. rn of leaf area). Successfully attacked trees and those that resisted attachs were destructively samp%ed and the %iiIIoiving information recorded : total height; height to the lowest live limb; total needle biomass: cross-sect ionai sapwood areas at breast height, midbole, and base sf crown; bark thicknessr diameter; radial increment (current year and last year); tree age, and
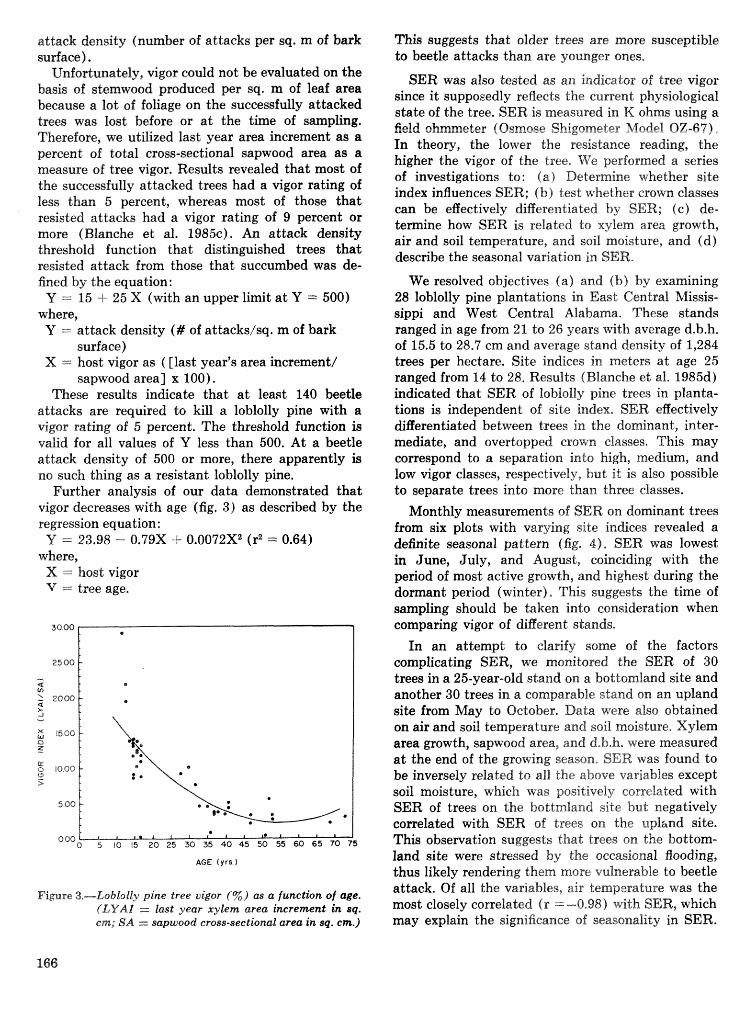
attack density (number of attacks per sq. m of bark sudace ) .
Unfostunakl3~., Ggos could not be evaluated on the basis of stemwood produced per sq. rn of leaf area because a lot of foliage on the successfully attacked trees was lost before or a t the t h e of smpling. Therefore, we utilized last year area increment as a percent of total, cross-sectional sapwood area as a measure of tree vigor, Results revealed that most of the successfulfy attaeked trees had a vigor rating of less than 5 percent, whereas most of those that resisted attacks had a vigor rating of 9 percent or more (Blanche et af. 1985~). An attack density threshold function that distinguished trees that resisted attack from those that succumbed was de- fined by the equation: U = 15 -4- 25 X (with an upper limit a t U = 500)
where, Y = attack density (# of attacks/sq. m of bark
surface) X == host vigor as ( [last year's area increment/
sapwood area] x 100). These results indicate that a t least 140 beetle
attacks are required to kill a loblolly pine with a vigor rating of 5 percent. The threshold function is valid for all values of Y less than 500. At a beetle attack density of 500 or more, there apparently is no such thing as a resistant loblolly pine.
Further analysis of our data demonstrated that vigor decreases with age (fig. 3) as described by the regression equation :
Y = 23.98 - 0.79X -t 0.0072X2 (r2 = 0.64) where,
X .= host vigor = tree age.
0 60
AGE f y r s
Figure 3.--Loblolly pine tree vigor f"%) as a function of age. (LVAZ I- last year xylem area increment in sq. cm; SA =I sapwood cross-sectional area in sq. cm.)
This suggests that older trees are molre susceptible to beetle attacks than are younger ones,
SER tvas also tested as sari indicator of tree vigor since it supposedly reflects the current physiological state of the tree. SER is measured in K ohms using a
eter ( Osmose Shigometer hfod~l RZ-67) , In theory, the lower the resistance reading, the higher the vigor of the tree. iVe performed a series of investigations to: (a) Determine whether site index influences SER; (b) test whether crown classes can be efictively differentiated by SER; (c) de- temine how SEE is related to xylem area growth, air and soif temperature, and soil moisture, and (d) describe the seasonal variation in SER.
We resolved objectives Ca) and (b) by examining 28 loblolly pint; plantations in East Central Missis- sippi and West Central Alabama. These stands ranged in age from 21 to 26 years with average d.b.h. of 15.5 to 28.7 cm and average stand density of 1,284 trees per hectare. Site indices in meters a t age 25 ranged from 14 to 28. Results (Blanche et al, 1985d) indicated that SER of loblolly pine trees in planta- tions is independent of side index. SER efectively differentiated between trees in the dominant, inter- mediate, and overtopped crown classes. This may correspond to a separation into high, medium, and low vigor classes, respectively, but it is also possible to separate trees into more than three classes.
Monthly measurements of SER on dominant trees from six plots with varying site indices revealed a definite seasonal pattern (fig. 4). SER was lowest in June, July, and August, coinciding with the period of most active growth, and highest during the dormant period (winter). This suggests the time of sampling should be taken into consideration when comparing vigor of diEerent stands.
In an attempt to clarify some of the factors complicating SER, we monitored the SER of 30 trees in a 25-year-old stand on a bottomland site and another 30 trees in a comparable stand on an upland site from May to October. Data were also obtained on air and soil temperature and soil moisture, Xylem area growth, sapwood area, and d,b.i&l, were measured a t the end of the growing serascan, SER was found to be inversely related to all the above variables except soil moisture, which was positively correlated with SER of trees on. the botkmland site but negatively correlated with SER of trees on the upland site. This observation suggests that trees on the bottom- land site were stressed by &he occasional flooding, thus likely rendering them mare vulnerable to beetle attack. Of all the variables, air temperature was the most closely correlated (r = -0,981 tvith SEE, which may explain the significance of seasonality in SER,
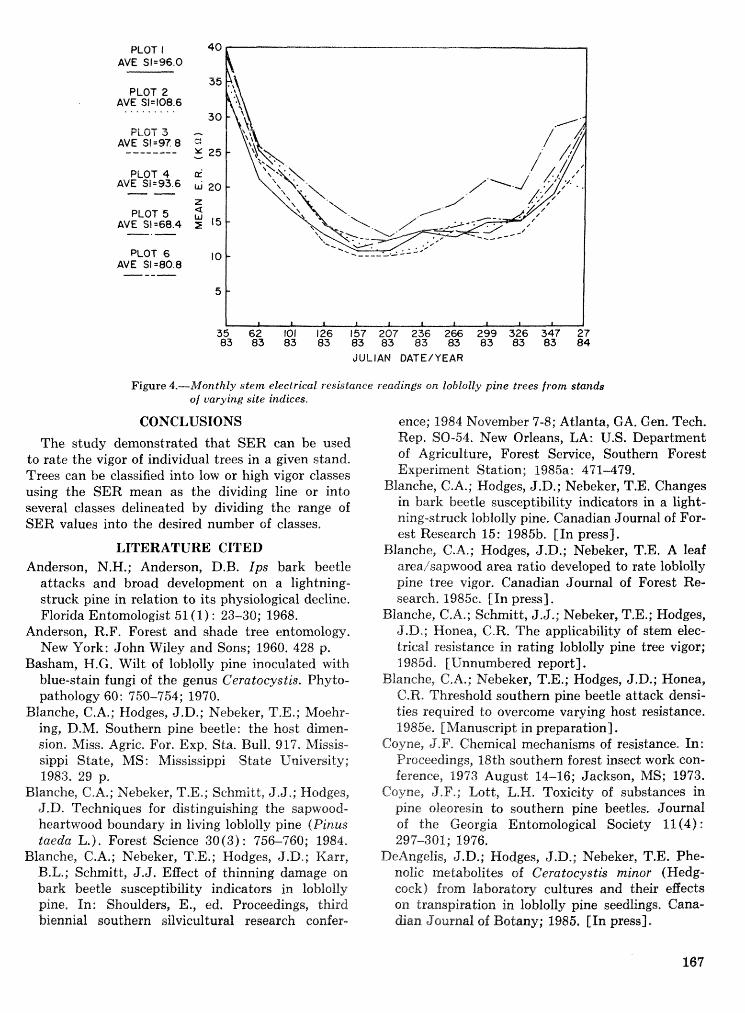
PLOT I AVE SI=96.0
PLOT 2 AVE S!=fQ8.fr
. . a ' . . . . '
PLOT 4 AVE Si=93.6
PLOT 5 AVE S1=68.4
-.-
PLOT 6 AVE Sl=80.8
Figure 4.-Monthly stem electrical resistance readings on loblolly pine trees from stands o f varying site indices.
CONCLUSIONS ence; 1984 November 7-8; Atlanta, GA. Gen. Tech.
The study demonstrated that SER can be used to rate the vigor of individual trees in a given stand. Trees can be classified into low or high vigor classes using the SER mean as the dividing line or into several classes delineated by dividing the range of SER values into the desired number of classes.
LITERATURE CITED
Rep. SO-54. New Orleans, LA: U.S. Department of Agriculture, Forest Service, Southern Forest Experiment Station; t985a: 411-479.
Blanche, C.A.; Hodges, J.D.; Nebeker, T.E. Changes in bark beetle susceptibility indicators in a light- ning-struck lobjolly pine. Canadian Journal of For- est Research 15: 1985b. [In press].
Blanche, C.A.; Hodges, J.D.; Nebeker, T.E. A leaf Anderson, N.H.; Anderson, D.B. Ips bark beetle arenisapwood area ratio developed to rate loblolly
attacks and broad development on a lightning- struck pine in relation to its physiological decline. Florida Entomologist 51 (1) : 23-30; 1968.
Anderson, R.F. Forest and shade tree entomology. New Uork: John Wiley and Sons; 1960, 428 p.
Basham, H.G. Wilt of loblolly pine inoculated with blue-stain fungi of the genus Ceratocystds. Phyto- pathology 60: 750-754; 1970.
Blanche, C.A.; Hodges, J.D.; Nebeker, T.E.; Moehs- ing, DM. Southern pine beetle: the host dimen- sion. Miss. Agrie. For. Exp. Sta. Bull. 917, blissis- sippi State, MS : Mississippi S.t;ate University; 1983. 29 p.
Blanche, C.A.; Nebeker, T.E.; Sehmitt, J.J.; Hodges, J.D. Techniques for distinguishing the sapwood- heartwood boundary in living loblolly pine (Pinus taeda L.) . Forest Science 30 (3) : 756-760; 1984.
Blanche, C.A.; Nebeker, T.E.; Hodges, J.D.; Karr, B.L.; Schmitt, J.J. Effect of thinning damage on bark beetle susceptibility indicators in loblolly pine, In: Shoulders, E., ed. Proceedings, third biennial southern silvicultural research confer-
pine tree vigor. Canadian Journal of Forest Re- search, f 985c. [In press].
Blanche, C.A.; Schmitt, J.J.; Nebeker, T.E.; Hodges, J.D*; Honea, C.R. The applicability of stem elec- trical resistance in rating loblolly pine tree vigor; f 985d. [Unnumbered report].
Blanche, C.A.; Nebeker, T.E.; Hodges, J.D.; Honea, C.R. Threshold southern pine beetle attack densi- ties required to overcome varying host resistance, 1985e. [ &fanuscript in preparation].
Coyne, J.F. Chemical mechanisms of resistance, In: Proceedings, 18th southern forest insect work eon- ference, 1973 August 14-16; Jackson, MS; 1973.
Coyne, J.F.; Lott, L.H. Toxicity of substances in pine oleoresin to sodhern pine beetles. Journal of the Georgia Entomological Society 11 (4) : 297-301; 1976.
DeAngelis, SD.; Hodges, J,I>.; Nebeker, T.E. Phe- nolic metabolites of Ccra tocys tis minor (Hedg- cock) from laboratory cultures and their effects on transpiration in loblolly pine seedlings. Cana- dian J Q U ~ M ~ ~ of Botany; 1985, [In press].
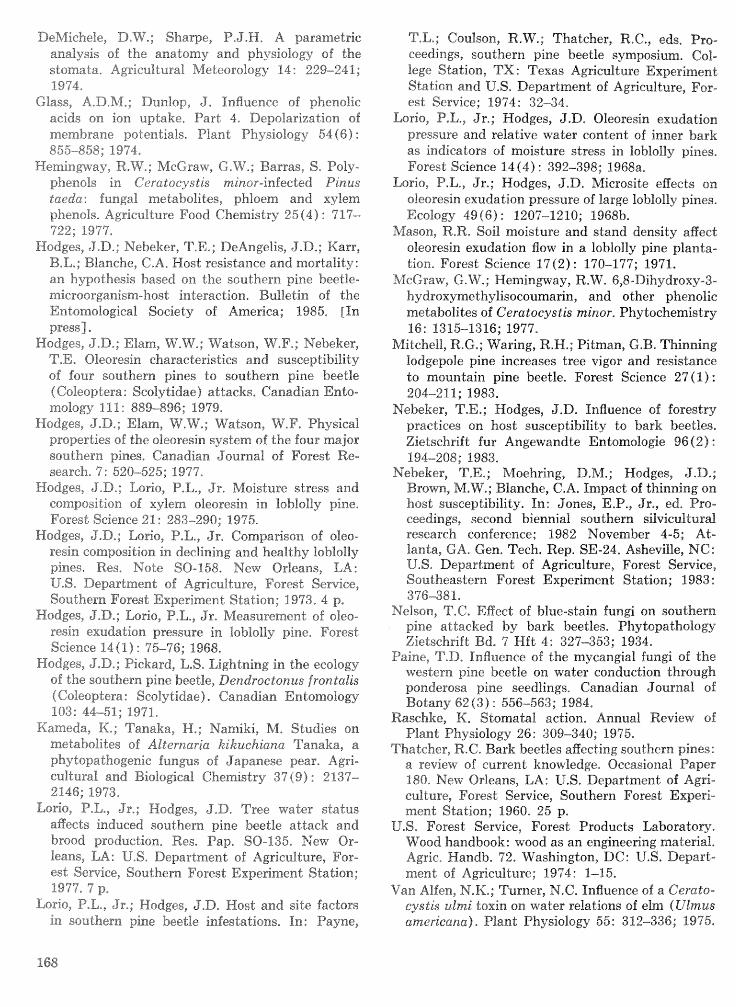
DeMiehele, D,W,; Sharpe, P,J,H, A parametric analysis of the anatomy and physiology of the stomata, AgriculGuraD Meteorology 14 : 229-241; 1914,
Glass, A,D,M,; Dunlop, %, Influence of phenolic acids on ion uptake, Part 4, Depo8arization of membrane potentials, Plant Physiology 54 (6) : 855--858; 1974,
Herningwag~~ R=$;%;*; AIcGraw, G,W,; Barras, S, Poly- phenols in Cerataeystis minor-infected Ptnus taeda: fungal metabolites, phloem and xylem phenols, Agriculture Food Chemistry 25 (4) : 917- 722; 1997,
Hsdges, $,D,; Nebeker, T,E,; DeAngelis, J,D,; Karr, BL,; Blanche, C,A, Host resistance and mortality: an hypothesis based on the southern pine beetle- microorganism-host interaction. Bul%e%in of the Entomological Society of America; 1985, [Pa. press1
Hodges, J,D,; Elam, W,iV,; Watson, W.F,; Nebeker, T,E, Oleoresin characteristics and susceptibility of four southern pines do southern pine beetle (Celeoptera: Scolytidae) attacks. Canadian Ento- mol~gy Ill : 889--896; 1999,
Hodges, J,D,; Elam, K7*W,; Watson, W,F, Physical properties sf the oleoresin system of the four major southern pines, Canadian Journal of Forest Re- search, 7: 52k525; 4977,
Hodges, J,D.; Lorio, P,L,, Jr, hfsisture stress and composition of xylem oleoresin in loblolay pine, Forest Science 21 : 283--298; 19'95,
Hodges, JD,; Lorio, P,L,, Jr, Gsmpahscin of oleo- resin composition in declining and healthy loblslly pines, Res, Note SO-158, New Orleans, LA:: U.S. Department of Agriculture, Forest Service, Southern Forest Exper6ment Station; 1973. 4 p,
Hodges, Jell,; Logo, P,L,, Jr. Measurement of oleo- resin exudation pressure in llobloHly pine, Forest Science 14 Q I) : 95-96; 1968,
Bndges, JD,; Pickard, %,S, LIgMrring in the ecology of the southern pine beetle, Dendroefonus frontalis Q Colesptera : Seoiy tidaeh Canadian Ex7atomolow 103: 44-51; 1971,
Kameda, K,; Tanaka, H,; Namiki, hf, Studies on metabolites of Alternaria kikktchiana Tanaka, 8
phytopathogenie fungus of Japanese pear. Agri- cuItsara4. and Biojragical Chemistry 37 49) : 213%- 2146; 1973,
Lorio, PL,, Jr,; Hodges, J.D, Tree water status affects induced southern pine beetle attaek and brood grod~cdion, Res, Pap, 50-135, New Or- leans, LA: US, Department of Agriculture, For- est Service, Southern Forest Experiment Ration; 1977, 7 p,
Eorio, PL, Jr.; Hodgee, J,D, Host and site factors in southern pine beetle infestations, In: Pagme,
1",L,; Coralson, R,W.; Thatcher, R,C., eds. Pro- ceedings, southern pine beetle symposium, Cat- Sege Station, TX: Texas Agriculture Experiment Station and U,S, Department of Agriculture, For- est Service; 1974: 32-34.
Lsrio, P*L, Jr.; Hadges, J,De Oleoresin exudation pressure and relative water content of inner bark as indicators of moisture stress in loblolly pines, Forest Science f 4 (4) : 392-398; 19688,
Lorio, P.L., Jr,; Hodges, J.D. Microsite effects on oleoresin exudation pressure of large loblolly pines, Ecology 4916) : 1207-1210; 1968b-
Mason, R.R. Soil moisture and stand density aEect oleoresin exudation Bow in a lablolly pine planta- tior?. Forest Science 1'7 (2) : 170---177; 1971,
McGraw, G.W.; Hemingway, R,W, 6,8-Dihydroxy-3- hydroxymethylisoeoumarin, and other phenolic metabolites of Ceratocystis minor, Phytochemistry 16: 1315-13163; 197'7.
MitcheH, PE.G,; Waring, R.H.; Pitman., G.B. Thinning lodgepole pine increases tree vigor and resistance to mountain pine beetle. Forest Scienee 27(1) : 204---211; 1983.
Nebeker, T.E. ; Hodges, J.D. Influence of forestry practices on host sarseeptihility to bark beetles, Zietsehrift fur Angewandte Entomologie 96 (2) : 194-208; 1983,
Nebeber, T,E,; hloehring, D.hf,; Hodges, J.D.; Brown, Maw.; Blanche, C.A. Impact of thinning on host susceptibility. In: Jones, E,P., Jr,, ed, Pro- ceedings, second biennial southern silvieultural research conference; 1982 November 4-5; At- lanta, @A, Gen. Tech. Rep. SE-24. Asheville, NG: U,S, Department of Agriculture, Forest Service, Southeastern Forest Experiment Station; 1983: 376-381,
Nelson, T,C, EBect of blue-stain. fungi on southern pine attacked by bark beetles, Phy topathology Zietschrift Bd, 7 Hft 4: 327-353; 1934.
Paine, T,D. Influence 06 the rnycavlgial fun^ of the western pine beetle on water conduction through ponderosa pine seedlings, Canadian Journal sf Botany 62 ( 3 ) : 556-563; 1984,
Rasehke, M. Stonnatal action, Annual Review of Plant Physiology 26: 309-340; 1975.
Thatcher, R.C. Bark beetles afEecGing southern pines: a review of current knowledge. Occasional Paper 188, Neav Orleans, LA: U.S. Department of Agri- culture, Forest Service, Southern Forest; Experi- ment Station; 1960, 25 p,
U.S, Forest Service, Forest Products L a b o r a t s ~ , Wood handbook: wood as an engineering material. Agric, Handb. 72. FVashivlgton, DC: U.S, Depart- ment sf Agricuidure; 1974: 1-15.
Van Aifen, N,K,; Turner, M.C. Influence of a Cerato- cyst& ulmi toxin on wader relations of elm (likmus asne~.teana), Plant Physiology 55: 312--336; 1975.
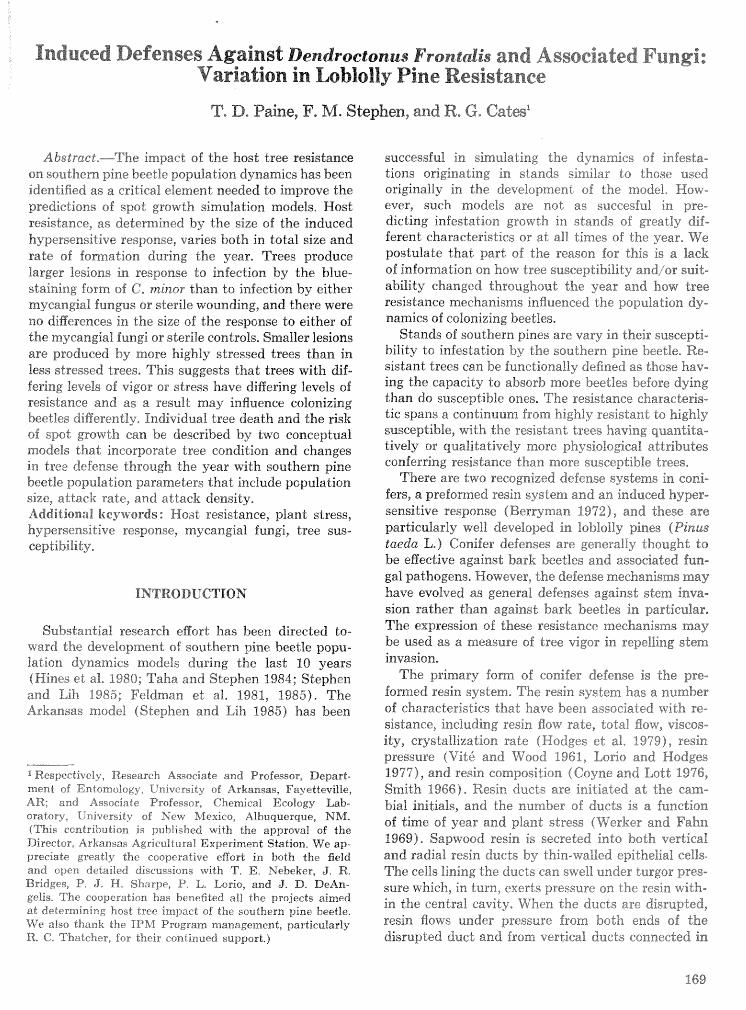
Induced Defenses Against Dendroctonus Frontalis and Associated Fungi: Variation in Loblolly Pine Resistance
e, F. M. Stephen, and R. G. Cates'
Abstract,-The i~npsaa3.t of the host tree resistance on southern pine beetle population dynamics has been identified as a critical element needed do improve the predictions of spot growth simulation models. Host resistance, as determined by the size of the induced hypersensitive response, varies both in total size and rate of fornation during the grear, Trees produce larger lesions in response do infection by the blue- staining form 06 C, minor than do infection by either myeangial fungus or sterile wounding, and there were no t9iiF"Eerenees in the size of 'the response to either of the mycangial fungi or sterile controls. Smaller lesions are produced by more highly stressed trees than in less stressed trees. This suggests that trees with dif- fering levels of vigor or stress have dilffering levels of resistance and as a result may influence colonizing beetles differently, Individual tree death and the risk of spot growth can be described by two conceptual. models that incorporate tree condition and changes in tree defense through the year with southern pine beetle population parameters that ~ M G I u ~ ~ population size, attack rate, and attack density. Additional keywords: Host resistance) plant stress, hypersensitive response, rnycangial fungi, tree sus- ceptibility,
INTRODUCTION
Substantial research e6Eort has been directed to- ward the d e v e ~ p e t of southern pine beetle popu- lation dynamics models during the last 10 years (Hines et al, 1980; Taha and Stephen 1984; Stephen and Lih 1985; Feldman eh; al, 1981, 1985). The Arkansas model (Stephen and Lih 1985) has been
1 Respectively, Research Associate and Professor, Depart- ment of Entomology, University of Arkansas, Fayettevitle, AR; and Associate Professor, Cherniea"lEeotogy Lab- oratory, University of Keiv hfexieo, Albuquerque, NM. (This ecnlribution is published with the approval of the Director, Arkansas Agricultural Experiment Station. We ap- preciate greatly the cooperative effort in both the 6eJd and open detailed discussions with 7". E. Nebeker, J. R. Bridges, P, J. R. Shaspe, P, L. Lorie, and J. T), BeAn- gefis. The cooperation has benefited all the projects aimed at determining host tree impact of the southern pine beetle. We; also thank the IPM Program management, particularly R. Q?, Thatekzer, for their continued support,)
suecessfrsl in simulating the dynamics of infesta- tions originating in stands similar to &hose used originally in the development of the mode%, How- ever, such models are not as succesful in pre- dicting infestation growth in stands of greatly dif- ferent characteristics or at all times 0% the year, We postulate that part of the reason for this is a lack of information on how tree susceptibility and/or suit- ability changed dhroug"iaout the year and how tree resistance meehanisms influenced the population dy- namics sf colonizing beetles,
Stands of southern pines are vary in their suscepti- bilitj~ to infestation by the southern pine beetle, Re- sistant trees can be funcdionakly defined as those kav- ing the capacity to absorb more beetles before dying than do susceptibfe ones, The resistance characteris- tic spans a continuum from highly resistant to highly susceplible, with the resistant trees having quantita- tively or qualitatively more physiological attributes conferring resistance than more susceptible trees,
There are two recognized defense systems in coni- fers, a preformed resin system and an induced hyper- sensitive response (Berryman 1972), and these are particularly well developed in loblolly pines (Pinus taedm L.) Conifer defenses are generally thought to be eEective against bark beetles and associated fun- gal pathogens, However, the defense mechanisms may have evolved as general defenses against stem inva- sion rather than against bark beetles in particular, The expression a6 these resistance mechanisms may be used as a measure of tree vigor in repelling stem invasion,
The primary form of conifer defense i s the pre- fomed resin system, The resin system has a number of characteristies that have been associated wixh re- sistance, including resin flow rate, total flow, VISGOS- ity, crystallization rate QHodges ed al, 1979), resin pressure (Vit6 and Wood 1961, Lori0 and Hodges 29770, and resin composition (Csyne and Eott 1976, Smith $966), Resin ducts are initiated at the cam- bial initials, and the nundsber of ducts is a function of time of year and plant stress (Werker rend Fahn f 969), Saprvsod resin i s secreted into both vertical and radial. resin ducts by thin-walled epithelial cells. The cells lining the ducts can sipi~ell under turgor pres- sure which, in turn, exerts pressure on the resin with- in the central cavity, When the ducts are disrupted, resin flows under pressure from both ends of the disrupted duct and from vertical ducts connected in
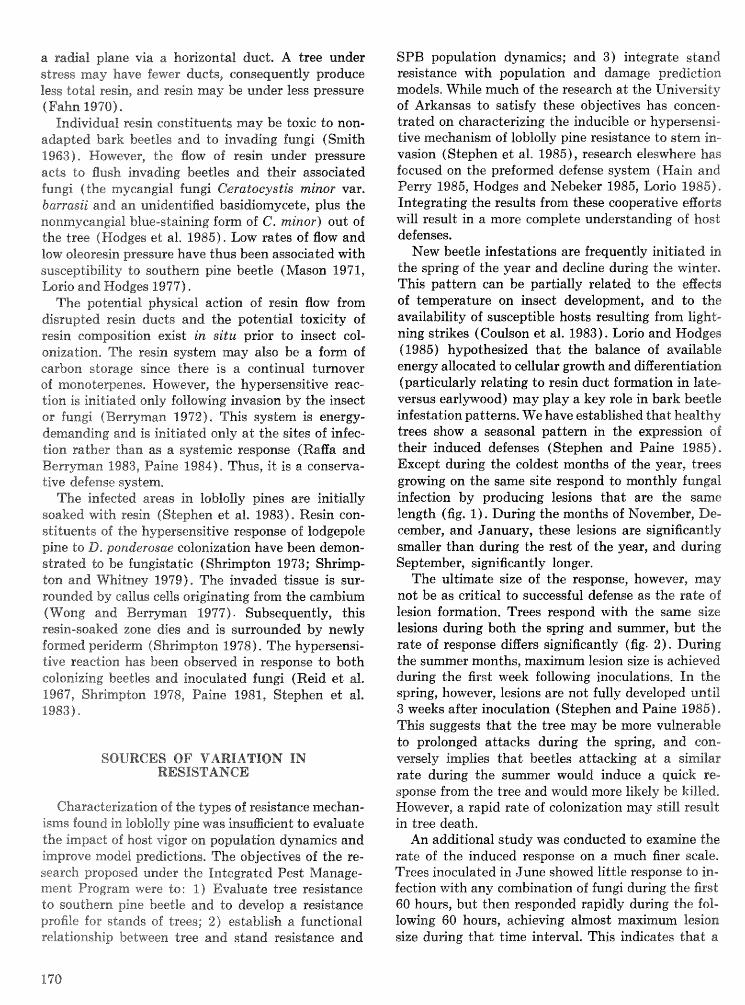
a ra&;al plane via a Ino~zonrtait duet. A tree under stress may have fewer ducts, consequently produce less total resin, and resin may be under less pressure (Fahn f @TO),
Individual resin constituents rnay be toxic to non- adapted bark bee"ies and to invading fungi (Smith 1963)- However, the Bow of resin under pressure acts do flush inva&ng beetles and their associated fungi (the myetlragial fungi Ceratacystis minor var. barrasii and an unidentified basidiomycete, plus the nonmyeangial blue-staining f o m of 6, minor) out of the tree ( Hcrdges et al, f 985). Low rates of flow and low oleorresin. pressure have thus been associated arith susceptibility to southern pine beetle ( IVgason f 971, Lorio and Hodges 1977).
The potential physical action of resin flow frorn disrupted resin duets and the potential toxicity of resin cornpasition exist in sidu prior to insect col- oniza.$isn, The resin system may also be a form of carbon storage since there is a continual turnover of monoterpenes, However, the hypersensitive reac- tion is initiated only following invasion by the insect or fungi (Berryman 19721, This system is energy- demanding and is initiated only at the sites of infec- tion rather than as a systemic response (Raffa and Berryman 1983, Paine 5984), Thus, it is a conserva- tive defense system,
The inkcted areas in loblolly pines are initially soaked with resin (Stephen et al. 19831, Resin con- stituents of the hypersensitive response of lodgepole pine to D, ponderosae colonization have been demon- strated to be fungistatic (Shrimpton 1973; Shrimp- ton and Whidney 1979). The invaded tissue is sur- rounded by callus cells originating from the cambium ( Wong and Berryman 1977). Subsequently, this resin-soaked zone dies and is surrounded by newly formed peridentan, (Shrimpton 1978). The hypersensi- Live reaction has been obsemed in response to both colonizing beetles and inoculated fungi (Reid et at. 1967, Shrimpton 1978, Paine 1981, Stephen et al. 1983).
SOURCES OF VARIATION IN RESISTANCE
Characterization sf the types of resistance mechan- isms found in loblolly pine was insugeient to evaluate the impact of host vigor OM population dynamics and improve model, predictions. The objectives of the re- search proposed under the Integrated Pest Manage- rsaenk Pmgram were to: I ) Evaluate tree resistance $0 southern pine beetle and to develop a resistance profile for stands of trees; 2) establish a functional relationship between tree and stand resistance and
SPI3 population dynamics; and 3) integrate stand resistance with population anid damage prediction models. M i l e much of the research a t the University of Arkansas to satisfy these objectives bas coneen- trated on charactefizing the inducible or hypersensi- tive mechanism of loblolly pine resistance to stem in- vasion. (Stephen et til. 19851, research eleswhere has focused on the preformed defense system (Hain and Perry 1985, Hodges and Nebeker 1985, L o ~ o 1985). Integrating the results frorn these cooperative eEorts will result in a more complete understanding of host defenses.
New beetle infestations are frequently initiated in the spring of the year and decline during the winder. This pattern can be partially related to the effects of temperature on insect development, and to the availability of susceptible hosts resulting from light- ning strikes (Coulson et al. 1983). Lorio and Hodges (1985) hypothesized that the balance of available energy allocated to cellular growth and differentiation (particularly relating to resin duct formation in lake- versus e a r l ~ o o d ) may play a key role in bark beetle infestation patterns. We have established that healthy trees show a seasonal pattern in the expression of their induced defenses (Stephen and Paine 1985)- Except during the coldest months of the year, trees growing on the same site respond to monthly fungal infection by producing lesions that are the same length (fig. 1 ) , During the months of November, De- cember, and January, these lesions are significantly smaller than during the rest of the year, and during September, significantly longer.
The ultimate size of the response, however, may not be as cdtical to successful defense as the rate of lesion formation. Trees respond with the same size lesions during both the spring and su rate of response differs significantly (fig. 2). Dufing the summer months, maximum lesion size is achieved during the first week following inoculations. In the spring, however, lesions are not fully developed until 3 weeks after inoculation (Stephen and Paine 1985) * This suggests that the tree rnay be more vulnerable to prolonged attacks during the spring, and con- versely impfjies that beetles attacking a t a similar rate during tibe summer would induce a quick re- sponse from the tree and would more likely be killed, However, a rapid rate of colonization may still result in tree death.
An additional study was conducted to examine the rate of the induced response on a much finer scale. Trees inoculated in June showed little response to in- fection with any combination of fungi during the first 60 hours, but then responded rapidly during the fol- lowing 60 hours, achieving almost maximum lesion size d u ~ n g that time interval, This indicates that EI
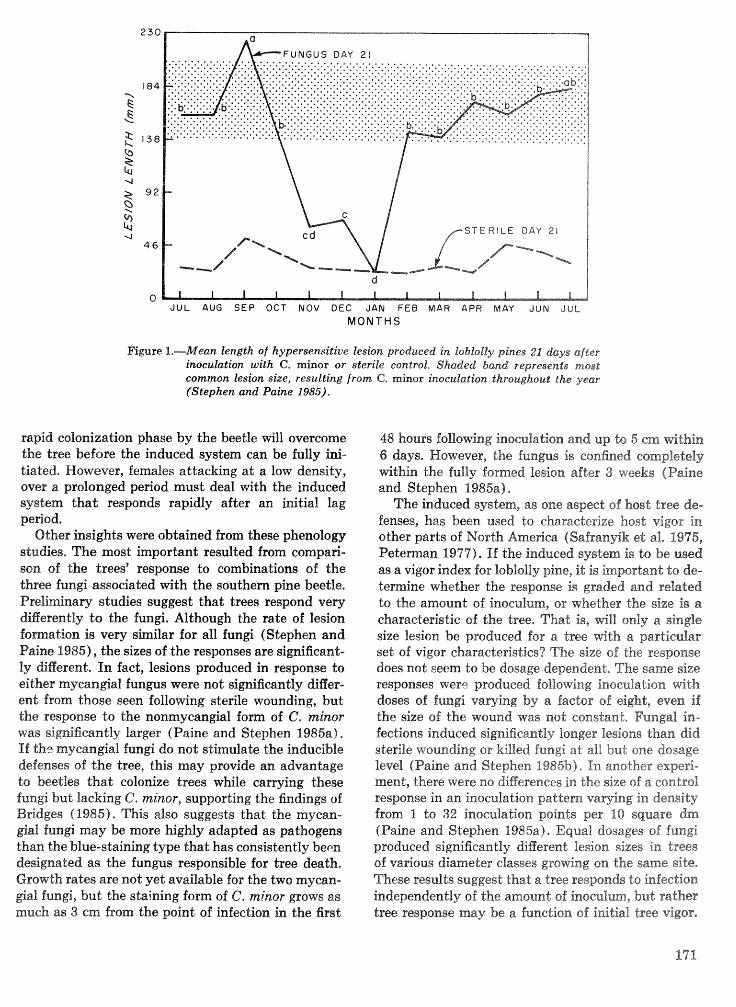
0 JUL AUG SEP OCT NOV DEC JAN FEB MAR APR MAY JUN JUL
MONTHS
Figure 1.-Mean length of hypersensitive lesion produced in loblolky pines 21 days after inoculation with C. minor or sterile control. Shaded band represents most common lesion size, resulting from 6. minor inoculation throughout the year (Stephen and Paine 1985).
rapid colonization phase by the beetle will overcome the tree before the induced system can be fully inji- tiated, However, females attacking a t a low density, over a prolonged period must deal with the induced system that responds rapidly after an initial lag p e ~ o d .
Other insights were obtained from these phenology studies. The most important resulted from comparji- son of the trees' response to combinations of the three fungi associated with the southern pine beetle. Preliminary studies suggest that trees respond very diflerently to the fungi, Although the rate of lesion fornation is very similar for all fungi (Stephen and Paine 1985), the sizes of the responses are siaificanl- fy diAFerent, In fact, lesions produced in response to either mycangial fungus were not simificantly difler- eat from those seen following sterile wounding, but the response La the nonmycangial form of C. minor was significantly larger ( Paine and Stephen 1985a) . If Lih2 myczangial fungi do not stimulah the inducible defenses of the tree, this may provide an advantage to beetles f i a t colonize trees while earwing the@@ fungi but lacking C. minor, supporting the findings of B ~ d g e s (1985). This also suggests that the mycan- &wZ hn& may be more highly adapted as pathogens than the blue-staining type that has consistently b e ~ n designated as the fungus responsible for tree death, Growth rates are not yet available for the two myan- @al fungi, but the staining form of 6, mkor grows as much as 3 em from the point of infeetian in the firat
48 hours following inoculation and up to 5 crn within 6 days. However, the fungus is eongned completely within the fully formed lesion after 3 weeks (Paine and Stephen P985a).
The induced system, as @me aspeet of host tree de- fenses, has been used to characterize host vigor in other parts of North America (Safranyik e t ale 19m5, Peteman 1977). If the induced system is to be used as a vigor index for loblolay pine, it is important to de- temine whether the response is graded and related to the amount of inoeulum, or whether the size is a characteristic of the tree, That is, ~ I Z only a single size lesion be produced for a tree with a particular set of vigor characteristics? The size of the response does not seem Lo be dosage dependent. The same size responses were produced foIIowing inoculation h t h doses of fungi varying by a factor of eight, even if the size of the wound was not constant, Fungal in- fections induced significantly longer lesions than did sterile wounding or killed fungi ad all but one dosage level (Paine and Stephen 4985b)- In ansther e x p e ~ - merit., there were no digerenees in the size of a control response in an inocufation pattern vaming in density from I to 32 inoculation points per 10 square h (Paine and Stephen f985a). Equal dosages of fungi produced significantly different lesion sizes in trees of various diameter classes grodng on. the same site* These results suggest that a tree responds to infection independently of the amsunk of inocu2um9 but rather tree response may be a. P"uractisn sf initial tree vigor*
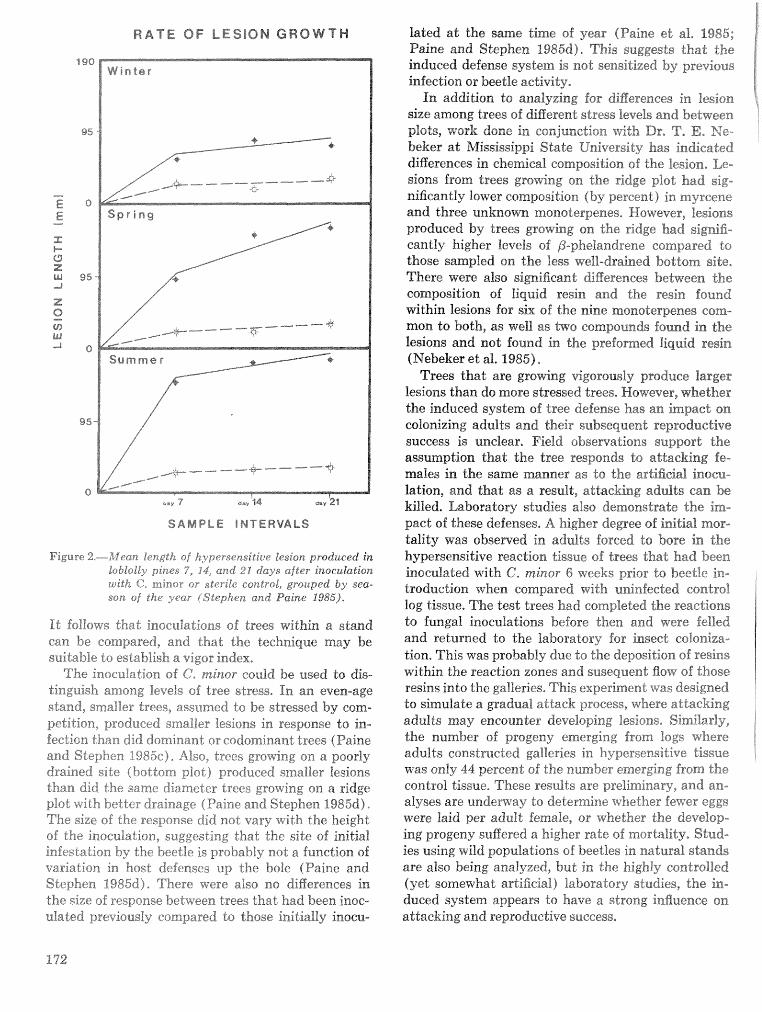
R A T E OF LESlON G R O W T H
S A M P L E SNTERVALS
Figure 2.-i%fee;rn length sf kypersensitiue lesion produced in loblolby pines 7, 14, and 21 days after inoculation with C. mincr or sterile control, grouped by sea- son of the year (Stephen and Paine 19851,
It follows that inoeuiwtisns of trees within a stand can be compared, and that the technique may be suitable do establish a vigor index,
Thc insculutisn of C, minor could be used to dis- tinguish among %eveis of tree stress. In an even-age stand, smaller trees, assumed to be stressed by com- petition, produced smaller lesions in response to in- fection than did dominant or codominand trees (Paine and Stephen 1985~)~ Also, trees growing on a poorly drained site (bottom plot) produced smaller lesions than did the same diameter trees growing on a ridge plot with better drainage (Paine and Stephen 8985d). The size of the response did not vary ~vxiith the height sf the inoculation, suggesting that the site of initial infestation by the beetle i s probably not a function of variation in host defenses up the bole (Pairne and Stephen 1985d), There were also no digerences in the size sf response between trees that had been inoe- ulated previousliy compared to those initially inocu-
lated at the s m e time sf year (Paine e% al, 1985; Paine and Stephen 19836)- This suggests that the induced defense system is not sensitized by previous infection or beetlie activity,
In addition to analyzing for diBerenees in lesion size among trees af cfigerentt stress levels and between plots, work done in conjunction with Dr, a", E, X e bekes at hfiississippi State UniversiGy has indicated &Berenee% in chemical eomposidicdn of the lesion, Le- sions horn trees gmwing on the ridge plot had sig- nifimratly lower composition (by percent) in rnyrcene and three unknown monoterpenes. Newever, lesions produced by trees growing on the ridge had signih- eantly higher levels sf P-phelandrene compared to those sampled on the less well-drained bottom side, There were also significant differences between the composition of liquid resin and the resin found within lesions for six of the nine msnoterpeares corn- mon to both, as well. as two compounds found in the lesions and not found in the prefomed liquid resin. (Nebeker e t ale 1985),
Trees that are growing vigorously produce larger lesions than do more stressed trees, However, whether the induced system of tree defense has an impact on colonizing adults and their subsequent reproductive success is unclear, Field observations support the assumption that the tree responds to attacking fe- males in the same manner as do the artificial inocu- lation, and that as a result, attacking adults can be killed, Laboratory studies also demonstrate the in-. pact of these defenses, A higher degree of initial mor- tality was observed in adults forced to Bore in the hypersensitive reaction tissue of trees that had been inoculated with C, minor 6 weeks prior to beetle in- troduetion when compared with uninfeeted control log tissue, The test trees had completed the reactions to fungal inoculations before then and were felled and returned to the laboratory for insect coloniza- tion, This was probably due to the deposition of resins within the reaction zones and susequeank flow of those resins into the galleries, This experiment was designed do simulate a gradual attack process, where attacking adults may encounter developing lesions, Similarly, the number of progeny emerging from logs where adrrZts cllhlinstrueted galleries in hypersensitive tissue was only 44 pe~ewd 06 the number emerging from the control tissue, These results are preliminary, and an- alyses are tmdemay ts determine whether fewer eggs were laid per adult female, or whether the develop- ing progeny suflered a higher rate sf moatality, Stud- ies using wild pcdpuladions of beetles in natural stands are also being analyzed, but in the highly controlled (yet somewhat artificial) laboratory studies, the in- duced system appears to have a strong influence on attacking and reproductive success,
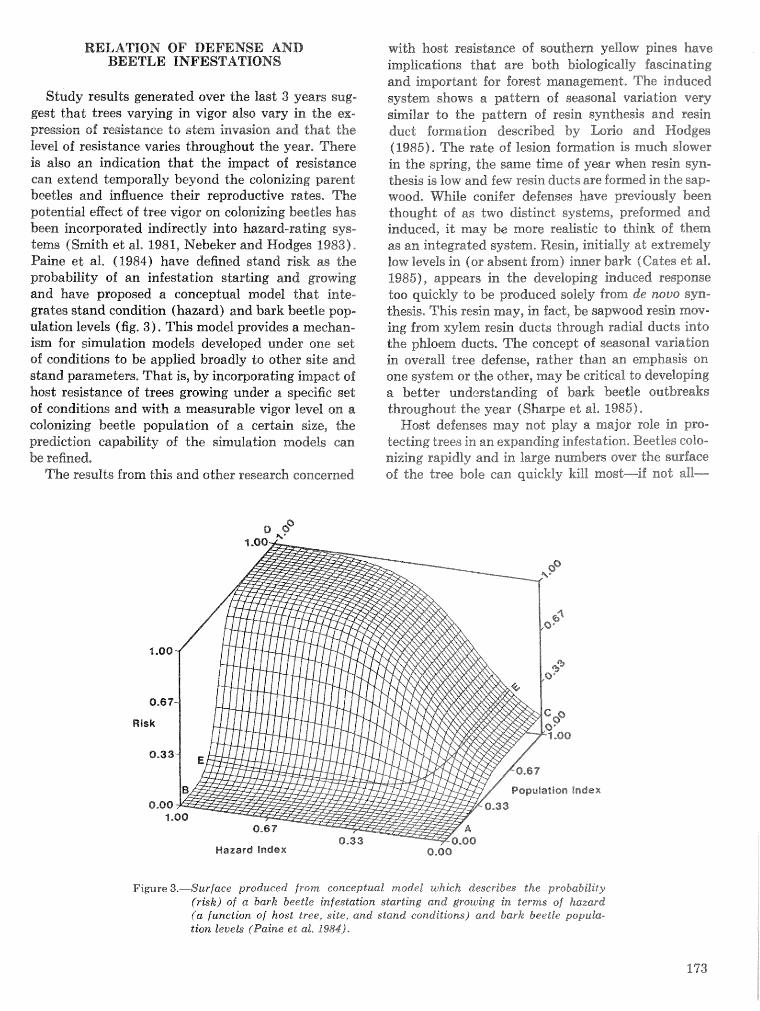
RELATHON OF DEFENSE AND with host resistance sf southem yellow pines have BEETLE INF3ESTATlisi)NS implications that are both biolo~call y fascinating
Shdy results generated over the last 3 years sug- gest that trees varying in vigor also v a v in the ex- pression of resistance Lo ~ t e m invasion and that the level of resistance valPies throughout; the year. There is also an indication that the impact of resisbnce can extend temporally beyond the colonizing parent beetles and influence their reproductive rates, The potential eEect of tree vigor on colonizing beetles has been iascorcposated indirectly into hazard-rating v s - terns (Smith et at, 1981, Nebeker and Hodges 1983)- Pairre ek al, (1984) have defined stand .risk as the prsbability of an infestation starting and growing and have proposed a conceptual model that inte- grates stand condition (hazard) and bark beetle psp- ulatitm levels (fig. 31, This model provides a mechan- ism for simulation models developed under one set of conditions to be applied broadly to other site and stand parameters, That is, by incorporating impact of host resistance of trees growing under a specific set of conditions and with a measurable vigor level on a colonizing beetle population of a certain size, the prediction capability of the simulation models can be refined,
The results from this and other research concerned
and irnporhnt for fomst management, The induced system shows a pattern of seasonal vadation very siPrailar to the pattern of resin synthesis and resin duct fonnatiorra descri"~ed by Lods and Hodges (198%). The rate sf lesion fornation is much sZdswer in the spfing, the same time of year when resin syn- thesis i s Isw and few resin ducts are formed in the sap- wood* m i l e conifer defenses have previous1y been thought of as h a distinct systems, preformed and induced, it may be more redistic to think of them as an integrated system, Resin, initially at extremely fcrw levels in (or absent from) inner bark (Cates et al, 19851, appears in the developing induced response too quickly to be produced solely horn de nouo syn- thesis, This resin may, in fact, be sapwood resin mov- ing from xylem resin ducts through radial ducts into the phloem dszcts, The concept of seasonal variation in overall tree defense, rather than an emphasis on one system or the other, may be critical to developing a better understandircag of bark beetle outbreaks throughout the year f Sharpe et aJi, 1985).
Host defenses may not play a major role in pro- tecting trees in an expanding infestation, Beetles eols- aizing rapidly and in Barge numbers over the surface of the tree bole can quickly kill mos
Fiwre 3.-Surface produced from eenceptual mode% which describes the probability (rkk) of a bark beetle infestation starting and gmruing in terms of hazard (a function of host tree, site, and stand conditions) and bark beetle p o p u k - tion levek ( f i i n e eQ a!. 3984)-
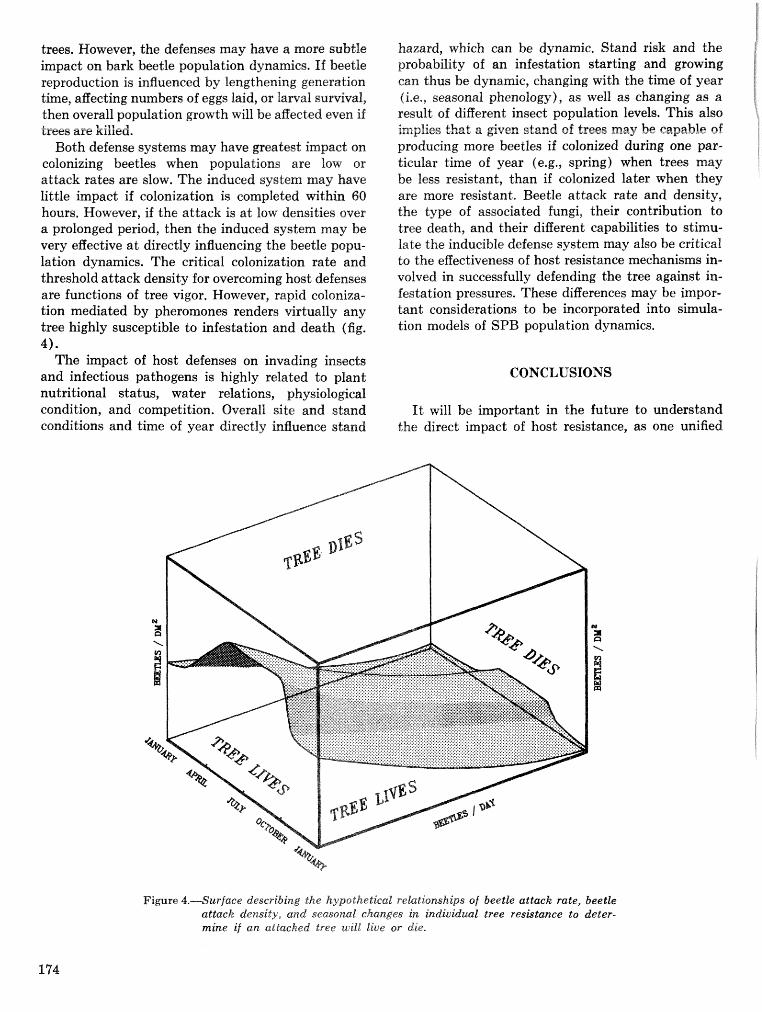
trees. However, the defenses may have a more subtle impact on bark beetle population dynamics, If beetle reproduction is influenced by lengthening generation time, agecting numbers of eggs laid, or larval suwival, then overall population growth will be affected even if Crees are kined.,
Both defense systems may have greatest impact on colonizing beetles when populations are low or attack rates are slow. The induced system may have little impact if colonization is completed within 60 hours. However, if the attack is a t low densities aver a prolonged period, then the induced system may be very effective a t directly influencing the beetfe popu- lation dynamics. The critical colonization. rate and threshold attack density for overcoming host defenses are functions of tree vigor. However, rapid coloniza- tion mediated by pheromones renders virtually any tree highly susceptible to infestation and death (fig. 4) *
The impact of host defenses on invading insects and infectious pathogens is highly related to plant nutritional status, water relations, physiological condition, and competition. Overall site and stand conditions and time of year directly influence stand
hazard, which can be dynamic. Stand risk and the probability of an infestation starting and growing can thus be dynamic, changing 6 t h the time of year (i.e., seasonal phenology), as well as changing as a result of different insect population levels. This also implies that a given stand 0% trees may be capable rlaf producing more beetles if colonized during one par- ticular time of year (e.g., spring) when trees may be less resistant, than if colonized later when they are more resistant;. Beetle attack rate and density, the type of associated fungi, their contribution to tree death, and their different capabilities to stimu- late the inducible defense system may also be critical to the eBectiveness of host resistance mechanisms in- volved in successfully defending the tree against in- festation pressures. These differences may be impor- tant considerations to be incorporated into sirnula- tion models of SPB population dynamics.
CONCLUSIONS
I t will be important in the future to understand the direct impact of host resistance, as one unified
Fiffure 4.-Surface describing the hypothetical relationships of beetle attack rate, beetle attack density, and seasonal changes in individual tree resisltanee to deter- mine if an attacked tree will liue or die.
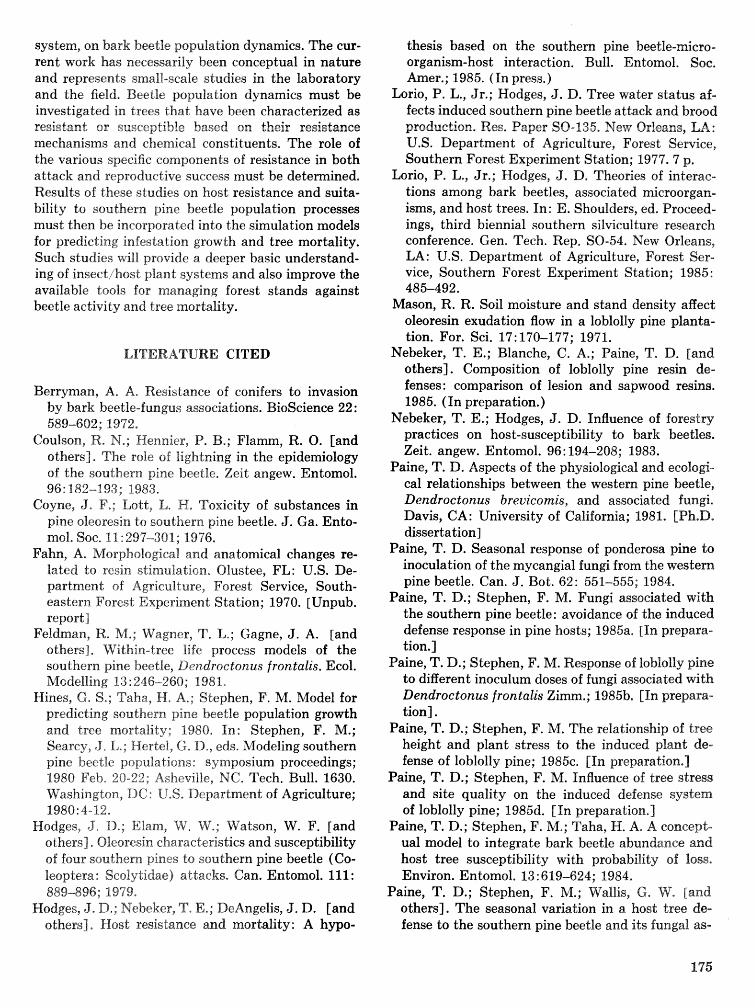
system, on bark beetie population dynamics. The cur- rent work has necessarily been conceptual in nature and represents small-scale studies in the laboratory and the field, Beetle population dynamics must be investigated in trees that have been characterized as resistant or susceptible based on their resistance mechanisms and chemical constituents. The role of the various specific components of resistance in both attack and reprsductive success must be detemined. Results of these studies on host resistance and suita- bility to southern pine beetie population processes must then be incorporated into the simulation models for predicting infestation growth and tree mortality. Such studies will provide a deeper basic understand- ing of inseeti host plant systems and also improve the available tools for managing forest stands against beetle activity and tree mortality.
LHTERATIJRE CITED
Berryman, A. A. Resistance of conifers to invasion by bark beetle-fungus associations. BioScience 22: 589-602; 1972.
Coulson, R. M,; Hennier, P. B.; Flamm, R. 0. [and others]. The role of lightning in the epidemiology of the southern pine beetle. Zeit angew. Entomol. 96: 182-193; 9983.
Coyne, J. F,; Lott, L. H, Toxicity of substances in pine oleoresin to southern pine beetle. J. Ga. Ento- mol. Soc. 1.1 :297-301; 1976,
Fahn, A. Morphological and anatomical changes re- lated to resin stimulation. Olustee, FL: U.S. De- partment of Agriculture, Forest Service, South- eastern Forest Experiment Station; 1970. [Unpub. report)
Feldmar?, R. M.; Wagner, T, L,; Gagne, J. A. [and others]. Within-tree l i fe process models of the southern pine beetle, Dendroetonus frontalis. Ecol. hfcdelling 13 : 246-260; 1981,
Hines, G. S,; Taha, H. A,; Stephen, F, M. Model for predicting southern pine beetle population growth and tree mortality; 1980. In: Stephen, F. M.; Searey, 9, L,; Hertel, 6, D,, eds. &%odeling southern pine beetle pcspuladisras: symposium proceedings; 1980 Feb. 20-22; AsheviiZe, NC, Tech. Bull. 1630. Washington, DC: U.S. Department of Agriculture; 1980: 4-12,
Hodges, J, D,; EIam, FV, W*; FVatson, W. F. [and others]. Oleoresin characteristics and susceptibility of four southern pines to southern pine beetle (Co- leopdera : Scoly tidae) attacks, Can. Entomol. 11 1 : 889-896; 19"9*
Hodges, J, D,; Nebeker, 39. E,; DeAngelis, J. D. [and others], Host resistance and mortality: A hypo-
thesis based on the southern pine beetle-micro- organism-host interaction. Bull. Zntomol, SOG. Amer.; 1985. (In press.)
h r i o , P. L., Jr.; Hodges, J. D. Tree water status af- fects induced southern pine beetle attack and brood produ~kion. Res, Paper SO-135, New Orleans, LA: U.S. Department of Agriculture, Forest Service, Southern Forest Experiment Station; 1977.7 p,
h r i o , P, L,, Jr,; Hodges, J. D, Theories sf interac- tions among bark beetles, associated microorgan- isms, and host trees. In: E. Shoulders, ed, Proceed- ings, third biennial southern silviculture research conference. Gen. Tech. Rep. SO-54. New Orleans, LA: U.S. Department of Agriculture, Forest Ser- vice, Southern Forest Experiment Station; 1985: 485-492.
Mason, R. R. Soil moisture and stand density affect oleoresin exudation flow in a loblolly pine planta- tion. For. Sci. 17:170-177; 1971.
Nebeker, T. E.; Blanche, C. A.; Paine, T. D. [and others]. Composition of loblolly pine resin de- fenses: comparison of lesion and sapwood resins. 1985. (In preparation.)
Nebeker, T. E.; Hodges, J. D. Influence of forestry practices on host-susceptibility to bark beetles. Zeit. angew. Entomol. 96: 194-208; 1983.
Paine, T. D. Aspects of the physiological and ecologi- cal relationships between the western pine beetle, Dendroetonus breuicomis, and associated fungi. Davis, CA: University of California; 1981, [Ph,D, dissertation]
Paine, T. D. Seasonal response of ponderosa pine to inoculation of the mycangial fungi from the western, pine beetle. Can. J. Bot. 62: 551-555; 1984.
Paine, T. D.; Stephen, F. M. Fungi associated with the southern pine beetle: avoidance of the induced defense response in pine hosts; 1985a. [In prepara- tion.]
Paine, T. D.; Stephen, F. M. Response of loblolly pine to different inoculum doses of fungi associated with Dendroctonus frontalis Z i m . ; 1985b. [In prepara- tion].
Paine, T, D.; Stephen, F. M. The relationship of tree height and plant stress to the induced plant de- fense of loblolly pine; 1985~. [In preparadicm,]
Paine, T. D.; Stephen, F. M. Influence of tree stress and site quality on the induced defense system of loblolly pine; 1985d. [In preparation.]
Paine, T. D.; Stephen, F. M,; Taha, )-I. A* A concept- ual model to integrate bark beetle abundance and host tree susceptibility with probability of loss* Environ. Entomol. 13:619-624; 1984.
Paine, T. D.; Stephen, F. M.; Wallis, 6. We [and others]. The seasonal variation in a host tree de- fense to the southern pine beetle and its fungal as-
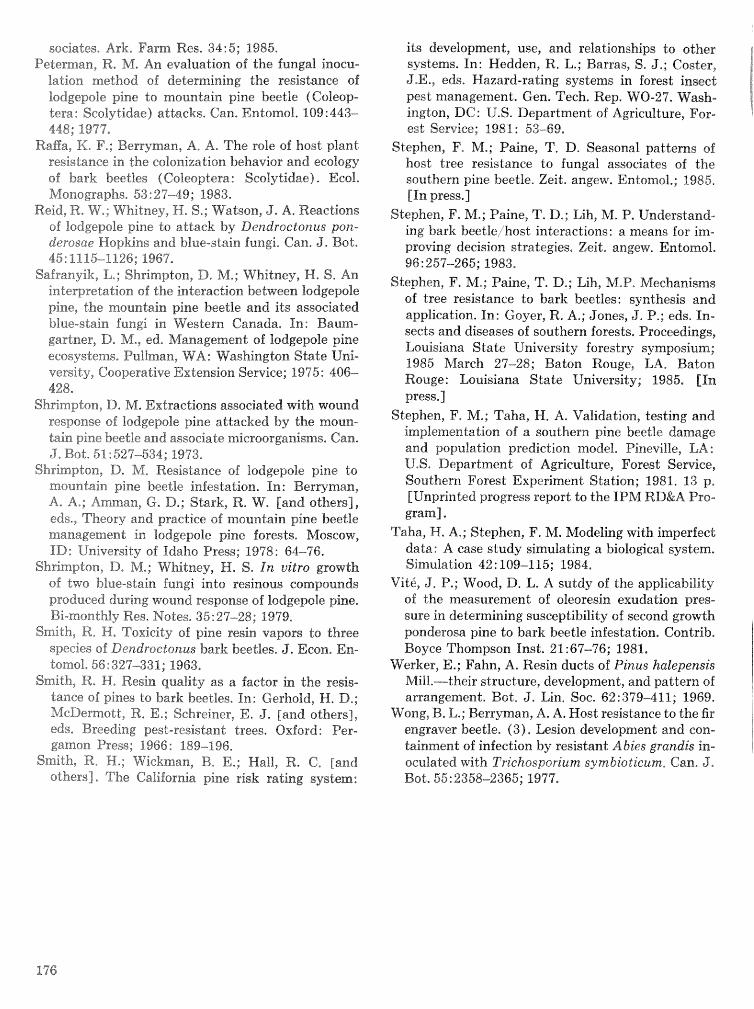
sociates, Ark, Farm Res, 34:s; 1985, Peterman, R. M, An evaluation of the fungal inocu-
lation method sf determining the resistance of lodgepole pine to ooundain pine beetle (Coleop- tera : Scralytidae) at-tsaeks. Can, Entomol, 109 : 443- 418; 1977,
Raga, K, F,; Berryman, A, A, The role of host plant resistance in the coPsnizatioln behavior and ecology of bark beetles (Coteoptera: Scalytidae) - Eesl- Monographs. 53: 2"3499; 1983,
Reid, R, W,; M7hitney, H. S,; Watson, J, A. Reactions of lodgepole pine to attack by Dendroctonus pon- derosae Hopkins and blue-stain fungi, Can. J, Bok, 45: 1115-$126; 1967,
Safranyik, L,; Shrimpton, D, I%%,; Whitney, H, S, An interpretation of the interaction between ledgepole pine, the mountain pine beetle and its associated blue-stain fungi in FYestern Canada, Xn: Baum- gartnes, D, M,, ed, Management of lodgepole pine ecosystems, Pullman, WA: Washington State Uni- versity, Cooperative Extension Service; 19'95: 406- 428,
Shrimpton, D, M. Extraetisns associated with wound response of I~dgepoBe pine attacked by the moun- tain pine beetle and associate microorganisms. Can, J, Bod, 51 : 527---534; 197'3,
Shrimpton, Dm M, Resistance of lodgepole pine to mountain pine beetle infestation, In: Berryman, A* A,; Amman, G, D,; Stark, R. We [and others], eds., Theory and practice of mountain pine beetle management in Zodgepsle pine fsrests. Moscow, ID: University of Idaho Press; 1978: 64-76.
Shrimpdon, D. h5,; Whidney, H. S* In slltro growth a6 two blue-stain fungi into resinous C O ~ ~ O U ~ ~ S
produced during wound response of lodgeycble pine, Bi-monthly Res, Notes. 35 : 27-28; 1999,
Smith, R, H, Toxicity of pine resin vapors do three species of Dendroctonus bark beetles. J. Eesn, En- tomsl, 56:327-331; 1963,
Smith, Re H, Resin quality as a factor in the resis- tance sf pines to bark beetles, In: Gerhsld, H, 33,; McDermott, R, E.; Sashreiner, E, J. [and others], eds, Breeding pest-resistant trees. Oxford: Per- gamon Press; 1966: 189-196,
Smith, R, He; Wickman* B, E.; Mall, R, C. [;and others]. The California pine risk rating system:
its development, use, and relationships to other systems. In: Hedden, R, L.; Barras, S. J.; Caster, J.E ., eds. Hazard-rating systems in. forest insect pest management. Gen. Tech. Rep, WO-27. Wash- ington, DC: U.S. Department of Agriculture, For- est Service; 1981 : 53- 89,
Stephen, F. Me; Paine, T, 3). Seasonal patterns of host tree resistance to fungal associakes of the southern pine beetle, Zeit. angew. EllrtomoI,; 1985, [In press,]
Stephen, F, M.; Paine, T, D,; Lih, nil[. P. Understand- ing bark beetlte,ihost interactions: a means for im- proving decision strategies. Zeit, angew. EntomoT, 96~257-265; 1 983,
Stephen, F. Me; Paine, T. El,; Lih, &3[,P, Mechanisms of tree resistance do bark beetles: synthesis and application. In: Goyer, R, A.; Jones, 9. I?,; eds, In- sects and diseases of southern forests. Proceedings, Louisiana State University forestry symposium; 1985 March 27-28; Baton Rouge, LA, Baton Rouge : Louisiana State University; 1985, [In press,
Stephen, F. M.; Taha, H, A. Validation, testing and impfernentadion. sf a southern pine beetle damage and population prediction model, Pinevile, LA: U,S, Department of Agriculture, Forest Semiee, Southern Forest Experiment Station; 1981. 13 p. [Unprinted progress report to the IPM RD&A Pro- gram].
Taha, H. A,; Stephen, F. M. Modeling with imperfect data: A case study simulating a biological system, Simulation 42 : 109-115; 1984.
Vit6, J, P.; \Vood, D. L. A sutdy of the applicability of the measurement of oleoresin exudation pres- sure in determining susceptibility of second growth ponderosa pine to bark beetle infestation. Contribe Boyce Thompson Inst. 21 :67-76; 1981,
Wesker, E.; Fahn, A. Resin ducts of Piaus halepensis hiill.-their structure, development, and pattern of arrangement. Bot. J. Lin. SOG. 62:379-411; 1969,
Wong, B, L,; Berryman, A, A. Host resistance to the fin: engraver beetie, (3) . Lesion development and con- tainment of infection by resistant R bies grandis in- oculated with Triehospcarium sy mbio t kcurn, Can* J* BoL, 56 : 2358-2365; 1977,
Variation in the Chemistry of Loblolly Pine in Relation to Infection by the Blue-Stain Fungus
Hewe A. Gambliel: Rex G. Cates, Margaret K. Caffey-Moquin, and T. D. Painei
A L:, I r act.-LoGluil2 pirne plrla~e~i r esperlaGs to iika- fection by the blue-stain fungus with the accun2ula- Gion of mcrnoterpene sfefins, $-ally1 anisole, and various resin acids a t the site of injury, The chemical response is due primarily to the presence of the fungus, and differs quantitatively hut not qualitn- tiveiy within each tree, This response, with regard to monoterpenes and resin acids, appears to be an ex- tension of the sapwood cleoresin system due to traumatic duct activation rather than synthesis of eompaunds in the phloem resulting from wounding or infection, Components of the ole~resin chemistry of the phloem lesions varied within and among trees, but the relative distribution 06 n~onotcrpene olefins and their enantiomers was specific to each of three trees tested, Infected phloem was less astringent than control phloem, Two novel methods were also developed for %ob8ollgf pine, One facilitates the simul- taneous measurement of individunl m:onoterpenes and resin acids, and the other allows concurrent micro-determination of specific rotation of alpha- pinene, beta-pinene, and limesnene, Additional keywords :: >Aono&erpenes, resin acids, en- andiomers, astringencyP hypersens%tive reaction, chemical response, phloem, Pinus taeda L,, Cera- tocystis minor Hedg,
Over the past decade, a considerable research egoart has focused on the population dynamics and economic impact of the southern pine beetle (Den- drsetonus frontalis Zimm,). Recently, the importance of the interaction between southern pine beetle (SPB), its associated fungi, and host tree chemistry has been recognized as an area where knowledge i s insu@cient, The available information concerning "re physical properlies and chemica1 c~rnposition of the oleoresin is summarized by Blanche et al, ($983),
1 Respectivefy, Researl.h Assariatc*, A.-saiciate Priifesjsor, a d Technician, GYricrnlca1 Et oYo.;., Laboratory, l--nivers~%y of New Mexico, Albuquerque. !SAT; and Research Assoelate, Department of Entomohgg2,, Cniv~rsi t j - ef Arkanvis, Fayette- ville,, AR, ( W e thank John Homer for i-evie~ing t he manu- script, and PPXI Program rn;ir-ragt rncnt, partiic~~larly Bob Thatcher, for their support Support far this research was provided through the Integrated Pest Rf:tnagement Besearch, Development, and Apphncations Program).
However, i t i s recognized that more information is needed about the qualitative and quantitative ehemi- ea8 attributes of the wound or hypersensitive re- sponse, a s well as the variability in this response within and among southern pine trees,
Our overall objective in a more encompassing study i s t o deterngiine the chemistry involved in the wound response or hypersensitive reaction of lob- lolly pine (Pinus taeda La) that may be conferring resistance and reducing the host suitability to the bark beetle-fungal complex, This particular paper reports on a novel practical method for simultaneous chemical quantification of monsterpenes and resin acids of %obPolly pine and a new method for de- termination of the specific rotation of mcrnoterpene olefin enantiomers using microgram quantities of sample, Also repsrted are some chemical attributes 06 the wound response to the blue-stain fungus, Ceratocg~sti;,. minor, including the monoterpenes, resin acids, and protein-complexi~~g capacity of in- jured and uninjured phloem tissue, In addition, aspects of the variation within and among trees in the secondary ehen~istry of wound lesions are investigated,
STUDY METEODS
Site Description and SampIe Collection
In May, 1984, 30 lobPolly pine trees were chosen in a uniform stand located in the Kisatchie National Fcrest, Rapides Parish, LA, as part sf a study to determine the nrithin- and among-tree variation in preformed and wound response chemistry, In the study reported here, six rings, equa1Iy spaced above and below breast height, were subdivided into three sectors in $0 of the SO trees studied, Four treatments were e,~tab~ished within each sector, These were: (1) A plug of phloem about $2 cm in diameter was removed from the free to serve as a control imme- diately prior to fungal %noeu%aticsn: 12) a plug of bark was removed from an adjacent site, and then a phloem disc, previously inoculated with e", minor following the methods of Paine et aX, (1985) was placed against the exposed inner bark and the origi'naP bark w*as replaced; (3) a sterile m u n d inccukation was performed in the same fashion, but without the inseulum disc, then placed next 10 the fungal inoculation treatment acd (4) a plug sf un-
infected phloem was removed 3 weeks after the initial phloem sample was collected. The lesions from treat- ments (2) and (3) were allowed to develop for 3 weeks; then they were collecled, measured, and stored a t -60°C until analyzed, Samples from 3 of the 10 trees were analyzed for monoterpenes, mono- teqene enantiomers, resin acids, and protein-com- plexing capacity, Chemical analyses from three of the four treatments (1, 2, and 3) are discussed here.
Mat erials and Equipment2
All reference monoterpene standards, which in- cluded: (!)- and (dl-alpha-pinene ( [ = ] = -45', neat, [a] -- i- 50.T0, neat, respectively), f p) -beta- pinene ( [@] ) -21°, neat), ( p) - and (d) -1honene ( [a] = -100°, c = 10, ethanol, [a] = 4- 106', c = 1, methanol), as well as all other monoterpenes and $-ally1 anisole, were of greater than 95 percent ched- cal purity.3 Resin acid standards were obtained through USDA Forest Service's Forest Products Laboratory, Madison, WIS4 Bovine hemoglobin Type 11 was used? Gas-liquid chromatography ( GLC ) was performed on a Perkin-Elmer 3920B instrument modified for on-column capillary injection (Jew* Scientific). High pressure liquid chromatography (HPLC) was perfomed on a Waters Associates dual pump system (Model 6000) fitted with a Rheodyne Model 7125 injector and equipped with a 20 p1 loop. The column, 7 percent silver nitrate on 7.5 Nu- cleosil (Macherey-Nagel) , was custom-packed.@ A Perkin-Elmer model 340 LC polarimeter was used for detection. Analytical quantification was per- formed by a Hewlett-Packard 3390A digital re- corderlintegrator. Gas liquid chromatography/mass spectrometry was carried out on a Finnigan instrument.
Extraction of Loblolfy Pine Phloem
After being weighed, each sample was ground with a pestle in liquid nitrogen, extracted serially and exhaustively four times with pentane, ether, me- thanol, and methanol/distiuled water (6:4) in a porcelain mortar. The extracts were then fiftered
2 Trade names used herein are for the infomation of the reader, Such use does not imply endorsement or approval by the Federal goverment to the exelusion of other products or services that may be suitable.
3 Obtained from Aldrich Gheraical Go., Inc., Milwaukee, WI.
4 Courtesy of Dr. D. Zinkel.
5 Obtained from Sigma ChernicaI Company, St. Louis, MO.
through glass wool and adjusted to 30 ml with the appropriate solvent. The pentane extract was used for the analysis of the enrantiomem. Aliquots of the pentane, ether, and methanol extracts were recom- bined and analyzed for monoterpene content and resin acid methyl esters. Aliquots of the methanol and methanol/water extracts were used for the protein-csmplexing capacity assay, These extraction procedures yielded greater than 95 percent of the extractable activity for each assay,
Monoterpenes and Resin Acid Methyl Esters
An aliquot of the recombined pentaneletherlnne- thznepl extracts was taken into 3 m! ether/methansl (9 : 1). Gamma-terpene, eugenol, and oleic acid (120 pg each) were then added as internal standards. An excess of diazomethane generated according to the supplier" directions (Aldrich Chemical Company 1982) was added until the characteristic yellow color persisted to generate the resin acid methyl esters, The reaction was allowed to proceed for 5 minutes a t room temperature, then the excess of diazomethane was removed under a stream of nitro- gen. Analysis was by fused silica capillary GLG using a 25 m x 0.25 mm ID bonded OV-101 column (Per- kin-Elmer) . A modified cool on-column injection system (J. W. Scientific) was used and found to be a significant improvement in the stability and quantification of resin acid methyl esters, a few of which are known to be thermally labile (Foster and Zinkel 1983). The conditions were: flow rate, 0.5 cclminute; helium detector temperature, 210°C; in- jection, room temperature; temperature program- ming, 4 minutes at 50°C, followed by a 16'Cldnute increase to 245'C; hold time, 16 minutes.
Diazomethane treatment did not significantly affect the quantification of any of the monoterpene hydrocarbons or of 4-ally1 anisole in loblolly pine under the above conditions. The inclusion of three internal standards was necessary. Gamma-terpinene was used to measure all monoterpene hydrocarbons. Eugenol and oleic acid were used to quantify 4-ally1 anisol e and resin acids, respective1 y, Chemical identi- fications were made by co-elution of loblolly pine components with authentic standards sn two cot- umns sf widely differing polarities and by GLCiMS. Each spectrum was matched by the computer to the library of spectra of the National Bureau of Standards.
Monoterpene Enantiomers
An aliquot of pentane extract (8-16 ml on a sliding scale depending on sample might) was eluted through a small column of silica gel @
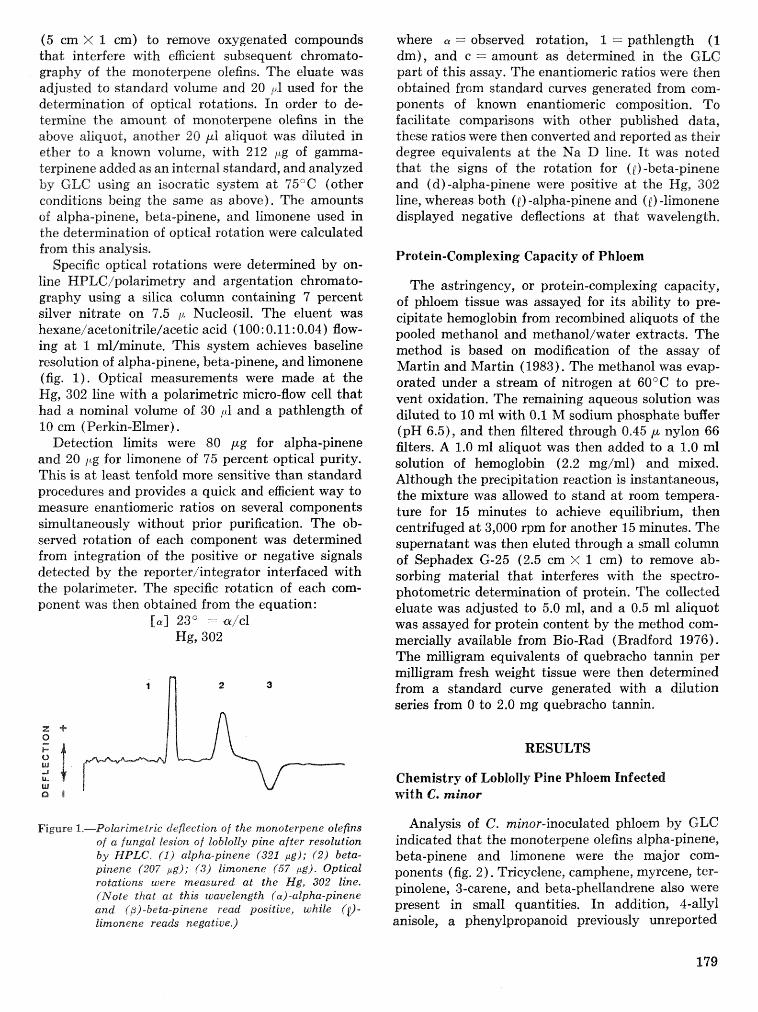
(5 em >c: I em) to remove oxygenated compounds that interfere with efficient subsequent chromato- graphy of the rnonoterpene olefins. The eluate was adjusted do standard volume and 20 /-i-l used for the determination of optical rotations. In order to de- termine the amount of monoterpene olefins in the above aliquot, another 20 aliquot was diluted in ether to a known volume, with 212 pg of ga terpinene added as an internal standard, and analyzed by GLC using an isocratic system at 75°C (other conditicns being the same as above). The amounts of alpha-pinene, beta-pinene, and limonene used in the determination of optical rotation were calculated from this analysis.
Specific optical rotations were determined by on- line HPLCipolarimetry and argentation chromato- graphy using a silica column containing 7 percent silver nitrate on 7.5 p Nucleosil. The eluent was hexaneiacetonitrile/acetic acid (100: 0.1 1 : 0.04) flow- ing a t 1 ml/minute. This system achieves baseline resolution of alpha-pinene, beta-pinene, and limonene (fig. 1). Optical measurements were made a t the Hg, 302 line with a polarimetric micro-flow cell that had a nominal volume of 30 pl and a pathlength of 10 cm ( Perkin-Elmer) .
Detection limits were 80 pg for alpha-pinene and 20 for limonene of 75 percent optical purity. This is a t least tenfold more sensitive than standard procedures and provides a quick and efficient way to measure enantiomeric ratios on several components simultaneously without prior purification. The ob- served rotation of each component was determined from integration of the positive or negative signals detected by the reporteriintegrator interfaced with the polarimeter. The specific rotation of each com- ponent was then obtained from the equation:
[a] 2 3 O = a ic l Hg, 302
where LY = observed rotation, 1 == pathlength (I dm), and c == amount as determined in the GLC part of this assay. The enantiomeric ratios were then obtained from standard curves generated from com- ponents of known enantiomeric composition. To facilitate comparisons with other published data, these ratios were then converted and reported as their degree equivalents a t the Na D line. I t was noted that the signs of the rotation for ( f ) -beta-pinene and (d) -alpha-pinene were positive at the Hg, 302 line, whereas both (p) -alpha-pinene and ( f ) -1" lmonene displayed negative deflectisns a t that wavelength.
Protein-Complexing Capacity of Phloem
The astringency, or protein-complerring capacity, of phloem tissue was assayed for its ability to pre- cipitate hemoglobin from recombined aliquots of the pooled methanol and methanollwater extracts. The method is based on modification of the assay of Martin and Martin (1983). The methanol was evap- orated under a stream of nitrogen a t 60°C to pre- vent oxidation. The remaining aqueous solution was diluted to 10 ml with 0.1 M sodium phosphate bufler (pH 6,5), and then filtered through 0,45 p nylon 66 filters. A 1.0 ml aliquot was then added to a 1.0 ml solution of hemoglobin (2.2 mglml) and mixed. Although the precipitation reaction is instantaneous, the mixture was allowed to stand at room tempera- ture for 15 minutes to achieve equilibrium, then centrifuged a t 3,000 rpm for another 15 minutes. The supernatant was then eluted through a small column of Sephadex G-25 (2.5 cm X 1 crn) to remove ab- sorbing material that interferes with the spectro- photometric determination of protein. The collected eluate was adjusted to 5.0 ml, and a 0.5 ml aliquot was assayed for protein content by the method com- mercially available from Bio-Rad (Bradford 1976). The milligram equivalents of quebracho tannin per milligram fresh weight tissue were then determined from a standard curve generated with a dilution series from 0 to 2.0 rng quebracho tannin,
RESULTS
Chemistry of Lobloll y Pine Phloem Znf ected with C. minor
Figure I.-Polarimetric degection of the monoterpene olefins of a fungal lesion of loblolly pine after resolution by HPLG. ( I ) alpha-pinene (321 ,ug); (2) beta- pinene (207 ,i&); (3) limonene (57 &j . Optical rotations were measured at the liTg, 302 tine. (Note that ad this wavelength (a)-alpha-pinene and (a)-beta-pinene read positive, while (!I- limonene reads negative,)
Analysis of C . minor-inoculated phloem by GLG indicated that the monoterpene olefins alpha-pinene, beta-pineno and limonene were the major com- ponents (fig. 2). Tricyclene, camphene, myrcene, ter- pinolene, 3-carene, and beta-phellandrene also were present in small quantities. In addition, 4-ally1 anisole, a phenylpropanoid previously unreported
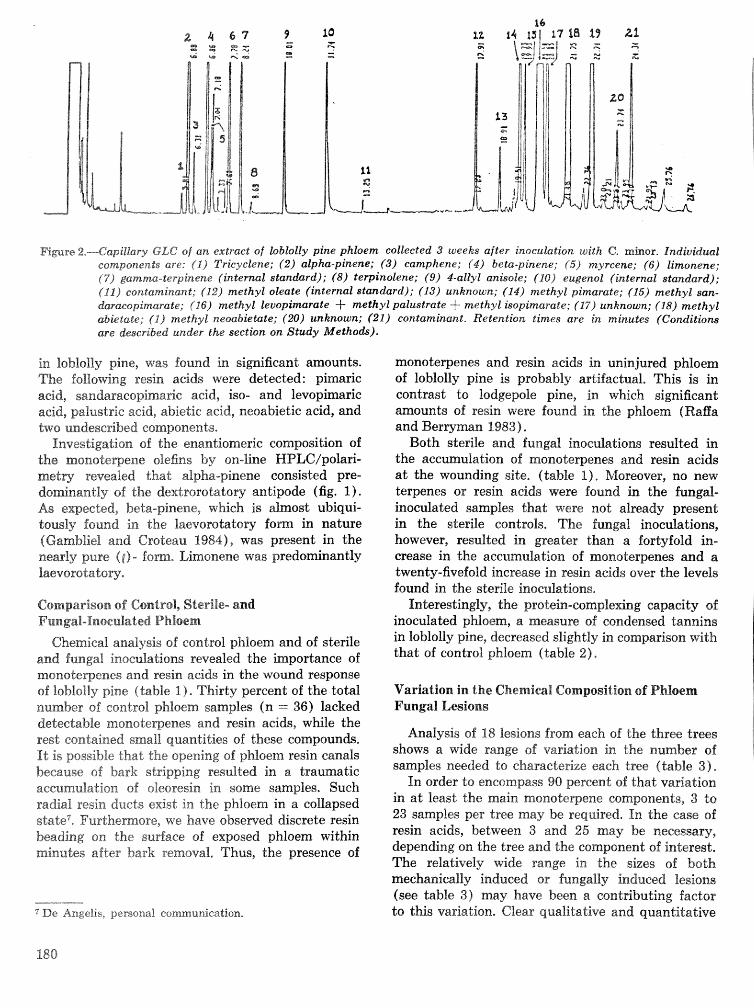
Ficse a,----Capiltary GLC! of an extract of bblolly pine phloem collected 3 weeks after inocukation with @. minor. P n d i ~ s ~ ( k l eamponefzts are: (11 Tricyclene; (2) alpha-pinene; (3) eamphene; (4) beta-pinene; ('5) myrcene; ( 6 ) limcznene; (7) gamma-terpdnene (internat2 standard); (8) terpinolene; (9) 4-ally1 anisole; (101 eugenol (internat standard); (11) eontaminant; (12) methyl oleate (internal standard); (13) unknown; (14) methyl pimarate; (1'5) methyl" Ban- daracopirnarate; (16) methyl levopimarate -k methyl palustrate 4- methyl isopimarate; (17) unknown; (18) methyl abietate; (1) methyl neoabietate; (20) unknown; (21) eontaminant, Retention limes are in minutes (Gonditiom are described under the seetion on Study Methods).
in loblc~Ily pine, was found in significant amounts. The fallowing resin acids uyere detected: pimaric wid, sandaracopima~c acid, iso- and levopimaric add, palustsic acid, abietic acid, neoabietic acid, and two undescribed components.
Investigation of the enanthmeric composition of the monoterpene olefins by on-line HPLC/pola~- metry revealed Ghat alpha-pinene consisted pre- dominantly of the dextrorotri;tory antipode (fig. 1). As expected, beta-pinene, which is almost ubiqui- tously found in the laevorotatory form in nature (Gambliel and Croteau 1984), was present in the nearly pure (E) - form. Limorsene was predminantly laevoretadosy.
Comparison of Control, Sterile- and Fungal-Inoculaded Phloem
Chemical analysis of control phloem and of sterile rand fungal ingbculiati~ns revealed the importance of monoterpencs and resin. aeids in the wound response of loblolly pine (table I). Thirty percent of the total number of control phloem samples (n =. 36) lacked detectable monoterpenes and resin aeids, while the rest contained smal quantities of these compounh. It is possible that the opening of phloem resin canals because of bark stripping resulted in a traumatic accramu~zztirm of oleoresin in some samples, Such radial resin ducts exist in the phloem in a collapsed state7, Furthermore, we have obsemed discrete resin beading on the surface of exposed phloem within minutes after bark removal, Thus, the presence of
7 D e Angelis, personal co
monoterpenes and resin acids in uninjured phloem of loblolly pine is probably artifactual. This is in contrast to lodgepole pine, in which significant amounts of resin were found in the phloem (Raga and Ber rpan 1983).
Both sterile and fungal inoculations resulted in the accumulation of monoterpenes and resin acids a t the wounding site. (table I), Pdoreover, no new terpenes or resin acids were found in the fungal- inoculated samples that were not already present in the sterile controls. The fungal inoculations, however, resulted in greater than a fortyfold in- crease in. the accumulation of monoterpenes and a twenty-fivefold increase in resin acids over the levels found in the sterile inoculations.
Interestingly, the protein-complexiing capacity of inoculated phloem, a measure of condensed tannins in loblolly pine, decreased slightly in comparison with that of control phIoem (table 2).
Variation in the Chemical Composition of Phlcrem Fungal Lwions
Analysis of 18 lesions from each of the three trees shows a wide range of variation in the number of samples needed to characterize each tree (table 3) .
In order to encompass 90 percent sf that variation in at least the main monoterperze components, 3 to 23 samples per tree may be required. In the ease of resin acids, between 3 and 25 may be necessary, depending on the tree and the component of interest, The relatively wide range in the sizes of both mechanically induced or fixngally induced lesions (see table 3) may have been a contributing factor to this vahation. Clear qualitative and quantitative
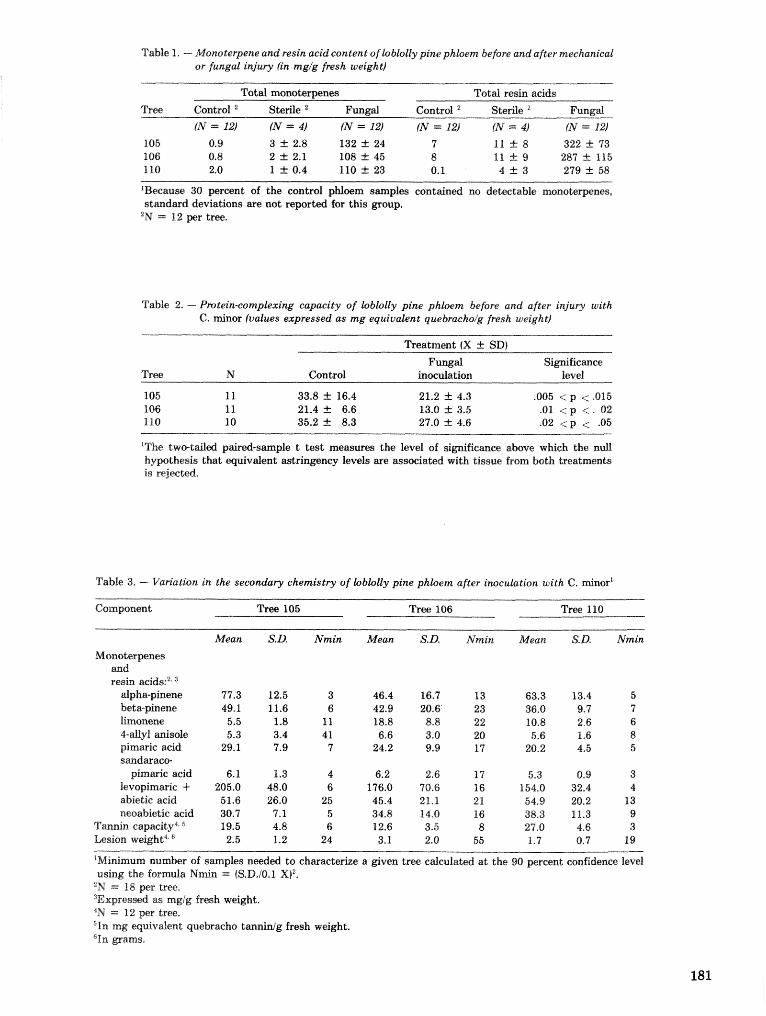
Table f . - Monokrpene and resin acid content of lobklly pine p h h m before and after mechanical or fungal injury (in mg/g fresh weight)
Total monokrpenes Totd resin acids
Tree Control Sterile Fun#@ Contrd SLr?rge Fungal (N = 12) IN = 41 fN = 12. (N = 12) (M = 41 ,i\r = 12)
"ecause 30 percent of the control phloem samplw e o n t a d no debtable monobpnes, stmdard deviations are not reported for this group.
'N = 12 per tree.
Table 2. - Pmtein-cornplexing capacity o f loblolly pine phloem before and after injury mith C. minor (values expressed as rng equivalent quebracho/g fresh weigh tl
Treatment (X + SDI
Fungd Significance Tree N Control inocdation level
105 11 33.8 + 16.4 21.2 1 4.3 '005 < p < .015 106 11 21.4 + 6.6 13.0 1: 3.5 .01 < p <. 02 110 10 35.2 + 8.3 27.0 -t 4.6 -02 < p < .05
'The two-tailed paired-sample t test measures the level of significance above which the null hypothesis that equivalent astringency levels are assmiatd with tissue from both treatments is rejected.
Table 3. - Variation in the seconhry chemistry of loblolly pine phloem after inoculatMn with C . mjinor'
Cowanent Tree 105 Tree 106 Tree 110
Monoterpenes and resin
dpha-pinene be ta-pinene limnene 4-dyl anisole pimaic acid smdaraco-
pirnaric acid levopimmic -f- abistic wid neoahietic acid
Tannin capacity4 Lesion wei& t4* "
Mean S.D. Nmin
3 6
11 41 7
4 6
25 5 6
24
Mean
46.4 42.9 18.8 6.6
24.2
6.2 176.0 45.4 34.8 12.6 3.1
Sf).
16.7 20.6 8.8 3.0 9.9
2.6 70.6 21.1 14.0 3.5 2.0
Mean
63.3 36.0 10.8 5.6
20.2
5.3 154.0 54.9 38.3 27.0 1.7
Nmin
5 7 6 8 5
3 4
13 9 3
19
"inimum numbr of smples needed to characterhe a given tree calculated at the 90 prcent confidence level using %he formula N ~ n = (S.D.IO.1 XI2. 'N = 18 p r tree. 3Expresmd as mgig fresh weight. 4N = 12 per tree.
nag equivdent quebracho tmninlg fresh weight. 61n pms ,
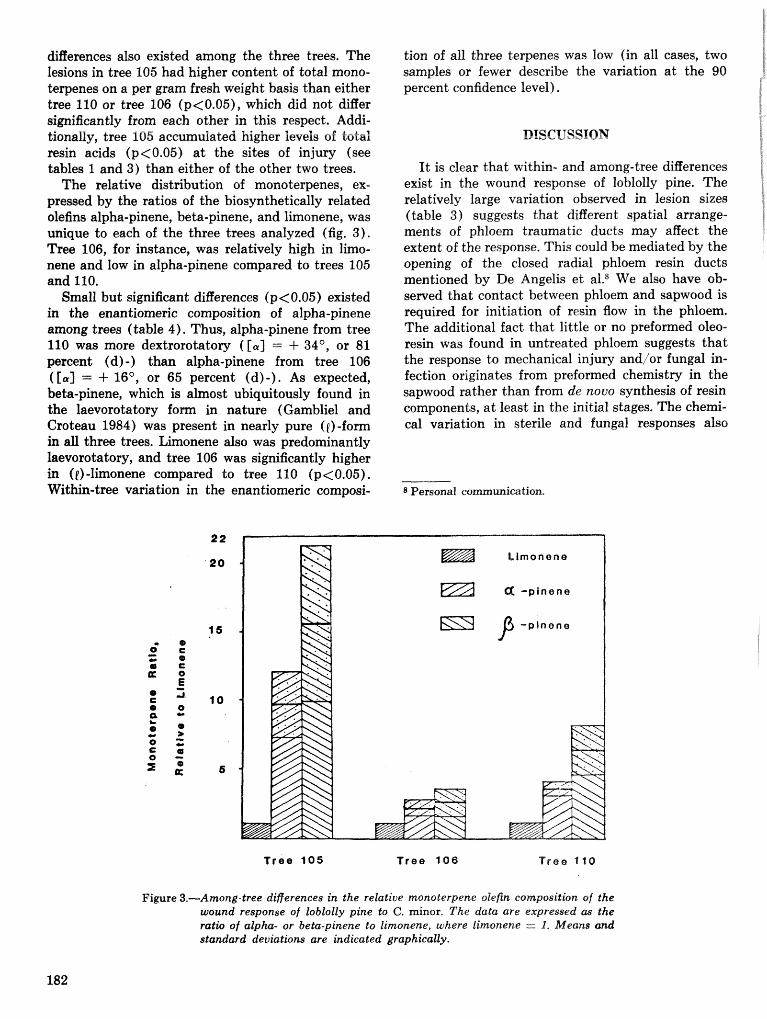
diEemnces also existed among the three trees. The lesions in tree 105 had higher content of total mono- terpenes on a per gram fresh weight basis than either tree 110 or tree 106 (p<0.05), which did not diBer significantly from each other in this respect. Addi- tionally, tree 105 accumulated higher levels of tota1 resin acids (p<O.OS) a t the sites of injury (see tables 1 and 3) than either of the other two trees.
The relative distsbution of monote~enes, ex- pressed by the ratios of the biosynthetically related olefins alpha-pinene, beta-pinene, and limonene, was unique to each of the three trees analyzed (fig. 3) . Tree 106, for instance, was relatively high in limo- nene and low in alpha-pinene compared to trees 105 and 110.
Small but significant dieerences ( p < 0.05) existed in the enantiomeric composition of alpha-pinene among trees (table 4). Thus, alpha-pinene from tree 110 was more dextrorotatory ( [a] = + 34', or 81 percent (d) -) than alpha-pinene from tree 106 ( f a r ] = i- 16O, or 65 percent (d)-). As expected, beta-pinene, which is almost ubiquitously found in the laevorotatory form in nature (Gambliel and Croteau 1984) was present in nearly pure ([)-form
tion of all three terpenes was low (in all cases, two samples or fewer describe the variation at the 90 percent confidence level).
DISCUSSION
It is clear that within- and among-tree diEerences exist in the wound response of loblofly pine. The relatively large variation observed in lesion sizes (table 3) suggests that different spatial arrange- ments of phloem traumatic ducts may affect the extent of the response. This could be mediated by the opening of the closed radial phloem resin ducts mentioned by De Angelis et a1.8 We also have 05- served that contact between phloem and sapwood is required for initiation of resin flow in the phloem. The additional fact that little or no preformed oleo- resin was found in untreated phloem suggests that the response to mechanical injury and/or fungal in- fection originates from preformed chemistry in the sapwood rather than from de novo synthesis of resin components, a t least in the initial stages. The chemi- cal variation in sterile and fungal responses also
in all three trees. Limonene also was predominantly laevorotatory, and tree 106 was significantly higher in (I)-lirnonene compared to tree 110 (p<0.05). Within-tree variation in the enantiomeric composi- 8 Personal comunication.
Tree 105 T r e e $ 0 6 Tree ll f O
Figure 3.-Among-tree differences in the relatiue monoterpene olefin composition of the wound response of loblolty pine to C . minor. The data are expressed as the ratio of alpha- or beta-pinene to limonene, where limonelte --. f, Means and standard deviations are indicated graphically.
Table 4. - Vm'atiolz in the en anti on ten"^ compositio:on of the monotergene olefins of bdikoliy pine lesions resulting from inoerth&on with C. rninos (N = 12 samples per tree?
23" Mean [al, equivdent It S.D.
23* 23' 23 " T [a], 3- SD 9% + SD [a], f SD 96 "G SSJD [&ID + SD 9% -t- SD 105 +28 f 4 15 z f : 4 -22 f 1 91 f 3 -82 f 21 83 -L- 9
"~peeific rotations are given along with their s t a n d d deviations in dew= equivderrts at the: Na D line to facilitab eomparjrsons with published data. Percentages reflwt the relative abun- dance of the predominating antime.
could to a small extent reflect variation in the mechanical component of the injury.
Specific qualitative chemical patterns in the fungal lesions are characteristic of individual trees. With respect to monoterpenes, the most interesting obser- vation is that fungal wound responses are best characterized by their relative ratio of monoterpene olefins (fig. 3). This is potentially very important, since bark beetles are thought to respond, not to any one, but rather, to a complex of host monoterpenes (Borden 1982) . In IobIolly pine, ( d) -alpha-pinene, if)-beta-pinene, and myrcene function either as pheromone precursors or as synergists in the south- ern pine beetle-fungal complex (Renrwick et al. 1976; Borden 1982). Limonene, another characteristic: component, has been implicated as an index of resistance in ponderosa pine (Smith 1977; Sturgeon 1979). Little within-tree variation was observed in the enantismeric composition of these olefins in the portion of the tree initially colonized by bark beetles. However, i t should be noted that differences were found in the enantiomeric ratios of alpha-pinene among the trees tested. This is expected to signifi- cantly affect the relative production of the bark beetle pheromones (d) -cis-verbenol and ( 8 ) -trans- verbenol (Renwick et al. 1976) and thus alter beetle colonization behavior. The presence of 4-ally1 anisole, a phenylpropanoid component, is interesting since i t requires a diRerent biosynthetie route from that of the terpenoid components of the oleresin, On the other hand, alpha-pinene, beta-pinene, cam- pbene, myrcene, and limonene are a11 made by just two cycfases with multiple activities and opposite enantiomerie specificity (Gambliel and Croteau 19843,
The data we present do not support a defensive role against 6. minor for condensed tannins in the wound response of loblolly pine. In fact, a post-infec- tion decrease in the overall astringency of the lesions suggests possible detoxiecation by the fungus, which
may possess phenyl oxydasesg. I t must be recognized, however, that the astringency assay that detects complexing capacity with respect to hemoglobin is not necessarily sensitive to the specificity that lob- loblolly pine tannins may have toward other proteins and/or carbohydrates.
Despite the decrease in astringency in the fungal- inoculated lesions, the survival of attacking beetle adults, and their reproduction, is lower when coloni- zation is forced into fungus-infected lesionsm. This may he due to the accumulation of oleoresin and/or stilbenes (e.g., pinosylvin, pinosylvin methyl ether) that have also been implicated in the fungal wound response of IobEslly pine (Hemingway et a]. 6977). These, as well as other phenolic components, will be the subject of another separt.
I t appears, therefore, that tree-specific monoter- pene olefin complements and enantiomeric ratios merit detailed consideration in future studies. Our findings underscore the need for further assessment of the among-tree variation in the secondwy chemis- try described in this report and for a careful de- termination of the relationship between secondargr chemistry and the powlation dynamics of the bark beetle-fungal complex,
LITERATURE CITED
Aldrich Chemical Company, Ine, &Iinzi Diazat&a ag- para tus. Technical Information Barlledirm. Number AL- 12 1, kfilwaukee, FVI : Aldrich Chemical Go,; 1982,
Blanche, C.A.; Hcdges, $23,; Nebeker, T.E. [and others], Southern pine beetle: the host dimension. hfiss, Agr, and For. Exp, Sta, Bull, 917. hfississippi State, h2S : &lississiypi State University; 9983, 29 p.
9 E l e ~ n g w a y , personal eo Paine and Stephen, unpublished information.
Borden, Jeff, Agpegation pheromones. In: Mitton, J,B,; Sturgeon, K,I3., eds. Bark beetles in North American conifers, Austin: University of Texas Press; 1982 : 109.
Bradford, kI.hf, A. rapid and sensitive method for the quanzitatictn of' microgram quantities of pro- tein utilizing the principle of protein-dye binding. Anal. Biochern, 72 2: 248-250; 1976.
Foster, D.0,; Zinkei, D.F. Qualitative and quantita- tive analysis of diterpene resin acids by glass capillary gas-liquid chromatography. J, Chroma- togr. 242 : 89-98; 1982.
Gambliel, H.; Croteau, R, Pinene cyclases 1 and II: two enzymes from sage (SaEuia ofieinalis) which catalyze stereospecific cyelizations of geranyl pyro- phosphate to monoterpene olefins of opposite con- figuration. J, Biol. Chem, 259 (2) : 740-748; 1984.
Heminmay, R.W.; MeGraw, G.W.; Barras, S.J. Polyphenols in Cera tocy s t i s minor-infected Pinus taeda: fungal metabolites, phloem and xylem phenols. 5. Agric. Food Chern. 25(4):717-722; 1977.
Martin, J.; Martin, &I. Tannin assays in ecolagicaf studies; lack of correlation between phenolics, proanthocyanidins, and protein-precipitating con- stituents in mature foliage of six oak species. Oecologia 54: 205-211; 1983.
Paine, T.D.; Stephen, F-bf,; Cakes, R,G, Induced defenses against Dendroetonrts frontatis and asso- cia ted fungi : variation in lobTIrolly pine resistance, In: Branham, Susan J.; Thatches, Robert C,, eds, Proceedings, integrated pest management research symposiram; I985 April 15-18; Asheville, NC, Gen, Tech. Rep. SO-56, New Orleans, LA: U,S, Depart- ment of Agriculture, Forest Senice, Southern Forest Experiment. Station; 1985 : 169-176,
Raffa, K.F.; Berryman, A,A. The role of host plant resistance in the eolonizakion behavior and ecology of bark beetles. EcoT, &lonograph 53 : 27-49; 1983,
Renwick, J,A,A.; Hughes, P,R,; KrulE, IS. Selective production of uis- arzd trans-verbenol from 4 - ); - and ( +)-alpha-pinene by a bark beetle, Science 191: 199-2011; 1976.
Smith, R.H, Monoterpenes sf ponderosa pine xylem resin in western United States, Tech, Bull, 4532, Washington, DC: U.S. Department of Agriculture; 1977.48 p.
Sturgeon, LC.B, Monoterpene variation in ponderoaa pine xylem resin related to western pine beetle predation. Evolution 33 : 803-814; 197 9,
Wood, D.L.; Brswne, L.E.; Ewing, B, [and others], Western pine beetle: speei6city among enan- tiomers of male and female eonrrtponents of an attractant pheromone, Science 192 : 896-898; 1976,

SESSION I D HOSTIPEST INTERACTIONS
Descriptive and Predictive Mode
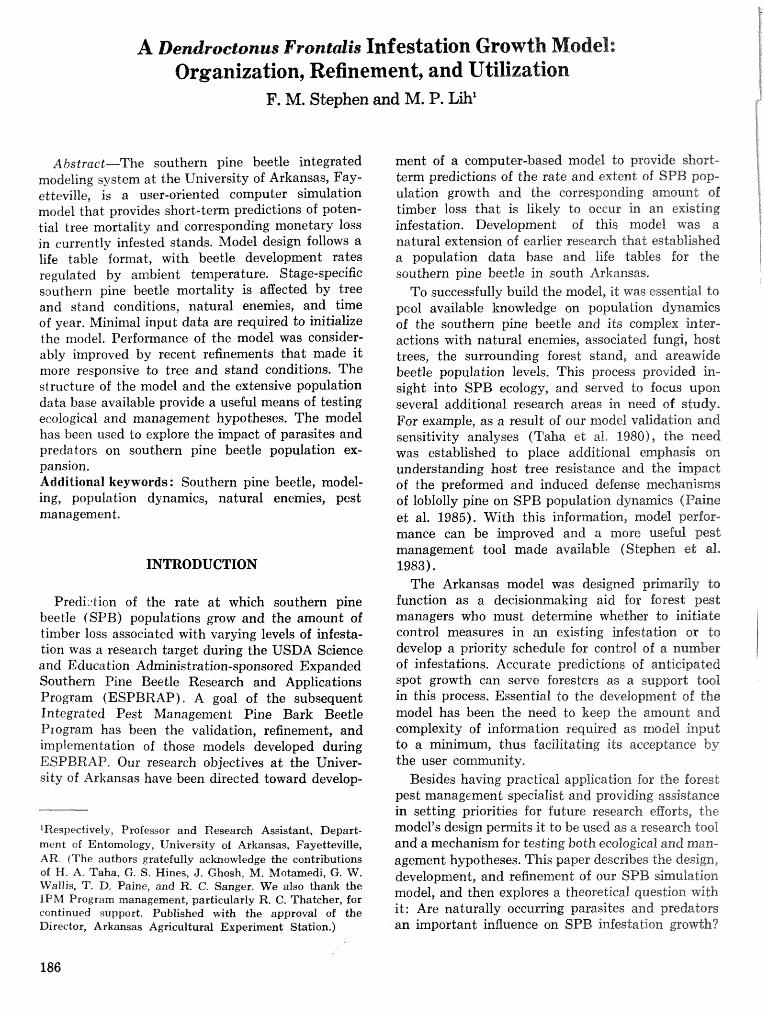
A Dendroctonus Frontalis Infestation Growth Model: Organization, Refinement, and Utilization
F. M. Stephen and M. P. Lih'
Abstmct-The southern pine beetle integrated modeling system a t the University of Arkansas, Fay- etteville, is a user-oriented computer simulation model that provides short-term predictions of poten- tial tree mortality and corresponding monetary loss in currently infested stands. Model design follows a life table format, with beetle development rates regulated by ambient temperature. Stage-specific s~uthern pine beetle mortality is affected by tree and stand conditions, natural enemies, and time of year. Minimal input data are required to initialize the model. Perfomance of the model was consider- ably improved by recent refinements that made i t more responsive to tree and stand conditions. The structure of the rnodel and the extensive population data base available provide a useful means of testing ecological and management hypotheses. The model has been used to explore the impact of parasites and predators on southern pine beetle population ex- pansion, Additional keywords: Southern pine beetle, model- ing, population dynamics, natural enemies, pest management.
INTRODUCTION
Prediztion of the rate a t which southern pine beetle (SPB) populations grow and the amount of timber loss associated with varying levels of infesta- tion was a research target during the USDA Science and Education Administration-sponsored Expanded Southern Pine Beetle Research and Applications Program (ESPBRAP). A goal of the subsequent Integrated Pest Management Pine Bark Beetle Program has been the validation, refinement, and implementation of those models developed during ESPBRAP, Our research objectives a t the Univer- sity of Arkansas have been directed toward develop-
"espectively, Professor and Research Assistant, Depart- ment of Entomology, 'University of Arkansas, Fayetteville, AR. f The authors gratefully acknowledge the contributions of H. A. Taha, C. S. Hines, J. Ghosh, M. Motarnedi, G. W. tYallis, T. I). Paine, and R. C. Sanger. We also thank the IIPM Program management, particularly R. C. Thatcher, for continued support. Published with the approval of the Director, Arkansas Agricultural Experiment Station.)
ment of a computer-based model. to provide short- term predictions of the rate and extent of SPB pap- ulation growth and the corresponding amount of timber loss that is likely to occur in an existing infestation. Development of this model was a natural extension of earlier researeh that established a population data base and life tables for the southern pine beetle in south Arkansas,
To successfully build the model, it was essential to pa01 available knowledge on population dynamies of the southern pine beetle and its complex inter- actions with natural enemies, associated fungi, host trees, the surrounding forest stand, and areawide beetle population levels. This process provided in- sight into SPB ecology, and served to focus upon several additional research areas in need of study. For example, as a result of our model validation and sensitivity a~alyses (Taha et ale 1980), the need was established to place additional emphasis on understanding host tree resistance and the impact of the preformed and induced defense mechanisms of loblolly pine on SPB population dynamics (Paine et al. 1985). With this information, model. perfor- mance can be improved and a more useful. pest management too1 made available (Stepbenn ed d. 1983).
The Arkansas model was designed primarily to function as a decisionmaking aid for forest pest managers who must determine whether to initiate control measures in an existing infestation or to develop a priority schedule for control of a number of infestations. Accurate predictions of anticipated spot growth can serve foresters as a support tool: in this process, Essential to the development of the model has been the need to keep the amount and complexity of infomation required as model. input to a minimum, thus facilitating its acceptance by the user communit y.
Besides having practical application for the forest pest management specialist and providing assistance in setting priorities for future research egorts, the model's design pemits it to be used as a research tool and a mechanism for testing both ecological and man- agement hypotheses, This paper describes the design, development, and refinement of our SPB sianulatian model, and then explores a theoretical question with it: Are naturally occurring parasites and predators an important influence on SPB infestation growth?
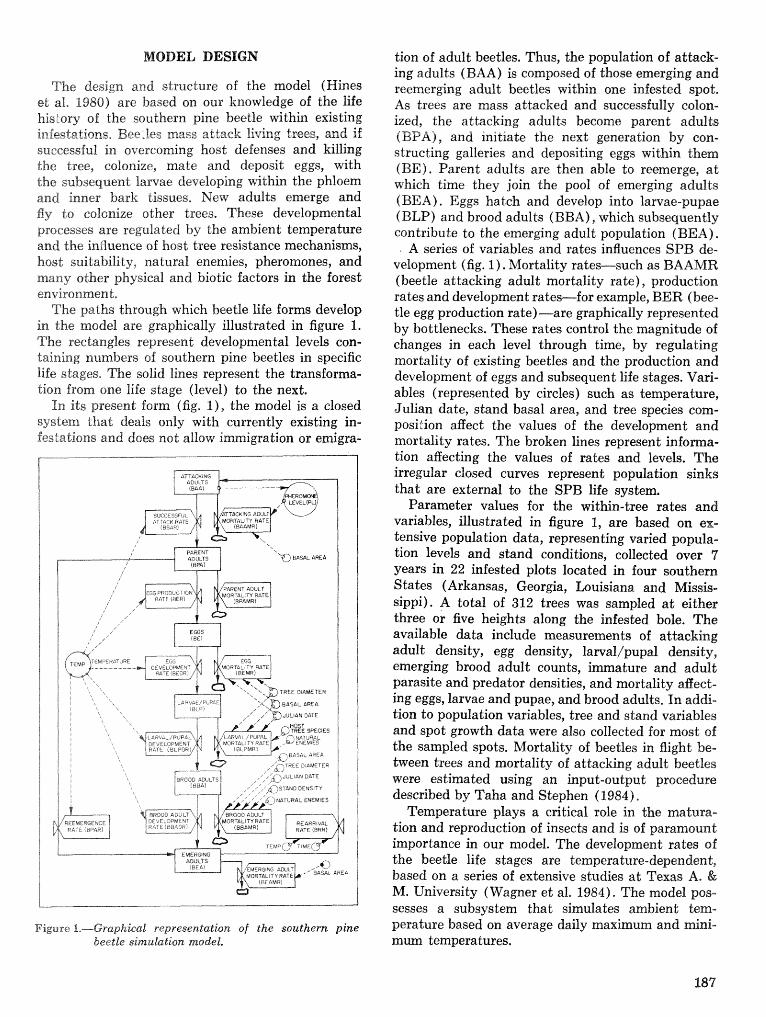
The design and structure of the model (Hines ed al, 1980) are based on our knowledge of the life EsIsiory of the southern pine beetle within existing infestations, Bee-les mass attack living trees, and if successful in overcoming host defenses and killing the tree, colonize, mate and deposit eggs, with the subsequent larvae developing within the phloem and inner bark tissues, Ne~v adults emerge and By to colonize other trees, These developmental processes are regulated h y the arnbient temperature and the influence of host tree resistance mechanisms, host suitability, natural enemies, pheromones, and many other pfaysieal and biotic factors in the forest environment.
The paths through which beetle life foms develop in. the model are graphically illustrated in figure I. The rectangles represent developmental levels con- taining numbers of southern pine beetles in specific life stages* The solid lines represent the transforma- tion from one life stage (level) to the next, In its present form (fig. I ) , the model is a closed
system that deals only vvitb currently existing in- festations and does not allow immigration or emigra-
\o 5BG% AREA
MTrj 'PAL ENEMIES
,,a -' BASAL AREA
Figure 1.----Gmphieal representation of the southern pine beetle simulation model,
tion of adult beetles, Thus, the population of a thek- ing adults (BAA) is composed of those emerging and reemerging adult beetles within one infested spot. As trees are mass attacked and successfully colon- ized, the attacking adults become parent adults (BPA), and initiate the next generation by con- structing galleries and depositing eggs within them (BE). Parent adults are then able to reemerge, a t which time they join the pool of emerging adults (BEA). Eggs hatch and develop into larvae-pupae (BLP) and brood adults (BBA) , which subsequently contribute to the emerg-ing adult population (BEA) .
A series of variables and rates inffuences SPB de- velopment (fig. I ) . Mortality rates-such as BAAMR (beetle attacking adult mortality rate), production rates and development rates-for example, BER (bee- tle egg production rate) -are graphically represented by bottlenecks, These rates control the magnitude of changes in each level through time, by regulating mortality of existing beetles and the production and development of eggs and subsequent life stages. Vari- ables (represented by circles) such as temperature, Julian date, stand basal area, and tree species com- position affect the values of the development and mortality rates, The broken lines represent infoma- tion aBecting the values of rates and levels. The irregular closed curves represent population sinks that are external to the SPB life system.
Parameter values for the within-tree rates and variables, illustrated in figure 1, are based on ex- tensive population data, representing varied popula- tion levels and stand conditions, collected over 7 years in 22 infested plots located in four southern States (Arkansas, Georgia, Louisiana and Missis- sippi). A total of 312 trees was sampled a t either three or five heights along the infested bole, The available data include measurements of attacking adult density, egg density, larval/pupal density, emerging brood adult counts, immature and adult parasite and predator densities, and mortality affect- ing eggs, larvae and pupae, and brood adults. In addi- tion to population variables, tree and stand variables and spot growth data were also collected for most of the sampled spots. Mortality of beetles in fiight be- h e e n trees and mortality of attacking adult beetles were estimated using an input-output procedure described by Taha and Stephen (1984).
Temperature plays a critical r de in the mabra.- tion and reproduction of insects and is of paramount importance in our model. The development rakes of the beetle life stages are temperature-dependent, based on a series of extensive studies a t Texas A. & M. University (Wagner et al. 1984). The model pos- sesses a subsystem that simulates ambient tern- perature based on average daily maximum and ~ n i - mum temperatures.
MODEL DEVELOPMENT AND USER ORIENTATION
The model bas been user-oriented since its incep- tion, and thus, minimizing input requirements with- out sacrificing predictive accuracy has been a per- sistent concern, Input data, as required in 19'79 and 1985, are compared in table 1, and it is evident that necessary input has been substantially reduced. Lon- gitude and latitude estimates for the infested site have been changed to the name of the State where the infested spot is Ioeated. Radial growth and tree age measurements are now optional input data. A count of previously infested and currenbly infested trees is required, but determination of the predom- inant beetle life stage present a t breast height in in- fested trees is now optional (though still highly rec- ommended). The diameter a t breast height (d.b.h.) distribution of all infested trees in the stand and the current stumpage prices for salvaged sawtimber and pulpwood are required only if estimates of volume and monetary loss are requested. The mean heights a t top and base of the infested portion of the tree and mean circumference a t the top of the infestation are no longer requested. All data may now be recorded in English or metric units. A practitioner" manual has been prepared that includes sample field forms and assists the user in the collection of necessary input data (Lih and Stephen 1985a).
The model has been incorporated into an inte- grated structure that allows the input, editing, and storage of data from infested spots, as well as execu- tion of simulation runs. A user's guide to the model (Lih and Stephen 198533) aids in summarization of
Table 1 . - Data required for model initialization: comparison of input requirements in 1979 versus 1985
Input requirements
- Date of ground survey - Number of days of simulation - Londtude and latitude of infestation - State in which infestation is located - Mean pine and hardwood basal areas - Host species composition -- Mean d,b.h. of infested trms - Number currently infested trees - Number previously infested trws - &fern 5-year radial mowth - Mean stand age - SPB life stage estim, in infested trees - Mean bt: top and base of infested trees - Mean ciremference at top infestation - J3.b.h' distribution of surveyed trees - Current stumpage prices
R = Required O = Optional 0 = Optional - highly recommended for accurate prediction Fj == Required for volume and monetary loss estimation
field-collected data for input to the model and pro- vides an example of an interactive session on the computer,
Once the user has accessed the iategrakd model- ing system (with the help of the user" s i de ) , a ""heJp" kcifity and optional instructions are avail- able to assist with data entry and model exwutiors, Users may specify length af time for the simulation to be conducted. The model can easily be made highly site-specific in regard to local temperature conditions, and whether estimates sf volume and monetary loss are needed can be stipulated. Repeated runs can be made on a single infested spot, if, for instance, the user m n t s to evaluate the efiects of unusually hot weather or an intended control treat- ment on predicted spot grow&.
In 1979, model output was expressed as a weekly prediction of the number of infested trees in each beetle life stage level, and the total numbers of in- fested and dead trees. Currently, model predictions are output on a user-determined dally or weekly basis. Projected spot growth is expressed as eonfi- dence intervals around the predicted numbers oh infested and dead trees over time. The confidence intervals provide the user with the predicted trend of spot growth, while both compensating for the uncertainty in estimating specific model parameters (Taha and Stephen 1984) and also helping to ac- count for individual digereaces associated with each infeshtion,
MODEL REFINEMENT
User needs have largely defined the current model input requirments, model output %omat, and strue- ture of the user-friendly integrated modeling system, Internal refinments have also been made to help users, For instance, height and eireumferct~ace at the top of the infested tree bole were required input variables until a regression equation was developed that used mean d.b.h. to predict the avemge errmount of infclsted bark area per tree (Stephen and Taha 1979). Southern pine beetle brood stage distribution at breast height for the infested trees is a recorn- mended (but not required) input; va~able, The de- fault brood stage astfibution assigned to infested trees when the actual distribution is unknown is the result of addtional rmearch to make the model more user-orien ted.
Pilot testing of the model was wnducted with SPB infestation data collected by U, S. Forest Sewice, State and Psitiate Forestry crews and University of Arkansas crews in several geographic regions aerom the South that represent dii8eren.l; forest site and stand conditions and different areawide levels of bark be&le populations* MsdeI pre&ctims were ac-
ceptable iaa circumstances where overall population levels were high9 and stand con&t;iorrs were s i ~ l a r to those sites in south Arkansas where data were eol- leckd for model constrtredion. However, model pre- dictions were not reliable under highly &Berent s k n d conditions and in situations where a r e a ~ d e SPB popuIations were at a Low level, The observed incon- sistencies in spot gotvth rate and the model's in- ability $89 account f o ~ the factors eausing these k- mnsistencies suggested that the model bad not cap- tured the essential nature of how Merences in tree and stand conditions and areawide population levels infiuenee SPB population dynamics.
Model behavior is under continual scrutiny, m e n output deviates substantjially from that expected or observed in the field, refinements may be required. One such instance resulted in the restructuring of the attacking adult subroutine to accommodate new data, and to produce a more realistic pattern of spot powth,
SensitiGty analysis was conducted on several of the model's input variables, parameters, and rates (Taha et a1, 1980), %kmis established the relative de- gree of infiuence that each parameter has on model output; is,, the number sf dead trees. Additional mode2 refinement egorts muld then be concentrated on finding reliable means for determining those para- meters that have the greatest efiect on model be- havior. The analysis indicated that within-tree beetle mortality rates (egg, larval-pupal, and brood adult mortalities) and the densities of attacking adults and eggs are relatively sensidiive pmmeters.
Although tree and stand conditions did play a role in the setting of beetle mortality rates in the early model versions, their impact was inferred by our in- tuitive understanding of the intmactions between stand variables and specific beetle population para- meters, Research was conducted to deternine wheth- er a funcGrsna% relationship could be established be- tween tree and stand conditions, and these five most sensitive population parameters (Lih and Stephen 1985~). Regression equations were developed for each, and these predictive equations were incorpo- rated into the ""new" or ""rfined" version of the s h - ulation model,
Test runs were then made on 90 infwtations fmm which data were available. The differences between obsemed and predicted numbem of infested and dead trees were calculated lor each spot. These residud values were adjusted for spot size, providing a per- cent error tern , and then plotted, Both the original and refined models have less error in predicted dead trees than in predicted i n f ~ d e d trees, It can be seen from the graphs showing numbers of dead trees that the predictions made lay the refined modd have much smaller percent rwiduaB aralues than do those made
by the original model (figs. 2 and 31, particularly as the simulation progresses through time. The pre- &cted and observed numbers of infested and dead trees were then compared graphically, The originall model had a strong tendency to overestiw-t;e nurn- bem sf dead trees (fig, 4). Although the refined model is less erratic in its predictions, it has a nearly equal tendency to over- and underpredict (fig. 5). The new modelk predictions are, on the average, sub- skntially closer to actual infeshtion gro&h data than were those of the early version.
The predicted modality rates from the r e h e d model were compared to those obtained through population sampling. Predicted values of brood adult mortality rate were less accurate than egg and larval- pupal mortality rate predictions, but overall the pre- dieted rates closely corresponded with observed values.
Work is now undemay to write a complete version of the model that will run on many of the micro- c q u t e r s currently being used by universities, in- dustry, and State or Federal Forest S e ~ c e organiza- tions. In addition, the integrated modeling system has been provided to Texas A&M University for in- @orcporatTon into the Southern Pine Beetle Decision Support System (Saunders et ale 1985).
NAmRAL ENEMY SIMULAmONS
Methods
The data base on stage-specific density and mor- tality of nrithin-tree populations of southern pine beetle was used to assess the impact of natural en- emies on beetle population dynannics. The population data were summarized and organized in life tables. Each life table-corresponds to the mean values from the population samples collected in a sin- gle infested spot during a single sampling period (about 4 days). The life tables include information on the within-tree beetle population parameters de- picted in the flow diagram of the model (fig. 1) ; i.e., the densities of the within-tree beetle life stages and the morklity rates affecting each immature develop- mental stage are included as variables in the life tables. The life tables also indicate the nurnbers of immature parasites, and both immature and adult predators that are present in the bark samples with the late larval and pupal stages of the beetle, These natural enemy counts are taken from mdiographs of infested bark.
The number of life bbles available for a single infested spot depends on the number of times the spot was sampled for SPB population data. Four infested spots that were sampled a t least three times each and that also had measuremenb sf &aU the stand
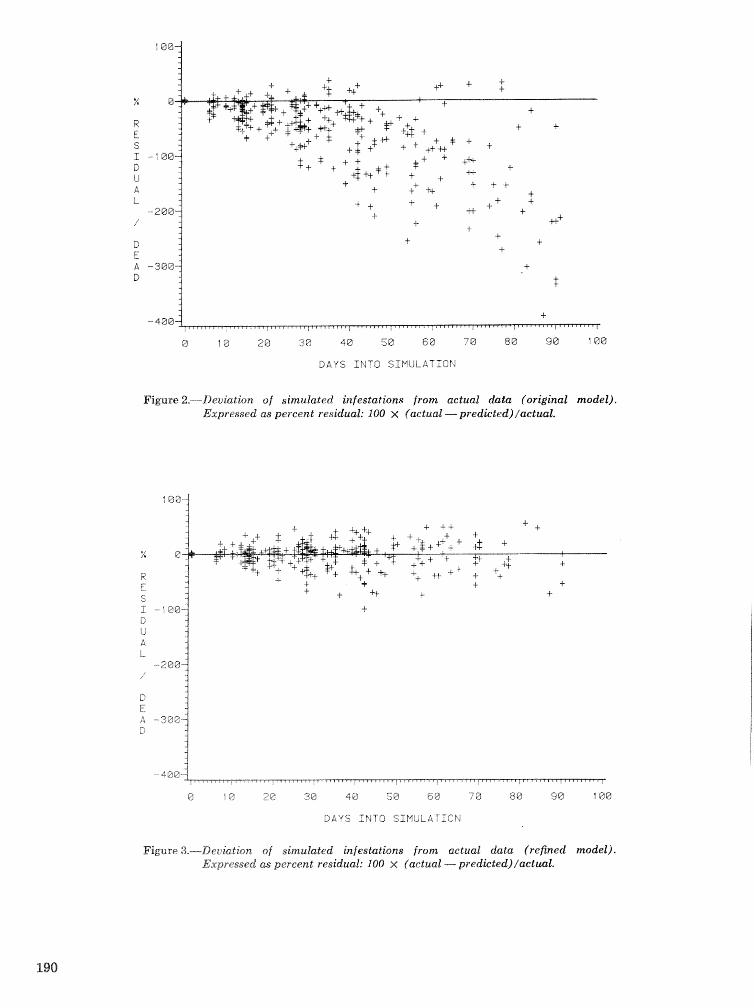
DAYS INTO S I M U L A T I O N
Fipre2.---DeviaLion of simulated infestations from actual data (original model). Expressed as percent residual: I00 x factual - predkted)/aetual.
DAYS INTO SIMULATION
Figure3,-Deuia:ntion of simulated infestations from actual data (refined model). Expressed as percent residual: 100 x (actual - predkted)laetwl.
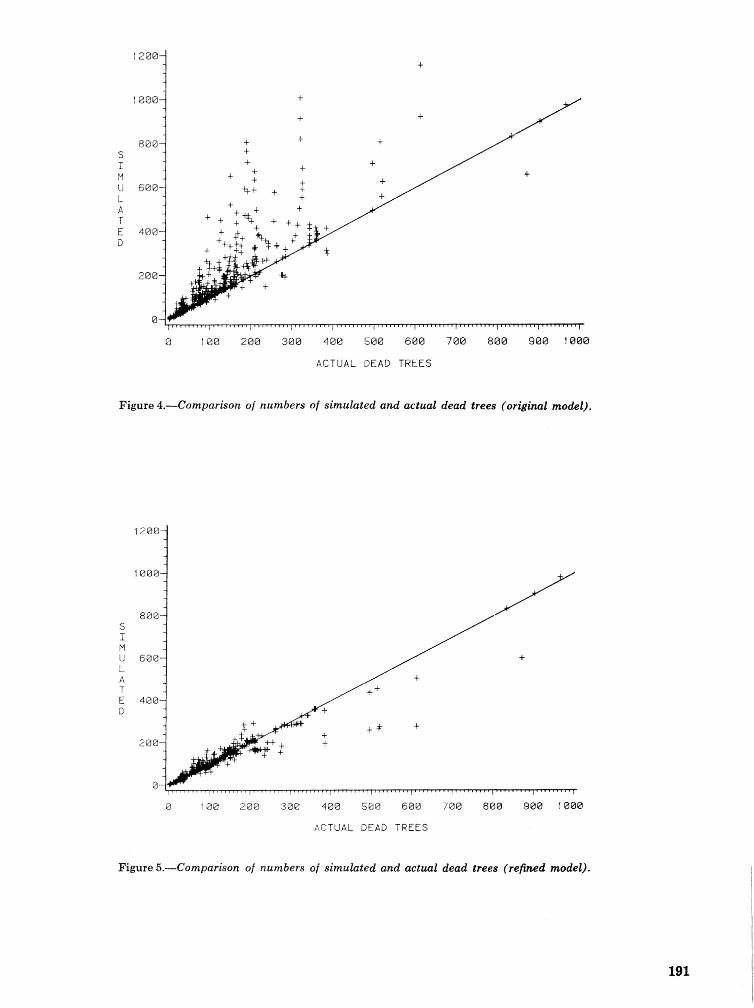
ACTUAL DEAD TREES
Figure 4.-Comparison of numbers of simulated and actual dead trees (original model).
1200
1 QQQ
0 I@@ 2638 300 400 5 6@@ 7063 800 988 1Q80
ACTUAL DEAD TREES
Figure 5.-Comparison of numbers of simulated and actual dead trees (re@ed model).
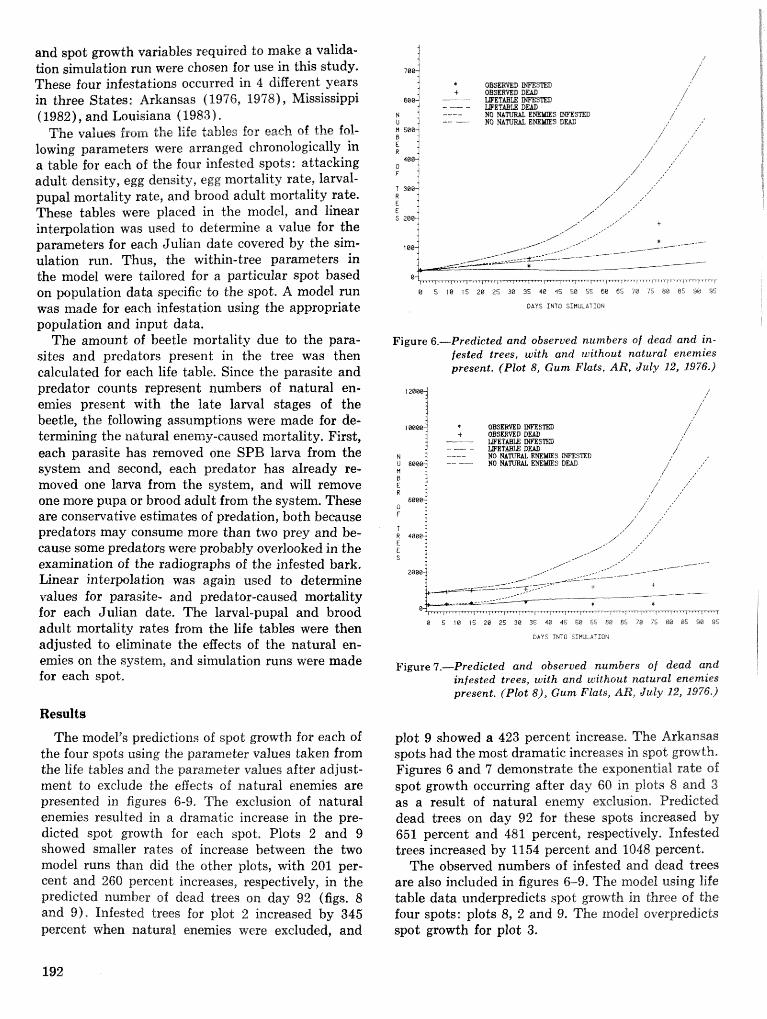
and spot growth variables required to make a valida- tion shulation run were chosen for use in this study. These four infestations occurred in 4 different years in three S h t w : Arkansas ( 1976, 1978), Mississippi ( 1982), and Louisiana ( 1983 ) .
The value from the fife tables for each of the fol- lowing parameters were arranged chronologically in a table for each of the four infested spots: attacking adult density, egg density, egg mortality rate, larval- pupal mortality rate, and brood adult mortality rate. These tables were placed in the model, and linear interpolation was used to determine a value for the parameters for each Julian date covered by the sim- ulation run, Thus, the within-tree parameters in the model were tailored for a particular spot based on population data specific to the spot. A model run was made for each infestation using the appropriate population and input data,
The amount of beetle mortality due to the para- sites and predators present in the tree was then calculated for each life table. Since the parasite and predator counts represent numbers of natural en- emies present with the late larval sbges of the beetle, the follouring assumptions were made for de- termining the natural enemy-caused mortality. First, each parasite has removed one SPB larva from the system and second, each predator has already re- moved one larva from the system, and wiU remove one more pupa or brood adult from the system. These are conservative estimatw of predation, both because predators may consume more than two prey and be- cause some predators were probably overlooked in the examination of the radiographs of the infested bark, Linear interpolation was again used to deternine values for parasite- and predator-caused mor&ality for each Julian date. The larval-pupal and brood adult mortality rates from the life tables were then adjusted to eliminate the effects of the natural en- emies on the system, and simulation runs were made for each spot,
Results
The model's predictions of spot growth for each of the four spots using the parameter values taken from the life tables and the parameter values after adjust- ment to exclude the effects of natural enemiw are presented in figures 6-9, The exclusion of natural enemies resulted in a dramatic increase in the pre- dicted spot growth for each spot. Plots 2 and 9 showed smaller rates of increase between the two model runs than did the other plots, vcritb 201 ger- cent and 260 percent increases, respectively, in the predicted number of dead trees on day 92 (figs. 8 and 9). Infested trees for plot 2 increased by 345 percent when natural enemies were excluded, and
S mSTED S DEAD
Figure 6.-Predicted and observed numbers of dead and in- fested trees, with and without natural enemies present. (Plot 8, Gum Flats, AR, July 22, 2976.)
OBSERVED m S T E D OBSERVED D m WETBE m S I F D METBLE DEAD
NO NATURAL EmJE16[ES D M
B 5 10 15 28 25 36 35 48 45 58 55 60 65 78 15 8B 85 98 95
DAYS IPI'C SIEULATICN
Figure 7.-Predicted and obserued numbers of dead and infested trees, with and without natural enemies present. (Plot 8), Gum Flats, AR, July 12, 1976.)
plot 9 showed a 423 percent increase. The Arkansas spots had the most dramatic increases in spot growth. Figures 6 and 7 demonstrate the exponential rate of spot growth occurring after day 60 in plots 8 and 3 as a result of natural enemy exelusion, Predicted dead trees on day 92 for these s p t s incrmsed by 651 percent and 481 percent, respectively* Infested trees increased by 1154 percent and 1048 percent,
The observed numbers of infested and dead trem are also included in figures 6-9. The model using l i fe table data underpredicts spot growth in three of the four spots: plots 8, 2 and 9. The model overpredicts spot growth for plot 3.
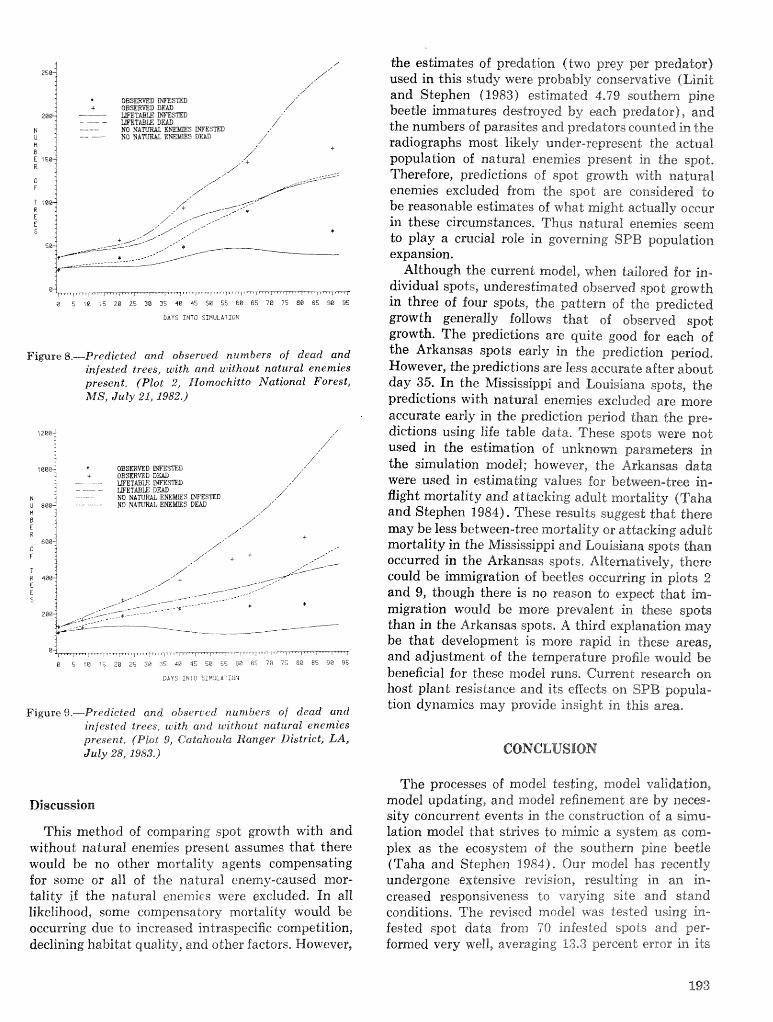
+ OBSmDmsm /'
ze+ - LllrBTmU mm ,/"
WETld3tE DUB N : ---- NO HA%= ENE$ifES m-w - NO N A R W $BmS DEAD ,/'
DAYS INTO SIP4iiiA"iOrJ
Figure8,-Predicd.ed and obserced numbers of dead and infested trees, with and zaitho~t natural enemies present. (Plot 2, Womoehitto National Forest, M S , July 21,1982.)
'a-+ri-rr? nrr7,-TiiTr?7 r v l v 7-7 7iT-;T7T1 -Ti- t i - ? m r - T m r F T -
@ 5 f B '5 z@ 25 20 35 I @ 45 5e 25 68 E5 78 7; 80 85 9@ 55
D A Y S k T T D SIY,LCT:CY
F'igurtl.9.-Predicted and observed numbers of dead arzrl infested trees, uiith and without rzntural enemies present. (Plot 9, Gatuhoula Ranger District, LA, July 28, 1983,)
This method of comparing spot growth with and without natural enemies present assumes that there would be no other mortality agents cornpensating for some or all of the natural enemy-caused mor- Lality if tihe natural enemies rvere excluded. In all likelihood, some compensatory mortality would be occurring due to increased intraspecific competition, declining habitat quality, and other factors, However,
the estimates of predation (two prey per predador) used in this study were probably consewative (Linit and Stephen (1983) estimated 4-79 southern pine beetle immatures destroyed by each predator), and the numbers of parasites and predators counted in the radiographs most likely under-represenl; the actual population of natural enemies present in the spot. Therefore, predictions of spot grtlw"l- h t k natural enemim excluded front the spot are considered to be reasonable estimates of what might actually occur in these circumstances, Thus natural enemies seem to play a crucial role in governing SPB population expansion.
Although the current model, when tailored far in- dividual spots, underestimated observed spot growth in three of four spots, the pattern of the predicted growth generally follows that of observed spot growth. The predictions are quite good for each of the Arkansas spots early in the prediction period. However, the predictions are less accurate aEter about day 35. In the Mississippi and Louisiana spots, the predictions with natural enemies excluded are more accurate early in the prediction period than the pre- dictions using life table data. These spots were not used in the estimation of unknown parameters in the simulation model; however, the Arliansas d a b were used in estimating values for between-tree in- flight mortality and attacking adult mortality (Taha and Stephen 1984). These results suggest that there may be less between-tree mortality or attacking adult mortality in the Mississippi and Louisiana spots than occurred in the Arkansas spots. Alternatively, there could be immigration of beetles occurring in plots 2 and 9, though fiere is no reason to exped that im- migration would be more prevalent in these spots than in the Arkansas spots. A third explanation may be that development is more rapid in these areas, and adjustment of the temperature profile would be beneficial for these model runs. Current research on host plant resistance and its el"fec&s on SPB popula- tion dynamics may provide ksight in this area,
CONCLUSION
The processes of model testing, model validation, model updating, and model refinement are by neees-. sity concurrent events in the eonstructisn of a. sirnu- lation model that s t ~ v e s to mimic a syste-m as corn- plex as the ecosyskm sf the southern pine beetle (Taha and Stephen $9841, Our model has recently undergone extensive revision, resulting in an in- creased responsiveness to varying site and stand conditions. The revised model was tested using in- fested spot data from $0 infested spots and per- fornetif very "i"~fell, avers-ging 83.3 percent error in its
prediction of numbers of dead trees over the 92-day prediction period (Lih and Stephen 1985~) . An evaluation of the model in the Gulf Coastal Plain, which was conducted by U. S. Forest Service, State and Private Forestry, is presented elsewhere in these proceedings (Nettleton and Connor P9861. The cur- rent dudy comprises part of a validation phase for the model, wherein spots are matched with spot- specific population data to determine whether addi- tional updating of other population parameters is appropriate a t this time, %fodel validation also helps to deternine which model parameters are in need of adjustment, New data may result in additional refinements, which initiate the cycle anew.
The model is structured to represent the life cycle of the southern pine beetle, and as such, pro- vides a tool for exploration of this intricate mo- system. The model has been used Lo demonstrate the restraining infiuence that natural enemies have on SPB population growth.
LITERATURE CITED
Hines, 6. S.; Taha, W. A,; Stephen, F. M. Model for predicting southern pine beetle population growth and tree mortality. in: Stephen, F. M.; Searcy, J. L.; Hertel, G. D., eds. hfodeling southern pine beetle populations: symposium proceedings; 1980 Feb. 20-22; Asheville, NC. Tech. Bull. 1630. Washington, DC: U.S. Department of Agriculture; 1980: 4-12.
Lih, M. P.; Stephen, F. M. Data requirements and colleztion procedures for using the SPB predictive model : a practitioner's manual. Fayetteville, AR : Arkansas Agricultural Experiment Station; 1985a. [In press] .
Lih, M. P,; Stephen, F. M. The southern pine beetle integrated modeling system a t the University of Arkansas: a user's guide. Fayetteville, AR: Arkan- sas Agricultural Experiment Station; 1985b. [In prms,
Lih, M. P.; Stephen, F. M. Refinement of a southern pine beetle infestation prediction model by in- corporation of tree and stand characteristics. Ecol. Modelling; 1985~. [In preparation.]
Linit, M. J.; Stephen, F. &.I. Parasite and predator component of .iYidhin-tree southern pine beetle (Coleoptera: Scolytidae) mortality. Can. Ent. 115: 679-688; 1983.
Nettleton, W. A*; Connor, M. D. Evaluation and ap- plicat:on of the TAMBEETLE and Arkansas spot growth models in the Gulf Coastal Plain, In:
Branham, S. J.; Thatcher, R. C., eds. Proceedings, integrated pest management research symposi 1985 April 15-18; Asheville, NC.. Gen. Tech. Rep, SO-56. New Orleans, LA: U.S. Departmen& of Agriculture, Forest; Service, Southern Forest Ex- pedmnent Station; 1985: 202-205.
Paine, T, D.; Stephen, F, M.; Gates, R. C. Induced defenses against; Dendroctonus frontalis and asso- ciated fungi: \.ariation in loblofly pine resistance* In: Branham, S. J.; Thatcher, R, C., eds, Pro- ceedings, integrated pest management research symposium; 1985 April f 5-18; Asheville, KC. Gen, Tech, Rep. SO-56. New Orleans, LA: U.S. De- partment of Agriculture, Forest Sewice, Southern Forest Experiment Station; 1985 : 169-176,
Saunders, M. C. [and others]. The southern pine beetle decision support system. In: Branham, Su- san J.; Thatcher, Robert C., eds. Proceedings, in- tegrated pest management research symposium; 1985 April 15-18; Asheville, NC. Gen. Tech. Rep. SO-56. New Orleans, LA: U.S. Depadment of Apiculture, Forest Service, Southern Forest Ex- periment Station; 1985 : 335-363.
Stephen, F. M.; Taha, H. A. Tree mortality, infested bark area, and beetle population measurements as components of treatment evaluation procedures on discrete forest management units. In: Goster, J. E.; Searcy, J. L., eds. Evaluating control tactics for the southern pine beetle: syl.nposium proceed- ings; 1979 Jan, 30-Feb. I; Many, LA, Tech. Bull, 1613. Washington, DC: U.S. Department of Agri- culture; 1979: 45-53.
Stephen, F. M.; Paine, T. D.; Lih, M. P. Understand- ing bark beetle/host interactions: a means for im- proving decision strategies. Zeit. angew. Entomol, 96(3): 256-265; 1983.
Taha, H. A*; Stephen, F. M.; Motamedi, N. Sensi- tivity analysis and uncertainty in estimatlion sf rates for a southern pine beetle model, In: Stephen, F. M.; Searcy, J. L.; Hertel, 6. D., eds. Model- ing southern pine beetle populations: symposium proceedings; 1980 Feb. 20-22; Asheville, Pa&=. Tech. Bull. 1630. FVashingdon, DC: U.S. Department of Agriculture; 1980: 13-19.
Taha, W. A.; Stephen, Fa M. blodeling with imperfect data: a case study simulating a biological system, Simulation 42 (3) : 109-115; 1984,
Wagner, T. L.; Gagne, J. A*; Sbawe, I?. J, H.; Csu2- son, Et. N, A hiophysiml model of southern pine beetle, Dendroc tonus f ron talis Zimmermann rf Cafe- optera: Scoly tidae) development. Ecol. Modelling 21: 125-147; 1984.
A Methodology for Biophysical Modeling Using TAMBEETLE as an Example
Richard M. Feldman, Terence L. Wagner, Guy L. Curry, Robert N. Coulson, and Peter J. H. Sharpel
A bs tract.-The steps and considerations involved in building a mechanistic model can be illustrated using the TAMBEETLE model as an example. The developmental process of TAMBEETLE, including its strengths and weaknesses, can serve as a basis for future research models for other insect/host sys- tems, A description of model components and refer- ences to publications containing more extensive de- tails enhance our understanding of the modeling ap- proach. Additional keywords : Population dynamics, mathe- matical modeling, iterative cohort methodology.
INTRODUCTION
exploration, (2) explanation, (3) projection, and (4) prediction. ( Rykiel 1984). As the sole modef-build- ing objective, prediction leads to poor experimental design, little scientific understanding or learning, and the development of inadequate and inffexible models. By contrast, formulation of mechanistic models pro- vides; a means for emphasizing and aecompEshing the four goals of model building.
The purpose of this paper is to summarize the steps and considerations involved in building a me- chanistic model, using TAMBEETLE as an example. The strengths and weaknesses of TAMBEETLE will be pointed out along with the general overview. The reasons for detailing developmental steps are two- fold: (1) It provides an understanding of the model itself, and (2) i t serves as a basis for future research
The southern pine beetle, Dendroctonus frontalis directed a t building mechanistic models for other
Zimmemann (Coleoptera: Scolytidae) , has been the insect/host systems.
subject of intensive research for more than a decade, principally because of its role in pine (Pinus spp.) mortality throughout the southern region of the United States. One of the primary goals of such re- search has been the development of an integrated management system. Obviously, an effective manage- ment system depends upon a thorough understand- ing of population dynamics of I>. frontal&. Much of the focus of the southern pine beetle research was, therefore, directed a t issues relating to population dynamics. As various research projects accrrznulated infomation on the insect, it became necessary to synthesize and integrate the many diverse aspects of population dynamics. To accomplish the '"warehous- ing" and coordination of the accumulating biologicaJ infomation, a mechanistic model of the D. frontalis population dynamics was developed. This model, rekrred to as TAMBEETLE, was developed by the Biosystems Research Group (Department of Indus- trial Engineering) and the Department of Entomol- ogy a t Texas A&M University.
The general reasons for building a model are (I)
f Reapeetively, Professor, Industrial Engineering Depart- ment; Research Associate, Department of Entomology; Pro- fessor, Industrial Engineering Department; Professor, De- partment of Entomology; and Professor, Industrial Engineer- ing Department, all Texas A&hf University, College Station, TX.
SYSTEMS ANALYSIS
Systems analysis involves activities of description, explanation, and control of a system's behavior over time, In general, a system refers to any collection of components along with the relationships between them.
In a modeling context, it is often convenient ta make a distinction between the system and its en- vironment, All components to be described or mod- eled are included as part of the sysbn2. The environ- ment consists of those factors that drive the system (modeled components), but are not tlr~e~nselves mod- eled. Instead, the environmental factors must usually be monitored. Thus, system behavior is guided or in- fluenced by its environment. For example, a typical population process treats the insects and host plants as system components and temperature as an ern- vironmental factsr. The modeling effort is directed a t describing the insecthlant dynamics treating tern- perature as the "driving force".
As another exmple, consider a field population of insects. The population growth of insects is certainly influenced by immigrating and emigrating popula- tions. When a global context is of interest, the sys- tem includes the ia-field, i igrating, and ernigra- a;ing components, However, when focusing on a single
field, we may choose to measure the immigrating and emigrating populations instead of modeling them Thus, these migrating populations would be consid- ered environmentd instead of system csn~ponents,
Selection 06 the system boundaries, sekmesnh8;im of the cnvironrne~t and the system into components, and descriptive modeling of system components in- volve both science and art, There are no absolute rules, and the experience gained in the develcaprne~ldt of TAh4BEE"PEE offers a guide to other modeling efforts,
Descriptive Aspects
Once the system has been defined and the en- vironmenta4. and system components compartmental- ized, system modeling can commence, The deserip- tivs aspect of systems analysis (is,, development of the model) is the critic81 activity in the analytical procedure, Because the model \viU be used to explain the biological system andisr as a tool for decision- making in regard to system management, the degree of reality it contains is of paramount importance* Rarely will quality predictions or decisions result from a subquality model, It should be realized that a model is merely an abstraction of the real system, Hence, every model has its limitations and validity range*
The level of detail or descriptive depth needed in a model depends on its intended use, For example, plane geometry i s a eo%lection of geometrical rela- tionships that have great utility and mathematical validity within the context of their envirrsnmen$. However, a basic assumption Eke "parallel lines never intersect" i s isnod adequate in the context of global travel where spherical geometry must be utilized- Thus, plane geometry might be suitable to describe short range travel, but the additional complexity of spherical geometry would be needed to describe long-distance travel, In a similar manner, modeling ""tradeoff" "decisions for biological systems must eon- stantly be made where realism and tractability are in conflict,
As with the analysis of any problem, the domain of concern should first be decided, This domain de- termines the approach for analysis, the components of the system that must be considered, and possibly the level sf detail applicable in the study, This do- main includes bath the time aspect and the physical region of interest, If we are attempting to model a statewide D, frontalis epidemic, then migration be- tween spots and spot initiation are important and must be rnodeied, Whereas, i f our goal is to model a single infestation bas in TAMBEETLE], then spot
initiation i s an initial condition and can be consid- ered as part of the environment,
A simi%ar analysis i s applicable for the dime aspect and i t s impact on the general ievel and detail needed for modeling purposes. If long-term studies are of ins- (I;er$d for 8 p1.4- pnpdst inn, then the sumirping frac- tion of the overwintering population must be in- cluded in the model since it is a major force in long- term ~opuIation behavior, Ho'ii~~ever, if one is inter- ested in a short-term population response, then% the overwintering population does not need do be part of %he system, Instead, it could be treated as an en- viranmentak component that is measured (sampled) at the start of the season and then used do initiate the model, From this initiation, it n ~ a y be possible do model adequately the dynamics of the psprxtatic~n throughout the period of concern,
System Components
Our approach to modeling population dynamics i s to segregate the general process into component parts, These system components for TAhIBEETLE included development, reproduction (galery con- struction and ovigj%-ssition) , reemergence, aggregation, tree susceptibility, and tree suitability, Individual components can be measured and analyzed more easily in isolation; however, by isolating components, experiments often induce an artificial aspect into the measurements taken, The isolated components are analyzed and modeled based on the environmendal factors affecting their behavior, These component models are then validated~calibrated indi~dually, Finally, the components are integrated into a general population model, This synthesis requires validation checks and composite response verification OM. in&- vidual components, The resultant component models may need to be recalibrated using data from general. population studies,
Model Validation
Field validation of biological models is a diEeult task, Afodel oalidation implies that the model accur- ately describes the entire physical system and system responses to the environment, In a strict sense, totan mode! validation is not possible since a model by definition i s an abstraction of a real world process, We use validation to mean that %he abstraction (i,e,, the model) captures the pertinent behavior sf the real system, Computer models are often validated in another sense in that they are certified as accurate translations of the n~athematieal abstraction into a computer prograa, This type of validation merely
establishes that the computes code is fianckioming properly, but does not validate the proper behavior of the model itself.
If population numbers over dime are modeled, then several independent populations must be sampled throughout the pedod of concern in order to perfom a statistical validation, Under field conditions, inten- sive sampling of even a single population through time is expensive, Thus, monitoring several indegerr- dent populations becomes diftieult and costly, How- ever, the major diEeulty for biols@cal systems is obtaining different sample populations that have identical conditions, Repeated sampling from a single population a t a given point in time reduces the samp- ling emor, but does not estimate the infierent bis- logical variation. I t should be noted that variation due do measurement errors associated with sampling generates confidence limits, However, these eonfi- dence intervals do not dese~be the variabiliity of the population being studied. Consequently, infer- ences concerning model validity should not be based on confidence intervals obtained from measurement error*
Although the above statements seem obvious, it is easy to fall into this trap. When model results are reposled with data, it is impressive to present a graph of the model together with the data and the error bounds for the data. The major problem is that the error bounds are usually those associated with sampling variability and not biological vasia- Lion, Bt is easy to see that the use of these (measure- ment error) confidence intervals is an improper pro- cedure by considering the logical conclusion when carded do an extreme. Such an approach could lead orre to emsaneousIy eonelude that bad sampling melh- sds (aarge sampling error range) produce good models since the model would be validated more frequently with large sampling error ranges. Bra the other hand, if sampling were perfsmed without error, the model would almsst never be valid since it is unlikely that i t would predict each sample mean exactly,
The underlying problem of validation concerns whether the model reasonably reproduces the growth or decline sf the actual. population, Under identical conditions, the population could take many diEerent trajectories, only ~ n e of which we generally have sampled, (A population trajectory refers to %he entire sequence of population sizes over time,) 1% we knew the distribution of all, possible population tra- jectoGes (instead of just the mean values), then we could perfam a comparison procedure for validating the model, 7'0 obtain an estimate of the distribution of the population trajectories, several independent populations must be sampled under identical eondi- tions or the rfiodel must predict variances and covad-
ances as well as means (Feildman et ale 8984). Un- fortunately, very few models predict other than mean trajectofies, The authors are not aware of methods other than mean-valued predictors for population modeling with enough realistic structure to he of practical use in integrated pesk, management
Even when a statistical approach can be properly applied, there is no absolute guarantee that the model is valid, Statistical tests are devised so as to have a high (known) probability of rejecting a false hypothesis and a relatively low probability of reject- ing a valid one. W e n a statistical hypothesis is rejected, there is a known probability sf making an error (called a Type I error), m e n rs. statistical hypothesis is not rejected, the probability of error is usually unknown with a maximum possible value of one minus the probabijity of a Type 1 error, Thus, the error bound for statistically aceep"cing the hy- pothesis that the model is predicting accurately is large, However, statistical tests are the best objective method for model validation,
Finally, the testing of model behavior is usually done with insuaeient data to properly assess the model's validity as &I surrogate for the true popu- lation, Often, models validated for a given location fail miserably in another geographical region* Fre- quently in these situations, a readjustment of some parameter values will result in acceptable model behavior for the new region. This parameter adjust- mend procedure for each general region is called model calibration, 1-2; i s not surprising that even 8 ""good" model must be recalibrated for different situ- ations, In general, models lack the structure to set the parameters automaticaliiy, Extending the model do cover the missing aspects may not even be possible with the current knowledge base, In general, there is a tradeofl between the utility of a more detailed model and the expense of further refinement. There- fore, calibration to acclimate the model to various site conditions should be an accepted and routine procedure,
THE COMPONENTS
Development and Emergenee
The temperature description sf psikilothem re- sponses for all components warrants discussion. These responses usually have characteristics that are consistent but di6cul.k to discern wder naturally varying environmental regimes. T e concept of a temperature-dependent rate function has been mil- ized with considerable success since the late f R O O k 9 . One popular specialization of this concept is the
degree-day concept. The common usage is to associate a fixed number of degree-day units with the com- pletion sf the process; however, a more accurate ap- proach is to utilize a distribution of completion times on the degree-day scale. This latter approach resulls in &be completion timie heing digtrirbuted for a eshoPt of individuals, which is a more phenomenon.
Although the degree-day concept is used for many applications, it has been shown to be applicable only over a narrow temperature range. This method as- sumes that the rate of development increases linearly with temperature. Another method, the rate sum- mation method, can be used for more general devel- opmental functions. I t is based on the concept that developmental rates are additive for changing tem- peratures and not restricted to a linear temperature response. Curry et al. (1978) gave the theoretical foundation for the rate function; Feldman et al. (1981b) gave the application to D. frontalis; and Wagner et al. (1984) gave a methodological discus- sion of the practical use of rate summation in a general situation.
Reemergence
Reemergence of parent adults was modeled the same way as the development of the immatures. That is, the rate suma t ion method was used to describe reemergence of the beetle. Although the timing of
cludes temperature and density as independent variables.
Models of reproduetion generally take the fsm of rates describing the population increase in differ- ential equation systems, Unfortunately, such models do not include age dependencies* The model of re- production used in our component-based biophysical model consists of two components: (1) An age- dependent reproductive profile dese~bing the propor- tion of the total reproductive potential that elapses during each time period and (2) a temperature-de- pendent function that gives the expected total re- production. Typically, reprcsdaaetion varies from low numbers a t both the high and low temperature ex- tremes to relatively high numbers in the midrange of the organism" viable temperature region.
For D, frontalis, the reproduction profile depends on a temperature-and-density normalized time, That is, both temperature-dependent and densily-depen- dent rate functions are used with the rake summation method to define nomalized time, Once rromalized time is obtained, the reproduetlive profile is a function of normalized time alone, The dotal reproductive po- tential function is dependent on both density and temperature. A discussion sf the reproductive model- ing approach and its justifications are given in Curry et al. (1978b) and the application to D, frontalis is in Feldman et al, (198lb) and Wagner et al. (1981).
Aggregation gallery construction and oviposition was strongly Aggregation is a critical population, component of density-dependent, reemergence not, and thus, many bark beetles and leads to successful coloniza- the temperature-driven rate summation was suitable. tion of the host tree and propagation of the species.
particular and parameter Through aggregation behavior, beetles attack a host together with a validation, are given in Feldman tree ,, ,as,,, overcoming its defense mechanism et al, (1981b). (resinosis) and subsequently rendering the tree a
Reproduction
Reproduction is a more complex process and thus more digcult to model. The great diversity in repro- ductive behavior implies a need for diversity in re- productive models. The experimental evidence of Wagner ed al. (1981) indicates that much more is involved in controlling reproduction than tempera- ture, Specifically, attacking-adult density, female size, and season of adult emergence affected repro- ductive rates. However, field data were usually col- lected between May and September, and thus the independent variable representing season of adult emergence was not incorporated in our model. Also, because female sizes were nod measured in the field, the size parameher could not be established. There- fore, the D. frontalis reproductive model only in-
suitable environment (moisture level and fungal com- position) for development of the next generation of beetles. Although aggregation i s critical, i t is ex- tremely difficult to model m d validate. For purposes of model description, trees are divided into two cate- gories: (1) Trees undergoing mass attack due to pheromone production (active trees) and (2) those undergoing random attacks due to their proximity to active trees (neighboring trees).
Attacks on actiue trms*-The dynamics of the at- tack process on acthe trees is eonlrraf%ed by the num- ber of beetles available for attack, tho produetian of pheromone from the attacking beetles, and the release of tree volatiles from the attacked host. The attack process lasts %or several days, As the amount of gallery within the tree increases, the proportion of beetles attacking it decreases, Residual beetles d r a m to the active tree go on to sattack neighboring
trees, Within an infestation, the proportion of beetles attracted to a given active tree is a furaction af the strength of the attractant emanating from that tree relrative Lo all other competing sourees of attraction, Tbus, to model aggregation, an expression is obtained that represents the attractiveness of each tree. Al- location of the available beetles is then made on the basis of the weighted average of the various attrac- tiveness factors from all active trees,
Attacks on neighboring trees.-After beetles are allocated to an active tree, a second criterion is used do determine how many of these beetles are rediree- Led to neighboring trees. As attacks on active trees progress, an increasing number of beetles 'gswitch" their attacks from active to neighboring (inactive) trees, Ira this fashion, the infestation spreads as beetles overcome the resistance of new trees, Attacks on neighboring trees nomally do not occur ad dis- tances greater than 6 to 7 meters from the active trees (Jahnson and Gosker 1W8). However, the dy- namics of attacks on neighboring trees involves many factors, and the critical distance of 6 to 7 meters is not constant but varies depending on local tempera- ture and wind conditions (Schowatter et al, 1981).
To model this switching phenomenon, an area of attractiveness around each active tree was defined. Beetles redirecting their attack could potentially at- tack any neighboring tree within this area of attrae- tiveness. At very high temperatures, a reduction (em- pirically determined) in the attractiveness region was made; that is, for each degree above 33"C, all dimen- sions of the attractiveness region were reduced 20 percent. There was also a high and low temperature Aight inhibitor based on results of White and Frank- lin (1976) that was used to reduce Aight a t tempera- tures not conducive to beetle activity, Once the area of attractiveness was established, the likelihood of attacks on neighboring trees within that area in- creased in proportion to the cross-sectional area of the tree and decreased with the square root of the distance from. the active tree for all trees beyond 3 meters. The 3-meter threshold and the use of the square root decrease were detemined empirically by comparing the times of attacks in field plots with model predictions. The specific mathematical fsmu- lation for the switching model is given in Feldman et af, (1881a).
Tree Susceptibility
If enough beetles attack a. neighboring tree to overcome its defense mechanisms, that tree will be- come attraetive, We define suseepdibi%ity in terns of the number sf attacks necessary to cause a tree to become active (an aggregatsr) , Many hetor8 infiu-
ence susceptibility, and these are incoworated in a prelimimry biophysical model (Skarpe and Wu 1985). This model has not yet been ineorpomteb into TAhfBEETLE. The present susceptibility model used in TAMBEETLE is an empirical function using landfcsm, average d,b,h,, l a d pine basal area, This function i s based on dab supplied by the U.3, Forelst Se~aiice (Nettleton et al. 1985). Ptlthou& suseeptibil- ii-ty should vary among trees, only an average value for the infestation is currently used. The suscepti- bility model is elearly an integral part of the agee- gation model; therefore, because the susceptibility eornponent is currently not a biophysical model, the aTloeatisn procedure of TA-MBEETEE is its weakest component.
Tree Suitabflity
Tree suitability is similar to tree susceptibility, Susceptibility has to do with the ability of the beetles to overcome the initial tree defenses; whereas, suit- ability has do do with developmental processes of the beetle within the tree, Pt is logical to assume that de- velopment rates and immature morta2ity would de- pend partly on tree factors, but currently there are few biological data to establish clear relationships.
THE POPULATION MODEL
The dynamics of population growth and decline is influenced by the individual components and their interactions. Both the components and component interactions must be approximated in the mathemati- cal model, One procedure for integrating model com- ponents is called the iterative cohort methad (Curry ed al, 197830). The general approach is to approxhak time as a discrete parameter and view the pspda- tian as a collection of cohorts, (A cohort is a group sf organisms within a developmental stage that begins the stage ad the same time and is under the influence of identical environmental factors.) The metbdology is concepGuakL%>~ an ""accounting" procedure that main- tains a record of the active cohorts making up the popdation, The process is initiated by an initial group of cohorts, A time increment equaling 1 day is used to itesatively compute the population avw t h e *
There are three types of cohorts: an hmature in- sect cohort, an adult insect cohort, and a tree cohortr- The immahaare insect coho& represents the develop- ing irnmadaxres from oviposition to brood emergenee. The actPzBt insect cohort represents the parent adult8 from first attack $0 reemergence, Thus, the beetle8 available for allocation to active and neighboring
trees are obtained from these two cohortsa For modeling purposes, &he insect cohorts are rep-
resented by a two-dimensional vector, The first num- ber within the vector gives the current number of insects remaining alive within the cohort, and the second number gives the current s~vnmralixed tizne (i,e., physisiogicaB age) sf the cohort, indicating its developmental status, Ad the end of each day (time increment), all newly deposited eggs within all trees during the day are accumulated to form a new irn- mature insect cohort, Similarly, all adults that ad- tacked trees during the day are accumulated do begin a new adult insect cohort. Based on the rates for emergence and reemergence, the emerging and re- emerging beetles are determined ad the start of each day b y ineremenling the norrnsalized time sf the co- horts, If a tree suitability component model becomes available, then it will be necessary to have mare than one immature cohort and one adult cohort formed each day, If tree characteristics affect emergence and reemergence times, then di-fferent cohorts would be forn~ed to represent the various tree charaeteristies present within an infestation,
Cohorts of trees are used do maintain the relevant information regarding active trees. Because many fac- tors influence the status 06 active trees, the tree CO.-
herts are much more complex, The information for each tree is: the day the tree became active, number of beetles within the tree, number of eggs within the tree, amount of gallery within the tree, distribution of insect density within the tree, and the tree atlrae- tiveness factor, With this information, the allocation of beetles and the status of the trees can be deter- mined each day.
CONCLUSIONS
The TA&IBEETEE model represents a synthesis of more than a decade of research directed specifically at population dynamics of D, frontalis, The goal of the modeling approach at the onset of the research was to organize knowledge on D. frsn2alis population dynamics for the following purposes: exploration, ex- planation, projection, and prediction. To varying de- grees, each of these purposes was ac~gsmpkished~ TAbTBEETLE is currently ara element in the South- ern Pine Beetle Decision Support System (Rykiel et al. 19841, and serves as a valuable aid in integrated pest management decisionmaking, It i s important to recognize that no aspect of the
research on population dynamics of D. frontalis is so %"yfeBi% understood Ghat additional research would be unx&-arranted* In our view, more research i s critically needed on host susceptibility, stand-growth model-
ing, beetle species interactions, and d g m a ~ e s sf within-tree morhlity.
Sensitivity analyses conducted on TAMBEETLE indicate that perfomance sf the model is greatly af- fected by variation in host susceptibility. The cur- rent version of TAhfBEETLE uses an empirical fune- Lion for host susceptibility that is clearly inadequate, Sharpe and Krrz (1985) have developed a conceptual model of hast susceptibility, which is based on funda- mental theor17 of plant physiology. This model even- tually will be incorporated into TAhfBEETLE,
Numerous stand growth and yield models are avail- able for southern pines. These models were developed using regression techniques. There has not been a concerted e8ifor.t to develop a mechanistic model that abstracts basic knowledge of plant physiology, This type of model has been developed for a number of diRerent crop plants and is needed for understanding and predicting interaction of plants (trees) with bi- otic and abiotic components of the environment.
Although D, frontalis is often. the most prominent insect species within a spot, several sther insects can iurflueaaee the growth and decline of an active infesta- tion, Wagner et al, (1985) reported prominent inter- actions among the five southern pine beetle species. In order for TA&IBEETLE to be an accurate model of an infestation, an Ips component must be added. We are in the process of integrating the I p s eompo- nents into a population model that can then be in- degraded into TAMBEETLE,
The factors involved in the dynamics of within-tree mortality are poorly understood, We know that about 80 to 90 percent of the within-tree population will perish, Certainly, natural enemies contribute to the sbsewed mortality, but sther factors are clearly involved. Describing or modeling within-tree mor- tality is a difficult problem that has not adequately been addressed,
Mast of the individual components of TAM- BEETLE have been calibrated for east Texas, The components of emergence, reemergence, and repro- duetion have been validated do a reasonable degree, However, as mentioned above, the tree susceplibilitgr, and thus the allocation procedure, need additional work, Through the eBorts of Nettleton and Connor of the USDA Forest Senfee, a large data set has been made avaihable for the testing of the model, Ba%ed on their data, the parameter values for the suscepti- bility model were adjusted; however, the model still did not perfom adequately in many of the spots. This emphasizes the need to have a susceptibility in- dex with a biophysical base and with the ability to vary among trees*
LITERATURE CITED concepts. New York: John Wiley and Sons; 1984: 151-178,
Curry, C , L.; Feldnaan, R. Id,; Sharpe, P. J. H. Foun- dations of stochastic development. J. Theor. Biof, 74: 397410; 1978a.
Curlagp, G* L.; Feldman:, H.M.; Smith, K C , A slochas- t i c model of a temperature dependent population. Theor, Poprxl, Eliol. 13: 197-213; 1978b.
Feldman, R, M,; Curry, G. L.; Goulson, R. N, A mathemadied model of field population dynamics sf the southern pine beetle. Ecological Modelling 13: 261-281; 1983ia.
Feldman, R, M.; Curry, G. L*; Wehrly, T. E, A sta- tistical procedure for a simple population model. Environ. Entomol. 13 : 1446-1451; 1984.
Feldman, R, M.; Wagner, T , L.; Sharpe, I?. J. H,; Gagne, J, A,; Coulssn, R. FJ. Within-tree life pro- cess models of the southern pine beetle. Ecological Modeling 13 : 247-260; 1981b.
Johnson, I?, E.; Coster, J. E. Probability of attack by southern pine beetle in relation to distance from an attractive host tree, For. Sci. 24: 574-580,
Nettledon, W. A,; Connor, Me D.; Ryan, G. VV, Evalu- ation and application sf the TAMBEETLE and Arkansas southern pine beetle spot growth models in the Gulf Coastal Plains, In: Branham, S, J.; Thatcher, R. C., eds, Proceedings, integrated pest management research symposium; 1985 April 15-18; Asheviile, NC, Gen. Tech. Rep. SO-56. New Orleans, LA: U.S, Department of Agriculture, Forest Service, Southern Forest Experiment Sta- tion; 1985: 202-205,
Rykiel, E, J., Jr, Modeling agroecosystems: lessons from ecology, In: Stinner, B.; Lawrance, R.; House, G., eds, Agricultural ecosystems: d f y i n g
RyEel, E. J,, Jr,; Saunders, I%, C.; Wagnrer, T, L,; Loh, D, K,; Turnbow, R, H,; Hu, L, C,; Pulley, P, E.; Coulsean, R, N* Computer-aided decision- making and infarmation accessing in pest manage- ment systems, with emphasis on the southern pine beetIe, J, Econ, Entsmol, 77%: 1093-$082; 1984,
Schowilfter, T, D*; Pope, 33. N.; GcruBsan, R, N,; Fargo, W. S, Patterns of southern pine beetle (Dendroetonus frontalis Zimm,) infestation en- largements, For* Sci, 27: 837----849; 1981.
Sharpe, P. J, H.; MTu, H. A preliminary model sf host susceptibility do bark beetle attack, In Sa- franyik, L,; Berryman, A, A,, eds, Pmsect,%host in- teractions, Proceedings, %UFRO Symposium; BanE, Alberta, Canada; 1985, [In press*]
Wagner, T. L.; Wu, H,; Sharpe, P. J, H.; Sehoesifield, R. M.; Goulson, R, N, Modeling insect development rates: a literature review and application of a bio- physical model, Ann, Entsmol, Ssc, Am, 13:1126- 1130; 1984,
Wagner, T, E,; Ffamm, R, 0,; CouEson, 8. N, Stsate- gies for cohabitation among the southern pine bark beetle species: comparisons of life process bislo- gies, In: Branham, S, J.; Thatcher, Re C,, eds, Proceedings, integrated. pest management re- search symposium; 19% April 15-15%; AsheviEle, NC, Gen, Tech, Rep. SO-66, New Orleans, LA: U.S. Department of Agriculture, Forest Service, Southern Forest Experiment Station; 1985,
FVhite, R. A,; Franklin, R. T. Activity of tke south- ern pine beetle in response to temperature. J. Georgia Endomsl. Soe, 4 1 3113--3E; 8956,
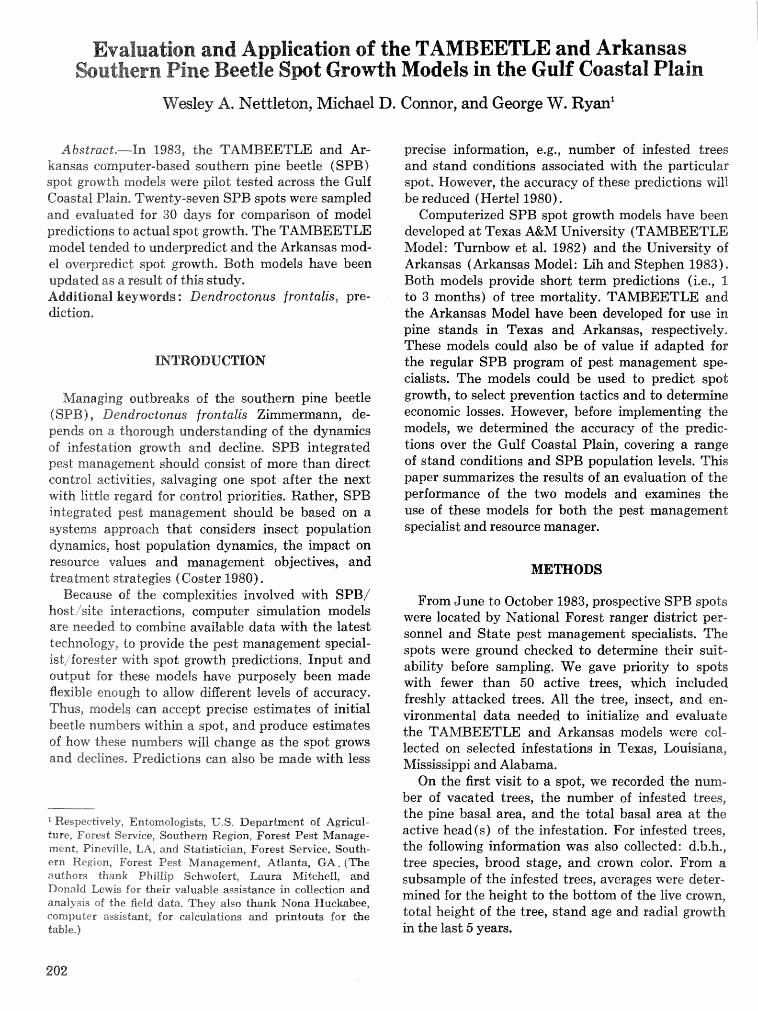
Evaluation and Application of the TAMBEETLE and Arkansas Southern Pine Beetle Spot Growth Models in the Gulf Coastal Plain
Wesley A. NetUeton, Michael D. Connor, and George W. Ryan1
A bsdract.-In 1983, the TAhfBEETLE and Ar- kansas computer-based southern pine beetle (SPB) spot growth msdefs were pilot "Lested across the Gulf Coastal Plain. Twenty-seven SPB spots were sampled and evaluated for 30 days for comparison of model predictions to actual spot growth, The TAMBEETLE model tended to underpredict and the Arkansas mod- el overpredict spot growth, Both models have been updated as a result of this study. Additional keywords: Dendroctortus Jrontakis, pre- &etion,
INTRODUCTION
Managing outbreaks of the southern pine beetle ( SPB ) , Dendroctonus Jrontakis Zimmermann, de- pends on a thorough understanding of the dynamics of infestation growth and decline.. SPB integrated pest management should consist of more than direct control activities, salvaging one spot after the nest with little regard for control priorities. Rather, SPB integrated pest management should be based on a systems approach that considers insect population dynamics, host population dynamics, the impact on resource values and management objectives, and treatment strategies (Coster 1980),
precise information, e.g., number of infested trees and stand conditions associated with the particular spot. However, the accuracy of these predictions wit1 be reduced (Hertel 1980).
Computerized SPB spot growth models have been developed a t Texas A&M University (TAMBEETLE Model: Turnbow et al, 1982) and the University of Arkansas (Arkansas Model: Lih and Stephen 1983). Both models provide short term predictions (i.e,, I to 3 months) of tree mortality. TAMBEETLE and the Arkansas Model have been developed for use in pine stands in Texas and Arkansas, respectively, These models could also be of value if adapted for the regular SPB program of pest management spe- cialists. The models could be used to predict spot growth, to select prevention tactics and to determine economic losses. However, before implementing the models, we determined the accuracy of the predie- tions over the Gulf Coastal Plain, covering a range of stand conditions and SPB population levels. This paper summarizes the results of an evaluation. of the perfomance of the two models and examines the use of these models for both the pest management specialist and resource manager.
METHODS
Because of the complexities involved with SPB/ From June to October 1983, prospective SPB spots host,'site interactions, computer simulation models were located by National Forest ranger district per- are needed to combine available data with the latest sonnel and State pest management specialists, The
to provide the pest management 'pecial" spots were ground checked to determine their suit- i s t forester with spot growth predictions. Input and ability before sampling. We gave priority to spots
f" m'"" have purposely been made with fewer than 50 active trees, which included fie''''e enough ' 0 allow different levels of accuracy* freshly trees* All the tree, insect, and en- Thus, models can accept precise estimates of initial vironmental data needed to initialize and evaluate beetle numbers within a spot, and produce estimates the TAMBEETLE and Arkansas models were of how these numbers will change as the 'pot grows lected on selected infestations in Texas, Louisiana, and declines. Predictions can also be made with less Mississippi and Alabama.
"espectively, Entomologists, U.S. Department, of Agricul- ture, Forest Sewice, Southern Region, Forest Pest Manage- ment, Pineviile, LA, and Statistician, Forest Service, South- ern Region, Forest Pest Management, Atlanta, 66%. (The authors thank Phillip Sehwolerd, Laura Mitchell, and Donald Lewis for their valuable assistance in collection and anatysls of the Reld data. They also thank Nonil Huekabee, computes assistant, for calculations and printouts for f i e table,)
On the first visit to a spot, we recorded the asurn- ber of vacated trees, the number of infested trees, the pine basal area, and the total basal area a t the active head(s) sf the infestation, For infested trees, the following information was also collected : d,b.h., tree species, brood stage, and crown color, From a subsample of the infested trees, averages were deter- mined for the height to the bottom of the live erom, total height of the tree, stand age and radial growth in the last 5 years.
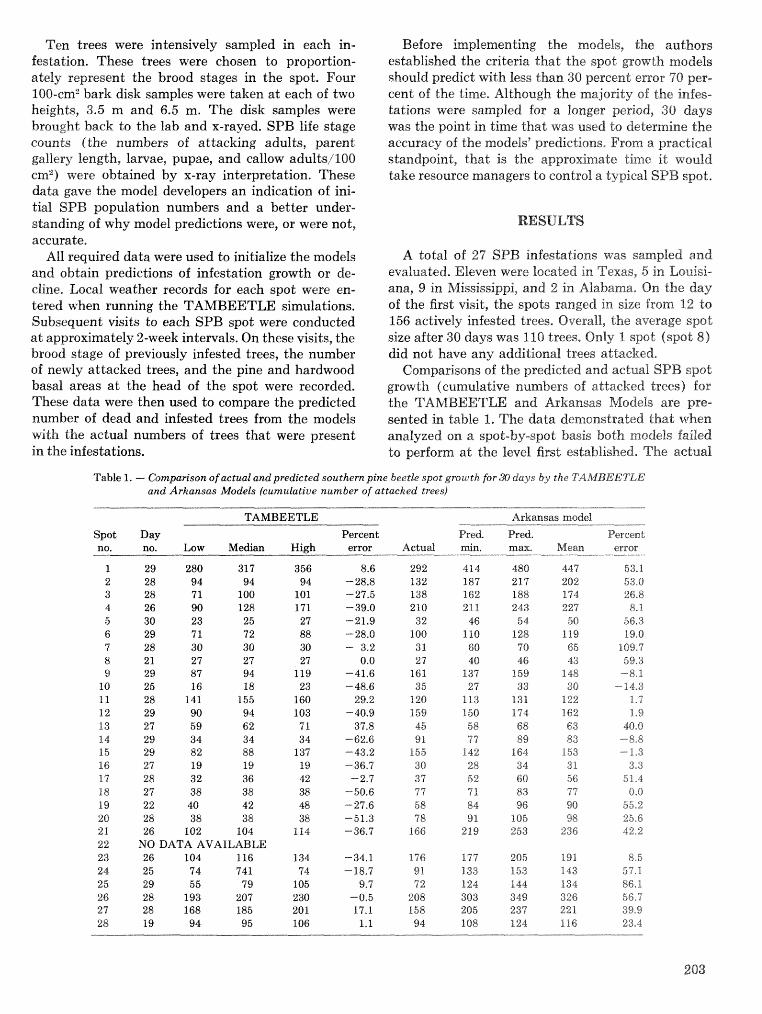
Ten trees were intensively sampled in each in- festation. These trees were chosen to proportion- ately represent the brood stages in the spot. Four 100-crn%bfark disk samples were taken at each of two heights, 3.5 rn and 6.5 m. The disk samples were Insought hack to the lab and x-rayed. SPB life stage counts (the numbers of attacking adults, parent gallery length, larvae, pupae, and callow adultsilOO ern" were obtained by x-ray interpretation. These data gave the model developers an indication of ini- tial SPB population numbers and a better under- standing of why model predictions were, or were not, accurate,
All required data were used to initialize the models and obtain predictions of infestation growth or de- cline. Local mather records for each spot were en- tered when running the TAMBEETLE simulations. Subsequent visits to each SPB spot were conducted a t approximately 2-week intervals. On these visits, the brood stage of previously infested trees, the number of newly attacked trees, and the pine and hardwood basal areas a t the head of the spot were recorded. These data were then used to compare the predicted number of dead and infested trees from the models with the actual numbers of bees that were present in the infestations.
Before implementing the models, the authsrs established the criteria that the spot growth models shouId predict with less than 30 percent error TO per- cent of the time. Although the majority of the infes- tations were sampled for a longer p e ~ o d , 30 days was the point in time that was used do determine the accuracy of the modeJs~predicdions~ From a practical standpoiink, that is the approximate time it would take resource managers to controt a typical SPB spot.
RESULTS
A total of 27 SPB infestations was sampled and evaluated. Eleven were located in Texas, 5 in Louisi- ana, 9 in Mississippi, and 2 in Alabama, On the day of the first visit, the spots ranged in. size from 12 to 156 actively infested trees. Overall, the average spot size after 30 days was 110 trees, Only I spat (spot 8) did not have any additional trees attacked,
Comparisons of the predicted rand actual SPB spot growth (cumulative numbers of attacked trees) for the TAMBEETLIE: and Arkansas Models are pre-. sented in table 1. The data demonstrated that when analyzed on a spot-by-spot basis both models failed to perfom a t the level first established. The actual
Table 1. - Compan'son of actual and predicted southern pine beetle spot growth for 30 days by the TAMBEETLE and Arkansas Models (cumulative number of attacked trees)
TAMBEETLE Arkansas mode!:
Spot no.
Day no. Low Median
29 280 317 28 94 94 28 7 1 100 26 90 128 30 23 25 29 7 1 7 2 28 30 30 21 27 27 29 87 94 25 16 18 28 141 155 29 90 94 27 59 62 29 34 34 29 82 88 27 19 19 28 3 2 36 27 38 38 22 40 42 28 38 38 26 102 104
NO DATA AVAILABLE 26 104 116 25 74 741 29 55 59 28 193 207 28 168 185 19 94 95
High
356 94
101 171 27 88 30 27
119 23
160 103 7 1 34
131 19 42 38 48 38
114
Percent error Actual
Pred. mill'
Pred. Percent ma;;;. Mean error
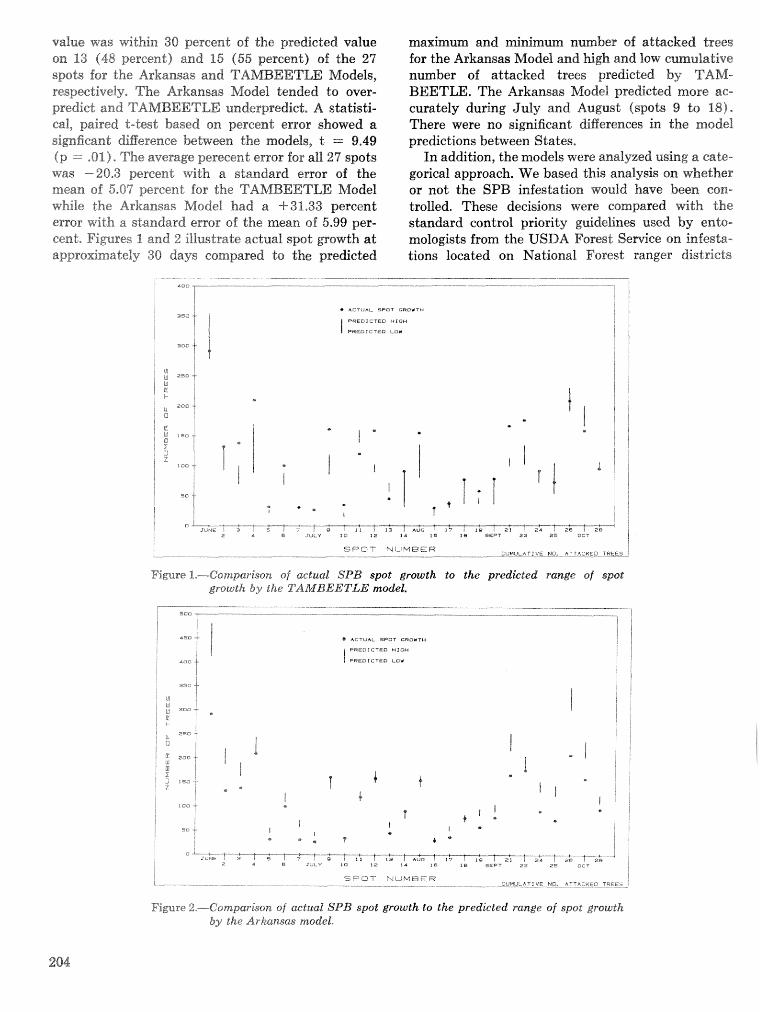
value was within 30 percent of the predicted value on 13 (48 percent) and 15 (55 percent) of the 24 spots for &he Arkansas and TAMBEETLE Models, respectively, The Arkansas Model tended to over- predict and TL4h1BEETLE underpredict, A statisti- cal, paired t-test based on percent error showed a simficant diEerence beheen the models, t == 9.49 (p = .db$), The average peseeent error for all 27 spots was -20-3 percent wi-l;k a standard ermr of the mean of 5.07 percent for the TAMBEETLE Modet whi'ie the Arkansas Model had a 4- 31-33 percent emor with a standard error sf the mean of 5.99 per- cent, Figures I and 2 il%rrsdrate actual spot p w t h at approximately 30 days compared do the predicted
maxhum and minim- number of attached trees for the Arkansas Model and ~& and low cumulaGive number of attacked trees predicted by TAM- BEETLE, The Arkansas Model predicted more ae- curately during July and August (spots 9 to 123)- There wre no signjlfieartt &Berenees in the model predictions between States.
In addition, the models were analyzed using a cade- g o ~ c a l approach, We based this analysis on whether or nod the SPB infestation would have been con- trolled. These decisions were compared e t h the standard control priority guidelines used by ento- mologists from the USDA Forest Sesviee on infesla- tions located on National Forest ranger districts
* A k f U A L SPOT CRDWTH
PREDICTED H I G H
I o ~ - ~ ~ : - + ~ ! ~ : * : ~ ~ ~ ~ c : ~ : : : - : : : i JUNE I 3 s I " i E" i 1 1 1 1 3 I AUG 1 15 / le i a > I aa 1 ae, I 2s
2 4 e JULY 10 z z 14 I B se SEPT n s zs OCT I I
SPOT PviiMEiER I & -- --- -- -- ClJMULrTZbE NO. ATTACK50 TREES
Figure $,-----Compariso~& of detual SPB spot growth to the predicted range of s p t growth by the TAMBEETLE mcrdel.
---- -- $3.. -- ----==7
1 4.0 + A C T U A L SPOT GROWTH 1 i
i PRBBtC'ED W16iH
; + I
PREDIkTECl L O W I
I I
C -- : ' + ' ? -11 i 1 3 I A ~ G 1 1 7 : 1 e T 2 1 1 2 4 1 2 6 ! 2e 1
2 4 8 J L L Y 1 O 12 I d 1s 1 8 SEPT 21 ZS DCT
S P C T N U M B E R CtiMl&...t?J"E fi.C2-\7 2&<f53_-T_REE!S - - - - -- -- -. _ _ _
Figure 2.-----Comhjarkon of actual SPB spot growth to the predicted raage of spot growth by the Arkamm model.
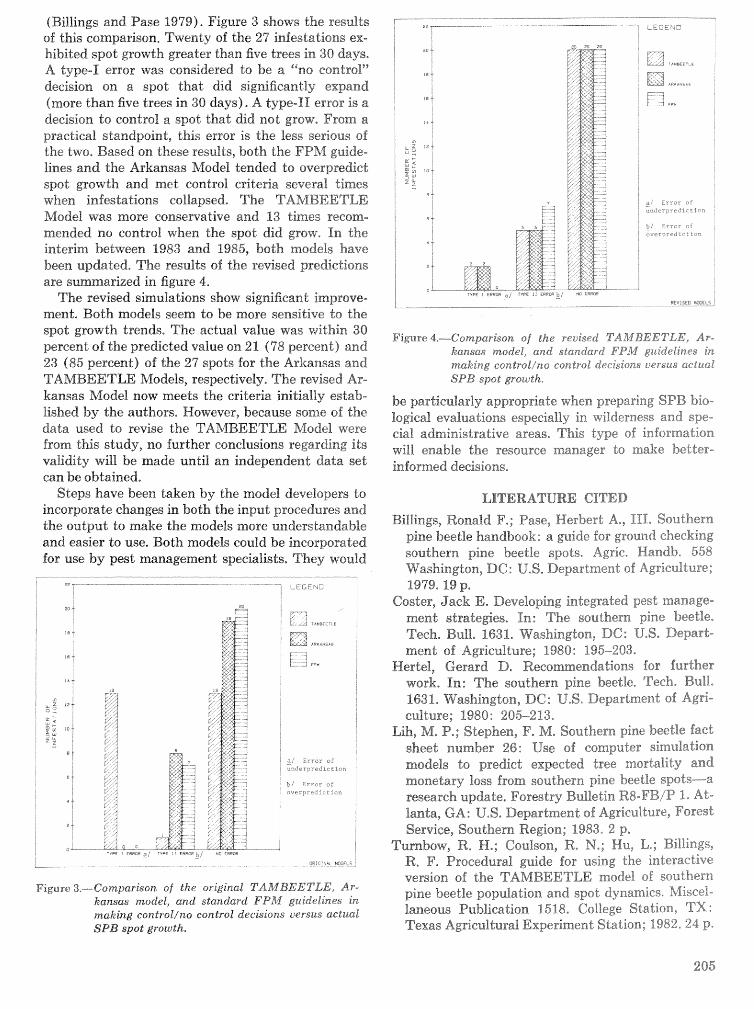
(Billings and Paise 1979). Figure 3 shows the results sf this comparison, Twenty of the 27 infestations ex- hibited spot growth greater than five trees in 30 days, A type-I error was considered to be a "no control" decision on a, spot that did significantly expand (more than five trees in 30 days), type-11 error is 23. decision do control a spot that did not grow, From a practical standpoint, this error is the less serious of the two, Based on these results, both the FPh1 guide- lines and the Arkansas &rodel tended to overpredict spot growth and met control c r i t e~a several times when infestations collapsed, The TAkIBEETLE &lode1 was rnore conservative and 13 times recorn- mended no control when the spot did grow, In the interim between 1983 and $985, both models have been updated, The resrrfts sf the revised predictions are summarized in figure 4,
The revised simlxZations show significant improve- mend, Both models seem to be more sensitive to the spot growth trends, The actual value was within 30 percent sf the predicted value on. 21 (48 percent) and 23 (85 percent) of the 2'7 spots Ifor the Arkarlsas and TAMBEETLE Models, respectively, The revised Ar- kansas Model now meets the criteria initially estab- lished by the authors, However, because sonle of the data used to revise the TAhIBEETLE Model were from &&s study, no further eonelusions regarding its validity will be made until an independent data set can be obtained.
Steps have been taken by the model developers to iurco~orade changes in both the input procedures and the output ts make the models rnore understandable and easier to use, Both models could be incorporated for use by pest management specialists, They would
--- * " i L. ,,A -,%Hec=-:F
$9KsNihC
i-- -= L 4 FPM
a/ Error o f - underpredictirn
t i E r r c r of :?<err rc.3"il-ii:p
P V u . % 6 - M$3C-+ -- -- -
Figure 3.---Camparkon of the original TkLaKfBEETLE, Ar- kansas model, and standard FE"1-b guidelines in making controkino control deekiord versus actual SPB spot growth.
Figure 4.-GomparrSopz of the reuiaed TAM'BEETLE, Ar- kansas model, and standard FPM guidelines in making contro%ias control decisions uersus actual SPB spot growth,
be particular& a%appreapriate when preparing SPB bio- logical evaluations especially in wilderness and spe- cial administrative areas, This type of information will enable the resource manager to make better- informed decisions,
LITERATURE CITED
bbi%Tings, Ronald F.; Pnse, Herbert A,, HI, Southern pine beetle handbook: a guide for ground checking southern pine beetle spots. Agric, Wandb, 558 Washington, DC: U,S, Department of Agriculture; 1979,19 p,
Caster, Jack E, Developing integrated pest manage- ment strategies, In: The southern pine beetle, Tech, Bull, 1631, Washington, DG: U,S. Depart- ment sf Ag&cu$&-ure; 1980: 195-203-
Hertel, Gerard D. Recommendations for further work, In: The southern pine beetle, Tech, Bull, 1631, Washington, DC: U S Department of Agri- culture; 1980: 205--213,
Lih, M. P.; Stephen, F. M. Southern pine beetle fact sheet number 26: Use of computer ~imbiiiation models to predict expected tree mortality and monehsy loss from southern pine beetle spots----a research update. Forestry Bulletin R8-FB/P 1. At- lanta, GA: U.S. Department of Agriculture, Forest Service, Southern Region; 1983, 2 p,
Turnbow, R, H,; Caulson, R, N,; Hu, L,; BiBliargs, R, F, Procedural guide for using the interactive version of the TAhfBEETLE mode% of southern pine beetle population and spot dynamics. Miscel- laneous Publication 1518, College Station, TX: Texas AgricuZdural Experiment Station; 1982,224 p.
Energetics of Pine Defense Systems to Bark Beetle Attack
Peter J. H. Sharpe, Hsin-i Wu, R. G. Cates, and J. D. Goeschll
A bstract.-A conceptual mathematical mode1 has been developed to consolidate and clarify. tree suscep- tibility hypotheses previously published, A systems model provides a framework far linking these hypo- theses and explaining system behavior. The primary focus of this study was the inAuence of short-term water stress regimes on tree defense energetics. Wader stress has two somewhat counteractive effects upon plant metabolism: 1) 11; increases soluble carbo- hydrate and amino acids, thereby increasing suit- ability of the tree for bark beetle colonization, re- production, brood development, and survival; 2) it increases the substrate reservoir for synthesis of carbon afleloehemicals for anti-herbivore defense, In- creased food value (as opposed to increased chemical defense) as a result of short-tern stress was found to be relatively important.
The secondary focus of the study was modeling the interrelationship between the resin duct defeiase system and tho wound response, two defense systems previously studied apart from each other, The mode8 has been extended to fink these two defense systen~s and the linked model shown to be consistent with the observed behavior of the seasonal dynamics of the wound response. Additional keywords : Tree physiology, tree stress, chemical response, wound response, host/pest inter- action, Dendroetonus frontalis Zimmermann, mech- anistic madeling.
Pine trees acquire light, water, and nutrients for a variety of physiological functions, including respira- tory metabolism, growth, reproduction, and defense,
f Respectively, iE"roEessor, Associate Professor and Senior Re- search Scientist, Biosyslems Research Group, Department of Industrial Engineering and Department of Sold Crop Sci- ences, Texas A&M University, College Station, TX; and As- sociate Professors, Chemical Ecology Laboratory, Department of Biology, University of New Mexico, Albuquerque, NM. (Technical discussions leading to model formulations were held with Peter Lorio, Robert Sommess, Karel Sztozek, Gary Pitman, Evan Neheker, Pamela Matsm, Alan Berry- man, 6, A. Blanche, Jack DeAngefis, John Hridges, Fred Stephen, Tim Paine, Robert Coulson, and Tom Payne. This study was jointly funded through National Science Foun- dation Grant BSR-84-06136 and the Integrated Pest Man- agement RD&A Program for Bark Beetles of Southern Pines, 'CJSDA Forest Service Grant Number FS-30-82-4.)
Energy and nutrients allocated to one function. are unavailable for others. Some ecological energetics studies such as Townsend and Calotv (1981) are based on the premise that a direct relationship exists between resource 6issimilationi'allocaLion and fitness; that resources are limited; and that their optimum allacation is essential, Wiens (1984) notes that this latter assumption is not necessarily supported by empirical studies.
Resource limitation can operate a t two distinct levels: individual and population. Tn the resource allocation context, limitation affects individuals, potentially altering their metabolic perfomance, growth, defense capabilities, or reproduction. These effects rnay or rnay nod be expressed as a resource lirulitadion for the population or be recognized as causing variations in population size or age structure, Some cireurnstanees, such as those reported by Whitlaam (198 1 ) , show that resource limitation caw be assessed a t both levels, but this is rare and often not; possible. A major limitation is that the specifics of system dynamics are unkmom, partiedarly the influence of resource interactions on availability.
Attributes such as chemical composition affect resource availability in. a variety of ways (IViesns 1984)- Variations in allelochemical eoncentralions in plant tissues have an effect on dietary suitability to ph y t ophagous insects and large herbivores ( Atsatt and 0'Dowd 1976; Feeny 1976; Rhoiztdes and Cates 1976; Rhoades 1979; Rosentbal and Janzen 1979; Bryant and Kuropat 1980; Gates et al. 1983).
A demonstration of such effects is provided by Whitham (1978, 1980, 1981) in studies of ztghids colonizing cottonwood leaves, Availability and suit- ability to aphids vary based nn size and shoot posi- tion at budbreak. Various portions of an individual leaf also vary in suitability. Zucher (1.982) has shown that these patterns are associated with variations in concentrations of phenolic compounds. FVhitharrr, (1981) suggests that this indrapfan-t variation is an adaptive response to herbivory, Similarly, availability and suitability of Douglas-fir to the western spruce bud\vorm are not only functions of shoot size but also of the composition land quantity of terpenes and possikky other compounds (such as phenolics) in shoots of digerent sizes; (Cates et al. 1983, Redak and Cates 1984, GamlrlieZ. and Gates.")
A large gap in the literature that is becoming an area of increased research eRort is the relationship between various piant physiclogical processes and anli-herbivore response as defined by defensive chemistry, A hyprltlnesis proposed for defoliators by Tuorni $1: al, (1 984) F ; I I ~ ~ P S ~ S that changes in carban- based allelochemicals may result frorn shifts in the plant" carboninartrjlent balance rather than from active defensive responses by the host plant to herbivory, These changes appear to be consistent with observed increases in carbon-based allelochemi- cals a t times of the year and under environmental conditions when there is a earbon surplus that cannot be used for maintenance and growth (Bryant et at, 1983). As a result of nutrient or other types of stress, carbon that cannot he invested in growth is diverted to secondary (allelochemical) metabolite production (Chew and Rodman 1979). Fertilization, however, diverts carbon to growth and tends to reduce excess carbon available for the production of alleloehemicals (Bryant et al, 1983) An alternative hypothesis is that a shift in carhon/nitrogen ratios resulting from defoliation may be a local stimulus resulting in the shi f t to more defensive allelochemi- cals. This shift in turn may increase the fitness of the plant, particularly &he foliage. I t would also be valuable to know i f the chemicals included in this increase are primarily those that may be toxic or detrimental to the herbivore (or pathogens, should they elicit the same response), Furthermore, abiotic stresses such as water, nutrients, or light may not result in the changes described by Tuomi e t al. (19841,
SOUTHERN PINE DEFENSE SYSTEMS
The southern pine bark beetle (SPE) has been extensively studied for the past 12 years, yet very little is known about the dynamics of the pine host defense sysLem and its inbraction with the attack- ing beetle, Dynamic changes in host defense occur through shifts in the tr)eegs metabolism that result in differing levels of alelochemictals, principally resin acids and msaodespenes, Changes in relative eon- centrations of these chemicals provide opportunities for bark beetle colonization,
Host defenses against bark beetle attack are com- plex phenomena involving numerous physiological processes and environmental regulators. Because of its complexity, host defense dynamics can best be described by a mathematicai model using the com- puter to integrate interdependent processes. Of particular interest are the interactions between host
stress factors on the primary defense and the wound response defense systems of southern pines.
The oleoresin production system in pines is the primary defense mechanism against bark beetle attack (Rudinsky 1966a, 1966b; Reid et al. 11967; Anderson and Anderson 1968; &gason 1977 ; Bi~rv- man 1972; Smith 1975; Hodges et al. 1979; Blanche e t al. 1983). Hodges et al. (1979) suggest that southern pines can be classified by bark beetle resistance or susceptibility using physical properties of oleoresin such as total Row, flow rate, viscosity, and time to crystallization. In addition, low oleo- resin exudation pressure (OEP) resulting frorn flood- ing or drought is generally correlated with. successful bark beetle attack (Thatcher 1960; Vit4 "191; Vit6 and Wood 1961; Lorio and Hodges 1968, 1977; Goeschl 1979).
The primary resin duct defense system has re- ceived the most research attention. Berryman (1972), Shrimpton (1978), Cates and Alexander (1982), and Hain et al, (1985) suggest that, in the most resistant trees, a combination of the primary resin response and a wound response is required to explain tree resistance or susceptibility. The wound response is also important in conifer species that do not have a primary resin system, or in those trees where beetles survive the primary resin response (Berryman 1972). The response characteristics of both systems have been considered in formulating this host resistance model.
A tree's susceptibility and resistance levels de- termine the probability of its being colonized by bark beetles. Susceptibility is clearly the opposite of resistance, depending on site characteristics and stand dynamics (stocking levels, stand composition, vigor, structure, tree and stand maturity; see Wuff and Cates 1985). In addition, resistance is greatly modified by insect population dynamics; few re- sistant trees are likely if the attacking insect popula- tion is sufficiently large. Bark beetle population dynamics and stand mortality, especially as influ- enced by seasonal and weather phenomena, have been included in an SPB spot growth model (Feld- man et al. 1981a, 1981b; 1985).
HOST STRESS PHYSIOLOGY
A recent focus of attention, which is of major importance to host-insect interactions, is "che egeet of stress on ecosystem processes. Terms such as stress, stressful environments, environmentally -s tressed in- dividuals and biological stress, however, have been used in several different ways in the plant-herbivore,
plant physiology, and ecosystem process literature, For example, little i s known about the effect of the duration of stress, type of stress or seasonality and magnitude of stress on the production of allelo- chemica%s, Stress has many effects on various ghysio- logical processes, above- and below-ground herbivory, nutrient and secondary metabolite allocation among tissues, deesmpssidion and nutrient cycling (Cades, Hsrner, and GOSZ),~ A comprehensive set of data, however, suggests that host tissue quality Is usually improved as a food resource when hosts are exper- iencing stress (Hsdges and Lsrio 1968, GoeschT %9X19, Rhoades 1979, Gates et a], $983)- In general, it is important to note that stress i s
considered in the context of long-term, adverse abio- t ic conditions, particularly when ecosystem processes are discussed. On the other hand, in plant defense theory, stress is usually considered in the short term, and is se>mew%dsat unpredictable in dime and space,
Long-term stress usually refers to such csnditions as soils unfavorable for plant growth due Lo adverse combinations of temperature, moisture, structure, mineralogy, texture, and pH, The disdinctisn between periodic short-term stress and long-term conditions unfavorable for growth has led to considerable con- fusion in predicting production and turnover of natural product chemistnrgr in plants, From the chemistry vieqoint , plants that have evolved under long-term stress have high levels of poiyphenots and organic acids (Gssz 1981, Cates, Hornes and Gosz"), It has been suggested that short-term stress in-
creases qualitative or toxin defenses and decreases the higher molecular weight tannin and resin acid defenses, Even though few rigorous studies are avail- able, the csnsiderations and models developed in this paper deal primari%y with short-term stress,
Kinds of Stresses
In fomuZading models of host stress physiology, it i s important $0 distinguish cleady between the functional dieerences among various kinds of stresses, For exarnpIe, while the literature suggests that toxins increase and tannins decrease under water stress (Rhoades 1979, Cates et an. 1983), both the %ow mo%ecular weight phenolics and tannins were demonstrated to decrease under reduced light stress (Cates, Van Horne and HarsXey),s Light stress <shade) results from decreasing photosynthate
"$inpublished data,
caused by competition for light among neighboring trees, Light stress and nutrient stress reduce the concentration of phsdssynthetlic enzymes (Farquhar and von Csaemmerer 1982). Moderate water stress has a greater inffuenee on photosynthate demand than on supply (Wadleigh ed al* 19461, Heavy do severe wader stress a@ecLs afT physiological processes,
The importance of fight stress as a factor in host defense has been well documented. Clemends ( 1974) found that the volume of oleoresin produced from southern pines is directly related to crown size, Waring and Pitman (1980) relate leaf area, sapwood growth, and hast resistance to host vigor, Ira southern forests, Ku ed al, (1976, 1980) found that pines attacked by SPB were generally associated with poor growth, smaller size, smaller crown, and. thinner bark relative do healthy trees, In selecting susceptible trees for attack during field experimentation, Hodges and Lorio (11973) chose rraosphoIogical features such as short yellowish needles, small cones, rand spame crowns, all characteristic of reduced-light stress.
Water stress is more complex than light stress because plant responses differ markedly according do the type of water stress (i.e., drought or water- logging) and its duration. Low or negligible water stress favors growth, or ad least does not impede it. Moderate wades stress limits growth but noQhhoto- synthesis. Photosyxsthate products are diverted from growth to the formation of diBerendiaQisn products such as rubber, essential oils, and oleoresin (Black 1957)- FVadleigh et al. (1946) showed interaction between water stress, growth and rubber synthesis in guayule; growth decreased with increasing water stress, while rubber yield percentage initially in- creased with water stress and then declined, These and similar studies suggest that osmoregulation re- sulting from mild water stsess favors synthesis of digerentiation products, Under severe water stress, all synthesis processes are reduced,
Tree Grawth and Suseepdibility
Growth has also been used as an indicator of vigor and, therefore, of susceptibility (Lorio 1973, Lsrio and Hedges 1974, Hicks et ai, 1978, Hicks P980), Because growth varies with site, age, soil moisture, basal area, and other factors, Blanche et af, (1983) and Cates ed ale (1983) suggest that the relationship between growth and susceptibility may be difficult Lo measure under fieEd conditions, This theoretical analysis, in which hypotheses of inter- actions between processes are proposed, p r o ~ d e s a method by which the underlying ~omplexid~7 can be explored, and pwsibly explained,
IkIODELIKG APPROACH
Host defense energetics involves the allocation processes sf plant carbon metabolism, Photosyn- thesis, respirat inn, growt hg ailelochemical synthesis, and vrsund response following beetle attack are the essential elements 0% an energetics model, The problem lies in combining these processes into a relatively simple mathematid model, The traditional modeling approach, which builds and then combines individual process models, has several draw~backs : I ) Interaction between processes must be imposed ex- t e r n a l ~ , 2) the con~puter code i s long and tedious and 3) the number sf parameters to be determined is usually large, A recently developed alternative is the continuous time Markov ( CThI) approach, C T M has a number of advantages because it represents physiologica'd. processes in terms of stakes and transi- tions, treats resources as an interacting group, and provides an approach whereby gathwrays for synthe- sizing defensive chemicals can be coupled with other competing synthesis pathways as well as phloem transport, photosynthesis, respiration and uptake of soil oxygen, water, light, and nutrients, The critical CTM feature (and one that greatly assists the development of this type of model) is the provision sf a means whereby physiological intee.r;actions can be made state-dependent and thereby- coupled with both resource availability and other competing precesses,
Earlier &godel Development
Photosynthesis and respiration were represented within a CTM context in the model by Sharpe (1983), which was based upon Deh4icheIe et al, (1998), In both these models, carbon metabolism was described as three processes: photosyntheBic light reaction, carbon reduction, and dark respira- tion, As presented, the model's major drawback was that the coupling of light and carbon reduction reac- tions required an iterative solution technique (De- hliehele et al, 19781, which made parameter esfi- madion tedious, The other drawback was that the mode% derivation was not set within the context sf established mathematical theory, Olson ea; a%, ( 1985) outlined an abstract CTRI approach for describing plant growth as a function of water, light, and nutrients, emphasizing four assumptions underlying CTLV methodology as eve%l as the abstract nature of the states, The states of the grovvth model, however, while abstract, are not arbitrary, and ;a physiological interpretation of system states and transitions i s necessary if the approach is to be of practical use in describing the energetics of host defense, A physiological interpretation of states and transi-
tions associated with plant growth in a CTM model has been outlined by Sharpe et al, [196"35), In the present model, physiological interpretations pre- sented in that study are modified and adapted to describe the energetics of southern pine defense against bark beetles,
The SPB Defense Model
The states and transitions sf the SPB defense model are shown in figure 1, There are five states in this diagram with transitions betvi~een skates show- by large arrows, The probabi1id.r transitions between states are abstract in that no material or energy AOWS are represented. Similarly, the stales are ab- stract because they do not represent material pools or compartments, The power of the CTM approach is its ability to combine processes that use different material and energy inputs, Transitions between states can be identified with, and states interpreted in terms of the probabilities sf, completing specific physiological processes.
Sequential arrangement sf transitions between states is organized Go satisfy the need for combining water, light, and nutrients as resource inputs leading to the competing prwesses sf growth, synthesis of resin acids, synthesis sf monoterpenes and, in the event of beetle attack, formation of a lesion, T h e pre- formed chemical defense system has been broken down into resin acids and monoterpenes for the fol- lowing reasons: 1) Resin acids have higher molecular weight and are more ceastly to synthesize and mono- terpenes; 2) resin acids apparently confer a greater protection against herbivory than do monoterpenes, 3) La\vreg14.ce9s (1971) study with southern pines shows thzt monoterpenes are readily remetabolized, whereas resin acids represent metabo%ic end products; 4) water stress effects upon southern pines change the relative composi%;isn sf ~Seoresin, Hodges and Lgsrio (1975) found that , as southern pines became water- stressed, the relative resin acid concentration de- creased while the monoterpene concentration in- creased, Similar effects were observed by Cates et al, (1983) in Douglas-fir where: under water stress as measured by xylem pressure potentiaks, some terpene concentrations increased, others decreased, and tann- ins decreased,
The wound response is included in the model for completeness, although the chemical mechanisms un- derlying it are not completely understood, ReeentIy, doubt has teen expressed as to whether the wound response in southern pices represents in situ syn- thesis of chemical compounds (Gambliel et al, 1985), The chemical ~ornp~s i t ion of the wound response is identical do the prefsmed oleoresin system in mono-
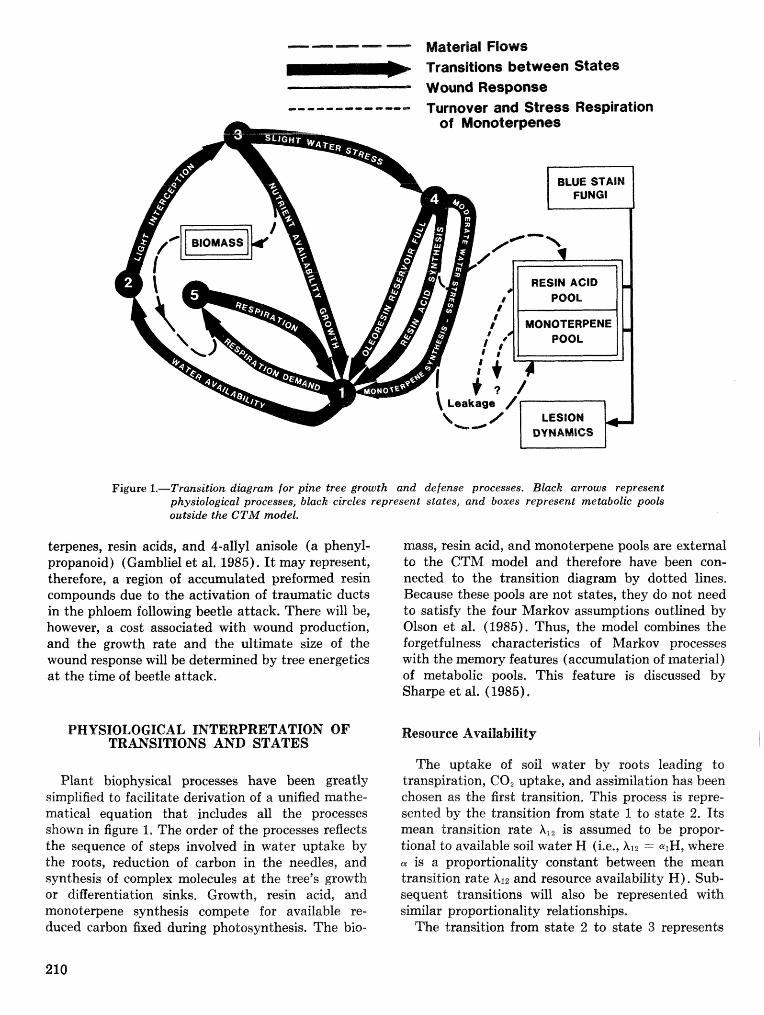
Material Flows 1 Transitions between States
Wound Response ~-..~llmmam-lmm~ Turnover and Stress Respiration
Figure 1.-Transition diagram for pine tree growth and defense processes. Black arrows represent physiological processes, black circles represent states, and boxes represent metabolic pools outside the CTM model.
terpenes, resin acids, and 4-ally1 anisole (a phenyl- propanoid) (Gambliel et al. 1985). It rnay represent, therefore, a region of accumulated preformed resin compounds due to the activation of traumatic ducts in the phloem following beetle attack. There will be, however, a cost associated with wound production, and the growth rate and the ultimate size of the wound response will be determined by tree energetics a t the time of beetle attack.
PHYSIOLOGICAL INTERPRETATION OF TRANSITIONS AND STATES
Plant biophysicd processes have been greatly simplified to facilitate derivation of a unified mathe- matical equation that includes all the processes shown in figure I. The order of the processes reflects the sequence of steps involved in water uptake by the soots, reduction of carbon in the needles, and synthesis of complex molecules a t the tree's growth or differentiation sinks, Growth, resin acid, and monoterpene synthesis compete for available re- duced carbon fixed during photosynthesis. The bio-
mass, resin acid, and monoterpene pools are external to the CTM model and therefore have been con- nected to the transition diagram by dotted lines, Because these pools are not states, they do not need to satisfy the four Markov assumptions outlined by Olson et al. (1985). Thus, the model combines the forgetfulness characteristics of Markov processes with the memory features (accumulation of material) of metabolic pools. This feature is discussed by Sharpe et al. (1985).
Resouree Availability
The uptake of soil water by mots leading to transpiration, CO, uptake, and assimilation has been chosen as the Rrst transition. This process is repre- sented by the transition from state 1 to state 2, Its mean transition rate A,, is assumed to be propor- tional to available soil water H (i.e., XI^ = qH, where m is a proportionality constant between the mean transition rate hrz and resource availability E-f) . Sub- sequent transitions will also be represented with similar proportionality relationships,
The transition from state 2 to state 3 represents
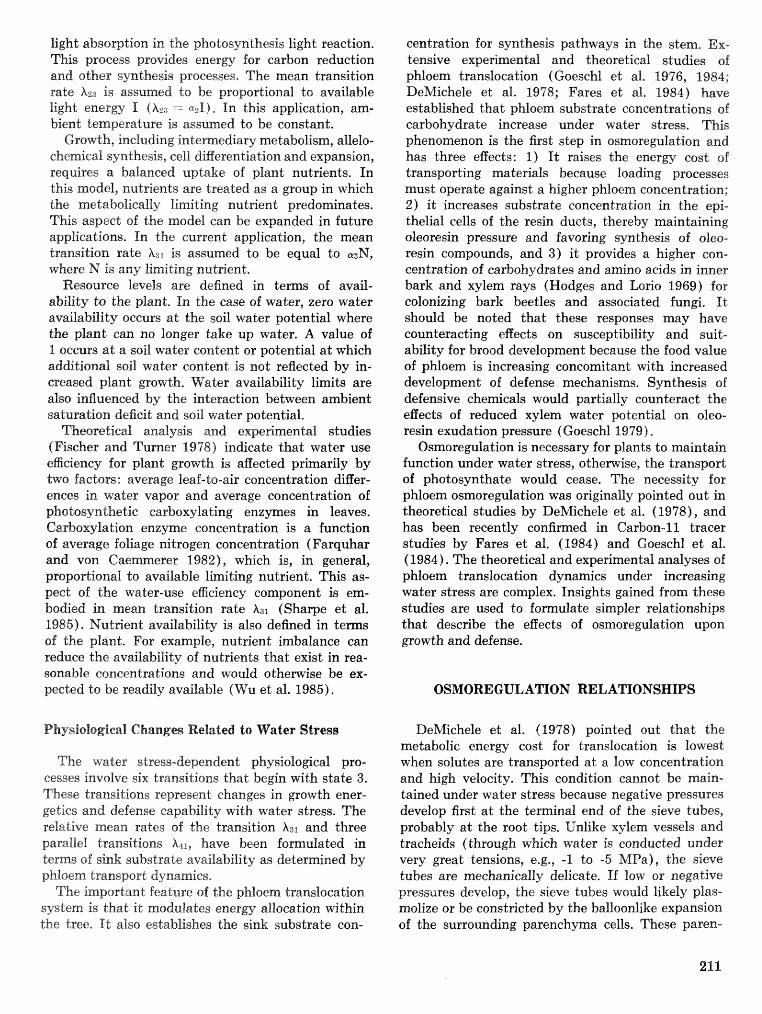
light absorption in the photosynthesis light reaction. This process provides energy for carbon reduction and other synthesis processes, The mean transition rate A23 is assumed do be proportional to available light energy I (A23 -- a 2 1 ) . In this application, am- bient temperature is a s s u e d to be constant.
Growth, including intermediary metabolism, allelo- chemical synthesis, cell. differentiation and expansion, requires a balanced uptake of plant nu t~ents . In this model, n u t ~ e n t s are treated as a group in which the metabolicafly limiting nutrient predominates. This aspect of the model can be expanded in future applications, In the current application, the mean transition rate As1 is assumed to be equal to a3N,
where N is any limiting nutri;en.t;. Resource levels are defined in t e m s of avail-
ability to the plant. In the case of water, zero water availability occurs a t the soil water potential where the plant can no longer take up water. A value of 1 occurs a t a soil water content or potential a t which additional soil water content is not reflected by in- creased plant growth, Water availability limits are also influenced by the interaction between ambient saturation deficit and soil water potential.
Theoretical analysis and experimental studies (Fischer and Turner 1978) indicate that water use egciency for plant growth is affected prbarily by two factors: average leaf-to-air concentration differ- ences in water vapor and average concentration of photosynthetic carboxylating enzmes in leaves. Carboxylation enzyme concentration is a function of average foliage nitrogen concentration (Farquhar and von Caemmerer 1982), which is, in general, proportional to available limiting nutrient. This as- pect of the water-use eficiency component is em- bodied in mean transition rate A31 (Shave et al. 1985). Nutrient availability is also defined in t e m s of the plant. For example, nutrient imbalance can src?duce the availability of nutrients tbat exist in rea- sonable concentrations and would othemise be ex- pected to be readily available (Wu et al. 1985).
Physiological Ckanga Related to Water Stress
The water stress-dependent physiological pro- cesses involve six transitions tbat begin with state 3. These transitions represent changes in growth ener- getics and defense capability with water stress. The relative mean rates of the transition A31 and three parallel transitions h;li, have been formufated in terms of sink substrate availability as determined by phloem transport dynamics.
The important feature of the phloem translocation system is that it modulates energy allocation within the tree, It also establishes the sink substrate con-
centration for synthesis pathways in the stem, Ex- tensive experimental and theoretical studies of phloem translocation ( Goeschl et al. 1976, f 984; DeMichele et al. 1998; Fares et al. 1984) have established that phloem substrate concentrations of carbohydrate increase under water stress. This phenornenon is the first step in osmoregulation and has three eEects: 1) I t raises the enerw cost of transporting materials because loading processes must operate against a higher phloem concentmtion; 2) it increases substrate concentration in the @pi- thelial cells of the resin ducts, thereby maintaining oleoresin pressure and favoring synthesis of oleo- resin compounds, and 3) i t provides a higher con- centration of carbohydrates and amino acids in inner bark and xylem rays (Hodges and Lorio 1969) for colonizing bark beetles and associated fun^. I t should be noted that these responses may have counteracting efiects on susceptibility and suit- ability for brood development because the food value of phloem is increasing concomitant with increased development of defense mechanisms. Synthesis of defensive chemicals would partially counteract the effects of reduced xylem water potential on oleo- resin exudation pressure (Goeschl 1979).
Osmoregulation is necessary for plants to maintain function under water stress, othemise, the transport of photosynthate would cease. The necessity for phloem osmoregulation was originally pointed out in theoretical studies by DeMichele et al. (1978), and has been recently confirmed in Carbon-11 tracer studies by Fares et al. (1984) and Goeschl et al. (1984) . The theoretical and experimental analyses of phloem translocation dynamics under increasing water stress are complex. Insights gained from these studies are used to fomulate simpler relationships that describe the effects of osmoregulation upon growth and defense.
OSMOREGULATION RELATIONSHIPS
DeMichele et al. (1978) pointed out that the metabolic energy cost for translocation is lowest when solutes are transported at a low concentration and high velocity. This condition cannot be main- tained under water stress because negative pressures develop first a t the terminal end of the sieve tubes, probably a t the root tips, Unlike xylem vessels and tracheids (through which water is conducted under very great tensions, e.g,, -1 to -5 MPa), the sieve tubes are mechanically delicate, If low or negative pressures develop, the sieve tubes would likely plas- rnolize or be constricted by the balloonlike expansion of the surrounding parenchyma cells. These paren-
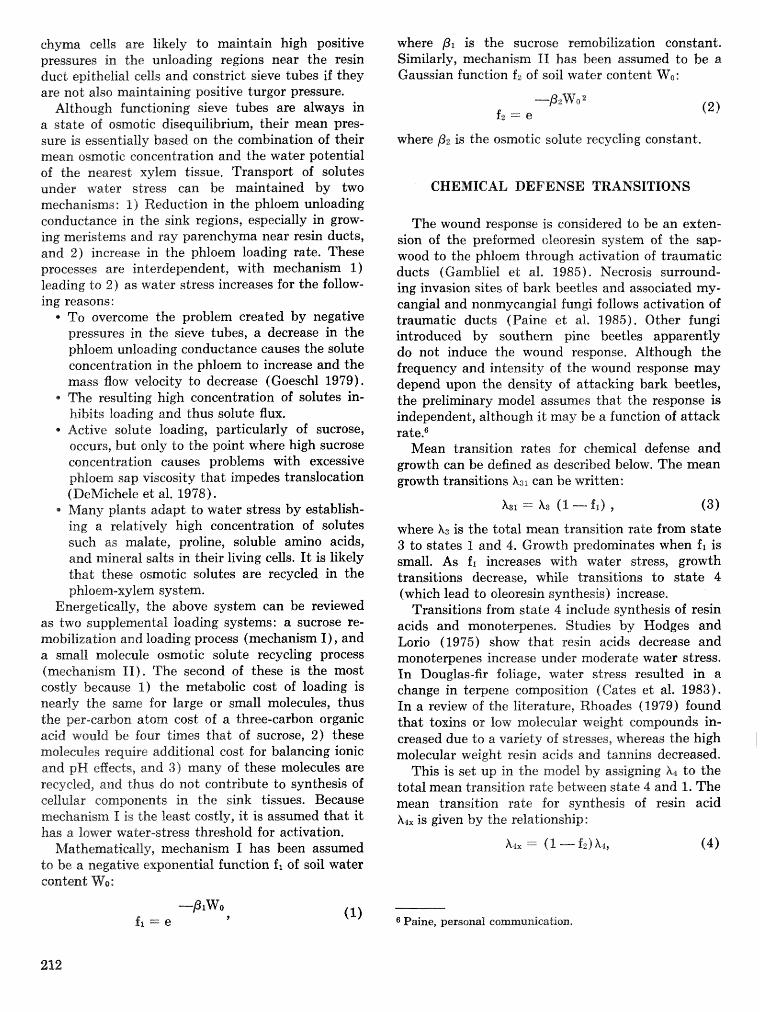
cbyma cells are likely to maintain high positive pressures in the unloading regions near the resin duct epithelial cells and constrict sieve tubes if they are not also maintaining positive turgor pressure.
Although functioning sieve tubes are always in a state of osmotic disequilibrium, their mean pres- sure is essentially based on the combination of their mean osmotic concentration and the water potential of the nearest xylem tissue, Transport of solutes under wader stress earn be maintained by two mechanisms: 4) Reduction in the phloem unloading conductance in the sink regions, especially in grow- ing meristems and ray parenchyma near resin ducts, and 2) increase in the phloem loading rate. These precesses are interdependent, with mechanism 1) leading to 2) as water stress increases for the follow- ing reasons:
* To overcome the problem created by negative pressures in the sieve tubes, a decrease in the phloem unloading conductance causes the solute concentration in the phloem to increase and the mass Row velocity to decrease (Goeschl 1979). The resulting high concentration of solutes in- hibits loading and thus solute flux.
* Active solute Ioading, particularly of sucrose, occurs, but only to the point where high sucrose concentration causes problems with excessive phloem sap viscosity that impedes translocation (DeMichelc: et al. 1978). Many plants adapt to water stress by establish- ing a relatively high concentration of solutes such as malate, proline, soluble amino acids, and mineral salts in their living cells. I t is likely that these osmotic solutes are recycled in the phloem-xylem system.
Energetically, the above system can be reviewed as two supplemental loading systems: a sucrose re- mobilization and loading process (mechanism I ) , and a small molecule osmotic solute recycling process (mechanism 11). The second of these is the most costly because I ) the metabolic cost of loading is nearly the s m e for large or small molecules, thus the per-carbon atom cost of a three-carbon organic acid would be four times that of sucrose, 2) these molecules require additional cost for balancing ionic and pH egects, and 3) many of these molecules are recycled, and thus do not contribute to synthesis of cellular components in the sink tissues. Because mechanism 1 is the least costly, it is assumed that i t has a lower water-stress threshold for activation.
MathematicaBIy, mechanism I has been assumed to be a negative exponential function f l of soil water eontent Wa:
-pplwa f, = e 9 (1)
where is the sucrose remobilization constant. Similarly, mechanism If has been assumed to be a Gaussian function f q of soil water content Wo:
where pz is the osmotic solute recycling constant.
CHEMICAL DEFENSE TRANSITIONS
The wound response is considered to be an exten- sion of the preformed oleoresin system of the sap- wood to the phloem through activation of traumatic ducts (Cambliel et al. 1985)- Necrosis surround- ing invasion sites of bark beetles and associated my- cangial and nonmycangial fungi follows activation of traumatic ducts (Paine et al, 1985). Other fungi introduced by southern pine beetles apparently do not induce the wound response. Although the frequency and intensity of the wound response may depend upon the density of attacking bark beetles, the preliminary model assumes that the response is independent, although it may be a function of attack ratee6
Mean transition rates for chemical defense and growth can be defined as described below. The mean growth transitions A31 can be written:
where ha is the total mean transition rate from state 3 to states I and 4. Growth predominates when f l is small. As f l increases with water stress, growth transitions decrease, while transitions to state 4 (which lead to oleoresin synthesis) increase.
Transitions from state 4 include synthesis of resin acids and monoterpenes. Studies by Hodges and Lorio (1975) show that resin acids decrease and monoterpenes increase under moderate water stress. In Douglas-fir foliage, water stress resulted in a change in terpene composition (Cates et al. 1983). In a review of the literature, Rhoades (1979) found that tor;ins or law molecular weight compounds in- creased due Lo a variety of stresses, whereas the high molecular weight resin acids and tannins decreased.
This is set up in the model by assigning b to the total mean transition rate between state 4 and 1. The mean transition rate for synthesis of resin acid X B ~ is given by the relationship:
6 Paine, personal communication.
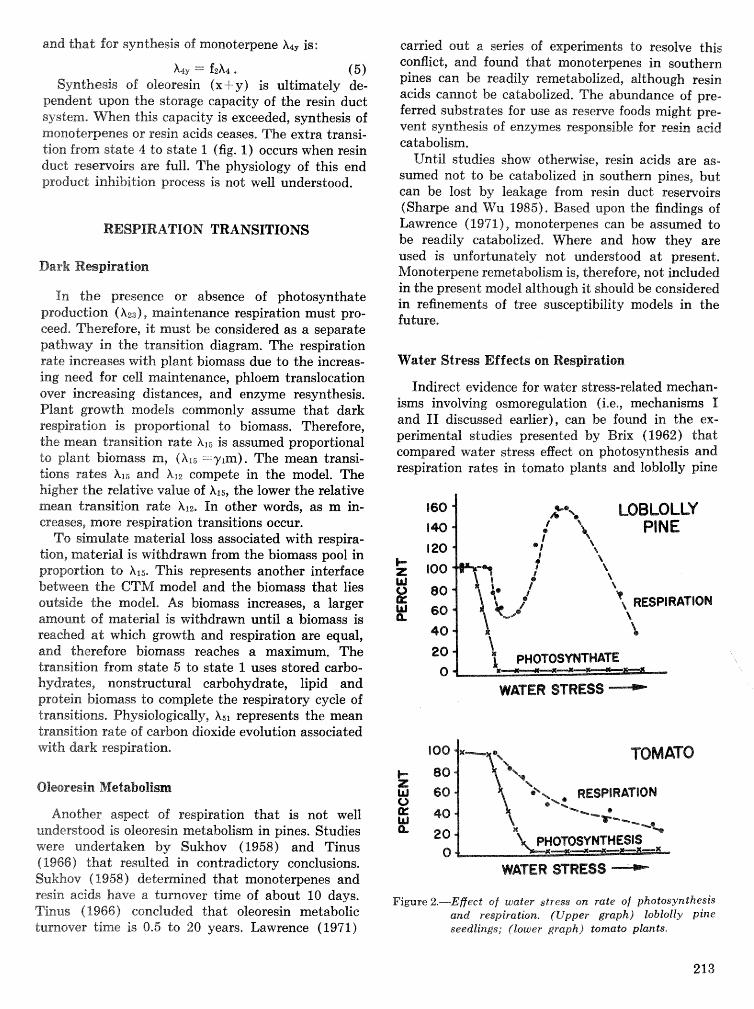
and that far synthesis of monoterpene A*, is:
h1y = f z b . (5) Synthesis of oleoresin (xi-y j is ultimately de-
pendent upon the storage capacity of the resin duct system. When this capacity is exceeded, synthesis of msnoterpenes or resin acids ceases. The extra transi- tion from state 4 do state 1 (fig. 1 ) occurs when resin duet reservoirs are full, The physiology of this end product inhibition process is not well understood.
RESPIRATION TRANSITIONS
Dark Rwpiiratiorr.
In the presence or absence of photosynthate production (h29) , maintenance respiration must pro- ceed. Therefore, i t must be considered as a separate pathway in. the transition diagram. The respiration rate increases with plant biomass due to the increas- ing need for cell maintenance, phloem translocation over increasing distances, and enzyme resynthesis. Plant growth models commonly assume that dark respiration is proportional to biomass. Therefore, the aean transition rate A15 is assumed proportional to plant biomass m, (At5 = y ~ m ) . The mean transi- tions rates XIS and X12 compete in the model. The higher the relative value of X15, the lower the relative mean transition rate A I ~ . In other words, as m in- creases, more respiration transitions occur.
To simulate material loss associated with respira- tion, material is withdrawn from the biomass pool in proportion to h15. This represents another interface between the CTM model and the biomass that lies outside the model, As biomass increases, a larger anmcauaat of material is withdrawn until a biomass is reached a t which growth and respiration are equal, and therefore biomass reaches a maximum. The transition from state 5 to state 1 uses stored carbo- hydrates, nonstructural carbohydrate, lipid and pmtein biomass to complete the respiratory cycle of transitions. Physiologically, A51 represents the mean transition rate of cahon dioxide evolution associated with dark respiration,
Another aspeek of respiration that is not well understood is oleoresin metabolism in pines. Studies were undertaken by Sukhov (1958) and Tinus (1966) Ghat resulted in. contradictory conclusions. Sukhov (1958) determined that monoterpenes and resin acids have a turnover time of about 10 days. Tinus (1966) concluded that oleoresin metabolic turnover time is 0.5 to 20 years, Lawrence (1971)
carried out a series of experiments to resolve this conflict, and found that monoteqenes in southern pines can be readily remetabolized, although resin acids cannot be catabolized. The abundance of pre- ferred substrates for use as reserve foods might pre- vent synthesis of enzymes responsible for resin acid catabolism.
Until studies show otfiemise, resin acids are as- sumed not to be catabolized in southern pines, but can be lost by leakage from resin duct reservoirs (Shave and Wu 1985). Based upon the findings af Lawrence (1971), monoterpenes can be assumed to be readily catabolized. Where and how they are used is unfortunately not understood a t present. Monoterpene remetabolism is, therefore, not included in the present model although it should be considered in refinements of tree susceptibility models in the future,
PCTater Stress Effects on Respiration
Tndireet evidence for water stress-related mechan- isms involving osmoregulation (i.e,, mechanisms f and I1 discussed earlier), can be found in the ex- perimental studies presented by Brix ( 1962) that compared water stress effect on photosynthesis and respiration rates in tomato plants and IobEolly pine
P 2.1 LOBLOLLY ? t. PINE
20 0
WATER STRESS
TOMATO
WATER STRESS
Figure 2.-Effect of m t e r stress on rate of photosynthesis and regpiration. (Upper graph) loblolly pine seedlings; (lower graph) tomato plants.
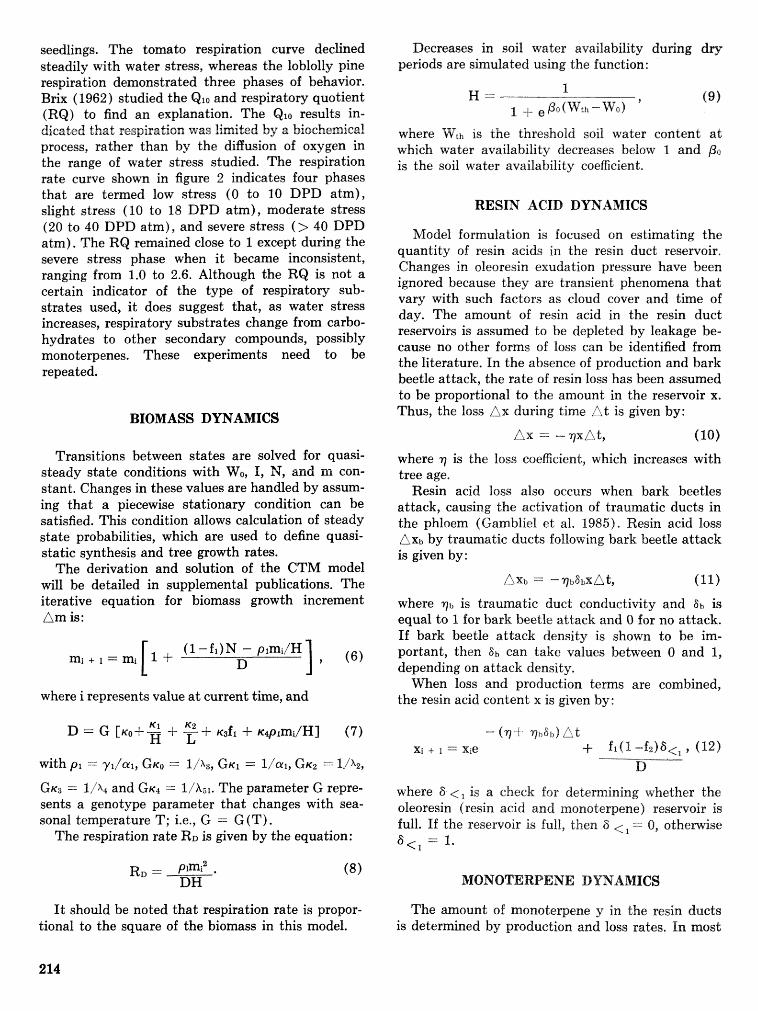
seedlings. The tomato respiration curve decEned steadily with water stress, whereas the loblolly pine respiration demonstrated three phases of behavior. Brix (1962) studied the Qlo and respiratory quotient (RQ) to find an explanation, The Qlo results in- dicated that respimtios, was limited by a biochemical process, rather than by the diffusion of oxygen in the range of water stress studied. The respiration rate cuwe shown in figure 2 indicates four phases that are termed low stress (0 to 10 DPD atm), slight stress (10 to 18 DPD atm), moderate stress (20 to 40 DPD atm), and severe stress (> 40 DPD atm). The RQ remained close to 1 except during the severe stress phase when it became inconsistent, ranging from 1.0 to 2.6. Although the FtQ is not a certain indicator of the type of respiratory sub- strates used, it does suggest that, as water stress increases, respiratory substrates change from carbo- hydrates to other secondary compounds, possibly monoterpenes. These experiments need to be repeated.
BIOMASS DYNAMICS
Transitions between states are solved for quasi- steady state conditions with Wo, I, N, and m. con- stant. Changes in these values are handled by assum- ing that a piecewise stationary condition can be satisfied. This condition allows calculation of steady state probabilities, which are used to define quasi- static synthesis and tree growth rates.
The derivation and solution of the CTM model will be detailed in supplemental publications. The iterative equation for biomass growth increment Am is:
where i represents value a t current time, and
with pl I- y~ /a l , GKO == G K ~ = ljal, G I C ~ "=" lJh,
GKB = I/% and GK* =. 1iAs1. The parameter G repre- sents a genotype parameter that changes with sea- sonal temperature T; i.e., G = G (T) .
The respiration rate RD is given by the equation:
Decreases in soil water availability d u ~ n g dry periods are simulated using the function:
where Wth is the threshold soil. water content; a t which water availability decreases below 1 and PO is the soil water availabif ity coe6cient.
RESIN ACID DYNAMICS
Model formulation is focused on estimating the quantity of resin acids in the resin duct reservoir. Changes in oleoresin exudation pressure have been ignored because they are transient phenomena that vary with such factors as cloud cover and time of day. The amount of resin acid in the resin duct reservoirs is assumed to be depleted by leakage be- cause no other forms of loss can be identified from the literature. In the absence of production and bark beetle attack, the rate of resin loss has been assumed to be proportional to the amount in the reservoir x, Thus, the loss Ax during time At is given by:
where q is the loss coegcient, which increases with tree age.
Resin acid loss also occurs when bark beetles attack, causing the activation of traumatic ducts in the phloem (Gambliel et al. 1985). Resin acid loss AX^ by traumatic ducts following bark beetle attack is given by:
where ~b is traumatic duet conductivity and 8b is equal to 1 for bark beetle attack and 0 for no attack. If bark beetle attack density is shown to be irn- portant, then 8 b can take values between 0 and 1, depending on attack density.
When loss and production terms are combined, the resin acid content x is given by:
where 6 <, is a cheek for determining whether the oleoresin (resin acid and monoterpene) reservoir is full. If the reservoir is full, then 8 (, = 0, othenvise
= 1.
It should be noted that respiration rate is propor- tional to the square of the biomass in this model.
The amount of monoterpene y in the resin ducts is determined by production and loss rates. In most
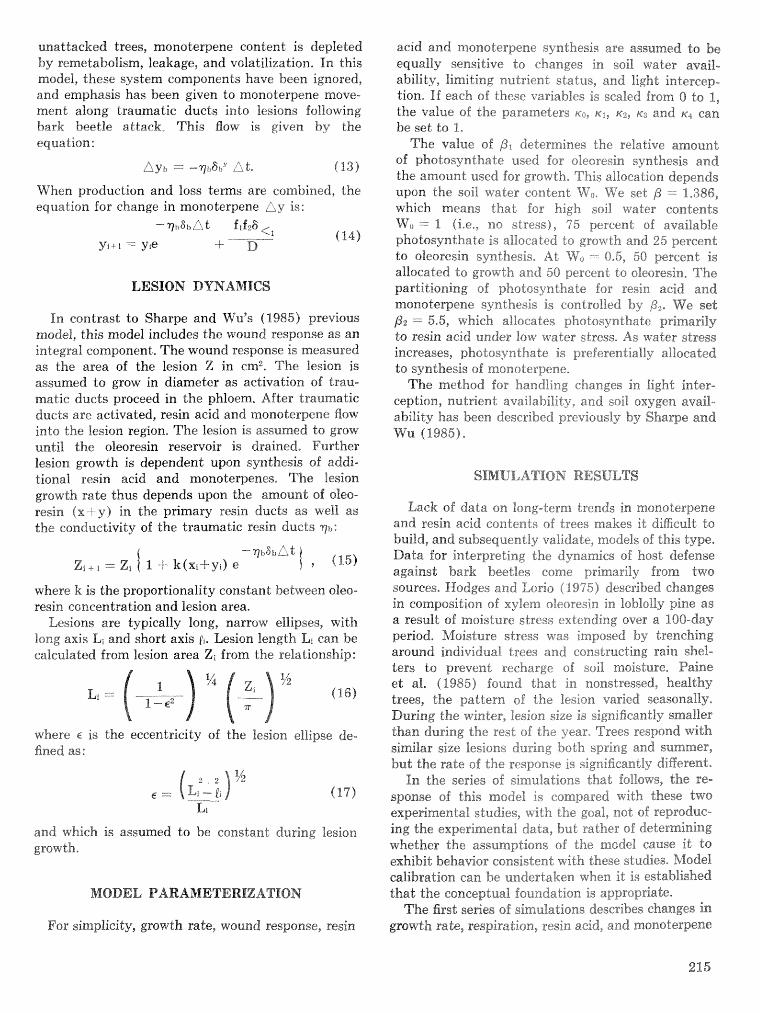
unattrrcked trees, rnonoterpene content is depleted by remetabolism, leakage, and volatilization, In this model, these system components have been ignored, and emphasis has been given to monoterpene move- ment along traumatic duets into lesions following hark heetle attack, This f l o f ~ ~ IS given by the equation :
\Vhen production and loss terms are combined, the eqrration. for change in rnonoterpene L y is:
LESION DYNAMICS
In contrast to Sharpe and tVu% (1985) previous model, this model includes the wound response as an integral component;, The wound response is measured as the area of the lesion Z in em2, The lesion is assumed to grow in diameter as activation of trau- matic ducts proceed in the phloem. After traumatie ducts are activated, resin acid and mofnoterpene Wow into the lesion region, The lesion is assumed to grow until the olearesin reservoir is drained. Further lesion growth is dependent upon synthesis of addi- tional resin acid and monotewenes, The lesion. growth rate thus depends upon the amount of oleo- seaisl (x + y ) in the primary sesin duets as well as the conductivity of the traumatic resin duets q b :
where k is the proportionality constant between oleo- sesin concentration and Eesion area.
Lesions are typically long, narrow ellipses, with long axis Li and short axis p,. Lesion length Lt can be calculated from lesion area Zi from the relationship:
where E is the eccentricity of the Eesion ellipse de- fined as:
and which is assumed to be constant during lesion growth*
MODEL PARAMETERlfZATB4)N
For simplicity, growth sate, wound response, resin
acid and menoterpene synthesis are assumed to be equally sensitive to changes in soil water avail-. ability, limiting nutrient status, and light intercep- tion. If each of these variables i s scaled from 0 to 1, the value of the parameters KC, K I , K Z ~ ~3 and K~ can 1363 set to 1,
The value 06 PI determines the relative amount of pkaotosyntha6e used for oleoresir? synthesis and the amount used for growth, This a9%oc;lti0n depends upon the soil water content \VO. lye set - 1.386, which means that for high soil water contents NTo = 1 fi-e,, no stress), 75 percent of available photosynthate is allocated to growth and 25 percent to oleoresin synthesis, A t WO = 8.5, 58 percentis allocated to growth and 50 percent to oleoresin, The partitioning of photcsynthate for resin acid and msnoterpene synthesis is controlled b y P,, We set /32 -- 5,5, which allocates photosynthate primarily to resin acid under low water stress, As water stress increases, photosynthate i s preferentially allocated do synthesis sf msnsterpene,
The method for handling changes in Bight inter- ception, nutrient avaiBability, and soil oxygen avail- ability has been described previously by Sharpe and WU (1985)-
SIBIUEATIOK RESULTS
Lack sf data on long-term trends in msnoterperne and resin acid contents of trees makes it diEcult t o build, and subsequently validate, models 0% this type- Data for interpreting the dynamics of host defense against bark beetles come primarily from two sources, Hsdges and Lori0 (1975) described changes in eompssitisn sf xylem oleoresin in lablofly pine as a result of moisture stress extending over a 180-day period. h4oisture stress was imposed by trenching around individual trees and constructing rain shel- ters to prevent recharge of soil moisture, Paine et al. (1985) found that in nonstressed, healthy trees, the pattern sf the lesion varied seassna12y, Drrrkg tho winter, lesion size i s significantly smaller than during the rest of the year, Trees respond with similar size lesions during both spring and summer, but the rate of the response is significandy different. In the series of simulations that iollows, the re-
sponse of this model i s compared with these two experimental studies, with the goal, not of reproduc- ing the experimenta1 data, but rather of determining whether the assumptions of .&;he model cause it to exhibit 'behavior consistent with these studies. %$ode1 calibration can be undertaken when it is established that the conceptual foundation is appropsiate*
The first series of simulations describes changes in growth rate, respiration, sesin acid, and monoterpene
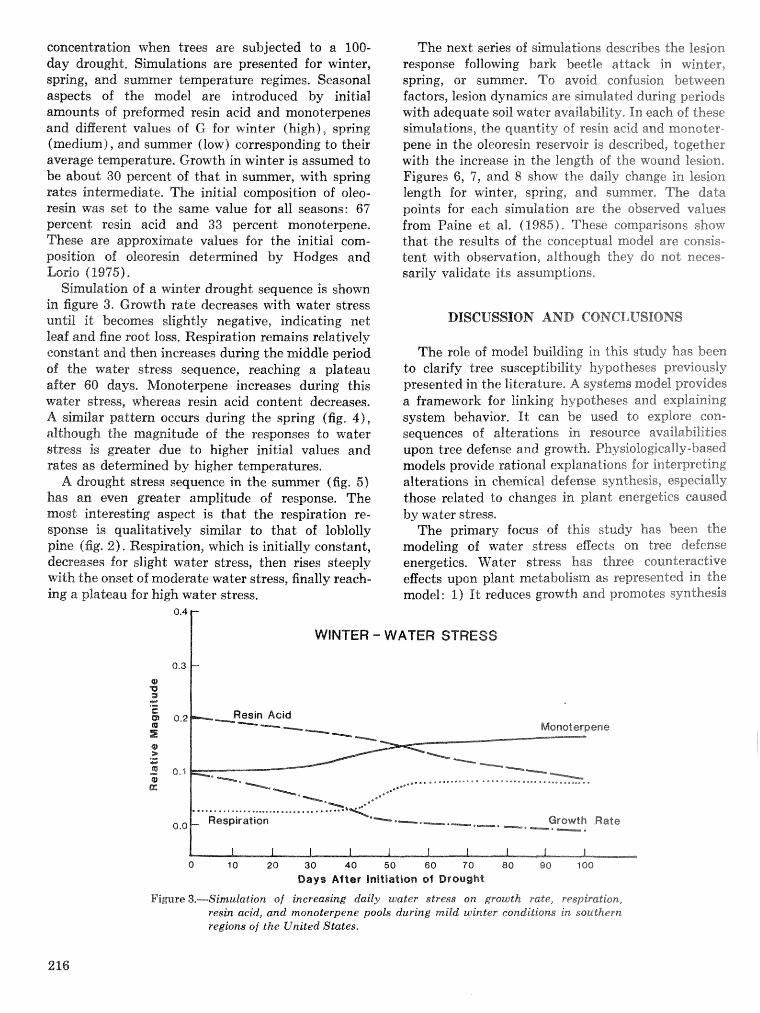
coneeatratisn when trees are subjected to a 200- day drought, Simulations are presented for winter, spring, and summer temperature regimes. Seasonal aspects of the model are introduced by initial amounts of preformed resin, acid and monoterpenes and diBerent; values nf G for winter (high), spring (medium), and summer flow) corresponding to their average temperature, Growth in winter is assumed to be about 30 percent of that in summer, with spring rates iratemediate, The initial composition of oleo- resin was set to the same value for all seasons: 67 percent resin acid and 33 percent monoterpene, These are approximate values for the initial corn- position of oleoresin delemined by Hodges and Loho (19"95),
Simulation of a winter drought sequence is shown in fimre 3, Growth rate decreases with water stress until id becomes slightly negative, indicating net leaf and fine root loss, Respiration remains relatively constant and then increases during the middle period of the water stress sequence, reaching a plateau after 60 days. Monoterpene increases during this water stress, whereas resin acid content decreases, A similar pattern occurs during the spring (fig. 41, r~ldhough the magnitude of the responses to water stress is greater due to higher initial values and mtes as detemined by higher temperatures.
A drought stress sequence in the summer (fig. 5 ) has an even greater amplitude of response. The mest interesting aspect is that the respiration re- sponse is qualitatively similar to that of loblolly pine (fig. 2). Respiration, which is initially constant, decreases for slight water stress, then rises steeply with the onset of moderate water stress, finally reach- ing a plateau for high water stress,
The next series of simulations describes the lesion response following bark beetle attack in winterP spring, or summer. To avoid confusion between factors, lesion dynamics are simulated during periods with adequate soil &rater availability, In each of these simulations, the quantity of resin acid and monoter pene in the oleoresin reservoir is described, together with the increase in the length sf the wound lesion, Figures 6, 7, and 8 show the daily change in lesion length. for winter, spring, and summer, The data points for each simulation are the observed values from Paine ed al, (1985). These comparisons show that the results of the eonceptuaB model are consis- tent with observation, although they do not neces- sarily validate ids assumptions,
DTSCUSSIQN AND CONCLUSIOXS
The role sf model building in this study has been to clarify tsee susceptibility hypotheses previously pesented in the literature. A systems model provides a framework far linking hypotheses and explaining system behavior. It can be used to explore con- sequences of alterations in resource availabilities upon tree defense and growth. Physiologically -based models provide rational explanations for interpreting alterations in chemical defense synthesis, especially those related ts changes in plant energetics caused by watm stress,
The primary focus of this study has been the modeling of water stress effects on tsee defense energetic% Water stress has three ecrunterac"ki%.e effects upon plant metabolism as represented in the model: 1) f t reduces growth and promotes synthesis
-
WINTER - WATER STRESS
Growth Rate
Bays After initiation 01 Drought
Fimre 3.--Simulation of! increasing daily water stress on growth rate, respiration, resin acid, and monoterpene pools during mild winter conditions in southern regions of the United Slates.
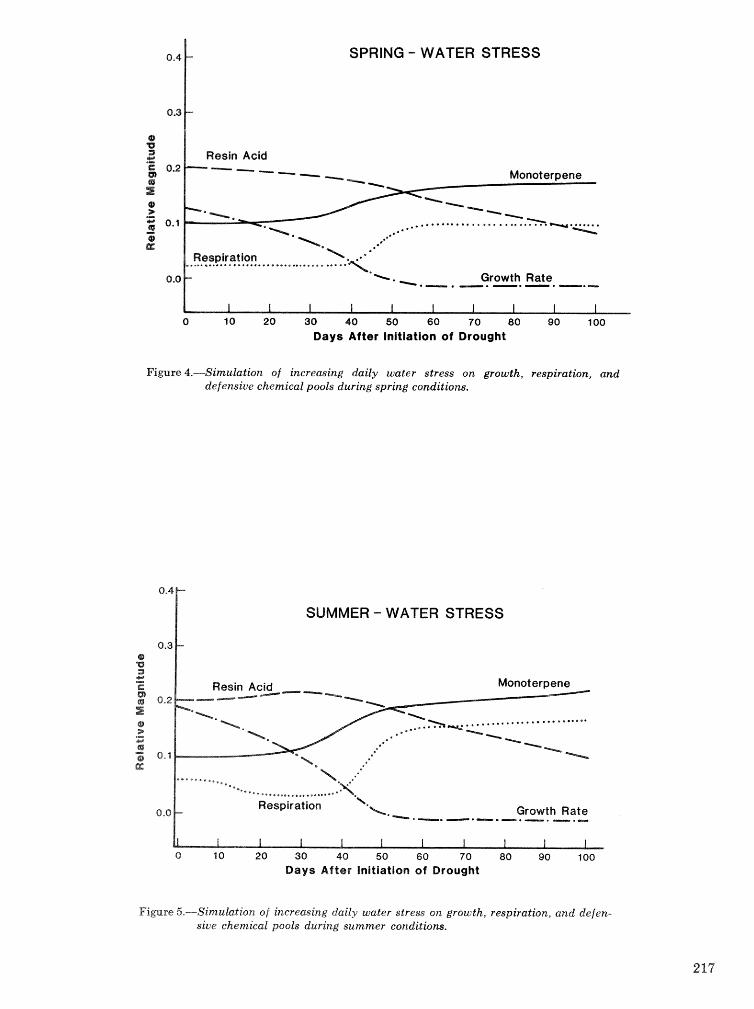
SPRING - WATER STRESS
0.0 -*"c, . Growth Rate -*<-* -*-.-.
0 10 20 30 40 50 60 70 80 90 100 Days After Initiation of Drought
Fimre 4.-Simulation of increasing daily water stress on growth, respiration, and defensive chemical pools during spring conditions.
SUMMER - WATER STRESS
70 20 30 40 50 60 70 80 90 100
Days After Initiation of Drought
Figure 5.-Simulation of increasing daily water stress on growth, respiration, and defen- sive chemical pools during summer conditions.
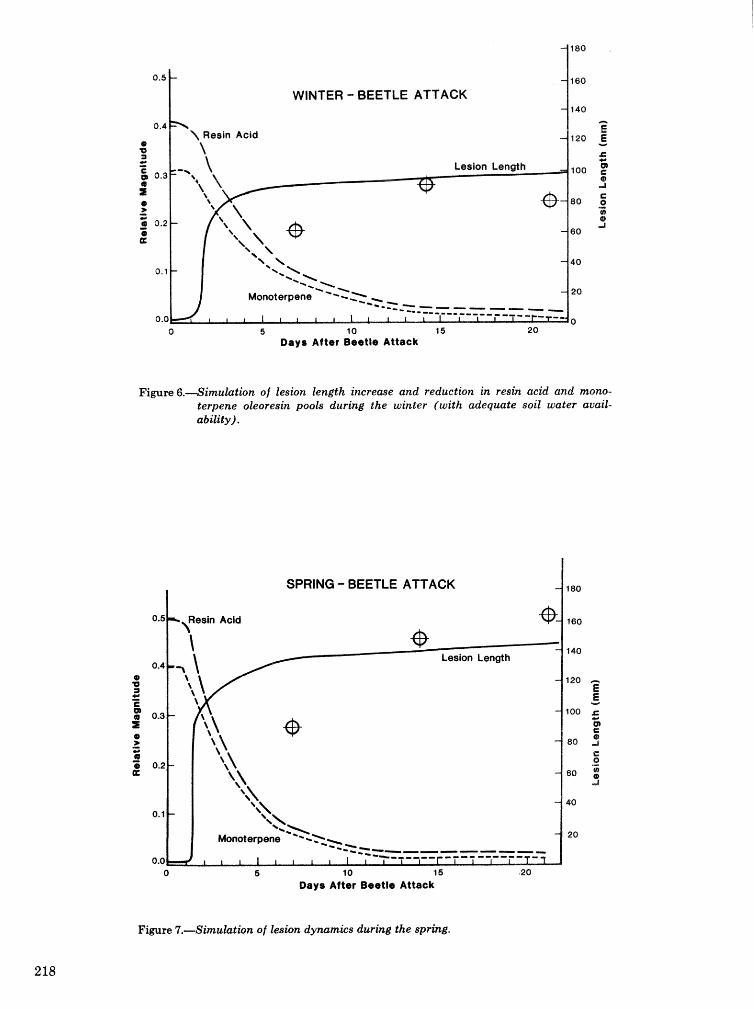
WINf ER - BEETLE ATTACK
5 10 15 Days After Beetle Attack
Figure 6.-Sirnutation of lesion length increase and reduction in resin acid and mono- terpene oleoresin pools during the winter (with adequate soil water avail- ability).
5 10 15 Days After Beetle Attack
Figure 7.-SimuLation of lesion dywnics during the spring.
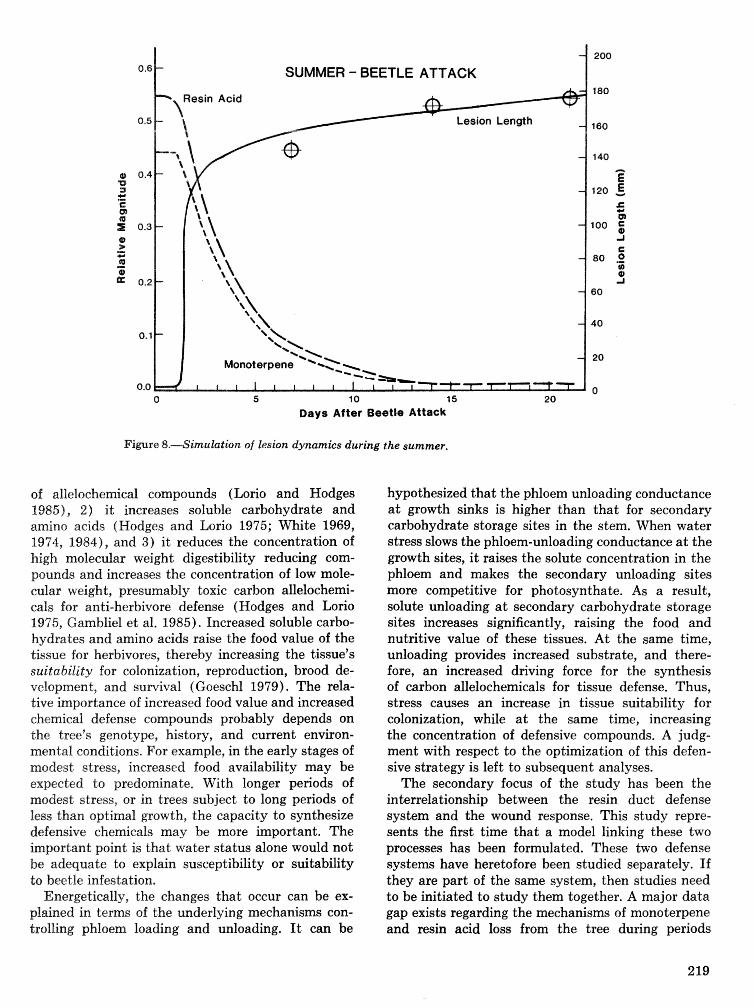
SUMMER - BEETLE ATTACK
5 10 15
Days After Beetle Attack
Figure 8.-Simulation of lesion dynamics during the summer,
of allelochemical compounds (Lorio and Hodges 19851, 2) it increases soluble carbohydrate and amino acids (Hodges and Lorio 1975; White 1969, 1974, 1984), and 3) it reduces the concentration of high molecular weight digestibility reducing com- pounds and increases the concentration of low mole- cular weight, presumably toxic carbon allelochemi- cals for anti-herbivore defense (Hodges and Lorio 1975, Gambliel et al. 1985). Increased soluble carbo- hydrates and amino acids raise the food value of the tissue for herbivores, thereby increasing the tissue's suitability for colonization, reproduction, brood de- velopment, and sunival (Goesehl 1979). The rela- tive importance of increased food value and increased chemical defense compounds probably depends on the tree's genotype, history, and current environ- mental conditions. For example, in the early stages of modest stress, increased food availability may be expected to predominate. With longer periods of madest stress, or in trees subject to long periods of less than optimal growth, the capacity to synthesize defensive chemicals may be more important. The important point is that water status alone would not be adequate to explain susceptibility or suitability do beetle infestation,
Energetically, the changes that occur can be ex- plained in terms of the underlying mechanisms con- trolling phloem loading and unloading. It can be
hypothesized that the phloem unloading conductance a t growth sinks is higher than that for secondary carbohydrate storage sites in the stem. When water stress slows the phloem-unloading conductance a t the growth sites, it raises the solute concentration in the phloem and makes the secondary unloading sites more competitive for photosynthate. As a result, solute unloading a t secondary carbohydrate storage sites increases significantly, raising the food and nutritive value of these tissues. At the same time, unloading provides increased substrate, and there- fore, an increased driving force for the synthesis of carbon allelochemicals for tissue defense. Thus, stress causes an increase in tissue suitability for colonization, while a t the same time, increasing the concentration of defensive compounds. A judg- ment with respect to the optimization of this defen- sive strategy is left to subsequent analyses.
The secondary focus of the study has been the interrelationship between the resin duct defense system and the wound response. This study repre- sents the first time that a model linking these two processes has been formulated. These two defense systems have heretofore been studied separately. If they are part of the same system, then studies need to be initiated to study them together. A major data gap exists regarding the mechanisms of monoterpene and resin acid loss from the tree during periods
without bark beetle attack, Likely sinks for these materials include accumulation in the xylem heart- wood, volatilization, and remetabolism, The dy- namics of these processes must be understood in. greater detail before a predictive model of tree susceptibility can be formulated.
LXTERATf3RE CITED
Anderson, N.H.; Anderson, B. Ips bark beetle attacks and brood development on a lightning-struck pine in relation do its physiological decline. Fla, En- tornol, 51 (1) : 23-30; 1968.
Atsatt, P.R.; Omowd, B.J. Plant defense guilds. Science 193: 24-29; 1976.
Berryman, A.A. Resistance of conifers to invasion by bark beetle-fungus associations, E3io.Sci. 22: 598-602; 1972.
Black, C. A. Soil plant relationships. New York: John Wiley and Sons; 1957: 116-152.
Blanche, C.A.; Hodges, J.D.; Nebeker, T.E.; Moehr- ing, D.M, Southern pine beetle: the host dimen- sion, Bull, 917. hsssissippi State, MS: Mississippi Agricultural and Forestry Experiment Station; 1983.29 p.
Brix, H. The effect of water stress on the rates of photosynthesis and respiration in tomato plants and loblolly pine seedlings. Physiol. Plantarum 15: 10-20; 1962.
Bryant, J.P. ; Kuropat, P. J, Selection of winter for- age by subarctic browsing vertebrates: the role of plant chemistry. Ann. Rev. Ecol. Syst. 11: 161- 185; 1980.
Bryant, J.P.; Chapin, F.S., 111; Klein, D.R. Car- baninutrient balance of boreal plants in relation to vertebrate herbivory. Oikos 40 : 357-368; 1983.
Gates, Re@.; Alexander, H.J. Host resistance and susceptibility. In.: Mitton, J.B.; Sturgeon, K.B., eds. Bark beetles in North American conifers: evolution and ecology. Austin, TX: University of Texas Press; 1982: 212-263.
Cakes, R.G. ; Redak, R.A. ; Henderson, C.B. Patterns in defensive natural product chemistry: Douglas- fir and western spruce budworm interactions. In: Heden, Paul, ed. Plant resistance to insects, Wash- ington, DC: American Chemical Society; 1983: 3--19,
Cates, R.G,; Redak, R.A. Douglas-fir-spruce bud- worm interactions: the effect of nutrition, chemi- cal defenses, tissue phenology, and tree physical parameters on budworm success. Oecologia 62: 61-67; 1984.
Chew, F.S,; Rodman, J.B. Plant resources for chemi- cal dense, In: Rosenthal, G.A.; Janzen, D.H., eds. Herbivores: their interaction with secondary
plant metabolites. New York: Aeadedc Press; 1979: 2'71-303.
Clements, R.W. Modern gum naval. stores methods. Gen. Tech. Rep. SE-7. Asheville, NC: U.S, Depart- ment of Agriculture, Forest Sewice, Ssukheaslesrr Forest Experiment Station; 1974. 20 p.
BeMichele, D.W.; Sharpe, i",J.H.; Goesehi, AD, Towards the engineering of photosyndknelii: pro- ductivity. Critical Reviews in Bio-engineer-ing 3: 29-91; West Palm Beach, FL: CRC Press; 1978,
Fares, Y,; Magnuson, C,E,; Goeschl, %,D, &fain- tenanee of phloem turgor in water stressed plants: experimental tests using 11C02 extended square wave tracer kinetics. Abstract, symposium on car- bon transport under wates stress. Annual meediprg, American Society of Agronomy, 1984 November 26-29; Las Tiegas, NV; 1984,
Farquhar, G.D.; van Caemmerer, S. Modelling of photosynthetic response to environmental ctaxldi- tions: In: Lange, 0.L; Nobel, P.S,; Osmond, C,B.; Zeigler, H., eds. Water relations and carbon as- similation. Physiological Plant Ecology I% (Eney- clopedia of Plant Physiology; new sere, Vol, 12B), Berlin - Heidleburg - New Y ork : Springer - Verlag ; 1982: 549-587.
Feeny, I?. Plant apparency and chemieaB defense. Recent Adv. Phytoehem 10: 1-40; 1976,
Feldman, R.M.; Curry, G.L.; CouZson R-N, A mathe- matical model of field population dynamics of the southern pine beetle, Dendroetanus frontatis* Ecol. Modelling 13 : 261-281; 1981a.
Feldman, R.M.; Wagner, R.L,; Sharpe, P.J.H.; Gagne, J.A.; Coulson, R.N. IVitlrin-tree life prs- cess models of the southern pine beetle, Bendroc- tonus frontalis. Ecol. Modelling 13: 247-259; 1981b,
Feldman, R.M.; Wagner, T.L.; Curry, 6.L.; Coulssn, R.N.; Sharpe, P.J.H. A methodology for bio- physical modeling using TAMBEETLE as an example, In: Branham, Susan ti,; Thatcher, Robert C., eds. Proceedings, integrated pest man- agement research symposium; 1985 April 15-18; Ashevillie, NC. Gen, Tech. Rep. SO-56. New Or- leans, LA: U.S. Department of Agriculture, Forest Service, Southern Forest Experiment Station; 1985: 195-201.
Gambliel, KA,; Cates, Re@. ; GaEey-Msquin, hP.K.; Paine, T.D, Variation in the chemistry of loblolly pine in relation to infection by the blue-stain fungus. In: Branham, S.J.; Thatcher, R.C., eds. Proceedings, integrated pest management research symposium; 1985 April 15-18; Asheviile, NC. Gen, Tech, Rep. SO-56. Nerv Orleans, LA: U.S. Depart- ment of Agriculture, Forest Service, Southern For- est Experiment Station; 1985: 177-184.
Goeschl, J,D, Hypothesis to explain the moderate level sf correlation among water stress, oleoresin pressure and success of colonizing pine beetles. Proceedings, 13th annual \vestern. forest insect work conference; 1979 March 6-8; Boise, ID; 1979. 110-1x1,
Goesckll, J-D,; R;2agnusomz, C,E,; Dehfichele, DSw,; Sharpe, P,J,H, Concentration dependent unload- ing as a necessary assumption for a closed form mathernadical model of osmotically driven pres- sure flow in phloem, Plant Physiol, 58: 556-5632; 1976*
Goesch1, J,D*; Magnuson, C.E.; Fares, Y.; Sharpe, PJJ-3, &4aintenance of phloem turgor in plants under water stress: a theoretical basis for reduced photosynthetic productivity. Abstract from sym- posium on carbon transport under water stress. Annual meeting, American Society of Agronomy; 1984 November 26-29; Las Vegas, NV; 1984.
Gssz, J. Nitrogen cycling in coniferous ecosystems. In: CIark, F,; RoswaEl, T., eds. Nitrogen cycling in terrestrial ecosystems: processes, ecosystem strategies, and management impacts, Ecological Bulletins (Stockhclm) 33: 405426; 19131,
Hain, FP,; Cook, S,P.; Matson, PA.; Wilson, M.G. Factors contributing to southern pine beetle host resistance, In: Branham, Susan J.; Thatcher, Robert C,, eds. Proceedings, integrated pest man- agement research symposium; 1985 April 15-18; Ashevllle, NC, Gen, Tech. Rep. SO-56. New Or- leans, LA: U S , Department of Agriculture, For- est Service, Southern Forest Experiment Station; 1985: $54---160,
Hicks, R,R,, Jr, Climate, side, and stand factors. In: Thatcher, R,C.: Searcy, J,L,; Goster, J.E.; Hertel, G,D,, eds, The southern pine beetle. Tech. Bull, 163 9, U,S, Department of Agriculture; 1980: 55-68,
Hicks, R,R,, Jr. ; Howard, J,E,; Coster, J.E. ; Watter- son, K G , The role of tree vigor in susceptibility of lobPolly pine to southern pine beetle. In: Hollis, Cali,; Squilanee, A,E., eds. Proceedings, fifth North American forest biology workshop. Gaines- ville, FL: University of Florida, School of Forest Res~urces; 1978: 177--1681,
Eodgesp J,D,; Lorio, I?-L,, Jr, Carbohydrate and nitrogen fractions of the inner bark of loblolly pines under moisture stress, Can. J. Bod, 47: 1652-1657; 1869,
Eodges, J,D,; Lsrirs, I),L,, Jr. Comparison of oleo- resin composition in declining and healthy lob- lolly pines. Res, Note SO-158, Mew Orleans, LA: U,S, Department of Agriculture, Forest Service, Southern Forest Experiment Station; 1973. 4 p,
Rodges, e8-D.; Loriop P.L,, Js, Moisture stress and composition of xylem oleoresin in loblolly pine,
For. Sci, 22: 283-290; 1 975, Hedges, J.D.; Elam, W.W.; wn"rson, N.R.; Nebeker,
T.E. Oleoresin characteristies and suscept ibifity of four southern pines to southern pine beetle f Coleoptera: Seolytidae) attacks. Can. Entornol. 112: 889-896; 11379,
Ku, T,T.; Sweeney, J.3I.; Shelhurne, V.B. Pre- liminary evaluation of site and stand eharaetes- istics associated with southern pine beetle infesta- tions in Arkansas. Ark, Farm. Res, 25(2) : 2; 1976.
Ku, TsM,; Sweeney, J,M,; Shelburne, V,B, Site and stand conditions associated with southern pine beetle outbreaks in Arkansas - a hazard-rating system. South. J, kppl. For. 4 (2) : 103-106; 1980.
Lawrence, 1R.H. Biosynthesis and metabolism of ter- peraoids in Pinus elliottii Engelm, rand Pinus palu- stris h4ill. Athens, GA: University of Georgia, School of Forest Resources; 1971. 117 p, [PhD. Dissertation ]
Lorio, P.L., Jr. Declining pines associated with bark beetle activity in Allen Parish, LA. Res. Note SO-163. New Orleans, LA: U.S. Department of Agriculture, Forest Service, Southern. Forest Ex- periment Station; 1973. 3 p.
Lorio, P.L., Jr.; Hodges, J.D. Microsite effects of oleoresin exudation pressure of large loblolly pines. Ecol. 49: 1207-1210; 1968.
Lorio, P.L., Jr.; Hodges, J.D. Host and site factors in southern pine beetle infestations. In: Payne, T.L.; Coulson, R .N . Thatcher, R.C, eds. Pro- ceedings, southern pine beetle symposium; College Station, TX. College Station: Texas Agricultural Experiment Station and U.S. Department of Agriculture, Forest Service; 1974: 32-34,
Lorio, P.L., Jr.; Hodges, J,D. Tree water status affects induced southern pine beetle attack and brood production. Res. Pap. SO-135. New Orleans, LA: U.S. Department of Agriculture, Forest Ser- vice, Southern Forest Experiment Station; 1977. 7 IP.
Lorio, P.E., Jr.; Hodges, J,D. Theories of interactions among barfs beetles, associated microorganisms, and host trees. In: Shoulders, E., ed. Proceedings, third biennial southern. silvieultazraf research eon- ference; 1984 November 7-8; Atlanta? GA. Gen. Tech, Rep, SO-54. New Orleans, LA: U.S. Depart- ment of Agriculture, Forest Service, Southern Forest Experiment Station; 1985: 485492.
Mason, R.R. Soil moisture and stand density affect oleoresin exudation Aow in a loblolZ5~ pine planta- tion, For, Sci, 17: 170-177; 1971,
Olson, R.L., Jr.; Sharpe, P.J.H,; Wu9 H. Whole plant modelling: a continuous time hlarkov ( CTM approach). Ecol, 3fllodelling 1985, [In press].
Paine, "b",D,; Stephen, P,M,; Gates, R,G, Induced defenses against Dendroctonus frontatis and asso- ciated fungi: variation in loblolly pine resistance, In: Branham, Susan %*; Thatcher, Robert C,, eds. Proceedings, integrated pest management research sympsium, 1985 L6$pri% 15-18; Aslre~lZe, NC, Gene Tech, Rep, SO-56, New Orleans, LA: U.9, Department of Agriculture, Forest Sewice, South- ern Forest Experiment Station; 1985: 169-176.
Reid, R.W, ; Tf7hitney, KS,; \jPatson, J,A. Reactions of lodgepole pine to attack by Dendrcctonus psn- derosa Hspkins and blue-stain fungi, Can. J. Bod. 45: Il.15-9126; 1967-
Rhoades, D,F, Evolution of plank chemical defense against herbivores, In : Rosenthaf, G-A,; Janzen, D,H,, eds, Eerbivores: their interaction with secondary pHan% metabolites, Xew Yosk: Academic Press; 1979: 3--54,
Rhoades, D,F,; Cates, R.C, A general theory of plant antiherbivore chemistry. In: \Tallace, J,W,; Man- sell, R,L,, e d ~ , Biochemical interaction between. plants and insects, Recent Advances in Phyto- chemistry (Val, l o ) , New Yerkr: Plenum Press; 3.978: 168-213,
Rosewthal, GA,; Janzen, D,H,, eds, Herbivores: their interaction with secondary plant metabolites, New York: Academic Press; 1979,
Rudinsky, J,A, Scolytidae beetles associated rvith Douglas-fir : responses to tespenes, Sei, 152 : 218- 219; 1966a,
Rudinsky, J - A , Host selection and invasion by the Douglas-fir beetle, Dendroctonus pseudotsugae Hopkins, in coastah Douglas-fir forests, Can. En- d ~ ~ g b l ~ l , 98 398-411; 1966b,
Shaspe, P,J,H, Photosynthetic and dark respirdion response to temperature, Ann, Bot. 52: 325343; 1983.
Sharpe, P,J,H.; Walker, J,; Penridge, L-EC-; wu, He A physioedsgieally based continuous time igv1arkov approach to plant growth modelling in semi-arid woodlands, Ecol, &%odeHfingg 1985, [In press].
Sharpe, P,J,H,; Wu, H, A preliminary model sf host susceptibility to bark beetle attack* Proceedings: international union of forest research organiza- tions, host insect work group; 1983 September; Banff, Alberta, Canada, Victoria, B,C,: Canadian Forestry Service; 1985 : 108-127,
Shrimpton, D,hk Extracts associated with wound response sf lodgepsie pine attacked by the moun- tain pine beetle and associated micro-organisms. Can, J, Bot, 51: 527-534; 1973,
Smith, R-H, Formula for describing the effect of in- sect and host tree factors on resistance to \vestern pine beetie attack J, Econ, Entomcsl, 68: 841-844; 1975,
Sukhov, G.V. The use of radiocarbon in the study of biosynthesis of terpenes. In: Extermann, R.C., ed, Radioisotopes in scientific research, Vof, IV, Research with radioisotopes in plant biology and artme general problems. New Vork: Pesgamsn Press; 1958 : 535-547.
Thatcher, R-C, Ba& beetles aEecl-ing southern pines: a review of cursent knowledge. Occras, Pap, 180, New Blrdeans, LA: U-S. Department of Agri- culture, Forest Service, Southern Forest Experi- ment Station; 1960; 25 p.
Tinus, R-FV, The role of oleoresin in the metabolism of Pinus pcrnderosu Laws. Berkeley, CA: Univer- sity of California; 1966, [PhD. Dissertation],
Townsend, f2.R; Cnlow, P., eds, Physiological. ecolo- gy; an evolutionary approach to resource use, Sunderland, hfA : Sinauer; 198 I.
Tuomi, J.; Niemela, B.; Haukioja, E.; Siren, S,; Neuvonen, S. Nutrient stress: an explanation far plant anti-herbivore responses to defofiaticsn. BecoPogia (Berlin) 61: 208-210; 1984.
'Vit4, J,P. The influence of water supply on oleoresin exudation pressure and resistance to bark beetle attack in Pinus ponderosa. Contrib. Boyce Thrimp- son Inst. 21: 37-66; 1961.
Vit6, J.P.; Wood, B.L. A study of the applicability of the measurement of oleoresin exudation pres- sure in determining susceptibility of second growth pondercpsa pine to bark beetle infestation. Conatrib, Boyce Thmpson Inst. 21 : 67-76; 1961.
Wadleigh, C.K; Gaarch, M.G. ; Magistad, 0.C Growth and rubber accurnulatiorn in guayufe as conditioned by soil salinity and irrigation regime. Tech. Bull, 925, Washington, DC: U.S. Depart- ment of Agriculture; 1946.
Waring, R.H,; Pitman, G.B. A simplle model of host resistance to bark beetles, Res, Note 65. @omallis, OR: Oregon State University, Forest Research Laboratory; 1980.2 p.
Weins, J.A, Resource systems, populations, and commmni-ties, In: Price, P.W.; SfobodchikoE, C.N.; Gaud, W,S., eds, A new ecology: novel approaches to interactive systems. New York: John \Vifey and Sons; 1984: 397---436.
i%'hitct, T,C,R, An index do measure weather relaked induced stress sf trees associated with outbreaks of Psyllids in Australia. Ecology 50: 905909; 1969,
RThite, T.C,R. A hypothesis to explain outbreaks sf looper caterpillars, with special reference do populations of Sekkdosema suauis in a population of Pinus radiata in New Zealand. Oecologia (Ber- lin) 16: 2"7-3031; 1974,
FVhite, T,C.R, The abundance of invertebrate herbi- vores in relation to the availability of nitrogen in

stressed food plants. Oeeologia (Berlin) 63 : 90- 105; 1984.
m i tham, T.G. Habitat selection by Pempfiigus aphids in response to resource limitation and competition. Ecology 59: 1164-11763; 1978.
Whitham, T.G. The theory of habitat selection: ex- amined and extended using Pempirzigus aphids, Am, Nat. 215: 449-466; 1980.
Whitham, T.G. Individual trees as heterogeneous en- vironments: adaptation to herbivory or epigenetic noise? In: Denno, R.F.; Dingle, H., eds, Insect; life history pakterns: habitat and geographic variation. New York : Springer-Verlag; 1981 : 9-27.
Wu, H,; Sharpe, P.J.H.; Walker, J.; Pensdge, L.K. Ecological field theory: a spatial analysis of re- source interference among plants. Ecol. Modelling; 1985. [In press].
Wulf, N.W.; Cates, R.G. Site and stand character- istics, In: Brookes, M.H.; Campbell, R.W.; Col- bert, J.; Mitchell, R.G.; Stark, R.W., eds. Western spruce budworm. Tech. Bull. 1694. Washing- ton, DC: U.S. Department of Agriculture; 1985. [In press].
Zucher, W.V. How aphids choose leaves: the role of phenolics in host selection by a galling aphid. Ecology 63: 972-981; 1982.

SBSION I MANAGEMENT APPROACHES AND IPM SYSTEMS
Hazard-Rating Systems
Development, Implementation, and Validation of a Large Area Hazard- and Risk-Rating System for Southern Pine Beetle
gs, C. M. Bryant, and K. H. Wilson'
A bstraet-.-A practical syskm for mapping the abundance and distribution of suihble habitat for the southern pine beetle (SPB), Dendroctanus fmn- tafis Zimmemann, was devised and applied to 11,8 million acres in east Texas in 1983, A wide area hazard-rating pmcedure was developed from a step- wise discriminant analysis of 1974 color inhared aerial photography (scale = 1:120,000) and com- puterized SPB infestation records for 19W-77, 'This procedure was then used to cIasfify 656 grid blocks (18,000-acre units) as low, moderate, or high hazard for SPB outbreaks, based on sitelstand information sampled from current photography. A further re- finement assigned a risk classification to each grid b!ock (very low, low, moderate, high, and extreme) by systematically combining the grid block's hazard dass with numbers of recent beetle infestations de- tented in the same grid block. To validate the system, actual numbers of beetle infestations (2 10 trees) recorded from 1982-84 operational records within 502 grid blocks were correlated with predetemined hazard and risk classifications. Grid blocks rated as high, moderate, and low hazard based on habitat conditions alone supported an average of 63.3, 20.6, and 6.8 infestations per grid block, respectively. In 1984, infestations averaged 89.2 in those grid blocks anticipated to be extreme risk. Levels decreased cor- respondingly by risk class to an average of only 3.6 infestations in grid blocks rated as very low risk. This system provides a means of monitoring temporal and spatial changes in SPB habitat conditions over wide areas-inf ormation essential for forecasting asso- ciated shifts in beetle infestation levels. Additional keywords : Dendroctonus frontalis, hab- itat mapping, aerial photography.
caused timber losses mn be avoided or minimized through long-range forest management planning (Pe- terson 19841, silvicultural manipulations (Belanger and Malac f988), and/or more responsive direct control tactics (Billings 1980),
The suscepl;ibility of single pine trees and forest stands to the SPB has received considerable atten- tion in reeent years (Blanche et al, 1983, Hiekg 1980). These research eiCforts have led to practical systems for hazard rating iindividual pine shnds for susceptibility to beetle infestations ( h r i o 71980). Less is known about factors influencing the spatial distribution and abundance of SPB outbreaks over wide areas.
Computerized historical records of SPB infesta- tions (spots) mahtained by the Texas Forest Service since 1973 (Pase and Fagala 1980) provide a valu- able source of infomation for analyzing spatial and temporal distributions of beetle populations in east Texas. Each infestation (> 10 Lrrees) detected throughout the 12 million acres of c forests is recorded by its specific location within unit tracts known as grid blocks. GSd blocks are rectan- gular mapping units delineated by 5-minute intewals of longitude and latitude on U.S. Geological Sumey maps. A grid block measures ca 5.74 miles (9.2 h) northisouth by ca 4.87 miles (7,8 km) east/wes$ and covers ca 18,000 acres (7,300 ha).
The objective of the study unde&aken by the Pest Control Section of the Texas Forest Service was bcr develop, implement, and validate a system for iden- tifying grid blocks capable of suppo&ing high in- festation levels of southern pine beetle, based on resource information, available from aerial photog- raphy. Once identified, "high-hazard"' grid blockg~ could reeeive prio&ty in detection and csntrsl pro- grams and be targeted for silvicultural treatments designed to reduce the psterstial for futur&? beetle outbreaks. In a further applicab;ion, t;he hazard-mtirag
To more eflectively manage populations of the system was modified vviitla input from recent beetle
southern pine beetle (SPB) , Dendroctonus frontalis infeshtion records to generate an up-do-date risk-
Zimmemann, forest managers need a reliable means rating scheme to identify areas where beetle out-
of predicting where infestations are most likely to breaks are most likely to occur during the conning
occur. Once this capability is developed, beetle- year. Hazard in this context refers to the relative susceptibility of an area to beetlie infestation, based solely on site/stand factors and host abundance. Risk is defined as the pmbability of a hark beetle hks ta -
Respectively, Principal Entomologist, fomer Project For- tion be~oming established within a givm e-irne span, ester, and Project Technician, Forest Pest Control Section, and results from the interaction of hazard and exis- Texas Forest Serviee, Lufkin, TX, Ling beetle population levels (Paine et a l 1984) +
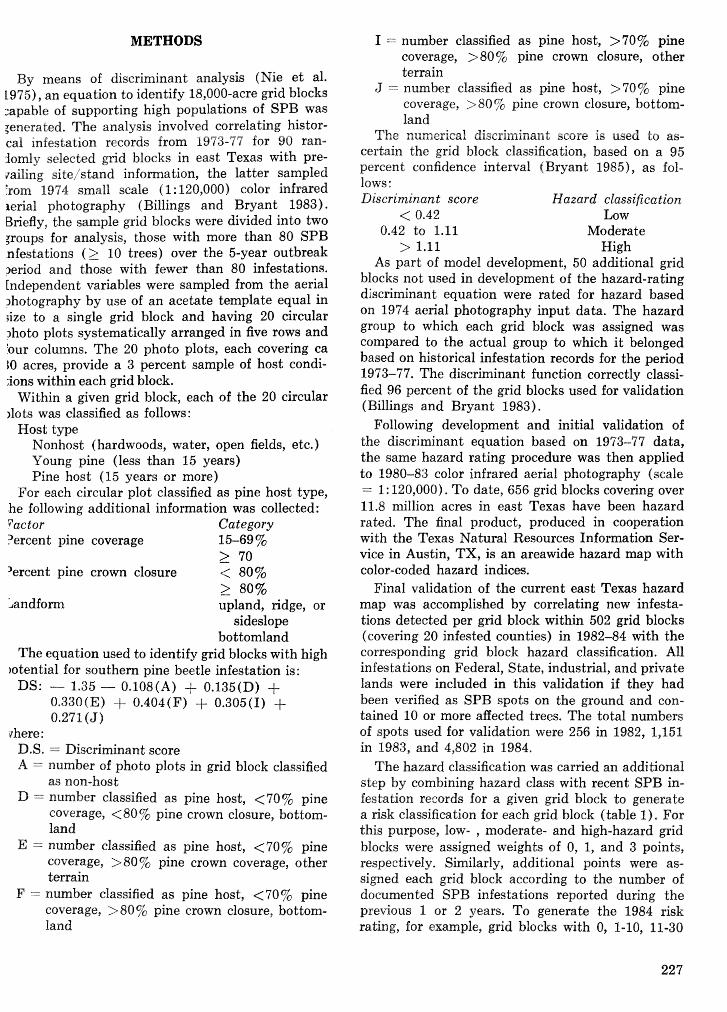
METHODS
By means of d i s c r i ~ n a n t analysis (Nie et al, 1975), an equation to identify 18,000-acre grid blocks :apable of supporting high populations of SPB was ;enertrted. The analysis involved correlating histor- ca% ~nfestation records from 1973-77 for 90 ran- ciomly selected grid blocks in east Texas with pre- flailing site,'st-and infomation, the latter sampled from 1974 small scale ( 1 : 120,000) color infrared gerial photography (Billings and Bryant 1983). Briefly, the sample grid blocks were divided into two groups for analysis, those with more than 80 SPB nfestations ( > 10 trees) over the 5-year outbreak 3eriod and those with fewer than 80 infestations. Endependent variables were sampled from the aerial 2hotography by use of an acetate template equal in size to a single grid block and having 20 circular 3hoto plots systematically arranged in five rows and 'our columns. The 20 photo plots, each covering ca 10 acres, provide a 3 percent sample of host condi- ions within each grid block.
Within a given grid block, each of the 20 circular >lots was classified as follows:
Host type Nonhost (hardwoods, water, open fields, etc.) Young pine (less than 15 years) Pine host (15 years or more)
For each circular plot classified as pine host type, vhe following additional information was collected: 'actor Category 'ercent pine coverage 15-69 %
> 70 'ercent pine crown closure < 80%
2 80% Landform upland, ridge, or
sideslope bottomland
The equation used to identify grid blocks with high botential for southern pine beetle infestation is:
DS: - 1.35 - 0.108(A) + 0.135(D) -+ 0.330(E) + 0.404(F) + 0.305(1) + 0.271 (J)
there: D.S. -- Discriminant score A = number of photo plots in grid block classified
as non-host D = number classified as pine host, <700/0 pine
cowrage, <80 % pine crown closure, bottom- land
E = number classified as pine host, < 70 % pine coverage, > 80 7, pine crown coverage, other terrain
F = number classified as pine host, < 70% pine coverage, > 80 % pine crown closure, bottom- land
I = number classified as pine host, >70% pine coverage, >80% pine c rom closure, other terrain
J = number classified as pine host, > 70% pine coverage, > 80 % pine crown closure, bothm- land
The numerical discriminant score is used to as- cedain the grid block classification, based on a 95 percent confidence interval (Bryant 1985), as fol- lows : Discriminant score Hazard classification
< 0.42 h w 0.42 to 1.11 Moderate
> 1.11 High As part of model development, 50 additional grid
blocks not used in development of the hazard-rating discriminant equation were rated for hazard based on 1974 aerial photography input data. The hazard group to which each grid block was assigned was compared to the actual group to which it belonged based on historical infestation records for the period 1973-77. The discriminant function correctly classi- fied 96 percent of the grid blocks used for validation (Billings and Bryant 1983).
Following development and initial validation of the discriminant equation based on 1973-77 data, the same hazard rating procedure was then applied to 1980-83 color infrared aerial photography (scale = 1 : 120,000). To date, 656 grid blocks covering over 11.8 million acres in east Texas have been hazard rated. The final product, produced in cooperation with the Texas Natural Resources Information Ser- vice in Austin, TX, is an areawide hazard map with color-coded hazard indices.
Final validation of the current east Texas hazard map was accomplished by correlating new infesta- tions detected per grid block within 502 grid blocks (covering 20 infested counties) in 1982-84 with the corresponding grid block hazard classification. AU infestations on Federal, State, industrial, and private lands were included in this validation if they had been verified as SPB spots on the ground and con- tained 10 or more affected trees. The total numbers of spots used for validation were 256 in 1982, 1,151 in 1983, and 4,802 in 1984,
The hazard classification was carried an additional step by combining hazard class with recent SPB in- festation records for a given grid block to generate a risk classification for each grid block (table 1). For this purpose, low- , moderate- and high-hazard grid blocks were assigned weights of 0, 1, and 3 points, respeetively. Similarly, additional points were as- signed each grid block according to the number of documented SPB infestations reported during the precious 1 or 2 years. To generate the 1984 risk rating, for example, grid blocks with 0, 1-10, 11-30
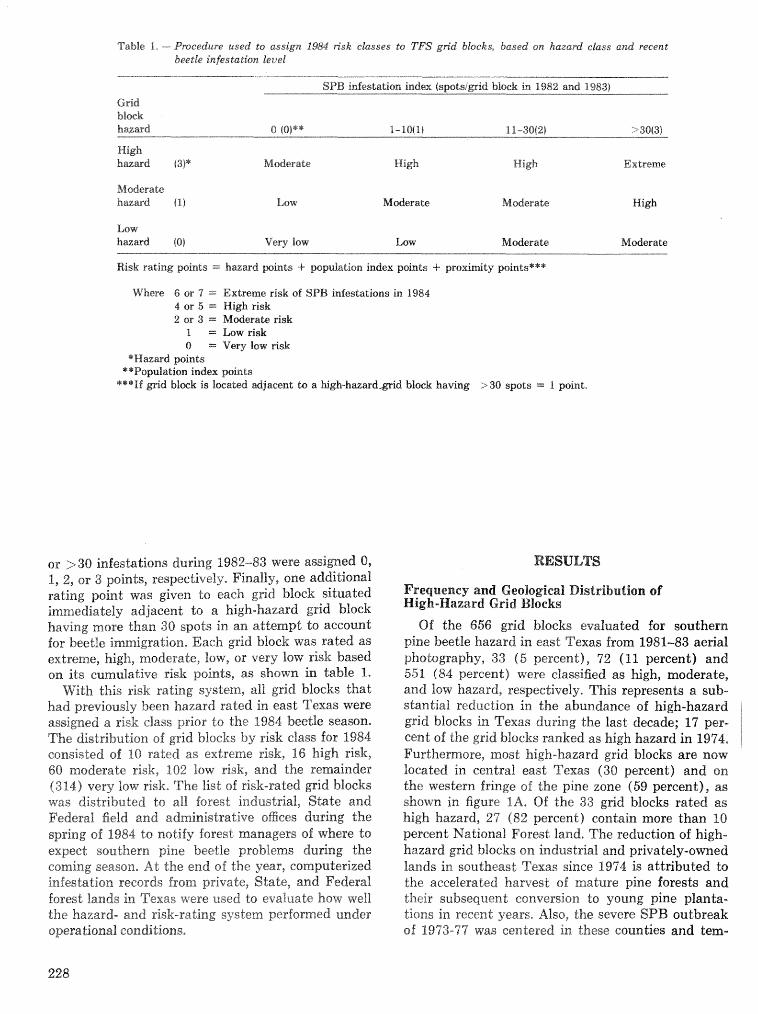
Tabte I. --- Pmeedure; used to assign 1984 risk elasses to TFS grid blocks, based on ha~db-)"hi! class and recent beetle ilafes tation buel
SPB infestation i n d a fspsts!aid bfwk in 1982 and 1983)
Grid blmk bmmd o IQI** n-lorl) 11-30(21 ‘, 30(3)
High hiszsd 63P Moderate High High Extreme
Moderate, bawd (1)
Low hazard (0)
Low Mderate Mctrderate High
Very low Low Maderate Moderak
Risk rating points = bawd p in t s 4- population index pdnts + proxinzity points***
Where 6 or 7 = Extreme risk of SPB infestations in 1984 4 or 5 -- High risk 2 or 3 =: Moderah risk
1 = Low risk O =. Very low risk
*H~ZLIT$ points **Population index points
***If mid bloek i s located eftcent to a Egk-hrtzmdsid block having > 30 q o t s -- I point,
or > 30 infestations during 1982-83 were assigned 0, 1, 2, or 3 points, respectively. Finally, one additional rating point was given to each grid block situated immediately adjacent to a high-hazard grid block having more than 30 spots in an attempt to account for beetle immigration, Each grid block was rated as extreme, high, moderate, low, or very low risk based on its eumulxtive risk points, as shown in table 3.
With this risk rating system, all grid blocks that had previously been hazard rated in east Texas were assigned a risk class prior In the I984 beetle season. The distribution of grxd blockrs by risk class for 1984 consisted of 10 rated as extreme risk, 16 high risk, 60 moderate risk, 802 low risk, and the remainder (3L4) very low risk. The f is t of risk-rat& grid blocks was distributed to afl forest industrial, State and Federal field and administriltiw oEces during the spring of 1984 to noti& forest managers of whew to expect souberas pine beetle problems duming the coming seassn~ At the end of the year, computerized infestation records from private, State, and Federal forest lands in Texas were used ko evaluate how well the hazard- and risk-sating system performed under operational conditions,
RESULTS
Frequency and GeoBogieal Disdribudiort of High-Hazard Grid Bloeks
Of the 656 grid blocks evaluated for southern pine beetle hazard in east Texas from 1981-83 aerial phobgraphy, 33 (5 percent), 72 (11 percent) and 551 (84 percent) were classified as high, moderate, alld low hazard, respectively. This represents a sub- stantial reduction in the abundance of high-hazard grid bloeks in Texas during L)ie last decade; 17 per- cent of the grid blocks ranked as high hazard in 1974. Furthermore, most high-hazard grid blocks are now located in en t ra l east Texas (30 percent) and rn the western fringe 06 the pine zone (59 percent), as shom~n in figure IA, Of the 33 grid blocks rated as high hazard, 27 (82 percent) contain more than I0 percent National Forest land* The reduction of high- hazad grid bloeks on industrial and privately-owned lands in southeast Texas since 1974 is attributed do the accelerated hamest of mature pine forests and their subsequent conversion Lo young pine planta- tions in recent years, Also, the severe SPB outbreak of 19'73-77 was centered in these counties and tern-
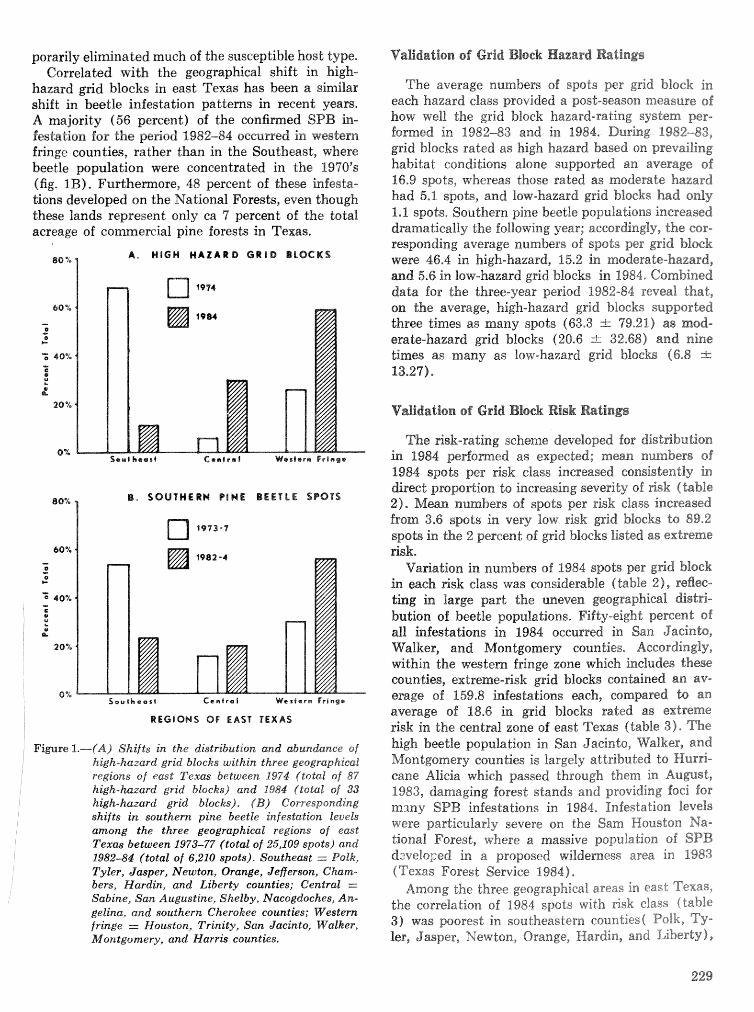
porarily eliminated mu& of the susceptible host type. Correlated with the geographical shift; in high-
hazard grid blocks in east Texas has been a simiiar shift in beetle infestation patterns in recent years. A majority (56 percent) of the caafimed SPB in- festation for the p e ~ o d 1982-84 oecumed in western fringe counties, rather than in f i e Southeast, where beetle population were concentrated in the 1970's (fig, IB), Furthemore, 48 percent of these hfesta- Lions developed on the National Forests, even though these lands represent only ca 7 percent of the total
ereistl pine forests in Texas.
80 % A, HIGH H A Z A R D G R l b BLOCKS
80% B . SOUTHERN P I N E B E E T L E SPOTS
Southeast C e n t r a l Western F r i n g e
REGIONS OF EAST TEXAS
Figure 1.--("A) SIzlSfts in the distribution and abundance of high-hazard grid blocks within three geographical regions of east Texas between 2974 (total of 87 high-hazard grid blocks) and 1984 (total of 33 high-hazard grid blocks). (B ) Corresponding shifts in southern pine beetle infestation levels among the three geographicat regions of east Texas between 1973-77 (total of 25;109 pots) and 1982-84 (total of 6,210 spots). Southeast == Polk, Tyler, Jasper, Newton, Orange, Jefferson, Cham- bers, Hardin, and Liberty counties; Central == Sabine, San Augustine, Shelby, Nacogdoehes, An- gelina, and southern Cherokee counties; Western fringe = Houston, Trinity, San Jacinto, Walker, Montgomery, and Harris counties.
Validation of Grid Block H~aard Rat inp
The average numbers of spots per grid block in each hazard class povided a post-season measure sf how well the grid block hazard-rating system ges- formed in 1982-83 and in 1984, During 1982-83, grid blocks rated as high hazard based on prevailing habitat conditions alone supported an average of 16-9 smts, whereas those rated as moderate hazard bad 5,1 spots, and low-hazard grid blocks had only I, 1 spots, Southern pine beetle populations increased dramatically the following year; accordingly, the mr- responding average numbers of spats per grid bbcb were 46.4 in high-hazard, 16.2 in moderate-hazar8, md 5.6 in low-hazard grid blocks in 1984. Combined data for the three-year period 1982-84 reveal that, OM. the average, high-hazard grid blocks supported three times as many spots (63-3 i- m-21) as mod- erate-hazard grid blocks (20.6 -"- 3%,68) and nine dimes as manly as low-hazard grid blocks 46-8 -zk 13-27)
Validation abf Grid Black Risk b t f n g s
The rigk-rating scheme developed for dist~bution in 9984 pepbomed as expected; mean numbers of 1984 spots per risk class increased consistently in &reel propardion do increasing severity of risk (table 2). Mean numbers of spots per risk class increased from 3.6 spots in very low risk grid blocks to 89-2 spob in. the 2 percent sf grid blocks listed as extreme risk*
Variation in numbers of 1984 spots per grid Mock in each fisk class wpas considerable (table 21, reflee- ting in large part the uneven geographical distri- bution of beethe populatlions, Fif ty-eight peseen t of d1 infestatims in 1984 oceumed in Sari b%acinLo, VValker, and Montgomery counties, Accordingly, thin the western fringe zone which indudes these countiw, ex8;rerne-risk grid bloeks conhirned an ov- emge of 159.8 infestations each, compared Lk) an avesage of 18.6 in grid bbeks gated as extreme risk in, the central zone of east Texas (table 3) * The high beetle population in San Jacinto, Walker, and h20ntgomery counties is largely attributed ds Wuari- cane Alicia which passed through them in August, 1983, damaging forest stands and providing foci for mxny SPB ?nfe%tations in 1984, Infestation levels were particularly severe on the Sam Houston Ns- tional Forest, where a massive population of SPB dzvelqed in a proposed wilderness area in 1983 (Texas Forest Service 1984)-
Among the three geographical areas in east Texas, the correlation of 1984 spots with risk class ( table 3 ) was poorest in southeastern counties( Polk, Ty- ler, Jasper, Newton, Orange, Hardin, and Liberty),
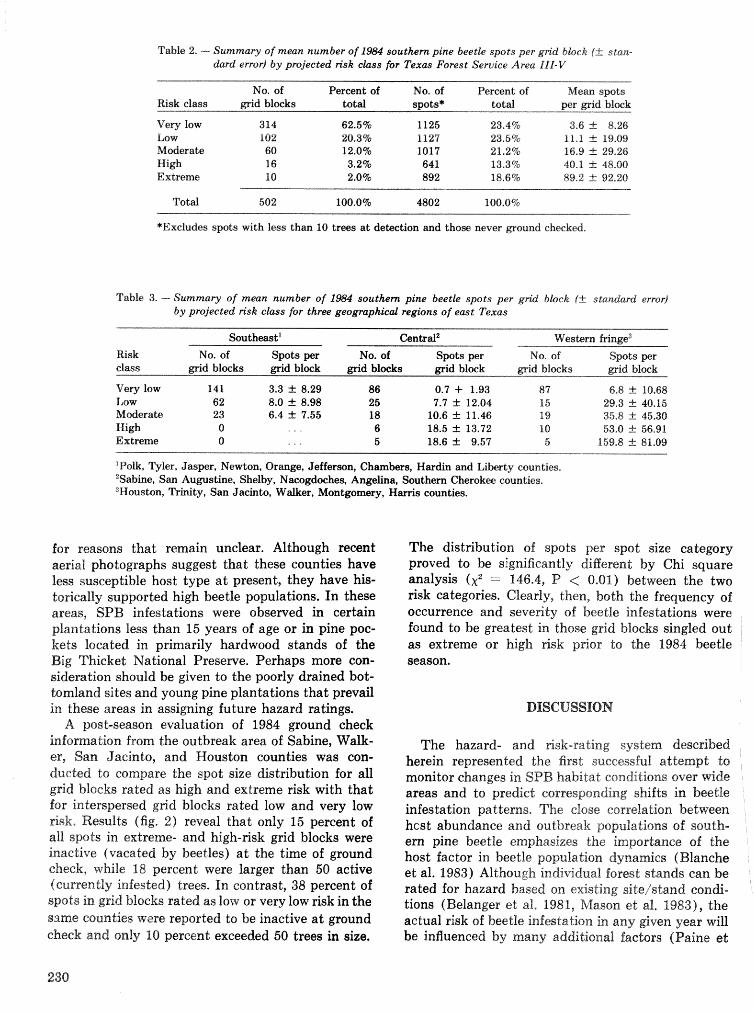
Table 2. - Summary o f mean number o f 198-4 southern pine beetle spots per gn'd block (2 stan- dard error) by pmjeeted risk class for Texm Forest Service Area I l l - V
No. of Pereent of KO, of spots Risk elass grid blocks total spots* totd p e w i d block
Very low 314 62.5% 1125 23.4% 3.6 C 8.26 L ~ V 102 20.3% I nals 23.690 l a . 1 t- 19.09 Moderate 60 12.01 1017 21.2% 1153 rfr 29.26 High 16 3.2% 64 1 13.3% 40.1 -i- 48.00 Extreme 10 2.0% 892 18.6% 89.2 rtr 92.20
*Exeludes spots with less than 10 trees at dewtion and those never ground checked.
Table 3. - Summary of mean number o f 19&4 southen pine beetle spots per grid block (IZ: standard error) by projected risk class for three geographical regions of east Texas
Risk No. of Spots per class grid blocks grid block
Very low 141 3.3 f 8.29 Low 62 8.0 f 8.98 Moderate 23 6.4 -t 7.55 High 0 . , . Extreme 0 . . .
No. of Spots per grid blocks grid block
86 0.7 + 1.93 25 7.7 f 12.04 18 10.6 f 11.46 6 18.5 f 13.72 5 18.6 f 9.57
Western f r i n ~ ~ No. of Spots per
grid blwks grid block
87 6.8 It: 10.68 15 29.3 ." 40.15 19 35.8 ti- 45.30 10 53.0 d- 56.91 5 159.8 f 81.09
T o k , Tyler, Jasper, Newton, Orange, Jefferson, Chambers, Hardin and Liberty counties. 'Sabine, San Augustine, Shelby, Nacogdoches, Angeiina, Southern Cherokee counties. 3Houston, Trinity, San Jacinto, Walker, Montgomery, Harris counties.
for reasons that remain unclear, Although recent aerial photographs suggest that these counties have less susceptible host type a t present, they have his- torically supported high beetle populations. In these areas, SPB infestations were observed in certain plantations less than 15 years of age or in pine poc- kets located in primarily hardwood stands of the Big Thicket National Presewe. Perhaps more con- sideration should be given to the poorly drained bot- tomland sites and young pine plantations that prevail in these areas in assigning future hazard ratings.
A post-season evaluation of 1984 ground check information from the outbreak area of Sabine, Walk- er, San Jacinto, and Houston counties was con- ducted to compare the spot size distribution for all grid bloeks rated as high and extreme risk with that for interspersed grid blocks rated low and very low 1Tisk. RaultS (fig. 2) reveal that only 15 percent of a11 spots in extreme- and high-fisk grid blocks were inactive (vacated by beetles) a t the time of ground check, while 18 percent were larger than 50 active (cumendty infested) trees. In contrast, 38 percent of spots in grid blocks rated as lorn or very low risk in the
The distribution of spots per spot size category proved to be significantly different by Chi square analysis (x2 = 146.4, P < 0.01) between the two risk categories. Clearly, then, both the frequency of occurrence and severity of beetle infestations were found to be greatest in those grid bloeks singled out as extreme or high risk prior to the 1984 beetle season.
The hazard- and ~sk-rat ing system described herein represented the first successful at tempt to monitor changes in SPB habitat conditions over ~ d e areas and to predict corresponding shifts in beetle infestation patterns, The close correlation between hcst abundance and outbreak populations of south- ern pine beetle emphasizes the importance of the host factor in beetle population d y n a ~ e s (Blanche et al. 1983) Although individual forest stands can be rated for hazard based on existing sitelstand con&- tions (Belanger et al. 1981, Mason, et 21. 1983), the
slme counties were reported to be inactive at ground actual risk of beetle infestation in any given year will check and only 10 percent exceeded 50 trees in size. be influenced by many additional factors (Paine et
230
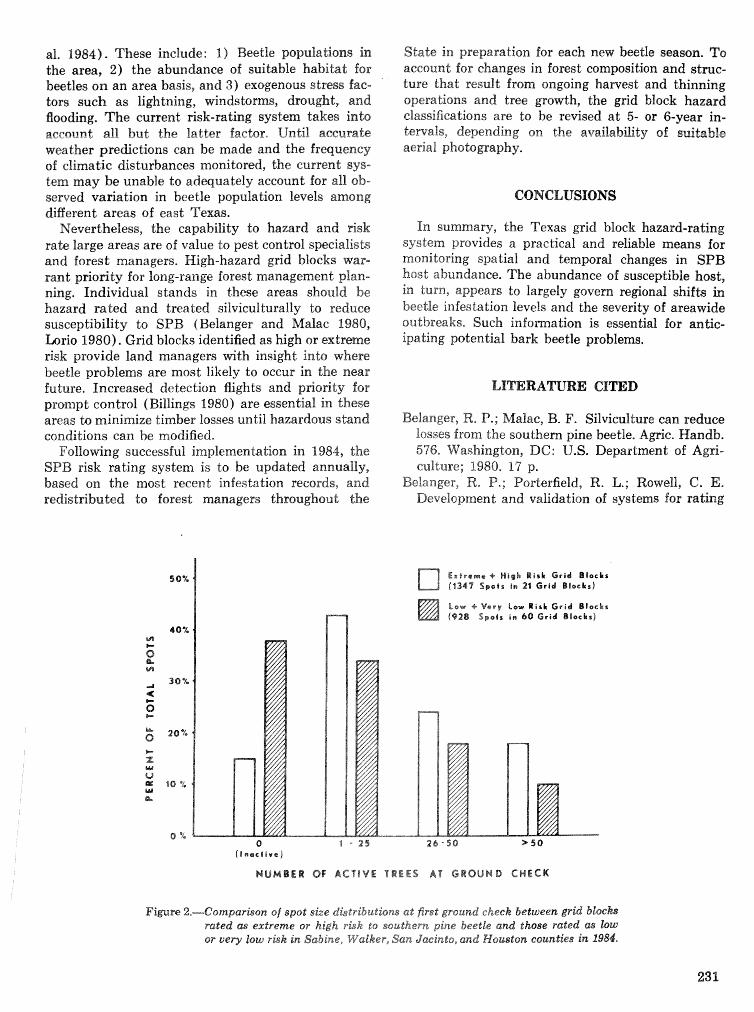
al. 1984). These include: I) Beetle populations in the area, 2) the abundance of suitable habikt for beetles on an area basis, and 3) exogenous stress fac- tors such as lightning, windstoms, drought, and flooding, The current risk-rating system takes into account all but the latter factor* Until accurate weather predictions can be made and the frequency of climatic distuhances monitored, &he current sys- tem may be unable to adequately account for all ob- served vadation in beetle population levels among diaFerent areas of east Texas.
Nevertheless, the capability to hazard and risk rate large areas are of value to pest control speeialisl-ls and forest managers. High-hazard grid blocks war- rant priorpity for long-range forest management plan- ning, Individual stands in these areas should be hazard rated and treated silvicul turally to reduce ~usceptibility to SPB (Belanger and Malac 1980, h r i o 1980). Grid blocks identified as high or extreme? risk provide land managers d t h insight into where beetle problems are most likely to occur in the near future, Increased detection Aights and priokty for prompt control (Billings 1980) are essential in these areas to minimize timber losses until hazardous stand eondi&ions can be modified.
F s l ' l o ~ n g successful implementation in 1984, the SPB risk rating system is to be updated annually, based on the most recent infestation records, and redistributed to forest managers throughout the
State in preparation for each new beetle season. To account for changes in forest composition and stmc- ture that result from ongoing harvest and thinning aperat-ions and tree growth, the grid block hazard classifications are to be revised a t 5- or 6-year in- tervals, depending on the availabitity of suitable aerial pholography.
CONCLUSIONS
In summary, the Texas grid block hazard-rating system provides a practical and reliable means for monitoring spatial and temporal changes in SPB host abundance. The abundance of susceptible host, in turn, appears to largely govern regional shifts in beetle infestation levels and the severity of areawide outbreaks. Such information is essential for antie- ipating potential bark beetle problems.
Betanger, R. P.; Malac, B. F. Silviculture can reduce losses from the southern pine beetle. Agric. Handb. 576, Washington, DC: U.S. Department of Agri- culture; 1980. 17 p,
Belanger, R* P.; Porterfield, It, L.; Rowell, 6, E. Development and validation of systems for rating
E x t r e m e + HigL Risk Grid Blocks (8347 %pols in 21 Grid Blocks)
b e w + Very Law Risk Grid Blecbs (928 Spots i n 60 Grid Blacks)
NUMBER Of MCBlVE T W L L S A T GROUND CHECK
Fimre 2.-Comparhon of spot size dktributiom at first ground cheek between grid blocks rated f ~ 4 extreme or high risk to southern pine beetle and those rated as EQW or very low r b k in Sabine, Walker, Sari Jwinto, and N O U E T ~ Q P ~ C O I L P L $ ~ ~ L ? in 1984,
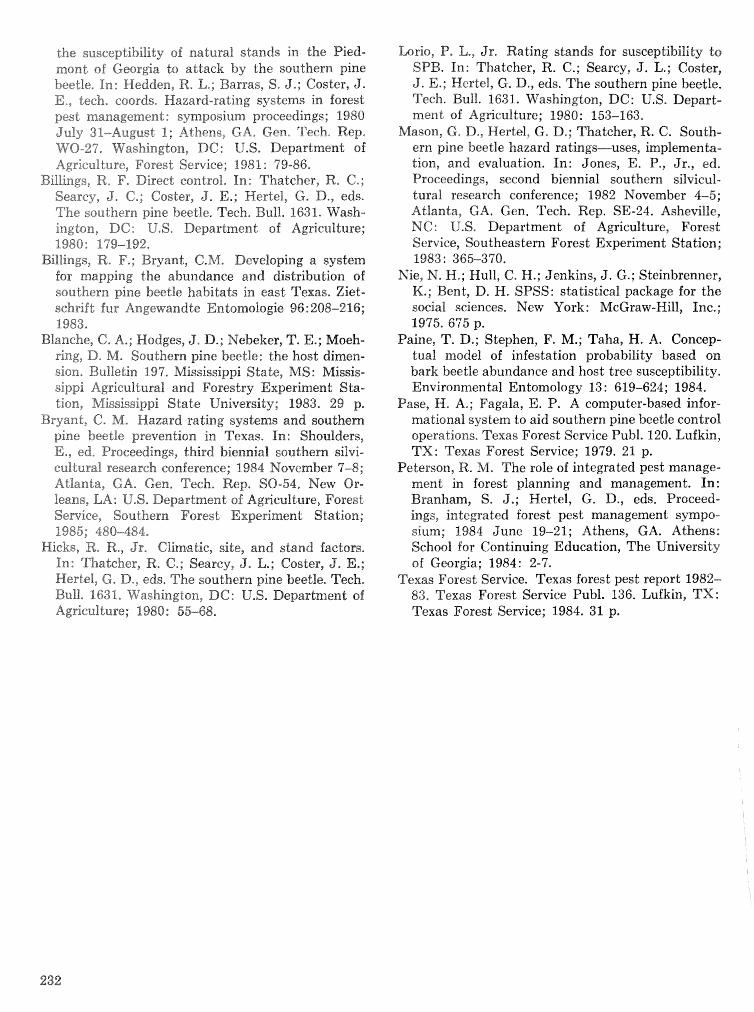
the susceptibility of natural stands in the Pied- mont of Georgia to attack by the southern pine beetle, In: Hedden, R, L,; Barras, $. J.; Caster, J. E,, tech, casrds, Hazard-rating systems in forest pest management: symposium proceedings; 1980 July "3B-A~wsic 1; Athens, GA, Cen, T P ~ X Rep. WO-27, Washington, DC: U,S, Department of Agriculture, Forest Service; t 981 : 79-86,
BillingsB R. F, Direct control. In: Thatcher, R, C*; Seascy, J, C,; Goster, J. E,; Hertei, G. D., eds. The southern pine beetle, Tech. Bull, l633* &rash- irmgfon, DC: U,S. Department 0% Agriculture?; 1980: 179-192,
Eilings, R. F.; Bryant, @,&/I, Developing a system for mapping the abundance and distribution of southern pine beetle habitats in east Texas, Ziet- schriftfus Angewar-ldte Endornologic: 96 : 208-216; 1983.
Blanche, C, A,; Hodges, J. D*; Nebeker, T. E.; Moeh- ring, D, M. Southern pine beetle: the host dimen- sion* Bulletin. 197, Mississippi State, MS: Missis- sippi Agricultural and Forestry Experiment Sta- tiof?8, Mississippi State university; 1983. 29 p,
Bryant, C, k%, Hazard rating systems and southern pine beetle prevention in Texas, In: Shoulders, E,, ed, Proceedings, third biennial southern silvi- cultural research conference; 1984 November 7-8; Atlanta, GA. Gen. Tech, Rep, SO-54, New Or- leans, LA: U,S, Department of Agriculture, Forest Service, Southern Forest Experiment Station; 1985; 480-484,
Hicks, R. R., Jr, Climatic, site, and stand factors, In: Thatcher, R, 6.; Searey, J. L.; Coster, J. E,; Herte8, C. D., eds. The southern pine beetle. Tech, Bull, 1631, Washhgton, DC: U,S. Department of Agriculture; 1980: 55-68.
b r i o , P* lid-) J r* Rating stands for susceptibility ts SPB. In: Thatcher, R. C.; Searcy, J. L.; Coster, J. E.; Hertel, G. D., eds. The southern pine beetle. Tech, Bull. 1631. iVzishingdm, DC: tl.23, Dgzpart- ment of Agr-iculture; 1980: 153-163,
Mason, 6, D*, Herte1, G, D.; matcher, R. 6. South- ern pine beetle hazard ratings-uses, implemenh- tion, and evaluation. In: Jones, E, P,, Jr., ed, Proceedings, second biennial southern sitvieut- Lural research conference; 1982 November 4-5; Atlanta, GA. Gen, Tech, Rep. SE-24, Asheville, NC: U,S, Department of Agriculture, Forest Serbrice, Southeastern Forest Experiment Station; 1983: 365-370.
Nie, N. H,; Hull, C. H.; Jeakins, J. G.; Steinbrenner, K,; Bent, D, H. SPSS: statistical package for the swial sciences. New York: McCraw-Hill, Pnc,; 1975. 675 p.
Paine, T. D.; Stephen, F. M.; Taha, H. A. Concep- tual model of infestation probability based on bark beetle abundance and host tree susceptibility. Environmental Entomology 13: 619-624; 1984.
Pase, W, A.; Fagala, E. P. A computer-based infor- mational system to aid southern pine beetle con"crol operations, Texas Forest Service Publ. 120. Lufkin, TX: Texas Forest Service; 1979. 21 p.
Peterson, R. M. The role of integrated pest manage- ment in forest planning and management. In: Branham, S. J.; P-fertel, G. D., eds. Proceed- ings, integrated forest pest management sympo- sium; 1984 June 19-21; Athens, GA. Athens: School for Continuing Education, The University of Georgia; 1984: 2-7.
Texas Forest Service. Texas forest pest report 1982- 83, Texas Forest Service Publ. 136. Lufkin, TX: Texas Forest Service; 1984. 31 p.
Predicting Susceptibility to Southern Pine Beetle Attack in the Coastal Plain, Piedmont, and Southern Appalachians
Roy L. Hedden and Roger P. Belangerl
Abstract,-Logistk regression equations were de- veloped for predicting the probability of southern pine beetle infestation (risk) in the Gulf Coastal Plain, Southern Piedmont, and Southern Appala- chians, These models are applicable to undisturbed and dishrbed natural and planted pine stands. The models, modified to aceommtbdate varying levels of SPB population, are used to generate the probability of infestation per acre in the CLEMBEETLE simu- lation program. In addition, these models can be used in combination with some measure of spot growth (hazard) to provide estimates sf expected timber loss from southern pine beetle attack. This composite measure of expected loss furnishes more information to decisionmakers than either risk or hazard rating alone, Additional keywords: Risk rating, hazard rating, Dendroetonus frontalis Zimm,
The key to preventing forest pesQroblems is un- derstanding the closely associated pest, tree, and site factors that make a stand susceptible to attack. In recent years, systems have been developed using this relationship which easily and reliably determine where pest attacks are most likely to occur (Hedden et al, 1981). These systems are commonly known as risk- and/or hazard-rating systems.
Although the terns risk or hazard are often used interchangeably, they have distinct meanings. Risk can be defined as the probability of pest occurrence per unit area (acre, hectare, etc.). Risk is synony- mous with susceptibility. Hazard, on the other hand, is the degree to which damage is likely to occur once a pest becomes established, Hazard is also known as vulnerability. In this paper, we will primarily be con-
rned with susceptibiIity or risk. Numerous methods for predicting susceptibility
ave been developed for the southern pine beetle PB ) , Dendoc troaus f rontulis Zimmermann (Bill-
ngs and Bryant 1982, Daniels et al. 1979, Hicks I; sit, 1980, Mason et al, 1881, Mushmaul et al. 1979,
Lorio and Sommers 1980). hlost of these systems deal with undisturbed natural stands in a fairly
restricted geographical area such as a State, The single exception is the model developed by Kushmaul et al. (1979) for undisturbed natural stands in east Texas, Louisiana, and l\iifississippi. The models pre- sented in this paper are applicable to disturbed and undisturbed natural and planted stands for the broad geographical regions of the Gulf Coastal Plain, Southern P i ehon t , and Southern Appalachians,
PROCEDURES
Data Data for the development of the models came from
the Coordinated SiteiStand Project of the Expanded Southern Pine Beetle Research and Applications Pro- gram (ESPBEEAP) (Caster and Searcy 1981). Infor- mation for the Gulf Coastal Plain was obtained frorn plots in Arkansas, Texas, Louisiana, and Mississippi, The Piedmont data were obtained from Georgia, South Carolina, and North Carolina. The data for the Southern Appalachians were csllected in Rabun County, GA, primarily in the Chattahoochee Na- tional Forest. Detailed data vcTere collected on soil, site, and stand conditions on both SPB infested and baseline plots. A complete description of the variables measured on each plot can be found in Coster and Searcy (1981). Infested plots were randomly selected from aerial or ground surveys. The center of each plot was established a t or near the point where the SPB infestation began. Most infestations sampled were less than 3 months old, and no plots were estab- lished in infestations older than 1 year. Baseline plots were established either randomly or on a systematic grid in uninfested stands.
Preliminary Analysis
The first part sf the analysis deternixled which stand disturbance and landform variables were sig- nificantly related to SPB occurrence, This step was accomplished by comparing the frequency of infested and baseline plots for each disturbance category with the frequency of infested and baseline plots that had no h o r n disturbances. The hypothesis tested was that stands in which disturbances occurred had dif- ferent frequencies of baseline and infested plots than those in which disturbances did not occur. A statis- tical procedure suggested by Brlznden (1972) as
4 Respectively, Professor, Department of Forestry, Clernson University, Clemson, SG; and Principal Silviculturist, USBA illustrated by Everitt (1977) was used. Also, since Forest Service, Southeastern Forest Ex1,eriment Station, hazard- rating systems presently in use in the Coastal Athens, GA. Plain (Mason et al, 1981) classify landform as
ridge (upland fiat or ridge), bottom (flood plain, stream terrace, bay, or lower sfope), or other (side- slope or steep sidesispe), the adequacy of this sys- tem of cfassifieation was tested,
Logistic Remession
The models for predicting the probability of SPB infestation for each subregion were fitted using step- wise logistic regression (Afifi and Clark 2984). The computer program LOGIST was used in the anal~rsis ( Harref 1980), hfodel coegcients were estimated using the method of maximum likelihood, Variables were selected for entry in the model based upon the criteria of a significant (P < .05) increase in the like- lihood ratio statistic, Criteria for evaluating the ade- quancy of the models were the percentages of correct plot classification by infestation status (attacked or baseline).
The southwide data were stratified by geographical subregion with separate models being developed for the Piedmont, Coastal Plain, and Southern Appala- chians, Natural and planted stands as well as dis- turbed and undisturbed plots were combined for analysis, Interaction terms between independent vami- able were included where appropriate,
The unmodified logistic regression equations re- sulting from the analyses are of the form:
A p = B;(1 f EXP [Bo -I- BiXi]) (1) n
where p == the estimated probability of infestation
Bs == the constant
Bi = the estimated regression coefticients Xi =. the independent variables
EXP = the exponential e
The constant, Bo, can be modified to remove the eReet of separate sampling of the baseline and in- fested plod data (Reed et al, 19821, This modified constant can then be adjusted for digerent beetle population levels (Appendix).
RESULTS AND 1IC)ISGUSSION
Gulf Coastal Plain
The preliminary analysis showed that "che &s- turbance categories for which the frequency of base- line and infested plots was significantly different were logging activity within the previous year, severe ice and/or hail damage with over half of the stems af- fected, evident lightning strike, wind damage, and a miscelIaneous category of all other disturbances (table I), Plots with these occurrences were con- sidered disturbed in the development of the l o ~ s t i c regression model,
In addition to disturbance, SPB infestation pattern as related to landfoms was also detemined. The re- sults (table 2) show that there is no significant dif- ference between the ridge and bottom categories, but that the sideslope category is significantly different from the other two, This result may partially explain the digerenees in the results between the risk-rating system developed for Arkansas (Ku et al. 1980), which indicated that infested plots were more likely to occur on dry sites than were baseline plots, and for the lower Coastal Plain, which showed that infes- tations occur more often on wet, low-lying sites (Mason et al, 1980). However, in order to maintain consistency with other risk-rating systems (Mason et at. 1980, Billings and Bryant P982), the three broad landform characteristics were used in devefop- ing the logistic probability models,
The adjusted lo&stic regression model used for estimating the per acre probability of infestation is:
A p .= 1 - ( l / [ l + EXP (In (S/[1000-S]) -3.30534
+ .01336 TBA + '83870 LAND1 + 1.09323 LAND2 - 12,01177/AGE + 2.50895 P P - 1.23183 DIST i- .00225 TBA * BIST])
A where p == the estimated probability of infestation
per acre S = the number of SPB infestations per
1,000 acres of susceptible host type
Table 1. - Frequency of baseline and infested plots for the diffizrent disturbance categon'es (note that a plot may have more than one disturbance)
Disturbance category Baseline
No known disturbance Logging activity within
the previous ye id Logging activity more than
1 year ago Severe ice andlor hail
damage with over half the stems affected3
Ice mdior hail damage with less tbm half the stems affected
Fire within the previous year Fire more than a year ago Evidence of lightning st*e3 Chemical brush control
within the previous year Wind damage3 Other3
No.' percent2
730 47
Baseline No. "ereen?
'The number of occurrences. ZPercentap of total plots in the category that are atbacked or baseline.
3Distmbanees for which the frequency of attacked and b a w h e plots was si&icmtly different (P < .05) from the frequency for the ""no knom disturbance" crztegory .
Table 2, - Frequency o f h e l i n e and atteckedplots for the different data, and the nurnber of individual investigators in- Eandfirm categon'es volved in data collection, the overall perfamanee of
Landform c a e o r y A t t a d 4 Baseline
N o . Percent No.' Percent Ridge 1167 63 672 37 Bottom 358 65 189 35 Other 298 42 418 58
-
The number of occurrences. 2Percentage of total plots in the category that are attacked or baseline.
TBA =. total basal area per acre in square feet LAND1 = 1 if the lantdfom is a ridge, 0 otherwise LAND2 =I 1 if the landfom is a bottom, 0 other-
wise AGE == stand age in years
PP == proportion of pine in the stand as a ratio of pine basal area to total basal area
DIST == 1 if the stand is disturbed, 1 otherwise
This equation was derived from 1,363 baseline plots and 1,968 attacked plots. The unmodified con- stant, Bo, was -2.93801 (Appendix). The equa- tion classified all plots as infested or baseline a t a rate of 74 percent. Baseline plots were classified cor- rectly 65 percent of the time, whereas the percentage of correct classification for all attacked plots was 82 percent. This difference in correct classification rate between attacked and baseline plots is understand- able since some of the baseline (uninfested) plots should have characteristics associated with stands with high infestation probability. This trend of higher correct classification rate for infested plots was ob- served for all data combinations (table 3). In general, disturbed plots were correctly classified more often than undisturbed ones. Also, natural stands had a higher correct classification rate than did planted stands (table 3) . Given the geographical range of the
this model is excetlent, On the Coastal Blain, the probability of infestation
(B) increases as basat area (TBA), age, and percent pine increases (PP), P is higher for disturbed than undisturbed stands, and higher on ridges or bottoms than on sideslopes, The most interesting character- istic sf tbe model is the interaction between dis- turbance and total basal area, For values of TBA around 200 square feet per acre, P is the same for both disturbed and undisturbed stands, This inter- action suggests that overstocked stands may be suf- fering stresses equal to those present in a stand when a disturbance occurs, The implications sf this phe- nomenon are that high-density, severly averstoeked pine stands may be very susceptible to beetle &tack, even during periods of very low populations. Fur- themore, since the attack probability for disturbed and severely overstocked stands is nearly equal, these overdense stands may be reservoirs for beetles sirni- lar to lightning-struck trees,
The method of classifying plots as undisturbed or disturbed used for the Coastal Plain was also used for the Piedmont plots, However, a different l a d - form classification system was used: essentially, plots that occurred on steep sideslspes were identified separately f r m all other ptots. In general, plots on steep sideslopes bad a much higher frequency of in- festation than did those on other landfoms (Coster and Searcy 1981). In addition, attacked plots oe- curred on sites with higher than average clay eon- tents in the surface soil. (0-15 em of the soil surface) (Coster and Searcy 1981). Also, shortleaf pine was more susceptible to attack than loblolly or Virginia pine. Based on these characteristics, the following model was developed for natural and planted stands
Table 3. - Percent correct classifications for various groupings of the infested and baseline plots for the Gdf Coastal Pl&n
Plot combinaLions
All plots All undisturbed All d i s t u r w All natural stands All plantations Undistur'bed natural Disturbed natural Undisturbed plantations Disturbed plantations
Number of plots
3332 2288 1044 3097
229 2114 983 169 60
Cqrree t" Percent clms~l~eatrsn baseline Attacked All xllots
There were no disturbed baseline plots.
in the Piednnont:
A p =1-41/[1 i- EXP (In [S.'(l000 -- S)] +
2,00767 -- .44092 PTUPE -- .42045 MNT) i- .69601 STVPE -i- ,59000 DIST - ,08931 NRG + .00669 PSI) ] A
where p =I the estimated probability of infestation per acre
S = the rruaber of SPB infestations per 1,800 acres of susceptible host type
PTVPE .= --1 if shortleaf pine, 1 othemise LAND = --I if the landfom is steep sideslope, 1
otherwise STYPE == 1 if the clay content of the surface soil
is > 28 percent, -1 o t h e ~ s e DXST .= 1 if the stand is disturbed, -1 otherwise NRG = for natural stands, the radial growth
during the last 5 years in mm, for planted stands NRG == 0
PSI = for planted stands, the site index in feet for base age of 50 years, for natural stands PSI == 0.
This equation was derived from 193 baseline plots and 161 attacked plots. The unmodified csnnstant, Bo, was 1.82638 (Appendix).
For tho purposes of this model, NRG can be predicted f rom the following equation :
NRG 13,10012: + 2.41042 PTYPE - 0.01730 TBA -+ 169.833/AGE - 0.05094 DBH
where NRG = the radial growth in mm during the last 5 years for a natural stand
PTYBE =. -I if shortleaf pine, 1 otherwise TBA =. the total basal area per acre in
square feet AGE = the stand age in years DBH == the average diameter a t breast
height in inches
This equation has a coeficient of detemination (R2) off 0,48 and a standard error of es tha te (sY.x)
of 3-85. The site index equation for the planted stands
(PSI) is from Schumacher and Coile (1960) : LOG (srb -- LOG (HT) +- 6.528 ( ~ / A I -
~ai'so~ 1 where SI = the site index a t age 50
HT = the average height in feet of the dominant and c o d o ~ n a n t trees in the stand
A =. the current age of the stand in years LOG = the base 10 logarithm
The logistie regression model classified all plots as infested or- baseline at a rate of 13 percent. Baseline
dots were correctly classified 75 percent of the time, whereas the percentage of corrwt classifications for all attacked plots m s 78 percent, The results are somewhat similar to those obtained for the Coastal Plain with natural stands having a higher correct classification rate than planted ones, and disturbed plots having a higher correct classifica.tit\n rate than undisturbed plots* The overall perfomance of this model is good; however, it's developed on a much smaller and geographicall57 restricted data base than the Coastal Plain logistic regression model (354 versus 3,332 plots).
In contrast, the case for the Coastal Plain, the probability of infestation (ED) inn the Piedmont is much more closely related to site factor8 than stand characteristics such as stocking level and stand corn- position. Shortleaf pine growing in soils k d h high clay content on steep sideslopes is most susceptible to attack. This combination of species and site is also very conducive to the development of Iittlefeaf dis- ease of pine. The frequency of disturbance in the Piedmont appears to be lower than in the Coastal Plain; however, disturbed stands have a higher prob- ability of infestation than rmdisturbed stands.
Southern Appalachians
Preliminary analysis of the data indicated that diameter at breast; height, bark "elhickness, radial growth, percent pine, and species of pine were poten- tial variables for the development of models. The final model is applicable to shortleaf, Virginia, and pitch pine. White pine stands have a very Isw proba- bility of infestation and they are nomally only at- tacked when in mixture with one of the more sus- ceptible pine species.
The adjusted probability model for estimating the per acre probability of infestation is:
A p = 1 - ( l i [ l + EXES (Ira (S! [I0069 --- S]) --- 5.90 -
3.97 PPS 4- 2.14 LRG)] where p = the estimated probability per acre
S =: the number 06 SPB infestation per 1800 acres of susceptible host type
PPS == the proportion sf pine LRG -- In (radial growth in the last year's Q:
4- -5 This equation was derived from $7 infested and
40 baseline plots. The unmodified constant, Bs, is -5.74 (Appendix). The equation had an overall correct classification ate of 75 percent, Baseline plats were correctly classified 70 percent of the time while the rate for infested plots was 79 percent, The proba- bility of infestation decreases as radial growth in- creases and increases as the proportion of pine in the stand increases,
Using the Mde19
These models were originally developed for use in the CLEMBEETLE (Hedden 1985) simulation pro- gram. CLEMBEETLE requires the probability of an infestation per acre in order to generate the expected proportion sf the stand killed in a given year. The logistic functions, modified to accommodate varying levels of SPB populations, are ideally suited for this use,
The models can he used like other risk- or hazard- rating systems to allocate stands to risk classes such as low, medium, or high. Risk classes are defined in a manner analogous to that for discriminant models, Indeed, both systems have been modified for this purpose (Hedden and Karpinski 1983; Karpinski et stl, 1984, 1985; Karpinski and Hedden 19843, The Piedmont version of the model has been exten- sively tested and is now being operationally used by the States of South Carolina and Georgia, and by the USDA Forest Service, These modified systems combine the probability of spot occurrence (risk) with the potential for spot spread (hazard) to deter- mine the potential for loss. The potential loss value is used to assign priorities for cultural treatments such as thinning, han~esting and the like,
The fundamental assumption in logistic regression analysis is that Ira [p/ (1-p) is linearly related to the independent variables. No assumptions are made regarding the distribution of the X variables, In fact, one of the major advantages of this function is that the X variables map either be continuous or discrete (Afifi and Clark 1984). In contrast, linear diserirni- nant analysis assumes that the populations of interest have a multivariate nomal distribution and that the covariance matrix is the same for both populations,
However, for risk rating forest stands, the major advantage of the logistic model is the continuous probability scale. This allows stands to be ranked from lowest to highest in order of infestation prober- bility. This ranking provides more infomadion to the deeisionmder than does a classification of stands into a discrete number of risk or hazard elasses, In addition, when the decisionmaker bas an estimate of spot growth (hazard); is., the number of trees or volume of timber kilZed by the SPB in a, stand over a specified period of time, then the product of the infestation probability and the loss from spot growth expresses the expected loss (Hedden and Billings 1979, Reed et al. 1981). For example, assume that the probability of a pine stand being infested by the SBB in an outbreak year is .I, and that if a spot becomes established the estimated loss is 200
trees, then the expected loss per acre would be .I x 200 = 20 trees/acre. This figure is the average expected loss for the stand. In other words, 9 out of 10 stands with similar conditions would have 0 loss, whereas one stand would have 200 trees killed for an average loss sf 208 trees per stand $200 trees/ %O stands).
The combination of risk (susceptibility) and haz- ard (vulnerability) is a better measure sf expected loss to SPB than either factor by itself* Stands can be low piski high hazard, high riskilow hazard, as both ZOW or high riskihazard, Combinations of low or high risk and 10w or high hazard are especially
on in the Piedmont where the infestation is related primarily to the site factors and spot growth is related to stand density, In this region, a combina- tion of risk and hazard rating do express expected loss provides more usefud inrhsmadion to decision- makers in the long run than either factor alone,
LITERATURE CITED
Afifi, A, A,; Clark, V, Computer-aided multivariate analysis, Belmond, CA: Lifetime Learning Publica- Lions; 1984, 458 p.
Belanger, P.; Posterfield, R, L,; Roswell, C, E, De- velopment and validation sf systems for rating the susceptibility of natural stands in the Piedmont of Georgia to attack by the southern pine beetle* In: Hedden, R, L,; Barras, S, J.; Coster, J, E,, csords, Hazard-rating systems in. forest insect pest man- agement : symposium proceedings, 1980 July 3 1- August 1; Athens, GA, Gen, Tech, Rep, W0-27. Washington, ID@: U,S, Department of Agriculture, Forest Service; E 98 1 : 79---86,
Billhgs, Re F.; Bryant, C, M. Southern pine beetje field guide for hazard rating, prevention, and con- trol. Tex, For, Serv, Girc, 259, Lufkin, TX: Texas Forest Service; f 982, 24 p*
Brunden, hf, N. The andysis of non-independent 2 >< 2 tables using sank sums, Biomedsics 28: 603- 607; 1992.
Csster, J, E,; Searey, 14, E,, eds, Site, stand and host charaeterise;ics of s~UJ;hern pine beetle infest* diorss;, Tech. BdI. 1612, %rashington, DC: %IrT*S. Department of Agriculture; 1981, 115 p.
Daniels, R, F,; Leuschner, W, A,; Zarnsch, S. J.; Burkhart, H, E,; Hicks, R, R, A method of estimat- ing the probability of southern pine beetle out- breaks, FOP, Sci, 25:265-269; 4979,
Everitt, B. S. The analysis of contingency tables, London: Chapman and Hall; 297'1, 628 pa
Harrell, F. The LOGIST procedure, In: Reinhasdt, I$. S,, ed. SAS supplemental library user" guide, Cary, NC: SAS Institute, Tnc.; 1980; 83-102,
Hedden, R, L. Simulation of southern pine beetle asscoiated timber loss using CLEMBEETLE. f n : Branham, S, 9.; Thatcher, R. C., eds. Proceedings, i~~tegrated pest management research symposium; 1985 April 15-18; Asheville, NC, Gen, Tech, Rep. SO-56, New Orleans, LA: U.S, Department sf Agricuilture, Forest Service, Southern Foresf lx- periment Station; 1985: 288-291,
I-fedden, 12, L.; Billings, R. F, Southern. pine beetle: factors affecting the growth and decline of sum- mer infestations in east Texas. For, Sci. 25:547-- 556; 1979,
Hedden, R. L.; Karpinski, C, Estin~ating potential loss from the southern pine beetle, For. Pest Leafl, No. 8. Clemson, SC: Clemson University, Depart- ment of Forestry and Cooperative Extension Ser- vice; 1983.
Hedden, R. L.; Barras, S. J,; Coster, J. C,, eds. Hazard-rating systems in forest insect pest man- agement : symposium proceedings. 1980 July 3 f - August 1; Athens, GA. Gen, Tech, Rep, WO-2'9, 'bvashington, DC: U.S, Department of Agrierrlture, Forest Service; 1981. 169 p.
Hieks, R. R., Jr,; Watterston, K, 6.; Coster, el, E. Rating east Texas stands for susceptibility do southern pine beetle attack, South, J, Appl, For, 5: 7-10; 1980,
Karpinski, 6. ; Ham, I). L.; Hedden, R. L. Predicting potential loss to southern pine beetle in natural stands in the Piedmont. For. Pest LeaA, No. 11, Clemson, SC: Clemson University, Department of Forestry and Cooperative Extension Service; l%8.
Karpinski, C., Jr.; Hedden, R. L.; Eelanger, R. P,; Price, T, S. Guidelines for managing pine bark beetles in Georgia, Georgia For, Goman, Pub, 235-1, Macon, GA: Georgia Forestry Commission; 1984. 61 p.
Ku, T. T.; Sweeney, J. M.; Shelbourne, V, B, Site and stand conditions associated with southern pine beetle outbreaks in Arkansas-a hazard-rating sys- tem, South, J. Appl. For. 4: 103-106; '11980.
Kushmaul, R. J.; Cain, &I. PO.; Rowen, C. E,; Porter- Geld, R. L. Stand and site conditions related to sout;kern pine susceptibility. For, Sci, 25: 656-664; 1979,
Laria, P, L., Jr.; Sommers, R, A. Use sf available re- source data to rate stands for southern pine beetle risk, In: Hedden, R, L.; Barras, S. J.; Caster, 3. E., eds. Hazard-rating systems in forest insect pest management: symposium proceedings; 1980 July 31-August I; Athens, GA. Gen, Tech. Rep, WO-27, Washington, DC: V.S. Department of Agriculture, Forest Sewice; 1981.
Mason, G. N.; Hieks, Re R.; Bryant, C, &I., V,; Ma-thews, M. L.; Kulhavy, D. L.; Howard, J. E, Rating southern pine beetle hazard by aerial pho- togrnpby. In: Hedden, R. L.; Barras, S. J.; Coster, J. C., eds. Hazard-rating systems in forest insect pest management : symposium proceedings; 1980 July 31-August 1; Athens, GA. Gen. Tech, Rep. W0-27. %Vashington, DC : U.S. Department of Agriculture, Forest Semice; 1981.
Reed, D, I).; Hedden, R. L,; Daniels, R. F. Estimat- ing the annual probability of southern pine beetle outbreak. For. Sci. 28: 202-206; 1982.
Reed, 8, B.; Burkhart, El.; Leuschner, W. A,; Hed- den, R. L. A severity model for southern pine beetle infestations. For, Sci, 37: 290-296; 2981.
Sader, S, A.; hliller, W. F. Development of a risk rating system for southern pine beetle infestation in Gopiah County, MS, In: Shnmrohki, F., ed. Proceedings, remote sensing of earth resources, Talahoma, TN: University of Tennessee; 1976: 277-294.
APPENDIX
The unmodified logistic regression equations re- sulking from the analyses are of the fom:
p = lib1 -+ EX$ [I30 -t BiXif ) (1) where p -- the estimated probability of infestation
Bo - the constant Bi = the estimated regression coefficients Xi = the independent variables
EXP = the exponential e. The constant, Bo, is modified to removed the
effects of the separate sampling procedure used in collecting baseline and infested plot data (Reed et 81. 1982):
Bm -- E3o - In (n~ina) (2) where Bm == the modified constant
t ? l ~ = the number of attacked plots used in developing the model
n2 -- the number of baseline plots used in developing the model
In -- the natural logrithrn Bm can then be adjusted for diResent beetle popu-
lation levels or stand conditions: Ba = Bm +- In ( N l j N 2 ) (3)
where Ba == the adjusted constant Bm --- the modified constant N2 = the number of uninfested stands or
acreage in the population of interest NI =. the total number of beetle infestations
or infested acreage in the population of N stands,
The adjusted constant, Ba, is substituted for E3a in equation 6 1 1. The resulting probabilities will be absolute in the sense that they represent the speci- fied beetle populadian levels and stand conditions.
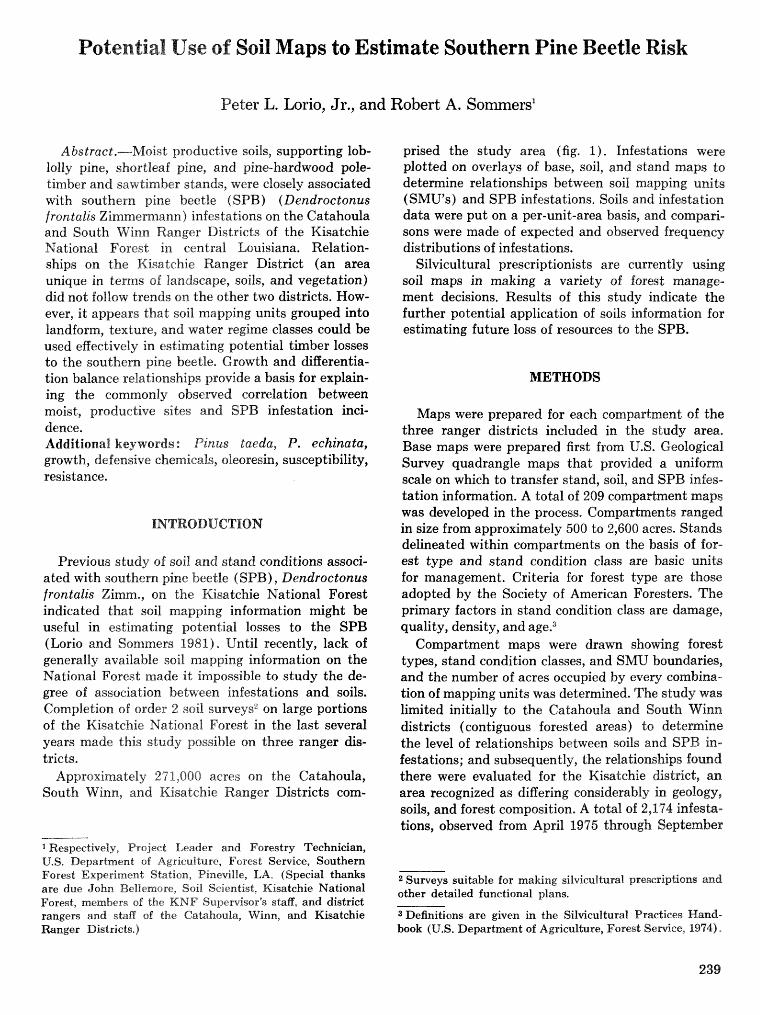
Potential Use of Soil Maps to Estimate Southern Pine Beetle Risk
Peter L. Lorio, Jr., and Robert A. Sommers'
A bs tract.-Moist productive soils, supporting lob- lolly pine, shortleaf pine, and pine-hardwood pole- timber and sawtimber stands, were closely associated with southern pine beetle ( SPB ) (Dendroe tonus fron talts Zirnmemmann) infestations on the Catahoula and South Winn Ranger Districts of the Kisatchie National Forest in central Louisiana, Relation- ships on the Kisatchie Ranger District (an area unique in terns sf landscape, soils, and vegetation) did not follow trends on the other two districts. How- ever, it appears that soil mapping units grouped into landform, texture, and water regime classes could be used eBective1y in estimating potential timber losses to the southern pine beetle. Growth and differentia- tion balance relationships provide a basis for explain- ing the commonly observed correlation between
prised the study area (fig. 1). Infestations were plotted on overlays of base, soil, and stand maps do determine relationships between soil mapping units (SMU's) and SPB infestations. Soils and infestation data were put on a per-unit-area basis, and compari- sons were made of expected and observed frequency distributions of infestations.
Silvicultural prescriptionists are currently using soil maps in making a variety of forest manage- ment decisions. Results of this study indicate the further potential application of soils information for estimating future loss of resources to the SPB.
METHODS
moist, productive sites and SPB infestation inci- Maps were prepared for each compartment of the dence. three ranger districts included in the study area, Additional keywords: Pinus taeda, 2'- echinata, Base maps were prepared first from U.S. Geological growth, defensive chemicals, oleoresin, susceptibility, Survey quadrangle maps that provided a uniform resistance. scale on which to transfer stand, soil, and SPB infes-
tation information. A total of 209 compartment maps
Previous study of soil and stand conditions associ- ated with southern pine beetle (SPB), Dendroctonus frontalis Zimm., on the Kisatchie National Forest indicated that soil mapping information might be useful in estimating potential losses to the SPB (Lorio and Sommers 1981). Until recently, lack of generally available soil mapping information on the National Forest made i t impossible to study the de- gree of association between infestations and soils. Completion of order 2 soil surveysZ on large portions of the Kisatchie National Forest in the last several years made this study possible on three ranger dis-
was developed in the process. Compartments ranged in size from approximately 500 to 2,600 acres. Stands delineated within compartments on the basis of for- est type and stand condition class are basic units for management. Criteria for forest type are those adopted by the Society of American Foresters. The primary factors in stand condition class are damage, quality, density, and age.3
Compartment maps were drawn shovving forest types, stand condition classes, and SMU boundaries, and the number of acres occupied by evew combina- tion of mapping units was determined. The study was limited initially to the Catahoula and South Winn districts (contiguous forested areas) to deternine the level of relationships between soils and SPB in-
tricts. festations; and subsequently, the relationhips found Approximately 271,000 acres on the Catahoula, there were evaluated for the Kisatchie district, an
South Winn, and Kisakchie Ranger Districts corn- area recognized as differing considerably in geology, soils, and forest composition, A total of 2,174 infesta- tions, observed from April 1915 through September
'1 Respectively, Project Leader and Forestry Technician, U.S. Department of Agriculture, Forest Service, Southern Forest Experiment Station, Pinevilje. LA. (Special thanks , suitable for making silvicultural prescriptions and are due John Bellemore, Soil Scientist, Kisatchie National other detailed functional plans. Forest, members of the KNF Supervisor's staff, and district rangers and staff of the Gatahoula, Winn, and Kisatchie 3 Definitions are given in the Silvicultural Practices Hand- %nger Districts.) book (U.S. Department of Agriculture, Forest S e ~ c t e , 1974) -
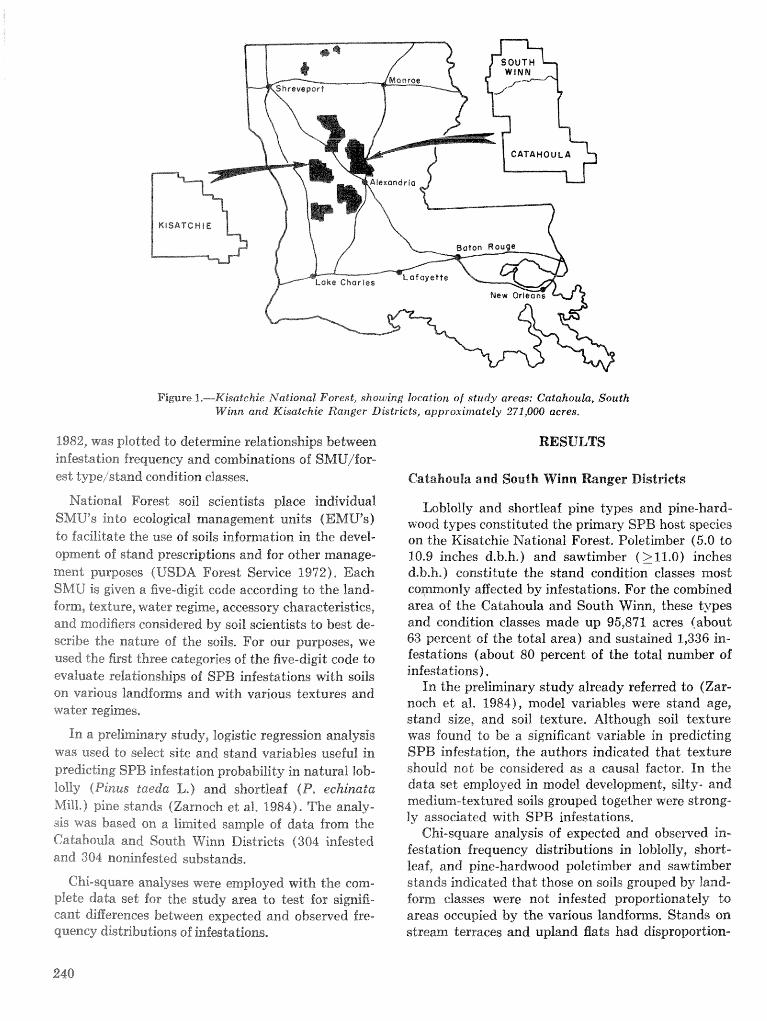
Fiwre 1.-K~atehie ili'adional Pores t, showing location of stuti'y areas: Catahoula, South Win, and Kisatchie Ranger Districts, approximately 271,000 acres.
1982,; was plotted to determine relationships between RESULTS infestation frequency and combinations of SMU/for- est typeistand condition elasses, Catakornla and South Winn Xtanger Districts
National Forest soil scientists place individual Loblolly and shortleaf pine types and pine-hard- SMU's into ecological management units (EMU'S) wood types constituted the primary SPB host species to facilitate the use of soils information in the devel- on the Kisatchie National Foreste Poletimber (5.0 to opmend sf stand preseriptims and for other manage- ment purposes (USDA Forest Service 1972), Each SMU is given a five-algit ccde according to the land- form, texture, ~ ~ a d e r regime, accessory characterislics, and modifiers considered by soil scientists to best de- scribe the nature of the soils, For our purposes, we used the first three categories of t h five-dg41 code to evaluate relationships of SPB infestations with soils on various landforms and with various textures and water regimes,
In a preliminary study, logistic regression analysis was used to select site and stand variables useful in predicting SPB irafestcztiun probability in natural lob- Iolly (Pinus tueda L,) and shortleaf (&". echinata Mil%-) pine stands (Zarnoch et al, 1964). T h e analy- sis was based on a Iirnited s a m e of data from the CatabouBa and South Wian Districts (304 infested and 304 noninfested substands.
Chi-square analyses were employed with the com- plete data set for the study area to test for signifi- cant differences bet-geen expected and observed fre- quency distribu"k_ions of infestations,
10.9 inches d.b.h.1 and sawtimber f >ll .0) inches d.b.h.) constitute the stand condition classes most commonly affected by infestations. For the combined area of the Gatahoula and South iVinn, these types and condition classes made up 95,871 acres (about 63 percent sf the total area) and sustained 1,336 in- festations (about 80 percent of the total number of infestations).
In the preliminary study already referred to (Zap- noch et al, 1984), model variables were stand age, stand size, and soil texture. Although soil texture was found to be a significant variable in predicting SPB infestation, the authors indicated that texture should not be considered as a causal factor. In the data set employed in model development, silty - and medium-textured soils grouped together were sdrong- ly associated with SPB infestations,
Chi-square analysis of expected and obsellved in- festation frequency distributions in loblolly, short- leaf, and pine-hardwood poletimber and sawtimber stands indicated that those on soils grouped by land- f o m classes were not infested proportionately to areas occupied by the various fandfoms. Stands on stream terraces and upland fiats had disproportion-
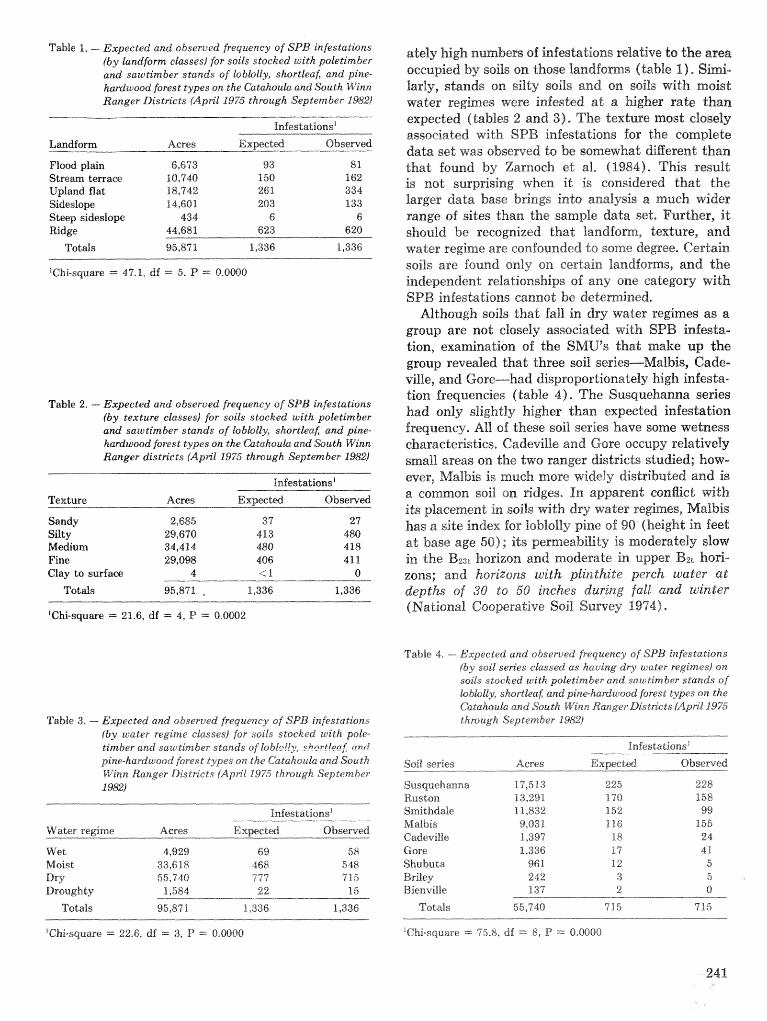
Table 1. - Expected and observed freqwncy of SPB infestations (by landform classed for soils stocked u i th poletimber and sawtimber stands sf lobbllgt, shortlea$ and pine- ftapdwaod forest dypes on the a tahouk aand ;South Winn Ranger Dfstdcts fAprZ:E 1975 through Sep tern ber 2982)
Infestations"
Landform Acres E xpeetcxt (Pbsemed
Flood plain 6,673 93 81 S t r e m terrae f 0,740 150 162 Upland fiat 18,742 261 334 Sideslope 14,661 203 133 Steep sideslope 434 6 6 Ridge 44,681 623 620
Totals 95,811 1,336 1,336
'Chi-squa;-e = 41.1, df -- 5, P =-: 0.0000
Table 2. - Expected and observed frequncy of SPB infestations (by texture elasses) for soils stocked with poletimber and saw timber stands of bblolly, shortkerzf; and pine- kcnsdwosd forest types on the Gatahouta; and ,%uth Winn Ranges distkets (Apn'l 1975 through September 1982)
Infestations1
Texture Acres Expect4 Bbsemed
Sandy 2,685 31 27 Silty 29,670 413 480 Medium 34,414 480 418 Fine 29,098 406 41 1 Clay to surfam 4 < 1 0
Totds 95,851. , 1,336 1,336
'Chi-square = 21.6, df = 4, P = 8,0W2
Table 3. - Expected and observed frequency of SPB infestations (by water regime classesj for soils stocked with psle- kimber and s a ~ timber sLands of kobk!!;~, shnrflonf: rind pine-lzard~ood firest types OPZ the Ga~"dhouIa and South Winn Ranger D i s t ~ c t s (April 1975 through September 19821
Infestations'
Water regime Aeres Expctesd Observed
Wet 4,928 69 58 Moist 33,618 468 548 Dr3" 55,140 777 7 15 Droughty 1,584 2 2 15
Totals 95,871 1,336 1,336
ICbi-square = 22.6, df = 3, 27 =: O.Q000
ately high numbers of infestations relative ts %E.le area occupied by soils on those landfsms (LakIe 1 ) , Sid- larIy, stands on silty soils and 012. soils with moist w t e r regimes were infested at a higher rate than expected (tables 2 and 3), The texture most cfosely associated with SPB infestations for the complete data set was observed Lo be somewhat diEereurt than that found by Zamoclrz. et af, (1984). This result is not surprising when it is considered that the larger data base brings into analysis a much wider range of sites than the sample data set, Further, i d should be recognized that, landfom, texture, and water regime are confounded to some degree. Certain soils are found only ~m certain landforms, and the independent relationships sf any one category with SPB infestations cannot be determined.
Although soils that fall in dry water regimes as a group are not closely associated with SPB iuafestta- tion, examination of the SMU's that make up the group revealed f iat three soil! series---Malbis, Cade-
had disproportionately high infesta- tion frequencies (table 41, The Srasquehanna series had only slightly higher than expected infestation frequency, All of these soil series have some wetness characteristics, Gadevifle and Gore occupy relsatllvely small areas on the k-vvo ranger districts studied; how- ever, kfalbis is much more widely distributed and is a common soil on ridges, BPI apparent conflict with ids placement in soils with dry water regimes, Malbis has a site index for lobtolly pine of 90 (height in feet ad base age 50); its permeability is moderately slow in the B23t horizon and moderate in upper B2t hod- zons; and horizons with plinthtie perch water at depths of 30 to 50 inches &ring fa7ill and winter (National Cooperative Soil Survey 1974).
Table 4. - Expected and observed frequency of SPB infccs tations (by soil series clased as having dry water regimes) on sods stocked with poletimber and sawtimber stands of bbio"oky* shsrl-leat and pine-hadwood forest types on tho Catahoula and South Win;% R a n ~ r Dis t~c ts (April 1975 through September f 982)
Soil series
Susqvehanna Ruston Smithdde Mdbis Cadevilhe Gore Shubuta Bri lq Bienvilte
Aeres
17,513 13,293: 11,832 9,03 1 1,391 1,336
96 l 242 137
Infestations'
Expet& Obsewed
225 228 3.70 158 152 99 116 155 18 24 I? 4 1 12 5 3 5 2 0
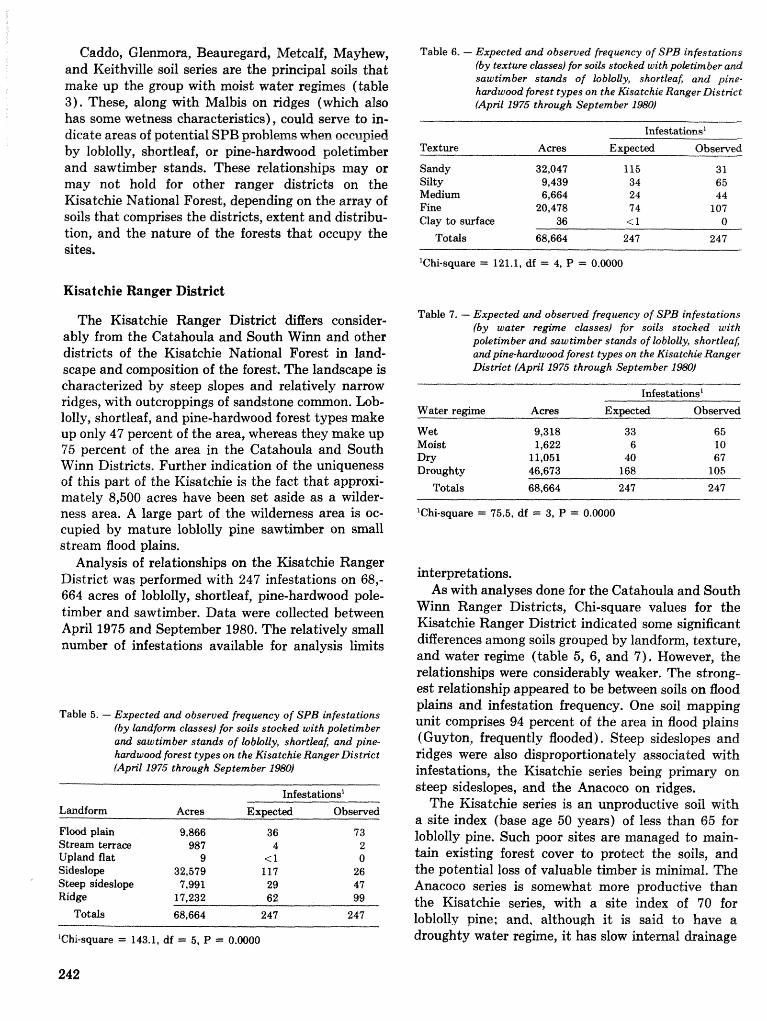
Caddo, Glemora, Beauregard, Metcalf, Mayhew, and Keithville soil series are the principal soils that make up the s o u p *th moist water regimes (table 3). These, along Pvitht MaZbis on ridges (which also has some wetness charackristics), could serve to in- dicate areas of paterrtial SPB problems when occupied by loblolly, shortleaf, or phe-hardwood polethber and sawtimber stands, These relationafiipa may or may not hold for other ranger districts on the Esatchie National Forest, depentfing on the array of soils that comprises the districts, extent and distribu- tion, and the nature of the forests that occupy the sites.
Kisatehie hnger Dktriet
The Ksatchie Ranger District differs consider- ably from the Catahoula and South Winn and other districts of the Kisatchie National Forest in land- scape and composition of the forest. The landscape is characterized by steep slopes and relatively narrow ridges, with outcroppings of sandstone common. h b - lolfy, shortleaf, and pine-hardwood forest types make up only 47 percent of the area, whereas they make up 75 percent of the area in the Catahoula and South Wifan Districts. Further indication of the uniqueness of this part of the Kisatchie is the fact that approxi- mately 8,500 acres have been set aside as a wilder- ness area. A large part of the wilderness area is oc- cupied by mature loblolly pine sawtimber on small stream flood plains.
Analysis of relationships on the Ksatchie Ranger District was performed with 247 infestations on 68,- 664 acres of loblolly, shortleaf, pine-hardwood pole- timber and sawtimber. Data were collected between April 19'75 and September 1980. The relatively small number of infestations available for analysis limits
Table 5. - Expected and obsemed Pequency of SPB infestations (by landfom classes) for soils stocked with poletimber and sawtim ber stands of tabtokly, shortleaf; and pine- hardwood forest types on, the Kisatchie Ranger Distn'ct [Aprik 1975 through September 1 W )
Flood plain Stream terra@ lipland flat Sidedope Steep sideslope Ridge
Totals
Infestations1 Acres Expected Obsenred
9,866 36 73 987 4 2
9 < l 0 32,579 117 26 7,991 29 47
17,232 62 99
68,664 247 247
'Chi-square = 143.1, df = 5, P = 0,0000
242
Table 6. - Elxpected and observed fieguency of SPE3 infestathas (by tezture c lass4 for soils stocked with poletr:nber and sawh'mber s t u d s of lobloUy, shortleaf; and pine-
wood forest types on the Kisatchie Rang-er District (April 2975 through September 19801
Infestations" Texture Acres Expect& Observeda -
Sandy 32,047 115 31 Silty 9,439 34 65 Medium 6,6fi4 24 44 Fine 20,478 7 4 107 Clay to surface 36 <1 0
Totds 68,664 247 247
Table 7. - LExpected and obsemed frequency of SPLB infestations (by water regime classes) for soils stocked with poletimber and saw timber stands of lob2olly, shortleafl and pine-hamlwmd forest types on the ki'satchie Ranger District (Apn'l1975 through September 1980)
Infestations" Water regime Acres Expected Obsetvd
Wet 9,318 33 65 Moist 1,622 6 10 Dry 11,051 40 67 Droughty 46,673 168 105
Totals 68,664 247 247
"hi-square = 75.5, df = 3, P = 0.0000
interpretations. As with analyses done for the Catahoula and South
Winn Ranger Districts, Chi-square values for the Kisatchie Ranger District indicated some significant differences among soils grouped by landform, texture, and water regime (table 5, 6, and 7). However, the relationships were considerably weaker. The strong- est relationship appeared to be between soils on flood plains and infestation frequency. One soil mapping unit comprises 94 percent of the area in flood plains (Guyton, frequently flooded). Steep sideslopes and ridges were also disproportionately associated with infestations, the Kisatchie series being primary on steep sideslopes, and the Anacoco on ridges.
The Kisatckie series is an unproductive soil vry-ith a site index (base age 50 years) of less than 65 for loblolly pine. Such poor sites are managed to main- tain existing forest cover to protect the soils, and the potential loss of valuable timber is minimlo The Anacoco series is somewhat more productive than the Kisatchie series, with a site index of 70 for loblolly pine; and, although it is said to have a droughty water regirne, it has slow internal drainage
and ~ e r c h e s water from December through April. Relationships with soil textural groups are so
broad as to be of little interpretive value; the same is true for water regime groups, where both wet and dry water regimes appear to be disproportionately associated with infestations.
In recent months, large infestations developed on flood plain areas in the Kisatchie Hills Wilder- ness Area of the Kisatchie Ranger District where the Guyton (frequently flooded) SMU prevails. Sev- eral hundred acres of mature and maturing loblolly stands were infested and, over time, infestations developed on slopes and ridges surrounding the flood plains.
The results of this study of the relationships of soil mapping units with SPB incidence indicate the potential application of such soils information in developing risk or hazard estimates of future SPB infestation. Further, they again emphasize relationships between site characteristics and SPB infestations frequently reported for the West Gulf Coastal Plain (Lorio 1968, 1978, 1980; Lorio and Bennett 1974; Lorio and Sommers 1981; Kush- maul and Cain 1981), which indicate that moist or wet productive sites are commonly associated with SPB infestations. Studies by Hicks et al. (1981) in eastern Texas and Ku et al. (1981) in southern Arkansas, which were conducted during outbreaks, indicate a somewhat lower site quality associated with SPB infestations. However, if one accepts that a relationship does exist between site productivity and the potential development of SPB infestations, a question remains as to its nature or possible cause.
We would like to offer a proposed explanation here for a close relationship between moist, produc- tive sites and SPB infestations based on the con- cept of growth-differentiation balance (Loomis 1932, 1953; Lorio and Hodges 1985). Photosynthates are partitioned among growth and differentiation pro- cesses a t least partly in response to environmental influences, and Loornis and Croteau (1980) suggest that the synthesis, storage, and catabolism of mono- terpenes are controlled by growth-differentiation balance.
A study by Lorio and Hodges (19'71) indicates how growth and differentation balance relation- ships probably are related to SPB infestation in- cidence and site characteristics in the West Gulf Coastal Plain. For example, fast-growing loblolly pines on a wet, productive site in southwest L o ~ s i -
ana experienced internittent severe water deficits during two growing seasons, and relatively slow- growing pines on slightly elevated, drier, better drained mounds were less affected. In this example, stem diameter growth on the intermound site con- tinued a t a very fast rate up to 2 months Xanger than on the mound. Under these conditions, the supply of carbohydrates available to produce de- fensive chemicals such as oleoresins (monoterpenes and resin acids) would be limited because of the demand by the growth process. In effect, the pro- longed period of fast growth on intermound sites provided an extended length of time during which such trees would be relatively less resistant to SPB attack than their neighbors on mounds. Further, pines on these sites demonstrated strong growth responses to intermittent rainfall in the mid- to late summer and tended to produce false rings with- in annual rings. Severe effects of water deficits in rnid- to late summer were evident in terns of re- duced oleoresin exudation pressure, cessation of diameter growth, and even shrinkage (Lorio and Hodges 1968, 1971). These responses were consis- tent with the nature of the root systems that de- veloped on such sites (Lorio et al. 1972).
Observations reported by Lorio (1968) and Thatcher (1971) indicate that SPB infestations tend to start on intermound areas in forest condi- tions in southeast Texas and central Louisiana similar to those described by Lorio and Hodges (1971), and Lorio et al. (1972). Pines on mounds either escape attack entirely, or are attacked later as infestations enlarge. Apart from excessive com- petition related to stocking, old age and root dis- ease effects, and various disturbances like lightning strikes, growth and differentiation balance rela- tionships provide a physiologically and biologically rational explanation for commonly observed SPB infestation tendencies. Particularly important to the initiation of new infestations in the spring (bfarcb through May) is the prolonged period of rapid growth that would make the general tree population on sites similar to those described especially sus- ceptible to SPB attack. Such conditions favor the potential success of attacking SPB populations that are said to disperse widely from falf-and-winter- initiated infestations (Thatcher 1971, 1974; Hed- den and Billings 1977; Billings and Kibbe 1978; Billings 1979; Payne 1980).
CONCLUSIONS
In a particular area, it appears quite feasible to develop relationships between soil mapping units
and SPB infestations and then use these relation- ships to identify potential future problem areas. This effort would require the further division of stands occupying several soil mapping units into substands occupying soils with common. characteristics, such as laxndfnrm~ tc.-xl-ure, and water regime- Clearly, however) the results for the Kisatcbie Ranger Dis- trict in Louisiana do not parallel those for the C a b h u l a and South Winn Districts, and illustrate the potential dificulties sf applying relationships in one forest area do other, apparently similar, areas without further evaluations,
In forests having landscapes and soils like those of the Gatahoula and South Winn Districts (with similar forest types and stand conditions), the potential risk of losses to SPB should be high in stands on stream terraces and upland flats that have silty-textured soils and moist water regimes. Wherever Aood plains (such as occur on the Kisat- chie) are occupied by maturing loblolly and short- leaf pine, the potential risk of loss to the SPB will be high, However, application of these relationships to other forest areas should be preceded by specific evaluations for the areas of interest.
Relationships between soils and SPB infestation incidence observed in this study and other studies in the $$rest Gulf Coastal Plain can be explained on the basis 06 growth and differentiation balance re- lationships, Prolonged rapid growth on moist, pro- ductive sides extends the period of high demand for photosynthates for growth processes and limits the potential synthesis of protective chemicals a t a time when SPB activity is high and many new infesta- tions are being initiated,
LITERATURE CITED
Billings, R,F, Detecting and aerially evaluating southern pine beetle outbreaks. South. J. Appl. For. 3: 50-54; 1979.
Billings, R.F.; Kibbe, A. Seasonal relationships be- tween southern pine beetle brood development and loFs&olly pine foliage color in east Texas. South- western Entomol, 3 (2) : 89-95; 1978,
Hedden, R.L,; BIEQIUings, R,F. Seasonal variations in fat content and size of the southern pine beetle in east Texas, Annals Entomol. Soc, Am. 70: 8'76- 880; 19197,
Hicks, R.R., Jr.; Watterston, K.G.; Coster, J.E.; and others, Gulf Costal iE3lain;eastern Texas. In: Costa, JX.; Searcy, J.L, eds. Site, stand, and host characteristics of southern pine beetle in- festations, Tech, Bull, 1612. RPashington, DG:
U.S, Department of Agriculture; 1981 : 13-15. Ku, T.T.; Sweeney, J.M.; Shelburne, V.B. Gulf
Coastal Plain 'southesmt Arkansas. In: Coster, J.E.; Searcy, J.L,, eds. Site, stand, and host char- acteristics of southern pine beetle infestations, Tech, Btllf, 7612, Washington, DC: US, Depart- ment of Agriculture; 1981: 16-22.
Kushmaul, RJ.; Cain, M.D, Gulf Coastal Plain/ southern Mississippi, Louisiana, and eastern Tex- as. In: Csster, J.E,; Searcy, J.L., eds, Site, stand, and host characteristics of southern pine beetle infestations. Tech, Bull, 1612. Washington, DC : U,S. Department of Agriculture; 1981: 4049,
Loomis, W.D.; Crodeart, R, Biochemistry of terpe- noids. In: Stumpf, P.K.; Gonn, E.E., eds. The bio- chemistry of plants (Vol, 4.). New York: Academic Press; 1980: 364-418.
Loomis, W.E. Growth-differentiation balance vs. car- bohydrate-nitrogen ratio. Proc. Am. Soc. Hort, Sci. 19: 240-245; 1932.
Loomis, W.E. Growth correlation, In : Loomis, W.E., ed. Growth and differentiation in plants. Ames, IA: Iowa State University Press; 1953: 197-217.
Lorio, P.L., Jr. Soil and stand conditions related to southern pine beetle activity in Hardin County, Texas. J. Econ. Entomol. 61: 565-566; 1968.
Lorio, P.L., Jr . Developing stand risk classes for the southern pine beetle. Res. Pap, SO-144. New Orleans, LA: US. Department of Agriculture, Forest Service, Southern Forest Experiment Sta- tion; 1978.9p.
Lorio, P.L., Jr. Loblolly pine stocking levels affect potential for southern pine beetle infestation. South. J. Appl. For. 4(4) : 262-165; 1980.
Lorio, P.L., Jr. ; Bennett, W.H, Recurring southern pine beetle infestations near Oakdale, Louisiana. Res. Pap. SO-95, New Orleans, LA: U.S. Depart- ment of Agriculture, Forest Service, Southern Forest Experiment Station; 1974: 6 p.
Lorio, P,L., Jr.; Hodges, d.D, Microsite effects sn oleoresin exudation pressure of large Zoblolly pines. Ecology 49 (6) : 1207-1210; 1968,
Loris, P.L., Jr.; Hodges, AD, Microrelief, soil mter regime, and loblolty pine growth on a wet, mounded site, Soil Sci, Sac, Am, Proc. 35: 795- 800; 1971,
Lorio, F".L,, Jr.; Hodges, J.D, Theories of interac- tions among bark beetles, associated microorgan- isms, and host trees, In: Shoulders, E., ed. Proceedings, third biennial southern silvieultural research conference; 1984 November 7-8; Atlanta, GA, Gen. Tech, Rep, SO-54. New Orleans, LA: U.S. Department of Agriculture, Forest Senriee, Southern Forest Experiment Station; 1985: 485- 492.
Lorio, P.L,, Jr.; Howe, V.K.; Martin, C.N. Loblolly pine rooking varies with microrelief on wet sites. Ecology 53: 1'134-1140; 1972.
LOGO, P,L., Jr,; Sommers, R.A. Gulf Coastal Plain/ central Louisiana. In : Coster, J.E.; Searcy, J.L., eds, Side, stand, and host characteristics of gouth- ern pine beetle infestations. Tech. Bull. 1612, Washington, DC : U.S. Department of Agricul- ture; 1981: 23-39.
Payne, T.L. Life history and habits. In: Thatcher, R.C.; and others, eds. The southern pine beetle. Tech, Bull. 1631, Washington, DC: U.S. Depart- ment of Agficulture; 1980: 7-28.
Thatcher, 12. C . Seasonal behavior of the southern pine beetle in centrai Louisiana. Auburn, AL: Auburn University; 1971. 102 p. [M.S. Thesis].
Thatcher, R. C. Past and present approaches to southern pine beetle, research-an overview. In:
Payne, T.L.; and others, eds. Southern pine beetle symposium; 19'74 kIarch 7-8; College Sdaltion, TX, College Station : Texas A&M University; 1974 : 8-11.
U.S. Department of Agriculture, Forest Service, Forest Sewrice handbook. Sec. 2471.1, R-8 (Sifvl- cultural practices handbook). Washington, DC: U.S. Department of Agriculture, Forest Senrice; 1974.
U.S. Department of Agriculhre, Forest Service. Soils southern region. Atlanta, GA:
U.S. Department of Agriculture, Forest Service, Southern Region; 1972. 48 p.
Zarnoch, S.J.; Lorio, P.E., Jr.; Sommers, R.A. A logistic model for southern pine beetle stand risk rating in central Louisiana. J. Georgia Entomol. SOC. 19 (2) : 168-175; 1984.
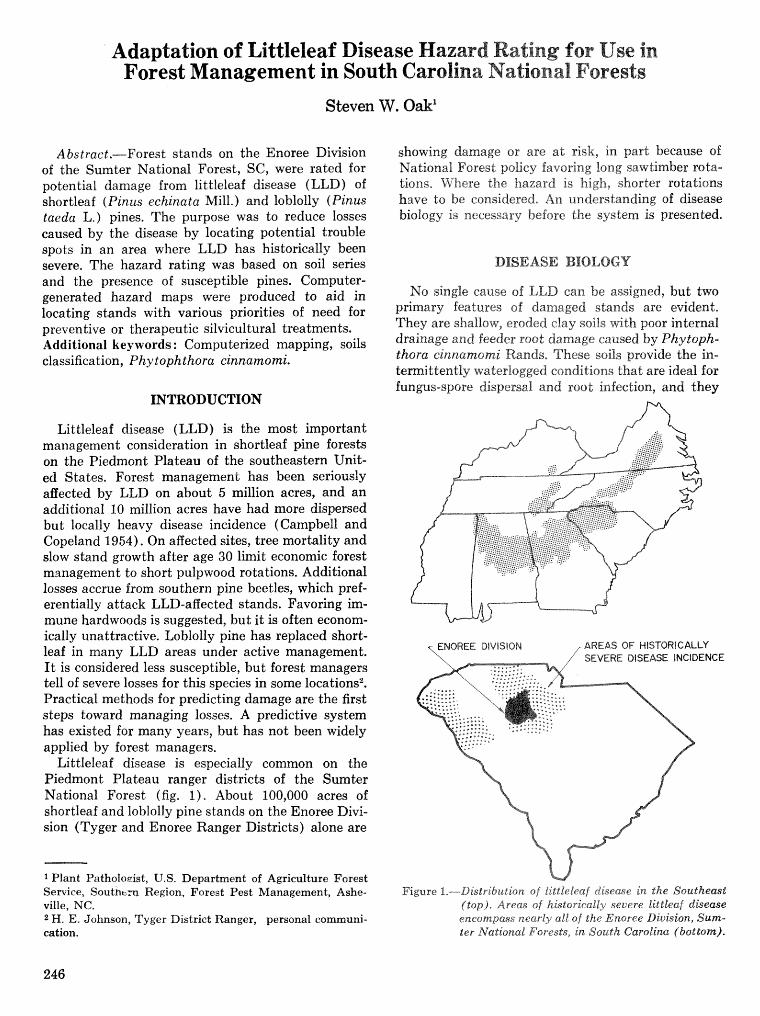
Adaptation of Littleleaf Disease Hazard Rating for Use in Forest Management in South Carolina National Forests
Abstract.-Forest stands on the Enoree Division of the Sumter National Forest, SC, were rated for potential damage from littleleaf disease (LLD) of shortleaf (Pinus echinata Mill,) and loblolly (Pinus taeda L.) pines. The purpose was to reduce losses caused by the disease by locating potential trouble spots in an area where LLD has historically been severe. The hazard rating was based on soil series and the presence of susceptible pines, Computer- generated hazard maps were produced to aid in locating stands with various priorities of need for preventive or therapeutic silvicultural treatments. Additional keywords: Computerized mapping, soils classification, Phy tophthora cinnamomi.
INTRODUCTION
Littleleaf disease (LLD) is the most important management consideration in shortleaf pine forests on the Piedmont Plateau of the southeastern Unit- ed States. Forest management has been seriously affected by LLD on about 5 million acres, and an additional 10 million acres have had more dispersed but locally heavy disease incidence (CampbeU and Copeland 1954). On affected sites, tree mortality and slow stand growth after age 30 limit economic forest management to short pulpwood rotations. Additional losses accrue from southern pine beetles, which pref- erentially attack LLD-affected stands. Favoring im- mune hardwoods is suggested, but it is often econorn- ically unattractive. Loblolly pine has replaced short- leaf in many LLD areas under active management. I t is considered less susceptible, but forest managers tell of severe losses for this species in some locations2. Practical methods for predicting damage are the first steps toward managing losses. A predictive system has existed far many years, but has not been widely applied by forest managers.
Littleleaf disease is especially common on the Piedmont Plateau ranger districts of the Sumter National Forest (fig, I ) , About 100,000 acres of shortleaf and loblolly pine stands on the Enoree Divi- sion (Tyger and Enoree Ranger Districts) alone are
1 Plant Patholoeist, U.S. Department of Agriculture Forest Service, Southex Region, Forest Pest Management, Ashe- ville, NC. 2 H. E. Johnson, Tyger District Ranger, personal communi- cation.
showing damage or are at risk, in part because of National Forest policy fa t io~ng long sa~vtimber rota- tions* FVhere the hazard i s high, shorter rotations have to be considered, An understanding of disease biology is necessary before the system is presented.
DISEASE BIOLOGY
No single cause of LLD can be assigned, but two primary features of damaged stands are evident. They are shallow, eroded clay soils with poor internal drainage and feeder soot damage caused by Phy toph- thora cinnamomi Rands, These soils provide the in- termittently waterlogged conditions that are ideal for fungus-spore dispersal and root infection, and they
T ENBREE DIVISION , AREAS OF W ISTORIGALLY
Figure 1.---Distribution of littleleaf disease in the Southeast ( top) . Arms sf histosieally severe liltleaf dkease encompass nearly aIE of the Enoree Diuision, Sum- ter LVational Forests, kt South Carolina (bot6om).
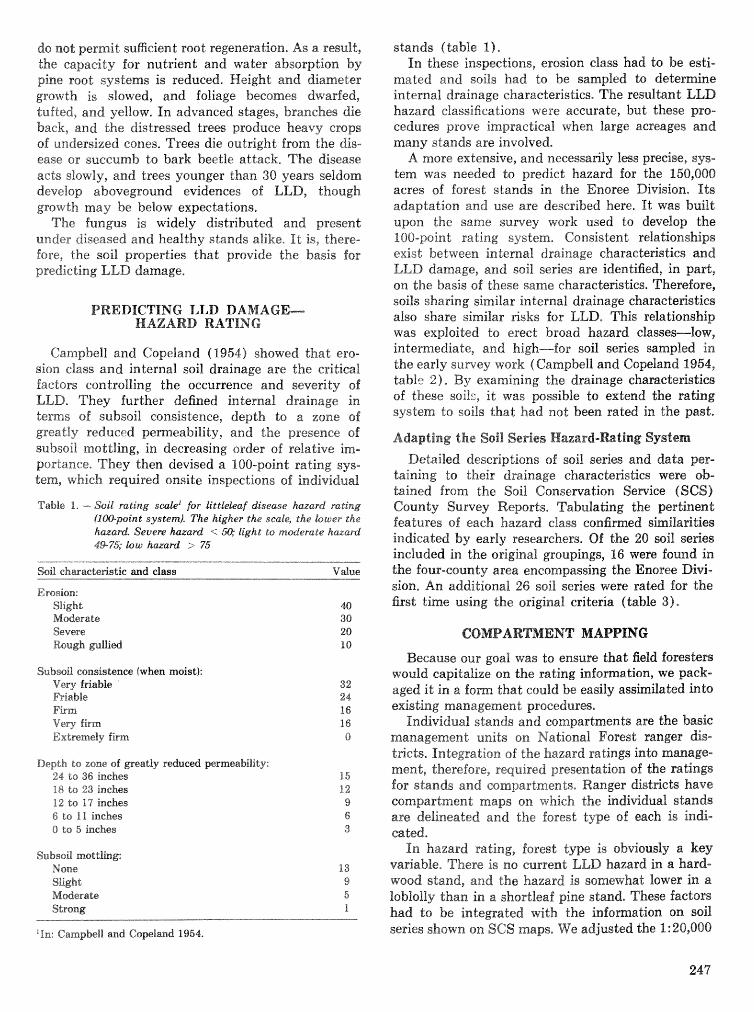
do nod permit sugcient root regeneration, As 6% result, the capa4ty for nutrient and water absorption. by pine root systems is reduced. Height and diameter growth is slowed, and foliage becomes dwarfed, tufted, and yellow, In advanced stages, branch- die back, and the distressed trees produce heavy craps of undersized cones. Trees die outright fmm the dis- ease or succumb to bark beetle attack, The disease acts slowly, and trees younger than 30 yeam seldom develop aboveground evidences of ELD, though growth may be below expectations,
The fungus is widely distributed and present under diseased and healthy stands alike, It is, there- fore, the soil properties that provide the basis for predicting LLD damage.
PRIEDICTlNG LLIl DAMAGE HAZARD RATING
Campbell and Gspeland (1954) showed that ero- sion class and internal soil drainage are the critical factors controlling the occurrence and severity of LLD. They further defined internal drainage in terms of subsoil consistence, depth to a zone of greatly reduced permeability, and the presence of subsoil mottling, in decreasing order of relative im- portance, They then devised a 100-point rating sys- tem, which required onsite inspections of individual
Tabfe 1. - Soil rating scale1 for littleleaf disease h s a r d rating (100-point system). "rhe higher the scale?, the lower the hazard Severe hazard < 50; light do moderate hazard 4475; taw hazard > 75
Soil eh~racl;eprist;ic and class Value
Erosicm; Sligb t M d e r a k %vere Rough $ulllied
Subsoil eonsisknce (when moist): V e v friable Friable Firm Very firm Extremely firm
Depth to zone of eeat ly r d u e d prmeability: 24 to 36 inches 18 to 23 inches 12 e~ 17 inches 6 do 11 inches O do 5 inches
Subsoil moldlhg: None SEghG: Mderate Strong
'In: Cmpbell a d Coplslnd 1954.
stands (table 1)' In these inspeetirsns, erosion class had to be esti-
mated and soils had to be sampled to dekrmhct internal: drainage characteristics. The resultant LLD hazard classifications were accurate, but these pro- cedures prove impnnctieal when large acreages and many stands are involved.
A more extensive, and necessarily less p ~ c i s e , sys- tem was needed to predict hazard for the 156,000 acres of forest stands in the Enoree Division. Its adaptation and use rase described here. I t was built u p n the same survey work used to develop the 180-point rating system, Consistent relationships exist between internal drainage characteristics and LLD damage, and soil series are identified, in part, on the basis of these same character?lsLics. Therefore, soils sharing similar internal drainage charactefistics also share similar ~ s k s for LLD, This relationship was exploited to erect broad hazard classes-low, intemediate, and high-for soil series sampled in the early survey work (Campbell and Copeland 1954, table 2). By examining the drainage characteristies of these soils, it was pmible to extend the rating system to soils that had not been ratedl in the past*
Adapting the Soil Series Hazard-Rating System Detailed descriptions of soil series and data per-
taining to their drainage characte~stics were ob- tained from the Soil Conservation Service (SCS) County Survey Reports, Tabulating the pertinent features of each hazard class confirmed similarities indicated by early researchers. Of the 28 soil s e ~ e s included in the original groupings, 16 were found in the four-county area encompassing the Enoree Divi- sion, An additional 26 soil series were rated for the first time using the original criteria (table 3),
COMPARTMENT MAPPING
Because our goal was to ensure that field foresters would eapitamize on the rating information, we pack- aged it in a f o m that could be easily assirmilated into existing management prscedurw.
Individual shnds and compartments are the basic management units on National Forest ranger dis- d ~ e t s . Integration sf the hazard rathgs into manage- ment, therefore, required presentation of the rrzrtings for stands a d compartments, Ranger dr;sstff.icls have cornpartrnent m p s on which the in&vidual stands are deli%te&ed and the forest type of each is in&- cated, In hazard mting, forest type i s oQviousIy a key
variable, There is no current LLD hazard in a hard- wood stand, and the hazard is somewhat lowel: in a lsbloly than ira a shortleaf pine stand. These factors had to be integrated with ehe information on soil series shown on SGS maps, We adjusted the 1: 20,0041
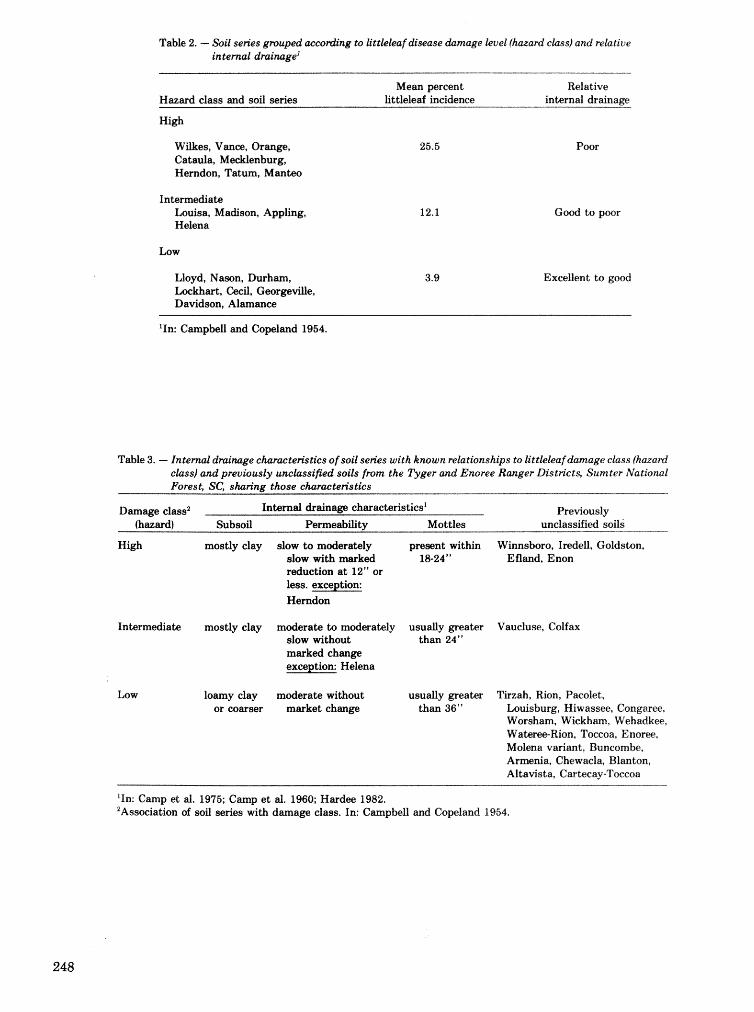
Table 2. - Soil series gmuped accodng to &ttikeleuf&seme d a m g e leuel [ h a r d chs) and reladive internal drainage"
Mean percent blat ive Hazard class and soil series fittieleaf -heiden= internal drainas
High
Willres, V a n e , Ormge, Cataula, MJleeklenburg, Hemdon, Tatum, Man&
Intermdate buisa , Madison, Appling, Helena
Low
Lloyd, Hason, Durham, Lockhart, Cecil, Georgeville, Davidson, Almance
25.5 Poor
12.1 Good to poor
3.9 Excellent to good
'In: Campkg and Copeland 1954.
Table 3. - Internat dntimge characteristics of soil series with known relationships to littleleaf damage class (hazard class) and previously tlnckssified soib from the Tyger and Enoree Ranger Distn'cts, Sumter National Forest, SC, sharing- those characteristics
Damage class2 Internal drainage characteristics' Previously (hazard) Subsoil Permeability Mottles unclassified soils
High mostly clay slow to moderately present within Winnsboro, Iredell, Goldston, slow with marked 18-24" Efland, Enon reduction at 12" or less. exception: Herndon
Intermediate mostly clay moderate to moderately usually greater Vaueluse, Colfax slow without than 24" marked change excention: Helena
Low loamy clay moderate without usually greater Tirzah, Rion, Pacolet, or coarser market change than 36'' Louisburg, Hiwasstte, Congaree,
Worsham, Wickham, Wehadkee, WaLereRion, Toecoa, Enore, Molena variant, Buncombe, Armenia, Chewaela, Blanton, Altavista, Carkcay-Toecoa
"n: Camp et d. 1975; Camp et d. 1960; Hardee 1982. 'Association of soil series with damage class. In: Capbel l and Copelruld 1954.
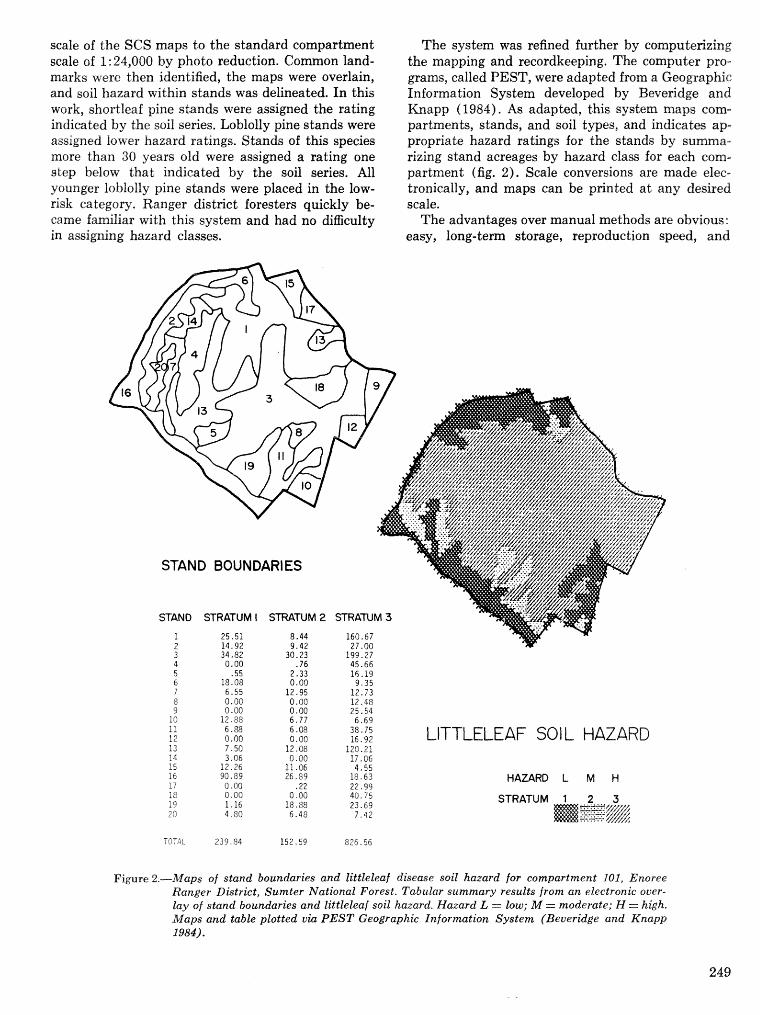
scale of the SCS maps to the standard compartment scale of 1 : 24,000 by photo reduction. Common land- marks were then identified, the maps were overlain, and soil hazard within stands was delineated. In this work, shortfeaf pine stands were assigned the rating indicated by the soil series, Loblolly pine stands were assigned lower hazard ratings, Sbnds of this species more than 30 years old were assigned a rating one step bdow that indicated by the soil series, All younger lobioily pine shnds were placed in the low- risk category. Ranger district foresters quickly be- came familiar with this system and had no difficulty in a s s ig~ng hazard classes.
The system was refined further by computerizing the mapping and recordkeeping. The computer pro- grams, called PEST, were adapted from a Geographic Information System developed by Beveridge and Knapp (1984). As adapted, this system maps eom- partments, stands, and soil types, and indicates ap- propriate hazard ratings for the stands by s rizing stand acreages by hazard class for each com- partment (fig. 2). Scale conversions are made elee- tronically, and maps can be printed at any desired scale.
The advantages over manual methods are obvious: easy, long-term storage, reproduction speed, and
STAND BOUNDARIES
STAND STRATUM I STRATUM 2 STRATUM 3
38.75 16.92 LITTLELEAF SO1 L HAZARD
HAZARD L M H
STRATUM 1 2 3
Figure 2.-Maps of stand boundaries and littleleaf disease soil hazard for compartment 102, Enoree Ranger District, Sumter National Forest. Tabular summary results from an electronic ocer- lay of stand boundaries and littleleaf soil hazard. Hazard fi = low; M = moderate; H = high. Maps and table plotted via PEST Geographic Information System (Beueridge and Knapp 1984).
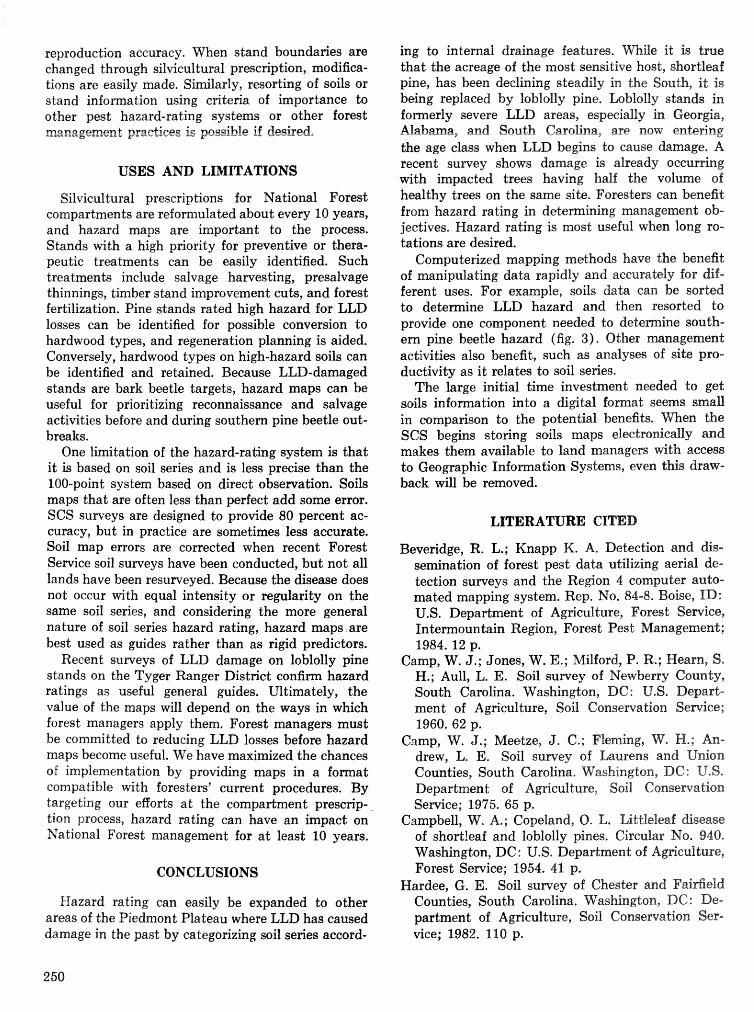
reproduction accuracy. When stand boundaries are changed through silvicultural prescription, modifica- tions are easily made. Similarly, resortiPlg of soils or stand infomation using criteria of importance to other pest hazard-rating systems or other forest managemerat practices is possible if desired*
USES AND LaITATIONS
Silvicultural prescrip~ons for National Forest compartments are refomulated about every 10 years, and hazard maps are important to the process* Stands with a high priority for preventive or thera- peutic treatments can be easily identified. Such treatmenh include salvage harvesting, presalvage thinnings, timber stand improvement cuts, and forest fertilization. Pine stands rated high hazard for LLD losses can be identified for possible conversion to hardwood types, and regeneration planning is aided. Conversely, hardwood types on high-hazard soils can be identified and retained. Because LLD-damaged stands are bark beetle targets, hazard maps can be useful for prioritizing reconnaissance and salvage activities before and during southern pine beetle out- breaks.
One limitation of the hazard-rating system is that it is based on soil series and is less precise than the 100-point system based on direct observation. Soils maps that are often less than perfect add some error. SCS surveys are designed to provide 80 percent ac- curacy, but in practice are sometimes less accurate. Soil map errors are corrected when recent Forest Service soil suweys have been conducted, but not all lands have been resurveyed. Because the disease does not occur with equal intensity or regularity on the same soil series, and considering the more general nature of soil series hazard rating, hazard maps are best used as guides rather than as rigid predictors.
Recent surveys of LLD damage on loblolly pine stands on the Tyger Ranger District confim hazard ratings as useful general guides. Ultimately, the value of the maps will depend on the ways in which forest managers apply them. Forest managem must be committed to reducing LLD losses before hazard maps become useful. We have maximized the chances of implementation by providing maps in a famat compatible with foresten' current procedures. By targeting our eBorLs at the cornpadent prescrip- tion pmeess, hazard rating can have an impact on National Forest management for a t least 10 years.
CONCLUSIONS
Hazard rating can easily be expanded to other areas of the Piedmont Plateau where LLD has caused damage in the past by categorizing soil series accord-
ing to internal drainage feiatur~, &%ile it is tme that the acreage of the most sensitive host, shortleaf pine, has been declining steadily in the South, it is being replaced by loblolfy pine, hblolly s h d s in fomerly severe LLD areas, especially in Geor~st, Alabma, and South Czarsllina, are now entering the age class when LLD begins to cause danzage, A recent suwey shows damage is already occurring with impacted trees having half the volume of healthy trees on the same site. Foresters a n benefit from hazard rating in detemining management ob- jedives. Hazard rating is most useful when long ro- tations are desired.
Computerized mapping methods have the benefit of manipulating data rapidl y and accurately for dif - ferent uses. For example, soils dab can be sorted to detemine LLD hazard and then resorted to provide one component needed to detemine south- ern pine beetle hazard (fig. 3). Other management activities also benefit, such as analyses of site pro- ductivity as it relates to soil series.
The large initial time investment needed to get soils information into a digital format seems smaU in comparison to the potential benefits. When the SCS begins storing soils maps electronically and makes them available to land managers tb"ith access to Geographic Information Systems, even this draw- back will be removed.
LITERATURE CITED
Beveridge, R. L.; Knapp K. A. Detection and dis- semination of forest pest data utilizing aerial de- tection surveys and the Region 4 computer auto- mated mapping system. Rep. No. 84-8. Boise, ID: U.S. Department of Agriculture, Forest Service, Inkmountain Region, Forest Pest Management; 1984.12 p.
Camp, W. J.; Jones, W. E.; Milford, P. R.; Heam, S. H.; Aull, L. E. Soil survey of Newberry County, South Carolina. Washington, DC: V.S. Bepart- ment of Agriculture, Soil Conservation Sewice; 1960.62 p.
Camp, W. J.; Meetze, J. C.; Fleming, W. H.; An- drew, L. E. Soil survey of bu rens and Union Counties, South Carolina. NTashington, DC : U.S. Department of Agriculture, Soil Consewatim Service; 1975. 65 p.
Campbell, W. A*; Gopeland, 0. L, I;itt%eleaf disease of shortleaf and loblolly pines. Circular No. 940. Washington, DC : U.S. Department of Agrjieuf ture, Forest Se~viee; 1954, 41 p,
Hardee, G. E. Soil survey of Chester and Fairfield Counties, South Carolina. FVasbington, LPC: De- partment of Agriculture, Soil Conservation Ser- vice; 1982. 110 p.
' ( p g 6 ~ d d v u x puv aiirp?~anag) w a ~ s A g uo?$wurrojup .n?qdvd8 -"a3 & g g d D?R palgold alqvl pzrv s d v m 'q8?jl~zi = H fa$vdapow = 14 fmo? = 1 PJWZDH ' p m -zvq ~ ? O S g d g p u ~ sa?dvpunoq puvgs l o A ~ l ~ a n o .n?uor$aapa uw wolf sllnsad Ldvwwns d q n q q 'pdvzvq ~ O S g d ~ a~npodd 02 r?pa)?do $uada;bl?p $u?sn paldosad a m (g ";J5C -lad) pdvzwy aszraqp /vala1$$?l Bzt?l$old u? pasn wlrtp SI?OS ')sa.rod 1vuo?;z.o~ .ia)wng "a?-i$e@ da8uwg aaarozrg "~07 ~ u a w l ~ v d u r o o do/ pdnzvq pas f g d g ) apaaq auld zldaqlnos puv sa?dvpunoq puvps fo sdvfir-.~ axn2;$
00'0 CE' IZ 56'02 PL ' OZ 0 5 - 0 2 S O ' S ? T 6 ' 1 36'6E 68'P 8 t P ' I T BZ ' ZT Z1.8 95.1 00'0 1 Z ' E Z 9Z" F Z9. fa.Lor
05*5T Bb' C Z E 6 ' C Z EP' 2 b6' LOT D S ' O T iZ'9T 86'10: 19.51 61 '617 E8.29
SL'E iE '9 '1 CS'EP io-lLl

SESSION III ANAGEMENT APPROACHES AND IPM SYSTEMS
Management Tactics
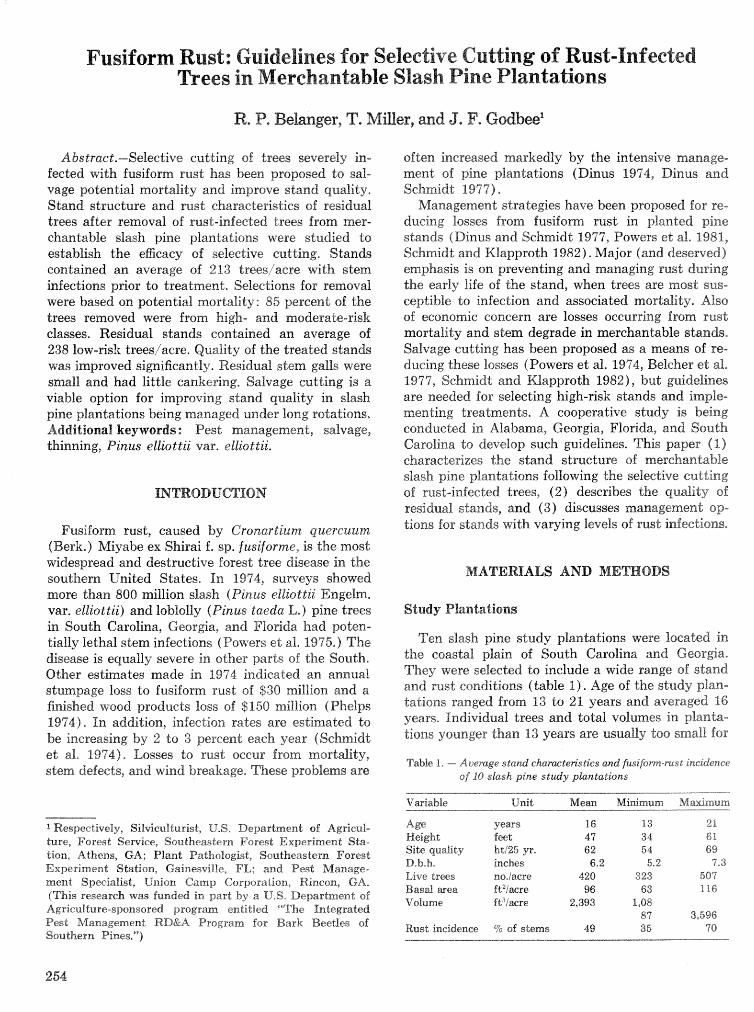
Fusiform Rust: Guidelines for Selective Cutting of Rust-Inf ected Trees in Merchantable Slash Pine Plantations
R. P. Belanger, T. Miller, and J. F. Godbee'
A bstract.-Selective cutting of trees severely in- fected with fusifom rust has been proposed t o sal- vage potential mortality and improve stand quality, Stand structure and rust characterisGics of residual trees after removal of rust-infected trees from mer- chantable slash pine plantations were studied to establish the eEcacy of selective cutting, Stands contained an average of 213 treesjaere ~ d h stem infections prior to treatment, Sellections for removal were based on potential mortality: 85 percent of the trees removed were from high- and moderate-risk classes. Residual stands contained an average of 238 low-risli treesiacre, Quality of the treated stands was improved significantly. Residual stem galls were smal and had little cankering. Salvage cutting is a viable option for improving stand quality in slash pine plantations being managed under long rotations. Additional keywords : Pest management, salvage, thinning, Pinus elliottii var, ell'iodtz'i.
Fusifom rust, caused by GronartEum quercruum (ISerk.) fcfiyabe ex Shirai f. ap. fusiforme, is the most widespread and destructive forest tree disease in the southern United States, In 1974, surveys showed more than 800 million slash (Pinus elliottii Engelm. var. elliottii) and loblolly (Pinus taeda L, ) pine trees in South Carolina, Georgia, and Florida had poten- tiafly lethal stem infections (Powers et al. 1935,) The disease is equally severe in other pards of the South* Other estimates made in 8974 indicated an annual stumpage loss to fusiform rust of $30 million and a finished wood products loss of $150 million (Phelps L9"ii%), In addition, infection rates are estimated to be increasing by 2 to 3 percent each year (Schmidt ed ale 1974). Losses to rust occur from mortality, stem defects, and wind breakage, These problems are
often increased markedly by the intensive manage- ment sf pine plantations (Dinus 1974, Dinus and Schmidt 1977)-
managem mend strate@es have been proposed for re- ducing losses from fusiform rust in planted pine stands (Dinus and Schmidt 1977, Powers ed al, 1981, Schmidt and Klapproth 1982). Major (and deserved) emphasis is on preventing and managing rust during the early life of the stand, when trees are most sus- ceptible to infection and associated morkality, Also of economic concern are losses occurring from rust mortality and stem degrade in merchantable stands, Salvage cutting has been prsposed as a means of re- ducing these losses (Powers et al. 1974, Belcher ed al* 1977, Schmidt and KJlapprotb 1982), but guidelines are needed for selecting high-risk stands rand imple- mending treatments, A cooperative study i s being conducted in Alabama, Georgia, Florida, and South Carolina to develop such guidelines. This paper (I) characterizes the stand structure of merchantable slash pine plantations following the selective cutting of rust-infected trees, (2) describes the qualiky sf residual stands, sand (3) discusses managemend sp- tions for stands with varying levels of rust infections,
MATERIALS AND METHODS
Study Plantations
Ten slash pine s h d y plantations were located in the coastal plain of South Carolina and Georgia, They were selected to include a wide range of stand and rust conditions (table 1). Age of the study plan- tations ranged from 13 to 21 years and averaged 16 years. Individual trees and total volumes in pBanta- tiaras younger than 13 years are usually too smdX for
Tabk P. ---- Average stand c h Q ! r a ~ k ~ s ~ c s and fusifom-rust incidence of I 0 slash pine study plantations
1 Respectively, SileeuBturist, U.S. Department of ibgrieu1- ture, Forest Service, Southeastern Forest Experiment Sta- tion, Athens, GA; Plant Pathologist, Southeastern Forest Experiment Station, Gainesville, FL: and Pest Manage- ment Specialist, Union Camp Corporation, Rineon, GA. (This research was hnded in part by a U.S. Department of Agriculture-sponsored program entitled ""The Integrated Pest h2anagemenf RD&A Program for Bark Beetlies of Southern Pines,"")
Vmiable Unit M e m Mikmlarn M&mum
Age yesrrs 16 13 21 Height feet 47 34 61 Site qudidy ht25 yr. 62 54 69 I3.b.h. inches 6.2 5.2 7.3 Live trees no.iacre 420 323 507 Basid mea ft2iacre 96 63 116 Volume fk'iacre 2,393 1,88
81 3,596 Rust incidence 5% of seems 49 35 '90
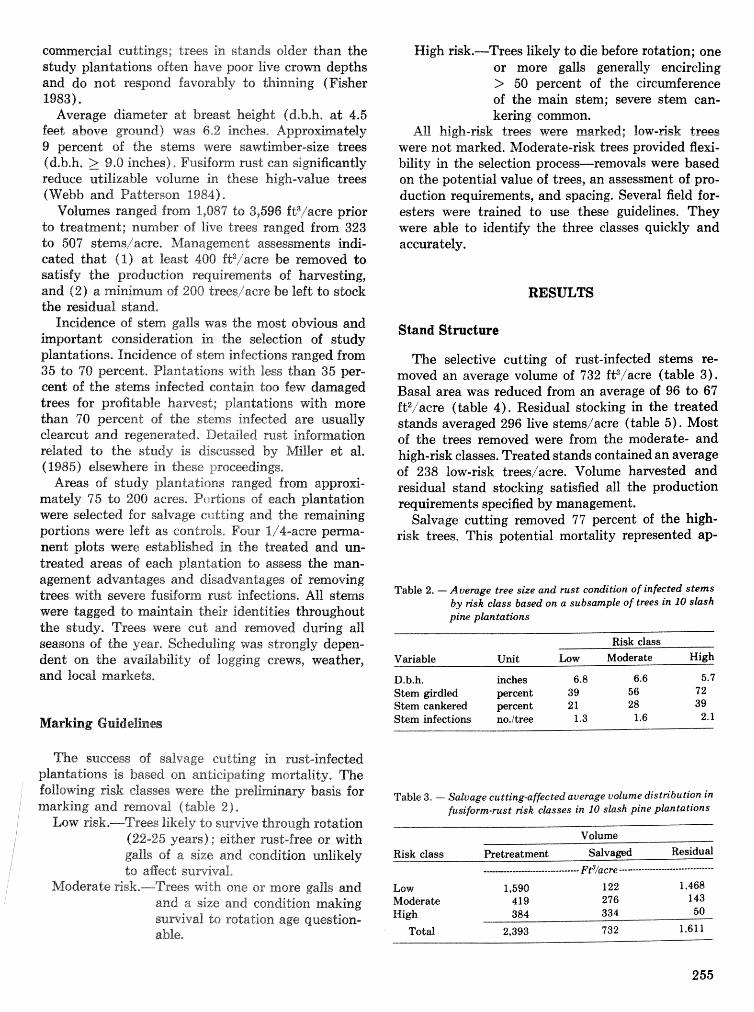
ereial cuttings; f;rees in stands older than the study plantations often have poor live cram depths and do not respond favorably to thiming (Fisher 1983).
Average diameter at breast height (d.b,h, a t 4.5 feet above ground) was 6 2 inches, Approximately 9 percent of the stems were sawthber-size trees (d,b,h. > 9.0 inches), Fusifom rust can simificantly reduce utilizable volume in these high-value trees (Webb and Patterson i1984),
Volumes rawed from 1,08"90 3,596 ft3/acre prior to treatment; number of l ive trees ranged from 323 to 507 slems/acre. Management assessments indi- cated &at (I) a t teast 400 ft3/acre be removed to satisfy the production requirements of hamesting, and (2) a, minimum of 200 treeslaere be left to shck the residual stand,
Incidence of stem galls was the most obvious and important consideration in. the selection of study plantations. Incidence 06 stem infections ranged from 35 to 70 percent, PZantations ~ f i t h less than 35 per- cent sf the stems infected contain too few damaged trees for profitable hawest; plantations with more than 70 percent of the stems infected are usually clearcut and regenerated, Detailed rust infomation related to the study is discussed by Miller et al. (1985) elsewhere in these proceedings.
Areas of study planttations ranged from approg- mately 95 do 200 acres, P4 rtions of each plantation were selected for salvage cutting and the remaining portions were left as esmtsaBs, Four 114-acre pema- nent plots were established in the treated and un- treated areas of each plantation ts assess the man- agement advantages and disadvantages of removing trees with severe fusiform rust infections, All sterns were tagged to maintain their identities throughout the study. Trees were cut and removed dufing all seasons of the yeas, Scheduling was strongly depen- dent on. the availability of lagging crews, weather, and local markets,
m e success sf salvage cutting in rwt-irafecbd plantations is based on anticipating mortali.ty, The following Ssk classes were the prelisninaw basis for marking sand removal (table 21,
Low fisk.-Trees likely to suwive through rotation (22-25 years) ; either rust-free or vvith gaHs of a size and condition unlikely do affect survival,
iMsdera%e risk,-----Trees with one or more galls and and a size and condition making suwival to rotation age question- able,
High risk.-Trees likely to die before rotation; one or more galls generally encircling > 50 percent of the circumference of the main stern; severe stem can- kering common.
All high-~sk trees were marked; lsw-risk trees were not marked, Moderate-risk trees provided Aezri- bility in the selection process-removals were based on the potential value of trees, an assessment of pro- duction requirements, and spacing. Several field for- esters were trained to use these widelines. They were able to identify the three classes quickly and accurately.
Stand Structure
The selective cutting of rust-infected stems re- moved an average volume of 732 ft3facre (table 3). Basal area was reduced from an average of 96 to 67 ft2/acre (table 4). Residual stocking in the treated stands averaged 296 live stemsiacre (table 5). Most of the trees removed were from the moderate- and high-risk classes. Treated stands contained an average of 238 low-risk treesiacre. Volume harvested and residual stand stocking satisfied all the production requirements specified by management.
Salvage cutting removed 77 percent of the high- risk trees. This potential mortality represented ap-
Table 2. - Average tree sire and rust condition o f infected stems by risk class based on a subsample of trees in 10 slash pint? plantations
Risk class Variable Unit Low Moderate High
I3.b.h. inches 6.8 6.6 5.7 Stem girdled percent 39 56 7 2 Stem cankered percent 21 28 39 Stem inf~t ions no.ltree 1.3 1.6 2.1
Table 3. ---- Salvage cutting-affected average volume distribution in fisiform-rust risk classes in 10 slash pine plantations
Volume
Risk class Pretreatment Salvaged Residual -------------------------.------ Ffliacre --.----.------------------------
Low 1,590 122 1,468 Moderate 419 276 143 High 384 334 50
Total 2,393 732 11,611
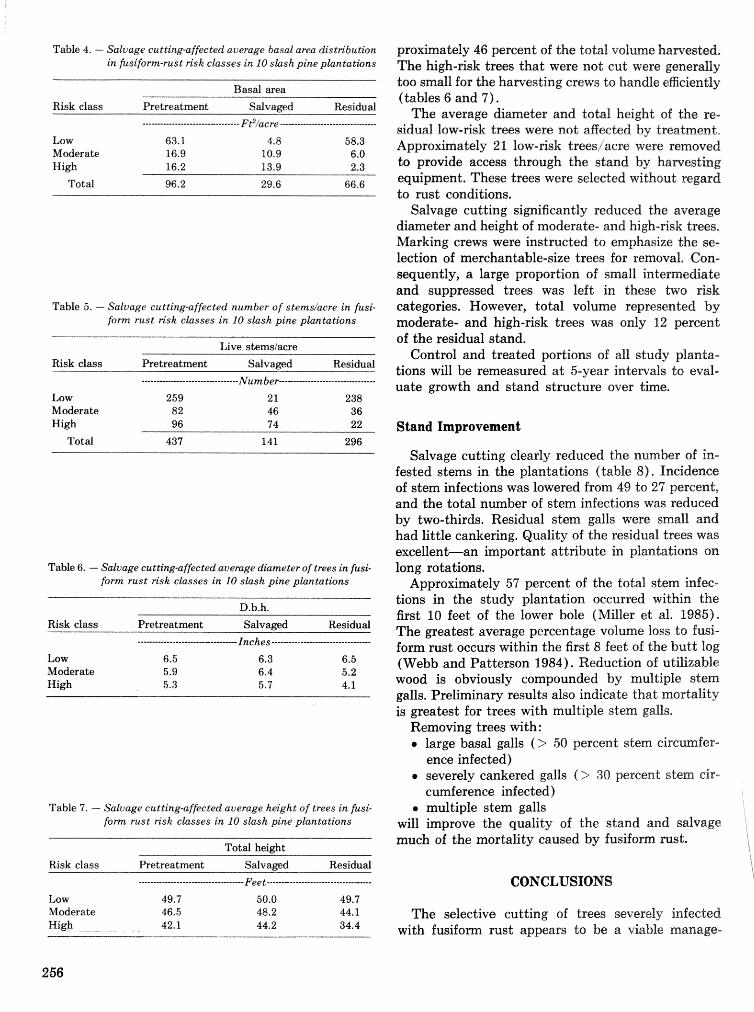
Table 4. - Salvage cu tting-affected average basal area distn'bution in fusifom-rust risk classes in 10 stash pine plantations
Basal area
Risk class Pretreatment Salva@ Residual ---.----------*-*--*-----------* pe/acre -------------------------- .-.--
Low 63.1 4.8 58.3 Moderate 16.9 10.9 6.0 H igh 16-2 13.9 2.3
Totd 96.2 29.6 66.6
Table 5. - Salvage cutting-affected number of stems/acre in fusi- form rust risk classes irt 10 slash pine plantations
Live stemsiacre
Risk class Pretreatment Salvaged Residual ---.--*------------------------- Mum her ma------------------------------
Low 259 21 238 Moderate 82 46 36 High 96 7 4 22
Total 437 141 296
Table 6. - Selvage cutting-affected average diameter of trees in fusi- form rust risk classes in 10 slash pine plantations
Risk class Pretreatment Salvaged Residual --------------------------------- Inches .................................
Low 6.5 6.3 6.5 Moderate 5.9 6.4 5.2 High 5.3 5.7 4.1
Table 7. - Salvage cutting-affected average height of trees in fusi- f o m rust risk classes in 20 s k s h pine plantations
Total height
Risk class Pretreatment Salvasd Residual
Low 49.7 50.0 49.7 Moderate 46.5 48.2 44.1 High - 42.1 44.2 34.4
proxhately 46 percent of the total volume harvested. The high-risk trees that were not cut were generalily too small for the hawesting crews to handle egciently (tables 6 and 7 ) .
The average diameter and toh l height of the re- sidual low-rirsk trees were not aEmter3. by treatment,
ately 21 low-risk trees/acre were rmoved to provide access through the stand by harvesting equipment, These trees were selected without regard to rust conditions.
Salvage cutting significantly reduced the average diameter and height of moderate- and high-risk trees, Marking crews were instructed to emphasize the se- lection of merchantable-size trees for removal, Con- sequently, a large proportion of small intermediate and suppressed trees was left in these two risk categories. However, total volume represented by moderate- and high-risk trees was only 12 percent of the residual stand.
Control and treated portions of all study planta- tions will be remeasured a t 5-year intervals to eval- uate growth and stand structure over time.
Stand Improvement
Salvage cutting clearly reduced the number of in- fested stems in the plantations (table 8). Incidence of stem infections was lowered from 49 to 27 percent, and the total number of stem infections was reduced by two-thirds. Residual stern galls were small and had little cankering. Quality of the residual trees was excellent-an important attribute in plantations on long rotations.
Approximately 57 percent of the total stem infec- tions in the study plantation occurred within the first 10 feet of the lower bole (Miller et al. 1985). The greatest average percentage volume loss to fusi- form rust occurs within the first 8 feet of the butt log (Webb and Patterson 1984). Reduction of utilizable wood is obviously compounded by multiple stem galls. Preliminary results also indicate that mortality is greatest for trees with multiple stern galls,
Removing trees with: * large basal galls ( > 50 percent stem circurnfer-
ence infected) e severely cankered galls (> 30 percexlt stern eir-
cmference infected) multiple stem galls
will irnprove the quality of the stand and salvage much of the mortality caused by fusifom rust.
CONCLUSIONS
The selective cutting of trees severely infected with fusifom rust appears to be a viable manage-
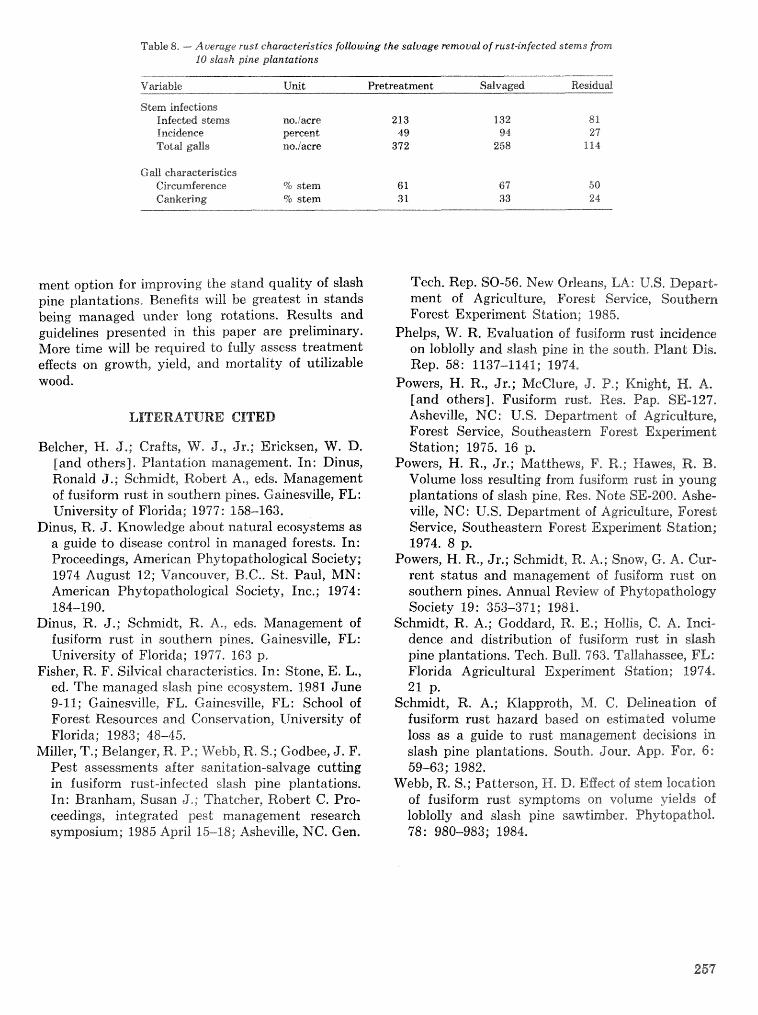
Table 8. - Average rust charwlten'sties following the salvage removal of rust-infected stems from %O slash pine plant.ations
"t';*siab%e Unit Pretreatment Sdvaged Residud
Stem infectiom Infect& skms nomiacre 213 Tneidekace persen t 49 TaLd gdls no-/acre 372
Gall chwacderistics Ckcurnference qo stem 6 1 Cmkering % stem 3 1
ment option for improving the stand quality of slash pine plantations. Benefits will be greatest in stands being managed under long rotations. Results and guidelines presented in this paper are preliminary. More time will be required to fully assess treatment effects on growth, yield, and mortality of utilizable wood.
LITERATURE CITED
Belcher, H. 9,; Crafts, We J., Jr,; Ericksen, W. D. [and others], Plantation management. In: Cinus, Ronald J.; Schmidt, Robert A., eds. Management of fusiform rust in southern pines. Gainesville, FL: University of Florida; 1977 : 158-163.
Dinus, R. J. Knowledge about natural ecosystems as a guide to disease control in managed forests. In: Proceedings, American Phy dopa thological Society; 1974 August 12; Vancouver, B.C.. St. Paul, MN: American Phytopathologieal Society, Inc.; 1974: 184-190.
Dinus, R. J.; Schmidt, R. A,, eds. -Management of f usifom rust in southern pines. Gainesville, FL: University of Florida; 1977. 163 p.
Fisher, R. F, Silvical characteristics, In: Stone, E. L., ed. The managed slash pine ecosystem. 1981 June 9- 11; Gainesville, FL, Gainesville, FL : School of Forest Resources and Conservation, University of Florida; 1983; 48-45.
Miller, T.; Belanger, R, P,; iVebb, 12.23.; Godbee, J. F. Pest assessments after sanitation-salvage cutting in fusiforrn rust-infected slash pine plantations. In: Branham, Susan J,; Thatcher, Robert 6. Pro- ceedings, integrated pest management research symposium; 1985 April 15---18; Asheville, NC. Gen.
Tech. Rep. SO-56. New Orleans, LA: U.S. Depart- ment of Agriculture, Forest Sewice, Southern Forest Experiment Station; 1985,
Phelps, W. R. Evaluation of fusiform rust incidence on loblolly and slash pine in the south, Plant Dis, Rep. 58: 1137-1141; 1974,
Powers, H, It., Jr.; MeClrare, J, P,; Knight, H, A. [and others]. Fusiform rust, Res. Pap. SE-127, Asheville, NC: U,S, Department of Agricufture, Forest Service, Southeastern Forest Experiment Station; 1975. 16 p.
Powers, H. R,, Jr.; Matthews, F, R,; Hawes, R, B, Volume loss resulting from fusifom rus"r;irs young plantations of slash pine, Res, Note SE-200, Ashe- ville, NG: U.S. Department of Agriculture, Forrest Service, Southeastern Forest Experiment Station; 1974. 8 p.
Powers, H. R., Jr , ; Schmidt, R. A,; Snoav, 6. A, Cur- rent status and management of fus i fom rust on southern pines. Annual Review of Pknydopadhslogy Society 19: 353-371; 1981,
Schmidt, R. A.; Coddard, R. E.; Hollis, @, A, Inci- dence and distribution of fusifsrm rust in slash pine plantations. Tech, Bull. 763, Tallahassee, FL: Florida Agricultural Experiment Station; 8974, 21 p.
Schmidt;, R. A.; Klapproth, M. 6, Ddineation of fusiform rust hazard based on estimated volume loss as a guide ts rust management decisions in slash pine plantations, South, Jour, App, For, 6: 59-63; 1 982.
Webb, R. S,; Patterson, H, D, Effect sf stem location of fusiform rust sgimptoms on volume yields sf loblolly and slash pine sawtimber, Phytopathol- 78: 980-983; 1984.
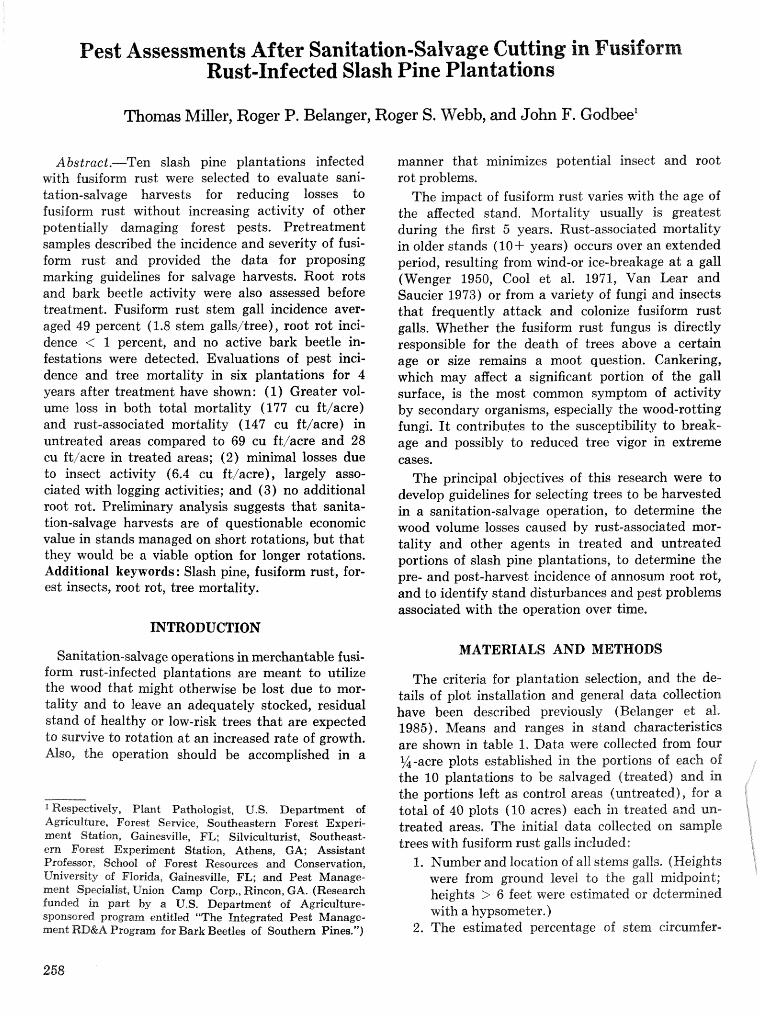
Pest Assessments After Sanitation-Salvage Cutting in Fusiform Rust-Infected Slash Pine Plantations
Thomas Miller, Roger P. Belanger, Roger S. Webb, and John F. Godbee'
Abstract.-Ten slash pine plantations infected vvith fusiform rust were selected to waluate sani- tation-salvage harvests for reducing losses to fusiform rust without increasing activity of other potentially damaging forest pests. Pretreatment samples described the incidence and severity of fusi- f o m rust and provided the data for proposing marking guidelines for salvage harvests. Root rots and bark beetle activity were also assessed before treatment. Fusiform rust stem gall incidence aver- aged 49 percent (1.8 stem gallutree), root rot inci- dence < 1 percent, and no active bark beetle in- festations were detected. Evaluations of pest inci- dence and tree mortality in six plantations for 4 years after treatment have shown: (1) Greater vol- ume loss in both total mortality (177 cu ftlacre) and rust-associated mortality (147 cu ftlacre) in untreated areas compared to 69 cu ft/acre and 28 cu ft,'acre in treated areas; (2) minimal losses due to insect activity (6.4 cu ftiacre), largely asso- ciated with logging activities; and (3) no additional root rot. Preliminary analysis suggests that sanita- tion-salvage harvests are of questionable economic value in stands managed on short rotations, but that they would be a viable option for longer rotations. Additional keywords: Slash pine, fusiform rust, for- est insects, root rot, tree mortality.
manner that minimizes potential insect and root rot problems.
The impact of fusiform rust varies with the age of the aEected stand. &fcrrtsrlity usually is greatest during the first 5 years. Rust-associated mortality in older stands (10 + years) occurs over an extended period, resulting from wind-or ice-breakage a t a gall (Wenger 1950, Cool et al. 19"il, Van Lear and Saucier 1973) or from a variety of fungi and insects that frequently attack and colonize fusiform rust galls. Whether the fusiform rust fungus is directly responsible for the death of trees above a certain age or size remains a moot question. Cankering, which may affect a significant portion of the gall surface, is the most common symptom of activity by secondary organisms, especially the wood-rotting fungi. I t contributes to the susceptibility to break- age and possibly to reduced tree vigor in extreme cases.
The principal objectives of this research were to develop guidelines for selecting trees to be harvested in a sanitation-salvage operation, to deternine the wood volume losses caused by rust-associated mor- tality and other agents in treated and untreated portions of slash pine plantations, to determine the pre- and post-harvest incidence of annosum root rot, and to identify stand disturbances and pest problems associated with the operation over time.
rnTRODUCTION
Sanitation-salvage operations in merchantable fusi- form rust-infected plantations are meant to utilize the wood that might otherwise be lost due to mor- tality and to leave an adequately stocked, residual stand of healthy or low-risk trees that are expected to sumive Zo rotation a t an increased rate of growth. Also, the operation should be accomplished in a
f Ressspectivefy, Plslnt Pathologist, U.S. Department of Agriculture, Forest Service, Southeastern Forest Experi- ment Station, Gainesvitle, FL; Silviculturist, Southeast- ern Forest Experhmt Station, Athens, GA; Assistant Professor, School of Forest Resources and Conservation, University of Florida, Gainesville, FL; and Pest Manage- ment Specialist, Union Camp Corp., Rincon, GA. (Research funded in part by a U.S. Department of Agric~iIture- sponsored program entitled ""The Integrated Pest Manage- mend RD&A Progrm for Bark Beetles of Southern Phes.")
MATERIALS AND METHODS
The criteria for plantation selection, and the de- tails of plot installation and general data collection have been described previously (Belanger et al. 1985). Means and ranges in strand characteristics are shown in table 1. Data were collected from four %-acre plots established in the portions of each sf the 10 plantations to be salvaged (treated) and in the portions left as control areas (untreated), %or a total of 40 plots (10 acres) each in treated and un- treated areas. The initial data collected on sample trees with fusiform rust galls included:
1, Number and location of all stems galls. (Heights were from ground level to the gall midpoint; heights > 6 feet were estimated or determined with a hypsometer.)
2. The estimated percentage of stem circumfer-
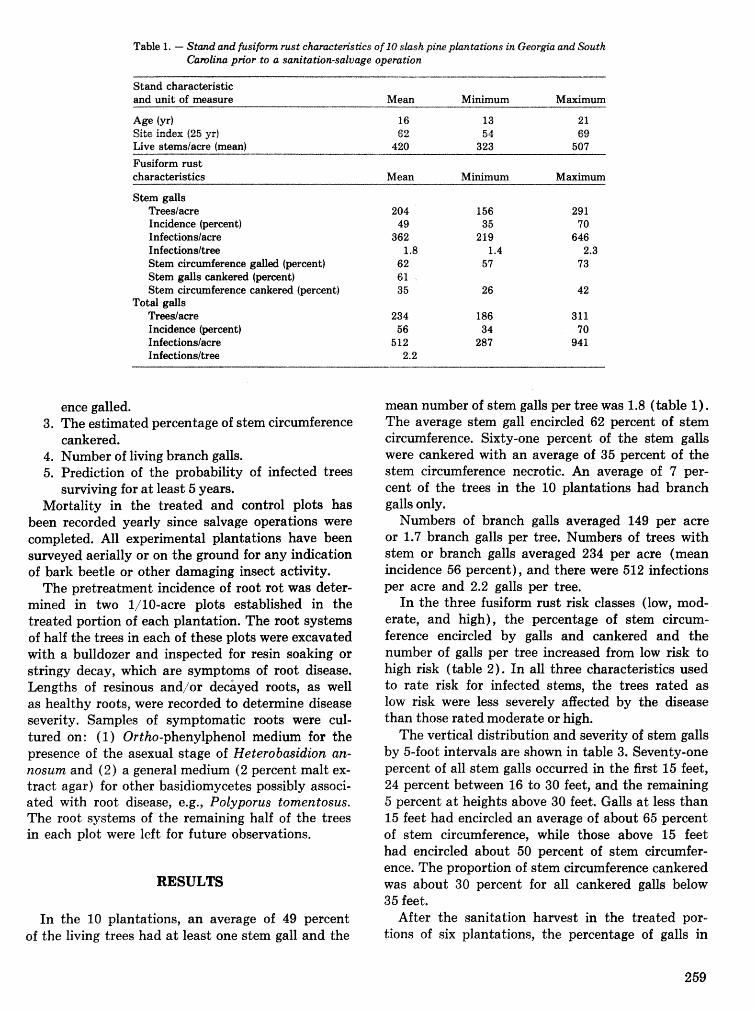
Table 1. - Stand and fusif jm rust chrmteristics o f f 0 s h h pim phlttahns in Geargitl (Elbd South Cambina prior to a sanitation-salvage operation
Stand characteristic and unit of nteasure Mean Minimum Maximum
Ar~e ( ~ f 16 13 21 Site kdex (25 yr) 62 54 69 Live stemsfam (meal 420 323 507
Fusiform mst characteristics Mean Minimum M d m
Stem galls TreesIacre Incidence (percent) Infectionslacre Infe~tionsltree Stem circumference galled (percent) Stem grills cankered (percent) Stem circmference cankered (percent)
Total galls Treeslacre Incidence (percent) Infectionslacre Infectionsltree
ence galled. 3. The estimated percentage of stem circumference
cankered. 4. Number of living branch galls. 5. Prediction of the probability of infected trees
surviving for at least 5 years. Mortality in the treated and control plots has
been recorded yearly since salvage operations were completed. All experimental plantations have been surveyed aerially or on the ground for any indication of bark beetle or other damaging insect activity.
The pretreatment incidence of root rot was deter- mined in two l/lO-acre plots established in the treated portion of each plantation, The root systems of half the trees in each of these plots were excavated with a bulldozer and inspected for resin soaking or stringy decay, which are symptoms of root disease. Lengths of resinous and/or decayed roots, as well as healthy roots, were recorded to determine disease severity. Samples of symptomatic roots were cul- tured on: (1) Ortho-phenylphenol medium for the presence of the asexual stage of Heterobasidion an- nosum and (2) a general medium (2 percent malt ex- tract agar) for other basidiomycetes possibly associ- ated with root disease, e.g., Polyporus tomentosus. The root systems of the remaining half of the trees in each plot were left for future observations.
In the 10 plantations, an average of 49 percent of the living trees had a t least one stem gall and the
mean number of stem galls per tree was 1.8 (table 1). The average stem gall encircled 62 percent of stem circumference. Sixty-one percent of the stem galls were cankered with an average of 35 percent of the stern circumference necrotic. An average of 7 per- cent of the trees in the 10 plantations had branch galls only.
Numbers of branch galls averaged 149 per acre or 1.7 branch galls per tree. Numbers of trees with stem or branch galls averaged 234 per acre (mean incidence 56 percent), and there were 512 infections per acre and 2.2 galls per tree.
In the three fusiform rust risk classes (low, mod- erate, and high), the percentage of stem circum- ference encircled by galls and cankered and the number of galls per tree increased from low risk to high risk (table 2). In all three characteristics used to rate risk for infected stems, the trees rated as low risk were less severely aEEected by the disease than those rated moderate or high.
The vertical distribution and severity of stern galls by 5-foot intervals are shown in table 3. Seventy-one percent of all stem galls occurred in the first 15 feet, 24 percent between 16 to 30 feet, and the remaining 5 percent a t heights above 30 feet. Galls a t less than 15 feet had encircled an average of about 65 percent of stem circumference, while those above 15 feet had encircled about 50 percent of stem circumfer- ence. The proportion of stem circmference cankered was about 30 percent for all cankered galls below 35 feet.
After the sanitation harvest in the treated por- tions of six plantations, the percentage of galls in
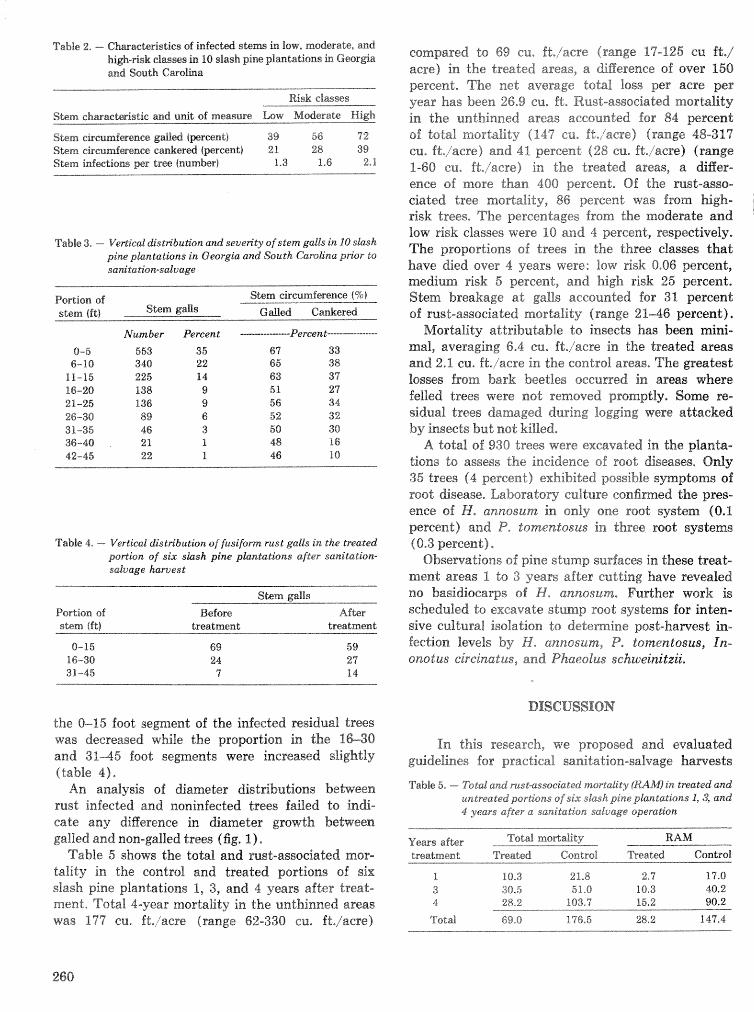
Table 2, - ChstpacdeGsdies of i ra fecd stew In low, mcrderade, mcd ii4iglz-risk classes in 10 slash pine platadions in Georda zsrd %uLh Garofiina
Risk elases
S b m characbristic aard unit of measwe Low M d e r a k High
Tabb 3, --- F"em*cd distn"bu~ort and seven'@ clf s&rn g& in 10 s h h p im ph'antations in Georgia a d South Carolina prior do samStatio:on-salvage
Portion of Sbem circumference (% )
stem f f t ) S b m g d s Gdc3.Q Cdcsred
Number Percent -- 553 35 348 22 225 14 138 9 136 9 89 6 46 3 21 1 22 1
Table 4, ---- Vertied cls'stribution of fusifirm rust galls: in the treated psrlion of sin shsh pine plantations after sanitatl'on- salvage harvest
S k m gdIs
Portion of Before Afbr stem ( f t ) treatment treadment
0-15 69 59 16-30 24 27 31-45 7 14
the 0--15 foot sement of the infected residual trees was decreased while the proportion in the 1&30 and 31-4 foot segments were increased slightly (table 4). An analysis of diameter distributi~ns between
rust infected and noninfected bees failed to indi- cate any digerenee in diameter growth between galled and non-galled trees (fig. 1).
Table 5 shows the total and mst-associated mar- tality in the control and treated psrt i~ns s% six slash pine plantations 1, 3, anad 4 years after treat- ment, Total $-year mortality in the undkainned areas was 177 Et,,'acre (range 62-338 cu. ft,/acre)
cornpared to 69 cu, fk,/acre (range 17-125 era fd,/ acre) in the treated areas, a diRerence of over 150 percent, The net average total loss per acre p r year has been 26,9 cu, ft, Rust-associated mortality in the ranthinned areas accounted for 84 percent O$ total raortalidy (147 eu, ft,i"acre) (range 48-317 cu, fd,iacre) rand 41 percent (28 cu, ft,lacre) (range 1-60 cu, ft,/'acre) in the treated areas, a. &Berm ence of more than 400 percent, Of the mst-asso- eiated tree mortality, 86 percent was from high- risk trees, The percentages from the moderate and low risk classes were 18 and 4 percent, respectively. The proportions of trees in the three elasses that have died over 4 years were: low risk 0,06 percent-, medium risk 5 percent, and high risk 25 percent. Stem breakage at galls accounted for 31 percent of rust-associated mortality (range 2 1 4 6 percent),
Mortality attributable to insects has been mini- mal, averaging 6,4 cu, ft,/aere in the treated areas and 2.1 eu. ft,,%aere in the control areas, The greatest losses from bark beetles occurred in areas d e r e felled, trees were not removed promptly. Some re- sidual trees damaged during logging were attacked by insects but not kiued,
A total 0% 938 trees were excavated in the planta- tions do assess the incidence of root diseases, Only 35 trees (4 percent) exhibited possible symptoms of root disease. Laboratory culture ctan6med the pres- ence 0 6 He annosum in only one rotat system (0.1 percent) and P, t~rnegltosu~ in three soot systems ( 0 3 percent).
Observations of pine stump surfaces in these treat- ment areas % to 3 years after cutting have revealed no basidioearps of H , annosum, Further work is scheduled to excavate stump root systems for inten- sive cultural isolation to determine post-harvest in- fection levels by He annosum, P. tomtrntosus, In- onotus circinatus, and Phaeslus schueinitzii,
DISCUSSION
In this research, we proposed and evaluated guidelines for practical sanitation-salvage hanests
Table 5. --- Totd and mst-~-ss~eiated mortaiity [RAM) in treated and untreated porgons ofsiz slash pine plantations L,3, and 4 years after a sanitation salvage opera~ora
Years afGer Total mo&di&y RAM
treatment Treated Control rSP"eated Control
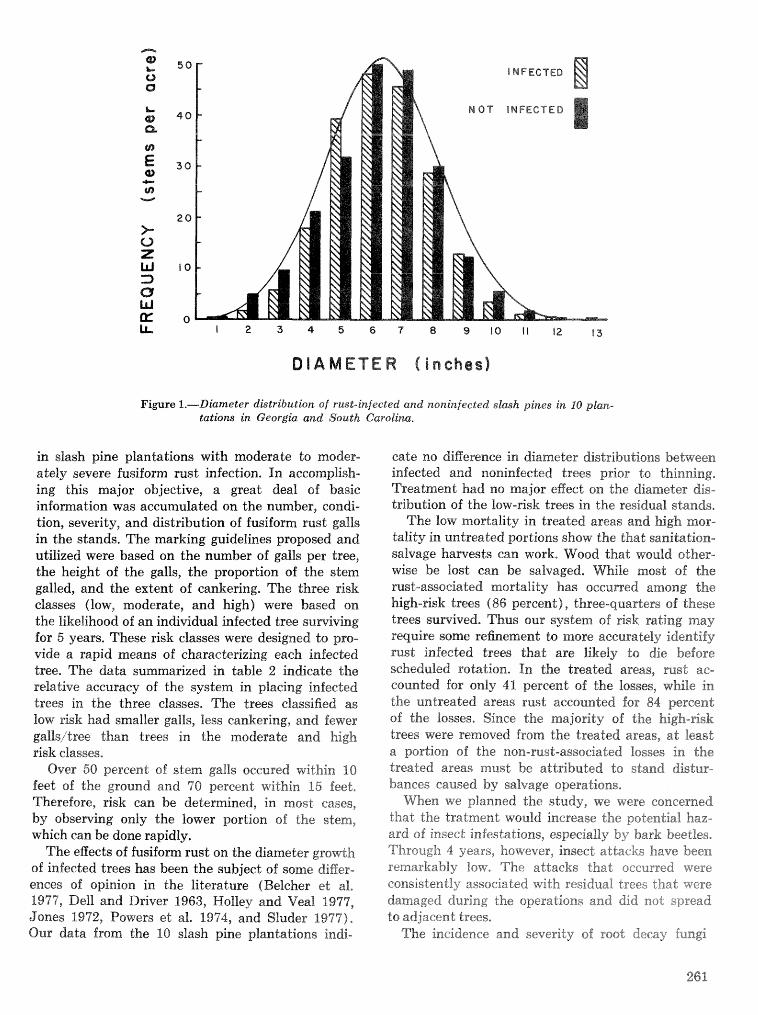
DIAMETER ( inchas)
Figure 1.-Diameter distribution sf rust-infeeled and noninfeeted slash pines in 10 plan- tations in Georgk aad Saekgh CarsLina.
in slash pine plantations with moderate to moder- ately severe fusiform rust infection. In accomplish- ing this major objective, a great deal of basic information was accumulated on the number, condi- tion, severity, and distribution of fusiform rust galls in the stands. The marking guidelines proposed and utilized were based on the number of galls per tree, the height of the galls, the proportion of the stem galled, and the extent of cankering. The three risk classes (low9 moderate, and high) were based on the likelihood of an individual infected tree surviving for 5 years. These risk classes were desimed to pro- vide a rapid means of characterizing each infected tree. The data summarized in table 2 indieate the relative accuracy of the system in placing infected trees in the three classes. The trees classified as low risk had smaller galls, less cankering, and fewer galldtree than trees in the moderate and high risk classes,
Over 50 percent of stem galls oceured within 10 feet of the ground and 70 percent within 15 feet, Therefore, risk can be determined, in most cases, by obser~iing only the Iower portion of the stem, which can be done ralpidly,
The egects of fusiforrn rust on the diameter growth of inkcted trees has been the subject of some diBer- ences of opinion in the literature (Belcher et al. 1977, Dell and Driver 1963, Holley and Veal 1977, Jones 1972, Powers et al. 1974, and Sluder 1971), Our data from. the 10 stash pine piantations indi-
cate no difference in diameter distributions between infected and noninfected trees prior Ls thinning, Treatment had no major effect on the diameter dis- tribution of the low-risk trees in the residual stands,
The low mortality in treated areas and high mar- tality in untreated portions show the that sanitation- salvage harvests can work. Wood that would other- wise be lost can be salvaged. While most of the rust-associated mortality has occurred among "I;e high-risk trees (86 percent), three-quarters of these trees survived, Thus our system of risk rating may require some refinement to more accurately identify rust infected trees that are likely to die before scheduled rotation. In the treated areas, mst ae- counted far only 41 percent sf the losses, while in the untreated areas rust accounted for 84 percent of the losses. Since the majority sf the high-risk trees were removed from the treated areas, at- least a portion of the nsn-rust-assseirrter$, losses in the treated areas must be attributed to stand distur- bances caused by salvage operations,
When we planned the study, we were concerned that the tratmend would increase the potential haz- ard sf insect hfestations, especially by bark beetles, Through 4 years, however, insect attacks have been remarkably 10w- The attacks that occurred were consistently associated with residual trees that were damaged during the operations and did not spread to adjacent trees,
The incidence and severity of root decay fungi
as supported by cultural dete nation of sympto- matic roots were negligible in the planbtions. Post- thinning disease levels in treatment areas appear to be similarly low, but future excavation work is planned to substantiate this conclusion with cultural isolations.
Although annosum root rot was found in only one tree in 10 plantations, thinning is the major man- agement procedure that favors development of root disease fungi, especially H , annosum, in southern pine stands, SaniLation,/salvage in fusiform-mst-in- feeted southern pine stands, therefore, should include allowance for stump treatment with borax in areas with proven incidence of H , annosum, m e r e H. annasum signs are absent, borax stump treatment is needed only where the chances of entry of H. anno- sum into the residual stand after thinning are high.
CONCLUSIONS
I, Preliminary analysis of accumulated average net losses (cu ft./acre/"year) due to fusiform rust in six slash pine plantations over 4 years suggests that sanitation-salvage harvests in stands managed on short rotations are economically questionable. How- ever, as concluded by Belanger et al. 1985, such treat- ments seem to be viable options for longer rotations.
2. Southern pine bark beetles or other insect pests were not a serious problem. The minor losses to bark beetles were associated with tree damage during logging and failure to remove felled stems from the stands promptly.
3. Annosum root rot was detected on the root system of only a single tree in the 10 plantations. Any recommendations about treating stump tops with borax in sanitation-salvage operations must await the results of observations and isolations from residual stumps over the next several years.
LITERATURE CITED
Belanger, R, P.; Miller, T.; Godbee, J. F. Fusiform rust; guidelines for selective cutting of rust- infected trees in merchantable slash pine planta- tions, In: Branbarn, S. J.; Thatcher, R. C., eds, Proceedings, integrated pest management research
symposim; 1985 April 15-18; Asbe~lie, NC. Gen. Tech. Rep. SO-56. New Orleans, LA: U.S. Depart- ment of Agriculture, Forest Sewice, Southern
ent Station; 1985: 254-257. Belcher, I-I. J.; Craft, W. J. Jr-; Erickson, W. D.;
Ward, R. H. Fusiform rust management strategies in practice : plantation management. In : Dinus, R. J.; Schmidt, R. A. eds. Proceedings, manage- ment of fusifom rust in southern pines symposium, 1976 December 7-8; Gainesville, FL, Cainesvifle: University of Florida; 1977 : 158---161, (Available from School of Forest Resources and Conservation, University of Florida, Gainesville, FL)
Cool, B. M.; Goebel, N. B.; Wooten, T. E.; Loadhalt, C . B. Glaze damage ts pine trees in the sandhills area of South Carolina. Forest Research Series No. 21. Clemson, SC: Clemson University, De- partment of Forestry; 1971. 13 p.
Dell, T. R.; Driver C. H. The relationship of D.B.H. to fusiform stem cankedng in old field slash pine plantations. Journal of Forestry 61: 872; 1963.
Holley, D. L.; Veal, M. A. Economic impact of fusi- form rust. In: Dinus, R. 9,; Schmidd, R. A., eds. Proceedings, management of fusifom rust in southern pines symposium; 19'36 December 7-8; Gainesville, FL. Gainesville: Uniwrsity of Florida; 1977: 39-50. (Available from School of Forest Re- sources and Conservation, University of Florida, Gainesville, FL)
Jones, E. P. Jr. Fusiform mst agects planted slash pine. Journal of Forestry 70: 350-352; 1972.
Powers, H. R., Jr.; McClure, J. P.; Knight, H. 8.; Dutrow, 6. F. Incidence and financial impact of fusiform rust in the south. Journal of Forestry 72 : 398-401; 1974.
Sluder, E. R. Fusiform rust in. Ioblolly and slash pine plantations on high-hazard sites in Georgia. Research Paper SE-160. Asheville, NC: U.S, De- partment of Agriculture, Forest Service, South- eastern Forest Experiment Station; 1971. 10 p,
Van Lear, D. H.; Saucier, J. R, Comparative glaze damage in adjacent shlads sf slash and longleaf pine. Forest Research Series KO, 27. Glemson, SC : Clemson University, Department sf Forestry; 1973.7 p.
Mnger, C. F, The mechanical egect of fusiform rust cankers on stems of lobZoIky pine, Journal of Forestry 48: 331-333; 1950,
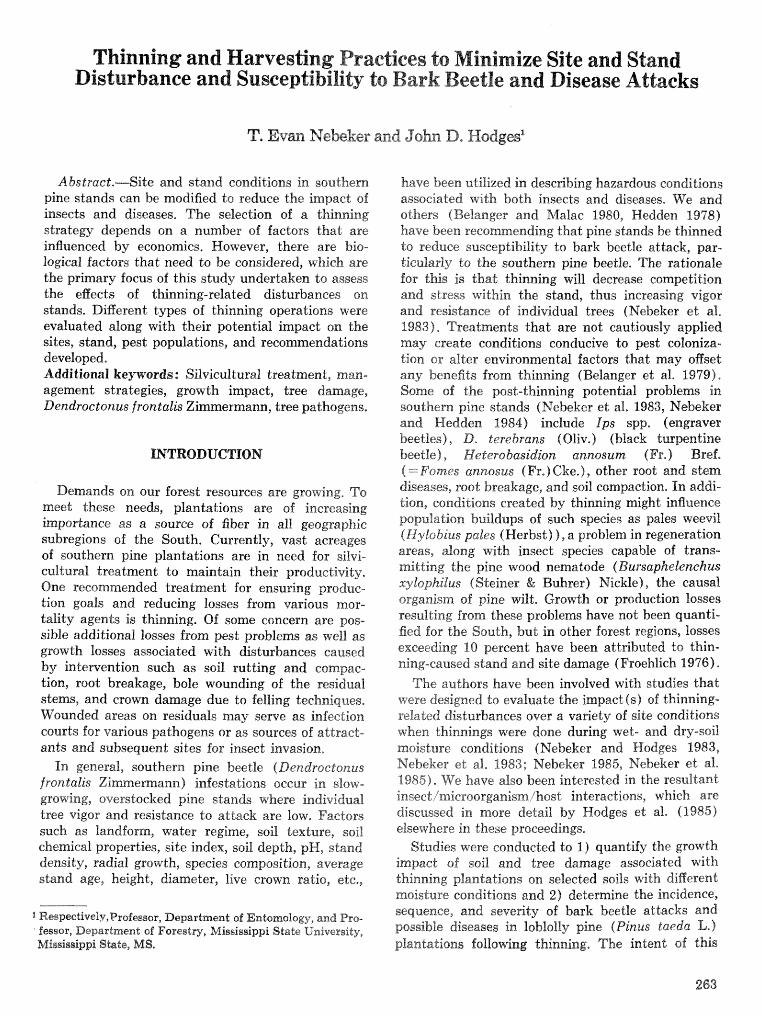
Thinning and Harvesting Practices to Minimize Site and Stand Disturbance and Susceptibility to Bark Beetle and Disease Attacks
T. Evan Nebeker and John D. Hodges'
Abstract.-Site and stand conditions in southern pine stands can be? modified to reduce the impact of insects and diseases. The selection of a thinning strategy depends on a number of factors that are influenced by economics, However, there are bio- logical factors that need to be considered, which are the primary focus of this study undertaken to assess the effects of thinning-related disturbances on stands. Diffierent types of thinning operations were evaluated along with their potential impact on the sites, stand, pest populations, and recommendations developed. Addi tisnal keywards : Silvicultural treatment, man- agement strategies, growth impact, tree damage, Dendrsctonus frontalis Zimmermann, tree pathogens.
Demands on our forest resources are growing, To meet these needs, plantations are of increasing importance as a source of fiber in all &c3ographis: subregions of the South. Currently, vast acreages of southern pine plantations are in need for siitvi- cultuml treatment to maintain their productivity, One recommended treatment for ensuring produc- tion goals and reducing losses from various mor- kli ty agents is thinning. Of some concern are pos- sible additional losses from pest problems as well as growth losses associated d t h disturbances caused by intervention such as soil rutting and compac- tion, root breakage, bole wounding of the rcsidual sterns, and crown damage due to felling techniques, Wounded areas on residuals may serve as inkctian courts for various pathogens or as sources of attract- ants and subsequent sites for insect invasion,
In general, southern pine beetle (Dendroedonus frontalis zimmernnann) infestations occur in slow- growing, oversdoeked pine stands where individual tree vigor and resistance to attack are IOW, Factors such as landform, water regime, soil texture, soil chernicaf properties, site index, soil depth, pH, stand density, radial groivtht speeie~ cornpetsition, average stand age, height, diameter, live crown ratio, etc*,
1 Respectively,Profe~t3o]li, Department of Entoazolom, and Pro- fessor, Department of Forestry, Mir~dssippi State University, Mi~eissippi %Late, MS.
have been utilized in descdbing hazardous conditions associated with both insects and diseases. We and others (Belanger and Mafae 1980, Hedden 1978) have been recommending that pine stands be thinned ts reduce susceptibifity to bark beetle attack, par- ticularly to the southem pine beetle, The rationale for this is that thinning will decrease competition and stress within the stand, thus increasing vigor and resistance of individual trees (Nebeker et al, 1983). Treatments that are not cautiously applied may create conditions conducive to pest coloniza- tion or alter environmental factors that may offset any benefits from thinning (Eelanger et a1. 1999). Some of the posd-thinning potential problems in southern pine stands (Nebeker et a]. 1983, Nebeker and Hedden 1984) include Ips spp. (engraves beetles), D, terebrans (Oliv. (black turpentine beetle), He tero basidion annosum (Fr, ) Bsef, (=Fomes annosus (Fr.)Cke.), other root and stem diseases, root breakage, and soil compaction. In addi- tion, conditions created by thinning might influence population buildups of such species as pales weevil (Hylobius paEes ( Herbst) ) , a problem in regeneration areas, along with insect species capable of trans- mitting the pine wood nematode (Bursaphelenehus xykophilus (Steiner 6% Buhrer) Nickle), the causal organism sf pine wilt. Growth or production losses resulting from these problems have not been qaaanti- fied for the South, but in other forest regions, losses exceeding 18 percent have been attributed to thin- ning-caused stand and site damage (Proelnlich 1916).
The authors have been involved with sdudkes that were designed to evaluate the impact ( s ) of thinning- related disturbances over a variety of site conditions when thinrtings were done during wek- and dry-soil moisture conditions (Nebeker and Hodges 1983, Nebeker ei: wi , 1983; Nebeker 1985, Nebeker ed 8%.
1985). !Ye have also been interested in the resultant insect/microorganism/hos$; interactions, which are discussed in more detail by Modges et; al. (1985) elsewhere in these proceedings,
Studies were conducted to I) quantify the growth impact of soil and tree damage associated with thinning plantations onr selected soils with differ& moisture conditions and 2) determine the incidence, sequence, and severity of bark beetle attacks and possible diseases in loblolly pine (Pinus t a ~ d a L.) planl;a%ions fallawing thinning. The intent on' this
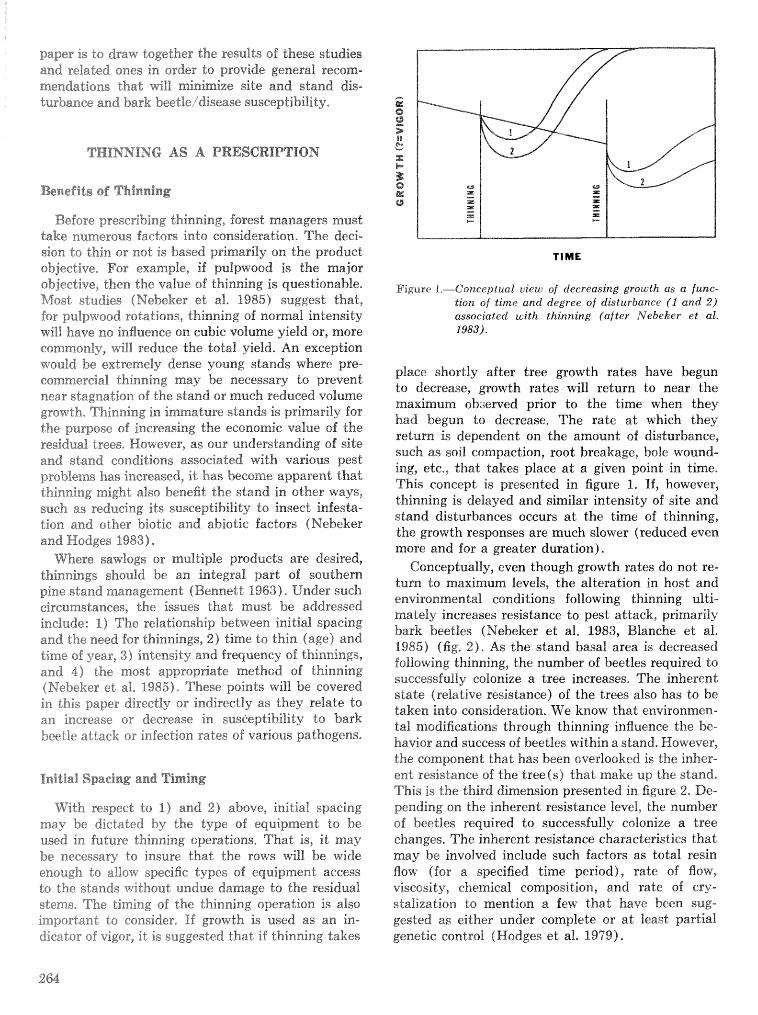
paper is to draw together the results of these studies and related ones in order to provide general recsm- mendations that will minhiae site and stand dis- turbance and bark beetle idisease suscept ibifity .
THINKING AS A PRESCRIPTION
Bend i ts of Thinning
Before prescribing thinnhng, forest managers must take numerous factors into consideration, The deci- sion to thin or not is based primasly on the product objective, For example, if pulpwood is the major objeckive, then the value sf thinning is questionable. M o ~ t studies (Nebeker et al, 1985) suggest that, for pulpwood rotations, thinning of normal intensity will have no influence on cubic volume yield or, more commonly, will reduce the total yield. An exception would be extremely dense young stands where pre- commercial thinning may be necessary do prevent near stagnation of the stand or much reduced volume growth, Thinning in immature stands is primarily for the purpose of increasing the eeclnclmic k~afrae of the residual trees* Ho\+ever, as our understanding sf site and stand conditions associated with various pest problems has increased, it has become apparent that thinning might also benefit the stand in other ways, such as reducing its susceptibility to insect infesta- tion and other biotic and abiotic factors (Nebeker and Hodges 1983).
Where sawlogs or mraldiplie products are desired, thinnings should be an integral part of southern pine stand management (Bennett 6963). Under such circumstances, the issues that must be addressed include: 1) The relationship between initial spacing and the need for thinnings, 2) time $0 thin (age) and time of year, 3) intensity and frequency sf thinnings, and 4) the most appropriate methcd of thinning (Nebeker ehal, 1985). These points will be covered in this paper directly or indirectly as they relate to an increase or decrease in susceptibility to bark beetle attack or infection rates of various pathogens*
Initial Spacing and Timing
With respect do 1) and 2 ) above, initial spacing may be dictated by the type of equipment do be used in future thinning operations, Thad is, it may be necessary to insure that the rows will be wide enough to allow specific types of equipment access to the stands without undue damage to the residual stems, The timing of the thinning operation is also important to consider, If growth is used as ran in- dicator of vigor, it i s suggested that if thinning takes
Figure 1.---Conceptual view of decreasing growth as ct fune- tion crf t ime and degree of disturbance (2 and 2) associated with thinning (af ter ~Vebeker e t at. 1983).
place shortly after tree growth rates have begun to decrease, growth rates will return to near the maximum obzerved prior to the time when they had begun to decrease. The rate a t which they return is dependent on the amount sf disturbance, such as soil compaction, root breakage, bole wound- ing, etc., that takes place a t a given point in time. This concept is presented in figure 1. If, however, thinning is delayed and similar intensity of site and stand disturbances occurs a t the time of thinning, the growth responses are much slower (reduced even more and for a greater duration).
Conceptually, even though growth rates do not re- turn to maximum levels, the alteration in host and environmental conditions following thinning ulti- mately increases resistance to pest attack, primarily bark beetles (Nebeker et al. 1983, Blanche et al, 1985) (fig, 21, As the stand basal area is decreased following thinning, the number of beetles required to successfully colonize a tree increases. The inherent stake (relative resistance) of the trees also has to be taken into consideration, We know that environmen- tal modifications through thinning influence the be- havior and success of beetles within a stand, However, &he component that has been overlooked is the inher- ent resistance of the tree(s) that make up the stand. This is the third dimension presented in figure 2. De- pending on the inherent resistance level, the number of beetles required to successfully colonize a tree changes, The inherent resistance characteristics that may be involved include such factors as total resin Aow (for a specified time period), rate of flow, viscosity, chemical composition, and rate of ery- stalization to mention ix few that have been sug- gested as either under complete or at least partial genetic control (Hodges et al. 1979),
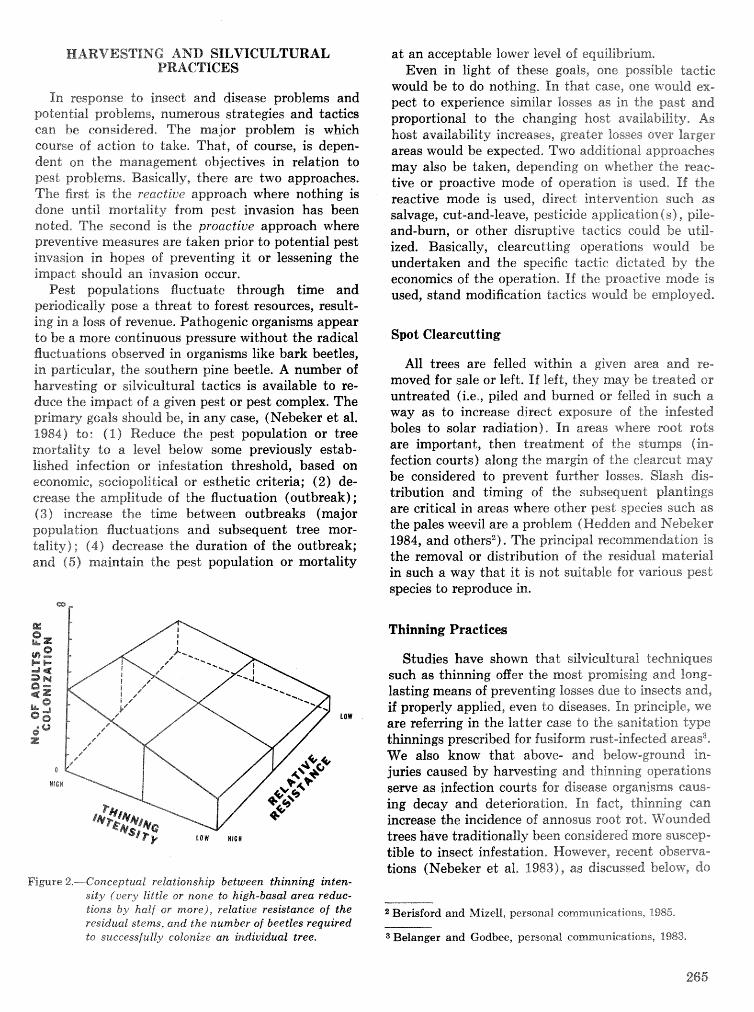
HARVESTING AND SILVICULTURAL PRACTICES
In response do insect and disease problems and potential problems, numerous strategies and tactics can Fie considered, The major problem is which course of action to take, That, of course, is depen- dent on the management objectives in relation to pest problems, Basicaffy, there are two approaches. The first is the reactice approach where nothing is done until mortality from pest invasion has been noted, The second is the proactiue approach where preventive measures are taken prior to potential pest invasion in hopes of preventing it or lessening the impact should an invasion occur.
Pest populations fluctuate through time and periodically pose a threat to forest resources, result- ing in a loss of revenue. Pathogenic organisms appear to be a more continuous pressure without the radical Buctmations observed in organisms like bark beetles, in particular, the southern pine beetle. A number of harvesting or sifviculturixl tactics is available to re- duce the impact; of a given pest or pest complex. The primary goals should be, in any case, (Nebeker et al. 1984) to: ( I ) Reduce the pest population or tree mortality to a level below some previously estab- lished infeetion or infestation threshold, based on economic, s~ciopolitical or esthetic criteria; (2) de- crease the amplitude of the fluctuation (outbreak) ; (3) increase the time between outbreaks (major population fluctuations and subsequent tree mor- tality); (4) decrease the duration of the outbreak; and (5) maintain the pest population or mortality
a t an acceptable lower level of equiEbrium, Even in. light of these goals, one possible Lactic
would be to do nothing, In that case, one ~vould ex- pect to experience similar losses as in the past and proportional to the changing host availability, As host availability increases, greater losses over larger areas would be expected, Two additional approaches may also be taken, depending on whether the reae- tive or proactive mode of operation i s used, If the reactive mode is used, direct intervention such as salvage, cut-and-leave, pesticide application ( s ) , pile- and-burn, or other disruptive tactics could be util- ized. Basically, clearcutting operations would be undertaken and the specific tactic dictated by the economics of the operation, If the proactive mode is used, stand modification tactics ~vould be employed*
Spot Clearcut ting
All trees are felled within a given area and re- moved for sale or left. If left, they may be treated or untreated (i.e., piled and burned or felled in such a way as to increase direct exposure of the infested boles to solar radiation), In areas where root rots are important, then treatment of &he stumps (in- fection courts) along the margin of the clearcut may be considered to prevent further Tosses, Slash dis- tribution and timing of the subsequent plantings are critical in areas where other pest species such as the pales weevil are a problem (Hedden and Nebeker 1984, and others2), The principal recommendation is the removal or distribution of the residual material in such a way that it is not suitable for various pest species to reproduce in.
Thinning Practiew
Studies have shown that silvieultural techniques such as thinning offer the most promising and long- lasting means of preven"cing losses due to inse~ts and, if properly applied, even to diseases. Tin principk, we are referring in the latter ease to the sanitation type thinnings prescribed for fusif orm rust-inf ecled areas3, We also know that above- and below-ground in- juries caused by harvesting and thinning operations serve as infection courts for disease organisms caus- ing decay and deterioration. In fact, thinning can increase the incidence of annosus root rot, Vkmnded trees have traditionally been considered more suscep- tible to insect infestation, However, recent obseWa-- tions (Nebeker et al, %983), as discussed below, do
Figure 2.---CsneeptuaE relatisnsizEp between thinning inten- sity ( w r y little or none to high-basal area reduc- tions by half or more), relative resistance of the residual stems, and the number of beetles required to successfully colonize an individual tree.
2 Berisford and Mizell, personal communications, 1985,
3 Belanger and Gsdbee, personal eommunicafions, 1983.
265
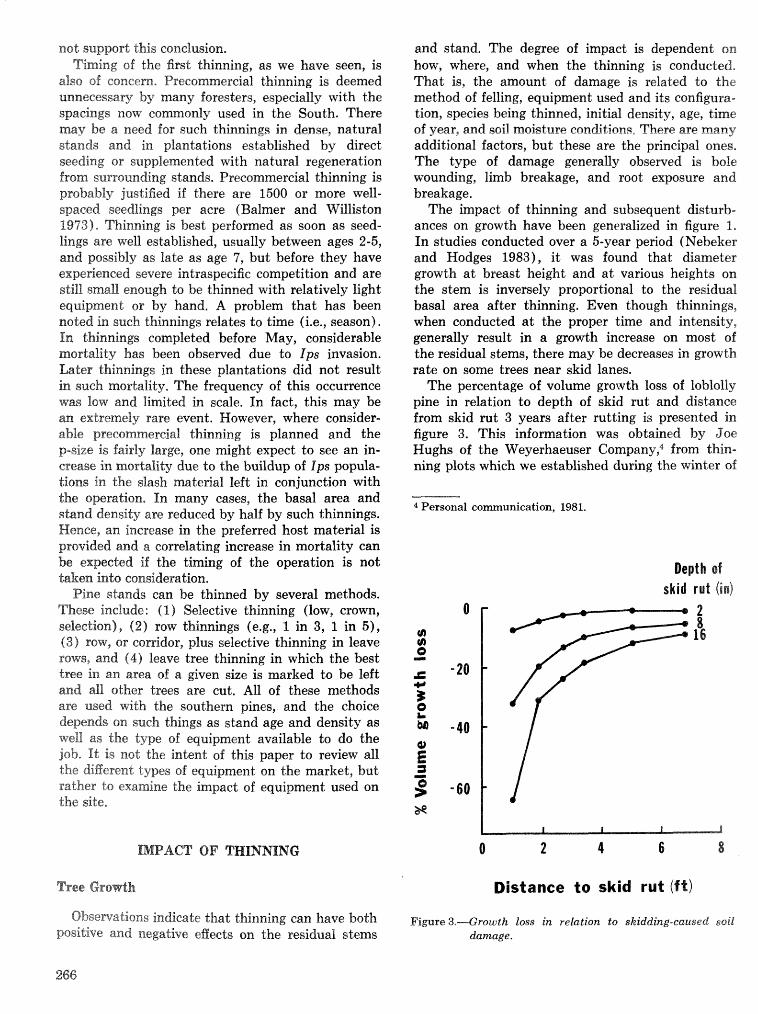
not support this conclusion, Timing of the first thinning, as we have seen, is
dso of concern. Precommercial thinning is deemed unnecessary by many foresters, especially with the spacings now commonly used in the South. There mav be a need for such thinnings in dense, na t~~sa l stands and in plantations established by direct seeding or supplemented with natural regeneration from sumouxrding stands. Precommereial thinning is probably justified if there are 1500 or more well- spaced seedlings per acre (Balmer and Williston 19731, Thinning is best performed as soon as seed- lings are well established, usually between ages 2-5, and possibly as late as age 7, but before they have expe9j;enced severe intraspecifie ccsmpetitiozl and are still small enough to be thinned with relatively light equipment or by hand. A problem that has been noted in such thinning8 relates to time (i.e., season). In thinning8 completed before May, considerable mortality has been observed due to Ips invasion. Later Lhinnixlgs in these plantations did not result in such mortality. The frequency of this occurrence was low and limited in scale. In fact, this may be an extremely rare event. However, where consider- able pzrecommereial thinning is planned and the p-size is fairly large, one might expect to see an in- crease in mortality due to the buildup of Ips popula- tions in the slash material left in conjunction with the operation. In many cases, the basal area and stand density are reduced by half by such thinnings. Hence, an. increase in the preferred host material is prcovided and sa correlating increase in mortality can be expected if the timing of the operation is not taken into consideration.
Pine stands can be thinned by several methods. These include : ( I ) Selective thinning (low, crown, selection), (2) row thinnings (e.g., 1 in 3, 1 in 51, (3) row, or corridor, plus selective thinning in leave rows, and (4) leave tree thinning in which the best tree in an area of a given size is marked to be left and all other trees are cut. All of these methods are used with the southern pines, and the choice ciepeands on such things as stand age and density as well as the type of equipent available to do the job* It is not the intent of this paper to review all "&he digereutt types of equ ipen t on the market, but rather to examine the impact of equipment used on the side,
and stand. The degree of impaet is dependent on how, where, and when the thinning is conducted, That is, the amount of damage is related ta the method of felling, equipment used and its configura- tion, species being thinned, initial density, age, time sf year, axad sail moisture conditions, There are many additional factors, but these are the principal ones. The type of damaigr? generally observed is bole wounding, limb breakage, and root exposure and breakage.
The impact of thinning and subsequent disturb- ances on growth have been generalized in figure I. In studies conducted over a 5-year period (Nebeker and Hodges 1983), it was found that diameter growth a t breast height and a t various heights on the stem is inversely proportional to the residual basal area after thinning. Even though thinnings, when conducted a t the proper time and intensity, generally result in a growth increase on most of the residual stems, there may be decreases in growth rate on some trees near skid lanes.
The percentage of volume grorvth loss of loblolly pine in relation to depth of skid rut and distance from skid rut 3 years after rutting is presented in figure 3, This information was obtained by Joe Hughs of the Weyerhaeuser Company ,4 from thin- ning plots which we established during the winter of
4 Personal communication, 1981.
Depth sf skid rut (in)
Tree Growth Distance to skid rut (ft)
Observations indicate that thinning can have both Figure 3.-Growth loss in to skidding-caused soil posithe and negative egects on the residual stems damage.
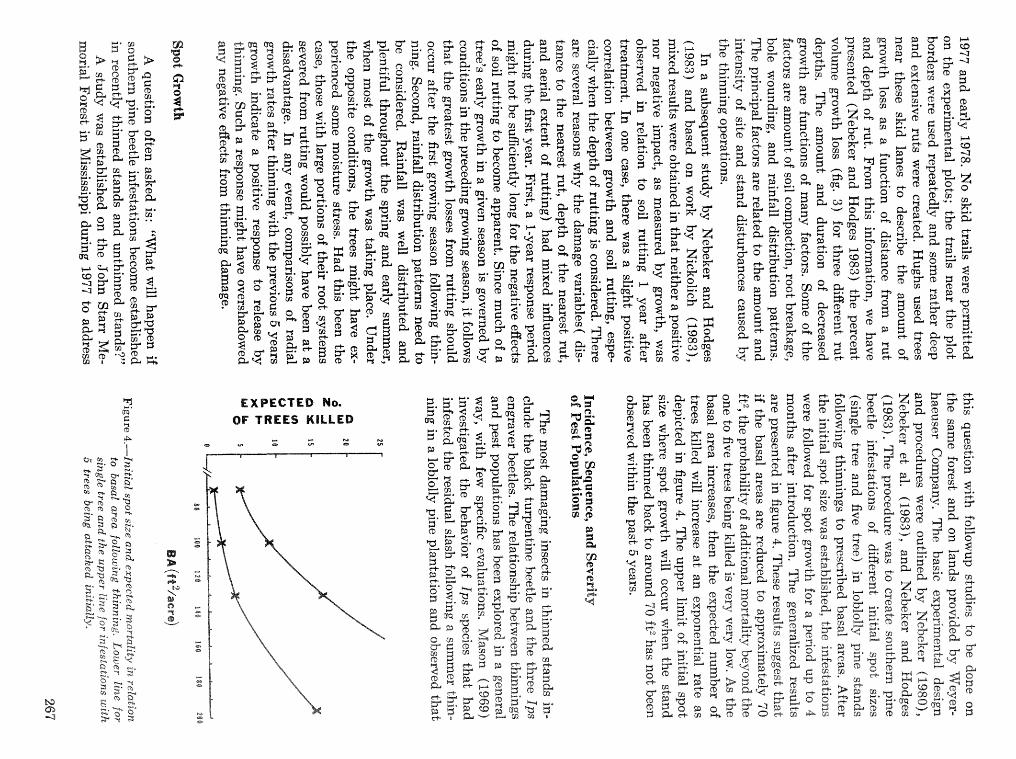
EXPECTED No. OF TREES NlLLED
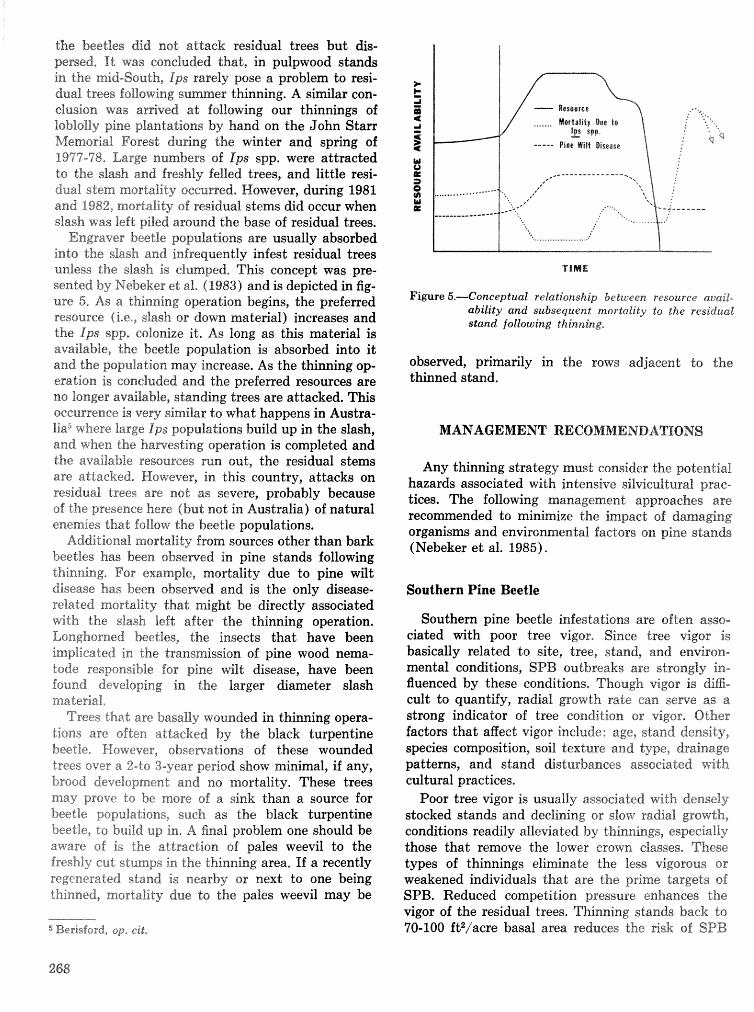
the beetlea did not attack residual trees but dis- persed, It was coneluded that, in pulpwood stands in the mid-South, Ips rarely pose a problem to resi- dual trees following su er thinning. A silnilar con- clusion was arrived a t following our thinnings of Ioblslly pine plantations by hand on the John Starr hfemorial Forest during the ~ n t e r and spring of 1977-78, Large numbers of Ips spp. were attracted do the slash and freshly felled trees, and little resi- dual stem mortaEity occurred, However? duhng 1981 and 1982, modality of residual stems did occur when stash was l e f t piled around the base of residual trees.
Engraver beetle populations are usually absorbed into the slash and infrequently infest residual trees unless the slash is clumped, This c ~ n ~ e p t was pre- sented by Nebeker e8; al, (1983) and is depicted in fig- ure 5, As a thinning operation begins, the preferred resource (i.e,, slash or down material) increases and the Ips spp. coBowiae it. As long as this material is available, the beetle population is absorbed into i t and the population may increase. As the thinning op- eration is conciraded and the preferred resources are no longer available, standing trees are attacked. This occurrence is very similar to what happens in Austra- l i d where large Ips populations build up in the slash, and when the hamesting operation is completed and the available resources run out, the residual stems are attacked, However, in this country, attacks on residual trees are not as severe, probably because of the presence here (but not in. Australia) of natural enemies that follow the beetle populations.
Additional mortality from sources other than bark beetles has been obsewed in pine stands following thinning. For example, mortality due to pine wilt disease has been ohsesved and is the only disease- related mortality that might be directly associated with the slash left after the thinning operation. Longhorned beetles, the insects that have been implicated in the transmission of pine wood nema- t ~ d e responsible 60% pine wilt disease, have been found developing in the larger diameter slash material,
Trees that are basally wounded in thinning opera- tions are often attacked by the black turpentine beetle, However, slsservations of these wounded trees over a 2-to 3-year period show minimal, if any, brood develspmenhnd no mortality. These trees may prove do be more sf a sink than a source for beetle popu%ations, s u c k a s the black turpentine beetle, to build up in, A final problem one should be aware of is the attraction of pales weeviI to the freshly cut stumps in &he thinning area. If a recently regenerated stand is nearby or next to one being thinned, mortality due do the pales weevil may be
Figure 5.-Conceptual relationship between resource avail- ability and subsequent mortality lo the residr4ck.l stand follming thinning.
observed, primarily in the rows adjacent to the thinned stand.
MANAGEMENT' REC0MMIENE)ATIBNS
Any thinning strategy must consider the potential hazards associated with intensive silvicultural prac- tices. The following management approaches are recommended to minimize the impact of damaging organisms and environmental factors on pine stands (Nebeker e t al. 1985).
Southern Pine Beetle
Southern pine beetle infestations are often asso- ciated with poor tree vigor, Since tree vigor i s basically related to site, tree, stand, and envirsn- mental conditions, SPB outbreaks are strongly in- fluenced by these conditions, Though vigor is diE- cult to quantify, radial, growth rate can sewe as a strong indicator of tree ecbnditisrs or vigor, Other factors that affect vigor include: age, stand density, species composition, soil texture and type, drainage patterns, and stand distrrrha~ces associated with cultural practices.
Poor tree vigor is usually associated with densely stocked stands and declining or slow7 radial growth, conditions readily alleviated by thinmings, espeeia%liy those that remove the lower crorvn classes, These types of thinnings eliminate the less vigorous or weakened individuals that are the prime targets of SPIB. Reduced competition pressure enhances the vigor of the residual trees. Thinning stands back do 70-100 ft2/acre basal area reduces the risk of SPB
attacks and may also help slow spot growth if an attack does occur. For greater ePEectiveness, Winning can be done in winter when the beetles are less active, Thinning to reduce the hazard is reeom- mended when basal area approaches I20 f-t2 [acre, or when live crown r a t i ~ s drop to about 40 percent, A properly conducted thinning w i l stimulate =dial groiv-th, reduce evapotranspiration, and increase rain throughfall. The reduetion in evapotranspiration slows down the depletion of groundwater and favors continued diameter gmwth. The prevention 06 severe water stress results in lower monoterpene eoneentra- Lion and higher levels of resin acids, which could be involved in making the stand less attractive to beetles (Hodges and L o ~ o 1975).
Pine stands in low-lying areas are frequently sub- jected to Alooding and become attractive to SPB, Thinning alone may not correct the problem in these areas. Additional management actions (such as drainage) to divert excess writer may be needed.
Any thinning strategy to reduce southern pine beetle risks should be compatible with management goals and consider such things as site and stand hctors, equipment, seasonality, and product objec- tive, Consideration of other potential. hazards (e.g,, annosus root rot, Ips spp., and black turpentine beetle) that might conflict with SPB recommenda- tions must also enter into the decisionmaking process.
Thinning is the single most important factor con- tributing to annosus root rot in pine stands since cutting exposes stump surfaces to infection, Damage due to the fungus increases with time after thinning up to about 8 years, after which the damage level stabilizes. Since annosus spore production is a t its bigbest level in January and February., thinning during the winter increases the likelihood of infec- tion. In addition to thinning, species susceptibility, vimZence of the disease, deep sandy soils, low soil organic matter, air temperature below 70" if"", dura- Lion of stump susceptibility, and pruning contkbute to and/or facilitate infection,
A comprehensive survey of annosus root rat dam- age GhroulEfhout the South revealed that 2,8 and -07 percent, respectively, of trees in plantations and natural stands were infected, In scattered high- hazard areas, 5-year volume loss fo2lswing thinning was estimated to be 20 percent of the stand (9 of 46 cords per acre). In general, volume loss following thinning ranges from 0.1 to 0.5 eordsiacreiyear (Alexander et al, 1981).
For high-hazard sites, the following measures are recommended for minimizing losses to annosus root
rot (Kuhlman et al, 1976) : (1) Delay thinning or reduce the number of thin-
n i n g ~ to reduce the risk of loss, Wider spac- ing and reduced thinning are beneficial practices.
( 2 ) Use borax on cut stumps for the most posi- tive control, Borax is not effective for a second thinning if not used for the first,
(3) Thin from April to August south of 34"N latitude do provide control because of high air and stump temperatures (rvhich are lethal to disease spores) and Isw spore numbers,
(4) Don% take any special precautions when re- planting previous1 y infected sites, The d: wease does not persist in the soil,
(5) Plant more resistant species on high-hazard sites (e.g,, longleaf is more resistant than loblolly ) .
There is some evidence that prescribed burning will reduce the severity of annosus root rot in thinned plantations (Froelich ed al, 1978), On Isw-hazard sites, chemical treatment of the stumps i s of doubtful value (Hodges 1974)- It is generally believed that on sites rated low hazard for annosus root rot, no restrictions on thinning are necessary, WThile the best strategy for reducing the disease on high-hazard sites may be to delay or do IIO thinning, stands on low-hazard sites may be thinned based on normal sifvieultural prescriptions dictated by product objec- tives, biological constraints, and desired capital re- covery. As recommended here, stumps on high- hazard sites should be treated with borax, and, in stands with confirmed root red, Peniophora gigantia (Fr,) h4assee, a saprophytic fungus, In addition, thinning should be done when possible during the hottest months of the year (May-August) do take advantage of high temperatures and low spore pro- duction/survival conditions. Prescribed burning may be done before and after thinning "k; further insure the proteetion of re8iC-dua~ stands from infection,
If spacing is widm khan 8 X 8 feet, and the product objective is pulpwood, thinning may be foregone, pasiiculairFy on high-hazard sites, Chemical thinnings should be done for precsmmereial thinning on high-hazard sites.
Since thinning to reduce the hazard of southern pine beetle incidence conflicts with management recommendations for annosups root rod, foresters should be aware of the tradeoffs in areas where both pests are Bikely to occur, Benei"st,.a must be weighed against potential losses for any chosen thinning strategy, In most cases, thinning should be done in the winter do reduce the SPB hazard and the stumps treated rvidh borax to prevent annosus inf ecdion,
Losses do fusiform rust have been estimated do exceed $25 million annually in value, making it the most economically damaging disease of southern. pines, Stash and loblolly pines are the preferred hosts, slash being the more sell.icously affected. The disease is more severe in plantations than in natural stands with mortality occurring primarily in the seedling stage,
Interestingly enough, cultural practices that favor fast stand growtfiincrease the incidence of fusiform rust, However, to prescribe against cultural practices that improve growth is neither sil~culturally nor economically sound. I t has been etairned tkat even a 50 percent rust infection rate in a stand can be ogset by an increase in volume resulting from such intensive cultural practices as site preparation and fertilization,
Thinning has little or no practical value in re- ducing fusiform rmst incidence because infection occurs a t the early stages of stand development, It must, therefore, be practiced for a diEerend pur- pose-to minimize losses due to rust; i.e., salvage, The first 5 years after planting are the critical period, Isrecommercial thinning may not be justified and may aggravate the problem by increasing the surface area for infection and by preventing natural pruning, This implication is supported by the finding tkat close spacing reduces fusiform rust incidence. Heavy thinning may also have an adverse eEect by favoring the growth of alternate hosts (oaks), thereby enhancing rust incidence, Thinning of heavily infected stands, on the other hand, can pro- foundly affect total wood production if heavily in- fected trees certain to die before final harvest are removed, If rust ineidence is less than 25 percent, the first thinning should remove most of the diseased trees, Opening up the stand too much can have unfavorable consequences on the residual stand in terms of growing and damage from ice and wind, Other factors such as windiwindthro~i, ice, etc. are considered in detail by Nebeker ed aB, (1985)-
LITERATURE CITED
Alexander, S.A; Skelly, J.M.; Webb, R,S. EBects of Heterobasidton annosum on radial growth in southern pine beetle-infested foblolly pine, Phyto- pathology 7% : 479-481; 1981.
Balmer, NT,E,; Williston, H.L. The need for psecsm- mercial thinning, Far. &$anage, Bull, Atlanta, GA: U.S, Department of Agriculture, Forest Sewice, Southeastern Area State and Private Forestry; 1973, 6 p,
BeZanger, R.P,; Malac, B.F. Silviculture can reduce losses horn the southern pine beetle. Agric. Handb. 576. Washington, DC: US , Department of Agri- culture; 1980. 17 p.
Belanger, R.P. ; Osgood, E.A.; Hat chefl, G.E. Stand, soil and site characteristics ihsscreiated with south- ern pine beetle infestations in the southern Appm- lachiarrs, Etes. Pap. SE-198, Asheville, NC: U.S. Department of Agriculture, Forest Sewice, South- eastern Forest Experiment Station; 1979, 7 p.
Bennett, F.Ae Growth and yield of stash pine plaata- tions, Res. Pap. SE-1. Asheville, NC: U.S. De- partment of Agriculture, Forest Service, South- eastern Forest Experiment Station; 1963, 23 p,
Blanche: C,A.; Nebeker, T.E.; Hodges, J.D.; Krarr, B.L; Schmitt, J.J. Efiect of thinning damage on bark beetle susceptibility indicators in loblolly pine. In: Shoulders, E., ed. Proceedings, third biennial southern silvicultural research conference; 1984 November 7-8; Atlanta, GA. Gen. Tech. Rep, SO-54. New Orleans, LA: U.S. Department of Agriculture, Forest Service, Southern Forest Experiment Station; 1985a: 471-479,
Proehlieh, H.A. The influence of different thinning systems on damage to soil and trees. Proc, XVL IUFRO Wodd Congress, Div. fV, Oslo, Nomay; 1976.
Froelich, R,C.; Hodges, C,%., Jr,; Saekett, S,S, Pre- scribed burning reduces severity of annosus root rot in the South. Forest Science "2 (I) : 93-100; 1938,
Hedden, R.L. The need for intensive forest manage- ment to reduce southern pine beetle activity in east Texas, South. Jour. Applied For. 1: 19-22; 1978.
Hedden, R.L.; Nebeker, T.E, Integrated forest pest management in pine stands (0-6 yrs.) "insects. In: Branham, S.J.; Hertel, G.D., eds. Proceedings, integrated forest pest management symposium; 1984 June 19-21; Athens, GA. Athens: Uni- versity of Georgia; 1984 : 39-53.
Hodges, C.S. Spmptornatology and spread of Pones annosus in southern pine plantations, Res. Pap, SE-114, Asheville, NG: U.S. Department of Agri- culture, Forest Service, Southeastern Forest Ex- periment Station; 1974. 10 p,
Hodges, J,D.; Lorio, P.L., Jr . hloisture stress and composition of xylem oleoresin in loblolly pine, Fsirrsst Science 21 ~283-290; 1975.
Hodges, J,D,; Elam, W.W.; Watson, W.F,; Nebeker, T,E, Oleoresin chasaeteristies and susceptibility of four southern pines to southern pine beetle (Coteoptera: Seolytidae) attacks. Canadian Ento- mology 111: 889496; 1979.
Hsdges, J.D,; Nebeker, T.E.; DeAngeliis, J.D.; Blanche, C,A, 1Fjfost:'beetle interactions: Influence of associated mircroorganisms, tree disturbance?, and
host vigor, In: Branham, S.J.; Thatcher, R.C., eds. Proceedings, integrated pest management research spmgssium; 1985 April 15-18; Asheville, NC. Gen. Tech, Rep. SO-56. New Orleans, LA: U.S. Depart- ment of Agriculture, Forest Service, Southern Forest Errpe~ment Station; 1985: 161-168.
Kuhlman, E,G,; Hodges, C.S., Jr,; Froelich, E.C. blinimizing losses to Fomes annosus in the south- ern United States. Res, Pap. SE-151, Ashevine, NC: U.S. Department of Agriculture, Forest Service, Southeastern Forest Experiment Station; 1976.16 p.
hfason, It"t,f;t, Behavior of Ips populations after sum- mer thinning in a loblolly pine plantation. Forest Science 15 (4) : 390--398; 1969.
Nebeker, T.E, Manipulation of stand density for prevention of southern pine beetle infestations in loblcllly pine plantations; 1980. [Final Tech. Rep. to lExpanded Southern Pine Beetle Research and Application Program-unpublished paper.
Nebeker, T,E, Influence of forestry practices on bark beetle populations: a perspective, In: Proceedings, Louisiana S Late University forestry symposium; 1985 Maseh 26-29; Baton Rouge, LA. Baton Rouge : Louisiana State University; 1985. [In press] .
Nebeker, T.E,; Hedden, R.L, Integrated pest man- agement in pine stands (6 +- yrs.)-insects. In: Branham, S.J,; Herdel, C.B., eds. Proceedings, integrated forest pest management symposium;
1984 June 19-21; Athens, GA. Athens: Uniwrsity of Georgia; 1984: 11Ci-125,
Nebeker, T.E.; Hodges, J.D. Influence of forestry. practices on host susceptibility to bark beetles, Zietschrift fur Angewandte Entomologie 96(2) : 194-208; 1983,
Nebeker, T.E.; Moehring, D.M.; Hodges, J.D.; Brown, M.W.; Blanche, G.A. Impact of thinning on host suseeptibility. In: Jones, E. P., Jr., ed. Proceedings, second biennial southern silvi~ultural research conference; 1982 November 4-5; Atlanta, CA. Gen. Tech. Rep. SE-24. Asheville, NC: U.S. Department of Agriculture, Forest Service, Soutb- eastern Forest Experiment Station; 1983: 376- 381.
Nebeker, T.E.; Mizell, R.F., III; BedweZ1, N.J. Man- agement of bark beetle populations: irnpact of manipulating predator cues and other control tactics. In: Garner, W.Y.; Harvey, J. Jr., eds. Chemical and biological controls in forestry, ACS Symposium Ser. 238: 25-33; 1984,
Nebeker, T.E. ; Hodges, J.D. ; Karr, B.L; Moehring, D.M. Thinning practices in the southern pines- with pest management recommendations. Tech. Bull. 1703, Washington, DC: U.S, Department of Agriculture; 1985. [In press].
Nickolich, M.B. The effect of soil rutting on the growth of residual loblolly pine trees following thinning operations. Mississippi State, MS : Mississippi State University; 1983. [M.S. Thesis].
Field Tests of Insecticides for Control of Black Turpentine Beetle John C. Nord, Alice S. Jones, and Felton L. Haskings'
Abstract.---Ths@e ppethroids, Ambush""., Pyclr;7nB9 and C y r n k ~ h ' ~ were field tested at three rates for preventive control of' black tuventine bee"rle an. lob- loiiy and slash pine in North Carolina land Florida in 1984, In addition, Dursbaazs and Sumithion@ were tested at three rates in Florida, Of the ppedhrsids, the high rate of Ambush (0.6 percent) and Gymbush (0.3 percent) appeared do be approaching the mini- mum eEeahtive rates for 2- to 3-month c~ntroZ, where- as the high rate of Pydrin (0.6 percent) did not, The high rate of Dursban and Sumithion (2.0 percent) appears to be egeertive. The results suggest that all insecticides except P y d ~ n should be tested further at slightly higher rates. Pydrin rates should be ele- vated substanticklIy in any future tesb. There was an indica-k;ion that lower rates of Pydrin and Gymbush in some way caused a sigraificaxlt increase in attacks over the controls, This might have been caused by an effect 06- the pyrethroids con adult behavior of the beetle, Additional keywords : Dendroctonus terebrans (01- ivier) , cypemethrin, fenitrothion, pemedhrin, fen- valera te, ehIorpyrrifcls, Ilindane.
Although lindane has been used for many years as an effective preventive control of black turpen- tine beetle (BTB) Dentroetonus terebrans (Oliivier) (Smith 1954, %958), there was a need do test alterna- tive insecticides that might be safer and more ef- fective than lindane, The inseeticides of interest are some of the pyrethroids, only one of which has been tested on BTB (Williams 1979), and Dursban and Sunithion because they have been shown to be eeectivc-, against southern pine beetle (Dendrcrctonus frontalis Zimmermann) (Hastings and Coster 1981), and they have also shown promise for controlling BTB (RIoore 8977, Merke2 19m9, ?~ferkel and Clark 1981),
1 Research Entomologist, Research Microbiobggist, and Prin- cipal Research Entomologist, resp?ctively, U.S. Department s f Agriculture, Forest Service, Southeastern Forest Experi- ment Station, Forestry Sciences Laboratory, Research Tri- angle Park, NG. (The authors wish to acknowledge the fof- lowing: Federal Paper Board Company, Inc., who provided the North Carolina research areas and Union Camp Corpo- ration, who provided the Florida site, and the Integrated Best hlanagement Research, Deveiopment and Applieatisns Program 60s Bark Beetles of Southern Pines, who funded the research,)
Contact toxicity tests of eight insecticides were conducted at our laboratory in Rmearch Triangle Park, NG, in the spring of f9832 Lo ded tive toxicity. In those tests, a 0.62 pl droplet of ac- etone v a r ~ n g in concentration of toxicant was ap- plied to &he ventral thorax of adult beetles after which the beetles were held at ambient temperature in ventilated cups of ground pine phloem for 48 hours. h/fortality counts were then made, and LD,, and LDeo dosages were calculated with POL02 (Rob- ertson eL ale 1981). Table 1 shows the results of those tests, All insecticides were 3 to 66 times as 'toxic as lindane, Deltarnetbrin, cypermethrin, and fenitrothion were particularly toxic to BTB rdativc to lindarte, Because deltamethrin was not likely I;rP be available commercially, we selected the other pyre- throids, Pydrin, Ambush, and Gymbush (=cyperme- thrin) to field test along with Dursban and Smithion f -: fenitrothion).
Three field tests of insecticides were established in June of 1984: two in North Carolina, one ncsar Lau- rinburg and the other near Aberdeen, one in north Florida near Palatka. Each test was established in a loblolly pine (Pinus taeda L.) or slash pine (P. elizo t lii Engelm.) plantation immediately adjacent to a fresh ~ i n e elearcut ar thinning, Table 2 gives &- tails of the test shnds.
Experimental Design
The experimental design was a randomized com- plete block design with three blocks, and all treat- ments were randomly assigned to 3-5 trees/bliockf month combination for a total of 9-15 treesitreat- merit X month in the expekmend.
The experiment was blocked by distance from the probable BTB source (stumps and root systems in adjacent cutting area) (fig, I) , The blocks were rectangular, approximately the same size for ea& test, and all oriented vGith the long side parallel to the edge of the clearcut.
Treatments
All trees in each test were sprayed ad one time (table 3) . Three pyrethroids, Pydrin, Ambush, and
Word et; aI, unpublished.
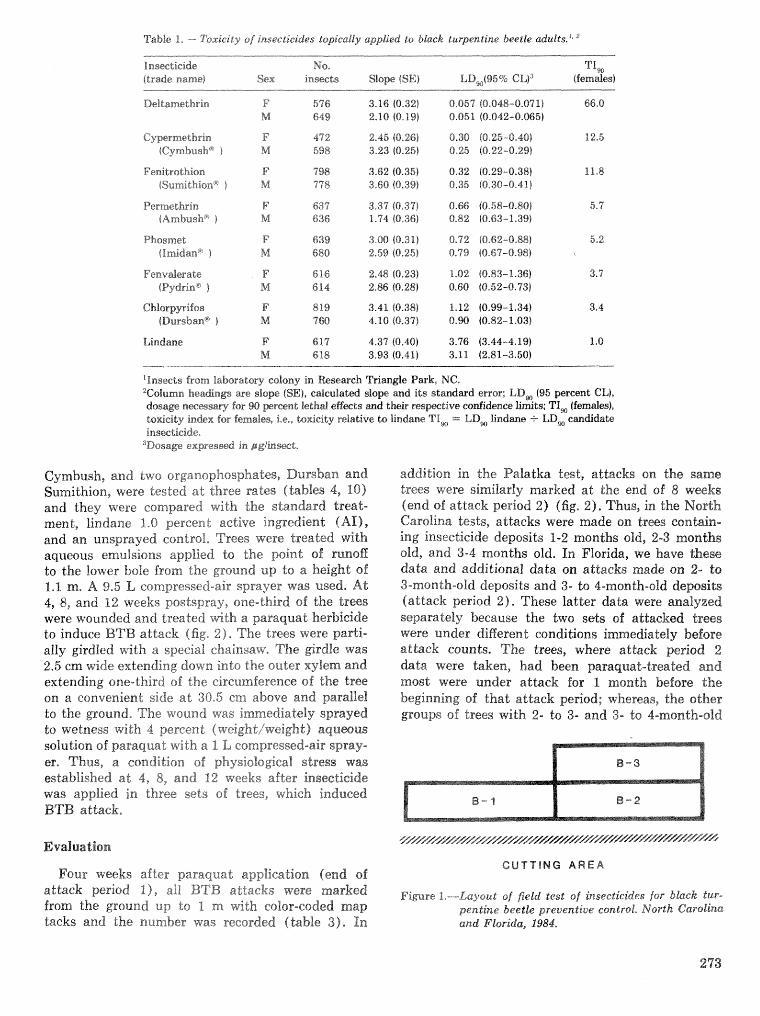
Table 1. --- Toxicity of insecticides topically applied to black turpentine beetb adults. I* '
Fenitrothion (Sumithion". )
"nseets from Laboratory colony in bselueh Triangle Pmk, NC. *Column headings are s l o p (SE], calculated slope and its standard error: LD, (95 percent CLI. dosae n w m s w for $30 preent lethd effwts md their resmtive confidmee b t s ; TIw (fmdes), todeity index for femdes, i,e., to&eidy relative to Endme? TI,, =: LD, Iindae -+ LD, earn&idak insecticide,
3Dosage expressed in yg/hswt.
Cymbush, and two organophosphates, Dursban and Sumithion, were tested at three rates (tables 4, 10) and they were compared with the standard treat- ment, lindane 1.0 percent active ingredient (AI) , and an unsprayed control. Trees were treated with aqueous enut.sions applied to the point of runoa to the lower bole from the ground up -to a height sf 1-1 m, A 9.5 L compressed-air sprayer was used. At 4, 8, and ?i.2 weeks postspray, one-third sf the trees were lvcsunded and treated with a paraquat herbicide to induce BTB attack (fig, 21, The trees were parli- ally girdled mritE.1 a special chainsaw, The girdle was 2.5 em wide extending down into the outer xylem and extending one-third of the circumference sf the tree on a convenient side ad 30-5 cm above and paraUe% to the ground, The wound was immediately sprayed &s wetness with 4 percent (weigh%/weight) aqumus salut i~n of paraquat with a 1 L compressed-air spsay-
addition in the Palatkil test, attacks on the same trees were similarly marked at the end of 8 weeks (end sf attack period 2 ) (fig, 2). Thus, in. the Norb;Bs Carolina tests, atGraeks were made on trees eonGn- ing insecticide deposits 1-2 months old, 2-3 month8 old, and 3-4 months old. In Florida, we have these data and additional data on attacks made on 2- to 3-month-old deposits and 3- to 4-month-old deposiim (attack period 2). These latter data were analyzed separately because the two sets of attacked trees were under different conditions i attack countse The tsees, where attack period 2 data were taken, had been paraquat-treated and most were under attack for 1 month before the beginning of that attack period; whereas, the other groups of trees with 2- to 3- and 3- to 4-month-old
ere T~LIS, a condition of physio%esgica% stress was established ad 4, 8, sand 12 weeks after insecticide was applied in three sets sf trees, which induced BTB attack,
Evaluation CUTT iNG A R E A
Four weeks after paraquat application (end of attack period BTB attacks were marked Figure I.--layout of field test of insecticides for black fur- from the ground up $0 1 nt with co1or-coded map pentine beetle preventive control, North Carolina tacks and the number was recorded (table 3). In and Florida, 1984,
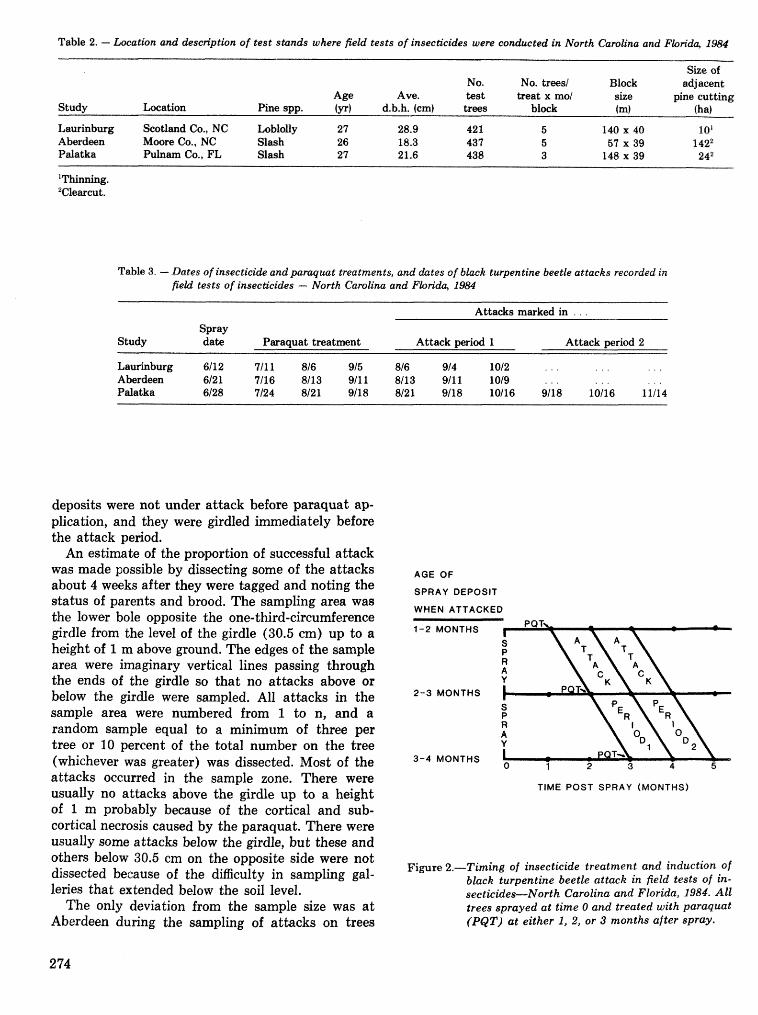
Table 2. - b a t i o n and desckption of test stands where field tests of insecticides were conrtLlcted in North Carolina and FLon'dct, 1984
Size of No. No. treed Blmk adjacent
A@ Ave. test treat x ma/ size pine cutting Study tion Pine spp. (yr) d.b.h. (em) trees block (mi (ha)
Table 3, - Bates of insecticide and p a w m t mtments , and dates of black turpentine beetle attacks recorded in fie& tests of insecEicides - North Camlina and Fhn'da, 1984
Attacks marked in . . .
Study date Paraquat treatment Attack period 1 Attack period 2
Lakburg 6112 711 1 816 915 816 914 1012 . . . . . . . . . A berdeen 6/21 7116 8113 9111 8/13 9111 1019 . . . . . . . , . Palatka 6/28 7/24 8/21 9118 8121 9118 10116 9/18 10116 11114
deposits were not under attack before paraquat ap- plication, and they were girdled immediately before the attack period.
An estimate of the proportion of successful attack was made possible by dissecting some of the attacks about 4 weeks after they were tagged and noting the status of parents and brood. The sampling area was the lower bole opposite the one-third-circumference girdle from the level of the girdle (30.5 cm) up to a height of 1 m above ground. The edges of the sample area were imaginary vertical lines passing through the ends of the girdle so that no attacks above or below the girdle were sampled. All attacks in the sample area were nunnbered from 1 to n, and a random sample equal to a minimum of three per tree or 10 percent of the total number on the tree (whichever was greater) was dissected. Most of the attacks occurred in the sample zone. There were usually no attacks above the girdle up to a height of 1 m probably because of the cortical and sub- cortical necrosis caused by the paraquat. There were usually some attacks below the girdle, but these and others below 30.5 cm on the opposite side were not dissected because of the difliculty in sampling gal- leries that extended below the soil level.
The only deviation from the sample size was a t Aberdeen during the sampling of attacks on trees
AGE OF
SPRAY DEPOSIT
WHEN ATTACKED
1-2 MONTHS
2-3 MONTHS
TIME POST SPRAY (MONTHS)
Figure 2.-Timing of insecticide treatment and induction of black turpentine beetle attack in field tests of in- secticides-North Carolina and Florida, f 984. A22 trees sprayed at time 0 and treated with paraquat (PQT) at either 1, 2, or 3 months after spray.
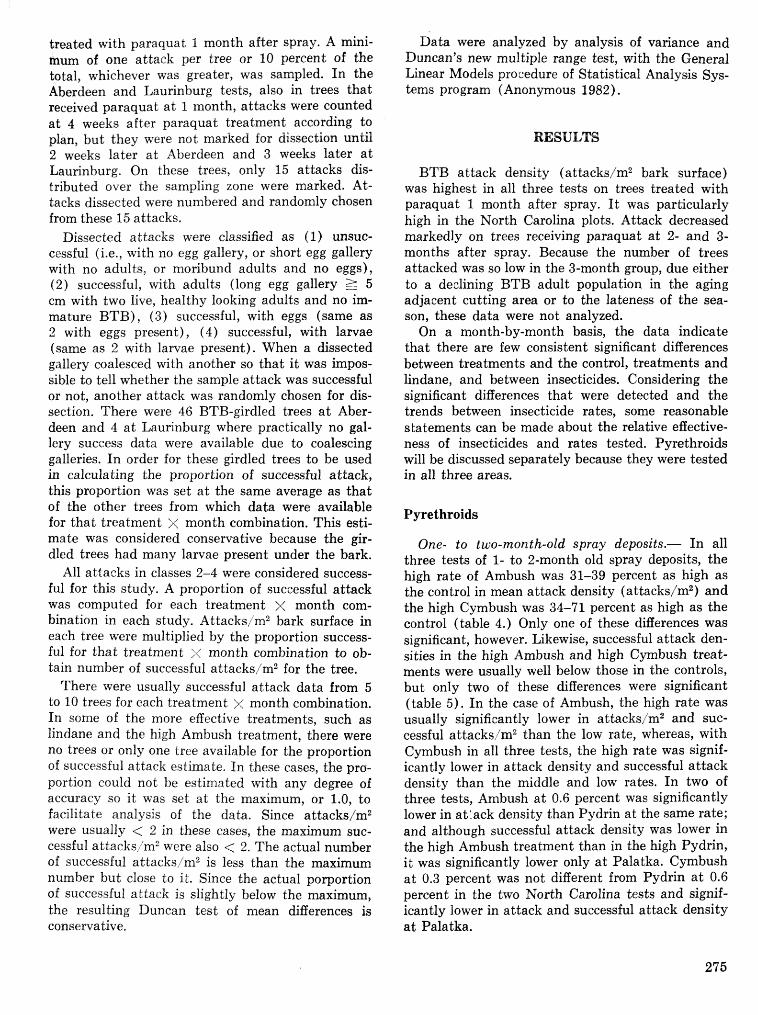
treated with paraquat 1 month after spray. A mini- mum of one attack per tree or 10 percent of the total, whichever was greater, was sampled. In the Aberdeen and Laurinhurg tests, also in trees that received paraquat a t 1 month, attacks were counted a t 4 weeks after paraquat treatment according to plan, but they were not marked for dissection until 2 weeks later a t Aberdeen and 3 weeks later a t Laurinburg. On these trees, only 15 attacks dis- tributed over the sampling zone were marked. At- tacks dissected were numbered and randomly chosen from these 15 attacks.
Dissected attacks were classified as (1) unsuc- cessful (i.e., with no egg gallery, or short egg gallery with no adults, or moribund adults and no eggs), (2) successful, with adults (long egg gallery 2 5 crn with two live, healthy looking adults and no im- mature BTB) , (3) successful, with eggs (same as 2 with eggs present), (4) successful, with larvae (same as 2 with larvae present). When a dissected gallery coalesced with another so that i t was impos- sible to tell whether the sample attack was successful or not, another attack was randomly chosen for dis- section. There were 46 BTB-girdled trees a t Aber- deen and 4 a t Laurinburg where practically no gal- lery success data were available due to coalescing galleries. In order for these girdled trees to be used in calculating the proportion, of successful attack, this proportion was set a t the same average as that of the other trees from which data were available for that treatment X month combination. This esti- mate was considered conservative because the gir- dled trees had many larvae present under the bark.
A11 attacks in classes 2-4 were considered success- ful for this study. A proportion of successful attack was computed for each treatment x month com- bination in each study. Attacks/m2 bark surface in each tree were multiplied by the proportion success- ful for that treatment x month combination to ob- tain number of successful attacks/m2 for the tree.
There were usually successful attack data from 5 to 10 trees for each treatment x month combination. In same of the more effective treatments, such as lindane and the high Ambush treatment, there were no trees or only one tree available for the proportion of succ~ssful attack estimate. In these cases, the pro- portion could not be estimated with any degree of accuracy so it vvas set a t the maximum, or 1.0, to facilitate analysis of the data. Since attacks/m2 were usually < 2 in these cases, the ma&um suc- cessful atdacks,'m2 were also < 2. The actual number of sticcessful attacks,'m2 is less than the maximum number but close to it. Since the actual porportion of S U G G ~ S S ~ ~ attack is slightly below the maximum, the resulting Duncan test of mean differences is conservative,
Data were analyzed by analysis of variance and Duncan's new multiple range test, with the General Linear Models procedure of Statistical Analysis Sys- tems program (Anonymous 1982).
RESULTS
BTB attack density (attacksJm2 bark surface) was highest in all three tests on trees treated with paraquat 1 month after spray. I t vvas particularly high in the North Carolina plots. Attack decreased markedly on trees receiving paraquat a t 2- and 3- months after spray. Because the number of trees attacked was so low in the 3-month group, due either to a declining BTB adult population in the aging adjacent cutting area or to the lateness of the sea- son, these data were not analyzed.
On a month-by-month basis, the data indicate that there are few consistent significant differences between treatments and the control, treatments and lindane, and between insecticides. Considering the significant differences that were detected and the trends between insecticide rates, some reasonable statements can be made about the relative effeetive- ness of insecticides and rates tested. Pyrethroids will be discussed separately because they were tested in all three areas.
Pyrethroids
One- to two-month-old spray deposits.- In all three tests of 1- to 2-month old spray deposits, the high rate of Ambush was 31-39 percent as high as the control in mean attack density (attacks/m2) and the high Cymbush was 34-71 percent as high as the control (table 4.) Only one of these differences was significant, however. Likewise, successful attack den- sities in the high Ambush and high Cymbush treat- ments were usually well below those in the controls, but only two of these differences were significant (table 5). In the case of Ambush, the high rate was usually significantly lower in attacks/m2 and suc- cessful attacks;m2 than the low rate, whereas, with Cymbush in all three tests, the high rate was signif- icantly lower in attack density and successful attack density than the middle and low rates. In two of three tests, Ambush a t 0.6 percent was significantly lower in at:ack density than Pydrin a t the same rate; and although successful attack density was lower in the high Ambush treatment than in the high Pydrin, it was significantly lower only a t Palatka. Cymbush a t 0.3 percent was not different from Pydrin a t 0.6 percent in the two North Carolina tests and signif- icantly lower in attack and successful attack density a t Pala tka.
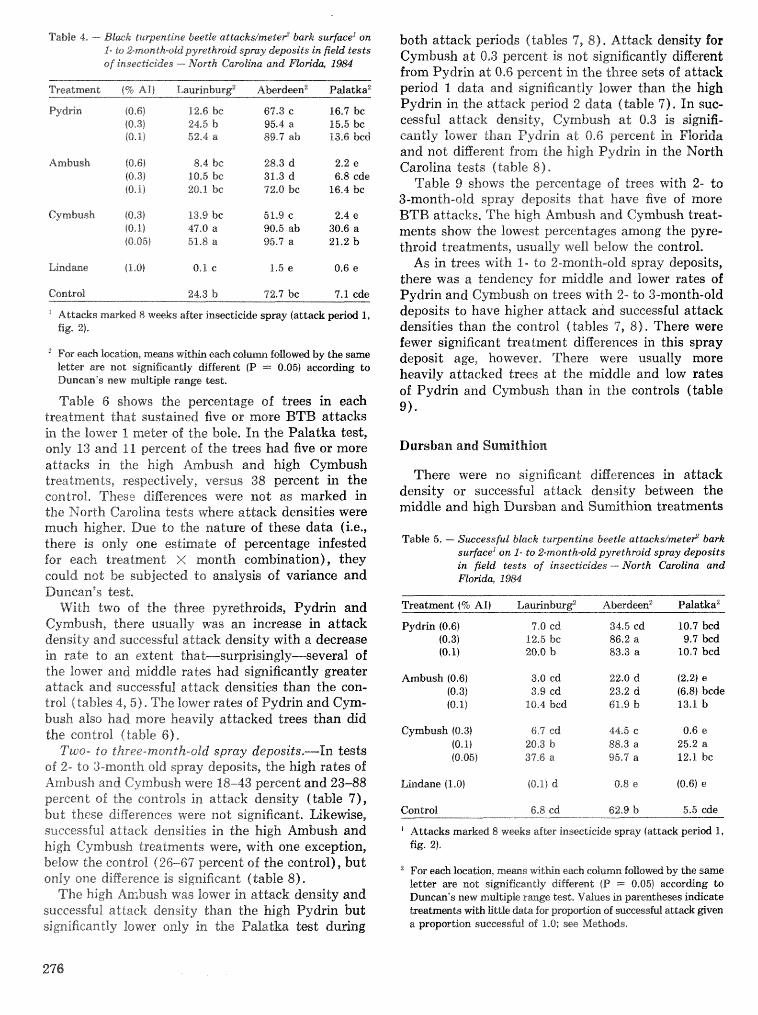
Tabb 4. --- Black Curpentine beeth attackslnzete? bark surface' on, 1- to ;i;t-mo~sth+kdpyrczthmiid spmy deposits iin field tests of insecticides ---- Zb'orth Carolina and E"kon"da, 19tk.f
Treatmend (%AT] Latarhbur$ A b r d e n 2 Palatka2
Py&in (0.61 12.6 bc 61.3 e 16.7 bc f8,3) 24.5 b 95.4 a 15.5 be (0. 1) 52.4 a 89.7 ab 13.6 bed
Ambush (0.6) 8,4 be 28.3 d 2.2 e 40-3) 10.5 bc 31.3 d 6.8 cde
P 20.1 be "7.0 be 16,4 bc
Cyrnbush (0.3) 133 be 51.9 c 2.4 e (0,ll 47.0 a 90.5 ab 30.6 a 10,6451 51.8 a 95.7 a 21.2 b
Control 24.3 b "3-7 bc 7.1 cde
"ttacks mmked 8 w e k s afhr inswtieide spray (att-ack period 1, fig. 25.
"or each twatisn, m m s ~ t b each colum foflowd by the s m e letkr me not sieifieantly d i f f e~n t fP = 0,051 according to Duacm's new multiple rmge test.
Table 6 shows the percentage of trees in each treatment that sustained five or more BTB attacks in the lower I meter of the bole. In the Palatka test, only I3 and I1 percent of the trees had five or more attacks in the high Ambush and high Cymbush tseadments, respectivdy, versus 38 p e ~ e n t in the control. These differences were not as marked in the North Carolina tests where attack densities were much higher, Due do the nature of these data (i.e., there is only one estimate of percentage infested for each treatment X month csmbinalion), they could not be subjected to analysis of variance and Duncan" test.
bVith two sf the three pyrethroids, Pydrin and Cymbrash, there usually was an increase in attack density and successful attack density with a decrease in rate to an extent that-surprisingly-several of the lower and middle rat- had sigxlificantly greater attack and successful. attack densities than the con- trol (tables 4,5). The lower rates of Pydrin and Gym- hush also had more heavily attacked trees than &d the control (kabfe 61,
Tux- to t%zre~-montr&-0Id spray deposits,-In tests of 2- to 3-month oid spray deposits, the high rates of Ambush and Cyrnbush were 18-43 percent and 23-88 percent of the controls in attack, density (table ?), but these differences were not significant. Liker?riise, successful attack densities in the high Ambush and high Gymbush treatments were, with one exception, below the contsc84. (26-67 percent sf the control), but only one diEerence is significant (table 8) .
The high An:bush was lower in attack density and successful attack density than the high P y d ~ n but significantly lower only in the Paliatka tmd d u ~ g
both attack periods (tables 7 , 8). Athek density for Cyrnbush at 0*3 percent is not significantly digerent from Pydrtn at 0.6 percent in the, three sets of attack period 1 data and significantly lower than the high Pydrin in the ahtack period 2 data (tab2e 7). In suc- cessful attack density, Gymbush a t 0.3 is signifi- cantly lower than Pydrin at 0,6 percent in Florida and not different from the high Pydrin in the North Carolina tests (table 8 ) .
Table 9 shows the percentage of trees with 2- to 3-monzh-old spray deposits that have five of more BTB attacks, The high Ambush and Gymbush treal- ments show the locvest percentages among tho pyre- throid treatments, usually well betow the control.
As in trees with 1- to 2-month-old spray deposits, there was a tendency for ~ d d l e and lower rates of Pydrin and Gymbush on trees k t h 2- do 3-month-old deposits to have higher attack and successful attack densities than the control (tables 7, I d ) . There were fewer significant treatment differences in this spray deposit age, however. There were usually more heavily attacked trees a t the middle and low rates of Pydrin and Cymbush than in the controls (table 9) *
Dursban and Sumithion
There were no significant diBerences in attack density or succesful attack density between the middle and high Dursban and Sumithion treatments
Table 5. - Sweessfub black turpentine b w t b attacks/mete? bark surfacehon 1- to 2-month-old pyrethroid spray deposits in field tests of inseeticides - Nclrdh Carolina and Flodda 2984
Treatment (% AZ) Laurinburg2 Aberdwn2 Palatka2
Pydrin (0.6) 7,0 eb 34.5 cd 10.7 h d (0.3) 12.5 be 86.2 a 9.7 bcd (0.1) 20.0 b 83.3 a 10.7 bcd
Ambush (0.6) 3.0 cd 22.0 d (2.2) e (0.3) 3.9 cd 23.2 d (6.8) bcde toma) 90.4 bcd 61.9 b 13.1 b
Cyrnbush (8.3) 6,7 cd 44.5 e 0.6 e (0- 1 1 20.3 b 88.3 a 25.2 a (0.05) 37.6 a 95'1 a 12.1 be
Control 6.8 cd 62,9 b 5.5 ede
Attacks mark& 8 weks afbr insecticide spray fattwk period 1, fig. 21,
For each loeation, mems *l;b each colum fcallowd by the s m e letter are nod significmtly difkrent (P =. 0.05) according to Duncan's new mdtiple rmge test. Vdues in pmentheses &dieate treatmmls ~ t h httle &%a for proprkion of sucwssM attack &vea a proportion suceesshl of 1.8; see Methods.
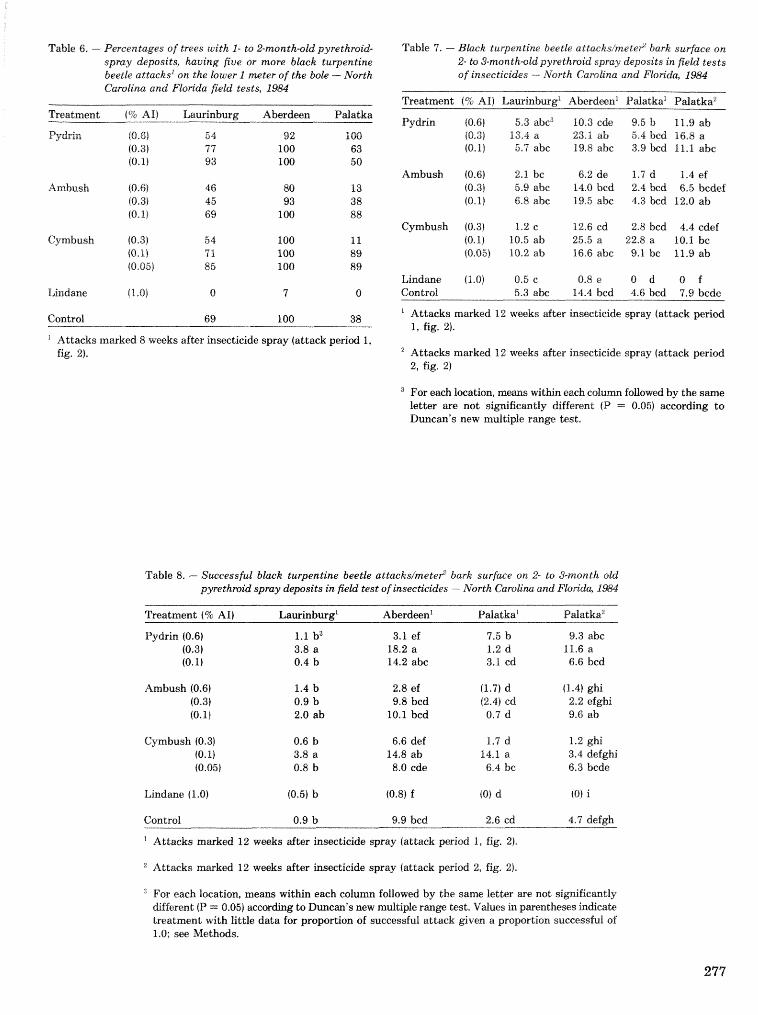
Table 6. -- Percentages of trees with 1- to 2-month-oldpyrethroid- spmy deposits, having five or more black? turpentine beetk adtacksbn the Eouer 1 meter of the bde - North Carolina and F l o ~ d a field tests, 1984
Treatment (% AI) Laurinburg Aberdeen Pdatka
Pydris (0.61 54 92 100 (0.31 7 7 100 63 (0.11 93 100 50
Control 69 100 38
Qttacks mat-ked 8 weeks after insecticide spray (attack period 1, fig. 2).
Table 7. - Black turpenti~zrr beeth attaeksim~te? bark surface on 2- to 3month-okdpyrethroid s p q deposits in field tests of inseetieides - North Carotilza and Floricla, 19%
Treatment 4% AI) Laurinburg' Aberdwn' Pdatka"PalatkaZ
Pydrin (0.6) 5.3 abc3 10.3 cde 9.5 b 11.9 ab (0.3) 13.4 a 23.1 ab 5-4 bcd 16.8 a (0.1) 5.5 abe 19.8 abe 3-9 bed 11.1 abe
Ambush (0.6) 2.1 bc 6.2de 1.7d I.4ef (0.3) 5.9 abe 14.0 bcd 2.4 h d 6.5 bcdef (0.1) 6.8 abc 19.5 abe 4.3 bcd 12.0 ab
Gymbush 10.3) 1.2 c f2,6ed 2.8bed 4.4cdef (0.1) 10.5 ab 25.5 a 22.8 a 10.1 be 10.05) 10.2 ab 16.6 abe 9.1 bc 11.9 ab
Lindme (1.0) 0 . 5 ~ 0.8e O d 0 f Control 5.3 a h 14.4 bed 4.6 bed 7.9 bcde
Attacks mmked 12 weeks after insecticide spray (attack pe~od 1, fig. 2).
Attacks marked 12 weeks after insecticide spray (attack period 2, fig. 2)
For each location, m m s w i t h each column followed by the same letter are not sirnificantly different (P = 0.05) according to Duncan's new multiple range test.
Table 8. - Sueeessful black turpentine beetle attackslmete? bark surface on 2- to Smonth old pyrethmid spray deposits in field test of insecticides - North Carolina and Flon"da, 1934
Treatment {% AI) Laurinburg' Aberdeenl Palatka' Palatkaz
Pydrin (0.6) 1.1 b3 3.1 ef 7.5 b 9.3 abe (0.3) 3.8 a 18.2 a 1.2 d 11.6 a (0.1) 0.4 b 14.2 abe 3.1 ed 6.6 bcd
Ambush (0.6) (0,3) (0.11
1.4 b 2.8 ef (1.7) d (1.4) Ffhi 0.9 b 9.8 bcd (2.4) cd 2.2 efgbi 2.0 ab 10.1 bcd 0.7 d 9.6 ab
Cymbush (0.3) 0.6 b 6.6 def 1.7 d 1.2 ghi (0.1) 3.8 a 14.8 ab 14.1 a 3.4 defghi (0.05) 0.8 b 8.0 cde 6-4 be 6.3 bcde
Control 0.9 b 9.9 bcd 2.6 ed 4.7 defgh
Attacks marked 12 weeks after insecticide spray (attack period 1, fig. 2).
Attacks msked 12 weeks after insecticide spray (attack period 2, fig. 2).
"or each location, means within each column followed by the same letter are not significantly &fferent (P = 0.06) acemding to Duncan's new mdtiple range test. Vdues in parentheses indieate treatment with little data for proportion of successful attack given a proportion successful of 1.0: see Methods.
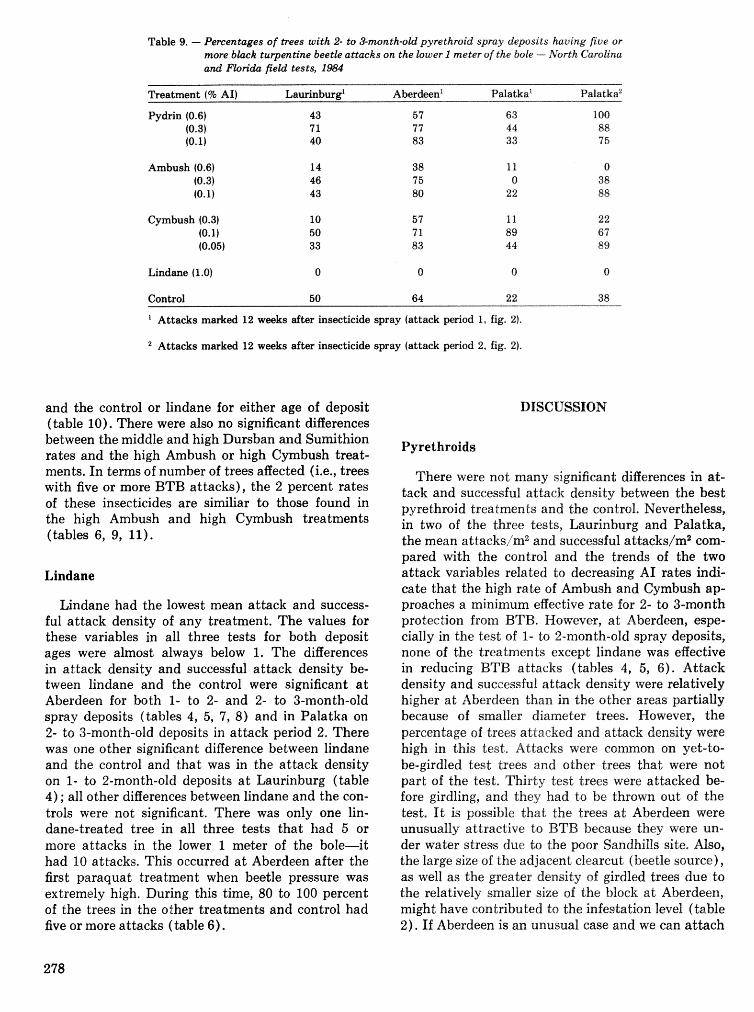
Table 9. - Percentages of trees with 2- to Smonth-old pyrethmid spray deposits having five or more b h k turpenh'ne beetle attacks on the lower 1 meter of the bole - firth- Carolina and I " l o ~ fieM tests, 1984
neatment 4% AI) Laurinburgl Aberdmnl Pdatba' PaliatkaZ
Pydrin (0.6) 43 57 63 100 (0.3) 71 77 44 88 f0.l) 40 83 33 15
Ambush (0.6) (0.31 (0.11
Cymbush (0.3) (0.11 (0.05)
Control 50 64 22 38
Attacks marked 12 weeks after insecticide spray (attack period 1, fig. 2).
Attacks marked 12 weeks after insecticide spray (attack period 2, fig. 2).
and the control or lindane for either age of deposit (table 10). There were also no significant differences between the middle and high Dursban and Sumithion rates and the high Ambush or high Cymbush treat- ments. In terms of number of trees affected (i.e., trees with five or more BTB attacks), the 2 percent rates of these insecticides are similiar to those found in the high Ambush and high Cymbush treatments (tables 6, 9, 11).
Lindane
Lindane had the lowest mean attack and success- ful attack density of any treatment. The values for these variables in all three tests for both deposit ages were almost always below 1. The differences in attack density and successful attack density be- tween lindane and the control were significant a t Aberdeen for both 1- to 2- and 2- to 3-month-old spray deposits (tables 4, 5, 7, 8) and in Palatkn on 2- to 3-month-old deposits in attack period 2. There was one other significant difference between lindane and the control and that was in the attack density on 1- to 2-month-old deposits a t Laurinburg (table 4) ; all other differences between lindane and the con- trols were not significant. There was only one lin- dane-treated tree in all three tests that had 5 or more attacks in the lower 1 meter of the b o l e i t had 10 attacks. This occurred a t Aberdeen after the first paraquat treatment when beetle pressure was extremely high. During this time, 80 to 100 percent of the trees in the other treatments and control had five or more attacks (table 6).
DISCUSSION
Pyrethroids
There were not many significant differences in at- tack and succasful attack density between the best pyrethroid treatments and the control. Nevertheless, in two of the three tests, Laurinburg and Palatka, the mean attacksjm2 and successful attacks//m2 com- pared with the control and the trends of the two attack variables related to decreasing A1 rates indi- cate that the high rate of Ambush and Cymbush ap- proaches a minimum effective rate for 2- to 3-month protection from BTB. However, a t Aberdeen, espe- cially in the test of 1- to 2-month-old spray deposits, none of the treatments except lindane was effective in reducing BTB attacks (tables 4, 5, 6). Attack density and successful attack density were relatively higher a t Aberdeen than in the other areas partially because of smaller diameter trees, However, the percentage of trees attacked and attack density were high in this test, attacks were common on yet-to- be-girdled test trees and other trees that were not part of the test, Thirty test trees were attacked be- fore girdling, and they had to be thrown out of the test. It is possible that the trees a t Aberdeen were unusually attractive to BTfS because they were un- der wakr stress due to the poor SandhiUs site, Also, the large size of the adjacent eleareut (beetle source), as well as the greater density of girdled trees due to the relatively smaller size of the block a t Aberdeen, might have contributed to the infestation level (table 2). If Aberdeen is am unusual ease and we can attach
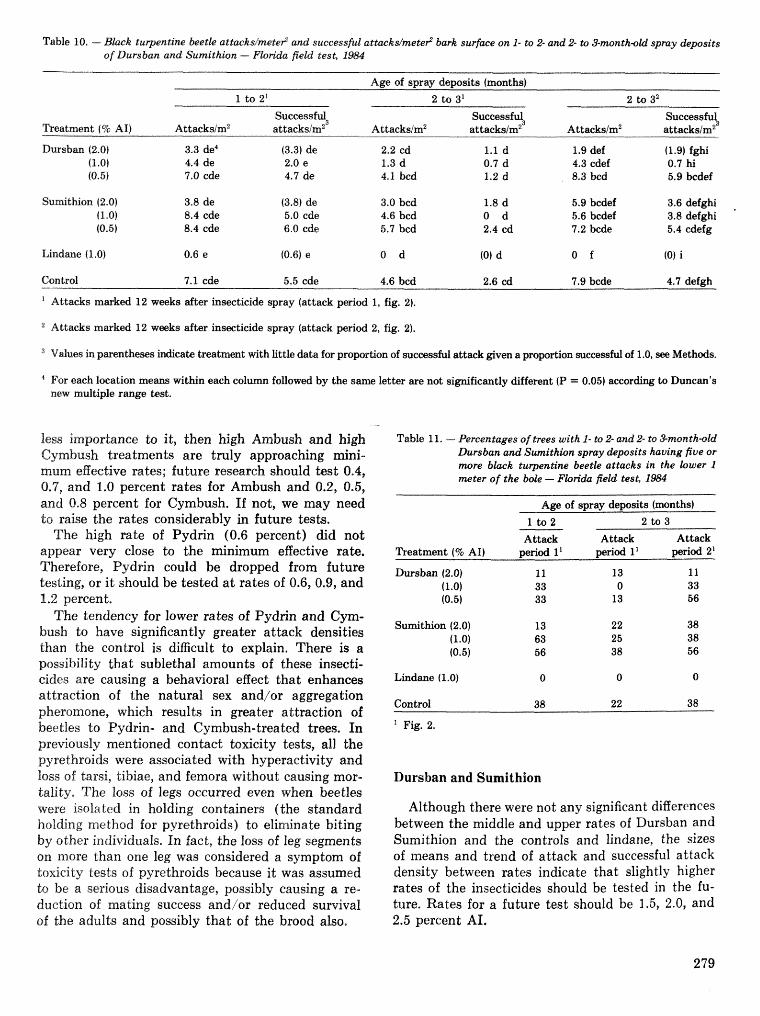
Table 10. - BkK turpentine beetle attacksimeter2 and successful attmkslmete? bark surface on 1- to 2- and 2- to Smonth-oCd spmy deposits of Dursban and Sumithion - Plon'da field desd, 1m
Age of spray deposits (months) 1 to 2l 2 to 3l 2 to 32
Successful Successq Sucmsshl Beatment (5% AI) Attackslm2 - -- - attacksim2' A ttacbsim2 attackslmZ Attacks/m2 a t t ack~ l rn~~
- - -
Dursban (2.0) 3.3 de4 13.3) de 2.2 cd 1.1 d 1.9 def (1.9) fghi 0.ot 4.4 de 2.0 e 1.3 d 0.7 d 4.3 cdef 0.7 hi (0.5) 7.0 cde 4.7 de 4.1 bcd 1.2 d 8.3 bed 5.9 bedef
Sunnithion (2,O) 3.8 de (3.8) de 3.0 bcd 1.8 d 5.9 bcdef 3,6 defghi 4 2 -0) 8.4 cde 5.0 cde 4.6 bed 0 d 5.6 bcdef 3.8 defghi (0.5) 8.4 cde 6.0 cde 5.7 bcd 2.4 cd 7.2 bcde 5.4 cdefg
Control 7.1 cde 5.5 cde 4.6 bcd 2.6 cd 7.9 bcde 4.7 defgh
Attacks m h e d 12 weeks after hsecticide spray (attack period 1, fig. 2).
Attacks mmked 12 weeks after insecticide spray (attack perid 2, fig. 2).
Vdues in pmntheses indicate treatment with little data for proportion of successful attack given a proportion successful of 1.0, see Methods.
For each location means within each column followed by the same letter are not significantly different (P = 0.05) according to Duncan's new multiple range test.
less importance ts it, then high Ambush and high Cymbush treatmenh are truly approaching mini- mum efliective rates; future research should test 0.4, 0.7, and 1.0 percent rates for Ambush and 0.2, 0.5, and 0.8 percent for Cymbush. If not, we may need do raise the rates considerably in future tests.
The high rate of Pydrin (0.6 percent) did not appear very close to the minimum effective rate. Therefore, Pydrin could be dropped from future testing, or i t should be tested a t rates of 0.6, 0.9, and
Table 1 1. --- Percentages of trees with 1- t~ 2- and 2- to Smonthsld Dursban and Sumithion spray deposits having five or more bkack turpentine beetle attacks in the lower 1 meter of the bole - Fion'da field test, 1984
Age of spray deposits (months)
1 to 2 2 to 3
Attack Attack Attack Treatment (5% AI) period 1' period 1' period 2'
Dursban (2.0) 11 13 11 (1.0) 33 0 33
1.2 percent. (0.5) 33 13 56
The tendency for lower rates of Pydrin and Cym- bush to have significantly greater attack densities than the control is difficult to explain. There is a possibility that sublethal amounts of these insecti- cides are causing a behavioral effect that enhances attraction of the natural sex and/or aggregation pheromone, which results in greater attraction of beetles to Pydrin- and Cymbush-treated trees. In previously mentioned contact toxicity tests, all the pyrethroids were associated with hyperactivity and loss a>f tarsi, tibiae, and femora without causing mor- tality, The loss of legs occurred even when beetles were isolated in holding containers (the standard holding method for pyrethroids) to eliminate biting by other individuals. In fact, the loss sf leg segments on more than one leg was considered a symptom of toxicity tests of pyrethroids because it was assumed to be a serious disadvantage, possibly causing a re- duction of mating success and/or reduced survival of the adults and possibly that of the brood also,
Lindane (1.0) 0 0 0
Control 38 22 38
Fig. 2.
Dursban and Sumithion
Although there were not any significant differences between the middle and upper rates of Dursban and Sumithion and the controls and lindane, the sizes of means and trend of attack and successful attack density between rates indicate that slightly higher rates of the insecticides should be tested in the fu- ture. Rates for a future test should be 1.5, 2.0, and 2.5 percent AI,
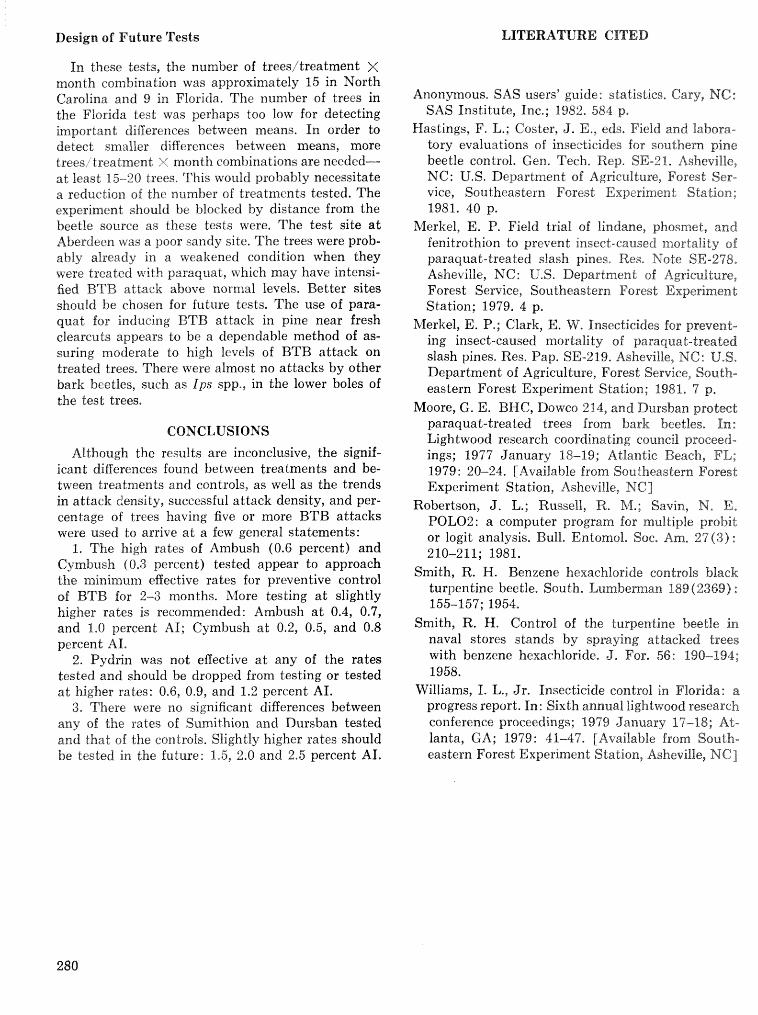
Design of Future Tests LITERATURE CITED
In these tests, the number of treesitreatment X month eombina tion was approximately 15 in North Carolina and 9 in Floric-la. The number of trees in the Fiorida test was perhaps too low for detecting Empartanl tliEereaees between means. In order to detect smaller differences between means, rnore treesiJtreatment %' month combinations are needed- at least 15-20 trees. This would probably necessitate a reduckion sf the number of treatments tested. The experiment should be blocked by distance from the beetle source as these tests were. The test site at Aberdeen rvas a poor sandy site. The trees were prob- ably already in a iveakened condition when t h y were treated with paraquat, which may have intensi- fied BTB attack above normal levels. Better sites should be chosen for future tests. The use of para- quat for inducing BTB attacli. in pine near fresh clearcuts appears to be a dependable method of as- strri.ng moderate to high levels of BTB attack on treated trees. There were almost no attacks by other bark beetles, such as Ips spp., in the lower boles of the test trees,
CONCLUSIONS
Although the results are inconclusive, the signif- icant differences found between treatments and be- tween treatments and controls, as well as the trends in attack density, successful attack density, and per- centage of trees having five or rnore BTB attacks were used to arrive a t a few general statements:
I. The high rates of Ambush (0.6 percent) and Cyrnbush (0.3 percent) tested appear to approach the minimum effective rates for preventive control of BTB for 2-3 months. itlore testing a t slightly higher rates is recommended: Ambush a t 0.4, 0.7, and 1-0 percent AI; Gymbush a t 0.2, 0.5, and 0.8 percent AI.
2. Pydrin was not effective a t any of the rates tested and should be dropped from testing or tested a t higher rates: 0.6, 0.9, and 1.2 percent AI,
3. There were no significant differences between any of the rates of Sumithion and Dursban tested and that of the controls, Slightly higher rates should be tested in the future: 1.5, 2.0 and 2.5 percent AI.
Anonmous. SAS userskguide: statistics, Cary, NC: SAS Institute, Inc.; 1982, 583 p.
Hastings, F. L,; Coster, J, E,, eds, Field and tabora- tory evaluations of insecticides for southern pine beetle control, Gen, Tech. Rep. SE-21, Asheville, NC: U.S* Department of Agfieulture, Forest Ser- vice, Southeastern Forest Experiment Station; 1981. $0 p.
hlerkel, E, P, Field trial of lindane, phssmet, and fenitrothion to prevent insect-caused mortality of paraquat-treated slash pines, Res. Note SE-278. Asheviffe, NC: U.S. Department of Agriculture, Forest Service, Sou theas tern Forest Experinnen t Station; 1979. 4 p.
Merkel, E. P.; Clark, E. Insecticides for prevent- ing insect-caused mortality of paraquat-treated slash pines. Res, Pap. SE-219, Asheville, NC: U,S. Department of Agriculture, Forest Service, South- eastern Forest Experiment Station; 1981. 7 p,
Moore, 6. E, BHC, Dowco 214, and Dursban protect paraquat-treated trees from bark beetles, In : Lightwood research coordinating council proceed- ings; 1977 January 18-19; Atlantic Beach, FIL; 1979: 20-24, [Available from Southeastern Forest Experiment Station, Asheville, NC f
Robertson, J. L.; Russell, R. hl.; Savin, N, E, POL02: a computer program for multiple probit or logit analysis. Bull, Entomol, Soe, Am, 2 4 ( 3 ) : 210-211; 1981.
Smith, R. H. Benzene hexachloride controls black turpentine beetle. South. Lumbeman 189 (2369) : 155-157; 1954,
Smith, R. H. Control of the turlpentine beetile in naval stores stands by spraying attacked trees with benzene hexachloride, J', For. 56: 190-194; 1958.
Wiltiams, I. L., Jr . Insec-t;icide control in Florida: a progress report. In: Sixth annual lightwood research conference proceedings; 1979 January 17-18; At- lanta, GA; 1979: 41-47. [Available from South- eastern Forest Experiment Station, Asheville, NC]
Effects of Frontalure in Suppressing Southern Pine Beetle Spot Growth Under Endemic and Epidemic Population Levels
T. L. Payne, L. H. Kudon, C. W. Berisford, B. P. O'Domell, and D. K. W&hl
A Es tract.-The application of frontalure has po- tential for use in suppressing infestations of the southern pine beetle under endemic infestation den- sities to prevent population buildup. Under epidemic conditions, the tactic appears to be less eRective in suppressing infestations, Formulated as an acrylic polymer mieroeneapsulant spray, frontalure appli- cation can be laborsaving at an operational level for use during routine ground cheeks. Addi tisnral key words : Dendroctonus, attractant, in- festation microeneapsulant, behavioral chemicals.
Research and development efforts aimed a t sup- pressing infestations of the southern pine beetle (Dendrsetcrnus frontatis Zimmermann) have been limited and fragmented since A, II). Hopkins first re- ported tho pest in the southeastern United States in the late 3880ks, Historically, efforts to control the beetle have been remedial in nature and pri- marily included the use of insecticides and salvage. Salvage is still practiced, but in the last decade, high costs and environmental restrictions have all but eliminated the operational use of insecticides in the forest* As a resuit, the forest manager is greatly limited in the choice of direct control methods with which to attempt to deal tvith the beetle. In recent years, eRorts have been underway to
develop additional and alternate means for suppres- sing southern pine beetle infestations (Coster 1957, Leusckzner et al, $977). Through the Expanded Southern Pine Beetle Research and Application Pro- gram, and subsequently through the ISM Bark
1 Respectively, Professor, Department of Entomology, Texas A&hf University, College Station, T X ; Research Associate and Professor, Department sf EntomoZogy, University of Georgia, Athens, GA; and Technicians, Texas A&M Univer- sity, College Station, TX. (This is Texas Agriculture Experi- ment Station Paper No, 20516, T h e work was funded in park by ibfcIntire-Stennis project 1525, the USDA-Forest Service, RB&A Program for Bark Beetles of Southern Pines, and funds allocated to the Georgia Agriculturat Experiment Sta- tions. iVe thank R. Billings, 6. Bryant, 7". CoEey, M. Dalusky, 9. Delorme, C. Russell, D. Ivans, J. Morrissey, and T. Potter for assistance in the field research.)
Beetle Program, some emphasis has been placed on behavioral chemicals because of the potential they oBer for managing beetle populations,
USING BEHAVIORAL CHEMICALS
Several behavioral chemicals have been found to play a role in the landing and attack behavior sf the southern pine beetle (Borden 9974, Vit6 and Francke 1976, Payne et al. 1978). Some of the chemicals have an attractant effect on beetle response.
In nature, attractants function to orieust Wying beetles to a common host tree so that they arrive in sufficient numbers over a relatively short period of time to overcome the resistance of the tree and successf ally colonize it. Frontalin (1,s-dimethyl- 6,8-dioxabicyclo 13.2.11 octane (Kinzer ed al. 1969), produced by the female and believed to be released when she makes contact with a suitable host tree (Renwick and Vit6 19691, is considered the primary aggregation pheromone of the southern pine beetle (Kinzer et al. 1969, Payne et al, 1978). By itself, frontalin attracts flying beetles of both sexes, but in the presence of host odor, suck as alpha-pinene, its effect can be greatly enhanced (Kinzer et al, 1969, Payne e t al, 1978). Alpha-pinerne supposedly func- tions as an arrestant in combination with frontalin (Renwick 1970); that is, the pheromone attracts beetles to the tree sand the host odor arrests their Aight so that they land.
These compounds have potential for managing southern pine beetle through baited traps, trap trees, and/or the disruption of the beetle's natural aggregation behavior. The attractant mixture fron- talure (frontalin plus alpha-pinene) was evaluated in a trap-tree application with the herbicide cacody- lic acid (Vit6 1970). The technique was influenced by several variables and met with limited success (coulson et al. 19'73a, 19$3b, 1975),, PronCalure was evaluated in an infestation-wide, aerial application to determine its effectiveness in disrupting the ag- gregation behavior of the southern pine beetle and the ability of the beetle to attack and colonize host trees (Vit4 et af. 1976), The application was not successful in halting activity in the infestation, since it resulted in increased attack on host trees, E ~ R -
ever, the attractant mixture does have implication for use in aggregating beetles within an infestation to be salvaged.
Frontalure" aag~gat ing effect on southern pine beetles suggested the mixture might have application in halting infestation growth when applied selectively within an infestation, rather than areawide.
In an attempt to determine the eBects of fronta- lure on southern pine beetle infestations in a com- bination of interrupticln and bait-tree methods, Rich- e r s ~ n et al. (1980 j conducted a series of field tests in two active infestations, each of ca, 75 loblolly pines (Pinus taedu L. ) , in Montgomery County, TX.
The numher of newly-attacked trees was moni- tored during a pretreatment period, a treatment period, and a post-treatment period after the at- tractant had been removed from the infestation. All host trees containing either emerging brood adults, callow adults, pupae, or 1st to 4th instar larvae, and all nonhost trees in the area of those infested host trees were baited. The synthetic attractant was not placed adjacent to naturally attractive sources a t the front of the infestation.
All tests showed that no previously uninfested trees came under successful mass attack during the frontalure treatment periods as opposed to during the pre- and post-treatment periods when southern pine beetles were S U C C ~ S S ~ U ~ ~ ~ attacking host trees.
This study concluded that the placement of fronta- lure within the infestation interrupted the spot growth phenomenon of beetle activity by containing emerging broods and randomly redistributing beetle numbers throughout the infestation. Consequently, insuficient numbers of beetles were present a t the active front to successfully overcome host resistance. Beetle activity outside the treated area did not occur. The nomal infestation spot growthjbeetle attack behavior was reestablished after the frontalure treat- ment was removed.
Results indicated the feasibility of attractant use in southern pine beetle control. Keeping beetles in an area of the infestation not conducive to popula- tion growth may disrupt spot dynamics to the extent that expansion is slowed greatly or stopped alto- gether. Hypothetically, if beetles are kept from aggre- gating on suitable hosts, they will succumb to the inGuerrce of abiotic and biotic factors.
Ira their tests, Richerson et al. (1980) did not con- sider the duration over which infestation growth could be suppressed in the presence of artificial at- tractants. Our study initiated field tests in Texas and Georgia to obtain that information and to deternine the potential far using frontalure as a tactic to sup- pms infestations of the southern pine beetle under both epidemic and endemic population levels.
METHODS AND PROCEDURES
Infestations
Candidate southern pine beetle infestations for test sites were categorized hy the following param- eters to aid in determining the likelihood an infest;&- tion would expand if left untreated: ( I ) Number of active trees, (2) predominant life stage in active trees, (3) tree species composition, (4) stand density, (5) edaphic barriers, and (6) available uninfested host type. All currently infested trees were marked. A pre- treatment evaluation period of ad least 1 week was generally used to select infestations that were ac- tively growing. Candidate infestations were visited weekly to monitor for the presence of newly attacked trees. Only infestations with a high likelihood of growth were selected for use in the test. In most cases, test infestations were limited to those in the 20-50 infested tree range due to the fact that, with the availability of host type, infestations in that size range have a high probability for growth (Hed- den and Billings 1979).
Because of the extensive variability that can occur between paired infestations selected as controls and treatments, pretreatment evaluation periods of each potential test infestation were used to provide control data. That is, a given infestation was slot treated unless the rate of growth during the pre- treatment period indicated the infestation would expand if left untreated.
In Texas, southern pine beetle infestation density was a t epidemic proportions in many areas. As a re- sult, the infestations treated in Texas were, in gen- eral, within close proximity of other active infesta- tions. In Georgia, southern pine beetle activity was a t endemic levels, and treated infestations were isolated.
Treatments
Frontalure was eluted from four different elution devices: 1. Screw cap vials and filters (Billings ed ale 1980), 2. prototype polyethylene bubblecaps (Phero Tech I ~ c . ) ~ , 3. a prototype pest striplike device in which frontalin and alpha-pinene were contained separately in two elution bubbles on its surface (Bend Research I ~ c . ) ~ , and 4, an acrylic polymer microencapsulant spray formulation, All devices were intended to elute a t a rate of 75-80 nngitree, and contained enough attractant for an estimated
2 Phero Tech Inc., Vancouver, B.G., Canada.
3 Bend Research Inc., Bend, OR, U.S.A.
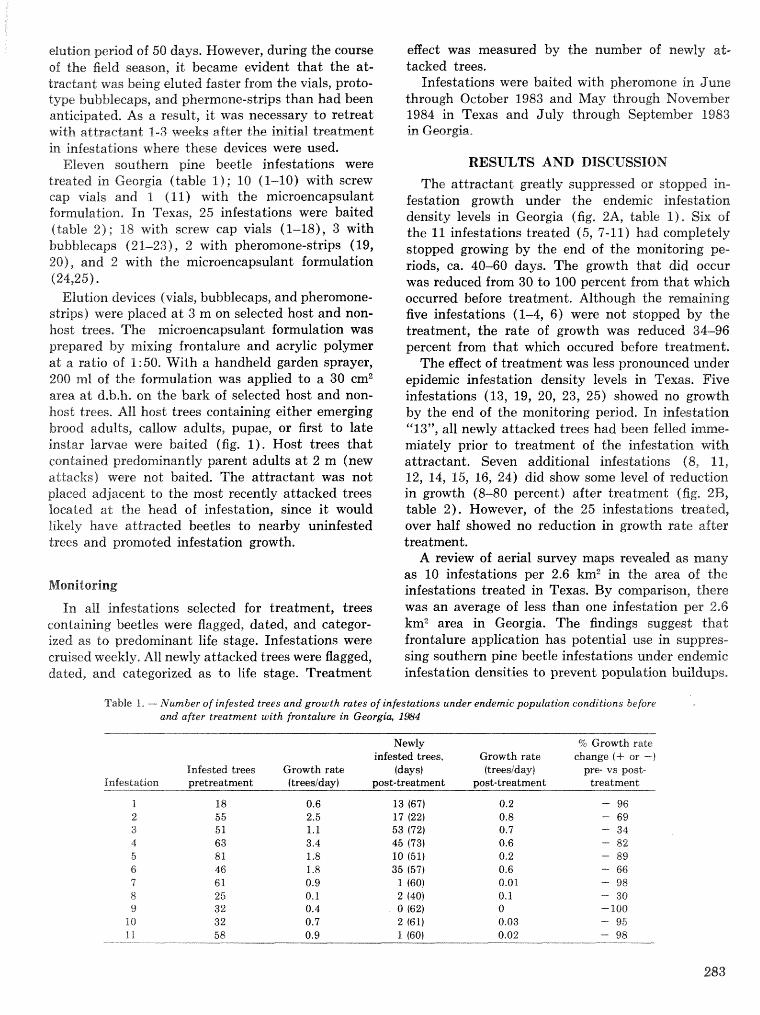
elution period of 50 days, However, during the course of the fiefd season, it became evident that the at- tractant was being eluted faster from the vials, proto- type bubblecaps, and phermone-strips than had been anticipated, As a result, it was necessary to retreat with attsartan$ 1-3 weeks after the inidid treatment in infestations where these devices were used.
Eleven southern pine beetile infestations were treated in Georgia (table 1) ; I0 (1-10) with screw cap vials and 1 (11) with the microencapsulant formulation, f n Texas, 25 infestations were baited (table 2") 118 with screw cap vials (1-18), 3 with bubblecaps (21-23), 2 with pheromone-strips (19, % 8 ) , and 2 with the unieroencapsulant fornulation (24,25).
Elution devices (vials, bubblecaps, and pheromone- strips) were placed a t 3 m on selected host and non- host trees, The microencapsulant formulation was prepared by mixing frontalure and acrylic polymer at a ratio of 1:50, With a handheld garden sprayer, 200 ml of the formulation was applied to a 30 cm2 area a t d.b.h. on the bark of selected host and non- host trees. All host trees containing either emerging brood adults, callow adults, pupae, or first to late instar larvae were baited (fig. 1). Host trees that contained predominantly parent adults a t 2 m (new attacks) were not baited. The attractant was not placed adjacent to the most recently attacked trees located at the bead of infestation, since it would likely have attracted beetles to nearby uninfested trees and promoted infestation growth.
In all infestations selected for treatment, trees containing beetles were flagged, dated, and categor- ized as do predominant life stage, Infestations were cruised weekly, All newly attacked trees were flagged, dated, and categorized as to life stage. Treatment
eBect was measured by the number of newly ad* tacked trees.
Infestations were baited with pheromone in June through October 1983 and May through November 1984 in Texas and July through September 1983 in Georgia,
RESULTS AND DISCUSSION
The attractant; greatly suppressed s r stopped in- festation growth under the endemic infestation density levels in Georgia (fig, 2A, table 1). Six of the 11 infestations treated (5, 7-11) had completely stopped growing by the end of the monitoring pe- riods, ca. 40-60 days. The growth that did occur was reduced from 30 to 200 percent from that which occurrd before treatment. Although the remaining five infestations (1-4, 6) were not stopped by the treatment, the rate of growth was reduced 34-96 percent from that which occured before treatment;.
The effect of treatment was less pronounced under epidemic infestation density levels in Texas, Five infestations (13, 19, 20, 23, 25) showed no growth by the end of the monitoring period. In infestation "13", all newly attacked trees had been felled imme- miately prior to treatment of the infestation with attractant. Seven additional infestations (8, 11, f 2, 14, 15, 16, 24) did show some level of reduction in growth (8-80 percent) after treatment (fig. 2B, table 2). However, of the 25 infestations treated, over half showed no reduction in growth rate after Lreatrnen t.
A review of aerial survey maps revealed as many as 10 infestations per 2.6 km2 in the area of the infestations treated in Texas. By comparison, there was an average of less than one infestation per 2.6 km2 area in Georgia. The findings suggest that frontalure application has potential use in suppres- sing southern pine beetle infestations under endemic infestation densities to prevent population buildups.
Table I . - Ntlmber of infested trees and growgh rates of infestations under endemic population conditions before and after treatment with frontalum in Georgia, 19%
Newly % Growth rate infested trees, Growth rate change (+ or --I
Infested trees Growth rate (daysf (treesiday] pre- vs post- Infestation pretreatment (treesiday) post-treatment post-treatment treatment
i 18 0.6 13 (67) 0.2 - 96 2 55 2.5 17 (22) 0.8 - 69 3 5 1 1.1 53 (72) 0.7 - 34 4 63 3.4 45 473) 0.6 - 82 5 81 1.8 10 (51) 0.2 - 813 6 46 1.8 35 (57) 0.6 - 66 'i 6 1 0.9 1 (60) 0.01 - 98 8 25 0.1 2 (40) 0.1 - 30 9 3 2 0.4 0 (62) 0 - 100
10 32 0.7 2 61) 0.03 - 95 I I 58 0.9 1 (60) 0.02 - 98
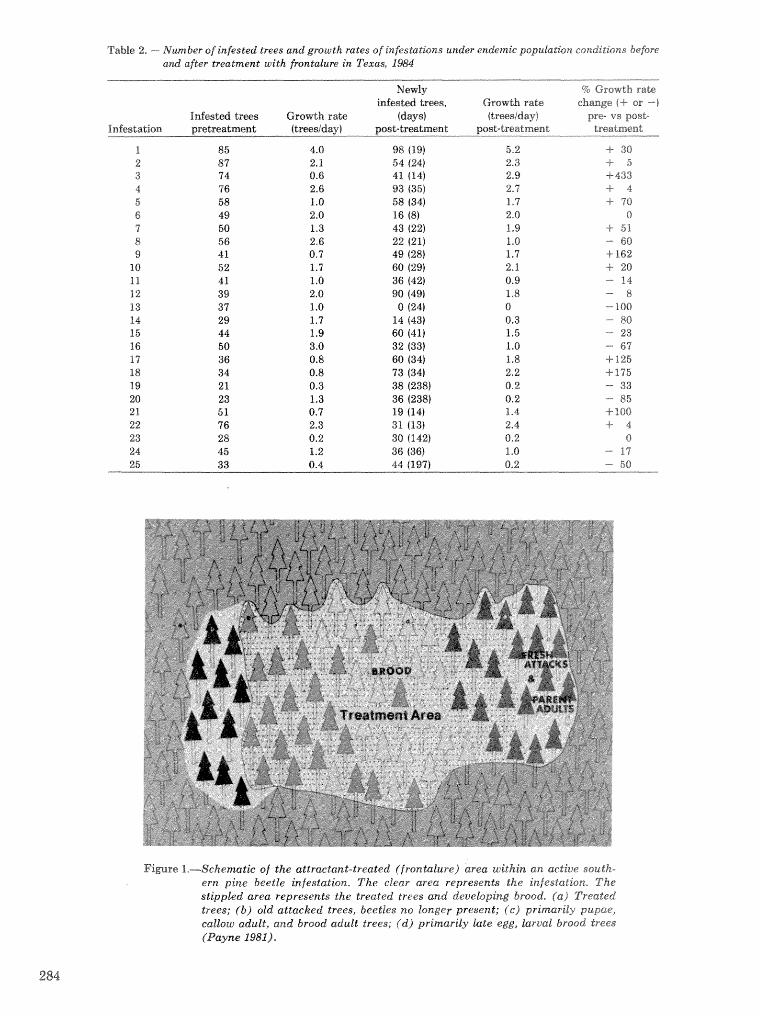
Taulie 2, -- Number of infested trees and growth races of infes&icions un&r endemic populakion conditions before a d after treatment with frcln~rzlure in %%as, _IW
Newly 5% Growth rate infested tres, Growth rate change (4- or ---I
Infested trws Growth rate (days) (trwsidq) pre- vs post- Infestation pretreatment flmsiday) post-trm(;menL post-treatme& treatment ---" ."-----,,-- ---- --"
II 85 4.0 98 (19) 5.2 + 30 2 87 2.1 54 (24) 2.3 4- 5 3 74 0.6 41 (14) 2.9 4-433 4 46 2.6 93 (35) 2.7 + 4 5 58 1.0 58 (34) 1.7 4- 70 6 49 2-0 16 (8) 2.0 0 7 50 1.3 43 (22) 1.9 -i- 51 8 66 2.6 22 (21) I .I) ---- 66 13 4 1 0.7 49 (28) 1.7 +- 162
10 5 2 1-7 60 (29) 2.1. + 20 11 4 1 1.0 36 (42) 0.9 - 14 12 39 2.0 90 (49) 1.8 - 8 13 37 1.0 0 @%I 0 -- 1630 L 4 29 1.7 14 (43) 0.3 - 80 15 44 1.9 60 (41) 1.5 --- 23 16 50 3.0 32 (33) 1.0 --- 61 I I 36 0.8 60 (34) 1.8 + 125 18 34 0.8 73 (34) 2.2 -4- 175 19 21 0.3 38 (238) 0.2 -- 33 20 23 1.3 36 (238) 0.2 --- 85 21 5 1 0.7 19 (14) 1.4 + 100 22 76 2.3 31 (13) 2.4 -I- 4 23 28 0.2 30 (142) 8.2 0 24 45 1.2 36 (361 1.0 - sa 25 33 0.4 44 (197) 0.2 - 50
Fimse I.----Schematic of: the attractant-treated (frsntalure) area within an active south- ern pine beetle infestation. The elear area represents the infestation, The stippled area represents the treated trees and deuelopiing brood. (a) Treated trees; ( b f old attacked trees, beetles no longer present; (a= ) primarily pupae, callow adult, and brood adult trees; ( d ) primarily laEe egg, krvai" brood trees QPayne 1981) *
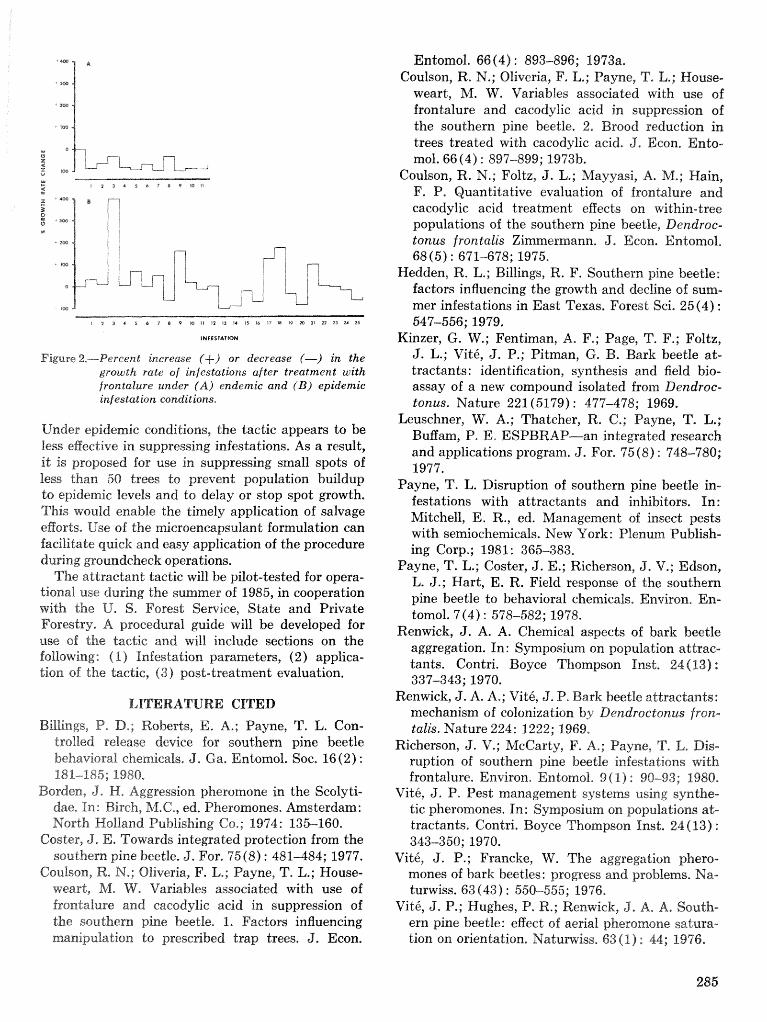
Figure 2.-Percend increase (+) or decrease f-) in the growth rate of infestations after treatment with frontakure under (A) endemic and ( B ) epidemic infestation conditions.
Under epidemic conditions, the tactic appears to be less effective in suppressing infestations. As a result, i t is proposed for use in suppressing small spots of less than 50 trees to prevent population buildup to epidemic levels and to delay or stop spot growth. This would enable the timely application of salvage efforts, Use of the microencapsulant formulation can facilitate quick and easy application of the procedure during groundcheck operations.
The attractant tactic will be pilot-tested for opera- tional use during the summer of 1985, in cooperation with the U, S. Forest Semice, State and Private Forestry, A procedural guide will be developed for use of the tactic and will include sections on the fanowing: ( 1 ) Infestation parameters, (2 ) applica- tion of the tactic, ( 3 ) post-treatment evaluation.
LITERATURE CITED Billings, P, D.; Roberts, E, A,; Payne, 2'. L. Con-
trolled release device for southern pine beetle behavioral chemicals, J. Ga. Entomof. Soc. 16(2) : 181-1145; 1980,
Borden, J, H, Aggression pheromone in the Scolyti- dae, In: Birch, &S,C,, ed, Pheromones. Amsterdam: North Holland Publishing Co.; 1974: 135-160,
Coster, J, E. Towards integrated protection from the southem pine beetle, J. For. 75 (8) : 481-484; 1977.
Coulson, Re N.; Oliveria, F. L*; Payne, 7'. L,; House- weart, M. W, Variables associated with use of frontalarre and caeodylic acid in suppression of the southern pine beetle. I. Factors influencing manipulation to prescribed trap trees. J, Econ.
Entomol, 66 (4) : 893-896; I973a. Coulson, R. N.; Oliveria, F, L.; Payne, 9". L,; House-
weart, M. W. Variables associated with use of frontalure and cacodylic acid in suppression of the southern pine beetle. 2, Brood reduction in trees treated with cacodylie acid. 3. Econ. Ento- mol. 66 (4) : 897-899; 1973b.
Coulson, Re N.; Foltz, J. L.; Mayyasi, A. M.; Hain, F. P. Quantitative evaluation of froxltalure and caeodylie acid treatment effects on within-tree populations of the southern pine beetle, Dendroe- tonus frontalis Zimrnermann. J, Econ. Entomol, 68 (5) : 671-678; 1975.
Heidden, R. L.; Billings, R. I". S~p~thern pine beetle: factors influencing the growth and decline of sum- mer infestations in East Texas, Forest Sci. 25(4) : 547-556; 1979.
Kinzer, G. W.; Fentiman, A. F.; Page, T. F.; Foltz, J. L.; Vit6, J. P.; Pitman, G. B. Bark beetle at- tractants: identification, synthesis and field bio- assay of a new compound isolated from Dendroc- tonus. Nature 221 (5179) : 477-478; 1969.
Leusckner, W. A.; Thatcher, R, C.; Payne, 71'. L.; Buffarn, I?. E, ESPBRAP-an integrated research and applications program, J. For. 75 (8) : 748-780; 1977.
Payne, T. L. Disruption of southern pine beetle in- festations with attractants and inhibitors. In: Mitchell, E. R., ed. Management of insect pests with semiochernicals. New Uork: Plenum Publish- ing Corp.; 1981: 365-383.
Payne, T. L.; Coster, J. E.; Richerson, J. V.; Edson, L. J.; Hart, E. R. Field response of the southern pine beetle to behavioral chemicals. Environ, En- tomol. 7 (4) : 578-582; 1978,
Renwick, J. A. A. Chemical aspects of bark beetle aggregation. In: Symposium on population attrac- tants. Contri. Boyce Thompson Inst, 24 (13) : 337-343; 1970.
Renwick, J. A. A.; Vit6, J. Ps Bark beetle attractants: mechanism of colonization by Deadroctonus Jrorz- talis. Nature 224: 1222; 1969,
Richerson, J. V.; MeCarty, F. A,; Payne, T, L, Dis- ruption of southern pine beetle infestations with frontalure, Environ* EnLomoZ. 9 ( 1) : 90-93; 1980.
Vit6, J, P. Pest management systems using synthe- tic pheromones. In: Symposium on populations at- tractants, Contri, Boy ce Thompson Tnst. 24 (13) : 343-350; 1970.
Vit6, J. P.; Francke, W. The aggregation phero- mones of bark beetles: progress and problems. Na- turwiss. 63 (43) : 550-555; 1976,
Vit6, J. P.; Hughes, P. R.; Renawick, Jr A. har South- ern pine beetle: eRect of aerial pheromone satura- tion on orientation. Natumviss, 63 (1) : 44; 1976.

SESSION III-MANAGEMENT APPROACHES AND IPM SYSTEMS
IPM Systems
Simulation of Southern Pine Beetle-Associated Timber Loss Using CLEMBEETLE
Roy L. Heddenl
A bstraet.-CLEMBEETLE is a simulation model for the southern pine beetle (SPE) cvith the capa- bility to project beetle-caused damage on a stand basis. Stand level losses can be aggregated to obtain multicounty and regional estimates of loss, The type of loss considered is the expected proportion of the stand killed, This value can be used to estimate the volume killed due to beetle attack. Additional keywords : Dendroctonus frontalis Zirnm., infestation probability, spot growth, southern pine.
SIMULATION PROCEDURE
The CLEMBEETLE damage projection system considers the damage occurring in many potential spots. This requires that the probability of an infes- tation occurring and the eventual size of the individ- ual spot be determined. These components of loss are simulated for each year as follows:
1. Calculate the probability of an infestation oc- curring per acre (P) , and test to see if the spot occurs by comparing P with a uniform random number (R) on the internal from 0-1. If a spot does not occur ( P < R), generate another P.
2. If a spot is created ( P >- R), then generate the number of active trees (AT).
3. Calculate the probability of spot being inactive (PI) , and test to see if the spot is active by eompar- ing PI with a uniform random number (R) on the interval 0-1.
4, If the spot is inactive (PI > R), then generate the n m b e r of dead trees in an inactive spot. (DEADI) ,
5 , If a spot is active (PI < R), then generate the number of trees killed per day (TK), and the num- ber of days a spot is active (DAYS),
6. Calculate the number of trees killed in the ae- tive spot: DEADACT =-- (TK*DAYS) +AT,
7 , Repeat this procedure 200 times accumulating DEAD1 and DEADACT: TOTMILL =- CDEADI +- EDEADACT,
8. Calculate the expected number of trees killed: ELOSS .I=. TOTKILLj200.
9. Calculate the proportion of the stand killed (PICILL) by dividing ELOSS by the number of pine trees per acre (&"PA) : SKILL = ELOSSIPPA.
10. Multiply the proportion of the stand killed by the proportion of the total region in an outbreak condition to obtain a weighted proportion of the stand killed. Then use this proportion to obtain the expected volume killed.
MODEL INPUT
The input necessary to run the CLEMBEETEE simulation program is mean diameter at breast height, total and pine basal area per acre, propor- tion of pine in the stand, number of pine stems per acre, and the predominant pine species (loblolly sr shortleaf) in the stand, Additional data needed -to run the model for the Piedmont are the clay con- tent of the surface soil, percent slope, and stand ori- gin (planted or natural). Additional input needed for the Coastal Plain is landfom (bottom, ridge, and sideslope),
SYSTEM COMPONENTS
The Probability of Infestation
The data set generated by the Coordinated Site/ Stand Regional Project of the Expanded Southern Pine Beetle Research and Applications Program (ESPBRAP) (Coster and Searcy 1981) was used Ls develop logistic models for predicting the probabil- ity of SPB infestation.
The data set was stratified by geographical sub- region with separate models being developed for the Piedmont and Coastal Plain regions, Natural and planted stands, as well as disturbed and uvkdistusbed plots, were combined for the analysis, Inkeracticln terns between independent variables were included when appropriate. A complete description of these models can be found in Hedden and Belanger ( 1985).
Spot Growth and Inactivity
1 Professor, Deparbent sf Forestry, Clemson University, The spot growth equations developed by Reed GIemson, sC. et al. (1981) are used to estimate the number of
trees killed per day. The equation requires as input the number of initial active trees, SPB population level expressed as the number of spots per 1,000 acres of susceptible hest type: diameter a t breast height, and total basal area per acre,
The number of initial active trees (AT) is the number of active trees at ground cheek. This number is generated as a random exponential variate with an expected value (EX) of active trees specified by the user ( A T = -EX In r, where r is a uniform random variate from 0-1 and In is the natural logarithm), The default value for EX is -15 times the number of trees per acre,
The user also has the option of speGifying the SPB population level for simulation purposes. The default value of population level is two spots per 1,000 acres of host type.
The probability of a spot being inactive within 30 days of detection is determined using the equation developed by Hedden and Reed (1980). If the spot is predicted to be inactive, then the number of dead trees (DEADI) is generated as a random exponen- tial variate with an expected value (EX) specified by the user (DEAD1 ---- --EX iln s ) , The default value for EX is 11 dead trees,
The number of trees dead (DEADACT) in arm rae- tive spot is the product of the number sf trees killed per day (TKILP) and the number of days the spot is active (DAYS), plus the number sf initial a c t i e trees (DEADACT - [TKD * DAYS] 4- AT). The number of days a spot remains active is generated as a random exponedial variate with an expected value (EX) specified by the user (DAYS -=: -EX In r). The default value of EX is 45 days.
MODEL VALIDATION
Methods
The ability of CLEMBEETLE to predict region- wide losses was tested using forest survey data for the region encompassed by the Southern and South- eastern Forest Experiment Sta"iions of the USDA Forest Service?.
Loss simulation was accomplished by the following steps :
(I) Calculate the probability of an infestatiora oc- curring per aere / PROB) ,
f 2) Generate the number of active trees (AT). (3) Calculate the probability of spot being in-
active a t detection (PRBBI) , (4) Test to see if the spot is inactive. (5) If the spot is inactive at ground cheek, cal-
culate the number of dead trees (DEADI) . (6) If the spot is not inactive, calculate the num-
ber sf trees Elled per day QTKD),
f 7) Calculate the number of trees killed in an ac- tive spot: DEADACT -- (TKD * DAYS) $-
AT. ( 8 ) Calculate the expected number: sf trees killed
(ELOSS) : (a) inactive spots: EEOSS -= PROB *
DEADI, and (b) active spots: ELOSS = PROB *
DEADACT, For each State, these steps were repeated 550 iirnes
for each forest survey plot that contained forest types susceptible to SBB* The sum of the EEOSS" \was divided by 150 to obtain the average expected n m - bers of trees killed,
The expected volume per acre ki8kd by the SPB was obtained by multiplying ELOSS by the average pine volume per tree for each sumey plod, The aver- age pine volume per tree was derived from the total pine volume per plot and the number of growing stock trees per plot, For the area covered by the Southeastern Forest Experiment Station, the num- ber of growing stock trees per acre was derived from the total number of live stems per acre, age, and basal area per acre, Survey data for the Southern Forest Experiment Station did not inelude the number of live stems per acre; therefore, trees per aere were estimated using forest type, age, and observed basal area per acre-
The expected volume killed per suwey pht was multiplied by the volume expansion factor for that plot. The expanded volume killed was then totaled for the survey unit.
In order to deternine the reliability sf the results of the simulation procedure, actual published data on the volume killed by the SPB (Price and Doggett 1982) were compared to the simulated losses for C;kie southern. region, Data for the decade 1941, to 1980 were used in the analysis. For each sumey unit, pre- dicted losses for the moderate SPB population level (two spots/1,000 acres) were multiplied by the pro- portion of the unit area in an outbreafi condition in. each year. These adjusted loss estimates were added to obtain total decade Tosses by survey ernit* The unitwide Iosses were then aggregated $0 obhaiw State and regional totals,
In order to obtain the loss; projections, an estimate of the average number of days a spot is allowed to grow m s needed. During outbreak periods, most States make three to four detection flights a year* Assuming the Bights were optimally timed, and that the spots w r e either controlled or inactive within 30 days of detect-ion, the average bndemat 0% spot growth ( De Steigueur and Heddera) 5 s :
2 Unpublished data,
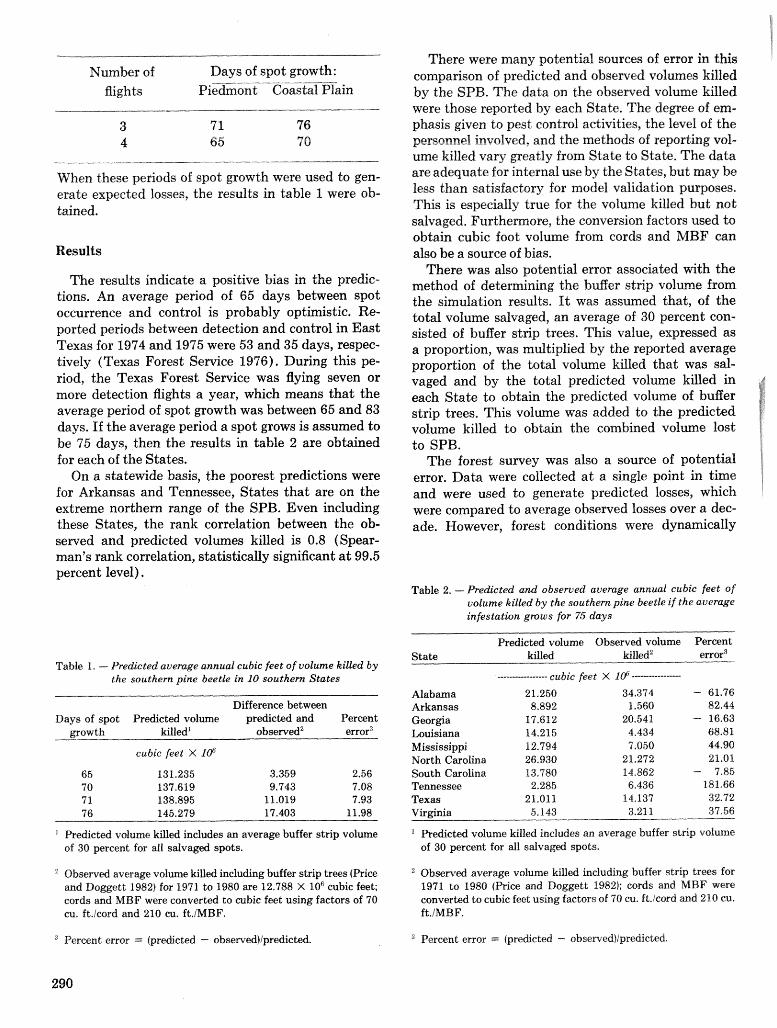
Number of Days of spot growth: flights Piedmont Coastal Plain
When these periods of spot growth were used to gen- erate expected losses, the results in table 1 were ob- tained.
Results
The results indicate a positive bias in the predic- tions, An average period of 65 days betmeen spot occurrence and control is probably optimistic. Re- ported periods between detection and control in East Texas for 1974 and 1975 were 53 and 35 days, respec- tively (Texas Forest Service 1976). During this pe- riod, the Texas Forest Service was flying seven or more detection flights a year, which means that the average period of spot growth was between 65 and 83 days. If the average period a spot grows is assumed to be 75 days, then the results in table 2 are obtained for each of the States.
On a statewide basis, the poorest predictions were for Arkansas and Tennessee, States that are on the extreme northern range of the SPB. Even including these States, the rank correlation between the ob- served and predicted volumes killed is 0.8 (Spear- man's rank correlation, statistically significant a t 99.5 percent level).
Table 1. - Predicted average annual eubic feet of volume killed by the southern pine beetle in 10 southern States
Difference between Days of spot Predicbd volme prc?dicted and Pereent
powth killed" observed2 errora
eubic feet X .ZOO:
Predict& volume killed includes an average buffer strip volume of 30 percent for dl salvaged spots.
Observd average volme killed including buffer strip trees (Price and Doggett 1982) for 1971 to 1980 are 12,788 X 10"ubic feet; cords and MBF were converted to cubic feet using factors of 70 cu. ft.icord and 210 cu. ft./MBF.
Percent error ;= {predicted - obsepvedllpredicted.
There were many potential sources of error in this comparison of predicted and observed volumes killed by the SBB, The data on the observed volume killed were those reported by each State. The degree of em- phasis given to pest control activities, the level of the pemonnel involved, and the methods of reporting vol- ume killed vary greatly from State to State. The data are adequate for internal use by the States, but may be less than satisfactary for model validation purposes. This is especially true for the volume killed but not salvaged, Furthermore, the conversion factors used to obtain cubic foot volume from cords and MBF can also be a source of bias.
There was also potential error associated with the method of detemining the buEer strip vsllme from the simulation results. It was assumed that, of the total volume salvaged, an average of 30 percent con- sisted of buffer strip trees. This value, expressed as a proportion, was multiplied by the reported average proportion of the total volume killed that was sal- vaged and by the total predicted volume killed in each State to obtain the predicted volume of bufier strip trees. This volume was added to the predicted volume killed to obtain the combined volme losk to SPB.
The forest survey was also a source of potential error. Data were collected at a single point in time and were used to generate predicted losses, which were compared to average observed losses over a dec- ade. However, forest conditions were dynamically
Table 2, - Predicted and observed average annual cubic feet of volume killed by the southern pine bee& if khe average infestation grows for 75 days
State
Alabma Arkansas Georgia Louisiana Mississippi North Carolina South Carolina Tennessee Texas Virginia
Predicted volume Observed volume Percent killed killed2 error3
me-*--e---------* cubic feet X 106 ---------------- 21.250 34.374 - 61.76
8.892 1.560 82.44 17,612 20.54'1 - 16.63 14.215 4.434 68.81 12.784 "9050 44-90 26.930 21.272 21.01 13.780 14.862 - 7.85 2.285 6.436 181.66
21.011 '14.137 32.72 5.143 3.21 1 37.56
"redieted volume killed includes an average buffer strip votunre of 30 percent for all salvagd spots.
O b s e a d average volume killed including buffer strip trees for 1971 to 1980 (Price and Doggett 1982); cords and MBF were converted to cubic feet; using factors of 70 cu. ft./eord and 210 cu. ft.lMBF.
Percent error = (predicted - obsepved)/predieted.
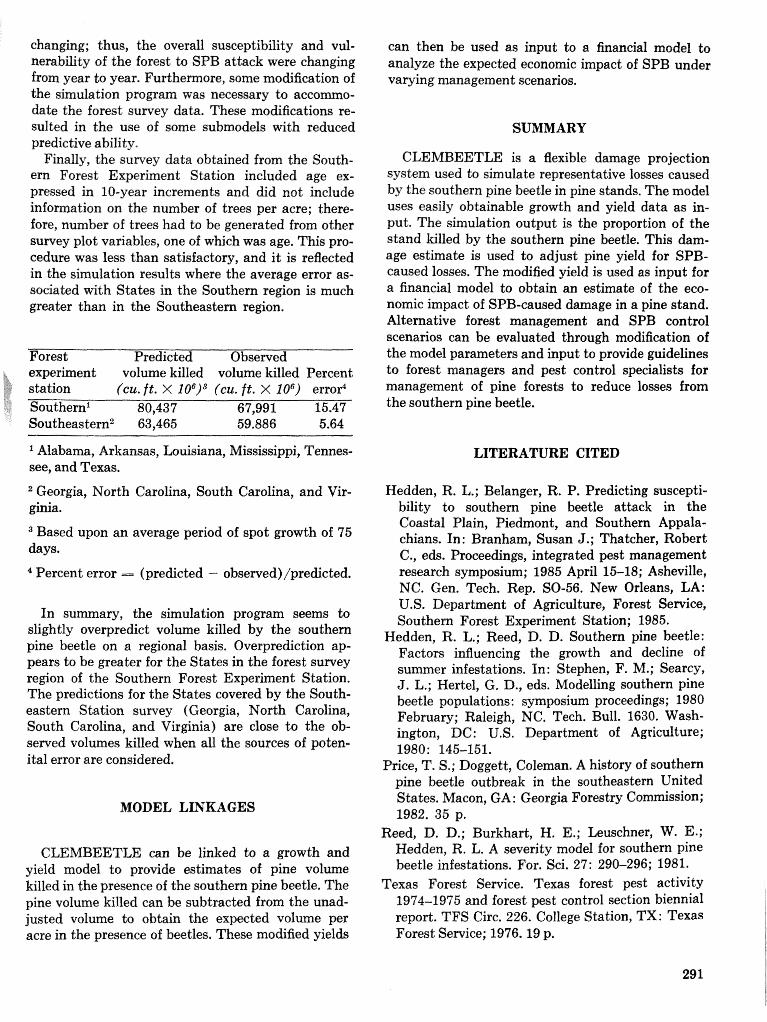
changing; thus, the overall susceptibility and vul- nerability of the forest to SPB attack were changing from year to year. Furthermore, some modification of the simulation program was necessary to acco date the forest survey data. These modifications re- sulted in the use of some submodels with reduced predictive ability*
Finally, the survey data obtained from the South- ern Forest Experiment Station included age ex- pressed in 10-year increments and did not include information on the number of trees per acre; there- fore, number of trees had to be generated from other survey plot variables, one of which was age. This pro- cedure was less than satisfactory, and it is reflected in the simulation results where the average error as- sociated with States in the Southern region is much greater than in the Southeastern region.
F'ores t Predicted Observed experiment volume killed volume killed Percent station (cu. ft. X (CU. ft. X 106) err09 Southern1 80,437 67,991 15.47 Southeastern2 63,465 59.886 5.64
can then be used as input to a financial model to analyze the expected economic impact of SPB under varying management scenarios.
CLEMBEETLE is a Aexible damage projection system used to simulate representative losses caused by the southem pine beetle in pine stands. The model uses easily obtainable growth and yield data as in- put. The simulation output is the proportion of the stand killed by the southem pine beetle. This dam- age estimate is used to adjust pine yield for SPB- caused losses. The modified yield is used as input for a financial model to obtain an estimate of the eco- nomic impact of SPB-caused damage in a pine stand. Alternative forest management and SPB control scenarios can be evaluated through modification of the model parameters and input to provide guidelines to forest managers and pest control specialists for management of pine forests to reduce losses from the southern pine beetle.
- -
Alabama, Arkansas, Louisiana, Mississippi, Tennes- see, and Texas.
Georgia, North Carolina, South Carolina, and Vir- ginia.
Based upon an average period of spot growth of 75 days.
* Percent error = (predicted - observed)/predicted.
In summary, the simulation program seems to slightly overpredict volume killed by the southern pine beetle on a regional basis. Overprediction ap- pears to be greater for the States in the forest survey region of the Southern Forest Experiment Station. The predictions for the States covered by the South- eastern Station survey (Georgia, North Carolina, South Carolina, and Virginia) are close to the ob- served volumes killed when all the sources of poten- ital error are considered.
MODEL LINKAGES
CLEMBEETLE can be linked to a growth and yield model to provide estimates of pine volume killed in the presence of the southern pine beetle. The pine volume killed can be subtracted from the unad- justed volume to obtain the expected volume per acre in the presence of beetles. These modified yields
LITERATURE CITED
Hedden, R. L.; Belanger, R. P. Predicting suscepti- bility to southern pine beetle attack in the Coastal Plain, Piedmont, and Southern Appala- chians. In: Branham, Susan J.; Thatcher, Robert C., eds. Proceedings, integrated pest management research symposium; 1985 April 15-18; Asheville, NC. Gen. Tech. Rep. SO-56. New Orleans, LA: U.S. Department of Agriculture, Forest Service, Southern Forest Experiment Station; 1985,
Hedden, R. L.; Reed, D. D. Southern pine beetle: Factors influencing the growth and decline of summer infestations. In: Stephen, F. M.; Searcy, J. L.; Hertel, G, D., eds. Modelling southern pine beetle populations: symposium proceedings; 1980 February; Raleigh, NC. Tech. Bull. 1630. Wash- ington, DC: U.S. Department of Agriculture; 1980: 145-151.
Price, T. S.; Doggett, Coleman. A history of southern pine beetle outbreak in the southeastern United States. Macon, GA: Georgia Forestry Co 1982. 35 p.
Reed, D. D.; Burkhart, H. E.; huschner, W. E.; Hedden, R. L. A severity model for southern pine beetle infestations. For. Sci. 27: 290-296; 1981.
Texas Forest Service. Texas forest pest activity 1974-1975 and forest pest control section biennial report. TFS Circ. 226. College Station, TX: Texas Forest Service; 1976.19 p.
SPB-MICROBEETLES: A Simulation System for Evaluating Economic Performance of Management Alternatives for Stands
Attacked by Southern Pine Beetles
A. Thompson'
A bs traei4.4PlB-MI CROBEETLES is a manage- mend tool for foresters managing southem pine8 that are aalbjecd to losses from southern pine beetles. Using basic stand inventory. data, bistos;-ic SPB in- festation levels, and price and cost data, tine system projects economic returns for a variety sf user- selected management scenarios, The results provide the manager with a good comparative basis for planning thinning and SPB control of loblolly and 8lslash pine stands over one rotation. Additional keywords : Stand growth, loblolly pine, 6j;nancial analysis, insect impacts, management strate@es,
SPB-MICROBEETLES is a simulation foreeast - ing tool for projecting stand yield and economic return from southem pines subject do attack by southern pine beetles (SPB). Its primav purpose is to provide forest managers with, a means of corn- paring the economic tradeolffs of v a ~ o u s SPB man- agement stmtegies, induding both thinning and direct SPB control treatmeats. The model combines stand growth and yield projection with management shulation, The costs and =venues generated are provided to the user in a number of reports, The system" modest input; requirements (standard for- e s t ~ inventory data) and implementation on a popular micrseompuder (Apple @, / @+ ,[ 9 e@, and 1 @I make it a readily accessible and practical tool for the practicing forest manager.
Ussietmt Professor, Appalachian Enviritnmenbf hbcrria- tory, University of Maryland, Frostburg, MD (and CSIRCI, Division of Forest Research, Banks Street, Yarralumla, Aea" 2600, Australia). (This research was supported ;by the IPM Progrm far Bark Beetlies of Southern Pines, USDA Forest Service, Pinevilfe, LA. The conceptual framework and many 0% the components of this model were derived from ITEMS, a mainframe computer model developed in conjunction with J. M. Vasievieln sf the U.8, Forest Service" Southeastern Forest Experiment Station, Research Triangle Bark, NC.)
SPB-MICROBEETEES combines a number of models: stand growth and yield; product mix; SPB infestation and timber loss; low thinning; and SPB control treatments. Associated with each manage- ment treatment are stand response, SPB response, and eash Aow (cost or revenue), Standard account- ing methods are used for calculating the net present value of the time stream of eash flows for the simulated period through $0 final hawest,
Stand Growth and Yield
The user provides initial data on stand condi- tions. From this, starad growth and yield are cal- culated using Sehumacher and Coihe's j 1960) equa- tions for natural stands of lioblolly or slash pine. For both forest types, stand growth is projected in yearly increments from height growth, stocking/ basal area, and mortality equations. Inputs required by the model are site index, stand age, height, basal area and density.
I* Height Ht+ 1 == Htexp[FHlln Q 10) + hzln (SISO) ) ,IAt/'At
+ 11 2 , Stocking/Basa% Area
St BtRt Rt br, --- b2Ht +- (b3 -"- b3Ent) /At
St+ r = 160exp [ (At/At+ 1)Bn (SJIOO) 1 Bt+l St-~/Rt+?i
3. Mortality Tt -I. I == Ttexp [mlln (SO) /At/"At -c I -i- mzln
(Ht+ l/Ht) + mdn (Bt+ 1/8t) 3 where Ht = stand height in year t
8150 = site index at age 50 At =" age in year L l-a~,kra == height growth parameters St = stocking (percent) in year & Bt = stand basal area in year t bi, . . ., b4 = stseking:"basal area
parameters Tt = stand density in year t ml, . . ., m3 =" morta11;ky parameters In -- natural Hogarith
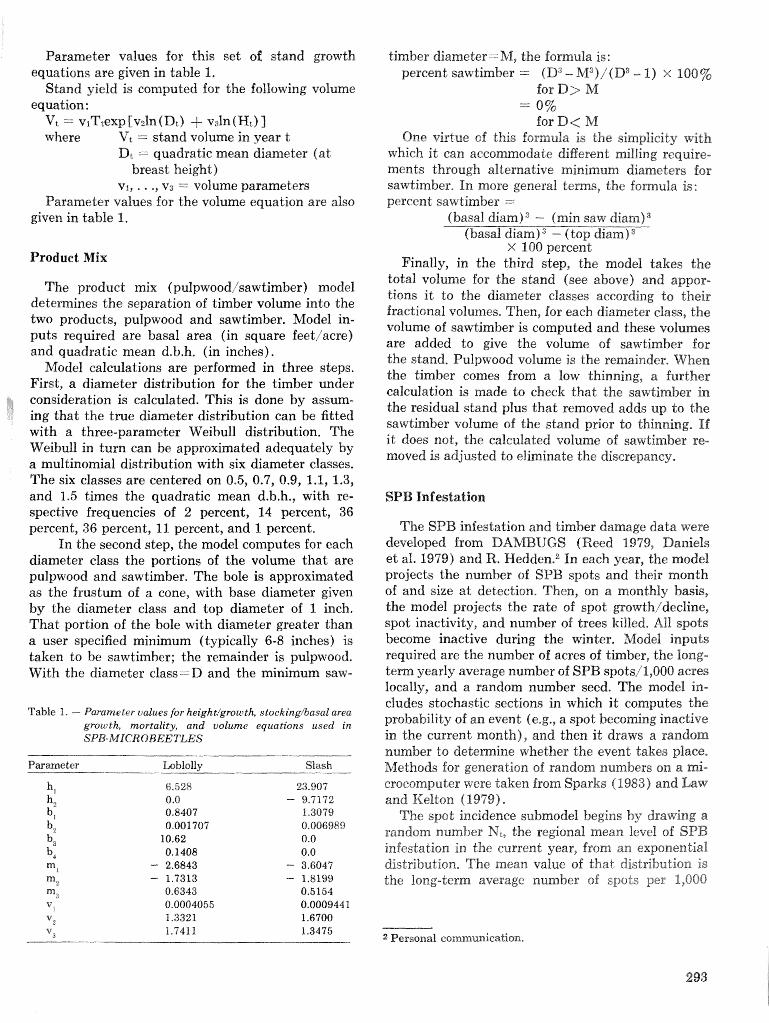
Parameter values for this set of stand growth equations are given in table 1.
Stand yield is computed for the following volume equation :
K -- wlTtexp [vntn (Dt) + vsln (Ht) 1 where Vt = stand volume in year t
Dt =. quadratic mean diameter (at- breast height)
Va, . . ., v3 =" volume parameters Parameter values for the volume equation are also
given in table 1.
Product Mix
me product mix (pulpwoodisawtimber) model determines the separation of timber volume into the two products, pulpwood and sawtimber. Model in- puts required are basal area (in square feetlacre) and quadratic mean d.b,h. (in inches).
Model calculations are performed in three steps. First, a diameter distribution for the timber under consideration is calculated. This is done by assum- ing that the true diameter distribution can be fitted with a three-parameter Weibull distribution. The Weibull in turn can be approximated adequately by a multinomial distribution with six diameter classes. The six classes are centered on 0.5, 0.7, 0.9, 1.1, 1.3, and 1.5 times the quadratic mean d.b.h., with re- spective frequencies of 2 percent, 14 percent, 36 percent, 36 percent, 11 percent, and 1 percent.
In the second step, the model computes for each diameter class the portions of the volume that are pulpwood and sawtimber. The bole is approximated as the frustum of a cone, with base diameter given by the diameter class and top diameter of 1 inch. That portion of the bole with diameter greater than a user specified minimum (typically 6-8 inches) is taken to be sawtimber; the remainder is pulpwood, With the diameter class=D and the minimum saw-
Table 1. - Parameter values for heightigrowth, stoeking/basal area growth, mortality, and volume equations used in SPB-RfICR OBEE TLES
Parameter -- -
Slash
timber diameter -- hf, the formula is : percent sawtimber = (D" -M3)/ (D3 - 1) x 100%
for D> M - - 0%
for D< M One virtue cf this formula is the simplicity with
which i t can accommodate different milling require- ments through alternative minimum diameters far sawtimber. In more general terns, the formula is: percent sawtimber ---
(basal diam) ((min saw diarrm)" (basal diam) - (top diam)3
Finally, in the third step, the model takes the total volume for the stand (see above) and appor- tions i t to the diameter classes according to their fractional volumes. Then, for each diameter class, the volume of sawtimber is computed and these volumes are added to give the volume of sawtimber for the stand, Pulpwood volume is the remainder. FVhen the timber comes from a low thinning, a further calculation is made to check that the sawtimber in the residual stand plus that removed adds up to the sawtimber volume of the stand prior to thinning. If it does not, the calculated volume of sawtimber re- moved is adjusted to eliminate the discrepancy.
SPB Inf estaticlina
The SPB infestation and timber damage data were developed from DAMBUGS (Reed 1979, Daniels et al. 1979) and R. Hedden.2 In each year, the model projects the number of SPB spots and their month of and size a t detection. Then, on a monthly basis, the model projects the rate of spot growth/decline, spot inactivity, and number of trees killed. All spots become inactive during the winter. Model inputs required are the number of acres of timber, the long- t e rn yearly average number of SPB spots/1,000 acres locally, and a random number seed. The model in- cludes stochastic sections in which i t computes the probability of an event (e.g., a spot becoming inactive in the current month), and then id draws a random number to determine whether the event takes place. hfethods for generation of random numbers OM a mi- croeompuLer were taken from Sparks (1983) and Law and l<elton (1979).
The spot incidence submodel begins by drawing a random number Nt, the regional mean level of SPB infestation in the current year, from an exponential distribution. The mean value of that distribution is the long-term average number of spots per 1,000
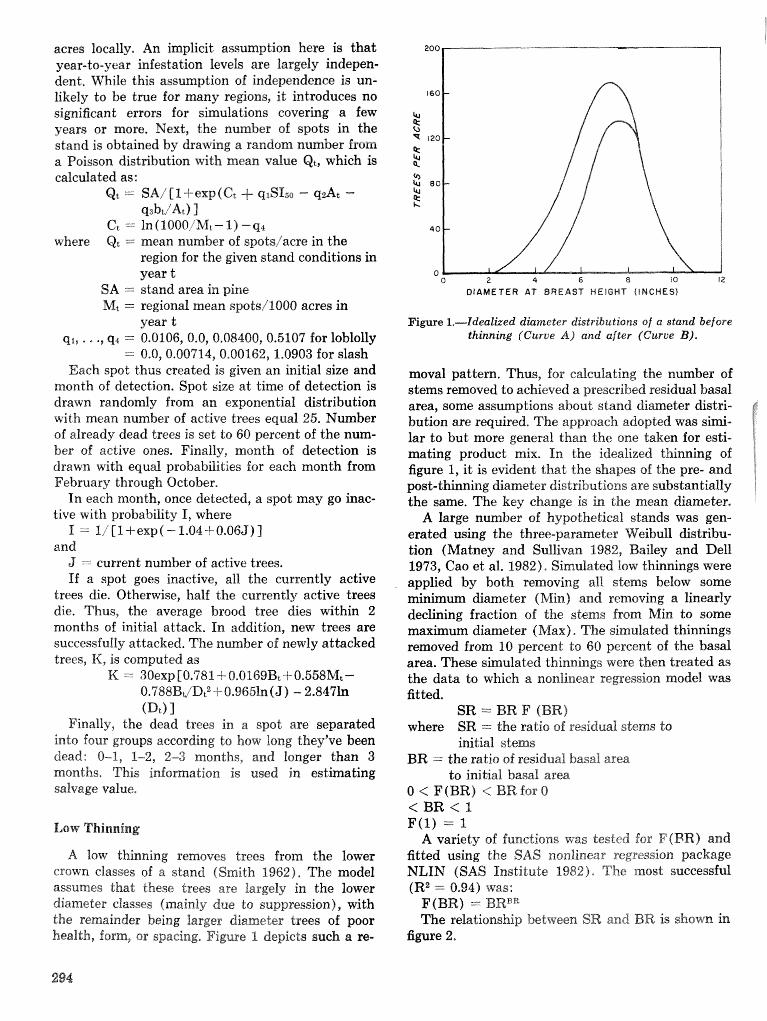
acres locally. An implicit assumption here is that year-to-year infestation levels are largely indepen- dent. While this assumption of independence is un- likely to be true for many regions, i t introduces no significant errors for simulations covering a few years or more. Next, the number of spots in the stand is obtained by drawing a random number from a Poisson distribution with mean value Qt, which is calculated as:
Qt = SA/ [l+ exp (Ct + q ~ S I s a - q2At - qsbt/At) l
Ct =. ln (1000/Mt - 2) - q,t where Qt = mean number of spots/acre in the
region for the given stand conditions in year t
SA = stand area in pine Mt = regional mean spots/1000 acres in
year t ql, . . ., q4 = 0.0106, 0.0, 0.08400,0.5107 for loblolly
= 0.0,0.00714,0.00162, 1.0903 for slash Each spot thus created is given an initial size and
month of detection. Spot size a t time of detection is drawn randomly from an exponential distribution with mean number of aetive trees equal 25. Number of already dead trees is set to 60 percent of the num- ber of aetive ones. Finally, month of detection is drawn with equal probabilities for each month from February through October.
In each month, once detected, a spot may go inac- tive with probability I, where
I = I/[l+exp(-1.04+0.065)] and
J = current number of active trees. If a spot goes inactive, all the currently active
trees die. Otherwise, half the currently active trees die. Thus, the average brood tree dies within 2 months of initial attack. In addition, new trees are successfully attacked. The number of newly attacked trees, K, is computed as
K = 30expE0.781 +0,0169Bt-i-0.558Mt- 0.788B JD? it 0.9651n (J 1 - 2.8471n (Dt) 1
Finally, the dead trees in a spot are separated into four groups according to how long they've been dead: 0-1, 1-2, 2-3 months, and longer than 3 months. This information is lased in estbating salvage value,
A low thinning removes trees from the lower crown classes of a stand (Smith 1962). The model assumes that these trees are largely in the lower diameter classes (mainly due to suppression), with the remainder being larger diameter trees of poor health, form, or spacing. Figure 1 depicts such a re-
OIllMETER AT BREAST HEIGHT ( INCHES)
Figure 1.-Idealized diameter distributions of n stand before thinning (Crcrve A) and after ('Curve I%).
moval pattern. Thus, for calculating the number of stems removed to achieved a prescribed residual basal area, some assumptions about stand diameter distri- bution are required. The approach adopted was simi- lar to but more general than the one taken for esti- mating product mix. In the idealized thinning of figure 1, it is evident that the shapes of the pre- and post-thinning diameter distributions are substantially the same. The key change is in the mean diameter.
A large number of hypothetical stands was gen- erated using the three-parameter Weibull distribu- tion (Matney and Sullivan 1982, Bailey and Dell 1973, Cao et al. 1982). Simulated low thinnings were applied by both removing all stems below some minimum diameter (Min) and removing a linearly declining fraction of the stems from Min to some maximum diameter (Max). The simulated thinnings removed from 10 percent to 60 percent of the basal area. These simulated thinnings were then treated as the data to which a nonlinear regression model was fitted.
STR = BR F (BR) where SR = the ratio of residual stems to
initial stems BR - the ratio of residual basal area
to initial basal area O < F(BR) < BR for O < B E E < I F(I) == 1
A variety of functions was tested for F(FR) and fitted using the SAS nonlinear regression package NLIN (SAS Institute 1982). The most successful (R2 = 0.94) was:
F(BR) = BRBR The relationship between SR and BR is shown in
figure 2.
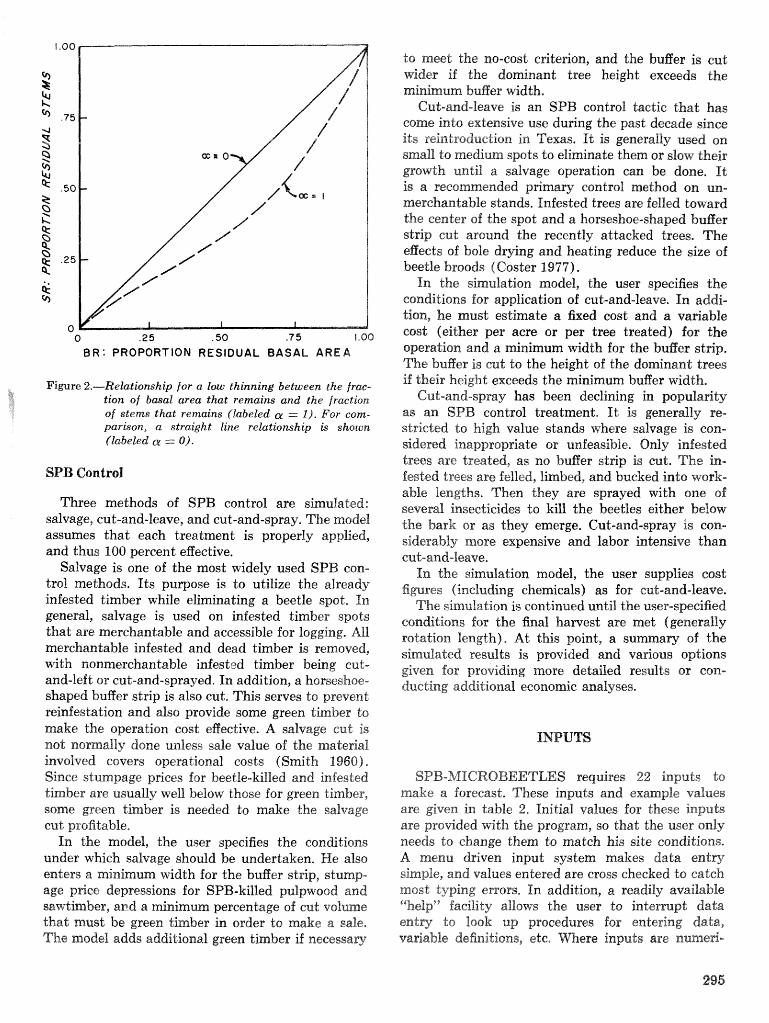
B R : PROPORTION RESIDUAL BASAL A R E A
Figure 2.-Relationship for a Zcuv thinning between the frac- tion of basal area that remains and the fraction of stems that remains (labeled a = 1). For eom- parison, a straight line relationship is shown (labeled = 0).
SPB Control
Three methods of SPB control are simulated: salvage, cut-and-leave, and cut-and-spray. The model assumes that each treatment is properly applied, and thus 100 percent e@ective.
Salvage is one of the most widely used SPB con- trol methods. Its purpose is to utilize the already infested timber while eliminating a beetle spot. In general, salvage is used on infested timber spats that are merchantable and accessible for logging. All merchantable infested and dead timber is removed, with nonmerchantable infested timber being cut- and-left or cut-and-sprayed. In addition, a horseshoe- shaped buffer strip is also cut, This serves to prevent reinfestation and also provide some green timber to make the operation cost eBective. A salvage cut is not normally done ul~less sale value of the material involved covers operational costs (Smith 1960)- Since stumpage prices for beetle-killed and infested timber are usually well below those for green timber, some green timber is needed to make the salvage cat profitable,
In the model, the user specifies the conditions under which salvage should be undertaken, He also enters a minimum vvidth for the buffer stI.ip, stump- age price depressions for SPB-killed pulpwood and sawtimber, ar_d a minimum percentage of cut v o l m e that must be green timber in order to make a sale, The model adds additional green timber if necessary
to meet the no-cost critepion, and the buBer is cut ~ d e r if the dominant tree height exceeds the arzjinkurn buff"er width,
Cut-and-leave is an SPB control tactic that has come i n b extensive use during the past decade since its reintroduction in Texas. It is genertxjly used on small do medium spots to eliminate them or slow their gm&h until a salvage operation can be done, It is a wcsmmended primary. control method on an- merchantable stands, Infested trees are felled toward the center of the spat and a horseshoe-shaped buBer strip cut around the recently attacked trees, The eBeets of bole dving and heating reduce the size of beetle broods ( Coster 1977).
In the simulation model, the user specifies the conditions for application of cut-and-leave, In addi- Lion, he must estimate a fixed cost and a variable cost (either per acre or per tree treated) for the operation and a minimum width for the buafer strip, The buffer is cut to the height of the dominant trees if their height exceeds the minimum buffer width.
Cut-and-spmy has been declining in popularity as an SPB control treatment. 1.k is generally re- stricted to high value stands where salvage is can- sidered inappropfiate or unfeasible. Only infested trees are treated, as no buffer strip is cut. The in- fested trees are felled, limbed, and bucked into work- able Lengths. Then they are sprayed with one of several insecticides to kill the beetles either belaw the bark or as they emerge. Cut-and-spray is con- siderably more expensive and labor intensive?: than cut-and-leave,
1x2. the simulation model, the user supplies cost fieres (including chemicals) as for cmt-and-leave.
The simuiiation is continued until the user-specified conditions for the final hamrest are met (generally rotation length). At this point, a su simulated results is provided and various options given for providing more detailed results or con- ductiag additional economic analyses.
SPB-LVIGROBEETLES requires 2% inputs to make a foreeast. These inputs and example values are given in table 2, Initial values for these inputs are provided with the program, so that the user only needs to change them to match his site conditions. A menix driven input system makes data entrpgr simple, and values entered are cross cheeked to catch most typing errors, In addition, a readily available ""help" hcility allows the user do intermpd data entry to 100k up procedures for: entering data, variable definitions, etc, Where inputs rare numed-
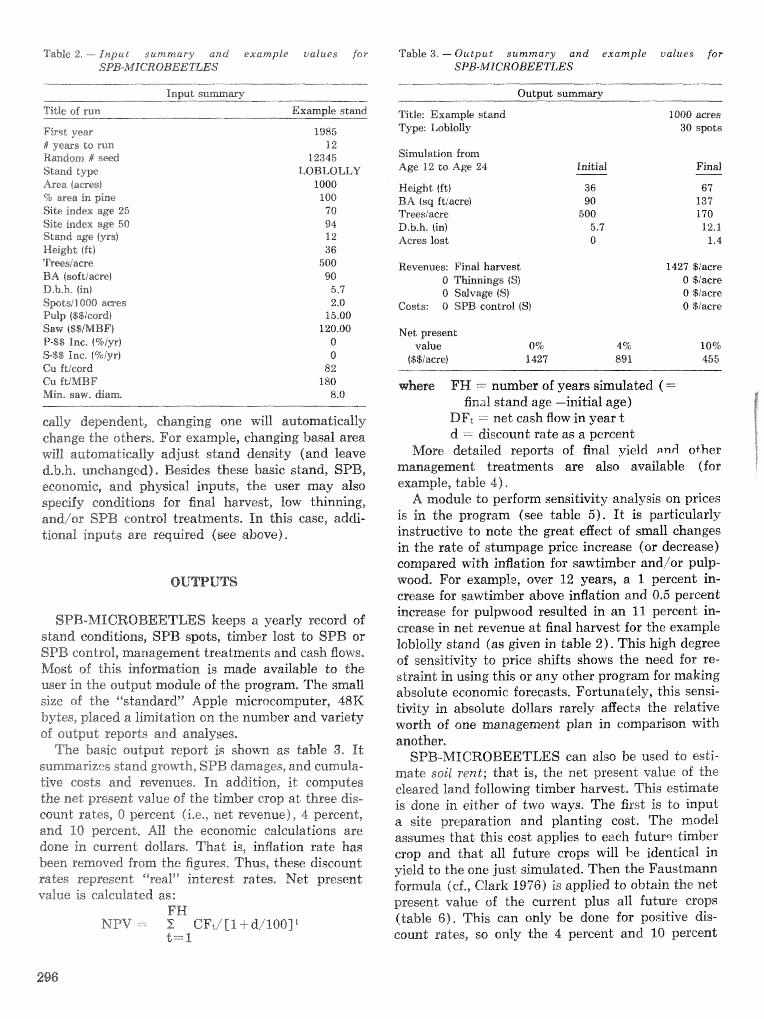
Table2,-1nput ~ u r n m a r y and example ucafr~es for SPB-iMrlCR OBEETLES
Table 3. - Output summary and example values for SPB-LWICR OBEE TLES
Input sumram~;
Title of run Example stinnd
Firer year f 985 f yews to run 12 Random f seed 12345 Slmd hype LOBLBLLY Area (acres) 1000 % area in pine 100 Site index age 25 70 Site index age 50 94 Sdmd age (yrs) 12 Height 4fd) 36 Trmsiaere 500 P5A Isoftiacre) 90 D,b,h, (in) 5.7 Spotsi4000 acres 2.1) Pulp ($$/cord) 15.00 Saw ($$IMBF) 120.00 P-$$ Bnc. (%iyrf C)
S-$$ Znc. (%iyr) 0 CU Ricord 82 CU ftiMBF 180 Min. saw, diam 8.0
cally dependent, changing one will automatically change the others. For example, changing basal area will autoannatica~~y d j u s t stand density (and leave d.b,h, unchanged), Besides these basic stand, SPB, economic, and physical inputs, the user may also specify conditions for final harvest, low thinning, and/or SPB eontroll treatments, In this ease, addi- tional inputs are required (see above),
SPB-MICROBEETLES keeps a yearly record of stand conditions, SPB spots, tisnber lost to SPB or SPB can"E01, management treatments and cash flows. Most sf this information is made available Go the user in the output module of the program. The small size of the ""standard" Apple microcomputer, 48K bytesp placed a iiimitatiorn on the number and variety of output reports and analyses.
The basic output report is shown as table 3, I t summarizes stand grow.t'l~, SPB damages, and cumula- tive costs and revenues. In addition, i d computes the net present value of the timber crop at three dis- count rates, 0 percent (i.e.? net revenue), 4 percent, and 10 percent, AIk the economic calculations are done in current dollars. That is, inflation rate has been removed from the figures, Thus, these discount rates represent "reeal hiratest rates, Met present value is ca%eulated as:
FH NPV --- 2 CF:,I [I. +d/lQCrf
t==f
Output summmy
Title: Example stmd 1000 aeres Tyw: Lobfolly 30 s p t a
Simulation from Age 1 2 to Age 24
Height (fti BA (sq ftiacre) Treesjacse D.b.h, (in) Acres lost
Revenues: Find harvest 0 Thirtnings $3) 0 Sdvage (Sf
Costs: O SCIB control (S)
Net present value 0% 4 C?c; 10%
($$/acre) 1427 89 1 455
where FEP = number of years simulated (= final stand age -initial age)
DFt -; net cash flow in year t d = discount rate as a percent
More detailed reports of final yield zlnil other management treatments are also available (for example, table 41,
A module to perf orm sensitivity analysis on prices is in the program (see table 5). I t is particularly instmetive Lo note the great effect of small changes in the rate of stumpage price increase (or decrease) compared with inflation for sawtimber and/or pulp- wood. For example, over 12 years, a 1 percent in- crease for sawtimber above inflation and 0.5 percent increase for pulpwood resulted in an 11 percent in- crease in net revenue a t final harvest for the example lablolly stand (as given in table 2). This high degree of sensitivity to price shifts shows the need for re- straint in using this or any other program for making absolute economic forecasts, Fortunately, this sensi- tivity in absolute dollars rarely affects the relative worth of one management plan in comparison with another.
SPB-MICROBEETLES can also be rased to esti- mate soil rent; that is, the net present value of the deared %and following timber harvest, This estimate is done in either af two ways. The first is to input a site preparation and planting cost. The model assumes that this cost applies to ezch futurq timber crop and that all future crops will he identical in yield to the one just simulated. Then the Faustmann formula (cf., Clark 1976) is applied to obtain the net present value of the current plus all future crops (table 6). This can only be done for positive dis- count rates, so only the 4 percent and 10 percent
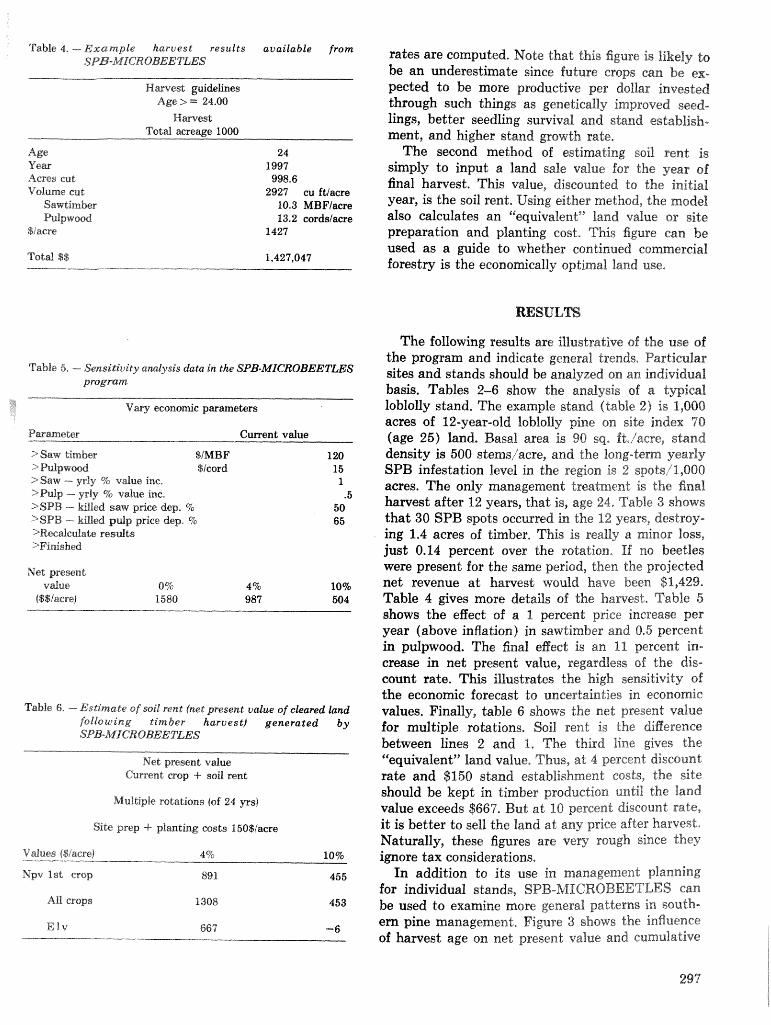
Table 4, - Example haruest results available from SPB-hfIcTR OBEE TLES
Harvest guidelines Age > = 24.00
Harvest Totd acreage 1000
Age 24 Y e a 1997 Acres cut 998.6 Volume cut 2927 eu fuaere
Sawtimber 10.3 MBFlacre Pulpwclod 13.2 cardslaere
rates are computed. Note that this figure is likely to be an underestimate since future crops can be ex- pected to be more productive per dolilar invested through such things as genetically improved seed- lings, better seedling survival and stand esdabiiah- ment, and higher stand growth rate*
The second method of estimating soil rent is simply to input a land sale value for the year of final harvest, This value, disc~unted to the initial year, is the soil rent. Using either method, the model also calculates an '%equit-alent"Yand value or site
$;acre 1427 preparation and planting cost. This figure can be used as a guide to whether continued commercial
Total $$ 1,427,047 forestry is the economically optimal land use.
The following results are illustrative of the use of
Table 5, -- Sensiidiviw analysis data in the SPB-MICBOBEETLES program
Vwy economic parameters
Pwaeter Current value
>Saw timber $IMBF 1 20 3 Pulpwod $/cord 15 >Saw --- yrly % vdue inc. 1 >Pulp -- yrliy 76 value inc. .5 BSPB -.-- kiUed saw price dep, "To 50 SSPB - kiHd pulp price dep, 9% 65 >Recdeuf ate results >Finished
Net present vdue 0% 4% 10%
($$/acre) 1580 987 504
Table 6. --- Estimade of soil reate (net present value of cleared land following timber harvest) generated by SPB-MICROBEETLES
Net ghesent vdue Current crop 9 soil rent
Multiple rotations (of 24 yrsf
the program and indicate general trends* Partieuilar sites and stands should be analyzed sn an individual basis. Tables 2-6 show the analysis of a typical loblolly stand. The example stand (table 2) is 1,000 acres of 12-year-old loblolliy pine out. site index 4'8 (age 25) land, Basal area is 90 sq, fa;*/acre, stand density is 500 sdems!aere, and the hng-term yearly SPB infestation level in the re@on is 2 spsts:'E,OOO acres. The only management treatment is the final harvest after 12 years, that is, age 24. Table 3 shows that 30 SPB spots occurred in the 12 years, destroy- ing 1.4 acres of timber, This is really a minor loss, just 0.14 percent over the rotation. If no beetles were present for the same period, then the projected net revenue at hawest would have been $1,429. Table 4 gives more details of the harvest, Table 5 shows the efiect of a 1 percent price increase per year (above inflation) in sawtimber and 8.5 percent in pulpwood. The final effect is an $1 percent in- crease in net present value, regardless sf the dis- count rate. This illustrates the high sensitivity of the economic forecast to uncertainties in economic values, Finally, table 6 shows the net present value for multiple rotations. Soil rent is the diEerence bebeen lines 2 and 1, The third line gives the '%equivalent" land value, Thus, at 4 percent discount rate and $150 strand establishment costs, the site should be kept in timber production until the land value exceeds $667. But at 18 percent discount sate,
prep 4- planting ecrsts 150$iacre it is better to sell the land at any price after harvest, Naturally, these figures are very rough since they
'ridues ($/acre) 4% 10% ignore tax considerations, ~ p v 1st crop 89 1 455 In addition to its use in management planning
for individual stands, SPB-hfICRCOBEETLES can All crops 1308 453 be used to examine more general patterns in south-
E lt . 667 -6 ern pine management. Figure 3 shows the influence of harvest age on net present value and cumulative
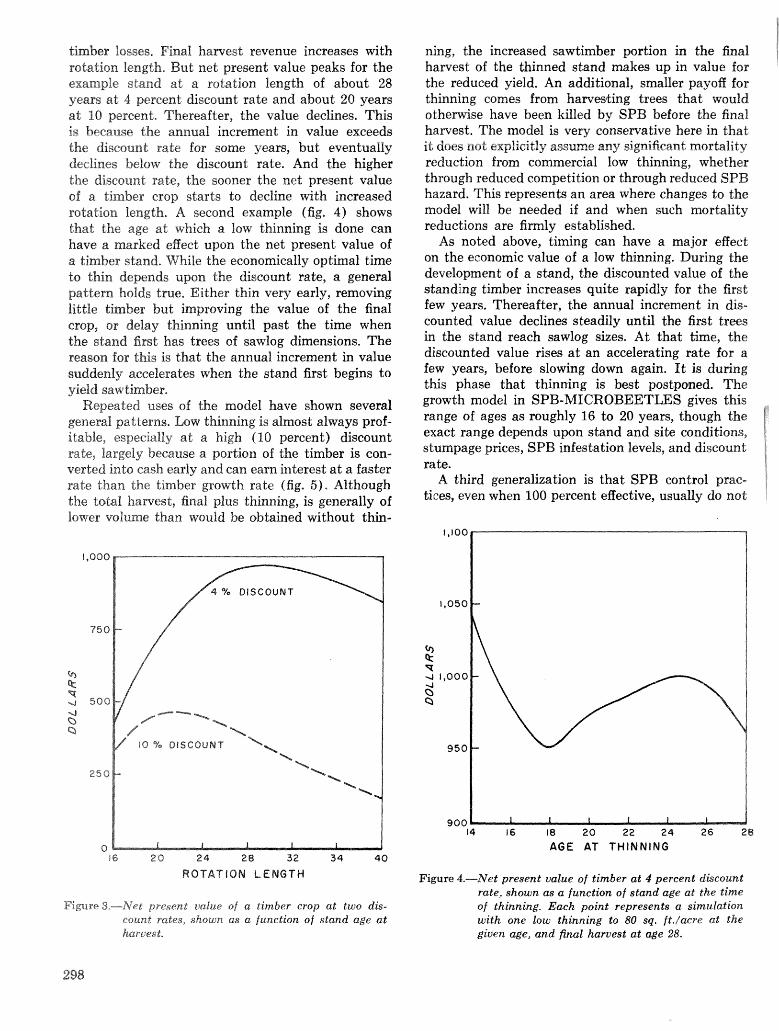
tirnber Issses, Final hawest revenue increases with rotation length, But net present value peaks for the example stand at a rotation length of about 28 years at 4 percent discount rate and about 20 years a t 10 percent. Thereafter, the value declines. This is because the annual increment in value exceeds the discount rate for some yeam, but eventually declines below the discount rate, And the higher the discount rate, the sooner the net present value of a timber crop starts to decline with increased rotation length. A seeand example (fig, 4) shows that the age at; which a low thinning is done can have a marked eEfeet upon the net present value of a tirnber stand, While the economically optimal time to thin depends upon the discaunt rate, a general pattern holds true, Either thin very early, removing little tirnber but improving the value of the final esclp, or delay thinning until past the time when tbe stand first has trees of sawlog dimensions. The reason for this is that the annual increment in value suddenly accelerates when the stand first begins to yield sawtimber,
Repeated uses of the model have shown several general patterns, Low thinning is almost always prof- itable, especially at a high (10 percent) dismunt rake, largely because a portion of the timber is con- verted into cask early and can earn interest a t a faster rate than the tirnber growth rate (fig. 5). Although the tcbbl harvest, final plus thinning, is generally of lower w l m e than would be htained without thin-
ning, the increased sawtimber portion in the final harvest of the thinned stand makes up in value for the reduced yield, An additional, smaller payoff for thinning comes from harvesting trees that would othemise have been killed by SPB before the final harvest. The model is very eonsewative here in that it does not explicitly assume any significant mortality reduction from commercial low thinning, whether through reduced competition or through reduced SPB hazard. This represents an area where changes to the model will be needed if and when such mortality reductions are fiml y established.
As noted above, timing can have a major effect on the economic value of a low thinning. During the development of a stand, the discounted value of the standing timber increases quite rapidly for the first; few years. Thereafter, the annual increment in as- counted value declines steadily until the first trees in the stand reach sawlog sizes. At that time, the discounted value rises a t an accelerating rate for a few years, before slowing d o m again, It is dufing this phase that thinning is best postponed. The growth model in SPB-MICROBEETLES gives this range of ages as roughly 16 to 20 years, though the exact range depends upon stand and site conditions, stumpage prices, SPB infestation levels, and discount rate.
A third generalization is that SPEZ control prac- tices, even when 100 percent effective, usually do not
16 20 24 28 3 2 34 40
ROTAT ION LENGTH
F i ~ r e 3.----Net present value of a timber crop at two dis- count rates, shown as a function of stand age at haruest.
AGE AT THINNING
Figure 4.-Net present value of timber at 4 percent; discount rate, shown as a function of stand age at the time of thinning. Each point represents a simulation with one low thinning to 80 sq. ft./acre at the given age, and final haruest at age 28.
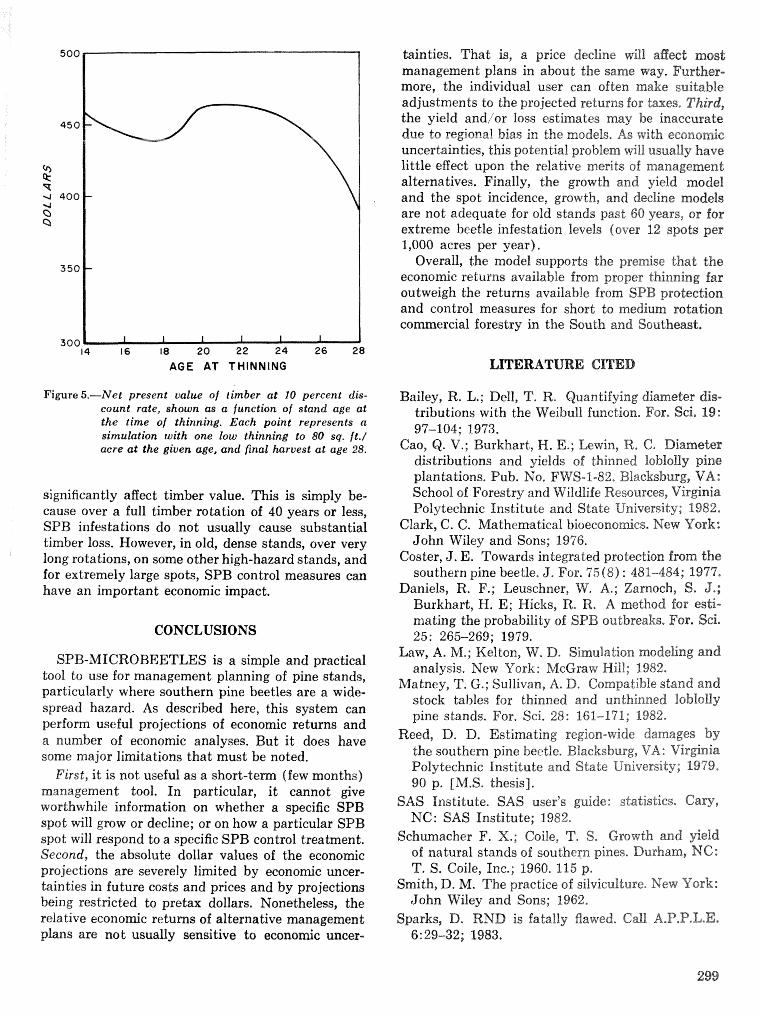
300 14 16 18 20 22 24 26 28
AGE AT THINNING
Figure 5.-Net present value of timber at 10 percent dis- count rate, shown as a functian of stand age at the time of thinning. Each point represents n simulation with one low thinning to 80 sg. ft ./ acre at the given age, and final harvest at age 28.
significantly affect timber value. This is simply be- cause over a full timber rotation of 40 years or less, SPB infestations do not usually cause substantial timber loss. However, in old, dense stands, over very long rotations, on some other high-hazard stands, and for extremely large spots, SPB control measures can have an important economic impact.
CONCLUSIONS
SPB-MICROBEETLES is a simple and practical tool to use for management planning of pine stands, particularly where southern pine beetles are a wide- spread hazard. As described here, this system can perform useful projections of economic returns and a number of economic analyses. But i t does have some major limitations that must be noted.
First, it is not useful as a short-term (few months) management tool. In particular, i t cannot give worthwhile information on whether a specific SPB spot will grow or decline; or on how a particular SPB
tainties. That is, a price decline wriSl etgeet most management plans in about the same way. Further- more, the individual user can often make suitable adjustments to the projected returns for taxes. Third, the yield and/or loss estimates may be inaccurate due to regional bias in the models, As with eeon@i&c uncertainties, this potential problem will usually have little effect upon the relative merits of management alternatives. Finally, the growth and yield model and the spot incidence, growth, and hiecline modds are not adequate for old stands past 60 years, or far extreme beetle infestation levels (over 12 spots per 1,000 acres per year),
Overall, the model supports the premise that the economic returns available from proper thinning far outweigh the retums available from SPB protection and control measures for short to medium rotation
ercial forestry in the South and Ssutlmeast.
Bailey, R. L.; Dell, 7". R. Quantifying diameter dis- tributions with the Weibaribll function* For, Sci, 19: 97-104; 1973.
Cao, Q. V.; Burkhart, M. E.; Lwin, R, C. Diametes dist~butions and yields of thinned Ioblolly pine plantations. Pub. No. FWS-1-82, Blcacksbwg, VA: School of Forestry and Wildlife Resources, Virginia Polytechnic ]Institute and State University; 1982,
Clark, C. C. Mathemtical bioecono~es, New York: John Wiley and Sons; 1976,
Coster, J. E. Towards integrated protection from the southern pine beetle. J, For. 75 (8) : 481--484; 1977.
Daniels, R. F.; Leuschner, FY. A.; Zarnoeh, S. J.; Burkhart, H. E; Hicks, R, R. A method for esti- mating the probability of SPB outbreaks, For. Sci, 25: 265-269; 1979,
taw, A. M.; Kelton, W, D. Simulation modeEng and analysis. New Uork: McGraw Hill; 1982,
Matney, T. G.; Sullivan, A. D. Compatible stand and stock tables for thinned and ranthinned IobirsPg~ pine stands. For, Sci, 28: 261-191; 1982,
Reed, D, D, Estimating region-wide damages by the southern pine beetle. Blacksburg, VA: Virginia Polytechnic Institute and State University; 1979, 90 p, EAM.S. thesis].
SAS Institute. SAS user" guide: statisticsa Cay, Plli"C: SAS Institute; 1982.
spot will respond to a specific SPB control treatment. Schmacher X.; Coile, T e S* Growth and field Second, the absolute dollar values of the economic of natural stands of southern pines, Durham, MC: projections are severely limited by economic uncer- T, S. Coile, Inc.; 1960. 115 p, hinties in future costs and prices and by projections Smith, D. M. The practice of silviculture. New Yorb: being restricted to pretax dollars. Nonetheless, the John Wiley and Sons; 2962. relative economic returns of alternative management Sparks, D. RND is fatally flawed. Call A.P.P.L.E. plans are not; usually sensitive to economic mcer- 6:29-32; 1983.
I-T-E-M-S: An Integrated Method to Project Southern Pine Stand Development
J. Michael Vasievich and William A. Thompson'
A lastrack,-The Integrated Timber Economic Man- agement Simulator (ITEMS) is a computerized sys- tem for assessing the silvicultural and financial de- velopment of southern pine timber stands subject to infestations of southern pine beetles. The system consists of three components: an input generator, a simulatisn processor, and a report generator. ITEMS was designed to project individual timber stands for up to 40 years under specified conditions of treatment costs, market prices, beetle populations, and management strategies, ITEMS is a stochastic model that can test the eaect of random variation in timber stand growth, timber management costs and prices, and beetle dgmamics. The primary purpose of the model is to study the integrated effects of dif- ferent management strategies on the economic per- formance of southern pine timber production. Additional keywords: Stand growth, financial an- alysis, pest impacts, southern pine, management strategies.
The southern pine beetle, Dendroctonus frontatis, Zimm,, is one of the most destructive pests of south- ern pine forests, Periodic outbreaks in some areas cause tree mortality and economic losses. Little can be done to prevent beetle population explosions, but the chances of heavy damage in individual stands can be l i ~ d e d and some can be salvaged. Treatments suck as decreasing planting densities, early harvests, and thinning reduce pine stocking and are thought to reduce the chances of severe beet;le infestations, but they nlso reduce potential product yields. Beetle spot ccintro% activities such as cut-and-leave or cut- and-spray e61n iimihspot spread, hut they are costly. Prompt salvage can control. spots and generate some revenue, bud it also has some cost. The multiple man-
Wespeedively, Research Forest Economist, U.S. Depart- ment of Agricdture, Forest Service, Southeastern Forest Experiment Station, Research Triangle Park, KC!, and Assistant Professor, Appalachian Environmental Lab, Uni- versity of &4arylanr%, Frostburg, MD, (The authors would 'like to acknowledge the fomer graduate students at Duke University who assisted in the development of ITEMS: namely, David Weas, Robin Wildermuth, Sallie Roper, Larry Ticknor, David Ellenbogen, and Lynn Luderer. Thanks also go to Dr- Roy Nedden of GIemson University, who provided valuable information to aid in the development of ITEMS.)
agement options and uncertain beetle impacts in de- veloping forests produce complex situations that defy rule-of-thumb analyses, Pf forests are do be managed for maximum profits, then forest managers need do determine how possible management strategies af- fect timber yields, beetle losses, cash flow, and profits, ITEb$S, the Integrated Timber &fanagemen-& Simu- lator, provides a method to deternine tho integrated effects of many of these factors,
MODEL OVERVIEW
Purpose and Description
The Integrated Timber Economic Management Simulator (ITEMS) displays the silvieulturaf and economic performance of southern pine forests af- fected by southern pine beetle infestations, Four processes associated with production 06 even-aged southern pine forests are modeled---timber growth and yield, cultural treatments, southern pine beetile attack and control, and economic analysis, The model allows stochastic variation in treatment costs, timber revenues, growth processes, and insect infes- tations.
The primary application of ITEMS is to test the economic effects of silvicultural and management ae- tivities in combination with beetle infestations. The model projects the development of one or more stands for 10 to 40 years. Cost and price trends, stand growth, and beetle spot development are projected; management practices are applied; and routine ae- counting functions are performed.
In its 5-year evolution, ITEMS has been improved as deficiencies have been identified, The current model produces reliable results, but efforts continue to improve accuracy, reduce computation time, add new features, improve the ease of use, reformat re- ports, and replace obsolete prsgram erampisnenls, The authors continue to strive for a model that more closely meets the original goals,
Goals
ITEMS was developed to study the economies 0% timber stand development, but the emphasis was on practical application. ITEhfS had to be capable
of answering questions on the financial consequences of timber stand management alternatives easily and accurately. Development standards were applied in! three main areas: the user interface, technical as- pects of the simulation, and computer code:
User Interface Easy to comprehend and use. No extraordinary data as input. Error checking to avoid mxntime failures, Clear and concise printed output, Flexibility to address a broad sets of problems, Be able to model a tvide array of management
strategies. Technical Aspects Of The Simulation
Realistic simulation results. The capability for stochastic variation of process
variables, Use of existing model technologies for stand and
beetle dynamics. Computer Code
Use of standard computer language syntax, without extensions,
Use of separate modules to facilitate improve- ments,
Transportability to many mainframe computers, Extensive documentation tvithin the computer
code. ITEMS does not identify optimum treatment
schedules directly. It contains no linear or other optimization routines. It can only identify superior management strategies through multiple trials of options recommended by the user. ITEMS was de- veloped to allow managers to test their recommended treatments rather than to provide optimal treatment schedules for managers to consider,
Structure of the System
The ITEMS system consists of three major pro- gram components written in ANSI FORTRAN 66, Inputs are entered with a user-friendly, interactive iraput generator, This program simplifies data entry with prompts, error checking, and editing capabili- ties, The simulation processor reads input data files, projects forest development, and writes okaLput data files. A report generator reads these files, eom- putes financial analyses, and prints summary reports, These three program components are executed in sequence and are linked through the operating sys- tern and data files.
The ITEMS model was originalIy developed for use on large mainframe computers, Inputs are era- tered a t a CRT terminal and reports are printed on a high-speed printer. Although the complete ITEMS
system is not operational on rnicrocompu$er$~ work is underway do adapt the full model to microcom- puters tvith sufilent memory and campaxtn&isnal speed. A modified version of f i e model, called SPB- MICROBEETLES is available for APPLE I% series computers and eompatibfes (Thompson %985),
Simulations With ITEMS
Simulations can be conducted with ITEMS on actual or hypothetical forest stands. The model can project future stand devef opment for existing forests after cursent inventory data and recebmmencaed treat- ments are entered, For experimental purposes, par- ticular stand conditions can be used as starting points. Multiple replic;ations sf identical stands can be tested with random variations in timber, beetle, and economic processes.
One of the most powerful features of ITEMS is the ability to test different management strategies, Management strategies consist 0% a list of forest treatments and the specific Limber stand conditions under which they rare to be applied, ITEMS allows the user wide latitude in specifying when and how different treatments are to be used. Users can specify that one group 06 stands be managed with one treat- ment list and another group of stands with a diBer- enulist,
Another feature of ITEMS is the ability to run simulations with or without implementing some ma- jor system features, For example, stands can be pro jeieted witheui implementing the pine beetle dynamics components of the model. Also, sirnula- Giorrs can be made deterministically or by invoking stochastic variability for Limber growth, management costs, or timber prices, These capabilities make ITEMS particularly suitable for Monte Carlo simu- lations to develop probability distributions of out- come for prespecified starting conditions, For example, ITEhqS can be run on 58 identicat stands to test the eBffeet of random variations in timber growth on expected volume production and rates of return,
SYSTEM COMPONEXTS
Interactive Data Entry
&$any complicated models require carefully for- matted input on cards or data files for operation, Input for IlTE&fS is entered interactively from a computer terminal, The input generator assists in tho process by prompting the user for data, checking for valid enfies, allowing data files to be saved and
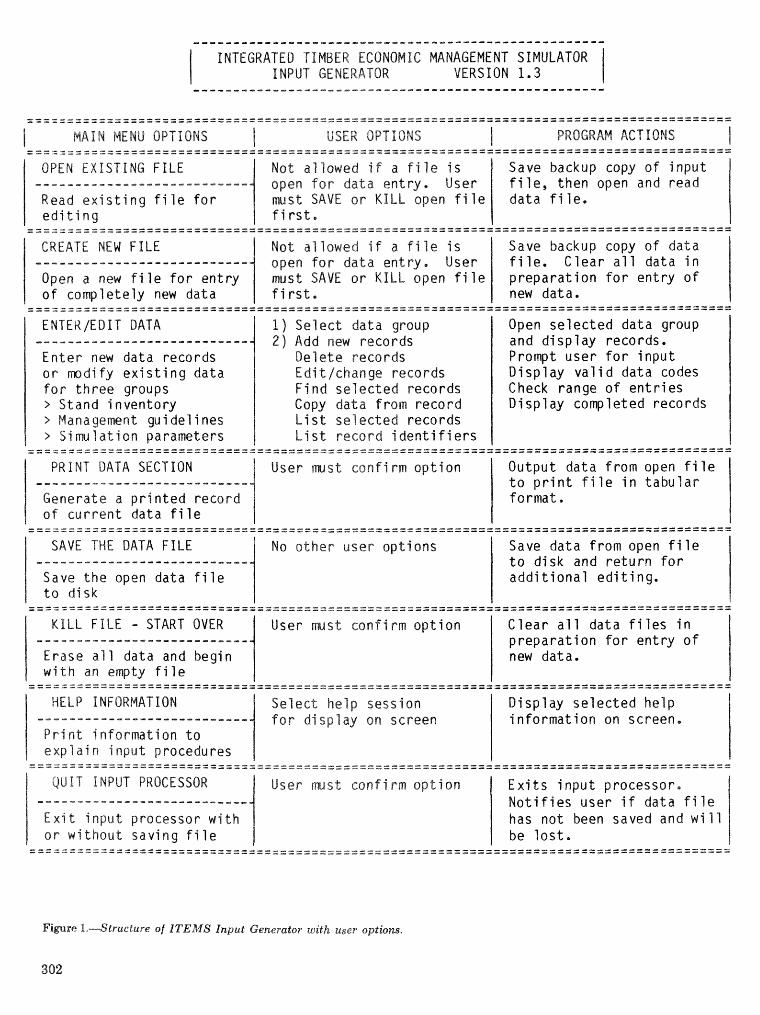
- L - - - - - - - L - - _ a I - - a m e - - - * - - a m - - - - - * - - - * - - - - e e - - - - " m - -
IMTEGRATED TIMBER ECONOMIC MANAGEMENT SIMULATOR 1 NPUT GENERATOR VERSION 1 . 3
---_l_____ql----~--__---l--------------~-------------~------d---------------------------------- - - - - - - - - - - - - - - - - - - - - - - - - - - - - - - - - - - - - - - - - -&-------- - - - - - - - - - - - - - - - - - - - - - - - - - - - - - - - - - - - - - - -
MAIN M E N U OPVIBHS USER OPTIONS PROGRAM ACT IONS ---------------------------- ---------1-1----1------------ ----------------- ----__---------------------- -------I----&---------------- ----------------- OPEN E X I S T I N G FILE No t a l lowed i f a f i l e i s p copy o f i n p u t
~ L _ _ _ _ _ ~ _ _ _ _ _ q l _ _ _ _ - - - - - - - - open f o r data ent ry . User open and read Read e x i s t i n g f i l e f o r must SAVE o r KILL open f i l e e d i t i n g f i r s t ,
___l_____-q_L1d-L--- - - - - - - - - -------------------LIL---------- ----------------- ---------------------------- I - - I P L - I - - L - - L I - 1 - I - - I - ----------------- CREATE NEW FILE Not a l lowed i f a f i l e i s Save backup copy o f da ta
_ _ - _ _ _ _ I _ _ _ _ _ L - - _ _ - - - - - - - - - open f o r data ent ry . User a r a11 data i n Open a new f i l e f o r e n t r y must SAVE o r KILL open f i l e n f o r en t r y of o f completely new data f i r s t . ---------------------------- -----1-11---1---------------- -----------------
_--_I__--I------------------ -------------I--------------- - - - - - - - - - -me-----
ENPEKIEBIT DATA 1) Se lec t data group Open se lec ted data group --L------------------------ 2 ) Add new records and d i s p l a y records. En te r new data records De le te records Prompt user f o r i n p u t o r m d i f y e x i s t i n g data Edi t /change records D i sp lay v a l i d data codes f o r t h r e e groups F i n d selected records Check range o f e n t r i e s s Stand inven to ry Copy data f rom reco rd D i sp lay completed records > Management gu ide l ines L i s t selected records > S i m l a t i o n parameters L i s t r eco rd i d e n t i f i e r s ---------------------------- --------- - - -&-------- - - - - - - - - - em- - - - - - - - - - - - - -
a----------------d---------- ............................. ----------------- P R I N T DATA SECTION User ~ s t csnf i sm o p t i o n a f rom open f i l e - _ _ _ _ - _ _ - - _ _ _ _ _ _ _ _ _ - - - ~ ~ - - ~ i l e i n t a b u l a r
Generate a p r i n t e d record of' c u r r e n t data f i l e ---------------------------- ............................. ----------------- ---------------------------- --------e--dd---------------- - - - - - - - - e m - - - - - - -
SAVE THE DATA FILE No o t h e r user op t ions Save data f rom open f i l e _ I _ _ _ _ _ - _ _ _ - - - - - _ _ _ - - - ~ - - - ~ t o d i sk and r e t u r n f o r Save t h e open data f i l e a d d i t i o n a l e d i t i n g . t o d isk ---------------------------- ............................. -----------------
- - - - - - - - - - - - - - - - - - - - - - w e - - - - ----------------------------- ----------------- KILL FILE - START OVER User ~ s t conf i rrn o p t i o n C l e a r a l l data f i l e s i n
_ _ - L ~ P - - _ _ - O ~ _ _ - _ _ _ - - - ~ - - - - n f o r e n t r y of E rase a l l data and begin w i t h an empty f i l e ---------------------------- ---------d------------------- ----------------- ---------------------------- ............................. -----------------
HELP INFORMATION Se lec t he lp session D i sp lay se lec ted he lp ----------e-------L---e---- f o r d i sp lay on screen i n f o r m a t i o n on screen. P r i n t i n f o rma t i on t o e x p l a i n i n p u t procedures
- - - - - - - - - - - - - - - - - - - - - - - - - - - - - - -m-- - - - - -e- - - - -e- - - - - - - - - - - - - - - - - - - - - - - - - - - -e- - - - - - - - - - - - - - --------------------------*----~-ea~~~~~d~~~--~---~--------------------------------------
Q U I T INPUT PROCESSOR User mst con f i rm o p t i o n E x i t s i n p u t processor, . . . . . . . . . . . . . . . . . . . . . . . . . . . N o t i f i e s user i f data f i l e
E x i t i n p u t processor w i t h has no t been saved and w i l l o r w i t hou t sav ing f i l e be l o s t .
Figure 1.-Structure of ITEMS Input Generator with user options,
302
then changed, and providing online help information to guide the user through the data entry process. The input generator greatly reduces the time and cost of setting up simulation runs. Some of the fea- tures and capabilities of the input generator are shown in figare 1,
Simulat ion. Processor The simulation processor is the most hpor tan t
component of the ITEMS system. This program reads in the input data files, projects forest develop- ment annually for 10 ts 40 years, and writes output files for the report generator.
The simulation processor applies four processes for each of the simulation in the foilowing order: (1) Timber price trends, (2) timber stand growth, (3) management treatment, and (4) southern pine beetle activities. These submodels are applied se- quentially rather than simultaneously or continu- ously. Therefore, all timber growth activities are applied before any management activities are done and before any simulated beetle population activity takes place, This procedure has the effect of causing timber stands to accurnufate an entire year's growth and mortality instantaneously and in isolation, rather than continuously or in small increments over an entire year. The strucL"ki;re of the simulation proc- essor is shown in figure 2,
The simulation processor also generates periodic costs and revenues and maintenance of a financial ledger. Costs or revenues are produced by manage- ment activities such as stand treatments, timber sales, or pest contsoE.
Report Generator
The report generator reads output data files created by the sinnulation processor, applies financial analysis procedures, and produces fomatted reports of simulation results, -o reports show aggregate results for a forest composed of all simulated stands. Three reports are produced for each stand: (1) A summary of stand inventory characteristics; (2) a log of all management activities, including costs and revenues; and (3) a financial analysis of the stand. Sample reports are presented in the Appendix along with descriptive information For each report.
SYSTEM INPUTS
Three groups of inputs are needed for the ITEMS model-stand inventory records, specification of management activities, and simulation parameters.
These data groupe are entered through the INPUT GENERATOR, Four different types of data are re- quested. DaGa items that require entry of text such as a stand name or run title are termed ALPHA entries. These entries are for identification purposes only asld text string is allowed, NUMERIC entries, the second t p , call for a number, The input gen- erator will automatically assign a default value if the entry is passed over by the user. Also, e n t ~ e s are autornatcially checked for a valid range. For the third data type, CODED, the user is presented with a list of available option codes and must choose one. A default is assigned if the data entry is bypassed. The fourth data type is the UES/NO type. &re, the user must answer a question with a yes or no,
The sections below briefly describe each data group and indicate the data types and default values for each entry.
Inventory Records
The first data group is stand inventory data. This group specifies the starting conditions for each stand including: stand identification, acres, forest type, site index, stand age, stocking, percent pine com- position, and timber quality indexes. Admissible variables are shown in table 1, Inventory data may be entered for up to 50 stands to be simulated in er single ITEMS run.
Management Activity SpeeifiezaCions
The second input group, shown in table 2, is a description of management activities to be applied to the simulated forest, Typical activities include: site preparation, planting, stocking control, thinning, final harvest, and beetle control activities (cut-and- spray, cut-and-leave, and spot salvage). Treatment cost, variation in costs, and silvicdtural consequen- ces of each treatment are specified as parameters, Up to 50 management activities may be entered.
Stand conditions that trigger application of each treatment are defined by this data group. Up to five application conditions formatted as equations or inequalities can be specified. These conditions are based on current forest response variables or other simulation parameters. To specif;)i a treatment con- dition, the user first selects a forest response variable from a list of 25 codes shown in table 3, Then, one of five relationships is selected from (1) less than; (2) less than or equal. to; (3) equal to; (4) greater than or equal to; or (5) greater than. Finally, a numeric constant is used to complete the condition,
If no conditions are specified for a management
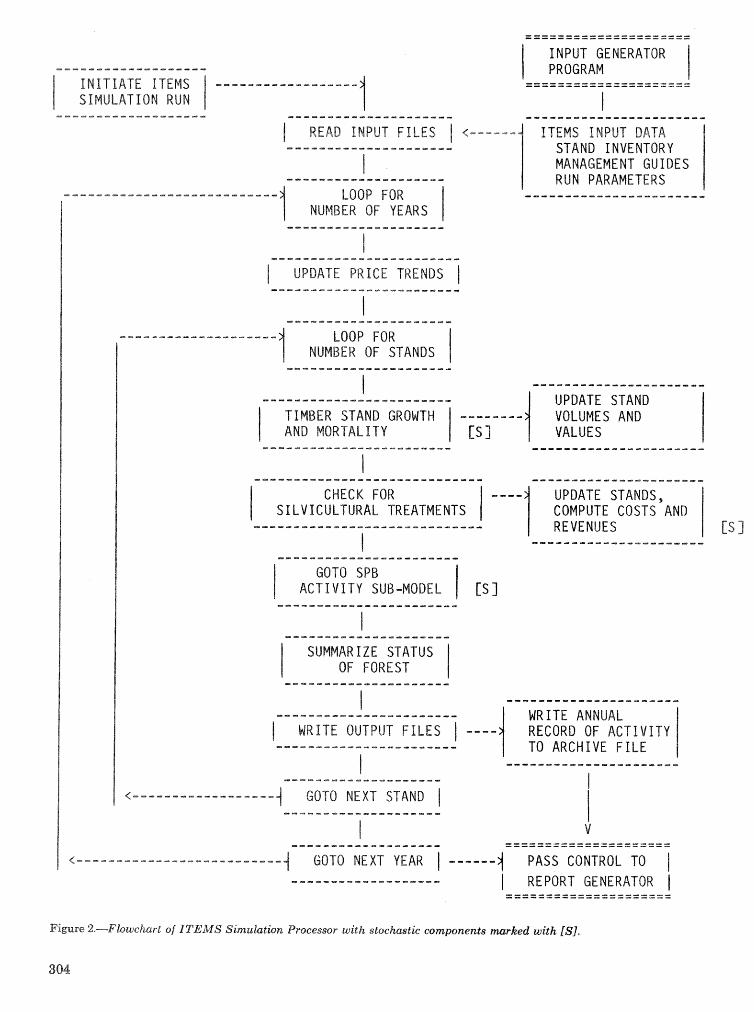
- - - - - e - w e - - - - - m - - - -
INffraTE ITEMS - - - - - - - - - m e - - - - e - -
SIMULAT ION R U N - - - - -_-- - - - -* - - - - - -1_
READ INPUT FILES
LOOP FOR NUMBER OF YEARS
1 UPDATE PRICE TRENDS
LOOP FOR NUMBER OF STANDS
INPUT GENERATOR PROGRAM
ITEMS INPUT DATA STAND INVENTORY MANAGEMENT GUfOES RUN PARAMETERS
I - - - - - - - - - I - - -L - I - -L - * -
--------1-----_--------- UPDATE STAND TIMBER STAND GROWTH VOLUMES AND AND MORTALITY VALUES
CHECK FOR I ---- UPDATE STANDS, SELVICULTURAL TREATMENTS COMPUTE COSTS AND
- - - - - e m - - - - - - - - - - - - - - - - - - - m . , . REVENUES - - - - - - - - - - - - - - - -m- - - - -
Cs 3 - - - - - - - - - - - - e - - _ - * - w
GOTO SPB
SUMMARIZE STATUS OF FOREST
I ------_--l---------s_e_ WRITE ANNUAL
WRITE OUTPUT F I L E S I ---- RECORD OF A C T I V I T Y - - - - - - - - - - - _ - - a s l - m - m - - TO ARCHIVE F I L E
I
M- - -s - - - -_ - - -_e-_ -a
(------------------ GOTO NEXT STAND
GOTO NEXT YEAR ( -----04 PASS CONTROL TO ------------------- I REPORT GENERATOR
Fimre 2.-----Flowchart of ITEAfS Sinauktion Processor with stoehastie components marked with [S].
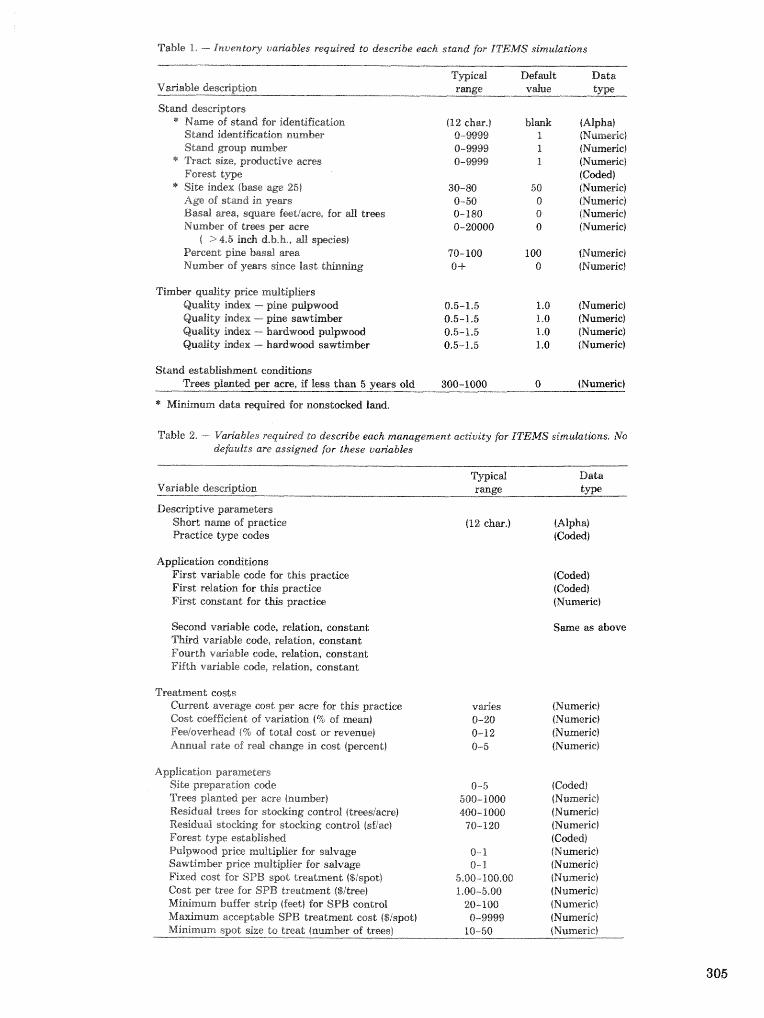
Table I. --- Inhiento? va~ables required to descsl'be each stand for ITEMS slmu~~1-t'ons
Sthund dacriptorsr * Name of s tmd for identification
S t m d identification asumbr Stand goup namkr
* Tract size, psductive acres Forest tm
* Site index (lame age 25) Age of stand in yews Basd area, scgtrme fmblacre, for iull tregs Nurnkr of trees per acre
4 > 4.5 inch d,b.h,, & spcies) Percenk pine basal area Nuanbr of y m s since last thindng
(Alpha) (Numeric) (Nmeric) (Numeric) (CCtdled) (Numehc) (Numeric) (Nmerie) (Nmeriei
Timhr qui-alidy price mdtipEers Qu&ty index - pine p u l g w d 0.5-1.5 1.0 [Numeric! Qu&ty idex -- pine: sawtimbr 0.5-1.5 1.0 (Numeric) Qu&ty index --- AmisrS-rrsd parlpwslod 0.5-1.5 1.0 {Numeric) Qu&t;y index - Paadvvd sawlimber 0.5-1.5 1.0 (Numeric)
Trma p la ted per acre, if less t k m 5 y w s old 300-1000 0 (Numeric)
* Minimum data required for nonstocked l a d .
Table 2. ---- Va~abdes required to describe each management activity (or ITEMS simulations. No defaults are assigmd for these c.an"ables
?'ypie&rl Vwiable desc~pdion range
Descriptive plvmeters Short name of practice Practice type codes
Application conditions First variable code far this practice First relation for this practice First csnstmt for this practice
Second v&able code, relation, constant Third varriable code, relation, constant Fourth variable c d e , relation, constant Fifth v~iablie code, relation, constmt
Treatment costs Cument average cost per acre for this practice vmies Cost ewfficient of vmrriadion (9: of mem) 8-20 Fee/overknead (96 of told cost; or revenue) 0-12 Annud rate of red chmge in cost (percent) 0-5
Application parameters Site preparation code Trees planted per acre Inumber) Eesidud trees for stmking control (tresiaerej Residud ssdockng for s;zm&ng control (s"fiac) Forest type established h l p w d -prim mrnuPGiiqEer for sdvage Sawtimhr price mul%;iF.lier for sdvwe Fixed eost for SPB spot treatment ($/spot) Cost per tree for SPB treatment ($i tre) Minimum buffer strip (fmt) for SPB control M&rnum aecepkable SPB treatment cost ($/spot) Minimum spot size LO treat (number sf trees~
(Coded) (Cded) (Numeric)
Same as above
(Numeric) (Numeric) (Mumenic) (Numeric)
(Corrledl (Numeric) (Numeric) (Numeric) (Coddl (Nurneriei (Numeric) (14unnerici (Numeric) (Numeric) (Numeric) (Numeric)
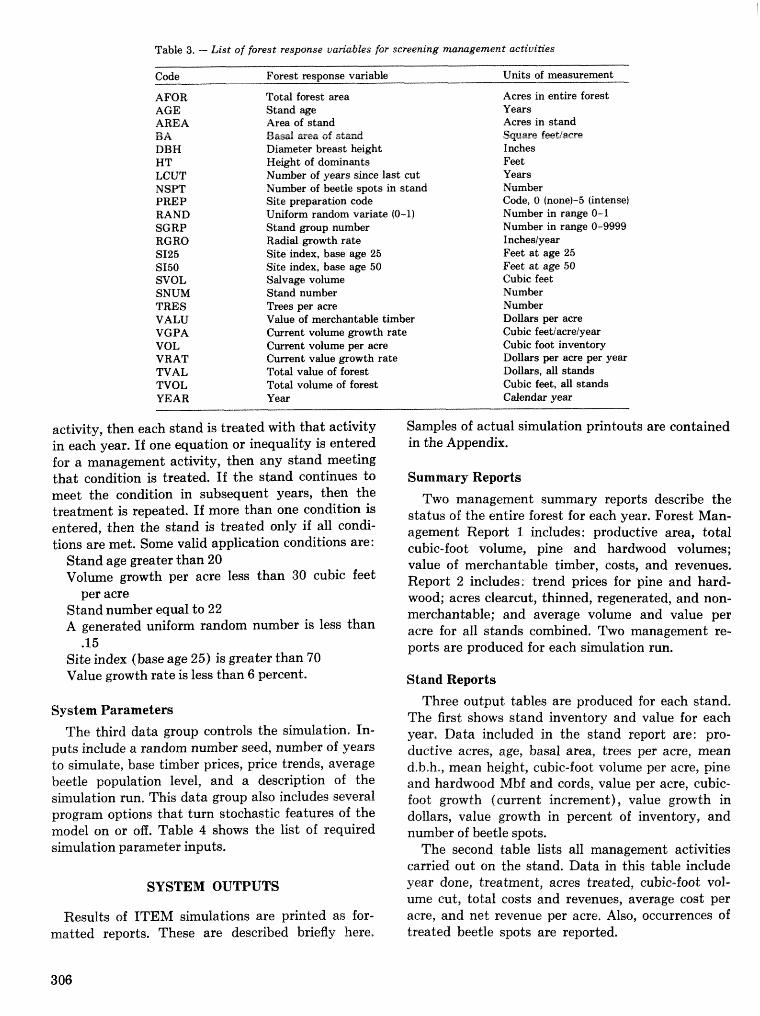
Table 3. - List of fo~est response va~ables for screesing mawgemeat activities
AFOR AGE AREA BA DBH NT LCUT NSW PREP RAND SGRP RGRO SI25 Sf50 SVOL SNUM TRES VALU VGPA. VOL VRAT TVAL TVOL YEAR
Forest res~onse variable Units of measurement
Total forest area Stand age Area of stand Bas& area s f stand Dimeter breast height Wekht of darninants Numbr of years since last cut Nu&r of Beetle spots in stmd Site preparation code Unifom random variate (0-1) Stand group number Radial powth rate Site index, base age 25 Site index, base age 50 Salvage volume Stand number T m s per acre Value of merchantable timber Current volume growth rate Current volume per acre Current value growth rate Total value of forest Total volume of forest Year
Acres in entire forest Years Acres in stand s q m e fwtiaere Inches Feet Years Numbr Code, 0 (none)-5 finbnse) Number in range 0-1 Number in range 0-9999 Incheslyear Feet at age 25 Feet at age 50 Cubic feet Numbr Numbr Dollars per acre Cubic feetiacrelyear Cubic foot inventory Dollars per acre per year Dollars, all stands Cubic feet, all stands Calendar year
activity, then each stand is treated with that activity Samples of actual simulation printouts are contained in each year. If one equation or inequality is entered in the Appendix. for a management activity, then any stand meeting that condition is treated. If the stand continues to Summary Reports meet the condition in subsequent years, then the Two management summary reports describe the treatment is repeated. If more than one a d i t i o n is status of the entire forest for each Forest Man- entered, then the stand is treated only if all condi- agement ~~~~~t 1 includes: productive area, total tions are met. Some valid application conditions are : cubic- foe volume, pine and hardwood volumes;
Stand age greater than 20 value of merchantable timber, costs, and revenues. "lume growth per acre less than 30 cubic feet Report 2 includes: trend prices for pine and hard-
per acre wood; acres clearcut, thinned, regenerated, and non- Stand number equal to 22 merchantable; and average volume and value per A generated uniform random number is less than acre for all stands combined, Two management re- -
.15 Site index (base age 25) is greater than 70 Value growth rate is less than 6 percent.
System Parameters
ports are produced for each simulation run.
Stand Reports
Three output tables are produced for each stand. The first shows stand inventory and value for each
The third data group controls the simulation. In- year, Data included in the stand report are; pro- puts include a random number seed? number of years ductive acres, age, basal area, trees per acre, mean to simulate, base timber prices, price trends, average d.b.h., mean height, cubic-foot per acre, pine beetle population level, and a description of the and hardwood Mbf and cords. value per acre. cubic- simulation run. This data group also includes several foot growth (current increment), value grdwth in Program options that turn stochastic features of the dollars, value growth in percent of inventory, and model on or off. Table 4 shows the list of required number of beetle spots. simulation parameter inputs. The second table lists all management activities
carried out on the stand. Data in this table include SYSTEM OUTPUTS year done, treatment, acres treated, cubic-foot volt-
urne cut, total costs and revenues, average cost per Results of ITEM simulations are printed as for- acre, and net revenue per acre. Also, occurrences of
matted reports. These are described briefly here. treated beetle spots are reported.
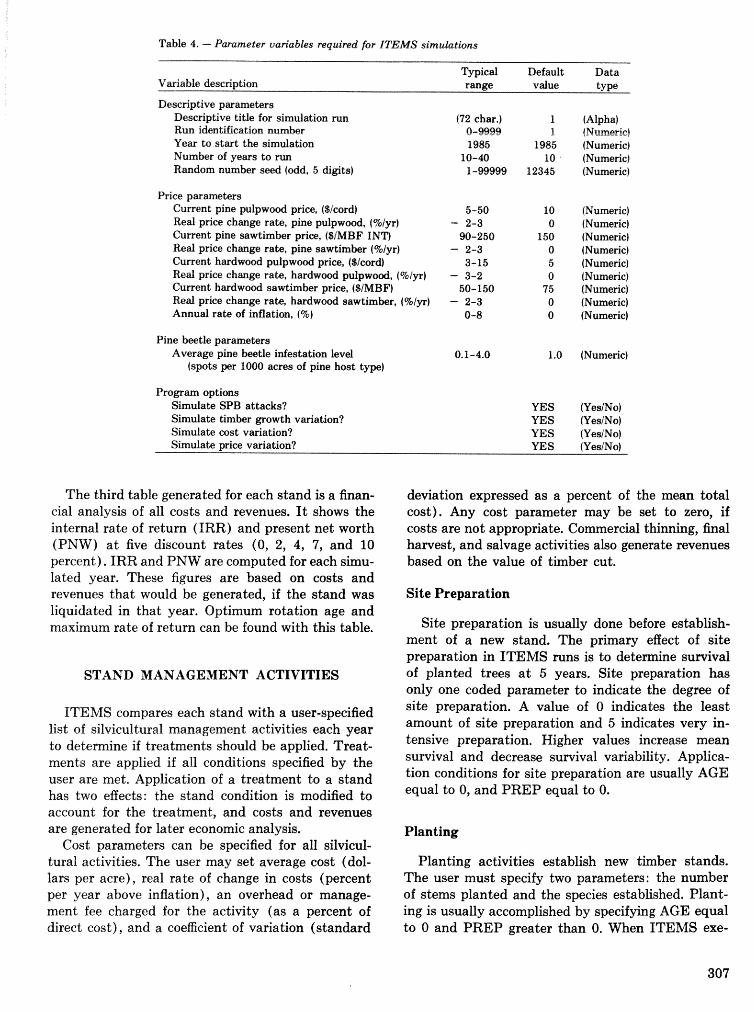
Table 4. - Parameter variables required for ITEMS simukttions
TvDical Default Data - - Variable description value type
Descriptive parameters Descriptive title for simulation run (72 char.) 1 (Alpha) Run identificat;ian nuanbtltr 0-%99 1 ( M u B B ~ ~ c . ) Year to start the simdation 1985 1985 (Numeric) Number of years to run 10-40 10 (Nume~c) Random number seed (odd, 5 digits) 1-99999 12345 (Numeric)
Price parameters Current pine p u l p w d price, ($/cord) Real price change rate, pine pulpwocrd, f%/yr) Current pine sawtimber priee, ($IMBF INT) Real price change rate, pine sawtimber (%/yr) Current hardwood pulpwood price, ($/cord) Red price change rate, hardwood p u l p w d , j%/yrj Current hardwood sawtimber price, ($IMBF) Real price change rate, hardwood sawtimber, (%/yr) Annual rate of inflation, (9%)
(Numeric) (Numeric) (Numeric) (Numeric) (Numeric) (Numeric) (Numeric) (Numeric) (Numeric)
Pine beetle parameters Average pine beetle infestation level 0.1-4.0 1.0 (Numeric)
(spots per 1000 acres of pine host type)
Program options Simulate SPB attacks? Simulate timber growth variation? Simulate cost variation?
YES (YesINo) YES (YeslNo) YES (YesiNo)
Simulate price variation? YES (YeslNo)
The third table generated for each stand is a finan- deviation expressed as a percent of the mean total cia1 analysis of all costs and revenues. It shows the cost). Any cost parameter may be set to zero, if internal rate of return (IRR) and present net worth costs are not appropriate. Commercial thinning, final (PNW) a t five discount rates (0, 2, 4, 7, and 10 harvest, and salvage activities also generate revenues percent), IRR and PNVV are computed for each simu- based on the value of timber cut. lated year. These figures are based on costs and revenues that would be generated, if the stand was Site Preparation liquidated in that year. Optimum rotation age and maximum rate of return can be found with this table. Site preparation is usually done before establish-
ment of a new stand. The primary effect of site preparation in ITEMS runs is to detemine survival
STAND MANAGEMENT ACTIVITIES of planted trees a t 5 years. Site preparation has only one coded parameter to indicate the degree of
ITEMS compares each stand with a user-specified site preparation. A value of 0 indicates the least
list of silvicultural management activities each year amount of site preparation and 5 indicates very in-
to determine if treatments should be applied. Treat- tensive preparation. Higher values increase mean
metnts are applied if all conditions specified by the survival and decrease survival variability. Applica-
user are met. Application of a treatment to a stand tion conditions for site preparation are usually AGE
has two efiects: the stand condition is modified to equal to 0, and PREP equal to 0.
account for the treatment, and costs and revenues are generated for later economic analysis. Planting
Cast parameters can be specified for all silvicul- turd activities. The user may set average cost (dol- Planting activities establish new timber stands. lars per acre), real rate of change in costs (percent The user must specify two parameters: the number per year above inflation), an overhead or manage- of stems planted and the species established. Plant- ment fee charged for the activity (as a percent of ing is usually accomplished by specifying AGE equal direct cost), and a coefficient of variation (standard to 0 and PREP greater than 0. W e n ITEMS exe-
cutes a planting activity, trees are planted and the stand begins to age, but the stand is not considered established rmtiit age 5,
Stocking Cantrol Treatments
Stocking control or TSI treatments are noncom- mercial reductions in basal area such as precommer- cia1 thinning, control of undesirable trees, or release sf crop trees. These treatments reduce basal area and volume, but mean height and diameter do not change, If a hardwood component is present in the stand, then the reduction in stocking is taken from the hardwood component before removal of any pine. No revenues are generated by this treatment. The user must specify either the residual number of trees or the residual basal area for this activity. Stocking control is usually triggered by setting a minimum and 'or maximum age limit and a minimum basal area before treatment.
Commercial Thinning
Two types of commercial thinning, uniform (or row) thinning and thinning from below, may be ap- plied to stands and generate revenues. Uniform thin- ning removes trees uniformly from the diameter dis- tribution and the mean diameter remains constant. Thinning from below reduces stocking to the specified level, but removes proportionately more small trees. Volume removed in a uniform thinning is directly pro- portional do basal area removal. For a thinning from below, volume reduction is less than basal area reduction, on a percentage basis, because smaller trees are removed. For all thinning activities, the user must specify the residual stocking level. Typical appljcation conditions for thinning are a minimum and maximum age and a minimum basal area.
Final Harvest
Final hawests remove all merchantable volume by clearcutting- Basal area, number of trees, and other stand variables are reset. No ITEMS param- eters are required for final basvests other than cost specifications. Costs associated with clearcuts are usually commissions paid as a percent of gross reve- nues. Users can specify many conditions to trigger final harvests. Some examples are to cut a t a pre- specified age, cut when value growth rate drops below some minimm, cut when volume increment falls below some set amount, or cut when a certain value QP volume is reached,
Sample Management Ackisgity Inpasts
A sample ITEMS simulation run has been pre- pared to illustrate the capability sf the model. The run consisted of eight nonstocked stands, each 100 acres in size. Site indexes were 60 and 80 feet (base age 251, and treatment vakables were thinning treat- ment (thinned and unthinned), and planting density (622 and 907 trees per asre), The stands were all initially planted in 1985 and simulated for 40 years, Final hawests were set for age 35 on tall stands. Pine beetles were also simulated in this run Kth an average long-run population level of 2.0 spots per 1,000 acres of pine host type per year. Another run was made with a similar format but for site 50 and 70 to produce additional results,
Seven management treatments were applied to the forest (composed of eight stands) as shown in table 5. The stands were separated for the three different treatments (site, thinning, and planting density) in several ways, A stand group number of 1 was assigned to stands planted with 622 stems per acre and group number 2 to stands at the 907 density. Thinning was accomplished by keying the activity to the: stand number, (i-e,, 1 to 8). Thinning was applied only if the stand number was less than 5. The site index variation was also accounted for by entering the stand inventory records in a specific order. Various results from these runs are presented throughout the text and in the Appendix,
TIMBER GROWTH AND YIELD
ITEMS can project growth for pine plantations and natural stands, Variable density stand yield models for Coastal Plain and Piedmont loblolly and slash pine (not old field) are included in ITEMS. Growth and volume estimates are based on stand models produced by Csile and Schumacher for nat- ural stands (Schumacher and Coile 1960) and plantations (Coilo and Schurniacher 1964). Coile and Schumacherk yield models were modified to produce realistic thinning responses and to model ggrwth of a minor hardwood component in stands.
Three main growth and yield processes-basal area increment, height growth, and suwival-are modeled by ITEMS, These processes are described here in general terns, Similar projection procedures, but different equations, are used Fvithin ITEMS to model each of these three components of stand growth. Equations are taken directly from work by Schumacher and Coile and are contained in the com- puter code,
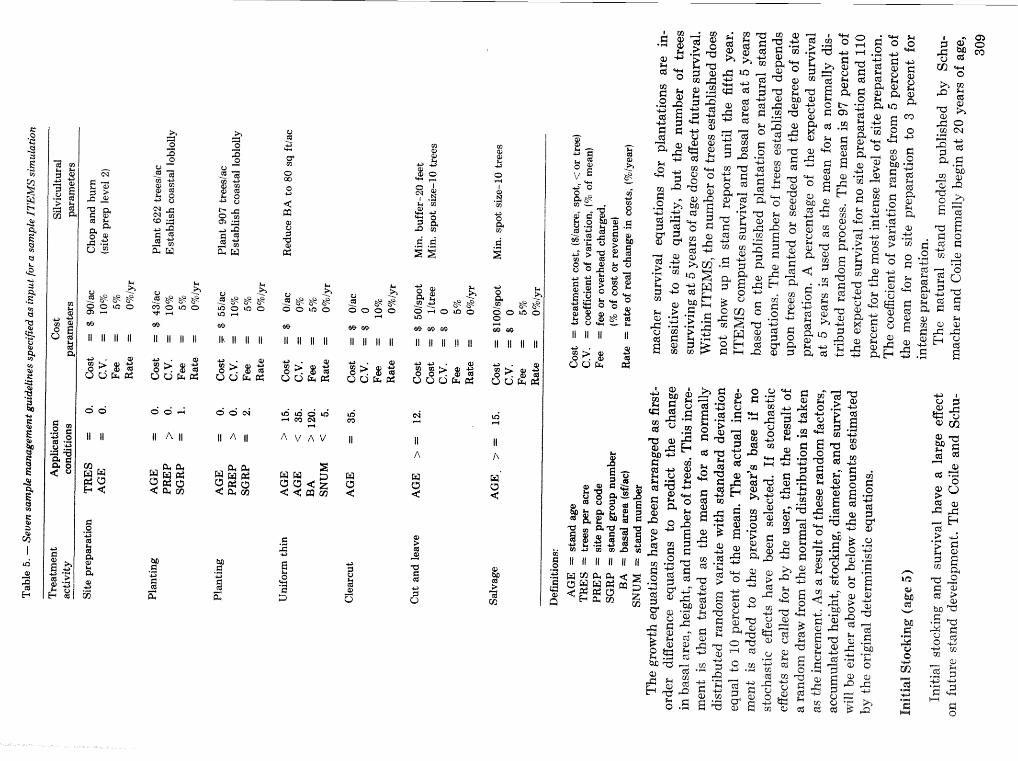
I-, I-,
0 ".?? -e 8 8 0 0 3 0
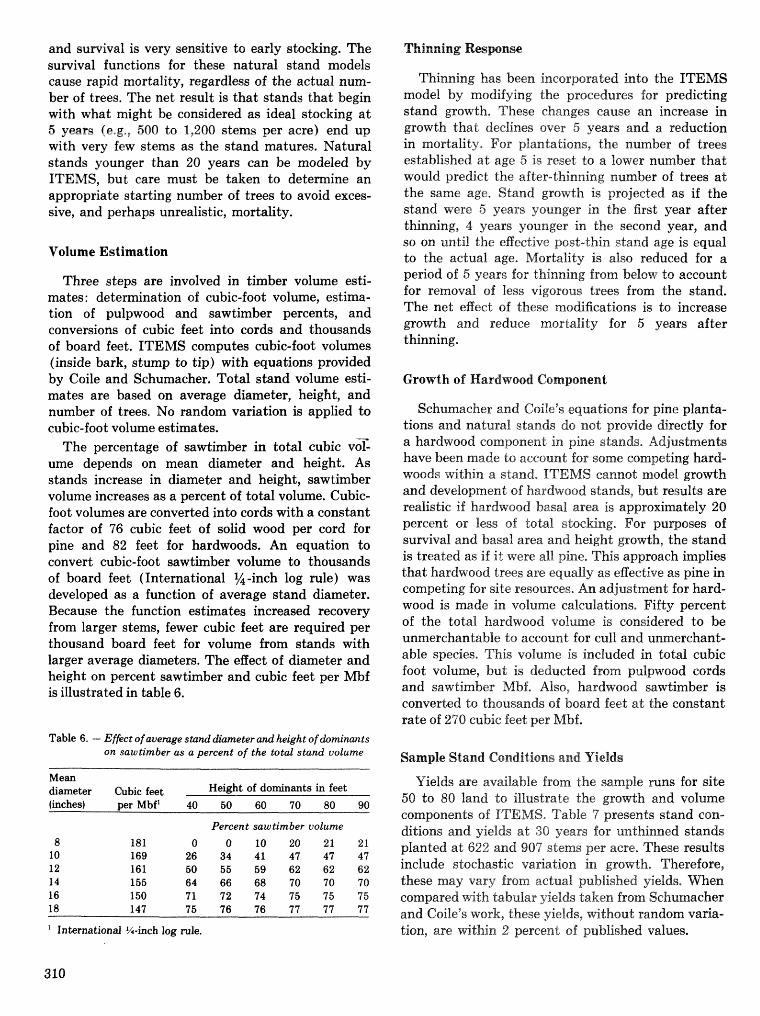
and survival is very sensitive to early sloeking. The survival functions for these natural stand models cause rapid mortality, regardless of the actual n m - ber of trees. The net result is that stands that begin with what might be considered as ideal stocking a t 5 years (e.g,, 500 to 1,200 stems per acre) end up with very few stems as the stand matures. Natural stands younger than 20 years can be modeled by ITEMS? but care must be taken to deternine an appropriate starting number of trees to avoid exces- sive, and perhaps unrealistic, mortality.
'Volume Estimation
Three steps are involved in timber volume esti- mates: determination of cubic-foot volume, estima- tion of pulpwood and sawtimber percents, and conversions of cubic feet into cords and thousands of board feet. ITEMS computes cubic-foot volumes (inside bark, stump to tip) with equations provided by Coile and Schumacher. Total stand volume esti- mates are based on average diameter, height, and number of trees. No random variation is applied to cubic-foot volume estimates.
The percentage of sawtimber in total cubic va- ume depends on mean diameter and height. As stands increase in diameter and height, sawtimber volume increases as a percent of total volume. Cubic- foot volumes are converted into cords with a constant factor of 76 cubic feet of solid wood per cord for pine and 82 feet for hardwoods. An equation to convert cubic-foot sawtimber volume to thousands of board feet (International %-inch log rule) was developed as a function of average stand diameter. Because the function estimates increased recovery from larger stems, fewer cubic feet are required per thousand board feet for volume from stands with larger average diameters. The effect of diameter and height on percent sawtimber and cubic feet per Mbf is illustrated in table 6.
Table 6. - Effect of auerage stand dkmeter and height of dominaats on sawtimber as a percent of the total stand volume
Mean dimeter Cubic feet Height of dominants in feet (inchest wrMbfl 40 50 60 70 80 90
- -
Percent saw timber uolume
8 181 0 0 10 20 21 21 10 169 26 34 41 47 47 47 12 161 50 55 59 62 62 62 14 155 64 66 68 70 70 70 16 150 71 72 74 75 75 75 18 147 75 76 76 77 77 77
' Internationoil %-inch log rule,
Thinning has been incorporated into the ITEMS model by modifying the procedures for predicting stand growth. These changes cause an increase in growth that declines over 5 years and a reduction in modality, For plantations, the number of trees established a t age 5 is reset to a lower number that would predict the rafter-thinning number of trees at the same age, Stand growth is projected as if the stand were 5 years younger in the furst year after thinning, 4 years younger in the second year, and so on until the effective post-thin stand age is equal to the actual age. Mortality is also reduced for a period of 5 years for thinning from below to accouk for removal of less vigorous trees from the stand. The net effect of these modifications is to increase growth and reduce mortaility for 5 years after thinning.
Growth of Hardwood Component
Schumacher and Coife's equations for pine planta- tions and natural stands do not provide directly for a hardwood component in pine stands. Adjustments have been made to account far some competing hard- woods within a stand, ITEMS cannot model growth and development of hardwood stands, but results are realistic if hardwood basal area is approximately 20 percent or less of total stocking, For purposes of survival and basal area and height growth, the stand is treated as if it were all pine. This approach implies that hardwood trees are equally as efFective as pine in competing for site resources. An adjustment for hard- wood is made in volume calculations. Fifty percent of the total hardwood volume is considered to be unmerchantable to account for cull and unmerchant- able species. This volume is included in total cubic foot volume, but is deducted from pulpwood cords and sawtimber Mbf, Also, hardwood sawtimber is converted to thousands of board feet a t the constant rate of 270 cubic feet per Mbf,
Sample Stand Coraditions and Yields
Yields are available from the sample runs for site 50 to 80 land to illustrate the growth and volume components of ITEMS, Table '7 presents stand can- ditions and yields at 30 years for ernthinned stands planted a t 622 and 90hstems per acre. These results include stochastic variation. in growth, Therefore, these may vary from actual published yields. m e n compared with tabular yields taken from Schumacher and Goile" work, these yields, without random varia- tion, are within 2 percent of published values.
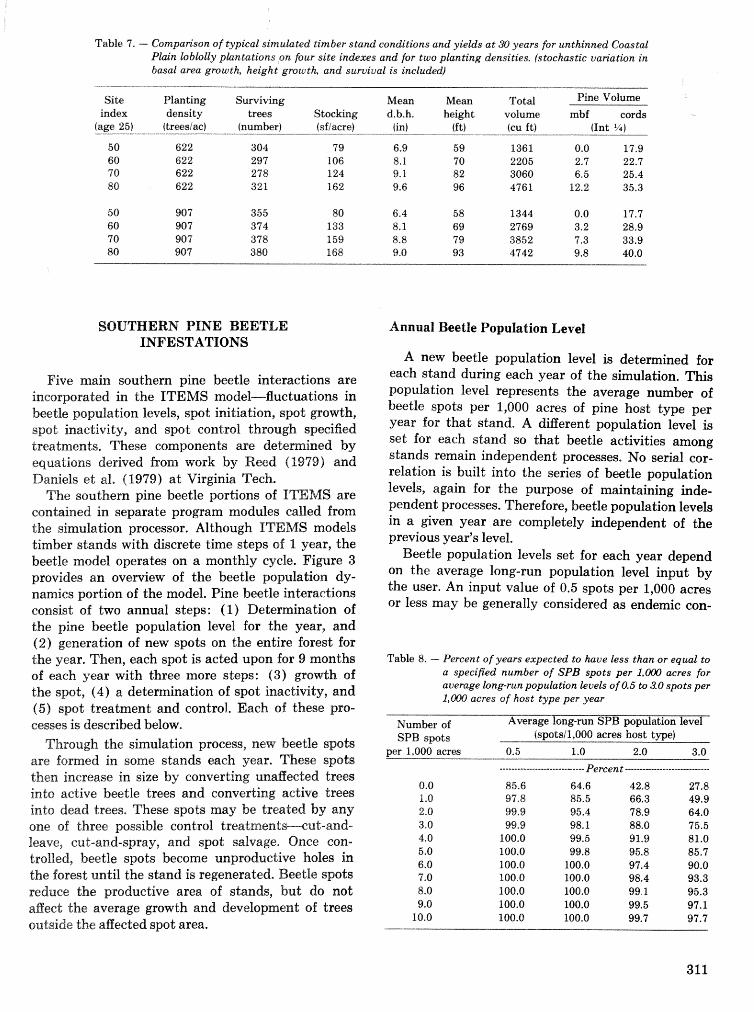
Table 7. - Compan"son o f tlvpical simulated timber stand eoncZitions and yieldts at 30 ymrs for unthinned Coastal Plain loblolly plantations on four site indexes and for two planting densities. (stochdstic variation in basal area growth, height growth, and survietal is included)
Site Planting index density
(tgz Ei - - ( t r = * k
50 622 60 622 70 622 80 622
Surviving trees
(number) -""- "" "-- 304 297 278 321
Mean height
(ft) --- - & -- - - 59 70 82 96
Tot& volume (cu f t ) - 1361 2205 3060 4761
Pine Volume
mbf cords (Int $141
SOUTHERN PINE BEETLE INFESI'AmONS
Five main southern pine beetle interactions are incorporated in the ITEMS model-fluctuations in beetle population levels, spot initiation, spot grodh, spot inactivity, and spot control through specified treatments. These components are determined by equations derived from work by Reed (1979) and Daniels et af. (1979) a t Virginia Tech.
The southern pine beetle portions of ITEMS are contained in separate program modules called from the simulation processor. Although ITEMS models timber stands with discrete time steps of 1 year, the beetle model operates on a monthly cycle. Figure 3 provides an overview of the beetle population dy- namics portion of the model. Pine beetle interactions consist of two annual steps: (1) Detemination of the pine beetle population level for the year, and (2) generation of new spots on the entire forest for the year. Then, each spot is acted upon for 9 months of each year with three more steps: (3) growth of the spot, (4) a detmination of spot inactivity, and (5) spot treatment and control. Each of these pro- cesses is described below,
Through the simulation process, new beetle spots are fomed in some stands each yeas. These spots then increase in size? by converting unafiected trees into active beetle trees and converting active trees into dead trees, These spots may be treated by any one of three possible control treatment leave, cud-and-spray, and spot salvage, Once eon- trolled, beetle spots become unproductive holes in the forest until the stand is regenerated, Beetle spots reduce the productive area of stands, bud do not affect the average growth and development of trees outside the affected spot area.
Annual Beetle Population Level
A new beetle population level is determined for each stand during each year of the simulation. This population level represents the average number of beetle spots per 1,000 acres of pine host type per year for that stand. A different population level is set for each stand so that beetle activities among stands remain independent processes. No serial cor- relation is built into the series of beetle population levels, again for the purpose of maintaining inde- pendent processes. Therefore, beetle population levels in a given year are completely independent of the previous year's level.
Beetle population levels set for each year depend on the average long-run population level input by the user. An input value of 0.5 spots per 1,000 acres or less may be generally considered as endemic con-
Table 8. - Percent of years expected to have less than or equal to a specified number o f SPB spots per 1,000 acres for average long-run population levels of 0.5 to 3.0 spots per 1,W acres of host type per year
Number of Average long-run SPB population level SPB spots Ispots/1,000 acres host type)
per 1,000 acres 0.5 1 .O 2.0 3.0
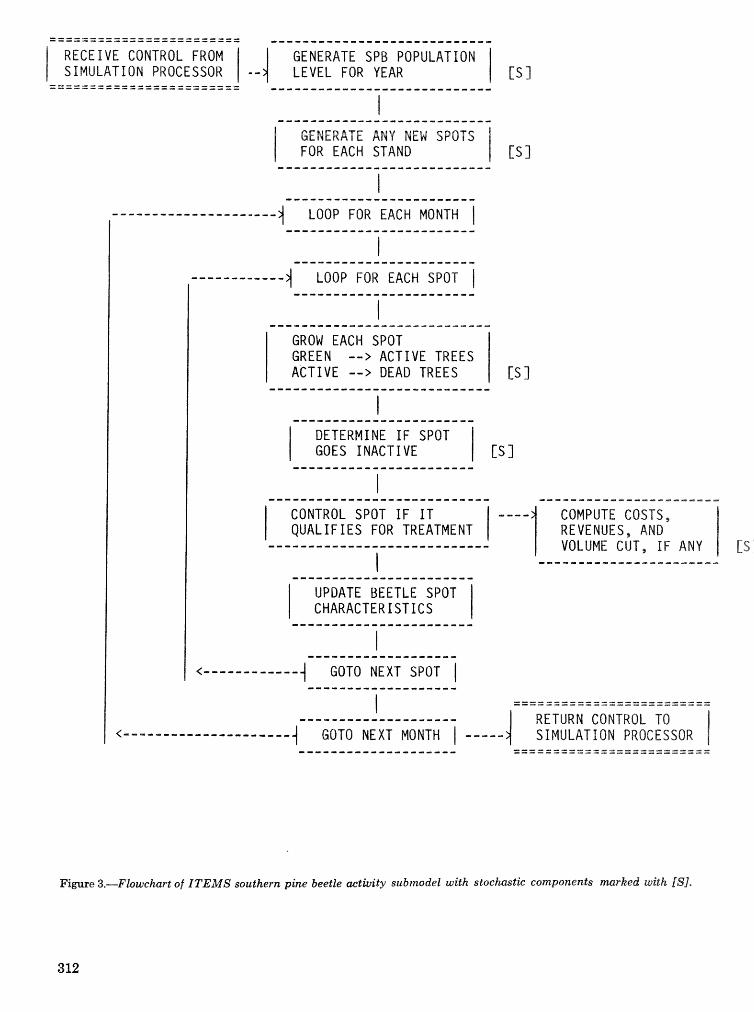
RECEIVE CONTROL FROM GENERATE SPB POPULATION S IMULAT ION PROCESSOR LEVEL FOR YEAR Cs 1
GENERATE ANY NEW SPOTS FOR EACH STAND El
I I - - - e - - - - L - - - L - - . . - -
1 LOOP FOR EACH MONTH
L--_-..______ LOOP FOR EACH SPOT I ---I---------------____
I -=--*e--------e------*----e-
GROW EACH SPOT GREEN --> ACT IVE TREES ACT IVE --> DEAD TREES I
....................... DETERMINE I F SPOT GOES I N A C T I V E
CONTROL SPOT I F I T ' ----I COMPUTE COSIS, I Q U A L I F I E S FOR TREATMENT REVENUES, AND ............................ i
VOLUME CUT, I F ANY
------I----------.-----
UPDATE BEETLE SPOT I CHARACTERISTICS
<------------ GOTO NEXT SPOT I
I ------------------------- ------------------------- ---..._-,.---- I---"..---- RETURN CONTROL TO
<---I-------l--P-I---- GOT0 NEXT MONTH I ----- S IMULAT ION PROCESSOR
Figure 3.-Flowchart of ITEMS southern pine beetle activity submodel with stochastic components marked with [S],
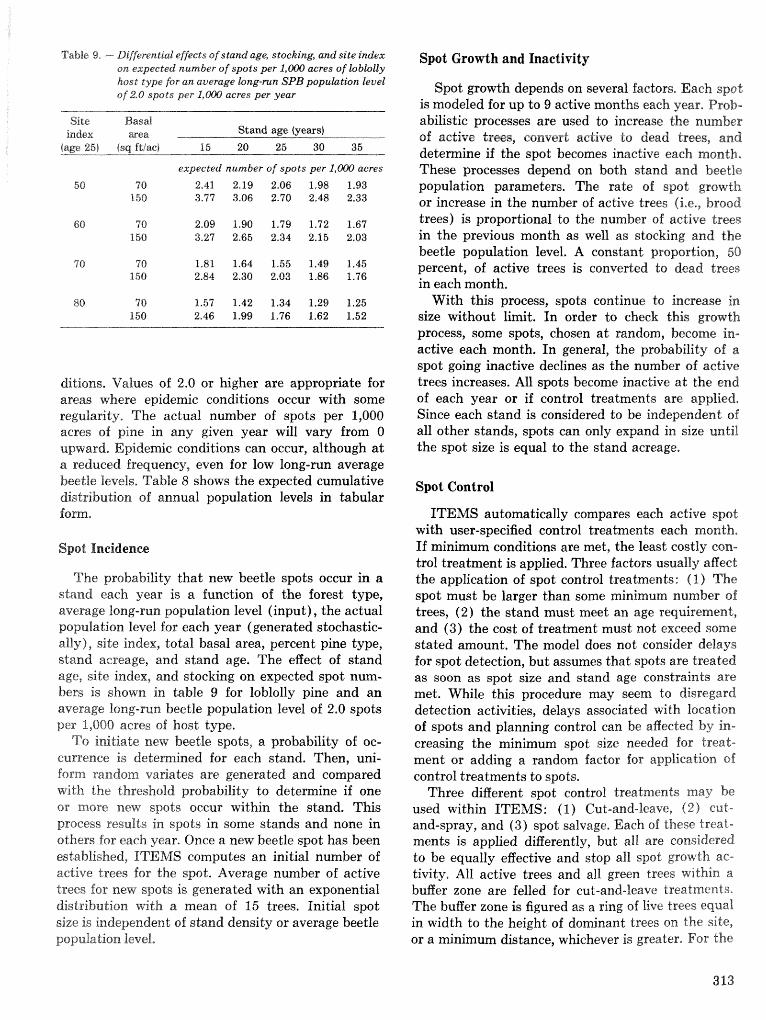
Table 9. - Differential effects sf stand age stockir~tg, uand site index on expected number of spots per 1,000 acres of ktblolly host type for an average haprun. SPB popuktion level of 2-0 spots per 1,W aeres per year
Site Basd index sea Stand age {years) --- - *-
(age 251 (sq fdlac) 15 20 25 30 35
expected number of spots per 1,008 acres
ditions. Values of 2.0 or higher are appropriate for areas where epidemic conditions occur with some regularity. The actual number of spots per 1,000 acres of pine in any given year will vary from 0 upward. Epidemic conditions can occur, although a t ia reduced frequency, even for low long-run average beetle levels, Table 8 shows the expected cumulative distribution of annual population levels in tabular form*
Spot Ineidenee
The probability that new beetle spots occur in a stand each year is a function of the forest type, average long-run population level (input), the actual population level for each year (generated stochastic- ally), site index, total basal area, percent pine type, stand acreage, and stand age. The effect of stand age, site index, and stocking on expected spot num- bers is shown in table 9 for loblolly pine and an average long-run beetle population level of 2.0 spots per 1,0065 acres of host type.
To initiate new beetle spots, a probability of oc- cursenee is determined for each stand. Then, uni- form random variates are generated and compared with the threshold probability to determine if one or more new spots occur within the stand. This process results in spots in some stands and none in others for each year. Once a new beetle spot has been established, ITE&IS computes an initial number of active trees for the spot. Average number of active trees for new spots is generated with an exponential distribution with a mean of 15 trees, Initial spot size is independent of stand density or average beetle population Jevel.
Spat Growth and Inactivity
Spot growth depends on several factors. Each spot is modeled for up to 9 active months each year. Prob- abilistic processes are used to increase the number of active trees, convert active to dead trees, and deternine if the spot becomes inactive each month. These processes depend on both stand and beetle population parameters. The rate of spot growth or increase in the number of active trees (i.e., brood trees) is proportional to the number of active trees in the previous month as well as stocking and the beetle population level, A constant proportion, 50 percent, of active trees is converted to dead trees in each month.
With this process, spots continue to increase in size Prithout limit. In order to check this growth process, some spots, chosen a t random, become in- active each month, In general, the probability of 8
spot going inactive declines as the number of active trees increases. All spots become inactive a t the end of each year or if control treatments are applied, Since each stand is considered to be independent of all other stands, spots can only expand in size until the spot size is equal to the stand acreage,
Spot Control
ITEMS automatically compares each active spot with user-specified control treatments each month, If minimum conditions are met, the least costly con- trol treatment is applied. Three factors usually affect the application of spot control treatments: (1) The spot must be larger than some minimum number of trees, (2) the stand must meet an age requirement, and (3) the cost of treatment must not exceed some stated amount. The model does not consider delays for spot detection, but assumes that spots are treated as soon as spot size and stand age constraints are met. While this procedure may seem to disregard detection activities, delays associated with location of spots and planning control can be affected by in- creasing the minimum spot size needed for treab ment or adding a random factor for application of control treatments to spots.
Three different spot control treatments may be used within ITEMS: (I) Cut-and-leave, (2) cut- and-spray, and (3) spot salvage. Each of these treat- ments is applied differently, but all are considered to be equally egective and stop all spot growth ac- tivity. All active trees and all green trees within a buffer zone are felled for cut-and-leave treatments, The buffer zone is figured as a ring of live trees equal in width to the height of dominant trees on the site, or a minimum distance, whichever is greater. For the
cut-and spray-treatment, only active brood trees are cut and treated. Salvage treatment calls for removal of all dead and active trees, plus a bufEer zone of live trees.
TTESiS automatically computes the total cost for application of ewc"hrea;tment and selects the least- cost option. A diBerent fixed cost per spot is charged far each treatment. Also, a cost per tree is charged for cut and leave or cut and spray treatments. For salvage, revenues are generated, but a t reduced prices, Pulpwood revenues are 50 percent off and sawtimber revenues 35 percent off the trend value for undamaged timber. If called for by the user, random variations are applied to these treatment costs.
FINANCIAL ANALYSIS FEATURES
A financial assessment of all costs and revenues is conducted for each stand by the report generator after the completion of the simulation. An annual record of all costs and revenues is maintained for each stand. IEtR and PNW are computed for each stand a t several discount rates, These criteria (IRR and PNW) are computed for each simulated year and include all cash flows occurring in prior years plus the value of standing timber in that year. Hence, a progression of PNWs and IRRs is produced for each stand from the beginning of the simulation to the end.
this projected total cost is treated as the mean of a normally distributed random process with the coefficient of variation input by the user.
Price Projections
Timber prices are projected in nearly the same manner as costs. A trend price for pine and hard- wood pulpwod and sawtimber is detemined for each year of the simulation based on starting prices, real rates of change, and inflation. Timber sale revenues generated by commercial thinning or final harvest are figured by multiplying product yields (cords and Mbf j by trend unit prices. If specified, the total sale revenue is subjected to a random process similar to that used for costs.
Financial Analysis
ITEMS maintains an annual ledger of all costs and revenues for subsequent financial analyses by the ITEMS report generator, These financial an- alyses compute pretax IRR and PGdFV. Results for each stand are contained in the Stand Financial Re- port. No income tax effects are included in the finan- cial analyses and no analysis is done on the aggregate cash flows for all stands in the simulated forest. Sf an inflation rate was specified in the simulation parameters, the results of these analyses should be considered as nominal or current dollar amounts.
Cost Estimation IRR and PNVV Calculations
Forest management costs are figured from cost data entered with each management activity. ITEB4S determines costs a t the time an activity is applied to a simulated stand. The projected total cost ac- counts for fixed and variable costs on all acres treated and for compounding for some real rate of change and inifation. The projected total cost (TC) is csmputed as: TC-(FGi-VC *':A) * ( l+OV) * ( l + r ) N * ( I+ i )N
where TC= total cost in $,'acre FG= base fixed cost in $/spot (SPB spot
treatments only) VG=base variable cost in $/acre ($/tree for
SPE spot treatments) OV-- management feeioverhead rate (per-
cent of direct costs) A .= acres treated r== real rate of price change in percentlyear i== annual rate of inflation in percentlyear
N== years since start of the simulation. If stochastic variation in costs is requested, then
IRR is computed using the secant algorithm for solution of nonlinear equations for each year. N1 costs and revenues generated by stand treatments done in the target year or earlier are included in the cash flow series. The value of mercbantabte timber in the target year assessed at the trend prices is also added to the cash Bow series, The financial criteria that result from this process indicate the return that would be generated if the stand were clearcut in that year. One variation with this process occurs in the year the final hamest is done, When stands are clearcut, some random variation may be applied to the timber sale revenue. The result is a higher or lower measure of return than would be expected if the trend prices were used without any stochastic eEects.
For PNW, five rates (0, 2, 4, 7, and 10 percent) are used to discount costs and revenues, Cash flaws are all discounted back to the first year sf the simulation.
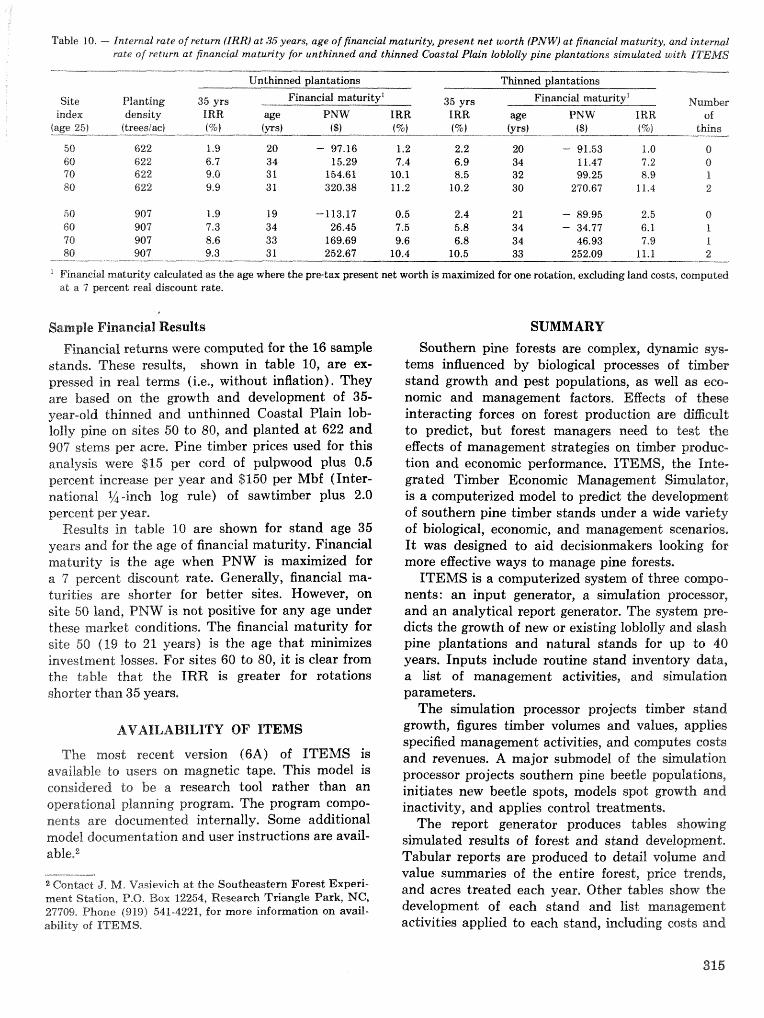
Table 10. - Internal rate of return ffRR) at 35 years, age of financial maturitx present net worth (PiV'W) at financial maturiQ, and internal rate of return at financial m a t u ~ t y for unthinned and thinned Coastal Pbain loblolly pine plantations simulated with rTEMS
Unthinned plantations
Site Planting 35 yrs Financid maturity" index density IRR W e PNW IRR
(age 251 Idrmsiac) {%I (.Ws 1 fa (%I
Thinned plantations
35 yrs Financial maturity" Number IRR We PNW ERR of (%I (yrsf W (%I t&ns - -----"--
"Pinmeid maturity cAcalated as the age where the pretax prwent net worth is rnaxr;dzcsd for one rotation, exciuding land costs, compukd at a 7 peremt red discount rate.
Sample Financial Results F'mancial returns were computed for the '16 sample
stands. These results, shown in table 10, are ex- pressed in real terms (i.e., without inflation). They are based on the growth and development of 35- year-old thinned and unthinned Coastal Plain lob- lolly pine on sites 50 to 80, and planted a t 622 and 907 stems per acre. Pine timber prices used for this analysis were $15 per cord of pulpwood plus 0.5 percent increase per year and $150 per Mbf (Inter- national %-inch log rule) of sawtimber plus 2.0 percent per year.
Results in table 10 are shorn for stand age 35 years and for the age of financial maturity. Financial maturity is the age when PNW is maximized for a 7 percent discount rate. Generally, financial ma- turities are shorter for better sites. However, on site 50 land, PNW is not positive for any age under these market conditions, The financial maturity for site 50 (19 to 21 years) is the age that minimizes investment tosses. For sites 60 to 80, i t is clear from the table that the TRR is greater for rotations shorter than 35 years.
AVAILABILITY OF f"rEMS
The most recent version (6A) of ITEMS is available to users on magnetic tape. This model is considered to be a research tool rather than an operational planning program, The program compo- nents are documented internally. Some additional model documentation and user instructions are avail- ablee2
SUMMARY Southern pine forests are complex, dynarnic sys-
tems influenced by biological processes of timber stand growth and pest populations, as well as eco- nomic and management factors. EEects of these interacting forces on forest production are diEcralt to predict, but forest managers need to test the effects of management strategies on timber produe- tion and economic performance. ITEMS, the Inte- grated Timber Economic Management Simulator, is a computerized model to predict the development of southern pine timber stands under a wide variety of biological, economic, and management scenahos, I t was designed to aid decisionmakers looking for more effective ways to manage pine forests.
ITEMS is a computerized system of three compo- nents: an input generator, a simulation processor, and an analytical report generator. The system pre- dicts the growth of new or existing loblolly and slash pine plantations and natural stands for up do 40 years. Inputs include routine stand inventory data, a list of management activities, and simulation parameters.
The simulation processor projects timber stand growth, figures timber volumes and values, applies specified management activities, and computes costs and revenues, A major submodel of the simulation processor projects southern pine beetle populations, initiates new beetle spots, models spot growth and inactivity, and applies control treatments,
The report generator produces tables showing simulated results of forest and stand development. Tabular reports are produced to detail volume and value summaries of the entire forest, price trends,
2 Contact J. fcf, Vasievieb at the Southeastern Forest Experi- ment Station, P.O. Box 12254, Research Triangle Park, NC,
and acres treated each year, Other tables show the
27709. Phone (919) 541-4221, fa r more infomation on avail- d"elOpment of each stand and list management absidy sf ITEMS, activities applied to each stand, including costs and
revenues. A financial analysis showing internal rate of return and present net worth is computed for each stand.
ITEMS rnodels many interactions that take place in managed pine Forests. The model is stochastic and can introduce r andm variation in stand grovvth, costs, prices, and beetle population levels as an option. Forest managers and researchers can utilize these powerful irztegnited and stochastic features to study the egects of different pine forest management methods under va~iable economic and bialogical can- didisns. Users of ITEhfS can readily determine how diEererrr.1; strategies affect timber volumes, financial returns, beetle infestations, and other measures of forest production.
LTTERATURE CITED
Goile, T.S.; Schumaeher, F.X. Soil-site relations,
stand stmcture, and yields of slash and loblolly pine plantations in the southern hji ted States, Durham, NC: T.S. Coile, Inc,; 1964, 296 p,
Daniels, 1EE.F.; huschner, W.A.; Zarnoch, S,J,; Burk- hart, H.E.; Hicks, R.R. A, method for estimating the probability of southern pine beetle outbreaks, For. Sci, 25: 265-269,1979.
Reed, D.D. Estimating region-wide damages by the southern pine beetle. Blacksburg, VA: Virginia Polytechnic Institute and State University; 2979. 90 p.
Schumacher, F.X.; Coile, T.S. Growth and yield of natural stands of the southern pines. Durham, PITC : T.S. Coile, Inc,; 1960. 115 p,
Thompson, W.A, SPB-MICROBEETLIES: A simu- lation system for evaluating economic returns from pine stands under various management regimes and southern pine beetle simulation levels. In: Branham, Susan d.; Thatcher, Robed C,, eds, Proceedings, integrated pest management research symposium; 1985 April 15-18; Asheville, NC. Gen. Tech. Rep. SO-56. New Orleans, LA: U.S. Department of Agriculture, Forest Service, South- ern Forest Experiment Station; 1985: 292-299.
APPENDIX - Output Reports
Each ITEMS run produces many pages o f p r i n t e d output . The t o t a l number o f p r i n t e d pages i s approx imate ly equal t o (8 + 3N) where N i s t h e number o f stands simulated. Since some t a b l e s a re w ider than t h e s tandard 80 columns, a p r i n t e r capable o f 132 charac te r l i n e s i s requi red. T h i s Appendix con ta ins p r i n t o u t s t a k e n d i r e c t l y f rom a sample ITEMS s i m l a t i o n run. F i v e r e p o r t s a re reproduced here t o i l l u s t r a t e t h e d e t a i l e d ou tpu t o f t h e model.
A p o r t i o n o f a sample ITEMS run i s i l l u s t r a t e d i n Tables A - l th rough A-5. The s i m l a t i o n began i n 1985 w i t h 8 nonstacked stands, each 100 acres i n s ize. The stands were a11 s i t e prepared and p lan ted t o coas ta l p l a i n l o b l o l l y p i ne i n 1986. All stands were c l e a r c u t a t 35 years o f age i n 2021.
All ITEMS ou tpu t t a b l e s s t a r t on a new page and begin w i t h a t a b l e heading t h a t con ta ins s tandard in fo rmat ion . Th i s heading l i s t s t h e vers ion o f ITEMS, t h e s i m u l a t i o n run t i t l e , t h e name o f t h e repor t , and t h e years o f data shown i n t h e t ab le . The s tand number, acreage, s i t e index, and s tand name are a l so p rov ided f o r each o f t h e 3 s tand l e v e l repor ts .
.............................................................................. RUN TITLE -- A d e s c r i p t i v e t i t l e f o r t h e s imu la t ion , en te red by t h e user.
REPORT NAME -- I d e n t i f i e s one o f t h e f i v e ou tpu t repor ts .
STAND NUMBER -- A unique i d e n t i f i c a t i o n number f o r t h e stand, assigned as inpu t .
ACRES -- T o t a l number o f acres i n t h e stand, i n c l u d i n g unproduc t i ve areas i n ho les c rea ted by b e e t l e spots.
SITE INDEX -- The s i t e i ndex (base age 25) f o r t h e stand, i n p u t by t h e user. T h i s value remains constant throughout t h e s i m u l a t i o n and changes i n s i t e index a r e no t computed i n cases where a d i f f e r e n t p i n e species i s p lanted.
STAND NAME -- The s tand name ass i gned t o each s tand as inpu t . - - O - B - - - - - Q - ~ - - Q L L - d - - d - - - - L - - - - - - - - - - - - - - - - - - - ~ - * - - - - - - - - - - - ~ - - - - - - -
T h i s r epo r t , Tab le A-1, p rov ides an overview o f the ITEMS s i m u l a t i o n f o r a l l stands combined. I nc l uded a re t imber volumes i n cub ic f ee t , cords and MbP f o r hardwood and pine, value o f a l l t imber , and cos t and revenue amounts f o r 1985 through 2025. Va r i ab les shown i n t h i s r e p o r t are descr ibed below.
- I ~ " ~ L I L I * " ~ I - I I - - - - - - - ~ - - ~ ~ - ~ - " ) . ) . ) . ) . ) . ) . ) . - ~ - ~ ~ - - ~ ~ - " - - - ~ - ~ - ~ ~ - - - - - ~ - - - - ~ ~ - - ~ - - - ~
YEAR -- The ca lendar yea r f o r each l i n e o f data i n tab les .
FOREST AREA -- T o t a l acres con ta ined i n a l l f o r e s t stands.
TOTAL VOLUME -- T o t a l volume o f a l l stems i n cub ic f ee t , stump t o t i p ,
HARDWOOD VOLUME -- T o t a l hardwood volume f o r pulpwood and sawtimber i n cords and thousand board f ee t , I n t e r n a t i o n a l 1 /4- inch l o g ru l e .
PINE VOLUME -- T o t a l p i n e volume f o r pulpwood and sawtimber i n cords and thousand board f ee t , I n t e r n a t i o n a l 1 /4 l o g ru l e .
TIMBER VALUE -- The value o f a l l merchantable t imbe r on t h e s tand f i g u r e d on t h e t r e n d values f o r p i n e and hardwood pulpwood and sawtimber.
MANAGEMENT FEES -- The cos t p a i d f o r overhead assessment o r management fees.
DIRECT COSTS -- The cos t p a i d f o r s tand t rea tment i n cu r ren t d o l l a r s , exc lud ing charges f o r overhead o r management fees.
GROSS REVENUE -- The t o t a l revenue rece ived f o r s a l e o f merchantable t imber products f rom commercial t h i nn ings , f i n a l harvests , and salvage o f bee t l e spots.
NET REVENUE -- To ta l revenue l e s s a l l d i r e c t and overhead costs, f o r management t reatments app l i ed t o t h e stand, - - - - - 1 " - - - - - - - m - - - - - - - - - - " - - - - - - w e - - - - - - - e e - - * - - - - e = - - - - - - - - - - - - - - - - - - - - - - - - - -
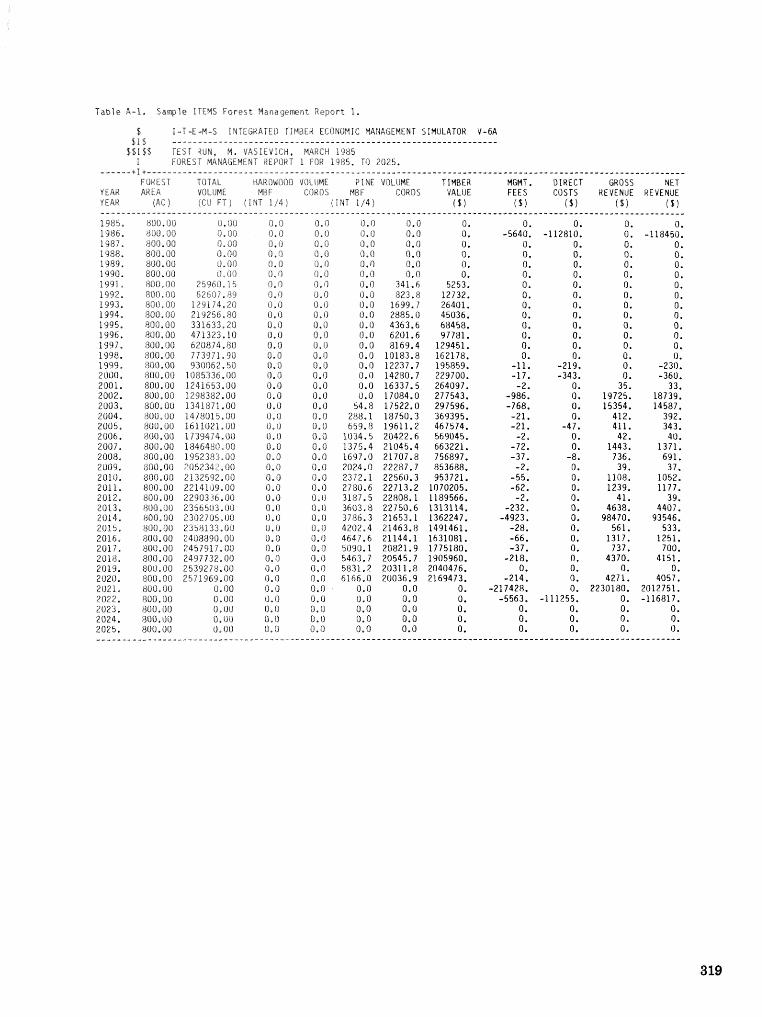
f a b l e A-1 , Sarrple lBEMS Forest Managemnt Report 1.
$ I -T -E -M-S I NTEGKATEO f IMBEK ECONOMIC MANAGEMENT SINULATOK V-6A $ I $ - - - - - - - - - - - - - - - - - - - - - - - - - - - - - - - - - - - - - - - - - - - - - - - - - - - - - - - - - - - - - - - - -
$ $ I $ $ TEST RUN, M. VASIEV:CH, MARCH 1985 1 FOREST MANAGEMENT dEPOKT I FOR 1385. TO 2025,
- - - - - - - i+ - - - - - - - - - - - - - - - - - - - - - - - - - - - - - - - - - - - - - - - - - - - - - - - - - - - - - - - - - - - - - - - - - - - - - - - - - - - - - - - - - - - - - - - - - - - - - - - - - - - - - - - - - - - -
F W E S T TOTAL HARDWOOD VOLUME F I NE V3LUME TIMBER M M T . DIRECT GROSS NET YEAR AREA VOLUME MB F CORDS HBF CORDS VALUE FEES COSTS REVENUE REVENUE YEAR (AC ( C U FI) i I N f 1 / 5 ) ( I N T 1/41 I $ ( $ f ( $ 1 ( $ 1 ( $ 1 - - - - - - - - - - - - - - - - - - - - - - - - - - - - - - - - - - - - - - - - - - - - - - - - - - - - - - - - - - - - - - - - - - - - - - - - - - - - - - - - - - - - - - - - - - - - - - - - - - - - - - - - - - - - - - - - - - - 1985, 800.00 0.00 3.0 0,O 0.0 8.0 0. 0. 0. 0. 0, 1986. i30o.00 o. on 0.0 0. i) 0.0 0.0 0, -5640. -112810. 0. -118450. 1987, 808.00 3.00 0.3 0.0 0.0 0.0 0 . 0. 0. 0. 0 1988, 800,OO 0.00 0.0 0.0 0.0 0.0 0. 0. 0, 0. 0. 1989. 800,OO it, 00 0.0 0.0 0.0 0.0 0. 0. 0. 0. 0. 1990. 800,00 0,OO 0,O 0.0 1?.0 0.0 0. 0. 0. 0. 0. 1991, 800,03 25960,15 0.0 0.0 0.0 341.6 5253. 0. 0. 0. 0. 1492. 900, DO 62503.89 0,O 0.0 0.0 823.8 12732. 0. 0. 0. 0. 1893, 800,OC 129114,20 0.0 0.0 0.0 1699.7 26401. 0. 0. 0. 0. 1994, 800.00 219256,RO 0.0 0.0 0.0 2885.0 45036. 0. 0. 0. 0. 1995. 900.00 331633,20 0,0 0.0 0.0 4363.6 68458. 0. 0. 0 0. 1996. 800.00 471323.10 0.0 13.0 8.0 6201.6 97781. 0. 0. 0. 0. 1997, 800.00 620874.80 0.0 0.0 0.0 8169.4 129451. 0. 0. 0. 0. 1998. 800.00 773971.90 0 -0 0.0 0.0 10183.8 162178. 0. 0. 0. 0. 1939, 300,00 930062.50 0.0 0.0 0.0 12237.7 195859. -1 1. -219. 0. -230. 2000. 800,OO 1085336.00 0.0 0.0 0.0 14280.7 229700. -17. -343. 0. -360. 2001. 800.00 1241653.00 0.0 0.0 0.0 16337.5 264097. -2. 0. 35. 33. 2002. 800.00 1298382.00 0.0 0. 0 0.0 17084.0 277543. -986. 0. 19725. 18739. 2003. 800.00 1341871.00 13.0 0.0 54.8 17522.0 297596. -768. 0. 15354. 14587. 2004. 800,OB 1478015,OO 0.0 0.0 288.1 18750.3 369395. -21. 0. 412, 392. 2005. 800.00 1611021.00 0, 3 0.0 659.8 19611.2 467574. -21. -47. 411. 343. 2006. 800.00 1739474,OO 0,0 0.0 1034.5 20422,6 569045, -2, 0. 42. 40. 2007, 800.00 184648t3,OO 0.0 0.0 1375.4 21045.4 663221. -72. 0. 1443. 1371. 2008, 800,00 1452383,00 0.0 0.0 1697.0 21707.8 756897. -37. -8. 736. 691. 2009. 800.00 305234.!.00 0.0 0.0 2024.0 22287.7 853688. -2. 0. 39. 37. 2010. 800-00 2132582.00 0.0 0.0 2372.1 22560.3 953721. -55. 0. 1108. 1052. 201 1, 800.00 22141 39,05 0 -0 0.0 2780.6 22713.2 1070205. -62. 0. 1239. 1177. 2012, 800.00 2290336.00 0,0 0,fl 3187.5 22808.1 1189566. -2. 0. 41. 39. 2013, 500.00 2356SU3,OO 0-0 0.0 3603.8 22750.6 1313114. -232. 0. 4638. 4407. 2014, 800,00 2302705.00 0.0 0.0 3786.3 21653.1 1362247. -4923. 0. 98470. 93546. 2019, 800.00 2358133.00 0.0 0.0 4202.4 21463.8 1491461. -28. 0. 561. 533. 2016. 800.00 2408890.00 0.0 0.0 4647.6 21144.1 1631081. -66. 0. 1317. 1251. 2017. 800.00 2457917.00 0,0 0.0 5090.1 20821.9 1775180. -37. 0. 737. 700. 2013. 880.00 2497732.00 0, IS 0.0 5463.7 20545.7 1905960. -218. 0. 4370. 4151. 2019. 800,OO 2539278,00 0 - 0 0.0 5831.2 20311.8 2040476. 0. 0. 0. 0. 2020. 800,00 2531969,OO 0.0 0,O 6166,O 20036.9 2169473. -214. 0. 4271. 4057. 2021, 800.00 0,00 0.0 0.0 0.0 0.0 0. -217428. 0. 2230180. 2012751. 2022. R00,00 0.00 t),O 0.0 0.0 0.0 0. -5563. -111255. 0. -116817, 2023. 800.00 0,OU 0. 0 0.0 0.0 0.0 0. 0. 0, 0. 0. 2024. 800.00 0.00 0-0 0.0 0.0 0.0 0. 0. 0. 0. 0. 2025. 800.00 0,00 0,0 0.0 0.0 0.0 0. 0. 0. 0. 0. ___ -_______-_______- - - - - - - - - - - - - - - - - - - - - - - - - - - - - - - - - - - - - - - - - - - - - - - - - - - - - - * - - - - - - - - - - - - - - - - - - - - - - - - - - - - - - - - - - - - - - - - -
Fores t Manasement R e ~ o r t 2
This r epo r t , Table 8-2, shows p r i c e s f o r harrtwaod and p i n e pulpwood and sawtimber, acres t r ea ted , non-merchantable acres and average volume and va lue p e r acre on t h e e n t i r e f o r e s t . Below i s a l i s t o f t h e va r i ab les conta ined i n t h i s r e p o r t .
---------------------------------*-------------------*------------------------
HARDWOOD P R I C E S -- P ro jec ted t r e n d p r i c e f o r hardwood pulpwood and sawtimber, based on i n i t i a l p r i c e en te red as i npu t , compounded each year .
PINE PRICES -- P ro jec ted t r e n d p r i c e f o r p i n e pulpwood and sawtimber, based on i n i t i a l p r i c e en te red as i npu t , compounded each year ,
ACRES CLEAKCUT -- The number o f acres c l e a r c u t f rom a1 1 stands f a r t h e year.
AGRES THINNED -- The number o f acres commercial ly t h i nned f o r t h e yea r f rom a l l stands,
ACRES REGENERATED -- The number o f acres p l a n t e d f o r t h e year .
NON-MERCHANTABLE ACRES -- The number o f acres on t h e f o r e s t i n a nonstocked c o n d i t i o n o r w i t h a s tand l ess than 5 years o f age.
VOtUME/ACKE -- Average volume per acre i n cub ic f ee t , based on t o t a l s tand area*
VALUE/ACKE -- The average value per acre f o r a l l merchantable t imber on t h e stand, based on t h e t r e n d values f o r p i n e and hardwood pulpwood and sawtimber. - - - - - - - - - - - - - - - - - - - - - - - - - - - - - - - - - - - - - - - - - - - - - - - - - - - - - - - - e - - - - - - - - - - - m - - - - - - - - -
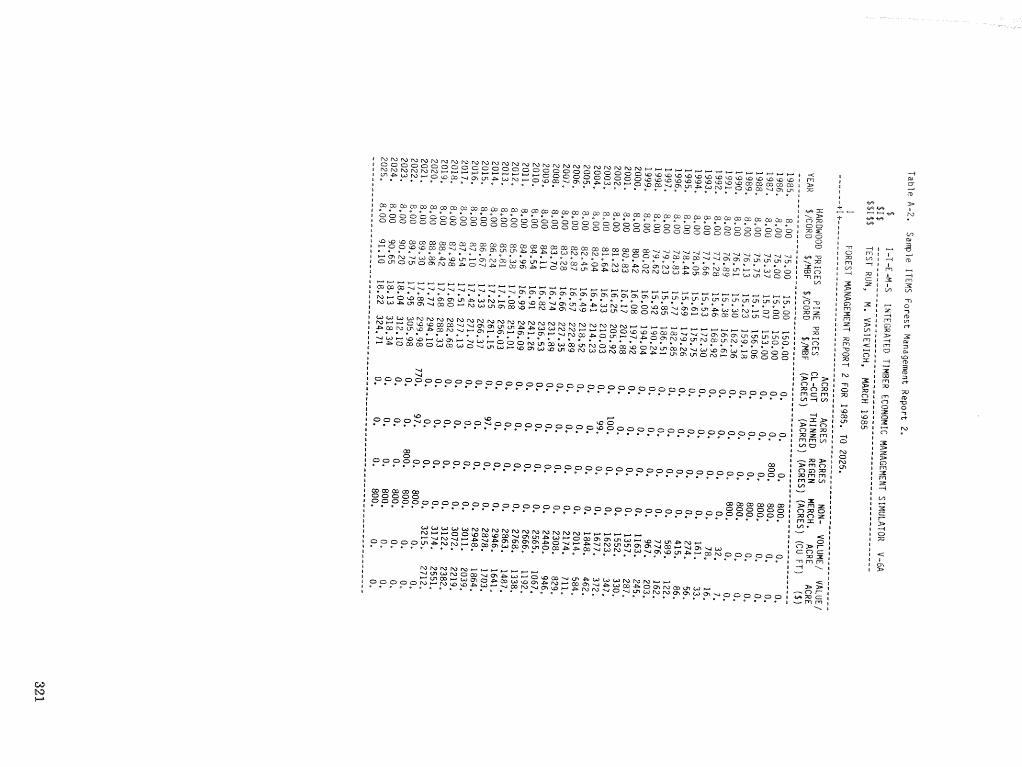
Three r e p o r t s descr ibe t h e development o f each s tand over t h e s imu la t i on per iod . Repor ts a re reproduced here f o r one stand. The stand, 100 acres o f coas ta l p l a i n l o b l o l l y ( p l an ted w i t h 907 stems pe r acre i n 1986), i s on s i t e i ndex 80 land. Two u n i f o r m t h i n n i n g s were a p p l i e d by ITEMS a t ages 16 and 28. The s tand was s i t e prepared and r ep lan ted i n 2022, t h e year f o l l o w i n g harvest .
The Stand Report, Tab le A-3, shows common meastjres o f s tock ing , volume, growth and value, among o t h e r i n fo rma t i on . Var iab les conta ined i n t h e Stand Report a re descr ibed below.
YEAR -- The ca lendar y e a r f o r each l i n e o f data i n a l l tab les .
GREEN AREA -- Number o f p roduc t i ve acres i n t h e stand, exc lud ing unproduc t i ve ho les c rea ted by b e e t l e spots.
STAND AGE -- Age o f t h e s tand i n years. P l a n t a t i o n s are zero years o l d i n t h e y e a r p lanted.
STOCKING (BASAL AREA) -- The s t o c k i n g o f a l l t r e e s i n t h e stand, p i n e and hardwood, i n square f e e t pe r acre.
STOCKING (TREES) -- The number o f a l l t rees, p i n e and hardwood, i n t h e stand.
DBH -- Diameter a t b reas t he igh t , i n inches, o f a t r e e o f mean basal area.
HEIGHT -- Height i n f e e t o f dominant and codominant t r ees i n t h e stand.
TOTAL VOLUME -- T o t a l volume o f a l l stems i n cub ic f ee t , stump t o t i p .
HARDWOOD VOLUME -- T o t a l hardwood volume f o r pulpwood and sawtimber i n cords and thousand board f ee t , I n t e r n a t i o n a l 1 /4- inch l o g r u l e .
PINE VOLUME -- T o t a l p i n e volume f o r pulpwood and sawtimber i n cords and thousand board f ee t , I n t e r n a t i o n a l 114- inch l o g ru l e .
STAND VALUE -- The value o f a l l merchantable t imbe r on t h e s tand f i g u r e d on t h e t r e n d values f o r p i n e and hardwood pulpwood and sawtimber*
GROWTH (VOLUME) -- Volume growth increment i n cub ic f e e t f o r t h e stand. Th i s i s t h e cu r ren t annual increment f o r a l l t rees, p i n e and hardwood,
GROWTH-VALUE ( $ ) -- Annual growth i n s tand value g iven i n d o l l a r s pe r acre. T h i s i s t h e change i n s tand value f rom t h e p rev ious year and inc ludes t h e e f f e c t s o f volume increment, change i n product mix, and t r e n d p r i ces .
GROWTH-VALUE (%) -- Annual growth i n s tand va lue given i n percent increase over t h e value f rom t h e p rev ious year. The e f f e c t s o f volume increment, change i n p roduc t mix, and t r e n d p r i c e s a re i nc l uded*
SPB SPOTS -- The ni~mber o f southern p i n e b e e t l e spots w i t h i n t h e s tand f o r t h e s p e c i f i e d year.
FOREST TYPE -- The f o r e s t type such as NONSTOCKED o r PLANTED LOB ( C O ) . - - - e - - - - - " - - - - - - m - - - - - - - - - - - - * " - - - - - " - - - - - - - - - - - - - - - e - - - - - - - - - " - - - - - - - - - - - - - - -
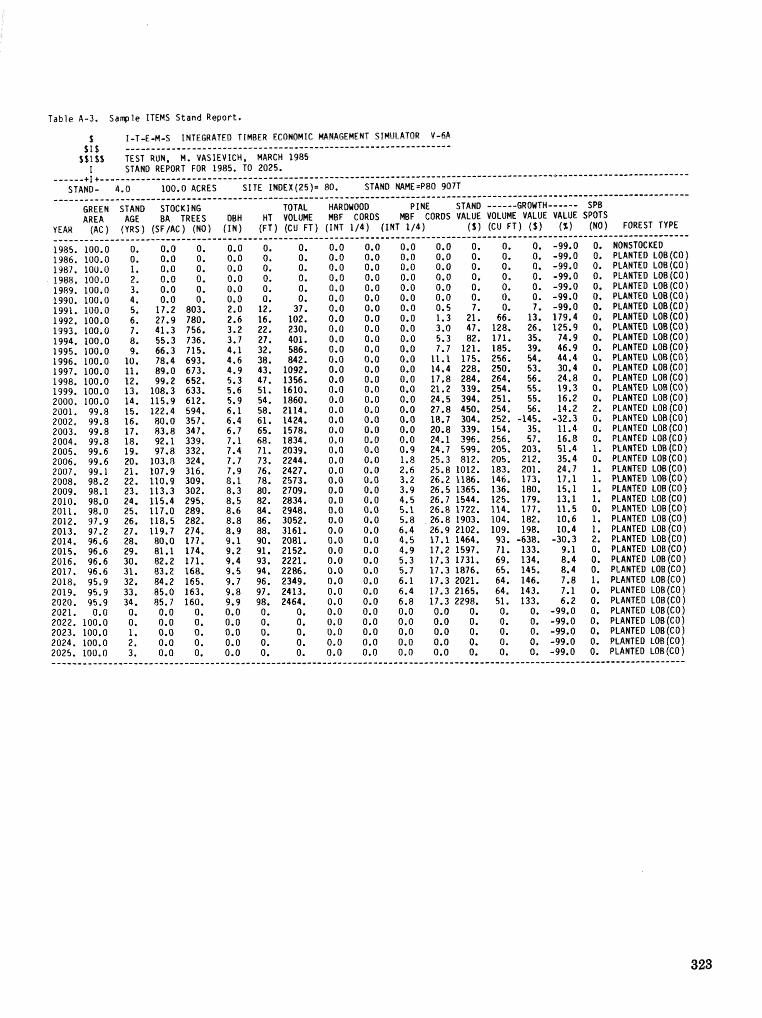
Table A-3, Sample ITEMS Stand Report.
f I -T-E-H-S I NTEGRATEO TIMBER ECQMGHIC WNAGFMENT SlMItkATOR V-6h $ I $ ----------------*----------------*------------------------------
$6166 TEST RUN, H. VASIEVICH, MARCH 1985 I STAN0 REPORT FOR 1985. TO 2025.
------+I+-------------*--------------------------------------*---d-------------------------------**-------------------------- STAND- 4.0 100.0 ACRES SITE INOEX(25)= 80, STAN0 NANE=P80 907T
_______*______-____--------------------------------*-*-----*-----------------------------------------------------------------
GREEN STAND STOCKING TOTAL HAROWOOO PINE STAND ------ GROWTH------ SPB AREA AGE 8A TREES DBH HT VOLUME MBF CORDS MBF CORDS VALUE VOLUME VALUE VALUE SPOTS
YEAR (A&) (YRS) (SFIAC) (NO) ( IN) (FT) (CU FT) flNT 1/41 (INT 1/4) ( $ ) (CU FT) ( b ) ( X ) (NO) FOREST TYPE ___________________-----*-------------------------"--------------------------------------------------------------------------
1985. 100.0 0. 0.0 0. 0.0 0. 0, 0.0 0.0 0.0 0.0 0. 0, 0. -99.0 0, NONSTOCKED 1986. 100.0 0, 0.0 0. 0.0 0. 0. 0.0 0.0 0.0 0.0 0, 0. 0. -99.0 0, PLANTED LDB(C0f 1987. 100.0 1. 0.0 0. 0.0 0. 0. 0.0 0.0 0.0 0.0 0. 0. 0, -99.0 0, PLANTEO LOB(C0) 1988.!00,0 2. 0.0 0, 0.0 0. 0. 0.0 0.0 0.0 0.0 0. 0. 0. -99.0 0. PLANTEDLOB(COJ 1989.100.0 3. 0.0 0. 0.0 0. 0. 0.0 0.0 0.0 0.0 0. 0. 0. -99.0 0, PLANTEOLOB(CO) 1990, 100.0 4, 0.0 0. 0.0 0' 0. 0.0 0.0 0.0 0.0 0. 0, 0. -99.0 0. PLANTED LOB(CO) 1991. 100.0 5. 17.2 803, 2.0 12, 37, 0.0 0.0 0.0 0.5 7. 0, 7, -99.0 0. PLANTED LOB(CO) 1992.100.0 6, 27.9 780. 2.6 16, 102, 0.0 0.0 0.0 1.3 21, 66. 13, 179.4 0. PLANTEDLoB(co) 1993. 100.0 7. 41.3 756. 3.2 22, 230. 0.0 0.0 0.0 3.0 47. 128. 26. 125.9 0. PLANTED LOB{CO) 1994.100.0 8. 55.3 736. 3.7 27. 401. 0.0 0.0 0.0 5.3 82. 171, 35. 74.9 0. PLANTEOLOB(C0) 1995.100.0 9. 66.3 715, 4.1 32. 586. 0.0 0.0 0.0 7.7 121, 185. 39. 46.9 0. PLANTEDLOB(C0) 1996. 100.0 10. 78.4 693. 4.6 38. 842. 0.0 0.0 0.0 11.1 175. 256, 54. 44.4 0. PLANTED LO%(CO) 1997. 100.0 11. 89.0 673. 4.9 43. 1092, 0.0 0.0 0.0 14.4 228, 250. 53. 30.4 0, PLANTEO LOB(C0J 1998.100.0 12. 99.2 652. 5.3 47. 1356. 0.0 0.0 0.0 17.8 284. 264. 56. 24.8 0. PLANTEDLOB(CO) 1999. 100.0 13. 108.3 633. 5.6 51. 1610. 0.0 0.0 0.0 21.2 339. 254. 55. 19.3 0. PLANTED LOB(CO) 2000. 100.0 14, 115.9 612. 5.9 54. 1860. 0.0 0.0 0.0 24.5 394. 251. 55. 16.2 0. PLANTEOLOB(CO) 2001. 99.8 15. 122.4 594. 6.1 58. 2114. 0.0 0.0 0.0 27.8 450. 254. 56. 14.2 2. PLANTED LOB(CO) 2002. 99.8 16. 80.0 357, 6.4 61. 1424. 0.0 0.0 0.0 18.7 304. 252. -145. -32.3 0. PLANTED LOB(CO) 2003. 99.8 17. 83.8 347. 6.7 65. 1578. 0.0 0.0 0.0 20.8 339. 154. 35. 11.4 0. PLANTEO LOB(CO) 2004. 99.8 18. 92.1 339. 7,l 68, 1834. 0.0 0.0 0.0 24.1 396. 256. 57. 16.8 0. PLANTED LOB(CO) 2005. 99.6 19. 97.8 332. 7.4 71. 2039, 0.0 0.0 0.9 24.7 599. 205. 203. 51.4 1. PLANTEO LOB(CO) 2006. 99.6 20. 103.8 324, 7.7 73. 2244. 0.0 0.0 1.8 25.3 812. 205. 212. 35.4 0. PLANTED LOB(C0) 2007. 99.1 21. 107.9 316. 7.9 76. 2427. 0.0 0.0 2.6 25.8 1012. 183. 201. 24.7 1. PLANTED LOB(C0) 2008. 98.2 22, 110.9 309. 8.1 78. 2573, 0.0 0.0 3.2 26.21186. 146, 133. 17.1 1. PLANTEOLOB(C0) 2009. 98.1 23. 113.3 302. 8.3 80. 2709. 0.0 0.0 3.9 26.5 1365. 136. 180. 15.1 1. PLANTEO LOB(C0) 2010. 98.0 24. 115.4 295. 8.5 82. 2834. 0.0 0.0 4.5 26.71544. 125. 179. 13.1 1. PLANTEOLOB(C0) 2011, 98.0 25. 117.0 289. 8.6 84. 2948. 0.0 0.0 5.1 26.81722. 114. 177. 11.5 0. PLANTEOLOB(C0) 2012. 97.9 26. 118.5 282. 8.8 86. 3052. 0.0 0.0 5.8 26.8 1903. 104. 182. 10.6 1. PLANTED LOB(C0) 2013. 97.2 27. 119.7 274. 8.9 88. 3161. 0.0 0.0 6.4 26.9 2102. 109. 198. 10.4 1. PLANTED LOB(CO) 2014, 96.6 28, 80.0 177, 9.1 90. 2081. 0.0 0.0 4.5 17.1 1464. 93. -638. -30.3 2. PLANTEO LOB(C0) 2015. 96.6 29. 81.1 174. 9.2 91. 2152. 0.0 0.0 4.9 17.2 1597. 71. 133. 9.1 0. PLANTEO LOB(C0) 2016. 96.6 30. 82.2 171. 9.4 93. 2221, 0.0 0.0 5.3 17.3 1731. 69. 134. 8.4 0. PLANTED LOB(C0) 2017. 96.6 31. 83.2 168. 9.5 94. 2286. 0.0 0.0 5.7 17.3 1876. 65. 145. 8.4 0. PLANTED LOB(C0) 2018. 95.9 32. 84.2 165. 9.7 96. 2349. 0.0 0.0 6.1 17.3 2021. 64. 146, 7.8 1. PLANTEO LOB(C0) 2019. 95.9 33. 85.0 163. 9.8 97. 2413. 0.0 0.0 6.4 17.3 2165. 64. 143. 7.1 0. PLANTED LOB(C0) 2020. 95.9 34. 85.7 160. 9.9 98, 2464. 0.0 0.0 6.8 17.32298. 51, 133. 6.2 0. PLANTEOLOB(C0) 2021. 0.0 0. 0.0 0. 0.0 0. 0. 0.0 0.0 0.0 0.0 0. 0. 0. -99.0 0. PLANTEDLOB(C0) 2022.100.0 0. 0.0 0. 0.0 0. 0. 0.0 0.0 0.0 0.0 0. 0. 0. -99.0 0. PLANTEOLOB(C0) 2023.100.0 1. 0.0 0. 0.0 0. 0. 0.0 0.0 0.0 0.0 0. 0. 0. -99.0 0. PLANTEOLOB(C0) 2024.100.0 2. 0.0 0. 0.0 0, 0. 0.0 0.0 0.0 0.0 0, 0. 0, -99.0 0. PLANTEOLOB(C0) 2025.100.0 3. 0.0 0. 0.0 0. 0. 0.0 0.0 0.0 0.0 0. 0. 0. -99.0 0. PLANTEOLOB(C0) ----*------------------------------------------------------------------------------------------*-----------------------------
The Stand Management Summary, T a b l e A-4, l i s t s a1 1 management practices applied t o the stand over the s imulat ion period. T h i s report shows acres t r ea ted , v o f u m remved, and cash flows, Each management treatment appl ied t o the s a q l e stand i s d e t a i l e d i n this report, T h i s repok t shows t h a t Pour major beetle s p o t s were sa lvaged account ing f o r 2.9 acres. The f i n a l harvest i n 2021 c u t t imbe r on 95.9 acres. The remain ing 1.2 acres (100 - (95.9 + 2.9)) were l o s t i n s t h e r b e e t l e spots too sma l l fo r treatment, The s t a n d produced a L o t a f o f 4449 cub i c f e e t on 100 acres over 35 years, o r an average of 127 cubic f e e t p e r ac re per year. The variables con ta ined i n t h i s r e p o r t are described below.
---~----e--~~---~**~~-&-~----e--*----*---------------w~------------*--------m-
MANAGEMENT PRACTICE -- D e s c r i p t i ve name o f t h e management practi ee,
ACRES TREATED -- Number o f acres t r e a t e d by a noanilgement p r a c t i c e , This i s t h e t o t a l p r o d u c t i v e s tand area f o r mst s i l v i c u l t u a a l t rea tments o r the s p o t size f o r SPB c o n t r o l t reatments ,
VOLUME REMOVED -- Cubic f o o t t imber volume r e m v e d f o r commercial t h i n s , f i n a l h a r v s t s , or beetle sal vage t reatments .
MANAGEMENT FEES -- Costs p a i d f o r overhead assessment o r management fees.
DIRECT COSTS -- The cost p a i d f o r s tand t rea tment i n current d o l l a r s , exc lud ing charges f o r overhead s r management fees.
GROSS REVENUES -- The total revenue rece ived f o r sale o f merchantable t i m b e r p roduc ts Prom commercial t h i nn i ngs , f i n a l ha rves ts , and salvage of beetle spots,
TOTAL COST PER ACRE -- Sum o f t he d i r e c t cos ts and management fees f o r t h e p r a c t i c e , expressed on a per acre bas i s .
NET REVENUE PER ACRE -- Net revenue d i v i d e d by the area t reated on the stand. - - - - - - - - - m - e - - ~ ~ - ~ a ~ ~ ~ ~ ~ w * m - ~ ~ - m ~ ~ - ~ ~ ~ - - - - - - - * - - - - - - - - - - - - - - - - - - * - - - - - - - - - - - - -
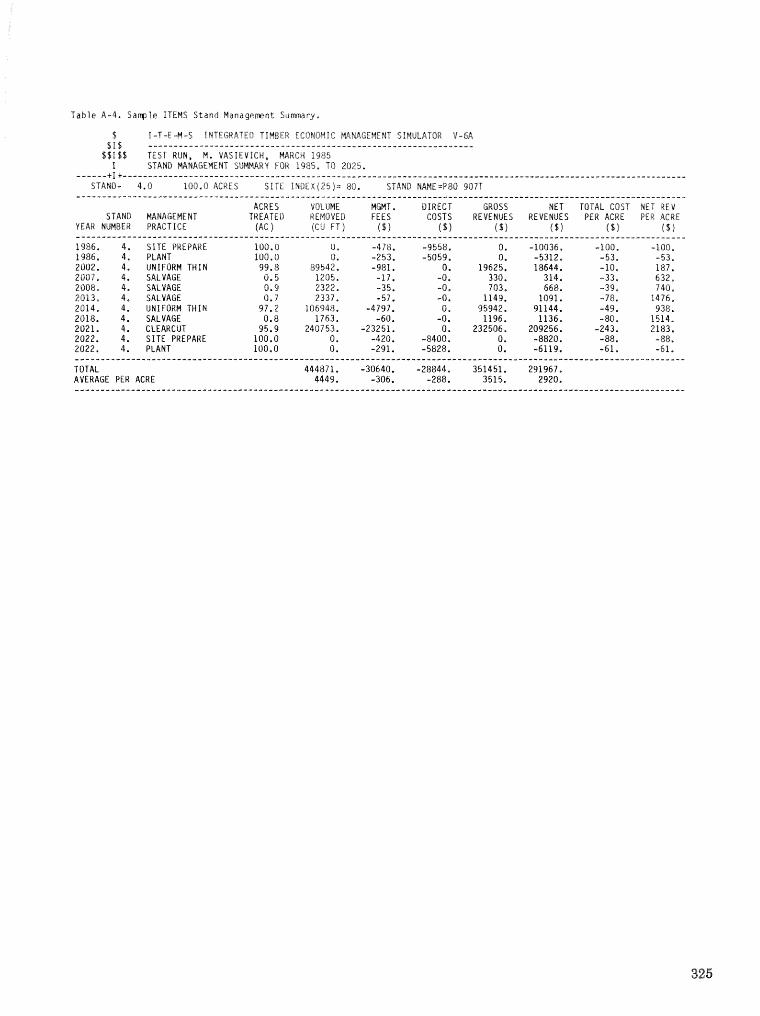
Table A-4. Sangle ITENS S t a n d PIanagernent S u m r y ,
% I -T-E 4 - S f lTEGCt ATED Tlh4EER EGrSNONIG W-rF.iAr3Ef.tENT SIMULATOR V-6A $I$ -----------------------------------------*----------------------
5618% TEST RUN, M. VASIEVICW, MARCH 1985 I STAND WNAGEMENT S"JMAAR FOR 1985, TO 2025,
- - - * - - + I + - - - - - - - - - - - - - - - - - - - - - - - - - - - - - - - - - - - - - - - - - - - - - - - - - - - - - - - - - " - - - - - - - - - - - - - - - - - - - - " * - - - - - - - - - - - - - - - - - " - m - - - - - - - - - - - - STAND- 4,O l00'0 ACRES S I T E I N O E X ( 2 5 ) = 80. STAND NAMEzP80 907T
------------------------------------------------------*-------------------------------*-------*-----"----*--------------
ACRES VOLUME NGHT. DIRECT GROSS NET TOTAL COST NET REV STAND MANAGEMENT TREATED REMOVED FEES COSTS REVENUES REVENUES PER ACRE PER ACRE
YEAR NUMBER PRACTICE (ac 1 (GO F T ) ( $ 1 ( $ 1 ( 8 1 ( $ 1 ( 6 1 ( $ 1 - - - - - " - I - - - - - " I - - - - * - - - - * - - - - - - - - - - - - - - - - - - - - - - - - - - - - - - - - - - - - - - - - - " - - - - - - - - - * - - - * - - - - - - - - - - - - - m - m * - - - - - - - - - - - - s - - - d - - - - -
1886. 4, SITE PREPARE 100.0 0. -478. -9558. 0. -10836, -100. -100, 1986, 4. PLANT 100.0 0. -253. -5059. 0. -5312. -53, -53, 2002. 4. UNIFORMTHIN 99.8 89542. -981, 0. 19525. 18644. -10, 187, 2007. 4. SALVAGE 0.5 1205. -17. -0. 339. 314, -33. 632, 2008. 4, SALVAGE 0.9 2322. -35. -0. 703. 6613. -39, 740. 2013, 4, SALVAGE 0.7 2337. -57. -0. 1149. 1042, -78. 1476. 2014, 4. UNIFORMTHIN 97.2 106948, -4797. 0. 95942. 91144. -49. 938. 2018, 4 . SALVAGE 0.8 1763. -60. -0. 1196. 1136. -80, 1514. 2021. 4. CLEAKCUT 95.9 240753. -23251. 0. 232506. 209256, -243, 2183. 2022. 4. SITEPREPARE 100.0 0 . -420. -8400, 0, -8820. -88. -88. 2022. 4. PLANT 100.0 0. -291. -5828. 0. -6119, -61. -61 e -"------------------------------------------------------------------------------------------------*-----------e-----e---
TOTAL 444871. -30640. -28844. 351451. 291967. AVERAGE PER ACRE 4449. -306. -288. 3515. 2920. - - - - - - - m - - - - - - - - - - - - - - - - - - - - - - - - - - - - - - - - - - - - - - - - - - - - - - - - - - - - - - - - - - - - - - - - - - - - - - - * - - - - - - - - - - - - - - - - - - - - - - " - - - - - - - - - - - - - - - - -

Stand F i n a n c i a l Regort _̂ ______I-p----"- ---,a
The Stand F i n a n c i a l Report, Tab le A-5, shows a d iscounted cash f l ow a n a l y s i s o f t h e cos ts and revenues f o r t h e sample stand. A l l cos ts and revenues and t h e market value o f t h e mftrchantable t imbe r i nven to ry a re f i s t e d i n t h e repo r t . The I n t e r n a l Rate o f Return (IRR) shows -999. f o r t h e f i r s t 8 years. Th i s en t r y i n d i c a t e s t h a t t h e I R R cou ld no t be c a l c u l a t e d because a f i n s u f f i c i e n t value o r revenues. Present ne t wor th (PNW) i s t h e va lue o f d iscounted revenues l ess d iscounted costs. I R R and PNW a re based on ac tua l c o s t s and revenues f o r t h e yea r c a l c u l a t e d and e a r l i e r , p l u s t h e ne t revenues t h a t would be generated i f a1 1 remain ing merchantable t imbe r on t h e s tand were c l e a r c u t i n t h a t yea r and produced revenues a t t h e t r e n d p r i ces . Wi th t h i s p ro - cedure, I R R and PNW may be somewhat h i ghe r o r lower than t h e expected a m u n t because s t o c h a s t i c market p r i c e v a r i a t i o n i s i n t r oduced i n t h e yea r t h e s tand i s a c t u a l l y c l ea rcu t .
The age o f f i n a n c i a l ma t t l r i t y can be determined by examining t h e l i s t o f PNWs f o r each d iscoun t ra te . The y e a r w i t h t h e h i ghes t PNW value represents one measure o f f i n a n c i a l m a t u r i t y f o r t h e scenar io presented a t t h a t d iscount ra te .
- - " - - - - - I - - - I - - - - - - * - - - - - - - - - - C - - - - - - - - - - - - - - - - - - - - - a - e - - - - - - - - - - - - - - - - "
COST -- The t o t a l cos t f o r s tand management a c t i v i t i e s f o r t h e year.
REVENUE -- The t o t a l revenues f rom t imber sa les f o r t h e year.
VALUE -- Value o f merchantable t imbe r on t h e s tand f o r t h e year.
INTERNAL RATE OF RETURN (IRR) -- The t r u e i n t e r n a l r a t e o f r e t u r n f o r the stand i n t h e year spec i f i ed .
PRESENT NET WORTH (PNW-nn%) -- The present ne t wor th f o r t h e s tand i n t h e year spec i f i ed , given i n percent and computed f o r 5 d i f f e r e n t d iscount ra tes. Data f o r these columns are l abe led w i t h PNW-nn%, where nn a re d iscount r a tes o f 0, 2, 4, 7, and 10 percent.
TOTAL ACRES -- Number o f t o t a l acres i n t h e stand, i n c l u d i n g unproduc t i ve areas i n holes created by b e e t l e spots. - - - - - - - - - - I - - - - " - - - - - s ( . " - - - - - - - - - - - - - - - - * - - - - - - - - - - - - - - - - - - - - - - " - - - - - - - - - - - - - - -
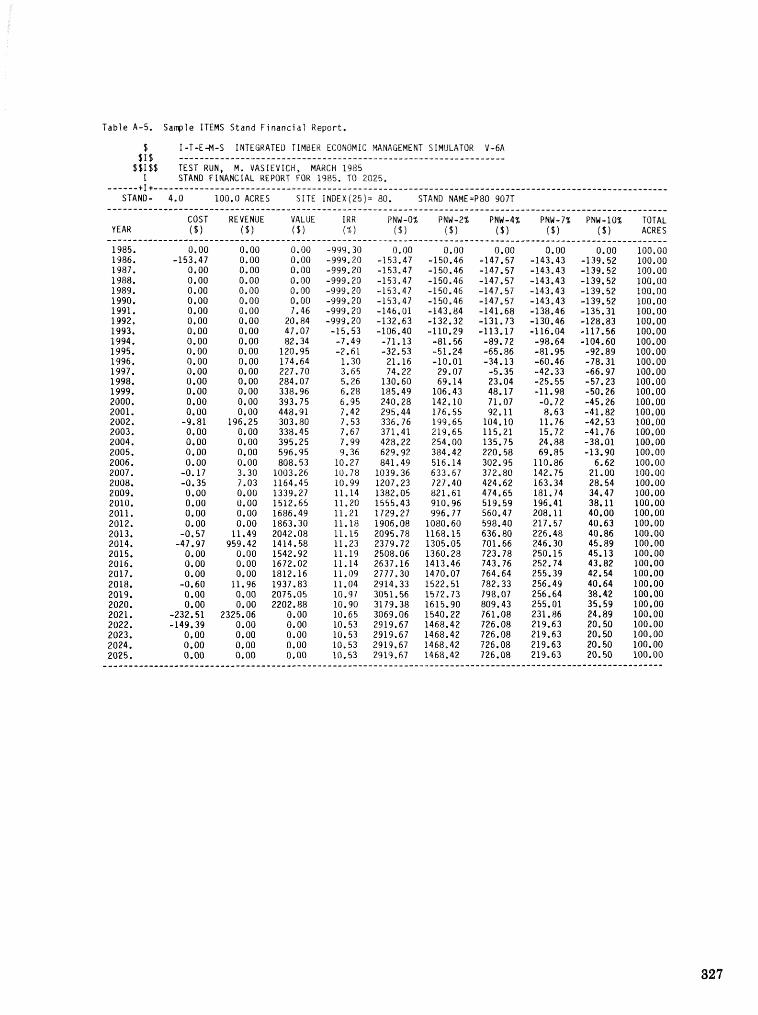
Table A-5. Sanple ITEMS Stand Financ i a l Report.
$ I-T-EM-S INTEGRATED TIMBER ECOMQMlC MAMAGEMENT SIMULATOR V-6A $ I $ ---------------------------------------------*--"----------------
$ $ I d $ TEST RUN, M. VASIEVICH, MARCH 1985 I STAN0 FINANCIAL REPORT FOR 1985. TO 2025,
------+I+-----------------------------------------------------------------------------------------------"----- STAND- 4.0 100.0 ACRES SITE INOEX(25 )= 80. STAND NAME=PBO 907T ..............................................................................................................
COST REVENUE VALUE I R R PWW -0% PMW -2% PNW -4% PNW -7% PNW -10% TOTAL YEAR ( d 1 ( l a 1 ($1 (%) ( $ 1 (b f ($1 ( $ 1 ($1 ACRES
-------------------------------------------------------------------------------*------------------------------
1985. 0.00 0.00 0.00 -999.30 0.00 0.00 0.00 0.00 0.00 100.00 1986. -153.47 0.00 0.00 -999.20 -153.47 -150.46 -147.57 -143.43 -139.52 100.00 1987. 0.00 0.00 0.00 -999.20 -153,47 -150.46 -147,57 -143,43 -139-52 100.00 1988. 0.00 0.00 0.00 -999.20 -153.47 -150.46 -147.57 -143.43 -139.52 100.00 1989. 0.00 0.00 0.00 -999.20 -153.47 -150.46 -147.57 -143.43 -139.52 100,OO 1990. 0.00 0.00 0.00 -999.20 -153.47 -150.46 -147.57 -143.43 -139.52 100.00 1991. 0.00 0.00 7.46 -999.20 -146.01 -143.84 -141.68 -138.46 -135.31 100.00 1992. 0.00 0.00 20.84 -999.20 -132.63 -132.32 -131.73 -130.46 -128.83 100.00 1993. 0.00 0.00 47.07 -15.53 -106.40 -110.29 -113.17 -116.04 -117.56 100.00 1994. 0.00 0.00 82.34 -7.49 -71.13 -81.56 -89.72 -98.64 -104.60 100.00 1995. 0.00 0.00 120.95 -2.61 -32.53 -51.24 -65.86 -81.95 -92.89 100.00 1996. 0.00 0.00 174.64 1.30 21.16 -10.01 -34.13 -60.46 -78.31 100.00 1997. 0.00 0.00 227.70 3.65 74.22 29.07 -5.35 -42.33 -66.97 100.00 1998. 0.00 0.00 284.07 5.26 130.60 69.14 23.04 -25.55 -57.23 100.00 1999. 0.00 0.00 338.96 6.28 185.49 106.43 48.17 -11.98 -50.26 100.00 2000. 0.00 0.00 393.75 6.95 240.28 142.10 71.07 -0.72 -45.26 100.00 2001. 0.00 0.00 448.91 7.42 295.44 176.55 92, l l 8.63 -41.82 100,OO 2002. -9.81 196.25 303.80 7.53 336.76 139,65 104.10 11.76 -42.53 100.00 2003. 0.00 0.00 338.45 7.67 371.41 219.65 115.21 15.72 -41.76 100.00 2004. 0.00 0.00 395.25 7.99 428.22 254.00 135.75 24.88 -38.01 100.00 2005. 0.00 0.00 596.95 9.36 629.92 384.42 220.58 69.85 -13.90 100.00 2006. 0.00 0.00 808.53 10.27 841.49 516.14 302.95 110.86 6.62 100.00 2007. -0.17 3.30 1003.26 10.78 1039.36 633.67 372.80 142.75 21.00 100.00 2008. -0.35 7.03 1164.45 10.99 1207.23 727.40 424.62 163.34 28.54 100.00 2009. 0.00 0.00 1339.27 11.14 1382.05 821.61 474.65 181.74 34.47 100.00 2010. 0.00 0.00 1512.65 11.20 1555.43 910.96 519.59 196.41 38.11 100.00 201 1 . 0.00 0.00 1686.49 11,21 1729.27 996.77 560.47 208.11 40.00 100.00 2012. 0.00 0.00 1863.30 11.18 1906.08 1080.60 598.40 217.57 40.63 100.00 2013. -0.57 11.49 2042.08 11.15 2095.78 1168.15 636.80 226.48 40.86 100.00 2014. -47.97 959.42 1414.58 11.23 2379.72 1305.05 701.66 246.30 45.89 100.00 2015. 0.00 0.00 1542.92 11.19 2508.06 1360.28 723.78 250.15 45.13 100.00 2016. 0.00 0.00 1672.02 11.14 2637.16 1413.46 743.76 252.74 43.82 100.00 2017. 0.00 0.00 1812.16 11-09 2777.30 1470.07 764.64 255.39 42.54 100.00 2018. -0.60 11.96 1937.83 11.04 2914.33 1522.51 782.33 256.49 40.64 100.00 2019. 0,OO 0.00 2075.05 10.97 3051.56 1572.73 798.07 256.64 38.42 100.00 2020. 0.00 0.00 2202.88 10.90 3179.38 1615.90 809.43 255.01 35.59 100.00 2021. -232.51 2325.06 0.00 10.65 3069.06 1540.22 761.08 231.86 24.89 100.00 2022. -149.39 0.00 0.00 10.53 2919.67 1468.42 726.08 219.63 20.50 10Oe00 2023. 0.00 0.00 0.00 10.53 2919.67 1468.42 726.08 219.63 20.50 100.00 2024. 0.00 0.00 0.00 10.53 2919.67 1468.42 726.08 219.63 20.50 100.00 2025. 0.00 0.00 0.00 10.53 2919.67 1468.42 726.08 219.63 20.50 100.00
___----_---_--_---_----------------------------------------a--------------------------------------------------
Risk Assessment of Investments in Loblolly Pine Plantations Threatened by Bark Beetles
Walter C. Anderson, Richard W. Gddin, and J. Michael Vasievich'
Abstract. ---- The Hertz-Thomas method of esk analysis: urhich involves Monte Carlo simulation, was applied to plantations grorvn on a 35-year rota- tion that included two site classes, two intenmediate management options, and three beetle attack levels. The plantations were assessed in terms of internal rate of return earned on the investment, I d was con- cluded that southern pine beetles (Dendroetonus frontalis Zimm.) are not a serious threat to loblolly pine (Pinus taeda L.) plantations being c o r n for sawtimber in the Coastal Plain, even where the at- tack level is high, Additional keywords : Southern pine beetle, internal rak of return, Monte Carlo sbulatisn,
Stands of loblolly pine (Pinus t'aeda L,), the dam- inant yellow pine species in the South, suffer serious losses due to the most widespread and destructive insect sf southern forests, the southern pine beetle (Dendroetonus f ron talis Zimm. ) . The risk of timber value losses due to southern pine beetle attacks re- duces the characes of obtaining an acceptable return from investments in loblolly pine plantations.
Stands of loblolly pine are found throughout the Piedn~ont and Coastal Plain. Because so much aban- doned cropland was reseeded by lobfolly pine, id is frequently called ""old-field pine" "ahl'ahlenberg 1960). After the old-growth pine was cut out in the mid- 1920%s, these old-field stands have sustained the southern forest products industry to the present day-
Characteristics associated with the most frequent- ly attacked stands have been used do assign stand hazard ratings (Lorio %978), Hazard.-rating systems show where beetle outbreaks are arr~ost likely to occur and where beetle activity and losses are likely to be greatest. Southern pine beetles are arm especially se-
I Respectively, Research Forest Economists, U.S, Depart- ment of Agriculture, Forest Service, Southern Forest Ex- periment Station, New Brlearrs, LA, and Research Forest Economist, Southeastern Forest Experbent Slatiota, Dur- ham, NC,
vere threat to mature, densely stocked, slow-growing, old-fie)& ~ltatural stands of southern pine (Hedden f 983) ,i The value lost when large trees in these stands are killed is substantial. Loblolly pine in the Coastal Plain is highly susceptible to southern pine beetle attacks, especially stands groPjing on poorly drained soils in low-lying areas ( Belanger 1981).
Lobldly pine is also the most widely planted pinf! in the South. Approxjmately 20 million acres have been planted to this species in the past 25 years, and additional stands are being planted a t the rate of 1.3 million acres a year. These plantations represent a. huge investment. I t can be conservatively esLi- mated that a t today's costs, each acre pIanted repre- sen& an outlay of $135 if all materials and sesvjices are purchased.
Managed plantations mdoubtedly face less risk from southern pine beetle attack than unmanaged mature natural stands, because they are not overly dense or slow growing. But the financial risk to plan- tations due to potential beetle attack is high because large direct-cash outlays have been made for growing timber. I t is this financial risk that most concerns long-range planners scheduling investments to satisfy the wood needs of mills several decades henee, The potential of financial losses from a beetle attack af- fects the choices of land managers when they allocate a firm" funds striving for maximum profits, I s it worth investing $135 per acre to create a loblolly pine plantation considering the risks involved? To answer this question, land managers need to know what rates of return can be expected on their capital outlays, taking into account the threat of potential losses from southern pine beetles and other destruc- tive agents,
Forest managers need better investment wide% than are currently available. Traditional forest in- vestment models provide inadequate guides for mak- ing choices where insects present an indefinite threat, because these deteministic models assume it is Innom with certainty whether a stand wiLI be at- tacked. But attacks cannot be predicted with eer- taind-y,
A method of investment analysis that recognizes risk bas been developed but seldom applied to for- estry investments, This procedure was used in the
study of investments in loblofly pine planhiions in the Coastal Plain where there is a high risk of fre- quent southern pine beetle infestations. In this paper, the method is described and its application is iflustrated.
RISK 1K PLANTATION INVESTMENTS
Knight (1921) wrote that uncertainty of outcome is increased by the span of time required to produce a pr~duct , The longer the production period, the less certain. the outcome. Uncertainty is inherent in fms t ry , because timber g r o ~ n g is one of the longest production. processes engaged in by man, Knight also pointed out that uncertainty takes one of two forms: ""l.isk" and ""uncertainty". Risk is defined as an out- come whose probability of oceurrence can be quan- tified, Uncertainty is an outcome whose probability of occurrence cannot be quantified. Investment as- sessments can recognize risk, but the influence of uncertainty must be acwpted by the investor as luck, either good or bad*
Foresters have tried in varlious ways to take a re- turn estimated by a deteministic investment model and adjust it for risk, One common way to do this has been to add a percentage point or two to the rate of interest used for discounting future returns or capitalizing costs. Unlws applied under appropriate csndigons, however, this method gives unreasonable results (Guttenberg 1950). Other means have been used to take ~ s k into account, but results have also been less than fully satisfactory.
THE HERTZ-THOMAS APPROACH TO RISK; ANALYSIS
A method of investment analysis that specifically ineluded risk was developed by Hertz and Thomas (1983). This method is a computer-based procedure involving hlonte Garlo simulation. First, the variables significantly afiecting the outcome of the investment are identified and a probability density function (pdf) i s constructed for each one, Next, a value is randomly drawn from the pdf for each variable, and this set of values is used to czalcu2ate the return on the investment using present net rvorth, internal rate of redurn, or some other procedure* Repeatedly, addi- tional sets of input values are selected, and the re- turn is calculated for each new set, After numerous iterations, returns are sorted from lowest to highest, grouped, and group frequencies computed. Finally, the rates of return are plotted as a cumulative dis- tribution func"ron to produce a risk profile showing h e chance: of earnkg at least a certain rate of return
on the proposed investment, In adapting the Hertz-Thomas approach to assess-
ments of loblolly pine planhtion investmen&, the risk of southern pine beetle attacks can be incorpo- rated into the analysis. Beetle attacks are treated as another input variable influencing the outcome af the investment, The economic impact depends on the Ievel of attack. Pdf's can be developed for each of the a thck levels considered, Costs associated with a tbcks are ineluded in the calculations of return on investment.
APPLICATION
The purpose of this study was to determine the mapi tude of the risk that southern pine beetle in- festations present to investors in loblslly pine plan- tations. The study proceeded in three steps, First, an existing forestry investment model w s upgraded to simulate the impacts of southern pine beetle at- tack on plantation growth, yield, and financial re- turn. Second, simulations were conducted d 0 deter- mine the distribution of rates of return under altes- native forest management and beetle athack scenarios, Finally, the Hertz-Thomas method of ~ s k analysis was applied to the model's output to evaluate the risk posed by various levels of bark beetle attack.
The Model
The study required a computer model that inte- grated beetle population dynamics with a timber growth and yield model in an economic framework. A search found that the Integrated Timber Economic Management Simulator (ITEMS) computer model developed by J. M, Vasie~ch and CV. A. Thompson met the needs of the study, VasieGch developed a version of the model that allows for stochastic varia- tion of treatment costs, timber revenuesp and stand growth. It also generates beetle spot oceurrence and expansion.
Although ITEMS m a stade-of-the-art model at the time the study was initiated, it is now aborat 3 years old. Individual model componenh may be available today that are better "Im those on which the ITEMS model is based, For example, timber growth and yield for Coastal Plain loblolly pine plantations in ITEMS use equations presented in Code and Schumacher (1964) for untkinned stands. The equations were adjusted to give reasonable re- sponses to simulated dhinning, The functional rda- tionships involved in the initiations of new spots were similar to the natural loblolly pine incidence model of Reed e t al. (1980). I t is not known how well
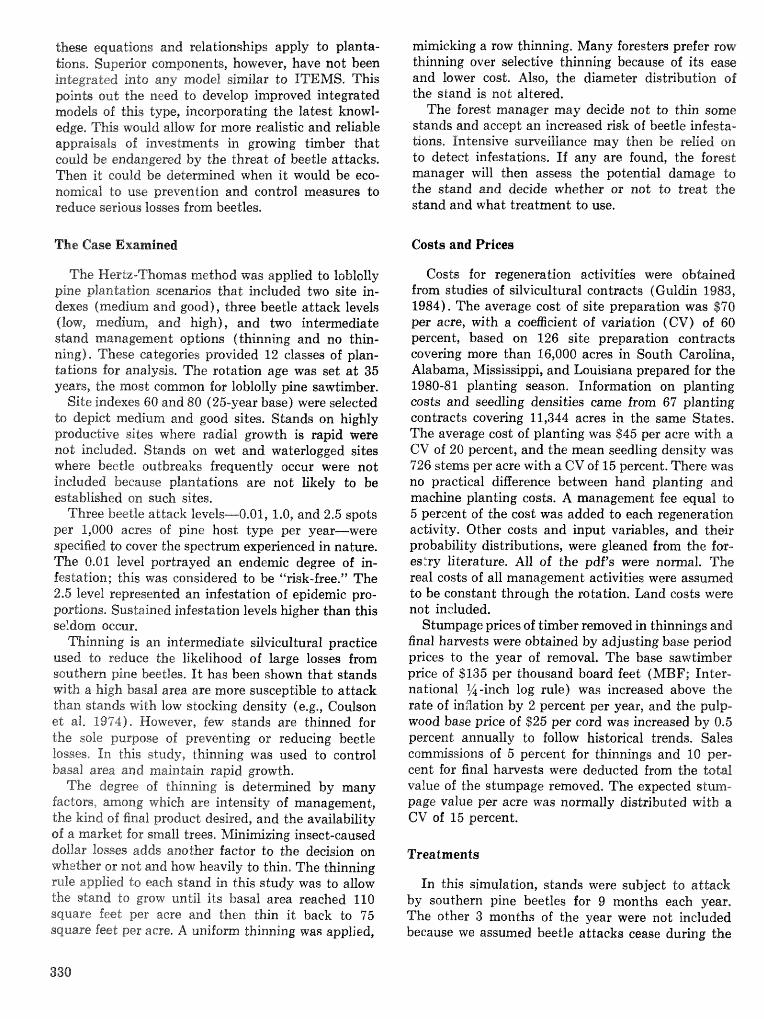
these equations and relationships apply to planta- Lions, Suge~iar components, however, have not been integrated into any model similar to ITEMS, This poink out the need tct develop improved integrated models of this type, incorpora~ng the latest howl- edge. This would alow for more realistic and reliable appraisals of investments in growing timber that could be endangered by the threat of beetle attacks, Then it could be detemined when it would be eco- nomical to use prevention and control measures to reduce serious losses from beetles.
TI-te Case Examined
The Herb-Thomas method was applied ta loblolly pine plantation scenafios f i a t included two site in- dexes (medium and good), Z;bree beetle a thck levels (Soap, medium, and high), and two intemediate shnd management; options (thinning and no thin- ning), These categories provided 12 classes of plan- btioas for analysiis. The rotation age was set a t 35 years, the most common for loblolly pine sawlimber.
Site indexes 60 and 80 (25-year base) were selected to depict medium and good sites. Stands on highly productive sites where radial growth is rapid were not inclu&d* Stands on wet and waterlogged sites where beetle outbrealns frequently occur were not included because plantations are not likely to be established OM such sites.
Three beetle attack levels-0.01, 1.0, and 2.5 spots per 1,000 acres of pine host type per yea, ---were specified ds cover the spectmm experienced in nature. l'he 0.01 level portrayed an endemic degree of in- festation; this was considered to be ""risk-free.'The 2.5 level represented an infestation of epidemic pro- portions, Sustained infesbtion levels higher than this seldom occur.
Thinning is an intermediate silvicultural practice used to reduce the likelihood of large losses from southern pine beetles. It has been shown that stands with a kzj,alt basal area are more susceptible to attack than stands with low stocking density (e.g., Coulson et al, 1974). However, few stands are thinned for the sole purp~se of preventing or reducing beetle losses. In this study, thinning was used to control basal area and maintain rapid growth.
The degree of thinning is determined by many factors, among which are intensity of management, the kind of final product desired, and the availability 0% a market for smaU trees. Mixraidzing insect-caused dollar losses adds another hetor to the decision on whether or not and how heavily to thin. The thinning rule applied to each stand in this study was to allow the stand to grow until its basal area reached 110 square feet per aere and then thin it back to 7 5 square feet per acre. A uniform thinning was applied,
mimicking a row thinning. Many foresters prefer row thinning over selective thinning because of its ease and lower cost. Also, the diameter distr;ihutiora of the stand is not; altered.
The forest manager may deeide not to thin some stands and accept an increased risk of beetle infesta- tions. Intensive surveillance may then be relied on to detect infestations, If any are found, the forest manager will then assess the pokntial damage h the stand and deeide whether or not to treat; the stand and what treatment to use.
Costs and Prices
Costs for regeneration activities were obhined from studies of silvicultural contmcts f Guldlin. 1983, 1984). The average cost of site preparation was $70 per acre, with a coefticient of variation (CV) of 60 percent, based on 126 site preparation contraeb covering more than 16,000 acres in South Carolina, Alabama, Mississippi, and Louisiana prepared for tbe 1980-8 4. planting season. Infomation on planting costs and seedling densities came from 67 planting contracts covering 11,344 acres in the same States. The average cost of planting was $45 per acre with a CV of 20 percent, and the mean seedling density was 726 sterns per acre with a CV of 15 percent. There was no practical difference between hand planting and machine planting costs. A management fee equal to 5 percent of the cost was added to each regeneration activity. Other costs and input variables, and their probability distributions, were gleaned from the far- eskry literature. All of the pdf's were nomal. The real costs of all management activities were assumed to be constant through the rotation. Land costs were not included.
Stumpage prices of timber removed in thinnings and final harvests were obtained by adjusting base period prices to the year of removal. The base sawtimber price of $135 per thousand board feet (MBF; Inter- national %-inch log rule) was increased above the rate of ingation by 2 percent per year, and the puhp- m o d base priGe of $25 per cord was increased by 0.5 percent annually to follow historical trends, Sales commissions of 5 percent for thinnings and 10 per- cent for final harvests were deducted from the LoLijll value of the stumpage removed. The expected stunr- page value per aere was normally distributed with fi
CV of 15 percent.
Treat menls
In this simulation, stands were subject to attack by southern pine beetles for 9 months each year. The other 3 months of the year were not included because we assumed beetle attacks cease during the
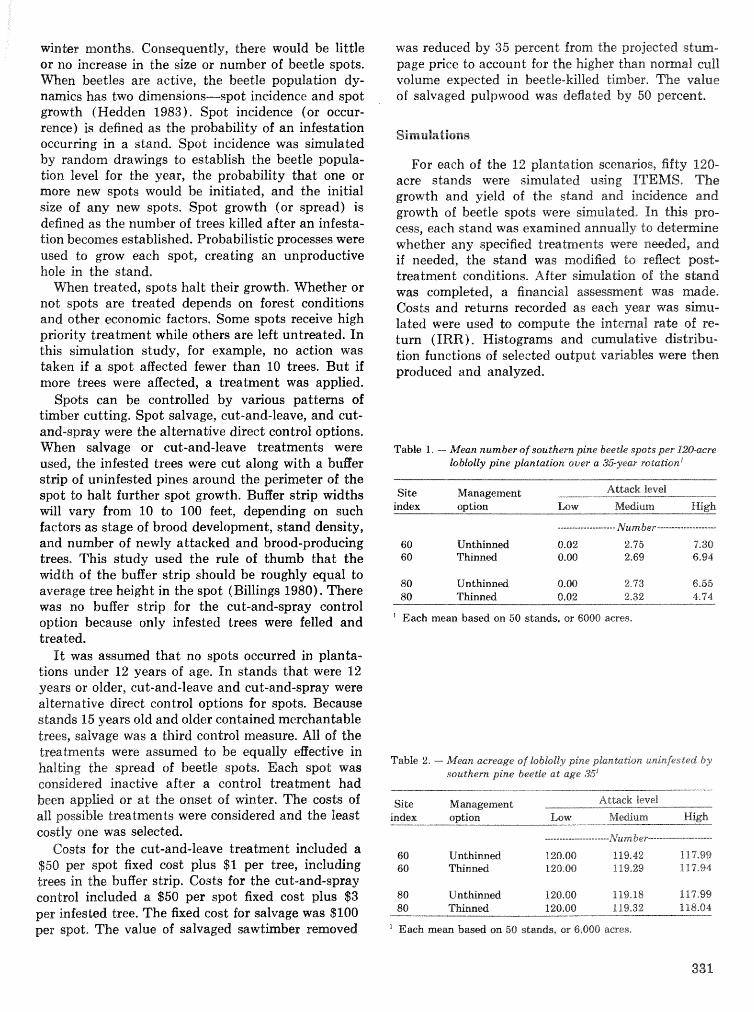
winhr months, Consequently, there would be little or no increase in the size or number of beetle spoh. M e n beetles are active, the beetle population dy- namics has two dimensions-spot incidence and spot gowth (Hedden 1983). Spot incidence (or occur- rence) is defined as the probability of an infeshtion occurring in a stand. Spot incidence was simulated by random dravvings to establish the beetle popufa- tion level for the year, the probability that one or more new spots would be initiated, and the initial size of any new spots. Spot growth (or spread) is defined as the number of trees killed after an infesta- Lion becomes established. Probabilistic processes were used to grow each spot, creating an unproductive hole in the stand.
M e n treated, spots halt their gro*h. Whether or not spots are treated depends on forest conditions and other sonomic factors. Some spots receive high priority treatment while others are left untreated. In this simulation study, for example, no action was taken if a spot afiected fewer than 10 trees. But if more trees were affected, a treatment was applied.
Spots can be controlled by vafious patterns of timber cutting. Spot salvage, cut-and-leave, and cut- and-spray were the alternabive direct control options. When salvage or cut-and-leave treatments were used, the infested trees were cut along with a buBer strip of uninfmted pines around the perimeter of the spot b;o halt further spot growth. Buffer strip widths will vary from 10 to 100 feet, depending on such factors as stage of brood development, stand density, and number of newly attacked and brood-producing trees. This study used the rule of thumb that the ~ d t h of the buffer strip should be roughly equal to average tree height in the spot (Billings 1980). There was no buffer strip for the cut-and-spray control option because only infested trees were felled and treated.
It was assumed that no spots occurred in planta- tions under 12 years of age. In stands that were 12 years or older, cut-and-leave and cut-and-spray were alternative direct control options for spots. Because stands 115 years old and older contained merchantable trees, salvage was a third control measure, A11 0% the treaMents were assumed to be equally eEective in h l t i n g the spread of beetle spots. Each spot was eonsidered inactive after a control treatment had been appfied or a t the onset of ~ n t e r . The casb of all possible treatments were considered and the least costly one was selected.
Costs for the cu t-and-leave treatment included a $50 per spot fixed cost plus $1 per tree, including trees in the buffer strip. Costs for the cut-and-spray control included a $50 per spot fixed cast plus $3 per infested tree. The fixed cost for salvage was $100 per spot. The value of salvaged sawtimber removed
was reduced by 35 percent from the projected stum- page price to account for the higher than nomal cult volume expected in beetle-killed timber, m e value of salvaged pulpwood was deflated by 50 percent,
For each of the 112 plantation scena~os, fifty 120- acre stands were simulated rasing ITEMS. The growth and yield of the stand and incidence and growth of beetle spots were simutaded, In this pro- cess, each stand was examined annually to deternine whether any sp&fied treatments were neded, and if needed, the stand was modified to r e A w t post- treatment conditions, After simulation of the stand was completed, a financial assessment was made. Costs and returns recorded as each year was simu- lated were used to compute the internal rate of re- turn (IRR) . Histograms and cumulative distribu- tion functions of selected output variablm were then produced and analyzed.
Table 1, - Mean number of southern pine beetle spots per l2OLaere loblolly pine plantation over a 35-year rotation"
Site Management Attack level index option Low Medium High
60 Unthinned 0.02 2.75 7.38 60 Thinned 0.00 2.69 6.94
80 Unthinntxi 0.00 2.7'3 6.55 80 Thinned 0.02 2.32 4.74
' Each mean based on 50 stands, or 6000 acres.
Table 2. - Mean acreage of Eoblodiy pine phndadion uninfested by southern pine beetle a t age 35"
Site Management Atback level
index option Low M d u m High
----.----------------- NurC .....................
60 Untbinnd 120.00 119,42 117.99 60 Thinned 120,e)O B19,29 117,918
"ach me- based on 58 stmds, or 6,000 acres.

Table 3. -- Real mean interrutl rate of return befbre taxes on doblolly pi- plantation investments the 35year rotation'
Site Mmagennent AGttack level index optSon Low Medium High
"ach mean bas& on 50 stads, or 6,000 acres. Means followed by the s m e ledkr me not simifiicantly different at the 5 percent level.
The mean nrmnber sf spots per stand varied by a~acilr level, but not by site index or whether or not the stand had been thinned (table 1). For the 200 stand8 (24,000 acres) in each beetle attack cate- g a ~ y , the law level of attack caused a grand total of 2 spots; the me&um level, 525 spots; and the high level, 1,276 sp-ts.
Within the same atlack level, there were no differ- ences among the 12 scenarios in average uninfested acreage remaining at age 35 (hble 2) . However, there were differences by att;ack level. Stands sub- ject to the highest level of attack had the least resi- dual forested acreage at the end of the rotation. Nevertheless, the average loss amounted to less than 2 percent 0% stand acreage, and the maximum loss for any stand was only 5.6 acrm,
The average IRR" far stands with a site index of 60 did not vary among attack levels or by thinning
regimes (table 3). Stands ~ t b a s ib index of 80 subjeei; to the low athek level, however, had a much higher average IRR than. the other stands, and thinned stands, regardless of attack level, had higher IRR's than unthinned stands.
Risk Results
The Hertz-Thomas method of ~ s k analysis was used to determine the chances that an IRR wil l equal or exceed a target IRR, This information was based on risk profiles, Separate risk profiles were plotted for stands with site indexes of 60 and 80 (figs. 1, 2),
Because the IRE% sfor stands with a site index of 60 did not difietr by atbck level or thinning regime combinations, all 300 stands were combined do gen- erate a single risk profile (fig, 1). IRR9s ranged be- tween 4.5 and 12 percent, indicating there is a 98 percent chance that the IRR will equal or exceed the target rate of 5 percent, This implies only a 2 per- cent risk of failure to obtain a 5 percent IRR on. an investment in establishing a plantation on land ~ t h a site index of 60. There is a 16 percent risk of failure to obtain a target rate of 6 percent HER,
For plantations growing on land ~ d & a site indew of 80, there were differences in fRR% by attack Ieveie and thinning regime combinations, Therefore, 1RR98 for the low-attack thinned and high-at.&-rzek un- thinned stands were plotted separately from the ~ s k profile generated by the 200 stands Eon: the remain- ing four attack level-thinning regicraae cambinations
4.0 5.0 6.0 7.0 8.0 9.0 10.0 I s .o 12.0
INTERNAL RATE OF RETURN ( I R R )
Fipre 1. - Risk profibs for lobtolly pine stands (site i n k 60) for all thin and southern pine beetle attack combinations.
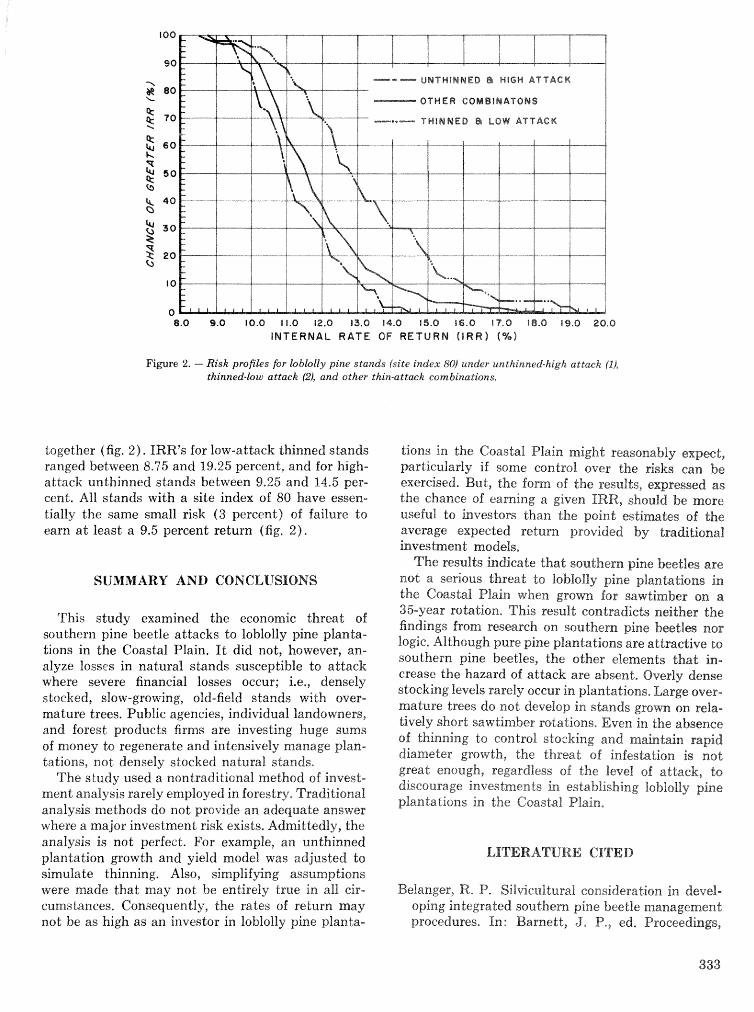
8.0 9.0 10.0 11.0 12.0 13,0 14.0 15.0 16.0 17.0 I8.O 19.0 28.6 INTERNAL RATE OF RETURN ( I R R ) (X I
F i e r e 2. - Risk profiles for loblolly pine stands (site index 80) un&r unthinned-high attack (2)) thinned-low attack 0, and other thin-attack combinations.
together (fig. 2) . IRR's for low-attack thinned st,ands ranged between 8.75 and 19.25 percent, and for high- attack unthinned stands between 9.25 and 14-5 per- cent. All stands with a site index of 80 have essen- tially the same small risk (3 percent) of failure to earn a t least a 9.5 percent return (fig. 2).
SUMMARY AND C0NGLI;STONS
This study exarnined the economic threat of southern pine beetle attacks to loblolly lp.ine planta- Lions in the Coastal Plain, I t did not, however, an- alyze losses in natural shnds susceptible to attack where severe financial losses occur; is . , densely stocked, slow-growing, old-field stands wi"c over- mature trees. Public agencies, individual landowners, and forest products firms are investing huge sums of money to regenerate and intensively manage plan- tations, not densely stocked natural stands.
The study used a nontraditional method of invest- ment analysis rarely employed in forestry, Traditional analysis methods do not provide an adequate answer where a major investment risk exists. Admittedly, the analysis is not perfect. For example, an unthinned plankation growth and yield model was adjusted Lo simulate thinning. Also, simplifying assumptions were made that may not be entl-irely true in all cir- cumstances. Consequently, the rates of return may not be as high as an investor in loblolly pine planta-
tions in the Coastal Plain might reasonably expect, particuIarly if some control over the risks can be exercised. But, the form of the results, expressed as the chance of earning a given IRR, should be more useful to investors than the point estimates of the average expected return provided by dra&tlional investment models,
The results indicate that southern pine beetles are not a serious threat ta loblolly pine plantations in the Csastal Plain when grown for sawtimber on a 35- yeas rotation, This result contradicts neither the findings from research on southern pine beetles nor logic. Although pure pine plantations are attractive bo southern pine beetles, the other elements that in- crease the hazard of attack are absed, Overly dense stocking levels rarely occur in plantations. Large over- mature trees do not develop in stiirrds g r a m an rela- tively short sawtimber rotations, Even in the absence of thinning 60 control stocking and maintain rapid diameter growth, the threat of infeshtion is not great enough, regardless of the level sf attack, to discourage investments in establishing loblolly pine plantations in the Coastal Plain,
LITERATURE CITED
Belanges, R. P. Silvieultural consideration in devel- oping integrated southern pine beetle m s n a g e m d procedures, In: Barnett, J, P,, ed, Proceedings,
first biennial southern silvicultural research con- ference; 1980 November 6-7; Atlanta, GA. Gen, Tech. Rep, SO-34. New Orleans, LA: U.S, Depart- ment of Agriculture, Forest Service, Southern For- est Experiment Station; 1981 : 279-286.
Billings, R. F. ""Ct-and-leave" control of southern pine beetle, Forest Farmer 39 4 10) : 6E; 1980,
Coile, T. S.; Shurnacher, F. X. Soil-s;ite relations, stand structure and yield of slash and lobloHy pine planbtisns in the southern. united States. @ur- ham, NC: T. S. Coile, Inc.; 1964.
Coulson, R. N.: Hain, F. P.; Payme, T. L, Radial growth characteristics and stand density of lob- lolly pine in relation to occurrence of the southern pine beetle. Environ. Entomol. 3:42M28; 1974.
Guldin, R. W. Site characteristics and preparation practices influence costs of handplanting southern pine. J. For. 82:97-100; 1984.
Culdin, R. W. Site preparation costs in the southern coastal plain-an update. Res. Note SO-292. New Orleans, LA: U.S. Department of Agriculture, For- est Service, Southern Forest Experiment Station; 1983. 3 p.
Guttenberg, S. The rate of interest in forest manage- ment. J. For. 48:3-7; 1950.
Hedden, R. L. Evaluation of loblolly pine thinning regimes for reduction of losses from southern pine beetle attack. In: Jones, E. P., ed. Proceedings, second biennial southern silvicultural research eon-
ference; 1982 November 4-5; Atlanta, GA. Gen. Tech. Rep. SE-24, Asheville, NC: U.S. Department of Agriculture, Forest Serwice, Southeastern Forest Experiment Station; 1983 : 3'71-375.
Hertz, D. B,; Thomas, W. Risk malysis and its ap- plications. New YorB, NY: John Wiley and Sons; 1983. 318 p.
Knight, F. H. Risk, uncerhinty and profit. Reprints of Scarce Tracts No, 16. London, U.K.: h n d o n School of Economies and Political Science; 1921, 381 p.
b r i o , P. L., Jr. Developing stand risk classes for the southern pine beetle. Res, Pap. SO-144. New Orleans, LA : U.S. Department of Agriculture, Fora t Service, Southern Forest Experiment Sta- tion; 1978. 9 p.
Reed, D. D.; Daniels, R. F.; Hedden, R. L.; Burk- hart, H, E.; Leuschner, W. A. A regional southern pine beetle damage projection system. In: Ste- phens, F. M., and others, eds. Modeling southern pine beetle populations. Tech. Bull. 1630. Wash- ington, DG : Department of Agriculture; 1980 : 132-1 44.
Vasievieh, J. M.; Thompson, W. A. ITEMS: An integrated method to project southern pine stand development; 1985. [In press].
Wahlenberg, W. G. Loblolly pine, Durham, NC: School of Forestry, Duke! University; 1960. 580 p.
Development and Implementation of the Southern Pine Beetle Decision Support System
M. C. Saunders, P. K. Loh, R. N. Coulson, E. J. Rykiel, T. L. Payne, P. E. Pulley, and L. C. Hu'
A bs trae t.-Recent research and development pro- grams have been directed toward expanding our knowledge base for dealing with the southern pine beetle. One of their goals has been to provide forest managers with toots that enhance the decision- making capability. The problem has been that, even though potentially available, new technology was not easily accessible, particularly in the case of mathematical models, A multidisciplinary team un- dertook to archive SPB knowledge into a single, computer-based, accessible system. Building upon the concepts of traditional management infomation sys- tems, decision support systems ( DSS ) are uniquely formulated to deal with ad hoe decisionmaking, which characterizes most pest management problems. The DSS allows decisionmakers to combine judgment with computer output in producing meaningful in- formation. I t uses mathematical or statistical models as well as data base elements for problem-solving. The process of developkg the Southern Pine Beetle Decision Support System (SPBDSS) involved iden- tifying and cataloging SPB-related problems and knowledge, developing single or multimodel prob- lem processing subroutines for handling specific prob- lem categories, devising an executive routine to direct the system" operation and link its compo- nents, and developing data storage facilities. SPBDSS is organized around a problem analysis routine that is built around four main problem cate- gories. A major feature in its development was the collection of all available SPB simulation models,
Wespectively, Assistant Professor, Department of Ento- mology, Pennsylvania State University, North East, PA; and Research Assistant, Department of Industrial Engineer- ing; Professor, Department of Entomology; Assistant Profes- sor, Department of Range Sciences; Professor, Department of Entomology; Associate Research Engineer, Data Proees- sing Center; and Assistant Professor, Industrial Engneering, all Texas A&M University, College Station, TX. (The au- thors would like to thank A. M. Bunting, D. Watkins, and L. Cattis for technical assistance in preparation of the manu- script. This research was supported by a USDA-sponsored program, Integrated Pest Management For Bark Beetles of Southern Pines, through Grant Nos. USDA-SEA-6510 and U.S. Forest Service-6510, and by the Texas Agricultural Ex- periment Station through Grant Mo. TAES-6009. This is Texas Agric. Exp. Sta. Pap. No, 20552.)
evaluation and selection of an appropriate subset of these models, translation of their computer codes into a common language (FORTRAN IV), and modification of noninteractive models to permit in- teractive processing. SPBDSS includes subroutines for hazard rating, spot dynamics, regionwide damage projection, spot control benefiti:cost analysis, and regionwide control project benefitlcost analysis, Additional keywords : Management information sys- tems, mathematical models. Dendroetonus frontalis Zimmermann, solution algorithm.
INTRODUCTION
Developing new ideas and concepts is the funda- mental activity of the research scientist. Researchers have the flexibility in their work to focus on any of an almost limitless variety of problems, and the freedom not to focus on others. At the opposite end of this spectrum sits the extension or application specialist who must apply newly developed concepts to a discipline that is already established and per- haps entrenched in traditional activities. The inertia inherent in these applied disciplines makes it very difficult for new ideas and tools to be accepted into the mainstream of use.
The inevitable lag between development and imple- mentation can be seen in the case of the southern pine beetle, Dendroetonus frontalis Zimmemann (SPB). Each year, this insect is responsible for the loss of thousands of acres of southern pines. A num- ber of accelerated research and development pro- grams in recent years has been directed toward improving our knowledge base for dealing with SE"EL2 The new knowledge gained from these programs exists in two principal forms: technical information about the insect and its influence on forests and mathematical models.
The technical information has been summarized in several types of publications including symposium
2 These programs include: the NSF-HuRaker Progrm, USDA Expanded Southern Pine Beetle Research and Ap- plications Program (ESPBRAP), and the USDA Forest Service Integrated Pest Management Program (IPM) .
proceedings (e-g., Coster et al. 1979, Stephen e% al. 1980, Payae ek; al. 1984); a compenciilam (Thatcher eL aB, 1980); USDA Forest Sewice handbooks and fact sheets, and numerous journal articles. There are more than 2,000 entries in cited literature deal- ing with SPB (Kulhavy et al. 1982).
In addition LO the technical information on SPS, numerous mathematical models have been developed to deaf with the various aspects of SPB problems, Some of the models have been available since the 19509ss, but most were developed during the period 1976-1980, These models fall into five general cate- gories (Turnbow et al. 1984) :
1) stand hazard models-for predicting tho likeli- hood of a SPB infestation (spot) occurring in a stand,
2) stand risk models-for predicting the prolifera- tion of existing SPB spots,
3) spot growth models-for predicting the de- velopment and spread of an existing SPB spot.
4) stand growth and yield models-for projecting the timber volumes a t rotation age from current stand characteristics.
5) economics models-for calculating cost/benefit ratios, and other economies information on control and salvage projects performed on SPB spots,
One of the goals of the accelerated programs was to provide technology to the forest manager that would serve to enhance decisionmaking capability. However, the knowledge base for SPB became so large that, although potentially available, it was not easily accessible. This problem was pa-rticularly acute with the model base. Because models were complex and generally inaccessible, these valuable decision aids were rarely used in forest management.
Forest pest management decisionmaking requires the ability to anticipate and evaluate changes in pest populations as well as their eEe& on forest resources, Conventionally, managers tend to focus attention on: the content rand credibility of the in- formation available for solving a problem, The im- portance of helping managers to fornulate a ""quality problem" and organize information is very often ignored (Vslkema 1983). Because of the relative paucity of properly trained personnel in the SPB man- agement environment, this failure to integrate new technology in a usable format became a cause for concern, A G C O P ~ ~ M ~ ~ ~ , a multidisciplinary team a t Texas A&M University undertook the task of archiv- ing SPB knowledge in a single, computer-based, accessible system.
SOUTHERN PINE BEETLE DECISION SUPPORT SYSTEM
Background
Since the mid-1 970fs, State forest service agencies have utilized the traditional concepts of manage- ment infomation systems (MIS) to help with tech- nology integration and transfer. An MIS is a corn- puler-based system with the eapabilit y of providing decision-oriented inrformation for controlling opera- tions that are definable within a well-structured framework (Thierauf f 982). These systems are com- monly used for routine and structured tasks or man- agerial review. Accordingly, MIS are often report- oriented in the sense that data are extracted and summarized into predefined formats, usually on a periodic basis (Moore and Chang 1980). The Opera- tional Information System (01s) developed by the Texas Forest Service (Pace and Fagala 1918) is an example of an MIS. This system has been used to monitor aerial detection, ground susvey, and control operations of SPB infestations throughout east Texas. With great efficiency, it carries out the routine tasks of listing SPB spots to be ground checked, listing active spots to be controlled, listing spots with action completed, and periodic evaluation, and summary.
An MIS usually increases the efficiency of the predefined tasks it performs, but not necessarily their egectiveness (Tbierauf 1982). Since most pest management problems are not predefinable, MIS are ill-suited for such ad hoc decisionmaking. MIS, with its rigid specifications and fomalized proce- dures, often ( I) intimidates the user/decisionmaker, (2) forces premature closure on problem approaches, and (3) inhibits the learning and searching processes that most managers must go through when address- ing less structured problems (Moore and Ghang 1983).
Fortunately, a new area of infomation technology, called expert or decision support systems (DSS) , has been developed to deal with ad hoe problem- solving, Such systems build upon the concepts of MIS and extend them by (I) freeing the user frrsm the struc"tures imposed by the system, and (2) or- ganizing, eol1ecting, sequencing, and reporting infor- mation. in a format that is relevant to each user's particular problem (Rykiel et al. 1984).
The DSS concept acknowledges that managers are discretionary users who may work with computers by choice, as opposed to committed users, who work with them as part of their profession. To capture the interest of discretionary users and support the
experLise of their judeend, the system must pro- vide infomation directly related to the managers' problems and ~ v e them active control over the elements of the howledge base Srom which they must draw (Bennett 1983)- A DSS, therefore, is a computer based system that allows the decisionmakes to combine judgment with computer output in a humara/machine interface for producing meaninghe information to support the de~isionmaking proce~s (Thierauf 1982), FYknena appropriate, a DSS wiEB utilize mathematical and/or statistical models as well as data base elements for solving the problems under scmtiury, An authentic DSS digers from con- ventional data processing systems (including MIS > in four ways:
f 1) The focus is OM deci~ionmaking in problem situations rather than simply infomation re- trieval, processing, or reporting (Moore and Chang L980),
(2) The system is an integral part of a user'^ decision process rather than a tool sitting on a shelf waiting for use (Sprague and Watr~on 1975).
(3) The procedures are ""losely defined" mther than pre-specified (Moore and Chrang 4980);,
(4) The pualpose is do improve the effectiveness of decisionmaking rather than improve eGeieacy of infomation retrieval (Bennett 19831,
The process of designing and buil&rtg the South- ern Pine Beetle Decision Support System (SPBDSS) involved several activities, These were : 1 ) Identify- ing and catalawing Slag-related problems, %) iden- tifying and cataloguing SPB-related knowledge, 3) developing solution algorithms (single or multi-model problem processing subroutines) for dealing with specific problem categories, 4) developing an execu- tive routine that directs the operation of the system and links its components to one another, and 5) de- veloping data storage facilities where stand and spot data can be stored for future use in decisionmaking.
The remainder of this paper deals with these dis- crete activities, and how they were accomplished, The order in which the SPBDSS components are dis- cussed is roughly analogous to their sequence of de- velopment,
Ifhe Problem Analysis Routine (FERRET)
Decision support systems are built around prob- lems, not technology, The main objective of a DSS is to meet a manager's needs in problem-solving situ- ations, In 1980: the ESPBRAP Technology Trans- fer Team requested participation by forest industry, State forestry agencies, and the U.S, Forest Ser\9ice9s State and Private Forestry Organization (S&PF) in
iderrtieing speci6c needs of an SPBDSS "uses unidy,"TTlrrese pcrtential users were queried to
determine what kinds of SPB-refaded questions would be addressable by SPBDSS.
Constrained by the available technology, four ma- jor categories of problems from the questionnaires were identified. These four were predictionievalua- tion, prevention, suppression, and utilization. Prob- lems in these categories generally have underspe- cified structures with infclrmation for s o l ~ n g them of a multisource nature and djidficult to organize. The focus of an SPB decision support system should, therefore, he on such problem resolution. F a l l s ~ n g is a list of the SPB-reEadd questions that were developed from these surveys,
(1) m a t is the probability of an infestation in a given stand over a given rotation and when will it occur?
(2) When and in what geographic area will the next outbreak occur?
(3) Of what value are biological evaluations con- ducted in October or January for predicting succeeding season losses?
(4) What factors are responsible for SPB out- break collapse?
(5) FVhat popmlatisn Bevels can be used do predict outbreaks?
(1) How large will a detected (aerial) spot grow (need the ability to rank OW site)?
(2) What are pseeaicted losses given variable atand parameters?
(3) What are expected losses in a given spot (a) without control, (b) during "che next month, and ( e ) until a spot goes inactive?
(4) what is the impact of not eontrotling spots of given size by season?
(5) Ascertain ei$ects of parasites, predators, and weather on beetlie populations and how they ag%ect timber mortality,
SUPPRESSION
(1) What are the chances and conditions for sue- cess of the differend control tactics?
(2) What is the best method based on cost-bene- fit for controlling a given spot (given size.
"artieipants included representatives from: Union Camp Corporation, Temple-Eastex Corporation, International Paper Company, the Georgia Forestry Commission, the Texas Forest Service, and the Forest Service" Southeastern Area S&PF,
location, infesktion-level parameters, and considerhg total stand management)? What are the advantages and disadvantages of al- ternative control methods?
(3) m a t proport;ion of active spots must be treated to affect outbreak trends?
(4) m a t effects will the various control tactics have on other insect and disease problems?
(5) If cut-and-leave is applied with a standard buflFer, what are the limits of spot size and season for which it is economically feasible?
(6) What are the effects of control tactics on spot proliferation?
(7) m a t are the environmental impacts of va- rious control tactics?
(8) Evaluate the use of behavioral chemicals, nat- ural enemies, and pathogens as suppression tactics.
PREVENTION
(1) What conditions predispose a tree or stand to attack?
(2) What strategies are available? (3) How much will these strategies prevent mor-
tali ty? (4) What influence will various control levels have
on continued losses? (5) What influence do thinning, fertilization, in-
tensive site preparation, prescribed burns, double spacing, maintaining mixed stands, and species selection have on stand suscep- tibili ty ?
(6) 'What is the net effect on yield of thinning to prevent attack? (Assess net effects of pre- vention strategies on yield on a cost-benefit basis.)
(7) 'What is the time factor between thinning and reduction of risk in given stands?
(8) Can prevention and suppression activities be applied concurrently to achieve reduction in activity?
(9) m a t are the influences of factors such as root rots, drought, and other bark beetles on initiating outbreaks?
UTILIZATION
(1) How much degrading (identify damage classes) is acceptable and what is a fair price?
(2) Assess market needs f supply and demand) for beetle-kiUed wood.
(3) What are eutting-power demands and fre- quency of saw sharpening in mills using live versus beetle-killed trees?
(4) Generate regional weight scales.
(5) What are the markets for blue-stained wood and paneling?
Many of these questionsfproblems were found to be research and development problems, logistical, or technology transfer problems. Such problem are not amenable to solution by reference to a DSS a t this time, due to a lack of technical knowledge, Several additional points can be made in reference to the problem set:
(1) The problem list is only a sample of a much larger potential set.
(2) It is not possible to anticipate what problem will be identified by users at a later date.
(3) The sequence and timing of requests for aid in problem solving by users annot be speci- fied a priori.
(4) The problem is presented on an ad hoc basis. (5) The problems do not have discrete solutions.
There will always be an element of user judg- ment in decisionmaking.
Based upon this problem set, logical relationships were developed into a hierarchial system of menus built around the four major problem categories. This problem analysis decison tree was named FERRET (fig. la, b, c), and in its initial version, its function was to identify a user's problem and specify the models most appropriate for dealing with that prob- lem (Turnbow et al. 1983). There are 49 unique pathways through FERRET for structuring a par- ticular problem, Not all pathways lead to unique problem-solving procedures. The intent, rather, is to include all the various ways forest managers view and interpret what essentially may be one problem. This "stand alone" FERRET served as the template for the development of model-based solution algorithms for use in problem solving.
Simulation Models and Solution. Algorithms
As mentioned previously, there are five general categories of simulation models developed to deal with SPB problems. These models were not pro- grammed in a common computer language nor were they desimed to run under a standard operating system. Accordingly, a major task in the develop- ment of SPBDSS was the collection of all available models, evaluation and selection of the most robust and appropriate subset of these models, translation of their computer codes to a common language (FORTRAN IV) , and modification of non-interac- tive models to permit interactive processing. The current catalogue of models contained in SPBDSS is shown in table 1. Of the 31 listed, 13 were selected based upon an evaluation of model performance, and the recommendations of IPM Program management..
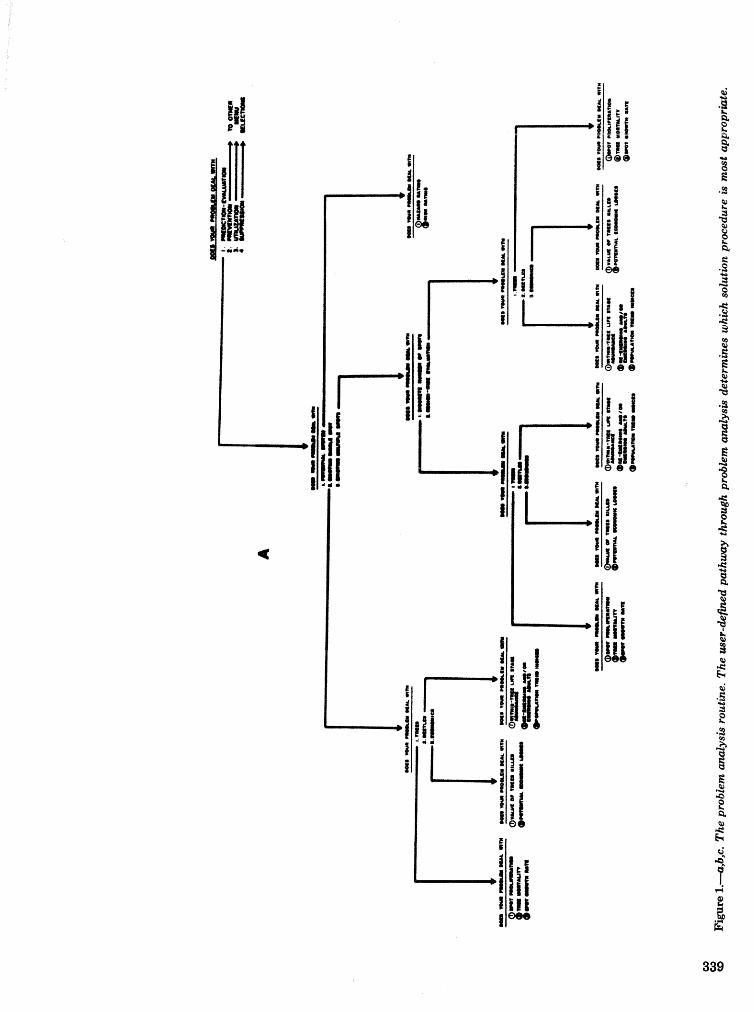
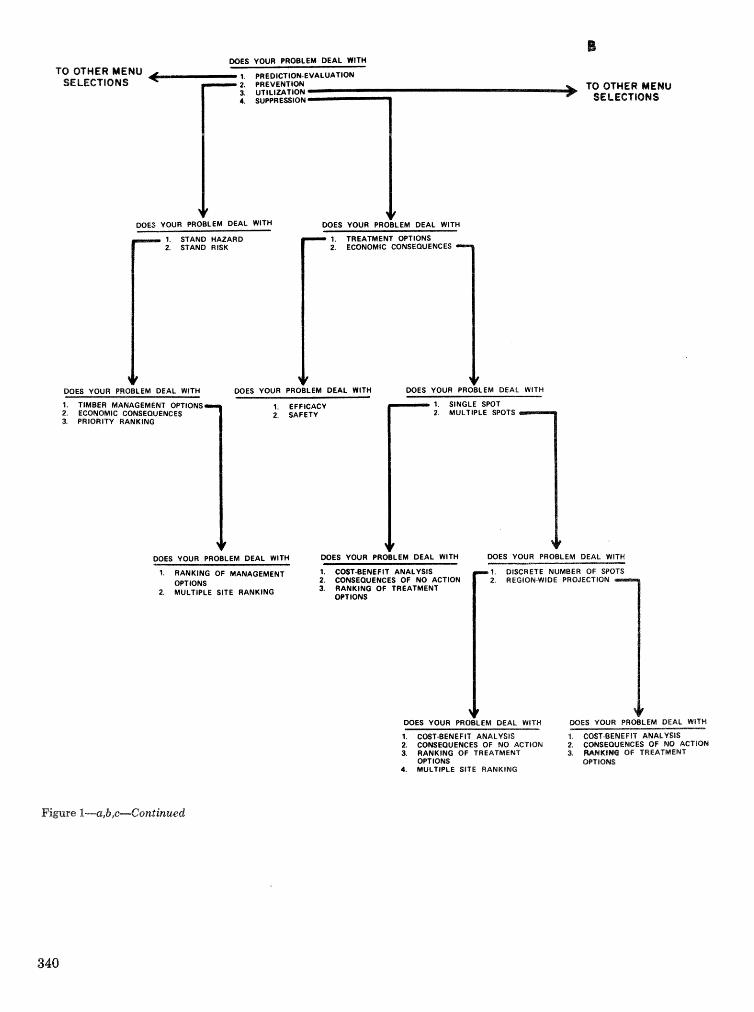
DOES Y W R PROBLEM DEAL WtTH TO OTHER MENU
SE LECTIOltiS 1. PREDICTiOhl-EVALUATION 2. PREVENTION 3 UTILIZATION 4. SU&PRESSION
TO QWWER MENU SE LECTIBNS
DOES YOUR PROBLEM DEAL WITH
1. STAND HAZARD 1. TREATMENT OPTIONS 2. STAND RISK 2. ECONOMIC CONSEQUENCES
1. TIMBER MANAGEMENT OPTIONS 1. EFFICACY 2. ECONOMIC CONSEQUENCES 2. SAFETY 3. PRIORITY RANKING
WES YOUR PROBLEM DEAL WITH MIES YOUR PROBLEM DEAL WITH WES YOUR PROBLEM DEAL WITH
1. COST-BENEFIT ANALYSIS " OPTIONS OF MANAGEMENT 2. CONSEQUENCES OF NO ACTION
2. MULTIPLE SITE RANKING 3. RANKING OF TREATMENT OPTIONS
1. COST-BENEFIT ANALYSIS 1, COST-BENEFIT ANALYSIS 2, CONSEQUENCES OF NO ACTION 2. CONSEQUENCES OF NO ACTION 3. RANKING OF TREATMENT 3. RChMKIHa OF TREATMENT
OPTIONS OPTIONS 4. MULTIPLE SITE RANKING
Figure I+, b,c-Con tinued
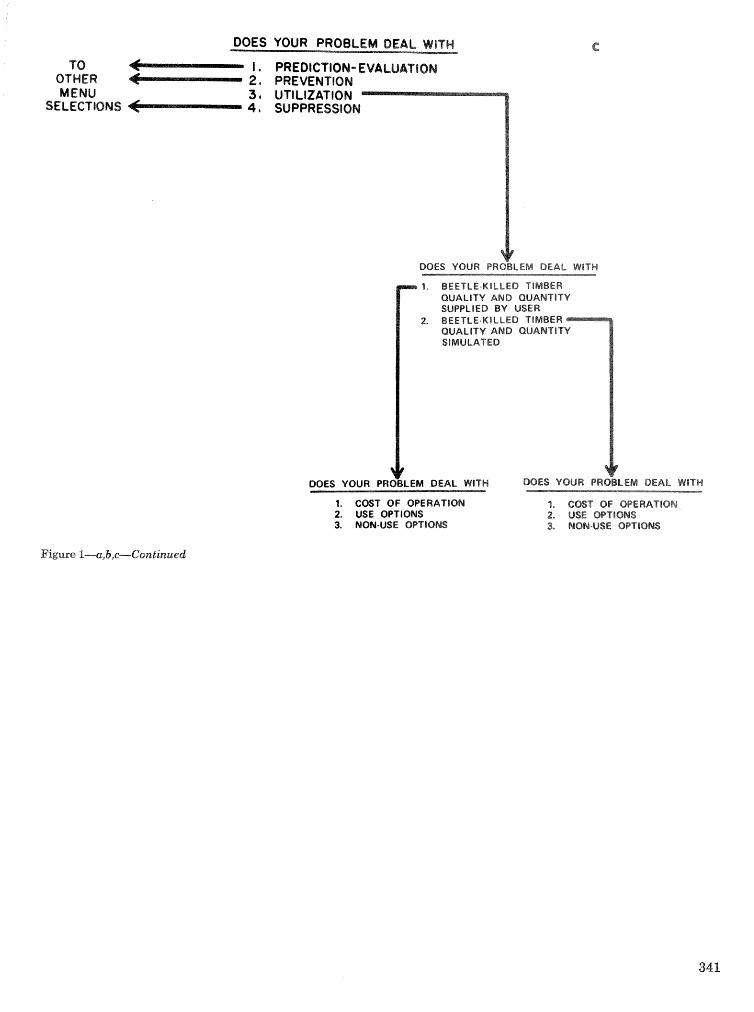
OOES YOUR PROBLEM DEAL VVliTH
TO I , PREDICTION- EVALUATION OTHER 2 , PREVENTION MENU 3. UTILIZATION
SELECT tOMS 4 * SUPPRESSION I
4 OOES YOUR PROBLEM DEAL WlTH
1, BEETLE-KILLED TIMBER QUALITY AND QUANTITY SUPPLIED BV USER
2, BEETLE-KILLED TIMBER QUALITY AND GUAMTIT SIMULATED
1. COST OF OPERATlQN 1. COST OF OPERATION 2. USE OPTIONS 2. USE OPIlONS 3. NON-USE OPTIONS 3. NOM-USE 8PT18FdS
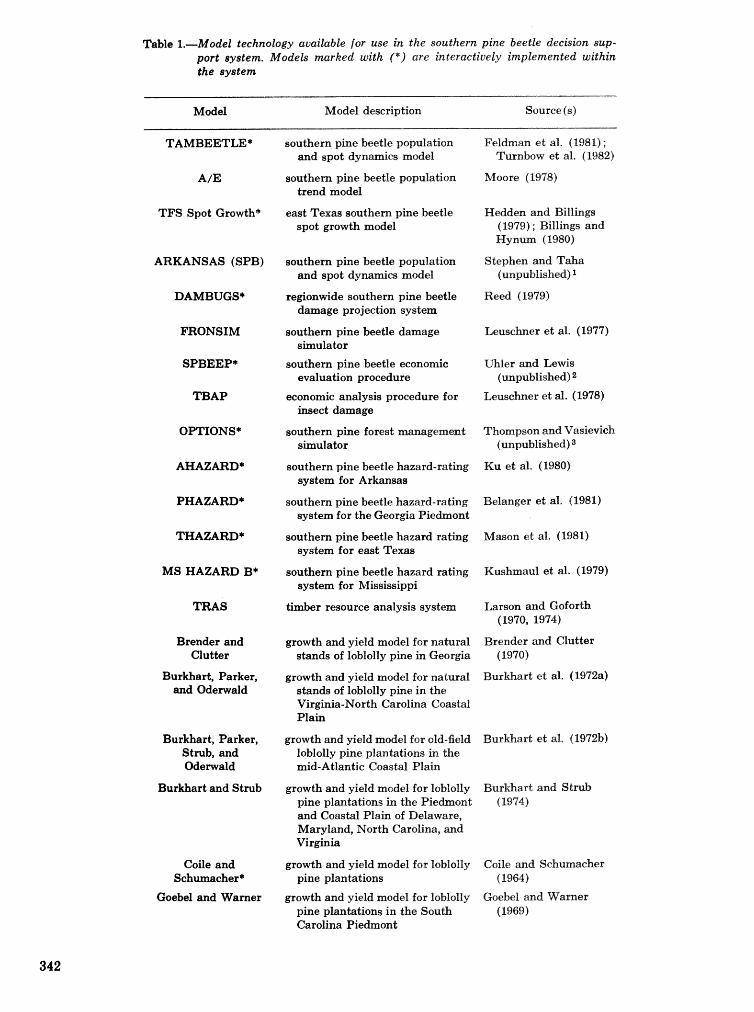
a M o d e l technology available for use in the southern pine beetle decision sup- port system. Models marked with (*) ate interactiuety implemented within the system
Node1 Model description Source (s)
southern. pine beetle population and spot dynamics model
Feldman ed al. (1981) ; Turnbow et al. (1982)
southern pine beetle population trend model
Moore (1978)
east Texas southern pine beetle spot growth model
Hedden and Billings (1979) ; Billings and Hynum (1980)
TFS Spot Growth*
Stephen and W a (unpublished) I
ARKANSAS (SPB) southern pine beetle population and spot dynamics model
DAMBUGS* regionwide southern pine beetle damage projection system
Reed (1979)
FRONSIM
SPBEEP*
TBAP
southern pine beetle damage simulator
Leuscher et al. (1977)
southern pine beetle economic evaluation procedure
Uhler and Lewis (unpublished) 2
Leuscber et al. (1978) economic analysis procedure for insect damage
OPTIONS* Thompson and Vasievich (unpublished) 3
southern pine forest management simulator
Ku et al. (1980) AHAZARD* southern pine beetle hazard-rating system for Arkansas
PHAZARD* southern pine beetle hazard-rating system for the Georgia P i ehon t
Belanger et al. (1981)
THAZARD* Mason et al. (1981) southern pine beetle hazard rating system for east Texas
MS HAZARD B* Kushmaul et al. (1979) southern pine beetle hazard rating system for Mississippi
Larson and Goforth (1970, 1974)
TRAS timber resource analysis system
Brender and Clutter
growth and yield model for natural stands of loblolly pine in Georgia
Brender and Clutter (1970)
Burkhart, Parker, and Oderwald
Burlrhart et al. (1972a) growth and yield model for natural stands of loblolly pine in the Virginia-North Carolina Coastal Plain
Burkhart, Parker, Strub, and Oderwald
growth and yield model for old-field loblolly pine plantations in the mid-Atlantic Coastal Plain
Burmart et al. (1972b)
Burkhart and Strub growth and yield model for loblolly pine plantations in the P i ehon t and Coastill Plain of Delaware, Maryland, North Carolina, and Vir*a
Coile and Sehurnaeher (1964)
Coile and Schumacher*
Coebel and Warner
growth and yield model for lobfolly pine plantations
growth and yield model for loblolly pine plantations in the South Carolina P i ehon t
Goebel and Warner (1969)
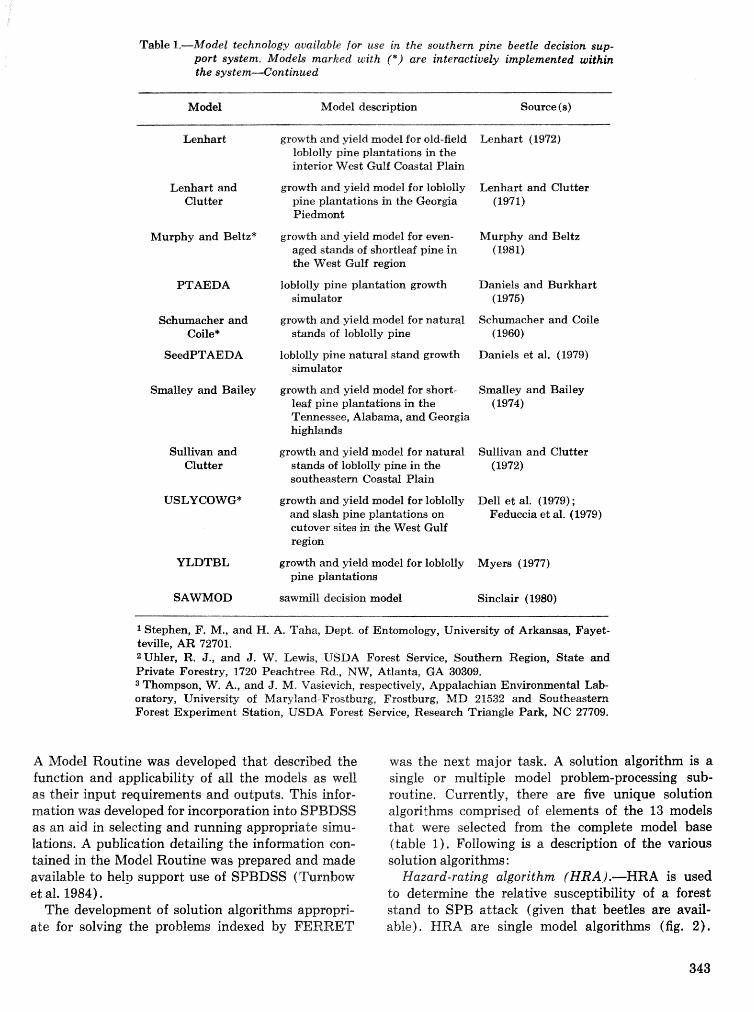
Table 1.-Model technology available for w e in the southern pine beetle decision sup- port system, Modeb marked with (*) are interaetiuely inzplemented within $he system4ontinued
Model Model dewription Source (s)
growth and yield model for old-field loblolly pine planbtions in the inbriar West Gulf Coastal Plain
Leda r t and Clutter
growth and yield rnodel for lobIolIy pine plantations in the Georgia Piedmont
Lenhart and Clutter (1971)
Murphy and Beltz* growth and yield model for even- aged stands of shortleaf pine in the West Gulf regiion
Murphy and Beltz (1981)
loblolly pine plantation growth silnula tor
Daniels and Burkhart (1975)
Schmacher and Coile*
growth and yield model for natural stands of loblolly pine
Schumacher and Coile (1960)
loblolly pine natural stand growth simulator
Daniels et al. (1979)
Srnalley and Bailey growth and yield rnodel for short- leaf pine plaratations in the Tennessee, Alabama, and Georgia highlands
Smalley and Bailey ( 1974)
Sullivan and Clutter
growth and yield model for natural stands of loblolly pine in the southeaatem Coasd Plain
Sullivan and Clutter (1972)
USLYCOVVG* growth and yield rnodel for loblolly and slash pine planbtions on cutover sites iPr the West Gulf re@on
Dell et al. (1979) ; Feduccia et al. (1979)
YLDTBI,
SAWMOD
growth and yield model for loblolly pine planktions
Myers (1977)
sawmill decision model
Stephen, F. M., and H. A. Taha, Bept. of Entomolol-;y, University of Arkansas, Fayet- teville, AR 72701. ZUhler, R. J., and J. W, Lewis, USDA Forest Service, Southern Region, State and Private Forestry, 1720 Peachtree Rd., NW, Atlanta, GA 30309. 3 Thompson, VV. A., and J. Rile Vasievieh, respectively, Appalachian Enviromental Lab- oratory, University of Maryland-Frostbmrg, Frostburg, MI3 21532 and Southeastern Forest Experiment Sbtion, USDA Forest S e ~ e e , Research Triangle Park, NC 27709.
A Model Routine was developed that described the function and applicability of all the models as well as their input requirements and outputs. This infor- mation was developed for incorporation into SPBDSS as an aid in selecting and running appropriate simu- lations. A publication detailing the infomation eon- tained in the Model Routine was prepared and made available to help support use of SPBDSS (Turnbow et al. 1984).
The development of solution algorithms appropri- ate for solving the problems indexed by FERRET
was the next major task. A solution algorithm is a single or multiple model problem-processing sub- routine. Currently, there are five unique solution algorithms comprised of elements of the 13 models that were selected from the complete model base (table 1). Following is a description of the various solution algorithms :
Hazard-rating algorithm (HRA).-HRA is used to determine the relative susceptibility of a forest stand to SPB attack (given that beetles are avail- able). HRA are single model algorithms (fig. 2).
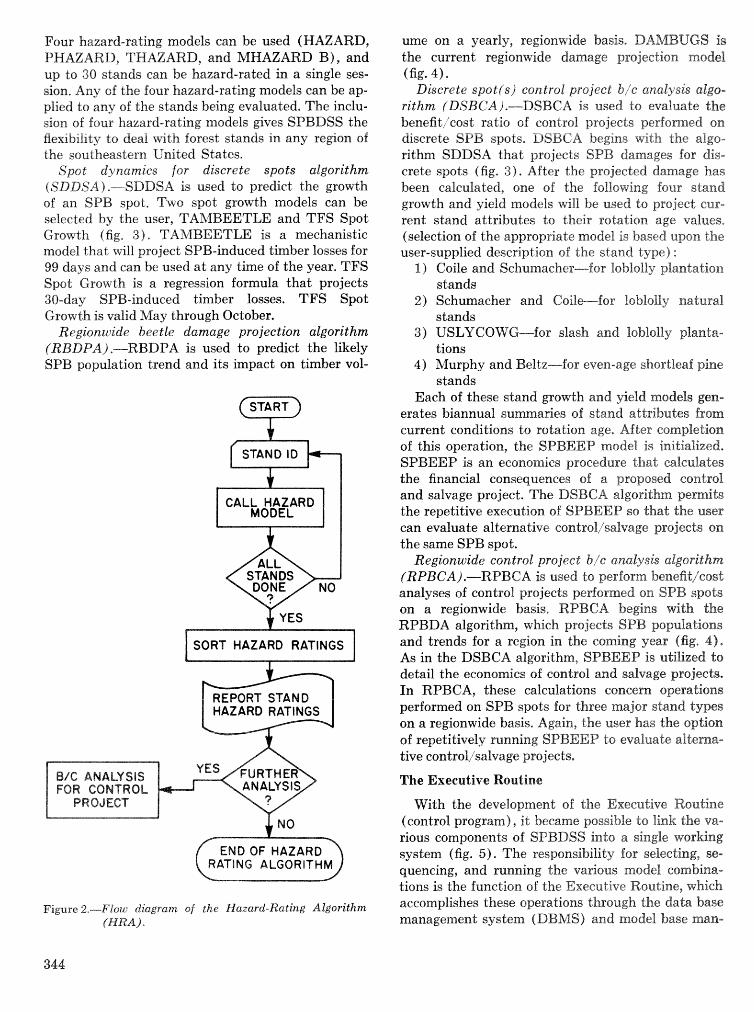
Four hazard-rating models can be used (HAZARD, PEAZARC), THAZARD, and MHAZARD B), and up to 30 stands can be hazard-raled in a single ses- sion, Any af the four hazard-rating models can be ap- plied to any of the stands being evaluated. The inclu- sion of four hazard-rating models gives SPBDSS the ftexlblhty to deal with forest stands in any region of the southeastern United States.
Spot dynamics for discrete spats algorithm (SDBSA) .-SDDSA is used Lo predict the growth of an SPB spot, Two spot growth models can be selected by the user, TAkIBEETLE: and TFS Spot Growth (fig. 3). TAhfBEETLE is a mechanistic model that will project SPB-induced timber losses for 99 days and can be used a t any time of the year. TFS Spot Growth is a regression formula that projects 31)-day SPB-induced timber losses, TFS Spot Growth is valid May through October.
Regionwide beetle damage projection algorithm (_RBDPA).---RBDPA is used to predict the likely SPB population trend and its impact on timber vol-
CALL HAZARD I MODEL I /
.) YES
I SORT HAZARD RATINGS I
AZARO RATINGS
Figure 2.-Fjow diagram of the Hazard-Rating Algorithm [HRA) .
ume on a yearly, regionwide basis, DAMBUGS is the current regionwide damage projection model (fig* 41
Discrete spot( s ) control project b/e analysis alga- rithm (DSBCA).-DSBCA is used do evaluate the benefit/cost ratio of control projects performed on discrete SPB spots. IUSBCA begins with the algo- rithm SDDSA that projects SPB damages lor dis- crete spots (fig. 3). After the projected damage has been calculated, one of the following four stand growth and yield models w i l be used to project cur- rent stand attributes to their rotation. age values, ('selection of the appropriate model is based upon the user-supplied description sf the stand type) :
1 ) Coile and Schurnaeher-f or loblolly plantation stands
2) Schumacher and Coil or ZoblolZy natural stands
3) USLYGO'tVG-for slash and loblolly planta- tions
4) Murphy and Beltz-for even-age shortleaf pine stands
Each of these stand growth and yield models gean- erates biannual summaries of stand attributes from current conditions to rotation age, After completion of this operation, the SPBEEP model is initialized, SPBEEP is an economics procedure that calculates the financial consequences of a proposed control and salvage project. The DSBCA algorithm pernits the repetitive execution of SPBEEP so that the user can evaluate alternative corrtrol/salvage projects on the same SPB spot.
Regionwide control project b/e analysig algorithm (RPBCA f .-RPBGA is used to perform benefit/csst analyses of control projects performed on SPB spots on a regionwide basis. RPBCA begins with the RPBDA algorithm, which projects SPB populations and trends for a region in the corning year (fig, 4)- As in the DSBCA algorithm, SPBEEP is utilized. to detail the economics of control and salvage projects, In RPBCA, these calcufatiml; concern operations performed on SPB spots for three major stand types on a regionwide basis, Again, the user has the option of repetitively running SPBEEP to evaluate alkrnla- tive control/salvage projects.
The Executive Routiac?
With the development sf the Executive Routine (control program), i"cbecame possible to link the va- rious components of SPBDSS into a single working system (fig. 5). The responsibility for selecting, se- quencing, and running the various model csmbina- tions is the function of the Executive Routine, which accomplishes these operations through the data base management system (DBhIS) and model base man-
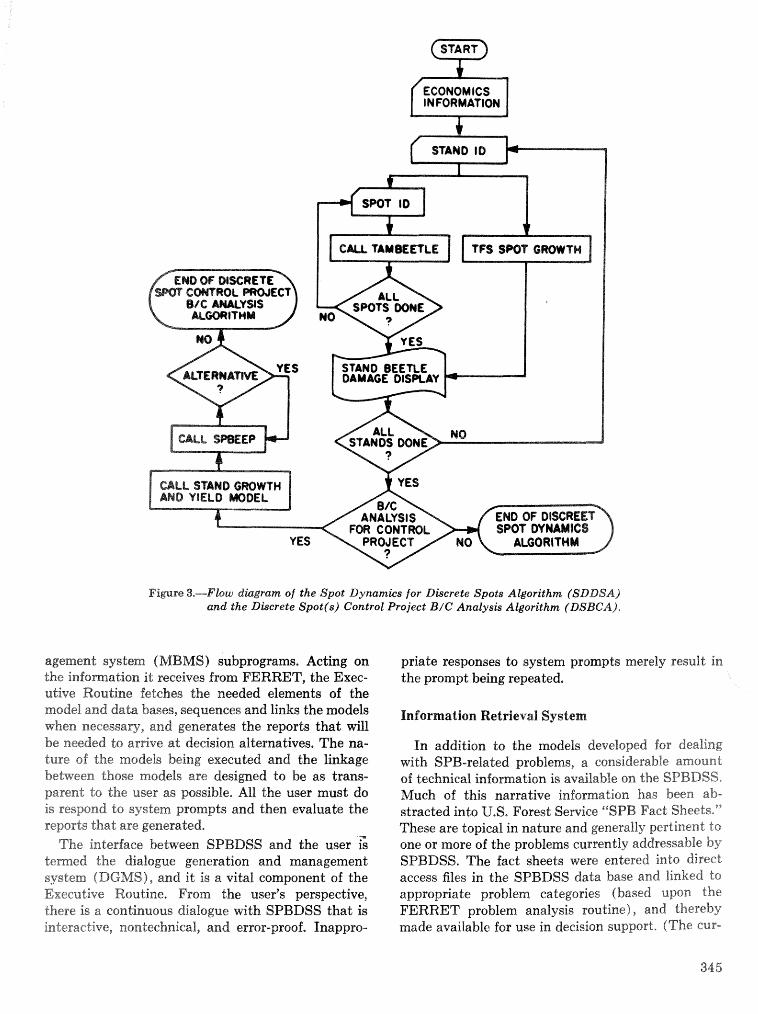
CALL STbNO GROWTH AN9 VlELO MOOEL
SPOT OYNA ROJECT AUORITWM
Fiere 3.-Flaw diagram of the Spot Dynamics for Discrete Spots Algorithm (SDDSA) and the Discrete Spot(s) Control Project B /G Analysis Algorithm (DSBCA).
agernerrt system (TcilEJMS) subprograms. Acting on the infomation id receives from FERRET, the Exec- utive Routine fetches the needed elements of the model and data bases, sequences and links the models when necessary, and generates the reports that will be needed do arrive at decision alternatives, The na- ture of the models being executed and the linkage between those models are designed to be as trans- parent to the user as possible, All the user must do is respond to system prompts and then evaluate the reports that are generated,
The ienterhce between SPBDSS and the user $ termed the dialogue generation and management system (DGMS), and it is a vital component of the Executive Routine, Prom the user" perspective, there is a continuous dialogue with SPBDSS that is interactive, nontechnieaE, and error-proof. Inappro-
priate responses to system prompts merely result in the prompt being repeated.
Information Retrieval System
In addition to the models developed for dealing with SPB-related problems, a considerable amount of technical information is available on the SPBDSS, Much of this narrative information has been ab- stracted into U.S, Forest Service ""SPB Fact Sheets*" 7'hese are topical in nature and generally pertinent to one or more of the problems currently addressable by SPBDSS. The fact sheets were entered into direct access files in the SPBDSS data base and linked to appropriate problem categories (based upon the FERRET problem analysis routine), and thereby made available for use in decision support. (The cur-
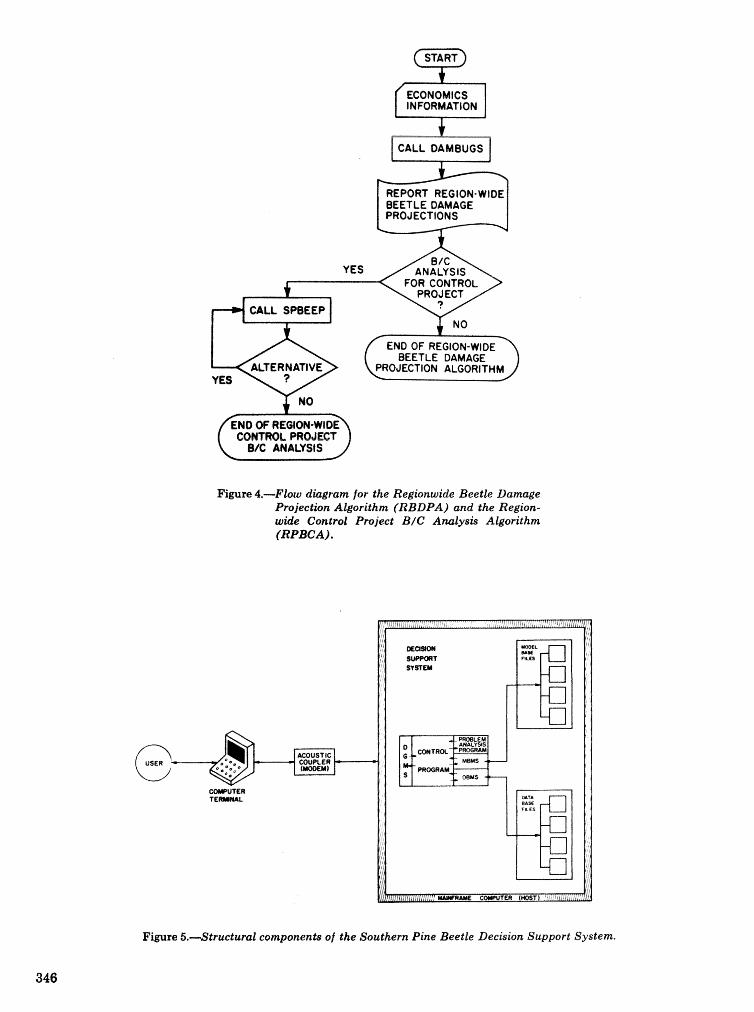
f-4 CALL SPBEEP I
CONTROL PROJIECT BIC ANALYSIS
PROJECTION ALGORITHM
Figure 4.-Flow diagram for the Regionwide Beetle Damage Projection Algorithm (RBDPA) and the Region- wide Control Project B/C Analysis Algorithm (RPBCA).
Figure 5.-Structural componenb of the Southern Pine Beetle Decision Support System.
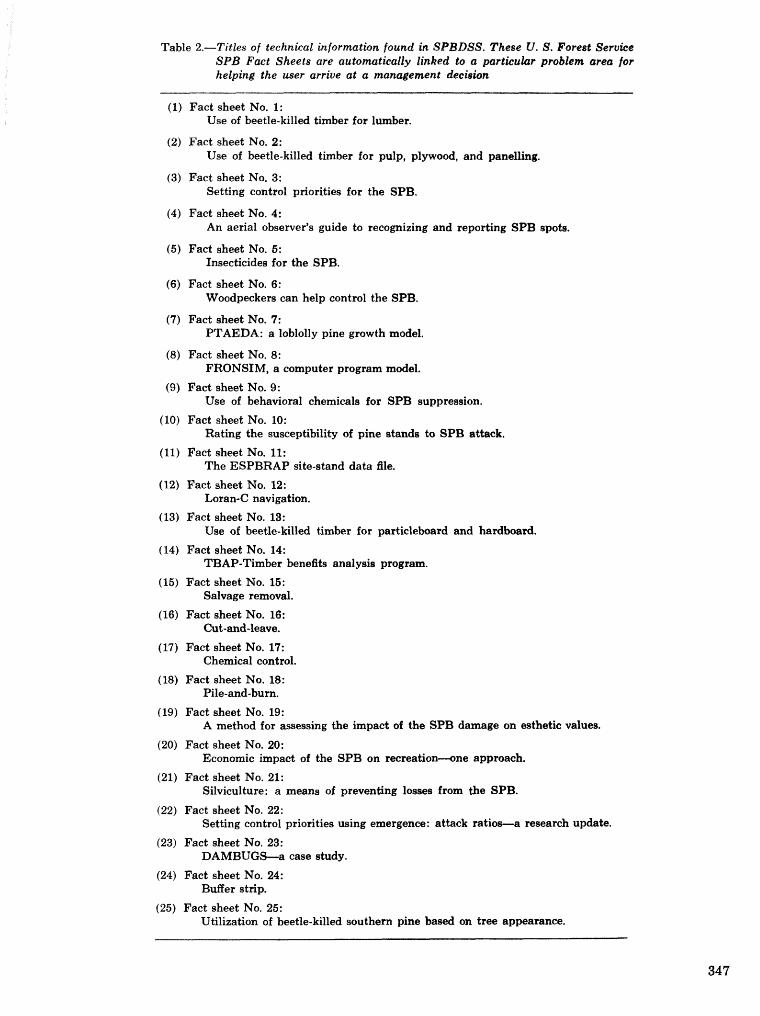
Table 8,-TitAes of technical inf~rmathn found in SPBDSS, These U. S. Forest Seruke SPB Fact Sheets are automcstkdly linked to a articular probkm area for helping the user arriue at a: management deckion
(1) Fact sheet No, 1: Use of beetle-killed timber for lumber.
(2) Faet sheet Xo, 2: Use of beetle-lrilled timber for pulp, plywood, and paneuing,
(3) Fact sheet No. 3: Setting control priorities for the SPB.
(4) Fact sheet No. 4: An aerial observer's guide to recomizing and reporting SPB spots.
(5) Fact sheet No. 5: Insecticides for the SPB.
(6) Fact sheet No. 6: Woodpeckers can help control the SPB.
(7) Fact sheet No. 7: PTAEDA: a loblolly pine growth model.
(8) Fact sheet No. 8: FRONSIM, a computer program model.
(9) Fact sheet No. 9: Use of behavioral chemicals for SPB suppression.
(10) Fact sheet No. 10: Rating the susceptibility of pine stands to SPB attack.
(11) Fact sheet No. 11: The ESPBRAP site-stand data file.
(12) Fact sheet No. 12: Loran-C navigation.
(13) Fact sheet No. 13: Use of beetle-killed timber for particleboard and hardboard.
(14) Fact sheet No. 14: TBAP-Timber benefits analysis program.
(15) Fact sheet No. 15: Salvage removal.
(16) Fact sheet No. 16: Cut-and-leave.
(17) Fact sheet No, 17: Chemical control.
(18) Fact sheet No. 18: Pile-and-burn.
(19) Fact sheet No. 19: A method for assessing the impact of the SPB damage on esthetic values.
(20) Fact sheet No. 20: Economic impact of the SPB on recreation-ne approach.
(21) Fact sheet No. 21: Silviculture: a means of preventing losses from the SPB.
(22) Fact sheet No. 22: Setting control priorities using emergence: attack ratios-a research update.
(23) Faet sheet No. 23: DAMBUGS-a case study.
(24) Fact sheet No. 24: Buffer strip.
(25) Fact sheet No. 25: Utilization of beetle-killed southern pine based on tree appearance.
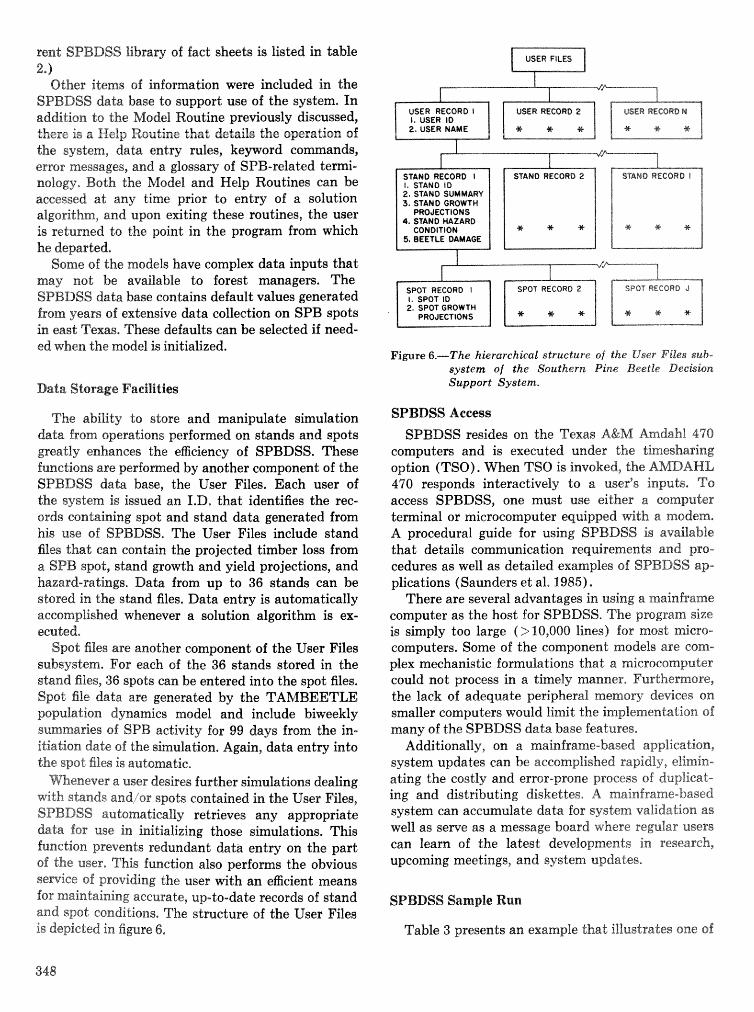
rent SPBDSS fibraq of fact sheets is listed in t;able 2,)
Other items of infomation m r e included in the SPBDSS data base to support use of the system. In addition to the Model Routine previously discussed, there is a Help Routine that details the apera~on of the system, data entry rules, keyword commands, error messages, and a glossary of SPB-related temi- nolsgy. Both the Model and Help Routines can be accessed a t any time prior to entry of a solution algorithm, and upon ezriting these routines, the user is returned to the point in the program from which he departed,
Some of the models have complex data inputs that may not be available to forest managers. The SPBBSS data base contains default values generated fmm years of extensive data collection on SPB spots in east Texas. These defaults can be selected if need- ed when the model is initialized.
Data Storwe Facilities
The ability to store and manipulate simulation data from operations performed on stands and spots greatly enhances the efficiency of SPBDSS. These functions are performed by another component of the SPBDSS data base, the User Files. Each user of the system is issued an I,D, that identifies the rec- ords containing spot and stand data generated from his use of SPBDSS. The User Files include stand files that can contain the projected timber loss from a SPB spot, stand growth and yield projections, and hazard-ratings, Data from up to 36 stands can be stored in the stand files. Data entry is automatically accomplished whenever a solution algorithm is ex- ecuted,
Spot files rere another component of the User Files subaysdem* For each of the 36 stands stored in the stand files, 36 spots can be entered into the spot files. Spot file data are generated by the TAMBEETLE population dynamics model and include biweekly surnrnades of SPB activity for 99 days from the in- itiaticm date of the simulation. Again, data entry into the spot files is audarnatic,
Whenever a user desires further simulations dealing with stands and/or spots contained in the User Files, SPBDSS automatically retrieves any appropriate data for use in initializing those simulations. This function prevents redundant data entry on the part of the user. This function also perfoms the obvious semice of providing the user with an egcient means for maintaining accurate, up-to-date records of stand and spot conditions. The structure of the User Files is depicted in figure 6,
USER FILES
I , STAND tD 2, STANO SUMMARY 3, STANO GROWTH
PROdiECT IOhlS 4, SmND HAZARD
CONOITION 5. BEETLE DAMAGE
Fimre 6.----The hierarchical structure of the User Files sub- c3ystem of the Southern Pine Beetle Deckion Support System.
SPBDSS Access
SPBDSS resides on the Texas A&M Amdahk 470 computers and is executed under the timesharing option (TSO). When TSO is invoked, the AMDAHL 470 responds interactively to a user" inputs, To access SPBDSS, one must use either a computer teminal or microcomputer equipped with a modem, A procedural guide for using SPBDSS is availabbe that details communication requirements and pro- cedures as well as detailed examples of SPBDSS ap- plications (Saunders et al. 1985).
There are several advantages in. using a. mainframe computer as the host for SPBDSS. The program size is simply too large (>10,000 lines) for most micro- computers. Some of the component models are cam- plex mechanistic formulations that a microcomputer could not process in a timely manner, Furthemore, the lack of adequate peripheraa memory devices on smaller computers would limit the implementation of many of the SPBDSS data base features*
Additionally, on a mainframe-based application, system updates can be accomplished rapidly, elinmain- ating the costly and error-prone process of duplicat- ing and distributing diskettes, A mainframe-based system can accumulate data for system validation as well as serve as a message board where regular users can learn of the latest developments in research, upcoming meetings, and system updates,
SPBDSS Sample Run
Table 3 presents an example that illustrates one of
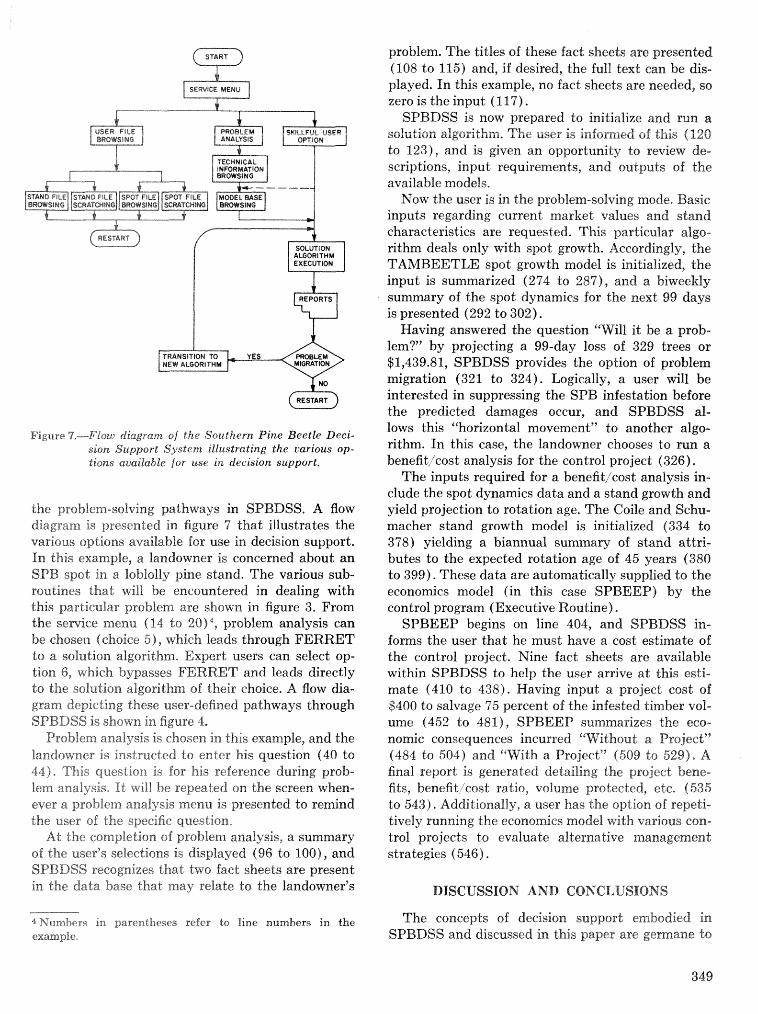
problem. The titles of these fact sheets are presented (108 to 115) and, if desired, the full text can be dis- played. In this example, no fact sheets are needed, so zero is the input (1 17).
SPBDSS is now prepared to initialize and mn. a solution algcsritknnl. The user is inforrned of this 4 120 to 123), and is given an opportunity do review de-
SPOT FILE BNWStNG
REPORTS 9
Figure 7.-Ftsw diagram of the Southern Pine Beetle Deci- sion Support System illustrating the various op- tions auailabte for use in decision support.
the problem-solving pathways in SPBDSS. A flow diagram is presented in figure 7 that illustrates the various options available for use in decision support. Ln this examplie, a landowner is concerned about an SPB spot in a loblolly pine stand. The various sub- routines that will be encountered in dealing with this particular problem are shown in figure 3. From the sewice menu (14 do fZ0)4, problem analysis can be chosen (choice 51, which leads through FERRET do a solution algorithm, Expert users can select op- tion 6, which bypasses FERRET and leads directly to the solution algorithm of their choice. A flow dia- gram depicting these user-defined pathways through SPBDSS is shorn in figure 4.
Problem analysis i s chosen in this example, and the landowner is instructed do enter: his question; (40 to $4)- This question i s for his reference during prob-
scriptions, input requirements, and outputs of the available models.
Now the user is in the problem-solving mode. Basic inputs regarding current market values and stand characteristics are requested. This particular algo- rithm deals only with spot growth. Accordingly, the TAMBEETLE spot growth model is initialized, the input is summarized (274 to 2871, and a biweekly summary of the spot dynamics for the next 99 days is presented (292 to 302).
Having answered the question "Will i t be a prob- lem?" by projecting a 99-day loss of 329 trees or $1,439.81, SPBDSS provides the option of problem migration (321 to 324). Logically, a user will be interested in suppressing the SPB infestation before the predicted damages occur, and SPBDSS al- lows this "horizontal movement" to another algo- rithm. In this case, the landowner chooses to run a benefit,cost analysis for the control project (326).
The inputs required for a benefiticost analysis in- clude the spot dynamics data and a stand growth and yield projection to rotation age. The Coile and Schu- macher stand growth model is initialized (334 to 318) yielding a biannual summary of stand attri- butes to the expected rotation age of 45 years (380 to 399). These data are automatically supplied to the economics model (in this case SPBEEP) by the control program (Executive Routine).
SPBEEP begins on line 404, and SPBDSS in- forms the user that he must have a cost eslimate of the control project. Nine fact sheets are available within SPBDSS to help the user arrive a t this esti- mate (410 to 438). Having input a project cost of $400 to salvage 75 percent of the infested timber vol- ume (452 to 481), SPBEEP summarizes the eeo- nornic consequences incurred "Without a Project" (484 to 504) and "With a Project" "(509 to 529), A final report is generated detailing the project bene-
lem analysis* It will be repeated on the screen when- fits, benefit/cost ratio, volume protected, ete. f 535 ever a problem analysis menu is presented to remind to 543). Additionally, a user has the op"t.icsn of repeti- the user of the specific question, tively running the economics model with various con- At the completion sf problem analysis, a summary trol projects to evaluate alternative management
of the user's selections is displayed (96 to 1001, and strategies (546). SPBDSS recognizes that two fact sheets are present in the data base that may relate do the landowner's DISCUSSION AND GONGLUSIONS
4 Numb~ss in parentheses refer to line numbers in the The concepts of decision support embodied in example. SPBDSS and discussed in this paper are germane to
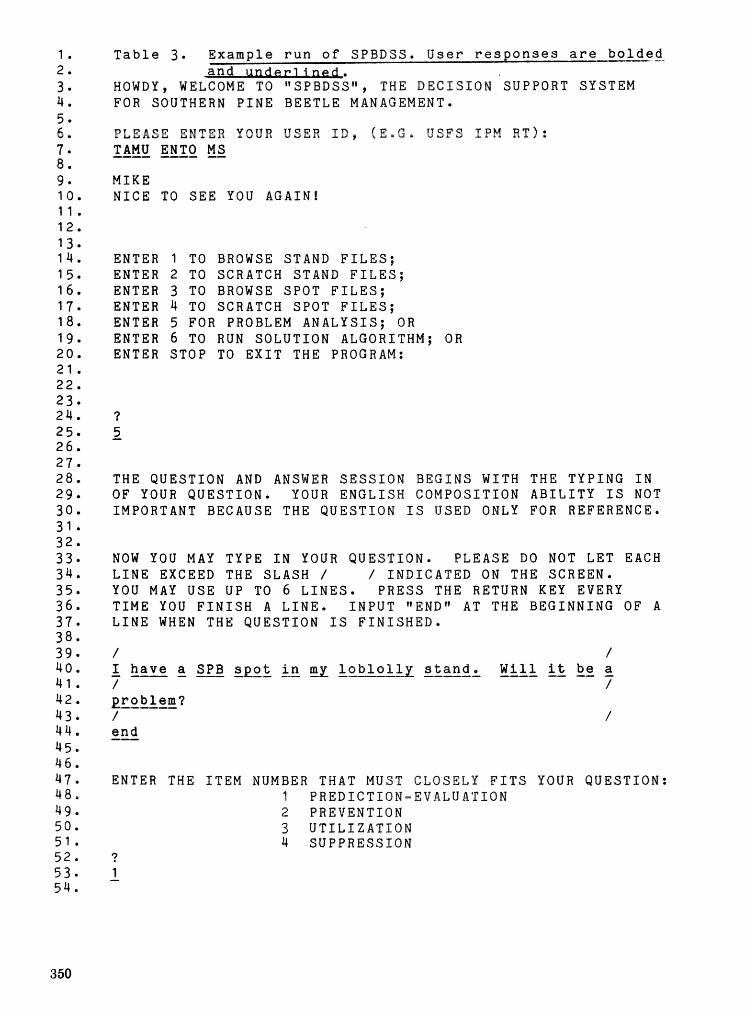
T a b l e 3 . -- d
HOWDY, WELCOME TO " S P B D S S " , THE D E C I S I O N S U P P O R T SYSTEM FOR SOUTHERN P I N E B E E T L E MANAGEMENT*
P L E A S E E M T E W Y O U R USER ID$ (E.c, USFS I P M R T I E TAHU ENTO MS -- -- v
M I K E N I C E TO S E E YOU AGAIN!
ENTER 1 TO BROWSE STAND F I L E S ; ENTER 2 TO SCRATCH STAND F I L E S ; ENTER 3 TO BROWSE S P O T F I L E S ; ENTER 4 TO SCRATCH S P O T F I L E S ; ENTER 5 FOR PROBLEM A N A L Y S I S ; OR ENTER 6 TO RUN S O L U T I O N ALGORITHM; OR ENTER S T O P TO E X I T THE PROGRAM:
THE Q U E S T I O N AND ANSMER S E S S I O N B E G I N S WITH THE T Y P I N G I N O F YOUR Q U E S T I O N * YOUR E N G L I S H C O M P O S I T I O N A B I L I T Y I S NOT IMPORTANT BECAUSE THE Q U E S T I O N I S USED ONLY FOR R E F E R E N C E .
NOW YOU MAY T Y P E I N YOUR Q U E S T I O N . P L E A S E DO NOT L E T EACH L I N E EXCEED THE S L A S H / / I N D I C A T E D ON THE S C R E E N * YOU MAY U S E UP TO 6 L I N E S . P R E S S THE RETURN KEY EVERY T I M E YOU F I N I S H A L I N E . I N P U T "ENDtt AT THE B E G I N N I N G O F A L I N E WHEN THE Q U E S T I O N I S F I N I S H E D *
/ / I have % SPB g p o t q I s b l o l l y standc W i l l & g - --- / / ~ o b l e m ? ---- / / end --
ENTER THE I T E M NUMBER THAT MUST CLOSELY F I T S YOUR Q U E S T I O N : 1 P R E D I C T I O N - E V A L U A T I O N 2 P R E V E N T I O N 3 U T I L I Z A T I O N 4 S U P P R E S S I O N
? 1 -
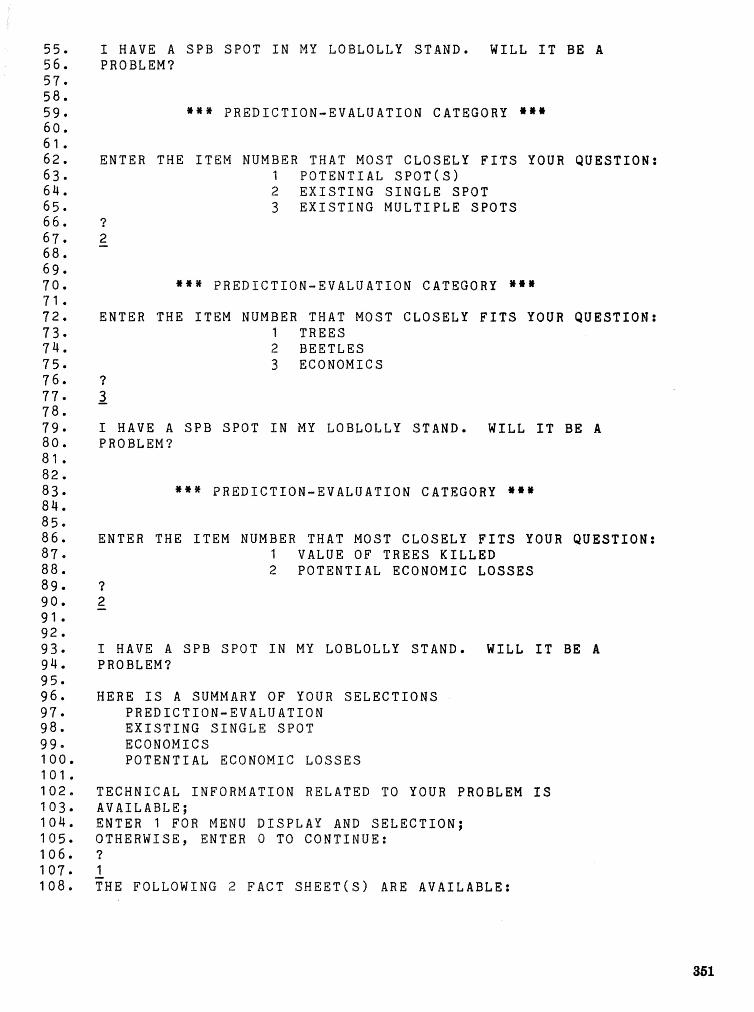
I HAVE A S P B S P O T I N MY LOBLOLLY S T A N D * W I L L I T BE A PROBLEM?
" * @ P R E D I C T I O N - E V A L U A T I O N CATEGORY ***
ENTER THE I T E M MUMBER THAT MOST CLOSELY F I T S YOUR Q U E S T I O N : 1 P O T E N T I A L S P O T ( S ) 2 E X I S T I N G S I N G L E S P O T 3 E X I S T I N G M U L T I P L E S P O T S
? 2 -
" 9 % P R E D I C T I O N - E V A L U A T I O N CATEGORY * * #
ENTER THE I T E M NUMBER THAT MOST CLOSELY F I T S YOUR Q U E S T I O N : 1 T R E E S 2 B E E T L E S 3 ECONOMICS
? 3 - I HAVE A S P B S P O T I N MY LOBLOLLY S T A N D * W I L L I T BE A PROBLEM?
" * # P R E D I C T I O N - E V A L U A T I O N CATEGORY * * *
ENTER THE I T E M NUMBER THAT MOST CLOSELY F I T S YOUR Q U E S T I O N : 1 VALUE O F T R E E S K I L L E D 2 P O T E N T I A L ECONOMIC L O S S E S
? 2 -
I HAVE A S P B S P O T I N MY LOBLOLLY STAND. W I L L I T BE A PROBLEM?
HERE I S A SUMMARY O F YOUR S E L E C T I O M S P R E D I C T I O N - E V A L U A T I O N E X I S T I N G S I N G L E S P O T ECONOMICS P O T E N T I A L ECONOMIC L O S S E S
T E C H N I C A L INFORMATION RELATED TO YOUR PROBLEM I S A V A I L A B L E ; ENTER 1 FOR MENU D I S P L A Y AND S E L E C T I O N ; O T H E R W I S E , ENTER O TO C O N T I N U E : ? 1 - T H E F O L L O W I N G 2 F A C T S H E E T ( S ) A R E A V A I L A B L E :

FACT SHEET N Q e l g A M E T H O D FOR ASSESSING THE IMPACT OF SOUTHERN PINE BEETLE DAMAGE ON ESTHETIC VALUES F A C T SHEET Hoe20 ECONOMIC IMPACT OF THE SOUTHERN PINE BEETLE ON RECREATION--ONE APPROACH
ENTER THE FACT SHEET NO* YOU D E S I R E : ? 0 -
SIMULATION M A Y AID YOU IN YOUR PROBLEM SOLVING; IMPUT 1 FOR M E N U QF MODELS IN THE MODEL BASE; I N P U T START TO R E S T A R T OR INPUT STOP TO E X I T ; O T H E R W I S E 9 ALT RETURN TO MAKE SIMULATION RUNCS).
?
T H I S I S THE E N D O F THE FRONTEND SESSION, NOW YOU ARE ENTERING THE PROBLEM SOLVING MODE.
INPUT THE PRICE INFORMATION IN THE SEQUENCE OF ( 1 ) GREEN PULPWOOD P R I C E ( $ / C O R D ) ; R A N C E ( ~ O , ~ ~ ) ( 2 ) GREEN SAWTIMBER P R I C E ( $ / M B F ) ; R A N G E ( ~ O , ~ O ~ ) ( 3 ) SALVAGE PULP PRICE($/CORD);RANGE(10,30~ ( 4 ) SALVAGE SAWTIMBER P R I C E ( $ / M B F ) ; R A N C E ( ~ O ~ ~ O O ~
VALUES ARE TO BE INPUT ON THE SAME LINE AND SEPARATED BY A COMMA:
I M P U T THE RATE OF CHANCE FOR THE STUMPAGE PRICE, WHICH N O R M A L L Y DOES NOT E X C E E D 3.0. I F YOU ARE NOT SURE WHAT IT MAY BE, INPUT 0 :
STAND IDENTIFIGATIQN FOR STAND NO* 1
?
EU&&XL I N P U T THE STAND TYPE AS FOLLOWS: I N P U T : 1 SLASH P I N E P L A N T A T I O N E N P U T : 2 LOBLOLLV PINE P L A N T A T I O N I N P U T 2 3 L6BLOLLY P I N E N A T U R A L STAND INPUT : 4 SHORTLEAF PINE P L A N T A T I O N 7 2 ENTER 2 TO R O N TAMBEETLE; ENTER 2 TO R U N TPS MODEL NOTE: THE RUN TIME FOR T A M B E E T L E MAY BE LENGTHY, BUT IT P R O V I D E S A H I G H L E V E L OF RESOLUTION*
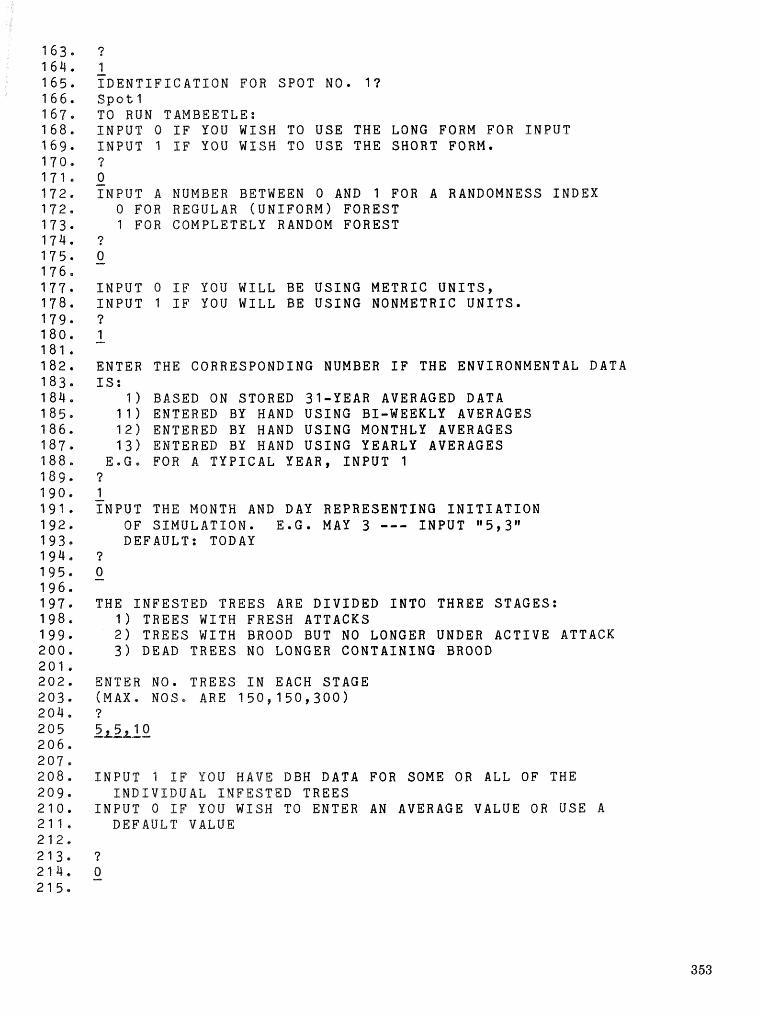
7 I - P B E N T Z F I C A T I O N FOR S P O T NO* I ? S p o t 1 TO RUM TAMBEETLE: I M P U T 0 I F YOU WXSW TO U S E THE LONG FORM FOR I N P U T I N P U T 1 IF YOU W I S H TO U S E THE SHORT FORM. "? 0 - I N P U T A NUMBER BETWEEN O AND 1 FOR A RANDOMNESS I N D E X
0 FOR REGULAR ( U N I F O R M ) F O R E S T 1 FOR COMPLETELY RANDOM F O R E S T
";Z 0 - I M P U T O I F YOU W I L L BE U S I N G M E T R I C U N I T S , I N P U T 1 I F YOU M I L L BE U S I N G NONMETRIC U N I T S . 7 1 - ENTER THE CORRESPONDING NUMBER I F THE ENVIRONMENTAL DATA IS :
1 ) BASED OM STORED 31-YEAR AVERAGED DATA 1 1 ) ENTERED BY BAND U S I N G BI-WEEKLY AVERAGES 1 2 ) ENTERED BY HAND U S I N G MONTHLY AVERAGES 1 3 ) ENTERED BY BAND U S I N G YEARLY AVERAGES
E e G e F O R A T Y P I C A L YEAR, I N P U T 1 "i" 1 - I N P U T THE MONTH AND DAY R E P R E S E N T I N G I N I T I A T I O N
OF S I M U L A T I O N . E.G. MAY 3 --- I N P U T " 5 , 3 " DEFAULT: TODAY
? 0 - THE I N F E S T E D T R E E S ARE D I V I D E D I N T O THREE S T A G E S :
1 ) T R E E S WITH F R E S H ATTACKS 2 ) T R E E S WITH BROOD BUT NO LONGER UNDER A C T I V E ATTACK 3 ) DEAD T R E E S NO LONGER C O N T A I N I N G BROOD
ENTER NO* T R E E S I N EACH S T A G E (MAX. NOS. ARE 1 5 0 , 1 5 0 , 3 0 0 ) p?
L Z L I Q
I N P U T 1 I F YOU W A V E DBM DATA FOR SOME OR ALL OF THE I N D I V I D U A L I N F E S T E D T R E E S
I N P U T 0 IF YOU W I S H TO ENTER AN AVERAGE VALUE O R U S E A DEFAULT VALUE
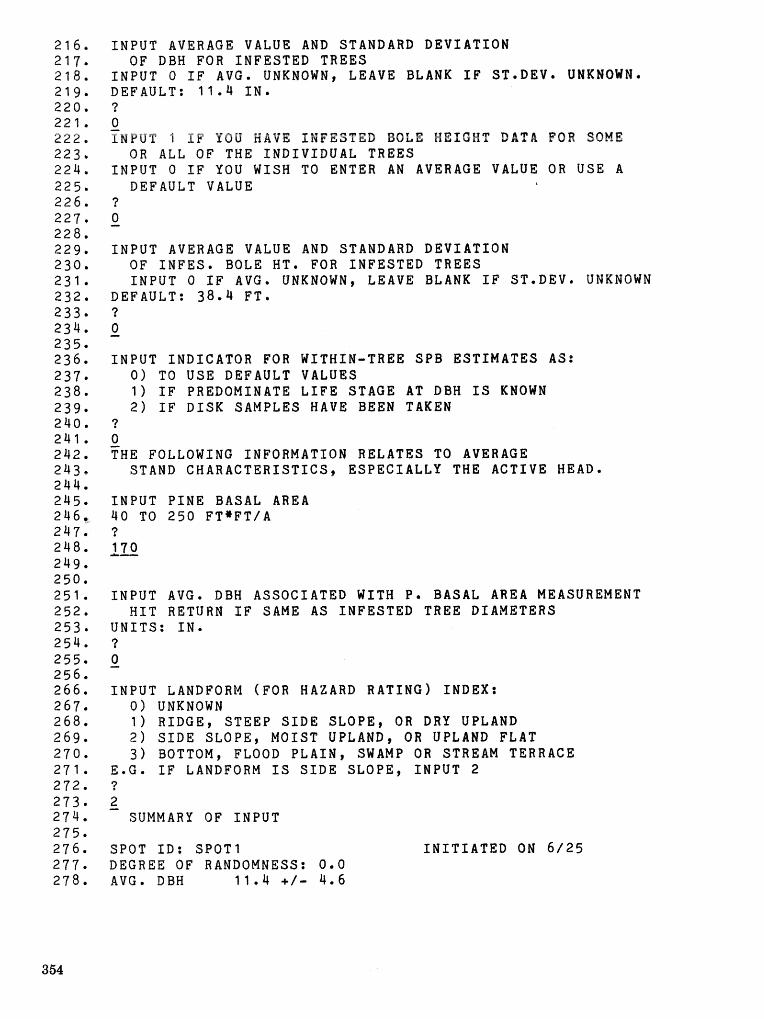
I N P U T AVERAGE VALUE AND STANDARD D E V I A T I O N OF DBH FOR I N F E S T E D T R E E S
I N P U T 0 I F AVGe UNKNOWN, LEAVE BLANK I F S T e D E V e U N K N O W N * DEFAULT: 1 1 e 4 I N * ? 0 - I N P U T 1 I F YOU HAVE I N F E S T E D BOLE HEIGHT DATA FOR SOME
OR ALL O F THE I N D I V I D U A L T R E E S I N P U T O I F YOU WISH TO ENTER A N AVERAGE VALUE OR USE A
DEFAULT VALUE L
? 0 - I N P U T AVERAGE VALUE AND STANDARD D E V I A T I O N
O F I N F E S . BOLE HT. FOR I N F E S T E D T R E E S I N P U T O I F AVGe UNKNOWN, LEAVE BLANK I F S T e D E V e U N K N O W N
DEFAULT: 38.4 F T e ? 0 - I N P U T INDICATOR FOR WITHIN-TREE SPB E S T I M A T E S AS:
0 ) TO U S E DEFAULT VALUES 1 ) I F PREDONINATE L I F E STAGE AT DBH I S KNOWN 2 ) I F D I S K SAMPLES HAVE BEEN TAKEN
? 0 - THE FOLLOWING INFORMATION RELATES TO AVERAGE
STAND C H A R A C T E R I S T I C S t E S P E C I A L L Y THE ACTIVE HEAD*
I N P U T P I N E BASAL AREA 4 0 TO 2 5 0 F T * F T / A ? 170 -L-
I N P U T AVGe DBH ASSOCIATED WITH P * BASAL AREA MEASUREMENT WIT RETURN I F SAME AS I N F E S T E D TREE DIAMETERS
U N I T S : I N * ? 0 - I N P U T LANDFORM (FOR HAZARD R A T I N G ) INDEX:
0 ) UNKNOWN 1 ) R I D G E , S T E E P S I D E S L O P E , OR DRY UPLAND 2 ) S I D E S L O P E , M O I S T UPLAND, OR UPLAND FLAT 3 ) BOTTOM, FLOOD P L A I N , SWAMP OR STREAM TERRACE
E e G e I F LANDFORM I S S I D E S L O P E , I N P U T 2 ? 2 -
SUMMARY OF I N P U T
SPOT I D : S P O T 1 DEGREE OF RANDOMNESS: O e O AVGe DBH l l e 4 +/ - 4 e 6
I N I T I A T E D ON 6 / 2 5
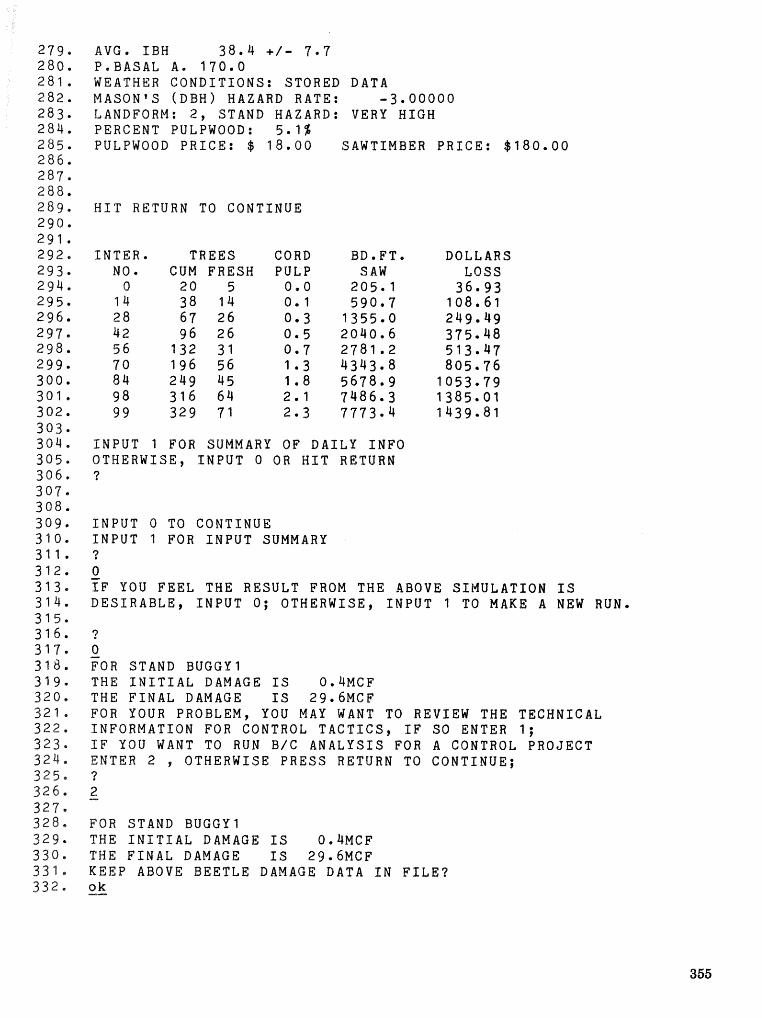
A V C * I B H 38 .4 +I- 7 . I PeBASAL A * 170eO WEATHER CONDITIONS: STORED D A T A MASON'S (DBW) H A Z A R D RATE: -3 . 0 0 0 0 0 LANDFORM: 2 , STAND H A Z A R D : V E R Y H I G H PERCENT PULPWOOD: 5 .19 PULPWOOD P R I C E : $ 18 .00 SAWTIMBER PRICE: $180 .00
H I T R E T U R N TO CONTINUE
I N T E R * TREES C O R D BBsFTo N O * C U M FRESH PULP S A W
0 2 0 5 0.0 2 0 5 , 1 I 4 3 8 14 0 * 1 590.7 28 67 26 0 * 3 1355.0 42 96 26 0 .5 2040 .6 5 6 132 31 0.7 2781 .2 70 1 9 6 56 1 . 3 4343 .8 84 249 4 5 1 . 8 5678.9 9 8 316 64 2 * 1 7486 .3 99 329 71 2 . 3 7773 .4
DOLLARS LOSS
3 6 * 9 3 108 .61 2 4 9 , 4 9 315.48 513.47 805 . '76
1053 .79 1385.01 1439.81
INPUT 1 FOR SUMMARY OF D A I L Y INFO OTHERWISE, INPUT 0 O R H I T R E T U R N ?
INPUT 0 TO CONTINUE INPUT 1 FOR INPUT SUMMARY ? 0 - I F Y O U FEEL THE RESULT FROM THE ABOVE SIMULATION I S DESIRABLE, INPUT 0; OTHERWISE, INPUT 1 TO M A K E A NEW R U N *
? 0 - FOR STAND BUGGY1 T H E I N I T I A L D A M A G E IS O , Q M C F T H E FINAL D A M A G E I S 29.6MCF FOR Y O U R PROBLEM, Y O U N A Y WANT TO R E V I E W THE T E C H N I C A L INFORMATION FOR C O N T R O L TACTICSt I F SO ENTER I ; IF Y O U W A N T TO R U N B / C ANALYSIS FOR A C O N T R O L PROJECT ENTER 2 OTHERWISE PRESS RETURN TO C O N T I N U E ; 2
FOR STAND BUGGY1 THE I N I T I A L D A M A G E I S 0.4MCF THE FINAL D A M A G E I S 29.6MCF KEEP ABOVE BEETLE D A M A G E D A T A I N FILE? ok --
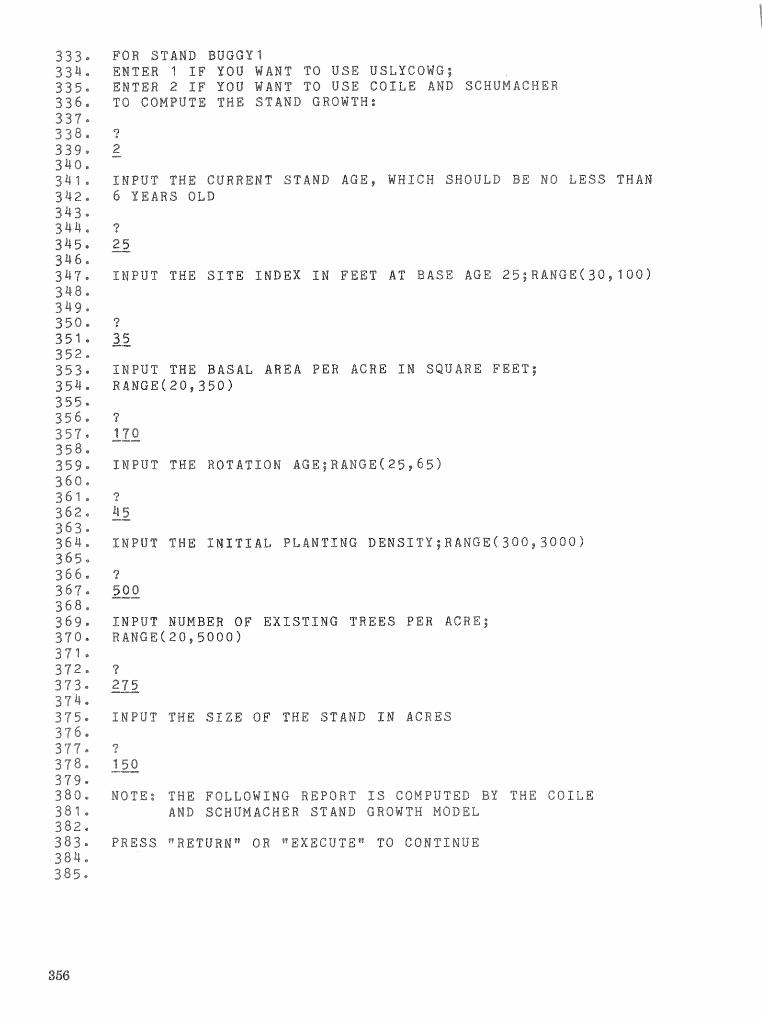
FOR STAND BUGGY7 ENTER 1 IF YOU W A N T TO USE USLYGOWG; ENTER 2 I F YOU W A N T TO USE CQLLE AND S C H U M A C W E R TO COMPUTE THE STAND GROWTH:
I N P U T THE C U R R E N T STAND ACEI WHICH SHOULD BE NO LESS THAM 6 YnaaRs OED
INPUT THE SITE INDEX IN F E E T AT BASE AGE 25;~8~@~(30,100)
I N P U T THE BASAL AREA PER A C R E IN S Q U A R E F E E T ; RANGE(~O, 3 5 0 )
I N P U T THE ROTWT$ON A G E ; R A M c E ( ~ ~ , ~ ~ )
INPUT THE I N I T I A L P L A N T I N G B E N S I T Y ; R A N G E ( % Q ~ , ~ ~ ~ ~ )
I N P U T NUMBER OF EXISTING T R E E S PER ACRE; RANGE(20,5800)
I N P U T THE S I Z E OF THE STAND IN ACRES
NOTE: T H E FOLLOWING REPORT IS C O M P U T E D BY THE G B I L E AND S C H U M A C H E W STAND G R O W T H MODEL
P R E S S 9 tRETURNf@ OR " E X E C U T E w TO C O N T I N U E
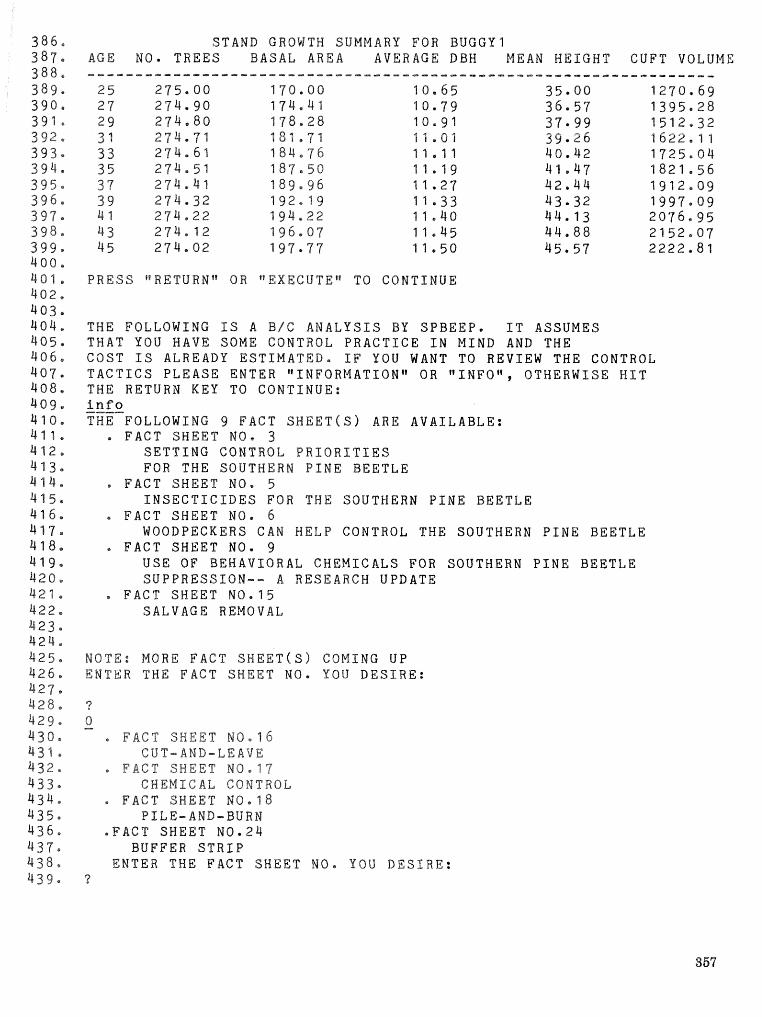
STAND GROWTH SUMMARY FOR BUGGY1 A G E NO* TREES BASAL A R E A A V E R A G E D B H M E A N HEIGHT C U F T V O L U M E ~ ~ ~ - - ~ L - - ~ ~ * m - * I - - - - - - - - - - . L I 1 . L I 1 . L I 1 I e - - - ~ - . I I . I I . I I . I I - - - - - ~ * - - ~ - - - ~ - - - - - - - - ~ - ~ -
2 5 2 7 5 . 0 0 170 ,SO 1 0 , 6 5 3 5 6 0 0 1 2 7 0 . 6 9 27 2 7 4 - 9 0 ~ l t t a L I ' l 1 0 . 7 9 3 6 , 5 1 1395 .28 2 9 274 .80 1 7 8 , 2 8 1 0 , 9 1 37 .99 1 5 1 2 * 3 2 3 4 274.71 181,71 "4 ,,81 39.24 i i622.11 33 2 V 4 , 6 1 1 8 4 , 1 6 1 1 , 1 1 40 .42 1725,011 3 5 2 1 4 , 5 1 18"P 50 1 1 , 1 9 4 1 . 4 7 1 8 2 1 , 5 6 3 7 2 7 t f , ~ l 1 1 8 9 ~ 9 6 1 1 . a ? 4 2 . ~ t 4 ~ g ~ z , o g 39 2 7 Q b 3 2 1 9 2 * 1 9 4 1 4 3 4 3 . 3 2 1 9 9 7 . 0 9 4 1 274,22 1 9 Q e 2 2 1 1 . 4 0 4 4 . 1 3 2 0 7 6 e 9 5 4 3 2 1 Q b 1 2 1 g & e 0 7 11,rd5 4 4 , 8 8 2 1 5 2 e 0 7 4 5 274 .02 1 9 7 0 ' 7 7 "1 ,50 4 5 . 5 7 a ;22a ,81
P R E S S "RETURN" O R " E X E C U T E t g TO CONTINUE
THE FOLLOWING IS A B I C ANALYSIS BY SPBEEP. I T ASSUMES THAT Y O U W A V E SOME CONTROL PRACTICE I N M I N D A N D THE COST I S ALREADY ESTIMATED@ I F Y O U WANT TO R E V I E W THE CONTROL TACTICS PLEASE ENTER iiINFORMATIONw O R wINFO1t, OTHERWISE HIT THE RETURN KEY TO CONTINUE: info THE FOLLOWING 9 FACT SHEET(S9 A R E AVAILABLE:
* FACT SWEET N O . 3 SETTING CONTROL PRIORITIES FOR THE SOUTHERN PINE BEETLE
c FACT SHEET N O * 5 INSECTICIDES FOR T H E SOUTHERN PINE BEETLE
FACT SHEET N O . 6 WOODPECKERS C A N HELP CONTROL THE SOUTHERN PINE BEETLE
FACT SHEET NO. 9 USE OF BEHAVIORAL CHEMICALS FOR SOUTHERN PINE BEETLE SUPPRESSION-- A RESEARCH UPDATE
FACT SHEET NO.15 SALVAGE REMOVAL
NOTE: M O R E FACT SHEET(S) C O M I N G UP ENTER T H E FACT SHEET N O . Y O U DESIRE:
2 6 *
F A C T SHEET M0.16 CUT-AND-LEAVE
a FACT SHEET NO147 G B E N E C A L CONTROL
FACT SWEET M0.18 P I L E - A N D - B U R N
* F A C T SHEET NO124 BUFFER S T R I P
ENTER THE FACT S H E E T NO* Y O U D E S I R E : '2

THE FOLLOWING I S A B I C A N A L Y S I S BY S P B E E P . I T ASSUMES THAT YOU HAVE SOME CONTROL P R A C T I C E I N MIND A N D THE C O S T I S ALREADY E S T I M A T E D * I F YOU WANT TO REVIEW THE CONTROL T A C T I C S P L E A S E ENTER " IMFORMATION" O R "PHFOf ' , O T H E R W I S E HIT THE RETURN KEY TO COMTINUE:
FOR THE ABOVE 1 S T A N D ( S ) I N Q U E S T I O N , I N P U T THE P R O J E C T COST: ? 400 -- I N P U T THE D I S C O U N T R A T E , WHICH I S NOT TO EXCEED 1 5 : 3 - I N P U T THE PERCENTAGE O F VOLUME K I L L E D THAT MAY BE SALVAGED WITHOUT CONTROL, AND THE PERCENTAGE O F VOLUNE K I L L E D THAT W I L L BE SALVAGED WITH CONTROL* VALUES ARE TO BE ENTERED ON THE SAME L I N E AND SEPARATED BY A COMMA* ?
!?AIZ FOR STAND BUGGY1 THE AGE I S AT 2 5 LNTERM HARVEST ? I F Y E S I N P U T 1 , I F NO I N P U T 0: 1 - AGE FOR THE I N T E R N HARVEST ? 30 -- PERCENT REMOVED ? 4 0 --
I F HARVEST FOR P U L P I N P U T 0 , I F HARVEST FOR SAW TIMBER I N P U T 1 : 0 - FOR STAND BUGGY1 THE AGE FOR F I N A L CUT I S 45 I F HARVEST FOR P U L P I N P U T 0 , I F HARVEST FOR S A W TIMBER I N P U T 1 : 1 -
WITHOUT A P R O J E C T em----- - - - - m - - -
VOLUME VOLUME AGE VOLUME AT P R I C E VALUE AT P R E S E N T AGE HARV L O S T THREAT AT HARVEST AT HARVEST VALUE
OBJ ( M C F ) ( M C F ) H A R V * ( M C F ) WARV.
P R E S S RETURN OR EXECUTE KEY TO C O N T I N U E :
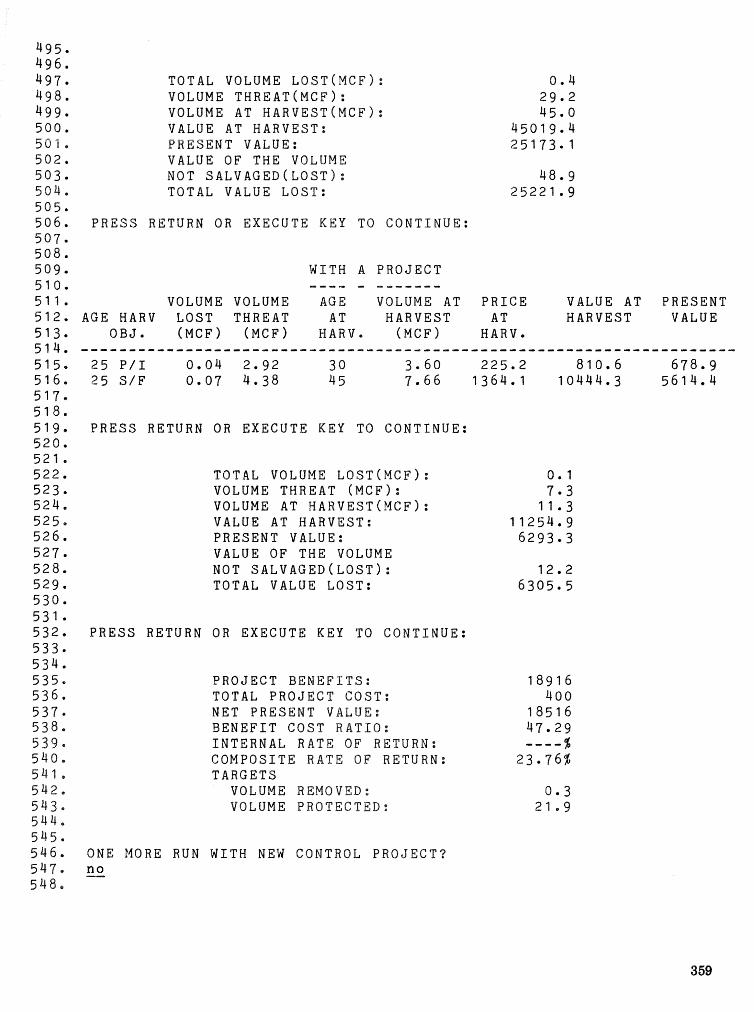
TOTAL VOLUME L O S T ( M C F ) : VOLUME T H R E A T ( N C F ) : VOLUME AT H A R V E S T ( M C F ) : VALUE AT H A R V E S T : P R E S E N T VALUE: VALUE O F T H E VOLUME NOT S A L V A G E D ( L O S T ) : TOTAL VALUE L O S T :
P R E S S RETURN OR E X E C U T E KEY TO C O N T I N U E :
W I T H A P R O J E C T - - I 1 e.. e------
VOLUME VOLUME AGE VOLUME AT P R I C E VALUE AT P R E S E N T ACE HARV L O S T T H R E A T AT H A R V E S T AT H A R V E S T VALUE
O B J . ( M C F ) ( M C F ) H A R V . ( M C F ) H A R V .
P R E S S RETURN OR E X E C U T E KEY TO C O N T I N U E :
TOTAL VOLUME L O S T ( M C F ) : V O L U M E T H R E A T ( M C F ) : VOLUME AT H A R V E S T ( M C F ) : VALUE AT HARVEST: P R E S E N T VALUE: VALUE O F T H E VOLUME NOT S A L V A G E D ( L O S T ) : TOTAL VALUE L O S T :
P R E S S RETURN OR E X E C U T E KEY TO C O N T I N U E :
P R O J E C T B E N E F I T S : TOTAL P R O J E C T C O S T : NET P R E S E N T VALUE: B E M E F I T C O S T R A T I O : I N T E R N A L RATE OF RETURN: C O M P O S I T E RATE OF RETURN: T A R G E T S
VOLUME REMOVED: VOLUME P R O T E C T E D :
ONE MORE RUN W I T H NEW CONTROL P R O J E C T ? no -
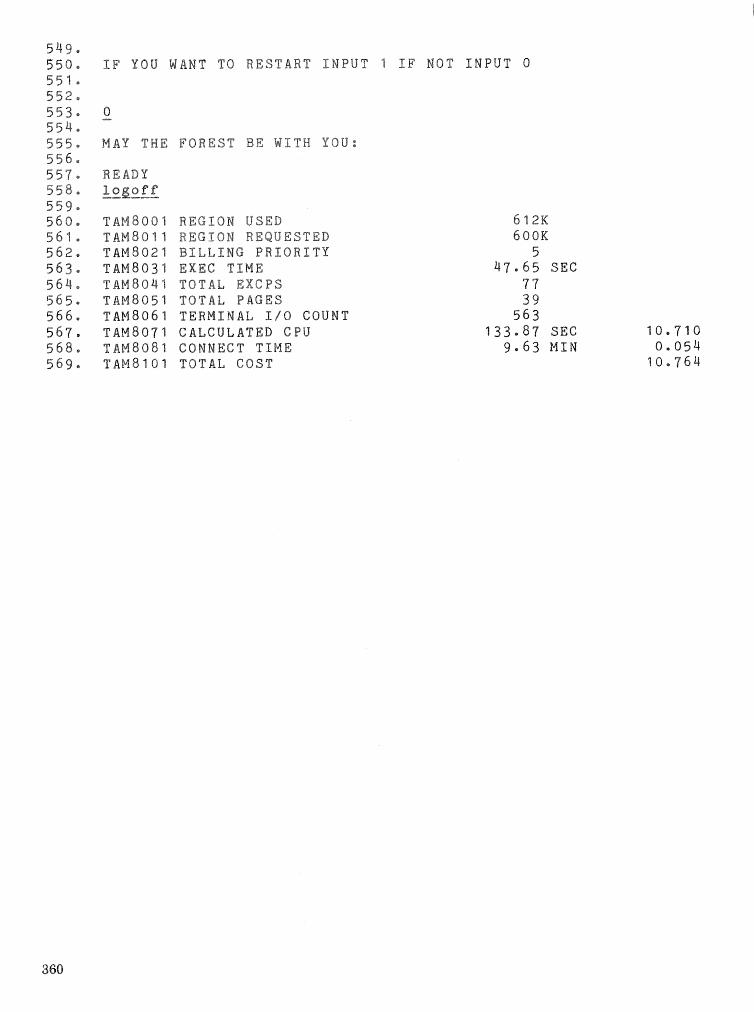
IF Y O U W A N T TO RESTART I N P U T 1 I F NOT I N P U T O
M A Y THE FOREST B E WITH Y O U :
TAM8002 R E G I O N USED T A M 8 6 1 1 R E G I O N REQUESTED TAM8021 BILLING P R I O R I T Y T A M 8 0 3 1 EXEC T I M E TAM8041 TOTAL E X G P S T A M 8 0 5 4 TOTAL PACES T A M 8 0 6 1 TERMINAL I I Q COUNT T A M 8 0 7 1 C A L C U L A T E D CPU T A M 8 0 8 1 CONNECT TXME T A M 8 1 0 1 TOTAL C O S T
612K 600K
5 r i T 0 6 5 S E C
77 39
563 " r 3 * 8 7 SEC
9 * 6 3 E1111\3
all IPM decisionmaking, As the amount and com- plexity of pest management infomation increase, forest managers are finding it increasingly difticult Lo keep up-to-date. By adopting a mll-managed and continuously updated DSS approach to pest man- agement, users will. always have the best infoma- tion available to them, regardless of their level of expertise.
In addition to technology transfer, the DSS struc- ture can provide other support for the problem area it represents, Because decision support systems are structured around problems, administrators can iden- tify where the current technology is ineffectual and where future research should be directed,
When used as an IPM teaching aid, a DSS pro- vides a powerful tool for simulating the outcome of various treatment strategies. Although no computer- based instruction can replace hands-on field experi- ence, DSS-based training can prevent the wasted ef- fort of a trial and error approach to fieldwork.
The experience gained from the development of SBPDSS and the feedback received from southern foresters indicate that the DSS concept is an excel- lent approach to IPM decisionmaking. The only ex- penses incurred using SPBDSS are for computer time and telephone charges. These expenses are in- significant relative to the losses that could be incurred as a result of an incorrect management decision. In the example run presented in table 3, the direct ex- penses associated with using SPBDSS are $10.76 (569) for computer costs, and (assuming the user is located in Atlanta) approximately $10 for a 20- minute long distance phone call. The potential losses that could result in the first 99 days of this SPB spot are approximately $45,000 (line 500). Em- bodied in the concepts of DSS is the philosophy that managers are, in general, competent, and that an inadequate decision reflects an inability to acquire and assimilate pertinent information (Keen and ~Vorton 1978). These constraints can be overcome and better forest management decisions made by using a DSS.
LITERATURE CITED
Belanger, R. P.; Porterfield, R, L.; Rowell, 6. E. De- velopment for rating the susceptibility of natural stands in the Piedmont of Georgia to attack by the southern pine beetle, In: Hedden, R. L.; Barras, S, J.; Coster, J.E., tech. coords.; Hazard-rating systems in, forest insect pest management: sym- posium proceedings; 1980 July 31-August I ; Athens, GA. Gen. Tech. Rep. WO-27. Washing- ton, DC: U.S. Department of Agriculture, Forest Service; f 981 : 79-86.
Bennett, J. L. Introduction note. In Bennett, J. L., ed, Building decision support systems, Reading, MA : Addison-Wesley Publishing Company; 1983 : 1-14.
Billings, R. F.; Hynum, B. 6. Southern pine beetle: guide for predicting timber losses from expanding spots in east Texas. Tex, For, Serv, Circ, 149, Lufiin, TX: Texas Forest Service; 1980. 2 p.
Brerrder, E. V.; Clutter, J. E. Yield of even-aged nat- ural stands of loblolly pine. Ga, For. Res, Coune, Rep. No. 23. Macon, GA: Georgia Forest Research Council; 1970, 7 p.
Burkhart, H. E.; Parker, R. C.; Odemald, R. 6. Yields for natural stands of lebloly pine, Publ. FWS-2-72. Blacksburg, VA: Division of Forestry and Wildlife Resources, Virginia Polytechnic In- stitute and State University; 1972a. 63 p.
Burkhart, H, E.; Parker, R. C.; Strub, M. Re; Oder- wald, R. G. Yields of old-field loblolly pine planta- tions. Publ. FWS-3-72. Blacksburg, VA: Division of Forestry and Wildlife Resources, Virginia Poly- technic Institute and State University; 1972b. 51 p,
Burkhart, H. E.; Strub, hl, E. A model for simulation of planted loblolly pine stands, In: Fries, J,, ed. Growth models for tree and atand simulation, Stockholm, Sweden: Royal College of Forestry; 1974.258 p.
Coile, T.S.; Schumacher, F.S. Soil-site relations, stand structure, and yields of slash and loblolly pine plantations in the southern United States. Durham, NC: T.S. Coile, Inc; 1964. 296 p.
Coster, J.E.; Searcy, J.L., eds. Evaluating control tactics for the southern pine beetle, sy mposiun~ proceedings; 1979 January 30-February 1; Many, LA. Tech, Bull. 1613. Atlanta, GA: U.S. Depart- ment of Agriculture, Forest Service; 19'39. 118 p.
Daniels, R.F.; Burkhart, H.E. Simulation of indi- vidual tree growth and stand development in man- aged loblolly pine plantations, FkVS-5-75, Blacks- burg, VA: Division of Forest and mTildlife Re- sources, Virginia Polytechnic Institute and Stale University; 1975. 69 p,
Daniels, R.F.; Burkhart, H.E.; Spittle, G.D.; Somers, G.L. Methods for modeling individual tree growtki and stand development in seeded toMolly pifie stands. Publ. FWS-1-79. Blacksburg, VA: Divi- sion of Forest and Wildlife Resources, Virginia Polytechnic Institute and State University; 1979. 50 p.
Dell, T.R.; Feduccia, D.P.; Campbell, T.E.; h h ~ , W.F., Jr.; Polmer, B.H. Yields of unthinned slash pine plantations on cutover sites in the west Gulf region. Res. Pap. SO-147. New Orleans, LA: U.S. Department of Agriculture, Forest Service, Sou! h- ern Forest Experiment Station; 1979; 64 p.
Feduccia, D.P., Dell, T.R.; Mann, W.F., Jr.; Camp- bell, T.E.; Polmer, B.H. Yields of unthinned lob- lolly pine plantations on cutover sites in the west Gulf region. Res. Pap. SO-148. New Orleans, LA: U.S. Department of Agriculture, Forest Service Southern Forest Experiment Station; 1979. 88 g .
Feldman, R.M., Curry, G.L.; Coulson, R.N. A mathe- matical model of field population dynamics of the southern pine beetle, Dendroctonus frontalis. Ecol, Model, 13: 261-281; 1981,
Goehel, N.B.; Warner, J.R. Volume yields of lob- lolly pine plantations for a variety of sites in the South Carolina Piedmont. Clemson, SC: Clemson University, Department of Forestry; 1969. 15 p.
Hedden, R.L.; Billings, R.F. Southern pine beetle: factors inAueracing the growth and decline of sum- mer infestations in east Texas. For Sci. 25: 547- 556; 1979,
Ku, T.T.; Sweeney, J.W.; Shelburne, V.B. Site and stand conditions associated with southern pine beetle outbreaks in Arkansas-a hazard rating system. South. J. Appl. For. 4: 103-106; 1980.
Kulhavy, D.L.; Johnson, P.C. Southern pine beetle: annotated bibliography, 1868-1982, Lufkin, TX: Lufkin Printing Co.; 1983.95 p.
Kushmaul, R,J.; Cain, M.D. ; Rowell, C.D. ; Porter- field, R.L, Stand and site conditions related to southern pine beetle susceptibility. For. Sci, 25 : 656-664; 1979,
Larson, R.'LY.; Goforth, r\,I.H. TRIPS: a computer program for the projection of timber volume, Agric. Haadb. 37X Washington, DC: U.S. Department of Agriculture; 1970.63 p.
Larson, 1Z.W.; Goforth, M.H. TRAS: a timber vol- ume projection model, Tech. Bull. 1508. Washing- ton, DC: U.S. Department of Agriculture; 1974. 15 p,
Lenhart, J,D. Cubic-foot yields for unthinned old- field loblolly plantations in the interior west Gulf coastal plain. Pap. No. 14. Nacogdoches, TX: Stephen F. Austin State University, School of Forestry; 597%- 46 p,
Lenhart, 9-79,; Clutter, J.L. Cubic-foot yield tables for old-field lsblolly pine plantations in. the Georgia Piedmont, Rep, No. 22, Sere 3, Itlacon, GA: Geor- gia Forest Research Council; 1971; 12 p,
Letaschner, W.A,; Sfatney, T.G.; Burkhart, H.E. Simulating southern pine beetle activity for pest management decisions, Can. J, For, Res, '7: 138- 144; 1977,
Leusckaer, W.A,; Max, T.A.; Spittle, G.D.; Wisdom, H-W, Estimating southern pine beetle timber dam- ages, Bull, Entomsl, Soe. Am. 2: 24-34; 1978.
Mason, G.N,; Hicks, Tt,R,, Jr.; Bryant, C.M.; &fatherpis, ML,; Kufhavy, D,L,; Howard, J.E.
Rating southern pine beetle hazard by aerial photography. In: Nedden, R.L.; Barras, S.J.; Caster, J.E., tech. coords, Wazard-rating systems in forest insect pest management: symposium pro- ceedings. 1980 July 31-August I ; Athens, GA. Gem Tech. Rep, W8-27. Nrashington, DC: U.Se Department of Agricul ture, Forest Sewice; 198 b : 109--114.
Moore, G.E. Factors determining population trends in southern pine beetle spots. Environ, Entornol. 7: 335-342; 1978.
Moore, J.H.; Chang, M.G. Design of decision support systems. Data Base 12 : 8-14; 1980.
Moore, J.H.; Chang, M.G. Meta-design considera- tions in building DSS. In: Bennett, J,L,, ed,: Building decision support systems. Reading, MA: Addison-Wesley Publishing Company; 1983: 173- 204.
Murphy, P.A.; Beltz, R.C. Growth and yield of shost- leaf pine in the west Gulf region. Res. Pap. SO- 169. New Orleans, LA: U,S. Department of Agri- culture, Forest Service, Southern Forest Experi- ment Station; 1981,15 p.
Myers, C.A. A computer program for variable. density yield tables for loblolly pine plantations, Tech, Rep. SO-11. New Orleans, LA: U.S. Department of Agriculture, Forest Service, Southern Forest Experiment Station; 1977.31 p.
Page, H.A.; Fagala, F.P. A computer-based inform- tion system to aid southern pine beetle control operations. Tex. For. Serv. Publ. 120. Lufkin, TX: Texas Forest Service; 1978.21 p.
Payne, T.L.; Billings, R.F.; Coulson, R.N.; Kulhavy, D.L., eds. History, status, and future needs for entomology research in southern forests. Tex. Agric, Exp. Sta. Misc. Publ. 1553. (East Texas Forest Entomology Seminar.) College Station, TX: Texas A&M University; 1984, 72 p.
Reed, D.D. Estimating region-wide damages caused by the southern pine beetle. Blacksburg, VA: Vir- ginia Polytechnic Institute and State University; 1979. [MS Thesis].
Rykiel, E.J.; Saunders, M.C.; Wagner, T.L.; Loh, D.K.; Turnbow, RH.; Hu, L.C.; Coulson, R,N, Computer-aided decisionmaking and informaLion accessing in integrated pest management, with emphasis on the southern pine beetle. J. Eeon. Entomol, 77: 1073-1082; 1984.
Saunders, M.C.; Loh, D.K.; Coulson, R.N.; Payne, T.L.; Rykiel, E.J.; Pulley, P.E.; Hu, L.C. Proce- dural guide to the southern pine beetle decision support system. Texas A&M Agric. Exp. Sta. Misc. Publ. 1579. College Station, TX: Texas A&M Uni- versity; 1985.
Schumacher, F.X.; Coile, T.S. Growth and yield of natural stands of southern pines. Durham, NC: T.S. Coile; 1960. 1 f 5 p.
Sinclair, S.A. SAWMOD: a tool for optimizing po- tential profit from beetle-killed southern pine saw- timber. Wood and Fiber 12: 29-39; 1980,
Smaliey, G.W.; Bailey, R.L. "Yield tables and stand structure for shortleaf pine plantations in Ten- nessee, Alabama, and Georgia Highlands. Res. Pap. SO-97. New Orleans, LA: U.S. Department; of Agriculture, Forest Service, Southern Forest Experiment Station; 1974. 58 p.
Sprague, I3,I-f.; Watson, H.J. MIS concepts. Part I. J. System Manage. 26: 34-37; 19'75,
Stephen, F.M.; Searcy, J.L.; Hertel, G,D., eds, Modeling southern pine beetle populations, sym- posium proceedings; 1980 February 20-22; Ashe- ville, NC. Tech, Bull. 1630. Washington, DC: U.S. Department of Agriculture; 1980. 174 p.
Sullivan, A.D.; Clutter, J.L. A simultaneous growth and yield model for loblolly pine. For. Sci. 18: 76-86; 1972.
Thatcher, R.G.; Searcy, J.L.; Caster, J.E.; Hertel, G-D., eds. The southern pine beetle. Tech. Bull. 1631. Washington, I3C: U.S. Department of Agri-
culture; 1980.267 p, Thierauf, R.J . Decision support systems for eRee-
Live planning and control, Emgfewood 61ili3es, NJ: Prentice-Hall; 1982,
Turnbow, R.H.; Coulson, R-N.; Hu, L.; Billings, f2,F, Procedural guide for using the interactive version of the TAMBEETLE model of southern pine beede population and spot dynamics, Tex. Agric, Exp, Sta. Misc. Publ, 1518. College Station, TX: Texas A&M University; 1982, 24 p,
Turnbow, R.H.; Hu, LC.; IZykieI, E.J,; Coulson, R.N.; Loh, D.K. Procedural guide for FERRET, the auestion analysis system for the decision sup- port system for southern pine beedle management, Tex. Agric, Exp. Sta, Misc, Prabl. 1553, Gdlege Station, TX: Texas A&M University; 1982, 21 p.
Turnbow, R,H.; Loh, D.KI; Coulson, R.N.; Wu, L.C.; Rykiel, E.J.; Payne, T.L.; Pulley P.E, Component implementation of the decision suppork system for southern pine beetle management, Se4, Rep. Series 84-1. College Station, TX: Texas Agr?;cuI- tu rd Experiment Station, Texas A&M Univer- sity; 1984.104 p.
Volkema, R.J. Problem formula"ing in phnniing and design. Manage. Sci. 29: 639-652; 19133,
OVERVIEW
Integrated Pest Management in the South: An Overview
R. C. Thatcher, G. N. Mason, and G. D. Hertel'
INTRODUCTION
Southern pine forests have long been ravaged by a host of insect and disease organisms that seriously affect their productive capacity, Most damaging are five species of bark beetles-the southern pine beetle (Dendrocdonus f ron talis Zimm. ) ( SPB ) , three Ips engraver beetles (Ips auulstls (Eichh.), I. grandi- coEEis (Eichh.) , and if. ealligraphus (Gem.) ) , and the black turpentine beetle (D, terebrans (Oliv.) (BTB)-and three tree-killing pathogens-fusiform rust (Cronartium quercum (Berk.) Miy. ex Shirai f. sp. %usiforme), annosus root rot (Heterobasidion crnnosum Fr. Bref. ) , and littleleaf disease (Phy- tophthora cinnamomi Rands). Every year, these organisms kill an estimated 1 billion cubic feet of timber in the southern United States, much of which is never utilized. Growth decline from disease adds to the loss, Thus, minimizing pest-caused losses has become a critical management issue for the southern forestry community,
Historically, pest control has been a crisis response to outbreaks after they have developed. But today's increasing demands dictate that greater volumes of high-quality timber and other forest resources be produced from an ever-diminishing southern land base, If we are to achieve this goal, the impact of insects and diseases on production objectives must be recognized and pest management incorporated into total resource management.
Integrated pest management (IPM), a concept virtually unrecognized a decade ago, involves all aspects of the forest system. I t combines the use of appropriate information on. forest pests to allow
Vrogram Manager, Integrated Pest Management RD&A Program for Bark Beetles of Southern Pines, U.S. Depart- ment of Agriculture, Forest Service, Southern Forest Ex- periment Station, Pineville, LA; Project Leader, Silvicul- tural Options for the Gypsy, Northeastern Forest Experiment Strrtioa, &%organtown, (formerly Research Coordinator for IPM Program) ; Program Manager for Gypsy Moth Re- search, Northeastern Forest Experiment Station, Broomall, PA (formerly Applications coordinator for IPM Progrm) .
timely, sound decisions on their suppression and prevention with environmentall y acceptable, cost- eflective means for regulating their numbers,
In 1973-74 and again in 19'78-79, the projected needs for wood products from the South, coupled with recurring pest outbreaks, dictated that aceele- rated research, development, and applicaticlns efiods be undertaken to provide new or improved methods and materials for controlling these pests of south- ern pine forests, Under the Expanded Southern Pine Beetle Research and Applications Program (ESPBRAP) 2, the emphasis was on expanding the base of knowledge on the SPB, its impacts on multiple forest resources, the host systems in which outbreaks occur, and treatment tactics and strate- gies. The Integrated Pest blanagement Research, Development and Applications Program for Bark Beetles of Southern Pines (PPM Program) was initiated in 1980 to expand this knowledge base and to transfer the technology to the research and applications community in the South.
Because of continuing severe SPB outbreaks in five southeastern States in 1979-88, early emphasis in the IPM Program was given to completing un- finished development and applications studies and the implementation of new or improved techno log^^ concerned with the control of this pest.
PROGRAM MISSION
The mission of the 5-year IPM Program mras do complete and apply technology resulting from ESPBRAP, begin to develop IPhi systems for the bark beetle and disease complex of southern pines, and promote the use of pest management as a part of total resource management on all forest lands (Thatcher et al, 1981).
Major consideration was given to the management of bark beetle-susceptible forests in order to assist resource managers in attaining their management
2 USDA Expanded Southern Beetle Research and Applica- tions Program (ESPBRAP) , October 1, 1975 - September 30, 1981.

Target 2, Increased utilization of beetk-killed ill decision guidelines, field proce-
ining the potential uses of beetle- killed timber based on tree appearance classes, and further work on the uses of beetle-killed timber for multiple forest products will be developed and/or implemented. Findings will be integated into eco- nomic impact and control decision support systems.
Outputs 05 : Sawmill Deckion Model
ill decision model for use by medium- to large-size mills developed and offered to procurement people and mi11 operators for detemining the profitability of sawing green and beetle-killed pines for lumber in the Gulf South.
06: Field Procedures for Determining Utiliza- tion Potential of Beetle-killed Timber
Field procedures (appearanee classes) for determining the state of deterioration and utilization potential of beetle-killed timber for various wood products validated and modi- fied, if necessary, for the Piedmont and Coast- al Plain,
Target 3, Measuring and evaluating the roles of biological and environmental factors affecting beetle populations.-Methods for sampling SPB popula- tions will be simplified and procedures developed for sampling Ips spp. populations in standing trees and logging residue. Sampling methods will be used to determine biological impacts. Interactions within and between SPB and Ips spp. populations will be deter- mined. The identity and collective roles of biological and environmental agents (not individual organisms) regulating bark beetle populations will also be deter- mined. Results will be integrated into biological im- pact (spot growth), control decisionmaking, host susceptibility, suppression and prevention tactics, and pest management technologies.
Outputs 07: Sampling Techniques for SPB and Ips
Populations Simplified sampling techniques for SPB in standing trees and Ips spp. in standing trees and logging residue.
08: Description of Beetle m d Mieroenuiron- mental Interactions
Beneficial or competitive relationships be- tween two or more beetle species attacking the same host trees detemined under con- trolled laboratory and endemic vs. epidemic conditions. Detemination of effects of beetle density, temperature, and mycangial fungi on. brood establishment, development, and sur- vival.
Target 4, Deueloping methods for measuring and predicting host susceptibility to beetle attack.- Techniques and stand rating systems for measuring and predicting host susceptibility to southern pine beetle attack will be developed for a variety of stand and environmental conditions. Methods will be de- veloped for identifying susceptible trees and shnds or for detemining the role of man-caused or natural disturbances in. triggering bark beetle and/or disease outbreaks. Findings will be integrated with &pact, control decisionmaking, factors regulating beetle populations, forest practices, behavioral chemicals, and pest management system results.
Outputs 09: Host and Enutronmental Conditions Favor-
ing Beetk Attack and Brood Development * Host and environmental conditions influencing
host susceptibility to SPB-Ips spp, attack evaluated. Particular attention given to deter- mining the effects of site, tree, stand, disease, and climatic conditions predisposing trees and stands to bark beetle attack and brood devel- opment.
10 : Models for Describing and Predicting Host Susceptibility to Bark Beetle Attack
* Models developed to describe and predict host susceptibility to bark beetle attack. Southern pine beetle, annosus root rot, and littleleaf disease stand rating systems vali- dated, refined, and implemented in natural stands and/or plantations.
Target 5. Formulating suppression and prevention tactics for bark beetles and associated tree pathogens, -Existing or new thinning and sanitation salvage studies will be undertaken and/or monitored in sev- eral areas to determine treatment effects on bark beetle and/or tree pathogen incidence and severity in planted and natural stands. Impact measurements, benefitjcosts, beetle population estimates, measures of host susceptibility, and prediction techniques will be utilized in evaluating thinning or sanitation sal- vage treatment effects. Harvesting practices (e.g., tree-length logging, timing of removal of various wood products, treatment and/or removal of all infested material) will be examined to deternine their eEeets on beetle spot or disease infection inci- dence, spot growth or proliferation, and the feasibil- ity of modifying such practices to reduce losses. At- tractant and inhibitor formulations will be tested, deployment strategies developed, and operational protocolis provided for field use. Again, impact meas- ures, benefit /costs, and beetle population sampling techniques will be utilized to evaluate treatment effects. The findings will be integrated into pest management systems. Uses of currently registered
toxicants will be extended to include Ips spp, and/ or black turpentine beetle (BTB). New or improved toxicants will be developed and registered, if needed, for the preventive and remedial control of Ips spp. and/or BTB if the registrations of currently approved toxiants are proposed for cancellation by EPA.
Outputs 11 : Management Guidelines to Reduce Pest
Losses in Natural and Planted Stands Information on thinning and associated pest activity in managed stands summarized in USDA-Forest Service Technical Bulletin.
* Management guidelines developed to minimize losses from bark beetles and major tree path- ogens in thinned or sanitation-salvaged stands.
12 : Identification of Harvesting and Thinning Practices Contributing to Bark Beetle- and Tree Pathogen-Caused Losses
The effects of current harvesting and thinning practices on site and stand disturbance and the incidence and severity of SPB, Ips spp., BTB, and major tree pathogens on industrial lands summarized in Mississippi Agricultural and Forestry Experiment Station Miscellan- eous Publication.
* Recommendations developed for modifying these practices to minimize pest losses, if warranted.
13 : Bark Beetle Behavioral Chemical Formu- lations and Deployment Strategies
Best SPB attractant formulation, release de- vice, and deployment strategy tested as a means for disrupting infestation spot growth. Behavioral chemicals used for monitoring Ips spp. andior BTB flight activity and determin- ing the best time for control.
14: Registration of Dursbans and/or Sumi- thion@ for Ips spp. and/or B T B
Efficacy (and safety data, if needed) deter- mined and registration extended on use of Dursban@ and,/or Sumithion@ for preventive treatment to protect high-value green trees from attack or remedial control of existing in- festations of Ips spp, and/or BTB in standing or felled trees.
15: Eficacy and Safety of Additional Chemicals * Efficacy and safety of several additional chemi-
cals for controlling SPB, Ips spp., and/or BTB determined.
Target 6, Developing and incorporating pest man- agement tactics and strategies into operational forestry programs.-Control decision guidelineslsys- tems will be developed by integrating knowledge of impacts, benefitjcosts or cost effectiveness of
treatment alternatives, utilization of beetle-killed timber, information on factors affecting beetle popu- lations, measures of host susceptibility, and treat- ment tactics into pest management tactics and strate- gies that can then be incorporated into forest management systems. Management guidelines will be developed to provide infomation needed by re- source managers and landomers to support control actions aimed a t minimizing losses caused by bark beetles and tree diseases. As time and resources per- mit, management approaches will be evaluated and refined for diflFerent management situations. This should assure earlier acceptance and use of the new or improved technology throughout the geographic range of the bark beetles and diseases in the South- east.
Outputs 16: Pest Management Systems for SPB
Information relating to impacts, bark beetle populations, host systems, treatment tactics, and benefiticosts assembled and made avail- able to resource managers and pest manage- ment specialists in an interactive, user-friendly decision support system. Training and onsite assistance provided to foresters, pest management specialists, and landowners to make them aware of available pest management methods and materials. Written and audiovisual information also pro- vided to various user groups.
17: Pest Management Approaches Incorporated into Forest Management Plans, Inventories, and Programs
Pest management tactics and strategies dem- onstrated to resource managers and land- owners. Managers and landowners encouraged to include them in management plans, inven- tories, and operational programs.
* Field or pilot studies conducted to validate research findings.
Operational pest management guidelines de- veloped for users.
Interactive, user-friendly management infor- mation systems provided that integrate im- pact, pest, host, and climatic information and display currently recommended best man- agement approach f es) or predict pest popu- lation/damage trends for different manage- ment scenarios.
In addition to the above, more than 50 specific research and applications project end products were identified that would be produced by individual funded projects.
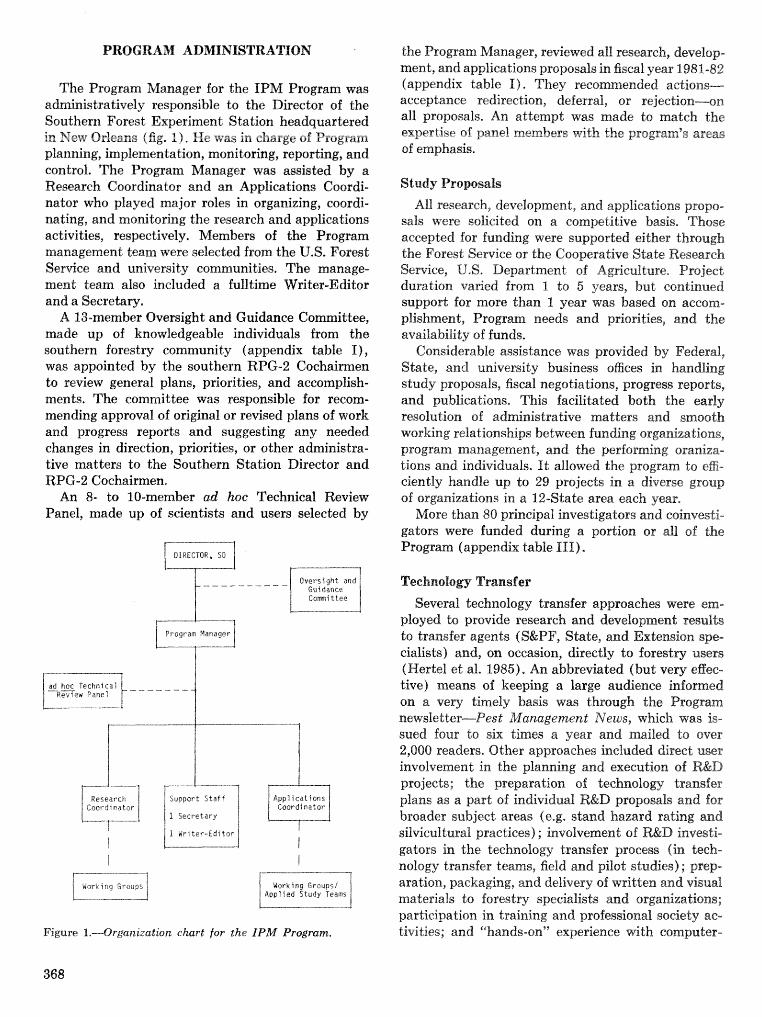
PROGRAM AGtNlfNllSTRATf ON
The Program Manager for the fPM Program was adrrllinistratively responsible to the Director of the Southern Forest Experiment Station headquartered in Xew Odeans (fig. 1 ) . He was in charge of Program plaming, implementation, monilorhg, reporting, and control. The Program Manager was assisted by a Research Coordinator and an Applications Coordi- nator who played major roles in organizing, coordi- nating, and monitoring the research and applications activities, respectively. Members of the Program management team were selected from the U.S, Forest S e ~ c e and university communities. The manage- ment team also included a fulltime Writer-Editor and a Secretary.
A 13-mernber Oversight and Guidance Committee, made up of knowledgeable individuals from the southern forestry community (appendix table I T ) , was appointed by the southern RPG-2 Cochaimen to review general plans, priorities, and accomplirrh- ments. The committee was responsible for recom- mending approval of original or revised plans of work and progress reports and suggesting any needed changes in direction, priorities, or other administrsz- tive matters to the Southern Station Director and RPG-2 Cochaimen.
An 8- to 10-member ad hoe Technical Review Panel, made up of scientists and users selected by
DIRECTOR, SO
----------
/ Program Manager I
Oversight and Guidance Comi t tee
Working Groups/ Applied Study leans
Figure 1.4rganization chart for the ZI;"M Program.
368
the Program Manager, reviewed all research, develop- meat, and applications proposals in fiscal year 1.981-82 (appendix table I). They recommended adions- acceptance redirection, deferral, or rejectio all proposals. An attempt was made to match the expertise of panell members with the program" areas of emphasis,
Study Proposals
All ~sea rcb , development, and appticalions propo- sals were solicited on a compelithe basis. Those accepted for funding were supported either througb the Forest Service or the Cooperative State Research Service, U,S. Department of Agficultuse. Project duration. v a ~ e d from 1 to 5 years, but continued support for more than 1 year was based on aceom- plishmerzt, Program needs and priorities, and the availability of funds.
Considerable assistance was provided by Federal, State, and university business ofices in handling study proposals, fiscal negotiations, progress reports, and publications, This facilitated both the e d y resolution of administrative matters and smooth working relationships between funding organizations, program management, and the perfomling oraniza- $ions and individuals. I t allowed the program ta ef i - ciently handle up to 29 projects in. a diverse group of organizations in a 12-State area each year,
More than 80 principal investigators and eoinvesti- gators were funded during a portion or all of the Program (appendix table I1 f ) .
Several technology transfer approaches were em- ployed to provide research and development results Lo transfer agents (SBtPF, State, and Extension spe- cialists) and, on occasion, directly to forestry users (Hertel et al, 1985). An abbreviated (but very eBee- tive) means of keeping a large audience infomed on a very timely basis was through the Program newsletter-Pest Management News, which was is- sued four to six times a year and mailed to over 2,000 readers, Other approaches ineluded direct user involvement in the plannling and execution of R&D projects; the preparation sf technolow transfer plans as a part sf individual R&D proposals and for broader subject areas (e.g. stand hazard rating and silvieuldural praetiees) ; involvement of ]R&D investi- gators in the tecl-mology transfer process (in tech- nology transfer terns, field and pilot studies); prep- aration, packaging, md delivery of written and visud materials to forestry specialists and orga~zatisns; participation in training and professional sodety ae- tivities; and ""hands-on" experience with eompraler-
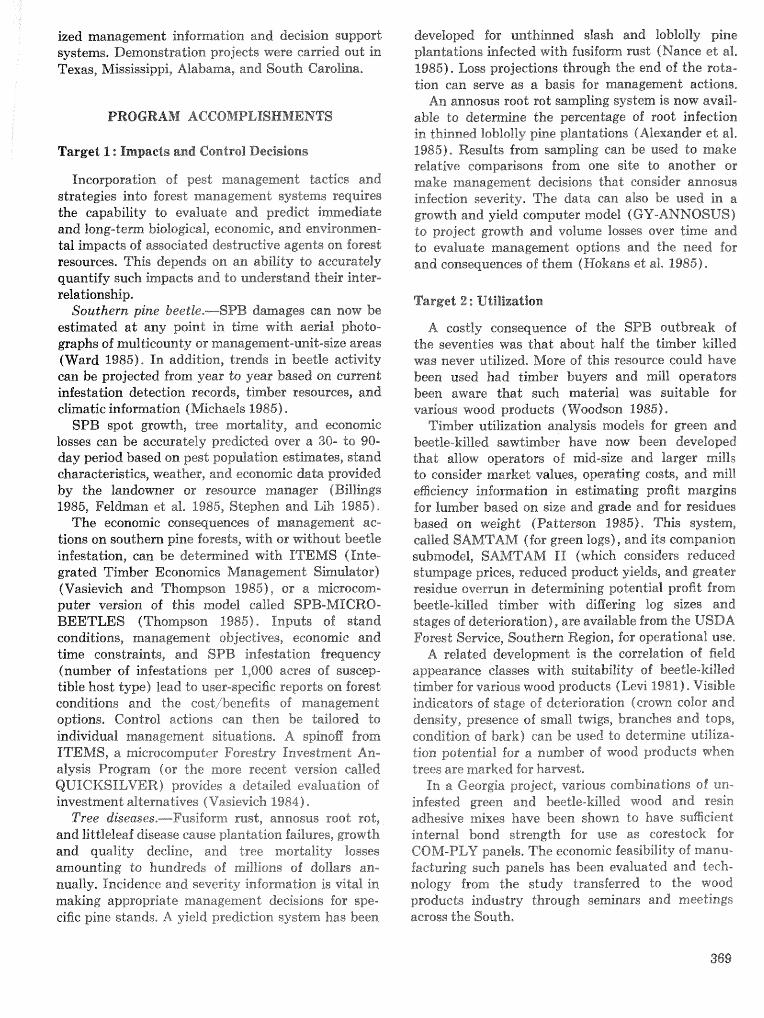
izecl martlagernerrat infomadion and decision support systems, BeanomsstraLion projects were csarfied out in Texas, Mississippi, Alabama, and South Carolina.
Target l : Innpacts and Cmtrol Decisions
Incorporation of pest management tactics and strategies into forest management systems requires the capability to evaluate and predict immediate and long-term biological, economic, and environmen- tal impacts of associated destructive agents on forest resources, This depends on an ability to accurately quantify sueh impacts and $0 understand their inter- relationship.
Southern pine beetee*-.---SPB damages can now be estimated at any point in time with aerial photo- graphs of multicounty or management-unit-8ize areas (Ward 1985). In addition, trends in beetle activity can be projected from year to year based on current infestation detection records, timber resources, and climatic infomation (Michaels 1985) ,
SPB spot growth, tree mortality, and economic losses can be accurately predicted over a 341- to 90- day period based on pest population estimates, stand characteristics, weather, and economic data provided by the landowner or resource manager (Billings 1985, Felidmaan et al. 1985, Stephen and Lih 1985).
The economic consequences of management ae- tioras on southern pine forests, with as without beetle infestation, can be determined with STEMS (Inte- grated Timber Economics Management Simulator) (Vasievich and Thompson 1985), om: a microeom- puter version sf this model called SPB-hfIGPd0- BEETLES (Thompson 19851, Inputs of stmd conditions, management objectives, economic and time constraints, and SPB infestation frequency (number of infestations per 1,000 acres a6 suscep- tible host type) lead to user-specific reports on forest conditions and the cost,'benefits of management options, Control actions can then be tailored to individual management situations, A spinoff from ITEhfS, a microccsmputcr Forestry Investment An- alysis Program (or the more recent version caZBed QUICKSILVER) provides a detailed evaluation of investment alternatives (Vasievich 1984),
Tree diseases.-Fusiform rust, annosus root rot, and littleleaf disease cause pkambtion failures, growth and quality decline, and tree mortality losses amounting to hundreds of millions sf dollass an- nually. Incidence and severizy information is vital in making appropriate management decisions for spe- cific pine stands, A yield prediction system has been
developed far unthinned slash and loblofly pine plantations infected with fusifom rust (Naace et al. 1985). Loss projections through the end of the rota- tion can serilie as a basis for management actions, An annostas root rot sampling system is now avail-
able to deternine the percentage of root infection in thinned loblslly pine plantations (Alexander et an, 1985), Results from sampling can be used to make relative esmparisons from one site do another or make management decisions that consider annosus infection seveGty. The data can also be used in e growth and yield computer model ( GY-ANNOSUS ) to project growth rand volume losses over time and do evaluate management options and the need for and consequences of them (Hskzhrss et ah 1985),
Target 2 : Utildizraftion
A costly consequence sf the SPB ou&break of the seventies was that about half the timber killed was never utilized. &fore sf this resource could have been used had timber buyers and m i l operators been aware that such material was suitable for various wood products (Woodson 1985) *
Timber utilization analysis modelis for green and beetle-killed sawtimber have now been developed that allow operators of mid-size and larger milla to consider market values, operating costs, and mill eEciency information in estimating profit margins for lumber based on size and grade and for residues based sa weight (Patterson 1985), This system, called SAMTAM (for green Isgs), and its companion submodel, SAMTAhf 11 (which considers reduced stumpage prices, reduced product yields, and greater residue overrun in determining potential profit from beetle-kiled timber with diEering log sizes and stages of deteriora"tioii), are available from the USDA Fares t Senice, Southern Region, for sperntioml use,
A related development is the correlation 0% field appearance cleasses with suitability of beet%e-killed timber for varbous wood products (Levi 198% ) , Visible indicators of stage of deterismtion (crown cohr a d densityp presence of small twigs, branches and tops, condition of bark) can be used to determine utiliza- tion potential far a mmber of wood products when trees are marked for hawest, In a Georgia project, various combinsatiopss of un-
infested green and beetle-killed wood and resin adhesive mixes have been shown to have sufficient internal bond strength for use as corestock for COM-PLY panels. The eeonnmic feasibility of manu- facturing sueh panels has been evaluated and tech- nology from the study transferred tea the wood products industry through seminars and meetings across the South,
Target 3 : Population Chmge
Beetle outbraks come and go, and their intensity varies geomaphieetUy, seasonally, m d from year to year. M e a s u ~ g , interprethg, and mticipathg these chmges in activity levels are fundamental to develop- h g mems faas reducing potential pest impaeb, Thh requires a thorough understading of the southern pine beetle's relationship with afsociated insech, microorganhm (mittss, nematodes), fungi, host t r w , and the enviroment.
SampGng techniques have been developed to esti- mate SPB and Ips engraver beetle numbers in stand- ing trees, as well as Ips populations in logging residue follovving t h J d n g or clearcutting (Berisford et al. 1985; Coulson et al. 1976; Foltz et ai. 41977, 41985). A trapping technique for capturing flying BTB populations provides an est te of population abm- dance that may affect r stands (Fatzinger 1985). These estimates are useful to but also have practical implications in the relationships between beetle activity levels and sub- sequent tree mortality and the need for hproved surveillance and control.
Procedures have also been developed that pemit specialists to d e t e ~ n e the role of various biological and environmental factors regulating beetle nmbers (Haaek et al. 1985; Hain 1985; Wagner et al. 1979, 1981, 1985). This will enable pest management spe- cialists to predict population and tree mortaliby trends and to evaluate the effectiveness of treatment strategies.
The beneficial and competitive interactions within and between bark beetle species and with other in- sects attacking the same host tree, along with information on life processes and developmental rates under different environmental conditions, have been quantified and incorporated into two computerized population dynafics models (TAMBEETLE and ARKANSAS SPB) that mimic field conditions (Coulvon et al. 1985, Feldman et al. 1985, Stephen and Lih 1985, Wagner et al. 1984). These models can be used to predict SPB population and tree mortality trends over the next 30 to 90 days and to evaluate treatment efiects on these populations.
New infomation available on the relationship be- tween SPB and the fungi they carry may explain the fluctuations in SPB activity trends (Bridges 1985). Results to date indicate that the presence of one fungus (a mycangial funms carried by adult females) favors beetle brood development and sur- vival. The absence of another fungus responsible for the blue stain observed in infested trees (Ceratocys- tis minor Hedg.) may signal favorable outbreak eon- ditions. Confirmation of these preliminary findings
t pest management speciaEsts to accu- rately predict the increase or decline of SPB out- breaks based on the presence or absence of the blue stain in beetle-infested trees in chronic problem areas.
Host preferences and switching habits of several wasps (Roptrocerus xylophagorum Ratz., Coeloides phsodis ( A s b , ) , Detldroscrter suleatus (&few*), and Meteorus sp.) that parasitize southern pine and Jp7s engraver beetles have been demonstrated in trees sbultarreously infesbd with t m or more bark beetle species (Kudon and Berisford 1985). These wasps tend to attack the same host species on which they developed and only switch to an alternate host when their preferred one is unavailable. These findings have important implications in understanding the role that natural enemies play in regulating bark beetle populations during low and high beetle ac- tivity periods.
Target 4 : Host Susceptibility
Susceptibility of host pines to beetle attack md their suitability for brood development and survival are critical factors in predicting outbreak and tree mortality trends and developing strategies to prevent or reduce losses. Attempts to define "susceptible" or "resistant" trees have included measuremenh of physical and chemical characteristics of host trees before and after they were stressed by natural and man-caused disturbance,
Studies of the reaction of pines inoculated with one of the fungi associated with SPB have demon- strated that the size and severity of the host reaction (often referred to as the hypersensitive reaction) could be an indicator of tree vigor (Cates et a1. 1985, Paine and Stephen 1985). Similarly, the eBect% of varying degrees of root and basal stem wounding on host condition and its relationship to subsequent pest attack have been evaluated (Hodges and Ne- beker 1985). Host data from individual trees, trees in the same stand, and trees in different stands have been correlated with beetle attack and brood development, spot growth patterns, and tree mar- tality. SPB "attack thresholds" have been fornu- lated based on host physiological condition, and data from these studies used to develop a '"ree vigor index" for ranking tree susceptibility to WB athek (Hain and Perry 1985, Nebeker and Hodges 1985). Findings are being integrated into population dy- namics models and will eventually be used to predict the risk potential for entire stands.
The effects of disturbances (basal stern and soot damage) associated with thinning and logging opera- tions on host condition have been evaluated and their initial eRects on growth and site productivity deter-
mined (Blanche et al. 1983, Mebeker and Hodges 1985, Nebeker eii ai, 1985). fnformation on site, tree, stand, and environmental conditions, tree chemical and physical characteristics and defense mechanisms, seasonal variation in host condition, and SPB popu- lation characteristics is being incorporated into a host susceptibility model to better evaluate the likeli- hssd sf trees and stands being attacked by bark beetles (Sharpe ed al, 71985).
Stand hazard rating can be a valuable tool in locating potential high-risk areas for SPB, annosus root rotl and littieleaf disease and evaluating the need for special suweillance and management ac- tions, The likelihood of infestation depends on the pwsenee of susceptible trees and stands, high hazard site conditions, and beetle andIior disease activity in a given area.
Bask beetle population estimates have been corre- lated with stand hazard to provide a means for determining the probability of an individual stand being attacked by the SPB (Billings and Bryant 1985, Hedden 1985, Lorio and Sommers 1985, Mason et al, 1985)- Hazard-rating systems for SPB and annosus root sot have been applied to Federal, State, industrial, and small, private, nonindustrial ho'ldings in several State% with considerabte success. Littleleaf and SPB hazard ratings have been applied on Federal lands in. the Piednaont and their effective- ness eonfirmed (Oak 1985).
Another recent innovation in forecasting tech- niques is the development: of large area models for predicting changes in areas affected by SPB out- breaks, The approach utilizes climatic information and mufticounty climatic districts, beetle infestation history in large geographic subregions, and informa- tion on the availability of susceptible stands to forecast changes in iarfestadion area in the coming season ( kliehaels 19851,
Target 5 : Csndrel Tactics
Losses caused by many forest pests can be eEec- tively prevented or reduced by applying forest man- agemend practices that promote tree and stand vigor under diEerenC site and stand conditions (Belanger and %lalac 1980). In other situations, direct control methods are required as a temporary expedient or because other management actions would be ineEec- tive in dealing with extensib.e areas of susceptible host type and a high level of pest activity (Swain and Remion 1981), When outbreaks do oeeur, early detection is necessary, control priorities must be set, and the most eEeetive method must be employed to minimize economic losses (Billings and Doggett 1980, BiHIirags and h s e 1979, Billings and Ward 19841,
Fusifom rust sanitation salvage cutting operations in South Carolina, Georgia, and Alabama plantations removed a high percentage of severely infected slash and loblolly pine trees that would othertvise have died before final harvest (Belanger et al, 1985, Miller et al, 19851, leaving a significantly larger proportion sf healthy trees in the residual stands, P r e l k i n a ~ y guidelines for thinning or sanitation salvaging of such plantations have been developed, which should aid managers faced with similar management situa- tions.
The resurgence of SPB across the South in 1982 and 1983 prompted Texas A&M and University of Georgia investigators to renew cooperative testing of a promising spot growth disruption technique that relies on the use of the SPB attractant frontalure, When properly deployed, using a microencapsulahd slow release spray applied with a garden sprayer, this chemical successfully stopped spot spread in in- festations with less than 50 actively infested trees and in areas where there was no competition with other nearby spots (Payne et al. 1985). The approach should serve as an alternative treatment technique, especially in high-value or special-use areas. Guide- lines for its use will be released after the successful completion of field and pilot studies in 1985.
In a Florida project, black turpentine beetle flight was monitored with turpentine-baited traps in naval stores stands (Fatzinger 1985). The traps also captured other insects, such as Ips engraver beetles, woodborers, and reproduction weevils. Results from such monitoring should aid naval stores managers in determining periods of peak bark beetle flight and timing chemical spraying.
In the area of safer chemical controls, Dursbana (chlorpyrifos) and Sumithion@ (fenitrothion) have proven effective against SPB and Ips spp., and have been registered for protecting green pines from beetle attack and controlling existing infestations in indi- vidual trees (Hastings and Coster 1981, Nord et al. 1985). (At this time, however, Sumithion@ cannot be purchased from regular pesticide suppliers.) The efficacy of pine oil as a preventive control for bark beetles has also been evaluated, but the treatment is not recommended because of general ineffective- ness and undesirable phytotoxic side eEects.
Target 6 : Integrated Pest Management
The final target of the IPM Program involved drawing together information from the literature, operational experience, and Program-sponsored re- search and development activities focused on identi- fying or developing, demonstrating, and applying the best management practices. This effort provided an
opportunity-as well as a challeng the various pieces of existing, newI or improved in- &matioaf, as they became available, into manage- ment tactics or strategies, to demonstrate their benegds in. the field, and to promote their use by State, Federal, industry, and private cooperators.
Mmagemen t systemts,-Pertiwe& infoman-&iaan and computer models for economics, beetle population dynamics, sknd hazard rating, growth and yield, and uti2izadicon have been assembled in an inter- active, user-friendly SPB decision support system (Sarsndess et 232, f985), The system provides prac- tical solutions to management problems as well as a means for evaluating the results from simulated treatments in various management situations. The decision support system and its individuai compo- nent models can presently be accessed through the Texas A&M Computer Center and are described in detail in a user's manual available from the developers,
Guiddilaes and innovative management plans to reduce losses caused by SPB have been developed to meet the special management needs of the Georgia State parks system. This should minimize future Xssses caused by the SPB and permit managers to achieve overall management objectives.
Technology developed in the IPM Program and its predecessor, ESPBRAP, has been demonstrated on National Forests, industrial lands, and small, pri- vate nonindustrial ownerships in several States. Some of the more applied infamation has also been pack- aged and provided to resource managers and land- owners for inclusion in forest management plans and crperadicns.
ITEMS and the Fosestry Investmnt Analysis Program have been used by consultants in develop- ing management plans for private, nonindustrial landomers in the south Atlantic Coastal States (Vasievich and Thompson 1985). The Forestry In- vestment Analysis and QUICKSILVER software packages have been widely distributed by the de- veloper and through the Forest Resources Systems Institut~;, Courtview Towers, Suite 24, 201 N. Pine Street, Florence, AL,
Demons trcrtion y ro jeets.-Dernon~tration projects were established in four States (Texas, Mississippi, Alabama, South Carolina) to accelerate the transfer sf new te~hnoaogy to potential users (Hertd et al. 1985). Field activities ineluded hazard rating and mapps"ng for SPB, littleleaf disease, and annosus root rot and reducing stand susceptibility through thin- ning or sanitation salvage. Publications, demonstra- tions, and educational programs were provided to lasers and recommendations for more efficient SPB control developed and implemented. Some of the
more significant achievements were: -fmplemerrtaPion of SPB hazard rating and man-
agement re~ommendatio~s on more than 30 demonstration forests in, Alabama.
-Testing and application of an annosus root rot sampling procedure and hazard rating in these same damsnetration forest%,
-Completion of SPB and annosus hazard rating and implementation of IPM practices in Dig- triet-level management decisionmaking on the Holly Springs National Forest in northern Mississippi.
-Preparation of compssite maps 04 moderate- and high-hazard SPB and annosus sites for con- sideration in developing management prescrip- tions and guidelines for managing areas where multiple pest problems occur on the Holly Springs NF.
-Issuance of SPB stand hazard maps to industrial owners in a two-county (Polk and Tyler) dem- onstration area in Texas, (These maps have been digitized to pemit computer storage, ac- cess, and future updating a t Texas A&M Uni- versi ty) .
-Provision of a portable sa ill and trained operators for lease to small landowners in Texas and South Carolina to promote preventive con- trol practices and aid in salvaging small infesta- tions and thinning high-hazard stands.
-Development of a grid block (18,080-acre unit) hazard-rating method using small-scale aesial photography and SPB infestation records. Near- ly 12 million acres of east Texas timberlands were rated and the results provided to landown- ers. This system has proven useful in monitoring changes in hazard and stand conditions over time, and in evaluating the general distribution of susceptible host types.
-Application of National Forest SPB risk rating using forest type, stand condition, and soil type on National Forests in Louisiana, Mississippi, Georgia, and South Carolina.
-Testing of a nondesdruetive plantation-level sampling technique for determining the amount of annosus colonization of root systems in thinned pine piantations in Mississippi, Aila- barna, Georgia, and South Carolina.
-Application of improved procedures for aerial detection, infestation spot growth predictions, control priority setting, and direct and indirect control practices.
-Use of interactive computer programs for record- keeping of SPB spots (SPBIS), setting treat- ment priorities, and projecting spot growth rate on National Forest Ranger Districts in Mississ-
ippi, Arkansas? Louisiana, and Texas, -Preparation of user" manuals for interactive
computer models for predicting infestation spot numbers and changes in outbreak status,
TECHXOLOGY TRAXSFER : A FINAL, 7YrfPRD
A major thrust of the IPM Program involved the packaging, transfer, and implementation of new or; improved technology. Federal, State and Exten- sion forest pest management specialists played a major role in disseminating program results to for- esters and iaradowrrers* The southern forestry com- munity, in turn, was kept informed of the latest developments as they were achieved, A complete description of the Program" sand the Southern Re- gion" approach to technology transfer i s detailed in Herte]! et ale 1985. Program-produced technolisgy has reached a vast audience as a result of special eR?fords by a Iarge number of organizations. Hopefully, these organizations will continue this effort beyond the Program's Germination in September 2985,
Appendix table 11 summarizes some sf the specific technology that was transferred by the IPM Program and its major cooperators during the 5-year period 1881.-85,
CONCLUSIiON
The resource needs of the 21st Century require that forest managers rely more heavily on compre- hcnsive systems that incorporate pest management technology into total resource management. This is particularly true in the South, where the highest average timber production potential of any section in the country exists, bud where Iarge volumes of timber have been lost to insects and diseases year after year, Southern forests have a great potential for fulfilling increased wood demands on a sustained yield basis in the future, But only through improved management practices that lessen threats do produe- tive capacity can we succeed in eapita%izing on. this potential,
The approaches developed by the accelerated IPM Program to help prevent and reduce losses caused by destructive pests are part of a continuing egord by forestry research in the United States to 6nd a means of assuring adequate timber supplies to meet present and future demands. New approaches that draw OM the Program" findings and combine them with operational experience can now be extensively applied. The success sf the Program and the reafiza- tisn of ids goats have been and should continue to be closely linked to cooperation with the southern forestry community, The benefits that landowners
and resource managers derive from the technology summarized here may well help to shape the future course of resource management in the southern United States,
LITERATURE CITED
Alemaadei-, SA- ; Hskans, R.H,; Faraelli, E X ; Kur- dyla, TM, hfethods for estimating annosus root rot in labSolly pine stands, In: Branham, Susan A; Thatcher, Robert C,, eds, Proceedings, integrated pest management research symposium; I985 April 15-18; Asheville, KC, Gen, T e c h Rep, SO-58, New Orlems, LA: U,S, Department of Agriculudre, Forest Service, Southern Forest Experiment Sda- Lion; 1985: 56-58,
Belanger, RP,; RIil%er, T,; Godbee, J,F, Fusifsrm rusk: guidelines for selective cutting of rust-in- feeted trees in merchantable slash pine plantations, In: Branham, Susan J,; Thatcher, Robert C,, eds, Proceedings, integrated pest management research symposium; 1985 April 15-18; AshevilEe, NC, Gen, Tech, Rep. $0-56- New Orleans, LA: U S , Depart- ment 06 Agriculture, Forest Service, Southern Forest Experiment Station; 1985: 254-257*
Beilanger, R,P,; &lalac, B,F, Silvicu8dure can reduce losses from the southern pine beetle, Agric, Handb, 576. Washington, DC: U,S, Department of Agriculture; 1980,17 p.
Berisfard, C,W,; MizeB1, RBI?*, 11%; Kudsn, E,H, Line intersect sampling technique for estimating Ips popudadisns in logging residue, In: Branham, Susan J.; Thatcher, Robert C,, eds, Proceedings, inte- grated pest management research symponsium; 4985 April 15-18; AshevilZe, KC, Gem Tech* Rep- SO-56, New Orleans, LA: U,S, Department of Agriculture, Forest Service, Southern Forest Ex- periment Station; 1985: 13-25,
Billings, R,F, TFS spot growth, For, Bull, R8-FB/P 20, Atlanta, GA: U.S. Department of Agricul- ture, Forest Serviee, Southern Region; Southern Pine Beetle Fact Sheet KO, 33; 1985. 2 p,
Billings, R.F,; Bryant, C. hI, Development, implemen- tadion, and validation of a large area hazard-and risk-rating system for southern pine beetle, In: Branham, Susan J,; Thatcher, Robert C., eds, Proceedingsl integrated pest management research ~ymposium; 1985 April 15-18; AshevilIe, NC, Gens* Tech, Rep, SO-56, Xevv Orleans, LA: U,S, Depart- ment 06 AgheuEture, Forest Service, Southern Forest Experiment Station; I985 : 226-232,
Billings, R,F,; Doggett, C, An aerial observer" guide for recognizing and reporting southern pine beetle spots, Agric, Handb, 568. Washington, DC: U,S, Department of Agriculture; 1980, 19 p.
Billings, R.F.; Pase, H.A., 111, Spot proliferation pat- terns as a measure of the area-wide effectiveness of southern pine beetle control tactics, In: Coster, J.E, ; Searcy, J,L,, eds. Evaluating control tactics for southern pine beetle: spposium proceedings. 1979 JanuaryJFebmary. Tech. Bull. 1613, Wash- ington, DC: U.S. Department of Agriculture; 1979: 86-97.
Billings, R.F.; Ward, J.D. How to conduct a south- ern pine beetle aerial detection survey. Circ. 16'7. College Station, TX: Texas Forest Service; 1984. 19 p.
Blanche, C.A.; Hodges, J.D.; Nebeker, T.E.; Moehr- ing, D.M. Southern pine beetle: the host dhen- sion. Bull, 917. Mississippi State, MS: Mississippi Agricultural and Forestry Experhent Station; 1983.29 p.
Bridges, J.R. Relationship of symbiotic fungi to southern pine beetle population trends. In: Bran- ham, Susan J.; Thatcher, Robert C., eds. Pro- ceedings, integrated pest management research symposium; 1985 April 15-18; Asheville, NC. Gen. Tech. Rep. SO-56. New Orleans, LA: U.S. Depart- ment of Agriculture, Forest Service, Southern Forest Experiment Station; 1985 : 127--135.
Coulson, R.N.; Flamm, R.O.; Wagner, T.L.; Rykiel, E.J.; Sharpe, P.J.H.; Payne, T.L.; Lin, F.K. Popu- lation dynamics of initiation and growth of south- ern pine beetle infestations. In: Branham, Susan J.; Thatcher, Robert C., eds. Proceedings, inte- grated pest management research symposium; 1985 April 15-18; Asheville, NC. Gen. Tech. Rep. SO-56. New Orleans, LA: U.S. Department of Agriculture, Forest Service, Southern Forest Ex- periment Station; 1985: 136-151.
Coulson, R.N.; Pulley, P.E.; Foltz, J.L.; Martin, W.C. Procedural guide for quantitatively sampling within-tree populations of Dendroctonus f rontaJis. Nisc. Pub. 1267. College Station, TX: Texas Agricultural Experiment Station; 1976. 26 p.
Fatzinger, C . W. Turpentine-baited traps capture black turpentine beetles and other forest Coleop- tera but do not prevent attacks on pines. In: Branham, Susan J.; Thatcher, Robert C., eds. Proceedings, integrated pest management research symposium; 1985 April 15-18; Asheville, NC. Gen. Tech. Rep. 50-56. New Orleans, LA: U.S. Depart- ment of Agriculture, Forest Service, Southern Forest Experiment Station; 1985: 26-31.
Feldman, R.M.; Wagner, T.L.; Curry, G.L.; Coulson, R.N.; Sharpe, P.J.H. A methodology for biophysi- cal modeling using TAMBEETLE as an example. In: Branham, Susan J.; Thatcher, Robert C., eds. Proceedings, integrated pest management research symposium; 1985 April 15-18; Asheville, NC. Gen. Tech. Rep. SO-56. New Orleans, LA: U.S. De-
partment of Agriculture, Forest Sewice, Southern Forest Experiment Station; 1985 : 195201.
Foltz, J. L,; Gomeil, J. A.; Reich, R. M. Procedures for sampling six-spined Ips populations in slash pine. In: Branham, Susan J.; Thatcher, Robert C., eds. Proceedings, integrated pest management re- search symposium; 1985 Aphl 15-18; AsheviUe, NC. Gen. Tech. Rep. SO-56. New Orleans, LA: U.S. Department of Agriculture, Forest Service, Southern Forest Experiment Station; 1985: 6 -12.
Foltz, J. L,; Pulley, P. E.; Coulson, R. N.; M a ~ i n , W.C. Procedural guide for estimating tvithin-spot populations of Dendroctonus frontatis. Misc. Publ. 1316. College Station, TX: Texas Agricultural Ex- periment Station; 1977.27 p.
Gambliel, H. A*; Cates, R. 6.; Cagey-Moquin, W. IC.; Paine, T. B. Variation in the chemistry of loblolly pine in relation to infection by the blue-stain fungus, Ceratocys tis minor Hedg . In: Branham, Susan J.; Thatcher, Robert C., eds. Proceedings, integrated pest management research symposium; 1985 April 15-18; Asheville, NC. Gen. Tech. Rep. SO-56. New Orleans, LA: U.S. Department of Agriculture, Forest Service, Southern Forest Ex- periment Station; 1985: 177-184.
Haack, R. A,; Foltz, J. L.; Wilkinson, R. C. Effects of temperature and slash pine phloem thickness on Ips calligraphus life processes. In: Branham, Susan J. ; Thatcher, Robert C., eds. Proceedings, inte- grated pest management research symposium; 1985 April 15-18; Asheville, NC. Gen. Tech. Rep. SO-56. New Orleans, LA: U.S. Department of Agriculture, Forest Service, Southern Forest Ex- periment Station; 1985: 102-113.
Hain, F. P.; Alya, A. B. Interactions of the southern pine beetle with competitor species and meteoro- logical factors. In: Branham, Susan J.; Thatcher, Robert C., eds. Proceedings, integrated pest man- agement research symposium; 1985 April 15-18; Asheville, NC. Gen. Tech. Rep. SO-56. New Or- leans, LA: U.S, Department of Agriculture, Forest Service, Southern Forest Experiment Station; 1985: 114-126,
Hain, F. I?.; Cook, S. P.; Matson, P. A,; Wilson, IC. G, Factors contributing Lo southern pine beetle host resistance. In: Bnanbam, Susan J.; Thatcher, Rob- ert C., e d ~ . Proceedings, integrated pest manage- ment research symposium; 1985 April 15-18; Ashe- ville, NC. Gen. Tech. Rep. 50-56. New Orleans, LA: U.S, Department, of Agriculture, Forest Ser- vice, Southern Forest Experiment Station; 1985: 154-160.
Hastings, F. L.; Coster, J. E., eds. Field and labora- tory evaluations of insecticides for southern pine beetle control. Gen. Tech. Rep. SE-21. Asheville, NC: U.S. Department of Agriculture, Forest Ser-
vice, Southeastern Forest Experiment Station; 1981, 40 p,
Hedden, Re L.; Belanger, Re P. Predicting suseepti- bifity to southern pine beetle attack in the Coastal Plain, Piedmont, and southern Appalachians. In: Branham, Susan J.; Thatcher Robert C, eds. Pro- ceedings, integrated pest management research symposium; 1985 April 15-18; Asheville, NC. Gen, Tech. Rep, SO-56, New Orleans LA: U.S. Depart- ment of Agriculture, Forest Service, Southern For- est Experiment Station; 1985: 233-238.
Hertel 6. D,; Branham S. J.; Swain K. M. Sr. Tech- nology transfer in integrated forest pest manage- ment in the South. Gen. Tech. Rep. SE-34. Ashe- ville, NC : U.S. Department sf Agriculture, Forest Service, Southeastern Forest Experiment Station; 1985.
Hodges, J. D.; Nebeker, T. E.; DeAngelis, J. D.; Blanche, C. A. Host/beetle interactions: influence of associated microorganisms, tree disturbance, and host vigor. In: Branham, Susan J.; Thatcher, Rob- ert C., e d ~ . Proceedings, integrated pest manage- ment research symposium; 1985 April 15-18; Ashe- ville, NC. Gen. Tech. Rep. SO-56. New Orleans, LA: U.S. Department of Agriculture, Forest Ser- vice, Southern Forest Experiment Station; 1985: 161-168.
Hokans, R. H.; Fanelli, E. S.; Alexander, S. A. Growth following thinning model for loblolly pine plantations infected by annosus root rot. In: Bran- ham, Susan J.; Thatcher, Robert C., eds. Pro- ceedings, integrated pest management research symposium; 1985 April 15-18; Asheville, NC. Gen. Tech. Rep. SO-56. New Orleans, LA: U.S. Depart- ment of Agriculture, Forest Service, Southern For- est Experiment Station; 1985 : 59-61,
Kudon, L. H.; Berisford, C. W. Host preference be- havior of insect parasites in the presence of south- ern pine beetle and one or more Ips species. In: Branham, Susan J.; Thatcher, Robert C., eds. Pro- ceedings, integrated pest management research symposium; 1985 April 15-18; Asheville, NC. Gen. Tech. Rep. SO-56. New Orleans, LA: U.S. Depart- ment of Agriculture, Forest Service, Southern Forest Experiment Station; 1985: 74-86,
Levi, hf. P. A guide for using beetle-killed southern pine based on tree appearance. Agric, Handb, 572. Washington, DC: U.S. Department of Agricul- ture; 1981. f 9 p.
Lorio, P. L., Jr.; Sommers, R. A. Potential use of soil maps to estimate southern pine beetle risk. In: Branham, Susan J.; Thatcher, Robert C,, eds. Proceedings, integrated pest management research symposium; 1985 April 15-18; Asheville, NC. Gen. Tech. Rep. SO-56. New Orleans, LA: U.S. De- partment of Agriculture, Forest Semice, Southern
Forest Experiment Station; 1985: 239-245. Mason, G. N.; Lorio, P. L., Jr.; Belanger, R, P.; Net-
tleton, W. A, Rating the susceptibility of stands to southern pine beetle attack. Agric. Handb. 645. Washington DC : U.S. Department of Agriculture; 1985.31 p.
Michaels, P. J.; Sappington, D. E.; Stenger, P. J. Objective prediction of climate-related changes in the distribution of southern pine beetle. In: Bran- ham, Susan J.; Thatcher, Robert C., eds. Proceed- ings, integrated pest management research sym- posium; 1985 April 15-18; Asheville, NC. Gen. Tech. Rep. SO-56. New Orleans, LA: U.S. Depart- ment of Agriculture, Forest Service, Southern For- est Experiment Station; 1985.
Miller, T.; Belanger, R. P.; Webb, R. S.; Godbee, J. F. Pest assessment after sanitation-salvage cut- ting in fusiform rust-infected slash pine planta- tions. In: Branham, Susan J.; Thatcher, Robert C., eds. Proceedings, integrated pest management re- search symposium; 1985 April 15-18; Asheville, NC. Gen. Tech. Rep. SO-56. New Orleans, LA: U.S. Department of Agriculture, Forest Service, Southern Forest Experiment Station; 1985.
Nance, W. L.; Shoulders, E.; Dell, T. R. Predicting survival and yield of unthinned slash and loblolly pine plantations with different levels of fusiform rust. In: Branham, Susan J.; Thatcher, Robert C., eds. Proceedings, integrated pest management re- search symposium: 1985 April 15-18; Asheville, NC. Gen. Tech. Rep. SO-56. New Orleans, LA: U.S. Department of Agriculture, Forest Service, Southern Forest Experiment Station; 1985: 62-72.
Nebeker, T. E.; Hodges, J. D. Thinning and harvest- ing practices to minimize site and stand disturb- ance and susceptibility to bark beetle and disease attacks. In: Branham, Susan J.; Thatcher, Robert C., eds. Proceedings, integrated pest management research symposium; 1985 April 15-18; Asheville, NC. Gen. Tech. Rep. SO-56. New Orleans, LA: U.S. Department of Agriculture, Forest Service, Southern Forest Experiment Station; 1985: 263- 271.
Nebeker, T. E.; Hodges, J. D.; Karr, B. L.; Moehring, D.M. 1985. Thinning practices in southern pines- with pest management recomendations. Tech. Bull, 1703. Washington DC: U.S, Department of Agriculture; 1985.
Nord, J. C.; Jones, A. S.; Hastings, F. L. Field tests of insecticides for control of black turpentine beetle. In: Branham, Susan J.; Thatcher, Robert C., eds. Proceedings, integrated pest management research symposium; 1985 April 15-18; Ashe~ille, NC. Gen. Tech. Rep. SO-56. New Orleans, LA: U.S. Depart- ment of Agriculture, Forest Service, Southern Forest Experiment Station; 1985: 272-280.
Oak, S. W, Adaptation of littleleaf disease hazard ra- ting for use in forest management in South Caro- lina National Forests. In: Branham, Susan J.; Thatcher, Robert C., eds. Proceedings, integrated pest management research symposium; 1985 April 15 18; Ashevillie KC, Gen, Tech, Rep. SO-56. New Orleans, LA: U,S, Department; of Agriculture, For- est Service, Southern Forest Experiment Station; 1985: 246-251.
Paine, T, D,; Stephen, F, M. Induced defenses against Dendroc tortus fron talk and associated fungi: variation in loblofly pine resistance, In: Branham, Susan J.; Thatcher, Robert C., eds, Pro- ceedings, integrated pest management research symposium; 3985 April 15-18; Askevifle, NC. @en, Tech, Rep. SO-56. New Orleans, LA: U.S, Depart- mend of Agriculture, Forest Service, Southern For- est Experiment Station; 1985: 169-196,
Patterson, D, iV. SAMTAM: a guide to sawmill profitability for green and beetle-killed timber. Agrie, Handb. 648. Washington, DC: U.S, Depart- mend of Agriculture; 1985.
Pay,,, T. L,; Kudon, L, H,; Berisford, 6. W.; O'Pfon- nell, B, P,; bValsh D. K, Effects of frontalure in suppressing southern pine beetle spot growth under endemic and epidemic population levels, In: Bran- ham, Susan J.; Thatcher, Robert C., eds, Pro- ceedings, integrated pest management research symposium; 1985 April 15-18; Asheville, NC. Gen. Tech. Rep, SO-56. New Orleans, LA: U.S. Depart- ment of Agrieultlare, Forest Service, Southern For- est Experiment Station; 1985: 281-285.
Saunders, &I. C,; laoh, 2)- M,; Coulson, R. N.; Rykiel, E, J.; Payne, T. L,; Pulley, P, E,; Hu, I;. C. Devel- opment and implementaLion of the southern pine beetle decision support system, In: Braakmm, Su- san J.; Thatcher, Robert C,, e d ~ , Proceedings, inte- grated pest management research symposium; 1985 April 15--18; Asheville NC, Gene Tech. Rep. SO-56. New Orleans, LA: U.S. Department of Agriculture, Forest Service, Southern Forest Experiment Sta- Lion; 1985: 335-363,
Skarpe, P. J. H.; Wu, H.; Gates, R. G.; Goesch, J. L).
Energetics of pine defense systems to bark beetle attack, In: Branham, Susan J,; Thatcher, Robert C,, eds, Proceedings, integrated pest management research symposium; 1985 April 15-18; Asheville, XC. Gen, Tech, Rep, SO-56, New Orleans, LA: U.S. Department of Agriculture, Forest Service, Southern Forest Experiment Station; 1985: 206- 223,
Stephen, F, hf,; Lib? &I, A Dendroctonus frontalis infestation growth model: organization, refinement, and utitization, In: Branham, Susan J.; Thatcher, Robert C., eds, Proceedings, integrated pest man- agement research symposium; 1985 April 15-18;
Asheville, NC. Gen. Tech, Rep, SO-56, New Or- leans, LA: U.S. Depadment of Agriculture, Forest Semice, Southern Forest Experiment Station; 1985: 186-194.
Swain, K, M.; Remian, M , 6. Direct control methods for srrwthczra pine beetle, A g ~ c , Handb, 575, Washington, DC: U*S. Department of Agriculture; 1981. 15 p.
Thatcher, R. C.; Mason, 6, N.; HerLel, 6, D,; Searcy, J. L. New combined program for management of forest pests. For. Farmer 40: 12. 1981,
Thompson, W. A. SPB &IICROBEETLES: a simula- tion system for evaluating economic performance of management alternatives for stands attacked by southern pine beetles, In: Branham, Susan 5.; Thatcher, Robert C., eds, Proceedings, integrated pest management research symposium: 1985 April 15-18; Asheville, NC, Gen, Tech, Rep, SO-56, New Orleans, LA: U.S. Department sf Agrieu%ture, Forest Service, Southern Forest Experiment Sta- tion; 1985 292-299,
Vasievich, J. M. Forest investment analysis program 1.1. In : Software directory-EconsmicsS EC0048- 01. Florence, AL: Forest Resources Systems Pn- stitute; 1984.2 p.
Vasievich, J. M.; Thompson, W. A, ITEhfS: an ink- grated method to project southern pine stand de- velopment. In: Branbarn, Susan J,; Thatcher, Robert, C,, eds. Proceedings, integrated pest man- agement research symposium; 1985 A p ~ l 15--98; Asheville, NC, Gen. Tech, Rep. SO-56, New Or- leans, LA: U.S. Department of Agriculture, Forest Service, Southern Forest Experiment Station; 1985: 300-316,
Wagner, T. L.; Gagne, J, A,; Doniswamy, P, C,; Cctul- son, R. N.; Brown, M, We Development time and mortality of Dendractonus Jrolztalts in relation Lo changes in tree moisture and xylem water poden- tial. Environmental Entomology 8: 1129-If 38; 1979.
Wagner, 1'. L.; Flamm, R. 0.; COUISOM, 11, PbT, Strate- gies for cohabitation among southern pine bark beetle species : comparisons of l i fe process biologies, In: Branham, Susan J,; Thatcher, Robert C,, eds, Proceedings, integrated pest management research symposium; 1985 April 15-.18; Ashevilfe, NC. Gen, Tech. Rep, SO-56, New Orleans, LA: a?,$, Depart- ment of Agriculture, Forest Sewice: Southern Forest Experiment Station; 1985: 87-101,
2". L.; Wu, El,; Sharpe, I?, J, H,; Schoolfield, R, M.; Coulson, R, N, hlodeling insect develop- ment rates: a literature revietv and application of a biophysical model, Annals of the Entomological Society of America 77 : 208-225; 1984,
NTard, J. D.; Dull, C, FV.; Ryan, 6, W*; Remion, M, C. Estimating southern pine beetle-caused dim-
ber losses aver extensive areas. En : Branham, Susan J.; Thatcher, Robert C., eds. Proceedings, inte- grated pest management research spposiurn; 1985 April 15-18; Asheville, NC, Gene Tech. Rep. 50-56, Mew Orleans, LA: U.S. Department of Agriculture, Forest Service, Southern Forest Ex- periment Station; 1985: 34-40.
Woodson, 6, Utilization of beetle-kiled southern pine, Gea, Tech. Rep. W8-47. Washington, DC: U,S, Department sf Agriculture, Forest Service and Cooperative State Research. Serviee; 1985,
Appendix Table 8.-Gon-tmitdee and Team r%$embers Respon- sible for f)ocumenlation and/or Reuiew for PPijf Program1
I. Planning Team, General Program Proposal Kent T, Adair, Bean, School of Forestry, Stephen F. Aus-
tin State University, Nacogdoches, TX. Thomas L. Payne, Professor, Department of Entomology,
Texas A&M University (also representing SEA-CR) , College Station, TX,
Amett 6 . Mace, Jr., Director, School of Forest Resources and Consemation, University of Florida, Gainesville, Ft.
Amel E. Landgraf, Assistant Director, State ;and Private Forestry, Southeastern Area, U.S. Forest Service, At- lanta, GA.
Robert L. Sckeer, Deputy Director, Southeastern Forest Experiment Station, U.S. Forest Service, Asheville, NG.
Thaddeus A. Harrington, Assistant Director, Southern Forest Experiment Station, U-S, Forest Service, New Orleans, LA,-Coordinator.
Robert C. Thatcher, Program Manager, Expanded South- ern Pine Beetle R&A Program, Pineville, LA.-Advisor.
Robert L. Lyon, Staff Entomologist, Forest Insect and Disease Research StaEf, U.S. Forest Service, Washington, Be.
12. Reciewers, General Program Proposal B. 6, Gresham, State Forester, Little Rock, AIR. (Assoeia-
tion of Southern State Foresters) Richard Q. Fitzgerald, Regional Silvieulturist, Southern
Region, U.S. Forest Serviee, Atlanta, GA. (National Forest System)
Lewis 6. Peters, Executive Vice President, Bennett ;and Peters, Inc,, Baton Rouge, LA, (Association of Consult- ing Foresters),
Darwin E. Fender, Manager, Forest Productivity and Re- search, Indernationa1 Paper Company, Mobile, AIL, (Southern Forest 1ndzast.b-y Research Council)
1, F. "ksew, Research Forester, Wesdvacs Corporation, Crozet, VA. (Southern Forest Industay. Research Corn- ea)
Nrauhington OEee Staffs of USDA Forest Serviee (Forest Insect and Disease Research, Forest Pest Managemen& State and Private Forestry, Deputy Chief-Research)
111. Teeiznic~t' Cornntr'ttee, Detailed 5-Year Actirrity Flow Kent T. Adair, Dean, School of Forestry, Stephen F. Aus-
tin State University, Naeogdoches, TX. Roy L. Hedden, Forest Entomologist, Glemson University,
elemson, SC. Robert L. Lyon, Staff Entomologist, Forest Insect and Dis- ease Research StaR, U.S. Forest Service, kVashington, DG.
Thomas Miller, Project Leader, Integrated Pest Manage- ment Research Work Unit, Southeastern Forest Experi- ment Station, U.S. Forest Service, Gainesville, FL.
Caleb L. Morris, Chief, Insect and Disease Investigations, Virginia Division of Forestry, Charlottesville, VA.2
Thomas L. Payne, Professor, Department of Entomology, Texas A&M University, College Station, T X ,
Hamey V. Toko, Staff Director, Forest Pest hganagement, Southeastern Area, State and Private Forestry, U S. Forest Service, Atlanta, GA.
Robert C , Thatcher, Chairman and Program Manager, Expanded Southern Pine Beetle R&A Program, U.S. Forest Service, Pineville, LA.-Advisor.
Gerard D. Hertel, Research Coordinator, Expanded South- ern Pine Beetle R&A Program1 U.S. Forest Service, Pineville, LA.4bserver.z .
IV. Reuiewers, Detailed 5-Year Aeliuity Flow Deans/Directors, sit fcrrestry sehoots in the South j l4j All State Foresters in the South (13) Regional Forester, Southern Region, U,S, Forest Semiee,
Atlanta, GA Area Director, Southeastern Area, State and Private For-
estry, U.S. Forest Service, Atlanta, GA Station Directors, Southeastern and Southern Forest Ex-
pe rhen t Stations, U.S. Forest Service, Asheville, NC, and New Orleans, LA, respectively
Southern Forest Industry Research Council User Represen ta tives3 Jim I;. Gillis, President, American Turpentine Farmers
Association Washington Office Staffs of USDA-Forest Sewice (Forest
Insect and Disease Research, Timber bfanagernent Re- search, Forest Pest Management-Staie %irad Private Forestry), Deputy Chief-Research.
V. IPAf Oversight and Guidance Committee Dr. SLanley J. Barras, Assistant Director for Research-
West, Southern Forest Experiment SLation, U.S. Forest ServiceNew Orleans, LA (Representing Forest Ser- vice-Research)
Dr. Benton Pi[. Box, Dean, GolEege of Forest and Recrea- tion Resources, Clemson University, Glernson, SG----. (Representing National Assn. of profession^ E Forestry Schools and Colleges)
Eley Frazier, Consulting Forester, Albany, GA (Repre- senting Consulting Foresters)
Dr. John F. Hosner, Director, School of Forestry and Wildlife Resources, Virginia Polytechnic Institute & State University, Blacksburg, VA---- (Representing South- ern State Agricultural Experiment Stations)
Dr. LeRoy Jones, Deputy Regional Forester, Southern Region, State & Private Forestry, U.S. Forest Service, Atlanta, GA- (Represen tin$ Forest Service-Slate and Private Forestry)
Leonard A. Kjilian, dr., State Forester, South Carolina issicsn, Columbia, SC ---- (Representing
Southern State Foresters) Br, Barry F. Malac, Technical Director, "a,Yoadlands Divi-
sion, Union Camp Corporation, Savannah, GA----(Repre- senting Southern. Forest Industry Research Council)
James E. Neaf, Regional Extension Forester, Cooperative Extension Service, University of Georgia, Athens, GA- (Representing Extension Service)
Dr. Jerry A. Sesco, Assistant Director, Research Program.: in Georgia and Florida, Southeastern Forest Experi- ment Station, U.S. Forest Serviee, Asheville, NG--- (Representing Forest Service-Research)
J. Ed Sheppard, Mid-South Raw Materials Planning &
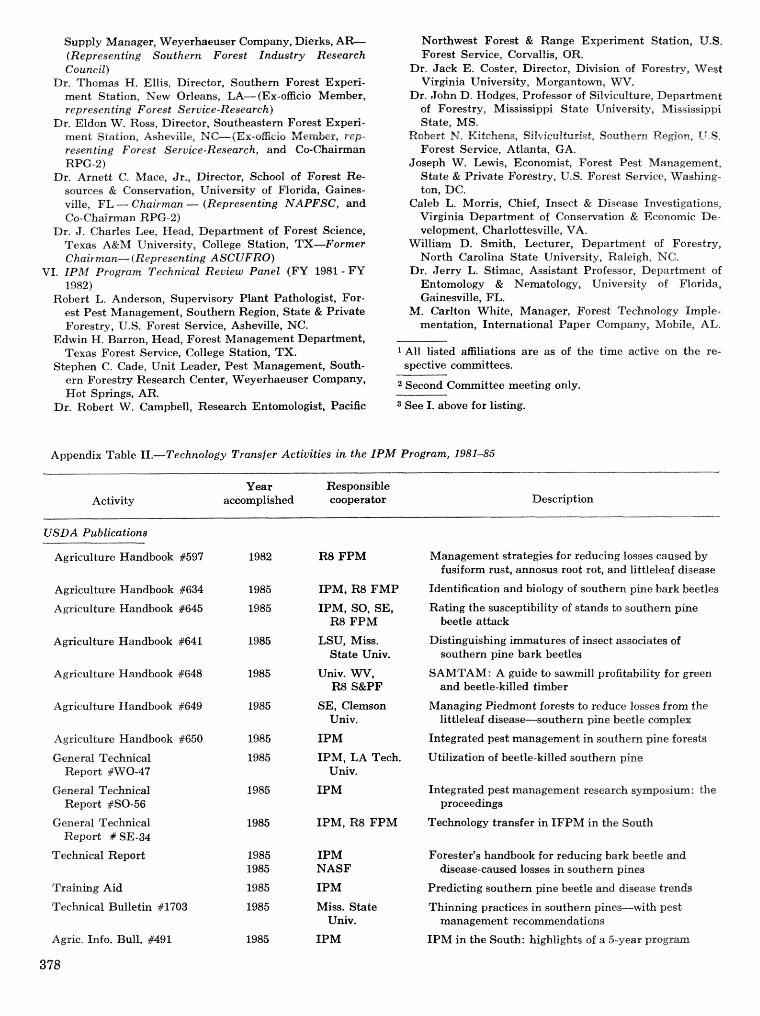
Supply Manager, Weyerhaeuser Compay, Dierks, A (Representing Southern Forest Industry Research Council)
Dr. Thomas 15. Ellis, Director, Southern Forest Experi- ment Station, New Orleans, LA-(Ex-oEcio Member, representing Forest Seruice-Research)
Dr. Eldon W. Ross, Director, Southeastern Forest Experi- meat Station, Asheviile, iW4G(Ex-oBeio Member, rep- resenting Forest Service-Research, and Go-Chairman RPC-2)
Dr, Arnett C. Mace, Jr., Director, School of Forest Re- sources El: Conservation, Univewity of morida, Gaines- ville, FL -- Chairman - (Representing NAPFSC, and Co-Chaiman RPG-2)
Dr. J. Charles Lee, Read, Department of Forest Science, Texas A&M University, College Station, TX-Former Chairman--- (Representing ASCUPRO)
VT, IPM Program Technical Reuiero Panel (FU 1981 - FY 19632)
Robert L. Anderson, Supemisory Plant Pathologist, For- est Pest Management, Southern Region, State & Private Forestry, U.S. Forest Service, Asheville, NC.
Edwin H. Rarron, Head, Forest Management Department, Texas Forest Service, College Station, TX.
Stephen C. Cade, Unit Leader, Pest Management, South- ern Forestry Research Center, Weyerhaeuser Company, Hot Springs, AR.
Dr. Robert '117. Campbell, Research Entomologist, Pacific
Northwest Forest & Range Experiment Sdation, U.S. Forest Service, Gorvallis, OR,
Dr. Jack E. Caster, Director, Dirtision of Forestry, IVest Virgnia University, Morgantown, \VV,
Dr. Jahn D. Hodges, Professor of Silviculture, Department of Forestry, Mississippi State University, Mississippi State, MS.
Robert M. Kitchens, Silvieufturist, Southern Region, U,S, Forest Service, Atlanta, GA.
Joseph W. L e e s , Economist, Forest Pest Management, State & Private Forestry, V.S. Forest Service, Washing- ton, DG.
Galeb t. Morris, Chief, Insect & Disease Investigations, Virginia Department of Conservation & Economic De- velopment, Charlottesville, VA,
UTilliam D. Smith, Lecturer, Department of Forestry, North Carolina State University, Raleigh, N6.
Dr. Jerry I,. Stimac, AssisLant Professor, Department of Entomology & Nematology , University sf Florida, Gainesville, FL.
M. Carlton White, Manager, Forest Technology Imple- mentation, International Paper Company, Mobile, AL,
1 All listed affiliations are as of the time active on the re- spective commit tees.
2 Second Committee meeting only.
3 See I. above for listing.
Appendix Table 11.-Technology Transfer Aetiuities in the IPM Program, 198145
Year Responsible accomplished cooperator Description Activity
USDA Publicatiorts
Agriculture Handbook $697 R8 FPM Management strategies for reducing losses caused by fusiform rust, annosus root rot, and littleleaf disease
Agriculture Handbook 1634
Agriculture Handbook %645
IPM, R8 FMP Identification and biology of southern pine bark beetles
IPM, SO, SE, R8 FPM
Rating the susceptibility of stands to southern pine beetle attack
Agriculture Handbook #641 LSU, Miss, State Univ.
Distinguishing i m a t u r e s of insect associates of southern pine bark beetles
SAMTAM: A guide to sawmill profitability for green and beetle-killed timber
Agriculture Handbook #648 Univ. W, R8 S&PF
Agriculture Handbook f 649 SE, Clemson Univ,
Managing Piedmont forests to reduce losses from the outhern pine beetle complex
Agriculture Handbook #650 I P N Integrated pest management in southern pine forests
General Technical Report iiiW0-47
IPM, LA Tech. Univ,
Utilization of beetle-killed southern pine
General Technical Report #SO-56
IPM Integrated pest management research synnposiurn: the proceedings
Technology transfer in IFPM in the South General Technical Report t SE-34
IPM, R8 FPM
Technical Report IPM NASF
Forester's handbook for reducing bark beetle md disease-caused losses in southern pines
Predicting southern pine beetle and disease trhsnds Training Aid
Technical Bulletin #I703
IPM
Miss. State Univ,
Thinning practices in southern pines-with pest management recommendations
Agric. Info. Bull. #491
378
I P N IPM in the South: highlights of a 5-year progrm
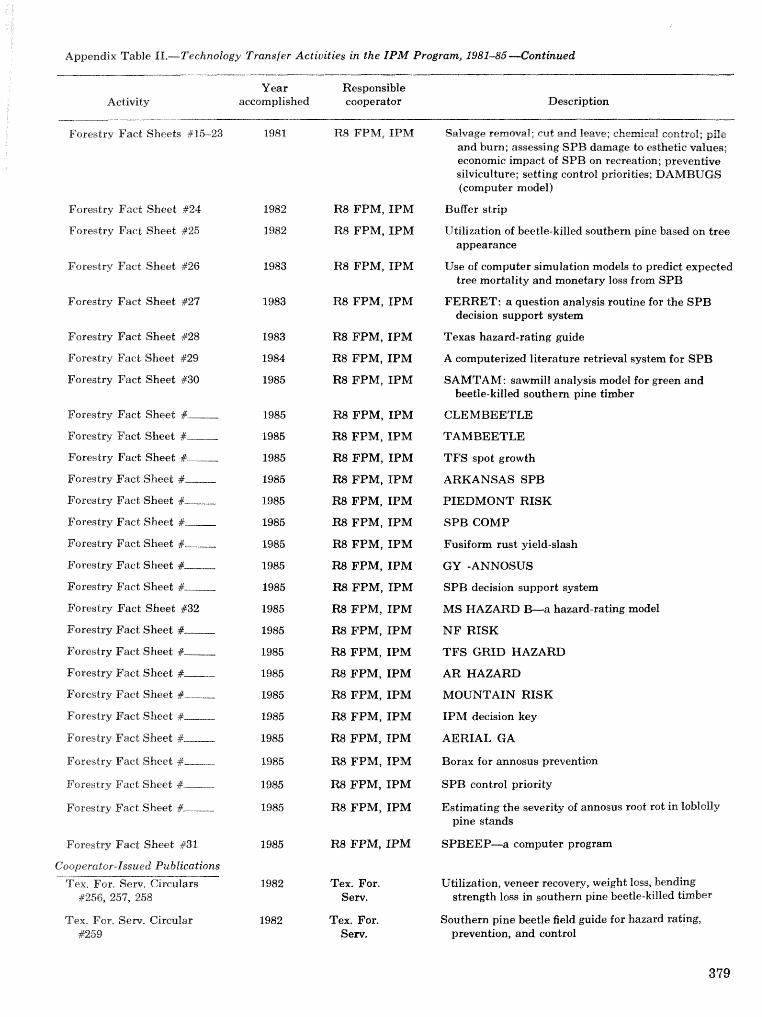
Appendix Table PI.-Technology Transfer Activities in the IPM Program, 1 9 8 1 4 4 0 n t i n u e d
Activity Year Responsible
accomplished cooperator Description --
Forestry Fact Sheets f 15-23 1981 R8 FPM, 1F"M Salvage removal; rut: and leave; chemical control; pile and 'bum; assessing SPB damage to esthetic values; economic impact of SPB on recreation; preventive silviculture; setting control priorities; DAMBUGS (computer model)
Forestry Fact Sheet $24 1982 R8 FPM, IPM Buffer strip
Forestry Fact Sheet it125 1982 R8 FPM, IPM Utilization of beetle-killed southern, pine based on tree appearance
Forestry Fact Sheet #26 1983 R8 FPM, I P N Use of computer simulation models to predict expected tree mortality and monetary loss from SPB
Forestry Fact Sheet #27 1983 R8 FPM, IPM FERRET: a question analysis routine for the SPB decision support system
Forestry Fact Sheet 228 1983 R8 FPM, IPM Texas hazard-rating guide
Forestry Fact Sheet #29 1984 R8 FPM, IPM A computerized literature retrieval system for SPB
Forestry Fact Sheet f30 1985 R8 FPM, IPM SAMTAM: sawmill analysis model for green rand beetle-killed southern pine timber
Forestry Fact Sheet #- 1985 R8 FPM, IPM CLEMBEETLE
Forestry Fact Sheet 8- 1985 I38 FPM, IPM TAMBEETLE
Forestry Fact Sheet #- 1985 R8 FPM, IPM TFS spot growth
Forestry Fact Sheet #- 1985 R8 FPM, IPM ARKANSAS SPB
Forestry Fact Sheet #- 1985 R8 FPM, IPM PIEDMONT RISK
Forestry Fact Sheet #- 1985 R8 FPM, IPM SPB COMP
Forestry Fact Sheet #- 1985 R8 FPM, IPM Fusiform rust yield-slash
Forestry Fact Sheet #-.--.. 1985 R8 FPM, IPM GU -ANNOSUS
Forestry Fact Sheet #- 1985 R.8 FPM, IPM SPB decision support system
Forestry Fact Sheet #32 1985 R.8 F P N , IPM MS HAZARD B-a hazard-rating model
Forestry Fact Sheet #- 1985 R8 FPM, IPM NF RISK
Forestry Fact Sheet #-...-- 1985 R8 FPM, IPM T F S GRID HAZARD
Forestry Fact Sheet #- 1985 R8 FPM, IPM AR HAZARD
Forestry Fact Sheet #- 1985 R8 FPM, IPM MOUNTAIN RISK
Forestry Fact Sheet #--..-.- 1985 R8 FPM, IPM IPM decision key
Forestry Fael; Sheet #..--,- 1985 R8 FPM, IPM AERIAL GA
Forestry Fact Sheet #- 1985 R8 FPM, IPM Borax for annosus prevention
Forestry Fact Sheet #- 1985 Et8 FPM, IPM SPB control priority
Forestry Fact Sheet #- 2985 R8 FPM, IPM Estimating the severity of annosus root rot in Ioblolly pine stands
Forestry Fact Sheet; #31 1985 R8 FPM, IPM SPBEEP-a computer progrm
Cooperator-Issued Publications
Tex. For. Serv. Circulars 1982 Tex. For. Utilization, veneer recovery, weight loss, bending #256, 257, 258 Serv. strength loss in southern pine beetle-killed timber
Tex. For. Sew. Circular 1982 Tex. For, Southern pine beetle field guide for hazard rating, f259 Serv. prevention, and control
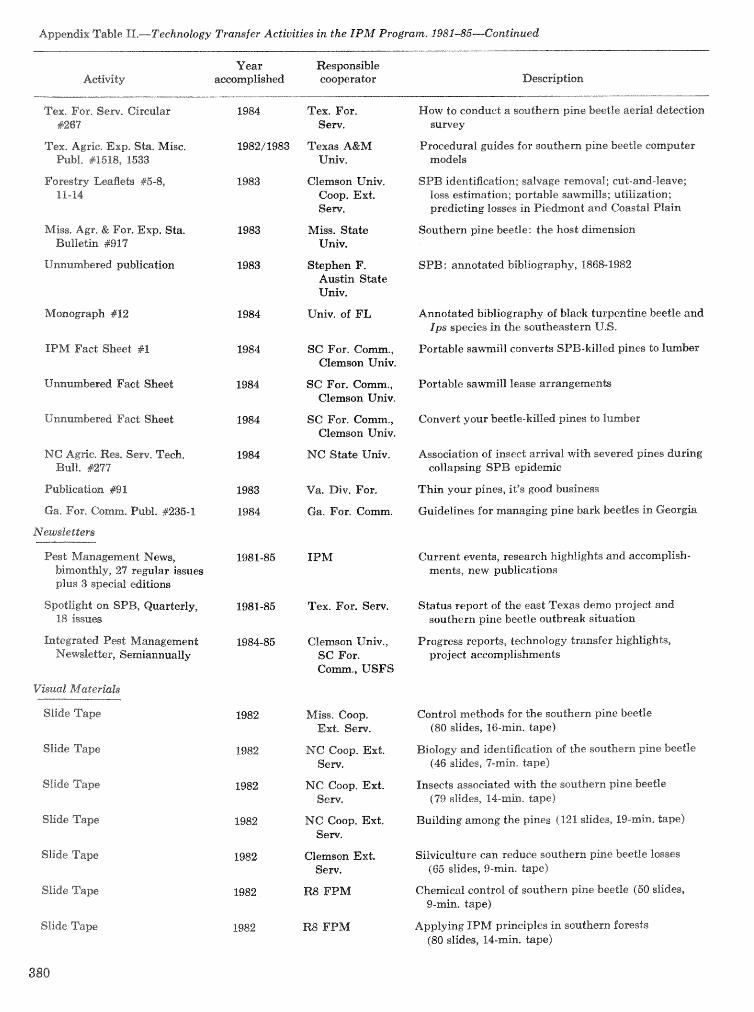
Appendix Trable 11,-Teehnolagy Transfer Activities in the IPM Program. 198145-Continued
Year Responsible ;aeeoarwplisbed cooperator
Tex, For. Sem.
How to conduct a southern pine beetle aerial detection survey
Procedural guides for southern pine beetle compukr models
Tex, Agric. Exp. Sh, Misc. Ir"ub2, #1518, 1533
Texas A&M U ~ v .
Forestry Leafiets #5-8, 91-14
Glernson Urriv, Coop. Ext. Sew,
SPB identification; salvage removal; cut-and-leave: loss estimation; portable sawmills; utilization; predicting losses in Piedmont and Coastal Plain
Miss. Agr. & For. Exp. Sta. iBuEle%b #917
Mias. State Univ.
Southern pine bee8e: the hss"tduneasion
Unnmbered publication SPB : annotated bibliography, 186t3-1982 Stephen F. Austin State U ~ v *
Univ, of FL Annotated bibliography of black turpentine beetle and Ips species in the southeastern U.S.
IPM Fact Sheet #I Portable sawmill converts SPB-killed pines to lunrlbsr SG For. Comm., Glenason Univ.
Unnmbered Fact Skeet SC For. Gomm., Clemson Univ,
Portable sawmill lease arrangernenb
Unnmbered Fact Sheet SC For. Comm., Glernson Univ.
Convert your beetle-killed pines to lumber
NC Agric. Res, Serv. Tech, Bull. #277
Association of insect arrival with severed pines b r i n g collapsing SPB epidemic
MG State U ~ v .
Publication #I Va. Div. For. Thin your pines, it% good business
Guidelines for managing pine bask beetles in Georgia Ga. For. Comm.
Newsletters
Pest h4anagement Nws , 1981-85 TPM bimonthly, 27 regular issues plus 3 special editions
Current events, research highlights and aeeomplish- ments, new publications
Spotfight on SPB, Quarterly, 1981-85 Tex. For. Serv. Status report of the east Texas demo project and 18 issues southern pine beetle outbreak situation
Integrated Pest Management 1984-85 Clemson Univ., Progress reports, technology transfer highlights, Newsletter, Semiannually SC For. project accomplishments
Sfide Tape
Slide Tape
Slide Tape
Slide Tape
Slide Tape
Slide Tape
Slide Tape
1982 Miss. Coop, Ext. Sem.
Control methods for the southern pine beetle (80 slides, 16-min. tape)
Biology sand identification of the southern pine beetle (46 slides, 7-min, tape)
1982 NC Coop. Ext. Sew.
Insects associated with the southern pine beetle (79 slides, 14-main. tape)
1982 NG Coop, Ext. $em.
Building among the pines (121 slides, LS-min, hpe)
Silviculture can reduce southern pine beetle losses (65 slides, 9-min, tape)
Chemical control of southern pine beetle (60 slides, 9-min. tape)
Applying IPM principles in southern forests (80 slides, 14-mina tape)
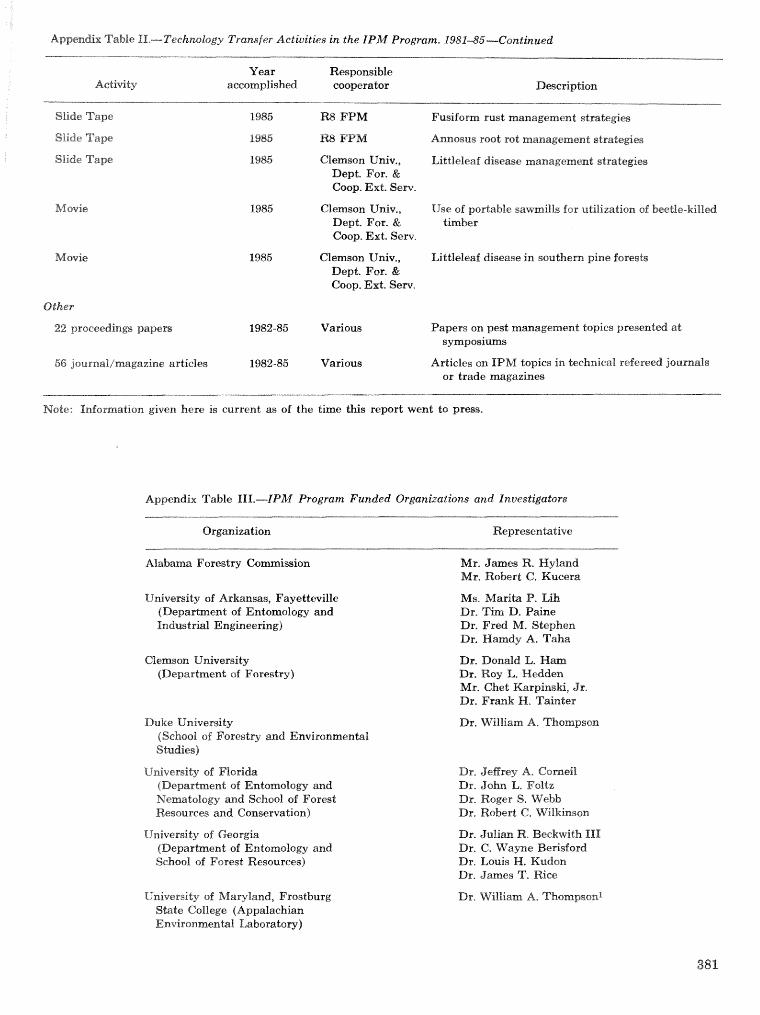
Appen&x Table 11,-Teehnokogy Transfer Activities in the IPM Program. 1981-85-Continued
Year Re~ponsible ActiGty aemmplished cooperator Dcsscription
Slide Tape
Slide Tape
Slide Tape
Movie
Ogker
22 proceedings papem
66 jsrrmal/magazine articles
1985 B FPM Fusifom rust management strategies
1986 E8 FPM Annosus root rot management strategies
1985 Clemson Univ., Littleleaf disease management strategies Dept. For. & Coop. Ext. Sew.
1985 Cfemson Univ., Use of podable sa ils for utilization of beetle-killed Dept. For. & tiaaber Coop. Ext. Serv.
f 985 Clemson Univ., Littleleaf &sease in southern pine foresb Dept. For. & Coop. Ext. Sem.
1982-85 Varlous Papers on pest mmagernent topics presented ad symposiums
1982-85 Various Articles an TPM topics in technical refereed journals or trade magazines
Note: Information given here is current as of the time this report went to pra3ss.
Appendix Table 111.-ZPM Program Funded Organizations and Investigators
Organization Representative
Alabama Forestry Co
University of Arkansas, Fayetteville (Department of Entomology and Industrial Engineering)
Clemssn University (Department of Forestry)
Duke University (School of Forestry md Environmenbl Studies)
G~vers i ly of FIo~d&t (Department of Entomology and Kematolegy and School sf Forest Resources and Conservation)
University of Georgia (DeparLmenL of Entornolorn and School of Forest Resources)
University of kfaryland, Frostburg S b t e College (Appalachian Environmental Laborator~p)
Mr. Jmes R. Hyland Mr. Robert C. Kueera
Ms, Marita I?. Lith Dr. Tian D, Paiae Dr. Fred M. Stephen Dr. Zlarady A, Taha
Dr. Donald L. W m Dr, Roy L. Hedda Mr. Chet Karpinski, Jr, Dr. Frmk 131. Tahter
Dr, William A, Thorrspsm
Dr, JeErey A, CclmeiI Dr. John L. Foltz Dr. Roger S. Webb Dr. Robed 6. Wilkhson
Dr. Julian R. Beckwith 111 Dr. G. Wayne Berisford Dr. Louis H. Kudon Dr. James T. Rice
Dr. i%Tilliarn A, Thcrmpson~
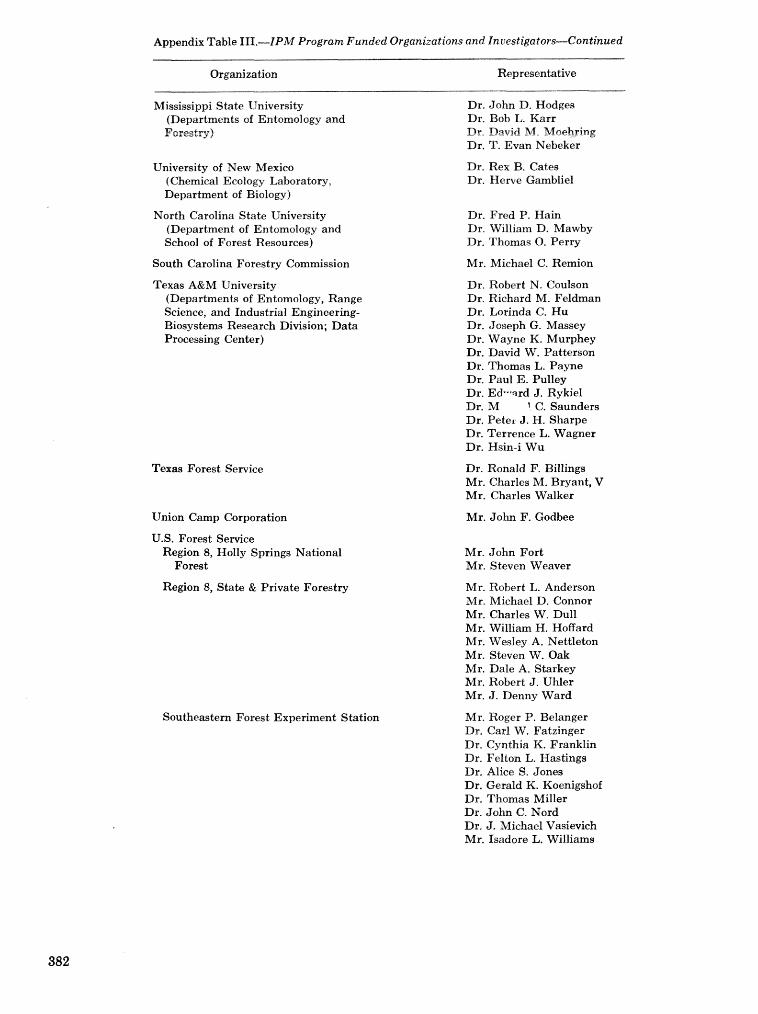
Appendix Table 111.-fPM Program Funded Organizations and Investigators-Continued
Organization Represenhtive
Mississippi State University (Departments of Entomology and Fsregtry )
'University of New Mexico (Chemical Ecology Laboratory, Department of Biology)
North Carolina State University (Department of Entomology and School of Forest Resources)
South Carolina Forestry Commission
Texas A&M University (Departments of Entomology, Range Science, and Industrial Engineering- Biosystems Research Division; Data Processing Center)
Texas Forest Service
Union Camp Corporation
U.S. Forest Service Region 8, Holly Springs National
Forest
Region 8, State & Private Forestry
Southeastern Forest Experiment Station
Dr. John D. Hodges Dr. Bob I,. Karr Dr, David M, Moehsing Dr. T. Evan Nebeker
Dr. Rex B. Gates Dr. Herve Gambliel
Dr. Fred P. Hain Dr. William D. Mawby Dr. Thomas 0. Perry
Mr. Michael C. Remion
Dr. Robert N. Coulson Dr. Richard M. Feldman Dr. Lorinda C. Hu Dr. Joseph G. Massey Dr. Wayne K. Murphey Dr. David W. Patterson Dr. Thomas L. Payne Dr. Paul E. Pulley Dr. Ed-srrd J. Rykiel Dr. M 1 C. Saunders Dr. Pete, J. H. Sharpe Dr. Terrence L. Wagner Dr. Hsin-i Wu
Dr. Ronald I?. Billings Mr. Charles M. Bryant, V Mr. Charles Walker
Mr. John F. Godbee
Mr. John Fort Mr. Steven Weaver
Mr. Robert L. Anderson birr, &fiehael D. Connor Mr. Charles W. Dull Mr. William H. Hoffard Mr. Wesley A. Nettleton Mr. Steven W. Oak Mr. Dale A. Starkey Mr. Robert J . Uhler Mr. J . Denny Ward
Mr. Roger P. Belanger Dr. Carl W. Fatzinger Dr. Cynthia K. Franklin Dr. Felton L. Hastings Dr. Alice S. Jones Dr. Gerald K. Koenigshof Dr. Thomas Miller Dr. John C. Nord Dr. J. Michael Vasievich Mr. Isadore L. Williams
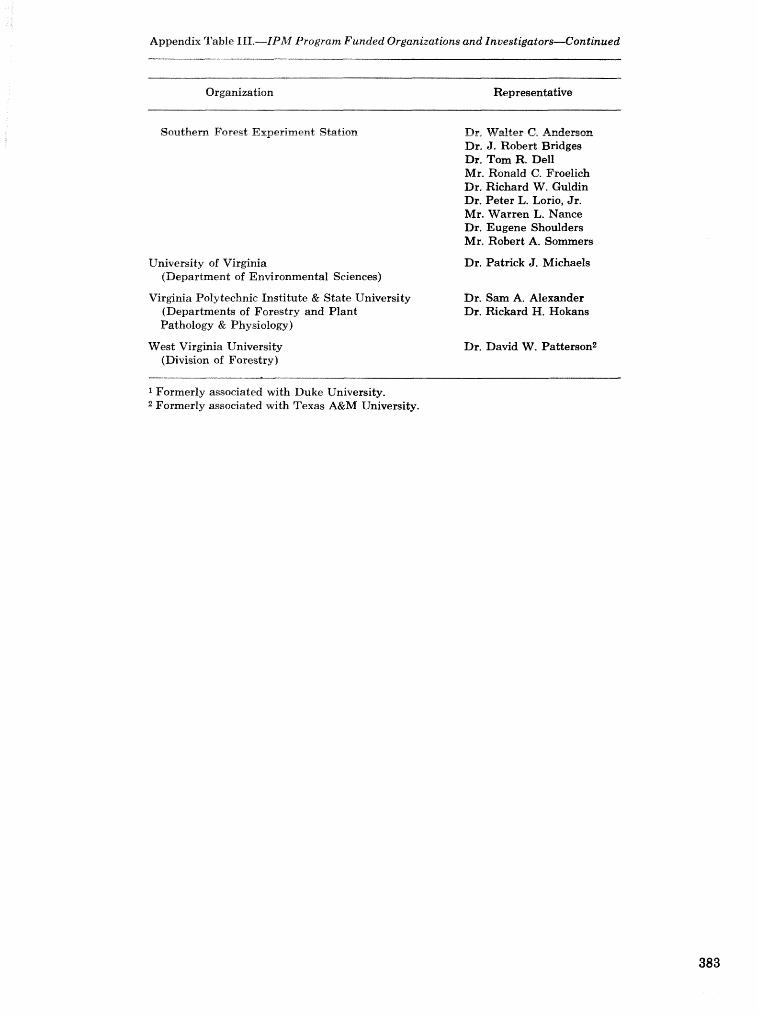
Appendix Table Ill.-IPM Program Funded Organizations and Inuestigators&ontinued
Organization Representative
Southern Forert Experiment Station
University of Virginia (Department of Environmental Sciences)
Virginia Polytechni~ Institute & State University (Deparbents of Forestry and Plant Pathology & Physiolom)
West Virghia University (Division of Forestry)
Ds, Walter 6, Anderrson Dr. J. Robert Bridges Dr. Tom R. DelI Mr. Ronald C. Froelieh Dr. Richard W. Guldin Dr. Peter L. Lorio, Jr. Mr. Warren L. Nance Dr. Eugene Shoulders Mr. Robert A. Sommers
Dr. Patrick J. Michaels
Dr. Sam A. Alexander Dr. Riekard H. Hokans
Dr. David W. Patterson2
1 Formerly associated with Duke University. 2 Formerly associated with Texas A&M University.
1 The use of trade or company names of products or services in these Pro- ceedings is for the benefit of the reader, Such use does not constitute an
i 1 endorsement or approval of any service or product by the Symposium spon- "sors to the exclarsim of others that m y be suitable. I
Remarks about pesticides appear in some technical papers contained in these Proceedings. Publication of "chese statements does not constitute endorsement or recsmmendatim of them by the Symposium sponsors, nor does it imply that uses discussed have been registered, Use of most pesticides is regulated by State or Federal law. Applicable regulations must be obtained from appropriaf e regulatory agencies,
CAUTION: Pesticides can be i n j u ~ o u s to hmans , domestic animalas, desirable plants, and fish or ather wildlife if they are not handled or applied prsgaedy, Use all pesticides selectively and earefu2ly. Follow recom- mended practices given on the label for use and disposal, of pesticides and pesticide containers,
-
,
Branham, Susan J.; Thatcher, Robert C.; eds. Integrated Pest Management Research Symposium: The Proceedings; 1985 April 15-18; Asheville, NC. Gen. Tech. Rep. SO-56. New Orleans, LA: U.S. Department of Agriculture, Forest Service, Southern Forest Experiment Station; 1985. 383 p.
i I Thirty-seven papers are presented that summarize the
findings from research and development work conducted as a part of the Integrated Pest Management RD&A Program for Bark Beetles of Southern Pines during the 5-year period
I 1980-85. Presentations cover the areas of sampling and
I impact assessment, bark beetle biology and ecology, host susceptibility, host/pest interactions, direct and indirect control, and management approaches and IPM systems.
aU.S. GOVEWMEMI PRIKTING OFFICE: I 9 8 5 - 5 7 3 - 6 9 w REGION NO. 4
Related Documents