E:\BHU\BHU.PM5 (303) Dr. Jyoti Joshi, Department of Geography, S. S. J. Campus, Almora-263601, Kumaun University, Uttarakhand, India. [email protected] Tectonic Processes and Landforms in the Lesser Himalayas : An experimental study from Khairna Watershed Jyoti Joshi Different types of landforms and processes in different parts of the earth surface are topic of interest for the people studying geomorphology. Landforms change with time through active processes. The role of these processes becomes very significant when we are concerned with the young and dynamic mountain system like the Himalayas. The changing intensity and speed of processes that are reflected in the landforms of a Himalayan watershed is the topic of interest in this study. Analysis of the tectonically controlled landforms within the watershed further help for a better understanding of sediment mobilization and transportation of earth material down slopes and downstream. Khairna watershed, a Lesser Himalayan drainage basin is used as an experimental laboratory for continuous monitoring of the geomorphologic processes and associated landforms. Field investigations were conducted in the Khairna watershed between 2004-2007.Steep to very steep scarps, terraces, triangular facets, and waterfalls in the study area are associated with the faults and are caused by vertical displacement of rocks due to differential uplift. Apart from direct tectonic origin, debris channels, debris fans and cones, cols and knolls, sudden changes in river profiles are examples of tectonically controlled landforms modified by denudation activities. Identification, monitoring and analysis of different processes and associated landforms in the experimental drainage basin may help to understand the geomorphic processes in a systematic way which affect the region as well as the people living in the region in various ways. Similar studies in different parts of the dynamic Himalayan watersheds may be helpful for the systematic analysis of landforms and the processes associated with their origin to a great extent. Key Words: Sediment mobilization, tectonic processes, landforms, drainage basin, differential uplift. Introduction Tectonic processes are related with the movements below the earth’s crust. The processes are responsible for the evolution of different types of landforms upon the earth surface. Therefore, these processes are of interest to the earth scientists. Though it is not easy to measure the role of these processes in quantitative terms, there are sufficient evidences to prove the role of these processes in a particular area. They are of special interest for researchers working in different parts of NGJI, An International Refereed Journal, (NGSI-BHU, ISSN: 0027-9374/2016/1596), vol. 62 (4), September : 303-314

Welcome message from author
This document is posted to help you gain knowledge. Please leave a comment to let me know what you think about it! Share it to your friends and learn new things together.
Transcript
E:\BHU\BHU.PM5 (303)
Dr. Jyoti Joshi, Department of Geography, S. S. J. Campus, Almora-263601, Kumaun University,Uttarakhand, India. [email protected]
Tectonic Processes and Landforms in the LesserHimalayas : An experimental study fromKhairna WatershedJyoti Joshi
Different types of landforms and processes in different parts of the earth surface aretopic of interest for the people studying geomorphology. Landforms change with time throughactive processes. The role of these processes becomes very significant when we are concernedwith the young and dynamic mountain system like the Himalayas. The changing intensity andspeed of processes that are reflected in the landforms of a Himalayan watershed is the topicof interest in this study. Analysis of the tectonically controlled landforms within the watershedfurther help for a better understanding of sediment mobilization and transportation of earthmaterial down slopes and downstream. Khairna watershed, a Lesser Himalayan drainagebasin is used as an experimental laboratory for continuous monitoring of the geomorphologicprocesses and associated landforms. Field investigations were conducted in the Khairnawatershed between 2004-2007.Steep to very steep scarps, terraces, triangular facets, andwaterfalls in the study area are associated with the faults and are caused by vertical displacementof rocks due to differential uplift. Apart from direct tectonic origin, debris channels, debrisfans and cones, cols and knolls, sudden changes in river profiles are examples of tectonicallycontrolled landforms modified by denudation activities. Identification, monitoring and analysisof different processes and associated landforms in the experimental drainage basin may helpto understand the geomorphic processes in a systematic way which affect the region as wellas the people living in the region in various ways. Similar studies in different parts of thedynamic Himalayan watersheds may be helpful for the systematic analysis of landforms andthe processes associated with their origin to a great extent.
Key Words: Sediment mobilization, tectonic processes, landforms, drainage basin,differential uplift.
IntroductionTectonic processes are related with the
movements below the earth’s crust. Theprocesses are responsible for the evolution ofdifferent types of landforms upon the earthsurface. Therefore, these processes are of
interest to the earth scientists. Though it is noteasy to measure the role of these processes inquantitative terms, there are sufficientevidences to prove the role of these processesin a particular area. They are of special interestfor researchers working in different parts of
NGJI, An International Refereed Journal, (NGSI-BHU, ISSN: 0027-9374/2016/1596), vol. 62 (4),September : 303-314

E:\BHU\BHU.PM5 (304)
the Himalayan mountain system because thisyoung orogeny has been supported by relatedresearch in the last century, which prove thatthe entire region is tectonically active. Theentire Lesser Himalayan belt and the SiwalikGroup are cut by a multiplicity of faults thatare occupied by streams. The structure of thepresent study area is not so simple as portrayedby earlier works (Auden, J.B., 1934;Heim andGanser, 1939; Gansser, A., 1964).TheHimalayan zone is a geosynclinal tractsqueezed between the two large continentalmasses of Eurasia and Gondwanaland (Wadia,1975). A number of studies including Pande,1950, Vashi and Merh (1965) Sharma (1981),Valdiya (1988), Shastri(1989), Bartarya(1993),Joshi(2015) have found evidences of thetectonic and neotectonic processes in thisregion lying in the Lesser Himalayan terrain.As a zone of recent folding and fracturing, largeamount of sediment yield and mobilizationthrough different processes result in changinglandscapes and landforms in the mountainousregion. In the tectonically active areas, themass wasting processes are more active.Majority of the third, fourth and fifth orderstreams flow along these lineaments and thefaults that are more susceptible to weathering,slope failures and erosion.
Different levels of terraces, shifting ofstreams, steep scarps are some of the verycommon features of the Himalayan region. Thelandforms and the processes directly affect thepeople living in the study area and indirectlythe entire country. Throughout the history ofthe evolution of the mighty Himalayas, theseprocesses have been active, have reshaped,and resized the landforms. Landforms(particularly the landforms of tectonic origin)have evolved through complex geomorphic
processes. Changing form and type of aparticular landform has its effect on series ofinterconnected landforms. Description oflandforms of a particular region, processesacting upon them and changes in the shape andsize of the landforms due to these continuousprocesses is necessary to understand thedynamics of the earth surface in general andsome specific area of interest in particular.These differences can be observed in differentparts of the Lesser Himalayan region. Naturalboundaries in the form of drainage basins canhelp to connect the link between individualprocesses and their interrelationship with thewhole system. The present study is an attempttowards understanding different landforms ofthe study area and the processes responsiblefor their existence.
Starting from the top, these processescarry down the earth material in various forms.The speed and rate of movement of everyprocess varies with space and time. Thornbury(1993) has stated that geologic structure is adominant control factor in the evolution oflandforms and is reflected in them. The termstructure includes all the ways in which theearth materials differ from one another in theirphysical and chemical attributes. Attitude ofspecific rocks, presence or absence of joints,bedding planes, folds, faults, rock massiveness,the physical hardness of the constituentminerals, the permeability of rocks and variousother ways by which the rocks of the earthcrust differ from one another. Thesedifferences can be observed in different partsof the Lesser Himalayan region. Flowing in theiryouthful stage, the Himalayan streams differfrom each other and; of course their drainagesystems too. The drainage basin as a unit forstudying the complex geomorphic processes
304 Jyoti Joshi
E:\BHU\BHU.PM5 (305)
may be helpful in quantitative geomorphologicstudies. Therefore, identification, location,measurements and understanding differenttypes of landforms associated with tectonicactivities in a lesser Himalayan drainage basinare the objectives of the present study.The Study Area
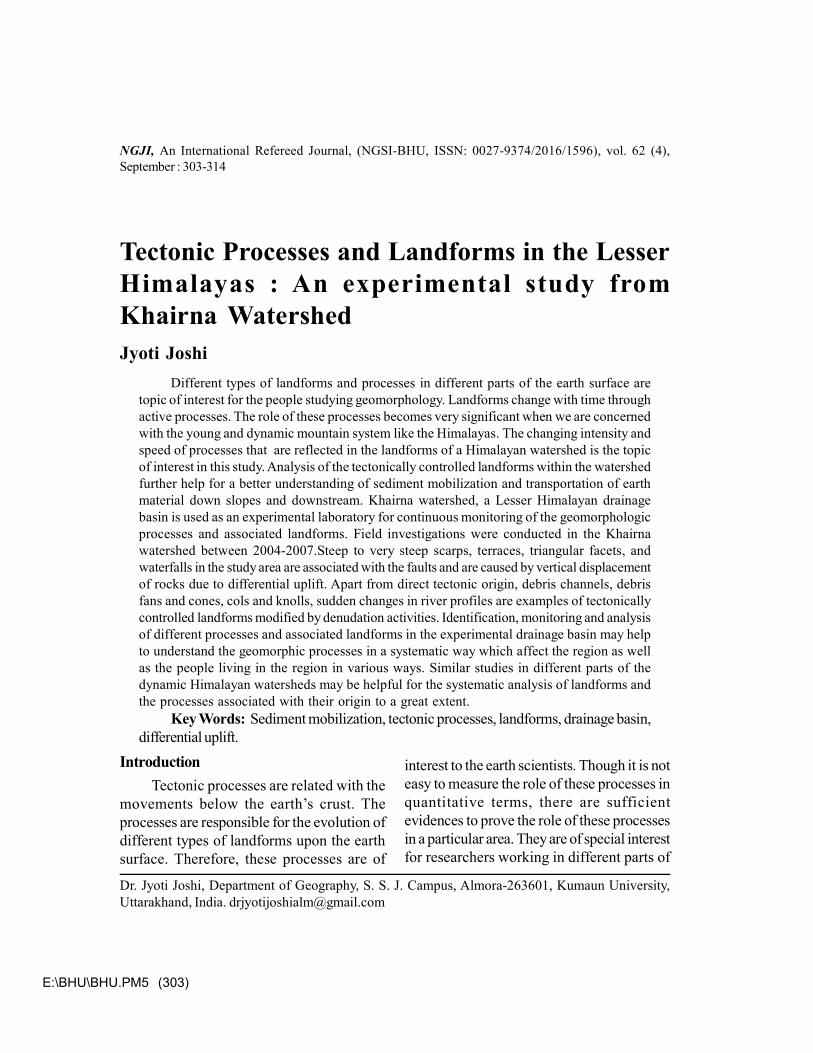
To study the complexities in landforms ofa particular area, drainage basin is the mostpractical unit, which is specifically helpful inquantitative geomorphologic studies. In thisstudy, the selected area includes the drainagebasin of Khairna stream. The drainage basinlies between 290 23' to 29031' North latitudesand 790 25' to 79039' East longitudes in theKumaun Lesser Himalayas (Fig. 1). All thestreams flowing within the Khairna stream arestructurally controlled (Valdiya, K. S. 1988).TheKhairna river is a sixth order stream comprisingas many as 380 first,76 second 19 third 5 fourth
and two fifth order streams. The area of thedrainage basin is about 125 km2.The areaenjoys cool temperate climatic conditions. Thestream flows from south to north and joins riverKosi at Khairna . The basin area lies in Nainitaldistrict in the hill state of Uttarakhand. Most ofthe southern part of the drainage basin issurrounded by Gagar Ninglat reserve forest.Mukteshwer, a tourist destination is located inthe southeastern part of the drainage basin.Along the southwestern boundary lies Nainital,famous tourist centre of Kumaun hills. Thewestern boundary is formed by Naina Reserveforest. More than half of the drainage basinarea is covered with forest. Agriculture is nota very profitable job in the steep hill slopes.Some patches of terraces are good to growfruits and vegetables. Bhowali-Ramgarh andKhairna Garampani are the places growingfruits (apples, plums, peaches, khubani pearsetc.) and vegetables (capsicum, beans, brinjals
Fig.1. Location of the study area
Tectonic Processes and Landforms in the Lesser Himalayas : An experimental.... 305
E:\BHU\BHU.PM5 (306)
peas, tomatoes, potatoes etc.). Two tributariesof the Khairna stream namely Ninglat streamand the Jakh gadhera are south-north flowingstreams while the Ramgarh stream flows ineast-west direction. The area is experiencingserious environmental hazards related to theinstability of the hill slopes (Valdiya, K. S. 1988).Khairna river basin has unique geologic andgeomorphic setting.
The Khairna stream and all its tributariesare structurally controlled. The region ischaracterised by numerous mountain ranges,dissected valleys and undulating steep slopes.The deposition of terraces of different levelsand differences in their heights from one levelto another, shifting of river channels, triangularfacets, steep scarps, debris fans and cones,debris channels suggests that the region hadhistory of tectonic rejuvenation. Earlier workers(Heim and Gansser, 1939) in Kumaon Himalayaseparate the underlying younger rocks of Krolnappe from those of Almora nappe above it.The town of Bhowali, situated on an anticline,perhaps is complementary to the above-mentioned structure to the north. BetweenBhowali and Ranikhet-Almora, Vashi and Merh(1965) have shown a thrust dipping due NE, isfound near Ramgarh. Heim and Gansser(1939)have joined the Ramgarh Thrust with NorthAlmora thrust. Gansser (1964) too hasconsidered the Ramgarh thrust as the southernlimb of the synformally folded Almora thrust.Merh (1968) has established a sequence ofthree major deformational events in CentralKumaon Himalaya. The first deformationcomprises large-scale isoclinals folding whichsynchronized with the progressive phase of theregional metamorphism of the Almora nappe,and the resulting metamorphic foliation,characterises the axial plane of the isoclinalfolds. The axes of the minor folds related to
this deformation so commonly recorded in thestudy area, mark the dominant lineation andgenerally plunge at various angles due N toNE.The eastern part of the study area is saidto be the lower part of Almora synform whichis constituted of two thrust sheets. Pande,(1950) recognized this as Ramgarh Nappe. Thearea constitutes of five major stratigraphcalgroups namely Krol formation, Blaini formation,Upper Jaunsar formation, Lower Jaunsarformation and the Ramgarh formation. Ninesub groups have been identified within thesegroups (Valdiya 1988). These groups havevaried rock types ranging from volcanic,quartzite, limestone and siltstone. These rocksare crushed and sheared at several places.Numerous folds that are open with one limbsteep and almost vertical while the other gentlydipping due NE. These folds extend NWSEand are overturned due south such that theiraxial planes show moderate dips due NE. Theirfold axes plunge gently due NW. numerousminor folds related to these structures arerecorded which show geometry identical to themajor structures. Ideal development of thesefolds is seen in the Khairna-Suyalbari regionon the two sides of the river Kosi. Thesestructures gradually tend to smoothen outsoutheastward and in Ramgarh-Nathuakhanarea, the folds practically disappear (Merh,et.al; 1971).Different landforms with variedgeomorphic features within the study area arethe indicators of the recent tectonic activities.The existence of five major stratigraphical unitsin this small watershed shows that the area isgeologically sensitive and is prone to hazardsand disasters.Objectives
The main objectives of the present studyare as follows :
306 Jyoti Joshi
E:\BHU\BHU.PM5 (307)
To identify, locate and understand thedifferent types of processes active in theselected drainage basin.
Morphometry (location, height andlength) of the landforms associated with theseprocesses and
To understand the dynamics of theselected drainage basin in context to the easternand western part.Materials and Methods
The following materials and methods usedfor the study helped to identify different typesof landscapes and landforms of the study area.
Topographical Sheets No. 530/7 and 530/11 published by Survey of India used as basemaps for the present study.
Detailed field survey to identify differenttypes of landforms, which are associated withthe geomorphic processes in the present as wellas past.
Continuous monitoring and measurementsduring field investigations.Results and discussions
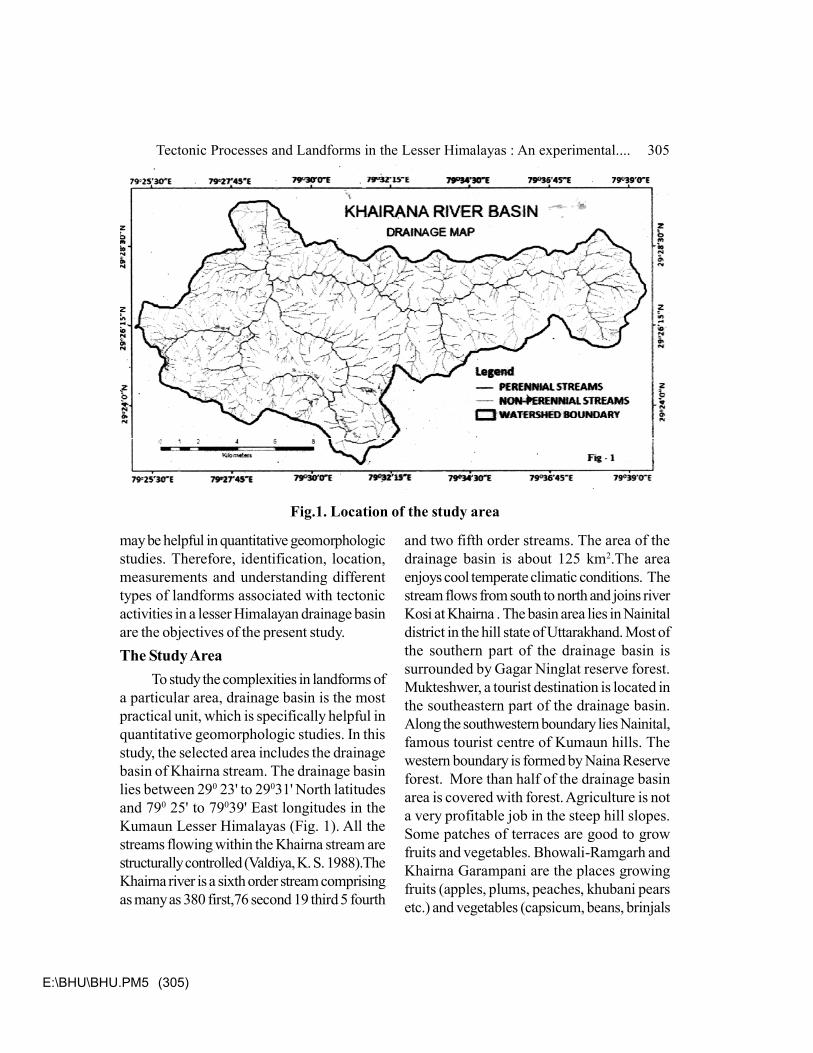
The contour map (Figure 2) of the studyarea depicts that in the western part of thestudy area there are steep slopes while in theeastern part the scarps are not much steep.The areas with steep slopes are either forestedor barren with steep rock scarps.
Detailed field investigations in the Khairnawatershed reveal that different types oflandscapes and landforms characterize thebasin. The landforms of the Khairna watershedare divided into following groups.
Tectonically controlled landscapes: Theassociated landforms with these landscapesare; Scarps, landslide scarps, triangular facets,waterfalls, terraced spurs, debris fans, cones,cols and knolls
Fluvial landscapes: Floodplains, alluvial
Fig. 2. Distribution of contours
Tectonic Processes and Landforms in the Lesser Himalayas : An experimental.... 307
E:\BHU\BHU.PM5 (308)
terraces, point bars, alluvial fans and cones arethe landforms associated with these landscapes.
Anthropogenic landscapes: Deforestedland, agricultural land, roads, settlements,bridges and canals include landforms due tohuman interference within the experimentalwatershed.Tectonic Landforms
Landforms formed because of tectonicactivities, are recognized as tectonic landforms.The mountainous region of the Himalayas isgoing through stress because of the recenttectonic activities along the main boundary faultclose to which the study area lies. The tectonicand tectonically controlled landscapes withinthe watershed show clear signatures in the formof various landforms. Several episodes oferosion and deposition have produced multipleterraces at different levels. Frequently availablefault aprons (debris cones and debris channels)
suggest that the basin is still tectonically active.The detailed field investigations depict the
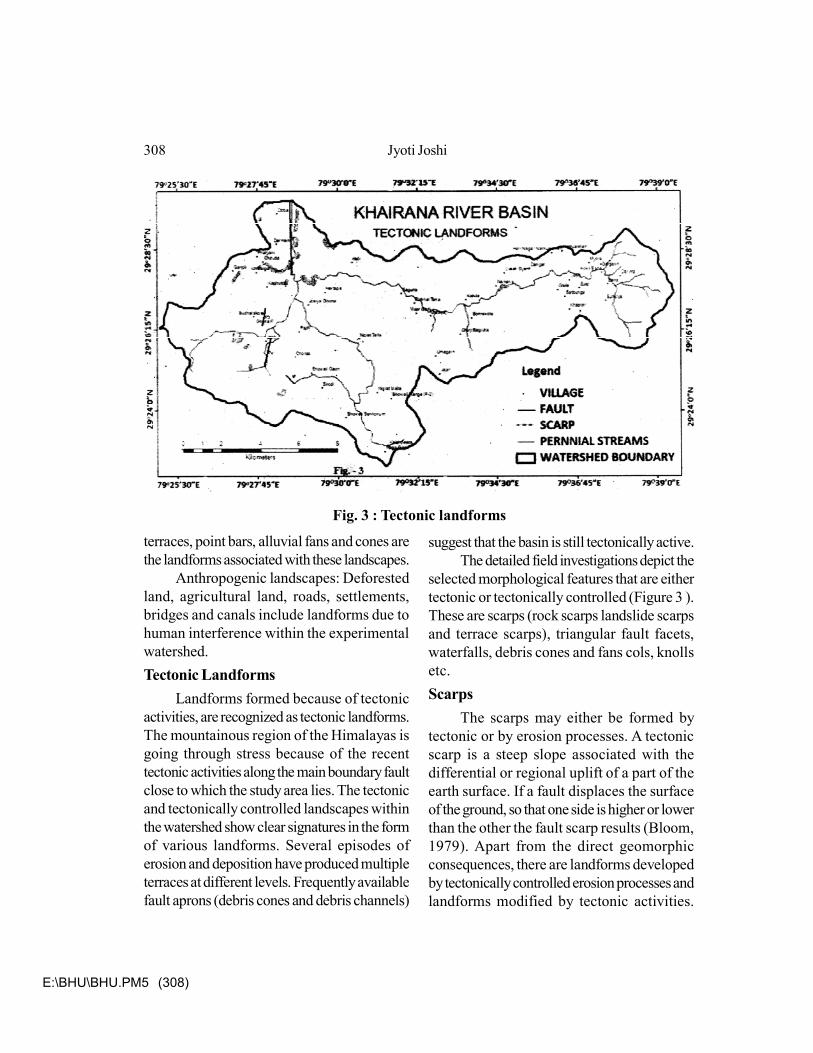
selected morphological features that are eithertectonic or tectonically controlled (Figure 3 ).These are scarps (rock scarps landslide scarpsand terrace scarps), triangular fault facets,waterfalls, debris cones and fans cols, knollsetc.Scarps
The scarps may either be formed bytectonic or by erosion processes. A tectonicscarp is a steep slope associated with thedifferential or regional uplift of a part of theearth surface. If a fault displaces the surfaceof the ground, so that one side is higher or lowerthan the other the fault scarp results (Bloom,1979). Apart from the direct geomorphicconsequences, there are landforms developedby tectonically controlled erosion processes andlandforms modified by tectonic activities.
Fig. 3 : Tectonic landforms
308 Jyoti Joshi

E:\BHU\BHU.PM5 (309)
Landforms evolved by tectonically controlledmass wasting processes along the faults anddislocation of surface area along the basin.
The scarps of the study area (Figure 3)are associated either with major faults of thebasin or regional uplift of the whole basin.1. Garampani Fault and the scarps
Garampani fault is linked with Manorathrust, which separate Bhowali quartziteunderlain by the rocks of Bhumiadharformations. East and west facing rock scarpsare associated with this fault. A number of eastand west facing crushed and sheared rockscarps are associated with this fault.Ratighatis a transverse fault which trends north south(Valdiya,1976) .It is tracable particularly atRatighat , Ramgarh, and follows the north southcourses of the Khairna and Ghuna gadstreams. The geomorphic processes within thedrainage basin show several signatures offolding, faulting, shearing and fragmentation ofrocks.The exceptionally wide valley along
Ramgarh and Ratighat of Khairna streamshows a number of landforms associated withthese processes. These landforms seen asdebris channels, adjacent debris fans and cones,steep scarps, sediment filled flood plains andwider terraces. The scarps are very steep-to-steep. The height of these scarps ranges inbetween 25 and 300 meters. Some scarps arecovered with grass while the others are devoidof vegetation cover.2. Jakh Fault and the scarps
The steep scarps near Talla Ghunna andDangichaura are the old fault scarps associatedwith the Jakh fault. These scarps are coveredwith grass and scrubs and with trees near someplaces. Apart from these, a number of verticalscarps (80°) are associated with this faultparticularly seen at Dangichaura, Jakh, PuranaChorsa etc.in the study area. These scarps aremainly devoid of vegetation cover.3. The Ghunna Fault and the scarps
South-east to north-west trending GhunnaTable 1 : Height, Length and Rock type of the Scarps (Eastern part of the Garampanifault)Location Height (m) Length (m) Rock typeRatighat (below road) 60 600 VolcanicHartap mafi 100 350 QuartziteMalla Ghuna 120 900 Quartzite and slateSouth East of Ratighat 80 200 Quartzite and slateNorth to Bisoda village 70 250 QuartziteWest bank of H.S.6 150 420 QuartziteNear Padli canal 1 90 500 QuartziteNear Padli canal2 50 250 QuartziteNear Bukhani village1 30 250 QuartziteNear Bukhani village2 20 550 QuartziteNear Kuleti 25 550 QuartziteNear Bhowaligaon 60 300 QuartziteAverage 71 427
Tectonic Processes and Landforms in the Lesser Himalayas : An experimental.... 309
E:\BHU\BHU.PM5 (310)
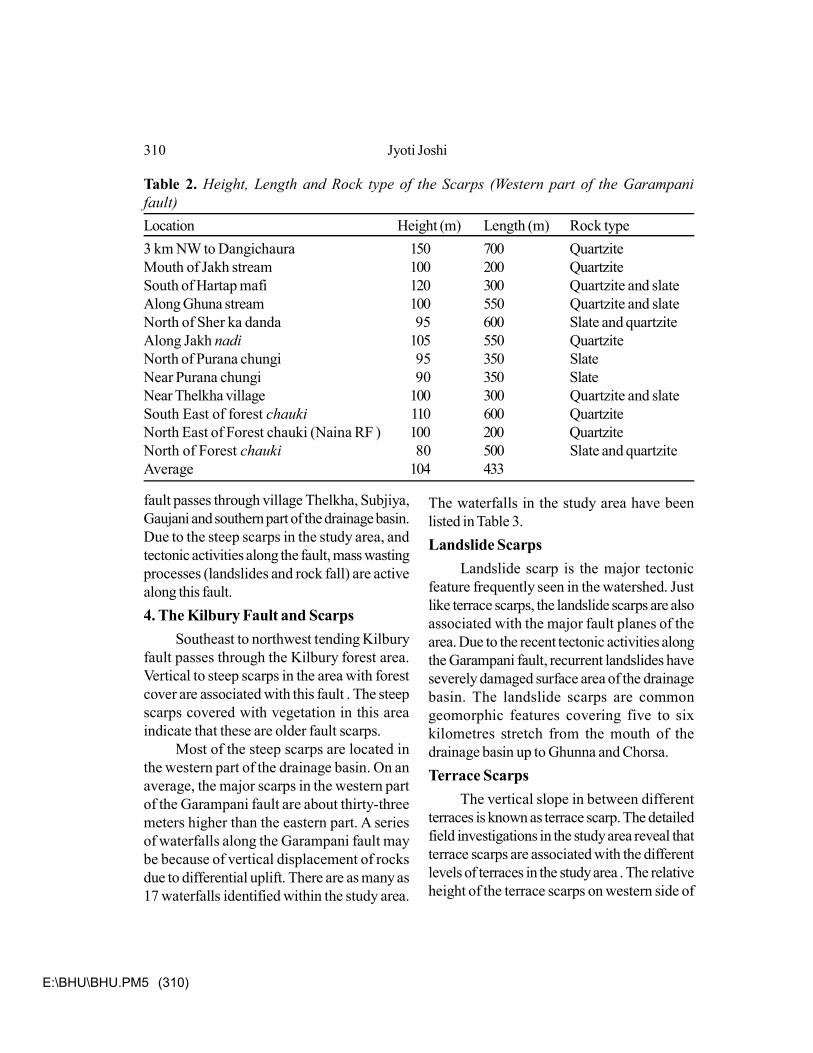
Table 2. Height, Length and Rock type of the Scarps (Western part of the Garampanifault)Location Height (m) Length (m) Rock type3 km NW to Dangichaura 150 700 QuartziteMouth of Jakh stream 100 200 QuartziteSouth of Hartap mafi 120 300 Quartzite and slateAlong Ghuna stream 100 550 Quartzite and slateNorth of Sher ka danda 95 600 Slate and quartziteAlong Jakh nadi 105 550 QuartziteNorth of Purana chungi 95 350 SlateNear Purana chungi 90 350 SlateNear Thelkha village 100 300 Quartzite and slateSouth East of forest chauki 110 600 QuartziteNorth East of Forest chauki (Naina RF ) 100 200 QuartziteNorth of Forest chauki 80 500 Slate and quartziteAverage 104 433
fault passes through village Thelkha, Subjiya,Gaujani and southern part of the drainage basin.Due to the steep scarps in the study area, andtectonic activities along the fault, mass wastingprocesses (landslides and rock fall) are activealong this fault.4. The Kilbury Fault and Scarps
Southeast to northwest tending Kilburyfault passes through the Kilbury forest area.Vertical to steep scarps in the area with forestcover are associated with this fault . The steepscarps covered with vegetation in this areaindicate that these are older fault scarps.
Most of the steep scarps are located inthe western part of the drainage basin. On anaverage, the major scarps in the western partof the Garampani fault are about thirty-threemeters higher than the eastern part. A seriesof waterfalls along the Garampani fault maybe because of vertical displacement of rocksdue to differential uplift. There are as many as17 waterfalls identified within the study area.
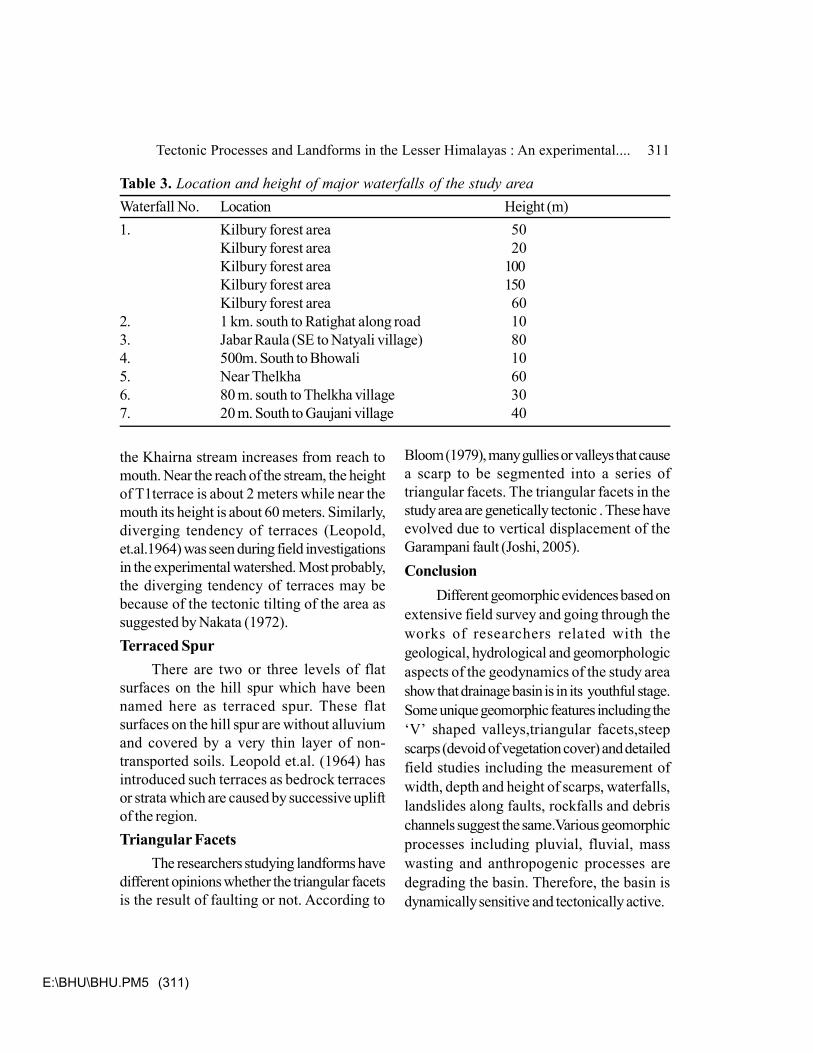
The waterfalls in the study area have beenlisted in Table 3.Landslide Scarps
Landslide scarp is the major tectonicfeature frequently seen in the watershed. Justlike terrace scarps, the landslide scarps are alsoassociated with the major fault planes of thearea. Due to the recent tectonic activities alongthe Garampani fault, recurrent landslides haveseverely damaged surface area of the drainagebasin. The landslide scarps are commongeomorphic features covering five to sixkilometres stretch from the mouth of thedrainage basin up to Ghunna and Chorsa.Terrace Scarps
The vertical slope in between differentterraces is known as terrace scarp. The detailedfield investigations in the study area reveal thatterrace scarps are associated with the differentlevels of terraces in the study area . The relativeheight of the terrace scarps on western side of
310 Jyoti Joshi
E:\BHU\BHU.PM5 (311)
the Khairna stream increases from reach tomouth. Near the reach of the stream, the heightof T1terrace is about 2 meters while near themouth its height is about 60 meters. Similarly,diverging tendency of terraces (Leopold,et.al.1964) was seen during field investigationsin the experimental watershed. Most probably,the diverging tendency of terraces may bebecause of the tectonic tilting of the area assuggested by Nakata (1972).Terraced Spur
There are two or three levels of flatsurfaces on the hill spur which have beennamed here as terraced spur. These flatsurfaces on the hill spur are without alluviumand covered by a very thin layer of non-transported soils. Leopold et.al. (1964) hasintroduced such terraces as bedrock terracesor strata which are caused by successive upliftof the region.Triangular Facets
The researchers studying landforms havedifferent opinions whether the triangular facetsis the result of faulting or not. According to
Bloom (1979), many gullies or valleys that causea scarp to be segmented into a series oftriangular facets. The triangular facets in thestudy area are genetically tectonic . These haveevolved due to vertical displacement of theGarampani fault (Joshi, 2005).Conclusion
Different geomorphic evidences based onextensive field survey and going through theworks of researchers related with thegeological, hydrological and geomorphologicaspects of the geodynamics of the study areashow that drainage basin is in its youthful stage.Some unique geomorphic features including the‘V’ shaped valleys,triangular facets,steepscarps (devoid of vegetation cover) and detailedfield studies including the measurement ofwidth, depth and height of scarps, waterfalls,landslides along faults, rockfalls and debrischannels suggest the same.Various geomorphicprocesses including pluvial, fluvial, masswasting and anthropogenic processes aredegrading the basin. Therefore, the basin isdynamically sensitive and tectonically active.
Table 3. Location and height of major waterfalls of the study areaWaterfall No. Location Height (m)1. Kilbury forest area 50
Kilbury forest area 20Kilbury forest area 100Kilbury forest area 150Kilbury forest area 60
2. 1 km. south to Ratighat along road 103. Jabar Raula (SE to Natyali village) 804. 500m. South to Bhowali 105. Near Thelkha 606. 80 m. south to Thelkha village 307. 20 m. South to Gaujani village 40
Tectonic Processes and Landforms in the Lesser Himalayas : An experimental.... 311
E:\BHU\BHU.PM5 (312)
Different landforms within the Khairnawatershed suggest that the entire drainagebasin has a history of tectonic activities in therecent past and are active at present too.Though the area has been least affected byhuman activities, but only small disturbances inthe natural system are responsible for thegeomorphic processes to activate faster. Asan example one can easily notice severallandslides along the main metallic road thatpasses through the drainage basin.
The study area is a showcase of differenttype of landscapes and landforms. A numberof tectonic features, may be in consequenceof the faults passing through this basin.Sediment mobilization in the form of differentmass wasting processes assessed throughmorphometric analysis indicates the same.
Study of the geomophic featuresconcludes that the western part of the drainagebasin is uplifting at a significant level. Study ofscarps suggests that the scarps of the westernblock of the Garampani fault are higher thanthat of the eastern part. The average height ofthe scarps of western and eastern block is 93.4and 69.6 m., respectively. The development ofdifferent type of landforms of tectonic originalso suggests some activities along the faultsand thrusts of the area. The study reveals that
the tectonic features have fractured andshattered the rocks to a sufficiently high degreeso that the area is becoming prone to differentmass wasting processes. Joshi (2015) revealsthat sediment was mobilized in the drainagebasin in different forms of mass wastingprocesses including debris flow, rock fall andlandslides. Added meteorological inputs alsoincrease the rate of erosion in the study area.The processes have their impact on humanbeings in the form of natural hazards anddisasters. Similar studies in different parts ofthe dynamic Himalayas, using drainage basinsas a unit for experimental studies may help tocalculate the input and output of the mobilizedmaterial within the drainage basin and dischargethrough basin mouth. Thus, detailed study ofthe processes and landforms in different partsof the Himalayan region may particularly helpin quantitative geomorphology. Comparativestudies in different parts can help in mitigatingthe adverse effects of these active processesin the tectonically active Himalayan region.Acknowledgements
The author is thankful to The Departmentof Science and Technology, Government ofIndia for financial assistance, Professor J. S.Rawat and Mr Vinod Rawat (NRDMS,Almora) for providing cartographic support.
ReferencesAuden, J. B. 1934, Geology of the Krol Belt. Rec. Geol. Surv. India, 67, pp. 357-434.
Bartarya, S. K. 1993, Hydrochemistry and rock weathering in a sub-tropical Lesser Himalayanriver basin in Kumaun, India, Journal of Hydrology, 146, pp. 149-174, Elsevier SciencePublishers, Amsterdam.
312 Jyoti Joshi
E:\BHU\BHU.PM5 (313)
Bloom, A. L., 1991, Geomorphology: A Systematic analysis of late Cenozoic Landforms, PrenticeHall of India Private Limited, New Delhi, pp. 35-63.
Heim, A., and Gansser, A., 1939, Central Himalaya - Geological observations of the Swissexpedition, 1936, Mem. Soc. Helv. Sci. Nat, 73, pp. 1–245.
Gansser, A. 1964. Geology of the Himalaya. Interscience Publishers, London, p. 289.
Joshi, J. 2005, Hillslope Processes and Sediment Routing; an experimental study from KumaunHimalaya, Progress Report -SR/WOS-A/ES-51/2003.
Joshi, J. 2015, Mass Wasting Processes in Khairna Basin: Kumaon Himalayas, UniversalJournal of Environmental Research and Technology, 5(4):pp. 201-209 ISSN 22490256. www.environmentaljournal.org.
Leopold, L. B., Wolman, M. G. and Millar, J. P. ,1964, The drainage basin as a geomorphic unitin Fluvial Processes in Geomorphology, Eur. Pub. House. New Delhi,: pp.132-150.
Mishra, D. K. ,1980, Nature of the Ramgarh thrust and tectonic position of the Amritpur granitein the Okhalkanda Kalagarh area, Nainital district, Kumaun Himalaya, HimalayanGeology,10: pp. 264-279.
Merh, S. S., Vashi, N. M. and Patel, J. P. ,1971, On the nature of the Ramgarh Thrust in KumaonHimalaya, Jour. Geol, Soc. India, 12: pp. 380-383.
Nakata, T., 1972, Geomorphic history and crustal movements of the foothills of theHimalayas.Science Reports of the Tohokw.Univ.7th Series Geography, 22(1), pp. 42-170.
Pande, J. C., 1950, A Geological note on the Ramgarh area, district Nainital, Q. J. Geol. Min.Metall. Soc. India, 22: pp.15-23.
Pandey, I. C., 1974, Tectonic interpretation of the geology of Nainital area, Himalayan Geology,4: pp. 532-546.
Sharma, A. K., 1981, Structural study of the area East of Nainital with special reference tohillside instability. Unpublished Ph. D. Thesis. Kumaun University, Nainital. p.126.
Shastri, J. ,1989, Sediment Budgets and Routing in the Ninglat drainage Basin, Kumaun LesserHimalaya. Ph. D. Thesis, Nainital (K.U.).
Thornbury, W. D., 1993, Principles of Geomorphology; John Wiley and sons, Inc. New Delhi.:pp. 34-162.
Valdiya, K. S. , 1976, Himalayan transverse faults and folds and their parallelism with subsurfacestructures of north Indian plains, Tectonophysics, 32: pp. 353-386.
Tectonic Processes and Landforms in the Lesser Himalayas : An experimental.... 313
E:\BHU\BHU.PM5 (314)
Valdiya, K. S. ,1988, Geology and the natural environment of the Nainital Hills, Kumaun Himalayas,Gyaodaya Prakashan, Nainital, p. 68.
Vashi, N. M. and Merh, S. S., 1965, Structural elements of the rocks in the vicinity of theS. Almora Thrust near Upradi, Almora District, Jour. M. S. Univ., Baroda, 14 ( 3) : pp.27-32.
Wadia, D. N., 1975, Geology of India, Tata Mc Graw. Hill publication CompanyLimited,New Delhi. : pp. 390-403.
314 Jyoti Joshi
E:\BHU\BHU.PM5 (315)
Geomorphological Mapping of AllahabadDistrict, Uttar PradeshRicha Chaturvedi
In this paper an attempt has been made to study the mapping of the geomorphologicallandform. The geomorphological mapping was carried out with the help of IRS (LISS III)imagery by visual interpretation technique.In India remote sensing has been used for variousapplications during the last four decades and has contributed significantly towards development.Identification of landforms using key interpretation features such as image tone, texture,association and terrain shadow has been done in this paper. Based on the existing landforms,drainage characteristics on the imagery, various geomorphic units have been identified indistrict Allahabad.
Keywords : Remote sensing, GIS, resolution, interpretation.
Dr. Richa Chaturvedi, Assistant Professor, Department of Geography, Indira Gandhi National TribalUniversity, Amarkantak, [email protected]
IntroductionTitle of this paper consists of two different
disciplines, Remote Sensing andGeomorphology. Remote sensing meansacquiring information without touching anyobject of the surface. Geomorphology dealswith the genesis of relief forms of the surfaceof the earth’s crust. Certain natural processesare responsible for the forms of the surface ofthe earth. A geomorphological map must giveinformation about morphology (appearance),morphometry (dimensions and slope values),morphogen (origin/genesis) andmorphochronology (the age) of each form (Rao,2002). The geomorphic mapping using remotelysensed data products has received a greatimpetus in regional survey during the recenttime at macro, meso and micro levels. Theutility of this technique enables to acquire the
final output cheaply as well as within a shorttime (Hazra and Bhowmik, 2002). The synopticcoverage and high precision of remotely senseddata coupled with the marked cost-effectiveness and time efficiency of the dataacquisition and analysis procedures have madesatellite based geomorphological mapping anextremely effective tool for management ofnatural resources in recent times (Rao, 1978,Bhattacharya, 1980, Srinivasan,1988). The useof remote sensing technology forGeomorphological studies has definitelyincreased its importance due to theestablishment of its direct relationship with allieddisciplines, such as geology, soils, vegetation/land use and hydrology (Karwariya, Tripathiand Shiva, 2013). Satellite imagery is helpful indemarcating the geomorphic features of a largearea. The temporal, spectral and spatial
NGJI, An International Refereed Journal, (NGSI-BHU, ISSN: 0027-9374/2016/1597), vol. 62 (4),September : 315-324
E:\BHU\BHU.PM5 (316)
resolutions of remotely sensed data are valuablefor analyzing geomorphic dynamics andmapping of relief and landforms. Geomorphicand geologic studies using remote sensing dataare largely being done by different scholars bothat national and international platform. Mentionof a few works may be made as presented byVerstappen (1977, 1983), Way (1978),Townshend (1981), Barnett and Curtis (1982),Curran (1985), Sabins (1987), Lillesand andKiefer (2000), Rao (1975), Mishra (1993, 97,2003), Nagaraja and Mishra (1998), Roy (2000),Bhan (2000) and Jha (2000).Study Area
Allahabad District (24045’N to 25045’N)and (81030’E to 82015’E) lies in the southeastern part of Uttar Pradesh, India at theconfluence of holy rivers Ganga, Yamuna andinvisible Sarswati, popularly known as TriveniSangam. Allahabad district occupies an areaof 5482.0 sq.km with the population of 59,54,391 persons (2011). Geologically it exhibitsmore complex nature and broadly becategorized into recent alluvium in the northand Vindhyan system in the south.The aim ofthe present study is to bring out thegeomorphologic map using IRS P 6 LISS IIIon 1: 250,000 and to utilize the knowledge forthe sustainable development by using Remotesensing and GIS techniquesData sources
Survey of India Topo-sheets at the scaleof 1:250,000 (No. 63G, H, K and L) along withremote sensing data of IRS P6 and LISS-III(23.5 m Spatial resolution) both in digital formatand hard copy (Path 101 and Row 54) wereconsulted for demarcating and mapping ofgeomorphological units.
MethodologyThe mapping of geomorphological units
involved a series of different steps which aregiven here: First, the base map was preparedbased on topo-sheet by adopting different stepsof geo-referencing, mosaicing and subsetcreations. Second, pre-field satellite imageinterpretation for identification, demarcation andmapping of geomorphological units wasattempted by using visual image processingtechniques. Third, the interpreted image- basedinformation was transferred on base map byselecting numerous control points and usingERDAS software. Fourth, selective fieldchecks were done to assess the validity of thepre-field image interpretation. Finally,incorporating the necessary alternations andcorrections based on the field checking, theimage-based maps were completed by usingArc View .Results
The mapping of geomorphologicalfeatures in Allahabad district has largely beenbased on remotely sensed data (IRS- P6, LISS-III) hard copy print on scale 1:250,000.Different geomorphic features of the area havebeen identified and delineated through visualinterpretation of the satellite image andscanning the image through Google earth andWikimapia. The area under study appears tobe the result of complex geologic andgeomorphic processes. In the northern alluvialplain, river Ganga with its tributary, Yamuna,has been playing a dominant role in shapingand reshaping the landforms with its frequentchanges in courses. On the other hand, thesouthern part covered under Vindhyan plateauis flown by rivers: Tons and Belan. The Gangaflood plain features include, new flood plain,
316 Richa Chaturvedi

E:\BHU\BHU.PM5 (317)
Demarcation of Geomorphological Units with the help of Different image interpretation Keys
Geocoded Image (IRS P6 LISS III)
(23.5Spatial Resolution)
Preparation of final Geomorphological Map
Field Survey for verify the result which are obtained from satellite
image
Updating and preparation of final Geomorphological Maps
Geological map and ancillary data
Flowchart: Different steps for preparation of Geomorphological Maps from SatelliteImage
old flood plain, paleo channel, channel bar, pointbar and ox-bow lakes etc. while Vindhyanupland include the features like buried pediment,pediment with vegetation, pediment with stonysurface and denudational hill etc (Fig. 1 andTable 1). The geomorphic features of the studyarea are largely governed by the geomorphicprocesses, geologic structures and stages ofdevelopment. For example, the area of recentalluvium, i.e., Ganga flood plain bears morelandform features developed by erosional anddepositional actions with less variation ingradient while the Vindhyan upland on the otherhand, characterizes with undulating surfacecaused by complex geomorphic processes. Onthe basis of observations, the district as a wholehas been dividing into two majorgeomorphological units: (i) Ganga Flood Plain,
and (ii) Vindhyan Upland (Table 1). Theassemblages of landforms comprising each ofthese categories are discussed below:Ganga Flood Plain Features
The northern portion of the district as awhole and some of the southern part coveringChaka, Uruva, Karachhana and Kaundhiyarablocks, possess relatively leveled surface whichis formed by gradual deposition of sedimentsbrought by river Ganga and its tributaries. Theflood plain surface can geomorphologically bedefined as landform composed primarily ofunconsolidated depositional materials derivedfrom sediments being transported by the relatedstream. The Ganga flood plain features include,new flood plain, old flood plain, paleo channels,channel bar, point bar and ox-bow lakes
Geomorphological Mapping of Allahabad District, Uttar Pradesh 317
E:\BHU\BHU.PM5 (318)
etc.(Fig.1).1 New flood plain
New flood plain known as ‘Khadar’ ornewer alluvium is formed by the deposition ofsediments brought by river Ganga and itstributaries during each flood. This is the nearestzone of area attached with the stream which isgenerally considered as an integral part of thestream. On the imagery, such landforms arecharacterized by dark red tones, smoothtextures and irregular shapes. The arealcoverage of new flood plain is marked in 8.66per cent of District. 2. Old flood plain
Old flood plain (OFP) locally known as‘Bangar’, represents older alluvium showinghigher surface located far from the channels.These features are generally observed onsatellite imagery with numerous characteristicsbut on the basis of tonal variations these arefurther divided into 3 sub-groups, such as, (i)OFP I (light to dark red tones) (ii) OFP II (lightred mixed with gray tones) and (iii) OFP III(red mixed with white tones).The arealcoverage of OFP I, OFP II and OFP III aremarked in 10.66 per cent, 15.55 per cent and6.86 respectively.3. Point bars
Point bars are formed on the convex sideof meanders and grow by individual incrementsoutwards into the meander curve (Thornbury,1969:165), these point bars have been formeddue to the deposition of sediments carried outby river Ganga. Numerous point bars can bemarked at both banks of the river Ganga,especially where it forms meanders. This unitis occupying 1.29 per cent in district. Point barformation by river Yamuna is limited at a few
places because of its restricted flow governedby attached Vindhyan plateau region in thesouth.4. Channel bars
The channel bars are formed by thedeposition of huge amount of sediments withinthe course of a stream with an elongated shapecaused by the deposition of sand and gravel.Channel bar, building some lines, take placewithin the channel by creating island andsplitting the stream into several channels.Sizeable channel bars can be marked at manyplaces in the river Ganga, especially in the northand north-west of Allahabad city covering 1.82per cent area of the whole district that are easilymarked by very light tone on satellite imagery.5. Island
Island is a tract of land in the riversurrounded by water of a stream. In due courseof time, the island may become the part of theflood plain when any one side of the channelsbecomes dry and is filled with sediments. Asizeable island has been formed in the riverGanga near Dubawal village of Bahadurpurblock at 20 km in the east of Allahabad citycovering 2.19 per cent area of the wholedistrict.6. Natural levees (Settlement)
Natural levees are narrow belt of higherrelief that is formed by the accumulation ofsediments brought by the rivers during floodswhen water overflows its banks and spreadsover the adjacent flood plains. On satelliteimagery, these features can be marked by lightto grey tones having higher ground than thesurrounding areas. Some of stabilized naturallevees have attracted the human settlementssuch as the old city of Allahabad towns like
318 Richa Chaturvedi

E:\BHU\BHU.PM5 (319)
Geomorphological Mapping of Allahabad District, Uttar Pradesh 319
E:\BHU\BHU.PM5 (320)
Phaphamau, Jhusi, Naini and Sirsa etc.Generally, the natural levees are supported bybackswamp in their countryside (back region)but in reference to Allahabad district, thesefeatures are either merged with new flood plainzone or not visible due to human interferences.The areal coverage of natural levees(settlement) is marked over 4.58 per cent ofDistrict.7. Oxbow lake
An oxbow lake is a crescent-shaped, oftenephemeral body of standing water, situated onthe abandoned channel (oxbow) where thestream -neck is cut-off and later filled up withsilted materials. Numerous such features aremarked in the Gangapar region such as Phulpur,Saidabad and Dhanupur where they are calledTals (lake).8. Palaeochannel
Palaeochannel, abandoned surfacechannels on flood plains are noticed at severalplaces which are the ancient routes of riverslike Ganga, Yamuna, Barna etc. The satelliteimages provide a very clear-cut vision ofpalaeochannels because of their specific terraincharacteristics, underlying materials, land useetc. These earlier river courses bear theirdistinct appearance with dark tone, irregularpattern and crescentic shape on satelliteimagery.Vindhyan Upland Features
The Vindhyan upland is composed mainlyof fluvio-marine deposits of probably theCambrian age, which has been uplifted andpeneplained several times (Pichamuthu1980:63-65). A great variety of geological andlithological phenomena existed in the area, haveinfluenced the remarkable landforms.
Weathering action has played a vital role indissecting several blocks of the rocks. As awhole, the landforms identified on VindhyanUplands by image interpretation may be enlistedas:
(i) Pediment with stony surface (Type I),(ii) Pediment covered with vegetation (TypeII), (iii) Shallow buried pediment, (iv) Deeplyburied pediment and (v) Denudational hill (Fig1).1. Pediment
A pediment is a gently inclined erosionsurface, carved in bedrock, thinly veneered withgravel, and developed at the base of mountains.The term pediment is used to designate the openrock – surfaces created by erosion processes.They are mostly surfaces of flat to very lowslope and sometimes, attached with denudedhills. The pediment is the characteristics featureof Vindhyan Upland. It has been generallyobserved on satellite imagery and classified intotwo types depending on their imagecharacteristics and nature of existence. (i)Pediments type I generally visualized by lightto very light tone (whitish) because of higherreflectance caused by bare rocks as there isno vegetation cover on it. (ii) Pediments typeII are those rock cut surfaces which arecovered with veneer of soils mixed with stonywaste materials and sparse vegetation orbushes. These features are found inYamunapar region. Pediment with Vegetationis very clearly marked on imagery by light tomoderate gray tones. The areal coverage ofPediment type I and II are marked on 5.17 percent and 8.23 per cent, respectively.2. Buried pediments
Buried pediments are those flat surfacesof the plateau region which consists of thin to
320 Richa Chaturvedi
E:\BHU\BHU.PM5 (321)
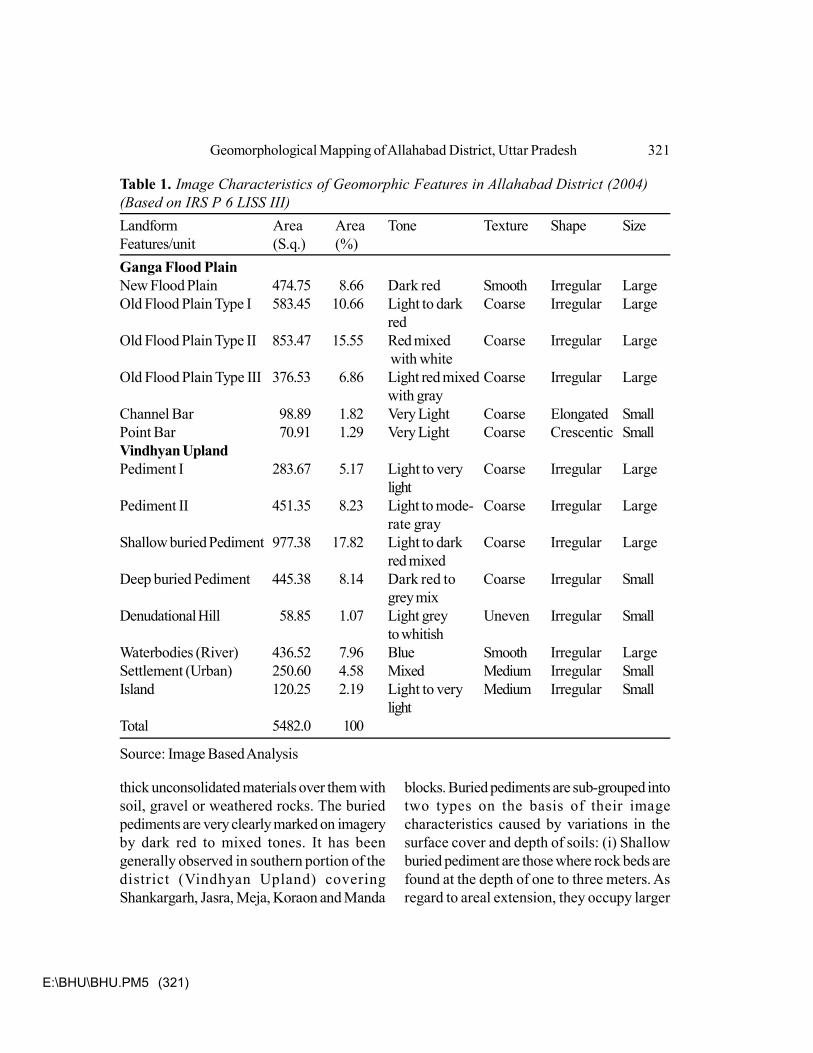
Table 1. Image Characteristics of Geomorphic Features in Allahabad District (2004)(Based on IRS P 6 LISS III)Landform Area Area Tone Texture Shape SizeFeatures/unit (S.q.) (%)Ganga Flood PlainNew Flood Plain 474.75 8.66 Dark red Smooth Irregular LargeOld Flood Plain Type I 583.45 10.66 Light to dark Coarse Irregular Large
redOld Flood Plain Type II 853.47 15.55 Red mixed Coarse Irregular Large
with whiteOld Flood Plain Type III 376.53 6.86 Light red mixed Coarse Irregular Large
with grayChannel Bar 98.89 1.82 Very Light Coarse Elongated SmallPoint Bar 70.91 1.29 Very Light Coarse Crescentic SmallVindhyan UplandPediment I 283.67 5.17 Light to very Coarse Irregular Large
lightPediment II 451.35 8.23 Light to mode- Coarse Irregular Large
rate grayShallow buried Pediment 977.38 17.82 Light to dark Coarse Irregular Large
red mixedDeep buried Pediment 445.38 8.14 Dark red to Coarse Irregular Small
grey mixDenudational Hill 58.85 1.07 Light grey Uneven Irregular Small
to whitishWaterbodies (River) 436.52 7.96 Blue Smooth Irregular LargeSettlement (Urban) 250.60 4.58 Mixed Medium Irregular SmallIsland 120.25 2.19 Light to very Medium Irregular Small
lightTotal 5482.0 100
Source: Image Based Analysis
thick unconsolidated materials over them withsoil, gravel or weathered rocks. The buriedpediments are very clearly marked on imageryby dark red to mixed tones. It has beengenerally observed in southern portion of thedistrict (Vindhyan Upland) coveringShankargarh, Jasra, Meja, Koraon and Manda
blocks. Buried pediments are sub-grouped intotwo types on the basis of their imagecharacteristics caused by variations in thesurface cover and depth of soils: (i) Shallowburied pediment are those where rock beds arefound at the depth of one to three meters. Asregard to areal extension, they occupy larger
Geomorphological Mapping of Allahabad District, Uttar Pradesh 321

E:\BHU\BHU.PM5 (322)
Fig.2
322 Richa Chaturvedi
E:\BHU\BHU.PM5 (323)
portion (17.82 per cent) of the Vindhyan uplandarea. (ii) Deeply buried pediment (8.14 percent) are those where depth of soil / underlyingmaterials are found to be more than threemetres. The later type is characterized withgood to very good cultivation in addition togrown up trees and gardens.3. Denudational hills
Denudational hills are formed due todifferential erosion and weathering, so thatmore resistant formation stands as hill.Denudational hills of various heights rangingfrom 354 m to 363 m, above mean sea level,are mostly covered with vegetation. Thedenudational hills having their flat top surfacesare marked at two locations in Yamunaparregion (Koraon block) at south east corner ofthe district (1.07 per cent). These hills aregenerally enclosed with barren land or rockysurfaces partly buried by debris.Conclusion
The results of the present study indicate
that the remote sensing and GIS are veryconvenient tools for mapping geomorphicfeatures of Allahabad district. The remotelysensed data of IRS-P6-LISS III with 23 mresolution is proved to be very suitable fordelineating the spatial extent of regionalgeomorphic features like new flood plain, oldflood plain, oxbow lake, natural levee, channelbar, point bar, island, paleo channel, pediment,and denudational hill.At last, the utility of remotesensing for geomorphological studies isimmense. It allows for the rapid assessment oflarge areas and for the monitoring of changesto these areas – things that would be impossibleto do using field studies alone. Properunderstanding on the principles of geomorphicprocess will definitly pave ways for betterresults in planning methods to exploit naturalresources and landform maps are widely usedin various fields of resource surveys,engineering application and geotechnicalstudies, environmental planning, hydrologicalstudies, mineral and oil explorations and also inhazard mitigation.
ReferenceE.C. Barrett and L.F. Curtis, 1982, Introduction to Eenvironmental Remote Sensing, 2nd ed.
Halsted Press, New York, .
S.K. Bhan, 2000, Role of Remote Sensing in Geomorphology and Terrain Evolution, In V.C. Jha(ed.) Geomorphology and Remote Sensing, acb Publication, Calcutta, : pp. 116-120.
A. Bhattacharya, 1980, Geological and Geomorphological Mapping Using Landsat-MSSData in Tripura Area, Proc. Indian Photo Interpretation Institute, Dehradun.
P.J. Curran, 1985, Principals of Remote Sensing. Longman, London.
P.B. Hazra and S. Bhowmik, 2002 , Use of Satellite Imagery in Geomorphology: A Case Study,In V. C. Jha (ed.) Geomorphology and Remote Sensing.acb Publication, Calcutta,: pp.103-108.
Geomorphological Mapping of Allahabad District, Uttar Pradesh 323
E:\BHU\BHU.PM5 (324)
V.C. Jha, (ed.), 2000, Geomorphology and Remote Sensing. acb Publication, Calcutta.
S.K. Karwariya, S.Tripathi and S. Shiva, 2013, Remote Sensing and GIS Applications inDetermination of Geomorphological Mapping of AchanakmarAmarkantak BiosphereReserve Using Multispectral Satellite Data”, International Journal of Remote Sensing& Geoscience (IJRSG), 2(4) : pp.44-49.
S.P. Mishra, 1997, Landform Evaluation through Integrated Remote Sensing. Indian Journalof Landscape System and Ecological Studies , 20 (1) : pp.136-141.
S.P. Mishra and S.K. Chaubey, 1999, Geomorphic Features and Their Relation with AgriculturalLand Quality: A Case Study of Chahania Block, Chandauli District, U.P., Trans. Inst.Indian Geographers, 21(2) : pp.23-34.
S.P. Mishra, 2003, Hydrogeomorphological Characteristics of Karmanasha Basin, Eastern UttarPradesh. Indian Geographical Journal, 78 (1) : pp.13-26.
R. Nagarajan and H.N. Mishra, 1998, Remote Sensing Techniques and Their Applications .In H.N. Mishra and V.P. Singh (ed.) Research Methodology in Geography.RawatPublications : pp. 162-175.
C.S. Pichamuthu, 1980, Physical Geography of India. National Book Trust of India,New Delhi.
D.P. Rao, 1975, Applied Geomorphological Mapping for Erosion Surveys: the Example of theOliva Basin, Calabria, ITC Journal, 3 : pp.341-350.
D.P. Rao, 1978, Utility of Landsat Coverage in Small-Scale Geomorphological Mapping :Some Example from India, Photonirvachak, Jour. Indian Soc. of Photo. Int., 6( 22): pp.49-53.
A. K. Roy, 2000, Applied Geomorphology Mapping and Remote Sensing in Resource Survey.In V.C. Jha (ed.) Geomorphology and Remote Sensing, abc Publication Calcutta, : pp.85-91.
P. Srinivasan, 1988, Use of Remote Sensing Techniques for Detail HydrogeomorphologicalInvestigation in Parts of Narmadasagar command Area, Photonirvachak, Jour. IndianSoc. of Remote Sensing,16(1) : pp.55-62.
W. D. Thornbury, 1969, Principles of Geomorphology, John Willey & Sons.
324 Richa Chaturvedi
E:\BHU\BHU.PM5 (325)
Perspectives of Migration in IndiaSayan Mondal and B. N. Singh
In the present paper, an attempt has been made to analyse the migration status ofpopulation in India from the perspectives of demography, economic and social reasons.Movement is an integral part of the human life and civilization dated back over five thousandyears. Human migration is mainly induced due to various reasons like searching for foods,searching for habitable places in a hostile environment, searching for better lifestyles, relieffrom the civil disobedience and wars etc. from the early age of civilization. Due to thephysical vastness and cultural variation across various regions, India experiences also somedifferent types of migration. The developmental plans by the various governments after thepost-colonial era were also influenced differently on the migration scenario in India. Thepresent study emphasizes on various aspect of migration scenario and their perspectivesfrom geographical point of view. The major sources of data for this paper are from Censusof India and the NSSO reports.
Keyword : Migration, reason/causes, employment.
IntroductionThe word migration has been derived
from the Latin word ‘Migrate’ which means tochange one’s residence. Literally it means thesettlement or shifting of an individual or a groupof individuals from one cultural area or placeof habitation to another, more or lesspermanently. Movement is an integral part ofhuman existence, and its manifestations arediverse. The concept of migration, however,also covers a change of milieu, i.e. ofenvironment. Thus, the change of dwellingplace and change of milieu is an importantaspect of migration (Joshi, 1994). Humanmigration from one place to another in search
of better livelihoods is a key feature of humanhistory. Normally, people move ahead andmigrate to access various emergingopportunities at the economically and sociallydeveloped areas. The gaps between rural andurban areas have also been widening day byday mainly due to industrialization whichinduced migration towards the industrial urbancentres.
Migration is another factor of populationchange besides the factors of fertility andmortality in demographic study. “Migration is ageographic mobility that involves a change ofusual residence between defined political oradministrative areas, or between residence
Sayan Mondal, Research Scholar and Dr. B.N. Singh, Professor, Department of Geography, B.H.U.,Varanasi- 221005.
NGJI, An International Refereed Journal, (NGSI-BHU, ISSN: 0027-9374/2016/1598), vol. 62 (4),September : 325-336
E:\BHU\BHU.PM5 (326)
areas of different types. In general usage, theterm has been restricted to relatively permanentchange” (International Encyclopedia ofPopulation, 1982). In Encyclopedia Americana,1968 it has been stated that “Migration is acoordinated voluntary movement of aconsiderable number of people from anaccustomed habitat to a new one”.
Early migration tended to be themovement of tribes, races and groups. Inmodern times, it is the movement of familiesand, still more of individuals seeking economicsettlement and transient work in other lands(Rawat, 1993). Numerous studies show thatthe process of migration is influenced by social,cultural and economic factors and outcomescan be vastly different for men and women,for different groups and different locations (cf.de Haan and Rogaly, 2002).Migration Scenario in India
Migration is a continuous process whichwas started from the time of the first humancivilization dated over thousands of years ago.There is not any place or time, in whichmigration didn’t occur. On the basis of thedifferent individuals, societies and culture, thescale, type and implications of migration varygreatly. Due to the physical vastness of thecountry and invariably differences in physicallandscape and cultural variation across thecountry, India has some special characteristicsof migration behaviour.
Indian people are by nature home lovingand majority of the Indian population spendsentire cycle of life in or around the place ofbirth (Joshi, 1994). Migration in India ispredominantly short distance, with around 60%
of migrants changing their residence within thedistrict of enumeration and over 20% withinthe state of enumeration while the rest moveacross the state boundaries. A significantproportion of women migrate over shortdistances, mainly following marriage.(Srivastava and Sashikumar, 2003)
India’s population has generally beencharacterized as non-mobile but recently forsome decades internal migration has recordedphenomenal increase (Rawat, 1993). In thecase of women migrants they have migratedmainly due to marriage. In India, marriagebetween a man and a woman from the samevillage is against the customs. So in other words,marriage means women migration. Joiningfamily members is also another reason behindmigration. First the husband gets employmentand settles. If he can get a decent job and house,he brings his family.
With regard to urban-urban migration,people move from one urban centre to anotherurban centre in search of better job conditionand income opportunities. The self employedand employers also move because of bettertrade and business prospects in larger cities.With this respects migrants prefer to converttheir fixed assets into money capital for theirtransfer purposes. Urban-urban migration istherefore more likely to be dominated by familyrather than individual migration (Oberai andSingh, 1983).
In 1951, the urban population in India was62 million, i.e. people roughly about17% of thetotal population. By 2011, the urban populationwas 377 million which was 31% of the totalpopulation. By 2025, 42.5% of the population
326 Sayan Mondal and B. N. Singh
E:\BHU\BHU.PM5 (327)
will be urban. By 2030, India’s urban populationis set to reach 590 million, an addition ofapproximately 300 million to India’s currenturban population. Much of this growth will bedue to rural-urban migration. Between 1992–1993 and 1999–2000, NSS data indicate anincrease in urban migration, but this is mainlydue to urban-urban flows (Srivastava andBhattacharya, 2002).
The proportion of people migrating foreconomic reasons is greater among long-distance migrants. Most male migrants movingbetween states did so for economic reasons.Again, economic motives are more significantin urban migration streams, especially for males.The share of inter-state to total migrants wasonly 11.8% in 1991 and such migrantscomprised 28% of all economic migrants.Similarly, 49% of male migrants were in urbanareas and 69.2% of such migrants migratedfor employment (Srivastava, 1998).
There are also important regionaldifferences in the pattern of female labourmobility between the northern and southernstates (Singh, 1984). Among inter-stateeconomic migrants, the share of the northernstates (Bihar, UP) is very large in malemigration, but the southern states have acomparatively larger share in female economicmigrants (Srivastava, 1998). But overall it canbe said that, females migrate smaller distancesthan of their male counterparts for the reasonof employments.
Due to the vast size of the country andlarge differences in physical and humandispositions across the country, migration trendin India shows some specific features. As per
2001 Census data on inter-state migration,Maharashtra received the largest number ofmigrants (8 million) from other states and othercountries by place of birth, followed by Delhi(6 million), and West Bengal (5.5 million). Onthe basis of net migration during the decade,i.e. the difference between in-migration andout-migration in each state, Maharashtra stoodat the top of the list with 2.3 million net migrants,followed by Delhi (1.7 million), Gujarat (0.68million) and Haryana (0.67 million) while UttarPradesh (minus 2.6 million) and Bihar (minus1.7 million) were the two states with the largestnumber of net out-migration from the state(GOI Census, 2001).
Social structures and the tempo or patternof development are the other major influentialfactors behind the migration scenario in India.The development policies by all thegovernments in the post colonial India haveaccelerated the process of migration. Spatialdifferentiations of the development anddisparities among the various social classes/segments/states are also the striking forces forhuman mobility.
Impact of Migration on Migrants andTheir Families
The uncertainty of earnings andmagnitude of remittances pushes women andchildren from poor labouring households toparticipate in the labour market under adverseconditions. Thus, the impact of migration onthe women can be two-sided but the stronginfluence of patriarchy restricts the scope ofwomen’s autonomy (Menon, 1995). The impactof male migration can be especially adversefor girls, who often have to bear additional
Perspectives of Migration in India 327
E:\BHU\BHU.PM5 (328)
domestic responsibilities and take care of theiryounger siblings. The absence of malesupervision further reduces their chances ofacquiring education (Srivastava, 2001).Objectives of the Study
In brief, following are the three majorobjectives which are to be examined in thispaper:
1. To study the proportion of migrantpopulations and their trends.
2. To study the general educational levelof the migrants.
3. To inquire the reasons behind themigration of migrants.Data Sources and Methodology
In the present study, the secondary dataobtained from the Census of India and NationalSample Survey (NSS) data have been used.The Census of India data provides an idea ofproportions of migrant population and their sexwise distribution. The latest data from NationalSample Survey (NSS) of 49th, 55th and 64th
round have been used for this study. This surveyis providing the information on household
characteristics including social anddemographic background of migrants and alsothe causes behind the migration.Findings and Discussions
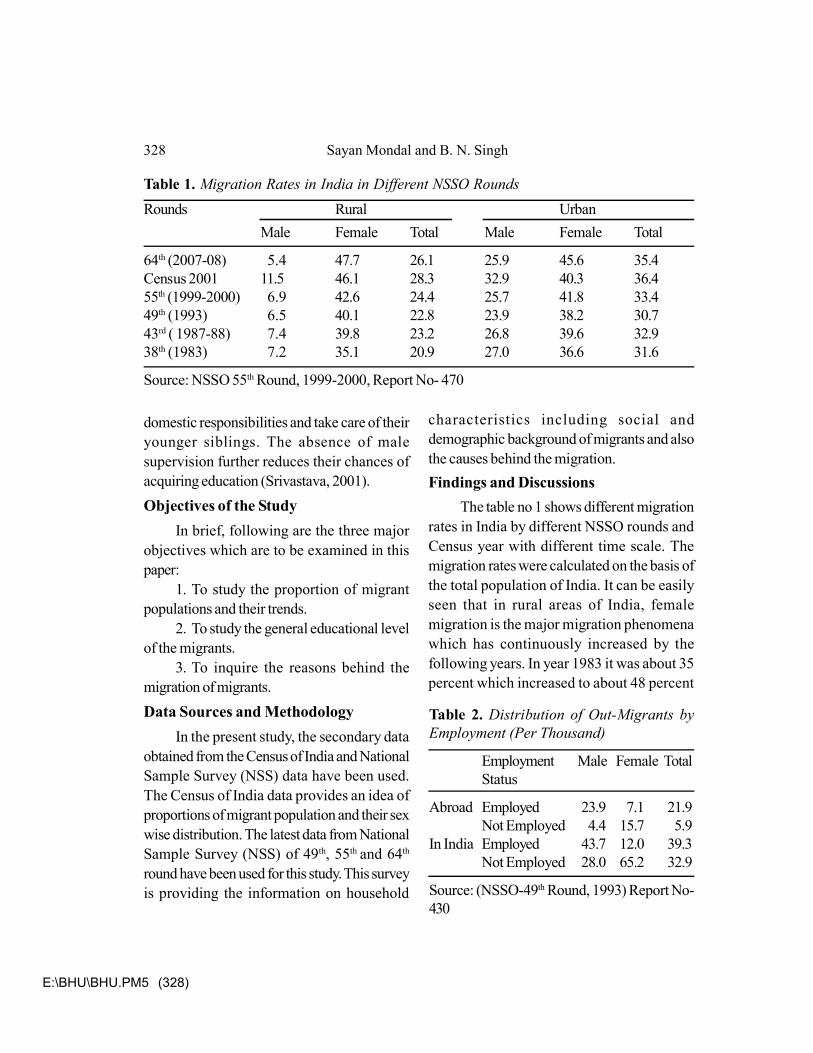
The table no 1 shows different migrationrates in India by different NSSO rounds andCensus year with different time scale. Themigration rates were calculated on the basis ofthe total population of India. It can be easilyseen that in rural areas of India, femalemigration is the major migration phenomenawhich has continuously increased by thefollowing years. In year 1983 it was about 35percent which increased to about 48 percent
Table 1. Migration Rates in India in Different NSSO RoundsRounds Rural Urban
Male Female Total Male Female Total
64th (2007-08) 5.4 47.7 26.1 25.9 45.6 35.4Census 2001 11.5 46.1 28.3 32.9 40.3 36.455th (1999-2000) 6.9 42.6 24.4 25.7 41.8 33.449th (1993) 6.5 40.1 22.8 23.9 38.2 30.743rd ( 1987-88) 7.4 39.8 23.2 26.8 39.6 32.938th (1983) 7.2 35.1 20.9 27.0 36.6 31.6
Source: NSSO 55th Round, 1999-2000, Report No- 470
Table 2. Distribution of Out-Migrants byEmployment (Per Thousand)
Employment Male Female TotalStatus
Abroad Employed 23.9 7.1 21.9Not Employed 4.4 15.7 5.9
In India Employed 43.7 12.0 39.3Not Employed 28.0 65.2 32.9
Source: (NSSO-49th Round, 1993) Report No-430
328 Sayan Mondal and B. N. Singh
E:\BHU\BHU.PM5 (329)
in 2007-08. In urban India also, femalemigration has the major share which is about46 percent in 2007-08. But in urban India, malemigration also has the reasonable percentage.Every one in four urban males was migrateddue to any reason. The probable reason behindthe excess share of female migrants in boththe rural and urban area, is due to Indian
patriarchal society and their marriage system.The table 2 has been computed from the
NSSO 49th round report which shows aboutthe employment status of the Indian migrantswho have migrated far away in different partsof the country within India. It can be easilyidentified that within the migrants, abroademployment status is smaller than the migrantswithin India. It can be also seen that largerproportion of male migrants are employedwhereas female migrants employed proportionis very little. So it can easily be concluded thatthe female migrants mostly migrated as a familymember of the employed male members whowent to abroad for their employment reason.In India also a sizable female populations whoare not employed have migrated due to
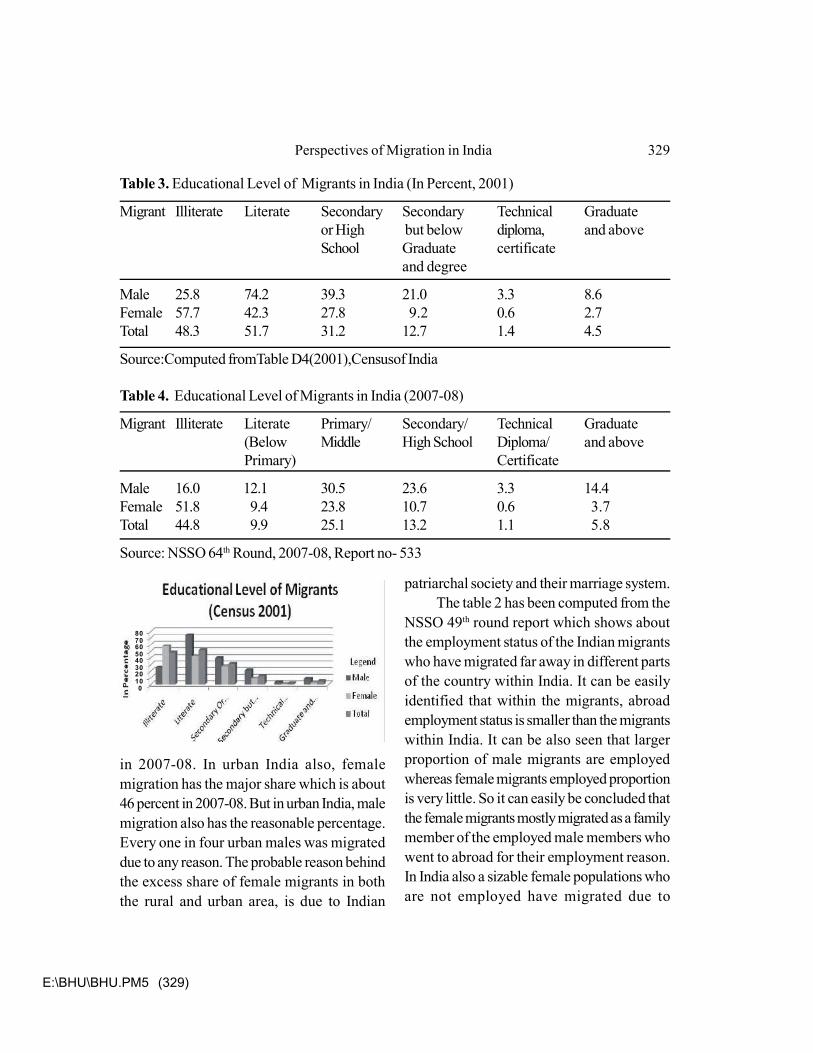
Table 3. Educational Level of Migrants in India (In Percent, 2001)
Migrant Illiterate Literate Secondary Secondary Technical Graduateor High but below diploma, and aboveSchool Graduate certificate
and degree
Male 25.8 74.2 39.3 21.0 3.3 8.6Female 57.7 42.3 27.8 9.2 0.6 2.7Total 48.3 51.7 31.2 12.7 1.4 4.5
Source:Computed fromTable D4(2001),Censusof India
Table 4. Educational Level of Migrants in India (2007-08)
Migrant Illiterate Literate Primary/ Secondary/ Technical Graduate(Below Middle High School Diploma/ and abovePrimary) Certificate
Male 16.0 12.1 30.5 23.6 3.3 14.4Female 51.8 9.4 23.8 10.7 0.6 3.7Total 44.8 9.9 25.1 13.2 1.1 5.8
Source: NSSO 64th Round, 2007-08, Report no- 533
80706050403020100
Perspectives of Migration in India 329
E:\BHU\BHU.PM5 (330)
marriage. The proportion of male migrants ofunder not employed category normally migratesfor the educational purpose.
The tables no 2 and 3 show about thegeneral educational level of migrants in Indiafor two different time periods of 2001 and 2007-08. According to Census of India, in 2001 abouthalf of the Indian migrants were not literate,within them ratio of female illiteracy was muchhigher. About three-fourth of male migrantswere literate, within whom about 40 percentwere below high school pass, about 21 percentwere above secondary but below graduate.Only 8.6 percent male were graduate whereas only 2.7 percent female migrants weregraduate. About 28 percent female migrantswere literate with high school degree only. It isclear that at the time of migration, malemigrants tend to have higher level of educationalattainment than the female population. In theyear (2007-08) the literacy condition improvedby the overall as well as its gender wise figures.The percentage of male migrants, havinggraduate and above degree increasedreasonably.Causes of Migration
Due to various reasons human havemoved from their origin areas to another areasfor centuries. Some are drawn to new placesby ‘pull’ factors, whereas for the others, theyfind it is problematic to remain in their place oforigin and moved due to ‘push’ factors. Thesehave contributed to the recent movement ofhuman and also are the reasons behind humanmigration to other areas or states or betweenthe countries. In India, as there are widediversities in the nature of migration so the
causes behind it are also bound to vary.According to Rawat, in the early stages
of civilization disasters like floods, famines,epidemics, wars, conquest and invasions,economic, political and religious oppressions athome, and love for adventure, aspiration formore wealth etc., were the probable causes ofmigration. However, the factors of recent timeare more explicitly specified than ever before(Rawat, 1993).
Factors such as age, education level,wealth, land owned, productivity and jobopportunities influence the participation ofindividuals and households in migration, but sodo social attitudes and supporting socialnetworks (Haberfeld et al, 1999; Rogaly et al,2001; Mosse et al, 2002).
National Sample Survey Organisation ontheir migration related reports broadly classifiedthe reasons behind the migration into 13categories. The categories are mainly relatedwith the economic reasons, marriage,movement with family, studies etc. arementioned below:Reasons for Migration
1. In search of employment2. In search of better employment3. To take up employment/ better
employment4. Transfer of service/ contract5. Proximity to the place of work6. Pursuing studies7. Acquisition of house/ flats8. Housing problem9. Social/ political problem10. Health11. Marriage
330 Sayan Mondal and B. N. Singh
E:\BHU\BHU.PM5 (331)
12. Movement of parents/ earning members
13. OthersFor the purpose of the present study the
above mentioned reasons are clubbed into sixcommon classes. The categories of 1-5 havebeen named as “Economic Reason”.“Marriage”, “Movements with parents” and“Studies” remain the same categories as theywere earlier. “Forced Migration” has beenadded on the 64th round of reports. All othersegments have been counted as the “Other
Reason”.The table 5 draws attention towards the
causes for migration in India in the variousNSSO rounds in the various time scales (49th
Round- 1993, 55th Round- 1999-2000, 64th
Round- 2007-08). This table clearly reflects thatthe “Economic Reason” is an important reasonbehind the male migration in both the urban andrural area. On the other hand “Marriage” isthe single dominant reason for the femalemigration mainly in the rural areas and theproportion of this segment has been increasing
Table 5. Reasons for Migration in Various Rounds in IndiaRural Urban
Male Female Male Female
Rounds 49th 55th 64th 49th 55th 64th 49th 55th 64th 49th 55th 64th
Economic Reason 47.7 30.3 28.6 8.3 1.0 0.7 41.5 51.9 55.7 4.9 3.0 2.7Marriage 2.3 9.4 9.4 61.6 88.8 91.2 0.9 1.6 1.4 31.7 38.5 60.8Mov. with parents 20.8 26.0 22.1 23.7 6.3 4.4 28.3 27.0 25.2 49.5 31.0 29.4Studies 4.1 5.3 10.7 1.1 0.4 0.5 18.0 6.2 6.8 7.0 1.3 2.2Forced Migration - - 4.2 - - 0.3 - - 1.3 - - 0.5Other Reasons * 25.1 29.0 25.0 5.3 3.5 2.9 11.3 13.3 9.6 6.9 6.2 4.4
*”Other Reasons” included housing problem, post retirement, acquisition of own house/ flats, health care etc.
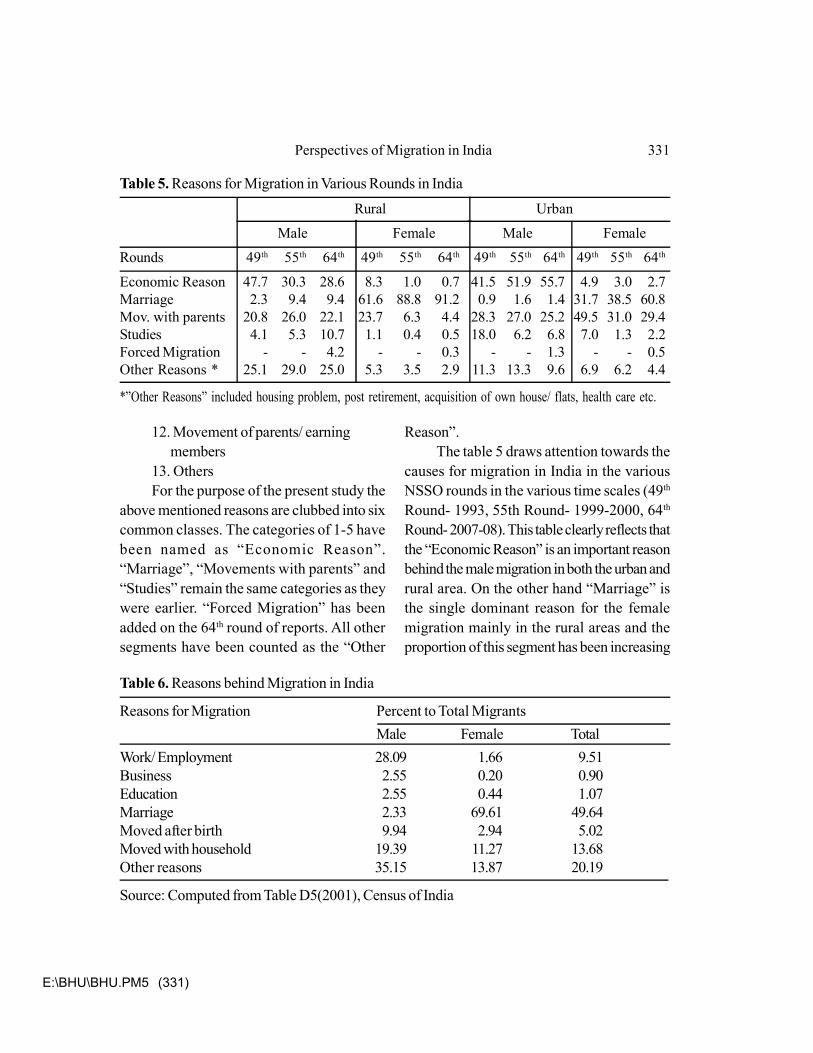
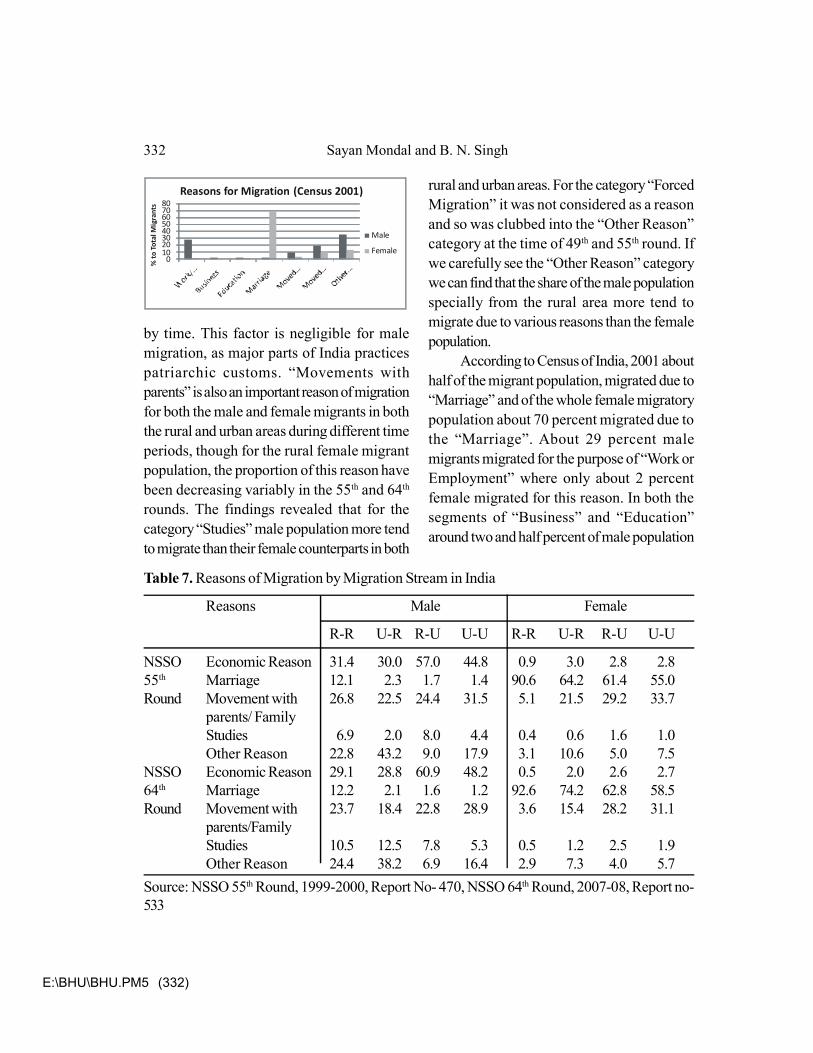
Table 6. Reasons behind Migration in India
Reasons for Migration Percent to Total MigrantsMale Female Total
Work/ Employment 28.09 1.66 9.51Business 2.55 0.20 0.90Education 2.55 0.44 1.07Marriage 2.33 69.61 49.64Moved after birth 9.94 2.94 5.02Moved with household 19.39 11.27 13.68Other reasons 35.15 13.87 20.19
Source: Computed from Table D5(2001), Census of India
Perspectives of Migration in India 331
E:\BHU\BHU.PM5 (332)
by time. This factor is negligible for malemigration, as major parts of India practicespatriarchic customs. “Movements withparents” is also an important reason of migrationfor both the male and female migrants in boththe rural and urban areas during different timeperiods, though for the rural female migrantpopulation, the proportion of this reason havebeen decreasing variably in the 55th and 64th
rounds. The findings revealed that for thecategory “Studies” male population more tendto migrate than their female counterparts in both
rural and urban areas. For the category “ForcedMigration” it was not considered as a reasonand so was clubbed into the “Other Reason”category at the time of 49th and 55th round. Ifwe carefully see the “Other Reason” categorywe can find that the share of the male populationspecially from the rural area more tend tomigrate due to various reasons than the femalepopulation.
According to Census of India, 2001 abouthalf of the migrant population, migrated due to“Marriage” and of the whole female migratorypopulation about 70 percent migrated due tothe “Marriage”. About 29 percent malemigrants migrated for the purpose of “Work orEmployment” where only about 2 percentfemale migrated for this reason. In both thesegments of “Business” and “Education”around two and half percent of male population
01020304050607080
% to
Tot
al M
igra
nts
Male
Female
Reasons for Migration (Census 2001)
Table 7. Reasons of Migration by Migration Stream in India
Reasons Male Female
R-R U-R R-U U-U R-R U-R R-U U-U
NSSO Economic Reason 31.4 30.0 57.0 44.8 0.9 3.0 2.8 2.855th Marriage 12.1 2.3 1.7 1.4 90.6 64.2 61.4 55.0Round Movement with 26.8 22.5 24.4 31.5 5.1 21.5 29.2 33.7
parents/ FamilyStudies 6.9 2.0 8.0 4.4 0.4 0.6 1.6 1.0Other Reason 22.8 43.2 9.0 17.9 3.1 10.6 5.0 7.5
NSSO Economic Reason 29.1 28.8 60.9 48.2 0.5 2.0 2.6 2.764th Marriage 12.2 2.1 1.6 1.2 92.6 74.2 62.8 58.5Round Movement with 23.7 18.4 22.8 28.9 3.6 15.4 28.2 31.1
parents/FamilyStudies 10.5 12.5 7.8 5.3 0.5 1.2 2.5 1.9Other Reason 24.4 38.2 6.9 16.4 2.9 7.3 4.0 5.7
Source: NSSO 55th Round, 1999-2000, Report No- 470, NSSO 64th Round, 2007-08, Report no-533
332 Sayan Mondal and B. N. Singh
E:\BHU\BHU.PM5 (333)
each have migrated in India. It can be easilyseen that after the birth in India there is moreprobability of male child migration for variousreasons, including their better health andeducation by their family members. There wasabout 10 percent male population and 3 percentfemale population who moved after their birth.About 20 percent of male migrant populationand about 11 percent female migrant populationmigrated with their families. This happened inIndia normally because of the joint familyculture. About 35 percent of the male populationand 14 percent of female population migrateddue to various “Other” reasons.
The table 7 depicts various migrationstreams in India by the male and femalepopulation. There are four migration streamsas rural to rural stream, urban to rural stream,rural to urban stream and urban to urban stream.Here for the study,we have collected data fromthe NSSO 55th round and 64th round. For themale migrants, economic reason is the singledominant and the most important cause behindthe migration in all of the four streams ofmigration, among which rural to urban andurban to urban migration take the largest shareof male migrants. For the same category andstreams, female migrants are very negligible.“Marriage” is the main reason for the femalemigration in all of the above four streams butrural to rural stream has the largest share. Fromrural to rural short distance migration mainlyfemale migration occurred due to the marriage.About one fourth of the migrant population inall the four streams independently by their sexoccurred mainly due to the “Movement withparents/ Family”. The above table alsohighlights that the category “Studies” is mainly
important among the male migrants.Conclusion
Likewise some other third world countries,India is also facing some migration related issuesin perspective of both the source areas anddestination areas, which is slightly differentfrom the condition of the developed countries.Migration from India to industrialised counties,though modest in scale, grew steadily between1950 and 2000. Nearly 1.25 million Indians havemigrated to the principal destinations. Althoughit can be seen that still in India female migrationhappens mostly due to marriage but it also canbe said that labour mobility or employmentrelated migration is also a key feature of thedevelopment process in India.
From the above study we can easilyidentify that from rural to urban areas the tempoof migration has been seen more. The reasonbehind this is that urban areas are moreprosperous due to better facilities of health,education etc. In urban areas there are morepossibilities of getting jobs and employment thanthe rural areas. So people are normally attractedto migrate in urban centres. Normally in ruralareas we can find lack of educational andhealth related institutions which are the basicservices for society. Also due to lack of properdevelopment, the employment situation or jobopportunity is much worse than in any urbanarea. Now due to heavy movements ofmigrants towards urban areas, the cities areexperiencing overcrowded situations, and alsounhygienic living situations such as slums etc.In most cases it can be seen that migrantsnormally live in such a poor condition wherebasic facilities like drinking water, electricity,
Perspectives of Migration in India 333
E:\BHU\BHU.PM5 (334)
drainage and sanitation facilities hardly exist.So it is desirable that government should takesteps for developing the conditions of rural areasand increasing more job opportunities by variousgovt. schemes. Those will directly influencereduce the number of migrants towards urbancentres for job perspectives. Government andurban authorities jointly should take steps fordeveloping the living situations of migrants inurban areas also.
Migration is a complex process and thisoccurs mainly due to a combination of factorslike migrants being unaware of their rights; pooreducation and skills. One of the most seriousproblems faced by migrants is their lack ofaccess to basic services like the basiceducation. In 2001 about 58 percent of femalemigrants were illiterate whereas about onefourth of the total male migrants were illiterate.But it can be seen that in 2007-08 about 51percent of female migrants and only 16 percentof male migrants were illiterate. Also thestandard of educational qualification has beenincreased by that certain periods. The malemigrants having educational qualification
“Graduate and above” has been increased from8 percent in 2001 to 14 percent in 2007-08.From the above study, it can be also concludedthat due to the improvement in the educationalcondition in India resulting into improvement inmigrant communities. This leads the migrantsto get better employment situation and higherliving standards. On the purpose of educationit also can be said that the children who wereaccompanied with their parents for severalmonths at a time were often not getting propereducation in the destination either for the newschool environment or the language problem inthe new area.
According to Census and NSSO dataabout 30 percent of male migrants mainlymigrated due to the economic reasons oremployment related issues where for the femalepopulation this reason is negligible. About 70percent of females migrate mainly for themarriage. Internal migration is largely drivenby the persistence of large regional inequalitiesand its potential positive impacts on the lives ofthe poor.
ReferencesBirks, J. S. and Sinclair, C. A., 1980, International Migration and Development in the Arab
Region. Geneva: ILO.
Demery, L.,1986, Asian labour migration: An empirical assessment. In: Arnold, F. andShah, N.M. eds. (1986) Asian Labour Migration: Pipeline to the Middle East.West View Special Studies in International Migration.
de Haan, A. and Rogaly, B., 2002, Introduction: Migrant workers and their role in rural change.Journal of Development Studies, 37(5).
Encyclopedia Americana, 1968, America Corporation, New York, 19, : p.48.
334 Sayan Mondal and B. N. Singh
E:\BHU\BHU.PM5 (335)
International Encyclopedia of Population,1982, The Free Press, New York, 2, : p.448.
Joshi, S.C.,1994, Migration to a Metropolis, R.B.S.A. Publishers, Jaipur, India.
Mosse, D., Gupta, S., Mehta, M., Shah, V., Rees, J. and KRIBP Team, 2002, Brokered livelihoods:Debt, labour migration and development in tribal western India. Journal of DevelopmentStudies, 38(5) : pp. 59–88.
Menon, G. , 1995, The impact of migration on the work and status of tribal women in Orissa. In:Schenk-Sandbergen, L. ed. (1995) Women and Seasonal Labour Migration. Indo-Dutch Series on Development Alternatives 16. New Delhi: Sage Publications.
Ministry of Labour ,1991, Report of the National Commission on Rural Labour (NCRL Report).New Delhi: Government of India.
Ministry of Labour , 2002, Report of the Second National Commission on Labour. New Delhi:Government of India.
Nayyar, D.,1994, Migration, Remittances and Capital Flows: The Indian Experience. NewDelhi: Oxford University Press.
Oberai, A. S.; H.K.Manmohan Singh.,1983, Causes and consequences of internal migration:A study in the Indian Punjab. Oxford University Press, New Delhi.
Oberai, A. S., Prasad,P.H. and Sardana, M.G. ,1989, Determinants and consequences ofInternal Migration in India: Studies in Bihar, Kerala and Uttar Pradesh, OxfordUniversity Press, New Delhi.
Rawat, P. S. ,1993, Migrationand Structural Change: A Study of Rural Society in GarhwalHimalaya, Sarita Book House, Delhi.
Srivastava, R. S. and Bhattacharyya, S., 2002, Globalisation, Reforms and Internal LabourMobility:Analysis of Recent Indian Trends. Paper presented at a seminar ‘LabourMobility and Globalising World: Conceptual and Empirical Issues’. September 18–192002, V. V. Giri National Labour Institute, ISLE and IHD.
Srivastava, R. S., 1998, Migration and the labour market in India. Indian Journal of LabourEconomics, 41(4).
Srivastava, R.S., 1998, Migration and the labour market in India. Indian Journal of LabourEconomics, 41(4).
Srivastava, R.S. , 2001, Access to basic education in Uttar Pradesh. In: Vaidyanathan, A. andGopinathan Nair, P.R. eds. (2001) Elementary Education in Rural India: A GrassrootsView. New Delhi: Sage Publications.
Perspectives of Migration in India 335

E:\BHU\BHU.PM5 (336)
Singh, A.M. ,1984, Rural to urban migration of women in India: Patterns and implications. In:Fawcett, J.T. et al. (1984) Women in the Cities of Asia: Migration and UrbanAdaptation. Boulder, Colorado: Westview Press.
Teerink, R. ,1995, Migration and its impact on Kandhesi women in the sugarcane harvest. In:Schenk-Sandbergen, L., ed. (1995) Women and Seasonal Labour Migration, Indo-Dutch Series on Development Alternatives 16. New Delhi: Sage Publications.
336 Sayan Mondal and B. N. Singh
E:\BHU\BHU.PM5 (337)
Role of Sugar Industry in Rural Development:A Case Study of Kushinagar District, U.P.Anil Kumar Tiwari, R. K. Pandey and V. N. Sharma
The agro-based industries have great significance in the Indian economy, whereagriculture accounts for over 35 percent of the national income and about two third of theworking population are engaged in agriculture. It is also noticeable that over three-fourths ofIndian population lives in rural area who eed to upgrade their standard of living. Agro-basedindustries play an important role in strengthening industrial and agricultural linkages. In referenceto eastern Uttar Pradesh, sugar industry is a major agro-based industry that plays a dominantrole in rural development mostly in tarai region including Kushinagar district. This districthas highest number of sugar mills, gur and khandsari units. Sugar industry used raw materialsfrom agriculture and their output has markets in rural and as well as urban areas along-withinternational markets. Surplus rural manpower can be absorbed by these industries in thisdistrict. This industry provides an excellent nexus in promoting integrated development ofagricultural and industry and in transforming a stagnant rural economy into a dynamic one inthis area. Present study is an attempt to examine the role of sugar industry in rural developmentwith the help of sample study of some selected nearby villages of sugar mills in Kushinagardistrict.
Key Words : Rural development, sugar industry, weighted value, composite value,composite index
Dr. Anil Kumar Tiwari, Assistant Professor, Kamla Devi Bajoria Degree College, Dubahar, Ballia,U.P., Email : [email protected]. R. K. Pandey, Assistant Professor, S.G.R.P.G. College, Dobhi, JaunpurDr. V.N. Sharma, Professor of Geography, Institute of Science, Banaras Hindu University, Varanasi-221005, U.P., INDIA, Email : [email protected]
IntroductionIndia has been the original home for
sugarcane as well as sugar making wheresugar industry provides a huge number ofemployment for the rural people. More thanfive crore farmers are engaged in sugarcanecultivation in India. Sugar mills (cooperative,private, and public) have been instrumental in
initiating a number of entrepreneurial activitiesin rural India (Pandey, 2007). Sugar industryis second largest agro-based industry after thecotton textiles in the country, which has a lion’sshare in accelerating industrialization andbringing socio-economic changes especially inrural areas. History of sugar and sugar cane inIndia goes back to several thousand years BC.
NGJI, An International Refereed Journal, (NGSI-BHU, ISSN: 0027-9374/2016/1599), vol. 62 (4),September : 337-350
E:\BHU\BHU.PM5 (338)
It was sometimes in 4th to 6th century whenart of sugar making was discovered. Thus, itcould be rightly said that India has been theoriginal home for sugarcane as well as sugarmanufacturing. The sugar industry has a brightfuture as one of the prospective players in theglobal sugar market. The demand for sugaracross the world has been growingexponentially. The sugar industry of UttarPradesh with its capacity can cater to thisinternational demand. The advantages for sugarindustry in Uttar Pradesh are abundant caneavailability due to favourable climatic conditionsand soils for sugarcane production and sufficientlabour availability. Uttar Pradesh is the largestsugarcane producing State in India. In 2011,125 sugar mills were in operation and crushed6434.85 lakh quintals of sugarcane (L.B.S.Ganna Shodh Sansthan, 2011), which wasalmost 48 per cent of the total production ofthe country. The sugar industry consists ofprivate, cooperative and public sector mills thatspread over the western, central and easternregions of the State. Over 50 per cent of thesemills are in the private sector and the remainingmills are in the other sectors.
Studies of role of sugar industry ineconomic development of rural area aresystematically analyzed in the work of Junningand Pingsun (2004). They studied the economicimpacts of shutting down Hawaii’s sugarindustry on surrounding environment, canefarmers, laborer’s earning and state taxes.Wada (2006) suggested cottage sugar industriesfor fulfilling the home demand of Nigeria. Gal,Lyne, Meyer, and Solar (2008) focused on therelationship between sugarcane growers andmillers at a specific management level and its
profit for rural areas. He suggested to improvethis relationship through the management ofcane flows from the grower’s farms to mill asa way to enhance the profitability of both. Singhand Ray (1975) studied the impact of sugarindustry on the living standards of rural peopleand economy of Uttar Pradesh. Yadav, Yadav,and Tejra (2003) compared the old and newtechniques of sugarcane cultivation with theexamples of china and India. He suggested themodern sugarcane machinery and labour savingdevices which reduce the cost of sugarcaneproduction. Pandey (2007) presented the caseof sugar industry as one of the strong basesfor rural India. He discussed history ofdevelopment of sugar industry, sugar policy, rawmaterials, production, export, import anddomestic consumption, its critical assessmentand challenges. Thus, these works show thatgeographers have not payed significant attentionto the role of this industry in enhancement ofliving standard of rural people at micro-level.This study is an attempt to examine the role ofsugar industry in the development of agriculturebased economy at micro-level.
Kushinagar district is (83º45' E - 84º15''E and 26º45' N - 27º15' N) covering an area of2,864.62 km² and population of 35,64,544persons. The district is delineated in the eastby the state boundary between Uttar Pradeshand Bihar, while the western boundary byMaharajganj and Gorakhpur districts. In thesouth, the district is delineated by the Deoriadistrict whereas northern point touches the Indo-Nepal International border. The district consistsof four tahsils, namely, Padrauna, Hata,Tamkuhi and Kasia, which are further sub-divided into fourteen development blocks.
338 Anil Kumar Tiwari, R. K. Pandey and V. N. Sharma
E:\BHU\BHU.PM5 (339)
Sugar industry automatically follows thedecentralization pattern due to scatteredcultivation of sugarcane in the district.Kushinagar district is rich in sugarcanecultivation but, it is not equally distributed allover the area. Alluvial soil, irrigation facility,adequate rainfall, availability of labour etc. areessential agricultural conditions that areavailable for sugarcane cultivation in this district.Kushinagar district produced 3,410,665 tonssugarcane in 2010-11 where 6 sugar mills arein operation. The geographical position of thedistrict has key advantage of easy access.Proper development of sugar industry in thedistrict can meet the increasing domesticdemands and improves the economic conditionsand general income level of the rural people.There are six working sugar mills (total 10 millsin which 4 mills are sick) and about two hundredsmall scale registered sugar refineries whichare playing the effective role in the ruraldevelopment of Kushinagar district.Data Sources and Methodology
The analysis of the role of sugar industryon rural development has been made on thebasis of primary data collected during the fieldsurvey in 2011. Secondary data was obtainedfrom the governmental and non-governmentalsources basically from office of Census ofIndia. Weighted value of every index ofindicators of rural development and sugarindustry development have been calculated bythe following formula (Sharma, 2004, 2006,Tiwari and Sharma, 2011, Tiwari, Pandey andSharma, 2016)
WV= N/M x 100Where, WV = Weighted value of
numbers in the series of indicator,M = Maximum number in the series, andN = Number in the series to be weightedWeighted value is calculated giving 100
as a weight to the maximum number of theseries. Every number of the each series isrevaluated in the reference to 100 and thus,revalued number is the real rational value ofthe series and composite index is the weightedvalue of the sum of revalued numbers. Thefacts are explained with a line graph for thecorrelation between indicators of sugar industrydevelopment and rural development.
The survey had been conducted in thesample villages. Four villages (nearer sugarmills) from four Community DevelopmentBlocks of Kushinagar district had been selectedon a random basis keeping in mind that theselected blocks and villages represent the wholedistrict. In the present study, a household wasconsidered as a respondent. Informationcollected through the schedule covers familycensus, agricultural development, income,migration and employment opportunities dataetc. The selected villages (Fig. 1) were Shahpur(Kaptanganj Block), Ratanwa (PadraunaBlock), Koindi Bariyarpur (Sevrahi Block) andMahuari (Hata Block). The collectedinformation from various sources is utilized toanalyze rural employment, rural income, rural-urban migration, rural education and agriculturaldevelopment for rural development and numberof uits, employment and capital investmet forsugar industry development.Profile of Sample Villages
These 4 villages have a population of7,813 persons in 1,275 households. A majority
Role of Sugar Industry in Rural Development: A Case Study of Kushinagar... 339
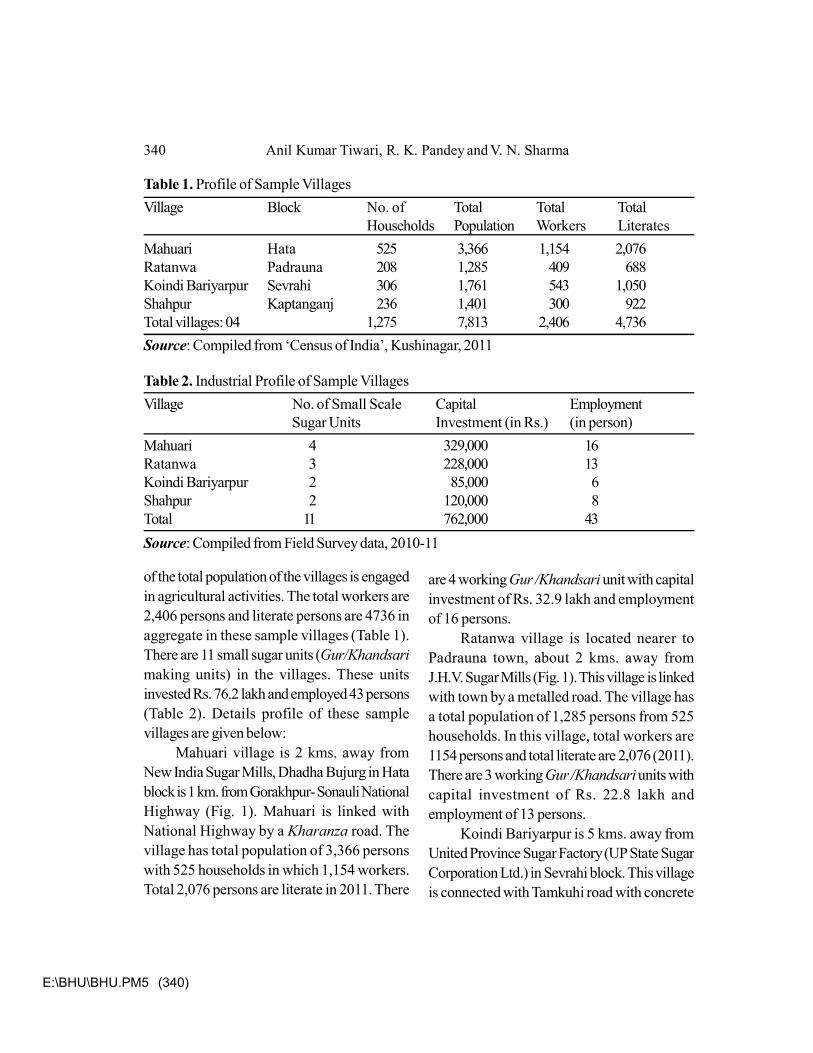
E:\BHU\BHU.PM5 (340)
of the total population of the villages is engagedin agricultural activities. The total workers are2,406 persons and literate persons are 4736 inaggregate in these sample villages (Table 1).There are 11 small sugar units (Gur/Khandsarimaking units) in the villages. These unitsinvested Rs. 76.2 lakh and employed 43 persons(Table 2). Details profile of these samplevillages are given below:
Mahuari village is 2 kms. away fromNew India Sugar Mills, Dhadha Bujurg in Hatablock is 1 km. from Gorakhpur- Sonauli NationalHighway (Fig. 1). Mahuari is linked withNational Highway by a Kharanza road. Thevillage has total population of 3,366 personswith 525 households in which 1,154 workers.Total 2,076 persons are literate in 2011. There
are 4 working Gur /Khandsari unit with capitalinvestment of Rs. 32.9 lakh and employmentof 16 persons.
Ratanwa village is located nearer toPadrauna town, about 2 kms. away fromJ.H.V. Sugar Mills (Fig. 1). This village is linkedwith town by a metalled road. The village hasa total population of 1,285 persons from 525households. In this village, total workers are1154 persons and total literate are 2,076 (2011).There are 3 working Gur /Khandsari units withcapital investment of Rs. 22.8 lakh andemployment of 13 persons.
Koindi Bariyarpur is 5 kms. away fromUnited Province Sugar Factory (UP State SugarCorporation Ltd.) in Sevrahi block. This villageis connected with Tamkuhi road with concrete
Table 1. Profile of Sample VillagesVillage Block No. of Total Total Total
Households Population Workers LiteratesMahuari Hata 525 3,366 1,154 2,076Ratanwa Padrauna 208 1,285 409 688Koindi Bariyarpur Sevrahi 306 1,761 543 1,050Shahpur Kaptanganj 236 1,401 300 922Total villages: 04 1,275 7,813 2,406 4,736Source: Compiled from ‘Census of India’, Kushinagar, 2011
Table 2. Industrial Profile of Sample VillagesVillage No. of Small Scale Capital Employment
Sugar Units Investment (in Rs.) (in person)Mahuari 4 329,000 16Ratanwa 3 228,000 13Koindi Bariyarpur 2 85,000 6Shahpur 2 120,000 8Total 11 762,000 43Source: Compiled from Field Survey data, 2010-11
340 Anil Kumar Tiwari, R. K. Pandey and V. N. Sharma
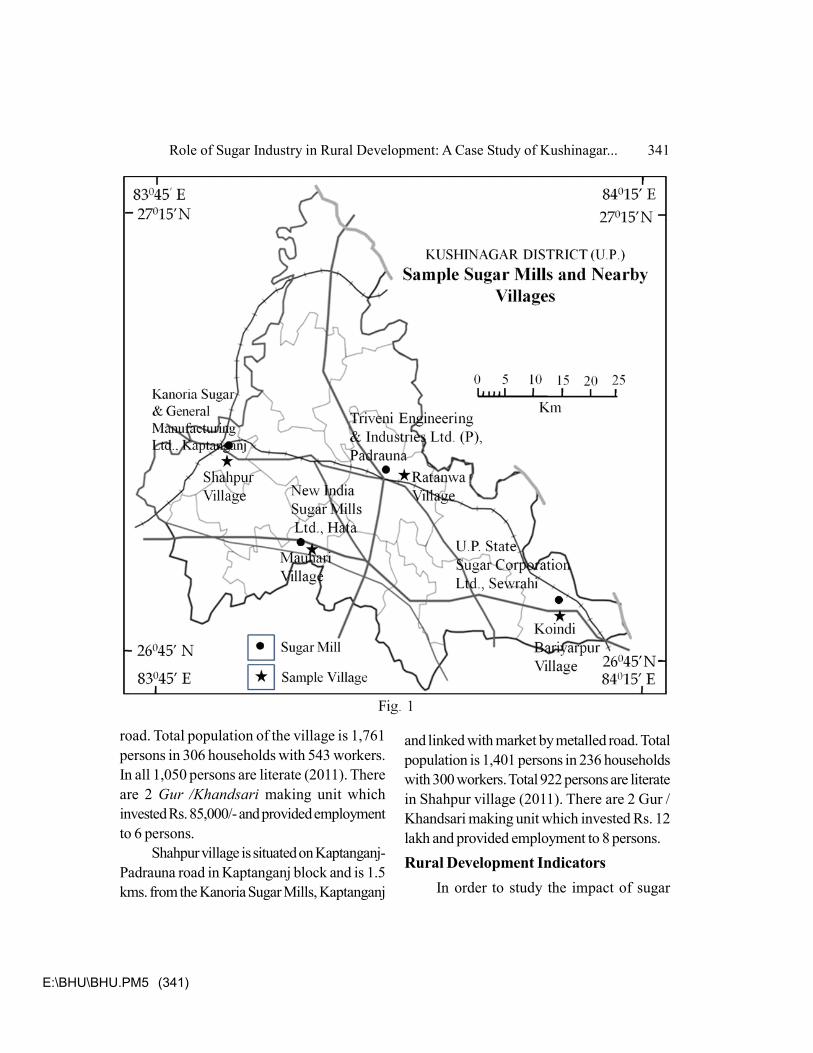
E:\BHU\BHU.PM5 (341)
road. Total population of the village is 1,761persons in 306 households with 543 workers.In all 1,050 persons are literate (2011). Thereare 2 Gur /Khandsari making unit whichinvested Rs. 85,000/- and provided employmentto 6 persons.
Shahpur village is situated on Kaptanganj-Padrauna road in Kaptanganj block and is 1.5kms. from the Kanoria Sugar Mills, Kaptanganj
and linked with market by metalled road. Totalpopulation is 1,401 persons in 236 householdswith 300 workers. Total 922 persons are literatein Shahpur village (2011). There are 2 Gur /Khandsari making unit which invested Rs. 12lakh and provided employment to 8 persons.Rural Development Indicators
In order to study the impact of sugar
Role of Sugar Industry in Rural Development: A Case Study of Kushinagar... 341

E:\BHU\BHU.PM5 (342)
industries on households, following factorsnamely agriculture, income, employment,migration and education are considered.
These factors are converted intoindicators for assessment of rural developmentas follows:
1. Per capita Annual Agricultural Surplus2. Per capita monthly Income3. Percentage of Employment4. Percentage of Migration5. Literacy rate
An attempt has been made to find outthe relationship between level of developmentof sugar industries and rural development. Thebasic unit of the study is a household comprisingof different size of households in Kushinagardistrict. Study of sample characteristics of eachhousehold is essential for analyzing the role ofthe factors responsible for socio-economicchange in the district. Distribution of samplehouseholds according to annual per capitaagricultural surplus, monthly per capita income,percentage of employed persons (other thanagriculture) in ratio to total population,percentage of migrated people and literacy ratehas been studied. All these variables have beendiscussed and compared for the sample villages
to study their impacts on each household.Observations
(i) Agricultural Surplus : Agriculture isthe backbone of the rural economy of theKushinagar district. This sector employed over80 percent of the working force of the district(2011). This heavy reliance of one sector isnot due to higher development of agriculture;rather it is indicative of the fact that the othersectors are relatively less developed. Although,77.27 per cent of the total area is net croppedhere (2010-11), the district is agriculturallyunder-developed because of traditional andrudimentary forms of the cultivation, orientedmainly to the production of cereals. There iscontinuous absence of industrial crops andcultivation of high yielding varieties of cropsand the use of chemical fertilizers are not up tothe mark. The total annual agricultural surplusof sample villages having sugar units is Rs.3,800,408/- of which 47.12 per cent (Rs.1,790,789) is devoted to Mahuari villagefollowed by Ratanwa (24.31 per cent, Rs.923,997), Shahpur (16.15 per cent, Rs. 471,999)and Koindi Bariyarpur (12.42 per cent, Rs.613,623). As for as, the relative data are
Table 3. Agricultural Surplus of Households of Sample Villages
Village Annual Agricultural Annual Agricultural Per capita AnnualSurplus (in Rs.) Surplus (in %) Agricultural Surplus (in Rs.)
Mahuari 1,790,789 47.12 532.02Ratanwa 923,997 24.31 719.06Koindi Bariyarpur 471,999 12.42 268.03Shahpur 613,623 16.15 437.99Total 3,800,408 100.00 486.42
Source: Compiled from Field Survey data, 2010-11
342 Anil Kumar Tiwari, R. K. Pandey and V. N. Sharma
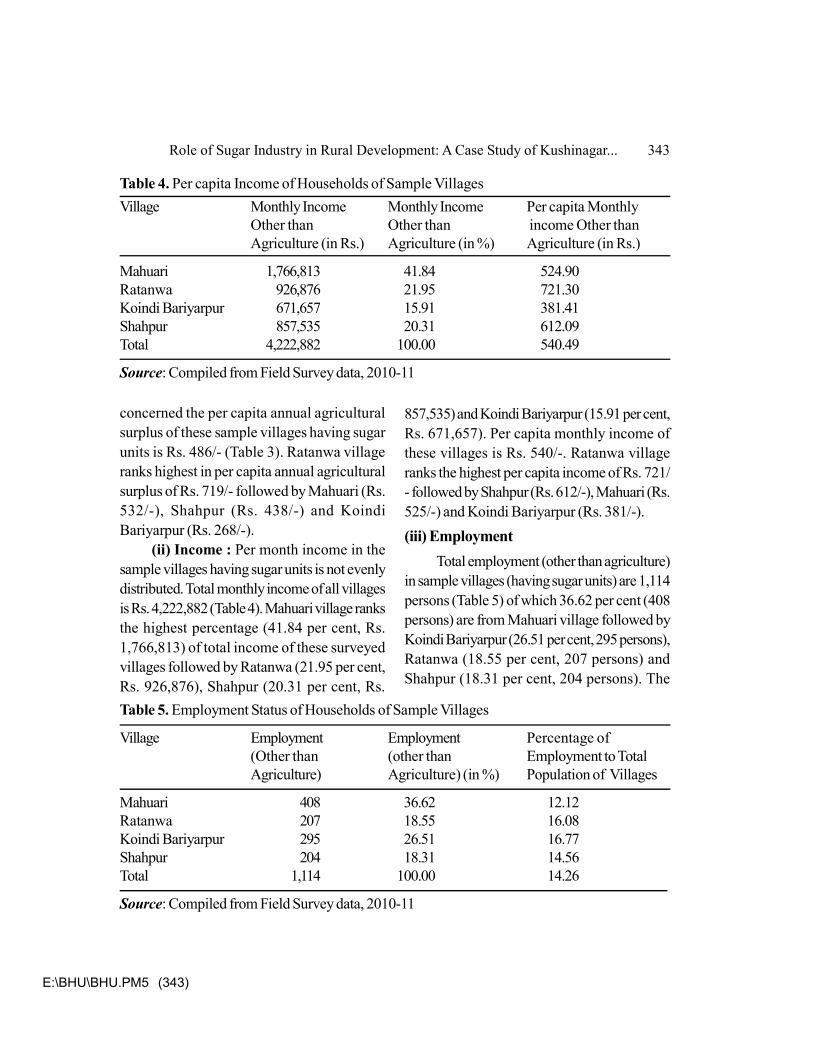
E:\BHU\BHU.PM5 (343)
concerned the per capita annual agriculturalsurplus of these sample villages having sugarunits is Rs. 486/- (Table 3). Ratanwa villageranks highest in per capita annual agriculturalsurplus of Rs. 719/- followed by Mahuari (Rs.532/-), Shahpur (Rs. 438/-) and KoindiBariyarpur (Rs. 268/-).
(ii) Income : Per month income in thesample villages having sugar units is not evenlydistributed. Total monthly income of all villagesis Rs. 4,222,882 (Table 4). Mahuari village ranksthe highest percentage (41.84 per cent, Rs.1,766,813) of total income of these surveyedvillages followed by Ratanwa (21.95 per cent,Rs. 926,876), Shahpur (20.31 per cent, Rs.
857,535) and Koindi Bariyarpur (15.91 per cent,Rs. 671,657). Per capita monthly income ofthese villages is Rs. 540/-. Ratanwa villageranks the highest per capita income of Rs. 721/- followed by Shahpur (Rs. 612/-), Mahuari (Rs.525/-) and Koindi Bariyarpur (Rs. 381/-).(iii) Employment
Total employment (other than agriculture)in sample villages (having sugar units) are 1,114persons (Table 5) of which 36.62 per cent (408persons) are from Mahuari village followed byKoindi Bariyarpur (26.51 per cent, 295 persons),Ratanwa (18.55 per cent, 207 persons) andShahpur (18.31 per cent, 204 persons). The
Table 4. Per capita Income of Households of Sample VillagesVillage Monthly Income Monthly Income Per capita Monthly
Other than Other than income Other thanAgriculture (in Rs.) Agriculture (in %) Agriculture (in Rs.)
Mahuari 1,766,813 41.84 524.90Ratanwa 926,876 21.95 721.30Koindi Bariyarpur 671,657 15.91 381.41Shahpur 857,535 20.31 612.09Total 4,222,882 100.00 540.49
Source: Compiled from Field Survey data, 2010-11
Table 5. Employment Status of Households of Sample Villages
Village Employment Employment Percentage of(Other than (other than Employment to TotalAgriculture) Agriculture) (in %) Population of Villages
Mahuari 408 36.62 12.12Ratanwa 207 18.55 16.08Koindi Bariyarpur 295 26.51 16.77Shahpur 204 18.31 14.56Total 1,114 100.00 14.26
Source: Compiled from Field Survey data, 2010-11
Role of Sugar Industry in Rural Development: A Case Study of Kushinagar... 343
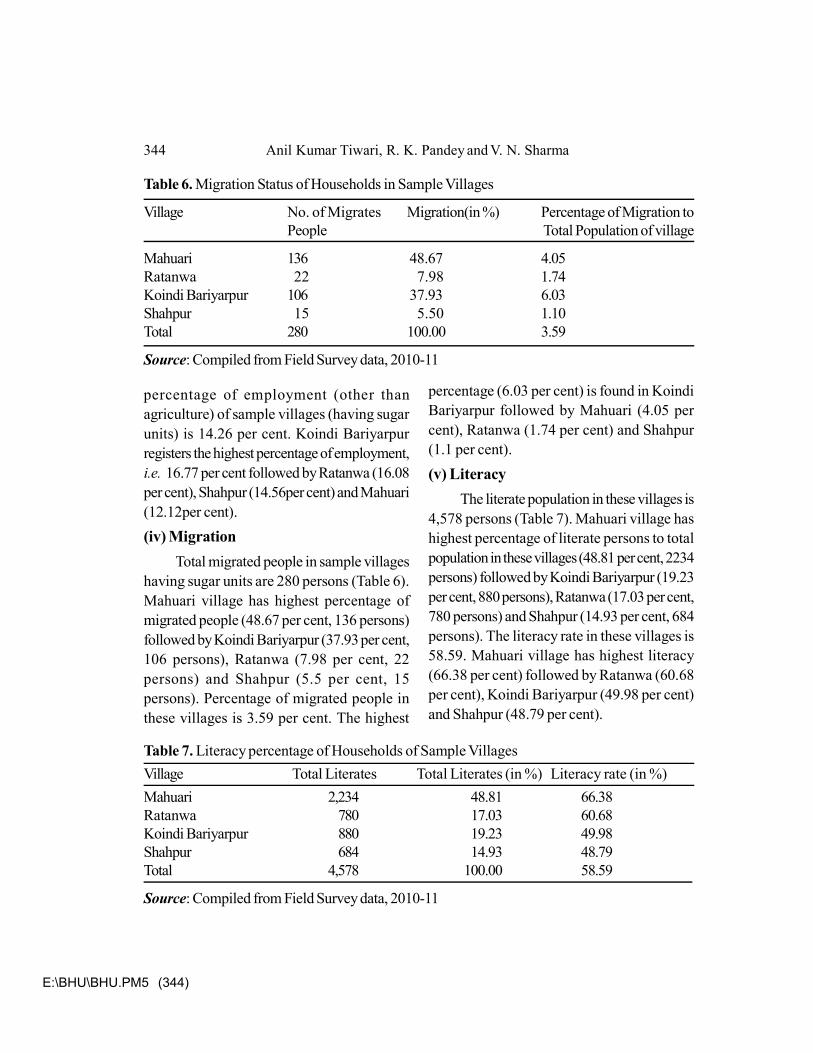
E:\BHU\BHU.PM5 (344)
percentage of employment (other thanagriculture) of sample villages (having sugarunits) is 14.26 per cent. Koindi Bariyarpurregisters the highest percentage of employment,i.e. 16.77 per cent followed by Ratanwa (16.08per cent), Shahpur (14.56per cent) and Mahuari(12.12per cent).(iv) Migration
Total migrated people in sample villageshaving sugar units are 280 persons (Table 6).Mahuari village has highest percentage ofmigrated people (48.67 per cent, 136 persons)followed by Koindi Bariyarpur (37.93 per cent,106 persons), Ratanwa (7.98 per cent, 22persons) and Shahpur (5.5 per cent, 15persons). Percentage of migrated people inthese villages is 3.59 per cent. The highest
percentage (6.03 per cent) is found in KoindiBariyarpur followed by Mahuari (4.05 percent), Ratanwa (1.74 per cent) and Shahpur(1.1 per cent).(v) Literacy
The literate population in these villages is4,578 persons (Table 7). Mahuari village hashighest percentage of literate persons to totalpopulation in these villages (48.81 per cent, 2234persons) followed by Koindi Bariyarpur (19.23per cent, 880 persons), Ratanwa (17.03 per cent,780 persons) and Shahpur (14.93 per cent, 684persons). The literacy rate in these villages is58.59. Mahuari village has highest literacy(66.38 per cent) followed by Ratanwa (60.68per cent), Koindi Bariyarpur (49.98 per cent)and Shahpur (48.79 per cent).
Table 6. Migration Status of Households in Sample Villages
Village No. of Migrates Migration(in %) Percentage of Migration toPeople Total Population of village
Mahuari 136 48.67 4.05Ratanwa 22 7.98 1.74Koindi Bariyarpur 106 37.93 6.03Shahpur 15 5.50 1.10Total 280 100.00 3.59
Source: Compiled from Field Survey data, 2010-11
Table 7. Literacy percentage of Households of Sample VillagesVillage Total Literates Total Literates (in %) Literacy rate (in %)Mahuari 2,234 48.81 66.38Ratanwa 780 17.03 60.68Koindi Bariyarpur 880 19.23 49.98Shahpur 684 14.93 48.79Total 4,578 100.00 58.59
Source: Compiled from Field Survey data, 2010-11
344 Anil Kumar Tiwari, R. K. Pandey and V. N. Sharma
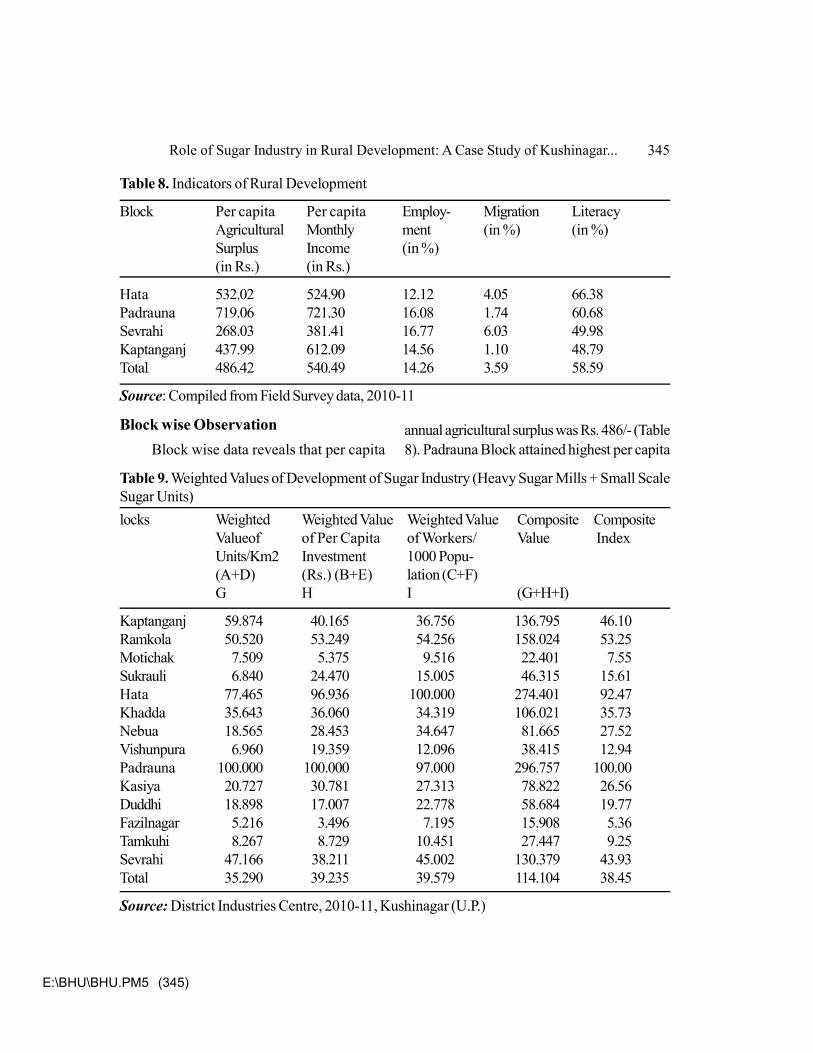
E:\BHU\BHU.PM5 (345)
Block wise ObservationBlock wise data reveals that per capita
annual agricultural surplus was Rs. 486/- (Table8). Padrauna Block attained highest per capita
Table 8. Indicators of Rural Development
Block Per capita Per capita Employ- Migration LiteracyAgricultural Monthly ment (in %) (in %)Surplus Income (in %)(in Rs.) (in Rs.)
Hata 532.02 524.90 12.12 4.05 66.38Padrauna 719.06 721.30 16.08 1.74 60.68Sevrahi 268.03 381.41 16.77 6.03 49.98Kaptanganj 437.99 612.09 14.56 1.10 48.79Total 486.42 540.49 14.26 3.59 58.59
Source: Compiled from Field Survey data, 2010-11
Table 9. Weighted Values of Development of Sugar Industry (Heavy Sugar Mills + Small ScaleSugar Units)locks Weighted Weighted Value Weighted Value Composite Composite
Valueof of Per Capita of Workers/ Value IndexUnits/Km2 Investment 1000 Popu-(A+D) (Rs.) (B+E) lation (C+F)G H I (G+H+I)
Kaptanganj 59.874 40.165 36.756 136.795 46.10Ramkola 50.520 53.249 54.256 158.024 53.25Motichak 7.509 5.375 9.516 22.401 7.55Sukrauli 6.840 24.470 15.005 46.315 15.61Hata 77.465 96.936 100.000 274.401 92.47Khadda 35.643 36.060 34.319 106.021 35.73Nebua 18.565 28.453 34.647 81.665 27.52Vishunpura 6.960 19.359 12.096 38.415 12.94Padrauna 100.000 100.000 97.000 296.757 100.00Kasiya 20.727 30.781 27.313 78.822 26.56Duddhi 18.898 17.007 22.778 58.684 19.77Fazilnagar 5.216 3.496 7.195 15.908 5.36Tamkuhi 8.267 8.729 10.451 27.447 9.25Sevrahi 47.166 38.211 45.002 130.379 43.93Total 35.290 39.235 39.579 114.104 38.45
Source: District Industries Centre, 2010-11, Kushinagar (U.P.)
Role of Sugar Industry in Rural Development: A Case Study of Kushinagar... 345
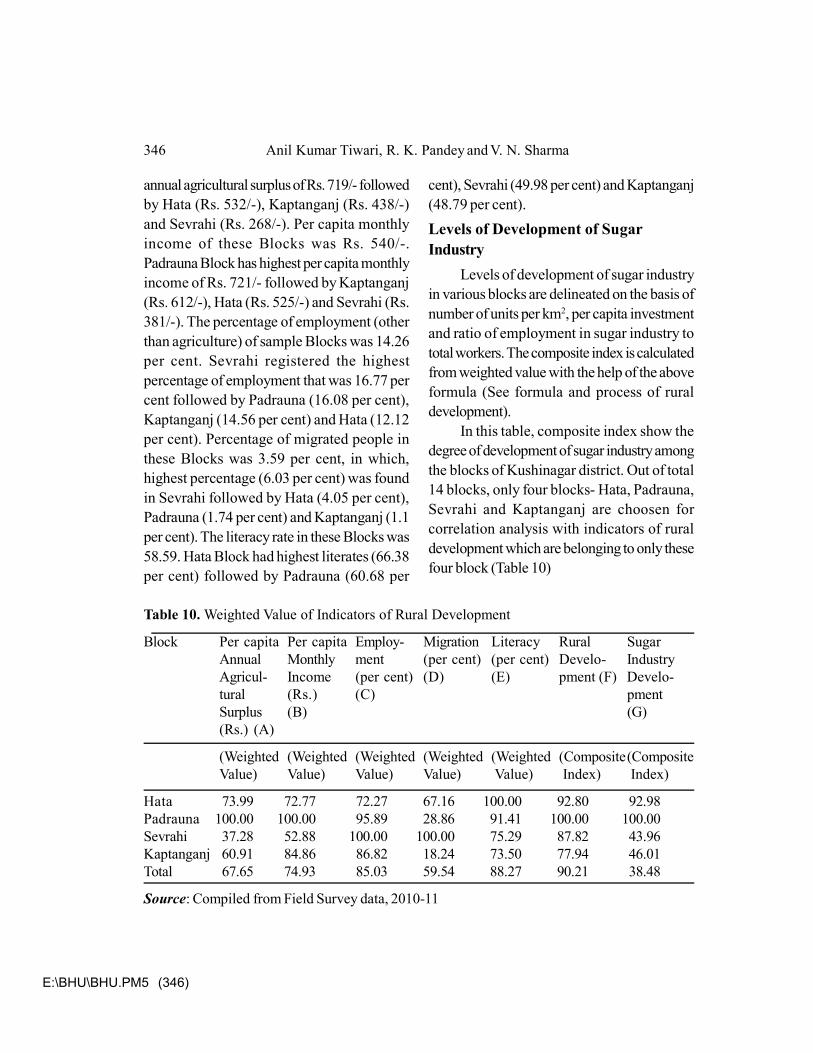
E:\BHU\BHU.PM5 (346)
annual agricultural surplus of Rs. 719/- followedby Hata (Rs. 532/-), Kaptanganj (Rs. 438/-)and Sevrahi (Rs. 268/-). Per capita monthlyincome of these Blocks was Rs. 540/-.Padrauna Block has highest per capita monthlyincome of Rs. 721/- followed by Kaptanganj(Rs. 612/-), Hata (Rs. 525/-) and Sevrahi (Rs.381/-). The percentage of employment (otherthan agriculture) of sample Blocks was 14.26per cent. Sevrahi registered the highestpercentage of employment that was 16.77 percent followed by Padrauna (16.08 per cent),Kaptanganj (14.56 per cent) and Hata (12.12per cent). Percentage of migrated people inthese Blocks was 3.59 per cent, in which,highest percentage (6.03 per cent) was foundin Sevrahi followed by Hata (4.05 per cent),Padrauna (1.74 per cent) and Kaptanganj (1.1per cent). The literacy rate in these Blocks was58.59. Hata Block had highest literates (66.38per cent) followed by Padrauna (60.68 per
cent), Sevrahi (49.98 per cent) and Kaptanganj(48.79 per cent).Levels of Development of SugarIndustry
Levels of development of sugar industryin various blocks are delineated on the basis ofnumber of units per km2, per capita investmentand ratio of employment in sugar industry tototal workers. The composite index is calculatedfrom weighted value with the help of the aboveformula (See formula and process of ruraldevelopment).
In this table, composite index show thedegree of development of sugar industry amongthe blocks of Kushinagar district. Out of total14 blocks, only four blocks- Hata, Padrauna,Sevrahi and Kaptanganj are choosen forcorrelation analysis with indicators of ruraldevelopment which are belonging to only thesefour block (Table 10)
Table 10. Weighted Value of Indicators of Rural Development
Block Per capita Per capita Employ- Migration Literacy Rural SugarAnnual Monthly ment (per cent) (per cent) Develo- IndustryAgricul- Income (per cent) (D) (E) pment (F) Develo-tural (Rs.) (C) pmentSurplus (B) (G)(Rs.) (A)
(Weighted (Weighted (Weighted (Weighted (Weighted (Composite(CompositeValue) Value) Value) Value) Value) Index) Index)
Hata 73.99 72.77 72.27 67.16 100.00 92.80 92.98Padrauna 100.00 100.00 95.89 28.86 91.41 100.00 100.00Sevrahi 37.28 52.88 100.00 100.00 75.29 87.82 43.96Kaptanganj 60.91 84.86 86.82 18.24 73.50 77.94 46.01Total 67.65 74.93 85.03 59.54 88.27 90.21 38.48
Source: Compiled from Field Survey data, 2010-11
346 Anil Kumar Tiwari, R. K. Pandey and V. N. Sharma
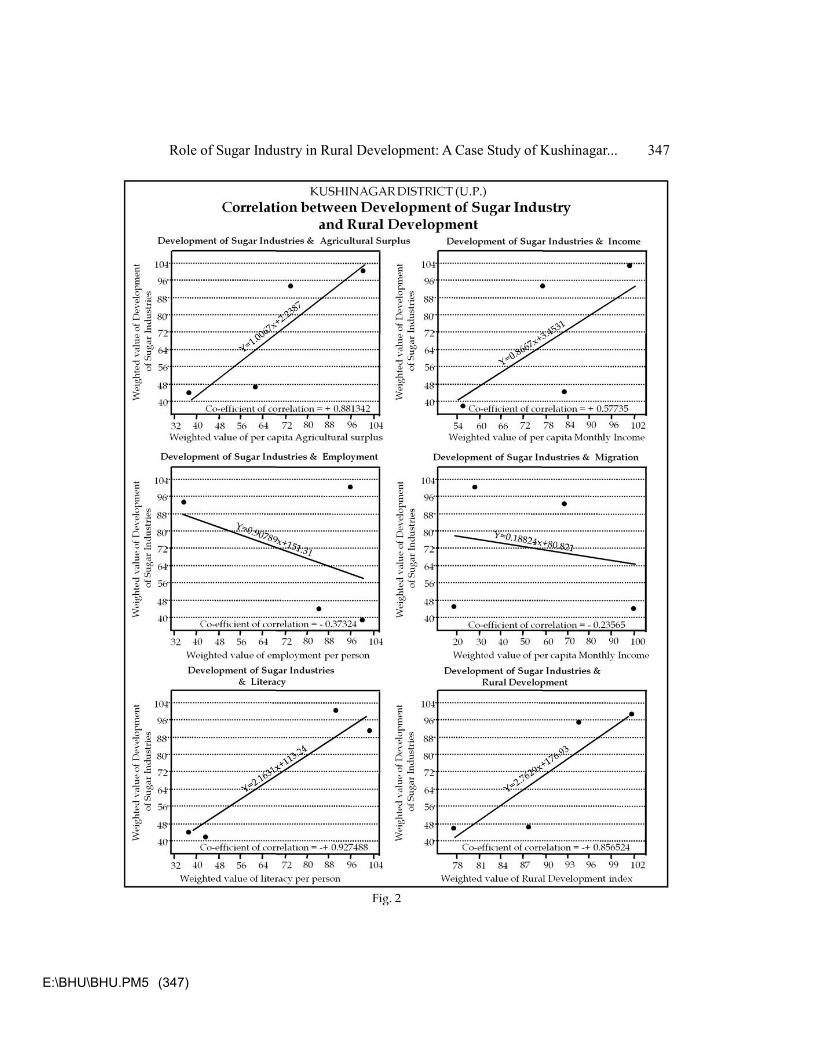
E:\BHU\BHU.PM5 (347)
Role of Sugar Industry in Rural Development: A Case Study of Kushinagar... 347
E:\BHU\BHU.PM5 (348)
Result and DiscussionCorrelations between composite index of
sugar industry development and weighted valueof indicators of rural development have beenanalyzed. The analysis has been made to point-out the impact of development of sugar industryon different indicators of rural development andfinally on rural development. Per capita annualagricultural surplus has the closest correlationwith the development of sugar industries(+0.881). It means as the number of sugarindustries increases, agricultural surplusincreases by approximately same rate. It is dueto the farmer’s involvement in initialcommercialization of agriculture. However,both sectors are in its initial stage ofmodernization. Development of sugar industriesin this area improves direct as well as indirectincome of the rural people, which is proved bythe closer positive correlation (+0.577) betweensugar industries development and per capitamonthly income.
There is not closer relationship as showed(-0.373) by percentage of employment withsugar industry development. However, sugarindustries are labour intensive and utilizedsimple technology, therefore, it employ morerural skilled as well non-skilled labourers. But,result shows that there is negative correlationdue to uneconomic size of old factories andthese units are producing Gur/Khandsari/Rabfor only domestic uses not for commercialpurposes. Percentage of migration also indicatesnegative correlation (-0.236) with sugarindustries development. Though, it is very poorcoefficient of correlation, but, it very clearlyreveals that as the sugar industry development
take place, tendency of migration goes down.The rural un-employed persons get engagementin sugar industries and allied activities, and,therefore, rural-urban migration decreaseswhich is the positive sign for economicdevelopment of this district. Literacy is one ofthe significant indicators of rural development.The rural people invest more money oneducation of their family if they had sufficientincome. The relationship between sugarindustries development and literacy rate showsthe coefficient of correlation of +0.927, whichreveals that as the sugar industry develops, theliteracy rate also increases. Finally, therelationship between development of sugarindustries and rural development is positive(+0.857), which shows the significant positiverole of sugar industries in rural development inthe Kushinagar district (Fig. 2).Conclusion
Rural development has always been amajor issue in all plans pertaining to economicdevelopment of any region, especially indeveloping countries. In the developingcountries, rural mass comprise a considerablemajority of the population. Rural developmenthas highest correlation with the ruralindustrialization. Agriculture is the backbone ofthe rural economy of the Kushinagar district.The net cropped area comprised 77.27 per centof the total area in 2010-11, yet the district isagriculturally under-developed because oftraditional and rudimentary forms of thecultivation, oriented mainly to the productionof cereals. Besides, sugarcane is a majorindustrial crop which helps development ofsugar industries in this district. And,
348 Anil Kumar Tiwari, R. K. Pandey and V. N. Sharma
E:\BHU\BHU.PM5 (349)
development of sugar industries and ruraldevelopment are positively correlated and sugar
industries play a positive role of in ruraldevelopment.
ReferencesChauhan, N. B., 2012, Rural Development, (unpublished assignment report), www.aau.in,
accessed on 14.06.2015.
Gal, L.P.Y., Lyne, P.W.L., Meyer, E. and Solar, L.G., 2008, Impact of Sugarcane Supply Schedulingon Mill Sugar Production: A South African Case study, Science Direct, Vol. 95, pp. 64-74, available online at www.sciencedirect.com, accessed on 10.09.2013.
Junning, Cai and Pingsun L., 2004, Economic impacts of shutting down Hawaii’s sugar industry,Cooperative Extension Service, El-06, pp. 1-4.
L.B.S. Ganna Shodh Sansthan (P.I.O.), 2011, Chini Mill Prarambh Hone ki Tithi, Gannakharid,Perai Va Chini Utpadan Ki Sthiti, L.B.S. Ganna Shodh Sansthan, Lucknow.
Pandey, A.P., 2007, Indian sugar industry - A Strong Industrial base for rural India, http://mpra.ub.unimuenchen. De /6065/ MPRA Paper No. 6065, posted 03. December 2007/ 12:26.
Sharma, V. N., 2004, Level of Industrial Development in Madhya Pradesh, Geographical Reviewof India, Vol. 66 (1).
Sharma, V. N., 2006, Agro-Based Industries in Maharajganj District (U.P.) A Regional Analysis,National Geographer, Vol. XLI, No. 1+2, p. 21-31.
Singh, J. and Ray, J.P., 1975, Impact of Sugar Industry in the Space Economy of U.P., UttarBharat Bhoogol Patrika, Vol. 11(June), p. 4.
Tiwari, A. K. and Sharma, V. N., 2011, ‘Level of agro-based industrial development in EasternUttar Pradesh’, National Geographical Journal of India, Vol. 57 (4), pp. 43-52.
Tiwari, A. K., Pandey, R. K. and Sharma, V. N., 2016, Status of Sugar Industry in Kushinagardistrict, U.P., Transaction, Institute of Indian Geographers, Vol. 38, No. 1, pp. 117-26.
Wada, A.C., Gbabo, A., Ndarubu, A.A., 2006, Cottage Sugar Industries as alternatives for
Role of Sugar Industry in Rural Development: A Case Study of Kushinagar... 349

E:\BHU\BHU.PM5 (350)
meeting Nigeria’s domestic Sugar Demands, Outlook on Agriculture, Vol. 35, No.1, pp. 65-71, IP Publishing Ltd.
Yadav, R.N.S., Yadav, S. and Tejra, R. K., 2003, Labour Saving and Cost Reduction Machineryfor Sugarcane Cultivation, Sugar Tech, Vol. 5 (l and 2), pp. 7-10.
350 Anil Kumar Tiwari, R. K. Pandey and V. N. Sharma
E:\BHU\BHU.PM5 (351)
Siddharth Shankar Rao, Research Scholar, email - [email protected] and Dr. A. P. Mishra,Professor, email - [email protected], Department of Geography, Banaras Hindu University,Varanasi-221005.
Spatial linkage of Poverty Determinants inDistrict Ambedkar Nagar : A GeographicalPerspectiveSiddharth Shankar Rao and A. P. Mishra
The problem of poverty is more acute in rural areas. Rural poor do not afford basicminimum needs that are reflected in their pattern of spatial location. Rural poor are moreisolated than urban poor. They are differentiated not only in terms of the intensity of deprivationbut also functionally in terms of their social participation and position in the structure ofagrarian relations. Accordingly the effect of different factors that determine the incidence ofrural poverty significantly varied between different segments of the rural society. The incidenceof rural poverty is determined by different socio-economic and political factors, such asdistribution of SC/STs population, small size of landholdings, daily wage labourers, marginalworkers, poor infrastructure facility, access to education facility, poor health quality, lowlevel of political participation etc. The determinants of poverty have its own linkages withevolving nature of society and space. The present study focuses on various povertydeterminants, social pattern of poverty and its spatial interlinkage to rural poor in AmbedkarNagar district.
Key words: Rural poor, poverty determinants, spatial linkage of poverty, SCs poverty
IntroductionPoverty is a chronic problem that
commonly exists in developing countries.Chronic poverty concerns to the people whoare poor for significant period of their lives, andthat is transferred from one generation toanother. The severity of poverty is descriptionof the degree of suffering and deprivation. Indiais a fast growing economy of the world butmost of the people are still suffering from acuteproblem of poverty. According to 2011 census,68.8 per cent of population is still residing in
rural areas and most of them are involved inprimary activities. Poverty, in most of ruralareas, is unevenly distributed and significantlyvaries with geographical relations. Ruralpoverty mostly exists in underdevelopedagrarian space confining to the lower strata ofsocial groups. In fact, poverty in rural areasowes its genesis to rampant of feudal agrarianstructure and low productivity in agrariansociety. The absolute poverty of the agrarianeconomy is proverbial and presentsfundamental problems to the process of
NGJI, An International Refereed Journal, (NGSI-BHU, ISSN: 0027-9374/2016/1600), vol. 62 (4),September : 351-362
E:\BHU\BHU.PM5 (352)
modernization and development. Eminenteconomists and sociologist have recorded thatmain causes of rural poverty such as use ofprimitive agricultural techniques, insufficientirrigation system, land fragmentation,uneconomic size of land holdings, over pressureon agriculture, alarming rural indebtedness and,above all, the existing land relation that needsin-depth analysis.
In Indian context, poverty is not definedby any single norm; rather it is more complexin nature and origin. In current scenario povertyadversely affects not only the health and vitalityof the rural people but also exhibits spatialbackwardness of their social, cultural andenvironmental conditions. The rural people ingeneral are ignorant, superstitious, andculturally backward which may be attributedto their abysmal confinement with culturalpoverty. As a consequence they cannot affordto participate in the process of modernizationand development. Thus, they remain excludedfrom any access to scientific knowledge of thenatural and social worlds imparted byeducational and cultural institutions. Economicprosperity is also the basic pre-requisition for aflourishing social and cultural life of rural poor.Hence, the problem of rural reconstruction ata high social and cultural level is bound up withthe problem of the eradication of rural poverty.The complex nature of poverty requires multipleapproach for its analysis and study. It cannotbe defined by a single norm of poverty. It isusually a relative expression and its naturediffers from time to time and place to place.Kurien (1978), considered in his study thatpoverty is ‘socio-economic phenomenonwhereby the resources available to a societyare used to satisfy the wants of the few, whilethe many do not have even their basic needs
met’. Poverty in the economic sense is definedas a ‘state wherein an individual cannot fulfilhis minimum requirements for reasonablehealthy living in a given social and culturalenvironment. Poverty in this sense is bothrelative and absolute. Relative poverty impliesthat some have more goods and services attheir command than others. It is mainly aproblem of inequality in the distribution ofincome and wealth, characteristic of advancedeconomy. Absolute poverty is the insufficiencyof basic necessities for a healthy life. In adeveloping country like India, the problem ofabsolute poverty is more severe. Poverty is theproblem of deprivation and it may bemultidimensional either economic or cultural orsocial or psychological or a combination of allof them. The problem of poverty is oftenconceptualized as ‘a socio-economicphenomenon whereby the resources availableto a society are used to satisfy the wants ofthe few while they may do not have even theirbasic needs met. So poverty is essentially asocial phenomenon as well as physical’ (Mishra,1988).
Deprivation of human resources isanother critical dimension of poverty. Itindicates to human development capture,important dimension of well-being and reflectsnot just the rate of growth in the economy butalso levels and quality of public spending. Theyalso broaden the picture of poverty and providea wider arena to fight against it. Effective publicspending on basic services, e.g. education,health, water and sanitation can compensatethe limited ability of the poor to acquire theseservices through the market. In continuation tothis, impact of spending on public goods andservices is another factor that accentuatespoverty. The nature of poverty in an agrarian
352 Siddharth Shankar Rao and A. P. Mishra
E:\BHU\BHU.PM5 (353)
social structure is an outcome of steadypopulation growth with emergence of risinglandlessness and dependence on wage labourand other productive assets that shape thepattern of poor and its process of deprivation.In its ‘structural dimension, poverty must beviewed in terms of the pattern of inequalityexhibited in a community. Such a pattern getsmanifested in the available stock of resources,their distribution and the way they are ownedor controlled by various groups in thatcommunity. Unequal distribution of resourcesdetermines not only unequal life chances butalso an unequal distribution of power’ (Reddy,1991). These factors may be considered asdeterminants for nature and extent of poverty.Determinants of poverty and itslinkages
Poverty as a complex phenomenon isdetermined by various indicators. Almost, in allthe developing countries, poverty persists inmore complex way because these countries areencountered with and still facing different basicproblems, like hunger, starvation, malnutrition,unemployment, illiteracy, shortage of drinkingwater etc. After more than seventy years ofindependence, India is still facing variousproblems and challenges. Among them, povertyis more acute problem in the rural areas. Ruralpeople are still unable to afford and fulfill theirbasic needs. The government have launchedvarious policies and programmes for thebetterment of living conditions of rural people,however, problem still remains. On this account,the origin and mechanism of poverty have itsmulti-dimensional characteristics that areneeded to be studied by researchers in socialsciences. ‘Human capital measured in termsof health status and education are considered
critical measures of non- monetary dimensionsof welfare as well as important inputs into anindividual’s earning ability’ (Sen, 1981). It isidentified that education as major indicator ofhuman development determined the socio-economic development of deprived sections,particularly among women and sociallyvulnerable groups. Illiteracy gives rise toorthodoxy in Indian society, which leads to theproblem of social and cultural poverty. Againilliteracy produces unskilled workers, who canonly be engaged in primary sectors. This is alsoa form of economic poverty. The quality ofhuman resources can be examined through thelevels of literacy and skilled training attainedby the people in the given area. Thus, illiteracyis an important determent of poverty in anygeographical region. Occupational structurealso refers rational view of poverty status inany geographical space. ‘It is necessary todefine the ‘agricultural holdings’ beforeattempting a discussion on the size pattern of‘agricultural holdings’ that implies the total areaof land which is hold for cultivations as a singleunit by an individual, joint family or more thanone farmer on a joint bases. Such land mayeither entirely be owned, taken on lease, or maybe partly owned partly rented’ (Mamoria,1979).The agricultural labourers as landless’social structure of SCs population may beclassified as major component for poverty. Mostof agricultural labourers get employmentopportunities only at the time of sowing andharvesting which are not only seasonal andintermittent but also conditioned by drought andflood. Thus, full period regular job opportunityis very limited. Agricultural labourerspredominately belong to Scheduled Castes(SCs) and Scheduled Tribes (STs). They areilliterate, ignorant and live in scattered villages.
Spatial linkage of Poverty Determinants in District Ambedkar Nagar : A... 353
E:\BHU\BHU.PM5 (354)
Just as the reality of poverty goes beyondmaterial deprivation, it badly brings down thestatus of human development. Exclusion andsocial marginalisation is often at the root of thisproblem. For many poor people, low castestatus and gender operate as major socialbarriers that exclude them from many realmsof social and economic opportunity.Vulnerability to adverse shocks is a fact of lifefor poor men and women. They are distressednot only by current low levels of resources andincomes, but also by the possibility of fallinginto deeper poverty and destitution. Gupta(1987) has considered in his study that fourmajor groups of variables characterising ruralpoverty: (1) economic components whichinclude occupation and income ;( 2) basic needcomponents which include food and shelter; (3)resource components which include health andeducation; and (4) socio-cultural componentswhich include demographic features, politicalparticipation and value interest. These majorfour components constitute the determinantsof poverty which must be fulfilled and forfulfilling these requirements there must be aminimum income and reach for betterment inquality of life. The basic determinants ofpoverty seem to remain unchanged whilepoverty levels show occasional improvement.However, the conditions of rural poor remainhighly vulnerable to the consequences ofpoverty. Inequality, low literacy rate, low healthstatus, malnutrition, high fertility and populationgrowth, and other related features may beenvisaged as the determinants of poverty; andas long these are not tackled, the depressedcondition of the poor remains depressed andthey endure it helplessly.
Poor individuals and communities aregenerally deprived of political influence also,
therefore they lack the leverage to ensure thatstate institution serve them fairly. As aconsequence, either they lack access to publicfacilities or have access only to goods andfacilities of inferior quality. Problem of socialidentity in particular castes and gender too islinked to poverty. Individuals with low castestatus are more likely to be employed as low-paid, low-status, agriculture labourers. Besides,they are often illiterate and live in poorlyconstructed houses with limited access to waterand sanitation. The destitute poor usually donot have other sources of income butconstrained with low-wage, intermittentlyavailable casual labour. In the worst case, theyare foraging and begging with rare exceptiondestitute households have very weak ties ofmutual assistance and support, as compared totheir wealthier counterparts. Poor women,particularly those with low-caste status, facehigh risk of becoming destitute. Exclusion-based poverty on the basis of gender and castepersists in rural areas that is a powerfulcontributing factor. The study discussed the roleplayed by gender and caste in limiting or barringopportunities to escape poverty. Social identityis a strong predictor of who is and is not poor,who is illiterate, who is employed in low-paid,low status, involved as agricultural labourer, andwho lives in poorly constructed houses withlimited access to basic services. Despite,decades of effort on the part of successivegovernments, SCs/STs are twice as likely tosuffer poverty as material deprivation, ascompared to majority individuals, as theaggregate of non-SC/STs. A number of factorsexplain the gap in living standards between SC/STs who tend to possess fewer private assetsin particular, less and poorer quality land, aswell as lower level of human capital. The latter
354 Siddharth Shankar Rao and A. P. Mishra
E:\BHU\BHU.PM5 (355)
trend is particularly disadvantageous in light ofdifficulties in redistributing land, and importanceof opportunities in the non-farm sector.Education could play an important role inimproving welfare for poor and sociallymarginalised households. Further, gender-basedpoverty is very common in study area becauseof discrimination practices still continue. Thepresent paper aims to investigate determinantsof poverty that persist in under developed areaslike Ambedkar Nagar.Study area
The Ambedkar Nagar district came intoexistence in September 29, 1995. Earlier it wasa part of Faizabad district. The district is locatedon the north eastern part of Uttar Pradeshwhich extends from 26009' N to 26040' Nlatitudes and 82012' E to 83005' E longitudes(Fig. 1). It is bounded on the north by Bastiand Sant Kabir Nagar districts, on the north-east by Gorakhpur district, on the south bySultanpur district, on the west by Faizabad andon the east by Azamgarh district.Administratively, district has five tehsils (sub-divisions) namely, Akbarpur, Tanda, Alapur,Jalalpur and Bhiti. The district is divided intonine development blocks namely Akbarpur,Katehri, Bhiti, Tanda, Baskhari, Ramnagar,Jalalpur, Jahangir Gunj and Bhiyaon (DistrictPlanning Map, 2005) that consisted 3955villages. The district has entirely plaintopography. The Ghaghara is the main river ofthe region which flows in the north of thedistrict. There are many small rivers andstreams which pass through the district fromwest to east direction. The district enjoysmonsoon type of climate. The Rainy season isalmost of three months. January becomes verycold whereas April, May and June witness rise
in temperature and go very hot. The averagerainfall in the district ranges from 1000-1200mm. According to 2011 census, the total areaof the district is 2350km2with a total populationof 23, 97,888 persons. Out of this figure maleand female consisted 1,212,410 and 1,185,478respectively. The district has a populationdensity of 1,020 persons per square kilometre.The growth rate of population during 2001-2011decade was 18.35 per cent. Ambedkar Nagarhas a sex ratio of 978 females per 1000 males.The literacy rate in the district is 72.23 per cent.Approximately, 90 per cent of the populationlives in rural areas with traditional mode offarming. As per 2011 Census, 24.65 per centof total population belongs to the ScheduleCastes (SCs) and 0.03 per cent to ScheduledTribes (STs) community. Major occupation ofthe study area is agriculture, as more than 60per cent population directly or indirectly dependson this activity. Potato, sugarcane, paddy,wheat, pulses and oil seeds are major cropsthat are grown in the district. Most of theirrigated land (80 per cent) gets irrigation waterby tube- wells while 15 per cent by canals.
The industrial development is almostinsignificant with its meagre contribution to thedevelopment process of the district exceptingTanda and Akbarpur blocks, Ambedkar Nagaris known for Tanda Terracotta artifacts whilein Tanda main economic activities are relatedto work on power looms. The Tanda has athermal power station that belongs to theNTPC. There is a cement manufacturing plantthat belongs to the Jaypee Group (Jaypee,Ayoudha,Greeding). The Akbarpur has a sugarfactory known as Akbarpur Sugar Mill whichis situated near Mijhaura, about ten kilometersfrom the district headquarters.
Spatial linkage of Poverty Determinants in District Ambedkar Nagar : A... 355
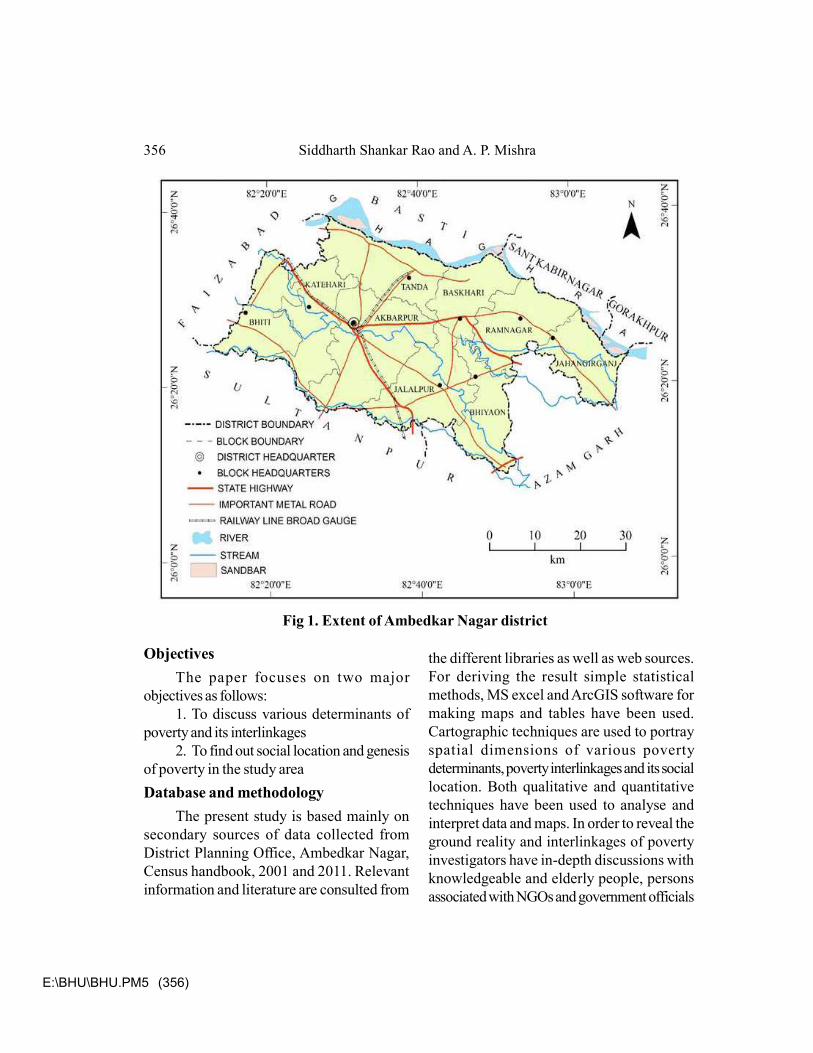
E:\BHU\BHU.PM5 (356)
Fig 1. Extent of Ambedkar Nagar district
ObjectivesThe paper focuses on two major
objectives as follows:1. To discuss various determinants of
poverty and its interlinkages2. To find out social location and genesis
of poverty in the study areaDatabase and methodology
The present study is based mainly onsecondary sources of data collected fromDistrict Planning Office, Ambedkar Nagar,Census handbook, 2001 and 2011. Relevantinformation and literature are consulted from
the different libraries as well as web sources.For deriving the result simple statisticalmethods, MS excel and ArcGIS software formaking maps and tables have been used.Cartographic techniques are used to portrayspatial dimensions of various povertydeterminants, poverty interlinkages and its sociallocation. Both qualitative and quantitativetechniques have been used to analyse andinterpret data and maps. In order to reveal theground reality and interlinkages of povertyinvestigators have in-depth discussions withknowledgeable and elderly people, personsassociated with NGOs and government officials
356 Siddharth Shankar Rao and A. P. Mishra
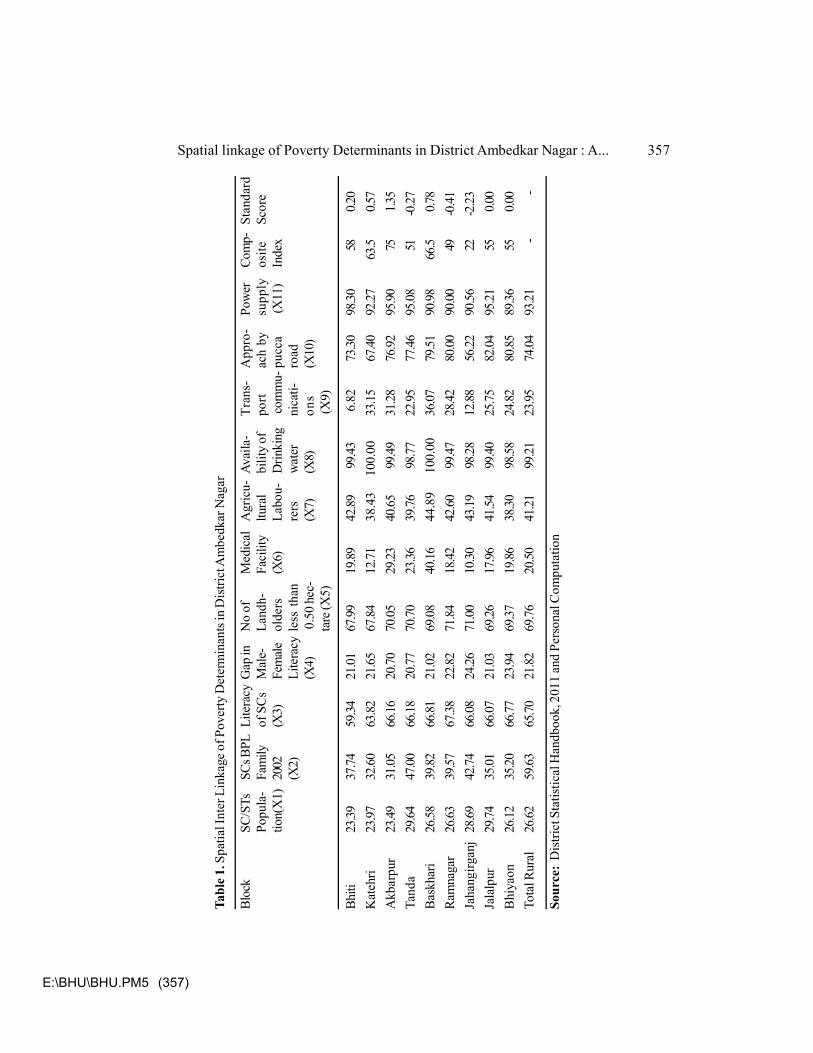
E:\BHU\BHU.PM5 (357)
Tabl
e 1. S
patia
l Int
er L
inka
ge o
f Pov
erty
Det
erm
inan
ts in
Dis
trict
Am
bedk
ar N
agar
Bloc
kSC
/STs
SCs B
PLLi
tera
cyG
ap in
No
ofM
edic
alA
gric
u-Av
aila
-Tr
ans-
App
ro-
Pow
erCo
mp-
Stan
dard
Popu
la-
Fam
ilyof
SC
sM
ale-
Land
h-Fa
cilit
yltu
ral
bilit
y of
port
ach
bysu
pply
osite
Scor
etio
n(X
1)20
02(X
3)Fe
mal
eol
ders
(X6)
Labo
u-D
rinki
ng co
mm
u-pu
cca
(X11
)In
dex
(X2)
Lite
racy
less
tha
nre
rsw
ater
nica
ti-ro
ad(X
4) 0
.50
hec-
(X7)
(X8)
ons
(X10
)ta
re (X
5) (X
9)
Bhiti
23.39
37.74
59.34
21.01
67.99
19.89
42.89
99.43
6.8
273
.3098
.3058
0.20
Kat
ehri
23.97
32.60
63.82
21.65
67.84
12.71
38.4
3
100
.00
33.15
67.40
92.27
63.5
0.57
Akb
arpu
r23
.4931
.0566
.1620
.7070
.0529
.2340
.6599
.4931
.2876
.9295
.9075
1.35
Tand
a29
.6447
.0066
.1820
.7770
.7023
.3639
.7698
.7722
.9577
.4695
.0851
-0.27
Bas
khar
i26
.5839
.8266
.8121
.0269
.0840
.1644
.89
1
00.0
036
.0779
.5190
.9866
.50.7
8Ra
mna
gar
26.63
39.57
67.38
22.82
71.84
18.42
42.60
99.47
28.42
80.00
90.00
49-0
.41Ja
hang
irgan
j28
.6942
.7466
.0824
.2671
.0010
.3043
.1998
.2812
.8856
.2290
.5622
-2.23
Jala
lpur
29.74
35.01
66.07
21.03
69.26
17.96
41.54
99.40
25.75
82.04
95.21
550.0
0B
hiya
on26
.1235
.2066
.7723
.9469
.3719
.8638
.3098
.5824
.8280
.8589
.3655
0.00
Tota
l Rur
al
26.62
59.63
65.70
21.82
69.76
20.50
41.21
99.21
23.95
74.04
93.21
--
Sour
ce:
Dis
trict
Sta
tistic
al H
andb
ook,
201
1 an
d Pe
rson
al C
ompu
tatio
n
Spatial linkage of Poverty Determinants in District Ambedkar Nagar : A... 357
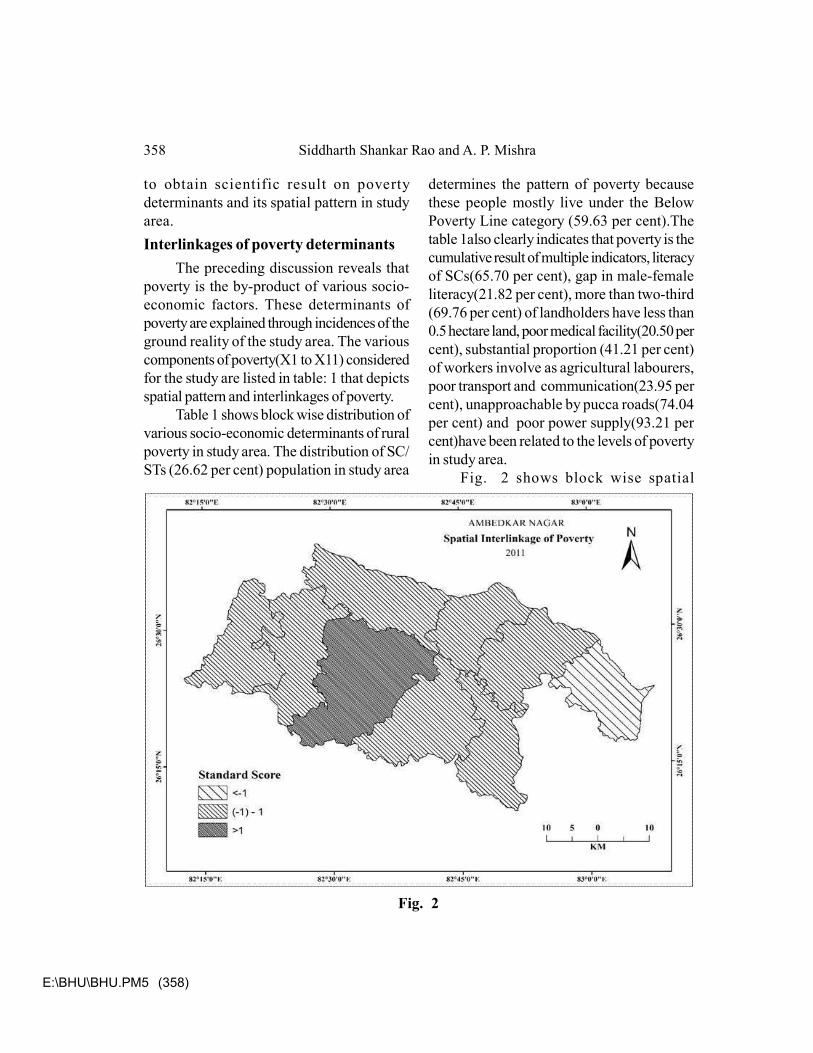
E:\BHU\BHU.PM5 (358)
to obtain scientific result on povertydeterminants and its spatial pattern in studyarea.Interlinkages of poverty determinants
The preceding discussion reveals thatpoverty is the by-product of various socio-economic factors. These determinants ofpoverty are explained through incidences of theground reality of the study area. The variouscomponents of poverty(X1 to X11) consideredfor the study are listed in table: 1 that depictsspatial pattern and interlinkages of poverty.
Table 1 shows block wise distribution ofvarious socio-economic determinants of ruralpoverty in study area. The distribution of SC/STs (26.62 per cent) population in study area
determines the pattern of poverty becausethese people mostly live under the BelowPoverty Line category (59.63 per cent).Thetable 1also clearly indicates that poverty is thecumulative result of multiple indicators, literacyof SCs(65.70 per cent), gap in male-femaleliteracy(21.82 per cent), more than two-third(69.76 per cent) of landholders have less than0.5 hectare land, poor medical facility(20.50 percent), substantial proportion (41.21 per cent)of workers involve as agricultural labourers,poor transport and communication(23.95 percent), unapproachable by pucca roads(74.04per cent) and poor power supply(93.21 percent)have been related to the levels of povertyin study area.
Fig. 2 shows block wise spatial
Fig. 2
358 Siddharth Shankar Rao and A. P. Mishra
E:\BHU\BHU.PM5 (359)
interlinkages of poverty determinants in studyarea. On the basis of standard score and spatialcharacteristics of poverty determinants, thestudy area has been divided into three majorpoverty groups: (i) Extreme poverty, (ii)Moderate poverty; and (iii) Low poverty.Area of Extreme Poverty
The figure 2 shows that area of extremepoverty is mainly concentrated in the easternpart of the district namely Jahangirganj (- 2. 23per cent) block. Due to a combination of variousfactors such as maximum concentration of SC/STs (28.69 per cent) population, high proportionof population fall under BPL categories (42.74per cent), highest percentage of gap in male-female literacy rate (24.26 per cent), very highnumber of households (71.00 per cent) haveless than 0.50 hectare land, poorest medicalfacility (10.30 per cent), higher number (43.19per cent) of population involved as agriculturallabourer, lack of potable drinking waterfacility(98.28 per cent) , very low transport andcommunication facilities (12. 88 per cent), andpoor approach of pucca roads to rural poor(56.22 per cent) etc. have contributed to generatesuch extreme poverty in the area.Area of Moderate Poverty
The table demonstrates that most ofblocks, Baskhari (0.78 per cent), Katehari (0.57per cent), Bhiti (0.20per cent), Jalalpur (0.00per cent), Bhiyaon (0.00 per cent), Ramnagar(-0.41 per cent) and Tanda (-0.27 per cent)fall under moderate category of poverty whichrepresent lower impact of poverty determinantson vulnerable sections of SC/ST population ofthe area.Area of Low Poverty
Area of low poverty is found only inAkbarpur (1.35 per cent) block. This happens
because various determinants of poverty havelower impacts on this particular block. Spatialdistribution of various poverty determinants,minimum SC/STs population (23.49 per cent),minimum BPL population (31.05 per cent), highliteracy rate (66.16 per cent), lowest in male-female literacy rate (20.07 per cent), betteravailability of drinking water facility (99.49 percent), and proper access to power supply(95.90 per cent ) etc. are higher than otherblocks.Social Location of Poverty
Every geographical region has itsown physical and cultural settings so the spatialpattern of poverty differs from one space toanother. The spatial linkages of poverty areproduct of multiple determinants of povertyelements in the specific geographic background.The extent and nature of poverty have veryclose linkage with the availability of resources(labour, land and capital), skilled, entitlements,participation in decision making process andother developmental activities with social andindividual capacities. The poverty in agrarianspace is followed in accordance with ethnicnature of social hierarchy, groups, level ofemployment, and participation in politicalprocess. In order to study the nature of povertyits socio-economic analysis may give someinformation and insight for a specificgeographical space. The poverty status of thestudy area has been marked through dataanalysis of various poverty components.
Most of the remaining unresolved issuesin poverty analysis are related directly orindirectly to the multidimensional nature anddynamics of poverty. Social, cultural andpsychological locations over space have manydimensions of poverty which require a scientificunderstanding of the issue. The social status in
Spatial linkage of Poverty Determinants in District Ambedkar Nagar : A... 359
E:\BHU\BHU.PM5 (360)
feudal society has many reasons for historicalexclusion groups that continues exploitation andposed social segregation and suffering in sociallife. Actually, social exclusion is often a farmore difficult challenge than material poverty.‘Social and cultural sources of exclusion (ineconomic, civil and political spheres) includingstigma, discrimination and denial of citizenshipare rooted in informal social structure’, (Thorat2007). In another observation, Haan and Dubey(2005) have observed that ‘the regional, socialand gender disparities are more prominentfactors which determine the poverty pattern’.Further, they argue that SC/STs people arefacing the core incidence of poverty ascompared to other social groups. Further, it wastheir conclusion that this descriptive explorationof existing data of what is now one of theIndia’s poorest states highlights the importanceof disparities within the state. Regionalinequality seems to have increased in respectto poverty incidences, and there is littleindication that regional gaps in humandevelopment indicators are being bridgeddespite for example the targeted attempts touniversalise education. Disparities betweensocial groups similarly are not being reducedsignificantly. Marginal sections of society sufferfrom the kinds of discrimination that have beenwell- documented for other parts of India.Gender disparities are equally significant, witheducation gaps not being reduced, and womencontinuing to suffer from specific healthdisadvantages. Thorat, 2010 has observed inhis study that ‘Indian society is primarily anidentity-based society. This identity of anindividual stems from caste, ethnicity, religiousor even regional belongings amongst others.Unfortunately these identities are stillentrenched in caste and religious hierarchal
institutions, governing general social conductand market transactions. This is seen to be moreprevalent in the rural areas where poverty iscomparatively high. Although the strict one toone correspondence of broad caste categorieswith class has eroded substantially over time,there still remain strong linkages between thetwo, which have been strengthened bypersistent cultural, social and religious ideas andtheir practices. India, therefore, suffers fromits unique problems with their implications onlivelihood outcomes, somewhat different fromsocieties stratified only on class lines’.
These aspects of poverty need attentionby social scientists which should be studied atmicro level to reveal in depth realities of poverty.The present paper is an attempt in this directionusing newer approaches to study poverty.
Table. 2 and fig. 3 show block wise sociallocation of poverty in study area. Based onvarious social locations, like General, OBC andSC/STs, pattern of poverty followed castereality that prevailed in Indian social hierarchy.The proportion of BPL shows the social locationof poverty in General (12.94 per cent), OBC(48.56 per cent) and SC/STs (38.54 per cent)that proves that social location is an importantphenomenon which determines poverty patternin any geographical space. In Indian society ithas played a significant role in perpetuation ofpoverty situations. Above discussion alsoproved that social organization and structureof society have played a major role in shapingthe pattern of poverty.Concluding observation
On the basis of above discussion it hasbeen observed that rural poverty is determinedby various socio-economic factors. Further, ithas been also investigated that the spatial pattern
360 Siddharth Shankar Rao and A. P. Mishra
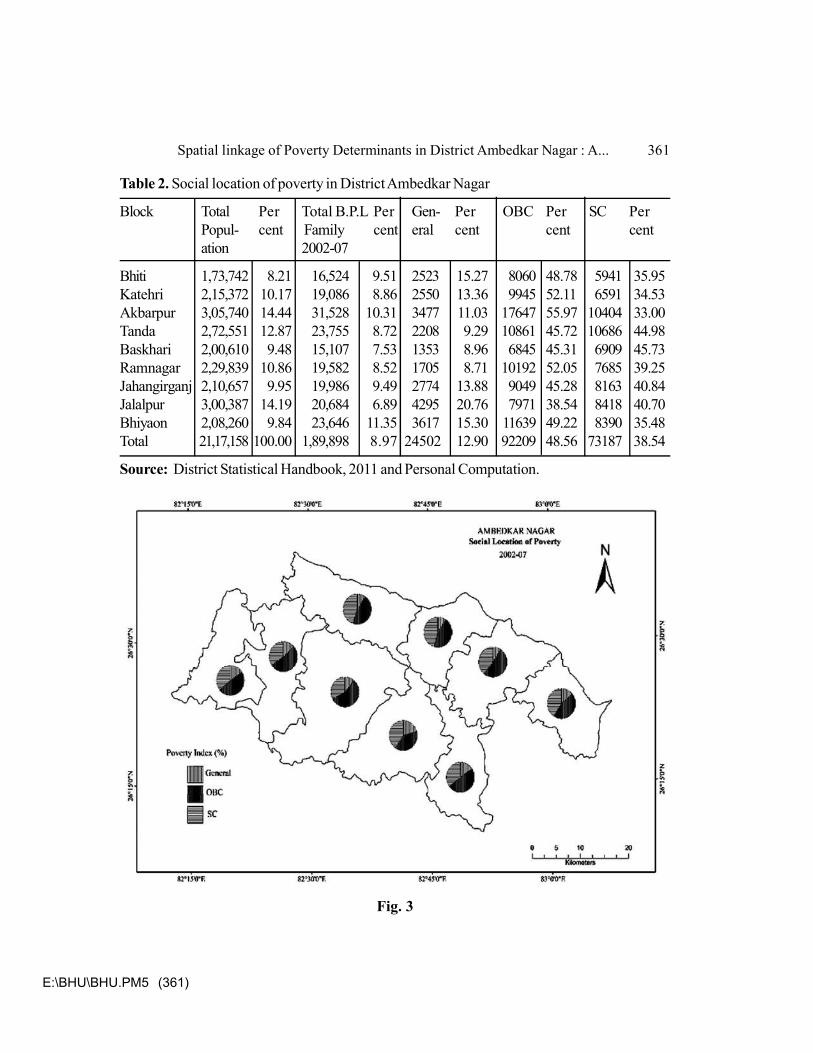
E:\BHU\BHU.PM5 (361)
Table 2. Social location of poverty in District Ambedkar Nagar
Block Total Per Total B.P.L Per Gen- Per OBC Per SC PerPopul- cent Family cent eral cent cent centation 2002-07
Bhiti 1,73,742 8.21 16,524 9.51 2523 15.27 8060 48.78 5941 35.95Katehri 2,15,372 10.17 19,086 8.86 2550 13.36 9945 52.11 6591 34.53Akbarpur 3,05,740 14.44 31,528 10.31 3477 11.03 17647 55.97 10404 33.00Tanda 2,72,551 12.87 23,755 8.72 2208 9.29 10861 45.72 10686 44.98Baskhari 2,00,610 9.48 15,107 7.53 1353 8.96 6845 45.31 6909 45.73Ramnagar 2,29,839 10.86 19,582 8.52 1705 8.71 10192 52.05 7685 39.25Jahangirganj 2,10,657 9.95 19,986 9.49 2774 13.88 9049 45.28 8163 40.84Jalalpur 3,00,387 14.19 20,684 6.89 4295 20.76 7971 38.54 8418 40.70Bhiyaon 2,08,260 9.84 23,646 11.35 3617 15.30 11639 49.22 8390 35.48Total 21,17,158 100.00 1,89,898 8.97 24502 12.90 92209 48.56 73187 38.54
Source: District Statistical Handbook, 2011 and Personal Computation.
Fig. 3
Spatial linkage of Poverty Determinants in District Ambedkar Nagar : A... 361
E:\BHU\BHU.PM5 (362)
and its interlinkages to poverty determinantsshow positive with differential impacts. On thebasis of degree and magnitude three categoriesare identified, extreme poverty, moderatepoverty and low poverty region and that aredetermined by various socio-economic andpolitical factors. It has also been observed thatthe spatial pattern of poverty mostly followedby prevailing nature of social hierarchy while
severity of poverty mostly concentratedamongst lowest social group as SC/STspopulation than other social groups, as OBCsand Generals. The study also illustrates theavailability of various amenities, like healthfacilities, transport and communication,approach by metalled roads etc. that are notdistributed equally among various social groups.
ReferencesDe Haan, A., & Dubey, A., 2005, Poverty, disparities, or the development of underdevelopment
in Orissa. Economic and Political Weekly, 2321-2329.Desai, A. R., 1994, Rural sociology in India. Popular Prakashan, Bombay.Dhamija, N. and Bhide, S., 2010, Dynamics of Poverty in India: A Rural Data Analysis. Economic
and Political Weekly, 45(13): pp. 91-96.Gupta, S. P., 1987, Structural dimensions of poverty in India. Mittal Publications., New Delhi.Kurien, C. T., 1978, Poverty, planning and social transformation.Allied Publication, New Delhi.Mamoria, C. B., 1979, Agricultural problems of India. Kitab Mahal, Allahabad.Mishra, A. P., 1988, Rural Poverty in India: Problems in Planning and Strategy for Poverty
Alleviation.Deep & Deep Publications, New Delhi.Mundle, S., 1983, Effect of Agricultural Production and Prices on Incidence of Rural Poverty: A
Tentative Analysis of Inter-State Variations. Economic and Political Weekly, A48-A53.Reddy, G. N., 1991, The Rural Poor. Chugh Publication, Allahabad.Reddy, S. S., Galab, S., & Rao, P. P., 2003. Trends and Determinants of Poverty: 1973-74 to
1999-2000. Economic and Political Weekly, 1262-1273.Sen, A., 1981, Public action and the quality of life in developing countries. Oxford Bulletin of
Economics and Statistics, 43(4), 287-319.Shergill, H. S., 1989, Agrarian structure as a factor in rural poverty: Some cross-section
evidence. Economic and Political Weekly, A9-A12.Thorat, S., & Mahamallik, M., 2007, Human poverty and socially disadvantaged groups in
India. New Delhi, UNDP-HDRC.Thorat, A., 2010, Ethnicity, caste and religion: Implications for poverty outcomes. Economic
and Political Weekly, 47-53.
362 Siddharth Shankar Rao and A. P. Mishra
E:\BHU\BHU.PM5 (363)
Baiga Settlements in the Environs of MaikalRange of Central IndiaJanki Prasad and R. S. Yadava
Baiga is one of the particular vulnerable tribe groups in India which generally inhabits inhilly and forested tracts of central highlands of the country such as ranges of Maikal andSatpura. It is argued that the remote and inaccessible areas are occupied by the Baigas whichis attributed to their security concerns from the interactions by the other societies. Theirsimple ways of life and nature loving personal traits reflect harmonious relationship of Baigatribe with natural environment. Various spheres of their life are intimately associated with theforests and forest products. The study reveals that Baiga settlements are somewhat differentfrom rest settlements of region in terms of its location, morphology and housing structure.In this study an attempt has been made to explore the relationships between natural environmentand tribal society. Focus has been led to analysis of socio-cultural processes that shape andalter cultural landscape in a unique and specific manner. The study will be useful for theresearchers interested in settlement geography as well as the scholars of social, cultural andenvironmental studies.
Key words : Maikal range, Baiga settlement, empirical study, village morphology,cultural practices
Dr. Janki Prasad, Assistant Professor, Department of Geography, Faculty of Earth Science, IndiraGandhi National Tribal University, Amarkantak- 484887, Madhya Pradesh. E-mail :[email protected]. R.S.Yadava, Professor, Department of Geography, Institute of Science, Banaras Hindu University,Varanasi-221005. E-mail : [email protected]
IntroductionSettlement is an important component of
the cultural landscape which consists of thethree basic human needs- food, shelter andcloth. “Settlements reflect not only man’sresponse to his environment but also thereligious and social customs of his society”(Leong and Morgan, 1982: 43). Settlementgeographers are concerned with the descriptionand analysis of spatial arrangement of buildings,morphology and functions. The tribal
settlements especially Baiga’s dwellings aremore closely associated with the naturalenvironment. The location of Baiga settlementsin the region is more affected by thetopographical features, sunshine, availability ofwater and the cultivable land. Thus, the Baigavillages reflect that specific physical, culturaland ecological characteristics which are relatedto its topography and climate. “Man makeschoice to mould space according to his culturalvalues, hence variations in habitations inresponse to environmental stimuli. He,
NGJI, An International Refereed Journal, (NGSI-BHU, ISSN: 0027-9374/2016/1601), vol. 62 (4),December : 363-376
E:\BHU\BHU.PM5 (364)
consciously or unconsciously, throughsettlements relates himself and his way of life,to the prevailing environment. Thus, settlementsbecome physical embodiments of an idealenvironment” (Singh, 2006:56).
Baiga tribal people are inhabited in the‘Highlands of Central India’, inaccessible areasof the Maikal and Satpura ranges and theNarmada trough. “The Maikal range, formingso to say a connecting link between theVindhyas and the Satpuras, is a large plateauwhich was once well populated but is nowhighly forested” (Krishnan, 1960:6). These tworanges join with Maikal hills at Amarkantak,the place is known for the origin of holy riverNarmada. The river traverses through a riftvalley that lies between Vindhyan and Satpuraranges. The valley and the connecting area ofall three hill ranges is the chief habitat of Baigatribe. This region/ habitat is having a richbiodiversity and covered with dense forest ofSal (shorea robusta), teak, bamboo, fruittrees, scrubs, grasses, medicinal plants androots. The main concentration area of Baigassettlement encompasses districts of MadhyaPradesh and Chhattisgarh namely Mandla,Dindori, Shahadol, Anuppur, Umaria, Balaghatand Bilaspur. The Baiga chak of Dindori districtis known for major concentration of Baigapeople. “The chak consists of 52 villages ofthe development blocks of Bajag, Karnjiya andSamnapur of Dindori district. The centre of theBaiga chak is a forest village Chanra”(Chaurasia, 2009:8).
Baiga tribe is known as an offshoot ofthe Bhuinyas of Chhota Nagpur plateau regionof India. Thus, they continue to inhabit inJharkhand and adjoining areas of Odisha Statealso. They spread towards south from theregion of origin and followed a path from dense
forests of Jharkhand, Sonbhadra district ofUttar Pradesh, and adjoining parts ofChhattisgarh and Madhya Pradesh and finallyconfined in the environs of Maikal range. Atpresent, the environs of Maikal range is havinglargest concentration of Baiga tribe. Theevolution of Baiga settlement in this range islargely affected by its topography, dense forestsand climatic conditions because these peoplehave fascination with nature. The Baiga peoplewho inhabit the environs of Amarkantak aremuch affected with the rapid deforestation andexploitation of land resources by the agrariansociety and others. As a consequence, Baigasare under force to move inside the forest fromtheir present home but the department offorests/administration restricts suchencroachments in the deep forests.
Baiga people belong to Proto-Austroloidstock. They speak Baigani dialect, easternHindi and Chhattisgarhi which belong to Indo-Aryan stock and Indo-European Phylum. Thepopulation of Baiga tribe in India is 5, 52,495that is distributed in States of Madhya Pradesh,Chhattisgarh, West Bengal, Uttar Pradesh,Jharkhand, Odisha, Bihar and Maharashtra(Census, 2011). The sex ratio of the tribe is993 females per thousand male. In general,Baigas are daily wage earners in this area.They are restricted from collecting requiredforest produces excepting some minorproduces. They prefer to do the work wheredaily wage payment system is under operationas their economic conditions still remain fromhand to mouth. Thus, they purchase food items-khanda (broken rice), spice, salt and oil daily.The lack of connectivity, water supply andabsence of electricity are common problemsin the Baiga settlements that is mainly due to
364 Janki Prasad and R. S. Yadava

E:\BHU\BHU.PM5 (365)
their isolated locations and poor attention/indifference by the concerned administration.Objectives
To describe salient features of theBaiga settlements
To reveal settlement morphology of theBaiga villages
To describe housing structure andground plan of houses and its changing scenarioand
To identify the main problemsregarding the settlements and suggest amicableremedial measuresDatabase and Methodology
The study is primarily conducted on field-based survey of various Baiga settlements ofthe Maikal range. These settlements includedvillages in the periphery of Amarkantak andthe Baiga chak such as Jamna dadar, Kabirchabutra, Baigan tola (Farri semar),Sarhakona, Baigan tola (Amarkantak), Lankatola (Omarguhan), Jaleshwar, Amanala,Thadpathra, Durgadhara, Mekal pahar,Chanra, Dhurkuta, Saila tola of village Ajgar,etc. The various ideas concerning settlementsand houses came out from the field study whichis mainly based on field observation andinteraction with help of open endedquestionnaire from individual person or focusgroup discussion with knowlegible persons ofBaiga community. The unit of measurement oflength and width of the ground plan of theirhouses is taken with help of measuring tape.The pattern of the settlements, structure ofhouses and construction materials areconsidered as these have its socio-cultural andenvironmental implications.
The study is based on empirical methods.Investigators have attempted at systematic
explanation of the geographical facts. Thehistorical and ecological approaches areaccorded due significance in the study. Theinterpretation of Baiga settlements is made interms of influence of topographical conditionsand environmental factors and socio-culturalprocesses that have gradually shaped andaltered its spatial pattern, morphology andfunctions. Terrestrial photographs of thehouses and settlements are taken from thefield. The relevant literature and informationare gathered and consulted from gazetteers,census handbooks, other different books andjournals.Baiga Settlements: An Overview
“A typical Baiga village gives animpression of a strong and vital corporate life.It is not bound together by an exacting code ofreciprocal obligations between kin, nor by acommon loyalty to some dictatorial chief; but itis vitalized by a vivid consciousness of the tribalidea, a devotion to Mother Earth, and anadherence to Baiga law” (Elwin, 2002: 22).Baiga settlements have separate identity aseither a village or a part of any village becausethey inhabited in a tola which is locatedgenerally far away from main settlement. Baigapeople live in a group and prefer to live in smalltolas (hamlets) which are known Baigan tola.‘Whole Baiga village is a tola of 8-10 houses’(Nirgune, 1986:25).
Generally, Baiga villages are commonlyseen as a group of 5-25 houses. These tolasare made up on flat-topped situation of hills bythe nature that is a major tendency of Baigas.Sometimes, their settlements are seen on hillslopes which are found in the areas receivingsunshine. The Baiga settlements are generallylocated in inaccessible areas in this territory
Baiga Settlements in the Environs of Maikal Range of Central India 365
E:\BHU\BHU.PM5 (366)
and people follow pagdandis (footpaths) thatis generally a path of cattle. The systematicBaiga villages came into existence much later.Earlier, they used to practice shifting cultivation‘Bewar’ without using the plough by clearingforests for this purpose; they used to shiftnearby area after a few years. Even today, theforests are the first choice to live. Bari is animportant adjacent part and parcel of theirhouses that usually covers an area of half anacre. The bari lie over back side of their housebut sometimes it may be on one side or front ofthe house which depends upon the availabilityof cultivable land and the nature of slope of theterrain.
The dwellings of Baiga are varying in itssize and composition. Various evidences ofextended family are found in the study areawhich constituted- father, mother, elder son andhis wife, younger son and his wife. They havea very little amount of domestic goods and clothsdue to their poor economic conditions and thesimple way of life. The headman of Baigavillage is known as Mukaddam and therepresentatives belong to each tola who helpthe headman. As per their tradition, threepersons of different social backgrounds aresettled in the village with the permission ofMukaddam, deeban, kotwar (panika/pathari) and samrath they are Ahir, Agariyaand Sahis. These people provide service to theBaiga community as to graze their cattle andsupply of water and the works of blacksmithand making madar (musical drum). A Guniyamay be either from the village community orany other settled in the settlement because heperforms his duty as worship to God/ Goddessand conducts various rituals. Besides, he alsogives the treatment to patients suffering fromailment/ diseases with the jadi-buti, jhad-
phunk and use of tantra-mantra.Dahyan is another feature of their
settlement which is constructed away from themain settlement on the top of the mound closeto agricultural fields where they keep cattle innight and a macha is also made for thecollection of paira of kodon, kutki and paddye.g. village Farri Semar. Some temporaryBaiga huts are made nearby the agriculturalfield during the growing seasons of the cropslike kodon/ kutki and paddy which are seenin small patches mainly in low lying areas, e.g.,the village Maikal Pahar. Thus, the seasonalmigration has also been seen among the Baigacommunities.
Baiga people are living with very limitedspace. Shortage of resources is commonphenomena in the tribal habitat. Most of thethings necessary for survival are taken fromnature directly and indirectly and vital domesticgoods and agricultural implements are preparedby themselves. The useful domestic things arealso very limited that are made up with bamboo,earthen material, aluminium, brass, and bronze.The leaves of mahlon have much importancein their life as it is a source of earning formeagre income. It is used in home forpreparation of plate and bowl and hasimportance on the occasions of marriageceremony. Women pick the leaves from thejungle. Presently, its picking is auctioned onlease that is taken by other people. Variousitems are prepared from bamboos by Baigasat home for making some earning in excess.Morphology of Baiga Settlements
The term settlement morphology refersto form, function and layout of the settlements.Thus, the settlement morphology may bedescribed into three ways- physical, social and
366 Janki Prasad and R. S. Yadava
E:\BHU\BHU.PM5 (367)
functional. “Internal arrangement of lanes,houses, with varied relationship, providesanother aspect named as settlementmorphology” (Singh, 2006:203).
Baigas are settled in small villages whichare called tolas. These tolas consisted a groupof houses. It may be in square or a linear patternalong the important street. These squares aregenerally inhabited by the members of a family;it may be called a large and extended family.Sometimes, their relatives are also foundinhabited in these tolas while the other personslike Agariya and Sahis are settled at somedistance from the main settlement, but withinthe mero (village limit). Thus, the houses ofAgariya and Sahis are located separately onthe available vacant land or personal landprovided by Baigas. The separation of thehouses of Sahis is based on the concept ofpurity because they involve in leather work.The houses of Ahirs were developed separatelywith sufficient space available for animals. Atpresent, their houses are generally found wherethey continue to live since long. Most of themhave left out their business of grazing animalsof Baiga people. Thus, the new pattern ofgrazing animals has emerged which is called‘oshari’ one wherein owner goes to grazevillage cattle on his turn.
Earlier, the Baiga settlements were quitesecure with a unified construction pattern. Theysettled in a square that was surrounded/ fencedwith the Sal woods. There was an entrance togo inside the tola which was in the east and ifthere was need of second gate it wasconstructed in the north while baries wereassociated with each house by a small gate thatwas made in the side of the house. Initially,there were only three sides of the squareoccupied by houses and one side left over as
vacant land for further construction of a newhouse with extension of the family for newlymarried couple. These settlements wereconstructed near the source of water such asbanks of river/nala. These tolas were settledin square with the erections of 3-4 huts/ housesin its periphery and sufficient space was left inthe centre which is known as courtyard. Therewas some gap made between houses for usingcalls of nature, etc., but it was covered byfencing. The gates/ doors of the each housewere opened in front of courtyard. The gateswere only three and half or four feet high whichdoes not only protect from oblique/ heavyrainfall in the area but also vital from securitypoint of view. The whole tola is looked afterby a single person from the centre of thesquare. It was also quite helpful to take careof playing children by grandmother in thecourtyard. All the social gatherings, rituals andcultural activities are smoothly run in thecourtyard. Apart from above, the making ofearthen pots and ovens, ropes, baskets are alsomade in the courtyard. Drying corn, roots,flower, fruits, leaves and any other itemprepared by raw material is also done in thecourtyard as well as sunbathing in winter. Saar(cattle shed) was also included in the part ofthe courtyard. Security concerns and the jointfamilies were possible to maintain andstrengthen relationships by using the commonspace for living. The concept of square patternsettlement has been changed in course of timeand uncommonly seen as pattern of settlements.At present, the process of dispersal of housesis going on with the increase of population andbreaking of joint families. They made theirhouses other side of bari or in the field. Aftermarriage young son either use to the partitionthe same house or make a separate house close
Baiga Settlements in the Environs of Maikal Range of Central India 367
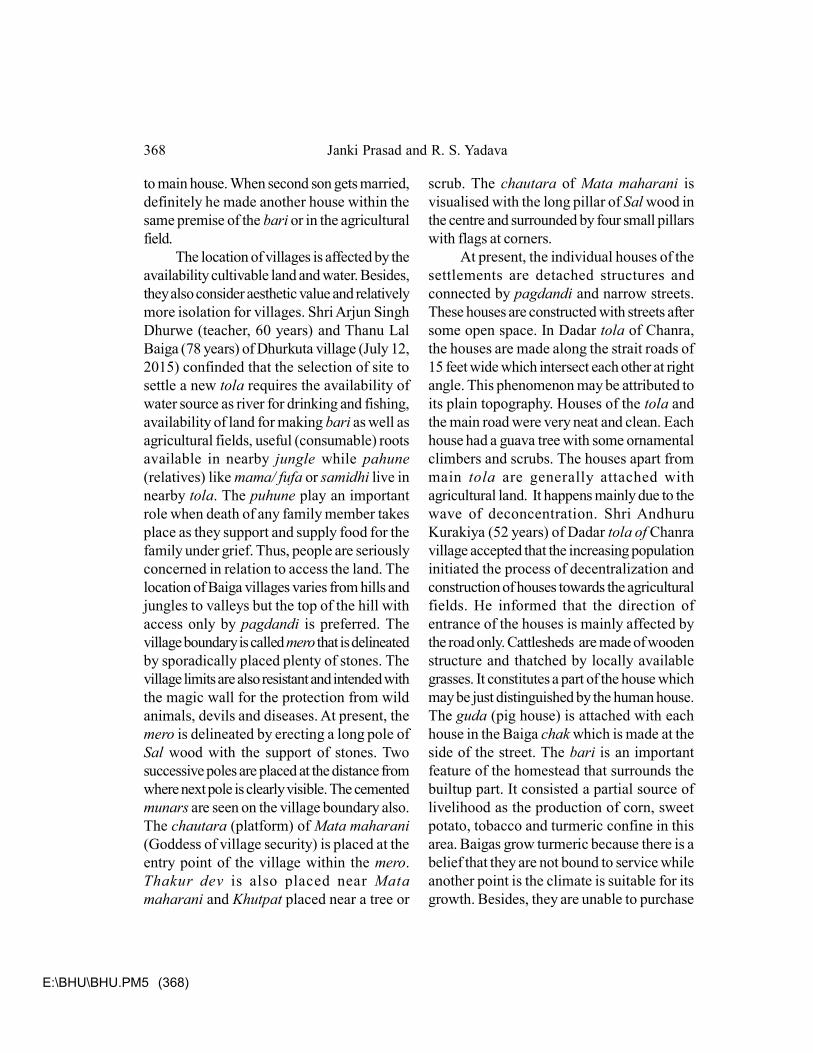
E:\BHU\BHU.PM5 (368)
to main house. When second son gets married,definitely he made another house within thesame premise of the bari or in the agriculturalfield.
The location of villages is affected by theavailability cultivable land and water. Besides,they also consider aesthetic value and relativelymore isolation for villages. Shri Arjun SinghDhurwe (teacher, 60 years) and Thanu LalBaiga (78 years) of Dhurkuta village (July 12,2015) confinded that the selection of site tosettle a new tola requires the availability ofwater source as river for drinking and fishing,availability of land for making bari as well asagricultural fields, useful (consumable) rootsavailable in nearby jungle while pahune(relatives) like mama/ fufa or samidhi live innearby tola. The puhune play an importantrole when death of any family member takesplace as they support and supply food for thefamily under grief. Thus, people are seriouslyconcerned in relation to access the land. Thelocation of Baiga villages varies from hills andjungles to valleys but the top of the hill withaccess only by pagdandi is preferred. Thevillage boundary is called mero that is delineatedby sporadically placed plenty of stones. Thevillage limits are also resistant and intended withthe magic wall for the protection from wildanimals, devils and diseases. At present, themero is delineated by erecting a long pole ofSal wood with the support of stones. Twosuccessive poles are placed at the distance fromwhere next pole is clearly visible. The cementedmunars are seen on the village boundary also.The chautara (platform) of Mata maharani(Goddess of village security) is placed at theentry point of the village within the mero.Thakur dev is also placed near Matamaharani and Khutpat placed near a tree or
scrub. The chautara of Mata maharani isvisualised with the long pillar of Sal wood inthe centre and surrounded by four small pillarswith flags at corners.
At present, the individual houses of thesettlements are detached structures andconnected by pagdandi and narrow streets.These houses are constructed with streets aftersome open space. In Dadar tola of Chanra,the houses are made along the strait roads of15 feet wide which intersect each other at rightangle. This phenomenon may be attributed toits plain topography. Houses of the tola andthe main road were very neat and clean. Eachhouse had a guava tree with some ornamentalclimbers and scrubs. The houses apart frommain tola are generally attached withagricultural land. It happens mainly due to thewave of deconcentration. Shri AndhuruKurakiya (52 years) of Dadar tola of Chanravillage accepted that the increasing populationinitiated the process of decentralization andconstruction of houses towards the agriculturalfields. He informed that the direction ofentrance of the houses is mainly affected bythe road only. Cattlesheds are made of woodenstructure and thatched by locally availablegrasses. It constitutes a part of the house whichmay be just distinguished by the human house.The guda (pig house) is attached with eachhouse in the Baiga chak which is made at theside of the street. The bari is an importantfeature of the homestead that surrounds thebuiltup part. It consisted a partial source oflivelihood as the production of corn, sweetpotato, tobacco and turmeric confine in thisarea. Baigas grow turmeric because there is abelief that they are not bound to service whileanother point is the climate is suitable for itsgrowth. Besides, they are unable to purchase
368 Janki Prasad and R. S. Yadava
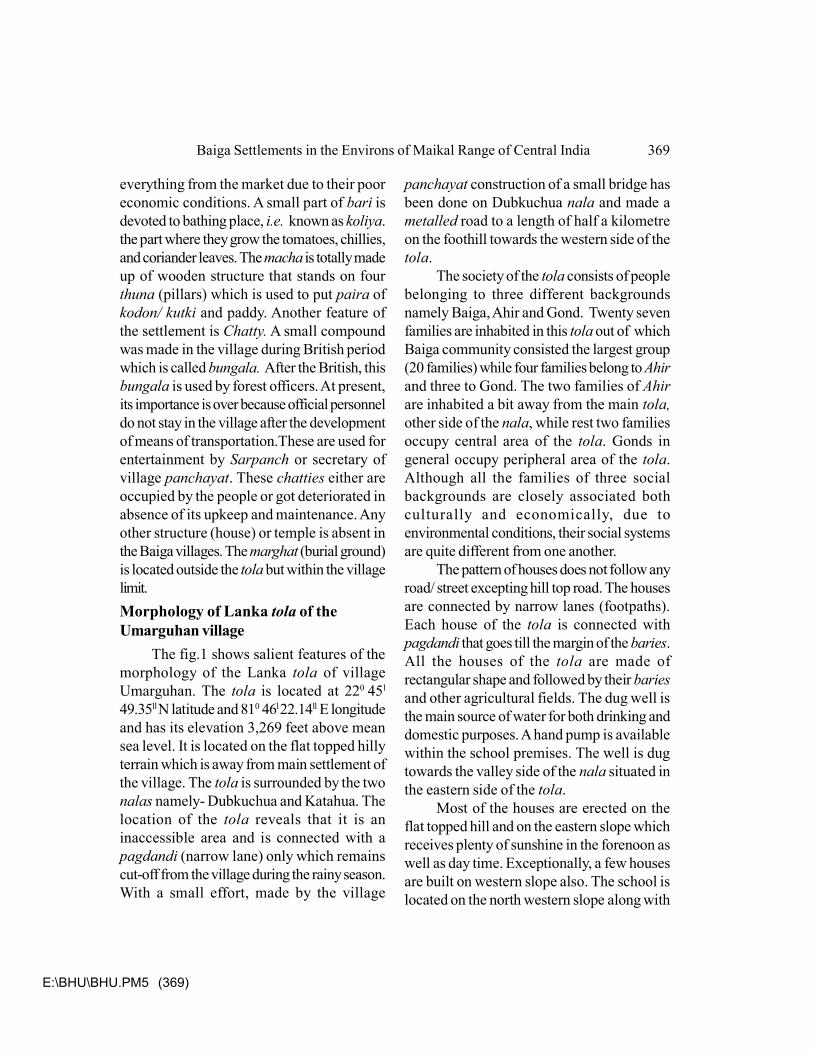
E:\BHU\BHU.PM5 (369)
everything from the market due to their pooreconomic conditions. A small part of bari isdevoted to bathing place, i.e. known as koliya.the part where they grow the tomatoes, chillies,and coriander leaves. The macha is totally madeup of wooden structure that stands on fourthuna (pillars) which is used to put paira ofkodon/ kutki and paddy. Another feature ofthe settlement is Chatty. A small compoundwas made in the village during British periodwhich is called bungala. After the British, thisbungala is used by forest officers. At present,its importance is over because official personneldo not stay in the village after the developmentof means of transportation.These are used forentertainment by Sarpanch or secretary ofvillage panchayat. These chatties either areoccupied by the people or got deteriorated inabsence of its upkeep and maintenance. Anyother structure (house) or temple is absent inthe Baiga villages. The marghat (burial ground)is located outside the tola but within the villagelimit.Morphology of Lanka tola of theUmarguhan village
The fig.1 shows salient features of themorphology of the Lanka tola of villageUmarguhan. The tola is located at 220 45l
49.35ll N latitude and 810 46l 22.14ll E longitudeand has its elevation 3,269 feet above meansea level. It is located on the flat topped hillyterrain which is away from main settlement ofthe village. The tola is surrounded by the twonalas namely- Dubkuchua and Katahua. Thelocation of the tola reveals that it is aninaccessible area and is connected with apagdandi (narrow lane) only which remainscut-off from the village during the rainy season.With a small effort, made by the village
panchayat construction of a small bridge hasbeen done on Dubkuchua nala and made ametalled road to a length of half a kilometreon the foothill towards the western side of thetola.
The society of the tola consists of peoplebelonging to three different backgroundsnamely Baiga, Ahir and Gond. Twenty sevenfamilies are inhabited in this tola out of whichBaiga community consisted the largest group(20 families) while four families belong to Ahirand three to Gond. The two families of Ahirare inhabited a bit away from the main tola,other side of the nala, while rest two familiesoccupy central area of the tola. Gonds ingeneral occupy peripheral area of the tola.Although all the families of three socialbackgrounds are closely associated bothculturally and economically, due toenvironmental conditions, their social systemsare quite different from one another.
The pattern of houses does not follow anyroad/ street excepting hill top road. The housesare connected by narrow lanes (footpaths).Each house of the tola is connected withpagdandi that goes till the margin of the baries.All the houses of the tola are made ofrectangular shape and followed by their bariesand other agricultural fields. The dug well isthe main source of water for both drinking anddomestic purposes. A hand pump is availablewithin the school premises. The well is dugtowards the valley side of the nala situated inthe eastern side of the tola.
Most of the houses are erected on theflat topped hill and on the eastern slope whichreceives plenty of sunshine in the forenoon aswell as day time. Exceptionally, a few housesare built on western slope also. The school islocated on the north western slope along with
Baiga Settlements in the Environs of Maikal Range of Central India 369
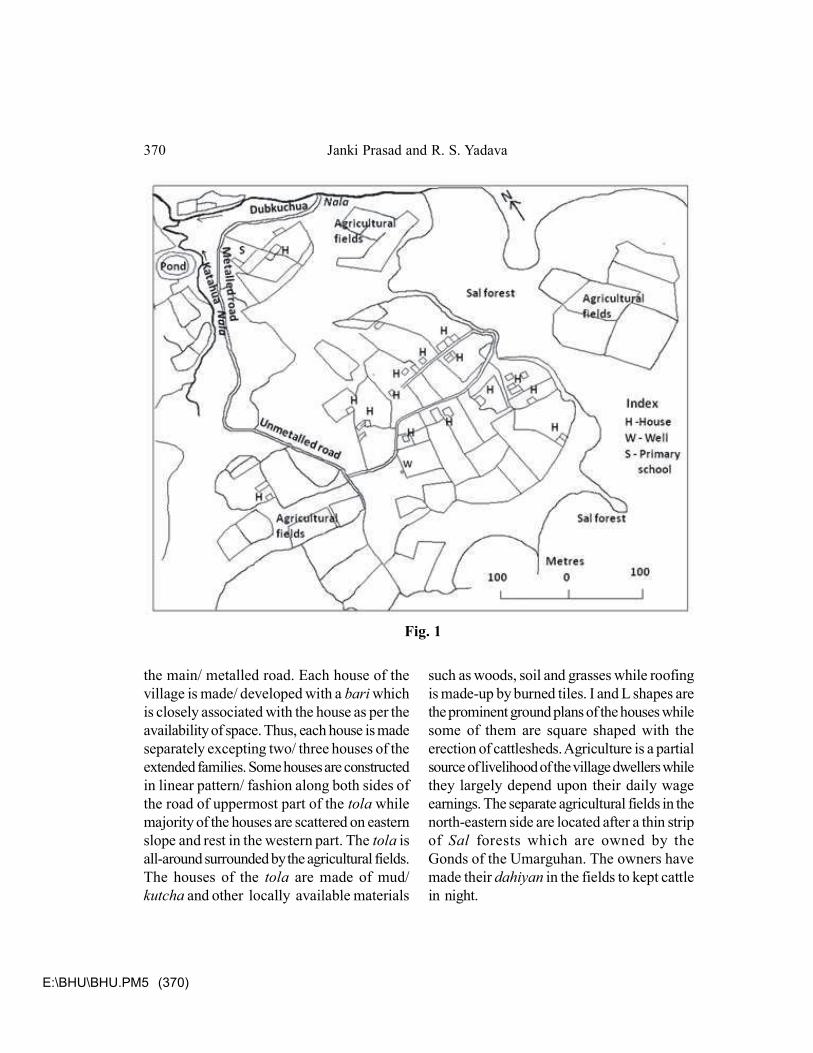
E:\BHU\BHU.PM5 (370)
Fig. 1
the main/ metalled road. Each house of thevillage is made/ developed with a bari whichis closely associated with the house as per theavailability of space. Thus, each house is madeseparately excepting two/ three houses of theextended families. Some houses are constructedin linear pattern/ fashion along both sides ofthe road of uppermost part of the tola whilemajority of the houses are scattered on easternslope and rest in the western part. The tola isall-around surrounded by the agricultural fields.The houses of the tola are made of mud/kutcha and other locally available materials
such as woods, soil and grasses while roofingis made-up by burned tiles. I and L shapes arethe prominent ground plans of the houses whilesome of them are square shaped with theerection of cattlesheds. Agriculture is a partialsource of livelihood of the village dwellers whilethey largely depend upon their daily wageearnings. The separate agricultural fields in thenorth-eastern side are located after a thin stripof Sal forests which are owned by theGonds of the Umarguhan. The owners havemade their dahiyan in the fields to kept cattlein night.
370 Janki Prasad and R. S. Yadava
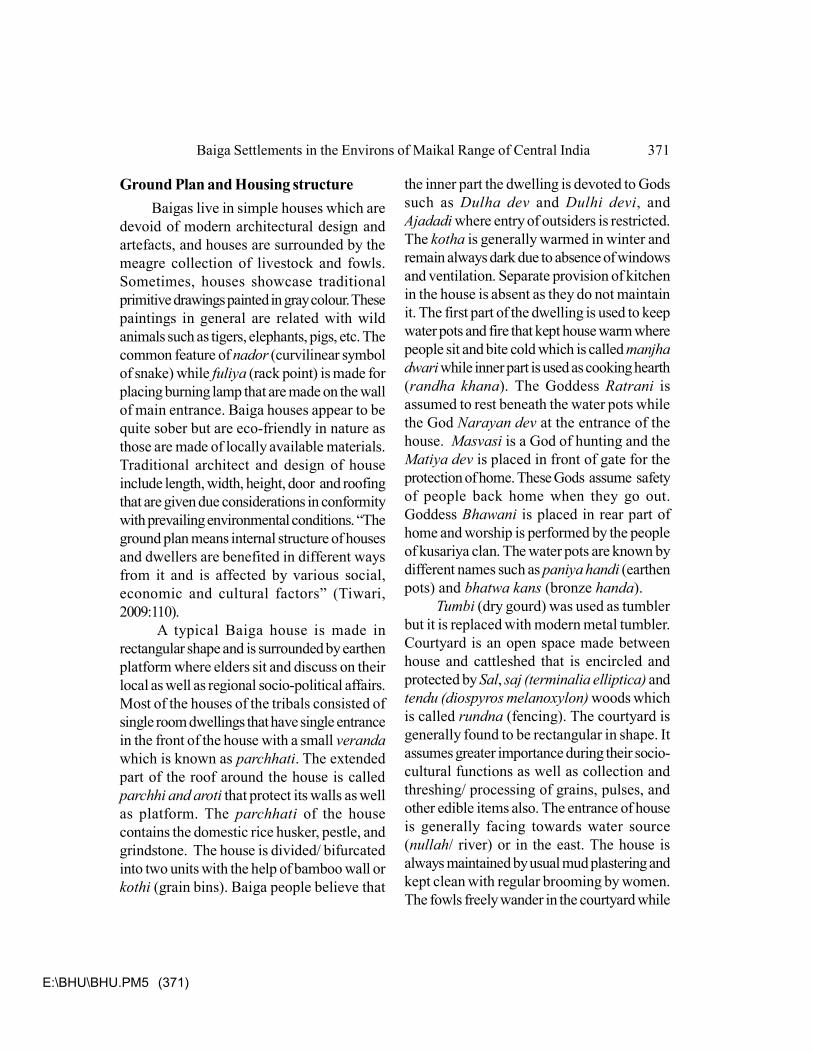
E:\BHU\BHU.PM5 (371)
Ground Plan and Housing structureBaigas live in simple houses which are
devoid of modern architectural design andartefacts, and houses are surrounded by themeagre collection of livestock and fowls.Sometimes, houses showcase traditionalprimitive drawings painted in gray colour. Thesepaintings in general are related with wildanimals such as tigers, elephants, pigs, etc. Thecommon feature of nador (curvilinear symbolof snake) while fuliya (rack point) is made forplacing burning lamp that are made on the wallof main entrance. Baiga houses appear to bequite sober but are eco-friendly in nature asthose are made of locally available materials.Traditional architect and design of houseinclude length, width, height, door and roofingthat are given due considerations in conformitywith prevailing environmental conditions. “Theground plan means internal structure of housesand dwellers are benefited in different waysfrom it and is affected by various social,economic and cultural factors” (Tiwari,2009:110).
A typical Baiga house is made inrectangular shape and is surrounded by earthenplatform where elders sit and discuss on theirlocal as well as regional socio-political affairs.Most of the houses of the tribals consisted ofsingle room dwellings that have single entrancein the front of the house with a small verandawhich is known as parchhati. The extendedpart of the roof around the house is calledparchhi and aroti that protect its walls as wellas platform. The parchhati of the housecontains the domestic rice husker, pestle, andgrindstone. The house is divided/ bifurcatedinto two units with the help of bamboo wall orkothi (grain bins). Baiga people believe that
the inner part the dwelling is devoted to Godssuch as Dulha dev and Dulhi devi, andAjadadi where entry of outsiders is restricted.The kotha is generally warmed in winter andremain always dark due to absence of windowsand ventilation. Separate provision of kitchenin the house is absent as they do not maintainit. The first part of the dwelling is used to keepwater pots and fire that kept house warm wherepeople sit and bite cold which is called manjhadwari while inner part is used as cooking hearth(randha khana). The Goddess Ratrani isassumed to rest beneath the water pots whilethe God Narayan dev at the entrance of thehouse. Masvasi is a God of hunting and theMatiya dev is placed in front of gate for theprotection of home. These Gods assume safetyof people back home when they go out.Goddess Bhawani is placed in rear part ofhome and worship is performed by the peopleof kusariya clan. The water pots are known bydifferent names such as paniya handi (earthenpots) and bhatwa kans (bronze handa).
Tumbi (dry gourd) was used as tumblerbut it is replaced with modern metal tumbler.Courtyard is an open space made betweenhouse and cattleshed that is encircled andprotected by Sal, saj (terminalia elliptica) andtendu (diospyros melanoxylon) woods whichis called rundna (fencing). The courtyard isgenerally found to be rectangular in shape. Itassumes greater importance during their socio-cultural functions as well as collection andthreshing/ processing of grains, pulses, andother edible items also. The entrance of houseis generally facing towards water source(nullah/ river) or in the east. The house isalways maintained by usual mud plastering andkept clean with regular brooming by women.The fowls freely wander in the courtyard while
Baiga Settlements in the Environs of Maikal Range of Central India 371
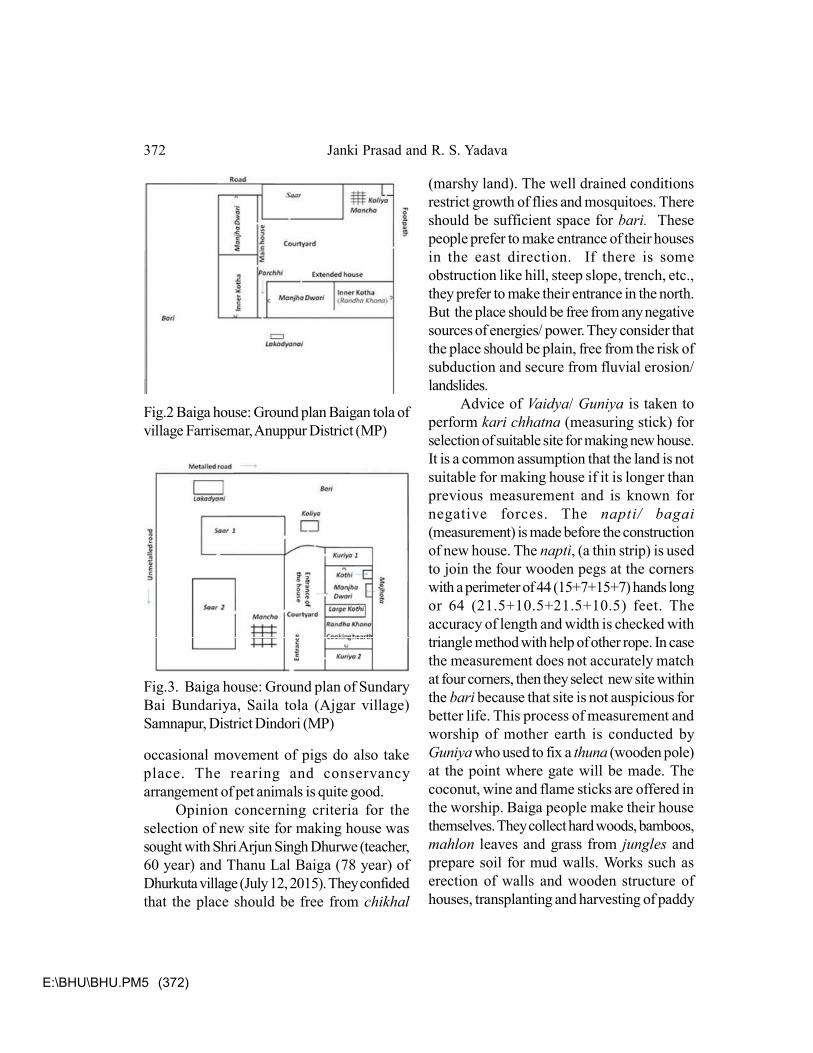
E:\BHU\BHU.PM5 (372)
occasional movement of pigs do also takeplace. The rearing and conservancyarrangement of pet animals is quite good.
Opinion concerning criteria for theselection of new site for making house wassought with Shri Arjun Singh Dhurwe (teacher,60 year) and Thanu Lal Baiga (78 year) ofDhurkuta village (July 12, 2015). They confidedthat the place should be free from chikhal
(marshy land). The well drained conditionsrestrict growth of flies and mosquitoes. Thereshould be sufficient space for bari. Thesepeople prefer to make entrance of their housesin the east direction. If there is someobstruction like hill, steep slope, trench, etc.,they prefer to make their entrance in the north.But the place should be free from any negativesources of energies/ power. They consider thatthe place should be plain, free from the risk ofsubduction and secure from fluvial erosion/landslides.
Advice of Vaidya/ Guniya is taken toperform kari chhatna (measuring stick) forselection of suitable site for making new house.It is a common assumption that the land is notsuitable for making house if it is longer thanprevious measurement and is known fornegative forces. The napti/ bagai(measurement) is made before the constructionof new house. The napti, (a thin strip) is usedto join the four wooden pegs at the cornerswith a perimeter of 44 (15+7+15+7) hands longor 64 (21.5+10.5+21.5+10.5) feet. Theaccuracy of length and width is checked withtriangle method with help of other rope. In casethe measurement does not accurately matchat four corners, then they select new site withinthe bari because that site is not auspicious forbetter life. This process of measurement andworship of mother earth is conducted byGuniya who used to fix a thuna (wooden pole)at the point where gate will be made. Thecoconut, wine and flame sticks are offered inthe worship. Baiga people make their housethemselves. They collect hard woods, bamboos,mahlon leaves and grass from jungles andprepare soil for mud walls. Works such aserection of walls and wooden structure ofhouses, transplanting and harvesting of paddy
Fig.3. Baiga house: Ground plan of SundaryBai Bundariya, Saila tola (Ajgar village)Samnapur, District Dindori (MP)
Fig.2 Baiga house: Ground plan Baigan tola ofvillage Farrisemar, Anuppur District (MP)
372 Janki Prasad and R. S. Yadava
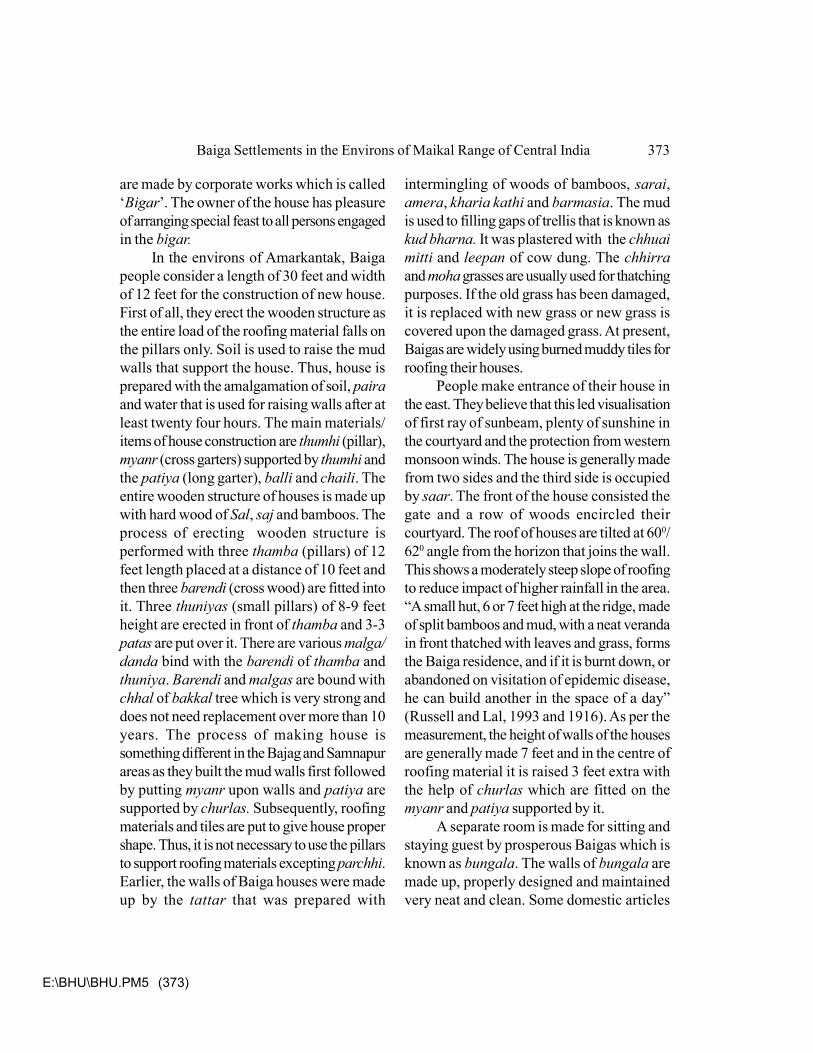
E:\BHU\BHU.PM5 (373)
are made by corporate works which is called‘Bigar’. The owner of the house has pleasureof arranging special feast to all persons engagedin the bigar.
In the environs of Amarkantak, Baigapeople consider a length of 30 feet and widthof 12 feet for the construction of new house.First of all, they erect the wooden structure asthe entire load of the roofing material falls onthe pillars only. Soil is used to raise the mudwalls that support the house. Thus, house isprepared with the amalgamation of soil, pairaand water that is used for raising walls after atleast twenty four hours. The main materials/items of house construction are thumhi (pillar),myanr (cross garters) supported by thumhi andthe patiya (long garter), balli and chaili. Theentire wooden structure of houses is made upwith hard wood of Sal, saj and bamboos. Theprocess of erecting wooden structure isperformed with three thamba (pillars) of 12feet length placed at a distance of 10 feet andthen three barendi (cross wood) are fitted intoit. Three thuniyas (small pillars) of 8-9 feetheight are erected in front of thamba and 3-3patas are put over it. There are various malga/danda bind with the barendi of thamba andthuniya. Barendi and malgas are bound withchhal of bakkal tree which is very strong anddoes not need replacement over more than 10years. The process of making house issomething different in the Bajag and Samnapurareas as they built the mud walls first followedby putting myanr upon walls and patiya aresupported by churlas. Subsequently, roofingmaterials and tiles are put to give house propershape. Thus, it is not necessary to use the pillarsto support roofing materials excepting parchhi.Earlier, the walls of Baiga houses were madeup by the tattar that was prepared with
intermingling of woods of bamboos, sarai,amera, kharia kathi and barmasia. The mudis used to filling gaps of trellis that is known askud bharna. It was plastered with the chhuaimitti and leepan of cow dung. The chhirraand moha grasses are usually used for thatchingpurposes. If the old grass has been damaged,it is replaced with new grass or new grass iscovered upon the damaged grass. At present,Baigas are widely using burned muddy tiles forroofing their houses.
People make entrance of their house inthe east. They believe that this led visualisationof first ray of sunbeam, plenty of sunshine inthe courtyard and the protection from westernmonsoon winds. The house is generally madefrom two sides and the third side is occupiedby saar. The front of the house consisted thegate and a row of woods encircled theircourtyard. The roof of houses are tilted at 600/620 angle from the horizon that joins the wall.This shows a moderately steep slope of roofingto reduce impact of higher rainfall in the area.“A small hut, 6 or 7 feet high at the ridge, madeof split bamboos and mud, with a neat verandain front thatched with leaves and grass, formsthe Baiga residence, and if it is burnt down, orabandoned on visitation of epidemic disease,he can build another in the space of a day”(Russell and Lal, 1993 and 1916). As per themeasurement, the height of walls of the housesare generally made 7 feet and in the centre ofroofing material it is raised 3 feet extra withthe help of churlas which are fitted on themyanr and patiya supported by it.
A separate room is made for sitting andstaying guest by prosperous Baigas which isknown as bungala. The walls of bungala aremade up, properly designed and maintainedvery neat and clean. Some domestic articles
Baiga Settlements in the Environs of Maikal Range of Central India 373
E:\BHU\BHU.PM5 (374)
like kunaita, jata, kumani, dali, tagira,khumari and tangia are seen inside that room.The majhota is made up on one side for keepingwater pots with beautiful wooden structure.Place for collection of firewood is made eitherseparately or close to the house wall as peravailability of space. The open doors arecommonly seen in the houses of Sarhakonavillage. It mainly happened due to the fear offorest guards as they take action against peoplewho use jungle woods. These people are notfinancially well to purchase finished/ readymadedoors from the market.Problems and Prospects
Baiga people were exploited by otherpeople as well as official personnel for long. Ingeneral, there is lack of potable water supply,electricity and all weather roads in theirsettlements. Level of education is very pooramong people of Baiga tribe. There is generallack of schools/ colleges. If there are schoolsthose do not have adequate teaching staff.Financially, they are very poor due to utterunemployment in the area. People in generaldepend upon natural sources of water. Theysuffer from shortage of water supply and facecrisis of water during summer and muddy waterduring the rainy season. Many a times theysuffer from chronic/ water borne diseaseswhich are not easily cured. Many of Baigapeople died without any treatment duringepidemics in the area due to non - availabilityof medical and health facilities in the area.
The employment generation reducesdependency of tribals on forests and improvestheir livelihood. The improvement in theenrolment and containing drop-out ratio at alllevel with provision of the quality of educationare urgently needed. Health institutions need
to be strengthened for better and timelytreatment of diseases and institutional deliveriesto reduce natal and maternal mortality rates inthe area. Tribal tourism may be promoted inthe area that will help in the betterment ofeconomic conditions of tribal people. Properaccess to the market-based economy of Baigapeople will reduce their exploitation from themiddlemen.Concluding Remarks
Baiga settlements are usually found ininaccessible locations and characterised withundulating terrain of central highlands. Theyprefer to make their settlements close to theforest on flat-tops of hills. These settlementsare devoid of basic facilities like potable water,all weather roads and electricity. Thesettlements are made in square form butscenario is changing with the increase in thepopulation, deforestation and interaction withother societies. Thus, the deconcentrationprocess is affecting the making of new houses.The tola of Baiga tribe consists of a group of5-25 houses and is inhabited by the closerelatives along with the other persons. Thesetolas are located at considerable distance dueto meagre availability of resources. Houses arevery simple in make-up and rectangular inshape, and are prepared with the locallyavailable raw materials. There is a gradualchange taking place in making new houses.They select the site for dwelling either withinthe bari or in the agricultural field due toincrease in the population. Earlier, they selectedsuitable place for house construction thandeveloped bari. The use of constructionmaterials is constantly under change with theallotment of Indira Avas and supply of electricityin some Baiga villages. Baiga people grow
374 Janki Prasad and R. S. Yadava
E:\BHU\BHU.PM5 (375)
certain necessary items within their ownpremises. The dependency on forests isgradually getting reduced and they are gettingemployment as daily wage labour in theconstructions of roads, digging ponds, buildingconstruction, plantation, etc. under MANREGAscheme. The habitat of Baigas is underencroachment by the other societies andcommencement of developmental activities.The threat of displacement is major cause ofconcern among Baigas.
The empirical field study of Baiga villagesin the environs of Maikal range, made us derivecertain conclusions and also conceivetheoretical views of the settlements.Theorizing Baiga Settlements
Baiga settlements are generally found inthe forest areas or close to the forests. It is agroup of 5-25 huts/ houses of same clan and/or close relatives that is commonly known asBaigan tola. These settlements are located onthe flat-topped hills or mounds. Settlements aregenerally situated in inaccessible areas ofuneven topography and cut - off from the other
settlements or transport routes through valleysand nullah due to security concern. Thesettlements followed the acess to sources ofwater and land for cultivation. The houses ofBaiga are separated with each other through asmall piece of land (bari) that has importancein their life as a partial source for the productionof maize and selected vegetables during rainyseason and use the place for bathing (koliya)and collecting compost, woods and paira.Generally, houses are constructed with the localavailable materials in a simple architecturaldesign of wooden structure and mud walls andrepair seasonally.
The close association with forests of thetribe clearly shows the dependency on forestsand less interference by the other group ofpeople. Earlier, their settlements were wellprotected but at present deconcentrationprocess is seen at many places with therestrictions in the forest areas and increase ofdependency on agricultural activities and dailywage earnings.
ReferencesCensus of India, Primary Census Abstract, 2011.
Chaurasia, V. ,2009, Prakriti Putra Baiga (in Hindi), Madhya Pradesh Hindi Granth Academy,Bhopal.
Dhurwe, A. S. and Baiga, T. L., July 12, 2015, Personal interview in their village Dhurkuta.
Elwin, V. ,2002, The Baiga, Gyan Publishing House, New Delhi.
Krishnan, M.S., 1960, Geology of India and Burma, CBS Publishers and Distributors, Delhi.
Kurakiya, A., July 12, 2015, Personal interview in his village Dadar tola, Chana.
Leong, G. C. and Gillian C. M., 1982, Human and Economic Geography, Oxford University
Baiga Settlements in the Environs of Maikal Range of Central India 375
E:\BHU\BHU.PM5 (376)
Press, United Kingdom.
Nirgune, V., 1986, Baiga (in Hindi), Adivasi Lok Kala Parishad Prakashan, Bhopal.
Russell, R.V. and Lal, R.B.H., 1916, The Tribes and Castes of the Central Provinces ofIndia, J. Jetley Asian Educational Services reprint, New Delhi 1993, 2 Vols, 88.(First published in 1916 by Macmillan and Co. Limited St. Martin’s Street, London).
Singh, R. Y., 2006, Geography of Settlement, Rawat Publications, Jaipur.
Tiwari, R. C., 2009, Adhivas Bhoogol (in Hindi), Pryag Pustak Bhawan, Allahabad.
376 Janki Prasad and R. S. Yadava
E:\BHU\BHU.PM5 (377)
Determining Poverty and Quality of Life inSlums of Varanasi CityDarshan Kumar Jha, Rahul Harshwardhan and V. K. Tripathi
This paper is an attempt to re-imagine Varanasi from the slums of the city. The paperalso attempts to determine the quality of life in slums of Varanasi city and present a spatialpattern of Quality of Life across different slums. To understand and analyse poverty at themicro level, 10 variables were chosen and detailed survey of 180 households has beenconducted in six slums located in different parts of the city. Z-score of the variables has beencalculated, and composite Z-score has been determined by adding them for every slum.Based on the Z -score, slums were grouped into three categories of Quality of life ( Moderate,Low, and Very Low). The study unfolds that there is another Varanasi, which is poor,unhygienic and lacks basic services. Besides, this city co-exists with its spiritual milieu andcultural mosaic of the city. The study reveals that low quality of life exists in the slums ofVaranasi city, but it varies from one slum to another.
Keywords: Quality of life, Slum, Urban Poor
IntroductionVaranasi is popularly known as cultural
capital of India. It is famous for its arcade ghats,temples, spirituality and traditional lifestyle. Itis a famous site of pilgrimage for Hindus,Buddhist and Jain. This city is associated withthe diverse faith of spiritualism, mysticism andtraditional Indian knowledge and has earnedrepute of a great centre of learning for ages.This spirituality and greatness of the city onlyportray a picture of one side of the story. AsVaranasi represents one of the million plus citiesof India, it is also facing similar types of
challenges such as inadequate urbaninfrastructure, poverty and rapidlymushrooming of slums.
The magnitude of slum population in Indiahas increased from about 33.1 million in 1985to 35 million in the early 90s and 40 million in2001 (Mallick, 2001). Further, the slumpopulation has increased from 52.3 million(2001) to 65.9 million in 2011. The decadalgrowth rate of slum population during 2001-11was 25%. The main reason for slumproliferation is rapid and non-inclusive patterns
Darshan Kumar Jha, Senior Research Fellow, Department of Geography, Banaras Hindu University,Varanasi-221005, [email protected] Harshwardhan, Senior Research Fellow (Corresponding Author) Department of Geography,Banaras Hindu University, Varanasi-221005, [email protected] V. K. Tripathi, Professor, Department of Geography, Banaras Hindu University, Varanasi-221005,[email protected].
NGJI, An International Refereed Journal, (NGSI-BHU, ISSN: 0027-9374/2016/1602), vol. 62 (4),September : 377-388

E:\BHU\BHU.PM5 (378)
of urbanisation catalysed by increasing ruralmigration to urban areas (The State of Slum inIndia, 2013). According to 2011 Census, 70%of the slum population of India is found in millioncities. Varanasi is one of the million plus citiesof India, and it is also facing similar type ofchallenges such as inadequate urbaninfrastructure, poverty and growing slums.During the last seven decades, the populationof the city has grown almost six folds from207,650 (1931) to 1,201,815 (2011). The rapidgrowth of the city has resulted in emergenceand growth of slums due to the absence ofaffordable housing and basic amenities. In 1941,the slum population constituted 9% of the totalcity’s population that increased to 33.86% in2011. Due to rapid growth in the populationhousing needs of the city also grew, that couldnot be met by the formal housing market.Varanasi City has total 209 slums out of which176 were built on land belongs to privateownership, 29 slums were situated on landbelongs to local body, three slums on the landbelong to the state government and remainingone slum on the land belong to Government ofIndia. The slums of Varanasi present a patheticpicture of the life of slums dwellers. (RCUES,2013)
Hundreds of study and researches havebeen carried out on the quality of life in slumsof India, still, it demands more study to revealthe reality. Status denotes the position of aperson vis-a-vis the person’s rights andobligations (Pande, 2005). Goswami & Manna(2013) discussed the strong linkage betweeneconomic prosperity and enriching the qualityof life, which is reflected in form of socialindicators namely health, longevity, literacy andenvironmental sustainability that present apathetic picture of slums dwellers life under
the most deplorable conditions. Jha and Tripathi(2014) argued that the situation of slum dwellersis miserable in developing countries like Indiaand presents a pathetic condition of life in slumsof Varanasi due to uncontrolled and rapidurbanisation. They also argued that there isspatial variation in the quality of life acrossdifferent slums.
Nowadays, quality of life seemsnecessary to understand and explain the socio-economic conditions and well-being of a societyand its strata. Various internationalorganisations, credit agencies, economists,sociologists and geographers took interest inthe process of identifying parameters forassessment of the quality of life anddevelopment of the quality of life indices. Morrishas tried to study the Physical Quality of LifeIndex (PQLI) with the help of three indicatorsnamely infant mortality, life expectancy andbasic literacy. PQLI is called a direct forerunnerof HDI and is classified under economicperspectives to QOL (Sirgy et al. 2006). HDI,as developed by United Nation DevelopmentProgram (UNDP), is the most popular indexof quality of life. It summarises the level ofhuman development attainment by a country.It is composed of sub-indices relating to health,education and income at the national level ofaggregation (Narayana, 2008). TheMultidimensional Poverty Index (MPI) is anindex designed to measure acute poverty onthe basis of the methodology of Alkire andFoster (2008, 2011). The significance of qualityof life was realised by modern thinkers quiterecently, particularly in the last quarter of the20th century.
Social problems, disparities, well-beingand quality of life are the new domains ofgeographic study in this post-modern era. This
378 Darshan Kumar Jha, Rahul Harshwardhan and V. K. Tripathi
E:\BHU\BHU.PM5 (379)
paper is an attempt to reimagine Varanasi fromthe slums of the city. The paper also attemptsto determine the quality of life in slums ofVaranasi and present a spatial pattern of Qualityof Life across slums of the city.Objectives
The major objectives of this paper are:1. To examine the existing facilites and
infrastructure in the slums of Varanasi city.2. To understand poverty at the micro
level and determine the Quality of Life of slumdwellers.Database and Methodology
The study is based on secondary as wellas primary data. Secondary data are collectedfrom Census of India 2011, District UrbanDevelopment Authority (DUDA) 2006, andSlum Free City Action Plan of Varanasi (RajivAwas Yojna2013). Primary data are collectedthrough an interview schedule by a field-basedsurvey of 180 household. To understand andanalyse poverty at micro level 10 variables werechosen and detailed household survey has beenconducted in six slums located in different partsof the city. Z-score of the every variable hasbeen calculated and composite Z-score hasbeen worked out by adding them for theselected slum. Slums were grouped into threecategories based on the composite Z-score ofthe Quality of life (Moderate, Low and VeryLow). The discussion starts with existingsituation of slums in this heritage city followedby micro-level analysis of poverty and qualityof life in the slums.Study area
Varanasi (also known as Kashi orBanaras) is known as the cultural and spiritualcapital of India. It is one of the oldest living
city in the world, with a continuous history datingback 3,000 to 5,000 years. Varanasi (82°56’E–83°03’E and 25°14’N-25o23’ N) is located onthe left crescent-shaped bank of the Gangariver. The city is a part of ‘Varanasi UrbanAgglomeration’ (VUA). Due to increasingpopulation growth and rapid urbandevelopment, Varanasi became a million cityby 1991. Rapid urbanisation has added to theurban problems in the city. Lopsidedurbanisation, faulty urban planning, andurbanisation with poor economic base and withpoor urban functions in the city led to somebasic problems in the city namely housing,slums, transport, water supply and sanitation,water pollution and air pollution, inadequateprovision for social infrastructure etc.Slums in Varanasi City: Existing Situation
Slums in Varanasi city have beencontinuously increasing from 1941 to 2011. Withthe increase in the population, housing needsof the city also grew, that could not be met outfrom the formal housing market. Migratingpopulation, which could not avail the facilitiesof the formal housing market get satisfied theirneeds building temporary shelters on vacant landthat culminate into the formation of slums.Another factor, which contributes to theformation of slums, is proximity to theworkplace and low level of income and un-affordability of pucca houses (CDP,JNNURM, 2006). People living in the slums ofthe city are poor working as labour, rickshawpullers and thela keepers. These poor peopleare unable to afford formal housing (Tripathi,2010).Total wards in Varanasi MetropolitanCorporation are 90, amongst these, the slumdwellings do exist only in 61 wards. Accordingto Census 2011, the population of urban poor
Determining Poverty and Quality of Life in Slums of Varanasi City 379

E:\BHU\BHU.PM5 (380)
and slum dwellers in Varanasi account for about33.86% of the city population.
Slum locations are spread all over the citybut major concentrations occur in the old cityareas, near the Ghats, industrial units and theRajghat area due to proximity to the workplace.Employment due to tourism and availability ofopen land led to indiscriminate squatting
(Tripathi, 2011). Varanasi has 227 slums spreadall over the city, either on government or privatelands. About 50% of slums are located incentral city, 13% in old city while 37% inperipheral areas. The average density in slumareas is approximately 330 persons per hectarein the city. The slum population of the city isconsistently increasing after independence. In1951, the slum population comprised 13% ofthe city’s population but in 2011 it has increasedto 37% of the city population. The total areaunder slum (522 ha) constitutes 7% area ofthe city. According to the report of Slum FreeCity Plan of Action (2013), slums are found inevery area or zone of the city but the majorityof them are located in the core of the city. Thecore of the city consists of 75% of the totalslums. In Varanasi, 93% slums have grown near
Table 1. Varanasi City : Population and Slums
Percent of (slum population to city 34%population)City Area (Ha) 7997Total Area under slums (Ha) 522.74Percent of slum area to city area. 7%Slum Density (Persons/Ha.) 779
Source: Census of India, 2011
Table 2. Physical Infrastructure Available in SlumsParticulars Varanasi City
Frequency Percentage
Sewage Connected 172 82.30Not Connected 37 17.70Total 209 100.00
Source of Water Supply Individual Tap 36218 46.28Public Tap 13486 17.24Hand Pump 15871 20.28Open Well 3343 4.28Tank 20 0.02Pond/River/Canal 25 0.03Water Tanker 2 0.002Others 9288 11.87Total 78253 100.00
Latrine Facility Public Community 4300 5.49Shared Latrine 4153 5.32Own Latrine 50989 65.16Open Defecation 18807 24.03Total 78249 100.00
Source: Slum Free City Plan of Action, Varanasi, 2013
380 Darshan Kumar Jha, Rahul Harshwardhan and V. K. Tripathi
E:\BHU\BHU.PM5 (381)
middle and high-income residential areas. Theslums are spread over the small and large areabut 30% of the slums are spread in areasranging from 1-2 Ha and 16% of slums arespread over the area more than 4 Ha. About34% of the slums are spread over an area lessthan 1 Ha. which reveals that the slums of thecity are congested with meagre opportunity forinfrastructural development. In Varanasi, 97%of the slums emerged 40 years ago which lackbasic infrastructure and amenities, many ofslums are prone to flood and water logging (47% of slums are prone to flood and 4% arelocated on hazardous sites). According to thereport of Slum Free City Plan of Action (2013),the majority of houses in slums of Varanasi arepucca (59%), while semi-pucca and kutchahouses (41%) are less. In the context ofdemographic characteristics, 44% of slumpopulation is below the poverty line and 79%of the slum dwellers belong to backward socialcommunities. It is also found that 43% of thehousehold of slums have an average incomeless than Rs. 1500 per month. In general slumsare deprived of basic services. In Varanasi,82% of the slums are connected with full orpartial water supply system (Table 2). About54% of the slum population depends on publictaps, tube wells, open wells, hand pumps andwells for drinking water. Only 46% householdsdo have access to individual tap connections.In terms of sanitation, 76% of the slums arenot connected to the city sewage system thatcontributes to pollution and makes theminhabitable. The report of Slum Free City Planof Action (2013) reveals that in Varanasi 24%of the slum households do not have an individualtoilet (Table:2). The slums also lack cleaningof open drains, such as drains of 46% of slumsfrequently remain choked. In terms of
vulnerability, 38% of the slums are moderatelyvulnerable and have the moderateinfrastructure, while 7% are most vulnerableand have the worst infrastructure. About 25%of the slums are least vulnerable and have themoderate infrastructure and only 1.5% are leastvulnerable and have better infrastructure.Parameters of quality of life
In the present study, altogether 10variables representing various dimensions of lifehave been carefully chosen to understandpoverty at the micro level and determine theexisting quality of life in slums of Varanasi city(Table 3).Source of lighting (X1)
Electricity is considered as an indicatorof development and quality of life (Jha andTripathi, 2014). In the slums, there are twomajor sources of lighting i.e. electricity andkerosene lamp. In six surveyed slums, Nagwahas the highest household (76%) havingelectricity as the source of lighting followed byDurgakund (72%), Rajghat (70%), Sigra(68%), Bajardiha (66%) and Omkaleshwar(64%). It is notable that most of the householdshave illegal electricity connection.
There are significant household users ofthe kerosene lamp in the slums. Omkaleashwaris at the top where 36% households were usingKerosene as the source of lighting, followedby Bajardiha (34%), Sigra (32%), Rajghat(30%), Durgakund (28%) and Nagwa (24%).The main cause of household not havingelectricity connection is lack of money and non-availability of valid documents required forseeking power connection.Fuel used for cooking (X2)
Slum dwellers have many options of
Determining Poverty and Quality of Life in Slums of Varanasi City 381
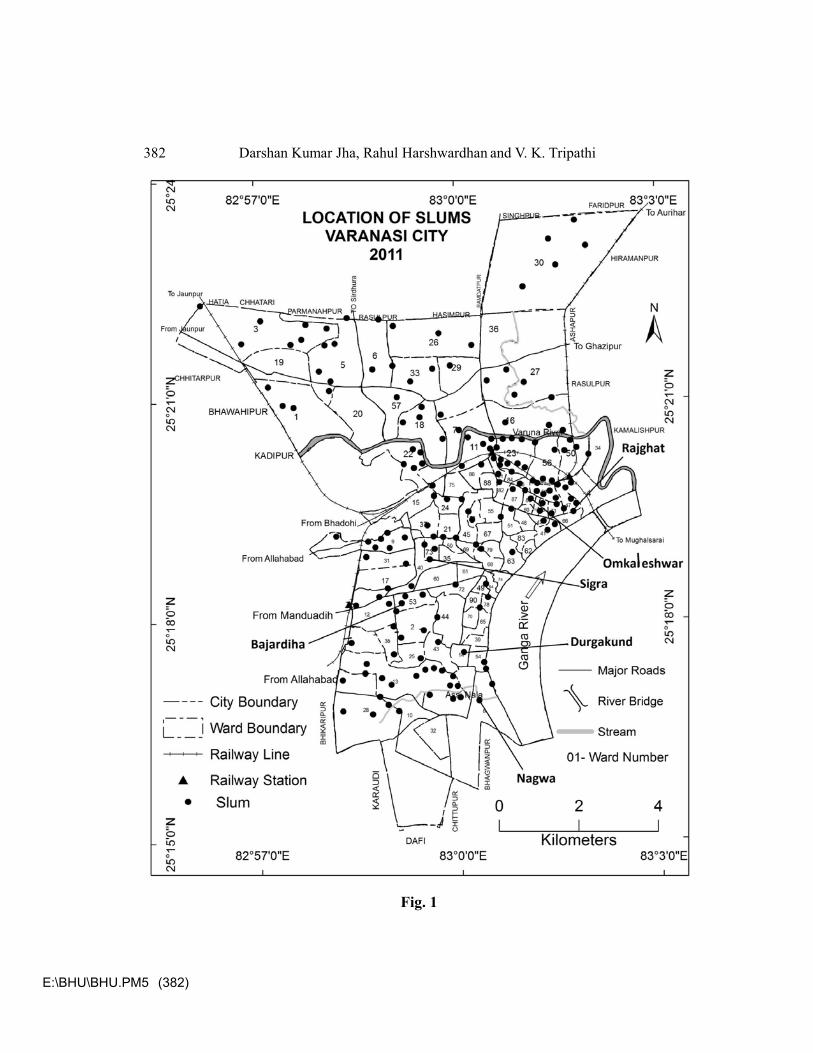
E:\BHU\BHU.PM5 (382)
Fig. 1
382 Darshan Kumar Jha, Rahul Harshwardhan and V. K. Tripathi
E:\BHU\BHU.PM5 (383)
cooking fuel ranging from LPG to cow dungcakes but it mainly depends upon theireconomic status to afford it. In surveyed slums,Sigra (48%) has the highest household usingLPG followed by Bajardiha (44%),Omkaleshwar and Durgakund having 40%households, Nagwa (36%) while in Rajghatonly 26% households were using LPG.Electricity has been also used for cooking insample slums. Nagwa is at the top having 32%household using electricity as fuel for cooking.Though many of households do have legal LPGconnection, they use small cylinders of 2 kg or4 kg. The 32% slum dwellers use the illegalelectric connection for illuminating their heaters.Source of drinking water (X3)
Safe and pure drinking water is the basicneed of human being. Slum areas, have limitedsources of safe drinking water. In sample slums,there are two major sources of drinking water;municipal tap and hand pump. In surveyedslums, hand-pump is found as the major sourceof drinking water. The sample survey revealsthat 64% residents of slums use water of handpump, while 36% use water for drinkingpurpose from municipal tap. The highestnumber of households depend on hand pumpin Nagwa (72%) followed by Rajghat (70%),Durgakund (64%), Bajardiha (60%),Omkaleshwar (56%) and lowest being foundin Sigra (52%). As Varanasi is located on thebank of river Ganga, the water table remainshigh. Therefore, hand-pump is a popular sourceof drinking water. But the quality of hand pumpwater does not meet the safety norm. The handpumps are very old but functional. The localauthorities are unable to provide the tap waterto the larger population of slum areas.Municipal tap is the second popular source ofdrinking water. About 44% of the households
of Sigra slum depend on municipal tap becausethis slum is located near the drinking waterpipeline of the city.Housing condition (X4)
One billion people of the world live inmiserable housing, mostly in slums and squattersettlements. The housing condition in the slumis inhabitable and pathetic, lacking very basicamenities. The types of houses basically dependupon the geographical environment as well aseconomic and social structure of the people(Sahay, 2006). In five surveyed slums, highestpucca houses are found in Durgakund (30%)because the slum dwellers of this slum haveenough income to construct concrete houses.Many of the dwellers are beneficiaries ofgovernment schemes as well. Sigra slum has20% pucca houses followed by Bajardiha(18%), Omkaleshwar (12%), Rajghar (10%)and Nagwa (8%). The slum dwellers ofNagwa are extremely poor; they hardly haveenough money for their food and medicine. Thesemi-pucca houses are also found in largenumber in the slums. Out of 180 dwelling units,138 houses had only one room. Kachha houseswhich are a characteristic feature of the ruralarea are abundantly found in slums. The highestnumber of kachha houses is found inOmkaleshwar (36%) because dwellers havemigrated to this slum and they do not have theirown land to build their house. The dwellers livingin kaccha houses are landless people and theyare living on rent in unhygienic and temporarydwellings.Sewage disposal facility (X5)
Sanitation is not only important for healthyliving but also ensuring a non-pollutedenvironment.The slums are characterised withthe spread of solid waste, choked drains, litter
Determining Poverty and Quality of Life in Slums of Varanasi City 383

E:\BHU\BHU.PM5 (384)
Table 3. Varanasi city : Urban Poverty at Micro level & Quality of LifeVari- Parameters Indicators Percent of HHables Rajghat Omkale- Sigra Durga Nagwa Bajardiha
shwar kundX1 Source of Electricity 70 64 68 72 76 66
lighting Kerosene 30 36 32 28 24 34X2 Fuel used LPG 26 40 48 40 36 44
for cooking Electricity 24 16 12 20 32 18Kerosene 18 16 20 16 12 14Coal 12 16 12 8 8 10Cow-Dung- 20 12 8 16 12 14Cakes
X3 Source of Municipal 30 44 48 36 28 40drinking Tapwater Hand Pump 70 56 52 64 72 60
X4 Housing Pucca 10 12 20 30 8 18condition Semi Pucca 60 52 62 64 70 58
Kaccha 30 36 18 6 22 24X5 Sewage Average 56 36 40 35 55 52
disposal Poor 44 64 60 65 45 48facility
X6 Place of Area Fixed 28 28 24 24 12 26waste By Municipalitydumping On Roads 60 56 64 68 48 46
Near Water 12 16 12 8 60 28Bodies
X7 Medical Govt. 40 40 36 16 36 34facilities Hospital
Private Clinic 50 44 48 56 40 42Traditional 10 16 16 28 24 24Practitioner
X8 Literacy Literate 19 20 30 18 25 22(% pop.) Illiterate 81 80 70 82 75 78
X9 Female Literate 10 12 20 15 18 16literacy Illiterate 90 88 80 85 82 84(% pop.)
X10 Ration Yellow Card 52 40 36 44 16 42(APL)
card type Red Card (BPL) 32 36 32 32 36 34Without Card 16 12 32 24 48 24
Source: Personal Survey 2013-14
384 Darshan Kumar Jha, Rahul Harshwardhan and V. K. Tripathi
E:\BHU\BHU.PM5 (385)
on roads etc. In sample slums, sewage disposalfacility is not satisfactory. Rajghat (56%) is atthe top in terms of availability of sewagedisposal facility, followed by Nagwa (55%),Bajardiha (54%) Sigra (40%), Omkaleshwar(36%) and Durgakund (35%). There are stilllarge numbers of household which have poorand insufficient sewage disposal facility. Thecondition of Durgakund is worst where morethan half of sample households had poor or nosewage facility. Highly congested, poorly builtand narrow lanes of Durgakund andOmkareshwar do not allow the construction ofdrains. Nagwa and Rajghat slums are locatedin close proximity to river Ganga and therefore,their maximum solid waste and sewage wasteis being thrown in river Ganga.Place of waste dumping (X6)
The risk to human health is compoundedin those slums, where garbage collection is non-existent and drainage tends to be poor,promoting the growth of insects and otherdiseases vectors (Sundari, 2003). Solid wastedisposal is a challenge in the slum of Varanasiand poses the problems for dwellers. It is thetask of the municipality to provide amenitiesfor waste disposal but Municipal Corporationis unable to provide such facility to this largeand scattered population. There is no properarrangement for the dumping of domesticwastes. Only one-third households used theplace fixed by the municipality for the dumpingof domestic wastes. The highest number ofhouseholds using such site are found in Rajghatand Omkaleshwar (28%). The water bodies(ponds and rivers) have been used for wastedumping which subsequently pollutes thesewater resources.
Medical facilities (X7)Around half of the urban population in
developing countries is suffering from one ormore of the diseases associated withinadequate provision of water and sanitation(DFID, 2001). The slum dwellers are morevulnerable to diseases due to unsafe drinkingwater and unhygienic housing conditions. Theyare also not economically sound to afford bestmedical treatment. So, they largely depend ongovernment and traditional medical practitioner.In sample slums, availing good medicaltreatment is a tough task for slum dwellers. InRajghat and Omkaleshwar about 40% of thehouseholds depend on government hospitals formedical treatment followed by Sigra andNagwa (both 36%), Bajardiha (34%) andDurgakund (16%). The slum dwellers ofDurgakund earn enough to afford private clinictreatment and hence 56 % of dwellers usedprivate medical facilities.Literacy (X8)
Due to widespread poverty in the slumareas, illiteracy prevails and even it can be saidthat poverty exists because illiteracy exists(Tripathi, 2010). The slum dwellers are deprivedof basic education because of economicconstraints and children are engaged ineconomic activities to support their familyfinancially. In surveyed slums, highest instanceof illiteracy is found in Durgakund (82%),followed by Rajghat (81%), Omkaleshwar(80%), Bajardiha (78%), Nagwa (75%) andSigra (70%). In all the slums, the majority ofslum population is illiterate because they do notconsider that education is necessary for theirchildren. Nowadays due to increasingawareness, slum dwellers are sending theirchildren to school. Though literacy rate is very
Determining Poverty and Quality of Life in Slums of Varanasi City 385

E:\BHU\BHU.PM5 (386)
poor in slums of Varanasi city, comparativelySigra and Nagwa wards are better in literacyrate than other wards. The local governmentbodies and non-governmental organisations arerunning community programs to educate slumdwellers. Night classes are being organised forworking adults and mid-day meals and otherscheme are running to attract children to schoolalong with the provision of free books anduniform to children.Female Literacy (X9)
Female literacy is not only an indicator ofdevelopment but also the status of women insociety. In six surveyed slums, the highestinstance of female illiteracy is found in Rajghat(90%), followed by Omkaleshwar (88%),Durgakund (85%), Bajardiha (84%), Nagwa(82%) and lowest in Sigra (80%). The womenresiding in slums are deprived of basic educationbecause of the burden of family responsibilities,early marriage, and engagement in work tosupport the family financially. The biasedmindset of males that women should not geteducated as they have to bear children andfamily responsibilities is another major causeof illiteracy among women. In Omkaleshwar,Rajghat, Bajardiha and Nagwa majority of theslum dwellers belong to Muslim and dalitcommunity who are socially backwards,orthodox in thought and not support the causeof women education. The local authorities andnon-governmental organisations are runningcommunity education programs and separatenight classes for working women in Bajardihaand Omkareshwar slum. The sample surveyshows very poor female literacy whichindicates the inequality of condition of womenas compared to the male folk in these slums.
Type of Ration Card (X10)Ration card is a significant indicator of
poverty in India. Red ration card holders arepeople living below the poverty line while yellowcard holders are people above poverty line. Insample slums, both types of card holders arefound. The highest numbers of red card holdersare found in Omkaleshwar and Nagwa (36%).There are many households in slums which donot have any type of card. These householdare devoid of getting government subsidies inform of entitled issue of grains, pulses, sugaretc.Levels of quality of life
To determine the level of quality of life, aquantitative analysis of data has been done.Aggregates of Z-score of all the variables havebeen taken. A composite Z-score has beencalculated by adding up the total of all Z-scoreof the variables for different slum separately.The level of quality of life on the basis of theirZ-score has been grouped and three levels ofquality of life have been found in the slums.Though three level of quality of life hasemerged, the condition of all sample slums wasquite poor. Sigra attained highest Z score and
Table 4. Level of Quality of Life
Slum Z-Score Level of Quality of Life
Rajghat -1.74487 Very LowOmkareshwar -1.63345 Very LowSigra 5.13166 ModerateDurgakund -1.34064 Very LowNagwa -2.29828 Very LowBajardiha 1.88558 Low
Source: Computed by authors
386 Darshan Kumar Jha, Rahul Harshwardhan and V. K. Tripathi

E:\BHU\BHU.PM5 (387)
this slum lies into the moderate level of qualityof life. The condition of slum dwellers of Sigraslum was better than other slums. Bajardihaslum has low quality of life which is dominatedby Muslim community. Many communitydevelopment programs are going on thatcontributed to improvements in the quality oflife in this slum.
Therefore, despite social backwardnessand poor condition of female slum dwellers,Bajardiha slum lies in the category of lowquality of life. The quality of life in Rajghat,Omkareshwar, Durgakund and Nagwa areworst and the residents of these slums areexperiencing the very low standard of living.Some basic facilities, such as drinking water,sanitation and housing condition in Durgakundand Omkareshwar slums were better thanothers. There were inadequate medical anddrinking water facilities in Rajghat slum. Thestudy highlights that low and very low qualityof life exists in the slums of Varanasi city.Conclusion
The study unfolds that there is another
Varanasi city which is poor, unhygienic and lacksbasic services and this city co-exists with thespiritual and cultural city of Varanasi. The studyreveals that low quality of life exists in theslums of Varanasi city but it varies from oneslum to another slum. The housing, literacy andmedical facilities are poor. The lack of pipedwater supply in the slum areas is leading tohigh dependence on ground water, the lack ofproper waste disposal facility and poor sewagesystem leading to pollution and health-relatedproblems. All these dismal facilities anddisparities are obviously related to the socio-economic setup of the city. The suggestion,therefore, is to improve the socio-economiccondition, which would improve the Quality oflife of slum dwellers. There are spatialvariations in problems that exists in the slums;therefore each and every slum needs thedifferent and exclusive strategy. In-situ up-gradation of slums, wherever possible, with theprovision of basic facilities, need to be takenup. To make Varanasi cultural and spiritualcapital of India in the real sense, there is a needof inclusive planning for the city as a whole.
ReferenceAlkire, S., 2008, Choosing Dimensions: The Capability Approach and Multidimensional Poverty;
in The many Dimensions of Poverty, eds. N. Kakwani and J. Silber. Basingstoke:Palgrave Macmillan.
Alkire, S. and Santos, M.A., 2011, MPI: Construction and Analysis.Training Material forProducing National Human Development Reports The Multidimensional PovertyIndex (MPI), Revised Draft, 2015, DOI =10.1.1.4.34.3363
Census of India, 2001, Series 1: Slum Population 640 Cities and Towns Reporting Slums,Vol.1, Published by Registrar general and Census Commissioner, India, New Delhi
G.o.I., 2013, The State of Slum in India: A Statistical Compendium 2013, Government ofIndia, Ministry of Housing and Urban Poverty Alleviation, National Building Organization.
Goswami, S. and Manna, S., 2013, Urban Poor Living in Slums: A Case Study of Raipur City in
Determining Poverty and Quality of Life in Slums of Varanasi City 387
E:\BHU\BHU.PM5 (388)
India, Global Journal of Human Social Science Sociology & Culture, 13 (4).
Jha, D.K. and Tripathi, V.K., 2014, Quality of Life in slums of Varanasi: A Comparative Study,Transactions, 36 (2): pp.171-183.
Mallick, Rabial, 2001, Urban Poor in Calcutta. Available at [email protected]
Narayana, M. R., 2008, Education, Human Development and Quality of Life: MeasurementIssues and Implications for India, Published online: Springer Science+Business MediaB.V.
RCUES, 2013, Slum Free City Plan of Action – Varanasi, Regional Centre for Urban andEnvironmental Studies, (Sponsored by Ministry of Urban Development, Govt. of India)Osmania University, Hyderabad.
Sahay, Anuradha, 2006,. Quality of life of slum dwellers: A case study of Bindtoli, Patna west,Annals of the National Association of geographers, India, Vol. XXVI (No. 2).
Sirgy, J., Michalos, A. C., Ferriss, A. L., Easterlin, R. A., Patrick, D., and Pavot, W., 2006. Thequality-of-life (QOL) research movement: Past, present, and future, Social IndicatorsResearch, 76, pp.343–466.
Sundari, S., 2003, Quality of Life of Migrant Households In Urban Slums; in Martin J. Bunch, V.Madha Suresh and T. Vasantha Kumaran, eds., Proceedings of the Third InternationalConference on Environment and Health, Chennai, India, 15-17 December, 2003.Chennai: Department of Geography, University of Madras and Faculty of EnvironmentalStudies, York University: pp. 537 – 552.
Tripathi. V. K., 2010, Socio-Economic Status of Urban poor Living in Slums of Varanasi City,Bhootal Digdarshan (Earth Science Review), Vol. 1 (2)
Tripathi. V. K., 2011, Urban poor living in slums of Varanasi city; in Sharma, P. R., Yadava R.S.,Sharma V.N.(eds.): Research methodology: Concepts and Studies, R.K. Books, NewDelhi: pp. 493-515.
388 Darshan Kumar Jha, Rahul Harshwardhan and V. K. Tripathi
Related Documents