Research Article Received: November, 8, 2017 - Revision received: December 27, 2017 Accepted: December 30, 2017 - Publised: December 30, 2017 TECHNOLOGY SUPPORT FOR LEARNING EXPONENTIAL AND LOGARITHMIC FUNCTIONS Merve Koştur 1 , Ayşenur Yılmaz 2 Abstract This study aims to examine the extent to which the mobile application of Desmos graphing calculator supports undergraduate students’ learning of exponential and logarithmic functions at the Middle School Mathematics Education Program in Faculty of Education. More specifically, the study investigates the undergraduate students’ views about and actions in utilizing Desmos while learning exponential and logarithmic functions. Convenience and purposive sampling methods were used to conduct this study. Seventeen freshmen were participated to the study within the context of Fundamentals of Mathematics course where the exponential and logarithmic functions were introduced to the undergraduates and in which one of the researchers was the instructor. Following the qualitative research principles, case study design was conducted to collect data from observation and documental sources. The data come from the observations of students' in-class activities, classroom discussions, researchers’ field notes, and reflection papers over a 3-week period that was scheduled to teach the concept of exponential and logarithmic functions. The content analyses of the data reveal that undergraduate students find Desmos graphing calculator beneficial by highlighting its affordances such as i) compensating the lack of procedural knowledge, ii) providing opportunities for exploration, and iii) enhancing engagement with the tasks. Thus, the study shows that Desmos is a multipurpose learning source for learning exponential and logarithmic functions. Finally, the study discusses the role of Desmos on learning functions and provides implications for its use in undergraduate mathematics courses. Keywords: Educational technology; Desmos graphing calculator; exponential function; logarithmic function; undergraduate students INTRODUCTION The affordances of the educational technologies are multi-faceted. They allow students to engage in mathematics through exploration of the content, reasoning for intentional actions on the tools, questioning the processes of the tool and students’ own reasoning, interacting with the technology and deciding on what to do (Karadeniz & Thompson, 2017). Moreover, conceptual understanding of mathematical topics can be supported with the use of technology (Liang, 2016), and procedural knowledge can be interpreted within a technological context. In fact, the use of educational technologies in undergraduate mathematics courses has been given great importance in learning the fundamental mathematical topics (Oates, Sheryn, & Thomas, 2014) and in helping students find quick and easy ways to discover the mathematical topics under the guidance of teachers (Hoang & Caverly, 2013). 1 Başkent University, Department of Mathematics and Science Education, Turkey, [email protected] 2 METU, Department of Mathematics and Science Education, Turkey, [email protected]

Welcome message from author
This document is posted to help you gain knowledge. Please leave a comment to let me know what you think about it! Share it to your friends and learn new things together.
Transcript
Research Article
Received: November, 8, 2017 - Revision received: December 27, 2017
Accepted: December 30, 2017 - Publised: December 30, 2017
TECHNOLOGY SUPPORT FOR LEARNING EXPONENTIAL AND
LOGARITHMIC FUNCTIONS
Merve Koştur1, Ayşenur Yılmaz2
Abstract
This study aims to examine the extent to which the mobile application of Desmos graphing calculator supports
undergraduate students’ learning of exponential and logarithmic functions at the Middle School Mathematics
Education Program in Faculty of Education. More specifically, the study investigates the undergraduate students’
views about and actions in utilizing Desmos while learning exponential and logarithmic functions. Convenience
and purposive sampling methods were used to conduct this study. Seventeen freshmen were participated to the
study within the context of Fundamentals of Mathematics course where the exponential and logarithmic functions
were introduced to the undergraduates and in which one of the researchers was the instructor. Following the
qualitative research principles, case study design was conducted to collect data from observation and documental
sources. The data come from the observations of students' in-class activities, classroom discussions, researchers’
field notes, and reflection papers over a 3-week period that was scheduled to teach the concept of exponential and
logarithmic functions. The content analyses of the data reveal that undergraduate students find Desmos graphing
calculator beneficial by highlighting its affordances such as i) compensating the lack of procedural knowledge, ii)
providing opportunities for exploration, and iii) enhancing engagement with the tasks. Thus, the study shows that
Desmos is a multipurpose learning source for learning exponential and logarithmic functions. Finally, the study
discusses the role of Desmos on learning functions and provides implications for its use in undergraduate
mathematics courses.
Keywords: Educational technology; Desmos graphing calculator; exponential function; logarithmic function;
undergraduate students
INTRODUCTION
The affordances of the educational technologies are multi-faceted. They allow students to engage in
mathematics through exploration of the content, reasoning for intentional actions on the tools,
questioning the processes of the tool and students’ own reasoning, interacting with the technology and
deciding on what to do (Karadeniz & Thompson, 2017). Moreover, conceptual understanding of
mathematical topics can be supported with the use of technology (Liang, 2016), and procedural
knowledge can be interpreted within a technological context. In fact, the use of educational technologies
in undergraduate mathematics courses has been given great importance in learning the fundamental
mathematical topics (Oates, Sheryn, & Thomas, 2014) and in helping students find quick and easy ways
to discover the mathematical topics under the guidance of teachers (Hoang & Caverly, 2013).
1 Başkent University, Department of Mathematics and Science Education, Turkey, [email protected] 2 METU, Department of Mathematics and Science Education, Turkey, [email protected]
IHEAD, e-ISSN 2528-9632, 2017, 2(2), 50-68 Koştur, M. & Yilmaz, A.
51
Teachers are aware of the fact that graphing calculators provide students with the opportunity to
investigate mathematical facts through visualization and dynamicity by giving time for exploration in
their lessons (Karadeniz & Thompson; 2017). Desmos program is a graphing calculator application with
a free and online/offline mode for using the application which requires only basic technological skills
(Thomas, 2015). Additionally, the program can be used on tablets or smartphones not only as a graphing
calculator but also as an application that enables users to download previously designed activities
(Desmos, 2015; Edwards, 2015). Learners in the related studies find it user friendly (Oates, Sheryn, &
Thomas, 2014). Besides, one can access the screen size of the device while using the application and it is
fast in graphing (King, 2017).
Functions, which constitutes one of the fundamental subjects of mathematics, is a unifying concept that
makes the interconnections of mathematical concepts visible (Argün, Arıkan, Bulut, & Halıcıoğlu, 2014).
Function concept and function types are considered to have a central role in mathematics, especially in
algebra and calculus (Carlson, Oehrtman, & Engelke, 2010). It is important for students to comprehend
the topic because it is taught in mathematics courses in each grade level (Biehler, Scholz, & Winkelman,
1993).
Exponential and logarithmic functions in school mathematics include the relations between exponential
functions and logarithm, and the meaning of variable and constant as mathematical concepts taught
within real-life situations (Çetin, 2004). The meaning of the symbols or notations denotes mathematics
as a special language (Weber, 2002a). Specifically, for logarithmic functions, students have difficulty in
interpreting the graphs (e.g., Ural, 2017), understanding the meaning of the notation (e.g., Zazkis, 2006),
and interpreting those functions regarding operations (e.g., Weber, 2002a; Weber, 2002b). According to
Hurwitz (1999), “students often have difficulty in thinking of a logarithm as the output of a function
because the notation used for logarithms does not look like the familiar f(x) notation” (p. 334) indicating
that the relationship between those functions is not so easy to be comprehended by students (Gramble,
2005). They need to deal with different mathematical concepts to capture the meaning of logarithm. The
areas where students have difficulties can be categorized as ‘logarithms as inverse functions’,
‘logarithmic notation’, and ‘unique properties of logarithms’ (Kenney & Kastberg, 2013; p. 17). These
difficulties in each category show that learners need to understand which notations for logarithmic
functions are used, how those notations can be considered together with prior experiences about
variable in an expression, and why students’ reasoning of those functions cannot be done in the way
they think.
Inverse functions, which explain the relationship between the exponential and the logarithmic
functions, cannot be easily comprehended. For instance, students tend to use a calculation process of
reversing x and y, and the function is solved for y as they were once taught in high school. In addition
to this, even if the tabular representation of the expressions is shown correctly, they may be
misrepresented as a linear graph (Ural, 2006). According to Weber (2002a), students have difficulty in
understanding exponents and logarithms as a process, and it is necessary that students perceive those
functions as process-object duality in order to understand calculus and advanced mathematics. Hence,
teachers intend to improve students' understanding by reasoning and forming accurate images of
logarithmic functions rather than memorizing (Kenney & Kastberg, 2013). Kenney and Kastberg (2013)
state that students’ understanding of logarithmic functions is based on understanding of two
descriptions of the logarithm; ‘logarithm as an exponent’ and ‘logarithm as a function’ (p. 13). Therefore,
the exploration that these two functions are the inverse of each other is necessary for solving problems
about these functions (Kenney & Kastberg, 2013).
It is equally important for teachers to design instructions by considering these needs of the students
considering their possible misunderstandings or lack of understandings of the functions. To overcome
these challenges, there is a number of mathematical software (i.e., GeoGebra, Desmos, and Cabri) that
enable students to make mathematical explorations of functions (Hoang & Caverly, 2003; Venturini,
2015). One of the most effective software programs supporting students to learn functions is Desmos
graphing calculator, which is a widely used technological tool (Liang, 2016). Smith and Shotsberger
Technology Support for Learning Exponential and Logarithmic Function … Koştur, M. & Yilmaz, A.
52
(1997) indicate that graphing calculators that help students in different mathematical topics have been
beneficial for students mostly in terms of exponential and logarithmic functions. In an experimental
study, for instance, Hollar and Norwood (1999) found that undergraduate students’ understanding of
functions were positively affected by their use of graphing calculators for ‘modeling a real-world
situation, interpreting a function in terms of a realistic situation, translating among different
representations of functions, or reifying functions’ (p. 22). An extended examination of the relevant
literature shows that Desmos graphing calculator is a useful and easy-to-use program that college-level
students find enjoyable while graphing (Oates, Sheryn, & Thomas, 2014).
For teaching secondary school mathematics, it is suggested that students’ cognitive conflicts can be used
as learning opportunities for meaningful understanding of some concepts (e.g., limit concept) while
interpreting related graphs via Desmos (Liang, 2016). To illustrate, a recent study conducted by King
(2017) showed that Desmos enhanced high school students’ learning of linear, quadratic, and absolute
value functions. In other words, it enabled the students to describe the distinction among these
functions, interpret the restrictions of domain and range of those functions, and identify the movements
of functions on axes, the directions of the graphs, and the changing domains of those
functions. Similarly, Bourassa (2014) suggested the use of the activities that are available on Desmos
website to learn mathematics with multiple solutions so that technology can be integrated into the
solutions of linear, quadratic and exponential functions, and solutions can be checked via Desmos. In
this regard, Desmos graphing calculator is a facilitator for meaningful learning of functions (Karadeniz
& Thompson, 2017).
The context of the study
In the Middle School Mathematics Education Program, as a graduation requirement to be a middle
school mathematics teacher, the undergraduate students take pedagogical and mathematics field
courses to be awarded a bachelor's degree in Middle School Mathematics Education. They broaden and
build up their mathematical knowledge each academic term and acquire a higher level of mathematics
knowledge as determined by the Council of Higher Education and the universities. In this study,
Desmos has been incorporated to the undergraduate mathematics course in order to reveal its impacts
on teaching and learning of the exponential and logarithmic functions in a technology integrated
learning environment. Desmos was chosen as an educational technology tool because it has a user-
friendly interface, related menus for functions, and a free downloadable feature with an offline use
option. Furthermore, it can be downloaded and used on mobile phones as well. These features are vital
for a technological tool to be selected as an educational tool for in-class teaching and exercises by the
educators. One of its advantages is that it does not require any preliminary preparation. Besides, among
other similar programs, these features all together are indigenous to Desmos.
This study emerged from the two major problems reported in previous studies about the undergraduate
students’ conceptual deficiencies in the functions subject. First of all, they are unable to construct graphs
of exponential functions and logarithmic functions in Calculus courses (Hollar & Norwood, 1999).
Second, they are having difficulties in stating algebraic and graphical expressions of the inverse
relationship between these functions (Williams, 2011). Building on the above mentioned difficulties in
learning exponential and logarithmic functions, Desmos graphing calculator was chosen as the main
instructional tool to remedy these challenges and enhance undergraduate students’ conceptual
understanding and relating of these two types of functions. The study focused on how and why
undergraduate students integrate Desmos graphing calculator in their learning of exponential and
logarithmic functions as an educational tool. Since the related literature showed that students are
profoundly affected by what they learn through the use of Desmos graphing calculator, the software
can have a significant potential to support the investigation of students’ learning on exponential and
logarithmic functions. Additionally, students’ reflections on their actions are essential to ascertain
affordances and constraints of the software for mathematics educators’ future applications of Desmos.
The aim of this study was to reveal how undergraduate students in Middle School Mathematics
Education Program use Desmos graphing calculator in their learning of exponential and logarithmic
IHEAD, e-ISSN 2528-9632, 2017, 2(2), 50-68 Koştur, M. & Yilmaz, A.
53
functions. To this end, the following research question was formulated. What are the views of
undergraduate students about the use of Desmos graphing calculator in learning exponential and
logarithmic functions?
METHOD
In this section, research design, participants, data collection processes, and data analyses are reported
in detail.
Research Design
The study was conducted by using qualitative research design. Among the qualitative research
strategies, the case study design allows researchers to explore phenomena such as cases, individuals,
and implementation processes within its original context through the triangulation of multiple data
sources (Creswell, 2013; Yin, 2013). In this respect, the case study research was designed in order to
carry out a detailed and reliable investigation of undergraduate students’ practices in and views about
learning exponential and logarithmic functions with the support of Desmos graphing calculator.
Design principles for teaching exponential and logarithmic functions.
The research was conducted within the Fundamentals of Mathematics course in the three-week period
where exponential and logarithmic functions are scheduled to be taught. The course covers a content
specific for Middle School Mathematics Education Program. One general goal of this course is to educate
the students as prospective mathematics teachers who know the meaning of the function types and their
components in order to draw the graphs of the functions as well as solve problems about exponential
and logarithmic functions. Additionally, it is essential for undergraduate students to understand and
interpret those graphs of functions and relate them to each other to make sense of fundamentals of
mathematics. Based on the observations of the first researcher of this study as the instructor of the
course, the undergraduate mathematics students schematize the functions as different concepts or
express the connection among the related concepts about functions inadequately. Therefore, the
Fundamentals of Mathematics course was designed in such a way that the undergraduate students can
have the opportunity to review and build on their prior knowledge and smooth away their existing
problems in conceptual understanding. With these in mind, the course was designed based on the
following four principles.
i. Using tasks that support conceptual and procedural understanding in the instructional
package for teaching exponential and logarithmic functions.
The studies in the related literature have documented that mathematics teachers need to have a good
command of the subject matter knowledge; that’s, they should know more than they will tell (Shulman,
1986; Ball, 2000). Otherwise, the lack of teacher knowledge and understanding of mathematics would
result in lack of student understanding and it would run the risk of causing misunderstanding.
Likewise, as prospective mathematics teachers, undergraduate students’ subject matter knowledge
should be essentially built on solid basis in order to have constructed mathematical knowledge. The
conflicts and difficulties that undergraduate students experience in the training process provide
mathematics educators with the necessary information about their needs in mathematics knowledge.
Rock and Brumbaugh (2013) aimed to investigate these needs of the undergraduate students and raised
a question to reveal what it means to continue understanding of mathematical concepts without
thinking of the meaning of a procedure. It is necessary to answer the question by indicating that there
should be a balance between the conceptual understanding and the application of procedural
information (Weber, 2002a; Williams, 2011) since conceptual and procedural knowledge are essential
components to facilitate a meaningful learning process for the students. As it is understood from the
following definition, conceptual knowledge of any concept illustrates multiple established connections
among interrelated concepts:
Technology Support for Learning Exponential and Logarithmic Function … Koştur, M. & Yilmaz, A.
54
‘... knowledge that is rich in relationships. It can be thought of as a connected web of knowledge, a network
in which the linking relationships are as prominent as the discrete pieces of information. Relationships
pervade the individual facts and propositions so that all pieces of information are linked to some network’
(Hiebert & Lefevre, 1986, pp. 3-4).
The students need to be guided to explore a mathematical concept throughout the learning process
through establishing connections since they can effectively learn by means of linking previous
knowledge to the newly discovered. In addition to the conceptual knowledge, the students need to be
procedurally competent while they are solving problems. In other words, conceptual knowledge is not
sufficient to come to the conclusion that the students possess necessary amount of knowledge in the
subject matter. One needs to be equipped with procedural knowledge as well, which can be defined in
two parts as in the following:
‘one part is composed of the formal language, or symbol representation system of mathematics. The other
part consists of the algorithms, or rules, for completing mathematical tasks’ (Hiebert & Lefevre, 1986, p.
6).
Weber (2002a) also proposes that students need to have procedural and conceptual knowledge for
exponential and logarithmic functions. However, it is also essential to determine how the students are
provided with this knowledge. While exponents are taught to the students as repeated addition, they
might have limited understanding of 2-1 or 21/2 (Weber, 2000b). In line with this, it is suggested that it is
necessary to consider exponentiation as a process, and in return, exponential and logarithmic functions
need to be viewed ‘as a result of applying this process’ (Weber, 2000b, p. 1020). This is also supported
by Williams (2011) who asserts that logarithms should be understood as objects, as processes, as
functions and within contextual problems.
Using the statements above as a springboard, it can be stated that there are stages to be accomplished
to develop the understanding of exponents and logarithms. In order to comprehend exponential
functions, the following stages need to be completed successfully: ‘exponentiation as an action’,
‘exponentiation as a process’, ‘exponential expressions as the result of a process’, and ‘generalization’.
When students conceptualize exponents as a process, they can have an understanding of the increase of
2x for every positive integer, and they can also comprehend that the verbal expression of the question
"x is the product of how many factors of b?" is logb x (Weber, 2002b, p.5). It is necessary for the students
to understand that this generalization can be drawn for other number sets such as fractions, negative
numbers, and irrational numbers as in natural numbers. What’s more, students have difficulty in
explaining the role of x within the function of f(x)= ax, and they need to answer the questions that
require understanding the reasons behind the procedural knowledge about the exponential and
logarithmic functions. Moreover, Weber (2002b) summarizes that for meaningful understanding of
exponential numbers, students need to comprehend multiple meanings of the number: operation,
mathematical structure, and function. While operational understanding is related to repeated
multiplication of an exponential number, structural understanding requires to consider it as a number
that is the product of x factors of b and as the number of factors of b that are in the number m’ (p.1020).
Aligned with the purpose of enhancing students’ procedural and conceptual knowledge in exponential
and logarithmic functions, the instructional package was in the form of a booklet prepared by and
utilized in Çetin’s study (2004). The booklet was basically composed of 4 parts: (1) Exponential
functions, (2) Transition from exponential functions to logarithmic functions, (3) Logarithmic functions,
and (4) Real life problems. Parts 1, 2 and 3 were designed with the same sequence of instructions with
a linear approach, and the last part included five linearly organized tasks on exponential and
logarithmic functions using real life situations and applications. For instance, paramecium production
problem was used for exponential growth. The students learnt and practiced comparison of these two
function types with respect to differing bases, examined the relationship between them, solved
problems about the algebraic expressions of these functions, and interpreted their graphs. More
IHEAD, e-ISSN 2528-9632, 2017, 2(2), 50-68 Koştur, M. & Yilmaz, A.
55
specifically, the tasks in the booklet required the students to model exponential and logarithmic
functions within different real-life situations, transfer data into tables, express the data mathematically,
calculate values, and draw graphics of the functions. Moreover, they consisted of questions requiring
examinations of the values that exponential and logarithmic functions can have with different bases,
the location of these values on the graph, and determination of the domain and range sets of the
functions. The students were also expected to make sense of the concepts of increasing and decreasing
functions and the symmetrical relation between them according to y=x, x=0, and y=0 lines. Besides, after
having completed these tasks, the students could understand that the exponential function and
logarithmic function are two different forms of the same function. At the end of the first part, the reverse
of the exponential function was questioned in order to evoke the need for logarithmic functions.
The researchers designated goals for the three-week implementation of the booklet. These goals were
driven from Higher education qualifications prepared in accordance with the learning objectives of the
course and the objectives of high school level curriculum. At the end of the implementation, upon
completing all of the tasks with didactic instructions in the booklet, the undergraduate students were
expected to be able to:
1. Understand and interpret mathematical definition of exponential and logarithmic functions
2. Write the expression of exponential and logarithmic functions
3. Draw and interpret the graph of exponential and logarithmic functions
4. Interpret exponential functions with different positive integer bases; f(x) = ax where a > 1.
5. Interpret exponential functions with different rational number bases; f(x) = ax where 0<a<1.
6. Interpret logarithmic functions with different positive integer bases; f(x) = loga x where a > 1.
7. Interpret logarithmic functions with different rational number bases; f(x) = loga x where 0<a<1.
8. Interpret logarithmic functions with the base of e; f(x)= loge x.
9. Recognize and interpret the domain and range sets of exponential and logarithmic functions.
10. Express the relationship between exponential and logarithmic functions.
In the ninth week of the Fundamentals of Mathematics course, after functions concept was thought, the
participants were asked to download the Desmos application on their mobile phones and the hard copy
of the exponential and logarithmic functions instructional package was distributed as a booklet to each
participant. They were asked to follow the instructions in order. The instructor guided the process by
initiating and ending each task, and directed the discussions at the end of each task. Upon completing
each task, the participants were directed to proceed to the next task and when everyone completed, they
were asked to share their solutions within groups. Then, the solution of the task was discussed as a
whole class. After deciding on the correct solution, the participants were allowed to move on to the
following task. By following this cycle, the booklet was completed in three weeks, in nine course hours.
ii. Peer interaction and collaboration.
Peer interaction was considered to be a principal requirement for the implementation of the
instructional package. The students were supposed to express their ideas, comment on each other's
answers, help each other sort out their misunderstandings, benefit from peer corrections for effective
classroom learning in technology supported classroom atmosphere (Liang, 2016). Students are likely to
have some common learning experiences about the exponential and logarithmic functions, and those
experiences can lead to learning opportunities through peer interaction. When functions are taken into
consideration in the level of undergraduate mathematics courses, students’ challenges and difficulties
can be remedied through peer discussions and collaborative work on problematic issues of students
(Caniglia, Borgerding & Meadows, 2017; Sfard, 1992). Considering these advantages, a collaborative
classroom environment was formed in the implementation process. To achieve this, the participants
were asked to work in groups of 3 or 4, engage in group discussions upon completing each task,
exchange ideas about different answers within the group, decide on one single group answer, and
report the group’s idea in classroom discussion.
Technology Support for Learning Exponential and Logarithmic Function … Koştur, M. & Yilmaz, A.
56
iii. The role of the instructor.
The instructor of the Fundamentals of Mathematics course - the first author of the study - collected the
data through observation, classroom discussions and her field notes. Hence, being in the participant-
observer role provided the researcher with the data for the study. In this role as the instructor of the
course, guiding questions were asked to the participants. Instructors' role of guiding in a technology-
enhanced instruction and collaborative environment provides students with learning opportunities and
the necessity of exploration (Liang, 2016). According to this view and parallel with the second principle,
the researcher adopted the role of a guide for the students in the collaborative classroom atmosphere.
Additionally, the instructor administered a classroom instruction within a discussion environment
where the students were given the opportunity to be aware of their confusions about the subject and
what the correct outcome should be while working on their tasks about exponential and logarithmic
functions. Throughout the course, the instructor guided the students first to work individually, then in
groups, and at the end as a whole class to share their solution strategies and then reach a consensus on
the correct solution of each task. In each task, the instructor moved around the class and asked questions
to each participant about his approach in solving the questions in the task while they were working
individually. When the participants moved on to the second stage where they worked in groups, the
researcher observed their discussions and solution processes. In the last part where all class presented
ideas about their solutions, the researcher guided the discussions by asking probing questions.
iv. Utilizing an educational technology.
McCulloch, Kenney, and Keene (2012) point out the importance of using graphing calculators in a
mathematics course by asking the following question:
Imagine the following situation: You have worked out a problem by hand and decide to check your solution
by doing the problem a second time using your graphing calculator. The solutions you get don’t match.
Which do you choose to trust? Why? (p. 464)
In this study, the Desmos graphing calculator application was used as an educational tool to understand
how students answer the variations of the above mentioned question in terms of calculation and
graphing. Desmos graphing calculator was utilized as the main educational technology in the
instruction of exponential and logarithmic functions booklet. Desmos is a technological tool that mainly
allows writing equations of functions, draw the corresponding graph, and generate a table for the
equation (Desmos, 2017). In addition to the basic functions, users can enter expressions with parameters.
The expressions box automatically forms a slider for each parameter that you can adjust and explore
the instant transformation on the graph. Basic menus such as save, add, undo, redo, zoom, and duplicate
are easily accessible on the screen (Desmos, 2017). Moreover, the user can explore the transformation in
graphs when equations of different types of functions were entered. The aims of use can be various
according to the needs of the student. In this study, these features of Desmos were aimed to be utilized
for completing the tasks in exponential and logarithmic functions instructional package. In the tasks
that required writing algebraic expressions, drawing graphs, finding the domain and range of the
functions, deciding the extremum points, finding x and y intercepts, and identifying the given function
as increasing or decreasing, the participants were asked to seek for solutions first using pen and paper,
then Desmos. Then, in the in-group discussions and classroom discussions they expressed how utilizing
Desmos differentiated their solution, if it did.
Participants
The participants of the study included seventeen freshmen - 15 female and 2 male students - in the
Middle School Mathematics Education Program at a private university in Turkey. The participants can
be said to be homogenous in terms of educational background as all of them recently graduated from
high school and enrolled in the Middle School Mathematics Education Program by receiving close
IHEAD, e-ISSN 2528-9632, 2017, 2(2), 50-68 Koştur, M. & Yilmaz, A.
57
scores from the national university entrance exam. The age of the students was between eighteen and
nineteen.
Convenience and purposive sampling methods were used to conduct this study. It was convenient to
conduct the study with these participants because the first author of the study was the instructor of the
Fundamentals of Mathematics course. Moreover, in this way, as a member of this class community, the
researcher aimed to collect as much reliable data as possible through multiple data sources. In addition,
the setting and the participants were appropriate for the aim of the study for two reasons. First of all,
first academic year of their undergraduate education is the first time that the students are introduced
exponential and logarithmic functions. In the following years, they work more on these functions in
courses such as Analysis I, Analysis II, Analytical Geometry, and Differential Equations. The
Fundamentals of Mathematics course was their first mathematics course in the university. It was
considered worthwhile investigating and enhancing undergraduate students’ practices before they
construct further knowledge of exponential and logarithmic functions in other mathematics courses at
the university. Secondly, the need for this research emerged from the actual needs of the students in the
course. That is, the need for the study appeared in the first four weeks of the course through observation
of students’ practices in and understanding of functions concept. The students’ preparedness was
inadequate for constructing knowledge of specific types of functions, as they could not progress in
defining and describing functions concept and types of functions. Prior to the implementation of
exponential and logarithmic functions, pre-discussions were held with the participants to determine
their deficiencies and misconceptions regarding functions concept in general and specifically
exponential and logarithmic functions. Based on the instructor’s classroom observation and discussions
on functions, it was evident that the participants had limited idea on the algebraic representations and
on graphical representations of exponential and logarithmic functions. Their earlier experiences with
functions were limited to simple calculation skills to solve an equation of a function for a given value of
x and they were actually unaware of a relationship between these two functions. Due to these reasons,
the participants were perfectly suitable to the purpose of the study since they were in need of a support
in learning exponential and logarithmic functions.
Data Collection Procedure
The data of this study were gathered through classroom observations, in class discussions, researcher’s
field notes, and reflection papers.
There was not a constructed observation protocol. Each participant’s process of completing the tasks in
the booklet was observed by the instructor of the course. Their written responses to questions of the
booklet and/or conversations within the group of students constitute the content of the observations.
The researcher who instructed the course, continuously observed and took notes about the tasks for
which the participants chose to use Desmos, the features of Desmos they utilized, each participant’s
solutions before and after they utilized Desmos. Based on the classroom observation, the instructor
asked the participants guiding questions to understand their utilization of Desmos while working on
tasks about exponential and logarithmic functions. The leading views of each participant both within-
group discussions and among groups were noted down simultaneously by instructor. To understand
the participants’ experiences from their own perspective, they were required to write about how they
utilized Desmos while working on the tasks about exponential and logarithmic functions after they
completed all the tasks in the instructional package.
The participants were assigned numbers from 1 to 17. The instructor's field notes were used to examine
the features of Desmos graphing calculator that the students utilized in learning exponential and
logarithmic functions. The focus of the analysis based on the sequence in the participants’ solution
processes while they were trying to solve the tasks via Desmos. Their actions while using Desmos were
observed and such observations provided information about how and why they used graphics within
the software, as well as what features of Desmos they applied to solve the problems in the tasks. In line
with this, the analyses of these observations helped researchers to understand the reflections of the
Technology Support for Learning Exponential and Logarithmic Function … Koştur, M. & Yilmaz, A.
58
participants while investigating their views about the support provided by Desmos while learning
exponential and logarithmic functions. In these discussions, the connections that were essential to
comprehend functions and exponential/logarithmic functions or to respond to the questions about
exponential/logarithmic functions were clues for categorizing students’ understanding of
exponential/logarithmic functions.
The data obtained from multiple data sources were interpreted and discussed together by the two
researchers. In the analysis process, the researchers separately coded the data. The results were
compared, and it was seen that 95% of the codings overlapped. Discussions continued until reaching
consensus on the 5% of diverse coding and then the analyses were finalized with total consensus.
Referring to what has been said in the related literature (Weber, 2002a; Weber, 2002b; Kenney &
Kastberg, 2013; Williams, 2011; Hiebert & Lefevre, 1986), in this study, the students’ own expressions
and actions were examined in this context and were compared and contrasted with the findings of the
previous studies in the literature. When any differences were observed, those were also interpreted in
the light of the descriptions in the related literature.
FINDINGS
The findings of the study were presented and discussed with narratives of exemplary actions and
supportive quotes related with the research question of what are the views of undergraduate students about
the use of Desmos graphing calculator in learning exponential and logarithmic functions?
We aimed to answer to the research question by determining which features of Desmos were utilized
to enhance students’ progress in completing the tasks about and thereby their learning of exponential
and logarithmic functions. The data obtained from classroom observations while participants were
working on the tasks of exponential and logarithmic functions, from researcher’s field notes, and from
the related ongoing discussions as well as reflection papers revealed the reasons of the participants’
specific preferences of Desmos over pen and paper and the advantages of using these features in
learning the two function types.
It was found out that the participants utilized Desmos to view the expressions and the corresponding
graphs of the functions on the same screen, displaying multiple graphs together on the same plane,
marking every graph in different colors, identifying x and y intercepts of any point on the graph,
graphing on an infinite coordinate axis with squared graphing background, drawing immediate and
accurate graphs, zooming in and out, dragging, activating and deactivating the graphs, and utilizing
the notations of functions that come ready within the menus of Desmos. The participants expressed that
these features of Desmos altogether provided them with the opportunity to obtain accurate and
immediate graphs and also they prevented the participants from making mistakes, inaccurate graphing,
and getting confused. Moreover, the participants stated that the aforementioned features enabled them
to observe the differences and similarities between the graphs of functions, to explore the relationship
between algebraic and graphical forms of the functions, to compare multiple functions at a time, to
identify the coordinates of all points on a graph, and to do more work in a shorter time. While working
on the graphing tasks, participants firstly sketched graphs of the functions without using Desmos by
giving values to variables or directly by guessing from the algebraic form of the function. In
observations and discussions, however, it was observed that in all drawing tasks, all of the 17
participants corrected their initial graphs after comparing them with the graphs on Desmos. In this
regard, this finding shows us that students use Desmos for making less error and control their solutions.
The analyses of the data obtained from classroom observation, in-class discussions, researcher’s filed
notes, and reflection papers revealed 3 main categories about the views of undergraduate students on
the use of Desmos graphing calculator while learning exponential and logarithmic functions. These
advantageous roles participants attributed to Desmos were i) compensating the lack of procedural
knowledge, ii) providing opportunities for exploration, and iii) enhancing engagement with the tasks.
i) Compensating the Lack of Procedural Knowledge
IHEAD, e-ISSN 2528-9632, 2017, 2(2), 50-68 Koştur, M. & Yilmaz, A.
59
The first category driven from the data analysis was the role of Desmos in compensating participants’
inadequate procedural knowledge in terms of solving algebraic expressions of exponential and
logarithmic functions. At the beginning of the study, it was observed that the students had deficiencies
in procedural knowledge. For instance, they were uncertain about how to use the x and y variables, how
to display them on the graph, the meaning of domain and range of a function, and different values of
these functions. Moreover, although the students were familiar with the name of the exponential or
logarithmic functions, they were not able to explain the relationship between those functions. In this
regard, exponential functions and logarithmic functions were separate concepts in their minds.
The participants were able to link their existing procedural knowledge, which indicates that they knew
how to assign values to x and make the calculation to find the corresponding value for y. However, they
failed to plot the graph of the logarithmic functions as they were not able to correctly calculate the result
of the logarithm for several values of x. They were better at calculating the values of exponential
functions, still not obtaining successful results entirely. This failure in finding the correct result hindered
them from completing the subsequent tasks such as analyzing the reason of increase or decrease of the
function and explaining the change in the shape and position of a graph when the base of the function
was changed. Accordingly, when the participants were observed while applying a corresponding
approach, their procedural deficiencies also hinder their conceptual understanding by causing them to
fail completing the tasks on pen and paper. At this point, the participants benefitted from Desmos.
Despite the fact that the teacher did not direct the students to use Desmos, they discovered that they
could compensate for their procedural deficiencies utilizing Desmos. It was seen that the participants
(P1, P2, and P4) demonstrated progress in interpreting graphs with the support of Desmos. One of the
participants (P1) stated their experiences as follows:
“I am not always good at solving exponential and logarithmic functions, especially logarithmic functions.
Therefore, I could not pass on to the upper level of drawing their graphs before (in high school). But with
Desmos, I was able to draw their graphs and answer all the questions about the related changes in
algebraic form of functions and their graphs. The symmetry of two graphs was apparent on Desmos, log3
x and log1/3 x. It was easy to conclude that base of the function was effective on increasing or decreasing.”
(P1)
As it is seen from the P1’s comment, the participant created the graph via Desmos and was able to
interpret the base and coefficient concepts of the logarithmic function on the graph displayed in
Desmos. In line with this, although the student could not solve the questions about the functions, he/she
thinks that it is important for him to understand the graph with the help of the program. According to
the experience of the student, Desmos compensated lack of procedural knowledge of the student.
Before taking any Desmos support, three participants (P3, P5, and P13) drew almost accurate graphs of
exponential functions by assigning values to both a and x. Although those graphs could be evaluated as
correct, the slope and the position of the graphs were not exactly true. For instance, the graph of f(x) =
3x looked like f(x) = 10x. The graphs of P3, P5, and P13 were correct considering the positions of the
graphs according to each other. That is, the graph of the function having the largest positive value for
base a was closest to x-axis. However, after entering the functions on Desmos, they corrected the
positions and slopes of their graphs.
“I gave 2, 3, 4, 5, and 6 for the values of a. As these were close values, the graphs overlapped in my own
drawing (on paper). Desmos helped me identify which graph is more close to x-axis. Moreover, I saw the
curves of the graphs exactly and accurately. Now, I know how the graph of an exponential function looks
like and how its shape changes when the base increases.” (P13)
As P13 mentioned, Desmos was helpful in interpreting the base concept of the logarithmic function and
it was used as tool to check their graphs. Unlike the previous student, this student was able to draw his
own graph at the beginning. The student identified and corrected the lack of knowledge about the axes
Technology Support for Learning Exponential and Logarithmic Function … Koştur, M. & Yilmaz, A.
60
placement by determining the x values and y values through the program. In this context, although the
student has the lack of knowledge in the process of drawing the graphs less than the previous student,
the program helped the student to understand the interpretation of the bases of these functions on
graphs. Although the deficiencies of the students' knowledge are at different levels, the program allows
the students to recognize this lack of knowledge and to answer the questions despite the shortcomings.
This category emerged from the data showed that the students had lack of procedural knowledge for
drawing accurate graphs, thus, used Desmos in order to create graphs and check their initial inaccurate
graphs. Additionally, Desmos supported the participants to overcome the procedural calculation
challenges, thereby explore exponential and logarithmic functions.
Ii) Providing Opportunities for Exploration
The participants’ views were mostly gathered under the exploration category. In the classroom
discussions, they indicated that they had the chance to explore and identify exponential and logarithmic
functions in various aspects by using Desmos. These aspects were explained through selected narrative
scripts from the courses.
In one group, the participants P7, P11, and P16 developed a strategy in which they traced over the
graphs of two exponential functions with the bases of ⅗ and ¼ (f(x)=3/5x and f(x)=1/4x) on Desmos and
tabulated the x and y values. They simply pointed on the graph tracing to the integer alues of x; the
corresponding y coordinate of the point appeared on the graph immediately, and they tabulated these
values on a paper. With this strategy, they aimed to compare the values of x and y and identify the
relationship between the algebraic expressions of the two functions. Before using Desmos, they only
sketched the graphs for positive x values, which appeared only in the first quadrant. When they used
Desmos, the graphs appeared as a whole in first and second quadrants which enabled them to explore
the graphs for both positive and negative values of x. At the end of the task, P11 described her
exploration process of graphing on Desmos as follows:
“If I were to draw these two functions in the way we used to (assign values to x and calculate
corresponding y values), I would only draw the graphs on the first quadrant of the coordinate plane and
relate the functions relying on that part of the graph. However, on Desmos, I was able to explore all parts
of the graph. I observed that the graphs changed position when they continued to the second quadrant of
the coordinate plane. Therefore, we (group members) decided to add x and y values from second quadrant,
too. After we tabulated the coordinates from both quadrants, we were able to interpret the relationship
between the change in the base of the exponential function and the shape of the graph.” (P11)
Considering P11’s explanation, it was evident that Desmos enabled her to examine the x and y values
exactly with the grid paper feature and comprehend the graph as a whole in both quadrants of the
coordinate plane. Similar to P11, another participant (P7) from the same group indicated that she was
able to explore the left part of the graph corresponding to the decreasing negative values of x.
“By dragging and zooming, we were able to move to the points we wanted to and found y values for any
x. You can even see the end of the graph.” (P7)
In this regard, all parts of the graph were explored through the dragging and zooming features of
Desmos which also made it possible to reach any points on the infinite graphs they came up with at the
end of the task.
The booklet began with a task about writing the algebraic expression of an exponential function for a
given situation. Then, the first task continued with the questions about calculating the values in the
exponential function; x or y. Following this, in the second task, the participants were asked to calculate
the f(x)=y values of exponential functions with the bases of 2, 3, and 5; f(x)=2x , g(x)=3x, and h(x)=5x. While
doing this, they assigned different values to x. Then, they used these x values to find y values and sketch
the three graphs. The participants compared their graphs with each other and discussed the differences.
Afterwards, they used Desmos to graph the three functions. The comparison questions at the end of the
IHEAD, e-ISSN 2528-9632, 2017, 2(2), 50-68 Koştur, M. & Yilmaz, A.
61
task were “write the set of the x values where f(x)>g(x)”, “write the set of the x values where f(x)<g(x)”,
and “write the set of the x values where f(x)=g(x).” They observed the graphs on Desmos and easily
found the sets of x values - the domain sets - for the given situations. P9, for instance, stated that she did
not need to calculate values for f(x), g(x), and h(x) functions to answer the questions in the task because
on Desmos she was able to explore the conditions given in the questions.
“We don’t need to make any calculations or sketching. We can just enter any exponential functions to
Desmos with bases like 5 and 15. Then, we can easily view the sets for x when these functions get higher
values from each other (f(x)>g(x) and f(x)<g(x)) or when they are equal (f(x)=g(x)). It is apparent on the
graph on Desmos.” (P9)
In a similar task in the logarithmic functions, the participants skipped the beginning steps and directly
entered the algebraic form of the functions to Desmos; y=log2 x and y= log5 x. Then, all of them were able
to find the sets for x values for given situations by exploring the graphs on Desmos. Upon completing
the task, they were asked to compare the graphs by referring to all of the differences and similarities.
P8’s view was remarkable in that she suggested the use of Desmos to make this comparison thoroughly
rather than using pen and paper.
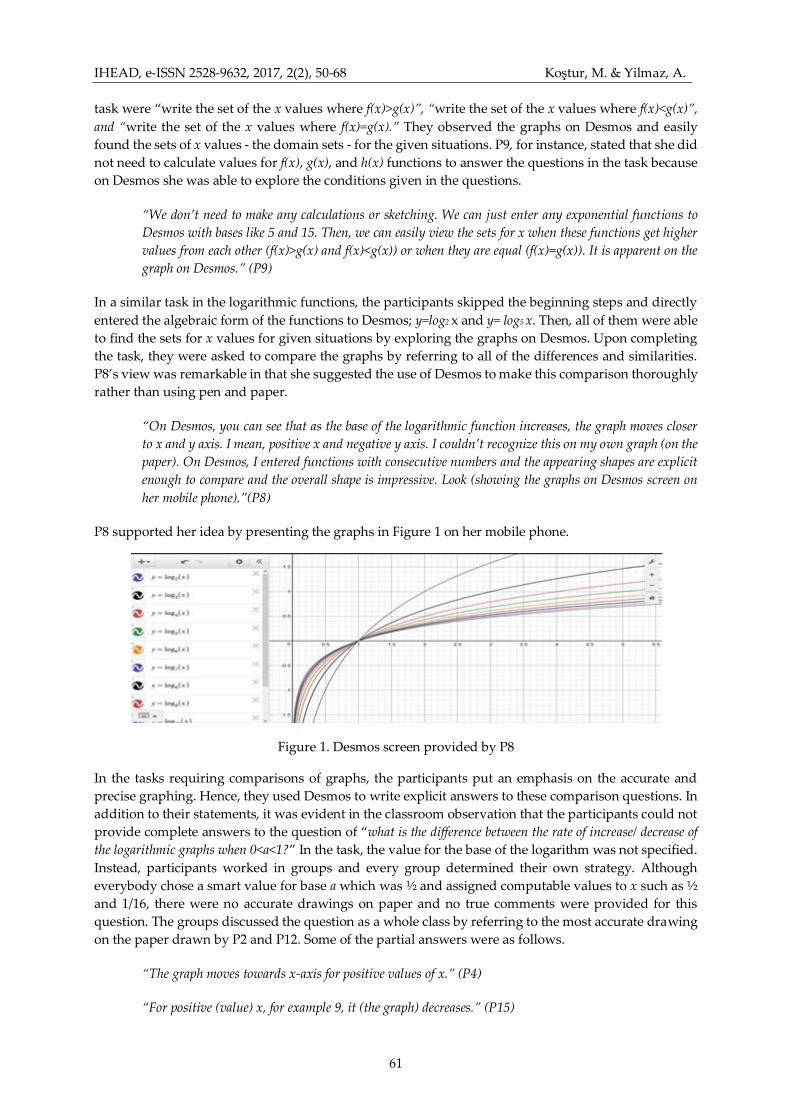
“On Desmos, you can see that as the base of the logarithmic function increases, the graph moves closer
to x and y axis. I mean, positive x and negative y axis. I couldn’t recognize this on my own graph (on the
paper). On Desmos, I entered functions with consecutive numbers and the appearing shapes are explicit
enough to compare and the overall shape is impressive. Look (showing the graphs on Desmos screen on
her mobile phone).”(P8)
P8 supported her idea by presenting the graphs in Figure 1 on her mobile phone.
Figure 1. Desmos screen provided by P8
In the tasks requiring comparisons of graphs, the participants put an emphasis on the accurate and
precise graphing. Hence, they used Desmos to write explicit answers to these comparison questions. In
addition to their statements, it was evident in the classroom observation that the participants could not
provide complete answers to the question of “what is the difference between the rate of increase/ decrease of
the logarithmic graphs when 0<a<1?” In the task, the value for the base of the logarithm was not specified.
Instead, participants worked in groups and every group determined their own strategy. Although
everybody chose a smart value for base a which was ½ and assigned computable values to x such as ½
and 1/16, there were no accurate drawings on paper and no true comments were provided for this
question. The groups discussed the question as a whole class by referring to the most accurate drawing
on the paper drawn by P2 and P12. Some of the partial answers were as follows.
“The graph moves towards x-axis for positive values of x.” (P4)
“For positive (value) x, for example 9, it (the graph) decreases.” (P15)
Technology Support for Learning Exponential and Logarithmic Function … Koştur, M. & Yilmaz, A.
62
As it was evident in this observation script, the deficiency in drawing hindered the participants from
finding answers to the questions requiring higher order thinking skills. Then, participants were allowed
to use Desmos. They entered y=log1/2 x to Desmos. They all made the right comment that graph cannot
be defined for negative values of x and x=0. Then, they entered other values for base a between 0 and 1
to make comparisons between the graphs. P9 expressed her group’s result by showing her Desmos
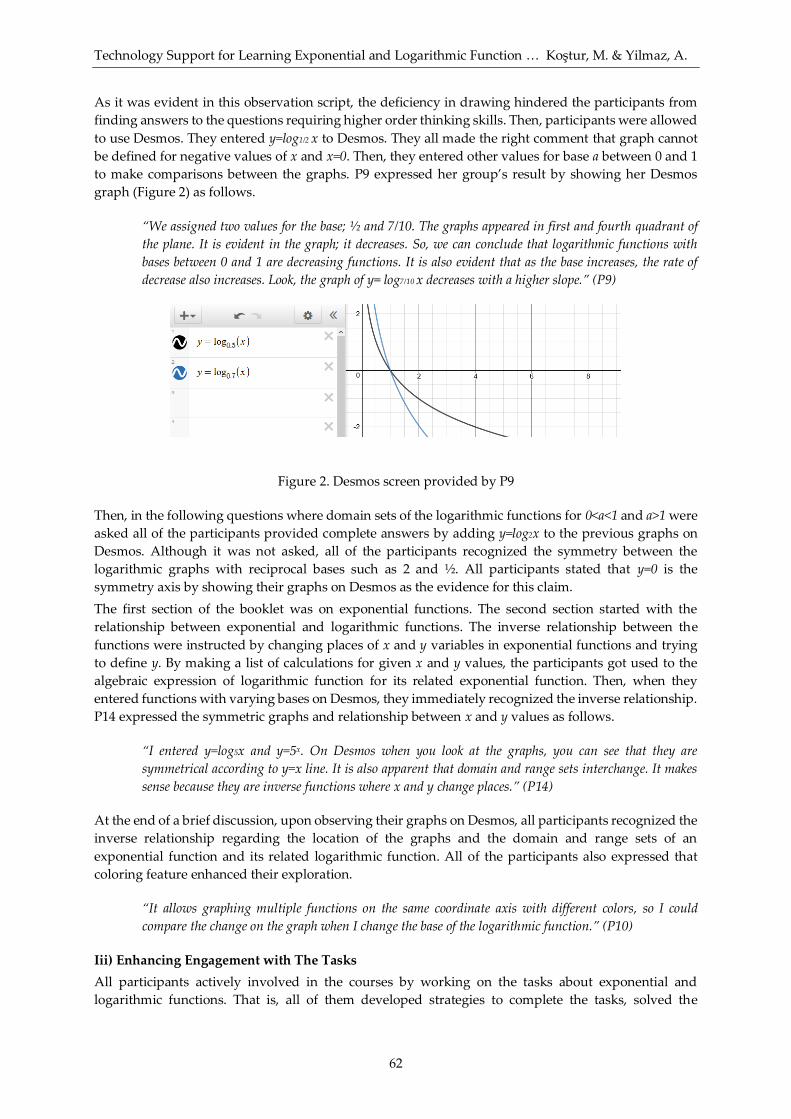
graph (Figure 2) as follows.
“We assigned two values for the base; ½ and 7/10. The graphs appeared in first and fourth quadrant of
the plane. It is evident in the graph; it decreases. So, we can conclude that logarithmic functions with
bases between 0 and 1 are decreasing functions. It is also evident that as the base increases, the rate of
decrease also increases. Look, the graph of y= log7/10 x decreases with a higher slope.” (P9)
Figure 2. Desmos screen provided by P9
Then, in the following questions where domain sets of the logarithmic functions for 0<a<1 and a>1 were
asked all of the participants provided complete answers by adding y=log2x to the previous graphs on
Desmos. Although it was not asked, all of the participants recognized the symmetry between the
logarithmic graphs with reciprocal bases such as 2 and ½. All participants stated that y=0 is the
symmetry axis by showing their graphs on Desmos as the evidence for this claim.
The first section of the booklet was on exponential functions. The second section started with the
relationship between exponential and logarithmic functions. The inverse relationship between the
functions were instructed by changing places of x and y variables in exponential functions and trying
to define y. By making a list of calculations for given x and y values, the participants got used to the
algebraic expression of logarithmic function for its related exponential function. Then, when they
entered functions with varying bases on Desmos, they immediately recognized the inverse relationship.
P14 expressed the symmetric graphs and relationship between x and y values as follows.
“I entered y=log5x and y=5x. On Desmos when you look at the graphs, you can see that they are
symmetrical according to y=x line. It is also apparent that domain and range sets interchange. It makes
sense because they are inverse functions where x and y change places.” (P14)
At the end of a brief discussion, upon observing their graphs on Desmos, all participants recognized the
inverse relationship regarding the location of the graphs and the domain and range sets of an
exponential function and its related logarithmic function. All of the participants also expressed that
coloring feature enhanced their exploration.
“It allows graphing multiple functions on the same coordinate axis with different colors, so I could
compare the change on the graph when I change the base of the logarithmic function.” (P10)
Iii) Enhancing Engagement with The Tasks
All participants actively involved in the courses by working on the tasks about exponential and
logarithmic functions. That is, all of them developed strategies to complete the tasks, solved the
IHEAD, e-ISSN 2528-9632, 2017, 2(2), 50-68 Koştur, M. & Yilmaz, A.
63
functions for given values, wrote algebraic expressions of functions, drew graphs, identified the domain
and range sets by referring at the graphs, compared the given functions, searched reasons for the
increase or decrease of functions, identified similarities and differences between functions, and related
algebraic and graphical representations of functions. Although they did not succeed in all steps, all
participants responded to all questions in the tasks by utilizing Desmos and all of them were willing to
express their answers in class.
In addition to the participants’ statements in the discussions, it was also evident in the classroom
observation that the support provided by Desmos motivated and encouraged all participants to engage
in the tasks including those having low mathematics success. For instance, P9 expressed that she felt
comfortable in attending the exponential and logarithmic functions tasks. The reason was that Desmos
provided immediate and accurate feedback.
“Desmos was a helper which always knows the truth. This felt very comfortable, so I was enthusiastic to
complete the tasks with everyone and I tried to catch others in the class. Without Desmos I would not
even initiate to answer any of the questions. I would wait until you write the correct answer, so I can
write it down, too.” (P9)
Depending on similar views of participants, the use of this software, supported by group work, supports
the motivation for solving the questions. As the participants pointed out in their comments, they felt
confident that they can complete tasks with Desmos. However, that feeling reveals the over dependency
of students about using Desmos for solving each task. If the student can not answer any questions
without Desmos, it is the result of the trust of students in Desmos. As a positive follow-up impact of
utilizing Desmos to the previous impact (i.e., compensating the lack of procedural knowledge), Desmos
helped the participants compensate for the lack of content knowledge; therefore, it increased their self-
confidence together with their amount of engagement with the tasks.
Similarly, P5 and P1 were encouraged to draw graphs since Desmos helped them about drawing
accurate graphs and provided multiple graphs to compare the positions and behaviors of the graphs.
“I don’t like to draw the graphs of a list of functions because it takes too much time. Even if I give that
time and effort to solve the function and find the coordinates of the graph, the drawing will not be
accurate. Then, I compare the graphs and make wrong or missing comments. Using Desmos saves time
and brings out true graphs. This enabled me to compare a list of exponential and logarithmic functions
with various bases.” (P5)
Moreover, it was observed that using Desmos enabled the participants to speak up without any fear of
making mistakes and they used Desmos as reference to their answers. Another student, P14 indicated
that he used Desmos to check his answers and relying on Desmos, he was encouraged to make
comparisons between logarithmic functions with different bases.
“I recommend everyone (undergraduate students) to use Desmos. It is useful to check your answers.
Sometimes it is complicated to calculate y for a given x in logarithmic functions. It is also hard to draw
the graph of these functions such as drawing with an accurate slope and position. To check my answers,
it was really a good opportunity to use Desmos. When I saw the graphs of the logarithmic functions with
different bases on Desmos, I knew I was making true comments on the behavior of the graphs according
to their bases.” (P14)
In accordance with P14’s comment above and the previous one, Desmos was a tool that allowed
participants to reach correct interpretations. Likewise, she benefited the program to check her solutions.
In addition to this, drawing functions with different bases was considered easy with the support of
Desmos. Therefore, she benefited from the program to provide an answer as well as to check her answer
that she found without Desmos.
Technology Support for Learning Exponential and Logarithmic Function … Koştur, M. & Yilmaz, A.
64
The freshmen who had different backgrounds and levels in computer skills adapted themselves to using
Desmos easily. They considered the mobile application of Desmos as a user-friendly program. P2
expressed that Desmos was a user-friendly tool enabling numerous function entries at the same time.
Thus, she was eager to draw graphs and answer the questions in the tasks.
“I entered a lot of versions, even the ones you did not mention. I changed the coefficients and observed
the changes in graphs. It was like trial and error game. It does not take too much time like drawing on
paper. It is easier to answer the questions this way.” (P2)
We see that the program supported P2 with exploration of changes in various graphs. The participant
drew the functions on Desmos as well as examined the change in the graphs.
DISCUSSION & CONCLUSION
Fundamentals of Mathematics course in Middle School Mathematics Education Program aims to
develop undergraduate students’ knowledge in basic mathematics subjects. It provides mathematical
basis for the higher-level courses in the following grades such as analysis, linear algebra, analytical
geometry, and differential equations. Moreover, undergraduate students take two methodology courses
in the third grade. In these methodology courses, in order to design courses and provide suggestions to
teach mathematics in the middle school, the prospective teachers need to be competent in mathematics
content knowledge. Hence, the course provides bases for profound understanding in mathematics for
undergraduates who will be middle school mathematics teachers in the future. However, this course
covers a challenging content for freshmen who lack mathematical knowledge and skills. Based on the
researchers’ teaching experiences and the related literature, undergraduate students have inadequate
and inaccurate understanding of exponential and logarithmic functions (Hurwitz, 1999; Kenney &
Katsberg, 2013; Weber, 2002a). Therefore, in the present study, technology utilization in mathematics
education was used to improve undergraduate students’ learning of exponential and logarithmic
functions. In this regard, in this study the undergraduate students' views about and actions in the use
of Desmos graphing calculator in learning exponential and logarithmic functions were investigated.
Desmos is described as a user-friendly tool (Oates, Sheryn, & Thomas, 2014; Thomas, 2015). Similarly,
all of the participants in this study expressed that Desmos was user-friendly and they were used to all
its menus and its usage at the end the very first course. They did not ask any questions about how to
operate a command on Desmos after the first course.
Participants mentioned in classroom discussions and reflection papers, the features of Desmos that
substituted pen and paper were related to dynamicity, visualization, motivation, and user-friendly
aspects of the software. A similar result was obtained in the study by Karadeniz and Thompson (2017)
in which they stated dynamic environment of graphing calculators and visualization enabled students
to explore mathematics. In the reflection papers, it was evident that these features offered learners an
effective setting for drawing related graphs, but cautiously interpreted for learning mathematics.
Because, in some cases (e.g.: drawing multiple graphs for interpreting the behavior of the graphs of
functions with differing bases), participants mentioned about Desmos usage in shortening the process
of responding to the question, in drawing the graph in a limited time, and in using trial-and-error
methods. That made the researchers think that students might have used the program as a means to
give the desired answer to the question, rather than learning mathematics. Moreover, the use of trial
and error method needs to be carefully evaluated because the strategies developed during this method
are also important. What is done by trial and the paths students use are required to be carefully
examined. Otherwise, effective learning might not be acquired. The performance of the calculator may
hide and hinder mathematical skills and students’ progress can be artificial (Zheng, 1998). In addition
to this, taking too much time is often a concern expressed by the participants. As opposed to what the
participants say, the essential skill during the learning should not be drawing a graph immediately.
Rather, it is important to draw graphs manually by paying attention to the steps of forming them.
IHEAD, e-ISSN 2528-9632, 2017, 2(2), 50-68 Koştur, M. & Yilmaz, A.
65
The first inference from the findings of the study was that the participants compensated their lack of
procedural skills by engaging in the learning process through the use of Desmos. Even though they had
difficulty in solving exponential and logarithmic functions, by using Desmos they were able to graph
and interpret the functions without being challenged by calculation. Technology has the power to move
the focus from computation to conceptual understanding (Esty, 2000). In standards of National Council
of Teachers of Mathematics (2000) it is emphasized that technological tools “furnish visual images of
mathematical ideas, facilitate organizing and analyzing data, and can compute quickly, efficiently, and
accurately so that students can focus on conceptual understanding” (p. 24). In line with this finding,
students may prefer this software because it is easier and faster to do their own calculations. In other
words, the use of this software may have led them to underestimate their insufficient procedural skills,
rather than progressing to the desired level in the computing skills of the students. Graphing skills lie
in the base of learning functions. However, computation is also a desired skill that the students need to
develop.
The second significant finding of the study was that the participants considered Desmos as an assistive
tool which provided exploration. Throughout the process of working on exponential and logarithmic
functions tasks, the participants were able to explore the graphs as a whole, observe all points on a
graph and identify their coordinates, compare the positions and behavior of multiple graphs at a time,
explore the relationship between algebraic and graphical forms of functions, recognize the inverse
relationship between exponential and logarithmic functions, and define and interpret this relationship
on graphical and algebraic representations through Desmos. It should also be noted that, the
participants emphasized the advantages of using Desmos especially for the reason that Desmos enabled
them to learn what they would not achieve through pen and paper. First and foremost, they emphasized
comparing functions from several aspects such as algebraic form of functions according to graphs,
domain and range sets, and exploring all points on a graph. Among the aspects the participants
mentioned, relating algebraic form of functions with the corresponding graphs was an important
outcome which was also stated in previous studies. In terms of symbols and notations in the algebraic
form, it was noted that students have difficulty in thinking logarithm as a function (Hurwitz, 1999).
Moreover, King (2017) found out that Desmos aided in exploring domain and range of functions and
change in the graphs of functions according to the change in the algebra formula of the functions. The
above mentioned two roles attributed to Desmos - i) compensating lack of procedural knowledge and
ii) providing opportunities for exploration - were advantageous for the freshmen to analyze,
understand, associate, and interpret exponential and logarithmic functions. Correspondingly, it can be
cautiously concluded that utilizing Desmos graphing calculator in learning exponential and logarithmic
functions facilitated undergraduate students’ conceptual understanding by providing accurate
graphical representations and enabling detailed exploration. Similar results were found in Quesada and
Maxwell’s (1994) study in which graphing calculators provided a learning environment that fostered
students’ construction of knowledge by its graphing utility in precalculus course.
Moreover, Bourassa (2014) suggested the use of technology in order to use both in solving and checking
the solutions in functions problems. Parallel reasons for calculator use emerged in this study because
the participants benefitted from Desmos in controlling their answers, making fewer mistakes, and
thereby thinking relationally of those graphs. As well as the technological infrastructure that the
software supports, those features also reveal the variety of experiences students wonder while creating
graphs of those functions that cannot be done easily with pen and paper. It is interesting to note that
the participants never insisted on telling that their graphs were correct. Instead, they tried to figure out
how the graphs of those functions can be drawn using the properties mentioned above. Therefore, this
program has the mathematical authority within the classroom.
As Weber (2002b) and William (2011) identified, students need to learn exponential and logarithmic
functions as processes. The real-life tasks in the instructional package and the use of Desmos while
working on those tasks provided learners with meaningful understanding. Desmos facilitates
meaningful learning of functions (Karadeniz & Thompson, 2017). If it is used as an educational
Technology Support for Learning Exponential and Logarithmic Function … Koştur, M. & Yilmaz, A.
66
technology and integrated with appropriate pedagogical and assessment strategies, it has the potential
to enhance and improve conceptual understanding (Thomas, 2015). In this study, the results showed
that Desmos allowed the participants to explore two types of functions deeply. Furthermore, they
discovered the relationship between these two functions. Recognizing and identifying the inverse
relationship between exponential and logarithmic functions is a complicated level of understanding
(Gramble, 2005). As Kenney and Kastberg (2013) stated students need to build the relationship by
considering logarithm both as a function and as an exponent. In this study, it was evident in the
classroom observations and in their written answers to the tasks that through the use of Desmos, all
participants reached the intended goals of the three-week long implementation about exponential and
logarithmic functions. The gains obtained by the support of Desmos were infeasible through traditional
teaching approaches.
The third main support the participants mentioned was that Desmos enhanced engagement with the
tasks. It was observed in the class hours that they were eager to solve the problems about exponential
and logarithmic functions by using Desmos. Moreover, they felt comfortable to express their thoughts
and related their answers to the output in Desmos. They attributed their engagement with the tasks to
Desmos because it was there to support or correct them while working on the tasks. All participants
expressed that Desmos was advantageous in their learning because it provided immediate and accurate
feedback, acted as a tool to check answers.
RECOMMENDATIONS
In this study, the use of Desmos as an educational tool aimed at facilitating undergraduate students’
learning of exponential and logarithmic in undergraduate education at the faculty of education. The use
of Desmos graphing calculator in teaching exponential and logarithmic functions also extended beyond
being a substitute of pen and paper. Considering these results of this study, it has the potential to
support learning in functions concept. It would be efficient to consider the support of Desmos in a true
experimental design that supposedly would provide sharper results when compared to a controlled
group.
It is necessary to express functions with multiple representations and Desmos provides exploration for
algebraic, tabular, and graphical representation types. In this context, this application can be integrated
into the undergraduate mathematics courses for students’ meaningful learning. Therefore, it can be
suggested that Desmos is a suitable tool for students to learn and construct functions throughout
mathematics courses. On the basis of the participants’ experience, it is necessary to clarify in what
extend students are expected to have procedural skills about those functions and whether students have
sufficient procedural knowledge when they answer questions via Desmos. Although the operational
skills of the participants were not the only criterion in this study, development of procedural skills
regarding functions can be investigated in a graphing calculator supported environment.
McCulloch et al. (2012) stated that calculus students’ preference to use a graphing calculator has the
following rationales in their learning process: ‘concerns about making careless errors’, ‘the need to check
work (their own written work or the calculator’s work) before making a choice’, ‘beliefs about graphing
calculator affordances and limitations’, and ‘confidence in their own mathematical ability’ (p. 465). In
contrast to the findings of the study mentioned, in this study participants did not share ideas about
‘beliefs about graphing calculator affordances and limitations’, and ‘confidence in their own
mathematical ability’. In this study, the participants expressed that graphical calculator was as a highly
competent tool, yet they did not mention any possible limitations of the graphic calculator. Additionally,
in this study participants did not trust their mathematical knowledge. Therefore, students who are
confident in their mathematics knowledge can use Desmos in different ways.
IHEAD, e-ISSN 2528-9632, 2017, 2(2), 50-68 Koştur, M. & Yilmaz, A.
67
REFERENCES
Argün, Z., Arıkan, A., Bulut, S., & Halıcıoğlu, S. (2014). Temel matematik kavramlarin künyesi. Ankara: Gazi Kitabevi.
Aslan-Tutak, F. (2013). Tarihi ve Uygulama Alanları ile Logaritma Fonksiyonu. In İsmail Özgür Zembat, Mehmet Fatih
Özmantar, Erhan Bingölbali, Hakan Şandır, Ali Delice. (Eds.), Tanımları ve Tarihsel Gelişimleriyle Matematiksel
Kavramlar (p. 399-414). Ankara: Pegem Akademi.
Ball, D., L. (2000). Bridging practices intertwining content and pedagogy in teaching and learning to teach. Journal of
Teacher Education, 51(3), 241 – 247.
Beigie, D. (2014). The algebra artist. Mathematics Teacher, 108(4), 258-265.
Bourassa, M. (2014). Technology corner - Desmos activities. Ontario Mathematics Gazette, 52(4), 8-10.
Caniglia, J., Borgerding, L. & Meadows, M. (2017). Strengthening oral language skills in mathematics for english
language learners through Desmos technology. International Journal of Emerging Technologies in Learning (iJET), 12(5),
189-194.
Carlson, M., Oehrtman, M., & Engelke, N. (2010). The precalculus concept assessment: A tool for assessing students’
reasoning abilities and understandings. Cognition and Instruction, 28(2), 113–145.
https://doi.org/10.1080/07370001003676587.
Çetin, Y. (2004). Teaching logarithm by guided discovery learning and real life applications. Unpublished master's Thesis).
Ankara, TR: Middle East Technical University.
Creswell, J. W. (2013). Research design: Qualitative, quantitative, and mixed methods approaches. Sage publications. 4th
edition.
Desmos (2017). Desmos user guide: variables and sliders. Retrieved online from
https://desmos.s3.amazonaws.com/Desmos_User_Guide.pdf in 14.08.2017.
Desmos (2015). About us section. Retrieved 9 September, 2017, from https://www.desmos.com/about
Ebert, D. (2015). Graphing projects with Desmos. Mathematics Teacher, 108(5), 388-391.
Edwards, C. M. (2015). Free online resources not to miss for teaching middle school mathematics. Iowa Council of Teachers
of Mathematics Journal, 41(Winter 2014-15), 46-51.
Ellington, A. J. (2003). A meta-analysis of the effects of calculators on students' achievement and attitude levels in
precollege mathematics classes. Journal for Research in Mathematics Education, 34(5) 433-463.
Gramble, M. (2005). Sharing teaching ideas: Teaching logarithms day one. Mathematics Teacher, 99(1), 66.
Hiebert, J., & Lefevre, P. (1986). Conceptual and procedural knowledge in mathematics: An introductory analysis. In J.
Hiebert (Ed.), Conceptual and procedural knowledge: The case of mathematics (pp. 1-27). Hillsdale, NJ: Lawrence Erlbaum
Associates.
Hoang, B. T. V, & Caverly, D. C. (2013). Techtalk : Mobile apps and college mathematics. Journal of Developmental
Education, 37(2), 30-31.
Hollar, J. C., & Norwood, K. (1999). The effects of a graphing-approach intermediate algebra curriculum on students’
understanding of function. Journal for Research in Mathematics Education, 30(2), 220.
Hurwitz, M. (1999). We have liftoff! Introducing the logarithmic function. Mathematics Teacher, 92(4), 344–345.
Karadeniz, I., & Thompson, D. R. (2017). Precalculus teachers’ perspectives on using graphing calculators: an example
from one curriculum. International Journal of Mathematical Education in Science and Technology, 1-14.
http://dx.doi.org/10.1080/0020739X.2017.1334968
Kenney, R., & Kastberg, S. (2013). Links in learning logarithms. Australian Senior Mathematics Journal 27(1), 12 - 20.
King, A. (2017). Using Desmos to draw in mathematics. Australian Mathematics Teacher, 73(2), 33 - 37.
Liang, S. (2016). Teaching the concept of limit by using conceptual conflict strategy and Desmos graphing calculator.
International Journal of Research in Education and Science, 2(1), 35-48.
Technology Support for Learning Exponential and Logarithmic Function … Koştur, M. & Yilmaz, A.
68
Mcculloch, A. W., Kenney, R. H., & Keene, K. A. (2012). My Answers Don’t Match ! Using the Graphing Calculator to
Check. Mathematics Teacher, 105(6), 464-468.
National Council of Teachers of Mathematics. (2000). Principles and standards for school mathematics. Reston, VA:
Author.
Oates, G., Sheryn, L., & Thomas, M. (2014). Technology-active student engagement in an undergraduate mathematics
course. Proceeding of PME 38 and PME-NA 36, 4, 329-336.
Rösken, B., & Rolka, K. (2007). Integrating intuition: The role of concept image and concept definition for students’
learning of integral calculus. The Montana Mathematics Enthusiast, 3, 181-204.
Shulman, L. (1986). Those who understand knowledge growth in teaching. Educational Researcher, 15(2), 4-14.
Smith, K. B., & Shotsberger, P. G. (1997). Assessing the use of graphing calculators in college algebra: Reflecting on
dimensions of teaching and learning. School Science and Mathematics, 97(7), 368-376.
Tall, D., & Vinner, S. (1981). Concept images and concept definitions in mathematics with particular reference to limits
and continuity. Educational Studies in Mathematics, 12(2), 151–169. https://doi.org/10.1007/bf00305619
Thomas, R. (2015, August). ‘‘A graphing approach to algebra using Desmos’‘. Presented at 27th International Conference
on Technology in Collegiate Mathematics, edited by Przemyslaw Bogacki, Las Vegas, Nevada.
Ural, A. (2006). Fonksiyon öğreniminde kavramsal zorluklar [Conceptual obstacles concerning the learning of the
function]. Ege Eğitim Dergisi, 7(2), 75–94.
Venturini, M. (2015). How teachers think about the role of digital technologies in student assessment in mathematics (Doctoral
Dissertation). Bologna, IT: Simon Fraser University. Retrieved from http://summit.sfu.ca/item/15703.
Vinner S. (1991) The role of definitions in the teaching and learning of mathematics. In: D. Tall (Ed.) Advanced
Mathematical Thinking. (pp. 65-81). Boston: Academic Publishers.
Weber, K. (2002a). Developing students' understanding of exponents and logarithms. Proceedings of the 24th Annual Meeting
of the North American Chapter of Μathematics Εducation (Vols. 1–4). Retrieved from
http://eric.ed.gov/ERICDocs/data/ericdocs2/content_storage_01/0000000b/80/27/e8/b5.pdf
Weber, K. (2002b). Students’ understanding of exponential and logarithmic functions. Proceedings from the 2nd International
Conference on the Teaching of Mathematics. Retrieved from http://www.eric.ed.gov/PDFS/ED477690.pdf
Williams, H. R. A. (2011). A conceptual framework for student understanding of logarithms (Unpublished master's thesis).
Provo, UT: Brigham Young University. Retrieved from http://scholarsarchive.byu.edu/etd/3123.
Yin, R. K. (2013). Case study research: Design and methods (4th ed.). Thousand Oaks, CA: Sage.
Zazkis, R., & Chernoff, E. J. (2008). What makes a counterexample exemplary? Educational Studies in Mathematics, 68(3),
195–208.
Zheng, T. (1998, August). Impacts of using calculators in learning mathematics. In The 3 rd Asian Technology Conference
on Mathematics (ATCM’98).
Zucker, A., Kay, R., & Staudt, C. (2014). Helping students make sense of graphs: an experimental trial of SmartGraphs
software. Journal of Science Education and Technology, 23(3), 441-457.
Related Documents