12 January 2006 Sector Focus Singapore Equity Research Refer to important disclosures at the end of this report In addition to the disclaimer at the end of this report, please note that DBS Vickers Securities (Singapore) Pte Ltd has been appointed as the designated market maker of structured warrant(s) Creative, CSM and Venture Corporation issued by DBS Bank. Technology Sector 2006 • Neutral weighting for 1Q06 • Promising outlook in 2006 driven by communications and consumer electronics segments • Still advocates stock picking and favors CSM, UTAC, ElectroTech, Magnecomp, DMX, FIRST & HUAN www.dbsvickers.com SINGAPORE

Welcome message from author
This document is posted to help you gain knowledge. Please leave a comment to let me know what you think about it! Share it to your friends and learn new things together.
Transcript
12 January 2006
Sector Focus
Singapore Equity Research
Refer to important disclosures at the end of this report In addition to the disclaimer at the end of this report, please note that DBS Vickers Securities (Singapore) Pte Ltdhas been appointed as the designated market maker of structured warrant(s) Creative, CSM and VentureCorporation issued by DBS Bank.
Technology Sector 2006
• Neutral weighting for 1Q06 • Promising outlook in 2006 driven by communications
and consumer electronics segments • Still advocates stock picking and favors CSM, UTAC,
ElectroTech, Magnecomp, DMX, FIRST & HUAN
ww
w.d
bsv
icke
rs.c
om
ww
w.d
bsv
icke
rs.c
om
SIN
GA
POR
E
Technology Sector
Table of Contents
Investment Summary 3
Technology – Still Neutral for now 8
Technology – Crystal ball gazing in 2006 11
25
Computers 30
Communications 34
Consumer Electronics 39
Outlook for the Hard Disk Drive Segment 57
Outlook for the Plastic Manufacturing Segment 61
Outlook for the IT Services Segment 65
Company Focus
Chartered Semiconductor 68
DMX 70
Electrotech 72
First Engineering 74
Huan Hsin 76
Magnecomp 78
United Test & Assembly Centre 80
MITA (P) NO. 065/10/2005
Don See (65) 6398 7955 Equity Analyst [email protected] Phua Bowen (65) 6398 7950 Equity Analyst [email protected] Dinesh Chandiramani (65) 6398 7967 Equity Analyst [email protected] Dr Chua Hak Bin (65) 6878 5396 Economist [email protected]
2
Technology – Risks abound, nothing is for sure
Semiconductors 26
Technology Sector
Investment Summary • Maintain Neutral Weight. We were overweight on the tech sector and suggested accumulation in 3Q05 and 4Q05 mainly because DBS ELI and several leading indicators were pointing towards a recovery in the sector in 2H05. We were forecasting growth for between 4 to 5 quarters in June as we believe the recovery is likely to be short and shallow due to shortening IT cycles. One of the shortest expansion lasted three quarters and that was in 1999. Our latest DBS ELI reading has flattened over the previous reading. Also US new orders to inventory and to shipment ratios are also leveling off. Together with falling non-oil retain imports and falling PMI reading in November and December respectively, we believe the first sign of slow down in the Singapore electronics exports and shipment could start to appear in 1Q06. • Baseline scenario – Shallow and short tech recovery. We have developed a baseline scenario and believe the current tech recovery should be a short and shallow one. Our house is of the view that electronics growth should continue to taper off in 2H05 and the manufacturing sector in Singapore could revert to single digit growth. We however have a positive bias and believe that sustained positive global growth momentum, better than expected take up rate in some product segments and a sustained capex discipline could yield better than expected returns for the tech sector. Semiconductor sales, barometer of the health of the global technology sector are expected to grow about 7%-8% over 2005, a marginal growth rate over 2005. Within the sector, the foundry segment is expected to lead the charge as the segment is expected to expand by 16% this year. NAND flash memory will expand by about 40% while outsourced test and assembly sales is forecasted to grow by about 8.0%. We believe if the various segments in the semiconductor sector can meet or exceed the projected growth, it should have a positive implication on the downstream suppliers and consequently the outlook of the technology sector. • Sector now only offers 16% upside compared to 24% and 20% at the beginning of 3Q05 and 4Q05 respectively. In 3Q05, when DBS ELI started to turn up, we recommended overweight on the sector. Based on a universe of stocks under our coverage, which has a market cap of at least US$100m and above, the sector then offered a return of about 24%. In 4Q05, when we continued to reiterate overweight, the same universe of stocks collectively offered about 20% return. Since then the prospects have declined to about 16%. The sector has had a decent run since July 2005 although the upside is still a relatively attractive 16%, we believe a neutral rating at this stage is apt since our leading indicators have started to show signs of weakness and we believe earnings growth momentum should slow on a sequential basis especially, when we have just passed the seasonally
3
stronger holiday quarter.
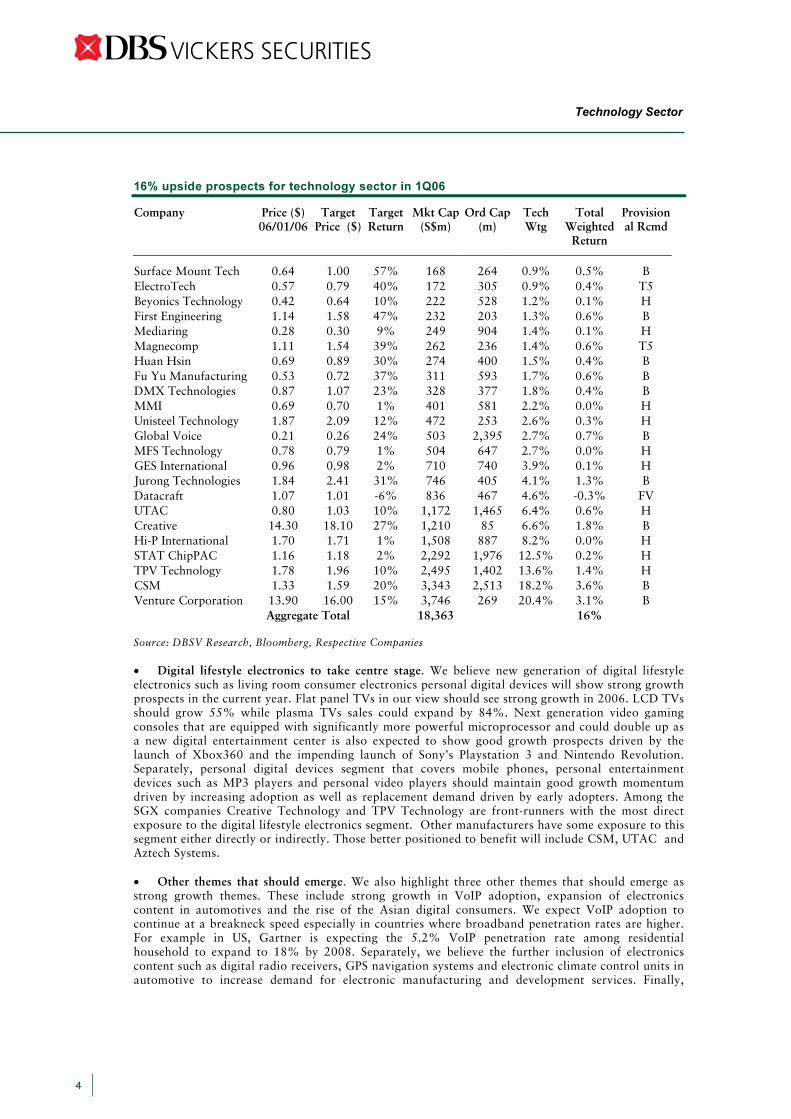
16% upside prospects for technology sector in 1Q06
Company Price ($) 06/01/06
Target Price ($)
Target Return
Mkt Cap (S$m)
Ord Cap (m)
Tech Wtg
Total Weighted
Return
Provisional Rcmd
Surface Mount Tech 0.64 1.00 57% 168 264 0.9% 0.5% B ElectroTech 0.57 0.79 40% 172 305 0.9% 0.4% T5 Beyonics Technology 0.42 0.64 10% 222 528 1.2% 0.1% H First Engineering 1.14 1.58 47% 232 203 1.3% 0.6% B Mediaring 0.28 0.30 9% 249 904 1.4% 0.1% H Magnecomp 1.11 1.54 39% 262 236 1.4% 0.6% T5 Huan Hsin 0.69 0.89 30% 274 400 1.5% 0.4% B Fu Yu Manufacturing 0.53 0.72 37% 311 593 1.7% 0.6% B DMX Technologies 0.87 1.07 23% 328 377 1.8% 0.4% B MMI 0.69 0.70 1% 401 581 2.2% 0.0% H Unisteel Technology 1.87 2.09 12% 472 253 2.6% 0.3% H Global Voice 0.21 0.26 24% 503 2,395 2.7% 0.7% B MFS Technology 0.78 0.79 1% 504 647 2.7% 0.0% H GES International 0.96 0.98 2% 710 740 3.9% 0.1% H Jurong Technologies 1.84 2.41 31% 746 405 4.1% 1.3% B Datacraft 1.07 1.01 -6% 836 467 4.6% -0.3% FV UTAC 0.80 1.03 10% 1,172 1,465 6.4% 0.6% H Creative 14.30 18.10 27% 1,210 85 6.6% 1.8% B Hi-P International 1.70 1.71 1% 1,508 887 8.2% 0.0% H STAT ChipPAC 1.16 1.18 2% 2,292 1,976 12.5% 0.2% H TPV Technology 1.78 1.96 10% 2,495 1,402 13.6% 1.4% H CSM 1.33 1.59 20% 3,343 2,513 18.2% 3.6% B Venture Corporation 13.90 16.00 15% 3,746 269 20.4% 3.1% B Aggregate Total 18,363 16% Source: DBSV Research, Bloomberg, Respective Companies • Digital lifestyle electronics to take centre stage. We believe new generation of digital lifestyle electronics such as living room consumer electronics personal digital devices will show strong growth prospects in the current year. Flat panel TVs in our view should see strong growth in 2006. LCD TVs should grow 55% while plasma TVs sales could expand by 84%. Next generation video gaming consoles that are equipped with significantly more powerful microprocessor and could double up as a new digital entertainment center is also expected to show good growth prospects driven by the launch of Xbox360 and the impending launch of Sony’s Playstation 3 and Nintendo Revolution. Separately, personal digital devices segment that covers mobile phones, personal entertainment devices such as MP3 players and personal video players should maintain good growth momentum driven by increasing adoption as well as replacement demand driven by early adopters. Among the SGX companies Creative Technology and TPV Technology are front-runners with the most direct exposure to the digital lifestyle electronics segment. Other manufacturers have some exposure to this segment either directly or indirectly. Those better positioned to benefit will include CSM, UTAC and Aztech Systems. • Other themes that should emerge. We also highlight three other themes that should emerge as strong growth themes. These include strong growth in VoIP adoption, expansion of electronics content in automotives and the rise of the Asian digital consumers. We expect VoIP adoption to continue at a breakneck speed especially in countries where broadband penetration rates are higher. For example in US, Gartner is expecting the 5.2% VoIP penetration rate among residential household to expand to 18% by 2008. Separately, we believe the further inclusion of electronics content such as digital radio receivers, GPS navigation systems and electronic climate control units in automotive to increase demand for electronic manufacturing and development services. Finally,
Technology Sector
4
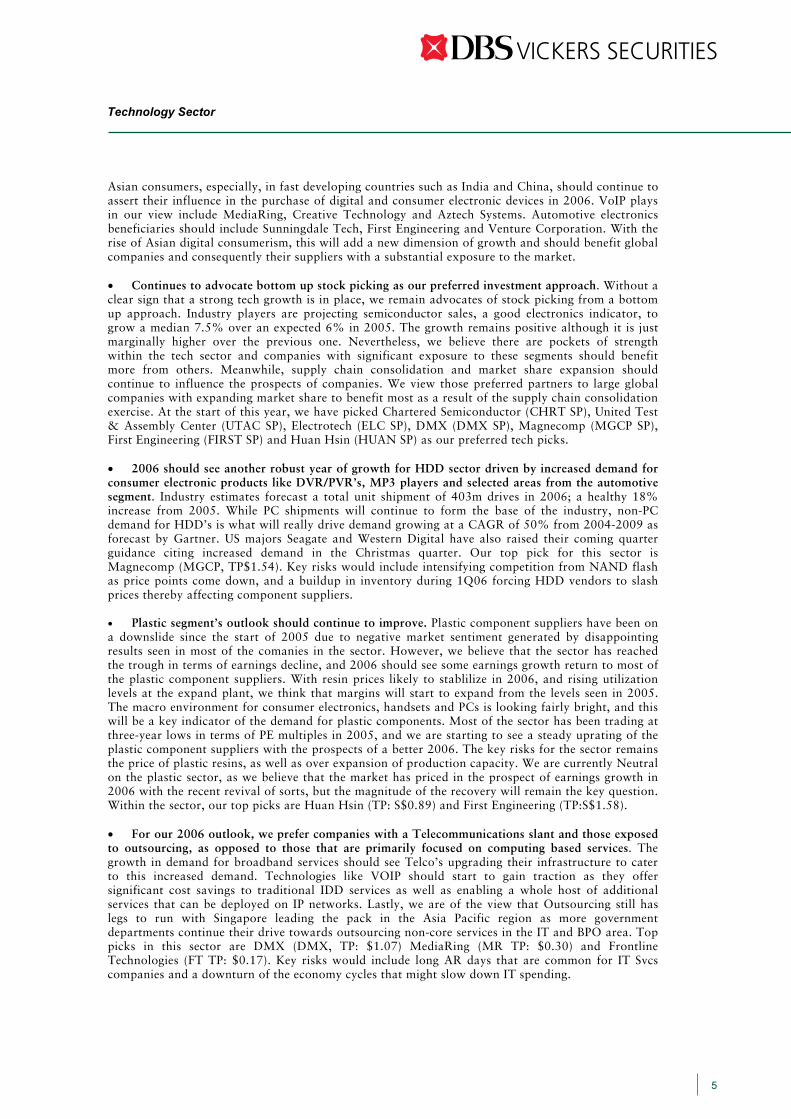
Asian consumers, especially, in fast developing countries such as India and China, should continue to assert their influence in the purchase of digital and consumer electronic devices in 2006. VoIP plays in our view include MediaRing, Creative Technology and Aztech Systems. Automotive electronics beneficiaries should include Sunningdale Tech, First Engineering and Venture Corporation. With the rise of Asian digital consumerism, this will add a new dimension of growth and should benefit global companies and consequently their suppliers with a substantial exposure to the market. • Continues to advocate bottom up stock picking as our preferred investment approach. Without a clear sign that a strong tech growth is in place, we remain advocates of stock picking from a bottom up approach. Industry players are projecting semiconductor sales, a good electronics indicator, to grow a median 7.5% over an expected 6% in 2005. The growth remains positive although it is just marginally higher over the previous one. Nevertheless, we believe there are pockets of strength within the tech sector and companies with significant exposure to these segments should benefit more from others. Meanwhile, supply chain consolidation and market share expansion should continue to influence the prospects of companies. We view those preferred partners to large global companies with expanding market share to benefit most as a result of the supply chain consolidation exercise. At the start of this year, we have picked Chartered Semiconductor (CHRT SP), United Test & Assembly Center (UTAC SP), Electrotech (ELC SP), DMX (DMX SP), Magnecomp (MGCP SP), First Engineering (FIRST SP) and Huan Hsin (HUAN SP) as our preferred tech picks. • 2006 should see another robust year of growth for HDD sector driven by increased demand for consumer electronic products like DVR/PVR’s, MP3 players and selected areas from the automotive segment. Industry estimates forecast a total unit shipment of 403m drives in 2006; a healthy 18% increase from 2005. While PC shipments will continue to form the base of the industry, non-PC demand for HDD’s is what will really drive demand growing at a CAGR of 50% from 2004-2009 as forecast by Gartner. US majors Seagate and Western Digital have also raised their coming quarter guidance citing increased demand in the Christmas quarter. Our top pick for this sector is Magnecomp (MGCP, TP$1.54). Key risks would include intensifying competition from NAND flash as price points come down, and a buildup in inventory during 1Q06 forcing HDD vendors to slash prices thereby affecting component suppliers. • Plastic segment’s outlook should continue to improve. Plastic component suppliers have been on a downslide since the start of 2005 due to negative market sentiment generated by disappointing results seen in most of the comanies in the sector. However, we believe that the sector has reached the trough in terms of earnings decline, and 2006 should see some earnings growth return to most of the plastic component suppliers. With resin prices likely to stablilize in 2006, and rising utilization levels at the expand plant, we think that margins will start to expand from the levels seen in 2005. The macro environment for consumer electronics, handsets and PCs is looking fairly bright, and this will be a key indicator of the demand for plastic components. Most of the sector has been trading at three-year lows in terms of PE multiples in 2005, and we are starting to see a steady uprating of the plastic component suppliers with the prospects of a better 2006. The key risks for the sector remains the price of plastic resins, as well as over expansion of production capacity. We are currently Neutral on the plastic sector, as we believe that the market has priced in the prospect of earnings growth in 2006 with the recent revival of sorts, but the magnitude of the recovery will remain the key question. Within the sector, our top picks are Huan Hsin (TP: S$0.89) and First Engineering (TP:S$1.58). • For our 2006 outlook, we prefer companies with a Telecommunications slant and those exposed to outsourcing, as opposed to those that are primarily focused on computing based services. The growth in demand for broadband services should see Telco’s upgrading their infrastructure to cater to this increased demand. Technologies like VOIP should start to gain traction as they offer significant cost savings to traditional IDD services as well as enabling a whole host of additional services that can be deployed on IP networks. Lastly, we are of the view that Outsourcing still has legs to run with Singapore leading the pack in the Asia Pacific region as more government departments continue their drive towards outsourcing non-core services in the IT and BPO area. Top picks in this sector are DMX (DMX, TP: $1.07) MediaRing (MR TP: $0.30) and Frontline Technologies (FT TP: $0.17). Key risks would include long AR days that are common for IT Svcs companies and a downturn of the economy cycles that might slow down IT spending.
Technology Sector
5

Technology Sector
•
dependent upon consumer confidence and consumer purchase. Slowdown in global and more specific economic growth (a/c for >20% of global GDP) should affect the health of end demand. Sustained interest rate hike should also have an adverse impact on the sector’s outlook while volatilities in prices of raw materials and shortages in certain key components could affect overall health of the sector. Meanwhile, with most currencies expected to depreciate against the USD, this could once again affect reported earnings of some companies with significant exposure to USD sales and production costs denominated in Asian currencies. Other “out of our control” or unpredictable risks type such as natural catastrophes, flu epidemic and terrorist attacks could spring a global surprise and affect global growth negatively. This should have negative implications on the sector.
6
Risk factors. For the sector, macroeconomic risk should be most influential. Demand is
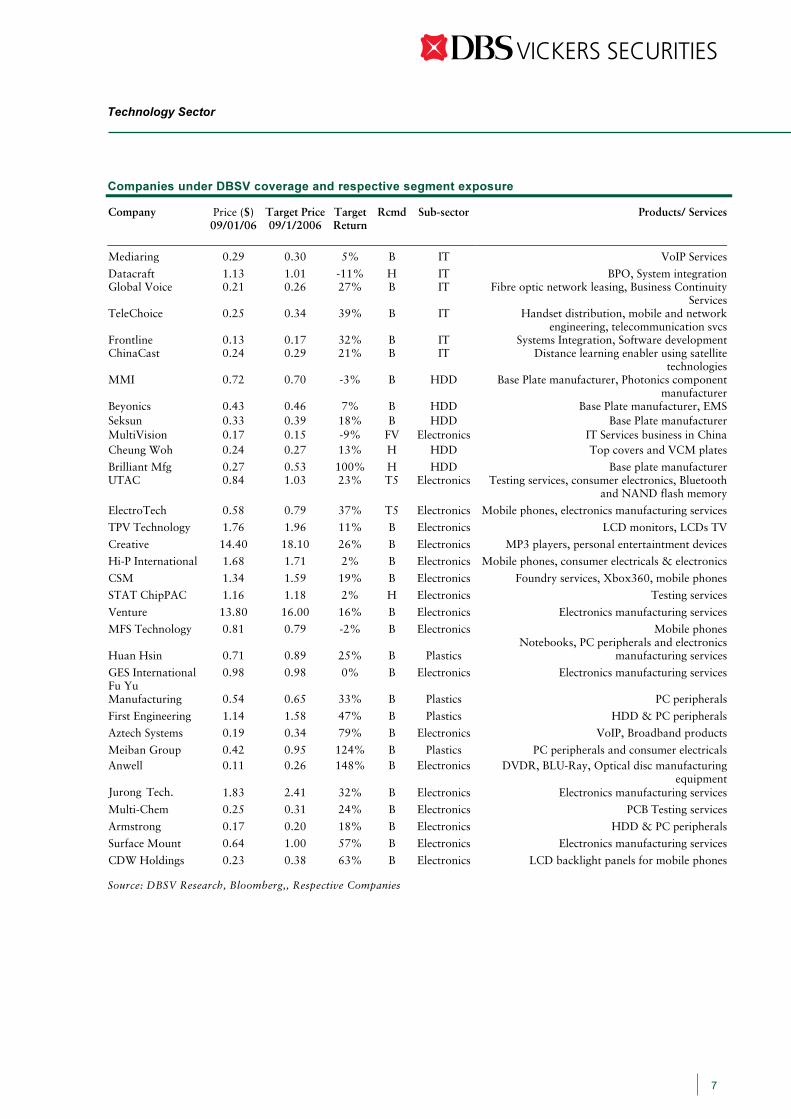
Companies under DBSV coverage and respective segment exposure
Company Price ($) 09/01/06
Target Price 09/1/2006
Target Return
Rcmd Sub-sector Products/ Services
Mediaring 0.29 0.30 5% B IT VoIP Services
Datacraft 1.13 1.01 -11% H IT BPO, System integrationGlobal Voice 0.21 0.26 27% B IT Fibre optic network leasing, Business Continuity
ServicesTeleChoice 0.25 0.34 39% B IT Handset distribution, mobile and network
engineering, telecommunication svcsFrontline 0.13 0.17 32% B IT Systems Integration, Software developmentChinaCast 0.24 0.29 21% B IT Distance learning enabler using satellite
technologiesMMI 0.72 0.70 -3% B HDD Base Plate manufacturer, Photonics component
manufacturerBeyonics 0.43 0.46 7% B HDD Base Plate manufacturer, EMSSeksun 0.33 0.39 18% B HDD Base Plate manufacturerMultiVision 0.17 0.15 -9% FV Electronics IT Services business in ChinaCheung Woh 0.24 0.27 13% H HDD Top covers and VCM plates
Brilliant Mfg 0.27 0.53 100% H HDD Base plate manufacturerUTAC 0.84 1.03 23% T5 Electronics Testing services, consumer electronics, Bluetooth
and NAND flash memory
ElectroTech 0.58 0.79 37% T5 Electronics Mobile phones, electronics manufacturing services
TPV Technology 1.76 1.96 11% B Electronics LCD monitors, LCDs TV
Creative 14.40 18.10 26% B Electronics MP3 players, personal entertaintment devices
Hi-P International 1.68 1.71 2% B Electronics Mobile phones, consumer electricals & electronics
CSM 1.34 1.59 19% B Electronics Foundry services, Xbox360, mobile phones
STAT ChipPAC 1.16 1.18 2% H Electronics Testing services
Venture 13.80 16.00 16% B Electronics Electronics manufacturing services
MFS Technology 0.81 0.79 -2% B Electronics Mobile phones
Huan Hsin 0.71 0.89 25% B Plastics Notebooks, PC peripherals and electronics
manufacturing services
GES International 0.98 0.98 0% B Electronics Electronics manufacturing servicesFu Yu Manufacturing 0.54 0.65 33% B Plastics PC peripherals
First Engineering 1.14 1.58 47% B Plastics HDD & PC peripherals
Aztech Systems 0.19 0.34 79% B Electronics VoIP, Broadband products
Meiban Group 0.42 0.95 124% B Plastics PC peripherals and consumer electricalsAnwell 0.11 0.26 148% B Electronics DVDR, BLU-Ray, Optical disc manufacturing
equipmentJurong 1.83 2.41 32% B Electronics Electronics manufacturing services
Multi-Chem 0.25 0.31 24% B Electronics PCB Testing services
Armstrong 0.17 0.20 18% B Electronics HDD & PC peripherals
Surface Mount 0.64 1.00 57% B Electronics Electronics manufacturing services
CDW Holdings 0.23 0.38 63% B Electronics LCD backlight panels for mobile phones
Source: DBSV Research, Bloomberg,, Respective Companies
Technology Sector
7
Tech.

Technology – Still to Neutral for now
Maintain Neutral weighting on SGX Technology sector
During 4Q04, we saw a positive rebound in stock price performance for the technology segment and we believe the optimism in the sector could be sustained through the first half of 1Q06. Much of the optimism in the technology sector stemmed from better than expected US holiday sales over Thanksgiving, especially with electronics goods. In addition, one by one, 18 of 21 technology majors revised their earnings guidance upwards from mid-October. We also had confirmation of the upturn for technology stocks in Singapore with better than expected October and November IPI figures for the Singapore electronics industry.
We expect prices of tech stocks to remain buoyant during the first two months of the quarter due to the Capricorn effect, positive news flow from the sector, mostly in relation to earnings announcements and marginally upbeat growth forecasts painted for various technology segments.
DBS Electronics Leading Index – Near term weakness
Source: DBSV Research
Coming from a buoyant 4Q04 which we had an Overweight call, we have shifted to a neutral weight stance in the current quarter. Our DBS Electronics Leading Index - which leads by 3 to 6 months - has leveled off after rising over the last few months. Growth in US new orders for electronics and computer products appear to be easing, with leading indicators such as the US new orders to inventory and US new orders to shipment ratios leveling off. Non-oil retained imports for Singapore, a leading indicator for exports going forward, also fell off sharply in November. The electronic cycle appears to be getting shorter. There are also some signs that US electronic inventories are no longer falling, and may be rising slightly. A scenario of a modest and shallow positive tech recovery represents our baseline scenario, until more positive data confirms otherwise. If global chip sales achieve earlier forecast to grow 7.9% in 2006 compared to 6.8% in 2005, a modest improvement, we might see a scenario that beats our expectation. Regionally, the anticipated pick up in global electronics demand has translated into stronger electronics exports growth in Asian economies over the last few months, particularly Korea, Taiwan and Singapore. Electronics exports rose 8.5% in Oct 2005 in Singapore, the highest growth rate in 2005. Electronic exports in Korea and Taiwan remained robust at about 8.3% and 19.5% respectively in Nov 2005. This will help to lift GDP growth in the 4Q05 and 1H06 across tech-dependent Asian economies, bearing in mind that electronics and exports did little to contribute to growth in the first 9 months of 2005.
-60
-40
-20
0
20
40
60
Jan-99 Apr-00 Jul-01 Oct-02 Jan-04 Apr-05
-60
-40-20
020
40
6080
100120
140DBS ELIGlobal chip sales (3mma, %yoy)SGX: electronics (rhs)
% yoy
Latest: Dec05
3mma,% yoy
Technology Sector
8

Lower-than-expected PMI readings in December The purchasing managers’ index (PMI) for overall manufacturing posted a lower reading of 52.2 in December from 53.5 in November - below consensus expectations of 53.8 and our forecast of 53.3. All sub-indices, except inventory, moderated. Production almost reversed its 4.9-point gain in November, declining 3.9 points in December. New orders from the domestic market weakened, while new export orders were largely unchanged. Electronics PMI similarly shed 1.4 points in December, but with major sub-indices particularly new orders, new export orders, and production falling more sharply (Chart 1). The saving grace was a 3.4-point jump in the employment sub-index, which is consistent with company expectations to increase hiring in 4Q05. Electronic leading indices easing; a shallow tech recovery The latest PMI readings is in line with our view that IPI growth in December will moderate from the accelerated pace in October and November (Chart 2). Pharmaceuticals will likely see a dip given the high base in Dec 2005. The electronics sector has, of late, posted double-digit growth while the transport and engineering sector has been outstanding throughout 2005. The weaker December PMI suggests that the electronics recovery could be quite modest and shallow. Our DBS Electronics Leading Index (ELI) is showing some signs of weakness, contracting 1.8% y-o-y in November (Chart 3). Singapore’s non-oil retained imports declined sharply, while stocks of finished goods, an inversely-related indicator, rose. US indicators have also been stuttering, with both the semiconductor book-to-bill and electronics shipment-to-inventory ratios falling. Our DBS ELI leads electronics output by about 3 to 6 months. These telltale signs suggest that the slowdown in electronics output and exports could be evident by end-1Q06. Our 2006 GDP growth forecast of 5.3% already factors in a baseline scenario of a modest and shallow tech recovery. Manufacturing will likely revert to high single-digit growth in 2006, from the blistering double-digit growth seen in the second half of 2005. Electronics growth is expected to taper off in the second half of this year, while non-electronics, such as oil rig construction and biomed, should remain robust.
Chart 1: Lower electronics PMI readings in Dec05
Chart 2: Weak overall manufacturing output in Dec05
Source: SIPMM, CEIC, DBS
35
40
45
50
55
60
65
70
75
80
Jan-99 Jan-00 Jan-01 Jan-02 Jan-03 Jan-04 Jan-05 Jan-99 Jan-00 Jan-01 Jan-02 Jan-03 Jan-04 Jan-05
Electronics PMI
Production
New export orders
Index
Latest: Dec05
40
42
44
46
48
50
52
54
56
58
60
-40
-30
-20
-10
0
10
20
30
40
Mfg PMI: productionIPI (rhs)
Index
Latest: Dec05
% yoy
Source: SIPMM, CEIC, DBS
Technology Sector
9
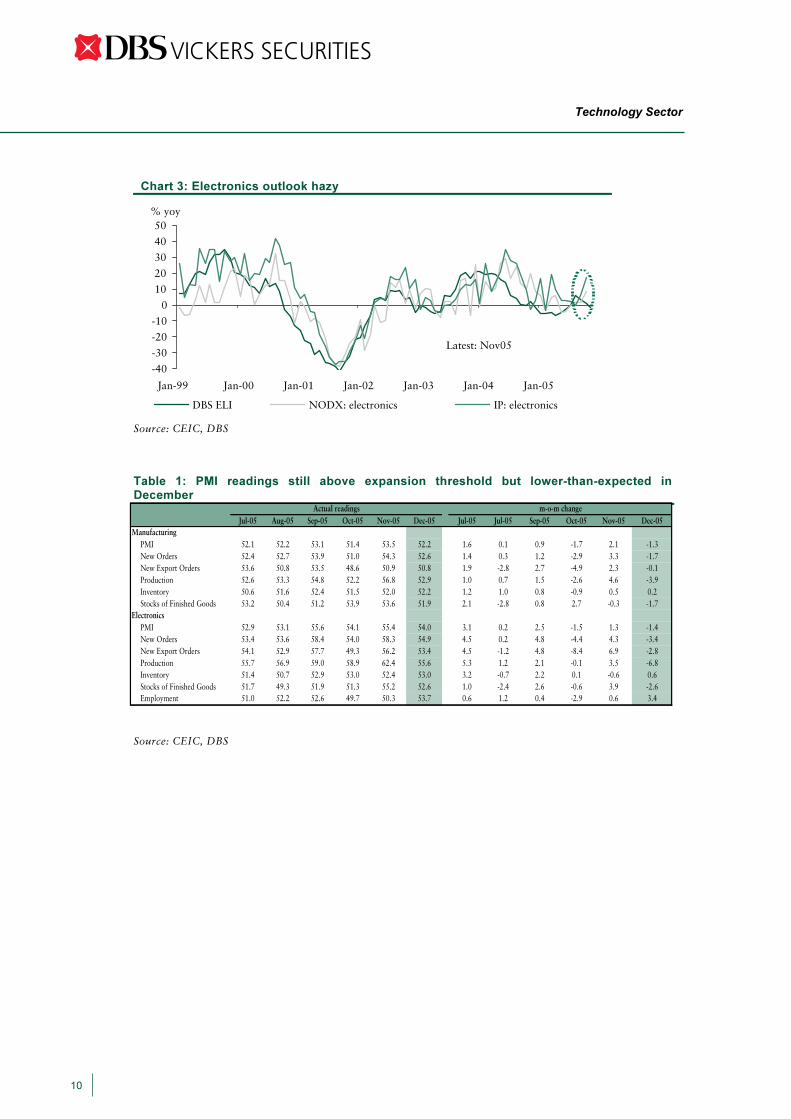
Chart 3: Electronics outlook hazy
Source: CEIC, DBS
Table 1: PMI readings still above expansion threshold but lower-than-expected in December
Source: CEIC, DBS
-40
-30
-20
-10
0
10
20
30
40
50
Jan-99 Jan-00 Jan-01 Jan-02 Jan-03 Jan-04 Jan-05
DBS ELI NODX: electronics IP: electronics
% yoy
Latest: Nov05
Jul-05 Aug-05 Sep-05 Oct-05 Nov-05 Dec-05 Jul-05 Jul-05 Sep-05 Oct-05 Nov-05 Dec-05Manufacturing
PMI 52.1 52.2 53.1 51.4 53.5 52.2 1.6 0.1 0.9 -1.7 2.1 -1.3New Orders 52.4 52.7 53.9 51.0 54.3 52.6 1.4 0.3 1.2 -2.9 3.3 -1.7New Export Orders 53.6 50.8 53.5 48.6 50.9 50.8 1.9 -2.8 2.7 -4.9 2.3 -0.1Production 52.6 53.3 54.8 52.2 56.8 52.9 1.0 0.7 1.5 -2.6 4.6 -3.9Inventory 50.6 51.6 52.4 51.5 52.0 52.2 1.2 1.0 0.8 -0.9 0.5 0.2Stocks of Finished Goods 53.2 50.4 51.2 53.9 53.6 51.9 2.1 -2.8 0.8 2.7 -0.3 -1.7
ElectronicsPMI 52.9 53.1 55.6 54.1 55.4 54.0 3.1 0.2 2.5 -1.5 1.3 -1.4New Orders 53.4 53.6 58.4 54.0 58.3 54.9 4.5 0.2 4.8 -4.4 4.3 -3.4New Export Orders 54.1 52.9 57.7 49.3 56.2 53.4 4.5 -1.2 4.8 -8.4 6.9 -2.8Production 55.7 56.9 59.0 58.9 62.4 55.6 5.3 1.2 2.1 -0.1 3.5 -6.8Inventory 51.4 50.7 52.9 53.0 52.4 53.0 3.2 -0.7 2.2 0.1 -0.6 0.6Stocks of Finished Goods 51.7 49.3 51.9 51.3 55.2 52.6 1.0 -2.4 2.6 -0.6 3.9 -2.6Employment 51.0 52.2 52.6 49.7 50.3 53.7 0.6 1.2 0.4 -2.9 0.6 3.4
Actual readings m-o-m change
Technology Sector
10

Technology – Crystal ball gazing in 2006 Last year, 2005, marked an interesting year for the global technology sector as a whole. New technology services and innovative products were introduced throughout the year. Many gained early acceptance while others became ubiquitous. There was no lack of trend shift as we saw the great promise of micro hard disk drives snubbed by NAND flash storage memory. Early prediction of mass adoption of DDRII memory fell below expectations as chipset shortages hindered the shift. Meanwhile, we also saw the merits of design, innovation and powerful brand exercises that helped to expand market share of some companies, notably, - Apple and Motorola. IP telephony also powered ahead strongly this year, which culminated in Ebay buying Skype for US$2.6bn. Earlier, we have identified 3G phones, notebooks, MP3 players and flat screen display monitors and TVs as the faster growing products for the year. With the exception of 3G phones (which nevertheless still saw growth) the demand for the other products, as we had expected, was strong given anecdotal evidence as well as the subsequent revision to earlier projections by various industry forecasters such as Gartner and iSuppli. For the current year, 2006, we identify several macro/product drivers that may influence and shape the global technology landscape. This exercise is critical as it shapes and formulates our expectations for the technology sector for the year. Subsequently, this will flow into our assumptions and expectations behind our forecasts and evaluations for companies that fall under the SGX Technology sector. The key trends we believe will play an important role in shaping the demand landscape for global technology companies and their related component suppliers are: a. Scope broadens and deepens for the Digital Home b. Proliferation and convergence of personal digital products c. Internet Telephony and Video Communication d. Electronics content in automotive set to expand e. Rise of the Asian Digital Consumers Scope broadens and deepens for the Digital Home
The digital home should continue to grab more limelight this year as we expect various new initiatives to encourage consumers to replace ageing home entertainment system, electronics home appliances and home desktop PCs. The arena is exciting and the prospects are very good given the paraphernalia available out there to lure increased purchase. Let’s review the prospects.
Flat panel display (FPD)
With falling panel prices, flat screen TVs, increasingly, are becoming ubiquitous in households. Besides its aesthetic factor, increased digital broadcasting of high definition TV (HDTV) programs are motivating consumers to upgrade and replace in order to receive these new digital programs. According to a survey done by the Consumer Electronics Association (CEA) market research team, the percentage of people who say their next TV will definitely be a HDTV has jumped to 21% from 12% in 2003. Meanwhile the popularity of high resolution DVD movie playback has coincided with consumers’ quest to build a home theater system. Hence the adoption of high resolution, high definition wide but flat screen TVs expanded. The two most popular flat screen TVs are LCD TVs and Plasma TVs. The more popular LCD TV is expected to register a 55% growth in 2006 while Plasma TV should see shipment increase by 84%
Digital Video Recorders (DVR)
After the first VHS Video Camera Recorder was released in 1977, it swept consumers off their feet as it finally freed them off the very sticky relationship with the google box. Previously, TV viewers had no way to record TV programs that they would miss and this has inconvenienced many. The liberation was significant as it was thought 20 years after the introduction of the VCR. The video rental business in US generated revenues of US$7.7bn during the period. With the gradual proliferation of HD TV content and
Technology Sector
11
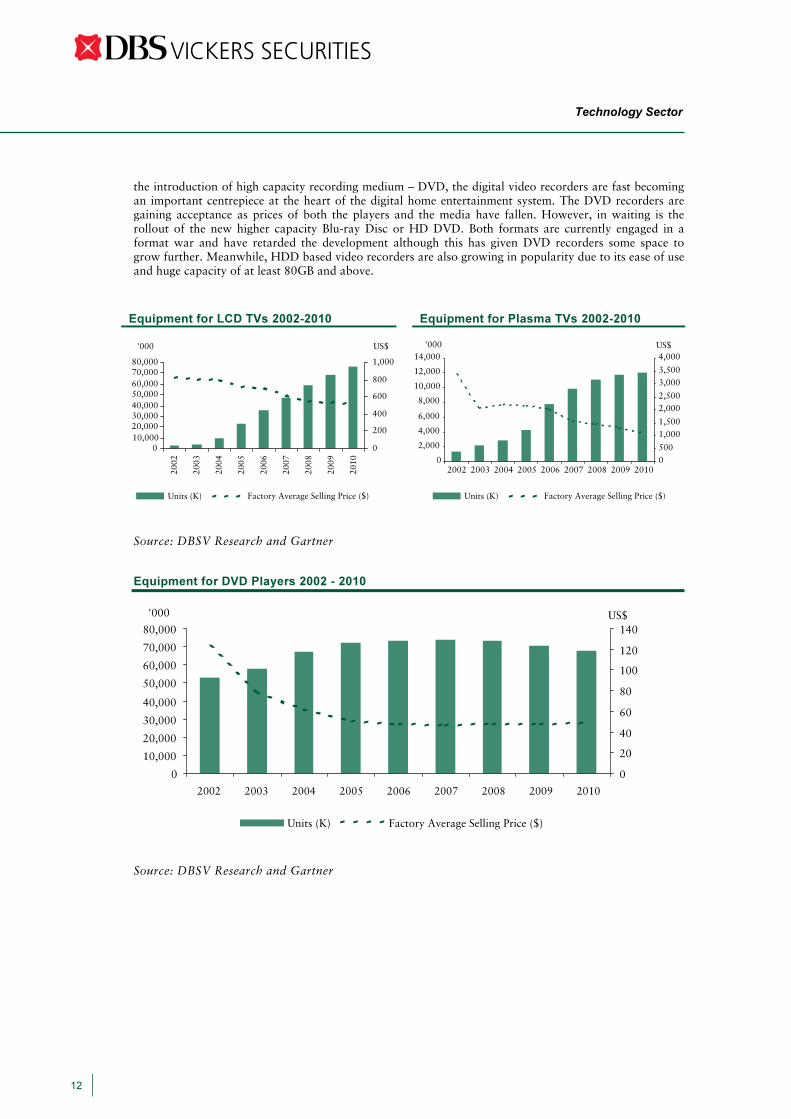
the introduction of high capacity recording medium – DVD, the digital video recorders are fast becoming an important centrepiece at the heart of the digital home entertainment system. The DVD recorders are gaining acceptance as prices of both the players and the media have fallen. However, in waiting is the rollout of the new higher capacity Blu-ray Disc or HD DVD. Both formats are currently engaged in a format war and have retarded the development although this has given DVD recorders some space to grow further. Meanwhile, HDD based video recorders are also growing in popularity due to its ease of use and huge capacity of at least 80GB and above.
Equipment for LCD TVs 2002-2010 Equipment for Plasma TVs 2002-2010
Source: DBSV Research and Gartner
Equipment for DVD Players 2002 - 2010
Source: DBSV Research and Gartner
010,00020,00030,00040,00050,00060,00070,00080,000
'000
0
200
400
600
800
1,000
US$
0
10,000
20,000
30,000
40,000
50,000
60,000
70,000
80,000
'000
0
20
40
60
80
100
120
140US$
Units (K) Factory Average Selling Price ($)
0
2,000
4,000
6,000
8,000
10,000
12,000
14,000
2002 200520042003 2006 2009 201020082007
2002 200520042003 2006 2009 201020082007
2002
2005
2004
2003
2006
2009
2010
2008
2007
'000
0500
1,0001,500
2,0002,500
3,0003,500
4,000US$
Units (K) Factory Average Selling Price ($) Units (K) Factory Average Selling Price ($)
Technology Sector
12

Digital Music Players/ System
Digital audio or music players will continue to see significant demand growth through 2010. Technologies transition from analog recordings to digital ones is sweeping the music recording industry. Earlier music piracy, the use of file sharing networks and the threat of billions of lost revenues have spurred the recording industry to initiate a legal battle in which they won. While some thought it marked the end of the digital music era, who would have guessed that Apple successfully launched legitimized iTunes music download service which integrate seamlessly with its hugely successful iPods series of digital audio players. When more than 100m songs were downloaded from iTunes in 2004, other service providers, mainly Internet portals with huge audience base, started to offer similar music download services. With the emergence of licensed digital music and its subsequent boom, it fired sales of digital MP3 players. This growth is expected to continue through 2010, according to Gartner’s projection. Although it was optimistic of strong growth for 1” hard drive players back in May 2005, Apple’s latest iPod Nano have resulted in a resurgence of Flash Memory digital audio players as the fastest growing product category. However, HDD digital audio players will remain sought after due to its larger storage capacity, low price per megabyte and a shrinking form factor. Flash memory digital audio players will be sought after mainly for its form factor and efficient power consumption. Based on its latest revision, which came after the launch of the iPod Nano in Sep 2005, Gartner now expects HDD digital audio player shipment to peak in 2007 with 33m units (from 14m units in 2004). Similarly, shipment of Flash memory audio players will peak in 2009 with more than 132m units (from 27m units in 2004) manufactured. For HDD players, unit CAGR growth and revenue CAGR growth between 2005 and 2010 are –2.2% and –7.6% respectively. For Flash players, unit CAGR growth and revenue CAGR growth between 2005 and 2010 are +10.8% and +3.6% respectively. Nevertheless, HDD players are poised to register a 27% unit shipment growth while flash memory players should register a 42% unit shipment growth.
Equipment for Flash MP3 Players 2002-2010 Equipment for HDD MP3 Players 2002-2010
Source: DBSV Research, Bloomberg, and Gartner
Game Consoles
0
20,000
40,000
60,000
80,000
100,000
120,000
140,000
'000
020406080100120140160180
US$
Units (K) Factory Average Selling Price ($) Units (K) Factory Average Selling Price ($)
2002 200520042003 2006 2009 2010200820070
5,000
10,000
15,000
20,000
25,000
30,000
35,000
'000
0
50
100
150
200
US$
2002 200520042003 2006 2009 201020082007
Technology Sector
13
The stage has been set for strong year of growth in 2006. The launch of Xbox360 was done amid much pomp and fanfare and the current shortfall in supply seem to be well orchestrated to create further hype. Sony’s Playstation 3 will be launched within the first quarter of the year and all eyes will be on its rollout and the market’s response towards the product. With Microsoft having established the early lead, Sony will be hard pressed to avoid any further delay to its planned product launched. Nintendo Revolution, Nintendo’s answer for the next generation video game console will be launched in 1H06. With the three hardware game console vendors already or slated to launch their respective next generation video game consoles, 2006 should herald an exceptional year for their electronic gaming hardware industry. According to a market research from Consumer Electronics Association, shipment revenues are expected to increase 18% to US$3.72bn in 2005 from US$3.16bn in 2004 and a further 35% to US$5.04bn in 2006. These next generation video game consoles sport much higher processing capabilities and the

Semiconductor consumption for Video Games Consoles 2002-2010
Source: DBSV Research and Gartner
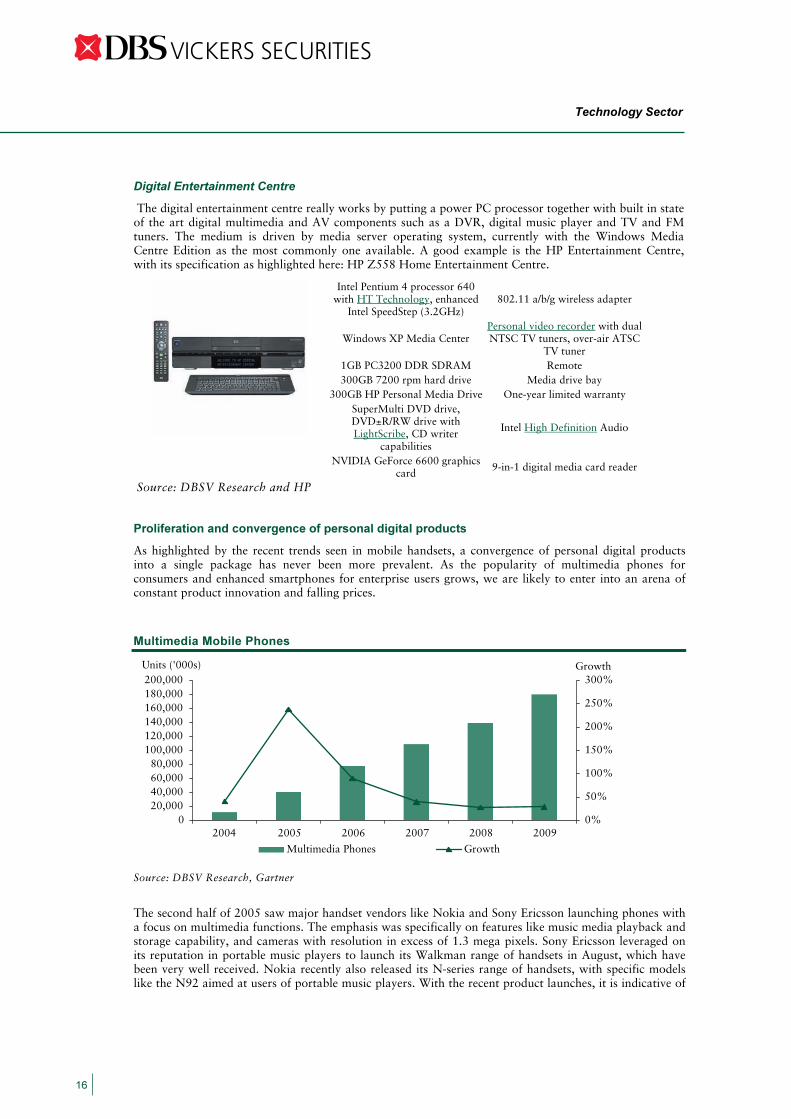
Set-top Boxes
A Set-top box is a household device that is connected to a television and an external signal source e.g. a TV program broadcaster. The box is a medium where the signal is decoded and converted into content on the television screen. Set-top boxes can be classified into digital, cable, IP and terrestrial ones. IP and terrestrial set-top boxes are expected to register stronger growth rates. IP set-top boxes will be supplied by IPTV network companies and it is really a medium that facilitates two-way communications on an IP network and the decoding of video streaming media. Terrestrial set-top boxes, on the other hand will decode signals, which are radio frequencies that are similar to analog TV signals. However, the key differences are the quality of the TV definition and audio and the more important fact that it uses multiplex transmitters that allow for the reception of multiple channels on a single frequency range.
0
5,000
10,000
15,000
20,000
25,000
30,000
35,000
40,000'000
0
20
40
60
80
100
120
140
160
180
200US$
Units (K) Factory Average Selling Price ($)
2002 200520042003 2006 2009 201020082007
Technology Sector
14
Xbox360 and PS3 will also support high definition video, built-in wireless connectivity, wireless controllers and removable hard disk storage according to CEA. Besides these improvements, the next generation gaming console is also heading towards the arena where it will attempt to establish itself as the hub of the digital home (Respective Company’s strategy).
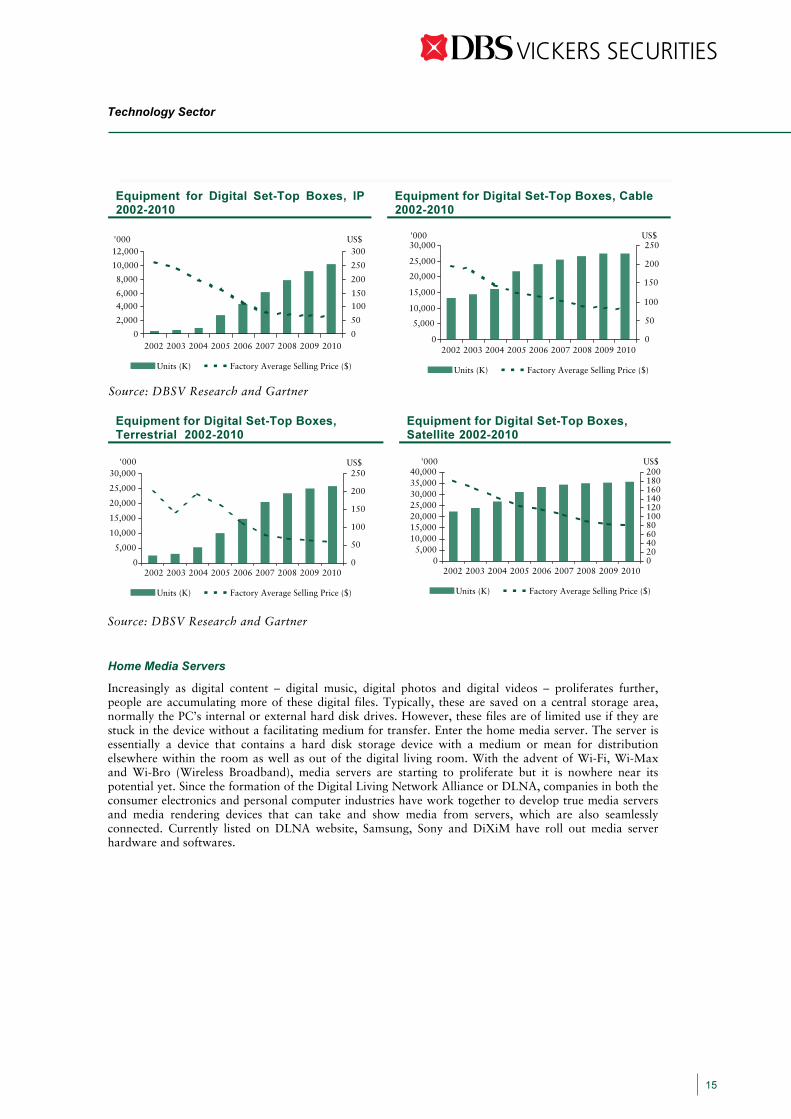
Equipment for Digital Set-Top Boxes, IP 2002-2010
Equipment for Digital Set-Top Boxes, Cable 2002-2010
Source: DBSV Research and Gartner
Equipment for Digital Set-Top Boxes, Terrestrial 2002-2010
Equipment for Digital Set-Top Boxes,
Source: DBSV Research and Gartner
Home Media Servers
Increasingly as digital content – digital music, digital photos and digital videos – proliferates further, people are accumulating more of these digital files. Typically, these are saved on a central storage area, normally the PC’s internal or external hard disk drives. However, these files are of limited use if they are stuck in the device without a facilitating medium for transfer. Enter the home media server. The server is essentially a device that contains a hard disk storage device with a medium or mean for distribution elsewhere within the room as well as out of the digital living room. With the advent of Wi-Fi, Wi-Max and Wi-Bro (Wireless Broadband), media servers are starting to proliferate but it is nowhere near its potential yet. Since the formation of the Digital Living Network Alliance or DLNA, companies in both the consumer electronics and personal computer industries have work together to develop true media servers and media rendering devices that can take and show media from servers, which are also seamlessly connected. Currently listed on DLNA website, Samsung, Sony and DiXiM have roll out media server hardware and softwares.
0
2,000
4,000
6,000
8,000
10,000
12,000'000
0
50
100
150
200
250
300US$
0
5,000
10,000
15,000
20,000
25,000
30,000'000
0
50
100
150
200
250US$
Units (K) Factory Average Selling Price ($)
2002 200520042003 2006 2009 201020082007
05,000
10,00015,00020,00025,00030,00035,00040,000
'000
020406080100120140160180200
US$
Units (K) Factory Average Selling Price ($)
2002 200520042003 2006 2009 2010200820070
5,000
10,000
15,000
20,000
25,000
30,000'000
0
50
100
150
200
250US$
Units (K) Factory Average Selling Price ($)
2002 200520042003 2006 2009 201020082007
Units (K) Factory Average Selling Price ($)
2002 200520042003 2006 2009 201020082007
Technology Sector
15
Satellite 2002-2010
Digital Entertainment Centre
The digital entertainment centre really works by putting a power PC processor together with built in state of the art digital multimedia and AV components such as a DVR, digital music player and TV and FM tuners. The medium is driven by media server operating system, currently with the Windows Media Centre Edition as the most commonly one available. A good example is the HP Entertainment Centre, with its specification as highlighted here: HP Z558 Home Entertainment Centre.
Intel Pentium 4 processor 640 with HT Technology, enhanced
Intel SpeedStep (3.2GHz) 802.11 a/b/g wireless adapter
Windows XP Media Center Personal video recorder with dual NTSC TV tuners, over-air ATSC
TV tuner 1GB PC3200 DDR SDRAM Remote 300GB 7200 rpm hard drive Media drive bay
300GB HP Personal Media Drive One-year limited warranty SuperMulti DVD drive, DVD±R/RW drive with LightScribe, CD writer
capabilities
Intel High Definition Audio
NVIDIA GeForce 6600 graphics card 9-in-1 digital media card reader
Source: DBSV Research and HP
Proliferation and convergence of personal digital products
As highlighted by the recent trends seen in mobile handsets, a convergence of personal digital products into a single package has never been more prevalent. As the popularity of multimedia phones for consumers and enhanced smartphones for enterprise users grows, we are likely to enter into an arena of constant product innovation and falling prices.
Multimedia Mobile Phones
Source: DBSV Research, Gartner
The second half of 2005 saw major handset vendors like Nokia and Sony Ericsson launching phones with a focus on multimedia functions. The emphasis was specifically on features like music media playback and storage capability, and cameras with resolution in excess of 1.3 mega pixels. Sony Ericsson leveraged on its reputation in portable music players to launch its Walkman range of handsets in August, which have been very well received. Nokia recently also released its N-series range of handsets, with specific models like the N92 aimed at users of portable music players. With the recent product launches, it is indicative of
020,00040,00060,00080,000
100,000120,000140,000160,000180,000200,000
2004 2005 2006 2007 2008 2009
Growth
0%
50%
100%
150%
200%
250%
300%Units ('000s)
Multimedia Phones Growth
Technology Sector
16

the fact that mobile phones featuring portable music devices are clearly gaining traction with mobile subscribers. This shift in the function of mobile handsets away from being entirely voice/text-centric started in the late 1990s. Currently, falling prices and emerging telecommunication markets in developing economies are continuing to support the demand for the handsets with lower end features. However, as the availability and popularity of multimedia feature rich handsets (such as MP3 playback, MPEG-4 decoders, FM radios, speakerphone operation, SD card slots, USB connectivity) continue to grow, subscribers are expected to switch from basic enhanced handsets.
3G Mobile Phones
Source: DBSV Research, Gartner
The next wave of handset growth is expected to be fueled by the popularity of 3G enabled phones on WCDMA, 1xEV-DO, and HSDPA (3.5G) networks. Currently, 2/2.5G phones on GSM networks (GSM, GPRS and EDGE) are still dominant in the market, accounting for 70% of all mobile terminals sold. As operators shift towards the more cost efficient 3G infrastructure from 2G for voice and data, 60% of all mobile terminals sold are expected to be 3G handsets by 2010. The applications that might drive consumer demand for 3G handsets could be mobile content like music downloads and video broadcast. While it is probably a safe bet that the popularity of 3G handsets will continue to rise, only selected markets are ready for it. 3G handset shipments to developed markets are expected to continue increasing, while 2/2.5G handsets will still be dominant in the emerging markets.
Enhanced Smart phones
Source: DBSV Research, Gartner
0
20,000
40,000
60,000
80,000
100,000
120,000
2004 2005 2006 2007 2008 2009
Growth
0%
100%
200%
300%
400%
500%
600%
700%Units ('000s)
Enhanced Smartphones Growth
0
100,000
200,000
300,000
400,000
500,000
600,000
2004 2005 2006 2007 2008 2009
Growth
0%
100%
200%
300%
400%
500%
600%Units ('000s)
3G Handsets Growth
Technology Sector
17
While enhanced smartphones (with enterprise capabilities like wireless e-mail, personal information management software, security and device management features) currently form a small percentage of the total mobile market as a whole, they do provide significantly higher margins than low-end phones for manufacturers. Lower end PDAs have seen their market share decline, as more affordable and feature packed smartphones came onto the market. The switch of users from lower end PDAs to enhanced smartphones, and increased enterprise users have seen shipment units grow by nearly seven-fold in 2004 and an estimated 230% increase in 2005. This trend of growth is expected to continue, albeit at a more modest pace. By 2009, enhanced smartphones are expected to comprise nearly 10% of total handset units shipped, up from 1.6% in 2005.
Internet Telephony and Video Communication
Internet Telephony, Voice over Internet Protocol or VoIP is set to see sharp growth with the number of residential VoIP users expected to increase to 197.2m by 2010 from 4.8m in 2004 and along the way powers wireline VoIP sales to $24.5bn from $8.04bn in 2004over the next years, causing market revenue for wireline VoIP equipment to more than triple from 2004 to reach $24.5bn in annual revenue in 2010, according to iSuppli Corp. The residential segment is expected to be the fastest growing segment with revenue expanding to $10.6bn by 2010 from $1.4bn currently. Japan and America are expected to dominate the residential VoIP subscriber market. They currently account for 83% of subscribers and even by 2010, they should account for more than 56.4% of VoIP subscribers. VoIP telephony service among US households is growing. According to Gartner’s assessment and forecast over VoIP telephony services among residential users, we can expect further growth over the next three years. Accordingly, VoIP connections could account for as much as 18% of US household telephony lines by 2008, up from just 5.2% expected this year, 2005. Although we recognize the fact that broadband penetration rates are among the highest in US, which is a key driver of VoIP usage, growth of VoIP services is undeniably strong among residential households. We expect these growth rates to be replicated in other countries and see the highest growth rates emerge from countries with a well developed broadband infrastructure.
Technology Sector
18
Household Wireline Telephony Service, 2002-2008 (Millions of Lines)
2002 2003 2004 2005 2006 2007 2008CAGR
(%) Household Telephony Lines Traditional PSTN Lines 124.4 121.4 119.2 116.0 111.2 104.6 99.2 -4.0Growth (%) -2.1 -2.4 -1.8 -2.6 -4.1 -5.9 -5.2 -VoIP Connections 0.0 0.1 2.3 6.4 10.7 16.2 21.8 174.1Growth (%) NA NA 1528.4 176.6 68.5 51.5 34.5 -Total Household Telephony Lines 124.4 121.6 121.5 122.4 121.9 120.9 121.0 -0.1Growth (%) -2.1 -2.3 -0.1 0.7 -0.4 -0.9 0.1 -Distribution of Lines Primarily for Voice Communications PSTN (%) 100.0 99.9 98.1 94.8 91.2 86.6 82.0 -VoIP (%) 0.0 0.1 1.9 5.2 8.8 13.4 18.0 -
Source: DBSV Research and Gartner
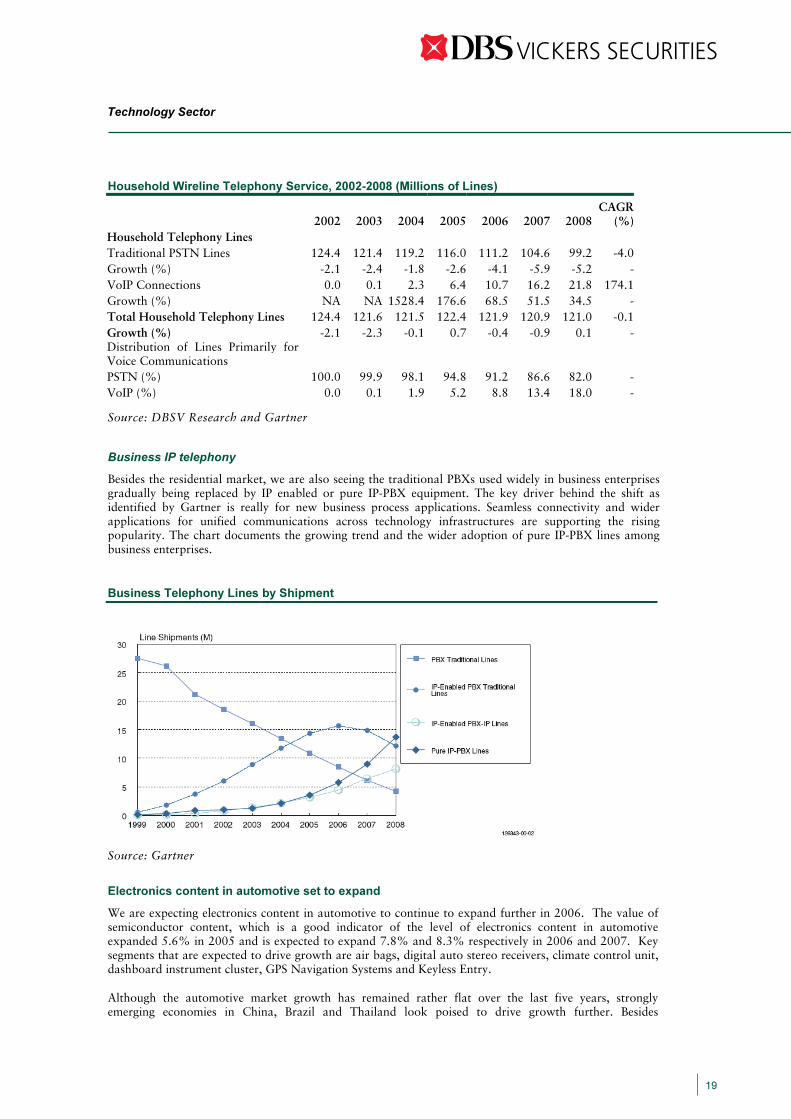
Business IP telephony
Besides the residential market, we are also seeing the traditional PBXs used widely in business enterprises gradually being replaced by IP enabled or pure IP-PBX equipment. The key driver behind the shift as identified by Gartner is really for new business process applications. Seamless connectivity and wider applications for unified communications across technology infrastructures are supporting the rising popularity. The chart documents the growing trend and the wider adoption of pure IP-PBX lines among business enterprises.
Business Telephony Lines by Shipment
Source: Gartner
Electronics content in automotive set to expand
We are expecting electronics content in automotive to continue to expand further in 2006. The value of semiconductor content, which is a good indicator of the level of electronics content in automotive expanded 5.6% in 2005 and is expected to expand 7.8% and 8.3% respectively in 2006 and 2007. Key segments that are expected to drive growth are air bags, digital auto stereo receivers, climate control unit, dashboard instrument cluster, GPS Navigation Systems and Keyless Entry.
Although the automotive market growth has remained rather flat over the last five years, strongly emerging economies in China, Brazil and Thailand look poised to drive growth further. Besides
Technology Sector
19

improvement in economies, another area of expansion is the amount of electronics content in car. Gartner is expecting the value of electronics of cars to reach about 30% of the cost of a new car by 2014. Besides the current stable of automotive electronics in car, new technologies and standards are likely to drive the use of electronics in automotive further. For example, Gartner believes networking technologies for electronic modules and systems such as Local Interconnect Network, Media Oriented Systems Transport and Safe-by-Wire Plus to have an impact on the use of electronics in automotive.
Currently, the highest values of electronics (semiconductor) content in automotive are airbags, antilock-braking systems, dashboard instrument clusters, GPS Navigation Systems and Engine control units. Car information and entertainment systems and safety enhancement systems would drive new areas of growth for electronics content in automotive. For safety systems, new enhancements such as active steering, brake-by-wire, Electronic Stability Program/ Electronic Stability Control, Auto Pilot, head up displays and lane departure warning and night vision enhancement systems are likely areas where new electronic content can be found. For car information and entertainment systems, there is likely convergence with current home, office or mobile electronics and the common electronic systems already found commonly could start to emerge in automotive. Those we expect to be included in automotives are flash memory storage, hard disk drive storage; CMOS image cameras, Bluetooth, remote diagnostics, digital radio, GPS systems and telematics.
Hype Circle for Automotive Electronics
Source: Gartner
Technology Sector
20

Electronics content in automotive expands
Source: Mentor Graphics
Semiconductor Consumption by Application, Worldwide, 2001-2010 (Millions of Dollars)
2004 2005 2006 2007 2008 2009 2010 CAGR
2005-2010
Automotive Electronics 15,759 16,645 17,952 19,434 21,315 21,553 23,241 6.9% Airbags 1,987 2,200 2,420 2,681 2,969 3,017 3,191 7.7% Antilock Braking Systems 1,653 1,680 1,737 1,821 2,000 1,996 2,123 4.8% Auto Stereo, Analog Receivers 795 731 736 745 777 707 695 -1.0% Auto Stereo, Digital Receivers 215 240 316 425 567 582 636 21.5% Climate Control Units 659 688 787 870 970 958 1,071 9.3% Dashboard InstrumentClusters 1,061 1,124 1,233 1,296 1,393 1,346 1,396 4.4% GPS Navigation Systems 1,732 2,000 2,309 2,599 3,015 3,337 3,788 13.6% Engine Control Units 2,891 2,986 3,159 3,376 3,675 3,611 3,736 4.6% Remote or Keyless Entry 230 246 271 285 320 315 336 6.4% Other Automotive Electronics 4,535 4,751 4,983 5,338 5,630 5,684 6,269 5.7%
Source: DBSV Research and Gartner
Technology Sector
21
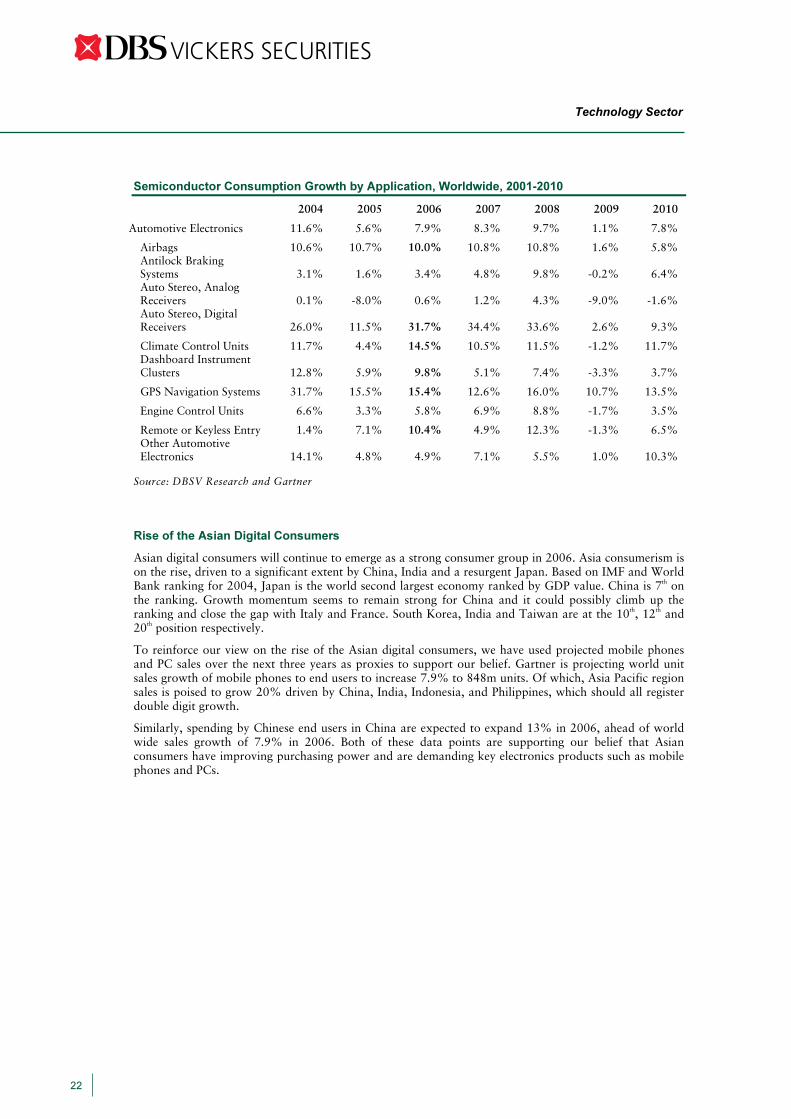
Semiconductor Consumption Growth by Application, Worldwide, 2001-2010
2004 2005 2006 2007 2008 2009 2010
Automotive Electronics 11.6% 5.6% 7.9% 8.3% 9.7% 1.1% 7.8%
Airbags 10.6% 10.7% 10.0% 10.8% 10.8% 1.6% 5.8%Antilock Braking Systems 3.1% 1.6% 3.4% 4.8% 9.8% -0.2% 6.4%Auto Stereo, Analog Receivers 0.1% -8.0% 0.6% 1.2% 4.3% -9.0% -1.6%Auto Stereo, Digital Receivers 26.0% 11.5% 31.7% 34.4% 33.6% 2.6% 9.3%
Climate Control Units 11.7% 4.4% 14.5% 10.5% 11.5% -1.2% 11.7%Dashboard Instrument Clusters 12.8% 5.9% 9.8% 5.1% 7.4% -3.3% 3.7%
GPS Navigation Systems 31.7% 15.5% 15.4% 12.6% 16.0% 10.7% 13.5%
Engine Control Units 6.6% 3.3% 5.8% 6.9% 8.8% -1.7% 3.5%
Remote or Keyless Entry 1.4% 7.1% 10.4% 4.9% 12.3% -1.3% 6.5%Other Automotive Electronics 14.1% 4.8% 4.9% 7.1% 5.5% 1.0% 10.3%
Source: DBSV Research and Gartner
Rise of the Asian Digital Consumers
Asian digital consumers will continue to emerge as a strong consumer group in 2006. Asia consumerism is on the rise, driven to a significant extent by China, India and a resurgent Japan. Based on IMF and World Bank ranking for 2004, Japan is the world second largest economy ranked by GDP value. China is 7th on the ranking. Growth momentum seems to remain strong for China and it could possibly climb up the ranking and close the gap with Italy and France. South Korea, India and Taiwan are at the 10th, 12th and 20th position respectively.
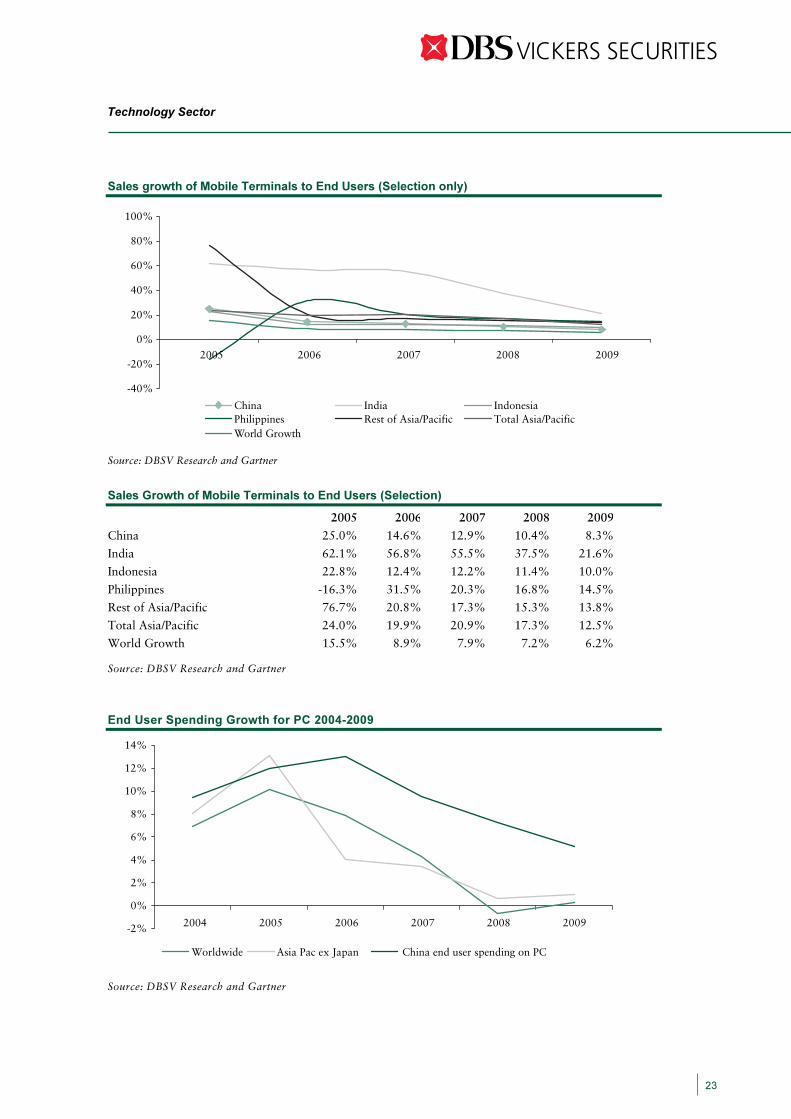
To reinforce our view on the rise of the Asian digital consumers, we have used projected mobile phones and PC sales over the next three years as proxies to support our belief. Gartner is projecting world unit sales growth of mobile phones to end users to increase 7.9% to 848m units. Of which, Asia Pacific region sales is poised to grow 20% driven by China, India, Indonesia, and Philippines, which should all register double digit growth.
Similarly, spending by Chinese end users in China are expected to expand 13% in 2006, ahead of world wide sales growth of 7.9% in 2006. Both of these data points are supporting our belief that Asian consumers have improving purchasing power and are demanding key electronics products such as mobile phones and PCs.
Technology Sector
22
Sales growth of Mobile Terminals to End Users (Selection only)
-40%
-20%
0%
20%
40%
60%
80%
100%
2005 2006 2007 2008 2009
2005 20062004 2007 2008 2009
China India IndonesiaPhilippines Rest of Asia/Pacific Total Asia/Pacific
-2%
0%
2%
4%
6%
8%
10%
12%
14%
Worldwide Asia Pac ex Japan
World Growth
Source: DBSV Research and Gartner
Sales Growth of Mobile Terminals to End Users (Selection)
2005 2006 2007 2008 2009
China 25.0% 14.6% 12.9% 10.4% 8.3%
India 62.1% 56.8% 55.5% 37.5% 21.6%
Indonesia 22.8% 12.4% 12.2% 11.4% 10.0%
Philippines -16.3% 31.5% 20.3% 16.8% 14.5%
Rest of Asia/Pacific 76.7% 20.8% 17.3% 15.3% 13.8%
Total Asia/Pacific 24.0% 19.9% 20.9% 17.3% 12.5%
World Growth 15.5% 8.9% 7.9% 7.2% 6.2% Source: DBSV Research and Gartner
End User Spending Growth for PC 2004-2009
Source: DBSV Research and Gartner
China end user spending on PC
Technology Sector
23

End User Spending Growth for PC 2004-2009
2004 2005 2006 2007 2008 2009Worldwide 6.9% 10.2% 7.9% 4.3% -0.6% 0.3%Asia Pac ex Japan 8.0% 13.1% 4.0% 3.4% 0.6% 0.9%China end user spending on PC 9.5% 12.0% 13.0% 9.5% 7.2% 5.2% Source: DBSV Research and Gartner Similarly, spending by Chinese end users in China are expected to expand 13% in 2006, ahead of world wide sales growth of 7.9% in 2006. Both of these data points are supporting our belief that Asian consumers have improving purchasing power and are demanding key electronics products such as mobile phones and PCs. GDP Growth
East Asia and Pacific 2003 2004 2005 2006 2007 GDP growth at market prices 8.0 8.3 7.4 6.9 7.2 GDP per capita, current USD 1154.3 1281.5 1469.4 1657.8 1976.3 Real per capita GDP growth 7.0 7.3 6.4 6.0 6.4 World 2003 2004 2005 2006 2007GDP growth at market prices 2.5 3.9 3.1 3.1 3.2GDP per capita, current USD 6099.2 6707.7 7194.9 7513.2 8010.2Real per capita GDP growth 1.4 2.7 2.0 2.1 2.2 Europe and Central Asia 2003 2004 2005 2006 2007GDP growth at market prices 5.9 6.8 5.5 4.9 5.0GDP per capita, current USD 2994.5 3634.9 4729.5 4849.4 4926.3Real per capita GDP growth 5.9 6.8 5.4 4.9 5.0 High Income Countries 2003 2004 2005 2006 2007GDP growth at market prices 1.9 3.2 2.4 2.6 2.6GDP per capita, current USD 30916.1 34038.3 36221.3 37957.6 40434.1Real per capita GDP growth 1.3 2.7 1.9 2.2 2.2 Source: DBSV Research, IMF and World Bank
Technology Sector
24

Technology – Risks abound, nothing is for sure
SGX’s tech related counters endured a tumultuous year in 2005 as several key factors influenced negatively on much of the sector’s earnings prospects. Sharp climb in various metals, oil and oil derivatives prices resulted in rising costs and lowered profitability at major technology companies. Extensive capacity expansion also drove profit lower as a result of start up losses, higher operating leverage and consequently lower factory utilization level. Interest rates hikes also hurt companies with higher gearing while demand uncertainty, especially in the United States that arose from the effect of two hurricanes and rising energy prices, also affected shipment and sales.
Raw material/ Energy price volatility
We are expecting oil price to remain stable and trade at an average rate of US$53 for 2006. Oil prices have been cited as the key factor that drives tech companies’ profitability lower in 2005. The impact of oil came either directly in the form of higher energy and component prices or indirectly through lower and more uncertain end demand as consumer tightens their purse and became more selective. Higher prices of oil derivatives such as plastic resins affected plastic manufacturing companies’ margins both directly and indirectly although recent capacity expansion and the lower utilization rates were also important factors in driving profits lower. Capacity/ Supply imbalances
Since 2000, the capacity and supply imbalances among technology companies have been monitored closely and kept in check. Companies and manufacturers are adding capacity carefully and are more disciplined in their approach towards it. Very clearly, we can see it from the pace of capacity expansion by semiconductor companies, where current cost to build a state of the art 300mm wafer fab could cost up to US$3bn. LCD manufacturing companies were facing oversupply issue in early 2005 but that has eased with the stronger than expected demand for the flat screen TV. The supply imbalances need to be monitored closely and companies need to ensure that any expansion keeps pace with demand expansion.
Strength of end demand
End demand health will always be a source of risk for companies and especially for companies with significant exposure to the consumer segment. Global GDP is expected to expand to 3.1% in 2005 and with US consumer confidence on the rise, it bodes well for consumer demand in 2006. At the same time, Asian consumers continue to assert its influence with important markets in South Korea, China, India and Indonesia maintaining its growth. As Japan seems to be emerging from a long period of deflationary pressure and benefiting from improving economic sentiment and consumer confidence, this second largest economy could play an important role in determining the direction and strength of global consumption of IT and digital products in 2006. Foreign exchange and interest rate volatilities
Sustained rate hikes in the United States drove the USD higher as capital flows into the country for investments in long-term asset instruments. The stronger USD was positive for most SGX listed tech companies as it resulted in favourable currency exposure since most had a significant portion of sales denominated in USD and cost of production incurred in a variety of other currencies, mostly Asian. For the current year, we are forecasting USD to decline against major currencies and the Asian currencies to strengthen against it. We expect this to have negative implications on tech companies with significant exposure to the respective currencies and this will be a critical risk to our SGD earnings assumptions.
Technology Sector
25
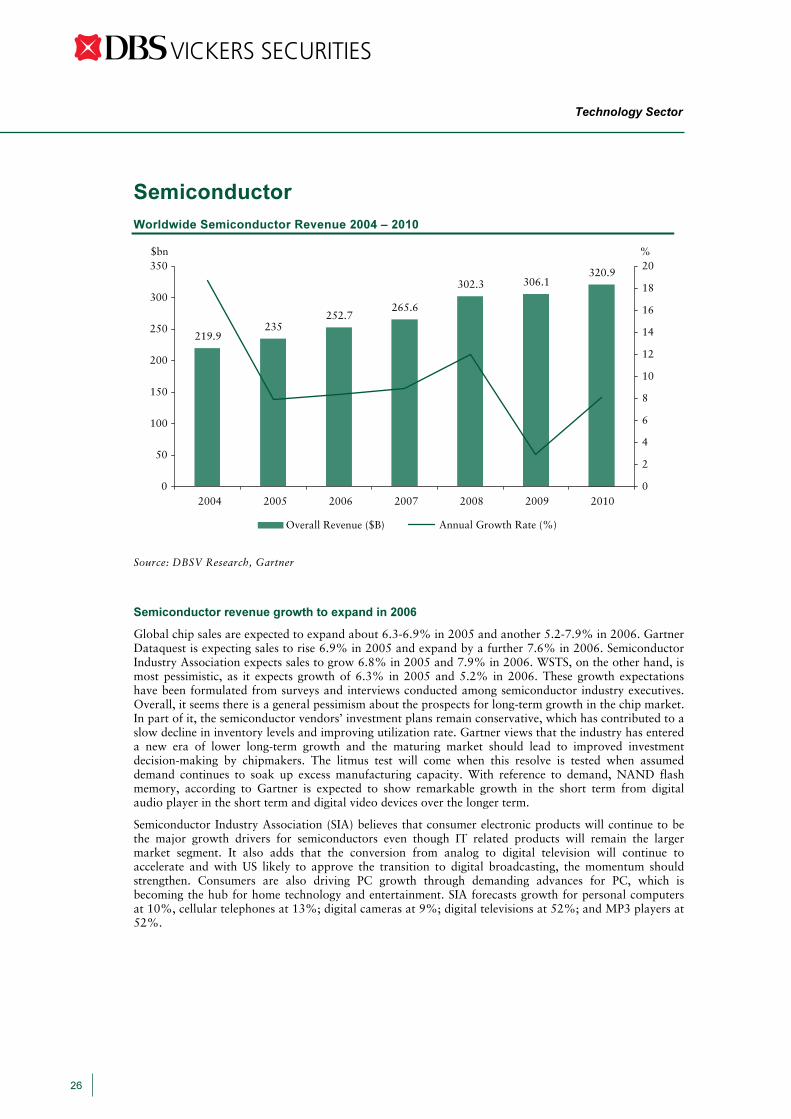
Semiconductor Worldwide Semiconductor Revenue 2004 – 2010
219.9235
252.7265.6
302.3 306.1320.9
0
50
100
150
200
250
300
350
0
2
4
6
8
10
12
14
16
18
20
Overall Revenue ($B)
20052004 2006 2009 201020082007
Source: DBSV Research, Gartner
Semiconductor revenue growth to expand in 2006
Global chip sales are expected to expand about 6.3-6.9% in 2005 and another 5.2-7.9% in 2006. Gartner Dataquest is expecting sales to rise 6.9% in 2005 and expand by a further 7.6% in 2006. Semiconductor Industry Association expects sales to grow 6.8% in 2005 and 7.9% in 2006. WSTS, on the other hand, is most pessimistic, as it expects growth of 6.3% in 2005 and 5.2% in 2006. These growth expectations have been formulated from surveys and interviews conducted among semiconductor industry executives. Overall, it seems there is a general pessimism about the prospects for long-term growth in the chip market. In part of it, the semiconductor vendors’ investment plans remain conservative, which has contributed to a slow decline in inventory levels and improving utilization rate. Gartner views that the industry has entered a new era of lower long-term growth and the maturing market should lead to improved investment decision-making by chipmakers. The litmus test will come when this resolve is tested when assumed demand continues to soak up excess manufacturing capacity. With reference to demand, NAND flash memory, according to Gartner is expected to show remarkable growth in the short term from digital audio player in the short term and digital video devices over the longer term.
Semiconductor Industry Association (SIA) believes that consumer electronic products will continue to be the major growth drivers for semiconductors even though IT related products will remain the larger market segment. It also adds that the conversion from analog to digital television will continue to accelerate and with US likely to approve the transition to digital broadcasting, the momentum should strengthen. Consumers are also driving PC growth through demanding advances for PC, which is becoming the hub for home technology and entertainment. SIA forecasts growth for personal computers at 10%, cellular telephones at 13%; digital cameras at 9%; digital televisions at 52%; and MP3 players at 52%.
Annual Growth Rate (%)
$bn %
Technology Sector
26

Semiconductor Revenue Breakdown 2004 - 2010
48 49.6 51.7 46.7 57.1 53.7 47.9
171.9 185.4201 218.9
245.2 252.4 273
0
50
100
150
200
250
300
350
Memory Revenue ($B) Nonmemory Revenue ($B)
20052004 2006 2009 201020082007
Semiconductor revenue growth to expand in 2006
Gartner Dataquest expects semiconductor sales to reach US$252.7bn in 2006, a 7.5% increase of 2005. Memory sales are expected to increase 4.2% to US$51.7bn in 2006. NAND flash memory is expected to drive sales in the segment, expanding about 37% to US$14.7bn while DRAM revenues will decline to US$20.1bn from US$25.3bn according to estimates. Despite the decline in DRAM revenues, ASP per bit for DRAM is not expected to decline excessively as DRAM makers are able to convert some excess capacity to produce NAND flash memory. At the same time, weaker pricing in 1H05 has slowed capacity expansion plans by various vendors. Along with the tighter capacity and the switch to produce more NAND flash memory to cope with the burgeoning demand by makers of consumer electronics appliances; this has help to avert a similar boom-bust cycle that DRAM memory tends to see.
NAND flash memory demand is driven by strong demand for digital consumer electronics products where high capacity, low cost, low power data storage is required. The explosive demand for NAND flash memory has led to new entrants, especially DRAM makers such as Hynix Semiconductor, Infineon Technologies, Micron Technology, Powerchip Semiconductor and STMicroelectronics into the industry. Production capacity can be switched rather quickly from DRAM to NAND flash and this has resulted in a capacity increase. Incumbent vendors such as Samsung and Toshiba/ Sandisk and soon new entrant Intel/ Micron are also planning substantial capacity increase in what they view as an explosive market.
Technology Sector
27
Source: DBSV Research, Gartner
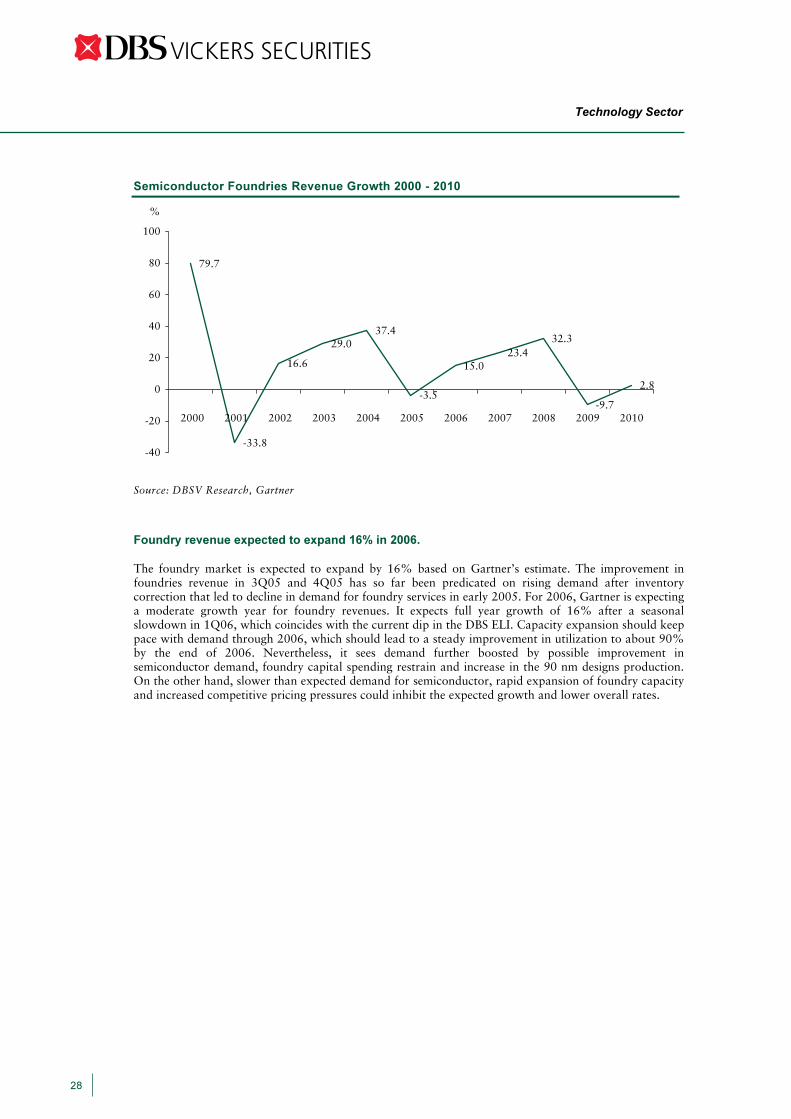
Semiconductor Foundries Revenue Growth 2000 - 2010
Source: DBSV Research, Gartner
Foundry revenue expected to expand 16% in 2006.
The foundry market is expected to expand by 16% based on Gartner’s estimate. The improvement in foundries revenue in 3Q05 and 4Q05 has so far been predicated on rising demand after inventory correction that led to decline in demand for foundry services in early 2005. For 2006, Gartner is expecting a moderate growth year for foundry revenues. It expects full year growth of 16% after a seasonal slowdown in 1Q06, which coincides with the current dip in the DBS ELI. Capacity expansion should keep pace with demand through 2006, which should lead to a steady improvement in utilization to about 90% by the end of 2006. Nevertheless, it sees demand further boosted by possible improvement in semiconductor demand, foundry capital spending restrain and increase in the 90 nm designs production. On the other hand, slower than expected demand for semiconductor, rapid expansion of foundry capacity and increased competitive pricing pressures could inhibit the expected growth and lower overall rates.
79.7
-33.8
16.6
29.037.4
-3.5
15.023.4
32.3
-9.7
2.8
-40
-20
0
20
40
60
80
100
%
2002 2005200420032000 2001 2006 2009 201020082007
Technology Sector
28
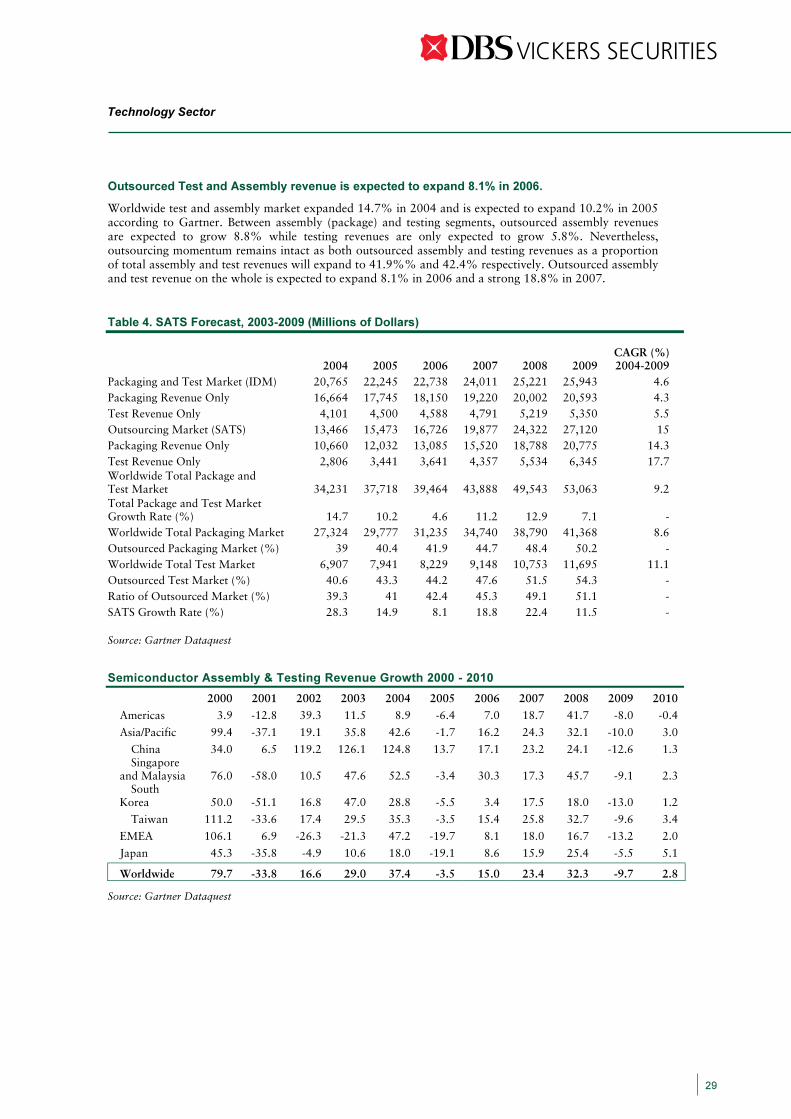
Outsourced Test and Assembly revenue is expected to expand 8.1% in 2006.
Worldwide test and assembly market expanded 14.7% in 2004 and is expected to expand 10.2% in 2005 according to Gartner. Between assembly (package) and testing segments, outsourced assembly revenues are expected to grow 8.8% while testing revenues are only expected to grow 5.8%. Nevertheless, outsourcing momentum remains intact as both outsourced assembly and testing revenues as a proportion of total assembly and test revenues will expand to 41.9%% and 42.4% respectively. Outsourced assembly and test revenue on the whole is expected to expand 8.1% in 2006 and a strong 18.8% in 2007.
Table 4. SATS Forecast, 2003-2009 (Millions of Dollars)
2004 2005 2006 2007 2008 2009 CAGR (%)2004-2009
Packaging and Test Market (IDM) 20,765 22,245 22,738 24,011 25,221 25,943 4.6Packaging Revenue Only 16,664 17,745 18,150 19,220 20,002 20,593 4.3Test Revenue Only 4,101 4,500 4,588 4,791 5,219 5,350 5.5Outsourcing Market (SATS) 13,466 15,473 16,726 19,877 24,322 27,120 15Packaging Revenue Only 10,660 12,032 13,085 15,520 18,788 20,775 14.3Test Revenue Only 2,806 3,441 3,641 4,357 5,534 6,345 17.7Worldwide Total Package and Test Market 34,231 37,718 39,464 43,888 49,543 53,063 9.2Total Package and Test Market Growth Rate (%) 14.7 10.2 4.6 11.2 12.9 7.1 -Worldwide Total Packaging Market 27,324 29,777 31,235 34,740 38,790 41,368 8.6Outsourced Packaging Market (%) 39 40.4 41.9 44.7 48.4 50.2 -Worldwide Total Test Market 6,907 7,941 8,229 9,148 10,753 11,695 11.1Outsourced Test Market (%) 40.6 43.3 44.2 47.6 51.5 54.3 -Ratio of Outsourced Market (%) 39.3 41 42.4 45.3 49.1 51.1 -SATS Growth Rate (%) 28.3 14.9 8.1 18.8 22.4 11.5 -
Source: Gartner Dataquest
Semiconductor Assembly & Testing Revenue Growth 2000 - 2010
2000 2001 2002 2003 2004 2005 2006 2007 2008 2009 2010 Americas 3.9 -12.8 39.3 11.5 8.9 -6.4 7.0 18.7 41.7 -8.0 -0.4
Asia/Pacific 99.4 -37.1 19.1 35.8 42.6 -1.7 16.2 24.3 32.1 -10.0 3.0
China 34.0 6.5 119.2 126.1 124.8 13.7 17.1 23.2 24.1 -12.6 1.3 Singapore
and Malaysia 76.0 -58.0 10.5 47.6 52.5 -3.4 30.3 17.3 45.7 -9.1 2.3 South
Korea 50.0 -51.1 16.8 47.0 28.8 -5.5 3.4 17.5 18.0 -13.0 1.2
Taiwan 111.2 -33.6 17.4 29.5 35.3 -3.5 15.4 25.8 32.7 -9.6 3.4
EMEA 106.1 6.9 -26.3 -21.3 47.2 -19.7 8.1 18.0 16.7 -13.2 2.0
Japan 45.3 -35.8 -4.9 10.6 18.0 -19.1 8.6 15.9 25.4 -5.5 5.1
Worldwide 79.7 -33.8 16.6 29.0 37.4 -3.5 15.0 23.4 32.3 -9.7 2.8 Source: Gartner Dataquest
Technology Sector
29

Computers
Robust growth of PCs in 2005 likely to slow going into 2006. According to Gartner, The current forecast for the growth in PC unit shipments for 2005 is likely to come in around 13%. Overall, PC shipments for 2006 and 2007 are still forecasted to continue growing, albeit at a slowing pace. Desktop-based PCs are expected to experience decelerating growth, while mobile PCs are projected to continue doing the same. From 2004-09, the total number of units shipped is expected to grow at a CAGR of 8.9%, from 136.2m to 169.1m.
Computers Growth in 2006 - Global PC Unit Forecast by Major Market and Form Factor, 2004-2009
2004 2005 2006 2007 2008 2009 CAGR (%) 2004-
2009Deskbased Units ('000)
136,188 145,573 151,206 155,305 161,912 169,101 4.4
Unit Growth (%) 8.4 6.9 3.9 2.7 4.3
4.4
Mobile Units ('000) 47,180 60,836 73,570 86,351 99,140 111,683 18.8Unit Growth (%) 23.0 28.9 20.9 17.4 14.8 12.8 All Units ('000) 183,367 206,409 224,776 241,656 261,051 280,785 8.9Unit Growth (%) 11.8 12.9 8.9 7.5 8.0 7.6 Source: Gartner Dataquest
Computers Growth in 2006 - Global PC ASP Forecast by Major Market and Form Factor, 2004-2009
2004 2005 2006 2007 2008 2009 CAGR (%) 2004-2009
Deskbased ASP ($) 958 836 751 685 631 584 -9.4Growth (%) -9.7 -12.7 -10.2 -8.8 -7.9 -7.4 Mobile ASP ($) 1,509 1,322 1,188 1,084 997 919 -9.4Growth (%) -6.8 -12.4 -10.2 -8.8 -8.1 -7.8 All PC ASP ($) 1,099 980 894 827 770 717 -8.2Growth (%) -7.7 -10.9 -8.7 -7.5 -7.0 -6.8 Source: Gartner Dataquest
Decreasing prices leading growth in demand. The main reason behind the growth in PC unit shipments continue to be falling ASPs. The increased affordability of a PC (desktop or mobile) has spurred double-digit growth in most regions, led by the emerging countries. Combined, ASPs for both desk-based and mobile PCs have fallen by 11%, from US$1,099 to US$980 per unit. Also, with the price gap between mobile and desk-based PCs narrowing, we are seeing more desktop users switch to mobile PCs.
Risks to growth in PC market. The forecast for continued growth in 2006 and 2007 could come under threat, depending on the launch date of Windows Vista, which is scheduled for a launch in 4Q06. If the new operating system (OS) is launched at the end of 4Q06, shipments for the quarter will be adversely affected, with buyers likely to wait for the new OS to be available before making the purchase.
Technology Sector
30

Computers Growth in 2006 – Global Computer Sales Forecast
Source: DBSV Research, Gartner Forecast from 2006 to 2009 –Unit Shipments and Growth by Form Factor Breakdown
Source: DBSV Research, Gartner
-
20,000.00
40,000.00
60,000.00
80,000.00
100,000.00
120,000.00
140,000.00
Desktop PCs Notebook PCs
Desktop PCs 130,479.60 121,721.60 113,551.20 106,380.50 102,158.90 98,754.40
-
20,000
40,000
60,000
80,000
100,000
120,000
140,000
160,000
180,000
2004 2005 2006 2007 2008 2009
2004 2005 2006 2007 2008 2009
Number of Units
0
5
10
15
20
25
30
35
%Growth
Deskbased PCs Mobile PCs Mobile Growth Deskbased Growth
Notebook PCs 71,224.80 80,377.60 87,436.80 93,657.60 98,802.70 102,652.30
Technology Sector
31

Forecast from 2006 to 2009 – Revenues, and ASPs by Form Factor Breakdown
Source: DBSV Research, Gartner
• Developed countries will still lead global consumption for PCs. Currently, Western European countries and the US account for 57% of all PC units shipped in 2005, and this figure is expected to drop to 50% by 2009. However, as a proportion of total revenues, they form 61% of the total amount spent on PCs globally, and this is expected to increase to 70% by 2009. This trend can be partly attributed to computer users in these countries switching from desk-based PCs to mobile replacements, as the trend of price convergence continues.
• Emerging countries to provide the growth in PC units shipped. The growth in PC unit shipments will be mostly be driven by emerging countries, as falling ASPs make PCs more affordable. Eastern European countries and the Asia Pacific region is expected to contribute the bulk of the growth, with CAGR of 16.5% and 11.5%, respectively.
-
20,000
40,000
60,000
80,000
100,000
120,000
140,000
ASP in US$
0
200
400
600
800
1,000
1,200
1,400
1,600
Global Spending US$ ('000s)
Deskbased Spending Mobile Spending Deskbased ASP Mobile ASP
20052004 2006 200920082007
Technology Sector
32
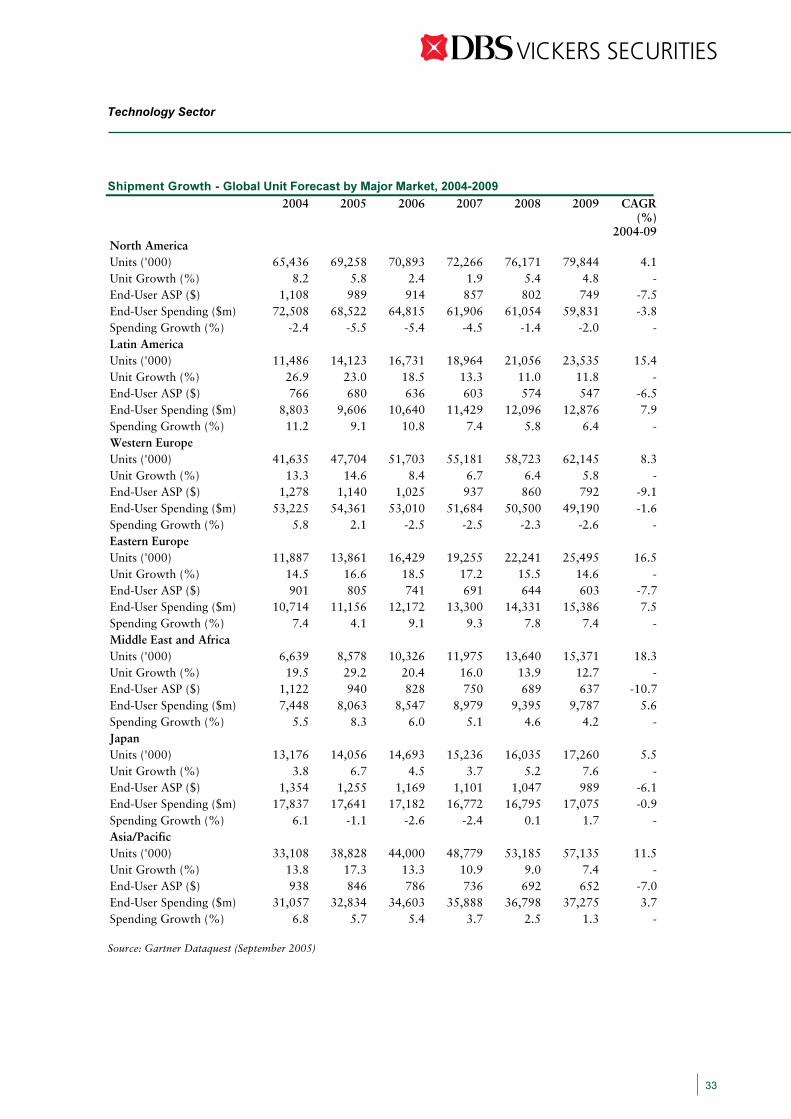
Shipment Growth - Global Unit Forecast by Major Market, 2004-2009
2004 2005 2006 2007 2008 2009 CAGR (%)
2004-09North America Units ('000) 65,436 69,258 70,893 72,266 76,171 79,844 4.1Unit Growth (%) 8.2 5.8 2.4 1.9 5.4 4.8 -End-User ASP ($) 1,108 989 914 857 802 749 -7.5End-User Spending ($m) 72,508 68,522 64,815 61,906 61,054 59,831 -3.8Spending Growth (%) -2.4 -5.5 -5.4 -4.5 -1.4 -2.0 -Latin America Units ('000) 11,486 14,123 16,731 18,964 21,056 23,535 15.4Unit Growth (%) 26.9 23.0 18.5 13.3 11.0 11.8 -End-User ASP ($) 766 680 636 603 574 547 -6.5End-User Spending ($m) 8,803 9,606 10,640 11,429 12,096 12,876 7.9Spending Growth (%) 11.2 9.1 10.8 7.4 5.8 6.4 -Western Europe Units ('000) 41,635 47,704 51,703 55,181 58,723 62,145 8.3Unit Growth (%) 13.3 14.6 8.4 6.7 6.4 5.8 -End-User ASP ($) 1,278 1,140 1,025 937 860 792 -9.1End-User Spending ($m) 53,225 54,361 53,010 51,684 50,500 49,190 -1.6Spending Growth (%) 5.8 2.1 -2.5 -2.5 -2.3 -2.6 -Eastern Europe Units ('000) 11,887 13,861 16,429 19,255 22,241 25,495 16.5Unit Growth (%) 14.5 16.6 18.5 17.2 15.5 14.6 -End-User ASP ($) 901 805 741 691 644 603 -7.7End-User Spending ($m) 10,714 11,156 12,172 13,300 14,331 15,386 7.5Spending Growth (%) 7.4 4.1 9.1 9.3 7.8 7.4 -Middle East and Africa Units ('000) 6,639 8,578 10,326 11,975 13,640 15,371 18.3Unit Growth (%) 19.5 29.2 20.4 16.0 13.9 12.7 -End-User ASP ($) 1,122 940 828 750 689 637 -10.7End-User Spending ($m) 7,448 8,063 8,547 8,979 9,395 9,787 5.6Spending Growth (%) 5.5 8.3 6.0 5.1 4.6 4.2 -Japan Units ('000) 13,176 14,056 14,693 15,236 16,035 17,260 5.5Unit Growth (%) 3.8 6.7 4.5 3.7 5.2 7.6 -End-User ASP ($) 1,354 1,255 1,169 1,101 1,047 989 -6.1End-User Spending ($m) 17,837 17,641 17,182 16,772 16,795 17,075 -0.9Spending Growth (%) 6.1 -1.1 -2.6 -2.4 0.1 1.7 -Asia/Pacific Units ('000) 33,108 38,828 44,000 48,779 53,185 57,135 11.5Unit Growth (%) 13.8 17.3 13.3 10.9 9.0 7.4 -End-User ASP ($) 938 846 786 736 692 652 -7.0End-User Spending ($m) 31,057 32,834 34,603 35,888 36,798 37,275 3.7Spending Growth (%) 6.8 5.7 5.4 3.7 2.5 1.3 - Source: Gartner Dataquest (September 2005)
Technology Sector
33

Communications Handset Sales in 2006 – Handset Sales Forecast 2004-2009 (‘000 units)
0
200,000
400,000
600,000
800,000
1,000,000
1,200,000Number of Units
0%
5%
10%
15%
20%
25%
30%
35%% Growth
Basic Phones Enhanced Phones Basic Smartphones
Enhanced Smartphones Wireless Cellular PDAs Overall Growth
20052004 2006 200920082007
Source: DBSV Research, Gartner Total Mobile Terminal Market — Worldwide, 2004-2009
2004 2005 2006 2007 2008 2009 CAGR 2005-2009
Sales to End Users ('000s) 674,002 778,751 847,725 914,414 980,704 1,041,808 7.5%Growth 29.6% 15.5% 8.9% 7.9% 7.2% 6.2% Wholesale Price ($) 173.9 168.3 167.9 165.3 162.2 161.6 -1.0%Total Revenue ($m) 117,190 131,097 142,339 151,165 159,063 168,398 6.5%Revenue Growth 22.5% 11.9% 8.6% 6.2% 5.2% 5.9% Retirements ('000s) 384,797 496,217 616,246 700,158 788,564 878,932 15.4%Installed Base ('000s) 1,548,748 1,813,236 2,044,715 2,258,971 2,451,111 2,613,986 9.6%Installed Base Growth 23.0% 17.1% 12.8% 10.5% 8.5% 6.6%
Source: Gartner Dataquest (July 2005)
Technology Sector
34
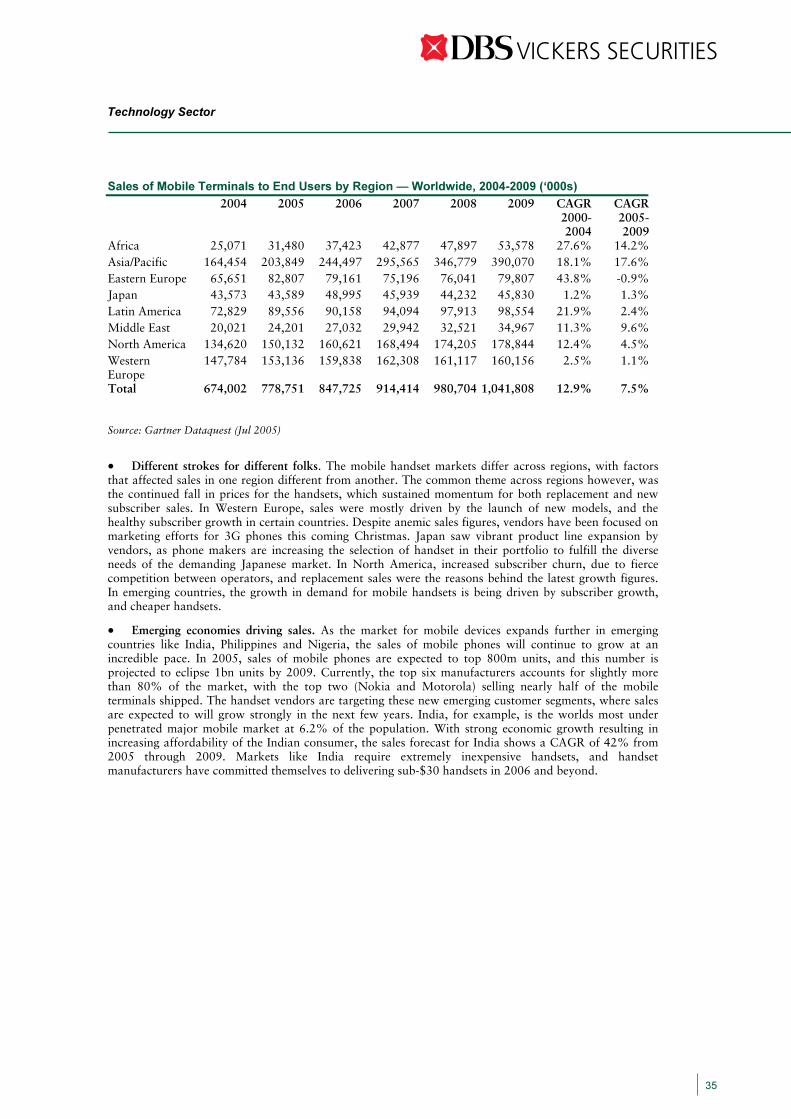
Sales of Mobile Terminals to End Users by Region — Worldwide, 2004-2009 (‘000s)
2004 2005 2006 2007 2008 2009 CAGR 2000-2004
CAGR 2005-2009
Africa 25,071 31,480 37,423 42,877 47,897 53,578 27.6% 14.2% Asia/Pacific 164,454 203,849 244,497 295,565 346,779 390,070 18.1% 17.6% Eastern Europe 65,651 82,807 79,161 75,196 76,041 79,807 43.8% -0.9% Japan 43,573 43,589 48,995 45,939 44,232 45,830 1.2% 1.3% Latin America 72,829 89,556 90,158 94,094 97,913 98,554 21.9% 2.4% Middle East 20,021 24,201 27,032 29,942 32,521 34,967 11.3% 9.6% North America 134,620 150,132 160,621 168,494 174,205 178,844 12.4% 4.5% Western Europe
147,784 153,136 159,838 162,308 161,117 160,156 2.5% 1.1%
Total 674,002 778,751 847,725 914,414 980,704 1,041,808 12.9% 7.5% Source: Gartner Dataquest (Jul 2005)
• Different strokes for different folks. The mobile handset markets differ across regions, with factors that affected sales in one region different from another. The common theme across regions however, was the continued fall in prices for the handsets, which sustained momentum for both replacement and new subscriber sales. In Western Europe, sales were mostly driven by the launch of new models, and the healthy subscriber growth in certain countries. Despite anemic sales figures, vendors have been focused on marketing efforts for 3G phones this coming Christmas. Japan saw vibrant product line expansion by vendors, as phone makers are increasing the selection of handset in their portfolio to fulfill the diverse needs of the demanding Japanese market. In North America, increased subscriber churn, due to fierce competition between operators, and replacement sales were the reasons behind the latest growth figures. In emerging countries, the growth in demand for mobile handsets is being driven by subscriber growth, and cheaper handsets.
• Emerging economies driving sales. As the market for mobile devices expands further in emerging countries like India, Philippines and Nigeria, the sales of mobile phones will continue to grow at an incredible pace. In 2005, sales of mobile phones are expected to top 800m units, and this number is projected to eclipse 1bn units by 2009. Currently, the top six manufacturers accounts for slightly more than 80% of the market, with the top two (Nokia and Motorola) selling nearly half of the mobile terminals shipped. The handset vendors are targeting these new emerging customer segments, where sales are expected to will grow strongly in the next few years. India, for example, is the worlds most under penetrated major mobile market at 6.2% of the population. With strong economic growth resulting in increasing affordability of the Indian consumer, the sales forecast for India shows a CAGR of 42% from 2005 through 2009. Markets like India require extremely inexpensive handsets, and handset manufacturers have committed themselves to delivering sub-$30 handsets in 2006 and beyond.
Technology Sector
35

Sales of Mobile Terminals to End Users by Technology — Worldwide, 2004-2009 (‘000s)
2004 2005 2006 2007 2008 2009 CAGR 2005-2009
Analog 139 84 32 0 0 0 -100.0%CDMA2000 1x 112,977 116,342 106,333 97,144 83,195 69,902 -12.0%CDMA2000 1x EV-DO 7,049 20,396 44,744 66,505 91,634 112,503 53.3%CDMA2000 1x EV-DV 0 0 0 0 0 0 NACDMA IS-95A 1,443 781 0 0 0 0 -100.0%CDMA IS-95B 1,097 133 0 0 0 0 -100.0%EDGE 13,087 50,833 100,093 112,958 120,411 111,938 21.8%GAIT 0 0 0 0 0 0 NAGPRS 353,529 413,300 395,355 391,281 340,261 286,740 -8.7%GSM 116,638 87,166 61,641 28,943 10,235 2,885 -57.3%GSM/CDMA2000 1x 354 291 249 75 90 106 -22.3%HSCSD 85 0 0 0 0 0 NAHSDPA 0 141 6,295 26,176 57,151 101,999 418.6%iDEN 14,318 17,103 18,128 15,557 8,305 5,058 -26.3%PDC 23,994 10,588 3,272 1,217 1,093 985 -44.8%TDMA 11,049 5,150 2,066 74 0 0 -100.0%TD-SCDMA 0 0 26 60 95 237 NAWCDMA 18,243 56,444 109,491 174,425 268,234 349,456 57.7%Total 674,002 778,751 847,725 914,414 980,704 1,041,808 7.5% Source: Gartner Dataquest (July 2005) Sales of Mobile Terminals to End Users by Technology — Worldwide, 2004-2009 (‘000s)
Source: DBSV Research, Gartner
0
200,000
400,000
600,000
800,000
1,000,000
1,200,000
% of Total
0%
10%
20%
30%
40%
50%
60%
Handset Units ('000s)
3G Handsets Total Handsets As % of Total
20052004 2006 200920082007
Technology Sector
36
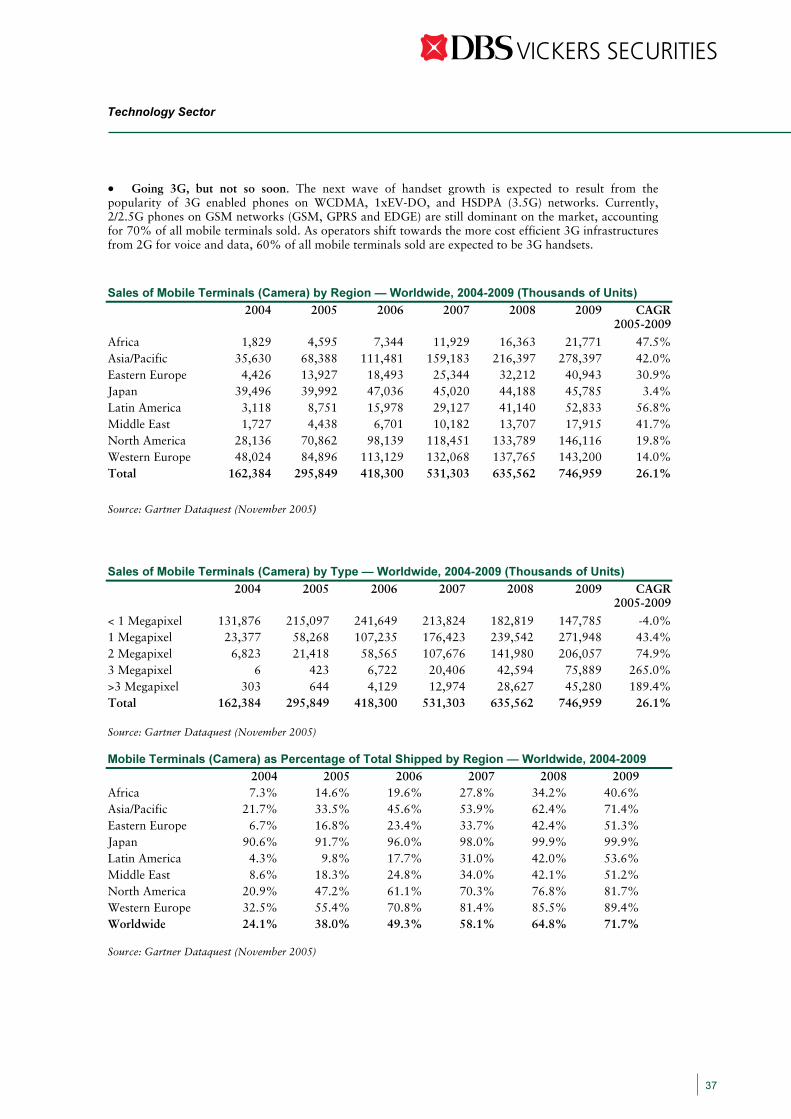
• Going 3G, but not so soon. The next wave of handset growth is expected to result from the popularity of 3G enabled phones on WCDMA, 1xEV-DO, and HSDPA (3.5G) networks. Currently, 2/2.5G phones on GSM networks (GSM, GPRS and EDGE) are still dominant on the market, accounting for 70% of all mobile terminals sold. As operators shift towards the more cost efficient 3G infrastructures from 2G for voice and data, 60% of all mobile terminals sold are expected to be 3G handsets.
Sales of Mobile Terminals (Camera) by Region — Worldwide, 2004-2009 (Thousands of Units)
2004 2005 2006 2007 2008 2009 CAGR 2005-2009
Africa 1,829 4,595 7,344 11,929 16,363 21,771 47.5%Asia/Pacific 35,630 68,388 111,481 159,183 216,397 278,397 42.0%Eastern Europe 4,426 13,927 18,493 25,344 32,212 40,943 30.9%Japan 39,496 39,992 47,036 45,020 44,188 45,785 3.4%Latin America 3,118 8,751 15,978 29,127 41,140 52,833 56.8%Middle East 1,727 4,438 6,701 10,182 13,707 17,915 41.7%North America 28,136 70,862 98,139 118,451 133,789 146,116 19.8%Western Europe 48,024 84,896 113,129 132,068 137,765 143,200 14.0%Total 162,384 295,849 418,300 531,303 635,562 746,959 26.1%
Source: Gartner Dataquest (November 2005)
Sales of Mobile Terminals (Camera) by Type — Worldwide, 2004-2009 (Thousands of Units)
2004 2005 2006 2007 2008 2009 CAGR 2005-2009
< 1 Megapixel 131,876 215,097 241,649 213,824 182,819 147,785 -4.0%1 Megapixel 23,377 58,268 107,235 176,423 239,542 271,948 43.4%2 Megapixel 6,823 21,418 58,565 107,676 141,980 206,057 74.9%3 Megapixel 6 423 6,722 20,406 42,594 75,889 265.0%>3 Megapixel 303 644 4,129 12,974 28,627 45,280 189.4%Total 162,384 295,849 418,300 531,303 635,562 746,959 26.1% Source: Gartner Dataquest (November 2005) Mobile Terminals (Camera) as Percentage of Total Shipped by Region — Worldwide, 2004-2009
2004 2005 2006 2007 2008 2009 Africa 7.3% 14.6% 19.6% 27.8% 34.2% 40.6% Asia/Pacific 21.7% 33.5% 45.6% 53.9% 62.4% 71.4% Eastern Europe 6.7% 16.8% 23.4% 33.7% 42.4% 51.3% Japan 90.6% 91.7% 96.0% 98.0% 99.9% 99.9% Latin America 4.3% 9.8% 17.7% 31.0% 42.0% 53.6% Middle East 8.6% 18.3% 24.8% 34.0% 42.1% 51.2% North America 20.9% 47.2% 61.1% 70.3% 76.8% 81.7% Western Europe 32.5% 55.4% 70.8% 81.4% 85.5% 89.4% Worldwide 24.1% 38.0% 49.3% 58.1% 64.8% 71.7%
Source: Gartner Dataquest (November 2005)
Technology Sector
37

• Camera phones are becoming increasingly ubiquitous. Integrated cameras in mobile terminals are fast becoming commonplace. In 2005, camera enabled phones are expected to hit 38% of all handsets shipped globally. In Japan, around 92% of the mobile handsets being sold is camera enabled. While the start of this trend can be attributed to countries like South Korea and Japan, users in other regions of the world have also been won over by the notion of having two devices, a still digital camera and a phone, in a single package.
• However, it is less of an occurrence in emerging countries. Due to the cost of integrating a camera into a mobile phone, hence it is no surprise that in the emerging markets, those low cost handsets without camera functions are prevalent.
• As the cookie crumbles. Simple logic indicates that as the cost of camera integration goes down, the adoption of camera-enabled phones will go up. The cost of integrating a 1-megapixel camera to a phone today adds US$4.5 to the total cost, and it is expected to reach US$2 by 2009. Adding a 3-megapixel camera adds an incremental cost of US$8.35, which will fall to US$3.20 in 2009. It is likely that price will be a catalyst for replacement sales in emerging markets, as camera phones reach a price point that subscribers are comfortable with.
Mobile Terminals (Camera) as Percentage of Total Shipped by Region — Worldwide, 2004-2009
Region/Country 2004 2005 2006 2007 2008 2009
Total Bluetooth enabled Phone Shipments 78,006 140,053 255,706 368,806 471,357 582,884 Africa 4.0% 8.0% 14.0% 19.1% 27.2% 35.2% Asia/Pacific (excluding Japan) 5.9% 11.6% 19.8% 29.6% 37.7% 46.5% Eastern Europe 5.3% 12.4% 19.8% 28.6% 38.5% 47.1% Japan 1.9% 3.0% 6.0% 10.0% 15.0% 21.0% Latin America 2.2% 7.5% 16.2% 22.0% 30.0% 37.8% Middle East 8.8% 15.7% 23.0% 30.3% 40.7% 51.3% North America 4.0% 12.0% 33.0% 50.0% 62.0% 74.0% Western Europe 36.7% 48.2% 68.6% 81.9% 87.5% 92.3%
Source: Gartner Dataquest
Bluetooth features become increasingly ubiquitous
• Global growth of mobile phones that support Bluetooth wireless technology. The cost of Bluetooth chipsets has fallen and this has resulted in more new phones coming with built-in Bluetooth. Adding Bluetooth to a mobile phone has fallen to about $3.75, from about $4.50 in 2004.
• Rising awareness of consumers. Another reason for the growth in Bluetooth phones is the marketing efforts being put in by handset makers. This has resulted in growing awareness for the product, especially in Europe and Asia Pacific. Along with the wider variety of affordable, stylish headsets available on the market, more consumers are buying Bluetooth phones. We expect that the price for Bluetooth headsets, which is the main driver of Bluetooth adoption, will continue to fall as widespread adoption occurs.
• Legislation is not such a bad thing after all. Another factor driving the popularity of Bluetooth handset and headsets have been the outlawing of mobile phone use by hand while driving in several countries. In addition, use of Bluetooth phones in conjunction with in-car GPS navigation units is picking up as well.
Technology Sector
38
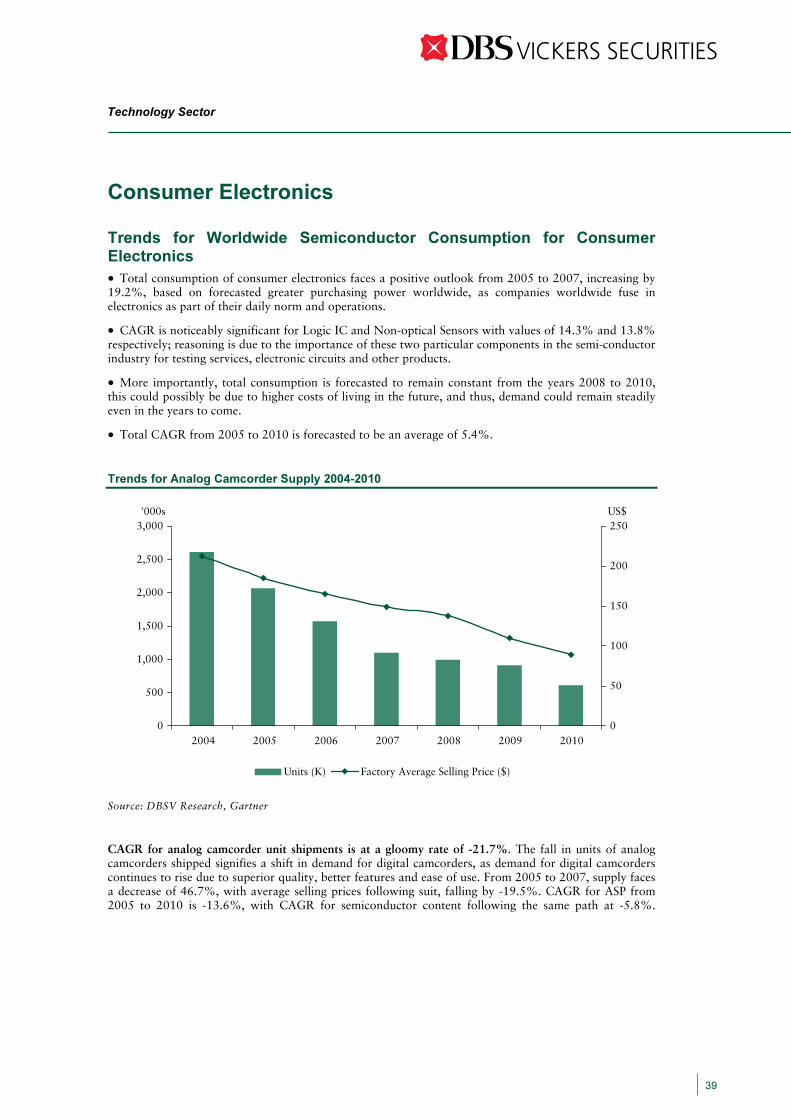
Consumer Electronics
Trends for Worldwide Semiconductor Consumption for Consumer Electronics
• Total consumption of consumer electronics faces a positive outlook from 2005 to 2007, increasing by 19.2%, based on forecasted greater purchasing power worldwide, as companies worldwide fuse in electronics as part of their daily norm and operations.
• CAGR is noticeably significant for Logic IC and Non-optical Sensors with values of 14.3% and 13.8% respectively; reasoning is due to the importance of these two particular components in the semi-conductor industry for testing services, electronic circuits and other products.
• More importantly, total consumption is forecasted to remain constant from the years 2008 to 2010, this could possibly be due to higher costs of living in the future, and thus, demand could remain steadily even in the years to come.
• Total CAGR from 2005 to 2010 is forecasted to be an average of 5.4%.
Trends for Analog Camcorder Supply 2004-2010
Source: DBSV Research, Gartner
CAGR for analog camcorder unit shipments is at a gloomy rate of -21.7%. The fall in units of analog camcorders shipped signifies a shift in demand for digital camcorders, as demand for digital camcorders continues to rise due to superior quality, better features and ease of use. From 2005 to 2007, supply faces a decrease of 46.7%, with average selling prices following suit, falling by -19.5%. CAGR for ASP from 2005 to 2010 is -13.6%, with CAGR for semiconductor content following the same path at -5.8%.
0
500
1,000
1,500
2,000
2,500
3,000'000s
0
50
100
150
200
250US$
Units (K) Factory Average Selling Price ($)
20052004 2006 2009 201020082007
Technology Sector
39
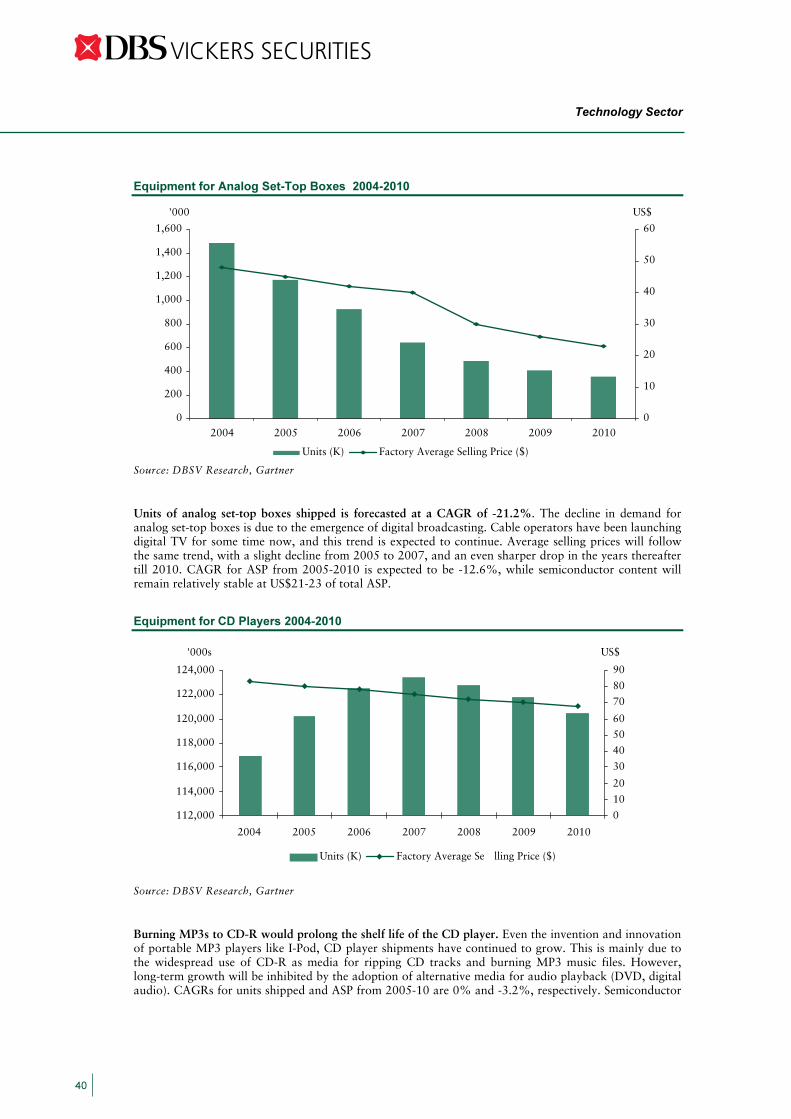
Equipment for Analog Set-Top Boxes 2004-2010
Source: DBSV Research, Gartner
Units of analog set-top boxes shipped is forecasted at a CAGR of -21.2%. The decline in demand for analog set-top boxes is due to the emergence of digital broadcasting. Cable operators have been launching digital TV for some time now, and this trend is expected to continue. Average selling prices will follow the same trend, with a slight decline from 2005 to 2007, and an even sharper drop in the years thereafter till 2010. CAGR for ASP from 2005-2010 is expected to be -12.6%, while semiconductor content will remain relatively stable at US$21-23 of total ASP.
Source: DBSV Research, Gartner
Burning MP3s to CD-R would prolong the shelf life of the CD player. Even the invention and innovation of portable MP3 players like I-Pod, CD player shipments have continued to grow. This is mainly due to the widespread use of CD-R as media for ripping CD tracks and burning MP3 music files. However, long-term growth will be inhibited by the adoption of alternative media for audio playback (DVD, digital audio). CAGRs for units shipped and ASP from 2005-10 are 0% and -3.2%, respectively. Semiconductor
112,000
114,000
116,000
118,000
120,000
122,000
124,000
'000s
0
10
20
30
40
50
60
70
80
90
US$
Units (K) Factory Average Se lling Price ($)
0
200
400
600
800
1,000
1,200
1,400
1,600
'000
0
10
20
30
40
50
60
US$
Units (K) Factory Average Selling Price ($)
20052004 2006 2009 201020082007
20052004 2006 2009 201020082007
Technology Sector
40
Equipment for CD Players 2004-2010
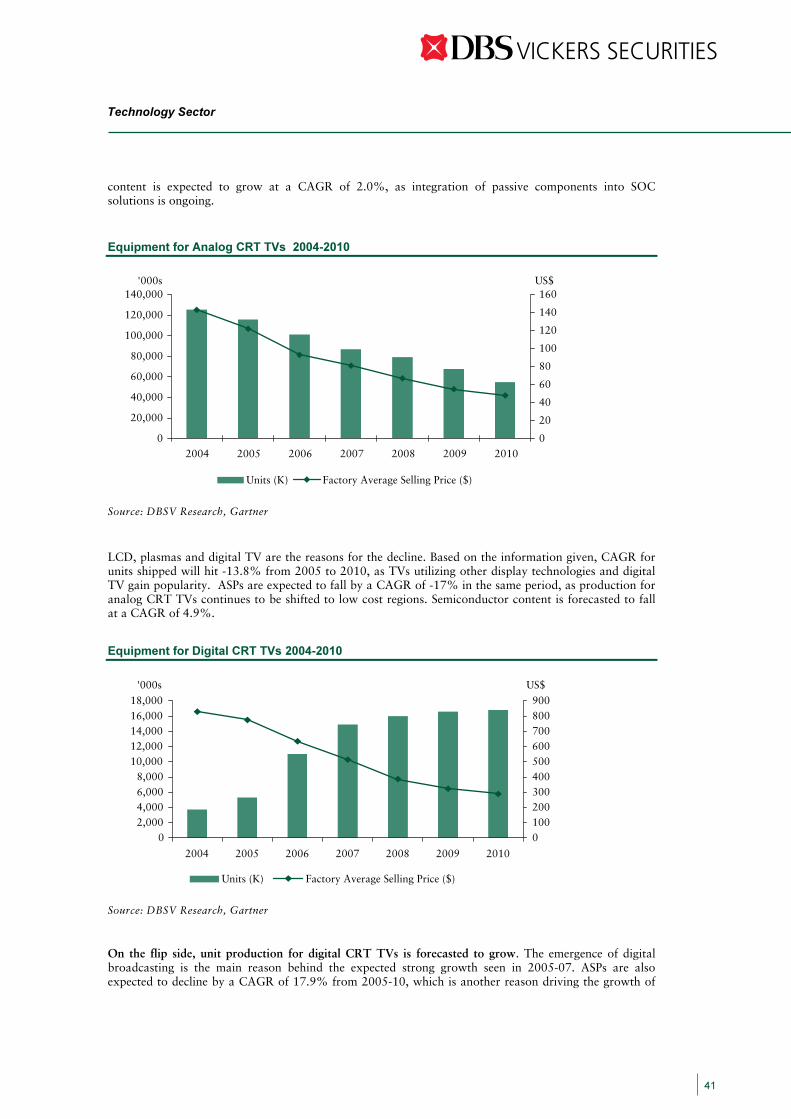
content is expected to grow at a CAGR of 2.0%, as integration of passive components into SOC solutions is ongoing.
Source: DBSV Research, Gartner
LCD, plasmas and digital TV are the reasons for the decline. Based on the information given, CAGR for units shipped will hit -13.8% from 2005 to 2010, as TVs utilizing other display technologies and digital TV gain popularity. ASPs are expected to fall by a CAGR of -17% in the same period, as production for analog CRT TVs continues to be shifted to low cost regions. Semiconductor content is forecasted to fall at a CAGR of 4.9%.
Source: DBSV Research, Gartner
On the flip side, unit production for digital CRT TVs is forecasted to grow. The emergence of digital broadcasting is the main reason behind the expected strong growth seen in 2005-07. ASPs are also expected to decline by a CAGR of 17.9% from 2005-10, which is another reason driving the growth of
0
20,000
40,000
60,000
80,000
100,000
120,000
140,000'000s
0
20
40
60
80
100
120
140
160US$
Units (K) Factory Average Selling Price ($)
02,0004,0006,0008,000
10,00012,00014,00016,00018,000
'000s
0100200300400500600700800900
US$
Units (K) Factory Average Selling Price ($)
20052004 2006 2009 201020082007
20052004 2006 2009 201020082007
Technology Sector
41
Equipment for Analog CRT TVs 2004-2010
Equipment for Digital CRT TVs 2004-2010
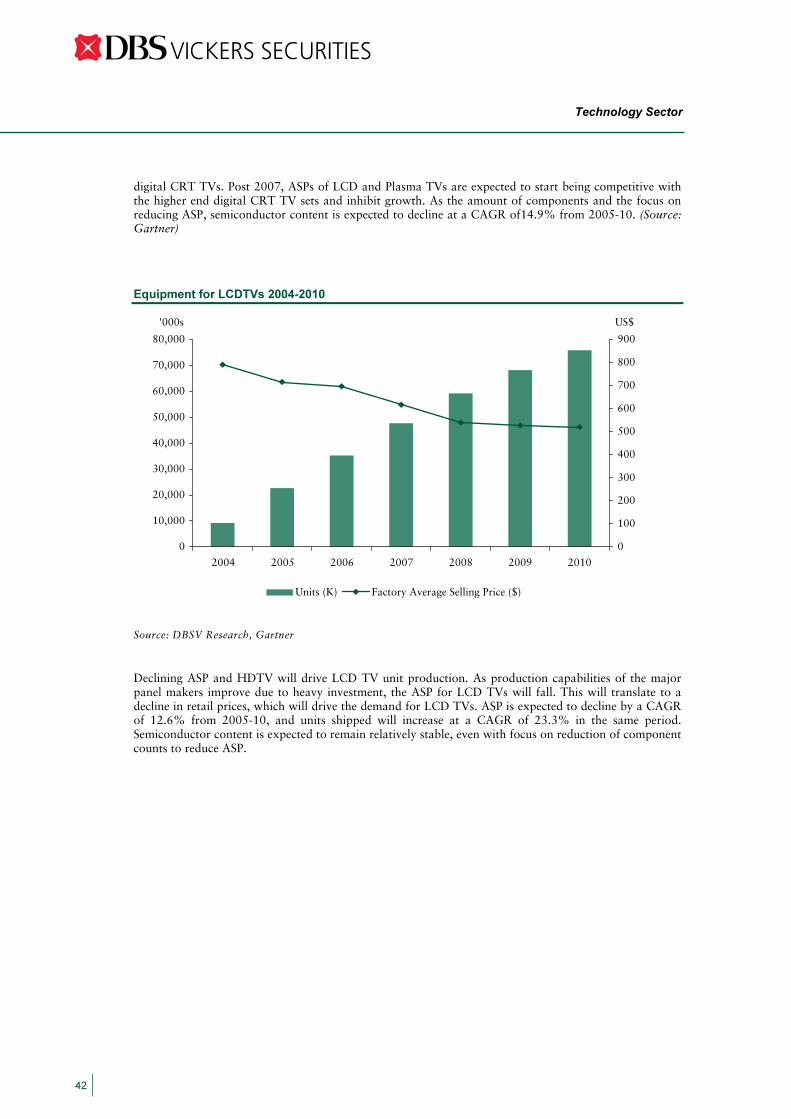
digital CRT TVs. Post 2007, ASPs of LCD and Plasma TVs are expected to start being competitive with the higher end digital CRT TV sets and inhibit growth. As the amount of components and the focus on reducing ASP, semiconductor content is expected to decline at a CAGR of14.9% from 2005-10. (Source: Gartner)
Source: DBSV Research, Gartner
Declining ASP and HDTV will drive LCD TV unit production. As production capabilities of the major panel makers improve due to heavy investment, the ASP for LCD TVs will fall. This will translate to a decline in retail prices, which will drive the demand for LCD TVs. ASP is expected to decline by a CAGR of 12.6% from 2005-10, and units shipped will increase at a CAGR of 23.3% in the same period. Semiconductor content is expected to remain relatively stable, even with focus on reduction of component counts to reduce ASP.
0
10,000
20,000
30,000
40,000
50,000
60,000
70,000
80,000
'000s
0
100
200
300
400
500
600
700
800
900
US$
Units (K) Factory Average Selling Price ($)
20052004 2006 2009 201020082007
Technology Sector
42
Equipment for LCDTVs 2004-2010

Equipment for Plasma TVs 2002-2010
0
2,000
4,000
6,000
8,000
10,000
12,000
14,000'000
0
500
1,000
1,500
2,000
2,500
3,000
3,500
4,000US$
Units (K)
0
5,000
10,000
15,000
20,000
25,000
30,000'000
02004006008001,0001,2001,4001,6001,800US$
Factory Average Selling Price ($)
20052003 20042002 2006 2009 201020082007
Units (K) Factory Average Selling Price ($)
20052003 20042002 2006 2009 201020082007
Source: DBSV Research, Gartner
More expensive HD panels will be competing against low-cost DLP, LCOS RPTVs and cheaper LCD TVs, pushing plasma-based TVs into fourth place in the new technology display market. ASP is expected to decline by a CAGR of 12.6% due to an expansion of production facilities and lower retail pricing, which would stimulate consumer sales. Units shipped will increase at a CAGR of 23.3%, and the vendors’ aim of ongoing reduction in component counts would mean semiconductor content would remain relatively stable from 2005 to 2010. Furthermore, a consistent trend in plasma display ASPs is the development of picture improvement circuitry, increasing the number of address channels supplied by the display drivers.
Equipemnt for Rear Projection TVs 2002-2010
Source: DBSV Research, Gartner
Rapid adoption by TV set manufacturers of DLP and LCOS-based RPTV technologies that are based on low-cost devices will accelerate production and units shipped by a CAGR of 23.8%, driving down retail prices. Poor yields of LCOS devices would hamper rapid ASP reductions, as it is forecasted to fall by a
Technology Sector
43

CAGR of 14.2%. In the aspect of semi-conductor content, TVs will be primarily digital for HD reception, the trends of lower component counts and ongoing integration is consistent with other technologies.
Equipment for HDD MP3 Players 2002-2010
Source: DBSV Research, Gartner
Growth in HDD-based digital audio player units is expected throughout the forecast period by a CAGR of approximately -2.2%. Apple’s iPod continues to dominate the market but competitors are improving their hardware offerings and software integration. Increasing popularity of online music stores, introduction of subscription-based services, less intrusive DRM systems, support for photos and improving synchronization capabilities are all growth accelerators for HDD based Digital Audio Players. Ongoing integration of multiple general purpose components results in a reduced component count and lower BOM costs in the aspect of semiconductor content; trends are expected to remain stable. Increasingly, the main differentiators for SOC vendors are firmware development kits, software development kits, and reference designs that allow vendors to differentiate their products while lowering development costs and enabling short time-to-market cycle.
0
5,000
10,000
15,000
20,000
25,000
30,000
35,000
'000
0
20
40
60
80
100
120
140
160
180
200
US$
Units (K) Factory Average Selling Price ($)
2005200420032002 2006 2009 201020082007
Technology Sector
44
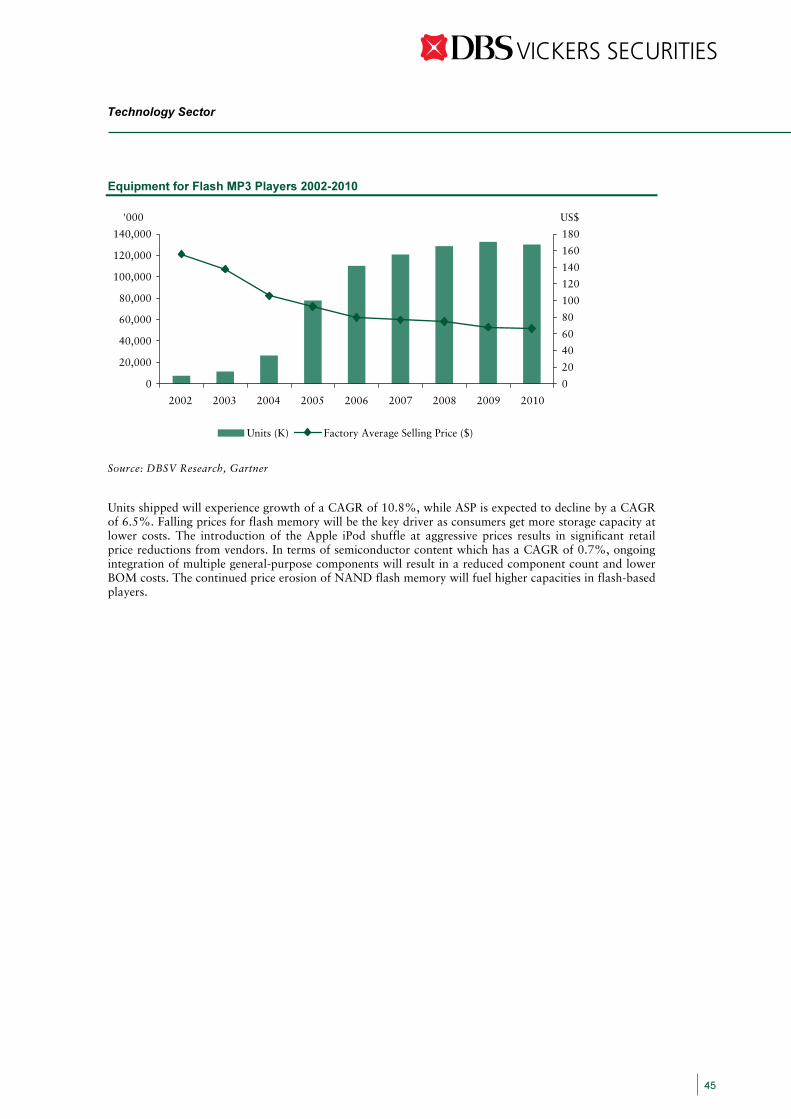
Equipment for Flash MP3 Players 2002-2010
Source: DBSV Research, Gartner
Units shipped will experience growth of a CAGR of 10.8%, while ASP is expected to decline by a CAGR of 6.5%. Falling prices for flash memory will be the key driver as consumers get more storage capacity at lower costs. The introduction of the Apple iPod shuffle at aggressive prices results in significant retail price reductions from vendors. In terms of semiconductor content which has a CAGR of 0.7%, ongoing integration of multiple general-purpose components will result in a reduced component count and lower BOM costs. The continued price erosion of NAND flash memory will fuel higher capacities in flash-based players.
0
20,000
40,000
60,000
80,000
100,000
120,000
140,000
'000
0
20
40
60
80
100
120
140
160
180
US$
Units (K) Factory Average Selling Price ($)
2005200420032002 2006 2009 201020082007
Technology Sector
45
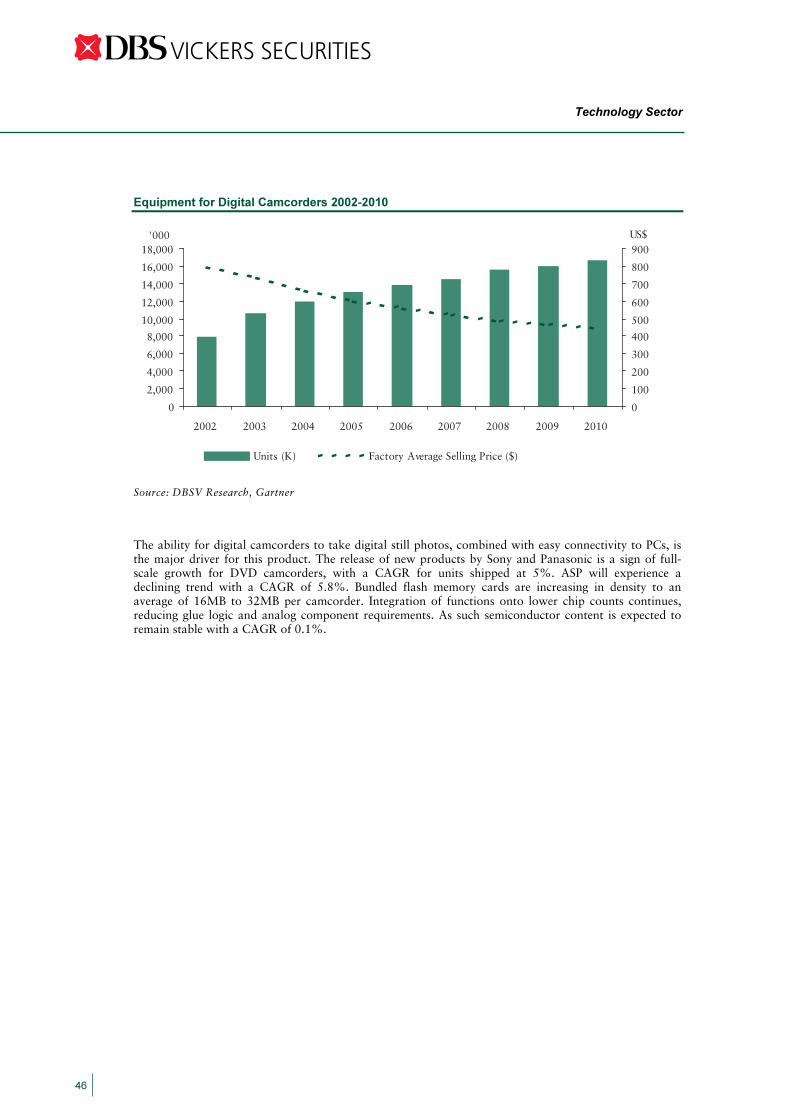
Equipment for Digital Camcorders 2002-2010
Source: DBSV Research, Gartner
The ability for digital camcorders to take digital still photos, combined with easy connectivity to PCs, is the major driver for this product. The release of new products by Sony and Panasonic is a sign of full-scale growth for DVD camcorders, with a CAGR for units shipped at 5%. ASP will experience a declining trend with a CAGR of 5.8%. Bundled flash memory cards are increasing in density to an average of 16MB to 32MB per camcorder. Integration of functions onto lower chip counts continues, reducing glue logic and analog component requirements. As such semiconductor content is expected to remain stable with a CAGR of 0.1%.
0
2,000
4,000
6,000
8,000
10,000
12,000
14,000
16,000
18,000
2002 2003 2004 2005 2006 2007 2008 2009 2010
'000
0
100
200
300
400
500
600
700
800
900US$
Units (K) Factory Average Selling Price ($)
Technology Sector
46

Equipment for Digital Set-Top Boxes, Cable 2002-2010
Source: DBSV Research, Gartner
Steady growth over the forecast period is expected as cable operators continue to transfer analog networks to digital, while increasing the functionality of their service offering to include PVR or VOD, as well as delivery of high definition content over IP-based technologies using improved video-compression algorithms. Units shipped grow at a CAGR of 4.7%, as ASP is expected to decline at a CAGR of 8.3%. In terms of semi-conductor content, there is ongoing integration in the front-end tuner section and continuing reduction of component count, particularly for digital cable STBs, there is constant pressure to lower BOM costs, as such, semi-conductor content is forecasted to decline at a CAGR of 9.1%.
0
5,000
10,000
15,000
20,000
25,000
30,000
'000
0
50
100
150
200
250
US$
Units (K) Factory Average Selling Price ($)
2005200420032002 2006 2009 201020082007
Technology Sector
47

Equipment for Digital Set-Top Boxes, IP 2002-2010
Source: DBSV Research, Gartner
There is expected to be a large number of small deployments, specifically in countries where alternative pay-TV operations are negligible. In the main pay-TV markets, competition remains intense and, without a compelling reason for consumers to switch from established pay-TV operators, growth in the IPTV sector will remain slow and confined to consumers unable to access other pay-TV systems of free-to-air digital broadcasting. CAGR for units shipped is 29.6%. ASP is forecasted to decline at a CAGR of 18.2%. In the aspect of semi-conductor content, as with all digital STBs, there is ongoing integration in all sections of the design and continuing reduction of component count, particularly for low-cost solutions. Semi-conductor content is seen to fall at a CAGR of 10.4%.
0
2,000
4,000
6,000
8,000
10,000
12,000'000
0
50
100
150
200
250
300US$
Units (K) Factory Average Selling Price ($)
2005200420032002 2006 2009 201020082007
Technology Sector
48
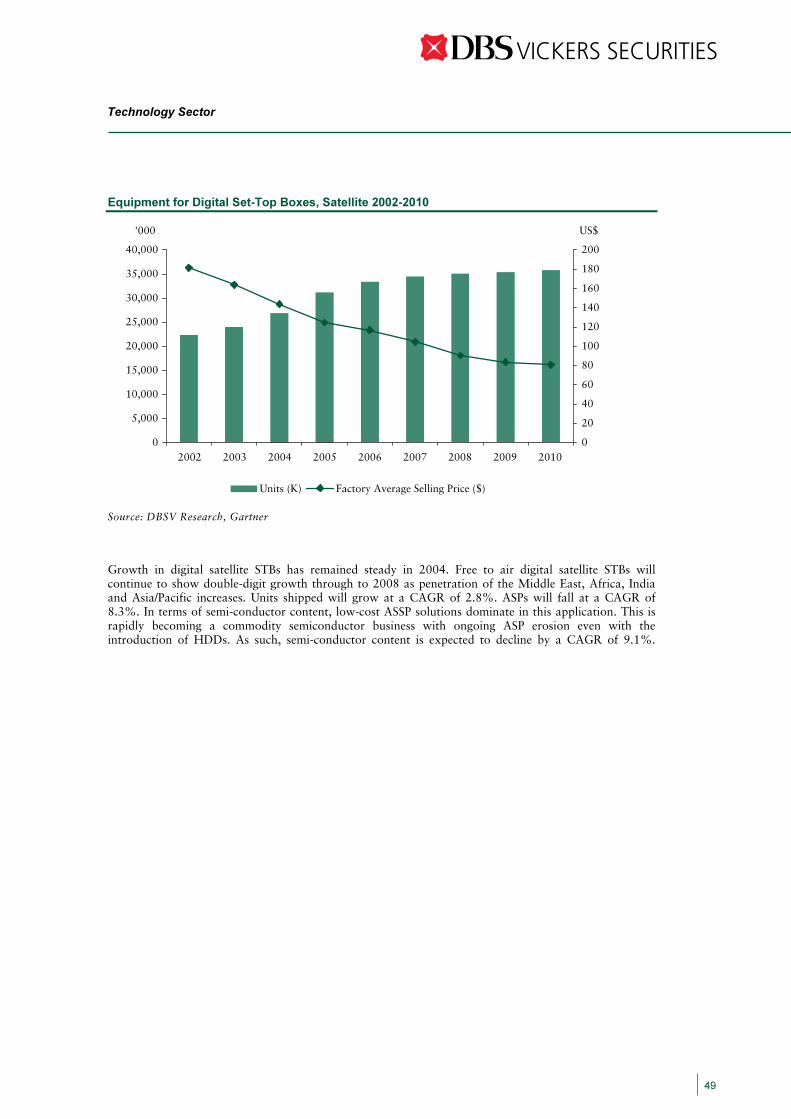
Equipment for Digital Set-Top Boxes, Satellite 2002-2010
Source: DBSV Research, Gartner
Growth in digital satellite STBs has remained steady in 2004. Free to air digital satellite STBs will continue to show double-digit growth through to 2008 as penetration of the Middle East, Africa, India and Asia/Pacific increases. Units shipped will grow at a CAGR of 2.8%. ASPs will fall at a CAGR of 8.3%. In terms of semi-conductor content, low-cost ASSP solutions dominate in this application. This is rapidly becoming a commodity semiconductor business with ongoing ASP erosion even with the introduction of HDDs. As such, semi-conductor content is expected to decline by a CAGR of 9.1%.
0
5,000
10,000
15,000
20,000
25,000
30,000
35,000
40,000
'000
0
20
40
60
80
100
120
140
160
180
200
US$
Units (K) Factory Average Selling Price ($)
2005200420032002 2006 2010200920082007
Technology Sector
49

Equipment for Digital Set-Top Boxes, Terrestrial 2002-2010
Source: DBSV Research, Gartner
Growth in digital terrestrial STBs remains strong and is expected to increase as digital terrestrial broadcasting spreads across Europe and Asia/Pacific. Units shipped is expected to rise at a CAGR of 20.7% as the widespread introduction of digital terrestrial free-to-air broadcasting across EMEA is increasing unit production of low-cost digital terrestrial receivers and DTVs. ASPs are expected to fall at a CAGR of 18.2%. There is generally ongoing integration in all sections of digital terrestrial STBs with the aim of reducing component count, particularly for low-cost free-to-air STBs. Semiconductor content will be forecasted to decline at a CAGR of 10.2%.
0
5,000
10,000
15,000
20,000
25,000
30,000
0
50
100
150
200
250
Units (K) Factory Average Selling Price ($)
US$'000
2005200420032002 2006 2010200920082007
Technology Sector
50
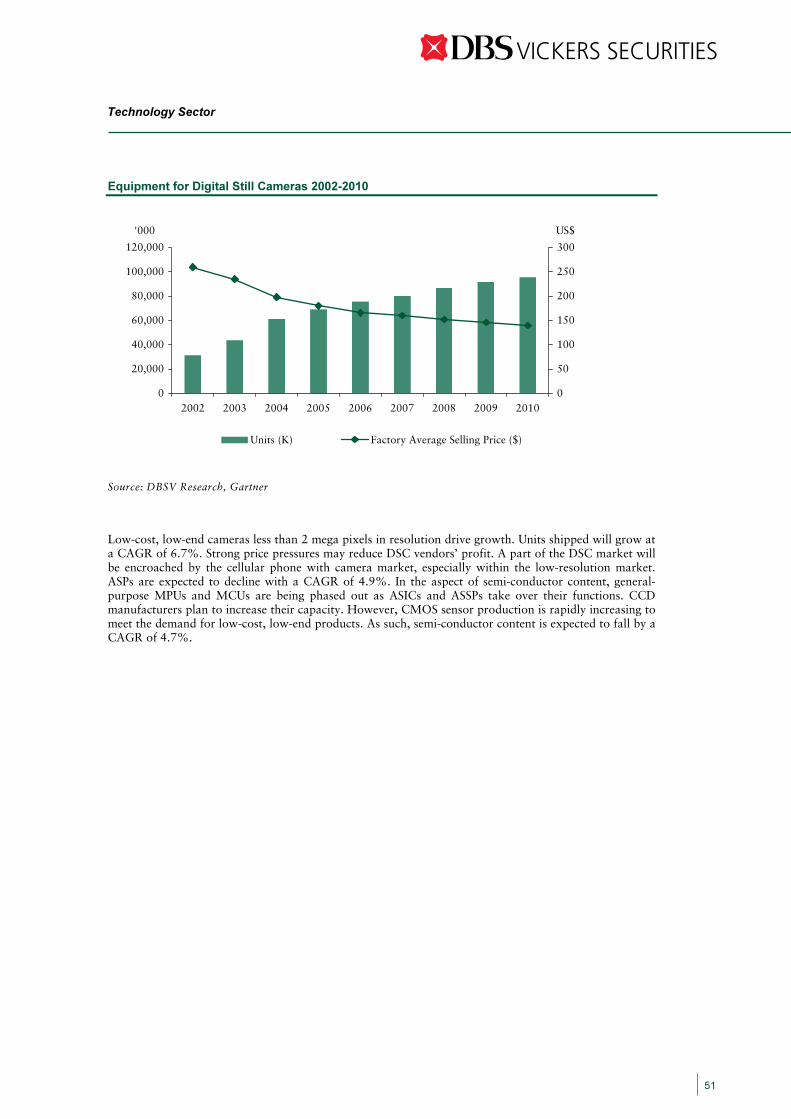
Equipment for Digital Still Cameras 2002-2010
0
20,000
40,000
60,000
80,000
100,000
120,000
'000
0
50
100
150
200
250
300
US$
2005200420032002 2006 2010200920082007
Source: DBSV Research, Gartner
Low-cost, low-end cameras less than 2 mega pixels in resolution drive growth. Units shipped will grow at a CAGR of 6.7%. Strong price pressures may reduce DSC vendors’ profit. A part of the DSC market will be encroached by the cellular phone with camera market, especially within the low-resolution market. ASPs are expected to decline with a CAGR of 4.9%. In the aspect of semi-conductor content, general-purpose MPUs and MCUs are being phased out as ASICs and ASSPs take over their functions. CCD manufacturers plan to increase their capacity. However, CMOS sensor production is rapidly increasing to meet the demand for low-cost, low-end products. As such, semi-conductor content is expected to fall by a CAGR of 4.7%.
Units (K) Factory Average Selling Price ($)
Technology Sector
51

Equipment for DVD Players 2002-2010
0
10,000
20,000
30,000
40,000
50,000
60,000
70,000
80,000
'000
0
20
40
60
80
100
120
140
US$
05,000
10,00015,00020,00025,00030,00035,00040,00045,000
'000
0
100
200
300
400
500
600
700US$
2005200420032002 2006 2010200920082007
2005200420032002 2006 2010200920082007
Source: DBSV Research, Gartner
Low-cost models lead the market, including home theater variants, particularly for the U.S. market. In EMEA, semiconductor TAM growth will come from integrated Class-D amplifiers in high-end home theater products. Units shipped will remain steady with a CAGR of –1.3%. ASPs with a slightly declining CAGR of 0.7% is expected to remain steady after 2005. DVD players are a commodity semiconductor application, with minimal margins countered by high volumes. This is an application dominated by ASSPs. The only use of ASICs tends to be in the audio side of higher-end DVD players. Semi-conductor content is expected to decline by a CAGR of 5.7%.
Equipment for DVD Recorders 2002-2010
Source: DBSV Research, Gartner
Units (K) Factory Average Selling Price ($)
Units (K) Factory Average Selling Price ($)
Technology Sector
52

• Low-cost models lead the market, replacing VCRs, especially in Japan and Asia/Pacific, with units shipped growing at a CAGR of 22.9%. Since pricing pressures for DVD recorders are strong, DVD recorder manufacturers are forced to reduce their cost. As such, ASP is expected to decline by 10%. DVD recorders are adding to the semiconductor dollar content, but their impact will be limited over the forecast period, semiconductor content will have declining rates with a CAGR of 4.5%.
Equipment for MiniDisc Players, Players, Worldwide 2002-2010
0
2,000
4,000
6,000
8,000
10,000
12,000
14,000
16,000
18,000
0
10
20
30
40
50
60
70
80
90
100
2005200420032002 2006 2010200920082007
Source: DBSV Research, Gartner
Networked MD players are extending the use of compressed ATRAC audio files, but this is still limited to Asia/Pacific and Japan’s markets, and competition from MP3 compression is strong. Units shipped will gradually decline with a CAGR of 11.7%. ASP is expected to fall steadily at a CAGR of 3.6%. Ongoing reduction in component count and increased connectivity are maintaining the semiconductor BOM level. Semiconductor content is expected to remain stable with a CAGR of 2.2%.
Units (K) Factory Average Selling Price ($)
'000 US$
Technology Sector
53
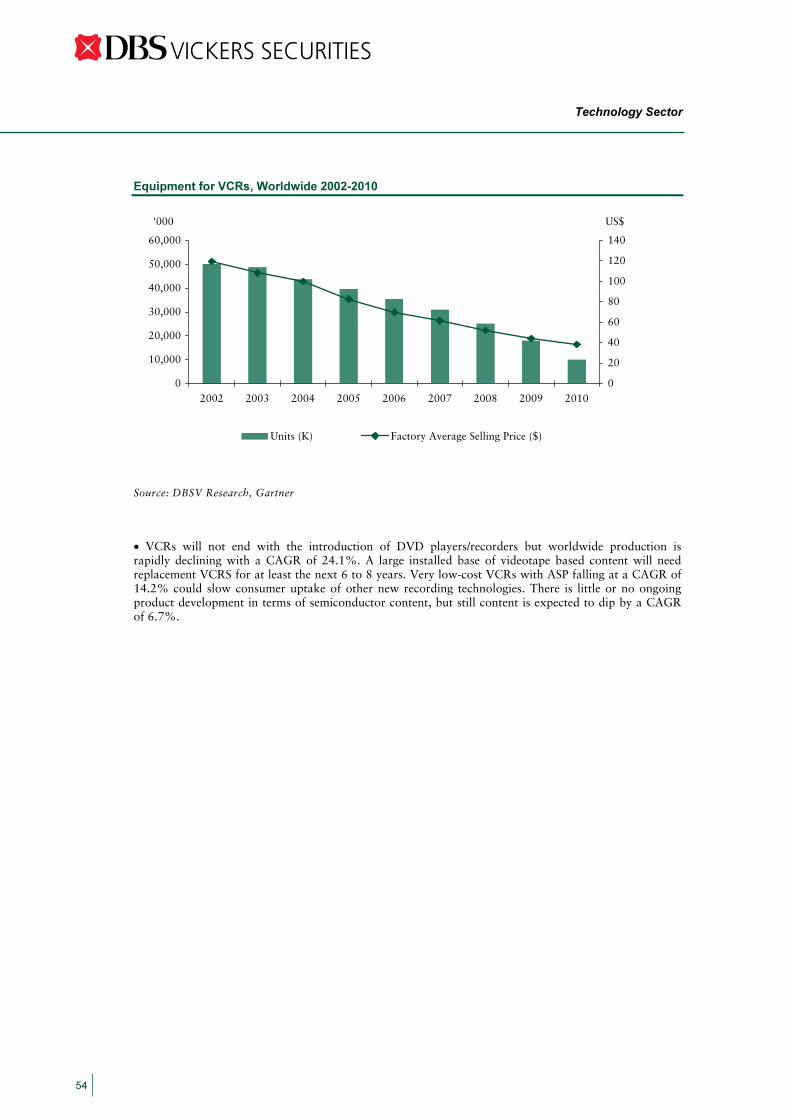
Equipment for VCRs, Worldwide 2002-2010
0
10,000
20,000
30,000
40,000
50,000
60,000
0
20
40
60
80
100
120
140
2005200420032002 2006 2010200920082007
Source: DBSV Research, Gartner
• VCRs will not end with the introduction of DVD players/recorders but worldwide production is rapidly declining with a CAGR of 24.1%. A large installed base of videotape based content will need replacement VCRS for at least the next 6 to 8 years. Very low-cost VCRs with ASP falling at a CAGR of 14.2% could slow consumer uptake of other new recording technologies. There is little or no ongoing product development in terms of semiconductor content, but still content is expected to dip by a CAGR of 6.7%.
Units (K) Factory Average Selling Price ($)
'000 US$
Technology Sector
54

Equipment for Video Game Consoles 2002-2010
0
5,000
10,000
15,000
20,000
25,000
30,000
35,000
40,000
'000
020406080100120140160180200
US$
2005200420032002 2006 2010200920082007
Source: DBSV Research, Gartner
The home video game console market is cyclical and influenced by the introduction of new generations of consoles. Microsoft introduced the Xbox360 in late 2005. Sony and Nintendo will follow suit in the first half of 2006 with Playstation 3 and Nintendo Revolution. Units shipped will depend very much on the timing of the releases, but is expected to have a CAGR of –2.7%. As new consoles are introduced, further price reductions may occur in the current generation. New generations will not drastically affect the video game console market. Overall, ASP is expected to grow slightly at a CAGR of 3.7%. Commodity pricing levels with ever increasing sophistication of functionality are the key focus for manufacturers during the forecast period. Semiconductor content is expected to remain stable at a CAGR of 0.1%.
Units (K) Factory Average Selling Price ($)
Technology Sector
55
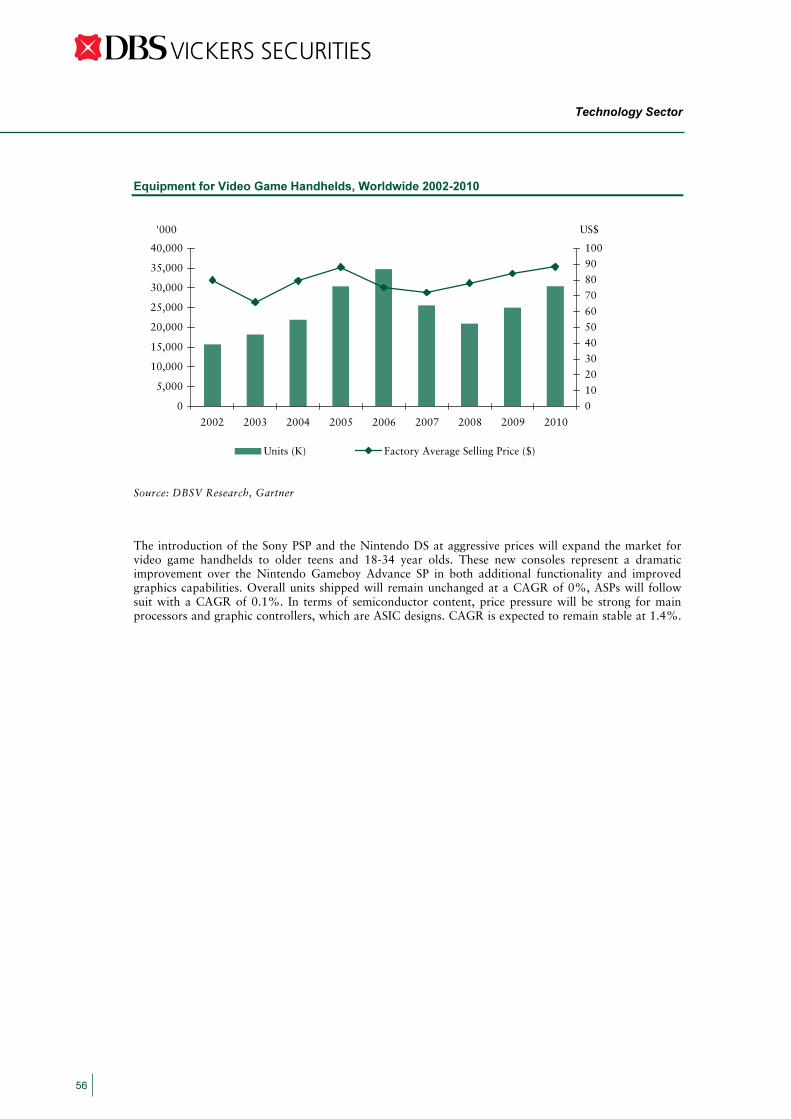
Equipment for Video Game Handhelds, Worldwide 2002-2010
0
5,000
10,000
15,000
20,000
25,000
30,000
35,000
40,000
0
10
20
30
40
50
60
70
80
90
100
2005200420032002 2006 2010200920082007
Source: DBSV Research, Gartner
The introduction of the Sony PSP and the Nintendo DS at aggressive prices will expand the market for video game handhelds to older teens and 18-34 year olds. These new consoles represent a dramatic improvement over the Nintendo Gameboy Advance SP in both additional functionality and improved graphics capabilities. Overall units shipped will remain unchanged at a CAGR of 0%, ASPs will follow suit with a CAGR of 0.1%. In terms of semiconductor content, price pressure will be strong for main processors and graphic controllers, which are ASIC designs. CAGR is expected to remain stable at 1.4%.
Units (K) Factory Average Selling Price ($)
'000 US$
Technology Sector
56

Outlook for the Hard Disk Drive Segment
We are expecting another robust year of growth for hard disk drive shipment in 2006. This will be driven by increased demand for consumer electronic products like DVR/PVR’s, MP3 players and selected areas from the automotive segment. Industry estimates forecast a total unit shipment of 403m drives in 2006; a healthy 18% increase from 2005. Although PC shipments will continue to form the base of the industry, we believe non-PC demand for hard disk drives will be the key driver behind the improved demand that is expected to grow at a CAGR of 50% from 2004-2009 as forecasted by Gartner. US majors Seagate and Western Digital have also raised their coming quarter guidance from 48 cents to 53 cents a share, and from 34 cents to 37 cents respectively citing increased demand during the Christmas quarter, driven by increased consumer electronics applications. Desktop, mobile and enterprise HDD unit shipments (‘000)
('000) 00 01 02 03 04 05 06 07 08 Desktop Drives 147,060 145,831 164,405 190,786 207,629 232,263 253,675 269,518 291,980Desktop PC Drives 145,509 141,694 152,749 170,910 184,376 195,766 202,321 208,211 219,242Desktop PC % of Total Desktop Drives
99% 97% 93% 90% 89% 84% 80% 77% 75%
Mobile Drives 30,224 30,744 35,784 50,907 69,889 87,558 126,321 161,777 207,563Mobile PC Drives 29,101 29,244 33,600 46,329 55,601 63,524 71,683 81,300 91,684 Mobile PC % of Mobile Drives
96% 95% 94% 91% 80% 73% 57% 50% 44%
Enterprise Drives 22,306 19,026 19,450 20,943 22,818 23,129 23,306 24,167 25,259
Total Drives 199,590 195,601 219,639 262,636 300,336 342,950 403,302 455,462 524,802
Source: DBSV Research and Gartner
PC shipments led by demand from the mobile segment will drive basic HDD growth. Worldwide PC shipments grew by 17.2% in 3Q05 from a year ago exceeding Gartner’s growth estimates for a second quarter in a row. As price points continue to decline, and mobile PCs penetrate the sub US$1000 mark, consumers will start to favour the mobility associated with laptop computers, resulting in their corresponding increase in demand. This will inturn boost demand for mobile PC drives which are expected to increase by 13% in FY06 and FY07. However, while the actual unit shipments of desktop and mobile PC drives are increasing, their percentage of total HDD’s shipped will continue to decline as non-PC drives driven by the consumer electronic products take over.
Mobile Drives spearheading HDD growth
-
100,000
200,000
300,000
400,000
500,000
99 00 01 02 03 04 05 06 07 08
('000)
Enterprise Drives Mobile Drives Desktop Drives
Source: DBSV Research and Gartner
Technology Sector
57
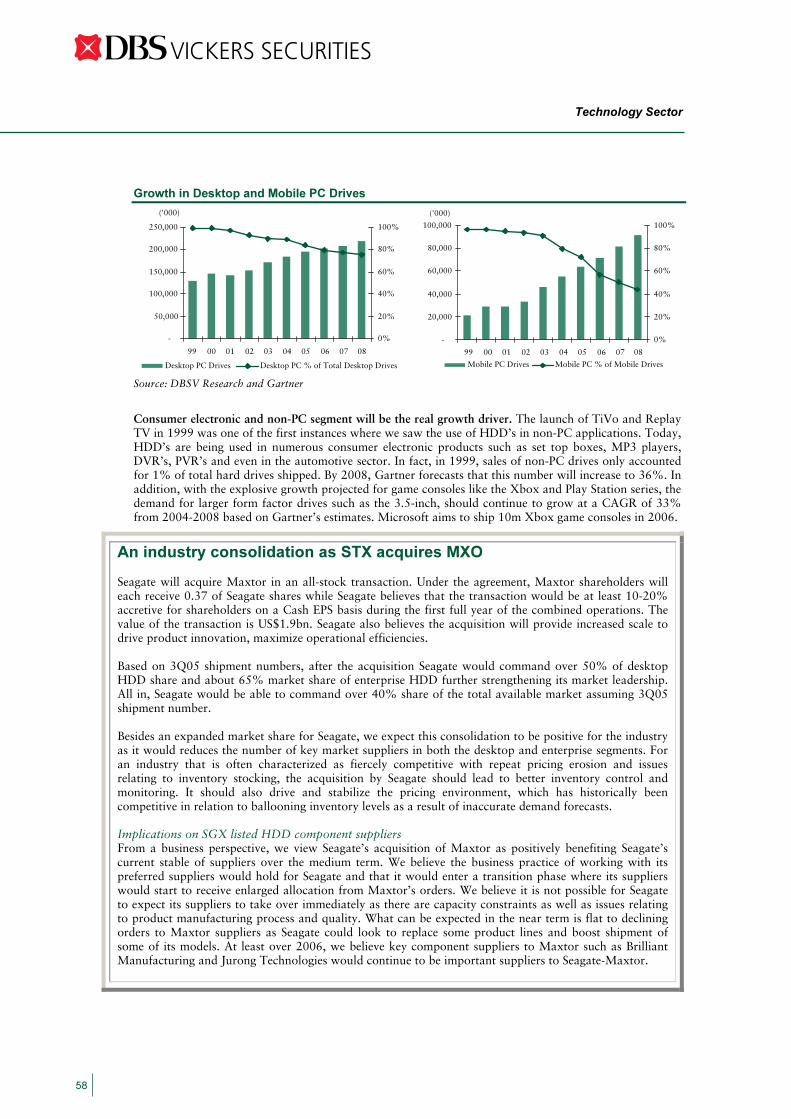
Growth in Desktop and Mobile PC Drives
Source: DBSV Research and Gartner
Consumer electronic and non-PC segment will be the real growth driver. The launch of TiVo and Replay TV in 1999 was one of the first instances where we saw the use of HDD’s in non-PC applications. Today, HDD’s are being used in numerous consumer electronic products such as set top boxes, MP3 players, DVR’s, PVR’s and even in the automotive sector. In fact, in 1999, sales of non-PC drives only accounted for 1% of total hard drives shipped. By 2008, Gartner forecasts that this number will increase to 36%. In addition, with the explosive growth projected for game consoles like the Xbox and Play Station series, the demand for larger form factor drives such as the 3.5-inch, should continue to grow at a CAGR of 33% from 2004-2008 based on Gartner’s estimates. Microsoft aims to ship 10m Xbox game consoles in 2006.
An industry consolidation as STX acquires MXO Seagate will acquire Maxtor in an all-stock transaction. Under the agreement, Maxtor shareholders will each receive 0.37 of Seagate shares while Seagate believes that the transaction would be at least 10-20% accretive for shareholders on a Cash EPS basis during the first full year of the combined operations. The value of the transaction is US$1.9bn. Seagate also believes the acquisition will provide increased scale to drive product innovation, maximize operational efficiencies. Based on 3Q05 shipment numbers, after the acquisition Seagate would command over 50% of desktop HDD share and about 65% market share of enterprise HDD further strengthening its market leadership. All in, Seagate would be able to command over 40% share of the total available market assuming 3Q05 shipment number. Besides an expanded market share for Seagate, we expect this consolidation to be positive for the industry as it would reduces the number of key market suppliers in both the desktop and enterprise segments. For an industry that is often characterized as fiercely competitive with repeat pricing erosion and issues relating to inventory stocking, the acquisition by Seagate should lead to better inventory control and monitoring. It should also drive and stabilize the pricing environment, which has historically been competitive in relation to ballooning inventory levels as a result of inaccurate demand forecasts. Implications on SGX listed HDD component suppliers From a business perspective, we view Seagate’s acquisition of Maxtor as positively benefiting Seagate’s current stable of suppliers over the medium term. We believe the business practice of working with its preferred suppliers would hold for Seagate and that it would enter a transition phase where its suppliers would start to receive enlarged allocation from Maxtor’s orders. We believe it is not possible for Seagate to expect its suppliers to take over immediately as there are capacity constraints as well as issues relating to product manufacturing process and quality. What can be expected in the near term is flat to declining orders to Maxtor suppliers as Seagate could look to replace some product lines and boost shipment of some of its models. At least over 2006, we believe key component suppliers to Maxtor such as Brilliant Manufacturing and Jurong Technologies would continue to be important suppliers to Seagate-Maxtor.
-
20,000
40,000
60,000
80,000
100,000
('000)
0%
20%
40%
60%
80%
100%
Mobile PC Drives Mobile PC % of Mobile Drives
-
50,000
100,000
150,000
200,000
250,000
99 00 01 02 03 04 05 06 07 08 99 00 01 02 03 04 05 06 07 08
('000)
0%
20%
40%
60%
80%
100%
Desktop PC Drives Desktop PC % of Total Desktop Drives
Technology Sector
58

The key and immediate beneficiaries in our view are MMI (Base plates, VCMA and capital equipment), Beyonics Technology, Magnecomp (supplies suspension assemblies to Seagate and Western Digital currently), Seksun Corporation (FIPG and top covers). Brilliant Manufacturing and Jurong Technologies would be adversely affected by this acquisition. For Jurong Technologies, we expect orders to decline gradually in line with the switchover and given that Seagate has its stable of electronics contract manufacturing partners – Beyonics Technology and Venture Corporation, it could potentially lose the entire business which currently accounts for about 15-20% of its sales and about 20-25% of its earnings. However, the converse is also true as Jurong Technologies could also seek to enter Seagate’s stable of suppliers. It is very much dependent on management’s aim and its ability to penetrate.
For BML, we believe it could become an attractive target for mergers and acquisition. We believe the potential candidates to propose the deal are MMI, Beyonics Technology and Seksun Corporation. It is in the interest of BML for the deal to go through. We believe Seagate could also encourage one of its suppliers to consider the acquisition as it would immediately give them access to an expanded base plates manufacturing capacity under a company which understands their stringent requirements and qualification process. The share price impact on these component suppliers has been pretty much within our expectations and as per what we have written in an earlier note. Finally, we believe this consolidation exercise will yield long run benefits and provide a more stable business, pricing and operating environment for local HDD suppliers. The consolidation could also better prepare HDD vendors in their competition against Flash memory vendors which is targeting to increase the penetration of solid state memory in consumer electronics and computing products.
Magnecomp International (BUY, TP: S$1.54) Impact: Positive We feel that MGCP will stand to benefit from the merger primarily because of its large exposure to Seagate. 75% of Magnecomp’s suspension assembly shipments are to Seagate, with Western Digital taking up 15% and Toshiba accounting for 5%. The Group currently does not have any exposure to Maxtor. While things may not change too much in the near term, we anticipate that once the deal goes through in 2H06, Seagate should increase their allocation to MGCP raising the latter’s overall market share at the expense of its competitors. In addition, given the currently tight supply situation due to the limited number of suppliers, ASP’s should continue to remain firm resulting in steady gross margins. While the Group is currently pumping out almost 80m units per quarter, they have the capacity to churn out 100m. Should their allocation increase, MGCP may increase their unit shipments from our original forecast of 356m units in FY06 resulting in a rerating of the stock. We are however keeping our estimates unchanged for the time being and are already the highest on the street with an FY06 EPS of S$0.193. Maintain BUY with FY06 price target of S$1.54 based on industry average 8x forward PE.
Seksun (BUY, TP: 0.39) Impact: Positive
Seksun relies quite heavily on Seagate for sales and is its major supplier for top covers and VCM’s. The Group accounts for 90% of Seagate’s allocation for top covers and 10% of Hitachi’s. Segmentally, HDD revenues form close to 70% of total Group revenues with Seagate contributing to 48% of total Group revenue. Going forward we feel that Seksun is in a good position to benefit from this merger as the Group has now been requested to manufacture disk clamps by Seagate as well. Seksun is also building a new plant in Thailand to handle the lack of capacity from Singapore and this is anticipated to be ready by the last quarter of next year; just in time to handle any new orders from Seagate for top covers and disk clamps. We are maintaining our FY06 estimates because we do not see any impact to earnings until probably FY07. Maintain BUY with a 1-year target price of S$0.39 based on 10x forward PE.
Unisteel Technology (BUY, TP: 2.09) Impact: Neutral
While Unisteel’s fastener business contributed a significant proportion to Group revenue (70% in FY04), this should decrease going forward as its subsidiary Valen starts to ramp up production. Currently Seagate accounts for approximately 23% of Group revenue with Western Digital coming in at 15% and Maxtor at 10%. We feel that the impact to Unisteel will be somewhat neutral given that for a start, the HDD
Technology Sector
59
segment makes up most but not all of the fastener revenue (75%) and that the Group’s exposure to all three US majors are somewhat balanced. However, Unisteel will continue to grow in line with the demand for HDD’s in general and margins will remain stable due to the oligopoly situation that the company is in where there are only three suppliers meeting global demand for fasteners. We therefore reiterate our BUY on the stock with an FY06 target price of S$2.09 based on 13x forward PE.
Beyonics (BUY, TP: 0.46) Impact: Neutral
Beyonics derived 91% of its revenue from the contract manufacturing and EMS segment in 1Q06 and only 9% came from the precision engineering segment which focuses on base plates supplied to Seagate. While the HDD business should be positively impacted from the merger because Beyonics supplies 40% of Seagate’s base plate allocation, the overall impact to Group revenue and profitability will be neutral. Beyonics is also facing capacity constraints due to the shortage of precision engineering machines so their ability to ramp up production in the event that Seagate increases their allocation will also be limited. We are however still positive on the Group’s long term prospects riding on the growth in HDD and maintain our BUY recommendation with an FY06 target price of S$0.46.
MMI (HOLD, TP: 0.70) Impact: Positive
MMI manufactures base plates, VCM’s and motor assemblies largely for Seagate and to a lesser extent for WD and Hitachi. It is estimated that Seagate accounts for approximately 65% to 70% of MMI’s revenue with HDD components making up 67% of FY05’s sales. The Group is in a good position to benefit from Seagate’s takeover of Maxtor and given its consistent ability to execute over the last few years, we feel that Seagate may increase overall allocation to MMI while reducing that of Brilliant. In fact, Brilliant in our opinion is a good acquisition target for MMI allowing MMI to further strengthen its market share and reduce competition thereby stabilizing ASPs. Should this happen, MMI may warrant a rerating upwards from possible earnings expansion. However, it is still too early to determine the full impact and whether MMI will takeover Brilliant. While the stock has had a decent run recently, it is however near our target price of S$0.70. We are therefore downgrading our recommendation to a HOLD in light of valuations while maintaining our FY06 target price of S$0.70.
Brilliant (Fully Valued, TP: 0.29) Impact: Negative
Brilliant is one of the leading manufacturers of base plates and top covers and derives over 90% of its revenues from Maxtor, with the remainder coming from WD. With its high focus on Maxtor, the Group is certainly at risk as a result of this merger. Based on our assumptions, BML is expected to supply 52m 2.5-inch and 3.5-inch base plates, and 28m topcovers representing 75% and 50% of Maxtor’s allocation respectively. However, we have toned down our unit shipment forecasts by 10% which has effectively lowered FY06 earnings to S$16.4m from S$18.2m. We peg BML at 8x forward PE which is a slight discount to our HDD industry peer average PE multiple of 8.2x. We therefore downgrade our recommendation from HOLD to Fully Valued with a one-year price target of S$0.29.
Jurong Technologies (BUY, TP: 2.41 - both under review) Impact: Negative
Jurong Technologies is a critical EMS partner to Maxtor and provides mainly PCB assembly services. As of 3Q05, HDD sales account for about 18% of its Group sales. Operating profit contribution however is likely higher at about 20-25% due to higher margin services and content. Although we believe there may be a possibility for Jurong Technologies to penetrate into Seagate’s account given the strong delivery and execution that it has shown in the past, at this juncture, we prefer to remain conservative and assume that Jurong Technologies would start to see orders and profit contribution from Maxtor falls as Seagate shits allocation away to other suppliers or reduce shipment of Maxtor product and replaces it with its own models. Our target price and recommendation is predicated on our expectation that Jurong Technologies would continue to receive rising orders from Maxtor but in the view of this acquisition, we are reviewing our assumptions in our earnings forecasts. We are likely to revise our earnings contributions from Maxtor lower without a corresponding change to our assumptions from other product segments. As a result, earnings estimates are likely to be revised downwards and correspondingly our target price will fall.
Technology Sector
60
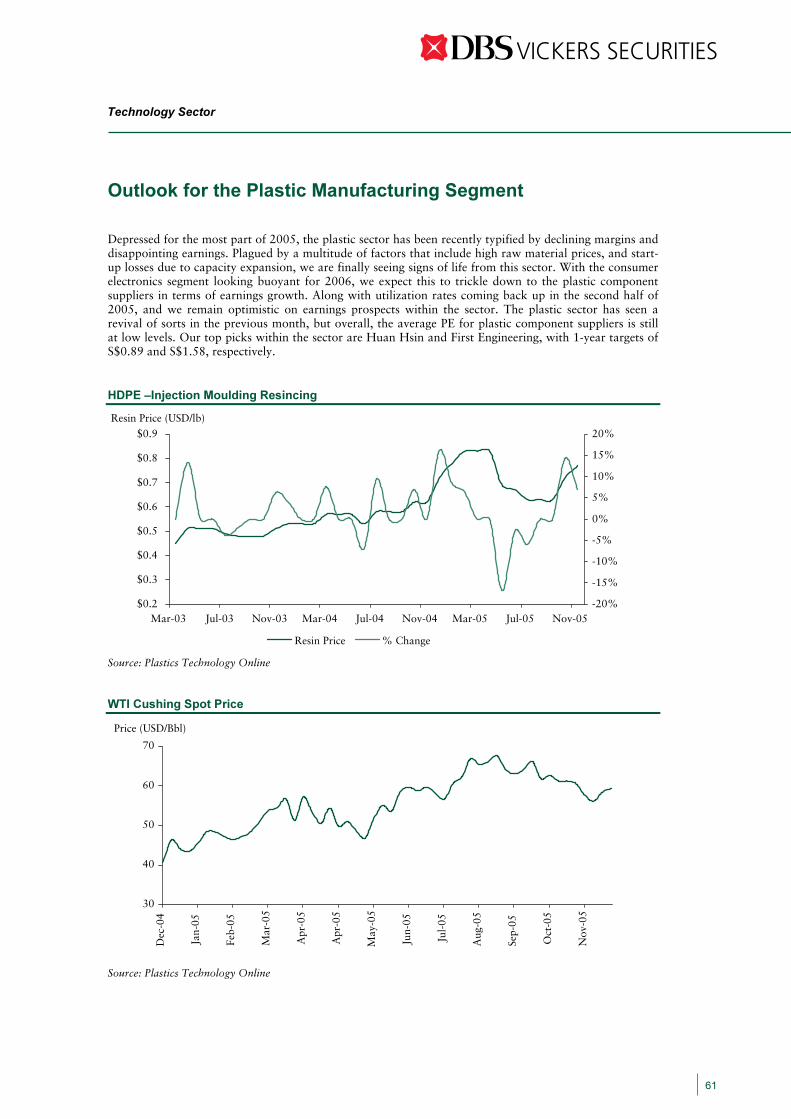
Outlook for the Plastic Manufacturing Segment
Depressed for the most part of 2005, the plastic sector has been recently typified by declining margins and disappointing earnings. Plagued by a multitude of factors that include high raw material prices, and start-up losses due to capacity expansion, we are finally seeing signs of life from this sector. With the consumer electronics segment looking buoyant for 2006, we expect this to trickle down to the plastic component suppliers in terms of earnings growth. Along with utilization rates coming back up in the second half of 2005, and we remain optimistic on earnings prospects within the sector. The plastic sector has seen a revival of sorts in the previous month, but overall, the average PE for plastic component suppliers is still at low levels. Our top picks within the sector are Huan Hsin and First Engineering, with 1-year targets of S$0.89 and S$1.58, respectively.
HDPE –Injection Moulding Resincing
Source: Plastics Technology Online
WTI Cushing Spot Price
Source: Plastics Technology Online
30
40
50
60
70
Dec
-04
Jan-
05
Feb-
05
Mar
-05
Apr
-05
Apr
-05
May
-05
Jun-
05
Jul-
05
Aug
-05
Sep-
05
Oct
-05
Nov
-05
Price (USD/Bbl)
$0.2
$0.3
$0.4
$0.5
$0.6
$0.7
$0.8
$0.9
Mar-03 Jul-03 Nov-03 Mar-04 Jul-04 Nov-04 Mar-05 Jul-05 Nov-05
Resin Price (USD/lb)
-20%
-15%
-10%
-5%
0%
5%
10%
15%
20%
Resin Price % Change
Technology Sector
61
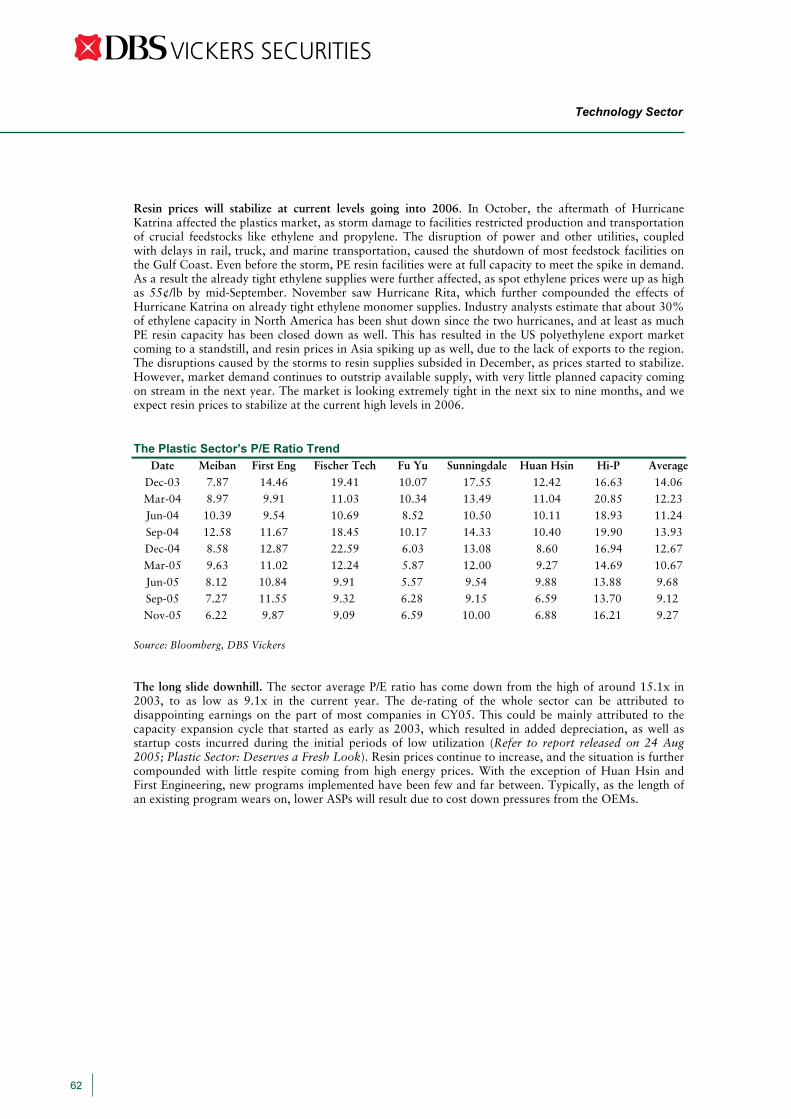
Resin prices will stabilize at current levels going into 2006. In October, the aftermath of Hurricane Katrina affected the plastics market, as storm damage to facilities restricted production and transportation of crucial feedstocks like ethylene and propylene. The disruption of power and other utilities, coupled with delays in rail, truck, and marine transportation, caused the shutdown of most feedstock facilities on the Gulf Coast. Even before the storm, PE resin facilities were at full capacity to meet the spike in demand. As a result the already tight ethylene supplies were further affected, as spot ethylene prices were up as high as 55¢/lb by mid-September. November saw Hurricane Rita, which further compounded the effects of Hurricane Katrina on already tight ethylene monomer supplies. Industry analysts estimate that about 30% of ethylene capacity in North America has been shut down since the two hurricanes, and at least as much PE resin capacity has been closed down as well. This has resulted in the US polyethylene export market coming to a standstill, and resin prices in Asia spiking up as well, due to the lack of exports to the region. The disruptions caused by the storms to resin supplies subsided in December, as prices started to stabilize. However, market demand continues to outstrip available supply, with very little planned capacity coming on stream in the next year. The market is looking extremely tight in the next six to nine months, and we expect resin prices to stabilize at the current high levels in 2006.
The Plastic Sector’s P/E Ratio Trend
Date Meiban First Eng Fischer Tech Fu Yu Sunningdale Huan Hsin Hi-P Average Dec-03 7.87 14.46 19.41 10.07 17.55 12.42 16.63 14.06 Mar-04 8.97 9.91 11.03 10.34 13.49 11.04 20.85 12.23 Jun-04 10.39 9.54 10.69 8.52 10.50 10.11 18.93 11.24
Sep-04 12.58 11.67 18.45 10.17 14.33 10.40 19.90 13.93 Dec-04 8.58 12.87 22.59 6.03 13.08 8.60 16.94 12.67 Mar-05 9.63 11.02 12.24 5.87 12.00 9.27 14.69 10.67
Jun-05 8.12 10.84 9.91 5.57 9.54 9.88 13.88 9.68 Sep-05 7.27 11.55 9.32 6.28 9.15 6.59 13.70 9.12 Nov-05 6.22 9.87 9.09 6.59 10.00 6.88 16.21 9.27
Source: Bloomberg, DBS Vickers
The long slide downhill. The sector average P/E ratio has come down from the high of around 15.1x in 2003, to as low as 9.1x in the current year. The de-rating of the whole sector can be attributed to disappointing earnings on the part of most companies in CY05. This could be mainly attributed to the capacity expansion cycle that started as early as 2003, which resulted in added depreciation, as well as startup costs incurred during the initial periods of low utilization (Refer to report released on 24 Aug 2005; Plastic Sector: Deserves a Fresh Look). Resin prices continue to increase, and the situation is further compounded with little respite coming from high energy prices. With the exception of Huan Hsin and First Engineering, new programs implemented have been few and far between. Typically, as the length of an existing program wears on, lower ASPs will result due to cost down pressures from the OEMs.
Technology Sector
62

Historical P/E Ratio Trend (Dec ‘03 – Nov ‘05)
Source: Bloomberg, DBS Vickers
Will the downtrend end? Things are starting to look better in the fourth quarter, with stabilizing raw material prices, improving utilization at newly built plants, and an upbeat outlook on consumer electronics going into 2006. Gross margins have been on a decline since mid-2004, due to high resin prices and startup losses incurred in the capacity expansion. Resin prices have stayed high, but some of the new plants have reached, or are close to achieving break-even utilization levels. This can be seen in the stabilizing average gross margin trend across the industry since Mar 2005. We think that most of the sector has reached the trough in terms of declining margins and earnings. Sequentially, we expect earnings growth to return to selected component suppliers in the plastic sector, like Huan Hsin and First Engineering.
Historical Gross Margin Trend (Mar 2003 – Sep 2005)
Source: Bloomberg, DBS Vickers
4
8
12
16
20
24
Dec-03 Mar-04 Sep-04Jun-04 Dec-04Mar-05 Jun-05 Nov-05Sep-05
MeiBan First Eng Fischer Tech Fu Yu
SunningdaleHuan Hsin Hi-P Average
PE (x)
10
15
20
25
30
35
40
45
Mar-03 Sep-03 Sep-04Mar-04 Sep-05Mar-05
First Huan Hsin Fu Yu MeibanSunningdale Fischer Tech Hi-P Average
%
Technology Sector
63
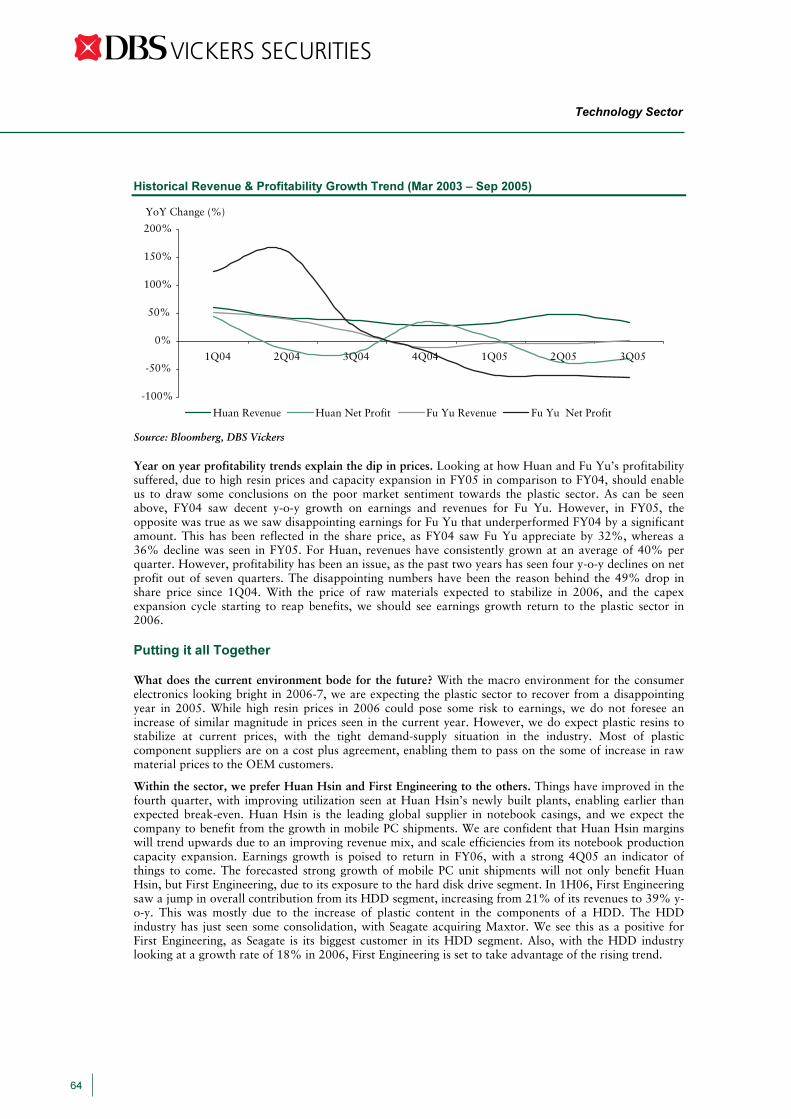
Historical Revenue & Profitability Growth Trend (Mar 2003 – Sep 2005)
Source: Bloomberg, DBS Vickers Year on year profitability trends explain the dip in prices. Looking at how Huan and Fu Yu’s profitability suffered, due to high resin prices and capacity expansion in FY05 in comparison to FY04, should enable us to draw some conclusions on the poor market sentiment towards the plastic sector. As can be seen above, FY04 saw decent y-o-y growth on earnings and revenues for Fu Yu. However, in FY05, the opposite was true as we saw disappointing earnings for Fu Yu that underperformed FY04 by a significant amount. This has been reflected in the share price, as FY04 saw Fu Yu appreciate by 32%, whereas a 36% decline was seen in FY05. For Huan, revenues have consistently grown at an average of 40% per quarter. However, profitability has been an issue, as the past two years has seen four y-o-y declines on net profit out of seven quarters. The disappointing numbers have been the reason behind the 49% drop in share price since 1Q04. With the price of raw materials expected to stabilize in 2006, and the capex expansion cycle starting to reap benefits, we should see earnings growth return to the plastic sector in 2006. Putting it all Together What does the current environment bode for the future? With the macro environment for the consumer electronics looking bright in 2006-7, we are expecting the plastic sector to recover from a disappointing year in 2005. While high resin prices in 2006 could pose some risk to earnings, we do not foresee an increase of similar magnitude in prices seen in the current year. However, we do expect plastic resins to stabilize at current prices, with the tight demand-supply situation in the industry. Most of plastic component suppliers are on a cost plus agreement, enabling them to pass on the some of increase in raw material prices to the OEM customers.
Within the sector, we prefer Huan Hsin and First Engineering to the others. Things have improved in the fourth quarter, with improving utilization seen at Huan Hsin’s newly built plants, enabling earlier than expected break-even. Huan Hsin is the leading global supplier in notebook casings, and we expect the company to benefit from the growth in mobile PC shipments. We are confident that Huan Hsin margins will trend upwards due to an improving revenue mix, and scale efficiencies from its notebook production capacity expansion. Earnings growth is poised to return in FY06, with a strong 4Q05 an indicator of things to come. The forecasted strong growth of mobile PC unit shipments will not only benefit Huan Hsin, but First Engineering, due to its exposure to the hard disk drive segment. In 1H06, First Engineering saw a jump in overall contribution from its HDD segment, increasing from 21% of its revenues to 39% y-o-y. This was mostly due to the increase of plastic content in the components of a HDD. The HDD industry has just seen some consolidation, with Seagate acquiring Maxtor. We see this as a positive for First Engineering, as Seagate is its biggest customer in its HDD segment. Also, with the HDD industry looking at a growth rate of 18% in 2006, First Engineering is set to take advantage of the rising trend.
-100%
-50%
0%
50%
100%
150%
200%
1Q04 3Q042Q04 1Q054Q04 3Q052Q05
YoY Change (%)
Huan Revenue Huan Net Profit Fu Yu Revenue Fu Yu Net Profit
Technology Sector
64
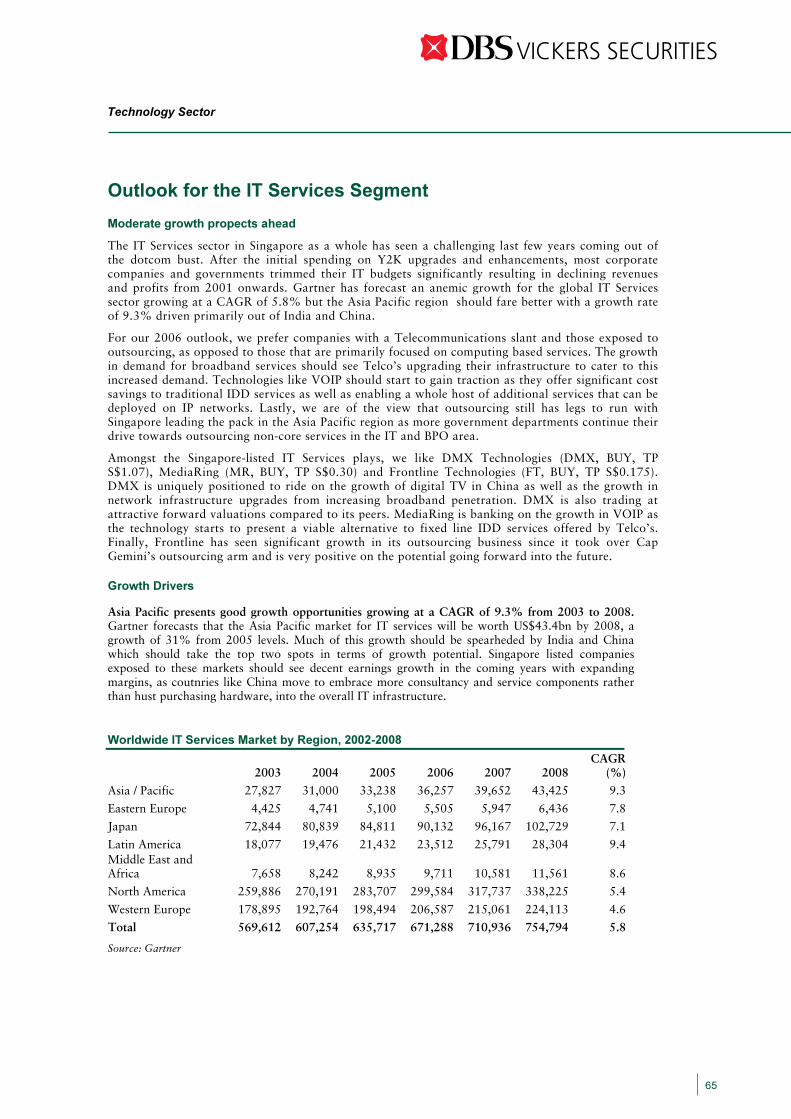
Outlook for the IT Services Segment
Moderate growth propects ahead
The IT Services sector in Singapore as a whole has seen a challenging last few years coming out of the dotcom bust. After the initial spending on Y2K upgrades and enhancements, most corporate companies and governments trimmed their IT budgets significantly resulting in declining revenues and profits from 2001 onwards. Gartner has forecast an anemic growth for the global IT Services sector growing at a CAGR of 5.8% but the Asia Pacific region should fare better with a growth rate of 9.3% driven primarily out of India and China.
For our 2006 outlook, we prefer companies with a Telecommunications slant and those exposed to outsourcing, as opposed to those that are primarily focused on computing based services. The growth in demand for broadband services should see Telco’s upgrading their infrastructure to cater to this increased demand. Technologies like VOIP should start to gain traction as they offer significant cost savings to traditional IDD services as well as enabling a whole host of additional services that can be deployed on IP networks. Lastly, we are of the view that outsourcing still has legs to run with Singapore leading the pack in the Asia Pacific region as more government departments continue their drive towards outsourcing non-core services in the IT and BPO area.
Amongst the Singapore-listed IT Services plays, we like DMX Technologies (DMX, BUY, TP S$1.07), MediaRing (MR, BUY, TP S$0.30) and Frontline Technologies (FT, BUY, TP S$0.175). DMX is uniquely positioned to ride on the growth of digital TV in China as well as the growth in network infrastructure upgrades from increasing broadband penetration. DMX is also trading at attractive forward valuations compared to its peers. MediaRing is banking on the growth in VOIP as the technology starts to present a viable alternative to fixed line IDD services offered by Telco’s. Finally, Frontline has seen significant growth in its outsourcing business since it took over Cap Gemini’s outsourcing arm and is very positive on the potential going forward into the future. Growth Drivers
Asia Pacific presents good growth opportunities growing at a CAGR of 9.3% from 2003 to 2008. Gartner forecasts that the Asia Pacific market for IT services will be worth US$43.4bn by 2008, a growth of 31% from 2005 levels. Much of this growth should be spearheded by India and China which should take the top two spots in terms of growth potential. Singapore listed companies exposed to these markets should see decent earnings growth in the coming years with expanding margins, as coutnries like China move to embrace more consultancy and service components rather than hust purchasing hardware, into the overall IT infrastructure.
Worldwide IT Services Market by Region, 2002-2008
2003 2004 2005 2006 2007 2008 CAGR
(%) Asia / Pacific 27,827 31,000 33,238 36,257 39,652 43,425 9.3
Eastern Europe 4,425 4,741 5,100 5,505 5,947 6,436 7.8
Japan 72,844 80,839 84,811 90,132 96,167 102,729 7.1
Latin America 18,077 19,476 21,432 23,512 25,791 28,304 9.4 Middle East and Africa 7,658 8,242 8,935 9,711 10,581 11,561 8.6
North America 259,886 270,191 283,707 299,584 317,737 338,225 5.4
Western Europe 178,895 192,764 198,494 206,587 215,061 224,113 4.6
Total 569,612 607,254 635,717 671,288 710,936 754,794 5.8
Source: Gartner
Technology Sector
65

Core outsourcing remains the main source of growth. We feel that the wave of outsourcing that has been set in motion will continue somewhat unabated for the next few years, growing globally by 7.5% and 8% respectively in 2006 and 2007 as forecast by Gartner. While countries like China are starting to realise the importance of software services and consulting to the overall IT infrastructure, we still think that Systems Integration will face continued scrutiny because it is seen more as a cost as opposed to something that can give the firm a competitive advantage. Companies that focus mostly on hardware sales and support would see very slow growth rates as PC replacement cycles from Y2K near an end. Worldwide IT Services Market by Segment, 2002-2008
2003 2004 2005 2006 2007 2008 CAGR
(%)
Product Support 130,282 135,659 138,795 143,075 147,759 153,287 3.3 Hardware Maintenance and Support 79,145 81,888 83,168 85,060 87,109 89,572 2.5
Software Support 51,137 53,771 55,627 58,015 60,650 63,715 4.5
Systems Integration 215,528 227,512 236,463 248,339 261,319 275,521 5
Consulting 41,915 43,803 45,414 47,632 50,205 53,034 4.8 Development and Integration 173,613 183,709 191,049 200,707 211,114 222,487 5.1
Core Outsourcing 223,802 244,084 260,459 279,874 301,858 325,986 7.8
IT Management 138,499 150,448 159,383 170,067 182,100 195,297 7.1
Process Management 85,303 93,636 101,076 109,807 119,758 130,689 8.9
Total 569,612 607,254 635,717 671,288 710,936 754,794 5.8 Source: Gartner
Growth in connectivity platforms is outpacing computing-based services. The tremendous growth in global broadband penetration coupled with the rise of services like VOIP, IPTV and triple play services is resulting in a situation where IT services built on connectivity hardware (LAN, WAN and public network systems) are exceeding growth rates of services built on computing (desktop and server) platforms. China is expected to have 52.4m users on broadband by 2008 which will place tremendous pressure on local Telco operators like China Netcom and China Telecom to upgrade their networks and install new equipment such as switches and routers to handle the increased demand. A similar situation is being experienced in Indonesia where technologies like ADSL are seeing subscriber growth at a CAGR of 20% from 2002 to 2008 as forecast by Gartner. Growth in services based on all computing platforms is forecast at 4.4% in 2008, while services based on all connectivity platforms is expected to reach 8.3% in 2008.
Broadband subscriber growth in several AP markets, 2002-2008
Source: Gartner
China
21.127.1
31.537.0
42.847.3
52.4
0.0
10.0
20.0
30.0
40.0
50.0
60.0subs (m)
0.70.9
1.11.3
1.61.9
2.32.0
2.32.5
2.7 2.8 2.8 2.8
0.70.7 0.7 0.7 0.7 0.7 0.8
0.0
0.5
1.0
1.5
2.0
2.5
3.0subs (m)
Indonesia Malaysia Singapore2005200420032002 2006 20082007 2005200420032002 2006 20082007
Technology Sector
66
Risks
The business is very susceptible to economic cycles. The IT spending cycle has appeared to bottom out and is on the rise after almost two years of sluggish growth. It is forecast that companies should now spend more on innovative new projects and invest to keep their businesses competitive. The global and regional economic recovery also is facilitating the spending mentality with PC and server shipments expected to grow at a 9.2% CAGR from 2003 to 2008. However, industry consensus seems to suggest that CIO’s are becoming increasingly demanding in ensuring an almost immediate return on investment, and carefully selecting IT projects that deliver this. It is also proven that IT spending drops sharply when the economy takes a turn for the worse. Thus if the current economic recovery in the region stalls, IT services companies could see a drop in revenues as corporations cut back sharply in IT spending to reduce costs.
Increased competition may eventually erode margins. Most IT Services companies that have a substantial amount of revenue coming out of consulting and software services enjoy high gross margins of 30% and above. These companies managed to maintain gross margins by acting as “value-added” systems architects to their vendor partners, and customers. However, the IT industry has evolved significantly and numerous “pure resellers” have also morphed into systems architects, able to add-value beyond purely pushing products. Similarly, barriers to entry can be said to be somewhat low and large outflows of skilled consultants from one company to another, may cripple the former. The industry is continuously in a state of intense competition and companies looking to maintain profitability have to look out for new opportunities and develop new technologies or else risk their margins being eroded by competing companies.
Technology Sector
67

Chartered Semiconductor Potential re-rating
Forecasts and Valuation General Data
Issued Capital (m shrs) 2,513Mkt Cap (S$m/US$m) 3,342 / 1,986Major Shareholders ST Private Ltd (%) 60.5
Free Float (%) 39.5Avg Daily Vol ('000 shrs) 9,692
Consensus Analyst Poll
Avg Rating Buy Hold Sell3 Mth 3.88 9 7 16 Mth 3.55 9 8 312 Mth 3.55 9 8 3Market 3.72Sector 3.93Source: BloombergAvg Rating: 1 = Sell, 3 = Hold, 5 = Buy
Share Price Chart Share Price Performance Share Rel Rel
Price STI SectorPast 1 mth 0% -5% -5%Past 3 mths 20% 14% 7%Past 6 mths -5% -5% 0%Past 12 mths 39% 23% 35%
BUY
S$1.33
At a Glance Price Target: 1-year S$1.59 Stock Code: Bloomberg:CSM SP Reuters: CSMF.SI Sector: Electronics – Foundry STI: 2,420.99 Consensus EPS: FY05 -7.1 US cts FY06 2.5 US cts DBSV vs Consensus EPS (% variance): FY05 nm FY06 +32.0%
Principal Business: Third largest dedicated foundry in the world with five fabrication facilities in Singapore.
FY Dec (US$m) 2003 2004 2005F 2006FTurnover 551.9 932.1 1031.4 1383.5EBITDA 141.1 386.3 322.5 685.4Pretax Profit -282.6 11.3 -148.2 113.7Net Profit -284.8 6.6 -163.9 84.0EPS (US cts) -11.4 0.3 -6.5 3.3EPS (S cts) -18.8 0.4 -10.8 5.5EPS Gth (%) nm nm nm nmPE (x) nm 309.1 nm 24.1P/Cash flow (x) 13.1 4.6 7.6 3.1EV/EBITDA (x) 16.1 6.7 7.5 3.3DPS (US cts) 0.0 0.0 0.0 1.0Div Yield (%) 0.0 0.0 0.0 1.2Net gearing (%) 20.6 44.3 26.7 18.1ROE (%) -17.4 0.4 -9.9 4.5Book value (US cts) 59.7 59.8 72.2 75.5P/Book Value (x) 1.4 1.3 1.1 1.1
Don See · 65-6398 7955 · [email protected]
Technology Sector Chartered Semiconductor
0.800.901.001.101.201.301.401.50
Jan-05 Mar-05 Jun-05 Aug-05 Oct-05 Jan-06
S$
100-Day MA
Chartered Semiconductor
68
The magnitude of CSM's upward revision to its 4Q05 earnings performance surprised us. CSM sales, for the quarter, are now expected to improve by US$10m (US$8m ex shares of SMP revenues) while net earnings should increase by about US$6m. In line with the change due mainly to improved sales mix, we are expecting CSM to report US$366m sales and US$16.4m earnings for the current quarter. With recent announcements of new customers, strong reception for Xbox360 and the good execution at Fab 7 which includes new services at new technology node, we believe CSM will turnaround in 2006 and could drive a re-rating. Maintain BUY with a price target of S$1.59.
• Favorable sales mix & expect better performance in communication segment. CSM is guiding for sales to increase by US$10m (US$8m ex SMP revenues) and earnings to expand by US$6m. The improvement was backed by better demand from its communication customers from whom it had earlier expected sales to decline sequentially. Although CSM has not revised its utilization guidance, we believe it should trend towards the higher end of its estimate (80-81%). We have also assumed a higher ASP of USD$1150.
• DBS ELI pointing to an optimistic 1H06. Our leading indicator, DBS ELI continues to point towards a positive 1H06 for the electronics sector. We believe amidst the good demand for electronics and the relatively tight supply due to a controlled expansion pace within the foundry industry, the expected decline in 1H06 due to seasonal factors could be less-than-expected. Given strong demand of Xbox360, we believe CSM may see a lower-than-expected drop in utilization across its wafer fabs in 1H06. • Earlier price objective met but maintain 1-yr target price of S$1.59. We maintain our 1-year target price of S$1.59 that is pegged to 1.3x (mid-cycle multiple) FY06 P/B based on expectations of further industry growth in 2006 (about 7-9% y-o-y). Although we believe upside to our target price could be limited in the near term given much of the positives could have been factored into the share price currently. We believe there may be re-rating of CSM should it continue to deliver for its 300mm customers and if it could maintain profitability. This could be possible as CSM has been able to roll out advanced technology services and are being qualified by new customers. The industry prospects for 2006 are currently expected to be marginally better than 2005, which should support the better outlook for CSM.

Income Statement (US$m) Balance Sheet (US$m)
Quarterly Income Statement (US$m)
Ratio (%)
Valuation Graph : Book Trading (x) Price Relative to Index
FY Dec 2003A 2004A 2005F 2006F
Turnover 551.9 932.1 1031.4 1383.5EBITDA 141.1 386.3 322.5 685.4Depr/Amort 439.3 437.6 428.4 562.7Opg Profit -298.2 -51.3 -105.9 122.7Associates Inc 23.2 27.6 0.5 19.3Interest (Exp)/Inc -30.1 -18.6 -39.2 -48.2Exceptionals 0.0 0.0 0.0 0.0Pre-Tax Profit -282.6 11.3 -148.2 113.7Tax -11.7 -4.8 -15.7 -29.7Minority Interest 9.5 0.0 0.0 0.0Net Profit -284.8 6.6 -163.9 84.0Sales Growth % 22.8 68.9 10.7 34.1Net Profit Gr % nm (97.7) nm (151.3)EBITDA Mgn % 25.6 41.4 31.3 49.5Opg Mgn % -54.0 -5.5 -10.3 8.9Tax Rate % 4.1 (42.1) 10.6 (26.1)
FY Dec 4Q04 1Q05 2Q05 3Q05
Turnover 190.6 181.4 194.0 290.1EBITDA 62.0 36.4 49.0 136.2Depr/Amort 106.5 108.0 108.8 151.5Opg Profit -44.6 -71.6 -59.8 -15.3Associates Inc -10.4 -9.0 0.8 4.2Interest (Exp)/Inc -1.2 -2.4 -8.6 -14.1Exceptionals 0.0 0.0 0.0 0.0Pre-Tax Profit -30.2 -81.1 -64.0 -29.5Tax 3.3 -3.4 -3.1 -5.0Minority Interest 0.0 0.0 0.0 0.0Net Profit -26.8 -84.5 -67.1 -34.5Sales Growth % (25.9) (80.5) 7.0 49.6 Net Profit Gr % nm nm nm nmEBITDA Mgn % 32.5 20.0 25.3 47.0Opg Mgn % -23.4 -39.5 -30.8 -5.3Tax Rate 11.0 (4.2) (4.9) (17.0)
0.000.20
0.400.60
0.801.00
1.201.40
Chartered Semiconductor
STI
05
101520253035404550
Chartered SemiconductorTechnology Sector
FY Dec 2003A 2004A 2005F 2006F
Fixed assets 1539 1915 2030 1979 Other LT Assets 323 374 375 394 Cash/ST Investments 905 569 622 763 Other Current Assets 253 232 255 336
Total Assets 3021 3090 3282 3472 ST Debt 224 353 353 353 Other Current Liabilities 253 271 286 392 LT Debt 989 883 754 754 Other LT Liabilities 61 78 78 78 Minority Interests 0 0 0 0 Shareholders' equity 1495 1506 1812 1896 Total Capital 3021 3090 3282 3472 Share Capital (m) 2505 2517 2510 2510 Net cash/(debt) (307) (666) (484) (343)Working capital 29 (15) (15) (26)
FY Dec (US$m) 2003A 2004A 2005F 2006F
ROE (%) -17.4 0.4 -9.9 4.5ROA (%) -9.0 0.2 -5.1 2.5Net Mgn (%) -51.6 0.7 -15.9 6.1Div Cover (x) nm nm nm nmIntr Cover (x) nm 3.0 0.6 nmAsset Turn (x) 0.2 0.3 0.3 0.4Asset /Debt (x) 2.5 2.5 3.0 3.1Gearing (%) 20.6 44.3 26.7 18.1Net gearing (%) 20.6 44.3 26.7 18.1Debt/EBITDA (x) 8.6 3.2 3.4 1.6Debt/Mkt Cap (x) 0.6 0.6 0.5 0.5Capex/Debt (x) 0.2 0.6 0.5 0.5Capex/Sales (x) 0.5 0.7 0.5 0.4EV (US$m) 2265 2601 2413 2253EV/EBITDA (x) 16.1 6.7 7.5 3.3
2003 2004 2005 20062002
1.60
2003 2004 2005 20062002
69
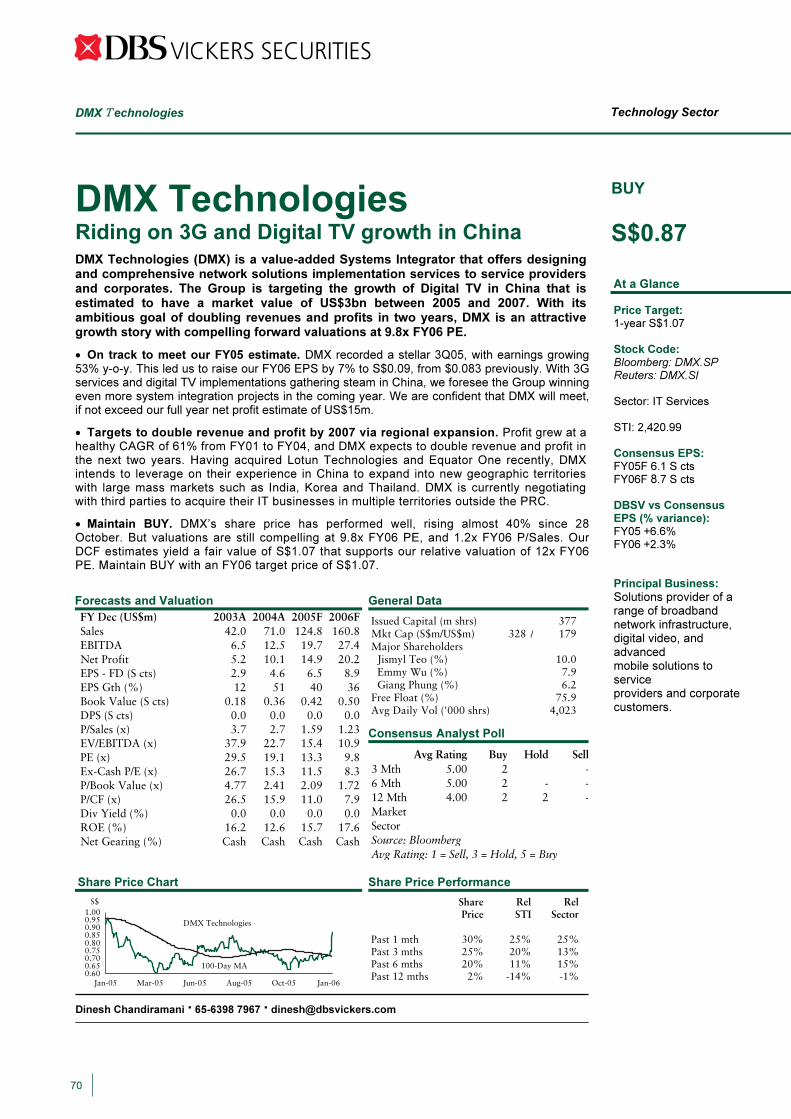
Technology Sector DMXTechnologies
DMX Technologies Riding on 3G and Digital TV growth in China
DMX Technologies (DMX) is a value-added Systems Integrator that offers designing and comprehensive network solutions implementation services to service providers and corporates. The Group is targeting the growth of Digital TV in China that is estimated to have a market value of US$3bn between 2005 and 2007. With its ambitious goal of doubling revenues and profits in two years, DMX is an attractive growth story with compelling forward valuations at 9.8x FY06 PE.
• On track to meet our FY05 estimate. DMX recorded a stellar 3Q05, with earnings growing 53% y-o-y. This led us to raise our FY06 EPS by 7% to S$0.09, from $0.083 previously. With 3G services and digital TV implementations gathering steam in China, we foresee the Group winning even more system integration projects in the coming year. We are confident that DMX will meet, if not exceed our full year net profit estimate of US$15m.
• Targets to double revenue and profit by 2007 via regional expansion. Profit grew at a healthy CAGR of 61% from FY01 to FY04, and DMX expects to double revenue and profit in the next two years. Having acquired Lotun Technologies and Equator One recently, DMX intends to leverage on their experience in China to expand into new geographic territories with large mass markets such as India, Korea and Thailand. DMX is currently negotiating with third parties to acquire their IT businesses in multiple territories outside the PRC.
• Maintain BUY. DMX’s share price has performed well, rising almost 40% since 28 October. But valuations are still compelling at 9.8x FY06 PE, and 1.2x FY06 P/Sales. Our DCF estimates yield a fair value of S$1.07 that supports our relative valuation of 12x FY06 PE. Maintain BUY with an FY06 target price of S$1.07.
Forecasts and Valuation General Data
Issued Capital (m shrs) 377Mkt Cap (S$m/US$m) 328 / 179Major Shareholders Jismyl Teo (%) 10.0 Emmy Wu (%) 7.9 Giang Phung (%) 6.2
Free Float (%) 75.9Avg Daily Vol ('000 shrs) 4,023
Consensus Analyst Poll
Avg Rating Buy Hold Sell3 Mth 5.00 2 -6 Mth 5.00 2 - -12 Mth 4.00 2 2 -MarketSectorSource: BloombergAvg Rating: 1 = Sell, 3 = Hold, 5 = Buy
Share Price Chart Share Price Performance
Share Rel RelPrice STI Sector
Past 1 mth 30% 25% 25%Past 3 mths 25% 20% 13%Past 6 mths 20% 11% 15%Past 12 mths 2% -14% -1%
At a Glance Price Target: 1-year S$1.07 Stock Code: Bloomberg: DMX.SP Reuters: DMX.SI Sector: IT Services STI: 2,420.99 Consensus EPS:
DBSV vs Consensus
Principal Business:
range of broadband network infrastructure, digital video, and advanced mobile solutions to service providers and corporate customers.
BUY
S$0.87
Dinesh Chandiramani · 65-6398 7967 · [email protected]
FY Dec (US$m) 2003A 2004A 2005F 2006FSales 42.0 71.0 124.8 160.8EBITDA 6.5 12.5 19.7 27.4Net Profit 5.2 10.1 14.9 20.2EPS - FD (S cts) 2.9 4.6 6.5 8.9EPS Gth (%) 12 51 40 36Book Value (S cts) 0.18 0.36 0.42 0.50DPS (S cts) 0.0 0.0 0.0 0.0P/Sales (x) 3.7 2.7 1.59 1.23EV/EBITDA (x) 37.9 22.7 15.4 10.9PE (x) 29.5 19.1 13.3 9.8Ex-Cash P/E (x) 26.7 15.3 11.5 8.3P/Book Value (x) 4.77 2.41 2.09 1.72P/CF (x) 26.5 15.9 11.0 7.9Div Yield (%) 0.0 0.0 0.0 0.0ROE (%) 16.2 12.6 15.7 17.6Net Gearing (%) Cash Cash Cash Cash
0.600.650.700.750.800.850.900.951.00
S$
100-Day MA
DMX Technologies
Jan-05 Mar-05 Jun-05 Aug-05 Oct-05 Jan-06
70
8FY06F 8
+FY05 6.6 %
Solutions provider of a
FY06 2.3% ++
FY05F 6.1 S cts
EPS (% variance):
.7 S cts

DMX TechnologiesTechnology Sector
Quarterly Income Statement (US$m) Ratios
Valuation Graph : PE Price Relative to Index
Income Statement (US$m) Balance Sheet (US$m)
FY Dec 2003A 2004A 2005F 2006FTurnover 42 71 125 161EBITDA 6.5 12.5 19.7 27.4Depr/Amort 0.6 2.0 3.2 4.8Opg Profit 5.9 10.8 16.7 22.8Associates Inc 0.0 0.0 0.0 0.0Interest (Exp)/Inc (0.0) 0.1 0.1 0.0Exceptionals 0.0 0.0 0.0 0.0Pre-Tax Profit 5.9 10.6 16.6 22.7Tax (0.7) (0.5) (1.7) (2.5)Minority Interest 0.0 0.0 0.0 0.0Net Profit 5.2 10.1 14.9 20.2Sales Growth % 24.1 69.0 75.9 28.8Net Profit Gr % 34.1 92.5 47.6 35.8EBITDA Mgn % 15.5 17.6 15.8 17.1Opg Mgn % 14.0 15.2 13.3 14.2Tax Rate % 11.2 5.0 10.0 11.0
FY Dec 2003A 2004A 2005F 2006FFixed assets 2 3 5 8Other LT Assets 0 0 6 11Cash/ST Investments 15 38 27 30Other Current Assets 3 4 4 4Total Assets 43 100 121 146ST Debt 6 3 2 1Other Current Liabilities 2 9 10 13LT Debt 0 0 0 0Other LT Liabilities 0 3 5 4Minority Interests 0 0 0 0Shareholders' equity 32 80 95 115Total Capital 44 100 121 146Share Capital (m) 294 366 377 377Net cash/debt 9 36 25 29Working capital 30 60 68 80Gearing (%) Cash Cash Cash Cash
FY Dec 1Q05 2Q05 3Q05Turnover 20.4 31.3 51.7EBITDA 2.4 4.3 0.0Depr/Amort 0.2 0.2 0.0Opg Profit 2.6 4.5 7.1Associates Inc 0.0 0.0 0.0Interest (Exp)/Inc (0.0) (0.0) (0.1)Pre-Tax Profit 2.6 4.5 7.1Tax (0.2) (0.6) (0.8)Minority Interest 0.0 0.1 0.1Net Profit 2.4 3.9 6.3Sales Growth % n.a. 53.1 65.3Net Profit Gr % n.a. 65.3 60.5EBITDA Mgn 11.9% 13.6% 0.0%Opg Mgn 12.9% 14.4% 13.8%Tax Rate 8.1% 12.6% 10.9%
FY Dec 2003A 2004A 2005F 2006FROE (%) 16.2 12.6 15.7 17.6ROA (%) 12.1 10.1 12.4 13.8Net Mgn (%) 12.5 14.2 11.9 12.6Div Cover (x) n.a. n.a. n.a. n.a.Intr Cover (x) 189.4 72.3 168.2 529.5Asset Turn (x) 1.0 0.7 1.0 1.1Asset /Debt (x) 7.2 37.4 68.2 190.7Gearing (%) Cash Cash Cash CashNet gearing (%) Cash Cash Cash CashDebt/EBITDA (x) 0.92 0.21 0.09 0.03Debt/Mkt Cap (x) 0.02 0.01 0.01 0.00Capex/Debt (x) 0.13 0.49 1.20 3.57Capex/Sales (x) 0.02 0.02 0.02 0.02EV (S$m) 247 283 303 299EV/EBITDA (x) 37.9 22.7 15.4 10.9
0.60
1.60
2.60
3.60
4.60
5.60
6.60
DMX
STI
6101418222630343842465054
Dec-02 Dec-04Dec-03 Dec-05 Dec-02 Dec-04Dec-03 Dec-05
71
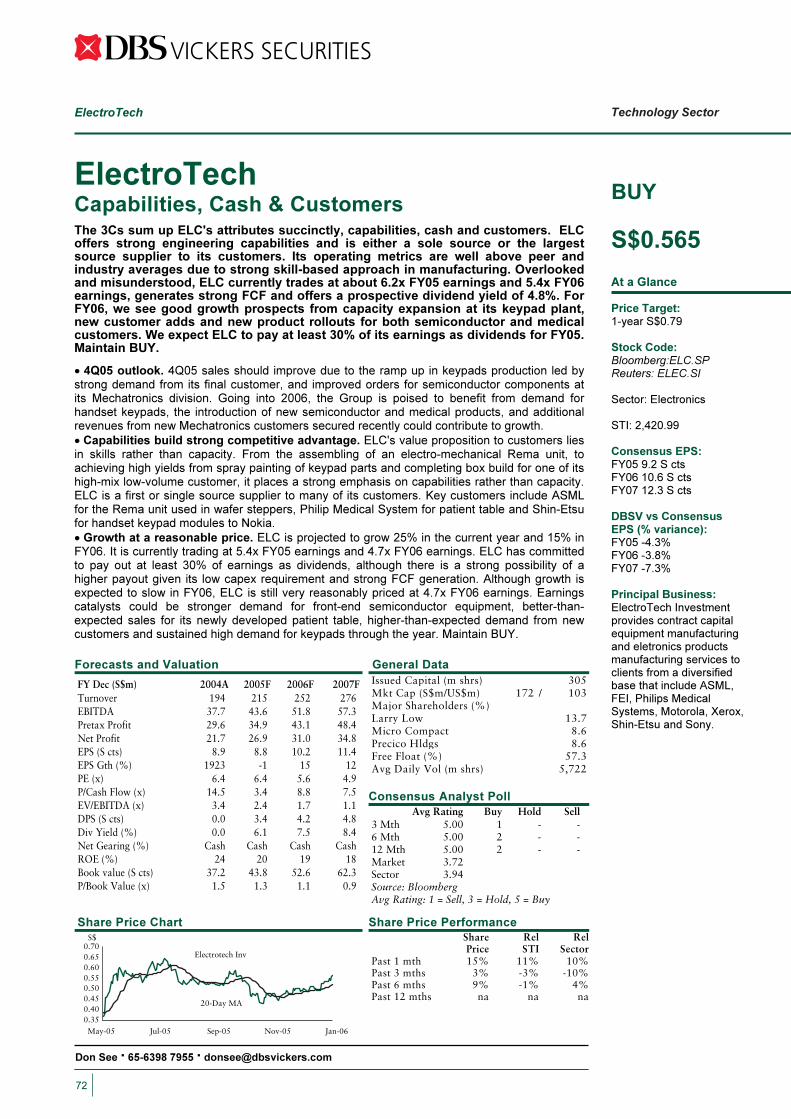
ElectroTech Capabilities, Cash & Customers
Forecasts and Valuation General Data
Issued Capital (m shrs) 305Mkt Cap (S$m/US$m) 172 / 103Major Shareholders (%)Larry Low 13.7Micro Compact 8.6Precico Hldgs 8.6Free Float (%) 57.3Avg Daily Vol (m shrs) 5,722
Consensus Analyst Poll
Avg Rating Buy Hold Sell3 Mth 5.00 1 - -6 Mth 5.00 2 - -12 Mth 5.00 2 - -Market 3.72Sector 3.94Source: BloombergAvg Rating: 1 = Sell, 3 = Hold, 5 = Buy
Share Price Chart Share Price Performance Share Rel Rel
Price STI SectorPast 1 mth 15% 11% 10%Past 3 mths 3% -3% -10%Past 6 mths 9% -1% 4%Past 12 mths na na na
BUY
S$0.565
At a Glance Price Target: 1-year S$0.79 Stock Code: Bloomberg:ELC.SP Reuters: ELEC.SI Sector: Electronics STI: 2,420.99 Consensus EPS: FY05 9.2 S cts FY06 10.6 S cts FY07 12.3 S cts DBSV vs Consensus EPS (% variance): FY05 4.3% FY06 -3.8% FY07 7.3%
Principal Business: ElectroTech Investment provides contract capital equipment manufacturing and eletronics products manufacturing services to clients from a diversified base that include ASML, FEI, Philips Medical Systems, Motorola, Xerox, Shin-Etsu and Sony.
FY Dec (S$m) 2004A 2005F 2006F 2007FTurnover 194 215 252 276EBITDA 37.7 43.6 51.8 57.3Pretax Profit 29.6 34.9 43.1 48.4Net Profit 21.7 26.9 31.0 34.8EPS (S cts) 8.9 8.8 10.2 11.4EPS Gth (%)PE (x) 6.4 6.4 5.6 4.9P/Cash Flow (x) 14.5 3.4 8.8 7.5EV/EBITDA (x)DPS (S cts) 0.0 3.4 4.2 4.8Div Yield (%)Net Gearing (%) Cash Cash Cash CashROE (%)Book value (S cts) 37.2 43.8 52.6 62.3P/Book Value (x) 1.5 1.3 1.1 0.9
Don See · 65-6398 7955 · [email protected]
Technology Sector ElectroTech
0.350.400.450.500.550.600.650.70
May-05 Sep-05Jul-05 Nov-05 Jan-06
S$
Electrotech Inv
20-Day MA
72
1923 -1 15 12
8.47.56.10.0
24 20 19 18
The 3Cs sum up ELC's attributes succinctly, capabilities, cash and customers. ELC offers strong engineering capabilities and is either a sole source or the largest source supplier to its customers. Its operating metrics are well above peer and industry averages due to strong skill-based approach in manufacturing. Overlooked and misunderstood, ELC currently trades at about 6.2x FY05 earnings and 5.4x FY06 earnings, generates strong FCF and offers a prospective dividend yield of 4.8%. For FY06, we see good growth prospects from capacity expansion at its keypad plant, new customer adds and new product rollouts for both semiconductor and medical customers. We expect ELC to pay at least 30% of its earnings as dividends for FY05. Maintain BUY.
• 4Q05 outlook. 4Q05 sales should improve due to the ramp up in keypads production led by strong demand from its final customer, and improved orders for semiconductor components at its Mechatronics division. Going into 2006, the Group is poised to benefit from demand for handset keypads, the introduction of new semiconductor and medical products, and additional revenues from new Mechatronics customers secured recently could contribute to growth. • Capabilities build strong competitive advantage. ELC's value proposition to customers lies in skills rather than capacity. From the assembling of an electro-mechanical Rema unit, to achieving high yields from spray painting of keypad parts and completing box build for one of its high-mix low-volume customer, it places a strong emphasis on capabilities rather than capacity. ELC is a first or single source supplier to many of its customers. Key customers include ASML for the Rema unit used in wafer steppers, Philip Medical System for patient table and Shin-Etsu for handset keypad modules to Nokia. • Growth at a reasonable price. ELC is projected to grow 25% in the current year and 15% in FY06. It is currently trading at 5.4x FY05 earnings and 4.7x FY06 earnings. ELC has committed to pay out at least 30% of earnings as dividends, although there is a strong possibility of a higher payout given its low capex requirement and strong FCF generation. Although growth is expected to slow in FY06, ELC is still very reasonably priced at 4.7x FY06 earnings. Earnings catalysts could be stronger demand for front-end semiconductor equipment, better-than-expected sales for its newly developed patient table, higher-than-expected demand from new customers and sustained high demand for keypads through the year. Maintain BUY.
-
-
3.4 2.4 1.7 1.1

Income Statement (S$m) Balance Sheet (S$m)
Quarterly Income Statement (S$m)
Ratio (%)
Valuation Graph : PE (x)
Price Relative to Index
0.901.00
1.101.201.30
1.401.501.60
1.701.80
Jan-06May-05 Jul-05 Sep-05 Nov-05
Electrotech
STI
4.0
4.5
5.0
5.5
6.0
6.5
7.0
7.5
May-05 Aug-05Jun-05 Sep-05 Oct-05 Dec-05
FY Dec 2005F 2006F 2007F
Turnover 194 215 252 276EBITDA 37.7 43.6 51.8 57.3 Depr/Amort 7.2 6.9 7.3 7.7 Opg Profit 30.4 35.6 43.4 48.5 Associates Inc/ Excep. 0.1 0.0 0.0 0.0 Interest (Exp)/Inc 0.9 0.7 0.4 0.1 Pre-Tax Profit 29.6 34.9 43.1 48.4 Tax 7.9 8.0 12.0 13.6 Minority Interest (0.0) 0.0 0.0 0.0 Net Profit 21.7 26.9 31.0 34.8 Sales Growth (%) 63.0 11.2 16.9 9.9Net Profit Gr (%) 1959 24 15 12Opg Mgn (%) 15.7 16.6 17.3 17.6Tax Rate (%) 26.6 23.0 28.0 28.0PATMI Margin 11.2 12.5 12.3 12.6
FY Dec 2005F 2006F 2007F
Fixed assets 46.4 50.5 49.6 48.5Other LT Assets 15.0 14.0 12.9 11.9Cash/ST Investments 13.6 64.6 84.1 107.0Other Current Assets 77.5 85.8 99.7 109.3Total Assets 152.5 214.8 246.4 276.6ST Debt 11.9 11.9 11.9 11.9Other Current Liabilities 41.6 49.6 58.2 62.9LT Debt 7.9 7.9 7.9 7.9Minority Interests 0.0 0.0 0.0 0.0Shareholders' equity 91.0 145.4 168.4 193.9Total Capital 152.5 214.8 246.4 276.6Share Capital (m) 245.0 305.0 305.0 305.0Net cash/debt -4.7 46.4 65.9 88.7Working capital 37.5 88.9 113.7 141.5Net Gearing (%) Cash Cash
FY Dec 4Q04 1Q05 2Q05 3Q05
Turnover 55 54 56 50EBITDA 10.7 11.5 11.3 9.8Depr/Amort 1.6 1.8 1.7 1.9Opg Profit 9.1 9.7 9.5 7.9 Associates Inc 0.0 0.0 0.1 0.1 Interest (Exp)/Inc (0.1) (0.1) (0.0) 0.1 Pre-Tax Profit 9.0 9.7 9.5 8.0 Tax (2.3) (2.9) (2.4) (1.2)Minority Interest (0.0) 0.0 0.0 0.0 Net Profit 6.7 6.8 7.2 6.8 Sales Growth q-o-q (%)
7.7 -2.3 5.0 -12.1
Net Profit Gr (%) -0.5 1.6 5.8 -5.1EBITDA Mgn (%) 19.5 21.4 19.9 19.7Opg Mgn (%) 16.5 18.1 16.8 15.9Tax Rate (%) 25.6 29.9 24.7 15.3
FY Dec 2004 2005F 2006F 2007F
ROE (%) 27.2 22.7 19.8 19.2ROA (%) 22.6 19.6 19.1 18.9Net Mgn (%) 11.2 12.5 12.3 12.6Div Cover (x) nm 2.56 2.40 2.40Intr Cover (x) 32.9 52.1 108.9 339.8Asset Turn (x) 1.3 1.1 1.1 1.1Debt/ Asset (%) 5 2 1 1Net gearing (%) 5.1 Cash Cash CashCash Ratio 0.1 0.3 1.1 1.2Current Ratio 1.5 1.7 2.4 2.6Quick Ratio 0.8 1.1 1.9 2.0EV (S$m) 127.2 106.1 86.6 63.8EV/EBITDA (x) 3.4 2.4 1.7 1.1EVA 13.4 13.7 15.6 17.0
ElectroTechTechnology Sector
73
5.1 Cash
2004A 2004A
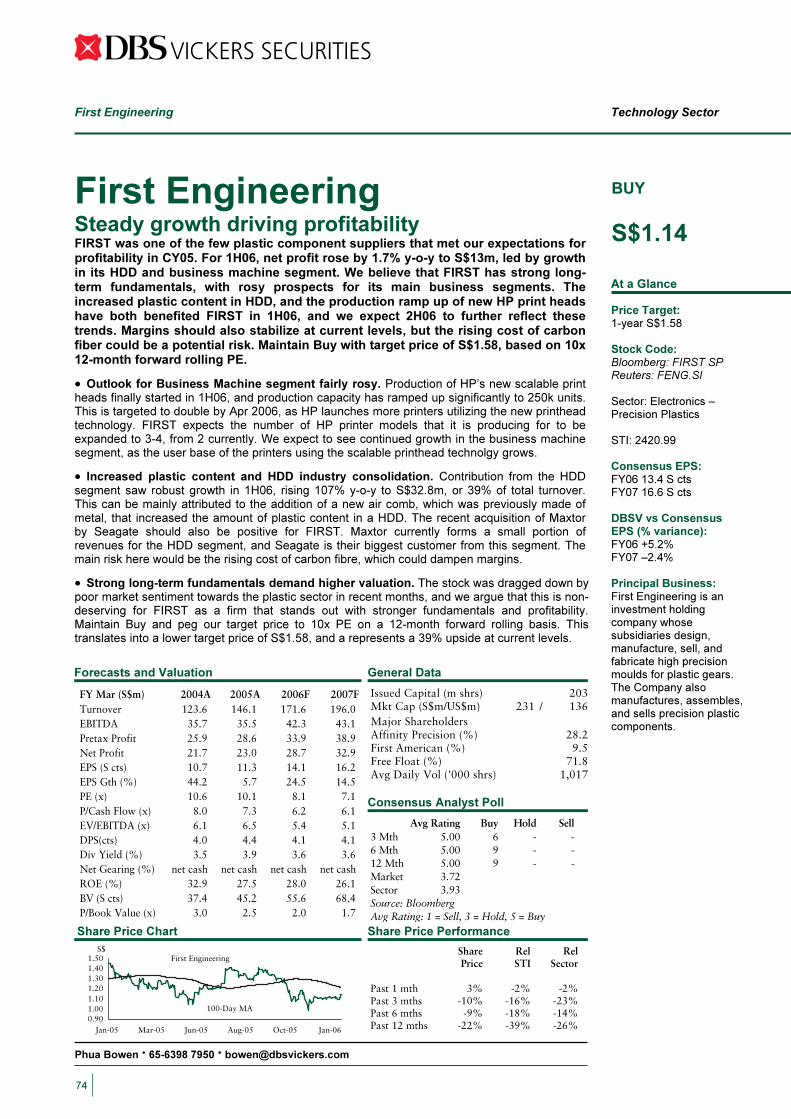
Technology Sector First Engineering
First Engineering Steady growth driving profitability
FIRST was one of the few plastic component suppliers that met our expectations for profitability in CY05. For 1H06, net profit rose by 1.7% y-o-y to S$13m, led by growth in its HDD and business machine segment. We believe that FIRST has strong long-term fundamentals, with rosy prospects for its main business segments. The increased plastic content in HDD, and the production ramp up of new HP print heads have both benefited FIRST in 1H06, and we expect 2H06 to further reflect these trends. Margins should also stabilize at current levels, but the rising cost of carbon fiber could be a potential risk. Maintain Buy with target price of S$1.58, based on 10x 12-month forward rolling PE.
• Outlook for Business Machine segment fairly rosy. Production of HP’s new scalable print
heads finally started in 1H06, and production capacity has ramped up significantly to 250k units.
This is targeted to double by Apr 2006, as HP launches more printers utilizing the new printhead
technology. FIRST expects the number of HP printer models that it is producing for to be
expanded to 3-4, from 2 currently. We expect to see continued growth in the business machine
segment, as the user base of the printers using the scalable printhead technolgy grows.
• Increased plastic content and HDD industry consolidation. Contribution from the HDD
segment saw robust growth in 1H06, rising 107% y-o-y to S$32.8m, or 39% of total turnover.
This can be mainly attributed to the addition of a new air comb, which was previously made of
metal, that increased the amount of plastic content in a HDD. The recent acquisition of Maxtor
by Seagate should also be positive for FIRST. Maxtor currently forms a small portion of
revenues for the HDD segment, and Seagate is their biggest customer from this segment. The
main risk here would be the rising cost of carbon fibre, which could dampen margins.
• Strong long-term fundamentals demand higher valuation. The stock was dragged down by
poor market sentiment towards the plastic sector in recent months, and we argue that this is non-
deserving for FIRST as a firm that stands out with stronger fundamentals and profitability.
Maintain Buy and peg our target price to 10x PE on a 12-month forward rolling basis. This
translates into a lower target price of S$1.58, and a represents a 39% upside at current levels.
Forecasts and Valuation General Data
Issued Capital (m shrs) 203Mkt Cap (S$m/US$m) 231 / 136Major ShareholdersAffinity Precision (%) 28.2First American (%) 9.5Free Float (%) 71.8Avg Daily Vol ('000 shrs) 1,017
Consensus Analyst Poll
Avg Rating Buy Hold Sell3 Mth 5.00 6 - -6 Mth 5.00 9 - -12 Mth 5.00 9 - -Market 3.72Sector 3.93Source: BloombergAvg Rating: 1 = Sell, 3 = Hold, 5 = Buy
Share Price Chart Share Price Performance
Share Rel RelPrice STI Sector
Past 1 mth 3% -2% -2%Past 3 mths -10% -16% -23%Past 6 mths -9% -18% -14%Past 12 mths -22% -39% -26%
At a Glance Price Target: 1-year S$1.58 Stock Code: Bloomberg: FIRST SP Reuters: FENG.SI Sector: Electronics – Precision Plastics STI: 2420.99 Consensus EPS: FY06 13.4 S cts FY07 16.6 S cts DBSV vs Consensus EPS (% variance): FY06 +5.2% FY07 –2.4%
Principal Business: First Engineering is an investment holding company whose subsidiaries design, manufacture, sell, and fabricate high precision moulds for plastic gears. The Company also manufactures, assembles, and sells precision plastic components.
BUY
S$1.14
Phua Bowen · 65-6398 7950 · [email protected]
FY Mar (S$m) 2004A 2005A 2006F 2007FTurnover 123.6 146.1 171.6 196.0EBITDA 35.7 35.5 42.3 43.1Pretax Profit 25.9 28.6 33.9 38.9Net Profit 21.7 23.0 28.7 32.9EPS (S cts) 10.7 11.3 14.1 16.2EPS Gth (%) 44.2 5.7 24.5 14.5PE (x) 10.6 10.1 8.1 7.1P/Cash Flow (x) 8.0 7.3 6.2 6.1EV/EBITDA (x) 6.1 6.5 5.4 5.1DPS(cts) 4.0 4.4 4.1 4.1Div Yield (%) 3.5 3.9 3.6 3.6Net Gearing (%) net cash net cash net cash net cash ROE (%) 32.9 27.5 28.0 26.1BV (S cts) 37.4 45.2 55.6 68.4P/Book Value (x) 3.0 2.5 2.0 1.7
0.901.001.101.201.301.401.50
S$
100-Day MA
First Engineering
Jan-05 Mar-05 Jun-05 Aug-05 Oct-05 Jan-06
74
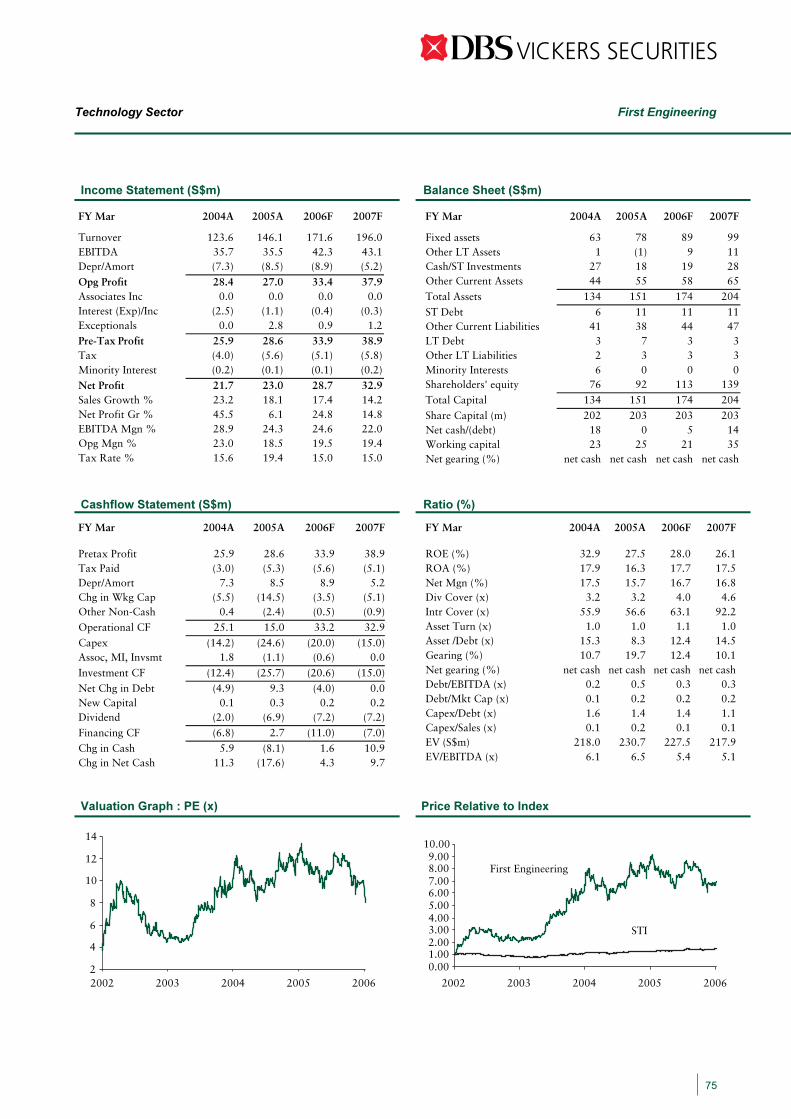
First EngineeringTechnology Sector
Income Statement (S$m) Balance Sheet (S$m)
Cashflow Statement (S$m)
Ratio (%)
Valuation Graph : PE (x) Price Relative to Index
2
4
6
8
10
12
14
2002 2003 2004 2005 2006 2002 2003 2004 2005 2006
0.001.002.003.004.005.006.007.008.009.00
10.00
First Engineering
STI
FY Mar 2004A 2005A 2006F 2007F
Turnover 123.6 146.1 171.6 196.0 EBITDA 35.7 35.5 42.3 43.1 Depr/Amort (7.3) (8.5) (8.9) (5.2)
Opg Profit 28.4 27.0 33.4 37.9 Associates Inc 0.0 0.0 0.0 0.0 Interest (Exp)/Inc (2.5) (1.1) (0.4) (0.3)Exceptionals 0.0 2.8 0.9 1.2 Pre-Tax Profit 25.9 28.6 33.9 38.9 Tax (4.0) (5.6) (5.1) (5.8)Minority Interest (0.2) (0.1) (0.1) (0.2)
Net Profit 21.7 23.0 28.7 32.9 Sales Growth % 23.2 18.1 17.4 14.2 Net Profit Gr % 45.5 6.1 24.8 14.8 EBITDA Mgn % 28.9 24.3 24.6 22.0 Opg Mgn % 23.0 18.5 19.5 19.4 Tax Rate % 15.6 19.4 15.0 15.0
FY Mar 2004A 2005A 2006F 2007F
Fixed assets 63 78 89 99 Other LT Assets 1 (1) 9 11 Cash/ST Investments 27 18 19 28 Other Current Assets 44 55 58 65
Total Assets 134 151 174 204 ST Debt 6 11 11 11 Other Current Liabilities 41 38 44 47 LT Debt 3 7 3 3 Other LT Liabilities 2 3 3 3 Minority Interests 6 0 0 0 Shareholders' equity 76 92 113 139 Total Capital 134 151 174 204
Share Capital (m) 202 203 203 203 Net cash/(debt) 18 0 5 14 Working capital 23 25 21 35 Net gearing (%) net cash net cash net cash net cash
FY Mar 2004A 2005A 2006F 2007F
Pretax Profit 25.9 28.6 33.9 38.9Tax Paid (3.0) (5.3) (5.6) (5.1)Depr/Amort 7.3 8.5 8.9 5.2Chg in Wkg Cap (5.5) (14.5) (3.5) (5.1)Other Non-Cash 0.4 (2.4) (0.5) (0.9)
Operational CF 25.1 15.0 33.2 32.9Capex (14.2) (24.6) (20.0) (15.0)Assoc, MI, Invsmt 1.8 (1.1) (0.6) 0.0
Investment CF (12.4) (25.7) (20.6) (15.0)Net Chg in Debt (4.9) 9.3 (4.0) 0.0New Capital 0.1 0.3 0.2 0.2Dividend (2.0) (6.9) (7.2) (7.2)Financing CF (6.8) 2.7 (11.0) (7.0)Chg in Cash 5.9 (8.1) 1.6 10.9Chg in Net Cash 11.3 (17.6) 4.3 9.7
FY Mar 2004A 2005A 2006F 2007F
ROE (%) 32.9 27.5 28.0 26.1ROA (%) 17.9 16.3 17.7 17.5Net Mgn (%) 17.5 15.7 16.7 16.8Div Cover (x) 3.2 3.2 4.0 4.6Intr Cover (x) 55.9 56.6 63.1 92.2Asset Turn (x) 1.0 1.0 1.1 1.0Asset /Debt (x) 15.3 8.3 12.4 14.5Gearing (%) 10.7 19.7 12.4 10.1Net gearing (%) net cash net cash net cash net cash Debt/EBITDA (x) 0.2 0.5 0.3 0.3Debt/Mkt Cap (x) 0.1 0.2 0.2 0.2Capex/Debt (x) 1.6 1.4 1.4 1.1Capex/Sales (x) 0.1 0.2 0.1 0.1EV (S$m) 218.0 230.7 227.5 217.9EV/EBITDA (x) 6.1 6.5 5.4 5.1
75
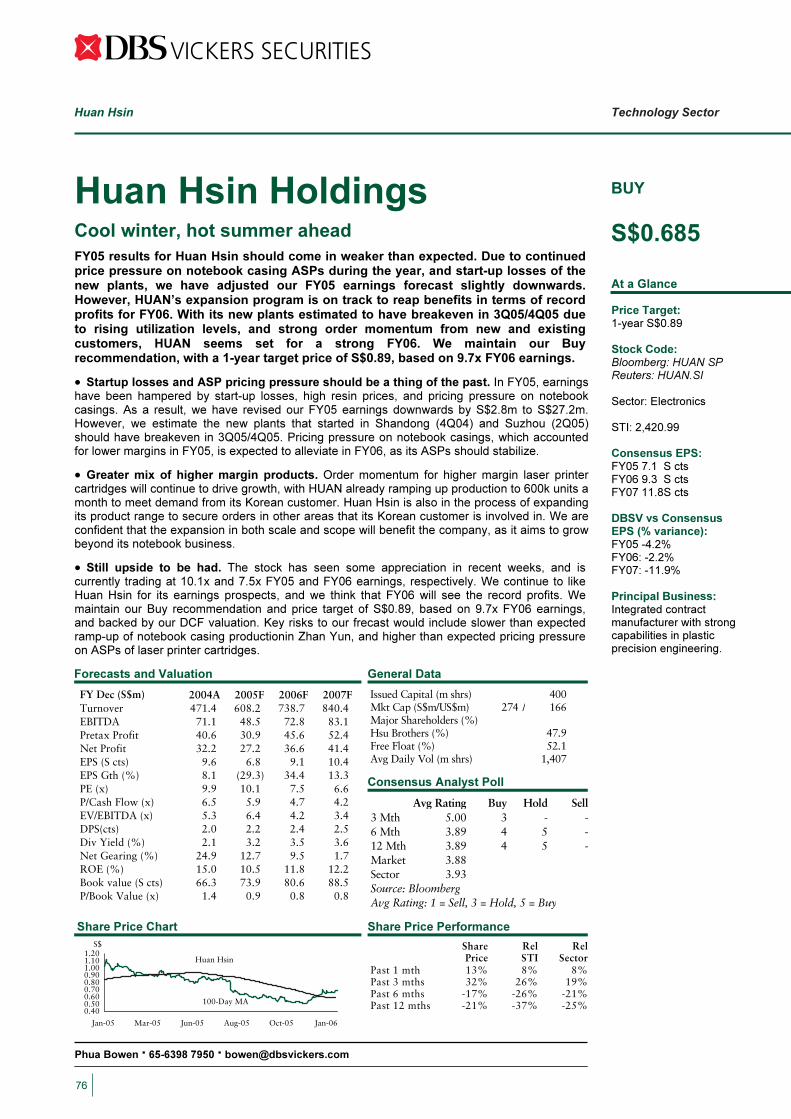
Technology Sector Huan Hsin
Huan Hsin Holdings Cool winter, hot summer ahead
FY05 results for Huan Hsin should come in weaker than expected. Due to continued price pressure on notebook casing ASPs during the year, and start-up losses of the new plants, we have adjusted our FY05 earnings forecast slightly downwards. However, HUAN’s expansion program is on track to reap benefits in terms of record profits for FY06. With its new plants estimated to have breakeven in 3Q05/4Q05 due to rising utilization levels, and strong order momentum from new and existing customers, HUAN seems set for a strong FY06. We maintain our Buy recommendation, with a 1-year target price of S$0.89, based on 9.7x FY06 earnings.
• Startup losses and ASP pricing pressure should be a thing of the past. In FY05, earnings
have been hampered by start-up losses, high resin prices, and pricing pressure on notebook
casings. As a result, we have revised our FY05 earnings downwards by S$2.8m to S$27.2m.
However, we estimate the new plants that started in Shandong (4Q04) and Suzhou (2Q05)
should have breakeven in 3Q05/4Q05. Pricing pressure on notebook casings, which accounted
for lower margins in FY05, is expected to alleviate in FY06, as its ASPs should stabilize.
• Greater mix of higher margin products. Order momentum for higher margin laser printer
cartridges will continue to drive growth, with HUAN already ramping up production to 600k units a
month to meet demand from its Korean customer. Huan Hsin is also in the process of expanding
its product range to secure orders in other areas that its Korean customer is involved in. We are
confident that the expansion in both scale and scope will benefit the company, as it aims to grow
beyond its notebook business.
• Still upside to be had. The stock has seen some appreciation in recent weeks, and is
currently trading at 10.1x and 7.5x FY05 and FY06 earnings, respectively. We continue to like
Huan Hsin for its earnings prospects, and we think that FY06 will see the record profits. We
maintain our Buy recommendation and price target of S$0.89, based on 9.7x FY06 earnings,
and backed by our DCF valuation. Key risks to our frecast would include slower than expected
ramp-up of notebook casing productionin Zhan Yun, and higher than expected pricing pressure
on ASPs of laser printer cartridges.
Forecasts and Valuation General Data
Issued Capital (m shrs) 400Mkt Cap (S$m/US$m) 274 / 166Major Shareholders (%)Hsu Brothers (%) 47.9Free Float (%) 52.1Avg Daily Vol (m shrs) 1,407
Consensus Analyst Poll
Avg Rating Buy Hold Sell3 Mth 5.00 3 - -6 Mth 3.89 4 5 -12 Mth 3.89 4 5 -Market 3.88Sector 3.93Source: BloombergAvg Rating: 1 = Sell, 3 = Hold, 5 = Buy
Share Price Chart Share Price Performance
Share Rel RelPrice STI Sector
Past 1 mth 13% 8% 8%Past 3 mths 32% 26% 19%Past 6 mths -17% -26% -21%Past 12 mths -21% -37% -25%
At a Glance Price Target: 1-year S$0.89 Stock Code: Bloomberg: HUAN SP Reuters: HUAN.SI Sector: Electronics STI: 2,420.99 Consensus EPS: FY05 7.1 S cts FY06 9.3 S cts FY07 11.8S cts DBSV vs Consensus EPS (% variance): FY05 -4.2% FY06: -2.2% FY07: -11.9%
Principal Business: Integrated contract manufacturer with strong capabilities in plastic precision engineering.
BUY
S$0.685
FY Dec (S$m) 2004A 2005F 2006F 2007FTurnover 471.4 608.2 738.7 840.4EBITDA 71.1 48.5 72.8 83.1Pretax Profit 40.6 30.9 45.6 52.4Net Profit 32.2 27.2 36.6 41.4EPS (S cts) 9.6 6.8 9.1 10.4EPS Gth (%) 8.1 (29.3) 34.4 13.3PE (x) 9.9 10.1 7.5 6.6P/Cash Flow (x) 6.5 5.9 4.7 4.2EV/EBITDA (x) 5.3 6.4 4.2 3.4DPS(cts) 2.0 2.2 2.4 2.5Div Yield (%) 2.1 3.2 3.5 3.6Net Gearing (%) 24.9 12.7 9.5 1.7ROE (%) 15.0 10.5 11.8 12.2Book value (S cts) 66.3 73.9 80.6 88.5P/Book Value (x) 1.4 0.9 0.8 0.8
Phua Bowen · 65-6398 7950 · [email protected]
0.400.500.600.700.800.901.001.101.20
S$
100-Day MA
Huan Hsin
Jan-05 Mar-05 Jun-05 Aug-05 Oct-05 Jan-06
76
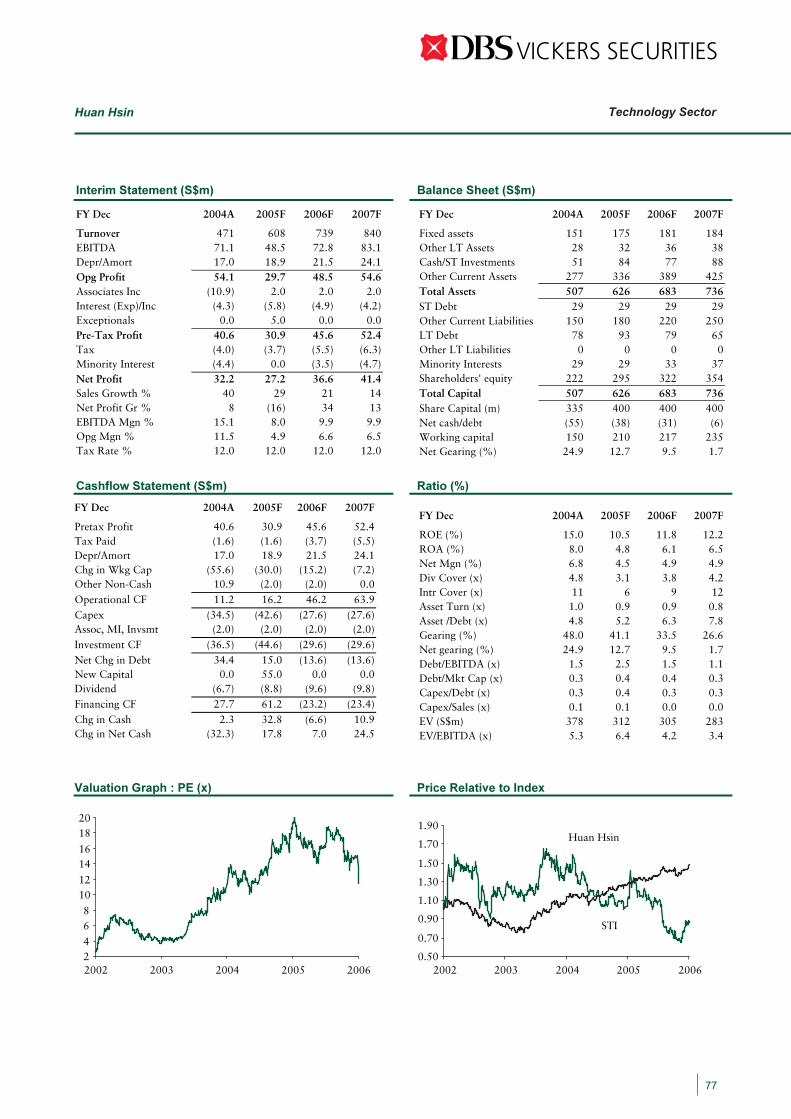
Technology SectorHuan Hsin
Interim Statement (S$m) Balance Sheet (S$m)
Cashflow Statement (S$m)
Ratio (%)
\
Valuation Graph : PE (x) Price Relative to Index
0.50
0.70
0.90
1.10
1.30
1.50
1.70
1.90
2002 2003 2004 2005 20062002 2003 2004 2005 2006
Huan Hsin
STI
24
68
1012
1416
1820
FY Dec 2004A 2005F 2006F 2007F
Turnover 471 608 739 840 EBITDA 71.1 48.5 72.8 83.1 Depr/Amort 17.0 18.9 21.5 24.1 Opg Profit 54.1 29.7 48.5 54.6 Associates Inc (10.9) 2.0 2.0 2.0 Interest (Exp)/Inc (4.3) (5.8) (4.9) (4.2)Exceptionals 0.0 5.0 0.0 0.0 Pre-Tax Profit 40.6 30.9 45.6 52.4 Tax (4.0) (3.7) (5.5) (6.3)Minority Interest (4.4) 0.0 (3.5) (4.7)Net Profit 32.2 27.2 36.6 41.4 Sales Growth % 40 29 21 14 Net Profit Gr % 8 (16) 34 13 EBITDA Mgn % 15.1 8.0 9.9 9.9 Opg Mgn % 11.5 4.9 6.6 6.5 Tax Rate % 12.0 12.0 12.0 12.0
FY Dec 2004A 2005F 2006F 2007F
Fixed assets 151 175 181 184 Other LT Assets 28 32 36 38 Cash/ST Investments 51 84 77 88 Other Current Assets 277 336 389 425 Total Assets 507 626 683 736 ST Debt 29 29 29 29 Other Current Liabilities 150 180 220 250 LT Debt 78 93 79 65 Other LT Liabilities 0 0 0 0 Minority Interests 29 29 33 37 Shareholders' equity 222 295 322 354 Total Capital 507 626 683 736 Share Capital (m) 335 400 400 400 Net cash/debt (55) (38) (31) (6)Working capital 150 210 217 235 Net Gearing (%) 24.9 12.7 9.5 1.7
FY Dec 2004A 2005F 2006F 2007F
Pretax Profit 40.6 30.9 45.6 52.4 Tax Paid (1.6) (1.6) (3.7) (5.5)Depr/Amort 17.0 18.9 21.5 24.1 Chg in Wkg Cap (55.6) (30.0) (15.2) (7.2)Other Non-Cash 10.9 (2.0) (2.0) 0.0 Operational CF 11.2 16.2 46.2 63.9 Capex (34.5) (42.6) (27.6) (27.6)Assoc, MI, Invsmt (2.0) (2.0) (2.0) (2.0)Investment CF (36.5) (44.6) (29.6) (29.6)Net Chg in Debt 34.4 15.0 (13.6) (13.6)New Capital 0.0 55.0 0.0 0.0 Dividend (6.7) (8.8) (9.6) (9.8)Financing CF 27.7 61.2 (23.2) (23.4)Chg in Cash 2.3 32.8 (6.6) 10.9 Chg in Net Cash (32.3) 17.8 7.0 24.5
FY Dec 2004A 2005F 2006F 2007F
ROE (%) 15.0 10.5 11.8 12.2ROA (%) 8.0 4.8 6.1 6.5Net Mgn (%) 6.8 4.5 4.9 4.9Div Cover (x) 4.8 3.1 3.8 4.2Intr Cover (x) 11 6 9 12Asset Turn (x) 1.0 0.9 0.9 0.8Asset /Debt (x) 4.8 5.2 6.3 7.8Gearing (%) 48.0 41.1 33.5 26.6Net gearing (%) 24.9 12.7 9.5 1.7Debt/EBITDA (x) 1.5 2.5 1.5 1.1Debt/Mkt Cap (x) 0.3 0.4 0.4 0.3Capex/Debt (x) 0.3 0.4 0.3 0.3Capex/Sales (x) 0.1 0.1 0.0 0.0EV (S$m) 378 312 305 283EV/EBITDA (x) 5.3 6.4 4.2 3.4
77

Technology Sector Magnecomp
Magnecomp International Driving on ahead
Magnecomp (MGCP) is well positioned to ride on the growth of the HDD sector in 2006. With 9M05 earnings coming in at a strong increase of 120% over last year, we are confident of the Group's ability to meet our earnings estimates of almost S$42m this year, translating to an EPS of S$0.18. Growth is coming from both the data storage and office automation division and we forecast ASPs remaining firm into 2006. In addition, Seagate's recent acquisition of Maxtor should see the Group gaining market share over its competitors because MGCP is a major supplier of suspension assemblies to Seagate. MGCP is trading at an undemanding 5.0x FY06 PE compared to its industry peers of 8.2x and is a dominant player in its space. We therefore maintain BUY with an FY06 target price of S$1.54 representing a forward PE of 8x which is inline with its industry peers. • Strong 3Q05 results from increased unit shipments. MGCP reported a strong set of
results with revenue growing by 81% y-o-y, but net profit grew by a more modest 25% due to
higher raw material prices. The integration of KR Precision into the Group has resulted in a much
stronger entity able to capture a larger share of the market. We forecast with the strong
momentum already in place, that the Group should be able to ship at least 85m units of
suspension assemblies in 4Q05 compared to 79m in 3Q05. Assuming ASPs stay firm into the 4Q
at S$1.29, the Group's data storage division would be forecasted to generate a revenue growth
of 70% over the previous year, to S$387m.
• NAND flash concerns are overrated while demand for 2.5 & 3.5-inch drives remain strong. While there has been much publicity recently on NAND flash encroaching into HDD's
space, we feel that the two will mutually co-exist with a possible flash-HDD hybrid drive being
created in the future. Furthermore, demand for 3.5-inch and 2.5-inch HDD's continue to be strong
into 2006 with Gartner forecasting growth of 9% and 27% respectively driven by growth in
notebooks, PVR/DVR's and the automotive segment.
• Valuations are undemanding. MGCP is trading an unusually cheap FY06 PE of 5.0x vs. it's
industry peer average of 8.2x. We feel that investors should not be too concerned about the
threat of NAND flash affecting the Group's 1-inch drive business because 1-inch drives only
constituted 2% of the Group's unit shipment for suspension assemblies. Any slowdown in this
segment will not affect earnings materially. Given that, we feel investors should relook at
MGCP's potential as it is operating in a market with high barriers to entry. We therefore reiterate
MGCP as one of our top HDD picks for 2006 with a one year target price of $1.54 based on 8x
FY06 PE.
Forecasts and Valuation General Data
Consensus Analyst Poll
Avg Rating Buy Hold Sell3 Mth 5.00 5 - -6 Mth 5.00 7 - -12 Mth 5.00 7 - -Market 3.88Sector 3.93Source: BloombergAvg Rating: 1 = Sell, 3 = Hold, 5 = Buy
Share Price Chart Share Price Performance
Share Rel RelPrice STI Sector
Past 1 m th 15% 10% 10%Past 3 m ths 19% 14% 7%Past 6 m ths 17% 7% 12%Past 12 m ths 33% 17% 30%
At a Glance Price Target: 1-year S$1.54 Stock Code: Bloomberg: MGCP.SP Reuters: MGCM.SI Sector: Electronics STI: 2420.99 Consensus EPS: FY05 17.7 S cts FY06 18.2 S cts DBSV vs Consensus EPS (% variance): FY05 0.0% FY06 6.0%
Principal Business: Magnecomp, through its subsidiaries, operates manufacturing and sale of suspension assemblies and tools and subassembles metal stamping parts. Thecompany also provides dye-making services.
BUY
S$1.10
Issued Capital (m shrs) 235Mkt Cap (S$m/US$m) 259 / 154Major ShareholdersAdvantec Holding 35.4JP Morgan 6.9Prudential Asset 4.7Free Float (%) 64.6Avg Daily Vol ('000 shares) 1,649
FY Dec (S$m) 2003A 2004A 2005F 2006FTurnover 329.2 379.2 643.7 734.6EBITDA 56.6 51.0 86.7 100.6Pretax Profit 32.2 26.9 48.8 53.1Net Profit 25.4 20.0 41.7 45.4EPS (S cts) 11.0 8.6 17.7 19.3EPS Gth (%) (208.6) (22.2) 107.3 8.8PE (x) 9.0 11.5 5.6 5.1EV/EBITDA (x) 4.1 5.2 4.1 3.6DPS (S cts) 1.0 1.0 1.8 1.9Div Yield (%) 1.0 1.0 1.8 2.0Net Gearing (%) Cash 8.0 55.7 49.7ROE (%) 18.0 13.0 21.8 19.5Book value (S$) 0.61 0.66 0.81 0.99P/Book Value (x) 1.6 1.5 1.2 1.0
Dinesh Chandiramani · 65-6398 7967 · [email protected]
0.600.700.800.901.001.101.20
S$
100-Day MA
Magnecomp International
Jan-05 Mar-05 Jun-05 Aug-05 Oct-05 Jan-06
78

MagnecompTechnology Sector
Income Statement (S$m) Balance Sheet (S$m)
Quarterly Income Statement (S$m)
Ratio (%)
Valuation Graph : PE (x) Price Relative to Index
0.00
0.50
1.00
1.50
2.00
2.50
3.00
Magnecomp
STI
0
2
4
6
8
10
12
2002 2003 2004 2005 2006 2002 2003 2004 2005 2006
FY Dec 2003A 2004A 2005F 2006F
Turnover 329 379 644 735 EBITDA 56.6 51.0 86.7 100.6 Depr/Amort 22.7 22.8 33.0 42.6 Opg Profit 33.8 28.3 54.5 58.8 Associates Inc 0.1 (0.1) (0.8) (0.8)Interest (Exp)/Inc (1.7) (1.2) (4.9) (4.9)Exceptionals Pre-Tax Profit 32.2 26.9 48.8 53.1 Tax (3.1) (1.8) (3.5) (4.2)Minority Interest (3.6) (5.1) (3.5) (3.5)Net Profit 25.4 20.0 41.7 45.4 Sales Growth % 55.6 13.3 72.5 11.8 Net Profit Gr % (224.8) (21.4) 108.8 8.8 EBITDA Mgn % 16.8 13.4 13.2 13.7 Opg Mgn % 10.0 7.4 8.3 8.0 Tax Rate % 9.6 6.8 7.3 7.9
FY Dec 2003A 2004A 2005F 2006F
Fixed assets 117 136 230 267 Other LT Assets 5 5 5 5 Cash/ST Investments 51 35 31 52 Other Current Assets 11 29 25 28 Total Assets 258 308 457 538 ST Debt 38 33 43 43 Other Current Liabilities 27 38 38 38 LT Debt 3 15 95 125 Other LT Liabilities 6 4 8 12 Minority Interests 14 23 20 16 Shareholders' equity 155 177 211 249 Total Capital 258 308 457 538 Share Capital (m) 231 234 235 235 Net cash/debt 11 (12) (107) (115)Working capital 41 56 80 114 Gearing (%) Cash 8 56 50
FY Dec 4Q04 1Q05 2Q05 3Q05
Turnover 116.9 134.5 153.4 176.9 EBITDA 15.4 28.0 18.2 23.6 Depr/Amort (5.9) (8.3) (9.9) (10.3)Opg Profit 9.4 19.7 8.3 13.3 Associates Inc (0.1) (0.1) (0.2) (0.3)Interest (Exp)/Inc (0.4) (0.6) (1.3) (1.8)Pre-Tax Profit 8.9 19.0 6.9 11.2 Tax 0.2 (0.6) (1.1) (0.9)Minority Interest (2.1) (0.0) (0.8) (1.8)Net Profit 7.0 18.3 5.0 8.5 Sales Growth % 19.6 15.1 14.1 15.3 Net Profit Gr % 63.5 162.2 (72.8) 70.1 EBITDA Mgn % 13.1 20.8 11.9 13.3Opg Mgn % 8.0 14.7 5.4 7.5Tax Rate -2.5 3.4 15.9 8.1
FY Dec 2003A 2004A 2005F 2006FROE (%) 18.0 13.0 21.8 19.5 ROA (%) 11.2 8.1 9.9 9.1 Net Mgn (%) 7.6 5.2 6.4 6.2 Div Cover (x) 11.0 8.6 10.0 10.0 Intr Cover (x) 19.3 22.7 11.2 12.1 Asset Turn (x) 1.3 1.2 1.4 1.4 Asset /Debt (x) 6.4 6.5 3.3 3.2 Gearing (%) Cash 8.0 55.7 49.7 Net gearing (%) Cash 0.1 0.5 0.5 Debt/EBITDA (x) 0.71 0.93 1.59 1.67 Debt/Mkt Cap (x) 0.18 0.21 0.59 0.72 Capex/Debt (x) 0.74 1.04 0.65 0.30 Capex/Sales (x) 0.09 0.13 0.14 0.07 EV (S$m) 230 266 358 364 EV/EBITDA (x) 4.1 5.2 4.1 3.6
79

Technology Sector United Test and Assembly Centre
United Test and Assembly Centre In all the right places
UTAC is poised to record its tenth & seventh respective quarterly of sequential sales and earnings growth later this month. Favorable factors and a strong, focused management execution should have allowed UTAC to capitalize on rising demand for NAND flash memory, communication, consumer electronics products and soon automotive electronics. A disciplined approach towards capacity expansion and ability to start deriving synergies from its UTC acquisition should propel earnings higher in 2006. UTAC is in all the right places and firing on all cylinders. Reiterate BUY.
• What has changed? We have revised UTAC’s 2005 and 2006 earnings higher by 1.4%
and 21.4% respectively and introduced our 2007 estimates. We have also revised our sales
estimates higher by 2.2% as we revised upwards our testing utilization assumption for 2006
from 65% to 70%. The revision takes into account our expectation of a 77% and 26%
increase in the number of testers for 2005 and 2006 respectively.
• Why has it changed? 3 key factors influenced our assumptions review. First, we believe
UTAC is deriving synergies from its earlier acquisition of UTC. Not only should it benefit
from economies of scale, but also an expansion of service coverage at UTAC (Taiwan).
Second, UTAC should continue to ride on the strong demand for NAND flash memory (+37%
sales increase in 2006) and expand sales with Sandisk and possibly other new customers.
Finally, UTAC has continued to secure new customers and new orders from its current
customers within the memory, consumer electronics and communication segments.
Bluetooth, a key product area, is finding its way into mobile phones. Shipments of Bluetooth
enabled phones are expected to jump 82% in 2006 from the previous year.
Target price raised, reiterate BUY. We have raised our target price for UTAC to S$1.03
from S$0.88 previously backed by our revision in earnings estimate. The DCF-derived target
price also pegs the stock to P/BV multiple of 1.65x FY06 earnings. We expect UTAC to see
an ROE expansion to 9.1% from 7.2% in 2004 and should revert to net cash position in
2006. Key risks include a potential slowdown in demand of key product segments and
service execution for critical customers. Owing to the high operating leverage nature of its
business, earnings could be negatively impacted due to high depreciation cost which is
about 30% of sales.
Forecasts and Valuation General Data
Issued C a p ita l (m sh rs) 1 ,46 5M kt C a p (S$ m /U S$ m ) 1 ,1 72 / 71 7M ajo r S ha reho ld ers (% )
A siaV est P a rtn ers 5 .8S 'p ore T echn o log ies 4 .3T ran spa c C a p ita l 2 .9U ltra T era C orp 2 .5T ran spa c N o m inees 2 .4C h arles C hen (C h a irm an ) 2 .1L ee Joo n C h un g (C E O ) 0 .4
Free F lo a t (% ) 7 9 .6A v g D a ily V o l ('0 00 sh rs) 1 4 ,50 3
Consensus Analyst Poll
Avg Rating Buy Hold Sell3 Mth 4.60 4 1 -6 Mth 4.71 6 1 -12 Mth 4.78 8 1 -Market 3.72Sector 3.93Source: Bloomberg
Share Price Chart Share Price Performance
Share Rel RelPrice STI Sector
Past 1 mth 18% 13% 13%Past 3 mths 28% 23% 16%Past 6 mths 24% 15% 20%Past 12 mths 54% 38% 51%
At a Glance Price Target: 1-year S$1.03 Stock Code: Bloomberg: UTAC SP Reuters: UTAC.SI Sector: Electronics – Semiconductor A&T STI: 2,420.99
DBSV vs Consensus EPS (% variance): FY05 +30.4 % FY06 +26.9 % FY07 +11.1 %
Principal Business: Leading global semiconductor assembly and testing house, specialising in memory, mixed-signal and logic semiconductors.
*Note: Calculation has been done based on weighted average number of shares
BUY
S$0.80
Don See · 65-6398 79555 · [email protected]
FY Dec (US$m) 2004 2005F 2006F 2007F
Turnover 170 323 377 411EBITDA 66.3 128.5 153.9 170.5Pretax Profit 13.6 35.1 48.7 58.3Net Profit 13.5 35.1 48.7 59.3EPS (US cts) 1.6 3.0 3.3 4.0EPS Gth (%) nm 87 9 22PE (x) 30.3 16.2 14.9 12.2P/Cash Flow (x) 6.2 5.6 4.7 4.2EV / EBITDA (x) 6.1 5.8 4.7 3.9DPS(cts) 0.0 0.0 0.0 0.0Div Yield (%) 0.0 0.0 0.0 na Net Gearing (%) cash 4 cash cashROE (%) 7.2 9.1 9.0 9.9Book value (US cts) 30 35 38 42P/Book Value (x) 1.6 1.4 1.3 1.2
0.500.550.600.650.700.750.800.85
S$
100-Day MA
UTAC
Jan-05 Mar-05 Jun-05 Aug-05 Oct-05 Jan-06
80
FY05 2.3 US cts
FY07 3.6 US cts
Consensus EPS:
FY06 2.6 US cts
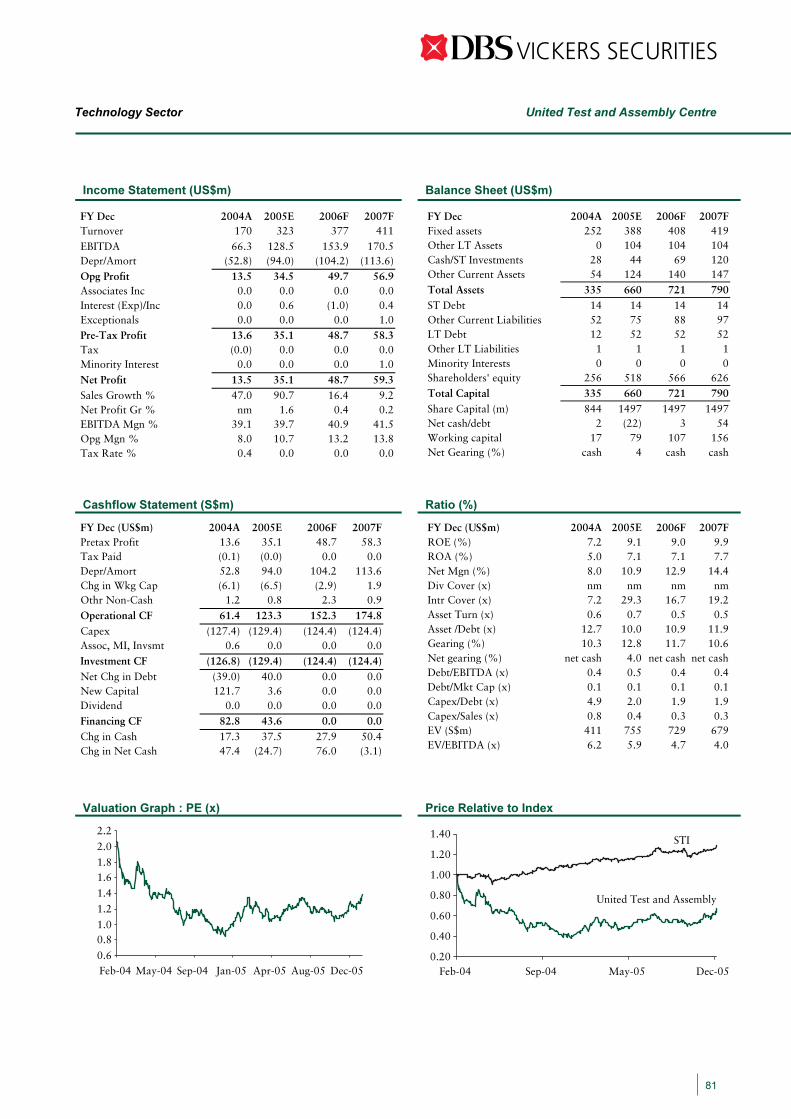
Technology Sector
Income Statement (US$m) Balance Sheet (US$m)
Cashflow Statement (S$m)
Ratio (%)
0.6
0.81.0
1.2
1.4
1.61.8
2.0
2.2
Feb-04 Sep-04May-04 Jan-05 Aug-05Apr-05 Dec-050.20
0.40
0.60
0.80
1.00
1.20
1.40
Feb-04 May-05Sep-04 Dec-05
United Test and Assembly
STI
FY Dec 2004A 2005E 2006F 2007FTurnover 170 323 377 411 EBITDA 66.3 128.5 153.9 170.5 Depr/Amort (52.8) (94.0) (104.2) (113.6)
Opg Profit 13.5 34.5 49.7 56.9 Associates Inc 0.0 0.0 0.0 0.0 Interest (Exp)/Inc 0.0 0.6 (1.0) 0.4 Exceptionals 0.0 0.0 0.0 1.0 Pre-Tax Profit 13.6 35.1 48.7 58.3 Tax (0.0) 0.0 0.0 0.0 Minority Interest 0.0 0.0 0.0 1.0
Net Profit 13.5 35.1 48.7 59.3 Sales Growth % 47.0 90.7 16.4 9.2 Net Profit Gr % nm 1.6 0.4 0.2 EBITDA Mgn % 39.1 39.7 40.9 41.5 Opg Mgn % 8.0 10.7 13.2 13.8 Tax Rate % 0.4 0.0 0.0 0.0
FY Dec 2004A 2005E 2006F 2007FFixed assets 252 388 408 419 Other LT Assets 0 104 104 104 Cash/ST Investments 28 44 69 120 Other Current Assets 54 124 140 147 Total Assets 335 660 721 790 ST Debt 14 14 14 14 Other Current Liabilities 52 75 88 97 LT Debt 12 52 52 52 Other LT Liabilities 1 1 1 1 Minority Interests 0 0 0 0 Shareholders' equity 256 518 566 626
Total Capital 335 660 721 790 Share Capital (m) 844 1497 1497 1497 Net cash/debt 2 (22) 3 54 Working capital 17 79 107 156
cash 4 cash cash
FY Dec (US$m) 2004A 2005E 2006F 2007FPretax Profit 13.6 35.1 48.7 58.3 Tax Paid (0.1) (0.0) 0.0 0.0 Depr/Amort 52.8 94.0 104.2 113.6 Chg in Wkg Cap (6.1) (6.5) (2.9) 1.9 Othr Non-Cash 1.2 0.8 2.3 0.9
Operational CF 61.4 123.3 152.3 174.8 Capex (127.4) (129.4) (124.4) (124.4)Assoc, MI, Invsmt 0.6 0.0 0.0 0.0
Investment CF (126.8) (129.4) (124.4) (124.4)Net Chg in Debt (39.0) 40.0 0.0 0.0 New Capital 121.7 3.6 0.0 0.0 Dividend 0.0 0.0 0.0 0.0
Financing CF 82.8 43.6 0.0 0.0 Chg in Cash 17.3 37.5 27.9 50.4 Chg in Net Cash 47.4 (24.7) 76.0 (3.1)
FY Dec (US$m) 2004A 2005E 2006F 2007FROE (%) 7.2 9.1 9.0 9.9 ROA (%) 5.0 7.1 7.1 7.7 Net Mgn (%) 8.0 10.9 12.9 14.4 Div Cover (x) nm nm nm nm Intr Cover (x) 7.2 29.3 16.7 19.2 Asset Turn (x) 0.6 0.7 0.5 0.5 Asset /Debt (x) 12.7 10.0 10.9 11.9 Gearing (%) 10.3 12.8 11.7 10.6 Net gearing (%) net cash Debt/EBITDA (x) 0.4 0.5 0.4 0.4 Debt/Mkt Cap (x) 0.1 0.1 0.1 0.1 Capex/Debt (x) 4.9 2.0 1.9 1.9 Capex/Sales (x) 0.8 0.4 0.3 0.3 EV (S$m) 411 755 729 679 EV/EBITDA (x) 6.2 5.9 4.7 4.0
Valuation Graph : PE (x)
Price Relative to Index
United Test and Assembly Centre
81
4.0 net cash net cash
Net Gearing (%)
Research Team Directory Analyst Sector E-mail Telephone
Regional Timothy Wong Group Head of Research [email protected] (65) 6398 7952 Dr. Chua Hak Bin Asian Economics & Strategy [email protected] (65) 6878 5396 Chris Sanda CFA Regional Transport [email protected] (65) 6398 7966
Singapore David Mok, CFA Strategy, Head of Research, Financials [email protected] (65) 6398 7954 Kok Ken Ji Real Estate [email protected] (65) 6398 7963 Jesvinder Sandhu Industrials [email protected] (65) 6398 7965 Eddy Loh, CFA Industrials [email protected] (8621) 6888 3373 Paul Yong Consumer [email protected] (65) 6398 7951 James Tan Consumer [email protected] (65) 6398 7969 Don See Electronics, Telecom & IT [email protected] (65) 6398 7955 Dinesh Chandiramani Electronics, Telecom & IT [email protected] (65) 6398 7967 Phua Bowen Electronics, Telecom & IT [email protected] (65) 6398 7950 Keith Wong Technical Analyst [email protected] (65) 6398 7970 Tan Weng Soon Traders Spectrum [email protected] (65) 6398 7964
Hong Kong / China Trevor Cheung Strategy, Head of Research, [email protected] (852) 2820 4602 Alice Hui CFA Consumer [email protected] (852) 2971 1960 Dennis Chung CFA Auto, Machinery & Toll Roads [email protected] (852) 2971 1732 Gideon Lo CFA Oil & Petrochemicals, [email protected] (852) 2863 8880 Pharmaceuticals & Shipping Helen Wang Basic Materials & Power [email protected] (8621)6888 3370 Jasmine Lai Banking & Finance [email protected] (852) 2971 1926 Johnson Yuen Technical Analysis [email protected] (852) 2971 1955 Joseph Ho CFA Electronics & Technology [email protected] (852) 2820 4685 Mavis Hui Media & General Retail [email protected] (852) 2863 8879 Oscar Choi Infrastructure, China Property [email protected] (852) 2863 8877 Patricia Yeung Industrials [email protected] (852) 2863 8908 Simon Chan Telecom VAS & Software [email protected] (852) 2863 8847 Winnie Chiu Conglomerates & Property [email protected] (852) 2971 1962
Malaysia Vincent Khoo CFA Strategy, Head of Research, [email protected] (603) 2711 2295 Regional Consumer & Gaming Wong Ming Tek Construction, Concessionaires, [email protected] (603) 2711 0956 Transportation Goh Yin Foo CFA Retail/ Technical Product [email protected] (603) 2711 0950 Ong Boon Leong CFA Telecommunications, Banks, [email protected] (603) 2711 0958 Eltricia Foong CFA Motor, Banks, Plantation [email protected] (603) 2711 0970 Ong Chee Ting Utilities, Oil & Gas, Property [email protected] (603) 2711 0972 Jenny Voo Manufacturing, Media (Press) [email protected] (603) 2711 2222 Chai Yit Sheng Technology, Media (Broadcasting) [email protected] (603) 2711 0972 Thailand Thanawat Patchimkul Strategy, Head of Research, Banks [email protected] 66 (0) 2657 7820 Chanpen Sirithanarattanakul Electronics, Commerce & Property [email protected] 66 (0) 2657 7824 Chirasit Vuttigrai Telecoms, Entertainment [email protected] 66 (0) 2657 7836 Vichitr Kuladejkhuna Building Materials, Energy, [email protected] 66 (0) 2657 7826
Indonesia Ferry Yosia Hartoyo Strategy, Head of Research [email protected] (6211) 3983 2662 Banking & Finance Joseph Tjokrowinoto Natural Resources [email protected] (6211) 3983 2662 Lina Afendy Consumer Goods, Pharmaceutical, [email protected] (6211) 3983 2662 Tobbaco, Retail Herry Dion Mahargono Infrastructure, Automotive, [email protected] (6211) 3983 2662 Natural Resource
Technology Sector
82
Asian Equities Sales, Sales Trading and Research Contacts Sales Heads Tel: Email:
Singapore Chai Szue Yin 65-6398 7319 [email protected] Hong Kong Andrew Au 852-2820 4992 [email protected] London Graham Booth 44-20-7618 1881 [email protected] Thailand Mark Lim 662-657 7750 [email protected] Indonesia Frans Widjaja 6221-3983 2668 [email protected] Sales Trading Contacts Tel: Email: Singapore David Teo 65-6398 6926 [email protected] Hong Kong Franco Law 852-2971 1828 [email protected] London Ross Phillpotts 44-20-7618 1884 [email protected] Research Heads Tel: Email: Regional Timothy Wong 65-6398 7952 [email protected] Singapore David Mok 65-6398 7954 [email protected] Hong Kong Trevor Cheung 852 2820 4602 [email protected] Malaysia Vincent Khoo 603-2711 2295 [email protected] Thailand Thanawat Patchimkul 662-657 7820 [email protected] Indonesia Ferry Hartoyo 6221-3983 2668 [email protected] DBS Vickers Securities – Regional Offices HONG KONG MALAYSIA SINGAPORE DBS Vickers (Hong Kong) Ltd Hwang-DBS Vickers Research Sdn Bhd DBS Vickers Securities (Singapore) Pte Ltd 18th Floor Man Yee Building Suite 13.01 13th Floor 8 Cross Street #02-00 68 Des Voeux Road Central Kompleks Antarabangsa PWC Building Central, Hong Kong Jalan Sultan Isqmail Singapore 048424 Tel: 852-2820 4888 50250 Kuala Lumpur Tel: 65-6533 9688 Fax: 852-2868 1523 Tel: 60-3-2711 2222 Fax: 65-6226 8048 Member of Stock Exchange of Hong Kong Fax: 60-3-2711 2333 INDONESIA THAILAND PT DBS Vickers Securities (Indonesia) DBS Vickers Securities (Thailand) Co Ltd Plaza Permata, Top Floor 15th Floor Siam Tower Jl. M.H. Thamrin Kav. 57 989 Rama 1 Road Jakarta 10350 Pathumwan, Bangkok 10330 Tel: 62-21-3983 2668 Tel: 66-2-658 1222 Fax: 62-21-3983 2669 Fax: 66-2-658 1269 UNITED KINGDOM DBS Vickers Securities (UK) Ltd 4th Floor Paternoster House 65 St Paul's Churchyard London EC4M 8AB United Kingdom Tel: 44-20-7618 1888 Fax: 44-20-7618 1900 Regulated by The Financial Services Authority
Technology Sector
83

As of 11 January 2006, the analyst and his / her immediate family do not hold positions in the securitiesrecommended in this report. DBS Vickers Securities (Singapore) Pte Ltd and its subsidiaries has a proprietary position in the Venture Corporationrecommended in this report as of 6 January 2006.
ANALYST CERTIFICATION The research analyst primarily responsible for the content of this research report, in part or in whole certifies that theviews about the companies and their securities expressed in this report accurately reflect his/her personal views. Theanalyst also certifies that no part of his/her compensation was, is, or will be, directly, or indirectly, related to specificrecommendations or views expressed in this report.
This document is published by DBS Vickers Research (Singapore) Pte Ltd ("DBSVR"), a direct wholly-ownedsubsidiary of DBS Vickers Securities (Singapore) Pte Ltd ("DBSVS") and an indirect wholly-owned subsidiary of DBSVickers Securities Holdings Pte Ltd ("DBSVH"). The research is based on information obtained from sourcesbelieved to be reliable, but we do not make any representation or warranty as to its accuracy, completeness orcorrectness. Opinions expressed are subject to change without notice. This document is prepared for generalcirculation. Any recommendation contained in this document does not have regard to the specific investmentobjectives, financial situation and the particular needs of any specific addressee. This document is for the informationof addressees only and is not to be taken in substitution for the exercise of judgement by addressees, who shouldobtain separate legal or financial advice. DBSVR accepts no liability whatsoever for any direct or consequential lossarising from any use of this document or further communication given in relation to this document. This document isnot to be construed as an offer or a solicitation of an offer to buy or sell any securities. DBS Vickers SecuritiesHoldings Pte Ltd is a wholly-owned subsidiary of DBS Bank Ltd. DBS Bank Ltd along with its affiliates and/orpersons associated with any of them may from time to time have interests in the securities mentioned in thisdocument. DBSVR, DBSVS, DBS Bank Ltd and their associates, their directors, and/or employees may have positionsin, and may effect transactions in securities mentioned herein and may also perform or seek to perform broking,investment banking and other banking services for these companies. DBSVR, DBSVS, DBS Bank Ltd and/or otheraffiliates of DBS Vickers Securities (USA) Inc ("DBSVUSA"), a U.S.-registered broker-dealer, beneficially own a totalof 1% or more of any class of common equity securities of DMX and UTAC mentioned in this document. DBSVR,DBSVS, DBS Bank Ltd and/or other affiliates of DBSVUSA, within the past 12 months, have received compensationand/or within the next 3 months seek to obtain compensation for investment banking services from Beyonics,Electrotech, HI-P, MFS and UTAC. DBSVUSA does not have its own investment banking or research department,nor has it participated in any investment banking transaction as a manager or co-manager in the past twelve months.Any US persons wishing to obtain further information, including any clarification on disclosures in this disclaimer, orto effect a transaction in any security discussed in this document should contact DBSVUSA exclusively. DBS VickersSecurities (UK) Ltd is an authorised person in the meaning of the Financial Services and Markets Act and is regulatedby The Financial Services Authority. Research distributed in the UK is intended only for institutional clients.
DBS Vickers Research (Singapore) Pte Ltd – 8 Cross Street, #02-01 PWC Building, Singapore 048424 Tel. 65-6533 9688, Fax: 65-6226 8048
Company Regn. No. 198600295W
Printed by Xpress Print Pte Ltd (65) 6880 2828
Technology Sector
84
Related Documents


