Technology for shaping everyday materials Company presentation June 2012

Welcome message from author
This document is posted to help you gain knowledge. Please leave a comment to let me know what you think about it! Share it to your friends and learn new things together.
Transcript
Technology for shaping
everyday materials
Company presentation
June 2012

1
Wood – Glass&Stone - Mechatronic

2
Biesse key successful factors
Biesse produces machine tools and systems for the secondary processing of wood,
glass and stone, together with associated numerical controls, motors, software and
precision components
strong commitment
and investments in
R&D
flexible and slim
business model
-lean company-
one-stop-shop for
superior quality products integrated
supply network
worldwide extensive
direct sales network
and support capabilities
Biesse has achieved operating excellence due to the following key factors:
3
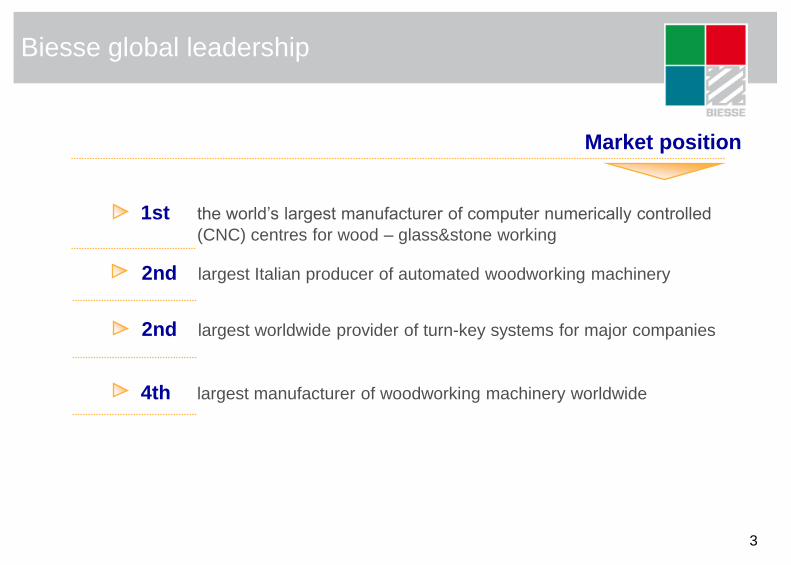
Biesse global leadership
Market position
1st the world’s largest manufacturer of computer numerically controlled
(CNC) centres for wood – glass&stone working
2nd largest Italian producer of automated woodworking machinery
2nd largest worldwide provider of turn-key systems for major companies
4th largest manufacturer of woodworking machinery worldwide

our history 1978 Realized the first numerical control boring machine for wood: Logic Control
1983 Rover: the first machining centre for the processing of wood is built
1987 Intermac is established: The company produces machining centres for processing
and engeneering glass and stone
1991 HSD is established: the company realizes and sells mechanical components and
numerical controls
1991 Biesse becomes international: the first foreign branches are opened
1992 Biesse starts “the acquisition period”: aimed operations in
wood/glass&stone/components and distribution network areas
1994 Biesse Engineering is established: new business unit fully dedicated to project and
realize entire lines and integrated systems
1998 Biesse group is formed. It’s composed of three divisions: wood, mechatronic, glass
and stone
1999 “Centro di Formazione e studi” (Biesse School) is established
2001 Biesse is quoted on the italian stock exchange (listed in STAR segment)
2006 Bre.Ma. is acquired: the company designs and realizes vertical numerical control
boring-inserting machine for the processing of wood
2007 AGM Inc (U.S.A.) is acquired: former distributor for glass & stone machinery becomes
Intermac U.S.A. subsidiary
2008 New plants for the wood division: Bangalore (India) first foreign production site
2009 Biesse Group incorporates Digipac brand - packaging technology –
2009 Biesse open new subsidiaries in Switzland and Dubai
2010 BiesseInside hosts for the first time 4 listed companies (Indesit-Elica-Prima Industrie-
Sabaf) to meet the financial community during an internal open-house
2011 Biesse appoints a new C.E.O. – Giorgio Pitzurra
2011 VIET - historic wood brand for calibration and sanding machines - added to the
Group
2011 Biesse acquires, through the Centre Gain Ltd (Hong Kong), /Korex Machinery
Dongguan (China)
4

5 5
our world structure
Italy – Pesaro H.O.
Milano-Treviso-Bergamo
U.K.
Daventry
Suisse
Lucerna
Sweden
Jonkoping
Russia
Moscow
Germany
Elchingen
Loehne
Gingen
France
Lyon
Spain
Barcelona
Portugal
Syntra
U.A.E.
Dubai
India
Bangalore
Indonesia
Jakarta
Malaysia
Kuala Lumpur
Australia
Sidney
Brisbane
Adelaide
Melbourne
Perth
New Zealand
Auckland
U.S.A. & Canada
Charlotte. N.C.
Ft. Lauderdale FL.
Toronto - Montreal
Asia
Singapore
China
Shanghai
Dongguan

6
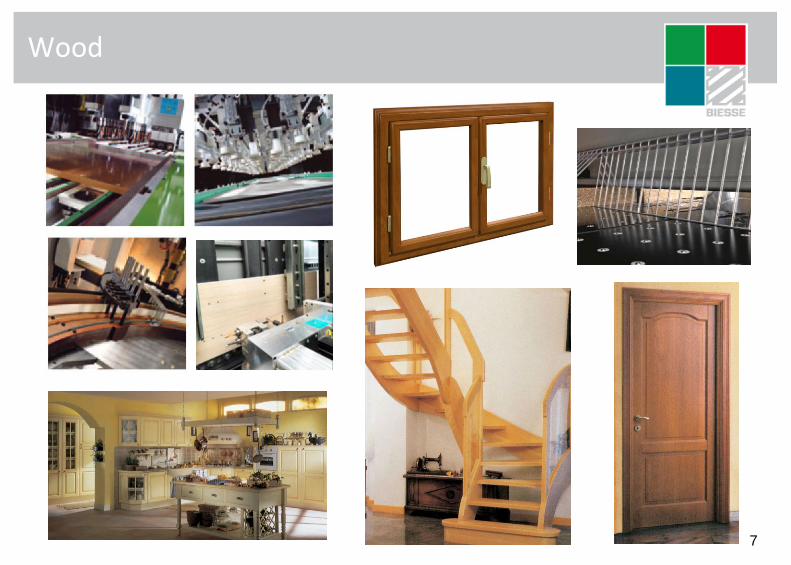
Wood
Biesse Wood Division is part of the Biesse Group, an industrial reality which employs a worldwide staff
of more than 2.700 people on a production surface area of over 100.000 square metres in Italy. Biesse
Wood Division develops and produces machinery for the furniture and carpentry industry, and offers a
full range of solutions covering the entire industrial processing cycle for wood, wood derivatives,
composite materials and non-ferrous alloys. Sizing, edgebanding, boring, sanding, routing, inserting,
assembling, handling: for each working cycle Biesse guarantees a complete range of technological
solutions. Stand alone machines or complete processing lines meeting high quality standards.
7
Wood

8
Wood
28
8 11,5
52,5
Rest of the Market same product segment
HOMAG same product segment
SCM same product segment
BIESSE
• woodworking machines market consensus growth 5.5%
• approx 3% of market shares increase in three years time
company evaluation of
the 2011 market shares
• entire secondary phase dimension € 3.8 bln
• secondary phase dimension where Biesse is insisting € 2.1 bln
today tomorrow
LOW
MEDIUM
LOW
MEDIUM
TOP
%
9
Glass & Stone
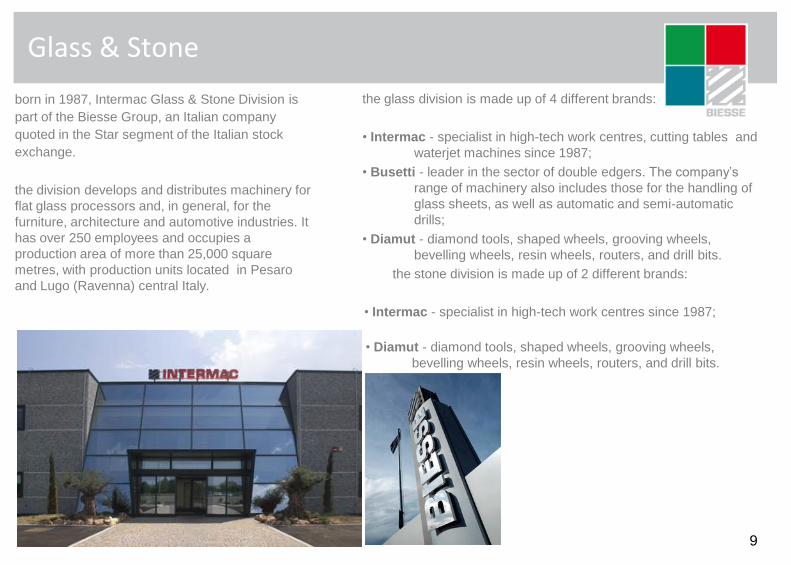
born in 1987, Intermac Glass & Stone Division is
part of the Biesse Group, an Italian company
quoted in the Star segment of the Italian stock
exchange.
the division develops and distributes machinery for
flat glass processors and, in general, for the
furniture, architecture and automotive industries. It
has over 250 employees and occupies a
production area of more than 25,000 square
metres, with production units located in Pesaro
and Lugo (Ravenna) central Italy.
the glass division is made up of 4 different brands:
• Intermac - specialist in high-tech work centres, cutting tables and
waterjet machines since 1987;
• Busetti - leader in the sector of double edgers. The company’s
range of machinery also includes those for the handling of
glass sheets, as well as automatic and semi-automatic
drills;
• Diamut - diamond tools, shaped wheels, grooving wheels,
bevelling wheels, resin wheels, routers, and drill bits.
the stone division is made up of 2 different brands:
• Intermac - specialist in high-tech work centres since 1987;
• Diamut - diamond tools, shaped wheels, grooving wheels,
bevelling wheels, resin wheels, routers, and drill bits.
10
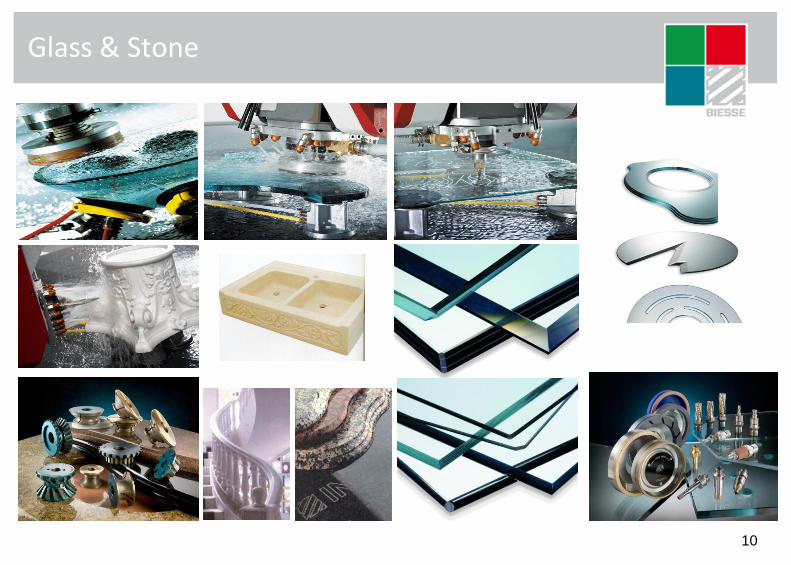
Glass & Stone
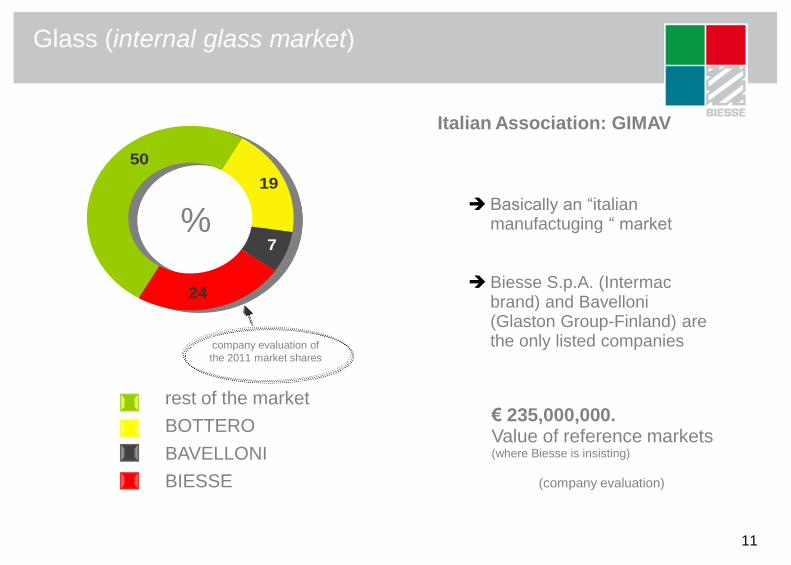
Glass (internal glass market)
Basically an “italian manufactuging “ market
Biesse S.p.A. (Intermac brand) and Bavelloni (Glaston Group-Finland) are the only listed companies
19
7
24
50
%
rest of the market
BOTTERO
BAVELLONI
BIESSE
€ 235,000,000. Value of reference markets
(where Biesse is insisting)
Italian Association: GIMAV
(company evaluation)
11
company evaluation of
the 2011 market shares

Stone
Biesse clear worldwide market leader
Biesse S.p.A. (Intermac brand) and Bavelloni (Glaston Co.) are the only listed companies
34
1875
%
rest of the market
BOTTERO
BAVELLONI
BIESSE
€ 45,000,000. Value of reference markets (where Biesse is insisting)
Italian Association: Marmomacchine
(company evaluation)
12
company evaluation of
the 2011 market shares
13
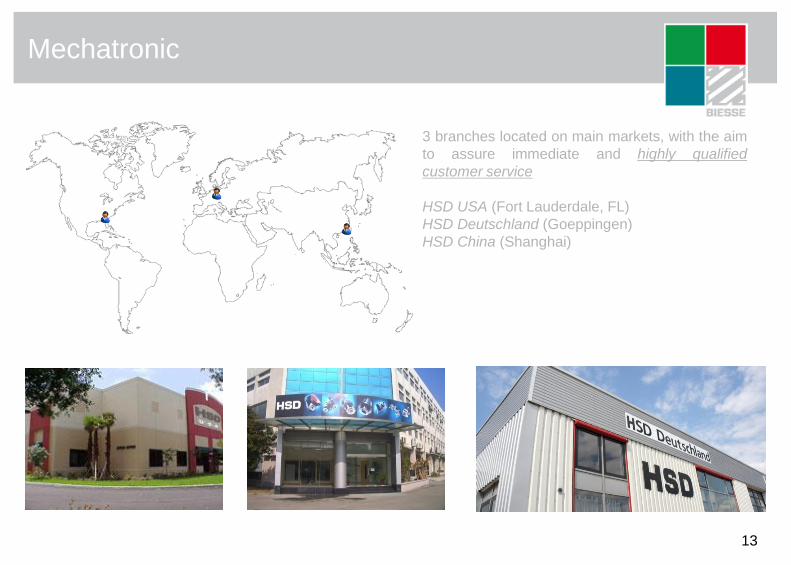
Mechatronic
3 branches located on main markets, with the aim
to assure immediate and highly qualified
customer service
HSD USA (Fort Lauderdale, FL)
HSD Deutschland (Goeppingen)
HSD China (Shanghai)
14
Some of our major clients (wood)

15
Some of our major clients (glass&stone)
…with an highly fragmented customer base

16
Some of our major clients (mechatronic)

17
17
Group orders intake
Group backlog
growth driver & mission
sales breakdown
India & China production sites
details

18
Biesse : Group sales breakdown March 31st 2012
9.8%
41.1%
14.0%
9.9%
16.7%
8.5%
by countries
Italy
Western E.
Eastern E.
U.S.A. - Canada
Asia Pacific
Rest of the W.
74.6%
14.1%
11.3%
by business division
wood
glass & stone
mechatronic & other*
*after intercompany
60.5%
10.5%
4.0%
25.0%
by end users
housing
office
store fixture
frames
68.0%
11.0%
21.0%
by type
machines
systems
spare parts & billable services
B.R.I.C. : 15% Brasile=4.3%
Russia=3.9%
India= 1.4%
Cina=5.4%

19
20,0
50,0
80,0
2009 IQ 2009 IIQ 2009 IIIQ
2009 IVQ
2010 IQ 2010 IIQ 2010 IIIQ
2010 IVQ
2011 IQ 2011 IIQ 2011 IIIQ
2011 IVQ
2012 IQ 2012 IIQE
€/mln
Group orders intake: quarterly trend 2009-2012

20
Group orders backlog: quarterly trend 2009 – 2012
IQ 09 IIQ 09 IIIQ 09 IVQ 09 IQ 10 IIQ 10 IIIQ 10 IVQ 10 IQ 11 IIQ 11 IIIQ 11 IVQ 11 IQ 12 0
20
40
60
80
100
120
€/mln
21
Main drivers (business plan)
growth:
increase the consolidated turnover beating the market growth rate expectations - especially in our business sectors -
catching the positive impulse deriving from the “emerging” countries. (BRIC)
gain market shares against our competitors in any business area and sector
reinforce our world-wide sale and distribution network (APAC & Americas)
open new potential and attractive end markets
strengthen Biesse reputation in large projects/key customers
maintain an important R & D through focused investments
expand the post-sale services improving their quality
efficiency:
complete and extend the cost cutting activity.
speed up and increase the reduction of the products/production costs
simplify/unify of the engineering process for a better standardization of the “offer range”

22
Execution details (business plan)
1. technology: mechatronic division as “owner” of the technology evolution
and development
2. product: innovation trend binded together to consolidation & semplification
of the entire products gamma
3. geographic breakdown: increase our APAC presence, beeing in
Asia “as a company”
direct garrison (localization) in the north/south America
progressive integration and management of the “new” chinese acquisition”
4. systems: focus on a “dedicated mentality” regarding the systems division
potentiality (“systems are not machines”)

Factory location: Bangalore (India)
23
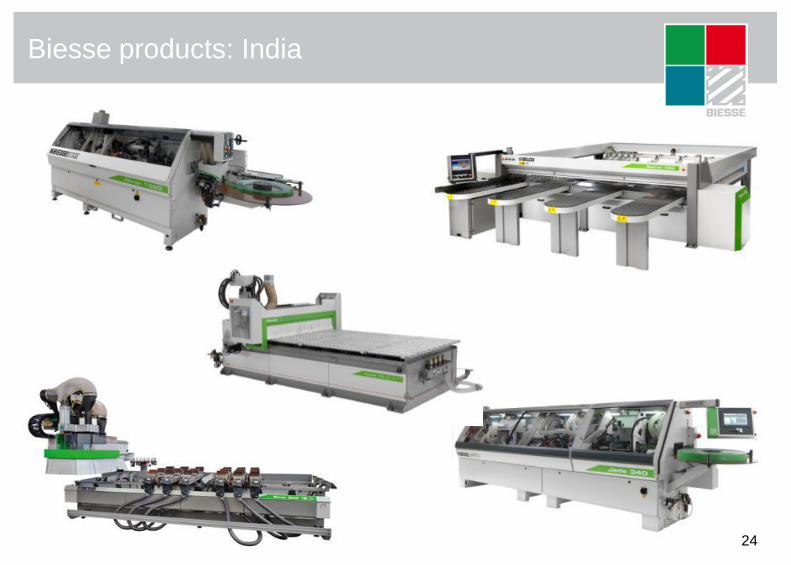
Biesse products: India
24
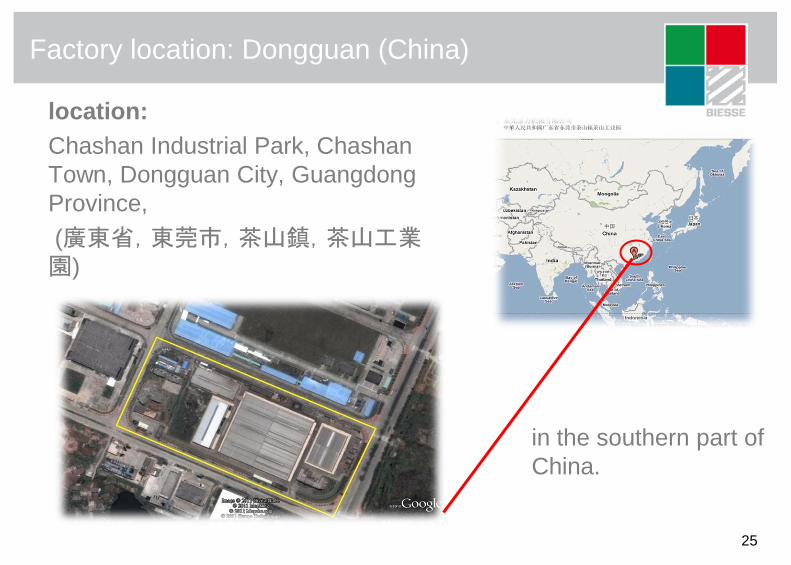
Factory location: Dongguan (China)
location:
Chashan Industrial Park, Chashan
Town, Dongguan City, Guangdong
Province,
(廣東省,東莞市,茶山鎮,茶山工業園)
in the southern part of
China.
25
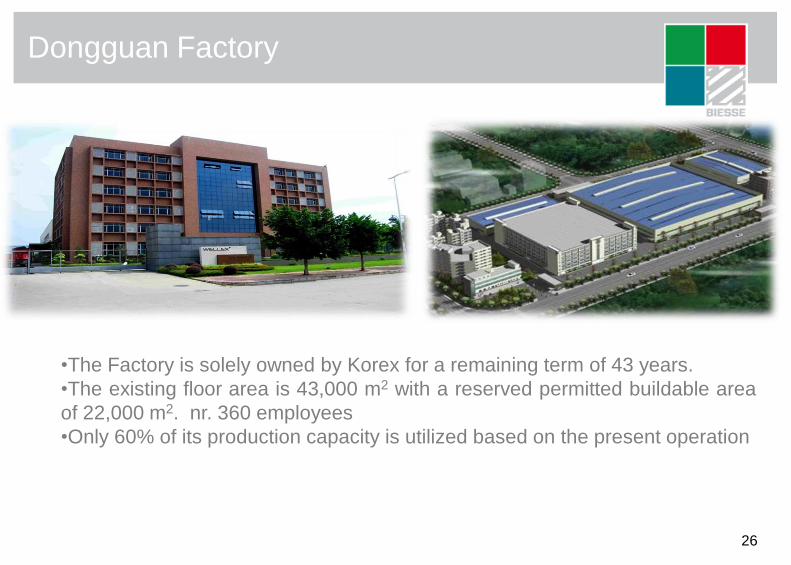
Dongguan Factory
•The Factory is solely owned by Korex for a remaining term of 43 years.
•The existing floor area is 43,000 m2 with a reserved permitted buildable area
of 22,000 m2. nr. 360 employees
•Only 60% of its production capacity is utilized based on the present operation
26

Biesse products: China
27

Expectations
28
INDIA activity: production – sale & sourcing (domestic and export)
CHINA activity: production – sale & sourcing (domestic and export)
29
29
P & L details
ebitda & ebit evolution
cashflow & net debt
consolidated sales
ratios & sharedolders
financials: 2012 IQ results & three years business plan remind

30
Group P&L details: March 31st 2012
€/mln
Net Sales
Value Added % of net sales
Labour cost % of net sales
EBIT % of net sales
EBITDA % of net sales
33.9 39.0%
31.4 36.1%
-1.0 -1.2%
2.5 2.9%
86.8 +15,3%
138.0 35.5%
115.6 29.7%
5.7 1.5%
22.4 5.8%
327.5 +22.2%
388.5 +18.6%
29.8 39.5%
29.4 39.1%
-2.9 -3.9%
0.3 0.5%
IQ 2012 FY 2011 IQ 2011
75.3

31
quarterly trend: net sales – ebitda margin
-10,0%
0,0%
10,0%
20,0%
0,0
20,0
40,0
60,0
80,0
100,0
120,0
140,0
IQ 2007
IIQ 2007
IIIQ 2007
IVQ 2007
IQ 2008
IIQ 2008
IIIQ 2008
IVQ 2008
IQ 2009
IIQ 2009
IIIQ 2009
IVQ 2009
IQ 2010
IIQ 2010
IIIQ 2010
IVQ 2010
IQ 2011
IIQ 2011
IIIQ 2011
IVQ 2011
IQ 2012
net sales x quarters ebitda margin

32
Group Net O.W.C.: March 31st 2012
€/mln
Inventories % on net sales
Trade receivables % on net sales
Trade payables % on net sales
N.O.W.C. % on net sales
IQ 2012 FY 2011
88.5 22.8%
112.2 28.9%
113.1 29.1%
87.6 22.5%
IQ 2011
96.9
81.7
108.2
70.4
96.2
109.2
116.0
89.4

33
Group Cashflow – Net debt: March 31st 2012
€/mln
Gross
Cashflow
Net total Capex % of net sales
Free Cashflow
N.F.P.
IQ 2012 FY 2011
-15.3
-16.2 4.2%
-31.5
-50.4
IQ 2011
-18.3
-37.2
-7.8
-3.7 4.2%
-11.5
-61.9
-15.6
-2.7 3.6%

34
Net financial position: quarterly trend 2005-2012 (IQ)
-60
-50
-40
-30
-20
-10
0
10
20
2008
2007
2006
2005 2009 2010 2011
€/mln
2012

35
Group consolidated revenues – yearly trend
€/mln
Net sales
€/mln
0
50
100
150
200
250
300
350
400
450
500
2007 2008 2009 2010 2011 2012e 2013e 2014e
466,0 454,3
268,0
327,5
388,5 408,3
438,7 467,5
CAGR 2012-2014: 6.4%

36
Group P&L details: 3 years plan
€/mln
Net Sales
Value Added % of net sales
Labour cost % of net sales
EBIT % of net sales
EBITDA % of net sales
152.1 37.2%
120.1 29.4%
15.1 3.7%
32.0 7.8%
69.4
178.2 40.6%
126.9 28.9%
34.3 7.8%
51.4 11.7%
FY 2012e FY 2013e FY 2014e
467.5 +6.6%
199.0 42.6%
130.8 28.0%
51.1 10.9%
68.2 14.6%
2011 vs 2014
+79.0 € 408.3 +5,1%
438.7 +7.4%
+61.0 €
+15.2 €
+45.8 €
+45.4 €
123.4 37.7%
107.7 32.9%
0.1 ---%
15.7 4.8%
FY 2010
327.5 +22.2%
327.5 +22.2%
EBIT (normal.) % of net sales
138.0 35.5%
115.6 29.7%
5.7 1.5%
22.4 5.8%
FY 2011
327.5 +22.2%
388.5 +18.6%
7.1 1.8%

37
Group Value Added evolution: 3 years plan
€/MIL
32,3%
36,9%
21,5%
38,7%
35,5%
37,2%
40,6%
42,6%
-5,0%
5,0%
15,0%
25,0%
35,0%
45,0%
-10,0
40,0
90,0
140,0
190,0
240,0
2007 2008 2009 2010 2011 2012e 2013e 2014e
Value Added
€/mln
38
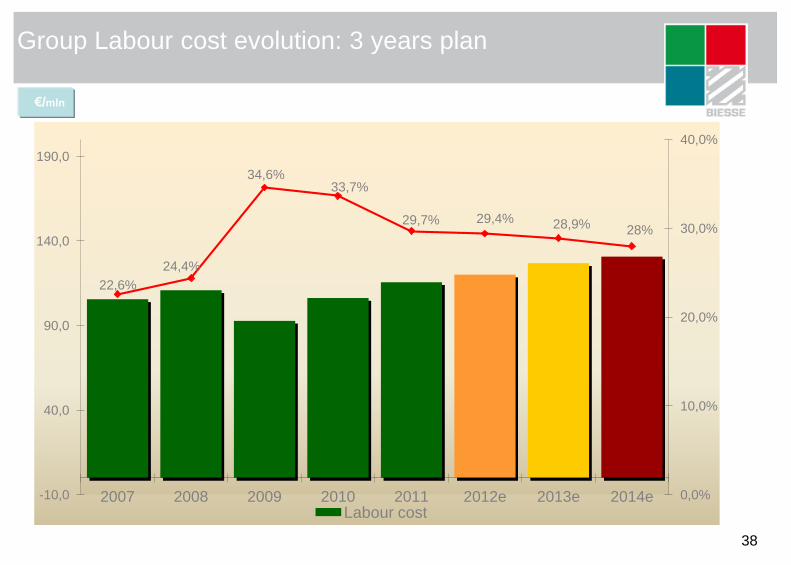
Group Labour cost evolution: 3 years plan
€/MIL
22,6%
24,4%
34,6% 33,7%
29,7% 29,4% 28,9% 28%
0,0%
10,0%
20,0%
30,0%
40,0%
-10,0
40,0
90,0
140,0
190,0
2007 2008 2009 2010 2011 2012e 2013e 2014e Labour cost
€/mln

39
Group EBITDA evolution: 3 years plan
€/MIL
17,0%
12,5%
-3,1%
5,1% 5,8%
7,8%
11,7%
14,6%
-7,0%
-2,0%
3,0%
8,0%
13,0%
18,0%
-10,0
0,0
10,0
20,0
30,0
40,0
50,0
60,0
70,0
80,0
90,0
2007 2008 2009 2010 2011 2012e 2013e 2014e
EBITDA
€/mln
40
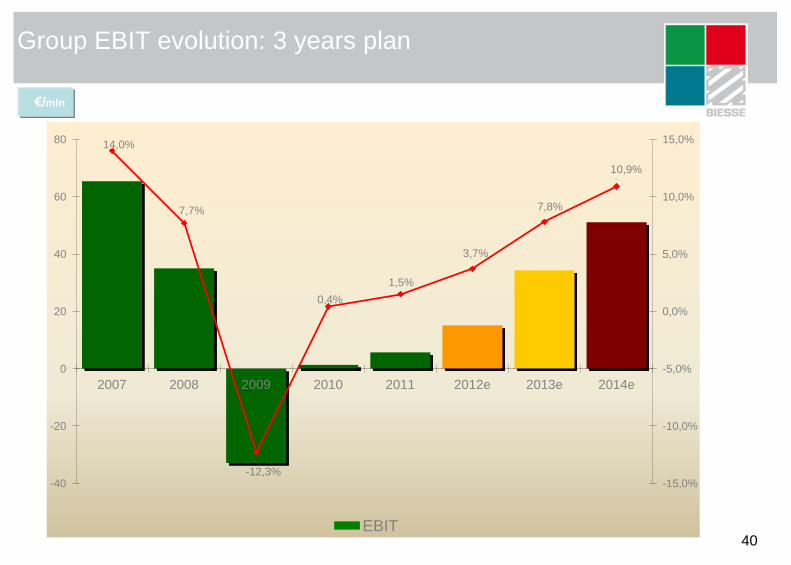
Group EBIT evolution: 3 years plan
€/MIL
14,0%
7,7%
-12,3%
0,4%
1,5%
3,7%
7,8%
10,9%
-15,0%
-10,0%
-5,0%
0,0%
5,0%
10,0%
15,0%
-40
-20
0
20
40
60
80
2007 2008 2009 2010 2011 2012e 2013e 2014e
EBIT
€/mln

41
Group EBITDA bridge: 2011 - 2014e
EBITDA 2011 delta operating expenses
+81.3
+10.0 22.4
68.2
EBITDA 2014e delta sales
-15.3
delta personnel cost
-2.7
€/mln
-17.5
delta COGS
44.1% of net sales
40.4% of net sales
29.7% of net sales
28.0% of net sales
20.9% of net sales
18.0% of net sales
2011 2011 2011 2014e 2014e 2014e

42
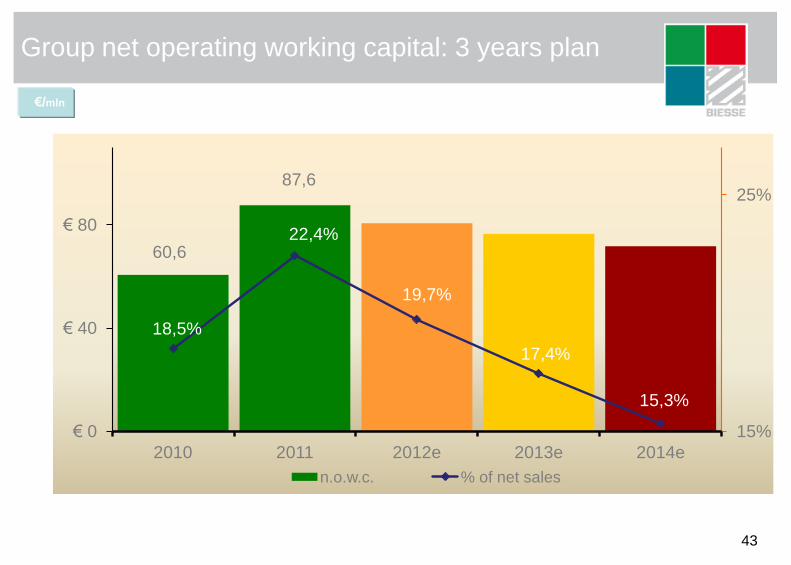
Group Net Operating Working Capital: 3 years plan
€/mln
Inventories % on net sales
Trade receivables % on net sales
Trade payables % on net sales
N.O.W.C. % on net sales
81.3 24.8%
90.4 27.6%
111.1 33.9%
60.6 18.5%
80.2
110.0
111.8
78.4
2010 2011 2012e 2013e 2014e China
8.3
2.2
1.3
9.2
2011
B A+B A
26.6%
28.1%
19.7%
26.5%
28.1%
17.4%
21.2% 19.1%
17.1%
26.3%
28.1%
15.3%
2011
88.5 22.8%
112.2 28.9%
113.1 29.1%
87.6 22.5%
43
Group net operating working capital: 3 years plan
60,6
87,6
18,5%
22,4%
19,7%
17,4%
15,3%
15%
25%
€ 0
€ 40
€ 80
2010 2011 2012e 2013e 2014e
n.o.w.c. % of net sales
€/mln

44
Group Cashflow – Net Financial Position: 3 years plan
€/mln
Gross
Cashflow
Net total Capex % of net sales
Free Cashflow
N.F.P.
13.3
-37.1
48.3
-20.2 4.9%
-14.5 3.0%
33.8
-3.3
2012-2013-2014
33.5 +146.9 €
-48.7 €
+98.2 €
2012e 2013e 2014e
65.1
-14.0 3.0%
51.1
47.8
FY 2010
13.8
-18.9
-12.1 3.8%
25.9
FY 2011
-31.5
-50.4
-16.2 4.2%
-15.3

45
Group Cashflow: free cashflow & total capex 3 years plan
13,8
-31,5
13,3
33,8
51,1
-12,1
-16,2
-20,2
-14,5
-14
-50,0 -20,0 10,0 40,0 70,0
2010
2011
2012e
2013e
2014e
capex
capex
capex
capex
capex
free cashflow
free cashflow
free cashflow
free cashflow
free cashflow
€/mln

46
Net financial position: yearly trend & forecast
-120
-100
-80
-60
-40
-20
0
20
40
60
2000 200 2002 2003 2004 2005
2006 2007
2008 2009 2010 2011 2012e 2013e
2014e
€/mln

47
Group ratios: 2007-2014e
-35,0%
-25,0%
-15,0%
-5,0%
5,0%
15,0%
25,0%
2007 2008 2009 2010 2011 2012e 2013e 2014e
r.o.c.e. r.o.e. e.v.a. spread

48
58.5
41.5
%
Bi.Fin s.r.l (Selci family)
free float*
treasury shares: 1.78%
* Including treasury shares -
shareholders breakdown > 2%

shareholders breakdown “by type”
49
12.4
29.1 58.5
retail
institutionals
Selci family
%

This presentation has been prepared by Biesse S.p.A. for information purposes only and for use in presentations of the Group’s results and strategies.
For further details on the Biesse S.p.A.. reference should be made to publicly available information. including the Quarterly Reports, the Annual Reports and the Three Years Business Plan.
Statements contained in this presentation, particularly the ones regarding any Biesse S.p.A. possible or assumed future performance, (business plan) are or may be forward looking statements and in this respect they involve some risks and uncertainties.
Any reference to past performance of the Biesse S.p.A. shall not be taken as an indication of future performance.
This document does not constitute an offer or invitation to purchase or subscribe for any shares and no part of it shall form the basis of or be relied upon in connection with any contract or commitment whatsoever.
By attending the presentation you agree to be bound by the foregoing terms.
disclaimer
50

appendix
51

52
Wood: products evolution
Multicenter Uniprof WMS
Numeric controlled
machining center Rover A 5
axes
Numeric controlled machining
center Rover A edge
Autoamtic edgebanding machine
Akron 1300
53
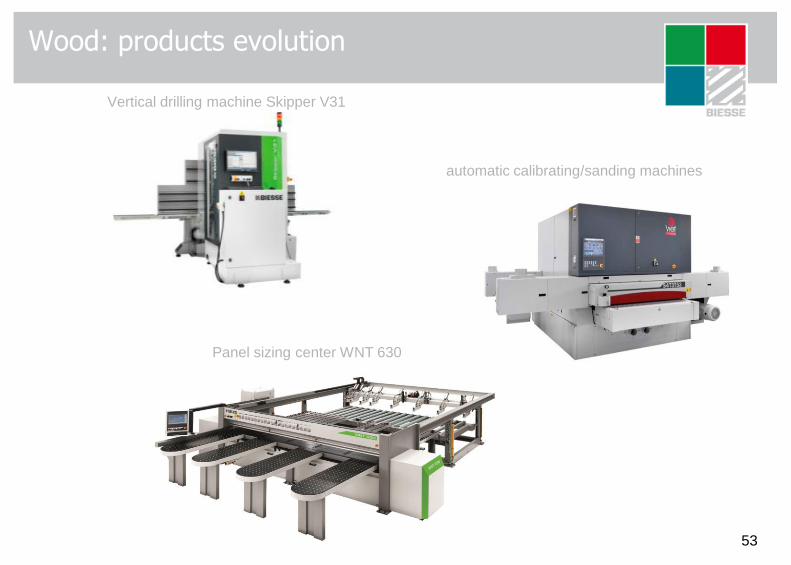
Wood: products evolution
Vertical drilling machine Skipper V31
Panel sizing center WNT 630
automatic calibrating/sanding machines
54
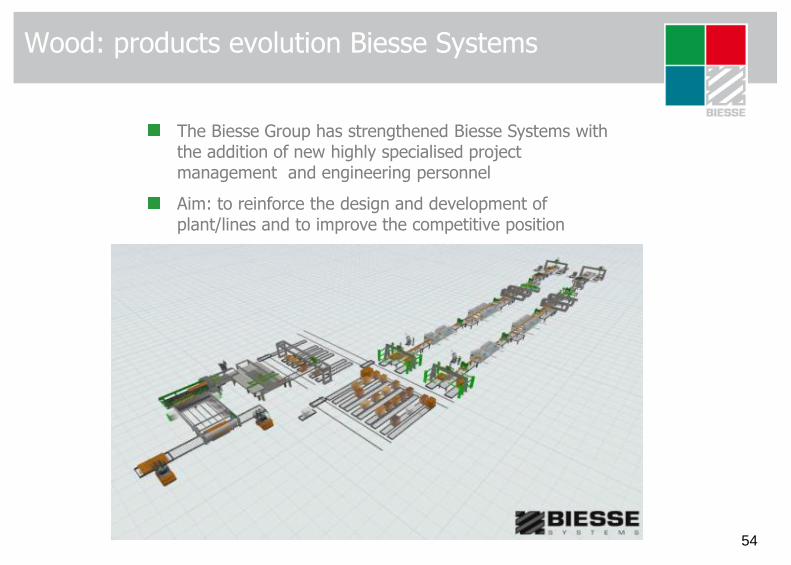
Wood: products evolution Biesse Systems
The Biesse Group has strengthened Biesse Systems with the addition of new highly specialised project management and engineering personnel
Aim: to reinforce the design and development of plant/lines and to improve the competitive position

55
Glass & Stone: products evolution
Genius LM-A for building (Glass)
Master series (Stone)
Primus series waterjet machinery (metal)

56
Automatic and manual Electrospindle for wood,
plastic, glass, marble, metal
Boring Units and Right Angle Head for wood,
plastic, glass, marble
Smart Motors, Brushless Motors and
Rotor/Stator
5 Axis Technology
Mechatronic: products evolution

57 57
acquisition objectives & drivers
target company
local outlook
sinergies
potentiality
China transaction remind:

Investment objectives & drivers
Biesse objectives
-Acquire Brand
-Manufacturing Base
-Market share
-Development capability
-Strong partnerships
Biesse drivers
-Woodworking machines low-end Brand
-Wide & well supported manufacturing
district
-2-3 % of local market share
-Know how and development capability
-Reliable partner & management team
58

Target companies: the existing business & markets
the existing business:
•manufacturing of “entry level” to “middle range” furniture machineries
up to European standard of quality;
•the products are sold to customers in the territories of China, Europe
and Russia and other such as Middle East, North America, South
Africa and India.
59
the existing markets:
•China (50%);
•Europe and Russia (40%) ;
•others such as Middle East, North America, South Africa and India (10%)

Target companies: existing products (extract)
60

Target companies: factory equipment
61

62
Outlook: woodworking market analysis
China:
•the world‘s third largest nominal GDP at 33.54 trillion yuan (US$4.91 trillion).
•increase on demand for new commercial and residential premise:- lead to
domestic demand for furniture in the Mainland China – hence the demand for
woodworking machineries.
•In the year of 2008, the recorded demand of woodworking machineries was
over 10 trillion with an estimated increase of 10% per annum.

63
Outlook: woodworking market analysis
Turnover - Value /000 Euros
2010 2011
TOTAL Market of Reference* 250,000 375,000
Turnover - Value /000 Euros
2010 2011
TOTAL 108,000 120,000
BIESSE 5,800 10,000
Mkt share 5.4% 8.3%
• sector potential high growth rate
• best competitor (Homag) performing more than € 100 mln turnover in 2011
Main industrial synergies & potentiality
The “new” Group will benefit of:
•technology: enlargement of the whole products gamma “Made in China”
due to the increasing utilization of the Biesse technology.
•manufacturing knowledge and management experience: improve the
quality of the products with the Biesse experience beeing a worldwide
leader (manufacturer & distributor).
•distribution network : use of the high potential China Distribution
Networks – Biesse & Wellex - to increase sales and profits concerning the
entire products gamma, including turnkey factories and engineered
systems.
64

Alberto Amurri Group Financial Manager & Head of Investor Relations Dept. Via della Meccanica 16 61122 Pesaro ITALY http://www.biesse.com/Corporate/en/InvestorRelations.cms Tel: +39 0721 439107 / Mob: +39 335 1219556 e-mail: [email protected]
65
Related Documents