Information Economics and Policy 12 (2000) 133–154 www.elsevier.nl / locate / econbase Technology, efficiency and sustainability of competition in the Indian telecommunications sector * Nibedita Das Economic Analysis Unit, Indian Statistical Institute, Bangalore 560 059, India Abstract Liberalisation of the Indian telecommunications services started in mid nineties with no change in the existing public monopoly structure, viz., Department of Telecommunications (DoT). In order to evaluate any proposed industry structure, it is essential to analyse the production technology of DoT so as to determine the rationale of liberalisation and sustainability of competition. Accordingly, this paper estimates a frontier multi-product translog cost function for DoT, where the cost function has been duly modified to account for the production technology of a public monopoly. The study finds that although DoT displays high allocational inefficiency, it is still a natural monopoly with very high degree of subadditivity of cost of production. This implies that the choice of any reform policy should consider the trade-off between the loss of scale and scope economies and cost saving from the reduction in inefficiency of the incumbent monopoly in the event of competition. 2000 Published by Elsevier Science B.V. All rights reserved. Keywords: Telecommunications; Productivity; Liberalisation; Market Structure; Regulation JEL Classification: L11; L96; L98; L32 1. Introduction In recent years, with increased integration of the global economy, telecommuni- * Corresponding author. E-mail address: [email protected] (N. Das) 1 An efficient information network increases efficiency in allocation of resources and productivity in all sectors of the economy. Telecommunication also reduces the cost of transactions leading to the development of other product and factor markets (Leff, 1984). Norton (1992) showed that the convergence hypothesis (tendency of poor countries to catch up with richer nations via faster growth) is stronger and more robust when telecommunications is included as one of the explanatory variable. 0167-6245 / 00 / $ – see front matter 2000 Published by Elsevier Science B.V. All rights reserved. PII: S0167-6245(00)00004-4

Welcome message from author
This document is posted to help you gain knowledge. Please leave a comment to let me know what you think about it! Share it to your friends and learn new things together.
Transcript
Information Economics and Policy 12 (2000) 133–154www.elsevier.nl / locate /econbase
Technology, efficiency and sustainability of competitionin the Indian telecommunications sector
*Nibedita DasEconomic Analysis Unit, Indian Statistical Institute, Bangalore 560 059, India
Abstract
Liberalisation of the Indian telecommunications services started in mid nineties with nochange in the existing public monopoly structure, viz., Department of Telecommunications(DoT). In order to evaluate any proposed industry structure, it is essential to analyse theproduction technology of DoT so as to determine the rationale of liberalisation andsustainability of competition. Accordingly, this paper estimates a frontier multi-producttranslog cost function for DoT, where the cost function has been duly modified to accountfor the production technology of a public monopoly. The study finds that although DoTdisplays high allocational inefficiency, it is still a natural monopoly with very high degreeof subadditivity of cost of production. This implies that the choice of any reform policyshould consider the trade-off between the loss of scale and scope economies and cost savingfrom the reduction in inefficiency of the incumbent monopoly in the event of competition. 2000 Published by Elsevier Science B.V. All rights reserved.
Keywords: Telecommunications; Productivity; Liberalisation; Market Structure; Regulation
JEL Classification: L11; L96; L98; L32
1. Introduction
In recent years, with increased integration of the global economy, telecommuni-
* Corresponding author.E-mail address: [email protected] (N. Das)
1 An efficient information network increases efficiency in allocation of resources and productivity inall sectors of the economy. Telecommunication also reduces the cost of transactions leading to thedevelopment of other product and factor markets (Leff, 1984). Norton (1992) showed that theconvergence hypothesis (tendency of poor countries to catch up with richer nations via faster growth) isstronger and more robust when telecommunications is included as one of the explanatory variable.
0167-6245/00/$ – see front matter 2000 Published by Elsevier Science B.V. All rights reserved.PI I : S0167-6245( 00 )00004-4
134 N. Das / Information Economics and Policy 12 (2000) 133 –154
1cation has become the key infrastructure facility for rapid economic development.As a result there has been a growing demand to transform the structure of thisindustry from that of a government monopoly to one characterised by morecompetition so that the communications services are provided efficiently, at thelowest price and with the highest quality. Accordingly, many countries decided toliberalise their telecommunications sector in the eighties. The liberalisation of thetelecom sector in India also started in mid eighties with the privatisation oftelecom equipment manufacturing firms. But the major stride in liberalisationcame in the early nineties, when, faced with a deteriorating balance of paymentssituation, India undertook wide-spread economic reforms including the disinvest-ment and deregulation of her public sector enterprises such as telecommunications.In May 1994, the Government of India decided to open the value added and basictelecom services to the private sector with the objective of providing universalaccess to telecom services of better quality and at a reasonable price.
Keeping in view the experience of other countries, whether liberalisation of theIndian telecommunications sector will succeed in achieving its objectives dependsmainly on two factors, viz: (i) the sustainability of competition and (ii) theefficiency of competition. Competition in an industry is said to be sustainable ifthere does not exist a price-output vector which, (a) allows the incumbent tooperate without losses and (b) does not allow any of the entrants to operatewithout losses at or below those prices so long as the incumbent remains in themarket (Baumol et al., 1982). One such unsustainable situation occurs when theindustry is a natural monopoly, i.e., when the firm’s cost function is subadditiveover the relevant range of output; then, the incumbent can meet the entire marketdemand at a lower cost, thus making competition infeasible.
The major assumption behind the above definition of sustainability is that thereis a single best technology and the incumbent and entrants efficiently use thattechnology. However, telecommunications being an industry of rapidly evolvingtechnology, recent years have witnessed substantial technological change withincreased use of fiber-optic cables, satellite, microwave, cellular and other radiotechnologies. For example, segments of local loop can now have wirelesstechnology (Spulber, 1995). Under such circumstances, even if the existingincumbent with its traditional wire based technology is a natural monopoly,competition in local technology is still sustainable with multiple operators, byproviding equal access and interconnectivity to existing network.
2An analysis of the Indian scenario shows that although the Athreya committee(1991) recommended restructuring of Department of Telecommunications (DoT)into zonal operating companies and subsequent privatisation of these zonalcompanies prior to introduction of competition, liberalisation has started without
2 The Ministry of Communications set up a high level committee under Dr. M. B. Athreya inDecember 1990, to recommend the most appropriate structure for telecommunications services in thecountry.
N. Das / Information Economics and Policy 12 (2000) 133 –154 135
implementation of the committee report. The entire country has been divided intotwenty-one telecom circles and the privately owned companies in each circle haveto compete with DoT. Some of the implications of the proposed market structureare as follows. First, DoT as the service provider for the entire country mightenjoy substantial economies of scale as compared to the private firms. Second,DoT might enjoy substantial economies of scope in the joint provision of DirectExchange Lines (DELs), local and inter circle long distance services. Such higheconomies of scale and scope may imply that DoT is a natural monopoly. As aresult DoT can indulge in discrimination or price-cutting against the privateoperators making their operations infeasible. Third, due to the high sunk cost andlong gestation period, initially the private firms have to operate on the existingnetwork owned by DoT. Since DoT will also be competing with the private firmsit is possible for DoT to charge the rivals more for this vital input and subsidisethe provision of its own services and thus impair the ability of the private firms tocompete. Hence, I find it important to analyse whether DoT, given its existingstructure and production technology, is a natural monopoly or not so that there isefficient unbundling of the DELs and basic services with appropriate accesspricing in order that competition is sustainable.
It is important to ensure sustainable competition in basic services in India evenif DoT is a natural monopoly, because a natural monopoly technology need notnecessarily be efficient. Given that DoT has operated in a protected market so farwith substantial barriers to entry, it is very likely that the production technology ofDoT is inefficient even with natural monopoly characteristics. Inefficiency in theproduction process may be of two types, viz, (i) price or allocative inefficiency
3and (ii) technical inefficiency (Farrell, 1957). Allocative inefficiency is thedeviation of the chosen input combination from the point of tangency of theisocost line and isoquant; in other words, it shows the increase in cost of thechosen input combination from the cost minimizing combination evaluated atmarket prices. Technical inefficiency is the inefficiency in the use of resources. Itshows the increase in cost due to choosing an input combination above theefficient isoquant to produce the same level of output. If the increase in cost due tothe presence of these inefficiencies in the production process of the incumbent isvery high it is necessary to ensure effective competition as competition will forcethe incumbent to reduce cost and increase efficiency. However, unrestrictedcompetition in the presence of a natural monopoly may also lead to unnecessaryduplication of fixed cost and loss of economies of scale and scope. Given the
3 There can also be inefficiency in the provision of services by DoT if the corresponding prices donot reflect cost, i.e., one service cross-subsidises another or one class of customers cross-subsidiseanother. However, in this analysis, the emphasis is only on the inefficiency in the allocation and use ofproductive inputs by DoT. The main reason for this is that the pricing of services is decided by thegovernment, keeping in view a broader framework of fulfilling social goals, and it is not a managerialdecision as in case of choice of productive inputs.
136 N. Das / Information Economics and Policy 12 (2000) 133 –154
importance and size of the telecommunication sector in India, any such loss ofscope or scale economies may have substantial adverse impact on social welfare.So competition is efficient if cost saving from reduction in production inefficiencyof the incumbent firm outweighs the loss of economies of scale and scope.
Hence, it is essential to analyse the economic characteristics of the incumbentfirm, viz., DoT, before introduction of competition in the Indian telecommunica-tions sector to ensure that competition is sustainable and economically efficient. Inparticular there is a need to examine the presence or absence of technical andallocative inefficiencies in the production technology of DoT; this paper alsoundertakes such an exercise.
The past research on the economics of the production technology of thetelecommunications industry in other countries has been inconclusive. Theempirical work in this direction received a spurt after the divestiture of AT&T inJanuary, 1984. Predictably, the majority of studies are based on testing themonopolistic nature of the Bell system in USA and Bell Canada.
Christensen et al. (1981) and Evans and Heckman (1984, 1986) estimated atranslog cost function with single output and multiple outputs respectively for thesame data and found that the cost function of the Bell system was not subadditive.Charnes et al. (1988) applied goal programming to the same data and arrived atexactly opposite results. Subsequently, Evans and Heckman (1988) in a rejoinderattributed the difference in results to difference in methodology used by bothstudies. Roller (1990a,b) rejected the flexible translog functional form used in theabove studies because of its poor global approximation ability. He estimated aproper cost function, i.e, a cost function which is non-negative, linearly homoge-neous, concave and non decreasing in input prices as well as having positivemarginal costs and showed that the Bell system was a natural monopoly prior todivestiture. Shin and Ying (1992) defended the estimation of translog cost functionas according to them, in a study of technical structure, flexibility is too high a priceto pay for properness. However, they criticised the time series data used in theabove studies because, in the presence of highly correlated variables, a smallnumber of observations makes the estimates vulnerable to specifications andestimation techniques. Accordingly, they estimated a multi-product translog costfunction for a pooled cross-sectional sample and concluded that the Bell systemwas not a natural monopoly at the time of divestiture.
However, all these studies have concentrated on the natural monopoly charac-teristics of the cost structure and the loss of welfare resulting from the loss of scaleand scope economies when a natural monopoly is broken up. But, very often in theabsence of competition, the production and pricing decisions of the monopolyincumbent may not be economically optimal resulting in technical and/orallocative inefficiencies. In the presence of inefficiency in the production processof the incumbent, it is necessary to introduce competition to induce efficiency,make prices socially optimal and improve the quality of the services. Oum andZhang (1995) showed that after introduction of competition in long distance
N. Das / Information Economics and Policy 12 (2000) 133 –154 137
market, the ratio of shadow price to market price of capital in the Bell system hasmoved closer to the equivalent ratio for labour showing substantial reduction in
4Averch–Johnson effect.None of the above studies has analyzed the scale and scope economies along
with the inefficiencies in production of the incumbent prior to introduction ofcompetition. Such an analysis is important in order to determine the trade-offbetween increase in cost due to production inefficiency of the incumbentmonopoly and loss of scale and scope economies in the event of introduction ofcompetition. This paper aims at analyzing the natural monopolistic characteristicssuch as presence or absence of economies of scale and scope and sub-additivity ofthe cost function along with the technical and allocational inefficiencies of DoT inorder to facilitate formulation of appropriate policy guidelines necessary to makeIndian telecommunications reforms a success.
The paper is organised as follows. The next section develops the methodologyadopted to analyse the cost function of DoT and also discusses the data sources.Section 3 analyses the results and the last section concludes the paper.
2. Data and methodology
2.1. The estimation methodology
This paper uses duality theory to study the production technology of DoT. Theduality approach has two main advantages. First, it addresses the issues raised byestimation of models with endogenous regressors. In our case, either due toregulatory environment, market imperfections, managerial discretion or laggedadjustment to prices, the inputs of the production process may be endogenous. Forexample, under the existing rate of return regulation, DoT may have a tendency toover use capital (Averch–Johnson effect). In that case, the estimation of theproduction function will give inconsistent results as the regressors are notexogenous. Hence, the alternative is to use the duality theory and estimate the costfunction where the regressors are exogenous. Second, from the the cost function,one can also derive the factor demand equations by use of Shephard’s Lemma. Inthis paper, the economic characteristics of the Department of Telecommunicationsare studied by using the cost function approach. The methodology used is theestimation of a multi-product translog cost function as this provides a convenient
4 Averch and Johnson (1962) showed that if the regulator allows a rate of return that exceeds thefirm’s cost of capital, then the firm has an incentive to expand its capital base beyond the extent that isefficient for the output level that it produces.
138 N. Das / Information Economics and Policy 12 (2000) 133 –154
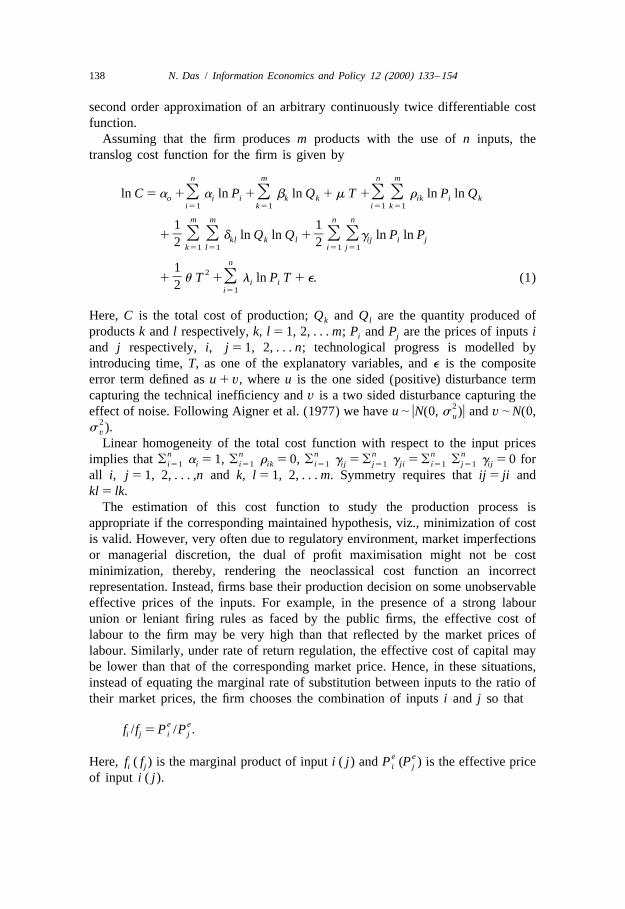
second order approximation of an arbitrary continuously twice differentiable costfunction.
Assuming that the firm produces m products with the use of n inputs, thetranslog cost function for the firm is given by
n m n m
ln C 5 a 1O a ln P 1O b ln Q 1 m T 1O O r ln P ln Qo i i k k ik i ki51 k51 i51 k51
m m n n1 1] ]1 O O d ln Q ln Q 1 O Og ln P ln Pkl k l ij i j2 2k51 l51 i51 j51
n1 2]1 u T 1O l ln P T 1 e. (1)i i2 i51
Here, C is the total cost of production; Q and Q are the quantity produced ofk l
products k and l respectively, k, l 5 1, 2, . . . m; P and P are the prices of inputs ii j
and j respectively, i, j 5 1, 2, . . . n; technological progress is modelled byintroducing time, T, as one of the explanatory variables, and e is the compositeerror term defined as u 1 v, where u is the one sided (positive) disturbance termcapturing the technical inefficiency and v is a two sided disturbance capturing the
2effect of noise. Following Aigner et al. (1977) we have u | uN(0, s )u and v | N(0,u2
s ).v
Linear homogeneity of the total cost function with respect to the input pricesn n n n n nimplies that o a 5 1, o r 5 0, o g 5 o g 5 o o g 5 0 fori51 i i51 ik i51 ij j51 ji i51 j51 ij
all i, j 5 1, 2, . . . ,n and k, l 5 1, 2, . . . m. Symmetry requires that ij 5 ji andkl 5 lk.
The estimation of this cost function to study the production process isappropriate if the corresponding maintained hypothesis, viz., minimization of costis valid. However, very often due to regulatory environment, market imperfectionsor managerial discretion, the dual of profit maximisation might not be costminimization, thereby, rendering the neoclassical cost function an incorrectrepresentation. Instead, firms base their production decision on some unobservableeffective prices of the inputs. For example, in the presence of a strong labourunion or leniant firing rules as faced by the public firms, the effective cost oflabour to the firm may be very high than that reflected by the market prices oflabour. Similarly, under rate of return regulation, the effective cost of capital maybe lower than that of the corresponding market price. Hence, in these situations,instead of equating the marginal rate of substitution between inputs to the ratio oftheir market prices, the firm chooses the combination of inputs i and j so that
e ef /f 5 P /P .i j i j
e eHere, f ( f ) is the marginal product of input i ( j) and P (P ) is the effective pricei j i j
of input i ( j).
N. Das / Information Economics and Policy 12 (2000) 133 –154 139
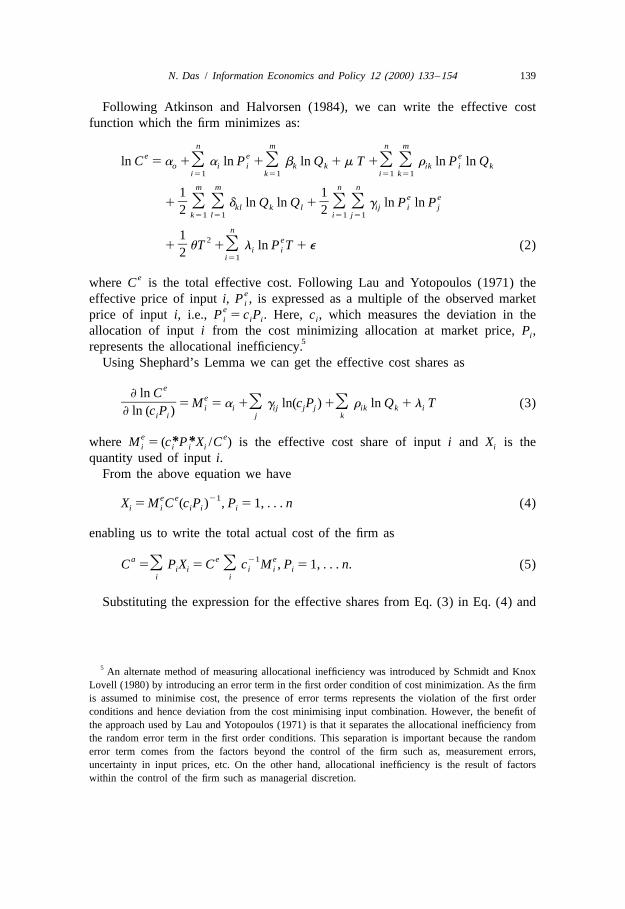
Following Atkinson and Halvorsen (1984), we can write the effective costfunction which the firm minimizes as:
n m n me e eln C 5 a 1O a ln P 1O b ln Q 1 m T 1O O r ln P ln Qo i i k k ik i k
i51 k51 i51 k51
m m n n1 1 e e] ]1 O O d ln Q ln Q 1 O O g ln P ln Pkl k l ij i j2 2k51 l51 i51 j51
n1 2 e]1 uT 1O l ln P T 1 e (2)i i2 i51
ewhere C is the total effective cost. Following Lau and Yotopoulos (1971) theeeffective price of input i, P , is expressed as a multiple of the observed marketi
eprice of input i, i.e., P 5 c P . Here, c , which measures the deviation in thei i i i
allocation of input i from the cost minimizing allocation at market price, P ,i5represents the allocational inefficiency.
Using Shephard’s Lemma we can get the effective cost shares as
e≠ ln C e]]]5 M 5 a 1O g ln(c P ) 1O r ln Q 1 l T (3)i i ij j j ik k i≠ ln (c P )i i j k
e e* *where M 5 (c P X /C ) is the effective cost share of input i and X is thei i i i i
quantity used of input i.From the above equation we have
e e 21X 5 M C (c P ) , P 5 1, . . . n (4)i i i i i
enabling us to write the total actual cost of the firm as
a e 21 eC 5O P X 5 C O c M , P 5 1, . . . n. (5)i i i i ii i
Substituting the expression for the effective shares from Eq. (3) in Eq. (4) and
5 An alternate method of measuring allocational inefficiency was introduced by Schmidt and KnoxLovell (1980) by introducing an error term in the first order condition of cost minimization. As the firmis assumed to minimise cost, the presence of error terms represents the violation of the first orderconditions and hence deviation from the cost minimising input combination. However, the benefit ofthe approach used by Lau and Yotopoulos (1971) is that it separates the allocational inefficiency fromthe random error term in the first order conditions. This separation is important because the randomerror term comes from the factors beyond the control of the firm such as, measurement errors,uncertainty in input prices, etc. On the other hand, allocational inefficiency is the result of factorswithin the control of the firm such as managerial discretion.
140 N. Das / Information Economics and Policy 12 (2000) 133 –154
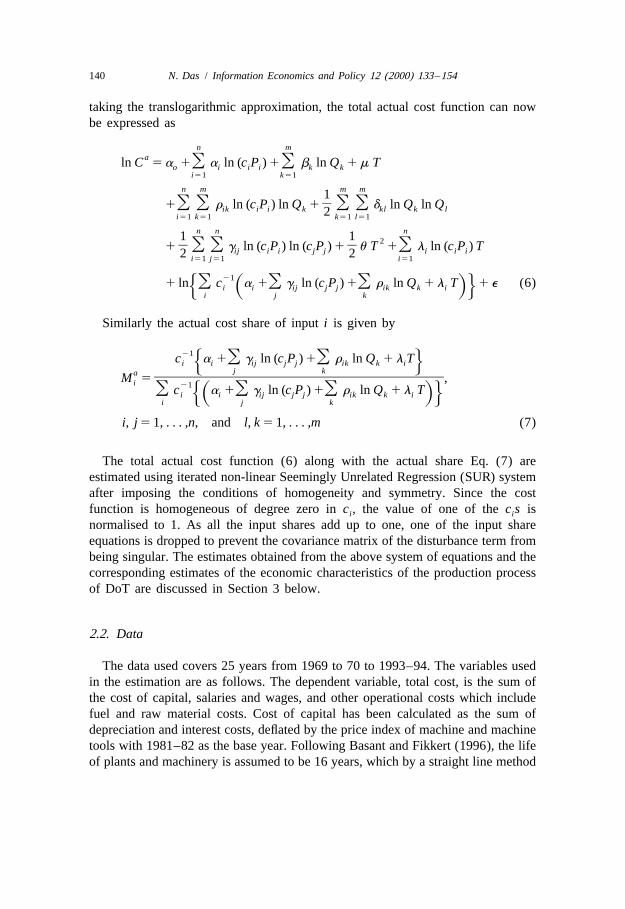
taking the translogarithmic approximation, the total actual cost function can nowbe expressed as
n maln C 5 a 1O a ln (c P ) 1O b ln Q 1 m To i i i k k
i51 k51
n m m m1]1O O r ln (c P ) ln Q 1 O O d ln Q ln Qik i i k kl k l2i51 k51 k51 l51
n n n1 1 2] ]1 O O g ln (c P ) ln (c P ) 1 u T 1O l ln (c P ) Tij i i j j i i i2 2i51 j51 i51
211 ln O c a 1O g ln (c P ) 1O r ln Q 1 l T 1 e (6)i i ij j j ik k iH S DJ
i j k
Similarly the actual cost share of input i is given by
21c a 1O g ln (c P ) 1O r ln Q 1 l Ti i ij j j ik k iH Jj ka ]]]]]]]]]]]]]]]M 5 ,i 21O c a 1O g ln (c P ) 1O r ln Q 1 l Ti i ij j j ik k iHS DJ
i j k
i, j 5 1, . . . ,n, and l, k 5 1, . . . ,m (7)
The total actual cost function (6) along with the actual share Eq. (7) areestimated using iterated non-linear Seemingly Unrelated Regression (SUR) systemafter imposing the conditions of homogeneity and symmetry. Since the costfunction is homogeneous of degree zero in c , the value of one of the c s isi i
normalised to 1. As all the input shares add up to one, one of the input shareequations is dropped to prevent the covariance matrix of the disturbance term frombeing singular. The estimates obtained from the above system of equations and thecorresponding estimates of the economic characteristics of the production processof DoT are discussed in Section 3 below.
2.2. Data
The data used covers 25 years from 1969 to 70 to 1993–94. The variables usedin the estimation are as follows. The dependent variable, total cost, is the sum ofthe cost of capital, salaries and wages, and other operational costs which includefuel and raw material costs. Cost of capital has been calculated as the sum ofdepreciation and interest costs, deflated by the price index of machine and machinetools with 1981–82 as the base year. Following Basant and Fikkert (1996), the lifeof plants and machinery is assumed to be 16 years, which by a straight line method
N. Das / Information Economics and Policy 12 (2000) 133 –154 141
6of depreciation gives the rate of depreciation to be 6% per annum. The interestrate considered is the long term interest rate on government bonds.
The explanatory variables are the prices of inputs, output quantities andtechnological progress. The inputs included are capital (c), labor (l), fuel and otherraw materials (r). The price of capital is calculated as P 5 (d 1 i)*I, where d isc
the rate of depreciation, i is the interest rate and I is the price index of machineand machine tools with 1981–82 as the base year. The price of labour has beencalculated as the total cost of wages and salaries divided by the number ofemployees; the average wage rate is then deflated by the consumer price index ofindustrial workers with 1981–82 as the base. Given the diversity of the itemsincluded in the raw material, the wholesale price index for the non-foodmanufactured goods is taken as proxy for the price of raw materials.
7The outputs included are the number of Direct Exchange Lines (DL) and thenumber of metered call units (CL). Since the data on the number of long distancecalls are not available, the metered call units are not divided further into local andlong distance calls. Technological progress is represented by the inclusion of timeas an explanatory variable.
All the data have been collected from the Annual Reports of the Department ofTelecommunications and Reserve Bank of India Reports on Currency and Finance.
3. Empirical results
It can be seen from (6) and (7) that the system of cost function and the shareequations is highly non-linear. The number of parameters to be estimated is alsovery large. Hence, the estimations are done in two stages. As the non-normaltechnical inefficiency in the disturbance term affects the estimation of only theconstant term, keeping the coefficients of all other variables unchanged, the systemof equations is estimated by iterated non-linear SUR along with the restrictions ofhomogeneity and symmetry, neglecting the technical inefficiency in the first stage.In the second stage, the technical inefficiency is estimated along with the corrected
6 The depreciation rate of 6% on Straight Line method is approximately equivalent to 331/3% onReducing Balance method. This is the rate of depreciation allowed by the Companies Act (1956) andIncome Tax Act (1961) in India. The life expectancy of some of the categories of capital set by theFederal Communications Commission (FCC), USA are, 16 to 18 years for digital switching, 8 to 12years for operating systems, 11 to 13 years for digital circuit equipment, 25 to 35 years for poles and 20to 25 years for metallic cables (Docket No. 92–296, FCC, 1995). This, on an average works out to be16 years of minimum life per unit of capital by Straight Line Method.
7 DL is the connection provided by DoT from the nearest exchange to the customer premise. Thecustomers pay a fixed amount by way of one time installation charge and a user fee for every twomonths.
142 N. Das / Information Economics and Policy 12 (2000) 133 –154
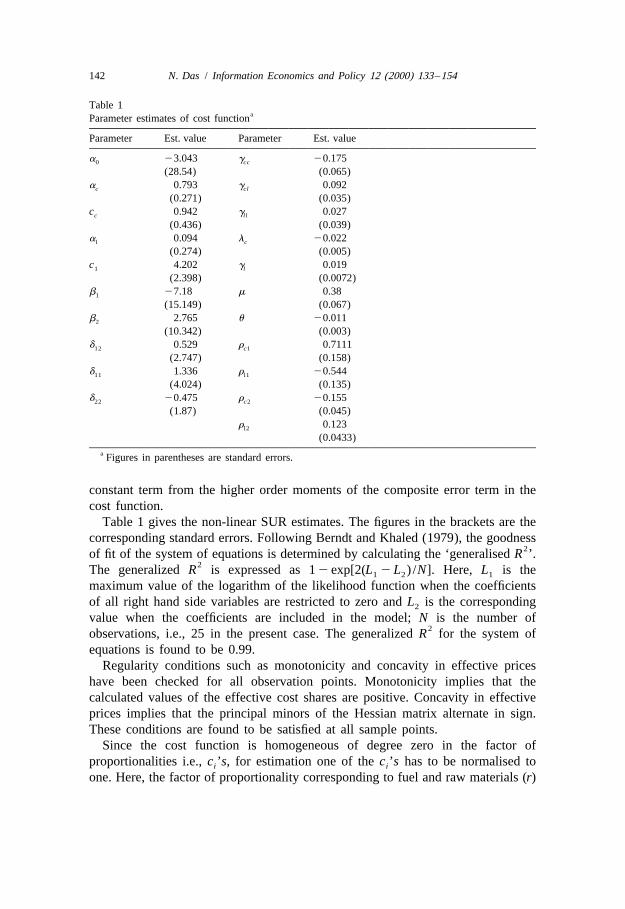
Table 1aParameter estimates of cost function
Parameter Est. value Parameter Est. value
a 23.043 g 20.1750 cc
(28.54) (0.065)a 0.793 g 0.092c cl
(0.271) (0.035)c 0.942 g 0.027c ll
(0.436) (0.039)a 0.094 l 20.022l c
(0.274) (0.005)c 4.202 g 0.0191 l
(2.398) (0.0072)b 27.18 m 0.381
(15.149) (0.067)b 2.765 u 20.0112
(10.342) (0.003)d 0.529 r 0.711112 c1
(2.747) (0.158)d 1.336 r 20.54411 l1
(4.024) (0.135)d 20.475 r 20.15522 c2
(1.87) (0.045)r 0.123l2
(0.0433)a Figures in parentheses are standard errors.
constant term from the higher order moments of the composite error term in thecost function.
Table 1 gives the non-linear SUR estimates. The figures in the brackets are thecorresponding standard errors. Following Berndt and Khaled (1979), the goodness
2of fit of the system of equations is determined by calculating the ‘generalised R ’.2The generalized R is expressed as 1 2 exp[2(L 2 L ) /N]. Here, L is the1 2 1
maximum value of the logarithm of the likelihood function when the coefficientsof all right hand side variables are restricted to zero and L is the corresponding2
value when the coefficients are included in the model; N is the number of2observations, i.e., 25 in the present case. The generalized R for the system of
equations is found to be 0.99.Regularity conditions such as monotonicity and concavity in effective prices
have been checked for all observation points. Monotonicity implies that thecalculated values of the effective cost shares are positive. Concavity in effectiveprices implies that the principal minors of the Hessian matrix alternate in sign.These conditions are found to be satisfied at all sample points.
Since the cost function is homogeneous of degree zero in the factor ofproportionalities i.e., c ’s, for estimation one of the c ’s has to be normalised toi i
one. Here, the factor of proportionality corresponding to fuel and raw materials (r)
N. Das / Information Economics and Policy 12 (2000) 133 –154 143
is restricted to 1 because fuel and raw materials constitute a very small proportionof total cost and it is more important to know the relative efficiency of capital andlabour for policy purposes.
3.1. Efficiency in the allocation of resources
Efficiency in the allocation of factors of production requires that the marginalrate of technical substitution is equal to the ratio of market prices. But, asexplained above, in the presence of market imperfections the firm does notminimise cost with respect to market prices of inputs but, instead chooses inputsso as to minimize cost with respect to corresponding effective prices of inputs. Forexample, for inputs c and l we have
MP c Pc c c]] ]]5 .MP c Pl l l
As can be seen from the above equation c , or . 1, i 5 c, l, r, implies that inputi
i is over-utilised or under-utilized respectively. As the cost function is homoge-neous of degree zero in c , one of the c ’s, c is normalised to one. Because of thei i r
normalization it is not possible to test for absolute price efficiency of the inputs,i.e., c 5 c 5 c 5 1. However, we can test for relative price efficiency of thec l r
factors of production in the production process of DoT, i.e., c 5 c 5 c , which inc l r
the present case implies the efficiency in the allocation of capital and labourrelative to efficiency in allocation of raw materials.
From the estimates given in Table 1, it can be seen that c is 0.94, implyingc
capital is almost as efficiently allocated as raw material. On the other hand, c isl
4.2, reflecting gross under utilisation of labour relative to raw material. The test forrelative efficiency is done by imposing the restriction c 5 c 5 c . The corre-c l r
2sponding LR test shows the x value to be 19.22 at 2 degrees of freedom, whichrejects the null hypothesis of relative price efficiency of all inputs at 5% level ofsignificance. The test for the relative efficiency of each pair of inputs is done byimposing the restrictions c 5 c ,c 5 c and c 5 c respectively and carrying onc l c r l r
the corresponding LR test. The test for relative efficiency of capital and labour2with the restriction c 5 c shows the x value to be 14.5. So capital is relativelyc l
inefficient to labour at the 5% level of significance. The over-utilisation of capitalrelative to labour reflects the possible existence of Averch–Johnson effect in the
8production process of DoT which is regulated by rate of return regulation. Thetest for the relative efficiency of capital to raw material with the restriction c 5 cc r
8 The interpretation that capital is over utilised relative to labour is also indicated by the fact that theshare of labour in total cost does not change even with the imposition of the relative price efficiency,while there is a substantial fall in the share of capital. The estimates of the price elasticities demand forinputs given in subsection 3.3 also reflect a similar trend.
144 N. Das / Information Economics and Policy 12 (2000) 133 –154
2gives the x value of 0.016, thus confirming the null hypothesis of relative2efficiency. The x test rejects the null hypothesis that labour is as efficiently used
as raw material.The effect of distortion in input use on the actual cost is measured by comparing
the actual fitted cost with the cost that would have been had relative priceefficiency been attained. The minimum cost of production for DoT is calculated byimposing the restriction of relative price efficiency. Comparison of this value withthe actual fitted cost shows an increase in the actual cost of as high as 26% due toinefficiency in the allocation of factors of production when estimated at the meansof the data.
3.2. Technical inefficiency
As explained in Section 2, technical inefficiency in the cost function is given by2the one sided (positive) disturbance, u, which is distributed as u | uN(0, s )u. Weu
can get estimates of the observation specific inefficiency by using the distributionof u conditional on the distribution of the composite error term, e (Jondrow et al.,1982). The expected value of this conditional distribution can be used as anestimate of u.
el2 v ]S Dfs s elu 2 s
]] ]]]] ]S DE(uue) 5 22 ef ss 3 4]S D1 2 Fs
2 2 2where e 5 u 1 v, s 5 s 1 s , l 5 s /s ; f and F are the standard normalu v u v2 2density and distribution functions respectively. The values of s and s areu v
obtained from the higher order moments of e. Estimation of E(uue) shows that theincrease in cost of production of DoT due to technical inefficiency is very small at0.02%.
Thus the analysis of inefficiencies in the production process shows that DoToperates at around 26% higher cost, mainly due to allocational inefficiency, which,given the huge size of the telecommunications industry and its socio-economicimportance, leads to substantial welfare loss. Further, as the investment require-ment in this sector to meet the outstanding demand is very high it is necessary thatDoT should function in a cost effective manner. However, the appropriate policyreform will depend on the other economic characteristics such as economies ofscale and scope and subadditivity of the cost function discussed in the followingsubsections.
3.3. Input specific elasticities of demand and substitution
The price elasticity of demand of input i, E , i 5 c,l and r, with respect to itsii
market price is given by
N. Das / Information Economics and Policy 12 (2000) 133 –154 145
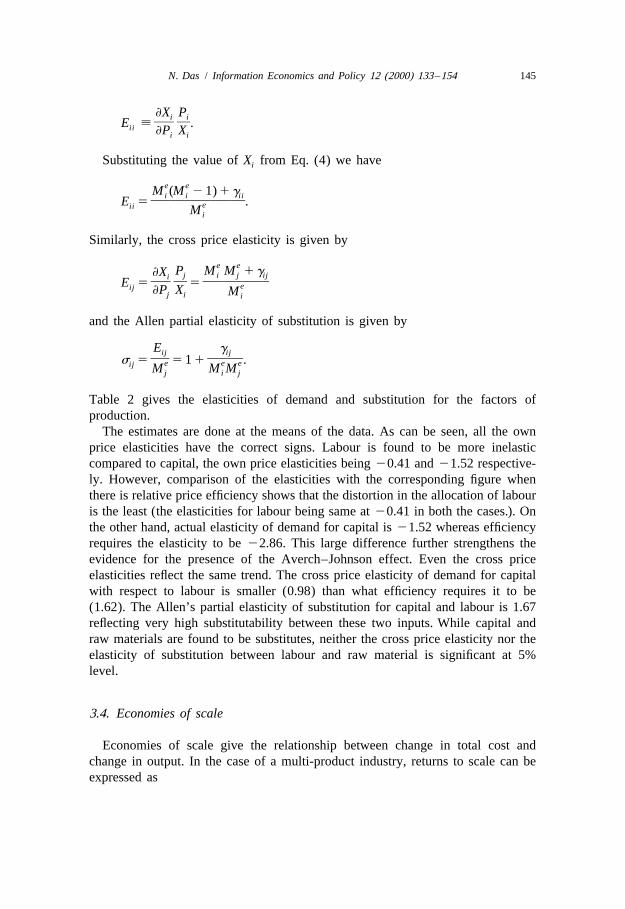
≠X Pi i]]E ; .ii ≠P Xi i
Substituting the value of X from Eq. (4) we havei
e eM (M 2 1) 1 gi i ii]]]]]E 5 .eii Mi
Similarly, the cross price elasticity is given by
e eP M M 1 g≠X j i j iji]] ]]]]E 5 5 eij ≠P X Mj i i
and the Allen partial elasticity of substitution is given by
E gij ij] ]]s 5 5 1 1 .e e eij M M Mj i j
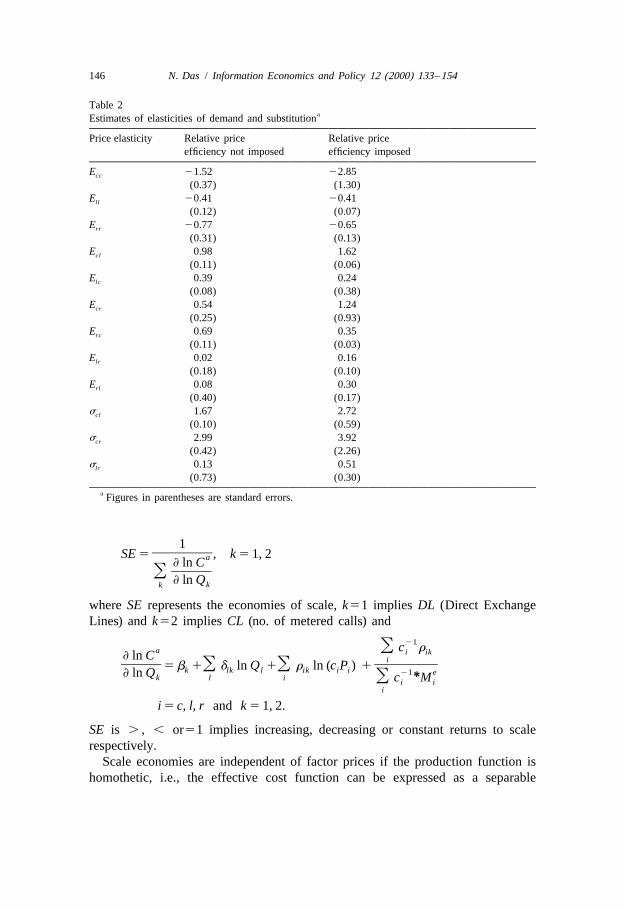
Table 2 gives the elasticities of demand and substitution for the factors ofproduction.
The estimates are done at the means of the data. As can be seen, all the ownprice elasticities have the correct signs. Labour is found to be more inelasticcompared to capital, the own price elasticities being 20.41 and 21.52 respective-ly. However, comparison of the elasticities with the corresponding figure whenthere is relative price efficiency shows that the distortion in the allocation of labouris the least (the elasticities for labour being same at 20.41 in both the cases.). Onthe other hand, actual elasticity of demand for capital is 21.52 whereas efficiencyrequires the elasticity to be 22.86. This large difference further strengthens theevidence for the presence of the Averch–Johnson effect. Even the cross priceelasticities reflect the same trend. The cross price elasticity of demand for capitalwith respect to labour is smaller (0.98) than what efficiency requires it to be(1.62). The Allen’s partial elasticity of substitution for capital and labour is 1.67reflecting very high substitutability between these two inputs. While capital andraw materials are found to be substitutes, neither the cross price elasticity nor theelasticity of substitution between labour and raw material is significant at 5%level.
3.4. Economies of scale
Economies of scale give the relationship between change in total cost andchange in output. In the case of a multi-product industry, returns to scale can beexpressed as
146 N. Das / Information Economics and Policy 12 (2000) 133 –154
Table 2aEstimates of elasticities of demand and substitution
Price elasticity Relative price Relative priceefficiency not imposed efficiency imposed
E 21.52 22.85cc
(0.37) (1.30)E 20.41 20.41ll
(0.12) (0.07)E 20.77 20.65rr
(0.31) (0.13)E 0.98 1.62cl
(0.11) (0.06)E 0.39 0.24lc
(0.08) (0.38)E 0.54 1.24cr
(0.25) (0.93)E 0.69 0.35rc
(0.11) (0.03)E 0.02 0.16lr
(0.18) (0.10)E 0.08 0.30rl
(0.40) (0.17)s 1.67 2.72cl
(0.10) (0.59)s 2.99 3.92cr
(0.42) (2.26)s 0.13 0.51lr
(0.73) (0.30)a Figures in parentheses are standard errors.
1]]]SE 5 , k 5 1, 2a
≠ ln C]]O≠ ln Qkk
where SE represents the economies of scale, k51 implies DL (Direct ExchangeLines) and k52 implies CL (no. of metered calls) and
21O c ra i ik≠ ln C i]] ]]]]5 b 1O d ln Q 1O r ln (c P ) 1k lk l ik i i 21 e≠ ln Qk l i *O c Mi i
i
i 5 c, l, r and k 5 1, 2.
SE is . , , or51 implies increasing, decreasing or constant returns to scalerespectively.
Scale economies are independent of factor prices if the production function ishomothetic, i.e., the effective cost function can be expressed as a separable
N. Das / Information Economics and Policy 12 (2000) 133 –154 147
function of price and output. So the test of the homotheticity of the productionfunction of DoT is done by imposing the restriction, r 50, i 5 c, l, r and k 5 1, 2ik
2which gives x value of 10.86 with 4 degrees of freedom. Thus the test statisticsrejects the homotheticity of the production function at 5% level of significance.The production function is homogeneous if and only if the elasticity of cost withrespect to output is constant, i.e., r 5 0, d 5 0 for all i 5 c, l, r and l, k 5 1, 2.ik lk
2This hypothesis is rejected at 5% level of significance, the corresponding x valuebeing 36.36 at 7 degrees of freedom.
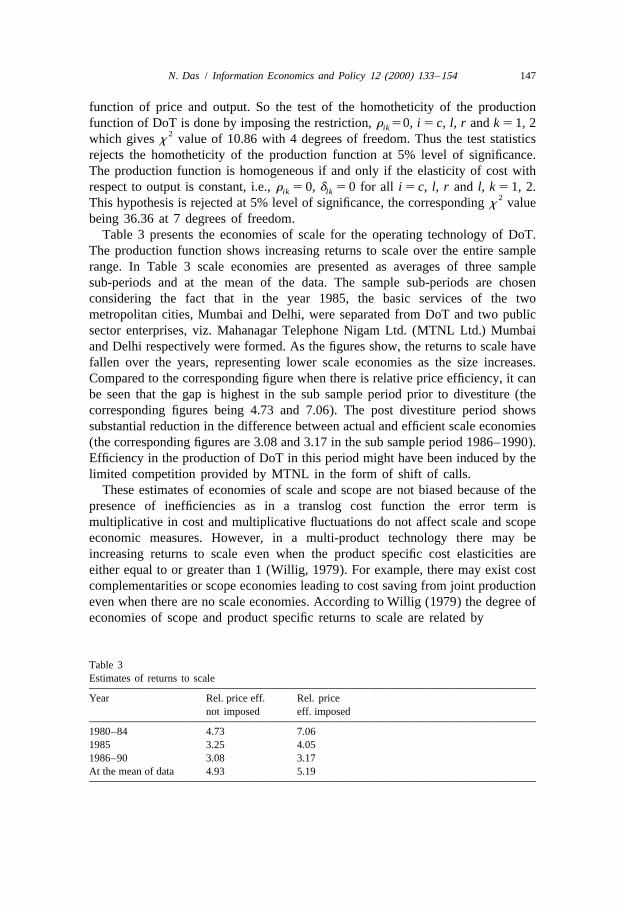
Table 3 presents the economies of scale for the operating technology of DoT.The production function shows increasing returns to scale over the entire samplerange. In Table 3 scale economies are presented as averages of three samplesub-periods and at the mean of the data. The sample sub-periods are chosenconsidering the fact that in the year 1985, the basic services of the twometropolitan cities, Mumbai and Delhi, were separated from DoT and two publicsector enterprises, viz. Mahanagar Telephone Nigam Ltd. (MTNL Ltd.) Mumbaiand Delhi respectively were formed. As the figures show, the returns to scale havefallen over the years, representing lower scale economies as the size increases.Compared to the corresponding figure when there is relative price efficiency, it canbe seen that the gap is highest in the sub sample period prior to divestiture (thecorresponding figures being 4.73 and 7.06). The post divestiture period showssubstantial reduction in the difference between actual and efficient scale economies(the corresponding figures are 3.08 and 3.17 in the sub sample period 1986–1990).Efficiency in the production of DoT in this period might have been induced by thelimited competition provided by MTNL in the form of shift of calls.
These estimates of economies of scale and scope are not biased because of thepresence of inefficiencies as in a translog cost function the error term ismultiplicative in cost and multiplicative fluctuations do not affect scale and scopeeconomic measures. However, in a multi-product technology there may beincreasing returns to scale even when the product specific cost elasticities areeither equal to or greater than 1 (Willig, 1979). For example, there may exist costcomplementarities or scope economies leading to cost saving from joint productioneven when there are no scale economies. According to Willig (1979) the degree ofeconomies of scope and product specific returns to scale are related by
Table 3Estimates of returns to scale
Year Rel. price eff. Rel. pricenot imposed eff. imposed
1980–84 4.73 7.061985 3.25 4.051986–90 3.08 3.17At the mean of data 4.93 5.19
148 N. Das / Information Economics and Policy 12 (2000) 133 –154
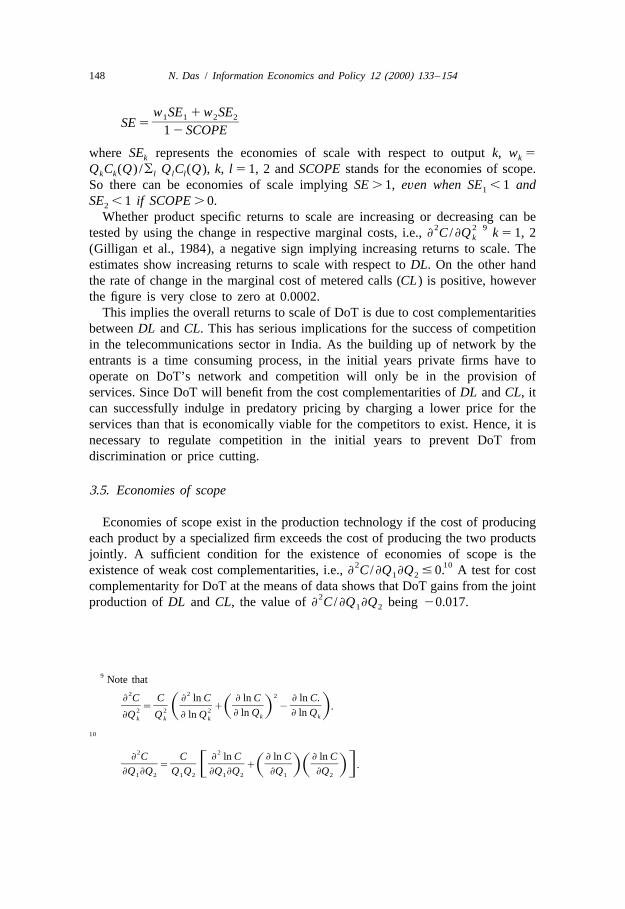
w SE 1 w SE1 1 2 2]]]]]SE 5 1 2 SCOPE
where SE represents the economies of scale with respect to output k, w 5k k
Q C (Q) /o Q C (Q), k, l 5 1, 2 and SCOPE stands for the economies of scope.k k l l l
So there can be economies of scale implying SE . 1, even when SE , 1 and1
SE , 1 if SCOPE . 0.2
Whether product specific returns to scale are increasing or decreasing can be2 2 9tested by using the change in respective marginal costs, i.e., ≠ C /≠Q k 5 1, 2k
(Gilligan et al., 1984), a negative sign implying increasing returns to scale. Theestimates show increasing returns to scale with respect to DL. On the other handthe rate of change in the marginal cost of metered calls (CL) is positive, howeverthe figure is very close to zero at 0.0002.
This implies the overall returns to scale of DoT is due to cost complementaritiesbetween DL and CL. This has serious implications for the success of competitionin the telecommunications sector in India. As the building up of network by theentrants is a time consuming process, in the initial years private firms have tooperate on DoT’s network and competition will only be in the provision ofservices. Since DoT will benefit from the cost complementarities of DL and CL, itcan successfully indulge in predatory pricing by charging a lower price for theservices than that is economically viable for the competitors to exist. Hence, it isnecessary to regulate competition in the initial years to prevent DoT fromdiscrimination or price cutting.
3.5. Economies of scope
Economies of scope exist in the production technology if the cost of producingeach product by a specialized firm exceeds the cost of producing the two productsjointly. A sufficient condition for the existence of economies of scope is the
2 10existence of weak cost complementarities, i.e., ≠ C /≠Q ≠Q # 0. A test for cost1 2
complementarity for DoT at the means of data shows that DoT gains from the joint2production of DL and CL, the value of ≠ C /≠Q ≠Q being 20.017.1 2
9 Note that2 2 2≠ C C ≠ ln C ≠ ln C ≠ ln C.] ] ]] ]] ]]5 1 2 .S DS D2 2 2 ≠ ln Q ≠ ln Q≠Q Q ≠ ln Q k kk k k
10
2 2≠ C C ≠ ln C ≠ ln C ≠ ln C
]] ]] ]] ]] ]]5 1 .F GS DS D≠Q ≠Q Q Q ≠Q ≠Q ≠Q ≠Q1 2 1 2 1 2 1 2
N. Das / Information Economics and Policy 12 (2000) 133 –154 149
However, the conclusion that scope economies exist at mean can be drawn fromcomplementarities if and only if they hold weakly for each pair of output pairingand for all output bundles smaller than the mean. Although the first difficulty isruled out because this study has only two outputs, the second condition is not
2satisfied as for a translog cost function, ≠ C /≠Q ≠Q . 0 must hold at some1 2
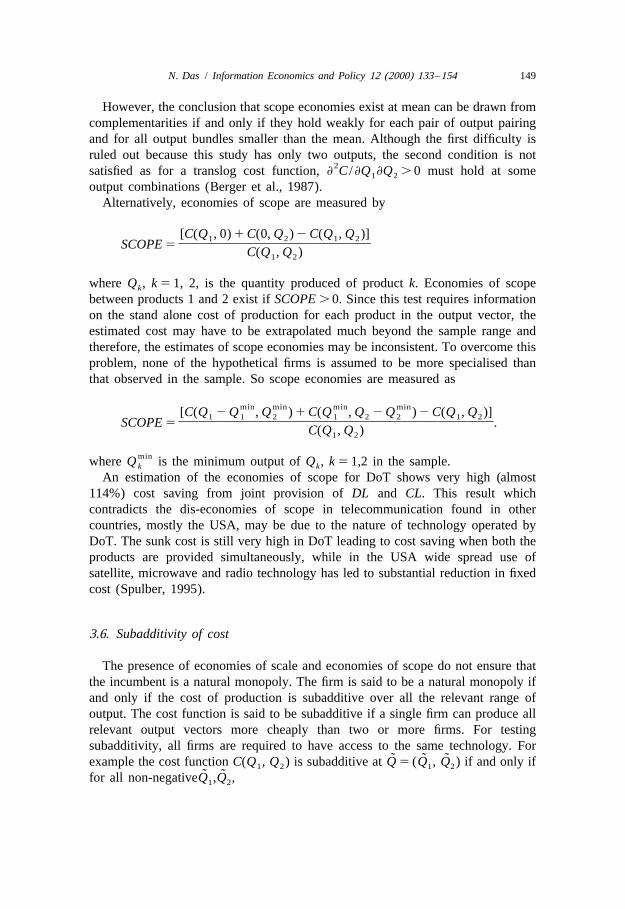
output combinations (Berger et al., 1987).Alternatively, economies of scope are measured by
[C(Q , 0) 1 C(0, Q ) 2 C(Q , Q )]1 2 1 2]]]]]]]]]]SCOPE 5
C(Q , Q )1 2
where Q , k 5 1, 2, is the quantity produced of product k. Economies of scopek
between products 1 and 2 exist if SCOPE . 0. Since this test requires informationon the stand alone cost of production for each product in the output vector, theestimated cost may have to be extrapolated much beyond the sample range andtherefore, the estimates of scope economies may be inconsistent. To overcome thisproblem, none of the hypothetical firms is assumed to be more specialised thanthat observed in the sample. So scope economies are measured as
min min min min[C(Q 2 Q , Q ) 1 C(Q , Q 2 Q ) 2 C(Q , Q )]1 1 2 1 2 2 1 2]]]]]]]]]]]]]]]]SCOPE 5 .
C(Q , Q )1 2
minwhere Q is the minimum output of Q , k 5 1,2 in the sample.k k
An estimation of the economies of scope for DoT shows very high (almost114%) cost saving from joint provision of DL and CL. This result whichcontradicts the dis-economies of scope in telecommunication found in othercountries, mostly the USA, may be due to the nature of technology operated byDoT. The sunk cost is still very high in DoT leading to cost saving when both theproducts are provided simultaneously, while in the USA wide spread use ofsatellite, microwave and radio technology has led to substantial reduction in fixedcost (Spulber, 1995).
3.6. Subadditivity of cost
The presence of economies of scale and economies of scope do not ensure thatthe incumbent is a natural monopoly. The firm is said to be a natural monopoly ifand only if the cost of production is subadditive over all the relevant range ofoutput. The cost function is said to be subadditive if a single firm can produce allrelevant output vectors more cheaply than two or more firms. For testingsubadditivity, all firms are required to have access to the same technology. For
˜ ˜ ˜example the cost function C(Q , Q ) is subadditive at Q 5 (Q , Q ) if and only if1 2 1 2˜ ˜for all non-negativeQ ,Q ,1 2
150 N. Das / Information Economics and Policy 12 (2000) 133 –154
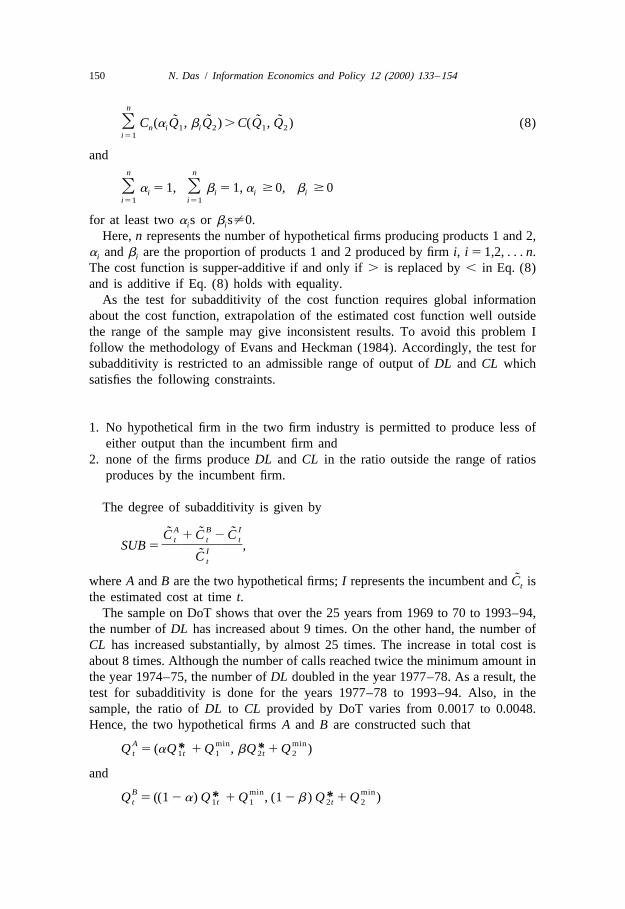
n
˜ ˜ ˜ ˜O C (a Q , b Q ) . C(Q , Q ) (8)n i 1 i 2 1 2i51
andn nO a 5 1, O b 5 1, a $ 0, b $ 0i i i i
i51 i51
for at least two a s or b s±0.i i
Here, n represents the number of hypothetical firms producing products 1 and 2,a and b are the proportion of products 1 and 2 produced by firm i, i 5 1,2, . . . n.i i
The cost function is supper-additive if and only if . is replaced by , in Eq. (8)and is additive if Eq. (8) holds with equality.
As the test for subadditivity of the cost function requires global informationabout the cost function, extrapolation of the estimated cost function well outsidethe range of the sample may give inconsistent results. To avoid this problem Ifollow the methodology of Evans and Heckman (1984). Accordingly, the test forsubadditivity is restricted to an admissible range of output of DL and CL whichsatisfies the following constraints.
1. No hypothetical firm in the two firm industry is permitted to produce less ofeither output than the incumbent firm and
2. none of the firms produce DL and CL in the ratio outside the range of ratiosproduces by the incumbent firm.
The degree of subadditivity is given by
A B I˜ ˜ ˜C 1 C 2 Ct t t]]]]SUB 5 ,IC̃ t
˜where A and B are the two hypothetical firms; I represents the incumbent and C ist
the estimated cost at time t.The sample on DoT shows that over the 25 years from 1969 to 70 to 1993–94,
the number of DL has increased about 9 times. On the other hand, the number ofCL has increased substantially, by almost 25 times. The increase in total cost isabout 8 times. Although the number of calls reached twice the minimum amount inthe year 1974–75, the number of DL doubled in the year 1977–78. As a result, thetest for subadditivity is done for the years 1977–78 to 1993–94. Also, in thesample, the ratio of DL to CL provided by DoT varies from 0.0017 to 0.0048.Hence, the two hypothetical firms A and B are constructed such that
A min min* *Q 5 (aQ 1 Q , bQ 1 Q )t 1t 1 2t 2
andB min min* *Q 5 ((1 2 a) Q 1 Q , (1 2 b ) Q 1 Q )t 1t 1 2t 2
N. Das / Information Economics and Policy 12 (2000) 133 –154 151
A Bwhere 0 # a # 1, 0 # b # 1, Q and Q are the outputs produced by thet tmin*hypothetical firms A and B respectively at time t, Q 5 Q 1 2Q is thekt kt kt
quantity of product k, k51, 2 produced by DoT at time t and
min*aQ 1 Q1t 1]]]]0.0017 # # 0.0048min*bQ 1 Q2t 2
andmin*(1 2 a) Q 1 Q1t 1
]]]]]]0.0017 # # 0.0048.min*(1 2 b ) Q 1 Q2t 2
Thus the values of a and b are chosen for each year so as to satisfy the aboveA Bconditions. In practice, following Evans and Heckman (1984), Q and Q aret t
constructed by varying a and b over a grid given by a 5 i /g and b 5 j /g, i,j 5 0,1, . . . g, where g is the grid size. Here g is assumed to be 10.
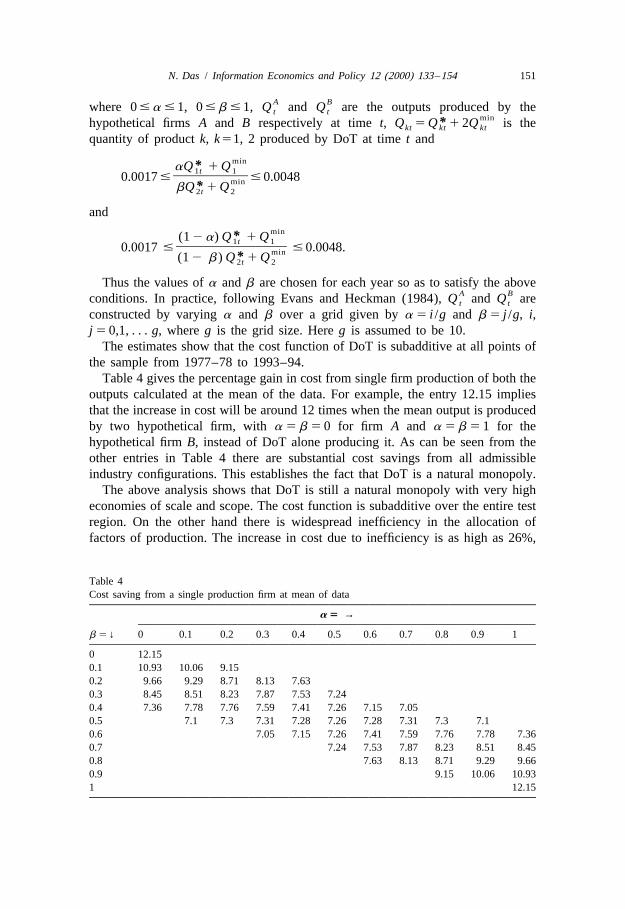
The estimates show that the cost function of DoT is subadditive at all points ofthe sample from 1977–78 to 1993–94.
Table 4 gives the percentage gain in cost from single firm production of both theoutputs calculated at the mean of the data. For example, the entry 12.15 impliesthat the increase in cost will be around 12 times when the mean output is producedby two hypothetical firm, with a 5 b 5 0 for firm A and a 5 b 5 1 for thehypothetical firm B, instead of DoT alone producing it. As can be seen from theother entries in Table 4 there are substantial cost savings from all admissibleindustry configurations. This establishes the fact that DoT is a natural monopoly.
The above analysis shows that DoT is still a natural monopoly with very higheconomies of scale and scope. The cost function is subadditive over the entire testregion. On the other hand there is widespread inefficiency in the allocation offactors of production. The increase in cost due to inefficiency is as high as 26%,
Table 4Cost saving from a single production firm at mean of data
a 5 →
b 5 ↓ 0 0.1 0.2 0.3 0.4 0.5 0.6 0.7 0.8 0.9 1
0 12.150.1 10.93 10.06 9.150.2 9.66 9.29 8.71 8.13 7.630.3 8.45 8.51 8.23 7.87 7.53 7.240.4 7.36 7.78 7.76 7.59 7.41 7.26 7.15 7.050.5 7.1 7.3 7.31 7.28 7.26 7.28 7.31 7.3 7.10.6 7.05 7.15 7.26 7.41 7.59 7.76 7.78 7.360.7 7.24 7.53 7.87 8.23 8.51 8.450.8 7.63 8.13 8.71 9.29 9.660.9 9.15 10.06 10.931 12.15
152 N. Das / Information Economics and Policy 12 (2000) 133 –154
thus giving a reason sufficient enough for reforming the telecommunication sectorof India.
4. Conclusions
In the past decade there has been widespread liberalisation of the telecommuni-cations sector all over the world. Even some of the developing countries such asChile, Venezuela, Argentina, and Mexico have successfully undertaken theliberalisation of their telecommunications industry. The main argument behindsuch reforms has been that telecommunication is no longer a natural monopoly andhence the economy can successfully reap the benefits of competition. However, thevarious empirical studies carried out on the production characteristics of thetelecommunications industry (particularly in the U.S.) have not been conclusive.So given the current process of liberalisation of the Indian Telecommunicationssector, it is very important to study the production technology of the Departmentof Telecommunications, in order to analyse the economic justification for theongoing liberalisation process.
Accordingly, a translog multi-product cost function for DoT has been estimatedin this paper. The estimates show the existence of very high economies of scaleand scope in the technology used by DoT. The return to scale is 4.93 at the meansof the variables and gain from cost saving from the joint provision of the servicesby one supplier is as high as 114%. The cost function also reflects subadditivityover the entire range contradicting the belief that telecommunication in India is nolonger a natural monopoly. However, the existing natural monopoly technologydoes not ensure efficiency in production. There has been severe over allocation ofcapital reflecting the presence of Averch–Johnson effect. The elasticity of demandof capital is 21.52 whereas relative efficiency requires the corresponding figure tobe 22.85. This distortion in the allocation of resources has led to an increase of26% in the cost of production of DoT. This is substantial in absolute termsconsidering the vast size of the industry. However, inefficiency in the use ofresources at about 0.02% of the total cost of production has not been very high.
In view of the finding that the DoT is an inefficient monopoly, the recentliberalisation of basic services in India is justified. However it should also be notedthat DoT is a natural monopoly with the existing technology, having very highscale and scope economies. Therefore it is necessary to restrict and regulatecompetition in the initial phase of liberalisation in order to reduce unnecessaryduplication of fixed cost. Telecommunications is an industry with fast evolvingtechnology. The recent years have seen increasing use of radio technologies andthe movement has been away from use of traditional copper wires which requiresubstantial fixed investment. With such changes in technology the sunk cost ofentrants will fall and the natural monopoly argument may cease to hold after apoint. At that stage of technological advancement the industry may be deregulated
N. Das / Information Economics and Policy 12 (2000) 133 –154 153
fully by allowing free entry into local telephony. It is thus very important todetermine the trade-off between the stage of technology adoption of the industryand the degree of liberalisation and any future policy of reforming the marketstructure should be commensurate with the progress in technology adoption. Thefindings of this paper reinforce this point.
The findings also reinforce the need of an autonomous and independentregulatory mechanism to provide a level playing field by proposing efficient accesspricing and restricting DoT from indulging in any price-cutting behaviour so thatoperations by the private firms are economically feasible. In designing theregulatory mechanism it is important to move away from rate-of-return regulationwhich has resulted in severe over-utilisation of capital with subsequent substantialincreases in cost of production to incentive regulation, Sappington (1995), so thatthe allocation and use of inputs are efficient.
Acknowledgements
I am grateful to Raghbendra Jha and P.G. Babu for their valuable comments andsuggestions.
References
Aigner, D., Knox Lovell, C.A., Schmidt, P., 1977. Formulation and estimation of stochastic frontierproduction function models. Journal of Econometrics 6, 21–37.
Atkinson, S., Halvorsen, R., 1984. Parametric efficiency tests, economies of scale, and input demand inUS electric power generation. International Economic Review 25, 647–661.
Averch, H., Johnson, L., 1962. Behaviour of the firm under regulatory constraint. American EconomicReview 52, 1052–1069.
Baumol, W., Panzer, J., Willig, R., 1982. Contestable Markets and the Theory of Industry Structure,Harcourt Brace Jovanovich, San Diego, CA.
Basant, R., Fikkert, B., 1996. The effect of R&D, foreign technology purchase, and domestic andinternational spillovers on productivity in Indian firms. Review of Economics and Statistics 78,187–199.
Berger, A.N., Hanweck, G.A., Humphrey, D.B., 1987. Competitive viability in banking: scale, scope,and product mix economies. Journal of Monetary Economics 20, 501–519.
Berndt, E.R., Khaled, M.L., 1979. Parametric productivity measurement and choice among flexiblefunctional forms. Journal of Political Economy 87, 1220–1245.
Charnes, A., Cooper, W.W., Sueyoshi, T., 1988. A goal programming/constrained regression review ofthe Bell system breakup. Management Science 34, 1–26.
Christensen, L.R., Cummings, D.C., Schoech, P.E., 1981. Econometric estimation of scale economies intelecommunications, Working Paper No. 8124, University of Wisconsin–Madison.
Evans, D., Heckman, J., 1984. A test for subadditivity of the cost function with an application to theBell system. American Economic Review 74, 615–623.
Evans, D., Heckman, J., 1986. A test for subadditivity of the cost function with an application to theBell system: erratum. American Economic Review 76, 856–858.
154 N. Das / Information Economics and Policy 12 (2000) 133 –154
Evans, D., Heckman, J., 1988. Natural monopoly and the Bell System: response to Charnes, Cooperand Sueyoshi. Management Science 34, 27–38.
Farrell, M.J., 1957. The measurement of productive efficiency. Journal of Royal Statistical Society, A120, 253–281.
Gilligan, T., Smirlock, M., Marshall, W., 1984. Scale and scope economies in multiproduct bankingfirm. Journal of Monetary Economics 13, 393–405.
Jondrow, J., Lovell, C.A.K., Materov, I.S., Schmidt, P., 1982. On the estimation of technicalinefficiency in the stochastic frontier production function model. Journal of Econometrics 19,233–238.
Lau, L., Yotopoulos, P., 1971. A test for relative efficiency and an application to Indian agriculture.American Economic Review 61, 94–109.
Leff, N.H., 1984. Externalities, information costs and social benefit–cost analysis for economicdevelopment: an example from telecommunications. Economic Development and Cultural Change32, 255–276.
Norton, S.W., 1992. Transaction costs, telecommunications and the macroeconomics of microeconom-ics growth. Economic Development and Cultural Change 41, 175–196.
Oum, T.H., Zhang, Y., 1995. Competition and allocative inefficiency: the case of the US. Review ofEconomics and Statistics 77, 82–97.
Roller, L.H., 1990a. Modeling cost structure: the Bell system revisited. Applied Economics 22,1661–1674.
Roller, L.H., 1990b. Proper quadratic cost function with an application to the Bell system. Review ofEconomics and Statistics 72, 202–210.
Sappington, D.E.M., 1995. Designing Incentive Regulation for the Telecommunications Industry, MITPress, Massachusetts.
Schmidt, P., Knox Lovell, C.A., 1980. Estimating stochastic production and cost frontiers whentechnical and allocative inefficiency are correlated. Journal of Econometrics 13, 83–100.
Shin, R.T., Ying, J.S., 1992. Unnatural monopolies in local telephone. Rand Journal of Economics 23,171–183.
Spulber, D.F., 1995. Deregulating telecommunications. Yale Journal on Regulation 12, 25–69.Willig, R., 1979. Multiproduct technology and market structure. American Economic Review 69,
346–351.
Related Documents


