UNITED NATIONS CONFERENCE ON TRADE AND DEVELOPMENT Powering Development with Renewable Energy Technologies TECHNOLOGY AND INNOV A TION REPOR T 201 1 EMBARGO The contents of this Report must not be quoted or summarized in the print, broadcast or electronic media before 29 November 2011, 17:00 hours GMT

Welcome message from author
This document is posted to help you gain knowledge. Please leave a comment to let me know what you think about it! Share it to your friends and learn new things together.
Transcript

U N I T E D N AT I O N S C O N F E R E N C E O N T R A D E A N D D E V E L O P M E N T
Powering Development with Renewable
Energy Technologies
TECHNOLOGY AND INNOVATION
REPORT 2011
EMBARGOThe contents of this Report must not be
quoted or summarized in the print, broadcast or electronic media before
29 November 2011, 17:00 hours GMT

U N I T E D N AT I O N S C O N F E R E N C E O N T R A D E A N D D E V E L O P M E N T
Powering Development with Renewable
Energy Technologies
TECHNOLOGY AND INNOVATION
REPORT 2011
New York and Geneva, 2011

ii TECHNOLOGY AND INNOVATION REPORT 2011
NOTE
The terms country/economy as used in this Report also refer, as appropriate, to territories or areas; the designations
employed and the presentation of the material do not imply the expression of any opinion whatsoever on the part of
the Secretariat of the United Nations concerning the legal status of any country, territory, city or area or of its authori-
ties, or concerning the delimitation of its frontiers or boundaries. In addition, the designations of country groups are
intended solely for statistical or analytical convenience and do not necessarily express a judgment about the stage of
development reached by a particular country or area in the development process. The major country groupings used
in this Report follow the classification of the United Nations Statistical Office. These are:
Developed countries: the member countries of the OECD (other than Chile, Mexico, the Republic of Korea and Tur-
key), plus the new European Union member countries which are not OECD members (Bulgaria, Cyprus, Latvia, Lithu-
ania, Malta and Romania), plus Andorra, Bermuda, Liechtenstein, Monaco and San Marino.
Transition economies: South-East Europe and the Commonwealth of Independent States.
Developing economies: in general all economies not specified above. For statistical purposes, the data for China
do not include those for Hong Kong Special Administrative Region (Hong Kong SAR), Macao Special Administrative
Region (Macao SAR) and Taiwan Province of China.
Least developed countries: These refer to a group of 48 countries that have been identified as “least developed”
in terms of their low GDP per capita, their weak human assets and their high degree of economic vulnerability.
The boundaries and names shown and designations used on the maps presented in this publication do not imply
official endorsement or acceptance by the United Nations.
Symbols which may have been used in the tables denote the following:
Two dots (..) indicate that data are not available or are not separately reported. Rows in tables are omitted in those
cases where no data are available for any of the elements in the row.
A dash (–) indicates that the item is equal to zero or its value is negligible.
A blank in a table indicates that the item is not applicable, unless otherwise indicated.
A slash (/) between dates representing years (e.g., 1994/95) indicates a financial year.
Use of a dash (–) between dates representing years (e.g. 1994–1995) signifies the full period involved, including the
beginning and end years.
Reference to “dollars” ($) means United States dollars, unless otherwise indicated.
Details and percentages in tables do not necessarily add to totals because of rounding.
The material contained in this study may be freely quoted with appropriate acknowledgement.
UNITED NATIONS PUBLICATION
UNCTAD/TIR/2011
Sales No. E.11.II.D.20
ISSN 2076-2917
ISBN 978-92-1-112840-6
Copyright © United Nations, 2011
All rights reserved. Printed in Switzerland

iiiPREFACE
PREFACE
As the evidence and impact of climate change increase, so does the urgency to develop new, clean ways of gener-
ating and using energy. And as global demand for energy increases, this quest will become even more urgent. This
year the population of the planet reached 7 billion. By 2050 it may top 9 billion. All will need access to modern and
affordable energy services.
The UNCTAD Technology and Innovation Report 2011 focuses on the important role of renewable energy technolo-
gies in responding to the dual challenge of reducing energy poverty while mitigating climate change. This is particularly
timely as the global community prepares for the Rio+20 Conference next year. The Report identifies key capacity
issues for developing countries and proposes concrete recommendations for the wider use of renewable energy
technologies to promote sustainable development and poverty reduction.
My high-level Advisory Group on Energy and Climate Change stressed that there is an urgent need to mobilize re-
sources and accelerate efforts to ensure universal access to energy. Creating an enabling environment for the pro-
motion and use of renewable energy technologies is a critical part of this effort, as recognized by the United Nations
General Assembly when it declared next year as the “International Year for Sustainable Energy for All”.
It is also at the heart of my recent launch of the Sustainable Energy for All initiative to help ensure universal access
to modern energy services; double the rate of improvement in energy efficiency; and double the share of renewable
energy in the global energy mix, all by the year 2030.
We can tackle both energy poverty and climate change by facilitating investment, enhancing access to technologies,
and doing more to help developing countries make a transition to a greener path of economic growth. The Technology
and Innovation Report 2011 helps point the way forward.
BAN Ki-moon
Secretary-General
United Nations

iv TECHNOLOGY AND INNOVATION REPORT 2011
ACKNOWLEDGEMENTS
The Technology and Innovation Report 2011 was prepared under the overall direction of Anne Miroux, Director
of UNCTAD’s Division on Technology and Logistics, and the direct supervision of Mongi Hamdi, Head, Science,
Technology and ICT Branch.
The report was written by a team comprising Padmashree Gehl Sampath (team leader), Michael Lim and
Carlos Razo. Inputs were provided by Dolf Gielen (Executive Director, IRENA Technology and Innovation
Center, Bonn), Professor Mark Jaccard, Simon Fraser University, Professor Robert Ayres (INSEAD), Aaron Cosbey
(IISD), Mathew Savage (IISD), Angel Gonzalez-Sanz (UNCTAD), Oliver Johnson (UNCTAD) and Kiyoshi Adachi (UNC-
TAD).
An ad hoc expert group meeting was organized in Geneva to peer review the report in its draft form. UNC-
TAD wishes to acknowledge the comments and suggestions provided by the following experts at the meeting:
Amit Kumar (The Energy and Resources Institute), Elisa Lanzi (OECD), Pedro Roffe (ICTSD), Ahmed Abdel Latif
(ICTSD), Vincent Yu (South Centre), Taffere Tesfachew (UNCTAD), Torbjorn Fredriksson (UNCTAD) and Zeljka Kozul-
Wright (UNCTAD). UNCTAD also acknowledges comments by the following experts: Manuel Montes (UN/DESA),
Francis Yamba (Centre for Energy Environment and Engineering, Zambia), Aiming Zhou (Asian Development
Bank), Youssef Arfaoui (African Development Bank), Mahesh Sugathan (ICTSD), Jean Acquatella (ECLAC) and
Alfredo Saad-Filho (UNCTAD).
The report was edited by Praveen Bhalla and research assistance was provided by Fernanda Vilela Ferreira and
Hector Dip. Nathalie Loriot was responsible for formatting and Sophie Combette designed the layout.

vCONTENTS
CONTENTS
Note ............................................................................................................................................................. ii
Preface ......................................................................................................................................................... iii
Acknowledgements .................................................................................................................................... iv
Contents ........................................................................................................................................................ v
List of abbreviations ...................................................................................................................................... x
Key messages ............................................................................................................................................. xii
Overview .................................................................................................................................................... xv
CHAPTER I. RENEWABLE ENERGY TECHNOLOGIES, ENERGY POVERTY AND CLIMATECHANGE: AN INTRODUCTION ...................................................................... 1
A. Background ........................................................................................................................................3
B. A new urgency for renewable energies ............................................................................................4
1. An energy perspective ...............................................................................................................................4
2. A climate change perspective ....................................................................................................................6
3. A developmental perspective .....................................................................................................................6
4. An equity and inclusiveness perspective ....................................................................................................7
C. Energy poverty and a greener catch-up: The role of science, technology and innovation
policies ................................................................................................................................................8
1. Towards technological leapfrogging ...........................................................................................................9
2. The crucial role of technology and innovation policies ..............................................................................10
3. Definitions of key terms
a. Energy poverty ....................................................................................................................................12
b. Renewable energy technologies ..........................................................................................................12
D. Organization of the Report ..............................................................................................................13
CHAPTER II. RENEWABLE ENERGY TECHNOLOGIES AND THEIR GROWING ROLEIN ENERGY SYSTEMS ............................................................................... 19
A. Introduction ......................................................................................................................................21
B. Defining alternative, clean and renewable energies .....................................................................22
1. The growing role of RETs in energy systems ............................................................................................23
2. Limits of RET applicability ........................................................................................................................26
3. Established and emerging RETs ...............................................................................................................28
a. Hydropower technologies....................................................................................................................28
b. Biomass energy technologies ..............................................................................................................29
(i) Traditional biomass ......................................................................................................................29
(ii) Modern biomass for electric power ..............................................................................................30
(iii) First and second generation biofuels ............................................................................................30
c. Wind energy technologies ...................................................................................................................31
d. Solar energy technologies ...................................................................................................................33
(i) Concentrating solar power systems ............................................................................................33
(ii) Solar thermal systems .................................................................................................................33
(iii) Solar photovoltaic technology ......................................................................................................34
e. Geothermal energy technology ............................................................................................................35
f. Ocean energy technologies .................................................................................................................36
g. Energy storage technologies ...............................................................................................................37
4. Scenarios on the future role of RETs in energy systems ...........................................................................38

vi TECHNOLOGY AND INNOVATION REPORT 2011
C. Trends in global investments and costs of RETs ...........................................................................39
1. Private and public sector investments in RETs .........................................................................................39
2. Costs of renewable energy and other energy sources compared .............................................................41
a. Problems with making direct cost comparisons ...................................................................................42
(i) Fiscal support by governments ..................................................................................................42
(ii) Factoring in costs specific to conventional energy: Subsidies and environmental externalities ......42
(iii) Factoring in costs specific to RETs ...............................................................................................42
b. Incorporating costs into the market price of energy options .................................................................43
3. The evidence on renewable energy costs ................................................................................................44
D. Summary ...........................................................................................................................................48
CHAPTER III. STIMULATING TECHNICAL CHANGE AND INNOVATION IN ANDTHROUGH RENEWABLE ENERGY TECHNOLOGIES ........................................ 53
A. Introduction ......................................................................................................................................55
B. Technology and innovation capabilities for RETs development: The context
1. Key networks and interlinkages for RETs ..................................................................................................57
a. Public science through public research institutions and centres of excellence ......................................59
b. Private sector enterprises ....................................................................................................................60
c. End-users (households, communities and commercial enterprises) ....................................................62
2. Linkages between RETs and other sectors of the economy ......................................................................63
C. Promoting a virtuous integration of RETs and STI capacity.........................................................64
1. Addressing systemic failures in RETs .......................................................................................................65
2. Tipping the balance in favour of RETs ......................................................................................................66
a. Government agencies and the general policy environment ..................................................................67
b. Facilitation of technology acquisition in the public and private sector ...................................................69
c. Promotion of specific renewable energy programmes and policies ......................................................69
d. Attainment of grid parity and subsidy issues ........................................................................................69
e. Promoting greater investment and financing options............................................................................70
f. Monetizing the costs of energy storage and supply .............................................................................70
3. Job creation and poverty reduction through RETs ....................................................................................71
D. Summary ...........................................................................................................................................72
CHAPTER IV. INTERNATIONAL POLICY CHALLENGES FOR ACQUISITION, USE ANDDEVELOPMENT OF RENEWABLE ENERGY TECHNOLOGIES ............................ 79
A. Introduction .......................................................................................................................................81
B. International resource mobilization and public financing of RETs ..............................................82
1. Financing within the climate change framework.........................................................................................82
2. Other sources of finance ...........................................................................................................................85
3. International support for financing of RETs: Outstanding issues .................................................................87
C. Technology transfer, intellectual property and access to technologies ......................................88
1. Technology transfer issues within the climate change framework ..............................................................90
2. Intellectual property rights and RETs..........................................................................................................91
a. The barrier versus incentive arguments ................................................................................................92
b. Preliminary trends in patented RETs .....................................................................................................95
3. Outstanding issues in the debate on intellectual property and technology transfer .....................................95
a. Beyond technology transfer to technology assimilation ........................................................................97

viiCONTENTS
b. Assessing the quality – and not the quantity – of technology transfer ...................................................97
c. Exploring flexibilities and other options within and outside the TRIPS framework ..................................98
D. The green economy and the Rio+20 framework ...........................................................................98
1. Emerging standards: Carbon footprints and border carbon adjustments ...................................................58
2. Preventing misuse of the “green economy” concept................................................................................100
E. Framing key issues from a climate change-energy poverty perspective ..................................101
1. Supporting innovation and enabling technological leapfrogging ...............................................................101
a. An international innovation network for LDCs, with a RETs focus .......................................................102
b. Global and regional research funds for RETs deployment and demonstration.....................................103
c. An international technology transfer fund for RETs .............................................................................103
d. An international training platform for RETs ..........................................................................................104
2. Coordinating international support for alleviating energy poverty and mitigating climate change .............104
3. Exploring the potential for South-South collaboration .............................................................................105
F. Summary ..........................................................................................................................................106
CHAPTER V. NATIONAL POLICY FRAMEWORKS FOR RENEWABLE ENERGYTECHNOLOGIES ...................................................................................... 111
A. Introduction .....................................................................................................................................113
B. Enacting policies with RET components and targets .................................................................114
C. Specific policy incentives for production and innovation of RETs .............................................117
1. Incentives for innovation of RETs ............................................................................................................118
a. Public research grants .......................................................................................................................119
b. Grants and incentives for innovation of RETs .....................................................................................119
c. Collaborative technology development and public-private partnerships .............................................121
d. Green technology clusters and special economic zones for low-carbon technologies .......................121
2. Innovation and production incentives and regulatory instruments in energy policies ...............................123
a. Quota obligations/renewable portfolio standards ................................................................................123
b. Feed-in tariffs .....................................................................................................................................124
3. Flexibilities in the intellectual property rights regime ................................................................................126
4. Applicability of policy incentives to developing countries..........................................................................127
D. Adoption and use of new RETs: Policy options and challenges ................................................128
1. Supporting the development of technological absorptive capacity .........................................................129
a. Establishing training centres for RETs .................................................................................................129
b. Development of adaptation capabilities ..............................................................................................130
c. Education, awareness and outreach ..................................................................................................130
2. Elimination of subsidies for conventional energy sources .......................................................................131
a. Removal of subsidies for carbon-intensive fuels. ................................................................................131
b. Carbon and energy taxes ..................................................................................................................132
c. Public procurement of renewable energy ...........................................................................................132
3. Applicability of policy incentives to developing countries ........................................................................133
E. Mobilizing domestic resources and investment in RETs ............................................................134
1. Grants and concessional loans ..............................................................................................................134
2. Tendering systems .................................................................................................................................135
3. Fiscal measures .....................................................................................................................................135
4. Facilitating foreign direct investment in RETs ..........................................................................................135

viii TECHNOLOGY AND INNOVATION REPORT 2011
F. National policies on South-South collaboration and regional integration of RETs..................137
1. Best practices in trade and investment ..................................................................................................138
2. Best practices in technology cooperation ..............................................................................................139
G. Summary .........................................................................................................................................140
CHAPTER VI. CONCLUSION ......................................................................................... 147
List of boxes
Box 1.1: Energy demand and the role of RETs ....................................................................................................5
Box 1.2: Africa’s energy challenge ......................................................................................................................5
Box 2.1: Definition of renewable energy ............................................................................................................23
Box 2.2. Developing “smart grids” to better integrate RE sources into energy systems .....................................27
Box 2.3: Energy efficiency and conventional measures of thermodynamic efficiency .........................................28
Box 2.4: Prices, production and capacity of PV systems ..................................................................................35
Box 2.5. Geothermal energy: technical aspects ................................................................................................35
Box 2.6: Ocean energy technologies: technical aspects ...................................................................................36
Box 2.7: Energy scenarios and the future role of RETs ......................................................................................38
Box 2.8: Declining costs of RETs: Summary of findings of the IPCC .................................................................46
Box 3.1: Policy-relevant insights into technology and innovation .......................................................................57
Box 3.2: The role of public science in building technological and innovative capacity ........................................59
Box 3.3: Examples of private firms in wind and solar energy: China and India ...................................................62
Box 3.4: Constraints on technology and innovation in developing countries .....................................................68
Box 4.1: Kyoto Protocol, emissions control and burden sharing .......................................................................83
Box 4.2: Technology transfer and Article 66.2 of the WTO Agreement on Trade-Related Aspects of Intellectual
Property Rights ..................................................................................................................................89
Box 4.3: The Clean Development Mechanism and technology transfer .............................................................91
Box 4.4: Patents in clean energy: Findings of the UNEP, EPO, ICTSD study .....................................................92
Box 4.5: The International Renewable Energy Agency ....................................................................................105
Box 5.1: Demystifying solar energy in poor communities: The Barefoot College in action ................................116
Box 5.2: Lighting a billion Lives: A success story of rural electrification in India ...............................................117
Box 5.3: Increasing energy security through wind power in Chile ....................................................................118
Box 5.4: Public support for RETs in the United States of America and China ..................................................119
Box 5.5: Examples of grant schemes in industrialized countries .....................................................................120
Box 5.6: The Renewable Energy and Adaptation to Climate Technologies Programme of the Africa Enterprise
Challenge Fund (AECF REACT) ........................................................................................................120
Box 5.7: Lighting Africa ..................................................................................................................................121
Box 5.8: Examples of public-private partnerships ...........................................................................................122
Box 5.9: Renewable portfolio standards in the Philippines ..............................................................................124
Box 5.10: Feed-in tariffs for biogas and solar PV, Kenya ...................................................................................126
Box 5.11: Promoting integrated approaches for increased production and use of RETs....................................128
Box 5.12: Importance of training for RETs: Experiences of Botswana and Bangladesh .....................................129
Box 5.13: Renewable energy technologies in Asia: Regional research and dissemination programme ..............130
Box 5.14: Tradable emissions permits ..............................................................................................................133
Box 5.15: FDI in the global market for solar, wind and biomass ........................................................................136
Box 5.16: The Turkana Wind Power Project, Kenya ..........................................................................................139

ix
List of figures
Figure 2.1: Renewable electric power capacity (excluding hydro), end 2010 ........................................................24
Figure 2.2: Global electricity supply by energy source, 2010 ................................................................................24
Figure 2.3. Levelized costs of some renewable energy technologies compared, 2008 and 2009 ($/MWh) ...........45
Figure 4.1: Funding arrangements of the UNFCCC ..............................................................................................85
Figure 4.2: Sustainable energy financing along the innovation chain .....................................................................86
Figure 4.3: Number of patent applications for five renewable energy sources, 1979–2003 ...................................93
Figure 4.4: Total number of patent applications for energy-generating technologies using renewable
and non-fossil sources, 1999–2008 ...................................................................................................93
Figure 4.5: Market shares held by the first, top five and top ten patent applicants in select technologies
Figure 4.6: Countries’ shares of patents in solar thermal and solar photovoltaics, ...............................................94
1988–2007 (per cent) .........................................................................................................................94
Figure 4.7: Patent flows in solar PV technologies from Annex I to non-Annex I countries, 1978–2007..................96
Figure 4.8: Patent flows in wind power technologies from Annex I to non-Annex I countries, 1988–2007 ............96
Figure 4.9: Patent flows in biofuel technologies from Annex I to non-Annex I countries, 1988–2007 .....................96
List of tables
Table 2.1: Global investment in renewable energy and related technologies, 2004–2010 ($ billion) .....................39
Table 2.2: RETs characteristics and energy costs ...............................................................................................47
Table 3.1: Relative specializations and potential entry points for firms in wind and solar energies........................61
Table 3.2: Access to electricity and urban and rural electrification rates, by region, 2009 ....................................64
Table 3.3: Annual investments in global innovation in various energy sources, 2010 ($ billion) .............................66
Table 4.1: Estimates of RETs investments needed for climate change adaptation and mitigation ........................83
Table 4.2: Multilateral and bilateral funding for low-carbon technologies .............................................................84
Table 4.3: Companies using the United Kingdom’s Carbon Reduction Label (by April 2011) ...............................99
Table 5.1: Renewable energy targets of selected developing economies ..........................................................115
Table 5.2: Countries/states/provinces with RPS policies ...................................................................................123
Table 5.3: Countries/states/provinces with feed-in tariff policies ........................................................................125
CONTENTS

x TECHNOLOGY AND INNOVATION REPORT 2011
LIST OF ABBREVIATIONS
ACRE Australian Centre for Renewable Energy
ADB Asian Development Bank
AECF REACT The Renewable Energy and Adaptation to Climate Technologies programme of the Africa
Enterprise Challenge Fund
AGECC Advisory Group on Energy and Climate Change (of the United Nations)
ARPA-E Advanced Research Project Agency-Energy
BCA border carbon adjustment
BSE barefoot solar engineers
Btu British thermal unit
CCGT combined cycle gas turbine
CCL climate change levy
CCMT climate change mitigation technologies
CCS carbon capture and storage
CDIP Committee on Development and Intellectual Property
CDM Clean Development Mechanism
CET clean energy technology
CHP combined heat and power
CIS Commonwealth of Independent States
CO2 carbon dioxide
COP Conference of the Parties
CSIR Council for Scientific and Industrial Research
CSP concentrating solar power
CTF Clean Technology Fund
EC European Commission
EGS engineered thermal system
EJ exajoule
EPO European Patent Office
ESMAP Energy Sector Management Assistance Programme
EST environmentally sound technology
ETI Energy Technologies Institute
EU European Union
EU ETS European Union's Emission Trading System
EU-27 27 member countries of the European Union
FDI foreign direct investment
FIT feed-in tariff
GDP gross domestic product
GEF Global Environment Facility
GHG greenhouse gas
GW gigawatt
GWEC Global Wind Energy Council
G-20 group of 20
ICT information and communication technologies
IEA International Energy Agency
IFC International Finance Corporation
IGCC integrated gasification combined cycle
IITC IRENA Innovation and Technology Centre
IPCC Intergovernmental Panel on Climate Change
IPR intellectual property right
IRENA International Renewable Energy Agency

xiLIST OF ABBREVIATIONS
JPOI Johannesburg Plan of Implementation
kgoe kilogram of oil equivalent
km kilometer
KMTC Knowledge Management and Technology Cooperation
kW kilowatt
kWh kilowatt-hour
kWp kilowatt-peak
LaBL Lighting a billion Lives
LCOE levelized cost of electricity
LDC least developed country
LDCF Least Developed Country Fund
MDG Millennium Development Goal
MW megawatt
MWh megawatt-hour
MWp megawatt power
NGO non-governmental organization
NRI national research institution
OECD Organization for Economic Co-operation and Development
OTEC ocean thermal energy conversion
PCT Patent Cooperation Treaty
PPA power purchase agreement
PPM particles per million
PPP public private partnership
PV photovoltaic
R&D research and development
RE renewable energy
REDP Renewable Energy Demonstration Program
RET renewable energy technology
ROC renewables obligation certificate
RPS renewable portfolio standard
SCCF Strategic Climate Change Fund
SEZ special economic zone
SHS solar home systems
SIDA Swedish International Development Agency
SME small and medium-sized enterprise
STI science, technology and innovation
TERI The Energy and Resources Institute
TIR Technology and Innovation Report
TRIPS Trade-related Aspects of Intellectual Property Rights (WTO Agreement)
TWh terawatt-hour (a terawatt is equivalent to a million megawatts)
UNCSD United Nations Conference on Sustainable Development
UNCTAD United Nations Conference on Trade and Development
UN/DESA United Nations Department of Economic and Social Affairs
UNDP United Nations Development Programme
UNEP United Nations Environment Programme
UNFCCC United Nations Framework Convention on Climate Change
UNIDO United Nations Industrial Development Organization
USAID United States Agency for International Development
VAT value-added tax
W watt
WIPO World Intellectual Property Organization
WSSD World Summit on Sustainable Development
WTO World Trade Organization

xii TECHNOLOGY AND INNOVATION REPORT 2011
KEY MESSAGES
On technology and innovation capacity for RETs:
1. A mutually compatible response to the dual challenge of reducing energy poverty and mitigating climate change
requires a new energy paradigm. Such a paradigm would have RETs complementing (and eventually substituting)
conventional energy sources in promoting universal access to energy.
2. Established RETs, such as solar PV technologies and onshore wind, are experiencing rapid ongoing technological
progress and reductions in energy generation costs.
3. RETs are already being deployed on a significant scale in some countries, though this varies by region.
4. Much progress can be achieved in alleviating energy poverty by focusing on rural, off grid applications alongside
efforts to establish more technologically and financially intensive grid-based RET applications.
5. In the absence of technological capabilities, national strategies for sustainable economic development are likely
to be constantly undermined.
6. Strengthening technological absorptive capacities is essential not only to build R&D capabilities for RETs in the
short and mid term, but also to promote adaptation and dissemination of RETs.
7. RETs use should be integrated within broader goals for poverty reduction and job creation for the more economi-
cally vulnerable groups in developing country economies.
On the international policy challenges for RETs:
1. There is an urgent need to reposition the debate within the international agenda on climate change so that obliga-
tions of countries to mitigate climate change is framed in terms of creating development opportunities for all in an
environmentally sustainable manner.
2. Such a repositioning also implies focusing on issues of finance, technology transfer and technology dissemination
for developing countries in the context of RETs.
3. The current international finance and technology transfer architecture is fragmented. It needs to be strengthened
with the aim of reducing energy poverty while mitigating climate change.
4. International support needs to work hand in hand with national frameworks on RETs, complementing efforts in
three critical areas: increasing financial resources for RETs, promoting greater access to technology and enabling
greater technological learning within the green economy and the Rio-plus-twenty framework.
5. The diffusion of RETs in developing countries involves much more than transferring technology hardware from
one location to another. This Report, noting the complexity of technological change in different contexts, calls
for targeted international support to foster RETs-related learning. Such support could include the following
elements:
(i) an international innovation network for LDCs, with a RET focus, that seeks to facilitate knowledge accumula-
tion and innovation in LDCs.
(ii) global and regional research funds for RETs deployment and demonstration, that focus attention on
making resources available to adaptation and incremental innovations in RETs for use in a wide variety of
contexts.
(iii) an international RETs technology transfer fund that is dedicated to facilitating private-private and private-public
transfer of technology for RETs.
(iv) an international RETs training platform that promotes capacity building and skills accumulation in developing
countries.
6. More support could take the form of augmenting and further strengthening the recently proposed technology
mechanism within the UNFCCC, particularly by increasing its focus on RETs.

xiiiKEY MESSAGES
On national policy frameworks for RETs:
1. National governments in developing countries can play a pivotal role in combining conventional sources of energy
with RETs in ways that will not only help reduce energy poverty, but also simultaneously promote climate-friendly
solutions to development.
2. This Report proposes that developing countries adopt a national integrated innovation policy framework to create
policy incentives in national innovation policies and national energy policies for the greater use, diffusion, produc-
tion and innovation of RETs.
3. Such a policy framework would have five key functions:
(i) Defining policy strategies and goals;
(ii) Providing policy incentives for R&D, innovation and production of RETs;
(iii) Providing policy incentives for developing greater technological absorptive capacity, which is needed for
adaptation and use of available RETs;
(iv) Promoting domestic resource mobilization for RETs in national contexts; and,
(v) Exploring newer means of improving innovation capacity in RETs, including South-South collaboration.
4. Not all of the policy options proposed in the Report are available or applicable to all developing countries and
LDCs.
5. Incentives for RETs production and innovation can be entrenched into the wider innovation policy framework and
energy policies of countries through a variety of policy measures.
6. For the poorer countries, the ability to undertake large-scale R&D or establish significant manufacturing capac-
ity will be constrained by the relatively small size of their domestic markets, lack of access to finance and weak
institutional capacity. In such cases, countries should consider incentives to build greater absorption capacity in
RETs and revisit their energy subsidy policies.
7. Incentive structures can start small, on low-scale projects, designed to encourage private sector solutions to
renewable energy technology development and deployment challenges in rural settings.
8. Developing countries will face different problems in RETs promotion, production and innovation, depending on
their respective starting points. Nevertheless, for all developing countries, RETs present real opportunities for
reducing energy poverty, and the right policies could influence the extent of benefits that could be derived from
RETs use, adaptation and dissemination.


xvOVERVIEW
OVERVIEW
RENEWABLE ENERGY TECHNOLOGIES,ENERGY POVERTY AND CLIMATE CHANGE
Sustained economic growth of the kind that leads to
continuous improvement in the living standards of all
people through poverty reduction rests on assuring
access to energy for all. Such a global energy access
agenda requires a greater focus on energy generation
and use from existing resources while minimizing waste.
However, the use of conventional energy sources (pri-
marily fossil fuels) are believed to have led to a rise in
greenhouse gas (GHG) emissions and to a resulting in-
crease in global average temperatures since the mid-
twentieth century. The fundamental conclusions of the
most recent assessment report of the IPCC are that
climate change is the result of human activity, that the
ongoing rate of climate change will have devastating ef-
fects if left unchecked, and that the costs of action for
mitigation and adaptation would be significantly lower
than the costs of inaction.1 Therefore from a climate
change perspective, there is a need for all countries
worldwide to embark upon low-carbon, high growth
trajectories. It also requires promoting the use of oth-
er, newer or more cost-effective energy sources in all
countries, which could complement the conventional
energy supplies predominantly in use today. Renewable
energy (RE) sources offer one such distinct possibility,
and established renewable energy technologies (RETs)
can complement more traditional sources of energy,
thereby providing countries with varied energy options
within their national energy matrices to suit their specific
needs and conditions. Given their enormous potential,
there is growing interest in the current and future role
of RETs in national energy supply systems worldwide.
This, however, is not an easy task for all developing and
least developed countries (LDCs), since the greater use
of RETs for energy supply and industrial development is
dependent on building technological capabilities. Against
this broad background, the Technology and Innovation
Report (TIR) 2011 analyses the important role of technol-
ogy and innovation policies in expanding the application
and wider acceptance of RETs, particularly in the con-
text of developing countries. Technology and innovation
policies can promote and facilitate the development, ac-
quisition, adaptation and deployment of RETs to support
sustainable development and poverty reduction in devel-
oping countries and LDCs.
Four current trends lend a new urgency to the need to
explore how far and how easily RETs could serve en-
ergy needs worldwide. First, ensuring universal access
to conventional energy sources using grids entails high
costs, which means that developing countries are un-
likely to be able to afford the costs of linking additional
households, especially those in rural areas, to existing
grids. Second, the climate change debate has injected a
greater sense of urgency into searching for newer energy
options, as a result of both ongoing policy negotiations
and the greater incidence of environmental catastrophes
worldwide. Third, from a development perspective, the
recent financial and environmental crises have caused
major setbacks in a large number of developing coun-
tries and LDCs, resulting in their further marginalization
from the global economy. The LDCs and many develop-
ing countries suffer from severe structural vulnerabilities
that are a result of their patterns of integration into the
global economy. The international community needs to
promote low-carbon, climate-friendly development while
fostering inclusive economic growth in these economies
as a matter of urgency. Lastly, there are extreme inequali-
ties within developing countries themselves, and lack of
access to energy affects the poorest of the poor world-
wide, impeding their ability to enjoy the basic amenities of
modern life that are available to others at the same level
of development.
Within the United Nations Framework Convention on
Climate Change (UNFCCC), polarized positions on who
should shoulder responsibility for the current state of
emissions and share the financial burden for mitigat-
ing climate change are based on the erroneous belief in
the incompatibility of the dual challenges of promoting
industrial development and mitigating climate change.
Developing countries, in particular, face the challenge of
promoting industrial development – a fundamental pre-
requisite for poverty reduction and equality in their so-
cieties – while reducing their reliance on conventional
energy sources that have played a central role in global
economic growth until recently.2 Most of these countries
also remain far more vulnerable to most of the environ-
mental threats arising from climate change.3
However, the advantages of using RETs will not accrue
automatically in developing countries. Although many of
the RETs needed for meeting a larger share of the global
energy demand already exist, or are on the verge of com-

xvi TECHNOLOGY AND INNOVATION REPORT 2011
mercialization, the knowledge and technological capabili-
ties required for their transfer to developing countries and
LDCs are not easily accessible. Developing countries
will need to strengthen their innovation systems,4 policy
frameworks and linkages to enable wider RET dissemi-
nation and to promote a greener catch-up process. Pro-
moting greater access to RETs and support for use and
adaptation of these technologies through all means pos-
sible will be important to enable developing countries to
sustainably integrate these processes into efforts aimed
at capital formation and transformation of their produc-
tive structures.
There is a need not only for strong domestic technology
and innovation policies, but also for greater international
efforts to make the international trade and intellectual
property rights (IPRs) regime more supportive of the tech-
nological needs of developing countries and LDCs. Inter-
national support to developing countries through various
channels should also include financial support and North–
South, South–South and triangular cooperation, as well as
effective technology transfer mechanisms. All of these will
be necessary complements to the development of local
capacities for RETs.
This TIR identifies five distinct issues that stand out in the
debate on technology and innovation of RETs, which are
of particular relevance for all developing countries and
LDCs. First, structural transformation that supports the
economic development of countries relies strongly on
the growth of national technological capabilities. At pres-
ent, inadequate energy supply is a constraint that applies
not only to the manufacturing sector, but also to other
sectors that are potentially important to the process of
industrialization and development, such as services,
tourism and agricultural processing, which depend on re-
liable, high-quality power supply. It is therefore important
to recognize the virtuous relationship between energy
security and technological capabilities: energy security is
a key aspect of the physical infrastructure required for
growth, and technological capabilities are a fundamental
prerequisite for greater adaptation and use of RETs within
domestic economies.
Second, incoherent, and often conflicting, policy devel-
opments at the multilateral level tend to adversely affect
national aspirations for technological empowerment in
developing countries. Although climate change will affect
all countries and communities worldwide, developing
countries (especially LDCs) will shoulder a disproportion-
ate burden from the fallout resulting from climate change,
including increasing climatic variations, extreme weather
events and natural disasters. The ongoing debates on
climate change reflect the diverse positions of countries
on how the burden should be shared.
Third, the issue of greater transfer of climate-friendly tech-
nologies that has been a key element in the global de-
bate on climate change is intricately linked to technology
and innovation infrastructures in countries. In the renew-
able energy (RE) sector, recent evidence shows that basic
approaches to solving technological problems have long
been off-patent, and therefore can be adapted and dis-
seminated in developing countries provided that some
technological prerequisites are met. This points to the
need for greater attention to strengthening the technol-
ogy absorptive capacity of countries through coordinated
policy support, in addition to making existing technologies
available and assisting in their greater diffusion.
Fourth, RETs will remain a distant goal as long as they are
prohibitively expensive. Innovation in RETs is moving at a
fast pace globally, but left on its own, or left to the “mar-
ket”, it is unclear to what extent this pace will continue
globally and to what extent it will lower the prices of these
technologies for use at the individual household and firm
level in the medium term.
Finally, RETs form part of the wider debate on emerging
patterns of investment and technology that fall under the
umbrella of the “green economy”. At a fundamental level,
the concept of the “green economy” itself has been high-
ly contested. Some argue that calling for large-scale in-
vestments in developing countries to facilitate the transi-
tion to a green economy imposes uneven costs, thereby
creating an additional burden on already disadvantaged
groups of people. The challenge is to ensure that the
green economy concept, which will also be the focus of
the Rio+20 framework, is structured in a way that it does
not adversely affect ongoing productive activities in de-
veloping countries while helping their transition to “green”
modes of development. Numerous issues will need to
be addressed in this context, including patterns of trade,
technological upgrading and specialization.
Analysing these five issues at length, the TIR 2011 ar-
gues that RETs can bring numerous benefits to devel-
oping countries. The potential impacts of RETs in terms
of reducing energy poverty, generating employment and
creating new production and innovative activity add to
their environmental advantages. Several established
RETs have significant potential to contribute to a broad
range of development goals. It is beyond the scope of
this Report to address the whole range of policy impli-
cations of all RETs in the very different contexts of the
various categories of developing countries. It therefore

xviiOVERVIEW
focuses on those that are (i) already mature enough to
make practical contributions to policy objectives in the
short term, but are sufficiently recent in their commer-
cialization to present challenges with which policymakers
may be less familiar; and (ii) particularly appropriate to the
objective of reducing and eventually eliminating energy
poverty in developing countries as complements (and
eventually substitutes) to conventional energy sources.
THE EXPANDING ROLEOF RENEWABLE ENERGY TECHNOLOGIES
Several RETs are well established
RETs are a diverse group of technologies that are currently
at different levels of maturity. Those based on wind, geo-
thermal, solar thermal and hydro are mature technologies
and are already being deployed widely. Others, including
second-generation biofuels and ocean energy, remain at
varying stages of pre-commercial development. Although
there are problems of intermittency associated with some
of them (for example, in the provision of solar energy, where
the sun is available for only a limited number of hours per
day), they are very versatile in that they can be deployed in
various configurations, either alone or, often, in combina-
tion with conventional energy technologies. Therefore they
offer the potential to contribute significantly to alleviating
energy poverty in diverse situations.
The TIR focuses primarily on RETs based on wind, solar
and modern biomass sources for electricity generation,
either in centralized or decentralized facilities. These are
among the most important and fastest growing RETs in
developing countries. There are also non-electric appli-
cations of REs, such as biofuels that are used for trans-
portation, space heating, hot water and cooking (e.g. by
solar cookers).
The role of RETs in alleviating energy povertyis growing
On a global scale, although the various advantages of
RETs are increasingly being recognized, established fossil
fuel sources still dominate energy supply at present, pro-
viding up to 89 per cent of all global energy. In 2008, RE
sources (including large hydro installations) accounted for
12.9 per cent of global primary energy supply, whereas
the bulk was supplied by fossil fuels (including oil, gas and
coal). However, a large proportion of the global population
cannot afford these conventional energy supplies. Accord-
ing to estimates of the International Energy Agency (IEA),
over 20 per cent of the global population (1.4 billion people
approximately) lacked access to electricity in 2010. South
Asia has the largest absolute numbers of people without
such access (42 per cent of the world total), in spite of
recent rapid progress. Taking the entire population of this
subregion, 38 per cent have no access to electricity, and
within this figure, 49 per cent of people living in rural areas
lack access. In relative terms, sub-Saharan Africa is the
most underserved region, with 69.5 per cent of the popu-
lation having no access to electricity, and only a meagre
14 per cent of the rural population having access.
Eliminating energy poverty and promoting greater ac-
cess to energy to promote economic development
therefore requires serious consideration of how RETs
could complement and/or even substitute convention-
al energy sources. Will such a new energy paradigm
that envisages a greater role for RETs be able to create
greater employment? Could those RETs be deployed in
remote rural areas that are hard to connect to the con-
ventional energy grid? Will such RETs be applicable and
easy to use by individual users, but at the same time
have the potential for scale-up within enterprises, firms
and sectors? Would they alleviate, at least partially, the
difficulties faced by vulnerable social groups affected
by poverty (e.g. rural populations, women, children and
indigenous groups) so that they can devote more time
and attention to income-generating and other activities?
A significant aspect of RE use is that they offer the possi-
bility of devising semi-grid or off-grid rural installations that
promote greater access to energy in developing countries
than that provided by conventional energy sources which
rely extensively on grid connections. Of the 1.4 billion peo-
ple not connected to electricity grids globally, approximate-
ly 85 per cent live in rural areas. Because of their possibility
of use in non-grid or semi-grid applications, RETs can be
an important means of energy supply in areas where other
energy sources are not available, such as in isolated rural
communities. Such decentralized, off-grid applications of
RETs are already in relatively wide use in developing coun-
tries, where they provide cost-effective energy solutions
that bring significant benefits to local communities.
RETs such as solar pumps, solar PV installations, small
wind, mini-hydro and biomass mini-grids offer higher
potential and cost advantages than traditional grid ex-
tension. They can be a reasonable option for providing
some degree of access to energy, particularly in rural
areas in developing countries and LDCs where national
energy grids are unlikely to expand in the near future.
Arguably, some of these applications are small in scale
and do not make much of an impact on energy provi-
sion at the national/global level, but they can still play an
important role in reducing energy poverty at the local/
rural level. In these cases, RETs offer a realistic option

xviii TECHNOLOGY AND INNOVATION REPORT 2011
for eradication, or at least for alleviation, of energy pov-
erty.
Technological progress and greaterinvestments and deployment are loweringcosts of established RETs
There has been rapid ongoing technological progress in
some RETs, such as solar PV technologies and onshore
wind energy, with accompanying reductions in energy
generation costs. The cost competitiveness of RETs rela-
tive to conventional energy sources is also improving, and
can be expected to improve even further with continued
technological progress and higher investment in their de-
velopment, production and deployment. The prices of so-
lar PV systems, for instance, have been falling extremely
rapidly. During the 18 months leading to June 2010, prices
of new solar panel modules fell by an estimated 50 per
cent. And in some off-grid and mini-grid applications
some RETs were already competitive with conventional
energy in 2005, even with the relatively low oil prices pre-
vailing at that time. It is reported that in Africa, Asia and
Latin America, the demand for modern energy is driving
the use of PV for mini-grid or off-grid solar systems, which
in many instances are already at price parity with fossil fu-
els. This implies that for precisely those applications which
may be most suitable for isolated communities (i.e. de-
centralized applications that do not require connection to
the national or regional energy grids) RETs may be at their
most cost-competitive. Rising, and increasingly volatile,
oil prices and growing investments in RETs may also be
contributing to this trend. However, additional technologi-
cal improvements that could help to better integrate RE
into the existing energy infrastructure (including through
the development of smart energy grids) and augment the
storage capacities of RETs will be valuable in promoting
their cost competitiveness.
Despite the ongoing surge in the deployment of RETs, at
present they account for only a small fraction of global
energy consumption. The TIR 2011 stresses that there
is still enormous technical potential for power generation
from RETs, and argues that such RETs are likely to play
an increasingly important role in meeting global energy
demand as continued technological progress, additional
investment and further deployment lead to cost reduc-
tions over the medium and long term globally. The analy-
sis in the Report shows that RETs will continue to evolve
as complements to existing energy sources globally, with
the eventual aim of replacing conventional energy in the
long term. For developing countries and LDCs, this is a
positive trend. The actual speed and extent of deploy-
ment of RETs and the role they will eventually play will de-
pend critically on the policy choices that are made today
and in the future. The policy issues that need to be con-
sidered within national frameworks for technology and
innovation and the ways and means of international sup-
port will be critical for harnessing the potential of RETs for
poverty reduction and sustainable development.
STIMULATING TECHNICAL CHANGEAND INNOVATION IN AND THROUGHRENEWABLE ENERGY TECHNOLOGIES
Technology and innovation capacity and reliable energy supply are intricately linked
Uninterrupted and reliable energy supply is an important
stimulant to innovative capacity and economic growth. In-
deed, a number of studies underline a direct causal rela-
tionship between the low supply of electricity and stunted
economic growth. At the same time, technology and inno-
vation capabilities are important for promoting R&D and in-
novation to produce state-of-the-art RETs, and for creating
a critical base of knowledge that is essential for adapting
and disseminating RETs. A critical threshold of technologi-
cal capability is also a prerequisite for making technical im-
provements to RETs that enable significant cost reductions
so that they can be deployed on a larger scale in developing
countries. The success of RETs-related technology transfer
initiatives also depends on the ability of actors in developing
countries to absorb and apply the technologies transferred.
The absence of, or limitations in, technological and innova-
tion capabilities is therefore likely to constantly undermine
national strategies for sustainable development based on
the greater use of RETs. This virtuous relationship between
RETs and technology and innovation capacity needs to be
recognized and fostered actively.
Countries’ capacities for technological absorption need
to be strengthened through coordinated policy support,
but an additional priority will be to make existing tech-
nologies available and assist in their greater diffusion. As
noted earlier, while innovation in RETs is moving at a fast
pace globally, ensuring this continues will require poli-
cies that promote the wider adaptation and deployment
of RETs. In the context of the current state of underde-
veloped energy infrastructure in developing countries
and LDCs, RETs could not only help to reduce energy
poverty in many novel ways; they could also help re-
duce social inequalities through the creation of new jobs
associated with the application of RETs. Public policy
therefore has an important role to play in this regard, in
addition to tipping the balance towards energy mixes
that give prominence to RETs development in develop-
ing countries.

xixOVERVIEW
Innovation policy frameworks for RETs area fundamental requirement
Innovation systems in developing countries are funda-
mental to shaping the capacity for the technological
learning needed for adaptation, use, production and
R&D-based innovation of RETs. There are several features
of technology and innovation unique to RETs compared
with other sectors that have been the focus of many
policy studies. First, there is already a well-established
energy system globally, and RETs are technologies that
seek to provide alternative solutions to achieve the same
results using natural and renewable resources of different
kinds (such as sun, wind and water). Their unique selling
point is that they offer environmentally friendly solutions
to energy needs for the same service, namely the supply
of energy. This is different from innovation in other sec-
tors where competition is structured around the provision
of newer products and services at reasonable prices.
Second, the intermittency issues related to RETs necessitate
a systemic approach to promoting innovation in the sector.
Evidence shows that intermittency of different RE supplies
can be dealt with quite easily within electricity systems when
solutions are designed from a systemic perspective.5 A sys-
temic treatment of RETs is also important from another per-
spective, namely, the management of demand for energy.
The end-use dimension (i.e. how many people can access
a particular supply and how effectively it can be provided)
will need to play a major role when considering RETs as a
means of alleviating energy poverty in developing countries.
Thus a systemic perspective should give due consideration
to the demand dimension when designing on-grid, off-grid
or semi-grid applications using RETs.
Third, it is often assumed, incorrectly, that technological
capability is required primarily for R&D aimed at the cre-
ation or development of newer RETs. As the TIR 2011
shows, technology and innovative capability is also fun-
damental for other aspects, such as:
(i) Making minor technical improvements that could
enable significant cost reductions in production
techniques, adaptation and use; and
(ii) Adaptation, dissemination, maintenance and
use of existing RETs within key sectors of the
economy, which depend not only on the availability
of materials, but also on diverse forms of
knowledge.
Fourth, in developing countries, there is an urgent need
to promote choices in innovation and industrial develop-
ment based on RETs. These choices may be different
depending on the conditions in the country and the kind
of RE resource(s) available. The specific characteristics
of different RETs, varied project sizes and the possibilities
for off-grid and decentralized supply, imply many new
players, both in project development (new and existing
firms, households and communities) and in financing
(existing lenders, new microcredit scheme, government
initiatives).
Therefore, strengthening national frameworks for tech-
nology and innovation in developing countries is a nec-
essary pre-condition for ensuring increased use and in-
novation of RETs through: (a) the greater integration of
RETs within socio-economic development strategies of
countries; (b) creation of capacity for increased technolo-
gy absorption in general, and in RETs in particular; and (c)
express policy support aimed at significantly integrating
RETs into the national energy mix by tipping the balance
in favour of RETs development, production and use.
National governments need to tip thebalance in favour of RETs
There is an urgent need for government action aimed
at substituting patterns of current energy use with reli-
able, established RETs. While off-grid RETs (especially
modern biomass-based ones) may be relatively easy to
deploy, many still remain very expensive at the scales
required to make an impact in developing countries,
despite rapid technological advances. For example, a
study by the IEA (2009) came to the conclusion that in
the United States, electricity from new nuclear power
plants was 15–30 per cent more expensive than from
coal-fired plants, and the cost of offshore wind power
was more than double that of coal, while solar power
cost five times as much. Changing from the current
global situation of no energy, or unreliable and often
undesirable sources of alternative energy (such as tra-
ditional biomass), to one where industrial development
begins to pursue a cleaner growth trajectory is essential
for driving down the costs of RETs.
Each time investment is made in generating more en-
ergy through RETs, there is not only a gradual shift in
the energy base; it also has a significant impact on the
capacity of RETs to supply energy more economically.
For example, according to recent reports, every time
the amount of wind generation capacity doubles, the
price of electricity produced by wind turbines falls by
9–17 per cent.6 This holds true for all RETs: with each
new installation, there is learning attached as to how the
technology can be made available more effectively and
efficiently in different contexts so as to lower costs over
a period of time.

xx TECHNOLOGY AND INNOVATION REPORT 2011
Government action will need to focus on two very
important areas of intervention: addressing systemic
failures in RETs, and tipping the balance away from
a focus on conventional energy sources and towards
RETs. Systemic failures in the RETs sector are varied
and emerge from sources other than just the market.
They can be caused by technological uncertainty, en-
vironmental failures or other systemic factors. There-
fore, it will be important for government intervention to
address these failures.
Policy incentives, critical for inducing a shift towards
the wider application of RETs in the energy mix of
countries, need to be designed and articulated at the
national and regional levels so that collective actions
can be fostered. Most importantly, energy production
should cater to local needs and demand in countries,
for which a systemic perspective is necessary. Policy
support needs to be directed at mobilizing greater do-
mestic resources to foster RETs development and use,
in addition to providing increased access to the most
advanced, cost-cutting technological improvements to
established RETs.
Governments can play a vital role in making RETs feasible
at each level: use, adaptation, production and innova-
tion. Government agencies and the policy framework
should aim at:
(i) Promoting the general innovation environment
for the development of science, technology and
innovation;
(ii) Making RETs viable; and
(iii) Enabling enterprise development of and through
RETs.
This requires governments to adopt an agenda of pro-
actively promoting access to energy services of the kind
that is conducive to development, while also focusing
on the important positive relationship between technol-
ogy and innovation capacity and increased use of RETs.
Greater international support for developing countries will
be critical on both these fronts.
INTERNATIONAL POLICY CHALLENGES FOR ACQUISITION, USE ANDDEVELOPMENT OF RENEWABLE ENERGY TECHNOLOGIES
The international discourse needs to be framed more positively, with a focus on mitigating climate change and alleviating energy poverty
Efforts at the national level aimed at harnessing the virtu-
ous relationship between RETs-related technology and
innovation capacity for inclusive economic development
and climate change mitigation need to be strengthened
through greater international support. At the interna-
tional level, discussions and negotiations on climate
change and the green economy have gained momen-
tum in recent years. A major focus of those discussions
relates to environmentally sustainable technologies, or
low-carbon, “clean” technologies,7 as a means of con-
tributing to climate change mitigation and adaptation
globally.8 This is a very important global goal, which will
serve the needs of developing countries in particular,
given the evidence that climate change is having dis-
proportionately damaging impacts on those countries.
However, along with efforts to mitigate climate change,
there needs to be an equally important focus on elimi-
nating energy poverty in developing countries, not only
to improve people’s living conditions but also to boost
economic development.
The TIR 2011 stresses upon the need for reposition-
ing issues within the international agenda, whereby the
obligations of countries to mitigate climate change are
framed in terms of creating development opportunities
for all in an environmentally sustainable manner. Central
to this repositioning is the triangular relationship between
equity, development and environment. From this per-
spective, recognition of the right of all people worldwide
to access energy services is long overdue and needs to
be addressed. Developing countries, especially the least
developed, have experienced a particularly large share of
natural disasters, such as hurricanes, tornados, droughts
and flooding, as a result of changing climatic conditions.
According to recent estimates, 98 per cent of those se-
riously affected by natural disasters between 2000 and
2004 and 99 per cent of all casualties of natural disasters
in 2008 lived in developing countries, particularly in Africa
and South Asia where the world’s poorest people live.
Such a repositioning also implies a greater focus on three
key challenges, namely international resource mobiliza-
tion for RETs financing; greater access to technology
through technology transfer and the creation of flexibili-
ties in the IPRs regime; and promoting wider use of RETs
and technological learning in the push for a green econo-
my and within the Rio+20 framework. These issues have
been and remain central to all debates and decisions of
the UNFCCC and the Kyoto Protocol that focus mainly
on environmentally sustainable – or clean – technologies,
of which RETs form a subset. In highlighting the need for
a greater focus on RETs in international discussions, the
Report also identifies the main hurdles in all these three
policy areas.

xxiOVERVIEW
International financial support for RETs needs to be strengthened and targeted
A number of estimates have been produced that try to
quantify the challenge of adaptation and climate change
mitigation. All of them consider slightly different catego-
ries of investments that will be needed in the immediate
or medium term. The International Energy Agency es-
timate covers only electricity generation technologies,
and therefore excludes investment in transport fuels
and heating technologies. While all the estimates are
indicative, the definitions of technology and the broad
goals assumed in the IEA (2000) are probably the most
relevant to the issues under consideration in this TIR.9
The proposal to halve energy-related emissions by
2050 corresponds roughly to the minimum mitigation
levels deemed necessary by the IPCC, and the defini-
tion of low-carbon energy technologies covers RETs.
The IEA’s estimates for the level of investments needed
are lower than the other estimates in the medium term,
at $300–$400 billion per annum up to 2020, but rise
thereafter to reach $750 billion by 2030.
This raises questions about the capacity of public fi-
nance to support the rapid and widespread deploy-
ment of RETs as part of adaptation efforts and the role
of international support. There are a number of known
sources of finance at the multilateral and regional levels
such as the World Bank’s Climate Investment Funds,
the Clean Technology Fund and the newly announced
UNFCCC Green Climate Fund. However, several cave-
ats apply when calculating the amount of finances avail-
able under all the funding figures. Some of the funds are
multiyear commitments and often cover mitigation and
adaptation. Also, some of the funds are not yet avail-
able. Taking all these caveats together, the total amount
of annual funding for RETs from public sources is likely
to be about $5 billion from the known sources. This fig-
ure is far from sufficient when compared to the global
needs. The International Renewable Energy Agency es-
timates that just the African continent would need an
investment of $40.6 billion per year to make energy ac-
cess a reality in a sustainable way.
It is therefore that in the area of finance, support for
greater investment in RETs and their use in developing
countries is critical today. In response to the global fi-
nancial and economic crisis, many countries initiated
stimulus packages that included funding for efforts to
build capacity in those areas of the green economy that
display the greatest growth potential. No doubt, the gen-
eral trend is towards policies that simultaneously aim at
securing environmental benefits through increased use
of RETs, development benefits through increased energy
provision, and economic benefits by increasing domestic
capacity in areas that show growth potential.
However, such ongoing efforts in developing countries
would be better served if outstanding issues relating
to international financial support for RETs could be ur-
gently resolved with the aim of promoting greater in-
novation, production and use of such technologies.
At present, international financing of clean technolo-
gies, which is largely multilateral, is highly fragmented,
uncoordinated and lacks transparency. It is also woe-
fully inadequate to meet total funding requirements for
climate change mitigation and adaptation. While such
financing may partly be targeted at RETs, additional
international funding for RETs is required as a priority.
Coordination of funding sources with the aim of main-
streaming RETs into national energy systems globally
should be an important aspect of climate change miti-
gation efforts. This would not only lead to the devel-
opment of more efficient energy systems globally; it
would also ensure that the financing contributes to
greater technological progress towards newer and/or
more cost-effective RETs.
Access to RETs and related technology transfer need to be more clearly articulated
Currently, most of the clean technologies needed for de-
veloping countries and LDCs are off-patent. Despite this
general finding, recent trends show that patenting activ-
ity in RETs is on the rise. Following an analysis of these
trends against the backdrop of the ongoing negotiations
on the draft UNFCCC,10 the TIR 2011 suggests that dis-
cussions on technology transfer of RETs within the cli-
mate change framework should move beyond a narrow
focus on the issue of technology transfer to a broader
focus on enabling technology assimilation of RETs. In-
deed, the recent Climate Change Conference at Cancun
in 2010 proposed to strengthen the focus on technol-
ogy transfer, including the creation of a new technology
mechanism to help enhance the technological capacity
of countries to absorb and utilize RETs.
Accumulation of technological know-how and learning
capabilities is not an automatic process. Learning ac-
companies the acquisition of production and industrial
equipment, including learning how to use and adapt it
to local conditions. In order to foster broader technology
assimilation, the technology transfer exercise will need to
take into account the specific technological dimensions
of RETs as well as the nature of actors and organizations
in developing countries. The quality of technology trans-

xxii TECHNOLOGY AND INNOVATION REPORT 2011
fer should be assessed by the extent to which the recipi-
ent’s know-how of a product, process or routine activity
is enhanced, and not just by the number of technology
transfer projects undertaken. A greater articulation of
flexibilities under the global IPRs regime in the specific
context of RETs is also required.
The green economy and the Rio+20 framework should promote wider use and learning of RETs
In addition to providing critical infrastructure to support
the emergence and shift in production structures in devel-
oping countries, RETs can serve the goals of their indus-
trial policy by helping those countries’ exporters become
more competitive in the face of increasingly stringent
international environmental standards. However, simply
forcing developing countries to use RETs through mea-
sures such as carbon labelling and border carbon adjust-
ments may not be sufficient to enable the transition. In-
deed, such measures may even have adverse effects on
industries in developing countries by acting as barriers
to imports, since enterprises and organizations may not
have the means (financial and technological) to conform
to the new requirements. To ensure that “green” require-
ments do not place an additional burden on industries in
developing countries and LDCs, global efforts aimed at
climate change mitigation need to be accompanied by
international support in finance and technology to help
these countries transition to RETs in a strategic and sus-
tainable manner.
Targeted international mechanisms forRETs-related innovation and technologicalleapfrogging are required
The obvious question for all developing countries and
for the global community is whether the BRICS coun-
tries (Brazil, the Russian Federation, India, China and
South Africa) are special cases. To some extent they are:
they have the prerequisites for competitive production of
many RETs, such as a workforce with advanced technical
training, supporting industries and services in high-tech
areas, access to finance, ample government assistance
and a large domestic market, all of which seem to favour
these larger emerging developing countries over smaller,
poorer developing countries and LDCs.
Historically, promoting technological learning and innova-
tion has remained a challenge for all developing coun-
tries. The experiences of China, India and other emerg-
ing economies show that public support, political will and
concerted policy coordination are key to promoting tech-
nological capabilities over time. Greater support for educa-
tion (especially at the tertiary level) and for the development
of small and medium-sized enterprises, as well as financial
support for larger firms and public science are important.
But in addition to such domestic policy support, greater
support from the international community is also needed.
The TIR 2011 proposes four mechanisms of international
support. The first of these, the STI Network, was approved
at the LDC IV Conference in Istanbul in May 2011.
NATIONAL POLICY FRAMEWORKS FOR RENEWABLE ENERGY TECHNOLOGIES
Integrated innovation policy frameworksat the national level are critical
The TIR 2011 calls on national governments to adopt
a new energy paradigm involving the greater use of
RETs in collaboration with the private sector. Such an
effort should be supported by a variety of stakehold-
ers, including public research institutions, the private
sector, users and consumers on an economy-wide ba-
sis. A policy framework that can strike an appropriate
balance between economic considerations of energy
efficiency and the technological imperatives of deploy-
ment of RETs in developing countries and LDCs will be
the cornerstone of such an agenda for change. This
will necessitate two separate but related agendas. The
first should ensure the integration of RETs into nation-
al policies for climate change mitigation. The second
should be the steady promotion of national innovation
capabilities in the area of RETs. The latter entails ad-
dressing issues that are not only generic to the innova-
tion policy framework, but also new issues, such as
creating standards for RETs, promoting grid creation,
and creating a more stable legal and political environ-
ment to encourage investments in RETs as an energy
option within countries.
The TIR 2011 proposes an integrated innovation policy
framework for RETs use, adaptation, innovation and pro-
duction in developing countries and LDCs. The concept
of such a framework envisages linkages between two
important and complementary policy regimes: national
innovation systems that provide the necessary condi-
tions for RETs development, on the one hand, and ener-
gy policies that promote the gradual integration of RETs
into industrial development strategies on the other. The
Report suggests that such a framework is essential for
creating a virtuous cycle of interaction between RETs and
science, technology and innovation.
Such a policy framework would perform five important
functions, namely:
(i) Defining policy strategies and goals;

xxiiiOVERVIEW
(ii) Enacting policy incentives for R&D, innovation
and production of RETs;
(iii) Enacting policy incentives for developing greater
technology absorptive capacity, which is needed
for adaptation and use of available RETs;
(iv) Promoting domestic resource mobilization for
RETs in national contexts; and
(v) Exploring newer means of improving innovation
capacity in RETs, including South-South
collaboration.
Policy strategies and goals are importantsignals of political commitment
The use and adaptation of RETs in countries requires the
establishment of long-term pathways and national RE
targets. These targets, although not necessarily legally
binding in nature, would have to be supported by a range
of policy incentives and regulatory frameworks. Defining
targets is an important signal of political commitment
and support, and the policy and regulatory frameworks
aimed at enforcing the targets would provide legal and
economic certainty for investments in RETs.
Different policy incentives for RETs innovation,production, adaptation and use are important
The successful development and deployment of any
technologies, especially relatively new ones such as
RETs, needs the support of several dedicated institu-
tions responsible for their different technical, economic
and commercialization aspects. Such support can be
organizational (through dedicated RET organizations)
or it can take the form of incentives to induce the kinds
of behaviour required to meet the targets set for RETs.
The TIR 2011 lists various policy incentives for R&D,
innovation and production of RETs and those that are
aimed specifically at promoting technology absorptive
capacity and learning related to RETs, which will be im-
portant for their wider use in national contexts. Many
RETs-related policy incentives proposed have already
been used by most of the industrialized countries, al-
though developing countries are also increasingly us-
ing them or experimenting with their use. Clearly, de-
veloping countries and LDCs will need to select policy
incentives that are geared to their specific situations
and requirements as much as possible.
The policy incentives discussed at length in the Report
pertain to two policy spheres: the innovation policy
frameworks of countries and their energy policies. This
is because energy policies often contain measures that
have an impact on particular kinds of technologies. On-
going reforms in the energy sectors of most developing
countries offer a good opportunity to establish regula-
tory instruments and production obligations geared to-
wards promoting investment in RETs and energy pro-
duction based on these technologies. Policy incentives
of both kinds (i.e. innovation-related and energy-related)
are important to induce risk-taking by the private sec-
tor, to improve enterprise capacity to engage in learning
activities, and to promote basic and secondary research
in the public sector. Some of the policy incentives could
be aimed specifically at the private sector, such as green
economic clusters and special economic zones to boost
enterprise activity, whereas others could be hybrid instru-
ments granted to promote both public and private sector
activity, such as collaborative public-private partnerships
(PPPs). Yet others, such as public research grants, would
be offered primarily to the public sector.
Greater domestic resources needto be mobilized for RETs
Financial incentives of various kinds can promote invest-
ment in RETs, and facilitate their quicker adaptation and
utilization at the national level. These incentives need to
be developed with an eye on the co-benefits of using
RETs not only for electricity generation, but also more
broadly as a tool for industrial development in countries.
All stages of the RETs innovation and adaptation pro-
cess require financing, and will depend on each coun-
try’s ability to provide a mix of different kinds of financ-
ing, including venture capital, equity financing and debt
financing. Particularly in developing countries that face
several financial constraints on the introduction and up-
take of new technologies, governments need to support
the private sector in its financing of innovation activities,
such as by offering loan guarantees, establishing busi-
ness development banks and/or mandating supportive
lending by State banks. Governments may also directly
fund innovation activities through, for example, grants,
low-interest loans, export credit and preferential taxation
policies (e.g. R&D tax credits, capital consumption allow-
ances).
South-South collaboration needs to be fostered
South-South collaboration presents new opportunities
not only for increasing the use and deployment of RETs
through trade and investment channels, but also through
technology cooperation, and this can be facilitated by
governments, intergovernmental organizations and/or
regional development banks. Such cooperation can also
be mediated by private sector owners of RETs, although
this is less frequent. Technology cooperation can take
several forms, ranging from training foreign nationals in

xxiv TECHNOLOGY AND INNOVATION REPORT 2011
the use and maintenance of RETs to supporting research
in partner countries to adapt existing technologies to
local needs. It can also include outright grants of RET-
related IPRs or licensing on concessionary terms. The
TIR 2011 shows that in several cases developed-country
institutions have been involved in bringing developing-
country partners together for this sort of cooperation.
The benefits of such collaboration are straightforward: it
hastens the wide dissemination of RETs among develop-
ing countries along with all the commensurate benefits
associated with it.
RETs can power development and a greenercatch-up process
Developing countries will face different problems in RETs
promotion, production and innovation, depending on
their respective starting points. Nevertheless, for all de-
veloping countries, RETs present real opportunities for
reducing energy poverty, and the right policies could
influence the extent of benefits that could be derived
from RETs use, adaptation and dissemination. This TIR
presents five relevant findings from ongoing national and
regional experiences with technology and innovation ca-
pacity-building of relevance to RETs.
First, the success of a number of emerging economies in
developing technological capabilities over time is largely
attributable to the role of national governments in pro-
viding strategic, concerted support for the use of RETs.
However, the experiences of industrialized countries or
the larger developing countries such as China and India
may not be replicable in other developing countries due
to their less favourable circumstances. The Report also
highlights some of the policy incentives that need to be
approached with caution. Of special note are those re-
lated to carbon taxes, but these may not be relevant or
useful for many developing countries.
Second, developing countries should consider different
kinds of energy regimes that give priority to the deploy-
ment of REs most suited to their specific contexts, while
ensuring that conventional energy sources are not subsi-
dized extensively.
Third, success in eliminating, or at least reducing, energy
poverty through the use of RETs does not necessarily re-
quire large-scale projects with huge investments. Smaller
initiatives have been highly successful as off-grid solu-
tions to rural electricity, and offer considerable potential
for replication.
Fourth, creating an integrated innovation policy framework
of the kind outlined in this Report should not be viewed as
a daunting exercise. In the developing-country context, a
few incentives can go a long way towards achieving sig-
nificant results. Further, many countries may already be
providing several of the policy incentives discussed in the
Report. The emphasis in such cases needs to be on en-
hanced coordination to reach targets in RETs use, promo-
tion and innovation.
Fifth, countries will need to experiment with different
policy combinations, and this learning process could
have positive impacts on the co-evolution of institutional
frameworks for RETs.
*******
National governments in developing countries have a
pivotal role to play in combining conventional sources of
energy with RETs. Proactive government interventions
will need the support of the international community to
benefit from the full potential that RETs offer for alleviat-
ing (and eventually eliminating) energy poverty, but also
simultaneously promote climate-friendly solutions on a
global scale. Forging strong partnerships with the inter-
national community could also lead to the widespread
dissemination of environmentally sustainable technolo-
gies worldwide, resulting in enhanced economic devel-
opment and greater opportunities for large segments of
populations that have been left behind in the process of
globalization.
Geneva, October 2011 Supachai PanitchpakdiSecretary-General of the UNCTAD

xxvOVERVIEW
REFERENCES
Girardet H and Mendoça M (2009). A Renewable World: Energy, Ecology, Equality. A report for the World Future
Council. Totnes, Devon, Green Books.
IEA (2000). Energy Technology Perspectives 2000. Paris, OECD/IEA.
IEA (2009). World Energy Outlook 2009. Paris, OECD/IEA.
IEA (2010). World Energy Outlook 2010. Paris, OECD/IEA.
Krohn S, Morthorst P-E and Awerbuch S (2009). The Economics of Wind Energy, European Wind Energy
Association.
REN21 (2010). Renewables 2010: Global Status Report. Paris, REN21 Secretariat.
REN21 (2011). Renewables 2011: Global Status Report. Paris, REN21 Secretariat.
UN/DESA (2009). A Global Green New Deal for Climate, Energy, and Development. New York, United Nations.
UNEP and Bloomberg (2011). Global Trends in Renewable Energy Investment 2011. Analysis of Trends and Issues
in the Financing of Renewable Energy. United Nations Environment Programme. Available at:
www.fs-unep-centre.org/publications/global-trends-renewable-energy-investment-2011.
UNCTAD (2011). Technology and Innovation Report 2011: Powering Development with Renewable Energy
Technologies. United Nations publication. New York and Geneva, United Nations.
World Bank (2010). Africa’s Infrastructure: A Time for Transformation. Washington, DC, World Bank.
NOTES
1. See: http://unfccc.int/press/fact_sheets/items/4987.php.
2. Since the beginning of the eighteenth century, production and consumption patterns in the now developed countries have been dependent on energy provided successively by coal, oil and gas, and to a lesser extent by nuclear fission. The dramatic increases in the use of fossil energy (which, at current levels of annual consumption, is estimated to represent between one and two million years of accumula-tion) have enabled massive increases in productivity in both farming and manufacturing (Girardet and Mendoça, 2009). Such productivity growth has made possible a roughly ten-fold increase in the global population over the past three centuries, accompanied by significant, if unevenly distrib-uted, improvements in living standards.
3. Recent estimates suggest that developing countries will continue to suffer 75–80 per cent of all environmental dam-ages caused by climate change (World Bank, 2010).
4. An innovation system is defined as a network of economic and non-economic actors and their interactions, which are critical for interactive learning and application of knowledge to the creation of new products, processes and organiza-tional forms, among others.
5. It is estimated that electricity supply systems can easily handle up to 20 per cent of RE, and even more if systems
are designed with some adjustments in intermittency.
6. Krohn, Morthorst and Awerbuch (2009) and UN/DESA (2009).
7. “Clean technologies” or “clean energies” cover a much broader range than RETs, and include clean coal, for ex-ample.
8. Broadly, the processes that fall under adaptation are those that seek to reduce/prevent the adverse impacts of ongoing and future climate change. These include actions, allocation of capital, processes and changes in the formal policy envi-ronment, as well as the establishment of informal structures, social practices and codes of conduct. Mitigation of climate change, on the other hand, seeks to prevent further global warming by reducing the sources of climate change, such as greenhouse gas (GHG) emissions.
9. The UNFCCC estimates cover only power generation, which includes carbon capture and storage (CCS), nuclear and large-scale hydro.
10. Access to environmentally sound technologies (which in-cludes RETs) and related technology transfer has become a cornerstone of the draft UNFCCC (see Articles 4.5 and 4.7 of the draft Convention).

RENEWABLE ENERGYTECHNOLOGIES, ENERGY
POVERTY ANDCLIMATE CHANGE:AN INTRODUCTION1


3CHAPTER I : RENEWABLE ENERGY TECHNOLOGIES, ENERGY POVERTY AND CLIMATE CHANGE: AN INTRODUCTION
CHAPTER I
RENEWABLE ENERGY TECHNOLOGIES,ENERGY POVERTY AND CLIMATE
CHANGE: AN INTRODUCTION
A. BACKGROUNDSustained economic growth of the kind that
leads to continuous improvement in the liv-
ing standards of all people through poverty
reduction rests on access to energy for all.
Such a global energy access agenda re-
quires a greater focus on energy efficiency
aimed at improving ways of energy genera-
tion and use from existing resources while
minimizing waste. It also requires promot-
ing the use of other, newer or more cost-
effective energy sources in all countries,
which could complement the conventional
energy supplies predominantly in use today.
Any proposals regarding newer sources of
energy need to take on board the over-
whelming environmental challenge facing
the world today, namely climate change
mitigation.
This report focuses on the important role
of technology and innovation policies in ex-
panding the application and wider accep-
tance of renewable energies, particularly in
the context of developing countries. It seeks
to contribute to the ongoing international
discourse on the need to promote the use of
climate-friendly technologies globally. In the
recent past, calls for reductions in emission
levels of countries and proposals for low-
carbon development pathways have been
made internationally, particularly through
the United Nations Framework Conven-
tion on Climate Change (UNFCCC).1 At the
same time, in the context of the Rio-plus-20
framework, there is an increasing advocacy
for moving towards a “green economy”.
However, questions arise as to whether and
to what extent these trends can be used to
the benefit of all countries. Within the UN-
FCCC, polarized positions on who should
shoulder responsibility for the current state
of emissions and share the financial burden
for mitigating climate change are based on
the seemingly mutually incompatible chal-
lenges of promoting industrial development
and mitigating climate change. Developing
countries, in particular, face the challenge
of promoting industrial development – a
fundamental prerequisite for poverty reduc-
tion and equality in their societies – while
reducing their reliance on conventional en-
ergy sources that have played a central role
in global economic growth until recently.2
Most of these countries also remain far
more vulnerable to most of the environmen-
tal threats arising from climate change.3
Fostering mutually acceptable solutions to
these interrelated issues has not been easy,
and, as part of the United Nations’ system-
wide efforts in this area,4 various interna-
tional agencies have been working in many
different socio-economic policy domains,
including trade, industrial, investment,
and technology and innovation policies.
The United Nations Secretary-General’s
high-level Advisory Group on Energy and
Climate Change (AGECC) has identified
several goals with the aim of achieving uni-
versal access to energy and reducing glob-
al energy intensity by 40 per cent by 2030
(AGECC, 2010). UNCTAD’s own work and
policy advice has been addressing the chal-
lenges posed by climate change to growth
and development in various ways (see, for
example, UNCTAD 2010a and 2010b).
Building further on the work in the United
Nations system and within UNCTAD, this
Technology and Innovation Report (TIR)
Access to energy
for all…requires the
promotion of other, cost-
effective energy sources.
Developing countries
face the challenge of
promoting industrial
development while
reducing their reliance
on conventional energy
sources.

4 TECHNOLOGY AND INNOVATION REPORT 2011
2011 focuses on policy issues and options
to address energy poverty and climate
change mitigation through the greater use
of renewable energy technologies (RETs).
This TIR argues that a mutually compatible
response to the dual challenge of reduc-
ing energy poverty and mitigating climate
change requires a new energy paradigm.
Such a paradigm would have RETs com-
plementing (and eventually substituting)
conventional energy sources in efforts to
alleviate energy poverty across the devel-
oping world. This is a realistic paradigm
given that the world is faced with energy
poverty issues that cannot be resolved us-
ing conventional fuel sources without risk-
ing irreversible climate change. Moreover,
rapid technological developments in RETs
not only rendered them cheaper than they
were a decade ago, but also the techno-
logical characteristics of many established
RETs today enable them to be more eas-
ily combined in complementary ways with
conventional energy sources. This makes
it easier to envisage energy solutions that
mix renewables with conventional energy
in the short term or mid-term, with the
view to ultimately replacing conventional
energy in the long term in the interest of
climate change (UN/DESA, 2011). In find-
ing newer energy solutions that integrate
renewable energy with existing energy
sources, developing countries will need to
develop technology and innovation capa-
bilities. This will be necessary not only to
enable the greater dissemination, adapta-
tion and use of existing RETs, but also for
promoting newer technological changes in
renewable energy that will be important for
a sustainable future.
B. A NEW URGENCY FOR RENEWABLE ENERGIES
Four current trends lend a new urgency
to the need to explore how far and how
easily RETs could serve energy needs
worldwide. First, ensuring universal ac-
cess to conventional energy sources us-
ing grids entails high costs, which means
that developing countries are unlikely to
be able to afford the costs of linking new
households, especially those in rural ar-
eas, to existing grids.5 Second, the climate
change debate has injected a greater
sense of urgency into searching for newer
energy options, as a result of both ongo-
ing policy negotiations (i.e. the impending
negotiations under the aegis of the UN-
FCCC) and the greater incidence of envi-
ronmental catastrophes worldwide.6 This
makes it imperative for countries to reach
some level of consensus on mitigating on-
going climate change effects as soon as
possible. Third, from a development per-
spective, the recent financial and environ-
mental crises have caused major setbacks
in a large number of developing countries
and least developed countries (LDCs), re-
sulting in their further marginalization from
the global economy. The LDCs and many
developing countries suffer from severe
structural vulnerabilities that are a result of
their patterns of integration into the global
economy (UNCTAD, 2010b). Promoting
low-carbon, climate-friendly development
while fostering inclusive economic growth
in these economies is an urgent impera-
tive for the international community. Lastly,
there are severe inequalities within devel-
oping countries themselves, and lack of
access to energy affects the poorest of
the poor worldwide, impeding their abil-
ity to enjoy the basic amenities of modern
life that are available to others at the same
level of development.
1. An energy perspective
The energy revolution that served as a
major impetus to industrial development
can be traced back to the introduction of
steam as a source of energy, which was
later followed by the discovery of oil and
gas. Use of these energy resources has
enabled steady economic growth glob-
ally, contributing to a 2 per cent annual
increase in industrial production. Over the
decades, dramatic increases in the use
of energy from fossil fuels have enabled
unprecedented productivity growth, ac-
companied by significant, albeit unevenly
A mutually compatible
response to the dual
challenge of reducing
energy poverty and
mitigating climate
change requires a new
energy paradigm…
…with energy solutions
that mix renewables with
conventional energy in
the short and mid-term,
ultimately replacing
conventional energy in
the long term.

5CHAPTER I : RENEWABLE ENERGY TECHNOLOGIES, ENERGY POVERTY AND CLIMATE CHANGE: AN INTRODUCTION
distributed, improvements in living stan-
dards. Thus, countries that have achieved
high levels of development also present
higher levels of energy use per capita and
per unit of output than countries at lower
levels of development (Martinez and Eb-
enhack, 2008).7 At the more advanced
stages of development, economies show
a decline in the energy intensity of output
because of structural change towards
less energy-intensive service activities and
more widespread availability of more effi-
cient technologies. Nevertheless, energy
use continues to grow in the industrialized
economies, and indeed, very significant in-
creases in energy demand have been fore-
cast for the developing world (see boxes
1.1 and 1.2 below).8
Box 1.1: Energy demand and the role of RETs
Under the International Energy Agency’s (IEA) New Policies Scenario laid out in its World Energy Outlook 2010, achieving basic
universal access to energy by 2030 would require an additional 950 terawatt-hours (TWh) of electricity generation and would
mean an additional generating capacity of 250 gigawatts (GW). A mix of different RETs, including extensive use of off-grid and
mini-grid applications, will be needed (380TWh on-grid, 400TWh via mini-grids and 172TWh via off-grid applications). Develop-
ing countries would require most of this additional electricity generation because, under the scenario, energy poverty will remain
more or less a developing-country problem by 2030. The main problem regions are sub-Saharan Africa (which would require an
additional 462TWh), India (requiring 245TWh) and other parts of Asia (requiring 221TWh).
Source: UNCTAD, based on IEA (2010).
Box 1.2: Africa’s energy challenge
With 5 per cent of global primary energy use and 15 per cent of the world population, per capita energy consumption in Africa is
only a third of the global average. Nearly half of the current energy use is traditional biomass, a major cause of health problems
and deforestation. In 2009, 657 million Africans relied on traditional biomass and 587 million people lacked access to electricity.
Limited and unreliable energy access is a major impediment for economic growth. In the coming decades the energy mix will
have to change to modern fuels, the per capita energy use will increase and the population will grow much faster than the global
average. Together these three factors will put tremendous pressure on future African energy supply.
Energy access is an important issue directly related to income and poverty. Access to modern energy rises from virtually zero for
the lowest income quintile to 70-90 per cent for the highest income quintile (Monari, 2011). Access can be split into two types:
access to electricity for residential and commercial use and access to modern cooking fuels.
Adequate electricity provision is a challenge for industry and policy makers. Between 1990 and 2005, the poor performance of
the power infrastructure retarded growth, shaving 0.11 per cent from per capita growth for Africa as a whole and as much as
0.2 per cent for Southern Africa (Foster and Briceno-Garmendia, 2010). In sub Saharan Africa, 30 out of 48 countries experi-
ence daily power outages. These cost more than 5 per cent of gross domestic product (GDP) in Malawi, Uganda and South
Africa, and 1-5 per cent in Senegal, Kenya and Tanzania (Foster and Briceno-Garmendia, 2010). Diesel generators are used to
overcome outages and more than 50 per cent of power generation capacity in countries such as the Democratic Republic of
Congo, Equatorial Guinea and Mauritania and 17 per cent in West Africa is based on diesel fuel. The resulting generation cost
can easily run to $400 per megawatt-hour (MWh). Reliable, affordable, low cost power supply is needed for economic growth.
Renewable energy can play an important role in filling this gap.
The International Renewable Energy Agency (IRENA) estimates that Africa spends about $10 billion per year on the power
sector: $2.27 billion for grid extension, $4.59 billion for grid supply, $1.37 billion for off-grid renewable electricity, $1.07 billion
for policy/regulation and $0.76 billion for efficient use of electricity (Monari, 2011). What would be needed is an investment of
$40.6 billion per year, consisting of $26.6 capital expenditure and $14.0 billion operation and maintenance. This implies a qua-
drupling of investments. Annual capacity additions would need to rise to 7 GW per year. The most remarkable feature of African
energy systems is the fact that the continent exports 40 per cent of the energy it produces. This is largely oil and gas that is ex-
ported from the North and West African countries. As such, energy scarcity is not an issue for Africa as a whole. The problem is
the uneven distribution of the resource and the fact that the indigenous population is too poor to afford commercial fossil energy.
Source: IRENA (2011), forthcoming.
Very significant
increases in energy
demand have been
forecast for the
developing world.

6 TECHNOLOGY AND INNOVATION REPORT 2011
Energy consumption can have a variety
of impacts on productivity, depending
on the level of development of countries.
In countries at more advanced levels of
industrialization, increased availability of
high-quality9 energy generally allows great-
er use of advanced machinery and trans-
port equipment, which raises labour pro-
ductivity. Better quality energy supply also
allows a reduction in the amount of capital
needed to ensure back-up capacity (e.g.
individual generators).10 Improving the reli-
ability of energy supplies for electricity for
lighting and for the operation of informa-
tion and telecommunications equipment in
developing countries is therefore expected
to have an immense positive impact on the
quality of life. Access to energy will also
help promote the implementation of sever-
al Millennium Development Goals (MDGs),
especially those relating to education and
health, with commensurate positive impli-
cations for the greater availability of human
resources for productive activities.11
2. A climate changeperspective
Use of conventional energy sources (pri-
marily fossil fuels) are believed to have led
to a rise in GHG emissions and to a result-
ing increase in global average temperatures
since the mid-twentieth century (IPCC,
2008). The fundamental conclusions of the
most recent assessment report of the IPCC
are that climate change is the result of hu-
man activity, that the ongoing rate of cli-
mate change will have devastating effects if
left unchecked, and that the costs of action
for mitigation and adaptation would be sig-
nificantly lower than the costs of inaction.12
Along the same lines, the Stern Review on
the Economics of Climate Change13 has
estimated that the cost of climate change
would amount to a loss of at least 5 per
cent of global GDP per annum, and could
even reach 20 per cent, while actions to
counter the worst effects of climate change
could cost about 1 per cent of global GDP
(2 per cent in more recent updates) (Stern,
2007). It has also been argued that the ef-
fects of climate change, if left unchecked,
could become a threat to global peace and
security.14
Dubbing climate change as a global market
failure, these reports present various pro-
posals for emission reductions (discussed
in chapter IV of this TIR). The contentious
issue here is the perceived divide between
the interests and obligations of developed
and developing countries. The latter believe
that developed countries—the source of
most of the past and current emissions of
GHGs — should act first and bear most of
the costs of reducing GHG emissions. The
varying levels of historical responsibility of
different countries for the climate change
problem, as well as the extreme differences
in the financial capacities of countries have
also led to discussions at the global level
on who should bear the major costs of cli-
mate change mitigation efforts. Additionally,
mechanisms and incentives for greater pri-
vate sector involvement – including tech-
nology transfer through the Clean Devel-
opment Mechanism (CDM), carbon credits
and tradable emission certificates – have all
proven to be rough terrain in international
negotiations.
Nevertheless, these debates have given a
much-needed impetus to international dis-
cussions on RETs and how they could help
to resolve the dual needs of reducing en-
ergy poverty and mitigating climate change.
Several discussions on how to make rel-
evant technologies and finances available
for RETs have been taking place in the in-
ternational debates on climate change. At
the same time, the development of green
businesses and the concept of the green
economy have both emerged as possible
effective responses for mitigating climate
change.
3. A developmental perspective
The extent to which energy policies can
accommodate new incentives and mecha-
nisms to promote low-carbon growth tra-
jectories will be different for each country
depending on its stage of development.
Industrialized countries maintain high living
standards and consumption patterns that
Energy consumption
can have a variety of
impacts on productivity,
depending on the level
of development of
countries.
The ongoing rate of
climate change will have
devastating effects if left
unchecked.

7CHAPTER I : RENEWABLE ENERGY TECHNOLOGIES, ENERGY POVERTY AND CLIMATE CHANGE: AN INTRODUCTION
have been dependent on high absolute
and per capita levels of carbon dioxide
(CO2) emissions. They present the largest
potential for quick reductions of carbon
emissions through changes in consump-
tion patterns.15 Industrialized countries
could potentially improve the technology
mix of their energy generation policies by
making RETs more widely available in their
countries and with relatively greater ease.
These changes are already being wit-
nessed in several European economies,
such as Denmark, Germany, Spain, and
the United Kingdom.
Larger developing countries, such as China
and India, could also benefit from gradual
efforts to reduce the carbon intensity of
their economies, especially as they push
ahead with industrial development over the
next decade. RETs have a clear role to play
in this development. A priority in this regard
will be to identify strategies to weaken the
association between the increase in GDP
per capita and carbon emissions.
The LDCs present levels of energy inten-
sity of output that are close to the world
average, although their GDP per capita is
around seven times lower than the world
average. Given that they are particularly af-
fected by energy poverty (see section B.4
below) and that they still produce low levels
of GHG emissions, along with the fact that
they have not contributed in any significant
way to the historical build-up of GHG con-
centrations in the atmosphere, the main
contribution of the LDCs to the rebalancing
of the world’s energy system should be as
beneficiaries, that is, through the provision
of modern energy services to those that
currently lack them. This should be done in
a way that relies as much as possible on
RETs or other low-carbon-intensive tech-
nologies. Although this may not be prac-
ticable or cheaply available in every case,
it is important that all developing countries
including LDCs, embark on a transition to a
low-carbon economy as soon as possible.
In the absence of this, their future growth
strategies will get locked into high-carbon
technologies that must become obsolete in
the short to medium term if climate change
on a catastrophic scale is to be avoided.
An example of this is China, whose own
industrial development has been enabled
by large investments into coal plants made
some decades ago. Despite China’s exten-
sive shift towards RETs, the coal plants will
take some more decades to become ob-
solete.
4. An equity and inclusiveness perspective
Substituting or complementing conven-
tional energy sources with RETs in order to
promote greater access to energy raises
all the issues that are currently prevalent in
the context of energy poverty and devel-
opment. Will such a new energy paradigm
that envisages a greater role for RETs be
able to create more employment? Will it be
applicable in remote rural areas which are
hard to connect to the conventional energy
grid? Will it be applicable and easy to use
by individual users, but at the same time
have the potential for scale-up within enter-
prises, firms and sectors? Would it alleviate,
at least partially, the difficulties faced by vul-
nerable social groups affected by poverty
(e.g. rural populations, women, children
and indigenous groups) so that they can
devote more time and attention to income-
generating activities?
A significant aspect of renewable energy
use is the possibility of devising semi-
grid or off-grid rural installations that
promote greater access to energy in de-
veloping countries than that provided by
conventional energy sources which rely
extensively on grid connections. This flex-
ibility enables the better consideration of
demand-side requirements in designing
renewable energy solutions. For instance,
the solar supply heating systems or solar
lamps that can be used in rural areas for
electrification can improve the quality of
life in contexts where on-grid solutions are
currently not possible.16 Of the 1.4 billion
people not connected to electricity grids
globally, approximately 85 per cent live in
rural areas where technologies such as so-
lar pumps, solar photovoltaic installations,
All developing countries
including LDCs, should
embark on a transition to
a low-carbon economy
as soon as possible.
Of the 1.4 billion people
not connected to
electricity grids globally,
approximately 85 per
cent live in rural areas.
8 TECHNOLOGY AND INNOVATION REPORT 2011
small wind, mini-hydro and biomass mini-
grids offer high potential and cost advan-
tages over traditional grid extension (IEA,
2010, chapter 8). As a result, when pitted
against the current state of underdevel-
oped energy infrastructure in developing
countries, RETs could help to reduce en-
ergy poverty in many novel ways, and at
the same time also reduce social inequali-
ties through the creation of new jobs in the
application processes of RETs. Therefore,
national strategies for RET development,
production, adaptation and use in devel-
oping countries need to be well integrated
into policies for industrial development and
poverty reduction.
From an equity perspective, subsidies have
had a significant distorting effect on con-
ventional fuels versus RETs and biofuels.
Developing countries still allocate a signifi-
cant amount of their financial resources to
subsidize conventional fuels. In 2009, sub-
sidies amounting to $312 billion were spent
on fossil fuel energy worldwide, but mainly
by developing countries,17 compared with
$57 billion spent worldwide on subsidies
for RETs and biofuels (IEA, 2010).18 It is es-
timated that a gradual phase-out of these
subsidies between 2013 and 2020 could
reduce global primary energy demand by
5 per cent, oil demand by 4.7 million bar-
rels/day and CO2 emissions by 5.8 per
cent by 2020 (IEA, 2009 and 2010). While
the distributional effects of this reduction
in fossil fuel subsidies need to be fully ana-
lysed, it is generally acknowledged that in
most countries it is the middle and higher
income groups that benefit the most from
fossil fuel subsidies. Therefore, a gradual
transfer of subsidies from fossil fuels to
RETs, particularly if these are applied to re-
ducing energy poverty, is likely to improve
both equity and efficiency. A phasing out
of subsidies in ways that target the middle
and higher income groups in all countries,
while protecting the lower income groups,
could also be desirable depending on the
situation in each country. These options
and the accompanying issues are dis-
cussed in greater detail in chapter V of this
Report.
C. ENERGY POVERTY AND GREENER CATCH-UP: THE ROLE OF TECHNOLOGY AND INNOVATION POLICIES
In much of the industrialized world, issues
relating to climate change have begun to
revolve around the notion of the “green
economy”. Still very much an evolving con-
cept, the green economy can be defined as
economic development that is cognizant of
environmental and equity considerations
and promotes the earth’s environment
while contributing to poverty alleviation. As
a recent report by a Panel of Experts to the
United Nations Conference on Sustainable
Development (UNCSD) notes, the concept
has gained currency in the light of the re-
cent multiple crises that the world has seen
(climate, food and financial) as a means to
promote economic development in ways
that “…will entail moving away from the
system that allowed, and at times generat-
ed, these crises to a system that proactively
addresses and prevents them” (UN/DESA,
UNEP and UNCTAD, 2010: 3). How far this
can actually be made to happen in an inclu-
sive way is still much debated. The “green
economy” and “clean energies” agenda are
very appealing to most developed coun-
tries but are viewed with skepticism and
concern by developing countries. The over-
whelming policy consideration for develop-
ing countries is whether such an agenda of-
fers the hope of an adequate energy supply
at reasonable costs to jump-start industrial
development and structural change, while
at the same time promoting the shift to a
low-carbon, sustainable development path.
They are also concerned about the potential
use of the green agenda as an instrument
of trade protectionism. To ease the linger-
ing concern, the transition of developing
countries to the green economy must be
supported through finance and investment,
technology transfer and other supportive
measures (see Chapter IV). Issues of tech-
nological change and innovation capacity
therefore need to be at the forefront of this
When pitted against
the underdeveloped
energy infrastructure in
developing countries,
RETs could help to
reduce energy poverty
in novel ways.
The overwhelming
policy consideration for
developing countries
is whether such an
agenda offers the hope
of an adequate energy
supply…to jump-start
industrial development.
9CHAPTER I : RENEWABLE ENERGY TECHNOLOGIES, ENERGY POVERTY AND CLIMATE CHANGE: AN INTRODUCTION
discourse and this TIR seeks to contrib-
ute to new policy insights in this extremely
complex area. In the absence of such a
focus, the transition to the green economy
and strategies for sustainable development
which seek to promote greater use of RETs
are likely to be constantly undermined by
the lack of technological and innovation
capabilities, which are required not only for
research and development (R&D) and inno-
vation of new RETs, but also for adaptation,
dissemination and use of RETs.
1. Towards technologicalleapfrogging
Only a limited number of developing coun-
tries (e.g. Brazil, China and India) are steadi-
ly making their mark as developers of RETs
and their firms are gaining significant mar-
kets in renewables globally (as discussed
in chapter III). Some studies and authors
have also noted that expertise in develop-
ing countries has been concentrated to a
large extent in less technology-intensive
RETs such as biofuels, solar thermal and
geothermal. Many of these countries ei-
ther have existing expertise, or stand good
chances of developing such expertise and
of becoming competitive exporters of such
technologies. Furthermore, in the case
of China and India, the sizeable domestic
markets have been springboards for export
success, driven, as in the member countries
of the Organization for Economic Co-oper-
ation and Development (OECD), by ambi-
tious domestic targets for renewable ener-
gy generation. For instance, China installed
16.5 GW of domestic wind power capacity
in 2010 – more than any other country and
more than three times the amount installed
in the United States (Ernst & Young, 2011).
India ranked third with a capacity addition
of 2.1 GW (Balanchandar, 2011).
The obvious question for other developing
countries, and for the global community as a
whole, is whether the capabilities in renew-
able energy technologies demonstrated by
the BRICS (Brazil, the Russian Federation,
India, China and South Africa) represent
special cases. To some extent they do: the
prerequisites for competitive production of
many RETs are a workforce with advanced
technical training, supporting industries and
services in the high-tech areas, access to
finance, ample government assistance and
a large domestic market, all of which would
seem to favour larger emerging develop-
ing countries over smaller, poorer develop-
ing countries and LDCs. In all developing
countries, promoting technological learning
and innovation has remained a challenge
historically. The successes of China, India
and other emerging economies shows that
public support, political will and concerted
policy coordination are key to promoting
technological capabilities over time. Great-
er support for education (especially tertiary
education) and for the development of small
and medium-sized enterprises, and finan-
cial support for larger firms as well as pub-
lic sector research are all important. In the
case of RETs too, the most relevant lesson
from both China and India is the importance
of constant policy support by governments
for the promotion of RETs. However, there
are other factors that also need to be con-
sidered when extrapolating from the more
advanced developing countries. China, for
example, may be heavily investing in RETs,
but it has already experienced significant
economic growth and industrial develop-
ment through investment in conventional
energy, which explains much of its global
economic competitiveness today.
Lastly, most RETs are still developed and
held by industrialized countries. As a result,
there is a tendency for firms in developing
countries, which are largely technology fol-
lowers in this field, to underinvest or they
have difficulties in accessing technologies
and related know-how from abroad and in
learning how to use it effectively. Most pro-
ponents of the leapfrogging argument tend
to argue that since technologies are already
available, they can be used at marginal
costs by developing countries and LDCs to
simply circumvent being “locked into” the
conventional, resource-intensive patterns
of energy development. Leapfrogging is
also possible, it is claimed, because RETs
can contribute to building new, long-term
infrastructure, such as transport and build-
Only a limited number
of developing countries
are steadily making their
mark as developers of
RETs.
The most promising way
to promote leapfrogging
through RETs would
be to integrate them
holistically as part of
the technology and
innovation policy
framework.
10 TECHNOLOGY AND INNOVATION REPORT 2011
ings, in ways that promote cogeneration of
technologies (Holm, 2005).19 This Report
suggests that the most promising way to
promote leapfrogging through RETs would
be to integrate them holistically as part of
the technology and innovation policy frame-
work of countries.
2. The crucial role of technology and innovation policies
Technology and innovation policies can
promote and facilitate the development,
acquisition, adaptation, deployment and
use of RETs to support sustainable devel-
opment and poverty reduction in develop-
ing countries and LDCs. Although many of
the RETs needed in order to meet a larger
share of the global energy demand already
exist, or are on the verge of commercial-
ization (IPCC, 2008), the knowledge and
technological capabilities required for their
transfer to developing countries and LDCs
are not easily accessible. The costs and
possibilities of making these technologies
available and adapting them to local con-
texts in developing countries and LDCs are
also unclear. Developing countries will need
to strengthen their innovation systems20
through innovation policy frameworks that
foster capacity and linkages to enable
wider RET dissemination and to promote
a greener catch-up process. International
support to developing countries through
various channels will be essential for this ef-
fort, including financial support and North–
South, South–South and triangular coop-
eration, and effective technology transfer
mechanisms. All of these will be necessary
complements to the development of local
capacities for RETs.
The advantages of using RETs will not ac-
crue automatically. The untapped opportu-
nities offered by already developed tech-
nologies and the unprecedented amount
of information and knowledge are neither
directly nor easily available. Not only are
strong domestic technology and innovation
policies needed, but also greater interna-
tional support is required to make the inter-
national trade and intellectual property re-
gime more supportive of the technological
needs of developing countries and LDCs.
Promoting greater access to RETs and sup-
port for use and adaptation of these tech-
nologies through all means possible will
be important for developing countries to
sustainably integrate these processes into
efforts aimed at capital formation and trans-
formation of their productive structures.
This TIR identifies five distinct issues that
stand out in the debates on technology
and innovation in RETs that are of particu-
lar relevance to developing countries and
LDCs. First, structural transformation that
supports the economic development of
countries relies strongly on the growth of
national technological capabilities. Wider
dissemination and use of RETs can be a
valuable part of their overall industrializa-
tion effort. The lack of energy is a constraint
that applies not only to the manufacturing
sector, which in most low-income countries
is nascent, but also to other sectors that
are potentially important to the process of
industrialization and development, such as
services, tourism and agricultural process-
ing, which depend on reliable, high-quality
power supply. It is therefore important to
recognize that energy security and techno-
logical capabilities have a virtuous relation-
ship: energy security is a key aspect of the
physical infrastructure that promotes enter-
prise growth in the early stages of structural
change, and technological capabilities are
a fundamental prerequisite for greater ad-
aptation and use of RETs within domestic
economies.
Second, incoherent, and often conflicting,
policy developments at the multilateral level
tend to adversely affect national aspirations
for technological empowerment in develop-
ing countries in this highly complex terrain
(see chapter IV). Although climate change
will affect all countries and communities
worldwide, developing countries (especially
LDCs in Africa and South Asia) will shoul-
der a disproportionate burden from the fall-
out resulting from climate change, includ-
ing increasing climatic variations, extreme
weather events and natural disasters. The
ongoing debates on climate change reflect
Developing countries will
need to strengthen their
innovation systems…
… to enable wider RET
dissemination and to
promote a greener
catch-up process.
Energy security
and technological
capabilities have a
virtuous relationship.

11CHAPTER I : RENEWABLE ENERGY TECHNOLOGIES, ENERGY POVERTY AND CLIMATE CHANGE: AN INTRODUCTION
the diverse positions of countries on how
the burden should be shouldered.
Third, the issue of greater transfer of cli-
mate-friendly technologies that has been a
key element in the global debate on climate
change is intricately linked to technology
and innovation infrastructures in countries.
The UNFCCC has repeatedly called on de-
veloped countries to take steps to promote
the transfer of technology to developing
countries, and technology issues will remain
a key component of the Conference of the
Parties’ work within the framework of the
UNFCCC for years to come. Noting this, the
Bali Action Plan called for greater attention
to “technology development and transfer to
support action on mitigation and adapta-
tion”, including the consideration of “effec-
tive mechanisms and enhanced means for
the removal of obstacles to, and provision
of financial and other incentives for, scal-
ing up of the development and transfer of
technology to developing country Parties in
order to promote access to affordable en-
vironmentally sound technologies”.21 In the
renewable energy sector, recent evidence
shows that basic approaches to solving
technological problems have long been off-
patent, and therefore can be adapted and
disseminated in developing countries pro-
vided that some technological prerequisites
are met. This points to the need for greater
attention to strengthening the technological
absorptive capacity of countries through
coordinated policy support, in addition to
making existing technologies available and
aiding in their greater diffusion.
Fourth, RETs will remain a distant goal as
long as they are prohibitively expensive.
Governments need to intervene through
the design of appropriate regulations and
innovation policies to promote public and
private financial investment in RETs, and
to ensure the wider use of RETs across all
productive sectors of the economy. Innova-
tion in RETs is moving at a fast pace glob-
ally, but left on its own, or left to the “mar-
ket”, it is unclear to what extent this pace
will continue globally and to what extent it
will lower the prices of these technologies
for use at the individual household and firm
level in the medium term. Governments in
developing countries will need to encour-
age a broader focus on RETs that ranges
from use, to adaptation, to production and
innovation, in collaboration with the private
sector and users.
Finally, RETs form part of the wider debate
on emerging patterns of investment and
technology that fall under the umbrella of
the green economy. At a fundamental level,
the concept of the green economy itself
has been highly contested. Some argue
that calling for large-scale investments in
developing countries to facilitate the tran-
sition to green economy imposes uneven
costs, thereby creating an additional bur-
den on already disadvantaged groups of
people. The challenge is to ensure that the
green economy concept, which will also be
the focus of the Rio-Plus-20 Framework,
is structured in a way that it does not ad-
versely affect ongoing productive activities
in developing countries, while helping their
transition to “green” modes of develop-
ment. Numerous issues will need to be ad-
dressed in this context, including patterns
of trade, technological upgrading and spe-
cialization.
Analyzing these five issues at length, this
Report argues that there are numerous
benefits of RETs for developing countries.
The potential impacts of RETs in terms of
reducing energy poverty, generating em-
ployment and creating new production and
innovative activity add to their environmen-
tal advantages. Several established RETs
have significant potential to contribute to
a broad range of development goals. It is
beyond the scope of this Report to ad-
dress the whole range of policy implications
of all RETs in the very different contexts of
the various categories of developing coun-
tries. It therefore focuses on those that are
(a) already mature enough to make practi-
cal contributions to policy objectives in the
short term, but are sufficiently recent in their
commercialization to present challenges
with which policymakers may be less fa-
miliar, and (b) particularly appropriate to the
Governments in
developing countries
need to encourage
a broader focus on
RETs that ranges from
use, to adaptation,
to production and
innovation.

12 TECHNOLOGY AND INNOVATION REPORT 2011
objective of reducing and eventually elimi-
nating energy poverty in developing coun-
tries as complements (and eventually sub-
stitutes) to conventional energy sources.
The two subsections below define the key
terms and present the structure of this TIR.
3. Definitions of key terms
Two important terms that need to be ex-
plained clearly at the outset are energy pov-
erty and renewable energy technologies.
These terms are discussed below, based
on widely accepted definitions of the con-
cepts.
a. Energy poverty
According to a commonly used definition,
energy poverty implies lack of access to
modern energy services, which includes
lack of household access to electricity and
clean cooking facilities (i.e. clean cook-
ing fuels and stoves, advanced biomass
cooking stoves and biogas systems) (see
AGECC, 2010; IEA, 2010). It has been esti-
mated that access to 100 kWh of electricity
and 100 kilograms of oil equivalent (kgoe)22
of modern fuels per person/year represent
the minimum level defining energy poverty
(IEA, 2010). By implication, anything below
this level would amount to energy poverty.
Other criteria for defining of energy poverty
relate to the extent of availability of elec-
trical and mechanical power for income-
generating activities, supply reliability (for
households as well as for enterprises) and
affordability.
In its report, the AGECC (2010) defines its
proposed goal of achieving universal en-
ergy access as “access to clean, reliable
and affordable energy services for cooking
and heating, lighting, communications and
productive uses”. This definition goes be-
yond the basic human needs that would be
covered by the IEA’s minimum threshold of
100 kWh plus 100 kgoe of modern fuels; it
also includes access to electricity, modern
fuels and other energy services to improve
productivity in areas such as agriculture,
small-scale industry and transport. It is this
broader definition of energy poverty that is
adopted and in this TIR, along with a dis-
cussion of the related issues.
The rationale for this choice is not based
on the view that the benefits of ending en-
ergy poverty in its most restricted definition
would be modest. On the contrary, as ar-
gued earlier, very significant gains in terms
of health, education, gender equality and
income generation could be expected from
the provision of basic electricity for lighting,
for the use of information and communica-
tion technologies (ICT), for health care, and
for cooking. However, the truly transfor-
mative effects of the availability of modern
forms of energy only manifest themselves
when energy can be applied to economic
activity on a significant scale so that it con-
tributes to improving livelihoods in such a
way as to change economic structures and
relationships, even if only at the local level.
Access to energy has long-term effects
when it has a direct impact on livelihoods
and revenue generation in addition to im-
proving living standards. Such impacts can
be ensured by enhancing the productivity
of an existing production process or by en-
abling new lines of activity that will gener-
ate employment and local demand. This
can happen by freeing labour from subsis-
tence activities so that it can be employed
in higher value-added ones which generate
surplus that can be saved and invested,
or by enabling the operation of even small
industries for serving local markets, usu-
ally beginning with the transformation of
agricultural products. It is only when en-
ergy services enable larger scale economic
undertakings and greater cooperation be-
tween economic actors, as well as broad-
ening the reach and hence the efficiency of
markets that they become drivers of long-
term development.23
b. Renewable energytechnologies
RETs are diverse technologies that convert
renewable energy (RE) sources into usable
energy in the form of electricity, heat and
fuel. And because some of them can be de-
ployed for many different applications, they
can play a significant role in diverse situa-
Very significant gains
in terms of health,
education, gender
equality and income
generation could be
expected from the
provision of basic
electricity.
The truly transformative
effects of modern forms
of energy only manifest
themselves when energy
can be applied to
economic activity on a
significant scale.
13CHAPTER I : RENEWABLE ENERGY TECHNOLOGIES, ENERGY POVERTY AND CLIMATE CHANGE: AN INTRODUCTION
tions. Simply put, renewable energy refers
to energy generated from naturally replen-
ishable energy sources (box 2.1 of chapter
II). The main types of RETs include hydro-
power, bioenergy (biomass and biofuels),
solar, wind, geothermal and ocean energy.
Currently, the so-called second generation
RETs, including solar energy in its various
forms (photovoltaic, heating and thermal
or concentrated), wind power technologies
and several modern forms of biomass use
technologies (particularly biogas digesters),
are the ones that are registering the fastest
deployment growth rates in both developed
and developing countries, and their upfront
costs are declining fast (REN 21, 2010).
These technologies can be applied in a
broad range of development contexts and,
in particular, demonstrate significant po-
tential for application in rural as well as ur-
ban areas in developing countries through
small-grid and non-grid systems (ESMAP,
2007; REN 21, 2010). Accordingly, most of
the information and discussion in this Re-
port is presented mainly from the perspec-
tive of the implications of wind, solar and
modern biomass RETs for development,
although this does not preclude consid-
eration of other forms of RETs in specific
contexts in developing countries. There are
social costs and consequences associated
with some RETs such as large hydro and
biofuels (see chapter II). The Report recog-
nizes that countries are faced with impor-
tant trade-offs when making development
choices. Some of these trade-offs may be
very complex, and require consideration of
how best to address them in specific na-
tional socio-cultural contexts.
D. ORGANIZATION OF THE REPORT
Following this introduction, chapter II de-
scribes current technological trends in
renewable energies, tracing trends in de-
velopment and use across a broad range
of RETs. The chapter examines ways in
which RETs could potentially complement
traditional sources of energy in develop-
ing countries based on their varied tech-
nological characteristics. It also describes
the declining costs of use of some RETs,
and highlights the technological progress
that makes them more cost competitive.
Using several examples from developing as
well as developed countries, the case for
broader applicability of such technologies is
presented.
Chapter III presents the framework for tech-
nology and innovation in the context of RETs.
The presence or absence of the elements of
the framework will determine the ability of
developing countries to harness the potential
of RETs as an engine of sustainable devel-
opment. It presents the mutually dependent
relationship between countries’ technology
and innovation capacity and the wider dis-
semination and use of RETs, and analyses
the role of interdependent factors. Chapter III
argues that there is a need for greater policy
intervention and support within countries as
part of their innovation policy frameworks to
promote the innovation, production, use and
diffusion of RETs, thereby harnessing energy
solutions for sustainable development pro-
cesses. Such deliberate policy actions taken
in technology and innovation policy frame-
works will help to: (a) integrate RETs within
the socioeconomic development strategies
of countries; and (b) provide the requisite na-
tional parameters that are necessary to fos-
ter technological absorption capacity. These
actions will increase the demand for RETs in
developing countries and LDCs creating the
requisite economies of scale in use and dif-
fusion that are required at the global level to
drive down the prices of these technologies.
Apart from a reduction of energy poverty,
the chapter argues for a need to clearly inte-
grate use of RETs into strategies for poverty
reduction and job creation, especially for the
more economically vulnerable groups in de-
veloping countries and LDCs.24
Chapter IV analyses four important policy
challenges related to climate change and
renewable energy technologies in the in-
ternational policy context. These are: (i) the
need for a new international narrative that
focuses on energy, (ii) financial support for
RETs within the international architecture on
The main types of RETs
include hydropower,
bioenergy (biomass and
biofuels), solar, wind,
geothermal and ocean
energy.
RETs can be applied
in a broad range of
development contexts
and, in particular, have
significant potential for
application in rural areas.

14 TECHNOLOGY AND INNOVATION REPORT 2011
climate change, (iii) technology transfer, and
(iv) intellectual property rights (IPRs). These
issues have been, and remain, central to
all debates and decisions of the UNFCCC
and the Kyoto Protocol. Many of these dis-
cussions refer to environmentally sustain-
able technologies or clean technologies,25
of which RETs form a subset. Developing
countries will need greater international
support to promote technology and inno-
vation capacity for RETs, which needs to be
factored in as an urgent priority in the in-
ternational negotiations and developments.
Noting the limitations of the ongoing inter-
national negotiations to deal with the impor-
tant issue of promoting RETs, the chapter
stresses the need for a new international
approach to energy that factors in techno-
logical issues related to RETs more robustly
in the climate change negotiations and the
Rio-Plus-20 framework. It makes concrete
suggestions on how the international policy
framework could support the use of RETs
through financing, technology transfer and
favourable treatment of IPR issues. Each
of these issues are examined in terms of
key international developments and the
main hurdles that remain to be overcome
in order to ensure that the international dis-
course on these issues serves the needs of
science, technology and innovation (STI) for
RETs development in developing countries.
Chapter V presents elements of a national
integrated innovation policy framework for
RETs to promote simultaneously the dif-
fusion and use of RETs, as well as their
production and innovation, as applicable
in different developing-country contexts. It
considers ways of mobilizing much-needed
investment, and the roles of public and pri-
vate finance in meeting those needs. Many
of the policy incentives discussed in this
chapter have been used more widely in the
industrialized countries, and there has been
an increasing level of use and experimen-
tation in developing countries. With this in
mind, the analysis seeks to focus the dis-
cussion on the developing-country context
as much as possible.

15CHAPTER I : RENEWABLE ENERGY TECHNOLOGIES, ENERGY POVERTY AND CLIMATE CHANGE: AN INTRODUCTION
NOTES
1 The UNFCCC was conceived at the United Nations Confer-ence on Environment and Development in 1992. The Con-vention aims to reduce greenhouse gases (GHGs) in an ef-fort to mitigate climate-change-related effects on the earth’s atmosphere. UNFCCC is also the name of the United Na-tions secretariat that is in charge of implementing the treaty and the negotiations related to it.
2 Since the beginning of the eighteenth century, production and consumption patterns in the more developed countries have been dependent on energy provided successively by coal, oil and gas, and to a lesser extent by nuclear fission. The dramatic increases in the use of fossil energy (which, at current levels of annual consumption, is estimated to represent between one and two million years of accumula-tion) have enabled massive increases in productivity in both farming and manufacturing (Girardet and Mendoça, 2009). Such productivity growth has made possible a roughly ten-fold increase in global population over the past three cen-turies, accompanied by significant, if unevenly distributed, improvements in living standards.
3 Recent estimates suggest that developing countries will continue to bear 75–80 per cent of all environmental dam-ages caused by climate change (World Bank, 2010).
4 Coherence in this area within the United Nations system is ensured through UN-Energy, which was established as part of the follow-up to the World Summit on Sustainable Development (WSSD). UN-Energy is concerned with policy development in the energy area, and its implementation. It also maintains a database of major ongoing initiatives throughout the system based on the UN-Energy work pro-gramme at global, regional, sub-regional and national levels. The Johannesburg Plan of Implementation (JPOI), decisions taken at CSD-9, Agenda 21 and the Programme for Further Implementation of Agenda 21 serve as the basis for action on energy (see http://esa.un.org/un-energy/index.htm).
5 It is estimated that connecting each family unit will cost roughly $2,000.
6 The Intergovernmental Panel on Climate Change (IPCC, 2008) has provided estimates of increasing climatic risks and catastrophes on a global scale as a result of climate change. A more recent report by the World Bank (2010) notes that new climatic risks in hitherto unknown places are becoming common. For example, floods, once rare in Africa, are now becoming common, and the first hurricane ever recorded in the South Atlantic hit Brazil in 2004.
7 While there is a clearly established relationship between economic growth and energy consumption, the direction of causation remains controversial. Efforts to establish it by empirically employing Granger or Sims techniques offer mixed results and therefore ambiguous policy implications (see, for example, Payne, 2010). Others believe that, like good health, energy use is a contributor to, as well as a consequence of, higher incomes. Conversely, energy pov-erty is a cause as well as a consequence of income poverty (Birol, 2007).
8 For example, IEA (2010) forecasts that world energy con-sumption will increase by 49 per cent in 2035, compared
with the consumption rate in 2007 (from 495 quadrillion British thermal units (Btu) in 2007 to 739 quadrillion Btu in 2035). It also estimates that non-OECD economies will con-sume 32 per cent more energy than OECD economies in 2020 and 63 per cent more in 2035 respectively.
9 This refers to energy from sources that provide a steady supply of energy in a controlled, safe and stable manner, such as coal, oil and gas (either used directly or through the generation of electricity). These can be obtained through technically simple and low-cost processes, besides being portable and having a high energetic content (capacity to do work) per unit of mass.
10 In a study on African infrastructure, the World Bank (2009) es-timates that the losses imputable to poor quality energy supply can be as much as 2 per cent of potential growth per year as a result of outages, excessive investment in back-up capacity, energy losses and inefficient use of scarce resources.
11 Nordhaus (1994) provides a striking illustration, viewing the cost of an hour’s evening reading time in terms of the av-erage time of work that would buy the necessary means of lighting. In ancient Babylon, it took the average worker more than 50 hours to pay for that light from a sesame oil lamp. In the United Kingdom in 1800, more than six hours of work were still needed to pay for an hour’s worth of a tal-low candle. Today, in advanced economies, electricity and compact fluorescent bulbs have lowered the cost to less than a second.
12 See: http://unfccc.int/press/fact_sheets/items/4987.php.
13 Commissioned by the Government of the United Kingdom.
14 See, for example, statements by representatives of several Member States of the United Nations and by Secretary-General Ban Ki-moon at the debate of the Security Council of the United Nations on 17 April 2007. (DPI’S PRESS RE-LEASE SC/9000 OF 17 April 2007, available at http://www.un.org/News/Press/docs/2007/sc9000.doc.htm).
15 Since the populations of developed countries are also the ones that are the least vulnerable to the consequences of climate change, modifications in their consumption pat-terns need to be articulated in way that is acceptable to the general electoral public in these countries. A number of interesting proposals have been made in this regard. One is the “2000 watt (W) society” initiative of the Swiss Federal Polytechnic School in Zurich, backed by the Swiss Fed-eral Office of Energy. The proposal includes changes that would cut the average per capita energy use in the devel-oped world to 2000 watts (17,520 kilowatt-hours (kWh)) by 2050 (or 2030 in the version proposed by the Swiss Solar Society). This is roughly equivalent to the current world average for energy use, and was the level of use of a Swiss citizen in the 1960s (corresponding to one of the world’s most affluent societies at the time). It is also about one third of the current average energy use in Western Europe or one sixth of that of the United States. The pro-posal emphasizes the need for technological innovation in RETs and materials, and investment in and renovation of housing and other infrastructure, particularly transport. The “2000 watt society” could thus be achieved without

16 TECHNOLOGY AND INNOVATION REPORT 2011
compromising the levels of comfort or security obtained in current lifestyles, with the exception of individual mobility in the absence of major technological breakthroughs (see Girardet and Mendoça, 2009).
16 See discussions in chapters III and V of this report.
17 A further breakdown of this amount shows that $126 bil-lion were spent on oil subsidies, $85 billion on natural gas, $6 billion on coal gas and $95 billion on fossil fuels for elec-tricity generation.
18 The amounts spent on these subsidies vary significantly from year to year, given the volatility in oil prices.
19 Cogeneration of technologies refers to the possibility of de-veloping new (but complementary) sets of technologies in parallel.
20 An innovation system is defined as a network of economic and non-economic actors, the interactions amongst whom are critical for collaborative learning and application of
knowledge to the creation of new products, processes, or-ganizational forms, among others.
21 See section 1(d) and particularly 1(d)(i) of the Bali Action Plan, available at: www.unfccc.int/resource/docs/2007/cop13/eng/06a01.pdf
22 Or 1,163 kWh.
23 See Energy Sector Management Assistance Programme (ES-MAP, 2008) for an interesting study of approaches to maxi-mize productive impacts of access to electrification projects.
24 The importance of integrating poverty reduction in discus-sions on the green economy and RETs is becoming increas-ingly clear. For example, the UNEP defines the green econ-omy as one …”[t]hat results in improved human well-being and social equity, while significantly reducing environmental risks and ecological scarcities”.
25 “Clean technologies”, or “clean energies”, is generally a much broader concept than RETs, and includes clean coal.
REFERENCES
AGECC (2010). Energy for a Sustainable Future: Summary Report and Recommendations. New York,
United Nations, April.
Balachandar G (2011). India closely follows China, US in wind power capacity addition. Available at:
http://www.mydigitalfc.com/news/india-closely-follows-china-us-wind-power-capacity-addition-752
(accessed 8 August, 2011).
Birol F (2007). Energy economics: A place for energy poverty in the agenda? The Energy Journal, 28(3): 1-6.
Ernst & Young (2011). Renewable energy country attractiveness indices, no. 28, February, available at:
www.energy-base.org/fileadmin/media/sefi/docs/publications/EY_RECAI_issue_28.pdf.
ESMAP (2007). Technical and economic assessment of off-grid, mini-grid and grid electrification technologies.
Technical Paper no. 121/07, Washington, DC, World Bank Group, December.
ESMAP (2008). Maximizing the productive uses of electricity to increase the impact of rural electrification programs.
Technical Paper no. 332/08, Washington, DC, World Bank Group, April.
Foster V and Briceno-Garmendia C (eds.) (2010). Africa’s Infrastructure .A Time for Transformation.
A co-publication of the Agence Française de Développement and the World Bank
http://webcache.googleusercontent.com/search?hl=en&q=cache:rMN_kUGQeMQJ:http://siteresources.
worldbank.org/INTAFRICA/Resources/aicd_overview_english_no-embargo.pdf+Foster+and+Briceno-
Garmendia+2010&ct=clnk
Girardet H and Mendoça M (2009). A Renewable World: Energy, Ecology, Equality. A report for the World Future
Council. Totnes, Devon, Green Books.
Holm D (2005). Renewable energy future for the developing world. ISES White Paper, International Solar Energy
Society, Freiburg.
IEA (2009). World Energy Outlook 2009. Paris, OECD/IEA.

17CHAPTER I : RENEWABLE ENERGY TECHNOLOGIES, ENERGY POVERTY AND CLIMATE CHANGE: AN INTRODUCTION
IEA (2010). World Energy Outlook 2010. Paris, OECD/IEA.
IPCC (2008). Climate Change 2007. Synthesis Report. Geneva, Switzerland.
IRENA (2011) forthcoming. Scenarios and Strategies for Africa. IRENA-Africa High-Level Consultations on
Partnership on Accelerating Renewable Energy Uptake for Africa’s Sustainable Development. Abu Dhabi.
Martínez DM and Ebenhack BW (2008). Understanding the role of energy consumption in human development
through the use of saturation phenomena. Energy Policy, 36(4): 1430–1435.
Monari L (2011). Presentation Africa energy access challenges. IEA, Paris, 13 May 2011.
Nordhaus WD (1994). Do real output and real wage measures capture reality? The history of lighting suggests not.
New Haven, CT, Cowles Foundation for Research in Economics, Yale University, September.
Payne JE (2010). Survey of the international evidence on the causal relationship between energy consumption and
growth. Journal of Economic Studies, 37(1): 53–95.
REN21 (2010). Renewables 2010. Global Status Report. Paris, REN21 Secretariat, September.
Stern NH (2007). The Economics of Climate Change: The Stern Review. Cambridge, Cambridge University Press.
UNCTAD (2010a). World Investment Report: Investing in a Low-carbon Economy. United Nations publication, sales
no. E.10.II.D.2. New York and Geneva, United Nations.
UNCTAD (2010b). The Least Developed Countries Report 2010: Towards a New International Development
Architecture for LDCs. New York and Geneva, United Nations.
UN/DESA, UNEP and UNCTAD (2010). The Transition to a Green Economy: Benefits, Challenges and Risks from a
Sustainable Development Perspective. Report of Panel of Experts to the Second Preparatory Committee Meeting of
the United Nations Conference on Sustainable Development. New York, United Nations. Available at:
http://www.uncsd2012.org/rio20/index.php?page=view&type=400&nr=12&menu=45
UN/DESA (2011). World Economic and Social Survey 2011: The Great Green Technological Transformation.
New York, United Nations Department of Economic and Social Affairs.
World Bank (2009). World Development Report 2010 : Development and Climate Change. Washington, DC,
World Bank.
World Bank (2010). Africa’s Infrastructure: A Time for Transformation. Washington, DC, World Bank.


RENEWABLE ENERGYTECHNOLOGIES AND
THEIR GROWING ROLEIN ENERGY SYSTEMS2


21CHAPTER II : RENEWABLE ENERGY TECHNOLOGIES AND THEIR GROWING ROLE IN ENERGY SYSTEMS
CHAPTER II
RENEWABLE ENERGY TECHNOLOGIESAND THEIR GROWING ROLE
IN ENERGY SYSTEMS
A. INTRODUCTIONThe need to expand access to energy in
order to drive global growth and job cre-
ation while simultaneously producing fewer
GHG emissions is becoming increasingly
recognized. Renewable energy technolo-
gies (RETs), which can be mixed with con-
ventional energy sources, could provide
countries with varied energy options within
their national energy matrices to suit their
specific needs and conditions. Given their
enormous potential, there is growing inter-
est in the current and future role of RETs in
national energy supply systems worldwide.
The nature of RETs and their current and
possible future role are examined in this
chapter, thereby establishing the basis for
the discussions of policies relating to RETs
in the subsequent chapters.
RETs are a diverse group of technologies,
and although there are problems of inter-
mittency associated with some of them
(for example, in the provision of solar en-
ergy, where sun is available only for a lim-
ited number of hours per day), they are
very versatile in that they can be deployed
in various configurations. Therefore they of-
fer the potential to contribute significantly to
alleviating energy poverty in diverse situa-
tions. They can either be applied alone or,
often, in combination with conventional
energy technologies. They offer flexibility in
their scale of application, from very small to
very large, ranging from non-grid-based to
semi-grid and large-scale grid applications.
Because of their possibility of use in non-
grid or semi-grid applications, RETs can
be an important means of energy supply in
areas where other energy sources are not
available, such as in isolated rural commu-
nities. Such decentralized, off-grid applica-
tions of RETs are already in relatively wide
use in developing countries, where they
provide significant benefits to local com-
munities (UNCTAD, 2010). While some of
these applications are small in scale and
do not make much of an impact on energy
provision at the national/global level, they
can still play an important role in reducing
energy poverty at the local/rural level. The
benefits of decentralized applications can
be very large relative to absolute amounts
of energy provided, because the marginal
utility of the first few units of electric power
(in particular) are much higher than the mar-
ginal utility of additional units of power for
those who already have access to national
grids. In other words, the value of gaining
some access to energy and the social re-
turns from that access for a severely ener-
gy-deprived population which currently has
little or no access are likely to be very high.
Also, RETs can be configured in many ways
to provide energy on a larger scale there-
by making a sizeable contribution both to
meeting global energy needs and to miti-
gating climate change.
Countries with abundant RE sources have
considerable potential to tap into them for
augmenting national energy supply. The
most mature and widely deployed RETs
are based on hydropower, biomass, wind
and solar energy. They are also the fast-
est growing, while several other RETs are
in their early stages of development. In
most scenarios on the role of RE sources in
global primary energy supply by 2030 and
2050, three RETs are expected to make the
RETs are very versatile
and can be deployed in
various configurations.
RETs can be an
important means
of energy supply in
areas where other
energy sources are not
available, because of
their possibility of use
in non-grid or semi-grid
applications.

22 TECHNOLOGY AND INNOVATION REPORT 2011
largest contribution: modern biomass, wind
and solar (IEA, 2010a; IPCC, 2011). How-
ever, the extent of future expansion of RETs
and their contribution to global energy sup-
ply will depend partly on further technologi-
cal progress leading to greater cost reduc-
tions in their use. It will also largely depend
on national and international policy choices
in the coming years. These choices relate
to measures that level the playing field and
have to do with fossil fuel subsidies, incor-
porating externalities not currently captured
by market prices for energy by establish-
ing a price for carbon, promoting additional
investments in RETs and improving energy
infrastructure, policy support to RE tech-
nology transfer, diffusion and absorption
among countries, and ensuring effective
financing mechanisms to enable such de-
ployment, especially to the poorer develop-
ing countries and LDCs (as discussed in
chapters III–V).
Section B of this chapter starts with a dis-
cussion of the nature of RETs, their char-
acteristics and the diverse configurations
in which they can be applied, as well as
their role today and in the future as alterna-
tive sources of energy. Section C presents
trends in private and public investment in
RETs globally, and discusses the key issue
of the high costs of RETs compared with
conventional sources of energy.
B. DEFINING ALTERNATIVE, CLEAN AND RENEWABLE ENERGIES
The term “alternative energy” is generally
intended to mean alternatives to fossil fu-
els. In some reports the terms renewable
and clean energy are used interchangeably.
However, for the purposes of this report,
RETs differ from clean energy technologies
(CETs) and “alternative” energy technolo-
gies, as defined below.
CETs are usually defined as those energy-
generating technologies that have the po-
tential to reduce GHG emissions (UNEP,
EPO and ICTSD, 2010). They emit relatively
little carbon dioxide (CO2) or other GHGs,
even though they may rely on non-renew-
able inputs, require significant waste dis-
posal and/or pose the risk of “dirty” acci-
dents. A major example is nuclear power,
which is relatively clean in terms of GHG
emissions, but is based on the fission
of uranium, which is a scarce natural re-
source. Nuclear waste is also highly toxic
and difficult to store, and nuclear accidents
can lead to the spread of health- and life-
threatening radioactive materials. A nar-
rower definition of “clean energy” than the
current one might therefore exclude nuclear
energy from the group of CETs. In terms of
GHG emissions, natural gas is “cleaner”
than coal and oil. “Clean coal”, defined as
manufactured gas or liquids, or even elec-
tric power, is based on a process that in-
corporates carbon capture and storage
(CCS), and is thus much lower in net GHG
emissions than “raw” coal. Therefore, it is
also often considered to be a clean energy
source. However, CCS technologies are in-
trinsically very energy-intensive, and have
yet to be applied effectively on a large scale.
There is no universally accepted definition
of renewable energy. Broadly speaking, it is
energy derived from naturally replenishable
sources (box 2.1).1 For purposes of this Re-
port, RETs are a diverse set of technologies
that convert renewable energy sources into
usable energy in the form of electricity, heat
or fuel. The main renewable energy sources
are flowing water (hydropower), biomass
and biofuels, solar heat, wind, geothermal
heat and ocean energy.
Most of the discussion on RETs in the litera-
ture, and in this Report, relates to electricity
generation, either in central or decentral-
ized facilities. Nevertheless, transport, in-
dustry, agriculture and housing account for
a large part of global energy consumption,
and there are non-electric RET applications
in all of them, such as biofuels for transpor-
tation, space heating, hot water and cook-
ing (e.g. by solar cookers). While the world
economy appears to be electrifying slowly
but surely, it is important to bear in mind
that electrification – and access to elec-
Future expansion
of RETs and their
contribution to global
energy supply will
depend on further
technological progress…
and on national and
international policy
choices.
RETs are a diverse set
of technologies that
convert renewable
energy sources into
usable energy in the
form of electricity, heat
or fuel.

23CHAPTER II : RENEWABLE ENERGY TECHNOLOGIES AND THEIR GROWING ROLE IN ENERGY SYSTEMS
tricity – may occur in a decentralized form
which does not require the universal avail-
ability of “central” power from large plants
delivered via a “grid”.
Furthermore, there is no standard classifi-
cation of RE sources and technologies. The
IPCC (2011) categorizes them as bio-en-
ergy, direct solar, geothermal, hydropower,
ocean and wind. Bio-energy includes bio-
mass and biofuels. However, some analysts
exclude biofuels, while others categorize
biomass and biofuels separately. UNCTAD
(2010) adopts the classification used by the
International Energy Agency (IEA, 2007, an-
nex 1), which subdivides ocean energy into
waves, tides and “other”, and includes a
separate category for combustible wastes,
as well as the standard set (wind, solar, bio-
mass and geothermal) already mentioned.
This Report does not discuss large hydro-
power and biofuels in detail. Large hydro-
power is a very mature technology with
limited, short-term growth potential, except
in remote locations, but it often requires
the displacement and relocation of large
numbers of people at great social and eco-
nomic cost. In many cases, those people
are self-sufficient tribal or rural societies that
are moved away from their ancestral lands.
Large hydroelectric projects can also have
serious impacts on the ecosystem. Simi-
larly, in the case of biofuels, linkages may
not always be positive and may compete
with other needs. These will need to be bal-
anced in national contexts, taking into con-
sideration the different aspects involved.
The focus of this Report is primarily on
RETs based on wind, solar and modern
biomass sources. These are among the
most important and fastest growing RETs in
developing countries (figure 2.1 shows the
status in 2010). Much of the energy from
solar photovoltaic (PV) installations in devel-
oping countries is generated off-grid, thus
the data in figure 2.1 may be an underesti-
mation of its actual use in those countries.
Biofuels are used mostly as alternative fuels
for automobiles, trucks and buses. In ad-
dition, solar, wind, wood (as chips or saw-
dust), agricultural waste (e.g. bagasse) and
biogas can also supply primary energy for
decentralized as well as centralized electric
power generation.2
1. The growing role of RETsin energy systems
The supply of energy by RETs has risen
rapidly over the past decade, especially
since 2003 when hydrocarbon prices be-
gan surging. However, RETs (excluding
large hydro-based technologies) still ac-
count for a relatively small fraction of global
energy capacity and supply because they
started from a very small base of installed
capacity. This section discusses the current
role of RETs globally and how that role may
expand in coming decades. This is followed
by the cost issue, which will strongly influ-
ence the speed and extent of their deploy-
ment globally.
In 2008, RE sources (including large hydro
installations) accounted for 12.9 per cent of
Box 2.1: Definition of renewable energy
Renewable energy has various definitions. It has been defined as energy obtained from the continuous or repetitive cur-
rents of energy recurring in the natural environment, or as energy flows that are replenished at the same rate as they are
“used” (Sorensen, 2000).a The IPCC defines RE as any form of energy from solar, geophysical or biological sources that is
replenished by natural processes at a rate that equals or exceeds its rate of use (IPCC, 2011: 10). The rate of replenish-
ment of these sources needs to be sufficiently high for them to be considered renewable sources by energy and climate
policies. Therefore, fossil fuels (e.g. coal, oil, natural gas) do not fall under this definition. As long as the rate of extraction
of the RE resource does not exceed the natural energy flow rate, the resource can be utilized for the indefinite future, and
may therefore be considered “inexhaustible.” However, not all energy classified as “renewable” is necessarily inexhaustible
(Boyle, 2004).
Source: UNCTAD.
a This definition has been in use since the 1980s (see, for example, Twidell and Weir, 1986).
Electrification – and
access to electricity
– may occur in a
decentralized form
which does not require
the universal availability
of “central” power.

24 TECHNOLOGY AND INNOVATION REPORT 2011
global primary energy supply (IPCC, 2011),
whereas the bulk was supplied by fossil fu-
els (including oil, gas and coal). An estimat-
ed 21,325 TWh of electricity was generated
in 2010 (REN21, 2011), of which 19.4 per
cent was contributed by RE (figure 2.2),
mainly in the form of hydropower (16.1 per
cent) and primarily from large hydro installa-
tions. Nuclear power accounted for 13 per
cent of the total in 2008. The share of fossil
fuels in electric power generation increased
slightly, not only accounting for the largest
share of global energy capacity, but also
constituting the main source of electricity in
2010 at 67.6 per cent of the total (REN21,
2011).
On a global scale, therefore, modern RETs
today still supply only a small proportion of
overall energy demand, despite very rapid
growth of deployment in recent years. How-
ever, the total potential RE resources avail-
able globally are greater than total global
energy demand, implying that there is much
more potential to harness RE in the short
to medium term through full implementa-
Fossil fuels 67.6 %
Hydropower 16.1 %
Other renewables
(non-hydro) 3.3 %
Nuclear 13.0 %
Figure 2.2: Global electricity supply by energy source, 2010
Source: Reproduced from REN21 (2011).
0 100 200 300 400
Geothermal power
Solar PV
Biomass power
Wind power
Total renewable
power capacity
Gigawatts
Developing countries
Developed countries
Figure 2.1: Renewable electric power capacity (excluding hydro), end 2010
Source: UNCTAD, based on REN21 (2011).
Note: Estimates of electric power generation by solar PV installations in developing countries are from REN21 (2010). Other technologies not included in the chart, such as solar thermal power and ocean (tidal) power, present low levels of generation capacity: 1.1 and 0.3 GW respectively.
The focus of this Report
is primarily on RETs
based on wind, solar
and modern biomass
sources…the fastest
growing RETs in
developing countries.
In 2008, RE sources
(including large hydro
installations) accounted
for 12.9 per cent of
global primary energy
supply.

25CHAPTER II : RENEWABLE ENERGY TECHNOLOGIES AND THEIR GROWING ROLE IN ENERGY SYSTEMS
tion of demonstrated technologies or prac-
tices (i.e. without any new technology than
is currently being utilized).3 The availability
of RE sources may differ greatly from the
technical potential of such resources, which
is the amount of renewable energy output
that is theoretically obtainable through the
full implementation of demonstrated tech-
nologies, regardless of costs, legal or other
barriers and policy issues. The estimated
technical potential of geothermal or wind
power alone exceeded the global demand
of 2008. The technical potential of RE for
heating is also huge (IPCC, 2011). Against
this background, the question arises as to
how much of this technical potential will ac-
tually be harnessed in the future. How fast
is power generation from RE and from the
deployment of RETs growing? And what
are the barriers to their wider deployment?
In this context, the following five trends are
worthy of note.
First, the relatively modest current contri-
bution of RETs to global energy supply ob-
scures the fact that some RETs have been
growing very rapidly in recent years. During
the period 2005–2010, for example, grid-
connected solar PV technologies grew the
fastest (at an average annual rate of 60 per
cent), followed by all solar PV (49 per cent)
and biodiesel production (38 per cent).
Growth in the solar PV market accelerated
still further in 2010, with the rapid decline
in PV module prices in 2009, which made
this technology more affordable and stimu-
lated additional demand, particularly for
small-scale, distributed generation proj-
ects, such as roof-mounted PV systems
(REN21, 2010; World Economic Forum,
2011). There was also rapid growth in wind
power (27 per cent), followed by concen-
trating solar power (CSP, by 25 per cent),
ethanol production (23 per cent) and solar
hot water/heating (16 per cent). By con-
trast, hydropower and geothermal power
grew at modest rates (3–4 per cent) over
the same period (REN21, 2011). Taking lon-
ger time periods, from 1971 to 2000 wind
power grew 52.1 per cent, while solar grew
by 32.6 per cent (Aitken, 2003). However,
even with rapid deployment, it will take con-
siderable time and investment in RETs for
them to grow into major global sources of
energy.
Second, in 2009, developing countries ac-
counted for about half of all electric power
generating capacity using RETs. The elec-
tricity generating capacity from RE (exclud-
ing large-scale hydropower) in developing
countries has grown rapidly, almost dou-
bling in five years, from 160 GW in 2004
to 305 GW in 2009 (REN21, 2005; and
REN21, 2010). A detailed disaggregation
by country or region is not possible due
to data limitations; however, available data
on global installed RE capacity in 2009
provide an indication of the breakdown by
developed and developing countries. They
show that developing countries accounted
for over half (650 GW, or 53 per cent) of
the total of 1,230 GW of RE electric power
capacity (REN21, 2010: 55). China’s share
in the developing-country total was 35 per
cent (or 246 GW), while India’s was 4 per
cent (or 49 GW). The 27 countries of the
European Union (EU-27) accounted for
20 per cent of the global capacity (246 GW)
and the United States for 11.7 per cent
(144 GW). A major share of total RE capac-
ity was from hydroelectric capacity from
large-scale installations. At the end of 2010,
excluding hydropower, 94 GW (or 30 per
cent) of the renewable electric power ca-
pacity of 312 GW was located in develop-
ing countries (figure 2.1).
Third, in recent years, members of the
Group of 20 (G-20) countries have account-
ed for most of the new investment in clean
energy (part of which is RE) – reportedly
90 per cent of total investment in clean en-
ergy. China has invested particularly heavily
in RE, and is also the fastest growing RE
market. In 2010, it was the largest inves-
tor in clean energy, followed by Germany
and the United States. Brazil and India have
also been among the largest investors in
clean energy in recent years. Over the pe-
riod 2005–2010, the G-20 countries that
have expanded clean energy investment
the fastest in percentage terms included (in
descending order) Turkey (with the highest),
During the period
2005–2010, grid-
connected solar PV
technologies grew the
fastest, followed by all
solar PV and biodiesel
production.
In 2009, developing
countries accounted for
about half of all electric
power generating
capacity using RETs.

26 TECHNOLOGY AND INNOVATION REPORT 2011
Argentina, South Africa, Indonesia, China,
Brazil, Mexico and the Republic of Korea
(Pew Charitable Trusts, 2011).
Fourth, RETs have already been deployed
on a significant scale in some countries,
though this varies by region. China, for in-
stance, has the largest installed RE power
capacity of all countries, and is further in-
creasing that capacity. Over the period
2005–2010, RE capacity in China grew
106 per cent, followed by the Republic of
Korea (88 per cent), Turkey (85 per cent),
Germany (67 per cent) and Brazil (42 per
cent) (Pew Charitable Trusts, 2011).
Finally, there is an increasing trend towards
more deployment of RETs across the differ-
ent regions. The following data on installed
power capacity for wind, hydropower
and geothermal power are indicative of
recent deployment trends in RETs. Wind
power capacity at the end of 2010 was
the largest in Europe (86,075 megawatts
(MW)), followed by Asia (58,641 MW),
North America (44,189 MW), the Pacific
(2,397 MW), Latin America and the Ca-
ribbean (2,006 MW) and Africa and the
Middle East (1,079 MW) (GWEC, 2011).4
Among developing countries, China
(42,287 MW) and India (13,065 MW) have
been the clear leaders in harnessing wind
power. Among the developed countries,
the United States (40,180 MW) was only
slightly ahead of Germany (27,214 MW)
and Spain (20,676 MW). Other develop-
ing economies with significant installed
wind capacity include Turkey (1,329 MW),
Brazil (931 MW), Mexico (519 MW), Taiwan
Province of China (519 MW), the Republic
of Korea (379 MW), Morocco (286 MW),
Chile (172 MW), Costa Rica (123 MW) and
Tunisia (114 MW) (GWEC, 2011). At least
49 countries added wind power capacity
during the course of 2009 (REN21, 2010).
In Africa, there has been less deployment,
with total installed hydro RE capacity of 23
GW in 2009 (IPCC, 2011). There remains
a large untapped potential, judging by the
difference between the technical poten-
tial (i.e. potential for installed capacity) for
annual power generation and actual gen-
eration, or installed capacity. Africa has a
particularly large untapped potential (with
92 per cent of the potential undeveloped)
followed by Asia (80 per cent) and Latin
America (74 per cent) (IPCC, 2011, table
5.1). Hydropower deployment has been
extensive in both Asia and Latin America,
where installed capacity was substantial
by 2009 (402 GW and 156 GW respec-
tively). Significant increases in hydropow-
er capacity are in the project pipeline for
2011, much of it concentrated in develop-
ing and emerging economies (including
Brazil, China, India, Malaysia, the Russian
Federation, Turkey and Viet Nam) (REN21,
2010).
Geothermal deployment has been signifi-
cant in developing countries in Asia – and
is expected to increase – but much less
so in Africa and Latin America, where it is
not projected to increase much by 2015
(IPCC, 2011: table TS4.1). Nearly 88 per
cent of the total known geothermal ca-
pacity is located in seven countries: the
United States (3,150 MW), the Philippines
(2,030 MW), Indonesia (1,200 MW), Mexi-
co (960 MW), Italy (840 MW), New Zealand
(630 MW) and Iceland (580 MW) (REN21,
2010). However, some 70 countries re-
portedly had geothermal projects under
development as of May 2010, and proj-
ects are being planned or are under way in
East Africa’s Rift Valley, including in Kenya,
Eritrea, Ethiopia, Uganda and the United
Republic of Tanzania (REN21, 2010). De-
spite this, there remains huge untapped
potential to further expand their use in all
regions and in all country groups.
2. Limits of RETapplicability
RETs vary in terms of technical efficiency,
the different scales of application (from
micro to macro), the potential for combin-
ing different technologies, the potential for
off-grid use, the level of maturity, the type
of energy product (electricity, heat or fuel)
and the cost of the useful energy that they
produce. The level of maturity is important
as it has relevance for whether applications
can be customized or whether large-scale
RETs have already been
deployed on a significant
scale in some countries,
though this varies by
region.
At least 49 countries
added wind power
capacity during the
course of 2009.

27CHAPTER II : RENEWABLE ENERGY TECHNOLOGIES AND THEIR GROWING ROLE IN ENERGY SYSTEMS
deployment of pre-manufactured units is
possible. The most advanced RETs (wind
and solar) suffer from two main drawbacks.
One is the intermittent supply of energy
due to natural cycles (e.g. solar power rely-
ing on sunlight, and wind power on wind),
which presents challenges for their integra-
tion into energy systems (IPCC, 2011). The
second is high initial capital costs, given
the reluctance of banks to lend to “risky”
projects, at any scale, as they are consid-
ered as depending on “unproven” technol-
ogies. This is especially problematic if coal
or natural gas is readily available. Unfortu-
nately, for most situations, fossil-fuel solu-
tions still offer the lowest up-front costs.
A diesel generator costs about $1,000/
kilowatt (kW) of capacity, compared with
$3,000/kW to $6,000/kW for low-head hy-
dropower.5
The energy output from some RETs is vari-
able, and to some degree unpredictable,
over different time scales – from minutes
to years (IPCC, 2011). Additional R&D in-
vestment could immensely improve energy
storage technologies for wind and solar
power, and for some other energy tech-
nologies, such as batteries for electric cars,
or for use with “smart” electric power grids
(box 2.2). It could also look into increasing
the cost-effectiveness of RETs for greater
use in developing countries. Currently, such
R&D is ongoing, and some possible solu-
tions to the intermittency problem have al-
ready been demonstrated in several differ-
ent grid-connected applications. However,
resolving the technological constraints of
intermittency will become more important
as wind and solar PV technologies increase
as a share of total energy supplied through
electric grids (REN21, 2010; Eyer and Co-
rey (2010); Singer 2010). The experience of
several OECD countries shows that inter-
mittency becomes a major issue for inte-
gration of wind power into energy systems
at around the point where RE accounts for
20 per cent of total average annual elec-
trical energy demand (IPCC, 2011). Below
this threshold intermittency is less of an is-
sue: at low rates of wind (or solar) penetra-
tion, intermittency may be managed by rely-
ing on a mix of REs along with conventional
sources. In general, the integration chal-
lenges associated with RE are contextual,
site-specific and complex (IPCC, 2011). In
situations where RETs are expected to sup-
ply a share greater than 20 per cent of the
total energy generated, problems of inter-
mittency will need to be resolved through
the development of local storage capability
and/or grid connections.
The successful integration of intermittent
energy sources on a large scale in the future
may require the development of “smart”
electric grids that can better accommodate
REs (box 2.2).
Box 2.2: Developing “smart grids” to better integrate RE sources into energy systems
The electric power grid is a network of generating plants, cables, switches and transformers that form the transmission and
distribution systems for electricity. The transmission system delivers electricity from power plants to substations, while the dis-
tribution system delivers electricity from substations to consumers. The grid can also include many smaller local networks. Both
Europe and the United States are actively considering how to upgrade existing electric power grids into “smart grids”.
In essence, a “smart grid” is a modernized electric grid with an improved ability to integrate intermittent energy sources, and to
efficiently manage all the different types of energy sources that feed into the grid in order to efficiently meet variations in electricity
demand throughout the day. It would facilitate the integration of small RE generators, such as solar PV home systems, as well
as larger RE sources such as onshore and offshore wind farms and solar power plants. The network would be “smart” in the
sense of delivering both reactive and interactive capabilities in transmission and distribution. It would integrate digital informa-
tion technology into regional and local electricity distribution networks, thereby making the electric grid more reliable, resilient
and secure. It would also enable better demand management and energy-efficiency gains by consumers and businesses, and,
incidentally, facilitate the large-scale deployment of electric vehicles.
Sources: UNCTAD, based on Eyer and Corey (2010); Singer (2010); Pollin, Heintz and Garrett-Peltier (2009) and various press
reports.
Additional R&D
investment… could
look into increasing the
cost-effectiveness of
RETs for greater use in
developing countries.
28 TECHNOLOGY AND INNOVATION REPORT 2011
In the absence of electricity storage, elec-
tric utilities are required to match output to
demand at all times. Gas turbines, stored
hydro and geothermal power can be acti-
vated quickly, and some coal-fired power
plants may be kept running in “spinning
reserve” to respond quickly to surges in de-
mand or to supply interruptions elsewhere
in the system. However, nuclear power is
very inflexible and operates best at full ca-
pacity. Wind farms, large solar PV farms,
wave and tidal stations provide only inter-
mittent power, generating electricity only
when conditions are favorable. Isolated
rooftop PV installations can be combined
with batteries, or they can be designed to
feed energy back to the grid (encouraged
by so-called “feed-in” tariffs, as discussed
in chapter V).
The ease with which RETs can be integrat-
ed into existing energy systems will affect
the rate of future deployment. Many differ-
ent energy systems exist globally, each with
distinct technical, market and financial dif-
ferences. Integration issues can be system-
specific and resource-related (IPCC, 2011),
such as rapidly dispatchable RE-based re-
sources (especially gas turbines or stored
hydropower). These may offer extra flex-
ibility for the system in terms of its ability
to integrate different RE sources (wind or
solar PV in particular). The issue of intermit-
tent energy supply is important because it
affects the efficiency of generating power
from existing installed capacity. Intermittent
power supply is inappropriate for base-load
requirements, and poses technical chal-
lenges to grid management. The difficulty of
integrating intermittent renewable energies
into electric grids can be reduced, to some
extent, by improved real-time forecasting
(on a time scale of minutes and hours) of
likely variations in wind, for example, or of
fluctuations in electricity demand. How-
ever, such integration necessitates large
investments in energy infrastructure (IPCC,
2011). In any case, large investments would
be needed to maintain and expand exist-
ing energy infrastructure in many countries,
even in the absence of a scaling up of re-
newable energy resources.
3. Established and emerging RETs
This section provides detailed descriptions
of established and emerging RETs, includ-
ing the characteristics and state of applica-
tion of each RET, and does not limit itself
to the three RETs that are the main focus
of this Report, namely wind, solar and bio-
mass. Considerations of energy efficiency
will play an important role in determining
the possible extent of integration of any
particular RET into national energy mixes.
Box 2.3 provides a simple explanation of
energy efficiency issues.
a. Hydropower technologies
Hydropower technologies use power gen-
erated by harnessing the flow of water
through a hydraulic turbine or equivalent.
They vary greatly in the scale of genera-
tion capacity.6 Small and large hydropower
systems are the most mature of the RETs,
Box 2.3: Energy efficiency and conventional measures of thermodynamic efficiency
According to a convention that is now widely adopted by government and international energy agencies, primary energy is
defined as the energy that is embodied in natural resources consumed by an economy (IPCC, 2011). Primary energy is trans-
formed into secondary energy through cleaning (for natural gas), refining into petroleum products (for crude oil), coking (for
coal) or by conversion into electricity, transport fuel or (useful) heat. Secondary energy that is delivered to an end-user, such as
electricity supplied from an electrical outlet of a building, is called final energy (IPCC, 2011).
Each energy conversion involves some loss, characterized as rejected energy. For example, when primary energy
(in the form of fuel) is converted to electric power, about two thirds of the primary energy is lost – or rejected – as low
temperature heat.
Efficiency measures can be defined for each stage of energy transformation or conversion.
Source: UNCTAD.
The ease with which
RETs can be integrated
into existing energy
systems will affect
the rate of future
deployment.
Considerations of
energy efficiency will
play an important role in
determining the possible
extent of integration.

29CHAPTER II : RENEWABLE ENERGY TECHNOLOGIES AND THEIR GROWING ROLE IN ENERGY SYSTEMS
and have been a relatively important source
of electric power production for many de-
cades in many countries (REN21, 2005).
Large hydro accounts for the bulk of hydro-
power energy capacity. The technologies in
installations of different sizes are not funda-
mentally different.
Theoretically, the total hydropower avail-
able globally has been estimated at 40,000
TWh per annum (WEC, 2010).Estimates of
its technical potential for power generation
range between 14,000 and 16,000 TWh
(Boyle, 2004; WEC, 2010).7 In 2008, hy-
dropower accounted for about 16 per cent
of global electricity supply and for 2.3 per
cent of global primary energy supply (IPCC,
2011), and it was by far the largest RE con-
tributor to electricity generation, although
biomass contributes more to global primary
energy supply.
Concerning the technical aspects, it is esti-
mated that only 25 per cent of global hydro-
power potential has been developed. Most
regions of the world have large untapped
hydro resources, especially Africa with
92 per cent of its hydro resources unde-
veloped, but also South America and Asia
(IPCC, 2011). Thus there is certainly scope
for further development in these regions.
Some developing countries have begun
to invest into hydropower. Ethiopia, for in-
stance, has formulated a 25-year national
energy plan in 2005 to increase generation
capacity from hydro resources, with the ex-
pectation that this will result in benefits for
the economy in the medium to long term.
The Government plan has so far resulted in
an increase of 39 percent in generation ca-
pacity in the last five years: from 2,587 MW
(2005) to 3981 MW (2010), most of which
is attributable to hydropower. Although hy-
dropower is a proven and well-advanced
technology, some aspects of it could be im-
proved further. Storage of hydro resources
could be used to buffer mismatches be-
tween supply and demand, which is a valu-
able attribute.
As mentioned earlier in this chapter, large
hydroelectric schemes are controversial for
environmental and social reasons, because
they rely on dams that can have negative
social and environmental impacts. The con-
struction of hydroelectric dams can also
cause political and social conflicts between
countries that share rivers and waterways
because upstream dams may reduce water
flow to downstream countries, either due to
diversion into irrigation projects, excessive
evaporation (e.g. the Aswan Dam in Egypt)
or via seepage into the ground. However,
despite these problems, evidence suggests
that relatively high levels of deployment are
feasible over the next 20 years (IPCC, 2011).
b. Biomass energy technologies
Biomass is biological material from either
living or recently deceased organisms. It in-
cludes many types of plants and trees, as
well as wood and waste, but is generally
understood to exclude fossil fuels. Biomass
energy technologies use both traditional
and more sophisticated methods (referred
to as modern biomass power) to produce
useful energy primarily from wood residues,
agricultural waste, animal waste and mu-
nicipal solid waste. Such energy is derived
from a variety of sources, including garbage
and food scraps (yielding biogas), wood,
municipal waste, landfill gases and alcohol
fuels. Traditional biomass (wood and char-
coal), “modern biomass” (i.e. collecting,
pre-processing and delivering combustible
cellulosic materials to electric power plants
or chemical plants) and biofuels are three
categories of biomass that are discussed
below.
(i) Traditional biomass
Traditional sources of biomass, such as
dead trees, tree branches and animal dung,
have long been used in many developing
countries for cooking and heating. The ma-
jor energy conversion technology in rural
communities consists of inefficient charcoal
production followed by combustion of the
char (or wood or dung) in simple cast iron or
brick stoves or furnaces. While charcoal is
often commercialized, traditional biomass,
such as straw, tree branches or dung, is
gathered without payment, largely by poor
households for their own use as cooking
Small and large
hydropower systems
are the most mature
of the RETs.
Biomass energy
technologies use both
traditional and more
sophisticated methods
(referred to as modern
biomass power) to
produce useful energy.

30 TECHNOLOGY AND INNOVATION REPORT 2011
fuel. It is estimated that 2.7 billion people,
mostly in Africa and Asia, still cook using
traditional biomass, which explains why it
is still the largest RE source of total global
primary energy supply today. However, tra-
ditional biomass is considered to be an ex-
tremely inefficient energy source, because
the charcoal is produced in primitive, open
air kilns that consume most of the energy
content of the fuel to drive off the moisture
and volatile materials.
Traditional indoor uses of biomass (such as
in crude stoves) are associated with various
health problems caused mainly by indoor
air pollution (as mentioned in chapter I).
Improved cooking stoves, which increase
energy efficiency and reduce indoor air pol-
lution, are being used increasingly in devel-
oping countries, but their wider deployment
is needed (see REN21, 2011). There are
also social and gender issues involved, be-
cause young girls and women are often as-
signed the task of collecting biomass, and
they may spend several hours a day walk-
ing long distances in search of it. This re-
duces the time available for their education,
leisure and other activities. It can also lead
to environmental degradation, because
young plants are often harvested for fuel
before they have a chance to grow (UNC-
TAD, 2010). Sustainability of traditional bio-
mass supply is therefore an important con-
cern for many developing countries. Energy
production from traditional biomass may fall
in the future, as more people gain access to
other sources of energy that are less harm-
ful and easier to harness.
(ii) Modern biomass for electric power
Biomass can also be converted into energy
through alternative methods that are more
efficient and do not give rise to the health
hazards and problematic social issues as-
sociated with traditional biomass. Agricul-
tural, animal and human waste, as well as
other organic waste, all release methane
(also called biogas or landfill gas (LFG))
when they decompose.8 The process
works on any scale, but the larger the scale
the more efficient it is likely to be.
Biogas of a more sophisticated type can
also be produced from cellulosic materials,
such as agricultural waste, by a process
called steam reforming. Commercial bio-
mass energy technologies to produce elec-
tric power are now fairly widely available.
Biomass power plants include biomass gas-
ifier power systems, biomass steam elec-
tric power systems, and municipal waste
and biogas electric power systems. There
is also the possibility of cogeneration – for
combined heat and power (CHP) produc-
tion – whereby heat is harnessed (for heat-
ing purposes) at the same time as electricity
is generated. Cogeneration plants therefore
improve energy efficiency by making use of
heat that might otherwise go waste. These
plants can use biomass, geothermal or so-
lar thermal resources (REN21, 2011), and
are similar to conventional power plants
that run on fossil fuels. Biogas power plants
generally range in size from a few hundred
kilowatts to as much as 100 MW, and they
may even be larger in big cities.
The production of biogas depends on the
supply of biomass, and, in principle, can
therefore be controlled. In this respect it is
similar to biofuels, but is different from most
other REs, which generally depend more
directly on natural energy flows to generate
power. Intermittency is therefore less of an
issue with biomass than with some other
REs.
Modern forms of biomass such as wood
chips or pellets are also being used increas-
ingly in advanced heating applications such
as home heating, especially in the countries
of the European Union (EU) (REN21, 2011)
and some other developed countries.
(iii) First and second generation biofuels
Biofuels are liquid fuels made from plant
material that can be used as a substitute
for, or as an additive to, petroleum-derived
fuels. There are two types of biofuels: al-
cohols (ethanol, methanol or butanol) and
biodiesel. Ethanol, which is by far the most
commonly used of the alcohols, is typi-
cally added to gasoline in a ratio of about
one part to ten. Biodiesel, which is an oil
2.7 billion people, mostly
in Africa and Asia, still
cook using traditional
biomass, which explains
why it is still the largest
RE source today.
Energy production from
traditional biomass may
fall in the future, as more
people gain access to
other sources of energy.

31CHAPTER II : RENEWABLE ENERGY TECHNOLOGIES AND THEIR GROWING ROLE IN ENERGY SYSTEMS
made from oilseeds, can be mixed with
conventional, petroleum-based diesel oil,
or in some cases it can replace petroleum-
based diesel fuel altogether.
Biofuels may be classified as either “first
generation” or “second generation”. First-
generation biofuels – those that are currently
available commercially – are produced from
edible food grains, seeds and sugar crops.
Ethanol and butanol are produced from sug-
ar cane (Brazil), sugar beets (Europe) or corn
(United States). Ethanol from sugar cane is
probably the most attractive option among
the first-generation biofuels since it is cheap-
er to produce (UNCTAD, 2008).
Biofuels compete with agricultural produce
in two important ways. First, they may be
based on edible biomass, which means
that many of the primary sources can be
used either as food (or feedstock) or as fuel,
resulting in direct competition between the
two uses. This is generally the case with
first-generation biofuels, which are based
on edible biomass. This competing use has
led to controversy over their potential to
reduce the availability of food and to raise
food prices, thereby contributing to food in-
security and food crises (see, for example,
Ford Runge and Senauer, 2007). Concerns
have also been raised about the relatively
low net energy output from many first-gen-
eration biofuels, as well as environmental
impacts resulting from the large-scale use
of water and fertilizers to produce them.
In some cases, the GHG abatement levels
from biofuels have also been criticized as
being low.
Even when biofuels are not based on edible
biomass (as in the case of second- genera-
tion biofuels), there could still be competi-
tion between producing material for biofu-
els and for food production in terms of land
use (in quantity and quality) and water use.
A potentially promising new approach is the
use of algae, grown either in fresh water
ponds or in salt water. In contrast to agri-
cultural crops, algal ponds can, in principle,
produce as much as 40,000 to 80,000 li-
ters of biodiesel per acre (Briggs, 2004).
However, so far it has been difficult to con-
trol the algae growth process adequately to
produce a continuous output of feedstock
for a refinery, and it is not clear whether
these difficulties are fundamental or tempo-
rary. In fact, a number of algae production
companies have failed.
It is evident that ethanol, methanol and
biodiesel do not currently qualify as nega-
tive cost (profitable) solutions. However the
long-term potential for second-generation
technology is quite favourable. The pros-
pects for second-generation biofuels will
be clearer in two or three years time, as a
result of recent biotech breakthroughs that
are expected to increase the productivity of
conversion processes, which are important
for extracting biofuels from biomass.
c. Wind energy technologies
Wind energy technologies, mainly wind tur-
bines, use kinetic energy from air currents
arising from uneven heating of the earth’s
surface to generate electricity. The wind tur-
bines, which are usually operated in groups
in the form of a wind farm, wind project or
wind power plant, are interconnected to a
common utility system through a system of
transformers, distribution lines and (usually)
one substation. There are also hybrids such
as small wind turbines combined with die-
sel generators or with solar PV panels.
Wind energy technologies are more stan-
dardized than solar technologies. The vari-
ations are mainly in terms of the size and
location of the units. The two main classes
are onshore and offshore. To date, offshore
wind turbine designs have been very simi-
lar to onshore designs, but they tend to be
larger and need special foundations to re-
sist the wave action. Wind turbines can be
applied off-grid or on-grid, though the larg-
er projects are generally grid-connected. It
is the larger, grid-connected wind farms,
mainly onshore, that provide the bulk of
electricity generation from wind, although
there is considerable potential for future de-
velopment offshore as well.
Wind turbines are rapidly being deployed,
but face several challenges. Wind power
Even when biofuels are
not based on edible
biomass, there could still
be competition between
producing material for
biofuels and for food in
terms of land and water
use.
Wind turbines can be
applied off-grid or on-
grid, though the larger
projects are generally
grid-connected.

32 TECHNOLOGY AND INNOVATION REPORT 2011
is location-specific, which constitutes a
significant limitation on its application. In-
termittency is the major problem with wind
energy, as the wind does not blow con-
tinuously and the electrical output of wind
power plants varies with fluctuating wind
speeds. The predictability of wind speeds
is also an issue, as fluctuations are very dif-
ficult to predict, even a few seconds in ad-
vance, especially in the case of wind gusts.
Storage remains a notable problem for wind
energy (as in the case of solar PV). The
state of storage technology is discussed
in a separate section, later in this TIR. Still,
experience and detailed studies from many
countries have shown that the integration
of wind energy into energy systems poses
no insurmountable technical barriers (IPCC,
2011).
Onshore wind energy systems are rela-
tively standard, whereas offshore wind
energy technology is less well developed,
and investment costs are generally higher.
Onshore wind energy can be competitive
with conventional energy sources, while
offshore wind energy is currently relatively
expensive. This is due to the comparatively
less mature state of the latter technology,
and because of the greater logistical chal-
lenges of maintaining and servicing offshore
turbines (IPCC, 2011). (In this respect, they
share similar maintenance challenges with
turbines used in some ocean energy tech-
nologies.) Wind power can be distributed
over existing networks when they are avail-
able nearby. However, for offshore wind
and for remote onshore locations, existing
transmission networks usually need to be
extended. The distance from large popula-
tion centers and energy consumers deter-
mines the amount of extension needed in
the transmission network and the associ-
ated cost, and therefore varies from case
to case.
Onshore wind energy technologies are ma-
ture, having been in use for several years.
However, the use of wind energy to gen-
erate electricity on a commercial scale be-
came viable only in the 1970s, starting in
Denmark, as a result of technical advances
and government support (IPCC, 2011). It is
now being widely deployed internationally.
Indeed, wind energy is now established as
part of the mainstream electricity industry in
many developed countries. However, exist-
ing wind power capacity remains regionally
concentrated, with most existing capacity
in Europe, North America and East Asia
(REN21, 2010). China has been actively
scaling up its wind power capacity. At least
82 countries use some wind energy on a
commercial basis, but countries in Latin
America, Africa, West Asia and the Pacific
regions have installed relatively little wind
power capacity to date, despite its signifi-
cant technical potential.
Over the past three decades, innovation in
wind turbine design has led to significant
cost reductions. Newer designs utilize light-
er materials (such as those used in aircraft)
and compact generators with powerful per-
manent magnets based on the iron-boron-
neodymium alloy.9 Modern, commercial
grid-connected wind turbines have evolved
from small and simple to larger, highly so-
phisticated devices. Scientific and engi-
neering expertise and advances, as well as
improved computational tools, design stan-
dards, manufacturing methods and oper-
ating and maintenance procedures, have
all supported technological progress and
learning. In order to reduce the levelized
cost of electricity (LCOE) from wind energy,
typical wind turbine sizes have grown signif-
icantly. The LCOE of a particular project is
defined as the constant price per kWh that
electricity would have to be sold at in order
for the project to break even over its life-
time. Many onshore wind turbines installed
in 2009 have a rated capacity of 1.5 MW to
2.5 MW, while that of offshore installations
goes up to 5 MW. Larger scale manufactur-
ing of wind turbines is expected to reduce
their cost still further.
Although wind resources depend on ge-
ography and are not evenly distributed
worldwide, in most regions of the world the
technical potential exists to enable signifi-
cant wind energy deployment. According to
the Global Wind Energy Council (GWEC), at
Intermittency is the
major problem with
wind energy…but the
integration of wind
energy into energy
systems poses no
insurmountable
technical barriers.
Over the past three
decades, innovation in
wind turbine design has
led to significant cost
reductions.

33CHAPTER II : RENEWABLE ENERGY TECHNOLOGIES AND THEIR GROWING ROLE IN ENERGY SYSTEMS
the end of 2010 there was 194,390 MW
of wind power capacity installed globally.
Most of the installed capacity was in Eu-
rope, Asia and North America. The bulk of
offshore wind capacity is located in Europe
(REN21, 2010). The wind power capacity
installed by the end of 2009 was capable of
meeting roughly 1.8 per cent of worldwide
electricity demand. According to the IPCC
(2011), that contribution could grow to over
20 per cent by 2050 under some scenarios.
A growing number of global wind resource
assessments have demonstrated that
global technical potential exceeds current
global electricity production (IPCC, 2011).
d. Solar energy technologies
Solar energy technologies capture energy
from the sun either as heat or as electric-
ity through conversion by solar PV panels.
There are three main classes of solar ener-
gy technologies: concentrating solar power
(CSP) systems; solar thermal systems for
heating residential and commercial build-
ings (which can be either active or passive
in nature) and solar PV power systems.
(i) Concentrating solar power systems
Concentrating solar power systems are
highly sophisticated and land-intensive, and
are suitable mainly for desert areas where
the sun shines during most daylight hours.
The idea is to use either lenses or mirrors
on the ground to capture solar energy that
can be focused on a small receiving unit.10
Moreover, because the period of maximum
heat capture (midday) does not necessarily
correspond to peak heat or electricity de-
mand, either the heat captured or the elec-
trical power produced needs to be stored.
An important advantage of CSP technolo-
gies (except for small units using parabolic
dishes with Stirling engines) is their ability to
store thermal energy after it has been col-
lected at the receiver and before it goes to
the heat engine. The majority of CSP plants
in operation today rely on parabolic trough
technology. This is however expected to
change. Nearly half of the capacity in con-
struction or under contract uses or will use
linear Fresnel, dish/engine, or power-tow-
er technology in the near future (REN21,
2010).
Costs of power from existing systems range
from 19 cents/kWh to 29 cents/kWh. With
increased plant sizes, better component
production capacities, more suppliers and
improvements through R&D, costs could
fall to a range of 15 cents/kWh–20 cents/
kWh (Greenpeace International, SolarPAC-
ES and ESTELA, 2009). Optimists believe
that costs of CSP could decline rapidly
to equal the cost of power from gas-fired
power plants in 5 to 10 years. Under the
most optimistic scenario, CSP could pro-
vide 18–25 per cent of global electricity
needs by 2050, depending on the degree of
improvements in energy efficiency achieved
(Greenpeace International, SolarPACES
and ESTELA, 2009).
Spain and the United States are currently
the leaders in CSP installed capacity, al-
though several developing countries (in-
cluding Abu Dhabi, Algeria, China, Egypt,
Jordan, Morocco, South Africa and Tunisia)
have begun to use CSP or have announced
plans for CSP projects (IPCC, 2011). In
North Africa, the Desertec project, sup-
ported largely by German firms, envisages
a total investment of €400 million. It could
not only provide a considerable share of
Europe’s demand for electricity, but could
also constitute a major new industry for the
Maghreb region of North Africa, especially
Algeria and Morocco.11
(ii) Solar thermal systems
Solar thermal heating for buildings is a rela-
tively old technology. However, it is increas-
ingly important for new buildings, especially
the “passive house” designs, which rely en-
tirely on solar heat, combined with insula-
tion, double- (or triple) glazed windows, and
counter-current heat exchangers to heat
incoming ventilation air (mainly to kitchens)
from the outgoing air. In the summer, this
procedure can be reversed to conserve air-
conditioning (Elswijk and Kaan, 2008). In
new construction, this technology can cut
energy consumption by 90–95 per cent, al-
An important advantage
of CSP technologies
is their ability to store
thermal energy after it
has been collected.
Costs of CSP could
decline rapidly to equal
the cost of power from
gas-fired power plants in
5 to 10 years.

34 TECHNOLOGY AND INNOVATION REPORT 2011
though the capital costs are roughly 10 per
cent higher than conventional designs. The
major challenge is to find ways to retrofit
some of these efficiency gains in existing
buildings at reasonable costs.
Unfortunately, the benefits that can be
achieved from fairly obvious leak reduc-
tions, such as insulating cavity walls, roofs
and double-glazing single-glazed windows,
are far fewer than can be achieved by new
construction with air-exchange systems.
According to one study, efficiency gains
from insulation add-ons which are a fairly
typical example – would probably be about
25 per cent (Mackay, 2008). However, low-
er thermostat settings can probably achieve
about the same level of improvement at no
(or negative) cost.
(iii) Solar photovoltaic technology
Solar PV is a semiconductor technology
that converts the energy of sunlight (pho-
tons) directly into electricity. This technol-
ogy has been known for a long time, but
the first commercial applications utilized
ultra-pure scrap silicon from computer
chip manufacturing. However, the purity
requirements for silicon PV cells are much
less stringent than for chips, and by 2000
the demand for solar PV systems justified
investment in specialized dedicated fabri-
cation facilities.12
Solar PV power systems can be either off-
grid or connected into mini-grids or larger
national grids. Grid-connected systems
may be either distributed or centralized.
The distributed version consists of a large
number of small local power plants, some
of which supply the electricity mainly to
on-site customers (such as houses), while
the surplus (if any) feeds the grid. The cen-
tralized system works as one large power
plant. Off-grid systems are typically dedi-
cated to a single or small group of cus-
tomers, and generally require an electrical
storage element or back-up power (IPCC,
2011). In addition to the various solar PV
technologies, there are various hybrids,
including solar-PV wind hybrids, and solar
and conventional mixed hybrids.
Intermittency is a major problem with so-
lar PV, which operates only when the sun
is shining. As with wind, storage for off-grid
applications is possible with storage batter-
ies, but the economics is unattractive. Thus
intermittency remains a problem that has
not yet been resolved and requires further
technological progress. In contrast, storage
is possible with CSP, although CSP with
thermal storage is more costly than CSP
without it.
Even for grid-connected solar PV systems,
local output varies, not only predictably ac-
cording to the diurnal (night and day) cycle,
but unpredictably according to weather
conditions. In some instances, this vari-
ability can have a significant impact on the
management and control of local transmis-
sion and distribution systems, and may
constrain integration into the power sys-
tem. Predictability also varies with location,
although in many cases where there is a
high level of solar exposure there is also a
reasonably high level of weather predict-
ability. In any case, solar PV applications
are expanding fast and the technology is
still developing rapidly, resulting in lower
prices (box 2.4).
Investments in production capacity in Chi-
na may have significantly exceeded global
demand, leading to a considerable over-
supply, so that price-cutting has become
endemic. Indeed, module prices fell by
25 per cent during the first half of 2011
(Photon International, 2011). Of the 400 or
more solar PV firms in the world in early
2011, quite a large number are likely to fail
in the coming months and years as the in-
dustry consolidates (Photon International,
2011).
Solar PV technology is currently being de-
ployed at a rapid rate, including in some de-
veloping countries. In 2009, installations for
RE generation worldwide were 7,000 MW
(7 GW), of which half was in Germany. Total
worldwide generating capacity at the end
of 2009 was 22 GW, of which 9 GW was in
Germany, followed by Spain, Japan and the
United States (IPCC, 2011).
Solar thermal heating
for buildings… can cut
energy consumption by
90–95 per cent.
Solar PV power systems
can be either off-grid
or connected into mini-
grids or larger national
grids.

35CHAPTER II : RENEWABLE ENERGY TECHNOLOGIES AND THEIR GROWING ROLE IN ENERGY SYSTEMS
Solar PV is a versatile technology for re-
ducing severe energy poverty and provid-
ing some degree of access to energy, even
in remote villages. While it is true that the
power is intermittent and available mostly
during the daylight hours, battery storage
for a few hours or days is feasible, and
some important uses (such as refrigera-
tion) can also be effective with intermittent
power.
Solar power is being used in many innova-
tive ways on a micro scale to power appli-
cations such as cookers, water pumps and
crop dryers, lights, radios and televisions.
These applications can help to consider-
ably improve the lives of energy-poor, iso-
lated rural communities in many develop-
ing countries, even though the quantity of
energy supplied may be of little significance
relative to global energy consumption. They
provide an effective tool for reducing energy
poverty when national power grids are se-
verely deficient and where large segments
of the population remain unconnected to
grids.
e. Geothermal energy technology
There are two geothermal technologies.
The oldest “conventional” technology ex-
tracts energy from existing reservoirs of
steam or hot water in porous rocks beneath
the earth’s surface. Indeed, the technology
for electricity generation from hydrothermal
reservoirs is mature and reliable, and has
been operating for about 100 years. Geo-
thermal reservoirs are located conveniently
near the earth’s surface in many places,
such as Iceland, where they already pro-
vide 25 per cent of the nation’s electricity.
Iceland is probably the most promising lo-
cation in the world for such RETs at pres-
ent, though other locations exist along the
“ring of fire” where volcanoes are located,
such as Indonesia, Japan, the Philippines,
the west coast of South America, and parts
of the western United States, as well as
Greece, Italy and Turkey.
Box 2.4: Prices, production and capacity of PV systems
The prices of PV modules have been declining worldwide as a result of progress in manufacturing (mainly larger scale
production), strong investment interest accompanied by policy support, tariff digressions and particularly technological
progress in cell architecture. These changes have triggered the spectacular rise in global production of PV modules over
the past decade. In 2010, a total estimated of 17 GW capacity has been added to the system. This represents a significant
rise in total new capacity, when compared to the 2009, where 7.3 GW capacity was added globally. On the whole, the
total global capacity in 2010 (approximately 40 GW) represents a 6 fold increase over what was observed in 2006 (7 GW)
(REN21, 2010).
Most of this increase in capacity is attributable to Spain, Japan, United States and China, which already stands out as one
of the largest producers. In terms of share of the global solar PV capacity, five countries represented about 80 per cent of
the total available capacity, i.e. Germany (44 per cent), Spain (10 per cent), Japan (9 per cent), Italy (9 percent) and United
States (6 per cent) (REN21, 2011: 23).
Source: UNCTAD, based on REN21 (2010) and REN21 (2011).
Box 2.5: Geothermal energy: technical aspects
The main system, called engineered geothermal system (EGS), consists of a pair of pipes drilled into a bed of hot dry rock which
is then fractured by water injection. (The fracturing process can cause small earthquakes, which will not be popular among local
residents.) The resulting steam is then brought to the surface through the second pipe and used in steam turbines to generate
electricity, or in heating equipment to provide industrial heating. At present, the steam from the exhaust is discarded into ponds,
but with improved technology it could be reinjected, both to maintain internal pressure and to extend the life of the system. At
present, although a number of projects are under development, the technologies for EGS are still at the demonstration stage.
The main types of direct geothermal applications include space heating of buildings, bathing and balneology, horticulture (green-
houses and soil heating), industrial process heat, agriculture, aquaculture (fish farming) and snow melting.
Source: UNCTAD, based on IPCC (2011) and Boyle (2004).
Solar PV is a versatile
technology for reducing
severe energy poverty
and providing some
degree of access to
energy, even in remote
villages.

36 TECHNOLOGY AND INNOVATION REPORT 2011
Heat can also be reached by drilling deep
enough at any location using an engineered
geothermal system (EGS), and brought to
the surface as hot water or steam to pro-
duce heat or electric power (box 2.5). In
principle, hot dry rock from 3 to 10 kilome-
ters (km) below the surface offers huge po-
tential in the United States – about 140,000
times the energy consumption of the United
States in 2007.
However, the operation of geothermal fields
may provoke local hazards arising from
natural phenomena, such as micro-earth-
quakes, hydrothermal steam eruptions and
ground subsidence (IPCC, 2011). Geother-
mal plants also require a large up-front in-
vestment due to the need to drill deep wells
and build power plants (of conventional
design). Despite this, they incur low vari-
able costs once the plants are constructed.
Costs of power generation depend on the
location of the geothermal reservoirs, which
are sometimes far from large population
centers and therefore require extension of
the transmission network.
Geothermal energy is a stable, non-inter-
mittent source and provides predictable
energy supply throughout the day, unlike
some other REs (Boyle, 2004). This makes
geothermal technologies particularly suit-
able for base-load supply, but much less
appropriate for isolated remote communi-
ties, except in very unusual circumstances.
Integration of new power plants into exist-
ing power systems does not present a ma-
jor challenge (IPCC, 2011).
The potential for additional energy supply
from geothermal sources is reported to be
high in a few areas where geothermal re-
sources are plentiful. Recent statistics indi-
cate that global geothermal power supply
today amounts to 10,715 MW, enough to
generate 67,250 GWh of energy. However,
only 24 countries are currently using this
source of energy (REN21, 2010; Johans-
son TB, 2011). In 2008, conventional geo-
thermal energy use represented only about
0.1 per cent of the global primary energy
supply. A number of start-ups in different
countries are planning EGS projects, and,
according to industry association forecasts,
the total energy supply from geothermal
sources will be 160 GW by 2050, about
half produced by EGS. This implies that by
2050 geothermal could meet roughly 3 per
cent of the global electricity demand and
5 per cent of the global demand for heating
and cooling (IPCC, 2011).
f. Ocean energy technologies
Ocean energy can be defined as energy
derived from technologies that utilize sea-
water as their motive power, or harness
the water’s chemical or heat potential. The
RE from the ocean comes from five dis-
tinct sources: wave energy, tidal range (or
tidal rise and fall), tidal and ocean currents,
ocean thermal energy conversion (OTEC)
and salinity gradient (or osmotic power).
Each of them requires different technolo-
gies for energy conversion, and there is a
considerable diversity of mechanisms in-
volved. Moreover, since each type of ocean
energy is driven from different natural ener-
gy flows, they each have different variability
and predictability characteristics (box 2.6).
Box 2.6: Ocean energy technologies: technical aspects
Wave energy is generated by wind blowing over the sea. Wave energy technologies involve different physical structures
(called wave energy converters) that move with the waves and convert their movement into usable energy. The movement
back and forth of the tides can be harnessed in several ways to generate power. One way is through tidal mills, which are
similar to watermills; another is by placing independent turbines in the tide; and a third is using a dam (called a tidal barrage)
to trap the water and pass its flow through sluice gates that drive water through turbo-generators. These barrages can have
environmental impacts similar to hydroelectric dams, discussed earlier. Also being developed are tidal current technologies
that use the tidal currents to power underwater turbines, but they are very new and remain at an early stage of development
(Boyle, 2004).
Source: UNCTAD, based on Boyle (2004).
Geothermal energy is a
stable, non-intermittent
source and provides
predictable energy
supply throughout
the day.

37CHAPTER II : RENEWABLE ENERGY TECHNOLOGIES AND THEIR GROWING ROLE IN ENERGY SYSTEMS
Ocean energy technologies are by far the
least mature of the major RETs (REN21,
2010). Most of them are still in their pre-
commercial stages of development, ranging
from the conceptual and pure R&D stages
to the prototype and demonstration stage.
Only tidal range technology using barrages
can be considered mature, and is the only
one commercially available so far. Currently
there are several technology options for
each ocean energy source, and, with the
exception of tidal range barrages, techno-
logical convergence between these various
sources has not yet occurred (IPCC, 2011).
These technologies appear to be relatively
expensive, although the data on cost char-
acteristics are not as well established as for
other RETs. There are encouraging signs
that the investment cost of ocean energy
technologies and the LCOE generated from
wave or tidal technologies will decline from
their present levels as R&D and demonstra-
tions proceed and as deployment occurs
(IPCC, 2011). How far and fast these re-
ductions take place will be a key determi-
nant of their deployment in the future.
It is estimated that 6 MW of wave/tide en-
ergy systems is operational or being tested
in Europe (off the coasts of Denmark, Italy,
the Netherlands, Norway, Spain and the
United Kingdom), with additional projects
off the coasts of countries such as Canada,
India, Japan, the Republic of Korea and the
United States. At least 25 countries are in-
volved in ocean energy development activi-
ties at present (REN21, 2010).
In principle, these technologies can supply
significant amounts of energy, particularly
in areas where there are large coastlines
or other water features that provide many
waves and large tidal movements. In fact,
the theoretical potential of 7,400 EJ/year
technically recoverable from the world’s
oceans easily exceeds current global ener-
gy requirements. The challenge remains in
harnessing this potential. The IPCC (2011)
finds that ocean energy technologies are
unlikely to make a significant short-term
contribution before 2020 due to their early
stage of development.
g. Energy storage technologies
Storage technologies are critical for sev-
eral RETs, especially wind and solar (PV
and CSP), but also for some of the ocean
technologies. The only large-scale stor-
age technology in general use is reservoir
hydro and its artificial cousin, pumped
storage. A pumped storage system con-
sists of an artificial pond or lake at the top
of a hill connected to a hydraulic turbine
at a lower altitude. There are quite a few
pumped storage facilities in developed
countries, but relatively few in developing
countries, except China, due to the high
front-end investment cost.
One of the technologies that can help
to make storage more accessible is the
“supergrid”, which has been proposed by
analysts to update and vastly extend the
European grid. This would have the virtue
of smoothing out fluctuations in local us-
age and in renewable supplies (wind and
solar). This is because a supergrid would,
for instance, be able to capture wind
power over large distances (up to 500
kms away, or further, where the weather
might be different), which would take care
of intermittency problems as well as being
able to provide electric power at a lower
cost.
Denmark utilizes this approach, enabling
it to export surplus wind power, when
available, to neighbouring countries (in-
cluding Germany, Norway and Sweden)
that have hydropower which can be tem-
porarily turned off. During the times when
demand in Denmark is greater than the
supply of wind, the power moves back
to Denmark. Denmark’s wind capacity is
3.1 GW, and it has a 1 GW connection to
Norway, 0.6 GW to Sweden and 1.2 GW
to Germany, or 2.8 GW altogether (Mack-
ay, 2008). Additional R&D investment is
needed to improve energy storage tech-
nologies for both wind and solar, as with
some other energy technologies such as
batteries for electric cars (or for provid-
ing storage with “smart” electric grids, as
discussed earlier in box 2.2).
Storage technologies
are critical for several
RETs, especially wind
and solar.
One of the technologies
that can help to make
storage more accessible
is the “supergrid”.

38 TECHNOLOGY AND INNOVATION REPORT 2011
4. Scenarios on the future roleof RETs in energy systems
Many scenarios have been developed to
determine potential RET deployment rates
in the future. However, it is difficult to fore-
cast the future rate of technological prog-
ress in RETs and of the scaling up of pilot
projects in various places. These will de-
pend somewhat on future policy choices
and on the scale of investments made in
research, development and demonstra-
tion, as well as on deployment subsidies
(discussed in chapter III). Future trends in
conventional energy prices will also strongly
influence the price competitiveness and de-
ployment of RETs. In this context, the pos-
sibility that the world may be approaching
a period of “peak oil” is an important con-
sideration. Box 2.7 presents a summary of
energy scenarios for the future. Under most
scenarios, including those presented by the
IEA (2010a), coal, oil and gas are likely to
remain the predominant sources of energy
until 2030 or 2035. Nuclear energy is also
expected to be a significant source, but will
gradually decline in importance. However,
safety concerns arising in the wake of the
recent nuclear reactor accident in Fukushi-
ma, Japan, may affect future trends in the
use of nuclear energy.
Energy scenarios are sensitive to changes
in their underlying assumptions, but they
are useful for analytical purposes to inves-
tigate the types of energy pathways that
may become possible. From the available
evidence and recent trends, it is forecast
that RETs will continue to expand, and
their share in providing renewable solu-
tions to global energy supply will gradually
rise. They will also continue to strengthen
the potential of REs as supplementary
to conventional energy sources over the
next two decades. Most scenarios, such
as those investigated by the IEA (2010a)
and IPCC (2011), show this type of out-
come. It is also forecast that RETs will play
a much greater role by 2030 or 2035 in
diverse portfolios of energy options that
Box 2.7: Energy scenarios and the future role of RETs
Two important recent studies, one by the IPCC (2011) and the other by the IEA (2010a), have produced a number of sce-
narios on the future role of RETs in energy supply systems. The IPCC study considers 164 different possible scenarios on
future energy mixes and climate change mitigation outcomes drawn from the literature on future energy scenarios, while
the IEA study presents several possible scenarios on future energy trends. They both generally project likely growth in
RETs as a growing complement to traditional energy sources, albeit with large differences in the possible roles that RETs
may eventually play. It must be mentioned, however, that the “standard” scenarios used by the IPCC (developed at Inter-
national Institute for Applied Systems Analysis) do not reflect the possibility that resource scarcity could limit economic
growth.
The IPCC study presents potential future pathways and does not predict any particular one as being more likely than the oth-
ers, though critics argue that some of them are too optimistic because they fail to take resource constraints into account. The
scenarios include a wide range of possibilities regarding future climate change mitigation and the future contribution of RETs in
meeting global primary energy supply. A majority of the scenarios show a substantial rise in RETs deployment by 2030, 2050
and further into the future.a Under these scenarios, there is no single dominant RET, but modern biomass, wind and solar
generally viewed as making the largest contributions among the RETs.
The most optimistic scenario regarding the future role of RETs, not included in the IPCC study, has been prepared by Ecofys
for the World Wide Fund for Nature (WWF, 2011). It suggests that 95 per cent of global energy consumption could come from
RE sources by 2050. This could be achieved in part through large savings as a result of energy efficiency, so that global energy
demand in 2050 is projected to be 15 per cent lower than in 2005. The IEA, by contrast, assumes continued fast economic
growth and consequent growth in global energy consumption. The issue of energy efficiency is clearly vital to future trends in
energy consumption. It is difficult to estimate the extent to which energy savings through efficiency gains will actually be realized,
especially if they entail major lifestyle changes.
Source: UNCTAD.
a See UN/DESA (2011) for a discussion on the barriers to realizing the full technical potential of RE sources.
It is forecast that RETs
will continue to expand,
and their share in
providing renewable
solutions to global
energy supply will
gradually rise.

39CHAPTER II : RENEWABLE ENERGY TECHNOLOGIES AND THEIR GROWING ROLE IN ENERGY SYSTEMS
will become available to many countries.
There are some scenarios which envis-
age RETs as playing a dominant role in the
global energy system in the longer term,
by 2050. Based on current trends and
such projections, a recent report of the
United Nations (UN/DESA, 2011) predicts
that by 2050 RETs will be well on their
way to completely replacing conventional
energy sources worldwide. This implies
extremely rapid development and deploy-
ment of RETs, combined with large energy
savings through improved energy effi-
ciency, and it would represent more of an
energy revolution than the current energy
evolution. The prices of energy generated
by some RETs have been falling more rap-
idly in recent years than expected by many
analysts, and RETs are playing a much
bigger role today than was expected by
most experts a decade ago. There could
also be major technology breakthroughs
in the near future as a result of ongoing
R&D on various aspects of RETs, including
storage and intermittency aspects, which
could pave the way for a rapid acceleration
in the growth of RETs. Developing broad
energy matrices that promote the role of
RETs in countries will help to keep options
open for harnessing new technological
innovations as they occur and to avoid a
lock-in to specific energy technologies and
infrastructures.
C. TRENDS IN GLOBAL INVESTMENTS AND COSTS OF RETS
1. Private and public sector investments in RETs
Keeping up with the trends, global invest-
ment in RETs has increased markedly dur-
ing the past decade, rising from $33 billion
in 2004 to $211 billion in 2010, and growing
at an average annual rate of 38 per cent
over that period, according to the most
recent estimates available (table 2.1). This
increase in investment has been closely as-
sociated with technological improvements
and declining costs of RETs production,
and has continued despite the global fi-
nancial crisis and recession of 2008-2009
and the resulting drop in conventional en-
ergy prices. Recovery of investments was
brisk in 2010 and prospects look bright for
their continued growth. Nevertheless, the
amount of investment remains too low to
enable sufficiently rapid development and
deployment of RETs.
Table 2.1: Global investment in renewable energy and related technologies, 2004–2010 ($ billion)
2004 2005 2006 2007 2008 2009 2010Average annual
growth rate2004–2010 (%)
Investment in technologydevelopment of which:
5.3 4.7 5.7 6.7 8.2 7.6 11.0 14.6
Venture capital 0.4 0.6 1.3 1.9 2.9 1.5 2.4 46.2
Government R&D 1.1 1.2 1.3 1.5 1.6 2.4 5.3 35.1
Corporate R&D 3.8 2.9 3.1 3.3 3.7 3.7 3.3 -1.5
Investment in equipment manufacturing
0.7 4.8 14.1 25.2 19.4 15.6 18.5 139.0
Investment in RE projectsof which:
26.9 47.9 72.6 109.0 140.3 141.1 193.4 41.0
Small distributed capacity 8.6 10.7 9.4 13.2 21.1 31.2 59.6 41.9
Total investment in RETs 33 57 90 129 159 160 211 38.3
Source: UNCTAD, based on UNEP and Bloomberg (2011).
Note: The data are estimates provided by Bloomberg New Energy Finance. They exclude large hydro, but include estimates for R&D investments by the private sector and governments as well as investments in small distributed RE projects.
It is predicted that by
2050, RETs will be
well on their way to
completely replacing
conventional energy
sources worldwide.

40 TECHNOLOGY AND INNOVATION REPORT 2011
In the first quarter of 2009, there was a
severe disruption of investments in RETs
due to the crisis and the near freezing of
developed-country credit markets. How-
ever, those investments recovered quickly
thereafter, largely as a result of govern-
ment stimulus packages in some countries,
which aimed at reducing the impact of the
crisis.13 The stimulus packages offered in
China and the United States are good ex-
amples of such governmental expenditure.
In addition, there was continued strong
investment in developing countries (UNEP
and Bloomberg, 2010; World Economic
Forum, 2011). In China, ambitious policy
targets accompanied the financial support
related to its economic stimulus plan in
2009 and 2010, mostly in wind power and
PV projects. Brazil and India also continued
to invest heavily in RETs (UNEP and Bloom-
berg, 2010; and 2011).
In 2010, investment in power generation
capacity accounted for 86 per cent of to-
tal RETs investment (or $181 billion). Most
of this investment was in large, utility scale
projects (mainly large wind farms, solar
parks, biomass power plants and biofuel
refineries). Investment in small-scale renew-
able energy projects (mostly in rooftop so-
lar PV panels) has also been rising rapidly
since 2009, along with increased activity
in small distributed capacity, partly stimu-
lated by dramatic price declines of solar PV
modules and systems (UNEP and Bloom-
berg, 2011; REN21, 2011). In addition, in-
vestments of $40–$45 billion were made in
large hydro plants in 2010, and estimated
investments of about $15 billion in solar
hot water collectors, neither of which are
reflected in table 2.2 (REN21, 2011). If in-
vestments in solar hot water collectors are
included, the global total in 2010 increases
to $226 billion (excluding the $40 billion in-
vested in large hydro projects).
Investment in RETs aimed at greater re-
newable capacity has three main financing
components: (i) asset financing of utility-
scale projects, (ii) refinancing and acquisi-
tion of such projects, and (iii) financing of
small-scale projects. In 2010, by far the
largest amount of asset financing went to
large utility-scale RE projects (86 per cent
of the total), and a very small share targeted
equipment manufacturing (8.8 per cent)
and technology development (5.2 per cent).
Investment in technology development in-
cluded both government and private R&D
investment and venture capital financing
(UNEP and Bloomberg, 2011).
Government R&D investment in RETs in-
creased significantly worldwide in both
2009 and 2010, in keeping with the over-
all trend observed between 2004 and
2010 when such investments rose at an
annual average rate of 35 per cent (table
2.1). Financing by State-owned multilateral
and bilateral development banks rose fol-
lowing distress in private capital markets
in 2008. Globally, 13 development banks
provided financing of $13.5 billion for RETs
projects in 2010 – a marked increase over
their financing in 2009 ($8.9 billion), 2008
($11 billion) and 2007 ($4.5 billion) (UNEP
and Bloomberg, 2011). Public policy sup-
port, including direct government sup-
port and development bank financing, has
played an important role in maintaining the
rate of RETs development and deployment
since 2008. This is in marked contrast to
the stagnation in corporate R&D in RETs,
which declined by an average annual rate of
1.5 per cent during the period 2004–2010.
Available data indicate that wind power has
been by far the largest recipient since 2007,
with new financial investments of $95 bil-
lion in 2010,14 representing 66 per cent of
the total. Solar has been the second larg-
est with $26 billion (18 per cent), followed
by modern biomass power with $11 bil-
lion (8 per cent) and biofuels with $6 billion
(4 per cent). As noted earlier, $40 –$45 bil-
lion were invested in large hydro projects
(not included in the data), whereas invest-
ments in small hydro, geothermal and ma-
rine energy were much smaller (UNEP and
Bloomberg, 2011).
Foreign direct investment (FDI) in RETs (in-
cluding electricity generation and the man-
ufacturing of RETs equipment) grew rapidly
over the period 2003–2010, at an average
In 2010, investment
in power generation
capacity accounted for
86 per cent of total RETs
investment.
Government R&D
investment in RETs
increased significantly
worldwide in both 2009
and 2010.

41CHAPTER II : RENEWABLE ENERGY TECHNOLOGIES AND THEIR GROWING ROLE IN ENERGY SYSTEMS
annual rate of 43.4 per cent. Growth was
especially rapid in 2006, 2007 and 2008,
after which the dislocation in international
credit markets associated with the global
financial crisis led to declines in FDI flows in
2009 and again in 2010. Developed econo-
mies were the main investors, accounting
for 89.5 per cent of all FDI in renewable en-
ergy over the period 2003–2010. They were
also the largest hosts of investments in
RETs, accounting for 55 per cent of global
FDI inflows in RETs. Developing economies
accounted for 9.6 per cent of global RETs-
related FDI outflows, and they invested
mainly in other developing economies (see
data and discussion in chapter V, box 5.14).
Higher oil prices, renewed concern over
the safety of nuclear energy and continued
public policy support should provide the ba-
sis for continued private and public invest-
ment in RETs. Against this positive picture,
private capital markets and private banks
have still not fully recovered from the global
financial crisis that erupted in 2008. Interna-
tional debt markets remain unsettled, and
private investors in many developed coun-
tries continue to remain constrained by re-
duced access to financing from banks and
international capital markets. In addition, a
number of developed countries are pursu-
ing policies of fiscal austerity, which may
cause them to reconsider their direct fiscal
support measures for renewable energy,15
although other support measures (such as
RE targets, renewable portfolio standards,
and/or tax credits) may remain in place. The
picture is therefore mixed.
However, for purposes of this Report, the
important issue is whether public support
measures and investment will continue to
provide the much-needed impetus to RETs
innovation and its wider dissemination over
the long term. Will investment in renewable
energy rise at rates that are fast enough to
meet the global challenge of reducing ener-
gy poverty and mitigating climate change?
Viewing the current trends and data avail-
able from this perspective, much more pri-
vate investment will be needed to acceler-
ate the development and deployment of
RETs worldwide. It has been estimated, for
instance, that at least $500 billion will need
to be invested in new, low-carbon tech-
nologies each year starting in 2020 in order
to stabilize climate change (BNEF, 2010: 1).
This applies particularly to many developing
countries and LDCs where investments in
RETs have been much lower than in some
of the larger developing countries.16
From a different perspective, large invest-
ments are also needed in order to scale
up RETs production and reduce unit costs
via the “experience curve” – which reflects
economies of scale and “learning by do-
ing”. This is very important to enable wider
deployment in several smaller developing
countries and LDCs that may not be able
to provide direct financial support for RETs.
Financing for improved RETs infrastructure,
transmission and distribution is particularly
important to enable the greater deployment
of some RETs. This will require much great-
er investments, including for upgrading the
energy network infrastructure (including
“smart grids”), to enable faster deployment
of RETs so as to mitigate climate change
and reduce energy poverty.
2. Costs of renewable energy and other energy sources compared
The cost of RE-generated electric power
will have a major impact on the extent of
its use among poor households in develop-
ing countries. Even in developed countries,
large-scale deployment of REs rests on their
ability to compete with conventional fossil
fuels in terms of price. Comparing costs of
REs with conventional energy sources is
difficult because certain costs are specific
to conventional energy and others to REs,
and they are difficult to factor into any finan-
cial equation, as the earlier discussions in
this chapter show. This is compounded by
the fact that certain large-scale applications
of REs are subsidized through fiscal sup-
port by governments in many developed
countries in order to compensate for con-
ventional energy sources that are not sold
at their true price. These issues are exam-
Higher oil prices…and
continued public policy
support should provide
the basis for continued
private and public
investment in RETs.
Financing for improved
RETs infrastructure,
transmission and
distribution is particularly
important to enable the
greater deployment of
some RETs.

42 TECHNOLOGY AND INNOVATION REPORT 2011
ined here, followed by a discussion of the
difficulties in incorporating the true price of
energy into market rates.
a. Problems with making directcost comparisons
(i) Fiscal support by governments
Currently, public fiscal support plays a role
in ensuring the price competitiveness of
RE in many developed countries, and it is
feared that such support may eventually
be withdrawn under the pressure of fiscal
austerity aimed at alleviating the heavy debt
burdens of those countries. Such support
is much easier to justify on grounds that
RETs will render such energy options more
price-competitive over time, and because
of the other benefits they can offer, such as
reduction of energy poverty, climate change
mitigation, job creation and poverty reduc-
tion (see chapter III). Rising oil prices and
increasing financial investments and specu-
lation in energy commodities are also fac-
tors that promote the greater use of RETs
for energy security purposes. And an ac-
celerated use of RETs would in turn result
in further cost reductions (see, for example,
IEA, 2010a and discussion in chapter III of
this Report). Moreover, the price differential
will decrease as fossil fuel prices rise as a
result of increasing global energy demand
in the coming decades.
(ii) Factoring in costs specific to conventional energy: Subsidies and environmental externalities
One clear problem in calculating the true
cost of energy lies in the difficulty of ac-
counting for the externalities inherent in
utilizing fossil fuels. Fossil fuel combustion
causes a number of harmful emissions,
including micro-particulates, sulfur and ni-
trogen oxides, volatile hydrocarbons and
GHGs, which contribute to climate change.
The fact that the costs resulting from these
emissions are not taken into account when
calculating the overall cost of fossil fuel
constitutes a large, hidden subsidy. Unfor-
tunately, the true magnitude of that subsidy
is difficult to quantify with any precision be-
cause of the number of assumptions that
need to be made with regard to the envi-
ronmental impact of fossil fuels. For exam-
ple, nuclear energy – which benefits from
limited liability laws in many countries – cre-
ates large public costs when accidents oc-
cur such as at Chernobyl and Fukushima.
This is in addition to the unresolved prob-
lem of storage of nuclear waste and the
costs of decommissioning nuclear plants.
The risk of nuclear accidents is incalculable
because of the human element, and this
presents difficulties in assigning probabili-
ties or prices to that risk.
In addition to the hidden subsidy from not
costing the environmental impact of fossil
fuels, many countries have been providing
direct subsidies to fossil fuel consumption
for many years. A common reason for such
subsidies in some developing countries is
to protect poor households from rising en-
ergy prices, or to promote access to mod-
ern energy sources by the poor. Subsidies
have also been used to promote the de-
velopment, deployment and use of nuclear
energy (IEA et al, 2010).
Energy subsidies can take many forms,
both direct and indirect. Direct subsidies
may be fairly easy to account for. However,
indirect ones, including tax exemptions and
preferential tax rates (e.g. reduced value-
added tax (VAT) rates or exemptions from
excise duties for fossil-fuel use) are difficult
to measure, but may also exist.17 Govern-
ments also provide subsidies for some
RETs to encourage their development and
deployment, but these are much smaller.
It is estimated that fossil fuel subsidies to
consumers amounted to $557 billion in
2008 (IEA, 2010a). Producing comprehen-
sive estimates are more difficult for nuclear
energy and RETs, but a rough estimate of
$100 billion annually for alternative energies
(including both nuclear and RETs) has been
reported (IEA et al., 2010).
(iii) Factoring in costs specific to RETs
Intermittency in power generation is a fea-
ture of most RETs, and this has implications
for efficiency and cost of electricity genera-
Public fiscal support...
is much easier to justify
on grounds that RETs
will render such energy
options more price-
competitive over time.
In addition to the
hidden subsidy
from not costing
the environmental
impact of fossil fuels,
many countries have
been providing direct
subsidies to fossil fuel
consumption.

43CHAPTER II : RENEWABLE ENERGY TECHNOLOGIES AND THEIR GROWING ROLE IN ENERGY SYSTEMS
tion. A more general problem is account-
ing for energy costs on a life-cycle basis,
which includes all the costs involved in an
energy project, from start to end. Life-cycle
cost accounting, which is a more compre-
hensive method of calculating costs, can
be used for comparisons of different en-
ergy sources. It includes project investment
costs, operation and maintenance costs,
and decommissioning costs once the use-
ful life of a mine, a drilling rig or a power
plant has ended. Moreover, the costs of
renewable energy are likely to vary further
depending, for example, on the geographic
location and the natural resource endow-
ments needed to generate power. The is-
sue of storage and transmission infrastruc-
ture is also relevant in this context, because
the distances involved in collecting and
transporting solid fuels, such as biomass
from agricultural waste, from the point of
generation to where it is processed vary by
location. This is apart from standard con-
siderations such as the cost of land or of
labour to install some RETs.
The intermittency of some RETs poses a
number of challenges relating to the need
for reserve generation over and above re-
sponding to increases in demand or plant
failure. One challenge is that capacity has
to be held in reserve to deal with short-term
fluctuations in RETs-based output. For in-
stance, when the wind is too low or too
strong for a wind farm to operate, reserve
capacity has to be brought online. Another
challenge associated with intermittency
arises from the need to hold excess capac-
ity (so-called “capacity credit”) in order to
meet peak demand.
Like conventional plants, intermittent RETs
suffer from risks of technical failure, but they
also suffer from the risk that their “fuel” may
not be available. And furthermore, if the
“fuel” is not available at one plant, it is high-
ly unlikely to be available at nearby plants.
Overcoming these intermittency challenges
incurs costs associated with the need for
back-up supply. From a purely financial per-
spective, the value of generation from inter-
mittent RETs should be lower than that from
conventional energy plants by roughly the
amount of these additional back-up costs
in order to make RETs competitive (Owen,
2004).
b. Incorporating costs into themarket price of energy options
The ideal approach to incorporating envi-
ronmental costs into market pricing is based
on the ‘polluter pays’ principle, but this is
seldom enforced. Apart from uncertainties
about the externality costs (noted above),
there are serious implementation difficulties
to be overcome. For energy technologies
relating to climate change mitigation, this
might be done through carbon pricing or
some form of exchangeable emission rights
(discussed in chapter IV). By regulating a
particular price for one ton of CO2-equivalent
emissions, project developers and investors
are forced to include this cost when decid-
ing on a particular technology. For instance,
GHG-emitting fossil-fuel power plants would
become more expensive because the cost-
benefit analysis of building and generating
power from them would not only include the
costs associated with capital investment,
operation and maintenance, and fuel, but
also the cost of GHGs emitted based on the
carbon price. Other environmental impacts,
such as localized air pollution, deforestation
from unsustainable biomass use, loss of
biodiversity from deforestation and/or pollu-
tion, are not necessarily accounted for in a
carbon price, although adjustments are pos-
sible. Other measures, which avoid the dif-
ficulties of pricing externalities, may include
mandating regulated electricity suppliers to
provide a certain proportion of their electric-
ity from “green” sources.
In the absence of a market price for car-
bon (or other GHG emissions), subsidies for
RETs may serve to compensate for some
externalities. They are also easier to justify
on theoretical grounds, because of their en-
vironmental, health and social benefits. In
addition, the many market failures in tech-
nology markets can justify public interven-
tion to promote technology development in
technologies that have high social welfare
returns, and that bring various social and
Intermittency in power
generation is a feature
of most RETs, and this
has implications for
efficiency and cost of
electricity generation.
In the absence of
a market price for
carbon (or other GHG
emissions), subsidies
for RETs may serve to
compensate for some
externalities.

44 TECHNOLOGY AND INNOVATION REPORT 2011
economic benefits that cannot be directly
accounted for in their price.18 For example,
providing basic energy services to energy-
poor communities can be seen as desir-
able, or even as an obligation of a govern-
ment to meet the most basic needs of its
citizens. And actions that reduce GHG
emissions and mitigate climate change
are considered global public goods. Thus,
there are economic arguments to support
such actions through policy measures, al-
though the cost of such support remains a
valid issue. An argument in support of RETs
use and deployment is that many RETs are
still not mature, and their costs are likely to
fall through economies of scale and with
experience. Of course, this dynamic aspect
cannot be fully factored into current com-
parisons, but it needs to be borne in mind.
3. The evidence on renewable energy costs
At the microeconomic or project level, power
projects are most commonly appraised on
the basis of their levelized cost of electric-
ity (LCOE).19 Assuming the project operates
at full capacity, the LCOE is determined by
comparing the discounted capital cost of
the project, the annual operating and main-
tenance costs and the expected annual fuel
costs, on the one hand, with the expected
annual production of electricity on the other
(Heal, 2009; Owen, 2004). It therefore takes
into account all the financial costs involved in
a project (investment, operation and mainte-
nance, fuel and decommissioning costs) and
amortizes these costs over the expected life
of a project. Usually, LCOE calculations do
not take into account subsidies or policy in-
centives for RETs.
Different studies on costs of REs lead to
different conclusions on their cost competi-
tiveness in relation to other sources of en-
ergy. One reason for this, as discussed ear-
lier in this chapter, is that RE resources and
costs differ substantially by location and by
project. The assumptions made regarding
discount rates can also have an important
impact on the LCOE. The relative econom-
ics of RE versus conventional sources is
largely driven by forecasts of fuel prices and
future technology costs and performance,
together with the prices of certain construc-
tion and manufacturing materials such as
steel, concrete, glass and silicon (ESMAP,
2007). As discussed in this section, evi-
dence indicates that for some applications
RETs are already cost-competitive com-
pared with traditional energy sources.
Most studies on RE costs agree that the
costs of energy generation from various
RETs are on the decline, and that this trend
will continue over time. Major technological
advances and associated cost reductions
are expected in, for instance advanced PV
and CSP technologies and manufacturing
processes, enhanced geothermal systems,
multiple emerging ocean technologies, and
foundation and turbine designs for offshore
wind energy. Further cost reductions in hy-
dropower are likely to be less significant
than in some of the other RE technologies,
but there is potential for R&D to make hy-
dropower projects technically feasible in a
wider range of natural conditions, and to
improve the technical performance of new
and existing projects (IPCC, 2011).
One study by ExxonMobil (2010) on global
energy trends to 2030 forecasts that coal,
gas and nuclear energy will remain more
price-competitive than solar PV and geo-
thermal for new, base-load power-genera-
tion plants that come online in the United
States in 2025, although by then, wind
will have become more competitive than
all three (coal, gas and nuclear). Wind is
more competitive than, and geothermal is
as competitive as, coal that incorporates
carbon capture and storage (which is more
costly than “dirty” raw coal). The study’s
projections indicate that both wind and
solar will become much larger sources of
power generation in coming decades. It
should be noted that the price projections
may differ for power plants in different coun-
tries, given that there are large location- and
project-specific variations. The study does
not appear to take into account different
configurations and scales of application of
RETs. Moreover, the assumptions underly-
ing the study are not explicitly noted.
Most studies on RE
costs agree that
the costs of energy
generation from various
RETs are on the decline,
and that this trend will
continue over time.
Major technological
advances and
associated cost
reductions are expected
in, for instance
advanced PV and
CSP technologies
and manufacturing
processes.

45CHAPTER II : RENEWABLE ENERGY TECHNOLOGIES AND THEIR GROWING ROLE IN ENERGY SYSTEMS
Taking account of different configurations and
scales of application provides more nuanced
results. This is illustrated by the results of a
detailed study, which found that in some off-
grid and mini-grid applications certain RETs
were already competitive with conventional
energy in 2005, even with the relatively low oil
prices prevailing at that time (ESMAP, 2007).
This implies that for precisely those applica-
tions which may be most suitable for isolated
communities (i.e. decentralized applications
that do not require connection to the national
or regional energy grids) RETs may be at their
most cost-competitive. Moreover, it is worth
noting that cost reductions have been more
rapid in some REs than the study had fore-
seen, notably in solar PV systems. These
cost reductions are an important trend for
many people in developing countries who
suffer from energy poverty and for whom the
most relevant consideration is the price of
RETs-based energy supply.
It is clear that actual energy generation
costs (in terms of the localized cost of elec-
tricity) based on some RETs have been de-
clining over time, and in some cases very
rapidly. The prices of solar-PV systems, in
particular, have been falling extremely rap-
idly, by a factor of 10 for PV modules over
the past 30 years (from $22/W in 1980 to
less than $1.50/W in 2010). The price of
an entire system has also declined steadily,
reaching $2.72/W for some thin-film tech-
nologies by 2009 (IPCC, 2011). During the
18 months to June 2010, prices fell by an
estimated 50 per cent for new solar panel
modules (BNEF, 2010: 4).
Between 2008 and 2009, the LCOE range
for thin-film PV completely shifted, and
traditional crystalline silicon PV modules
became much cheaper (figure2.3). The
cost of thin-film PV reported here ap-
pears to be lower than that projected by
ESMAP (2007) for off-grid and mini-grid
applications in 2015, since actual prog-
ress is much faster than was projected.
It is reported that in Africa, Asia and Latin
America, the demand for modern en-
ergy is driving the use of PV for mini-grid
or off-grid solar systems, which in many
instances are already at price parity with
fossil fuels (REN21, 2010). Such systems
are contributing significantly to reduc-
ing energy poverty by providing access
to energy where grid connection remains
elusive. Some other recent findings on the
declining costs of RETs are presented in
box 2.8 below.
Source: Reproduced from BNEF (2010).
Note: c-Si refers to traditional crystalline silicon PV modules. The above data are based on an assumed expected internal rate of return of 10 per cent for investors in such generating projects.
– 100 200 300 400 500 600
2008 2009
Solar Thermal
c-SiPV
Thin-Film PV
Wind Offshore
Wind Onshore
Geothermal
Figure 2.3: Levelized costs of some renewable energy technologies compared,2008 and 2009 ($/MWh)
Between 2008 and 2009,
the LCOE range for
thin-film PV completely
shifted, and traditional
crystalline silicon PV
modules became much
cheaper.

46 TECHNOLOGY AND INNOVATION REPORT 2011
Table 2.2 shows the costs of energy pro-
duced by various RETs. The table helps
to underscore two important points. First,
the energy costs generated by RETs vary
substantially by application, as noted ear-
lier in this chapter. Second, for some ap-
plications, RE costs vary within a relatively
narrow range, for instance: 14 cents/
kWh–18 cents/kWh for energy from a CSP
power plant, 17 cents/kWh–34 cents/kWh
from a rooftop solar PV, and 5 cents/kWh–
12 cents/kWh either from a small biomass
power plant of 1 to 20 MW, or a mini or
small hydro installation. RETs can also be
particularly competitive for heating and
cooling. The price ranges shown in table
2.2 can be very broad due to location- and
project-specific variations. Individual proj-
ects falling at the lower end of LCOE ranges
are relatively cost-competitive.
Recent data from the IEA (2010b) allow a
comparison of the LCOE of conventional
sources of energy with those of onshore
wind and solar PV systems. The data pres-
ent the median values (in $/MWh) of LCOE
cost ranges based on data collected on dif-
ferent energy installations in various coun-
tries using discount rates of 5 per cent and
10 percent respectively. The results indicate
that with a discount rate of 5 per cent, nu-
clear power plants generate the cheapest
electricity among the technologies stud-
ied, at $59/MWh, followed closely by coal-
fired plants ($62/MWh for coal plants with
Box 2.8: Declining costs of RETs: Summary of findings of the IPCC
The IPCC (2011) has reviewed a broad number of studies which provide additional support for the view that some RETs are
already cost-competitive under some circumstances. The main findings for solar, wind, hydropower and geothermal are dis-
cussed below.
The localized cost of PV depends heavily on the cost of individual system components, of which the PV module is the most
costly. The current LCOE from solar PV is generally still higher than wholesale market prices for electricity, although in some
applications PV systems are already competitive with other local conventional energy alternatives for energy access. Recent
LCOEs for different types of PV systems showed wide variations, from as low as $0.074/kWh to as high as $0.92/kWh,
depending on a wide set and range of input parameters. Narrowing the range of parameter variations, the LCOE in 2009
for utility-scale PV electricity generation in regions of high solar irradiance in Europe and the United States was reported to
be in the range of $0.15/kWh to $0.4/kWh at a 7 per cent discount rate, but it could be lower or higher depending on the
available resource and other conditions. These calculations on the LCOE for different RETs show that the cost of solar PV
energy remains higher than that for other RETs, but this may not fully take into account the recent rapid decline in the price
of PV technologies.
For onshore and offshore wind, the LCOE varies substantially, depending on assumed investment costs, energy production
and discount rates. In some areas with good wind resources, the cost of wind energy is already competitive with current energy
market prices, even without considering externalities of conventional energy such as environmental impacts. For onshore wind
energy in good to excellent wind resource regimes, the IPCC estimates the LCOE to average 5 cents/kWh to 10 cents/kWh,
and it could reach more than 15 cents/kWh in areas with poor wind conditions. Although the offshore cost estimates are less
certain, typical LCOEs are estimated to range from 10 cents/kWh to more than 20 cents/kWh for recently built or planned plants
located in relatively shallow water.
Hydropower is often economically competitive with traditional energy, although the cost of developing, deploying and operating
new hydropower projects varies from project to project. This is because hydro projects differ greatly in nature. The LCOE of
hydropower projects, using a large set and range of input parameters, ranges from as low as 1.1 cents/kWh to 15 cents/kWh,
depending on site-specific parameters for investment costs of each project and on assumptions regarding the discount rate,
capacity factor, lifetime, and operating and maintenance costs. Under favourable conditions, where the costs of those param-
eters are low, the LCOE of hydropower can be in the range of 3 cents/kWh to 5 cents/kWh.
Geothermal costs also vary by project, but the LCOEs of power plants using hydro-thermal resources are reportedly often
competitive in electricity markets. The same is reported to be true for direct uses of geothermal heat. The LCOE of geothermal
projects based on a large set and range of input parameters is estimated to range from 3.1 cents/kWh to 17 cents/kWh, de-
pending on the particular type of technology and project-specific conditions.
Source: UNCTAD.
RETs can also be
particularly competitive
for heating and cooling.

47CHAPTER II : RENEWABLE ENERGY TECHNOLOGIES AND THEIR GROWING ROLE IN ENERGY SYSTEMS
Technology Typical characteristics Typical energy costs
(cents/kWh, unless indicated otherwise)
Power Generation
Large hydro Plant size: 10 MW–18,000 MW 3–5
Small hydro Plant size: 1–10 MW 5–12
Onshore wind Turbine size: 1.5–3.5 MWBlade diameter: 60–100 meters
5–9
Offshore wind Turbine size: 1.5–5 MW Blade diameter: 70–125 meters
10–20
Biomass power Plant size: 1–20 MW 5–12
Geothermal power Plant size: 1–100 MW;Types: binary, single- and double-flash, natural steam
4–7
Solar PV (module) Cell type and efficiency: crystalline 12–19%; thin film 4–13%
–––
Rooftop solar PV Peak capacity: 2–5 kW-peak 17–34
Utility-scale solar PV Peak capacity: 200 kW–100 MW 15–30
Concentrating solar thermal power (CSP) Plant size: 50–500 MW (trough), 10–20 MW (tower); Types: trough, tower, dish
14–18(trough)
Hot Water/Heating/Cooling
Biomass heat Plant size: 1–20 MW 1–6
Solar hot water/heating Size: 2–5 m2 (household); 20–200 m2 (medium/multi-family);0.5–2 MWh (large/district heating);Types: evacuated tube, flat–plate
2–20 (household)
1–15 (medium)1–8 (large)
Geothermal heating/cooling Plant capacity: 1–10 MW; 0.5–2
Biofuels
Ethanol Feedstocks: sugar cane, sugar beets, corn,cassava, sorghum, wheat (and cellulose in the future)
30–50 cents/liter (sugar)60–80 cents/liter (corn,
gasoline equivalent)
Biodiesel Feedstocks: soy, rapeseed, mustard seed, palm,jatropha, and waste vegetable oils
40–80 cents/liter(diesel equivalent)
Rural Energy
Mini-hydro Plant capacity: 100 –1,000 kW 5–12
Micro-hydro Plant capacity: 1–100 kW 7–30
Pico-hydro Plant capacity: 0.1–1 kW 20–40
Biogas digester Digester size: 6–8 m3 n/a
Biomass gasifier Size: 20–5,000 kW 8 –12
Small wind turbine Turbine size: 3–100 kW 15–25
Household wind turbine Turbine size: 0.1–3 kW 15–35
Village-scale mini-grid System size: 10–1,000 kW 25–100
Solar home system System size: 20–100 W 40–60
Table 2.2: RETs characteristics and energy costs
Source: Reproduced from REN21 (2011: 33).
48 TECHNOLOGY AND INNOVATION REPORT 2011
CCS and $65/MWh for supercritical/ultra-
supercritical coal-fired plants). Electricity
from combined cycle gas turbine (CCGT)
plants is more expensive, at $86/MWh,
onshore wind is even more expensive
($96.74/MWh) and solar PV is by far the
most costly of the group (at $411/MWh).
With a 10 per cent discount rate, the order
of competitiveness shifts for coal, gas and
nuclear, but onshore wind and solar PV re-
main the most expensive by a substantial
margin. Based on the data reported here,
on average, onshore wind and solar PV
seem to remain more costly than conven-
tional energy sources.
In summary, there is evidence that while in
many large-scale applications convention-
al energy is often more cost-competitive,
this is not always the case. Some RETs
are cost-competitive, although cost char-
acteristics are highly context-specific and
can vary from one system to another. In
small-scale applications that are off-grid
or integrated into mini-grids, RETs are al-
ready competitive, providing solutions that
are difficult for conventional grid-based en-
ergy sources to emulate. In that respect, it
is reasonable to conclude that the wider
deployment of RETs could make an im-
portant contribution to reducing energy
poverty, particularly through off-grid and
mini-grid applications. These smaller, de-
centralized applications should be particu-
larly useful in small isolated communities in
LDCs and other developing countries, as
well as in developed countries, assuming
that the required RE resources are avail-
able in those locations. It must be borne
in mind that some of the RETs remain
dynamic and subject to ongoing techno-
logical development. As they are further
scaled up, and with growing experience
and technological learning, prices can be
expected to drop further.
D. SUMMARYThe basic messages of this chapter may be
summarized in the following five points.
First, RETs are a diverse group of technolo-
gies that are currently at different levels of
maturity. Those based on wind, geother-
mal, solar thermal and hydro are mature
technologies and are already being de-
ployed widely. Solar concentrators and so-
lar PV systems are rapidly penetrating new
markets, even as development continues.
Still others, including second-generation
biofuels and ocean energy, remain at vary-
ing stages of pre-commercial development.
Second, some RETs for off-grid and mini-
grid applications may also already provide
cost-effective energy solutions. There have
been rapid cost reductions in solar PV, but
the relative cost competitiveness of differ-
ent PV technologies is not clear. Still, where
good alternatives do not exist, solar PV can
represent a reasonable option to provide
some degree of access to energy, particu-
larly in rural areas in developing countries
and LDCs where national energy grids are
unlikely to expand in the near future. In
these cases, RETs offer a realistic option for
eradication, or at least for alleviation, of en-
ergy poverty. In some developing countries
that lack adequate physical infrastructure,
grid connection rates are extremely low and
RETs could provide alternate energy supply
sources for large segments of the popula-
tion.
Third, some RETs are experiencing rapid
ongoing technological progress and reduc-
tions in energy generation costs, particu-
larly of solar PV technologies, but also of
onshore wind energy. The cost competi-
tiveness of RETs relative to conventional
energy sources is improving, and can be
expected to improve even further with con-
tinued technological progress and higher
investment in development, production
and deployment. Rising, and increasingly
volatile, oil prices may also be contribut-
ing to this trend. Additional technological
progress is needed for integrating RE into
the existing energy infrastructure, including
through the development of smart energy
grids. Such grids could help overcome the
intermittency problem associated with en-
ergy from solar and wind energies. Also,
further progress in the storage capabilities
for these two RETs is needed.
In small-scale
applications that are
off-grid or integrated
into mini-grids, RETs
are already competitive,
providing solutions
that are difficult for
conventional grid-based
energy sources.

49CHAPTER II : RENEWABLE ENERGY TECHNOLOGIES AND THEIR GROWING ROLE IN ENERGY SYSTEMS
Fourth, some RETs are being deployed rap-
idly, but are starting from a small base, and
therefore still account for only a small frac-
tion of global energy consumption today.
However, the rate of growth of global in-
vestment and deployment in RETs has risen
over the past decade. Both developed and
developing countries are participating in
this growth, although there is a need for ex-
panding RETs-related investment in smaller
developing countries and LDCs.
Fifth, there is huge technical potential for
power generation from RETs, and therefore
they are likely to play an increasingly impor-
tant role in meeting global energy demand
as continued technological progress, ad-
ditional investment and further deployment
lead to cost reductions over the medium
and long term globally.
This chapter has presented and assessed
the many different scenarios on the future
role that RETs could play in global energy
supply. The analysis shows that RETs will
continue to evolve as complements to
existing energy sources globally, with the
eventual aim of replacing conventional en-
ergy in the long term. For developing coun-
tries and LDCs, this is a positive trend. The
actual speed and extent of deployment of
RETs and the role they will eventually play
will depend critically on the policy choices
that are made today and in the future. The
policy issues that need to be considered
within national frameworks for technology
and innovation and the ways and means of
international support are discussed in sub-
sequent chapters of this Report.

50 TECHNOLOGY AND INNOVATION REPORT 2011
NOTES
1 This definition has been in use since the 1980s (see, for example, Twidell and Weir, 1986).
2 The use of bagasse for power and heat production (for example, through cogeneration) is reportedly significant in developed and developing countries that have a large sug-arcane industry (REN21, 2011).
3 The IPCC notes the same point for the year 2008, when the technical potential of renewable energy to generate electric-ity was much greater than global electricity demand regis-tered that year (IPCC, 2011).
4 The Middle East figures referred to here correspond to Global Wind Energy Council (GWEC) classification.
5 The cost of a fossil fuel generator will depend upon the type of generator (soundproof or not) as well as the type of fuel it runs on.
6 According to standard terminology, pico-hydro has the smallest power capacity, of 0.1–1 kW, micro-hydro covers a range of 1–100 kW, mini-hydro a range of 100–1,000 kW (1 MW) and small hydro a range of 1–10 MW, while large hydro implies capacity of over 10 MW. Hydropower plants can be classified into three main categories according to operation and type of flow: run-of- river, reservoir based (storage) hydropower and pumped storage. Each of these has different variability and predictability characteristics with respect to power generation.
7 The IPCC (2011) estimates the technical potential of global hydropower to be 14,575 TWh (or 52.47 exajoules (EJ)).
8 The resulting gas consists of 50–70 per cent methane,
5–10 per cent hydrogen, and the rest mainly CO2 (FAO, 2006). This anaerobic decay happens naturally under silt in swamps, but the process can be simulated using fairly simple equipment, the main purpose of which is to keep air away from the waste materials and to capture the methane as it is released.
9 Neodymium is one of the “heavy” rare earths, currently pro-duced almost exclusively in China.
10 The solar radiation itself has a temperature of nearly 5,777 degrees Kelvin, or 5,477 degrees Celsius, so the re-ceiver gets very hot and transmits that heat into a “working fluid”, which could be helium or water or one of the hydrocar-bons. However, the mirrors on the ground have to be control-lable to keep aimed at the sun as it moves across the sky.
11 For more information, see: www.desertec-africa.org.
12 Many such facilities have been built in Japan, Spain and the
United States. Costs per kWh are still much higher than for
coal-based electricity, but solar PV costs continue to de-
cline, especially since China recently began exporting solar
panels on a large scale. Several PV technologies have been
developed in parallel. The panels can be arranged on virtu-
ally any scale, from a single panel on a rooftop to multiple
panels organized in arrays to form solar farms.
13 Under those packages, over $194 billion were part of gov-
ernment commitments to spending on clean energy (World
Economic Forum, 2011).
14 Financial investment refers to asset finance, plus capital
raising by companies from venture capital, private equity
and public market investors. Excludes small-scale projects
and government and corporate R&D.
15 These include cuts in national and State/province-level sup-
port in 2010 in the Czech Republic, France, Italy, Germany,
Spain and the United Kingdom (REN21, 2010).
16 Larger developing countries, especially China, are begin-
ning to receive the largest share of new investments in RETs
(UNEP and Bloomberg, 2011).
17 Examples include reduced VAT on fossil fuels in Italy and the
United Kingdom, and variable excise taxes on petrol and
diesel in Mexico (for other examples, see IEA et al., 2010).
18 See, for example, UNCTAD (2010) on RETs-based electrifi-
cation in rural areas.
19 It should be noted that the use of LCOEs to compare in-
termittent REs (such as wind or solar) with dispatchable
energy sources has been criticized as being faulty be-
cause the wholesale price of electricity varies widely over
a day, month or year, and because intermittent generating
technologies have very different energy production profiles
than dispatchable ones (Joskow, 2011). Joskow proposes
that such comparisons utilize evaluations based on three
elements: the expected market value of the electricity that
will be supplied, total life-cycle costs and expected profit-
ability.

51CHAPTER II : RENEWABLE ENERGY TECHNOLOGIES AND THEIR GROWING ROLE IN ENERGY SYSTEMS
REFERENCES
Aitken JW (2003). Transitioning to a renewable energy future. Freiburg, International Solar Energy Society.
BNEF (Bloomberg New Energy Finance) (2010). Crossing the valley of death: Solutions to the next generation energy
problem. June. Available at: http://www.cleanegroup.org/assets/Uploads/CEGBNEF-2010-06-21valleyofdeath.pdf.
Boyle G (2004). Renewable Energy: Power for a Sustainable Future. Second edition. Glasgow, Oxford University
Press.
Briggs M (2004). Widescale biodiesel production from algae. Energy Bulletin, October. Durham, NH,
University of New Hampshire.
Elswijk M and Kaan H (2008). European embedding of passive houses. Promotion of European Passive Houses.
Available at: http://erg.ucd.ie/pep/pdf/European_Embedding_of_Passive_Houses.pdf
ESMAP (2007). Technical and economic assessment of off-grid, mini-grid and grid electrification technologies.
Technical Paper no. 121/07, Washington, DC, World Bank, December.
Eyer J and Corey G (2010). Energy storage for the electricity grid: Benefits and market potential assessment guide
no. SAND2010-0815. Alberquerque, NM, Sandia National Laboratories.
ExxonMobil (2010). The outlook for energy: A view to 2030. Available at: http://www.exxonmobil.com/Corporate/
files/news_pub_eo.pdf.
FAO (2006). A system approach to biogas technology. Rome.
Ford Runge C and Senauer B (2007). How biofuels could starve the poor. Foreign Affairs, May/June Tampa, FL,
Council on Foreign Relations Inc.
GWEC (2011). Annual market update 2010, March.
Greenpeace International, SolarPACES and ESTELA (2009). Concentrating Solar Power – Global Outlook 09:
Why Renewable Energy is Hot. Available at: http://www.greenpeace.org/raw/content/international/press/reports/
concentrating-solar-power-2009.pdf
Heal G (2009). The economics of renewable energy. Cambridge, MA, National Bureau of Economic Research, June.
IEA (2007). Renewables in Global Energy Supply 2007. Paris.
IEA (2010a). World Energy Outlook 2010. Paris, OECD/IEA.
IEA (2010b). Key World Energy Statistics 2010. Paris.
IEA, OPEC, OECD and World Bank (2010). Analysis of the scope of energy subsidies and suggestions for the G-20
Initiative, IEA, OPEC, OECD, WORLD BANK Joint Report, June.
IPCC (2011). IPCC Special Report on Renewable Energy Sources and Climate Change Mitigation. Geneva.
Johansson TB (2011). Development of sustainable energy. Paper presented at the 19th OSCE Economic and Envi-
ronmental Forum first preparatory meeting in Vienna, 7 February 2011. Available at: http://www.osce.org/eea/75430.
Joskow P (2011). Comparing the costs of intermittent and dispatchable electricity generating technologies.
American Economic Review, 101(3): 238–241, May. American Economic Association.
MacKay DJ (2008). Sustainable Energy - Without the Hot Air. Cambridge, UIT Cambridge Ltd.
Owen A (2004). Environmental externalities, market distortions and the economics of renewable energy technologies.
The Energy Journal, 25(3): 127–156.
Pew Charitable Trusts (2011). Who’s winning the clean energy race? Washington, DC. Available at:
www.pewenvironment.org/uploadedFiles/PEG/Publications/Report/G-20Report-LOWRes-FINAL.pdf
52 TECHNOLOGY AND INNOVATION REPORT 2011
Photon International (2011). Global PV cell production expanded 118% to 27.2 GW in 2010. SolarServer.com solar
magazine, 18 January.
Pollin R, Heintz J and Garrett-Peltier H (2009). The economic benefits of investing in clean energy. How the
economic stimulus program and new legislation can boost U.S. economic growth and employment. Amherst,
MA, Department of Economics and Political Economy Research Institute (PERI), University of Massachusetts.
REN21 (2005). Renewables 2005: Global Status Report. Washington, DC, Worldwatch Institute.
REN21 (2010). Renewables 2010: Global Status Report. Paris, REN21 Secretariat.
REN21 (2011). Renewables 2011: Global Status Report. Paris, REN21 Secretariat.
Singer P (2010). Energy storage and the grid. Renewable Energy World North America Magazine. December.
Available at: http://www.renewableenergyworld.com/rea/news/article/2010/12/energy-storage-and-the-grid
Sorensen, B (2000). Renewable Energy (Second Edition). Academic Press, London.
Twidell J and Weir D (1986). Renewable Energy Resources. London, E & FN Spon.
UNCTAD (2008). Biofuel Production Technologies: Status, Prospects and Implications for Trade and Development.
New York and Geneva, UNCTAD.
UNCTAD (2010). Renewable Energy Technologies for Rural Development. New York and Geneva, UNCTAD.
UN/DESA (2011). World Economic and Social Survey 2011: The Great Green Technological Transformation.
New York, United Nations Department of Economic and Social Affairs.
UNEP and Bloomberg (2010). Global Trends in Sustainable Energy Investment 2010: Analysis of Trends and Issues
in the Financing of Renewable Energy and Energy Efficiency. United Nations Environment Programme. Available at:
http://bnef.com/Download/UserFiles_File_WhitePapers/sefi_unep_global_trends_2010.pdf.
UNEP and Bloomberg (2011). Global Trends in Renewable Energy Investment 2011. Analysis of Trends and Issues
in the Financing of Renewable Energy. United Nations Environment Programme. Available at:
www.fs-unep-centre.org/publications/global-trends-renewable-energy-investment-2011.
UNEP, European Patent Office and ICTSD (2010). Patents and Clean Energy: Bridging the Gap between Evidence
and Policy. Final report. Available at: http://documents.epo.org/projects/babylon/eponet.nsf/0/cc5da4b168363477c
12577ad00547289/$FILE/patents_clean_energy_study_en.pdf.
WEC (2010). 2010 Survey of Energy Resources. London.
World Economic Forum (2011). Green Investing 2011: Reducing the Cost of Financing. Geneva, April.
WWF (World Wildlife Fund) (2011). The energy report: 100% renewable energy by 2050. Available at:
http://wwf.panda.org/what_we_do/footprint/climate_carbon_energy/energy_solutions/renewable_energy/
sustainable_energy_report/.

STIMULATING TECHNICAL CHANGE AND INNOVATION
IN AND THROUGHRENEWABLE ENERGY
TECHNOLOGIES3


55CHAPTER III : STIMULATING TECHNICAL CHANGE AND INNOVATION IN AND THROUGH RENEWABLE ENERGY TECHNOLOGIES
CHAPTER III
STIMULATING TECHNICAL CHANGEAND INNOVATION IN AND THROUGHRENEWABLE ENERGY TECHNOLOGIES
A. INTRODUCTIONThe historically unprecedented rapid growth
rates in the industrialized countries over the
past century have been made possible by
the application of science to productive ac-
tivities, which underscores the importance
of knowledge and innovation for growth,
competitiveness and poverty reduction
(Rosenberg, 1982; Baumol, 2003; Nel-
son and Winter, 1982; Reinert, 2007). This
growth has led to a widening gap between
the industrialized and developing countries;
but also over the past three decades, there
has been a growing divergence among de-
veloping countries themselves (Ocampo
and Vos, 2008). Within this broader land-
scape, a gradual reconfiguration of innova-
tion activities is taking place in which many
developing countries are beginning to play
a larger role.1 For example, in 2006, China
accounted for 36 per cent of all value add-
ed manufactured goods produced world-
wide (UNCTAD, 2007), and since 1999 it
has been steadily increasing its expenditure
on R&D by an average of about 24 per cent
per annum. As a result, its R&D/GDP ratio
more than doubled in a decade, to reach
1.34 per cent in 2005 (UNCTAD, 2005).
Similarly, India was ranked immediately af-
ter the United States as the second most
favoured location for offshore R&D globally
(Economist Intelligence Unit, 2007). How-
ever, a large number of other countries
(especially, least developed countries) have
not been able to keep pace.
These divergences have been attributed
largely to the wide disparity among coun-
tries in technology and innovation capabili-
ties, which is greatly impeding their ability to
promote equitable growth and reduce pov-
erty in a sustainable way. Uninterrupted and
reliable energy supply is an important stim-
ulant of innovative capacity and economic
growth. As mentioned in chapter I of this
Report, studies suggest a very high corre-
lation between physical infrastructure (par-
ticularly energy) and industrial development
in countries at low levels of development.
A survey of a large number of developing-
country firms in Africa concluded that the
lack of reliable power supply is a crippling
bottleneck in developing countries’ indus-
trialization efforts (Ramachandran, Gelb
and Shah, 2009). This conclusion was
confirmed by a recent study in Bangladesh
that collected empirical data for the period
1973–2006, which found a direct causal re-
lationship between the low supply of elec-
tricity and stunted economic growth (Sarker
and Alam, 2010).
At the same time, technology and innova-
tion capabilities are important for promoting
R&D and innovation to produce state-of-
the-art RETs on the one hand, and for cre-
ating a critical base of knowledge (including
the requisite physical infrastructure, techni-
cal maintenance and managerial capaci-
ties) required for adapting and disseminat-
ing RETs, on the other (UNFCCC, 2010). A
critical threshold of technological capability
is also a prerequisite for making technical
improvements to RETs, which enable sig-
nificant cost reductions so that they can
be deployed on a larger scale in develop-
ing countries. The success of RETs-related
technology transfer initiatives also depends
on the ability of actors in developing coun-
tries to absorb and apply the technologies
The lack of reliable
power supply is a
crippling bottleneck in
developing countries’
industrialization efforts.
Technology and
innovation capabilities
are important for
promoting R&D and
innovation to produce
state-of-the-art RETs…
and for adapting and
disseminating RETs.

56 TECHNOLOGY AND INNOVATION REPORT 2011
transferred. The absence of, or limited, tech-
nological and innovation capabilities is there-
fore likely to constantly undermine national
strategies for sustainable development aim-
ing to promote the greater use of RETs.
In 2006, developing countries as a whole
accounted for 23 per cent of new invest-
ments in renewable energy sources world-
wide (GTZ, 2007),2 but a large share of these
investments went to the more technologi-
cally advanced developing countries such
as Brazil, China and India. Recent data for
2010 show that China recorded the largest
new investments in renewables and related
technologies (amounting to $49 billion),
followed closely by Germany ($41.1 bil-
lion), the United States ($30 billion), Italy
($14 billion) and Brazil ($7 billion) (see table
2.1, chapter II). India ranked eighth with
total new investments of $3.8 billion, and
all of Africa accounted for just $3.6 billion
(REN21, 2011). These figures underscore
the variations in RET use and innovation
among developing countries. Countries
such as Brazil, China, India and South Afri-
ca are making significant technological ad-
vances in certain RE industries in the wind
and solar sectors. However, progress in
manufacturing, research, development and
adaptation in most other developing coun-
tries and LDCs has been limited due to their
relatively weak innovation capabilities.
Developing countries therefore find them-
selves at a crossroads on the issue of how to
use established RETs, especially, wind, solar
and biomass to successfully alleviate energy
poverty, deploying them to complement tra-
ditional energy sources in the short and me-
dium term, and even replacing those sourc-
es in the long term (UN/DESA, 2011). Issues
of technological change and innovative ca-
pacity are at the forefront of this discourse.
Countries’ capacities for technological ab-
sorption need to be strengthened through
coordinated policy support, but an additional
priority should be to make existing technolo-
gies available and to assist in their greater
diffusion. Innovation in RETs is moving at a
fast pace globally, but there are some ques-
tions to which there are no clear answers at
this point in time. As estimates presented in
chapter II of this Report show, global projec-
tions of future energy supply vary widely. Left
to its own, or left to the “market”, it is unclear
to what extent the surge in RETs will con-
tinue globally, and to what extent it will bring
down the prices of these technologies for
use at the individual household and firm level
in the medium term. Public policy therefore
has an important role to play in this regard,
in addition to tipping the balance towards
energy mixes that give prominence to RETs
development in developing countries.
This chapter presents a framework for tech-
nology and innovation in developing coun-
tries, which is a necessary pre-condition for
ensuring the greater use and innovation of
RETs. It calls for: (a) a greater integration of
RETs within socio-economic development
strategies of countries; (b) the creation of ca-
pacity for increased technology absorption
in general, and in RETs in particular; and fi-
nally (c) express policy support aimed at sig-
nificantly integrating RETs into the national
energy mix by tipping the balance in favour
of RETs development, production and use.
Section A presents an innovation systems
perspective with regard to RETs. Section B
describes the mutually dependent relation-
ship between technology and innovation
capabilities and the wider dissemination and
use of RETs. It also shows the importance
of promoting energy access as a neces-
sary step towards economic development
in developing countries. The chapter argues
that greater policy intervention and support
within countries aimed at all three areas
listed above will help create the requisite
economies of scale in use and diffusion that
are required at the global level to drive down
the prices of established RETs. At the same
time, access to energy is also key to achiev-
ing many of the MDGs because of its impact
on social development in terms of educa-
tion, health and gender equality, among
others (IEA, 2010). Section C suggests that
there is also a need to integrate RETs use
into policies and programmes aimed at pov-
erty reduction and job creation, especially for
the more economically vulnerable groups in
developing countries and LDCs.3
The absence of, or
limited, technological
and innovation
capabilities is likely to
constantly undermine
national strategies for
the greater use of RETs.

57CHAPTER III : STIMULATING TECHNICAL CHANGE AND INNOVATION IN AND THROUGH RENEWABLE ENERGY TECHNOLOGIES
B. TECHNOLOGY AND INNOVATION CAPABILITIES FOR RETs DEVELOPMENT: THE CONTEXT
Theory and evidence point to several re-
sults that now form the basis of interna-
tional policy debates on innovation for de-
velopment. First, innovation (as opposed to
information or even knowledge) is the result
of the interactions between firms and other
organizations within a system, shaped by
social, economic, political and historical
factors (also called systems of innovation).
Second, within countries and systems, ac-
cumulation of knowledge for technological
change and innovation depends on a learn-
ing environment that promotes interactive
learning. This is the process through which
diverse actors in both the public and private
domains communicate and collaborate for
the creation, use and dissemination of new
knowledge (Johnson and Lundvall, 2003).
Accordingly, ways and means through
which knowledge is perceived, applied and
transformed are all influenced by socially
and historically conditioned human percep-
tions and notions. This makes innovation
– defined in the sense of “frontier” innova-
tion and R&D, or as an incremental process
leading to the building of technological ca-
pabilities – as much a social and cultural
process as a scientific and technological
one. Third, no technology, no matter how
simple or complex, can be fully expressed in
terms of its material value and components
(Nelson, 1987). The unwritten, tacit (not
easily embodied) knowledge explains why,
when two producers in different parts of the
world use the same technologies, there is
always a discrete possibility that they may
branch out into different applications, there-
by producing completely different results.
This focuses attention on a critical causal
relationship between the availability of tech-
nologies and the importance of processes
that underlie technological absorption ca-
pacity within countries.4 Policy studies from
developing and developed countries show
that common constraints hinder knowledge
accumulation (box 3.1).
Box 3.1: Policy-relevant insights into technology and innovation
Studies in evolutionary economics and technical change stress the need to view technical change and knowledge accumulation
within countries from a systemic perspective. The “national systems of innovation” framework, which derives from concepts
of evolutionary economics, is based on the premise that technological change and knowledge accumulation that contribute
significantly to economic development across countries are systemic in nature. Also known as the systems failure approach, it
emerged in the works of Freeman (1987, 1988), Lundvall (1985 and 1992) and Nelson (1993). It originated primarily as a tool to
help explain how country-specific factors contribute to innovative performance and economic growth,a and initially focused on
the impact of improved coordination between R&D institutions and other secondary research units on the production system in
its early stages (Lundvall, 1985).b
A basic premise of the concept of systems of innovation is that firms operate, grow and innovate within a network of firms
and actors through interactive learning, which is essentially incremental and cumulative, leading in turn to the accumulation
of new in-house capabilities. Both market and non-market mechanisms mediate interactive learning and innovation, and
therefore market failure is only one component of the system. This failure can be rectified by altering the costs and benefits
or payoffs of R&D to firms. As opposed to this, a system failure occurs when market and non-market agents interact in sub-
optimal ways, or do not interact at all, and when critical actors within an innovation system do not promote innovation (see,
for example, OECD, 1998).
Source: UNCTAD.
a The term “national system of innovation” was used first by Freeman (1987), when conducting an analysis of Japan’s
economic performance and growth. Nelson (1993) compares institutions and mechanisms that support technological
innovation in 15 countries.
b The approach relies largely on evolutionary economics, although some scholars emphasize other theories, such as the
theory of interactive learning and Schumpeterian economics.
There is a critical causal
relationship between
the availability of
technologies and the
processes that underlie
technological absorption
capacity within
countries.

58 TECHNOLOGY AND INNOVATION REPORT 2011
There are several unique features of tech-
nology and innovation in RETs compared
with other sectors on which many policy
studies have focused. First, there is already
a well-established energy system globally,
and RETs are technologies that seek to
provide alternative solutions to achieve the
same result using natural resources of a dif-
ferent kind (such as sun, wind and water).
Their unique selling point is that they offer
environmentally friendly solutions to energy
needs for the same service, namely the
supply of energy. This is different from inno-
vation in other sectors where competition
is structured around the provision of newer
products and services at reasonable prices.
Second, RETs demonstrate intermittency
issues, as pointed out in chapter II, which
calls for a systemic approach to promot-
ing innovation in the sector. The systemic
dimension is important to balance steady
sources of energy that are largely predict-
able (such as availability of sun for a cer-
tain number of hours each day) with other
sources of energy supply that may be more
variable (such as wind intensity). Evidence
shows that intermittency of different re-
newable energy supplies can be dealt with
quite easily within electricity supply systems
when solutions are designed from a sys-
temic perspective.5 A systemic treatment
of renewable energy technologies is impor-
tant from another perspective, namely the
management of demand for energy, which
is at least as important as the consider-
ation of different sources of energy in the
energy matrix of countries. Work regularly
undertaken by organizations that promote
RE-based solutions in developing countries
(some of which were consulted for this TIR)
shows that demand for energy in rural ar-
eas can be met very effectively by rural off-
grid energy solutions using RETs (box 5.2
in chapter V).6 The end-use dimension (i.e.
how many people can access a particular
supply and how effectively it can be provid-
ed) will need to play a major role in consid-
erations of RETs as a means of alleviating
energy poverty in developing countries. A
systemic perspective, as proposed in this
chapter, helps also to consider the demand
dimensions when designing on-grid, off-
grid or semi-grid applications using RETs,
depending on the needs of countries.
Third, it is often assumed, incorrectly, that
technological capacity is required primar-
ily for R&D aimed at the creation or de-
velopment of newer RETs. As this chapter
shows, technology and innovation capacity
is fundamental for other aspects of RETs as
well, such as:
(i) Making minor technical improvements
that could enable significant cost
reductions in production techniques,
adaptation and use; and
(ii) Adaptation, dissemination, maintenance
and use of existing RETs within key
sectors of the economy, which depend
not only on the availability of materials,
but also on diverse forms of knowledge
(IPCC, 2007).
Fourth, in developing countries, there is
an urgent need to promote choices in in-
novation and industrial development based
on RETs. These choices may differ among
countries depending on their specific con-
ditions and the kinds of renewable energy
resource(s) available. The specific charac-
teristics of different RETs, varied project siz-
es and the possibilities for off-grid and de-
centralized supply, imply many new players,
both in project development (new and ex-
isting firms, households and communities)
and in financing (existing lenders, new mi-
crocredit scheme, government initiatives).
An innovation systems perspective for RETs
helps to map the various kinds of compe-
tencies that interact in the processes of
R&D, innovation, adaptation and use of
RETs. Linkages between the actor net-
works not only help to foster learning in
various RETs, but are also essential for the
integration of RETs into other sectors of the
economy, such as transport and construc-
tion. Viewing RETs from an innovation per-
spective helps to establish the key linkages
that need to be fostered through policy in-
tervention. The networks and linkages that
play this important role are explored in this
section.
Technology and
innovation capacity
is fundamental for
making minor technical
improvements that could
enable significant cost
reductions in production
techniques, adaptation
and use.

59CHAPTER III : STIMULATING TECHNICAL CHANGE AND INNOVATION IN AND THROUGH RENEWABLE ENERGY TECHNOLOGIES
1. Key networks andinterlinkages for RETs
a. Public science through public research institutions andcentres of excellence
Public science (i.e. scientific research
funded by governments) has been a ma-
jor source of new knowledge, and has
played a critical role in the emergence of
several new technologies, including RETs,
that are of increasing importance to the
global economy. The positive relationship
between academic research and innova-
tion capabilities is well established, with
the caveat that several factors condition
the extent to which public science leads to
technological innovation. Complementarity
between public science and technological
innovation varies among sectors: scien-
tific research may be more applicable to
technological advances and product de-
velopment in some sectors than in others
(see, for example, Andersson and Ejermo,
2004; and Dosi et al., 2006).
In the specific case of RETs, a large number
of mature technologies currently in use and
many others that are being developed (in-
cluding electric cars) rely extensively on
primary and applied research feedback
loops with universities and educational
centres of excellence (Stäglich, Lorkows-
ki and Thewissen, 2011). In industrialized
countries, whereas public funding for
research in high technologies has been
gradually shrinking, it is still the mainstay
of research and innovation for RETs.7 His-
torically, public science carried out in uni-
versities, research institutions and cen-
tres of excellence has aimed at expanding
the science base for new and risky tech-
nologies that were not fully mature or that
were applied in various sectors of pro-
duction (box 3.2). Public-funded research
is equally relevant for RETs for a variety of
purposes, including for use and adapta-
tion, incremental technological improve-
ments and new scientific breakthroughs
for application. For convenience, they can
be classified into the following categories
(ISPRE, 2009; see also Henzelmann and
Grünenwald, 2011):
(i) Energy efficiency, including better
conversion efficiency, performance,
reliability and durability;
Box 3.2: The role of public science in building technological and innovative capacity
Public research institutions serve two main functions in the development and maintenance of competencies. First, they act
as primary centres of innovation when various technical disciplines are initially introduced. They foster interactive learning be-
tween public and private institutions by: (i) promoting a product/market focus in innovation efforts in public sector institutions
that often tend to be disconnected from product development; (ii) increasing mobility of skills and personnel between public
and private sector institutions; and (iii) attracting funding from the private sector for important research programmes. When
innovation systems are sufficiently developed, public science continues to perform a supportive role at two critical stages
of the R&D cycle. In research, public science provides much needed state-of-the-art applied research support to smaller
firms engaged in niche areas. It also provides substantial support services to universities with a specialized focus, matching
advanced laboratory facilities and human resources, and in many instances it promotes interaction between universities and
industry.
Whereas some areas of social science (such as human capital theories) have viewed schooling as a factor in enhancing the
productivity of workers, recent studies on innovation have begun to unravel the extent to which schooling, higher education
and industrial productivity are correlated (see, for instance, Gehl Sampath, 2010). It is still difficult to map the impact of certain
kinds of educational investments made by countries as they proceed along their technological trajectories, because opportu-
nities are driven by technological breakthroughs, markets, customer preferences, and, most importantly, by the ability of the
innovation system in a country to respond rapidly to such stimuli. But clearly ex-ante decisions on various aspects of innovative
capacity, such as a country’s schooling system, its preferences for secondary and tertiary education (e.g. whether there should
be a greater emphasis on natural sciences or other disciplines, or whether there should be centres of excellence for tertiary
education) and investment in public sector research, all have an impact on the technological absorptive capacities of countries
and sectors.
Source: UNCTAD.
RETs rely extensively
on primary and applied
research feedback loops
with universities and
educational centres of
excellence.

60 TECHNOLOGY AND INNOVATION REPORT 2011
(ii) Material efficiency, including
advanced manufacturing
techniques for components that
substitute expensive with cheaper
and reliable material inputs and
reduce the use of toxic materials;
(iii) Sustainable management, including
sustainable production processes
that can reduce environmental
impacts of manufacturing, use and
final disposal;
(iv) Storage efficiency, including better
methods for grid storage and
integration of RETs into existing
distribution systems;
(v) Technological change and
development, including new
mitigation and adaptation
technologies (UN/DESA, 2009); and
(vi) New R&D into state-of-the-art
RETs.
In many developing countries, an increasing
share of public science activities is being di-
rected towards strengthening capabilities in
material sciences, chemistry, engineering
and physics in areas related to RETs. For
example, in India, the Council for Scientific
and Industrial Research (CSIR) accounted
for more than 30 per cent of all green patent
applications filed between 2000 and 2007
(OECD, 2010).
Given the knowledge-intensive and interdis-
ciplinary nature of RETs research, universi-
ties are important for promoting innovation
for the following reasons:
(i) They are able to provide the
requisite level and quality of human
skills (amount and quality of
researchers), train new people and
conduct research.
(ii) They possess the appropriate
laboratory technology and
equipment to train students in
interdisciplinary areas of research.
(iii) Public research serves a coordinating
function for promoting interaction
between researchers engaged in
the same/similar or related fields in
universities and public institutions
within the country and abroad.
Other specific channels for public science
exist in the case of RETs. For already prov-
en technologies, such as wind and water-
based RETs, the private sector is actively
engaged in R&D that seeks to make them
more adaptable to different situations. It can
be supported through short-term, public-
funded R&D in developing countries aimed
at improving receptivity and acceptance of
such technologies in the domestic context.
In the case of some other RETs, such as so-
lar PV installations, both basic and applied
research are required to achieve cost-cutting
in the technology, such as through higher
conversion efficiency, lower consumption of
materials and use of cheaper inputs in the
manufacture of PV panels. Newer break-
throughs in public-funded research can help
achieve cost reductions in such RETs, so as
to ensure that those RETs can compete (in
the absence of subsidies) with established
fossil-fuel sources of energy “…once exter-
nal environmental costs and other contribu-
tions to social goals (e.g. access, security)
are taken into account” (ISPRE, 2009). Uni-
versity research also plays a key role in tack-
ling socio-economic challenges that inevi-
tably arise in the process of demonstrating
and deploying new technologies. In the case
of modern biomass technologies, there are
still numerous environmental challenges that
public science can help to resolve.
b. Private sector enterprises
Innovation, ideally induced by competition,
creates winners and losers. Innovative firms
have a negative externality on firms that do
not innovate, and the latter therefore lag be-
hind the state-of-the-art innovators in any
field of technology. Such an externality gets
internalized through the market mecha-
nism, since innovation induces changes
in production functions that result in lower
costs of production, so that firms that do
not upgrade fail to compete. The process of
innovation based on constant competition
promotes social welfare, and therefore the
primary aim of policies should be to pro-
mote competitive environments for firms to
thrive within sectors, RETs being no excep-
tion to this general rule.
In many developing
countries, an increasing
share of public
science activities
is being directed
towards strengthening
capabilities in areas
related to RETs.
Newer breakthroughs in
public-funded research
can help achieve cost
reductions in RETs.

61CHAPTER III : STIMULATING TECHNICAL CHANGE AND INNOVATION IN AND THROUGH RENEWABLE ENERGY TECHNOLOGIES
The degree of vertical integration in sec-
tors is often related to its technological
characteristics.8 R&D in RETs is becom-
ing increasingly globalized9 though a large
share of all new product/process develop-
ment is undertaken by the industrialized
countries. In wind technology, 8 of the 10
leading manufacturers of wind turbines
are European, including companies such
as Vestas (Denmark), Enercon (Germany),
Gamesa (Spain), GE Energy (Germany/
United States), Siemens (Denmark/Ger-
many), Nordex (Germany), Acciona (Spain)
and Repower (Germany). Despite this, sev-
eral new technological entry points have
begun to open up for developing-country
firms that are seeking to specialize in one
or more aspects of RET production pro-
cesses. The solar PV industry, for instance,
is quite fragmented. A United States-based
company, First Solar, is the leading firm
worldwide, but firms from China, such as
Suntech, Yingli Green Energy and Motech
Solar, are rapidly expanding their market
shares globally at the expense of already
well-established German and Japanese
firms (Hader et al., 2011).
There are also growing opportunities to
participate in value chains for RETs, such
as those for solar PV technologies that are
fast emerging globally, in order to adapt and
reduce costs, attain economies of scale of
production and access untapped markets.
For wind energy, two slightly varied market
trends are emerging. While mature markets
are focusing on larger turbines and offshore
installations, developing countries are fo-
cusing on smaller products and onshore in-
stallations. A second important trend is that
the market for provision of wind energies
by utilities is gradually expanding, thereby
creating potential manufacturing possi-
bilities along the value chain for small and
medium-sized players, including indepen-
dent power producers. New entrants are
emerging, especially in China, the Republic
of Korea, and some other Asian countries,
including India, to tap into these technol-
ogy entry points. These local suppliers are
providing products along the value chain,
and increased outsourcing is foreseeable,
especially given the need to cut production
costs further (Hader et al., 2011). Table 3.1
provides a list of emerging specialization
and entry points for developing-country
firms dealing in wind and solar technologies
(see also box 3.3 for examples from China
and India). This table lists some of the tech-
nological niches in which firms from devel-
oping countries have accumulated capabili-
ties and emerged as suppliers globally.
The possibility to participate in global value
chains, or other entry points, as discussed
here, could provide a useful means for firms
in developing countries to potentially ac-
cumulate new technological capabilities
Table 3.1: Relative specializations and potential entry points for firms in wind and solar energies
TechnologyTechnological sophistication
and entry pointsDeveloping countries with
significant capacities
Solar photovoltaic installations Highly sophisticated, but with increased opportunity to specialize in niches along the value chain
Brazil, China and India
Multi-megawatt offshore turbines (wind) Highly sophisticated
Small turbines (wind) Relatively sophisticated, with increased opportunity to specialize in niches along the value chain
China, India
Biofuels Relatively sophisticated, especially for large-scale production
Brazil, China, India, Indonesia, Malaysia,the Philippines and Thailand
Biomass Low sophistication, easy applicability Bangladesh, China, India and Kenya
Low head turbines (hydropower) Relatively sophisticated; potential opportunity forexpansion exists but is currently limited by the low level of use in developing countriesa
Chinab
Source: UNCTAD.a The percentage of untapped hydropower globally is estimated at 65 per cent, whereas in Asia, Africa and South America,
90 per cent of total hydropower capacity is currently untapped (Hader et al., 2011).b China is expected to become Asia’s largest hydropower generator by 2015 (Hader et al., 2011).
New technological entry
points have begun to
open up for developing-
country firms seeking
to specialize in one or
more aspects of RET
production processes.
62 TECHNOLOGY AND INNOVATION REPORT 2011
in order to gradually move up the innova-
tion chain. Although these developments
are positive, the results will not accrue au-
tomatically. Production and manufacturing
possibilities need to be steadily augmented
by means of a policy environment that pro-
motes the accumulation of knowledge and
capacity-building in order for firms to up-
grade and progress technologically. Failing
this, there is always a risk that a large num-
ber of firms in developing countries will be
entrenched at the lower ends of global man-
ufacturing chains, as experienced in several
other sectors such as readymade garments
and electronics. An enabling environment for
innovation and technological upgrading is
discussed in chapter V of this Report.
c. End-users (households,communities and commercial enterprises)
Households and communities could play
an important role in both on-grid and off-
grid installations of RETs. Modern biomass
and off-grid installations of RETs are aimed
at rural communities as the primary target
group. Providing the means to cook, elec-
tricity for basic household chores and en-
ergy for men and women to engage in eco-
nomic activities could help boost economic
growth and development (see chapter V
for examples). RETs could also promote
newer sources of employment and greater
prosperity in rural areas, even through small
off-grid installations, such as for selling
milk-based products or for storing impor-
tant temperature-sensitive drugs, as well as
for ICT-based applications. For some other
RETs, such as solar PV installations or utili-
ties based on wind power, households are
important actors. In countries, such as In-
dia and Tunisia, use of solar PV panels by
individual households is on the rise. Energy
providers also target households with new
energy-mix schemes that combine inter-
mittent supplies, such as wind power, with
conventional sources. Commercial build-
ings, especially business and office spaces,
account for a large amount of energy usage
and could be very important user commu-
nities for RETs in developing countries in the
medium and long term.
Box 3.3: Examples of private firms in wind and solar energy: China and India
Solar: China is the world’s biggest exporter of solar PV panels; around 95 per cent of its total production is exported to other
parts of the world. In 2009, China exported over $10 billion worth of solar panels and cells, more than twice as much as the
second biggest exporter and almost 80 times the value exported only 10 years earlier.a Suntech, the third largest solar company
in the country had an annual production capacity of 1 GW in 2009. India also has several large solar manufacturers such as
Moser Baer Photovoltaic Ltd, Tata BP Solar, Central Electronics Ltd and Reliance Industries. Indian firms manufactured solar
PV modules and systems worth 335 megawatt power (MWp) up to March 2007, of which 225 MWp was reportedly exported.
The Indian Government now plans to build the world’s largest solar power plant in the state of Gujarat at an estimated cost of
$10 billion, with an expected capacity of 3,000 MW.
Wind: China ranks second worldwide for installed wind capacities, with private firms using advanced technology for the
production of wind turbines. Sinovel, a Chinese firm, is the third largest wind turbine manufacturer in the world, account-
ing for 3,495 MW of energy supply in 2009, and it is also China’s largest wind turbine manufacturer. Three Chinese com-
panies now rank among the top 10 in terms of market shares for wind power (Bouée, Liu and Xu, 2011), though they fo-
cus almost exclusively on meeting domestic demand. Goldwind, another large Chinese wind turbine company, has
recently acquired a majority stake in Germany’s Vensys in an effort to expand its know-how. India, currently ranked
as the third largest wind producer worldwide, is following closely behind China. Indian companies supply many of
the components required for the generation of wind energy worldwide. These components are mostly exported, and
the Indian company, Sulzon, is the world’s third largest supplier of components to wind power operators, with a 6.4 per
cent share of the global market (BTM Consult, 2009). Sulzon operates in three continents to produce components for
the entire supply chain. It has R&D facilities in Belgium, Denmark, Germany and the Netherlands.
Source: UNCTAD, based on Bouée, Liu and Xu (2011) for China and Kalmbach (2011) for India.
a UN Comtrade database (HS 854140: Photosensitive semiconductor devices, including photovoltaic cells whether or
not assembled in modules or made up into panels; light emitting diodes).
Production and
manufacturing
possibilities need to
be steadily augmented
by means of a policy
environment that
promotes the
accumulation of
knowledge and
capacity-building.

63CHAPTER III : STIMULATING TECHNICAL CHANGE AND INNOVATION IN AND THROUGH RENEWABLE ENERGY TECHNOLOGIES
2. Linkages between RETs and other sectors of the economy
Ultimately, developing innovation capa-
bilities depends on the ability of agents to
collaborate and cross-fertilize ideas and
results across a broad range of disciplines
and skills in firms and other organizations.
Collaborative networks also ensure that
knowledge is constantly accumulated and
used through a combination of tacit skills
and codified information produced in in-
novation processes and exchanged be-
tween public and private sector institutions
through a dynamic, self-reinforcing process
of capabilities formation.
The reasons for intensified networking vary.
Determining factors include access to new
forms of knowledge, shared risks as a re-
sult of escalating costs of innovation, and
the leveraging of market and skills oppor-
tunities. Inter-firm and inter-organizational
flows of knowledge and skills in a user-pro-
ducer relationship could take various forms,
including the movement of skilled staff from
one firm to another, subcontracting (man-
ufacturing), licensing and joint ventures,
franchises and collaborative agreements
for marketing of products, and supplier-
customer relations. Most importantly, asset
pooling, be it in the form of human resourc-
es, finance or machines, is an important
reason for collaboration.
Interactive learning in general depends on
better linkages between university depart-
ments, centres of excellence and public
research institutions, and those involved in
product development, including the private
sector. Other forms of knowledge interac-
tions, such as those between foreign firms
and universities, and between consumers,
investors, developers and intermediary or-
ganizations – especially those that help
gauge local demand, such as market re-
search organizations – are also important.
In the case of RETs, establishing these in-
terlinkages is important from several per-
spectives. Following from the discussion in
chapter II, depending on the scale of the
RET in question, different technologies will
have different user profiles and markets
within developing countries. These need
to be carefully established and the link-
ages appropriately fostered to ensure that
the adaptation and use of RETs deliver the
expected benefits. Apart from comple-
menting electricity generation, newer uses
of RETs in different sectors of the economy
are emerging. These are mostly associated
with the drive to promote “green innova-
tion”, which denotes innovation conducted
in an environmentally sustainable way. For
instance, RETs are becoming more impor-
tant in the transport sector, in building and
construction, in battery technologies and in
the chemical industry.10 It is estimated, for
example, that residences and commercial
buildings in the United States account for
40 per cent of the country’s total energy use
(Reers, Benecchi and Koper, 2011). Simi-
larly, in the automobile sector, it is increas-
ingly clear that simply enhancing internal
combustion efficiency in vehicles will not be
sufficient to reduce carbon emissions (Stae-
glich, Lorkowski and Thewissen, 2011).
Recent trends towards promoting the use
of electric vehicles have forced a rethinking
about the entire automotive industry value
chain, including R&D in particular niches
such as batteries, vehicle assembly, infra-
structure, and new business models that
guarantee care and maintenance (Henzel-
mann and Gruenenwald, 2011). This also
implies greater possibilities for firms in de-
veloping countries to anticipate newer tech-
nological entry points related to RETs that
are not necessarily limited to energy sup-
ply systems, as discussed in the previous
section. These developments underscore
the many positive externalities that RETs
production and use can have for develop-
ing economies, depending on how these
interlinkages are structured and fostered by
countries. There are a few instances where
RETs may have linkages with sectors of
the economy that are not always positive,
and where they compete with other needs
such as in the case of biofuels (discussed
in chapter II). Thus the costs and benefits of
such linkages need to be balanced within
national policy frameworks.
These developments
underscore the many
positive externalities
that RETs production
and use can have for
developing economies.
Apart from
complementing
electricity generation,
newer uses of RETs in
different sectors of the
economy are emerging.

64 TECHNOLOGY AND INNOVATION REPORT 2011
C. PROMOTING A VIRTUOUS INTEGRATIONOF RETs ANDSTI CAPACITY
Despite the various potential advantages
cited with regard to the use of RETs, es-
tablished fossil-fuel sources still dominate
energy supply at present, providing up to
89 per cent of all global energy (Chichilni-
sky, 2009). A large proportion of the global
population cannot afford these convention-
al energy supplies, as noted in chapter I of
this Report, which makes the eradication of
energy poverty an immediate goal for eco-
nomic development.
According to estimates of the International
Energy Agency (IEA, 2011), over 20 per cent
of the global population (1.4 billion people
approximately), most of whom live in rural
areas, had no access to electricity in 2010.
South Asia has the largest proportion of
people without access to electricity (42 per
cent of the world total), in spite of recent
fast progress. Taking the entire population
of this subregion, 38 per cent lack access
to electricity, and 49 per cent of people liv-
ing in rural areas lack access. In relative
terms, sub-Saharan Africa is the most un-
derserved region, with 69.5 per cent of the
population having no access to electricity,
and only a meagre 14 per cent of the rural
population having access (table 3.2).
A large number of people in developing
countries and LDCs (especially South Asia
and sub-Saharan Africa) who lack access to
affordable conventional energy sources rely
on biomass (including wood, crop waste
and charcoal), which continues to provide
at least one third of all primary energy sup-
ply in these countries.11 Use of such an al-
ternative energy source is generally neither
efficient nor healthy for the users and the
environment. Therefore there is urgent need
for government action to change current
patterns of energy use with reliable, estab-
lished RETs. While off-grid RETs (especially
modern biomass-based) may be easier to
deploy, others still remain very expensive at
the scales required to make an impact in
developing countries, despite rapid tech-
nological advances (UN/DESA, 2009). For
example, a study by the IEA (2009) came
to the conclusion that in the United States,
electricity from new nuclear power plants
was 15–30 per cent more expensive than
from coal-fired plants, and the cost of off-
shore wind power was more than double
that of coal, while solar power cost five
times as much. Changing from the current
global situation of no energy, or unreliable
Table 3.2: Access to electricity and urban and rural electrification rates, by region, 2009
RegionNumber of
people without electricity (millions)
Electrification rate(%)
Urbanelectrification rate
(%)
Ruralelectrification rate
(%)
Africa 587 41.9 68.9 25.0
North Africa 2 99.0 99.6 98.4
Sub-Saharan Africa 585 30.5 59.9 14.3
Developing Asia 799 78.1 93.9 68.8
China and East Asia 186 90.8 96.4 86.5
South Asia 612 62.2 89.1 51.2
Latin America 31 93.4 98.8 74.0
Middle East 22 89.5 98.6 72.2
Developing countries 1 438 73.0 90.7 60.2
OECD and transitioneconomies
3 99.8 100.0 99.5
World total 1 441 78.9 93.6 65.1
Source: Reproduced from IEA (2010).
There is urgent need
for government action
to change current
patterns of energy use
with reliable, established
RETs.
65CHAPTER III : STIMULATING TECHNICAL CHANGE AND INNOVATION IN AND THROUGH RENEWABLE ENERGY TECHNOLOGIES
and often undesirable sources of alterna-
tive energy (such as traditional biomass), to
one where industrial development adopts a
cleaner growth trajectory is also essential
for driving down the costs of RETs.
Mobilizing additional domestic resources
in support of RETs will require the con-
scious development of policy strategies by
governments all over the world, including
overcoming different kinds of systemic fail-
ures inherent in the use of RETs. States, in
designing institutional incentives, will need
to play a fundamental role in tipping the
balance towards energy sources that use
RETs. Such incentives need to be designed
and articulated at the national and regional
levels so that collective actions can be fos-
tered. Most importantly, energy production
should cater to local needs and demand in
countries, for which a systemic perspec-
tive is necessary. The International Renew-
able Energy Agency (IRENA) estimates that
40 per cent of all energy produced in Af-
rica is exported, despite large-scale energy
poverty in that region (see box 1.2, chap-
ter I).
Government action will need to focus on
two very important areas of intervention:
addressing systemic failures in RETs, and
tipping the balance away from a focus on
conventional energy sources and towards
RETs. Systemic failures in the RETs sector
are varied and emerge from sources other
than just the market; they can be caused
by technological uncertainty, environmental
failures or other systemic factors. Therefore,
government intervention will be very impor-
tant for addressing those failures. Similarly,
while it is clear that there is a growing role
for RETs as energy providers globally, gov-
ernment action will be critical for inducing a
shift towards a wider application of RETs in
the energy mix of countries.
1. Addressing systemicfailures in RETs
The risks associated with the potential, via-
bility and scale of application of RETs is due
to four uncertainties: market-related, tech-
nological, general systems-related and en-
vironment-related. Both technological and
market-related uncertainties tend to dic-
tate firm-level actions and decisions for the
building of capabilities in particular ways,
which explains the varied performance of
firms across sectors over time.12 In the case
of RETs, two other kinds of failure exist:
systems-related and environmental, which
also need to be taken into account.
Innovation across all sectors and industries
requires investment, the returns on which
are uncertain. Since innovation denotes the
application of R&D results to create com-
mercially viable products, demand plays
an important role in returns on investment.
Economic theory suggests that market fail-
ures caused by uncertain returns on invest-
ment can be corrected through a range of
market-based instruments, including pat-
ents, tax incentives and subsidies. Govern-
ment intervention in the form of industrial
policy could minimize information asym-
metries between user-producer networks,
mitigate inefficient resource use and also
address public goods issues.
Markets for RETs are only just develop-
ing, and forecasts of total market demand
and market size vary depending on the as-
sumptions made, not only with regard to
the expansion of RETs per se but also to
carbon pricing13 and the availability of al-
ternative sources of conventional energy,
especially gas.14 In such an environment,
firms and organizations are faced with the
choice of whether to invest in RETs as op-
posed to other technological sectors where
returns are more secure (from a current per-
spective). Further technological uncertainty
is caused by the constant flow of newer
technologies that not only affect products
and innovation cycles, but also consumer
behaviour. Moreover, this also leads to a
continuous reallocation of the technology-
based strategic advantages of firms. In
addition, changes in firms’ organizational
arrangements affect their technological op-
portunities and outcomes (e.g. Robertson
and Langlois, 1995; Brusoni and Prencipe,
2001). Firms constantly need to compete
and reorganize their internal strengths so
Government action will
need to focus on two
very important areas of
intervention: addressing
systemic failures in
RETs, and tipping the
balance towards RETs.

66 TECHNOLOGY AND INNOVATION REPORT 2011
that they are well prepared to exploit new
technological opportunities presented by
RETs.
Systemic failures exist as well, which under-
mine possibilities of expanding into RETs
in developing countries. Most importantly,
countries and sectors are path-dependent,
and RETs face systemic risks of not being
adapted, used or applied in other sectors
of the economy. Manufacturing firms in de-
veloping countries are under considerable
pressure in today’s global trade environ-
ment to retain their competitiveness and
export orientation. Therefore, policies that
dictate a shift from conventional energy
supplies to a mix of conventional and RETs,
or purely RETs, to sustain their production
will involve sunk costs. In the absence of
political will and government and market-
based incentives for firms to help offset
such costs, such a shift will be difficult, es-
pecially for developing countries.
Lastly, positive effects on the environment
created by the use of RETs are not quantifi-
able. Besides, no single user/firm/investor
has the incentive to take the risk to promote
the use of RETs for the greater social good.
2. Tipping the balance infavour of RETs
Combining conventional sources of energy
with RETs is a policy choice that requires the
mobilization of greater domestic resources
for innovation and technical change on the
one hand, and sustainable pathways of
development on the other. Both the policy
framework and State intervention will play a
decisive role in determining the future role of
RETs and the appropriate mix of RETs and
conventional technologies within a country.
Currently, as chapter II shows, RETs can
sometimes be more expensive than con-
ventional sources of energy, mainly be-
cause price estimates of conventional ener-
gies do not usually include the costs of grid
connections and storage (which can con-
siderably increase total costs). They also fail
to reflect the environmental costs of these
energies. Despite this, as noted in chapter
II, average annual growth rates of capac-
ity in the period 2005–2009 were between
10 per cent and 60 per cent for many RETs
(IPCC, 2011). Globally, solar PV has grown
the fastest of all RETs (over 60 per cent an-
nually), followed by biodiesel production
(51 per cent), wind power (27 per cent),
solar water heating (19 per cent) and etha-
nol production (20 per cent) (Hader et al.,
2011). Projections indicate that installed
wind capacity will grow annually by 13 per
cent worldwide until 2014, with a total in-
stalled wind capacity reaching an estimated
600 GW in 2020 (Hader et al., 2011).
In 2010, the amount invested globally in
RET innovations equalled that spent on in-
novation in fossil fuel energy supplies, and it
was greater than investments in nuclear en-
ergy innovations (table 3.3). This indicates
increasing investments into RET innova-
tions. However, much less is being invested
globally in the diffusion of renewable energy
when compared with the diffusion of other
energy alternatives, and therefore this re-
quires more emphasis.
Each time investment is made in generating
more energy through RETs, not only does
this result in a gradual shift in the energy
Table 3.3: Annual investments in global innovation in various energy sources, 2010 ($ billion)
Energy categoryInnovation
(research, development and deployment)Diffusion
End-use and efficiency >>8 300–3 500
Fossil fuel supply >12 200–550
Nuclear >10 3-8
Renewable energy >12 >20
Electricity (generation and R&D) >>1 450–520
Other, unspecified >>4 1 000–5 000
Source: UNCTAD, adapted from Davis (2011).
Combining conventional
sources of energy
with RETs is a policy
choice that requires the
mobilization of greater
domestic resources.

67CHAPTER III : STIMULATING TECHNICAL CHANGE AND INNOVATION IN AND THROUGH RENEWABLE ENERGY TECHNOLOGIES
base, but it also has a significant impact
on the capacity of RETs to supply energy
economically. For example, according to re-
cent reports, every time the amount of wind
generation capacity doubles, the price of
electricity produced by wind turbines falls
by 9–17 per cent (Krohn, Morthorst and
Awerbuch, 2009; and UN/DESA, 2009).
This holds true for all RETs: with each new
installation, there is learning attached as to
how the technology can be made available
more effectively and efficiently in different
contexts so as to lower costs over a period
of time. According to UN/DESA (2009: 10),
“…the more we learn about how to pro-
duce renewable energy, the less expensive
it becomes”. This effect has been demon-
strated with regard to RETs over the past
few decades: significant cost reductions
have been observed with technological ad-
vances and growing usage.
The future expansion of RETs and their price
competitiveness will depend on how and to
what extent governments will proactively
promote an agenda that combines (a) en-
forcement of carbon emission standards to
reduce reliance on carbon-intensive tech-
nologies; (b) the use of RETs at domestic
and industrial levels to complement existing
sources of energy so that established tech-
nologies, such as solar PV, can rely on the
economies of scale required to reduce the
costs of production; and (c) improvements
in the general technology and innovation
capacities of countries to foster a virtuous
cycle of RETs integration. Such a “big push
strategy” or “tipping point” is important to
lower the price of RETs, which will not fall
rapidly on its own. It is also important to
ensure that expanded markets for RETs re-
sult in greater investments in technological
improvements and increased production in
order to achieve cost competitiveness (UN/
DESA, 2009).
A range of policy opportunities exist to
create synergies between R&D, technical
change, production and dissemination for
entrepreneurs as well as end-users in de-
veloping countries, as discussed in chap-
ter V of this TIR. The role of governments
is critical for making RETs feasible at each
of these entry points. Government agencies
and the policy framework can play a deci-
sive role in the following ways:
(i) Promoting the general innovation
environment for the development of
science, technology and innovation;
(ii) Making RETs viable; and
(iii) Enabling enterprise development in
and through RETs.
a. Government agencies and the general policy environment
Total grid-based electricity capacity us-
ing RETs was estimated to amount to
3,400 GW in 2000, of which 1,500 GW
was attributable to developing countries
(Martinot et al., 2002).15 This capacity has
been expanding steadily, and developing
countries have been investing in differ-
ent kinds of RETs based on relative en-
dowments (see the case of wind power
in Chile, discussed in chapter V). Further
integration of RETs into national develop-
ment strategies of countries needs to be
supported by express policy incentives
that promote learning-by-doing, learning-
by-using and networking opportunities, all
of which affect the cost and value of RETs
(Jaffe, Lerner and Stern, 2005; Skoglund
et al., 2010). Government support and the
general policy environment are important
for fostering STI capacity, given the mutu-
ally dependent relationship between RETs
and the STI environment. The general pol-
icy framework needs to address a range
of constraints on innovation in developing
countries (box 3.4).
Supportive policy frameworks that remove,
or at least help to overcome, some of these
constraints on technological change are
important for several reasons. Universities
and public research can perform a range
of short- and medium-term support func-
tions, as identified in the previous sec-
tion, for example by providing ways and
means to adapt existing RETs instead of,
or in conjunction with, the private sector.
They can also create awareness of RETs
and promote their acceptance by people
in developing countries. The presence and
Each time investment is
made in generating more
energy through RETs…
it has a significant
impact on the capacity
of RETs to supply energy
economically.
Future expansion of
RETs will depend on
how governments will
proactively promote an
agenda that combines
the enforcement
of carbon emission
standards alongwith the
wider use of RETs.

68 TECHNOLOGY AND INNOVATION REPORT 2011
availability of skilled human resources and
a conducive innovation environment are
important for promoting what is increas-
ingly known as deployment-related learn-
ing in RETs. Deployment-related learning
fosters skills that are essential to maximiz-
ing their efficiency of use. The final cost of
RET use, which will be decisive from the
consumer’s perspective, depends not only
on the cost at which the RET is available
for the first purchase (for example, a solar
panel) but also on the cost of maintaining
and sustaining it over time. In the case of
solar PV installations, for example, a cost
breakdown shows that only 50 per cent of
the total cost is for the PV cells, and the
remaining costs are split between installa-
tion costs (30 per cent) and maintenance
(20 per cent). Deployment-related learning
is also important for finding new and locally
suitable means to connect RET-based en-
ergy supplies with grid or mini-grid appli-
cations as well as for ensuring energy effi-
ciency of use and storage. The installation
and use of solar PV requires skills in roof-
ing and electrical engineering, which are
needed to ensure that the energy source
is fully connected to a grid for usage. In the
absence of reliable maintenance, loss of
energy is common and the costs of shift-
ing to RETs increases.
Box 3.4: Constraints on technology and innovation in developing countries
The main constraints on technology and innovation capacities in developing countries can be categorized as follows:
(a) Lack of local capacity to absorb and use knowledge, primarily determined by the availability of human skills locally and the
institutional capacity of the system to provide the basis for innovative activity within any of the four knowledge domains
identified in the previous section. In the absence of this, access to knowledge remains at best just access to information,
since the actors lack the capacity to build further upon it.
(b) Lack of well-developed institutional frameworks to forge second-best responses to innovation issues, which manifests in
the form of high transaction costs to conduct innovation activities. Institutional frameworks that are either incomplete or
do not clearly specify the roles and responsibilities of various actors often result in organizations being set up with overlap-
ping competencies and duplication of, or gaps in, roles and responsibilities.
(c) Lack of resources in the general innovation environment, which includes lack of physical and knowledge infrastruc-
ture, as well as financial instruments for reducing innovation risks. Innovation processes are associated with their own
range of technological and market-related uncertainties, but at the same time innovation outcomes can vary when the
same activities are conducted by diverse groups of individuals in different contexts whose levels of “imagination and
accuracy” differ. This largely explains the varying performances of firms and sectors (Archibugi and Michie, 1997). In
resource-constrained developing countries, there are few, if any, institutions that reduce market- related uncertainties
and promote innovation.
(d) Lack of a supportive public sector that has the human and financial capacity to conduct relevant basic and applied
research and industrial R&D. This constraint can have very different consequences for different sectors. In sectors that
require the involvement of publicly funded research, such as pharmaceuticals, agriculture and new technologies, an ef-
ficient and well-endowed public sector is a prerequisite for innovation.
(e) Lack of a thriving private sector that can uptake results of industrial R&D conducted in public sector organizations is a
common constraint on innovation in developing countries.
(f) Lack of collaborative linkages that allow mobility of ideas and human capital between firms and organizations alike. Com-
peting agendas of organizations involved in STI, lack of a collaborative culture amongst academics and industry practitio-
ners, lack of incentives that reward collaborative conduct, and lack of discernable benefits of collaborative linkages within
the system, all contribute to poor or no collaborations, and therefore to the absence of interactive learning.
(g) Lack of policy competence in developing countries is perhaps as complex a phenomenon as the lack of innovation
capability itself. Governments, by their actions as well as inactions, make technology choices for national development.
They should be able to identify market failures and opportunities, make strategic choices, translate them into policies and
ensure effective implementation of those policies.
Source: UNCTAD, based on Gehl Sampath (2010).
Deployment-related
learning fosters skills
that are essential to
maximizing the efficiency
of use of RETs.

69CHAPTER III : STIMULATING TECHNICAL CHANGE AND INNOVATION IN AND THROUGH RENEWABLE ENERGY TECHNOLOGIES
b. Facilitation of technologyacquisition in the publicand private sector
An increased absorptive capacity of
the innovation system as a whole, involv-
ing local actors in the public and private
sector, is a prerequisite for local adaptation
and use of existing technologies in the re-
newable energy sector, as well as for other
innovative pursuits. In addition, the policy
framework needs to proactively support the
acquisition of RETs by establishing a legal
and institutional environment that promotes
the expansion of RETs-based private sector
activity. All policy efforts aimed at technol-
ogy transfer and technology sharing should
actively seek to engage the private sector.
There are several impediments to develop-
ing-country firms accessing existing tech-
nologies. Searching for technology suppli-
ers can be a costly and time-consuming
process. Negotiating for the rights to use
certain technologies can also require skills
in legal and managerial capacity, which may
not be easily available to firms in develop-
ing countries. These competencies need to
be fostered through the general innovation
policy framework. Furthermore, as chapter
IV shows, there seems to be an increasing
trend toward IPRs protection of climate-
friendly technologies. It is not clear whether
and to what extent such IPRs will affect the
acquisition of technologies by firms and
private sector organizations in developing
countries in the future. Therefore it may be
important to design national IPR regimes
in ways that they do not impede technol-
ogy acquisition priorities of countries (see
chapter V).
c. Promotion of specific renewable energy programmes and policies
Several of the larger developing
countries have initiated large-scale renew-
able energy programmes in an effort to har-
ness the potential of alternative sources of
energy. Apart from China and India, both
of which targeted renewable energy use
to supply at least 10 per cent of their total
demand by 2010, other countries, includ-
ing Brazil, Croatia, Egypt, Jordan, Mexico,
Morocco, the Philippines, South Africa,
Thailand and Tunisia, and have RETs pro-
grammes (Siegel, 2006).
Newer projects, some of which are regional
in nature, are in the process of being imple-
mented in many other countries, and they
could contribute significantly to alleviating
energy poverty in those countries. A prom-
ising venture is the Turkana wind corridor
project currently under way in East Africa
(see chapter V).
d. Attainment of grid parityand subsidy issues
For grid-based usage, the feasibil-
ity of RETs adaptation and use on a wide
scale depends on the attainment of grid
parity. This is the level at which the renew-
able energy source is equal to or cheaper
than the other conventional sources of
electricity. Such grid parity depends on
the RET in question, and is determined not
only by its technological characteristics,
but also by regional differences in cost and
performance, infrastructure limitations and
discount rates (IPCC, 2011, figure 5)16. Ex-
periences of several industrialized countries
show that government incentives and sub-
sidies often play a very important role in the
achievement of grid parity. A case in point
is solar PV energy, which owes its develop-
ment to the efforts of the governments of
Germany and Japan, both of which began
to massively subsidize PV technologies in
the 1990s.17 Other countries followed, lead-
ing to a wider, much broader application of
solar-based RETs.
Governments have also subsidized the
adoption of RETs to a very large extent. Evi-
dence available on the dissemination and
use of RETs in countries shows that the dif-
ferences in scale of use of solar technolo-
gies in India or the Republic of Korea, or
even France, compared with what is ob-
servable in Germany and Spain is largely
due to the amount of subsidies and user in-
centives offered by the governments of the
latter countries. According to the analysis
in chapter II of this Report and that of the
IPCC (2011), some RETs are clearly emerg-
Experiences of several
industrialized countries
show that government
incentives and subsidies
often play a very
important role in the
achievement of grid
parity.
Several of the larger
developing countries
have initiated large-
scale renewable energy
programmes in an effort
to harness the potential
of alternative sources of
energy.

70 TECHNOLOGY AND INNOVATION REPORT 2011
ing as competitive alternatives to energy in
several markets.
e. Promoting greater investmentand financing options
Different kinds of RETs require dif-
ferent scales of ex-ante investments, and
technological characteristics dictate the
kinds of support infrastructure required. It
is projected that European countries, for
instance, will invest €120 billion in wind en-
ergy development alone by 2020 (Hader et
al., 2011). While it is unrealistic to assume
that developing countries and LDCs will be
able to make similar investments in RETs,
technological choices often rest on several
known and unknown parameters. Amongst
the known ones, both wind and solar ener-
gies are subject to fluctuations, and with-
out “enablers” they are unable to provide a
steady, reliable source of energy. Since so-
lar energy cannot be generated at night and
wind speeds are unreliable, smart grids are
important infrastructural requirements to
store energy for use on a larger scale. While
some technologies for storage already ex-
ist, others are being developed, and future
developments may reduce the costs of
some of the options currently available.18
Policy choices will need to be made that
will mix intermittent energies generated by
RETs with other steady sources of energy,
which could be RET-based or conventional
energy-based (Delucchi and Jacobson,
2011). At the same time, there are many
unknown factors. For example, what could
be the potential cost reductions of RETs
in the medium term? Will solar thermal or
solar PV take the lead in world markets?
The answers to these highly relevant ques-
tions are currently only guesstimates, de-
spite the trends in cost reductions of RETs.
Therefore, it would be useful for developing
countries to consider promoting a basket
of RETs, as suggested in chapter II. In par-
ticular, they need to explore greater financ-
ing options for bolstering enterprises’ small,
medium and large-scale RETs projects.
Judging by current trends, it seems that
international financing for climate change
mitigation efforts focuses on large-scale
projects (see chapter IV) and increasingly
on small-scale initiatives (UN/DESA, 2011;
Hamilton, 2011). However, there is also a
need to provide financial support for the
expansion of medium-sized projects by the
private sector in developing countries.
Facilitation of foreign direct investment in
the sector would also be important, and,
if designed and implemented well, it could
result in greater investment and technology
transfer to host countries. This involves cre-
ating so-called enabling conditions to make
the host country an attractive environment
for investors as a key goal of the broader in-
novation policy framework for RETs. Inves-
tors, both foreign and domestic, consider a
number of factors when making decisions.
They assess the risks and difficulties of in-
vesting in a given country in products using
any given technology, and add this to the
expected costs. Broadly, the factors inves-
tors consider include political and macro-
economic stability, an educated workforce,
adequate infrastructure (transportation,
communications, and energy), a function-
ing bureaucracy, rule of law, a strong fi-
nancial sector, as well as ready markets for
their products and services. Many factors
contribute to shaping a country’s national
energy policy – including its policy on RETs
– such as history, politics, geography (natu-
ral resource endowments) and chance, on
the one hand, and innovation and produc-
tion climate on the other. Studies have not-
ed that many developing countries, particu-
larly the least developed among them, are
not getting their full share of investments
for the development of renewable energy
because existing national policies do not
render such investments attractive for most
projects (Amin, 2000; Chandler and Gwin,
2008; Point Carbon, 2007; Dayo 2008;
Neuhoff 2008; Cosbey et al., 2009).
f. Monetizing the costs of energy storage and supply
Monetizing the costs of energy storage and
supply of conventional energy sources,
along with an estimate of the environmen-
tal costs of using such energy, will make it
easier for RETs to compete. Countries and
Policy choices will
need to be made that
will mix intermittent
energies generated by
RETs with other steady
sources of energy, which
could be RET-based or
conventional energy-
based.
Different kinds of RETs
require different scales
of ex-ante investments,
and technological
characteristics dictate
the kinds of support
infrastructure required.
71CHAPTER III : STIMULATING TECHNICAL CHANGE AND INNOVATION IN AND THROUGH RENEWABLE ENERGY TECHNOLOGIES
consumers will base their ultimate choice of
energy sources not just on the costs of sup-
ply alone, but rather on a combination of
price competitiveness and the costs of inte-
grating the new sources into current modes
of operation, along with environmental and
social considerations (IPCC, 2011).
3. Job creation and poverty reduction through RETs
The current state of underdeveloped energy
infrastructure in developing countries could
be partially remedied through the use of
RETs. Not only could RETs potentially help
reduce energy poverty; they could also re-
duce social inequalities through the creation
of new jobs in their application. Germany,
for example, created 40,000 new jobs in
the RE sector (particularly for electricity)
between 1990 and 2002, and these are
projected to increase to 250,000 –350,000
by 2050 (Holm, 2005). Some of the main
barriers to greater market penetration of
RETs in developing countries are the lack of
trained installers/service craftsmen and an
absence of national standards/testing facili-
ties, all of which have the potential to create
jobs if training opportunities are provided.
For example, it has been estimated that if
South Africa were to use RETs in generat-
ing just 15 per cent of its total electricity by
2020, a total of 36,400 new jobs could be
created without reducing employment in
the coal-based electricity sectors (AGAMA
Energy, 2003). It is estimated that other
RETs, such as solar water heating and sus-
tainable biomass production, have greater
potential for direct job creation, the latter
being particularly labour-intensive (Holm,
2005). More generally, simply the provision
of greater access to energy through RETs
would help to improve the income-generat-
ing capacity of the poor in three important
ways: by creating new income-generating
opportunities (such as working on electri-
cal machinery), improving efficiency and
productivity of existing opportunities (such
as replacing manual tailoring with electric
tailoring machines) making them more prof-
itable, and, finally, reducing the time spent
on existing chores such as women’s daily
collection of fuelwood for cooking (Practical
Action, 2010).
Furthermore, RETs can help promote the
MDGs in various ways (Practical Action,
2010) including:
(i) By providing greater access to health
care. For example health centres in
remote villages in the Philippines,
have solar powered refrigerators
for storing medicines and vaccines
for people from the neighbouring
villages. This initiative, the result of
a joint community-based project
of the Australian and Philippine
governments, requires residents to
maintain the solar batteries on their
own.
(ii) By providing greater access to ICTs.
In several countries (Kenya being a
good example), access to energy
through RETs has enabled greater
penetration of ICTs into rural areas.
The electricity required to power
appliances and charge batteries for
ICT use is made available through
extension of the grid or through
decentralized energy systems such
as solar panels.
(iii) By promoting gender parity. Greater
access to energy enables a large
percentage of women in developing
countries to reduce the time spent
on household chores and to take
on additional income-generating
activities, which promotes gender
parity. Women also find more time to
participate in social and community
activities, including improving their
literacy rates.
Reducing inequality and poverty through
RETs also requires rural enterprise devel-
opment and small-scale financing, neither
of which receives particular or adequate
attention in discussions concerning RETs.
However, there are some examples of suc-
cessful support in these areas, such as that
provided by the Grameen Bank in Bangla-
desh, and consumer credit for home solar
systems provided by Grameen Shakti (Ban-
gladesh), Viet Nam’s Women’s Associa-
RETs can help promote
the MDGs in various
ways.
Not only could RETs
potentially help reduce
energy poverty; they
could also reduce social
inequalities through the
creation of new jobs in
their application.

72 TECHNOLOGY AND INNOVATION REPORT 2011
tion (Viet Nam), Sarvodaya (Sri Lanka) and
Agricultural Financial Corporation (Zimba-
bwe). A survey of experiences in promoting
RETs in the rural context shows that they
are the most beneficial in contexts where
economic development is already taking
place (Martinot et al., 2002). Two lessons
stand out. The first one is that local knowl-
edge matters, as noted also by the Can-
cun Adaptation Framework of 2010. The
Framework stresses that adaptation needs
to be based on a combination of the best
available science and the local and indig-
enous knowledge of communities (UN-
FCCC, 2010). Second, RETs are most eas-
ily disseminated when bundled with existing
products, as this helps to lower costs for
private users and small-scale industries that
can arise from an abrupt transition to RETs.
For example, dealers of farm machinery,
fertilizers, generators, batteries, electron-
ics and electrical utilities can all bundle their
services with RETs in order to make their of-
fers more easily acceptable to consumers.
But poverty eradication is not a direct, au-
tomatic consequence of RETs, as is often
assumed; it requires clear, express policy
action by governments that link the use of
RETs to poverty reduction as much as to
the reduction of energy poverty.
D. SUMMARYThis chapter has contextualized the tech-
nology and innovation issues relating to
promoting the generation, adaptation and
use of RETs. The analysis shows that devel-
oping countries and LDCs may have differ-
ent needs and capabilities in using existing
technology and innovation capacity to sup-
port the expansion of RETs in their econo-
mies. Despite this, several common issues
remain, which are applicable to all develop-
ing countries. The successful use of RETs
will depend on the ability to integrate them
into countries’ innovation strategies in order
to reap maximum synergies for sustainable
development. This calls for governments to
adopt an agenda of proactively promoting
access to energy services of the kind that
is conducive to development, while also
focusing on the important positive relation-
ship between technology and innovation
capacity and increased use of RETs. The
chapter also shows that technology and
innovative capacity are critical not only for
RETs production and R&D-based innova-
tion, but also for adaptation and greater
use of RETs. Regular maintenance, adapta-
tion and incremental improvements to RETs
suited to local contexts could lead to their
greater acceptance in developing countries,
but this depends on local actors possess-
ing some level of innovative capabilities. In-
novation systems in developing countries
are fundamental to shaping the needed ca-
pacity for the technological learning that is
important for adaptation, use, production,
R&D and innovation of RETs. Finally, the
chapter stresses the need for greater mo-
bilization of financial resources, in addition
to increased access to the most advanced,
cost-cutting technological improvements
to established RETs. Greater international
support for developing countries will be
critical on both these fronts. At the same
time, national policy frameworks should
aim at harnessing the virtuous relationship
between technology and innovation capac-
ity of RETs for inclusive economic devel-
opment, job creation, reduction of energy
poverty and climate change mitigation. In-
ternational policy challenges and sources of
support are discussed in the next chapter.
Eliminating poverty
through RETs requires
clear policy action
by governments that
promotes poverty
reduction hand-in-hand
with universal energy
access.

73CHAPTER III : STIMULATING TECHNICAL CHANGE AND INNOVATION IN AND THROUGH RENEWABLE ENERGY TECHNOLOGIES
NOTES
1 For a discussion on the reorganization of global innovation and the emergence of developing-country capacities, see Castellaci and Archibugi (2008) and Chesbrough (2003).
2 In 2006, total new global investments in renewable ener-gy sources amounted to about $71 billion, an increase of 43 per cent over 2005. However, only $15 billion of this was invested in developing and emerging countries (GTZ, 2007).
3 The importance of including poverty reduction in discus-sions on the green economy and RETs is becoming increas-ingly clear. For example, UNEP (2011: 2) defines the green economy as an economy “[t]hat results in improved human well-being and social equity, while significantly reducing en-vironmental risks and ecological scarcities.”
4 With regard to innovation, scholars have long identified the relevance of country-level absorptive capacity. A firm’s ab-sorptive capacity lies in its ability to identify important sourc-es of knowledge and technological change, route them into its internal learning processes and utilize them to build its own competitive advantages as an ongoing process (Co-hen and Levinthal, 1990). Innovation systems of countries where firms are located are dynamic and dictate the pro-cess through which capabilities are formed.
5 It is estimated that electricity systems can easily handle up to 20 per cent of renewable energy, and even more if sys-tems are designed with some adjustments in intermittency.
6 Based on consultations with The Energy and Resources In-stitute (TERI), India.
7 Examples include the Frauenhofer institutes in Germany and the Commonwealth Scientific and Industrial Organisa-tion (CSIRO), a national science and research agency in Australia (Henzelmann and Grünenwald, 2011).
8 There is still substantial ambiguity in the literature as to whether greater technological change in a sector induces firms to increase or reduce vertical integration and how this can be studied (see Ciarli et al, 2008; and Dosi et al, 2006).
9 UNCTAD estimates that over 80 per cent of global R&D is conducted in just 10 countries, and most of it (including for technologies required for climate change mitigation) is di-
rectly undertaken by transnational corporations (UNCTAD,
2010).
10 A case in point is Dupont, which has entered the renew-
ables business by creating renewable polyester (Dupont
Sorona) and renewably sourced theroplastic elastomer (Du-
pont Hytrel RS).
11 Some estimates suggest biomass accounts for up to 45 per
cent of all primary energy supply (e.g. Martinot, 2003).
12 See, for example, Archibugi (2001); Malerba (2002) and
(2004); Marsili and Verspagen (2002); Dosi et al (2006).
13 This is discussed in detail in the next chapter.
14 For example, forecasts about whether or not the prices of
solar PVs will fall over the next two decades vary accord-
ing to whether the assumptions take into account greater
market penetration and use of the technology as well as
the emergence of gas as an important supplement to oil
amongst the conventional sources of energy (ExxonMobil,
2010). See also the discussion on varying estimates and
projections for RETs in chapter II of this Report.
15 This estimate includes electricity generated through a vari-
ety of renewable resources, including small hydropower (as
defined in footnote 6, chapter II), biomass, wind, geother-
mal and solar (thermal and photovoltaic).
16 For example, for wind and solar energies the thresholds
vary for grid parity with conventional sources.
17 In the early 1990s, the German Government began to heav-
ily subsidize the installation of rooftop PV panels as part of
its 1,000 Rooftops project. As a result of the initial success,
the project was later expanded to a 100,000 Rooftops proj-
ect (Hader et al., 2011). In Japan, the Ministry of Economy,
Trade and Industry initiated a project called the New Sun-
shine Project in 1993 to develop solar technologies.
18 For example, solar energy is stored in salt and melted salts,
but scientists are trying to find ways to use concrete in-
stead. If this technological development materializes, the
cost of solar storage would be reduced by half, from €30–
40/kWh to below €20/kWh (Hader et al., 2011).

74 TECHNOLOGY AND INNOVATION REPORT 2011
REFERENCES
AGAMA Energy (2003). Employment Potential of Renewable Energy in South Africa.
Report prepared for the Sustainable Energy and Climate Change Partnership Johanesburg. Available at
http://projects.gibb.co.za/LinkClick.aspx?fileticket=S6HB67wKzQU%3D&tabid=174&mid=797
Amin A (2000). Prototyping structural description using an inductive learningprogram.
IEEE Transactions on Systems, Man, and Cybernetics, Part C: Applications and Reviews, 30(1): 150-157.
Andersson M and Ejermo O (2004). How does Accessibility to Knowledge Sources
affect the Innovativeness of Corporations? - Evidence from Sweden, Royal Institute of Technology, CESIS -
Centre of Excellence for Science and Innovation Studies, May.
Archibugi D (2001). Pavitt’S Taxonomy Sixteen Years On: A Review Article. Economics of Innovation and
New Technology, Economics of Innovation and New Technology, 10(5): 415-425.
Archibugi D and Michie J (1997). Technological globalisation or national systems of innovation? Futures, 29(2):
121-137.
Baumol WJ (2003). Welfare Economics and the Theory of the State. In: C K Rowley and F Schneider, eds.
The Encyclopedia of Public Choice. Boston, MA Springer US.
Bouée C-E, Liu W and Xu A (2011). China - Greed on an unimaginable scale. Green Growth, Green Profit:
How Green Transformation Boosts Business. Basingstoke Palgrave Macmillan.
Brusoni S and Prencipe A (2001). Managing Knowledge in Loosely Coupled Networks: Exploring the Links between
Product and Knowledge Dynamics. Journal of Management Studies, 38(7): 1019-1035.
BTM Consult (2009). BTM World Market Update 2009, Copenhagen.
Castelacci F and Archibugi D (2008). The technology clubs: The distribution of knowledge across nations.
Research Policy, 37(10): 1659–1673
Chandler W and Gwin H (2008). Financing energy efficiency in China. Washington, D.C., Carnegie Endowment for
International Peace.
Chesbrough HW (2003). Open innovation: the new imperative for creating and profiting from technology.
USA, Harvard Business Press.
Ciarli, T., Leoncini, R., Montresor, S. and M. Valente (2008) “Technological Change and the Vertical Organization of
Industries”, Journal of Evolutionary Economics,18: 367-387.
Chichilnisky G (2009). Financial Innovations & Carbon Markets. EU Chronicle, XLVI(3&4).
Cohen WM and Levinthal DA (1990). Absorptive Capacity: A New Perspective on Learning and Innovation.
Administrative Science Quarterly, 35(1): 128-152.
Cosbey A, Ellis J, Malik M and Mann H (2009). Clean Energy Investment. Project synthesis report, Winnipeg,
Manitoba, IISD.
Davis G (2011). The global energy assessment. Presented at Vienna Energy Forum 2011. Vienna. Available at:
www.unido.org/fileadmin/user_media/Services/Energy_and_Climate_Change/Renewable_Energy/VEF_2011/
Presentations/The%20Global%20Energy%20Assessment%20Presentation.pdf.
Dayo FB (2008). Clean Energy Investment in Nigeria: The domestic context, IISD.
Delucchi MA and Jacobson MZ (2011). Providing all global energy with wind, water, and solar power, Part II:
Reliability, system and transmission costs, and policies. Energy Policy, 39(3): 1170-1190.
Dosi G, Malerba F, Ramello GB and Silva F (2006). Information, appropriability, and the generation of innovative
knowledge four decades after Arrow and Nelson: an introduction. Industrial and Corporate Change, Industrial and
Corporate Change, 15(6): 891-901.

75CHAPTER III : STIMULATING TECHNICAL CHANGE AND INNOVATION IN AND THROUGH RENEWABLE ENERGY TECHNOLOGIES
Economist Intelligence Unit 2007: Industry Forecast Healthcare and Pharmaceuticals India. London. November.
ExxonMobil (2010) The Outlook for Energy: A View to 2030 available at www.exxonmobil.com/energyoutlook
Freeman C (1987). Technology, policy, and economic performance: lessons from Japan. London and New York,
Pinter Publishers.
Freeman C (1988). Japan: a new national system of innovation? In: G Dosi et al., eds. Technical Change and
Economic Theory. UK Pinter Pub Ltd.
Gehl Sampath P (2010). Reconfiguring Global Health Innovation. Oxon; New York, Routledge.
GTZ (2007). Energy-Policy Market Conditions for Electricity Markets and Renewable Energies: A 23 Country
Analyses, Division Environment and Infrastructure TERNA Wind Energy Programme, Eschborn.
Hader M, Hertel G, Körfer-Schün M and Stoppacher J (2011). Renewable energy advancing fast. In: Roland Berger,
ed. Green Growth, Green Profit: How Green Transformation Boosts Business. Palgrave Macmillan.
Hamilton K (2011). Investing in renewable energy in the MENA region: financier perspectives. EEDP Working Paper,
Chatham House, June.
Henzelmann T and Grünenwald S (2011). Green services are the unsung heroes. In: Roland Berger and Von Roland
Berger Strategy Consultants GmbH, eds. Green Growth, Green Profit: How Green Transformation Boosts Business.
Palgrave Macmillan.
Holm D (2005). Renewable Energy Future for the Developing World. ISES White Paper, Friburg, International Solar
Energy Society (ISES).
IEA (2009). World Energy Outlook 2009. Paris, OECD/IEA.
IEA (2010). World Energy Outlook 2010. Paris, OECD/IEA.
IEA (2011). Clean Energy Progress Report, Paris, OECD/IEA.
IPCC (2007). Climate Change 2007: Mitigation of climate change. Cambridge, Cambridge University Press.
IPCC (2011). IPCC Special Report on Renewable Energy Sources and Climate Change Mitigation, IPCC.
ISPRE (2009). Research and Development on Renewable Energies: A Global Report on Photovoltaic and
Wind Energy, Paris, International Science Panel on Renewabe Energies.
Jaffe A, Lerner J and Stern S, eds. (2005). Innovation policy and the economy. Volume 5. Cambridge
Massachussets, MIT Press.
Johnson B and Lundvall Bengt-Åke (2003). National Systems of Innovation and Economic Development. In:
M Muchie, P Gammeltoft, and Bengt-Ake Lundvall, eds. Putting Africa First: The Making of African Innovation
Systems. Aalborg Aalborg University Press.
Kalmbach R (2011). India-Cannot afford not to go green. Green Growth, Green Profit: How Green Transformation
Boosts Business. Palgrave Macmillan.
Krohn S, Morthorst P-E and Awerbuch S (2009). The Economics of Wind Energy, European Wind Energy
Association.
Lundvall Bengt-Åke (1985). Product innovation and user-producer interaction. Aalborg, Aalborg University Press.
Lundvall Bengt-Ake, ed. (1992). National Systems of Innovation: Towards a Theory of Innovation and Interactive
Learning. Pinter Pub Ltd.
Malerba F (2002). Sectoral systems of innovation and production. Research Policy, 31(2): 247-264.
Malerba F (2004). Sectoral systems of innovation: concepts, issues and analyses of six major sectors in Europe.
Cambridge UK, Cambridge University Press.

76 TECHNOLOGY AND INNOVATION REPORT 2011
Marsili O and Verspagen B (2002). Technology and the dynamics of industrial structures: an empirical mapping
of Dutch manufacturing. Industrial and Corporate Change, 11(4): 791 -815.
Martinot E, Chaurey A, Lew D, Moreira JR, et al. (2002). Renewable Energy Markets in Developing Countries.
Annual Review of Energy and the Environment, 27(1): 309-348.
Martinot E (2003). Renewable energy market indicators and references. Available at:
http://www.martinot.info/markets.htm (accessed: 22 August, 2011).
Nelson RR (1987). Understanding Technical Change As an Evolutionary Process. Elsevier Science Ltd.
Nelson RR (1993). National Innovation Systems: A Comparative Analysis. Oxford University Press, USA.
Nelson RR and Winter SG (1982). An evolutionary theory of economic change. Harvard University Press.
Neuhoff K (2008). Learning by Doing with Constrained Growth Rates:An Application to Energy Technology Policy.
The Energy Journal, 29(01)
Ocampo JA and Vos R (2008). Uneven economic development. United Nations Publications.
OECD (1998). The Emerging Digital Economy Report, Paris, Organization for Economic Cooperation and
Development.
OECD (2010). Interim Report of the Green Growth Strategy: Implementing our Commitment for a Sustainable Future,
Paris, OECD.
Point Carbon (2007). Carbon 2007. A new climate for carbon trading.
Practical Action (2010). Poor people’s energy outlook 2010, Rugby, UK.
Ramachandran V, Gelb A and Shah M (2009). Africa’s Private Sector: What’s Wrong with the Business Environment
and What to Do About It – Brief.
Reers J, Benecchi A and Koper S (2011). The United States - A chance to reinvent itself. Green Growth,
Green Profit: How Green Transformation Boosts Business. Palgrave Macmillan.
Reinert ES (2007). How Rich Countries Got Rich and Why Poor Countries Stay Poor. Constable.
REN21 (2011). Renewables 2011 Global Status Report, Paris, REN21 Secretariat.
Robertson PL and Langlois RN (1995). Innovation, networks, and vertical integration. Research Policy,
Research Policy, 24(4): 543-562.
Rosenberg N (1982). Inside the Black Box: Technology and Economics. Cambridge UK; New York,
Cambridge University Press.
Sarker AR and Alam K (2010). Nexus between Electricity Generation and Economic Growth in Bangladesh.
Asian Social Science, 6(12): 16-22.
Siegel J (2006). Financing Renewable Energy in Developing Countries2006. Available at:
http://apps.americanbar.org/environ/committees/renewableenergy/teleconarchives/041906/Siegel_Presentation.pdf.
Skoglund A, Leijon M, Rehn A, Lindahl M, et al. (2010). On the physics of power, energy and economics of
renewable electric energy sources - Part II. Renewable Energy, 35(8): 1735-1740.
Stäglich J, Lorkowski J and Thewissen C (2011). Electric mobility comes of age. In: Von Roland Berger Strategy
Consultants GmbH, ed. Green Growth, Green Profit: How Green Transformation Boosts Business.
Palgrave Macmillan.
UNCTAD (2005). World Investment Report 2005: Transnational corporations and the internationalization of R&D.
United Nations publication, sales No. E.05.II.D.10. New York and Geneva, United Nations.
UNCTAD (2007). Regional cooperation for development. New York and Geneva, United Nations.

77CHAPTER III : STIMULATING TECHNICAL CHANGE AND INNOVATION IN AND THROUGH RENEWABLE ENERGY TECHNOLOGIES
UNCTAD (2010). World Investment Report: Investing in a Low-carbon Economy. United Nations publication, sales
no. E.10.II.D.2. New York and Geneva, United Nations.
UN/DESA (2009). A Global Green New Deal for Climate, Energy, and Development. New York, United Nations.
UN/DESA (2011). World economic and social survey 2011: the great green technological transformation. New York,
United Nations Department of Economic and Social Affairs.
UNEP (2011). Towards a Green Economy: Pathways to Sustainable Development and Poverty Eradication -
A Synthesis for Policy Makers, www.unep.org/greeneconomy.
UNFCCC (2010). Outcome of the work of the Ad Hoc Working Group on long-term Cooperative Action under the
Convention.


INTERNATIONAL POLICY CHALLENGES FOR
ACQUISITION, USE ANDDEVELOPMENT OF
RENEWABLE ENERGYTECHNOLOGIES4


81CHAPTER IV : INTERNATIONAL POLICY CHALLENGES FOR ACQUISITION, USE AND DEVELOPMENT OF RENEWABLE ENERGY TECHNOLOGIES
CHAPTER IV
INTERNATIONAL POLICY CHALLENGES FOR ACQUISITION, USE AND DEVELOPMENT OF
RENEWABLE ENERGY TECHNOLOGIES
A. INTRODUCTIONInternational discussions and negotiations
on climate change and the green economy
have gained momentum in recent years. A
major area under consideration relates to
environmentally sustainable technologies,
or low-carbon, “clean” technologies, as a
means of contributing to climate change
mitigation and adaptation globally.1 This
is a very important global goal, which will
serve the needs of developing countries, in
particular, given the evidence that climate
change will have disproportionately damag-
ing impacts on those countries. However,
even as efforts are made to mitigate climate
change, there needs to be an equally im-
portant focus on eliminating energy poverty
in developing countries, not only to improve
people’s living conditions, but also to boost
economic development, as earlier chapters
of this TIR have stressed.
This chapter calls for a repositioning of
issues within the international agenda,
whereby the obligations of countries to miti-
gate climate change are framed in terms of
creating development opportunities for all
in an environmentally sustainable manner.
Central to this repositioning is the triangu-
lar relationship between equity, develop-
ment and environment. From this perspec-
tive, recognition of the right of all people
worldwide to access energy services (as
discussed in chapter I) is long overdue and
needs to be addressed. Developing coun-
tries, especially the least developed, have
experienced a particularly large share of
natural disasters, such as hurricanes, tor-
nados, droughts and flooding, as a result
of changing climatic conditions. According
to recent estimates, 98 per cent of those
seriously affected by natural disasters be-
tween 2000 and 2004 and 99 per cent of
all casualties of natural disasters in 2008
lived in developing countries (Tan, 2010;
Global Humanitarian Forum, 2009; UNDP,
2007; and UN/DESA, 2009a), particularly
in Africa and South Asia where the world’s
poorest people live. These disasters have
not only caused food shortages; in many
instances, they have also ruined the liveli-
hoods of large numbers of people already
living in extreme poverty. Consequently, the
heightened economic insecurity caused by
climatic events has been borne dispropor-
tionately by developing countries.
A repositioning also implies focusing on is-
sues of finance and technology transfer and
acquisition for developing countries, espe-
cially in the context of RETs. These issues
may be considered within ongoing discus-
sions on financing for climate change adap-
tation, but they may also require separate
and newer initiatives that focus particular
attention on enabling the economic de-
velopment of countries and people. Spe-
cifically, how can adequate resources be
mobilized to ensure that people living in de-
veloping countries secure access to energy
and employment opportunities? Efficiency
in meeting the energy needs of developing
countries requires use of the most efficient
technologies available worldwide (Birdsall
and Subramanian, 2009).
This chapter argues for the need for inter-
national support to complement national
frameworks that seek to promote tech-
nology and innovation capacity in RETs. It
analyses three important policy challenges
As efforts are made to
mitigate climate change,
there needs to be an
equally important focus
on eliminating energy
poverty in developing
countries.
Such a shift in
positioning implies
focusing on issues of
finance and technology
transfer and acquisition
for developing countries,
especially in the context
of RETs.

82 TECHNOLOGY AND INNOVATION REPORT 2011
related to climate change and RETs: (i) in-
ternational resource mobilization for RETs
financing, (ii) greater access to technology
through technology transfer and the greater
use of flexibilities in the intellectual property
(IP) regime, and (iii) promoting technological
learning and wider use of RETs through the
green economy and the Rio+20 framework.
These issues have been and remain central
to all debates and decisions of the UNFCCC
and the Kyoto Protocol. Much of these
discussions refer to environmentally sus-
tainable, or clean, technologies,2 of which
RETs form a subset. The chapter examines
financing, technology transfer and IP issues
that are being discussed in international
negotiations and in debates to the extent
that they apply to RETs. By highlighting the
key international developments, often con-
flicting policy developments3 and the main
hurdles that remain to be overcome, the
chapter calls for the international discourse
to consider the needs of developing coun-
tries for science, technology and innovation
of RETs. In this context, it makes proposals
for greater international support to develop-
ing countries, including an international in-
novation network of RETS for LDCs, global
and regional research funds for RETs de-
ployment and demonstration, an interna-
tional RETs technology transfer fund and an
international RETs training platform.
B. INTERNATIONAL RESOURCE MOBILIZATION AND PUBLIC FINANCING OF RETs
The role of RETs in complementing and
eventually even replacing existing energy
sources worldwide will remain just rhetoric
if they are prohibitively expensive. Finance
has been at the forefront of all issues in in-
ternational discussions on climate change
mitigation. This is largely because of the
dauntingly large amounts of investments
in RETs that are needed if the world is to
avoid dangerous anthropogenic climate
change. An important forum where this is-
sue of financing is being discussed is the
UNFCCC. Although these discussions refer
to environmentally sustainable, or clean,
technologies,4 of which RETs form a sub-
set, these discussions offer an important
basis to analyse the key issues relating to
international resource mobilization for RETs.
1. Financing within the climate change framework
Several proposals have been made con-
cerning the sharing of the burden of cli-
mate change mitigation (box 4.1). The UN-
FCCC5 stipulates that developed countries
should ensure the availability of “new and
additional financial resources” to meet the
“agreed full costs” involved in enabling de-
veloping countries to meet their national
commitment requirements under Article
12 of the Convention. Article 4(3) calls on
developed countries to provide “such fi-
nancial resources, including the transfer of
technology” to all developing countries to
meet “the agreed full incremental costs”
of implementing mitigation and adaptation
actions and other commitments identified
in Article 4(1), including reporting of emis-
sions and carbon sink removals, integra-
tion 2 of climate change considerations into
national policies, education, training and
public awareness, and research on climate
change. Additionally, the UNFCCC requires
commitments from developed countries
to finance adaptation costs in developing
countries.6
A number of estimates have been pro-
duced that try to quantify the challenge of
adaptation and climate change mitigation
(see table 4.1 for summaries of the major
estimates). All of them consider slightly dif-
ferent categories of investments that will
be needed in the immediate or medium
term. The International Energy Agency
(IEA, 2010a) estimate covers only electric-
ity generation technologies, and therefore
excludes investment in transport fuels and
heating technologies. The UNFCCC (2008)
estimates cover only power generation,
which includes carbon capture and storage
(CCS), nuclear and large-scale hydro. While
all the estimates are indicative, the defini-
tions of technology and the broad goals
The role of RETs
in complementing
and eventually even
replacing existing energy
sources worldwide will
remain just rhetoric…
… if they are
prohibitively expensive.

83CHAPTER IV : INTERNATIONAL POLICY CHALLENGES FOR ACQUISITION, USE AND DEVELOPMENT OF RENEWABLE ENERGY TECHNOLOGIES
Box 4.1: Kyoto Protocol, emissions control and burden sharing
Climate change has been touted as the greatest market failure in the world. The Kyoto Protocol and important reports on the
topic, such as the Stern Report on the Economics of Climate Change of 2007 and UNDP’s Human Development Report 2008,
have advocated allocating the future burden of emission reductions according to an 80-20 formula whereby the rich countries
agree to cut emissions by 80 per cent by 2050 from their 1990 levels and poor countries by 20 per cent. From a historical
perspective, it has been suggested that it is mainly emissions from today’s developed countries during their process of indus-
trialization that have contributed to the level of greenhouse gases (GHGs) in the world today. However, China has now replaced
the United States as the world’s largest emitter of GHGs, and India and China together host over a third of the world’s popula-
tion. If these and other countries were to pursue industrialization using the same conventional technologies and energy sources
that developed countries used during their process of industrialization, the effects on climate change, with all their ramifications,
would be unthinkable, as chapter I has pointed out. Yet, limiting developing countries’ choices of technologies and energies
to more climate-friendly ones, which require greater investments and costs, could imply their having to forsake development
opportunities. The debates on burden sharing by different countries therefore tend to focus on their varying capabilities and
contributions to the past and current levels of GHG emissions as well as the opportunity costs of shifting to a low-carbon, high-
growth mode of development.
Five main proposals have emerged over time (Mattoo and Subramanian, 2010). The equal per capita emissions proposal is
based on the premise that, regardless of all past and future responsibilities, every country should be treated alike in assessing its
right to emit GHGs. A second proposal, based on historical responsibility, suggests that the allocation of rights to all future emis-
sions should be inversely linked to the past emission records of countries. A third proposal is based on ability to pay, and links
payments for climate change mitigation and adaptation to poverty criteria. There are several versions of this proposal, the most
extreme version proposing that below a particular level of income, individuals or countries themselves will have no obligation to
pay. A fourth proposal seeks to preserve future development activities by allocating sufficient carbon allowances to countries
that are currently poor and have not made enough use of their carbon allowances for development purposes. A fifth proposal
relates to the distribution of adjustment costs. The 80-20 formula by Stern (2007) and UNDP (2008), also fall in this category.
It is not clear how these proposals fit into the broadly accepted and negotiated “common-but-differentiated” obligations of the
UNFCCC. Indeed, the issue of burden sharing has proved to be problematic.
Source: UNCTAD.
assumed in the IEA (2000) are probably
the most relevant. The proposal to halve
energy-related emissions by 2050 corre-
sponds roughly to the minimum mitigation
levels deemed necessary by the IPCC, and
the definition of low-carbon energy tech-
nologies corresponds well to the scope of
this TIR, which covers RETs. The IEA’s es-
timates for the level of investments needed
are lower than the other estimates in the
medium term, at $300–$400 billion per an-
num up to 2020, but rise thereafter to reach
$750 billion by 2030.
All these analyses examine the conditions
broadly necessary to bring about tech-
nological transformation. As such, they
Source: UNCTAD, based on Cosbey and Savage (2011).
Table 4.1: Estimates of RETs investments needed for climate change adaptation and mitigation
Source PublicationAnnual investment
neededPurpose of investments
IEA Energy TechnologyPerspectives 2000
$300–$400 billion between 2010 and 2020, and upto $750 billion by 2030
Low-carbon energy technologies needed to achieve IEA’s BLUE Map scenario (related CO2 emissions fall by half between 2005 and 2050)
IEA World Energy Outlook 2010 Average of $316 billionbetween 2010 and 2035
Electricity generation only; needed to reach IEA’s 450 scenario (i.e. atmospheric GHGs at 450 particles per million (ppm)CO2 equivalent, or an average temperature rise of 2ºC)
UNFCCC Investment and Financial Flows to Address Climate Change: An Update (2008)
$148.5 billion by 2030 Needed to reduce GHG emissions by 25 per cent below2000 levels. Includes CCS, nuclear and large hydro
UNEP SEFI/BloombergNew Energy Finance
Global Trends inSustainable Energy Investment 2010
$500 billion by 2030 To reduce GHG emissions from 42 Gt to 39 Gt by 2030.Excludes large (>50 MW) hydro

84 TECHNOLOGY AND INNOVATION REPORT 2011
include investments throughout the inno-
vation chain, from R&D through demon-
stration and commercialization to dissemi-
nation and deployment of RETs (figure 4.1).
This raises questions about the capacity
of public finance to support the rapid and
widespread deployment of RETs as part
of adaptation efforts and the role of inter-
national support. There are a number of
known sources of finance at the multilateral
and regional levels (table 4.2). Notable ex-
amples include the World Bank’s Climate
Investment Funds and, specifically, the
Clean Technology Fund, with commitments
of $4.5 billion until 2010. As of November
2010 the Clean Technology Fund had ap-
proved $2.4 billion to support large-scale
renewable deployment in 14 middle-income
developing countries (Algeria, Egypt, Indo-
nesia, Jordan, Kazakhstan, Mexico, Moroc-
co, the Philippines, South Africa, Thailand,
Tunisia, Turkey, Ukraine and Viet Nam), and
through its Scaling Up Renewable Energy
in Low Income Countries Program, it had
planned to provide support for renewables
in an additional six pilot low-income coun-
tries (World Bank, 2010).
Table 4.2 provides a list of multilateral and
bilateral funding programmes, but it is by
no means exhaustive. For instance, it does
not include the newly announced UNFCCC
Green Climate Fund, since the details of this
Fund are not yet known. Neither does it in-
clude the $30 billion fast-start financing be-
tween 2010 and 2012, and the target to mo-
bilize $100 billion per year by 2020 (UNFCCC,
2010), which was announced as part of the
Copenhagen Accord (at least some of which
will certainly be administered by the Green
Climate Fund). This funding was signed into
UNFCCC commitments as part of the Can-
cun Agreements in December 2010.
Table 4.2: Multilateral and bilateral funding for low-carbon technologies
FundTotal amount
($ million)
Major multilateral initiatives
World Bank Climate Investment Funds 6 100
Clean Technology Fund 4 700
Strategic Climate Fund 1 400
International Finance Corp. Sustainable Energy and Water 2 000
GEF-4 (various, incl. land-use change and forestry)
1 400
Asian Development Bank Climate Change Fund 40
Clean Energy Financing Partnership Facility 90
Poverty and Environment Facility 4
European Development Bank Multilateral Carbon Credit Fund 276
Subtotal 16 009
Major bilateral initiatives
Japan Hatoyama Initiativea 15 000
Netherlands Development Cooperation 725
Australia International Forest Carbon Initiative 132
United Kingdom Environmental Transformation Funda 1 182
Norway Climate Forest Initiative 2 250
Germany International Climate Initiative 764
European Commission Global Climate Change Alliance 76
Spain MDG Achievement Fund 92
Subtotal 20 221
Total 36 230
Source: IEA (2010b). a Also includes funding for adaptation, which has little if any relevance for RETs.
This raises questions
about the capacity
of public finance to
support the rapid and
widespread deployment
of RETs as part of
adaptation efforts and
the role of international
support.

85CHAPTER IV : INTERNATIONAL POLICY CHALLENGES FOR ACQUISITION, USE AND DEVELOPMENT OF RENEWABLE ENERGY TECHNOLOGIES
A number of caveats with respect to these
funding figures need to be considered
before they can be accurately compared
with the estimates of need shown in table
4.1. First, all are multi-year commitments,
whereas the figures in table 4.1 are an-
nual requirements. Several of the largest
sources of funds in table 4.2 are slated to
cover both mitigation and adaptation. Fi-
nally, while the commitments made under
the Cancun Agreements are valuable, the
long-term $100 billion dollar benchmark
is a commitment to mobilize that amount
of money from both the private and public
sector, and there is no clear idea so far as
to the respective shares of the two sec-
tors. Also, some of these funds are not
yet available. Taking all these caveats to-
gether, the total amount of annual funding
for RETs from public sources is likely to be
about $5 billion from the known sources in
table 4.2. If the full funding levels under the
Cancun Agreement are reached, they will
contribute some percentage of $100 bil-
lion of government support for RETs,
which is only a part of the $100 billion dol-
lar commitment to annual funding targeted
to be achieved by the year 2020. This falls
far short of the estimates of the needed
investment, which range from a low of
about $150 billion to a high of $750 billion
by 2030.
The Conference of the Parties (COP) to the
UNFCCC initiated a funding mechanism
through the Global Environment Facility
(GEF) in 1998 and also created the Adapta-
tion Fund Board in 2008, which deals with
climate change mitigation and adaptation,
including, inter alia, RETs. The GEF oper-
ates three trust funds established under
the Convention – the GEF Trust Fund, the
Strategic Climate Change Fund (SCCF)
and the Least Developed Countries Fund
(LDCF) – while the Adaptation Board oper-
ates the Adaptation Fund (figure 4.1). The
first three funds rely on voluntary contribu-
tions from all UNFCCC parties, both de-
veloped and developing countries, while
the Adaptation Fund is funded by a 2 per
cent levy on transactions under the Kyoto
Protocol’s Clean Development Mechanism
(CDM) (box 4.3).
2. Other sources of finance
Figure 4.2 shows how the various sources
of finance typically contribute at different
Figure 4.1: Funding arrangements of the UNFCCC
Source: Reproduced from Tan (2010).
UNFCCC financing
Article 11 UNFCCC: Financial MechanismNon-UNFCCC financing
Article 11(5):
Bilateral, regional or
multilateral channels
Global Environment Facility
(UNFCCC):
Funded by voluntary contributions
from developed countries
Operating
entities
Adaptation Fund Board
(Kyoto Protocol):
Funded by 2% levy on transactions
under the CDM but can also
receive contributions
GEF
Trust
Fund
Special
Climate
Change
Fund
(SCCF)
Least
Developed
Countries
Fund
(LDCF)
Adaptation Fund
Operating entities under the UNFCCC financial
mechanism report to and operate under the guidance
of the UNFCCC Conference of Parties
…this falls far short of
the estimates of the
needed investment,
which range from a low
of about $150 billion to
a high of $750 billion
by 2030.
If the full funding
levels under the
Cancun Agreement are
reached…

86 TECHNOLOGY AND INNOVATION REPORT 2011
stages of the innovation chain (i.e. the se-
quence of stages through which any inno-
vation must pass before it becomes widely
disseminated). That chain starts with R&D,
then moves to manufacturing scale-up
(i.e. developing scaled up commercial pro-
cesses and building demonstration proj-
ects) and finally ends with roll-out, which
involves investment in large-scale deploy-
ment and dissemination of the technology.
At the early stages of research, funding is
almost entirely public, though some may
also be undertaken in private sector re-
search divisions. When a concept reaches
the development stage, while it may still
benefit from government support, it be-
comes interesting enough to attract ven-
ture capital and private equity – sources
of finance that tolerate higher risks (and
demand commensurately higher returns).
As the innovation progresses and be-
comes more demonstrably sound, it can
attract funding from public equity markets,
or it may become the object of a merger
or acquisition. When the concept appears
viable on a commercial scale, debt-financ-
ing becomes an option. It should be noted
that figure 4.2 does not show the relative
scale of funding needs, which become
progressively greater along the innovation
chain to the extent that it would be highly
unlikely that a government alone would en-
gage in asset finance for commercial roll-
out (funding the development of a wind
farm, for example).
Currently, there are a number of multilat-
eral programmes and funds – typically
aiming to help achieve the goals of climate
change mitigation – that might support the
difference in costs between conventional
and renewable new capacity in large-scale
generation scenarios where RETs are more
costly than conventional alternatives. At
the same time, a number of national and in-
ternational grassroots agencies are work-
ing to promote RETs as solutions to energy
poverty, and many of them are supported
by multilateral funding agencies.
Medium-scale projects that represent
technological improvements on exist-
ing RETs, or mini-grid-based applications
Figure 4.2: Sustainable energy financing along the innovation chain
Source: UNCTAD, adapted from UNEP and Bloomberg (2010).
As the innovation
progresses and
becomes more
demonstrably sound, it
can attract funding from
public equity markets.
At the early stages of
research, funding is
almost entirely public.

87CHAPTER IV : INTERNATIONAL POLICY CHALLENGES FOR ACQUISITION, USE AND DEVELOPMENT OF RENEWABLE ENERGY TECHNOLOGIES
using RETs which can be combined with
conventional energy sources, offer innova-
tive niches for firms in developing coun-
tries to learn through adaptation of existing
technologies and innovations. However, in
general, developing country firms initia-
tives lack access to the extensive financing
and venture capital infrastructure needed
for such entrepreneurial initiatives. It also
seems evident that while in the near fu-
ture governmental and international sup-
port will play a critical role in expanding
the use, adaptation and innovation in RETs
across countries, government support can
only constitute a small proportion of the
total amount of investments needed for
this purpose. In the long term, the major
source of investment in RETs needs to
be non-governmental, mostly in the form
of asset finance (from utilities and energy
groups from their own balance sheets,
or from debt or equity finance) and pri-
vate equity and venture capital finance, or
contributions from homeowners and small
installations for small distributed capacity.
Therefore, the best way to position such
international support is to ensure that it
plays a catalytic role to help facilitate the
much larger flows of private investment
needed for widespread dissemination and
building of technological capabilities in
RETs in developing countries.
3. International support forfinancing of RETs:Outstanding issues
A macroeconomic climate that supports
greater investment in RETs and their use
in developing countries is critical today.
In response to the global financial and
economic crisis, many countries initiated
stimulus packages which included efforts
to build capacity in areas of the green
economy that display the greatest growth
potential. Approximately $188 billion of
“green” stimulus spending began to be
disbursed globally in 2009, much of it fo-
cusing on renewable energy technologies
(UNEP and Bloomberg, 2010). The United
States made the largest commitment, of
$66.6 billion, followed by China and the
Republic of Korea with $46.9 billion and
$24.7 billion respectively. The only other
developing country in the top 10 pledges
was Brazil with $2.3 billion (Ibid.). China’s
“green push” amounted to over 34 per
cent of its stimulus spending, and it tar-
geted areas such as green transportation,
smart grids, low-carbon vehicles, and
advanced waste and water infrastructure
(Robins, Clover and Singh, 2009). While
not all of the green spending was targeted
at REs, it is estimated that RETs received
support amounting to about $57 billion
that year (IEA, 2010a). As chapter III has
pointed out, by early 2010, over 100 coun-
tries – developed and developing – were
providing policy support to promote the
use and dissemination of RETs. No doubt,
the general trend is towards policies that
simultaneously aim at securing environ-
mental benefits through increased use of
RETs, development benefits through in-
creased energy provision, and economic
benefits by increasing domestic capacity
in areas that show growth potential.
However, such ongoing efforts in devel-
oping countries would be better served if
outstanding issues relating to international
financial support for RETs could be urgently
resolved with the aim of promoting greater
innovation, production and use of such
technologies. The major issues are sum-
marized below.
(i) At present, international financing of
clean technologies, which is largely
multilateral, is highly fragmen-
ted, uncoordinated and lacks
transparency. Figuring largely within
the climate change framework,
its high degree of stratification,
with multiple funds and complex
financing arrangements, results in
considerable overlap. It is also highly
inadequate to meet total funding
requirements for climate change
mitigation and adaptation (Tan,
2010; UN/DESA, 2009b). While such
financing may partly cover RETs,
additional international funding for
RETs is required as a priority. IRENA
estimates that Africa alone needs
International
financing of clean
technologies, which
is largely multilateral,
is highly fragmented,
uncoordinated and lacks
transparency.
Firms in developing
countries lack access to
the extensive financing
and venture capital
infrastructure needed
for such entrepreneurial
initiatives.

88 TECHNOLOGY AND INNOVATION REPORT 2011
$40 billion per annum for its power
sector. The requirements of other
developing regions are likely to be
similar, if not higher.
(ii) There is a large gap between the
financial needs of countries and
what is provided for RETs. It is
therefore necessary to explore what
additional measures are needed to
address these shortcomings.
(iii) Coordination of funding sources with
the aim of mainstreaming RETs into
national energy systems globally
should be an important aspect of
climate change mitigation efforts.
This would not only lead to the
development of more efficient energy
systems globally; it would also
ensure that the financing results in
more technological progress towards
newer and/or more cost-effective
RETs.
(iv) International policy support for
RETs by setting an international
target (specifying the extent to
which RETs would form part of
the global energy system by a
particular deadline) would be an
important policy signal to national
governments, as well as private
investors. Given the uncertainties
surrounding the development
of these technologies, a target-
based policy signal (as opposed
to stop-and-go policy signals)
would be important for stimulating
investments.
(v) International financing for RETs
should be coordinated with national
aspirations for RETs development
and expansion. As chapter III
points out, a number of developing
countries have enacted policy
targets to provide greater access
to energy through RETs expansion.
International financing of RETs
should be coordinated with such
policy goals of countries and
mainstreamed into development
cooperation programmes.
C. TECHNOLOGY TRANSFER, INTELLECTUAL PROPERTY AND ACCESS TO TECHNOLOGIES
Although technology transfer has been a
key issue in international forums and an in-
trinsic part of treaty texts since the 1970s,
there is no single, widely accepted defini-
tion of this term (see, for example, Patel,
Roffe and Yusuf, 2000; and Maskus and
Reichman, 2005). At a general level, the
growing technological divergence between
developing countries since the 1970s7 and
the gradual technological downgrading wit-
nessed among the LDCs (see UNCTAD,
2010) have prompted discussions on how
technology transfer to developing countries
and LDCs could be promoted. Article 66.2
of the Agreement on Trade-Related Aspects
of Intellectual Property Rights (TRIPS) of the
World Trade Organization (WTO) embodies
a legal obligation on the part of developed-
country members to provide specific incen-
tives for promoting technology transfer to
LDCs (Correa, 2005; and box 4.2).
Generally, the transfer of technology can
occur on a day-to-day basis, including
through informal channels such as the cir-
culation and transfer of educational mate-
rials, skills accumulation through employ-
ment of local people in international firms,
trade fairs, and general education and
training. Some of the more formal means
of technology transfer include joint ven-
tures that promote the sharing of know-
how, training of local personnel, or simply
employment of local staff; technical as-
sistance programmes and other forms of
aid; research collaborations in the public
and private sectors; subcontracting agree-
ments and technology licensing contracts
(see, for example, UNCTAD, 2007 and
2010). In all its forms, technology transfer
is central to accessing relevant knowledge
through the transfer of not only codified
information (in the form of blueprints, tech-
nology and equipment), but also intangible
International financing
for RETs should be
coordinated with
national aspirations for
RETs development and
expansion.
There is a large gap
between the financial
needs of countries and
what is provided for
RETs.

89CHAPTER IV : INTERNATIONAL POLICY CHALLENGES FOR ACQUISITION, USE AND DEVELOPMENT OF RENEWABLE ENERGY TECHNOLOGIES
know-how, which is an essential compo-
nent to enable developing-country recipi-
ents to absorb, apply and use the technol-
ogy for various industrial purposes (Arora
and Gambardella, 2004).
In the specific context of technology trans-
fer, whatever the channel, the acquisition
of information concerning the technology
is only one part of the whole process of
transfer. The process of learning how to
use and maintain the technology is just
as important, as is the capacity to adapt
the acquired technology to local condi-
tions. Such adaptation may ultimately lead
to the development of new applications
of the transferred technology. Thus, suc-
cessful technology transfer goes through
the phases of acquiring information, as-
similation and absorption of technological
knowledge, adaptation to local conditions,
absorption of subsequent improvements
and the dissemination of the transferred
knowledge. These phases jointly account
for the complex process of technology
transfer.
Mounting evidence on the role of tacit
knowledge and the presence of hu-
man skills to absorb technologies (learn-
ing by doing, and incremental innovation
in developing countries) shows that the
eventual success of technology transfer
depends on the ability of local actors to
absorb and effectively use and innovate
imported technologies. In sum, success-
ful transfer of technologies depends more
on local capabilities to absorb than on the
technologies themselves. Narratives about
industrial policy are replete with examples
of countries that managed to build sectors
primarily on the basis of consistent invest-
ments in technological capabilities without
large-scale transfers of technology. Local
capacity to develop locally appropriate
productive technologies (and to adapt ex-
isting technologies to local conditions) is
an essential adjunct to effective policies
relating to technology transfer and adapta-
tion. For RETs as for any other sector, local
capacity in a variety of areas is important
for adaptation, dissemination and use as
much as for innovation, as discussed in
chapter III.
International support to promote access
to existing technologies and related know-
how should complement national efforts
to boost absorptive capacity by supplying
much-needed technological know-how.
Box 4.2: Technology transfer and Article 66.2 of the WTO Agreement on Trade-Related Aspects of Intellectual Property Rights
The legal obligation for technology transfer contained in Article 66.2 of the TRIPS Agreement is reflected in the following pro-
vision: “Developed country members shall provide incentives to enterprises and institutions in their territories for the purpose
of promoting and encouraging technology transfer to least developed country members in order to enable them to create a
sound and viable technological base.” Clearly, the intent of this provision is to encourage the transfer of technology to LDCs
members of the WTO. To what extent this has materialized in practice is a matter of intense dispute. One of the only reviews
on the topic examines whether Art. 66.2 has resulted in an increase in business between developed countries and LDCs
(Moon, 2008). Based on country self-reports to the TRIPS Council between 1999 and 2007, and focusing mainly on the
public policies and programmes that developed countries undertake to encourage their organizations/enterprises to engage
in such technology transfer, the study concludes that the absence of a clear definition of key terms such as “technology
transfer” and “developed country” renders it difficult to determine which members are obligated to provide incentives, in what
form and towards what ends. Since many countries did not submit reports regularly to the Council, and those that submitted
did so irregularly, the review concludes that of 292 programmes and policies reported, only 31 per cent specifically targeted
LDC members of the WTO. Of these, approximately a third of the programmes that did target LDCs did not specifically pro-
mote technology transfer. Thus, of the 292 programmes, only 22 per cent involved technology transfer specifically targeted
at LDC members (Moon, 2008). At the April 2010 session of the Committee on Development and Intellectual Property (CDIP)
in World Intellectual Property Organization (WIPO), the group of like-minded developing countriesa called for a study on the
extent to which TRIPS Article 66.2 had been fulfilled. However, developed countries contend that the article reaches beyond
the mandate of the WIPO into business, trade, financial and other areas.
Source: UNCTAD.
a The like-minded countries are mainly the African Group, the Arab Group, Brazil and India.
The process of learning
how to use and maintain
the technology is just
as important, as is the
capacity to adapt the
acquired technology to
local conditions.

90 TECHNOLOGY AND INNOVATION REPORT 2011
1. Technology transfer issues within the climate change framework
A key issue that has emerged in the climate
change negotiations relates to greater ac-
cess to clean technologies. Indeed there
was a similar emphasis when the issue of
transfer of environmentally sound technolo-
gies was first raised in chapter 34 of Agen-
da 21 of the 1992 United Nations Confer-
ence on Environment and Development.8
Of the various provisions, Article 4.5 of
the UNFCCC has emerged as the lynch-
pin of the debate. Article 4.5 of the draft
UNFCCC calls on developed countries to
take adequate steps to promote the trans-
fer of technology to developing countries. It
states: “The developed countries and other
developed countries in Annex II shall take all
practicable steps to promote, facilitate and
finance, as appropriate, the transfer of or ac-
cess to environmentally sound technologies
and know-how to other Parties, particularly
developing country Parties, to enable them
to implement the provisions of the Conven-
tion.” Furthermore, Article 4.7 recognizes
that implementation of commitments by
developing-country parties to the Conven-
tion will depend upon their receiving appro-
priate transfers of technology. It states: “The
extent to which developing country Parties
will effectively implement their commitments
under the Convention will depend on the ef-
fective implementation by developed coun-
try Parties of their commitments related to
financial resources and transfer of technol-
ogy.”
The following five themes were identified for
further discussion by the COP at the sev-
enth session of the UNFCCC in 2001:
(i) Technology needs and needs
assessment, comprising a set
of country-level activities that
identify mitigation and adaptation
technology as priorities;
(ii) Technology information, comprising
all hardware and software
components that could facilitate
the flow of information aimed
at enhancing the transfer
of environmentally sound
technologies;
(iii) Enabling environments, consisting
of government actions, including
policies on fair trade, removal of
technical, legal and administrative
barriers to the transfer of
technology, economic policies,
regulatory frameworks, and greater
accountability and transparency;
(iv) Capacity-building, which refers
to processes to build, strengthen
and promote existing scientific
and technical capabilities and
institutions in developing countries
with a view to enhancing their
capacity to absorb environmentally
sound technologies; and
(v) Technology transfer mechanisms,
to support financial, institutional
and methodological activities, with
a view to enhancing coordination
of stakeholders in different
regions and countries, engaging
in technological cooperation and
partnerships at all levels, and
developing new projects to support
these goals.
These five core themes cover key aspects
relating to technology transfer, including
financing, supportive regulatory frame-
works, institution building and developing
greater absorptive capacity for environ-
mentally sound technologies in developing
countries. A closer look at the proceedings
of the thirteenth session of the COP to the
UNFCCC in 2007 shows a clear consen-
sus that technology transfer is central to
the implementation of the Convention be-
yond 2012. In order to follow through on
the five issues identified in the seventh
session of the COP in 2001, an expert
group on technology transfer was estab-
lished, and the Bali Action Plan of 2007
called for: “enhanced action on technology
development and transfer to support ac-
tion on mitigation and adaptation, includ-
ing, inter alia, consideration of effective
mechanisms and enhanced means for the
removal of obstacles to, and provision of
financial and other incentives for, scaling
Article 4.5 of the draft
UNFCCC has emerged
as the lynchpin of the
debate.

91CHAPTER IV : INTERNATIONAL POLICY CHALLENGES FOR ACQUISITION, USE AND DEVELOPMENT OF RENEWABLE ENERGY TECHNOLOGIES
up of the development and technology to
developing country Parties in order to pro-
mote access to affordable environmentally
sound technologies (ESTs)”.
Developing countries (G-77+China) pro-
posed the establishment of an institu-
tional mechanism on technology transfer
and the creation of a new Multilateral Cli-
mate Technology Fund in 2008 at the UN-
FCCC. The dominant view was that IPRs
had to be addressed in a systematic and
cross-cutting manner to enhance access
to environmentally sustainable technolo-
gies.
To this end, the Cancun Climate Change
Conference in 2010 proposed a new
Technology Mechanism which could
help enhance the technological capacity
of countries to absorb and utilize RETs.
The Mechanism is intended to bolster
international support for technology de-
velopment and transfer, particularly to
developing countries, in support of cli-
mate change mitigation and adaptation.
However, the financial and institutional
aspects of the Mechanism still need to
be worked out, especially its two com-
ponents: the Technology Executive Com-
mittee and the Climate Technology Centre
and Network. Some earlier efforts, such
as the CDM (box 4.3), may also need
to be reconsidered and enhanced along
with private sector initiatives to facilitate
the greater diffusion of RETs.
2. Intellectual property rights and RETs
Over the past decade, development schol-
ars have tried to reconcile the universal
standards of IPR protection that the TRIPS
Agreement calls for, with the technological
realities of developing countries and LDCs.
As noted in the relevant economic litera-
ture, the extension of IPRs entails costs of
various kinds to developing countries, es-
pecially to those countries that are not par-
ticularly technologically advanced (Maskus,
2000).10 At the same time, three broad in-
direct benefits from extending IPRs have
been highlighted for a large number of de-
veloping and LDCs where R&D capabilities
are low: (i) higher foreign direct investment
(FDI), technology transfer, licensing and
technology sourcing of value-added goods
through foreign subsidiaries with potential
positive impacts on domestic learning; (ii)
greater innovative activities from access to
patent disclosures and technologies; and
(iii) competitive returns to innovative firms
in developing countries from stronger IPRs
and less legal uncertainty (Lai and Qiu,
2003). It has been argued that all of these
(especially increased technology transfer
and FDI) would help developing countries
catch up, and even leapfrog.
Ways and means to address these issues
and to finance innovation of relevance to
the poorer countries remain controver-
sial. The policy debates on IPR issues
Box 4.3: The Clean Development Mechanism and technology transfer
Article 12 of the Kyoto Protocol defines the CDM as a market-based mechanism set up as an incentive for the financing and dif-
fusion to developing countries of emission-reducing technologies by the private sector. Several studies have sought to evaluate
CDM’s role in promoting implementation of the Protocol (see, for example, Dechezleprêtre, Glachant and Ménière, 2008; and
Seres, Haites and Murphy, 2009). The CDM was a means by which Annex I countries could initiate projects that would result
in “certified emission reductions” (CERs) in non-Annex I countries, thereby helping to mitigate climate change. According to
the conceptual logic of this mechanism, Annex I countries would be able to count the certificates from their projects as part of
their quantified emission targets under Article 3 of the Protocol. In essence, it was a way for developed countries to offset their
carbon emissions by supporting emission reduction projects in developing countries that would help them to purchase carbon
credits. There is considerable disagreement on how and to what extent mechanisms such as CDM can help raise finances for
climate change mitigation (and technology transfer) due to the high volatility of carbon markets. A second area of discord relat-
ing to the CDM is the financial relationship between the CDM and the Adaptation Fund which is meant to support climatically
vulnerable countries under Article 12.8 of the Kyoto Protocol.
Source: UNCTAD.

92 TECHNOLOGY AND INNOVATION REPORT 2011
tend to emphasize the safeguards (gen-
erally referred to as “flexibilities” in the
TRIPS Agreement) contained in the global
IPR regime – notably parallel imports and
compulsory licensing – which are limited in
scope.11 Moreover, many countries have, to
varying degrees, forgone these flexibilities
through “TRIPs-plus” regimes adopted by
major technology exporters. The debates
have focused on certain key areas of pub-
lic interest such as health,12 agriculture,13
and, more recently, climate change.14 The
key issues and way ahead for developing
countries with regard to the use, adaptation
and innovation of climate-friendly RETs are
discussed at length here.
a. The barrier versus incentivearguments
Many of the RETs needed to alleviate en-
ergy poverty in developing countries are off-
patent (IPCC, 2007). On the issue of new in-
ventions, a recent joint study by UNEP, EPO
and ICTSD (2010) points out that there is
increasing patent activity in many clean en-
ergy technologies by the OECD countries,
and that most of the applications for these
patents are being filed in developed coun-
tries and China. Noting the strategic inter-
national trade motive – which it also calls
the “Kyoto effect” – the study observes a
surge in the patenting of clean energy tech-
nologies since the early 2000s. While these
findings are for clean technologies, they are
also relevant to the discussion on RETs (see
box 4.4 for a summary of the key findings).
This increasing tendency to patent is con-
firmed by other independent analyses of
patent trends relating to climate change
mitigation technologies. For instance, a re-
cent study found that between 1988 and
2007, Japan had the highest number of
claimed priorities for patents in all kinds
of climate change mitigating technologies
considered in the analysis (Haš i et al.,
2010). Japan was followed by the United
Box 4.4: Patents in clean energy: Findings of the UNEP, EPO, ICTSD study
A study by UNEP, the European Patent office and the International Centre for Trade and Sustainable Development (2010) re-
views recent evidence on IPRs and RET transfer and ownership, and RET patents for eight clean energy technologies: solar
PV, solar thermal, wind, geothermal, hydro/marine, biofuels, CCS and integrated gasification combined cycle (IGCC) clean coal
technology. Most of these are RETs, although CCS is used with fossil fuels (coal to be precise).
The review finds that current evidence on whether IPRs constitute a barrier to transfer of RETs is inconclusive. The study also
finds that there is relatively little out-licensing of RET patents to developing countries, but that the level is no lower than for
other sectors. In addition, it notes that there are the normal sorts of constraints involved in licensing out RET patents, such as
those related to high transaction costs, identifying suitable partners and mutual agreement of licensing conditions. Given the
urgency to achieve wider diffusion of RETs, the study argues that greater attention should be paid to developing mechanisms
that facilitate their licensing. This could be done by improving information flows, reducing transaction costs, expanding capacity
in developing countries to negotiate technology licensing and otherwise supporting technology licensing.
Regarding ownership of RET patents, the report finds that patenting of RETs is dominated by OECD countries, although several
developing countries also hold some patents, albeit a small proportion. The degree of concentration of patents in the eight
technologies considered is found to be similar to that in other technologies, with six OECD countries – France, Germany, Japan,
the Republic of Korea, the United Kingdom and the United States – accounting for almost 80 per cent of all patent applications
considered in the study. China and Taiwan Province of China are the largest RET patent holders among the non-OECD coun-
tries, with most other developing countries accounting for little or none of the total patenting share. Further, the study notes that
China and India, despite their growing role in the manufacturing of RETs-related machinery and equipment hold a fraction of the
patents held by their Western counterparts.
These findings illustrate that only a relatively small number of countries (or firms in those countries) are generating new patent-
able knowledge and pushing the technological frontier in RETs. This trend in RETs mirrors a similar trend in patents for technolo-
gies more broadly, with few developing countries at the technology frontier of innovation. The developing countries with patents
in RETs are relatively advanced, with strong science, technology and innovation capabilities and reasonably well-functioning
innovation systems in RETs. No LDCs have any RET patents, if the data reported are accurate.
Source: UNCTAD.
There is increasing
patent activity in
many clean energy
technologies by the
OECD countries.
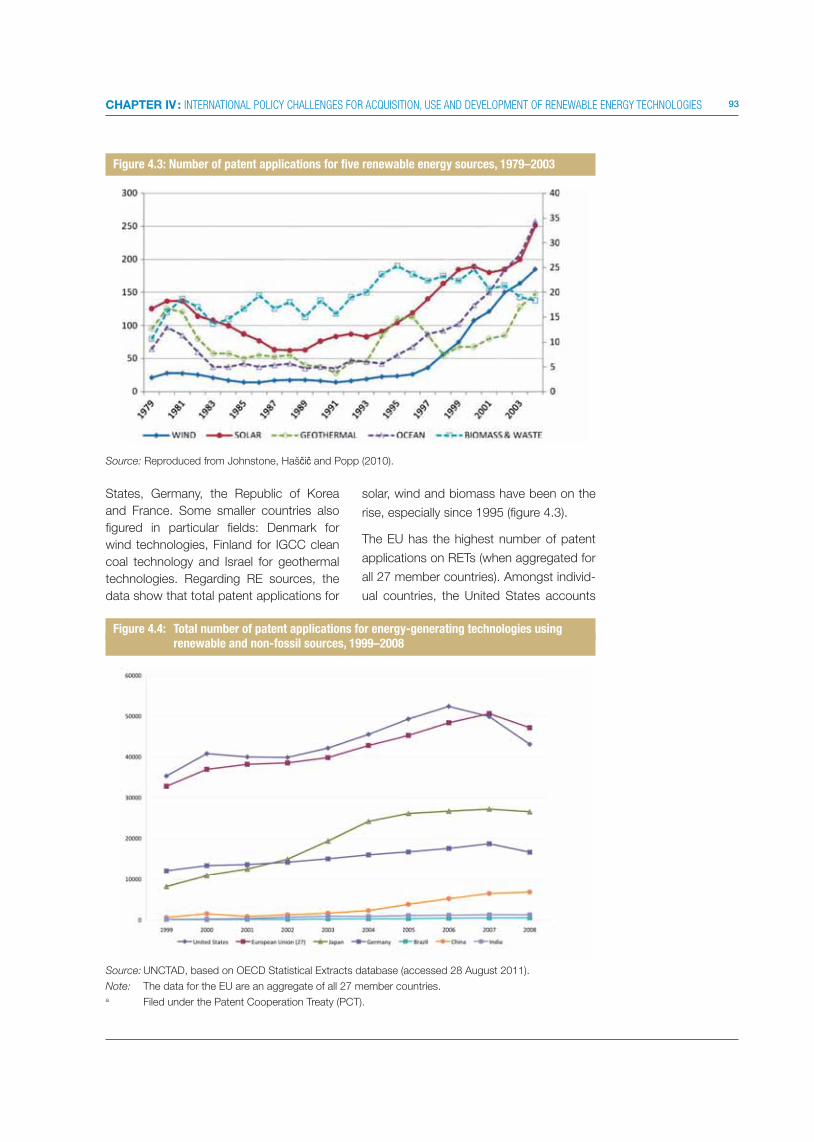
93CHAPTER IV : INTERNATIONAL POLICY CHALLENGES FOR ACQUISITION, USE AND DEVELOPMENT OF RENEWABLE ENERGY TECHNOLOGIES
States, Germany, the Republic of Korea
and France. Some smaller countries also
figured in particular fields: Denmark for
wind technologies, Finland for IGCC clean
coal technology and Israel for geothermal
technologies. Regarding RE sources, the
data show that total patent applications for
solar, wind and biomass have been on the
rise, especially since 1995 (figure 4.3).
The EU has the highest number of patent
applications on RETs (when aggregated for
all 27 member countries). Amongst individ-
ual countries, the United States accounts
Figure 4.3: Number of patent applications for five renewable energy sources, 1979–2003
Figure 4.4: Total number of patent applications for energy-generating technologies usingrenewable and non-fossil sources, 1999–2008
Source: Reproduced from Johnstone, Haš i and Popp (2010).
Source: UNCTAD, based on OECD Statistical Extracts database (accessed 28 August 2011).
Note: The data for the EU are an aggregate of all 27 member countries.a Filed under the Patent Cooperation Treaty (PCT).
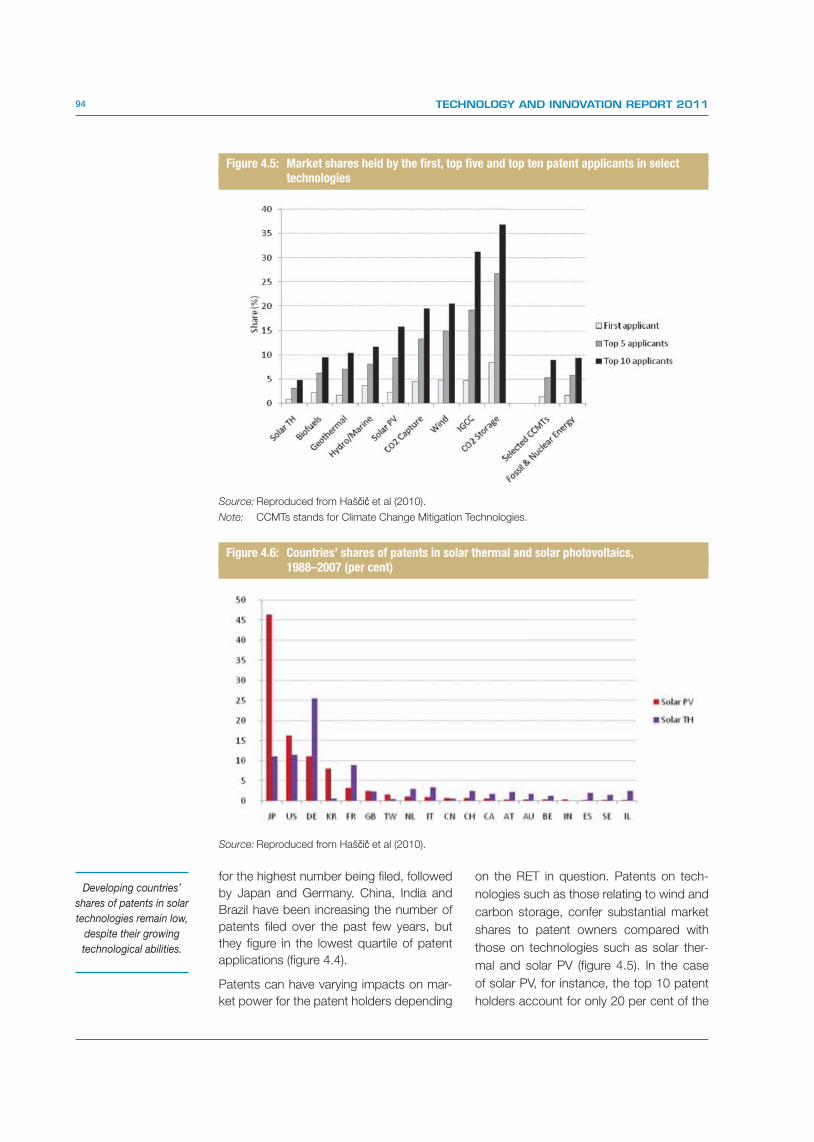
94 TECHNOLOGY AND INNOVATION REPORT 2011
Figure 4.5: Market shares held by the first, top five and top ten patent applicants in select technologies
Figure 4.6: Countries’ shares of patents in solar thermal and solar photovoltaics,1988–2007 (per cent)
Source: Reproduced from Haš i et al (2010).
Note: CCMTs stands for Climate Change Mitigation Technologies.
Source: Reproduced from Haš i et al (2010).
for the highest number being filed, followed
by Japan and Germany. China, India and
Brazil have been increasing the number of
patents filed over the past few years, but
they figure in the lowest quartile of patent
applications (figure 4.4).
Patents can have varying impacts on mar-
ket power for the patent holders depending
on the RET in question. Patents on tech-
nologies such as those relating to wind and
carbon storage, confer substantial market
shares to patent owners compared with
those on technologies such as solar ther-
mal and solar PV (figure 4.5). In the case
of solar PV, for instance, the top 10 patent
holders account for only 20 per cent of the
Developing countries’
shares of patents in solar
technologies remain low,
despite their growing
technological abilities.

95CHAPTER IV : INTERNATIONAL POLICY CHALLENGES FOR ACQUISITION, USE AND DEVELOPMENT OF RENEWABLE ENERGY TECHNOLOGIES
market share. And developing countries’
shares of patents in solar technologies re-
main low (figure 4.6), despite their growing
technological abilities.
In conclusion, despite the general finding
that most clean technologies needed for de-
veloping countries and LDCs are off-patent,
patenting activity in RETs is on the rise. In
certain RETs, such as those related to wind
power, patents seem to confer a large share
of the market, indicating a positive relation-
ship between patenting and market access,
whereas in some other technologies, such
as solar PV, this is not the case.15 In the case
of solar PV, for example, the market structure
is largely dominated by products that are not
patent protected, and patented products still
have a market share of about 20 per cent.
Although certain developing countries have
developed R&D capabilities in some RETs,
the share of patents held by developing-
country firms is still low compared with those
held by developed-country firms. However,
it is important to point out that the statistics
do not capture certain incremental innova-
tions and adaptations of RETs in the local
developing-country context, unless they are
patented. Moreover, licensing contracts of-
ten contain more than the simple licence for
intellectual property, and licensing contracts
are not always registered with government
authorities. Also patent mapping does not
capture licensing activity and trends, as not
all registered patents are licensed. It would
be impossible to comprehensively map trade
secrets or utility models, as the former are
not registered, and, with respect to the latter,
many countries do not confer utility model
protection over incremental innovations.
Lastly, from these results and from the pre-
liminary trends in patented RETs (discussed
below), it is not clear to what extent IPRs will
be an incentive for firms to develop RETs or,
more broadly, to develop environmentally
sustainable technologies in the future.16
b. Preliminary trends inpatented RETs
A recent study on patent flows and applica-
tions for RET-based inventions in countries
other than the inventor’s home country for
solar photovoltaic, wind and biofuel tech-
nologies shows emerging trends (Haš i et
al., 2010). The study examines the transfer
of those technologies from UNFCCC Annex
1 countries to non-Annex 1 countries dur-
ing the period 1978–2007 (figures 4.7–4.9).
The thickness of the arrows in the figures
denotes the magnitude of the patents de-
posited by inventors of these RETs in differ-
ent parts of the world.
The figures are instructive in pointing to some
key trends. First, the number of patents being
applied for in different countries by the same
innovators for solar PV is three times higher
than for wind technologies and biofuels.
China remains the major patent application
country of all technologies being patented
in all three areas. Other countries that figure
prominently are Brazil, the Republic of Korea
and South Africa. Some countries are major
recipients of patent applications for particular
RETs. For instance, Morocco is a large recipi-
ent of patent applications for wind power and
Indonesia is an important recipient for car-
bon capture technologies (not shown in the
figures). A second significant trend evident
from these figures is that even in 2007 hardly
any patent applications flowed from Annex I
countries to almost all of northern and sub-
Saharan Africa (with the exception of South
Africa), large parts of Latin America and South
Asia. These trends are important indicators of
where and how patent applications are being
filed worldwide, reflecting where the learn-
ing implications of patent information, if any,
could be expected.
3. Outstanding issues in thedebate on intellectualproperty and technology transfer
The limited data and the ongoing debate on
the transfer of environmentally sustainable
technologies, and RETs in particular, raises a
number of issues relating to technology as-
similation, the quality – rather than the quan-
tity – of technology transfer, and flexibilities
and other options available to developing
countries. These are discussed below.
Discussions on
technology transfer
of RETs in the climate
change framework…
…should move beyond
focusing narrowly on the
transfer of technology
to a broader focus on
enabling technology
assimilation of RETs.
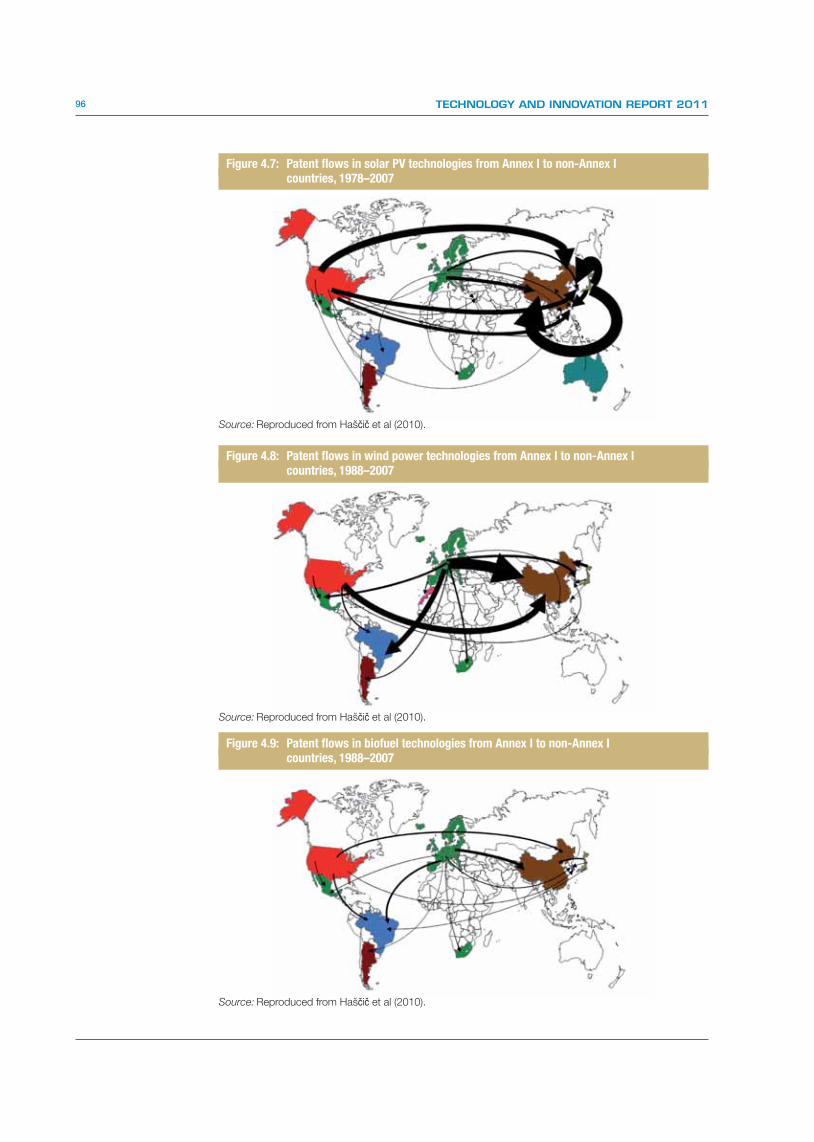
96 TECHNOLOGY AND INNOVATION REPORT 2011
Figure 4.7: Patent flows in solar PV technologies from Annex I to non-Annex Icountries, 1978–2007
Figure 4.8: Patent flows in wind power technologies from Annex I to non-Annex Icountries, 1988–2007
Figure 4.9: Patent flows in biofuel technologies from Annex I to non-Annex Icountries, 1988–2007
Source: Reproduced from Haš i et al (2010).
Source: Reproduced from Haš i et al (2010).
Source: Reproduced from Haš i et al (2010).

97CHAPTER IV : INTERNATIONAL POLICY CHALLENGES FOR ACQUISITION, USE AND DEVELOPMENT OF RENEWABLE ENERGY TECHNOLOGIES
a. Beyond technology transferto technology assimilation
Discussions on technology transfer of RETs
in the climate change framework and be-
yond should move beyond focusing nar-
rowly on the transfer of technology to a
broader focus on enabling technology as-
similation of RETs. Accumulation of tech-
nological know-how and learning capabili-
ties is not an automatic process. Learning
accompanies the acquisition of production
and industrial equipment, including learning
how to use and adapt it to local conditions.
In order to promote broader technology as-
similation, the technology transfer exercise
will need to take into account the specific
technological dimensions of RETs as well
as the nature of actors and organizations
in developing countries. For example, it has
been suggested that developing-country
research institutions need to be better in-
tegrated with development initiatives on
RETs, thereby building their capabilities for
developing and deploying these technolo-
gies, as mentioned earlier in this Report.
There is no doubt that many local research
institutions in developing countries will have
much to offer by collaborating with devel-
oped-country research institutions, includ-
ing undertaking valuable fieldwork to test
technologies and adapt them to the local
context.
As noted in chapter III, many countries have
public research institutions that are actively
engaged in RETs research. Regarding the
private sector, while small and medium-sized
enterprises (SMEs) in developed countries
tend to be at the forefront of risk-taking and
innovation, this is not the case of similarly
placed firms in developing countries. More
and more evidence from successful coun-
tries and sectors reveals that larger firms in-
novate much more and are more resilient,
and therefore, while SMEs remain very im-
portant in developing countries and LDCs,
greater support aimed at the expansion of
these firms is required. Making technolo-
gies more widely available and in ways that
promote the national aspirations of coun-
tries for technology-led development will be
important for expanding the technological
base of RETs in developing countries.
b. Assessing the quality – and not the quantity – of technology transfer
The quality of technology transfer should
be assessed by the extent to which the re-
cipient’s know-how of a product, process
or routine activity is enhanced, and not by
the number of technology transfer projects
undertaken. The impact of any technology
transfer initiative in terms of increasing the
recipient’s know-how varies widely. It de-
pends on the nature of the countries and
firms in question (which determines the
scope for complementary exchange and
learning), the activities under consideration
(e.g. prototyping or design) and the tech-
nologies involved, as well as on the kinds of
activities undertaken as part of the initiative
(including training or other forms of capacity
building). Technological content in any field
is relative, varying according to the domain
and the level of the technology that currently
defines the frontier. Inventors regularly face
the question of whether to disclose an in-
vention in the hope of obtaining a patent, or
to keep it protected through other means.
For technologies that are developed with-
out the intent to receive any IPRs protection
(such as those developed under a grant
which prohibits taking out personal IPRs on
an invention), there is no database similar
to patent searches that would explore and
identify existing technologies in the public
domain. Even where patent information is
disclosed, or even when there are no pat-
ents on RETs, it is frequently difficult to find
available technologies and to seek transfer
or engage in technological learning activi-
ties based on such RETs in the absence
of domestic capabilities. Finally, often the
disclosed information contained in a patent
application is insufficient to fully exploit the
patent. This is as true for RETs as for other
technologies.
The nature of licensing possibilities there-
fore assumes importance for firms that
are able to negotiate voluntary licences for
technology transfer. In this regard, licensing
The quality of
technology transfer
should be assessed by
the extent to which the
recipient’s know-how
of a product, process
or routine activity is
enhanced…
…and not by the number
of technology transfer
projects undertaken.

98 TECHNOLOGY AND INNOVATION REPORT 2011
agreements can contain more than just the
licence of an IPR, depending on the bar-
gaining position and awareness of the par-
ties involved. They often contain provisions
for the transfer of the related know-how re-
quired to exploit the invention (which can
also be a trade secret). This can take the
form of training or specification manuals, for
instance.
Negotiation for a technology transfer li-
cence can be a formidable challenge for
many developing-country firms. The joint
study by UNEP, EPO and ICTSD (2010) on
patents and clean energy points out that
70 per cent of respondents to a survey con-
ducted for the study indicated that “they
were prepared to offer more flexible terms
when licensing to developing countries with
limited financial capacity.” However, it is un-
clear whether this would be enough to spur
a rapid uptake of RETs in the near future.
While RETs markets tend to be relatively
competitive, with the possibility of choos-
ing among a range of alternatives, licensing
royalties and other restrictive terms com-
manded by owners of IP could still be prob-
lematic for many developing countries.
c. Exploring flexibilities and other options within and outside the TRIPS framework
At the international level, including at the
UNFCCC intergovernmental discussions,
it has been suggested that flexibilities simi-
lar to those advocated for promoting ac-
cess to public health and medicines could
be used in order to enable greater access
and diffusion of RETs in developing coun-
tries (UNCTAD, 2009).17 To some extent,
such discussions have focused on the use
of compulsory licences as one means of
supporting greater and more rapid transfer
of RETs. A number of recent studies point
out that there may be important differenc-
es between pharmaceutical technologies
and RETs. For instance, in the pharma-
ceutical sector, an individual patent may
have a very substantial impact because
a specific drug may not have substitutes
(Barton, 2007) and creating a substitute
may require years of uncertain R&D in-
vestments. Such a situation grants the
patent holder a very strong market posi-
tion, and a compulsory licence is often a
powerful negotiating tool that may help in
obtaining favourable terms for technology
transfer licences or cheaper drug prices.
A second difference is that in the case of
pharmaceuticals, non-availability or non-
affordability of a particular drug in develop-
ing countries due to patent protection can
result in direct losses of health and life.
D. THE GREEN ECONOMY ANDTHE RIO+20 FRAMEWORK
For much of the industrialized world, is-
sues related to climate change have begun
to revolve around the notion of the “green
economy”. Still an evolving concept, the
green economy can be defined as eco-
nomic development that is cognizant of
environmental and equity considerations
while contributing to poverty alleviation.18 A
report by a Panel of Experts to the United
Nations Conference on Sustainable Devel-
opment notes that the concept has gained
currency in the light of the recent multiple
crises in the world (climate, food and finan-
cial), as a means of promoting economic
development in ways that “…will entail
moving away from the system that allowed,
and at times generated, these crises to a
system that proactively addresses and pre-
vents them” (UN/DESA, UNEP and UNC-
TAD, 2010: 3).
The green economy concept is not entirely
novel; in many ways, it builds on the well-
known notion of sustainable development,
and has gained ground as a multilateral ne-
gotiating process within the Rio+20 frame-
work. Fundamentally, it gives credence to
the view that economic activities need to
be environmentally sustainable, and that
therefore it is imperative to factor in all envi-
ronmental externalities of modern day pro-
cesses. Most industrialized countries view
this in terms of regulating economic activi-
ties (individual or firm-level) to reduce their
The green economy
concept…
… gives credence to
the view that economic
activities need to
be environmentally
sustainable.

99CHAPTER IV : INTERNATIONAL POLICY CHALLENGES FOR ACQUISITION, USE AND DEVELOPMENT OF RENEWABLE ENERGY TECHNOLOGIES
carbon emissions. However, it is important
to make sure that such regulatory measures
do not end up blocking imports of goods
and services from developing countries on
the grounds of their non-compatibility with
the green economy.
How far this can actually be made to hap-
pen in an inclusive way is still much de-
bated. For most developing countries, the
issue still remains one of how constant
technological learning and innovation that
underlies structural transformation can be
ensured using the possibilities offered by
RETs (as analysed in chapter III). In the spe-
cific context of this report, what remains
important is that the emerging standards
on carbon footprinting and border carbon
adjustments are not used in ways that may
be inimical to developing countries.
1. Emerging standards: Carbon footprints and border carbon adjustments
Border carbon adjustments involve trying
to level the playing field between domestic
producers that are subject to carbon pric-
ing and foreign producers that face lower
regulatory costs. Carbon footprinting stan-
dards are country-based standards that
seek to reduce the carbon footprint of eco-
nomic activities by setting standards on the
amounts of GHG emissions caused by an
individual, organization, firm or product.
Product carbon footprint labelling involves
labelling of goods, either on a voluntary
or mandatory basis, to inform consumers
of the amount of carbon that is embodied
in their life cycle. Increasingly, private sec-
tor labels are being used by major retail
Table 4.3: Companies using the United Kingdom’s Carbon Reduction Label (by April 2011)
Company name Product description
Dyson Hot air hand dryer
Walkers All varieties of standard crisps sold in single packets
Tate and Lyle 1kg bag of granulated cane sugar
Tesco Range of toilet paper and kitchen roll
Tesco Milk: skimmed, semi-skimmed, whole
Tesco Range of own-brand laundry detergent
Tesco Range of chilled and long-life orange juices
Tesco Range of light bulbs
Tesco/MMUK Jaffa oranges / soft fruit
PepsiCo Quaker oats and Oats-so-Simple
Morphy Richards Range of irons
Allied Bakeries Kingsmill wholemeal, white and 50:50 loaves of bread
British Sugar A range of white granulated sugar – British Sugar - B2B
British Sugar A range of white granulated sugar – Silver Spoon - B2C
Haymarket Magazines – Marketing and ENDS report
Continental Clothing A range of over 800 t-shirts and other cotton apparel
Continental Clothing Woven bags (United States and Japan) and t-shirt Internet retailing service
Marshalls Complete range of 2,500 paving products
Mey Selections Scottish honey and shortbread
Sentinel Central heating cleaning fluid
Stalkmarket Biodegradable, disposable catering service packaging
Aggregate Industries Three varieties of paving products – Bradstones
Axion Recycled plastic/polymer
Baxter Flexbumin (health care)
Suzano Pulp and paper products
Source: UNCTAD, based on Cosbey and Savage (2011).
It remains important that
the emerging standards
on carbon footprinting
and border carbon
adjustments are not
used in ways that may
be inimical to developing
countries.

100 TECHNOLOGY AND INNOVATION REPORT 2011
chains in some OECD countries, but there
are several methodological problems with
these, primarily concerning their scope.
For instance, it is unclear whether their cal-
culations take into account the emissions
from land conversion to crops (Plassmann
et al., 2010), or whether they focus only
on transport (so-called “food-miles” labels)
– a criterion that inherently discriminates
against foreign producers. Private sec-
tor voluntary standards are on the rise,
gradually becoming an important factor for
developing-country exporters to gain mar-
kets in some sectors (Potts, van der Meer
and Daitchman, 2010). Current schemes
focus primarily on agriculture and agri-
food products, but increasingly a num-
ber of consumer manufactures are being
included. The United Kingdom’s Carbon
Reduction Label, managed by the Carbon
Trust, covers a wide range of products (ta-
ble 4.3). Another problem with the labeling
currently is that they use different methods
to calculate the carbon content, pointing
to the need for clear benchmarks using
which such schemes can be devised.
In June 2010, France passed an envi-
ronmental bill (Grenelle 2) and one of its
articles mandates carbon footprint label-
ling for a range of products. Details of the
methodologies to be used have yet to be
determined. Similarly, the EU has initiated
studies on carbon footprint labelling to as-
sess possible methodologies and features
that might be “relevant for future policy
development” (Swedish National Board of
Trade, 2010). It is likely that these studies
will eventually lead to some sort of EU-wide
labelling scheme.
Similarly, border carbon adjustment (BCA)
has been proposed by a number of ana-
lysts, and has been incorporated in one
form or another in every piece of United
States climate legislation to date.19 Some
EU countries are actively promoting it in the
context of the third phase of the EU’s Emis-
sions Trading Scheme. It involves assessing
a tax adjustment at the border, or requiring
importers to buy into a domestic cap-and-
trade regime for carbon emissions. The le-
gal status of such regimes is not possible
to assess ex ante, as much depends on
the details of the specific policy, and there
is no legal consensus on the effectiveness
of BCAs as an policy tool within the WTO
(Cosbey, 2009).
Both carbon labelling and border carbon
adjustments operate by trying to assess
the embodied carbon in goods at the bor-
der, and sanctioning accordingly. To the
extent that labelling continues to spread,
and BCAs are implemented by major im-
porting countries (neither of which is cer-
tain), developing countries will be forced
to resort to the use of RETs to comply
with import restrictions. However, simply
forcing developing countries to use RETs
through measures such as carbon label-
ling and BCAs may not be sufficient to
enable the transition. Indeed it may even
have adverse effects on industries in de-
veloping countries by acting as barriers
to imports, since enterprises and organi-
zations may not have the means (finan-
cial and technological) to meet these new
requirements. To ensure that industries in
developing countries and LDCs are not
additionally saddled with “green” require-
ments, the global move towards climate
change mitigation needs to be accompa-
nied by international finance and technolo-
gy support measures that help developing
countries and LDCs to transition to RETs
in a strategic and sustainable manner. This
is very important to ensure that the green
economy concept does not impose addi-
tional constraints on the industrial perfor-
mance of these countries.
2. Preventing misuseof the “green economy” concept
In addition to providing critical infrastructure
to support the emergence and shift in pro-
duction structures within developing coun-
tries, RETs can serve the goals of industrial
policy by helping those countries’ export-
ers become more competitive in the face of
increasingly stringent international environ-
mental standards. To ensure a smooth and
equitable transition of all countries to RET-
The global move
towards climate change
mitigation needs to
be accompanied by
international finance
and technology support
measures…
…that help developing
countries and LDCs to
transition to RETs in a
strategic and sustainable
manner.

101CHAPTER IV : INTERNATIONAL POLICY CHALLENGES FOR ACQUISITION, USE AND DEVELOPMENT OF RENEWABLE ENERGY TECHNOLOGIES
based energy use, it is important to iden-
tify and cope with the trade-offs posed by
the green economy concept for develop-
ing countries and LDCs. The principle of
common-but-differentiated responsibili-
ties, which has become a significant cor-
nerstone of the climate change negotia-
tions, provides the best starting point for
this.
Developing countries and policymakers
have raised concerns about possible mis-
use of the green economy concept, par-
ticularly since adoption of this concept
without considering its negative effects on
developing countries could worsen their
situation. Developing countries may be-
come vulnerable to protectionist policies
that have environmental objectives (UN/
DESA, UNEP and UNCTAD, 2010). It has
been proposed that the stage of develop-
ment of countries and their ability to cope
with the requirement to shift to “green” pro-
duction and consumption processes need
to be considered when implementing this
new development paradigm.
E. FRAMING KEY ISSUES FROMA CLIMATECHANGE-ENERGY POVERTY PERSPECTIVE
As mentioned earlier in this chapter, there is
an urgent need for a shift in positioning is-
sues within the international agenda. The
obligations of countries to mitigate climate
change should be framed in terms of en-
vironmentally sound development oppor-
tunities for all. Such a repositioning implies
actively supporting RETs in developing coun-
tries through financial, technology transfer
and technology acquisition measures. This
section presents options for consideration
within ongoing discussions on financing cli-
mate change adaptation, but they may also
be considered in separate and new initiatives
that focus particular attention on the needs
of developing countries.
1. Supporting innovation and enabling technologicalleapfrogging
A limited number of developing countries
are steadily making a mark as developers of
RETs and their firms are gaining significant
markets in RETs, as discussed in chapter
III. Some studies have also noted that ex-
pertise in developing countries has been
concentrated largely in the lower tech RETs
such as biofuels, solar thermal and geo-
thermal, in which they have either existing
expertise, or good chances of developing
competitive exports (Steenblik, 2006). Fur-
thermore, in China and India, the sizeable
domestic markets have been springboards
for their subsequent success in exports,
driven, as in the OECD countries, by am-
bitious domestic targets for renewable en-
ergy generation. China installed 16.5 GW
of domestic wind power capacity in 2010
– more than any other country, and more
than three times the amount installed in the
United States (Ernst & Young, 2011). India
ranked third with a capacity addition of 2.1
GW (Balachandar, 2011).
Still, most RETs are developed and pro-
duced by industrialized countries (IPCC,
2007). As a result, firms in developing coun-
tries, which are largely technology followers
in this field, tend to underinvest, or they
have difficulties in accessing technologies
and related know-how from abroad and in
learning how to use it effectively. Most pro-
ponents of the leapfrogging argument (e.g.
Gallagher, 2006) tend to posit that since
technologies are already available, they can
be used at marginal costs by developing
countries and LDCs to circumvent being
“locked into” the conventional, resource-
intensive patterns of energy development. It
is also claimed that leapfrogging is possible
because RETS can contribute to building
new long-term infrastructure, such as for
transport and buildings, in ways that pro-
mote cogeneration of technologies (Holm,
2005).20 These are indeed advantages of
using RETs, but they will not accrue auto-
matically. Tapping into already developed
technologies and related knowledge that
Advantages of using
RETs will not accrue
automatically.
There is a greater need
to make the international
trade and IPR regimes
more supportive of
the technological
requirements of
developing countries
and LDCs.
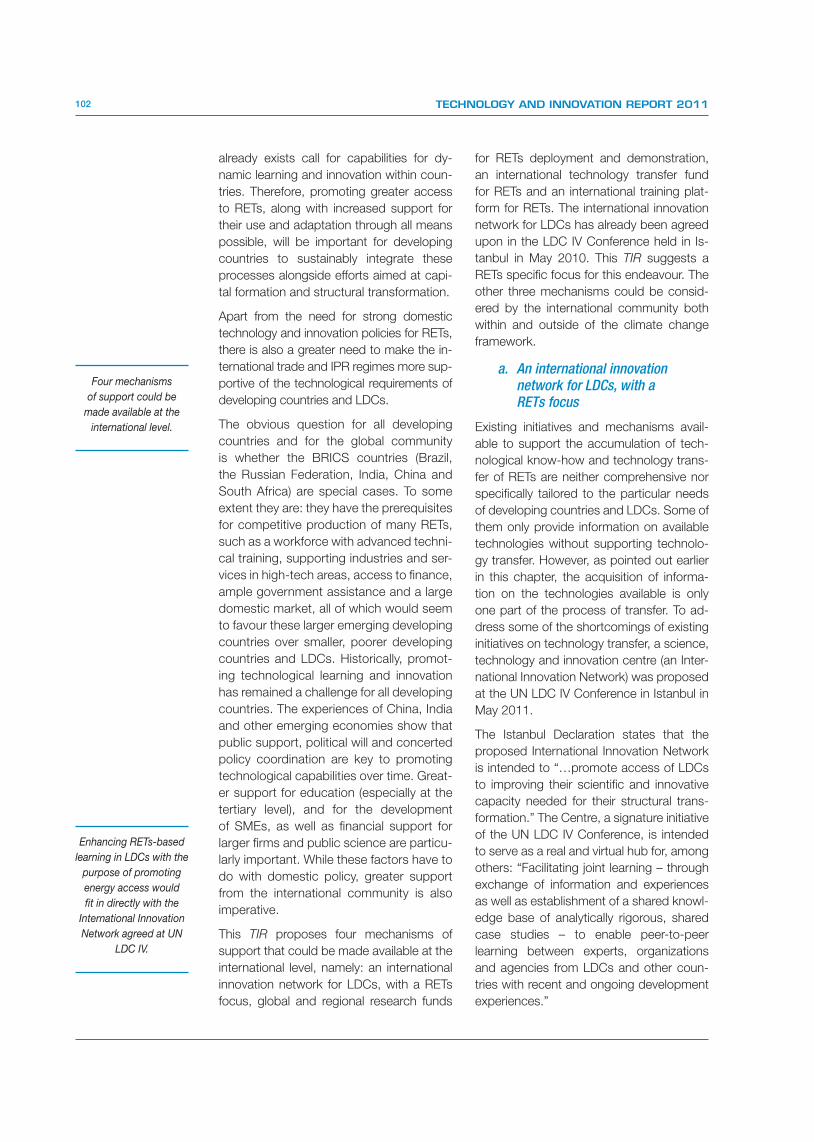
102 TECHNOLOGY AND INNOVATION REPORT 2011
already exists call for capabilities for dy-
namic learning and innovation within coun-
tries. Therefore, promoting greater access
to RETs, along with increased support for
their use and adaptation through all means
possible, will be important for developing
countries to sustainably integrate these
processes alongside efforts aimed at capi-
tal formation and structural transformation.
Apart from the need for strong domestic
technology and innovation policies for RETs,
there is also a greater need to make the in-
ternational trade and IPR regimes more sup-
portive of the technological requirements of
developing countries and LDCs.
The obvious question for all developing
countries and for the global community
is whether the BRICS countries (Brazil,
the Russian Federation, India, China and
South Africa) are special cases. To some
extent they are: they have the prerequisites
for competitive production of many RETs,
such as a workforce with advanced techni-
cal training, supporting industries and ser-
vices in high-tech areas, access to finance,
ample government assistance and a large
domestic market, all of which would seem
to favour these larger emerging developing
countries over smaller, poorer developing
countries and LDCs. Historically, promot-
ing technological learning and innovation
has remained a challenge for all developing
countries. The experiences of China, India
and other emerging economies show that
public support, political will and concerted
policy coordination are key to promoting
technological capabilities over time. Great-
er support for education (especially at the
tertiary level), and for the development
of SMEs, as well as financial support for
larger firms and public science are particu-
larly important. While these factors have to
do with domestic policy, greater support
from the international community is also
imperative.
This TIR proposes four mechanisms of
support that could be made available at the
international level, namely: an international
innovation network for LDCs, with a RETs
focus, global and regional research funds
for RETs deployment and demonstration,
an international technology transfer fund
for RETs and an international training plat-
form for RETs. The international innovation
network for LDCs has already been agreed
upon in the LDC IV Conference held in Is-
tanbul in May 2010. This TIR suggests a
RETs specific focus for this endeavour. The
other three mechanisms could be consid-
ered by the international community both
within and outside of the climate change
framework.
a. An international innovationnetwork for LDCs, with aRETs focus
Existing initiatives and mechanisms avail-
able to support the accumulation of tech-
nological know-how and technology trans-
fer of RETs are neither comprehensive nor
specifically tailored to the particular needs
of developing countries and LDCs. Some of
them only provide information on available
technologies without supporting technolo-
gy transfer. However, as pointed out earlier
in this chapter, the acquisition of informa-
tion on the technologies available is only
one part of the process of transfer. To ad-
dress some of the shortcomings of existing
initiatives on technology transfer, a science,
technology and innovation centre (an Inter-
national Innovation Network) was proposed
at the UN LDC IV Conference in Istanbul in
May 2011.
The Istanbul Declaration states that the
proposed International Innovation Network
is intended to “…promote access of LDCs
to improving their scientific and innovative
capacity needed for their structural trans-
formation.” The Centre, a signature initiative
of the UN LDC IV Conference, is intended
to serve as a real and virtual hub for, among
others: “Facilitating joint learning – through
exchange of information and experiences
as well as establishment of a shared knowl-
edge base of analytically rigorous, shared
case studies – to enable peer-to-peer
learning between experts, organizations
and agencies from LDCs and other coun-
tries with recent and ongoing development
experiences.”
Four mechanisms
of support could be
made available at the
international level.
Enhancing RETs-based
learning in LDCs with the
purpose of promoting
energy access would
fit in directly with the
International Innovation
Network agreed at UN
LDC IV.

103CHAPTER IV : INTERNATIONAL POLICY CHALLENGES FOR ACQUISITION, USE AND DEVELOPMENT OF RENEWABLE ENERGY TECHNOLOGIES
The knowledge-sharing activities of the
Network are intended to focus on four key
areas, one of which would promote techno-
logical leapfrogging for facilitating access to
energy by building combined clean energy
and ICT-networked infrastructures. This TIR
suggests that a specific focus on enhanc-
ing RETs-based learning in LDCs with the
purpose of promoting energy access would
fit in directly with the currently identified key
areas.
Such a RETs-based area of work, as this
Report suggests, could focus on:
(i) Promoting a network-based model of
learning and sharing of experiences of
countries on how to increase energy ac-
cess through RETs in rural, mini-grid areas;
(ii) Promoting access to financing opportu-
nities and technology licences needed for
upgrading the RE technological base in the
private sector in LDCs, by establishing part-
nerships with both international firms and
donor agencies; and lastly,
(iii) Establishing an information-sharing
mechanism where different kinds of stake-
holders could network and work together
to enhance the knowledge base in LDCs
on RETs use, adaptation, production and
innovation.
b. Global and regional research funds for RETs deploymentand demonstration
RETs are a key area of particular interest to
developing countries that has lacked fund-
ing for technology development and dem-
onstration. As chapter III has noted, public
expenditures in this area in even the more
advanced developing countries has been
relatively stagnant. The dedicated funds, in
their designated organizational structures,
could act as the focal point for the coor-
dination of ongoing research both at the
national and regional levels, and among
private, public and non-profit organizations.
The funds could also ensure open access
to all available research.
Scaled up technical cooperation and train-
ing programmes could complement these
funds, involving skilled workers from both
developed and emerging economies (en-
gineers, teachers and technicians, among
others) moving on a temporary basis to
help develop local capacity in developing
countries and LDCs. These kinds of initia-
tives are already under way in other areas
such as public health.21
Regional R&D facilities which focus on tech-
nological improvements aimed at making
RETs cost-effective would be an important
part of such initiatives. Such facilities could
be created by developing countries and
LDCs themselves or through South-South
collaboration, or even as a triangular facil-
ity between developing countries and LDCs
(offering and receiving technical know-how
and training) and developed countries (of-
fering financial assistance). Such facilities
have been a core component of industrial
sector policies in several economies, in-
cluding China, India, the Republic of Korea
and Taiwan Province of China. The regional
R&D funds could also set research priori-
ties for technological expansion of RETs by
firms.
c. An international technologytransfer fund for RETs
The limited data analysed earlier in this
chapter shows a trend of proliferation of
patents in RETs which may lead to a more
skewed and unfair distribution of future op-
portunities for firms in developing and least
developed countries in these technological
domains. Not only do firms in developing
countries and LDCs find it difficult to search
and inform themselves of appropriate RETs
for technological acquisition, they may of-
ten lack the capacities required to negoti-
ate licences for the technologies in ques-
tion. Bargaining costs of acquiring licences
can be extremely high. Firms also lack in-
formation on the kinds of similar technolo-
gies available, and their relative costs and
merits, which limits their ability to make in-
formed choices.
A technology transfer fund for RETs could
address all three of these issues by acting
as a licensing pool for technologies, which
Dedicated funds for
RETs deployment and
demonstration could
act as the focal point for
coordination of ongoing
research both at the
national and regional
levels.
A technology transfer
fund for RETs could
address issues by acting
as a licensing pool for
technologies.

104 TECHNOLOGY AND INNOVATION REPORT 2011
would offer the RETs at a subsidized rate for
firms from LDCs and from developing coun-
tries with low technological capabilities.
Funds generated by such developing coun-
tries and LDC governments themselves, or
by donor agencies, or both jointly, could be
used to subsidize the licensing costs to the
recipient firms. The fund could also provide
a database of similar technologies and their
relative merits and licensing costs, thereby
creating a much-needed service for firms
and organizations in developing countries
and LDCs. By acting as a clearing house
for the licensed technologies, it would also
reduce bargaining asymmetries between
firms in developed countries on the one
hand, and those in developing countries
and LDCs on the other.
As incentives for firms in the industrialized
countries to participate in the RET technology
transfer fund, the initiative could provide the
market fees of licensing for the firm, in ad-
dition to guaranteeing internationally agreed
standards of IPR protection. The firms in in-
dustrialized countries that participate in the
fund could also receive a label (similar to eco-
labelling) indicating that they support “pro-
green economy”, thereby procuring goodwill
from global markets, similar to “fair trade”
labels. Firms from developing countries and
LDCs that qualify to receive the technologies
transferred would be subsidized according
to their ability to pay. To this end, the initiative
could set a series of financial thresholds that
would determine the amount that the recipi-
ent firms will be charged for the technologies
available as part of the fund.
The RETs technology transfer fund would
be different from patent pooling in two im-
portant respects. The fund would provide
licences not only for patented products, but
also for products that are protected through
other forms of IP, thereby covering a wide
range of sectors and firms. Second, the
fund would not rely on the altruistic motives
of firms in industrialized countries; the firms
that own the technology transfer licences
would stand to gain from “pro-green econ-
omy” labelling in addition to receiving the
market price for the licences.
d. An international trainingplatform for RETs
Use and adoption of RETs is a relatively new
process in many developing countries and
LDCs. The underlying processes for this
could be significantly facilitated through ap-
propriate training and skills creation, which
are presently under-provided in many de-
veloping countries and LDCs. As noted in
chapter III, the availability of skilled person-
nel for installation and maintenance of RETs
is important for making them cost-effective.
Further, the availability of trained staff in var-
ious aspects of RETs use would promote
general awareness of the technologies and
enable countries to exploit their versatility
for combination with conventional energy
sources, while also assuring their proper
maintenance and optimal use.
Establishing an international training plat-
form specifically for RETs, as proposed by
this TIR, would serve the important goal of
creating a skilled staff base across devel-
oping countries for the wider use and pro-
motion of RETs in domestic and industrial
contexts. The proposed international RETs
training platform could operate at two differ-
ent levels: a physical institute based in one or
several places throughout the world, which
would offer training on various aspects of
RETs use, adaptation and production; and a
virtual training platform offering online, com-
puterized courses of various kinds. In both
forms of training (through the physical cen-
ters and the virtual training platform), RETs-
related learning could involve various fields,
such as material sciences, marketing, legal
issues, energy combinations and RET appli-
cations in various industrial fields.
2. Coordinating international support for alleviatingenergy poverty andmitigating climate change
International cooperation is important for
various aspects of renewable energy, such
as for ensuring the availability of compa-
rable and comprehensive statistical data
sets to inform policy, promoting technology
transfer and innovation, capacity-building
Establishing an
international training
platform specifically for
RETs…
…would serve the
important goal of
creating a skilled staff
base across developing
countries for their wider
use and promotion.

105CHAPTER IV : INTERNATIONAL POLICY CHALLENGES FOR ACQUISITION, USE AND DEVELOPMENT OF RENEWABLE ENERGY TECHNOLOGIES
and financing. So far, international support
has been fragmented, with various inter-
national organizations working in the field,
including UNEP, the United Nations Indus-
trial Development Organization (UNIDO),
UNCTAD and several other agencies ac-
tive in particular aspects of RETs use and
promotion. While some have emphasized
the climate change dimension, others have
stressed the green economy and yet others
have focused on RETs.
A dedicated international agency, the Inter-
national Renewable Energy Agency (IRE-
NA), was established in 2010 with the spe-
cific purpose of promoting the widespread
use and adaptation of RETs, as well as for
dealing with issues of renewable energy-
related innovation by promoting greater
dialogue (box 4.5). IRENA could also serve
to coordinate international support, which
could be an important step in promoting
joint efforts in this area.
3. Exploring the potential for South-South collaboration
The success of many developing coun-
tries in the development and production
of RETs implies the existence of consider-
able potential for technology flows, trade,
investment and cooperation among these
countries. They provide a huge market for
such technologies and capturing even a
portion of it would bring significant devel-
opment benefits. Thus, intra-South trade in
RETs and/or investment in the production
of RETs could contribute towards building
globally viable domestic capacity of devel-
oping countries in the sector. Given the ex-
isting patterns of intraregional trade, it may
Box 4.5: The International Renewable Energy Agency
The statute creating IRENA was adopted on 26 January 2009, and entered into force on 8 July 2010. IRENA’s purpose is to
promote the widespread and increased adoption and sustainable use of all forms of RE (biomass, geothermal, hydro, marine,
solar and wind). The statute of IRENA has been ratified by 76 States (of its 148 members) and the EU. It took only 27 months
from the founding conference to the creation of the Agency, which reflects the high degree of importance accorded to this area
by various countries. IRENA is the only agency with a global mandate for RE.
The first session of the IRENA Assembly, held on 4–5 April 2011 in Abu Dhabi, mandated the Agency to play a strong role,
regionally and globally, to support countries in accelerating their adoption of renewable energy as a key component of national,
subregional and regional development plans.
IRENA’s Work Programme for 2011 includes action on three key fronts: the Knowledge Management and Technology Coop-
eration (KMTC) sub-programme is designated to facilitate an increased role for RE; the Policy Advisory Services and Capacity
Building sub-programme seeks to stimulate an enabling environment for uptake of RE; and the Innovation and Technology
sub-programme aims at creating a framework for technology support, identification of the potential for cost reduction and the
wider use of standards.
In order to assist governments in their efforts to develop efficient and effective RETs and innovation strategies, the IRENA In-
novation and Technology Centre (IITC) is collecting and analysing data on scenarios and strategies with the aim of transforming
them into policy-relevant information for decision-makers. Additionally, this information will be used by the renewables readiness
assessments expected to be undertaken as part of the Knowledge Management and Technology Cooperation sub-programme.
At present, the main focus is on Africa, but preparations have begun for a similar undertaking in the Pacific region. One of the
essential elements for greater deployment of REs in developing countries is technology transfer and dissemination. This could
be facilitated by greater use of the existing patents that could be made available to these countries at little or no cost. A website
on patent search is under development, which will include tools for simplifying the search functions and utilities.
IITC has commenced its work on technology road mapping with the aim of identifying prospects, technological barriers, financ-
ing, and development and policy needs. In order to gain a better understanding of the costs involved in the wider use of RETs
across countries, and how technology development could potentially help reduce those costs, the IITC is expected to report on
aspects of power generation using RETs. This information is expected to assist the member countries in their investment deci-
sions and in identifying opportunities for further cost reductions. Further expansion of such a reporting system to other end-use
sectors of the economy (such as transport) is planned for the future.
Source: IRENA for Technology and Innovation Report 2011.

106 TECHNOLOGY AND INNOVATION REPORT 2011
also be an easier starting point for developing
countries’ exports to, or investments in, de-
veloped countries. However, there are some
obstacles to the export of RETs from develop-
ing countries, including inadequate marketing
channels and expertise. These challenges are
particularly acute for SMEs and new entrants
(Semine, 2010). However, increased trends
in South-South cooperation imply that such
problems may not be too daunting for many
developing-country firms.
Another major benefit of South-South trade
and investment is that developing-country
partners have similar needs for many tech-
nologies, at least more so compared with
developed-country markets. Solar cook-
ing stoves, for example, are an innovation
well suited to developing-country contexts,
where there is generally ample sunshine,
and they are uniquely adapted to the needs
of developing-country consumers, many of
whom have been forced to rely on traditional
biomass for cooking. The same may be said
for solar PV-powered lights and lanterns,
the biggest markets for which are poor ru-
ral locations without grid access. As such,
developing-country partners can provide a
market for RETs that have been developed
to serve domestic needs or for non-indige-
nous technologies that have been adapted
to serve local needs. Of course this is not
equally valid for all RETs; installation of wind
turbines, for example, does not vary among
developed and developing countries.
F. SUMMARYThis chapter has analysed the key issues in
international policy-making that are impor-
tant for developing capabilities in all aspects
of RETs use and innovation in developing
countries and LDCs. Focusing on finance,
technology transfer and IPRs, it shows how
incoherent and often conflicting policy de-
velopments at the international level tend
to adversely affect national aspirations for
technological empowerment in developing
countries. The chapter argues for an inter-
national agenda that focuses equally on cli-
mate change mitigation and energy poverty
alleviation. It makes the case for more con-
certed international support for RETs use,
adaptation and innovation in developing
countries, including the following:
(i) Financing for RETs needs to be conceived
and implemented both within and outside
the climate change framework as a prior-
ity. This would serve the dual need of miti-
gating climate change as well as support-
ing economic development in developing
countries. The positive implications of RETs
use for development need to be better in-
cluded in the discussions on the financing
of climate change mitigation efforts. The in-
ternational financing architecture for climate
change mitigation needs to be redefined
accordingly, and additional measures for
the financing of RETs introduced.
(ii) The technological empowerment of devel-
oping countries and LDCs to use, adapt and
innovate in RETs should be the fundamental
goal of technology transfer in this area. This
should be based not on the number of ongo-
ing technology transfer projects at any given
point in time, but rather on an assessment
of the quality of technologies transferred. A
parallel emphasis on strengthening regulato-
ry frameworks, building institutional capacity
and enhancing the absorptive capacity of
recipient countries is also necessary.
(iii) Greater international support in the area
of technology and innovation for RETs
could take the form of several important
initiatives. The chapter has proposed four
such initiatives, namely, an international
innovation network for LDCs, with a RET
focus, global and regional research funds
for RETs deployment and demonstration,
an international RETs technology transfer
fund and an international RETs training plat-
form. More support could take the form of
augmenting and further strengthening the
recently proposed technology mechanism
within the UNFCCC, so as to strengthen its
focus on RETs.
Building further on this analysis, the next
chapter proposes incentives as part of an
integrated innovation policy framework
within countries to achieve these goals at
the national level.
A major benefit of
South-South trade
and investment is that
developing-country
partners have similar
needs for many
technologies.

107CHAPTER IV : INTERNATIONAL POLICY CHALLENGES FOR ACQUISITION, USE AND DEVELOPMENT OF RENEWABLE ENERGY TECHNOLOGIES
NOTES
1 Broadly speaking, the processes that fall under adaptation
are those that seek to reduce/prevent the adverse impacts
of ongoing and future climate change. These include ac-
tions, allocation of capital, processes and changes in the
formal policy environment, as well as informal structures, in-
cluding social practices and codes of conduct. Mitigation of
climate change, on the other hand, seeks to prevent further
global warming by reducing the sources of climate change,
such as GHG emissions.
2 “Clean technologies” or “clean energies” cover a much
broader range than RETs, and include clean coal, for ex-
ample.
3 For instance, on the one hand, countries are expected to
grant IPRs in accordance with the TRIPS Agreement that
restrains their access to patent protected technologies, but
at the same time, the climate change framework calls for
greater access to technologies, whether or not such tech-
nologies are patent protected.
4 “Clean technologies” or “clean energies” is generally a much
broader concept than RETs, and includes clean coal.
5 The Climate Change Convention is currently in its draft form,
awaiting formal ratification and adoption.
6 See Article 4(3), 4(4) and 4(7) of the Draft Climate Change
Convention.
7 Ocampo and Vos (2008), for example, note that while some
developing countries have achieved significant progress
over the past three decades, several others have remained
stagnant.
8 The relevant provision reads thus: “In the case of privately
owned technologies, the adoption of the following measures,
in particular for developing countries: iv. In compliance, with
and under the specific circumstances recognized by, the rel-
evant international conventions adhered to by States, the un-
dertaking of measures to prevent the abuse of IPRs, including
with respect to their acquisition through compulsory licensing,
with the provision of equitable and adequate compensation.”
UN/DESA (2009b) also makes an implicit reference to tech-
nology transfer in the context of the environmental and
development goals of the 1972 United Nations Conference
on the Human Environment.
9 UNFCCC 2007, Bali Action Plan, Document FCCC/
CP/2007/L.7/Rev.1.
10 Prior to the TRIPS Agreement in 1994, not many develop-
ing countries and LDCs provided the same standards of
protection as were required by the subsequent Agreement.
Their patent protection terms were much shorter than the
20 years mandated by the Agreement and national patent
laws contained several provisions which are not allowed un-
der the Agreement, such as a “working” requirement that
mandated that inventions be produced domestically in or-
der to qualify for grant of a patent.
11 These are provisions that can be used to nuance the impacts
of IPRs on domestic regimes for technological learning and
industrial development. Several such flexibilities exist in the
TRIPS Agreement. For a discussion of the key TRIPS flex-
ibilities and how they can be used, see for example, Reich-
mann, 1996; Correa, 2000; and CIPR, 2002.
12 See the discussions under the auspices of the Com-
mission on Intellectual Property Rights, Innovation and
Health (CIPIH) and negotiations leading to the Glob-
al Strategy and Plan of Action of the World Health
Organization (WHO), which came into force in 2009 (www.
who.int/gb/ebwha/pdf_files/A61/A61_R21-en.pdf)
13 See discussions relating to the International Convention for
the Protection of New Varieties of Plants (UPOV Conven-
tion, 1991 version), the rights of farmers in developing coun-
tries and the sui generis option under Article 27(3)(b) of the
TRIPS Agreement.
14 The Cancun negotiations in 2010.
15 The data only show patented products in the wind and solar
markets. When these markets are considered in their totality
(i.e. including inventions that are off-patent), individual firms
may have smaller market shares (denoting the absence
of an oligopolistic market structure). Although the data for
conducting such an analysis are currently unavailable, this
needs to be borne in mind.
16 A recent study concludes that the patenting system does
not drive significant levels of R&D in most environmentally
sustainable technologies (Maskus, 2010). The study reveals
that IPRs alone are insufficient incentives for small techno-
logical solutions in uncertain markets.
17 Brazil, China and India have advocated stronger use of TRIPS
flexibilities at the UNFCCC intergovernmental meetings,
including the greater use of compulsory licences.
18 In the ongoing negotiations relating to the Rio+20 frame-
work, the concept of green economy is viewed in the
context of sustainable development and poverty reduction.
19 For an overview of BCAs, their effectiveness and the ele-
ments of the proposed regimes, see Wooders, Cosbey
and Stephenson, 2009.
20 Cogeneration of technologies refers to the possibility of
developing new (but complementary) sets of technologies
in parallel, as explained in chapter I.21 A good example is the Engineering Capacity Building Pro-
gramme by the Deutsche Gesellschaft für Internationale
Zusammenarbeit (GIZ). As part of this program, a bioequiv-
alence facility for the East African Region is being set up
in collaboration with two pharmaceutical companies from
Kenya, one from Tanzania and one from Ethiopia and the
School of Pharmacy, University of Addis-Ababa.

108 TECHNOLOGY AND INNOVATION REPORT 2011
REFERENCES
Arora A and Gambardella A (2004). The globalization of the software industry: Perspectives and opportunities for
developed and developing countries. Cambridge, MA, National Bureau of Economic Research, June.
Balachandar G (2011). India closely follows China, US in wind power capacity addition. Available at:
http://www.mydigitalfc.com/news/india-closely-follows-china-us-wind-power-capacity-addition-752
(accessed 8 August, 2011).
Barton JH (2007). Intellectual property and access to clean energy technologies in developing countries: An analysis
of solar photovoltaic, biofuel and wind technologies. Geneva, ICTSD.
Birdsall N and Subramanian A (2009). Energy needs and efficiency, not emissions: Re-framing the climate change
narrative. Washington, DC, Center for Global Development, November.
CIPR (2002). Integrating Intellectual Property Rights and Development Policy, London. Available at:
http://www.iprcommission.org/papers/pdfs/final_report/CIPRfullfinal.pdf
Correa CM (2000). Intellectual Property Rights, the WTO, and Developing Countries: The TRIPS Agreement and
Policy Options. London, Zed Books.
Correa CM (2005). Can the TRIPS Agreement foster technology transfer to developing countries? In:
Maskus KE and J. H. Reichman JH, eds. International Public Goods and Transfer of Technology under
a Globalized Intellectual Property Regime. New York, Cambridge University Press: 227–256.
Cosbey A (2009). A sustainable development roadmap for the WTO. Manitoba, International Institute for
Sustainable Development.
Cosbey A and Savage M (2011). RETs for sustainable development: Designing an integrated response for
development. Background paper for TIR 2011. Geneva, UNCTAD.
Dechezleprêtre A, Glachant M and Ménière Y (2008). The Clean Development Mechanism and the
international diffusion of technologies: An empirical study. Energy Policy, 36(4): 1273–1283.
Ernst & Young (2011). Renewable energy country attractiveness indices no. 28.
Gallagher K (2006). Limits to leapfrogging in energy technologies? Evidence from the Chinese automobile industry.
Energy Policy, 34(4): 383–394.
Global Humanitarian Forum (2009). Human Impact Report: Climate Change–The Anatomy of a Silent Crisis. Geneva.
Available at: http://www.ghf-ge.org/human-impact-report.pdf.
Haš i I, Johnstone N, Watson F and Kaminker C (2010). Climate policy and technological innovation and transfer.
An overview of trends and recent empirical results. OECD Environment Working Papers, No. 30, OECD, Paris.
Available at: http://www.oecd-ilibrary.org/docserver/download/fulltext/5km33bnggcd0.pdf?expires=1313138057&id
=id&accname=guest&checksum=5F9A4AE055F43297CA7AEFFF51EB78BE
Holm D (2005). Renewable energy future for the developing world. ISES White Paper, International Solar Energy
Society, Freiburg.
IEA (2000). Energy Technology Perspectives 2000. Paris, OECD/IEA.
IEA (2010a). World Energy Outlook 2010. Paris, OECD/IEA.
IEA (2010b). Energy Technology Perspectives 2010. Paris, OECD/IEA.
IPCC (2007). Climate Change 2007: Mitigation of Climate Change. Contribution of Working Group III to the Fourth
Assessment Report of the Intergovernmental Panel on Climate Change. Cambridge and New York,
Cambridge University Press.
Johnstone N, Haš i I and Popp D (2010). Renewable energy policies and technological innovation: Evidence based
on patent counts. Environmental & Resource Economics, 45(1): 133–155.

109CHAPTER IV : INTERNATIONAL POLICY CHALLENGES FOR ACQUISITION, USE AND DEVELOPMENT OF RENEWABLE ENERGY TECHNOLOGIES
Lai E C and Qiu LD (2003). The North’s intellectual property rights standard for the South? Journal of International
Economics, 59(1): 183–209.
Maskus KE (2000). Intellectual Property Rights in the Global Economy. Washington, DC, Peterson Institute
for International Economics, Peterson Institute Press.
Maskus KE (2010). Differentiated intellectual property regimes for environmental and climate technologies. Paris,
OECD Publishing, May.
Maskus KE and Reichman J, eds. (2005). International Public Goods and Transfer of Technology: Under a Globalized
Intellectual Property Regime. Cambridge, Cambridge University Press.
Mattoo A and Subramanian A (2010). Equity in climate change: an analytical review. Washington, DC, World Bank,
July.
Moon S (2008). Does TRIPS Article 66(2) encourage technology transfer to least developed countries?
An analysis of country submissions to the TRIPS Council (1999-2007). ICTSD Policy Brief No.2, ICTSD, Geneva.
Ocampo JA and Vos R (2008). Uneven Economic Development. United Nations Publications.
Patel S, Roffe P and Yusuf A, eds. (2000). International Technology Transfer: The Origins and Aftermath of
the United Nations Negotiations on a Draft Code of Conduct. The Hague, Kluwer Law International.
Plassmann, K and Edwards-Jones, G. (2010). Carbon footprinting and carbon labelling of food products.
In: Sonesson U, Berlin J and Ziegler F, eds. Environmental Assessment and Management in the Food Industry:
Life Cycle Assessment and Related Approaches. Woodhead Publishing Series in Food Science, Technology
and Nutrition No. 194. Cambridge, Woodhead Publishing.
Potts J, van der Meer J, Daitchman J (2010). The State of Sustainability Initiatives Review 2010: Sustainability
and Transparency. Winnipeg: International Institute for Sustainable Development.
Reichman J (1996). From free riders to fair followers: Global competition under the TRIPS Agreement.
New York University Journal of International Law and Politics, 29: 11–93.
Robins N, Clover R and Singh C (2009). A climate for recovery: The colour of stimulus goes green. London, HSBC
Global Research.
Semine, N (2010). Green technologies: Opportunities for South-South trade. International Trade Forum, Issue 1.
Geneva, International Trade Centre.
Seres S, Haites E and Murphy K (2009). Analysis of technology transfer in CDM projects: An update. Energy Policy,
37(11): 4919–4926.
Steenblik R (2006). Liberalisation of trade in renewable energy and associated technologies, biodiesel, solar thermal
and geothermal energy. OECD Trade and Environment Working Papers, no. 2006/01, OECD, Paris, April.
Stern N (2007). The Economics of Climate Change: The Stern Review. Cambridge and New York, Cambridge
University Press.
Swedish National Board of Trade (2010). The Swedish Climate Standard Project of the Swedish Ministry of Foreign
Affairs. Newsletter No. 2/10. Stockholm
Tan C (2010). Confronting climate change: Towards a new international agenda for meeting the financial challenges
of the climate crisis in least developed countries. Background paper for UNCTAD’s Least Developed Countries
Report 2010. Geneva, UNCTAD.
UNCTAD (2007). The Least Developed Country Report: Knowledge, Technological Learning and Innovation for
Development. United Nations publication, sales No. E.07.II.D.8. New York and Geneva, United Nations.
UNCTAD (2009). Trade and Development Report, pp. 165-66. New York and Geneva, United Nations
UNCTAD (2010). The Least Developed Countries Report 2010: Towards a New International Development
Architecture for LDCs. United Nations publication, sales No. E.10.II.D.5. New York and Geneva, United Nations.

110 TECHNOLOGY AND INNOVATION REPORT 2011
UN/DESA. (2009a). World Economic and Social Survey 2009: Promoting Development, Saving the Planet.
New York, United Nations.
UN/DESA (2009b). A Global Green New Deal for Climate, Energy, and Development. New York, United Nations.
UN/DESA, UNEP and UNCTAD (2010). The Transition to a Green Economy: Benefits, Challenges and Risks from a
Sustainable Development Perspective. New York and Geneva. Available at: http://www.unep.org/greeneconomy/
Portals/88/documents/research_products/UN-DESA,%20UNCTAD%20Transition%20GE.pdf.
UNDP (2007). Annual Report 2007: Making Globalization Work for All. New York
UNDP (2008). Annual Report 2008. Capacity Development: Empowering People and Institutions. New York.
UNEP and Bloomberg (2010). Global Trends in Sustainable Energy Investment 2010: Analysis of Trends and Issues
in the Financing of Renewable Energy and Energy Efficiency. United Nations Environment Programme. Available at:
http://bnef.com/Download/UserFiles_File_WhitePapers/sefi_unep_global_trends_2010.pdf.
UNEP, EPO and ICTSD (2010). Patents and Clean Energy: Bridging the Gap between Evidence and Policy.
Final report. Available at www.epo.org/clean-energy
UNFCCC (1998). Kyoto Protocol. Bonn
UNFCCC (2001). Report of the global environment facility to the conference. Note by the secretariat,
FCCC/CP/2001/8. Bonn.
UNFCCC (2007). Ad Hoc Working Group on Long-term Cooperative Action under the Convention, Bali Action Plan,
Document FCCC/CP/2007/L.7/Rev.1. Available at : http://unfccc.int/resource/docs/2007/cop13/eng/l07r01.pdf.
UNFCCC (2008). Investment and Financial Flows to Address Climate Change: An update. Availble at
http://unfccc.int/resource/docs/2008/tp/07.pdf
UNFCCC (2010). Report of the Conference of the Parties on its sixteenth session. Cancun, December.
Available at: www.unfccc.int/resources/docs/2010/cop16/eng/07a01.pdf#page=2
Wooders P, Cosbey A and Stephenson J (2009). Border carbon adjustment and free allowances: Responding
to competitiveness and leakage concerns. Paper presented at the Round Table on Sustainable Development,
Singapore, 23 July. Paris, OECD.
World Bank (2010). Climate Technology Fund. Semi-annual operational report. Washington, DC, November.

NATIONAL POLICYFRAMEWORKS
FOR RENEWABLEENERGY
TECHNOLOGIES5

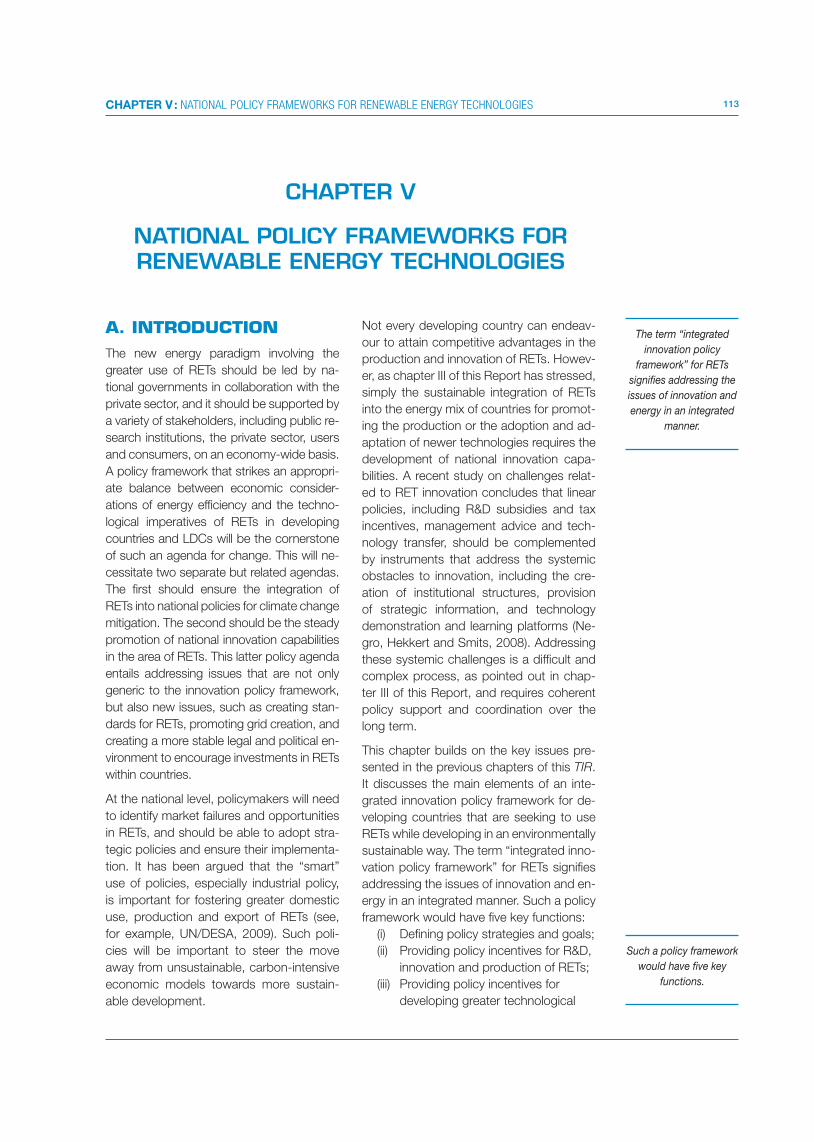
113CHAPTER V : NATIONAL POLICY FRAMEWORKS FOR RENEWABLE ENERGY TECHNOLOGIES
CHAPTER V
NATIONAL POLICY FRAMEWORKS FORRENEWABLE ENERGY TECHNOLOGIES
A. INTRODUCTIONThe new energy paradigm involving the
greater use of RETs should be led by na-
tional governments in collaboration with the
private sector, and it should be supported by
a variety of stakeholders, including public re-
search institutions, the private sector, users
and consumers, on an economy-wide basis.
A policy framework that strikes an appropri-
ate balance between economic consider-
ations of energy efficiency and the techno-
logical imperatives of RETs in developing
countries and LDCs will be the cornerstone
of such an agenda for change. This will ne-
cessitate two separate but related agendas.
The first should ensure the integration of
RETs into national policies for climate change
mitigation. The second should be the steady
promotion of national innovation capabilities
in the area of RETs. This latter policy agenda
entails addressing issues that are not only
generic to the innovation policy framework,
but also new issues, such as creating stan-
dards for RETs, promoting grid creation, and
creating a more stable legal and political en-
vironment to encourage investments in RETs
within countries.
At the national level, policymakers will need
to identify market failures and opportunities
in RETs, and should be able to adopt stra-
tegic policies and ensure their implementa-
tion. It has been argued that the “smart”
use of policies, especially industrial policy,
is important for fostering greater domestic
use, production and export of RETs (see,
for example, UN/DESA, 2009). Such poli-
cies will be important to steer the move
away from unsustainable, carbon-intensive
economic models towards more sustain-
able development.
Not every developing country can endeav-
our to attain competitive advantages in the
production and innovation of RETs. Howev-
er, as chapter III of this Report has stressed,
simply the sustainable integration of RETs
into the energy mix of countries for promot-
ing the production or the adoption and ad-
aptation of newer technologies requires the
development of national innovation capa-
bilities. A recent study on challenges relat-
ed to RET innovation concludes that linear
policies, including R&D subsidies and tax
incentives, management advice and tech-
nology transfer, should be complemented
by instruments that address the systemic
obstacles to innovation, including the cre-
ation of institutional structures, provision
of strategic information, and technology
demonstration and learning platforms (Ne-
gro, Hekkert and Smits, 2008). Addressing
these systemic challenges is a difficult and
complex process, as pointed out in chap-
ter III of this Report, and requires coherent
policy support and coordination over the
long term.
This chapter builds on the key issues pre-
sented in the previous chapters of this TIR.
It discusses the main elements of an inte-
grated innovation policy framework for de-
veloping countries that are seeking to use
RETs while developing in an environmentally
sustainable way. The term “integrated inno-
vation policy framework” for RETs signifies
addressing the issues of innovation and en-
ergy in an integrated manner. Such a policy
framework would have five key functions:
(i) Defining policy strategies and goals;
(ii) Providing policy incentives for R&D,
innovation and production of RETs;
(iii) Providing policy incentives for
developing greater technological
The term “integrated
innovation policy
framework” for RETs
signifies addressing the
issues of innovation and
energy in an integrated
manner.
Such a policy framework
would have five key
functions.

114 TECHNOLOGY AND INNOVATION REPORT 2011
absorptive capacity, which is
needed for adaptation and use
of available RETs;
(iv) Promoting domestic resource
mobilization for RETs in national
contexts; and
(v) Exploring newer means of
improving innovation capacity
in RETs, including South-South
collaboration.
Many of these policy incentives have been
used by most of the industrialized coun-
tries, although developing countries are
also increasingly using them or experiment-
ing with their use. Keeping this in mind, the
analysis seeks to contextualize the discus-
sion to developing countries as much as
possible. As the previous chapters of this
TIR have stressed, developing countries
will face different problems in RETs promo-
tion, production and innovation, depending
on their respective starting points. Never-
theless, for all developing countries, RETs
present real opportunities for reducing en-
ergy poverty, and the right policies could
influence the extent of benefits that could
be derived from RETs use, adaptation and
dissemination.
B. ENACTING POLICIES WITH RET COMPONENTS AND TARGETS
The development of policies for RETs is
complex and involves a large number of
potential stakeholders. It should be ap-
proached in an integrated manner, with a
long-term perspective and clearly defined
roles and responsibilities. Moreover, it
should include fiscal and regulatory incen-
tives, both on the supply side (R&D and
innovation) and the demand side (use and
adaptation). Developing countries need to
ensure that national energy policies con-
tain targets for RE where possible, and that
such targets are properly factored into in-
novation strategies, including mandates for
on-grid and off-grid energy supply. Focus-
ing only on either supply-side (RE provision)
or demand-side management issues (such
as particular user groups) may not yield as
many benefits as a focus on both aspects
in the long term.
RETs use and adaptation within coun-
tries requires the establishment of long-
term pathways and national RE targets.
These targets, although not necessarily
legally binding in nature, would have to
be supported by a range of policy incen-
tives and regulatory frameworks. Defining
targets is an important signal of political
commitment and support, and the policy
and regulatory frameworks aimed at en-
forcing those targets would provide legal
and economic certainty for investments in
RETs.
Targets may be defined in terms of requir-
ing a specified share of REs in primary
energy, and/or electricity generation. Set
at regional, national and sub-national lev-
els, they can provide a stable investment
environment for project developers to
operate. As noted in chapter III, a review
of policy trends across countries shows
a steady increase in policy activity in this
regard: by 2010, more than 100 countries
had introduced either a target or policy
mechanism for promoting RETs. This
represents a doubling of policy incen-
tives compared with 2005. There has also
been a rapid increase in the number of
developing countries that are beginning
to implement policies on RETs, and they
now represent more than half of all the
countries with such policy frameworks in
place (REN21, 2010). Many new targets
enacted over the past three years call for
a range of 15–30 per cent of shares of
renewables in energy or electricity sup-
ply by 2020. Some targets are as high as
90 per cent. Other targets require a share
of renewables in primary energy or final
energy supply, generally set in the range
of 10–20 per cent. Developing countries
now make up more than half of all coun-
tries with policy targets (45 out of 85
countries) (table 5.1).
The EU’s 2007 Directive on Renewable
Energy has set an ambitious target, which
Defining targets is an
important signal of
political commitment
and support…
… and the policy and
regulatory frameworks
aimed at enforcing those
targets would provide
legal and economic
certainty for investments
in RETs.

115CHAPTER V : NATIONAL POLICY FRAMEWORKS FOR RENEWABLE ENERGY TECHNOLOGIES
requires that member States source an
average of 20 per cent of energy from re-
newables. This target has resulted in intra-
regional burden sharing, with some coun-
tries, such as Sweden, setting a target of
49 per cent, and others, such as Luxem-
bourg, setting a target of as low as 11 per
cent. The share of renewables in electricity
supply in EU member States is expected
to double to meet this target, although
each member State is free to determine to
what extent the power sector will contrib-
ute to meeting this share in overall energy
supply.1
In the developing world, China adopted in
2009 a target of a 15 per cent share of re-
newables in final energy consumption by
2020, which is in line with EU standards, al-
though this also includes nuclear as a non-
fossil fuel source (Martinot and Li, 2010).
China’s RE targets are also supported by
carbon intensity targets (i.e. GHG emissions
relative to GDP). Other countries that have
adopted RE deployment targets include
Brazil, which has set a target of 75 per cent
of electricity from RE sources by 2030, in-
cluding through large-scale hydropower.
Targets can also be restricted to a specific
RET that is more applicable in the context
of a particular country. For example, India
has set a target of 20 GW of solar power by
2022, while Kenya has mandated 4 GW of
geothermal by 2030 (REN21, 2010). Egypt,
Indonesia, Malaysia, the Republic of Korea
and South Africa have also implemented
some RE targets.2 In addition, a number of
sub-national governments have implement-
ed targets for RE use, such as the state of
Karnataka in India which has set a 6 GW
target of renewable energy by 2015, and
Jiangsu Province in China, which has set
a 400 MW target for solar PV by the end
of 2011.
Policymakers in developing countries
should also be aware of the potential trade-
offs and co-benefits between low-carbon
energy systems and the energy access
agenda. There are some obvious advantag-
es to be had from moving away from fossil
Table 5.1: Renewable energy targets of selected developing economies
Source: REN21 (2010).
Targets can also be
restricted to a specific
RET that is more
applicable in the context
of a particular country.

116 TECHNOLOGY AND INNOVATION REPORT 2011
Box 5.1: Demystifying solar energy in poor communities: The Barefoot College in action
The Barefoot College is a non-governmental organization (NGO) that was established in 1972 in the state of Rajasthan, India.
Its goal is to empower rural communities by making them self-sufficient in sustainable energy supply through the application of
different solutions and approaches, one of them being the adoption of solar technology to electrify rural and remote villages. The
College has pioneered solar electrification in rural areas since 1984. Since then it has contributed to electrifying villages across
16 states of India and 17 countries in Africa, Asia and South America, which represents a total solar energy generating capacity
of more than 800 kWp (kilowatt-peak).
The mission of the College is “the demystification of solar technology and decentralisation of its application”. This means giving
responsibility for the fabrication, installation, utilization, repair and maintenance of sophisticated solar lighting units to rural and
often illiterate and semi-literate men and women. It believes that people from rural or poor backgrounds do not need formal
educational qualifications to acquire skills that can be of service to their community. Therefore the training of local inhabitants,
so- called barefoot solar engineers (BSEs), is an essential part the Barefoot College programme. The BSEs are responsible for
installing, repairing and maintaining the necessary equipment for a period of at least five years, as well as for setting up a rural
electronic workshop where components and equipment needed for the repair and maintenance of solar units are stored. The
programme has received funding from the European Commission, the Asian Development Bank (ADB), United Nations Develop-
ment Programme (UNDP) and the Indian Ministry of Non-conventional Energy Sources.
Under the Barefoot College approach, every family that wishes to obtain solar lighting must pay an affordable contribution every
month, irrespective of how poor it is. This is considered important for creating a sense of ownership and responsibility. The
monthly fee to be paid by each electrified household is determined by how much each family spends on kerosene, candles,
torch batteries and wood for lighting every month. A percentage of the total contributions made by the households helps to pay
the monthly stipend of every BSE, and the remainder covers the costs of components and spare parts.
The process of solar electrification is not undertaken until the villagers have expressed a desire for solar lighting and agree,
in writing, to pay or collect the nominal monthly fee, select BSEs for training and arrange for a rural electronic workshop to
be set up. Barefoot College implements this agreement on behalf of the rural community, initiating and ensuring complete
participation.
Several organizations, including the ADB, UNDP, Skoll Foundation (United States), Fondation Ensemble (Together Foundation)
(France), Het Groene Woud (The Green Forest) (Holland) and the Indian Technical and Economic Cooperation Division of the
Ministry of Foreign Affairs have supported its replication in Afghanistan, Bolivia, Bhutan, Cameroon, Ethiopia, Gambia, Malawi,
Mali, Mauritania, Rwanda, Sierra Leone and the United Republic of Tanzania.
Sources: UNCTAD, based on Barefoot College website at: http://www.barefootcollege.org/.
fuel energy generation (that is exposed to
high and volatile input costs) towards the
use of many existing RETs that are already
competitive with conventional systems in
terms of cost and reliability. For instance,
small-scale RETs can often be provided at
lower cost than grid extension, and they
may be very important in the provision of
energy to rural areas, as discussed in a
previous chapter. Much progress could be
made to alleviate energy poverty by focus-
ing on rural, off-grid applications alongside
efforts to establish more technologically
and financially intensive grid-based RET
applications. Boxes 5.1 and 5.2 provide
some interesting examples of how RETs
have been used in off-grid applications to
promote rural energy in India.
Countries may also choose to move away
from conventional energy to increase their
national energy security. For example, over
the past decade Chile’s energy policy has
focused on increasing its energy security
and efficiency, as well as improving the en-
vironmental sustainability of its energy ma-
trix (CNE, 2009). The Government accords
considerable importance to diversifying its
energy matrix because its entire fossil fuel
supplies to meet its requirements are im-
ported, which results in considerable price
fluctuations of domestic electricity prices,
depending on the international prices of oil
and gas. Renewable energy sources, par-
ticularly wind power, have been included
into the country’s energy matrix with note-
worthy results (box 5.3).
Dedicated incentives
will also help to tip the
balance in favour of
RETs over conventional
fossil fuel technologies
in direct and indirect
ways.

117CHAPTER V : NATIONAL POLICY FRAMEWORKS FOR RENEWABLE ENERGY TECHNOLOGIES
Box 5.2: Lighting a billion Lives: A success story of rural electrification in India
The Energy and Resources Institute (TERI), an international think tank based in India, launched an ambitious global initiative
called Lighting a billion Lives (LaBL) in February 2008. It seeks to provide energy-impoverished communities around the world
with access to clean sources of lighting through solar technologies, and to replace kerosene/paraffin lamps with clean and
environment-friendly solar lanterns.
The LaBL initiative is based on an entrepreneurial model of energy service delivery aimed at providing high-quality and cost-
effective solar lanterns that are disseminated through solar charging stations set up in non-electrified or poorly electrified
villages. The charging station is operated and managed by a local entrepreneur trained under the initiative, who charges the
rural inhabitants a small, affordable fee for renting the solar lanterns every evening. This fee-for-service model ensures that the
poorest socio-economic groups have access to clean energy at an affordable price. While the capital cost of setting up the
charging station in the village is raised by TERI through government agencies, corporate donors and communities, the opera-
tion and maintenance costs are borne by the users of the solar lanterns in the form of the rent that they pay to the operator of
the charging station.
Since its launch in 2008, the initiative has been replicated successfully across 640 villages in 16 states of India, improving the
lives of more than 175,000 people. So far, around 35,000 rural households in India have replaced kerosene lamps with clean
and environment-friendly solar lanterns. The project has provided “green” livelihood opportunities to 700 rural people who have
become operators of the solar charging stations, with monthly earnings of 3,000–4,000 Indian rupees from renting out the solar
lanterns in their villages. Furthermore, the initiative is currently saving more than 100,000 litres of kerosene every month (based
on an estimate of 3 litres per household/per month) that was previously being used by the beneficiaries for lighting. This trans-
lates into a mitigation of around 400 tons of CO2 every month.
The initiative has also formed a basis for South-South cooperation through structured training and capacity-building pro-
grammes, technology transfer initiatives, piloting of successful delivery models and identification of local partners for replicat-
ing and scaling up the model in various developing countries. In collaboration with the United States Agency for International
Development (USAID), high-quality solar lanterns developed under the initiative are being sent to Afghanistan. In addition, the
fee-for-service delivery model is being piloted in Cameroon, the Central Africa Republic, Kenya and Malawi, in collaboration
with UN-Habitat, and in Bangladesh and Sierra Leone with UNIDO support. Furthermore, South-South cooperation is being
established under the ADB’s Energy for All partnership through capacity-building and training-of-trainer programmes in Cam-
bodia, Indonesia and the Philippines. The initiative is also being expanded in Uganda through local partnerships developed in
collaboration with private distribution networks in the country.
At the national policy level in India, the LaBL initiative has caught the attention of the central Government. Its delivery model
has been adopted by the Government of India’s Jawaharlal Nehru National Solar Mission initiative, and is being promoted to
enhance access to clean energy in remote energy-impoverished regions of the country. In addition, the solar charging stations
are also being used to provide a mobile telephone recharge facility under the Government’s programme to provide last-mile
connectivity to rural and remote communities, thus creating linkages between different development-oriented initiatives.
Source: TERI for Technology and Innovation Report 2011.
C. SPECIFIC POLICY INCENTIVES FOR PRODUCTIONAND INNOVATIONOF RETs
The successful development and deploy-
ment of any technology, especially rela-
tively new ones such as RETs, needs the
support of several dedicated institutions
responsible for the different technical,
economic and commercialization aspects.
Such support can be organizational (dedi-
cated RET organizations) or it can take the
form of incentives to induce the kinds of
behaviour required to meet the targets set
for RETs. The dedicated incentives will also
help to tip the balance in favour of RETs
over conventional fossil fuel technologies
in direct and indirect ways, as described
in chapter III. The most direct impact of
such dedicated incentives for RETs will
be their fostering of technological activi-
ties for developing state-of-the-art RETs,
and promoting their adoption and utiliza-
tion in countries. An indirect effect of such
incentives would be to encourage innova-
tors to engage in incremental technologi-
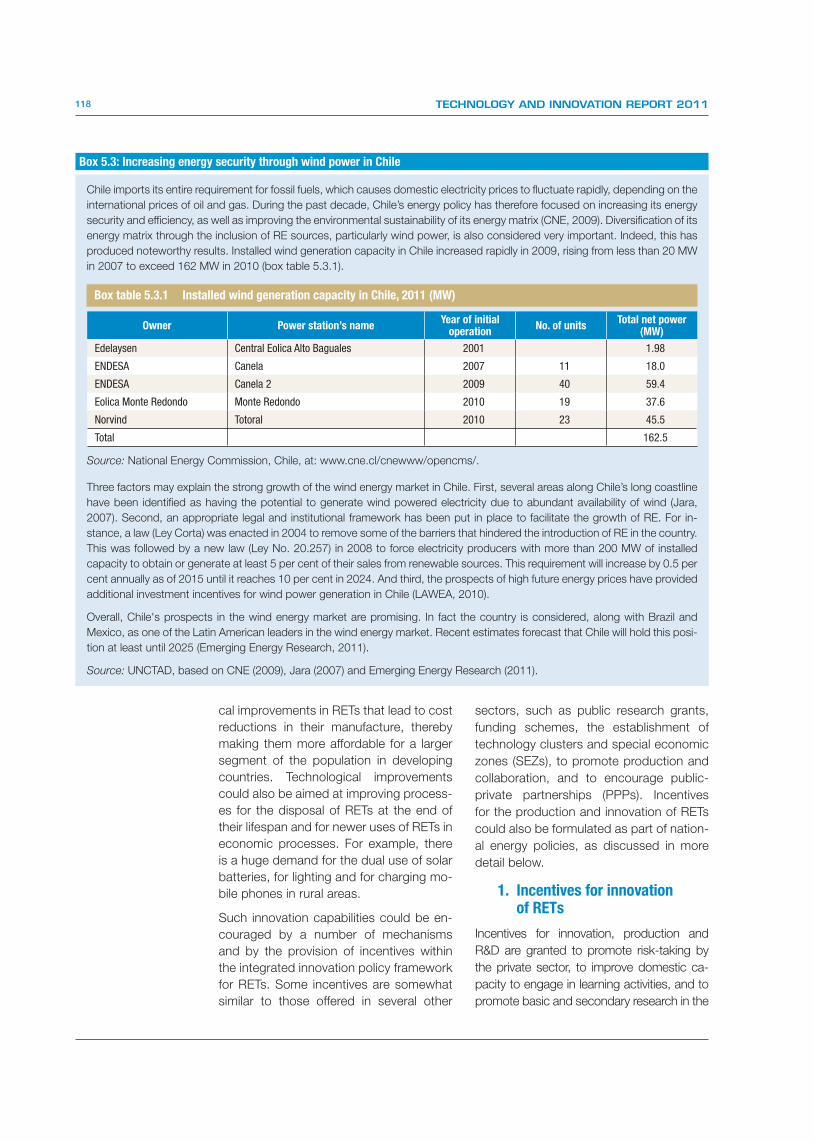
118 TECHNOLOGY AND INNOVATION REPORT 2011
cal improvements in RETs that lead to cost
reductions in their manufacture, thereby
making them more affordable for a larger
segment of the population in developing
countries. Technological improvements
could also be aimed at improving process-
es for the disposal of RETs at the end of
their lifespan and for newer uses of RETs in
economic processes. For example, there
is a huge demand for the dual use of solar
batteries, for lighting and for charging mo-
bile phones in rural areas.
Such innovation capabilities could be en-
couraged by a number of mechanisms
and by the provision of incentives within
the integrated innovation policy framework
for RETs. Some incentives are somewhat
similar to those offered in several other
sectors, such as public research grants,
funding schemes, the establishment of
technology clusters and special economic
zones (SEZs), to promote production and
collaboration, and to encourage public-
private partnerships (PPPs). Incentives
for the production and innovation of RETs
could also be formulated as part of nation-
al energy policies, as discussed in more
detail below.
1. Incentives for innovationof RETs
Incentives for innovation, production and
R&D are granted to promote risk-taking by
the private sector, to improve domestic ca-
pacity to engage in learning activities, and to
promote basic and secondary research in the
Box 5.3: Increasing energy security through wind power in Chile
Chile imports its entire requirement for fossil fuels, which causes domestic electricity prices to fluctuate rapidly, depending on the
international prices of oil and gas. During the past decade, Chile’s energy policy has therefore focused on increasing its energy
security and efficiency, as well as improving the environmental sustainability of its energy matrix (CNE, 2009). Diversification of its
energy matrix through the inclusion of RE sources, particularly wind power, is also considered very important. Indeed, this has
produced noteworthy results. Installed wind generation capacity in Chile increased rapidly in 2009, rising from less than 20 MW
in 2007 to exceed 162 MW in 2010 (box table 5.3.1).
Source: National Energy Commission, Chile, at: www.cne.cl/cnewww/opencms/.
Three factors may explain the strong growth of the wind energy market in Chile. First, several areas along Chile’s long coastline
have been identified as having the potential to generate wind powered electricity due to abundant availability of wind (Jara,
2007). Second, an appropriate legal and institutional framework has been put in place to facilitate the growth of RE. For in-
stance, a law (Ley Corta) was enacted in 2004 to remove some of the barriers that hindered the introduction of RE in the country.
This was followed by a new law (Ley No. 20.257) in 2008 to force electricity producers with more than 200 MW of installed
capacity to obtain or generate at least 5 per cent of their sales from renewable sources. This requirement will increase by 0.5 per
cent annually as of 2015 until it reaches 10 per cent in 2024. And third, the prospects of high future energy prices have provided
additional investment incentives for wind power generation in Chile (LAWEA, 2010).
Overall, Chile's prospects in the wind energy market are promising. In fact the country is considered, along with Brazil and
Mexico, as one of the Latin American leaders in the wind energy market. Recent estimates forecast that Chile will hold this posi-
tion at least until 2025 (Emerging Energy Research, 2011).
Source: UNCTAD, based on CNE (2009), Jara (2007) and Emerging Energy Research (2011).
Box table 5.3.1 Installed wind generation capacity in Chile, 2011 (MW)
Owner Power station’s nameYear of initial
operationNo. of units
Total net power (MW)
Edelaysen Central Eolica Alto Baguales 2001 1.98
ENDESA Canela 2007 11 18.0
ENDESA Canela 2 2009 40 59.4
Eolica Monte Redondo Monte Redondo 2010 19 37.6
Norvind Totoral 2010 23 45.5
Total 162.5

119CHAPTER V : NATIONAL POLICY FRAMEWORKS FOR RENEWABLE ENERGY TECHNOLOGIES
public sector. Some of the policy incentives
listed here are aimed specifically at the private
sector, such as green economic clusters and
SEZs, to boost enterprise activity, whereas
others are hybrid instruments that can be
granted to promote both public and private
sector activity, such as collaborative PPPs.
Others, such as public research grants, are
offered primarily to the public sector.
a. Public research grants
The most common form of government
support for supply-side RET innovation is
the provision of government grants to uni-
versities and R&D centres for early stage
development. Increasingly, grants are being
offered for the development of low-carbon
energy technologies, rather than for all
RETs. They take into account the potential
for decarbonizing existing fossil fuel tech-
nologies through carbon capture and stor-
age (CCS), or they seek to promote the use
of nuclear energy as a low-carbon alterna-
tive. Both of these have the potential to re-
duce growth in emissions from coal plants
in rapidly industrializing countries. In early
2009, both the EU and the United States
announced significant funding for R&D in
CCS technologies and for demonstration
projects (box 5.4). Committed funding in
the United States for early-stage deploy-
ment is currently $4.3 billion (box 5.4), while
carbon credits set aside specifically for
CCS in the EU could total over €12 billion
by 2014 (ZEP, 2008).
b. Grants and incentives forinnovation of RETs
Most industrialized countries have used
grant-support schemes to promote the
use of low-carbon or renewable energy
resources in the development and early-
stage deployment of RETs for electricity,
heat and transport, and for installing more
energy-efficient power-generation plants.
These grant schemes are usually competi-
tive in nature, with governments seeking to
maximize returns (box 5.5).
In some developing countries, innovative
mechanisms are being developed to reduce
the risk to technology developers in design-
ing and delivering more cost-effective and
resilient RETs. Examples and experiences of
countries (e.g. as described in box 5.2) help
to demonstrate an important policy find-
ing: not all countries need to provide large
grants. In countries that have significant re-
source constraints, incentive structures can
target small-scale projects designed to en-
courage private sector involvement in RET
development and deployment in small rural
settings. An example is the Africa Enterprise
Challenge Fund’s Renewable Energy and
Adaptation to Climate Technologies (AECF
REACT) programme (box 5.6).
Box 5.4: Public support for RETs in the United States of America and China
In the United States, public support initiatives for early-stage technologies are funded through the Department of Energy’s
Advanced Research Project Agency-Energy (ARPA-E). The current stimulus package provided over $400 million in 2009-2010,
with awards ranging from between $0.5 and $10 million per annum. Spanning over three funding cycles, the RE projects funded
include those associated with biomass, direct solar fuels, electro-fuels, vehicle technologies and grid storage applications. Grant
recipients have been primarily universities, R&D departments in large private corporations and companies pursuing individual
early-stage technologies. Many of the companies have gone on to raise venture capital finance, which demonstrates that grant
provision can leverage private sector investment. The American Energy Innovation Council has called for a massive scale-up of
funding for the APRA-E programme from existing levels to $1 billion per annum (Cleantech Open, 2010).
Among developing countries, China has several projects in carbon-capture technology as a way to offset rising emissions from
indigenous coal-based power production. The Luzhou Natural Gas Chemicals plant is already capturing CO2 on a commercial
scale for use in urea production. China and Japan are jointly cooperating on the Harbin Thermal Power Plant in Heilungkiang
Province. The plant will capture CO2 and transport it to the Daqing Oilfield approximately 100 km away where it will be injected
into a disused reservoir. Other projects under development include the GreenGen IGCC Coal Power Plant in Tianjin, and the
Shanghai Shidongkou ultra-critical power plant.
Source: UNCTAD.
In some developing
countries, innovative
mechanisms are being
developed to reduce
the risk to technology
developers in designing
and delivering more
cost-effective and
resilient RETs.

120 TECHNOLOGY AND INNOVATION REPORT 2011
Box 5.5: Examples of grant schemes in industrialized countries
In the EU, the Seventh Framework Research Programme (FP7) for the period 2007–2013 seeks to strengthen the European
industrial technology base while encouraging international competitiveness in RETs. The energy component within this major
regional programme is worth €2.35 billion. Competitive grants provided to commercial companies cover up to 50 per cent of
their costs, and those to non-commercial bodies cover up to 75 per cent of costs. Demonstration projects receive up to 50 per
cent of costs. Research is funded across a range of technologies, including hydrogen and fuel cells, the use of renewables for
electricity generation, heating and cooling, and renewable fuel production.a
In Australia, the Renewable Energy Demonstration Program (REDP) is the centerpiece of the Australian Centre for Renewable
Energy (ACRE), which provides substantial grants to fund large-scale, grid-connected RET demonstration projects across a
range of sectors and technologies. The grants cover expenditure of up to a third of total costs. The REDP has funded four large
projects, including two geothermal projects (amounting to 152 million Australian dollars), one ocean energy project (66 million
Australian dollars) and one integrated project (15 million Australian dollars). The Australian Solar Institute, which provides similar
grant support for solar thermal and PV technologies, had disbursed more than 44 million Australian dollars to 13 projects by
mid-2010.b
The Canadian Clean Energy Fund also seeks to support RETs demonstration projects, both on- and off-grid, including smart
grid concepts, electrical and thermal energy storage, hybrid systems (including those with limited fossil fuel input), marine en-
ergy, solar PV, solar thermal, very low head hydro and in-stream river current systems, geothermal and bio-energy. Established
in 2010, the fund will provide 850 million Canadian dollars, of which 80 per cent will be for CCS and 200 million Canadian
dollars for smaller scale RE projects. There is an additional 150 million Canadian dollar R&D grant facility. The fund aims to
support systems demonstration that includes codes, permits and grid connections, as well as those that reduce capital costs
and demonstrate reliability. Funds are provided for up to 50 per cent of the total demonstration costs up to a limit of 50 million
Canadian dollars per project.c
Source: UNCTAD.
a cordis.europa.eu/fp7/home_en.html.
b www.ret.gov.au/energy/energy%20programs/cei/acre/redp/Pages/default.aspx.
c www.nrcan.gc.ca/eneene/science/ceffep-eng.php.
Box 5.6: The Renewable Energy and Adaptation to Climate Technologies Programme of the Africa EnterpriseChallenge Fund (AECF REACT)
This programme seeks to catalyse private sector investment and innovation in low-cost, clean energy and climate change
technologies, particularly those aimed at rural populations that have limited or no grid access. It operates on the basis of a
“challenge fund”, managed by a private sector fund manager, which can be accessed through competitive applications by for-
profit RET companies. Successful applicants receive grants and interest free repayable grants up to a maximum of $1.5 million.
Applicant companies are required to match the AECF’s REACT funding with an amount equal to or greater than 50 per cent
of the total cost of the project. As AECF’s REACT aims to leverage its funds, those applications where companies contribute a
greater percentage of matched funds, or that incorporate a greater percentage of the repayable grant, are given more favour-
able consideration.
The World Bank Group has taken similar approaches to reduce the risk to private sector developers in adapting existing tech-
nologies to developing-country environments. One such project is the International Finance Corporation’s Fuel Cell Financing
Initiative for Distributed Generation Applications (IFC FCFI). This IFC/Global Environment Facility-funded project seeks to pro-
mote the utilization of fuel cells in stationary power applications. It targets a range of potential technologies that could provide
efficiencies of up to 90 per cent. As part of this project, contracts have been signed with IST holdings (South Africa) and Plug
Power Inc. (United States) in 2005, with the intention of installing 400 fuel cells in remote locations across South Africa.
Source: UNCTAD, based on AECF (www.aecfafrica.org/react/index.php) and IFC.
(http://www.thegef.org/gef/sites/thegef.org/files/repository/Global-FuelCellsFinancingInit-DistribGeneration.pdf).

121CHAPTER V : NATIONAL POLICY FRAMEWORKS FOR RENEWABLE ENERGY TECHNOLOGIES
Other examples of similar smaller scale
projects that have achieved significant re-
sults abound (see, for example, box 5.7).
c. Collaborative technologydevelopment and public-private partnerships
Several OECD governments have estab-
lished PPPs to promote the commercial-
ization and deployment of RETs. Providing
public funding for long-term technology
collaboration, together with private sector
technology know-how, may result in more
effective innovation in RETs. The European
Commission (EC) has recognized that mar-
kets and energy companies acting alone are
unlikely to deliver the technological break-
throughs quickly enough to meet climate
change and RET policy goals. Owing to
locked in investments, vested interests in
existing technology models and potentially
large investment risks, progress is likely to be
slow without some form of PPP (EC, 2010).
To accelerate the commercialization and de-
ployment of RETs, the EC has developed a
series of RET roadmaps for key sectors that
promote PPPs in this area (box 5.8).
Some developing countries, such as Ban-
gladesh, are also actively assessing the
benefits of PPP structures for both R&D
and deployment of RETs. They have been
exploring PPP solutions across a range of
other sectors, including energy and health.
Promoting such models in the energy sec-
tor may complement national efforts to en-
courage growth of innovation capacity and
energy security.
d. Green technology clustersand special economic zonesfor low-carbon technologies
National and sub-national governments in
both developed and developing countries
are increasingly providing targeted support
to encourage critical mass in low-carbon
manufacturing and RET cluster centres.
Recognizing the rapid growth in demand
for RETs, governments are competing
Box 5.7: Lighting Africa
Lighting Africa is a joint initiative of the World Bank and the IFC. Its goal is to provide safe, affordable and modern off-grid lighting
using RETs to 2.5 million people by 2012, including a target of 250 million people by 2030 in sub-Saharan Africa. The initiative
targets rural, urban and peri-urban populations who lack access to electricity, especially low-income households and busi-
nesses. As mentioned earlier in this Report, it is estimated that energy poverty is especially severe in sub-Saharan Africa, with
the region accounting for 500,000 of around 1.7 billion people worldwide who live without electricity. Rural electricity access
rates in the region are as low as 2 per cent, which hinders social and economic development.
In order to achieve its goals, the programme works with product manufacturers and distributors, consumers, financial institu-
tions, development partners and governments to help build markets for reliable off-grid lighting products. Lighting Africa's
strategy is based on four pillars: (i) facilitating consumer access to a range of affordable and reliable products and services; (ii)
catalysing the private sector by strengthening the ties between the different actors to provide lower cost products; (iii) improving
market conditions, by removing technical, financial, policy and/or institutional barriers; and (iv) mobilizing the international com-
munity to promote delivery of modern lighting services to the poor in Africa.
Despite its relatively recent creation in September 2007, the initiative has already achieved significant results: over 190,000 por-
table solar lamps, which had passed Lighting Africa quality tests, have been sold in Africa, providing more than 950,000 people
with cleaner, safer, better lighting and improved energy access. So far, eight products have passed Lighting Africa quality tests,
and are available in the African market at prices ranging between $22 and $97. Since February 2011, the first testing laboratory
in East Africa has been offering testing of off-grid lighting products as a commercial service to manufacturers and distributors.
The laboratory, located at the University of Nairobi, uses Lighting Africa’s low-cost initial screening method. The governments
of Ethiopia, Mali and Senegal have signed agreements with Lighting Africa to integrate lighting services into their rural energy
programmes.
In addition, Lighting Africa has established the Lighting Africa Outstanding Products Awards which provide increased recogni-
tion and visibility to particularly good off-grid lighting products in different categories: best room lighting performance, best task
lighting performance, best portable torch light, best economic value and top performer overall.
Source: UNCTAD, based on Lighting Africa, at: www.lightingafrica.org/.
Providing public funding
for long-term technology
collaboration, together
with private sector
technology know-how,
may result in more
effective innovation in
RETs.

122 TECHNOLOGY AND INNOVATION REPORT 2011
to secure investment in R&D and manu-
facturing, both from developed-country
manufacturers seeking to scale up pro-
duction in lower cost markets, and from
emerging-economy manufacturers in India
and China.
For developing countries, low-carbon SEZs
and green clusters may be useful measures
for enhancing industrial competitiveness and
FDI, especially for boosting the private sec-
tor. They can be used as a means to diversify
economic activity while maintaining protec-
tive barriers, and to pilot new policies and
approaches. Where there are successes,
these can feed into wider innovation policy
and set benchmarks for the development
of domestic industry. Environmental and ef-
ficiency standards developed within an SEZ
can be taken up by governments and ap-
plied at national and/or regional levels.
These clusters typically provide suitable in-
frastructure, skills and proximity to markets.
Many countries where RET clusters have
been successfully deployed have already
set ambitious domestic carbon reduction
goals and created supportive regulatory
environments.
In China, the idea of a low-carbon SEZ was
first proposed in 2007, with support from
the Government of the United Kingdom and
China’s National Development and Reform
Commission. An initial pilot low-carbon SEZ
is being set up in the industrial province of
Jilin. In India, the Ministry for New and Re-
newable Energy has announced support for
manufacturing of RETs through the creation
of a dedicated SEZ in the city of Nagpur. It
will focus on strategically important input
materials, process and testing equipment,
devices and systems components. The min-
istry is offering to facilitate joint ventures and
technology transfers to achieve this as part
of an overall package of incentives for invest-
ment in this sector. Other measures include
rationalizing the customs and excise duty
structure, liberalizing import regulations, and
providing income tax concessions and con-
cessional financing.
Masdar, a venture in Abu Dhabi is another
example which is positioning itself as an
R&D hub for new energy technologies to
drive the commercialization and adoption of
these and other technologies in sustainable
energy, carbon management and water con-
servation. In the United States, cities such as
Seattle and Boston have been suggested as
potential clean-tech innovation hubs. In ad-
dition, a number of universities are support-
ing renewable technology business incuba-
tors, such as the New York City Accelerator
for a Clean and Renewable Economy.
Box 5.8: Examples of public-private partnerships
The United Kingdom has created the Energy Technologies Institute (ETI) – a PPP between the Government and a number of
multinational companies: BP, Caterpillar, EDF, E.ON, Rolls-Royce and Shell. Each of these companies has a seat on the board.
The Government is committed to providing funds of £50 million annually over a period of 10 years starting in 2008-2009. Match-
ing funds are to be raised by the Energy Research Partnership, a government entity created for such a purpose. The ETI is
tasked with developing technologies that will help the United Kingdom meet its legally binding 2050 carbon reduction targets
under the Climate Change Act. It funds projects that deliver sustainable and affordable energy for heat, power transport and
associated infrastructure using a range of technology options. The Institute seeks to demonstrate technologies and develop
the skills base and necessary supply chains for the required level of technology deployment during the period 2020–2050. It is
not a grant-awarding body; rather, it makes targeted investments in large-scale engineering projects that may have a strategic
impact on the country’s economy.
In the United States, the Department of Energy’s Energy Frontier Research Center Program is also adopting a PPP approach by
bringing together corporations, national laboratories and universities. In 2009, 46 research centres were established, each with
an annual funding of $2–$5 million as part of this programme. Energy innovation hubs have also been established to address
specific technological challenges. These include the Energy Efficient Building Design Hub, led by Pennsylvania State University,
and the Fuels from Sunlight Energy Innovation Hub led by the Joint Center for Artificial Photosynthesis. There are concerns
that the ability of such PPPs to attract long-term private sector finance may suffer unless there is more ambitious legislation on
climate mitigation and REs.
Source: UNCTAD, based on Cleantech Open (2010).
For developing
countries, low-carbon
SEZs and green clusters
may be useful
measures.

123CHAPTER V : NATIONAL POLICY FRAMEWORKS FOR RENEWABLE ENERGY TECHNOLOGIES
2. Innovation and production incentives and regulatory instruments in energy policies
As noted earlier in this chapter, a funda-
mental characteristic of integrated innova-
tion policy frameworks for RETs is that they
promote interactions between general in-
novation policy incentives and energy poli-
cies of countries. Ongoing reforms in the
energy sector of most developing countries
offer a good opportunity to establish regu-
latory instruments and production obliga-
tions geared towards promoting investment
in RETs and energy production based on
these technologies. Many regulatory instru-
ments are available, including assessment
and auditing, benchmarking, mandates,
monitoring, standards and quota systems,
and associated tradable certificates/per-
mits (IEA, 2011; Komor and Bazilian, 2005;
Oliver et al., 2001; Schaeffer and Voogt,
2000). Production incentives can take the
form of financial incentives for installed RE
capacity to be used, reducing the risk of in-
vesting in and using RETs to provide energy
services by increasing the rate of return,
and reducing the payback period (van Al-
phen, Kunz and Hekkert, 2008).
a. Quota obligations/renewable portfolio standards
Quota obligations or renewable portfolio
standards (RPSs) are hybrid economic/reg-
ulatory mechanisms that mandate electric-
ity providers to supply a specific minimum
amount of electricity generated from RE
sources by a set target date. These instru-
ments have been used in many countries
to accelerate the transition to RE systems
and to achieve the same outcomes as
feed-in tariffs. The additional costs of meet-
ing the quota are usually passed through
to consumers. By 2010, RPSs had been
introduced by at least 10 national govern-
ments and 46 sub-national bodies glob-
ally (table 5.2). Most obligations required
a RE-generated electricity component of
Table 5.2: Countries/states/provinces with RPS policies
Year Cumulative No. Countries/states/provinces added that year
1983 1 Iowa (United States)
1994 2 Minnesota (United States)
1996 3 Arizona (United States )
1997 6 Maine, Massachusetts, Nevada (United States )
1998 9 Connecticut, Pennsylvania, Wisconsin (United States )
1999 12 New Jersey, Texas (United States ); Italy
2000 13 New Mexico (United States)
2001 15 Flanders (Belgium); Australia
2002 18 California (United States); Wallonia (Belgium); United Kingdom
2003 21 Japan; Sweden; Maharashtra (India)
2004 34 Colorado, Hawaii, Maryland, New York, Rhode Island (United States);Nova Scotia, Ontario, Prince Edward Island (Canada), Andhra Pradesh,Karnataka, Madhya Pradesh, Orissa (India); Poland
2005 38 District of Columbia, Delaware, Montana (United States); Gujarat (India)
2006 39 Washington State (United States)
2007 44 Illinois, New Hampshire, North Carolina, Oregon (United States); China
2008 49 Michigan, Ohio (United States); Chile; the Philippines; Romania
2009 50 Kansas (United States)
Sources: Reproduced from IEA, Global Renewable Energy Policies and Measures database; REN21 (2010).
Note: Cumulative number refers to number of jurisdictions that had enacted RPSs in a given year. Juris-dictions are listed under year of first policy enactment; many policies were revised insubsequent years. Six Indian states (Haryana, Kerala, Rajasthan, Tamil Nadu, Uttar Pradesh,and West Bengal) are not shown in the table since the year is uncertain.
Ongoing reforms in the
energy sector of most
developing countries
offer a good opportunity
to establish regulatory
instruments and
production obligations…
…geared towards
promoting investment
in RETs and energy
production based on
these technologies.

124 TECHNOLOGY AND INNOVATION REPORT 2011
between 5 per cent and 20 per cent, with
targets usually extending to 2020 and be-
yond (REN21, 2010). As the table shows,
developing countries such as Chile, China,
India and the Philippines have also intro-
duced RPSs.
Renewable portfolio standards can act as
a powerful tool for RETs promotion, since
they can be accompanied by regulations
that force electricity distributors to disclose
the mix of fuels and related emissions in
their power supply. In the United Kingdom,
for example, the Renewables Obligation
introduced in April 2002 is the main policy
mechanism which aims at increasing RE
deployment. The policy obliges electricity
suppliers to source an increasing share of
their electricity from REs. It contains a pen-
alty structure that can be invoked when the
renewables obligation is not met. The ob-
ligation to source renewables is a moving
target within the policy: as of 2002-2003,
it required that a minimum of 3 per cent of
electricity supplied be sourced from renew-
ables, and this share is set to increase to
15.4 per cent in 2015. A tradable certificate
called a Renewables Obligation Certificate
(ROC) is issued for each MWh of electric-
ity produced. Electricity suppliers can meet
their obligation either through their own
power generation, purchase certificates
from other generators, pay a buy-out pen-
alty, or a combination of the above. The
ROC system has been under constant de-
velopment since its introduction in 2002. As
of 2009, a conscious policy decision was
made to encourage technologies that were
less developed by providing higher levels
of financial support that such technologies
required. It also sought to ensure that more
mature technologies, such as onshore
wind, were not being overcompensated.
In practice, different technologies received
a different number of ROCs per MWh pro-
duced. Key to the ROC’s success has been
the setting of long-term time frames. The
scheme was recently extended to 2037.
While the mechanism itself may have been
relatively efficient, the actual deployment of
renewable generation capacity has been
hampered somewhat by planning delays
and by issues related to grid connection.
The United Kingdom’s energy regulator, Of-
gem, has estimated that the Renewables
Obligation cost the average household in
the country £7.35 per annum in 2007 (ap-
proximately £200 million), and has forecast
that this will rise to £11.41 by 2010–2011
(Scottish Executive, 2009).
In May 2003, Sweden introduced a system
of electricity certificates in order to meet its
targets for the production of electricity from
RE sources. Since its introduction in 2003,
the policy objective of the legislation has
Box 5.9: Renewable portfolio standards in the Philippines
In the Philippines, RE is steadily becoming a greater part of the energy portfolio. In terms of installed capacity, the Philippines
is currently second in the world for geothermal and third for biomass power (REN21, 2009). In 2009, RE sources accounted
for 34 per cent of total installed capacity (Almendras, 2010). However, a number of problems relating to RE have emerged. For
instance, some commercial wind turbines have been disabled and their components made of valuable materials, such as cop-
per and aluminum, are sold on the black market. Also, incumbent transmission and distribution companies have been able to
charge higher transmission rates for wheeling power from renewable resources (Sovacool, 2010). The Government has taken
steps to address these issues and continue the promotion of RE through the Renewable Energy Act in 2008.
This Act includes mandates for on-grid and off-grid, and addresses general issues relating to the provision of energy through an
RPS. For on-grid and off-grid suppliers, the newly created National Renewable Energy Board will set minimum required quotas
for sourcing from REs, thereby contributing to RE growth. A number of mechanisms have been created as incentives for stake-
holders to invest in RE, including feed-in tariffs that give priority to RE systems for connections to grid and the purchase of this
electricity by grid operators, as well as a fixed tariff for each type of RE for no less than 12 years. An RE certification process has
also been created. In general, RE suppliers are entitled to an income tax holiday for the first 7 years of operation and duty-free
importation of equipment for the first 10 years, although these are subject to a number of conditions. Also, consumers have the
option of purchasing renewable power from suppliers (Government of the Philippines, 2008).
Sources: REN21 (2009); Government of the Philippines (2008); Sovacool (2010) and Almendras (2010).
Renewable portfolio
standards can act as a
powerful tool for RETs
promotion.

125CHAPTER V : NATIONAL POLICY FRAMEWORKS FOR RENEWABLE ENERGY TECHNOLOGIES
been expanded to include the production
of electricity from peat as a fuel in combined
heat and power plants. With effect from
1 January 2007, the policy target includes
an increase in the production of electric-
ity from renewable sources by 17 TWh by
2016, relative to 2002. This system has
also been extended to 2030.
Some developing countries, such as the
Philippines, are also using RPS (box 5.9).
b. Feed-in tariffs
The most common form of a guaranteed
fixed price system is the feed-in tariff (FIT),
which offers a price incentive to investors.
Governments determine the price per kWh
that the local distribution company will have
to pay for power generation from renew-
ables that is fed into the local distribution
grid. The costs can be financed through
a levy on electricity applied to all consum-
ers. Tariffs vary widely between countries,
and even within countries, according to the
technology used, time (e.g. peak or base
load tariffs) and seasons. FITs are agreed as
part of a power purchase agreement (PPA).
Standard, reliable, long-term PPAs offer a
clear guarantee to the private sector and
their financiers that they can hook up their
power plant to the grid and receive a cer-
tain payment for energy over a set period of
time (Oliver et al., 2001).
Table 5.3: Countries/states/provinces with feed-in tariff policiesa
YearCumulative
No.b Countries/states/provinces added that year
1978 1 United States
1990 2 Germany
1991 3 Switzerland
1992 4 Italy
1993 6 Denmark; India
1994 8 Spain; Greece
1997 9 Sri Lanka
1998 10 Sweden
1999 13 Portugal; Norway; Slovenia
2000 13 —
2001 15 France; Latvia
2002 21 Algeria; Austria; Brazil; the Czech Republic; Indonesia; Lithuania
2003 27 Cyprus; Estonia; Hungary; the Republic of Korea; Slovakia; Maharashtra (India)
2004 33 Israel; Nicaragua; Prince Edward Island (Canada); Andhra Pradesh and Madhya Pradesh (India)
2005 40 Karnataka, Uttarakhand and Uttar Pradesh (India); China; Turkey; Ecuador; Ireland
2006 45 Ontario (Canada); Kerala (India); Argentina; Pakistan; Thailand
2007 54 South Australia (Australia); Albania; Bulgaria; Croatia; the Dominican Republic; Finland; Mongolia; The former Yugoslav Republic of Macedonia; Uganda
2008 67 Queensland (Australia); California (United States); Chattisgarh, Gujarat, Haryana, Punjab, Rajasthan, Tamil Nadu and West Bengal (India); Kenya; the Philippines;the United Republic of Tanzania; Ukraine
2009 77 Australian Capital Territory, New South Wales, Victoria (Australia); Japan; Serbia; South Africa; Taiwan Province of China; Hawaii, Oregon and Vermont (United States).
Early 2010 78 United Kingdom
Sources: Reproduced from REN21 (2010).
Note: a Many policies have been revised or reformulated in years subsequent to the initial year shown for a given country. For example, India's national feed-in tariff from 1993 was largely discontin-ued, but new national feed-in tariffs were enacted in 2008.
b Cumulative number refers to the number of jurisdictions that had enacted a feed-in policy bythe given year, but policies in some countries were subsequently discontinued. The number of existing policies cited in REN21 (2010) is 75.
The most common
form of a guaranteed
fixed price system is the
feed-in tariff (FIT), which
offers a price incentive
to investors.

126 TECHNOLOGY AND INNOVATION REPORT 2011
Feed-in tariffs generally have been very ef-
fective, and experience in developed coun-
tries shows that this policy instrument has
resulted in a substantial increase in capac-
ity of RE-based power systems (van Al-
phen, Kunz and Hekkert, 2008; IEA, 2011;
Komor and Bazilian 2005; Schaeffer and
Voogt, 2000).3 Table 5.3 shows the num-
ber of countries/states/provinces around
the world that have adopted FIT policies to
date.
There is limited experience of FIT imple-
mentation in developing countries, but
there has been a recent upsurge over the
past five years. For example, in Algeria, the
price of energy generated by hydro, waste,
wind and solar PV/concentrated solar pow-
er includes a renewable premium calcu-
lated as a percentage of the average price
of electricity. In Ghana, Botswana, Swazi-
land, South Africa and the United Republic
of Tanzania, plans for FITs are being devel-
oped for a range of technologies. Mauritius
has had an FIT for bagasse cogeneration
since 1957, and there are plans to extend
this to wind, solar and hydro. Many other
countries are in the process of developing
FITs (Curren, 2010), and there have been
special efforts to make FITs appropriate
to developing-country contexts (Moner-
Girona, 2009; and see box 5.10 for FITs in
Kenya).
3. Flexibilities in the intellectual property rights regime
Much has been written about the various
flexibilities contained in the WTO Agree-
ment on Trade-Related Aspects of Intel-
lectual Property Rights (TRIPS Agreement)
that can be used to mitigate adverse ef-
fects of IPRs on reverse engineering and
on incremental innovation in developing
countries, both of which are important for
technological learning. These flexibilities are
discussed below.
(i) Patentability criteria. Since the three pre-
requisites of novelty, industrial applicability/
utility and inventive step are not defined
under Article 27 of the TRIPS Agreement,
hence national patent regimes set different
standards that need to be met by inven-
tors.4 A lax standard (low level) for ‘inventive
step’ can result in a proliferation of patents
over a given technology, whereas a strin-
gent standard implies that improvements
that are not significant cannot be accorded
a patent right. It has been argued that set-
ting a high level for inventive step allows
firms in developing countries to engage in
incremental innovations, since these will not
be allowed to be patented within their do-
mestic contexts.
(ii) Exceptions to granted patent rights. In
some sectors, such as public health, two
important exceptions can be made. One is
the experimental use exception, which al-
lows universities and public sector institu-
tions to use patented products for research
purposes, and in some countries this has
also been extended to firms. The second is
the regulatory review exception. The pos-
sibility of its application to RETs remains to
be explored.
Box 5.10: Feed-in tariffs for biogas and solar PV, Kenya
The Government of Kenya has introduced a special FIT for electricity. Geothermal power genera-
tors will receive 8.5 cents (around 6.60 Kenyan shillings) per kWh, and wind power producers and
biomass producers will receive 12 cents and 8 cents respectively. The FIT was launched in 2008
in order to provide an incentive for RE-sourced power generation and was revised in 2010 to in-
clude geothermal power. The rates for wind and biomass were also raised. Power producers sell
electricity to the Kenya Power and Lighting Company at a predetermined fixed tariff for a certain
period of time. The feed-in tariff was again revised in January 2010 to include biogas and solar PV
sources of electricity generation. Kenya is the regional leader in the solar market, with an installed
capacity of 4 MW. The technology benefits 200,000 rural homes and 25,000–30,000 photovoltaic
modules have been sold so far.
Source: UNCTAD.
There is limited
experience of FIT
implementation in
developing countries,
but there has been a
recent upsurge over the
past five years.
Flexibilities in the TRIPS
Agreement can be used
to mitigate adverse
effects of IPRs.
127CHAPTER V : NATIONAL POLICY FRAMEWORKS FOR RENEWABLE ENERGY TECHNOLOGIES
(iii) Parallel imports. According to Article 6
of the TRIPS Agreement, WTO members
are free to authorize or to exclude parallel
imports of IPR-protected goods.
(iv) Compulsory licences. The TRIPS Agree-
ment authorizes the granting of compulsory
licences without limiting the substantive
grounds for such grant. As discussed in
chapter IV, it has been proposed in sev-
eral international forums that compulsory li-
censing could be used to promote the goal
of greater access to and diffusion of RETs in
developing countries.5
(v) Competition law and policy. By effec-
tively controlling an abuse of dominant po-
sitions, such as the unjustified refusal by the
patent holder to license an invention for the
purpose of extending monopoly power to a
secondary market not covered by the IPR,
competition law and policy may make im-
portant contributions to the design of an IP
system that appropriately balances incen-
tives for originators and the promotion of
follow-on innovation.
4. Applicability of policyincentives to developing countries
The policy incentives discussed above are
highly relevant for promoting innovation
capabilities in developing countries. Sev-
eral of these mechanisms, such as public
research grants, green clusters, SEZs and
collaborative partnerships, have worked
well in various countries when applied to
other technologies. Depending on the level
of development of a country, parameters for
implementation and support may need to
be nuanced.
The two incentives related to the energy
sector presented above can be useful for
encouraging new, cost-effective innovations
in RETs by both the private and public sec-
tor. Of the two, quotas/renewable portfolio
standards offer more advantages. Firstly,
they may be cost-effective, as they can
drive low-cost technologies and promote
competition for cost-reducing RETs. They
also set targets that allow more accurate
energy planning and policy-making for cli-
mate change mitigation. However, experi-
ence indicates that quota obligations have
not been particularly successful in promot-
ing more costly RETs. Such quotas/ renew-
ables obligations leave a level of uncertainty
with regard to the additional costs of deploy-
ment. Feed-in tariffs, on the other hand, can
provide price certainty to investors and help
emerging technologies get off the ground.
However, there are also some problems
with the use of both kinds of policy incen-
tives. They seldom encourage competi-
tion among investors, and they provide
insufficient incentives for technological
development and innovation. Large sub-
sidies do not encourage developers or
manufacturers to reduce costs, although
phasing out the FIT could help (Schaef-
fer and Voogt, 2000; Oliver et al., 2001).
Nevertheless, there is considerable po-
tential for selective application and exper-
imentation with these policy incentives in
developing countries.
Developing countries need to bear in mind
two important aspects when designing in-
tegrated innovation policy frameworks us-
ing these incentives. First, mobilizing the
volume of RETs required for the reduction
of energy poverty and climate change miti-
gation requires an unprecedented level of
cooperation between government bodies
and the private sector. Therefore enabling
such cooperation should be an institu-
tional priority. Second, an analysis of how
the more advanced developing countries
managed to scale up their capacity for
RETs production and use shows that in
their integrated frameworks for promo-
tion of RETs they provided dedicated in-
centives to promote the dual objectives of
production on the one hand, and greater
deployment and use on the other. Such an
approach relies on a greater level of coor-
dination between energy targets and inno-
vation strategies. China, which is placing
significant emphasis on RETs, has adopt-
ed such an integrated approach, and has
emerged as the developing world’s most
successful developer and installer of RETs
in recent times (box 5.11).
Quotas/ renewable
portfolio standards
offer more advantages
over FITs to developing
countries.
Overall success in policy
implementation…relies
on a greater level of
coordination between
energy targets and
innovation strategies.
128 TECHNOLOGY AND INNOVATION REPORT 2011
Like China, India too has an effective inte-
grated RET policy. Other developing coun-
tries should also consider adopting integrat-
ed innovation policy frameworks for RETs
that set clear RET targets and promote them
for industrial and commercial use. However,
not all developing countries will be able to
provide an extensive network of financing
and capacity-building of the kind found in
China or even India, due to institutional and
financing constraints that may impede the
granting of policy incentives.
Regarding the use of flexibilities under the
TRIPS Agreement, all developing countries
are hard pressed to promote greater access
to knowledge and learning in their domestic
contexts. Particularly, given the rising trends
in patenting for RETs, as shown in chap-
ter IV, developing countries could consider
ways and means to restrict patents on incre-
mental innovations in this field by providing
for a high inventive step requirement in their
domestic IPR regimes. This has been used
in the pharmaceutical sector to prevent in-
novations involving only minor technical im-
provements from getting patented.
D. ADOPTION AND USE OF NEW RETs: POLICY OPTIONS AND CHALLENGES
The importance of greater access to tech-
nologies needs to be emphasized in inter-
national forums such as those dealing with
climate change negotiations, as discussed
in chapter IV. Access to technologies plays
a critical role in the process of accumula-
tion of capabilities in developing coun-
tries. However, the experiences of many
countries and sectors indicate that lack
of easy access to technologies is not the
only impediment to developing countries
that are seeking to build their technological
capabilities. Equally important is the need
to improve their technological absorptive
capacity, which refers broadly to the tacit
elements that facilitate technological learn-
ing among firms and enterprises both in the
public and private domain within countries.
The lack of technical and human capac-
ity, combined with underdeveloped trade
Box 5.11: Promoting integrated approaches for increased production and use of RETs
The total capacity of energy generated in China reached 225 GW in 2009. This represents more than a quarter of China’s total
installed energy capacity. Over the period 2005–2009, wind power in the country increased 30-fold, and it took China less than
four years to emerge as the largest supplier of wind turbines, with three Chinese producers among the world’s top ten compa-
nies by volume of output.
Two main policy instruments seem to have supported the rise of Chinese production capacity: supportive domestic policy
targets, and a policy requirement mandating domestic production of wind turbine components. Such aggressive policy tar-
gets include the provisional 2020 target to produce over 500 GW of RE capacity, which would include 300 GW of hydro, 150
GW of wind, 30 GW of biomass and 20 GW of solar PV. This represents more than 30 per cent of China’s expected installed
capacity of 1,600 GW. These targets are underpinned by a number of demand-side policy mechanisms initially set out in the
2005 Renewable Energy Law. These included mandated portfolio standards, feed-in tariffs for biomass, government-regulated
prices, concession programmes for wind, and obligations to purchase all new grid-connected renewable power, together with
a number of fiscal and R&D support mechanisms.a Additionally, the wind turbine industry was subject to a policy requirement
of at least 70 per cent domestic content in terms of the value of materials and components. Similarly, domestic incentives have
enabled China to become the world’s largest producer of solar PV, supplying more than 40 per cent of global output in 2009
(Martinot and Li, 2010).
The rapid growth of the RETs sector has promoted a more comprehensive government policy, with amendments to the Renew-
able Energy Law in December 2009. These include better coordination and planning of RETs within the overall energy strategy
at national and provincial levels, further development of the energy storage policy and smart grids, removing bottlenecks relat-
ing to transmission and interconnections, strengthening of requirements for utilities to purchase all RE-generated power, and
increases in the levies on electricity sales to meet the increasing volume of RET subsidies.
Source: UNCTAD, based on the Renewable Energy Law of the People's Republic of China (2005).
a See: http://www.ccchina.gov.cn/en/NewsInfo.asp?NewsId=5371.
Developing countries
could consider ways
and means to restrict
patents on incremental
innovations in this field.

129CHAPTER V : NATIONAL POLICY FRAMEWORKS FOR RENEWABLE ENERGY TECHNOLOGIES
and logistic facilities results in high costs of
RETs production that make them uncom-
petitive on international markets. They also
affect the processes involved in RETs adop-
tion and use. In particular, many develop-
ing countries lack the technical capability
for testing, operation and maintenance of
RETs, as noted in chapter III. Creating the
requisite technology absorptive capacity of
the kind that facilitates the private sector’s
greater involvement in the development of
RETs is critical for the future deployment
and scale-up of locally manufactured and
adapted technologies, as witnessed in Bra-
zil, China and India. The provision of subsi-
dies for fossil fuels is another important area
that hinders the greater use of RETs.
1. Supporting the development of technological absorptive capacity
Fostering the ability to absorb, learn and ap-
ply knowledge for the greater use of RETs
in countries involves a number of key ele-
ments: training of technical support staff to
undertake the design, installation and main-
tenance of RE systems and to interact with
users to solve technical problems and pro-
vide them with information on equipment
operation; supporting engineers, scientists
and researchers to enable them to develop
new RE systems and processes; educat-
ing decision-makers, including economists,
administrators, regulators and financial in-
stitutions/investors in order to establish bet-
ter coordination between energy needs and
technology choices; and promoting greater
public awareness of and consumer confi-
dence in RETs (Benchikh, 2001; Parthan et
al., 2010). In this section, capability/compe-
tence development is discussed in terms of
training, development of adaptation capaci-
ties, and education and outreach.
a. Establishing training centresfor RETs
Countries would benefit from establishing
RET-specific training centres or introduc-
ing RET-specific training in established
centres domestically (similar to the sugges-
tion in chapter IV at the international level).
This is because, for the diffusion of RETs
to be sustainable, it is necessary to have a
well-trained workforce capable of installing,
maintaining and adapting RETs, as well as
trained target groups such as users, tech-
nicians, researchers/scientists, govern-
ment officials and investors. Such training
can take many forms, from formal degrees
and certificates to informal workshops and
web-based courses. There are a number
of examples of training being integral to the
sustainable transfer and diffusion of RETs
(box 5.12).
Box 5.12: Importance of training for RETs: Experiences of Botswana and Bangladesh
In Botswana, the lack of trained manpower for repair and maintenance of solar energy devices resulted in the failure of those
devices, loss of revenue and dwindling consumer confidence in solar technologies (Jain, Lungu and Mogotsi, 2002). To rectify
this situation, seven training programmes aimed at progressively increasing skills and expertise were introduced. They included
certificate level courses, a national craft certificate programme, a higher diploma for supervisory personnel and a short course
for senior managers in decision-making positions.
Similarly, in Bangladesh, investment in training has been central to the success of Grameen Shakti, a non-profit rural enterprise
that enables rural communities to lead a better life through the use of RETs. From the start, Grameen Shakti involved the local
community in the planning, implementation and maintenance of solar home systems (SHS). It is now planning to involve local
people in providing components and servicing in their community, as they would be familiar with the community’s needs. To
achieve this, Grameen Shakti has started a network of technology centres managed mainly by women engineers, which train
other women as solar technicians. At more than 40 technology centres based in rural areas the women undergo an initial 15
days of training on how to assemble and charge controllers and mobile phone chargers, and how to install and maintain solar
home systems. Users are also trained to take care of their own systems and to diagnose simple faults. These technology cen-
tres are intended to become self-sufficient businesses that will carry out the routine servicing of SHS in return for a fee that will
be paid by Grameen Shakti. The centres will be able to take out small loans to purchase tools and equipment and also sell their
services directly to customers (Ho, 2010; Barua, 2008).
Source: UNCTAD.
Countries would benefit
from establishing
RET-specific training
centres or introducing
RET-specific training
in established centres
domestically.

130 TECHNOLOGY AND INNOVATION REPORT 2011
Several new regional and national donor
initiatives are increasingly being designed
to address lack of skills and expertise. In
South-East Asia, for example a regional
training programme funded by the Swedish
International Development Agency (SIDA)
has had a significant impact (box 5.13).
b. Development of adaptationcapabilities
Various systemic failures identified in chap-
ter III necessitate the implementation of
domestic policies to support the develop-
ment of innovative capabilities for adapting
and modifying transferred technologies.
Supporting R&D and adaptation of RETs
through such measures as demonstration
projects, dedicated research programmes,
specific technology deployment and diffu-
sion activities and development of tech-
nologies can reduce perceived investment
risks and assist the adaption of technolo-
gies to local contexts. Engineering and de-
sign (non-R&D) capabilities that enable lo-
cal firms to experiment with the absorption
of technologies are likely to be as relevant
as building scientific R&D capabilities in
public research institutions.
However, imitating the RET innovation
systems in developed countries, or in the
more advanced developing countries such
as China or India, needs to be approached
with caution. While there are important les-
sons for replication in the policy context,
specific differences in the socio-cultural
context and in economic capacity, the lack
of or low level of activities of local enterpris-
es, and low local technological skills may
be limiting factors. These limitations imply
the need for additional policy support.
Collaboration and joint ventures can be an
important means of transferring skills as
well as hardware. Other examples of skills
transfer include through PPPs or climate
technology centres and networks. The lat-
ter connect institutions and people around
the world working on common themes
related to climate change, which also in-
cludes learning venues for RETs. One of
the lessons drawn from a recent study of
existing technology centres and networks
by UNEP and Bloomberg (2010) was the
need to provide participation incentives,
particularly as participating centres can-
not make capacity available without com-
pensation and they often cater to favoured
vested interests. In addition, such centres
should, as far as possible, be located in ex-
isting institutions that have the appropriate
infrastructure, and their funding needs to be
long-term and reliable. Developing coun-
tries should actively promote the creation
of such centres and networks with the aim
of increasing their absorptive capacity spe-
cifically for RETs within ongoing work under
the climate change agenda.
c. Education, awarenessand outreach
Lack of information regarding technologies,
user needs, local contexts, and regulations
and standards are all barriers to investment
in and use of RETs. Education and market-
ing of RETs at every point along the supply
chain – from investors and project devel-
opers to users – can help remove some of
the barriers. Education should encompass
firms, financial institutions, community co-
operatives and individuals. Knowledge of
the various incentives to invest in and pro-
Box 5.13: Renewable energy technologies in Asia: Regional research and dissemination programme
This SIDA-funded capacity-building programme, coordinated by the Asian Institute of Technology, was implemented between
1997 and 2004. It was undertaken within and by national research institutions (NRIs) in six countries: Bangladesh, Cambodia,
the Lao People’s Democratic Republic, Nepal, the Philippines and Viet Nam. Key components were local training programmes,
workshops/seminars, demonstrations and development of training manuals by the NRIs. Target groups were identified for train-
ing on specific technologies which focused on operation, installation, trouble-shooting and maintenance of RE systems. Overall,
16 manuals for training courses were published, 46 local seminars/workshops were conducted, 48 courses were completed
and 1,100 technicians were trained.
Source: UNCTAD, based on Bhattacharyya and Ussanarassamee (2004).
Engineering and design
(non-R&D) capabilities
that enable local firms
to experiment with
the absorption of
technologies are likely
to be as relevant as
building scientific R&D
capabilities.

131CHAPTER V : NATIONAL POLICY FRAMEWORKS FOR RENEWABLE ENERGY TECHNOLOGIES
duce energy from RETs, coupled with an
awareness of the opportunities small-scale
RETs can offer local communities, are all
important for stimulating demand as well as
supply. Consumer awareness of energy ser-
vices provided by RETs can further increase
demand, thereby providing a positive signal
to investors and also public awareness of
such services. Policymakers and regulators
also need information on how to deal with
and integrate RETs into the existing energy
system, while project developers need to
understand the financial options available
and the needs of users.
Improving consumer awareness requires
education and outreach of various kinds.
This can include advice and/or aid in im-
plementation, the creation of best practice
guides, development of comparison and
endorsement labels, consultation, dis-
semination of information and promotional
activities (IEA, 2011; Komor and Bazilian,
2005; Oliver et al., 2001). By increasing
customers’ awareness of the advantages
of RETs they would be more likely to agree
to pay higher tariffs for “green electric-
ity”, and the utilities could guarantee to
purchase the corresponding amounts of
electricity from RE producers (Ackermann,
2001).
2. Elimination of subsidiesfor conventional energy sources
Neither the environmental advantages of
RETs nor the environmental costs of fos-
sil fuels are currently captured by market
mechanisms, which is a very significant
problem for policymakers to resolve in or-
der to promote RET-based energy sources.
As an initial step, they could eliminate the
subsidies for fossil fuels. This may be not
be easy because conventional energy tech-
nologies tend to enjoy considerable subsi-
dies in many countries, many of which have
become embedded in the energy system
over time. Targeted and proactive domestic
policy interventions could help overcome
these challenges and encourage the diffu-
sion of RETs.
a. Removal of subsidies forcarbon-intensive fuels
High subsidies for the production and dis-
tribution of fossil fuels for power genera-
tion can make RETs less competitive than
would otherwise be the case. Therefore,
their reduction, where possible, should be a
key policy objective of governments. There
is already a downward trend in subsidies
for fossil fuel production, especially coal,
in many OECD countries, reflecting the
steady privatization and liberalization of en-
ergy markets. Many of these countries are
switching support from production of elec-
tricity generated from fossil sources towards
economic restructuring and redeployment
of the workforce. A global review of energy
subsidies in 2010 measured the shortfall
between the costs of supply and the costs
to consumers (price-gap approach) in 37
countries (almost all non-OECD countries)
that have significant consumption subsidies
(IEA, 2010). It found that the consumption
subsidies amounted to $312 billion in 2009.
Subsidies for the production of fossil fuels
(most often offered by OECD countries)
have been estimated at another $100 bil-
lion per year (GSI and IISD, 2010).
Germany, where the coal industry had been
subsidized for more than 50 years, primarily
to support electricity production, offers an
example of successful subsidy reform. Total
subsidy support reached a peak in 1996,
at €6.7 billion, despite declining levels of
coal production, but in 2007 such support
fell to approximately €2.5 billion, although
this still represented an annual support of
€90,000 per employee within the industry.
The Government has decided that by 2018
all subsidies to the indigenous German coal
industry will be phased out (UNEP, 2008).
In developing countries, energy subsidies
are often considered a tool of social policy,
as they protect the poor from the increas-
ingly high prices of fossil fuels. However,
this means that many governments pay a
disproportionate percentage of their bud-
getary funds in mitigating the impact of high
fuel prices. Moreover, fossil fuel subsidies
reduce the incentive to improve efficiency,
…which is a
significant problem for
policymakers to resolve
in order to promote RET-
based energy sources.
Neither the
environmental
advantages of RETs
nor the environmental
costs of fossil fuels are
currently captured by
market mechanisms…
132 TECHNOLOGY AND INNOVATION REPORT 2011
and to switch to more reliable and cost-
effective forms of energy. They also divert
investment away from potential improve-
ments in grid and generation efficiency.
An analysis of fossil fuel subsidy reforms in-
dicates that their removal would result in in-
creases in GDP for both developed and de-
veloping countries, ranging from of 0.1 per
cent in total for 2010 and 0.7 per cent per
year by 2050 (GSI and IISD, 2010). There
would also be substantially positive envi-
ronmental impacts. A recent study projects
a 10 per cent reduction in GHG emissions
by 2050 if consumer subsidies were to be
withdrawn in 20 non-OECD countries (Bur-
niaux et al., 2009). From a social protection
perspective, the evidence remains unclear,
but it is possible to redirect subsidies to-
wards social protection in a much more tar-
geted manner than is currently being done
(IISD, 2010). One potential way could be to
specifically limit the subsidies only to the
poor in the short and medium term so that
they do not bear an undue burden resulting
from the removal of subsidies.
b. Carbon and energy taxes
Several countries have successfully intro-
duced carbon-related energy taxes in a bid
to improve plant efficiency and reduce emis-
sions. For example, from 1970 to 1990,
Sweden invested heavily in RET-related
R&D, but without significant deployment
of these technologies. It was only with the
introduction of carbon taxes in 1991 that
substantial progress was made in terms of
switching from cheaper electric and oil-fired
boilers for district heating to biomass co-
generation. As a result of the taxes, the use
of biomass increased by more than 400 per
cent during the period 1990–2000. This
led to a number of follow-on technological
developments, such as biomass extrac-
tion technologies (Johansson and Turken-
burg, 2004). Finland, the Netherlands and
Norway are other examples of developed
countries that introduced carbon taxes in
the 1990s.
The United Kingdom has implemented a
tax on energy use for large industrial and
commercial customers, known as the Cli-
mate Change Levy (CCL). The CCL taxes
electricity consumption at 0.456 pence per
kWh. The levy encourages voluntary ef-
ficiency improvements by raising the price
of electricity, but it allows exemptions of up
to 80 per cent if participants meet certain
efficiency improvement targets. Electricity
sourced from renewables is also exempted
from the levy. The CCL has been extremely
successful in encouraging major energy us-
ers to cut their emissions, and it is expect-
ed that the instrument will result in at least
5 million tons of CO2 reductions by 2010.
Tradable emission permits are another
widely used policy intervention in industrial-
ized countries (box 5.14).
c. Public procurement ofrenewable energy
Public procurement of renewable energy
can provide a strong signal to markets
and the private sector about the level of
commitments by governments to support
long-term targets, in addition to providing
significant stimulus to technology develop-
ment and distribution. The promotion of
RE sourcing, alongside energy efficiency
standards and smart networks are part of
the ECs Energy 2020 strategy (EC, 2010).
Questions have been raised about the po-
tential conflict between procuring higher
cost RE and best-value procurement rules,
which might lead to concerns over fair
competition. Procurement guidelines are
important in this respect.
A number of countries have promoted pub-
lic procurement. For example, the Nether-
lands, as part of its implementation of the
Kyoto Protocol, introduced the Renew-
able Energy for Public Buildings scheme
in 2006, which aims to support a shift to
climate-neutral supply of energy for gov-
ernment structures by 2012. During the pe-
riod 2002–2004, a mandate required that
50 per cent of the consumption of electric-
ity of all government buildings be derived
from RE sources.7 In Sweden, in addition
to a pre-existing 1997 Investment Sup-
port Programme, the Government estab-
…in addition to
providing significant
stimulus to technology
development and
distribution.
Public procurement of
renewable energy can
provide a strong signal
to markets and the
private sector about the
level of commitments by
governments to support
long-term targets…
133CHAPTER V : NATIONAL POLICY FRAMEWORKS FOR RENEWABLE ENERGY TECHNOLOGIES
lished a five-year technology procurement
programme in January 1998 specifically
for electricity production based on renew-
ables. Total funds for this programme were
100 million Swedish kronor (€11 million).
The programme was replaced by the En-
ergy Act, which took effect in 2003. These
types of targeted activities are increasingly
being supplanted by broader attempts to
decarbonize overall energy supply.
3. Applicability of policyincentives to developing countries
This section has discussed two types of
incentives to foster the increased use and
adaptation of RETs in developing coun-
tries. The first type of incentives, intended
to enhance the technology absorptive ca-
pacity of actors in developing countries,
remain very important. Not only do they
promote the wider adaptation and use of
RETs, they are also the first step in develop-
ing incremental innovation capacity across
countries. These forms of incentives should
be actively promoted through appropriate
policy frameworks. The second type of in-
centives is intended to promote integrated
approaches to RETs among those devel-
oping countries that have some capabili-
ties for innovation and production of RETs.
Such countries should adopt integrated
approaches to RETs that simultaneously
promote innovation, production and greater
adaptation, as discussed in box 5.11. Elimi-
nation of subsidies on fossil fuels and send-
ing strong signals that support the use of
RETs through public procurement will also
be very important. While eliminating subsi-
dies, special safety nets for the poor should
be designed to ensure that they are not un-
duly affected. Measures such as imposition
of carbon and energy taxes that are being
widely used in industrialized countries will
Box 5.14: Tradable emissions permits
Emissions trading schemes have developed as a key policy option to reduce carbon intensity in the electricity sector because
of their economic efficiency. Creating liquid carbon markets can help economies identify and realize economical ways to reduce
emissions of GHGs and other energy-related pollutants and/or improve efficiency of energy use. The largest tradable permit
schemes include the EU’s Emission Trading System (EU ETS) and the Kyoto Protocol’s Clean Development Mechanism and
Joint Implementation mechanism. Other schemes are under development in Australia, New Zealand and the United States.
The EU ETS is the major policy instrument within the EU to reduce GHG emissions. Although some EU member States intro-
duced unilateral energy and carbon taxes, it was decided in 1999 that a cap-and-trade system would be more economically ef-
ficient. More than 10,000 sites are currently included in the scheme, representing approximately half of the total CO2 emissions
within the EU. Electricity and heat production facilities with a 20 MW capacity or more are a key target group within the scheme.
It has been argued that the electricity sector was the best suited of all sectors to be covered by the EU ETS because it was
responsible for one third of the total CO2 emissions in the EU (Svendsen and Vesterdal, 2003). Indeed, many low-cost CO2
emission-reduction opportunities existed within the sector, and companies were relatively well-informed of the opportunities
to reduce their CO2 emissions, which would lead to premature trading of emissions. Moreover, the sector was already tightly
regulated.
As a result, the power sector had the largest GHG reduction burden under the EU ETS. Allocations were made at a national
level, without any overall sectoral target for EU power sector emissions. During the second phase (from 2005 to 2008), the
power sector was consistently short on emission allowances and had to purchase them in the market to cover those allow-
ances. This is primarily due to the allocation process at national level, where individual governments have assigned short posi-
tions to their electricity producers.
A number of issues have arisen related to the participation of the power sector in the EU ETS. The most important of these is
the perception of windfall profits by participating power suppliers that passed along the “costs” (based on market value) of their
freely issued allowances to their customers. To counter this, full auctioning of permits to the electricity sector will begin in Phase
3 starting in 2013.a
Source: UNCTAD.
a For details see Directive 2009/29/EC of the European Parliament and of the council of 23 April 2009, available at:
http://eur-lex.europa.eu/LexUriServ/LexUriServ.do?uri=OJ:L:2009:140:0063:0087:EN:PDF.
While eliminating
subsidies, special safety
nets for the poor should
be designed to ensure
that they are not unduly
affected.

134 TECHNOLOGY AND INNOVATION REPORT 2011
need to be carefully thought through for
their socio-economic implications before
use in developing- country policy frame-
works.
E. MOBILIZING DOMESTIC RESOURCES AND INVESTMENTIN RETs
Financial incentives of various kinds can
promote investment in RETs, and facilitate
their quicker adaptation and utilization.
These incentives need to be developed
with an eye on the co-benefits that can be
derived from using RETs not only for elec-
tricity generation, but also more broadly as
a tool for industrial development in coun-
tries. All stages of the RETs innovation
and adaptation chain require financing, as
noted in previous chapters, and will depend
on countries’ ability to provide a mix of dif-
ferent kinds of financing, including venture
capital, equity financing and debt financ-
ing. Particularly in developing countries that
face several financial constraints on the in-
troduction and uptake of new technologies,
governments need to support the private
sector in its financing of innovation activi-
ties, such as by offering loan guarantees,
establishing business development banks
or mandating supportive lending by State
banks. Governments may also directly fund
innovation activities through, for example,
grants, low-interest loans, export credit
and preferential tax policies (e.g. R&D tax
credits, capital consumption allowances).
While designing support packages for the
private sector, national policymakers need
to ensure that technology developers are
not overcompensated for their financial
and economic risks. However, where it is
important to prove the feasibility or viability
of a new technology or sector, or where in-
formation or coordination failures are being
addressed, forms of concessional finance
and support may be justified. Some finan-
cial incentives that can be provided for the
private and public sector are discussed in
this section. While designing financial in-
centives, developing countries should bear
in mind the need for financing local enter-
prises’ medium-scale projects that lead to
incremental, adaptive learning in RETs, as
highlighted in previous chapters of this TIR.
1. Grants andconcessional loans
National governments may choose to
make funds available at a subnational level
to support investments in RE and environ-
mental sustainability. One example is the
Swedish Local Investment Program (LIP),
which was implemented by the Swedish
Environmental Protection Agency. The LIP
provides grants to local authorities to make
investments in pre-defined areas slated to
bring environmental benefits, and it over-
sees the environmental outcomes. The
potential scope for investments is relatively
broad, covering energy efficiency as well
as renewable power generation projects.
The programme was expected to result in a
conversion to 2.6 TWh per annum, leading
to an annual emission reduction of 1.7 mil-
lion tons.8
Among developing countries, examples in-
clude China, which has established a fund
in excess of $400 billion to support clean
power and RE. Similarly, the Philippines
has supported the deployment of renew-
ables through a $2 billion fund. In 2009,
the Bangladesh Central Bank established a
$29 million fund for similar purposes.
At the regional and international level, sev-
eral multilateral development agencies con-
tribute to the Clean Technology Fund (CTF)
and the Scaling up Renewable Energy pro-
gramme, both under the Climate Invest-
ment Funds.9 They include subnational
grants and concessional finance as core
components, and are administered either
directly or through national governments.10
2. Tendering systems
Tendering systems are quantity-driven
mechanisms that aim to promote either
investment in RETs or the greater use of
RETs for electricity generation. For projects
requiring investments, an announcement is
…governments need
to support the private
sector in its financing of
innovation activities.
Particularly in developing
countries that face
several financial
constraints on the
introduction and uptake
of new technologies…

135CHAPTER V : NATIONAL POLICY FRAMEWORKS FOR RENEWABLE ENERGY TECHNOLOGIES
made about a proposed investment sup-
port package and companies compete on
the basis of the amount of capacity they
plan to install in the proposed project. For a
capacity mechanism, the desired installed
capacity is announced, and investors com-
pete on the basis of cost. Both routes use
a bidding process in which commercial
developers compete to maximize the eco-
nomic efficiency of RET deployment. This
structure was pioneered by the Non-Fossil
Fuel Obligation of the United Kingdom, but
has been taken up by a number of other
countries as well. Tenders are being used
in Denmark for offshore wind, in France for
wind, biomass and biogas, and in Latvia
and Portugal for wind and biomass (Canton
and Lindén, 2010).
A number of developing-country govern-
ments have used a system of competitive
bidding to install fixed quantities of RE ca-
pacity. For example, China initiated a wind
power concession between 2003 and
2007, part of which involved a competitive
bidding process for additional capacity on a
yearly basis. A total of 3.4 GW was added,
but the scheme was later substituted by
feed-in tariffs for new capacity. In Brazil, the
PROFINA programme sought tenders for
3.3 GW capacity using small hydro, wind
and biomass under its first phase in 2009.
Other countries in Latin America have im-
plemented similar tendering auctions, with
Uruguay offering 60 MW of wind, biomass
and small hydro in 2009, and Argentina of-
fering 1 GW. Peru has indicated its willing-
ness to tender up to 500 MW of renewable
capacity by 2012 (REN21, 2010).
3. Fiscal measures
Fiscal measures relate to taxes and expen-
ditures, and have been used extensively
to support the deployment of renewables-
sourced electricity generation. These may
be in the form of tax exemptions, reduc-
tions or credits.
One of the earliest tax credit programmes
was the Japan Solar Roof programme,
which led to Japan becoming the world’s
leading installer and manufacturer of grid-
connected PV systems in 2005. In India,
the government has reduced its customs
levy on imports of machinery, instruments,
equipment and appliances used in solar PV
and solar thermal plants to 5 per cent. In
Africa, Kenya and Zimbabwe have recently
removed excise tax on PV systems.
Since 2003, China has operated preferen-
tial tax policies for RE. Foreign investment
in biogas and wind projects have benefited
from reduced income tax rates of 15 per
cent. There are a number of RE enterprises
and development projects that are eligible
for tax reductions. Wind turbines, solar PV
modules and their components also benefit
from preferential excise rates. In addition,
China provides significant capital subsidies
for solar PV installations. For large-scale
building systems (50 kw+), and for land-
based grid-connected systems (300 kw+)
it offers capital investment subsidies of up
to 50 per cent, and for off-grid projects the
capital subsidies can reach 70 per cent.
Subsidies are also helping to support a
solar PV pipeline of up to 500 MW, which
is expected to be completed by 2012. In
other parts of Asia, Indonesia introduced a
5 per cent tax credit for RETs in 2010, and
the Philippines has granted tax exemptions
and removed VAT for investments in RETs.
In India, there are specific tax exemptions
and accelerated depreciation allowances
for investments in wind power.
Mexico introduced the Accelerated Depre-
ciation for Environmental Investment pro-
gramme in 2005, which allows a deduction
of up to 100 per cent of the investment in
the first year of an RE-related investment.
The plant has to remain operational for at
least five years and should be able to pro-
duce a stipulated minimum output in com-
pliance with local legislation.11
4. Facilitating foreign direct investment in RETs
Facilitation of foreign direct investment (FDI)
involves creating enabling conditions for
attracting investors, and this will remain a
key goal of the broader innovation policy
framework for RETs. Investors, both foreign
Fiscal measures relate to
taxes and expenditures,
and have been used
extensively to support
the deployment of
renewables-sourced
electricity generation.

136 TECHNOLOGY AND INNOVATION REPORT 2011
and domestic, consider a number of fac-
tors when making investment decisions,
particularly those concerning the domestic
environment for investment. They assess
how risky or difficult it will be to make an
investment in a given country using a given
technology, and add this to the expected
costs. Broadly, investors look for political
and macroeconomic stability, an educated
workforce, adequate infrastructure (trans-
portation, communications and energy), a
functioning bureaucracy, the rule of law, a
strong financial sector, and ready markets
for their products and services. Policy bar-
riers differ fundamentally from country to
country, and from sector to sector. In the
case of RETs, there are many factors that
shape national energy policies, including
history, politics, geography and chance, on
the one hand, and innovation and produc-
tion climate on the other. Various studies
have noted that many developing countries,
particularly the least developed among
them, are not getting their full share of in-
vestment in renewables because their ex-
isting policies make them unattractive, ex-
cept for projects with the highest potential
returns (Amin, 2000; Chandler and Gwin,
2008; Point Carbon, 2007; Dayo, 2008;
Neuhoff, 2008; Cosbey and Savage, 2010).
Government-led efforts to facilitate the
uptake of RETs need to identify and over-
come the main barriers to trade and in-
vestment in these technologies. FDI could
be an important source of technology for
recipient countries, and could also lead to
the accumulation of tacit know-how in the
host countries with regard to plant opera-
tion, maintenance and RETs use. Countries
could attract FDI through policy incentives,
but at the same time they should consider
ways and means to make sure FDI leads to
building technological absorptive capacity,
such as requiring FDI to include training and
sharing of know-how on production, main-
tenance and use of RETs.
Box 5.15 presents some recent global
trends in RE-related FDI.
Box 5.15: FDI in the global market for solar, wind and biomass
FDI flows to the renewable energy industry have increased significantly in recent years. In 2003, the estimated value of such
flows was less than $10 billion, and rose steadily thereafter, reaching close to $121 billion in 2008. The global financial crisis in
2009 interrupted this trend, resulting in a fall in RE-related FDI to below $100 billion. Continued economic weakness and tight
credit conditions hampered investments in 2010, with overall FDI dropping further, to roughly $61 billion. However, investments
in RET manufacturing projects experienced a rebound in 2010, rising to $20.2 billion from $13.6 billion in 2009.
Source: UNCTAD, based on UNCTAD’s FDI/TNC database.
Box figure 5.15.1 Evolution of FDI flows in RE-based electricity generation and RETs manufacturing,
2003–2010 ($ billion)
Countries should
consider ways and
means to make sure
FDI leads to building
technological absorptive
capacity in RETs.

137CHAPTER V : NATIONAL POLICY FRAMEWORKS FOR RENEWABLE ENERGY TECHNOLOGIES
Box 5.15: FDI in the global market for solar, wind and biomass (continued)
FDI in the renewable energy market can flow to two main segments: (i) RE-based electricity generation, also referred to as the
downstream segment; and (ii) manufacturing of RETs, also referred to as the upstream segment. The latter includes the fabrica-
tion of equipment needed in the downstream segment, such as wind turbines, solar panels, or plants and equipment needed
in the production of biofuels.
During the period 2003–2010, most of the merger and acquisition activity took place in the market for RE-based electricity genera-
tion. In terms of the number of announced greenfield investment projects, there was a more balanced distribution between the up-
stream and downstream markets, with 46 per cent and 54 per cent respectively. During the period 2003–2010, UNCTAD estimates
that FDI in RE projects amounted to $406 billion. The regional distribution of these investments is shown in the box table below.
Source: UNCTAD, based on UNCTAD’s FDI/TNC database
Developed economies have been by far the biggest investors in the REs industry. Over the period 2003–2010, they accounted
for nearly 90 per cent of the reported FDI flows, followed by developing economies with 9.6 per cent and South- East Europe
and the Commonwealth of Independent States (CIS) with 0.9 per cent. In terms of destination of these flows, developed
economies have been the main target, attracting 57 per cent of total FDI, whereas developing countries attracted 39.3 per
cent and South-East Europe and the CIS 3.7 per cent. Although developed economies stand out as the main recipients of
FDI in RE projects, developing economies are becoming increasingly popular investment destinations in the manufacturing of
environmental technology products. Indeed, during the period 2007–2010 developing economies as a whole attracted more
investment projects in this area, by value, than developed countries. However, this generalization obscures the fact that China
accounted for a large share of this investment.
Source: UNCTAD.
Box table 5.15.1 Shares of FDI in renewable energy technologies by investing and host economic groupings,
2003–2010 (Per cent)
Reporting (investing) regions
Partner (host) region Developed economies Developing economies South-East Europe and CIS Total
Developed economies 55.2 1.7 0.1 57.0
Developing economies 31.3 7.5 0.5 39.3
South-East Europe and CIS 3.0 0.4 0.4 3.7
Total 89.5 9.6 0.9 100
Two important caveats need to be noted with respect to
FDI. First, removing some or all of the general barriers to
investment may not necessarily lead to greater FDI for
RETs in developing countries. Second, not all investment
is desirable investment. In the rush to attract FDI in the
RETs sector, governments should not abandon their other
public policy objectives, or waive the due diligence pro-
cess in screening and regulating investors in RETs projects
that they would apply to investors in other sectors.
F. NATIONAL POLICIES ON SOUTH-SOUTH COLLABORATION AND REGIONAL INTEGRATIONOF RETs
South-South collaboration presents new opportunities
for increasing the use and deployment of RETs not only
through trade and investment channels, but also through
technology cooperation, and this can be facilitated by gov-
ernments, intergovernmental organizations and/or devel-
opment banks (as noted in chapter IV). Such cooperation
can also be mediated by private sector owners of RETs,
although this is less frequent. Technology cooperation can
take several forms, ranging from training foreign nationals
in the use and maintenance of RETs to supporting research
in partner countries to adapt existing technologies to local
needs. It can also include outright grants of RET-related
intellectual property rights, or licensing on concessionary
terms. In several cases a developed-country institution
has been involved in bringing developing-country partners
together for this sort of cooperation, as discussed below.
The benefits of such collaboration could include the wide
dissemination of RETs among developing countries, along
with the commensurate benefits discussed earlier in this
analysis.

138 TECHNOLOGY AND INNOVATION REPORT 2011
1. Best practices in tradeand investment
There are several modes by which trade
and investment can help in the South-
South dissemination of RETs. They include
the simple flow of traded goods, the flow
of investments or joint investments in new
RETs (such as energy generation facilities),
or the award of a concession for anything
from the building of new capacity to a com-
plete turnkey operation that involves build-
ing, operating and maintaining new RE
capacity. As a general rule, the greater the
involvement of the more technologically ad-
vanced developing country in the venture,
the greater will be the degree of technology
learning in the recipient country, which will
provide a better basis for building domes-
tic capabilities for production in that sector.
However, the extent of technology transfer
and learning will vary depending on the
characteristics of different RETs.
Trade in RETs and associated goods is one
way to effect technology transfer, though by
itself it offers a limited means of dissemi-
nating technologies. Ideally, it would be
accompanied by ancillary investments and
training where the technologies are novel.
It may also be limited in generating back-
ward and forward linkages and cultivating
domestic capabilities in the sector. Brazil,
for example, exports hydrous ethanol to
facilities in Jamaica and Trinidad that then
dehydrate the stock to create anhydrous
ethanol (USDA, 2008). The finished product
is exported tariff-free to the United States
under the Caribbean Basin Initiative free
trade agreement, thereby avoiding a 54
cents/litre tariff to which Brazilian exports
would have been subject. This example
shows that trade alone does not necessar-
ily lead to the dissemination of RETs, since
there is no uptake of the ethanol as fuel in
the processing countries.
Another example of South-South collabora-
tion is that of China’s Trina Solar, which was
contracted to export its PV modules used
by an Indian company (Lanco Infratech) to
build a 5 MW solar PV plant in India’s state
of Rajasthan – the country’s largest at the
time of building. Here the source firm was
simply part of the developer’s global supply
chain, which was beneficial for both firms in
terms of increased learning and economic
viability.
Often, host countries seek to develop their
RET capacity by means of concessions to
build, and potentially operate and maintain,
RE facilities. For example India’s Suzlon En-
ergy reported in February 2011 that it had
won a bid to build, operate and maintain
a 218 MW wind power installation in the
states of Ceará and Rio Grande do Norte
in Brazil. The ultimate impact of such deals
will probably depend on the details of the
arrangement (which were unavailable in
this case). Purchasing governments can
specify various requirements such as local
content, the nature of the joint venture, the
use of a specified percentage of nationals in
management, use of local R&D, and other
requirements designed to foster greater
backward and forward linkages, and to
stimulate domestic industrial capacity.
However, in many instances, performance
requirements contravene WTO rules and
regional trade agreements.12 In this con-
text, export-related performance require-
ments are effective at creating linkages and
spillover effects within the host economy,
while those related to technology sharing
and joint ventures are on the whole less ef-
fective (Moran, 1999 and 2001; UNCTAD,
2003; Kumar, 2005).
Private sector investment, a common form
of South-South collaboration in general, is
an effective means of disseminating RETs.
For example, in 2010 China’s Suntech
Power Holdings signed an agreement to
develop solar PV capacity of up to 100 MW
– an investment estimated to be worth
$350–$400 million (Reuters, 2010). The
investment was to involve a South African
company as a local partner. In 2007, Su-
zlon Energy established a factory in Tianjin,
China, to manufacture rotor blades, gen-
erators, hubs and other wind turbine com-
ponents, which would be able to produce
a capacity equivalent of 600 MW per an-
num, and it has also established an on-site
Private sector
investment, a common
form of South-South
collaboration in general,
is an effective means of
disseminating RETs.

139CHAPTER V : NATIONAL POLICY FRAMEWORKS FOR RENEWABLE ENERGY TECHNOLOGIES
R&D centre. Suzlon has also partnered with
domestic investors on Chinese wind instal-
lations, and has recently opened a sales of-
fice in the Republic of Korea on the expec-
tation of strong future sales in that country.
As with concession agreements, these
sorts of investments vary in their impact ac-
cording to the specifics of each case, with
government policy being a key determinant.
As noted earlier in this Report, another key
determinant is domestic capacity to absorb
the technology in question, and to capture
spillover benefits. Use of local qualified staff
in management and senior operating ca-
pacities creates potential for learning by do-
ing in aspects that include the technology
itself, its operating procedures and man-
agement practices. In addition, the avail-
ability of local firms and organizations with
the capacity to partner with or act as sup-
pliers to the investors stimulates domestic
capacity by exposing those firms to globally
competitive standards and practices.
Developing countries need to be able to ex-
ploit the immense potential of South-South
investment in RETs through institutional in-
centives, while at the same time ensuring
that those investments promote national
strategic interests and development goals.
For example, Abellon Clean Energy of India
recently announced a plan to invest in Gha-
na, in an operation that would involve the
cultivation of feedstocks and the refining of
solid biofuels for export. The plan envisages
cultivation on 10,000 hectares of “derelict”
land (Bloomberg, 2011). This investment
could represent an unqualified boon for
Ghana: company projections are for em-
ployment of 21,000 farmers and 4,000 fac-
tory workers. But it will be important for
Ghana to ensure that this investment aligns
well with domestic public policy goals by
ensuring, among other things, that the proj-
ect will not unduly exacerbate existing wa-
ter shortages through irrigation or industrial
use, that industrial effluent will not exceed
acceptable levels, and that the legal status
of the land in question is clearly defined.
Newer projects for regional cooperation
are in the process of being implemented
in countries, some of which are regional in
nature, and they offer hope that regional
ventures may well provide significant solu-
tions in this area. A promising venture is the
Turkana Wind Power project currently un-
der way in East Africa (box 5.16). The pro-
jected capacity of the Turkana wind corridor
is 300 MW, which would be twice the cur-
rent installed capacity of Chile (discussed in
box 5.3 above).
2. Best practices in technology cooperation
Cooperation agreements are another form
of South-South collaboration on RETs,
which involve sharing of technologies, train-
ing or joint R&D between countries and
firms. These may be led by the govern-
ments involved, and/or facilitated by inter-
governmental organizations, or multilateral
or regional development banks. They may
also be led by the private sector, but usually
the private sector participates as a partner
in efforts organized by others.
There are a number of examples of such
arrangements. Under the Bilateral Memo-
randum of Understanding to Advance Co-
operation on Biofuels between Brazil and
Box 5.16: The Turkana Wind Power Project, Kenya
The Lake Turkana Wind Power Project located near Lake Turkana in north-western Kenya aims
to take advantage of the winds that are channeled through the Turkana Corridor between the
Ethiopian and Kenyan highlands. The project envisages the construction of a wind park compris-
ing 353 wind turbines, each with a capacity of 850 KW. The initial phase of this wind farm was
supposed to start production in June 2011, and it is expected that when it reaches full production
by July 2012 it will provide 300 MW of clean power to the country’s national grid, which amounts
to 30 per cent or more that would be added to the total existing installed capacity in Kenya.
Source: UNCTAD, based on Lake Turkana Wind Power Project website at:
http://laketurkanawindpower.com/default.asp
Cooperation agreements
are another form
of South-South
collaboration on RETs,
which involve sharing of
technologies, training
or joint R&D between
countries and firms.
Developing countries
need to be able to
exploit the immense
potential of South-South
investment in RETs
through institutional
incentives.

140 TECHNOLOGY AND INNOVATION REPORT 2011
the United States in 2007 the Organization
of American States, as an institutional part-
ner to the agreement, promotes technical
assistance and policy reform in a number
of countries (the Dominican Republic, El
Salvador, Haiti, Guatemala, Jamaica, and
Saint Kitts and Nevis) to enable the devel-
opment and local use of ethanol, based in
part on Brazilian experience and expertise.
The Brazilian industry association for etha-
nol producers (UNICA) is involved as a part-
ner.
In China, UNIDO helped create the Gansu
Natural Energy Research Institute, the In-
ternational Solar Energy Center for Tech-
nology Promotion and Transfer and the
Asia-Pacific Research and Training Center
for Solar Energy. The two former institutions
cooperate with UNIDO to conduct training
and convene conferences for foreign na-
tionals in solar and other RETs. Between
1991 and 2008, they trained more than
800 solar energy users from 104 countries,
most of them from other developing coun-
tries. They routinely send staff to the field
to conduct training and provide technical
assistance in developing countries. This
is an excellent model of capacity-building
coupled with R&D and supported by inter-
governmental agencies.
Another example of technology coopera-
tion is Brazil’s willingness to share its ex-
pertise in the production of ethanol. Largely
through its agricultural research institute,
EMBRAPA, the Brazilian Government has
carried out extension work in a number of
developing countries, including 15 African
countries that plan to produce ethanol with
technology and supervision provided by
Brazil.13 In Ghana, the Brazilian firm Con-
stran has invested more than $300 million
in developing the infrastructure necessary
to produce up to 180 million litres of ethanol
annually (El Pais, 2008). EMBRAPA has set
up a permanent facility in Ghana to facilitate
the ongoing projects there, which includes
supporting domestic R&D. This model in-
volves private sector and government co-
operation in seeking economic expansion
and investment opportunities, and in the
process building capacity in the host coun-
tries. Several projects mentioned in this
chapter are being implemented in a number
of developing countries. For example, the
the Barefoot College and the Lighting a bil-
lion Lives Initiative (boxes 5.1 and 5.2) ini-
tiated in India are now being implemented
in several other developing countries and
LDCs.
G. SUMMARYThis chapter has presented elements of
an integrated innovation policy framework
for RETs use, adaptation, innovation and
production in developing countries. The
concept of such a framework envisages
linkages between two very important and
complementary policy regimes: national in-
novation systems that provide the neces-
sary conditions for RETs development, on
the one hand, and energy policies that pro-
mote the gradual integration of RETs into
industrial development strategies on the
other. The chapter suggests that such a
framework is essential for harnessing ben-
efits from the virtuous cycle of interaction
between RETs and science, technology
and innovation.
The analysis has identified elements of a
national integrated innovation framework
for developing countries under the follow-
ing five headings:
(i) setting policy strategies and goals;
(ii) providing policy incentives for R&D,
innovation and production of RETs;
(iii) providing policy incentives for greater
technological absorptive capacity that
is needed for adaptation and use of
available RETs;
(iv) promoting domestic resource
mobilization for RETs in national
contexts; and finally,
(v) exploring newer means of improving
innovation capacity in RETs, including
South-South collaboration.
Developing countries may face a variety of
constraints in each of these areas, but there
are also several opportunities. The chapter
has presented numerous examples of ini-
tiatives, including policy incentives, which
Developing countries
may face a variety of
constraints in each
of these areas, but
there are also several
opportunities.
141CHAPTER V : NATIONAL POLICY FRAMEWORKS FOR RENEWABLE ENERGY TECHNOLOGIES
have worked well in both developed and
developing countries. Some important les-
sons from these initiatives are summarized
below.
First, the success of a number of emerging
economies in developing technological ca-
pabilities over time is largely attributable to
the role of national governments in provid-
ing strategic, targeted policy support for the
use, adaptation and deployment of RETs.
However, the kinds of incentives, which
have been used by industrialized countries
or by the larger developing countries such
as India or China may not be applicable to
other developing countries due to their less
favourable circumstances. The chapter also
highlights some of the policy incentives
that need to be approached with caution.
Of special note are those related to carbon
taxes, which may not be relevant or useful
in the context of many developing countries.
Second, developing countries should con-
sider diversified energy regimes that give
priority to the deployment of REs most
suited to their contexts, while ensuring
that conventional energy sources are not
subsidized extensively. This includes recti-
fying unfavourable arrangements such as
monopoly providers of power that control
both generation and distribution, and where
there are no requirements (or no require-
ments on reasonable terms) for those pro-
viders to purchase independently produced
power. Some means of resolving this issue
are through the provision of fiscal incentives
for renewables (e.g. feed-in tariffs), or man-
dated requirements for sourcing electricity
generation from a given percentage of re-
newables (e.g. renewable purchase obliga-
tions).
Third, success in eliminating, or at least
reducing, energy poverty through the use
of RETs does not necessarily require large-
scale projects with huge investments.
Smaller initiatives have been highly suc-
cessful as off-grid solutions to rural elec-
tricity, and offer considerable potential for
replication.
Fourth, creating an integrated innovation
policy framework of the kind outlined in
this chapter should not be viewed as a
daunting exercise. Nor is a comprehensive
policy framework a prerequisite for begin-
ning to harness the potential of RETs for
energy access and sustainable develop-
ment. In the developing-country context,
a few well-coordinated incentives can go
a long way in achieving significant results,
and these can serve as the building blocks
for an integrated framework in the years
to come. Further, many countries may al-
ready be providing several of the policy in-
centives listed here. The emphasis in such
cases needs to be on enhanced coordina-
tion to reach targets in RETs use, promo-
tion and innovation.
Fifth, countries will need to experiment
with different policy combinations, and this
learning process could have positive im-
pacts on the RETs sector. With time, incen-
tives and policy frameworks evolve in tan-
dem with the technological sophistication
of the sector.
Finally, as noted in chapter IV, and stressed
elsewhere in this TIR, developing countries
will need the support of the international
community to benefit from the potential
that RETs offer for alleviating (and eventually
eliminating) energy poverty and for climate
change mitigation. Forging a strong part-
nership with the international community
could lead to the widespread dissemination
of environmentally sustainable technologies
worldwide, resulting in enhanced economic
development and greater opportunities for
large segments of populations that have
been left behind in the process of global-
ization.
Countries will need to
experiment with different
policy combinations, and
this learning process
could have positive
impacts on the RETs
sector.
Success in eliminating,
or at least reducing,
energy poverty through
the use of RETs does
not necessarily require
large-scale projects with
huge investments.

142 TECHNOLOGY AND INNOVATION REPORT 2011
NOTES
1 http://ec.europa.eu/energy/renewables/targets_en.htm
2 See REN21 (2010) for a list of renewable electricity produc-tion targets set by different developing countries as of 2010.
3 Couture and Gagnon (2010) present seven ways to struc-ture a FIT. For country case studies, see, for example, Chua, Oh and Goh (2011) for Malaysia, del Río González (2008) for Spain and Schaeffer and Voogt (2000) for Denmark, Ger-many and Spain.
4 Article 27 of the TRIPS Agreement specifies that ‘novelty’, ‘industrial applicability/utility’ and ‘inventive step’ are the criteria for grant of patents, the provision does not define these criteria. As a result, they can be interpreted in different ways within national regimes.
5 Brazil, China and India have advocated stronger use of TRIPS flexibilities at the UNFCCC intergovernmental meet-ings, including the greater use of compulsory licences.
6 Technological absorptive capacity is a critical prerequisite for countries across many sectors (as discussed in TIR 2010 in the context of agricultural innovation).
7 http://www.rijksoverheid.nl/ministeries/ienm.
8 See: www.naturvardsverket.se/en/In-English/Menu/Legisla-tion-and-other-policy-instruments/Economic-instruments/In-vestment-Programmes/Local-Investment-Programmes-LIP/.
9 CIF are channelled through the African Development Bank, the ADB, the European Bank for Reconstruction and De-velopment, the Inter-American Development Bank and the World Bank Group.
10 The CIF is composed of the Clean Technology Fund (CTF) and the Strategic Climate Fund (SCF). Each of them is governed by a separate Trust Fund Committee having equal representation from contributor and recipi-ent countries (see: http://www.climateinvestmentfunds.org/cif/sites/climateinvestmentfunds.org/files/Financ-ing%20Modalit ies%20nov2010_110810_key_docu-ment.pdf).
11 www.ine.gob.mx.
12 The WTO Agreement on Trade-Related Investment Mea-sures prohibits performance requirements related to exports and imports, as well as domestic content requirements, if they are used as a condition for obtaining some advantage. The WTO’s Agreement on Subsidies and Countervailing Measures (Article 3) similarly prohibits subsidies that are conditional on export performance or the use of domestic content.
13 The 15 countries are: Benin, Burkina Faso, Cape Verde, Gambia, Ghana, Guinea, Guinea-Bissau, Côte d’Ivoire, Liberia, Mali, Niger, Nigeria, Senegal, Sierra Leone and Togo.

143CHAPTER V : NATIONAL POLICY FRAMEWORKS FOR RENEWABLE ENERGY TECHNOLOGIES
REFERENCES
Ackermann T (2001). Overview of government and market driven programs for the promotion of renewable power
generation. Renewable Energy, 22(1-3): 197–204.
Almendras JR (2010). Philippine energy market outlook and the national renewable energy plan. Presented at
Renewable Energy and Conference Expo Manila 2010. Manila, Philippines, 2 December 2010. Available at:
http://www.doe.gov.ph/Sec%20Corner/Philippine%20Energy%20Market%20Outlook%20and%20The%20
National%20RE%20Plan.pdf.
Amin A-L (2000). The power of networks: Renewable electricity in India and South Africa. Brighton,
University of Sussex.
Barua D (2008). Rapidly growing solar installer provides clean cooking as well. The Ashden Awards for Sustainable
Energy case study. Available at: http://www.ashdenawards.org/files/reports/grameen_case_study_20081105.pdf.
Benchikh O (2001). Global renewable energy education and training programme (GREET Programme).
Desalination, 141(2): 209–221.
Bhattacharyya SC and Ussanarassamee A (2004). Decomposition of energy and CO2 intensities of Thai industry
between 1981 and 2000. Energy Economics, 26(5): 765–781.
Bloomberg (2011). India’s Abellon plans 25,000 biofuel jobs in Ghana, UNDP says. 24 February. Available at:
http://www.bloomberg.com/news/2011-02-24/india-s-abellon-plans-to-create-25-000-biofuel-jobs-in-ghana-
undp-says.html (accessed 24 February).
Burniaux J-M, Château J, Dellink R, Duval R and Jamet S (2009). The economics of climate change mitigation:
How to build the necessary global action in a cost-effective manner. Paris, OECD Publishing, June.
Canton J and Lindén A J (2010). Support schemes for renewable electricity in the EU. Brussels, European Commis-
sion, Directorate-General for Economic and Financial Affairs.
Chandler W and Gwin H (2008). Financing energy efficiency in China. Washington, DC, Carnegie Endowment for
International Peace.
CNE (2009). Modelación del recurso solar y eólico en el norte de chile. Comisión Nacional de Energia. Available at:
http://www.cne.cl/cnewww/export/sites/default/05_Public_Estudios/descargas/ModelacionRecursoSolarEolico.pdf.
Chua SC, Oh TH and Goh WW (2011). Feed-in tariff outlook in Malaysia. Renewable and Sustainable Energy
Reviews, 15(1): 705–712.
Cleantech Open (2010). Driving innovation trends, technology and investment. Preliminary report. Redwood City,
CA, November 2010.
Couture T and Gagnon Y (2010). An analysis of feed-in tariff remuneration models: Implications for renewable energy
investment. Energy Policy, 38(2): 955–965.
Cosbey A and M. Savage (2010). RETs for sustainable development: Designing an integrated response for
development. Background paper for TIR 2011, UNCTAD, Geneva.
Curren J (2010). The design of adapted feed-in tariff for African countries. Presented at REEEP-SERN Regional
Workshop on Feed-In Tariffs. Johannesburg, November 2010.
Dayo FB (2008). Clean energy investment in Nigeria: The domestic context. Manitoba, International Institute for
Sustainable Development.
del Río González P (2008). Ten years of renewable electricity policies in Spain: An analysis of successive feed-in tariff
reforms. Energy Policy, 36(8): 2917–2929.
El Pais (2008). El desembarco africano de Brasil, Río de Janeiro. Available at: http://www.elpais.com/articulo/
internacional/desembarco/africano/Brasil/elpepuint/20081125elpepuint_22/Tes (accessed 24 February 2011).

144 TECHNOLOGY AND INNOVATION REPORT 2011
EC (2010). Energy 2020: A strategy for competitive, sustainable and secure energy. Communication from
the Commission to the European Parliament, The Council, The European Economic and Social Committee
and the Committee of Regions. Brussels.
Emerging Energy Research (2011). Brazil leads Latin america wind energy markets to 46 GW by 2025.
Available at: http://www.emerging-energy.com/content/press-details/Brazil-Leads-Latin-America-Wind-
Energy-Markets-to-46-GW-by-2025/29.aspx (accessed 19 September 2011).
Government of the Philippines (2008). Renewable Energy Act of 2008. Manila. Available at:
http://www.lawphil.net/statutes/repacts/ra2008/ra_9513_2008.html (accessed 19 September, 2011).
GSI (Global Subsidies Initiative) and IISD (International Institute for Sustainable Development) (2010).
Relative subsidies to energy sources: GSI estimates. Available at: www.globalsubsidies.org/files/assets/
relative_energy_subsidies.pdf.
Ho M-W (2010). Grameen Shakti for renewable energies. London, Institute for Science in Society.
Available at: http://www.i-sis.org.uk/grameenShaktiRenewableEnergies.php (accessed 15 August 2011).
IEA (2010). World Energy Outlook 2010. Paris, OECD/IEA.
IEA (2011). Clean Energy Progress Report. Paris, OECD/IEA.
IISD (International Institute for Sustainable Development) (2010). The effects of fossil-fuel subsidy reform:
A review of modelling and empirical studies. Winnipeg.
Jara W (2007). Energía eólica: la experiencia de endesa chile. Presented at Seminario Oportunidades en el
Desarrollo de las Redes de Energía Electrica: Conductores de Alta Capacidad y Parques Eólicos, Chile, 2007.
Available at: http://www.cigre.cl/sem_9_sept/presentaciones/endesa%20eco.pdf.
Jain PK, Lungu EM and Mogotsi B (2002). Renewable energy education in Botswana: Needs, status and proposed
training programs. Renewable Energy, 25(1): 115–129.
Johansson TB and Turkenburg W (2004). Policies for renewable energy in the European Union and its member
states: An overview. Energy for Sustainable Development, 8(1): 5–24.
Komor P and Bazilian M (2005). Renewable energy policy goals, programs, and technologies. Energy Policy, 33(14):
1873–1881.
Kumar N (2005). Performance requirements as tools of development policy: Lessons from experiences of developed
and developing countries for the WTO Agenda on trade and investment. In: Gallagher K, ed. Putting Development
First. London, Zed Press.
LAWEA (2010). 2009-2010 energía eólica en América Latina. Wind Energy Association for Latin America.
Available at: http://www.lawea.org/YearBook/2009-2010/EspanolFinal/espanol.pdf.
Martinot E and Li J (2010). China’s latest leap: An update on renewables policy. Available at:
http://www.renewableenergyworld.com/rea/news/print/article/2010/07/renewable-energy-policy-update-for-china.
Moner-Girona M (2009). A new tailored scheme for the support of renewable energies in developing countries.
Available at: http://www.sciencedirect.com/science/article/pii/S0301421508007222.
Moran TH (1999). Foreign direct investment and development: A reassessment of the evidence and policy implica-
tions. In: OECD. Foreign Direct Investment, Development and Corporate Responsibility. Paris, OECD.
Moran TH (2001). Parental supervision: The new paradigm for foreign direct investment and development.
Washington, DC, Peterson Institute for International Economics.
Negro SO, Hekkert MP and Smits R (2008). Stimulating renewable energy technologies by innovation policy. Utrecht,
Department of Innovation Studies, Utrecht University.
Neuhoff K (2008). International support for domestic climate policies: Policy summary. Cambridge, Climate
Strategies. Available at: http://www.climatestrategies.org/research/our-reports/category/40/99.html.

145CHAPTER V : NATIONAL POLICY FRAMEWORKS FOR RENEWABLE ENERGY TECHNOLOGIES
Oliver T, Lew D, Redlinger R and Prijyanonda C (2001). Global energy efficiency and renewable energy policy options
and initiatives. Energy for Sustainable Development, 5(2): 15–25. June.
Parthan B, Osterkorn M, Kennedy M, Hoskyns St. J, Bazilian M and Monga P (2010). Lessons for low-carbon energy
transition: Experience from the Renewable Energy and Energy Efficiency Partnership (REEEP). Energy for Sustainable
Development, 14(2): 83–93.
Point Carbon (2007). Carbon 2007: A new climate for carbon trading. Available at: http://www.pointcarbon.com/
polopoly_fs/1.189!Carbon_2007_final.pdf.
REN21 (2009). Renewables Global Status Report 2009, update. Paris, REN21 Secretariat.
REN21 (2010). Renewables 2010 Global Status Report 2010. Paris, REN21 Secretariat.
Reuters (2010). Suntech signs MOU to build solar power plants in S. Africa, 26 August. Available at:
http://af.reuters.com/article/topNews/idAFJOE67P00J20100826.
Schaeffer GJ and Voogt MH (2000). Policy options for the stimulation of renewable energy in a liberalising market:
An analysis. In: World Renewable Energy Congress VI. Oxford, Pergamon: 1685–1688.
Scottish Executive (2009). The Renewables Obligation Order 2009. Scotland. Available at:
http://www.legislation.gov.uk/ssi/2009/140/pdfs/ssien_20090140_en.pdf.
Sovacool B (2010). A comparative analysis of renewable electricity support mechanisms for Southeast Asia.
Energy Policy, 35(4), April: 1779–1793.
Svendsen GT and Vesterdal M (2003). How to design greenhouse gas trading in the EU? Energy Policy, 31(14):
1531–1539.
UNCTAD (2003). Foreign Direct Investment and Performance Requirements: New Evidence from Selected
Countries. United Nations publication, sales no. E.03.II.D.32. New York, United Nations.
UNCTAD (2010). Technology and Innovation Report 2010: Enhancing Food Security in Africa through Science,
Technology and Innovation. New York and Geneva, United Nations.
USDA (2008). Brazil Bio-Fuels Annual – Ethanol 2008, no. BR8013. Washington, DC.
UNEP (2008). Reforming Energy Subsidies: Opportunities to Contribute to the Climate Change Agenda (No. 1).
Available at: http://www.unep.org/pdf/PressReleases/Reforming_Energy_Subsidies.pdf
UNEP and Bloomberg (2010). Global Trends in Sustainable Energy Investment 2010: Analysis of Trends and Issues
in the Financing of Renewable Energy and Energy Efficiency. United Nations Environment Programme.
Available at: http://bnef.com/Download/UserFiles_File_WhitePapers/sefi_unep_global_trends_2010.pdf.
UN/DESA (2009). A global green new deal for climate, energy, and development. Available at:
http://www.un.org/esa/dsd/resources/res_pdfs/publications/sdt_cc/cc_global_green_new_deal.pdf.
van Alphen K, Kunz HS and Hekkert MP (2008). Policy measures to promote the widespread utilization of renewable
energy technologies for electricity generation in the Maldives. Renewable and Sustainable Energy Reviews, 12(7),
September: 1959–1973.
ZEP (2008). EU demonstration program for CO2 capture and storage (CCS). European Technology
Platform for Zero Emission Fossil Fuel Power Plants (ZEP), October.


CONCLUSION6


149CHAPTER VI : CONCLUSION
CHAPTER VI
CONCLUSION
Energy poverty remains the key issue in the
interface of climate change and develop-
ment. As highlighted in this TIR, RETs of-
fer a distinct possibility of tackling the dual
challenge of climate change and energy
poverty. Established RETs offer an impor-
tant means not only of reducing energy
poverty, but also of complementing national
strategies for climate change mitigation. All
countries have the potential to transition to
an energy sector that contains suitable mix-
es of conventional and renewable energy
sources in order to alleviate energy poverty,
and to reposition their economies on green-
er catch up trajectories. However, the chal-
lenge for developing countries and LDCs is
to build their technological capabilities and
domestic markets so that they can promote
the use, large-scale adaptation, production
and innovation of RETs for development
of manufacturing and other sectors of the
economy. The ensuing added benefits in
terms of job creation and export potential
will lend the much-needed impetus to their
economic development.
These are not individual challenges, as
much of the analysis in this Report points
out. Like many other issues in development
today, there is an increasing convergence
of causative factors. The following areas of
interface stand out in the debates on tech-
nology, innovation and climate change that
are of particular relevance for all developing
countries.
(i) Developing countries are at a cross
roads currently with regard to
exploring the extent to which already
established RETs can help alleviate
energy poverty by complementing
traditional energy sources. Access
to energy is such a crucial element
in contributing to well-being and
development that it is repeatedly
being referred to in policy debates
as the “missing MDG”.
(ii) The structural transformation
of countries is fundamental to
development, and this relies strongly
on the growth of national technological
capabilities. Deployment of RETs
can be a valuable part of an overall
industrialization effort. However, the
lack of reliable power supplies is a
crippling bottleneck in the process
of industrialization in developing
countries and LDCs. In particular,
it inhibits growth of productive
sectors in many of these countries.
It also impedes the development
and performance of other sectors
that are potentially important to
the process of industrialization and
development, such as services,
tourism, agricultural processing, and
others that depend on a reliable,
high quality power supply regime.
This Report has therefore stressed
the need for recognizing that
energy security and technological
capabilities have a virtuous
relationship. Energy security is key
to the provision of the necessary
physical infrastructure that promotes
high levels of enterprise growth in the
early stages of structural change,
and technological capabilities are
a fundamental prerequisite for the
increased adaptation and use of
RETs within domestic economies.
National strategies for sustainable
development that include promoting
a greater use of RETs are likely to
be constantly undermined by the
lack of technological and innovation
capacity which are required not

150 TECHNOLOGY AND INNOVATION REPORT 2011
only for R&D and innovation of
new RETs, but also for adaptation,
dissemination and use of existing
RETs.
(iii) Policy developments at the
international level tend to have
a significant impact on national
aspirations for technological
empowerment in developing
countries, and particularly LDCs,
in this highly complex terrain.
International negotiations and
developments in the context of
climate change and the green
economy as part of the Rio+20
framework raise several important
issues for developing countries.
Joining forces with the work being
done by other United Nations
agencies in this regard, this Report
has called for the international
agenda to place a greater focus on
the elimination of energy poverty by
promoting the greater use of RETs
for mitigating climate change. This
is not simply a matter of rhetoric; it
implies a greater emphasis on RETs
in the climate change financing
architecture and the technology
transfer discourse. In the context of
the green economy, this Report has
focused on RETs mainly, emphasizing
that there is a greater need to
make technologies and investment
available for the development,
adaptation and deployment of
RETs in developing countries and
LDCs, rather than imposing “green”
deadlines on those countries.
(iv) The diffusion of RETs in developing
countries involves much more than
transferring technology hardware
from one location to another. This
Report, noting the complexity of
technological change in different
contexts, calls for targeted
international support to foster RETs-
related learning. Such support could
include the following elements:
an international innovation network
for LDCs, with a RET focus;
global and regional research
funds for RETs deployment and
demonstration;
an international RETs technology
transfer fund; and,
an international RETs training
platform.
(v) National governments in developing
countries can play a pivotal role in
combining conventional sources
of energy with RETs in ways that
will not only help reduce energy
poverty, but also simultaneously
promote climate-friendly solutions to
development. This Report proposes
that developing countries adopt a
national integrated innovation policy
framework to create policy incentives
in national innovation policies and
national energy policies for the
greater use, diffusion, production
and innovation of RETs.
(vi) Not all of the policy options propo-
sed in the Report are available or
applicable to all developing countries
and LDCs. For the poorer countries,
the ability to undertake large-
scale R&D or establish significant
manufacturing capacity will be
constrained by the relatively small
size of their domestic markets,
lack of access to finance and weak
institutional capacity. It may be
unrealistic to expect smaller countries
to become price competitive in
the large-scale manufacture and
distribution of RETs at least in
the short and mid-term. Regional
cooperation arrangements will
be important for innovation and
energy generation and distribution
for many such smaller developing
countries.
(vii) While remaining ambitious,
developing countries may wish
to consider focusing on adapting
existing RETs to their domestic
contexts and markets, potentially
for off-grid applications, lowering
their costs and improving their
operational performance. This

151CHAPTER VI : CONCLUSION
Report has stressed that, in the
context of developing countries
and LDCs, innovation is as
valuable for adaptation and use as
it is for incremental technological
improvements that may reduce
costs and improve energy efficiency.
This Report emphasizes that proactive
government interventions and international
support that integrate RETs into national
science, technology and innovation strate-
gies will be critical for simultaneously reduc-
ing energy poverty and promoting sustain-
able industrial development.
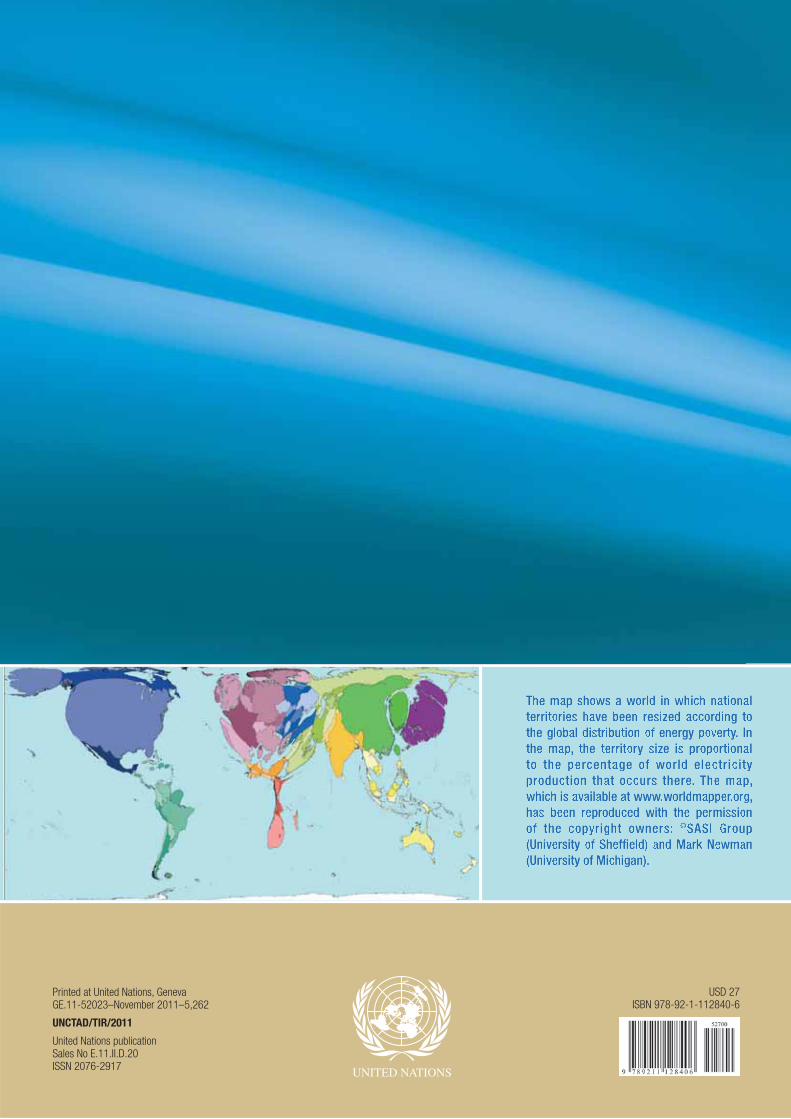
The map shoThe map shows a wws a world in whicorld in which nationalh nationalterritories haterritories have been rve been resized accoresized according toding tothethe globalglobal distributiondistribution ofof enerenergygy popovertyverty. In. Inthe mapthe map,, the territorthe territory size is proportionaly size is proportionalto the perto the percentage of wcentage of world electricityorld electricityproduction that occurs therproduction that occurs theree.. The mapThe map,,whicwhich is ah is avvailable at wwwailable at www.w.worldmapperorldmapper.or.orgg,,has been rhas been reproduced with the pereproduced with the permissionmissionof the copof the copyright oyright owners:wners: ©©SASI GroupSASI Group(University of Sheffield) and Mark Newman(University of Sheffield) and Mark Newman(University of Mic(University of Michigan).higan).
USD 27ISBN 978-92-1-112840-6
Printed at United Nations, GenevaGE.11-52023–November 2011–5,262
UNCTAD/TIR/2011
United Nations publicationSales No E.11.II.D.20ISSN 2076-2917
Related Documents