Elisabetta Croci Angelini and Francesco Farina Technological choices under institutional constraints: measuring the impact on earnings dispersion 6 / 2007 DIPARTIMENTO DI POLITICA ECONOMICA, FINANZA E SVILUPPO UNIVERSITÀ DI SIENA DEPFID WORKING PAPERS DEPFID DEPARTMENT OF ECONOMIC POLICY, FINANCE AND DEVELOPMENT UNIVERSITY OF SIENA

Welcome message from author
This document is posted to help you gain knowledge. Please leave a comment to let me know what you think about it! Share it to your friends and learn new things together.
Transcript

Elisabetta Croci Angelini and Francesco Farina
Technological choices under institutional constraints: measuring the impact on
earnings dispersion
6 / 2007
DIPARTIMENTO DI POLITICA ECONOMICA, FINANZA E SVILUPPO UNIVERSITÀ DI SIENA
DEPFID WORKING PAPERS
DEPFID
DEPARTMENT OF ECONOMIC POLICY, FINANCE AND DEVELOPMENT
UNIVERSITY OF SIENA
DEPFID Working Papers – 6 / September 2007
Technological choices under institutional constraints: measuring the impact on earnings dispersion
Elisabetta Croci Angelinii and Francesco Farinaii
Abstract
Also due to the competitive pressure of imports from the developing countries, a switch to labour-saving techniques has happened in most sectors of OECD countries in the last decades. The distribution of earnings levels has been significantly affected. Wage dispersion is strictly interwoven with employment rates across skill levels, as they are jointly determined by the trajectories followed by firms in choosing their productive techniques, as well as by labour market institutions providing insurance to risk averse workers against unemployment and low wages. We conduct empirical estimates on the technological patterns determined by restrictions placed by labour market regulation on the employers’ production decisions, which narrow the capacity of the firm to decide on the employment level and on the productive techniques combining high-skill and low-skill workers. Our investigation relies on: (i) an index of earning dispersion (for each country under scrutiny and for each sector the skill premium and the high-skill ratio), to disentangle the combined effect of earnings and employment percentages of high, intermediate, and low skill workers; (ii) a Theil decomposition, to analyse the trends in earnings and wage dispersion between-sectors and within-sectors and account for the evolution of wages and employment at the sectoral level. We show that European firms, differently from the hypothesis put forward by Krugman (1994), do not stay passive in front of institutional constraints, but their technological choices are meant to combine productive strategies with labour market conditions. KEYWORDS: Technology, institutions, earnings dispersion.
JEL CLASSIFICATION: E24; J31; O33.
ADDRESS FOR CORRESPONDENCE: [email protected]
ACKNOWLEDGMENTS: The authors wish to thank MIUR for financial support (PRIN 2004) and Simone Bertoli, Marisa Civardi, Chris Gilbert and Renata Targetti Lenti for helpful comments on previous versions of this paper. The usual disclaimer applies. i Department of Studies on Economic Development, University of Macerata ii Department of Economic Policy, Finance and Development, University of Siena Dipartimento di Politica Economica, Finanza e Sviluppo – Università di Siena
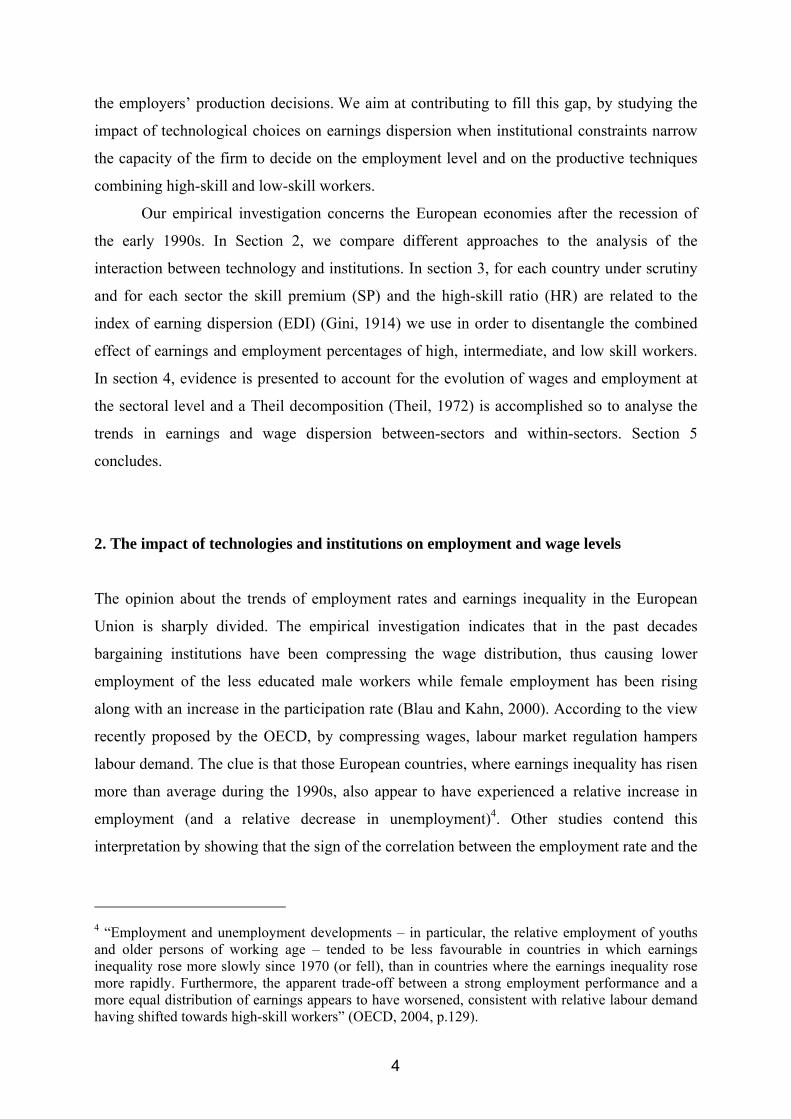
1. Introduction
The performance of a country is more often evaluated in terms of too high an unemployment
rate than too high earnings1 inequality. The technological decisions of the firms in developed
countries have been held responsible for the employment rate, but their impact on earnings
dispersion is much less debated. By the same token, labour market regulation is alleged to
move the economic system away from the macroeconomic equilibrium, as the minimum wage
and the employment protection legislation (EPL) reduce labour demand and slow down the
flow of the younger labour force towards employment; nevertheless, the focus is on the target
for the employment rate more than on how wide earnings inequality should be tolerated.
Recently, wages as well as earnings inequality has gained momentum – almost to the same
extent of employment and unemployment rates - not only on equity, but also on efficiency
grounds, as the firms’ production process is considered a co-determining factor in the
evolution of pay disparities.2
It is apparent that wage dispersion is strictly interwoven with employment rates across
skill levels, as they are jointly determined by the trajectories followed by firms in choosing
their productive techniques, as well as by labour market institutions providing insurance to
risk averse workers against unemployment and low wages. In addition, the competitive
pressure of imports from the developing countries is part of the explanation of the switch to
labour-saving techniques.3
Very scant research work has been carried on so far to provide empirical evidence on
the technological patterns determined by restrictions placed by labour market regulation on 1 In the following, earnings disparities (i.e. all workers: employees and self-employed) are analysed; when labour is limited to the sub-set of employees only, reference will be made to wage disparities (which include wages and salaries). 2 Huge difficulties both on theoretical and on empirical grounds arise when labour needs be precisely separated from capital (for the self-employed) and in particular from human capital (for the skilled labour). Although some corrections have been proposed and extensively relied upon, (Guscina, 2006) so far they have been mainly regarded as rules of thumb. The empirical flair of this paper, based on microdata supplied by ECHP, makes the debate about the definition of labour somewhat unnecessary: “total net personal income” (PI100) is broken down into “total net income from work” (PI110), “non-work private income” (PI120) and “total social insurance receipts” (PI130); in turn, code PI110 is broken down into “wage and salary earnings” (PI111) and “self-employment income” (PI112), while “capital income” is coded PI121. Data availability has induced the choice of the variable PI110, and the inclusion of the warning. 3 Globalization and trade openness also propose an explanation for recent developments, such as a rising ratio of temporary over long-term labour contracts and a rising earnings inequality (Feenstra, 2007). We do not directly deal with international trade, but its impact on earnings dispersion is at least partially embodied in the way in which technological and institutional factors interact in the determination of jobs and pays.
3
the employers’ production decisions. We aim at contributing to fill this gap, by studying the
impact of technological choices on earnings dispersion when institutional constraints narrow
the capacity of the firm to decide on the employment level and on the productive techniques
combining high-skill and low-skill workers.
Our empirical investigation concerns the European economies after the recession of
the early 1990s. In Section 2, we compare different approaches to the analysis of the
interaction between technology and institutions. In section 3, for each country under scrutiny
and for each sector the skill premium (SP) and the high-skill ratio (HR) are related to the
index of earning dispersion (EDI) (Gini, 1914) we use in order to disentangle the combined
effect of earnings and employment percentages of high, intermediate, and low skill workers.
In section 4, evidence is presented to account for the evolution of wages and employment at
the sectoral level and a Theil decomposition (Theil, 1972) is accomplished so to analyse the
trends in earnings and wage dispersion between-sectors and within-sectors. Section 5
concludes.
2. The impact of technologies and institutions on employment and wage levels
The opinion about the trends of employment rates and earnings inequality in the European
Union is sharply divided. The empirical investigation indicates that in the past decades
bargaining institutions have been compressing the wage distribution, thus causing lower
employment of the less educated male workers while female employment has been rising
along with an increase in the participation rate (Blau and Kahn, 2000). According to the view
recently proposed by the OECD, by compressing wages, labour market regulation hampers
labour demand. The clue is that those European countries, where earnings inequality has risen
more than average during the 1990s, also appear to have experienced a relative increase in
employment (and a relative decrease in unemployment)4. Other studies contend this
interpretation by showing that the sign of the correlation between the employment rate and the
4 “Employment and unemployment developments – in particular, the relative employment of youths and older persons of working age – tended to be less favourable in countries in which earnings inequality rose more slowly since 1970 (or fell), than in countries where the earnings inequality rose more rapidly. Furthermore, the apparent trade-off between a strong employment performance and a more equal distribution of earnings appears to have worsened, consistent with relative labour demand having shifted towards high-skill workers” (OECD, 2004, p.129).
4
earnings inequality turns out to be negative when reference is made to the household level5,
and for jobs in traditional sectors6.
The OECD view relies upon a well-known approach to wage inequality in Europe,
which interprets the labour market performances of European countries as a result of the
degree of labour market regulation (Krugman, 1994). According to the Krugman hypothesis,
a downward shift in the relative labour demand for low-skill workers is expected to result in a
higher wage inequality in countries characterised by a flexible labour market and in a higher
unemployment rate in countries characterised by a rigid labour market. In fact, the tenet is
widely shared that starting from the end of the 1970s in many European countries labour
market institutions have increasingly protected the wages of the insiders, at the cost of a lift in
structural unemployment in the two subsequent decades. Under wage compression,
employment and participation rates of the low-skill labour force were stuck, especially in
those sectors more exposed to harsher international competition.
The Krugman hypothesis was anticipating that in Europe - differently from what was
happening in the US where a flexible labour market exists - wage inequality would have
decreased, as a consequence of persistent unemployment causing a much lower proportion of
low-pay workers at the bottom of the wage distribution7. Yet, data for the 1980s and the early
1990s seem to indicate a fall in labour demand not only for the low-skill but also for the high-
skill workers; in addition, in the second half of the 1990s labour market deregulation is
alleged to have improved the overall employment rate in most EU countries, due to an
increasing number of low-skill workers in low-pay jobs, albeit at the cost of widening the
wage inequality8. While the implementation of active labour market programmes (ALMP)
was expected to rise workers’ skills and capabilities, and cause an upgrading in wage levels,
with possible reduction in wage and/or earnings disparities (Agell, 1999 and 2002), other
5 “Unlike for earnings inequality among full-time employed individuals, for pretax-pretransfer income among households we observe sizeable increases over time in most countries. This development appears to have been driven to an important extent by changes in employment. In countries with better employment performance, low-earning households benefited relative to high-earning ones; in nations with poor employment performance, low-earning households fared worse.” (Kenworthy and Pontusson, 2005, pp21-2). 6 “In sum, our examination of the wage compression hypothesis (like that of the other empirical researchers) finds little support for the belief that lack of jobs in the EU is due to the effect of the compression of wages on employment in low skill industries” (Freeman and Schettkat, 2001, pp.25). 7 Atkinson and Brandolini (2006) have drawn attention on the unemployment rate as a major cause of variation of wage and salaries inequality, by taking into account the differences between skilled and unskilled workers. 8 In the year 2000 temporary contracts were 13,4% in the EU-15, ranging from over 33% in the “outlier” Spain, to 6,7% in the United Kingdom and below 5% in Ireland and Luxembourg.
5
labour market reforms have favoured the expansion of jobs for low-skill workers with
temporary labour contracts (Layard and Nickell, 1999).
Empirical evidence also indicates that economic growth has remained sluggish in
Europe, a possible reason being an interaction between institutions and technological choices
which determines an inverse correlation between productivity and employment (von Ark et
al., 2003). During the first half of the 1990s, productivity gains largely came from the
expulsion of low-skill workers; later on, in the period 1996-2001, a rising labour input caused
the slowdown in labour productivity and in wage levels at the bottom of the wage distribution
(Blanchard, 2004 and 2006). Wage levels for every skill level seems to be influenced in
Europe by investment decisions made by firms driven by the need to cope with productivity
of workers at a constant employment level (Pischke, 2005).
These studies suggest that an alternative to the Krugman’s view can be envisaged. The
influence of institutions does not absolutely orient firms towards the choice of labour-saving
techniques, thus compressing the wage distribution and enlarging the unemployment rate.
Technological patterns differ, depending on sectoral characteristics, the skill distribution of
the labour force, and a varying degree of labour market regulation.
The two main technological strategies conceived by Acemoglu (1999, 2002) respond
to different combinations of these factors. The first strategy is the skill biased technical
change (SBTC) driven by the ICT-intensive producing and using sectors. The incentive of
high profits stemming from investment in innovation determined in the United States a strong
labour demand for high-educated workers, well above the rising supply of new entrants in the
labour market with university degrees, thus widening the wage distance between high-skill
and low-skill workers (the so-called skill premium). Empirical evidence confirms that wider
wage dispersion across skill levels in the US manufacturing was a result of skill-biased
organizational changes both within and across plants (Dunne et al., 2004).
Acemoglu presents a production function with constant elasticity of substitution
(CES):
( ) ( )[ ] ρρρ /1)()()()()( tHtAtLtAtY HL +=
where ρ≤1 , and its implicit relative labour demand function, expressing the skill premium, is:
( ) ( )( )( )
( ) σ
σ
ρ /1
1
1 //
//
−
−
−− ==LHAA
LHAA
ww LHLH
L
Hi
The skill premium depends on AH and AL, the factor-augmenting technological terms, and on
the elasticity of substitution - )1/(1 ρσ −≡ - between the high-skill (H) and the low-skill (L)
6
workers. The condition for the implementation of SBTC is labour market flexibility. The
productivity gaps created by SBTC between the high-skill and the low-skill workers through
AH and AL respectively, should be reflected by the wage and employment gaps between these
two groups of workers. Under the condition of σ>1, a rising wage inequality is explained by
an increase in the AH/AL ratio higher than the H/L ratio, which rises the relative wage rate for
the more educated and more productive high-skill workers.
In many European countries the SBTC could not develop, as firms have been suffering
from an opportunity set of production techniques restrained by labour market institutions,
with job protection and minimum wage playing a very relevant role (Acemoglu, 2003). To
equalise the low-skill workers productivity to their wage above the equilibrium level,
employers would have been compelled to resort to “complementary technologies”, whereby
low-skill workers share functions and mansions with high-skill workers so raising their labour
performances. Differently from the Krugman interpretation, the company facing a rigid labour
market does not remain passive, but adjusts its productive technology in order to cope with
possible inefficiencies connected to labour market regulation.
To understand why labour market regulation may have prevented Europe from
following the skill-biased technological trajectories which characterised the US economy
during the 1990s, we construct an example, inspired to Acemoglu (2003), to describe an
institutionally-constrained technological decision. Suppose labour market regulation consists
of a minimum wage equal to 6 and an EPL causing high firing costs. Assume that in a firm
one high-skill worker and one low-skill worker are employed, and the bargaining makes the
wage to be equal to ¾ and ½ of productivity, for the high-skills and the low-skills
respectively. The high-skill worker’s productivity is equal to 24, so that her wage level is 18,
while the low-skill worker productivity is equal to 8, but must be paid the minimum wage 6
instead of 4, thus exceeding the ½ of productivity. Total production is 32, total wages are 24,
and profits are 8. Suppose now a switch to SBTC, through an innovative investment which
costs 1 to the firm. As a second high-skill worker substitutes the low-skill worker, the two
high-skill workers are paid, as before, ¾ of productivity. Total production rises to 48, so that
the minimum wage would no longer be binding and profits increase to 11 (=48-36-1).
Alternatively, in order to avoid possibly prohibitive firing costs, but still escape the minimum
wage constraint, the firm could lay-out an investment in a “complementary technology”,
whereby the low-skill worker shares mansions with the high-skill worker. The employer
could consider an investment, assumed to cost 2 and allowing the low-skill worker’s
productivity to rise from 8 to 12, while the high-skill worker’s productivity stays at 24. Since
7
total production would be 36, the minimum wage would not be binding, and profits would
increase to 10 (=36-24-2).
While profits appear to be higher with the SBTC, we did not quantify yet the firing
costs. Under the SBTC the low-skill worker could not be substituted, but must be paid even if
he does not take part in production, until the legal dispute is settled. Hence, whether or not the
SBTC dominates the “complementary technology” depends on the effect of the second
institutional factor - the EPL - combining with the minimum wage. If the job protection
legislation is such to determine a firing cost higher than 1, the higher profitability warranted
by the SBTC vanishes.
The rationale conveyed by the numerical example is that when the higher profits
permitted by SBTC cannot be obtained, as litigation costs discourage firing the low-skill
workers, a “complementary technology” may be chosen, allowing the low-skill workers’
productivity to match the minimum wage. By pointing to the adjustment of technology to
institutions, this view may explain why SBTC has spread in Europe to a much lesser extent
than in the US. Yet, a comprehensive analysis considering different labour market institutions
across the European countries constraining the employers’ technological decisions, and their
fall-out on labour demand and the wage level for different skill groups, is still lacking.9
This interpretative impasse over interactions between technology and institutions as
the determinant of earnings dispersion is confirmed by simple calculations. On the basis of
the information provided by the ECHP dataset, covering the 15 EU countries (hereafter, EU-
15) in the years 1994-2001, we have computed for each country a Gini index for wages net of
taxes as well as the ratio of working (with an employer in paid job for at least 15 hours per
week) to total population. Since the ECHP dataset only surveys the population aged at least
16, this “working ratio” is meant to be more informative of both: 1) the employment rate10, as
it focuses on the self-declared employed, while keeping information about the population
9 Additional factors are likely to be involved in the evolution of technological choices, first of all the conditions of competitiveness of the market structure, as studied by the rapidly developing literature on the negative impact on growth and employment of rigid goods and labour markets (Bassanini, Hemmings, and Scarpetta, 2001; Blanchard and Giavazzi, 2003). 10 While the employment rate refers to the percentage of workers who actually have jobs, different definitions co-exist: Eurostat refers to the employed persons aged 15-64 as a percentage of the same age population, the UK Office for National Statistics (ONS) refers to the proportion of the working age population who are in employment: aged 16-64 if men, 16-59 if women. In addition the definitions of both workers and jobs may differ e.g. as to whether the job is paid and the weekly hours are at least 15.
8
structure like the activity rate does; and 2) the activity rate11, as it provides information on the
working population net of the unemployed and of children under 16. The picture is lifted up,
but does not change substantially when the working ratio is referred to all employed persons
including the self-employed and those with unpaid work in family enterprise.
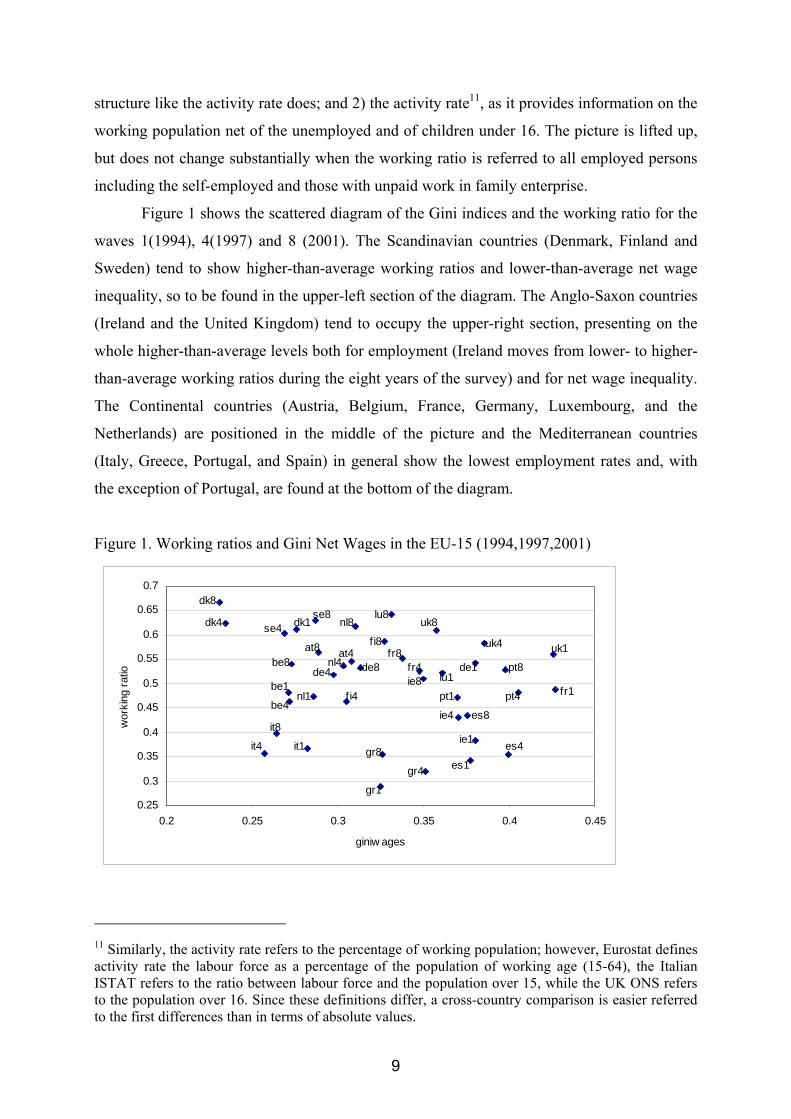
Figure 1 shows the scattered diagram of the Gini indices and the working ratio for the
waves 1(1994), 4(1997) and 8 (2001). The Scandinavian countries (Denmark, Finland and
Sweden) tend to show higher-than-average working ratios and lower-than-average net wage
inequality, so to be found in the upper-left section of the diagram. The Anglo-Saxon countries
(Ireland and the United Kingdom) tend to occupy the upper-right section, presenting on the
whole higher-than-average levels both for employment (Ireland moves from lower- to higher-
than-average working ratios during the eight years of the survey) and for net wage inequality.
The Continental countries (Austria, Belgium, France, Germany, Luxembourg, and the
Netherlands) are positioned in the middle of the picture and the Mediterranean countries
(Italy, Greece, Portugal, and Spain) in general show the lowest employment rates and, with
the exception of Portugal, are found at the bottom of the diagram.
Figure 1. Working ratios and Gini Net Wages in the EU-15 (1994,1997,2001)
0.25
0.3
0.35
0.4
0.45
0.5
0.55
0.6
0.65
0.7
0.2 0.25 0.3 0.35 0.4 0.45
giniw ages
wor
king
ratio
dk8
dk4 dk1
nl1
it1it4
it8
be1
se4
be4fi4
be8 de1
ie1
ie4
es1
es4
uk1
lu1fr1
gr1
gr4
gr8
pt1
es8
pt4
uk4
se8
at8
de4nl4
at4pt8
ie8
nl8lu8
fi8
de8fr8
uk8
fr4
11 Similarly, the activity rate refers to the percentage of working population; however, Eurostat defines activity rate the labour force as a percentage of the population of working age (15-64), the Italian ISTAT refers to the ratio between labour force and the population over 15, while the UK ONS refers to the population over 16. Since these definitions differ, a cross-country comparison is easier referred to the first differences than in terms of absolute values.
9
Therefore, no evidence of a unified pattern for employment and wage dispersion
emerges in the eight-years period throughout the EU-15, let alone when focusing on the
evolution across countries, as the role institutions play in each country is unclear. On the one
hand, the wage distribution of European economies was certainly affected by the large
movements in employment rates of the 1990s. After the sharp fall in unemployment had
caused the 1990-93 recession in the whole EU except Germany (whose cycle was overheated
by the inflationary consequences of reunification), the recovery in growth rates in the second
half of the decade boosted an Europe-wide lift up in the employment rates, also signalled by a
structural break in econometric estimates (Mourre, 2004; Arpaia and Mourre, 2005). On the
other hand, in many econometric estimates “(c)ountry dummies explain a larger proportion of
the relation between wage inequality and unemployment” (Bertola, Blau, and Kahn, 2002,
p.18). Hence, differing “initial conditions” across countries – such as technological gaps in
the productive structure and the impact of the educational system on the skill distribution of
the labour force12 - could have differently impinged both on the employment performance and
earnings disparities. The EU-15 widespread heterogeneity in the relationship between
employment and earnings dispersion may conceal the presence of more profound regularities
underneath aggregate data. In the following, we exploit the availability of microdata directly
observing the human capital of the employed workers through the matching between skills
and working positions.
3. The evolution of employment rates and earnings inequality in Europe
Research work and empirical evidence about employment growth and wage dispersion across
skill levels is very scant. A recent IMF investigation is far from conveying the real picture, as
“due to available data, (...) results relate to income shares of workers in skilled and un-skilled
sectors, rather than to income shares of skilled and un-skilled workers themselves” (IMF,
2007, p. 168). To find out how interactions between institutions and technology impact on
earnings distribution, we enquire how the rise in ICT investment relates both to the skill
premium and the larger utilization of low-skill and low-pay workers permitted by the
relaxation of employment and wage rigidities. In fact, a measure of earnings inequality is
12 However, the measurement of the technological level of workers through the general educational attainment of the population leads to inconsistency problems (Croci Angelini and Farina, 2007).
10
needed whereby in measuring earnings dispersion changes in employment across skill levels
are taken into account. For instance, in the event of recourse to the strategy of SBTC, due to
the decrease induced by labour-saving techniques in the number of low-skill workers, the
widening of wage disparities could have been underestimated by the computation of earnings
dispersion.
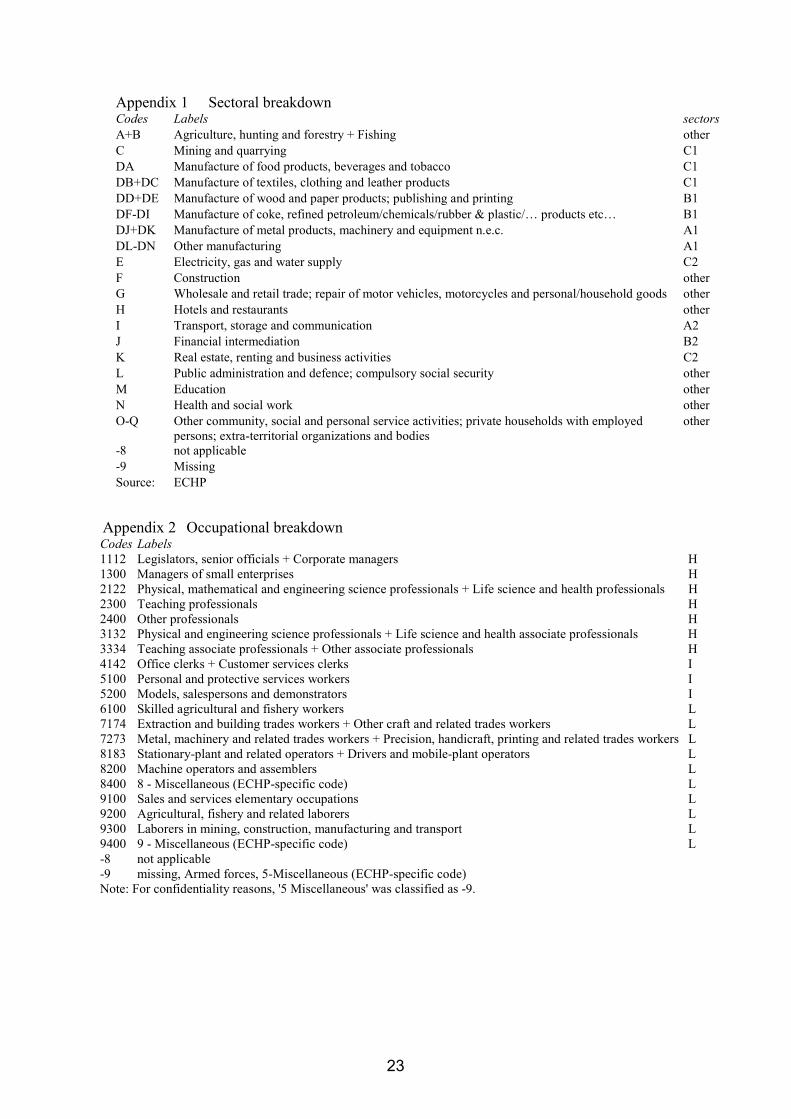
The ECHP dataset permits the break-down of earnings distribution across 18
economic sectors and 20 working positions, described in Appendix 1 and 2, respectively. All
information was re-aggregated in three macro-sectors according to their link with information
and communication technologies (ICT)13: ICT producing (A), intensively ICT users (B), and
less intensive utilizing sectors (C), both for Manufacturing (1) and Services (2), while
working positions were aggregated into three skill levels: high (H), intermediate (I) and low
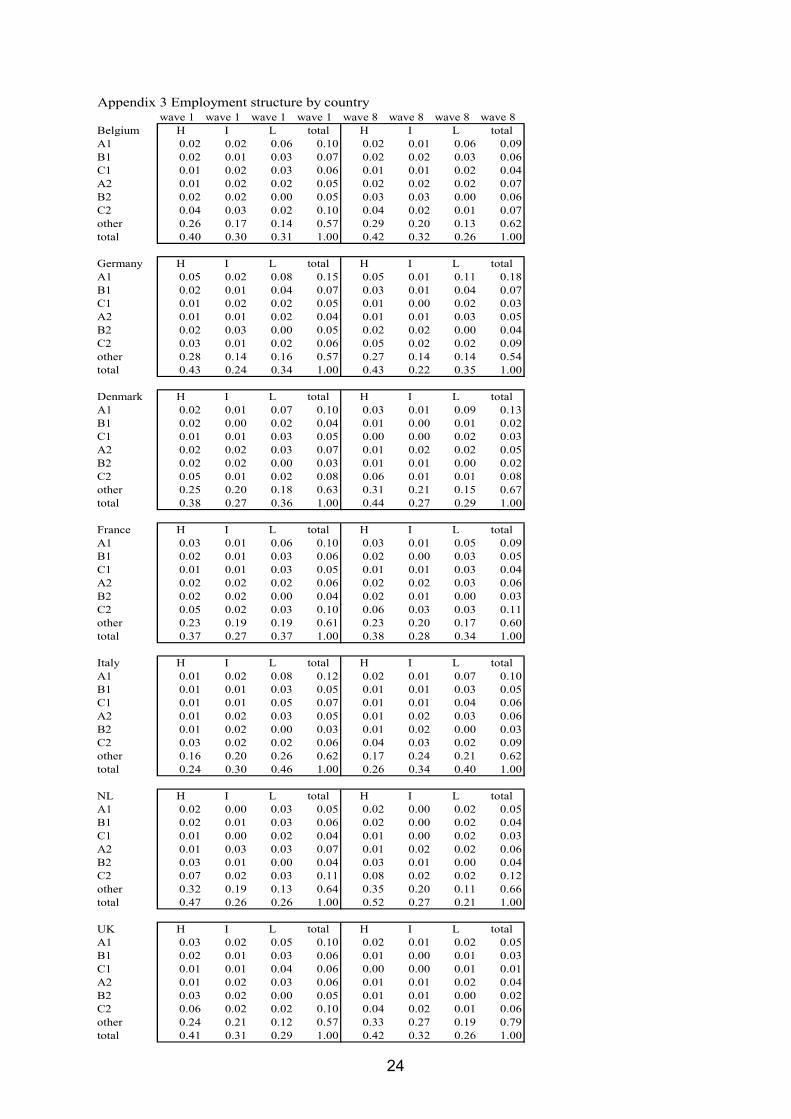
(L). Our investigation covers seven European countries - Belgium, Denmark, France, Italy,
Germany, the Netherlands, United Kingdom – whose sectoral structure in terms of
employment is described in Appendix 3 for wave 1 (1994) and wave 8 (2001). The reason
behind this selection is to refer our analysis to clusters of countries characterized by similar
labour markets institutions, so to compare the cluster of the so-called Continental countries to
a representative country from each cluster, namely the United Kingdom for the Anglo-Saxon,
Denmark for the Scandinavian, and Italy for the Mediterranean cluster.
Variations in the skill premium (SP) - the wedge across wages: LH wwSP /= – are
contrasted with variations in the “high-skill ratio” (HR), the fraction of high to lower skill
workers, where )/( LIHHR += . While the SP signals how the employees’ bargaining power
interacts with the firm’s choice of techniques, the HR signals how the relative proportions of
workers across skill categories evolve over time by following this choice.
To better characterize this empirical background, we devise four patterns of
technological choices, depending on a varying combination of technological choices and
institutions: 1. SBTC; 2. Complementary Technology; 3. Restructuring; 4. Downsizing.
1) In case regulation does not constrain the substitution of capital and high-skill workers to
low-skill workers, firms may find profitable to introduce labour-saving techniques. The
presence of SBTC manifests in an increase of both SP and HR, as the high skill-intensive
techniques implying the expulsion of low-skill workers push up the share of high-skill
workers vis-à-vis the low-skill and low-pay workers; 2) In case regulation constrains, firms
13 The six macro-sectors are formed by re-aggregating the 18 ECHP manufacturing and service sectors according to the classification used by the European Commission services (see Denis et al., 2005).
11
realize complementary technologies, by investing on low-skill workers when EPL inhibits
their dismissal due to high firing costs (i.e. too high litigation costs in the courts) and their
productivity has to be raised to the level of the minimum wage (legally imposed or defended
by unions). The choice of a “complementary technology” entails a decrease both in the SP
and in the HR, through the reduction of minimum wage and/or the relaxation of EPL
enlarging the relative number of intermediate and low-skill workers. Firms might also choose
intermediate strategies resulting from the influence of additional variables, such as the
country’s productive structure and the peculiar skill characteristics of the labour force: 3) the
restructuring strategy, whereby the retrenchment of the low-skill traditional productions under
the competitiveness pressure of developing economies causes the loss (or the out-sourcing) of
low-pay jobs, so that in spite of deregulation wage compression remains (or SP even falls)
and the high-skill to low-skill workers ratio (HR) increases; 4) the downsizing strategy,
whereby labour market deregulation prompts the structural change towards small-size firms,
with a higher percentage of low-skill workers in presence of lowering wage rates, so causing
an increase in SP and a fall in HR.
The four patterns of technological choices, reflecting different decisions about product
and process innovation taken by firms under institutional constraints, are reflected by the
measure of earnings dispersion. Figure 2 shows the construction of the Earnings Dispersion
Index (EDI) where workers are ranked on the basis of their average wages (and corresponding
skill level).
Figure 2
1
β α
λ
sα
sβ
γ X1
sγ
Y2
Y1
X2
12
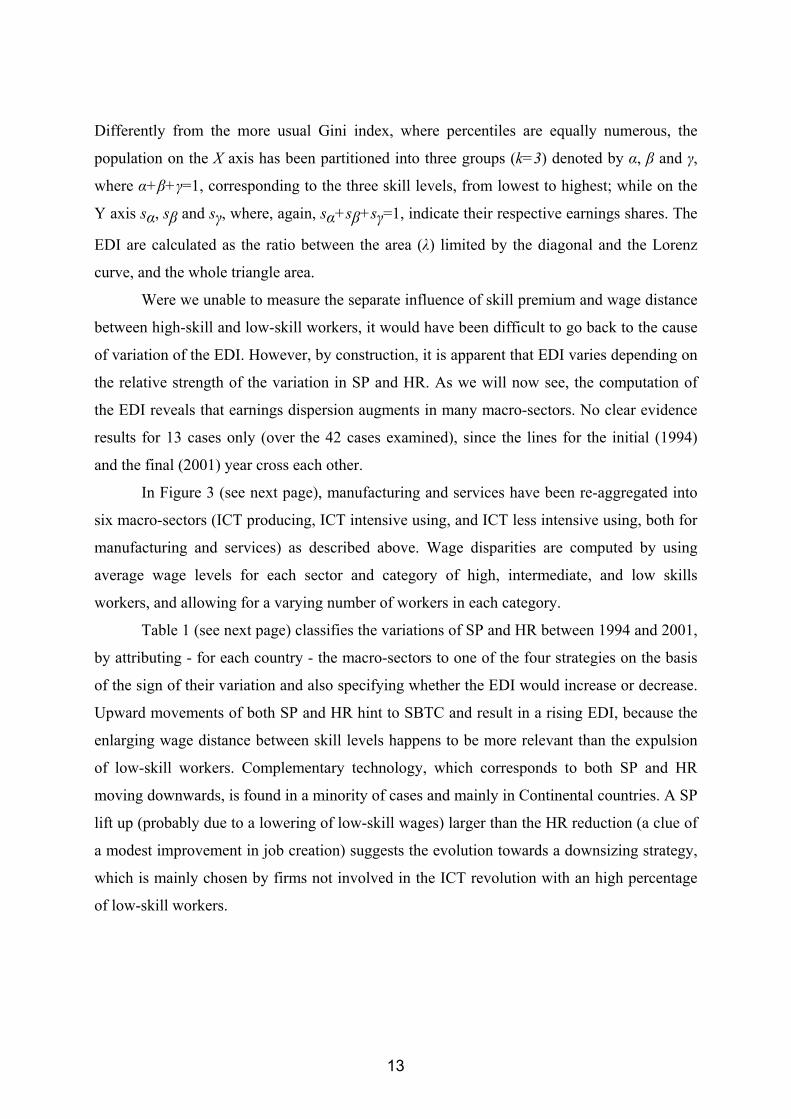
Differently from the more usual Gini index, where percentiles are equally numerous, the
population on the X axis has been partitioned into three groups (k=3) denoted by α, β and γ,
where α+β+γ=1, corresponding to the three skill levels, from lowest to highest; while on the
Y axis sα, sβ and sγ, where, again, sα+sβ+sγ=1, indicate their respective earnings shares. The
EDI are calculated as the ratio between the area (λ) limited by the diagonal and the Lorenz
curve, and the whole triangle area.
Were we unable to measure the separate influence of skill premium and wage distance
between high-skill and low-skill workers, it would have been difficult to go back to the cause
of variation of the EDI. However, by construction, it is apparent that EDI varies depending on
the relative strength of the variation in SP and HR. As we will now see, the computation of
the EDI reveals that earnings dispersion augments in many macro-sectors. No clear evidence
results for 13 cases only (over the 42 cases examined), since the lines for the initial (1994)
and the final (2001) year cross each other.
In Figure 3 (see next page), manufacturing and services have been re-aggregated into
six macro-sectors (ICT producing, ICT intensive using, and ICT less intensive using, both for
manufacturing and services) as described above. Wage disparities are computed by using
average wage levels for each sector and category of high, intermediate, and low skills
workers, and allowing for a varying number of workers in each category.
Table 1 (see next page) classifies the variations of SP and HR between 1994 and 2001,
by attributing - for each country - the macro-sectors to one of the four strategies on the basis
of the sign of their variation and also specifying whether the EDI would increase or decrease.
Upward movements of both SP and HR hint to SBTC and result in a rising EDI, because the
enlarging wage distance between skill levels happens to be more relevant than the expulsion
of low-skill workers. Complementary technology, which corresponds to both SP and HR
moving downwards, is found in a minority of cases and mainly in Continental countries. A SP
lift up (probably due to a lowering of low-skill wages) larger than the HR reduction (a clue of
a modest improvement in job creation) suggests the evolution towards a downsizing strategy,
which is mainly chosen by firms not involved in the ICT revolution with an high percentage
of low-skill workers.
13
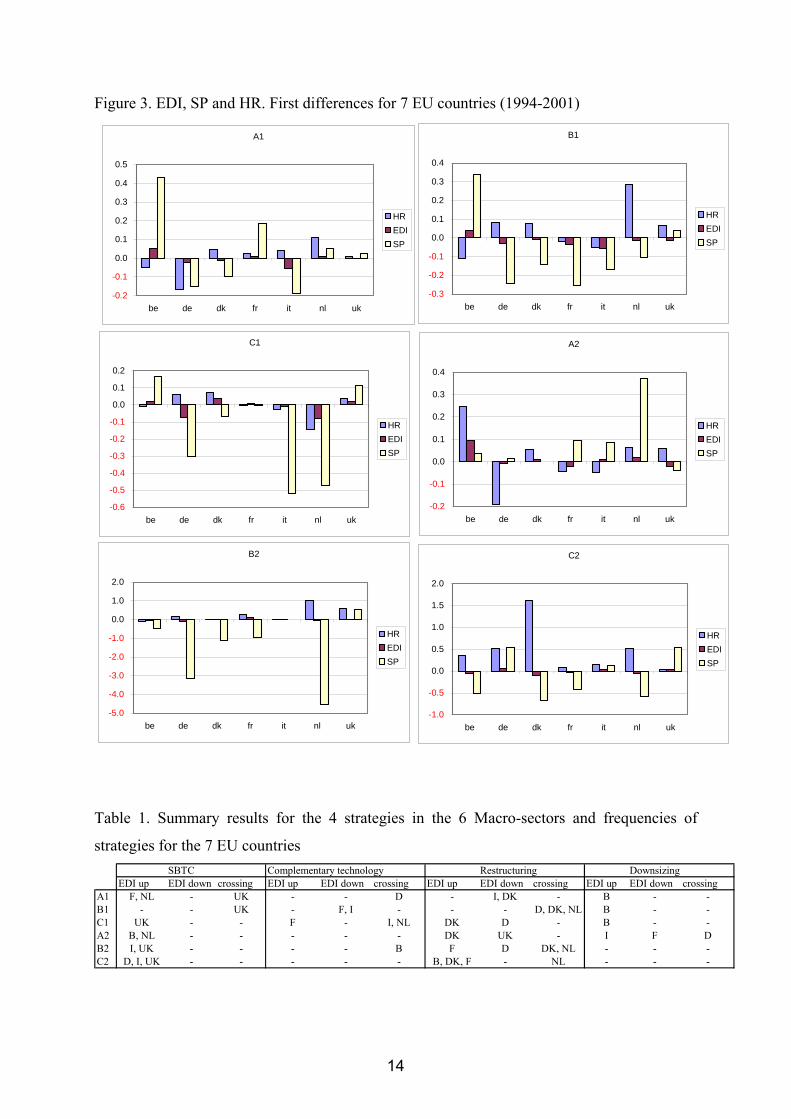
Figure 3. EDI, SP and HR. First differences for 7 EU countries (1994-2001)
A1
-0.2
-0.1
0.0
0.1
0.2
0.3
0.4
0.5
be de dk fr it nl uk
HREDISP
B1
-0.3
-0.2
-0.1
0.0
0.1
0.2
0.3
0.4
be de dk fr it nl uk
HREDISP
C1
-0.6
-0.5
-0.4
-0.3
-0.2
-0.1
0.0
0.1
0.2
be de dk fr it nl uk
HREDISP
A2
-0.2
-0.1
0.0
0.1
0.2
0.3
0.4
be de dk fr it nl uk
HREDISP
B2
-5.0
-4.0
-3.0
-2.0
-1.0
0.0
1.0
2.0
be de dk fr it nl uk
HREDISP
C2
-1.0
-0.5
0.0
0.5
1.0
1.5
2.0
be de dk fr it nl uk
HREDISP
Table 1. Summary results for the 4 strategies in the 6 Macro-sectors and frequencies of
strategies for the 7 EU countries SBTC Complementary technology Restructuring Downsizing
EDI up EDI down crossing EDI up EDI down crossing EDI up EDI down crossing EDI up EDI down crossingA1 F, NL - UK - - D - I, DK - B - -B1 - - UK - F, I - - - D, DK, NL B - -C1 UK - - F - I, NL DK D - B - -A2 B, NL - - - - - DK UK - I F DB2 I, UK - - - - B F D DK, NL - - -C2 D, I, UK - - - - - B, DK, F - NL - - -
14
The most frequent strategy in Europe seems to be the restructuring strategy, as a
decreasing SP and an increasing HR point to the prevalence of reduction of low-skill jobs in
presence of wage compression, both in manufacturing and in service sectors. All Denmark
macro-sectors manifest SP and HR variations indicating restructuring; the Netherlands and
Germany follow, with three macro-sectors each. However, due to the crossing of the initial
and final lines, the computation of EDI does not offer a clear interpretation for the
complementary technology and the restructuring strategy.
The United Kingdom is the only country where all macro-sectors (except the
producing ICT service sectors14) present the sign of variations of SP and HR corresponding to
the choice of SBTC. Only a few countries - in particular France and Italy, both in intensive
and less intensive ICT using manufacturing - present SP and HR variations corresponding to
complementary technologies. Finally, the downsizing strategy is confirmed by the EDI
increasing in four over six cases. This technological choice, which is shown by earnings
dispersion varying as an effect of rising low-skill employment levels more than of the wage
wedge, seems to be followed basically by Belgium (where low-skill employment increases
concern two out of six macro-sectors), and by the ICT producing service sectors of Germany,
France and Italy.
4. Theil decomposition of earnings dispersion between and within sectors
Whatever the direction of the SP and HR values, the above picture could be distorted by
movements in the earnings inequality indicators occurring between sectors, rather than within
sectors. The values of the earnings inequality computed by the EDI could hence conceal a
compositional effect.
The strong increase in the EU-15 employment during the second half of the 1990s
stems mostly from the creation of new jobs in market-related services, which experienced a
very strong value-added growth (Marimon and Zilibotti, 1998). In fact, labour market
flexibility fuelled the process of job shifting from the more capital-intensive manufacturing
sectors to low-productivity and low-pay service sectors. In the period 1997-2001, job intensity
of growth (the ratio of employment growth to value-added growth) reached very high values
14 Among the most important sub-sectors of the producing ICT service sectors, computer services is lacking, as the ECHP does not classify them in a separate category. Hence, the measurement of the EDI for this sub-sector is likely to be biased.
15
in financial, real estate renting and business services. Also in sectors like trade, repairs, hotels
and restaurant, transport and communication, characterized by a large percentage of self-
employment and temporary positions, employment has grown at a faster pace than in
manufacturing and the relative price of labour has fallen accordingly.
The employment expansion in the EU -15 services sector has regarded both high-skill
researchers, engineers and managers in the ICT producing and using sectors, and low-skill
workers in technology extension and provision of software service either to firms or directly
to consumers. In the labour-intensive service sectors the employment increases has instead
regarded the utilisation of intermediate-skill workers, in operations which cannot be
informatised by firms in manufacturing (for instance, the outsourcing of non-routine
occupations by computer-using companies). Finally, in more recent years the production and
use of ICT has started increasing also in the EU-15, with investment in ICT reaching 18%
over total investment and contributing 42% of labour productivity growth; in the US these
percentages were of 29% and 80%, respectively (Denis et al., 2005).
These structural changes legitimate the suspicion that a compositional effect might
play a part in explaining developments in employment growth. The “Baumol disease”
hypothesis predicts that productivity growth rates are lower in the service sectors
characterised by routine occupations than in manufacturing. Since labour market deregulation
should translate differential productivity growth into wider wage differentials, low-skill
workers are expected to move from manufacturing to service occupations. In increasing the
employment levels, the expansion of the service sectors could have been a more important
factor than the interaction between technology and institutions.
By consequence, the variation in wage inequality in the period 1994-2001 could have
been different from the variation in earnings inequality. Due to a varying speed of relaxation
of constraints posed by labour market institutions on employment growth in services across
European countries, the measurement of within-sectors earnings inequality could have been
affected by a shift of workers towards self-employment and/or by a rising share of temporary
contracts in services’ jobs. These two phenomena artificially reduce the width of earnings
inequality, thus underestimating the gap between earnings inequality and wage inequality.
To get a hint about this possible bias, we computed the Theil decomposition, both for
the earnings and the wage distributions. By separating out the between-sectors vis-à-vis the
within-sectors inequality, we aim to assess the relative expansion of the service sector. It is
also worth noticing that the between-sector component refers to reallocation of resources
across industries due to market share reshuffling among sectors, as well as entry and exit. A
16
rising market contestability encourages firms to invest in innovation mainly when the sector
and/or the country is close to the technological frontier, and the incumbents are under the
threat of a Schumpeterian process of imitation (Aghion et al., 2005). Hence, a stimulus to
technical change as an effect of deregulation also depends on how far from the technological
frontier were in the middle of the 1990s the manufacturing and service sectors of the EU-15
economies.
The Theil decomposition in the within-sectors and the between-sectors variation of the
earnings and the wage inequality described in Figure 4 (see next page) was conducted on the
ECHP dataset over the whole 18 sectors of the seven EU countries for the period 1994-2001.
Self-employed workers and temporary contracts are the main source of divergence
between the earnings and wage measures of dispersion, as well as across employment rates.
Hence, evidence showing that the same variations happen within and between sectors for both
measures (wages of employees as well as total remunerations) will be taken as a clue that the
expansion of service sectors is not significantly affecting the wage and earnings trends, so that
the measurement of the EDI should not be biased by a composition effect. On the contrary,
where the evolution of earnings inequality between sectors does not find confirmation for
wages - or the change in between-sectors inequality indices significantly differs from the
change for the within-sectors indices - the composition effect consisting of a disproportional
rise in self-employment and/or temporary positions in the expanding service sectors is likely
to be at work.
17
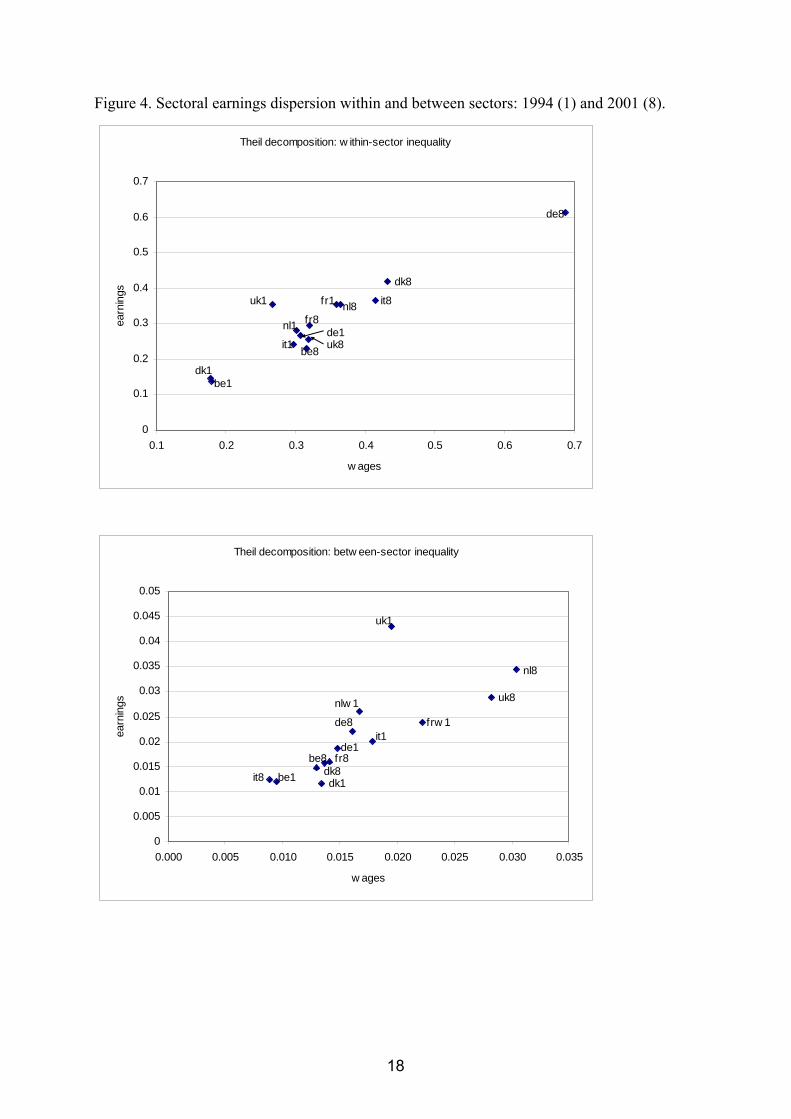
Figure 4. Sectoral earnings dispersion within and between sectors: 1994 (1) and 2001 (8).
Theil decomposition: w ithin-sector inequality
0
0.1
0.2
0.3
0.4
0.5
0.6
0.7
0.1 0.2 0.3 0.4 0.5 0.6 0.7
w ages
earn
ings
de8
nl8
dk8
it8uk1
dk1be1
de1nl1
it1 be8
fr1
uk8
fr8
Theil decomposition: betw een-sector inequality
0
0.005
0.01
0.015
0.02
0.025
0.03
0.035
0.04
0.045
0.05
0.000 0.005 0.010 0.015 0.020 0.025 0.030 0.035
w ages
earn
ings
uk1
nl8
uk8nlw 1
frw 1de8it1
de1
it8 be1 dk1dk8
fr8be8
18
Since in most countries the sign of variation of the inequality indices replicates both
for wages and earnings as well as for the within and the between sectors components, the
Theil decomposition seems to signal that the evidence of a composition effect is not
impressive. The earnings and wage inequality appear to increase in most Continental
countries (Belgium, Germany, the Netherlands), while is decreasing in France both for the
“within” and “between” indices.
Table 2. First differences in wages and earnings inequality within and between sectors (1994-2001)
within inequality between inequality earnings earnings + - + -
wages + B, D, DK, I, NL wages + B, D, NL DK - UK F - UK F, I
Yet, the United Kingdom presents a higher inequality for earnings and a lower
inequality for wages, both within and between sectors (see Table 2). This is a clear hint of an
upward lift of the earnings of self-employed workers, to a larger extent in the technology-
based services, whereas the wage wedge among the dependent workers is shrinking in both
the Theil components. In other words, the contemporaneous increase of the two indices of
earnings dispersion signals that the income gap of self-employed workers (and, possibly, also
some mistaken reporting of the pay of temporary contracts) widens both in terms of average
wage across sectors than in terms of within-sectors dispersion, possibly increasing the gap of
the upper portion of the earnings distribution due to the relative expansion of the ICT service
companies.
Two countries show uneven results across Theil decomposition. Italy shows a
tendency towards shrinking disparities across sectors both for wage and total remunerations.
Since sectors characterized by a lower than average wage level appear to be approaching the
high average wage sectors, the expansion of the services does not seem to concern the
technology-based sectors. Contrary to the overall trend, a composition effect – wherever
present – is perhaps driving the earnings distribution towards compression. Denmark appear
to join the Continental countries as for the within-sector inequality indices, while the
between-sectors earnings dispersion decreases. The broad message is that a divide has
probably opened between those European economies where investments in the ICT sectors
have lifted up the salaries of highly-educated self-employed workers and the European
laggards both in product and process innovation and in the formation of the human capital.
19
5. Concluding remarks
Our aim in this paper was to show that European firms, differently from the hypothesis put
forward by Krugman, do not stay passive in front of institutional constraints, but their
technological choices are meant to combine productive strategies with labour market
conditions.
During the 1990s, a wide range of productive strategies have been implemented in
European countries, as witnessed by the variety of variations experienced by the skill
premium and by the High-skill ratio. The Earnings Dispersion Index suggests that the most
frequent technological decisions taken by European firms in the second half of the 1990s can
be regarded as a restructuring strategy. The recourse to complementary technology has not
been practised much by firms. The likely explanation is that institutional reforms
implemented during the 1990s in the EU-15 labour markets have introduced wage flexibility -
and also the abatement of job protection, though to a lesser extent - which enlarged the
opportunity set of technological choices with respect to the previous period (to which the
Acemoglu hypothesis refers).
To the question whether rising earnings dispersion in European countries during the
1990s stemmed from SBTC, the computation of the EDI analysis provides a negative answer,
except in the case of the United Kingdom.15 Hence, our computation confirms that the United
Kingdom largely differentiates from the other EU countries, as the only productive structure
where the presence of skill-biased techniques is pervasive. The UK is also the only country
for which the computation of the Theil decomposition clearly shows that a composition effect,
due to the expansion of the technology-based service sectors, drifts the evolution of the
earnings dispersion away from the wage dispersion, due to the increasing number of high-
income high-skill workers disproportionately widening the earnings distribution.
15 These findings are confirmed by recent studies comparing the growth performances of the EU and the US economies. During the 1990s, for the first time after the last two decades, both the capital deepening and the TFP presented growth rates lower in the EU than in the US. While the declining capital investment in Europe might be partially explained by the end of the capital-for-labour substitution which followed the rise in the wage/profit rate, the second indicator definitely points to lower rate of innovation and ICT investment in the EU vis-à-vis the US (O’Mahony and van Ark, 2003). Moreover, in the EU a productivity growth in the ICT-producing manufacturing industries much lower than the US one, was only partially counteracted by the relatively better productivity performance in ICT-using manufacturing and ICT-producing services in the first half of the 1990s (von Ark et al., 2003).
20
References
Acemoglu D. (1999), “Changes in Unemployment and Wage Inequality: An Alternative Theory and Some Evidence”, in American Economic Review, 89: 1259-78.
Acemoglu D. (2002), “Technical Change, Inequality, and the Labour Market”, Journal of Economic Literature, 40: 7-72.
Acemoglu D. (2003), “Cross-Country Inequality Trends”, Economic Journal, 113: F121-F149.
Agell J. (1999), “On the Benefits from Rigid Labour Markets: Norms, Market Failures and Social Insurance”, Economic Journal, 109: F143-F164.
Agell J. (2002), “On the Determinants of labour market institutions: Rent seeking versus social insurance”, German Economic Review, 3: 107-135.
Aghion P., N. Bloom, R. Blundell, R. Griffith, and P. Howitt (2005), “Competition and Innovation”: An Inverted-U Relationship, Quarterly Journal of Economics, 120: 701-28.
von Ark B., R. Inklaar, R. McGuckin, and M. Trimmer (2003), “The Employment Effects of the ‘New Economy’. A comparison of the European Union and the United States”, National Institute Economic Review, n.184.
Arpaia A. and G. Mourre (2005), “Labour Market Institutions and Labour Market performance: A Survey of the Literature”, European Economy, Economic Papers, n.235.
Atkinson A.B. and A. Brandolini (2006), “From Earnings Inequality to Income Inequality in European and U.S. Labour Markets”, in F. Farina and E. Savaglio (eds.), Inequality and Economic Integration, Routledge, London.
Bassanini A., P. Hemmings, and S. Scarpetta (2001), “Economic Growth: The Role of Policies and Institutions. Panel data evidence from OECD countries”, OECD Economic Department Working Paper n. 283.
Bertola G., F.D. Blau and L.M. Kahn (2002), “Comparative analysis of labour market outcomes: lessons for the US from international long-run evidence”, in A. Kruger and R. Solow (eds.), The Roaring Nineties: Can full Employment be Sustained?, Russell Sage and Century Foundations.
Blanchard O. (2004), “The Economic Future of Europe”, Journal of Economic Perspectives, 18: 3-26
Blanchard O. (2006), “European Unemployment: The evolution of facts and ideas”, Economic Policy, 16: 5-59
Blanchard O. and F. Giavazzi (2003), “Macroeconomic Effects of Regulation and Deregulation in Goods and Labour Markets”, Quarterly Journal of Economics, 118: 879-907.
Blau F. D. and L. M. Kahn 2000. "Gender Differences in Pay", Journal of Economic Perspectives, 14: 75-99.
Croci Angelini E. and F. Farina (2007), “Wage Inequality in Europe: The Role of Labour Market and Welfare Institutions”, in N. Acocella and R. Leoni (eds.), Social Pacts, Employment and Growth: A Reappraisal of Ezio Tarantelli’s Thought, Physica-Verlag, Berlin.
Denis C., K. McMorrow, W.Roger, and R.Veugelers (2005), The Lisbon Strategy and the EU’s structural productivity problem, European Economy, Economic Papers, n.221.
Dunne T., L. Foster, J. Haltiwanger, and K.R. Troske (2004), “Wage and Productivity Dispersion in United States Manufacturing: The Role of Computer Investment”, Journal of Labour Economics, 22: 397-429.
21
Feenstra R.C. (2007), “Globalization and its Impact on Labor”, Global Economy Lecture 2007, Vienna Institute for International Economic Studies.
Freeman R. and R. Schettkat (2001), Differentials in service industry employment growth: Germany and the US in the comparable German American structural database, Bruxelles, European Commission, DG Employment and Social Affairs.
Gini C. (1914), “Sulla misura della concentrazione e della variabilità dei caratteri”, in Atti del Reale Istituto Veneto di Scienze, Lettere e Arti, Vol. LXXIII: 1203-48 (english translation: “On the measurement of concentration and variability characters”, Metron (2005), LXIII: 3-38).
Guscina, 2006 Effects of Globalization on Labour’s Share in National Income, IMF Working Paper No. 06/294, the International Monetary Fund.
IMF (2007), World Employment Outlook, Washington. Kenworthy L. and J. Pontusson (2005), “Rising Inequality and the Politics of Redistribution
in Affluent Countries”, Perspectives on Politics, 1: 1-44. Krugman P. (1994), “Past and Prospective Causes of High Unemployment”, in Reducing
Unemployment: Current Issues and Policy Options, Kansas City, Federal Reserve Bank of Kansas City.
Layard R. and Nickell S.J. (1999), “Labour Market Institutions and Economic Performance” in O. Ashenfelter and D.Card (eds.), Handbook of Labor Economics, North-Holland, Amsterdam.
Marimon, R. and M. Zilibotti (1998), “Actual versus virtual employment in Europe: Is Spain different?”, European Economic Review, 42: 123-53.
Mourre G. (2004), “Did the pattern of aggregate employment growth change in the euro area in the late 1990s?”, Applied Economics, 38: 1783–1807.
OECD (2004), Employment Outlook 2004, Paris. O’Mahony M. and B. van Ark (2003), “EU Productivity and Competitiveness: An Industry
Perspective – Can Europe Resume the Catching-up?”, Enterprise Directorate-General, European Commission, Bruxelles.
Pischke J.-S. (2005), “Labour market institutions, wages and investment: Review and implications”, CESifo Economic Studies, 5: 47-75.
Theil H. (1972), Statistical Decomposition Analysis: With Applications in the Social and Administrative Sciences, Amsterdam-London, North Holland Publishing Company.
22
Appendix 1 Sectoral breakdown Codes Labels sectors A+B Agriculture, hunting and forestry + Fishing other C Mining and quarrying C1 DA Manufacture of food products, beverages and tobacco C1 DB+DC Manufacture of textiles, clothing and leather products C1 DD+DE Manufacture of wood and paper products; publishing and printing B1 DF-DI Manufacture of coke, refined petroleum/chemicals/rubber & plastic/… products etc… B1 DJ+DK Manufacture of metal products, machinery and equipment n.e.c. A1 DL-DN Other manufacturing A1 E Electricity, gas and water supply C2 F Construction other G Wholesale and retail trade; repair of motor vehicles, motorcycles and personal/household goods other H Hotels and restaurants other I Transport, storage and communication A2 J Financial intermediation B2 K Real estate, renting and business activities C2 L Public administration and defence; compulsory social security other M Education other N Health and social work other O-Q Other community, social and personal service activities; private households with employed
persons; extra-territorial organizations and bodies other
-8 not applicable -9 Missing Source: ECHP
Appendix 2 Occupational breakdown Codes Labels 1112 Legislators, senior officials + Corporate managers H 1300 Managers of small enterprises H 2122 Physical, mathematical and engineering science professionals + Life science and health professionals H 2300 Teaching professionals H 2400 Other professionals H 3132 Physical and engineering science professionals + Life science and health associate professionals H 3334 Teaching associate professionals + Other associate professionals H 4142 Office clerks + Customer services clerks I 5100 Personal and protective services workers I 5200 Models, salespersons and demonstrators I 6100 Skilled agricultural and fishery workers L 7174 Extraction and building trades workers + Other craft and related trades workers L 7273 Metal, machinery and related trades workers + Precision, handicraft, printing and related trades workers L 8183 Stationary-plant and related operators + Drivers and mobile-plant operators L 8200 Machine operators and assemblers L 8400 8 - Miscellaneous (ECHP-specific code) L 9100 Sales and services elementary occupations L 9200 Agricultural, fishery and related laborers L 9300 Laborers in mining, construction, manufacturing and transport L 9400 9 - Miscellaneous (ECHP-specific code) L -8 not applicable -9 missing, Armed forces, 5-Miscellaneous (ECHP-specific code) Note: For confidentiality reasons, '5 Miscellaneous' was classified as -9.
23
Appendix 3 Employment structure by countrywave 1 wave 1 wave 1 wave 1 wave 8 wave 8 wave 8 wave 8
Belgium H I L total H I L totalA1 0.02 0.02 0.06 0.10 0.02 0.01 0.06 0.09B1 0.02 0.01 0.03 0.07 0.02 0.02 0.03 0.06C1 0.01 0.02 0.03 0.06 0.01 0.01 0.02 0.04A2 0.01 0.02 0.02 0.05 0.02 0.02 0.02 0.07B2 0.02 0.02 0.00 0.05 0.03 0.03 0.00 0.06C2 0.04 0.03 0.02 0.10 0.04 0.02 0.01 0.07other 0.26 0.17 0.14 0.57 0.29 0.20 0.13 0.62total 0.40 0.30 0.31 1.00 0.42 0.32 0.26 1.00
Germany H I L total H I L totalA1 0.05 0.02 0.08 0.15 0.05 0.01 0.11 0.18B1 0.02 0.01 0.04 0.07 0.03 0.01 0.04 0.07C1 0.01 0.02 0.02 0.05 0.01 0.00 0.02 0.03A2 0.01 0.01 0.02 0.04 0.01 0.01 0.03 0.05B2 0.02 0.03 0.00 0.05 0.02 0.02 0.00 0.04C2 0.03 0.01 0.02 0.06 0.05 0.02 0.02 0.09other 0.28 0.14 0.16 0.57 0.27 0.14 0.14 0.54total 0.43 0.24 0.34 1.00 0.43 0.22 0.35 1.00
Denmark H I L total H I L totalA1 0.02 0.01 0.07 0.10 0.03 0.01 0.09 0.13B1 0.02 0.00 0.02 0.04 0.01 0.00 0.01 0.02C1 0.01 0.01 0.03 0.05 0.00 0.00 0.02 0.03A2 0.02 0.02 0.03 0.07 0.01 0.02 0.02 0.05B2 0.02 0.02 0.00 0.03 0.01 0.01 0.00 0.02C2 0.05 0.01 0.02 0.08 0.06 0.01 0.01 0.08other 0.25 0.20 0.18 0.63 0.31 0.21 0.15 0.67total 0.38 0.27 0.36 1.00 0.44 0.27 0.29 1.00
France H I L total H I L totalA1 0.03 0.01 0.06 0.10 0.03 0.01 0.05 0.09B1 0.02 0.01 0.03 0.06 0.02 0.00 0.03 0.05C1 0.01 0.01 0.03 0.05 0.01 0.01 0.03 0.04A2 0.02 0.02 0.02 0.06 0.02 0.02 0.03 0.06B2 0.02 0.02 0.00 0.04 0.02 0.01 0.00 0.03C2 0.05 0.02 0.03 0.10 0.06 0.03 0.03 0.11other 0.23 0.19 0.19 0.61 0.23 0.20 0.17 0.60total 0.37 0.27 0.37 1.00 0.38 0.28 0.34 1.00
Italy H I L total H I L totalA1 0.01 0.02 0.08 0.12 0.02 0.01 0.07 0.10B1 0.01 0.01 0.03 0.05 0.01 0.01 0.03 0.05C1 0.01 0.01 0.05 0.07 0.01 0.01 0.04 0.06A2 0.01 0.02 0.03 0.05 0.01 0.02 0.03 0.06B2 0.01 0.02 0.00 0.03 0.01 0.02 0.00 0.03C2 0.03 0.02 0.02 0.06 0.04 0.03 0.02 0.09other 0.16 0.20 0.26 0.62 0.17 0.24 0.21 0.62total 0.24 0.30 0.46 1.00 0.26 0.34 0.40 1.00
NL H I L total H I L totalA1 0.02 0.00 0.03 0.05 0.02 0.00 0.02 0.05B1 0.02 0.01 0.03 0.06 0.02 0.00 0.02 0.04C1 0.01 0.00 0.02 0.04 0.01 0.00 0.02 0.03A2 0.01 0.03 0.03 0.07 0.01 0.02 0.02 0.06B2 0.03 0.01 0.00 0.04 0.03 0.01 0.00 0.04C2 0.07 0.02 0.03 0.11 0.08 0.02 0.02 0.12other 0.32 0.19 0.13 0.64 0.35 0.20 0.11 0.66total 0.47 0.26 0.26 1.00 0.52 0.27 0.21 1.00
UK H I L total H I L totalA1 0.03 0.02 0.05 0.10 0.02 0.01 0.02 0.05B1 0.02 0.01 0.03 0.06 0.01 0.00 0.01 0.03C1 0.01 0.01 0.04 0.06 0.00 0.00 0.01 0.01A2 0.01 0.02 0.03 0.06 0.01 0.01 0.02 0.04B2 0.03 0.02 0.00 0.05 0.01 0.01 0.00 0.02C2 0.06 0.02 0.02 0.10 0.04 0.02 0.01 0.06other 0.24 0.21 0.12 0.57 0.33 0.27 0.19 0.79total 0.41 0.31 0.29 1.00 0.42 0.32 0.26 1.00
24

DIPARTIMENTO DI POLITICA ECONOMICA, FINANZA E SVILUPPO UNIVERSITÀ DI SIENA
PIAZZA S. FRANCESCO 7 I- 53100 SIENA http://www.depfid.unisi.it/WorkingPapers/
ISSN 1972 - 361X
DEPFID WORKING PAPERS
Related Documents


