Welcome message from author
This document is posted to help you gain knowledge. Please leave a comment to let me know what you think about it! Share it to your friends and learn new things together.
Transcript
1
Techno-economic assessment of CO2-containing
polyurethane rubbers
Georg A. Buchnera, Nils Wulfesa, Reinhard Schomäckera*
Technische Universität Berlin, Department of Chemistry, Straße des 17. Juni 124, 10623
Berlin, Germany
a Technische Universität Berlin, Department of Chemistry, TU Berlin, Straße des 17. Juni
124, 10623 Berlin, Germany
E-mail addresses: [email protected] (G.A. Buchner), [email protected] (N.
Wulfes), [email protected] (R. Schomäcker)
* Corresponding author details: E-mail: [email protected]; Phone: +49-(0)-30-314-
24973; Address: Technische Universität Berlin, Department of Chemistry, TU Berlin, Strasse
des 17. Juni 124, Sekretariat TC 8, 10623 Berlin, Germany
2
Abstract
Carbon capture and utilization technologies can open up new synthesis routes with economic
benefits. Recently, the inclusion of carbon dioxide in polyols was extended by
copolymerizing double bond agents. This allows for subsequent chain-extension with
diisocyanates to polyurethane rubbers. This paper assesses their economic viability. A
preliminary techno-economic assessment based on extended block flow diagrams reveals
substantial uncertainty in profitability indicators due to applying a short-cut capital
expenditure estimation method. Consequently, a process design for the polyol production was
carried out, enabling a refined TEA incorporating an equipment-cost-based approach. Positive
net present values are reported for multiple [double bond agent]-[diisocyanate]-[benchmark]
combinations. The net present value is most sensitive to the sales and propylene oxide prices.
The choice of the double bond moiety has decisive effect; the choice of the diisocyanate has
minor effect on the TEA. Finding a favorable market position remains the biggest challenge
for CO2-containing synthetic polyurethane rubbers.
Keywords: Carbon dioxide utilization, polyurethane, rubber, elastomer, techno-economic
assessment, process design
3
1 Introduction
While carbon capture and utilization (CCU) technologies are mostly viewed from the
perspective of climate change mitigation, they can at the same time open up new synthesis
routes with possible economic benefits [1–3]. A variety of CCU technologies have been
proposed and research, development and deployment (RD&D) has experienced a very
dynamic growth in recent years [4]. The copolymerization of carbon dioxide (CO2) with
epoxides to form polyether carbonate polyols as building blocks in polyurethane
manufacturing has attracted market interest due to life cycle impact reductions in nine
categories such as global warming impact [4,5] as well as potential economic benefits through
cost reduction [6–8]. Polyurethane chemistry shows great versatility and intensive research on
material properties with the intent of broadening the spectrum of applications is undergoing
[9]. In this context, CO2-containing polyols that include double bonds (DB) in the polymer
chain were invented, providing additional functionality [10]. The introduction of this new
polyurethane building block enables new pathways; two general research directions can be
distinguished [11,12]:
I) Low DB content, bifunctional: These polyols can be elongated with diisocyanates to
polyurethanes. The resulting material is a synthetic rubber (i.e. (linear) unsaturated
polymer chains) that is compounded and vulcanized to elastomers in following steps
[13]. Hence, the novel chemistry presents an alternative for the chemical production
steps (in a narrower sense) in typical elastomer value chains as depicted in Figure 1.
II) High DB content, multi (>2) OH-functionality: These polyols can for example be
employed similarly to conventional polyols in thermoset polyurethane elastomers [9]
and provide additional cross-linking, leading to potentially denser materials with
enhanced properties. Additional applications are currently in research and
development [14].

4
Figure 1: Value chain of synthetic elastomers, the dashed line box is filled with the novel
CO2-containing polyurethane rubber synthesis
RD&D of new technologies is only possible with prospects of monetary gain. Decision-
makers rely heavily on sound assessments as tools for answering their question about what
technology to invest scarce resources in. Recently, pitfalls and conceptual challenges in
assessing chemical innovations in general and CCU technologies in particular were identified
and tackled with the introduction of a respective techno-economic assessment structure and
framework [15] and techno-economic assessment (TEA) & life cycle assessment (LCA)
guidelines for CO2 utilization [16]. This paper is a worked example of the proposed
methodology. Its aim is to assess the general economic viability of novel CO2-containing
rubbers as part of research direction I) shown above. The scope of this paper’s assessment is
limited to TEA; an LCA of the same group of polymers was published recently [17]. Routes
associated with research direction II) are not in the scope of this paper. A first assessment
aligning TEA and LCA for products of research direction II) was reported earlier by the same
authors [14].
For the structure of the body of this paper, a classical separation into methods, results and
discussion, which is typically found in scientific literature, is not reasonable. The aim of this
paper rather is to mirror an actual (RD&D and) TEA approach. In particular, the interplay of
methodology selection and result calculations remains an often discussed issue in literature
[16,18] and project work. For this paper, three tiers of methodology decisions can be seen:
Tier 1: Approach on the overall scientific study, general work principles
5
Tier 2: Selection of depth of data analysis and grade of methodology
Tier 3: Specific calculation methods
Process design and assessment are two different parts of technology innovation (data
exchange and feedback between practitioners of both fields is crucial!). Thus, this work is
separated into process design and TEA (tier 1). Initially, the technology of interest is
described (chapter 2). A preliminary TEA is carried out in the following (chapter 3). The
preliminary TEA leads to a decision of further process design which is subsequently laid out
using established chemical engineering methodology (chapter 4). This then serves as the data
basis for a refined TEA (chapter 5). Both preliminary and refined TEA follow the
aforementioned methodological frameworks and guidance (chapter 3).
The process description and design is conducted on two levels of detail (process design, tier
2): First, extended block flow diagrams (BFD); second, preliminary process flow diagrams
(PFD). This separation is expected to deliver insights into the depth of analysis and
engineering effort needed for sound assessment in early to mid levels of data availability (see
also [19]). The description and design sections are introduced with discussions about the data
foundations and lead to the respective flow diagrams. A variety of specific, established
approaches and methods for process and equipment design (process design, tier 3) are applied.
TEA is a process that reflects a separation similar to ‘methods, result and discussion’ in its
phases: In phase I, the goal & scope phase of a TEA, the general methodology is selected, i.e.
the depth of the analysis and guidance on the methods that can be selected (TEA, tier 2).
Basic methodology such as composition of cost items which can be found in the
aforementioned frameworks is recapitulated alongside the study only where deemed helpful
or adapted. The numbering in the TEAs is: [paper chapter].[TEA item according to [15] and
Figure 2].[further division] The selection of specific methods (especially for smaller parts
such as single equipment cost calculation) can be carried out in the subsequent phases which
can contain their own separation into method selection and calculation tasks [15]. For this
reason, the specific methods applied and assumptions made are briefly introduced at the point
of their effect (TEA, tier 3). Results are calculated in phases II and III and thereinafter
discussed (‘interpreted’) in phase IV.
6
2 Process Description
2.1 TEA-process design interface
Every assumption and decision in process design has economic impacts. For this reason,
overlaps between process design and TEA are unavoidable. The currently available data
(‘Literature data’ in Figure 2) define both the process design’s level of detail and the
technology maturity and consequently the depth of adequate TEA methodology. The TEA
scope has to match the technology that is currently in RD&D whose planning is reflected in
the design scope. At the same time, the design scope will follow a set of parameters that are
defined in the TEA scope. Two prominent examples for this relation are system boundaries
and plant capacity. For market reasons, this paper’s design and TEA scope is limited to the
production of polyols and production of polyurethanes (as touched upon in chapter 1 and
explicated 3.2.2) which are considered separate steps. Furthermore, initial market
considerations for an adequate plant capacity yield values that define also the design scope
(see 2.2). Every aspect of a technology is associated with cost; this means that design results
are at the same time model inputs to cost estimation methods. Concurrently, while selecting
equipment, the engineer is responsible to select equipment that performs the desired task in an
economical way. For example, the design yields equipment specifications that are model input
to capital expenditure (CapEx) estimation. In the reflection upon the design and impacts, TEA
has to consider only those deviations in sensitivity and uncertainty analyses which are
technologically relevant. Simultaneously, TEA has to give economically probable deviations
that have to be examined in terms of design consequences. The engineering and TEA scopes
will be redefined according to the respective risk and uncertainty reflections. Figure 2 depicts
the interplay between process design and TEA tasks as performed in this study.
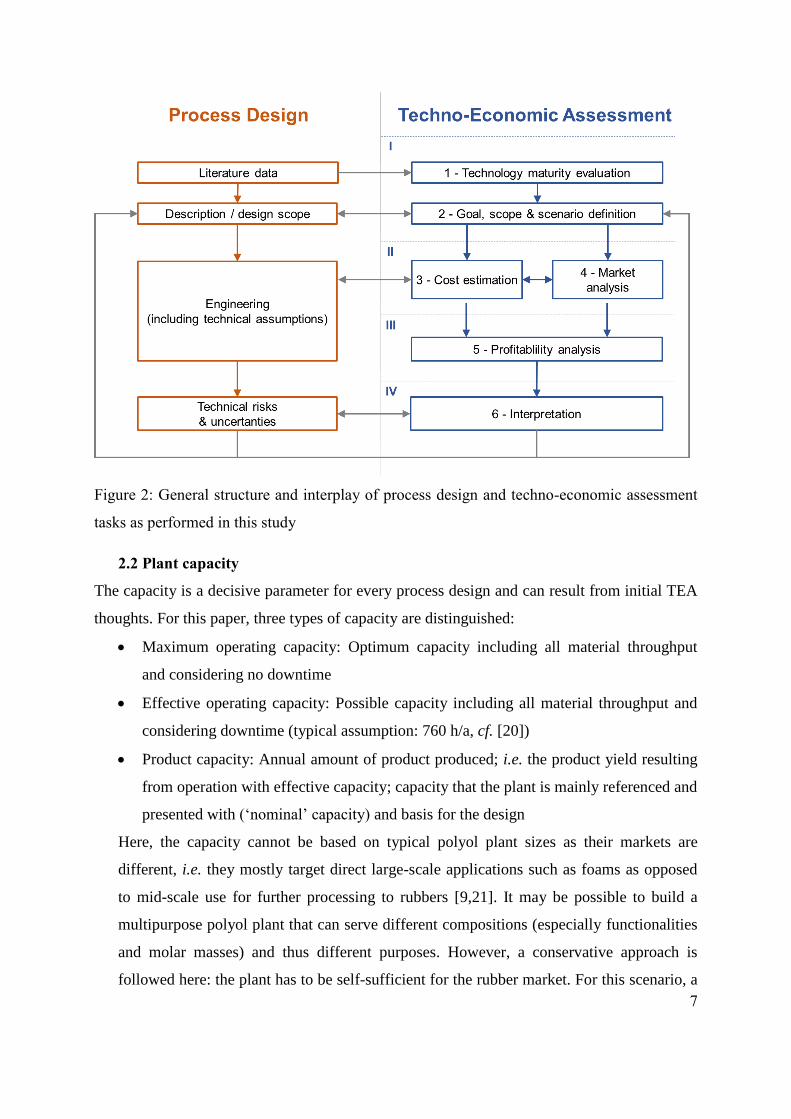
7
Figure 2: General structure and interplay of process design and techno-economic assessment
tasks as performed in this study
2.2 Plant capacity
The capacity is a decisive parameter for every process design and can result from initial TEA
thoughts. For this paper, three types of capacity are distinguished:
Maximum operating capacity: Optimum capacity including all material throughput
and considering no downtime
Effective operating capacity: Possible capacity including all material throughput and
considering downtime (typical assumption: 760 h/a, cf. [20])
Product capacity: Annual amount of product produced; i.e. the product yield resulting
from operation with effective capacity; capacity that the plant is mainly referenced and
presented with (‘nominal’ capacity) and basis for the design
Here, the capacity cannot be based on typical polyol plant sizes as their markets are
different, i.e. they mostly target direct large-scale applications such as foams as opposed
to mid-scale use for further processing to rubbers [9,21]. It may be possible to build a
multipurpose polyol plant that can serve different compositions (especially functionalities
and molar masses) and thus different purposes. However, a conservative approach is
followed here: the plant has to be self-sufficient for the rubber market. For this scenario, a

8
combination of both market expectations and typical benchmark plants' capacities serves
as orientation for the plant capacity. Initial market sizes for (near) drop-in solutions most
likely do not exceed 30% of the immediate benchmark’s capacity in the targeted region.
The most prominent benchmark is expected to be nitrile butadiene rubber (NBR) in the
US at ~93.8 kt/a [22], leading to an estimated initial market of ~28.2 kt/a (details are part
of the market analysis, section 3.4). Typical NBR plants range from 10 to 35 kt/a [23].
Thus, a maximum operating capacity of 30.0 kt/a is selected here which for the base case
corresponds with an effective operating capacity of about 27.4 kt/a and leads to a product
capacity of just above 23.6 kt/a.
2.3 Approach and literature
For a first process description, relevant literature is collected and the description’s scope is
defined. Subsequently, block flow diagrams (BFD) can be drawn, and after setting up and
scaling of the material balance, extended with mass flows (see Figure 3). The extended BFDs
contain the process idea in the form of a sequence of characteristic process steps and their
rough operating conditions. Assumptions include rules of thumb and expert guesses believed
to be in at least correct order of magnitude range.
Figure 3: Methodological sequence for the process description leading to extended block flow
diagrams
To our best knowledge, the novel rubbers are currently solely developed by Covestro
Deutschland AG. Information about the technology is predominantly taken from patents
related to their activities. For the CO2-containing polyols, relevant patents are available [24–
26]. It is assumed that this technology can easily be adapted to including maleic anhydride (or
allyl glycidyl ether) as a third co-monomer. Further information on this CO2-polyol formation
9
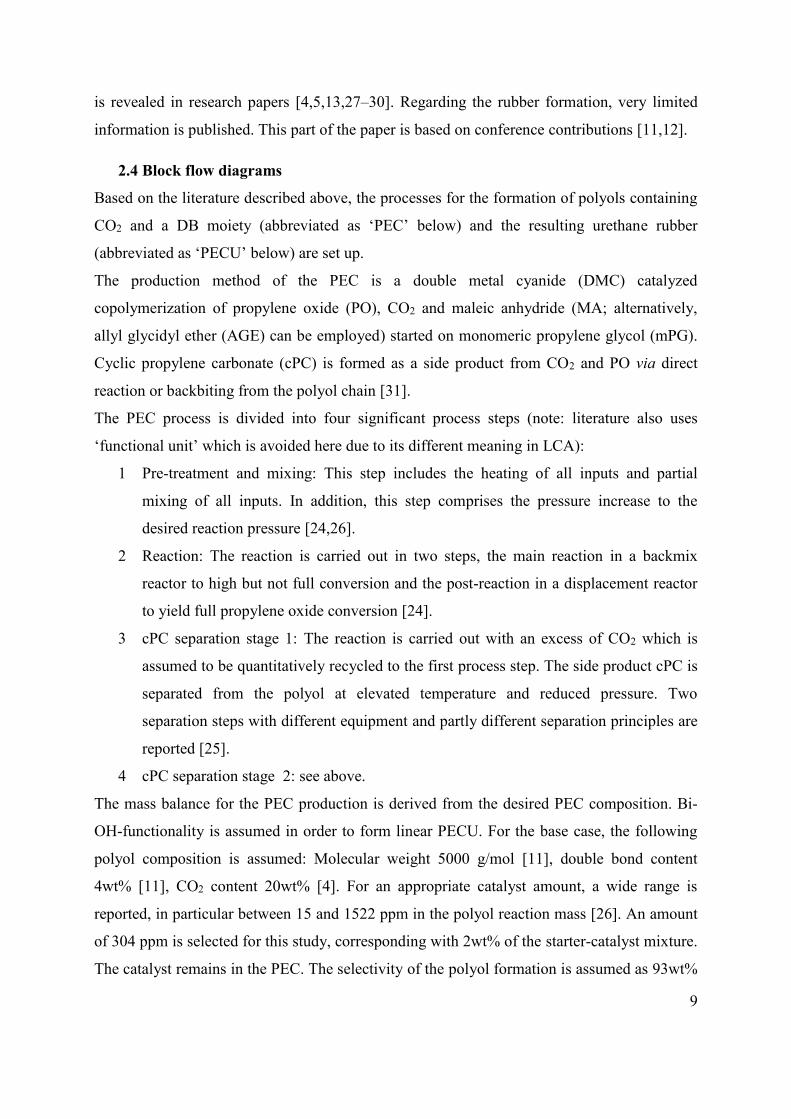
is revealed in research papers [4,5,13,27–30]. Regarding the rubber formation, very limited
information is published. This part of the paper is based on conference contributions [11,12].
2.4 Block flow diagrams
Based on the literature described above, the processes for the formation of polyols containing
CO2 and a DB moiety (abbreviated as ‘PEC’ below) and the resulting urethane rubber
(abbreviated as ‘PECU’ below) are set up.
The production method of the PEC is a double metal cyanide (DMC) catalyzed
copolymerization of propylene oxide (PO), CO2 and maleic anhydride (MA; alternatively,
allyl glycidyl ether (AGE) can be employed) started on monomeric propylene glycol (mPG).
Cyclic propylene carbonate (cPC) is formed as a side product from CO2 and PO via direct
reaction or backbiting from the polyol chain [31].
The PEC process is divided into four significant process steps (note: literature also uses
‘functional unit’ which is avoided here due to its different meaning in LCA):
1 Pre-treatment and mixing: This step includes the heating of all inputs and partial
mixing of all inputs. In addition, this step comprises the pressure increase to the
desired reaction pressure [24,26].
2 Reaction: The reaction is carried out in two steps, the main reaction in a backmix
reactor to high but not full conversion and the post-reaction in a displacement reactor
to yield full propylene oxide conversion [24].
3 cPC separation stage 1: The reaction is carried out with an excess of CO2 which is
assumed to be quantitatively recycled to the first process step. The side product cPC is
separated from the polyol at elevated temperature and reduced pressure. Two
separation steps with different equipment and partly different separation principles are
reported [25].
4 cPC separation stage 2: see above.
The mass balance for the PEC production is derived from the desired PEC composition. Bi-
OH-functionality is assumed in order to form linear PECU. For the base case, the following
polyol composition is assumed: Molecular weight 5000 g/mol [11], double bond content
4wt% [11], CO2 content 20wt% [4]. For an appropriate catalyst amount, a wide range is
reported, in particular between 15 and 1522 ppm in the polyol reaction mass [26]. An amount
of 304 ppm is selected for this study, corresponding with 2wt% of the starter-catalyst mixture.
The catalyst remains in the PEC. The selectivity of the polyol formation is assumed as 93wt%
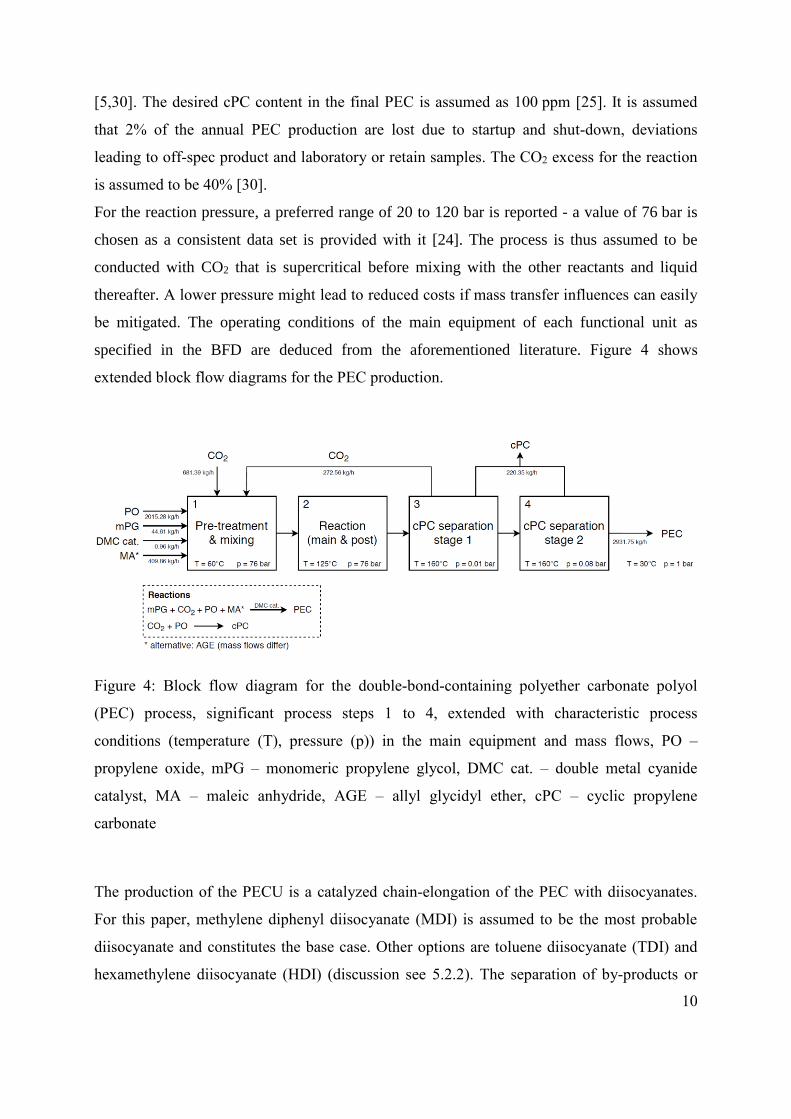
10
[5,30]. The desired cPC content in the final PEC is assumed as 100 ppm [25]. It is assumed
that 2% of the annual PEC production are lost due to startup and shut-down, deviations
leading to off-spec product and laboratory or retain samples. The CO2 excess for the reaction
is assumed to be 40% [30].
For the reaction pressure, a preferred range of 20 to 120 bar is reported - a value of 76 bar is
chosen as a consistent data set is provided with it [24]. The process is thus assumed to be
conducted with CO2 that is supercritical before mixing with the other reactants and liquid
thereafter. A lower pressure might lead to reduced costs if mass transfer influences can easily
be mitigated. The operating conditions of the main equipment of each functional unit as
specified in the BFD are deduced from the aforementioned literature. Figure 4 shows
extended block flow diagrams for the PEC production.
Figure 4: Block flow diagram for the double-bond-containing polyether carbonate polyol
(PEC) process, significant process steps 1 to 4, extended with characteristic process
conditions (temperature (T), pressure (p)) in the main equipment and mass flows, PO –
propylene oxide, mPG – monomeric propylene glycol, DMC cat. – double metal cyanide
catalyst, MA – maleic anhydride, AGE – allyl glycidyl ether, cPC – cyclic propylene
carbonate
The production of the PECU is a catalyzed chain-elongation of the PEC with diisocyanates.
For this paper, methylene diphenyl diisocyanate (MDI) is assumed to be the most probable
diisocyanate and constitutes the base case. Other options are toluene diisocyanate (TDI) and
hexamethylene diisocyanate (HDI) (discussion see 5.2.2). The separation of by-products or

11
side products is neither reported nor expected. The PECU process is divided into two
significant process steps:
5 Reactive extrusion: For the PECU formation process, public statements are "reactive
extrusion"[11] and "standard TPU plant" [12]; however, no specific information is
published. Most thermoplastic polyurethane (TPU) production processes are carried
out in solvent-free systems and apply either one-shot operation or reactive extrusion
[32]. A single but potentially rather complex reactive extrusion step is assumed for the
PECU formation. Elevated temperature is necessary [9], a range of 100 to 180°C is
reported for most polyurethanes [21]; as no further information is available, an
average value was chosen.
6 Solid handling/packaging: Following the reactive extrusion, a generic solid handling
step is employed in order to prepare freight shape. TPUs are commonly supplied as
resin (granules), and rubbers are often shipped in other shapes (NBR: bales; EPDM:
bales, pellets; CR: chips). For PECU, a viscosity that is by trend lower than
conventional comparable rubbers is reported [13]. Shipping as bales is thus assumed
here; however, as there is no specification at hand, this preliminary evaluation treats
this step as generic ‘solid handling / packaging’ at ambient conditions. As it may
involve curing, it is placed inside battery limits (ISBL).
The mass balance for the PECU production is derived from the desired PECU composition.
Stoichiometric input is assumed in order to form linear PECU. The catalyst is unknown; the
mass of the catalyst is neglected. It is assumed that 2% of the annual PECU production is lost
due to startup and shut-down, deviations leading to off-spec product as well as laboratory or
retain samples. Figure 5 shows extended block flow diagrams for the PECU production.

12
Figure 5: Block flow diagram for the polyether carbonate polyurethane rubber (PECU)
process, significant process steps 5&6, extended with characteristic process conditions
(temperature (T), pressure (p)) in the main equipment and mass flows, MDI – methylene
diphenyl diisocyanate, TDI – toluene diisocyanate, HDI – hexamethylene diisocyanate
For both PEC and PECU, the energy and utilities (E&U) demand calculations on BFD level
are based on the basic thermodynamics of the key unit operations, i.e. without equipment
design, not considering heat integration or efficiencies. For the PECU energy calculations, it
is assumed that the reactive extruder is the dominating energy consumer. An electrical energy
demand of 0.15 kWh/kg(PECU) is assumed (see also [33]) for the motor; heating is assumed
to be powered with electricity, cooling is not considered.
3 Preliminary techno-economic assessment
3.1 TRL rating (preliminary)
The general depth of analysis follows the degree of knowledge about the process, which is
reflected in its maturity. For a maturity evaluation, rating with technology readiness levels
(TRL) [19] is recommended [16]. The data availability for this paper is believed to be notably
lower than the level of information present to the developing institution. While patents reveal
ideas for the PEC process, the PECU process remains unpublished. As a consequence,
publically ‘observed TRLs’ (see also [19]) remain at conceptual stages, while the developing
institution’s ‘real TRLs’ (see also [19]) are believed to be substantially higher. The
preliminary TEA is based on the process descriptions given in chapter 2 whose observed level
of data availability corresponds with TRL 4.
13
3.2 Goal, scope and scenario definition (preliminary)
3.2.1 Goal definition (preliminary)
The goal of this study is to assess the general economic viability of a novel polyurethane
rubber formed from a CO2-containing polyol based on propylene oxide and including double
bonds, which is reacted with diisocyanates. The polyol as well as polyurethane synthesis are
examined. A product capacity of 23.6 kt/a for a plant located at the US gulf coast (USGC) in
the base year 2018 is projected. A full-scope assessment (see also [15]) is targeted, allowing
for a direct comparison of cost of goods sold (COGS) to benchmarks’ market prices.
Furthermore, recommendations for an approach on a refined TEA shall be given. An R&D
perspective is taken, aiming at an audience of practitioners from both academia and industry.
3.2.2 Scope and scenario definition (preliminary)
The scope of the preliminary TEA is limited to the base case. The base case scenario is
constituted by a plant on the USGC which will sell (mainly) to the US market. This decision
offers a reasonable market size nearby, established infrastructure for chemical production and
easy access to feedstocks. The currency of the analysis is USD. The base year is 2018 as it is
the latest year sufficient price data are available; price forecasts are avoided. The chosen
capacity is explained in 2.2 and 3.4. The system boundaries for this case study are set by the
chemical production (in a narrower sense) and are highlighted in Figure 1. The conventional
inputs to the PEC production can be included in the assessment via their market prices; CO2
will be discussed separately in section 3.3.2. The PECU is seen as a (near) drop-in solution for
selected synthetic specialty rubbers [12,13] (see 3.4).
3.3 Cost estimation (preliminary)
3.3.1 General remarks (preliminary)
All cost of goods sold (COGS) are included in this TEA. COGS are the sum of operational
expenditure (OpEx), capital expenditure (CapEx) and general expenses (GenEx). OpEx is
further divided into material, energy & utility (E&U) and indirect cost as their estimation
methodology differs due to different data bases. Cost estimation is itself a process of three (or
four) phases: selection of method, cost inventory and cost impact calculation (and cost
interpretation). All phases are combined in the respective sections for better overview. An
interpretation of cost in the sense of an assessment is only possible as a cost-comparison
which is excluded here. In contrast, a comparison to the benchmark – as given by the market
analysis – reveals the profitability which is calculated in 3.5 and interpreted in 3.6. In general,
14
the combination of OpEx/GenEx and CapEx is part of the profitability calculation as these
costs refer to different time spans and thus cannot be directly combined to a single impact.
3.3.2 Material cost
For the material cost, the different items in the material balance for different inputs/outputs
are ‘tagged’ with prices retrieved from trade data bases and supplier information; see
compiled in the supporting information Table S1. The CO2 price is subject to intense
discussion [16]: For this study, the CO2 price is composed of four elements: capture,
transport, profit margin, compression. The CO2 source for this process is a point source [5]. A
natural gas fired power plant is selected as it allows for flexible site selection, coming with the
disadvantage of additional investment for the capture unit which leads to higher overall
capture cost. The capture cost, including purification to ≥99,95 vol%, is calculated from
Naims [34] and adjusted for inflation to 84.65 $/t. With transport and profit margin neglected
(see also [35]) and if target pressure equals the pressure at which the CO2 is used (which in
this case is a reasonable assumption as the use pressure is about 76 bar and typical transport
pressures would be about 100 bar [30,36]), the CO2 cost is not affected by the location of the
compression. As no reliable price data including compression are at hand, the compression is
included in the PEC plant. The CO2 input cost thus equals the calculated capture cost in this
case. Total material cost is 34.33 M$/a (1.50 $/kg). The material cost is dominated by the PO
cost (~66.8%; 68wt% in the PECU), followed by MA cost (11.3%) and MDI cost (10.8%).
The inputs’ contributions to the material cost are shown in Figure 6.

15
Figure 6: Input cost contributions to material cost in the polyether carbonate polyurethane
rubber (PECU), PO – propylene oxide, mPG – monomeric propylene glycol, DMC cat. –
double metal cyanide catalyst, MA – maleic anhydride, AGE – allyl glycidyl ether, cPC –
cyclic propylene carbonate, Ureth. cat. – urethanization catalyst, MDI – methylene diphenyl
diisocyanate
3.3.3 Energy & utility cost (preliminary)
For a rough estimate of the E&U cost, the process is divided into general unit operations that
are calculated in single steps (e.g., no intercooling for high ratio compressions) in order to
represent a conservative thermodynamic situation:
Heating up of reactants (low pressure steam)
Compression of reactants (electricity), cooling of reactants if necessary (cooling
water)
Cooling of total reaction heat (cooling water)
Heating up to separation heat (medium pressure steam)
Vacuum as compression to pressure inverse (electricity)
Cooling of PEC, cPC (cooling water)
Heating of reaction mixture (electricity)
Extrusion (electricity)
The condition data in the block flow diagrams were taken as start and end points. Simplifying
assumptions for material properties were made and efficiencies were neglected. Energy &
utility prices are listed in the supporting information in Table S2. The steam prices were
calculated for a system of 40, 20 and 3 bar with natural gas for heating and electricity
generated from expansion. Total E&U cost is 0.45 M$/a (0.019 $/kg).

16
3.3.4 Indirect operational expenditure
Indirect OpEx are commonly estimated with factored estimation in development stages. A
table with the respective factors along with the cost items they are applied to is given in the
supporting information (Table S3). Standard literature values were chosen, tending towards
higher values if ranges are given due to the fact that this new technology may come with
slightly increased operating effort. For maintenance and repairs, a relatively high factor of 8%
on FCI (see compilations in [15] and [37] for comparison) was chosen as a) this novel process
may need adaptions and optimization, b) processes with increased operating pressure show
higher maintenance and repair cost and c) extruder screws and conveyor belts are subject to
abrasion, frequent replacements may occur. Operating intellectual property is assumed to be
proprietary, and packaging/loading/shipping is included in marketing & sales of GenEx for
this study. The total indirect OpEx is 6.37 M$/a (0.27 $/kg).
3.3.5 Capital expenditure (preliminary)
PEC and PECU steps are treated as separate fixed capital investments (FCI). For the
preliminary TEA, FCI was calculated with a process step counting method presented by
Klumpar et al. [38], using information given in the process description (chapter 2). This
method has shown to deliver satisfying estimates for thermochemical plants that do not
include numbering-up [39] and is representative for a group of process step counting methods.
The process steps in the PEC and PECU processes deviate from the list of descriptions for
standard characteristic steps as they are not dominated by a single unit operation but combine
a multitude of equally important physical effects. Therefore, the recommended generic
complexity exponent was chosen. The method returns direct ISBL cost. Indirect ISBL cost are
believed to account for 28.84% (calculated from [40]) of the total ISBL cost. A factor of 30%
on ISBL cost was chosen for OSBL cost. Table 1 lists the FCI items’ values.
17
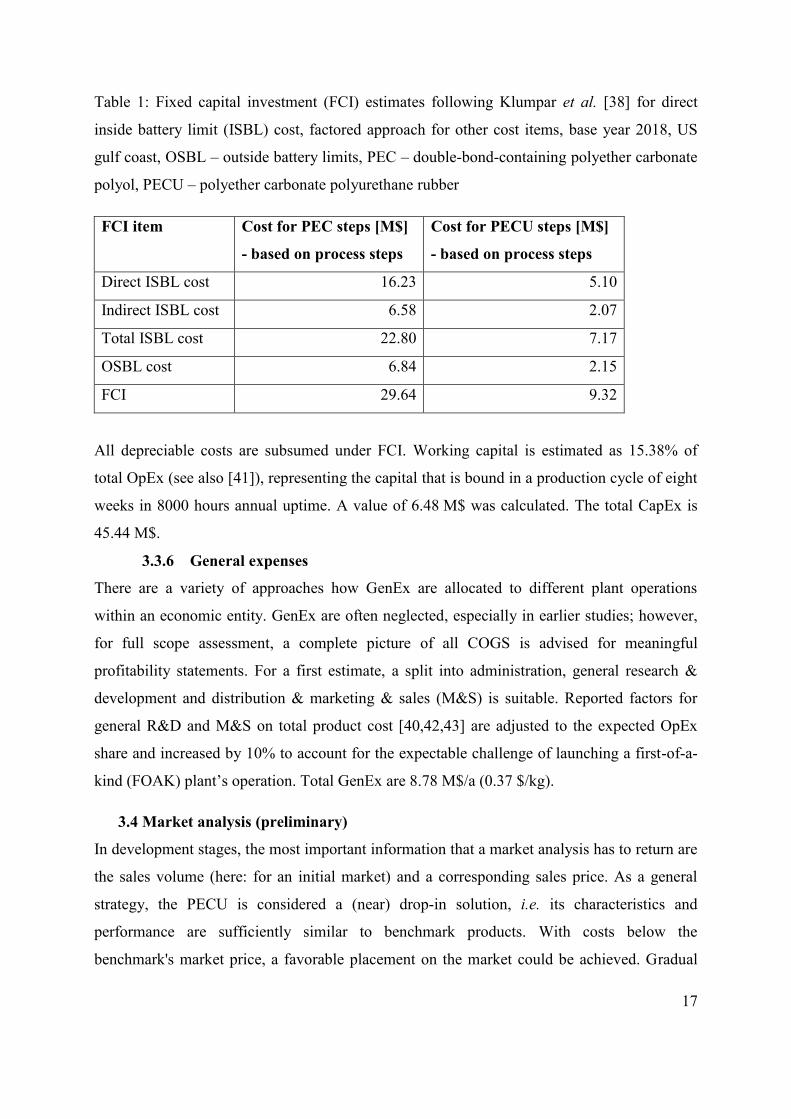
Table 1: Fixed capital investment (FCI) estimates following Klumpar et al. [38] for direct
inside battery limit (ISBL) cost, factored approach for other cost items, base year 2018, US
gulf coast, OSBL – outside battery limits, PEC – double-bond-containing polyether carbonate
polyol, PECU – polyether carbonate polyurethane rubber
FCI item Cost for PEC steps [M$]
- based on process steps
Cost for PECU steps [M$]
- based on process steps
Direct ISBL cost 16.23 5.10
Indirect ISBL cost 6.58 2.07
Total ISBL cost 22.80 7.17
OSBL cost 6.84 2.15
FCI 29.64 9.32
All depreciable costs are subsumed under FCI. Working capital is estimated as 15.38% of
total OpEx (see also [41]), representing the capital that is bound in a production cycle of eight
weeks in 8000 hours annual uptime. A value of 6.48 M$ was calculated. The total CapEx is
45.44 M$.
3.3.6 General expenses
There are a variety of approaches how GenEx are allocated to different plant operations
within an economic entity. GenEx are often neglected, especially in earlier studies; however,
for full scope assessment, a complete picture of all COGS is advised for meaningful
profitability statements. For a first estimate, a split into administration, general research &
development and distribution & marketing & sales (M&S) is suitable. Reported factors for
general R&D and M&S on total product cost [40,42,43] are adjusted to the expected OpEx
share and increased by 10% to account for the expectable challenge of launching a first-of-a-
kind (FOAK) plant’s operation. Total GenEx are 8.78 M$/a (0.37 $/kg).
3.4 Market analysis (preliminary)
In development stages, the most important information that a market analysis has to return are
the sales volume (here: for an initial market) and a corresponding sales price. As a general
strategy, the PECU is considered a (near) drop-in solution, i.e. its characteristics and
performance are sufficiently similar to benchmark products. With costs below the
benchmark's market price, a favorable placement on the market could be achieved. Gradual
18
exploitation of a bigger market can occur by a) replacing other elastomers using lower cost as
major competitive advantage and/or b) filling into general market growth.
The technical analysis of benchmarks suggests four possible competitive products [13]: Three
‘specialty rubbers’ [23], nitrile butadiene rubber (NBR), ethylene propylene diene methylene
rubber (here: EPDM), chloroprene rubber (CR) as well as one ‘high-performance rubber’
[23], hydrogenated nitrile butadiene rubber (HNBR).
NBR is the preferred benchmark [11]. Hence, the potential sales volume and sales price of
NBR are set as values for the base case. Additional benchmarks will be described in market
analysis of the refined TEA (5.4).
Nitrile butadiene rubber is a specialty rubber with "good oil resistance" [23]. Its biggest
markets are: Automotive, oil&gas, mechanical engineering [22]. Products include fluid lines,
seals/O-rings/gaskets, dampers, membranes, timing belts, cables [22,23,44]. In general, higher
acrylonitrile content increases the elastomer performance [44]. The addressed market is the
US and an entry market share of 30% is assumed. The demand in 2018 is considered for the
following calculations: The possible sales volume is 28.2 kt/a [22] (~20% above product
capacity) at a price of 2812.80 $/t [45]. The chosen NBR market shows a moderate growth (2-
3% p.a. until 2025) [22].
3.5 Profitability analysis (preliminary)
The most important criterion in TEA is profitability. Other criteria can be found in literature
but remain inconclusive (as explained in [14,15]). The specific profit (in static calculation) is
chosen as an indicator for the preliminary TEA. As the possible sales volume exceeds the
plant’s capacity, the specific profit equals the static profit divided by the market potential. It
can thus be added to the list of TRL 4 indicators (see [15], GenEx are added to the
calculation, only depreciable CapEx items are considered) and corresponds with the TRL
rating and defined goal. The plant lifetime is 10 years and here equals the allocation time in
static calculation. This conservative timeframe is decided as the FOAK plant is expected to
lose value quickly. The sales price is set as the benchmark’s market price. This is possible as
synthetic rubber plants currently operate with negligible margins (see also [46]). A specific
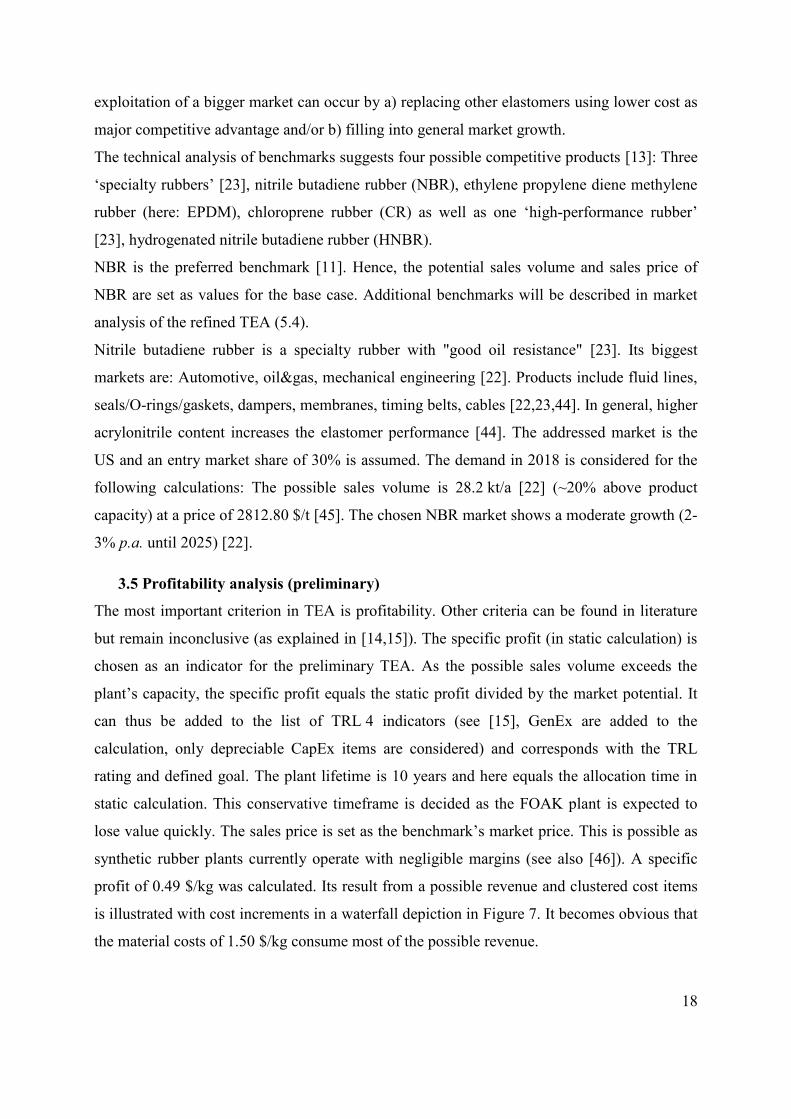
profit of 0.49 $/kg was calculated. Its result from a possible revenue and clustered cost items
is illustrated with cost increments in a waterfall depiction in Figure 7. It becomes obvious that
the material costs of 1.50 $/kg consume most of the possible revenue.
19
Figure 7: Waterfall diagram of revenue and clustered cost items, cost increments, static
calculation, 10 year allocation time, product capacity equals sales volume, sales price equals
benchmark price, GenEx – general expenses, FCI – fixed capital investment, OpEx –
operational expenditure, E&U – energy and utilities
3.6 Interpretation (preliminary)
3.6.1 Interpretation of indicators (preliminary)
Every TEA interpretation includes the following parts: interpretation of indicators (3.6.1),
sensitivity analysis and uncertainty analysis (SA and UA, 3.6.2). The TEA & LCA guidelines
for CO2 utilization [16] include multi-criteria decision analysis (MCDA) in the interpretation
phase. MCDA can be an additional step that prepares decision making by combining different
criteria. This is not applicable here as only profitability is analyzed. TEA itself is a tool that
prepares decisions and it is acknowledged that in addition to the general interpretation,
specific analyses can be demanded by the respective decision-maker. Preparing a specific
decision-making about future development is showcased in 3.6.3.
A positive indication for future RD&D is given if the specific profit is positive or exceeds a
target value. For this academic study, no target value is given. As the specific profit is
positive, a positive indication for future RD&D is given.
20
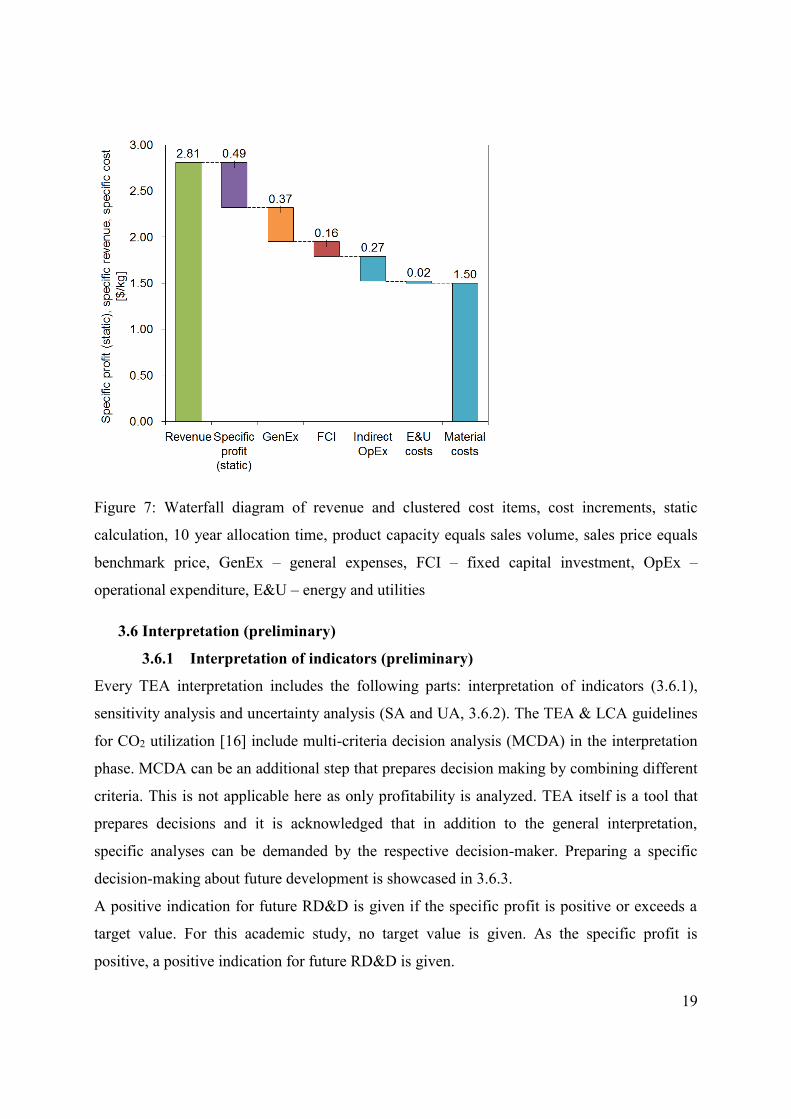
3.6.2 Sensitivity and uncertainty analyses (preliminary)
In a first analysis, the influences of all major cost items and the sales price on the above
presented indicator are examined while capacity and plant life-time are viewed as invariable.
A tornado plot shows the target outputs’ outcomes with +/-20% model input deviation for the
base case (Figure 8).
Figure 8: Sensitivity analysis (SA) of clustered cost items and sales price for specific profit
(static calculation), tornado depiction, +/-20%, GenEx – general expenses, FCI – fixed capital
investment, OpEx – operational expenditure, E&U – energy and utilities, NBR – nitrile
butadiene rubber
In the presented base case situation, the specific profit is very sensitive to the sales price
(sensitivity coefficient [47]: 5.73), followed by high sensitivity to material costs (-3.64) which
are the decisive OpEx item (total OpEx: -4.35). As the mass balance is given from process
design, special attention to the uncertainties of the retrieved prices should be paid. The
sensitivity coefficients of indirect OpEx, GenEx and FCI range between -0.76 and -0.34; their
absolute cost increments are similar to the specific profit. For this reason, these cost items
may need consideration in future calculations if they come with high uncertainties.
At this point, no distributions of the cost clusters are at hand. These will have to be calculated
from their important model input distributions. An in-depth uncertainty analysis is included in
the refined TEA. The uncertainty of FCI and its implications are discussed within the
following decision preparation.

21
3.6.3 Preparing the decision for subsequent R&D
The observed TRL was rated to be 4. In engineering terms, the next level, TRL 5, is
summarily characterized as a level of data availability that is associated with a
(first/preliminary) PFD and its accompanying tables. The question is raised if for the current
technology assessment an engineering effort leading to a PFD will help the TEA. In order to
answer this question, it has to be examined whether and how TEA methods change with a
PFD. The latter question is answered separately for the earlier presented cost clusters in Table
2.
22
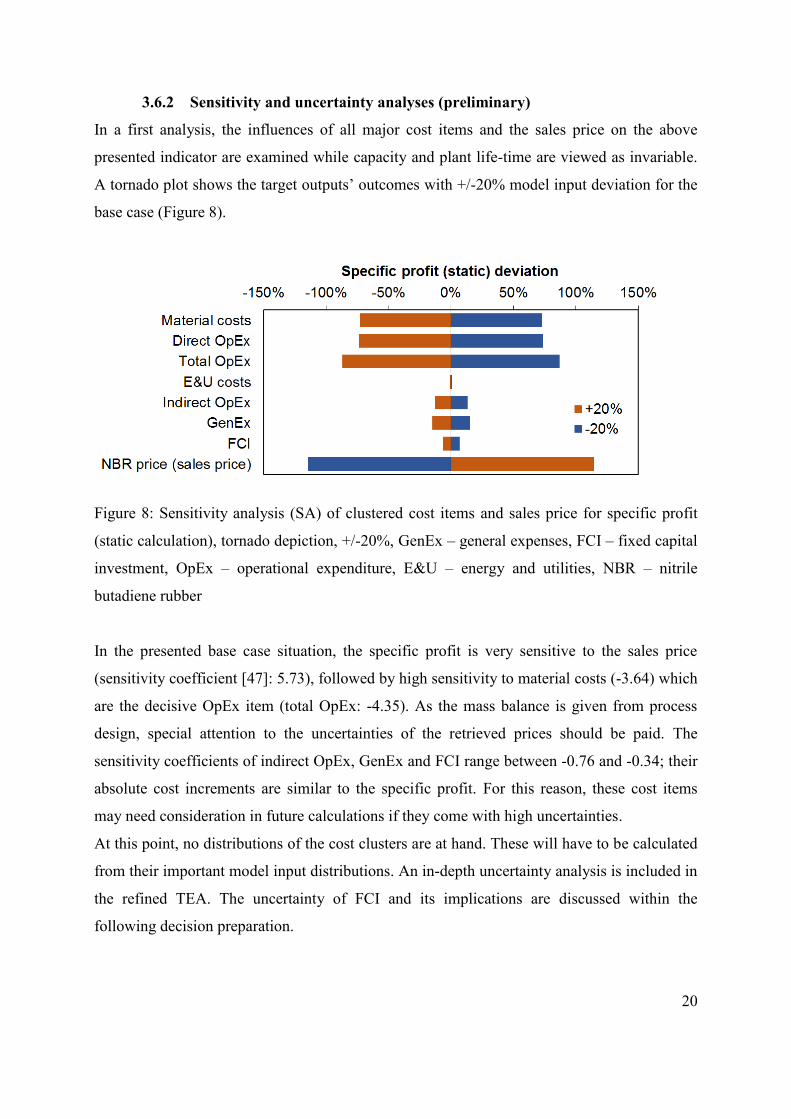
Table 2: Methodological changes regarding techno-economic assessment (TEA) with
technology readiness level (TRL) increase and implications for and of uncertainty and
sensitivity analyses (UA, SA), GenEx – general expenses, CapEx – capital expenditure, OpEx
– operational expenditure, E&U – energy and utilities, FCI – fixed capital investment, PFD –
process flow diagram, PEC, ISBL – inside battery limits, OSBL – outside battery limits, PEC
– double-bond-containing polyether carbonate polyol
Cost item Methodology change with PFD? Do UA/SA within cost cluster? Implication of UA/SA?
Material cost Prices are not affected
Material balance is set up based on
stoichiometry of reaction and data of
stream composition
Process design will be tailored to material
balance
For first process design, only negligible
adaptions to material balance expected
which will not be considered
no
no -
E&U cost Prices are not affected
E&U balance is based on material balance
and thermodynamic key steps
For first process design, changes are
largely limited to the equipments’
efficiencies and refined material
properties
yes
SA shows a negligible
dependency of the specific profit
from E&U costs
Methodological changes are
limited due to restrictions of
thermodynamics; uncertainty is
judged to be less than -/+50%
no
-
Indirect
OpEx
Factored on OpEx and FCI
no
no -
CapEx Working capital is not affected as it is
factored on OpEx
Characteristic process step counting
method based on block flow diagram can
be changed to equipment-cost-based
methodology [15]
Change of methodology for direct ISBL
cost – which is the biggest of all CapEx
parts (and majority of PEC FCI)
yes
Characteristic process step
counting method can have very
large errors
Equipment-factored methods
have by trend lower errors [15]
yes
Uncertainty of FCI is very high (-36%, + 131%,
middle 80%)
Specific profit is not very sensitive to OSBL and
indirect ISBL factors – these will not be changed
with altered methodology
Profit is not very sensitive to process temperature
and pressure extremes (as considered in [38])
Profit is very sensitive to complexity exponent
(as considered in [38])
In order to reduce uncertainty, process design
and change of methodology is indicated
GenEx Factored on OpEx and FCI
no
no -
The uncertainties presented below reflect ‘quantity uncertainty’ [48]. For price data
uncertainty, the variability of events is considered; the contributions of single events’
uncertainties are neglected. For all other model inputs, the uncertainty reflects the credibility
of data sources and overall data quality. The reported uncertainties depict frequencies of past
events and plausible deviations from chosen values respectively and are therefore inherently
23
not probability distributions. However, they are at the same time judged to be suitable
assumptions for probability distributions which are valid for the projected time span and can
serve the TEA’s orientation toward future prospects. Uncertainty propagation in the TEA
model is concluded from the quantity uncertainty. Monte Carlo simulation was used for
uncertainty propagation (single analysis, 10000 iterations).
As FCI estimation methodology changes as a consequence of process design and high
uncertainty can considerably affect the profitability. Therefore, the uncertainty of FCI was
calculated (shown in Figure 9), applying normal distributions for the complexity exponents
and triangular distributions for all process conditions as well as OSBL and indirect FCI
factors. The FCI lies between 24.8 and 89.9 M$ in the interdecile range. With this FCI
calculation, contingency for a P80 estimate needs to be about 32.3 M$, adding about 83% to
the base FCI estimate. The uncertainty corresponds with AACE international class 5 [49] or
can be associated with TRL 3 [15] (-36% and +131% for middle 80%). The calculated
uncertainty considerably exceeds the error expectations presented in the proposition of the
method (cf. [38]).

24
Figure 9: Fixed capital investment (FCI) distribution as result of uncertainty analysis (UA) for
double-bond-containing polyether carbonate polyol (PEC) and polyether carbonate
polyurethane rubber (PECU), estimate based on extended block flow diagrams, step counting
method, Monte Carlo (10000 iterations)
Both PEC and PECU complexity exponents reveal strong sensitivities, coefficients -2.88 and -
0.91 respectively, and are asymmetric, i.e. showing disproportionately high percentage
changes in the specific profit when altered. Process condition extremes as well as factors for
additional FCI elements show sensitivity coefficients between -0.32 and -0.01 and thus do not
require special attention even with higher uncertainty. A tornado plot shows the specific
profit’s outcome with +/-20% deviation in the model inputs to the selected FCI estimation
method for the base case (Figure 10).
25
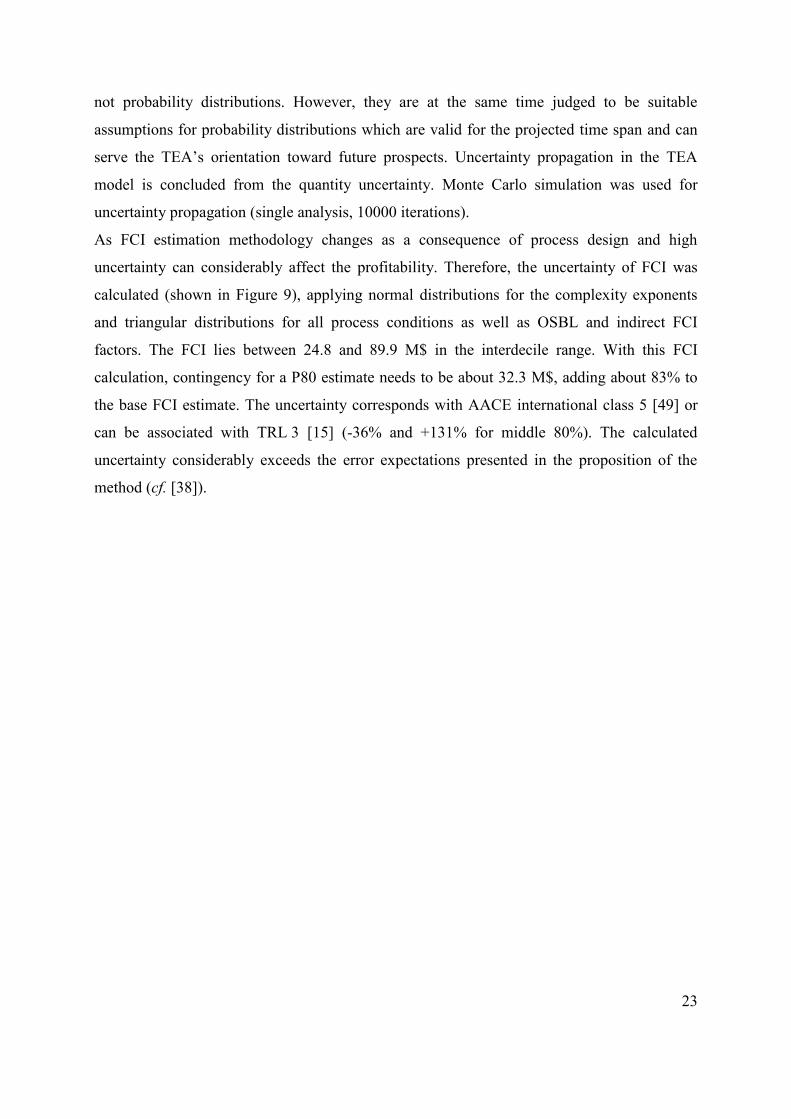
Figure 10: Sensitivity analysis (SA) of cost estimation method model inputs for fixed capital
investment, tornado depiction, +/-20%, FCI – fixed capital investment, OSBL – outside
battery limits, PEC – double-bond-containing polyether carbonate polyol, PECU – polyether
carbonate polyurethane rubber
As the PEC’s process FCI is about three times the PECU’s, the PEC complexity exponent is
the single most important parameter in the current CapEx calculation and strongly affects the
profitability indicators. The PEC complexity exponent itself is very unreliable. It can be
avoided by altered methodology at a higher TRL. In conclusion, the indication is given to
improve the data basis for the next TEA iteration by more detailed process design at the level
of a preliminary PFD and change the estimation method accordingly. The decision about
whether to follow this indication or not is not part of the TEA itself but rather a project
decision as it directly affects RD&D.
4 Process design
4.1 Design procedure
Based on the preliminary TEA’s indication, the decision is made to invest in a more detailed
process design at the level of a first PFD for the most probable process (i.e. the base case).
The design is limited to the PEC process. For PECU, it was found that the literature situation
is not satisfactory (i.e. especially regarding reaction kinetics, catalyst type and amount,
material properties) and no further design can be conducted. How this affects the data basis
for the TEA is discussed in sections 5.1 and 5.2.2).
26
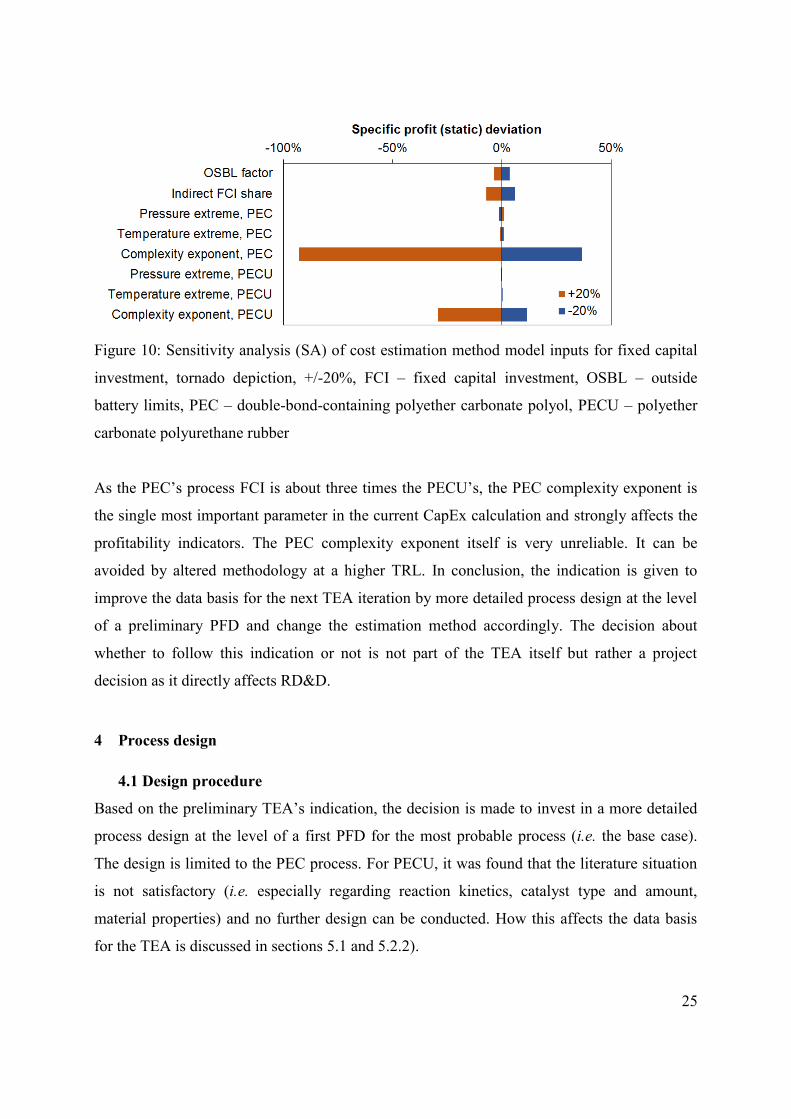
The process design includes knowledge given with the process description (chapter 2) and
follows a typical design process: After definition of the design scope, a process flow diagram
is drawn and subsequently equipment sizing and E&U calculations are carried out (Figure
11).
Figure 11: Methodological sequence for the process design leading to a process flow diagram,
starting from a process description including block flow diagrams
As this paper takes an outside perspective, re-engineering from publically available data is
conducted, including major assumptions; conformity with the actual process at the developing
institution is not claimed. The resulting PFD includes a first equipment design and E&U
balance, thus detailing the process conditions given in the extended BFDs. The design has to
stop at a preliminary level since data are not sufficiently available for a detailed design. The
following general rules for the preliminary design were decided:
No heat integration (see Table 2 and Figure 8: E&U is not important for the TEA)
Delivery pumps excluded, i.e. pressure loss heat exchangers, piping, etc. neglected;
plant layout neglected, i.e. delivery head neglected
Reactor residence time from patents, i.e. no distinct kinetic model
Steady state calculations, i.e. no dynamic behavior
Simplifying assumptions for material properties, e.g., heat capacities assumed as
additive, heat capacity and density of liquids assumed as independent from
temperature when only minor changes are expected, or similar
4.2 Process flow diagram
The equipment sizing and E&U calculations were based on spreadsheets (partial calculations
in ASPEN HYSYS and Berkeley Madonna) and follow standard approaches on preliminary
design described in common textbooks (such as [40,41,43,50,51]). Information from patents
27
EP3164441B1 [24] (steps 1&2) and EP3164443B1 [25] (steps 3&4) serve as the main basis
for the following process: The compression of CO2 from standard to mixing conditions (76.23
bar, 60°C) is carried out in three stages with intercooling. Catalyst and mPG starter are mixed
in a separate vessel and heated up at the same time. The starter-catalyst mixture is mixed with
first PO and then CO2 at mixing conditions and fed into the reactor. A mixture of MA and PO
is fed to the reactor separately. The main reaction is carried out in two parallel CSTRs at
107°C with 96% PO conversion during a residence time of 3.36 h. The post reaction is
conducted in an insulated (nearly adiabatic) PFTR to full PO conversion during a residence
time of 0.12 h, reaching 125°C at the reactor outlet. The excess CO2 is flashed at 4.24 bar and
fed back to the CO2 compression (after the first stage). The remaining mixture of PEC and
cPC is heated to 160°C and fed into an agitated falling film evaporator operating at 10 mbar
in which 70% of the cPC is evaporated. The cPC is condensed and cooled to 30°C. The
mixture of PEC and remaining cPC is fed to a packed column operating at 160°C and 80 mbar
(head pressure) in which almost all remaining cPC is separated by a combination of
evaporation and stripping with nitrogen as strip gas. The cPC is subsequently condensed and
cooled to 30°C. PEC (with 100 ppm cPC rest) is obtained at the bottom of the column and
cooled to 30°C. Figure 12 shows the preliminary PFD for the PEC process. Accompanying
equipment summary, stream summary and utility stream summary tables are enclosed in the
supporting information (Tables S4 to S6).

28
Figure 12: Process flow diagram for the double-bond-containing polyether carbonate polyol
(PEC) process, maximum operating capacity: 30 kt/a, product capacity: 23.6 kt/a, base case,
a) pre-treatment & mixing and reaction steps (and flash separation), b) cPC separation steps,
separation stream numbers ‘S’, cPC – cyclic propylene carbonate; DMC cat. – double metal
cyanide catalyst, mPG – monomeric propylene glycol, PO – propylene oxide, MA – maleic
anhydride

29
5 Refined TEA
5.1 TRL rating (refined)
The process design (re-engineering based on observed data) provided in chapter 4 increases
the data availability in a way that full-scope TEA methodology associated with up to observed
TRL 5 (PEC) or TRL 4 (PECU) can be applied (see also [15,19]).
5.2 Goal, scope and scenario definition (refined)
5.2.1 Goal definition (refined)
The goal of the preliminary TEA is applicable for the refined TEA. In addition, the results of
the process design (chapter 4) are included. Dynamic profitability calculation is aimed at.
5.2.2 Scope and scenario definition (refined)
In general, the scope of the refined TEA remains unchanged. All preliminary TEA results are
also contained in the refined TEA. On top, the following adaptions refinements are made: For
the cost estimation, the process design now gives the data basis for E&U cost and FCI
estimation of the PEC process. The market analysis is extended to cater to the scenario
analysis. The profitability analysis targets dynamic indicators. Furthermore, sensitivity and
uncertainty analyses are enlarged to include model inputs of all cost clusters. In addition, the
results of the preliminary TEA and the refined TEA are compared.
For an assessment of the general viability of a new technology, it is recommended to examine
multiple technology options, i.e. TEA scenarios. Varying parameters are the DB moiety, the
diisocyanate for PECU production and the market situation as implied by the benchmarks.
Any detailed judgement of technical implications of combinations – especially implications of
altered polymer composition on properties and thus sales price (benchmark) – is left to the
development team and cannot be done here due to lack of data. For the DB agent, MA and
AGE are considered. The isocyanate selection follows the economic idea of easy availability
and accessibility. Most established linear polyurethanes are made with MDI or aliphatic
diisocyanates [9]. MDI accounts for 65-70% of the global diisocyanate market, TDI for 27-
32% and aliphatic diisocyanates for 3-4% with HDI being the most popular aliphatic
diisocyanate [9]. It is expected that chain-elongation can be performed with those three major
isocyanates in very similar manner. Alternative benchmarks are EPDM and CR. HNBR is
currently excluded as a benchmark. The exclusion of HNBR leads to 18 possible
combinations, with ‘MA-MDI-NBR’ fixed as the base case.
30
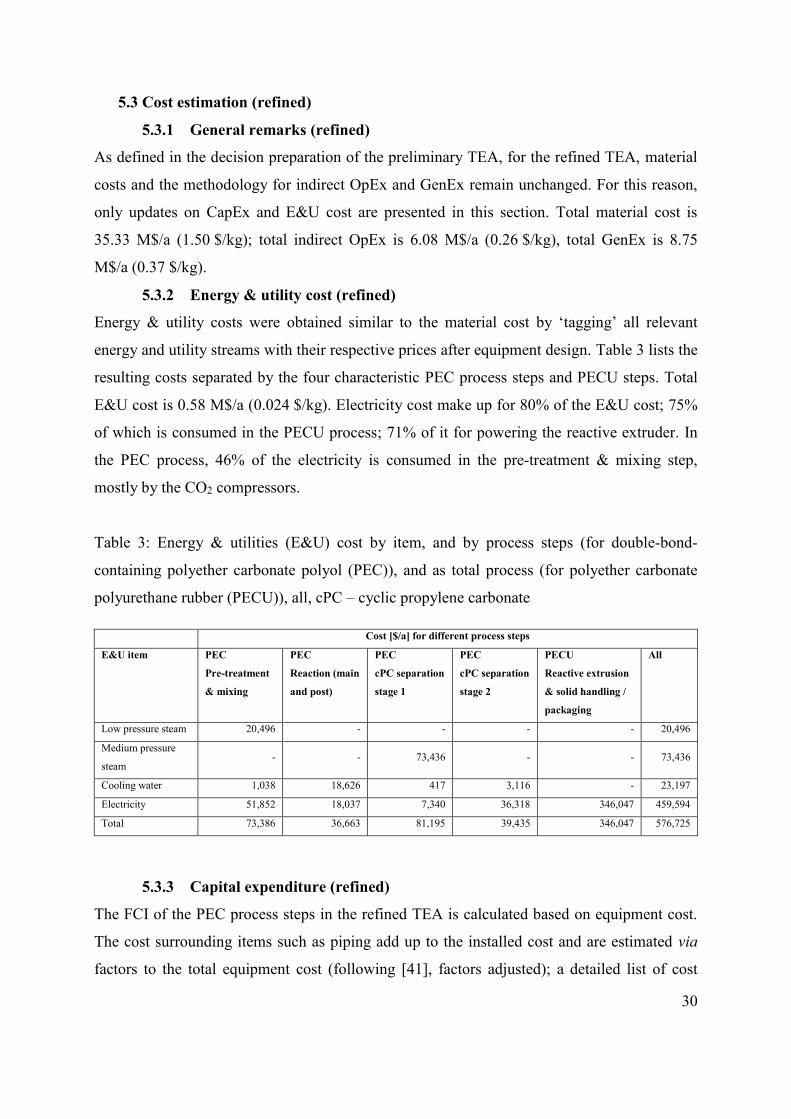
5.3 Cost estimation (refined)
5.3.1 General remarks (refined)
As defined in the decision preparation of the preliminary TEA, for the refined TEA, material
costs and the methodology for indirect OpEx and GenEx remain unchanged. For this reason,
only updates on CapEx and E&U cost are presented in this section. Total material cost is
35.33 M$/a (1.50 $/kg); total indirect OpEx is 6.08 M$/a (0.26 $/kg), total GenEx is 8.75
M$/a (0.37 $/kg).
5.3.2 Energy & utility cost (refined)
Energy & utility costs were obtained similar to the material cost by ‘tagging’ all relevant
energy and utility streams with their respective prices after equipment design. Table 3 lists the
resulting costs separated by the four characteristic PEC process steps and PECU steps. Total
E&U cost is 0.58 M$/a (0.024 $/kg). Electricity cost make up for 80% of the E&U cost; 75%
of which is consumed in the PECU process; 71% of it for powering the reactive extruder. In
the PEC process, 46% of the electricity is consumed in the pre-treatment & mixing step,
mostly by the CO2 compressors.
Table 3: Energy & utilities (E&U) cost by item, and by process steps (for double-bond-
containing polyether carbonate polyol (PEC)), and as total process (for polyether carbonate
polyurethane rubber (PECU)), all, cPC – cyclic propylene carbonate
Cost [$/a] for different process steps
E&U item PEC
Pre-treatment
& mixing
PEC
Reaction (main
and post)
PEC
cPC separation
stage 1
PEC
cPC separation
stage 2
PECU
Reactive extrusion
& solid handling /
packaging
All
Low pressure steam 20,496 - - - - 20,496
Medium pressure
steam - - 73,436 - - 73,436
Cooling water 1,038 18,626 417 3,116 - 23,197
Electricity 51,852 18,037 7,340 36,318 346,047 459,594
Total 73,386 36,663 81,195 39,435 346,047 576,725
5.3.3 Capital expenditure (refined)
The FCI of the PEC process steps in the refined TEA is calculated based on equipment cost.
The cost surrounding items such as piping add up to the installed cost and are estimated via
factors to the total equipment cost (following [41], factors adjusted); a detailed list of cost
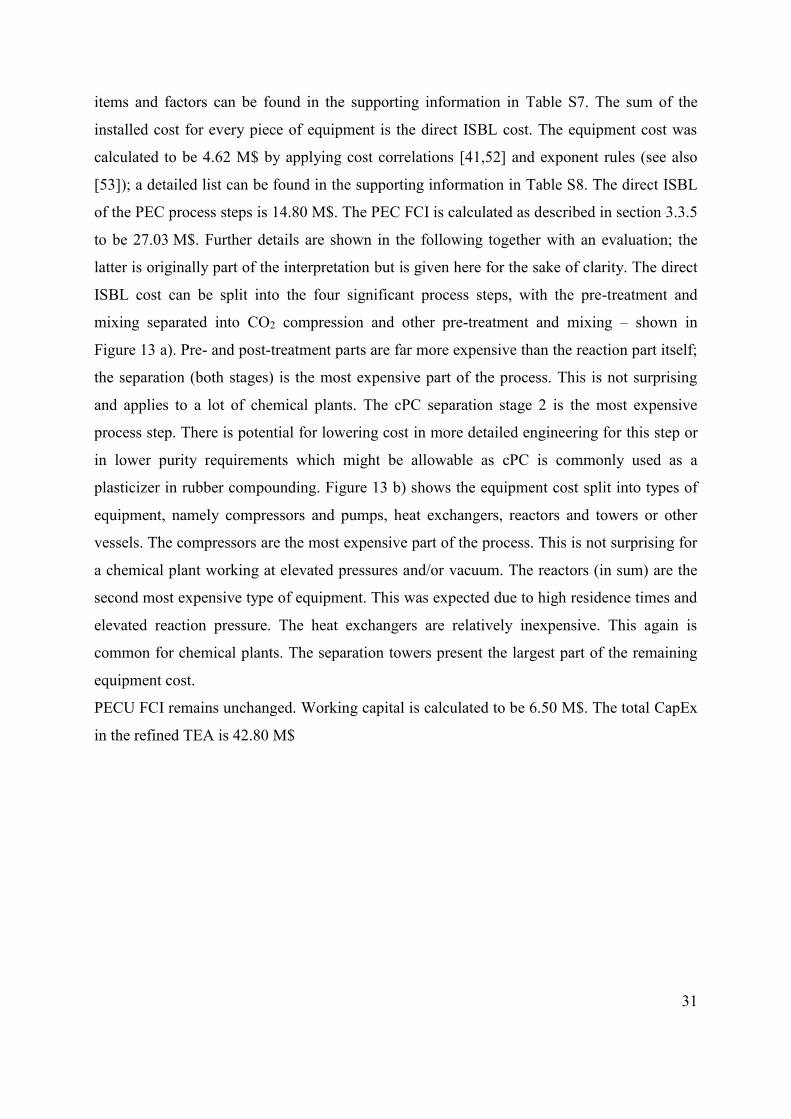
31
items and factors can be found in the supporting information in Table S7. The sum of the
installed cost for every piece of equipment is the direct ISBL cost. The equipment cost was
calculated to be 4.62 M$ by applying cost correlations [41,52] and exponent rules (see also
[53]); a detailed list can be found in the supporting information in Table S8. The direct ISBL
of the PEC process steps is 14.80 M$. The PEC FCI is calculated as described in section 3.3.5
to be 27.03 M$. Further details are shown in the following together with an evaluation; the
latter is originally part of the interpretation but is given here for the sake of clarity. The direct
ISBL cost can be split into the four significant process steps, with the pre-treatment and
mixing separated into CO2 compression and other pre-treatment and mixing – shown in
Figure 13 a). Pre- and post-treatment parts are far more expensive than the reaction part itself;
the separation (both stages) is the most expensive part of the process. This is not surprising
and applies to a lot of chemical plants. The cPC separation stage 2 is the most expensive
process step. There is potential for lowering cost in more detailed engineering for this step or
in lower purity requirements which might be allowable as cPC is commonly used as a
plasticizer in rubber compounding. Figure 13 b) shows the equipment cost split into types of
equipment, namely compressors and pumps, heat exchangers, reactors and towers or other
vessels. The compressors are the most expensive part of the process. This is not surprising for
a chemical plant working at elevated pressures and/or vacuum. The reactors (in sum) are the
second most expensive type of equipment. This was expected due to high residence times and
elevated reaction pressure. The heat exchangers are relatively inexpensive. This again is
common for chemical plants. The separation towers present the largest part of the remaining
equipment cost.
PECU FCI remains unchanged. Working capital is calculated to be 6.50 M$. The total CapEx
in the refined TEA is 42.80 M$
32
Figure 13: Double-bond-containing polyether carbonate polyol (PEC) process steps fixed
capital investment (FCI) details, a) distribution of inside battery limits (ISBL) cost for the
PEC plant by process steps, b) distribution of equipment cost for the PEC plant by equipment
type, cPC – cyclic propylene carbonate
5.4 Market analysis (refined)
As defined in the goal & scope phase of the refined TEA (5.2.2), two additional benchmark
materials must be analyzed, EPDM and CR (see also 3.4): EPDM is considered a specialty
rubber with "good heat and weather resistance" [23]. However, the term ‘EPDM’ summarizes
a particularly wide range of chemical compositions; it is rather a class of materials than a
single material [54]. For this reason, the market is comparably huge but is has to be
considered that a lot of available EPDM structure options may not be a suitable benchmark.
The following information and calculations refer to average market values. The biggest
markets are the automotive, electrical or building & construction industries [55]. Products
include lubricant additives, cable covers, tubing, belts, seals or profiles for construction
[23,55]. A market growth of 5-6% p.a. until 2025 is currently expected; the possible sales
volume is calculated to be 220.59 kt/a [55] (which is ~9 times the product capacity) at an
average price of 2072.50 $/t [56]. CR is a specialty rubber with "medium oil resistance and
good ozone resistance [and] low flammability" [23]. Products include conveyor belts, cables,
profiles (such as window seals) or hoses/sheaths [23,57,58]. The US market has experienced a
slow growth or stagnation at < 0.4% p.a. The global market is very concentrated and as the
US market is saturated [59]. Export may be necessary, adding to the cost of goods sold. The
possible sales volume was calculated to be 68.00 kt/a (demand in North America 2020 [59]
(which is ~14% below product capacity) at a price of 5247.60 $/t [60]. It is acknowledged that
33
this market analysis is limited to market average values and uncertain data. More in-depth
analyses require commercial intelligence data which could not be accessed for this study and
are left to actual development and deployment projects for this technology.
5.5 Profitablility analysis (refined)
It can be discussed whether the increased level of observed readiness and data availability
may allow for the calculation of dynamic indicators. This study presents a borderline case
with large parts of the process considered TRL 5 and other parts falling behind. As
particularly a net present value (NPV) is often asked for and is a powerful profitability
indicator, it is provided here. However, it is acknowledged that static calculation might be
preferred by some practitioners at this level of data availability (see 5.6.3). For NPV
calculations, an initial market diffusion phase of three years with increasing sales potential
(70-80-90% of product capacity) is assumed. The plant is constructed over two years, starting
2018, with half of the FCI spent each year, followed by one year of commissioning in which
the working capital is due. Depreciation is linear over the plant lifetime of 10 years. A
potential salvage value is neglected. The tax rate is assumed as 28.5% [61] and a WACC
value of 7% (see also [62]) is used as discount rate. The NPV for the base case with refined
cost items is 31.58 M$, corresponding with an internal rate of return of 17.02%. The
minimum required sales price is 2.49 $/kg.
Fernández-Dacosta et al. [30] report COGM of about 1.33 $/kg for a polyol with 20wt% CO2
(starter: glycerin/mPG 80/20, Mw ~4000 g/mol, 250 kt/a, 2015, NWE, reaction conditions:
135°C, 20 bar). In comparison, this study calculates COGM of 1.72 $/kg for a PEC without
double bonds (adjusted to 25 years, 7.5% discount rate to enable comparison). The difference
of 0.39 $/kg can in large parts be attributed to the vastly different plant sizes and differing
technical assumptions, most notably the inclusion of cPC separation effort and different
reaction conditions in this analysis.
5.6 Interpretation (refined)
5.6.1 Interpretation of indicators (refined)
A positive indication for future RD&D is given if the NPV is positive or exceeds a target
value. For this academic study, no target value is given. As the NPV is positive, a positive
indication for future RD&D is given.

34
5.6.2 Sensitivity and uncertainty analyses (refined)
A sensitivity analysis is performed for the NPV, varying the model inputs within the cost
clusters. A SA of CapEx is omitted as its composition was shown earlier and all calculations
from equipment cost to CapEx are linear. A comprehensive SA, split into substance prices,
PEC composition, E&U prices, indirect OpEx, GenEx and parameters for dynamic
profitability calculation is included in the supporting information as tornado plots (Figures S1
to S6); selected influential model inputs (more than 10% NPV change with +20% variation)
are shown in a tornado plot in Figure 14. The analyses show that the NPV is very sensitive to
the sales price (sensitivity coefficient: 8.52), followed by the PO cost (-3.67). The NPV is
particularly insensitive to E&U prices and indirect OpEx apart from maintenance & repairs.
Figure 14: Sensitivity analysis (SA) of selected the ten most important model inputs for net
present value (NPV), tornado depiction, +/-20%, NBR – nitrile butadiene rubber, PO –
propylene oxide, MA – maleic anhydride, WACC – weighted average cost of capital, GenEx
– general expenses, PEC – double-bond-containing polyether carbonate polyol, MDI –
methylene diphenyl diisocyanate, OpEx – operational expenditure, cPC – cyclic propylene
carbonate
For the uncertainty analysis of the refined FCI estimate, triangular distributions of the
equipment installation items between 90 and 110% are set up, corresponding with a 'Lang
factor' of 4.19 to 4.81. Similarly, for the equipment, triangular distributions between 70 and
130% percent are set up. The total FCI distribution including the refined PEC FCI estimate is
shown in Figure 15. The FCI lies between 32.1 and 55.6 M$ in the interdecile range. With this

35
calculation, contingency for a P80 estimate needs to be about 12.1 M$, adding about 33% to
the base FCI estimate; contingency for a P50 estimate needs to be about 3.4 M$, adding about
9% to the base FCI estimate. Contingency is a management decision and thus not included in
this study (see also [63–66]). The uncertainty corresponds with AACE international class 4
[49] or can be associated with TRL 4 or 5[15] (-12% and +53% for middle 80%).
Figure 15: Fixed capital investment (FCI) distribution as result of uncertainty analysis (UA)
for double-bond-containing polyether carbonate polyol (PEC) and polyether carbonate
polyurethane rubber (PECU), estimate based on extended block flow diagram (PECU) with
step counting method and equipment-cost-based (PEC), Monte Carlo (10000 iterations)
For the UA of the NPV, distributions for all major model inputs (including substance prices,
PEC composition, E&U prices, indirect OpEx, GenEx and parameters for dynamic
profitability calculation) were set up. As the NPV is particularly sensitive to material costs
and selling price, special attention was payed to their uncertainties: Distributions were derived
36
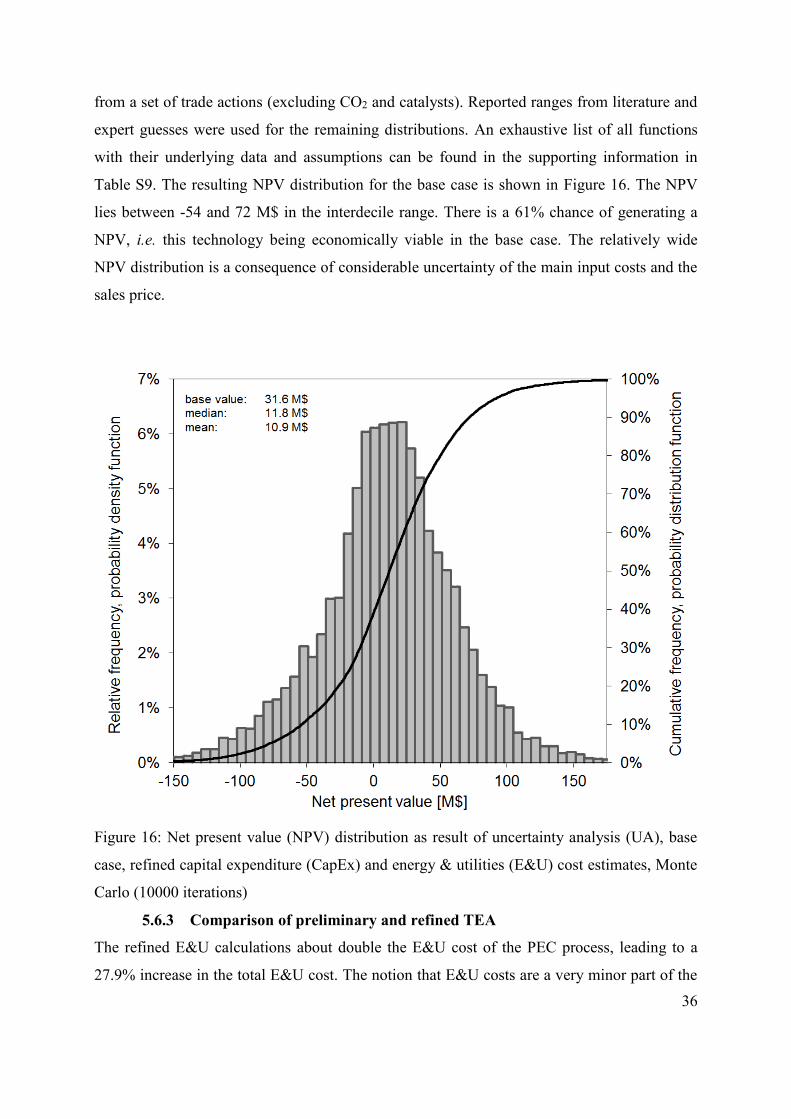
from a set of trade actions (excluding CO2 and catalysts). Reported ranges from literature and
expert guesses were used for the remaining distributions. An exhaustive list of all functions
with their underlying data and assumptions can be found in the supporting information in
Table S9. The resulting NPV distribution for the base case is shown in Figure 16. The NPV
lies between -54 and 72 M$ in the interdecile range. There is a 61% chance of generating a
NPV, i.e. this technology being economically viable in the base case. The relatively wide
NPV distribution is a consequence of considerable uncertainty of the main input costs and the
sales price.
Figure 16: Net present value (NPV) distribution as result of uncertainty analysis (UA), base
case, refined capital expenditure (CapEx) and energy & utilities (E&U) cost estimates, Monte
Carlo (10000 iterations)
5.6.3 Comparison of preliminary and refined TEA
The refined E&U calculations about double the E&U cost of the PEC process, leading to a
27.9% increase in the total E&U cost. The notion that E&U costs are a very minor part of the

37
COGS remains unaffected. The refined CapEx estimate is 5.8% lower than the preliminary
estimate due to an FCI PEC decrease of 8.8%. Whereas the FCI base values are very similar,
they display a substantial decrease in uncertainty with absolute narrowing of 24% for lower
and 78% for upper estimate respectively (middle 80%). This implies an advance from AACE
international class 5 to 4 and is associated with a TRL increase from 3 to 4 or 5. Refined E&U
and CapEx calculations increase the base value of the specific profit by 3.9% to 0.51 $/kg. To
show the influence of the FCI uncertainty on the overall profitability, UAs were repeated for
the specific profit, only applying the FCI model input distributions. The analysis was carried
out for both the preliminary FCI estimate (Figure 17 a) and the refined FCI estimate based on
equipment cost for the PEC process (Figure 17 b) respectively:
a) Preliminary: The specific profit (static) lies between -0.03 and 0.64 $/kg in the
interdecile range. There is a 11.1% chance of achieving a negative profit due to FCI
uncertainty.
b) Refined: The specific profit (static) lies between 0.31 and 0.55 $/kg in the interdecile
range. There is a 0.7% chance of achieving a negative profit due to FCI uncertainty.
The profitability’s uncertainty was thus drastically reduced with the refined analysis
after the process design.
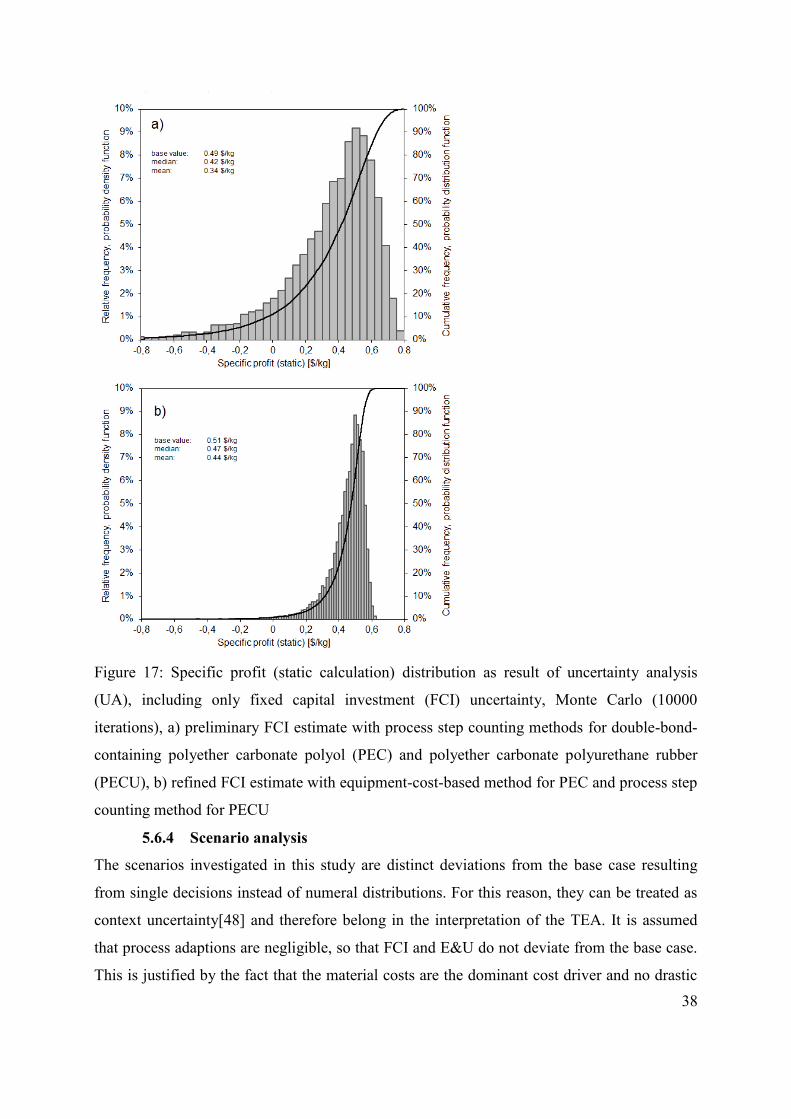
38
Figure 17: Specific profit (static calculation) distribution as result of uncertainty analysis
(UA), including only fixed capital investment (FCI) uncertainty, Monte Carlo (10000
iterations), a) preliminary FCI estimate with process step counting methods for double-bond-
containing polyether carbonate polyol (PEC) and polyether carbonate polyurethane rubber
(PECU), b) refined FCI estimate with equipment-cost-based method for PEC and process step
counting method for PECU
5.6.4 Scenario analysis
The scenarios investigated in this study are distinct deviations from the base case resulting
from single decisions instead of numeral distributions. For this reason, they can be treated as
context uncertainty[48] and therefore belong in the interpretation of the TEA. It is assumed
that process adaptions are negligible, so that FCI and E&U do not deviate from the base case.
This is justified by the fact that the material costs are the dominant cost driver and no drastic
39
changes in the process are expected due to polymer composition changes. In addition, effects
of varied polymer composition on market opportunities are neglected here. In order to account
for changes in market opportunities for different PECU compositions, both structure-property
and cost-performance relations would be needed.
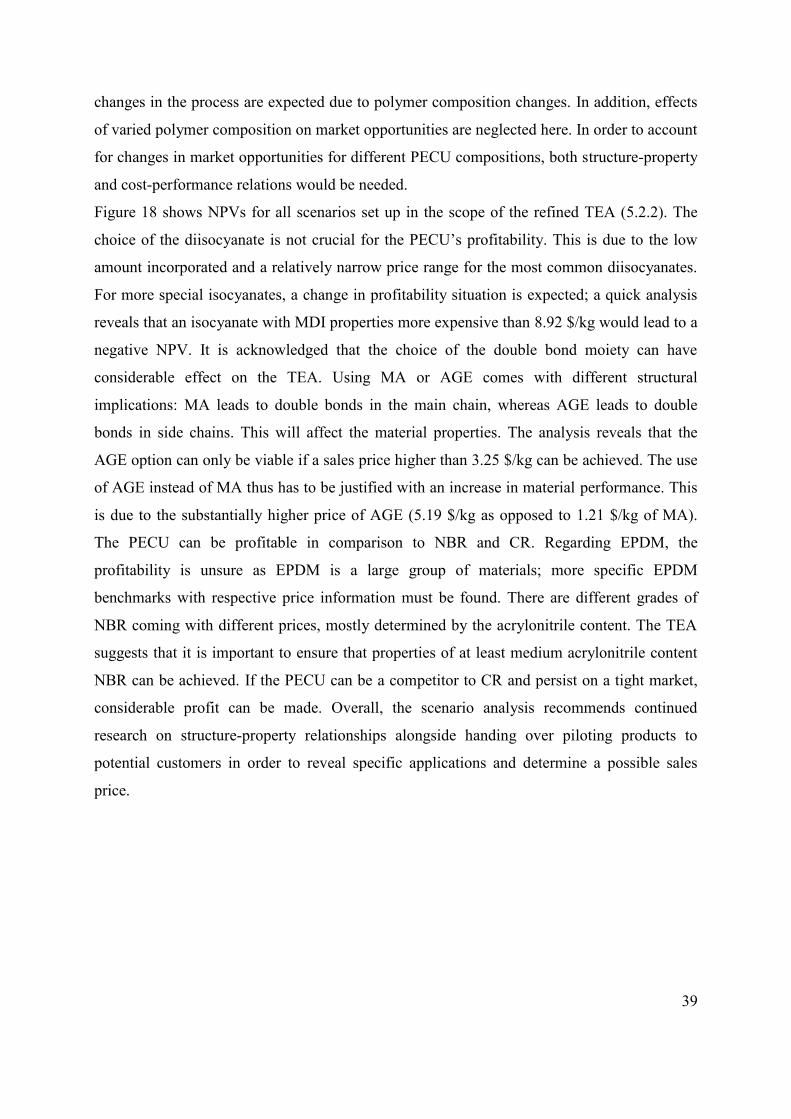
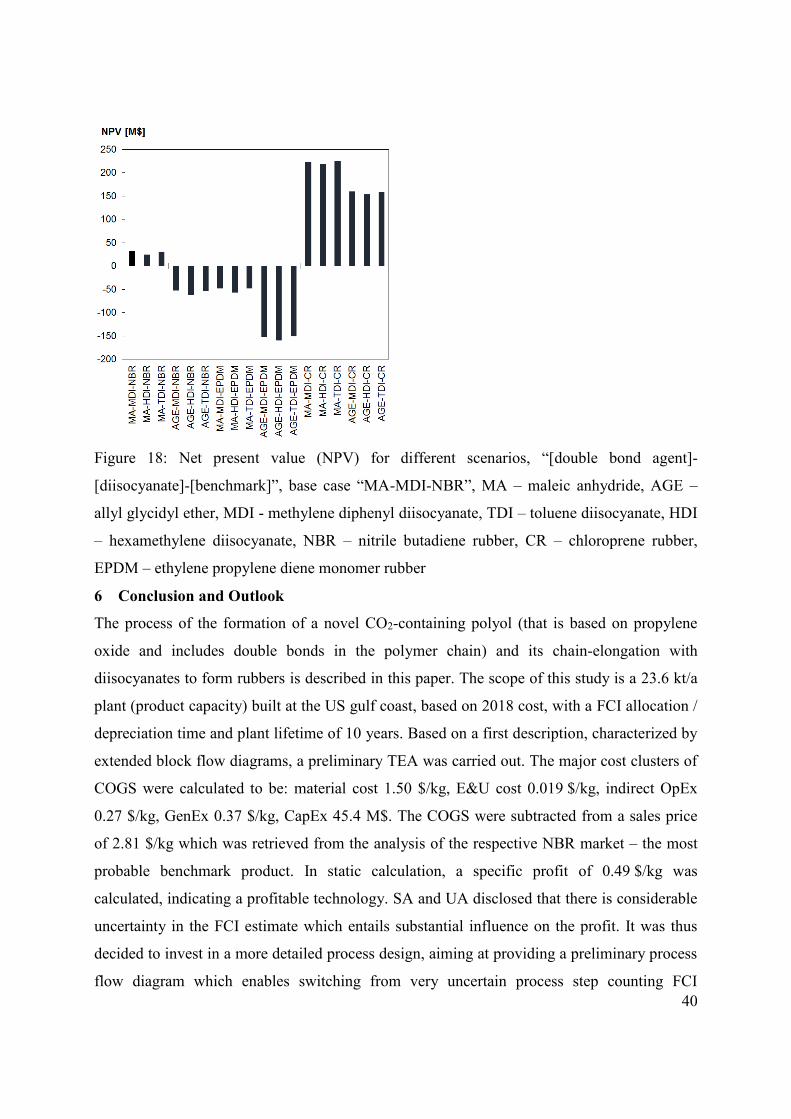
Figure 18 shows NPVs for all scenarios set up in the scope of the refined TEA (5.2.2). The
choice of the diisocyanate is not crucial for the PECU’s profitability. This is due to the low
amount incorporated and a relatively narrow price range for the most common diisocyanates.
For more special isocyanates, a change in profitability situation is expected; a quick analysis
reveals that an isocyanate with MDI properties more expensive than 8.92 $/kg would lead to a
negative NPV. It is acknowledged that the choice of the double bond moiety can have
considerable effect on the TEA. Using MA or AGE comes with different structural
implications: MA leads to double bonds in the main chain, whereas AGE leads to double
bonds in side chains. This will affect the material properties. The analysis reveals that the
AGE option can only be viable if a sales price higher than 3.25 $/kg can be achieved. The use
of AGE instead of MA thus has to be justified with an increase in material performance. This
is due to the substantially higher price of AGE (5.19 $/kg as opposed to 1.21 $/kg of MA).
The PECU can be profitable in comparison to NBR and CR. Regarding EPDM, the
profitability is unsure as EPDM is a large group of materials; more specific EPDM
benchmarks with respective price information must be found. There are different grades of
NBR coming with different prices, mostly determined by the acrylonitrile content. The TEA
suggests that it is important to ensure that properties of at least medium acrylonitrile content
NBR can be achieved. If the PECU can be a competitor to CR and persist on a tight market,
considerable profit can be made. Overall, the scenario analysis recommends continued
research on structure-property relationships alongside handing over piloting products to
potential customers in order to reveal specific applications and determine a possible sales
price.
40
Figure 18: Net present value (NPV) for different scenarios, “[double bond agent]-
[diisocyanate]-[benchmark]”, base case “MA-MDI-NBR”, MA – maleic anhydride, AGE –
allyl glycidyl ether, MDI - methylene diphenyl diisocyanate, TDI – toluene diisocyanate, HDI
– hexamethylene diisocyanate, NBR – nitrile butadiene rubber, CR – chloroprene rubber,
EPDM – ethylene propylene diene monomer rubber
6 Conclusion and Outlook
The process of the formation of a novel CO2-containing polyol (that is based on propylene
oxide and includes double bonds in the polymer chain) and its chain-elongation with
diisocyanates to form rubbers is described in this paper. The scope of this study is a 23.6 kt/a
plant (product capacity) built at the US gulf coast, based on 2018 cost, with a FCI allocation /
depreciation time and plant lifetime of 10 years. Based on a first description, characterized by
extended block flow diagrams, a preliminary TEA was carried out. The major cost clusters of
COGS were calculated to be: material cost 1.50 $/kg, E&U cost 0.019 $/kg, indirect OpEx
0.27 $/kg, GenEx 0.37 $/kg, CapEx 45.4 M$. The COGS were subtracted from a sales price
of 2.81 $/kg which was retrieved from the analysis of the respective NBR market – the most
probable benchmark product. In static calculation, a specific profit of 0.49 $/kg was
calculated, indicating a profitable technology. SA and UA disclosed that there is considerable
uncertainty in the FCI estimate which entails substantial influence on the profit. It was thus
decided to invest in a more detailed process design, aiming at providing a preliminary process
flow diagram which enables switching from very uncertain process step counting FCI
41
estimation methodology to more certain equipment-cost-based FCI estimation. A process
design was carried out for the PEC process, increasing the (observed) level of data availability
from TRL 4 to TRL 5. A process design for the PECU process was omitted due to insufficient
literature data. The process design results form the basis for a refined TEA which was
subsequently carried out and provides updated E&U cost of 0.024 $/kg and CapEx of
42.8 M$ (material cost: 1.50 $/kg, indirect OpEx: 0.26 $/kg, GenEx: 0.37 $/kg). The
profitability analysis confirms in dynamic calculation that the technology can generate profit:
In the base case, an NPV of 31.6 M$ is achieved. The UA reveals a 61% chance of the NPV
being positive. The NPV is most sensitive to the sales price (assumed as benchmark price),
followed by the PO price. This comes as no surprise, as the final product contains 68wt%
propylene oxide and is produced in a relatively inexpensive process. AGE as a double bond
agent entails considerably higher COGS and renders profit impossible below a sales price of
3.25 $/kg (compared to 2.49 $/kg with MA). The general profitability situation is not affected
by the choice of the diisocyanate if the options are limited to readily available and relatively
inexpensive substances, especially MDI, TDI and HDI. NBR, EPDM and CR are presented as
benchmark substances both with respect to properties as well as market opportunities. For
NBR, the general increase in performance and price with increasing acrylonitrile content has
to be considered. EPDM is a large group of substances; the presented PECU is economically
viable in comparison to EPDM average values; however, deeper market insights are needed to
strengthen this position. The CR market is tight and stagnating but shows by trend higher
sales prices that indicate positive market and revenue potential if CR can be replaced by
PECU.
Recommendations for future R&D are: Prior to deployment, it is imperative to further
examine market implications of different structural options and retrieve corresponding sales
prices as well as entry markets. In addition, more detailed process design, especially for the
PECU formation and subsequent treatment, can further reduce uncertainty in the COGS and
help to reveal suitable commercial strategies. A recent LCA of the same group of polymers
shows substantial reductions in global warming impact and fossil resource depletion [17]. It is
recommended to survey whether or not customers are willing to pay a premium for a synthetic
specialty rubber with this altered environmental profile.

42
Acknowledgement
The authors would like to thank Jason Collis and Philipp Kretzschmar (TU Berlin) for
valuable leads on the process design, Annika Marxen and Johannes Wunderlich (TU Berlin)
for intense assessment methodology discussions, Kai Stepputat, Arian Hohgräve and Laura
Heine (TU Berlin) for the preparation of this work. This work was funded by the European
Institute of Technology (EIT) Climate-KIC initiative and the German Federal Ministry of
Education and Research (BMBF) FONA3 r+Impuls program.

43
Funding: This work was supported by the European Institute of Innovation and Technology
Climate-KIC and the German Federal Ministry of Education and Research (BMBF).

44
Declarations of interest: none
45
References
[1] P. Styring, E.A. Quadrelli, K. Armstrong, eds., Carbon Dioxide Utilisation - Closing
the Carbon Cycle, 1st ed., Elsevier B.V., 2014. doi:10.1016/B978-0-444-62746-
9.00001-3.
[2] CO2 Sciences - The Global CO2 Initiative, Global Roadmap for Implementing CO2
Utilization, 2016.
https://assets.ctfassets.net/xg0gv1arhdr3/27vQZEvrxaQiQEAsGyoSQu/44ee0b72ceb92
31ec53ed180cb759614/CO2U_ICEF_Roadmap_FINAL_2016_12_07.pdf.
[3] A.W. Zimmermann, M. Kant, eds., CO2 Utilisation Today, Berlin, Germany, 2017.
doi:10.14279/depositonce-5806.
[4] J. Artz, T.E. Müller, K. Thenert, J. Kleinekorte, R. Meys, A. Sternberg, A. Bardow, W.
Leitner, Sustainable Conversion of Carbon Dioxide: An Integrated Review of Catalysis
and Life Cycle Assessment, Chem. Rev. 118 (2018) 434–504.
doi:10.1021/acs.chemrev.7b00435.
[5] N. von der Assen, A. Bardow, Life cycle assessment of polyols for polyurethane
production using CO 2 as feedstock: Insights from an industrial case study, Green
Chem. 16 (2014) 3272–3280. doi:10.1039/c4gc00513a.
[6] A. Scott, Learning To Love CO2, Chem. Eng. News. (2015).
https://cen.acs.org/articles/93/i45/Learning-Love-CO2.html (accessed April 1, 2019).
[7] A.H. Tullo, Novomer takes CO2 chemistry to market, Chem. Eng. News. (2016).
https://cen.acs.org/articles/94/i46/Novomer-takes-CO2-chemistry-market.html
(accessed April 1, 2019).
[8] S. Robinson, Econic: making good use of carbon dioxide (CO2), Urethanes Technol.
Int. (2018). https://utech-polyurethane.com/information/econic-making-good-use-co2/
(accessed April 1, 2019).
[9] M.F. Sonnenschein, Polyurethanes: Science, Technology, Markets, and Trends, Wiley
& Sons, Incorporated, Hoboken, NJ, 2015.
[10] J. Norwig, CroCO2PETs: Cross-linkable CO2–polyether polyols, EnCO2re - Enabling
46
CO2 Re-Use. (2016). http://enco2re.climate-kic.org/projects/croco2pets/ (accessed
April 1, 2019).
[11] J. Norwig, CO2 – A Versatile Building Block - for a Broad Range of Applications,
Presentation, NOVA 11th International Conference on Bio-based Materials, May 16th,
(2018).
[12] J. Norwig, CroCO2PETs - Cross-linkable Polymers from CO2, Presentation,
Macromolecular Colloquium Freiburg, Germany, Feb 16th, (2017).
[13] C. Hopmann, A. Lipski, Optimisation of the Compound Quality of CO2-based Rubber
Compounds, KGK, Elastomers Plast. (2017) 28–31.
[14] G.A. Buchner, R. Schomäcker, R. Meys, A. Bardow, Guiding innovation with
integrated life-cycle assessment (LCA) and techno-economic assessment (TEA) - the
case of CO2-containing polyurethane elastomers, EIT Climate-KIC enCO2re report,
2018.
[15] G.A. Buchner, A.W. Zimmermann, A.E. Hohgräve, R. Schomäcker, Techno-economic
Assessment Framework for the Chemical Industry - Based on Technology Readiness
Levels, Ind. Eng. Chem. Res. 57 (2018) 8502–8517. doi:10.1021/acs.iecr.8b01248.
[16] A.W. Zimmermann, J. Wunderlich, G.A. Buchner, L. Müller, K. Armstrong, S.
Michailos, A. Marxen, H. Naims, P. Styring, R. Schomäcker, A. Bardow, Techno-
Economic Assessment & Life Cycle Assessment Guidelines for CO2 Utilization,
CO2Chem Media and Publishing Ltd, 2018. doi:10.3998/2027.42/145436.
[17] R. Meys, A. Kätelhön, A. Bardow, Towards sustainable elastomers from CO2: life
cycle assessment of carbon capture and utilization for rubbers, Green Chem. (2019).
doi:10.1039/c9gc00267g.
[18] A.W. Zimmermann, R. Schomäcker, Assessing Early-Stage CO2 utilization
Technologies-Comparing Apples and Oranges?, Energy Technol. 5 (2017) 850–860.
doi:10.1002/ente.201600805.
[19] G.A. Buchner, K.J. Stepputat, A.W. Zimmermann, R. Schomäcker, Specifying
Technology Readiness Levels for the Chemical Industry, Ind. Eng. Chem. Res. 58
47
(2019) 6957–6969. doi:10.1021/acs.iecr.8b05693.
[20] R.A. Ogle, A.R. Carpenter, Calculating the Capacity of Chemical Plants, Aiche CEP
Mag. (2014) 59–63.
[21] N. Adam, G. Avar, H. Blankenheim, W. Friedrichs, M. Giersig, E. Weigand, M.
Halfmann, F.-W. Wittbecker, D.-R. Larimer, U. Maier, S. Meyer-Ahrens, K.-L. Noble,
H.-G. Wussow, Polyurethanes, Ullmann’s Encyclopedia of Industrial Chemistry, 2012.
doi:10.1002/14356007.a21.
[22] Grand View Research, Nitrile Butadiene Rubber (NBR) Market Analysis By Product
(Hoses, Belts, Cables, Molded, Seals & O-rings, Gloves), By Application (Automotive,
Oil & Gas, Mining, Construction, Medical), And Segment Forecasts, 2018 - 2025, San
Francisco, CA, 2015. https://www.grandviewresearch.com/industry-analysis/nitrile-
butadiene-rubber-market/request.
[23] D. Threadingham, W. Obrecht, W. Wieder, G. Wachholz, R. Engehausen, Rubber, 3.
Synthetic Rubbers, Introduction and Overview, Ullmann’s Encycl. Ind. Chem. (2011)
1–26. doi:10.1002/14356007.a23_239.pub5.
[24] S. Braun, H. Zwick, M. Wohak, J. Hofmann, A. Wolf, M. Traving, R. Bachmann,
Method for producing polyether carbonate polyols and device for the same,
EP3164441B1, 2015.
[25] J. Hofmann, S. Braun, K. Laemmerhold, M. Wohak, C. Ahmadzade-Youssefi, J.
Bausa, Method for the purification of polycarbonate polyols and cleaning device for the
same, EP3164443B1, 2015.
[26] J. Hofmann, S. Braun, A. Wolf, Method for manufacturing polyether carbonate
polyols, EP3219741A1, 2016.
[27] J. Langanke, A. Wolf, J. Hofmann, K. Böhm, M.A. Subhani, T.E. Müller, W. Leitner,
C. Gürtler, Carbon dioxide (CO2) as sustainable feedstock for polyurethane production,
Green Chem. 16 (2014) 1865–1870. doi:10.1039/c3gc41788c.
[28] J. Langanke, A. Wolf, Intensified Co-Oligomerization of Propylene Oxide and Carbon
Dioxide in a Continuous Heat Exchanger Loop Reactor at Elevated Pressures, Org.
48
Process Res. Dev. 19 (2015) 735–739. doi:10.1021/op500268r.
[29] M. Pohl, E. Danieli, M. Leven, W. Leitner, B. Blümich, T.E. Müller, Dynamics of
Polyether Polyols and Polyether Carbonate Polyols, Macromolecules. 49 (2016) 8995–
9003. doi:10.1021/acs.macromol.6b01601.
[30] C. Fernández-Dacosta, M. van der Spek, C.R. Hung, G.D. Oregionni, R. Skagestad, P.
Parihar, D.T. Gokak, A.H. Strømman, A. Ramirez, Prospective techno-economic and
environmental assessment of carbon capture at a refinery and CO2 utilisation in polyol
synthesis, J. CO2 Util. 21 (2017) 405–422. doi:10.1016/j.jcou.2017.08.005.
[31] J. Langanke, A. Wolf, Intensified Co-Oligomerization of Propylene Oxide and Carbon
Dioxide in a Continuous Heat Exchanger Loop Reactor at Elevated Pressures, Org.
Process Res. Dev. 19 (2015) 735–739. doi:10.1021/op500268r.
[32] T. Ouhadi, S. Abdou-Sabet, H.-G. Wussow, L.M. Ryan, L. Plummer, F.E. Baumann, J.
Lohmar, H.F. Vermeire, F.L.G. Malet, Thermoplastic Elastomers, Ullmann’s Encycl.
Ind. Chem. (2013) 1–41. doi:10.1016/B978-0-12-394584-6.00013-3.
[33] C. Abeykoon, A.L. Kelly, E.C. Brown, J. Vera-Sorroche, P.D. Coates, E. Harkin-Jones,
K.B. Howell, J. Deng, K. Li, M. Price, Investigation of the process energy demand in
polymer extrusion: A brief review and an experimental study, Appl. Energy. 136
(2014) 726–737. doi:10.1016/j.apenergy.2014.09.024.
[34] H. Naims, Economics of carbon dioxide capture and utilization - a supply and demand
perspective, Environ. Sci. Pollut. Res. 23 (2016) 22226–22241. doi:10.1007/s11356-
016-6810-2.
[35] Global CCS Institute, CO2 Transport Costs, Feasibility Study CCS-Readiness
Guangdong 2010 Annu. Rep. (2010).
https://hub.globalccsinstitute.com/publications/feasibility-study-ccs-readiness-
guangdong-gdccsr-2010-annual-report/co2-transport-costs (accessed April 1, 2019).
[36] S. Paul, R. Shepherd, P. Woollin, Material selection for supercritical CO2 transport, in:
First Int. Forum Transp. CO2 by Pipeline, 2010.
[37] T.J. Ward, Economic evaluation, in: Kirk-Othmer Encycl. Chem. Technol., John Wiley
49
& Sons, 2001: pp. 525–550.
[38] I. V. Klumpar, R.F. Brown, J.W. Fromme, Rapid Capital Estimation Based on Process
Modules, AACE Trans. (1983) B-8.1-6.
[39] G.A. Buchner, J. Wunderlich, R. Schomäcker, (EST-2912) Technology Readiness
Levels Guiding Cost Estimation in the Chemical Industry, in: AACE Int. Trans.,
Morgantown, WV, 2018: p. EST.2912.1-23.
[40] M.S. Peters, K.D. Timmerhaus, R.E. West, Plant Design and Economics for Chemical
Engineers, fith ed., McGraw Hill, New York, 2004.
[41] R. Sinnott, G. Towler, Chemical Engineering Design, 2014 repri, Elsevier Ltd,
Amsterdam, 2009.
[42] S.Y. Ereev, M.K. Patel, Practitioner ’ s Section Standardized cost estimation for new
technologies ( SCENT ) - methodology and tool, 9 (2012).
[43] R. Turton, R.C. Bailie, W.B. Whiting, J.A. Shaeiwitz, D. Bhattacharyya, Analysis,
Synthesis, and Design of Chemical Processes, Prentice Hall, Pearson, Upper Saddle
River, NJ, USA, 2012.
[44] International Institute of Synthetic Rubber Producers Inc., Acrylonitrile-Butadiene
Rubber (NBR), 2012. https://iisrp.com/wp-content/uploads/07NBR16Aug2012.pdf.
[45] UN Comtrade Database, HS 400259, US, imports, (2018). http://comtrade.un.org.
[46] C.A. Saavedra, The Marketing Challenge for Industrial Companies, Advanced
Concepts and Practices, Springer International Publishing Switzerland, 2016.
[47] A. Saltelli, K. Chan, E.M. Scott, eds., Sensitivity Analysis, John Wiley & Sons Ltd.,
Chichester, West Sussex, 2000.
[48] E. Igos, E. Benetto, R. Meyer, P. Baustert, B. Othoniel, How to treat uncertainties in
life cycle assessment studies?, Int. J. Life Cycle Assess. (2018). doi:10.1007/s11367-
018-1477-1.
[49] L.R. Dysert, P. Christensen, AACE International Recommended Practice No. 18R-97;
Cost Estimate Classificaton System – As applied in engineering, procurement, and
50
construction for the process industries - TCM Framework: 7.3 – Cost Estimating and
Budgeting, Morgantown, 2016.
[50] W.D. Seider, J.D. Seader, D.R. Lewin, S. Widagdo, Product and Process Design
Principles, Wiley & Sons (Asia), New Delhi, 2010.
[51] R. Smith, Chemical Process Design and Integration, 2nd editio, John Wiley & Sons,
Chichester, West Sussex, 2016.
[52] D. Milligan, J. Milligan, Matches’ Process Equipment Cost Estimates, (2014).
http://www.matche.com/equipcost/Default.html (accessed April 3, 2019).
[53] R. Williams Jr., Six-Tenths Factor Aids in Approximating Costs, Chem. Eng. 54
(1947) 124–125.
[54] International Institute of Synthetic Rubber Producers Inc., Ethylene-Propylene Rubbers
& Elastomers (EPR / EPDM), 2012.
[55] Grand View Research, Ethylene Propylene Diene Monomer (EPDM) Market Size,
Share & Trends Analysis Report By Application (Electrical & Electronics, Building &
Construction, Wires & Cables), And Segment Forecasts, 2019 - 2025, sample, San
Francisco, CA, 2019. https://www.grandviewresearch.com/industry-analysis/ethylene-
propylene-diene-monomer-epdm-market/request.
[56] UN Comtrade Database, HS 400270, US, imports, (2018). http://comtrade.un.org.
[57] Grand View Research, Chloroprene Rubber Market Size, Application Analysis,
Regional Outlook, Competitive Strategies And Forecasts, 2014 To 2020, San
Francisco, CA, 2020. https://www.grandviewresearch.com/industry-
analysis/chloroprene-rubber-market/request-toc.
[58] International Institute of Synthetic Rubber Producers Inc., Polychloroprene,
Chloroprene Rubber (CR), 2012.
[59] Jacobs Consultancy Ltd, Assessment of Technical and Financial Viability of Nairit
Chemical Plant Operation, Washington, DC, 2015.
[60] UN Comtrade Database, HS 400249, US, imports, (2018). http://comtrade.un.org.
51
[61] K. Pomerleau, The United States’ Corporate Income Tax Rate is Now More in Line
with Those Levied by Other Major Nations, (2018). https://taxfoundation.org/us-
corporate-income-tax-more-competitive/ (accessed April 1, 2019).
[62] A. Damodaran, Cost of Capital by Sector (US), (2019).
http://pages.stern.nyu.edu/~adamodar/New_Home_Page/datafile/wacc.htm (accessed
April 1, 2019).
[63] AACE International, K.K. Humphreys, AACE International Recommended Practice
No. 41R-08; Risk Analysis and Contingency Determination Using Range Estimating,
2008.
[64] AACE International, J.K. Hollmann, AACE International Recommended Practice No.
42R-08; Risk Analysis and Contingency Determination Using Parametric Estimating,
2011.
[65] AACE International, R. Prasad, AACE International Recommended Practice No. 43R-
08; Risk Analysis and Contingency Determination Using Parametric Estimating -
Example Models as Applied for the Process Industries, 2011.
[66] AACE International, J.K. Hollmann, AACE International Recommended Practice No.
44R-08: Risk Analysis and Contingency Determination Using Expected Value, 2012.
52
Vitae
Georg A. Buchner received his M.Sc. in Industrial Engineering
and Management from TU Berlin. Since 2015, he has been a
researcher in the group of Prof. Schomäcker at the same
institution. His research focusses on techno-economic
assessment, reaction engineering, and the development of
scalable process concepts for polymer syntheses and multiphase
reaction systems. In 2019, he joined the MIT Energy Initiative as
a visiting researcher.
Nils Wulfes is a graduate student in TU Berlin’s Industrial
Engineering and Management program. His studies focus on
chemical & process engineering for polymer starters and
intermediates. He has professional experience in the development
of alternative powertrains and business models.
Reinhard Schomäcker is Professor for Reaction Engineering at
TU Berlin. His research fields are reaction kinetics, reactors and
process concepts as well as technology assessment. He has
experience in green chemistry research such as photocatalytic
water splitting, wastewater treatment, and electrochemical
conversion of CO2. He received the Innovation Award of the
German Gas Industry for his research in oxidative coupling of
methane in 2016.
Related Documents