©2008 Waters Corporation Techniques and Strategies for Transferring Techniques and Strategies for Transferring Methods from HPLC to UPLC Methods from HPLC to UPLC Dan Root, Ph.D. Dan Root, Ph.D. Systems Marketing Lab Systems Marketing Lab Waters Corporation Waters Corporation 720002520EN

Welcome message from author
This document is posted to help you gain knowledge. Please leave a comment to let me know what you think about it! Share it to your friends and learn new things together.
Transcript
©2008 Waters Corporation
Techniques and Strategies for Transferring Techniques and Strategies for Transferring Methods from HPLC to UPLCMethods from HPLC to UPLC
Dan Root, Ph.D.Dan Root, Ph.D.
Systems Marketing LabSystems Marketing Lab
Waters CorporationWaters Corporation
720002520EN

©2008 Waters Corporation 2
IntroductionIntroduction
Implementation
When a lab invests in UPLC® technology their focus moves to the implementation of this new technology in order to reap it’s many benefits.
HPLC methods must be transferred or migrated to the ACQUITY UPLC®
This may seem like a tremendous challenge but doesn’t have to be.
Waters has software tools that can make this transition rapid and seamless.
©2008 Waters Corporation 3
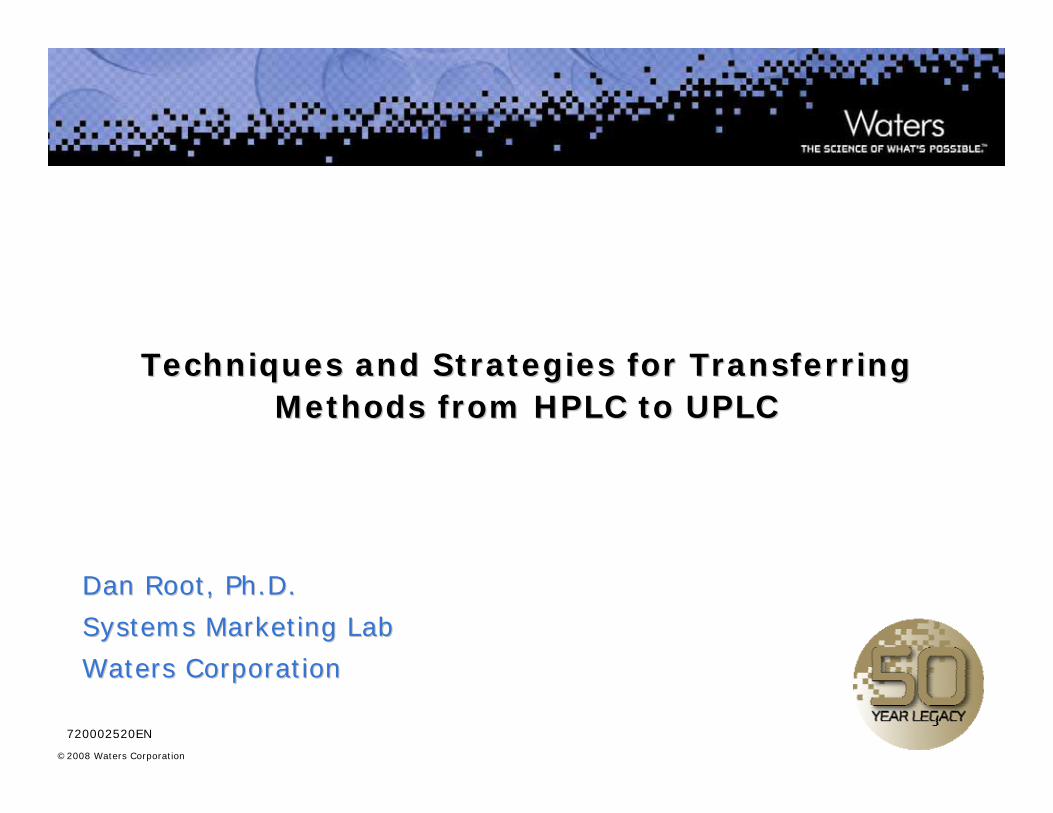
Method Transfer: a DefinitionMethod Transfer: a Definition
The movement or migration of an HPLC-based method to the ACQUITY UPLC
This is an integrated solution consisting of the instrument AND the sub 2µm particle columns with their wide variety of chemistries.
Only by utilizing the entire package can the user truly reap the maximum benefits of this new technology
©2008 Waters Corporation 4
In this TalkIn this Talk
-Go through the method transfer sequence for both an Isocratic and Gradient HPLC method.
-Use Waters software tools
-No theory
-No manual calculations
-Process-oriented talk

©2008 Waters Corporation 5
Transfer SequenceTransfer Sequence
1. Know as much as possible about method to be transferredGoals of method – resolution/speed Method must be adequate to the task
2. Select appropriate column and dimensionsWaters Column Selectivity chart – column chemistryL/dp index – column dimensions
3. Scale the HPLC method to UPLCACQUITY Columns Calculator
4. Input scaled parameters, inject and evaluate
5. Optimize if necessary
6. Get back to work!

©2008 Waters Corporation 6
Method Sequence Method Sequence
Step 1: Know Your Method

©2008 Waters Corporation 7
Step 1: Know Your HPLC MethodStep 1: Know Your HPLC Method
USP Fluconazole related compounds, test 1
Flow rate: 0.50 mL/minSample analytes: Fluconazole (10 μg/mL)
Fluconazole Related Substance A (10 μg/mL) Fluconazole Related Substance B (10 μg/mL)Fluconazole Related Substance C (10 μg/mL)
Molecular weight(s): 306.27Sample diluent: water/acetonitrile (80/20)Injection: 20μLDetection: 260 nmColumn Temperature: 40°CMobile phase: isocratic water/acetonitrile (80/20)Solid Phase: Sunfire™ C18Particle Size: 3.5 µmID: 4.6 mmLength: 150 mm

©2008 Waters Corporation 8
Isocratic ExampleIsocratic ExampleOriginal HPLC methodOriginal HPLC method
AU
0.000
0.010
0.020
0.030
0.040
0.050
0.060
0.070
0.080
0.090
Minutes0.00 1.00 2.00 3.00 4.00 5.00 6.00 7.00 8.00 9.00 10.00 11.00 12.00 13.00 14.00
Resolution (A-B) = 16Resolution (B-C) = 2.5Resolution (C-Flu) = 4.6
Critical resolution for B-C must be > 1.5
A
B
C
Fluconazole

©2008 Waters Corporation 9
Method Sequence Method Sequence
Step 2: Select Column Chemistry

©2008 Waters Corporation 10
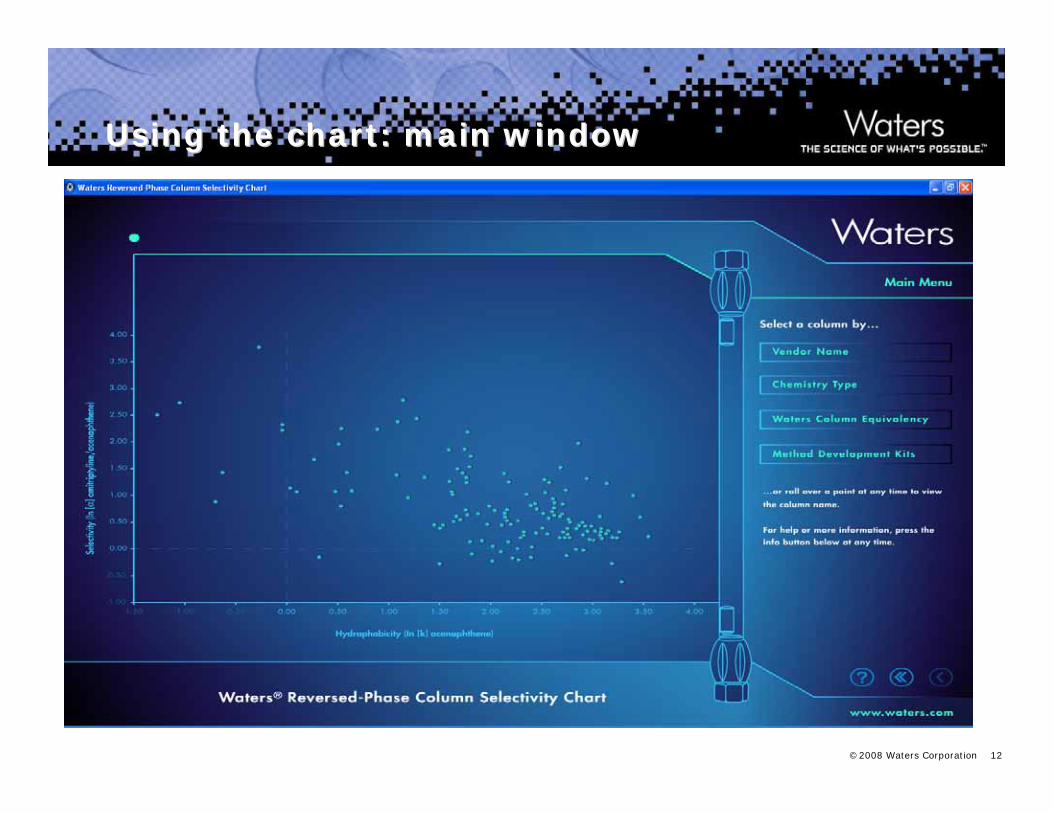
Step 2: The ColumnStep 2: The Column
Waters Column selectivity chart
Link:

©2008 Waters Corporation 11
Icon on DesktopIcon on Desktop
©2008 Waters Corporation 12
Using the chart: main windowUsing the chart: main window

©2008 Waters Corporation 13
Using the chart: Vendor name Using the chart: Vendor name SelectionSelection
Vendor

©2008 Waters Corporation 14
Using the chart: Vendor name Using the chart: Vendor name Selection_WatersSelection_Waters –– columns displayed columns displayed when when mousedmoused overover

©2008 Waters Corporation 15
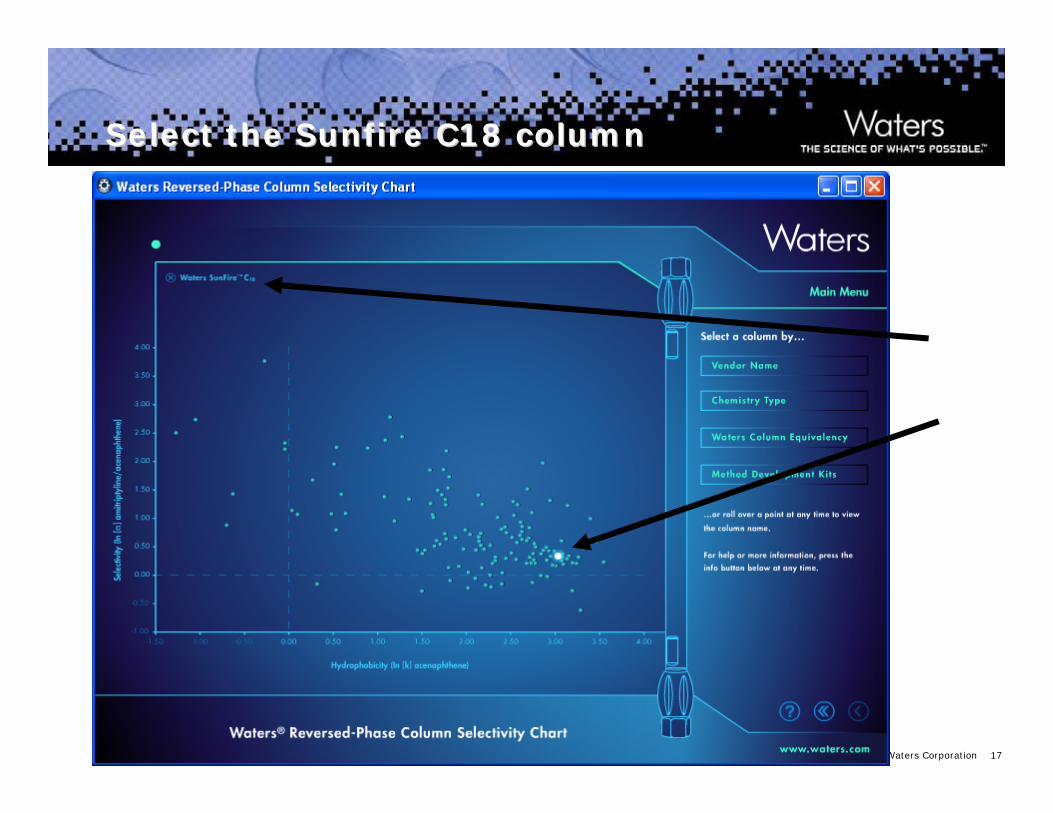
Using the chart: Vendor name Using the chart: Vendor name Selection_WatersSelection_Waters –– columns displayed as columns displayed as list list –– sunfiresunfire C18 highlightedC18 highlighted

©2008 Waters Corporation 16
Using the chart: remember Using the chart: remember SunfireSunfireposition and return to main pageposition and return to main page
©2008 Waters Corporation 17
Select the Select the SunfireSunfire C18 columnC18 column

©2008 Waters Corporation 18
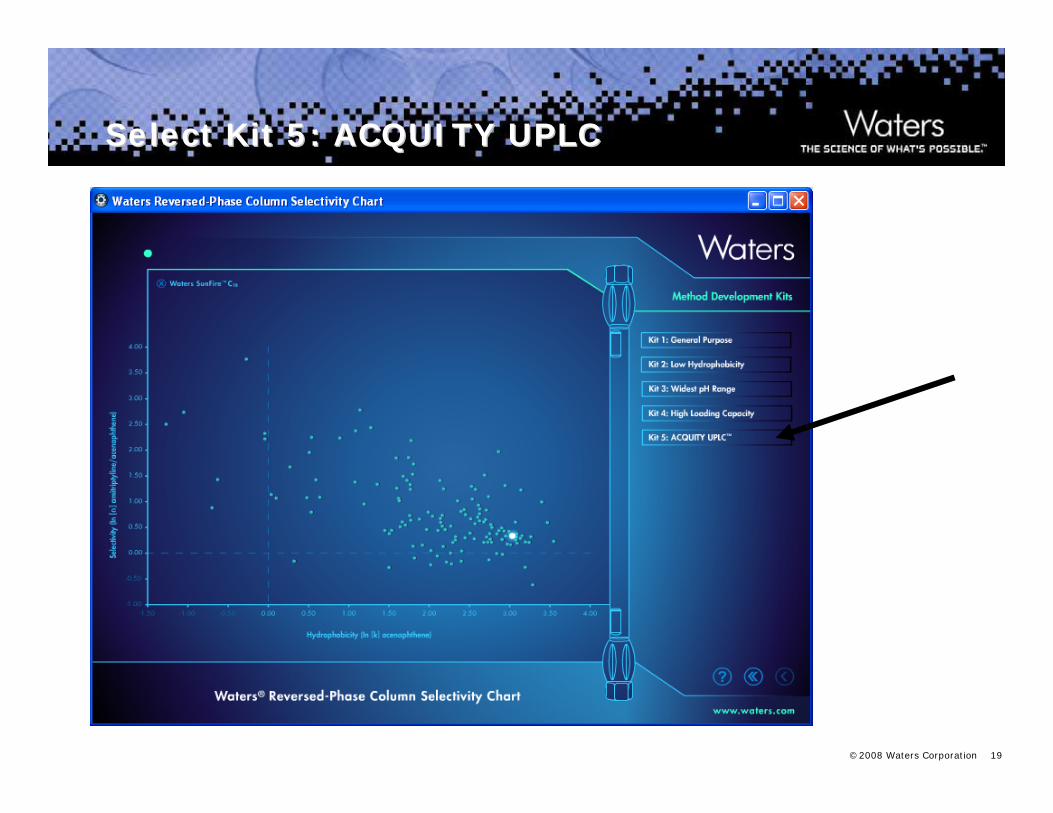
Select the Method Development KitsSelect the Method Development Kits
©2008 Waters Corporation 19
Select Kit 5: ACQUITY UPLCSelect Kit 5: ACQUITY UPLC

©2008 Waters Corporation 20
ACQUITY HSS T3ACQUITY HSS T3

©2008 Waters Corporation 21
ACQUITY BEH C18ACQUITY BEH C18

©2008 Waters Corporation 22
Which one?Which one?
Closest ACQUITY columns to the Sunfire are:
1) ACQUITY HSS T32) ACQUITY BEH C18
Since the HSS and the Sunfire are both Silica columns we’ll select the HSS chemistry. (BEH is a hybrid particle)
HSS T3
BEH C18

©2008 Waters Corporation 23
Step 2: Selecting the ColumnStep 2: Selecting the Column
So, from the chart:
ACQUITY HSS T3 chemistry
We have the column chemistry selected, now we need the dimensions.
Is there a straightforward way to do this?

©2008 Waters Corporation 24
Method Sequence Method Sequence
Step 2: Column Dimensions

©2008 Waters Corporation 25
Step 3: Selecting the Column DimensionsStep 3: Selecting the Column Dimensions
L/dp RATIO
Column Length/Particle Diameter = Dimensionless #
30,000150mm =5 μm =150,000μm5 μm
We use this ratio as a means of comparing the ‘resolving power’ of columns.
Example:
If you keep the L/dp ratio the SAME for 2 columns, you will obtain the SAME Resolution.
©2008 Waters Corporation 26
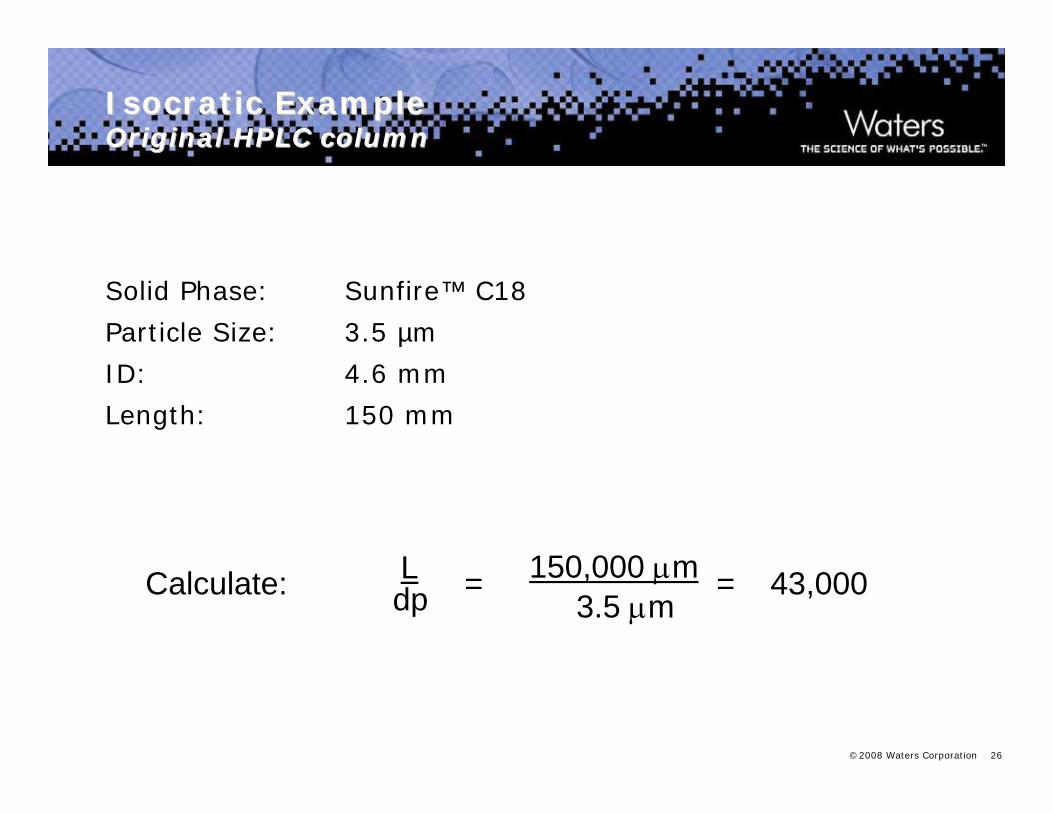
Isocratic Example Isocratic Example Original HPLC columnOriginal HPLC column
Solid Phase: Sunfire™ C18
Particle Size: 3.5 µm
ID: 4.6 mm
Length: 150 mm
Calculate: dp150,000 μm
3.5 μm= = 43,000L

©2008 Waters Corporation 27
Isocratic ExampleIsocratic ExampleL/L/dpdp Comparison for LC ColumnsComparison for LC Columns
5.0
3.5
2.5
1.8μmUPLC®
HSS
1.7μmUPLC®
BEH
Ldp
4,000
5,700
8,000
11,110
20mm
6,000
8,600
12,000
16,670
17,650
30mm
10,000
14,300
20,000
27,770
29,410
50mm
20,000
28,600
55,556
58,820
100mm
50,00030,000
71,40042,900
83,333
88,230
250mm150mm

©2008 Waters Corporation 28
Isocratic Example Isocratic Example Original HPLC columnOriginal HPLC column
So we now have a column chemistry and the column dimensions:
HSS T3 1.8 µm 2.1 x 100 mm
This was the hardest part!
Now we scale the method parameters…

©2008 Waters Corporation 29
Method Sequence Method Sequence
Step 3: Scale Method Parameters to the ACQUITY UPLC

©2008 Waters Corporation 30
Isocratic SeparationIsocratic Separation

©2008 Waters Corporation 31
Isocratic SeparationsIsocratic Separations

©2008 Waters Corporation 32
Fill In Isocratic HPLC ConditionsFill In Isocratic HPLC Conditions
©2008 Waters Corporation 33
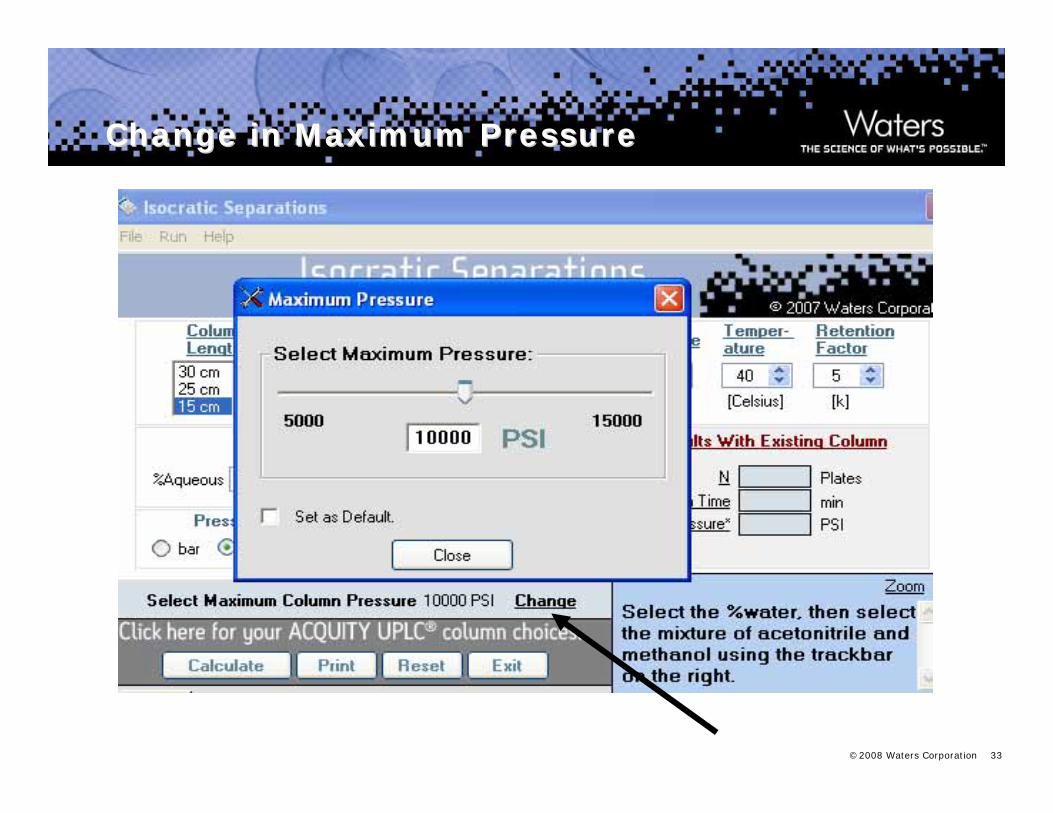
Change in Maximum PressureChange in Maximum Pressure

©2008 Waters Corporation 34
Maximum Pressure ChangedMaximum Pressure Changed

©2008 Waters Corporation 35
Calculate UPLCCalculate UPLC®® ConditionsConditions

©2008 Waters Corporation 36
UPLCUPLC®® ResultsResults
2.1 x 100 mm column at a flow rate of 0.738 ml/min with an injection volume of 2.8 µl

©2008 Waters Corporation 37
Method Sequence Method Sequence
Step 4: Inject and Evaluate

©2008 Waters Corporation 38
Step 4: Inject and Evaluate: Step 4: Inject and Evaluate: The Original HPLC Method ProfileThe Original HPLC Method Profile
AU
0.000
0.010
0.020
0.030
0.040
0.050
0.060
0.070
0.080
0.090
Minutes0.00 1.00 2.00 3.00 4.00 5.00 6.00 7.00 8.00 9.00 10.00 11.00 12.00 13.00 14.00
Resolution (A-B) = 16Resolution (B-C) = 2.5Resolution (C-Flu) = 4.6
Critical resolution for B-C must be > 1.5
A
B
C
Fluconazole
©2008 Waters Corporation 39
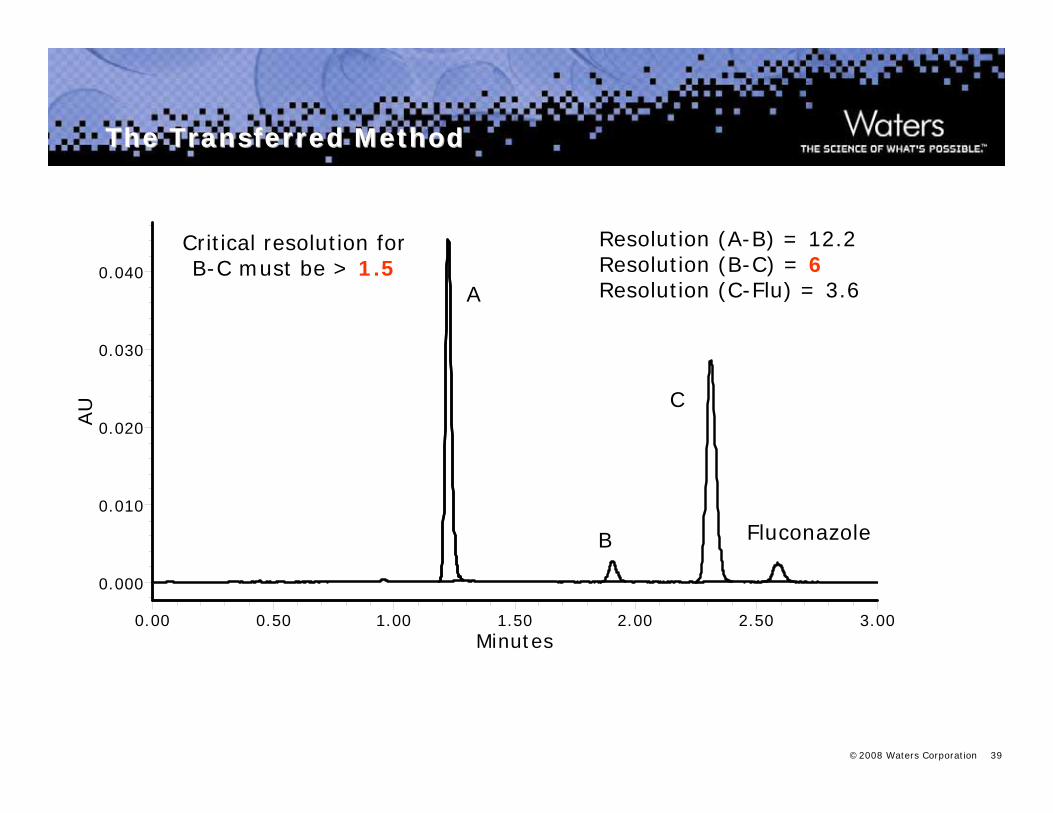
The Transferred MethodThe Transferred Method
AU
0.000
0.010
0.020
0.030
0.040
Minutes0.00 0.50 1.00 1.50 2.00 2.50 3.00
Critical resolution for B-C must be > 1.5
Resolution (A-B) = 12.2Resolution (B-C) = 6Resolution (C-Flu) = 3.6A
B
C
Fluconazole

©2008 Waters Corporation 40
Parameter Comparison: Parameter Comparison: Isocratic ExampleIsocratic Example
Original Transferred
Flow rate: 0.50 mL/min 0.738 mL/minInjection: 20μL 2.8 µLDetection: 260 nm 260 nmSolid Phase: Sunfire™ C18 HSS T3Particle Size: 3.5 µm 1.8 µmID: 4.6 mm 2.1 mmLength: 150 mm 100 mmRun Time: 15 minutes 3 minutes (80% faster!)
Resolution (A-B) = 16Resolution (B-C) = 2.5Resolution (C-Flu) = 4.6
Resolution (A-B) = 12.2Resolution (B-C) = 6.0Resolution (C-Flu) = 3.6

©2008 Waters Corporation 41
Method Sequence Method Sequence
Step 5: Optimize if Necessary

©2008 Waters Corporation 42
Transfer Sequence Recap: IsocraticTransfer Sequence Recap: Isocratic
1. Know as much as possible about method to be transferred
Goals of method – resolution/speed
Method must be adequate
2. Selected appropriate column
Waters Column Selectivity chart
L/dp index – column dimensions
3. Scaled the HPLC method to the ACQUITY UPLC
ACQUITY Columns Calculator
4. Injected and evaluated
5. Optimization was not necessary
Transfer Successful! …now for a gradient method

©2008 Waters Corporation 43
Method Sequence Method Sequence
Step 1: Know Your Method

©2008 Waters Corporation 44
Gradient Example Gradient Example Step 1 Step 1 -- Original HPLC methodOriginal HPLC method
Flow rate: 1.00 mL/minSample analytes: peak #1 - 2-Acetylfuran (4 μg/mL)
peak #2 - Acetanilide (4 μg/mL) peak #3 - Acetophenone (4 μg/mL) peak #4 - Propiophenone (1 μg/mL)peak #5 - Butylparaben (1 μg/mL)peak #6 - Benzophenone (1 μg/mL)
Molecular weight(s): roughly from ~200 - 300Column temperature: 40°CSample Diluent: 10/90 acetonitrile/waterInjection: 15 μLDetection: 254 nmMobile phase: A: 0.1% TFA in water
B: 0.1% TFA in acetonitrile
Column: Atlantis T3 5µm 4.6 x 150 mm

©2008 Waters Corporation 45
Gradient Example Gradient Example Original HPLC gradient profileOriginal HPLC gradient profile
5951.00Initial
69551.0201
11
11
6
Curve
5951.025.13
5951.0304
9551.0252
%B%AFlow Rate
Time since injection
Gradient Step
©2008 Waters Corporation 46
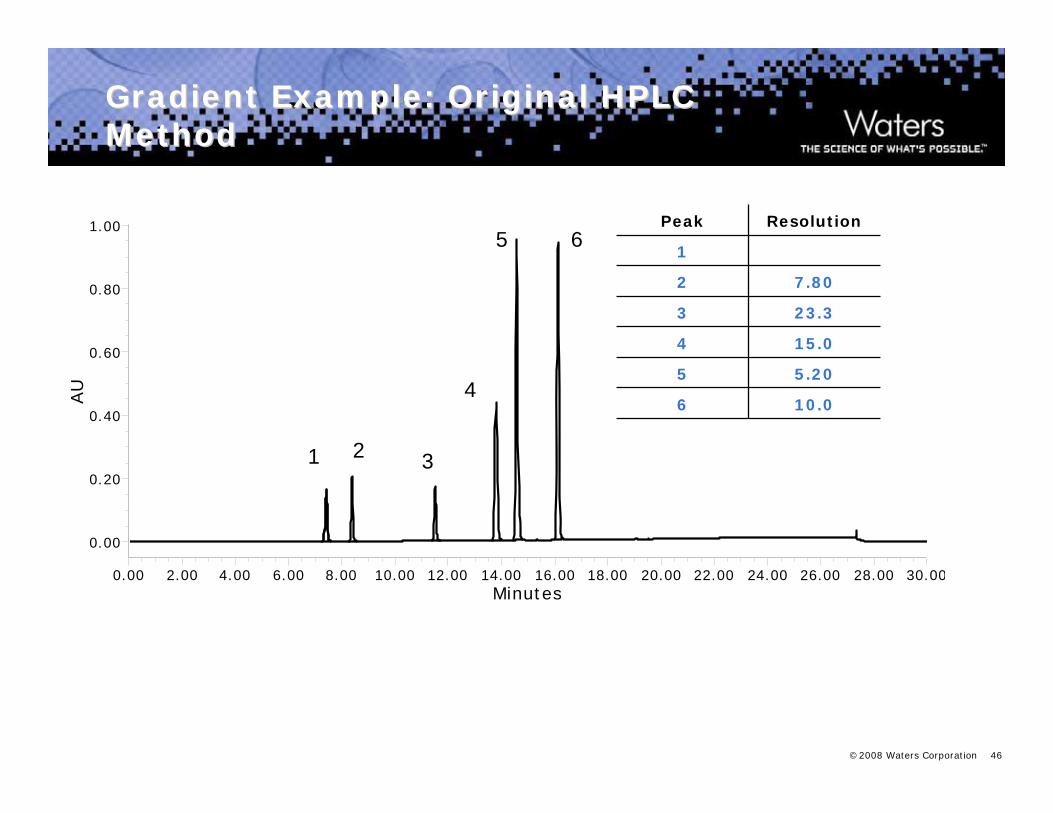
Gradient Example: Original HPLC Gradient Example: Original HPLC MethodMethod
AU
0.00
0.20
0.40
0.60
0.80
1.00
Minutes0.00 2.00 4.00 6.00 8.00 10.00 12.00 14.00 16.00 18.00 20.00 22.00 24.00 26.00 28.00 30.00
1 2 3
4
5 6
10.06
5.205
15.04
23.33
7.802
1
ResolutionPeak

©2008 Waters Corporation 47
Method Sequence Method Sequence
Step 2: Select Column

©2008 Waters Corporation 48
Step 2: Select the Column Step 2: Select the Column ChemistryChemistry
©2008 Waters Corporation 49
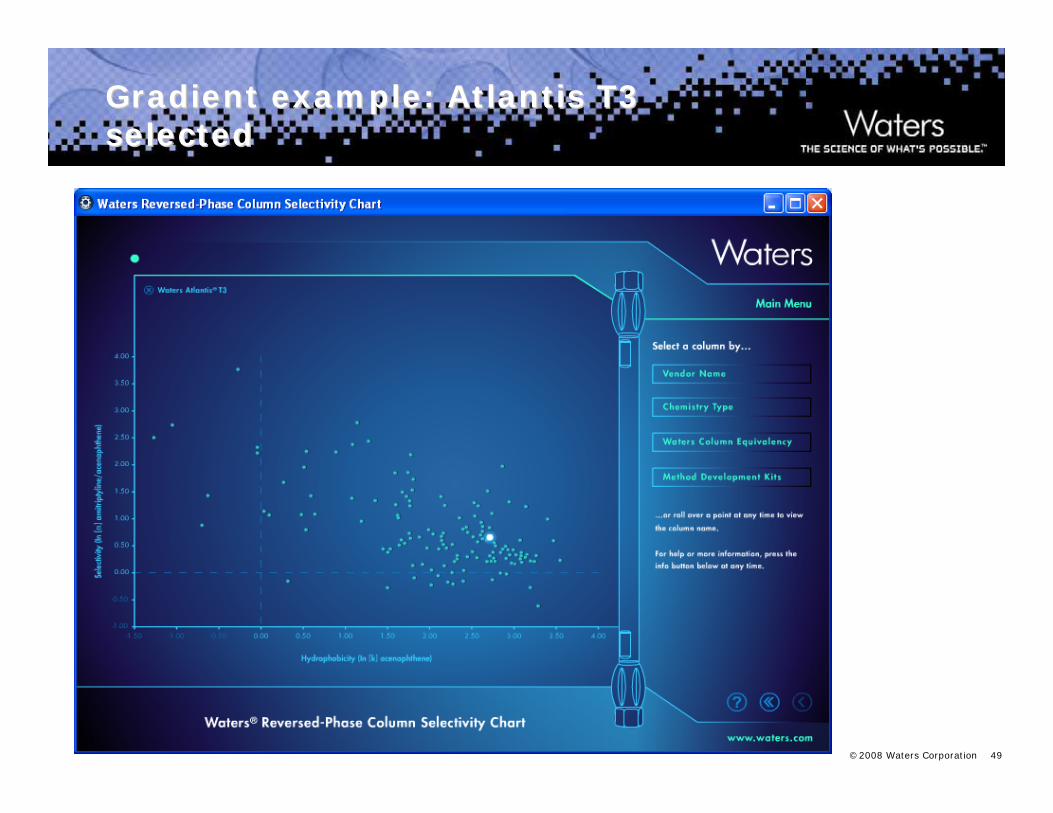
Gradient example: Atlantis T3 Gradient example: Atlantis T3 selectedselected

©2008 Waters Corporation 50
Gradient example: ACQUITY HSS T3 Gradient example: ACQUITY HSS T3 closest matchclosest match
©2008 Waters Corporation 51
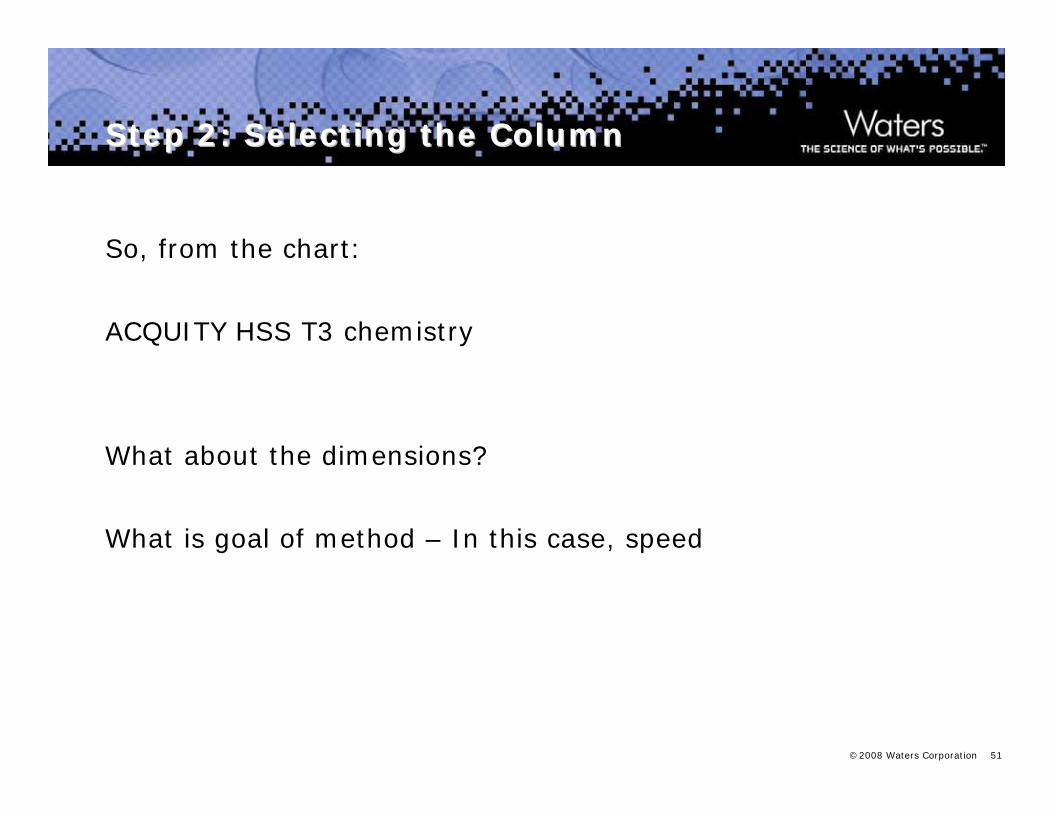
Step 2: Selecting the ColumnStep 2: Selecting the Column
So, from the chart:
ACQUITY HSS T3 chemistry
What about the dimensions?
What is goal of method – In this case, speed
©2008 Waters Corporation 52
Method Sequence Method Sequence
Step 2: Column Dimensions

©2008 Waters Corporation 53
Step 3: Column DimensionsStep 3: Column Dimensions
Solid Phase: Atlantis T3
Particle Size: 5.0 µm
ID: 4.6 mm
Length: 150 mm
Calculate: dp150,000 μm
5 μm= = 30,000L

©2008 Waters Corporation 54
Gradient ExampleGradient ExampleL/L/dpdp Comparison for LC ColumnsComparison for LC Columns
5.0
3.5
2.5
1.8μmUPLC®
HSS
1.7μmUPLC®
Packed
Ldp
4,000
5,700
8,000
11,110
20mm
6,000
8,600
12,000
16,670
17,650
30mm
10,000
14,300
20,000
27,770
29,410
50mm
20,000
28,600
55,556
58,820
100mm
50,00030,000
71,40042,900
83,333
88,230
250mm150mm

©2008 Waters Corporation 55
Step 3: The ColumnStep 3: The Column
So the column chemistry and the column dimensions are:
HSS T3 1.8 µm 2.1 x 50 mm
Now we scale the gradient parameters to the ACQUITY UPLC

©2008 Waters Corporation 56
Method Sequence Method Sequence
Step 3: Scale Method Parameters to the ACQUITY UPLC

©2008 Waters Corporation 57
Gradient ExampleGradient Example
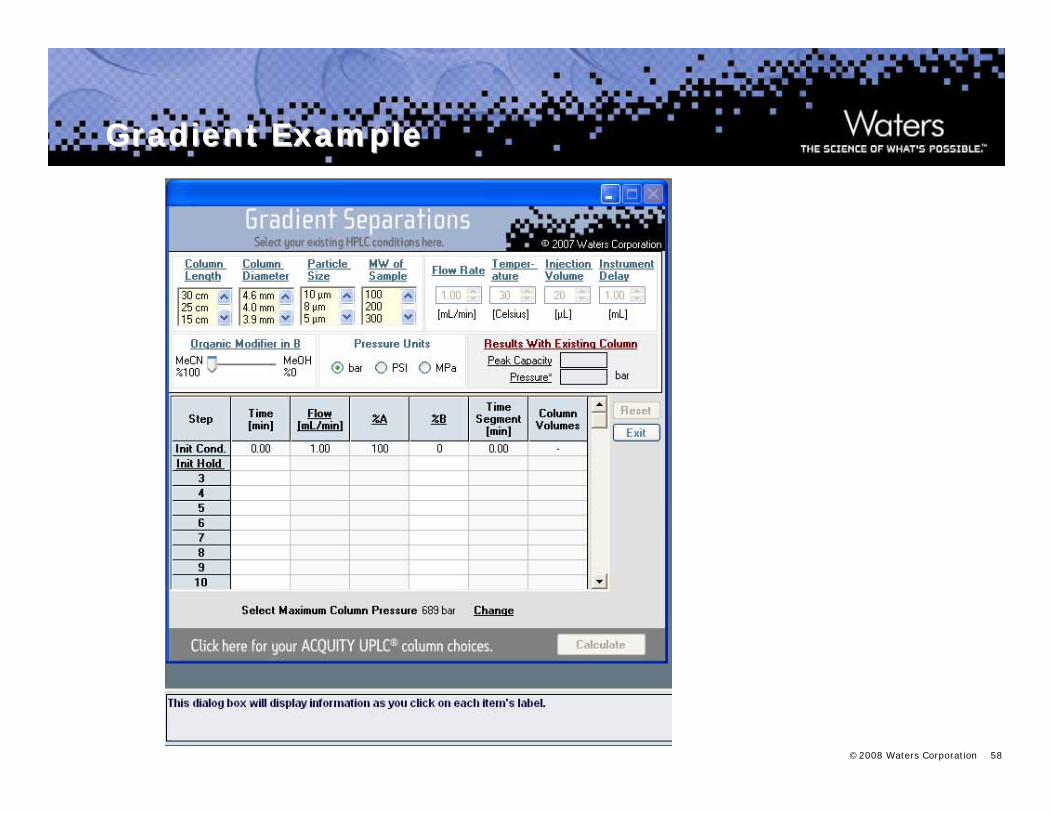
©2008 Waters Corporation 58
Gradient ExampleGradient Example

©2008 Waters Corporation 59
Gradient ExampleGradient Example
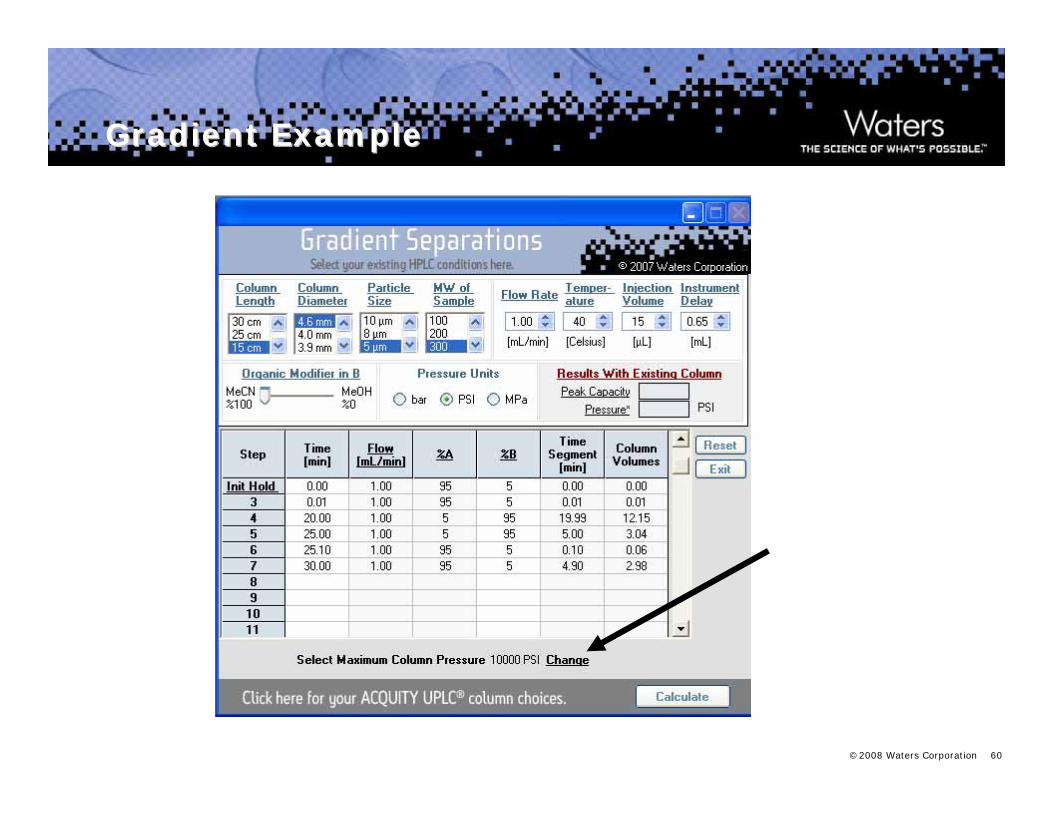
©2008 Waters Corporation 60
Gradient ExampleGradient Example

©2008 Waters Corporation 61
Gradient ExampleGradient Example
©2008 Waters Corporation 62
Gradient ExampleGradient Example

©2008 Waters Corporation 63
Gradient ExampleGradient Example

©2008 Waters Corporation 64
Gradient ExampleGradient Example
©2008 Waters Corporation 65
Gradient Example: PrintGradient Example: Print--out out

©2008 Waters Corporation 66
Method Sequence Method Sequence
Step 4: Inject and Evaluate

©2008 Waters Corporation 67
Gradient Example: Original HPLCGradient Example: Original HPLC
AU
0.00
0.20
0.40
0.60
0.80
1.00
Minutes0.00 2.00 4.00 6.00 8.00 10.00 12.00 14.00 16.00 18.00 20.00 22.00 24.00 26.00 28.00 30.00
1 2 3
4
5 6
10.06
5.205
15.04
23.33
7.802
1
ResolutionPeak

©2008 Waters Corporation 68
Gradient Example: Transferred MethodGradient Example: Transferred Method
AU
0.00
0.10
0.20
0.30
0.40
Minutes0.00 0.50 1.00 1.50 2.00 2.50 3.00 3.50
10.0
5.20
15.0
23.3
7.80
Resolution
UPLC
6
5
4
3
2
1
Peak
1 2 3
4
56

©2008 Waters Corporation 69
Parameter Comparison: Parameter Comparison: Gradient ExampleGradient Example
Original Transferred
Flow rate: 1.0 mL/min 1.287 mL/minInjection: 15μL 1.0 µLDetection: 254 nm 254 nmSolid Phase: Atlantis T3 HSS T3Particle Size: 5.0 µm 1.8 µmID: 4.6 mm 2.1 mmLength: 150 mm 50 mmRun Time: 30 minutes 3.86 minutes (87% faster!)
10.0
5.20
15.0
23.3
7.80
Resolution
UPLC
8.006
9.205
15.24
18.23
8.902
1
Resolution
HPLC
Peak
©2008 Waters Corporation 70
Method Sequence Method Sequence
Step 5: Optimize if Necessary

©2008 Waters Corporation 71
Transfer Sequence Recap: GradientTransfer Sequence Recap: Gradient
1. Know as much as possible about method to be transferred
Goals of method – resolution/speed
Method must be adequate
2. Selected appropriate column
Waters Column Selectivity chart
L/dp index – column dimensions
3. Scaled the HPLC method to the ACQUITY UPLC
ACQUITY Columns Calculator
4. Injected and evaluated
5. Optimization
Another Successful Transfer!

©2008 Waters Corporation 72
SummarySummary
In both examples we followed a series of straight-forward steps to rapidly and effectively transfer HPLC methods to the ACQUITY UPLC.
The resultant transferred methods were significantly faster and maintained or improved the original HPLC method resolutions.
The Column Selectivity Chart and ACQUITY Columns Calculator are simple, useful tools that will enable rapid, seamless implemenation of the ACQUITY UPLC.

©2008 Waters Corporation 73
Empower 2 Method Validation Empower 2 Method Validation ManagerManager
Waters Method Validation Manager Software is designed to streamline the set-up, execution, calculation and reporting of a method validation.
It provides easy data tracking and complete organization of validation data and results monitored by the built-in oversight of automated error checking.
MVM reduces the time and costs required to perform chromatographic method validation by as much as 80%.
Because MVM allows the entire chromatographic method validation process to be efficiently performed within Empower 2, fewer software applications need be deployed, validated, and maintained
Many other powerful features.
Related Documents