CONNECTICUT DEPARTMENT OF AGRICULTURE BUREAU OF AQUACULTURE MILFORD, CONNECTICUT, USA Techniques and Practices for Vibrio Reduction: Connecticut Final Report to the Interstate Shellfish Sanitation Conference Submitted March 21, 2016 Submitted by Kristin DeRosia-Banick, David H. Carey, Joseph DeCrescenzo

Welcome message from author
This document is posted to help you gain knowledge. Please leave a comment to let me know what you think about it! Share it to your friends and learn new things together.
Transcript

CONNECTICUT DEPARTMENT OF AGRICULTURE BUREAU OF AQUACULTURE MILFORD, CONNECTICUT, USA
Techniques and Practices for Vibrio Reduction:
Connecticut Final Report to the
Interstate Shellfish Sanitation Conference Submitted March 21, 2016
Submitted by Kristin DeRosia-Banick, David H. Carey, Joseph DeCrescenzo

Techniques and Practices for Vibrio Reduction: Connecticut Final Report Submitted to the Interstate Shellfish Sanitation Conference (ISSC) March 21, 2016 Submitted by: Kristin DeRosia-Banick,
a David H. Carey,a Joseph DeCrescenzo
a
State of Connecticut Department of Agriculture Bureau of Aquaculturea Milford, Connecticut, USA Project Partners: Michael Whitneyb, Evan Wardb
University of Connecticut Department of Marine Sciences Groton, Connecticut, USAb
In 2014, the Interstate Shellfish Sanitation Conference (ISSC) published a Request for Proposals for
Techniques and Practices for Vibrio Reduction. The purpose of the Request for Proposals, was to
invite qualified entities to propose studies that could offer viable process options for the shellfish
industry that would reduce risk of Vibrio illnesses. The Connecticut Department of Agriculture,
Bureau of Aquaculture and Laboratory Services (CT DA/BA) program managers sought and were
successful in having their proposal selected; the result of the proposal was to accomplish several
complementary objectives through the ISSC funding opportunity, described below in detail.
One objective of this study was to compare the levels of total, tdh+, and trh+ V. parahaemolyticus
in oysters subjected to one (1) of five (5) post-harvest cooling treatments at specified intervals from
the time of harvest. Treatments included the use of ice slurry to reduce the internal temperature of
oysters to less than 10°C (50°F) immediately post-harvest, and to an internal temperature of 50°F
(10°C) at one (1) hour, three (3) hours, and five (5) hours from harvest, respectively. The National
Shellfish Sanitation Program (NSSP) standard Vibrio parahaemolyticus Control Plan (VPCP) option
of placing oysters under mechanical refrigeration at or below 45°F (7.2°C) within five (5) hours of
harvest and reducing the internal temperature of oysters to 50°F (10°C) within ten (10) hours of
being placed under refrigeration was also evaluated. Most probable number (MPN) real-time
polymerase chain reaction (MPN-Rti-PCR) methods were used for enumeration of total V.
parahaemolyticus and pathogenic (tdh+ and/or trh+) V. parahaemolyticus. V. parahaemolyticus was
detected in all process study samples, with a median result of 1.88 log MPN/g for all oyster samples
tested.
Differences in total V. parahaemolyticus levels between the VPCP traditional mechanical
refrigeration method and treatments using ice slurry to cool to an internal temperature of 50°F (10
°C) immediately following harvest, and within one (1) hour and three (3) hours of harvest were
statistically significant (P < 0.005). The difference in the means of total V. parahaemolyticus levels
between the five (5) hour to 50°F (10°C) ice slurry treatment and both the zero (0) hour (0Hr) and
one (1) hour treatments were also statistically significant. These data indicate that post-harvest
growth of V. parahaemolyticus is more effectively controlled by rapidly cooling oysters to an
internal temperature of 50°F (10°C) within three (3) hours of harvest as compared to the traditional
process of placing oysters under mechanical refrigeration within five (5) hours of harvest and
reducing internal temperatures of oysters to 50°F (10°C) with ten (10) hours of being placed under
refrigeration. The results can be used to evaluate and refine Vibrio control plan cooling strategies
employed by risk managers and State Shellfish Control Authorities (SSCAs).
Complementary to the post-harvest controls study, the study provided a mechanism to gain a better
understanding of V. parahaemolyticus levels in the environment and their relevance to implementing

meaningful Vibrio controls in Connecticut growing waters. The 2014/2015 monitoring plan
included the collection of environmental parameters, e.g. water temperature, air temperature,
salinity, and depth in order to assess their relationship to levels of V. parahaemolyticus bacteria in
shellfish. Vibrio monitoring and continuous environmental observations have been used to inform
the understanding of the temporal variability and spatial distribution of V. parahaemolyticus in Long
Island Sound (LIS) oyster production areas. These data allowed the state to proactively manage V.
parahaemolyticus during 2015 by requiring more stringent controls under those specific
environmental conditions that have historically correlated to a higher risk of illness, rather than
relying on a trigger based on the specific dates associated with illness alone.
Executive Summary
Vibrio parahaemolyticus is a Gram-negative, curve-shaped rod found in estuarine and marine
environments worldwide (Lampel, 2012). The incidence of vibriosis in the United States
increased between 1996 through 2010, driven primarily by an increase in V. parahaemolyticus
which increased from 0.01 to 0.13 per 100,000 population via Cholera and Other Vibrio Illness
Surveillance (COVIS) and from 0.06 to 0.23 via the Foodborne Diseases Active Surveillance
Network (Food-Net) (Newton, 2012). V. parahaemolyticus typically manifests as mild to
moderate gastroenteritis, however wound infection and septicemia may also occur (Lampel,
2012). There are many pathogenic and non-pathogenic strains of this bacterium, which are typically
identified at higher concentrations in shellfish in the northeast region from April through October
when coastal waters are warm. Consumers may be exposed to these pathogenic bacteria by eating
raw or undercooked molluscan shellfish and crustaceans.
During the summers of 2012 and 2013, V. parahaemolyticus infections of a strain previously traced
only to the Pacific Northwest were associated with consumption of oysters and other shellfish from
several Atlantic Coast harvest areas (Martinez-Urtaza, et al., 2013). Connecticut growing waters
were the source of at least 23 confirmed cases of V. parahaemolyticus during the summer of 2013,
with an additional 15 multi-source cases potentially linked to Connecticut waters. Connecticut
shellfish growing areas had not been the confirmed source of an outbreak in the years prior to 2013,
however the V. parahaemolyticus risk evaluation conducted by the SSCA for Connecticut had
determined the need for a VPCP beginning in 2012. For Connecticut, the high risk season was
determined to be between June 1 and September 30, based on seasonal air and water temperatures
and salinity levels in the optimal range for V. parahaemolyticus proliferation. The VPCP that was
in place at the time of the 2013 outbreak included the NSSP standard time to temperature control
measure of limiting time from harvest to refrigeration to no more than five (5) hours, and required
the original dealer to cool oysters to an internal temperature of 50°F (10°C) or below within ten (10)
hours after placement into refrigeration. Unfortunately, the national standard V. parahaemolyticus
controls that were in place at the time of the 2013 outbreak were inadequate to prevent illnesses from
occurring, and on-board rapid-cooling was selected by the SSCA for the 2014 and 2015 V.
parahaemolyticus seasons in order to reduce the risk of illness associated with oysters harvested
from the outbreak area.
In 2014, the Connecticut Department of Agriculture Bureau of Aquaculture (DA/BA) acquired real-
time PCR technology (Life Technologies 7500 Fast Real Time PCR System) which has allowed the
Bureau in their role as the SSCA to conduct both environmental monitoring as well as post-harvest
process studies for total, tdh+ and trh+ V. parahaemolyticus bacteria.

Evaluation of Post-Harvest V. parahaemolyticus Controls
The primary objective of the Connecticut Techniques and Practices for Vibrio Reduction study was
to evaluate the effectiveness of post-harvest controls that could potentially reduce the risk of Vibrio
illnesses. The use of ice slurry for rapidly cooling the internal temperatures of oysters to 50°F (10°C)
was compared to the NSSP standard VPCP controls requiring placement under temperature control
[in this case, mechanical refrigeration at or below 45°F (7.2°F)] within five (5) hours of harvest and
cooling to an internal temperature of 50°F (10°C) within ten (10) hours of being placed under
temperature control. The effectiveness of several post-harvest time and temperature strategies were
evaluated using continuous temperature data loggers (ACR Smart Button) to record the length of
time each sample took to reach 50°F (10°C) and via enumeration of total, tdh+, and trh+ V.
parahaemolyticus associated with each treatment sample.
The project industry partner’s (Norm Bloom & Son Norwalk, CT) on-vessel ice slurry equipment
was used for rapidly cooling shellfish to an internal temperature of 50°F (10°C). The ice slurry
process used by Norm Bloom & Son was first evaluated in 2014 and approved for use under
Connecticut’s rapid cooling VPCP during the 2014 and 2015 Vibrio seasons. A rapid cooling control
plan was required during 2014 and 2015 for the harvest of oysters from the municipalities of
Westport, Norwalk, and Darien growing areas confirmed and implicated in the 2013 outbreak.
Studies completed by the DA/BA during 2014 conclusively proved that via the use of on-vessel ice
slurry, harvesters were able to rapidly cool oysters to an internal temperature of 50°F (10°C) in less
than thirty (30) minutes throughout the Vibrio season.
The post-harvest controls study period was July 14 through September 23, 2015, inclusive. The CT
DA/BA collected eight (8) shellstock samples approximately every two weeks for a total of 51
samples; occasional runs were rescheduled or sample runs missed due to scheduling limitations.
Each of the eight (8) samples collected had been subjected to one (1) of five (5) post-harvest
treatments, plus replicates. Shellfish samples were analyzed for total V. parahaemolyticus using
(MPN-Rti-PCR) as previously described by Kinsey et al (Kinsey, Lydon, Bowers, & Jones, 2015).
treatments, plus replicates. Shellfish samples were analyzed for total V. parahaemolyticus using a
MPN-Rti-PCR method as previously described by Kinsey et al (Kinsey, Lydon, Bowers, & Jones,
2015). A second multiplex Rti-PCR method targeting the tdh and trh hemolysin genes was used for
identification and MPN enumeration of pathogenic V. parahaemolyticus. Norm Bloom & Son’s on-
vessel global positioning system (GPS) was used to verify that oyster samples were collected from
the same shellfish lease location each sample run.
Processes investigated include:
1) Zero (0) Hour (Baseline): Immediate post-harvest rapid cooling to internal temperature of
50°F (10°C) or less using ice slurry, and
2) One (1) hour from harvest to internal temperature of 50°F (10°C) or less using ice slurry (45
minutes on deck then into slurry for 15 minutes rapid cooling), and
3) Three (3) hours from harvest to internal temperature of 50°F (10°C) or less using ice slurry
(two (2) hours 45 minutes on deck prior to slurry for 15 minutes), and
4) Five (5) hours from harvest to internal temperature of 50°F (10°C) or less using ice slurry
(four (4) hours 45 minutes on deck prior to slurry for 15 minutes), and
5) NSSP standard VPCP: Five (5) hours from harvest into mechanical refrigeration at or below
45°F (7.2°C) and maximum of ten (10) hours to an internal temperature of 50°F (10°C).

Environmental Monitoring for V. parahaemolyticus:
Complementary to the post-harvest controls study, the SSCA sought to gain a better understanding
of V. parahaemolyticus levels in the environment and their relevance to implementing meaningful
Vibrio controls in Connecticut growing waters. The 2014/2015 monitoring plan included the
collection of environmental parameters, e.g. water temperature, air temperature, salinity, and depth
that may correlate to levels of Vibrio bacteria in shellfish. The SSCA uses Vibrio monitoring and
continuous environmental observations to understand the temporal variability and spatial
distribution of V. parahaemolyticus in Long Island Sound (LIS) oyster production areas. These data
allowed the state to proactively manage V. parahaemolyticus during 2015 by requiring more
stringent controls under those specific environmental conditions that have historically correlated to
a higher risk of illness, rather than relying on a trigger based on the specific dates associated with
illness alone.
The environmental monitoring study period was June 15 to October 31, 2014, and June 1 through
October 31, 2015, inclusive. The CT DA/BA collected eight (8) shellstock samples every two weeks
for a total of 101 samples (n = 101). Shellfish samples were analyzed for total V. parahaemolyticus
using (MPN-Rti-PCR). A second multiplex Rti-PCR method targeting the tdh and trh hemolysin
genes was used for identification and MPN enumeration of pathogenic V. parahaemolyticus as
described above. On-vessel global positioning system (GPS) was used to verify the location from
which each sample was collected. The primary oyster production areas in Connecticut waters were
targeted, with more intensive sampling focused on the Westport/Norwalk/Darien inner island
growing area associated with the 2013 outbreak.
Materials and Methods
Post-Harvest Controls Study
The study tested the hypothesis that post-harvest control of oyster temperatures utilizing ice slurry
for on-board rapid cooling of oysters to 50°F (10°C) within one (1) hour of harvest effectively limits
the proliferation of Vibrio bacteria (total, tdh+ and trh+ V. parahaemolyticus) and is more effective
than the NSSP standard VPCP cooling allowing five (5) hours from harvest to temperature control
at or below 45°F (7.2°C) and ten (10) hours to an internal temperature of 50°F (10°C). Treatments
investigated during the 2015 study period include:
1) Zero (0) Hour (Baseline): Immediate post-harvest rapid cooling to internal
temperature of 50°F (10°C) or less using ice slurry, and
2) One (1) hour from harvest to internal temperature of 50°F (10°C) or less using ice
slurry (45 minutes on deck then into slurry for 15 minutes rapid cooling), and
3) Three (3) hours from harvest to internal temperature of 50°F (10°C) or less using ice
slurry (two (2) hours 45 minutes on deck prior to slurry for 15 minutes), and
4) Five (5) hours from harvest to internal temperature of 50°F (10°C) or less using ice
slurry (four (4) hours 45 minutes on deck prior to slurry for 15 minutes), and
5) NSSP standard 5/10 Hour VPCP: Five (5) hours from harvest into mechanical
refrigeration at or below 45°F (7.2°C)and maximum of ten (10) hours to an internal
temperature of 50°F (10°C).
6) Replicate sample Zero (0) Hour (Baseline)
7) Replicate sample One (1) hour
8) Replicate sample NSSP 5/10 Hour VPCP
On each sample collection run, the industry vessel captain harvested 160 oysters from oyster lease
103-L-43, located in Conditionally Approved Area #1 in the municipality of Norwalk, CT. All
samples were collected and processed by the state Vibrio manager with the assistance of one staff
analyst. Internal shellfish temperatures were recorded at the time of collection by using a gloved
hand and partially shucking the oyster then inserting a calibrated probe thermometer into the deepest
part of the tissue. Eight (8) oysters were partially shucked keeping the adductor muscle intact, a
Smart Button data logger (ACR Systems Inc. Surrey, British Columbia) was inserted, and the oyster
zip-tied closed. These oysters were placed with remaining oysters and held in a bushel basket on
the deck of the vessel. The basket was located in a shaded area on the deck of the vessel to represent
conditions that a typical commercial harvest would be exposed to during the VPCP control months
when shading is required. Consecutive samples were pulled from the basket at identified intervals.
Ambient post-harvest air temperatures were recorded during each sample collection run using a
Smart Button data logger attached to the basket.
Each sample consisted of twenty (20) oysters: three (3) oysters were used to take internal shellfish
tissue temperatures using a calibrated probe thermometer (DeltaTRAK® 08C1), one (1) oyster was
used for the Smart Button temperature logger, and sixteen (16) oysters were brought to the lab, of
which twelve (12) were used in the analysis.
For samples 1 and 6, oysters were placed into a mesh bag and placed immediately into ice slurry,
allowing for 15 minutes in the ice slurry to reach an internal temperature of 10°C (50°F) or less prior
to collection. Following rapid cooling via on-board ice slurry, samples were placed into a plastic
bag, labeled with the sample identification, and placed on ice in an insulated cooler for transport to
the laboratory.
Samples 2, 3, 4, and 7 were held on deck for 45 minutes, 165 minutes, 285 minutes, and 45 minutes,
respectively, prior to being placed in a mesh shellstock bag and placement into the ice slurry,
allowing for 15 minutes in the ice slurry to reach an internal temperature of 10°C (50°F) or less prior
to sample collection. Following rapid cooling, samples were placed into a plastic bag, and placed
on ice in an insulated cooler for transport to the laboratory.
Samples 5 and 8 were held on either the deck of the boat or on shore for five (5) hours prior to
placement in the shellfish dealer’s mechanical refrigeration unit at or below 45°F, five (5) hours
from the time of harvest. In order to achieve the ten (10) hour cool-down rate, samples were placed
in plastic bags and wrapped in bubble wrap, then placed inside an insulated cooler in order to slow
the cooling process to meet the ten (10) hour time window as recorded by the temperature loggers.
Based on previous VPCP verification studies conducted at Norm Bloom & Son’s facility, the
expected time for oyster internal temperatures to reach 10°C (50°F) in the mechanical refrigeration
unit was known to be three (3) hours or less, however in this study the attempt was to achieve the
ten (10) hours to 50°F (10°C) cool down currently required by NSSP V. parahaemolyticus Control
Plan options (NSSP Model Ordinance 2013 Revision) in the absence of a more restrictive state
VPCP. Samples were cooled to an internal temperature of 10°C (50°F) within ten (10) hours after
placement under temperature control at or below 45°F and held overnight. Samples were collected
by DA/BA staff the following morning from the dealer’s mechanical refrigeration unit and placed
into an insulated cooler on ice for transport to the laboratory.
Environmental Monitoring
In June of 2014, DA/BA environmental analysts deployed 16 HOBO® Water Temp Pro v2 (U22-
001) (Onset Corp. Bourne, MA) temperature data loggers at near-bottom depth and six (6) DST
conductivity, temperature, and depth (CTD) data loggers (Star-Oddi, Iceland) were deployed at near-
surface and near-bottom depth at three (3) shellfish cage locations in the municipalities of Westport
and Milford (Figure 1). One Vantage Pro 2 remote weather station (Davis Instruments, Vernon
Hills, IL) was deployed in the municipality of Milford to monitor meteorological conditions,
including rainfall and air temperature. During the June 2015 deployment, Star-Oddi DST loggers
were replaced with Hobo® conductivity and temperature (U24-002-C) loggers to record the near-
bottom temperature and salinity; Hobo® temperature loggers (U22-001) were used to record near-
surface temperatures.
Stations were located to provide spatial coverage throughout Connecticut growing waters that are
actively in use for oyster cultivation. A higher intensity of data collection focused on the waters of
the municipalities of Norwalk and Westport, CT, where the majority of oysters associated with the
2013 V. parahaemolyticus outbreak were harvested.
From July 1 to September 30, 2014, and June 1 through September 30, 2015, eight (8) shellstock
samples were collected on a bi-weekly basis for environmental monitoring and analyzed for total,
tdh+, and trh+ V. parahaemolyticus levels (Figure 2). Temperature and salinity (near-bottom and
near-surface) were measured at the time of collection using an YSI Model 30 or Pro30 (YSI, Inc.
Yellow Springs, OH). Latitude, longitude, and water depth at the time of collection were recorded
from the on-vessel GPS and depth finder. Internal shellfish temperatures were recorded at the time
of collection by partially shucking and inserting a calibrated probe thermometer into the deepest part
of the tissue.

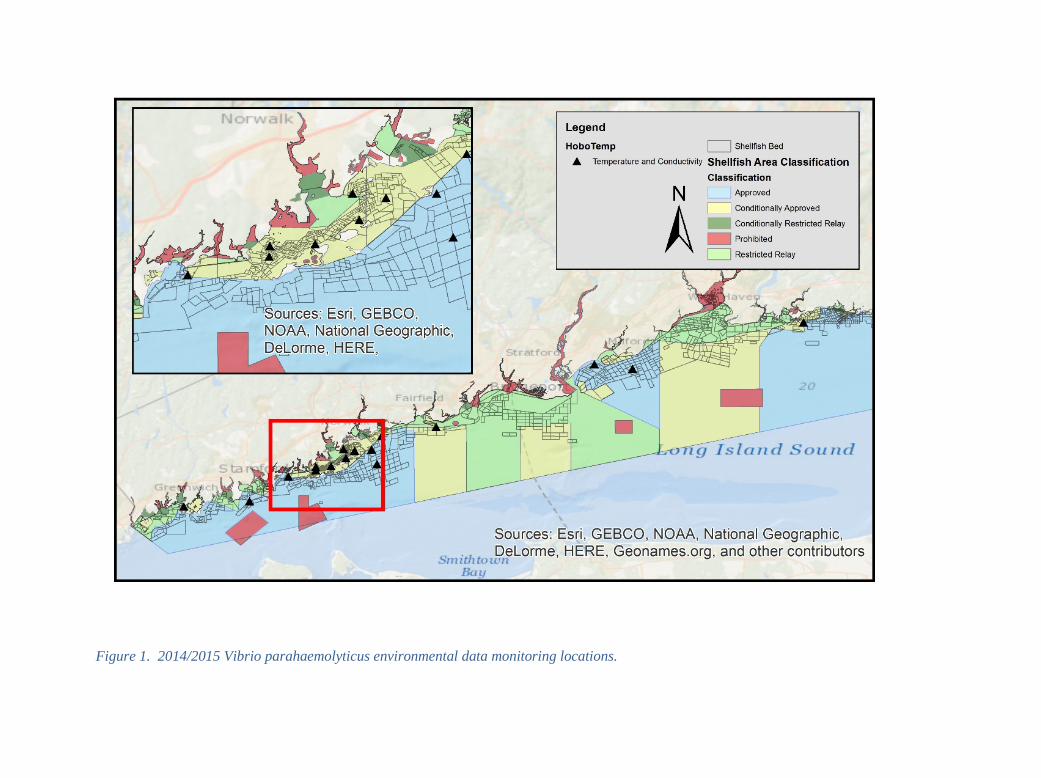
Figure 1. 2014/2015 Vibrio parahaemolyticus environmental data monitoring locations.

Figure 2. 2014/2015 Vibrio parahaemolyticus sample collection locations. Samples analyzed for total, tdh+, and trh+ V. parahaemolyticus levels.

Sample Analysis
Sample analysis was initiated within 24 hours of sample collection. Shellfish samples were analyzed
for Vibrio spp. using most probable number (MPN) real-time (Rti) PCR. For each sample, the entire
shell contents of 12 animals were aseptically removed and homogenized. The homogenate was used
to prepare a three-tube, multiple-dilution MPN series in alkaline peptone water (APW) and incubated
overnight (18-24 hours) at 35°C. A second multiplex Rti-PCR method targeting the tdh, tlh and trh
genes, with an internal amplification control (IAC), was used for identification of both total and
pathogenic V. parahaemolyticus as per Kinsey et al, 2015. All primers and nuclease style probes
were purchased from Integrated DNA Technologies (IDT) (Coralville, IA) or Life Technologies.
Cycling was conducted on an Applied Biosystems 7500 Real Time PCR System with an initial
denaturation/polymerase activation at 95°C for 60 seconds, followed by 45 cycles of 95°C for 5
seconds and 59°C for 45 seconds with instrument optics turned to the on position. Default instrument
analysis parameters were used, except that the threshold was set at 0.02 and the background end
cycle set at 10.
Statistical Analysis: Post-Harvest Controls
All analyses were conducted using SigmaPlot 3.5 (Systat Software, Inc., San Jose, CA). Plots
and graphs were created in Excel or Sigma Plot 3.5. Data tables were created in Excel.
One-Way Analysis of Variance
Differences between the means of the treatment groups were evaluated using One-Way
Analysis of Variance (ANOVA) of the log transformed total V. parahaemolyticus observations.
Pairwise comparisons between treatment groups were conducted following Fisher’s protected LSD
procedure with an overall significance level of 0.05.
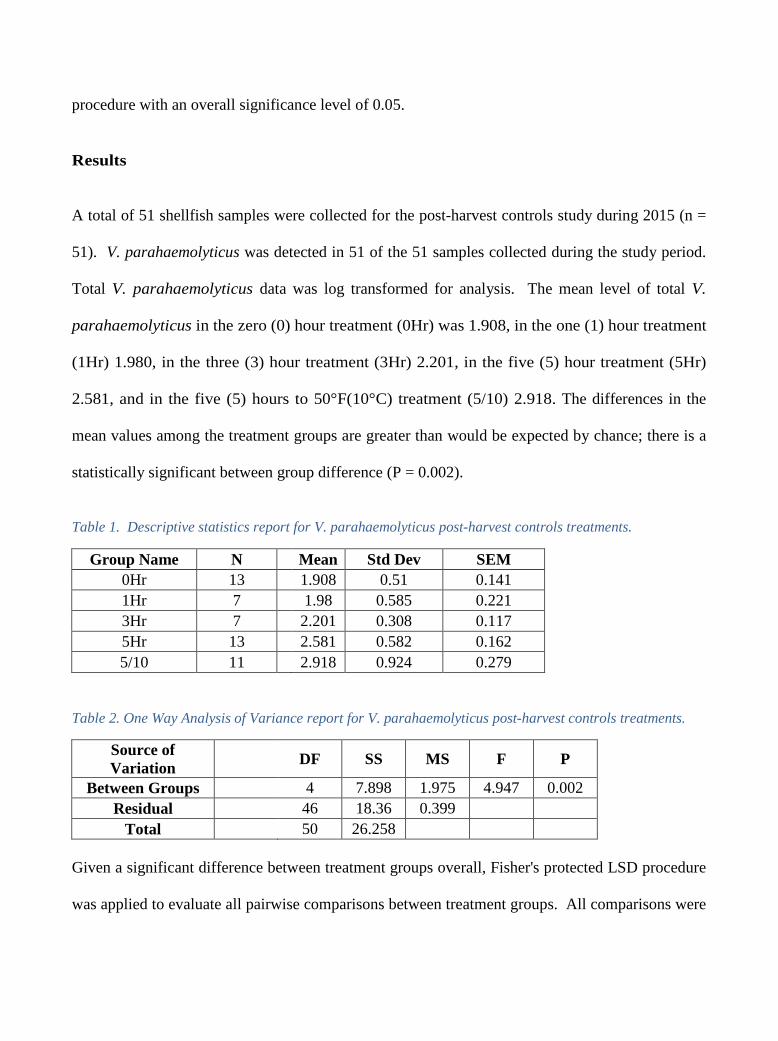
Results
A total of 51 shellfish samples were collected for the post-harvest controls study during 2015 (n =
51). V. parahaemolyticus was detected in 51 of the 51 samples collected during the study period.
Total V. parahaemolyticus data was log transformed for analysis. The mean level of total V.
parahaemolyticus in the zero (0) hour treatment (0Hr) was 1.908, in the one (1) hour treatment
(1Hr) 1.980, in the three (3) hour treatment (3Hr) 2.201, in the five (5) hour treatment (5Hr)
2.581, and in the five (5) hours to 50°F(10°C) treatment (5/10) 2.918. The differences in the
mean values among the treatment groups are greater than would be expected by chance; there is a
statistically significant between group difference (P = 0.002).
Table 1. Descriptive statistics report for V. parahaemolyticus post-harvest controls treatments.
Group Name N Mean Std Dev SEM 0Hr 13 1.908 0.51 0.141 1Hr 7 1.98 0.585 0.221 3Hr 7 2.201 0.308 0.117 5Hr 13 2.581 0.582 0.162 5/10 11 2.918 0.924 0.279
Table 2. One Way Analysis of Variance report for V. parahaemolyticus post-harvest controls treatments.
Source of Variation DF SS MS F P
Between Groups 4 7.898 1.975 4.947 0.002 Residual 46 18.36 0.399
Total 50 26.258
Given a significant difference between treatment groups overall, Fisher's protected LSD procedure
was applied to evaluate all pairwise comparisons between treatment groups. All comparisons were

conducted at a significance (alpha) level of 0.05, unadjusted for the total number of pairwise
comparisons and implying a type I error rate of 0.05 per comparison (Table 3). Comparison results
indicate that the difference of the means between the five (5) hours to mechanical refrigeration and
ten (10) hours to 50°F (10°C) treatment (5/10) and the zero hour (0Hr), one (1Hr) and three hour
(3Hr) ice slurry treatments are statistically significant. Also, the difference of the means between
the five (5) hour to 50°F (10°C) ice slurry treatment (5Hr) and both the zero hour (0Hr) and one hour
(1Hr) are statistically significant. There was no statistically significant difference identified between
any of the other pairs of treatments.
Table 3. All Pairwise Multiple Comparison Procedures means of post-harvest control treatments.
All Pairwise Multiple Comparison Procedures (Fisher LSD Method): Comparisons for factor:
Process Study Code
Comparison Diff of Means LSD(alpha=0.050) P Diff >= LSD 5/10 vs. 0Hr 1.01 0.521 <0.001 Yes 5/10 vs. 1Hr 0.938 0.615 0.004 Yes 5/10 vs. 3Hr 0.717 0.615 0.023 Yes 5/10 vs. 5Hr 0.337 0.521 0.199 No 5Hr vs. 0Hr 0.673 0.499 0.009 Yes 5Hr vs. 1Hr 0.601 0.596 0.048 Yes 5Hr vs. 3Hr 0.38 0.596 0.206 No 3Hr vs. 0Hr 0.294 0.596 0.327 No 3Hr vs. 1Hr 0.222 0.68 0.515 Do Not Test 1Hr vs. 0Hr 0.072 0.596 0.809 Do Not Test
Shown are box plots of total V. parahaemolyticus log MPN/g concentration in oysters following
each of five post-harvest treatments (Figure 3). Results identified as 0Hr were placed into ice slurry
immediately upon harvest. Results identified as 1Hr, 3Hr and 5Hr were cooled using ice slurry and
indicate the time interval from harvest to an internal temperature of 10°C (50°F). The results

identified as 5/10 is the National Shellfish Sanitation Program Vibrio parahaemolyticus Control Plan
(VPCP) treatment of 5 hours from harvest to refrigeration and 10 hours to an internal temperature
of 10°C (50°F). The band inside each box indicates the median value. Lower and upper lines of the
box represent the 25th and 75th percentiles, respectively. Lower and upper limits of the whiskers
represent the 10th and 90th percentiles, respectively.

Figure 3. V. parahaemolyticus levels in shellfish harvested from Long Island Sound. Shown are box plots of total V. parahaemolyticus log MPN/g concentration in oysters following each of five post-harvest treatments. Results identified as 0Hr were placed into ice slurry immediately upon harvest. Results identified as 1Hr, 3Hr and 5Hr were cooled using ice slurry and indicate the time interval from harvest to an internal temperature of 10°C. The results identified as 5/10 is the National Shellfish Sanitation Program Vibrio parahaemolyticus Control Plan (VPCP) treatment of 5 hours from harvest to refrigeration and 10 hours to an internal temperature of 10°C. The band inside each box indicates the median value. Lower and upper lines of the box represent the 25th and 75th percentiles, respectively. Lower and upper limits of the whiskers represent the 10th and 90th percentiles, respectively.
Treatment ID
Log
Tota
l Vp
MPN
/g

Environmental Monitoring for V. parahaemolyticus
Environmental monitoring of shellfish for total, tdh+, and trh+ V. parahaemolyticus was conducted
July 1 through September 30, 2014 and June 1 through September 30, 2015. Results are presented
as log Vp in MPN/g and plotted against the bottom water temperature in °C at the time of collection
(Figure 4). A variety of descriptive statistics, exploratory data analyses, and linear regression were
performed on the data, with the most significant predictive variable for total V. parahaemolyticus
being bottom seawater temperature at the time of collection. In general, findings suggest that
environmental total V. parahaemolyticus is identified at low levels (<2.0 MPN/g) early in the Vibrio
season when near-bottom and near-surface water temperatures are less than 20°C, and levels climb
steadily through the summer as water temperatures increase. Total V. parahaemolyticus in the
environment peaks when water temperatures are at their highest; during 2014 and 2015 near-bottom
seawater temperatures reached 24°C to 25°C by the end of August and into early September. During
2014, levels remained relatively elevated even as water temperatures dropped off through
September. In 2015, total V. parahaemolyticus dropped off rapidly as water temperatures dropped
through September.
Association of Vibrio parahaemolyticus with Environmental Parameters
A total of 101 shellfish samples were collected during 2014 and 2015 (n = 101). V. parahaemolyticus
was detected in 100 of the 101 samples collected during the study period. Median V.
parahaemolyticus levels were 1.380 log MPN/g and ranged from the limit of detection (LOD =
-0.523 log MPN/g) to 4.362. V. parahaemolyticus tdh+ was identified in 19 of 101 samples
analyzed with median tdh+ levels of -0.444 log MPN/g, ranging from the LOD to 0.362 log
MPN/g. V. parahaemolyticus trh+ was identified in 18 of 101 samples with median trh+ levels

of -0.444 log MPN/g, ranging from the LOD to 0.362 log MPN/g.

Figure 4. Log total Vp in MPN/g plotted versus near-bottom water temperature in °C recorded at the time of collection. Background environmental monitoring for Vp conducted between May 2014 and September 2015.
15
17
19
21
23
25
27
-2.0
-1.0
0.0
1.0
2.0
3.0
4.0
5.0
Bott
om W
ater
Tem
pera
ture
in °C
Log
Tota
l Vo
in M
PN/g
Connecticut Environmental Monitoring for Vibrio paramahemolyticus
May 2014 through October 2015Log Total Vp in MPN/g versus Bottom Water Temperature in °C
LogTotalVp BottomTempC
The majority of monitoring samples collected during the study period were oysters of the species
Crassostrea virginica (n = 98 of 101 total samples), which is the species of concern in terms of V.
parahaemolyticus illnesses associated with Connecticut waters. Three hard clam samples of the
species Mercenaria mercenaria were analyzed during the study period (n = 3 of 101 total samples).
Near-surface salinity ranged from 22.2 to 27.8 parts per thousand (ppt) with a median salinity of
25.0 ppt during the study period. Near-bottom salinity ranged from 22.2 to 27.9 with a median
salinity of 25.1 ppt.
The near-bottom seawater temperatures recorded at the time of sample collection (n = 97) ranged
from 16.2 to 25.1°C, with a median temperature of 21.6°C. Near-surface seawater temperatures
ranged from 17.2 to 25.6°C with a median temperature of 22.6°C. Minimum, maximum and average
of near-bottom temperatures collected during each sample run are plotted in Figure 5.
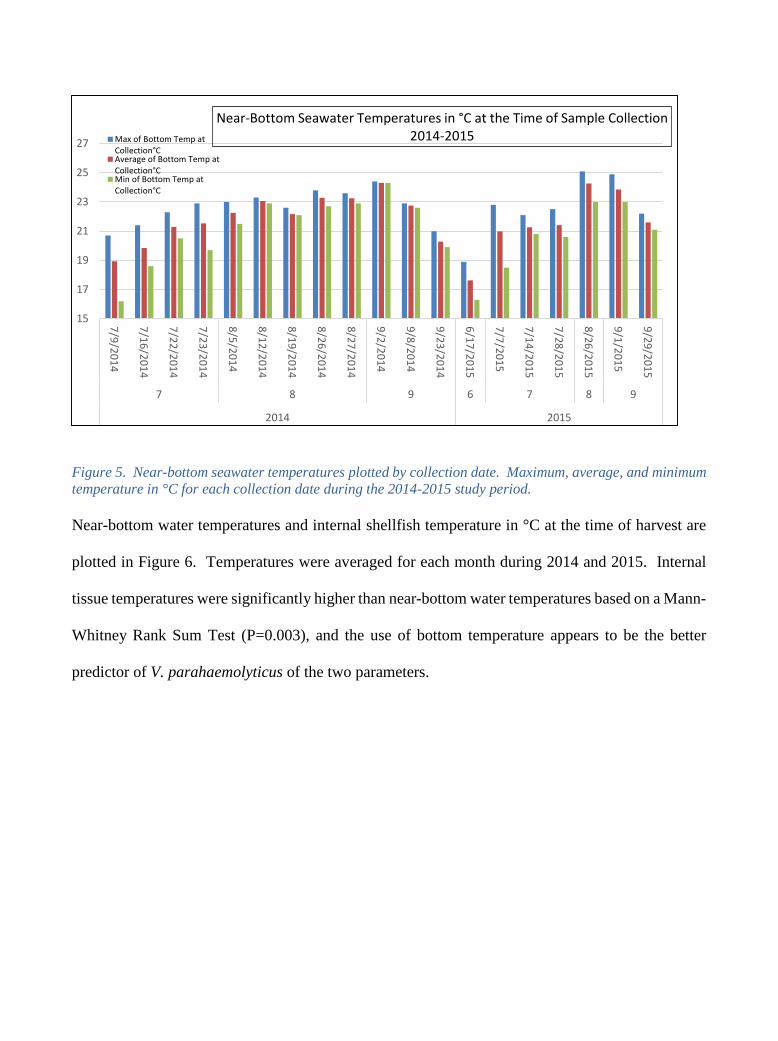
Figure 5. Near-bottom seawater temperatures plotted by collection date. Maximum, average, and minimum temperature in °C for each collection date during the 2014-2015 study period.
Near-bottom water temperatures and internal shellfish temperature in °C at the time of harvest are
plotted in Figure 6. Temperatures were averaged for each month during 2014 and 2015. Internal
tissue temperatures were significantly higher than near-bottom water temperatures based on a Mann-
Whitney Rank Sum Test (P=0.003), and the use of bottom temperature appears to be the better
predictor of V. parahaemolyticus of the two parameters.
15
17
19
21
23
25
27
7/9/2014
7/16/2014
7/22/2014
7/23/2014
8/5/2014
8/12/2014
8/19/2014
8/26/2014
8/27/2014
9/2/2014
9/8/2014
9/23/2014
6/17/2015
7/7/2015
7/14/2015
7/28/2015
8/26/2015
9/1/2015
9/29/2015
7 8 9 6 7 8 9
2014 2015
Near-Bottom Seawater Temperatures in °C at the Time of Sample Collection 2014-2015Max of Bottom Temp at
Collection°CAverage of Bottom Temp atCollection°CMin of Bottom Temp atCollection°C

Figure 6. Average monthly near-bottom temperatures and internal shellfish temperatures in °C at the time
of collection.
Forward stepwise regression for total V. parahaemolyticus including environmental parameters of
water depth at the time of collection, surface salinity, bottom salinity, surface temperature, near-
bottom temperature, and internal temperature was performed.
Backward stepwise regression for total V. parahaemolyticus including environmental parameters of
water depth at the time of collection, surface salinity, bottom salinity, surface temperature, near-
bottom temperature, and internal temperature was performed.
The most significant predictor of total V. parahaemolyticus in any of the models explored for this
dataset was near-bottom temperature, and a simple linear regression model was chosen for predicting
15
16
17
18
19
20
21
22
23
24
25
7 8 9 6 7 8 9
2014 2015
Tem
pera
ture
°CNear-Bottom Seawater Temperatures and Internal Shellfish Temperatures in °C
at the Time of Collection 2014-2015 Average ofInternalTempHarvestMean_C

total V. parahaemolyticus, which included only bottom temperature. A significant positive
correlation was identified between total V. parahaemolyticus and bottom temperature (R = 0.432,
P = <0.001).
Near-bottom temperature accounts for 18.7% of the variation in total V. parahaemolyticus when
the simple linear regression model is applied. The linear regression results [including raw data,
confidence interval of the regression, and confidence interval of the population] are plotted in
Figure 7 and presented in Table 4. These initial regression model findings should be considered
preliminary, as additional parameters and models will be continue to be explored in future
modeling efforts.
Linear regression models were also tested for the V. parahaemolyticus tdh+ and trh+ data,
however none of the variables tested appear able to predict the levels of tdh+ or trh+. The
majority of tdh and trh results were below the level of detection in this dataset (tdh+ N = 83;
trh+ N = 85 less than the LOD).
Additional environmental parameters will be added to the environmental monitoring program
during 2016, in order to build a more robust predictive model for Connecticut V.
parahaemolyticus data. In addition to the parameters collected in this study, variables to be explored
in 2016 will include turbidity, chlorophyll a, and dissolved oxygen.

Figure 7. Linear regression, confidence interval of regression, and confidence interval of population.
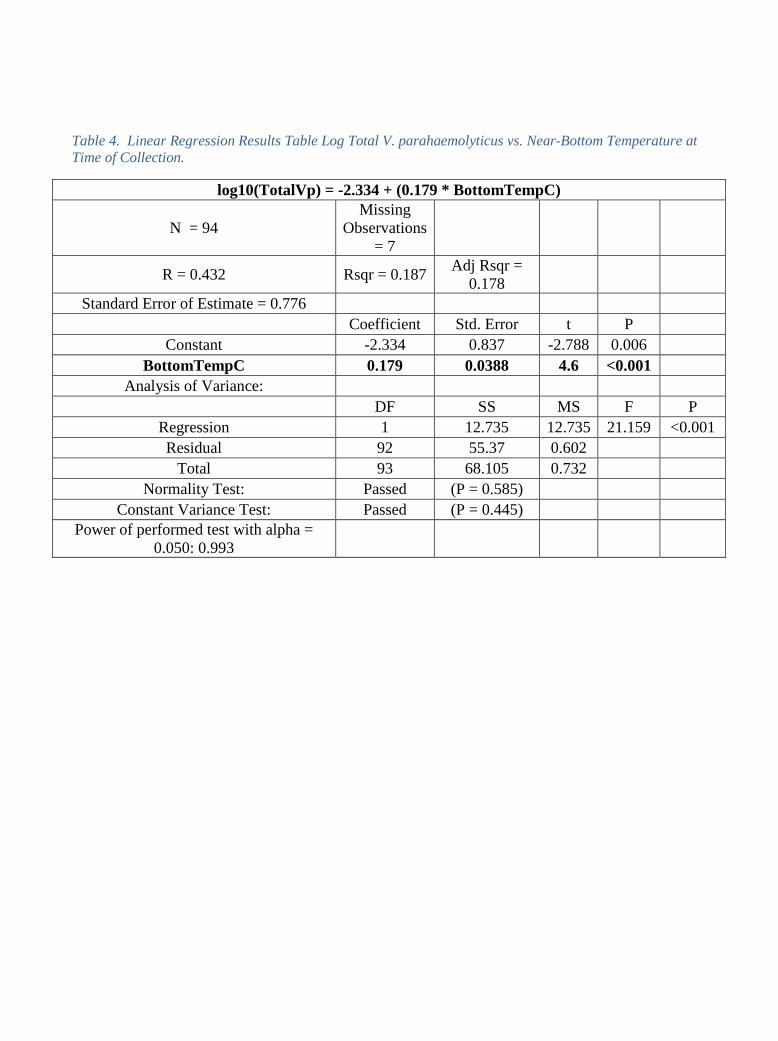
Table 4. Linear Regression Results Table Log Total V. parahaemolyticus vs. Near-Bottom Temperature at Time of Collection.
log10(TotalVp) = -2.334 + (0.179 * BottomTempC)
N = 94 Missing
Observations = 7
R = 0.432 Rsqr = 0.187 Adj Rsqr = 0.178
Standard Error of Estimate = 0.776 Coefficient Std. Error t P
Constant -2.334 0.837 -2.788 0.006 BottomTempC 0.179 0.0388 4.6 <0.001
Analysis of Variance: DF SS MS F P
Regression 1 12.735 12.735 21.159 <0.001 Residual 92 55.37 0.602
Total 93 68.105 0.732 Normality Test: Passed (P = 0.585)
Constant Variance Test: Passed (P = 0.445) Power of performed test with alpha =
0.050: 0.993

Connecticut’s 2015 Vibrio parahaemolyticus Risk Assessment
Based on Connecticut’s 2015 V. parahaemolyticus Risk Assessment, environmental conditions
present at the time of illnesses were assessed for correlation to risk of illness. Water temperature
was identified as the most important parameter for Connecticut’s shellfish growing area in terms of
triggering the need for V. parahaemolyticus Controls. In-situ water temperature data for the growing
areas associated with the 2013 illness outbreak were not available due to a lack of sensors recording
continuous data at that time. To overcome that challenge, water temperatures were hind-cast for the
2013 outbreak, using the Long Island Sound Vp Prediction System (Whitney, Ward, & DeRosia-
Banick, 2016). Examples of how the hind cast data were developed may be seen in the figures
below, but to summarize, satellite sea-surface temperatures were acquired (Figure 8) and
incorporated into an existing Long Island Sound hydrodynamic model (Figure 9) to predict and
estimate the bottom temperatures in the growing area. Several different model-predicted and in-situ
water temperature parameters were associated with each illness in the database (n = 82 including
multi-state cases) going back to 2010 to 2014 and confirmed Connecticut cases (n = 34) were plotted
in order to assess the water temperature associated with the highest risk of illness over the period
between 2010 and 2014 (Figure 10).

Figure 8. Daily sea-surface temperature (SST) data are acquired from the G1SST product (from the NASA Jet Propulsion Laboratory) that includes observations from satellites. The prior week (7 days) of SST are averaged together to construct the weekly-averaged surface temperature field throughout LIS.
Figure 9. Previous results from a hydrodynamic model of LIS and adjacent coastal waters (run by Mike Whitney’s research group) were analyzed to determine the top-to-bottom temperature differences (ΔT) at locations throughout LIS. Four years of model results (2009-2012) were averaged together to determine the average annual cycle of ΔT at each location. Temperature differences are smallest during the winter and largest during the summer; the differences typically are larger for deeper areas. The ΔT estimate from the model-based average annual cycle then is subtracted from the weekly-averaged surface temperatures to produce an estimate of the bottom temperature field.

All confirmed illnesses associated with a Connecticut growing area (n =34 of 82) have occurred
when surface seawater temperatures exceeded 19.9°C (67.8°F). Illnesses coded 1 were traced back
to a single Connecticut growing area. Illnesses coded 2 were traced back to one of several
Connecticut growing areas. Sea surface temperatures for traceback code 1 or 2 as measured by the
NASA G1SST temperature estimate at each harvest area on each harvest date ranged from 20.5 to
26.4°C. Sea surface temperatures as measured at the nearest NOAA coastal buoy (BRHC3-
Bridgeport, CT) ranged from 19.9 to 26.5°C.

Figure 10. NASA G1SST Daily Sea Surface Temperature in C and Maximum NOAA BRHC3 daily Seawater Surface Temperature in C associated with Vp illnesses 2010 to 2015, plotted by Traceback Code. Code 1 cases are single CT source harvest location/date, code 2 cases were confirmed CT source, multiple potential CT harvest location/date.

Table 5. Confirmed V. parahaemolyticus cases linked to Connecticut shellfish, 2010 through 2015.
Year Confirmed Cases Linked to CT Shellfish
Multi-State Shellfish Cases Including CT Source
2010 1 2 2011 1 2 2012 1 3 2013 23 (23 outbreak area) 11 2014 1 (1 outbreak area) 2 2015 2 (1 outbreak area) 8
DISCUSSION
The primary objective of the Connecticut Techniques and Practices for Vibrio Reduction study was
to evaluate the effectiveness of post-harvest controls that could potentially reduce the risk of Vibrio
illnesses. The use of ice slurry for rapidly cooling the internal temperatures of oysters to 50°F (10°C)
was compared to the NSSP standard VPCP controls requiring placement under temperature control
[in this case mechanical refrigeration at or below 45°F (7.2°F)] within five (5) hours of harvest and
cooling to an internal temperature of 50°F (10°C) within ten (10) hours of being placed under
temperature control. The effectiveness of several post-harvest time and temperature strategies were
evaluated using continuous temperature data loggers (ACR Smart Button) to record the length of
time each sample took to reach 50°F (10°C) and enumerating the total V. parahaemolyticus, tdh+
and trh+ associated with each treatment sample.
In order apply the findings of this study to the process of choosing appropriate V. parahaemolyticus
controls, a SSCA might consider the rate at which different cooling methods can bring the internal
temperature of oysters down to a target temperature where the risk of post-harvest V.

parahaemolyticus growth is effectively minimized, or to an internal temperature of 50°F (10°C) or
less as per NSSP guidance for V. parahaemolyticus growth. Based on the findings of this study, the
greatest benefit in terms of limiting post-harvest V. parahaemolyticus growth can be achieved by
meeting this target temperature within three (3) hours of harvest. By five (5) hours post-harvest, the
mean V. parahaemolyticus level increased from 1.908 log MPN/g to 2.581 log MPN/g.
The use of traditional controls based only on time from harvest to mechanical refrigeration should
be applied with caution in growing areas that have been associated with V. parahaemolyticus
outbreaks, as the time to an internal temperature of 50°F (10°C) can vary greatly and is much less
consistent in terms of controlling the rate of cooling when compared to the use of ice slurry results.
An exposure time of five (5) hours to ambient air temperatures followed by placement under
mechanical refrigeration at 45°F (7.2°C) or less during the V. parahaemolyticus season allows for
significantly more growth than rapid cooling controls utilizing ice slurry which drop the internal
temperatures of the oysters to 50°F (10°C) within three (3) hours of harvest or tidal exposure. While
this study focused on the effectiveness of the traditional controls on limiting V. parahaemolyticus
growth, our agency has several seasons of data evaluating the effectiveness of a wide range of
mechanical refrigeration units in reducing the internal temperature of oysters to 50°F (10°C). We
have observed that the times to 50°F (10°C) can range from less than one (1) hour to greater than 24
hours and the rate of cool down depends on a number of factors, including size of the cooler,
condenser maintenance, stocking density and placement, air circulation, temperature of incoming
product, etc. Refrigeration units may be intended for holding cold product, rather than for cooling
down warm product, and any cool down process utilizing mechanical refrigeration must be carefully
designed, controlled and validated.

A rapid cooling process utilizing ice slurry is much faster and more consistent than a cooling process
using only mechanical refrigeration, and has been observed to cool product to an internal temperature
of 50°F (10°C) within 30 minutes; in many instances cool down was achieved in a little as 15 minutes
or fewer.
In addition to evaluating the effectiveness of these control strategies on limiting post-harvest V.
parahaemolyticus growth, Connecticut also has had two seasons of V. parahaemolyticus illness data
to evaluate in order to assess the practical effectiveness of the application of rapid cooling in
reducing the number of illnesses associated with Connecticut shellfish growing areas.
As previously mentioned, Connecticut growing waters were the source of 23 confirmed cases of V.
parahaemolyticus during the summer of 2013, with an additional 15 multi-source cases potentially
linked to Connecticut waters (Table 5). The VPCP that was in place at the time of the 2013 outbreak
included the National Shellfish Sanitation Program standard time to temperature control measure of
limiting time from harvest to refrigeration to no more than five (5) hours, and required the original
dealer to cool oysters to an internal temperature of 50°F (10°C) or below within ten (10) hours after
placement into refrigeration. Unfortunately the standard V. parahaemolyticus controls that were in
place at the time of the 2013 outbreak were inadequate to prevent illnesses from occurring, and on-
board rapid-cooling was selected by the Authority for the 2014 and 2015 V. parahaemolyticus
seasons in hopes of reducing the risk of illness associated with oysters harvested from the outbreak
area.
The number of illnesses associated with shellfish growing areas within the municipalities of
Westport, Norwalk and Darien was reduced from 23 during 2013 to one (1) case in 2014 and one
(1) in 2015, achieving an illness reduction of 95.6% in each of those years as compared to the 2013

season. Clinical isolates associated with confirmed cases linked to Connecticut growing areas in
2014 and 2015 provide evidence that the O4:K12 virulent strain is still present in Connecticut
growing areas. Based on the results of the post-harvest controls study and on recent illness data, we
believe that the use of the standard five (5) hour harvest to temperature controls and mechanical
refrigeration for cool down were contributing factors to the 2013 outbreak and provide convincing
evidence that the use of ice slurry for rapid cooling has prevented similar outbreak events in 2014
and 2015.
Complementary to the post-harvest controls study, this ISSC project also provided a mechanism for
the SSCA to gain a better understanding of V. parahaemolyticus levels in the environment and their
relevance to implementing meaningful Vibrio controls in Connecticut growing waters. These data
have been incorporated into a Long Island Sound V. parahaemolyticus Prediction System (Whitney,
Ward, & DeRosia-Banick, 2016). Vibrio monitoring and continuous environmental observations
have been used to inform the understanding of the temporal variability and spatial distribution of V.
parahaemolyticus in Long Island Sound (LIS) oyster production areas. This data has also been used
to look at environmental conditions leading up to illness events and has allowed the state to
proactively manage V. parahaemolyticus during 2015 by requiring more stringent controls under
those specific environmental conditions that have historically been correlated to a higher risk of
illness, rather than relying on a trigger based on a specific date alone.
Water temperature was identified as the most important parameter for Connecticut’s shellfish
growing area in terms of triggering the need for V. parahaemolyticus controls. All illnesses
confirmed to be associated with Connecticut shellfish harvest areas have occurred when surface
water temperatures are greater than 68°F (20°C). Several different model-predicted and in-situ water

temperature parameters were associated with each illness in the database (n = 82 including multi-
state cases) going back to 2010 to 2015 and confirmed Connecticut cases (n = 34) were plotted in
order to assess the water temperature associated with the highest risk of illness over the period
between 2010 and 2015.
In 2015, Connecticut’s V. parahaemolyticus Control Plan (VPCP) for the 2013 outbreak area was
triggered when surface seawater temperatures reached 68°F (20°C) as measured using the NASA
G1SST product [incorporated into the Long Island Sound hydrodynamic model] and the NOAA
BRHC3 coastal buoy located in Bridgeport, CT. The use of a trigger based on environmental
conditions rather than a pre-determined start date proved to be effective during 2015, as no illnesses
were confirmed prior to the June 19, 2015 start date of the rapid cooling VPCP.
ACKNOWLEDGMENTS
The CT DA/BA thanks Norm and James (Jimmy) Bloom and their captains for sample
collection and for providing the oysters and equipment used for the post-harvest controls portion
of the study, in addition to shellfish samples used for the environmental monitoring portion of
the study.
A special thank you to DA/BA Environmental Analyst Jenifer Yeadon for her expertise and
field support in conducting all aspects of the post-harvest and environmental monitoring
projects. This study would not have been able to have been completed without her strict
attention to detail and organization.
Additionally, the DA/BA would like to thank the number of Connecticut’s commercial
harvesters for providing multiple shellfish samples throughout the study period.

The agency is grateful for the critical review of this report by the Food and Drug
Administration’s Jessica Jones, John Bowers, and Amy Fitzpatrick and by Christopher Schillaci
of the MA Division of Marine Fisheries.
The project was supported by the Interstate Shellfish Sanitation Conference (ISSC). The
DA/BA thanks the ISSC membership for funding this research project and the Food and Drug
Administration for allocating this funding to the ISSC.
References
Kinsey, e. a. (2015). Improved detection of pathogenic Vibrio parahaemolyticus from oyster,
water, and sediment using real-time PCR. Gen. Meet. Soc. Microbiol.
Kinsey, T., Lydon, K., Bowers, J., & Jones, J. (2015). Effects of Dry Storage and Resubmsersion
of Oysters on Total Vibrio vulnificus and Total and Pathogenic (tdh+/trh+) Vibrio
parahaemolyticus Levels. Journal of Food Protection, 78(No. 8), 1574-1580.
Lampel, K. A. (2012). Bad Bug Book, Foodborne Pathogenic Microorganisms and Natural
Toxins. Second Edition. Food and Drug Administration.
Martinez-Urtaza, J., Austin-Baker, C., Jones, J. L., Newton, A. E., Gonzalez-Aviles, G. D., &
DePaola, A. (2013). Spread of Pacific Northwest Vibrio parahaemolyticus Strain. New
England Journal of Medicine , 1573-1574.
Newton, A. A. (2012). Increasing Rates of Vibriosis in the United States, 1995-2010: Review of
Surveillance Data from 2 Systems. Clinical Infectious Disease, 54(Supplement 5).

Whitney, M., Ward, E., & DeRosia-Banick, K. (2016, 3 11). http://cprime.uconn.edu/vibrio/.
Retrieved 3 11, 2016, from Modeling Vibrio parahaemolyticus Outbreaks in Commercial
Shellfish Areas: http://cprime.uconn.edu/vibrio/
Related Documents