Voices of the Hungry The Voices of the Hungry project has developed the Food Insecurity Experience Scale, a new metric for household and individual food insecurity. It brings us a step closer to hearing the voices of the people who struggle every day to have access to safe and nutritious food. Number 1/August 2016 (Revised Version) Technical Report

Welcome message from author
This document is posted to help you gain knowledge. Please leave a comment to let me know what you think about it! Share it to your friends and learn new things together.
Transcript

Voices of the Hungry The Voices of the Hungry project has developed
the Food Insecurity Experience Scale, a new metric for household and individual food insecurity.
It brings us a step closer to hearing the voices of the people who struggle every day to have access to safe and nutritious food.
Number 1/August 2016 (Revised Version)
Technical Report

Photo cover: ©FAO/Giulio Napolitano

VOICES ────── of the ──────
HUNGRY
Methods for estimating
comparable prevalence rates of food insecurity
experienced by adults throughout the world.
Carlo Cafiero*, Mark Nord, Sara Viviani, Mauro Eduardo Del Grossi, Terri Ballard,
Anne Kepple, Meghan Miller, Chiamaka Nwosu
FOOD AND AGRICULTURE ORGANIZATION OF THE UNITED NATIONS
Rome, 2016
ii
Recommended citation:
FAO. 2016. Methods for estimating comparable rates of food insecurity experienced by adults throughout the
world. Rome, FAO.
Note to the reader:
In this version of the report, statistics for Mexico have been revised due to a processing error
for Mexico national survey data in the earlier release. Minor typos have also been corrected,
but the only changes in statistical results are those for Mexico prevalence rates.
The designations employed and the presentation of material in this information product do not imply the
expression of any opinion whatsoever on the part of the Food and Agriculture Organization of the United
Nations (FAO) concerning the legal or development status of any country, territory, city or area or of its
authorities, or concerning the delimitation of its frontiers or boundaries. The mention of specific companies
or products of manufacturers, whether or not these have been patented, does not imply that these have
been endorsed or recommended by FAO in preference to others of a similar nature that are not mentioned.
The views expressed in this information product are those of the author(s) and do not necessarily reflect
the views or policies of FAO.
ISBN 978-92-5-108835-7
© FAO, 2016
FAO encourages the use, reproduction and dissemination of material in this information product. Except
where otherwise indicated, material may be copied, downloaded and printed for private study, research and
teaching purposes, or for use in non-commercial products or services, provided that appropriate acknowl-
edgement of FAO as the source and copyright holder is given and that FAO’s endorsement of users’ views,
products or services is not implied in any way.
All requests for translation and adaptation rights and for resale and other commercial use rights should be
made via www.fao.org/contact-us/licence-request or addressed to [email protected].
FAO information products are available on the FAO website (www.fao.org/publications) and can be
purchased through [email protected].

iii
Contents
Tables ............................................................................................................................ iv
Figures ........................................................................................................................... iv
Acknowledgments ......................................................................................................... v
A formidable challenge ................................................................................................. 1
1. The concept: food insecurity seen through the lens of people’s
experiences.............................................................................................................. 3
2. The Food Insecurity Experience Scale Survey Module (FIES-SM) ................... 7
3. Data collection through the Gallup World Poll ................................................. 9
4. Analyzing FIES data with the Rasch model ....................................................... 11
5. Developing the FIES global standard scale ........................................................ 15
6. Computing comparable prevalence rates ......................................................... 17
7. Results to date: data quality ................................................................................ 21
8. Results to date: prevalence rates ........................................................................ 27
Filling a gap in our ability to measure food insecurity ............................................ 31
References ..................................................................................................................... 34
Appendix ...................................................................................................................... 36
Annex I - Prevalence Rates Based on National Government Survey Data .......... 41
Annex II - Number of food insecure adults and number of individuals in the
total population affected by food insecurity ...................................................... 48

iv
Tables
Table 2-1 Questions in the Food Insecurity Experience Scale Survey Module for
Individuals (FIES SM-I) as fielded in the 2014GWP ........................................................ 7
Table 7-1 Summary of missing responses to food security questions in the first 146
datasets for which 2014 GWP data were available ...................................................... 21
Table 7-2 Summary of item infit statistics for 136 datasets in the 2014 GWP ................. 22
Table 7-3 Summary of item outfit statistics for 136 datasets in the 2014 GWP .............. 22
Table 7-4 Mean residual correlations between items (136 datasets from the 2014
GWP) ................................................................................................................................ 23
Table 8-1 Descriptive statistics of the food insecurity prevalence rates (143
datasets in 2014) .............................................................................................................. 27
Table 8-2 Distribution of countries, areas or territories for different classes of
FImod+sev and FIsev ............................................................................................................... 28
Table 8-3 Spearman’s rank correlation between food insecurity indicators and
selected indicators of development at country level. ................................................... 28
Table 8-4 Regression analysis of food security and poverty indicators on child
mortality rates ................................................................................................................. 29
Table A-1 Prevalence rates of food insecurity in 146 countries, areas or territories
in 2014 ............................................................................................................................... 36
Table A-2 Selected Indicators of Development used in the correlation analysis ............. 40
Table A-3 Prevalence rates calculated from national government survey data and
from FAO- GWP data. .................................................................................................... 47
Figures
Figure 1-1 Food insecurity experiences and associated severity levels ............................... 4
Figure 6-1 Estimated distributions of true severity among respondents with each
raw score .......................................................................................................................... 18
Figure 7-1 Distributions of standardized values of item severity across countries. ......... 25
Figure 7-2 The FIES global standard ..................................................................................... 25

v
Acknowledgments
This publication is the revision of a preliminary version of the technical report that was circulated for
comments with a restricted list of reviewers in March 2015, in preparation for a technical expert meeting
that was hosted at FAO headquarters on May 21-22 2015.
We wish to thank Ricardo Aparicio, Luis Beccaria, Jennifer Coates, Luis Pérez Melgar, Rafael Pérez
Escamilla, Giovanni Battista Rossi, Ana Maria Segall-Corrêa, Mark Wilson, Andrea Leigh McMillan (who
coordinated the review conducted by Stats Canada), and Steve Crutchfield (who coordinated the one
conducted at USDA – ERS) for the input provided.
Thanks are due to Pietro Gennari, Josef Schmidhuber, Piero Conforti and Vikas Rawal, in addition to all
participants in the expert meeting in May 2015, for useful comments and suggestions.
Our gratitude also goes to the members of the original “Experience-Based Measures of Food Insecurity
Technical Advisory Group”, including Angus Deaton, Lawrence Haddad, Romulo Paes de Sousa, Hugo
Melgar-Quiñonez and Bob Tortora, whose encouragement and guidance put us on what has proven to be
the right path.
The authors wish to thank Dana Glori, Elizabeth Graham, Elisa Miccinilli, Aymeric Songy and Verena Wilke
for their valuable contribution throughout the process of data collection and analysis, and Barbara Sbrocca
for the skillful graphic design of the publication. Special thanks are due to Andrew Rzepa and Mike Ilecki
and to the entire Gallup Inc. team for the continued and competent support and for the patience in
answering all our questions regarding the details of data collection.
Implementation of the Voices of the Hungry project has been made possible by the direct financial support
from the United Kingdom Department for International Development (DfID) and by the financial support
from the Kingdom of Belgium through FAO Multipartner Programme Support Mechanism (FMM).
The responsibility for all statements, comments, opinions or judgments included in this
technical report rests with the authors only and do not imply any official position by FAO or
by the Statistics Division
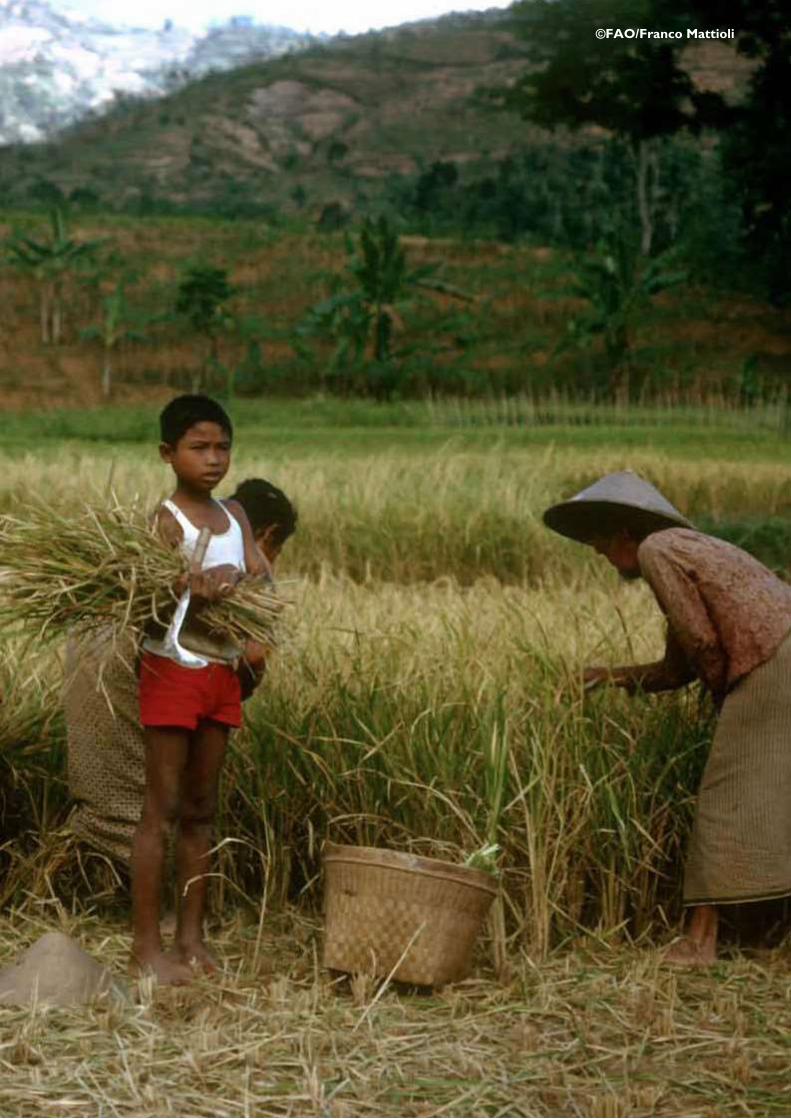
©FAO/Franco Mattioli

1
A formidable challenge
How to estimate national prevalence rates of food
insecurity that are comparable across countries
and population groups.
“Food security exists when all people, at all times, have
physical, social and economic access to sufficient safe and
nutritious food that meets their dietary needs and food pref-
erences for an active and healthy life.” (FAO, 2009).
A key objective of the Voices of the Hungry project (VoH) is to estimate comparable
prevalence rates of food insecurity in national populations for more than 140 countries
every year. These estimates are based on conditions and behaviors reported by adults
through the Food Insecurity Experience Scale survey module (FIES-SM). The data col-
lected in nationally representative surveys of the adult population in each country are
used to compute a measure of severity of the food insecurity status for each respondent,
focusing on conditions reflecting limited access to food. Individual measures are then
calibrated against a common global reference scale of severity, thus allowing classifica-
tions and estimates of prevalence rates that are comparable across countries and popu-
lation groups.
Defining the global reference scale and appropriate methods for calibration is a
formidable challenge, given the differences in languages, cultures, and livelihood ar-
rangements that exist across countries. Though statistical theory and methods for latent
trait analysis based on Item Response Theory (IRT) provide a general approach and
many of the statistical tools needed to accomplish this task, some adaptation and exten-
sion of those methods is required. This report describes the adaptations and extensions
of IRT methods developed by VoH, providing details of the process from data collection
to the production of comparable national statistics. It then presents the results of the
analyses of data collected through the Gallup® World Poll (GWP) in 146 different coun-
tries, areas or territories in 2014, leading to preliminary estimates of the prevalence of
moderate and severe food insecurity.
The main purpose of the report is to allow food security analysts to evaluate the statisti-
cal soundness and adequacy of the methods described. Descriptions assume that the
reader has a basic understanding of statistical measurement methods based on Item Re-
sponse Theory, and in particular on the Rasch measurement model. Readers lacking this
background may want to consult Nord (2014) as an introduction to those methods.

Sections are as follows:
1. Overview of the concepts of food security and food insecurity and the role
of experience-based measures within the field of food security assessment.
2. Description of the questionnaire module, the FIES-SM.
3. Data collection: sampling, interviewing, editing and weighting.
4. Analysis of each country’s food security data: Measurement model estimation—
calculation of the FIES, assessment of each item and of the scale for each country.
5. Development of the VoH global reference scale—the bridge by which prevalence
rates in countries will be compared.
6. Adjusting each country’s scale to the global reference scale and calculating
prevalence rates of food insecurity at two levels of severity.
7. Results to date: measures of item and model fit, assessment of conditional
independence of items, parameters and robustness of the global reference scale,
summary of consistency of country-level scales to the global reference scale
8. Results to date: preliminary analysis of correlations between estimated prevalence
rates and other indicators of development at country level.

3
1. The concept: food insecurity seen through
the lens of people’s experiences
Overview of the concepts of food security
and food insecurity, and the use of experience-based measures
for food security assessments.
Combined scientific and political efforts have
converged on a growing consensus regarding
conceptual frameworks and measures of food
security. Because no single indicator can account
for the multiple dimensions of food security,
the discussion has focused on defining a suite of
indicators based on measures of aspects ranging
from food production and availability, to die-
tary quality and the prevalence of nutrition-re-
lated outcomes in the population (FAO, 2012a;
Coates, 2013; Jones et al, 2013; FAO, IFAD &
WFP, 2014).
The Food Insecurity Experience Scale (FIES) is
expected to make an important contribution in
the area of food security assessment by better
capturing the access dimension of food security.
It does so by providing the set of tools needed to
compute valid and reliable indicators of the
prevalence of food insecurity, at different levels
of severity, in a population reached by a repre-
sentative survey. By gauging the scope and
depth of limited access to food, such indicators
will be a valuable addition to the suite of exist-
ing food security indicators at country level,
(Ballard et al., 2013).
The FIES establishes an experience-based met-
ric for the severity of the food insecurity condi-
tion of individuals or households. The metric is
calculated from data on people’s direct re-
sponses to questions regarding their access to
food of adequate quality and quantity. The con-
struct it measures is thus fully consistent with a
view that the key defining characteristic of food
security is “secure access at all times to sufficient
food” (Maxwell & Frankenberger, 1992, p. 8).
1 The first one was the Escala Brasileira de Insegurança Alimentar (EBIA) used in Brazil since 2004 (Segall-Corrêa et al., 2004), fo-llowed
by the Escala Mexicana de Seguridad Alimentaria (EMSA) adapted for use in Mexico (Pérez-Escamilla).
Ethnographic research carried out in the USA to
understand the lived experience of hunger re-
vealed it to be a process characterized initially
by anxiety about having enough food, followed
by dietary changes to make limited food re-
sources last, and finally, decreased consumption
of food in the household (Radimer, Olson &
Campbell, 1990; Radimer et al, 1992). Although
the original ethnographic study was based on a
small number of households in a wealthy coun-
try, a review conducted years later of studies de-
rived from many countries in different regions
of the world concluded that these dimensions of
the experience of hunger appear to be common
across cultures (Coates et al., 2006).
This theoretical construct of food insecurity
formed the basis for the U.S. Household Food
Security Survey Module (US HFSSM), which
has been applied annually in the United States
since 1995 and has served as a model for the
FIES. Numerous other experience-based food
insecurity scales emerged from the same theo-
retical basis in diverse countries around the
world.1 Two measures in particular, the House-
hold Food Insecurity Access Scale (HFIAS)
(Coates, Swindale & Bilinsky, 2007) and the
Escala Latinoamericana y Caribena de Seguridad Al-
imentaria (ELCSA) (Pérez-Escamilla et al., 2007;
FAO, 2012b) included analytic methods to make
the measures comparable across countries. The
FIES builds heavily on the ELCSA as well as
other scales by providing an analytic framework
to improve the precision of comparability across
countries and to extend comparability to all
countries.

4
The measurement theory behind the
FIES
Research has revealed how different experien-
tial domains are typically associated with differ-
ent levels of food insecurity, with possible asso-
ciations shown in Figure 1-1. This observation
paved the way towards identifying potential
questions to be included in a questionnaire to
form a proper basis for measurement scales of
food insecurity, such as the FIES.
The fundamental assumption behind the FIES
and similar food security scales is that the sever-
ity of the food insecurity condition of a house-
hold or an individual can be analysed as a latent
trait. Latent traits cannot be observed directly,
but their measure can be inferred from observa-
ble evidence through application of measure-
ment models based on Item Response Theory
(IRT), a set of methods rooted in statistics with
broad application to measurement problems in
the human and social science domains.
In applying IRT models to the measurement of
food insecurity, we postulate that: (a) the severity
of the food insecurity condition of the respondent
and that associated with each of the experiences
can be located on the same one-dimensional
scale, and that: (b) higher severity of the food in-
security condition of a respondent will increase
the probability of reporting occurrence of experi-
ences associated with food insecurity.
By defining a probabilistic model that links the
(unknown) measure of food insecurity to the
(observable) responses to experience-based
questionnaires, it is possible to obtain estimates
2 Notice that, as in any estimation model based on empirical data, this is deemed true only in a probabilistic sense, meaning that
deviations from the expected patterns of response are admitted. The frequency and magnitude of such deviations are the elements
against which the validity of the model is tested with any specific dataset (see section 4 below).
of the former using data collected on any sample
of individuals.
The simplest of such models that preserves all
desirable qualities of a proper measurement
model is the Rasch model, named for the Danish
mathematician Georg Rasch, who first proposed
it, which is also referred to as the one-parameter
logistic (1PL) model. (Rasch, 1960; Fischer & Mo-
lenaar, 1995).
In this model, the probability that a respondent
will report a given experience is a logistic func-
tion of the distance between the respondent’s
and the item’s positions on the severity scale:
Prob(𝑥ℎ,𝑖 = 1|𝜃ℎ , 𝛽𝑖) =𝑒𝜃ℎ−𝛽𝑖
1+𝑒𝜃ℎ−𝛽𝑖 ,
where 𝑥ℎ,𝑖 is the response given by respondent ℎ
to item 𝑖, coded as 1 for “yes” and 0 for “no”.
The relative severity associated with each of the
experiences (the parameters 𝛽𝑖 in the formula
above) can be inferred from the frequency with
which they are reported by a large sample of re-
spondents, assuming that, all else being equal,
more severe experiences are reported by fewer
respondents. Once the severity of each experi-
ence is estimated, the severity of a respondent’s
condition (the 𝜃ℎ parameter) can be computed
by noting how many of the items have been af-
firmed. The rationale for this is that, on average,
it is expected that a respondent will answer af-
firmatively to all questions that refer to experi-
ences that are less severe of their food insecurity
situation, and negatively to questions that refer
to situations that are more severe.2
Figure 1-1 Food insecurity experiences and associated severity levels
Food insecurity experiences and associated severity levels
mild food insecurity moderate food insecurity severe food insecurity
worrying about
ability
to obtain food
compromising
quality and variety
of food
reducing quantities,
skipping meals
experiencing
hunger

5
The mathematics of the model imply that a
proper statistical measure of the respondent’s
food insecurity level can be based only on the
raw score (number of affirmative answers), irre-
spective of which specific experiences were af-
firmed.3 Raw score-based classifications are typ-
ically used with the US HFFSM, the ELCSA and
other similar scales to monitor the food security
situation in a given population over time. How-
ever, they may be problematic for cross-country
comparisons, as nothing ensures that the same
raw score would correspond to the same sever-
ity level in different countries, even when using
the same questionnaire. This is because differ-
ences across countries in languages, cultures,
and livelihood arrangements almost certainly
affect the way in which any given question is un-
derstood and the related condition is experi-
enced.
Owing to the analytic protocol developed by
FAO and detailed in this report, the FIES is the
first experience-based food insecurity meas-
urement system that generates formally com-
parable measures with desirable measurement
properties across such a large number of coun-
tries.
Use of FIES-based indicators
As no single measure can account for the com-
plex nature and multiple dimensions of food se-
curity at country level, FIES-based indicators
should be seen as a key addition to a suite of
complementary measures. Most existing indica-
tors of food insecurity focus on its likely deter-
minants or potential consequences. The FIES
fills a gap in global food security monitoring by
directly measuring the access dimension of
food insecurity at the individual and household
levels. Other direct measures, such as those
based on food consumption data, require con-
siderably higher investments in terms of finan-
cial resources, time and level of professional
training.
3 The fact that the simple raw score is a proper ordinal measure, (irrespective of which items are affirmed) seems surprising at first.
However, it is readily demonstrated mathematically under assumptions of the measurement model that raw score is a sufficient
statistic for the measure on the latent trait. This becomes more intuitively credible when we consider that the raw score takes into
account not only what is affirmed, but also what is denied, and that there is information on the food security condition of a respondent
both in reporting an experience and in denying it. For example, a respondent who affirmed only one item, but a rather severe one,
will have denied several less severe items. Those denials also inform our estimate of the respondent’s true food insecurity.
Prevalence estimates of food insecurity at differ-
ent levels of severity can be analyzed together
with indicators of determinants and conse-
quences of food insecurity at the population
level. Such analyses will contribute to a more
comprehensive understanding of food insecu-
rity and inform more effective policies and inter-
ventions to address it.
In summary, compared to other indicators of
food security, experience-based indicators stand
out because of their analytic soundness, ease of
administration, comparatively low cost and
timeliness of reporting. Indicators derived
from the FIES in particular have the distinctive
advantage of being more precisely comparable
across countries.
In addition to allowing the computation of prev-
alence rates in a population, the FIES will also
produce measures of food insecurity severity for
each respondent in a survey. Expected measure-
ment errors, reflecting the extent of uncertainty
around individual measures of severity, are typ-
ically too large to make them useful for pro-
gramme purposes, for example targeting indi-
viduals to receive benefits. However, these
measures can be used to conduct micro level
analyses of association of food insecurity status
with other individual or household characteris-
tics. For such uses, individual or household level
food insecurity measures are best defined either
as categorical indicators or as (continuous)
probabilities of belonging to a given food se-
curity class (e.g. food secure, moderately food
insecure, severely food insecure) in appropriate
regression models with limited (discrete or trun-
cated) dependent variables. (See Voices of the
Hungry, 2015 for further details.)

6
©FAO/Sailendra Khare ©FAO/Sailendra Khare

7
2. The Food Insecurity Experience Scale
Survey Module (FIES-SM)
A description of the questionnaire.
The FIES Survey Module (FIES-SM) is com-
posed of eight questions4 with simple dichoto-
mous responses (“yes”/”no”). Respondents are
asked whether anytime during a certain refer-
ence period they have worried about their abil-
ity to obtain enough food, their household has
run out of food, or if they have been forced to
compromise the quality or quantity of the food
they ate due to limited availability of money or
other resources to obtain food.5 (See Ballard et
al., 2013 for a description of the development of
the FIES module).
The FIES-SM is flexible with regard to recall pe-
riod (“during the previous one month”, “…three
4 The eight FIES questions are derived directly from the eight questions referring to adults in the ELCSA. 5 It is essential to include a resource constraint in the questions as it contributes to define the construct of food insecurity as limited
access to food. Enumerators are trained to emphasize the expression “because of a lack of money or other resources” to avoid
receiving positive responses due to fasting for religious reasons or dieting for health reasons. The “other resources” notion has been
tested in several contexts, to make it appropriate for respondents who normally acquire food in ways other than purchasing it with
money.
months”, or “…12 months”) and unit of refer-
ence (individual, e.g. “you were…” or house-
hold, e.g. “you, or others in your household,
were…”).
In the version that has been applied globally
through the GWP, questions are framed with
reference to individuals and have a reference
period of 12 months (Table 2-1). This is because
the GWP is conducted in different months in dif-
ferent countries and a shorter recall period
might result in lack of comparability across sur-
veyed countries due to the possible interaction
of seasonality of food insecurity and season of
data collection.
Table 2-1 Questions in the Food Insecurity Experience Scale Survey Module for Individuals (FIES SM-I) as fielded in the 2014GWP
Questions in the Food Insecurity Experience Scale Survey Module for Individuals
(FIES SM-I) as fielded in the 2014 GWP
Now I would like to ask you some questions about food.
During the last 12 MONTHS, was there a time when… : (label)
(Q1) … you were worried you would not have enough food to eat because of a lack of
money or other resources? (WORRIED)
(Q2) … you were unable to eat healthy and nutritious food because of a lack of money or
other resources? (HEALTHY)
(Q3) … you ate only a few kinds of foods because of a lack of money or other resources? (FEWFOODS)
(Q4) … you had to skip a meal because there was not enough money or other resources
to get food? (SKIPPED)
(Q5) … you ate less than you thought you should because of a lack of money or other re-
sources? (ATELESS)
(Q6) … your household ran out of food because of a lack of money or other resources? (RANOUT)
(Q7) … you were hungry but did not eat because there was not enough money or other
resources for food? (HUNGRY)
(Q8) … you went without eating for a whole day because of a lack of money or other re-
sources? (WHLDAY)

8
In general, shorter recall periods may be ex-
pected to provide more reliable data, as recall er-
rors are reduced. Periods as short as the previ-
ous 30 days may be more appropriate, depend-
ing on the objectives of the specific survey, espe-
cially if the survey can be repeated during the
year. VoH is planning additional research to ex-
plore formally the link between results obtained
using a 12 month FIES and those obtained using
shorter reference periods.
Within the context of the GWP, which is a sur-
vey of adult individuals weighted to represent
the national populations aged 15 or more,6 the
6 In the context of the GWP, adults are defined as 15 years of age and older. 7 The insertion of one question referring to a household situation is consistent with an individually framed questionnaire. As the
experience of running out of food in the house may be thought of as affecting all of the household members it is also an individual
experience. 8 The 2014 GWP included, as an adjunct to the FIES, two questions about the food security of children under age 5. Scales that
included these questions were explored, but the questions added little to the reliability of the FIES. Since many households do not
have children, two scales would have been required in each country to incorporate the child items. It was not considered worthwhile
to incur this additional complexity for relatively little gain in reliability, so the VoH assessment was limited to the eight item, adult-
referenced FIES. In addition, since the GWP is a survey of adults and weighted to represent adults, it was not possible to aggregate
information from the child questions to provide meaningful statistics on children’s food security. The child questions will be omitted
from the 2015 GWP surveys.
questions in the FIES are - with one exception7 -
referenced to the individual respondent.8
For surveys that are sampled and weighted to
represent households, a modified version of the
FIES-SM referenced to the respondent’s house-
hold is available.
The aim of the Voices of the Hungry project is to
promote inclusion of the FIES-SM in national-
level large scale surveys such as Household In-
come and Expenditure Surveys, Household
Budget Surveys, Living Standard Measurement
Surveys and health and nutrition surveys.
©FAO/Daniel Hayduk
9
3. Data collection through the
Gallup World Poll
Sampling, interviewing, editing, and weighting.
The Gallup® World Poll (GWP), created in 2005,
is a survey of individuals 15 years of age and
older conducted annually in over 150 countries,
areas or territories. The survey is administered
to a representative sample of individuals in each
country, area or territory to collect information
on people’s opinions, experiences and aspira-
tions. Among the topics covered are law and or-
der, food and shelter, institutions and infrastruc-
ture, job climate, and financial, social, physical
and self-reported well-being. The GWP includes
a set of core questions applied in most countries
throughout the world with additional region-
specific questions applied where relevant. The
majority of items are framed as questions requir-
ing dichotomous (yes/no) responses, although
some feature a wider response set. Beginning in
2014, the FIES Survey Module (FIES-SM) has
been included in the GWP.9
In 2013, VoH conducted linguistic adaptations
of the FIES-SM in national languages of Angola,
Ethiopia, Malawi and Niger, using a methodol-
ogy that included consultations with country-
level specialists and officials and focus group
discussions (Gallup, 2013; Manyamba, 2013;
Massaoud and Nicoló, 2013). These experiences
provided valuable information and corrobo-
rated studies conducted in other countries re-
garding phrases and concepts that require more
careful adaptation. FAO used this information
to prepare a document to guide GWP’s country-
level partners who carry out the standard ques-
9 The GWP is not an ideal vehicle for our purpose, but at present, there is no better option. The project is also promoting and providing
technical support for inclusion of the FIES in national Governmental surveys. As data from those surveys become available, reliance on
the GWP will decline. Moreover, the purpose of the VoH project is to estimate national level prevalence rates of food insecurity. For
this goal, the sample size may be adequate. However, caution is needed when disaggregating at subnational level. 10 See: http://www.fao.org/3/a-be898e.pdf. 11 Translations of the FIES-SM in all languages used by the GWP are available through the VoH website. 12 The GWP methodology documentation can be found at: http://www.gallup.com/poll/105226/world-poll-methodology.aspx. 13 The threshold of 80 percent for telephone coverage may not be adequate for some countries, and would need to be higher to ensure
adequate representativeness of the adult population. Unfortunately, VoH project is a minor part of the GWP and has no ability to set
this parameter differently. Its effect is partially mitigated by the post-stratification weighting of the sample to national control totals,
which typically include educational attainment as well as age, sex and other standard demographic information.
tionnaire translation procedure.10 Gallup em-
ploys multiple independent professional trans-
lators to develop versions of the questionnaire in
the major conversational languages and dialects
of each country. Translations are checked by in-
dependent back-translation to the source lan-
guage. This same approach is used by Gallup for
translation of the FIES-SM. In a few cases where
VoH had contact with local experts fluent in a
language, translations were assessed by those
experts and the GWP generally included their
suggested improvements in the final question-
naire.11
The GWP samples are intended to be nationally
representative of the male and female resident
population aged 15 years and older in each
country. Sample sizes of 1,000 are most com-
mon, although larger samples are taken for
some countries such as India (3,000 individuals)
and China (5,000 individuals). Samples are
probability based, and coverage includes both
rural and urban areas. The entire country is in-
cluded except in exceptional cases where safety
is a concern or travel to a remote area is exceed-
ingly difficult. 12
Surveys in much of Latin America, Africa, Asia,
Eastern and Central Europe and the former So-
viet Republics are administered through face-to-
face interviews. Only in medium and high-in-
come countries with at least 80 percent tele-
phone coverage are surveys conducted by tele-
phone.13

10
For face-to-face interview countries, the first
stage of sampling involves the identification of
100-135 sampling units (clusters of households).
These clusters are stratified by population size
or geographic units. The second stage of sam-
pling involves the selection of households
through a random route procedure. Samples for
telephone survey countries are selected using
random digit dialing or a nationally representa-
tive list of phone numbers, and a dual sampling
frame is used where cell phone use is high.
The final stage of sampling for both types of sur-
veys is the selection of an individual member
of the household to interview. This is done by
collecting each person’s birthday and using a
Kish grid to identify the eligible individual to be
interviewed. In certain cultural contexts where
gender matching of interviewer and respondent
is necessary, the person to interview is selected
from among the eligible men or women of the
household. Usually three attempts are made to
interview the selected individual in the selected
household. If the interview cannot be com-
pleted, a formal substitution method is followed
to identify another household (but not a differ-
ent adult within the originally selected house-
hold, because of concern that this would bias re-
sults by under-representing working adults).
Interviewers complete extensive training ses-
sions with qualified trainers using Gallup’s
standardized manual. They are trained to follow
the sample selection protocol and rules for con-
ducting interviews. Following data collection,
the data are reviewed for quality and con-
sistency. Household size and oversamples are
accounted for by base sampling weights. Post-
stratification weights are provided to allow pro-
jection of results to the national population.
Where adequate population statistics are availa-
ble, post-stratification weights are adjusted so
that survey sample totals match as close as pos-
sible national totals for gender, age, education
and socioeconomic status.
©FAO/Daniel Hayduk

11
4. Analyzing FIES data with the Rasch model
The protocol for the analysis of each country dataset.
As described in section 1 above, the Rasch model
provides the theoretical basis to link the data ob-
tained through the FIES survey module to a
proper measure of food insecurity severity. Close
adherence of the data to the assumptions of the
Rasch model is a precondition for establishing va-
lidity and reliability of the measures obtained
with the FIES.14 The first phase in the analytic
protocol is thus aimed at assessing the quality of
each country’s data (particularly in terms of how
closely they reflect the assumptions for valid
measurement of a unidimensional latent trait
embedded in the single parameter logistic model)
while at the same time, estimating item and re-
spondent parameters for that country. This pro-
cess is carried out separately for each country
based on that country’s data only, and consists of
the steps described below.
Dealing with missing responses
Cases with any missing responses are excluded
from the analysis. The proportion of cases with
missing responses to any of the eight items is
calculated along with the proportion of missing
responses to each item (for respondents with
any valid responses). A disproportionately high
number of missing responses can indicate ques-
tions that are difficult to understand or answer
or that are too sensitive.
Estimating item severity parameters
Using the single-parameter logistic IRT (Rasch)
model, item severity parameters are estimated
from the responses to the eight dichotomous
FIES items using conditional maximum likeli-
hood (CML) methods implemented in R15, an
open-source statistical software. The alternative
14 The processes described in this section are essential for establishing the internal validity of an experience-based measure when it
is first introduced into a language or culture. Once validity has been established in a sufficiently large and diverse sample, further
administrations of the same module in that population will not generally require such extensive validation and can use parameters
calculated from the original validation survey. 15 See http://www.r-project.org/ 16 The VoH R software is freely available from VoH upon request by writing to [email protected].
estimation methods based on marginal maxi-
mum likelihood (MML) produces essentially
identical item parameter estimates in all coun-
tries, as do joint maximum likelihood (JML)
methods if the JML estimates are adjusted for
their known bias toward over-dispersion of item
parameters.
Open-access software is used to facilitate trans-
fer of the basic scale assessment technology to
national statistical agencies that may lack re-
sources for commercial software or are legally
required to use open-access software.
The model-fitting program was written ex-
pressly for this particular application because
existing R functions for this purpose have limi-
tations (such as not accepting sampling weights,
not assessing conditional independence of items
and not producing some of the needed fit statis-
tics). The VoH R program for weighted Rasch
model estimation was tested on simulated
Rasch-consistent data and the output compared
with that of other commercial and open source
available software to ensure integrity. 16
The sample used to estimate the parameters of
the measurement model is limited to the cases
where the eight responses are not all “yes” or all
“no”. Obviously, all complete responses (includ-
ing those with raw score 0 and raw score 8) are
used to estimate prevalence rates.
Estimating respondent parameters
Given estimated item parameters, respondent
(person) parameters and associated errors (i.e.
the extent of uncertainty around the parameter
estimate) are obtained for each raw score as the

12
maximum likelihood estimates.17 The CML pro-
cedure cannot yield an estimate for extreme raw
scores of 0 or 8.18 To classify cases with such ex-
treme values of the raw score, an ad hoc proce-
dure is required.19 For the VoH global assess-
ment, respondents with raw score zero are as-
sumed to be food secure with no measurement
error. This assumption is unlikely to introduce
any bias in the published classifications since
any reasonable severity parameter associated
with raw score zero is far below the threshold
set for moderate food insecurity. The probability
that a case reporting raw score zero might be-
long to that class is negligible.
The treatment of cases with the maximum raw
score of 8 is more problematic. This is important
because an appropriate threshold for estimating
the national prevalence rates of severe food inse-
curity will be set at quite a high level. This means
that a substantial proportion of cases with raw
score 8 are likely to be less severe than that
threshold under any reasonable assumption re-
garding the distribution of the latent trait in the
population. To avoid overestimating the preva-
lence of severe food insecurity, as would be the
case if all respondent with raw score 8 were as-
signed to that class, we assign to raw score 8 a
parameter based on pseudo raw scores between
17 Under the Rasch model’s assumptions, the raw score is a sufficient statistic for respondents’ parameters (see the discussion in
section 1 above). The respondent parameter for each raw score can be easily computed from the so-called test characteristic curve,
which is the function expressing the expected raw score as a function of the respondent severity level, and which depends only on
the item severity parameters. The severity associated with each raw score is then simply the value of severity corresponding to the
point where the test characteristic curve crosses the integer values from 1 to 7. The measurement error is the square root of the
inverse of the derivative of the test characteristic curve at that point. (That derivative is the Fischer information function.) 18 The reason why no severity level can be associated with extreme raw scores of 0 or 8 can be intuitively appreciated by considering
that any respondent with low enough severity would be expected to deny all items, and any respondent with high enough severity would
affirm all of them. Given a finite number of items, a scale can only measure severity over a certain range, defined by the severity associated
with the items included in the scale. 19 The issue of estimating parameters and margins of errors for zero and maximum raw scores has not been explored much in previous
statistical work on experience-based food security measurement. All countries that regularly use these methods categorize the severity
of food insecurity discretely based on raw score. Cases with raw score zero are usually classified as “food secure”, while those with
maximum row score as “severely food insecure”. 20 This method is based on reasonable assumptions but not on strong statistical theory. When the survey module for use with the
2014 GWP was defined, the occurrence of large proportions of cases in raw score 8 was not anticipated, assuming that the more
severe item would capture a severe enough situation to be rare in most countries. Instead, frequencies of raw score 8 over 40
percent have been observed in a few countries, which calls for the need to carefully consider the possible distribution of severity for
these cases (the reader should note however that this high proportion reflects the reference period of 12 months). Methods to
enable the FIES-SM to more adequately represent the severe end of the severity scales are being explored, either by adding more
severe questions (or follow-up questions about how often the more severe conditions occurred) to the module or by using marginal
maximum likelihood methods to estimate the measurement model. So far, limited application of each of these alternative methods
has resulted in estimates of severe food insecurity that do not differ greatly from those based on the interim method using pseudo
raw scores. Follow-ups to the two most severe questions, asking how often the condition occurred were included in surveys in
several countries in 2014 and will be added in all low-income countries in 2015. 21 As a further check on the Rasch-model assumption of equal discrimination, a 2-parameter logistic model (allowing for differing
discrimination of items) was estimated for several countries using marginal maximum likelihood methods implemented in R. Differ-
ences due to violation of the assumption of equal discrimination were not substantial.
7.5 and 7.7. The exact value used for each country
is higher the higher the proportion of cases with
raw score 8, implying that the distribution of true
severity of respondents with raw score 8 is as-
sumed to be located more towards the severe end
of the scale when there is a larger proportion of
cases with that extreme raw score.20
Testing Rasch model assumptions
The Rasch model assumption of equal discrimi-
nation is assessed by examining standardized
item infit statistics. These statistics have quite
large sampling errors for sample sizes typical in
the GWP data. These errors are taken into ac-
count and infit statistics in the range of 0.8 to 1.2
are considered excellent. Those in the range of
0.7 to 1.3 are considered to be acceptable. Those
higher than 1.3 are flagged for investigation to
assess the need for improved translation, espe-
cially if the high infit is observed again in the fol-
lowing year. To date, no infit values have been
observed so high as to justify omitting the item
from the scale in any country.21 (See Table 7-2).
Item outfit statistics are also examined to identify
items with unusual occurrence of highly erratic
responses (see Box 1 and Nord 2014 for further
specifics). No specific criteria are set, but items

13
with unusually high outfit statistics are flagged
for possible improvement of translation.
To check whether subsets of items measure ad-
ditional latent phenomena other than food inse-
curity, the assumption of conditional independ-
ence of the items is assessed by calculating con-
ditional correlations22 among each pair of items
and submitting the correlation matrix to princi-
pal components factor analysis. The correlation
matrix is examined to identify any strong corre-
lations among pairs of items. Factor eigenvalues
and item loadings from the factor analysis of
conditional correlations are examined to iden-
tify the presence of any strong second dimen-
sions in the data.
22 Expected correlations among items are calculated under Rasch model assumptions given the item parameters, probabilities of each
response pattern within each raw score and the distribution of cases across raw scores. Residual correlations are then calculated as
partial correlations given the observed and expected correlations. 23 Model variation is the sum of squares of difference of each raw score parameter from the average. Error variation is the sum of
squared measurement error across raw scores. Total variation is the sum of model variation and error variation. Rasch reliability is
not technically a measure of model fit, but for scales comprising the same items it is highly correlated with model fit across data sets
and provides a readily accessible statistic for comparing model fit.
Finally, overall model fit is assessed by Rasch
reliability statistics—the proportion of total var-
iation in true severity in the sample that is ac-
counted for by the model.23 Two Rasch reliabil-
ity statistics are calculated. The standard Rasch
reliability statistic weights components in each
raw score by the number of cases with that raw
score, and it is therefore sensitive to the distribu-
tion of cases across raw scores. For this reason,
also a “Flat” Rasch reliability is calculated, based
on the assumption of an equal number of cases
in each non-extreme raw score class. This statis-
tic provides a more comparable measure of
model fit across countries with sizable differ-
ences in prevalence rates of food insecurity.
Box 1
Infit and outfit statistics
The infit and outfit statistics assess the “performance” of the items included in the
scale; that is, the strength and consistency of the association of each item with the
underlying latent trait. These are obtained by comparing the way in which the ob-
served patterns of responses compare to the ones that would be expected under
the truth of the measurement model.
One of the Rasch model assumptions is that all items discriminate equally, which
means that, ideally, all infit statistics would be 1.0. Infit values in the range of 0.7-1.3
are generally considered to meet the model assumption of equal discrimination to an
acceptable degree. Infit statistics in the range 1.3 to 1.5 identify items that can still be
used for measurement, but attention to possible improvement of such item may be
worthwhile. Values larger than 1.5 indicate items that should not be used for scoring,
as they may induce considerable biases in the measure.
On the opposite side, items with infit statistics lower than 0.8 can still be used for
measurement, although such low values of residuals will imply that the particular item
will be somewhat undervalued in its contribution to the overall measure. Similar stand-
ards may be applied to item outfit statistics, but in practice, outfit statistics are very
sensitive to a few highly unexpected observations. As few as two or three highly unex-
pected responses (i.e. denials of the least severe items by households that affirm the
most severe ones) among several thousand households can elevate the outfit for that
item to 10 or 20. Carefully interpreted, outfit statistics may help identify items that
present cognitive problems or have idiosyncratic meanings for small subpopulations.

14
©FAO/Ami Vitale

15
5. Developing the FIES global standard scale
The bridge by which prevalence rates are compared
across countries.
Application of the Rasch model on a single
country dataset produces estimates of parame-
ters on a scale that is, to some extent, arbitrary
and idiosyncratic to that country.24 Before com-
paring measures obtained in two different
countries, it will be necessary to calibrate the
two scales on a common metric. The calibra-
tion of two scales on the same metric is ob-
tained formally by equating the mean and the
standard deviation of the set of items that are
common to the two scales, allowing for the pos-
sibility that each scale may also have a number
of additional items contributing to the measure
that are unique to that scale.
To obtain prevalence rates that are comparable
across the large number of countries covered
by the VoH project, we define the FIES global
standard scale as a set of item parameters
based on the results from application of the
FIES-SM in all countries covered by the GWP
survey in 2014. By calibrating each country’s
scale against the FIES global standard, the re-
spondent severity parameters obtained in each
country are effectively adjusted to a common
metric, thus allowing the production of compa-
rable measures of severity for respondents in
all countries as well as comparable national
prevalence rates at specified thresholds of se-
verity.
One challenge in defining the global scale and
in adjusting each country’s scale to the global
standard is that in any given country, one or
24 Recall that with N items in a scale, only N-1 item parameters can be separately identified. Our Rasch model-fitting software estimates
the scale for each country on a logistic metric with mean item parameter arbitrarily set at zero. Moreover, average discrimination of the
items will differ across countries, reflecting primarily differences in statistical noise in the scales, with the consequence that items may
be spaced differently around zero on the severity scale in different countries. 25 One reviewer suggested an alternative procedure to define the global reference scale consisting of estimating the Rasch model on
the pooled sample of data from all countries. That procedure produces a global standard that is nearly equivalent to the one we
obtain with the algorithm described in this report. The small differences between the results of the two methods are due to the
specification in the VoH method of some items in some countries as unique and the omission of those items from the calculation of
the global standard. This process is statistically superior to the simple pooled estimation.
more items may differ in severity from the se-
verity level associated with the same item in
most other countries. In other words, even if in
principle each single item is intended to repre-
sent the same experience of food insecurity
everywhere, the severity of that item relative
to that of the others may differ in a country for
several reasons. Translation may not be accu-
rate, so that the question is understood by re-
spondents to refer to a somewhat different set
of objective conditions in one country com-
pared to another. In other cases, the relation-
ships between specific objective conditions and
the latent trait of food insecurity may differ
somewhat in one country compared with oth-
ers due to differences in culture, livelihood ar-
rangements or management of food scarcity.
Identifying items that are “unique” to a coun-
try (that is, whose relative position in the scale
differs from what it has on the global standard)
is important, as they should neither be used to
define the FIES global standard nor to adjust
the country’s scale to it. Unique items remain
in the scale for that country, however, contrib-
uting to the measure of person parameters.
We have taken into account differences in item
severity across countries both in the develop-
ment of the global standard and in the process
of adjusting each country’s scale to the stand-
ard. The FIES global standard is developed
through an iterative process, programmed in
R, with the following steps.25

16
1. Item parameters are estimated separately
in each country using CML, as described
in section 4 above.
2. Each item parameter is multiplied by the
inverse of the standard deviation of the
item parameters estimated for that coun-
try. This results in normalized parameters
with mean of zero and a standard devia-
tion of one for each country.26
3. An interim global standard parameter for
each item is calculated as the median nor-
malized parameter for that item across all
countries.
4. For each country, items differing from the
interim global standard by more than a
specified critical value are declared unique
to that country.27
5. Each country’s parameters are readjusted
to the interim global standard by equating
the mean and standard deviation of com-
mon (i.e. non-unique) items in the country
scale to the mean and standard deviation
of the corresponding items in the interim
global standard.
6. The interim global standard parameter for
each item is recalculated as the median
across countries of the adjusted parameter
for that item, omitting the parameter for
items identified as unique.
7. The critical value for identifying items as
unique is reduced by a small increment,
and iteration continues with steps 3-6 until
a specified minimum critical value is
reached. The minimum critical value cur-
rently specified is 0.3, which corresponds
to about 0.5 logistic units on the average
scale.
8. The final global standard is then adjusted
by a linear transformation in order that
item parameters have a mean of zero and
standard deviation of one.
26 We chose a standard deviation of one for convenience. Notice that rescaling is only done at this stage to identify items that are unique
in a country and to define the global standard. The differences in discrimination across countries are taken into account later when
respondent parameters are adjusted to the global standard, to preserve the actual discrimination of the scale in each country. 27 The critical value is set at a rather large value initially, and reduced in successive iterations as described in step 6, until reaching a
minimum critical value.
Although this procedure worked satisfactorily
in most cases, a few situations required special
handling:
If an item parameter in a country is based
on fewer than 10 affirmative responses,
that item is always identified as unique
and is not used to calculate the global
standard. This occurs for severe items in
countries that are highly food secure. The
reason for excluding items with very few
affirmative responses is the concern that,
due to lack of statistical consistency, the
parameter estimate may be unstable.
If more than three items are identified as
unique in a country, data from that coun-
try are not used to calculate the global
standard. This occurs in relatively few
countries, as detailed in Section 7 of this
report.
If data from a country appear to be prob-
lematic in the assessments described in
Section 4 or are based on a very small sam-
ple of non-extreme cases (as may occur in
some very food secure countries), data
from that country may be omitted entirely
from calculation of the global standard.
17
6. Computing comparable prevalence rates
Adjusting each country’s scale to the global standard and
calculating prevalence rates of food insecurity at two
levels of severity with comparable thresholds.
The scale for each country is adjusted to the
global standard metric (described in Section 5)
in order to derive comparable food insecurity
prevalence rates. The same adjustment for each
country, calculated from item parameters, is
then applied to all measures of severity (includ-
ing respondent parameters and measurement
errors). This allows setting thresholds and ob-
taining estimates of prevalence rates and mar-
gins of errors that are comparable across coun-
tries. The adjustment consists of a simple linear
transformation, calculated so that the mean and
standard deviation of the parameters of items
identified as “common” for a country (i.e. omit-
ting items identified as unique to that country)
equal the mean and standard deviation of the
parameters for the corresponding items in the
global standard. For most countries, the set of
items considered to be common is identical to
the set identified as common in the development
of the global standard (see Section 5).
This process of equating scales, that is, of mak-
ing their adjusted severity parameters compara-
ble, does not require items identified as common
to have exactly the same severity as their corre-
sponding items on the global standard scale. Ra-
ther, it constrains only the mean and standard
deviation of the set of common items to be equal
to their counterparts on the global standard
while preserving the relative severity of all items,
common and unique, as seen in the original scale
for the country. The multiplicative constant in
the linear transformation is also applied to the
measurement error (see below) for each raw
28 Within countries, however, discrete assignment of food security status by raw score is the norm. This method is used in all
countries with established periodic assessment of food security using experience-based measurement scales. Even within countries,
the mapping of raw scores to respondent parameters may differ among some subpopulations. In most cases, however, probabilistic
assignment of food security status as described here may be used to assess the extent of possible biases in prevalence comparisons
among subpopulations. The advantages of discrete raw score-based assignment of food security status in terms of transparency and
ease of explanation to the public and to policy officials have made it the preferred method for within-country classification.
score, so that differences across countries in av-
erage discrimination of items (i.e. overall model
fit) are taken into account in calculation of prev-
alence rates.
Approximate comparability of prevalence rates
across countries could be achieved by assigning
food security status discretely based on raw
score. In this case, the specific raw-score thresh-
olds defining each range would differ as neces-
sary from country to country to more closely
represent the same level of severity of the ad-
justed respondent parameters for each raw
score. As a result, for example, in one country
respondents with raw score 4 and higher might
be classified as having moderate or severe food
insecurity while in another country, those with
raw scores 3 and higher might be so classified.
Such comparisons would be inevitably biased
one way or another between most pairs of coun-
tries, because discrete raw-score-based thresh-
olds are rarely exactly equivalent across coun-
tries.28
To overcome this problem, the VoH project uses
a more precise method to calculate comparable
food insecurity prevalence rates that takes into
account estimated measurement error (i.e. the
extent of uncertainty) around the parameter es-
timate associated with each raw score. (See
chapter 5 of Nord, 2012 for a detailed descrip-
tion of this methodology.) The procedure entails
the steps described below.
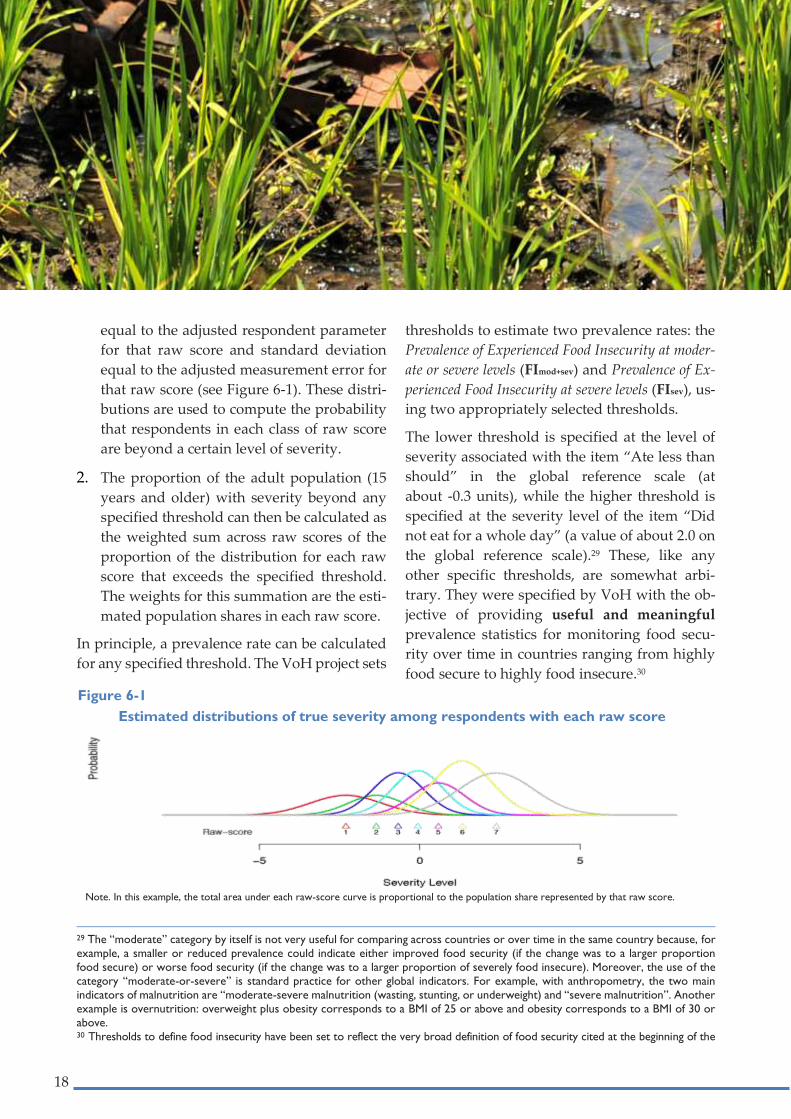
1. For each country, the distribution of true se-
verity of respondents at each raw score is as-
sumed to be normal (Gaussian) with a mean
18
equal to the adjusted respondent parameter
for that raw score and standard deviation
equal to the adjusted measurement error for
that raw score (see Figure 6-1). These distri-
butions are used to compute the probability
that respondents in each class of raw score
are beyond a certain level of severity.
2. The proportion of the adult population (15
years and older) with severity beyond any
specified threshold can then be calculated as
the weighted sum across raw scores of the
proportion of the distribution for each raw
score that exceeds the specified threshold.
The weights for this summation are the esti-
mated population shares in each raw score.
In principle, a prevalence rate can be calculated
for any specified threshold. The VoH project sets
29 The “moderate” category by itself is not very useful for comparing across countries or over time in the same country because, for
example, a smaller or reduced prevalence could indicate either improved food security (if the change was to a larger proportion
food secure) or worse food security (if the change was to a larger proportion of severely food insecure). Moreover, the use of the
category “moderate-or-severe” is standard practice for other global indicators. For example, with anthropometry, the two main
indicators of malnutrition are “moderate-severe malnutrition (wasting, stunting, or underweight) and “severe malnutrition”. Another
example is overnutrition: overweight plus obesity corresponds to a BMI of 25 or above and obesity corresponds to a BMI of 30 or
above. 30 Thresholds to define food insecurity have been set to reflect the very broad definition of food security cited at the beginning of the
thresholds to estimate two prevalence rates: the
Prevalence of Experienced Food Insecurity at moder-
ate or severe levels (FImod+sev) and Prevalence of Ex-
perienced Food Insecurity at severe levels (FIsev), us-
ing two appropriately selected thresholds.
The lower threshold is specified at the level of
severity associated with the item “Ate less than
should” in the global reference scale (at
about -0.3 units), while the higher threshold is
specified at the severity level of the item “Did
not eat for a whole day” (a value of about 2.0 on
the global reference scale).29 These, like any
other specific thresholds, are somewhat arbi-
trary. They were specified by VoH with the ob-
jective of providing useful and meaningful
prevalence statistics for monitoring food secu-
rity over time in countries ranging from highly
food secure to highly food insecure.30
Figure 6-1 Estimated distributions of true severity among respondents with each raw score
Estimated distributions of true severity among respondents with each raw score
Note. In this example, the total area under each raw-score curve is proportional to the population share represented by that raw score.

19
Countries that use experience-based measure-
ment scales in national surveys for monitoring
food security are encouraged to specify thresh-
olds appropriately linked to descriptive labels
that are meaningful within the public dialogue
of the country. If those thresholds differ from the
VoH thresholds, however, it is then important to
keep those differences in mind when comparing
to VoH prevalence rates. National classification
systems may also be applied to the country-spe-
cific GWP data for comparison and research
purposes.
FImod+sev and FIsev as estimated from GWP data are
representative of the national population because
sampling weights are included in their calcula-
tion. Confidence intervals around these mean es-
timates are calculated taking into account sam-
pling and measurement error. The sampling er-
ror is obtained using the complex survey design
information. The procedure varies depending on
the type of interview and entails Taylor series lin-
earization estimation. In face-to-face interviews,
the geographical stratification variable and pop-
ulation clusters within strata (primary sampling
units or PSUs) are included. In the case of tele-
phone interviews, only the stratification variable
is used, as there are no PSUs.
The extent of uncertainty around the measure
(i.e. measurement error) is calculated consider-
ing that within each raw score, the variance in
the proportion with true severity beyond a set
paper (food security at all times, for all people). Consequently, food insecurity prevalence rates may look particularly high for some
counties. In interpreting these thresholds it may be worth recalling that they are based on items that ask whether the experiences have
occurred even just once over the reference period. 31 The intuitive explanation for multiplying by the square of the share is that multiplying by share converts variance as a ratio to
proportion of sample in the raw score, into variance as a ratio to the total sample; multiplying by share again provides weights for
the weighted sum across raw scores.
threshold is given by 𝑝(1 − 𝑝)/𝑛, where 𝑝 is the
proportion estimated by the method used to es-
timate prevalence and 𝑛 is the number of un-
weighted cases in the considered raw score.
These variances are then summed across raw
scores and weighted by the square of the respec-
tive share, i.e. the proportion of weighted cases
in the raw score.31
Because sampling and measurement errors are
considered independent, they are combined to
obtain the global prevalence standard error as
follows:
SEtot=√(Sampling Error)2+(Measurement Error)2
As future years of data collection become avail-
able, the VoH project’s tentative plan is to esti-
mate item parameters and adjustment-to-global-
standard parameters based on the first three
years of data collection and then fix those pa-
rameters for subsequent years. This will require
revising the first two years’ prevalence estimates
when data from a third year will be in hand, but
will result in reasonably stable inter-country
comparability and, more importantly, good
time-trend comparability within countries.

20
©FAO/Issouf Sanogo

21
7. Results to date: data quality
Consistency of the data collected through the 2014 round
of the GWP in 146 countries, areas or territories with
assumptions of the Rasch measurement model.
This section summarizes findings on data qual-
ity and consistency with assumptions of the
Rasch measurement model and presents the re-
sults obtained from the 146 datasets collected in
the 2014 round of the GWP.
Missing Responses
Table 7-1 summarizes the data on missing
responses. Missing responses were relatively
rare in most cases: 127 datasets had 5 percent or
fewer cases with missing responses to any of the
eight FIES-SM questions and among those, 48
had fewer than 1 percent such cases. The mean
frequency of missing responses across all coun-
tries was 2.7 percent (data not shown). In only
six datasets, more than 10 percent of cases had
one or more missing responses: the highest fre-
quency was 17.7 percent.32
32 Possible causes of the relatively high proportion of missing responses in these datasets will be explored separately. 33 Cases with any missing response could not have raw score 8 and those with two or more missing responses could not have raw
score 7. It is almost certain, therefore, that including cases with missing responses in the prevalence estimates would bias the esti-
mated prevalence of severe food insecurity downward, unless an appropriate treatment is made of missing responses. The distribu-
tion across raw scores of cases with missing responses indicated that they were somewhat more likely to have raw scores 1 to 3
and less likely to have raw score 0 than cases with no missing responses.
No single item stood out as having consistently
higher proportions of missing responses and
this was true even in the four countries with the
highest share of missing responses (analysis not
shown). All cases with any missing responses
were omitted from the computation of
prevalence rates.33
Item Infit Statistics
In spite of the wide range of cultures and lan-
guages in which the FIES-SM was administered
and the attendant challenges of translation, the
fit of all the items to the measurement model
was remarkably good. Infit statistics for each
item were between 0.8 and 1.2 in a large majority
of countries (80 percent), and between 0.7 and
1.3 in 93 percent of countries for all items. (Table
7-2). The highest mean infit (1.15) was for the
Table 7-1 Summary of missing responses to food security questions in the first 146 datasets for which 2014 GWP data were available
Summary of missing responses to food security questions in the first 146 datasets
for which 2014 GWP data were available
Characteristic and range Number of datasets Percent of datasets
Cases with any missing responses:
<1% 48 33
1% to 5% 79 54
>5% 19 13
Cases with no valid responses:
0 78 53
>0 to 1% 61 42
>1% 7 5

22
item Did not eat whole day. The highest infits for
five of the eight items exceeded 1.4. However,
only seven countries had any item with an infit
higher than 1.4, and with one exception, those
were countries with small number of non-ex-
treme cases. We see no reason for particular con-
cern at this point. If high infits are observed for
the same items in the same countries in data col-
lected the following year, larger combined sam-
ples will enable further exploration of possible
causes. The lowest mean infits were for Hungry
but did not eat (0.87) and Ate less than should (0.89).
Those items also had the largest proportions of
infits lower than 0.7 (6 percent in each case, re-
sults not shown). These low infit statistics imply
Table 7-3 Summary of item outfit statistics for 136 datasets in the 2014 GWP
Summary of item outfit statistics for 136 datasets in the 2014 GWP1
Item2 Outfit < 2.0
(%. of cases) Mean outfit Minimum outfit Maximum outfit
WORRIED 82% 1.52 0.70 4.81
HEALTHY 84% 1.46 0.48 12.02
FEWFOODS 87% 1.23 0.36 5.07
SKIPPED 92% 0.91 0.24 3.22
ATELESS 92% 0.86 0.23 3.94
RANOUT 91% 0.90 0.14 2.25
HUNGRY 90% 0.86 0.07 3.70
WHLDAY 69% 2.22 0.02 16.25
Notes: 1 Data were available for an additional 10 datasets for which samples with complete and non-extreme responses included less than
100 cases, too small to provide reliable fit statistics. 2 See Table 2-1 in this report for the complete wording of the questions, which referred to a 12-month recall period and specified
that the behavior or experience occurred because of a lack of money or other resources.
Table 7-2 Summary of item infit statistics for 136 datasets in the 2014 GWP
Summary of item infit statistics for 136 datasets in the 2014 GWP1
Item2 Infit
0.8 to 1.2
(% of cases)
Infit
0.7 to 1.3
(% of cases)3
Mean
infit
Minimum
infit
Maximum
infit
WORRIED 80 93 1.11 0.82 1.49
HEALTHY 89 96 1.02 0.67 1.53
FEWFOODS 88 98 0.96 0.63 1.55
SKIPPED 85 96 0.92 0.61 1.58
ATELESS 79 95 0.89 0.53 1.29
RANOUT 80 98 0.91 0.59 1.34
HUNGRY 66 91 0.87 0.47 1.40
WHLDAY 73 87 1.15 0.75 1.90
Notes: 1 Data were available for an additional 10 datasets for which samples with complete and non-extreme responses included less than
100 cases, too small to provide reliable fit statistics. 2 See Table 2-1 in this report for the complete wording of the questions, which referred to a 12-month recall period and specified
that the behavior or experience occurred because of a lack of money or other resources. 3 Includes those with infit between 0.8 and 1.2.

23
that the items were most consistently associ-
ated with the latent trait measured by all of the
items. Although these items may be slightly un-
dervalued in the equally weighted Rasch meas-
ure, their higher discrimination is not so great as
to be substantially distorting, and it may be con-
sidered encouraging, given their cognitive con-
tent, that they are indeed the items most
strongly associated with the latent trait of food
insecurity.
Item Outfit Statistics
Outfit statistics are sensitive to even a few cases
with highly improbable response patterns. They
are useful primarily for identifying items that
may be inconsistently understood by a small
proportion of respondents, but may also reflect
just one or two careless responses or recordings
by the interviewer.
The most severe item, Did not eat whole day, had
the highest mean outfit (2.22), the highest pro-
portion of countries with outfit greater than 2.0
(31 percent) and the highest single outfit (16.25).
(Table 7-3). A high outfit for this most severe
34 These statistics are for “flat” Rasch reliability, that is, calculated giving equal weight to each non-extreme raw score rather than
weighting by the proportion of cases in each raw score as in the standard statistic.
The “flat” statistic is more comparable across countries because it is not sensitive to the distribution of cases across raw scores, which
may differ from country to country. See section 4 above.
item reflects affirmation of the item by a few re-
spondents who denied many or most other less
severe items. The highest outfit of 16.25 was one
of only four outfits higher than 5.0 for any coun-
try (analysis not shown). The causes of the high
outfits in these countries bear investigation in the
2014 data and follow-up observation in the 2015
data. Overall, the outfit statistics computed for
the 2014 application of the FIES with the GWP
do not indicate substantial model misfit or dis-
tortion of severity estimates for respondents to
warrant any change in the estimation procedure.
Model Fit—Rasch Reliability
Mean Rasch reliability34 was 0.740 (analysis not
shown). Reliability was between 0.70 and 0.80
for 79 percent of countries. These levels of relia-
bility for a scale comprising just eight items re-
flect reasonably good model fit. Simulation
analyses (not shown) suggest that measurement
error implied by these levels of reliability intro-
duce errors in national prevalence estimates that
are substantially smaller than sampling errors.
Table 7-4 Mean residual correlations between items (136 datasets from the 2014 GWP)
Mean residual correlations between items (136 datasets from the 2014 GWP)1
Item2 HEALTHY FEWFOODS SKIPPED ATELESS RANOUT HUNGRY WHLDAY
WORRIED 0.04 -0.01 -0.08 -0.03 -0.04 -0.08 -0.16
HEALTHY - 0.16 -0.06 -0.03 -0.06 -0.08 -0.16
FEWFOODS - - -0.02 0.07 -0.03 -0.06 -0.16
SKIPPED - - - 0.15 0.08 0.15 -0.03
ATELESS - - - - 0.09 0.10 -0.08
RANOUT - - - - - 0.17 0.00
HUNGRY - - - - - - 0.10
Notes: 1 Data were available for an additional 10 datasets, but samples with complete and non-extreme responses were too small for reli-
able correlation calculations (N<100).
2 The complete wording of the questions specified a 12-month recall period and specified that the behavior or experience oc-
curred because of a lack of money or other resources (see Section 2 of this report)

24
The lowest Rasch reliability was 0.676 and the
highest was 0.847.35
Conditional Independence of Items
Residual correlations were not found to be ex-
cessive for any pairs of items in countries with
sufficient sample size of non-extreme cases to
produce reliable assessments. (Table 7-4) There
was an initial concern that the two diet quality
items (Unable to eat healthy nutritious food and Ate
only a few kids of foods) might be somehow redun-
dant, tapping into the same behavior. However,
the residual correlations for this pair of items
were not unusually high in general (Table 7-4).
The mean residual correlation for the pair was
small (0.16) and the highest was 0.5 (not shown).
In a number of datasets, factor analysis of the
residual correlation matrix suggested a weak
second dimension in the response data charac-
terized by the diet quality versus food intake
quantity items. These sets of items represent the-
oretically distinct domains. This pattern is also
seen in the mean residual correlations, which
tend to be negative among items in different do-
mains and positive among items in the same do-
main. However, the pattern in the mean correla-
tions is quite weak, and the scree plots in the fac-
tor analyses and eigenvalues of the first factor
also indicate that the second dimension in the
data is not strong enough to substantially distort
measurement in any country. Although the do-
mains may represent distinct dimensions, they
are, apparently very nearly collinear.
Three dataset-item pairs had residual correla-
tions larger than 0.50, but none exceeded 0.60
(analysis not shown). The largest residual corre-
lations were seen between Unable to eat healthy
nutritious food and Ate only a few kinds of foods
(0.54) and between Skipped meal and Hungry but
didn’t eat (0.57). Almost all of these are from
countries with small non-extreme samples (i.e.
highly food secure) and are, therefore, not very
reliable. For these countries, additional years of
35 For cases with the lowest reliabilities, possible causes, such as differential item function across language groups or other identifiable
subpopulations (such as rural-urban or by educational attainment), will be investigated. Improvements might be obtained by increasing
the attention to accuracy and nuances of translation.
data will be needed to verify whether any con-
ditional correlations are high enough to require
re-examination of translations.
Results of the equating procedure
Based on the procedure described in section 5,
standardized measures of severity associated
with each item have been obtained for 146 coun-
tries. These values are distributed as in Figure 7-
1. Using the median value of the distribution of
standardized severity for each item, VoH de-
fined the provisional FIES global standard rep-
resented in Figure 7-2.
Items are considered common when their sever-
ity in a country differs from the one on the global
standard by less than 0.35 units on the global ref-
erence scale. In 93 percent of the countries, a set
of at least 5 common items was identified, thus
allowing a robust equating procedure to be car-
ried out. For the few cases for which it was not
possible to identify at least 5 common items, the
analysis was conducted on a case-by-case basis.
We compared the rates of prevalence that would
be obtained with alternative sets of items for
equating, even if one or two of the items consid-
ered in the equating differed from the global
standard by more than the set tolerance. For
these countries, prevalence rates were consid-
ered valid only if the choice of alternative possi-
ble combinations of items for equating gener-
ated essentially the same prevalence rates.
No acceptable solution to the equating problem
was found for only 3 datasets (from Azerbaijan,
China mainland, and Bhutan). In those cases,
prevalence rates were computed by associating
to each of the items the severity they have in the
FIES global standard. These estimates should
thus be considered provisional, pending revi-
sion once additional data from these countries
will become available and research will reveal
possible ways to improve adaptation of the
questionnaire.

25
Figure 7-1 Distributions of standardized values of item severity across countries.
Distributions of standardized values of item severity across 146 datasets.
Figure 7-2 The FIES global standard
The FIES global standard
-1.2
6
-1.0
9
-0.9
0
-0.2
5
0.4
1
0.4
5
0.8
0
1.8
3
WO
RR
IED
FEW
FO
OD
S
HEA
LT
HY
AT
ELESS
*
SK
IPPED
RU
NO
UT
HU
NG
RY
WH
LD
AY
**
* Provisionally set as the threshold for moderate or severe food insecurity
** Provisionally set as the threshold for severe food insecurity

26
©FAO/Shah Marai

27
8. Results to date: prevalence rates
Estimated prevalence of food insecurity in the adult
populations.
Given the overall positive results on adherence
of the data collected to the conditions for valid
measurement through the Rasch model, the per-
centages of individuals that have experienced
moderate-or-severe food insecurity (FImod+sev)
and that have experienced severe food insecu-
rity (FIsev) in 2014 was estimated following the
procedure described in section 6 above in each
of the datasets analyzed. Table A-I in the Appen-
dix presents the results for the 146 countries, ar-
eas or territories covered by the GWP in 2014.36
Before experience-based measures of food insecu-
rity could be properly tested across different
countries, languages, cultures and livelihood con-
ditions, the fear arose that they would capture
people’s subjective perceptions of their condition
relative to the food security situation of those
around them. This led to a concern that these
measures might not yield comparable results, as
they would reveal similar prevalence rates of food
insecurity irrespective of the actual situation.
Table 8 - 1 shows, instead, the very broad varia-
tion of estimated food insecurity across the
populations covered by 143 datasets, with val-
ues of FImod+sev varying from a minimum of 2.97
percent to a maximum of 92.25 percent, and
those for FIsev from values less than 0.5 percent37
36 For countries for which recent national data from comparable food security scales where available, prevalence rates are based on
national data. This includes Brazil, Guatemala, Mexico and the United States of America. See the discussion in Annex I for a comparison
of these results with national assessments conducted with the same data. 37 Half a percentage point is the lowest prevalence rate VoH reports. For sample sizes typical of the GWP, this is about the lowest
level that can be meaningfully detected with tools like the FIES. 38 The three datasets for which no acceptable equating procedure was possible have been excluded from the analysis.
to 76.24 percent. Median values across the da-
tasets are 19.66 percent for FImod+sev and 5.67 per-
cent for FIsev.
The data in Table 8-2 show how countries and
territories are distributed across classes of food
insecurity prevalence. Twenty-eight of the 146
datasets analyzed (19 percent), reveal that more
than half the represented population likely ex-
perienced moderate or severe food insecurity in
2014, a disturbing result. The incidence of food
insecurity was found to be quite small
(FImod+sev < 5 percent) for the populations repre-
sented by 10 of the 146 datasets. In terms of the
most severe condition, prevalence rates are quite
high in 30 countries, areas or territories
(FIsev > 20 percent) and very small in 22 others
(FIsev < 1 percent).
Preliminary analysis of correlations be-
tween estimated prevalence rates and
other indicators.
One way to validate the results presented thus far
would be to situate the estimated values of
FImod+sev and FIsev in the broader context of the as-
sessment of human development. Toward this
end, preliminary values of VoH indicators for 143
countries have been analyzed in comparison with
a number of major development indicators.38
Table 8-1 Descriptive statistics of the food insecurity prevalence rates (143 datasets in 2014)
Descriptive statistics of the food insecurity prevalence rates (143 datasets in 2014)1
Food insecurity class Minimum Median Maximum
Moderate or severe (FImod+sev) 2.97% 19.66% 92.25%
Severe (FIsev) < 0.5% 5.67% 76.24%
1 For three datasets no acceptable solution to the equating problem was found.

28
Table 8-2 Distribution of countries, areas or territories for different classes of FImod+sev and FIsev
Distribution of countries, areas or territories
for different classes of FImod+sev and FIsev.
Moderate or severe (FImod+sev) Severe (FIsev)
Range (%) N. of cases % of cases Range (%) N. of cases % of cases
< 5 11 7.5 < 1 22 15.1
5-14.99 50 34.2 1-4.99 48 32.9
15-24.99 24 16.4 5-9.99 22 15.1
25-50 33 22.6 10-20 24 16.4
> 50 28 19.2 > 20 30 20.5
Total 146 100.0 146 100.0
Table 8-3 Spearman’s rank correlation between food insecurity indicators and selected indicators of development at country level.
Spearman’s rank correlation between food insecurity indicators1
and selected indicators of development at national level.
Indicator Period N FImod+sev FIsev
Under-5 mortality rate 2013 137 0.833** 0.775**
Sanitation facilities (% with access) 2012 130 -0.829** -0.757**
Human Development Index 2013 136 -0.818** -0.737**
Adolescent fertility rate (women ages 15-19) 2012 139 0.798** 0.728**
Fertility rate 2012 140 0.795** 0.782**
Water source (% with access) 2012 133 -0.777** -0.703**
Gross National Income per capita 2011-2013 137 -0.783** -0.690**
Poverty headcount ratio at $1.25 a day 2010-2013 76 0.755** 0.738**
Life expectancy at birth 2013 136 -0.754** -0.666**
Prevalence of undernourishment 2014 135 0.757** 0.695**
Youth (15-24 years) literacy rate (%) 2015 113 -0.749** -0.728**
Adult literacy rate (%) projection 2015 113 -0.697** -0.721**
Multidimensional Poverty Index 2009-2013 42 0.642** 0.598**
Children aged 0-59 months Stunting 2009-2013 102 0.666** 0.645**
Gender-related development index (GDI) 2013 124 -0.599** -0.641**
Rural population (% ) 2011-2013 139 0.595** 0.515**
Children aged 0-59 months Underweight 2009-2013 102 0.596** 0.600**
GINI index 2009-2013 91 0.482** 0.479**
Children aged 0-59 months Wasting 2009-2013 101 0.345** 0.377**
Children aged 0-59 months Overweight 2009-2013 90 -0.354** -0.363**
Notes 1 See Table A-2 in the Appendix for a description of the indicators and sources of data.
* Correlation is significant at the 0.05 level (2-tailed). ** Correlation is significant at the 0.01 level (2-tailed).
N = number of valid cases.
Periods 2009 to 2013: last value available.

29
Table 8-3 presents the values of Spearman’s rank
correlation between the two indicators of preva-
lence of food insecurity and a number of inter-
nationally recognized indicators of develop-
ment. The data reveal that FImod+sev and FIsev
show significant and high correlation in the ex-
pected direction with most accepted indicators
of development.
Although informative, the pairwise compari-
sons in Table 8-3 may be revealing possible spu-
rious correlations. Various indicators that are re-
lated to access to food (prevalence of food inse-
curity, extreme poverty, and prevalence of un-
dernourishment) may be capturing the same
fundamental information and therefore be
somehow redundant in predicting, for example,
child mortality rates.
To verify whether this is the case, multiple re-
gression analyses were conducted with child
mortality rate as the dependent variable and
poverty, undernourishment and food insecurity
as independent variables. Even though results
are to be interpreted with caution, given the pro-
visional nature of FImod+sev and FIsev and the fact
that the various indicators do not refer to the
same time period, they reveal interesting pat-
terns (Table 8-4).
Four different models have been estimated, us-
ing either FImod+sev or FIsev, with and without con-
trolling for extreme poverty. Models 1 and 2
show that both the PoU and either FImod+sev or
FIsev reveal strong predictive power for child
mortality rates across countries.
What is more interesting, as shown in Model 3
and 4, is that both food security indicators main-
tain significant predictive power even when
controlling for extreme poverty. This suggests
that experience-based food insecurity
measures capture aspects related to difficulties
in access to food beyond what can be explained
in terms of monetary poverty, evidence that in-
come alone is insufficient to capture many fac-
tors that determine food security, and in partic-
ular food access, at the household level.
Expansion of this type of analysis to other poten-
tial outcomes of food insecurity and addition of
carefully selected covariates may shed light on
differences in the aspects of food insecurity cap-
tured by the FIES and the PoU, as well as the
mechanisms that link food insecurity to various
outcomes.
Table 8-4 Regression analysis of food security and poverty indicators on child mortality rates
Regression analysis of food security and poverty indicators
on child mortality rates
Response variable: Logarithm of Child Mortality Rate(1)
Model 1 Model 2 Model 3 Model 4
Standardized regression coefficient
(P-value Ho: coefficient = 0)
Log-odds(PoU(2)) 0.420
(< 0.001)
0.509
(< 0.001)
0.260
(< 0.001)
0.284
(< 0.001)
Log-odds(FImod+sev) 0.499
(< 0.001) -
0.312
(< 0.001) -
Log-odds(FIsev) - 0.409
(< 0.001) -
0.264
( < 0.001)
Log-odds (Extreme poverty(3)) - - 0.351
(<0.001)
0.373
(< 0.001)
Adjusted R-squared 0.741 0.716 0.769 0.759
N 135 135 103 103
Notes (1) Child Mortality: Under-five mortality rate is the probability per 1,000 that a newborn baby will die before reaching age five. Last
value available. Source: UNICEF, 2013 (2) PoU: Prevalence of Undernourishment. 2012-14. Source: SOFI 2014 (3) Extreme Poverty: Poverty headcount ratio at $1.25 a day (PPP) (% of population) from the World Bank (last value available in
2010-2013). When missing, it has been imputed using POVCALNET, the poverty rate calculator available from the World Bank.

30
©FAO/Alessandra Benedetti

31
Filling a gap in our ability to measure
food insecurity
FIES based procedures produces valid measures of
experienced food insecurity (access to food) that are
formally comparable across applications over populations
that differ greatly by language, culture and livelihood
conditions
This report describes the analytic developments and presents the preliminary results of
the Voices of the Hungry project – the latest FAO initiative in the field of food security
measurement. The project aims to fill an important gap in our collective ability to meas-
ure household or individual food insecurity, by developing and applying a cost effective
method to estimate the prevalence of food insecurity at different levels of severity in a
population, on a global scale.
The methodology described here is shown to produce estimates of the prevalence of food
insecurity at various levels of severity that are valid, reliable and properly comparable
across populations. The simplicity of the questionnaire and the availability of the neces-
sary software for data analysis allows obtaining results much more quickly and at a frac-
tion of the costs needed to obtain analogous measures using other approaches. Measures
based on the FIES are thus particularly attractive for monitoring food insecurity in a
timely manner, with great potential for improving food security governance, even on a
global scale. Innovations presented in this report have led to the definition of two indi-
cators – the percentages of individuals in the population aged 15 years or more, experi-
encing moderate-or-severe (FImod+sev) and severe levels of food insecurity (FIsev). The in-
dicators have been computed using the data collected by FAO with the FIES through the
GWP or, when available, national data from recent applications of experience-based
food security scales such as the HFSSM, the EMSA, the EBIA and the ELCSA, which can
be analyzed with the FIES analytic methods presented in this report.
The discussion highlights several advantages of this approach. First, the theoretical foun-
dation of the method on IRT permits statistical testing of the empirical validity and the
goodness of fit of the data collected. This implies that the data collection process can be
validated and the data evaluated in terms of their statistical reliability before computing
the indicators. Moreover, confidence intervals reflecting both measurement and sam-
pling errors can be computed, a feature that is rather uncommon among existing food
security measures. Analyses performed on the data from 146 different datasets have
shown how – with the exception of only three cases – the FIES-based methods have
yielded reliable results that can be used with confidence to compare the extent of food
insecurity across populations. Even with samples of only about 1000 individuals, con-
fidence intervals are sufficiently narrow to be able to detect relevant differences between
populations.

32
As an additional indication of the validity of the method, national prevalence rates of
moderate and severe food insecurity obtained through the FIES are significantly and
highly correlated, in the expected direction, with various other measures of economic
and human development at country level. Furthermore, the national rates of food inse-
curity prevalence reveal statistically significant coefficients when used in regression
analyses of child mortality rates across countries, even after controlling for the preva-
lence of undernourishment or of extreme poverty. This is a particularly relevant result,
as it suggests that these measures of food insecurity capture specific aspects related to
difficulties in access to food beyond what can be explained in terms of monetary poverty.
Due to the ease of FIES data collection and analysis, assessments can be produced in a
very limited time span, allowing real time monitoring. Broad use of the FIES will thus
bring undeniable advantages in generating food security information in time to guide
actions.
All of these aspects make FImod+sev and FIsev particularly apt as indicators to monitor food
insecurity on a global scale, even when obtained from relatively small samples like those
used in the GWP survey, and thus at very low cost compared to other indicators that
might provide a comparable level of detail and reliability.
The positive implications of all this for any global monitoring initiative are clear. Ideal
indicators in such contexts are policy relevant; appropriate for global monitoring (i.e.,
cross-country comparable); based on sound methodology; easy to interpret and com-
municate; sustainable and of high quality; and can be disaggregated by sub-national ge-
ographic area, gender, income class, etc. The indicators based on the FIES meets all of
these criteria, and therefore they may play an important role in monitoring the Sus-
©FAO/A.K. Kimoto

33
tainable Development Goals (SDGs) and the post-2015 development agenda, in par-
ticular Goal 2 on eradicating hunger and all forms of malnutrition. Moreover, analyses
such as those conducted within the framework of the Integrated Food Security Phase
Classification (IPC), implemented by a consortium of international organizations, would
certainly greatly benefit from the availability of analytically sound, properly comparable
indicators of food insecurity like the ones obtained with the FIES, which can be produced
at subnational level when a suitable data collection vehicle is used.
Benefits from the Voices of the Hungry project are not limited to global monitoring of
food insecurity by FAO and its partners. Through its advocacy and capacity develop-
ment activities, VoH will promote the inclusion of the FIES-SM in national censuses and
in demographic, health and agricultural surveys and provide the needed technical sup-
port. The FIES-SM is already available in more than 200 different languages or dialects
and dedicated open source software is freely available for data analysis. Countries and
institutions can choose and apply the version of the FIES-SM appropriate for their needs.
The inclusion of the module in national surveys will enable comparison of the food in-
security condition among sub-groups of the populations, i.e. according to gender, age,
income, education level, employment or geographic area. Until now, such comparisons
have been largely based on meta analyses of information derived from different indica-
tors, using data collected in a non-integrated fashion, typically in different periods, with
validity of the results dependent on unverifiable hypotheses regarding the possibility of
proper ex-post integration. The capacity to detect differences in the prevalence of food
insecurity among men and women using the FIES individual survey module is a partic-
ularly relevant innovation in the area of food security assessment. Separate assessments
of the prevalence of food insecurity among men and among women in the same popu-
lation had been hindered so far by the lack of suitable data at the individual level. The
ability to detect and understand gender related differences in food insecurity will likely
have important implications for food security policies and programmes worldwide.
The results presented in this report allow us to conclude with confidence that the FIES
produces valid measures of experienced food insecurity (access to food) that are for-
mally comparable across applications over populations that differ greatly by lan-
guage, culture and livelihood conditions. The VoH project looks forward to working
with international, national and non-governmental institutions to promote adoption of
the FIES methodology to inform food security policy and programme design, to target
resources and to monitor progress over time.
34
References
Ballard, T., Kepple, A. & Cafiero, C. 2013. The Food Insecurity Experience Scale: Devel-
opment of a Global Standard for Monitoring Hunger Worldwide. Rome, FAO.
(available at http://www.fao.org/3/a-as583e.pdf).
Coates, J. 2013. Build it back better: Deconstructing food security for improved measure-
ment and action. Global Food Security, 2(3): 188-194.
Coates, J., Frongillo, E.A., Rogers, B.L., Webb, P., Wilde, P.E. & Houser, R. 2006. Com-
monalities in the experience of household food insecurity across cultures:
what are measures missing? Journal of Nutrition 136: 1438S-1448S.
Coates, J., Swindale, A. & Bilinsky, P. 2007. Household Food Insecurity Access Scale
(HFIAS) for measurement of household food access: indicator guide (v. 3).
Washington, DC., Food and Nutrition Technical Assistance Project, Academy
for Educational Development.
FAO. 2009. Declaration of the World Summit on Food Security, World Summit on Food
Security, Rome, 16-18 November.
FAO. 2012a. Proceedings of the International Scientific Symposium on Food and Nutri-
tion Security information: from Valid Measurement to Effective Decision Mak-
ing. 17-19 January 2012. Rome.
(available at http://www.fao.org/docrep/017/i3244e/i3244e.pdf).
FAO. 2012b. Escala Latinoamericana y Caribeña de Seguridad Alimentaria (ELCSA):
Manual de uso y aplicaciones. Santiago, FAO Regional Office.
(available at http://www.fao.org/3/a-i3065s.pdf).
FAO, IFAD & WFP. 2014. The State of Food Insecurity in the World 2014. Strengthening
the enabling environment for food security and nutrition. Rome.
(available at http://www.fao.org/3/a-i4030e.pdf).
Fischer, G.H, & Molenaar, I.W. 1995. Rasch Models. Foundations, Recent Developments,
and Applications. Verlag, Springer.
Gallup. 2013. Ethiopia food security scale focus group report and recommendations.
Technical note prepared for: the Food and Agriculture Organization of the
United Nations (FAO). Rome, FAO.
(available at http://www.fao.org/fileadmin/templates/ess/voh/Gallup_FAO_-
Food_Security_in_Ethiopia_Focus_Group_Report_FINAL__08_28_13_.pdf).
Jones, A.D., Ngure, F.M., Pelto, G. & Young, S.L. 2013. What are we assessing when we
measure food security? A compendium and review of current metrics. Adv.
Nutr. 4: 481–505.
Manyamba, C. 2013. Piloting the Global Food Insecurity Experience Scale for the Gallup
World Poll in Malawi. Linguistic adaptation in Chichewa and Chitumbuka.
Rome, FAO.
(available at http://www.fao.org/fileadmin/templates/ess/voh/MALAWI___-
FIES_Language_Adaptation_Report_Aug2013.pdf).
Massaoud, M. W. & Nicoló, G.F. 2013. Rapport du travail d’adaptation du questionnaire
de l’Echelle asee sur l’Experience de l’Insecurite Alimentaire (Food Insecurity
Experience Scale - FIES) en langue Haoussa et Djerma – Niger. Rome, FAO.
(available at http://www.fao.org/fileadmin/templates/ess/voh/Niger_RAP-
PORT_Adaptation_FIES_Niger-final.pdf).

35
Maxwell, S. & Frankenberger, T.R.. 1992. Household food security: concepts, indicators,
measurements. A technical review. United Nations Children Fund and Inter-
national Fund for Agricultural Development. New York/Rome.
Nord, M. 2012. Assessing Potential Technical Enhancements to the U.S. Household Food
Security Measures Technical Bulletin No. TB-1936. Washington D.C., Eco-
nomic Research Service, United States Department of Agriculture (available at
http://www.ers.usda.gov/publications/tb-technical-bulletin/tb1936.aspx).
Nord, M. 2014. Introduction to Item Response Theory Applied to Food Security Meas-
urement: Basic Concepts, Parameters and Statistics. Rome, FAO (available at
http://www.fao.org/3/a-i3946e.pdf).
Pérez-Escamilla, R., Melgar-Quiñonez, H., Nord, M., Alvarez Uribe, M.C. & Segall-
Corrêa, A.M. 2007. Escala Latinoamericana y Caribeña de Seguridad Alimen-
taria (ELCSA) [Latinamerican and Caribbean Food Security Scale]. Perspecti-
vas en Nutrición Humana (supplement): 117-134. Antiochia.
Radimer, K.L., Olson, C.M. & Campbell, C.C. 1990. Development of indicators to assess
hunger. Journal of Nutrition, 120 Suppl (11): 1544-8.
Radimer, K.L., Olson, C.M., Greene, J.C., Campbell, C.C. & Habicht, J.P. 1992. Under-
standing hunger and developing indicators to assess it in women and chil-
dren. Journal of Nutrition Education (24) Suppl: 36-45.
Rasch, G. 1960. Probabilistic models for some intelligence and attainment tests. Copen-
hagen: The Danish Institute of Educational Research (expanded edition, 1980.
Chicago, The University of Chicago Press.)
Segall-Corrêa, A.M., Pérez-Escamilla, R., Archanjo Sampaio, M.F., Marín-Léon, L., Pani-
gassi, G., Kurdian Maranha, L. 2004. Acompanhamento e avaliação da
Segurança alimentar de Famílias Brasileiras: Validação de métodos e de
instrumento de colheita de informação: Urbano/Rural. Universidade de Cam-
pinas, 004, Relatório Técnico UNICAMP. Campinas.
Voices of the Hungry. 2015. Modeling Food Insecurity in Bivariate and Regression Anal-
yses. Rome, FAO.

36
Appendix
Table A-1 Prevalence rates of food insecurity in 146 countries, areas or territories in 2014
Prevalence rates of food insecurity in 146 countries, areas or territories in 2014§
Countries, areas or territories FImod+sev FIsev
Prev.* MoE** N1
*** N2**** Prev.* MoE** N1
*** N2****
(thousands) (thousands)
1 Afghanistan********** 45.1% (±3.92%) 7,248 14,468 20.3% (±3.35%) 3,267 6,587
2 Albania 36.2% (±3.06%) 889 1,204 9.8% (±2.06%) 242 338
3 Algeria 6.3% (±1.58%) 1,829 2,547 1.3% (±0.65%) 383 541
4 Angola 62.4% (±4.26%) 7,211 14,357 19.7% (±3.86%) 2,278 4,761
5 Argentina 13.3% (±2.82%) 4,181 5,867 4.7% (±1.52%) 1,465 1,914
6 Armenia 15.5% (±2.58%) 367 470 2.0% (±1.03%) 48 60
7 Australia 10.6% (±2.36%) 2,032 2,803 2.6% (±1.15%) 493 698
8 Austria 6.6% (±2.30%) 482 587 2.2% (±1.32%) 159 190
9 Azerbaijan† 7.8% (±1.27%) 571 705 < 0.5% (±0.18%) 29 31
10 Bahrain 18.5% (±6.72%) 199 250 7.3% (±4.72%) 79 101
11 Bangladesh 33.5% (±4.49%) 36,262 55,734 10.8% (±2.29%) 11,678 18,661
12 Belarus 8.3% (±1.95%) 661 722 < 0.5% (±0.36%) 35 36
13 Belgium 7.8% (±2.57%) 723 876 2.8% (±1.56%) 261 319
14 Belize 27.7% (±4.19%) 61 106 9.3% (±2.60%) 20 36
15 Benin 49.7% (±4.63%) 2,982 5,074 21.6% (±3.35%) 1,293 2,171
16 Bhutan† 2.8% (±0.98%) 15 19 < 0.5% (±0.04%) 1 1
17 Bolivia (Plurinational State of) 29.7% (±3.12%) 2,061 3,428 16.3% (±2.35%) 1,134 1,911
18 Bosnia and Herzegovina 8.0% (±1.86%) 252 278 0.9% (±0.54%) 29 32
19 Botswana 52.1% (±4.27%) 699 n.a. 31.6% (±4.12%) 424 n.a.
20 Brazil 8.3% (±0.20%) 12,561 19,556 < 0.5% (±0.03%) 579 948
21 Bulgaria 12.9% (±2.58%) 803 989 1.1% (±0.69%) 65 94
22 Burkina Faso 36.3% (±4.56%) 3,419 6,622 13.2% (±3.25%) 1,246 2,434
23 Burundi 79.0% (±3.71%) 4,644 8,383 40.3% (±4.19%) 2,371 4,448
24 Cambodia 53.3% (±3.34%) 5,601 8,298 24.7% (±2.80%) 2,589 3,871
25 Cameroon 50.8% (±4.13%) 6,554 11,946 26.5% (±3.29%) 3,422 6,193
26 Canada 8.0% (±1.90%) 2,368 3,022 2.0% (±0.98%) 587 788
27 Chad 61.9% (±3.97%) 4,182 8,101 20.1% (±3.27%) 1,362 2,554
28 Chile 12.0% (±2.45%) 1,661 2,622 3.7% (±1.22%) 514 731
29 China†,¥ 2.1% (±0.42%) 23,536 30,639 < 0.5% (±0.07%) 832 1,611
30 China, Hong Kong, S.A.R. 8.6% (±1.78%) 546 632 1.1% (±0.68%) 71 83
NOTES TO TABLE A-1 § All prevalence rate estimates presented in this table must be considered provisional, pending further consolidation
of the global FIES reference scale and an analysis of the stability of the FIES performance in all countries based on
the data that will be collected in the next two years. * Prevalence is the estimated percentage of individuals aged 15 or more in the national population who are food insecure. ** MoE is the margin of error at 90% confidence. *** N1 is the estimated number of individuals aged 15 or more in the national population who are food insecure. It is obtained by
multiplying the prevalence by the total number of individuals aged 15 or more in the national population (UNSD – Population Division
data, as downloaded in May 2015). **** N2 is an estimate of the number of individuals in the total population living in households where at least one individual aged 15
or more is classified as food insecure. See Annex II for details. † Estimates for Azerbaijan, Bhutan and China are subject to revision, as no satisfactory solution to the equating procedure was found.
Item severity has been imputed for all items, based on the FIES global standard. ¥ Data for China excludes Hong Kong, S.A.R and Taiwan, province of China, listed separately. Estimates for Brazil are based on data collected by the Instituto Brasileiro de Geografia y Estadistica (IBGE) in the 2013 Pesquisa Nacional por Amostra de Domicilios (PNAD) using the Escala Brasileira de Insegurança Alimentar (EBIA). FImod+sev and FIsev are computed
by calibrating the severity associated with the eight adult items of the EBIA on the FIES global reference scale and using the threshold
defined by FAO for global assessment. These prevalence rates are therefore different from the rates published by IBGE, being based
on different thresholds of severity. See Annex I for details.

37
Table A-1 Prevalence rates of food insecurity in 146 countries, areas or territories in 2014
Prevalence rates of food insecurity in 146 countries, areas or territories in 2014§
Countries, areas or territories FImod+sev FIsev
Prev.* MoE** N1
*** N2**** Prev.* MoE** N1
*** N2****
(thousands) (thousands)
31 Colombia 25.3% (±3.15%) 8,835 12,629 8.6% (±1.79%) 2,991 4,372
32 The Dem. Rep. of the Congo 73.3% (±3.88%) 27,726 52,768 40.2% (±4.90%) 15,202 29,244
33 The Congo 63.4% (±3.67%) 1,669 3,032 38.8% (±3.54%) 1,021 1,714
34 Costa Rica 19.9% (±2.41%) 738 1,049 4.4% (±1.07%) 163 236
35 Croatia 7.0% (±1.91%) 255 521 1.2% (±0.75%) 45 169
36 Cyprus 15.3% (±3.12%) 145 167 5.0% (±1.99%) 48 55
37 The Czech Republic 6.8% (±2.31%) 625 712 1.5% (±0.99%) 141 168
38 Denmark‡ 4.9% (±1.88%) 229 294 0.6% (±0.68%) 30 39
39 The Dominican Republic 53.3% (±3.59%) 3,861 5,387 18.6% (±2.18%) 1,349 1,938
40 Ecuador 22.2% (±3.79%) 2,448 3,590 8.7% (±2.50%) 956 1,447
41 Egypt 29.9% (±2.86%) 17,096 26,300 12.1% (±2.04%) 6,883 10,399
42 El Salvador 37.7% (±2.92%) 1,635 2,437 9.6% (±1.62%) 414 695
43 Estonia 8.4% (±1.71%) 91 110 1.3% (±0.60%) 14 16
44 Ethiopia 48.4% (±3.68%) 25,962 48,880 12.1% (±2.23%) 6,496 12,561
45 Finland 9.4% (±2.01%) 426 469 3.2% (±1.25%) 143 149
46 France 6.9% (±2.35%) 3,660 4,181 1.7% (±1.21%) 909 1,091
47 Gabon 56.3% (±4.28%) 591 925 35.4% (±4.01%) 372 591
48 Georgia 23.5% (±3.17%) 842 1,048 2.4% (±0.95%) 85 112
49 Germany‡ 4.3% (±1.44%) 3,064 3,527 0.7% (±0.54%) 504 570
50 Ghana 48.9% (±4.41%) 7,899 13,620 22.6% (±3.78%) 3,640 6,411
51 Greece 17.2% (±2.71%) 1,632 1,942 2.1% (±0.87%) 203 244
52 Guatemala 44.7% (±0.70%) 4,151 7,117 10.9% (±0.50%) 1,011 1,735
53 Guinea 73.6% (±3.98%) 5,065 9,051 36.1% (±4.50%) 2,482 4,514
54 Haiti 82.0% (±4.32%) 5,474 8,121 70.8% (±4.74%) 4,729 6,841
55 Honduras 56.0% (±3.53%) 2,926 4,644 23.2% (±2.71%) 1,210 1,988
56 Hungary 9.7% (±2.11%) 819 947 1.1% (±0.62%) 94 110
57 India 24.8% (±3.33%) 219,369 337,943 12.4% (±2.43%) 109,831 172,513
58 Indonesia 13.1% (±3.12%) 23,218 38,219 3.3% (±1.86%) 5,812 8,283
59 Iran (Islamic Republic of) 39.9% (±3.34%) 23,918 30,854 8.5% (±1.77%) 5,106 6,690
60 Iraq 40.4% (±3.10%) 8,255 14,355 17.6% (±2.49%) 3,595 6,215
61 Ireland 10.9% (±2.63%) 401 504 4.3% (±1.97%) 157 203
62 Israel 5.7% (±1.88%) 324 406 < 0.5% (±0.33%) 18 26
63 Italy 8.2% (±3.01%) 4,323 5,191 1.0% (±0.88%) 540 630
64 Côte d’Ivoire 53.5% (±4.87%) 6,474 10,778 18.4% (±3.26%) 2,224 3,664
65 Jamaica 43.1% (±4.44%) 857 1,141 22.9% (±3.74%) 455 608
66 Japan‡ 3.0% (±1.21%) 3,268 3,560 0.6% (±0.57%) 612 659
67 Jordan 28.5% (±3.21%) 1,386 2,278 13.7% (±2.27%) 666 1,095
68 Kazakhstan 10.2% (±1.87%) 1,272 1,804 0.7% (±0.53%) 91 97
69 Kenya 57.9% (±3.67%) 15,152 27,407 31.7% (±3.34%) 8,281 15,320
70 Kosovo§ 17.3% (±2.55%) 267 316 4.5% (±1.35%) 70 84
71 Kuwait 13.6% (±2.49%) 355 448 4.9% (±1.52%) 127 156
‡ For Denmark, Germany, Japan, Netherlands, Norway, Singapore, Sweden and Switzerland there were too few (less than 100) cases
with non-extreme response patterns to allow robust estimation of item parameters, which have therefore been imputed using the
global FIES reference scale. These estimates are subject to revision, when more valid cases from these countries will be available. Estimates for Guatemala are based on data collected by the Instituto Nacional de Estadistica (INE) in the 2011 Encuesta Nacional de Condición de Vida (ENCOVI) using the ELCSA. FImod+sev and FIsev are computed by calibrating the severity associated with the nine
adult items of the ELCSA on the corresponding items in the FIES global reference scale, and using the threshold defined by FAO for
global assessment. These prevalence rates are different from rates published by INE, being based on different severity thresholds.
See Annex I for details. § References to Kosovo shall be understood to be in the context of the U.N. Security Council resolution 1244 (1999).

38
Table A-1 Prevalence rates of food insecurity in 146 countries, areas or territories in 2014
Prevalence rates of food insecurity in 146 countries, areas or territories in 2014§
Countries, areas or territories FImod+sev FIsev
Prev.* MoE** N1
*** N2**** Prev.* MoE** N1
*** N2****
(thousands) (thousands)
72 Kyrgyzstan 20.5% (±3.71%) 807 1,239 5.9% (±2.24%) 234 395
73 Latvia 10.4% (±1.86%) 182 219 1.8% (±0.69%) 32 38
74 Lebanon 7.8% (±2.43%) 295 426 2.0% (±1.17%) 76 116
75 Liberia 84.8% (±2.92%) 2,112 3,727 63.9% (±3.70%) 1,593 2,817
76 Lithuania 19.6% (±3.69%) 500 601 3.3% (±1.24%) 84 98
77 Luxembourg 6.3% (±1.97%) 28 31 2.4% (±1.20%) 11 12
78 The former Yugoslav
Republic of Macedonia 15.9% (±3.11%) 278 360 5.3% (±1.73%) 92 117
79 Madagascar 53.9% (±4.38%) 7,184 13,227 12.3% (±2.50%) 1,643 3,185
80 Malawi 86.6% (±2.18%) 7,899 14,364 56.1% (±3.19%) 5,114 9,317
81 Malaysia 19.8% (±2.91%) 4,314 5,779 10.0% (±2.17%) 2,194 3,006
82 Mali 17.9% (±3.44%) 1,506 2,879 2.6% (±1.22%) 219 372
83 Malta 5.9% (±1.39%) 22 31 1.5% (±0.73%) 6 8
84 Mauritania 19.7% (±3.64%) 467 815 7.0% (±2.09%) 166 284
85 Mauritius 9.3% (±2.04%) 91 134 3.6% (±1.23%) 36 58
86 Mexico 26.9% (±1.07%) 24,736 36,099 3.9% (±0.41%) 3,586 5,510
87 Republic of Moldova 11.9% (±1.82%) 342 409 1.1% (±0.58%) 33 38
88 Mongolia 13.8% (±2.88%) 290 409 1.0% (±0.60%) 21 32
89 Montenegro 14.2% (±2.42%) 71 91 1.7% (±0.85%) 9 11
90 Morocco 25.6% (±3.16%) 6,157 8,673 8.1% (±1.80%) 1,958 2,732
91 Myanmar 11.1% (±2.35%) 4,426 6,349 1.0% (±0.65%) 403 558
92 Namibia 61.3% (±3.70%) 897 1,502 42.2% (±3.51%) 617 1,049
93 Nepal 21.2% (±2.78%) 3,747 6,566 8.3% (±1.85%) 1,476 2,551
94 The Netherlands‡ 5.5% (±1.86%) 758 921 0.8% (±0.82%) 108 135
95 New Zealand 9.3% (±2.00%) 335 465 2.9% (±1.24%) 106 140
96 Nicaragua 42.3% (±2.90%) 1,711 2,733 15.6% (±2.01%) 631 1,020
97 Niger 57.6% (±4.25%) 5,355 11,049 18.4% (±3.22%) 1,710 3,480
98 Nigeria 52.7% (±5.06%) 52,623 92,246 26.8% (±4.42%) 26,814 45,203
99 Norway‡ 3.9% (±0.45%) 161 215 0.6% (±0.23%) 25 40
100 Pakistan 44.2% (±3.57%) 52,856 89,260 16.8% (±2.89%) 20,128 35,835
101 Palestine 27.6% (±3.73%) 709 1,303 10.0% (±2.46%) 258 495
102 Panama 28.7% (±3.72%) 798 1,201 10.9% (±2.34%) 302 470
103 Paraguay 32.8% (±3.98%) 1,509 2,373 4.5% (±1.49%) 209 346
104 Peru 27.5% (±3.02%) 5,927 9,292 8.5% (±1.83%) 1,831 2,646
105 The Philippines 45.7% (±3.59%) 29,610 48,366 12.0% (±2.11%) 7,793 13,271
106 Poland 12.1% (±1.98%) 3,919 5,348 2.8% (±0.99%) 912 1,679
107 Portugal 14.0% (±2.78%) 1,262 1,483 4.3% (±1.73%) 387 461
108 Puerto Rico 18.1% (±4.14%) 530 675 7.5% (±2.50%) 221 275
109 Romania 18.9% (±2.66%) 3,476 4,591 6.3% (±1.50%) 1,156 1,480
110 The Russian Federation 6.5% (±1.32%) 7,862 8,649 0.7% (±0.39%) 792 924
Due to limited coverage of the 2014 GWP samples, estimates for Madagascar, Mali, Myanmar, Somalia, South Sudan, The Sudan
and Viet Nam may not be representative of the entire national population. Estimates for Mexico are based on data collected by the Instituto Nacional de Estatística y Geografia (INEGI) in the 2012 Encuesta
Nacional de Ingresos y Gastos de Hogares (ENIGH) using the EMSA. FImod+sev and FIsev are computed by calibrating the severity associated
with the eight adult items of the EMSA on the corresponding items in the FIES global reference scale and using the threshold defined
by FAO for global assessment. These prevalence rates are different from the rates published by INEGI, being based on different severity thresholds. See Annex I for details. ‡ For Denmark, Germany, Japan, Netherlands, Norway, Singapore, Sweden and Switzerland there were too few (less than 100) cases
with non-extreme response patterns to allow robust estimation of item parameters, which have therefore been imputed using the
global FIES reference scale. These estimates are subject to revision, when more valid cases from these countries will be available.

39
Table A-1 Prevalence rates of food insecurity in 146 countries, areas or territories in 2014
Prevalence rates of food insecurity in 146 countries, areas or territories in 2014§
Countries, areas or territories FImod+sev FIsev
Prev.* MoE** N1
*** N2**** Prev.* MoE** N1
*** N2****
(thousands) (thousands)
111 Rwanda 34.7% (±4.85%) 2,325 4,608 10.6% (±2.86%) 708 1,388
112 Saudi Arabia 23.6% (±2.89%) 4,795 6,877 10.0% (±2.10%) 2,040 3,231
113 Senegal 22.5% (±3.07%) 1,845 3,365 5.4% (±1.77%) 441 765
114 Serbia 10.0% (±2.22%) 787 1,047 0.9% (±0.60%) 74 78
115 Sierra Leone 67.7% (±3.96%) 2,431 4,248 46.4% (±4.45%) 1,665 2,933
116 Singapore‡ 4.3% (±1.17%) 197 204 1.1% (±0.59%) 51 53
117 Slovakia 6.0% (±1.99%) 278 369 0.8% (±0.55%) 39 55
118 Slovenia 12.2% (±2.33%) 218 254 1.5% (±0.88%) 27 33
119 Somalia 46.2% (±3.61%) 2,612 5,287 28.0% (±3.09%) 1,584 3,305
120 South Africa 41.2% (±3.43%) 15,398 22,574 21.0% (±2.79%) 7,846 11,494
121 Republic of Korea 7.9% (±2.47%) 3,263 4,234 0.9% (±0.82%) 362 460
122 South Sudan 92.3% (±1.90%) 6,191 10,854 76.2% (±3.24%) 5,116 8,936
123 Spain 7.1% (±2.14%) 2,850 3,715 1.5% (±1.12%) 584 849
124 Sri Lanka 17.7% (±2.10%) 2,847 4,137 7.1% (±1.97%) 1,135 1,711
125 The Sudan 44.1% (±4.59%) 9,911 20,662 20.5% (±4.11%) 4,605 9,238
126 Sweden‡ 3.1% (±1.01%) 253 305 0.5% (±0.42%) 37 44
127 Switzerland‡ 3.0% (±1.03%) 209 296 < 0.5% (±0.28%) 18 20
128 Taiwan Province of China 3.6% (±1.21%) 744 876 0.8% (±0.62%) 158 186
129 Tajikistan 14.6% (±2.84%) 785 1,172 4.3% (±1.81%) 230 343
130 United Republic of Tanzania 49.9% (±4.70%) 13,964 26,407 23.9% (±3.65%) 6,683 12,556
131 Thailand 4.8% (±1.82%) 2,629 3,084 < 0.5% (±0.33%) 201 234
132 Togo 65.5% (±4.44%) 2,653 4,632 34.4% (±4.33%) 1,394 2,452
133 Tunisia 17.5% (±4.36%) 1,488 2,016 10.3% (±3.67%) 873 1,197
134 Turkey 31.3% (±3.15%) 17,426 n.a. 5.4% (±1.40%) 3,002 n.a.
135 Uganda 69.8% (±4.42%) 13,859 28,325 36.1% (±4.22%) 7,181 15,435
136 Ukraine 12.3% (±3.04%) 4,751 5,064 1.0% (±0.74%) 384 401
137 The United Arab Emirates 10.8% (±2.62%) 880 967 3.5% (±1.93%) 286 315
138 The United Kingdom 10.1% (±2.88%) 5,315 8,399 4.5% (±2.11%) 2,357 4,660
139 United States of America 10.2% (±0.27%) 25,755 33,252 1.2% (±0.08%) 2,849 3,488
140 Uruguay 15.9% (±2.47%) 422 610 5.1% (±1.39%) 135 201
141 Uzbekistan 11.1% (±1.95%) 2,288 3,340 2.2% (±0.82%) 457 689
142 Venezuela (Bolivarian Rep. of) 27.6% (±5.53%) 6,012 8,686 11.9% (±3.73%) 2,596 3,888
143 Viet Nam 16.8% (±2.42%) 11,921 15,331 1.1% (±0.49%) 775 1,018
144 Yemen 34.4% (±3.30%) 4,982 9,114 7.9% (±1.77%) 1,147 2,067
145 Zambia 73.1% (±3.73%) 5,827 11,164 43.2% (±4.04%) 3,441 6,694
146 Zimbabwe 57.9% (±4.09%) 4,966 8,559 32.1% (±3.66%) 2,750 4,887
‡ For Denmark, Germany, Japan, Netherlands, Norway, Singapore, Sweden and Switzerland there were too few (less than 100) cases
with non-extreme response patterns to allow robust estimation of item parameters, which have therefore been imputed using the
global FIES reference scale. The estimates presented here are therefore subject to possible revision in the future, when more valid
cases from these countries will be available. Due to limited coverage of the 2014 GWP samples, estimates for Madagascar, Mali, Myanmar, Somalia, South Sudan, The Sudan
and Viet Nam may not be representative of the entire national population. Estimates for the United States of America are based on data collected by the US Census Bureau in the Decemebr 2013 Current Population Survey Food Security Supplemental using the US Household Food Security Survey Module. FImod+sev and FIsev are computed
by calibrating the severity associated with the eight adult items of the US HFSSM on the FIES global reference scale and using the
threshold defined by FAO for global assessment. These prevalence rates are therefore different from the rates published by USDA based
on different severity thresholds.
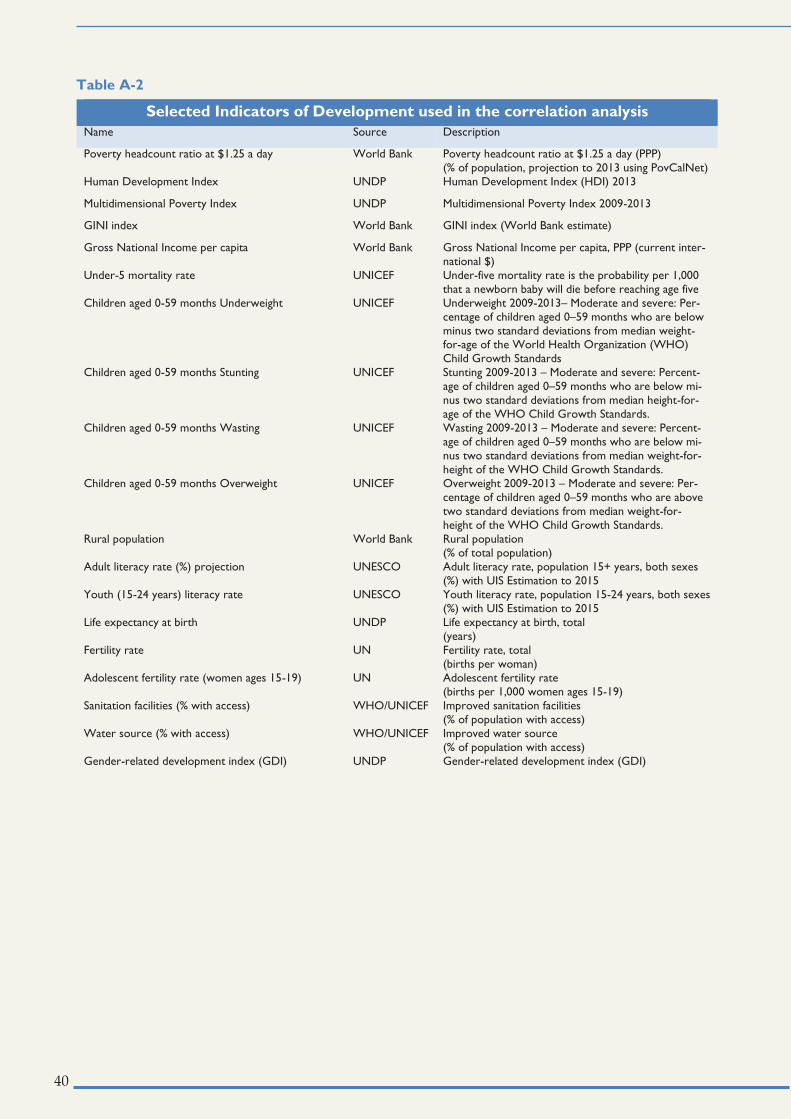
40
Table A-2 Selected Indicators of Development used in the correlation analysis
Selected Indicators of Development used in the correlation analysis
Name Source Description
Poverty headcount ratio at $1.25 a day World Bank Poverty headcount ratio at $1.25 a day (PPP)
(% of population, projection to 2013 using PovCalNet)
Human Development Index UNDP Human Development Index (HDI) 2013
Multidimensional Poverty Index UNDP Multidimensional Poverty Index 2009-2013
GINI index World Bank GINI index (World Bank estimate)
Gross National Income per capita World Bank Gross National Income per capita, PPP (current inter-
national $)
Under-5 mortality rate UNICEF Under-five mortality rate is the probability per 1,000
that a newborn baby will die before reaching age five
Children aged 0-59 months Underweight UNICEF Underweight 2009-2013– Moderate and severe: Per-
centage of children aged 0–59 months who are below
minus two standard deviations from median weight-for-age of the World Health Organization (WHO)
Child Growth Standards
Children aged 0-59 months Stunting UNICEF Stunting 2009-2013 – Moderate and severe: Percent-
age of children aged 0–59 months who are below mi-
nus two standard deviations from median height-for-
age of the WHO Child Growth Standards.
Children aged 0-59 months Wasting UNICEF Wasting 2009-2013 – Moderate and severe: Percent-
age of children aged 0–59 months who are below mi-
nus two standard deviations from median weight-for-
height of the WHO Child Growth Standards.
Children aged 0-59 months Overweight UNICEF Overweight 2009-2013 – Moderate and severe: Per-
centage of children aged 0–59 months who are above
two standard deviations from median weight-for-
height of the WHO Child Growth Standards.
Rural population World Bank Rural population
(% of total population)
Adult literacy rate (%) projection UNESCO Adult literacy rate, population 15+ years, both sexes
(%) with UIS Estimation to 2015
Youth (15-24 years) literacy rate UNESCO Youth literacy rate, population 15-24 years, both sexes
(%) with UIS Estimation to 2015
Life expectancy at birth UNDP Life expectancy at birth, total
(years)
Fertility rate UN Fertility rate, total
(births per woman)
Adolescent fertility rate (women ages 15-19) UN Adolescent fertility rate
(births per 1,000 women ages 15-19)
Sanitation facilities (% with access) WHO/UNICEF Improved sanitation facilities
(% of population with access)
Water source (% with access) WHO/UNICEF Improved water source
(% of population with access)
Gender-related development index (GDI) UNDP Gender-related development index (GDI)

41
Annex I - Prevalence Rates Based on
National Government Survey Data
A.1 General remarks
The Voices of the Hungry (VoH) Project encourages, and provides technical support for,
collection of food insecurity experience data in nationally representative surveys con-
ducted by government statistical agencies. Prevalence rates published in this report are
based on national government survey data rather than GWP data for countries in which
such data have been collected within the last three years, provided that the data can be
made reasonably comparable with the data collected on the FIES administered in the
GWP. In the present report, this includes Brazil, Mexico, Guatemala and the United
States.
It should be noted that prevalence rates in this report for the four countries differ from
those published in the official reports of the respective national statistical agencies,
mainly due to the difference in the threshold used for classification. National statistical
agencies use thresholds based on raw score, with no attention given to the possibility of
equating them to thresholds used in other countries. In order for prevalence rates for
these countries to be comparable with rates estimated for other countries using the GWP
data, they must be based on the same methodology and thresholds of severity as are
used for the GWP data. This annex provides the official statistics for each country and
describes the differences in methodology and thresholds that account for the difference
between the prevalence rates published here and the official rates published for each
country. The most important differences are described below.
Different thresholds of severity.
Population prevalence rates of food insecurity are based on categories, or ranges of se-
verity of food insecurity defined against thresholds of severity. However, the underly-
ing measure of severity of food insecurity is essentially a continuous measure and the
specification of thresholds is statistically arbitrary. Each country specifies thresholds of
severity to demarcate ranges of severity of food insecurity that are judged to have policy
relevance, and gives labels to those ranges so as to facilitate understanding by policy
officials and the general public of the severity represented by each prevalence rate. How-
ever, the ranges of severity that are relevant in a high-income or middle-income country
may be quite different from ranges of severity that are informative in very low-income
countries. The thresholds specified on the VoH Global Standard scale, especially the
threshold for severe food insecurity, are more severe than those of any of the countries
for which national government data are currently available. This is consistent with the
purpose of these statistics, which is to provide information on countries with more se-
vere conditions of food insecurity. For example, the threshold for severe food insecurity
(labeled “very low food security” in the United States) is at the level of severity where
individuals have reduced food intake below usual levels what they consider appropri-
ate. On the VoH Global Standard, the threshold for severe food insecurity is at the level
of severity where individuals have, at times, gone a whole day without eating. Similarly,
in most countries with established food security monitoring, the threshold for moderate
food insecurity (labeled “low food security” in the United States) represents primarily
reductions in quality, variety, and desirability of meals, whereas on the VoH Global

42
standard, the threshold with that same label represents at least some reduction in quan-
tity of food intake below levels considered appropriate. As such, prevalence rates in ta-
ble A-I of this report — especially the rates of severe food insecurity — are generally
lower than the officially reported prevalence rates, with differences in thresholds ac-
counting for most of the differences in prevalence rates. [An analogy: The percentage of
a population who are elderly is smaller if elderly is defined as “70 or older” than if el-
derly is defined as “55 or older”].39
Difference in reference period.
The GWP asks each question in the FIES with reference to “the last 12 months.” The 12-
month reference period is essential in order to avoid possible biases due to seasonality,
since the survey is conducted during a few weeks and at different times of the year
across a large number of countries. Official food insecurity prevalence rates for the U.S.
and Canada are also based on a 12-month reference period, but those for Brazil, Guate-
mala, and Mexico are based on a 3-month reference period. (Respondent recall for a
shorter reference period is considered to be more accurate and the 3-month reference
may be preferable to a 12-month reference provided seasonality is not considered sub-
stantial enough to bias results.) Prevalence rates over a three-month period will be lower
than those over a 12-month period since not all food insecurity is chronic or continuous.
The extent of the difference depends on the volatility of food insecurity and may differ
from country to country. Based on information available from the U.S. where a second
nationally representative survey uses a 30-day reference period, the difference between
a 3-month and 12-month reference period are not expected to be substantial, but it
should be kept in mind that prevalence rates for Brazil, Guatemala, and Mexico in table
A-1 may be biased slightly downward compared with those of other countries due to
the different reference periods employed.
Difference in reporting unit.
The GWP is a survey of individual adults (aged 15 and older), and food insecurity prev-
alence rates are expressed as percentages of adults. The FIES questions (with one excep-
tion) ask only about the food insecurity experiences of the sampled adult. In contrast,
most national government surveys are household-referenced and the most commonly
cited official prevalence rates are expressed percentages of households. The food secu-
rity questions in those surveys ask about 'you or other adults in the household' and 'any
child in the household' and the household is considered food insecure if anyone is food
insecure. Some countries also report the percentages of adults (usually ages 18 and
older) by the food security status of their household, but it is not known if all adults in
the household were food insecure. Statistics in table A-3 are calculated from microdata
and represent individuals ages 15 and older, but the reported food security status is that
of their household. It is likely that this biases prevalence rates for these countries upward
somewhat vis-a-vis prevalence rates based on the GWP, since food security status may
differ between adults in the same household.
39 Brazil, Guatemala and Mexico also report prevalence of “mild” food insecurity, and this category is sometimes
included in statistics on overall food insecurity. Canada and the US specify a category of “marginal food security” in
their data products, but do not generally report statistics for this less severe range of food insecurity and do not
include the category in the totals reported as food insecure.
43
A.2 National Government Survey Data Comparisons
Brazil
Data were collected in the Pesquisa Nacional de Amostra de Domicílios – PNAD (National
Household Survey) conducted by the Instituto Nacional de Geografia e Estatística (IBGE)
in 2013. The sample used by VoH to calculate prevalence estimates included 280,107
individuals ages 15 and older in 116,540 households. The Brazilian food insecurity scale,
or Escala Brasileira de Insegurança Alimentar (EBIA) which was included as a supplement
in the survey, includes eight adult and household referenced questions and six child-
referenced questions. The EBIA is referenced to the household and to the three months
prior to the survey. In the official Brazilian statistics, the food security status of house-
holds with children is based on responses to all 14 items, while that of households with
no children is based on responses to the eight adult/household items.
To be as consistent as possible with the methodology used in the GWP, to measure the
food security status of households the scale based only on the adult and household ques-
tions was used. Responses to those items were fit to the Rasch model, household
weighted with one record for each household and the scale was adjusted to the VoH
Global Standard metric based on the item parameters. The complete and non-extreme
sample used to estimate the Rasch model included 25,450 households, giving very pre-
cise item parameter estimates. Two items, RANOUT and WHLDAY, were considered
unique (not comparable with the VoH Global Standard) a priori because their cognitive
content differs between the EBIA and the FIES. The remaining six items matched very
well to the Global Standard. The largest deviation was .26 units on the Global Standard,
or about .35 logits and the correlation among common items was .973, giving confidence
that prevalence results calculated against the VoH Global Standard thresholds were
comparable with those of countries in the GWP. Standard VoH methodology was then
used to estimate prevalence rates of food insecurity using person-weighted data and
attributing the raw score for a household to all individuals aged 15 and older in the
household.
According to the official statistics for Brazil, 22.6 percent of households experienced
some level of food insecurity (including mild food insecurity) in 2013 (table A-3). This
total included 7.8 percent with either moderate or severe food insecurity and 3.2 percent
with severe food insecurity. Published statistics for individuals by age give similar re-
sults for adults ages 18 and older; 7.8 percent either moderately or severely food insecure
and 3.1 percent with severe food insecurity. Including older children (ages 15 and older)
along with adults increased prevalence rates only slightly. Classifying those same indi-
viduals using only the eight adult/household items resulted in somewhat higher preva-
lence rates (10.6 percent moderate or severe, including 4.2 percent severe).40 Finally, clas-
sifying those same individuals probabilistically (i.e. based on raw score, but taking
measurement error into account) gives the VoH prevalence rates published in table A-1
and repeated in the far right column of table A-3: 8.3 percent moderate or severe, includ-
ing 0.4 percent severely food insecure. The difference between the final two columns is
entirely due to the greater severity of the VoH thresholds.
40 The higher prevalence rate based only on adult and household items is because the raw score-based thresholds
for moderate food insecurity and severe food insecurity in the EBIA classification system are higher on the 15-item
scale applied to households with children compared to the 8-item scale applied to households with no children, used
for this report to be more comparable with classifications based on the FIES.

44
Guatemala
Data were collected in the Encuesta Nacional de Condiciones de Vida (ENCOVI) conducted
by the Instituto Nacional de Estadística (INE) in 2011. The sample used by VoH to calculate
prevalence estimates included 12,667 households, with 40,509 individuals ages 15 and
older. The Latin American and Caribbean Food Security Scale, or Escala Latinoamericana
y Caribeña de Seguridad Alimentaria (ELCSA), included as a supplement in the survey,
includes eight adult and household referenced questions and seven child-referenced
questions. The ELCSA is referenced to the household and to the three months prior to
the survey. In the official statistics, the food security status of households with children
is based on responses to all 15 items, while that of households with no children is based
on responses to the eight adult/household items.
Here a scale based only on the adult and household questions was used to measure the
food security status of households to be as consistent as possible with the methodology
used in the GWP. Responses to those items were fit to the Rasch model, household
weighted with one record for each household and the scale was adjusted to the VoH
Global Standard metric based on the item parameters. The complete and non-extreme
sample used to estimate the Rasch model included 9,476 households. Two items, WOR-
RIED and SKIPPED, were considered unique (not comparable with the VoH Global
Standard). The remaining six items matched well to the Global Standard. The largest
deviation was .36 units on the Global Standard metric, or about .45 logits, and the cor-
relation among common items was .989, giving confidence that prevalence results cal-
culated against the VoH Global Standard thresholds were comparable with those of
countries in the GWP. Standard VoH methodology was then used to estimate preva-
lence rates of food insecurity using person-weighted data and attributing the raw score
for a household to all individuals aged 15 and older in the household.
According to the published statistics for Guatemala based on official thresholds, 80.8
percent of households experienced some level of food insecurity (including mild food
insecurity) in 2011 (table A-3). This total included 41.5 percent with either moderate or
severe food insecurity and 14.4 percent with severe food insecurity. Calculated statistics
for individuals by age give slightly higher results for adults ages 18 and older: 42.8 per-
cent either moderately or severely food insecure and 16.8 percent with severe food inse-
curity. Including older children (ages 15 and older) along with adults increased preva-
lence rates only slightly. Classifying those same individuals using only the eight
adult/household items resulted in somewhat lower prevalence rates (45.9 percent mod-
erate or severe, including 15.6 percent severe). Finally, classifying those same individu-
als probabilistically (i.e. based on raw score, but taking measurement error into account)
gives the VoH prevalence rates published in table A-1 and repeated in the far right col-
umn of table A-3: 44.7 percent moderate or severe, including 10.9 percent severely food
insecure. The difference between the final two columns is entirely due to the greater
severity of the VoH thresholds.
Mexico
Data were collected in the Encuesta Nacional de Ingresos y Gastos de los Hogares (ENIGH)
conducted by the Instituto Nacional de Geografia e Estatística in 2012. The sample used by
VoH to calculate prevalence estimates included 9,000 households, with 23,920 individ-
uals ages 15 and older. The Mexican food security scale, or Escala Mexicana de Seguridad
Alimentaria (EMSA), included as a supplement in the survey, includes nine adult and

45
household referenced questions and seven child-referenced questions. The EMSA is ref-
erenced to the household and to the three months prior to the survey. In the official
Mexican statistics, the food security status of households with children is based on re-
sponses to all 16 items, while that of households with no children is based on responses
to the nine adult/household items.
Again, a scale based only on the adult and household questions was used to measure
the food security status of households to be as consistent as possible with the method-
ology used in the GWP. Responses to those items were fit to the Rasch model, household
weighted with one record for each household, and the scale was adjusted to the VoH
Global Standard metric based on the item parameters. The complete and non-extreme
sample used to estimate the Rasch model included 4,834 households. Two items,
RUNOUT and WHLDAY, resulted to be unique when compared to the severities on the
Global Standard, while the item “Mendigar por comida” was considered unique a priori
because conceptually not comparable with any of the FIES questions. The remaining six
items matched reasonably well to the Global Standard. The largest deviation was .47
units for the WORRIED item on the Global Standard metric, or about .56 logits, and the
correlation among common items was .956, giving confidence that prevalence results
calculated against the VoH Global Standard thresholds were comparable with those of
countries in the GWP. Standard VoH methodology was then used to estimate preva-
lence rates of food insecurity using person-weighted data and attributing the raw score
for a household to all individuals aged 15 and older in the household.
According to the calculated statistics for Mexico based on official thresholds, 21.8 per-
cent of households experienced either moderate or severe food insecurity in 2012 (table
A-3), 9.5 percent with severe food insecurity. Calculated statistics for individuals by age
give similar results for adults ages 18 and older: 21.3 percent either moderately or se-
verely food insecure and 8.9 percent with severe food insecurity. Including older chil-
dren (ages 15 and older) along with adults increased prevalence rates only slightly. Clas-
sifying those same individuals using only the adult/household items resulted in approx-
imately the same moderate and severe prevalence rate (21.7 percent), and severe preva-
lence rate (9.0 percent). Finally, classifying those same individuals probabilistically (i.e.
based on raw score, but taking measurement error into account) gives the VoH preva-
lence rates published in table A-I and repeated in the far right column of table A-3: 26.9
percent moderate or severe, including 3.9 percent severely food insecure. The difference
between the final two columns is entirely due to the different severity of the VoH thresh-
olds.
United States
Data were collected in the Current Population Survey Food Security Supplement (CPS-
FSS) by the U.S. Census Bureau in December 2013 and analyzed and reported by the
Economic Research Service (ERS) of the U.S. Department of Agriculture (Coleman-Jen-
sen et al., 2014). The sample included 83,303 individuals ages 15 and older in 42,014
households with valid food security data. The U.S. Household Food Security Scale
(USHFSS) includes 10 adult and household referenced questions and eight child-refer-
enced questions if there are children in the household.41 The USHFSS is referenced to
41 More precisely, the US-HFSSM comprises eight adult and household items and seven child reference items if the
household includes children. Two of the adult-referenced items and one child-referenced item include follow up
questions to affirmative responses asking, “how many times did this happen?” The base (yes/no) question and follow-
up question in each case are analyze as a single item with three categories, using a Rasch partial credit measurement
model.

46
the household (i.e. questions ask about “you or other adults in the household” and about
“any child in the household”) and to the 12 months prior to the survey. In the official
U.S. household statistics, the food security status of households with children is based
on responses to all 18 items, while that of households with no children is based on re-
sponses to the 10 adult and household items. However, ERS also publishes prevalence
rates for adults (18 and older) based only on the 10 adult and household items.
Once again, in order to be consistent with the methodology used in the GWP, a scale
based only on the adult and household questions was used to measure the food security
status of households. Responses to those items were fit to the Rasch model, household
weighted, with one record for each household, and the scale was adjusted to the VoH
Global Standard metric based on the item parameters. The complete and non-extreme
sample used to estimate the Rasch model included 8,693 households, which provides
very precise item parameter estimates. Two items, RANOUT and SKIPPED, were con-
sidered unique (not comparable with the VoH Global Standard) a priori because their
cognitive content differs between the USHFSS and the FIES. The lower Rasch-Thurstone
threshold for the two items with “how often did this happen?” follow-up questions was
considered equivalent to the corresponding yes/no item in the FIES. The BALANCED
MEALS question in the USHFSS was considered equivalent to both HEALTHY and
FEWFOODS in the FIES, resulting in six items considered equivalent between the scales.
The severity parameters of these six items matched well to the Global Standard. The
largest deviation was .30 units on the Global Standard, or about .45 logits and the corre-
lation among common items was .984, giving confidence that prevalence results calcu-
lated against the VoH Global Standard thresholds were comparable with those of coun-
tries in the GWP. Standard VoH methodology was then used to estimate prevalence
rates of food insecurity, using person-weighted data and attributing the raw score for a
household to all individuals ages 15 and older in the household.
According to the official statistics for the United States, 14.3 percent of households were
food insecure (i.e. with low or very low food security) in 2013, including 5.6 percent with
severe food insecurity (i.e. very low food security; table A-3). Published statistics for
adults ages 18 and older are slightly lower, 14.0 and 5.1 percent. Including older children
(ages 15 and older) along with adults lowers the prevalence of food insecurity to 13.4
percent, but increases the prevalence of severe food insecurity (very low food security)
to 5.4 percent. Column 4 does not differ from column 3 in the U.S. since both are based
only on adult and household items. Finally, classifying those same individuals proba-
bilistically (i.e. based on raw score, but taking measurement error into account) gives
the VoH prevalence rates published in table A-1 and repeated in the rightmost column
of table A-3: 10.2 percent moderate or severe, including 1.2 percent severely food inse-
cure. The difference between the final two columns is entirely due to the greater severity
of the VoH thresholds.

47
Table A-3 Prevalence rates calculated from national government survey data and from FAO- GWP data.
Prevalence rates calculated from national government survey data
and from FAO- GWP data*
Country and range of severity (A) (B)
(A1) (A2)1 (A3)2 (A4) (B1)3
Brazil (2013)4
Mild, moderate, or severe food insecurity 22.6
Moderate or severe food insecurity 7.8 7.8 7.9 10.6 8.3 (0.2)
Severe food insecurity 3.2 3.1 3.2 4.2 0.4 (0.03)
Guatemala (2011)4
Mild, moderate, or severe food insecurity 80.8 80.8 82.0 83.2
Moderate or severe food insecurity 41.5 42.8 44.5 45.9 44.7 (0.7)
Severe food insecurity 14.4 16.8 19.5 15.6 10.9 (0.5)
Mexico (2012) 4
Moderate or severe food insecurity 21.8** 21.3 21.7 19.2 26.9 (1.07)
Severe food insecurity 9.5** 8.9 9.0 9.3 3.9 (0.41)
United States (2013)
Moderate or severe food insecurity
(Low or very low food security) 14.3 14.0 13.4 13.4 10.2 (0.27)
Severe food insecurity (Very low food security)
5.6 5.1 5.4 5.4 1.2 (0.08)
(A) – Based on discrete assignment of food security status by raw score, and national thresholds for food security status
(A1) – Published (Household)
(A2) – Published adults (18+) by food security status of household
(A3) – Adults (15+) by food security status of household; classification based on national classification system
(A4) – Adults (15+) by food security status of household; classification based on adult items only
(B) – Based on probabilistic food security status assignment, and VoH global thresholds
(B1) - Adults (15+) by food security status of household based on adult items. Margins of Error (MoE) at 90% confidence in paren-theses.
Notes:
* The prevalence rate calculated from national government survey data are compared with rates for the same countries, using the
same data, calculated to be comparable with rates for other countries based on the Food Insecurity Experience Scale administered
in the Gallup World Poll.
** These prevalence rates are not, in fact, the official published rates for Mexico, because they are based on households rather than
persons, and because the Mexico official rate omits households for which other measures of poverty are not available. 1 Published percentages, or calculated from published statistics by age. 2 Calculated from national government survey microdata. 3 These are the statistics most directly comparable with statistics for other countries published in table A-I. 4 All Brazil, Guatemala and Mexico national government statistics based on a 3-month reference period

48
Annex II - Number of food insecure adults
and number of individuals in the total
population affected by food insecurity
This Annex explains how the figures included in Table A-1, columns labeled “N1” and
“N2” for both moderate or severe and severe food insecurity are computed.
VoH main outputs are prevalence rates (percentages) of moderate and severe food inse-
curity (%MOD+SEV) and of severe food insecurity (%SEV) among adults, defined as individ-
uals older than 15, which compose the reference population of the GWP.
The corresponding numbers of food insecure adults (15 or older) in the national popu-
lation are therefore easily obtained as
𝑁1,𝑀𝑂𝐷+𝑆𝐸𝑉 = %𝑀𝑂𝐷+𝑆𝐸𝑉 × 𝑃𝑜𝑝15+
and
𝑁1,𝑆𝐸𝑉 = %𝑆𝐸𝑉 × 𝑃𝑜𝑝15+
where Pop15+ is the national population of individuals aged 15 or more, obtained from
United Nations Department of Economic and Social Affairs, Population Division, 2015
revision.
When analyzing the numbers reported in the columns labeled “N1” against other closely
related indicators – such as the number of individuals in extreme poverty (published by
the World Bank) and the number of people undernourished (published by FAO) – care
should be taken in recognizing that these other indicators usually refer to individuals of
all ages.
To estimate the number of individuals of all ages who are food insecure or live in food
insecure household at the two levels of severity, we therefore need to compute also an
estimate of the number of children (i.e. individuals aged 14 or less) who live in house-
holds where an adult is found to be food insecure. Let us call these numbers N3.
The procedure to obtain an estimate of N3 is as follows:
Step 1: Estimate an approximate "children weight" for each sampled adult as:
children weight = 𝑤𝑡
Nadults × 𝑁children
where wt is the GWP post-stratification adult weight.
As only one adult is sampled in each household reached by the GWP, dividing the post-
stratification weight by the number of eligible adults in that household creates an ap-
proximate household sampling weight. Multiplying it by the number of children living
in the same household gives an estimate of the number of children represented by the
sampled adult.42
Step 2: Calculate a weighted distribution of children across raw scores, using the chil-
dren weights and the corresponding adult raw scores.
Step 3: Multiply the probability of belonging to a food insecurity class, conditional on a
given raw score, by the weighted proportion of children associated with that raw score.
42 Gallup reports both the number of eligible adults and the number of children in each sampled household.

49
(Recall that the probability of being food insecure conditional on Raw score zero is as-
sumed to be zero.)
Step 4: Sum the products obtained in Step 3 across raw scores to obtain an estimate of
the prevalence of food insecurity in each severity class among children (14 and younger),
that is %𝑀𝑂𝐷+𝑆𝐸𝑉𝑐ℎ𝑖𝑙𝑑 and %𝑆𝐸𝑉
𝑐ℎ𝑖𝑙𝑑
Step 5: Multiply the prevalence rates obtained in Step 4 by the national population of
individuals aged 14 or less (Pop14-), again from UNDESA Population Division Data.
Rates (moderate or more and severe) calculated in step 3 are multiplied by the total cen-
sus population for children to get total number of food insecure children, therefore
𝑁3,𝑀𝑂𝐷+𝑆𝐸𝑉 = %𝑀𝑂𝐷+𝑆𝐸𝑉𝑐ℎ𝑖𝑙𝑑 × 𝑃𝑜𝑝14−
and
𝑁3,𝑆𝐸𝑉 = %𝑆𝐸𝑉𝑐ℎ𝑖𝑙𝑑 × 𝑃𝑜𝑝14−
The values reported under columns N2 are the sum of N1 and N3.
Obviously, even if referring to the same reference populations, these values will differ
from closely related indicators such as the number of individuals in extreme poverty,
because they represent somewhat different conditions and different levels of severity.

50

51

Voices of the Hungry
Technical Report
Number 1 / August 2016 (Revised version)
http://www.fao.org/in-action/voices-of-the-hungry
Related Documents


