Technical University Tallinn, ESTONIA 1 Faults in Circuits and Fault Diagnosis F 1 F 2 F 3 F 4 F 5 F 6 F 7 T 1 0 1 1 0 0 0 0 T 2 1 0 0 1 0 0 0 T 3 1 1 0 1 0 1 0 T 4 0 1 0 0 1 0 0 T 5 0 0 1 0 1 1 0 T 6 0 0 1 0 0 1 1 Fault F 5 located Fault table E 1 E 2 E 3 0 0 1 0 1 0 0 1 0 1 0 1 1 0 1 0 0 0 Test experiment Test generation Fault simulation Fault diagnosis Fault modeling Testing How many rows and columns should be in the Fault Table?

Welcome message from author
This document is posted to help you gain knowledge. Please leave a comment to let me know what you think about it! Share it to your friends and learn new things together.
Transcript
Technical University Tallinn, ESTONIA
1
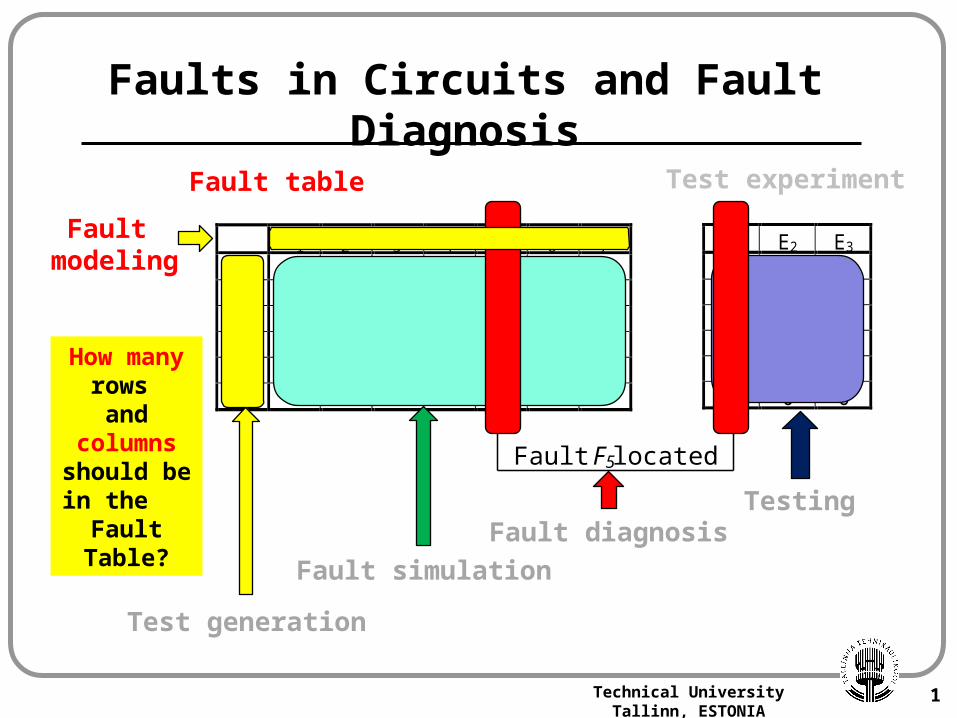
Faults in Circuits and Fault Diagnosis
F1 F2 F3 F4 F5 F6 F7
T1 0 1 1 0 0 0 0T2 1 0 0 1 0 0 0T3 1 1 0 1 0 1 0T4 0 1 0 0 1 0 0T5 0 0 1 0 1 1 0T6 0 0 1 0 0 1 1
Fault F5 located
Fault table
E1 E2 E3
0 0 10 1 00 1 01 0 11 0 10 0 0
Test experiment
Test generation
Fault simulation
Fault diagnosis
Fault modeling
Testing
How many rows and
columns should be
in the Fault
Table?
Technical University Tallinn, ESTONIA
2
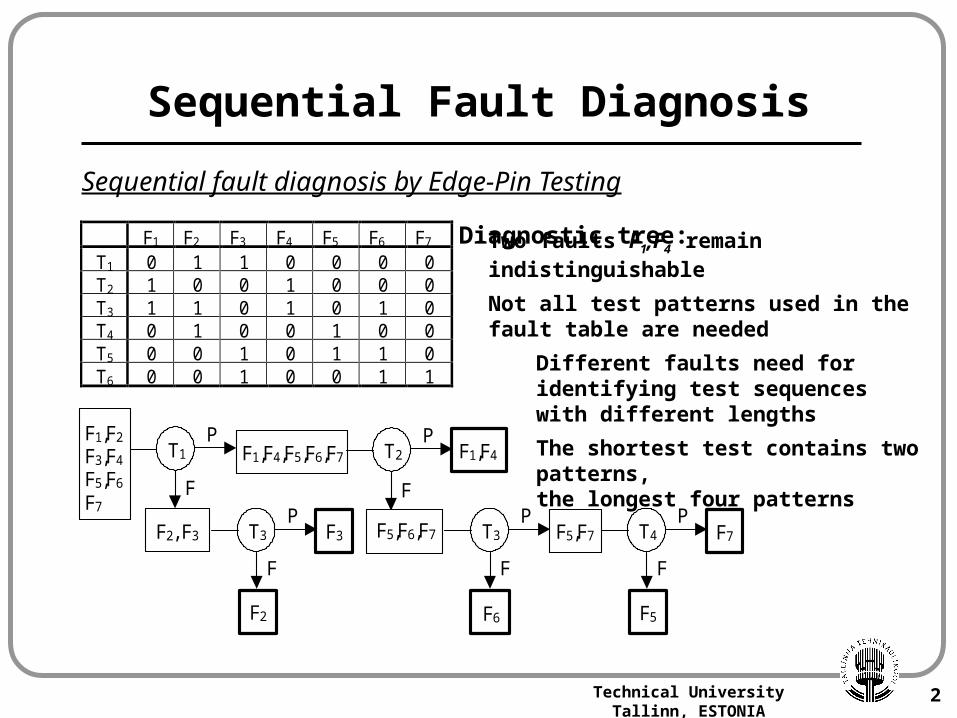
Sequential Fault Diagnosis
Sequential fault diagnosis by Edge-Pin Testing
T1 F1,F4,F5,F6,F7
PT2
PF1,F4
F2, F3 T3P
F3
F
F
F2
F
F5,F6,F7 T3P
F5,F7
F
F6
T4P
F7
F
F5
F1,F2
F3,F4
F5,F6
F7
F1 F2 F3 F4 F5 F6 F7
T1 0 1 1 0 0 0 0T2 1 0 0 1 0 0 0T3 1 1 0 1 0 1 0T4 0 1 0 0 1 0 0T5 0 0 1 0 1 1 0T6 0 0 1 0 0 1 1
Two faults F1,F4 remain indistinguishable
Not all test patterns used in the fault table are needed
Different faults need for identifying test sequences with different lengths
The shortest test contains two patterns, the longest four patterns
Diagnostic tree:

Technical University Tallinn, ESTONIA
3
Stuck-at Faults and their Properties
Fault equivalence and fault dominance:
&ABC
D
A B C D Fault class
1 1 1 0 A/0, B/0, C/0, D/1 Equivalence class0 1 1 1 A/1, D/01 0 1 1 B/1, D/0 Dominance classes1 1 0 1 C/1, D/0
&
Fault collapsing:
& 11
1
Dominance
1
0Equivalence
&&1
0
1
1
0
DominanceEquivalence
Technical University Tallinn, ESTONIA
4
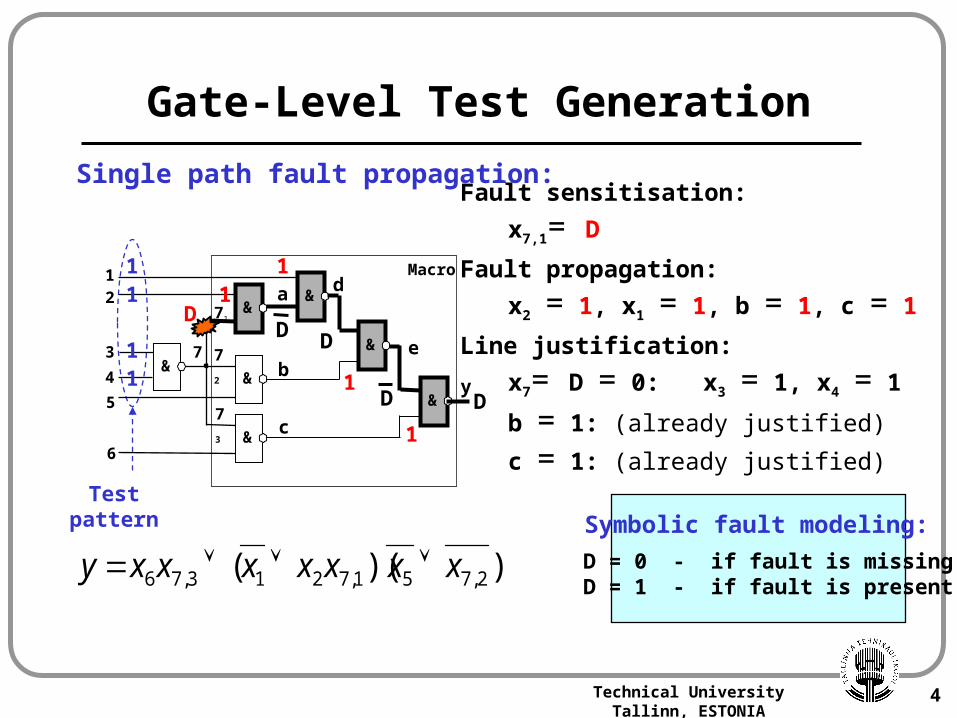
Gate-Level Test Generation
Single path fault propagation:
&
&
&
&
&
&
&
1
2
3
4
5
6
7
71
72
73
a
b
c
d
e
y
Macro
DD
D
D D
11
1
1
Fault sensitisation:
x7,1= DFault propagation:
x2 = 1, x1 = 1, b = 1, c = 1
Line justification:
x7= D = 0: x3 = 1, x4 = 1
b = 1: (already justified)
c = 1: (already justified)
))(( 2,751,7213,76 xxxxxxxy Symbolic fault modeling:
D = 0 - if fault is missingD = 1 - if fault is present
11
11
Test pattern
Technical University Tallinn, ESTONIA
5
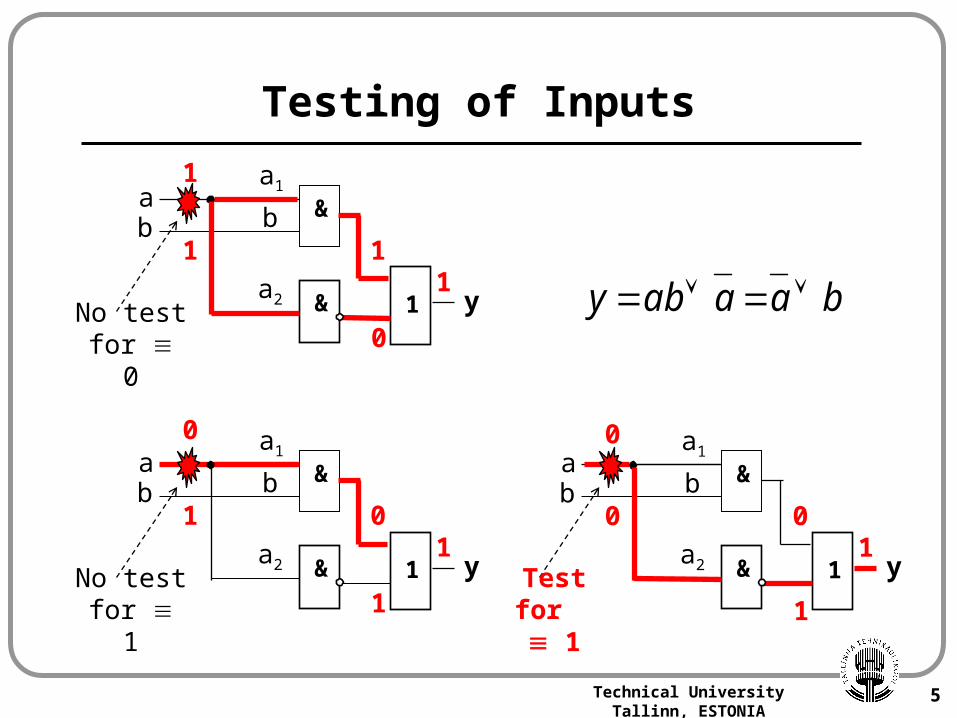
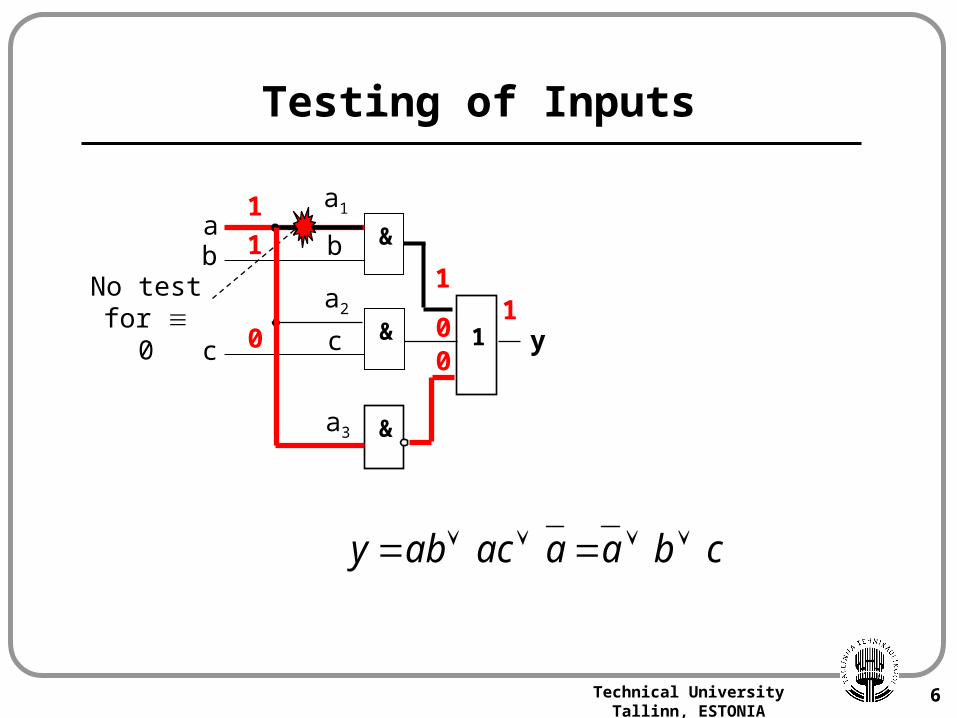
Testing of Inputs
1&
& 1
ab
y
a1
b
a2
1 1
0
1
No test for 0
0
&
& 1
ab
y
a1
b
a2
1 0
1
1
No test for 1
0
&
& 1
ab
y
a1
b
a2
0 0
1
1
Test for 1
baaaby
Technical University Tallinn, ESTONIA
6
Testing of Inputs
1&
&
1
ab
y
a1
b
a3
11
0
1No test for 0
cbaaacaby
&c
a2
c0 0
Technical University Tallinn, ESTONIA
7
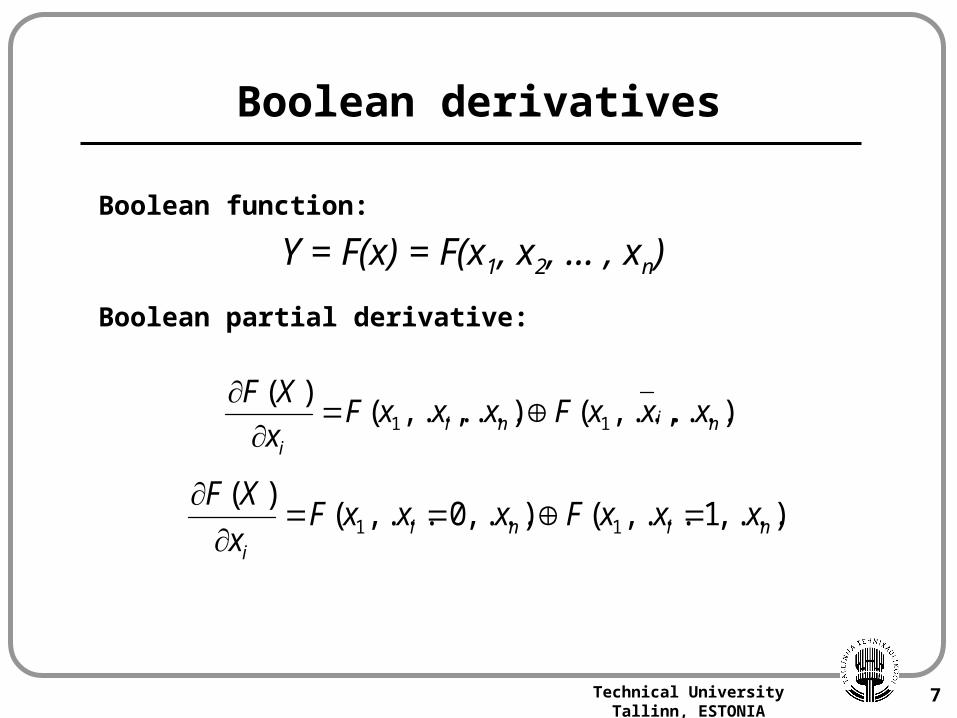
Boolean derivatives
Boolean function:
Y = F(x) = F(x1, x2, … , xn)
Boolean partial derivative:
),...,...(),...,...()(
11 ninii
xxxFxxxFx
XF
),...1,...(),...0,...()(
11 ninii
xxxFxxxFx
XF

Technical University Tallinn, ESTONIA
8
Boolean Derivatives
Useful properties of Boolean derivatives:
These properties allow to simplify the Boolean differential equation
to be solved for generating test pattern for a fault at xi
If F(x) is independent of xi
ii x
XGXF
x
XGXF
)()(
)()(
ii x
XGXF
x
XGXF
)(
)()()(
)( 32321 xxxxx
1)( xXF 3232)( xxxxXG
Näide:
ix
XGx
x
XGXF
)()()(1
2
Technical University Tallinn, ESTONIA
9
5
625414233121
)))(((
x
xxxxxxxxxxxx
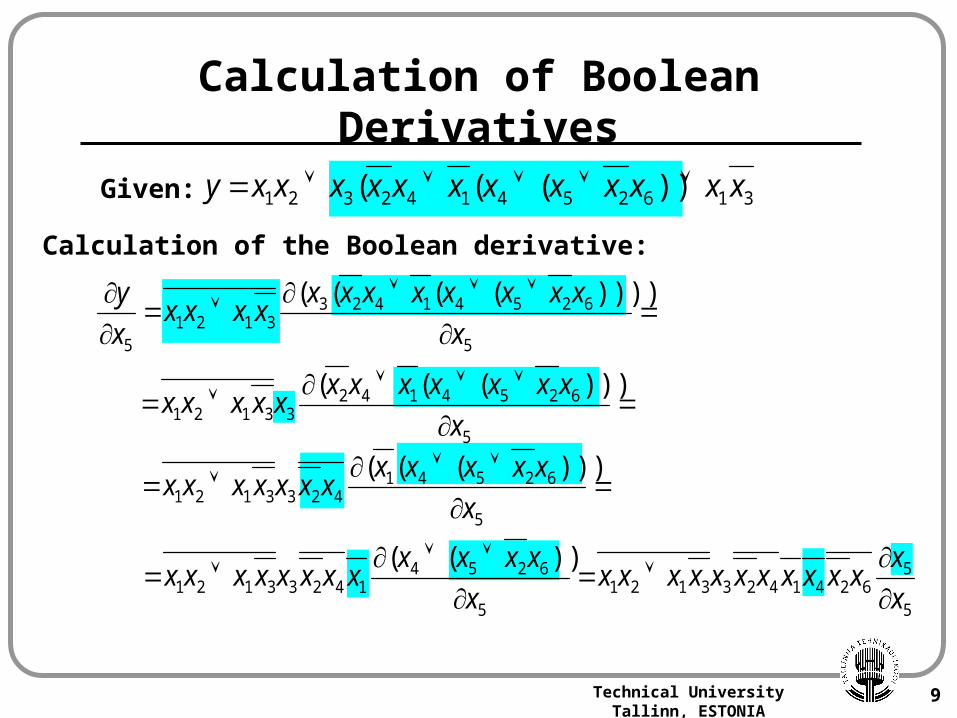
Calculation of Boolean Derivatives
Given:
Calculation of the Boolean derivative:
5
625414233121
5
))))((((
x
xxxxxxxxxxxx
x
y
5
625414233121
)))(((
x
xxxxxxxxxxxx
5
562414233121
5
625414233121
))((
x
xxxxxxxxxxxx
x
xxxxxxxxxxxx
316254142321 ))((( xxxxxxxxxxxxy
Technical University Tallinn, ESTONIA
10
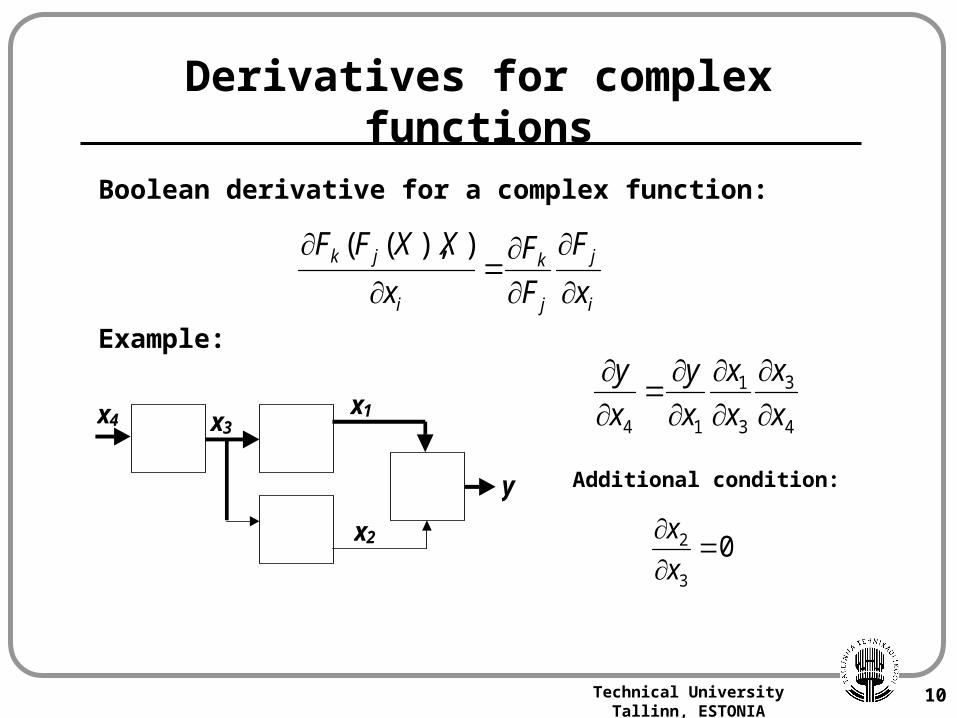
Derivatives for complex functions
Boolean derivative for a complex function:
Example:i
j
j
k
i
jk
x
F
F
F
x
XXFF
)),((
y
x2
x1x3x4
4
3
3
1
14 x
x
x
x
x
y
x
y
Additional condition:
03
2
x
x
Research in ATI© Raimund Ubar
BDDs and Testing of Logic Circuits
x1
x2
y
x3
x4 x5
x6 x7
0
11
0x 1
x2
y
x3
x4 x5
x6 x7
0
1
1
0
0
1
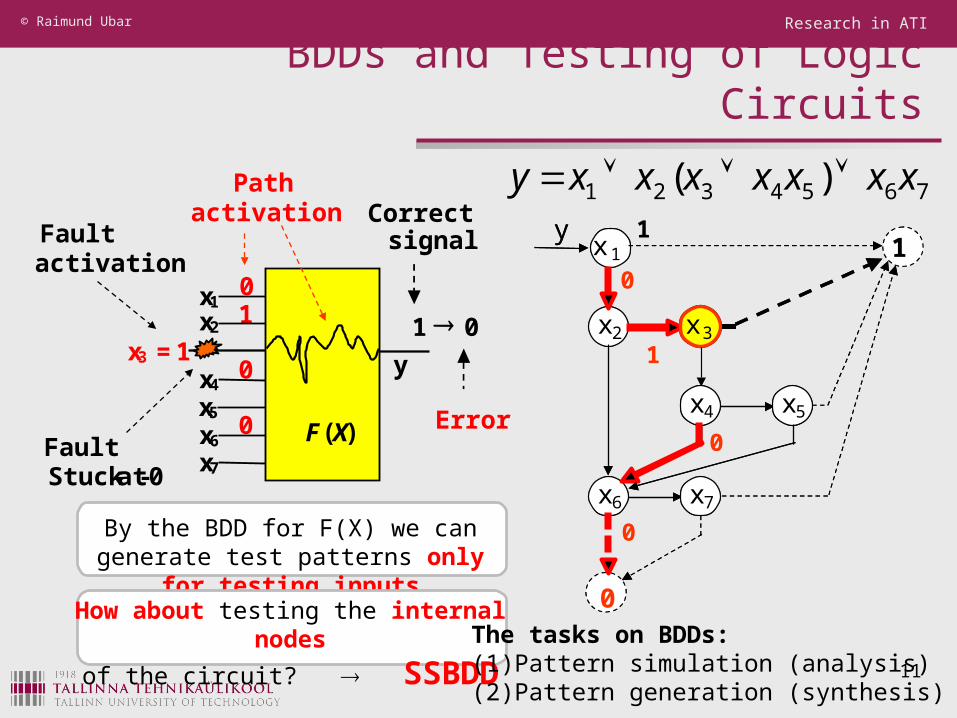
Path activation
Fault Stuck-at-0
Fault activation
Correct signal
Error
1 ® 0 x1 x2
x3 = 1 x4 x5 x6 x7
y
0
0
0 F (X)
By the BDD for F(X) we can generate test patterns only for testing inputs
11
How about testing the internal nodes
of the circuit? SSBDD
7654321 )( xxxxxxxy
The tasks on BDDs:(1) Pattern simulation (analysis)(2) Pattern generation (synthesis)
Technical University Tallinn, ESTONIA
12
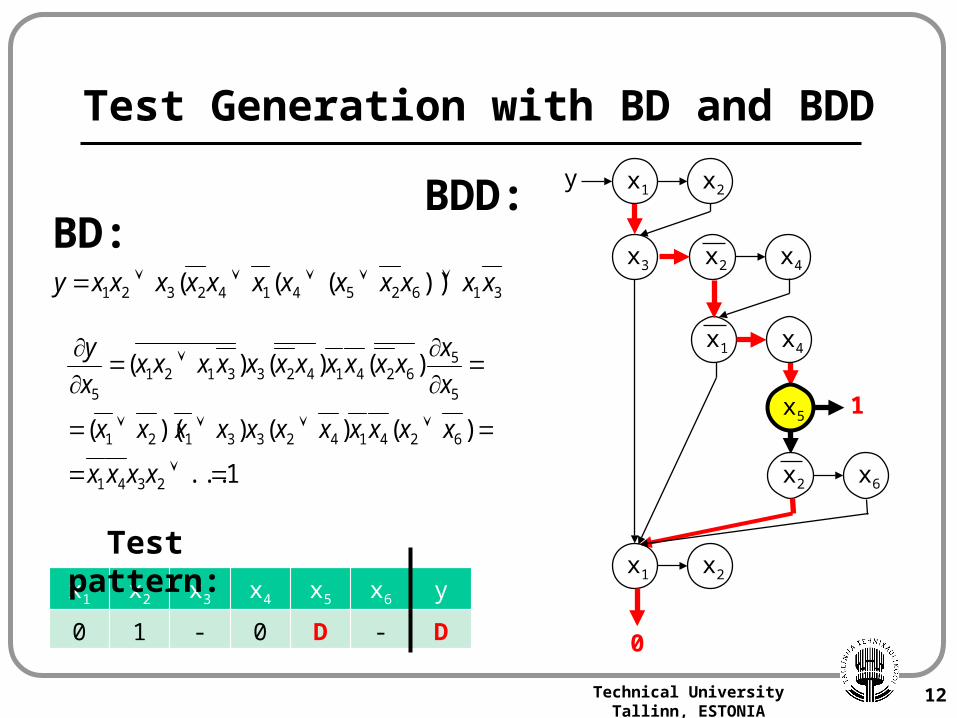
316254142321 ))((( xxxxxxxxxxxxy
1...
)()())((
)()()(
2341
62414233121
5
562414233121
5
xxxx
xxxxxxxxxxx
x
xxxxxxxxxxxx
x
y
x1 x2y
x3 x2 x4
x1 x4
x5
x2 x6
x1 x2
1
0
Test Generation with BD and BDD
BD:BDD:
x1 x2 x3 x4 x5 x6 y
0 1 - 0 D - D
Test pattern:
Research in ATI© Raimund Ubar
13
&
&
&
1
&
x1
x2
x3x4
y
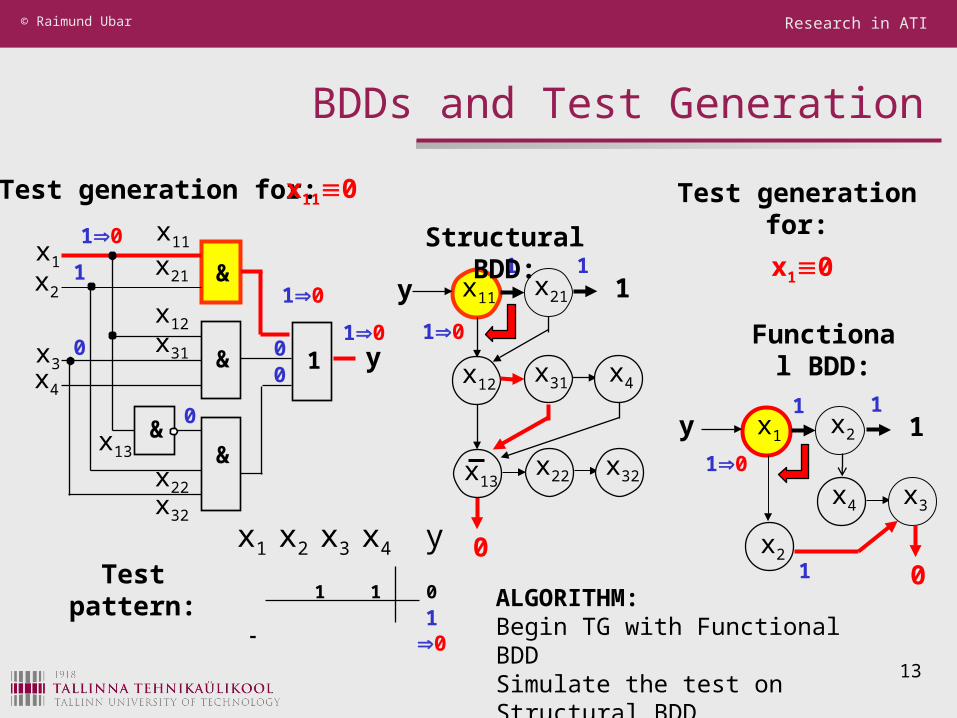
Test generation for:
x11
x21
x12
x31
x13
x22x32
x110
10
1
00
0
0
10
10
0
x11y x21
x12 x31 x4
x13x22 x32
11 1
10
Structural BDD:
x1y x2
x4 x3
x2
Functional BDD:
0
11
10
1
1x1 x2 x3 x4 y
1 1 0 -
Test pattern:
1 0
Test generation for:
x10
BDDs and Test Generation
ALGORITHM:Begin TG with Functional BDDSimulate the test on Structural BDDUpdate the test on Structural BDD

Technical University Tallinn, ESTONIA
Example: Test Generation with SSBDDs
&
&
&
1
&
x1
x2
x3x4
y
x1 x2 x3 x4 y
0 0 1 1 0
Testing Stuck-at-1 faults on paths:
Test pattern:
x11
x21
x12
x31
x13
x22x32
Tested faults: x121, x221
Not tested: x111
x11y x21
x12 x31 x4
x13x22 x32
1
0
1
1
Research in ATI© Raimund Ubar
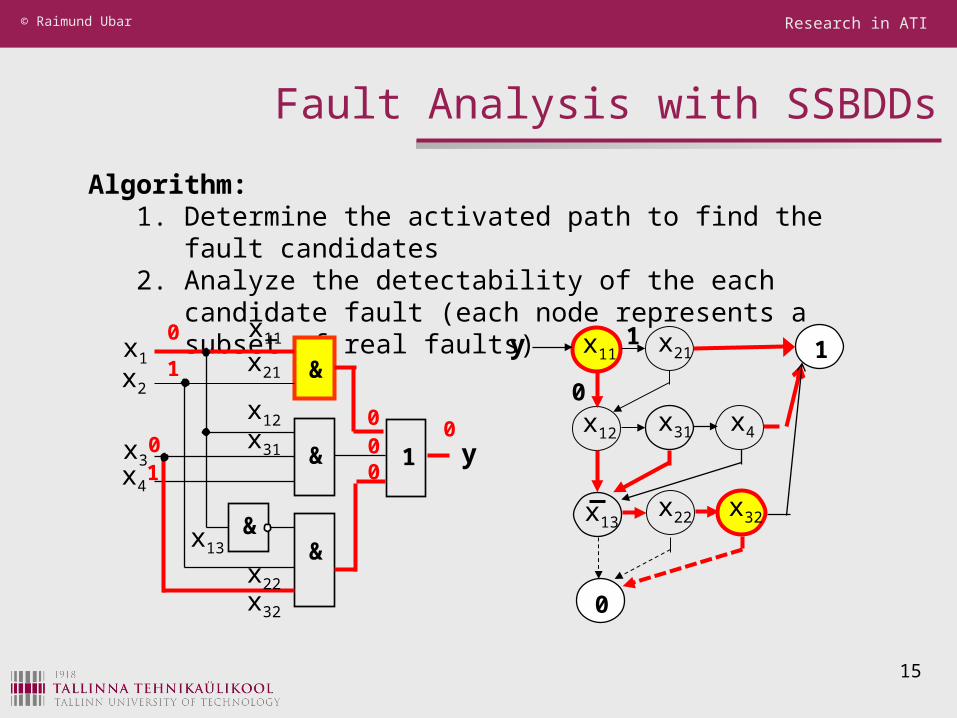
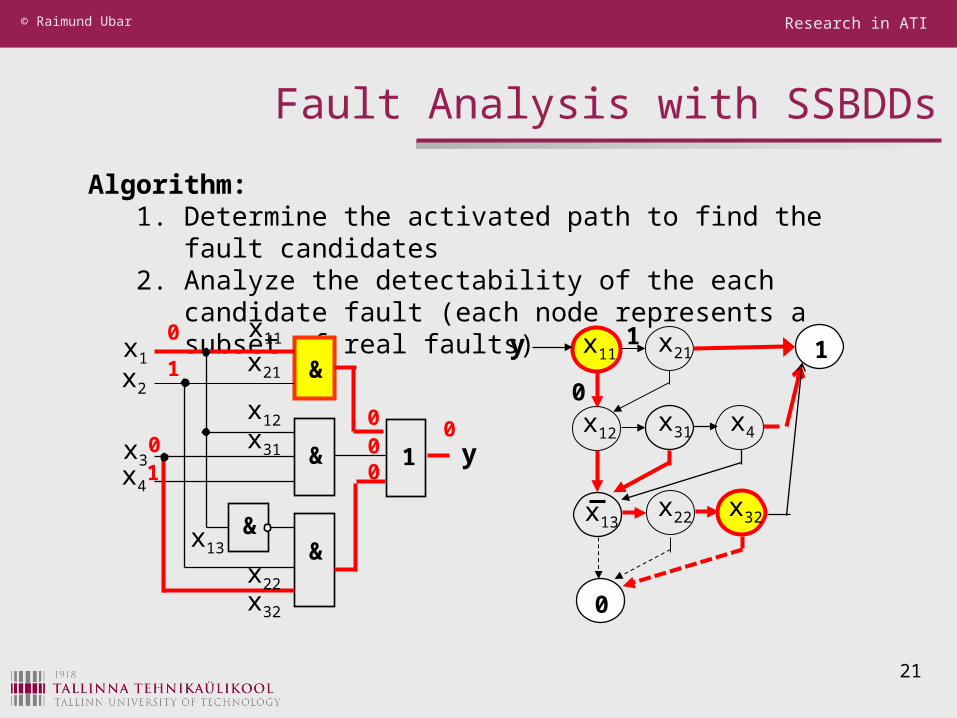
Algorithm:1. Determine the activated path to find the fault candidates2. Analyze the detectability of the each candidate fault
(each node represents a subset of real faults)
Fault Analysis with SSBDDs
x11y x21
x12 x31 x4
x13x22 x32
0
1
0
1
15
&
&
&
1
&
x1
x2
x3x4
y
x11
x21
x12
x31
x13
x22x32
0
1
0 001
00
Research in ATI© Raimund Ubar
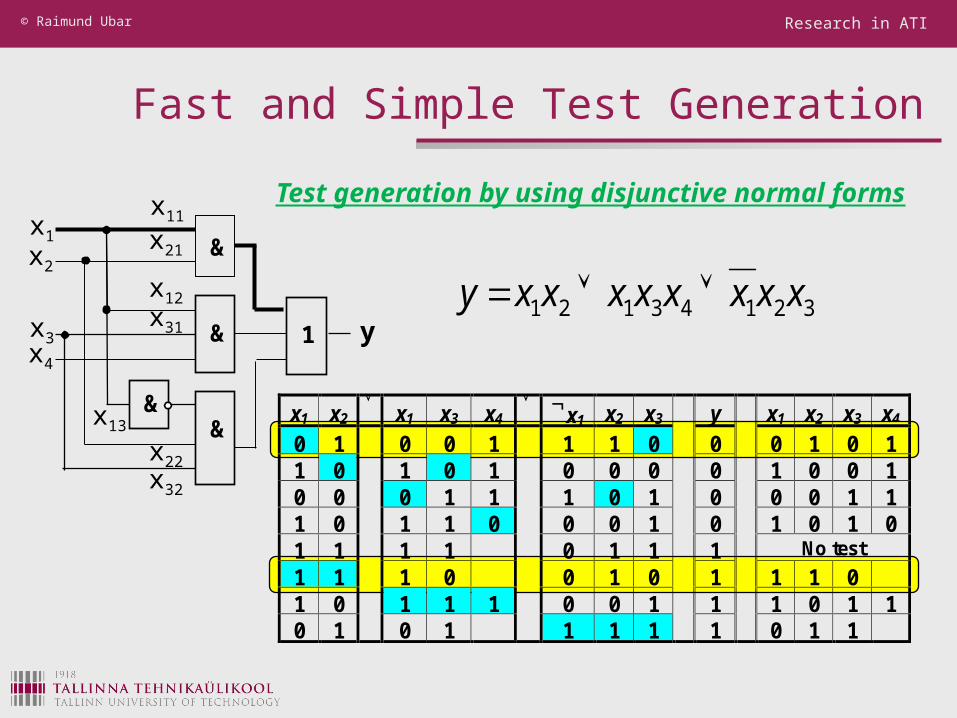
Fast and Simple Test Generation
Test generation by using disjunctive normal forms
32143121 xxxxxxxxy
x1 x2 x1 x3 x4
x1 x2 x3 y x1 x2 x3 x4
0 1 0 0 1 1 1 0 0 0 1 0 11 0 1 0 1 0 0 0 0 1 0 0 10 0 0 1 1 1 0 1 0 0 0 1 11 0 1 1 0 0 0 1 0 1 0 1 01 1 1 1 0 1 1 1 No test
1 1 1 0 0 1 0 1 1 1 01 0 1 1 1 0 0 1 1 1 0 1 10 1 0 1 1 1 1 1 0 1 1
&
&
&
1
&
x1
x2
x3x4
y
x11
x21
x12
x31
x13
x22x32
Technical University Tallinn, ESTONIA
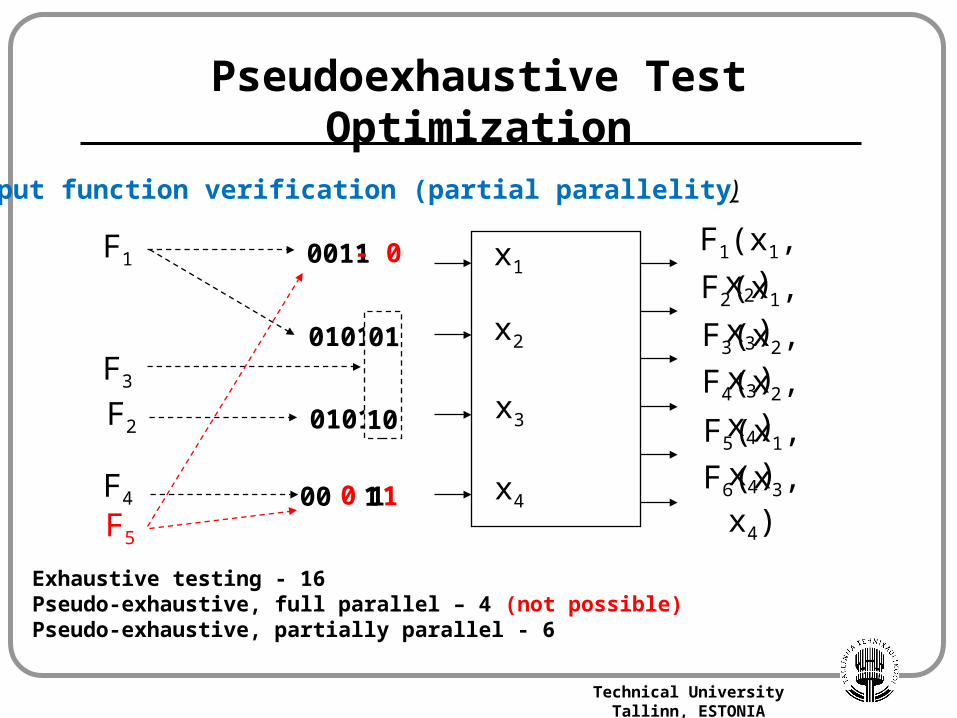
Pseudoexhaustive Test Optimization
Output function verification (partial parallelity)
x1
x2
x3
x4
F1(x1, x2)
F2(x1, x3)
F3(x2, x3)
F4(x2, x4)
F5(x1, x4)
F6(x3, x4)
0011
0101
F1
0101F2
F3
Exhaustive testing - 16Pseudo-exhaustive, full parallel – 4 (not possible)Pseudo-exhaustive, partially parallel - 6
01
10
00 1F4 1
- 0
F5
10
Research in ATI© Raimund Ubar
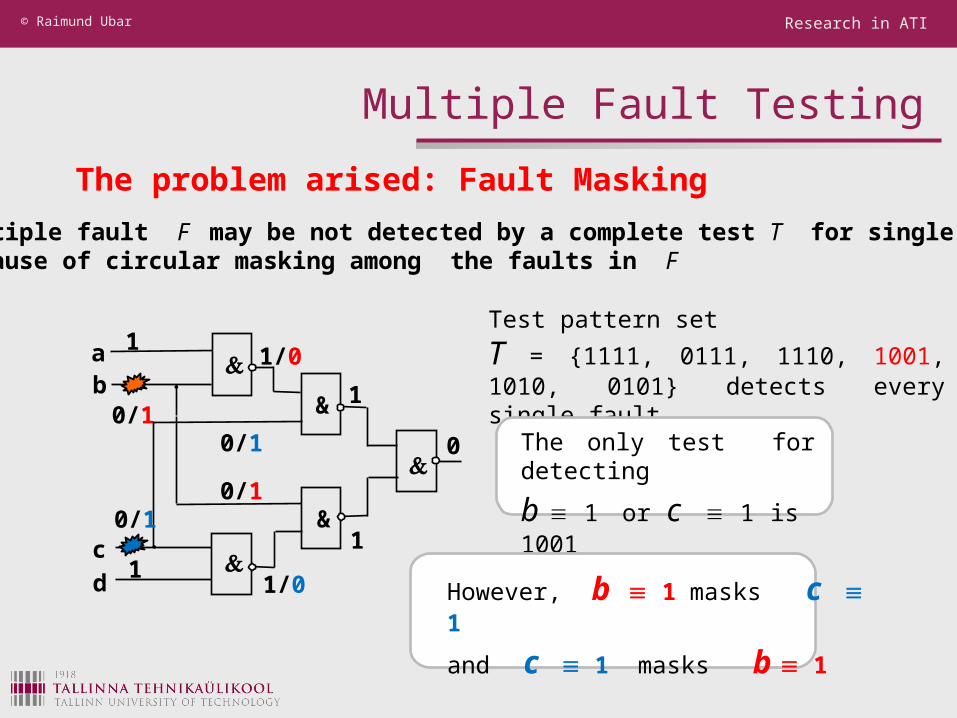
Multiple Fault Testing
The problem arised: Fault Masking
&
&
&
&
1/0
&
1
1
0/1
1/0
1
1
00/1
0/10/1
ab
c
d
Multiple fault F may be not detected by a complete test T for single faults because of circular masking among the faults in F
Test pattern set
T = {1111, 0111, 1110, 1001, 1010, 0101} detects every single fault
The only test for detecting
b 1 or c 1 is 1001
However, b 1 masks c 1
and c 1 masks b 1

Research in ATI© Raimund Ubar
Test Pairs for Multiple Fault Testing
To test a path
under any multiple faults,
two pattern test is needed
&
&
&
&
00
&
11
1111/00
10/11
01/00
0100
ab
c
d
Testing of multiple faults by pairs of patterns
b 1
11
Tested path for b 1/0
00/11
11/11
The lower path from b is under test
A pair of patterns is applied on b There is a masking fault c 1
01
c 1
1st pattern: fault b 1 is maskedEither the fault on the path is detected
or the masking fault is detected
No error
Error
2nd pattern: fault c 1 is detected
The secret: 1st pattern tests b2nd pattern tests c
Technical University Tallinn, ESTONIA
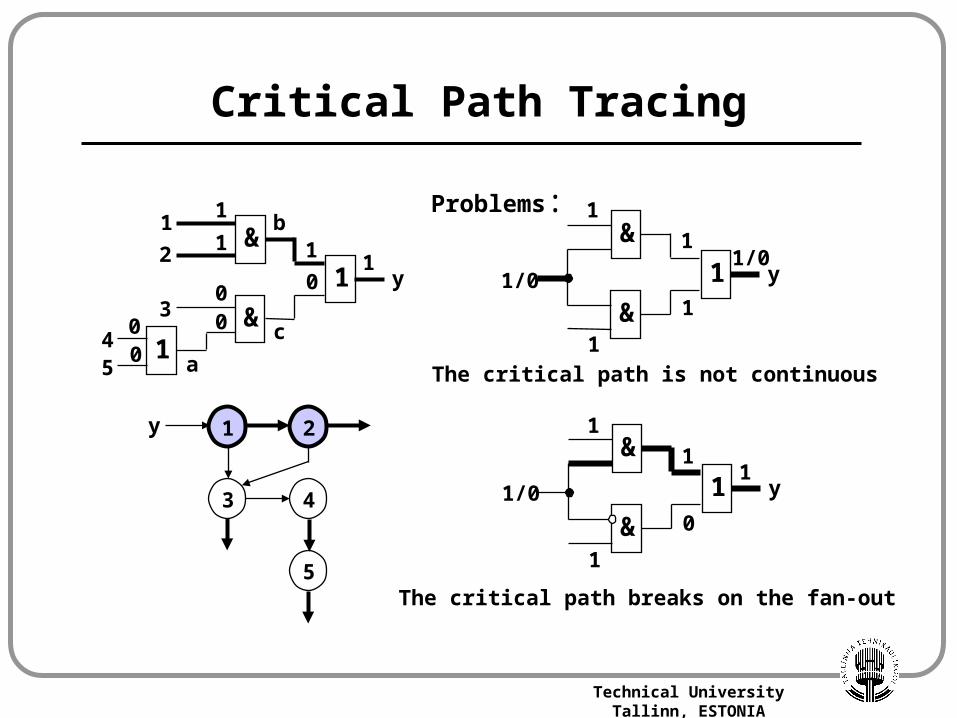
Critical Path Tracing
&
&
1
1
1
2
3
45 a
c
b1
1
0
00
0
0
11
y
1 2
3 4
5
y
Problems:&
&
11
11/0
y
&
&
10
11
y
1/0
1
1
1/0
1
1
The critical path is not continuous
The critical path breaks on the fan-out
Research in ATI© Raimund Ubar
Algorithm:1. Determine the activated path to find the fault candidates2. Analyze the detectability of the each candidate fault
(each node represents a subset of real faults)
Fault Analysis with SSBDDs
x11y x21
x12 x31 x4
x13x22 x32
0
1
0
1
21
&
&
&
1
&
x1
x2
x3x4
y
x11
x21
x12
x31
x13
x22x32
0
1
0 001
00
Technical University Tallinn, ESTONIA
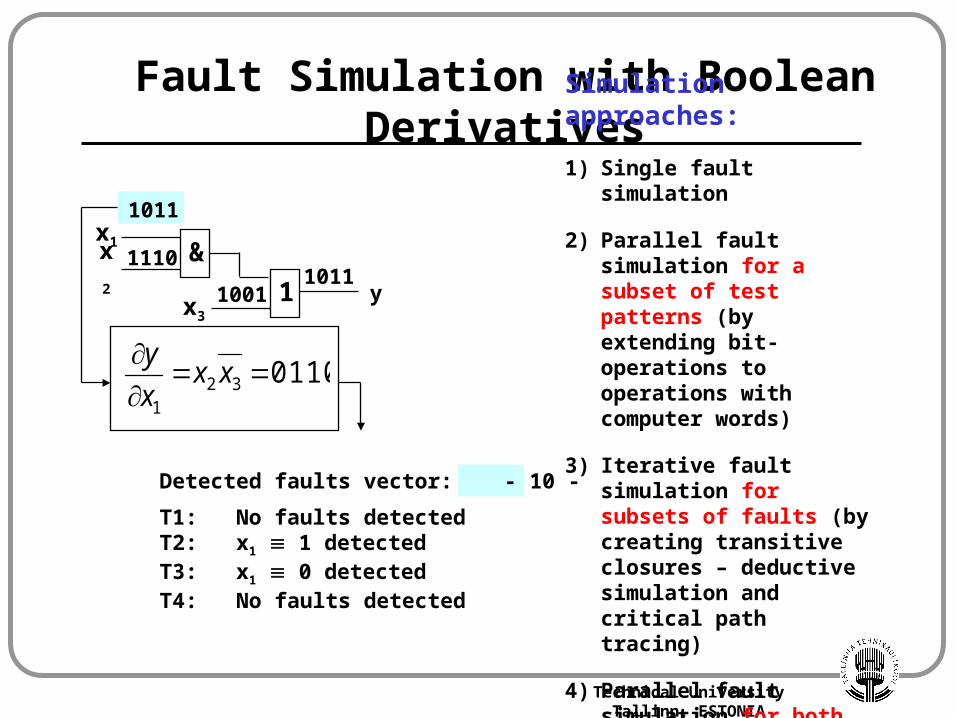
Fault Simulation with Boolean Derivatives
&
1
x1
y
0110321
xxx
y
1011
1110
10011011
Detected faults vector: - 10 -
T1: No faults detectedT2: x1 1 detectedT3: x1 0 detectedT4: No faults detected
x3
x
2
Simulation approaches:
1) Single fault simulation
2) Parallel fault simulation for a subset of test patterns (by extending bit-operations to operations with computer words)
3) Iterative fault simulation for subsets of faults (by creating transitive closures – deductive simulation and critical path tracing)
4) Parallel fault simulation for both, patterns and faults

Technical University Tallinn, ESTONIA
Parallel Critical Path Tracing
&
1
x1
y
0110321
xxx
y
1011
1110
10011011
Detected faults vector: - 10 -
T1: No faults detectedT2: x1 1 detectedT3: x1 0 detectedT4: No faults detected
x3
x
2
Handling of fanout points: • Fault simulation• Boolean differential calculus
x y
xk
x2
x1
F
))(),...,(( 11 x
xx
x
xxFy
x
y kk
Research in ATI© Raimund Ubar
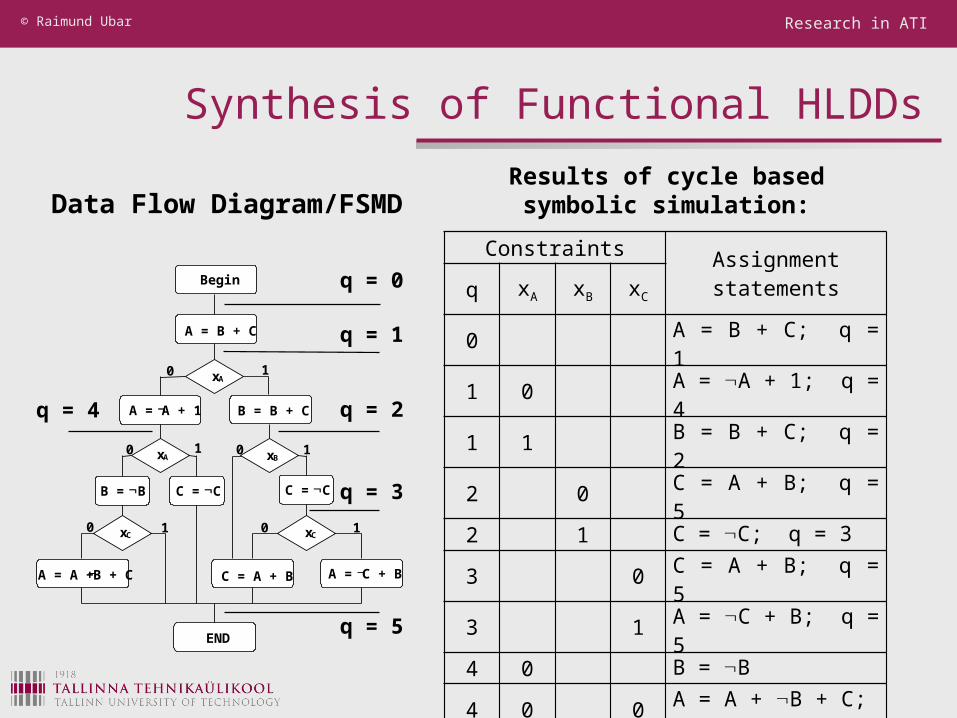
Synthesis of Functional HLDDs
Data Flow Diagram/FSMD
Begin
A = B + C
xA
A = A + 1 B = B + C
xA
B = B C = C
xB
C = C
xC
A = A + B + C
xC
C = A + B A = C + B
END
0
0
0
0
0
1
1
1
1
1
ConstraintsAssignment statementsq xA xB xC
0 A = B + C; q = 1
1 0 A = A + 1; q = 4
1 1 B = B + C; q = 2
2 0 C = A + B; q = 5
2 1 C = C; q = 3
3 0 C = A + B; q = 5
3 1 A = C + B; q = 5
4 0 B = B
4 0 0A = A + B + C; q = 5
4 0 1 q = 5
4 1 C = C; q = 5
Results of cycle based symbolic simulation:
q = 0
q = 1
q = 2
q = 3
q = 4
q = 5
Research in ATI© Raimund Ubar
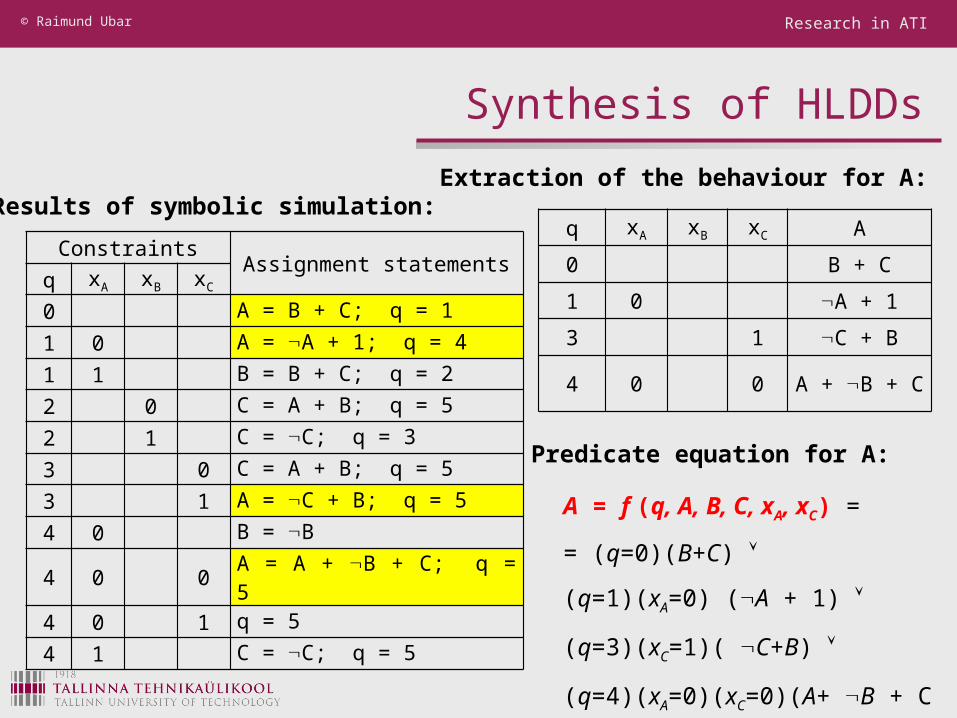
Synthesis of HLDDs
ConstraintsAssignment statements
q xA xB xC
0 A = B + C; q = 1
1 0 A = A + 1; q = 4
1 1 B = B + C; q = 2
2 0 C = A + B; q = 5
2 1 C = C; q = 3
3 0 C = A + B; q = 5
3 1 A = C + B; q = 5
4 0 B = B
4 0 0 A = A + B + C; q = 5
4 0 1 q = 5
4 1 C = C; q = 5
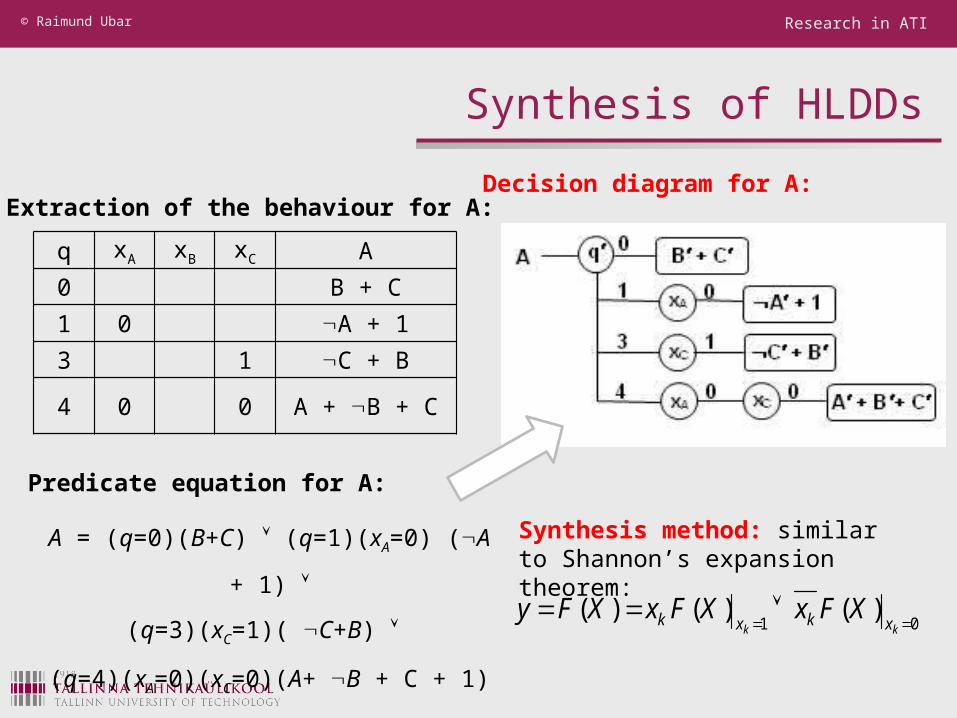
Results of symbolic simulation:q xA xB xC A
0 B + C
1 0 A + 1
3 1 C + B
4 0 0 A + B + C
Extraction of the behaviour for A:
A = f (q, A, B, C, xA, xC) =
= (q=0)(B+C)
(q=1)(xA=0) (A + 1)
(q=3)(xC=1)( C+B)
(q=4)(xA=0)(xC=0)(A+ B + C + 1)
Predicate equation for A:
Research in ATI© Raimund Ubar
Synthesis of HLDDs
q xA xB xC A
0 B + C
1 0 A + 1
3 1 C + B
4 0 0 A + B + C
Extraction of the behaviour for A:
A = (q=0)(B+C) (q=1)(xA=0) (A + 1)
(q=3)(xC=1)( C+B)
(q=4)(xA=0)(xC=0)(A+ B + C + 1)
Predicate equation for A:
Decision diagram for A:
Synthesis method: similar to Shannon’s expansion theorem:
01)()()(
kk xkxk XFxXFxXFy

Technical University Tallinn, ESTONIA
High-Level Decision Diagrams
R2M3
e+M1
a
*M2
b
R1
IN
c
d
y1 y2 y3 y4
Superposition of High-Level DDs:
A single DD for a subcircuit
Instead of simulating all the components in the circuit, only a single path in the DD should be traced
y4
y3 y1 R1 + R2
IN + R2
R 1 * R2
IN* R2
y2
R2 0
1
2 0
1
0
1
0
1
#0
R2
IN
R12
3
R2
R2 + M3
M1
M2
Technical University Tallinn, ESTONIA
Test Generation for Digital Systems
R2M3
e+M1
a
*M2
b
·
·
R1
IN ·
·
·
c
d
y1 y2 y3 y4
y4
y3 y1 R1 + R2
IN + R2
R1* R2
IN* R2
y2
R2 0
1
2 0
1
0
1
0
1
#0
R2
IN
R12
3
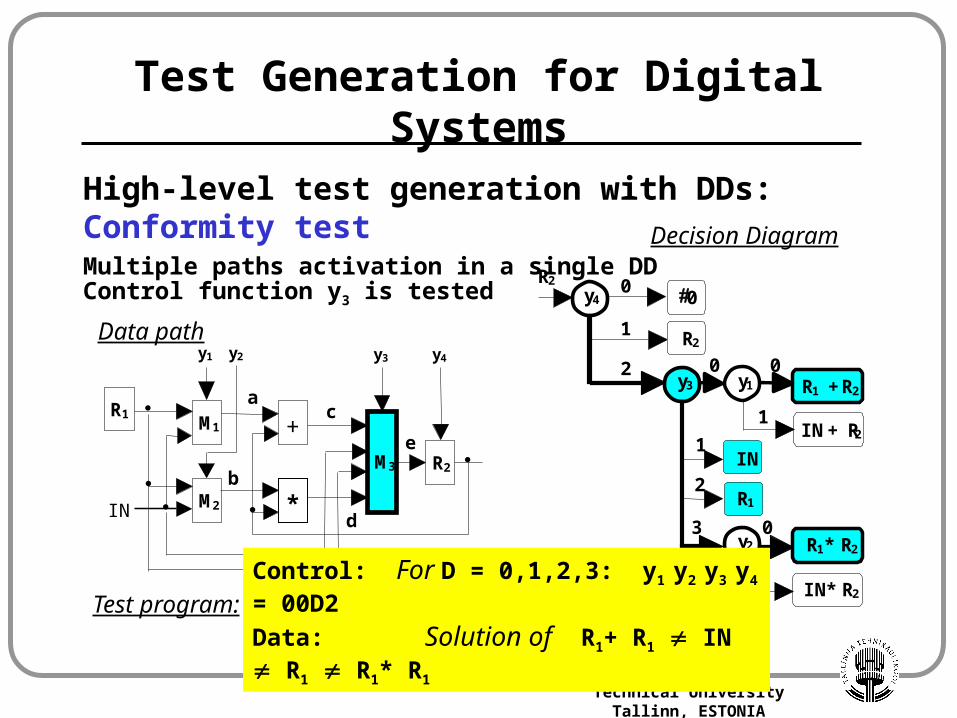
Multiple paths activation in a single DDControl function y3 is tested
Data path
Decision Diagram
High-level test generation with DDs: Conformity test
Control: For D = 0,1,2,3: y1 y2 y3 y4 = 00D2
Data: Solution of R1+ R1 IN R1 R1* R1
Test program:
Technical University Tallinn, ESTONIA
Test Generation for Digital Systems
R2M3
e+M1
a
*M2
b
·
·
R1
IN ·
·
·
c
d
y1 y2 y3 y4
y4
y3 y1 R1 + R2
IN + R2
R1* R2
IN* R2
y2
R2 0
1
2 0
1
0
1
0
1
#0
R2
IN
R12
3
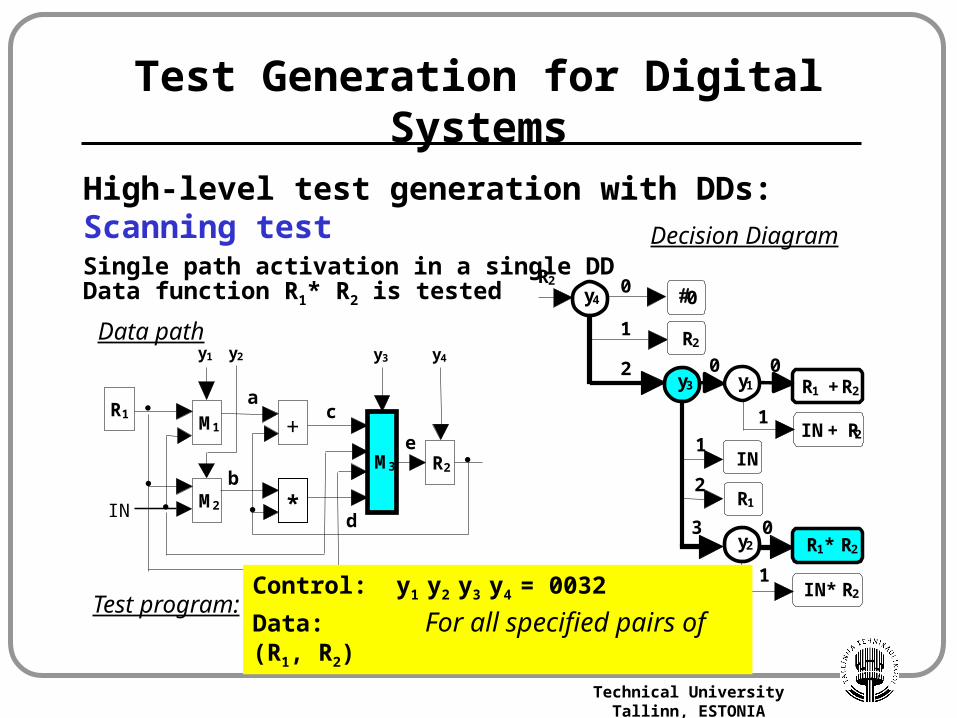
Single path activation in a single DDData function R1* R2 is tested
Data path
Decision Diagram
High-level test generation with DDs: Scanning test
Control: y1 y2 y3 y4 = 0032
Data: For all specified pairs of (R1, R2)
Test program:

Technical University Tallinn, ESTONIA
Decision Diagrams for Microprocessors
I1: MVI A,D A IN
I2: MOV R,A R A
I3: MOV M,R OUT R
I4: MOV M,A OUT IA
I5: MOV R,M R IN
I6: MOV A,M A IN
I7: ADD R A A + R
I8: ORA R A A R
I9: ANA R A A R
I10: CMA A,D A A
Instruction set:
I A2
R
IN5
R
1,3,4,6-10
A I IN1,6
IN2,3,4,5
A + R7
A R8
A R9
A10
I R3
A
OUT4
DD-model of themicroprocessor:

Technical University Tallinn, ESTONIA
Decision Diagrams for Microprocessors
High-Level DD-based structure of the microprocessor (example):
DD-model of themicroprocessor:
OUT
R
A
IN
I
I R3
A
OUT4
I A2
R
IN5
R
1,3,4,6-10
I IN1,6
A
A2,3,4,5
A + R7
A R8
A R9
A10
A + R
Technical University Tallinn, ESTONIA
Test Program Synthesis for Microprocessors
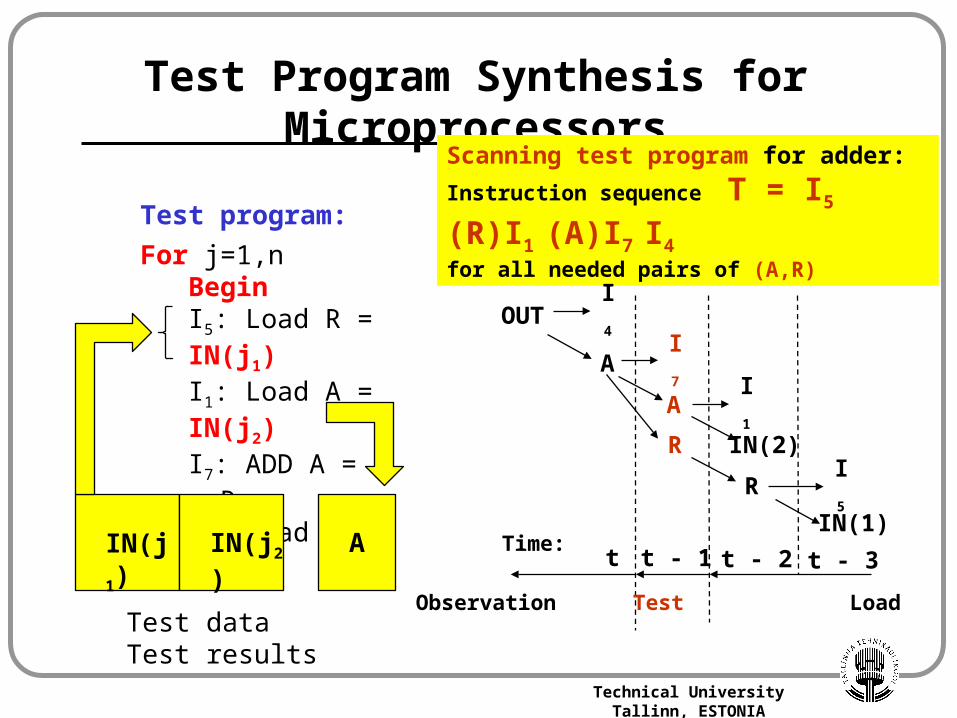
Scanning test program for adder:
Instruction sequence T = I5 (R)I1 (A)I7 I4for all needed pairs of (A,R)
OUTI
4
AI
7
A
R
I
1
IN(2)
IN(1)
RI
5
Time:t t - 1 t - 2 t - 3
Observation Test Load
Test program:
For j=1,nBeginI5: Load R = IN(j1)I1: Load A = IN(j2)I7: ADD A = A + RI4: Read A End
IN(j1) IN(j2) A
Test data Test results

0 M1R0 A1
R0
R1 A1
R0
R2 A1
R0
1
2
M1y1
0
IN
0y2 A
B
A+B
1
2
A-B3
10
OUT y3A2 R0
B y3
B
R1
R1
1
2
0
1
A y3
2
DMUX1 y3DMUX
ALU
A 1
R0
R1
R2
R0
R1
R2
RB
MUXy1 MUXy
ROUTA 2
y2
M1
RIN
M2
A
MUX WRITE READ ALU DMUXy1 Transfer A1 Addressing A2 Addressing y2 Operation y3 Transfer
0 M1=ALU 0 R0 = M1 0 M2 = R0 0 ALU = A 0 OUT = M2
1 M1 = IN 1 R1 = M1 1 M2 = R1 1 ALU= B 1 B = M2
2 R2 = M1 2 M2 = R2 2 ALU=A + B 2 A = M2
3 ALU= A - B
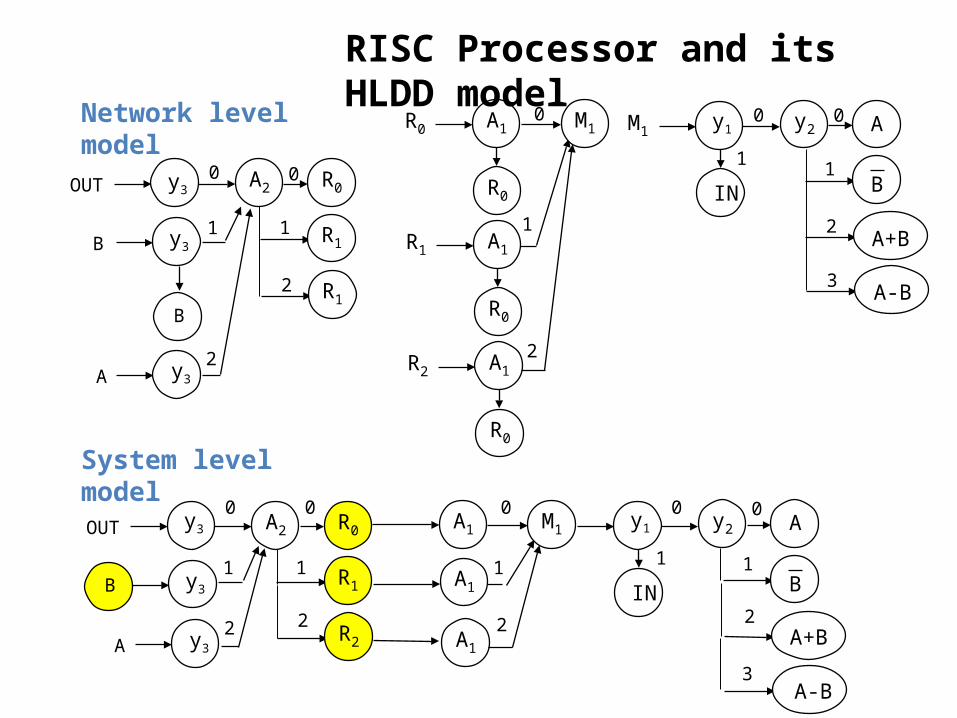
RISC Processor and its HLDD model
Register block
Output behaviour ALU
0 M1R0 A1
R0
R1 A1
R0
R2 A1
R0
1
2
M1y1
0
IN
0y2 A
B
A+B
1
2
A-B3
10
OUT y3A2 R0
B y3
B
R1
R1
1
2
0
1
A y3
2
0OUT y3 A2 R0
y3B R1
R2
1
2
0
1
0M1A1
A1
A1
1
2
y1
0
IN
0y2 A
B
A+B
1
2
A-B3
1
A y3
2
RISC Processor and its HLDD model
Network level model
System level model

0OUT y3 A2 R0
y3B R1
R2
1
2
0
1
0M1A1
A1
A1
1
2
y1
0
IN
0y2 A
B
A+B
1
2
A-B3
1
A y3
2
0OUT y3 A2 R0
y3B R1
R2
1
2
0
1
0M1A1
A1
A1
1
2
y1
0
IN
0y2 A
B
A+B
1
2
A-B3
1
A y3
2
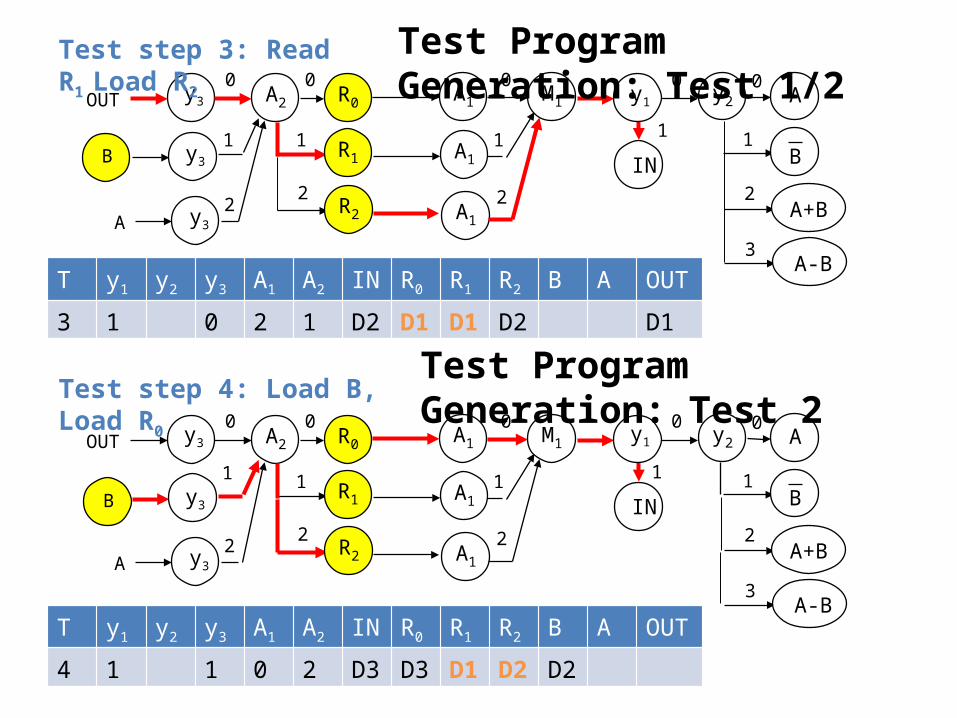
T y1 y2 y3 A1 A2 IN R0 R1 R2 B A OUT
1 1 0 D1 D1
T y1 y2 y3 A1 A2 IN R0 R1 R2 B A OUT
2 0 0 2 1 0 D1 D1 D1
Test Program Generation: Test 1Test step 1: Load R0
Test step 2: Testing ALU (M1 = A, Transfer A to R1)
0OUT y3 A2 R0
y3B R1
R2
1
2
0
1
0M1A1
A1
A1
1
2
y1
0
IN
0y2 A
B
A+B
1
2
A-B3
1
A y3
2
0OUT y3 A2 R0
y3B R1
R2
1
2
0
1
0M1A1
A1
A1
1
2
y1
0
IN
0y2 A
B
A+B
1
2
A-B3
1
A y3
2
T y1 y2 y3 A1 A2 IN R0 R1 R2 B A OUT
3 1 0 2 1 D2 D1 D1 D2 D1
T y1 y2 y3 A1 A2 IN R0 R1 R2 B A OUT
4 1 1 0 2 D3 D3 D1 D2 D2
Test step 3: Read R1 Load R2Test Program Generation: Test 1/2
Test Program Generation: Test 2Test step 4: Load B, Load R0
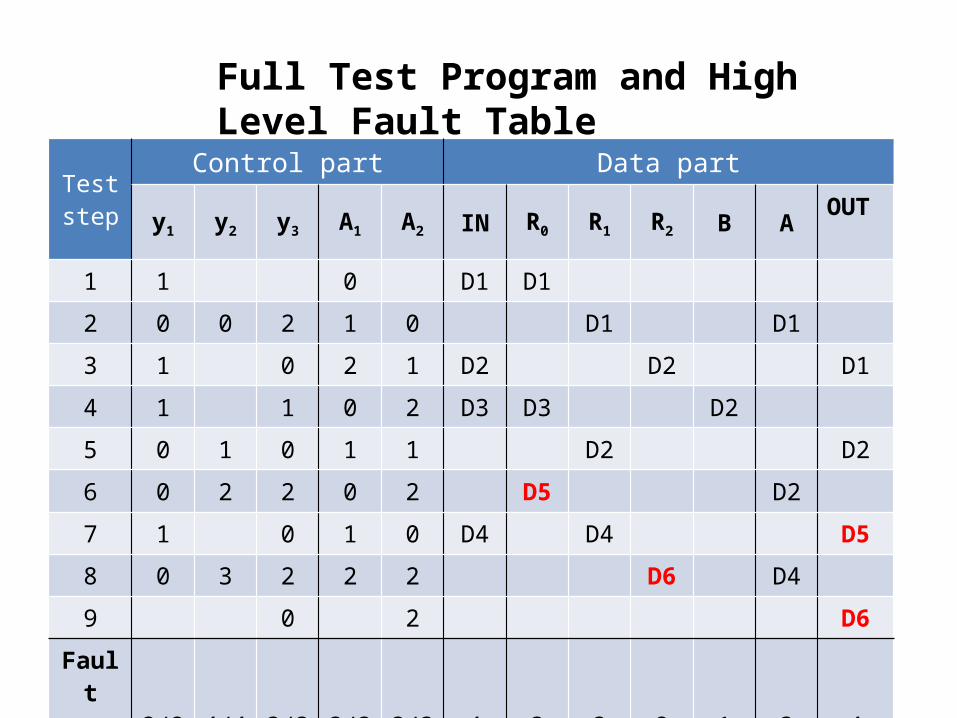
Test step
Control part Data part
y1 y2 y3 A1 A2 IN R0 R1 R2 B A OUT
1 1 0 D1 D1
2 0 0 2 1 0 D1 D1
3 1 0 2 1 D2 D2 D1
4 1 1 0 2 D3 D3 D2
5 0 1 0 1 1 D2 D2
6 0 2 2 0 2 D5 D2
7 1 0 1 0 D4 D4 D5
8 0 3 2 2 2 D6 D4
9 0 2 D6
Fault cove-rage
2/2 4/4 3/3 3/3 3/3 4 3 3 2 1 3 4
Full Test Program and High Level Fault Table
Related Documents