Technical Research Monday, 27 th November 2017 JAKARTA COMPOSITE INDEX (JCI): 6067.142 Daily Range: 6022.815 – 6092.018 Commentary: JCI chart rose 0,06% at level 6067.142 during the end of trading session on 24 November 2017. Based on the daily pivot from Bloomberg data, first and second support are at level 6044.979 and 6022.815. Meanwhile, first and second resistance are at level 6079.580 and 6092.018. Based on the daily indicator, MACD has established a golden cross formation at the positive area. Meanwhile, Stochastic and RSI are neutral. A bullish pin bar is detected signifying bullish continuation. Therefore, index will eventually ascend towards the resistance between level 6080 and 6092, on the upside. Komentar: IHSG berhasil ditutup menguat 0,06% di level 6067.142 pada 24 November 2017. Berdasarkan daily pivot dari Bloomberg, support pertama dan kedua berada pada level 6044.979 dan 6022.815. Sementara itu, resistance pertama dan kedua berada pada level 6079.580 dan 6092.018. Berdasarkan indikator daily, MACD berhasil membentuk pola golden cross di area positif. Sementara itu, Stochastic dan RSI berada di area netral. Terlihat pola bullish pin bar candle yang mengindikasikan adanya potensi bullish continuation pada pergerakan indeks saham. Dengan demikian, IHSG akan berpotensi menuju ke area resistance pada level 6080 dan 6092. Analyst: M. Nafan Aji Gusta Utama E-Mail: [email protected] JCI, Daily

Welcome message from author
This document is posted to help you gain knowledge. Please leave a comment to let me know what you think about it! Share it to your friends and learn new things together.
Transcript
Technical ResearchMonday, 27th November 2017
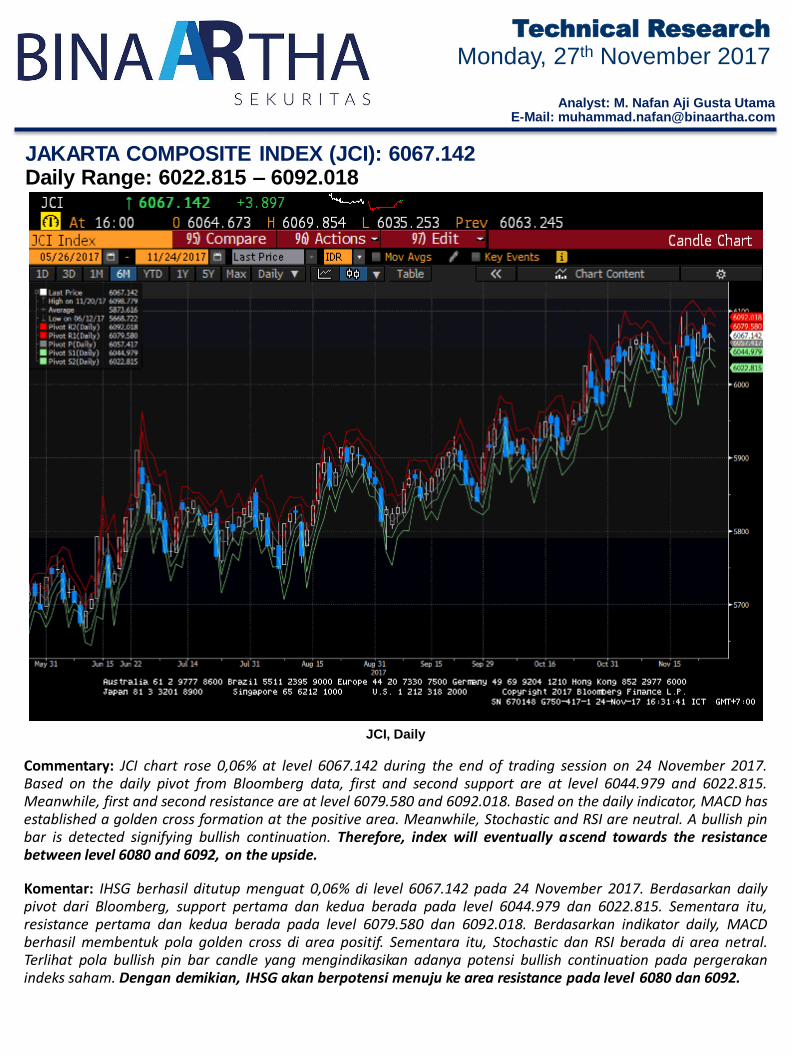
JAKARTA COMPOSITE INDEX (JCI): 6067.142Daily Range: 6022.815 – 6092.018
Commentary: JCI chart rose 0,06% at level 6067.142 during the end of trading session on 24 November 2017.Based on the daily pivot from Bloomberg data, first and second support are at level 6044.979 and 6022.815.Meanwhile, first and second resistance are at level 6079.580 and 6092.018. Based on the daily indicator, MACD hasestablished a golden cross formation at the positive area. Meanwhile, Stochastic and RSI are neutral. A bullish pinbar is detected signifying bullish continuation. Therefore, index will eventually ascend towards the resistancebetween level 6080 and 6092, on the upside.
Komentar: IHSG berhasil ditutup menguat 0,06% di level 6067.142 pada 24 November 2017. Berdasarkan dailypivot dari Bloomberg, support pertama dan kedua berada pada level 6044.979 dan 6022.815. Sementara itu,resistance pertama dan kedua berada pada level 6079.580 dan 6092.018. Berdasarkan indikator daily, MACDberhasil membentuk pola golden cross di area positif. Sementara itu, Stochastic dan RSI berada di area netral.Terlihat pola bullish pin bar candle yang mengindikasikan adanya potensi bullish continuation pada pergerakanindeks saham. Dengan demikian, IHSG akan berpotensi menuju ke area resistance pada level 6080 dan 6092.
Analyst: M. Nafan Aji Gusta UtamaE-Mail: [email protected]
JCI, Daily
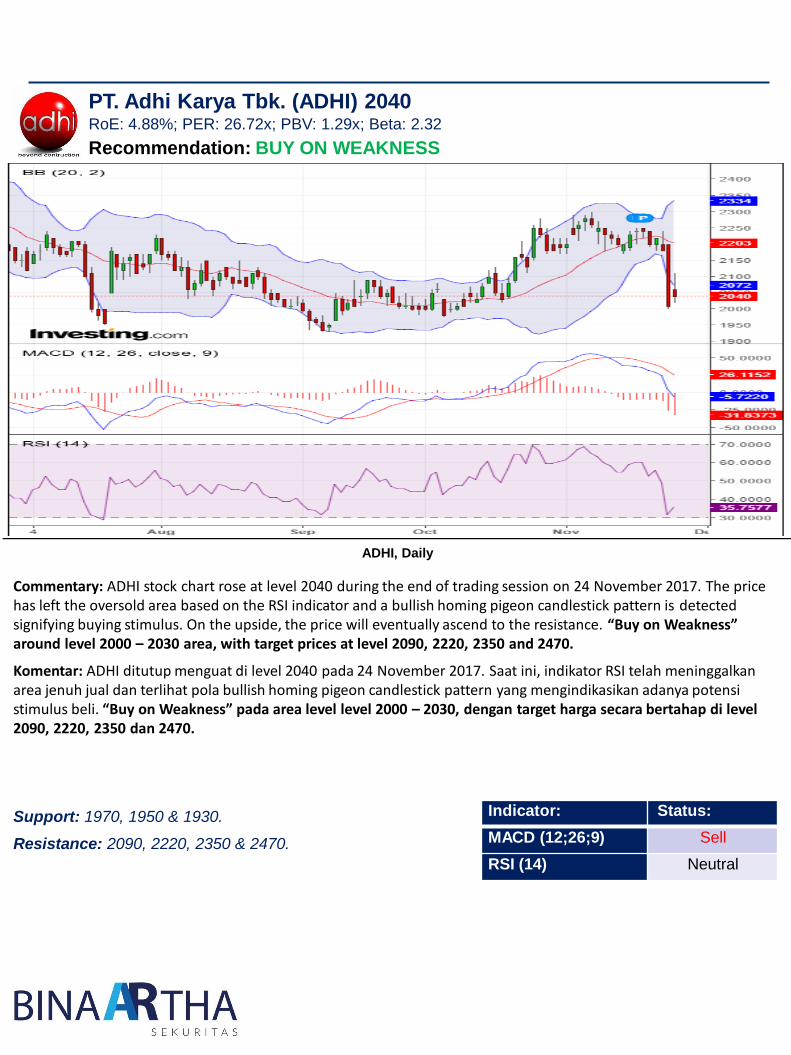
PT. Adhi Karya Tbk. (ADHI) 2040
Recommendation: BUY ON WEAKNESS
ADHI, Daily
Commentary: ADHI stock chart rose at level 2040 during the end of trading session on 24 November 2017. The price has left the oversold area based on the RSI indicator and a bullish homing pigeon candlestick pattern is detected signifying buying stimulus. On the upside, the price will eventually ascend to the resistance. “Buy on Weakness” around level 2000 – 2030 area, with target prices at level 2090, 2220, 2350 and 2470.
Komentar: ADHI ditutup menguat di level 2040 pada 24 November 2017. Saat ini, indikator RSI telah meninggalkan area jenuh jual dan terlihat pola bullish homing pigeon candlestick pattern yang mengindikasikan adanya potensi stimulus beli. “Buy on Weakness” pada area level level 2000 – 2030, dengan target harga secara bertahap di level 2090, 2220, 2350 dan 2470.
Indicator: Status:
MACD (12;26;9) Sell
RSI (14) Neutral
RoE: 4.88%; PER: 26.72x; PBV: 1.29x; Beta: 2.32
Support: 1970, 1950 & 1930.
Resistance: 2090, 2220, 2350 & 2470.

PT. Alam Sutra Reality Tbk. (ASRI) 384
Recommendation: BUY
ASRI, Daily
Commentary: ASRI stock chart fell at level 384 during the end of trading session on 24 November 2017. A target price at level 396 was reached successfully. The price is above the lower band of the bollinger and a bullish inverted hammer candle is detected signifying buying stimulus. On the upside, the price will eventually ascend to the resistance. “Accumulative Buy” around level 380 – 384 area, with target prices at level 394, 410 dan 416.
Komentar: ASRI ditutup melemah di level 384 pada 24 November 2017 Adapun target harga pada level 396 berhasil tercapai. Saat ini, terlihat pola bullish inverted hammer candle yang mengindikasikan adanya potensi stimulus beli. Selain itu, harga bertahan di atas garis bawah dari bollinger. “Akumulasi Beli” pada level 380 – 384, dengan target harga secara bertahap di level 394, 410 and 416.
Indicator: Status:
MACD (12;26;9) Neutral
RSI (14) Neutral
RoE: 17.30%; PER: 5.08x; PBV: 0.87x; Beta: 2.36
Support: 372.
Resistance: 394, 410 & 416.

PT. Bank Pembangunan Daerah Jawa Timur Tbk. (BJTM) 710
Recommendation: BUY
BJTM, Daily
Commentary: BJTM stock chart fell at level 710 during the end of trading session on 24 November 2017. The target prices at level 710 and 720 were reached successfully. The price is above the middle band of the bollinger and a tweezer bottom candlestick pattern is detected signifying buying stimulus. On the upside, the price will eventually ascend to the resistance. “Accumulative Buy” around level 700 – 710 area, with target prices at level 725, 740 and 755.
Komentar: BJTM ditutup melemah di level 710 pada 24 November 2017. Adapun target harga pada level 710 and 720 berhasil tercapai. Saat ini, terlihat pola tweezer bottom candlestick pattern yang mengindikasikan adanya potensi stimulus beli. Selain itu, harga bertahan di atas garis tengah dari bollinger. “Akumulasi Beli” pada area level 700 – 710,dengan target harga secara bertahap di level 725, 740 dan 755.
Indicator: Status:
MACD (12;26;9) Buy
RSI (14) Neutral
RoE: 17.29%; PER: 7.77x; PBV: 1.35x; Beta: 1.94
Support: 700 & 690.
Resistance: 725, 740 & 755.

PT. Harum Energy Tbk. (HRUM) 2100
Recommendation: BUY ON WEAKNESS
HRUM, Daily
Commentary: HRUM stock chart remained stagnant at level 2100 during the end of trading session on 24 November 2017. The price is above the lower band of the bollinger and a bullish harami doji star candlestick pattern is detected signifying buying stimulus. On the upside, the price will eventually ascend to the resistance. “Buy on Weakness” around level 2060 – 2090 area, with target prices at level 2290, 2400, 2510 and 2750.
Komentar: HRUM ditutup stagnan di level 2100 pada 24 November 2017. Saat ini, harga bertahan di atas garis bawah dari bollinger dan terlihat pola bullish harami doji star candlestick pattern yang mengindikasikan adanya potensi stimulus beli. “Buy on Weakness” pada level 2060 – 2090, dengan target harga secara bertahap di level 2290, 2400, 2510 dan 2750.
Indicator: Status:
MACD (12;26;9) Sell
RSI (14) Neutral
RoE: 11.10%; PER: 9.75; PBV: 1.08x; Beta: 0.61
Support: 2080 & 2000.
Resistance: 2290, 2400, 2510 & 2750.

PT. Vale Indonesia Tbk. (INCO) 2940
Recommendation: BUY
INCO, Daily
Commentary: INCO stock chart rose at level 2940 during the end of trading session on 24 November 2017. All target prices were reached successfully. The price is above the lower band of the bollinger and a bullish harami doji star candlestick pattern is detected signifying buying stimulus. In addition, the MACD indicator specifies a golden cross formation. On the upside, the price will eventually ascend to the resistance. “Accumulative Buy” around level 2890 -2940 area, with target prices at level 3050 and 3270.
Komentar: INCO ditutup mengaut di level 2940 pada 24 November 2017. Adapun seluruh target harga berhasil tercapai. Saat ini, harga bertahan di atas garis bawah dari bollinger dan terlihat pola bullish harami doji star candlestick pattern yang mengindikasikan adanya potensi stimulus beli. Adapun indikator MACD sudah membentuk pola golden cross. “Akumulasi Beli” pada area level 2890 - 2940, dengan target harga secara bertahap di level 3050 dan 3270.
Indicator: Status:
MACD (12;26;9) Neutral
RSI (14) Neutral
RoE: -1.45%; PER: -82.43x; PBV: 1.20x; Beta: 0.41
Support: 2820.
Resistance: 3050 & 3270.

PT. Pp Persero Tbk. (PTPP) 2730
Recommendation: BUY
PTPP, Daily
Commentary: PTPP stock chart remained stagnant at level 2730 during the end of trading session on 24 November 2017. A target price at level 2810 was reached successfully. The price is above the lower band of the bollinger and a tweezer bottom candlestick pattern is detected signifying buying stimulus. On the upside, the price will eventually ascend to the resistance. “Accumulative Buy” around level 2690 – 2730 area, with target prices at level level 2810 and 3110.
Komentar: PTPP ditutup stagnan di level 2730 pada 24 November 2017. Adapun target harga pada level 2810 berhasil tercapai. Saat ini, harga bertahan di atas garis bawah dari bollinger dan terlihat pola tweezer bottom candlestick pattern yang mengindikasikan adanya potensi stimulus beli. “Akumulasi Beli” pada area level 2690 – 2730, dengan target harga secara bertahap di level 2810 dan 3110.
Indicator: Status:
MACD (12;26;9) Neutral
RSI (14) Neutral
RoE: 10.36%; PER: 13.01x; PBV: 1.35x; Beta: 1.6
Support: 2690 & 2510.
Resistance: 2810 & 3110.

STOCK RECOMMENDATION UPDATES
Stock Date BuyArea Target Profit Protection Status for Today
AALI 23/11/2017 14200 - 14300 14525, 14975, 15325, 15600 and 16125
14125 Hold
AGRO 3/11/2017 515 - 525 540, 615 and 655 Switch to 540 Hold
AKRA 21/11/2017 6625 - 6650 6975, 7575, 7950 and8550
6375 Hold
ASII 22/11/2017 8075 - 8125 8425, 8525 and 8650 Switch to 8525 Hold
BBCA 14/11/2017 20400 - 20475 21375 20000 Hold
BEST 23/11/2017 272 - 276 288, 302 and 324 256 Hold
BJBR 16/11/2017 2260 - 2350 2470, 2570 and 2750 Switch to 2480 Hold
BMRI 15/11/2017 6850 - 6950 7125 and 7425 Switch to 7425 Take Profit at Market Price
BMTR 20/11/2017 565 - 580 600, 620 and 660 550 Hold
DOID 24/11/2017 790 – 815 870, 910, 945 and 1015
775 Keep Buy on Weakness
DSFI 23/11/2017 114 - 117 125, 134 and 142 110 Hold
ELSA 2/11/2017 302 – 308 318, 342 and 450 Switch to 342 Hold
EXCL 22/11/2017 3040 - 3090 3290 and 3690 2800 Hold
GJTL 16/11/2017 660 - 670 700, 735 and 820 Switch to 735 Hold
INDF 22/11/2017 7575 - 7675 8050, 8325, 8525, 8700, 8800 and 9200
7400 Hold
INTP 24/11/2017 19500 – 19600 20000 & 22000 18325 Keep Buy on Weakness
JPFA 20/9/2017 1150 - 1160 1220 and 1470 Switch to 1220 Hold
KAEF 22/11/2017 2430 - 2450 2630, 2770 and 2900 2340 Hold
KBLI 6/11/2017 426 - 432 444 and 484 Switch to 444 Hold
KLBF 11/11/2017 1585 – 1600 1630 and 1730 Switch to 1630 Hold
LPPF 31/10/2017 8600 - 8675 9175, 10000 and 11175
Switch to 11175 Take Profit at Market Price
PPRO 21/11/2017 198 - 202 214, 224, 256 and 266
192 Hold
SMGR 24/11/2017 9900 - 10050 10400, 10600 and 11200
9750 Hold
SRIL 18/9/2017 336- 342 368, 418 and 496 Switch to 368 Hold
SSMS 23/11/2017 1465 - 1475 1530, 1630 and 1795 1365 Hold

Indicators
•MACD (Moving Average Convergence Divergence): momentum indicator.
•RSI (Relative Strength Index): compares the magnitude of recent gains to recent losses in attempt to
determine ‘overbought’ and ‘oversold’ conditions of the asset.
RESEARCH TEAM(62-21) 520-6678 ext. 610 / 612
Disclaimer: PT Binaartha Sekuritas has compiled this report in good faith, using information believedto be reliable. PT Binaartha Sekuritas and its analyst take no responsibility for the accuracy of theinformation contained in this report. This report has been produced for distribution to clients of PTBinaartha Sekuritas only. This report is not an invitation to buy or sell any security. PT BinaarthaSekuritas may have used the information in this report prior to publication. The company or its clientsmay have positions in or may from time to time buy or sell the securities mentioned in this report orother related securities.
Related Documents


