Technical Reports SeriEs No. Sediment Distribution Coefficients and Concentration Factors for Biota in the Marine Environment 422

Welcome message from author
This document is posted to help you gain knowledge. Please leave a comment to let me know what you think about it! Share it to your friends and learn new things together.
Transcript
Technical Reports SeriEs No.
Sediment DistributionCoefficients and
Concentration Factors for Biota in the
Marine Environment
422

SEDIMENT DISTRIBUTION COEFFICIENTS AND
CONCENTRATION FACTORSFOR BIOTA IN
THE MARINE ENVIRONMENT
The following States are Members of the International Atomic Energy Agency:
AFGHANISTANALBANIAALGERIAANGOLAARGENTINAARMENIAAUSTRALIAAUSTRIAAZERBAIJANBANGLADESHBELARUSBELGIUMBENINBOLIVIABOSNIA AND
HERZEGOVINABOTSWANABRAZILBULGARIABURKINA FASOCAMEROONCANADACENTRAL AFRICAN
REPUBLICCHILECHINACOLOMBIACOSTA RICACÔTE D’IVOIRECROATIACUBACYPRUSCZECH REPUBLICDEMOCRATIC REPUBLIC
OF THE CONGODENMARKDOMINICAN REPUBLICECUADOREGYPTEL SALVADORERITREAESTONIAETHIOPIAFINLANDFRANCEGABONGEORGIAGERMANYGHANA
GREECEGUATEMALAHAITIHOLY SEEHONDURASHUNGARYICELANDINDIAINDONESIAIRAN, ISLAMIC REPUBLIC OF IRAQIRELANDISRAELITALYJAMAICAJAPANJORDANKAZAKHSTANKENYAKOREA, REPUBLIC OFKUWAITKYRGYZSTANLATVIALEBANONLIBERIALIBYAN ARAB JAMAHIRIYALIECHTENSTEINLITHUANIALUXEMBOURGMADAGASCARMALAYSIAMALIMALTAMARSHALL ISLANDSMAURITIUSMEXICOMONACOMONGOLIAMOROCCOMYANMARNAMIBIANETHERLANDSNEW ZEALANDNICARAGUANIGERNIGERIANORWAYPAKISTANPANAMA
PARAGUAYPERUPHILIPPINESPOLANDPORTUGALQATARREPUBLIC OF MOLDOVAROMANIARUSSIAN FEDERATIONSAUDI ARABIASENEGALSERBIA AND MONTENEGROSEYCHELLESSIERRA LEONESINGAPORESLOVAKIASLOVENIASOUTH AFRICASPAINSRI LANKASUDANSWEDENSWITZERLANDSYRIAN ARAB REPUBLICTAJIKISTANTHAILANDTHE FORMER YUGOSLAV
REPUBLIC OF MACEDONIATUNISIATURKEYUGANDAUKRAINEUNITED ARAB EMIRATESUNITED KINGDOM OF
GREAT BRITAIN AND NORTHERN IRELAND
UNITED REPUBLICOF TANZANIA
UNITED STATES OF AMERICAURUGUAYUZBEKISTANVENEZUELAVIETNAMYEMENZAMBIAZIMBABWE
The Agency’s Statute was approved on 23 October 1956 by the Conference on the Statuteof the IAEA held at United Nations Headquarters, New York; it entered into force on 29 July 1957.The Headquarters of the Agency are situated in Vienna. Its principal objective is “to accelerate andenlarge the contribution of atomic energy to peace, health and prosperity throughout the world’’.
© IAEA, 2004
Permission to reproduce or translate the information contained in this publication may beobtained by writing to the International Atomic Energy Agency, Wagramer Strasse 5, P.O. Box 100,A-1400 Vienna, Austria.
Printed by the IAEA in AustriaApril 2004
STI/DOC/010/422
SEDIMENT DISTRIBUTIONCOEFFICIENTS AND
CONCENTRATION FACTORSFOR BIOTA IN
THE MARINE ENVIRONMENT
TECHNICAL REPORTS SERIES No. 422
INTERNATIONAL ATOMIC ENERGY AGENCYVIENNA, 2004
IAEA Library Cataloguing in Publication Data
Sediment distribution coefficients and concentration factors for biota inthe marine environment. — Vienna, International Atomic EnergyAgency, 2004.
p. ; 24 cm. — (Technical reports series, ISSN 0074–1914 ; no. 422)STI/DOC/010/422ISBN 92–0–114403–2Includes bibliographical references.
1. Marine sediments. 2. Aquatic organisms. I. International AtomicEnergy Agency. II. Series: Technical reports series (InternationalAtomic Energy Agency) ; 422.
IAEAL 04-00355
FOREWORD
In 1985 the IAEA published Technical Reports Series No. 247 (TRS 247),Sediment Kds and Concentration Factors for Radionuclides in the MarineEnvironment, which provided sediment distribution coefficients (Kds) and con-centration factor (CF) data for marine biological material that could be used inmodels simulating the dispersion of radioactive waste that had been disposedof in the sea. TRS 247 described an approach for calculating sediment or waterKds using stable element geochemical data developed by J.M. Bewers, eventhough the use of field derived data was emphasized whenever possible.
Over the years, TRS 247 has proved to be a valuable reference for radio-ecologists, marine modellers and other scientists involved in assessing theimpact of radionuclides in the marine environment. In 2000 the IAEA initiateda revision of TRS 247 to take account of the new sets of data obtained since1985. The outcome of this work is this report, which contains revised sedimentKds for the open ocean and ocean margins and CFs for marine biota. CFs fordeep ocean ferromanganese nodules, which were provided in Table II of TRS247, can now be found in the Appendix. In addition, this report contains CFsfor a limited number of elements for marine mammals not included in TRS 247.
This revision was carried out at three IAEA Consultants Meetings heldin Monaco and Vienna between April 2000 and December 2002. The IAEAwishes to acknowledge the contribution of those responsible for the draftingand review of this report. Their names are listed at the end of this report. TheIAEA officers responsible for this project were S.W. Fowler of the MarineEnvironmental Laboratory, Monaco, and T. Cabianca of the Division ofRadiation and Waste Safety, Vienna.

EDITORIAL NOTE
Although great care has been taken to maintain the accuracy of information con-tained in this publication, neither the IAEA nor its Member States assume any responsi-bility for consequences which may arise from its use.
The use of particular designations of countries or territories does not imply anyjudgement by the publisher, the IAEA, as to the legal status of such countries or territo-ries, of their authorities and institutions or of the delimitation of their boundaries.
The mention of names of specific companies or products (whether or not indicatedas registered) does not imply any intention to infringe proprietary rights, nor should it beconstrued as an endorsement or recommendation on the part of the IAEA.
CONTENTS
1. INTRODUCTION . . . . . . . . . . . . . . . . . . . . . . . . . . . . . . . . . . . . . . . . . 1
1.1. Background to Technical Reports Series No. 247 . . . . . . . . . . . 11.2. Changes since the publication of TRS 247 . . . . . . . . . . . . . . . . . 1
1.2.1. Regional and international regulatory framework . . . . . . 21.2.2. Radionuclide sources . . . . . . . . . . . . . . . . . . . . . . . . . . . . . . 31.2.3. Radiological assessments . . . . . . . . . . . . . . . . . . . . . . . . . . . 4
1.3. Improved scientific knowledge . . . . . . . . . . . . . . . . . . . . . . . . . . . 61.4. Environmental impact . . . . . . . . . . . . . . . . . . . . . . . . . . . . . . . . . . 71.5. Use of recommended Kds and CFs in models . . . . . . . . . . . . . . 8
2. SEDIMENT–WATER DISTRIBUTION COEFFICIENTS . . . . . . 8
2.1. Introduction . . . . . . . . . . . . . . . . . . . . . . . . . . . . . . . . . . . . . . . . . . 82.2. Open ocean Kds (Table I) . . . . . . . . . . . . . . . . . . . . . . . . . . . . . . . 9
2.2.1. Derivation of open ocean Kds . . . . . . . . . . . . . . . . . . . . . . 92.2.2. Alternative derivation of Kds:
review of published data . . . . . . . . . . . . . . . . . . . . . . . . . . . 152.2.3. Maximum and minimum values for open ocean Kds . . . 17
2.3. Ocean margin Kds (Table II) . . . . . . . . . . . . . . . . . . . . . . . . . . . . 172.3.1. Derivation of ocean margin Kds . . . . . . . . . . . . . . . . . . . . 172.3.2. Alternative derivation of ocean margin Kds: review of
published data . . . . . . . . . . . . . . . . . . . . . . . . . . . . . . . . . . . 232.3.3. Maximum and minimum values for
ocean margin Kds . . . . . . . . . . . . . . . . . . . . . . . . . . . . . . . . . 252.4. Estuaries: a special case . . . . . . . . . . . . . . . . . . . . . . . . . . . . . . . . . 25
3. CONCENTRATION FACTORS FORBIOLOGICAL MATERIAL . . . . . . . . . . . . . . . . . . . . . . . . . . . . . . . . 26
3.1. Basic derivation . . . . . . . . . . . . . . . . . . . . . . . . . . . . . . . . . . . . . . . 263.2. Factors affecting CFs . . . . . . . . . . . . . . . . . . . . . . . . . . . . . . . . . . . 273.3. Tabulated values: general remarks . . . . . . . . . . . . . . . . . . . . . . . . 29
3.3.1. Comments on carbon and lead . . . . . . . . . . . . . . . . . . . . . 303.3.2. Surface water fish (Table III) . . . . . . . . . . . . . . . . . . . . . . . 313.3.3. Crustaceans (Table IV) . . . . . . . . . . . . . . . . . . . . . . . . . . . . 32
3.3.4. Molluscs (Table V) . . . . . . . . . . . . . . . . . . . . . . . . . . . . . . . 323.3.5. Macroalgae (Table VI) . . . . . . . . . . . . . . . . . . . . . . . . . . . . 333.3.6. Plankton: zooplankton and phytoplankton
(Tables VII and VIII) . . . . . . . . . . . . . . . . . . . . . . . . . . . . . 333.3.7. Cephalopods (Table IX) . . . . . . . . . . . . . . . . . . . . . . . . . . . 343.3.8. Mesopelagic fish . . . . . . . . . . . . . . . . . . . . . . . . . . . . . . . . . 353.3.9. Mammals (Tables X–XII) . . . . . . . . . . . . . . . . . . . . . . . . . . 35
APPENDIX: CONCENTRATION FACTORS FORDEEP OCEAN FERROMANGANESE NODULES . . . 73
REFERENCES . . . . . . . . . . . . . . . . . . . . . . . . . . . . . . . . . . . . . . . . . . . . . . . . . 77CONTRIBUTORS TO DRAFTING AND REVIEW . . . . . . . . . . . . . . . . 95
1. INTRODUCTION
1.1. BACKGROUND TO TECHNICAL REPORTS SERIES No. 247
The oceans and coastal waters are influenced by a complex variety ofphysical, geochemical and biological processes, which influence the behaviour,transport and fate of radionuclides released into the marine environment. Keyparameters describing these processes are represented in models that may beused either to assess the impact of radionuclide contributions or to develop reg-ulations for controlling the release of radionuclides into the marine environment.
In the decade prior to the publication of Technical Reports Series No. 247(TRS 247) [1] there had been considerable international effort to investigatethe potential impact of existing low level solid waste disposal [2] and the poten-tial suitability of the sub-seabed disposal of high level waste [3]. This resultedin a number of initiatives, including a GESAMP1 report, An OceanographicModel for the Dispersion of Wastes Disposed of in the Deep Sea [4]. It was rec-ognized that the representation of geochemical and biological processes in suchmodels by means of distribution coefficients (Kds) and concentration factors(CFs) (see Sections 2 and 3 for their definitions) was sometimes inadequateand in any case poorly documented. The original version of TRS 247 describedan approach based both on stable element abundances and literature Kds andCFs, with emphasis on field observations for selection of the latter when avail-able. These recommended values could then be used in models designed toprovide the definition of radioactive waste unsuitable for dumping at sea [5],as required by annex I of the then London Dumping Convention.
1.2. CHANGES SINCE THE PUBLICATION OF TRS 247
A number of significant developments have occurred since the publica-tion of TRS 247, including changes to the regional and international regulatoryframework controlling radionuclide inputs to the marine environment, changesin the type and extent of radionuclide inputs, greater disclosure of previous
1
1 GESAMP (International Maritime Organization, Food and AgricultureOrganization of the United Nations, United Nations Educational, Scientific andCultural Organization, World Meteorological Organization, World HealthOrganization, IAEA, United Nations, United Nations Environment Programme JointGroup of Experts on the Scientific Aspects of Marine Environmental Protection).
at-sea waste disposal practices by nations and a number of post-TRS 247 inter-national radiological assessments, in addition to those carried out as part ofroutine national programmes [6–8].
1.2.1. Regional and international regulatory framework
The most significant changes to the international regulatory frameworksince 1985 have been:
(a) In 1992 the Convention for the Protection of the Marine Environment ofthe North-East Atlantic (OSPAR Convention) was adopted by the 14 sig-natory states to the Oslo and Paris Conventions, Switzerland and theEuropean Commission (EC). The OSPAR Convention commits theContracting Parties to take all possible steps to prevent and eliminate pol-lution of the marine environment of the northeast Atlantic by applyingthe precautionary approach and using the best environmental technolo-gies and environmental practices. At the 1998 Ministerial Meeting of theOSPAR Commission held in Sintra the signatories to the OSPARConvention pledged to undertake a progressive and substantial reductionof discharges, emissions and losses of radioactive substances, with the ulti-mate aim of reducing concentrations in the environment to near back-ground levels for naturally occurring radioactive substances and close tozero for artificial radioactive substances. In achieving this objective, issuessuch as legitimate uses of the sea, technical feasibility and radiologicalimpacts on humans and biota should be taken into account [9].
(b) In 1993 the Sixteenth Consultative Meeting of the London Convention1972 adopted Resolution LC.51(16), amending the London Conventionand prohibiting the disposal at sea of all radioactive waste and otherradioactive matter [10]. The resolution entered into force on 20 February1994 for all Contracting Parties, with the exception of the RussianFederation, which had submitted to the Secretary General of theInternational Maritime Organization (IMO) a declaration of non-acceptance of the amendment contained in Resolution LC.51(16),although stating that it will continue its endeavours to ensure that thesea is not polluted by the dumping of waste and other matter.
(c) In the past few years there has been an increasing emphasis on the needto address radiological impacts on the environment as a whole, includingnon-human biota. The long held view that protection of the environmentwas assured as a consequence of protecting the human population,endorsed by International Commission on Radiological Protection
2
(ICRP) Publication 60 [11], is at present under review. In 1999 the IAEApublished a discussion report [12] on the protection of the environmentfrom the effects of ionizing radiation. The European Union has recog-nized the need for further initiatives [13], and this issue is under discus-sion in the peer reviewed scientific literature [14–16].
(d) In 1996 the IAEA adopted the new Basic Safety Standards for radiationprotection [17].These International Basic Safety Standards for Protectionagainst Ionizing Radiation and for the Safety of Radiation Sources werebased on the recommendations of the ICRP and were sponsored by fiveother organizations: the Food and Agriculture Organization of the UnitedNations, the International Labour Organization, the OECD NuclearEnergy Agency, the Pan American Health Organization and the WorldHealth Organization. Over the past few years the Basic Safety Standardshave become the basis for national regulations in a large number of coun-tries and their adoption has led many countries to review and revise theirrelevant national regulations.
1.2.2. Radionuclide sources
The most significant events since the publication of TRS 247 that have ledto an actual or potential input of radionuclides into the marine environmenthave been the following.
(a) The accident at the Chernobyl nuclear power plant in April 1986 was thesingle largest contribution to radioactivity in the marine environmentresulting from accidental releases from land based nuclear installations.The most radiologically significant radionuclides released in the accidentwere 137Cs, 134Cs, 90Sr and 131I. The inventories of 137Cs and 134Cs ofChernobyl origin in northern European waters, from direct depositionand runoff, were estimated to be 10 PBq and 5 PBq [18], respectively,affecting mainly the Baltic Sea. It has also been estimated that the totalinput of 137Cs into the Mediterranean Sea and Black Sea was between 3and 5 PBq and 2.4 PBq, respectively [19].
(b) In May 1993 the Russian Federation disclosed information on sea disposaloperations of the Former Soviet Union (FSU) and the Russian Federationin the Kara Sea, Barents Sea and Sea of Japan [20]. In October of the sameyear the Russian Federation informed the IAEA and IMO about a liquidwaste disposal operation that had taken place in the Sea of Japan in 1993[21]. Additional information on disposal operations carried out by Swedenin 1959 and 1961 in the Baltic Sea and by the United Kingdom in its coastalwaters from 1948 to 1976 was also made public in 1992 and 1997 [22, 23].
3
In addition, changes in the pattern of routine releases of radioactive wasteinto the sea have also occurred.
(i) Since the mid-1980s there have been significant changes in the relativecomposition and quantities of discharges of radioactive material to riversand coastal waters, especially from nuclear fuel reprocessing installations.Overall discharges to the sea from nuclear installations in mid-latitudeshave been reduced in the intervening period. Conversely, changes inwaste management practices at the nuclear fuel reprocessing plants atCap de la Hague (France) and Sellafield (UK) led to increases in dis-charges of 129I and 99Tc in the 1990s. This has been accompanied by anupsurge in interest in the use of 99Tc and 129I as tracers of oceanographicprocesses [24, 25]. As a result, there are far more data available on theseradionuclides than at the time of the compilation of TRS 247. The highaccumulation rates of 99Tc by some biota stimulated a limited number offield measurements, from which additional CFs have been derived.
(ii) Since the early 1990s it has been recognized that contaminated seabedsediments represent significant secondary sources of radionuclides; forexample, since the 1980s the Irish Sea seabed has been a more significantsource of caesium and plutonium to the water column than direct dis-charges from Sellafield [25, 26]. The phenomenon is also thought to occurin the Baltic Sea as a result of the deposition that followed the accident atChernobyl and in the Rhone Delta in the Mediterranean Sea, which wasthe recipient of radioactive waste from the nuclear fuel reprocessing plantat Marcoule [27].
(iii) In recent years there has also been an increased recognition of the radio-logical significance of non-nuclear sources of natural radioactivity, in par-ticular 226Ra, 228Ra, 222Rn, 210Pb and 210Po, produced, for example, byphosphate processing plants, offshore oil and gas installations and theceramics industry [28–31].
1.2.3. Radiological assessments
Since the publication of TRS 247 a number of international assessmentshave been carried out.
(a) Between 1985 and 1996 the EC commissioned three assessments of theradiological exposure of the population of the European Communityfrom radioactivity in north European marine waters (Project Marina[18]), the Mediterranean Sea (Project Marina-Med [19]) and the BalticSea (Project Marina-Balt [32, 33]). In 2000 the European Union initiated
4
a revision of the original Marina project. This study took account ofchanges in direct discharges from nuclear installations and remobilizationfrom contaminated sediments, used more realistic habit data to derivedoses to critical groups and placed more emphasis on the impact of natu-rally occurring radioactive material from the processing of phosphate oreand from the offshore oil and gas industry [34].
(b) In the early 1990s an IAEA Co-ordinated Research Project, Sources ofRadioactivity in the Marine Environment and their RelativeContributions to Overall Dose Assessment from Marine Radioactivity,conducted a global radiological assessment of doses to members of thepublic from 210Po and 137Cs through the consumption of seafood [35, 36].
(c) Following the disclosure that the FSU had dumped radioactive waste inthe shallow waters of the Arctic Seas, in 1993 the IAEA established theInternational Arctic Seas Assessment Project (IASAP) with the objec-tives of specifically examining the radiological conditions in the westernKara Sea and Barents Sea and assessing the risks to human health andthe environment associated with the radioactive waste disposed of inthose seas [37–40]. A detailed review of Kds and CFs for marine biotawas carried out as part of this project. There have been several otherrelated initiatives that have been part of larger international, multilat-eral or national programmes, such as the Arctic Monitoring andAssessment Programme (AMAP), the Joint Russian–Norwegian ExpertGroup for the investigation of radioactive contamination in northernareas and the US Arctic Nuclear Waste Assessment Programme(ANWAP).
(d) Between 1996 and 1998 the IAEA conducted an international study toassess the radiological consequences of the 193 nuclear experiments(nuclear tests and safety trials) conducted by the French Government atMururoa and Fangataufa Atolls in the South Pacific Ocean [41]. A largenumber of measurements of radionuclide concentrations in sea water,sediments and marine biota were collected during this investigation.
(e) In the same years the IAEA also undertook a review of the assessmentsof the radiological conditions at Bikini Atoll in relation to nuclearweapon tests carried out in the territory of the Marshall Islands between1946 and 1958 [42].
(f) The Nord-Cotentin Radioecology Group was set up by the FrenchGovernment in 1997 to conduct an assessment of the region adjacent tothe reprocessing plant at Cap de la Hague in northwest France. Thisincluded a consideration of marine pathways and the derivation of Kdsand CFs from field measurements. The work of this group was completedin 1999 [43].
5
(g) In recent years a number of assessments have been carried out of theradiological consequences resulting from European non-nuclear activi-ties, such as the extraction of phosphogypsum by the phosphate processingindustry [44, 45].
1.3. IMPROVED SCIENTIFIC KNOWLEDGE
The developments that followed the publication of TRS 247 have led to agreater concentration of effort on coastal, estuarine and shelf processes and onthe behaviour and impact of radionuclides in these environments. Much of thefield data in TRS 247 were based on temperate regions and there has been con-cern expressed as to the applicability of the derived Kds and CFs to otherregions. Since then there has been an increased emphasis on Arctic and, to alesser extent, tropical environments (Mururoa, Bikini), reflecting changing cir-cumstances and the radiological assessments that have been undertaken subse-quently. In some cases assessments have used the Kds and CFs recommendedin TRS 247. However, there have been specific studies to improve the databaseon radionuclide partitioning in response to particular radiological issues.Increased discharges of 99Tc from the Sellafield reprocessing plant in the mid-1990s created a need to improve the database of 99Tc in crustaceans (seeTable IV). The initial IASAP calculations were performed using values takenfrom TRS 247, but the pressure to conduct a thorough radiological assessmentof the Kara Sea dumping operations led to an experimental programme to pro-vide site specific Kds using sediment collected from the region [46, 47]. TheMururoa and Nord-Cotentin assessments also used site specific CFs.
There have been significant advances in the fields of chemical and bio-logical oceanography since the publication of TRS 247. This applies both to theunderstanding of oceanographic processes and to the provision of reliable dataon element concentrations in sea water [48]. Wherever possible these improve-ments in our knowledge base have been incorporated into this report.
Many of the sediment Kds and biological CFs provided in this report dif-fer significantly from the values published in TRS 247. These new values reflectnew measurements primarily coming from coastal regions, often as part ofnational monitoring programmes, such as the National Oceanic andAtmospheric Administration’s National Status and Trends Program in theUnited States of America, that follow standardized sampling and analyticalprotocols. In addition, in many cases the new CFs reflect the latest understand-ing of dissolved element concentrations in sea water (provided in Tables I andII); for example, with the increased application of clean sampling and analyti-cal techniques for trace metal determination, a more reliable and internally
6
consistent oceanographic data set now exists for dissolved metal concentra-tions. Typically the recent metal measurements are significantly below earlierestimates of dissolved concentrations. Consequently, in calculating sedimentKds or CFs for organisms using wet weight concentrations of metals in organ-ism tissues, the new metal CFs published in this report are generally higher thanthose in TRS 247. In addition, improved sampling and analytical protocols formeasuring the concentrations of radionuclides in sea water, sediments and bio-logical tissues have generated a more reliable database for some radionuclidesand their stable analogues, leading to altered recommended sediment Kds andCFs.
1.4. ENVIRONMENTAL IMPACT
Until relatively recently it was assumed that protection of the environ-ment was assured as a consequence of protecting the human population. Thishypothesis was endorsed in ICRP 60 [11]:
“The Commission believes that the standard of environmental controlneeded to protect man to the degree currently thought desirable willensure that other species are not put at risk.”
This assumption is now being challenged on the grounds that there maybe situations in which it is not valid and that there is a need to demonstrate thatenvironmental protection has been specifically addressed [15].The assessmentscarried out by the IASAP [38] and AMAP in the area where the Russiannuclear submarine Komsomolets sank [49] both included estimations of eco-logical risk, and in both cases the risk was found to be negligible.
There is now a requirement under annex V of the OSPAR Convention[9] to acknowledge “the protection and conservation of the ecosystems andbiological diversity of the maritime area”. International symposia have beenrecently organized around this topic [50, 51]. In 1999 the IAEA issued areport for discussion, in which the need for developing a system for protect-ing the environment against the effects of ionizing radiation was elaborated[12]. In 2000 and 2001 the IAEA held two specialist meetings on the subject,at which the ethical principles that could underlie such a system wereexplored [52].
The biological data compiled in this study are likely to be of limited valuefor predicting radiological effects on biota. The distribution of radionuclides inspecific organs will be more critical for assessing harm to the organism, and isa topic beyond the scope of this report. The focus of this report is to provide
7
information that would allow an assessment of the potential risks associatedwith human consumption of edible fractions.
1.5. USE OF RECOMMENDED Kds AND CFs IN MODELS
The following sections provide recommended Kds or CFs for use in radio-logical assessment models. They can be thought of as best estimates or defaultvalues in the absence of site specific data, and replace the mean values ofTRS 247. It is recommended that the explanatory footnotes accompanying thetables be consulted, as these may refer the user to more detailed informationthat may be of relevance to particular assessments. No attempt has been madeto provide statistical distributions of Kds or CFs for each element–matrix com-bination. There are very few cases where the database is adequate to derive adistribution empirically. It is suggested that the influence of the Kd or CFshould be included in a model sensitivity analysis using arbitrary parameter dis-tributions, and that further site specific values be sought if necessary. Ranges ofKds and CFs have been removed from the revised tables. In most cases maxi-mum and minimum values can be assumed to be within one order of magnitudeof the recommended value.
2. SEDIMENT–WATER DISTRIBUTION COEFFICIENTS
2.1. INTRODUCTION
This section provides details of the approach adopted for the derivationof sediment–water Kds for use in radiological assessment models of the marineenvironment. The Kd provides a convenient means to describe the relationshipbetween radionuclide concentrations in suspended particulate matter or bot-tom sediments and water:
or:
8
Kd (dimensionless) =
Concentration per unit mass of particuulate (kg/kg or Bq/kg dry weight)Concentration per unit maass of water (kg/kg or Bq/kg)
By adopting the Kd concept we have to assume that there exists anequilibrium balance between dissolved and particulate phases, with theexchanges of nuclides between particles and water being wholly reversible.This is a simplification of reality, especially for short timescale exchanges,but is justifiable for the purposes of running most radiological assessmentmodels, particularly when there is inadequate knowledge about the actualdistribution and behaviour of relevant radionuclides. An important excep-tion is in cases where the presence of hot particles [53, 54] must be taken intoconsideration in the radiological risk assessment. It does not preclude theuse of more realistic modelling techniques when the needs of the assessmentand the availability of data justify it. Usually it is not known whether the Kdrepresents equilibrium partitioning between water and all the particulatephases that are available for exchange over varying times and whether thepartitioning involves wholly reversible or some irreversible processes.
Kds have been determined from both field observations and laboratorysorption experiments for several radionuclides of radiological significance. Suchdata are essential for artificial nuclides; however, for nuclides of naturally occur-ring elements it is possible to use an alternative approach to the derivation ofKds based on the use of stable element geochemical data and the choice of rea-sonable, if arbitrary, assumptions. In this way we can assess the proportions ofthe particulate phase abundances of the elements that are likely to be exchange-able with the aqueous phase. Combining both approaches provides a best esti-mate value for each element that can be used as a generic value.
2.2. OPEN OCEAN Kds (TABLE I)
2.2.1. Derivation of open ocean Kd s
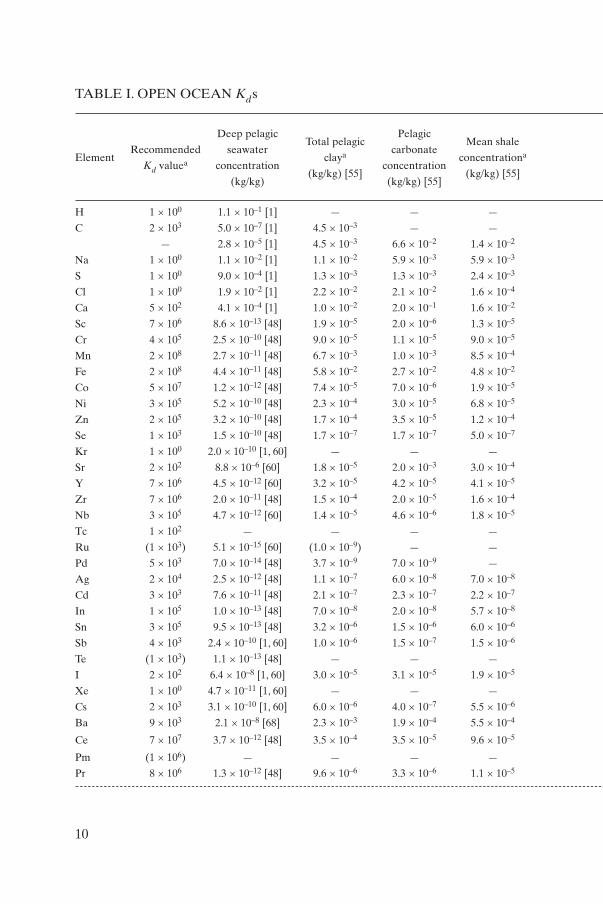
Recommended Kds for the open ocean environment for a number of ele-ments are listed in column 2 of Table I. In addition, a selection of Kds based onfield observations or laboratory experiments has been compiled and is pre-sented in the last column, where possible using values published in peerreviewed literature. The remainder of Table I contains the details from whichthe recommended values were calculated.
9
Kd (L/kg) =
Concentration per unit mass of particulate (kg/kkg or Bq/kg dry weight)Concentration per unit volume of waater (kg/L or Bq/L)
10
TABLE I. OPEN OCEAN Kds
Deep pelagic Pelagic
Recommended seawaterTotal pelagic
carbonateMean shale
ElementKd valuea concentration
clayaconcentration
concentrationa
(kg/kg) (kg/kg) [55]
(kg/kg) [55](kg/kg) [55]
H 1 × 100 1.1 × 10⁻¹ [1] — — —
C 2 × 10³ 5.0 × 10⁻⁷ [1] 4.5 × 10⁻³ — —
— 2.8 × 10⁻⁵ [1] 4.5 × 10⁻³ 6.6 × 10⁻² 1.4 × 10⁻²
Na 1 × 100 1.1 × 10⁻² [1] 1.1 × 10⁻² 5.9 × 10⁻³ 5.9 × 10⁻³
S 1 × 100 9.0 × 10⁻⁴ [1] 1.3 × 10⁻³ 1.3 × 10⁻³ 2.4 × 10⁻³
Cl 1 × 100 1.9 × 10⁻² [1] 2.2 × 10⁻² 2.1 × 10⁻² 1.6 × 10⁻⁴
Ca 5 × 10² 4.1 × 10⁻⁴ [1] 1.0 × 10⁻² 2.0 × 10⁻¹ 1.6 × 10⁻²
Sc 7 × 10⁶ 8.6 × 10⁻¹³ [48] 1.9 × 10⁻⁵ 2.0 × 10⁻⁶ 1.3 × 10⁻⁵
Cr 4 × 10⁵ 2.5 × 10⁻¹⁰ [48] 9.0 × 10⁻⁵ 1.1 × 10⁻⁵ 9.0 × 10⁻⁵
Mn 2 × 10⁸ 2.7 × 10⁻¹¹ [48] 6.7 × 10⁻³ 1.0 × 10⁻³ 8.5 × 10⁻⁴
Fe 2 × 10⁸ 4.4 × 10⁻¹¹ [48] 5.8 × 10⁻² 2.7 × 10⁻² 4.8 × 10⁻²
Co 5 × 10⁷ 1.2 × 10⁻¹² [48] 7.4 × 10⁻⁵ 7.0 × 10⁻⁶ 1.9 × 10⁻⁵
Ni 3 × 10⁵ 5.2 × 10⁻¹⁰ [48] 2.3 × 10⁻⁴ 3.0 × 10⁻⁵ 6.8 × 10⁻⁵
Zn 2 × 10⁵ 3.2 × 10⁻¹⁰ [48] 1.7 × 10⁻⁴ 3.5 × 10⁻⁵ 1.2 × 10⁻⁴
Se 1 × 10³ 1.5 × 10⁻¹⁰ [48] 1.7 × 10⁻⁷ 1.7 × 10⁻⁷ 5.0 × 10⁻⁷
Kr 1 × 100 2.0 × 10⁻¹⁰ [1, 60] — — —
Sr 2 × 10² 8.8 × 10⁻⁶ [60] 1.8 × 10⁻⁵ 2.0 × 10⁻³ 3.0 × 10⁻⁴
Y 7 × 10⁶ 4.5 × 10⁻¹² [60] 3.2 × 10⁻⁵ 4.2 × 10⁻⁵ 4.1 × 10⁻⁵
Zr 7 × 10⁶ 2.0 × 10⁻¹¹ [48] 1.5 × 10⁻⁴ 2.0 × 10⁻⁵ 1.6 × 10⁻⁴
Nb 3 × 10⁵ 4.7 × 10⁻¹² [60] 1.4 × 10⁻⁵ 4.6 × 10⁻⁶ 1.8 × 10⁻⁵
Tc 1 × 10² — — — —
Ru (1 × 10³) 5.1 × 10⁻¹⁵ [60] (1.0 × 10⁻⁹) — —
Pd 5 × 10³ 7.0 × 10⁻¹⁴ [48] 3.7 × 10⁻⁹ 7.0 × 10⁻⁹ —
Ag 2 × 10⁴ 2.5 × 10⁻¹² [48] 1.1 × 10⁻⁷ 6.0 × 10⁻⁸ 7.0 × 10⁻⁸
Cd 3 × 10³ 7.6 × 10⁻¹¹ [48] 2.1 × 10⁻⁷ 2.3 × 10⁻⁷ 2.2 × 10⁻⁷
In 1 × 10⁵ 1.0 × 10⁻¹³ [48] 7.0 × 10⁻⁸ 2.0 × 10⁻⁸ 5.7 × 10⁻⁸
Sn 3 × 10⁵ 9.5 × 10⁻¹³ [48] 3.2 × 10⁻⁶ 1.5 × 10⁻⁶ 6.0 × 10⁻⁶
Sb 4 × 10³ 2.4 × 10⁻¹⁰ [1, 60] 1.0 × 10⁻⁶ 1.5 × 10⁻⁷ 1.5 × 10⁻⁶
Te (1 × 10³) 1.1 × 10⁻¹³ [48] — — —
I 2 × 10² 6.4 × 10⁻⁸ [1, 60] 3.0 × 10⁻⁵ 3.1 × 10⁻⁵ 1.9 × 10⁻⁵
Xe 1 × 100 4.7 × 10⁻¹¹ [1, 60] — — —
Cs 2 × 10³ 3.1 × 10⁻¹⁰ [1, 60] 6.0 × 10⁻⁶ 4.0 × 10⁻⁷ 5.5 × 10⁻⁶
Ba 9 × 10³ 2.1 × 10⁻⁸ [68] 2.3 × 10⁻³ 1.9 × 10⁻⁴ 5.5 × 10⁻⁴
Ce 7 × 10⁷ 3.7 × 10⁻¹² [48] 3.5 × 10⁻⁴ 3.5 × 10⁻⁵ 9.6 × 10⁻⁵
Pm (1 × 10⁶) — — — —
Pr 8 × 10⁶ 1.3 × 10⁻¹² [48] 9.6 × 10⁻⁶ 3.3 × 10⁻⁶ 1.1 × 10⁻⁵
11
Kd based on Kd based onKd based on
Potential claytotal pelagic potential
potential
enrichmentclay enrichment
carbonate Other derived Kds
(kg/kg)(kg/kg) (kg/kg)
exchange
(kg/kg)
— — — — —
— 9.0 × 10³ — — —
— 1.6 × 10² — 2.4 × 10³ —
5.1 × 10⁻³ 1.0 × 100 4.6 × 10⁻¹ — 1 × 10⁻¹–2.4 × 100 [56, 57]
— 1.4 × 100 — — —
2.2 × 10⁻² 1.2 × 100 1.1 × 100 — —
— 2.4 × 101 — 4.9 × 10² 1 × 10² [56]
6.0 × 10⁻⁶ 2.2 × 10⁷ 7.0 × 10⁶ — 4 × 10⁷–5 × 10⁷ [56, 58]
— 3.6 × 10⁵ — — 3 × 10⁵–5 × 10⁵ [56, 58]
5.9 × 10⁻³ 2.5 × 10⁸ 2.2 × 10⁸ — 8 × 10⁶–2 × 10⁷ [4, 57, 58]
1.0 × 10⁻² 1.3 × 10⁹ 2.3 × 10⁸ — 5 × 10⁵–5 × 10⁷ [4, 57, 58]
5.5 × 10⁻⁵ 6.2 × 10⁷ 4.6 × 10⁷ — 1 × 10⁶–6 × 10⁶ [4, 57, 58]
1.6 × 10⁻⁴ 4.5 × 10⁵ 3.1 × 10⁵ — 3 × 10⁵–5 × 10⁵ [56, 58]
5.0 × 10⁻⁵ 5.3 × 10⁵ 1.6 × 10⁵ — 1 × 10⁵–4 × 10⁵ [56–58]
— 1.1 × 10³ — — 8 × 10²–1 × 10⁴ [57–59]
— — — — —
— 2.0 × 100 — 2.5 × 10² 1 × 10⁻¹ [56]
— 7.1 × 10⁶ — — 8 × 10⁷ [56]
— 7.4 × 10⁶ — — 8 × 10⁶ [56]
— 3.0 × 10⁶ — — —
— — — — 1 × 100–1 × 101 [61–66]
— (2.0 × 10⁵) — — —
— 5.3 × 10⁴ — — —
4.0 × 10⁻⁸ 4.4 × 10⁴ 1.6 × 10⁴ — 3 × 10³–5 × 10³ [56, 58]
— 2.8 × 10³ — — 9.5 × 101–1 × 10⁴ [56–58]
1.3 × 10⁻⁸ 6.7 × 10⁵ 1.3 × 10⁵ — 1 × 10⁶ [56]
— 3.4 × 10⁶ — — 1 × 10⁵ [57]
— 4.1 × 10³ — — 5 × 10³–2.1 × 10⁴ [57, 58]
— — — — —
1.1 × 10⁻⁵ 4.7 × 10² 1.7 × 10² — 1 × 10²–1.3 × 10⁴ [59, 67]
— — — — —
5.0 × 10⁻⁷ 2.0 × 10⁴ 1.6 × 10³ — 4 × 10²–2 × 10⁴ [56–58]
1.8 × 10⁻³ 1.1 × 10⁵ 8.3 × 10⁴ 9.0 × 10³ 2 × 10⁴–1 × 10⁵ [56, 57]
2.5 × 10⁻⁴ 9.4 × 10⁷ 6.8 × 10⁷ — 1 × 10⁸ [56]
— (1.0 × 10⁷) — — —
— 7.6 × 10⁶ — — 2 × 10⁷ [56]
12
TABLE I. (cont.)
Deep pelagic Pelagic
Recommended seawaterTotal pelagic
carbonateMean shale
ElementKd valuea concentration
clayaconcentration
concentrationa
(kg/kg) (kg/kg) [55]
(kg/kg) [55](kg/kg) [55]
Sm 5 × 10⁵ 1.2 × 10⁻¹² [48] 6.2 × 10⁻⁶ 3.8 × 10⁻⁶ 7.0 × 10⁻⁶
Eu 2 × 10⁶ 3.0 × 10⁻¹³ [48] 1.8 × 10⁻⁶ 6.0 × 10⁻⁷ 1.2 × 10⁻⁶
Gd 7 × 10⁵ 2.0 × 10⁻¹² [48] 7.4 × 10⁻⁶ 3.8 × 10⁻⁶ 6.0 × 10⁻⁶
Tb 4 × 10⁵ 2.7 × 10⁻¹³ [48] 1.1 × 10⁻⁶ 6.0 × 10⁻⁷ 1.0 × 10⁻⁶
Dy (5 × 10⁶) 9.1 × 10⁻¹³ [48] (6.0 × 10⁻⁶) 2.7 × 10⁻⁶ 5.8 × 10⁻⁶
Tm 2 × 10⁵ 2.9 × 10⁻¹³ [48] 5.6 × 10⁻⁷ 1.0 × 10⁻⁷ 6.0 × 10⁻⁷
Yb 2 × 10⁵ 1.9 × 10⁻¹² [48] 2.9 × 10⁻⁶ 1.5 × 10⁻⁶ 3.9 × 10⁻⁶
Hf 6 × 10⁶ 2.1 × 10⁻¹³ [48] 4.1 × 10⁻⁶ 4.1 × 10⁻⁷ 2.8 × 10⁻⁶
Ta 5 × 10⁴ 2.4 × 10⁻¹² [48] 1.2 × 10⁻⁶ 1.0 × 10⁻⁸ 2.0 × 10⁻⁶
W 1 × 10³ 1.0 × 10⁻¹⁰ [1, 60] 1.1 × 10⁻⁶ 1.1 × 10⁻⁷ 1.9 × 10⁻⁶
Ir (3 × 10⁶) 1.7 × 10⁻¹⁵ [48] 3.0 × 10⁻¹⁰ — (3.0 × 10⁻¹²)
Hg 3 × 10⁴ 2.5 × 10⁻¹³ [60] 8.0 × 10⁻⁸ 4.6 × 10⁻⁷ 1.8 × 10⁻⁷
Tl 9 × 10⁴ 1.0 × 10⁻¹¹ [1, 60] 9.0 × 10⁻⁷ 1.6 × 10⁻⁷ 1.2 × 10⁻⁶
Pb 1 × 10⁷ 4.0 × 10⁻¹² [1, 60] 8.0 × 10⁻⁵ 1.7 × 10⁻⁵ 2.3 × 10⁻⁵
Po (2 × 10⁷) 2.3 × 10⁻¹⁸ [60] — — —
Ra 4 × 10³ 5.6 × 10⁻¹⁶ [69, 70] 2.0 × 10⁻¹¹ 2.0 × 10⁻¹² 1.1 × 10⁻¹²
Ac (2 × 10⁶) 6.9 × 10⁻²⁰ [60] — — —
Th 5 × 10⁶ 1.0 × 10⁻¹³ [1, 72] 5.0 × 10⁻⁶ 1.0 × 10⁻⁶ 1.2 × 10⁻⁵
Pa (5 × 10⁶) 1.7 × 10⁻¹⁷ [76] — — —
U 5 × 10² 3.2 × 10⁻⁹ [1, 60] 1.0 × 10⁻⁶ 1.6 × 10⁻⁶ 3.7 × 10⁻⁶
Np 1 × 10³ — — — —
Pu 1 × 10⁵ — — — —
Am 2 × 10⁶ — — — —
Cm 2 × 10⁶ — — — —
Bk (2 × 10⁶) — — — —
Cf (2 × 10⁶) — — — —
a Values in parentheses indicate that data are insufficient to calculate Kds using the methodology
described in Section 2.2.1 and therefore the recommended values were chosen to be equal to the
Kds of periodically adjacent elements.
13
Kd based on Kd based onKd based on
Potential claytotal pelagic potential
potential
enrichmentclay enrichment
carbonate Other derived Kds
(kg/kg)(kg/kg) (kg/kg)
exchange
(kg/kg)
— 5.1 × 10⁶ — — —
6.0 × 10⁻⁷ 5.9 × 10⁶ 2.0 × 10⁶ — —
1.4 × 10⁻⁶ 3.8 × 10⁶ 7.1 × 10⁵ — —
1.0 × 10⁻⁷ 4.0 × 10⁶ 3.6 × 10⁵ — —
2.0 × 10⁻⁷ (6.6 × 10⁶) (2.2 × 10⁵) — —
— 1.9 × 10⁶ — — —
— 1.5 × 10⁶ — — —
1.3 × 10⁻⁶ 2.0 × 10⁷ 6.3 × 10⁶ — 1 × 10⁶ [56]
— 5.1 × 10⁵ — — —
— 1.1 × 10⁴ — — —
— (1.8 × 10⁵) — — —
— 3.2 × 10⁵ — — 3 × 10³–5 × 10³ [56, 58]
— 9.0 × 10⁴ — — 1 × 10⁵ [56]
5.7 × 10⁻⁵ 2.0 × 10⁷ 1.4 × 10⁷ — 1 × 10⁴–5 × 10⁷ [4, 56, 59]
— — — — —
1.9 × 10⁻¹¹ 3.6 × 10⁴ 3.4 × 10⁴ 3.6 × 10³ 5 × 10² [59]
— — — — —
— 4.9 × 10⁷ — — 1 × 10⁵–1 × 10⁷ [4, 56, 58,
59, 71, 73–75]
— — — — 1 × 10⁴–1 × 10⁷ [4, 59]
— 3.1 × 10² — 5.0 × 10² 5 × 10² [56, 58, 59]
— — — — 1 × 10²–5 × 10⁴
(see Section 2.2.2)
— — — — 1 × 10⁴–1 × 10⁶
(see Section 2.2.2)
— — — — 1 × 10⁵–2 × 10⁷
(see Section 2.2.2)
— — — — —
— — — — —
— — — — —
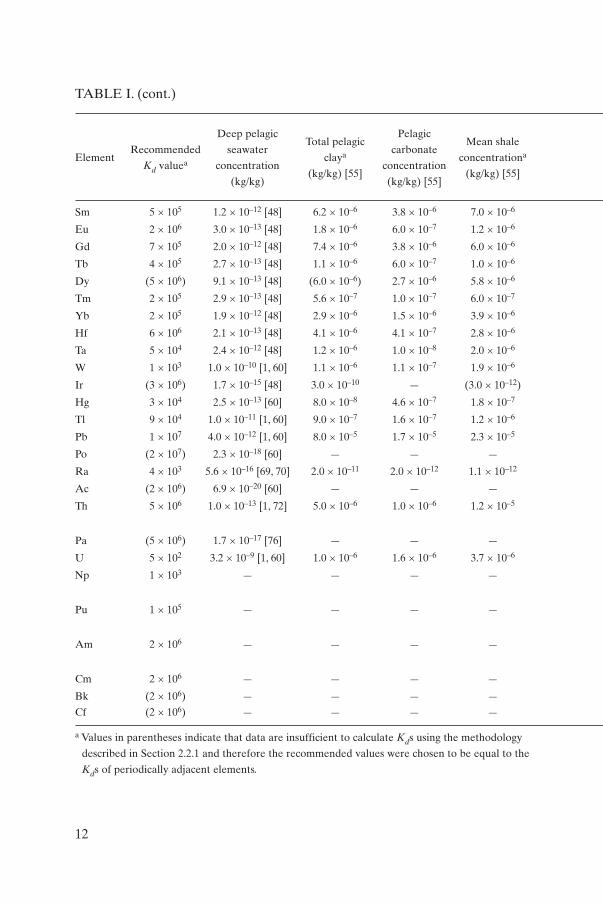
The recommended Kds (column 2) are based on the estimate of pelagicclay enrichment in relation to source rocks. Where no such enrichment isindicated, it has been assumed, arbitrarily, that 10% of the total pelagic clayabundance represents the proportion of exchangeable phase particulate ele-ment. The only exceptions to this procedure are where the experimentalmeasurements, presented in the table, suggest that the Kd is closer to the valuebased on the total pelagic clay concentration than to the value based on 10%of this concentration (Sc, Cr, Se, Y, Zr, Cd, Sb, Pr and Tl).
Deep water dissolved element concentrations (column 3) represent, inmost instances, the mean of Atlantic and Pacific values taken from the mostreliable and recent sources. This is a departure from TRS 247, in which NorthAtlantic values were preferentially used. The dissolved concentrations werebased on either analysis of filtered samples of sea water or, for trace con-stituents, analysis of the acid soluble fraction of unfiltered samples of sea water.For aluminum, iron and manganese the concentrations given in Table I arethose resulting from analysis of filtered samples of sea water, as unfiltered seawater contains significant additional colloidal and fine particulate contribu-tions of these elements.
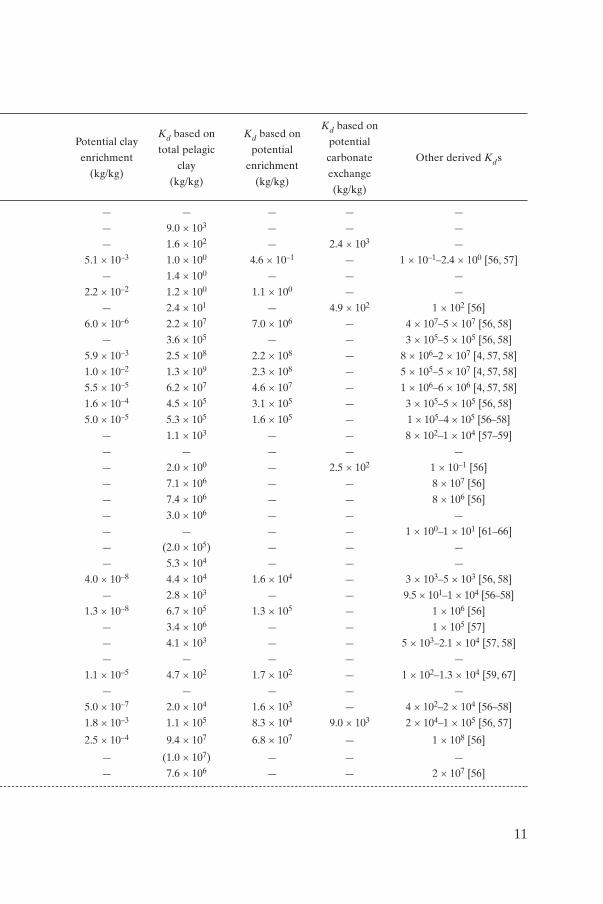
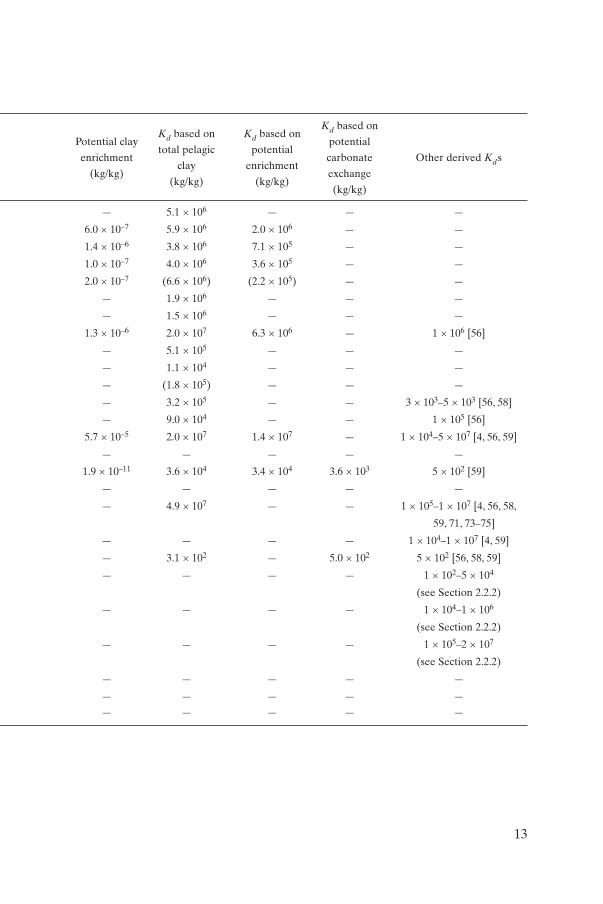
The detailed calculation was as follows. The concentrations of the ele-ments in pelagic clay (column 4), pelagic carbonate sediments (column 5) andmean shales (column 6) were derived from Bowen [55]. The ratio of the con-centration of an element in pelagic clays to that in deep ocean water providesone estimate of the Kd (column 8) for the element. Several authors havereported marine elemental mass balances, and the partitioning of elementsbetween various marine phases was determined on this basis [56, 58, 77–81].However, for the purpose of deriving suitable Kds for use in oceanographic andradiological models applied to the transport of radioactive waste, an estimateof the wholly exchangeable particulate phase component is needed. This wasestimated from the difference between the total pelagic clay element concen-tration and the source rock abundance. Where this difference is positive it hasbeen assumed to be a measure of the augmentation of pelagic clays by authi-genic components during transport between weathering and sedimentation. Invery few cases does the crude estimate of potentially exchangeable elementconcentration depend on whether shale or mean crustal abundances have beenused to subtract detrital (crystalline) phase concentrations from total pelagicclay concentrations; such cases are those of selenium, mercury and thallium.For all three, the mean crustal abundance provides the greater estimate ofexchangeable phase concentration. The mean shale was used as the basis forassessing pelagic clay enrichment. Where the difference between pelagic clayand mean shale concentrations is positive, suggesting that pelagic clay sedi-ments are enriched over source rock abundance, the difference is shown in
14
column 7 of Table I. This value was subsequently divided by the seawater con-centration to yield a value of Kd based on potential pelagic clay enrichment(column 9). Where the difference between pelagic clay and source rock abun-dance is zero or negative, no entry appears in column 7 and the estimate of theKd is provided by dividing the total pelagic clay concentration by the seawaterconcentration (column 8).
The recommended Kds for elements that are primary constituents of cal-careous biogenic material (Ca, Sr, Ba, Ra and U) were derived from the Kdsbased on potential carbonate exchange (column 10), which were determinedfrom the ratio of the concentrations in calcareous pelagic sediments (column 5)to those in deep pelagic water (column 3). A Kd is also provided in column 10for carbon, based on the ratio of carbon in carbonaceous sediments to that indissolved organic and carbonate forms in sea water.
2.2.2. Alternative derivation of Kds: review of published data
Experimental and field data published in the literature were reviewed tocompare them with the Kds derived using the methodology described inSection 2.2.1 and to determine Kds for those elements for which such amethodology could not be applied. This approach was adopted, in particular,for those nuclides of elements no longer occurring naturally on Earth, whichwere introduced into the environment from nuclear activities, such as tech-netium and the transuranics.
Difficulty is frequently experienced in relating Kds derived under exper-imentally controlled conditions with those measured using marine environ-mental samples. The considerable ranges of experimental Kds reported forsome elements [82–88] are often a direct result of variations in the materialsand/or procedures adopted. Factors that can significantly influence the appar-ent Kd include: the solid to liquid ratio; the initial concentrations of tracer andcarrier in solution; the pH of the liquid before and after equilibration with thesolids; the grain size of the solids; the time allowed for equilibration; the proce-dure used for separating the two phases (e.g. filtering or decanting); whethersamples are shaken or left to stand; the phase(s) used to estimate the Kd (fre-quently only one phase is measured); loss of tracer on container walls or filters;and competition from other ions in solution. In many cases, particularly thosestudies related to radionuclide migration through rock and fractured media,lack of control of one or more of the above factors, or use of experimental con-ditions far removed from those found in the marine environment, hinder theadoption of experimentally derived Kds for ocean disposal models.Experimentally derived Kds were therefore only considered whenever few, orno, environmental data exist.
15
For technetium, the recommended Kd (1 × 10²) is based on environ-mentally derived values from the Irish Sea [71]. Although they may accuratelyreflect the partitioning between 99Tc and the sedimentary material in thatarea, the extent to which water and sediments are in equilibrium is notknown. It should not be inferred that the Kds obtained are universally appli-cable. In particular, the influence of organic material, such as that arising frombenthic algae, has not been determined. Early experimental studies suggestedthat technetium, in either the reduced or oxidized form, generally exhibits aKd of less than 10 [61–66]. In the absence of further particulate data, it istherefore suggested that the recommended value represents an upper boundin oxic systems.
Neptunium Kds for suspended sediment in coastal waters of the UK [89,90] and for sediment pore water in the Irish Sea [71] have been reported.Experimental Kds for northeast Atlantic calcareous ooze and clay fall withinthis range [91, 92]. Other reported experimental values, for various substrates,are much lower and are not directly applicable [66, 93, 94].
The recommended Kd for plutonium is for a mixture of oxidation states(i.e. Pu III/IV plus V/VI).A relatively large number of environmental Kds havebeen reported from a wide variety of marine, riverine and lacustrine environ-ments, and they consistently fall within the range 1 × 10⁴–1 × 10⁶ [47, 71,95–107]. There seems to be little justification in extending the range for sensi-tivity analysis. A large number of experimental determinations have also beenmade, and with very few exceptions (e.g. approximately 1 × 101–1 × 10⁴ forNorth Pacific red clays [108]) Kds fall within the range 1 × 10⁴–1 × 10⁶ [71, 86,92, 109–114]. The latter range also includes values for calcareous sedimentsfrom the northeast Atlantic [71, 92].
Environmental Kds for americium and curium are given by Pentreath etal. [101, 102], Lovett (unpublished data) [106],Aarkrog et al. [104] and Noshkin(unpublished data) [107]. Few experimental data are available for curium,although Erickson [108] gives values for abyssal red clays. Far more experi-mental data are available for americium, with most studies reporting values inthe range of the field data [86, 92, 108, 113–116].
A default Kd of 1 was assigned to non-reactive elements such as hydrogen,the major elements in sea water (Na, Cl and S) and inert gases (Kr and Xe).
For some elements (Ru, Te, Pm, Dy and Ir) insufficient data are availableto calculate Kds using the methodology described in Section 2.2.1 or to deriveKds from published data. The recommended Kds for these elements were cho-sen to be equal to Kds for periodically adjacent elements and appear in paren-theses in Table I.
From experimental studies it is assumed that trivalent californiumbehaves like curium and americium [117, 118].
16
The oceanic distribution of 210Po is influenced by biological recycling insurface waters, and 210Po/210Pb disequilibria have been reported [119].However, over the whole water column, 210Po and 210Pb are in balance withrespect to their partitioning between water and particulate fractions [120], andtheir respective Kds should be similar. Ranges of Kd were determined from thedata of Brewer et al. [79, 121] and Whitfield and Turner [122]. Ocean marginKds for polonium are assumed to be identical to open ocean values.
Protactinium behaves in a similar fashion to thorium in the open ocean.Values for the Panama and Guatemala Basins, and for the North Pacific, havebeen reported [123, 124]. The Kd appears to correlate with the manganese con-tent, and scavenging is enhanced at ocean margins. Coastal sediment CFsshould be similar to those of the open sea.
2.2.3. Maximum and minimum values for open ocean Kds
Table I provides a single recommended Kd for each element and does notinclude a range of maximum and minimum values, in contrast to TRS 247.Where a range of values is required, as in the case of conducting a sensitivityanalysis for a radiological assessment, different approaches for assigning a Kdrange can be used. These include the use of site specific data, choosing an arbi-trary range (e.g. maximum and minimum values could be assumed to be a fac-tor of 10 higher and lower than the recommended value (this is supported byavailable data, see column 10 of Table I)) or the application of a probability dis-tribution of values. Sensitivity analysis should indicate whether more data arerequired for the assessment.
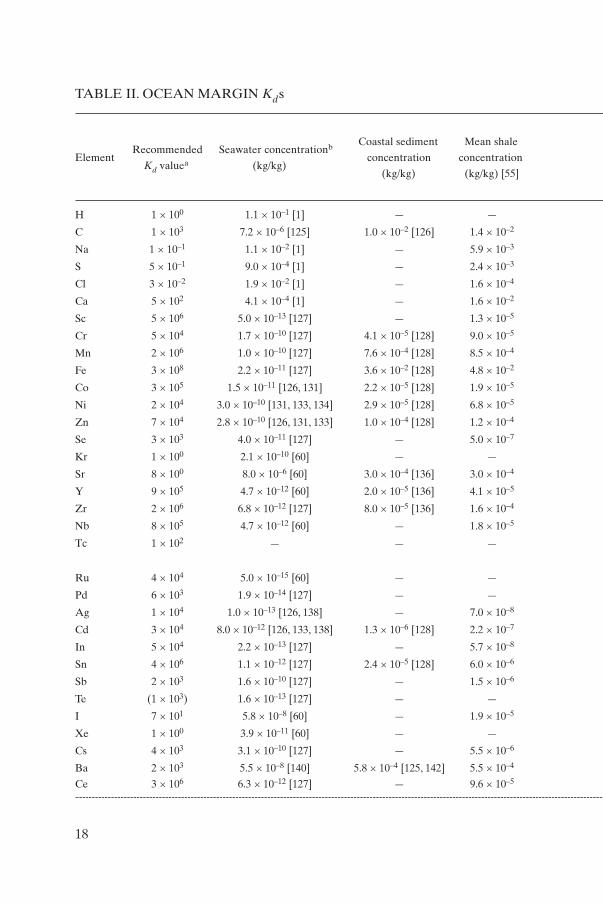
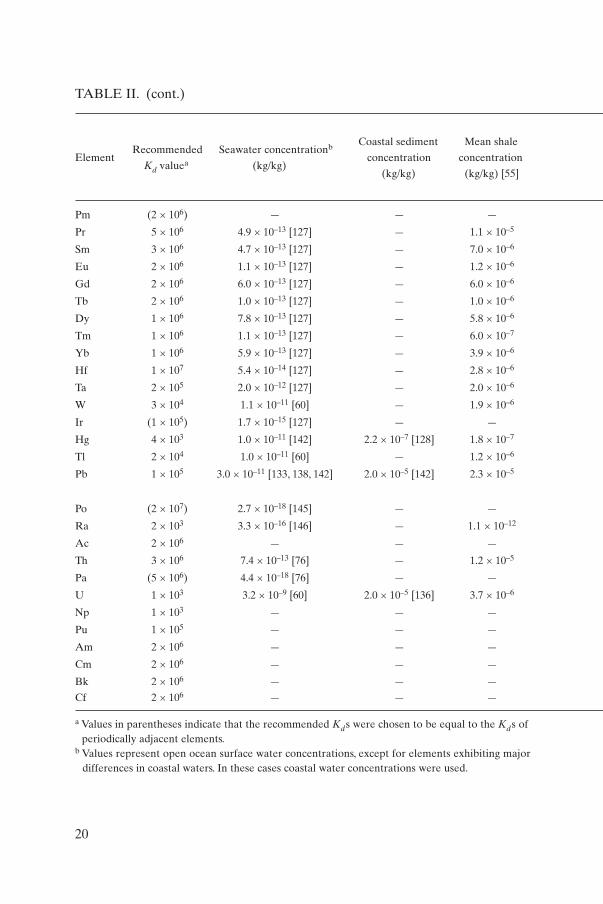
2.3. OCEAN MARGIN Kds (TABLE II)
2.3.1. Derivation of ocean margin Kds
The recommended Kds for coastal and continental shelf environments fora selected number of elements are listed in column 2 of Table II. In addition, aselection of Kds based on field observations or laboratory experiments,published in peer reviewed literature, has been compiled and presented forcomparative purposes in the last column. The remainder of Table II containsthe details from which the majority of recommended values were calculated.
A similar approach was adopted for the calculation of coastal Kds as hadbeen used for open ocean values in Section 2.2, in this case using open ocean,surface dissolved element concentrations (column 2) based on the most recentreliable sources [76, 127] or coastal water concentrations, whenever available
17
18
TABLE II. OCEAN MARGIN Kds
Recommended Seawater concentrationb Coastal sediment Mean shale
ElementKd valuea (kg/kg)
concentration concentration
(kg/kg) (kg/kg) [55]
H 1 × 100 1.1 × 10⁻¹ [1] — —
C 1 × 10³ 7.2 × 10⁻⁶ [125] 1.0 × 10⁻² [126] 1.4 × 10⁻²
Na 1 × 10⁻¹ 1.1 × 10⁻² [1] — 5.9 × 10⁻³
S 5 × 10⁻¹ 9.0 × 10⁻⁴ [1] — 2.4 × 10⁻³
Cl 3 × 10⁻² 1.9 × 10⁻² [1] — 1.6 × 10⁻⁴
Ca 5 × 10² 4.1 × 10⁻⁴ [1] — 1.6 × 10⁻²
Sc 5 × 10⁶ 5.0 × 10⁻¹³ [127] — 1.3 × 10⁻⁵
Cr 5 × 10⁴ 1.7 × 10⁻¹⁰ [127] 4.1 × 10⁻⁵ [128] 9.0 × 10⁻⁵
Mn 2 × 10⁶ 1.0 × 10⁻¹⁰ [127] 7.6 × 10⁻⁴ [128] 8.5 × 10⁻⁴
Fe 3 × 10⁸ 2.2 × 10⁻¹¹ [127] 3.6 × 10⁻² [128] 4.8 × 10⁻²
Co 3 × 10⁵ 1.5 × 10⁻¹¹ [126, 131] 2.2 × 10⁻⁵ [128] 1.9 × 10⁻⁵
Ni 2 × 10⁴ 3.0 × 10⁻¹⁰ [131, 133, 134] 2.9 × 10⁻⁵ [128] 6.8 × 10⁻⁵
Zn 7 × 10⁴ 2.8 × 10⁻¹⁰ [126, 131, 133] 1.0 × 10⁻⁴ [128] 1.2 × 10⁻⁴
Se 3 × 10³ 4.0 × 10⁻¹¹ [127] — 5.0 × 10⁻⁷
Kr 1 × 100 2.1 × 10⁻¹⁰ [60] — —
Sr 8 × 100 8.0 × 10⁻⁶ [60] 3.0 × 10⁻⁴ [136] 3.0 × 10⁻⁴
Y 9 × 10⁵ 4.7 × 10⁻¹² [60] 2.0 × 10⁻⁵ [136] 4.1 × 10⁻⁵
Zr 2 × 10⁶ 6.8 × 10⁻¹² [127] 8.0 × 10⁻⁵ [136] 1.6 × 10⁻⁴
Nb 8 × 10⁵ 4.7 × 10⁻¹² [60] — 1.8 × 10⁻⁵
Tc 1 × 10² — — —
Ru 4 × 10⁴ 5.0 × 10⁻¹⁵ [60] — —
Pd 6 × 10³ 1.9 × 10⁻¹⁴ [127] — —
Ag 1 × 10⁴ 1.0 × 10⁻¹³ [126, 138] — 7.0 × 10⁻⁸
Cd 3 × 10⁴ 8.0 × 10⁻¹² [126, 133, 138] 1.3 × 10⁻⁶ [128] 2.2 × 10⁻⁷
In 5 × 10⁴ 2.2 × 10⁻¹³ [127] — 5.7 × 10⁻⁸
Sn 4 × 10⁶ 1.1 × 10⁻¹² [127] 2.4 × 10⁻⁵ [128] 6.0 × 10⁻⁶
Sb 2 × 10³ 1.6 × 10⁻¹⁰ [127] — 1.5 × 10⁻⁶
Te (1 × 10³) 1.6 × 10⁻¹³ [127] — —
I 7 × 101 5.8 × 10⁻⁸ [60] — 1.9 × 10⁻⁵
Xe 1 × 100 3.9 × 10⁻¹¹ [60] — —
Cs 4 × 10³ 3.1 × 10⁻¹⁰ [127] — 5.5 × 10⁻⁶
Ba 2 × 10³ 5.5 × 10⁻⁸ [140] 5.8 × 10⁻⁴ [125, 142] 5.5 × 10⁻⁴
Ce 3 × 10⁶ 6.3 × 10⁻¹² [127] — 9.6 × 10⁻⁵
19
Coastal sediment
Mean crustal concentration Ocean
Kd based on
concentration based onmargin Kd
carbonate Other derived Kds
(kg/kg) [55] 20% exchangeable exchange
phase (kg/kg)
— — — — —
4.8 × 10⁻⁴ 1.0 × 10⁻² 1.4 × 10³ — —
2.3 × 10⁻² 1.2 × 10⁻³ 1.1 × 10⁻¹ — —
2.6 × 10⁻³ 4.8 × 10⁻⁴ 5.3 × 10⁻¹ — —
1.3 × 10⁻⁴ 3.2 × 10⁻⁵ 1.7 × 10⁻³ — —
4.1 × 10⁻² 3.2 × 10⁻³ 7.8 × 100 4.9 × 10² —
1.6 × 10⁻⁵ 2.6 × 10⁻⁶ 5.2 × 10⁶ — —
1.0 × 10⁻⁴ 8.2 × 10⁻⁶ 4.8 × 10⁴ — —
9.5 × 10⁻⁴ 1.5 × 10⁻⁴ 1.5 × 10⁶ — 1 × 10³–1 × 10⁶ [129]
4.1 × 10⁻² 7.2 × 10⁻³ 3.3 × 10⁸ — 1 × 10⁵–1 × 10⁷ [129, 130]
2.0 × 10⁻⁵ 4.4 × 10⁻⁶ 2.9 × 10⁵ — 1 × 10⁴–2.7 × 10⁵ [47, 57, 132]
8.0 × 10⁻⁵ 5.8 × 10⁻⁶ 1.9 × 10⁴ — 1 × 10³–1.6 × 10⁴ [129, 130]
7.5 × 10⁻⁵ 2.0 × 10⁻⁵ 7.2 × 10⁴ — 1 × 10⁴–1 × 10⁶ [129, 130, 135]
5.0 × 10⁻⁸ 1.0 × 10⁻⁷ 2.5 × 10³ — —
— — — — —
3.7 × 10⁻⁴ 6.0 × 10⁻⁵ 7.5 × 100 2.5 × 10² 2 × 100–3 × 10² [47, 57]
3.0 × 10⁻⁵ 4.0 × 10⁻⁶ 8.5 × 10⁵ — —
1.9 × 10⁻⁴ 1.6 × 10⁻⁵ 2.4 × 10⁶ — —
2.0 × 10⁻⁵ 3.6 × 10⁻⁶ 7.7 × 10⁵ — —
— — — — 2 × 10²–5 × 10³ [71, 137] (see
Table I)
1.0 × 10⁻⁹ 2.0 × 10⁻¹⁰ 4.0 × 10⁴ — —
6.0 × 10⁻¹⁰ 1.2 × 10⁻¹⁰ 6.3 × 10³ — —
7.0 × 10⁻⁸ 1.4 × 10⁻⁸ 1.4 × 10⁴ — 1 × 10⁴–1 × 10⁶ [135, 139]
1.1 × 10⁻⁷ 2.6 × 10⁻⁷ 3.3 × 10⁴ — 1 × 10⁴–1 × 10⁵ [129, 130]
4.9 × 10⁻⁸ 1.1 × 10⁻⁸ 5.2 × 10⁴ — —
2.2 × 10⁻⁶ 4.8 × 10⁻⁶ 4.4 × 10⁶ — —
2.0 × 10⁻⁷ 3.0 × 10⁻⁷ 1.9 × 10³ — —
5.0 × 10⁻⁹ 1.0 × 10⁻⁹ 6.3 × 10³ — —
1.4 × 10⁻⁷ 3.8 × 10⁻⁶ 6.6 × 101 — —
— — — — —
3.0 × 10⁻⁶ 1.1 × 10⁻⁶ 3.5 × 10³ — 3 × 10²–2 × 10⁴ [42, 47, 57, 132]
5.0 × 10⁻⁴ 1.2 × 10⁻⁴ 2.1 × 10³ 9.5 × 10³ —
6.8 × 10⁻⁵ 1.9 × 10⁻⁵ 3.0 × 10⁶ — —
20
TABLE II. (cont.)
Recommended Seawater concentrationb Coastal sediment Mean shale
ElementKd valuea (kg/kg)
concentration concentration
(kg/kg) (kg/kg) [55]
Pm (2 × 10⁶) — — —
Pr 5 × 10⁶ 4.9 × 10⁻¹³ [127] — 1.1 × 10⁻⁵
Sm 3 × 10⁶ 4.7 × 10⁻¹³ [127] — 7.0 × 10⁻⁶
Eu 2 × 10⁶ 1.1 × 10⁻¹³ [127] — 1.2 × 10⁻⁶
Gd 2 × 10⁶ 6.0 × 10⁻¹³ [127] — 6.0 × 10⁻⁶
Tb 2 × 10⁶ 1.0 × 10⁻¹³ [127] — 1.0 × 10⁻⁶
Dy 1 × 10⁶ 7.8 × 10⁻¹³ [127] — 5.8 × 10⁻⁶
Tm 1 × 10⁶ 1.1 × 10⁻¹³ [127] — 6.0 × 10⁻⁷
Yb 1 × 10⁶ 5.9 × 10⁻¹³ [127] — 3.9 × 10⁻⁶
Hf 1 × 10⁷ 5.4 × 10⁻¹⁴ [127] — 2.8 × 10⁻⁶
Ta 2 × 10⁵ 2.0 × 10⁻¹² [127] — 2.0 × 10⁻⁶
W 3 × 10⁴ 1.1 × 10⁻¹¹ [60] — 1.9 × 10⁻⁶
Ir (1 × 10⁵) 1.7 × 10⁻¹⁵ [127] — —
Hg 4 × 10³ 1.0 × 10⁻¹¹ [142] 2.2 × 10⁻⁷ [128] 1.8 × 10⁻⁷
Tl 2 × 10⁴ 1.0 × 10⁻¹¹ [60] — 1.2 × 10⁻⁶
Pb 1 × 10⁵ 3.0 × 10⁻¹¹ [133, 138, 142] 2.0 × 10⁻⁵ [142] 2.3 × 10⁻⁵
Po (2 × 10⁷) 2.7 × 10⁻¹⁸ [145] — —
Ra 2 × 10³ 3.3 × 10⁻¹⁶ [146] — 1.1 × 10⁻¹²
Ac 2 × 10⁶ — — —
Th 3 × 10⁶ 7.4 × 10⁻¹³ [76] — 1.2 × 10⁻⁵
Pa (5 × 10⁶) 4.4 × 10⁻¹⁸ [76] — —
U 1 × 10³ 3.2 × 10⁻⁹ [60] 2.0 × 10⁻⁵ [136] 3.7 × 10⁻⁶
Np 1 × 10³ — — —
Pu 1 × 10⁵ — — —
Am 2 × 10⁶ — — —
Cm 2 × 10⁶ — — —
Bk 2 × 10⁶ — — —
Cf 2 × 10⁶ — — —
a Values in parentheses indicate that the recommended Kds were chosen to be equal to the Kds ofperiodically adjacent elements.
b Values represent open ocean surface water concentrations, except for elements exhibiting majordifferences in coastal waters. In these cases coastal water concentrations were used.
21
Coastal sediment
Mean crustal concentration Ocean
Kd based on
concentration based onmargin Kd
carbonate Other derived Kds
(kg/kg) [55] 20% exchangeable exchange
phase (kg/kg)
— — — — 2 × 10⁶–1 × 10⁷ [141]
9.5 × 10⁻⁶ 2.2 × 10⁻⁶ 4.5 × 10⁶ — —
7.9 × 10⁻⁶ 1.4 × 10⁻⁶ 3.0 × 10⁶ — —
2.1 × 10⁻⁶ 2.4 × 10⁻⁷ 2.2 × 10⁶ — —
7.7 × 10⁻⁶ 1.2 × 10⁻⁶ 2.0 × 10⁶ — —
1.1 × 10⁻⁶ 2.0 × 10⁻⁷ 2.0 × 10⁶ — —
6.0 × 10⁻⁶ 1.2 × 10⁻⁶ 1.5 × 10⁶ — —
4.8 × 10⁻⁷ 1.2 × 10⁻⁷ 1.1 × 10⁶ — —
3.3 × 10⁻⁶ 7.8 × 10⁻⁷ 1.3 × 10⁶ — —
5.3 × 10⁻⁶ 5.6 × 10⁻⁷ 1.0 × 10⁷ — —
2.0 × 10⁻⁶ 4.0 × 10⁻⁷ 2.0 × 10⁵ — —
1.0 × 10⁻⁶ 3.8 × 10⁻⁷ 3.5 × 10⁴ — —
3.0 × 10⁻¹² 6.0 × 10⁻¹³ 3.5 × 10² — —
5.0 × 10⁻⁸ 4.4 × 10⁻⁸ 4.4 × 10³ — 4 × 10⁴–1.6 × 10⁵ [143]
6.0 × 10⁻⁷ 2.4 × 10⁻⁷ 2.4 × 10⁴ — —
1.4 × 10⁻⁵ 4.0 × 10⁻⁶ 1.3 × 10⁵ — 3 × 10³–1 × 10⁷ [129, 130, 135,
144]
— — — — —
6.0 × 10⁻¹³ 2.2 × 10⁻¹³ 6.7 × 10² 2.9 × 10⁴ —
— — — — —
1.2 × 10⁻⁵ 2.4 × 10⁻⁶ 3.2 × 10⁶ — 1 × 10⁴–1 × 10⁷ [141, 144, 147]
— — — — —
2.4 × 10⁻⁶ 4.0 × 10⁻⁶ 1.3 × 10³ — 1 × 10³ [141]
— — — — 5 × 10³–1 × 10⁴ [144, 148]
— — — — 4 × 10⁵ [141]
— — — — 2 × 10⁶ [141]
— — — — 1 × 10⁶ [148]
— — — — —
— — — — 2 × 10⁴–1 × 10⁵ [117]
22
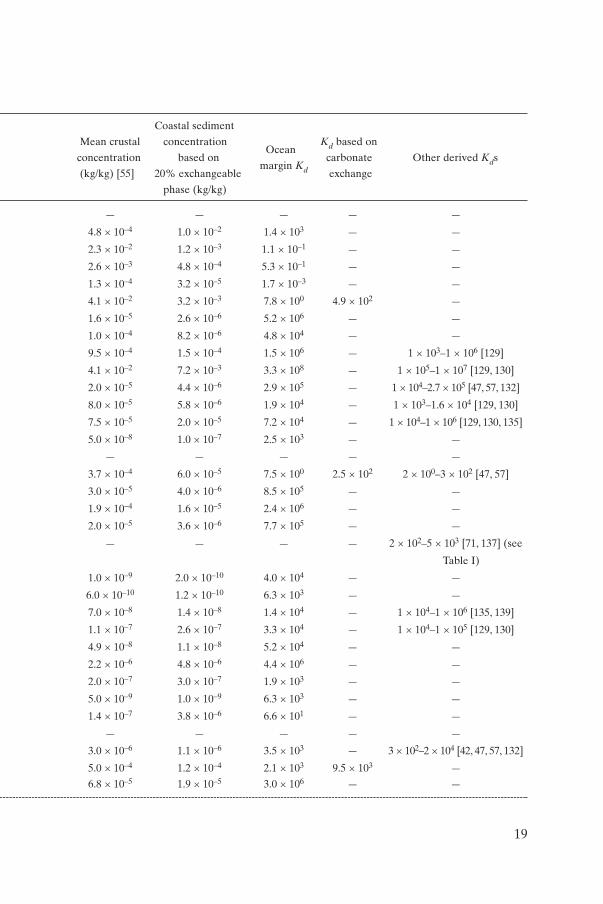
[125, 126, 142]. Many more Kds have been obtained by direct measurement incoastal environments, and these studies provide a valuable source of data.However, this does not apply to the entire suite of elements required for radio-logical assessment purposes. In addition, coastal sediments generally are veryheterogeneous, in terms of grain size and mineralogy, and data obtained from asingle location are not necessarily universally applicable.
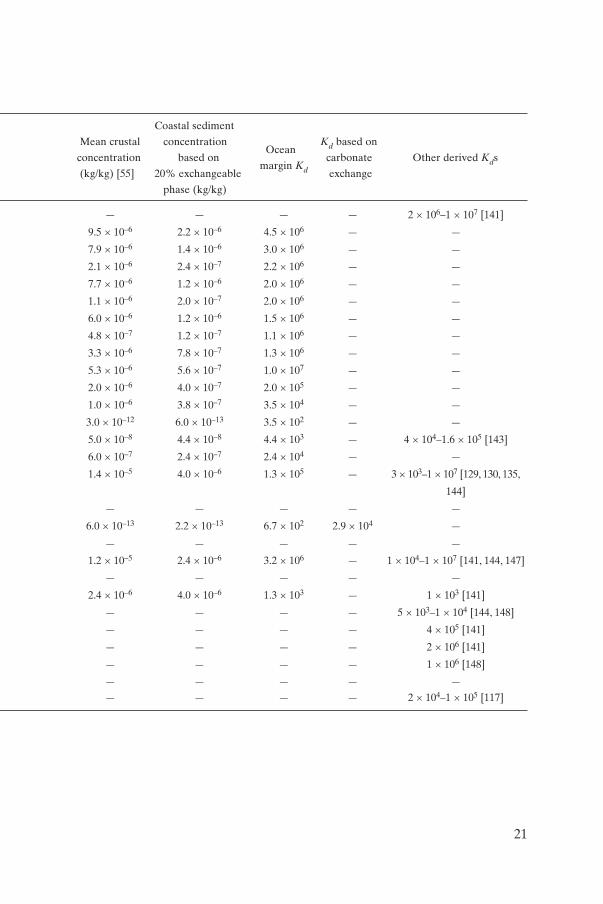
Concentrations in near shore sediments for 16 elements (C, Cr, Mn, Fe,Co, Ni, Zn, Sr, Y, Zr, Cd, Sn, Ba, Hg, Pb and U) were derived from publishedvalues [128, 136 149–151] (column 4). With few exceptions, these values werefound to be within a factor of 2 of the mean shale concentrations (column 5)taken from Bowen [55]. Sedimentary concentrations for the remaining ele-ments were then taken from a compilation of mean shale compositions. Forruthenium, lead, tellurium and iridium, mean concentrations in continentalcrust (column 6) were used. While this is an arbitrary procedure, it should pro-vide values for the concentration of the elements in coastal sediment silts andclays that are well within an order of magnitude of the real values in all cases.
The next challenge was to represent the average bulk composition ofcoastal sediments and estimate the exchangeable (or non-detrital) proportionsof the elements in these sediments. The bulk composition of coastal sedimentsvaries widely from essentially zero silt–clay to 100% silt–clay. The averagecoastal zone sediment might comprise 50% fine and 50% coarse (sand sizedand coarser) material, but no firm average can be chosen.The proportion of thetotal elemental abundance in coastal sediments that is exchangeable with theaqueous phase is equally difficult to determine. Estimates of the proportions ofmetals, for example, that are present in easily leachable fractions of sedimentvary widely according to both the bulk composition of the matrix and thechemical extraction methodologies. Nevertheless, in fine (pelitic) sediments,substantial proportions of some elements, namely manganese, cadmium, zincand copper, are found to be easily solubilized by weak acids. The avenue takento resolve these two problems was to assume for all elements except carbonthat 20% of the total concentration of the elements in pelitic coastal sediments(clays and silts) represents the exchangeable phase components of the ele-ments. This arbitrary choice is intended to take into account both the varyingproportions of coarse material (which is not generally involved in exchangeprocesses) in coastal sediments and the proportion of the elements associatedwith pelitic fractions available for exchange with the aqueous phase. For carbon,it has been assumed that the sediments are largely pelitic and that all theassociated carbon is available for exchange with carbon in the dissolved phase.
The estimates of mean exchangeable sedimentary abundances of theelements (column 7) were then divided by the coastal water concentrations toprovide Kds for coastal sediments (column 8).
Values of Kd on exchange with calcareous material were also calculatedfor calcium, strontium, barium and radium using the pelagic carbonate concen-trations given in Table I (column 5) and are provided in column 9 of Table II.Only the recommended Kd for calcium, however, is derived from the valuebased on carbonate exchange, since most of the material in the coastal zone isterrigenous in origin.
2.3.2. Alternative derivation of ocean margin Kds: review of published data
Experimental and field data published in the literature were reviewed tocompare them with the Kds derived using the methodology described inSection 2.3.1 and to determine Kds for those elements for which such amethodology could not be applied.
Variation in marine Kds can occur as a result of a number of factors,including particle size, the formation of colloidal complexes and iron andmanganese coatings on particle surfaces. Such coatings tend to mask the influ-ence of mineralogy. Changes in redox chemistry, which can occur near thesediment–water interface and in poorly ventilated deep basins (e.g. fjords), alsoinfluence the adsorption–desorption of redox sensitive elements such as cobalt,manganese [152] and plutonium [153]. Detailed site specific investigations canbe of benefit, particularly when attempting to provide more realistic modelpredictions, or for situations in which radioecological data are limited (e.g. theArctic). Studies with an appropriate experimental design can provide usefulinformation on which factors may be critical in particular circumstances, or forsituations in which it would be impractical to collect in situ data.
The impetus to improve the marine Kd database diminished following thecessation of deep ocean disposal in 1983. However, there has been renewedinterest in Japan, in relation to both coastal discharges [152] and radioactivewaste dumping by the Russian Federation and the FSU in the Sea of Japan[137]. In addition, revelations about the dumping of radioactive waste in theKara Sea and the Barents Sea [20] by the Russian Federation and the FSU ledto the establishment of the IASAP by the IAEA [154]. The Kds recommendedin TRS 247 were used in the preliminary assessment, although efforts weremade to provide more realistic values for some of the key model parameters.Site specific Kds for the principal radionuclides of concern were derived fromuptake experiments using sediment collected from two bays (Abrosimov andStepovogo) used extensively as dump sites off the coast of Novaya Zemlya [46].The variables selected were salinity and suspended sediment concentration(mg/L). The authors concluded that the salinity changes observed in the twobays would have a minimal impact on the Kds of the radionuclides studied andthat Kd was inversely proportional to the sediment loading, a phenomenon
23
observed in other experimental studies. The study did reveal some apparentdifferences between the sorption characteristics of sediments from the twobays that might warrant further study. The measured Kds for caesium, cadmiumand americium fell within the IAEA recommended range, although the meanvalues for all the radionuclides studied fell below the IAEA recommendedmean.
Many more measurements of 99Tc in sea water of the Irish Sea and theNorth Sea have been made as a result of increased discharges from Sellafieldin the mid-1990s. These measurements support the notion that 99Tc is conser-vative in sea water, lending credibility to the few experimental studies that havebeen reported [155]. In contrast, the very limited particulate analyses reportedin the literature [71] suggest Kds in the range 1 × 10²–1 × 10³. The lack ofparticle characterization means that a possible contribution of organic debriscannot be discounted. However, there is growing evidence that 99Tc can bepresent as a reduced form in anoxic sediments and in poorly ventilated waterbodies [156]. This form is more particle reactive, and the use of higher Kds maybe justified in such situations.
In a 1992 investigation of Irish Sea sediments, MacKenzie et al. [157] con-cluded that Kds for 137Cs within the seabed were in the range 1 × 10⁴–1 × 10⁵,on the basis of the observed 137Cs/241Am ratios in three sediment cores. Theauthors suggested that these higher values, well outside the IAEA compilationrange, might have been due to differences in the sediment phase compositioncompared with the overlying suspended particulate material. This suggestionwas supported by an experimental study in which contaminated intertidal andsalt marsh sediment, from the Solway Firth, north of Sellafield, were subjectedto a variety of desorption conditions. The desorption Kd for 137Cs was of theorder of 1 × 10⁵. The authors concluded that a more labile fraction of 137Cs hadbeen removed prior to on-shore particulate transport. Differences betweenadsorption and desorption Kds in batch experiments have been reported else-where [152]. It would be prudent to extend the range of recommended 137CsKds up to 1 × 10⁵ for the modelling of seabed sources.
Recent water column measurements [158, 159] have confirmed the valid-ity of the TRS 247 recommended range of values for plutonium and americium,although in the former study the estimated range of Kds (~1 × 10⁴ to ~7 × 10⁴)was significantly lower than previously published values.
No attempt has been made to update the previously recommended Kdsfor curium, berkelium and californium. The recommended Kds for tellurium,promethium and iridium were chosen to be equal to Kds for periodically adja-cent elements in accordance with TRS 247 and appear in parentheses inTable II. Finally, a default Kd of 1 was assigned to non-reactive elements suchas hydrogen and inert gases (Kr and Xe).
24
2.3.3. Maximum and minimum values for ocean margin Kds
Similarly to Table I, Table II provides a single recommended Kd for eachelement and does not include a range of maximum and minimum values, incontrast with TRS 247. Where a range of values is required, as in the case ofconducting a sensitivity analysis for a radiological assessment, differentapproaches for assigning a Kd range can be used. These include using site spe-cific data, choosing an arbitrary range (e.g. maximum and minimum valuescould be assumed to be a factor of 10 higher and lower than the recommendedvalue) or applying a probability distribution of values. Sensitivity analysisshould indicate whether more data are required for the assessment.
2.4. ESTUARIES: A SPECIAL CASE
Estuaries tend to be very dynamic systems with a high degree of tempo-ral and spatial variability in factors such as pH, salinity, dissolved organic carbon(DOC) and turbidity. High levels of DOC can lead to relatively low lead andplutonium Kds [160]. Particulate attached plutonium may be released uponcontact with low pH river water [161]. Biological recycling in estuarine inter-tidal sediments can lead to the formation of organoliths composed of iron andmanganese deposits with a relatively high radionuclide content that will showseasonality in their abundances [162]. Equilibrium is at best transitory in suchsystems, and this should be recognized in any modelling and assessment work.A further complication is the preservation in estuaries of hot particles, wherethese have been present in the original discharges, as has been the case withthe Sellafield and Dounreay reprocessing plant discharges. These can bedefined as discrete clusters of radioactivity measured using some form ofautoradiographic detector (e.g. CR-39 for alpha activity). Assinder et al. [163]reported a wide range of Kds based on in situ measurements at different tidalstates from the Esk Estuary close to the Sellafield outfall, illustrating the non-equilibrium nature of such systems. If such sophistication can be justified,mathematical treatments can be applied that may reduce some of the variabil-ity in Kds, provided data on the temporal and spatial distribution of contribu-tory factors (e.g. salinity, pH and DOC) are available [164].
25
3. CONCENTRATION FACTORS FOR BIOLOGICAL MATERIAL
3.1. BASIC DERIVATION
The quantity of an element or radionuclide in biological tissue is almostalways discussed in terms of concentration, either on a dry or wet weight basis.For modelling purposes, this value is then usually represented in terms of a concentration relative to that of the ambient sea water, traditionally expressedas a CF. If both biological material and seawater concentrations are derived perunit mass, this term is dimensionless:
In some instances the seawater concentration is derived in terms of unitvolume; the CF is then expressed in L/kg, but this makes, numerically, little difference to the CF thus derived:
For practical purposes, such as in studies with plankton, the concentrationin the biological material may also be derived in terms of unit volume. Unlessotherwise noted, all values herein relate to wet weight.
The CFs (in L/kg) presented in this report were calculated using the bestavailable compilation of concentrations in filtered sea water. These data weregenerated using ultra-clean sampling and analytical protocols. We considerboth surface and deep bottom water concentrations, depending upon the typeof organism. For organisms on the continental shelf (water depths of less than200 m), an average of Atlantic and Pacific surface water concentrations wasused. The operational definition of ‘dissolved’ is typically ‘less than 0.45 µm’.However, it is recognized that metals that fall into this dissolved category maybe complexed with organic matter or associated with colloidal particles thatmay or may not be available for biological uptake. Furthermore, bioavailabilitycan be strongly dependent upon the speciation of the metals where the free
CF (L/kg) =
Concentration per unit mass of organism (kg/kg oor Bq/kg wet weight)Concentration per unit volume of sea wwater (kg/L or Bq/L)
CF (dimensionless)
Concentration per unit mass of organism
= (kg/kg or Bq/kg wet weight)
Concentration per unit mass off sea water (kg/kg or Bq/kg)
26
metal ion is commonly believed to be the bioavailable form. It is outside thescope of this study to consider the speciation of the metals in the dissolvedphase and therefore all metal in the dissolved phase is essentially presumed tobe in one pool.
Some confusion may arise from the different terminology used in theliterature. Bioaccumulation factors of elements are analogous to bioconcentra-tion factors, except that the former are defined as grams element per gram tissue (or whole organism) divided by grams element per gram water (dissolvedplus particulate). In this case, the total water contains both dissolved elementand element bound to suspended particulate matter. Since particle loads inoceanic systems are typically low (less than 1 mg/L), total and dissolved elementconcentrations are very nearly identical, even for particle reactive metals.Differences can become pronounced, however, for particle reactive metals inturbid coastal waters, where extreme particle loads of tens of mg/L can occur.
It should also be noted that, except for algae, the term CF as used in thesecircumstances does not imply that all the elements within the organism areconcentrated by direct accumulation from the water. It is simply a value thatrelates the concentration in the organism, which may have been derived byuptake from sea water, particulate matter and food, to that of the medium inwhich it lives.
The term is also used by radiobiologists studying the accumulation ofradionuclides by organisms under controlled laboratory conditions, usually thatof direct uptake from sea water. In some experiments, the results obtained aresimilar to those derived from environmental data; in others they are not. Thereare many reasons for such discrepancies, and these are often the subjects ofinvestigation. It is therefore potentially misleading to use laboratory deriveddata uncritically, and, wherever possible, environmentally derived data havebeen used in this report, although these may be equally varied for a number ofreasons, and often environmental CF data are simply lacking for certain elements.
3.2. FACTORS AFFECTING CFs
A number of factors must be considered in evaluating the applicability ofCFs in marine organisms.The preponderance of data on metal and radionuclideconcentrations in marine organisms is based on work with organisms fromtemperate ecosystems. Only recently have attempts been made to measuremetal concentrations in polar organisms, and some attempts have begun to com-pare temperate and polar CFs. Given the limited data available on this issue, allconclusions must be considered preliminary. However, studies suggest that, as a
27
rule, differences between polar and temperate zone CFs are not pronounced[165, 166].There is a striking lack of reliable data on metal and radionuclide con-centrations in tropical ecosystem organisms, and extrapolation of temperateecosystem data sets to tropical regions must also be performed with appropriatecaution. Metabolic rates and food web complexity can be very different betweentropical and temperate regions, and these factors can greatly affect the extent towhich metals are concentrated in organisms, particularly for metals accumulatedprincipally via trophic transfer. Seasonal variation in the biological uptake ofmetals may be great, particularly in polar and temperate regions, where meta-bolic rates vary appreciably between winter and summer. Relatively little efforthas been made to quantify the seasonal variation in metal CFs in marine organ-isms. For all these reasons the tabulations of CFs presented in this report shouldbe considered first estimates, but not, as yet, a complete data set.
As with metal Kds, the oxidation state of redox metals (Mn, Co, Cr, Se,Tc, Pu, Fe and others) can complicate the interpretation of data. The particlereactivity and bioavailability of certain metals in sea water may differ greatlywith oxidation state (e.g. Cr(VI) versus Cr(III), Se(IV) versus Se(VI), Pu(III)versus Pu(V)). Further, the oxidation state of some metals may change uponassociation with an organism or particle, rendering those metals much lessavailable for release from the organism or particle. Hence the underlyingassumption of exchangeability in considering CFs is not met for these metals.
The relationship between the concentration of an element or radionu-clide in a living organism and the ambient sea water is a dynamic one. Rates ofboth uptake and excretion are known to be affected by body size, rate ofchange of body size, temperature, light (in the case of algae), salinity, etc. Anumber of elements that are accumulated by some organisms are not subse-quently eliminated, with a variable fraction being virtually permanently incor-porated into some parts of the body structure. Skeletal tissues may act asdepositories for a number of elements, particularly multivalent cations. Someelements become incorporated into granules, probably as a means of detoxifi-cation, which may or may not be subsequently excreted. Crustaceans, whichgrow by a process of moulting, may lose absorbed material in cast moults aswell as resorbing, before moulting, certain other elements that are then rein-corporated into the new exoskeleton.
Added to these factors is the continuing change in the concentration ofsome elements or radionuclides (in coastal waters) over short periods of time.It is to be expected, therefore, that real differences exist between some CFs,even for the same element and species, and that the variability in the datareflects true environmental fluctuations in any one area.
In considering the CFs compiled in this report, it is important to realizethat an assumption underlying these values is that organisms are in equilibrium
28
with their ambient sea water with respect to element concentrations. Thus therates of biological uptake and release of an element or radionuclide are notconsidered in this report. However, under certain circumstances (such as a spillor periodic discharge), risk assessment exercises may wish to focus on thekinetics of uptake into or out of organisms. The rates of uptake into marineorganisms and the uptake pathways (e.g. dietary versus solute uptake) are out-side the scope of this report and should be considered separately.
3.3. TABULATED VALUES: GENERAL REMARKS
The tabulated values represent an attempt to update those published inTRS 247, but a full review of the very large amount of data available has notbeen possible. The values required are those that relate concentrations inmarine foodstuffs to those of sea water. Some subjective judgements have beenmade as to which parts of a marine organism, and in what proportions, are likelyto be consumed by humans; these are explained in the following sections.
In making such an update, emphasis has been given to revising those val-ues that were previously derived as best guess estimates and for which data arenow available, those values which appeared to have particularly low or highCFs, those materials most likely to be consumed and those radionuclides con-sidered of particular significance in view of their half-lives, expected mobilityor likely abundance in nuclear waste. For many elements, a full revision has notbeen possible and, by default, the values published in TRS 247 have beenretained as current best estimates.
As a general rule, literature concentrations expressed as dry or freezedried weights were converted to wet weight concentrations by multiplying by0.18. Concentrations normalized to ash sample weights were converted to wetweight concentrations by multiplying by 0.01. Of particular value were the datacompiled by Bowen [55], Eisler [167], Phillips [168], Coughtrey and Thorne[169–171] and Jackson et al. [172]; use was also made of the text of Vinogradov[173]. Where necessary, stable element data in organisms were divided by thecoastal water concentrations given in Table II. A number of values, of course,were also based entirely on radionuclide results. Methods employed to estimatevalues where data were inadequate or could not be obtained are described inthe notes to the tables. As with sediment Kds, the default CFs for hydrogen,inert gases (Kr and Xe) and sodium in fish were taken to be 1.
Some comments are warranted on the variability of the data in compilingbiological CFs. Generally, insufficient reliable data are available to allow accurateassessments of ranges around a recommended value for most element–organismcombinations. Where a reliable database does exist for a given element and
29
type of organism, in nearly every case the range of minimum and maximumCFs is one order of magnitude (or less) from the recommended value.Consequently, the ranges of CFs around recommended values are not includedin this report. For those few elements for which reliable data indicate thatgreater variability is apparent for a given CF, comments are provided in thenotes.Where greater variability exists, it is almost always for elements for whichthe uptake is actively mediated by the organism rather than for elements thatare passively adsorbed. This is generally the case for elements with known bio-logical functions, for example as blood pigments, electron transport chain com-ponents or enzyme cofactors, and the great variability reflects widely divergentrequirements for the element in question among organisms. In some casesorganisms actively transport non-essential elements through other elementuptake pathways; for example, selenium uptake is an active, enzymaticallymediated process in phytoplankton, and different types of phytoplankton havegreatly varying requirements for this element, with CFs varying by four orders ofmagnitude. Similarly, technetium accumulation in macroalgae and crustaceans,iron accumulation in diverse organisms and other elements can display a vari-ability of a few orders of magnitude around the recommended values. Theseexceptions have been noted where they are known to exist. Thus, except wherenoted, models can assume that maximum and minimum CFs are one order ofmagnitude above and below the recommended value.
3.3.1. Comments on carbon and lead
There are two elements upon which some general comments are neces-sary, namely carbon and lead. For the former, although concentrations of car-bon in marine organisms have been accurately determined, a major difficultyarises with regard to selecting the appropriate seawater value as a denomina-tor. In calculations for all other elements the total concentration of the elementdissolved in sea water (filtrate) was used. If the same assumption is made withrespect to carbon, this includes dissolved organic carbon, carbonate, bicarbon-ate and CO2. There are insufficient data to indicate what fraction, if any, wouldnot equilibrate with 14C and to what extent any of the forms of carbon wouldor would not become biologically incorporated. It was therefore decided toadopt the value based on organic carbon in sea water given in Table II in orderto be consistent. The wet weight tissue values for carbon were 95 g/kg for fish,80 g/kg for crustaceans and molluscs, 65 g/kg for benthic algae, 80 g/kg for zoo-plankton and 45 g/kg for phytoplankton [55].
With regard to lead, there are again many data in the literature, themajority having been derived from contaminated environments and for whichlocal seawater values were not obtained. There has been considerable debate
30
over the lengths to which it is necessary to go in order to derive accurate leadconcentrations in both biological material or sea water. When extensive pre-cautions have been taken, the values obtained away from contaminated areas[174] are very much lower than those derived by other workers. In derivingCFs for lead, therefore, only data on 210Pb have been used, unless otherwiseindicated.
3.3.2. Surface water fish (Table III)
The relevant CFs are those relating concentrations in the food substanceto those of ambient sea water; consideration therefore has to be given to thefraction of the organism consumed. For fish this usually consists of fillets: mus-cle plus, possibly, some skin. When such fillets are commercially prepared theyare often contaminated by, for example, gut contents and other organs such asliver and kidney; portions of bone might also be included. When chemicalanalyses are made, however, fish are usually quite carefully dissected. Since theconcentrations of many elements differ markedly from one organ to another,with muscle usually having one of the lowest concentrations, quite differentresults in the apparent concentration of an element in the edible portion can beobtained. Such differences resulting from analyses of laboratory and commer-cially derived fish samples for plutonium analyses have been commented uponby Pentreath et al. [175]. In suggesting a CF appropriate to models used toassess dose to humans, some adjustment (upwards) of the value derived fromlaboratory prepared samples would appear to be appropriate in some cases,and this has been done. It is also necessary to consider the consequences of theconsumption of whole fish, such as anchovies, which would also include gutcontents. It would not be realistic to bias all data to allow for continual con-sumption of nothing but whole fish, but nevertheless some form of adjustmentis clearly necessary. Data from a sample of 24 650 people in the USA [176] indi-cate that less than 0.5% consumed anchovies. If one assumes that the quotientof the whole body CF to flesh CF is Z, the effect of eating 0.5% whole fishwould be to adjust the recommended CF in the following manner:
CF = (CFflesh ¥ 0.995) + (CFflesh ¥ 0.005 ¥ Z)
In some cases tinned fish consisting only of flesh and bone is consumed;it may be possible that the bone CF is greater than that of the whole body CF,in which case, in order to be conservative, the recommended CF has beenrounded upwards. There are other considerations, such as the consumption offish gonads (roe), but the data available on their consumption, and separateCFs, are too limited to make any sensible recommendations. Three types of
31
32
2 It is worth noting that tinned fish has reduced levels of 210Po, compared withfreshly caught produce, owing to the decay of unsupported 210Po.
database were considered before a mean value and range were adopted foreach element. Consideration was first given to field derived radionuclide con-centrations in fish and sea water, including 54Mn, 60Co, 90Sr, 95Zr, 95Nb, 99Tc,106Ru, 137Cs, 144Ce, 210Pb, 210Po 2, 226Ra, 232Th, 238U, 237Np, 239/240Pu, 241Am and242/244Cm. Consideration was then given to data derived from the simultaneousdetermination of stable elements in fish and water, and finally to tabulatedstable element data for fish, with the coastal water stable element estimatesgiven in Table II being used as a denominator. In addition to the general refer-ences listed in Section 3.3, the review by Pentreath [177] was used extensively,although in some cases the data were modified in the light of more recent infor-mation.
3.3.3. Crustaceans (Table IV)
A variety of crustacean species are taken for human consumption. Themuscle portion is the fraction usually consumed; this consists of the ‘tails’ ofshrimps, prawns and lobsters, and the limb muscles of crabs. Other tissues arealso eaten, however, and are converted into pastes; these tissues consist ofhepatopancreas and gonad.The gut and gills are usually removed, and the cara-pace is not intentionally consumed.
To arrive at a recommended CF for each element it was not consideredplausible to make appropriate adjustments for the consumption of these dif-ferent fractions, and thus the values were derived primarily from whatever ‘softpart’ data were available. The selection criteria were essentially those adoptedfor the fish values, with emphasis being given to data obtained from simultane-ous radionuclide derived water and biological material analyses, simultaneousstable element analyses and finally using the seawater values given in Table IIapplied to any stable element data in biological material from non-contaminatedenvironments.
3.3.4. Molluscs (Table V)
Gastropod, lamellibranch and cephalopod molluscs are consumed byhumans. For gastropods and lamellibranchs the ‘total soft parts’ are the relevantfractions for estimating CFs, and these usually include gut contents, althoughcommercially obtained molluscs may have been held in cleansing tanks before
sale. Consumption of cephalopods is somewhat different; this is discussed inSection 3.3.7. The criteria used for selection of the data are essentially thoseadopted for fish and crustaceans. In general, the values for lamellibranchs andgastropods have been pooled to obtain average values, but it is assumed thatmore lamellibranchs are taken for human consumption than gastropods.
3.3.5. Macroalgae (Table VI)
Macroalgae (benthic algae) that enter the human diet consist ofRhodophyceae (red), Chlorophyceae (green) and Phaeophyceae (brown)species. Species of red and green algae are directly consumed in many coun-tries, but brown algae are largely taken for conversion into alginates. There areexceptions; some Phaeophyceae are consumed in China, Japan and other FarEastern countries, but probably not in large quantities. The extent to whichradionuclides incorporated into alginates enter the human diet is not known,but for the purposes of this report it is assumed that 10% of the algae appearin alginate products.
By no means are all species, of even red and green algae, consumed;unfortunately, many of the species for which elemental concentration data areavailable are among those that are not. This includes the genus Fucus, whichhas been extensively studied because of its utility as an ‘indicator’ organism formany elements, especially metals. There are also marked differences for someelements in the extent to which they are accumulated (by the three groups) rel-ative to the concentrations in ambient sea water. Where such differences arevery large and consistent, the recommended CFs have been deliberately biasedtowards the red and green algae data.
For many elements it must be assumed that the data derived are likely tobe influenced by the method of sample collection. Owing to the mucous surfacecoating in many species, particulate material adheres to the samples and, con-versely, the mucilaginous coating often sloughs off after the plant has beenremoved from sea water. Such factors may influence the wide range of valuescited in some of the literature reviews. In selecting the CF data, as with thosederived for fauna, emphasis has been given, wherever possible, to thoseobtained from simultaneously derived plant and seawater (radionuclide andstable element) values.
3.3.6. Plankton: zooplankton and phytoplankton (Tables VII and VIII)
Pelagic organisms that float in the sea and are non-motile, or have limitedpowers of movement, are collectively called plankton. Planktonic organisms maybe either plants (phytoplankton) or animals (zooplankton). Phytoplankton
33
includes many groups; prominent among these are diatoms, dinoflagellates, coc-colithopores, green algae and cyanobacteria. Zooplankton is derived frommany groups of animals that range in size from about 5 µm to 1 m in diameter.Important groups include copepod crustaceans, euphausiids (krill), cnidarians,ostracod crustaceans, pteropod molluscs, chaetognaths and pelagic tunicates.Many species have an entirely planktonic life history; these constitute the holo-plankton. Other organisms, including some of those that otherwise live on or inthe seabed, spend only part of their life history in plankton, particularly as eggsand larvae, and these temporary components of plankton are called mero-plankton.
Since plankton consists of such a variety of organisms, it was desirable todivide this section into at least phytoplankton and zooplankton. Many of the datain the literature simply refer to either of these two groups without further detail,but it is assumed that most data on zooplankton refer to crustacean forms, unlessotherwise specified. In view of the large surface area to volume ratio, a frequentrequirement of passively floating pelagic organisms, it is likely that many ele-ments are accumulated by adsorptive processes, and many laboratory derivedCF data are in good agreement with estimates made from in situ investigations.A full literature review has not been possible, however, and many of the valuesrecommended have simply been drawn from earlier compilations. With regardto the consumption of plankton by humans, this is usually thought of in termsof harvesting krill, the food of the mysticeti (whalebone) whales. Whalebonewhales actually feed on many different types of plankton, although usuallysome forms predominate in different waters: mysids off Vancouver, golatheidsin the Chilean fjords, copepods in the Bay of Fundy. However, the term krill ismost universally applied to the Antarctic euphausiid, Euphausia superba. Thisis a large euphausiid, some 6 cm in length when adult. Chemical determinationsof this species are few and it is difficult to determine whether the crustacean orzooplankton CFs should be applied. However, as many of the zooplankton val-ues are based on other euphausiids and as plankton harvesting is likely toinclude other species, it is suggested that the zooplankton CFs are preferable.
3.3.7. Cephalopods (Table IX)
Cephalopods are taken from both surface water and mid-water depths forhuman consumption.The edible fractions of squid are usually the mantle (fromwhich the viscera have been removed), the head and the tentacles, whereas foroctopods it is usually the tentacles only. These edible portions do not thereforecontain sedimentary material or those organs that contain high concentrationsof many elements; thus they differ from the ‘total soft parts’ of other molluscsin terms of their concentrations of many elements. It is not possible to develop
34
a complete list of CFs for cephalopods, but some values derived for a numberof elements are listed in Table IX, and these can be compared with the recom-mended CFs for fish and other molluscs.
3.3.8. Mesopelagic fish
All the recommended CFs presented in Section 3.3.2 refer to, and arebased on, surface water fish data.The extent to which such values can be appliedto fish living at depths greater than about 200 m is not entirely clear, and thereis certainly an insufficient database to derive a complete separate list of CFs forthem. From a brief perusal of the literature, it appears that the concentrations ofa number of trace elements (Mn, Fe, Cu and Zn) are not significantly differentin mesopelagic and coastal water fish, nor are 137Cs and 90Sr concentrations[178]. The same applies to coastal water and mesopelagic cephalopods. It istherefore suggested that either the surface water fish CFs be used throughout,or that the CF, if applied to deep ocean water, be adjusted in proportion to theratio of the surface water to deep water elemental concentrations.
3.3.9. Mammals (Tables X–XII)
Marine mammals are considered to be at or near the top of the marinefood chain. In addition, many species are consumed by indigenous populations,particularly in the Arctic region. Therefore, in terms of establishing adequateradiation dose models, for the sake of completeness, transfer factors to this linkin the marine food chain leading to humans should be included. Radionuclideand trace element data are extremely limited for marine mammals when com-pared with other marine organisms. Furthermore, the fact that many marinemammals are not in constant contact with water and that they derive most oftheir radionuclide or trace element burden directly from their food makes thecomputation of CFs somewhat tenuous. Nevertheless, in order to make relevantcomparisons with CFs in other marine species, CFs for mammals have beencomputed using ambient concentrations of radionuclides and trace elements inthe surrounding waters (see notes to the tables). As both muscle and liver areoften consumed by humans, where data exist CFs for these two tissues are given.It should be kept in mind that since mammals obtain the majority of their con-taminant load from food and some mammals feed at very different levels of thefood chain, CFs are likely to vary considerably within any one group of mam-mals. A good example of such variability is mercury in whalebone whales, whichconsume plankton, compared with mercury in carnivorous toothed whales.Given the importance of diet, transfer mechanisms through the food chain alsoprobably control the body burdens in other mammal species.
35
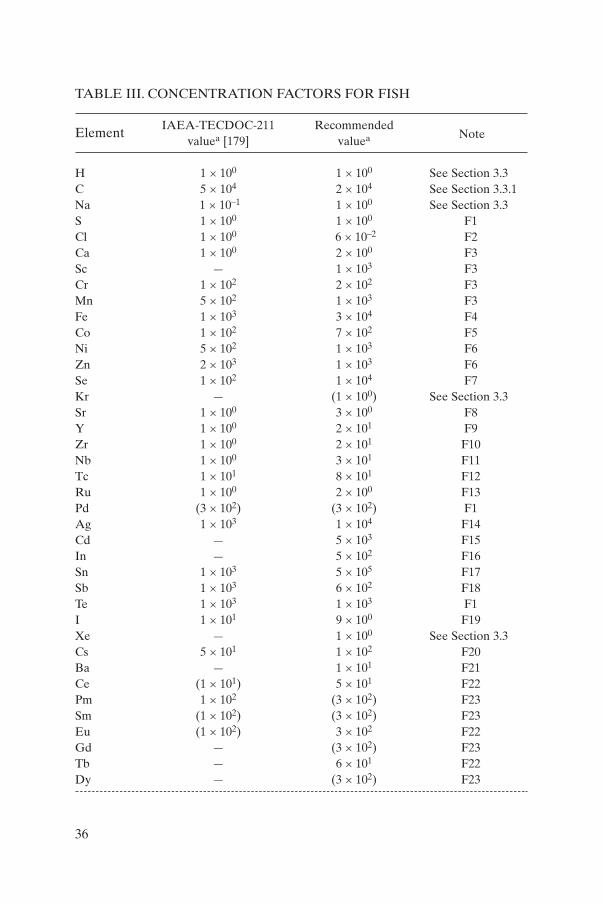
TABLE III. CONCENTRATION FACTORS FOR FISH
ElementIAEA-TECDOC-211 Recommended
valuea [179] valuea Note
H 1 × 100 1 × 100 See Section 3.3C 5 × 10⁴ 2 × 10⁴ See Section 3.3.1Na 1 × 10⁻¹ 1 × 100 See Section 3.3S 1 × 100 1 × 100 F1Cl 1 × 100 6 × 10⁻² F2Ca 1 × 100 2 × 100 F3Sc — 1 × 10³ F3Cr 1 × 10² 2 × 10² F3Mn 5 × 10² 1 × 10³ F3Fe 1 × 10³ 3 × 10⁴ F4Co 1 × 10² 7 × 10² F5Ni 5 × 10² 1 × 10³ F6Zn 2 × 10³ 1 × 10³ F6Se 1 × 10² 1 × 10⁴ F7Kr — (1 × 100) See Section 3.3Sr 1 × 100 3 × 100 F8Y 1 × 100 2 × 101 F9Zr 1 × 100 2 × 101 F10Nb 1 × 100 3 × 101 F11Tc 1 × 101 8 × 101 F12Ru 1 × 100 2 × 100 F13Pd (3 × 10²) (3 × 10²) F1Ag 1 × 10³ 1 × 10⁴ F14Cd — 5 × 10³ F15In — 5 × 10² F16Sn 1 × 10³ 5 × 10⁵ F17Sb 1 × 10³ 6 × 10² F18Te 1 × 10³ 1 × 10³ F1I 1 × 101 9 × 100 F19Xe — 1 × 100 See Section 3.3Cs 5 × 101 1 × 10² F20Ba — 1 × 101 F21Ce (1 × 101) 5 × 101 F22Pm 1 × 10² (3 × 10²) F23Sm (1 × 10²) (3 × 10²) F23Eu (1 × 10²) 3 × 10² F22Gd — (3 × 10²) F23Tb — 6 × 101 F22Dy — (3 × 10²) F23
36
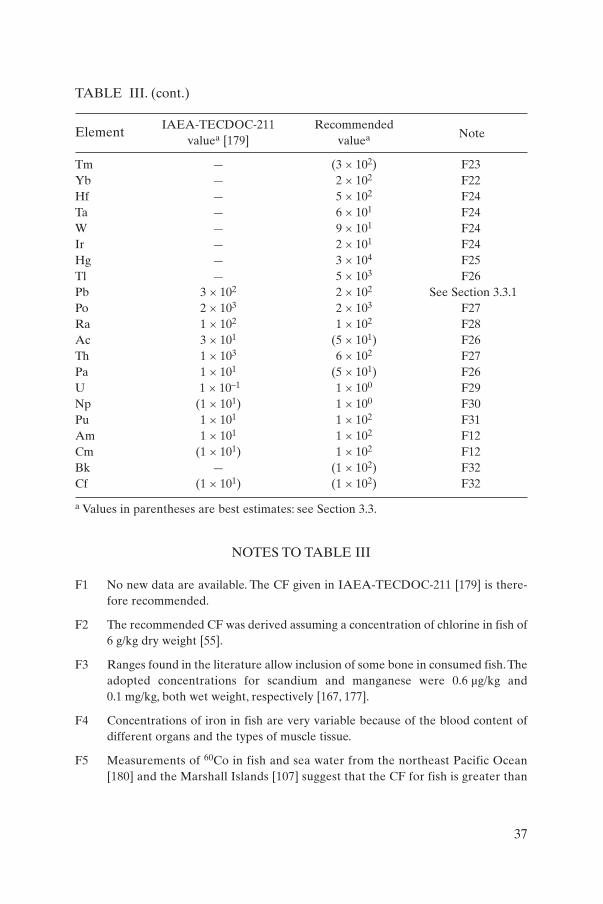
TABLE III. (cont.)
ElementIAEA-TECDOC-211 Recommended
valuea [179] valuea Note
Tm — (3 × 10²) F23Yb — 2 × 10² F22Hf — 5 × 10² F24Ta — 6 × 101 F24W — 9 × 101 F24Ir — 2 × 101 F24Hg — 3 × 10⁴ F25Tl — 5 × 10³ F26Pb 3 × 10² 2 × 10² See Section 3.3.1Po 2 × 10³ 2 × 10³ F27Ra 1 × 10² 1 × 10² F28Ac 3 × 101 (5 × 101) F26Th 1 × 10³ 6 × 10² F27Pa 1 × 101 (5 × 101) F26U 1 × 10⁻¹ 1 × 100 F29Np (1 × 101) 1 × 100 F30Pu 1 × 101 1 × 10² F31Am 1 × 101 1 × 10² F12Cm (1 × 101) 1 × 10² F12Bk — (1 × 10²) F32Cf (1 × 101) (1 × 10²) F32
a Values in parentheses are best estimates: see Section 3.3.
NOTES TO TABLE III
F1 No new data are available. The CF given in IAEA-TECDOC-211 [179] is there-fore recommended.
F2 The recommended CF was derived assuming a concentration of chlorine in fish of6 g/kg dry weight [55].
F3 Ranges found in the literature allow inclusion of some bone in consumed fish.Theadopted concentrations for scandium and manganese were 0.6 µg/kg and0.1 mg/kg, both wet weight, respectively [167, 177].
F4 Concentrations of iron in fish are very variable because of the blood content ofdifferent organs and the types of muscle tissue.
F5 Measurements of 60Co in fish and sea water from the northeast Pacific Ocean[180] and the Marshall Islands [107] suggest that the CF for fish is greater than
37
1 × 10³. There is, however, a significant body of stable element concentrationsfor cobalt in fish flesh, which average at about 0.01 mg/kg wet weight. This con-centration was used to derive the recommended CF.
F6 The range of data is considerable. Concentrations in flesh are likely to be lowerthan the values used to calculate the CFs in the table for both nickel and zinc, butallowance was made for whole fish consumption.
F7 Concentrations of selenium in flesh vary from 0.1 to 2.0 mg/kg wet weight. Anaverage value of 0.5 mg/kg wet weight was assumed [167].
F8 CFs for flesh for strontium reported in the literature are less than 1. The recom-mended value allows for bone and whole fish consumption.
F9 Yttrium data give a CF range of 2 to 10 [181]. These values were multiplied by 3.5to allow for whole fish consumption.
F10 Few data are available for zirconium, indicating a CF for flesh of about 100 [177].It should be noted, however, that 95Zr is barely detectable in muscle samples fromknown contaminated areas. Therefore a CF ten times lower seems more reason-able. This CF was then doubled to allow for contamination and consumption ofother organs.
F11 The only extensive measurements of concentrations of niobium in fish flesh arethose of Schroeder and Balassa [182]. For a variety of species the average con-centration was 0.3 mg/kg wet weight. Dividing this number by the estimated nio-bium coastal water concentration results in an average CF of 6 × 10⁴. If this isindeed the CF, 95Nb should be more than readily detectable in fish from con-taminated areas such as the Irish Sea, but it is not [183]. The stable element valuewas therefore not used. Instead, the zirconium CF was multiplied by 1.5 on thebasis that some enhancement of 95Nb over 95Zr has been observed in biologicalmaterial [184].
F12 The recommended CF was determined using data for the English Channel fromthe Institut de protection et de sûreté nucléaire (IPSN) [43].
F13 CFs for muscle for 106Ru suggest a range of 0.1 to 1 [177]. Applying a whole fishto muscle ratio of 3.5 a CF of 2 is therefore recommended.
F14 A muscle value of 0.01 mg/kg wet weight for silver is suggested [177], giving a CFof 1 × 10⁴.
F15 Concentrations of cadmium in fish are very variable, many samples analysed hav-ing been taken from contaminated waters. The recommended CF was derivedusing a typical concentration of cadmium in muscle of 0.04 mg/kg wet weight.
F16 The recommended CF for indium is an upper limit based on the mean of detec-tion limits for fish [185].
38
F17 The recommended CF for tin was derived from concentrations of the stable ele-ment [167]; these ranged from 0.2 to 2.0 mg/kg wet weight. A value of 0.5 mg/kgwet weight was selected.
F18 Stable antimony values in fish flesh vary considerably [167]. The recommended CFwas derived assuming a concentration of antimony in fish of 0.1 mg/kg wet weight.
F19 The recommended CF was calculated using a concentration of iodine in fish of0.5 mg/kg wet weight taken from Pentreath [177].
F20 The recommended CF is based primarily on measurements of 137Cs in fish andsamples of sea water.The CFs are different for different species taken in the sameenvironment, and variations in concentration with size are also evident [177, 186].
F21 The recommended CF for barium is based on data given in Ewing et al. [185] andGoldberg [187].
F22 Data on CFs for a number of rare earths are reported by Suzuki et al. [188]. Forcerium, the average CF derived from muscle analyses was about 300, related to‘soluble’ cerium concentrations in sea water. It should be noted, however, that144Ce is not observed in fish samples taken from the Irish Sea, which suggests thatthe CF is unlikely to be greater than 50 for the consumable portion. In situ datafrom Japan [189] suggest a value of 50. For the other rare earths (europium, ter-bium and ytterbium) no in situ data are available and thus the CFs estimated bySuzuki et al. [188] have been retained.
F23 The recommended CFs are conservatively rounded up values based on the high-est measured CF for the other rare earth elements (see Note F24).
F24 Average upper limits for concentrations of these elements in fish have beenreported by Ewing et al. [185]. The recommended CFs were derived using thesevalues, except for iridium.
F25 The recommended CF was derived using a representative concentration for totalmercury in sea water (5 ng/L) from the Persian Gulf and Arabian Sea [142, 190]and a typical total mercury concentration in fish (0.15 µg/g) from the same region[191–193].
F26 No new data are available.
F27 The recommended CF was derived using data taken from Jackson et al. [172].
F28 The recommended CF was derived using the average concentration of 226Ra fromall tissues, reported by Jackson et al. [172].
F29 Typical concentrations of uranium in fish flesh of about 0.2 µg/kg wet weight arereported in the literature [177]. The CF derived using this concentration is lessthan 0.1; it has been increased to 1 to allow for the possible inclusion of some bonein the edible fraction.
39
F30 The only concentrations of 237Np in environmental samples are those reported byPentreath and Harvey [89]. An estimated CF for fish flesh, based on these data, isless than 0.01. In view of the uncertainty of this number, a value of 1 is recom-mended, to allow for whole fish consumption.
F31 A large number of data are available on plutonium in fish tissues, many of whichhave been summarized [172]. CFs average at 3.5 × 10² [71] and 1 × 10² in theEnglish Channel [43]. A recommended value of 1 × 10² is given.
F32 Data on berkelium and californium in the literature are scarce. The behaviour ofberkelium and californium is assumed to be similar to that of americium and curium, and therefore the CFs for americium and curium are recommended forboth berkelium and californium.
40
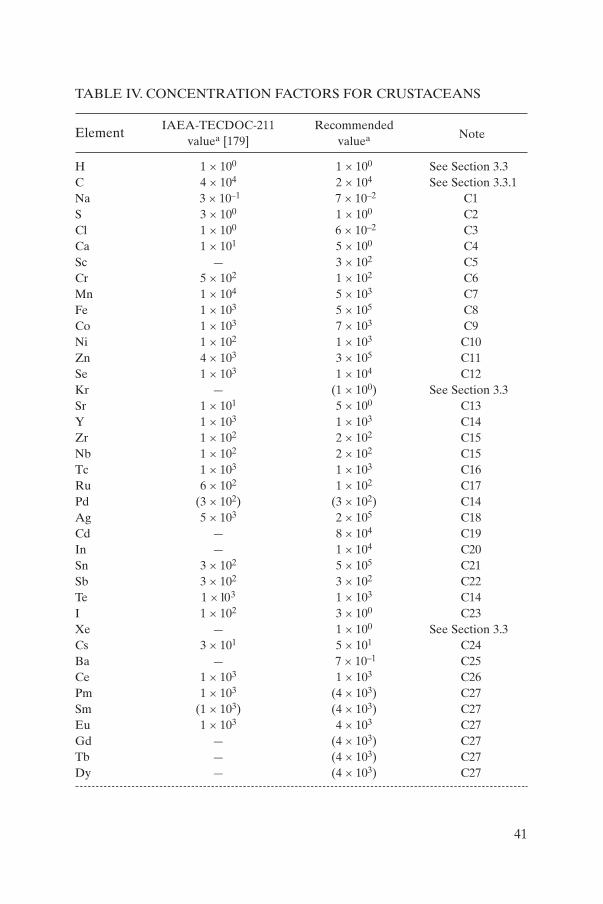
TABLE IV. CONCENTRATION FACTORS FOR CRUSTACEANS
ElementIAEA-TECDOC-211 Recommended
valuea [179] valuea Note
H 1 × 100 1 × 100 See Section 3.3C 4 × 10⁴ 2 × 10⁴ See Section 3.3.1Na 3 × 10⁻¹ 7 × 10⁻² C1S 3 × 100 1 × 100 C2Cl 1 × 100 6 × 10⁻² C3Ca 1 × 101 5 × 100 C4Sc — 3 × 10² C5Cr 5 × 10² 1 × 10² C6Mn 1 × 10⁴ 5 × 10³ C7Fe 1 × 10³ 5 × 10⁵ C8Co 1 × 10³ 7 × 10³ C9Ni 1 × 10² 1 × 10³ C10Zn 4 × 10³ 3 × 10⁵ C11Se 1 × 10³ 1 × 10⁴ C12Kr — (1 × 100) See Section 3.3Sr 1 × 101 5 × 100 C13Y 1 × 10³ 1 × 10³ C14Zr 1 × 10² 2 × 10² C15Nb 1 × 10² 2 × 10² C15Tc 1 × 10³ 1 × 10³ C16Ru 6 × 10² 1 × 10² C17Pd (3 × 10²) (3 × 10²) C14Ag 5 × 10³ 2 × 10⁵ C18Cd — 8 × 10⁴ C19In — 1 × 10⁴ C20Sn 3 × 10² 5 × 10⁵ C21Sb 3 × 10² 3 × 10² C22Te 1 × l03 1 × 10³ C14I 1 × 10² 3 × 100 C23Xe — 1 × 100 See Section 3.3Cs 3 × 101 5 × 101 C24Ba — 7 × 10⁻¹ C25Ce 1 × 10³ 1 × 10³ C26Pm 1 × 10³ (4 × 10³) C27Sm (1 × 10³) (4 × 10³) C27Eu 1 × 10³ 4 × 10³ C27Gd — (4 × 10³) C27Tb — (4 × 10³) C27Dy — (4 × 10³) C27
41
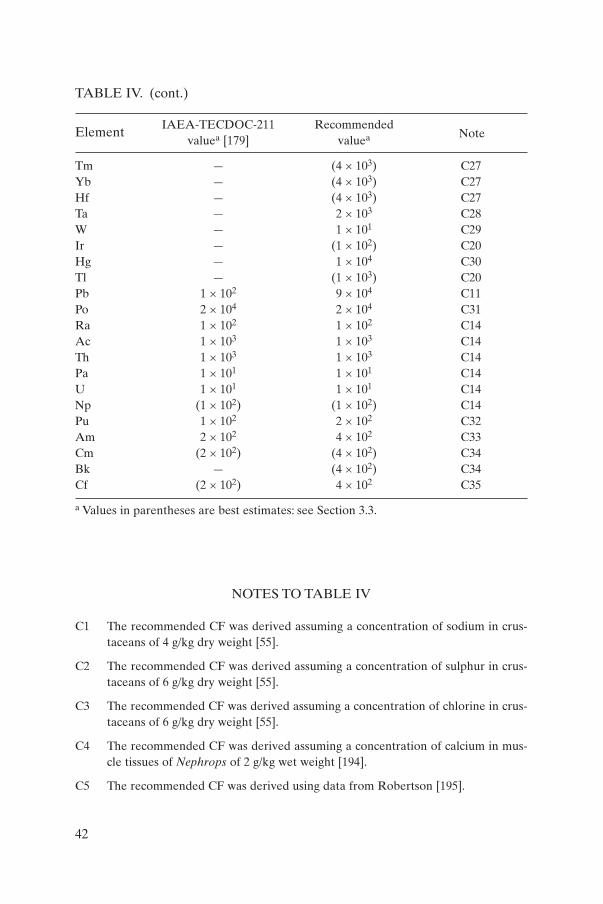
TABLE IV. (cont.)
ElementIAEA-TECDOC-211 Recommended
valuea [179] valuea Note
Tm — (4 × 10³) C27Yb — (4 × 10³) C27Hf — (4 × 10³) C27Ta — 2 × 10³ C28W — 1 × 101 C29Ir — (1 × 10²) C20Hg — 1 × 10⁴ C30Tl — (1 × 10³) C20Pb 1 × 10² 9 × 10⁴ C11Po 2 × 10⁴ 2 × 10⁴ C31Ra 1 × 10² 1 × 10² C14Ac 1 × 10³ 1 × 10³ C14Th 1 × 10³ 1 × 10³ C14Pa 1 × 101 1 × 101 C14U 1 × 101 1 × 101 C14Np (1 × 10²) (1 × 10²) C14Pu 1 × 10² 2 × 10² C32Am 2 × 10² 4 × 10² C33Cm (2 × 10²) (4 × 10²) C34Bk — (4 × 10²) C34Cf (2 × 10²) 4 × 10² C35
a Values in parentheses are best estimates: see Section 3.3.
NOTES TO TABLE IV
C1 The recommended CF was derived assuming a concentration of sodium in crus-taceans of 4 g/kg dry weight [55].
C2 The recommended CF was derived assuming a concentration of sulphur in crus-taceans of 6 g/kg dry weight [55].
C3 The recommended CF was derived assuming a concentration of chlorine in crus-taceans of 6 g/kg dry weight [55].
C4 The recommended CF was derived assuming a concentration of calcium in mus-cle tissues of Nephrops of 2 g/kg wet weight [194].
C5 The recommended CF was derived using data from Robertson [195].
42
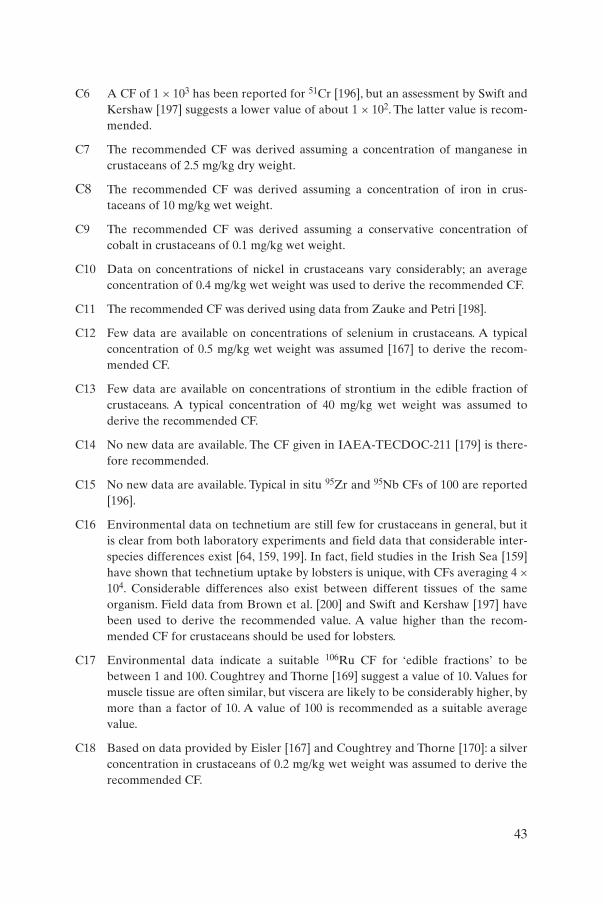
C6 A CF of 1 × 10³ has been reported for 51Cr [196], but an assessment by Swift andKershaw [197] suggests a lower value of about 1 × 10². The latter value is recom-mended.
C7 The recommended CF was derived assuming a concentration of manganese incrustaceans of 2.5 mg/kg dry weight.
C8 The recommended CF was derived assuming a concentration of iron in crus-taceans of 10 mg/kg wet weight.
C9 The recommended CF was derived assuming a conservative concentration ofcobalt in crustaceans of 0.1 mg/kg wet weight.
C10 Data on concentrations of nickel in crustaceans vary considerably; an averageconcentration of 0.4 mg/kg wet weight was used to derive the recommended CF.
C11 The recommended CF was derived using data from Zauke and Petri [198].
C12 Few data are available on concentrations of selenium in crustaceans. A typicalconcentration of 0.5 mg/kg wet weight was assumed [167] to derive the recom-mended CF.
C13 Few data are available on concentrations of strontium in the edible fraction ofcrustaceans. A typical concentration of 40 mg/kg wet weight was assumed toderive the recommended CF.
C14 No new data are available. The CF given in IAEA-TECDOC-211 [179] is there-fore recommended.
C15 No new data are available. Typical in situ 95Zr and 95Nb CFs of 100 are reported[196].
C16 Environmental data on technetium are still few for crustaceans in general, but itis clear from both laboratory experiments and field data that considerable inter-species differences exist [64, 159, 199]. In fact, field studies in the Irish Sea [159]have shown that technetium uptake by lobsters is unique, with CFs averaging 4 ×10⁴. Considerable differences also exist between different tissues of the sameorganism. Field data from Brown et al. [200] and Swift and Kershaw [197] havebeen used to derive the recommended value. A value higher than the recom-mended CF for crustaceans should be used for lobsters.
C17 Environmental data indicate a suitable 106Ru CF for ‘edible fractions’ to bebetween 1 and 100. Coughtrey and Thorne [169] suggest a value of 10. Values formuscle tissue are often similar, but viscera are likely to be considerably higher, bymore than a factor of 10. A value of 100 is recommended as a suitable averagevalue.
C18 Based on data provided by Eisler [167] and Coughtrey and Thorne [170]: a silverconcentration in crustaceans of 0.2 mg/kg wet weight was assumed to derive therecommended CF.
43
C19 Concentrations of cadmium vary considerably from one tissue to another. Thiselement is particularly accumulated in the hepatopancreas. It appears that crabstend to accumulate more cadmium than either shrimps or lobsters, and it is rec-ommended to allow for such differences.The recommended CF was derived usingdata from Zauke and Petri [198].
C20 No new data are available.
C21 Few data are available on concentrations of tin in crustaceans. A typical concen-tration of 0.5 mg/kg wet weight [167, 171] was assumed to derive the recommendedCF.
C22 Data on concentrations of antimony in crustaceans vary considerably. VanWeers and van Raaphorst [201] report an average concentration of antimony of0.04 kg/kg dry weight in shrimps, but other data range from 0.02 to 10 mg/kg dryweight [167, 171]. Data from Swift and Kershaw [197] were used to derive therecommended CF.
C23 Few recent iodine data are available and there is little to support or refute theconcentration of 1 mg/kg dry weight given by Bowen [55]. This concentration wasused to derive the recommended CF.
C24 The recommended CF was derived using data from Fisher et al. [166].
C25 The recommended CF was derived assuming a concentration of barium in crus-taceans of 0.2 mg/kg dry weight [55].
C26 No new data are available. The CF given in IAEA-TECDOC-211 [179] is there-fore recommended. This is probably an upper limit.
C27 Very few data are available on the lanthanides in crustaceans. Fowler [202] givesa value of 2.3 µg/kg dry weight for europium in whole euphausiids; this gives a CFon a wet weight basis of about 4 × 10³. CFs for other rare earths, for which nomeasurements are available, are assumed to be equal to the value for europium.
C28 The recommended CF was derived assuming a concentration of tantalum in crus-taceans of 0.027 mg/kg dry weight [55].
C29 Bowen [55] reports a concentration of tungsten of 0.5 µg/kg dry weight and Eisler[167] reports a value of <0.3 µg/kg dry weight. The recommended CF was derivedassuming a concentration of tungsten in crustaceans of 0.1 µg/kg wet weight.
C30 A large number of mercury data are available, many from contaminated environ-ments [167]. The recommended CF was derived assuming a concentration of mer-cury in crustaceans of 0.1 mg/kg wet weight.
C31 The recommended CF was based on whole body concentrations of 210Po [203] anddata from Swift and Kershaw [197].
44

C32 CFs for 239/240Pu reported in the literature range from 4 × 101 to 3 × 10² for theedible fractions of crustaceans [172]. Data from Swift and Kershaw [197] wereused to derive the recommended value.
C33 There is some evidence to suggest that 241Am may be slightly more biologicallyavailable than plutonium [199]. The CF for americium was assumed to be thesame as that for californium.
C34 The same CF as that for americium is recommended because it was assumed that thebehaviour of curium and berkelium is similar to americium.
C35 The recommended CF was derived using data from Swift and Kershaw [197] andFowler et al. [204].
45
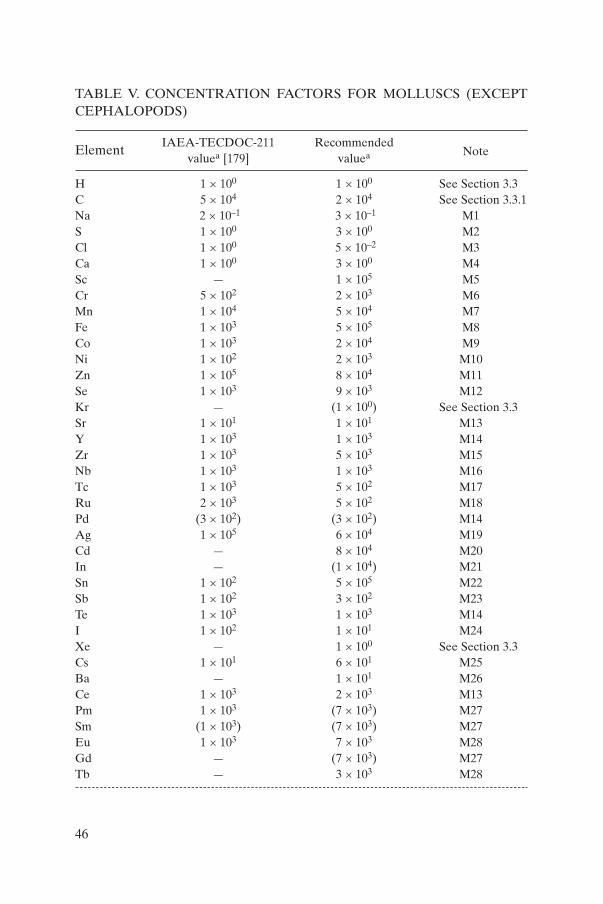
TABLE V. CONCENTRATION FACTORS FOR MOLLUSCS (EXCEPTCEPHALOPODS)
ElementIAEA-TECDOC-211 Recommended
valuea [179] valuea Note
H 1 × 100 1 × 100 See Section 3.3C 5 × 10⁴ 2 × 10⁴ See Section 3.3.1Na 2 × 10⁻¹ 3 × 10⁻¹ M1S 1 × 100 3 × 100 M2Cl 1 × 100 5 × 10⁻² M3Ca 1 × 100 3 × 100 M4Sc — 1 × 10⁵ M5Cr 5 × 10² 2 × 10³ M6Mn 1 × 10⁴ 5 × 10⁴ M7Fe 1 × 10³ 5 × 10⁵ M8Co 1 × 10³ 2 × 10⁴ M9Ni 1 × 10² 2 × 10³ M10Zn 1 × 10⁵ 8 × 10⁴ M11Se 1 × 10³ 9 × 10³ M12Kr — (1 × 100) See Section 3.3Sr 1 × 101 1 × 101 M13Y 1 × 10³ 1 × 10³ M14Zr 1 × 10³ 5 × 10³ M15Nb 1 × 10³ 1 × 10³ M16Tc 1 × 10³ 5 × 10² M17Ru 2 × 10³ 5 × 10² M18Pd (3 × 10²) (3 × 10²) M14Ag 1 × 10⁵ 6 × 10⁴ M19Cd — 8 × 10⁴ M20In — (1 × 10⁴) M21Sn 1 × 10² 5 × 10⁵ M22Sb 1 × 10² 3 × 10² M23Te 1 × 10³ 1 × 10³ M14I 1 × 10² 1 × 101 M24Xe — 1 × 100 See Section 3.3Cs 1 × 101 6 × 101 M25Ba — 1 × 101 M26Ce 1 × 10³ 2 × 10³ M13Pm 1 × 10³ (7 × 10³) M27Sm (1 × 10³) (7 × 10³) M27Eu 1 × 10³ 7 × 10³ M28Gd — (7 × 10³) M27Tb — 3 × 10³ M28
46
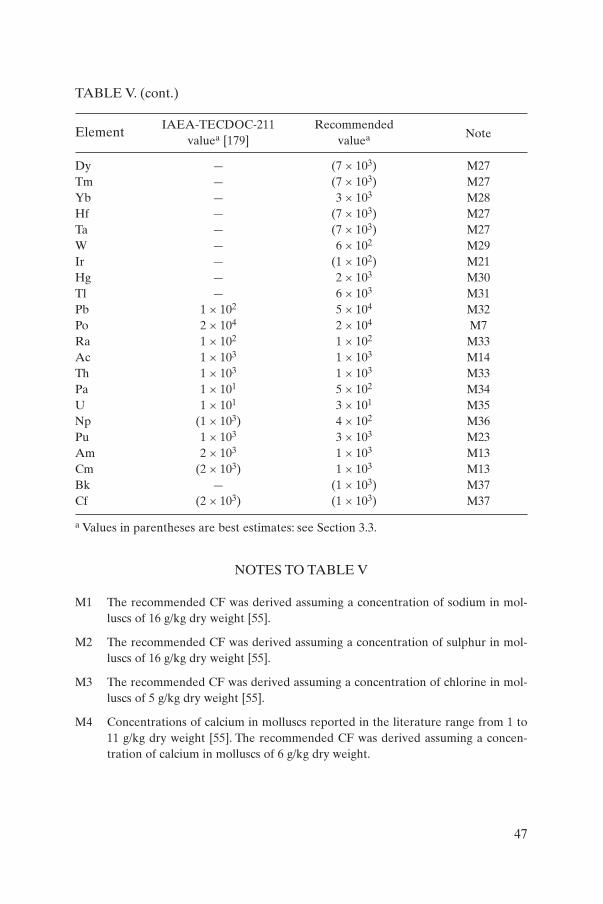
TABLE V. (cont.)
ElementIAEA-TECDOC-211 Recommended
valuea [179] valuea Note
Dy — (7 × 10³) M27Tm — (7 × 10³) M27Yb — 3 × 10³ M28Hf — (7 × 10³) M27Ta — (7 × 10³) M27W — 6 × 10² M29Ir — (1 × 10²) M21Hg — 2 × 10³ M30Tl — 6 × 10³ M31Pb 1 × 10² 5 × 10⁴ M32Po 2 × 10⁴ 2 × 10⁴ M7Ra 1 × 10² 1 × 10² M33Ac 1 × 10³ 1 × 10³ M14Th 1 × 10³ 1 × 10³ M33Pa 1 × 101 5 × 10² M34U 1 × 101 3 × 101 M35Np (1 × 10³) 4 × 10² M36Pu 1 × 10³ 3 × 10³ M23Am 2 × 10³ 1 × 10³ M13Cm (2 × 10³) 1 × 10³ M13Bk — (1 × 10³) M37Cf (2 × 10³) (1 × 10³) M37
a Values in parentheses are best estimates: see Section 3.3.
NOTES TO TABLE V
M1 The recommended CF was derived assuming a concentration of sodium in mol-luscs of 16 g/kg dry weight [55].
M2 The recommended CF was derived assuming a concentration of sulphur in mol-luscs of 16 g/kg dry weight [55].
M3 The recommended CF was derived assuming a concentration of chlorine in mol-luscs of 5 g/kg dry weight [55].
M4 Concentrations of calcium in molluscs reported in the literature range from 1 to11 g/kg dry weight [55]. The recommended CF was derived assuming a concen-tration of calcium in molluscs of 6 g/kg dry weight.
47
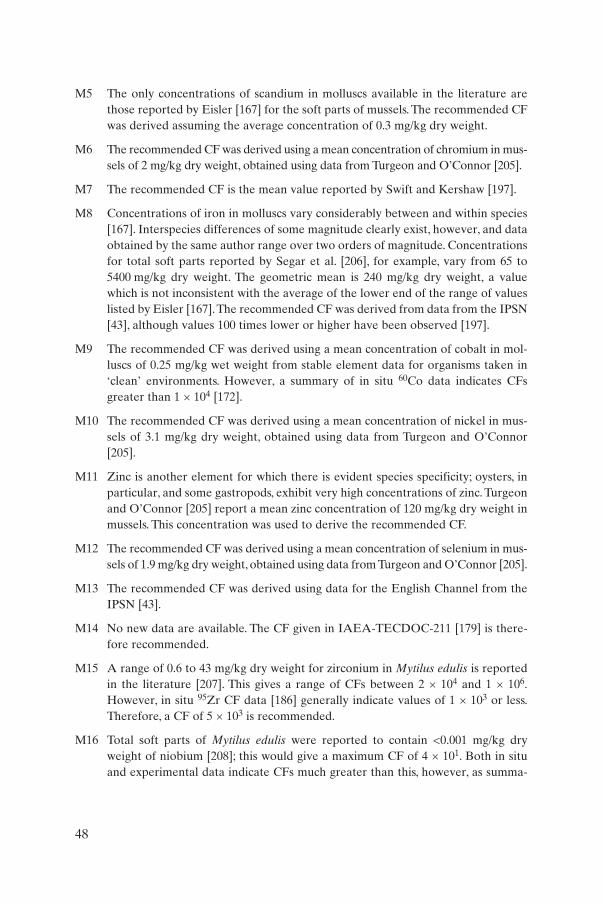
M5 The only concentrations of scandium in molluscs available in the literature arethose reported by Eisler [167] for the soft parts of mussels. The recommended CFwas derived assuming the average concentration of 0.3 mg/kg dry weight.
M6 The recommended CF was derived using a mean concentration of chromium in mus-sels of 2 mg/kg dry weight, obtained using data from Turgeon and O’Connor [205].
M7 The recommended CF is the mean value reported by Swift and Kershaw [197].
M8 Concentrations of iron in molluscs vary considerably between and within species[167]. Interspecies differences of some magnitude clearly exist, however, and dataobtained by the same author range over two orders of magnitude. Concentrationsfor total soft parts reported by Segar et al. [206], for example, vary from 65 to5400 mg/kg dry weight. The geometric mean is 240 mg/kg dry weight, a valuewhich is not inconsistent with the average of the lower end of the range of valueslisted by Eisler [167].The recommended CF was derived from data from the IPSN[43], although values 100 times lower or higher have been observed [197].
M9 The recommended CF was derived using a mean concentration of cobalt in mol-luscs of 0.25 mg/kg wet weight from stable element data for organisms taken in‘clean’ environments. However, a summary of in situ 60Co data indicates CFsgreater than 1 × 10⁴ [172].
M10 The recommended CF was derived using a mean concentration of nickel in mus-sels of 3.1 mg/kg dry weight, obtained using data from Turgeon and O’Connor[205].
M11 Zinc is another element for which there is evident species specificity; oysters, inparticular, and some gastropods, exhibit very high concentrations of zinc. Turgeonand O’Connor [205] report a mean zinc concentration of 120 mg/kg dry weight inmussels. This concentration was used to derive the recommended CF.
M12 The recommended CF was derived using a mean concentration of selenium in mus-sels of 1.9 mg/kg dry weight, obtained using data from Turgeon and O’Connor [205].
M13 The recommended CF was derived using data for the English Channel from theIPSN [43].
M14 No new data are available. The CF given in IAEA-TECDOC-211 [179] is there-fore recommended.
M15 A range of 0.6 to 43 mg/kg dry weight for zirconium in Mytilus edulis is reportedin the literature [207]. This gives a range of CFs between 2 × 10⁴ and 1 × 10⁶.However, in situ 95Zr CF data [186] generally indicate values of 1 × 10³ or less.Therefore, a CF of 5 × 10³ is recommended.
M16 Total soft parts of Mytilus edulis were reported to contain <0.001 mg/kg dryweight of niobium [208]; this would give a maximum CF of 4 × 101. Both in situand experimental data indicate CFs much greater than this, however, as summa-
48
rized by Ancellin et al. [196], and thus the CF of 1 × 10³ given in IAEA-TECDOC-211 [179] was retained.
M17 The recommended CF was derived using data from Brown et al. [200] and fromthe IPSN [43].
M18 A mean CF of 4 × 10² is reported by Swift and Kershaw [197], similar to the CFof 6 × 10² reported by the IPSN [43]. A CF of 5 × 10² for ruthenium in molluscs istherefore recommended.
M19 The recommended CF was derived using a mean concentration of silver in mus-sels of 0.32 mg/kg dry weight, obtained using data from Turgeon and O’Connor[205]. Oysters can display 10 times higher concentrations of silver, and thereforeit is recommended that a CF 10 times higher than the CF given in Table V be usedfor oysters.
M20 The recommended CF was derived using a mean concentration of cadmium in mus-sels of 3.6 mg/kg dry weight, obtained using data from Turgeon and O’Connor [205].
M21 No new data are available.
M22 From the limited data available [167, 171] a tin concentration of 0.5 mg/kg wetweight was derived.
M23 The recommended CF was derived using data for the English Channel from theIPSN [43], consistent with data compiled by Swift and Kershaw [197].
M24 The recommended CF was derived assuming a concentration of iodine in mol-luscs of 4 mg/kg dry weight [55].
M25 The recommended CF was derived from in situ 137Cs data in Arctic waters report-ed by Fisher et al. [166]. The value is consistent with data for the English Channelreported by the IPSN [43].
M26 A value of 3 mg/kg dry weight for barium is given by Bowen [55]; Karbe et al.[207] report a range of values from 0.8 to 26 mg/kg dry weight. The recommendedCF was derived assuming a concentration of barium in molluscs of 0.6 mg/kg wetweight.
M27 The behaviour of these elements was assumed to be similar to that of europium,terbium and ytterbium. The recommended CF is assumed equal to the highestmeasured CF for the other rare earth elements (see Note M31).
M28 The recommended CFs were derived using data from Suzuki et al. [188]. Othereuropium data are available [207], but these have a large range and simultaneouswater analyses were not made.
M29 The recommended CF was derived using a mean concentration of tungsten inmussels of 6 µg/kg wet weight, obtained using the data from Fukai and Meinke[209, 210] for soft parts of Tapes japonicus.
49
M30 The recommended CF was derived using a mean concentration of mercury inmussels of 0.13 mg/kg dry weight, obtained using data from Turgeon andO’Connor [205].
M31 The recommended CF was derived assuming a concentration of thallium in mol-luscs of 0.34 mg/kg dry weight [55].
M32 The recommended CF was derived using a mean concentration of lead in musselsof 8.8 mg/kg dry weight, obtained using data from Turgeon and O’Connor [205].
M33 No CF data for lamellibranch or gastropods molluscs were located.
M34 No environmental data were located. Lucu et al. [211] obtained CFs of up to2 × 102 for the digestive tract of Mytillus galloprovincialis for 233Pa in laboratorystudies. Other tissue CFs were 60 for gill, 15 for gonad and 10 for muscle. Theseexperiments were only of 20 days duration, and only labelled water was used. Itis suggested that these values be increased by at least an order of magnitude,and therefore a CF of 5 × 10² is recommended.
M35 Reported data give 238U concentrations of 3.0, 5.5, 4.6 and 13 Bq/kg dry weight forfour different lamellibranch molluscs, giving a mean concentration of 1.2 Bq/kgwet weight [212]. The recommended CF was derived using this concentration andis consistent with the mean CF reported by Swift and Kershaw [197].
M36 The only published environmentally derived CFs for 237Np are those given inPentreath et al. [102]. The recommended CF is the mean of the CFs reported.
M37 The same CF as that for americium is recommended because it was assumed thatthe behaviour of berkelium and californium is similar to americium.
50
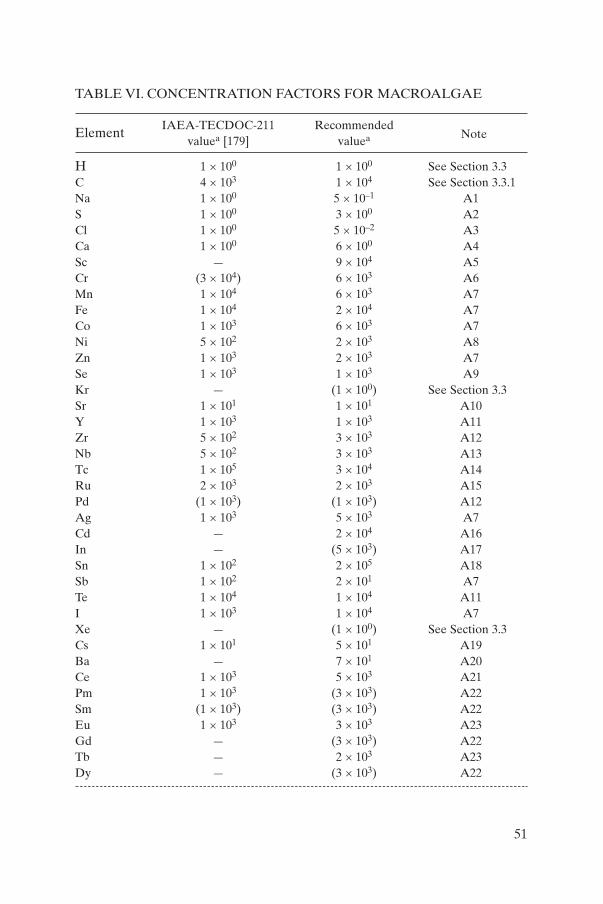
TABLE VI. CONCENTRATION FACTORS FOR MACROALGAE
ElementIAEA-TECDOC-211 Recommended
valuea [179] valuea Note
H 1 × 100 1 × 100 See Section 3.3C 4 × 10³ 1 × 10⁴ See Section 3.3.1Na 1 × 100 5 × 10⁻¹ A1S 1 × 100 3 × 100 A2Cl 1 × 100 5 × 10⁻² A3Ca 1 × 100 6 × 100 A4Sc — 9 × 10⁴ A5Cr (3 × 10⁴) 6 × 10³ A6Mn 1 × 10⁴ 6 × 10³ A7Fe 1 × 10⁴ 2 × 10⁴ A7Co 1 × 10³ 6 × 10³ A7Ni 5 × 10² 2 × 10³ A8Zn 1 × 10³ 2 × 10³ A7Se 1 × 10³ 1 × 10³ A9Kr — (1 × 100) See Section 3.3Sr 1 × 101 1 × 101 A10Y 1 × 10³ 1 × 10³ A11Zr 5 × 10² 3 × 10³ A12Nb 5 × 10² 3 × 10³ A13Tc 1 × 10⁵ 3 × 10⁴ A14Ru 2 × 10³ 2 × 10³ A15Pd (1 × 10³) (1 × 10³) A12Ag 1 × 10³ 5 × 10³ A7Cd — 2 × 10⁴ A16In — (5 × 10³) A17Sn 1 × 10² 2 × 10⁵ A18Sb 1 × 10² 2 × 101 A7Te 1 × 10⁴ 1 × 10⁴ A11I 1 × 10³ 1 × 10⁴ A7Xe — (1 × 100) See Section 3.3Cs 1 × 101 5 × 101 A19Ba — 7 × 101 A20Ce 1 × 10³ 5 × 10³ A21Pm 1 × 10³ (3 × 10³) A22Sm (1 × 10³) (3 × 10³) A22Eu 1 × 10³ 3 × 10³ A23Gd — (3 × 10³) A22Tb — 2 × 10³ A23Dy — (3 × 10³) A22
51
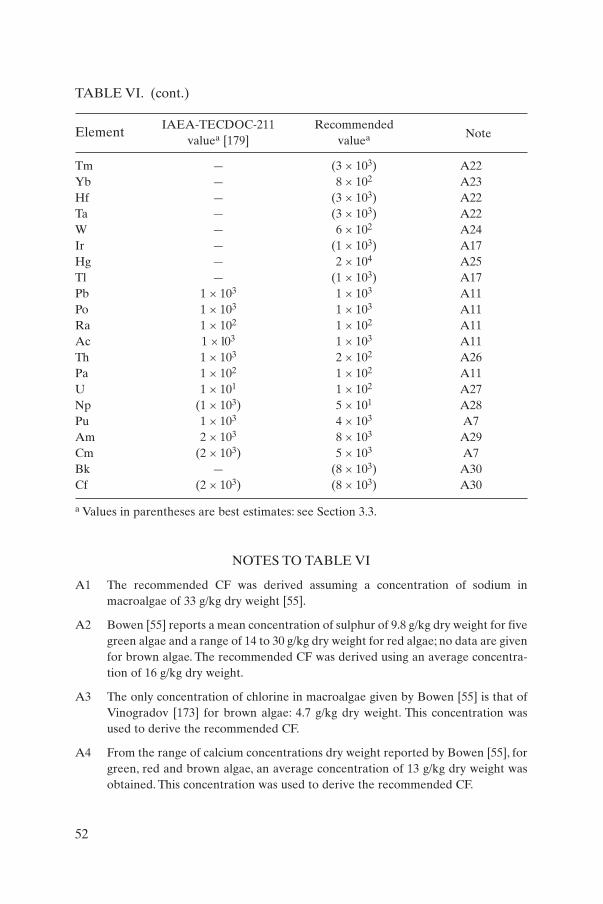
TABLE VI. (cont.)
ElementIAEA-TECDOC-211 Recommended
valuea [179] valuea Note
Tm — (3 × 10³) A22Yb — 8 × 10² A23Hf — (3 × 10³) A22Ta — (3 × 10³) A22W — 6 × 10² A24Ir — (1 × 10³) A17Hg — 2 × 10⁴ A25Tl — (1 × 10³) A17Pb 1 × 10³ 1 × 10³ A11Po 1 × 10³ 1 × 10³ A11Ra 1 × 10² 1 × 10² A11Ac 1 × l03 1 × 10³ A11Th 1 × 10³ 2 × 10² A26Pa 1 × 10² 1 × 10² A11U 1 × 101 1 × 10² A27Np (1 × 10³) 5 × 101 A28Pu 1 × 10³ 4 × 10³ A7Am 2 × 10³ 8 × 10³ A29Cm (2 × 10³) 5 × 10³ A7Bk — (8 × 10³) A30Cf (2 × 10³) (8 × 10³) A30
a Values in parentheses are best estimates: see Section 3.3.
NOTES TO TABLE VI
A1 The recommended CF was derived assuming a concentration of sodium inmacroalgae of 33 g/kg dry weight [55].
A2 Bowen [55] reports a mean concentration of sulphur of 9.8 g/kg dry weight for fivegreen algae and a range of 14 to 30 g/kg dry weight for red algae; no data are givenfor brown algae. The recommended CF was derived using an average concentra-tion of 16 g/kg dry weight.
A3 The only concentration of chlorine in macroalgae given by Bowen [55] is that ofVinogradov [173] for brown algae: 4.7 g/kg dry weight. This concentration wasused to derive the recommended CF.
A4 From the range of calcium concentrations dry weight reported by Bowen [55], forgreen, red and brown algae, an average concentration of 13 g/kg dry weight wasobtained. This concentration was used to derive the recommended CF.
52
A5 Concentrations of scandium of 0.45 and 0.07 mg/kg dry weight for red and brownalgae, respectively, are reported by Horowitz et al. [213] and cited by Bowen [55].The recommended CF was calculated assuming a mean value of 0.26 mg/kg dryweight.
A6 A wide range of chromium concentration values is indicated in the literature [55,167]. From these data a value of 2.7 mg/kg dry weight was derived for brownalgae, and means of the ranges, 7 mg/kg and 7.5 mg/kg, both dry weight, wereobtained for green and red algae, respectively. An average value of 5.7 mg/kg dryweight was used to derive the recommended CF.
A7 The recommended CF was derived using data for the English Channel from theIPSN [43].
A8 A mean nickel concentration of 0.7 mg/kg wet weight was derived for red, greenand brown algae from Eisler [167]. The recommended CF derived is not dissimi-lar from those summarized by Ancellin et al. [196] for red and brown algae andconsistent with data for the English Channel from the IPSN [43].
A9 The limited data in the literature [55, 167, 171] indicate a selenium concentrationin algae of about 0.05 mg/kg wet weight.This concentration was used to derive therecommended CF.
A10 Concentrations of strontium differ between the three groups of benthic algae, itbeing particularly accumulated by calcareous red forms such as Halimeda. Thecalcareous red algae are not of importance as far as human consumption is con-cerned, however, and thus such high values have not been included in the assess-ment.The data in the literature vary considerably. Early studies by Mauchline andTempleton [214], quoted by Eisler [167], report strontium concentrations of 6.4,0.22 and 1.2 mg/kg wet weight for red, green and brown algae, respectively. Thedata in Bowen [55] indicate mid-range values of 270, 140 and 1200 mg/kg dryweight for red, green and brown algae, respectively. The recommended CF wasderived using a mean concentration of about 100 mg/kg wet weight.
A11 No new data are available. The CF given in IAEA-TECDOC-211 [179] is there-fore recommended.
A12 There are a number of in situ data on CFs for 95Zr and 95Nb. Of 12 species listedby Pentreath [215], the highest values were for green algae, which ranged from 2× 10³ to 5 × 10³, while CFs for red algae were 1 × 10³ or less and the maximumbrown alga CF was 8 × 10². In situ data [169] also indicate a similar range. A CFof 3 × 10³ is recommended.
A13 There are insufficient data to distinguish between the accumulation of 95Zr and95Nb, and thus it is suggested that the zirconium data be used.
A14 The IAEA-TECDOC-211 [179] value of 1 × 10⁵ was, presumably, based on a lim-ited amount of data available for brown algae. It is now known that large and realdifferences exist in the affinities of different species for technetium. Masson et al.
53
[64], for example, indicate that concentrations of 99Tc in red and green algae aretwo orders of magnitude less than those in brown algae in the vicinity of LaHague. These and other authors have also shown, experimentally, that brownalgae accumulate substantially more technetium than other forms. Two independ-ent measurements of technetium in brown algae by the IPSN in the EnglishChannel [43] and by Brown et al. [200] determined CFs of 3 × 10⁴, which is rec-ommended.
A15 From the data reported by Pentreath [215], it appears that green algae accumu-late more 106Ru than red algae, and brown algae accumulate the least.An averageCF for red and green algae of 2 × 10³ can be derived, while a CF of 3 × 10² can beobtained for brown algae. These values are not inconsistent with the CFs report-ed by Coughtrey and Thorne [169] and Ancellin et al. [196].
A16 The recommended CF was derived using an average cadmium concentration inmacroalgae of 0.15 mg/kg wet weight biased towards red and green algae. Brownalgae appear to have higher concentrations, but many of the data have beenderived from contaminated areas.
A17 No new data are available.
A18 The recommended CF was derived using an average concentration of tin in algaeof 0.2 mg/kg wet weight from data reported by Eisler [167] and Coughtrey andThorne [171].
A19 Data for the Irish Sea [215] indicate that CFs for 137Cs vary considerably fromspecies to species. The highest values were observed in green algae, which had amean CF of 60. The average value for red algae was 36 and that for brown algaewas 34.These data are in general agreement with the values compiled by Coughtreyand Thorne [169]. Based on these data a CF of 50 is therefore recommended.
A20 Concentrations of barium of 1.5 mg/kg dry weight in green algae, a range of 11 to31 mg/kg dry weight in brown algae and a range of 2.8 to 50 mg/kg dry weight in redalgae are cited [55]. Assuming that the larger values for red algae are those of cal-careous species, the mid-range value for brown algae of 20 mg/kg dry weight wasused as an average value to calculate the recommended CF. This concentration isprobably too high for green algae, but possibly too low for red algae.
A21 Data in Pentreath [215] indicate much greater CFs for 144Ce in green algae (aver-age CF: 7 × 10³) than in red (average CF: 2 × 10³), with brown algae having thelowest values (average CF: 8 × 10²). These values are somewhat higher than thedata reported by Coughtrey and Thorne [169]. The stable element CFs derived bySuzuki et al. [188] are 6 × 10³ for Ulva and a range of 5 × 10² to 3 × 10³ for brownalgae, which is in reasonable agreement with Pentreath [215].
A22 The behaviour of these elements was assumed to be similar to that of europium,terbium and ytterbium. The recommended CF of 3 × 10³ is assumed to be equalto the highest CF of these elements.
54
A23 The recommended CFs are the maxima observed values for algae reported bySuzuki et al. [188].
A24 The only tungsten concentrations available in the literature are the values of 0.029and 0.042 mg/kg dry weight in Porphyra and Ulva reported by Fukai and Meinke[210]. A concentration of 0.036 mg/kg dry weight was used to derive the recom-mended CF.
A25 From the data reported by Eisler [167] an average mercury concentration of 0.2mg/kg wet weight was derived for brown algae and 0.1 mg/kg for red and greenalgae. The higher concentration was used to derive the recommended CF.
A26 Data in the literature [216, 217] indicate a range of CFs between 950 and 1300 for230Th and between 750 and 1300 for 232Th in brown algae, on a dry weight basis.These were converted to an average wet weight CF of 2 × 10².
A27 The data reported by Holm and Persson [216] for brackish water and Nilsson etal. [217] give a dry weight CF of 700 for uranium in brown algae. Uranium-238determinations [212], however, for Macrocystis, another brown alga, give an aver-age concentration of 7.2 Bq/kg dry weight, indicating a CF of about 35. A value of1 × 102 is recommended, but this may well be too high.
A28 The only CFs for neptunium in the literature are those reported by Pentreath etal. [102] for brown algae, which give an average CF of 30. Unpublished data, againfor brown algae, indicate a range of 20 to 90. The apparent general difference inthe behaviour of neptunium from that of plutonium, americium and curium hasbeen substantiated in a number of papers [91, 199, 218].
A29 Data for 241Am [102, 104, 216, 217] indicate CFs between 5 × 10³ and 1 × 10⁴ forbrown algae. A mid-range CF of 8 × 10³ is therefore recommended.
A30 No in situ data are available, but experimental results from Aston and Fowler[117] and Fisher et al. [218] indicate that the adsorptive behaviour of californiumis similar to that of americium. The behaviour of berkelium is also assumed to besimilar to that of americium.
55
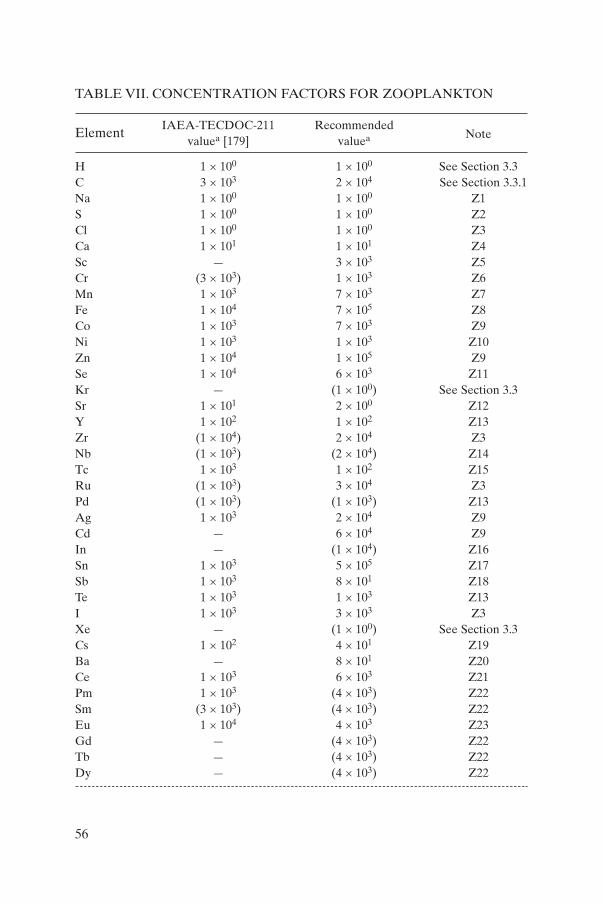
TABLE VII. CONCENTRATION FACTORS FOR ZOOPLANKTON
ElementIAEA-TECDOC-211 Recommended
valuea [179] valuea Note
H 1 × 100 1 × 100 See Section 3.3C 3 × 10³ 2 × 10⁴ See Section 3.3.1Na 1 × 100 1 × 100 Z1S 1 × 100 1 × 100 Z2Cl 1 × 100 1 × 100 Z3Ca 1 × 101 1 × 101 Z4Sc — 3 × 10³ Z5Cr (3 × 10³) 1 × 10³ Z6Mn 1 × 10³ 7 × 10³ Z7Fe 1 × 10⁴ 7 × 10⁵ Z8Co 1 × 10³ 7 × 10³ Z9Ni 1 × 10³ 1 × 10³ Z10Zn 1 × 10⁴ 1 × 10⁵ Z9Se 1 × 10⁴ 6 × 10³ Z11Kr — (1 × 100) See Section 3.3Sr 1 × 101 2 × 100 Z12Y 1 × 10² 1 × 10² Z13Zr (1 × 10⁴) 2 × 10⁴ Z3Nb (1 × 10³) (2 × 10⁴) Z14Tc 1 × 10³ 1 × 10² Z15Ru (1 × 10³) 3 × 10⁴ Z3Pd (1 × 10³) (1 × 10³) Z13Ag 1 × 10³ 2 × 10⁴ Z9Cd — 6 × 10⁴ Z9In — (1 × 10⁴) Z16Sn 1 × 10³ 5 × 10⁵ Z17Sb 1 × 10³ 8 × 101 Z18Te 1 × 10³ 1 × 10³ Z13I 1 × 10³ 3 × 10³ Z3Xe — (1 × 100) See Section 3.3Cs 1 × 10² 4 × 101 Z19Ba — 8 × 101 Z20Ce 1 × 10³ 6 × 10³ Z21Pm 1 × 10³ (4 × 10³) Z22Sm (3 × 10³) (4 × 10³) Z22Eu 1 × 10⁴ 4 × 10³ Z23Gd — (4 × 10³) Z22Tb — (4 × 10³) Z22Dy — (4 × 10³) Z22
56
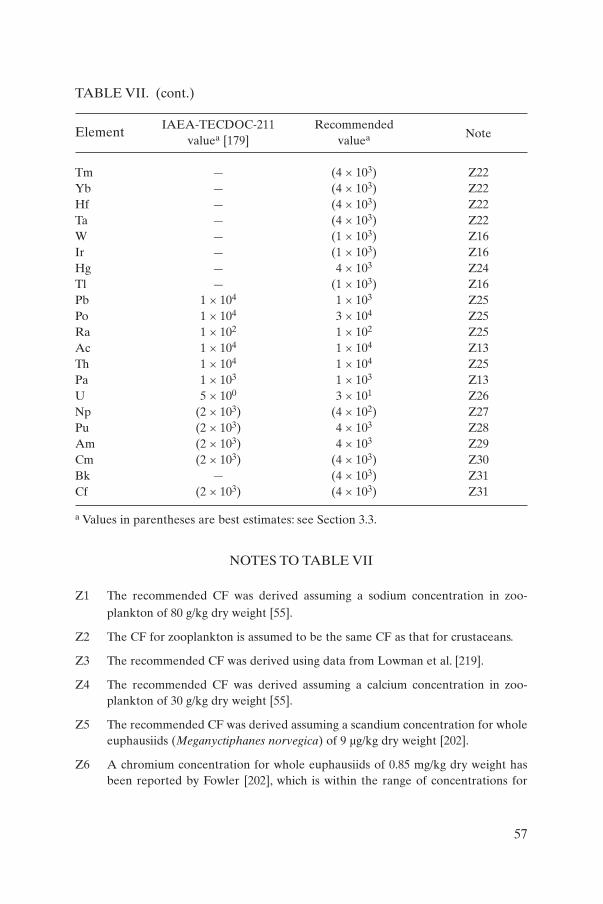
TABLE VII. (cont.)
ElementIAEA-TECDOC-211 Recommended
valuea [179] valuea Note
Tm — (4 × 10³) Z22Yb — (4 × 10³) Z22Hf — (4 × 10³) Z22Ta — (4 × 10³) Z22W — (1 × 10³) Z16Ir — (1 × 10³) Z16Hg — 4 × 10³ Z24Tl — (1 × 10³) Z16Pb 1 × 10⁴ 1 × 10³ Z25Po 1 × 10⁴ 3 × 10⁴ Z25Ra 1 × 10² 1 × 10² Z25Ac 1 × 10⁴ 1 × 10⁴ Z13Th 1 × 10⁴ 1 × 10⁴ Z25Pa 1 × 10³ 1 × 10³ Z13U 5 × 100 3 × 101 Z26Np (2 × 10³) (4 × 10²) Z27Pu (2 × 10³) 4 × 10³ Z28Am (2 × 10³) 4 × 10³ Z29Cm (2 × 10³) (4 × 10³) Z30Bk — (4 × 10³) Z31Cf (2 × 10³) (4 × 10³) Z31
a Values in parentheses are best estimates: see Section 3.3.
NOTES TO TABLE VII
Z1 The recommended CF was derived assuming a sodium concentration in zoo-plankton of 80 g/kg dry weight [55].
Z2 The CF for zooplankton is assumed to be the same CF as that for crustaceans.
Z3 The recommended CF was derived using data from Lowman et al. [219].
Z4 The recommended CF was derived assuming a calcium concentration in zoo-plankton of 30 g/kg dry weight [55].
Z5 The recommended CF was derived assuming a scandium concentration for wholeeuphausiids (Meganyctiphanes norvegica) of 9 µg/kg dry weight [202].
Z6 A chromium concentration for whole euphausiids of 0.85 mg/kg dry weight hasbeen reported by Fowler [202], which is within the range of concentrations for
57
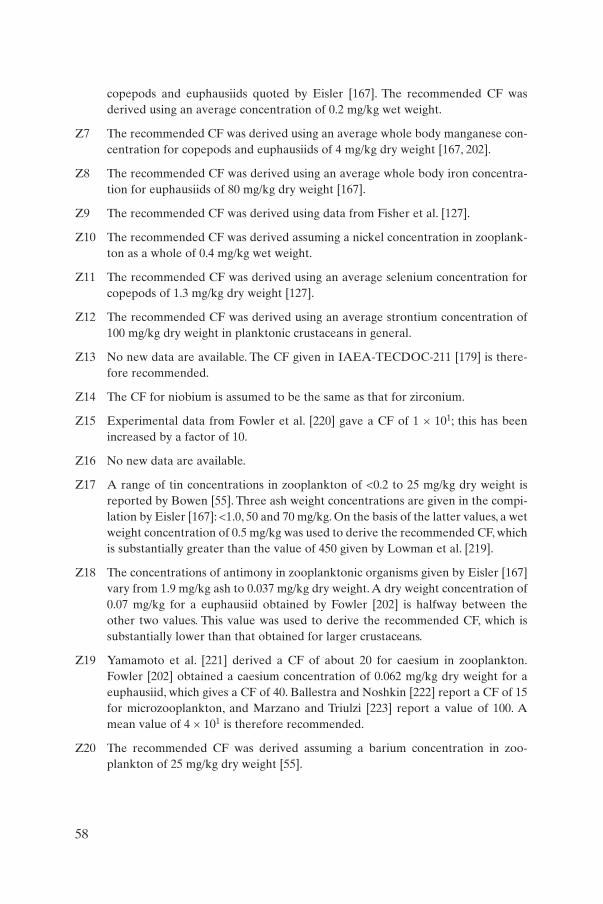
copepods and euphausiids quoted by Eisler [167]. The recommended CF wasderived using an average concentration of 0.2 mg/kg wet weight.
Z7 The recommended CF was derived using an average whole body manganese con-centration for copepods and euphausiids of 4 mg/kg dry weight [167, 202].
Z8 The recommended CF was derived using an average whole body iron concentra-tion for euphausiids of 80 mg/kg dry weight [167].
Z9 The recommended CF was derived using data from Fisher et al. [127].
Z10 The recommended CF was derived assuming a nickel concentration in zooplank-ton as a whole of 0.4 mg/kg wet weight.
Z11 The recommended CF was derived using an average selenium concentration forcopepods of 1.3 mg/kg dry weight [127].
Z12 The recommended CF was derived using an average strontium concentration of100 mg/kg dry weight in planktonic crustaceans in general.
Z13 No new data are available. The CF given in IAEA-TECDOC-211 [179] is there-fore recommended.
Z14 The CF for niobium is assumed to be the same as that for zirconium.
Z15 Experimental data from Fowler et al. [220] gave a CF of 1 × 101; this has beenincreased by a factor of 10.
Z16 No new data are available.
Z17 A range of tin concentrations in zooplankton of <0.2 to 25 mg/kg dry weight isreported by Bowen [55]. Three ash weight concentrations are given in the compi-lation by Eisler [167]: <1.0, 50 and 70 mg/kg. On the basis of the latter values, a wetweight concentration of 0.5 mg/kg was used to derive the recommended CF, whichis substantially greater than the value of 450 given by Lowman et al. [219].
Z18 The concentrations of antimony in zooplanktonic organisms given by Eisler [167]vary from 1.9 mg/kg ash to 0.037 mg/kg dry weight. A dry weight concentration of0.07 mg/kg for a euphausiid obtained by Fowler [202] is halfway between theother two values. This value was used to derive the recommended CF, which issubstantially lower than that obtained for larger crustaceans.
Z19 Yamamoto et al. [221] derived a CF of about 20 for caesium in zooplankton.Fowler [202] obtained a caesium concentration of 0.062 mg/kg dry weight for aeuphausiid, which gives a CF of 40. Ballestra and Noshkin [222] report a CF of 15for microzooplankton, and Marzano and Triulzi [223] report a value of 100. Amean value of 4 × 101 is therefore recommended.
Z20 The recommended CF was derived assuming a barium concentration in zoo-plankton of 25 mg/kg dry weight [55].
58
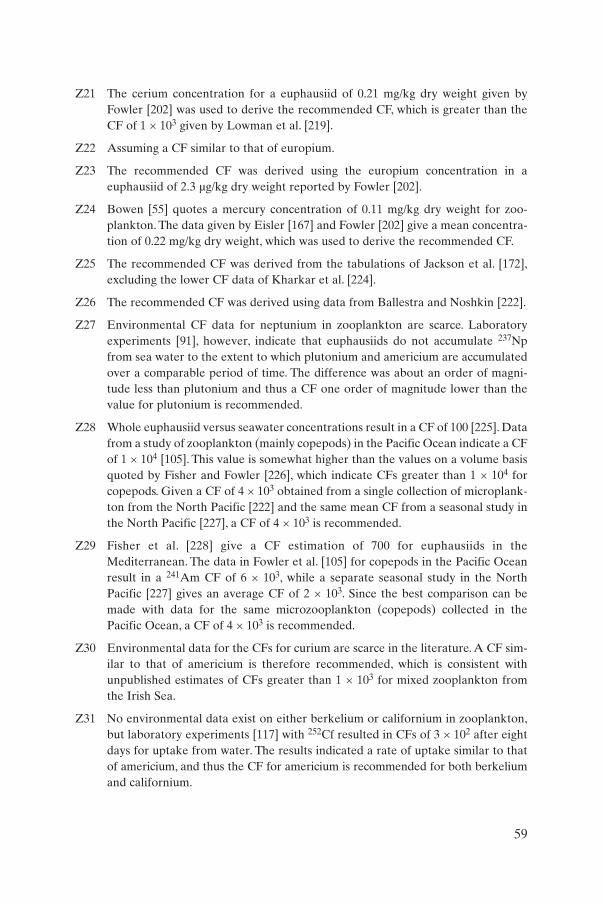
Z21 The cerium concentration for a euphausiid of 0.21 mg/kg dry weight given byFowler [202] was used to derive the recommended CF, which is greater than theCF of 1 × 10³ given by Lowman et al. [219].
Z22 Assuming a CF similar to that of europium.
Z23 The recommended CF was derived using the europium concentration in aeuphausiid of 2.3 µg/kg dry weight reported by Fowler [202].
Z24 Bowen [55] quotes a mercury concentration of 0.11 mg/kg dry weight for zoo-plankton. The data given by Eisler [167] and Fowler [202] give a mean concentra-tion of 0.22 mg/kg dry weight, which was used to derive the recommended CF.
Z25 The recommended CF was derived from the tabulations of Jackson et al. [172],excluding the lower CF data of Kharkar et al. [224].
Z26 The recommended CF was derived using data from Ballestra and Noshkin [222].
Z27 Environmental CF data for neptunium in zooplankton are scarce. Laboratoryexperiments [91], however, indicate that euphausiids do not accumulate 237Npfrom sea water to the extent to which plutonium and americium are accumulatedover a comparable period of time. The difference was about an order of magni-tude less than plutonium and thus a CF one order of magnitude lower than thevalue for plutonium is recommended.
Z28 Whole euphausiid versus seawater concentrations result in a CF of 100 [225]. Datafrom a study of zooplankton (mainly copepods) in the Pacific Ocean indicate a CFof 1 × 10⁴ [105]. This value is somewhat higher than the values on a volume basisquoted by Fisher and Fowler [226], which indicate CFs greater than 1 × 10⁴ forcopepods. Given a CF of 4 × 10³ obtained from a single collection of microplank-ton from the North Pacific [222] and the same mean CF from a seasonal study inthe North Pacific [227], a CF of 4 × 10³ is recommended.
Z29 Fisher et al. [228] give a CF estimation of 700 for euphausiids in theMediterranean. The data in Fowler et al. [105] for copepods in the Pacific Oceanresult in a 241Am CF of 6 × 10³, while a separate seasonal study in the NorthPacific [227] gives an average CF of 2 × 10³. Since the best comparison can bemade with data for the same microzooplankton (copepods) collected in thePacific Ocean, a CF of 4 × 10³ is recommended.
Z30 Environmental data for the CFs for curium are scarce in the literature. A CF sim-ilar to that of americium is therefore recommended, which is consistent withunpublished estimates of CFs greater than 1 × 10³ for mixed zooplankton fromthe Irish Sea.
Z31 No environmental data exist on either berkelium or californium in zooplankton,but laboratory experiments [117] with 252Cf resulted in CFs of 3 × 10² after eightdays for uptake from water. The results indicated a rate of uptake similar to thatof americium, and thus the CF for americium is recommended for both berkeliumand californium.
59
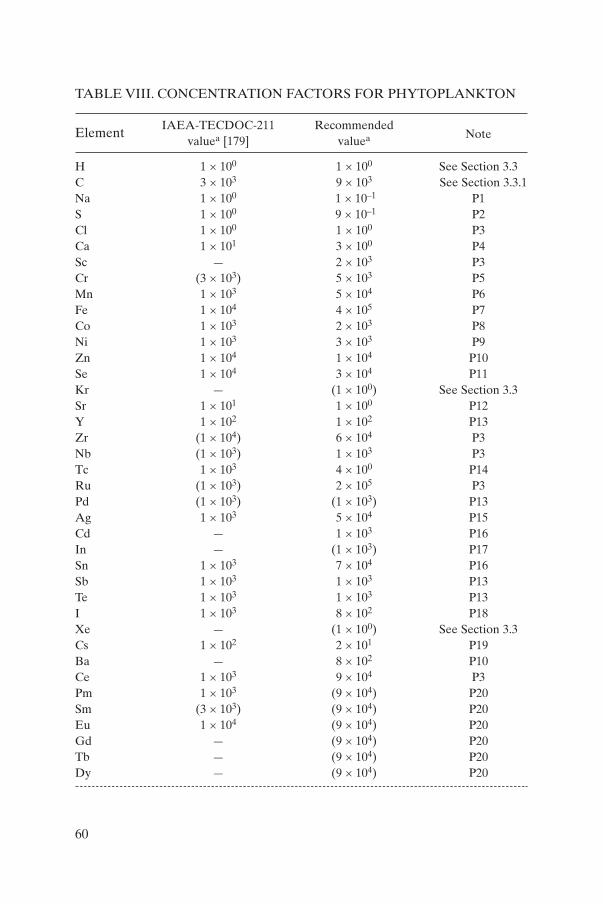
TABLE VIII. CONCENTRATION FACTORS FOR PHYTOPLANKTON
ElementIAEA-TECDOC-211 Recommended
valuea [179] valuea Note
H 1 × 100 1 × 100 See Section 3.3C 3 × 10³ 9 × 10³ See Section 3.3.1Na 1 × 100 1 × 10⁻¹ P1S 1 × 100 9 × 10⁻¹ P2Cl 1 × 100 1 × 100 P3Ca 1 × 101 3 × 100 P4Sc — 2 × 10³ P3Cr (3 × 10³) 5 × 10³ P5Mn 1 × 10³ 5 × 10⁴ P6Fe 1 × 10⁴ 4 × 10⁵ P7Co 1 × 10³ 2 × 10³ P8Ni 1 × 10³ 3 × 10³ P9Zn 1 × 10⁴ 1 × 10⁴ P10Se 1 × 10⁴ 3 × 10⁴ P11Kr — (1 × 100) See Section 3.3Sr 1 × 101 1 × 100 P12Y 1 × 10² 1 × 10² P13Zr (1 × 10⁴) 6 × 10⁴ P3Nb (1 × 10³) 1 × 10³ P3Tc 1 × 10³ 4 × 100 P14Ru (1 × 10³) 2 × 10⁵ P3Pd (1 × 10³) (1 × 10³) P13Ag 1 × 10³ 5 × 10⁴ P15Cd — 1 × 10³ P16In — (1 × 10³) P17Sn 1 × 10³ 7 × 10⁴ P16Sb 1 × 10³ 1 × 10³ P13Te 1 × 10³ 1 × 10³ P13I 1 × 10³ 8 × 10² P18Xe — (1 × 100) See Section 3.3Cs 1 × 10² 2 × 101 P19Ba — 8 × 10² P10Ce 1 × 10³ 9 × 10⁴ P3Pm 1 × 10³ (9 × 10⁴) P20Sm (3 × 10³) (9 × 10⁴) P20Eu 1 × 10⁴ (9 × 10⁴) P20Gd — (9 × 10⁴) P20Tb — (9 × 10⁴) P20Dy — (9 × 10⁴) P20
60
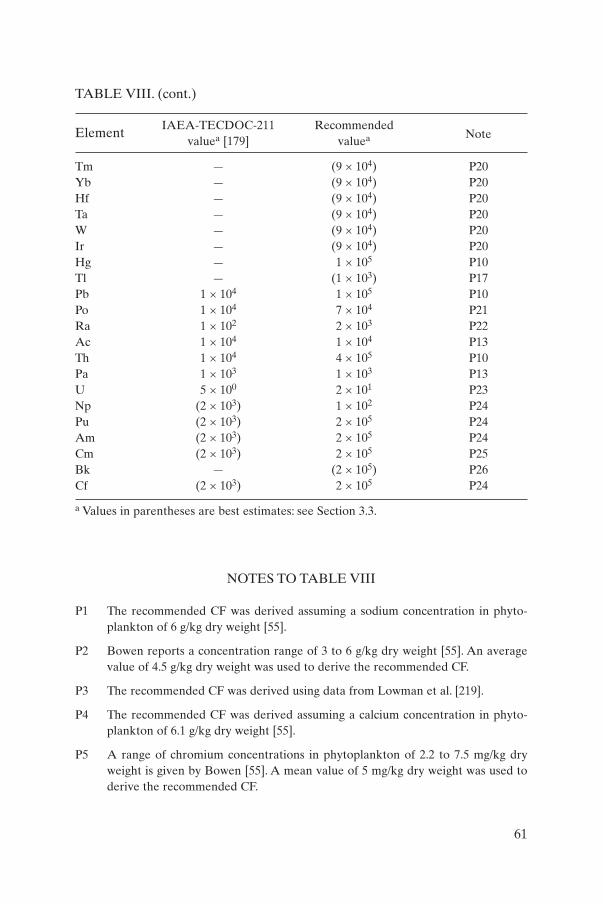
TABLE VIII. (cont.)
ElementIAEA-TECDOC-211 Recommended
valuea [179] valuea Note
Tm — (9 × 10⁴) P20Yb — (9 × 10⁴) P20Hf — (9 × 10⁴) P20Ta — (9 × 10⁴) P20W — (9 × 10⁴) P20Ir — (9 × 10⁴) P20Hg — 1 × 10⁵ P10Tl — (1 × 10³) P17Pb 1 × 10⁴ 1 × 10⁵ P10Po 1 × 10⁴ 7 × 10⁴ P21Ra 1 × 10² 2 × 10³ P22Ac 1 × 10⁴ 1 × 10⁴ P13Th 1 × 10⁴ 4 × 10⁵ P10Pa 1 × 10³ 1 × 10³ P13U 5 × 100 2 × 101 P23Np (2 × 10³) 1 × 10² P24Pu (2 × 10³) 2 × 10⁵ P24Am (2 × 10³) 2 × 10⁵ P24Cm (2 × 10³) 2 × 10⁵ P25Bk — (2 × 10⁵) P26Cf (2 × 10³) 2 × 10⁵ P24
a Values in parentheses are best estimates: see Section 3.3.
NOTES TO TABLE VIII
P1 The recommended CF was derived assuming a sodium concentration in phyto-plankton of 6 g/kg dry weight [55].
P2 Bowen reports a concentration range of 3 to 6 g/kg dry weight [55]. An averagevalue of 4.5 g/kg dry weight was used to derive the recommended CF.
P3 The recommended CF was derived using data from Lowman et al. [219].
P4 The recommended CF was derived assuming a calcium concentration in phyto-plankton of 6.1 g/kg dry weight [55].
P5 A range of chromium concentrations in phytoplankton of 2.2 to 7.5 mg/kg dryweight is given by Bowen [55]. A mean value of 5 mg/kg dry weight was used toderive the recommended CF.
61
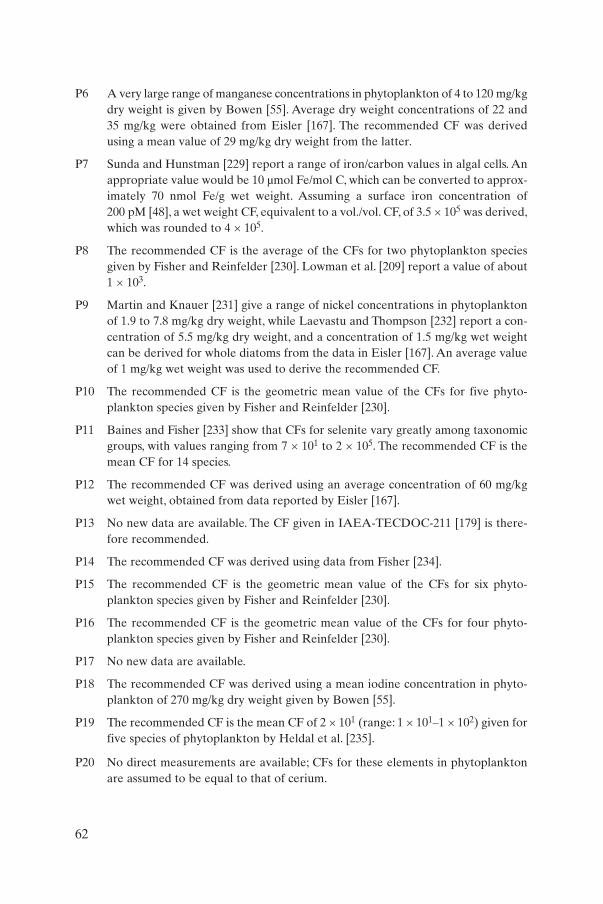
P6 A very large range of manganese concentrations in phytoplankton of 4 to 120 mg/kgdry weight is given by Bowen [55]. Average dry weight concentrations of 22 and35 mg/kg were obtained from Eisler [167]. The recommended CF was derivedusing a mean value of 29 mg/kg dry weight from the latter.
P7 Sunda and Hunstman [229] report a range of iron/carbon values in algal cells. Anappropriate value would be 10 µmol Fe/mol C, which can be converted to approx-imately 70 nmol Fe/g wet weight. Assuming a surface iron concentration of200 pM [48], a wet weight CF, equivalent to a vol./vol. CF, of 3.5 × 10⁵ was derived,which was rounded to 4 × 10⁵.
P8 The recommended CF is the average of the CFs for two phytoplankton speciesgiven by Fisher and Reinfelder [230]. Lowman et al. [209] report a value of about1 × 103.
P9 Martin and Knauer [231] give a range of nickel concentrations in phytoplanktonof 1.9 to 7.8 mg/kg dry weight, while Laevastu and Thompson [232] report a con-centration of 5.5 mg/kg dry weight, and a concentration of 1.5 mg/kg wet weightcan be derived for whole diatoms from the data in Eisler [167]. An average valueof 1 mg/kg wet weight was used to derive the recommended CF.
P10 The recommended CF is the geometric mean value of the CFs for five phyto-plankton species given by Fisher and Reinfelder [230].
P11 Baines and Fisher [233] show that CFs for selenite vary greatly among taxonomicgroups, with values ranging from 7 × 101 to 2 × 10⁵. The recommended CF is themean CF for 14 species.
P12 The recommended CF was derived using an average concentration of 60 mg/kgwet weight, obtained from data reported by Eisler [167].
P13 No new data are available. The CF given in IAEA-TECDOC-211 [179] is there-fore recommended.
P14 The recommended CF was derived using data from Fisher [234].
P15 The recommended CF is the geometric mean value of the CFs for six phyto-plankton species given by Fisher and Reinfelder [230].
P16 The recommended CF is the geometric mean value of the CFs for four phyto-plankton species given by Fisher and Reinfelder [230].
P17 No new data are available.
P18 The recommended CF was derived using a mean iodine concentration in phyto-plankton of 270 mg/kg dry weight given by Bowen [55].
P19 The recommended CF is the mean CF of 2 × 101 (range: 1 × 101–1 × 10²) given forfive species of phytoplankton by Heldal et al. [235].
P20 No direct measurements are available; CFs for these elements in phytoplanktonare assumed to be equal to that of cerium.
62
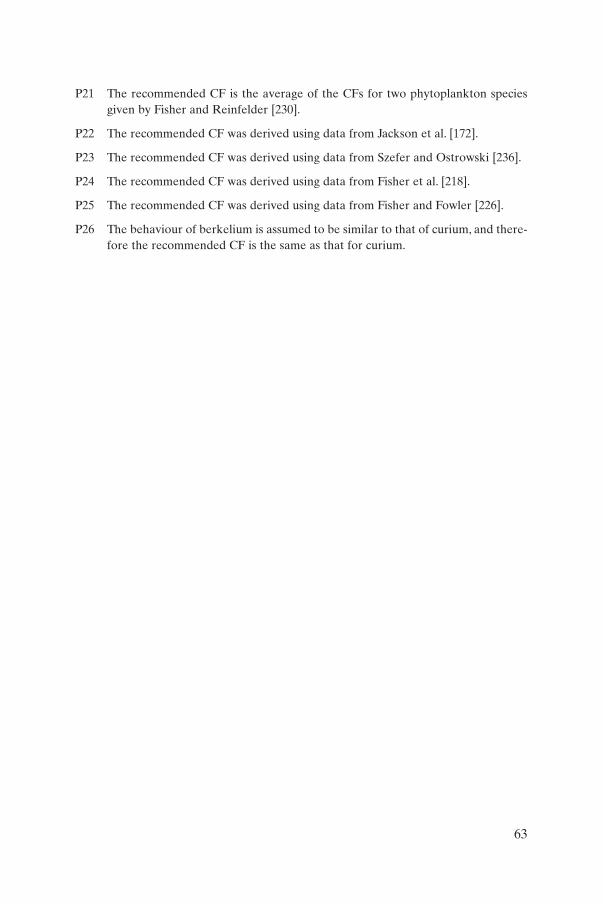
P21 The recommended CF is the average of the CFs for two phytoplankton speciesgiven by Fisher and Reinfelder [230].
P22 The recommended CF was derived using data from Jackson et al. [172].
P23 The recommended CF was derived using data from Szefer and Ostrowski [236].
P24 The recommended CF was derived using data from Fisher et al. [218].
P25 The recommended CF was derived using data from Fisher and Fowler [226].
P26 The behaviour of berkelium is assumed to be similar to that of curium, and there-fore the recommended CF is the same as that for curium.
63
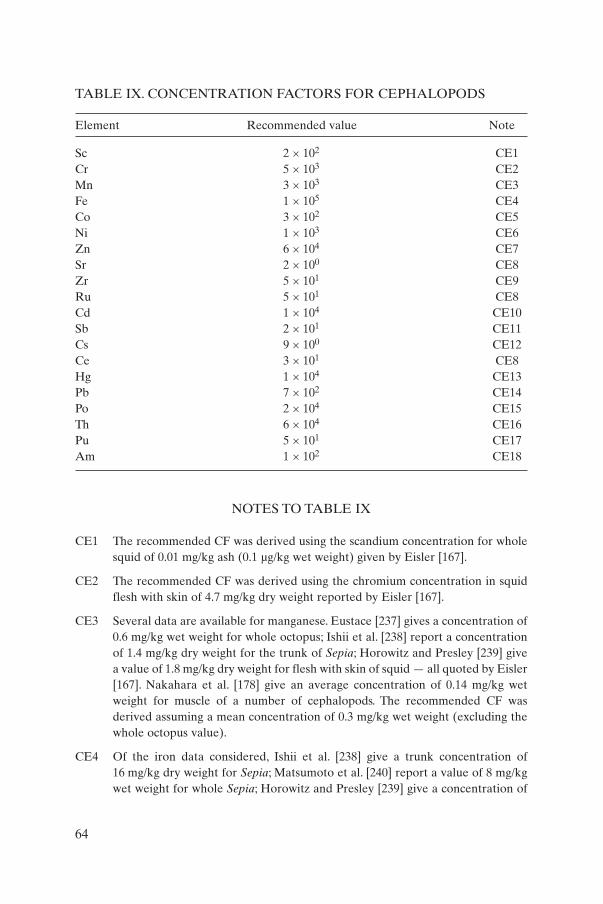
TABLE IX. CONCENTRATION FACTORS FOR CEPHALOPODS
Element Recommended value Note
Sc 2 × 10² CE1Cr 5 × 10³ CE2Mn 3 × 10³ CE3Fe 1 × 10⁵ CE4Co 3 × 10² CE5Ni 1 × 10³ CE6Zn 6 × 10⁴ CE7Sr 2 × 100 CE8Zr 5 × 101 CE9Ru 5 × 101 CE8Cd 1 × 10⁴ CE10Sb 2 × 101 CE11Cs 9 × 100 CE12Ce 3 × 101 CE8Hg 1 × 10⁴ CE13Pb 7 × 10² CE14Po 2 × 10⁴ CE15Th 6 × 10⁴ CE16Pu 5 × 101 CE17Am 1 × 10² CE18
NOTES TO TABLE IX
CE1 The recommended CF was derived using the scandium concentration for wholesquid of 0.01 mg/kg ash (0.1 µg/kg wet weight) given by Eisler [167].
CE2 The recommended CF was derived using the chromium concentration in squidflesh with skin of 4.7 mg/kg dry weight reported by Eisler [167].
CE3 Several data are available for manganese. Eustace [237] gives a concentration of0.6 mg/kg wet weight for whole octopus; Ishii et al. [238] report a concentrationof 1.4 mg/kg dry weight for the trunk of Sepia; Horowitz and Presley [239] givea value of 1.8 mg/kg dry weight for flesh with skin of squid — all quoted by Eisler[167]. Nakahara et al. [178] give an average concentration of 0.14 mg/kg wetweight for muscle of a number of cephalopods. The recommended CF wasderived assuming a mean concentration of 0.3 mg/kg wet weight (excluding thewhole octopus value).
CE4 Of the iron data considered, Ishii et al. [238] give a trunk concentration of16 mg/kg dry weight for Sepia; Matsumoto et al. [240] report a value of 8 mg/kgwet weight for whole Sepia; Horowitz and Presley [239] give a concentration of
64
19.3 mg/kg dry weight for flesh with skin of squid, and Nakahara et al. [178] anaverage value of 1.8 mg/kg wet weight for several species. The recommended CFwas derived assuming a concentration of 3 mg/kg wet weight.
CE5 The cobalt concentration of 0.06 mg/kg dry weight for the trunk of Sepia givenby Ishii et al. [238] is greater than any values reported by Nakahara et al. [178]for the muscle of several cephalopods (average concentration: 5.3 µg/kg wetweight; range: 2.2–8.8 µg/kg wet weight). The recommended CF was derivedassuming a concentration of 5 µg/kg wet weight.
CE6 Two nickel concentrations are available: 1.1 mg/kg dry weight for Sepia trunkgiven by Ishii et al. [238] and 2.5 mg/kg dry weight for squid flesh with skinreported by Horowitz and Presley [239]. A value of 0.35 mg/kg wet weight wasused to derive the recommended CF.
CE7 A number of zinc concentrations are available: 18.5 mg/kg wet weight for wholeoctopus [237]; 58 mg/kg dry weight for the trunk of Sepia [238]; 16 mg/kg wetweight for the mantle of Sepia [241] and 52 mg/kg dry weight for the same tissue[242]; 144 mg/kg dry weight for the flesh with skin of squid [239]; and an averageof 12.2 mg/kg wet weight for muscle of a number of species [240]. The averageconcentration from these data, 16 mg/kg wet weight, was used to derive therecommended CF.
CE8 The recommended CF was derived using data from Kurabayashi et al. [189].
CE9 The recommended CF was derived using data for 95Zr and 95Nb fromKurabayashi et al. [189].
CE10 Hamanaka et al. [243] report a cadmium concentration of 0.72 mg/kg dry weightfor the muscle of Ommastrephes bartrami, while Horowitz and Presley [239] givea value of 1 mg/kg dry weight for the flesh with skin of squid, and Leatherlandand Burton [242] report a concentration of 0.03 mg/kg dry weight for the mantleof Sepia. A concentration of 0.1 mg/kg wet weight was used to derive the recom-mended CF.
CE11 The only antimony concentrations available are 0.01 mg/kg dry weight for Sepiamantle [242] and 0.46 mg/kg ash for whole squid [195]. The recommended CFwas derived using a mean concentration of 3.5 µg/kg wet weight.
CE12 Ishii et al. [238] report a caesium concentration of 0.016 mg/kg dry weight forSepia trunk, which gives a CF of 9 × 100. This is consistent with the in situ CF for137Cs of 1 × 101 obtained from the data from Kurabayashi et al. [179] and themean CF of 1.4 × 101 from the data from Suzuki et al. [244]. A value of 1 × 101 istherefore recommended.
CE13 A number of mercury concentration data are available [167], from which a meanof 0.1 mg/kg wet weight was obtained to derive the recommended CF.
CE14 The recommended CF is the mean value for 210Pb (whole animal) reported byHeyraud and Cherry [203].
65
CE15 Guary et al. [245] give a CF of 2 × 10³ for 210Po in octopus ‘remainder’, which isbelow the range for whole cephalopods given by Heyraud and Cherry [203]. Theaverage value is 2 × 10⁴.
CE16 The recommended CF was taken from the 232Th data for octopus ‘remainder’given by Guary et al. [245].
CE17 The recommended CF is the CF for cephalopods taken off Tokai, Japan, given inKurabayashi et al. [189]. Guary et al. [245] report a CF for 239/240Pu of 6 × 101 forwhole octopus.
CE18 The recommended CF is the CF for 241Am for ‘remainder’ of octopus given byGuary et al. [245].
66
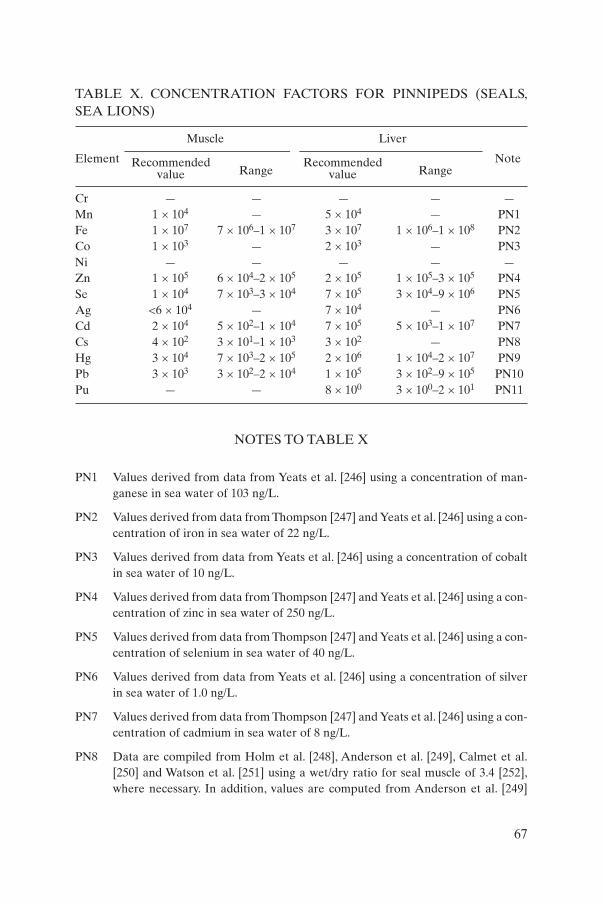
TABLE X. CONCENTRATION FACTORS FOR PINNIPEDS (SEALS,SEA LIONS)
Muscle Liver
Element NoteRecommended Range
RecommendedRangevalue value
Cr — — — — —Mn 1 × 10⁴ — 5 × 10⁴ — PN1Fe 1 × 10⁷ 7 × 10⁶–1 × 10⁷ 3 × 10⁷ 1 × 10⁶–1 × 10⁸ PN2Co 1 × 10³ — 2 × 10³ — PN3Ni — — — — —Zn 1 × 10⁵ 6 × 10⁴–2 × 10⁵ 2 × 10⁵ 1 × 10⁵–3 × 10⁵ PN4Se 1 × 10⁴ 7 × 10³–3 × 10⁴ 7 × 10⁵ 3 × 10⁴–9 × 10⁶ PN5Ag <6 × 10⁴ — 7 × 10⁴ — PN6Cd 2 × 10⁴ 5 × 10²–1 × 10⁴ 7 × 10⁵ 5 × 10³–1 × 10⁷ PN7Cs 4 × 10² 3 × 101–1 × 10³ 3 × 10² — PN8Hg 3 × 10⁴ 7 × 10³–2 × 10⁵ 2 × 10⁶ 1 × 10⁴–2 × 10⁷ PN9Pb 3 × 10³ 3 × 10²–2 × 10⁴ 1 × 10⁵ 3 × 10²–9 × 10⁵ PN10Pu — — 8 × 100 3 × 100–2 × 101 PN11
NOTES TO TABLE X
PN1 Values derived from data from Yeats et al. [246] using a concentration of man-ganese in sea water of 103 ng/L.
PN2 Values derived from data from Thompson [247] and Yeats et al. [246] using a con-centration of iron in sea water of 22 ng/L.
PN3 Values derived from data from Yeats et al. [246] using a concentration of cobaltin sea water of 10 ng/L.
PN4 Values derived from data from Thompson [247] and Yeats et al. [246] using a con-centration of zinc in sea water of 250 ng/L.
PN5 Values derived from data from Thompson [247] and Yeats et al. [246] using a con-centration of selenium in sea water of 40 ng/L.
PN6 Values derived from data from Yeats et al. [246] using a concentration of silverin sea water of 1.0 ng/L.
PN7 Values derived from data from Thompson [247] and Yeats et al. [246] using a con-centration of cadmium in sea water of 8 ng/L.
PN8 Data are compiled from Holm et al. [248], Anderson et al. [249], Calmet et al.[250] and Watson et al. [251] using a wet/dry ratio for seal muscle of 3.4 [252],where necessary. In addition, values are computed from Anderson et al. [249]
67
using seawater data for a corresponding period reported by Camplin [253] andCarroll et al. [254].
PN9 Values derived from data from Thompson [247] and Yeats et al. [246] using aconcentration of mercury in sea water of 10 ng/L.
PN10 Values derived from data from Thompson [247] and Yeats et al. [246] using a con-centration of lead in sea water of 20 ng/L.
PN11 Values derived from data from Watson et al. [251] using concentrations of pluto-nium in sea water for 1995 from Leonard et al. [255].
68
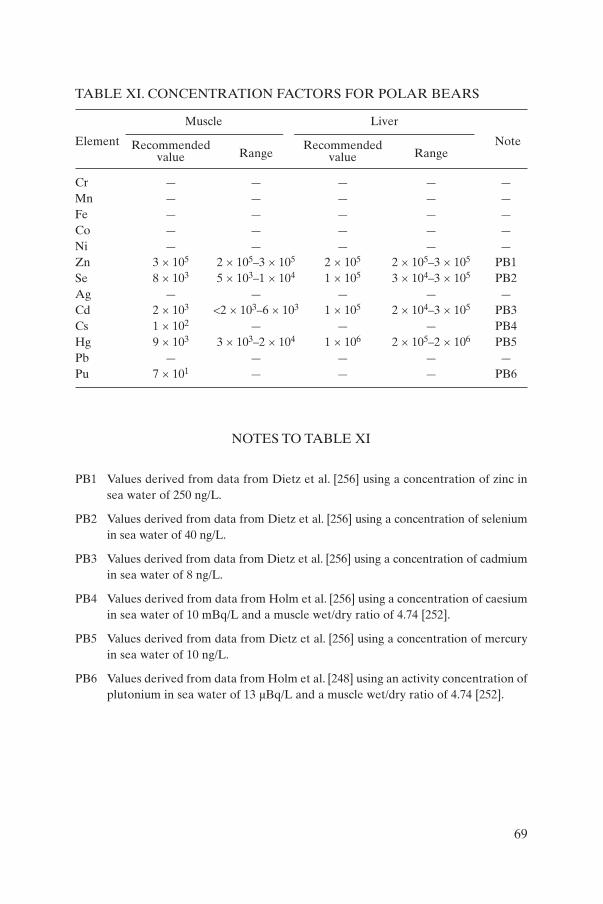
TABLE XI. CONCENTRATION FACTORS FOR POLAR BEARS
Muscle Liver
Element NoteRecommended Range
RecommendedRangevalue value
Cr — — — — —Mn — — — — —Fe — — — — —Co — — — — —Ni — — — — —Zn 3 × 10⁵ 2 × 10⁵–3 × 10⁵ 2 × 10⁵ 2 × 10⁵–3 × 105 PB1Se 8 × 10³ 5 × 10³–1 × 10⁴ 1 × 10⁵ 3 × 10⁴–3 × 105 PB2Ag — — — — —Cd 2 × 10³ <2 × 10³–6 × 10³ 1 × 10⁵ 2 × 10⁴–3 × 105 PB3Cs 1 × 10² — — — PB4Hg 9 × 10³ 3 × 10³–2 × 10⁴ 1 × 10⁶ 2 × 10⁵–2 × 106 PB5Pb — — — — —Pu 7 × 101 — — — PB6
NOTES TO TABLE XI
PB1 Values derived from data from Dietz et al. [256] using a concentration of zinc insea water of 250 ng/L.
PB2 Values derived from data from Dietz et al. [256] using a concentration of seleniumin sea water of 40 ng/L.
PB3 Values derived from data from Dietz et al. [256] using a concentration of cadmiumin sea water of 8 ng/L.
PB4 Values derived from data from Holm et al. [256] using a concentration of caesiumin sea water of 10 mBq/L and a muscle wet/dry ratio of 4.74 [252].
PB5 Values derived from data from Dietz et al. [256] using a concentration of mercuryin sea water of 10 ng/L.
PB6 Values derived from data from Holm et al. [248] using an activity concentration ofplutonium in sea water of 13 µBq/L and a muscle wet/dry ratio of 4.74 [252].
69
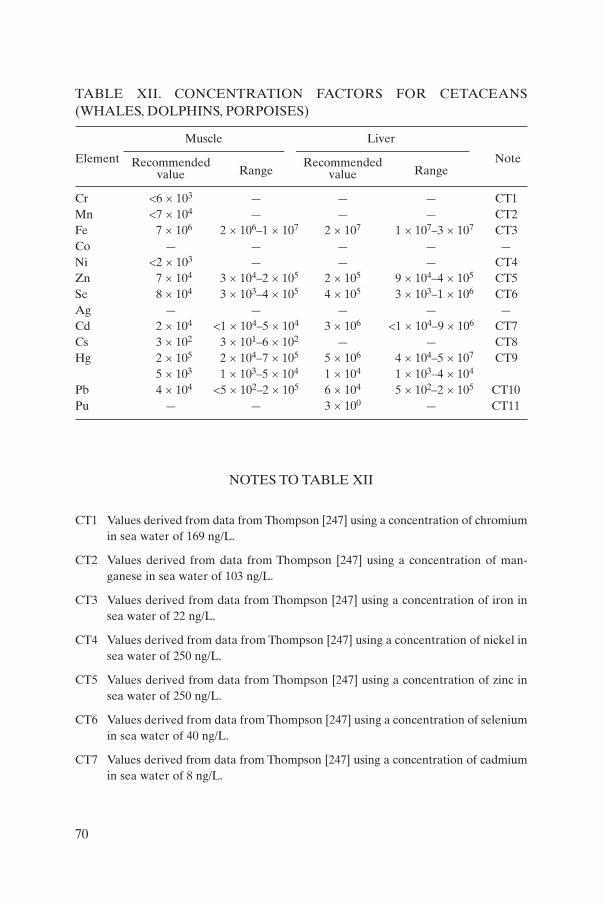
TABLE XII. CONCENTRATION FACTORS FOR CETACEANS(WHALES, DOLPHINS, PORPOISES)
Muscle Liver
Element NoteRecommended Range
RecommendedRangevalue value
Cr <6 × 10³ — — — CT1Mn <7 × 10⁴ — — — CT2Fe 7 × 10⁶ 2 × 10⁶–1 × 10⁷ 2 × 10⁷ 1 × 10⁷–3 × 10⁷ CT3Co — — — — —Ni <2 × 10³ — — — CT4Zn 7 × 10⁴ 3 × 10⁴–2 × 10⁵ 2 × 10⁵ 9 × 10⁴–4 × 10⁵ CT5Se 8 × 10⁴ 3 × 10³–4 × 10⁵ 4 × 10⁵ 3 × 10³–1 × 10⁶ CT6Ag — — — — —Cd 2 × 10⁴ <1 × 10⁴–5 × 10⁴ 3 × 10⁶ <1 × 10⁴–9 × 10⁶ CT7Cs 3 × 10² 3 × 101–6 × 10² — — CT8Hg 2 × 10⁵ 2 × 10⁴–7 × 10⁵ 5 × 10⁶ 4 × 10⁴–5 × 10⁷ CT9
5 × 10³ 1 × 10³–5 × 10⁴ 1 × 10⁴ 1 × 10³–4 × 10⁴
Pb 4 × 10⁴ <5 × 10²–2 × 10⁵ 6 × 10⁴ 5 × 10²–2 × 10⁵ CT10Pu — — 3 × 100 — CT11
NOTES TO TABLE XII
CT1 Values derived from data from Thompson [247] using a concentration of chromiumin sea water of 169 ng/L.
CT2 Values derived from data from Thompson [247] using a concentration of man-ganese in sea water of 103 ng/L.
CT3 Values derived from data from Thompson [247] using a concentration of iron insea water of 22 ng/L.
CT4 Values derived from data from Thompson [247] using a concentration of nickel insea water of 250 ng/L.
CT5 Values derived from data from Thompson [247] using a concentration of zinc insea water of 250 ng/L.
CT6 Values derived from data from Thompson [247] using a concentration of seleniumin sea water of 40 ng/L.
CT7 Values derived from data from Thompson [247] using a concentration of cadmiumin sea water of 8 ng/L.
70
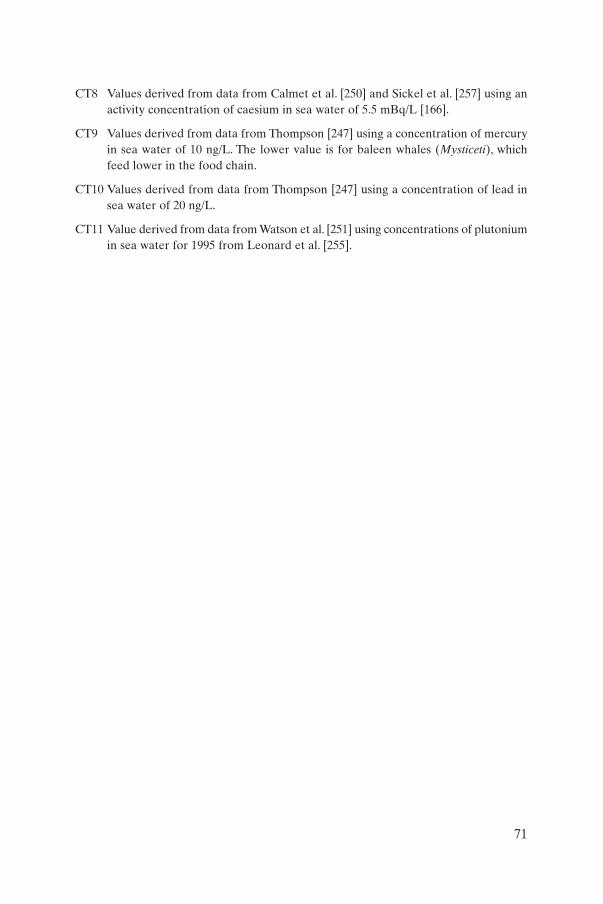
CT8 Values derived from data from Calmet et al. [250] and Sickel et al. [257] using anactivity concentration of caesium in sea water of 5.5 mBq/L [166].
CT9 Values derived from data from Thompson [247] using a concentration of mercuryin sea water of 10 ng/L. The lower value is for baleen whales (Mysticeti), whichfeed lower in the food chain.
CT10 Values derived from data from Thompson [247] using a concentration of lead insea water of 20 ng/L.
CT11 Value derived from data from Watson et al. [251] using concentrations of plutoniumin sea water for 1995 from Leonard et al. [255].
71
Appendix
CONCENTRATION FACTORS FOR DEEP OCEAN FERROMANGANESE NODULES
In the years preceding the publication of TRS 247 there had been con-siderable discussion on the potential of mining deep sea ferromanganesenodules as a source of trace metals. It was considered useful to include the min-ing of nodules as a potential whereby radionuclides disposed of in the deepocean could have a radiological impact on the human population. At present,nodules are not being considered as a source of metals on a commercial scale.It was not thought to be justified to conduct an extensive review of the avail-ability of new data since the publication of TRS 247. However, the values inTable XIII have been adjusted to take account of the revised deep water ele-ment concentrations. The following paragraphs are taken from TRS 247.
In addition to average pelagic sediments Kds, CFs for deep ocean ferro-manganese nodules are required for modelling purposes. These CFs havemerely been derived from a comparison of the total concentrations of metalsin manganese nodules with those in deep ocean water. The elements in suchnodules, excluding constituents of the host nucleus around which accretionoccurs, are assumed to be derived from sea water.Thus the composition of nod-ules is determined by authigenic processes, and it is doubtful that the reactionsare wholly reversible. However, no reduction of the CFs to account for the pro-portion of exchangeable phase material in these matrices was felt justified forthe intended application. The compilation of abundances in ferromanganesenodules [55], together with the calculated CFs, is shown in Table XIII. In thecases of promethium, hafnium and radium, for which there exist no reliableestimates of their concentrations in ferromanganese nodules, values derived byLi [58, 258] have been given.
In a situation of continuous input of a radionuclide into the water column,the stable element derived value is clearly applicable because the decay constantfor the nuclide, relating to the quantity in the water and the nodule, cancels out.For purposes of calculation of the IAEA’s definition of radioactive wasteunsuitable for dumping at sea, which assumes continuous input, the CFs asgiven in Table XIII are used. Where the input is not constant, however, it canbe assumed that physical decay will reduce the CF value, because this processis faster than that of nodule growth. It should also be pointed out that whereinput is likely to be of limited duration it may be more appropriate, for radio-nuclides with a half-life of less than 100 years, to assume that manganese nodulesrespond like any other particle, with adsorption–desorption reactions occurringat its surface; thus CFs considerably lower than those given in Table XIII would
73
be more appropriate for deep sea sediments. The relatively large particle sizeof ferromanganese nodules that are likely to be exploited commercially, theirvery slow accretion rate and the fact that adsorption–exchange only occurs atexternal surfaces, could probably best be accounted for by the introduction ofa modifying factor to the nodule CFs given in Table XIII for exposure pathwaycalculations for short lived and medium lived radionuclides. This modifyingfactor would correspond to the ratio of the average mass of the thin surfaceshell (that is likely to be involved in adsorption–exchange reactions) to theaverage mass of nodules being considered in the exposure pathway.
74
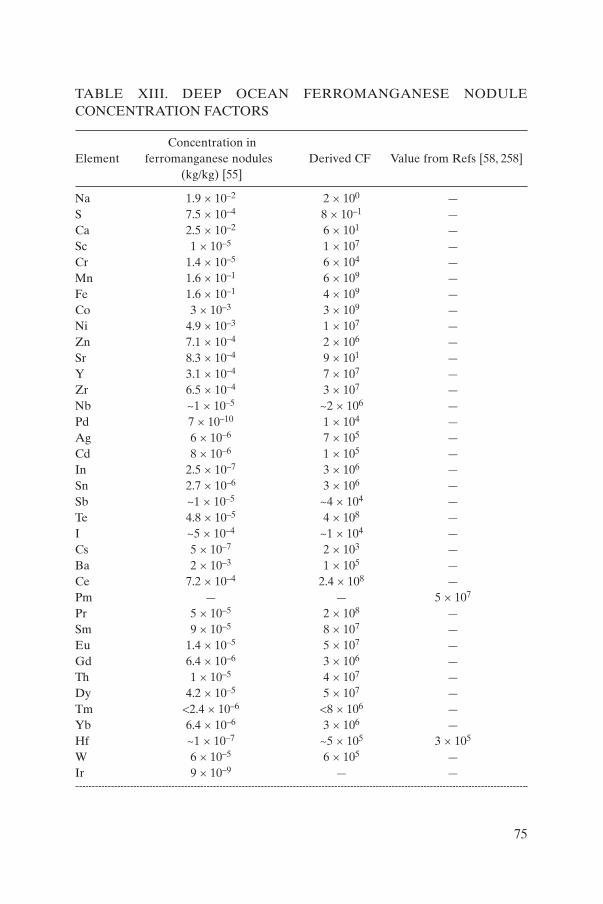
TABLE XIII. DEEP OCEAN FERROMANGANESE NODULE CONCENTRATION FACTORS
Concentration in Element ferromanganese nodules Derived CF Value from Refs [58, 258]
(kg/kg) [55]
Na 1.9 × 10⁻² 2 × 100 —S 7.5 × 10⁻⁴ 8 × 10⁻¹ —Ca 2.5 × 10⁻² 6 × 101 —Sc 1 × 10⁻⁵ 1 × 10⁷ —Cr 1.4 × 10⁻⁵ 6 × 10⁴ —Mn 1.6 × 10⁻¹ 6 × 10⁹ —Fe 1.6 × 10⁻¹ 4 × 10⁹ —Co 3 × 10⁻³ 3 × 10⁹ —Ni 4.9 × 10⁻³ 1 × 10⁷ —Zn 7.1 × 10⁻⁴ 2 × 10⁶ —Sr 8.3 × 10⁻⁴ 9 × 101 —Y 3.1 × 10⁻⁴ 7 × 10⁷ —Zr 6.5 × 10⁻⁴ 3 × 10⁷ —Nb ~1 × 10⁻⁵ ~2 × 10⁶ —Pd 7 × 10⁻¹⁰ 1 × 10⁴ —Ag 6 × 10⁻⁶ 7 × 10⁵ —Cd 8 × 10⁻⁶ 1 × 10⁵ —In 2.5 × 10⁻⁷ 3 × 10⁶ —Sn 2.7 × 10⁻⁶ 3 × 10⁶ —Sb ~1 × 10⁻⁵ ~4 × 10⁴ —Te 4.8 × 10⁻⁵ 4 × 10⁸ —I ~5 × 10⁻⁴ ~1 × 10⁴ —Cs 5 × 10⁻⁷ 2 × 10³ —Ba 2 × 10⁻³ 1 × 10⁵ —Ce 7.2 × 10⁻⁴ 2.4 × 10⁸ —Pm — — 5 × 10⁷
Pr 5 × 10⁻⁵ 2 × 10⁸ —Sm 9 × 10⁻⁵ 8 × 10⁷ —Eu 1.4 × 10⁻⁵ 5 × 10⁷ —Gd 6.4 × 10⁻⁶ 3 × 10⁶ —Th 1 × 10⁻⁵ 4 × 10⁷ —Dy 4.2 × 10⁻⁵ 5 × 10⁷ —Tm <2.4 × 10⁻⁶ <8 × 10⁶ —Yb 6.4 × 10⁻⁶ 3 × 10⁶ —Hf ~1 × 10⁻⁷ ~5 × 10⁵ 3 × 10⁵
W 6 × 10⁻⁵ 6 × 10⁵ —Ir 9 × 10⁻⁹ — —
75
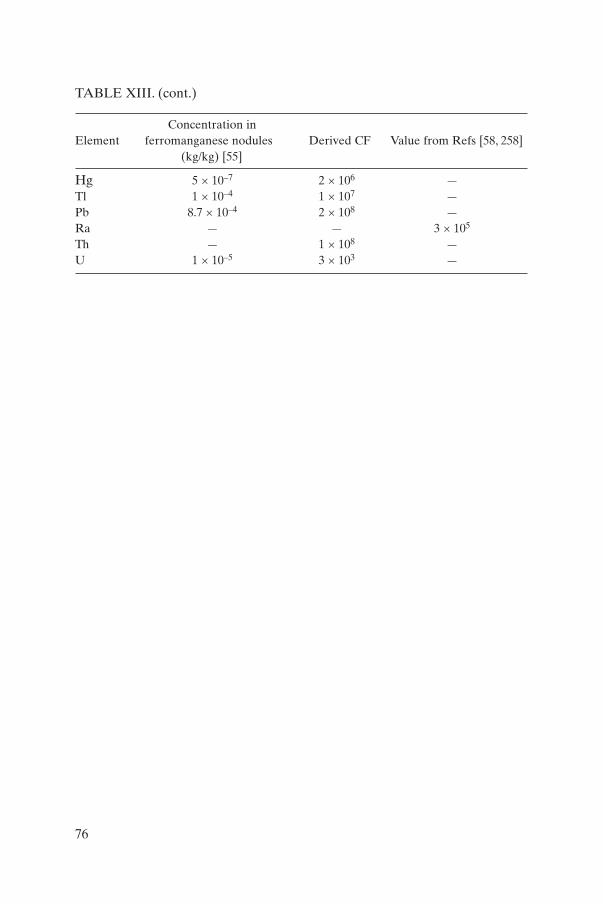
TABLE XIII. (cont.)
Concentration in Element ferromanganese nodules Derived CF Value from Refs [58, 258]
(kg/kg) [55]
Hg 5 × 10⁻⁷ 2 × 10⁶ —Tl 1 × 10⁻⁴ 1 × 10⁷ —Pb 8.7 × 10⁻⁴ 2 × 10⁸ —Ra — — 3 × 10⁵
Th — 1 × 10⁸ —U 1 × 10⁻⁵ 3 × 10³ —
76
REFERENCES
[1] INTERNATIONAL ATOMIC ENERGY AGENCY, Sediment Kds andConcentration Factors for Radionuclides in the Marine Environment, TechnicalReports Series No. 247, IAEA, Vienna (1985).
[2] OECD NUCLEAR ENERGY AGENCY, Coordinated Research andEnvironmental Surveillance Programme Related to Sea Disposal of RadioactiveWaste, CRESP Final Rep. 1991–1995, OECD, Paris (1996).
[3] OECD NUCLEAR ENERGY AGENCY SEABED WORKING GROUP,Feasibility of Disposal of High-level Radioactive Waste into the Seabed, Vols 1–8,OECD, Paris (1988).
[4] INTERNATIONAL MARITIME ORGANIZATION, FOOD AND AGRI-CULTURE ORGANIZATION OF THE UNITED NATIONS, UNITEDNATIONS EDUCATIONAL, SCIENTIFIC AND CULTURAL ORGANIZA-TION, WORLD METEOROLOGICAL ORGANIZATION, WORLDHEALTH ORGANIZATION, INTERNATIONAL ATOMIC ENERGYAGENCY, UNITED NATIONS, UNITED NATIONS ENVIRONMENT PRO-GRAMME JOINT GROUP OF EXPERTS ON THE SCIENTIFIC ASPECTSOF MARINE POLLUTION, An Oceanographic Model for the Dispersion ofWastes Disposed of in the Deep Sea, Reports and Studies No. 19, IAEA, Vienna(1983).
[5] INTERNATIONAL ATOMIC ENERGY AGENCY, The Oceanographic andRadiological Basis for the Definition of High-level Wastes Unsuitable forDumping at Sea, Safety Series No. 66, IAEA, Vienna (1984).
[6] FOOD STANDARDS AGENCY, SCOTTISH ENVIRONMENT PROTEC-TION AGENCY, Radioactivity in Food and the Environment, 1999, RIFE-5,FSA, SEPA, London (2000).
[7] RADIOACTIVE WASTE MANAGEMENT CENTER, Transfer Parameters ofRadionuclides in the Marine Environment, Environmental Parameter Series 7,RWMC, Tokyo (1996).
[8] RADIOACTIVE WASTE MANAGEMENT CENTER, Concentration Factorsof Radionuclides in the Marine Organisms, Environmental Parameter Series 6,RWMC, Tokyo (1996).
[9] OSPAR CONVENTION FOR THE PROTECTION OF THE ENVIRON-MENT OF THE NORTH EAST ATLANTIC, Sintra Statement, MinisterialMeeting of the OSPAR Convention, Sintra, 22–23 July 1998, Summary RecordOSPAR 98/14/1, Annex 45 (1998).
[10] INTERNATIONAL MARITIME ORGANIZATION, Report of the SixteenthConsultative Meeting of the Contracting Parties to the Convention on thePrevention of Marine Pollution by Dumping of Wastes and Other Matter, LC16/14, Resolution LC.51(16), IMO, London (1993).
[11] INTERNATIONAL COMMISSION ON RADIOLOGICAL PROTECTION,Recommendations of the International Commission on Radiological Protection,Publication 60, Pergamon Press, Oxford and New York (1991).
77
[12] INTERNATIONAL ATOMIC ENERGY AGENCY, Protection of theEnvironment from the Effects of Ionizing Radiation: A Report for Discussion,IAEA-TECDOC-1091, IAEA, Vienna (1999).
[13] HOWARD, B.J., STRAND, P., Interim Report of the Radioecological SensitivityForum, European Commission, Luxembourg (1999).
[14] CLARKE, R.H., Controllable dose: A discussion on the control of individualdoses from single sources, Radioprotection 34 (1999) 217.
[15] PENTREATH, R.J., A system for radiological protection of the environment:Some initial thoughts and ideas, J. Radiol. Prot. 19 (1999) 117.
[16] HOWARD, B.J., The concept of radioecological sensitivity, Radiat. Prot. Dosim.92 (2000) 29.
[17] FOOD AND AGRICULTURE ORGANIZATION OF THE UNITEDNATIONS, INTERNATIONAL ATOMIC ENERGY AGENCY, INTERNA-TIONAL LABOUR ORGANISATION, OECD NUCLEAR ENERGYAGENCY, PAN AMERICAN HEALTH ORGANIZATION, WORLDHEALTH ORGANIZATION, International Basic Safety Standards forProtection against Ionizing Radiation and for the Safety of Radiation Sources,Safety Series No. 115, IAEA, Vienna (1996).
[18] EUROPEAN COMMISSION, The Radiological Exposure of the Population ofthe European Community from Radioactivity in North European Marine Waters,Project “Marina”, Rep. EUR-12483-EN, European Commission, Luxembourg(1990).
[19] EUROPEAN COMMISSION, The Radiological Exposure of the Population ofthe European Community from Radioactivity in the Mediterranean Sea, Project“Marina-Med”, Rep. EUR-15564-EN, European Commission, Luxembourg(1994).
[20] YABLOKOV, A.V., et al., Facts and Problems Related to Radioactive WasteDisposal in Seas Adjacent to the Territory of the Russian Federation, Office of thePresident of the Russian Federation, Moscow (1993).
[21] INTERNATIONAL ATOMIC ENERGY AGENCY, Inventory of RadioactiveWaste Disposals at Sea, IAEA-TECDOC-1105, IAEA, Vienna (1999).
[22] TITLEY, J.G., et al., Assessment of the Radiological Implications of Dumping inBeaufort’s Dyke and Other Coastal Waters from the 1950s, Rep. NRPB-M859,National Radiological Protection Board, Chilton, UK (1997).
[23] LARSSON, A., KARLSSON, L.G., Handling of Radioactive Waste in SwedenBefore 1980 and Radium and Radium Waste Until 1996, Rep. SKI-R-96-78 SSI-96-18, Swedish Nuclear Power Inspectorate and Swedish Radiation ProtectionInstitute, Stockholm (1996).
[24] SMITH, J.N., ELLIS, K.M., BOYD, T., Circulation features in the central ArcticOcean revealed by nuclear fuel reprocessing tracers from scientific ice expedi-tions 1995 and 1996, J. Geophys. Res. 104 C12 (1999) 29663.
[25] KERSHAW, P.J., McCUBBIN, D., LEONARD, K.S., Continuing contamination ofnorth Atlantic and Arctic waters by Sellafield radionuclides, Sci. Total Environ.237–238 (1999) 119.
78
[26] POOLE, A.J., DENOON, D.C., WOODHEAD, D.S., “The distribution and inven-tory of 137Cs in sub-tidal sediments of the Irish Sea”, Radionuclides in the Oceans,RADOC 96–96, Part 1. Inventories, Behaviour and Processes (GERMAIN, P.,GUARY, J.C., GUÉGUÉNIAT, P., MÉTIVIER, H., Eds), Radioprotection 32 C2(1997) 263.
[27] CHARMASSON, S., et al., Nuclear Fuel Cycle and Marine Environment.Behavior of the Rhone River Effluents in the Mediterranean Sea and of WastesDumped in the Northeast Atlantic, Rep. CEA-R-5826, Commissariat à l’énergieatomique, Cherbourg (1998).
[28] VAN WEERS, A.W., et al., Current Practice of Dealing with NaturalRadioactivity from Oil and Gas Production in EU Member States, Rep. EUR-17621-EN, European Commission, Luxembourg (1997).
[29] LYSEBO, I., TUFTO, P., Handling of Natural Occurring Radioactive Deposits inthe Oil and Gas Industry in Norway, United Kingdom and the Netherlands, Rep.NRPA-1999:2, Norwegian Radiation Protection Authority, Østerås (1999).
[30] OSPAR CONVENTION FOR THE PROTECTION OF THE ENVIRON-MENT OF THE NORTH EAST ATLANTIC, Report on Discharges ofRadioactive Substances by Non-nuclear Industries, Oslo and Paris Commissions,Paris (1997).
[31] RUTHERFORD, P.M., DUDAS, M.J., SAMEK, R.A., Environmental impact ofphosphogypsum, Sci. Total Environ. 149 (1994) 1.
[32] NIELSEN, S.P., The Radiological Exposure of the Population of the EuropeanCommunity to Radioactivity in the Baltic Sea, Project “Marina-Balt”, Rep. EUR-19200-EN, European Commission, Luxembourg (2000).
[33] NIELSEN, S.P., et al., The radiological exposure of man from radioactivity in theBaltic Sea, Sci. Total Environ. 237–238 (1999) 133.
[34] EUROPEAN COMMISSION, MARINA II, Update of the MARINA Project onthe Radiological Exposure of the European Community from Radioactivity inNorth European Marine Waters, Radiation Protection 132, EuropeanCommission, Luxembourg (2003).
[35] AARKROG, A., et al., A comparison of doses from 137Cs and 210Po in marinefood: A major international study, J. Environ. Radioact. 34 (1997) 69.
[36] INTERNATIONAL ATOMIC ENERGY AGENCY, Sources of Radioactivity inthe Marine Environment and their Relative Contributions to Overall DoseAssessment from Marine Radioactivity (MARDOS), IAEA-TECDOC-838,IAEA, Vienna (1995).
[37] INTERNATIONAL ATOMIC ENERGY AGENCY, Radiological Conditions ofthe Western Kara Sea, Assessment of the Radiological Impact of the Dumping ofRadioactive Waste in the Arctic Sea, Radiological Assessment Reports Series,IAEA, Vienna (1998).
[38] OSVATH, I., POVINEC, P.P., BAXTER, M.S., Kara Sea radioactivity assessment,Sci. Total Environ. 237–238 (1999) 167.
[39] NIELSEN, S.P., IOSJPE, M., STRAND, P., Collective doses to man from dumpingof radioactive waste in the Arctic Seas, Sci. Total Environ. 202 (1997) 135.
79
[40] SJOEBLOM, K.L., et al., International Arctic Seas assessment project, Sci. TotalEnviron. 237–238 (1999) 153.
[41] INTERNATIONAL ATOMIC ENERGY AGENCY, The Radiological Situationat the Atolls of Mururoa and Fangataufa, Summary Report, RadiologicalAssessment Reports Series, IAEA, Vienna (1998).
[42] INTERNATIONAL ATOMIC ENERGY AGENCY, Radiological Conditions atBikini Atoll: Prospects for Settlement, Radiological Assessment Reports Series,IAEA, Vienna (1998).
[43] INSTITUT DE PROTECTION ET DE SÛRETÉ NUCLÉAIRE, The Report ofthe Nord-Cotentin Radioecology Group, IPSN, Fontenay-aux-Roses (1999).
[44] CAMPLIN, W.C., BAXTER, A.J., ROUND, G.D., The radiological impact of dis-posals of natural radionuclides from a phosphate plant in the United Kingdom,Environ. Int. 22 Suppl. 1 (1996) 5259.
[45] LEENHOUTS, H.P., STOOP, P., VAN TUINEN, S.T., Non-nuclear Industries inthe Netherlands and Radiological Risks, Rep. RIVM-610053003, Rijksinstituutvoor Volksgezondheid en Milieuhygiene, Bilthoven (1996).
[46] CARROLL, J., BOISSON, S.W., FOWLER, S.W., TEYSSIE, J.-L., Radionuclideadsorption to sediments from nuclear waste dumping sites in the Kara Sea, Mar.Pollut. Bull. 35 (1997) 296.
[47] CARROLL, J., et al., Distribution coefficients (Kds) for use in risk assessmentmodels of the Kara Sea, Appl. Radiat. Isot. 51 (1999) 121.
[48] DONAT, J.R., BRULAND, K.W., “Trace elements in the oceans”, Trace Elementsin Natural Waters (SALBU, B., STEINNES, E., Eds), CRC Press, Boca Raton, FL(1995) 247.
[49] BALONOV, M., TSATUROV, Y., HOWARD, B., STRAND, P., RadioactiveContamination in the Russian Arctic, Rep. 1999:1, AMAP Data-Centre forRadioactivity, Østerås (1999).
[50] AMIRO, B., AVADHANULA, R., JOHANSSON, G., LARSSON, C.-M.,LÜNING, M. (Eds), Protection of the Natural Environment (Proc. Int. Symp.Stockholm, 1996), Swedish Radiation Protection Institute, Stockholm (1996).
[51] STATHER, J.W., HOPEWELL, J.W., SANDALLS, J., THOMPSON, I.M.G.,Environmental dosimetry, proceedings of a workshop, Avignon, France, 22–24November 1999, Radiat. Prot. Dosim. 92 (2000).
[52] INTERNATIONAL ATOMIC ENERGY AGENCY, Ethical Considerations inProtecting the Environment from the Effects of Ionizing Radiation: A Report forDiscussion, IAEA-TECDOC-1270, IAEA, Vienna (2002).
[53] HAMILTON, E.I., The role of near-shore industrial waste releases in the disper-sion of radionuclides in the NE Irish Sea, J. Environ. Radioact. 44 (1999) 297.
[54] BOLSUNOVSKY, A.Ya., TCHERKEZIAN, V.O., Hot particles of the YeniseiRiver flood plain, Russia, J. Environ. Radioact. 57 (2001) 167.
[55] BOWEN, H.J.M., Environmental Chemistry of the Elements, Academic Press,London (1979) 333.
[56] WHITFIELD, M., TURNER, D.R., Ultimate removal mechanisms of elementsfrom the ocean — A comment, Geochim. Cosmochim. Acta 46 (1982) 1989.
80
[57] NYFFELER, U.P., LI, Y.H., SANTSCHI, P.H., A kinetic approach to describetrace element distribution between particles and solution in natural aquatic sys-tems, Geochim. Cosmochim. Acta 48 (1984) 1513.
[58] LI, Y.-H., Interelement relationship in abyssal Pacific ferromanganese nodulesand associated pelagic sediments, Geochim. Cosmochim. Acta 46 (1982) 1053.
[59] OECD NUCLEAR ENERGY AGENCY, Report of the Interim Meeting held atNAGRA, Baden, Switzerland, September 19–24, 1982, OECD/NEA SeabedWorking Group System Analysis Task Team Report, École des Mines de Paris,Fontainebleau (1982) 56.
[60] NOZAKI, Y., A fresh look at element distribution in the North Pacific Ocean,EOS, Trans. Am. Geophys. Union 78 221 (1997).
[61] GROMOV, V.V., SPITSYN, V.I., Sorption of 239Pu, 106Ru and 99Tc by bottom sed-iments of the Pacific Ocean, Radiokhimiya 16 (1973) 157.
[62] DESCH, R.G., LYNCH, A.W., “Radionuclide transport in a dolomite aquifer”,Scientific Basis for Nuclear Waste Management, Vol. 2 (NORTHRUP, C.J.M.,Ed.), Plenum Press, New York (1980) 617.
[63] BEASLEY,T.M., Biogeochemical Studies of Technetium in Marine and EstuarineEcosystems, Progress Report, Rep. DOE/EV/10251-3, Department of Energy,Washington, DC (1981) 75.
[64] MASSON, M., APROSI, G., LANIECE, A., GUÉGUÉNIAT, P., BELOT, Y.,“Approches expérimentales de l’étude des transferts du technétium à des sédi-ments et des espèces marines benthiques”, Impacts of Radionuclide Releases intothe Marine Environment (Proc. Symp. Vienna, 1980), IAEA, Vienna (1981) 341.
[65] FOWLER, S.W., ASTON, S.R., BENAYOUN, G., PARSI, P., Bioavailability oftechnetium from artificially labelled North-East Atlantic deep-sea sediments,Mar. Environ. Res. 8 (1983) 87.
[66] MacKENZIE, A.B., SCOTT, R.D., McKINLEY, I.G., WEST, J.M., A Study ofLong-term (103–104 y) Elemental Migration in Saturated Clays and Sediments,Rep. FLPU 83-6, Institute of Geological Sciences, Harwell, UK (1983) 48.
[67] SANTSCHI, P.H., et al., Evidence for elevated levels of iodine-129 in the deepWestern Boundary Current in the Middle Atlantic Bight, Deep-Sea Res. 43 (1996)259.
[68] CHAN, L.H., et al., Radium and barium at GEOSECS stations in the Atlantic andPacific, Earth Planet. Sci. Lett. 32 (1976) 258.
[69] KU, T.-L., HUH, C.-A., CHEN, P.-S., Meridional distribution of 226Ra in the east-ern Pacific along GEOSECS cruise tracks, Earth Planet. Sci. Lett. 49 (1980) 293.
[70] KU, T.-L., LUO, S., New appraisal of radium-226 as a large-scale oceanic mixingtracer, J. Geophys. Res. 99 C5 (1994) 10255.
[71] HARVEY, B.R., KERSHAW, P.J., “Physico-chemical interactions of long-livedradionuclides in coastal marine sediments and some comparison with the deep seaenvironment”, The Behaviour of Long-lived Radionuclides in the MarineEnvironment (CIGNA,A., MYTTENAERE, C., Eds), Rep. EUR 9214, EuropeanCommission, Luxembourg (1984) 131.
81
[72] HUH, C.-A., MOORE, W.S., KADKO, D.C., Oceanic Th-232: A reconnaissanceand implications of global distribution from manganese nodules, Geochim.Cosmochim. Acta 53 (1989) 1357.
[73] BACON, M.P., ANDERSON, R.F., Distribution of thorium isotopes betweendissolved and particulate forms in the deep sea, J. Geophys. Res. 87 C3 (1982)2045.
[74] GUO, L., SANTSCHI, P.H., BASKARAN, M., Interactions of thorium isotopeswith colloidal organic matter in oceanic environments, Colloids Surf.A 120 (1997)255.
[75] BASKARAN, M., SANTSCHI, P.H., GUO, L., BIANCHI, T.S., LAMBERT, C.,123Th:238U disequilibria in the Gulf of Mexico: Importance of organic matter andparticle concentration, Cont. Shelf Res. 16 (1996) 353.
[76] NOZAKI, Y., YAMADA, M., Thorium and protactinium isotope distributions inwaters of the Japan Sea, Deep-Sea Res. 34 (1990) 1417.
[77] WHITFIELD, M., The mean oceanic residence time (MORT) concept — Arationalization, Mar. Chem. 8 (1979) 101.
[78] WHITFIELD, M., TURNER, D.R., “Chemical periodicity and the speciation andcycling of the elements”, Trace Metals in Seawater (WONG, C.S., BOYLE, E.,BRULAND, X.W., BURTON, J.D., GOLDBERG, E.D., Eds), Plenum Press, NewYork (1983) 719.
[79] BREWER, P.G., et al., The distribution of particulate matter in the AtlanticOcean, Earth Planet. Sci. Lett. 32 (1976) 393.
[80] LI, Y.-H., Ultimate removal mechanisms of elements from the ocean, Geochim.Cosmochim. Acta 45 (1981) 1659.
[81] LI, Y.-H., Geochemical cycles of elements and human perturbation, Geochim.Cosmochim. Acta 45 (1981) 2073.
[82] AMES, L.L., RAI, D., Radionuclide Interactions with Soil and Rock Media, Vols1 and 2, Rep. EPA/520/6-78/007-B, Environmental Protection Agency,Washington, DC (1978) 345.
[83] BEALL, G.W., “A review of the sorption of actinides on natural minerals”,Alternative Nuclear Waste Forms and Interactions in Geologic Media (Proc.Workshop, Gatlinburg, TN, 1980), CONF-8005107, USAEC TechnicalInformation Center, Oak Ridge, TN (1980) 242.
[84] FRIED, S. (Ed.), Radioactive Waste in Geologic Storage, ACS Symposium SeriesNo. 100, American Chemical Society, Washington, DC (1979).
[85] NORTHRUP, C.J.M. (Ed.), Scientific Basis for Nuclear Waste Management, Vol.2, Plenum Press, New York (1980).
[86] SEYMOUR, A.H., NEVISSI, A., SCHELL, W.R., SANCHEZ, A., DistributionCoefficients for Radionuclides in Aquatic Environments, Rep. NUREG/CR-0801,Nuclear Regulatory Commission, Washington, DC (1979).
[87] SPENCER, D.W., BREWER, P.G., SACHS, P.L., SMITH, C.L., Distribution ofSome Chemical Elements Between Dissolved and Particulate Phases in theOcean, Rep. NYO-4150-9, Woods Hole Oceanographic Institution, MA (1970)18.
82
[88] JOHNSON, H.M., GILLHAM, R.W., A Review of Selected RadionuclideDistribution Coefficients of Geologic Material, Rep. TR-90, Atomic Energy ofCanada Ltd, Chalk River, Ontario (1980) 147.
[89] PENTREATH, R.J., HARVEY, B.R., The presence of 237Np in the Irish Sea, Mar.Ecol. Prog. Ser. 6 (1981) 243.
[90] HARVEY, B.R., unpublished data.[91] FOWLER, S.W., ASTON, S.R., Application of 235Np in experimental aquatic
radioecology: Preliminary observations on neptunium behaviour in seawater, sed-iments and zooplankton, Health Phys. 42 (1982) 515.
[92] HIGGO, J.J.W., REES, L.V.C., CRONAN, D.S., Radionuclide Sorption by MarineSediments, Part 3: Plutonium, Americium and Neptunium, Rep. DOE/RW/83/131,Department of the Environment, London (1983).
[93] BEALL, G.W., ALLARD, B., KREJEWSKI, T., O’KELLEY, G.D., “Chemicalreactions in the bedrock–groundwater system of importance for the sorption ofactinides”, Scientific Basis for Nuclear Waste Management, Vol. 2 (NORTHRUP,C.J.M., Ed.), Plenum Press, New York (1980) 625.
[94] SHEPPARD, J.C., CAMPBELL, M.J., CHENG,T., KITTRICK, J.A., Retention ofradionuclides by mobile humic compounds and soil particles, Environ. Sci.Technol. 14 (1980) 1349.
[95] WONG, K.M., NOSHKIN, V.E., SURPRENANT, L., BOWEN, V.T., Plutonium-239 in Some Marine Organisms and Sediments, Rep. HASL-227, Energy Researchand Development Administration, New York (1970) 125.
[96] HETHERINGTON, J.A., JEFFERIES, D.P., LOVETT, M.B., “Some investiga-tions into the behaviour of plutonium in the marine environment”, Impacts ofNuclear Releases into the Aquatic Environment (Proc. Symp. Otaniemi, 1975),IAEA, Vienna (1975) 193.
[97] WAHLGREN, M.A., ALBERTS, J.J., NELSON, D.M., ORLANDINI, K.A.,“Study of the behaviour of transuranics and possible chemical homologues inLake Michigan water and biota”, Transuranium Nuclides in the Environment(Proc. Symp. San Francisco, CA, 1975), IAEA, Vienna (1976) 9.
[98] NELSON, D.M., LOVETT, M.B., Oxidation state of plutonium in the Irish Sea,Nature (London) 276 (1978) 599.
[99] PILLAI, K.C., MATHEW, E., “Plutonium in the aquatic environment, its behav-iour, distribution and significance”, Transuranium Nuclides in the Environment(Proc. Symp. San Francisco, 1975), CA, IAEA, Vienna (1975) 25.
[100] NOSHKIN, V.E., “Transuranic elements in components of the benthic environment of Enewetak Atoll”, Transuranic Elements in the Environment(HANSON, W., WATTERS, R.A., Eds), Department of Energy, Washington, DC(1980).
[101] PENTREATH, R.J., JEFFERIES, D.F., LOVETT, M.B., NELSON, D.M., “Thebehaviour of transuranic and other long-lived radionuclides in the Irish Sea and itsrelevance to the deep sea disposal of radioactive wastes”, Marine Radioecology(Proc. 3rd OECD/NEA Sem. Tokyo, 1979), OECD, Paris (1980) 203.
83
[102] PENTREATH, R.J., JEFFERIES, D.F.,TALBOT, J.W., LOVETT, M.B., HARVEY,B.R., “Transuranic cycling behaviour in the marine environment”, TransuranicCycling Behaviour in the Marine Environment, IAEA-TECDOC-265, IAEA,Vienna (1982) 121.
[103] WATTERS, R.A., et al., “Synthesis of the research literature”, TransuranicElements in the Environment (HANSON, W., WATTERS, R.A., Eds),Department of Energy, Washington, DC (1980).
[104] AARKROG, A.A., DAHLGAARD, H., NILSSON, K., “Studies on the distribu-tion of transuranics in the Baltic Sea, the Danish Belts, the Kattegat and the NorthSea”, Transuranic Cycling Behaviour in the Marine Environment, IAEA-TEC-DOC-265, IAEA, Vienna (1982) 23.
[105] FOWLER, S.W., BALLESTRA, S., LAROSA, J., FUKAI, R.,Vertical transport ofparticulate-associated plutonium and americium in the upper water column of theNortheast Pacific, Deep-Sea Res. 30 (1983) 1221.
[106] LOVETT, M.B., unpublished data.[107] NOSHKIN, V.E., unpublished data.[108] ERICKSON, K.L.,“Radionuclide sorption studies on abyssal red clays”, Scientific
Basis for Nuclear Waste Management, Vol. 2 (NORTHRUP, C.J.M., Ed.), PlenumPress, New York (1980) 641.
[109] DUURSMA, E.K., PARSI, P., “Distribution coefficient of plutonium betweensediment and seawater”, Activities of the International Laboratory of MarineRadioactivity, 1974 Report, IAEA-TECDOC-163, IAEA, Vienna (1974) 94.
[110] GROMOV, V.V., Investigation of the behaviour of microelements in ocean waterby the desorption method, Sov. Radiochem. 16 (1974) 742.
[111] BONDIETTI, E.A., REYNOLDS, S.A., SHANKS, M.H., “Interaction of plutoni-um with complexing substances in soils and natural waters”, TransuraniumNuclides in the Environment (Proc. Symp. San Francisco, CA, 1975), IAEA,Vienna (1976) 273.
[112] MO, T., LOWMAN, F.G., “Laboratory experiments on the transfer dynamics ofplutonium from marine sediments to seawater and to marine organisms”,Radiology and Energy Resources (CUSHING, C.E., Jr., Ed.), Halstead Press,New York (1976) 86.
[113] VAN DALEN, A., DE WITTE, F., WISKTRA, J., Distribution Coefficients forSome Radionuclides Between Saline Water and Clays, Sandstones and OtherSamples from the Dutch Sub-soil, Rep. RCN-75-109, Reactor CentrumNederland, Petten (1975).
[114] EPIDAL, B.R. (Ed.), Laboratory Studies of Radionuclide Distributions BetweenSelected Groundwaters and Geologic Media, Rep. LA-8088-PR, Los AlamosScientific Laboratory, NM (1979).
[115] VANGENECHTEN, J.D.H., ASTON, S.R., FOWLER, S.W., Uptake of americi-um-241 from two experimentally labelled deep-sea sediments by three benthicspecies: A bivalve mollusc, a polychaete and an isopod, Mar. Ecol. Prog. Ser. 13(1983) 219.
84
[116] SHANBHAG, P.M., MORSE, J.W., Americium interaction with calcite and arag-onite surfaces in seawater, Geochim. Cosmochim. Acta 46 (1982) 241.
[117] ASTON, S.R., FOWLER, S.W., Preliminary observations on californium-252behaviour in seawater, sediments and zooplankton, Health Phys. 44 (1983) 359.
[118] BEALL, G.W., KETELLE, B.H., HAIRE, R.G., OIKELLEY, G.D., “Sorptionbehavior of trivalent actinides and rare earths on clay minerals”, RadioactiveWaste in Geologic Storage (FRIED, S., Ed.), ACS Symposium Series No. 100,American Chemical Society, Washington, DC (1979) 201.
[119] BACON, M.P., SPENCER, D.W., BREWER, P.G., 210Pb/226Ra and 210Po/210Pbdisequilibria in seawater and suspended particulate matter, Earth Planet. Sci. Lett.32 (1976) 272.
[120] COCHRAN, J.K., “The oceanic chemistry of the U- and Th- series nuclides”,Uranium Series Disequilibriums Applications to Environmental Problems(IVANOVICH, M., HARMON, R.S., Eds), Clarendon Press, Oxford (1982) 384.
[121] BREWER, P.G., NOZAKI, Y., SPENCER, D.W., FLEER, A.P., Sediment trapexperiments in the deep North Atlantic: Isotopic and elemental fluxes, J. Mar. Res.38 (1980) 703.
[122] WHITFIELD, M., TURNER, D.R., Water–rock partition coefficients and thecomposition of seawater and river water, Nature (London) 278 (1979) 132.
[123] ANDERSON, R.F., BACON, M.P., BREWER, P.G., Removal of 230Th and 231Pafrom the open sea, Earth Planet. Sci. Lett. 61 (1983) 7.
[124] ANDERSON, R.F., BACON, M.P., BREWER, P.G., Removal of 230Th and 231Paat ocean margins, Earth Planet. Sci. Lett. 66 (1983) 73.
[125] MONTÉGUT, G.D., AVRIL, B., Vertical distribution and temporal variation ofdissolved organic carbon in the North-Western Mediterranean Sea, Deep-SeaRes. 40 (1993) 1963.
[126] FISHER, N.S., et al., Trace metals in marine copepods: A field test of a bioaccu-mulation model coupled to laboratory uptake kinetics data, Mar. Ecol. Prog. Ser.194 (2000) 211.
[127] KENNISH, M.J., Practical Handbook of Estuarine and Marine Pollution, CRCPress, Boca Raton, FL (1997) 524.
[128] DUURSMA, E.K., EISMA, D., “Theoretical, experimental and field studies con-cerning reactions of radioisotopes with sediments and suspended particles in thesea, Part C: Applications to field studies”, Radioactivity in the Sea, PublicationNo. 32, IAEA, Monaco (1972).
[129] TANG, D., WARNKEN, K.W., SANTSCHI, P.H., Distribution and partitioning oftrace metals (e.g., Ni, Cu, Cd, Pb, Zn) in Galveston Bay Waters, Mar. Chem. 78(2002) 29.
[130] WEN, L.S., SANTSCHI, P.H., PATERNOSTRO, C., GILL, G., Estuarine tracemetal distributions in Galveston Bay I: Importance of colloidal forms in the spe-ciation of the dissolved phase, Mar. Chem. 63 (1999) 185.
[131] FLEGAL, A.R., SMITH, G.J., GILL, G.A., SANUDO-WILHELMY, S.,ANDERSON, L.C.D., Dissolved trace elements cycles in the San Francisco Bayestuary, Mar. Chem. 36 (1991) 329.
85
[132] LI, Y.-H., BURKHARDT, L., BUCHHOLTZ, M., O’HARA, P., SANTSCHI,P.H., Partition of radiotracers between suspended particles and seawater,Geochim. Cosmochim. Acta 48 (1984) 2011.
[133] NOLTING, R.F., DE BAAR, H.J.W., TIMMERMANS, M.K.R., BAKKAR, K.,Chemical fractionation of zinc versus cadmium among other metals nickel, cop-per and lead in the northern North Sea, Mar. Chem. 67 (1999) 267.
[134] LEGALL, A.C., STATHAM, P.J., MORELY, N.H., HYDES, D.J., HUNT, C.H.,Processes influencing distributions and concentrations of Cd, Cu, Mn and Ni atthe northwest European shelf break, Mar. Chem. 68 (1999) 97.
[135] BENOIT, G., et al., Partitioning of Cu, Pb, Ag, Zn, Fe, Al, and Mn between filter-retained particles, colloids and solution in six Texas estuaries, Mar. Chem. 45(1994) 307.
[136] AHRENS, L.H., PRESS, F., RUNCORN, S.K., UREY, H.C. (Eds), Physics andChemistry of the Earth, Vol. 8, Pergamon Press, Oxford (1969) 337.
[137] KANG, D.-J., CHUNG, C.S., KIM, K.-R., HONG, G.H., Distribution of 137Cs and239,240Pu in the surface waters of the East Sea (Sea of Japan), Mar. Pollut. Bull. 35(1997) 305.
[138] FLEGAL, A.R., SANUDO-WILHELMY, S., Comparable levels of trace metalcontamination in two semi-enclosed embayments: San Diego Bay and South SanFrancisco Bay, Environ. Sci. Technol. 27 (1993) 1934.
[139] WEN, L.S., SANTSCHI, P.H., GILL, G., PATERNOSTRO, C., Colloidal and par-ticulate silver in river and estuarine waters of Texas, Environ. Sci. Technol. 31(1997) 723.
[140] GUAY, C.K., FALKNER, K.K., A survey of dissolved barium in the estuaries ofmajor Arctic rivers and adjacent seas, Cont. Shelf Res. 18 (1998) 859.
[141] HARVEY, B.R., “Interstitial water studies on Irish Sea sediments and their rele-vance to the fate of transuranic nuclides in the marine environment”, Techniquesfor Identifying Transuranic Speciation in Aquatic Environments (Proc. Tech.Comm. Mtg, Ispra, 1980), IAEA, Vienna (1981) 247.
[142] FOWLER, S.W., Critical review of selected heavy metal and chlorinated hydro-carbon concentrations in the marine environment, Mar. Environ. Res. 29 (1990) 1.
[143] STORDAL, M.C., GILL, G.A.,WEN, L.-S., SANTSCHI, P.H., Mercury phase spe-ciation in the surface waters of selected Texas estuaries: Importance of colloidalforms, Limnol. Oceanogr. 41 (1996) 52.
[144] BASKARAN, M., SANTSCHI, P.H., The role of particles and colloids in thetransport of radionuclides in coastal environments of Texas, Mar. Chem. 43 (1993)95.
[145] BROECKER, W.S., PENG, T.-H., Tracers in the Sea, Lamont-Doherty GeologicalObservatory, Columbia University Press, Palisades, NY (1982) 690.
[146] MOORE, W.S., Large groundwater inputs to coastal waters revealed by 226Raenrichments, Nature (London) 380 (1996) 612.
[147] GUO, L., SANTSCHI, P.H., BASKARAN, M., ZINDLER,A., Distribution of dis-solved and particulate 230Th and 232Th in seawater from the Gulf of Mexico andoff Cape Hatteras, as measured by SIMS, Earth Planet. Sci. Lett. 133 (1995) 117.
86
[148] INTERNATIONAL ATOMIC ENERGY AGENCY, Transuranic CyclingBehaviour in the Marine Environment, IAEA-TECDOC-265, IAEA, Vienna(1982).
[149] RÖSLER, H.J., LANGE, H., Geochemical Tables, Elsevier, Amsterdam (1972).[150] CALVERT, S.E., “The mineralogy and geochemistry of near-shore sediments”,
Chemical Oceanography, Vol. 6 (RILEY, J.P., CHESTER, R., Eds), AcademicPress, London (1976) 187.
[151] BRYAN, G.W., “Bioavailability and effects of heavy metals in marine deposits”,Wastes in the Ocean, Vol. 6: Nearshore Waste Disposal (KETCHUM, B.H., et al.,Eds), Wiley, New York (1985) 42.
[152] FUKUI, M., Desorption kinetics and mobility of some radionuclides in sediments,Health Phys. 59 (1990) 879.
[153] KERSHAW, P.J., PENTREATH, R.J., WOODHEAD, D.S., HUNT, G.J., A reviewof radioactivity in the Irish Sea. A report prepared for the Marine PollutionMonitoring Management Group, Rep. MAFF-AEMR-32, Directorate of FisheriesResearch, Lowestoft, UK (1992).
[154] BAXTER, M.S., HARMS, I., OSVATH, I., POVINEC, P.P., SCOTT, E.M.,Modelling the potential radiological consequences of radioactive waste dumpingin the Kara Sea, J. Environ. Radioact. 39 (1998) 161.
[155] ASTON, S.R., FOWLER, S.W., “Bioavailability of technetium, plutonium andamericium from deep-sea sediments to the clam Venerupis decussata”, OceanicProcesses in Marine Pollution, Vol. 2: Physicochemical Processes and Wastes inthe Oceans (O’CONNER, T.P., BURT, W.V., DUEDALL, I.W., Eds), Robert E.Krieger, Melbourne (1987).
[156] MASSON, M., et al., Synthesis of French experimental and in-situ research on theterrestrial and marine behaviour of Tc, Health Phys. 57 (1989) 269.
[157] MacKENZIE,A.B., COOK, G.T., McDONALD, P., JONES, S.R.,The influence ofmixing timescales and re-dissolution processes on the distribution of radionu-clides in north-east Irish Sea sediments, J. Environ. Radioact. 39 (1998) 35.
[158] COOK, G.T., MacKENZIE, A.B., McDONALD, P., JONES, S.R., Remobilizationof Sellafield-derived radionuclides and transport from the north-east Irish Sea, J.Environ. Radioact. 35 (1997) 227.
[159] MITCHELL, P.I., CONDREN, O.M., VINTRO, L.L., McMAHON, C.A., Trendsin plutonium, americium and radiocaesium accumulation and long-term bioavail-ability in the western Irish Sea mud basin, J. Environ. Radioact. 44 (1999) 223.
[160] BASKARAN, M., RAVICHANDRAN, M., BIANCHI, T.S., Cycling of 7Be and210Pb in a high DOC, shallow, turbid estuary of south-east Texas, Estuar. CoastalShelf Sci. 45 (1997) 165.
[161] HAMILTON-TAYLOR, J., KELLY, M., MUDGE, S., BRADSHAW, K., Rapidremobilisation of plutonium from estuarine sediments, J. Environ. Radioact. 5(1987) 409.
[162] HAMILTON, E.I., Radionuclides and large particles in estuarine sediments, Mar.Pollut. Bull. 20 (1989) 603.
87
[163] ASSINDER, D.J., KELLY, M., ASTON, S.R., Tidal variations in dissolved and par-ticulate phase radionuclide activities in the Esk Estuary, England, and their distribu-tion coefficients and particulate activity fractions, J. Environ. Radioact. 2 (1985) 1.
[164] ABRIL, J.M., FRAGA, E., Some physical and chemical features of the variabilityof Kd distribution coefficients for radionuclides, J. Environ. Radioact. 30 (1996)253.
[165] TEMPLETON, W., HARRISON, F., KNEZOVICH, J., FISHER, N., LAYTON,D., “Bioconcentration of radionuclides in marine food-web organisms”,Radionuclides in the Arctic Seas from the Former Soviet Union: Potential Healthand Ecological Risks, Arctic Nuclear Waste Program, Office of Naval Research,Washington, DC (1997).
[166] FISHER, N.S., et al., Radionuclide bioconcentration factors and sediment parti-tion coefficients in Arctic seas subject to contamination from dumped nuclearwastes, Environ. Sci. Technol. 33 (1999) 1982.
[167] EISLER, R., Trace Metal Concentrations in Marine Organisms, Pergamon Press,New York (1981).
[168] PHILLIPS, D.J.H., Quantitative Aquatic Biological Indicators, Applied SciencePublishers, London (1980) 488.
[169] COUGHTREY, P.J., THORNE, M.C., Radionuclide Distribution and Transportin Terrestrial and Aquatic Ecosystems, Vol. 1, A.A. Balkema, Rotterdam (1983)496.
[170] COUGHTREY, P.J., THORNE, M.C., Radionuclide Distribution and Transportin Terrestrial and Aquatic Ecosystems, Vol. 2, A.A. Balkema, Rotterdam (1983)500.
[171] COUGHTREY, P.J., THORNE, M.C., Radionuclide Distribution and Transportin Terrestrial and Aquatic Ecosystems, Vol. 3, A.A. Balkema, Rotterdam (1983)372.
[172] JACKSON, D.W., GOMEZ, L.S., MARIETTA, M.G., Compilation of SelectedMarine Radioecological Data for the U.S. Subseabed Program, Rep. SAND-73-1725, Sandia Natl Laboratories, Albuquerque, NM (1983) 237.
[173] VINOGRADOV, A.P., The Elementary Chemical Composition of MarineOrganisms, Sears Foundation for Marine Research, Memoir 2, Yale Univ. Press,New Haven, CT (1953) 647.
[174] CHOW, T.J., et al., Occurrence of lead in tuna, Nature (London) 251 (1974) 159.[175] PENTREATH, R.J., LOVETT, M.B., HARVEY, B.R., IBBETT, R.D., “Alpha-
emitting nuclides in commercial fish species caught in the vicinity of Windscale,UK, and their radiological significance to man”, Biological Implications ofRadionuclides Released from Nuclear Industries (Proc. Symp. Vienna, 1979),IAEA, Vienna (1979) 227.
[176] RUPP, E.M., MILLER, F.L., BAES, C.F., Some results of recent surveys of fishand shellfish consumption by age and region of US residents, Health Phys. 39(1980) 165.
[177] PENTREATH, R.J., Radionuclides in fish, Oceanogr. Mar. Biol. Ann. Rev. 15(1977) 365.
88
[178] NAKAHARA, M., EUDA, T., SUZUKI, T., ISHII, T., SUZUKI, H.,“Concentration factors of mesopelagic organisms”, Marine Radioecology (Proc.3rd OECD/NEA Sem. Tokyo, 1979), OECD, Paris (1980) 323.
[179] INTERNATIONAL ATOMIC ENERGY AGENCY, The Radiological Basis ofthe IAEA Revised Definition and Recommendations Concerning High-levelRadioactive Waste Unsuitable for Dumping at Sea, IAEA-TECDOC-211, IAEA,Vienna (1978).
[180] JENKINS, C.E., Radionuclide distribution in Pacific salmon, Health Phys. 17(1969) 507.
[181] TEMPLETON, W.L., “Fission products and aquatic organisms”, The Effects ofPollution on Living Material, Institute of Biology, London (1959) 125.
[182] SCHROEDER, H.A., BALASSA, J.J., Trace metals in man: Niobium, J. ChronicDis. 18 (1965) 229.
[183] PENTREATH, R.J., JEFFERIES, D.F., The uptake of radionuclides by I-groupplaice (Pleuronectes platessa) off the Cumberland coast, Irish Sea, J. Mar. Biol.Assoc. U.K. 51 (1971) 963.
[184] DUNSTER, H.J., GARNER, R.J., HOWELLS, H., WIX, L.P.U., Environmentalmonitoring associated with the discharge of low activity radioactive waste fromWindscale works to the Irish Sea, Health Phys. 10 (1964) 353.
[185] EWING, R.A., HOWES, J.E., PRICE, R.B., Bioenvironmental and RadiologicalSafety Feasibility Studies, Atlantic–Pacific Interoceanic Canal: Radionuclide andStable-element Analyses of Environmental Samples from Routes 17 and 25, Rep.BMI-171-29, Battelle Memorial Institute, OH (1969) 52.
[186] NOSHKIN, V.E., Concentrations and Concentration Factors of SeveralAnthropogenic and Natural Radionuclides in Marine Vertebrates andInvertebrates, Environmental Protection Agency, Washington, DC (1984).
[187] GOLDBERG, E.D., Elemental composition of some pelagic fishes, Limnol.Oceanogr. 7 Suppl. (1962) 72.
[188] SUZUKI, H., ROYANAGI, T., SAIRI, M., “Studies on rare earth elements in sea-water and uptake by marine organisms”, Impacts of Nuclear Releases into theAquatic Environment (Proc. Symp. Otaniemi, 1975), IAEA, Vienna (1975) 77.
[189] KURABAYASHI, M., FUKUDA, S., KUROKAWA, Y., “Concentration factorsof marine organisms used for the environmental dose assessment”, MarineRadioecology (Proc. 3rd OECD/NEA Sem. Tokyo, 1979), OECD, Paris (1980)355.
[190] AL-MADFA, H., ABOUL DAHAB, O., HOLAIL, H., Mercury pollution inDoha (Qatar) coastal environment, Environ. Toxicol. Chem. 13 (1994) 725.
[191] INTERNATIONAL ATOMIC ENERGY AGENCY, Survey of Mercury in Fishand Sediments from the ROPME Sea Area: Final Data Report, IAEA MarineEnvironment Laboratory, Monaco (1990).
[192] AL-HASHIMI, A.H., AL-ZORBA, M.A., Mercury in some commercial fish fromKuwait: A pilot study, Sci. Total Environ. 106 (1991) 71.
[193] TARIQ, J., JAFFAR, M., Mercury concentrations in ten fish species form theArabian Sea, Pakistan, Toxicol. Environ. Chem. 34 (1991) 57.
89
[194] HALCROW, W., MacKAY, D.W., THORNTON, I., The distribution of trace met-als and fauna in the Firth of Clyde in relation to the disposal of sewage sludge, J.Mar. Biol. Assoc. U.K. 53 (1973) 721.
[195] ROBERTSON, D.E., Trace Elements in Marine Organisms, Rep. BNWL-481-2,Battelle-Northwest, Pacific Northwest Lab., Richland, WA (1967) 56.
[196] ANCELLIN, J., GUÉGUÉNIAT, P., GERMAIN, P., Radioécologie Marine,Editions Eyrolles, Paris (1979) 256.
[197] SWIFT, D.J., KERSHAW, P.J., Generic Parameters for Modelling Marine andFreshwater Systems, Environ. Techn. Note RL 7/99, Centre for Environment,Fisheries and Aquaculture Science, Lowestoft, UK (1999) 47.
[198] ZAUKE, G.P., PETRI, G., Ecotoxicology of Metals in Invertebrates(DALLINGER, R., RAINBOW, P.S., Eds), Lewis Publishers, Boca Raton, FL(1993) 23.
[199] PENTREATH, R.J., “The biological availability to marine organisms of transura-nium and other long-lived nuclides”, Impact of Radionuclide Releases into theMarine Environment (Proc. Symp. Vienna, 1980), IAEA, Vienna (1981) 241.
[200] BROWN, J.E., et al., Levels of 99Tc in seawater and biota samples fromNorwegian coastal waters and adjacent seas, Mar. Pollut. Bull. 38 (1999) 560.
[201] VAN WEERS, A.W., VAN RAAPHORST, J.G., “Accumulation of trace elementsin coastal marine organisms”, Marine Radioecology (Proc. 3rd OECD/NEA Sem.Tokyo, 1979), OECD, Paris (1980) 303.
[202] FOWLER, S.W., Trace metals in zooplankton particulate products, Nature(London) 269 (1977) 51.
[203] HEYRAUD, M., CHERRY, R.D., Polonium-210 and lead-210 in marine foodchains, Mar. Biol. 52 (1979) 227.
[204] FOWLER, S.W., CARVALHO, F.P., ASTON, S.R., Experimental studies on cali-fornium bioavailability to marine benthic invertebrates, J. Environ. Radioact. 3(1986) 219.
[205] TURGEON, D.D., O’CONNOR, T.P., Long Island Sound: Distributions, trends,and effects of chemical contamination, Estuaries 14 (1991) 279.
[206] SEGAR, D.A., COLLINS, J.D., RILEY, J.P., The distribution of the major andsome minor elements in marine animals, Part II: Molluscs, J. Mar. Biol.Assoc. U.K.51 (1971) 131.
[207] KARBE, L., SCHNIER, C., SIEWERS, H.O., Trace elements in mussels (Mytilusedulis) from coastal areas of the North Sea and the Baltiez multielement analysesusing instrumental neutron activation analyses, J. Radioanal. Chem. 37 (1977) 927.
[208] CARLISLE, D.B., Niobium in ascidians, Nature (London) 181 (1958) 933.[209] FUKAI, R., MEINKE, W.W., Some activation analyses of six trace elements in
marine biological ashes, Nature (London) 184 (1959) 815.[210] FUKAI, R., MEINKE, W.W., Activation analyses of vanadium, arsenic, molybde-
num, tungsten, rhenium, and gold in marine organisms, Limnol. Oceanogr. 7(1962) 186.
[211] LUCU, C., JELISAVCIC, O., LUCIC, S., STRORAL, P., Interactions of 233Pa withtissues of Mytilus galloprovincialis and Carcinus mediterraneus, Mar. Biol. 2(1969) 103.
90
[212] HODGE, V.F., KOIDE, M., GOLDBERG, E.D., Particulate uranium, plutoniumand polonium in the biogeochemistries of the coastal zone, Nature (London) 277(1979) 206.
[213] HOROWITZ, C.T., SCHOCK, H., HOROWITZ-KISIMOVA, L.A., The contentof scandium, thorium, silver and other trace elements in different plant species,Plant Soil 40 (1974) 397.
[214] MAUCHLINE, J.,TEMPLETON,W.L., Strontium, calcium and barium in marineorganisms from the Irish Sea, J. Cons. Int. Explor. Mer 30 (1966) 161.
[215] PENTREATH, R.J., Monitoring of Radionuclides, Fish. Tech. Paper 150, FAO,Rome (1976) 8.
[216] HOLM, E., PERSSON, B.R.R., “Behaviour of natural (Th and U) and artificial(Pu and Am) actinides in coastal waters”, Marine Radioecology (Proc. 3rdOECD/NEA Sem. Tokyo, 1979), OECD, Paris (1980) 237.
[217] NILSSON, M., et al., “Radionuclides in Fucus from inter-Scandinavian waters”,Impacts of Radionuclide Releases into the Marine Environment (Proc. Symp.Vienna, 1980), IAEA, Vienna (1981) 501.
[218] FISHER, N.S., BJERREGAARD, P., FOWLER, S.W., Interactions of marineplankton with transuranic elements, 1. Biokinetics of neptunium, plutonium,americium and californium in phytoplankton, Limnol. Oceanogr. 28 (1983) 432.
[219] LOWMAN, F.G., RICE, T.R., RICHARDS, F.A., “Accumulation and redistribu-tion of radionuclides by marine organisms”, Radioactivity in the MarineEnvironment, National Academy of Sciences, Washington, DC (1971) 161.
[220] FOWLER, S.W., BENAYOUN, G., PARSI, P., ESSA, M.W.A., SHULTE, E.H.,“Experimental studies on the bioavailability of technetium in selected marineorganisms”, Impacts of Radionuclide Releases into the Marine Environment(Proc. Symp. Vienna, 1980), IAEA, Vienna (1981) 319.
[221] YAMAMOTO, T., FUJITA, T., ISHIBASHI, M., Chemical studies on the sea-weeds (25). Vanadium and titanium contents in seaweeds, Rec. Oceanogr. WorksJpn. 10 (1970) 125.
[222] BALLESTRA, S., NOSHKIN, V., Report on the Intercomparison Run:Radionuclides in Seawater and Collected Outside Mururoa Atoll, IAEA/AL/044,IAEA, Vienna (1991).
[223] MARZANO, F.N., TRIULZI, C., A radioecological survey of Northern andMiddle Adriatic Sea before and after the Chernobyl event (1979–1990), Mar.Pollut. Bull. 28 (1994) 244.
[224] KHARKAR, D.P., THOMSON, J., TUREKIAN, K.K., FORSTER, W.O.,Uranium and thorium decay series nuclides in plankton from the Caribbean,Limnol. Oceanogr. 21 (1976) 294.
[225] HIGGO, J.J.W., CHERRY, R.D., HEYRAUD, M., FOWLER, S.W., Rapidremoval of plutonium from the oceanic surface layer by zooplankton faecal pel-lets, Nature (London) 266 (1977) 623.
[226] FISHER, N.S., FOWLER, S.W., “The role of biogenic debris in the vertical trans-port of transuranic wastes in the sea”, Oceanic Processes in Marine Pollution,Vol. 2: Physiochemical Processes and Wastes in the Ocean (BURT, W.V.,DUEDALL, I.W., O’CONNOR, T.P., Eds), Krieger, Malaban, FL (1987) 197.
91
[227] FOWLER, S.W., LA ROSA, J., LOPEZ, J.-J., TEYSSIE, J.-J., SMALL, L.F.,“Interannual variation in transuranic flux at the VERTEX time-series stationin the Northeast Pacific and its relationship to biological activity”,Radionuclides in the Study of Marine Processes (Proc. Int. Symp. Norwich, UK,1991) (KERSHAW, P.J., WOODHEAD, D.S., Eds), Elsevier, London (1991) 286.
[228] FISHER, N.S., BJERREGAARD, P., FOWLER, S.W., Interactions of marineplankton with transuranic elements, 3. Biokinetics of americium in euphausiids,Mar. Biol. 75 (1983) 261.
[229] SUNDA, W.G., HUNTSMAN, S.A., Interrelated influence of iron, light and cellsize on marine phytoplankton growth, Nature (London) 390 (1997) 389.
[230] FISHER, N.S., REINFELDER, J.R., “The trophic transfer of metals in marinesystems”, Metal Speciation in Aquatic Systems (TESSIER, A., TURNER, D.R.,Eds), Wiley, Chichester (1995) 363.
[231] MARTIN, J.H., KNAUER, G.A., The elemental composition of plankton,Geochim. Cosmochim. Acta 37 (1973) 1639.
[232] LAEVASTU, T., THOMPSON, T.G., The determination and occurrence of nickelin seawater, marine organisms, and sediments, J. Cons. Int. Explor. Mer 21 (1956)125.
[233] BAINES, S.B., FISHER, N.S., Interspecific differences in the bioconcentration ofselenite by phytoplankton and their ecological implications, Mar. Ecol. Prog. Ser.213 (2001) 1.
[234] FISHER, N.S., Bioaccumulation of technetium by marine phytoplankton,Environ. Sci. Technol. 16 (1982) 579.
[235] HELDAL, H.E., STUPAKOFF, I., FISHER, N.S., Bioaccumulation of 137Cs and57Co by five marine phytoplankton species, J. Environ. Radioact. 57 (2001) 231.
[236] SZEFER, P., OSTROWSKI, S., On the occurrence of uranium and thorium in thebiosphere of natural waters, 1. Uranium and thorium in plankton and inherentplants, Oceanology 13 (1980) 35.
[237] EUSTACE, I.J., Zinc, cadmium, copper and manganese in species of finfish andshellfish caught in the Derwent Estuary, Tasmania, Aust. J. Mar. Freshwat. Res. 25(1974) 209.
[238] ISHII, T., SUZUKI, H., KOYANAGI, T., Determination of trace elements inmarine organisms, 1. Factors for variation of concentration of trace element, Bull.Jpn. Soc. Sci. Fish. 44 (1978) 155.
[239] HOROWITZ, A., PRESLEY, B.J., Trace metal concentrations and partitioning inzooplankton, neuston, and benthos from the South Texas Outer Continental Shelf,Arch. Environ. Contam. Toxicol. 5 (1977) 241.
[240] MATSUMOTO,T., SATAKE, M.,YAMAMOTO, J., HARUNA, S., On the micro-constituent elements in marine invertebrates, J. Oceanogr. Soc. Jpn. 20 (1964) 15.
[241] ESTABLIER, R., Estudio de la contaminación marina por metales pesados y susefectos biológicos, Inf. Tee. Inst. Invest. Pesqueras 47 (1977) 36.
[242] LEATHERLAND, T.M., BURTON, J.D., The occurrence of some trace metals incoastal organisms with particular reference to the Solent region, J. Mar. Biol.Assoc. U.K. 54 (1974) 457.
92
[243] HAMANAKA, T., KATO, H., TSUJITA, T., Cadmium and zinc in ribbon seal,Histriophoca fasciata, in the Okhotsk Sea, Res. Inst. N. Pac. Fish., HokkaidoUniversity, Special Volume (1977) 547.
[244] SUZUKI,Y., NAKAHARA, M., NAKAMURA, R.,Accumulation of cesium-137by useful mollusca, Bull. Jpn. Soc. Sci. Fish. 44 (1978) 325.
[245] GUARY, J.C., HIGGO, J.J.W., CHERRY, R.D., HEYRAUD, M., High concentra-tions of transuranics and natural radioactive elements in the branchial hearts ofthe cephalopod Octopus vulgaris, Mar. Ecol. Prog. Ser. 4 (1981) 123.
[246] YEATS, P.A., STENSON, G., HELLOU, J., Essential elements and priority con-taminants in liver, kidney, muscle and blubber of harp seal beaters, Sci. TotalEnviron. 243–244 (1999) 157.
[247] THOMPSON, D.R., “Metal levels in marine vertebrates”, Heavy Metals in theMarine Environment (FURNESS, R.W., RAINBOW, P.S., Eds), CRC Press, BocaRaton, FL (1990) 143.
[248] HOLM, E., PERSSON, B.R.R., HALLSTADIUS, L., AARKROG, A., DAHL-GAARD, H., Radio-cesium and transuranium elements in the Greenland andBarents Seas, Oceanol. Acta 6 (1983) 457.
[249] ANDERSON, S.S., LIVENS, F.R., SINGLETON, D.L., Radionuclides in greyseals, Mar. Pollut. Bull. 21 (1990) 343.
[250] CALMET, D., WOODHEAD, D., ANDRE, J.M., 210Pb, 137Cs and 40K in threespecies of porpoises caught in the eastern tropical Pacific Ocean, J. Environ.Radioact. 15 (1992) 153.
[251] WATSON, W.S., et al., Radionuclides in seals and porpoises in the coastal watersaround the UK, Sci. Total Environ. 234 (1999) 1.
[252] HOLM, E., University of Lund, personal communication, 1999.[253] CAMPLIN, W.C., Radioactivity in Surface and Coastal Waters of the British Isles,
1993, Aquatic Environment Monitoring Report No. 42, Directorate of FisheriesResearch, Lowestoft, UK (1994).
[254] CARROLL, J.,WOLKERS, H.,ANDERSEN, M., RISSANEN, K., 137Cs in ArcticSeals, Mar. Pollut. Bull. (in press).
[255] LEONARD, K.S., McCUBBIN, D., BLOWERS, P., TAYLOR, B.R., Dissolvedplutonium and americium in surface waters of the Irish Sea, 1973–1996, J. Environ.Radioact. 44 (1999) 129.
[256] DIETZ, R., RIGET, F., BORN, E.W., Geographical differences of zinc, cadmium,mercury and selenium in polar bears (Ursus maritimus) from Greenland, Sci.Total Environ. 245 (2000) 25.
[257] SICKEL, M.A.K., et al., Radioactivity in the Marine Environment, Report fromthe National Surveillance Programme, Strålevern Rep. 1995:1, NorwegianRadiation Protection Authority, Østerås (1995).
[258] LI, Y.-H., A brief discussion on the mean oceanic residence time of elements,Geochim. Cosmochim. Acta 46 (1982) 2671.
93
CONTRIBUTORS TO DRAFTING AND REVIEW
Cabianca, T. International Atomic Energy Agency
Carroll, J. Akvaplan-niva AS, Polar Environmental Centre,Norway
Fisher, N.S. Marine Sciences Research Center, Stony Brook University, United States of America
Fowler, S.W. International Atomic Energy Agency
Kershaw, P.J. Centre for Environment, Fisheries and Aquaculture Science, United Kingdom
Consultants Meetings
Monaco: 25–28 April 2000;Vienna, Austria: 30 October–3 November 2000, 2–4 December 2002
95
Related Documents