1 Technical Report Vulnerabilities in Major Operating Systems O. H. Alhazmi Y. K. Malaiya I. Ray {omar,malayia,indrajiy}@colostate.edu Department of Computer Science Colorado State University 2004

Welcome message from author
This document is posted to help you gain knowledge. Please leave a comment to let me know what you think about it! Share it to your friends and learn new things together.
Transcript

1
Technical Report
Vulnerabilities in Major Operating Systems
O. H. Alhazmi Y. K. Malaiya I. Ray
{omar,malayia,indrajiy}@colostate.edu Department of Computer Science
Colorado State University
2004
2
ABSTRACT
Operating systems are complex pieces of software. The usage environment puts challenges on systems causing them to uncover previously unknown defects. Some of these defects are concerned with the security requirements they are referred to as vulnerabilities. In this work, we attempt to study some reported data and try to identify some repeatable patterns. This is currently an initial work to put bases for further work in this area. Our ultimate goal is to try to model vulnerability growth and provide an estimation formula that will help us determine the present and the future.
Characterizing such vulnerability in a quantitative manner will allow us to assess security risks. We, therefore, analyze the historical data related to identification of vulnerabilities in several major operating systems through their different releases. In this work we will study effort and how can it affect accumulation of vulnerabilities. We believe that such a quantitative characterization of vulnerabilities is useful to estimate how much resources should be allocated to test a new operating system for security.

3
1. Introduction is widely recognized that fault free software is very difficult to achieve. While
extensive testing can isolate a large fraction of the defects, it is impossible to eliminate them completely. A defect density ranging from 3 to 6 faults per one thousand lines of software code (KSLOC) has been common [16] in the past. Thus, numerous attempts have been made by researchers to estimate, in a quantitative manner, the number of defects in a particular release version of software. These measures help in determining the resources that need to be allocated to test a particular piece of software since the operating system vulnerabilities – the faults associated with maintaining security requirements– are considered to be a special case of software defects, a similar measure for estimating security vulnerabilities is warranted. In this paper, we quantitatively examine the number of vulnerabilities in several recent operating systems. Such quantitative characterization of vulnerabilities can used to evaluate metrics which can guide the allocation of resources for security testing, scheduling, and development of security patches. Furthermore, it can be used by end-users to assess risks and estimate needed redundancy in resources and procedures to handle potential security breaches. . A vulnerability may be defined as a defect “which enables an attacker to bypass security measures” [7].
We will examine several operating systems. We have grouped them into related families. We have plotted the cumulative number of vulnerabilities as reported. One of our objectives is to identify possible reasons for the changes in the trend. We have examined data for both the both operating systems and the usage environment for these. In this paper, we study some of the attributes of usage environment and its effect on the vulnerabilities plots. We chose to study the accumulative vulnerability trends’ behavior because it gives better view of the discovery of vulnerabilities.
Researchers in software reliability engineering have developed methods that use plots of cumulative number of defects found against time. Methods have been developed to project the mean time to failure (MTTF) etc. that will result after a specific testing time [13, 15, 17]. Very little quantitative work has been done to characterize security vulnerabilities along the same line. One major difference makes understanding the vulnerability discovery rate harder. Throughout the lifetime of the software since its release, it encounters changes in its usage environment. When the new version of an operating version is released, its installed base starts to grow. However when a newer version of the operating system is released, the number of installations of the older version starts to decline. The rate at which the vulnerabilities are discovered are influenced by the interaction between the system and the environment. We need to look at both to form a comprehensive perspective of security.
Connectivity of computing systems has brought security of operating systems under intense scrutiny. Much of the work on security has been qualitative, focused on detection and prevention of vulnerabilities in these systems. In this paper we address feasibility of quantitative characterization of security risks in terms of vulnerabilities present in the software. Such characterization of vulnerabilities can provide us metrics that can be used by the developers and potential users. It is can be used to develop guidelines for allocation of resources for security testing, scheduling, and development

4
of security patches. Furthermore, it can be used by the users for assessing risk and estimating needed redundancy in resources and procedures to handle potential breaches. Quantitative characterization requires use of models that capture repeatable behavior. Such models have been in use in software reliability engineering field where the number of defects and the defect finding rate can be measured. In this paper we examine available data to identify possible factors to be considered.
Fortunately we have access to actual data about vulnerabilities found in major operating systems. In this paper we will try to address some major questions. Based on available data, do we observe any similarity of behavior when we observe new vulnerabilities discovery rate for different systems so that we can develop suitable models? It has been noted that for a given state of technology, the defect density of software systems at release tend to fall within a range [14]. This makes defect density a suitable measure for managing software projects. Is it possible to do something similar for vulnerabilities in the systems software? We have attempted to identify metrics that are potentially measurable and can be used for managing risk in such systems.
5
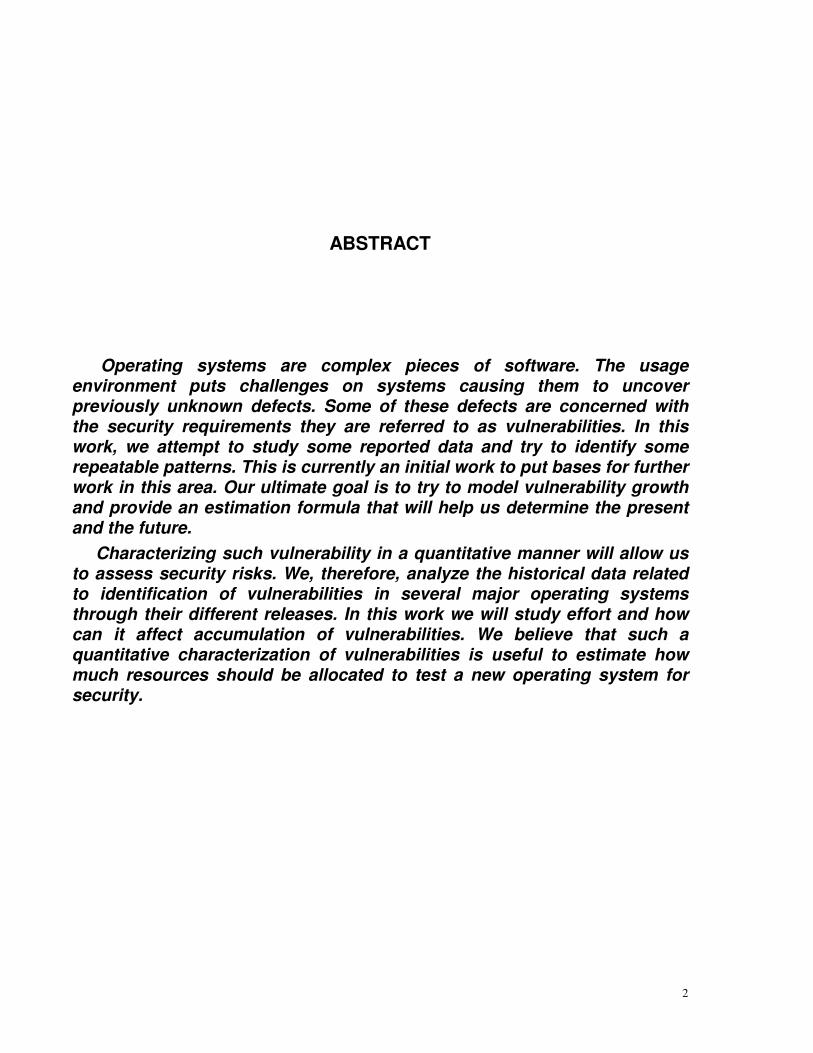
2. Related Work
Some work has recently been done on the quantitative aspects of security, but many important problems are yet to be investigated. We need generally accepted metrics that are practical, useful and meaningful.
Quantitative evaluation of security has different scopes. Depending on how we view systems, the applicable metric can be different. In [3, 11], Littlewood et al have presented some work using the dependability and reliability backgrounds. They have tried to measure and assess security from this prospective. They have compared the reliability and security attributes of systems. They have proposed the usage of effort instead of time to characterize the accumulation of vulnerabilities. However, they did not specify how to assess effort.
Some other researchers have focused on modeling and designing tools that will make some kind of security assessment possible [6, 10]. Wang and Wulf have [19] proposed a framework to measure and compare systems security by dividing the system into smaller components and considering their individual significance and probabilities of failure. Arbach et al. [2] and Browne et al. [4] have examined several systems using the vulnerability data reported by CERT. Browne et al. [4] examined some actual statistical data to study the growth of cumulative vulnerabilities found. They have suggested that cumulative vulnerabilities C accumulate according to MSIC += ; where M is time, and I and S are estimated using regression.
We need to develop an understanding of what processes control the discovery rates of the vulnerabilities. As more data becomes available to us, we can verify the models and enhance them. The goal is to be confident that the model we have will enable developers and users to better assess security of these systems.

6
3. Observable Trends in Vulnerability Data
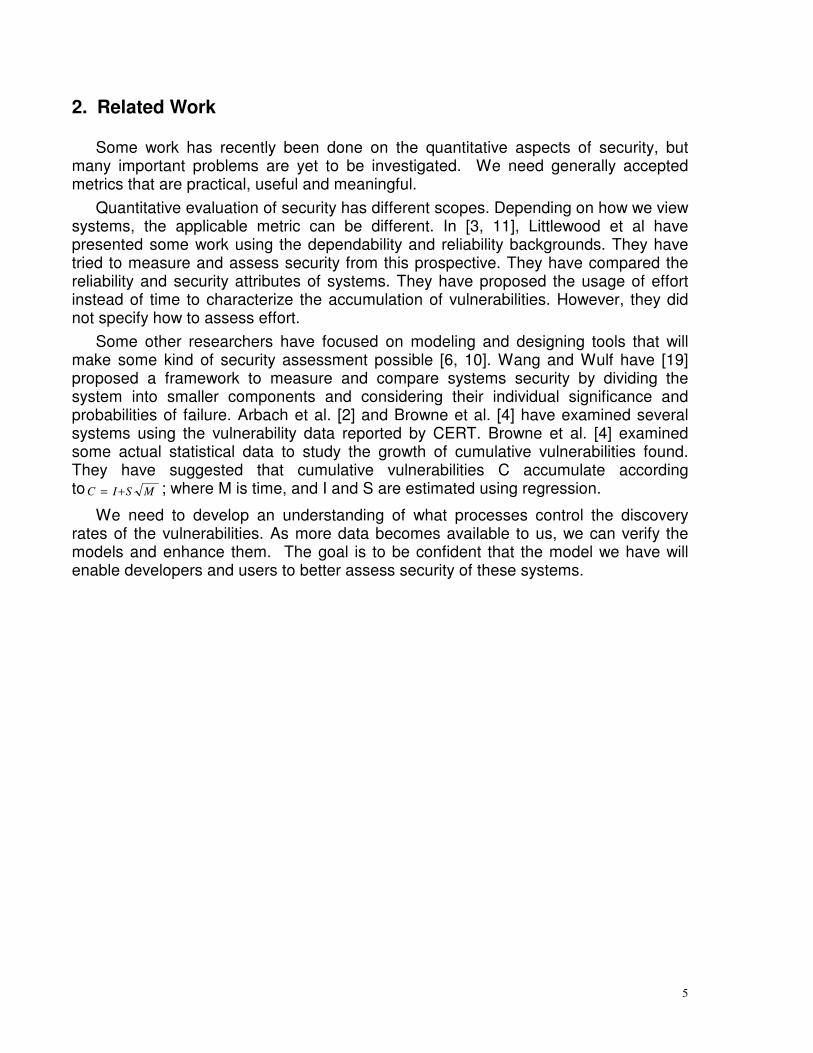
Operating Systems face escalating security challenges because connectivity is growing and the overall number of incidents is increasing. CERT and other databases keep track of reported vulnerabilities and incidents. The data they have published is plotted in Figures 1 and 2 [5]. These figures shows rapid growth in both number of reported incidents and number of vulnerabilities discovered. Note that an incident is defined as the act of violating an explicit or implied security policy.
To get an idea of the threat posed by security incidents, we plotted normalized data in Figure 3 which gives the number of incidents reported per vulnerability. It shows a rising trend of incidents reported per vulnerability, but the trend is not growing exponentially. The overall trend for the eight year period is perhaps linear, suggesting a possible correlation between rates of incidents and the vulnerability finding rate. The positive slope suggests that the number of incidents is rising faster than the complexity of the systems.
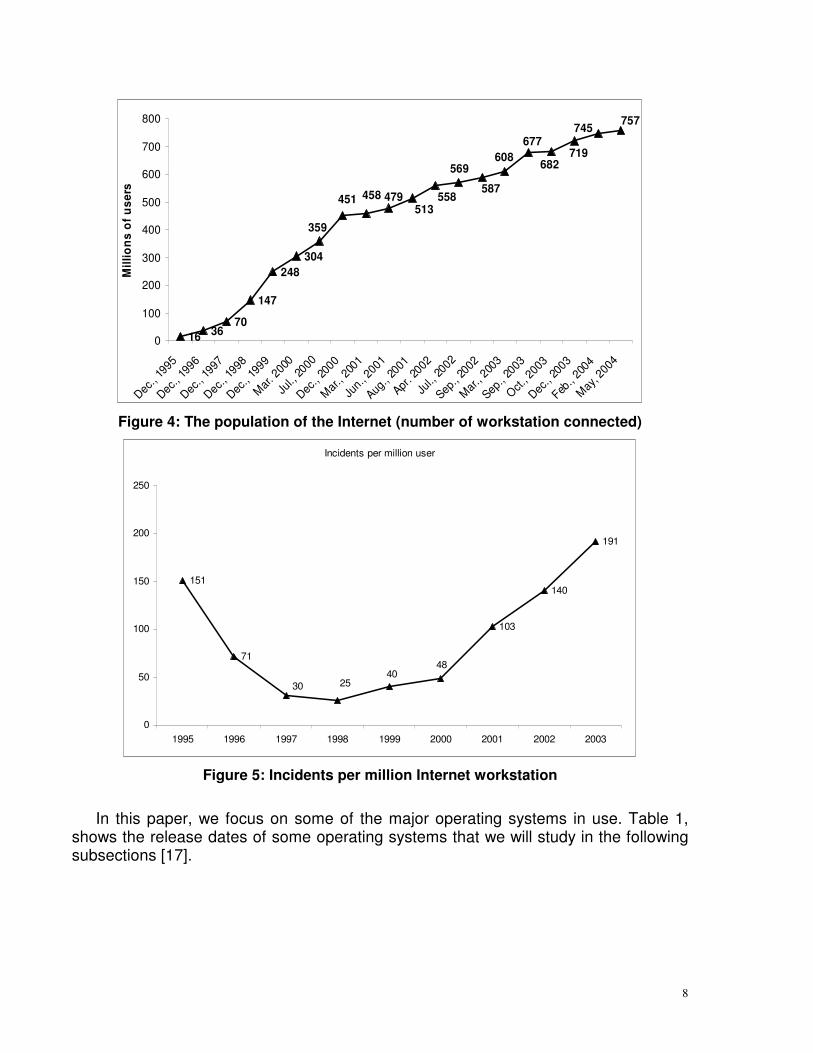
The number of the users of the internet, the environment that incidents take place in, has shown fast growth as shown in Figure 4 [9]. To see the correlation between the internet population and the number of incidents we plotted the number of incidents per million workstations, given in Figure 5.
417
1090
2437
171 345 262
3,7844129
0
500
1000
1500
2000
2500
3000
3500
4000
4500
1995 1996 1998 1999 2000 2001 2002 2003
Vuln
erab
iliti
es R
epor
ted
Figure 1: Number of vulnerabilities reported
7
52,658
82,094
137,529
21,756
9,8593,734
2,1342,5732,412
2,3401,334
7734062520
20000
40000
60000
80000
100000
120000
140000
160000
1990 1991 1992 1993 1994 1995 1996 1997 1998 1999 2000 2001 2002 2003
Inci
den
ts �
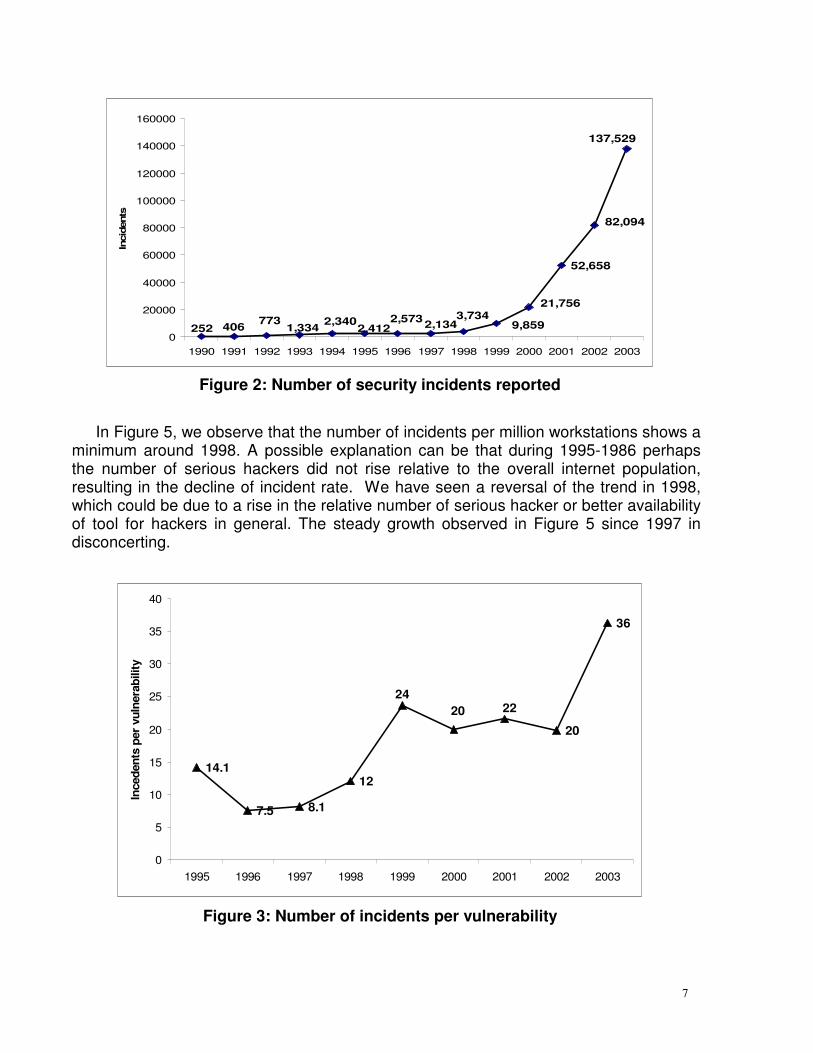
Figure 2: Number of security incidents reported
In Figure 5, we observe that the number of incidents per million workstations shows a
minimum around 1998. A possible explanation can be that during 1995-1986 perhaps the number of serious hackers did not rise relative to the overall internet population, resulting in the decline of incident rate. We have seen a reversal of the trend in 1998, which could be due to a rise in the relative number of serious hacker or better availability of tool for hackers in general. The steady growth observed in Figure 5 since 1997 in disconcerting.
14.1
7.5 8.1
12
20
36
20 2224
0
5
10
15
20
25
30
35
40
1995 1996 1997 1998 1999 2000 2001 2002 2003
Ince
dent
s pe
r vu
lner
abili
ty
Figure 3: Number of incidents per vulnerability
8
16 3670
147
248304
757745
719682
677608
587
569
558513
479458451
359
0
100
200
300
400
500
600
700
800
Dec., 1
995
Dec., 1
996
Dec., 1
997
Dec., 1
998
Dec., 1
999
Mar. 20
00
Jul.,
2000
Dec., 2
000
Mar., 2
001
Jun.,
2001
Aug., 2
001
Apr. 2
002
Jul.,
2002
Sep., 2
002
Mar., 2
003
Sep., 2
003
Oct., 2
003
Dec., 2
003
Feb., 2
004
May, 2
004
Mill
ion
s o
f u
sers
Figure 4: The population of the Internet (number of workstation connected)
Incidents per million user
151
71
103
140
191
4840
30 25
0
50
100
150
200
250
1995 1996 1997 1998 1999 2000 2001 2002 2003
Figure 5: Incidents per million Internet workstation
In this paper, we focus on some of the major operating systems in use. Table 1, shows the release dates of some operating systems that we will study in the following subsections [17].
9
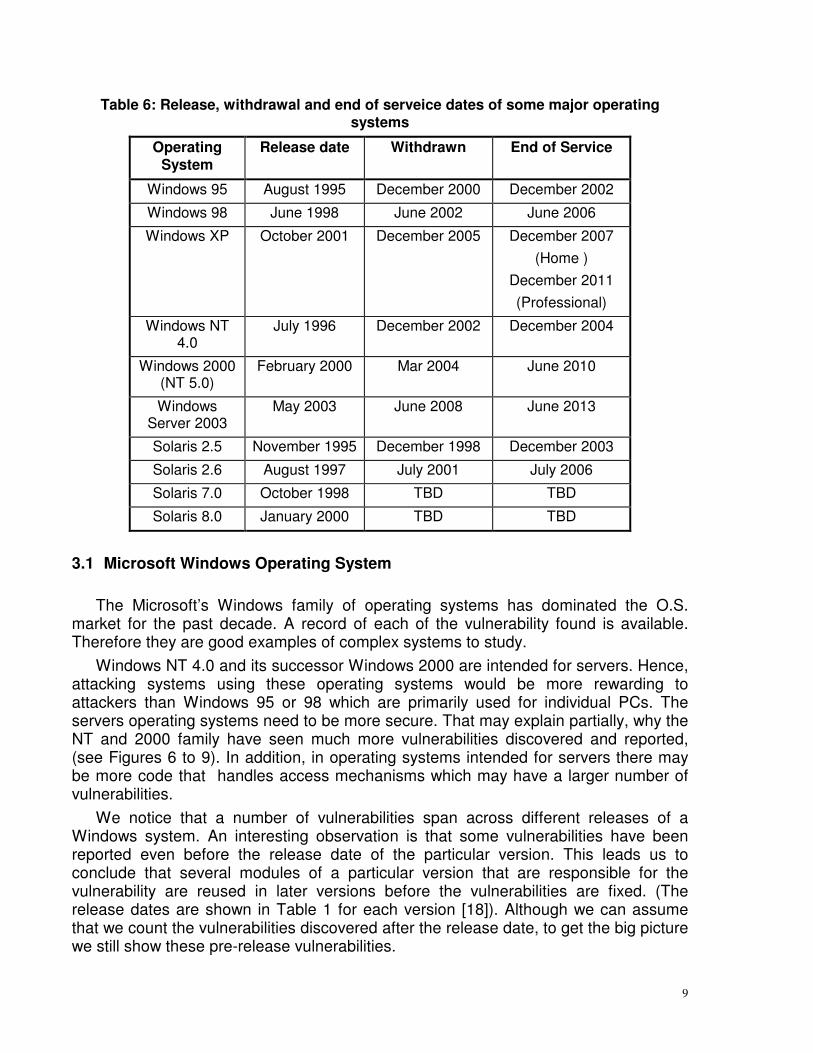
Table 6: Release, withdrawal and end of serveice dates of some major operating systems
Operating System
Release date Withdrawn End of Service
Windows 95 August 1995 December 2000 December 2002
Windows 98 June 1998 June 2002 June 2006
Windows XP October 2001 December 2005 December 2007 (Home )
December 2011 (Professional)
Windows NT 4.0
July 1996 December 2002 December 2004
Windows 2000 (NT 5.0)
February 2000 Mar 2004 June 2010
Windows Server 2003
May 2003 June 2008 June 2013
Solaris 2.5 November 1995 December 1998 December 2003
Solaris 2.6 August 1997 July 2001 July 2006
Solaris 7.0 October 1998 TBD TBD
Solaris 8.0 January 2000 TBD TBD
3.1 Microsoft Windows Operating System
The Microsoft’s Windows family of operating systems has dominated the O.S. market for the past decade. A record of each of the vulnerability found is available. Therefore they are good examples of complex systems to study.
Windows NT 4.0 and its successor Windows 2000 are intended for servers. Hence, attacking systems using these operating systems would be more rewarding to attackers than Windows 95 or 98 which are primarily used for individual PCs. The servers operating systems need to be more secure. That may explain partially, why the NT and 2000 family have seen much more vulnerabilities discovered and reported, (see Figures 6 to 9). In addition, in operating systems intended for servers there may be more code that handles access mechanisms which may have a larger number of vulnerabilities.
We notice that a number of vulnerabilities span across different releases of a Windows system. An interesting observation is that some vulnerabilities have been reported even before the release date of the particular version. This leads us to conclude that several modules of a particular version that are responsible for the vulnerability are reused in later versions before the vulnerabilities are fixed. (The release dates are shown in Table 1 for each version [18]). Although we can assume that we count the vulnerabilities discovered after the release date, to get the big picture we still show these pre-release vulnerabilities.
10
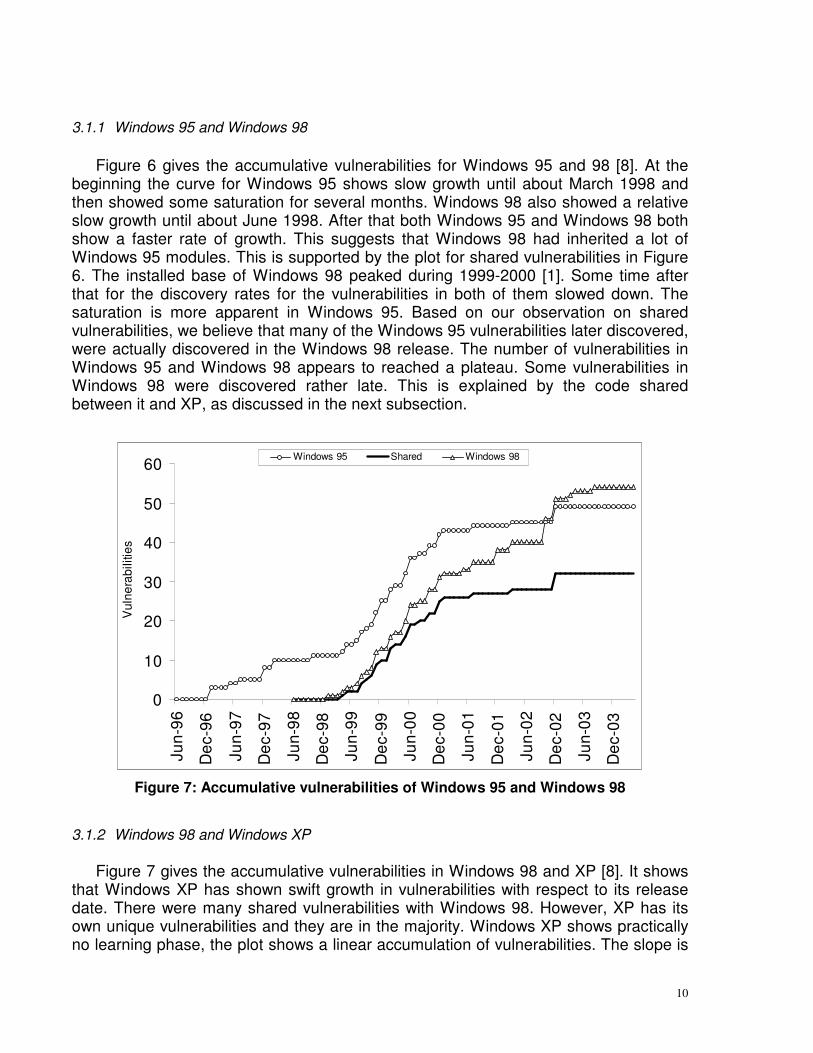
3.1.1 Windows 95 and Windows 98
Figure 6 gives the accumulative vulnerabilities for Windows 95 and 98 [8]. At the beginning the curve for Windows 95 shows slow growth until about March 1998 and then showed some saturation for several months. Windows 98 also showed a relative slow growth until about June 1998. After that both Windows 95 and Windows 98 both show a faster rate of growth. This suggests that Windows 98 had inherited a lot of Windows 95 modules. This is supported by the plot for shared vulnerabilities in Figure 6. The installed base of Windows 98 peaked during 1999-2000 [1]. Some time after that for the discovery rates for the vulnerabilities in both of them slowed down. The saturation is more apparent in Windows 95. Based on our observation on shared vulnerabilities, we believe that many of the Windows 95 vulnerabilities later discovered, were actually discovered in the Windows 98 release. The number of vulnerabilities in Windows 95 and Windows 98 appears to reached a plateau. Some vulnerabilities in Windows 98 were discovered rather late. This is explained by the code shared between it and XP, as discussed in the next subsection.
0
10
20
30
40
50
60
Jun-
96
Dec
-96
Jun-
97
Dec
-97
Jun-
98
Dec
-98
Jun-
99
Dec
-99
Jun-
00
Dec
-00
Jun-
01
Dec
-01
Jun-
02
Dec
-02
Jun-
03
Dec
-03
Vul
nera
bilit
ies
Windows 95 Shared Windows 98
Figure 7: Accumulative vulnerabilities of Windows 95 and Windows 98
3.1.2 Windows 98 and Windows XP
Figure 7 gives the accumulative vulnerabilities in Windows 98 and XP [8]. It shows that Windows XP has shown swift growth in vulnerabilities with respect to its release date. There were many shared vulnerabilities with Windows 98. However, XP has its own unique vulnerabilities and they are in the majority. Windows XP shows practically no learning phase, the plot shows a linear accumulation of vulnerabilities. The slope is

11
significantly sharper than for Windows 98. The sharpness of the curve for XP is explained by its fast adoption rate [1] making finding vulnerabilities in XP more rewarding. Windows 98 has shown longer learning phase followed by a linear accumulation, later followed by saturation.
0
10
20
30
40
50
60
Jul-9
8
Oct
-98
Jan-
99
Apr
-99
Jul-9
9
Oct
-99
Jan-
00
Apr
-00
Jul-0
0
Oct
-00
Jan-
01
Apr
-01
Jul-0
1
Oct
-01
Jan-
02
Apr
-02
Jul-0
2
Oct
-02
Jan-
03
Apr
-03
Jul-0
3
Oct
-03
Jan-
04
Vul
nera
bilti
es
Windows XP Shared Windows 98
Figure 8: Accumulative vulnerabilities reported in Windows 98 and its successor
Windows XP
3.1.3 Windows 98 and shared vulnerabilities with Windows 95 and Windows XP The relationship between the vulnerabilities reported in the older Windows 95,
Windows 98 and Windows XP is important. As we can observe in Figure 8, Windows 98 inherited most of the older vulnerabilities in Windows 95. Vulnerabilities reported for Windows 98 slowed down at some point, only to pick up again when Windows XP was released. It appears that Windows XP has contributed to the discovery of most of the later Windows 98 vulnerabilities.
The data for the three operating systems demonstrates that there is significant interdependence among vulnerability discovery rates for three versions. This interdependence due to the sharing of code and shifting shares of the installed base needs to be taken into account when examining the vulnerability discovery trends. Windows 98 represents a middle stage between the other two versions from the perspective of vulnerability discovery.
3.1.4 Windows NT 4.0 and Windows 2000
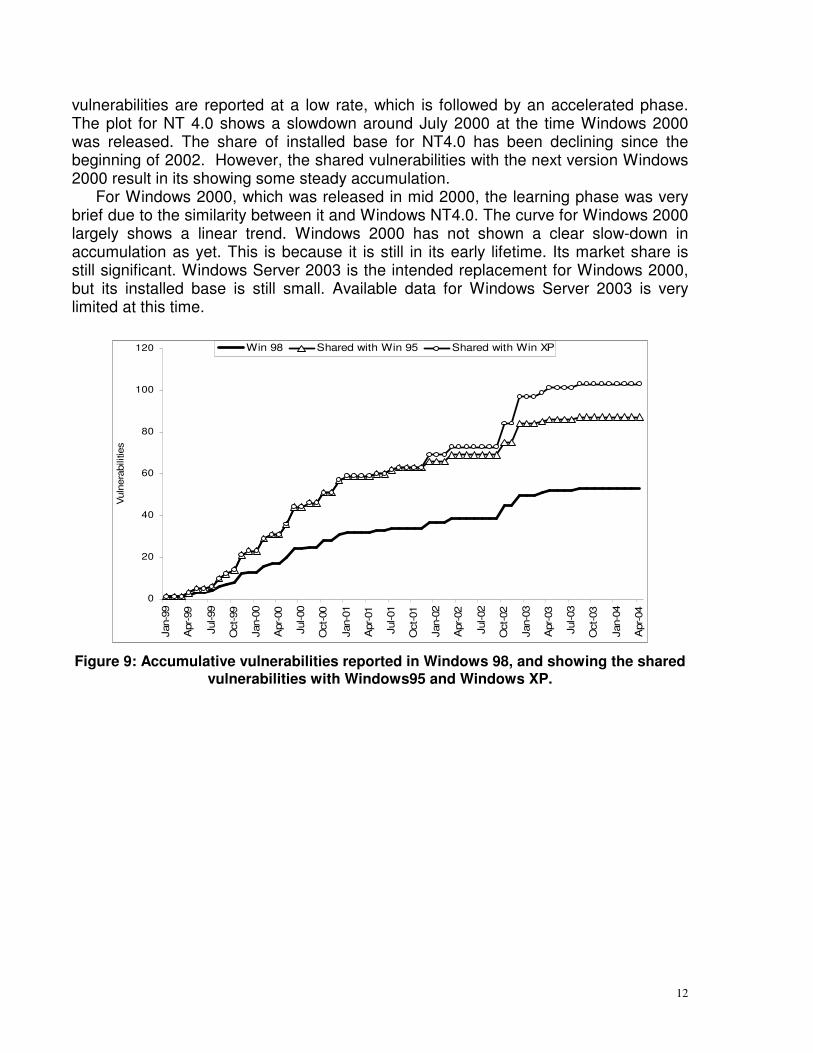
Figure 9 gives the plots for vulnerability discovery in the Windows NT family, which includes Windows 2000 [8]. An initial learning phase is observed in which
12
vulnerabilities are reported at a low rate, which is followed by an accelerated phase. The plot for NT 4.0 shows a slowdown around July 2000 at the time Windows 2000 was released. The share of installed base for NT4.0 has been declining since the beginning of 2002. However, the shared vulnerabilities with the next version Windows 2000 result in its showing some steady accumulation.
For Windows 2000, which was released in mid 2000, the learning phase was very brief due to the similarity between it and Windows NT4.0. The curve for Windows 2000 largely shows a linear trend. Windows 2000 has not shown a clear slow-down in accumulation as yet. This is because it is still in its early lifetime. Its market share is still significant. Windows Server 2003 is the intended replacement for Windows 2000, but its installed base is still small. Available data for Windows Server 2003 is very limited at this time.
0
20
40
60
80
100
120
Jan-
99
Apr
-99
Jul-9
9
Oct
-99
Jan-
00
Apr
-00
Jul-0
0
Oct
-00
Jan-
01
Apr
-01
Jul-0
1
Oct
-01
Jan-
02
Apr
-02
Jul-0
2
Oct
-02
Jan-
03
Apr
-03
Jul-0
3
Oct
-03
Jan-
04
Apr
-04
Vul
nera
bilit
ies
Win 98 Shared with Win 95 Shared with Win XP
Figure 9: Accumulative vulnerabilities reported in Windows 98, and showing the shared vulnerabilities with Windows95 and Windows XP.

13
0
20
40
60
80
100
120
140
160
180
Jul-9
6
Nov-96
Mar-97
Jul-9
7
Nov-97
Mar-98
Jul-9
8
Nov-98
Mar-99
Jul-9
9
Nov-99
Mar-00
Jul-0
0
Nov-00
Mar-01
Jul-0
1
Nov-01
Mar-02
Jul-0
2
Nov-02
Mar-03
Jul-0
3
Nov-03
Mar-04
Vul
nera
bilit
ies
Windows NT 4.0 Shared Windows 2000
Figure 10: Windows NT 4.0 and Windows 2000 vulnerabilities reported. Large triangle represents the release date for Win 2000.
3.2 Solaris
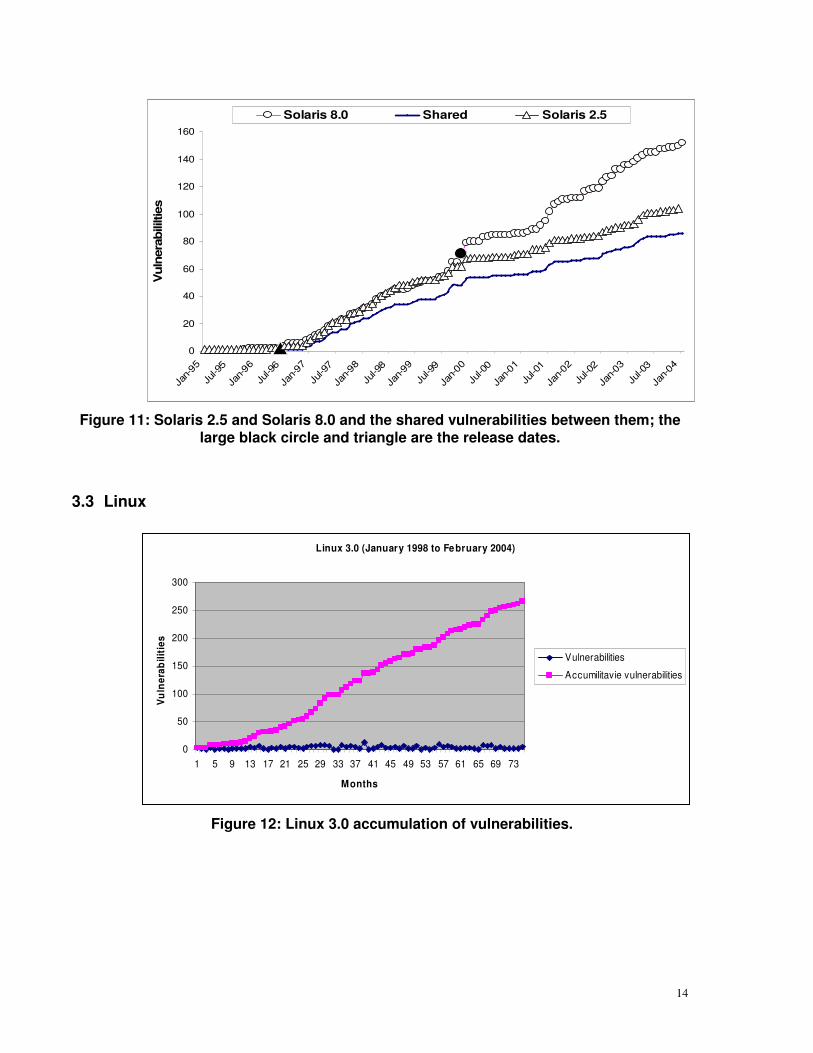
We next look at a very different operating system – the SunOS Solaris family, which has had several versions. We look at two versions of Solaris, version 2.5 and version 8.0. We compared their vulnerabilities accumulation and they seem to be very correlated. Solaris 8.0 is the successor so it contained most of the vulnerabilities of version 2.5. Then version 8.0 started to show some unique vulnerabilities with a few shared ones. For version 2.5 all the vulnerabilities reported later were also reported in 8.0. Thus we conclude that these vulnerabilities were inherited by version 8.0, and were discovered in either 8.0 or 2.5. No saturation is seen in either of them at this time.
For the Solaris operating systems, we do not see the changes as abrupt as in the windows operating systems. As we can see in Figure 10, the linear growth dominates the behavior.
14
0
20
40
60
80
100
120
140
160
Jan-
95
Jul-9
5
Jan-96
Jul-9
6
Jan-
97
Jul-9
7
Jan-98
Jul-9
8
Jan-
99
Jul-9
9
Jan-
00
Jul-0
0
Jan-01
Jul-0
1
Jan-
02
Jul-0
2
Jan-03
Jul-0
3
Jan-
04
Vuln
erab
ililti
es
Solaris 8.0 Shared Solaris 2.5
Figure 11: Solaris 2.5 and Solaris 8.0 and the shared vulnerabilities between them; the large black circle and triangle are the release dates.
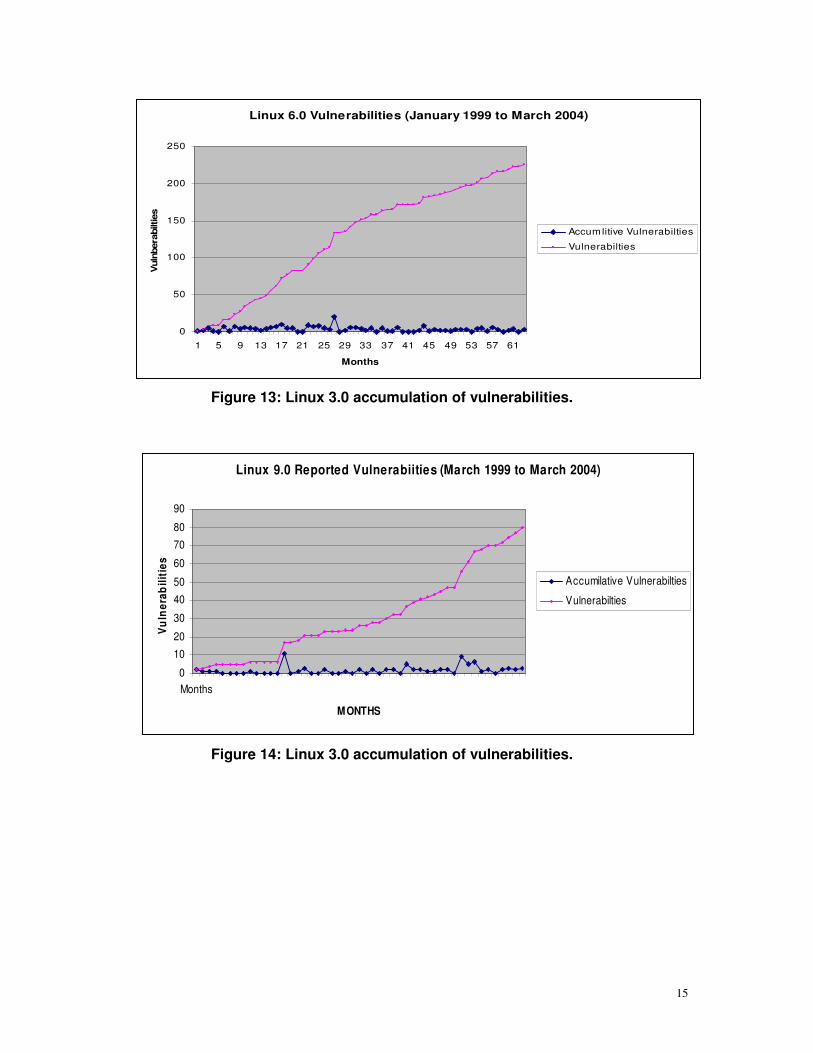
3.3 Linux
Linux 3.0 (January 1998 to February 2004)
0
50
100
150
200
250
300
1 5 9 13 17 21 25 29 33 37 41 45 49 53 57 61 65 69 73
Months
Vuln
erab
iliti
es
Vulnerabilities
Accumilitavie vulnerabilities
Figure 12: Linux 3.0 accumulation of vulnerabilities.
15
Linux 6.0 Vulnerabilities (January 1999 to March 2004)
0
50
100
150
200
250
1 5 9 13 17 21 25 29 33 37 41 45 49 53 57 61
Months
Vul
nber
abilt
ies
Accumlitive Vulnerabilties
Vulnerabilties
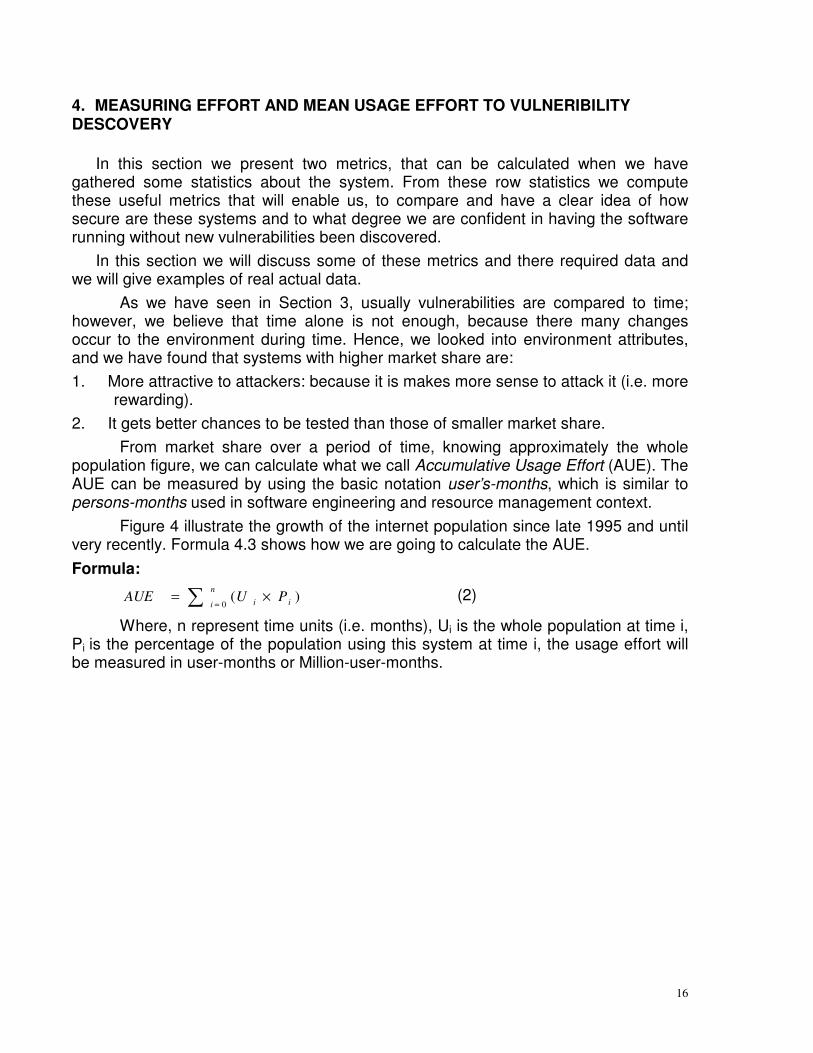
Figure 13: Linux 3.0 accumulation of vulnerabilities.
Linux 9.0 Reported Vulnerabiities (March 1999 to March 2004)
0
1020
30
4050
60
7080
90
Months
MONTHS
Vu
lner
abili
ties
Accumilative Vulnerabilties
Vulnerabilties
Figure 14: Linux 3.0 accumulation of vulnerabilities.
16
4. MEASURING EFFORT AND MEAN USAGE EFFORT TO VULNERIBILITY DESCOVERY
In this section we present two metrics, that can be calculated when we have gathered some statistics about the system. From these row statistics we compute these useful metrics that will enable us, to compare and have a clear idea of how secure are these systems and to what degree we are confident in having the software running without new vulnerabilities been discovered.
In this section we will discuss some of these metrics and there required data and we will give examples of real actual data.
As we have seen in Section 3, usually vulnerabilities are compared to time; however, we believe that time alone is not enough, because there many changes occur to the environment during time. Hence, we looked into environment attributes, and we have found that systems with higher market share are: 1. More attractive to attackers: because it is makes more sense to attack it (i.e. more
rewarding). 2. It gets better chances to be tested than those of smaller market share.
From market share over a period of time, knowing approximately the whole population figure, we can calculate what we call Accumulative Usage Effort (AUE). The AUE can be measured by using the basic notation user’s-months, which is similar to persons-months used in software engineering and resource management context.
Figure 4 illustrate the growth of the internet population since late 1995 and until very recently. Formula 4.3 shows how we are going to calculate the AUE. Formula:
)(0 i
n
i i PUAUE ×= � = (2)
Where, n represent time units (i.e. months), Ui is the whole population at time i, Pi is the percentage of the population using this system at time i, the usage effort will be measured in user-months or Million-user-months.

17
0
10
20
30
40
50
60
May-99
Aug-9
9
Nov-99
Feb-0
0
May-00
Aug-0
0
Nov-00
Feb-0
1
May-01
Aug-0
1
Nov-01
Feb-0
2
May-02
Aug-0
2
Nov-02
Feb-0
3
May-03
Aug-0
3
Nov-03
Feb-0
4
Mar
ket S
hare
Per
cent
age
Windows 95 Windows 98Windows XP Windows NTWindows 2000 Others
Figure 15: Trends showing users percentage for each OS.
0
50
100
150
200
250
300
350
400
May-99
Aug-9
9
Nov-99
Feb-0
0
May-00
Aug-0
0
Nov-00
Feb-0
1
May-01
Aug-0
1
Nov-01
Feb-0
2
May-02
Aug-0
2
Nov-02
Feb-0
3
May-03
Aug-0
3
Nov-03
Feb-0
4
Win 95 Win 98 Win XP Win NT 2000
Figure 16: Trend shows the actual number of users for each system. From the data in the tables 15 and figure 16, we compiled the total number of
workstation that has the system installed in each month individually see figure 18. Figure 19, shows only a limited part of the picture, from that picture we can view a three operating system model, it would look very much close to what figure 20 shows.

18
Figure 17: The usage environment challenge effort against time during the
lifetime of three consecutive versions of an O.S.
0
2000
4000
6000
8000
10000
12000
14000
May-99
Aug-9
9
Nov-99
Feb-0
0
May-00
Aug-0
0
Nov-00
Feb-0
1
May-01
Aug-0
1
Nov-01
Feb-0
2
May-02
Aug-0
2
Nov-02
Feb-0
3
May-03
Aug-0
3
Nov-03
Feb-0
4
win 95 win 98 win XP win nt 2000
Figure 18: Accumulative User-month.
Then we used formula 2 to build the accumulative usage effort for each system,
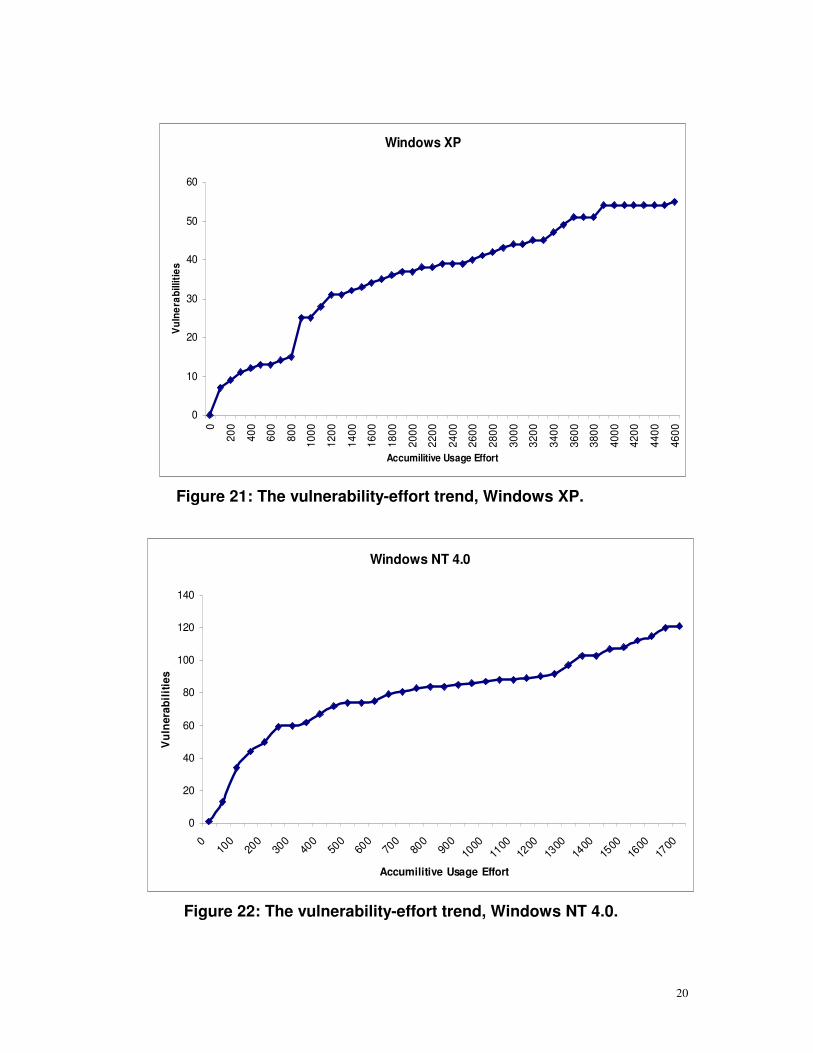
see figure 18. Now after what we have got in figure 18, we want to eliminate time as a factor to get vulnerability-AUE plots for each system individually. Figure 18, shows Windows 95, but because the analyzed data had started at a late stage of the lifetime of Windows 95(i.e. from May 1999), while Windows 95 was
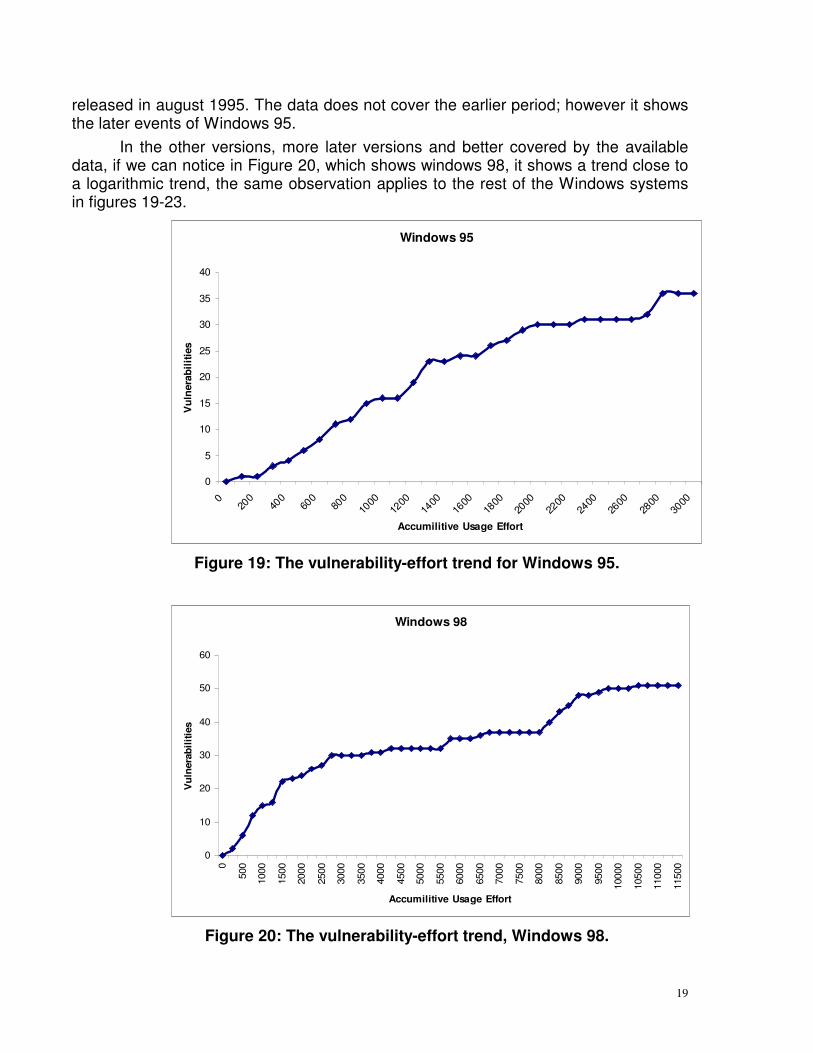
19
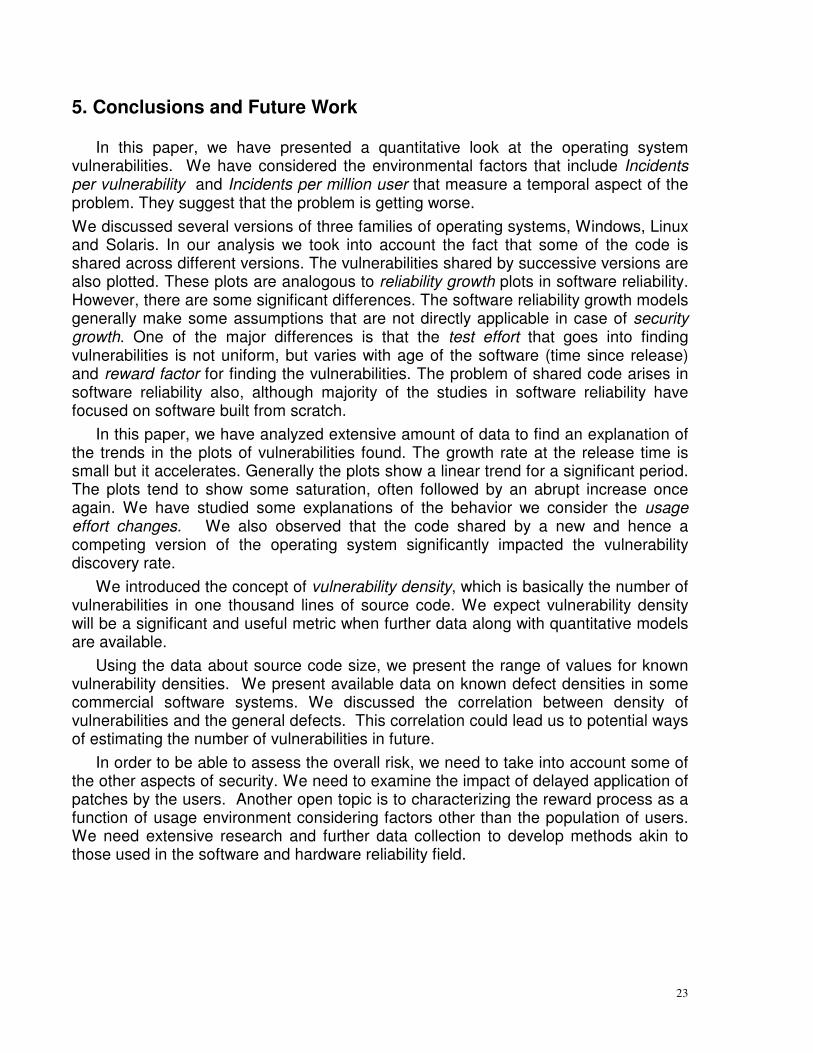
released in august 1995. The data does not cover the earlier period; however it shows the later events of Windows 95. In the other versions, more later versions and better covered by the available data, if we can notice in Figure 20, which shows windows 98, it shows a trend close to a logarithmic trend, the same observation applies to the rest of the Windows systems in figures 19-23.
Windows 95
0
5
10
15
20
25
30
35
40
020
040
060
080
010
0012
0014
0016
0018
0020
0022
0024
0026
0028
0030
00
Accumilitive Usage Effort
Vul
ner
abili
ties
Figure 19: The vulnerability-effort trend for Windows 95.
Windows 98
0
10
20
30
40
50
60
0
500
1000
1500
2000
2500
3000
3500
4000
4500
5000
5500
6000
6500
7000
7500
8000
8500
9000
9500
1000
0
1050
0
1100
0
1150
0
Accumilitive Usage Effort
Vul
nera
bilit
ies
Figure 20: The vulnerability-effort trend, Windows 98.
20
Windows XP
0
10
20
30
40
50
60
0
200
400
600
800
1000
1200
1400
1600
1800
2000
2200
2400
2600
2800
3000
3200
3400
3600
3800
4000
4200
4400
4600
Accumilitive Usage Effort
Vul
nera
billi
ties
Figure 21: The vulnerability-effort trend, Windows XP.
Windows NT 4.0
0
20
40
60
80
100
120
140
010
020
030
040
050
060
070
080
090
010
0011
0012
0013
0014
0015
0016
0017
00
Accumilitive Usage Effort
Vul
nera
bilit
ies
Figure 22: The vulnerability-effort trend, Windows NT 4.0.

21
Windows 2000
0
20
40
60
80
100
120
140
020
040
060
080
010
0012
0014
0016
0018
0020
0022
0024
0026
0028
0030
0032
0034
0036
0038
0040
0042
00
Accumilitive Usage Effort
Vul
nera
bilit
ies
Figure 23: The vulnerability-effort trend, Windows 2000.
From this, we come to the conclusion that there is a rate of occurrences �; we
can calculate the mean effort to vulnerability discovery as follows: Formula:
VU
MUTV E= (3)
And at the same time,
EUV=λ (4)
Where UE is total usage effort and V is the total number of vulnerabilities. Example:
To calculate MUTV for Windows 95, 98, XP, NT 4.0 and 2000, for the period that effort is calculated which represents the period from may 1999 to February 2004, based on the vulnerabilities discovered reported, by using formula (4).
In this example, we can see that we need 83.33 million user months to discover a new vulnerability in windows 95, and because the rate of usage effort spent in Windows 95 per month is much less than Windows xp, we expect that we will discover vulnerabilities faster per month than Windows XP, while they are very close in MUTV

22
to each other 83.65 to 83.33 , the other class of windows is the server versions NT 4.0 and 2000 ,we can see the gap in the MUTV , we can see that windows 2000 is better than Windows NT 4.0 because we need more usage effort than 2000.
Table 24: Calculating METV for some systems System Effort
(Millions User-months)
Number of vulnerabilities
METV (Millions User-
months) Windows 95 3000 36 83.33 Windows 98 11500 51 225.5 Windows XP 4600 55 83.65
Windows 98 and Windows XP
16100 90 178.9
Windows NT 4.0 1700 121 14.05 Windows 2000 4300 129 33.33
23
5. Conclusions and Future Work
In this paper, we have presented a quantitative look at the operating system vulnerabilities. We have considered the environmental factors that include Incidents per vulnerability and Incidents per million user that measure a temporal aspect of the problem. They suggest that the problem is getting worse. We discussed several versions of three families of operating systems, Windows, Linux and Solaris. In our analysis we took into account the fact that some of the code is shared across different versions. The vulnerabilities shared by successive versions are also plotted. These plots are analogous to reliability growth plots in software reliability. However, there are some significant differences. The software reliability growth models generally make some assumptions that are not directly applicable in case of security growth. One of the major differences is that the test effort that goes into finding vulnerabilities is not uniform, but varies with age of the software (time since release) and reward factor for finding the vulnerabilities. The problem of shared code arises in software reliability also, although majority of the studies in software reliability have focused on software built from scratch.
In this paper, we have analyzed extensive amount of data to find an explanation of the trends in the plots of vulnerabilities found. The growth rate at the release time is small but it accelerates. Generally the plots show a linear trend for a significant period. The plots tend to show some saturation, often followed by an abrupt increase once again. We have studied some explanations of the behavior we consider the usage effort changes. We also observed that the code shared by a new and hence a competing version of the operating system significantly impacted the vulnerability discovery rate.
We introduced the concept of vulnerability density, which is basically the number of vulnerabilities in one thousand lines of source code. We expect vulnerability density will be a significant and useful metric when further data along with quantitative models are available.
Using the data about source code size, we present the range of values for known vulnerability densities. We present available data on known defect densities in some commercial software systems. We discussed the correlation between density of vulnerabilities and the general defects. This correlation could lead us to potential ways of estimating the number of vulnerabilities in future.
In order to be able to assess the overall risk, we need to take into account some of the other aspects of security. We need to examine the impact of delayed application of patches by the users. Another open topic is to characterizing the reward process as a function of usage environment considering factors other than the population of users. We need extensive research and further data collection to develop methods akin to those used in the software and hardware reliability field.

24
6. References
1. O. H. Alhazmi, Y. K. Malaiya, I. Ray, , Tech Report, Computer Science Dept, Colorado State University, 2004.
2. W. A. Arbaugh, W. L. Fithen, J. McHugh, “Windows of Vulnerability: A Case Study Analysis”, IEEE Computer, Vol. 33, No. 12, pp. 52-59, December 2000.
3. S. Brocklehurst, B. Littlewood, T. Olovsson and E. Jonsson, “On Measurement of Operational Security”. Proc. 9th Annual IEEE Conference on Computer Assurance, Gaithersburg, pp. 257-66, IEEE Computer Society, 1994.
4. H. K. Browne, W. A. Arbaugh, J. McHugh, W.L. Fithen, “A Trend Analysis of Exploitation”, Proc. IEEE Symposium on Security and Privacy, 2001, May 2001, pp. 214 – 229.
5. CERT/CC Statistics 1988-2003, CERT Coordination Centre, http://www.cert.org/stats / cert_stats.html, January 22, 2004.
6. M. Dacier, Y. Deswarte and M. Kaâniche, Quantitative Assessment of Operational Security: Models and Tools, Technical Report, LAAS Report 96493, May 1996.
7. E. Eugene Schultz Jr., David S. Brown and Thomas A. Longstaff, Responding to Computer Security Incidents, Lawrence Livermore National Laboratory, July 23, 1990.
8. ICAT Metabase, http://icat.nist.gov/icat.cfm, September 12, 2003.
9. Internet World Stats, http://www.Internetworld stats.com/emarketing.htm, February 2004.
10. I. Krusl, E. Spafford, M. Tripunitara, Computer Vulnerability Analysis, Department of Computer Sciences, Purdue University. COAST TR 98-07 1998.
11. B. Littlewood, S. Brocklehurst, N. Fenton, P. Mellor, S. Page, D. Wright; “Towards Operational Measures of Computer Security”, Journal of Computer Security, V. 2 (2/3), pp 211-230, 1993.
12. M. R. Lyu Ed., Handbook of Software Reliability Engineering, McGraw-Hill 1995.
13. Y. K. Malaiya and J. Denton, “What Do the Software Reliability Growth Model Parameters Represent?” Int. Symp. on Software Reliability Engineering, 1997. pp. 124-135.
14. Y. K. Malaiya, P. K. Srimani, Software Reliability Models: Theoretical Development, Evaluation and Applications, IEEE Computer Society Press, 1990.
15. J. D. Musa, A. Ianino, K. Okumuto, Software Reliability Measurement Prediction Application, McGraw-Hill, 1987.
25
16. A. Pang, Software development, http://www.Softwaredevelopment.ca/fyios.sh tml, 2004.
17. Software Development Canada, http://www.softwaredevelopment.ca/ fyios.shtml, December 10, 2003.
18. C. Wang; W. Wulf; “Towards a Framework for Security Measurement”, NICSS97 Conference Proceedings, 1997, pp. 522-533.
Related Documents