TECHNICAL REPORT Technical Documentation for “The Low-Income Housing Tax Credit: Past Achievements, Future Challenges” Amanda Gold Matthew Gerken Carl Hedman Corianne Payton Scally July 2018 Updated September 2018 FROM SAFETY NET TO SOLID GROUND

Welcome message from author
This document is posted to help you gain knowledge. Please leave a comment to let me know what you think about it! Share it to your friends and learn new things together.
Transcript

T E C H N ICA L R E PO R T
Technical Documentation for “The
Low-Income Housing Tax Credit: Past
Achievements, Future Challenges” Amanda Gold Matthew Gerken Carl Hedman Corianne Payton Scally
July 2018
Updated September 2018
F R O M S A F E T Y N E T T O S O L I D G R O U N D

A BO U T THE U RBA N IN S T ITU TE
The nonprofit Urban Institute is a leading research organization dedicated to developing evidence-based insights
that improve people’s lives and strengthen communities. For 50 years, Urban has been the trusted source for
rigorous analysis of complex social and economic issues; strategic advice to policymakers, philanthropists, and
practitioners; and new, promising ideas that expand opportunities for all. Our work inspires effective decisions that
advance fairness and enhance the well-being of people and places.
Copyright © July 2018. Urban Institute. Permission is granted for reproduction of this file, with attribution to the
Urban Institute. Cover image by Tim Meko.

Contents Acknowledgments iv
Technical Documentation for the Low-Income Housing Tax Credit Program: Past Achievements,
Future Challenges 1
Overview of Data Sources 2
The National Housing Preservation Database 2
Comparison of the NHPD with the HUD LIHTC Database 3
Data Cleaning and Variable Creation 5
NHPD Variables of Interest 5
Defining Variables 6
Defining Post-2000 properties 8
Three Levels of Analysis for Property-Level Assisted-Unit Counts 8
Properties Excluded from This Analysis 9
Data Validation and Benchmarking 10
Data Limitations 11
Implications for LIHTC Data Analysis 13
Notes 14
References 15
About the Authors 17
Statement of Independence 18

I V A C K N O W L E D G M E N T S
Acknowledgments This report was funded by the Robert Wood Johnson Foundation. We are grateful to them and to all our
funders, who make it possible for Urban to advance its mission.
The views expressed are those of the authors and should not be attributed to the Urban Institute,
its trustees, or its funders. Funders do not determine research findings or the insights and
recommendations of Urban experts. Further information on the Urban Institute’s funding principles is
available at urban.org/fundingprinciples.
This work is part of the Urban Institute’s 50-year history of forecasting and analyzing major shifts in
federal policies, including remaking the safety net. As policymakers consider profound changes in the
safety net, our researchers remain committed to producing important evidence-based resources for
policymakers and the American public to understand the implications of changing federal policy.
We would like to thank Andrew Aurand at the National Low Income Housing Coalition as well as
Keely Stater and Kelly McElwain at the Public and Affordable Housing Research Corporation for their
guidance and support in understanding the data from the National Housing Preservation Database. We
also thank Michael Hollar from the US Department of Housing and Urban Development’s Office of
Policy Development and Research for answering questions about the National Low Income Housing Tax
Credit Database. Kirk McClure at the University of Kansas provided thorough and thoughtful feedback
on a previous draft. Within the Urban Institute, we would like to thank our colleagues Mary
Cunningham, Susan J. Popkin, Genevieve Kenney, Elaine Waxman, and Stephen Zuckerman for their
guidance and comments throughout the writing process. We also thank Megan Thompson for logistical
assistance. Any errors or omissions remain our own.

Technical Documentation for the
Low-Income Housing Tax Credit: Past
Achievements, Future Challenges This technical report accompanies the Low-Income Housing Tax Credit: Past Achievements, Future
Challenges (Scally et al. 2018), which explores the importance of the Low-Income Housing Tax Credit
(LIHTC) to the social safety net. This report describes the data sources and methodology used in that
analysis and aims to help researchers use these data to further understand the LIHTC and its impact at
the national, state, and local levels.
This report covers four primary topics: (1) an overview of two national LIHTC data sources (the
National Housing Preservation Database, or NHPD, and the US Department of Housing and Urban
Development’s, or HUD’s, LIHTC database), including a summary of their key differences; (2) our
process of data cleaning and variable creation; (3) our process of data validation; and (4) a summary of
key data strengths and limitations. Identified strengths of the NHPD include its unduplicated counts of
LIHTC properties and units, a robust geocoding process for missing addresses in the HUD LIHTC
database, and information about other federal housing tax credits that could provide insight into
layered sources of funding (however, such insight is beyond the scope of our analysis). Data limitations
we discuss include that the existing data on LIHTC may be undercounting the of number units placed in
service after 2012, some data are missing (particularly for properties placed in service before 2000), tax
credit start dates on some properties are uncertain, and the NHPD’s property-level file may undercount
the number of units placed in service. Given these data limitations, we recommend using newer data
(2000–2015) when performing similar analyses and that people using NHPD data attempt to validate
that information against local data sources. Researchers who do not need to use geocoded data may
choose to use the HUD LIHTC database instead, since it is the database of record.

2 T E C H N I C A L D O C U M E N T A T I O N F O R L I H T C : P A S T A C H I E V E M E N T S , F U T U R E C H A L L E N G E S
Overview of Data Sources
The NHPD
In the Low-Income Housing Tax Credit: Past Achievements, Future Challenges (Scally et al. 2018), the
research team analyzed the spatial distribution of LIHTC properties and units to understand past
patterns of production and discuss potential future implications for the production patterns. The
analysis relied on property-level data from the NHPD. The NHPD is maintained by the Public and
Affordable Housing Research Corporation and the National Low Income Housing Coalition, and the
data are available to users at no cost.1 The NHPD contains deduplicated information on the federally
assisted housing stock and can be used as a tool to highlight preservation needs across several federal
programs, including LIHTC. The NHPD draws data about each financial deal from the HUD LIHTC
database, which collects information each time a tax credit is processed on a property. As of fall 2017,
the NHPD contains data on 40,575 unique (unduplicated) LIHTC-financed properties placed in service
between 1987 and 2015. All address data integrated into the system is automatically cleaned and
standardized according to US Postal Service standards. Once addresses have been cleaned, they are
matched to existing records in the database. New addresses are verified using an address verification
system. Inaccurate addresses are subject to manual review and are corrected by conducting searches
online for the apartment name and location. The database removes duplication across records by
matching addresses using different combinations of the following attributes: property address, city,
state, property name, zip code, total units, property ID, latitude and longitude, and referencing subsidy
ID. More information about these cleaning procedures can be found on the NHPD website.
Lens and Reina (2016) use the NHPD to analyze the location of LIHTC and Project-Based Section 8
properties and the date of a property’s affordability requirement expiration. In their analysis, the
authors link properties to census tracts to explore demographic and neighborhood features of the
communities in which LIHTC and Project-Based Section 8 properties are located that will soon reach
the end of their affordability periods or rent subsidies. One strength of the NHPD database the authors
note is its ability to track properties over time and across several programs. Unlike other data sources
that track financial transactions, the NHPD’s property-level data allow the authors to see if a property
received a new round of LIHTC financing or an additional subsidy through another federal program
after the initial affordability requirement expired. However, the authors note that data on properties
with older tax credits in the database are less reliable, and for that reason they exclude properties with
tax credits expiring before 2000 from their analysis.

T E C H N I C A L D O C U M E N T A T I O N F O R L I H T C : P A S T A C H I E V E M E N T S , F U T U R E C H A L L E N G E S 3
Comparison of the NHPD with the HUD LIHTC Database
The NHPD relies on LIHTC data from the national LIHTC database maintained by HUD. HUD’s LIHTC
database, available to the public since 1997, contains information on 45,905 properties and 2.97 million
housing units placed in service between 1987 and 2015.2 The database intends to track production and
preservation activity at the property level, collecting information each time a tax credit is processed on
a property and then updating the existing record with any information that has changed, including the
service date and allocation years. However, the database does include some duplicated records.
The HUD LIHTC database only includes information on active projects that are still within the 30-
year period of maintaining affordable rents required of properties financed by LIHTC since 1990 (for
properties financed before that year, the affordability period was only 15 years). Through subsequent
data refreshes, the NHPD has been able to track older projects that may not be active any longer
because they have seem to have exceeded their affordability period or have dropped out of HUD’s data.
The organization tracks this through a tax credit status variable that can be set to “active” (the year
placed in service date is less than 29 years in the past), “inconclusive” (the year placed in service date is
more than 29 years in the past), or “inactive” (data on the project has not been included in subsequent
refreshes of the HUD database and assumed to no longer be active). Key differences between the two
datasets are summarized in table 1.
4 T E C H N I C A L D O C U M E N T A T I O N F O R L I H T C : P A S T A C H I E V E M E N T S , F U T U R E C H A L L E N G E S
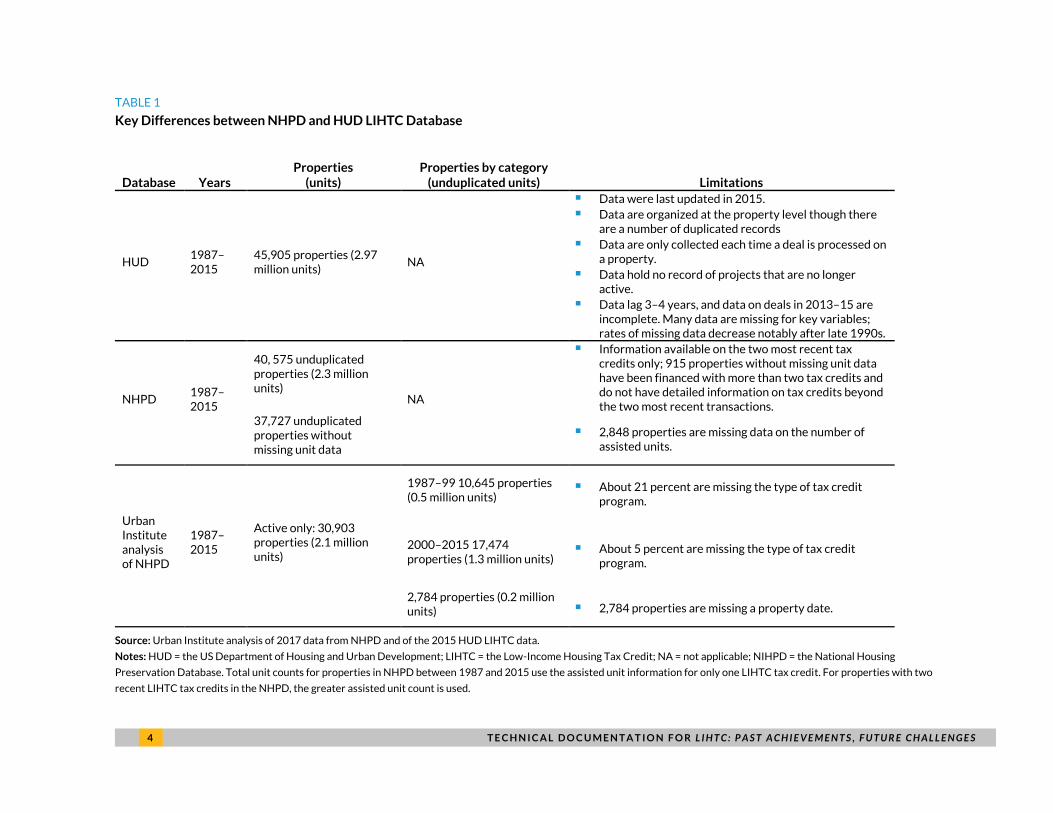
TABLE 1
Key Differences between NHPD and HUD LIHTC Database
Database Years Properties
(units) Properties by category
(unduplicated units) Limitations
HUD 1987–2015
45,905 properties (2.97 million units)
NA
Data were last updated in 2015. Data are organized at the property level though there
are a number of duplicated records Data are only collected each time a deal is processed on
a property. Data hold no record of projects that are no longer
active. Data lag 3–4 years, and data on deals in 2013–15 are
incomplete. Many data are missing for key variables; rates of missing data decrease notably after late 1990s.
NHPD 1987–2015
40, 575 unduplicated properties (2.3 million units)
NA
Information available on the two most recent tax credits only; 915 properties without missing unit data have been financed with more than two tax credits and do not have detailed information on tax credits beyond the two most recent transactions.
37,727 unduplicated properties without missing unit data
2,848 properties are missing data on the number of assisted units.
Urban Institute analysis of NHPD
1987–2015
Active only: 30,903 properties (2.1 million units)
1987–99 10,645 properties (0.5 million units)
About 21 percent are missing the type of tax credit program.
2000–2015 17,474 properties (1.3 million units)
About 5 percent are missing the type of tax credit program.
2,784 properties (0.2 million units) 2,784 properties are missing a property date.
Source: Urban Institute analysis of 2017 data from NHPD and of the 2015 HUD LIHTC data.
Notes: HUD = the US Department of Housing and Urban Development; LIHTC = the Low-Income Housing Tax Credit; NA = not applicable; NIHPD = the National Housing
Preservation Database. Total unit counts for properties in NHPD between 1987 and 2015 use the assisted unit information for only one LIHTC tax credit. For properties with two
recent LIHTC tax credits in the NHPD, the greater assisted unit count is used.

T E C H N I C A L D O C U M E N T A T I O N F O R L I H T C : P A S T A C H I E V E M E N T S , F U T U R E C H A L L E N G E S 5
Data Cleaning and Variable Creation
Here, we discuss variables in the NHPD that describe individual tax credits. Then we describe how we
created property-level variables using information on the individual tax credits. Finally, we define the
different time periods used in our analysis and describe the properties that are excluded in each
analysis.
NHPD Variables of Interest
The NHPD has several variables for up to the two most recent tax credits on a property: status,
construction type, start date, assisted units, and program type. These variables formed the basis of our
analysis.
The status of a tax credit is either active, inactive, or inconclusive. According to the NHPD Data
Dictionary, a tax credit is active if the affordability period (in most cases 30 years) occurs after the date
of the most recent NHPD data refresh. A tax credit is inactive if the property drops out of the HUD
database and is no longer tracked by HUD. A tax credit is inconclusive if its expiration or maturity date
is in the past (as of the most recent NHPD data refresh), if data on both the Year Placed in Service and
the Year the Project Received Allocation/the Year the Bond was issued are blank, or if the tax credit is
classified as nonprogrammatic in the NHPD. A tax credit can be classified as nonprogrammatic if it is no
longer monitored by HUD (and is no longer affordable) or for other reasons. It is unclear how this
reporting field is used by Housing Finance Agencies to track the status of tax credits.
Tax credits are classified by four construction types. The four construction types are New
Construction, Both New Construction and Acquisition and Rehab, Existing, or Acquisition and Rehab.
For the purposes of our analysis, we define a tax credit as New Construction if its construction type is
New Construction or Both New Construction and Acquisition and Rehab. We define a tax credit as
Preservation if its construction type is Existing or Acquisition and Rehab.
The start date is the start date of the tax credit. The NHPD uses information from the HUD LIHTC
database to construct the start date. It is equal to either the Year Placed in Service or, if the Year Placed
in Service is missing, the Year the Project Received Allocation or the Year the Bond was Issued (for
projects receiving tax-exempt bond financing and 4 percent tax credits). The HUD LIHTC database data
collection form states that if a project is a multiple-building project with multiple placed-in-service
dates, the most recent date is used for the Year Placed in Service. The form also states that if a project

6 T E C H N I C A L D O C U M E N T A T I O N F O R L I H T C : P A S T A C H I E V E M E N T S , F U T U R E C H A L L E N G E S
received several allocations, the earliest allocation year is used for the Year the Project Received
Allocation.3
The assisted units count provides the number of units that benefit from a tax credit. A property
and its units can receive more than one tax credit based on the years and types of tax credits we are
analyzing. We take the assisted unit count from the tax credit we are describing, defined in greater
detail later in this section.
The program type is the program name of the tax credit. The program types include 9 percent tax
credits; 4 percent tax credits; 4 percent and 9 percent tax credits; 4 percent and 7 percent tax credits; 7
percent tax credits; and the Tax Credit Exchange Program, a temporary program implemented during
the Great Recession.
Although detailed information is only provided for the two most recent tax credits on a property,
the NHPD also stores the total number of active, inactive, and inconclusive tax credits that have ever
existed on a property (see table 2 for total number of tax credits received by properties financed
between 2000 and 2015).
Defining Variables
Information on the two most recent tax credits on a property were used to create several property-
level variables. These include property-level status, construction type, start date, a variable combining
status and construction type, and program type.
We classified each property as active, inactive, or inconclusive. A property is considered active if
either or both of its two most recent tax credits are active. A property is considered inactive if both of
the two most recent tax credits are inactive or if the property has just one tax credit and that tax credit
is inactive. Similarly, a property is considered inconclusive if both of the two most recent tax credits are
inconclusive or if the property has just one tax credit and that tax credit is inconclusive. A property that
has one tax credit that is active and another tax credit that is inactive or inconclusive is considered
active.
Each property was classified as New Construction or Preservation. If one or both of the two most
recent tax credits on a property is a New Construction type (i.e., is New Construction or Both New
Construction and Acquisition and Rehab), the property is considered a New Construction property. A
property is considered a Preservation property if both of the two most recent tax credits on a property
is a Preservation type (i.e., Existing or Acquisition and Rehab) or if the property has just one tax credit
T E C H N I C A L D O C U M E N T A T I O N F O R L I H T C : P A S T A C H I E V E M E N T S , F U T U R E C H A L L E N G E S 7
and that tax credit is a Preservation type. A property with one New Construction tax credit and one
Preservation tax credit is considered New Construction.3
We determined the start date for each property, doing so separately for New Construction
properties and Preservation properties. For the New Construction properties, the property-level New
Construction start date is set as the start date of the tax credit with a New Construction type. If both
tax credits have a New Construction type, the start date is set to the start date of the tax credit with the
older start date. For Preservation properties, the property either has just one tax credit, and that one
tax credit is a Preservation type, or the property has two tax credits that are both a Preservation type.
The property-level Preservation start date is set as the start date of the tax credit with a Preservation
type or, if both tax credits have a Preservation type, to the start date of the tax credit with the older
start date.
We then flagged properties if they were both New Construction and active or both Preservation
and active. Much of the report analysis focuses exclusively on Active properties and on the
construction type of those properties. A property was determined to be active New Construction if at
least one of the two most recent tax credits is a New Construction type and if at least one of the tax
credits that is a new Construction type is also active. Properties that have one tax credit that is active
and a Preservation type, and another that is a New Construction type that is also active, we classify as
active New Construction. A property was determined to be active Preservation if it had just one tax
credit that is both Preservation and active or if it had two tax credits that were both Preservation and at
least one of the tax credits was active.
We determined the program type for each property, depending on whether the property is a New
Construction property or Preservation property. For New Construction properties, the property-level
New Construction program type was set as the program type of the tax credit with a New Construction
type. If both tax credits have a New Construction type, the program type was set to the program type of
the tax credit with the older start date. For Preservation properties, the property either has just one tax
credit, and that one tax credit is a Preservation type, or the property has two LIHTC properties that are
both a Preservation type. The property-level program type for Preservation properties was set as the
program type of the tax credit with a Preservation type, or to the program type of the tax credit with
the older start date if both tax credits have a Preservation type.
8 T E C H N I C A L D O C U M E N T A T I O N F O R L I H T C : P A S T A C H I E V E M E N T S , F U T U R E C H A L L E N G E S
Defining Post-2000 properties
Much of the analysis focuses on the 2000–2015 period. Because the property-level start dates were
based on the start dates of the individual tax credits, which themselves are classified as New
Construction or Preservation, we define post-2000 new construction properties and post-2000
preservation properties separately.
A property is classified as a post-2000 new construction property if its property-level New
Construction start date is in or after 2000. This excludes all new construction properties with a new
construction start date before 2000 and new construction properties with a missing start date. There
are 11,824 post-2000 active, new construction properties; of those, 11,480 (97 percent) have
nonmissing active, New Construction LIHTC-assisted unit information.
A property is classified as a post-2000 preservation property if its property-level Preservation
start date is in or after 2000. This excludes all preservation properties with a preservation start date
before 2000 and preservation properties with a missing start date. There are 6,186 post-2000 active,
Preservation properties; of those, 5,994 (97 percent) have nonmissing active, Preservation LIHTC-
assisted unit information.
Summing these two types of properties together, there are 18,010 properties that are either post-
2000 New Construction or post-2000 active Preservation, and 17,474 properties (97 percent) have
nonmissing active assisted unit information.
Three Levels of Analysis for Property-Level Assisted-Unit Counts
Using the variables available in the NHPD and the variables created, we calculated counts of LIHTC
properties and LIHTC assisted units for three levels of analysis.
LEVEL 1: GLOBAL NUMBER OF ASSISTED UNITS (1987–2015)
The first level of analysis includes all LIHTC properties from 1987 to 2015 regardless of status or
construction type. This provides a global estimate of unduplicated LIHTC assisted units. About 86
percent of properties have had only one LIHTC transaction. For these properties, we use the number of
assisted units financed by that tax credit. The remaining 14 percent of properties have had two or more
tax credits. For these properties, we use the larger of the assisted unit counts across both tax credits to
estimate the total number of unduplicated assisted units

T E C H N I C A L D O C U M E N T A T I O N F O R L I H T C : P A S T A C H I E V E M E N T S , F U T U R E C H A L L E N G E S 9
LEVEL 2: ACTIVE ASSISTED UNITS (1987–2015)
The second level of analysis includes all active LIHTC properties from 1987 to 2015 to provide a count
of all active LIHTC assisted units. Whereas the first level of analysis pulled unit counts from both tax
credits, this level creates a property-level active assisted unit count equal only to the assisted unit count
of the active tax credit. If both tax credits on the property are active, the property-level assisted unit
count pulls from the tax credit with the older start date.
LEVEL 3: ACTIVE, NEW CONSTRUCTION ASSISTED UNITS AND ACTIVE, PRESERVATION
ASSISTED UNITS (2000–2015)
The third level of analysis includes all active New Construction and active Preservation properties with
a start date after 2000. This provides a count of all post-2000 active New Construction and post-2000
active Preservation LIHTC assisted units. For active new Construction properties, we created a
property-level assisted unit count that is equal to the assisted unit count of the active New
Construction tax credit. If both tax credits are active New Construction, the property-level assisted unit
count is equal to the assisted unit count of the tax credit with the older start date. Similarly, for active
Preservation properties, we created a property-level assisted unit count that is equal to the assisted
unit count of the active Preservation tax credit. If both tax credits are active Preservation, the property-
level assisted unit count is equal to the assisted unit count of the tax credit with the older start date. The
property-level new construction start date and preservation start date were used to isolate post-2000
properties.
We classified properties and units differently at different levels of analysis because of the filters we
applied.
Properties Excluded from This Analysis
For our first level of analysis, all properties with nonmissing LIHTC assisted unit information are
included regardless of their start date, construction type, or status; this provides us with a global
number of LIHTC-assisted units. However, certain properties are dropped at other levels of analysis.
When considering only active properties from 1987 to 2015, we excluded inconclusive
properties and inactive properties; the number of inconclusive properties decreases when we look
only at properties financed between 2000 and 2015. There are 30,903 active properties with
nonmissing LIHTC assisted-unit information from 1987 to 2015. A total of 835 inactive LIHTC
properties and 5,989 inconclusive properties were excluded from the analysis when we consider only

1 0 T E C H N I C A L D O C U M E N T A T I O N F O R L I H T C : P A S T A C H I E V E M E N T S , F U T U R E C H A L L E N G E S
active LIHTC properties. However, many of the inconclusive properties are older. When we narrow our
analysis and look only at properties between 2000 and 2015, there are 52 inconclusive properties. We
used Google and Google Maps to look up 11 inconclusive properties placed in service between 2000
and 2015 and were not able verify that these properties still existed or were still within the period of
affordability. Although it is possible that excluding inconclusive properties might lead to undercounting,
the bulk of our analysis (focused on properties between 2000 and 2015) excludes only these 52
inconclusive properties (sometimes fewer); the magnitude of potential error is therefore quite low.
In addition to other properties that have been excluded, we excluded properties missing
information on construction type or tax credit start date, as well as properties with a property-level
New Construction or Preservation start date before 2000, from the active New Construction and
active Preservation 2000–2015 analysis. Because the tax credit construction types and start dates
were used to create the property-level New Construction and Preservation start dates that determined
the sample of 2000–2015 properties, we excluded properties missing this information. Moving from the
active 1987–2015 analysis to the active New Construction and active Preservation 2000–2015
analysis, 13,429 of the 30,903 properties were dropped. The remaining 17,474 properties with
nonmissing LIHTC assisted-unit information are split between 11,480 post-2000 active New
Construction properties and 5,994 post-2000 active Preservation properties.
Data Validation and Benchmarking
When using data for the first time, data validation and benchmarking is important for ensuring that data
are accurate, clean, and useful. Our process of data validation involved comparing counts of LIHTC
properties included in the NHPD with counts from the DC Preservation Catalog, a database of assisted
housing in the District of Columbia (DC). The DC Preservation Catalog is a database that the Urban
Institute maintains and updates through federal sources and conversations with the DC Housing
Authority and local housing advocates; we believe it is a reliable source for federally assisted units in
the District. However, some data in the catalog is more current than others. For example, in 2017 Urban
reviewed all of the public housing records with the DC Housing Authority to correct some cases where
properties were incorrectly listed or not listed as public housing. However, the DC Preservation
Catalog has not updated its LIHTC numbers in a few years and may exclude projects that were placed in
service more recently.
LIHTC unit counts differed between the two databases, and we were unable to resolve the source
of the difference. Although this data validation step was inconclusive, we still chose to use the data from

T E C H N I C A L D O C U M E N T A T I O N F O R L I H T C : P A S T A C H I E V E M E N T S , F U T U R E C H A L L E N G E S 1 1
the NHPD because of its national coverage and data cleaning process that identifies unduplicated
LIHTC properties. When possible, we recommend validation of NHPD against local sources, though
these data may not always be available.
Data Limitations
Issues with the availability and quality of LIHTC data create several limitations for our analysis. The
undercounting of units placed in service after 2012 limits our ability to understand recent production
and preservation and limits our assessment of the program’s recovery after the Great Recession.
Missing data and uncertainty surrounding tax credit start dates on some properties are also limitations,
though data quality improves after 2000. In addition, the NHPD’s property-level file may undercount
the total number of LIHTC financed units over time, so researchers interested in getting an accurate
overall count should consider using the HUD LIHTC database instead. These limitations are discussed in
greater detail later in this section.
Undercounting in recent years. The HUD LIHTC database was last updated in fall 2016, reflecting
properties placed in service in 2015. For a property to be reported as placed in service, it must meet
stringent legal requirements. For most local agencies, it generally takes three to four years to meet the
requirements to submit a full list of placed in service properties, producing a corresponding lag in the
database. As demonstrated using the NHPD database in table 2, the significant drop-off in assisted
units witnessed after 2012 is not an actual decrease in production or preservation activity but rather a
result of incomplete data. The information on the properties that submitted to the database between
2013 and 2015 are accurate, but they do not reflect the full portfolio of LIHTC projects placed in service
during those years. The full universe of properties placed in service is only complete through 2012.
Missing data. Although the NHPD has detailed information on up to two of the most recent tax
credits for every property, missing data for older properties continues to be a challenge. A total of
22,458 properties have a tax credit dating before 2000. Roughly 30 percent of these properties are
missing data on construction type (e.g., preservation or new construction), almost 40 percent are
missing information on the type of tax credit program (e.g., 9 percent tax credits), and about 10 percent
are missing information on the number of assisted units.
Data quality for properties with tax credit start dates between 2000 and 2015 is better. Roughly 12
percent of properties are missing data on construction type, 20 percent are missing information on the
type of tax credit program, and about 5 percent are missing information on the number of assisted units.

1 2 T E C H N I C A L D O C U M E N T A T I O N F O R L I H T C : P A S T A C H I E V E M E N T S , F U T U R E C H A L L E N G E S
HUD reports the percentage of projects with missing data by variable and year placed in service on
its website. Across variables, the rates of missing data decrease notably after the late 1990s.
TABLE 2
New Construction and Preservation LIHTC-Assisted Units: 2000–2015
New construction units Preservation units
Complete 2000 55,197 32,930 2001 59,911 33,835 2002 58,446 31,076 2003 75,010 36,009 2004 74,931 41,245 2005 74,361 36,886 2006 68,119 45,944 2007 63,136 47,563 2008 47,120 41,429 2009 44,866 24,904 2010 34,608 26,785 2011 44,224 40,135 2012 41,667 27,309
Incomplete 2013 28,368 20,789 2014 14,943 11,345 2015 3,718 1,071
Source: Urban Institute analysis of data from the 2017 National Housing Preservation Database.
Notes: LIHTC = the Low-Income Housing Tax Credit. Data after 2012 (years 2013, 2014, and 2015) are incomplete because of a
three- to four-year lag in the US Department of Housing and Urban Development’s LIHTC database.
Tax credit start date. The start date for each tax credit is based on two variables from the HUD
LIHTC database, the Year Placed in Service, and the Year the Project Received Allocation or a Bond was
Issued. The tax credit start date is set to the Year Placed in Service or to the Year the Project Received
Allocation if the Year Placed in Service is missing. Because these two HUD LIHTC variables are not
included in the NHPD, we do not know which year the tax credit start dates are based on without
additional comparisons with the HUD LIHTC database.
The NHPD’s property-level file may undercount LIHTC-financed units. The NHPD’s property-
level file contains detailed information on only the most recent two tax credits, but it also includes a
count of the total number of active, inconclusive, and inactive tax credits that have ever been attached
to a property. Although almost 86 percent of properties have had only one tax credit, about 14 percent
have had two or more. Using the total number of tax credits attached to a property, we estimate the
number of units placed in service by multiplying the total number of tax credits by the largest LIHTC
assisted-unit count of the two most recent tax credits on each property. We calculated this for the
37,727 properties that did not have missing data on the number of assisted units and estimate that

T E C H N I C A L D O C U M E N T A T I O N F O R L I H T C : P A S T A C H I E V E M E N T S , F U T U R E C H A L L E N G E S 1 3
HUD has placed in service 2.77 million units. The NHPD also has a transaction-level long file that gives
each LIHTC transaction its own row. Staff who manage the database shared with us that this file finds
2.85 million units placed in service.
However, both numbers from the NHPD are lower than HUD’s published number of units placed in
service (2.97 million). We did not conduct an independent analysis of the NHPD’s transaction-level file
or HUD’s LIHTC database, and there could be several reasons for this gap. As stated earlier, staff who
manage the NHPD informed us that HUD could have duplicative records that the staff removed from
the NHPD. The NHPD also excludes properties with missing or incomplete address data. More research
is required to understand the differences between the two sources. Researchers who want to have
duplicate records removed and want high quality address data should consider using the NHPD’s
property-level file. However, there is the possibility of geocoding errors in the NHPD. Thus, some users
may prefer to use the HUD LIHTC database as the system of record, particularly if addresses are less
important for analysis.
Implications for LIHTC Data Analysis
The NHPD provides national coverage of LIHTC investments and, unlike the HUD LIHTC database, it
identifies unduplicated LIHTC properties. The NHPD also contains information about other sources of
federal housing assistance and could provide insight into layered sources of funding, though this was
not a focus of our analysis. This makes it a good tool for understanding the scale and distribution of
LIHTC investments to date.
However, users of the NHPD need to be aware of the data limitations. HUD’s LIHTC database was
last updated in 2015, and that update lags three to four additional years. Data quality for older
properties, including missing data and properties whose active status is inconclusive, is also a challenge.
As the largest affordable rental housing production and preservation program in the country, this is an
area of concern because data limitations stymie efforts to evaluate the LIHTC program effectively.
To mitigate data quality issues in the short-term, we recommend analyses that rely on newer data
(2000–2015) and that users attempt to validate the NHPD against local sources, though these data may
not always be available. A more permanent solution would be to increase reporting requirements to
track all projects annually as well as to expand the data requested. The Government Accountability
Office has in the past called for Congress to authorize HUD as a joint administrator of the LIHTC
program with the IRS to add additional oversight (GAO 2015).

1 4 N O T E S
Notes 1 See “Data Notes” at the National Housing Preservation Database, Public and Affordable Housing Research
Corporation and the National Low Income Housing Coalition, updated September 2017.
2 See “LIHTC Database,” US Department of Housing and Urban Development, updated through 2015.
3 The HUD LIHTC Database Collection Form can be accessed at “HUD LIHTC Database Collection Form,” US
Department of Housing and Urban Development, accessed June 27, 2018. Construction type definitions come
from the HUD LIHTC database, which does not provide any additional detail on how these categories are
defined.
R E F E R E N C E S 1 5
References GAO (US Government Accountability Office). 2015. Low-Income Housing Tax Credit: Joint IRS-HUD Administration
Could Help Address Weakness in Oversight. GAO-15-330. Washington, DC: GAO.
Lens, Michael, and Vincent Reina. 2016. “Preserving Neighborhood Opportunity: Where Federal Housing Subsidies
Expire.” Housing Policy Debate 26 (4-5): 714–32.
Scally, Corianne Payton, Amanda Gold, Carl Hedman, Matthew Gerken, and Nicole DuBois. 2018. The Low-Income
Housing Tax Credit: Past Achievements, Future Challenges. Washington, DC: Urban Institute.
1 6 E R R A T A
Errata An earlier version of this report mistakenly stated in several places that HUD’s LIHTC database
included each tax credit transaction but that they were not aggregated at the level of the property or
address. They are aggregated by property. We have corrected these statements throughout the
document. This did not affect any part of our data analysis or findings.

A B O U T T H E A U T H O R S 1 7
About the Authors Amanda Gold is a research analyst in the Metropolitan Housing and Communities Policy Center at the
Urban Institute. Her research interests include affordable housing and community and economic
development. Before joining Urban, Gold interned with the Metropolitan Policy Program at the
Brookings Institution, New York City’s Department of City Planning, the Center for an Urban Future,
and the National Housing Conference. Gold holds a BA from Kenyon College and an MPP from
Georgetown University.
Matthew Gerken is a research analyst in the Metropolitan Housing and Communities Policy Center. His
areas of interest include affordable housing, homelessness, and community development. Before joining
Urban, Gerken interned with several organizations engaged in affordable housing and community
development, including Habitat for Humanity, the US Department of Housing and Urban Development,
the Self-Help Credit Union, and Thrive DC, a homeless shelter in Washington, DC. Gerken holds a BS in
mathematics and a BA in nonprofit administration from Stetson University and an MPP from Duke
University.
Carl Hedman is a research analyst in the Metropolitan Housing and Communities Policy Center. His
work focuses on examining policy issues surrounding economic and racial residential segregation,
neighborhood change, early childhood education, financial services, and housing affordability. Before
joining Urban, Hedman was an intern at the Coalition for a Livable Future, where he worked to address
housing and resource equity issues in the Portland, Oregon, metropolitan area. Hedman received his BA
in economics from Reed College.
Corianne Payton Scally is a senior research associate in the Metropolitan Housing and Communities
Policy Center. Her areas of expertise include federal, state, and local affordable housing programs and
partners, covering topics from policy development and advocacy to program funding and
implementation to on-the-ground development and operations. She is a former associate professor in
urban planning at the State University of New York at Albany, as well as a former affordable housing
developer. Scally received her BA in international affairs and MS in urban planning from Florida State
University, and her PhD in urban planning and policy development from Rutgers University.
S T A T E M E N T O F I N D E P E N D E N C E
The Urban Institute strives to meet the highest standards of integrity and quality in its research and analyses and in
the evidence-based policy recommendations offered by its researchers and experts. We believe that operating
consistent with the values of independence, rigor, and transparency is essential to maintaining those standards. As
an organization, the Urban Institute does not take positions on issues, but it does empower and support its experts
in sharing their own evidence-based views and policy recommendations that have been shaped by scholarship.
Funders do not determine our research findings or the insights and recommendations of our experts. Urban
scholars and experts are expected to be objective and follow the evidence wherever it may lead.

2100 M Street NW
Washington, DC 20037
www.urban.org
Related Documents