TECHNICAL REPORT EDITORS YOOMIN JEAN ROLF DACH ASTRONOMICAL INSTITUTE UNIVERSITY OF BERN 2014

Welcome message from author
This document is posted to help you gain knowledge. Please leave a comment to let me know what you think about it! Share it to your friends and learn new things together.
Transcript
TECHNICAL REPORT
EDITORS
YOOMIN JEANROLF DACH
ASTRONOMICAL INSTITUTE UNIVERSITY OF BERN
2014

Technical Report 2014
IGS Central Bureau
http://www.igs.org
Editors: Y. Jean, R. DachAstronomical Institute, University of Bern
Published in May 2015
IGS Central BureauJet Propulsion Laboratory, M/S 238–5404800 Oak Grove DrivePasadena, CA 91109–8099 USA
Tel: +1− 818− 354− 2077Fax: +1− 818− 393− 6686E–mail: [email protected]: http://www.igs.org
National Aeronautics and Space Administration
Jet Propulsion LaboratoryCalifornia Institute of TechnologyPasadena, California, USA
International GNSS Service
International Association of GeodesyInternational Union of Geodesy and Geophysics
Astronomical Institute, University of BernBern, SwitzerlandCompiled in April 2015, by Yoomin Jean, Rolf Dach (Eds.)
AbstractApplications of the Global Navigation Satellite Systems (GNSS) to Earth Sciences arenumerous. The International GNSS Service (IGS), a federation of government agencies,universities and research institutions, plays an increasingly critical role in support ofGNSS–related research and engineering activities. This Technical Report 2014 includescontributions from the IGS Governing Board, the Central Bureau, Analysis Centers,Data Centers, station and network operators, working groups, pilot projects, and othershighlighting status and important activities, changes and results that took place andwere achieved during 2014.
This report is available online as PDF version atftp://igs.org/pub/resource/pubs/2014_techreport.pdf.
The IGS wants to thank all contributing institutions operating networkstations, data centers or analysis centers or supporting the IGS in any otherform. All contributions are welcome. They guarantee the success of the IGSalso in future.

Contents
I Executive Groups 1
Governing Board 3
U. Hugentobler
Central Bureau 11
R. Neilan, S. Fisher, G. Walia, R. Khachikyan, D. Maggert, G. Mize,A. Craddock, and J. Ceva
II Analysis Centers 19
Analysis Center CoordinatorNo report submitted
Center for Orbit Determination in Europe (CODE) 21
R. Dach, S. Schaer, S. Lutz, D. Arnold, H. Bock, E. Orliac, L. Prange,A. Villiger, L. Mervart, A. Jäggi, G. Beutler, E. Brockmann, D. Ineichen,A. Wiget, A. Rülke, D. Thaller, H. Habrich, W. Söhne, J. Ihde, P. Steigen-berger, and U. Hugentobler
Natural Resources Canada (NRCan) 35
B. Donahue, R. Ghoddousi–Fard, Y. Mireault, and F. Lahaye
European Space Agency/European Space Operations Center (ESA/ESOC) 41
T.A. Springer, F. Dilssner, W. Enderle, J. Feltens, M. van Kints,I. Romero, E. Schoenemann, and R. Zandbergen
GeoForschungsZentrum (GFZ) 52
M. Fritsche, Z. Deng, M. Ge, T. Nischan, M. Uhlemann, G. Beeskow,A. Brandt, M. Bradke, and M. Ramatschi
v
Contents
Geodetic Observatory Pecný (GOP)No report submitted
Centre National d’Etudes Spatiales/Collecte Localisation Satellites (CNES/CLS) 62
S. Loyer, F. Mercier, F. Perosanz, H. Capdeville, A. Mezerette, andL. Lestarquit
Jet Propulsion Laboratory (JPL) 67
S. Desai, W. Bertiger, M. Garcia-Fernandez, B. Haines, D. Kuang, C. Selle,A. Sibois, A. Sibthorpe, and J. Weiss
Massachusetts Institute of Technology (MIT)No report submitted
National Geodetic Survey (NGS)No report submitted
Scripps Institution of Oceanography (SIO)No report submitted
United States Naval Observatory (USNO) 72
C. Hackman, S. M. Byram, V. J. Slabinski, J. Tracey, and J. R. Rohde
University of Wuhan (WHU) 81
C. Shi, M. Li, Q. Zhao, and Y. Lou
EUREF Permanent Network (EPN) 89
C. Bruyninx, A. Araszkiewicz, E. Brockmann, A. Kenyeres, R. Pacione,W. Söhne, G. Stangl, K. Szafranek, and C. Völksen
SIRGAS 101
L. Sánchez
III Data Centers 111
Infrastructure Committee 113
I. Romero
vi
Contents
Crustal Dynamics Data Information System (CDDIS) 115
C. Noll
Scripps Institution of Oceanography (SIO)No report submitted
Institut National de l’Information Géographique et Forestière (IGN)No report submitted
Korean Astronomy and Space Science Institute (KASI)No report submitted
IV Working Groups, Pilot Projects 127
Antenna Working Group 129
R. Schmid
Bias and Calibration Working Group 133
S. Schaer
Clock Products Working GroupNo report submitted
Data Center Working Group 141
C. Noll
Ionosphere Working Group 145
A. Krankowski, Y. Cherniak, I. Zakharenkova, R. Langley, M.D. Bu-tala, A. Komjathy, T.F. Runge, B.D. Wilson, X. Pi, A.J. Mannucci,M. Hernandez–Pajares, and P. Vergados
Multi–GNSS Working Group 161
O. Montenbruck and P. Steigenberger
Space Vehicle Orbit Dynamics Working GroupNo report submitted
vii
Contents
Real–Time Service 171
L. Agrotis, M. Caissy, A. Ruelke, and S. Fisher
Reference Frame Working Group 179
P. Rebischung, B. Garayt, and Z. Altamimi
RINEX Working GroupNo report submitted
Tide Gauge Benchmark Monitoring Project 187
T. Schöne, R. Bingley, Z. Deng, J. Griffiths, H. Habrich, A. Huneg-naw, M. Jia, M. King, M. Merrifield, G. Mitchum, R. Neilan, C. Noll,E. Prouteau, L. Sánchez, N. Teferle, D. Thaller, P. Tregoning, G. Wöppel-mann, and P. Woodworth
Troposphere Working Group 203
C. Hackman and S. Byram
viii

Part I
Executive Groups
1

IGS Governing BoardTechnical Report 2014The Development of the IGS in 2014– The Governing Board’s Perspective
Urs Hugentobler
Technische Universität München, Munich, Germany
1 Introduction
Since its founding twenty years ago the IGS developed rapidly as a service of the IAG.The IGS tracking network grew from some 30 stations to well over 400 today, with orbitquality improving from a level of several decimeters down to a few centimeters. Sinceits beginning the IGS provides, on an openly available basis, the highest quality GNSSdata, products and services for a large variety of applications that benefit the scientificcommunity and society. This impressive success and achievement of a collaborative effortwere commemorated at the anniversary workshop “Celebrating 20 Years of Service” heldin June 2014 in Pasadena, California. There were several other accomplishments in 2014,such as the launch of a new website, the extension of the MGEX network to more than100 tracking sites worldwide, and the revision of the Terms of Reference. But the IGSalso continues to face challenges, such as the difficulty to find a new Analysis CenterCoordinator. This report describes some highlights, and challenges, in 2014 as well asrelated GB activities.
2 IGS Operational Activities
The daily routine operations are the heart of the IGS. Various components of the serviceensure that tracking data and products are made publicly available every day. About 440tracking stations are maintained and operated globally, by many institutions and stationoperators, making tracking data available at different time latencies, from daily RINEX
3
IGS Governing Board
files to real–time streams. The amount of IGS tracking data and products held by eachof the four global Data Centers on permanently accessible servers increased over the lastyear by 2 TB to a total of 11 TB (135 million files) while significant additional storagecapabilities are provided by regional Data Centers. Twelve Analysis Centers and a numberof Associate Analysis Centers utilize tracking data from 70 to more than 350 stations togenerate precision products up to four times per day. Product Coordinators combine theseproducts on a continuous basis and assure the quality of the products made available tothe users. About 700 IGS final, rapid, ultra–rapid and GLONASS–only product files,and 126 ionosphere files are made available per week as well as daily troposphere files formore than 300 stations. A total of 640 million tracking data files (60 TB) and 110 millionproduct files (15 TB) were downloaded in 2014 from CDDIS, one of the four global DataCenters, by more than 10,000 unique hosts – demonstrating the intense interest of usersin IGS data and products. The Central Bureau has the responsibility for day–to–daymanagement, interaction with station operators, and answering typically some 150–200questions and requests from users per month. All these activities are performed yearround, on a day–by–day basis, with high redundancy and reliability – an impressive effortwhich is only possible by a strong engagement of many individuals and the support ofmore than 240 institutions worldwide.
3 IGS Highlights in 2014
The highlight of 2014 was without question the 20th Anniversary IGS Workshop. Itdemonstrated that with constructive collaboration, the IGS has accomplished over thepast twenty years what no single entity could do alone and provided the forum to discussthe future developments of our service. On August 28 the launch of the new and extensivelyreorganized IGS website at www.igs.org, which was developed with strong support fromUNAVCO, could be announced. Our Real–Time Service is running smoothly and withan availability exceeding 99% under the auspice of our Real–Time Analysis Coordinator.At the end of 2014, about 500 users from 66 countries worldwide were registered at theCB, most of them from academia, from engineering services and from GNSS equipmentand software manufacturers. The MGEX network has grown to some 120 multi–GNSStracking stations. Six Analysis Centers compute orbits for three new satellite systems. ARINEX3 transition plan, developed under the guidance of the Infrastructure Committee,was endorsed by the Governing Board; the plan defines the steps required for a transitionto long filenames for RINEX3 files, a prerequisite for the transition of the multi–GNSSIGS activities into routine operations. The reprocessing activities are almost completedwith the contribution to ITRF2014 being finalized. The 2014 highlights were accompaniedby several major challenges, the most important being the departure of Jake Griffiths asAnalysis Center Coordinator.
4
5 Revision of Terms of Reference
4 IGS Workshop “Celebrating 20 Years of Service”
The highlight of 2014 was the IGS workshop held from June 23 to 27 in Pasadena, Cali-fornia, USA, where 189 attendees celebrated 20 years of service. It was a forum to lookback to the impressive achievements of the IGS in the last twenty years, to determinethe status of the IGS today, and to discuss the steps for the next twenty years in fruitfultechnical, organizational and strategic discussions.
Rolf Dach, as the chair of the Scientific Organizing Committee, together with ShailenDesai and Andrzej Krankowski, put together an excellent scientific program, while theLocal Organizing Committee, led by Ruth Neilan and Steve Fisher, strongly supportedby Allison Craddock, made sure that we could work in an excellent environment takingadvantage of the facilities of the CalTech Campus. The workshop format allowed enoughtime for discussions and splinter meetings. The program included an ice breaker party,a conference dinner and an Anniversary Colloquium, and was complemented by thrillingmatches transmitted from the Soccer World Championships in Brazil. During the breakswe were served excellent coffee, and the whole week was favored by the best Californianweather.
The scientific program included plenary and poster sessions focusing on the Real–TimeService and its applications, the progress and developments in the MGEX project, theIGS infrastructure, antenna calibrations, format issues, the reference frame and the repro-cessing effort, orbit modeling effects in IGS products, ionosphere and troposphere mod-eling, and diverse applications of IGS products. The workshop presentations, posters,and recommendations, including videos recorded from the presentations, can be found athttp://igs.org/presents. The Workshop compendium is available at http://kb.igs.org/hc/en-us/articles/204895687.
5 Revision of Terms of Reference
After a first discussion of modifications of the Terms of Reference (ToR) at the December2013 GB meeting the proposed changes prepared by the CB and Executive Committeewere extensively discussed at the June 2014 GB meeting and approved by email vote onOctober 15, 2014. The new ToR include three important changes:
1. The mission statement of the IGS was updated, now explicitly mentioning the openavailability of data and products as a basic principle of the IGS.
2. In order to underline the importance of the IGS Real–Time Service the Real–TimeAnalysis Coordinator was designated a voting member of the GB. The number ofvoting members thus was increased up to 19 and Loukis Agrotis, the IGS Real–TimeAC was welcomed as a new member of the GB.
5
IGS Governing Board
3. The position of a Chair–elect as non–voting member was installed in order to allowfor a smoother transition from one GB chair to the next with an overlap period ofat least one year.
Finally, the definition of the different product types was cleaned up throughout the text.
6 Governing Board Meetings in 2014
The GB discusses the activities of the various components, sets policies and monitorsthe progress with respect to the agreed strategic plan using newly developed tools. TheBoard met three times in 2014. A GB business meeting took place on April 27 associatedwith the EGU General Assembly in Vienna, the 43rd GB meeting took place on June22 with a wrap–up meeting on June 27. The 44th GB meeting, the regular end–of–yearmeeting, took place on December 15 during the AGU Fall Meeting in San Francisco.The IGS Executive Committee – consisting of Urs Hugentobler, Chuck Meertens, RuthNeilan, Chris Rizos, Tim Springer and with regular participation of Steve Fisher, AllisonCraddock, and of WG Chairs as required – has met five times in 2014 by teleconference.Topics covered at the different meetings included the preparations for the IGS Workshop inJune, the update of the Terms of Reference, the progress of the Multi–GNSS Experiment,Real–Time Service and RINEX3, the launch of the new IGS website, and the search for anew ACC.
A summary of the GB meeting in December 2014 may be found in IGS Mail 7024 and inthe IAG Newsletter of January 2015. Tab. 1 lists the important events in 2014.
Table 1: IGS events in 2014
Date Event
Apr. 27 GB Business Meeting in Vienna (EGU)Jun. 22 43rd GB Meeting in Pasadena with wrap–up meeting on June 27
– Reappointment of Chuck Meertens for a further term of four years– Extension of MGEX project until end of 2015
Jun. 23–27 IGS Workshop “Celebrating 20 Years of Service” in Pasadena, USAOct. 15 Updated Terms of Reference approved by the GB
– Loukis Agrotis new voting member of the GBDec. 15 44th GB Meeting in San Francisco (AGU)
– Gary Johnston elected as new Chair of the GB– Rolf Dach elected as Analysis Center Representative– Carine Bruyninx re–elected as Network Representative
6
8 Outreach
7 Governing Board Membership
A number of changes in the GB membership took place in 2014. As the term of Urs Hugen-tobler as Chair of the GB ended 2014, a Search Committee consisting of Urs Hugentobler(Chair), Chris Rizos and John Dow sought candidates for the position. Marek Ziebart(University College London) and Gary Johnston (Geoscience Australia) were ready tostand for election by the GB and gave very strong and visionary statements on theirideas for the future development of the IGS. Both received strong support by the votingmembers of the GB. However Gary Johnston was elected as the new Chair of the IGS for2015–2018.
Two positions were up for elections, namely an Analysis Center Representative and aNetwork Representative, as the terms of Urs Hugentobler and Carine Bruyninx ended atthe end of 2014. Six candidates agreed to stand in the elections, which were organizedby a Nominating Committee consisting of Chuck Meertens (Chair), Carey Noll, and RalfSchmid. The candidates were Rolf Dach, Mathias Fritsche and Tom Herring as AnalysisCenter Representatives, and Carine Bruyninx, Ludwig Combrinck and Yuki Hatanakaas Network Representatives. All candidates received strong support from the AssociateMembers. As a result of the election Rolf Dach (University of Bern, Switzerland) waselected as Analysis Center Representative and Carine Bruyninx (Royal Observatory ofBelgium, Brussels) was re–elected as Network Representative.
With the update of the Terms of Reference the Real–Time AC became a voting member ofthe GB. Loukis Agrotis (ESA/ESOC) was welcomed as a new voting member of the GB inOctober 2014. Unfortunately Jake Griffiths decided to leave NGS and ended his positionas Analysis Center Coordinator on May 18. Jake’s departure was a severe loss to the IGS;his position was taken over by Kevin Choi who demonstrated excellent competences ascoordinator of the IGS analysis activities.
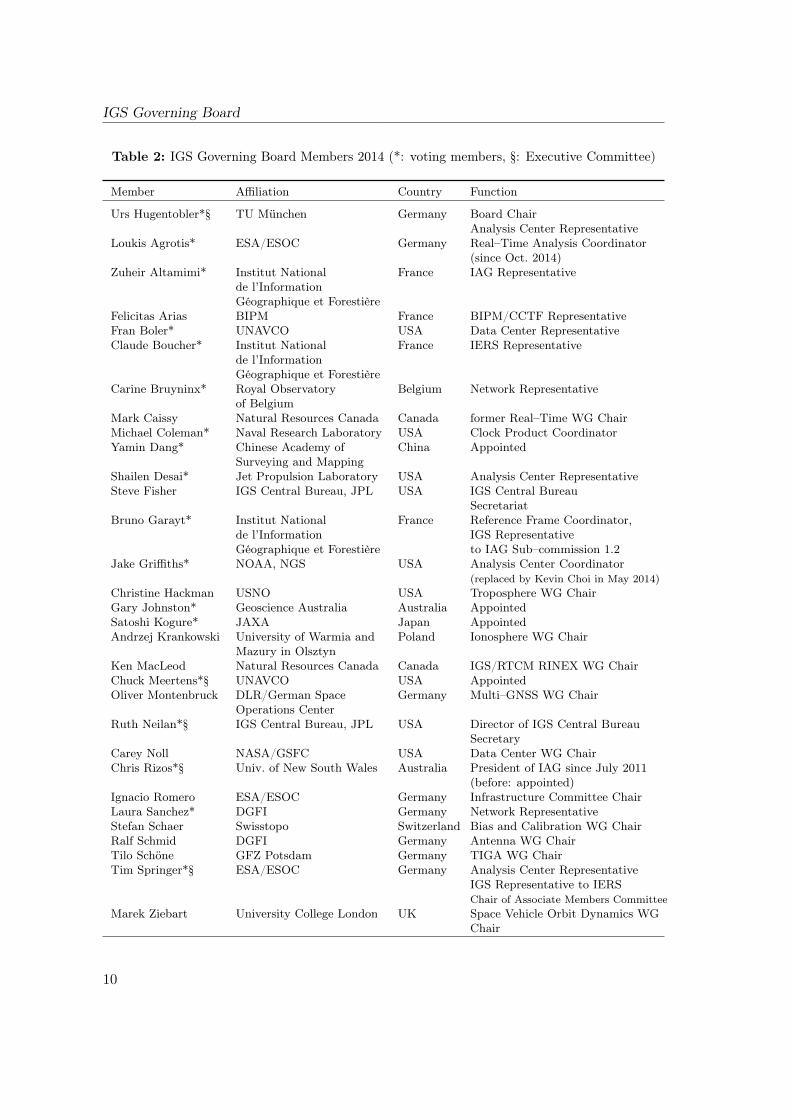
All WG chairs whose terms concluded at the end of 2014 were unanimously extended bythe GB until 2016 based on their contributions as demonstrated at the IGS Workshop:Andrzej Krankowski as Chair of the Ionosphere WG, Oliver Montenbruck as Chair of theMulti–GNSS WG, Stefan Schaer as Chair of the Bias and Calibration WG, Ralf Schmidas Chair of the Antenna WG, Tilo Schöne as Chair of the TIGA WG, and Marek Ziebartas Chair of the Space Vehicle Orbit Dynamics WG. Tab. 2 lists the members of the IGSGoverning Board for 2014.
8 Outreach
The IGS is well represented on the GGOS Coordinating Board. It plays a leadershiprole in the International Committee on GNSS (ICG), co–chairing Working Group D onReference Frames, Timing and Applications, and facilitating a resolution for use of ITRS
7
IGS Governing Board
by all GNSS providers, and the International GNSS Monitoring and Assessment (IGMA)Subgroup within ICG Working Group A. In these roles the IGS participated in the ICG–9meeting in November 2014 in Prague, Czech Republic. The IGS is also well–representedin the International Earth Rotation and Reference Systems Service (IERS), in IAG Sub–Commission 1.2 on reference frames, in the RTCM SC104, and others.
IGS has been involved with many outreach activities in 2014. The following list providesa selection of presentations at international meetings and articles in geospatial magazines.As in previous years the IGS was also given visibility as session organizers of, or presentersin, IGS–related sessions at conferences such as those of the EGU in Vienna and AGU inSan Francisco.
Selection of presentations at international meetings:
• Munich Satellite Navigation Summit 2014, Munich, Germany, March 26, Panel Dis-cussion with Georg Weber in session “Precise Point Positioning” on IGS Real–TimeService.
• Munich Satellite Navigation Summit 2014, Munich, Germany, March 27, Munich,Panel Discussion with Chris Rizos and Urs Hugentobler in session “Monitoring ofthe System Earth and Disaster Monitoring” on IGS products.
• Chinese Satellite Navigation Conference 2014, Nanjing, China, May 12–15, Mon-tenbruck, Hugentobler, Steigenberger: “Recent Progress of IGS Multi–GNSS Exper-iment”.
• Wuhan University, Wuhan, China, May 26, Montenbruck, Hugentobler, Steigen-berger: “The IGS Multi–GNSS Experiment (MGEX)”.
• Hong Kong Polytechnic University, HK, May 28, Rizos: “The International GNSSService (IGS) in a Multi–Constellation GNSS World”.
• FIG Congress, Kuala Lumpur, Malaysia, June 19, Rizos: “The IGS in a Multi–GNSSWorld”.
• 6th Asia–Oceania Regional Workshop on GNSS, Phuket, Thailand, October 9–11,Rizos: “IGS Activities in Multi–GNSS and Real–Time Service”.
• 9th Meeting of the ICG, Prague, Czech Republic, November 9–14, Rizos, Neilan:“The IGS in its 20th Anniversary Year: New GNSS Activities Related to MGEXand the Real–Time Service”.
Reports, Brochures, Flyers:
• Technical Report 2013
• IGS Network Fact Sheet
• Contribution to IERS Annual Report 2012
8
9 Outlook
9 Outlook
The year 2015 poses a number of challenges. The transition to RINEX3 was approved andhas to be implemented in the course of 2015. The Multi–GNSS Experiment is progressingtowards a Pilot Service, the network is further extended, new satellites are launched, andthe tracking data will be integrated into the standard IGS directory trees. It is the taskof the Governing Board to define the criteria triggering the end of the experiment phasebased on a concept note that will be drafted during 2015. A new ionosphere scintillationproduct is under preparation. The Real–Time Service is moving towards Full OperationalCapability. To define the next steps forward the RT WG Chair plays a pivotal role andthe vacant position should again be filled.
Most critical is the transition to a new Analysis Center Coordinator by the end of 2015, atask of the highest priority. The challenge to find the next ACC also indicates that after20 years the existence of the IGS cannot be taken for granted. The permanent operationof the IGS requires an every–day effort by the engaged institutions and many enthusiasticindividuals. Continuous effort is required to increase the sustainability of the Service,which is today indispensable for numerous applications.
As outgoing Chair I would like to thank the Governing Board members for the cooperationand support they have given over the past four years, as well as all those associated with theIGS for their continuing effort and support for advancing our Service. The IGS remainsan impressive organization, with a large number of individuals from many institutionsfrom all over the world devoting their expertise and investing their time to the IGS in anexemplary spirit of cooperation. I wish our new GB Chair all the best and much successin leading the IGS into an exciting future.
9
IGS Governing Board
Table 2: IGS Governing Board Members 2014 (*: voting members, §: Executive Committee)
Member Affiliation Country Function
Urs Hugentobler*§ TU München Germany Board ChairAnalysis Center Representative
Loukis Agrotis* ESA/ESOC Germany Real–Time Analysis Coordinator(since Oct. 2014)
Zuheir Altamimi* Institut National France IAG Representativede l’InformationGéographique et Forestière
Felicitas Arias BIPM France BIPM/CCTF RepresentativeFran Boler* UNAVCO USA Data Center RepresentativeClaude Boucher* Institut National France IERS Representative
de l’InformationGéographique et Forestière
Carine Bruyninx* Royal Observatory Belgium Network Representativeof Belgium
Mark Caissy Natural Resources Canada Canada former Real–Time WG ChairMichael Coleman* Naval Research Laboratory USA Clock Product CoordinatorYamin Dang* Chinese Academy of China Appointed
Surveying and MappingShailen Desai* Jet Propulsion Laboratory USA Analysis Center RepresentativeSteve Fisher IGS Central Bureau, JPL USA IGS Central Bureau
SecretariatBruno Garayt* Institut National France Reference Frame Coordinator,
de l’Information IGS RepresentativeGéographique et Forestière to IAG Sub–commission 1.2
Jake Griffiths* NOAA, NGS USA Analysis Center Coordinator(replaced by Kevin Choi in May 2014)
Christine Hackman USNO USA Troposphere WG ChairGary Johnston* Geoscience Australia Australia AppointedSatoshi Kogure* JAXA Japan AppointedAndrzej Krankowski University of Warmia and Poland Ionosphere WG Chair
Mazury in OlsztynKen MacLeod Natural Resources Canada Canada IGS/RTCM RINEX WG ChairChuck Meertens*§ UNAVCO USA AppointedOliver Montenbruck DLR/German Space Germany Multi–GNSS WG Chair
Operations CenterRuth Neilan*§ IGS Central Bureau, JPL USA Director of IGS Central Bureau
SecretaryCarey Noll NASA/GSFC USA Data Center WG ChairChris Rizos*§ Univ. of New South Wales Australia President of IAG since July 2011
(before: appointed)Ignacio Romero ESA/ESOC Germany Infrastructure Committee ChairLaura Sanchez* DGFI Germany Network RepresentativeStefan Schaer Swisstopo Switzerland Bias and Calibration WG ChairRalf Schmid DGFI Germany Antenna WG ChairTilo Schöne GFZ Potsdam Germany TIGA WG ChairTim Springer*§ ESA/ESOC Germany Analysis Center Representative
IGS Representative to IERSChair of Associate Members Committee
Marek Ziebart University College London UK Space Vehicle Orbit Dynamics WGChair
10
IGS Central BureauTechnical Report 2014
R. Neilan1, S. Fisher1, G. Walia1,R. Khachikyan2, D. Maggert3, G. Mize3,
A. Craddock4, J. Ceva4
1. NASA/Jet Propulsion Laboratory, Caltech, Pasadena, California2. Raytheon, Inc., Pasadena, California3. UNAVCO, Inc., Boulder, Colorado4. SBAR, Inc., Pasadena, California
1 Introduction
The Central Bureau supports IGS focusing on two principal functions: 1) executive man-agement of the service, including international coordination and outreach, and 2) coordi-nation of IGS infrastructure, including the IGS tracking network and the CB informationsystem (CBIS) where the IGS web, ftp and mail services are hosted. Specific responsibili-ties of the Central Bureau are outlined in the IGS Terms of Reference (see www.IGS.org).
The CB is hosted at the California Institute of Technology/Jet Propulsion Laboratory andis funded by NASA. It contributes significant staff, resources and coordination to advancethe IGS mission.
In 2014, the CB staff included part time contributions by the individuals listed in Tab. 1together with their corresponding roles within the CB. Regrettably, funding limitationshave resulted in an approximate 1.5 fte reduction in the CB staff since October 1 that isanticipated to continue through at least the NASA fiscal year ending in September 2015.
2 Board Participation
R. Neilan and S. Fisher continued to fulfill designated GB responsibilities on behalf of theCB in 2014. The entire CB staff helps to facilitate the GB meetings and interaction, and
11
IGS Central Bureau
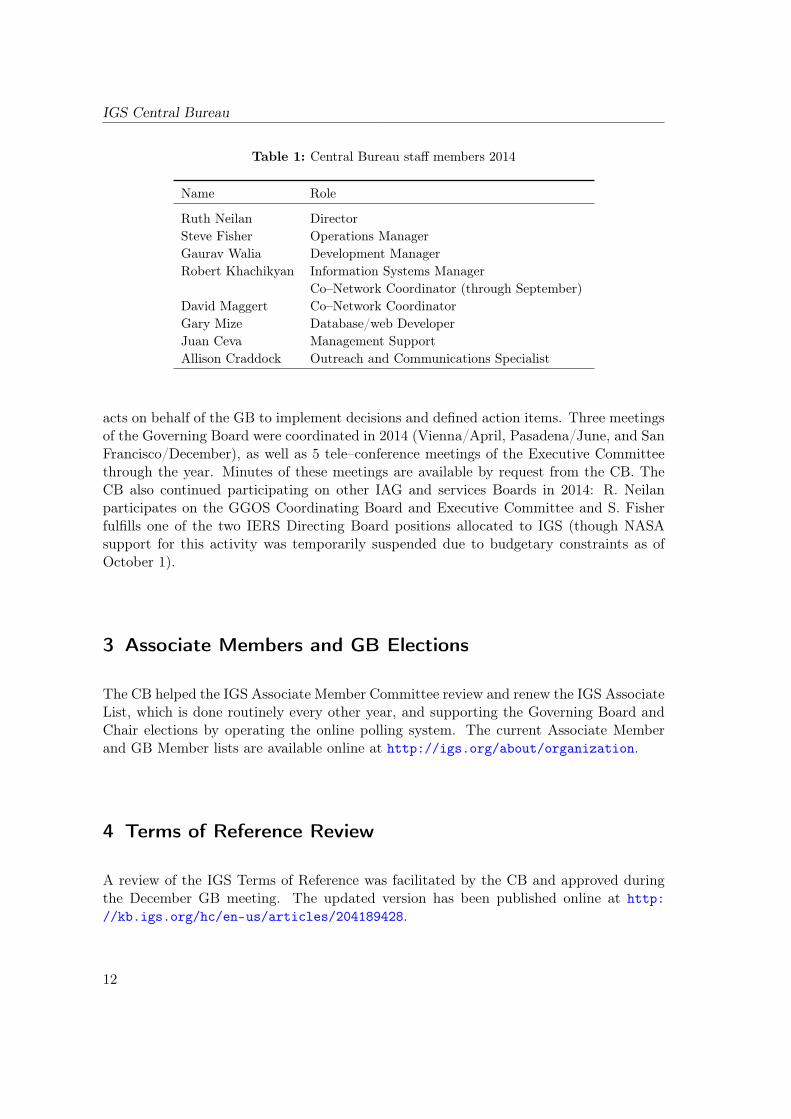
Table 1: Central Bureau staff members 2014
Name Role
Ruth Neilan DirectorSteve Fisher Operations ManagerGaurav Walia Development ManagerRobert Khachikyan Information Systems Manager
Co–Network Coordinator (through September)David Maggert Co–Network CoordinatorGary Mize Database/web DeveloperJuan Ceva Management SupportAllison Craddock Outreach and Communications Specialist
acts on behalf of the GB to implement decisions and defined action items. Three meetingsof the Governing Board were coordinated in 2014 (Vienna/April, Pasadena/June, and SanFrancisco/December), as well as 5 tele–conference meetings of the Executive Committeethrough the year. Minutes of these meetings are available by request from the CB. TheCB also continued participating on other IAG and services Boards in 2014: R. Neilanparticipates on the GGOS Coordinating Board and Executive Committee and S. Fisherfulfills one of the two IERS Directing Board positions allocated to IGS (though NASAsupport for this activity was temporarily suspended due to budgetary constraints as ofOctober 1).
3 Associate Members and GB Elections
The CB helped the IGS Associate Member Committee review and renew the IGS AssociateList, which is done routinely every other year, and supporting the Governing Board andChair elections by operating the online polling system. The current Associate Memberand GB Member lists are available online at http://igs.org/about/organization.
4 Terms of Reference Review
A review of the IGS Terms of Reference was facilitated by the CB and approved duringthe December GB meeting. The updated version has been published online at http://kb.igs.org/hc/en-us/articles/204189428.
12
7 Website Development
5 IGS 20th Anniversary Workshop Organization
All of the local preparations, registrations and coordination with program committeewere conducted by the CB. Approximately 190 people attended the 5 day long work-shop, which included plenary presentations, Working Group splinter meetings, postersand social events. Information about the Workshop, including the key recommendationsthat were developed, are published online at http://kb.igs.org/hc/en-us/sections/200369263.
6 Strategic Plan/ Progress
The year of 2014 marked the second full year of formal monitoring of progress on StrategicPlan objectives. The 2014 update of the IGS Dashboard of performance metrics tracked bythe CB is published online at http://kb.igs.org/hc/en-us/sections/200623533. The2015 Strategic Implementation Plan which defines the principal IGS activities throughthe year was compiled by the CB with input from the Component leads and approved bythe GB during the December meeting. It is published online at http://kb.igs.org/hc/en-us/sections/200287408.
7 Website Development
The updated IGS website was released in beta in May for broad review by IGS participantsand users. The first production release in October marked the official switchover to thenew site, though the old website remnants active for legacy purposes. With this release,the phase I development goals were completed that resulted in the following improvementsin 2014:
• New navigation and graphics were introduced.
• All content was re written or otherwise updated.
• A consistent template for WG content was introduced and working with WGs toimproving information content.
• Most key processes have been migrated to globally available external servers.
• Knowledge Base functionality was implemented and populated with all relevant in-formation from the old IGS website.
• Workflows for backup and disaster recover across all CB servers were reviewed anddocumented.
13
IGS Central Bureau
• The Site Log Manager database application was released for production use by theIGS station operators
– Completed testing phase, now in production with approximately 45 registeredusers representing all of the largest station operators and a majority of stations.
– The database has been populated with all categories of IGS stations – full IGS,MGEX, RTS, proposed, dormant, etc.
– The external user interface is via the website network page.
– Information is updated by the Station Operators either within the database orby text or XML log exchange.
– Supporting XML metadata exchange, scripts schema implemented, have iden-tified improvements to this that we are coordinating through the data centerWG.
– Database is used to generate the main IGS SINEX file, working on a singleunified SINEX file that includes additional select MGEX and RTS stations tobe fully integrated within IGS.
– Participated in 2014 IGS Workshop with poster and breakout demonstrationof the Site Log Manager.
– Videos and user documentation are in the KB at http://kb.igs.org/hc/en-us/sections/200562873.
8 Network/station management
There are 453 official stations within the IGS network at the end of 2014. Eighteen newstations were added in the past year (Tab. 2) that required significant coordination withstation operators in processing the applications, and verifying station meta data and datafiles. Five stations that had been decommissioned in 2014 were deleted from the activenetwork list. Additional site data and meta data were processed and verified for 17 newMGEX (now totaling 115) stations, and processing and verification of metadata for 18NGA stations whose historical data was provided to IGS was completed. Thirty–nine newequipment models were added to the rcvr_ant.tab and available sketches with their ARPdefinitions were added to the antenna.gra.
14

9 Project Support, Committee and Working Group Participation
Table 2: New IGS stations in 2014
Station Location
ARUC Aruch–Yerevan, ArmeniaDAKR Dakar, SenegalGODN Greenbelt, MD, USAGODS Greenbelt, MD, USAGRAC Caussols, FranceJFNG Jiufeng, ChinaKIRI Betio, KiribatiKRGG Kerguelen IslandsMELI Melilla, SpainMETG Metsahovi, FinlandNAUR Nauru, NauruPOHN Pohnpei, MicronesiaSEYG Pointe Larue, SeychellesTONG Naku’alofa, TongaTUVA Funafuti, TuvaluSEJN Sejong, KoreaLCK3 Lucknow, IndiaLKC4 Lucknow, India
9 Project Support, Committee and Working GroupParticipation
The CB has continued to broadly support the IGS Working Groups and Projects. Progressin 2014 has included:
• Regular coordination with IC on broad range of network and other matters, partic-ipating in RINEX3 transition planning.
• Operate RTS website, caster, user registrations, user support. Maintain redundantstation streams from 75 priority stations. Participate in RT WG activities to developthe IGS/RTS network.
• Coordinating with COSMIC to participate within IGS, helping to define COS-MIC/LEO ground subnetwork and shared stations.
• Supporting MGEX website, integrated MGEX station meta data within SLM.
• Participate on Antenna WG and maintain antenna and equipment files on IGS web-site.
• Interface with all other WGs as necessary on a variety of topics.
15
IGS Central Bureau
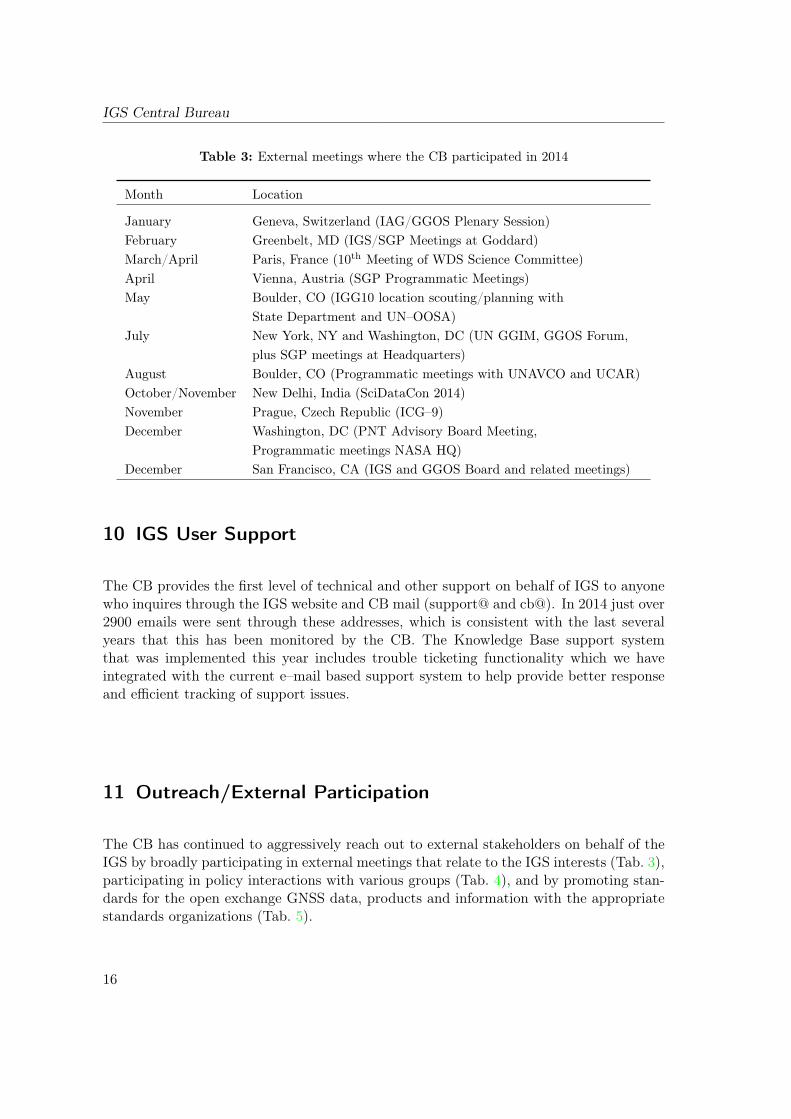
Table 3: External meetings where the CB participated in 2014
Month Location
January Geneva, Switzerland (IAG/GGOS Plenary Session)February Greenbelt, MD (IGS/SGP Meetings at Goddard)March/April Paris, France (10th Meeting of WDS Science Committee)April Vienna, Austria (SGP Programmatic Meetings)May Boulder, CO (IGG10 location scouting/planning with
State Department and UN–OOSA)July New York, NY and Washington, DC (UN GGIM, GGOS Forum,
plus SGP meetings at Headquarters)August Boulder, CO (Programmatic meetings with UNAVCO and UCAR)October/November New Delhi, India (SciDataCon 2014)November Prague, Czech Republic (ICG–9)December Washington, DC (PNT Advisory Board Meeting,
Programmatic meetings NASA HQ)December San Francisco, CA (IGS and GGOS Board and related meetings)
10 IGS User Support
The CB provides the first level of technical and other support on behalf of IGS to anyonewho inquires through the IGS website and CB mail (support@ and cb@). In 2014 just over2900 emails were sent through these addresses, which is consistent with the last severalyears that this has been monitored by the CB. The Knowledge Base support systemthat was implemented this year includes trouble ticketing functionality which we haveintegrated with the current e–mail based support system to help provide better responseand efficient tracking of support issues.
11 Outreach/External Participation
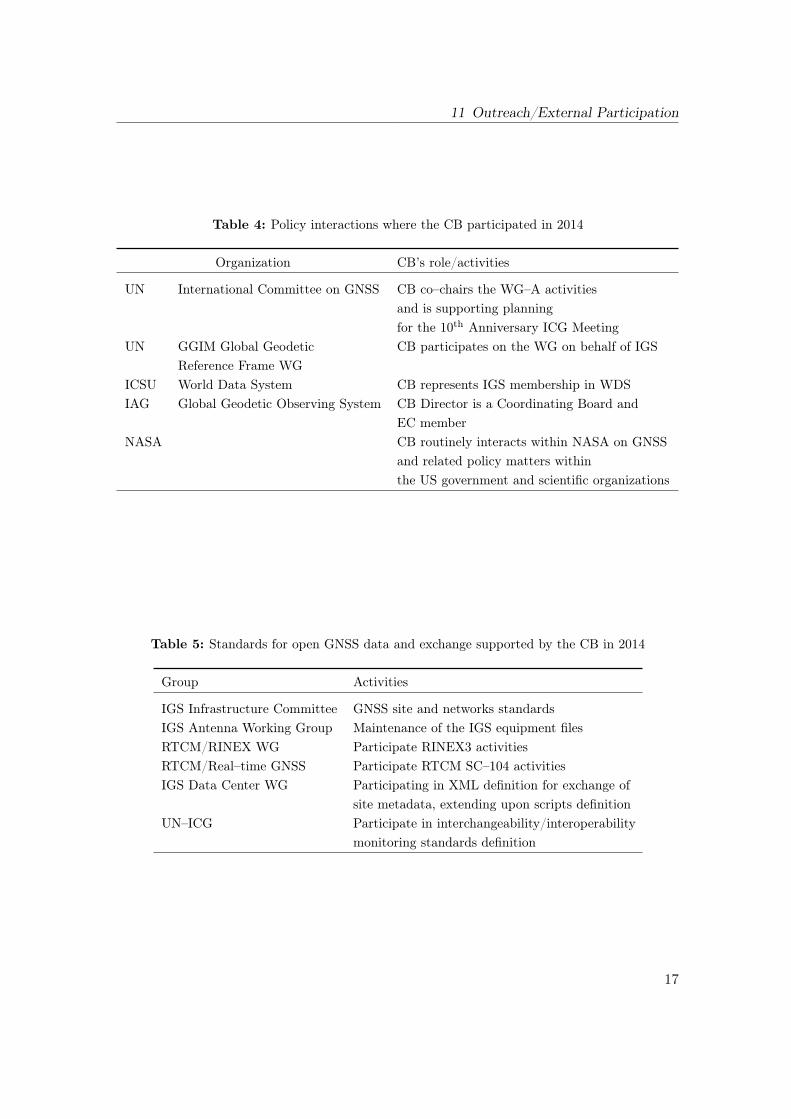
The CB has continued to aggressively reach out to external stakeholders on behalf of theIGS by broadly participating in external meetings that relate to the IGS interests (Tab. 3),participating in policy interactions with various groups (Tab. 4), and by promoting stan-dards for the open exchange GNSS data, products and information with the appropriatestandards organizations (Tab. 5).
16
11 Outreach/External Participation
Table 4: Policy interactions where the CB participated in 2014
Organization CB’s role/activities
UN International Committee on GNSS CB co–chairs the WG–A activitiesand is supporting planningfor the 10th Anniversary ICG Meeting
UN GGIM Global Geodetic CB participates on the WG on behalf of IGSReference Frame WG
ICSU World Data System CB represents IGS membership in WDSIAG Global Geodetic Observing System CB Director is a Coordinating Board and
EC memberNASA CB routinely interacts within NASA on GNSS
and related policy matters withinthe US government and scientific organizations
Table 5: Standards for open GNSS data and exchange supported by the CB in 2014
Group Activities
IGS Infrastructure Committee GNSS site and networks standardsIGS Antenna Working Group Maintenance of the IGS equipment filesRTCM/RINEX WG Participate RINEX3 activitiesRTCM/Real–time GNSS Participate RTCM SC–104 activitiesIGS Data Center WG Participating in XML definition for exchange of
site metadata, extending upon scripts definitionUN–ICG Participate in interchangeability/interoperability
monitoring standards definition
17
IGS Central Bureau
12 Funding Development
Although the CB extended considerable programmatic effort to sustain its funding, nowthrough the NASA/Space Geodetic Program, CB funding was reduced significantly from2013 levels.
13 IGS Institute (IGSI)
IGSI is now an essential, integral part of the CB. In 2014, the IGSI:
• Business plan was updated (available by request).
• Supported registrations and vendor contracts for the Pasadena Workshop.
• Supported website/IT, branding and marketing activities.
• Is developing capacity/programs to accept contributions to support IGS activitiesto be pursued in 2015.
14 Publications
• 2014 IGS Performance Dashboard
• IGS 2013 Technical Report section
• 2012 IERS Annual Report – IGS section
• 2014 Workshop Compendium
• SGP/ICO project plan and activity report
• Updated RTS and Network brochures, solicited other WG’s to provide one pagesummary brochures for IGS portfolio.
• Reviewed quality of service table and found that no updates are needed
18
Part II
Analysis Centers
19

CODE Analysis CenterTechnical Report 2014
R. Dach1, S. Schaer2, S. Lutz1,2, D. Arnold1,H. Bock1, E. Orliac1, L. Prange1, A. Villiger1,
L. Mervarta, A. Jäggi1, G. Beutler1,E. Brockmann2, D. Ineichen2, A. Wiget2,
A. Rülke3, D. Thaller3, H. Habrich3, W. Söhne3,J. Ihde3, P. Steigenberger4, U. Hugentobler4
1 Astronomical Institute, University of Bern, Bern, SwitzerlandE–mail: [email protected]
2 Federal Office of Topography swisstopo, Wabern, Switzerland3 Federal Agency of Cartography and Geodesy,
Frankfurt a.M., Germany4 Institut für Astronomische und Physikalische Geodäsie,
Technische Universität München, Munich, Germany
1 The CODE consortium
CODE, the Center for Orbit Determination in Europe, is a joint venture of the followingfour institutions:• Astronomical Institute, University of Bern (AIUB), Bern, Switzerland• Federal Office of Topography swisstopo, Wabern, Switzerland• Federal Agency of Cartography and Geodesy (BKG), Frankfurt a.M., Germany• Institut für Astronomische und Physikalische Geodäsie, Technische Universität
München (IAPG, TUM), Munich, Germany
The operational computations are performed at AIUB, whereas IGS–related reprocessingactivities are usually carried out at IAPG, TUM. All solutions and products are generatedwith the latest development version of the Bernese GNSS Software (Dach et al. 2007).
aInstitute of Geodesy, Czech Technical University in Prague, Czech Republic
21
CODE Analysis Center
2 CODE products available to the public
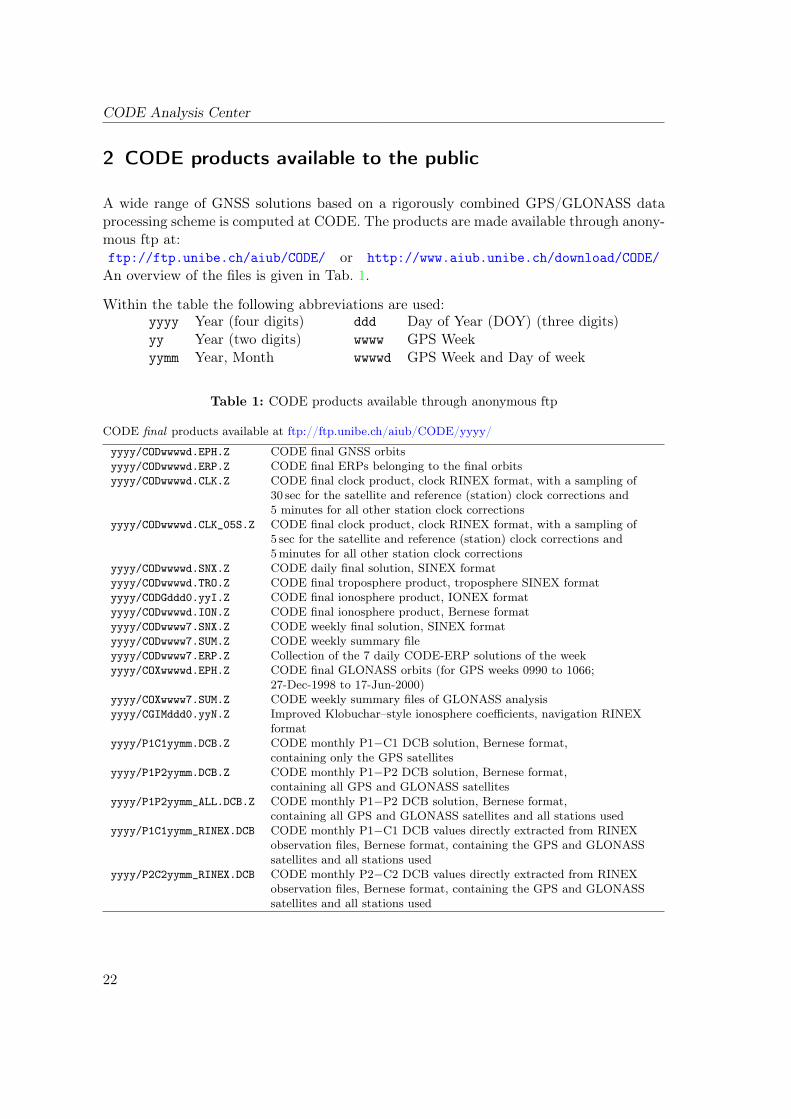
A wide range of GNSS solutions based on a rigorously combined GPS/GLONASS dataprocessing scheme is computed at CODE. The products are made available through anony-mous ftp at:ftp://ftp.unibe.ch/aiub/CODE/ or http://www.aiub.unibe.ch/download/CODE/An overview of the files is given in Tab. 1.
Within the table the following abbreviations are used:yyyy Year (four digits)yy Year (two digits)yymm Year, Month
ddd Day of Year (DOY) (three digits)wwww GPS Weekwwwwd GPS Week and Day of week
Table 1: CODE products available through anonymous ftp
CODE final products available at ftp://ftp.unibe.ch/aiub/CODE/yyyy/
yyyy/CODwwwwd.EPH.Z CODE final GNSS orbitsyyyy/CODwwwwd.ERP.Z CODE final ERPs belonging to the final orbitsyyyy/CODwwwwd.CLK.Z CODE final clock product, clock RINEX format, with a sampling of
30 sec for the satellite and reference (station) clock corrections and5 minutes for all other station clock corrections
yyyy/CODwwwwd.CLK_05S.Z CODE final clock product, clock RINEX format, with a sampling of5 sec for the satellite and reference (station) clock corrections and5minutes for all other station clock corrections
yyyy/CODwwwwd.SNX.Z CODE daily final solution, SINEX formatyyyy/CODwwwwd.TRO.Z CODE final troposphere product, troposphere SINEX formatyyyy/CODGddd0.yyI.Z CODE final ionosphere product, IONEX formatyyyy/CODwwwwd.ION.Z CODE final ionosphere product, Bernese formatyyyy/CODwwww7.SNX.Z CODE weekly final solution, SINEX formatyyyy/CODwwww7.SUM.Z CODE weekly summary fileyyyy/CODwwww7.ERP.Z Collection of the 7 daily CODE-ERP solutions of the weekyyyy/COXwwwwd.EPH.Z CODE final GLONASS orbits (for GPS weeks 0990 to 1066;
27-Dec-1998 to 17-Jun-2000)yyyy/COXwwww7.SUM.Z CODE weekly summary files of GLONASS analysisyyyy/CGIMddd0.yyN.Z Improved Klobuchar–style ionosphere coefficients, navigation RINEX
formatyyyy/P1C1yymm.DCB.Z CODE monthly P1−C1 DCB solution, Bernese format,
containing only the GPS satellitesyyyy/P1P2yymm.DCB.Z CODE monthly P1−P2 DCB solution, Bernese format,
containing all GPS and GLONASS satellitesyyyy/P1P2yymm_ALL.DCB.Z CODE monthly P1−P2 DCB solution, Bernese format,
containing all GPS and GLONASS satellites and all stations usedyyyy/P1C1yymm_RINEX.DCB CODE monthly P1−C1 DCB values directly extracted from RINEX
observation files, Bernese format, containing the GPS and GLONASSsatellites and all stations used
yyyy/P2C2yymm_RINEX.DCB CODE monthly P2−C2 DCB values directly extracted from RINEXobservation files, Bernese format, containing the GPS and GLONASSsatellites and all stations used
22
2 CODE products available to the public
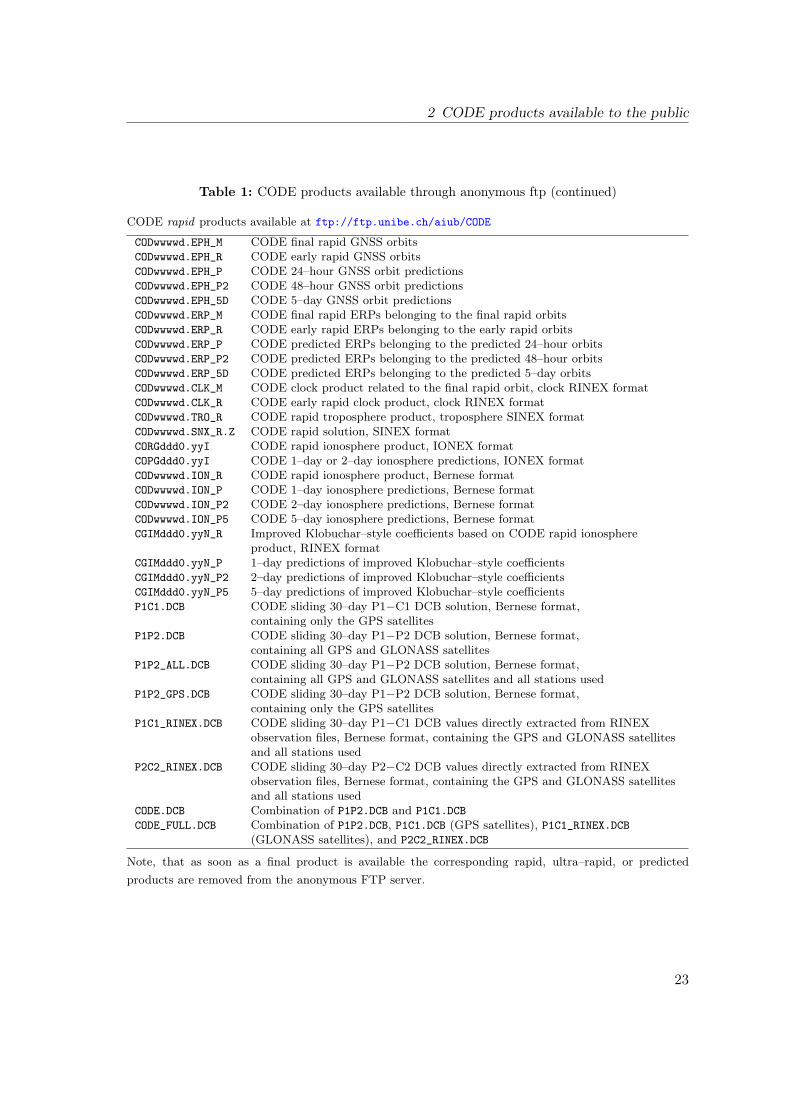
Table 1: CODE products available through anonymous ftp (continued)
CODE rapid products available at ftp://ftp.unibe.ch/aiub/CODE
CODwwwwd.EPH_M CODE final rapid GNSS orbitsCODwwwwd.EPH_R CODE early rapid GNSS orbitsCODwwwwd.EPH_P CODE 24–hour GNSS orbit predictionsCODwwwwd.EPH_P2 CODE 48–hour GNSS orbit predictionsCODwwwwd.EPH_5D CODE 5–day GNSS orbit predictionsCODwwwwd.ERP_M CODE final rapid ERPs belonging to the final rapid orbitsCODwwwwd.ERP_R CODE early rapid ERPs belonging to the early rapid orbitsCODwwwwd.ERP_P CODE predicted ERPs belonging to the predicted 24–hour orbitsCODwwwwd.ERP_P2 CODE predicted ERPs belonging to the predicted 48–hour orbitsCODwwwwd.ERP_5D CODE predicted ERPs belonging to the predicted 5–day orbitsCODwwwwd.CLK_M CODE clock product related to the final rapid orbit, clock RINEX formatCODwwwwd.CLK_R CODE early rapid clock product, clock RINEX formatCODwwwwd.TRO_R CODE rapid troposphere product, troposphere SINEX formatCODwwwwd.SNX_R.Z CODE rapid solution, SINEX formatCORGddd0.yyI CODE rapid ionosphere product, IONEX formatCOPGddd0.yyI CODE 1–day or 2–day ionosphere predictions, IONEX formatCODwwwwd.ION_R CODE rapid ionosphere product, Bernese formatCODwwwwd.ION_P CODE 1–day ionosphere predictions, Bernese formatCODwwwwd.ION_P2 CODE 2–day ionosphere predictions, Bernese formatCODwwwwd.ION_P5 CODE 5–day ionosphere predictions, Bernese formatCGIMddd0.yyN_R Improved Klobuchar–style coefficients based on CODE rapid ionosphere
product, RINEX formatCGIMddd0.yyN_P 1–day predictions of improved Klobuchar–style coefficientsCGIMddd0.yyN_P2 2–day predictions of improved Klobuchar–style coefficientsCGIMddd0.yyN_P5 5–day predictions of improved Klobuchar–style coefficientsP1C1.DCB CODE sliding 30–day P1−C1 DCB solution, Bernese format,
containing only the GPS satellitesP1P2.DCB CODE sliding 30–day P1−P2 DCB solution, Bernese format,
containing all GPS and GLONASS satellitesP1P2_ALL.DCB CODE sliding 30–day P1−P2 DCB solution, Bernese format,
containing all GPS and GLONASS satellites and all stations usedP1P2_GPS.DCB CODE sliding 30–day P1−P2 DCB solution, Bernese format,
containing only the GPS satellitesP1C1_RINEX.DCB CODE sliding 30–day P1−C1 DCB values directly extracted from RINEX
observation files, Bernese format, containing the GPS and GLONASS satellitesand all stations used
P2C2_RINEX.DCB CODE sliding 30–day P2−C2 DCB values directly extracted from RINEXobservation files, Bernese format, containing the GPS and GLONASS satellitesand all stations used
CODE.DCB Combination of P1P2.DCB and P1C1.DCBCODE_FULL.DCB Combination of P1P2.DCB, P1C1.DCB (GPS satellites), P1C1_RINEX.DCB
(GLONASS satellites), and P2C2_RINEX.DCB
Note, that as soon as a final product is available the corresponding rapid, ultra–rapid, or predictedproducts are removed from the anonymous FTP server.
23
CODE Analysis Center
Table 1: CODE products available through anonymous ftp (continued)
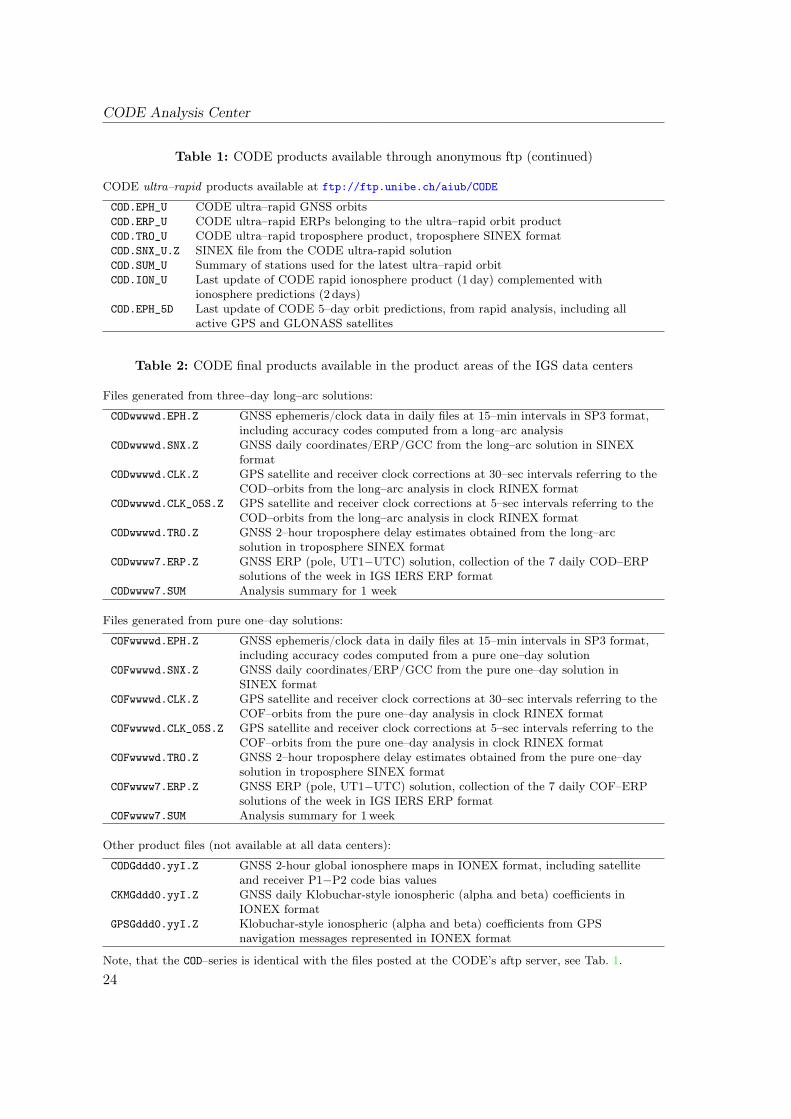
CODE ultra–rapid products available at ftp://ftp.unibe.ch/aiub/CODE
COD.EPH_U CODE ultra–rapid GNSS orbitsCOD.ERP_U CODE ultra–rapid ERPs belonging to the ultra–rapid orbit productCOD.TRO_U CODE ultra–rapid troposphere product, troposphere SINEX formatCOD.SNX_U.Z SINEX file from the CODE ultra-rapid solutionCOD.SUM_U Summary of stations used for the latest ultra–rapid orbitCOD.ION_U Last update of CODE rapid ionosphere product (1 day) complemented with
ionosphere predictions (2 days)COD.EPH_5D Last update of CODE 5–day orbit predictions, from rapid analysis, including all
active GPS and GLONASS satellites
Table 2: CODE final products available in the product areas of the IGS data centers
Files generated from three–day long–arc solutions:
CODwwwwd.EPH.Z GNSS ephemeris/clock data in daily files at 15–min intervals in SP3 format,including accuracy codes computed from a long–arc analysis
CODwwwwd.SNX.Z GNSS daily coordinates/ERP/GCC from the long–arc solution in SINEXformat
CODwwwwd.CLK.Z GPS satellite and receiver clock corrections at 30–sec intervals referring to theCOD–orbits from the long–arc analysis in clock RINEX format
CODwwwwd.CLK_05S.Z GPS satellite and receiver clock corrections at 5–sec intervals referring to theCOD–orbits from the long–arc analysis in clock RINEX format
CODwwwwd.TRO.Z GNSS 2–hour troposphere delay estimates obtained from the long–arcsolution in troposphere SINEX format
CODwwww7.ERP.Z GNSS ERP (pole, UT1−UTC) solution, collection of the 7 daily COD–ERPsolutions of the week in IGS IERS ERP format
CODwwww7.SUM Analysis summary for 1 week
Files generated from pure one–day solutions:
COFwwwwd.EPH.Z GNSS ephemeris/clock data in daily files at 15–min intervals in SP3 format,including accuracy codes computed from a pure one–day solution
COFwwwwd.SNX.Z GNSS daily coordinates/ERP/GCC from the pure one–day solution inSINEX format
COFwwwwd.CLK.Z GPS satellite and receiver clock corrections at 30–sec intervals referring to theCOF–orbits from the pure one–day analysis in clock RINEX format
COFwwwwd.CLK_05S.Z GPS satellite and receiver clock corrections at 5–sec intervals referring to theCOF–orbits from the pure one–day analysis in clock RINEX format
COFwwwwd.TRO.Z GNSS 2–hour troposphere delay estimates obtained from the pure one–daysolution in troposphere SINEX format
COFwwww7.ERP.Z GNSS ERP (pole, UT1−UTC) solution, collection of the 7 daily COF–ERPsolutions of the week in IGS IERS ERP format
COFwwww7.SUM Analysis summary for 1week
Other product files (not available at all data centers):
CODGddd0.yyI.Z GNSS 2-hour global ionosphere maps in IONEX format, including satelliteand receiver P1−P2 code bias values
CKMGddd0.yyI.Z GNSS daily Klobuchar-style ionospheric (alpha and beta) coefficients inIONEX format
GPSGddd0.yyI.Z Klobuchar-style ionospheric (alpha and beta) coefficients from GPSnavigation messages represented in IONEX format
Note, that the COD–series is identical with the files posted at the CODE’s aftp server, see Tab. 1.
24
3 Changes in the daily processing for the IGS
GNSSGPS only
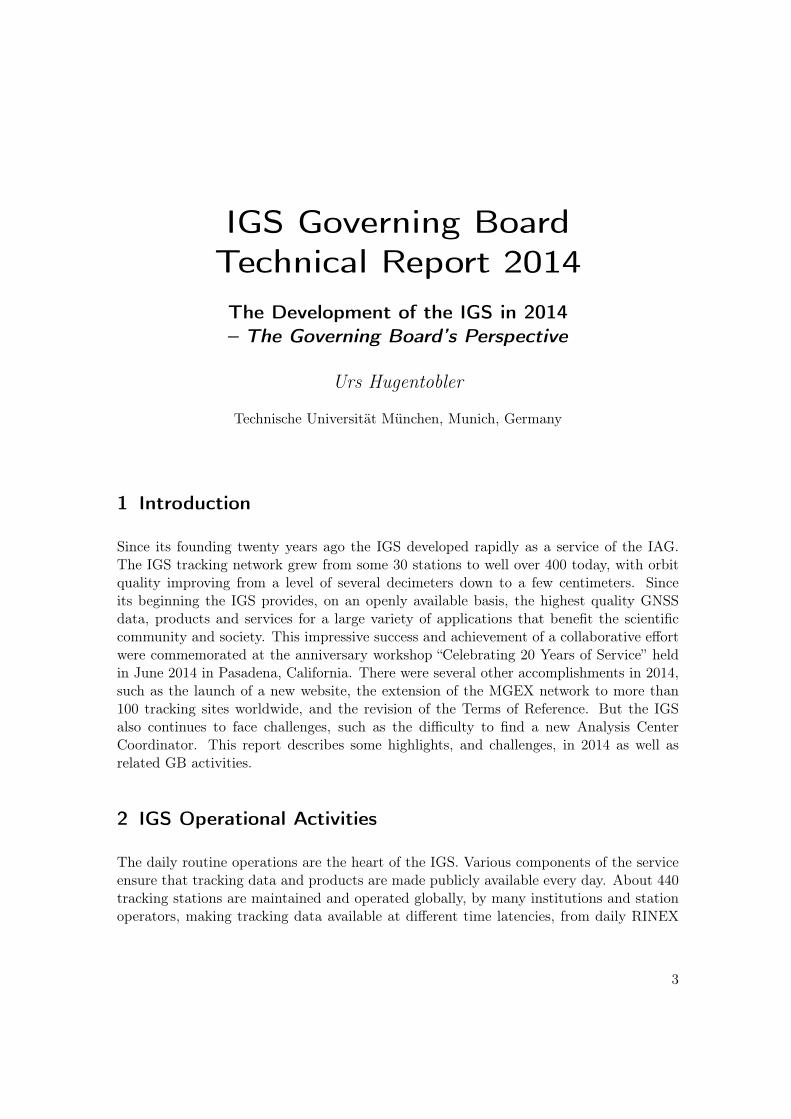
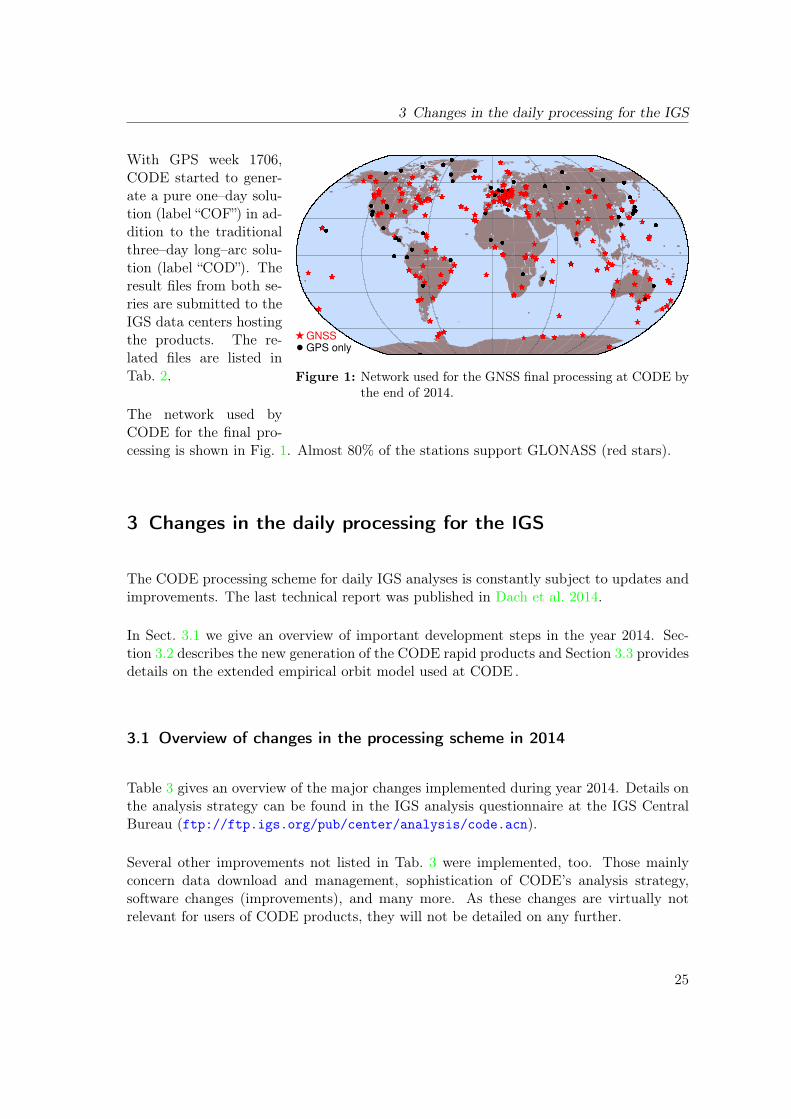
Figure 1: Network used for the GNSS final processing at CODE bythe end of 2014.
With GPS week 1706,CODE started to gener-ate a pure one–day solu-tion (label “COF”) in ad-dition to the traditionalthree–day long–arc solu-tion (label “COD”). Theresult files from both se-ries are submitted to theIGS data centers hostingthe products. The re-lated files are listed inTab. 2.
The network used byCODE for the final pro-cessing is shown in Fig. 1. Almost 80% of the stations support GLONASS (red stars).
3 Changes in the daily processing for the IGS
The CODE processing scheme for daily IGS analyses is constantly subject to updates andimprovements. The last technical report was published in Dach et al. 2014.
In Sect. 3.1 we give an overview of important development steps in the year 2014. Sec-tion 3.2 describes the new generation of the CODE rapid products and Section 3.3 providesdetails on the extended empirical orbit model used at CODE .
3.1 Overview of changes in the processing scheme in 2014
Table 3 gives an overview of the major changes implemented during year 2014. Details onthe analysis strategy can be found in the IGS analysis questionnaire at the IGS CentralBureau (ftp://ftp.igs.org/pub/center/analysis/code.acn).
Several other improvements not listed in Tab. 3 were implemented, too. Those mainlyconcern data download and management, sophistication of CODE’s analysis strategy,software changes (improvements), and many more. As these changes are virtually notrelevant for users of CODE products, they will not be detailed on any further.
25
CODE Analysis Center
Table 3: Selected modifications of the CODE processing over 2014
Date DoY/Year Description
16-Mar-2014 075/2014 Vienna non–tidal atmospheric pressure loading model switched fromversion 2 to 4 (no effect on the products because it is deactivated withscaling factors, see Dach et al. 2013)
04-Jun-2014 155/2014 Major revision of the ultra–rapid and rapid product generation:• Separated product generation and NEQ manipulation to
significantly speed up the processing• Automatic datum definition verification• New: SINEX from ultra-rapid solution, currently with daily
resolution of the Earth rotation parameters• Setup of Z (and X/Y ) satellite antenna offsets
(Z included in SNX)• A new product line extracted from the middle day of a rapid and
ultra-rapid solution is implemented
10-Jun-2014 158/2014 Start to produce bias-SINEX (BIA) result files from ionosphereprocessing
10-Jun-2014 160/2014 Start to submit middle-day solutions for the IGS rapid combination froma subsequent ultra-rapid solution
12-Jun-2014 162/2014 Start to post the middle-day submissions to the IGS separately with thelabel _M files to ftp server
22-Sep-2014 264/2014 Increase the number of stations in the clock final solution(new limit is 150)
23-Sep-2014 265/2014 Increase the number of stations in the clock rapid solution(new limit is 120)
24-Sep-2014 266/2014 Clock rapid: backsubstitution of epoch parameters using only phasemeasurements (as done in final clock estimation)
14-Nov-2014 292/2014 Global ionosphere map estimation completely redesigned,temporal resolution increased from 2 hours to 1 hour
03-Dec-2014 337/2014 Activate a completely revised RINEX data download system:• Efficient download with a multi–threading Perl tool• Construct an XML database on the content of each RINEX file• Evaluation of the XML database instead of the original RINEX
files for observation statistic generation
16-Dec-2014 347/2014 Improvement in the program for Helmert Transformation to be used forthe automated datum definition verification
26
3 Changes in the daily processing for the IGS
3.2 Enhancing the CODE rapid product generation
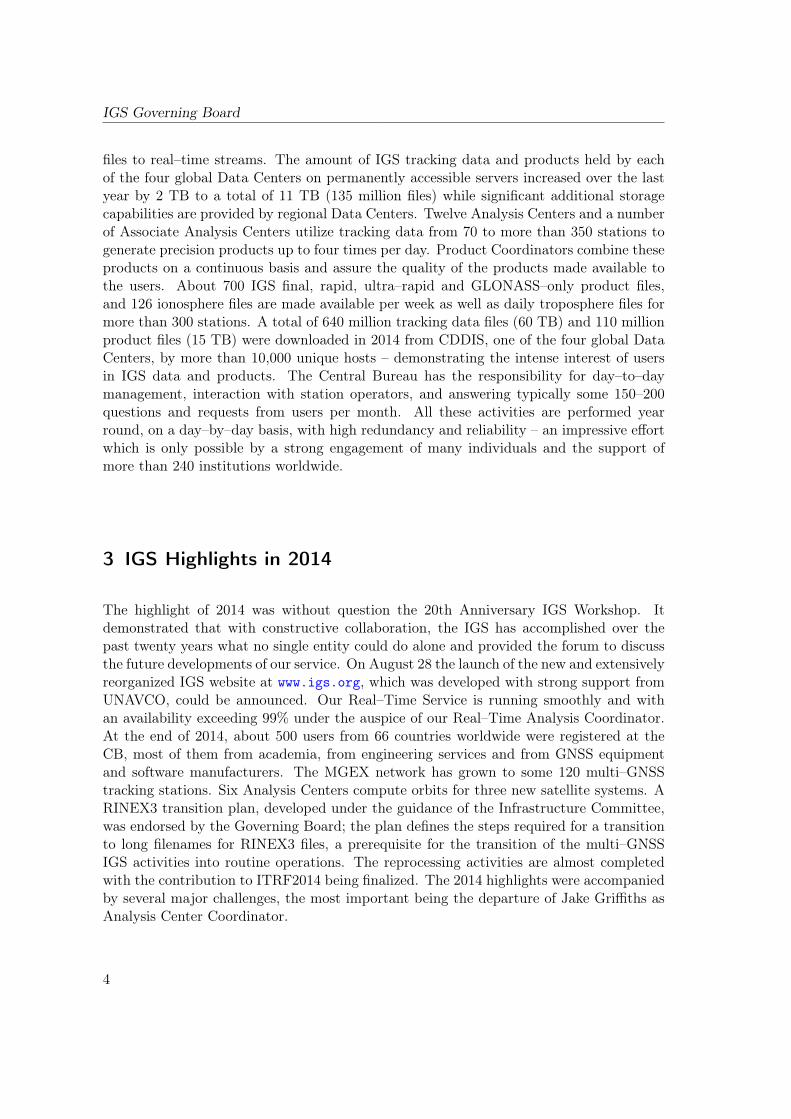
The procedure to compute ultra-rapid solutions at CODE was deeply revised in 2013(reported in Lutz et al. 2014) . The processing of the observations results in normalequation (NEQ) files from which different ultra-rapid solutions can be derived. Eachultra-rapid update may produce in the same way also a solution taylored for the IGSrapid solution with a set of Earth rotation parameters (offset and drift) referring to noonand an estimated orbit arc from midnight to midnight for the day before the ultra-rapidsolution itself.
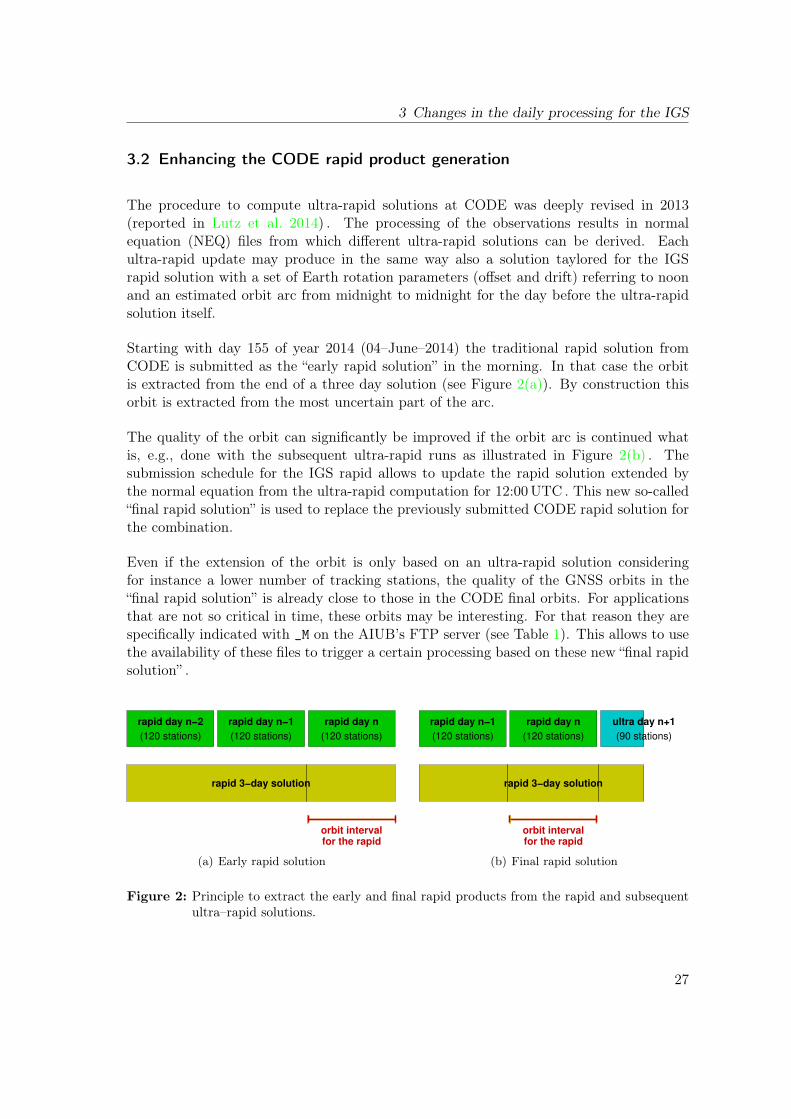
Starting with day 155 of year 2014 (04–June–2014) the traditional rapid solution fromCODE is submitted as the “early rapid solution” in the morning. In that case the orbitis extracted from the end of a three day solution (see Figure 2(a)). By construction thisorbit is extracted from the most uncertain part of the arc.
The quality of the orbit can significantly be improved if the orbit arc is continued whatis, e.g., done with the subsequent ultra-rapid runs as illustrated in Figure 2(b) . Thesubmission schedule for the IGS rapid allows to update the rapid solution extended bythe normal equation from the ultra-rapid computation for 12:00UTC . This new so-called“final rapid solution” is used to replace the previously submitted CODE rapid solution forthe combination.
Even if the extension of the orbit is only based on an ultra-rapid solution consideringfor instance a lower number of tracking stations, the quality of the GNSS orbits in the“final rapid solution” is already close to those in the CODE final orbits. For applicationsthat are not so critical in time, these orbits may be interesting. For that reason they arespecifically indicated with _M on the AIUB’s FTP server (see Table 1). This allows to usethe availability of these files to trigger a certain processing based on these new “final rapidsolution” .
rapid day n−2
(120 stations)
rapid day n−1
(120 stations)
rapid day n
(120 stations)
rapid 3−day solution
orbit intervalfor the rapid
(a) Early rapid solution
rapid day n−1
(120 stations)
rapid day n
(120 stations)
ultra day n+1
(90 stations)
rapid 3−day solution
orbit intervalfor the rapid
(b) Final rapid solution
Figure 2: Principle to extract the early and final rapid products from the rapid and subsequentultra–rapid solutions.
27
CODE Analysis Center
3.3 Studies for Updating the ECOM
The Empirical CODE Orbit Model (ECOM, Beutler et al. 1994) was developed in theearly 1990s, motivated by the lack of reliable satellite information. It is widely used in theIGS and allows for a successful modeling of non-gravitational accelerations — especiallyinduced by solar radiation pressure — acting on GPS satellites.
The ECOM decomposes the perturbing accelerations into three orthogonal directions
~eD.=
~rs − ~r
|~rs − ~r| , ~eY.= − ~er × ~eD|~er × ~eD|
, ~eB.= ~eD × ~eY , (1)
where ~rs and ~r are the geocentric vectors of the Sun and the satellite, respectively, and ~er isthe unit vector associated with ~r. The vector ~eD is the unit vector in the direction satellite-Sun, ~eY points along the satellite’s solar panel axis, and ~eB completes the orthogonalsystem. The total acceleration of a satellite due to solar radiation pressure can then bewritten as
~a = ~a0 +D(u)~eD + Y (u)~eY +B(u)~eB , (2)
where ~a0 is a selectable a priori model, and where u is the satellite’s argument of latitude.In the original ECOM the functions D(u), Y (u) and B(u) are represented as Fourierseries truncated after the once-per-revolution (1pr) terms. Springer et al. 1999 proposedthe so-called reduced ECOM,
D(u) = D0
Y (u) = Y0
B(u) = B0 +Bc cosu+Bs sinu ,
(3)
which was used for the IGS contributions of CODE until 5 January 2015. Up to 2005the reduced ECOM was set up on top of the ROCK-T models, then on top of an a priorimodel derived from the parameters of the ECOM (Springer et al. 1999; Dach et al. 2009).From July 2013 to January 2015 the reduced ECOM was used at CODE without any apriori model ~a0, after having implemented albedo modeling.
When applied to GLONASS satellites, the ECOM reveals shortcomings, which map intospurious signals in time series of geophysically interesting parameters, like geocenter coor-dinates or Earth rotation parameters (ERPs). These problems grew creepingly with theincreasing influence of the GLONASS in recent years (Meindl 2011; Meindl et al. 2013).Rodriguez-Solano et al. 2014 documented a significant reduction of the spurious signalsby replacing the reduced 5-parameter ECOM for GPS and GLONASS by an adjustablebox-wing model.
The mentioned problems asked for a thorough review of the ECOM. Arnold et al. 2015showed that the largest deficit of the ECOM, when applied to GLONASS satellites (whichare of an elongated shape), is the lack of periodic terms in the ~eD-direction. Guided by
28
3 Changes in the daily processing for the IGS
10 20 100 200 300 5000
2
4
6
8
10
12
14
16
days
µas
x pole differences w.r.t. IERS 08 C04
D4B1
D2B1
COF
GLONASS−harmonics
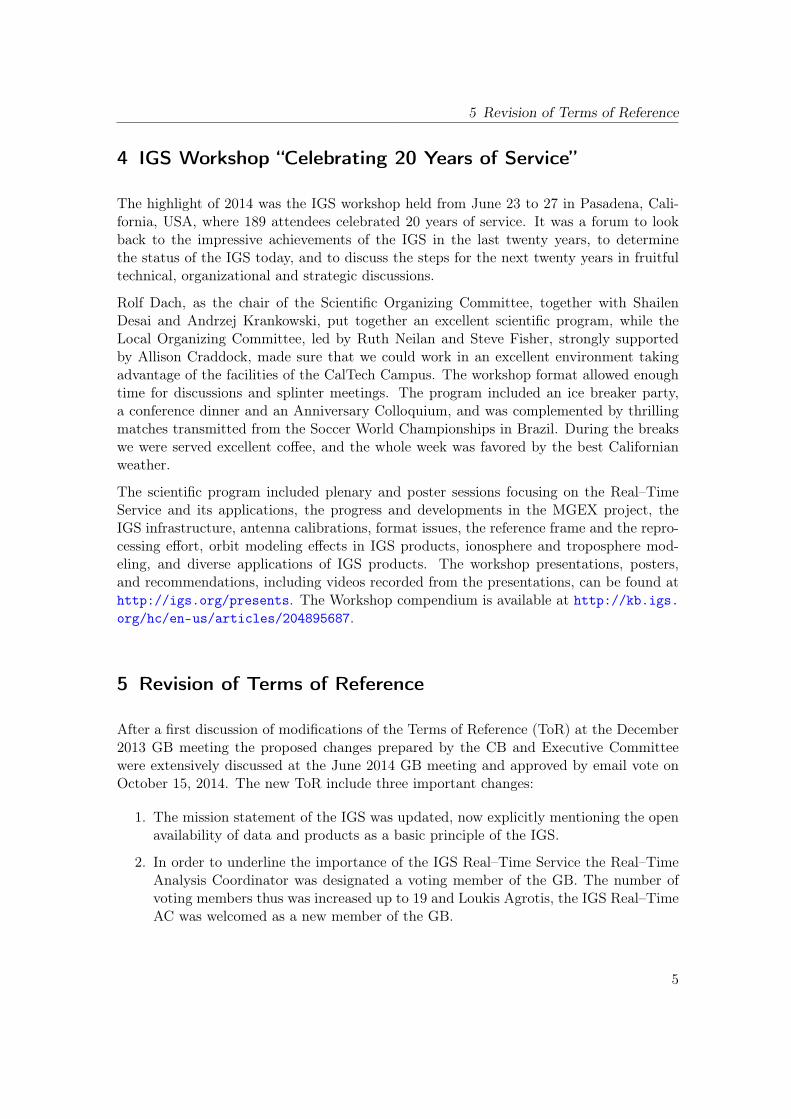
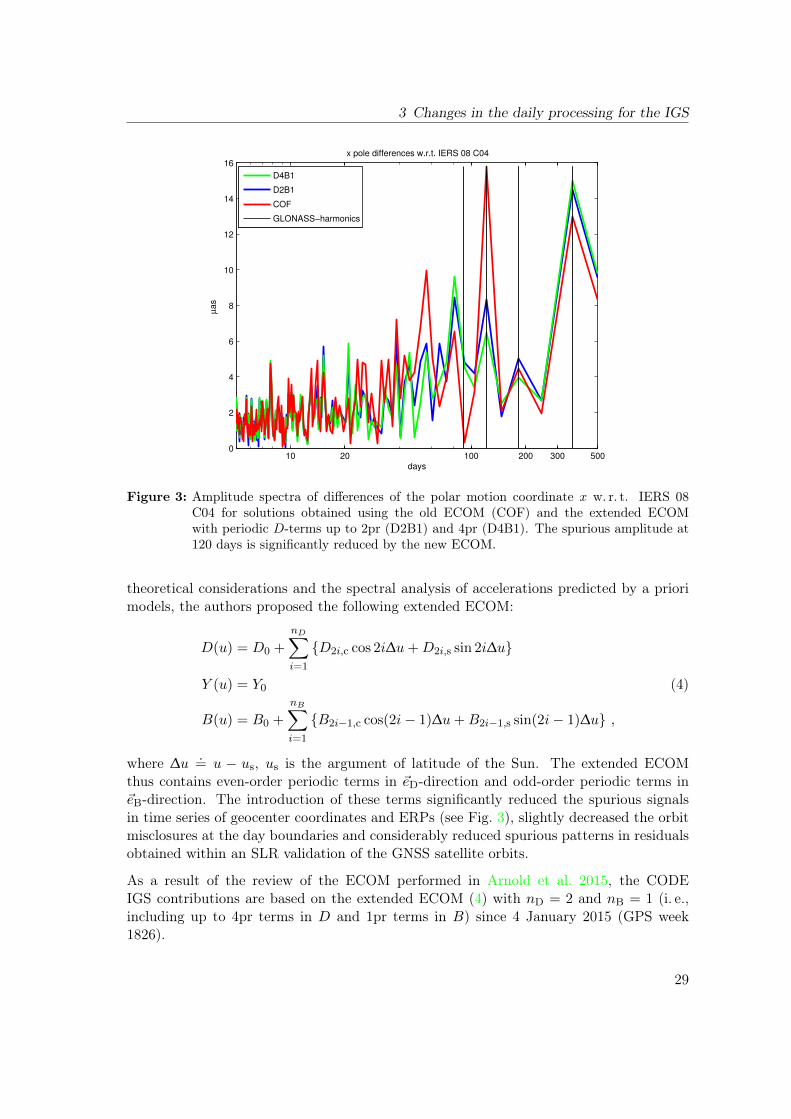
Figure 3: Amplitude spectra of differences of the polar motion coordinate x w. r. t. IERS 08C04 for solutions obtained using the old ECOM (COF) and the extended ECOMwith periodic D-terms up to 2pr (D2B1) and 4pr (D4B1). The spurious amplitude at120 days is significantly reduced by the new ECOM.
theoretical considerations and the spectral analysis of accelerations predicted by a priorimodels, the authors proposed the following extended ECOM:
D(u) = D0 +
nD∑
i=1
{D2i,c cos 2i∆u+D2i,s sin 2i∆u}
Y (u) = Y0
B(u) = B0 +
nB∑
i=1
{B2i−1,c cos(2i− 1)∆u+B2i−1,s sin(2i− 1)∆u} ,
(4)
where ∆u.= u − us, us is the argument of latitude of the Sun. The extended ECOM
thus contains even-order periodic terms in ~eD-direction and odd-order periodic terms in~eB-direction. The introduction of these terms significantly reduced the spurious signalsin time series of geocenter coordinates and ERPs (see Fig. 3), slightly decreased the orbitmisclosures at the day boundaries and considerably reduced spurious patterns in residualsobtained within an SLR validation of the GNSS satellite orbits.
As a result of the review of the ECOM performed in Arnold et al. 2015, the CODEIGS contributions are based on the extended ECOM (4) with nD = 2 and nB = 1 (i. e.,including up to 4pr terms in D and 1pr terms in B) since 4 January 2015 (GPS week1826).
29
CODE Analysis Center
4 CODE contribution to the IGS–MGEX campaign
Since 2012 CODE contributes to the IGS Multi-GNSS EXperiment (MGEX) aiming at theintegration of new GNSS into existing processing chains. In 2014 CODE’s focus was onremoving bottlenecks in the Bernese GNSS Software that so far prevented the processingof more than three GNSS (GPS, GLONASS, Galileo) together. Besides the software alsothe MGEX orbit and clock processing chains have been updated to BeiDou and QZSSprocessing capability. Satellite clock estimates and related inter-frequency biases (IFB)are now also provided for GLONASS. This means that CODE is now able to provideorbits and satellite clock corrections (plus related biases) for the GNSS GPS, GLONASS,Galileo, BeiDou (MEO and IGSO), and QZSS in a fully integrated solution.
This capability has been demonstrated on MGEX data of the whole year 2014. Theincreasing number of tracking stations providing RINEX3 data (via MGEX and non-MGEX sources), the different characteristics of the involved GNSS (regional vs. globalnavigation systems), and the fact that not all MGEX stations track all GNSS, made itnecessary to pay more attention to the station selection. From the RINEX pool stationsubsets optimized for only one GNSS at the same time are selected paying attention toa good station distribution for the GNSS in question, respectively. The sub-networks aremerged. When forming baselines for the double-difference processing weakly observedGNSS (QZSS, BeiDou) are preferred. Thanks to the station selection and the constantlyimproving MGEX network satellite clock corrections could be provided at a rate of almost100 percent for most involved satellites at the end of 2014. The overall number of selectedstations is limited to 130.
−150
−100
−50
0
50
100
150
−90 −45 0 45 90
SLR
resid
uals
[cm
]
Beta [deg]
(a)
0.0
0.5
1.0
1.5
2.0
-90 -45 0 45 90
RM
S o
f lin
ea
r clo
ck f
it [
ns]
β [deg]
(b)
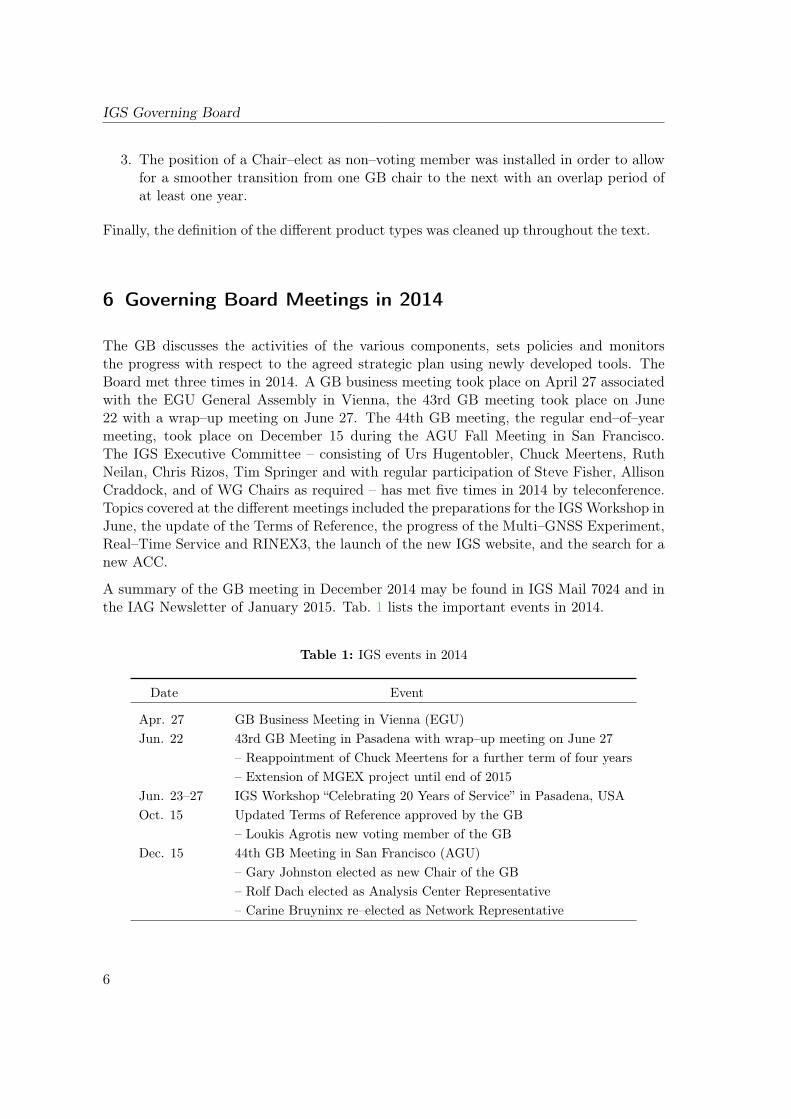
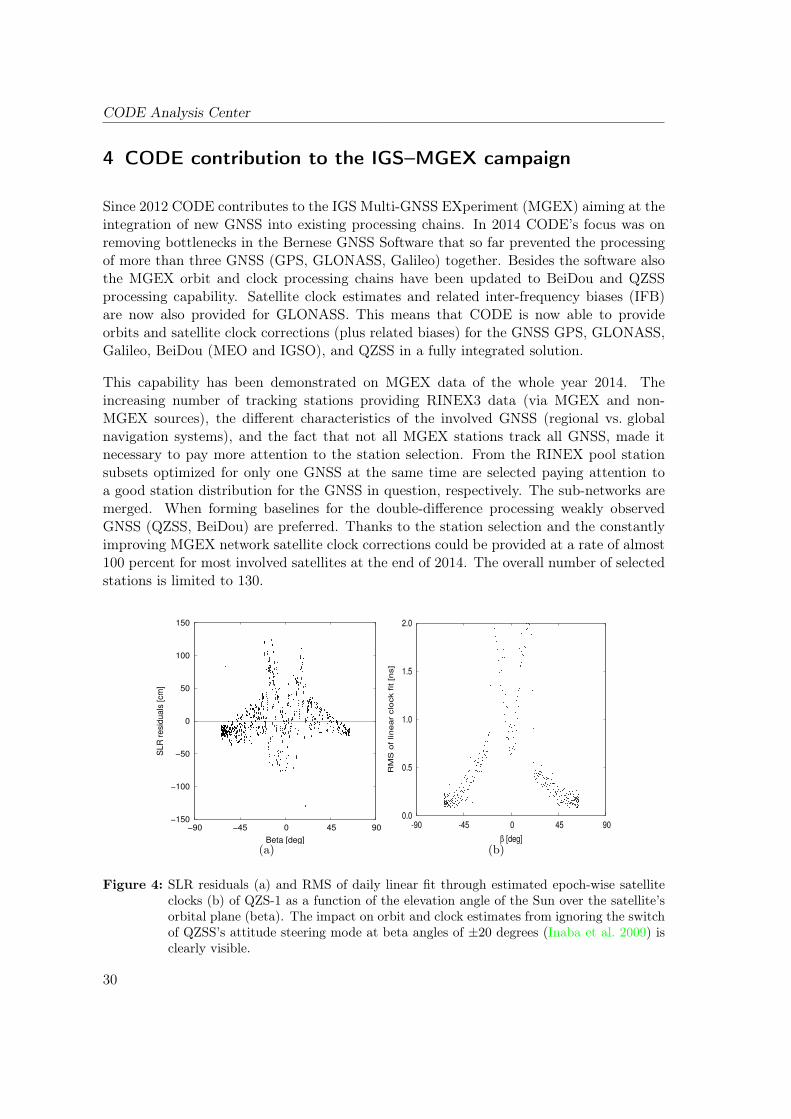
Figure 4: SLR residuals (a) and RMS of daily linear fit through estimated epoch-wise satelliteclocks (b) of QZS-1 as a function of the elevation angle of the Sun over the satellite’sorbital plane (beta). The impact on orbit and clock estimates from ignoring the switchof QZSS’s attitude steering mode at beta angles of ±20 degrees (Inaba et al. 2009) isclearly visible.
30
5 CODE contribution to IGS repro2
The analysis of the long time series of CODE MGEX products clearly shows that certainmodels (e.g., the ECOM SRP model (Springer et al. 1999)) and assumptions (e.g., yaw-attitude mode is nominal) working fine for GPS and GLONASS must be re-consideredor improved if new GNSS are involved. On the other hand the MGEX results confirmthat the clocks of some new GNSS spacecraft (i.e., Galileo, QZSS, GPS IIF) are so stablethat their estimated clock corrections are suitable for orbit validation purposes (see, e.g.,Fig. 4). These results suggest that our focus in 2015 should be on qualitative aspects,such as the introduction of the updated ECOM RPR model (Arnold et al. 2015), attitudemodeling, and satellite antenna phase center modeling for the new GNSS. Furthermoreit is planned to deliver the CODE-MGEX ("com") products (available at ftp://cddis.gsfc.nasa.gov/gnss/products/mgex) with a shorter delay in the future.
5 CODE contribution to IGS repro2
Detailed information on the CODE contribution to the IGS repro2 effort were alreadyprovided in Dach et al. 2014 .
In April 2014, the results are posted to the CDDIS server (ftp://cddis.gsfc.nasa.gov/gnss/products/repro2/). Table 4 provides the list of files. The long-arc series(COD) have been published on the CODE’s FTP server (ftp://ftp.unibe.ch/aiub/
Table 4: CODE repro2 products available in weekly subdirectories at ftp://cddis.gsfc.nasa.gov/gnss/products/repro2/.
Files generated from three–day long–arc solutions:
co2wwwwd.eph.Z GNSS ephemeris/clock data in daily files at 15–min intervals in SP3 format,including accuracy codes computed from a long–arc analysis
co2wwwwd.snx.Z GNSS daily coordinates/ERP/GCC/satellite antenna offsets from the long–arcsolution in SINEX format
co2wwwwd.tro.Z GNSS 2–hour troposphere delay estimates obtained from the long–arc solution introposphere SINEX format
co2wwww7.erp.z GNSS ERP (pole, UT1−UTC) solution, collection of the 7 daily CO2–ERPsolutions of the week in IGS IERS ERP format
co2wwww7.sum.Z Analysis summary for 1 week
Files generated from pure one–day solutions:
cf2wwwwd.eph.Z GNSS ephemeris/clock data in daily files at 15–min intervals in SP3 format,including accuracy codes computed from a pure one–day solution
cf2wwwwd.snx.Z GNSS daily coordinates/ERP/GCC/satellite antenna offsets from the pureone–day solution in SINEX format
cf2wwwwd.tro.Z GNSS 2–hour troposphere delay estimates obtained from the pure one–daysolution in troposphere SINEX format
cf2wwww7.erp.Z GNSS ERP (pole, UT1−UTC) solution, collection of the 7 daily COF–ERPsolutions of the week in IGS IERS ERP format
cofwwww7.sum.Z Analysis summary for 1week
31
CODE Analysis Center
REPRO_2013/). The publication of the reprocessing series includes the file ftp://ftp.unibe.ch/aiub/REPRO_2013/CODE_REPRO_2013.ACN containing a detailed description ofthe models used.
References
Arnold, D., M. Meindl, G. Beutler, R. Dach, S. Schaer, S. Lutz, L. Prange, K. Sosnica,L. Mervart, and A. Jäggi. CODE’s new empirical orbit model for the IGS. Journal ofGeodesy, under review, 2015.
Beutler, G., E. Brockmann, W. Gurtner, U. Hugentobler, L. Mervart, and M. Rothacher.Extended Orbit Modeling Techniques at the CODE Processing Center of the Interna-tional GPS Service for Geodynamics (IGS): Theory and Initial Results. ManuscriptaGeodaetica, 19(6):367–386, April 1994.
Dach, R., G. Beutler, H. Bock, P. Fridez, A. Gäde, U. Hugentobler, A. Jäggi, M. Meindl,L. Mervart, L. Prange, S. Schaer, T. Springer, C. Urschl, and P. Walser. Bernese GPSSoftware Version 5.0. Astronomical Institute, University of Bern, Bern, Switzerland,jan 2007. URL http://www.bernese.unibe.ch/docs/DOCU50.pdf. User manual.
Dach R, E. Brockmann, S. Schaer, G. Beutler, M. Meindl, L. Prange, H. Bock, A. Jäggi,and L. Ostini. GNSS processing at CODE: status report. Journal of Geodesy 83(3–4):353–366, 2009, doi: 10.1007/s00190-008-0281-2 .
Dach, R., S. Schaer, S. Lutz, M. Meindl, H. Bock, E. Orliac, L. Prange, D. Thaller,L. Mervart, A. Jäggi, G. Beutler, E. Brockmann, D. Ineichen, A. Wiget, G. Weber,H. Habrich, J. Ihde, P. Steigenberger, and U. Hugentobler. CODE IGS AnalysisCenter Technical Report 2012. In R. Dach, and Y. Jean, editors, IGS 2012 TechnicalReports, pages 35–46, 2013. IGS Central Bureau.
Dach, R., S. Schaer, S. Lutz, C. Baumann, H. Bock, E. Orliac, L. Prange, D. Thaller,L. Mervart, A. Jäggi, G. Beutler, E. Brockmann, D. Ineichen, A. Wiget, G. Weber,H. Habrich, W. Söhne, J. Ihde, P. Steigenberger, and U. Hugentobler. CODE IGSAnalysis Center Technical Report 2013. In R. Dach, and Y. Jean, editors, IGS 2013Technical Reports, pages 21–34, 2014. IGS Central Bureau.
Inaba, N., A. Matsumoto, H. Hase, S. Kogure, M. Sawabe, and K. Terada. Design Conceptof Quasi Zenith Satellite System. Acta Astronautica, 65(7–8):1068–1075, 2009, doi:10.1016/j.actaastro.2009.03.068 .
Lutz, S., G. Beutler, S. Schaer, R. Dach, and A. Jäggi. CODE’s new ultra-rapid orbitand ERP products for the IGS. GPS Solutions, accepted 2014, in press doi: 10.1007/s10291-014-0432-2 .
32
References
Meindl M. Combined Analysis of Observations from Different Global Navigation SatelliteSystems. Geodätisch-geophysikalische Arbeiten in der Schweiz, Vol 83, Eidg. Technis-che Hochschule Zürich, Switzerland, 2011
Meindl M., G. Beutler, D. Thaller, A. Jäggi, and R. Dach. Geocenter coordinates estimatedfrom GNSS data as viewed by perturbation theory. Advances in Space Research, Vol51(7):1047–1064, 2013 doi: doi:10.1016/j.asr.2012.10.026 .
Petit, G. and B. Luzum (Eds). IERS Conventions (2010). IERS Technical Note 36,Bundesamt für Kartographie und Geodäsie, Frankfurt am Main, 2010. URL http://www.iers.org/IERS/EN/Publications/TechnicalNotes/tn36.html.
Rodriguez-Solano C. J., U. Hugentobler, P. Steigenberger, M. Blossfeld, and M. Fritsche.Reducing the draconitic errors in GNSS geodetic products. Journal of Geodesy, 88:(6):559–574, 2014. doi: 10.1007/s00190-014-0704-1.
Springer, T.A., G. Beutler, and M. Rothacher. A new Solar Radiation Pressure Modelfor the GPS Satellites. GPS Solutions, 3(2):50–62, 1999.
All publications, posters, and presentations of the Satellite Geodesy research group atAIUB are available at http://www.bernese.unibe.ch/publist .
33

CODE Analysis Center
34
NRCan Analysis CenterTechnical Report 2014
Brian Donahue, Reza Ghoddousi–Fard,Yves Mireault, François Lahaye
Natural Resources Canada, Canadian Geodetic Survey615, Booth Street, Ottawa ON, Canada K1A 0E9E–mail: [email protected]
1 Introduction
This report covers the major activities conducted at the NRCan Analysis Center (NRCan–AC) and product changes during the year 2014 (products labelled ’em*’). Additionally,changes to the IGS stations operated by NRCan are briefly described. Readers are referredto the Analysis Coordinator website (http://acc.igs.org) for historical combinationstatistics of the NRCan–AC products.
2 NRCan Core Products
There were no major changes for NRCan–AC Ultra–Rapid, Rapid and Final (GLONASS)core products in 2014. The Bernese GNSS Software supporting these will be updated toversion 5.2 during 2015. There were no major changes to the NRCan–AC Real–Time GPScorrection stream.
During 2014 the NRCan–AC re–estimated its core GPS products for the years 1994 to2014. This contribution to the 2nd IGS reprocessing campaign (repro2) was carried outusing JPL’s GIPSY–OASIS Software v6.3 running on Linux servers. The NRCan repro2products (em2) were estimated following the latest set of IGS recommended models. Alsoduring 2014 the NRCan–AC Final GPS products were upgraded using GIPSY–OASISv6.3 with the latest recommended IGS models starting with 2014–03–30. For details onthe NRCan–AC Final GPS (emr) and repro2 (em2) strategies please refer to the IGScentral bureau summary. (ftp://igs.org/pub/center/analysis/emr.acn)
35
NRCan Analysis Center
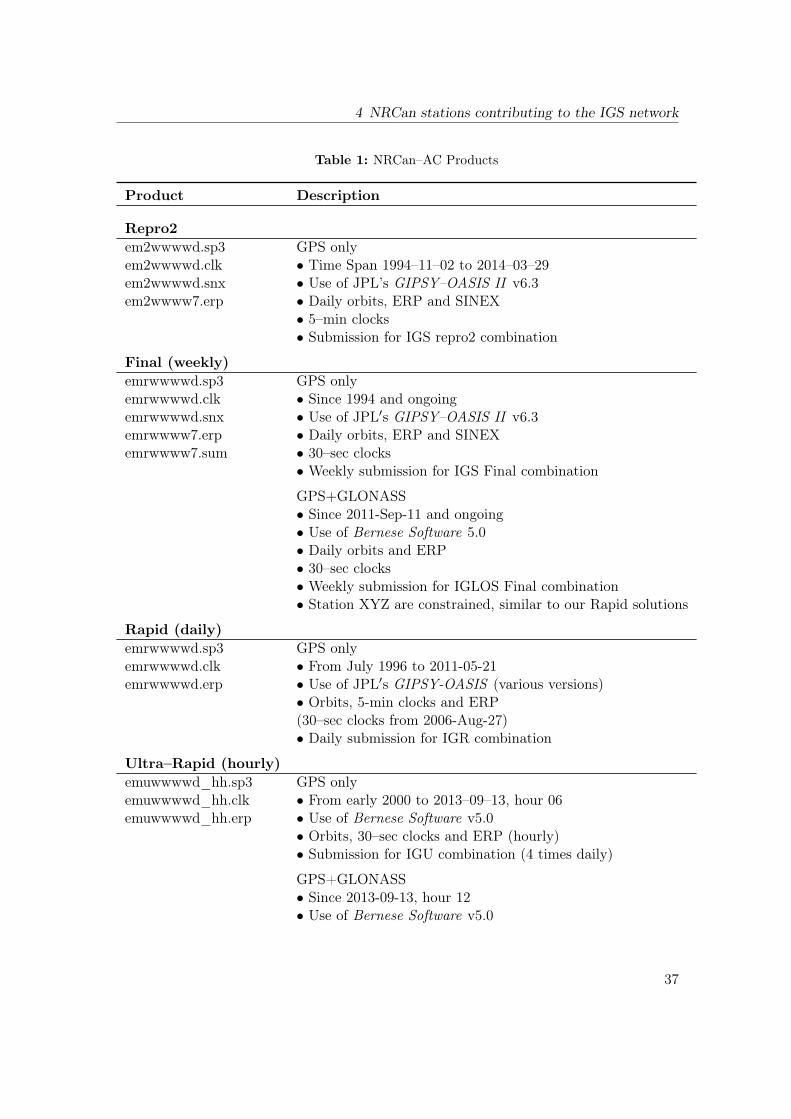
Table 1 summarizes the products available from the NRCan–AC. The Final and Rapidproducts are available from the following anonymous ftp site: ftp://rtopsdata1.geod.nrcan.gc.ca/gps/products
3 Ionosphere and DCB monitoring
Daily and near–real–time ionosphere products and DCB estimates continue to be gener-ated internally. Following a recommendation made at the 2014 IGS workshop, hourly TECmaps are being included in NRCan’s daily files since 2014–07–29. Contribution of dailyTEC maps to Final IGS combined global ionosphere products are awaiting evaluation byIGS ionosphere working group chair.
4 NRCan stations contributing to the IGS network
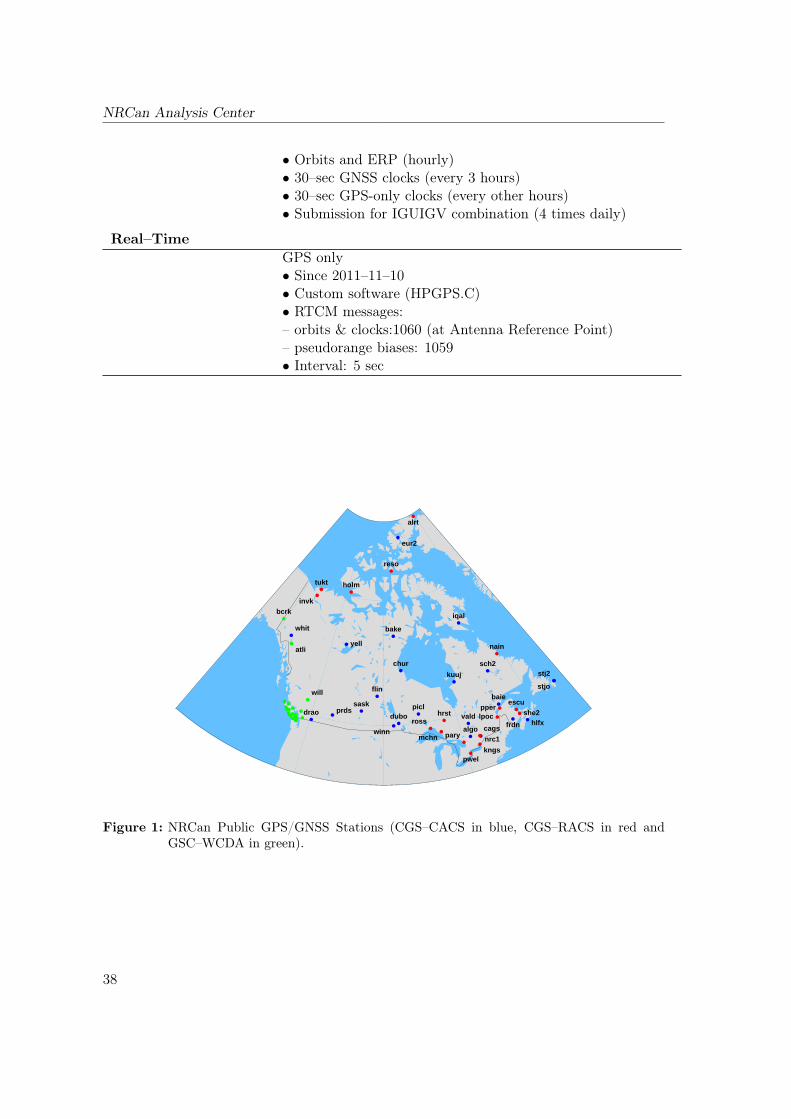
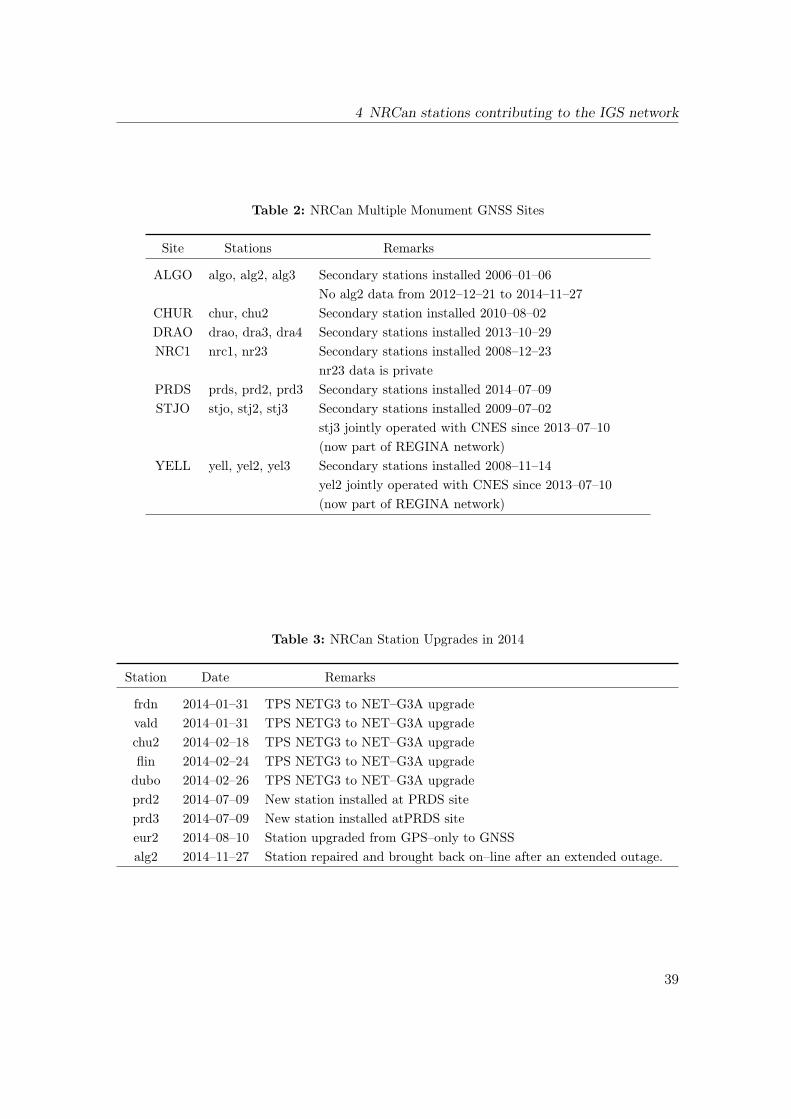
In addition to routinely generating all core IGS products, NRCan is also providing publicaccess to GPS/GNSS data for more than 60 stations. This includes 38 stations cur-rently contributing to the IGS network through the Canadian Geodetic Survey’s Cana-dian Active Control System (CGS–CACS), the CGS Regional Active Control System(CGS–RACS), and the Geological Survey of Canada’s Western Canada Deformation Ar-ray (GSC–WCDA). The NRCan contribution to the IGS network includes 22 GNSS + 16GPS only stations. In addition, several of the most important sites have multiple mon-uments in order to monitor the stability of the monument and the quality of the GNSSobservations. These NRCan core sites with multiple monuments are listed in Tab. 2. Sev-eral upgrades to the CGS–CACS were completed in 2014 and these are listed in Tab. 3.Figure 1 shows a map of the NRCan GPS/GNSS network as of January 2015. Furtherdetails about NRCan stations and access to NRCan public GPS/GNSS data and site logscan be found at http://geod.nrcan.gc.ca or from the following anonymous ftp site:ftp://rtopsdata1.geod.nrcan.gc.ca/gps
36
4 NRCan stations contributing to the IGS network
Table 1: NRCan–AC Products
Product Description
Repro2em2wwwwd.sp3 GPS onlyem2wwwwd.clk • Time Span 1994–11–02 to 2014–03–29em2wwwwd.snx • Use of JPL’s GIPSY–OASIS II v6.3em2wwww7.erp • Daily orbits, ERP and SINEX
• 5–min clocks• Submission for IGS repro2 combination
Final (weekly)emrwwwwd.sp3 GPS onlyemrwwwwd.clk • Since 1994 and ongoingemrwwwwd.snx • Use of JPL′s GIPSY–OASIS II v6.3emrwwww7.erp • Daily orbits, ERP and SINEXemrwwww7.sum • 30–sec clocks
• Weekly submission for IGS Final combination
GPS+GLONASS• Since 2011-Sep-11 and ongoing• Use of Bernese Software 5.0• Daily orbits and ERP• 30–sec clocks• Weekly submission for IGLOS Final combination• Station XYZ are constrained, similar to our Rapid solutions
Rapid (daily)emrwwwwd.sp3 GPS onlyemrwwwwd.clk • From July 1996 to 2011-05-21emrwwwwd.erp • Use of JPL′s GIPSY-OASIS (various versions)
• Orbits, 5-min clocks and ERP(30–sec clocks from 2006-Aug-27)• Daily submission for IGR combination
Ultra–Rapid (hourly)emuwwwwd_hh.sp3 GPS onlyemuwwwwd_hh.clk • From early 2000 to 2013–09–13, hour 06emuwwwwd_hh.erp • Use of Bernese Software v5.0
• Orbits, 30–sec clocks and ERP (hourly)• Submission for IGU combination (4 times daily)
GPS+GLONASS• Since 2013-09-13, hour 12• Use of Bernese Software v5.0
37
NRCan Analysis Center
• Orbits and ERP (hourly)• 30–sec GNSS clocks (every 3 hours)• 30–sec GPS-only clocks (every other hours)• Submission for IGUIGV combination (4 times daily)
Real–TimeGPS only• Since 2011–11–10• Custom software (HPGPS.C)• RTCM messages:– orbits & clocks:1060 (at Antenna Reference Point)– pseudorange biases: 1059• Interval: 5 sec
2015 Jan 27 20:51:05
whit
algo
bake
chur
drao dubo
flin
iqal
kuuj
sask
sch2
baiepicl
vald
stj2
stjo
winnfrdn
eur2
yell
prds
hlfx
nrc1
cags
hrst
escu
holm
nain
reso
tukt
pary
rosslpocpper
mchn
invk
alrt
pwelkngs
she2
will
bcrk
atli
Figure 1: NRCan Public GPS/GNSS Stations (CGS–CACS in blue, CGS–RACS in red andGSC–WCDA in green).
38
4 NRCan stations contributing to the IGS network
Table 2: NRCan Multiple Monument GNSS Sites
Site Stations Remarks
ALGO algo, alg2, alg3 Secondary stations installed 2006–01–06No alg2 data from 2012–12–21 to 2014–11–27
CHUR chur, chu2 Secondary station installed 2010–08–02DRAO drao, dra3, dra4 Secondary stations installed 2013–10–29NRC1 nrc1, nr23 Secondary stations installed 2008–12–23
nr23 data is privatePRDS prds, prd2, prd3 Secondary stations installed 2014–07–09STJO stjo, stj2, stj3 Secondary stations installed 2009–07–02
stj3 jointly operated with CNES since 2013–07–10(now part of REGINA network)
YELL yell, yel2, yel3 Secondary stations installed 2008–11–14yel2 jointly operated with CNES since 2013–07–10(now part of REGINA network)
Table 3: NRCan Station Upgrades in 2014
Station Date Remarks
frdn 2014–01–31 TPS NETG3 to NET–G3A upgradevald 2014–01–31 TPS NETG3 to NET–G3A upgradechu2 2014–02–18 TPS NETG3 to NET–G3A upgradeflin 2014–02–24 TPS NETG3 to NET–G3A upgradedubo 2014–02–26 TPS NETG3 to NET–G3A upgradeprd2 2014–07–09 New station installed at PRDS siteprd3 2014–07–09 New station installed atPRDS siteeur2 2014–08–10 Station upgraded from GPS–only to GNSSalg2 2014–11–27 Station repaired and brought back on–line after an extended outage.
39

NRCan Analysis Center
Acknowledgment
ESS Contribution number/Numéro de contribution du SST: 20140427c©Her Majesty the Queen in right of Canada 2015
40
ESA/ESOC Analysis CenterTechnical Report 2014
T.A. Springer, F. Dilssner, W. Enderle, J. Feltens,M. van Kints, I. Romero, E. Schoenemann, R. Zandbergen
European Space Operations Center, Darmstadt, Germany
1 Introduction
The IGS Analysis Center of the European Space Agency (ESA) is located at the EuropeanSpace Operations Center (ESOC) in Darmstadt, Germany. The ESA/ESOC AnalysisCenter has been involved in the IGS since its very beginning in 1992. In this report wegive a summary of the IGS related activities at ESOC in 2014.
2 Overview 2014
2.1 Routine Products
The ESA/ESOC IGS Analysis Center contributes to all the core IGS analysis centerproducts, being:
• Reprocessed Final GPS products (repro2)
– Provided from 1995 to 2014 day 140, from there on our normal Final products.
– Based on 24–hour solutions using 150 stations GPS–only, until 2008
– Based on 24–hour solutions using 110 stations GPS+GLONASS, from 2009
– Consisting of Orbits, Clocks (300s), daily SINEX coordinates, and EOPs
– Clocks with 30s sampling are also generated but not made publicly available
• Final GNSS (GPS+GLONASS) products
– Provided weekly, normally on Friday after the end of the observation week
41
ESA Analysis Center
– Based on 24–hour solutions using 150 stations
– True GNSS solutions obtained by simultaneously and fully consistently process-ing of GPS and GLONASS measurements, using a total of around 55 GNSSsatellites
– Consisting of Orbits, Clocks (30s), daily SINEX coordinates and EOPs, andIonosphere
• Rapid GNSS (GPS+GLONASS) products
– Provided daily for the previous day
– Available within 3 hours after the end of the observation day
– Based on 24–hour solutions using 110 stations
– True GNSS solutions obtained by simultaneously and fully consistently process-ing of GPS and GLONASS measurements, using a total of around 55 GNSSsatellites
– Consisting of Orbits, Clocks, Ionosphere, and EOPs
– Rapid SINEX coordinates and EOPs available as well
• Ultra-Rapid GNSS (GPS+GLONASS) products
– Provided 4 times per day covering a 48 hour interval; 24 hours of estimatedplus 24 hours of predicted products
– Available within 3 hours after the end of the observation interval which startat 0, 6, 12, and 18 hours UTC
– Based on 24 hours of observations using 110 stations
– True GNSS solutions obtained by simultaneously and fully consistently process-ing of GPS and GLONASS measurements, using a total of around 55 GNSSsatellites
– Consisting out of Orbits, Clocks, and EOPs
– Separate Ionosphere estimates and predictions
• Real–Time GNSS services
– Generation of two independent real–time solution streams
– Analysis Center Coordination
– Generation and dissemination of the IGS Real Time Combined product stream
• GNSS Sensor Stations
42
2 Overview 2014
– A set of 10 globally distributed GNSS sensor stations
– Station data available in real–time with 1 second data sampling
Besides these core products ESA is very active in different working groups. Most no-tably are our efforts in the Real–Time Service where besides being one of the analysiscenters we are also responsible for the analysis center coordination. Also our efforts in thescope of MGEX, the antenna calibrations and satellite orbit modeling working groups aresignificant.
An up to date description of the ESA IGS Analysis strategy may always be found at:ftp://dgn6.esoc.esa.int/products/esa.acn
2.2 Product Changes
The main changes in our processing in 2014 were the following:
• Upgrade of the ESA/ESOC GNSS Sensor Station network
• Using a box–wing model for the GNSS satellites to a priori model the Solar andEarth Albedo radiation pressure
2.3 Product Highlights
The main highlight of the ESA/ESOC Analysis Center products is that they are one ofthe best products available from the individual IGS analysis centers. Furthermore, theESA products are one of the most complete GNSS products. In fact ESA/ESOC was thefirst IGS analysis center to provide a consistent set of GNSS orbit and clock products.Our GNSS products constituted the very first products that could, and are, used for trueGNSS precise point positioning. In particular for this purpose, the sampling rate of ourfinal GPS+GLONASS clock products is 30 seconds. Another special feature of the ESAproducts is that they are based on completely independent 24–hour solutions. Althoughthis does not necessarily lead to the best products, as in the real world the orbits and EOPsare continuous, it does provide a very interesting set of products for scientific investigationsas there is no aliasing and no smoothing between subsequent solutions. Another uniquefeature is that our rapid products are, besides being one of the best, also one of the mosttimely available products. Normally our GNSS rapid products are available within 2 hoursafter the end of the observation day whereas the official GPS–only IGS products becomeavailable only 17 hours after the end of the observation day, a very significant difference.
The largest change, or rather improvement, we made in our processing in 2014 was thatwe started using a box–wing model for the GNSS satellites to a priori model the Solar–and Earth Albedo radiation pressure. The GNSS block type specific models were testedthoroughly in the scope of our IGS reprocessing and the results were presented at the
43
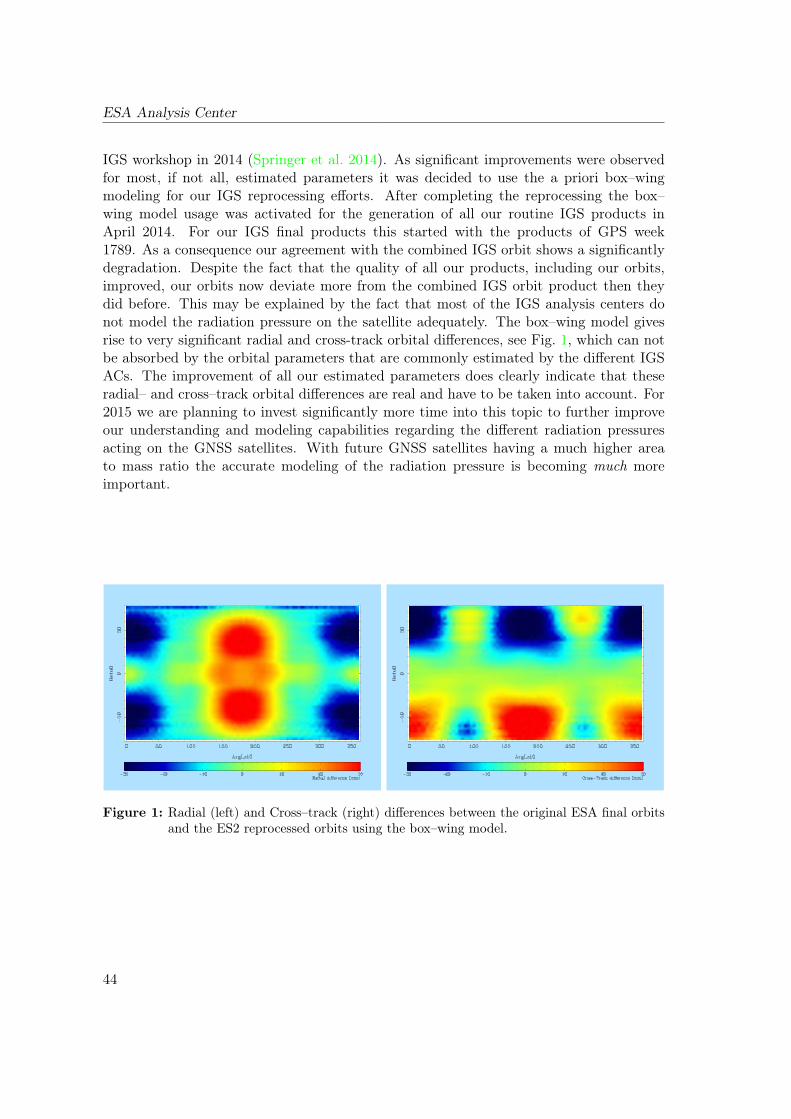
ESA Analysis Center
IGS workshop in 2014 (Springer et al. 2014). As significant improvements were observedfor most, if not all, estimated parameters it was decided to use the a priori box–wingmodeling for our IGS reprocessing efforts. After completing the reprocessing the box–wing model usage was activated for the generation of all our routine IGS products inApril 2014. For our IGS final products this started with the products of GPS week1789. As a consequence our agreement with the combined IGS orbit shows a significantlydegradation. Despite the fact that the quality of all our products, including our orbits,improved, our orbits now deviate more from the combined IGS orbit product then theydid before. This may be explained by the fact that most of the IGS analysis centers donot model the radiation pressure on the satellite adequately. The box–wing model givesrise to very significant radial and cross-track orbital differences, see Fig. 1, which can notbe absorbed by the orbital parameters that are commonly estimated by the different IGSACs. The improvement of all our estimated parameters does clearly indicate that theseradial– and cross–track orbital differences are real and have to be taken into account. For2015 we are planning to invest significantly more time into this topic to further improveour understanding and modeling capabilities regarding the different radiation pressuresacting on the GNSS satellites. With future GNSS satellites having a much higher areato mass ratio the accurate modeling of the radiation pressure is becoming much moreimportant.
Figure 1: Radial (left) and Cross–track (right) differences between the original ESA final orbitsand the ES2 reprocessed orbits using the box–wing model.
44
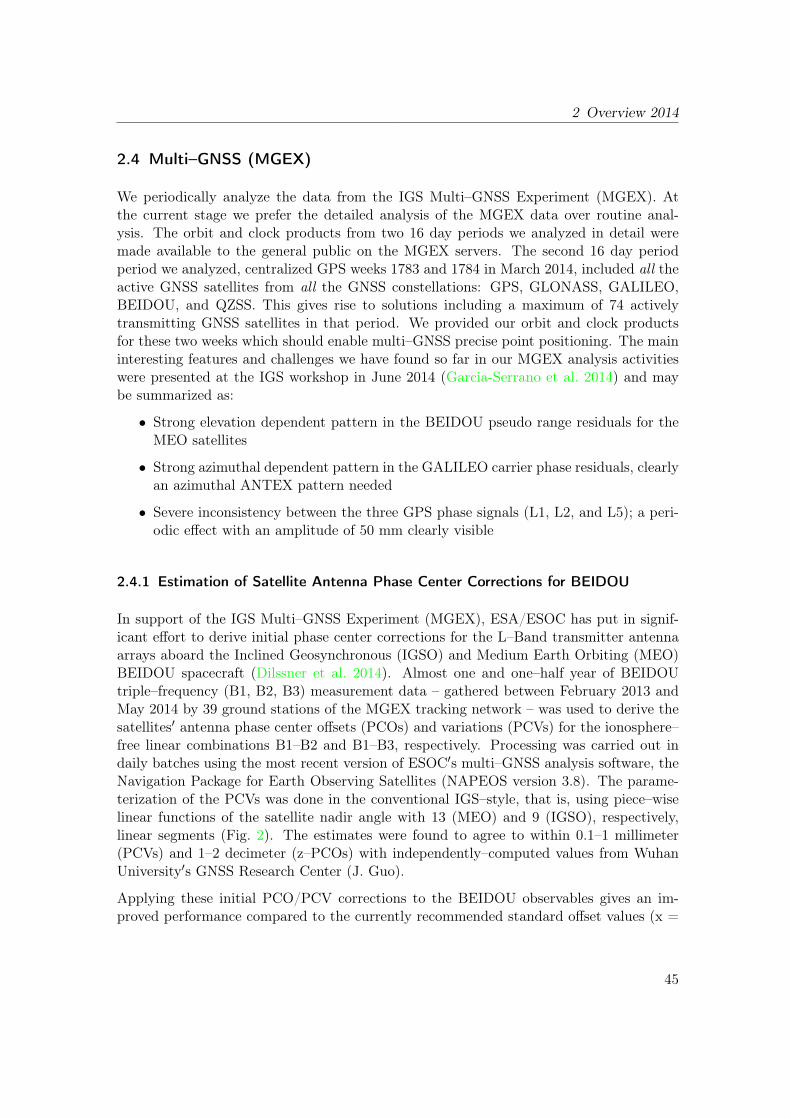
2 Overview 2014
2.4 Multi–GNSS (MGEX)
We periodically analyze the data from the IGS Multi–GNSS Experiment (MGEX). Atthe current stage we prefer the detailed analysis of the MGEX data over routine anal-ysis. The orbit and clock products from two 16 day periods we analyzed in detail weremade available to the general public on the MGEX servers. The second 16 day periodperiod we analyzed, centralized GPS weeks 1783 and 1784 in March 2014, included all theactive GNSS satellites from all the GNSS constellations: GPS, GLONASS, GALILEO,BEIDOU, and QZSS. This gives rise to solutions including a maximum of 74 activelytransmitting GNSS satellites in that period. We provided our orbit and clock productsfor these two weeks which should enable multi–GNSS precise point positioning. The maininteresting features and challenges we have found so far in our MGEX analysis activitieswere presented at the IGS workshop in June 2014 (Garcia-Serrano et al. 2014) and maybe summarized as:
• Strong elevation dependent pattern in the BEIDOU pseudo range residuals for theMEO satellites
• Strong azimuthal dependent pattern in the GALILEO carrier phase residuals, clearlyan azimuthal ANTEX pattern needed
• Severe inconsistency between the three GPS phase signals (L1, L2, and L5); a peri-odic effect with an amplitude of 50 mm clearly visible
2.4.1 Estimation of Satellite Antenna Phase Center Corrections for BEIDOU
In support of the IGS Multi–GNSS Experiment (MGEX), ESA/ESOC has put in signif-icant effort to derive initial phase center corrections for the L–Band transmitter antennaarrays aboard the Inclined Geosynchronous (IGSO) and Medium Earth Orbiting (MEO)BEIDOU spacecraft (Dilssner et al. 2014). Almost one and one–half year of BEIDOUtriple–frequency (B1, B2, B3) measurement data – gathered between February 2013 andMay 2014 by 39 ground stations of the MGEX tracking network – was used to derive thesatellites′ antenna phase center offsets (PCOs) and variations (PCVs) for the ionosphere–free linear combinations B1–B2 and B1–B3, respectively. Processing was carried out indaily batches using the most recent version of ESOC′s multi–GNSS analysis software, theNavigation Package for Earth Observing Satellites (NAPEOS version 3.8). The parame-terization of the PCVs was done in the conventional IGS–style, that is, using piece–wiselinear functions of the satellite nadir angle with 13 (MEO) and 9 (IGSO), respectively,linear segments (Fig. 2). The estimates were found to agree to within 0.1–1 millimeter(PCVs) and 1–2 decimeter (z–PCOs) with independently–computed values from WuhanUniversity′s GNSS Research Center (J. Guo).
Applying these initial PCO/PCV corrections to the BEIDOU observables gives an im-proved performance compared to the currently recommended standard offset values (x =
45
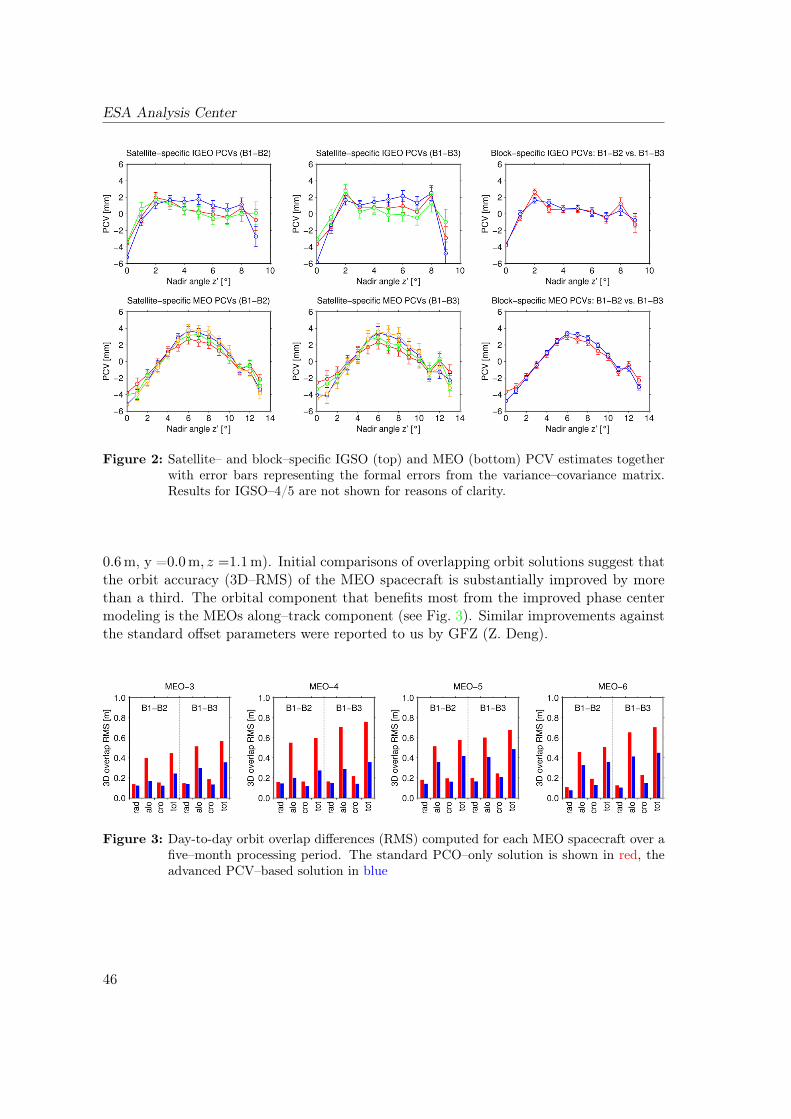
ESA Analysis Center
Figure 2: Satellite– and block–specific IGSO (top) and MEO (bottom) PCV estimates togetherwith error bars representing the formal errors from the variance–covariance matrix.Results for IGSO–4/5 are not shown for reasons of clarity.
0.6m, y =0.0m, z =1.1m). Initial comparisons of overlapping orbit solutions suggest thatthe orbit accuracy (3D–RMS) of the MEO spacecraft is substantially improved by morethan a third. The orbital component that benefits most from the improved phase centermodeling is the MEOs along–track component (see Fig. 3). Similar improvements againstthe standard offset parameters were reported to us by GFZ (Z. Deng).
Figure 3: Day-to-day orbit overlap differences (RMS) computed for each MEO spacecraft over afive–month processing period. The standard PCO–only solution is shown in red, theadvanced PCV–based solution in blue
46
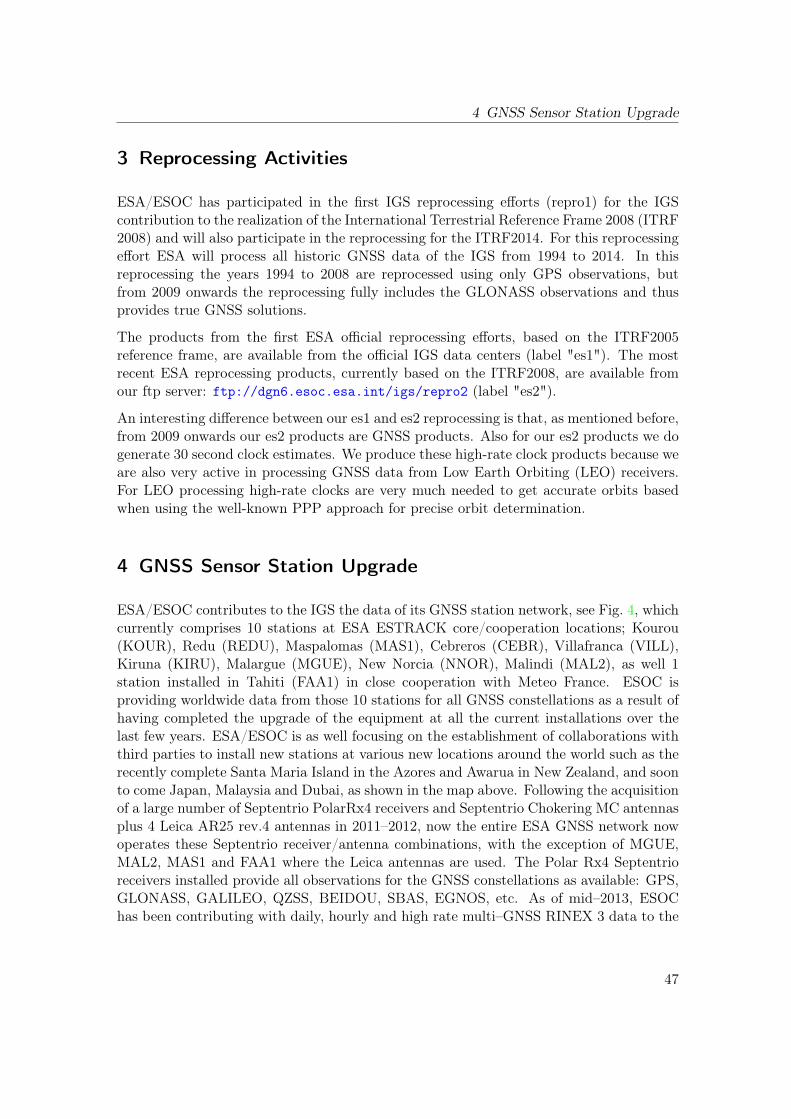
4 GNSS Sensor Station Upgrade
3 Reprocessing Activities
ESA/ESOC has participated in the first IGS reprocessing efforts (repro1) for the IGScontribution to the realization of the International Terrestrial Reference Frame 2008 (ITRF2008) and will also participate in the reprocessing for the ITRF2014. For this reprocessingeffort ESA will process all historic GNSS data of the IGS from 1994 to 2014. In thisreprocessing the years 1994 to 2008 are reprocessed using only GPS observations, butfrom 2009 onwards the reprocessing fully includes the GLONASS observations and thusprovides true GNSS solutions.
The products from the first ESA official reprocessing efforts, based on the ITRF2005reference frame, are available from the official IGS data centers (label "es1"). The mostrecent ESA reprocessing products, currently based on the ITRF2008, are available fromour ftp server: ftp://dgn6.esoc.esa.int/igs/repro2 (label "es2").
An interesting difference between our es1 and es2 reprocessing is that, as mentioned before,from 2009 onwards our es2 products are GNSS products. Also for our es2 products we dogenerate 30 second clock estimates. We produce these high-rate clock products because weare also very active in processing GNSS data from Low Earth Orbiting (LEO) receivers.For LEO processing high-rate clocks are very much needed to get accurate orbits basedwhen using the well-known PPP approach for precise orbit determination.
4 GNSS Sensor Station Upgrade
ESA/ESOC contributes to the IGS the data of its GNSS station network, see Fig. 4, whichcurrently comprises 10 stations at ESA ESTRACK core/cooperation locations; Kourou(KOUR), Redu (REDU), Maspalomas (MAS1), Cebreros (CEBR), Villafranca (VILL),Kiruna (KIRU), Malargue (MGUE), New Norcia (NNOR), Malindi (MAL2), as well 1station installed in Tahiti (FAA1) in close cooperation with Meteo France. ESOC isproviding worldwide data from those 10 stations for all GNSS constellations as a result ofhaving completed the upgrade of the equipment at all the current installations over thelast few years. ESA/ESOC is as well focusing on the establishment of collaborations withthird parties to install new stations at various new locations around the world such as therecently complete Santa Maria Island in the Azores and Awarua in New Zealand, and soonto come Japan, Malaysia and Dubai, as shown in the map above. Following the acquisitionof a large number of Septentrio PolarRx4 receivers and Septentrio Chokering MC antennasplus 4 Leica AR25 rev.4 antennas in 2011–2012, now the entire ESA GNSS network nowoperates these Septentrio receiver/antenna combinations, with the exception of MGUE,MAL2, MAS1 and FAA1 where the Leica antennas are used. The Polar Rx4 Septentrioreceivers installed provide all observations for the GNSS constellations as available: GPS,GLONASS, GALILEO, QZSS, BEIDOU, SBAS, EGNOS, etc. As of mid–2013, ESOChas been contributing with daily, hourly and high rate multi–GNSS RINEX 3 data to the
47
ESA Analysis Center
Figure 4: ESA/ESOC GNSS Station Network.
MGEX effort. Also, since the beginning of 2013, ESOC has been providing NBS (NavBits)data from this same set of stations to Eumetsat to support LEO satellite occultationprocessing. The ESOC station network also supports the new RINEX 3 file naming aspromoted within the IGS for the mainstream adoption of the RINEX 3 format, as well asretaining the distribution of the legacy GPS+Glonass RINEX 2.11 files.
5 Ionosphere Modeling Activities
ESA/ESOC contributes with IONEX products to the IGS Ionosphere Working Groupsince its inception in 1998, initially with daily global ionospheric TEC maps in final mode(11 days latency). ESA/ESOC′s activities for the ionosphere in the frame of the IGS since2004 can briefly be summarized as follows:
• Spring 2004: Start routine delivery of daily global ionospheric TEC maps in rapidmode (1 day latency)
• December 2005: Start routine delivery of TEC maps in 2–hour time resolution, i.e.since then each ESA IONEX file provides 13 TEC and RMS maps per day
• September 2009: Commence submission of IONEX files containing 1 and 2 daysahead predicted TEC maps in 2–hour time resolution
• February 2009 – January 2010: ESA Study: GNSS Contribution to Next GenerationGlobal Ionospheric Monitoring (Feltens et al. 2009 and Feltens et al. 2010)
48
5 Ionosphere Modeling Activities
• July 2010: Commence combination of predicted Ionosphere Associate Analysis Cen-ters (IAACs) TEC maps and submission of combined predicted IGS IONEX files in2 hour time resolution
• February 2011: Commence submission of ESA IONEX files with 1–hour time reso-lution
• January 2013: The IONMON became an integral part of ESOC′s NAPEOS softwareallowing for GPS+GLONASS based ionosphere estimation
• Summer 2014: : Mathematical algorithms of a new 3D TEC and electron densitiesassimilation approach worked out and coded as new NAPEOS component.
ESOC employs the Ionosphere Monitoring Facility (IONMON) for its ionosphere process-ing. IONMON algorithms were initially devoted to single layer approaches. Since 1999,investigations were undertaken into the direction of 3D ionosphere modelling. Startingwith an extended Chapman profile approach, in the subsequent years the concept of amultilayer modelling was developed, combining empirical surface functions to describethe horizontal structures of the ionosphere with vertical profile functions, which should, tosome limited extent, also allow for a physical interpretation of results. It was foreseen thatthis new modelling should process TEC data from GNSS combined with observed elec-tron density profiles from different sources, namely CHAMP, F3/COSMIC and ionosondein least squares fits. In relation to these IONMON developments, from March 2009 toJanuary 2010 the ESA Study "GNSS Contribution to Next Generation Global IonosphericMonitoring" was conducted, Feltens et al. 2009 and Feltens et al. 2010, working out rec-ommendations for a new ionosphere monitoring system.
In summer 2013, the IONMON became an integral part of ESOC′s NAPEOS software.ESOC′s actual ionosphere model development efforts are clearly directed to 3D modelling,where the concept had to be changed from the least squares fitting of TEC and electrondensity data into a model comprising a combination of vertical and horizontal functions, toan approach in which TEC and electron density observables from different sources will beassimilated into a background model. It turned out that, in spite of including F3/COSMICand CHAMP electron densities in addition to GNSS TEC observables, the data coveragewas not yet dense enough to perform reliable and stable least squares fits. This was also oneof the results from the Iono Study conducted in 2009–10. The mathematical algorithmsfor this new 3D assimilation approach were worked out and coded as new component ofNAPEOS in 2014. From its design, the assimilation scheme shall also enable NRT & RTprocessing and upgrade time resolutions down to several minutes, i.e. simple, fast androbust algorithms are required.
49
ESA Analysis Center
5.1 Actual / Future Activities
The 3D assimilation model code within NAPEOS has still to be tested. Once the newassimilation approach in NAPEOS will be operational, ESOC′s ionosphere processingwill be switched over from the current single layer modelling to this new 3D modellingtechnique. This will then also concern ESOC′s ionosphere products delivered to the IGS,including new aspects such as 3D IONEX.
A follow-up study to the Iono Study of 2009–10 is currently under planning.
The implementation of a more sophisticated Iono prediction scheme at ESOC will be animportant future topic too.
In parallel to the tasks described above, other ionosphere-related activities are ongoing atESOC:
• Establishment of a new model for the plasmasphere in a cooperative effort withthe German Aerospace Center (DLR) in Neustrelitz, Germany. This plasmaspheremodel will then complement the new 3D assimilation approach.
• Establishment of an ionospheric & tropospheric media calibration service to be op-erationally used by the ESOC Flight Dynamics Department.
• Routine contributions to ESA′s Space Situational Awareness (SSA) service – spaceweatherpart.
6 Summary
The European Space Operations Center (ESOC) of the European Space Agency (ESA)Analysis Center has continued to produce "best in class" products for the IGS in 2014.Practically all products are generated using the Navigation Package for Earth OrbitingSatellites (NAPEOS) software. NAPEOS is a state of the art software that is highly accu-rate, very efficient, robust and reliable. It enables ESA/ESOC to deliver the high qualityproducts as required for the IGS but also for the other space geodetic techniques DORISand SLR. This is important because besides being an IGS Analysis Center, ESA/ESOCis also an Analysis Center of the IDS and the ILRS.
References
Springer, T., R. Zandbergen, and A. Águeda Maté, NAPEOS Mathematical Mod-els and Algorithms. DOPS–SYS–TN–0100–OPS–GN, Issue 1.0, 2009. Available atftp://dgn6.esoc.esa.int/napeos
50
References
Feltens, J., M. Angling, N. Jakowsk, Ch. Mayer, M. Hoque, M. Hernández-Pajares,A. García-Rigo, R. Orús-Perez, and A. Aragón-Ange. Analysis of the State of theArt Ionosphere Modelling and Observation Techniques. DOPS-SYS-TN-0017-OPS-GN, Iss. 1/0, 26/06/2009, 2009.
Feltens, J., M. Angling, N. Jackson–Booth, N. Jakowsk, M. Hoque, Ch. Mayer,M. Hernández-Pajares, A. García-Rigo, R. Orús-Perez, A. Aragón-Ange, andJ. Miguel Juan Zornoza. Recommendations for a New European Ionosphere Mon-itoring System. DOPS-SYS-RP-5001-OPS-GN Iss. 1/0, 20/01/2010, 2010.
Dilssner, F., T. Springer, E. Schönemann, andW. Enderle. Estimation of Satellite AntennaPhase Center Corrections for BEIDOU. IGS Workshop 2014, June 23–27, PasadenaUSA, 2014.
Garcia-Serrano, C., L. Agrotis, F. Dilssner, J. Feltens, M. van Kints, I. Romero,T. Springer, and W. Enderle. The ESA/ESOC Analysis Center Progress and Im-provements. IGS Workshop 2014, June 23-27, Pasadena USA, 2014.
T. Springer, M. Otten, C. Flohrer, F. Pereira, F. Gini, and W. Enderle. GNSS SatelliteOrbit Modeling at ESOC. IGS Workshop 2014, June 23–27, Pasadena USA, 2014.
51
GFZ Analysis CenterTechnical Report 2014
M. Fritsche, Z. Deng, M. Ge, T. Nischan,M. Uhlemann, G. Beeskow, A. Brandt,
M. Bradke, M. Ramatschi
Helmholtz-Zentrum PotsdamDeutsches GeoForschungsZentrum (GFZ)Department 1: Geodäsie und FernerkundungTelegrafenberg A 17, 14473 Potsdam, GermanyE-mail: [email protected]
1 Summary
During 2014 the standard IGS product generation was continued with minor changes in theprocessing software EPOS–8. The GNSS observation modeling was adapted to conformto the GFZ repro–2 (2nd IGS Reprocessing campaign) settings for IGS Final productgeneration.
End of 2014 the repro–2 processing for IGS (GF2) and TIGA (GT2) was nearly finished.Newly re-runs for GF2 and GT2 became necessary, because a preliminary SINEX combi-nation of repro–2 submissions revealed systematic problems for GFZ SINEX submissionsrelated to station network scale and length of day (LOD) estimates.
A routine multi–GNSS processing including GPS, GLONASS, BeiDou and Galileo hasbeen set up similar to the IGS Rapid processing scheme.
At the end of February 2014, Dr. Gerd Gend retired from GFZ and such also resignedas head of the IGS analysis center. We would like to take the opportunity to expressour sincere appreciation and gratitude to him for his longstanding efforts within the IGScommunity but also for his collegial spirit over many years.
52
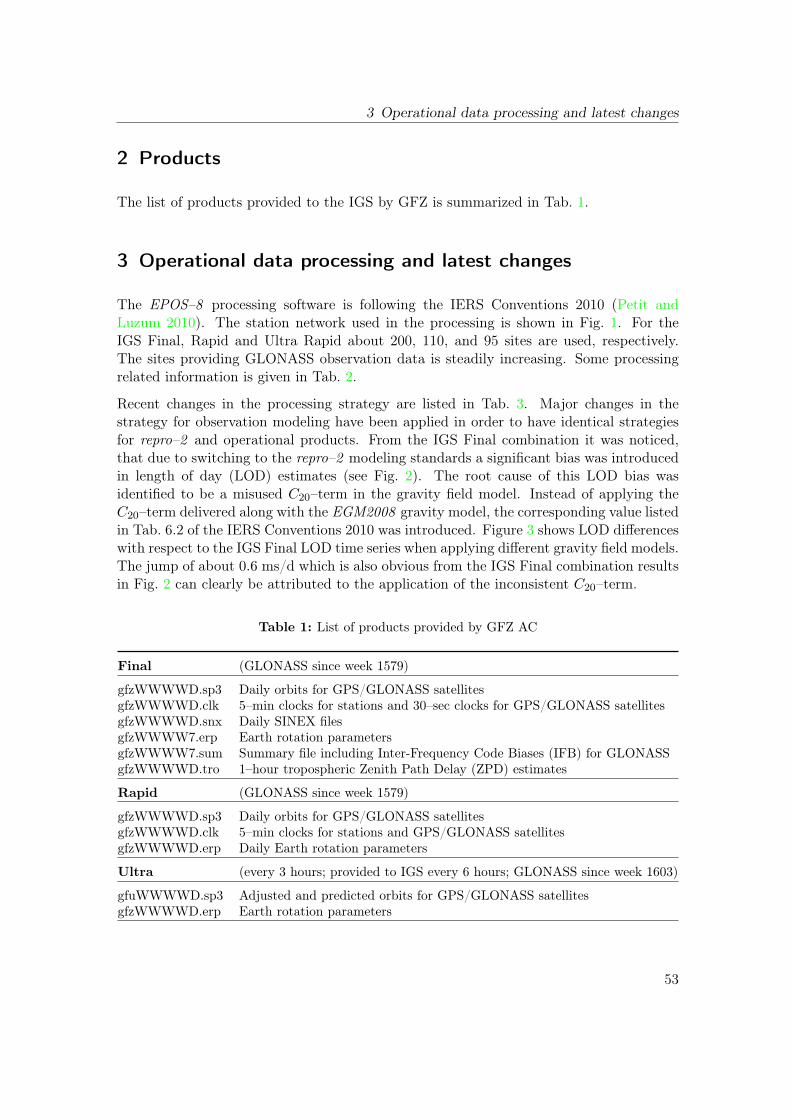
3 Operational data processing and latest changes
2 Products
The list of products provided to the IGS by GFZ is summarized in Tab. 1.
3 Operational data processing and latest changes
The EPOS–8 processing software is following the IERS Conventions 2010 (Petit andLuzum 2010). The station network used in the processing is shown in Fig. 1. For theIGS Final, Rapid and Ultra Rapid about 200, 110, and 95 sites are used, respectively.The sites providing GLONASS observation data is steadily increasing. Some processingrelated information is given in Tab. 2.
Recent changes in the processing strategy are listed in Tab. 3. Major changes in thestrategy for observation modeling have been applied in order to have identical strategiesfor repro–2 and operational products. From the IGS Final combination it was noticed,that due to switching to the repro–2 modeling standards a significant bias was introducedin length of day (LOD) estimates (see Fig. 2). The root cause of this LOD bias wasidentified to be a misused C20–term in the gravity field model. Instead of applying theC20–term delivered along with the EGM2008 gravity model, the corresponding value listedin Tab. 6.2 of the IERS Conventions 2010 was introduced. Figure 3 shows LOD differenceswith respect to the IGS Final LOD time series when applying different gravity field models.The jump of about 0.6 ms/d which is also obvious from the IGS Final combination resultsin Fig. 2 can clearly be attributed to the application of the inconsistent C20–term.
Table 1: List of products provided by GFZ AC
Final (GLONASS since week 1579)
gfzWWWWD.sp3 Daily orbits for GPS/GLONASS satellitesgfzWWWWD.clk 5–min clocks for stations and 30–sec clocks for GPS/GLONASS satellitesgfzWWWWD.snx Daily SINEX filesgfzWWWW7.erp Earth rotation parametersgfzWWWW7.sum Summary file including Inter-Frequency Code Biases (IFB) for GLONASSgfzWWWWD.tro 1–hour tropospheric Zenith Path Delay (ZPD) estimates
Rapid (GLONASS since week 1579)
gfzWWWWD.sp3 Daily orbits for GPS/GLONASS satellitesgfzWWWWD.clk 5–min clocks for stations and GPS/GLONASS satellitesgfzWWWWD.erp Daily Earth rotation parameters
Ultra (every 3 hours; provided to IGS every 6 hours; GLONASS since week 1603)
gfuWWWWD.sp3 Adjusted and predicted orbits for GPS/GLONASS satellitesgfzWWWWD.erp Earth rotation parameters
53
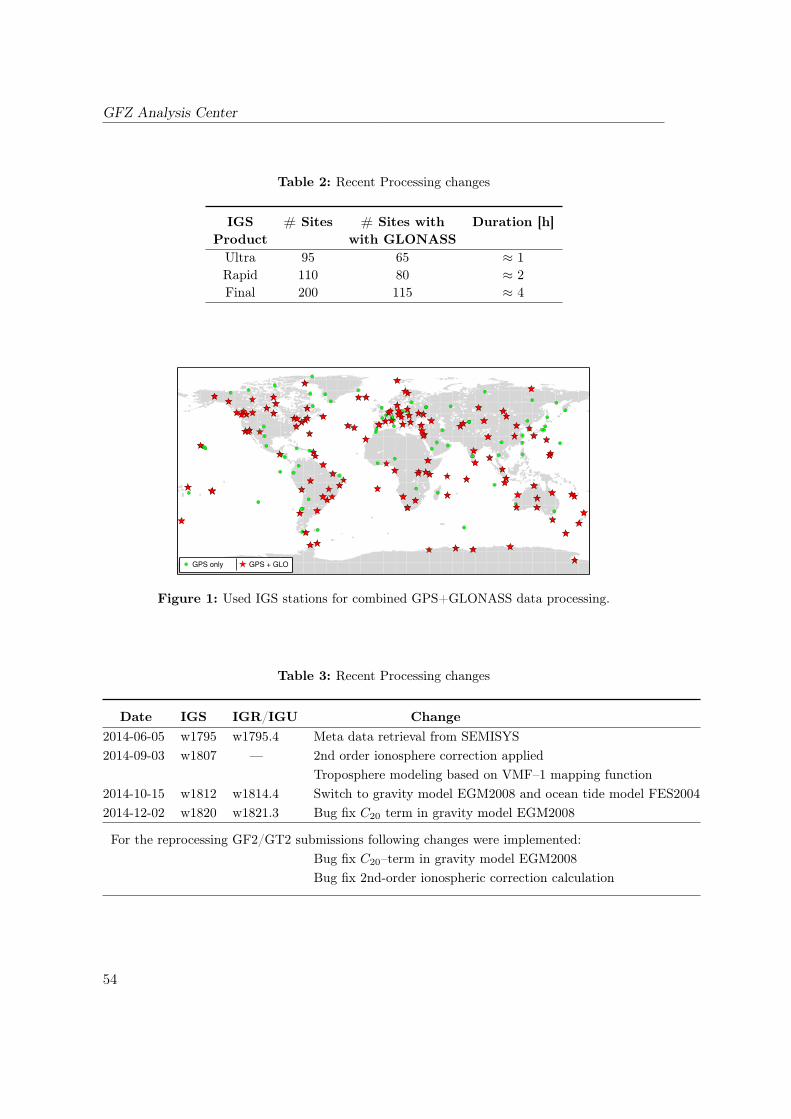
GFZ Analysis Center
Table 2: Recent Processing changes
IGS # Sites # Sites with Duration [h]Product with GLONASSUltra 95 65 ≈ 1Rapid 110 80 ≈ 2Final 200 115 ≈ 4
GPS only GPS + GLO
" "
Figure 1: Used IGS stations for combined GPS+GLONASS data processing.
Table 3: Recent Processing changes
Date IGS IGR/IGU Change2014-06-05 w1795 w1795.4 Meta data retrieval from SEMISYS2014-09-03 w1807 — 2nd order ionosphere correction applied
Troposphere modeling based on VMF–1 mapping function2014-10-15 w1812 w1814.4 Switch to gravity model EGM2008 and ocean tide model FES20042014-12-02 w1820 w1821.3 Bug fix C20 term in gravity model EGM2008
For the reprocessing GF2/GT2 submissions following changes were implemented:Bug fix C20–term in gravity model EGM2008Bug fix 2nd-order ionospheric correction calculation
54
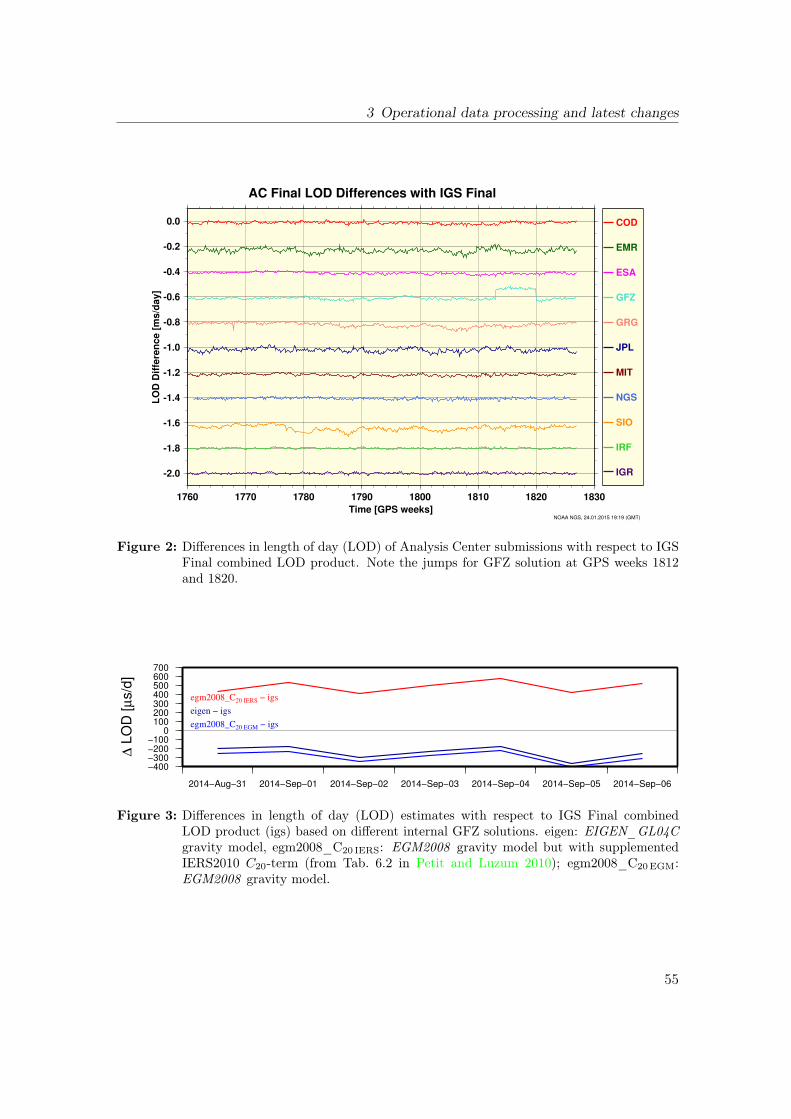
3 Operational data processing and latest changes
-2.0
-1.8
-1.6
-1.4
-1.2
-1.0
-0.8
-0.6
-0.4
-0.2
0.0
LO
D D
iffe
ren
ce [
ms/d
ay]
1760 1770 1780 1790 1800 1810 1820 1830
Time [GPS weeks]
AC Final LOD Differences with IGS Final
NOAA NGS, 24.01.2015 19:19 (GMT)
COD
EMR
ESA
GFZ
GRG
JPL
MIT
NGS
SIO
IRF
IGR
Figure 2: Differences in length of day (LOD) of Analysis Center submissions with respect to IGSFinal combined LOD product. Note the jumps for GFZ solution at GPS weeks 1812and 1820.
−400−300−200−100
0100200300400500600700
∆ L
OD
[µ
s/d
]
2014−Aug−31 2014−Sep−01 2014−Sep−02 2014−Sep−03 2014−Sep−04 2014−Sep−05 2014−Sep−06
eigen − igs
egm2008_C20 EGM − igs
egm2008_C20 IERS − igs
Figure 3: Differences in length of day (LOD) estimates with respect to IGS Final combinedLOD product (igs) based on different internal GFZ solutions. eigen: EIGEN_GL04Cgravity model, egm2008_C20 IERS: EGM2008 gravity model but with supplementedIERS2010 C20-term (from Tab. 6.2 in Petit and Luzum 2010); egm2008_C20EGM:EGM2008 gravity model.
55
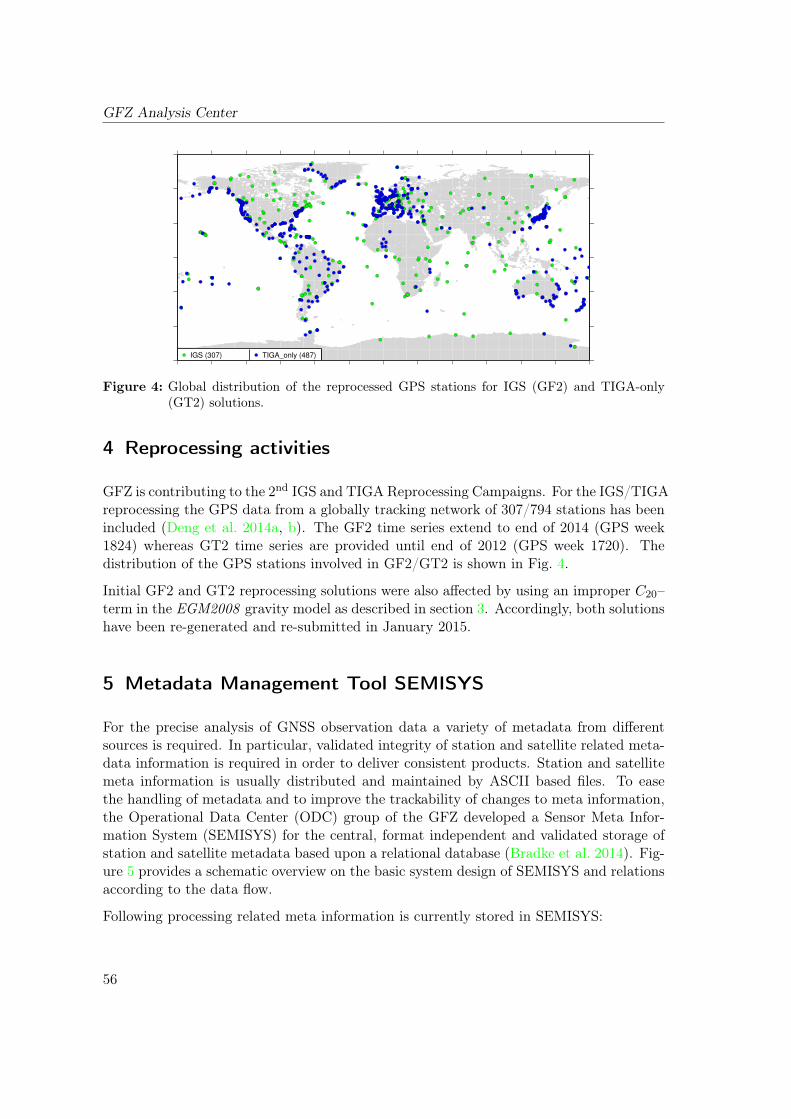
GFZ Analysis Center
IGS (307) TIGA_only (487)
Figure 4: Global distribution of the reprocessed GPS stations for IGS (GF2) and TIGA-only(GT2) solutions.
4 Reprocessing activities
GFZ is contributing to the 2nd IGS and TIGA Reprocessing Campaigns. For the IGS/TIGAreprocessing the GPS data from a globally tracking network of 307/794 stations has beenincluded (Deng et al. 2014a, b). The GF2 time series extend to end of 2014 (GPS week1824) whereas GT2 time series are provided until end of 2012 (GPS week 1720). Thedistribution of the GPS stations involved in GF2/GT2 is shown in Fig. 4.
Initial GF2 and GT2 reprocessing solutions were also affected by using an improper C20–term in the EGM2008 gravity model as described in section 3. Accordingly, both solutionshave been re-generated and re-submitted in January 2015.
5 Metadata Management Tool SEMISYS
For the precise analysis of GNSS observation data a variety of metadata from differentsources is required. In particular, validated integrity of station and satellite related meta-data information is required in order to deliver consistent products. Station and satellitemeta information is usually distributed and maintained by ASCII based files. To easethe handling of metadata and to improve the trackability of changes to meta information,the Operational Data Center (ODC) group of the GFZ developed a Sensor Meta Infor-mation System (SEMISYS) for the central, format independent and validated storage ofstation and satellite metadata based upon a relational database (Bradke et al. 2014). Fig-ure 5 provides a schematic overview on the basic system design of SEMISYS and relationsaccording to the data flow.
Following processing related meta information is currently stored in SEMISYS:
56
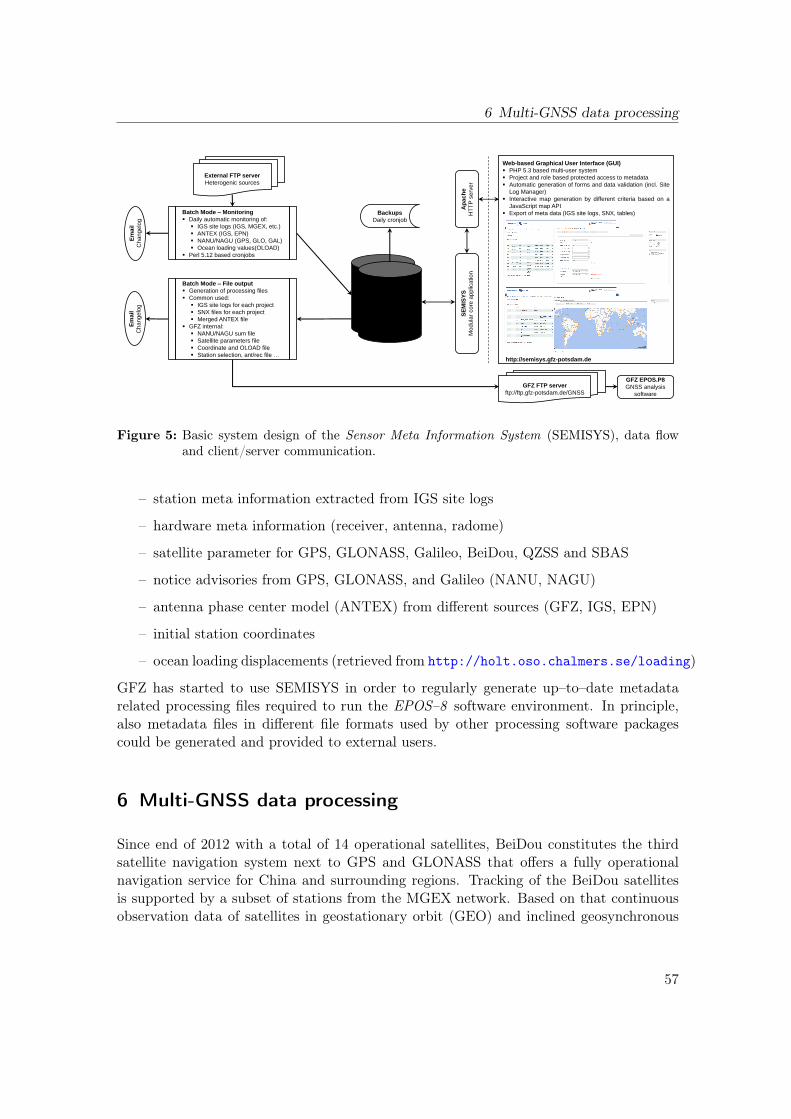
6 Multi-GNSS data processing
Web-based Graphical User Interface (GUI)
PHP 5.3 based multi-user system
Project and role based protected access to metadata
Automatic generation of forms and data validation (incl. Site
Log Manager)
Interactive map generation by different criteria based on a
JavaScript map API
Export of meta data (IGS site logs, SNX, tables)
Ap
ac
he
HT
TP
se
rve
r
http://semisys.gfz-potsdam.de
SE
MIS
YS
Modula
r core
applic
ation
GFZ EPOS.P8
GNSS analysis
software
PostgreSQL 9.2
Database
Backups
Daily cronjob
Batch Mode – Monitoring
Daily automatic monitoring of:
IGS site logs (IGS, MGEX, etc.)
ANTEX (IGS, EPN)
NANU/NAGU (GPS, GLO, GAL)
Ocean loading values(OLOAD)
Perl 5.12 based cronjobs
Batch Mode – File output
Generation of processing files
Common used:
IGS site logs for each project
SNX files for each project
Merged ANTEX file
GFZ internal:
NANU/NAGU sum file
Satellite parameters file
Coordinate and OLOAD file
Station selection, ant/rec file …
External FTP server
Heterogenic sources
GFZ FTP server
ftp://ftp.gfz-potsdam.de/GNSS
Em
ail
Ch
ang
elo
g
Em
ail
Ch
ang
elo
g
Figure 5: Basic system design of the Sensor Meta Information System (SEMISYS), data flowand client/server communication.
– station meta information extracted from IGS site logs
– hardware meta information (receiver, antenna, radome)
– satellite parameter for GPS, GLONASS, Galileo, BeiDou, QZSS and SBAS
– notice advisories from GPS, GLONASS, and Galileo (NANU, NAGU)
– antenna phase center model (ANTEX) from different sources (GFZ, IGS, EPN)
– initial station coordinates
– ocean loading displacements (retrieved from http://holt.oso.chalmers.se/loading)
GFZ has started to use SEMISYS in order to regularly generate up–to–date metadatarelated processing files required to run the EPOS–8 software environment. In principle,also metadata files in different file formats used by other processing software packagescould be generated and provided to external users.
6 Multi-GNSS data processing
Since end of 2012 with a total of 14 operational satellites, BeiDou constitutes the thirdsatellite navigation system next to GPS and GLONASS that offers a fully operationalnavigation service for China and surrounding regions. Tracking of the BeiDou satellitesis supported by a subset of stations from the MGEX network. Based on that continuousobservation data of satellites in geostationary orbit (GEO) and inclined geosynchronous
57
GFZ Analysis Center
orbit (IGSO) can be provides as well as partial tracking of the four satellites in mediumEarth orbit (MEO) is enabled.
At GFZ an upgraded version of EPOS.P8 software is used for processing dual-frequencyGPS+BDS data. Ambiguity–fixing was also set up for BeiDou IGSO and MEO typesatellites. The ionosphere–free linear combination of B1 (1561.098 MHz) and B2 (1207.140MHz) frequencies is applied for estimation of satellite orbits, clocks, and other relevantparameters. The a priori BeiDou orbits are taken from the broadcast navigation messagefiles, which are available from the MGEX network. More details are described in Denget al. 2014c, d.
Since 28th January, 2014 GFZ generates IGR-like GPS+BeiDou orbits and 5 min clockproducts routinely. For the analysis, GPS and BeiDou data of the MGEX and IGS net-works is used. Starting with 8th July, 2014 (doy 200) besides GPS and BeiDou, alsoGLONASS and GALILEO are included in the analysis. Table 4 gives an overview on thenumber satellites included per system and the frequencies used for product generation.Associated final products are provided as GBM products (ftp://ftp.gfz-potsdam.de/pub/GNSS/products/mgex).
In order to check the quality of the GBM orbits the median daily RMS of orbit differenceswith respect to GFZ rapid orbit GFR are computed (doy 200 to 250 in 2014, Deng et al.2014e). Statistical results are shown in Fig. 6. Looking at GPS, the RMS values for mostof the satellites are on a level of about 1.5 cm. The RMS for GLONASS satellites is on theorder of 3 cm. Since the GFR orbit has an accuracy of approximately 2.5 cm, 3.0 cm forGPS and GLONASS, respectively, the accuracy of the GBM GPS and GLONASS orbitsare assumed to be on a similar order of magnitude.
Besides the orbit differences with respect to GFR, the RMS of the differences from over-lapping orbit positions (4 hours interval) has been evaluated. Figure 7 shows the dailymedian RMS of the orbit overlaps for each satellite. Corresponding RMS values are below10 cm for most of the GPS satellites, while they vary between 10 and 20 cm for GLONASS.For GALILEO satellites, we find an RMS of about 10 cm. For BeiDou, there are three dif-ferent types of orbits: GEO, IGSO and MEO. Because of the weak observation geometryand the lack of orbit change with respect to the ground tracking station network, GEOsatellites reveal the largest RMS value of 1 to 2 meter. The IGSO and MEO satelliteshave RMS values of 40 cm and 12 cm, respectively.
Fortunately, all BeiDou and Galileo satellites are equipped with laser reflectors. An in-dependent validation of the microwave-based satellite orbits can be performed via SLRmeasurements (mainly the radial component). Figure 8 shows the resulting mean bias andstandard deviation for different satellite types which indicate the achieved orbit accuraciesfor that satellites (Uhlemann et al. 2014) currently observed by the International LaserRanging Service.
58
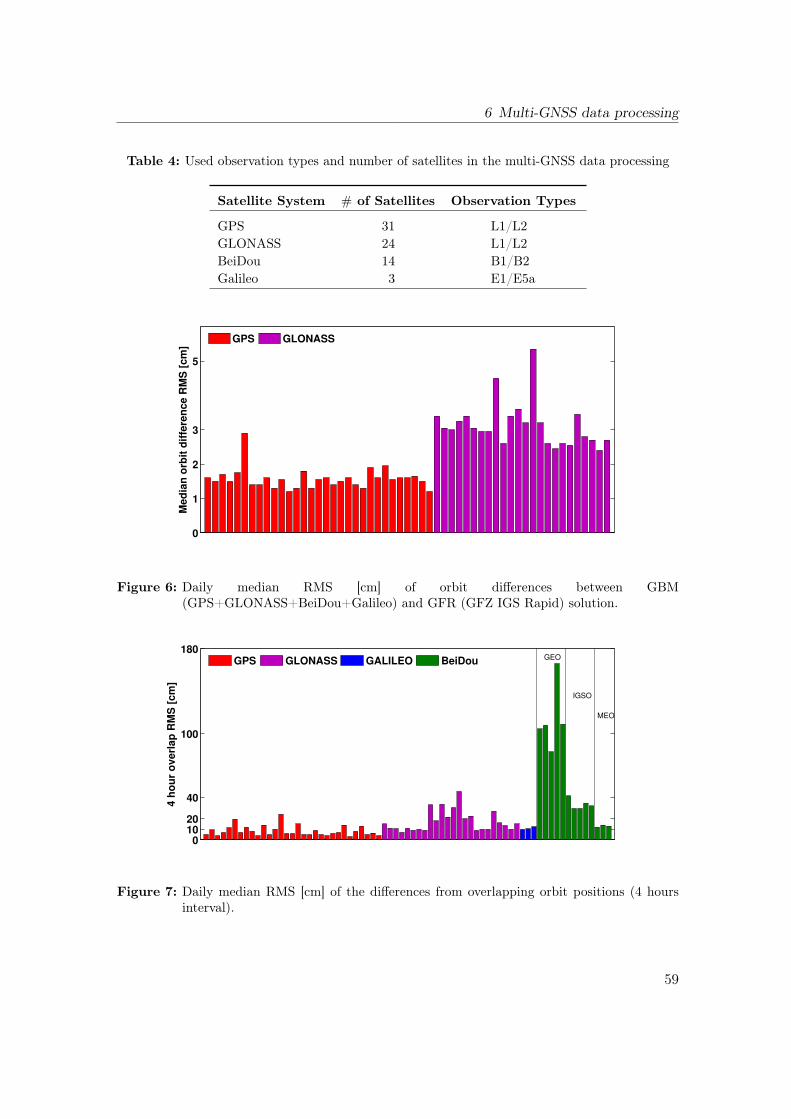
6 Multi-GNSS data processing
Table 4: Used observation types and number of satellites in the multi-GNSS data processing
Satellite System # of Satellites Observation Types
GPS 31 L1/L2GLONASS 24 L1/L2BeiDou 14 B1/B2Galileo 3 E1/E5a
0
1
2
3
5
Med
ian
orb
it d
iffe
ren
ce R
MS
[cm
]
GPS GLONASS
Figure 6: Daily median RMS [cm] of orbit differences between GBM(GPS+GLONASS+BeiDou+Galileo) and GFR (GFZ IGS Rapid) solution.
01020
40
100
180
4 h
ou
r o
ve
rla
p R
MS
[c
m]
GPS GLONASS GALILEO BeiDou
IGSO
MEO
GEO
Figure 7: Daily median RMS [cm] of the differences from overlapping orbit positions (4 hoursinterval).
59
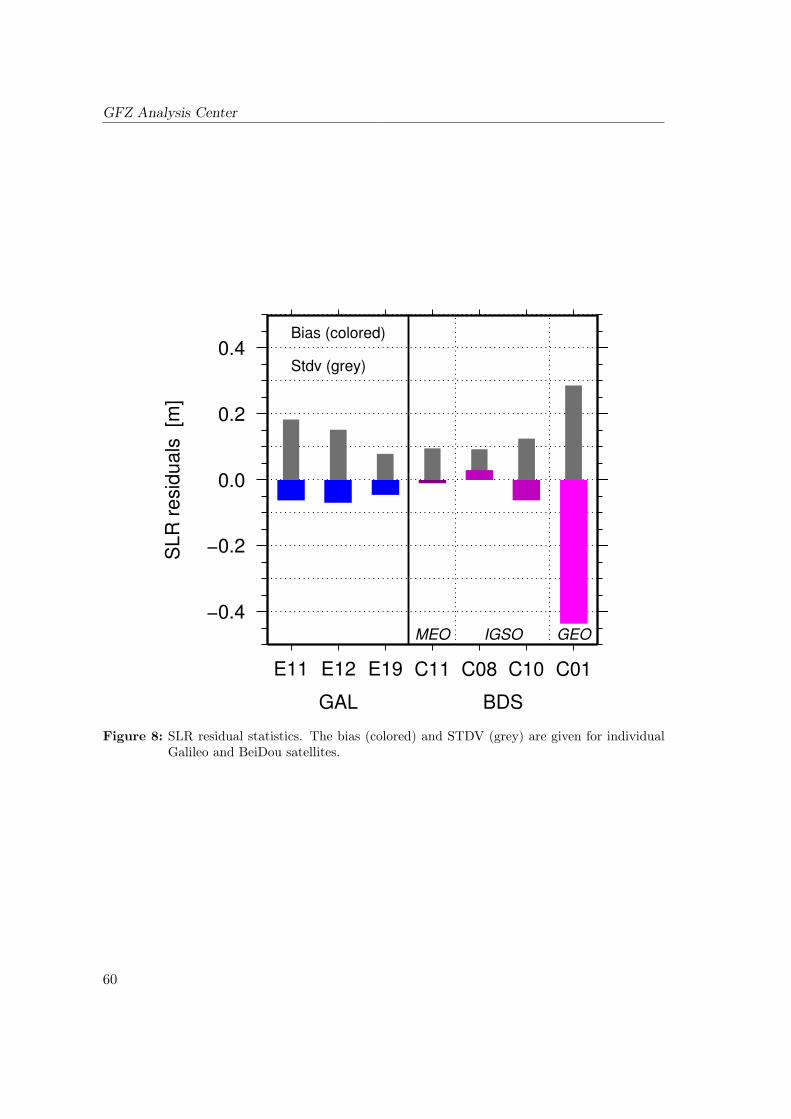
GFZ Analysis Center
−0.4
−0.2
0.0
0.2
0.4
SLR
resid
uals
[m
]
GAL BDS
MEO IGSO GEO
E11 E12 E19 C11 C08 C10 C01
Bias (colored)
Stdv (grey)
Figure 8: SLR residual statistics. The bias (colored) and STDV (grey) are given for individualGalileo and BeiDou satellites.
60
References
References
Bradke, M., T. Nischan, and M. Ramatschi. GFZ Sensor Meta Information System – Nextgeneration IGS metadata handling. IGS workshop 2014, Pasadena USA, 23–27 June,2014.
Deng, Z., M. Ge, M. Uhlemann, and Q. Zhao. Precise orbit determination of BeiDouSatellites at GFZ. IGS workshop 2014, Pasadena USA, 23–27 June, 2014a.
Deng Z., G. Gendt, and T. Schöne. TIGA Reprocessing at GFZ. IGS Workshop 2014,Pasadena USA, 23–27 June, 2014b.
Deng Z., G. Gendt, T. Schöne, T. Nischan, and M. Fritsche. IGS 2nd Reprocessing atGFZ. IGS Workshop 2014, Pasadena USA, 23–27 June, 2014c.
Deng Z., M. Uhlemann, G. Dick, M. Fritsche, and J. Wickert. Multi-GNSS Processingat GFZ and Tropospheric Products. COST ES1206 WG meeting, Varna Bulgaria,September, 2014d.
Deng Z., Q. Zhao, T. Springer, L. Prange, and M. Uhlemann. Orbit and Clock Determi-nation – BeiDou. IGS workshop 2014, Pasadena USA, 23–27 June, 2014e.
Petit, G. and B. Luzum (eds). IERS Conventions (2010). Number 36. Verlag des Bun-desamtes für Kartographie und Geodäsie, Frankfurt am Main, Germany, 2010. ISBN3-89888-989-6. IERS Technical Note No. 36.
Uhlemann, M ., Z. Deng, and M. Fritsche. Multi-GNSS Orbit and Clock Products of theGFZ Analysis Centre. Geodätische Woche, Berlin Germany, 7–9 October, 2014.
61
CNES–CLS Analysis CenterTechnical Report 2014
S. Loyer1, F. Mercier2, F. Perosanz2,H. Capdeville1, A. Mezerette1, L. Lestarquit2
1 Collecte Localisation Satellites31520 Ramonville Saint Agne, FranceE–mail: [email protected]
2 Centre National d’Etudes Spatiales31400 Toulouse, France
1 Introduction
The GINS CNES/GRGS software (Marty et al. 2011) is routinely operated in order todeliver to IGS, final GPS and GLONASS products. We process zero–difference GNSSobservations and the details of our strategy are described in Loyer et al. 2012. Moreinformation on our AC activity can also be found at: www.igsac-cnes.cls.fr.
In 2014, the activities were dominated by our contribution to REPRO2 campaign.
2 Operational products delivery
Since GPS week 1786 the GRG satellite clock solution is aligned using a combinationof the best stations clocks. This significantly improves the Allan variance of each dailyGRG clock solution. There is no specific processing to achieve a correct behavior of theirreference between successive days. This improves significantly the RMS of GRG clocksrelatively to the combined solution as shown on Fig. 1.
62
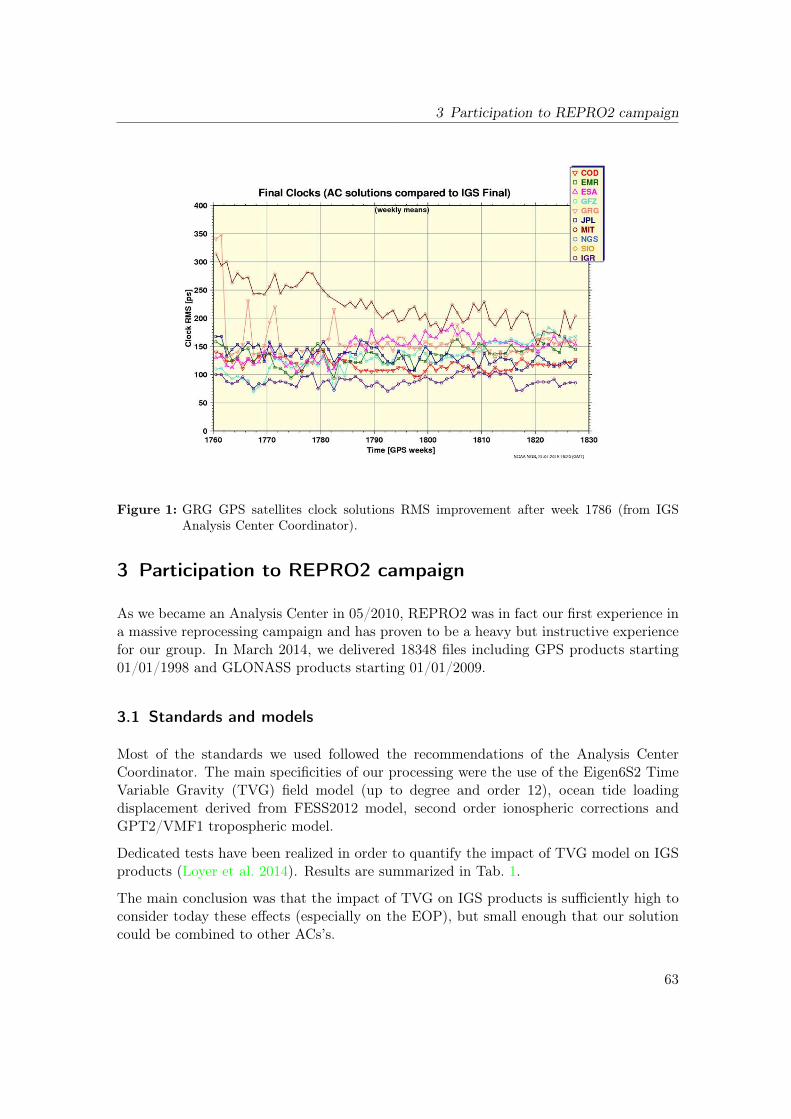
3 Participation to REPRO2 campaign
Figure 1: GRG GPS satellites clock solutions RMS improvement after week 1786 (from IGSAnalysis Center Coordinator).
3 Participation to REPRO2 campaign
As we became an Analysis Center in 05/2010, REPRO2 was in fact our first experience ina massive reprocessing campaign and has proven to be a heavy but instructive experiencefor our group. In March 2014, we delivered 18348 files including GPS products starting01/01/1998 and GLONASS products starting 01/01/2009.
3.1 Standards and models
Most of the standards we used followed the recommendations of the Analysis CenterCoordinator. The main specificities of our processing were the use of the Eigen6S2 TimeVariable Gravity (TVG) field model (up to degree and order 12), ocean tide loadingdisplacement derived from FESS2012 model, second order ionospheric corrections andGPT2/VMF1 tropospheric model.
Dedicated tests have been realized in order to quantify the impact of TVG model on IGSproducts (Loyer et al. 2014). Results are summarized in Tab. 1.
The main conclusion was that the impact of TVG on IGS products is sufficiently high toconsider today these effects (especially on the EOP), but small enough that our solutioncould be combined to other ACs’s.
63
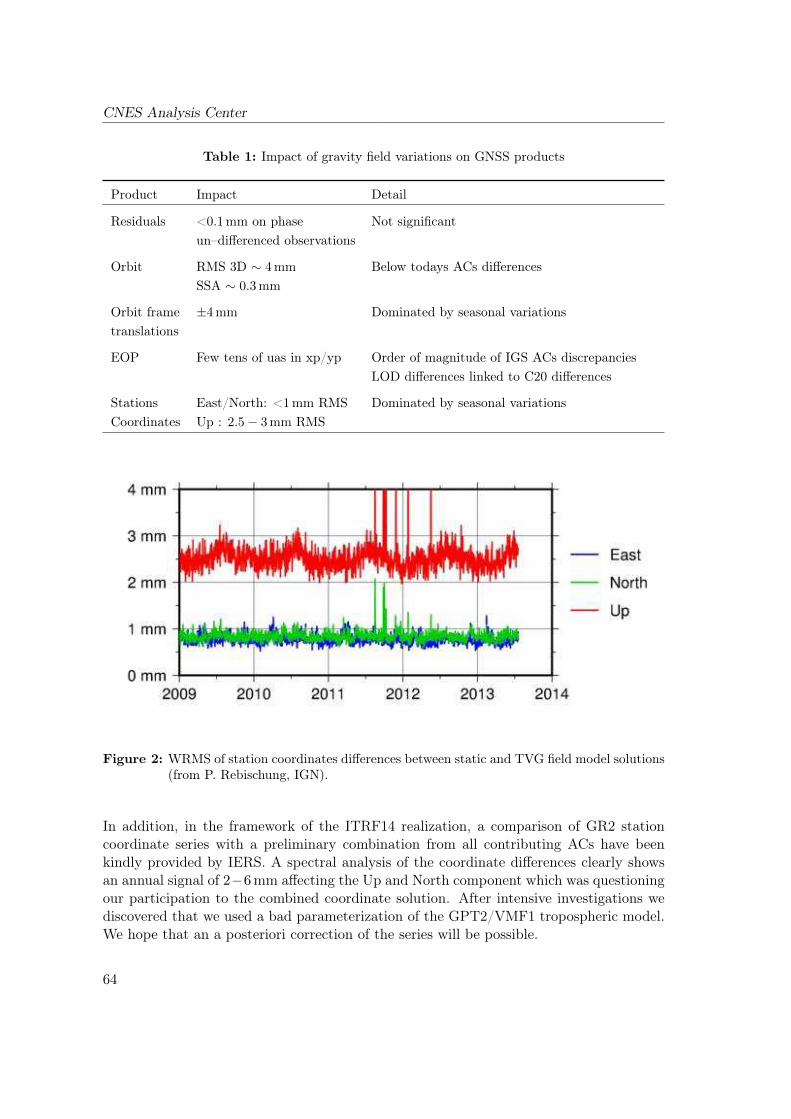
CNES Analysis Center
Table 1: Impact of gravity field variations on GNSS products
Product Impact Detail
Residuals <0.1mm on phase Not significantun–differenced observations
Orbit RMS 3D ∼ 4mm Below todays ACs differencesSSA ∼ 0.3mm
Orbit frame ±4mm Dominated by seasonal variationstranslations
EOP Few tens of uas in xp/yp Order of magnitude of IGS ACs discrepanciesLOD differences linked to C20 differences
Stations East/North: <1mm RMS Dominated by seasonal variationsCoordinates Up : 2.5− 3mm RMS
Figure 2: WRMS of station coordinates differences between static and TVG field model solutions(from P. Rebischung, IGN).
In addition, in the framework of the ITRF14 realization, a comparison of GR2 stationcoordinate series with a preliminary combination from all contributing ACs have beenkindly provided by IERS. A spectral analysis of the coordinate differences clearly showsan annual signal of 2−6mm affecting the Up and North component which was questioningour participation to the combined coordinate solution. After intensive investigations wediscovered that we used a bad parameterization of the GPT2/VMF1 tropospheric model.We hope that an a posteriori correction of the series will be possible.
64
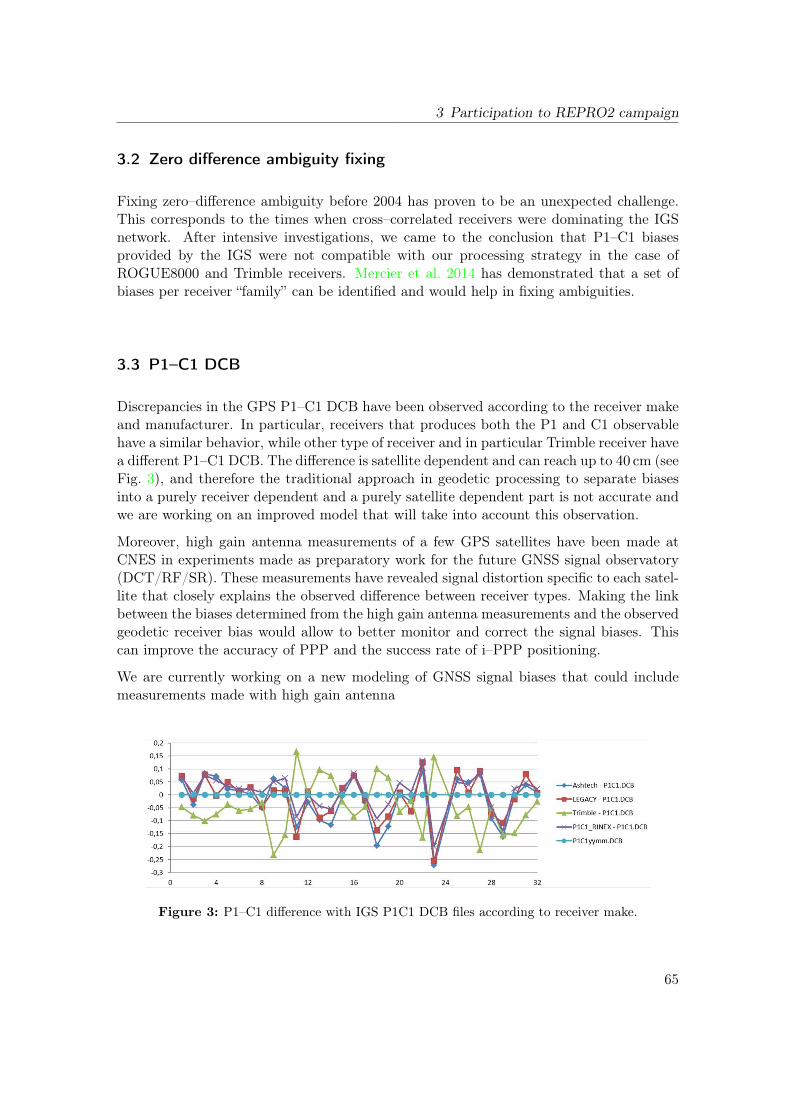
3 Participation to REPRO2 campaign
3.2 Zero difference ambiguity fixing
Fixing zero–difference ambiguity before 2004 has proven to be an unexpected challenge.This corresponds to the times when cross–correlated receivers were dominating the IGSnetwork. After intensive investigations, we came to the conclusion that P1–C1 biasesprovided by the IGS were not compatible with our processing strategy in the case ofROGUE8000 and Trimble receivers. Mercier et al. 2014 has demonstrated that a set ofbiases per receiver “family” can be identified and would help in fixing ambiguities.
3.3 P1–C1 DCB
Discrepancies in the GPS P1–C1 DCB have been observed according to the receiver makeand manufacturer. In particular, receivers that produces both the P1 and C1 observablehave a similar behavior, while other type of receiver and in particular Trimble receiver havea different P1–C1 DCB. The difference is satellite dependent and can reach up to 40 cm (seeFig. 3), and therefore the traditional approach in geodetic processing to separate biasesinto a purely receiver dependent and a purely satellite dependent part is not accurate andwe are working on an improved model that will take into account this observation.
Moreover, high gain antenna measurements of a few GPS satellites have been made atCNES in experiments made as preparatory work for the future GNSS signal observatory(DCT/RF/SR). These measurements have revealed signal distortion specific to each satel-lite that closely explains the observed difference between receiver types. Making the linkbetween the biases determined from the high gain antenna measurements and the observedgeodetic receiver bias would allow to better monitor and correct the signal biases. Thiscan improve the accuracy of PPP and the success rate of i–PPP positioning.
We are currently working on a new modeling of GNSS signal biases that could includemeasurements made with high gain antenna
Figure 3: P1–C1 difference with IGS P1C1 DCB files according to receiver make.
65

CNES Analysis Center
4 Contribution to MGEX
Our main short time objective is to provide the IGS with fully hybridized GPS+GLONASS+ Galileo final products. To reach this goal several software implementations have beenrealized and are routinely tested in parallel to our operational activities. The major im-provements include the capabilities to:
• Mix RINEX2 and 3 files
• Choose and manage the frequencies used for the processing (and the pre–processing)
• Include automatically new MGEX stations and new satellites
• Consider PCO/PCV and attitude laws provided by MGEX working group
Preliminary results derived from a dual frequency simultaneous processing of respectively31, 23 and 3, GPS, GLONASS and Galileo satellites are very encouraging.
Reference
Lestarquit, L. and F. Mercier. P1–C1 DCB determination using a high gain antennacoupled to the LCI method. Receiver type impact. IGS Workshop 2014, PasadenaCalifornia, June 23–27, 2014.
Loyer, S., F. Perosanz, F. Mercier, and H. Capdeville. Zero–difference GPS ambiguityresolution at CNES–CLS IGS Analysis Center. Journal of Geodesy, 86(11):991–1003,2012. DOI: 10.1007/s00190–012–0559–2
Loyer, S., J-M. Lemoine, and F. Perosanz. Time Variable Gravity (TVG). IGS Workshop2014, Pasadena California, June 23–27, 2014.
Loyer, S., F. Mercier, H. Capdeville, A. Mezerette, and F. Perosanz. GR2 Reprocessingfrom CNES/CLS IGS Analysis Center: specificities and results. IGS Workshop 2014,Pasadena California, June 23–27, 2014.
Marty J.C., S. Loyer, F. Perosanz, F. Mercier, G. Bracher, B. Legresy, L. Portier,H. Capdeville, F. Fund, J.M. Lemoine, R. Biancal. GINS : the CNES/GRGS GNSSscientific software. 3rd International Colloquium Scientific and Fundamental Aspectsof the Galileo Programme, ESA Proceedings WPP326, 31 August – 2 September 2011,Copenhagen, Denmark, 2011.
Mercier, F., F. Perosanz, S. Loyer, and H. Capdeville. Wide–Lane ambiguity fixing anoma-lies observed in Repro2 solutions. IGS Workshop 2014, Pasadena California, June23–27, 2014.
66
JPL Analysis CenterTechnical Report 2014
S. Desai, W. Bertiger, M. Garcia-Fernandez,B. Haines, D. Kuang, C. Selle, A. Sibois,
A. Sibthorpe, J. Weiss
Jet Propulsion LaboratoryCalifornia Institute of Technology4800 Oak Grove Drive, M/S 238-600Pasadena, CA 91001, U.S.A.E-mail: [email protected]: +1–818–354–6102
1 Introduction
In 2014, the Jet Propulsion Laboratory (JPL) continued to serve as an Analysis Center(AC) for the International GNSS Service (IGS). We contributed operational and repro-cessed orbit and clock solutions for the GPS satellites; position, clock and tropospheresolutions for the ground stations used to determine the satellite orbit and clock states;and estimates of Earth rotation parameters (length–of–day, polar motion, and polar mo-tion rates). This report summarizes the activities at the JPL IGS AC in 2014, includingour contribution to the second IGS reprocessing campaign (Repro 2).
Table 1 summarizes our contributions to the IGS Rapid and Final products. All of ourcontributions are based upon daily solutions centered at noon and spanning 30–hour. Eachof our daily solutions is determined independently from neighboring solutions, namelywithout applying any constraints between solutions. Of note, JPL began to operationallydeliver high–rate (30–second) Final GPS clock products to the IGS starting October 26,2014.
The JPL IGS AC also generates Ultra-Rapid orbit and clock products for the GPS con-stellation (Weiss et al. 2010). These products are generated with a latency of less than2 hours and are updated hourly. Although not submitted to the IGS, our Ultra-Rapid
67
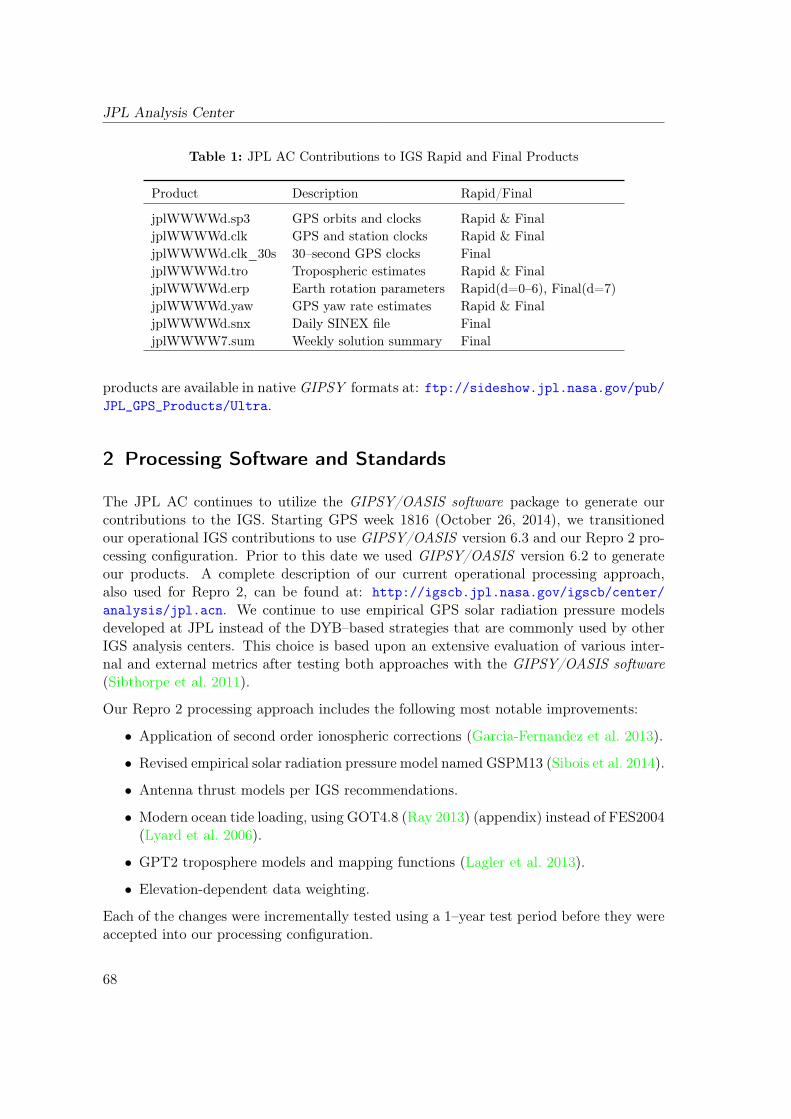
JPL Analysis Center
Table 1: JPL AC Contributions to IGS Rapid and Final Products
Product Description Rapid/Final
jplWWWWd.sp3 GPS orbits and clocks Rapid & FinaljplWWWWd.clk GPS and station clocks Rapid & FinaljplWWWWd.clk_30s 30–second GPS clocks FinaljplWWWWd.tro Tropospheric estimates Rapid & FinaljplWWWWd.erp Earth rotation parameters Rapid(d=0–6), Final(d=7)jplWWWWd.yaw GPS yaw rate estimates Rapid & FinaljplWWWWd.snx Daily SINEX file FinaljplWWWW7.sum Weekly solution summary Final
products are available in native GIPSY formats at: ftp://sideshow.jpl.nasa.gov/pub/JPL_GPS_Products/Ultra.
2 Processing Software and Standards
The JPL AC continues to utilize the GIPSY/OASIS software package to generate ourcontributions to the IGS. Starting GPS week 1816 (October 26, 2014), we transitionedour operational IGS contributions to use GIPSY/OASIS version 6.3 and our Repro 2 pro-cessing configuration. Prior to this date we used GIPSY/OASIS version 6.2 to generateour products. A complete description of our current operational processing approach,also used for Repro 2, can be found at: http://igscb.jpl.nasa.gov/igscb/center/analysis/jpl.acn. We continue to use empirical GPS solar radiation pressure modelsdeveloped at JPL instead of the DYB–based strategies that are commonly used by otherIGS analysis centers. This choice is based upon an extensive evaluation of various inter-nal and external metrics after testing both approaches with the GIPSY/OASIS software(Sibthorpe et al. 2011).
Our Repro 2 processing approach includes the following most notable improvements:
• Application of second order ionospheric corrections (Garcia-Fernandez et al. 2013).
• Revised empirical solar radiation pressure model named GSPM13 (Sibois et al. 2014).
• Antenna thrust models per IGS recommendations.
• Modern ocean tide loading, using GOT4.8 (Ray 2013) (appendix) instead of FES2004(Lyard et al. 2006).
• GPT2 troposphere models and mapping functions (Lagler et al. 2013).
• Elevation-dependent data weighting.
Each of the changes were incrementally tested using a 1–year test period before they wereaccepted into our processing configuration.
68
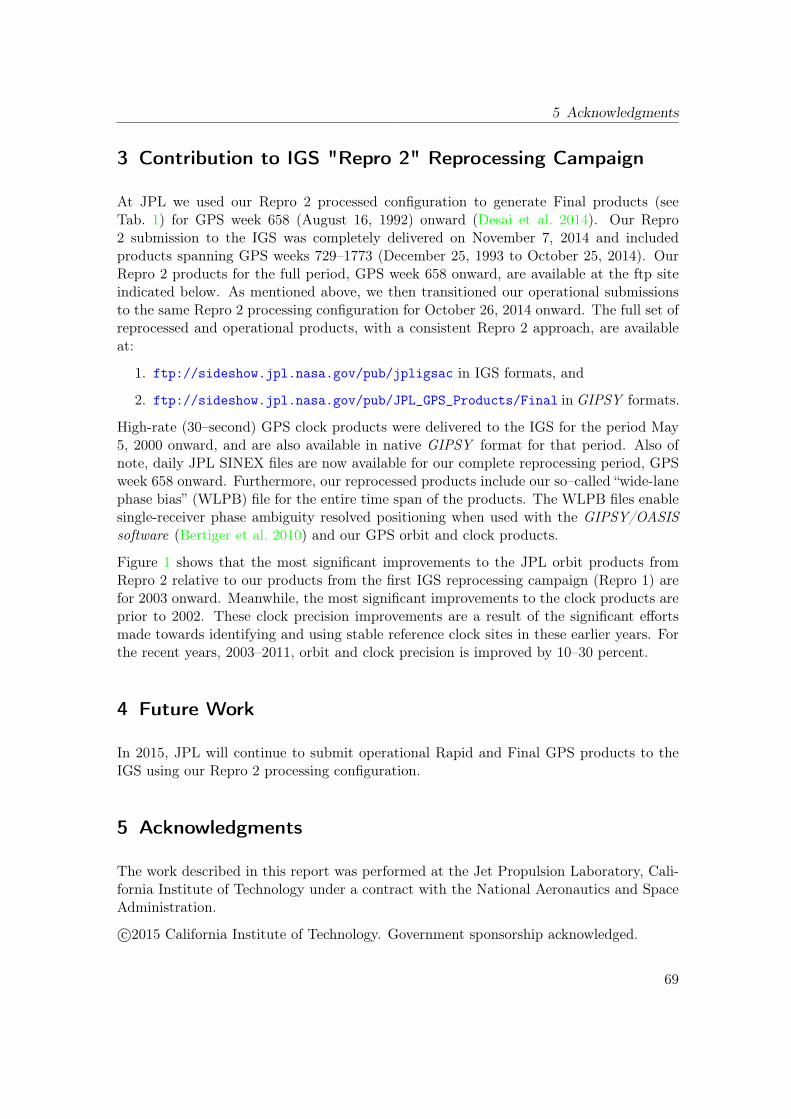
5 Acknowledgments
3 Contribution to IGS "Repro 2" Reprocessing Campaign
At JPL we used our Repro 2 processed configuration to generate Final products (seeTab. 1) for GPS week 658 (August 16, 1992) onward (Desai et al. 2014). Our Repro2 submission to the IGS was completely delivered on November 7, 2014 and includedproducts spanning GPS weeks 729–1773 (December 25, 1993 to October 25, 2014). OurRepro 2 products for the full period, GPS week 658 onward, are available at the ftp siteindicated below. As mentioned above, we then transitioned our operational submissionsto the same Repro 2 processing configuration for October 26, 2014 onward. The full set ofreprocessed and operational products, with a consistent Repro 2 approach, are availableat:
1. ftp://sideshow.jpl.nasa.gov/pub/jpligsac in IGS formats, and
2. ftp://sideshow.jpl.nasa.gov/pub/JPL_GPS_Products/Final in GIPSY formats.
High-rate (30–second) GPS clock products were delivered to the IGS for the period May5, 2000 onward, and are also available in native GIPSY format for that period. Also ofnote, daily JPL SINEX files are now available for our complete reprocessing period, GPSweek 658 onward. Furthermore, our reprocessed products include our so–called “wide-lanephase bias” (WLPB) file for the entire time span of the products. The WLPB files enablesingle-receiver phase ambiguity resolved positioning when used with the GIPSY/OASISsoftware (Bertiger et al. 2010) and our GPS orbit and clock products.
Figure 1 shows that the most significant improvements to the JPL orbit products fromRepro 2 relative to our products from the first IGS reprocessing campaign (Repro 1) arefor 2003 onward. Meanwhile, the most significant improvements to the clock products areprior to 2002. These clock precision improvements are a result of the significant effortsmade towards identifying and using stable reference clock sites in these earlier years. Forthe recent years, 2003–2011, orbit and clock precision is improved by 10–30 percent.
4 Future Work
In 2015, JPL will continue to submit operational Rapid and Final GPS products to theIGS using our Repro 2 processing configuration.
5 Acknowledgments
The work described in this report was performed at the Jet Propulsion Laboratory, Cali-fornia Institute of Technology under a contract with the National Aeronautics and SpaceAdministration.
c©2015 California Institute of Technology. Government sponsorship acknowledged.
69
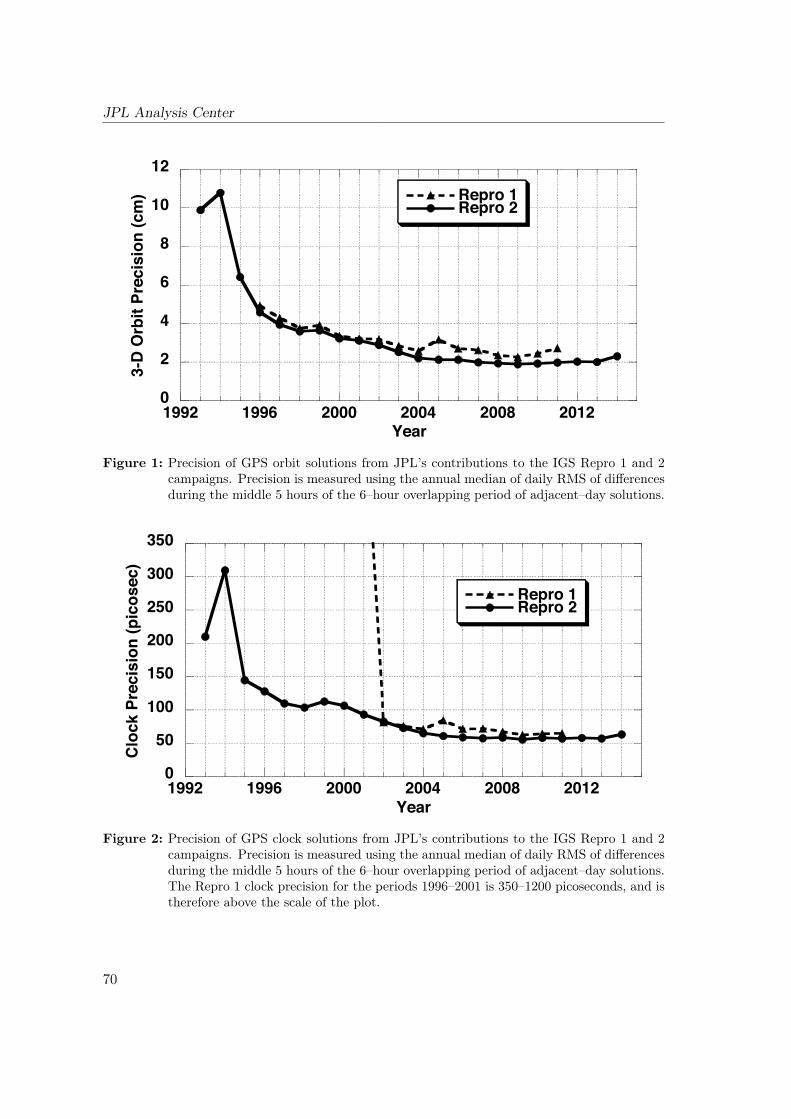
JPL Analysis Center
0
2
4
6
8
10
12
1992 1996 2000 2004 2008 2012
Repro 1Repro 2
3-D Orbit Precision (cm)
Year
Figure 1: Precision of GPS orbit solutions from JPL’s contributions to the IGS Repro 1 and 2campaigns. Precision is measured using the annual median of daily RMS of differencesduring the middle 5 hours of the 6–hour overlapping period of adjacent–day solutions.
0
50
100
150
200
250
300
350
1992 1996 2000 2004 2008 2012
Repro 1Repro 2
Clock Precision (picosec)
Year
Figure 2: Precision of GPS clock solutions from JPL’s contributions to the IGS Repro 1 and 2campaigns. Precision is measured using the annual median of daily RMS of differencesduring the middle 5 hours of the 6–hour overlapping period of adjacent–day solutions.The Repro 1 clock precision for the periods 1996–2001 is 350–1200 picoseconds, and istherefore above the scale of the plot.
70
References
References
Bertiger, W., S. Desai, B. Haines, N. Harvey, A. Moore, S. Owen, and J. Weiss (2010),Single receiver phase ambiguity resolution with GPS data, J. Geodesy, 84(5), 327–337,doi:10.1007/s00190-010-0371-9.
Desai, S. D., W. Bertiger, M. Garcia-Fernandez, B. Haines, N. Harvey, C. Selle, A. Sibois,A. Sibthorpe, and J. P. Weiss (2014), JPL’s reanalysis of historical GPS data for thesecond IGS reanalysis campaign, Fall AGU, San Francisco, CA, December 15–19.
Garcia–Fernandez, M., S. D. Desai, M. D. Butala, and A. Komjathy (2013), Evaluationof different approaches to modeling the second-order ionosphere delay on GPS mea-surements, J. Geophys. Res., 118(12), 7864-7873, doi:10.1002/2013JA019356.
Lagler, K., M. Schindelegger, J. Bohm, H. Krasna, and T. Nilsson (2013), GPT2: Empir-ical slant delay model for radio space geodetic techniques, Geophys. Res. Lett., 40(6),1069–1073, doi:10.1002/grl.50288.
Lyard, F., F. Lefevre, T. Letellier, and O. Francis, Modeling the global ocean tides:Insights from FES2004 (2006), Ocean Dyn., 56(5–6), 394–415, doi:10.1007/s10236-006-0086-x.
Ray, R. D., Precise comparisons of bottom-pressure and altimetric ocean tides (2013),J. Geophys. Res., 118, 4570–4584, doi:10.1002/jgrc.20336.
Sibois, A., C. Selle, S. Desai, A. Sibthorpe, and J. Weiss (2014), An update empiricalmodel for solar radiation pressure forces acting on GPS satellites, IGS Workshop,Pasadena, CA, June 23–27.
Sibthorpe, A., W. Bertiger, S. D. Desai, B. Haines, N. Harvey, and J. P. Weiss (2011), Anevaluation of solar radiation pressure strategies for the GPS constellations, J. Geodesy,85(8), 505-517, doi:10.1007/s00190-011-0450-6.
Weiss, J. P., W. Bertiger, S. D. Desai, B. J. Haines, and C. M. Lane (2010), Near real timeGPS orbit determination: Strategies, performance, and applications to OSTM/Jason-2, Adv. Astronaut. Sci., 137, 439–452.
71
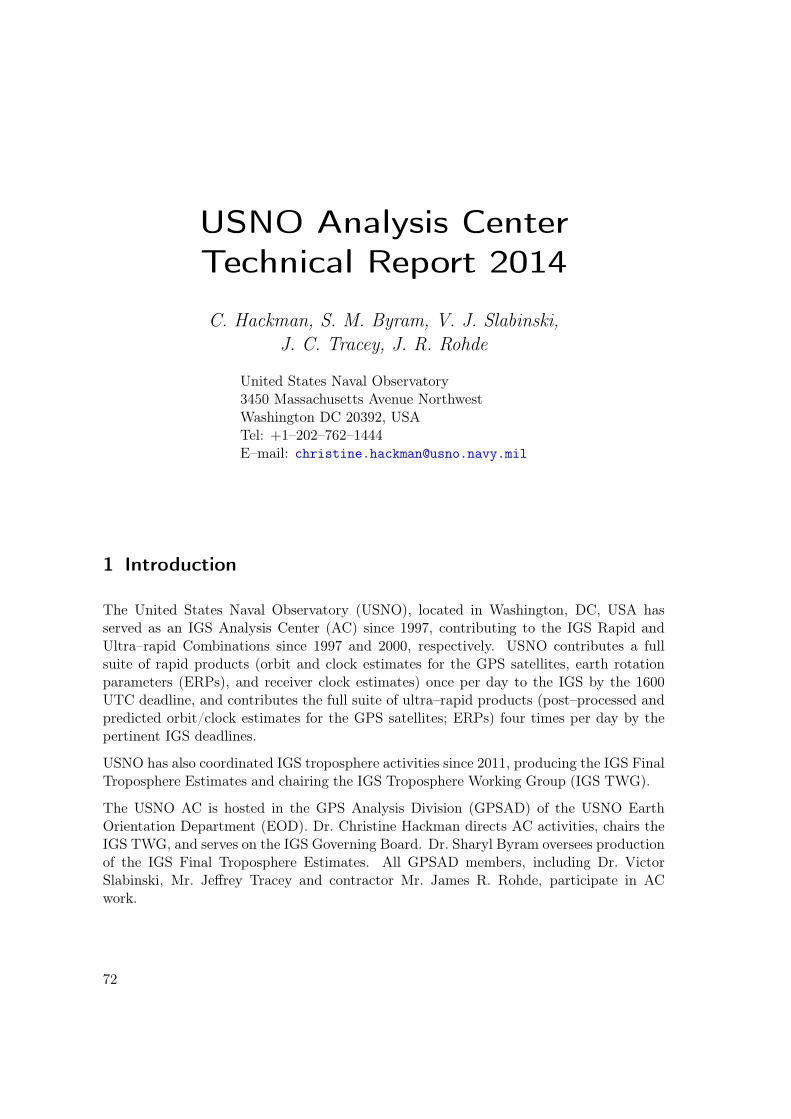
USNO Analysis CenterTechnical Report 2014
C. Hackman, S. M. Byram, V. J. Slabinski,J. C. Tracey, J. R. Rohde
United States Naval Observatory3450 Massachusetts Avenue NorthwestWashington DC 20392, USATel: +1–202–762–1444E–mail: [email protected]
1 Introduction
The United States Naval Observatory (USNO), located in Washington, DC, USA hasserved as an IGS Analysis Center (AC) since 1997, contributing to the IGS Rapid andUltra–rapid Combinations since 1997 and 2000, respectively. USNO contributes a fullsuite of rapid products (orbit and clock estimates for the GPS satellites, earth rotationparameters (ERPs), and receiver clock estimates) once per day to the IGS by the 1600UTC deadline, and contributes the full suite of ultra–rapid products (post–processed andpredicted orbit/clock estimates for the GPS satellites; ERPs) four times per day by thepertinent IGS deadlines.
USNO has also coordinated IGS troposphere activities since 2011, producing the IGS FinalTroposphere Estimates and chairing the IGS Troposphere Working Group (IGS TWG).
The USNO AC is hosted in the GPS Analysis Division (GPSAD) of the USNO EarthOrientation Department (EOD). Dr. Christine Hackman directs AC activities, chairs theIGS TWG, and serves on the IGS Governing Board. Dr. Sharyl Byram oversees productionof the IGS Final Troposphere Estimates. All GPSAD members, including Dr. VictorSlabinski, Mr. Jeffrey Tracey and contractor Mr. James R. Rohde, participate in ACwork.
72
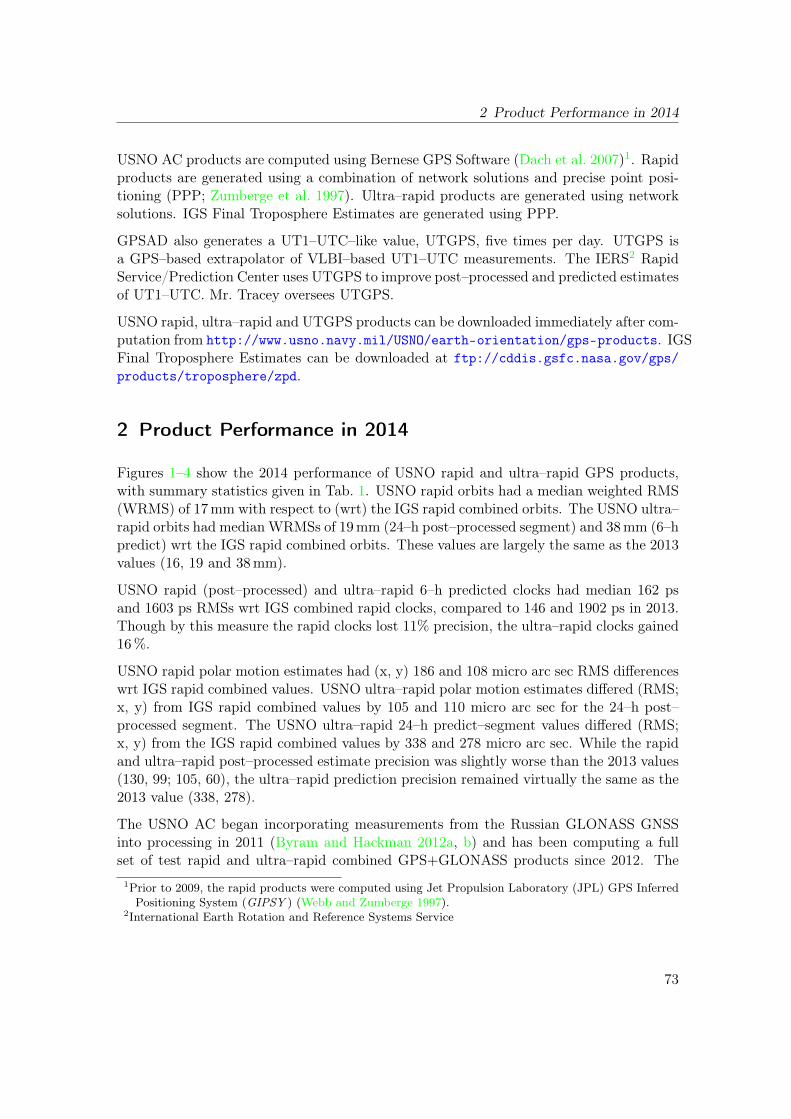
2 Product Performance in 2014
USNO AC products are computed using Bernese GPS Software (Dach et al. 2007)1. Rapidproducts are generated using a combination of network solutions and precise point posi-tioning (PPP; Zumberge et al. 1997). Ultra–rapid products are generated using networksolutions. IGS Final Troposphere Estimates are generated using PPP.
GPSAD also generates a UT1–UTC–like value, UTGPS, five times per day. UTGPS isa GPS–based extrapolator of VLBI–based UT1–UTC measurements. The IERS2 RapidService/Prediction Center uses UTGPS to improve post–processed and predicted estimatesof UT1–UTC. Mr. Tracey oversees UTGPS.
USNO rapid, ultra–rapid and UTGPS products can be downloaded immediately after com-putation from http://www.usno.navy.mil/USNO/earth-orientation/gps-products. IGSFinal Troposphere Estimates can be downloaded at ftp://cddis.gsfc.nasa.gov/gps/products/troposphere/zpd.
2 Product Performance in 2014
Figures 1–4 show the 2014 performance of USNO rapid and ultra–rapid GPS products,with summary statistics given in Tab. 1. USNO rapid orbits had a median weighted RMS(WRMS) of 17mm with respect to (wrt) the IGS rapid combined orbits. The USNO ultra–rapid orbits had median WRMSs of 19mm (24–h post–processed segment) and 38mm (6–hpredict) wrt the IGS rapid combined orbits. These values are largely the same as the 2013values (16, 19 and 38mm).
USNO rapid (post–processed) and ultra–rapid 6–h predicted clocks had median 162 psand 1603 ps RMSs wrt IGS combined rapid clocks, compared to 146 and 1902 ps in 2013.Though by this measure the rapid clocks lost 11% precision, the ultra–rapid clocks gained16%.
USNO rapid polar motion estimates had (x, y) 186 and 108 micro arc sec RMS differenceswrt IGS rapid combined values. USNO ultra–rapid polar motion estimates differed (RMS;x, y) from IGS rapid combined values by 105 and 110 micro arc sec for the 24–h post–processed segment. The USNO ultra–rapid 24–h predict–segment values differed (RMS;x, y) from the IGS rapid combined values by 338 and 278 micro arc sec. While the rapidand ultra–rapid post–processed estimate precision was slightly worse than the 2013 values(130, 99; 105, 60), the ultra–rapid prediction precision remained virtually the same as the2013 value (338, 278).
The USNO AC began incorporating measurements from the Russian GLONASS GNSSinto processing in 2011 (Byram and Hackman 2012a, b) and has been computing a fullset of test rapid and ultra–rapid combined GPS+GLONASS products since 2012. The1Prior to 2009, the rapid products were computed using Jet Propulsion Laboratory (JPL) GPS InferredPositioning System (GIPSY ) (Webb and Zumberge 1997).
2International Earth Rotation and Reference Systems Service
73
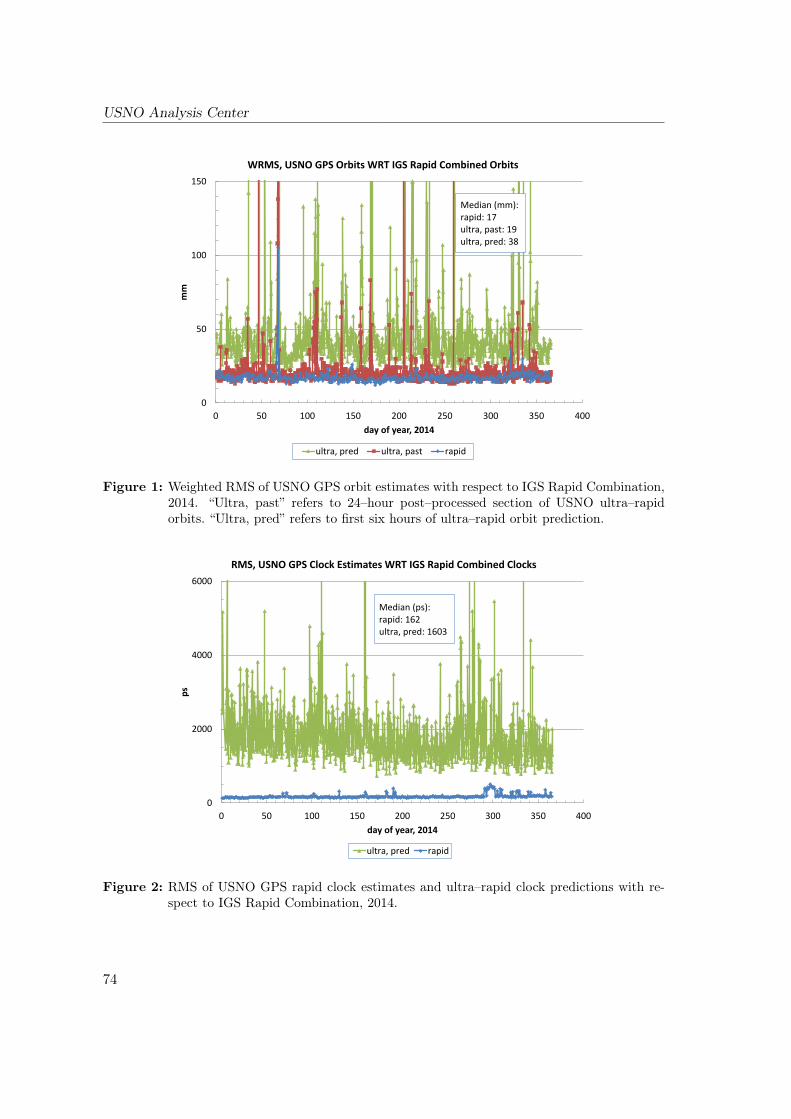
USNO Analysis Center
0
50
100
150
0 50 100 150 200 250 300 350 400
mm
day of year, 2014
WRMS, USNO GPS Orbits WRT IGS Rapid Combined Orbits
ultra, pred ultra, past rapid
Median (mm): rapid: 17 ultra, past: 19 ultra, pred: 38
Figure 1: Weighted RMS of USNO GPS orbit estimates with respect to IGS Rapid Combination,2014. “Ultra, past” refers to 24–hour post–processed section of USNO ultra–rapidorbits. “Ultra, pred” refers to first six hours of ultra–rapid orbit prediction.
0
2000
4000
6000
0 50 100 150 200 250 300 350 400
ps
day of year, 2014
RMS, USNO GPS Clock Estimates WRT IGS Rapid Combined Clocks
ultra, pred rapid
Median (ps): rapid: 162 ultra, pred: 1603
Figure 2: RMS of USNO GPS rapid clock estimates and ultra–rapid clock predictions with re-spect to IGS Rapid Combination, 2014.
74
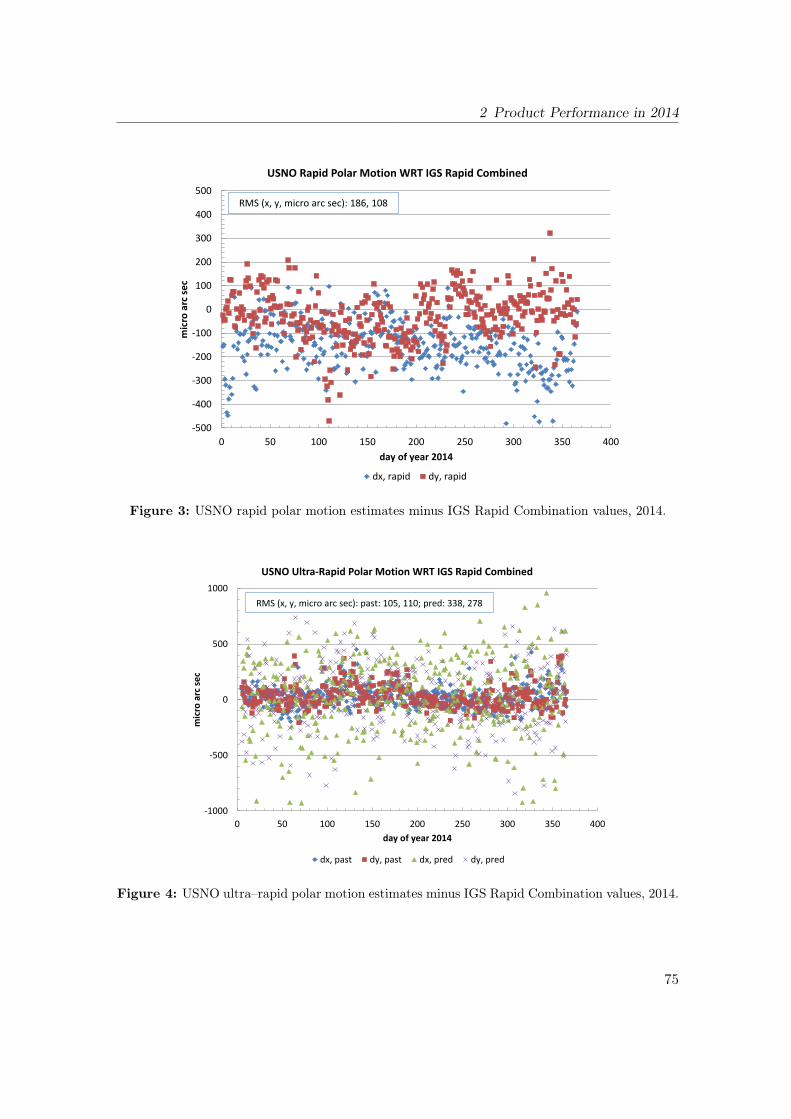
2 Product Performance in 2014
-500
-400
-300
-200
-100
0
100
200
300
400
500
0 50 100 150 200 250 300 350 400
mic
ro a
rc s
ec
day of year 2014
USNO Rapid Polar Motion WRT IGS Rapid Combined
dx, rapid dy, rapid
RMS (x, y, micro arc sec): 186, 108
Figure 3: USNO rapid polar motion estimates minus IGS Rapid Combination values, 2014.
-1000
-500
0
500
1000
0 50 100 150 200 250 300 350 400
mic
ro a
rc s
ec
day of year 2014
USNO Ultra-Rapid Polar Motion WRT IGS Rapid Combined
dx, past dy, past dx, pred dy, pred
RMS (x, y, micro arc sec): past: 105, 110; pred: 338, 278
Figure 4: USNO ultra–rapid polar motion estimates minus IGS Rapid Combination values, 2014.
75
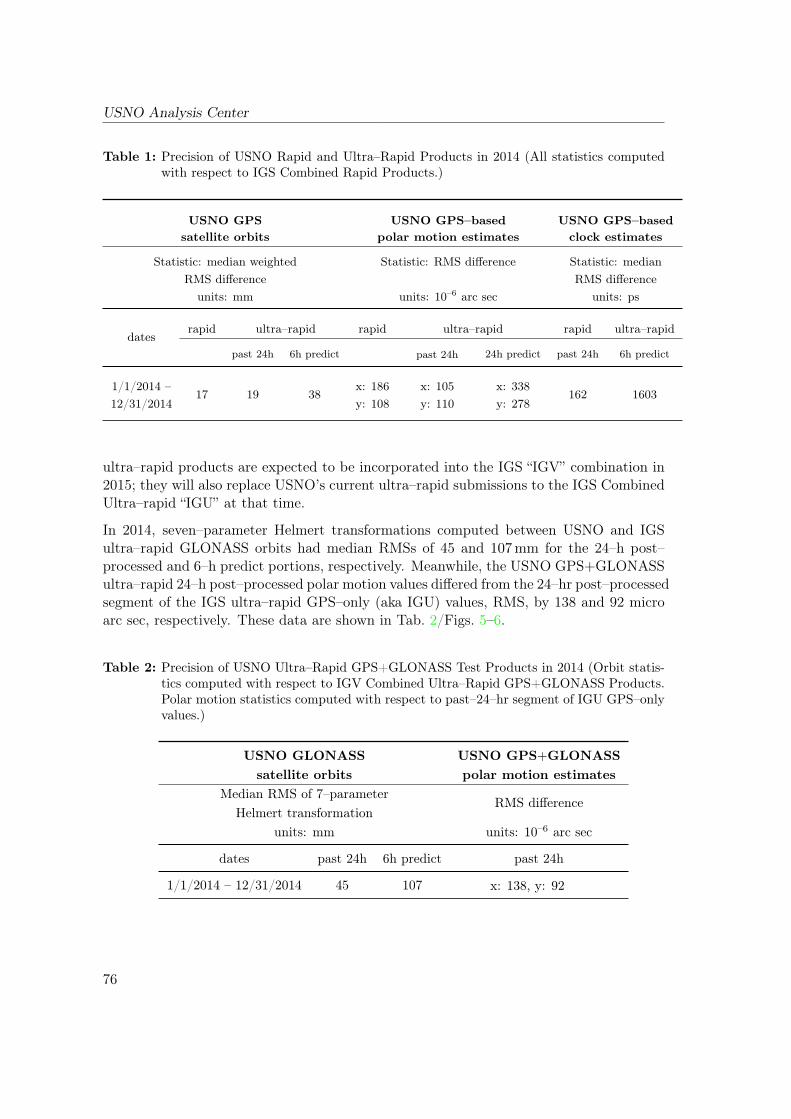
USNO Analysis Center
Table 1: Precision of USNO Rapid and Ultra–Rapid Products in 2014 (All statistics computedwith respect to IGS Combined Rapid Products.)
USNO GPS USNO GPS–based USNO GPS–basedsatellite orbits polar motion estimates clock estimates
Statistic: median weighted Statistic: RMS difference Statistic: medianRMS difference RMS difference
units: mm units: 10–6 arc sec units: ps
datesrapid ultra–rapid rapid ultra–rapid rapid ultra–rapid
past 24h 6h predict past 24h 24h predict past 24h 6h predict
1/1/2014 –17 19 38
x: 186 x: 105 x: 338162 1603
12/31/2014 y: 108 y: 110 y: 278
ultra–rapid products are expected to be incorporated into the IGS “IGV” combination in2015; they will also replace USNO’s current ultra–rapid submissions to the IGS CombinedUltra–rapid “IGU” at that time.
In 2014, seven–parameter Helmert transformations computed between USNO and IGSultra–rapid GLONASS orbits had median RMSs of 45 and 107mm for the 24–h post–processed and 6–h predict portions, respectively. Meanwhile, the USNO GPS+GLONASSultra–rapid 24–h post–processed polar motion values differed from the 24–hr post–processedsegment of the IGS ultra–rapid GPS–only (aka IGU) values, RMS, by 138 and 92 microarc sec, respectively. These data are shown in Tab. 2/Figs. 5–6.
Table 2: Precision of USNO Ultra–Rapid GPS+GLONASS Test Products in 2014 (Orbit statis-tics computed with respect to IGV Combined Ultra–Rapid GPS+GLONASS Products.Polar motion statistics computed with respect to past–24–hr segment of IGU GPS–onlyvalues.)
USNO GLONASS USNO GPS+GLONASSsatellite orbits polar motion estimates
Median RMS of 7–parameterRMS difference
Helmert transformationunits: mm units: 10–6 arc sec
dates past 24h 6h predict past 24h
1/1/2014 – 12/31/2014 45 107 x: 138, y: 92
76
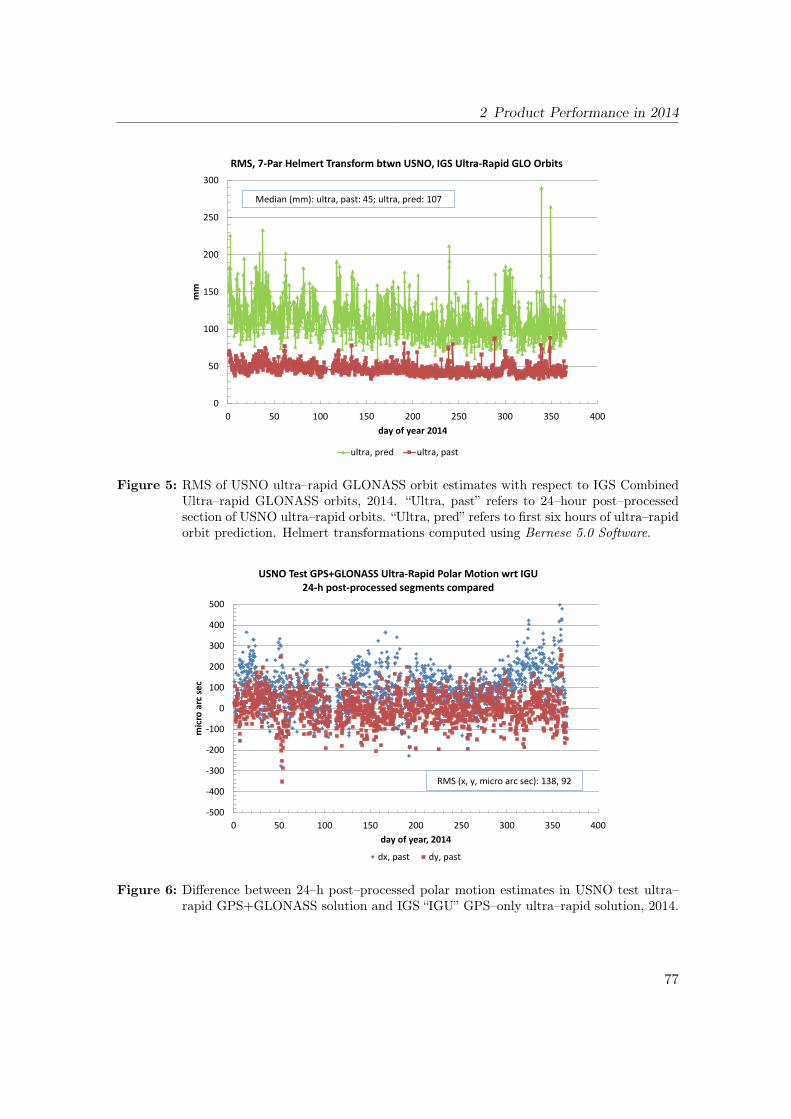
2 Product Performance in 2014
0
50
100
150
200
250
300
0 50 100 150 200 250 300 350 400
mm
day of year 2014
RMS, 7-Par Helmert Transform btwn USNO, IGS Ultra-Rapid GLO Orbits
ultra, pred ultra, past
Median (mm): ultra, past: 45; ultra, pred: 107
Figure 5: RMS of USNO ultra–rapid GLONASS orbit estimates with respect to IGS CombinedUltra–rapid GLONASS orbits, 2014. “Ultra, past” refers to 24–hour post–processedsection of USNO ultra–rapid orbits. “Ultra, pred” refers to first six hours of ultra–rapidorbit prediction. Helmert transformations computed using Bernese 5.0 Software.
-500
-400
-300
-200
-100
0
100
200
300
400
500
0 50 100 150 200 250 300 350 400
mic
ro a
rc s
ec
day of year, 2014
USNO Test GPS+GLONASS Ultra-Rapid Polar Motion wrt IGU 24-h post-processed segments compared
dx, past dy, past
RMS (x, y, micro arc sec): 138, 92
Figure 6: Difference between 24–h post–processed polar motion estimates in USNO test ultra–rapid GPS+GLONASS solution and IGS “IGU” GPS–only ultra–rapid solution, 2014.
77
USNO Analysis Center
The USNO AC acquired Bernese GNSS Software V5.2 in 2013 and plans to release officialAC products generated using it in 2015. The GPS+GLONASS rapid and ultra–rapidsolutions referenced above have been generated using Bernese GNSS Software V5.2 sinceDecember 2014.
3 USNO AC Conference Presentations/Publications
USNO AC members played an active role at the 2014 IGS Workshop (23–27 June 2014;Pasadena, CA), contributing three posters and chairing three sessions: Plenary Session09A, GNSS–Derived Troposphere Delays, Poster Session 05, Estimation and Applicationof GNSS–Based Troposphere Delay, and the IGS Troposphere Working Group meeting.They also presented their research results at symposia such as ION GNSS+ 2014 and theAmerican Astronomical Society Division on Dynamical Astronomy. Their publications areas follows:
S. Byram and C. Hackman. IGS Final Troposphere Product Update. IGS Workshop2014, Poster Session PS05, Pasadena CA, 2014.
S. Byram and C. Hackman. Multi–GNSS Based Processing at the USNO. IGS Workshop2014, Poster Session PS11, Pasadena CA, 2014.
J. Dousa, S. Byram, G. Gyori, O. Böhm, F. Zus, and C. Hackman. Development TowardsInter-Technique Tropospheric Parameter Comparisons and Their Exploitation. IGSWorkshop 2014, Plenary Session PY09, Pasadena CA, 2014.
C. Hackman, S.M. Byram, V.J. Slabinski, and J.C. Tracey. USNO GPS/GLONASS PNTProducts: Overview, and GPS+GLONASS vs. GLONASS Only PPP Accuracy.Proc. 2014 IEEE/Institute of Navigation (ION) Position Location and NavigationSymposium, 793–803, 2014.
C. Hackman, S.M. Byram, V.J. Slabinski, J.C. Tracey, and J.R. Rohde. USNO AnalysisCenter Progress 2012–2014, IGS Workshop 2014, Poster Session PS01, PasadenaCA, 2014.
C. Hackman. Mitigating the Impact of Predicted–Satellite–Clock Errors on GNSS PPPPositioning. Proc. ION 2014 International Technical Meeting, 743–50, 2014.
U. Hugentobler and C. Hackman. International GNSS Service (IGS)–Products and Mod-els for Precise GNSS Analyses. COST Action ES1206 Meeting, Munich, Germany,36 pp, 2014.
V. Slabinski. When did the Mean Solar Day Equal 86,400 SI Seconds? Am. As-tron. Soc. Div. on Dynamical Astronomy 2014 Meeting, Session 300, PhiladelphiaPA, 2014.
J.C. Tracey. Analysis of GNSS Signal Strength. Proc. ION GNSS+ 2014, 1270–3, 2014.
78
References
References
Byram, S. and C. Hackman. GNSS–Based Processing at the USNO: Incorporation ofGLONASS Observations. IGS Workshop 2012, Olstzyn, Poland, 2012a.
Byram, S and C. Hackman. High–Precision GNSS Orbit, Clock and EOP Estimation atthe United States Naval Observatory. Proc. of 2012 IEEE/ION Position Location andNavigation Symposium, 659–63, 2012b.
Dach, R., U. Hugentobler, P. Fridez, and M. Meindl. Bernese GPS Software Version 5.0(User Manual). Astronomical Institute, University of Bern, 2007.
Webb, F.H. and J.F. Zumberge (eds.). An Introduction to GIPSY/OASIS–II: PrecisionSoftware for the Analysis of Data from the Global Positioning System. JPL internalpublication D–11088, Jet Propulsion Laboratory, Pasadena, California, 1997.
Zumberge, J.F., M.B. Heflin, D.C. Jefferson, M.M. Watkins, and F.H. Webb. Precise PointPositioning for the Efficient and Robust Analysis of GPS Data from Large Networks.J. Geophys. Res., 102(B3):5005–17, 1997.
79

USNO Analysis Center
80
WHU Analysis CenterTechnical Report 2014
C. Shi, M. Li, Q. Zhao, Y. Lou
GNSS Research Center, Wuhan UniversityWuhan, ChinaE–mail: [email protected]
1 Introduction
The IGS Analysis Center of the Wuhan University (WHU) has contributed to the In-ternational GNSS Service (IGS) since 2012 with a regular determination of the preciseGPS+GLONASS ultra–rapid and rapid products. All the products are produced withthe latest development version of the Positioning And Navigation Data Analyst (PANDA)Software (Liu and Ge 2003).
In this report we give a summary of the IGS related activities at WHU during the year2013.
2 PANDA software
The PANDA software package is capable of simultaneously processing various types ofmeasurements from GNSS, SLR, KBR, star trackers and accelerometers in order to es-timate ground station coordinates, ZTDs, ERPs and orbits for GNSS satellites, LEOsand GEOs. Various methods for kinematic, dynamic and reduced–dynamic precise orbitdetermination of LEO satellite orbits are developed in this software package.
Both least–squares estimator (for post–processing) and square–root information filter (forreal–time processing) are implemented in the state estimator module (Liu and Ge 2003)for PANDA. In order to speed up the data processing, an efficient approach of removaland recovery of station coordinate and ambiguity parameters is employed in the least–squares estimator (Shi et al. 2010). Besides, the ambiguity–fixing can also be performedin network mode or precise point positioning mode, significantly improving the positioningaccuracy of WHU final solutions.
81
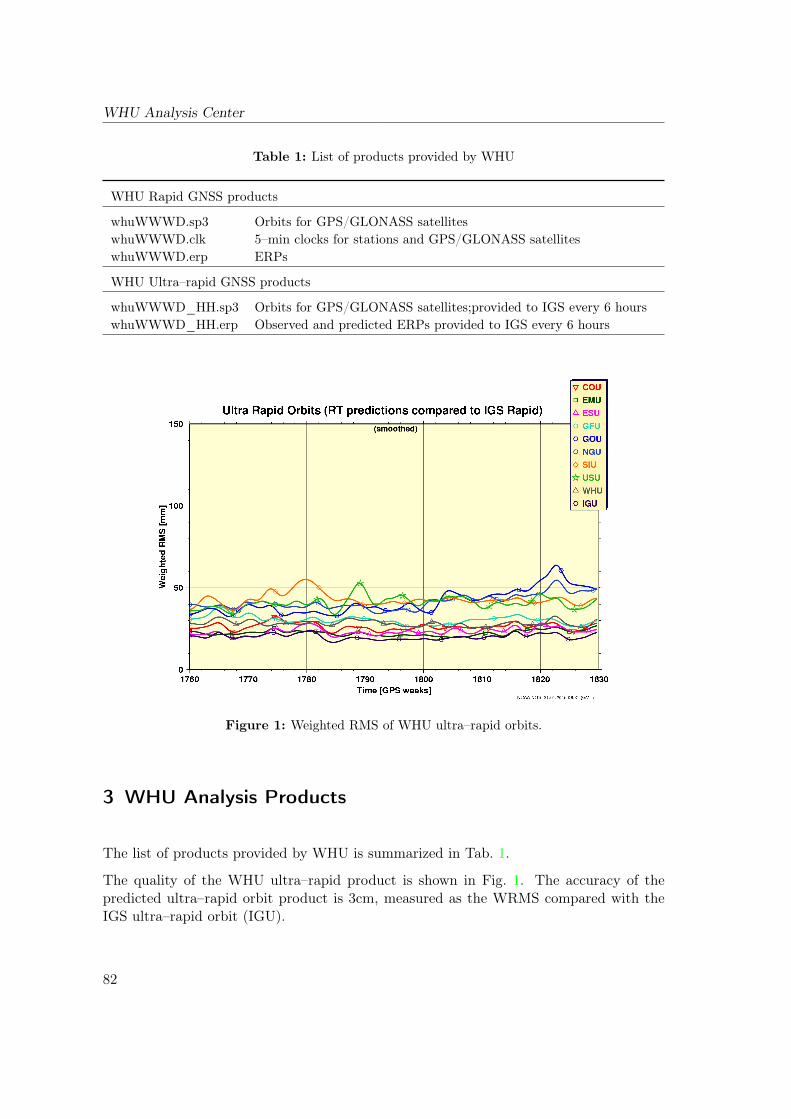
WHU Analysis Center
Table 1: List of products provided by WHU
WHU Rapid GNSS products
whuWWWD.sp3 Orbits for GPS/GLONASS satelliteswhuWWWD.clk 5–min clocks for stations and GPS/GLONASS satelliteswhuWWWD.erp ERPs
WHU Ultra–rapid GNSS products
whuWWWD_HH.sp3 Orbits for GPS/GLONASS satellites;provided to IGS every 6 hourswhuWWWD_HH.erp Observed and predicted ERPs provided to IGS every 6 hours
Figure 1: Weighted RMS of WHU ultra–rapid orbits.
3 WHU Analysis Products
The list of products provided by WHU is summarized in Tab. 1.
The quality of the WHU ultra–rapid product is shown in Fig. 1. The accuracy of thepredicted ultra–rapid orbit product is 3cm, measured as the WRMS compared with theIGS ultra–rapid orbit (IGU).
82
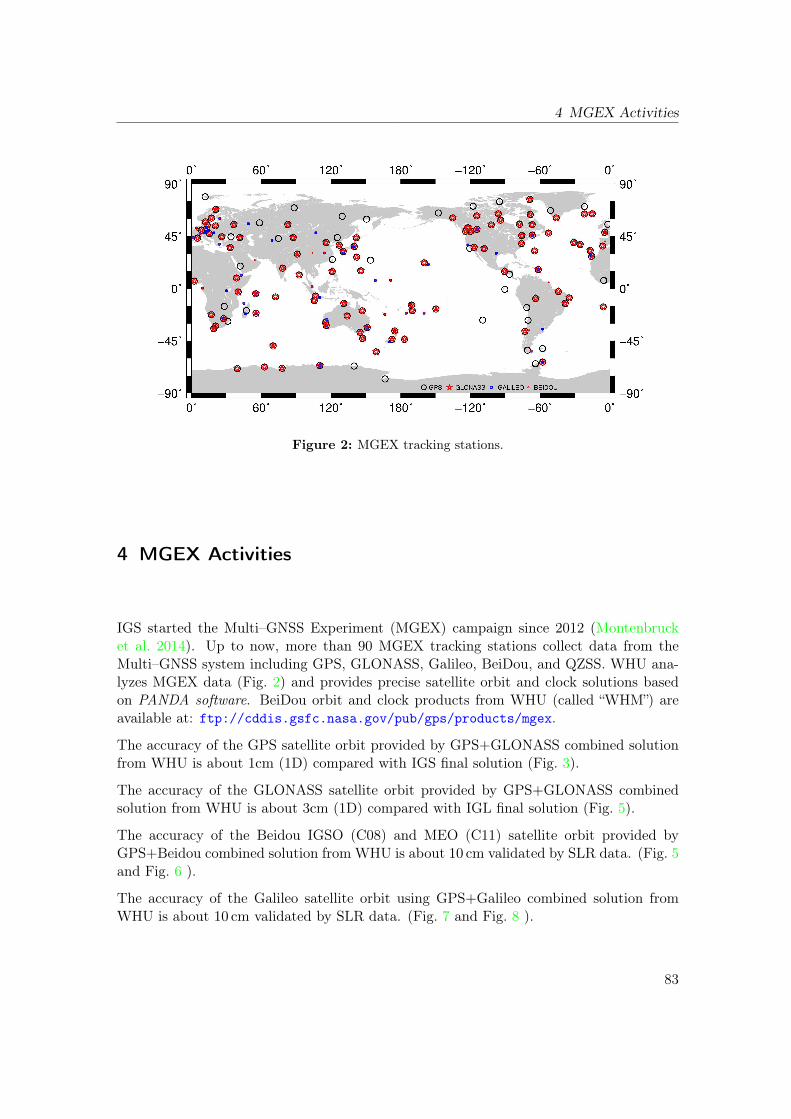
4 MGEX Activities
Figure 2: MGEX tracking stations.
4 MGEX Activities
IGS started the Multi–GNSS Experiment (MGEX) campaign since 2012 (Montenbrucket al. 2014). Up to now, more than 90 MGEX tracking stations collect data from theMulti–GNSS system including GPS, GLONASS, Galileo, BeiDou, and QZSS. WHU ana-lyzes MGEX data (Fig. 2) and provides precise satellite orbit and clock solutions basedon PANDA software. BeiDou orbit and clock products from WHU (called “WHM”) areavailable at: ftp://cddis.gsfc.nasa.gov/pub/gps/products/mgex.
The accuracy of the GPS satellite orbit provided by GPS+GLONASS combined solutionfrom WHU is about 1cm (1D) compared with IGS final solution (Fig. 3).
The accuracy of the GLONASS satellite orbit provided by GPS+GLONASS combinedsolution from WHU is about 3cm (1D) compared with IGL final solution (Fig. 5).
The accuracy of the Beidou IGSO (C08) and MEO (C11) satellite orbit provided byGPS+Beidou combined solution from WHU is about 10 cm validated by SLR data. (Fig. 5and Fig. 6 ).
The accuracy of the Galileo satellite orbit using GPS+Galileo combined solution fromWHU is about 10 cm validated by SLR data. (Fig. 7 and Fig. 8 ).
83
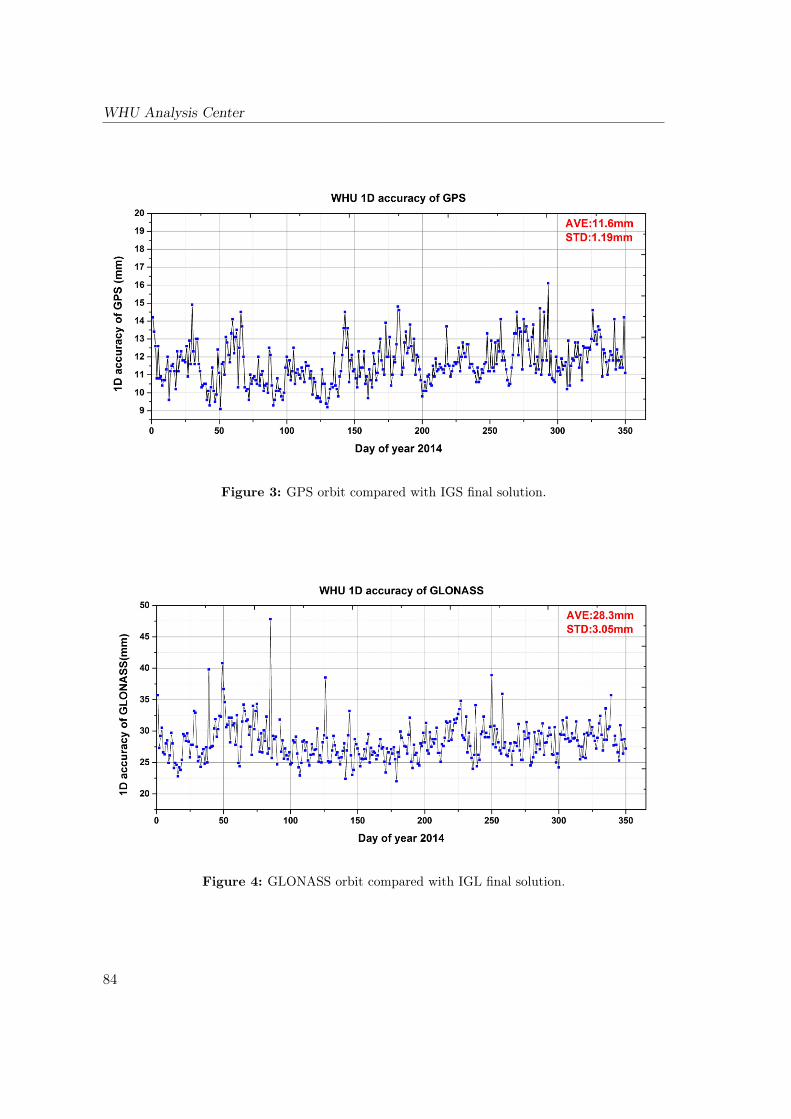
WHU Analysis Center
Figure 3: GPS orbit compared with IGS final solution.
Figure 4: GLONASS orbit compared with IGL final solution.
84
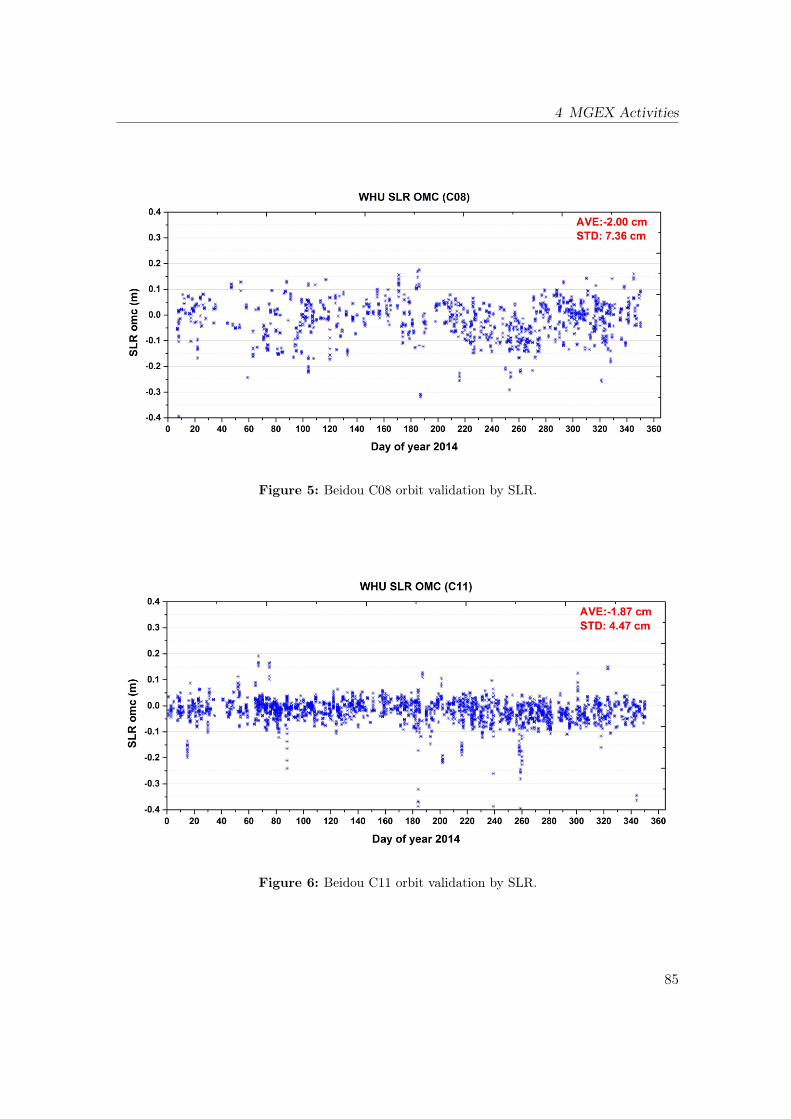
4 MGEX Activities
Figure 5: Beidou C08 orbit validation by SLR.
Figure 6: Beidou C11 orbit validation by SLR.
85
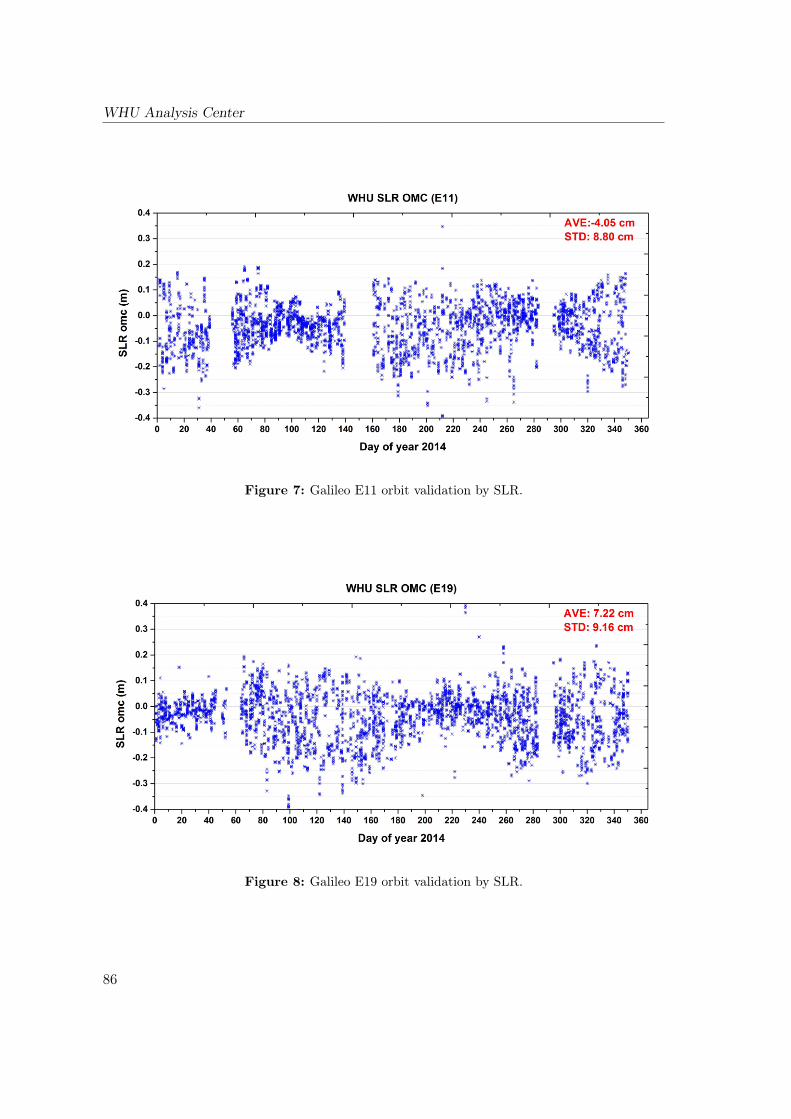
WHU Analysis Center
Figure 7: Galileo E11 orbit validation by SLR.
Figure 8: Galileo E19 orbit validation by SLR.
86
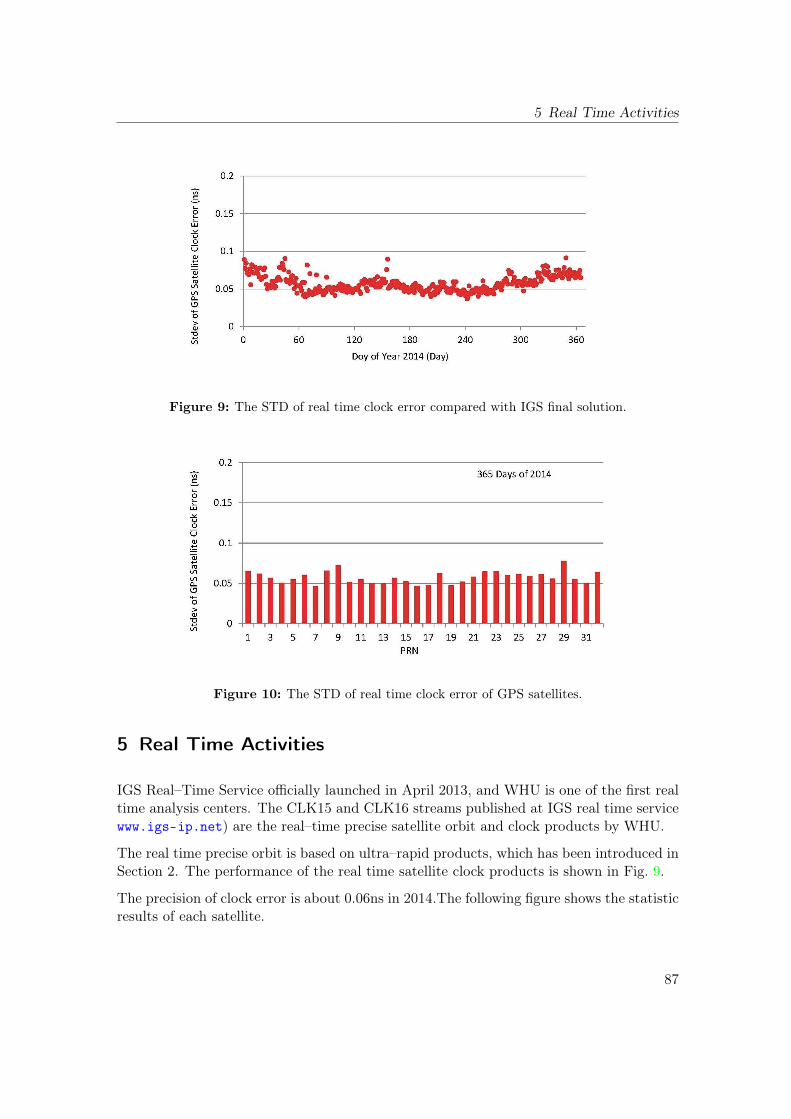
5 Real Time Activities
Figure 9: The STD of real time clock error compared with IGS final solution.
Figure 10: The STD of real time clock error of GPS satellites.
5 Real Time Activities
IGS Real–Time Service officially launched in April 2013, and WHU is one of the first realtime analysis centers. The CLK15 and CLK16 streams published at IGS real time servicewww.igs-ip.net) are the real–time precise satellite orbit and clock products by WHU.
The real time precise orbit is based on ultra–rapid products, which has been introduced inSection 2. The performance of the real time satellite clock products is shown in Fig. 9.
The precision of clock error is about 0.06ns in 2014.The following figure shows the statisticresults of each satellite.
87
WHU Analysis Center
The statistical result of each satellite is shown in Fig. 10, and the precisions all GPSsatellites have equivalent performance during the year 2014.
Reference
Liu, J. and M. Ge. A software and its preliminary result of positioning and orbit deter-mination. Wuhan University Journal of Natural Sciences, 8(2):603–609, 2003.
Shi, C., Y. Lou, H. Zhang, Q. Zhao, J. Geng, R. Wang, R. Fang, and J. Liu. Seismicdeformation of the M–w 8.0 Wenchuan earthquake from high–rate GPS observations.Advances in Space Research, 46(2):228–235, 2010.
Montenbruck, O., P. Steigenberger, R. Khachikyan, G. Weber, R.B. Langley, L. Mervart,and U. Hugentobler. IGS–MGEX: Preparing the Ground for Multi–ConstellationGNSS Science. INSIDE GNSS, 9(1):42–49, 2014.
88
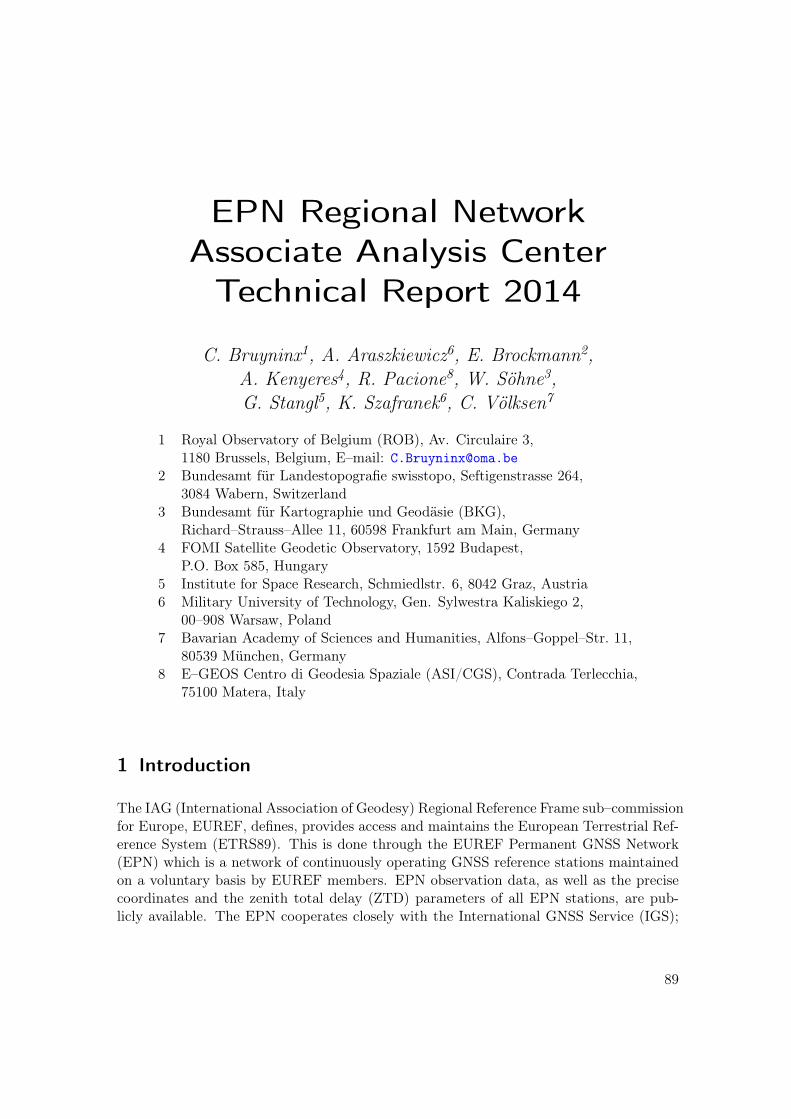
EPN Regional NetworkAssociate Analysis CenterTechnical Report 2014
C. Bruyninx1, A. Araszkiewicz6, E. Brockmann2,A. Kenyeres4, R. Pacione8, W. Söhne3,G. Stangl5, K. Szafranek6, C. Völksen7
1 Royal Observatory of Belgium (ROB), Av. Circulaire 3,1180 Brussels, Belgium, E–mail: [email protected]
2 Bundesamt für Landestopografie swisstopo, Seftigenstrasse 264,3084 Wabern, Switzerland
3 Bundesamt für Kartographie und Geodäsie (BKG),Richard–Strauss–Allee 11, 60598 Frankfurt am Main, Germany
4 FOMI Satellite Geodetic Observatory, 1592 Budapest,P.O. Box 585, Hungary
5 Institute for Space Research, Schmiedlstr. 6, 8042 Graz, Austria6 Military University of Technology, Gen. Sylwestra Kaliskiego 2,
00–908 Warsaw, Poland7 Bavarian Academy of Sciences and Humanities, Alfons–Goppel–Str. 11,
80539 München, Germany8 E–GEOS Centro di Geodesia Spaziale (ASI/CGS), Contrada Terlecchia,
75100 Matera, Italy
1 Introduction
The IAG (International Association of Geodesy) Regional Reference Frame sub–commissionfor Europe, EUREF, defines, provides access and maintains the European Terrestrial Ref-erence System (ETRS89). This is done through the EUREF Permanent GNSS Network(EPN) which is a network of continuously operating GNSS reference stations maintainedon a voluntary basis by EUREF members. EPN observation data, as well as the precisecoordinates and the zenith total delay (ZTD) parameters of all EPN stations, are pub-licly available. The EPN cooperates closely with the International GNSS Service (IGS);
89
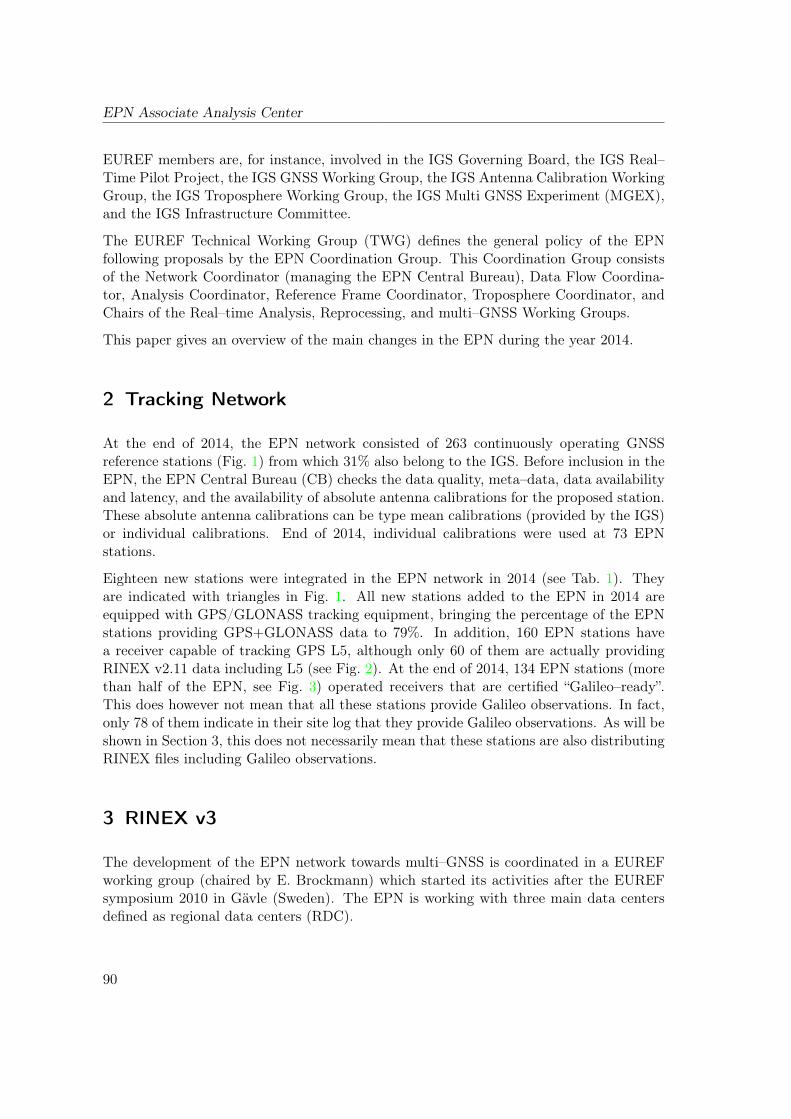
EPN Associate Analysis Center
EUREF members are, for instance, involved in the IGS Governing Board, the IGS Real–Time Pilot Project, the IGS GNSS Working Group, the IGS Antenna Calibration WorkingGroup, the IGS Troposphere Working Group, the IGS Multi GNSS Experiment (MGEX),and the IGS Infrastructure Committee.
The EUREF Technical Working Group (TWG) defines the general policy of the EPNfollowing proposals by the EPN Coordination Group. This Coordination Group consistsof the Network Coordinator (managing the EPN Central Bureau), Data Flow Coordina-tor, Analysis Coordinator, Reference Frame Coordinator, Troposphere Coordinator, andChairs of the Real–time Analysis, Reprocessing, and multi–GNSS Working Groups.
This paper gives an overview of the main changes in the EPN during the year 2014.
2 Tracking Network
At the end of 2014, the EPN network consisted of 263 continuously operating GNSSreference stations (Fig. 1) from which 31% also belong to the IGS. Before inclusion in theEPN, the EPN Central Bureau (CB) checks the data quality, meta–data, data availabilityand latency, and the availability of absolute antenna calibrations for the proposed station.These absolute antenna calibrations can be type mean calibrations (provided by the IGS)or individual calibrations. End of 2014, individual calibrations were used at 73 EPNstations.
Eighteen new stations were integrated in the EPN network in 2014 (see Tab. 1). Theyare indicated with triangles in Fig. 1. All new stations added to the EPN in 2014 areequipped with GPS/GLONASS tracking equipment, bringing the percentage of the EPNstations providing GPS+GLONASS data to 79%. In addition, 160 EPN stations havea receiver capable of tracking GPS L5, although only 60 of them are actually providingRINEX v2.11 data including L5 (see Fig. 2). At the end of 2014, 134 EPN stations (morethan half of the EPN, see Fig. 3) operated receivers that are certified “Galileo–ready”.This does however not mean that all these stations provide Galileo observations. In fact,only 78 of them indicate in their site log that they provide Galileo observations. As will beshown in Section 3, this does not necessarily mean that these stations are also distributingRINEX files including Galileo observations.
3 RINEX v3
The development of the EPN network towards multi–GNSS is coordinated in a EUREFworking group (chaired by E. Brockmann) which started its activities after the EUREFsymposium 2010 in Gävle (Sweden). The EPN is working with three main data centersdefined as regional data centers (RDC).
90
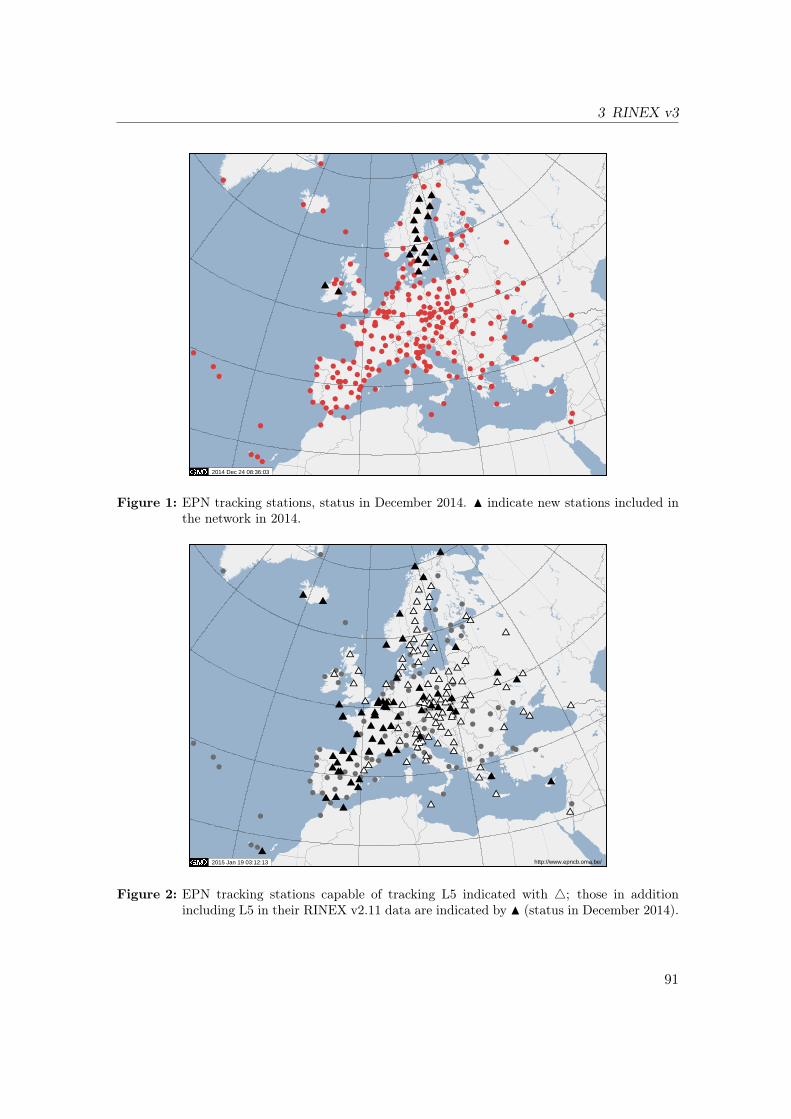
3 RINEX v3
2014 Dec 24 08:36:03
Figure 1: EPN tracking stations, status in December 2014. N indicate new stations included inthe network in 2014.
http://www.epncb.oma.be/ 2015 Jan 19 03:12:13
Figure 2: EPN tracking stations capable of tracking L5 indicated with 4; those in additionincluding L5 in their RINEX v2.11 data are indicated by N (status in December 2014).
91
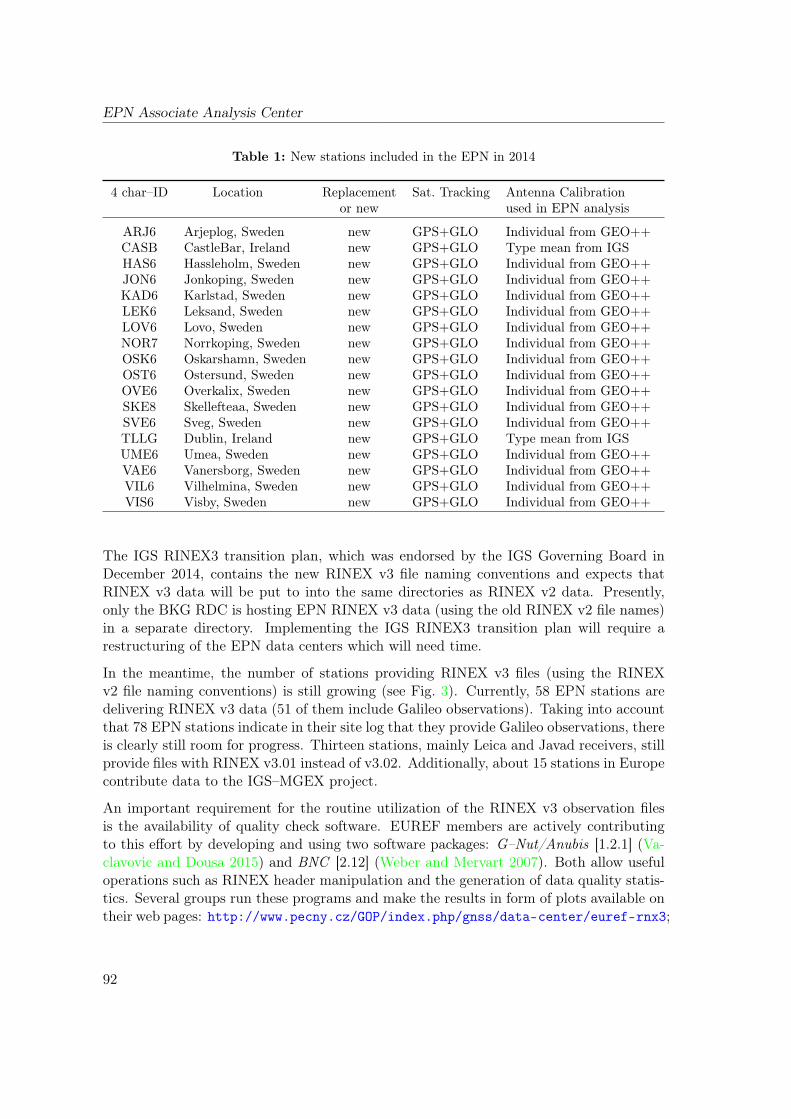
EPN Associate Analysis Center
Table 1: New stations included in the EPN in 2014
4 char–ID Location Replacement Sat. Tracking Antenna Calibrationor new used in EPN analysis
ARJ6 Arjeplog, Sweden new GPS+GLO Individual from GEO++CASB CastleBar, Ireland new GPS+GLO Type mean from IGSHAS6 Hassleholm, Sweden new GPS+GLO Individual from GEO++JON6 Jonkoping, Sweden new GPS+GLO Individual from GEO++KAD6 Karlstad, Sweden new GPS+GLO Individual from GEO++LEK6 Leksand, Sweden new GPS+GLO Individual from GEO++LOV6 Lovo, Sweden new GPS+GLO Individual from GEO++NOR7 Norrkoping, Sweden new GPS+GLO Individual from GEO++OSK6 Oskarshamn, Sweden new GPS+GLO Individual from GEO++OST6 Ostersund, Sweden new GPS+GLO Individual from GEO++OVE6 Overkalix, Sweden new GPS+GLO Individual from GEO++SKE8 Skellefteaa, Sweden new GPS+GLO Individual from GEO++SVE6 Sveg, Sweden new GPS+GLO Individual from GEO++TLLG Dublin, Ireland new GPS+GLO Type mean from IGSUME6 Umea, Sweden new GPS+GLO Individual from GEO++VAE6 Vanersborg, Sweden new GPS+GLO Individual from GEO++VIL6 Vilhelmina, Sweden new GPS+GLO Individual from GEO++VIS6 Visby, Sweden new GPS+GLO Individual from GEO++
The IGS RINEX3 transition plan, which was endorsed by the IGS Governing Board inDecember 2014, contains the new RINEX v3 file naming conventions and expects thatRINEX v3 data will be put to into the same directories as RINEX v2 data. Presently,only the BKG RDC is hosting EPN RINEX v3 data (using the old RINEX v2 file names)in a separate directory. Implementing the IGS RINEX3 transition plan will require arestructuring of the EPN data centers which will need time.
In the meantime, the number of stations providing RINEX v3 files (using the RINEXv2 file naming conventions) is still growing (see Fig. 3). Currently, 58 EPN stations aredelivering RINEX v3 data (51 of them include Galileo observations). Taking into accountthat 78 EPN stations indicate in their site log that they provide Galileo observations, thereis clearly still room for progress. Thirteen stations, mainly Leica and Javad receivers, stillprovide files with RINEX v3.01 instead of v3.02. Additionally, about 15 stations in Europecontribute data to the IGS–MGEX project.
An important requirement for the routine utilization of the RINEX v3 observation filesis the availability of quality check software. EUREF members are actively contributingto this effort by developing and using two software packages: G–Nut/Anubis [1.2.1] (Va-clavovic and Dousa 2015) and BNC [2.12] (Weber and Mervart 2007). Both allow usefuloperations such as RINEX header manipulation and the generation of data quality statis-tics. Several groups run these programs and make the results in form of plots available ontheir web pages: http://www.pecny.cz/GOP/index.php/gnss/data-center/euref-rnx3;
92
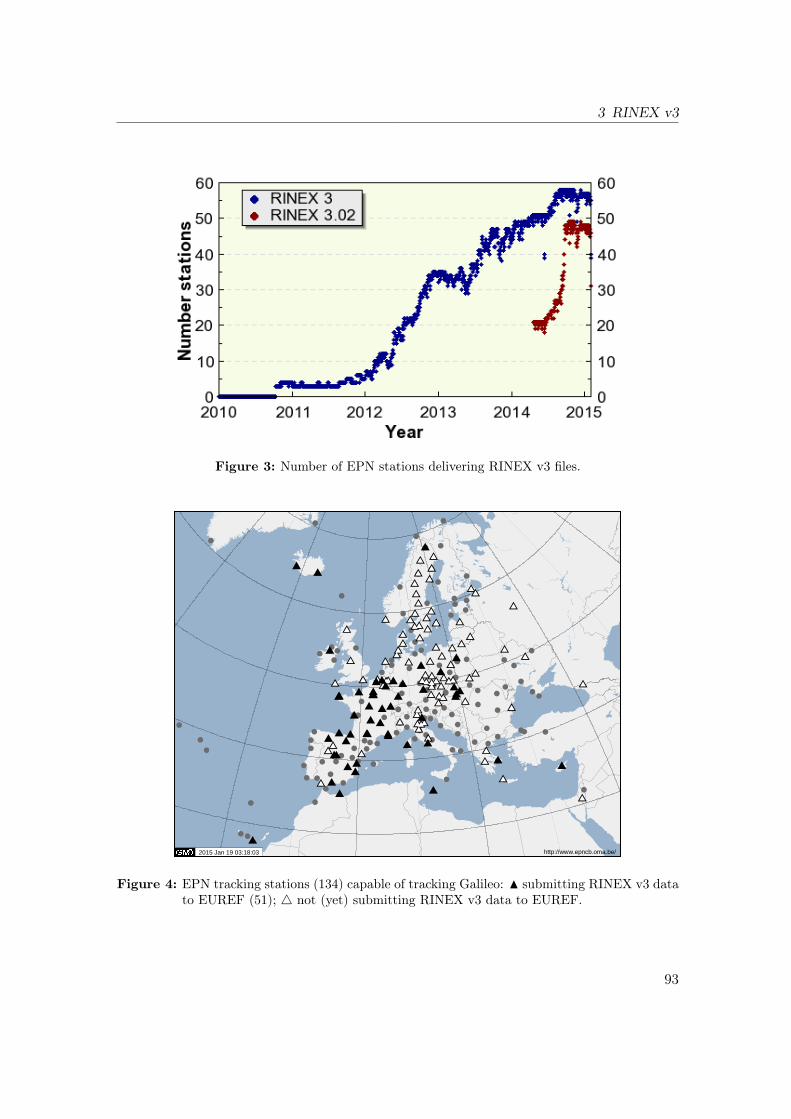
3 RINEX v3
CONTROL PANEL > GRAPHS & MAPS > NUMBER RINEX3 STATIONS
NUMBER RINEX3 STATIONS
machine-readable file
EPN CENTRAL BUREAU > Graphs & Maps > Number RINEX3 stations http://www.epncb.oma.be/controlpanel/graphs/number_RINEX3_statio...
1 of 1 02-Feb-15 10:41
Figure 3: Number of EPN stations delivering RINEX v3 files.
http://www.epncb.oma.be/ 2015 Jan 19 03:18:03
Figure 4: EPN tracking stations (134) capable of tracking Galileo: N submitting RINEX v3 datato EUREF (51); 4 not (yet) submitting RINEX v3 data to EUREF.
93
EPN Associate Analysis Center
http://www.swisstopo.admin.ch/swisstopo/geodesy/pnac/html/en/anubis_monitor_r3.html
In addition, the EPN Central Bureau today already routinely cross–checks the RINEX v3headers against the site log information (similarly to what is done for the RINEX v2 data)and also verifies the conformity of the RINEX v3 headers with respect to the RINEX v3format description. Station managers are notified in case errors occur. In the course of2015, the EPN CB web site will be extended with this information.
4 Data Analysis
4.1 Positions
Currently, 16 (from 18 existing) Local Analysis Centers (LACs) deliver SINEX solutionsfor the weekly EPN combination. Since January 2014, the GOP LAC focuses on theEPN reprocessing activities. The DEO LAC does not submit its solutions anymore since2009, but is planning to restart routine analysis in 2015. The new Analysis CombinationCenter (Military University of Technology/Warsaw University of Technology consortium)delivered its first weekly final EPN solution for GPS week 1768 (November 2013). Toensure the coherence of the MUT/WUT combinations during the first months, the samestrategy as the one used by the previous ACC (BKG) was applied. Since GPS week 1774(January 2014), only stations processed by at least three LACs are taken into considerationin the final daily and weekly solutions which enables the detection of outliers and thereliability of the solutions. However, exceptions are made for new stations which are,in the beginning of their lifetime, and still processed by less than three LACs. SinceGPS week 1787, the number of reference stations was decreased from 71 to 46 stations inorder to exclusively use EPN stations included in the most recent IGb08 realization. Thenew ACC also continues to deliver rapid daily combinations (since 1770 GPS week) andultra–rapid daily combinations (since GPS week 1773) which are mainly used for rapidmonitoring of the EPN station positions.
All combinations are performed with the Bernese GNSS Software (Dach et al. 2013).Prior to the combination process, the LAC SINEX files provided by the different LAC areautomatically checked against possible metadata inconsistencies (e.g. antenna types andcalibration models, receiver types) and problematic stations are excluded from the combi-nation. Information about these products and coordinate time series are presented at theEPN ACC webpage (http://www.epnacc.wat.edu.pl). For the rapid combinations, suchinformation, together with characteristics of the combined solution and the inconsisten-cies from the LAC SINEX files, can be found in the combination reports sent to the BKGproduct center (ftp://igs.bkg.bund.de/EUREF/products/WWWW/eurWWWWmr.sum).
Fourteen of the sixteen LACs use both GPS and GLONASS data (in 2014 two LACsupdated their Bernese software and started to include GLONASS observations). The
94
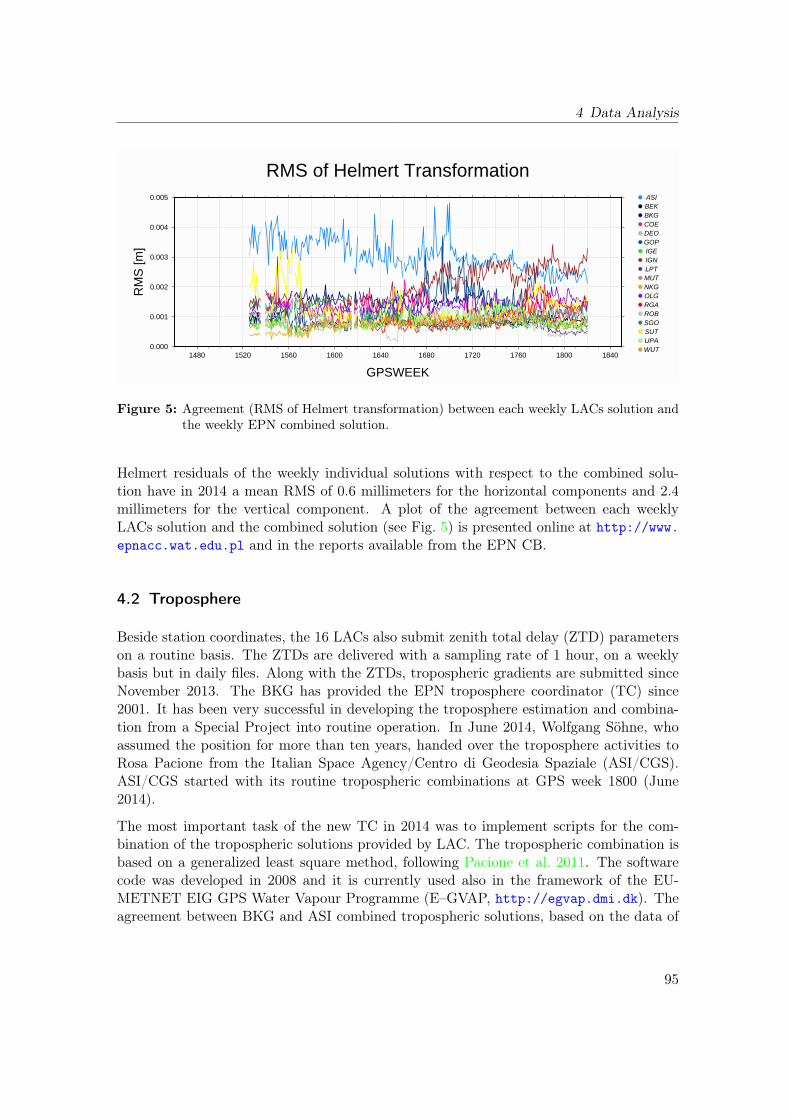
4 Data Analysis
0.000
0.001
0.002
0.003
0.004
0.005
RM
S [m
]
1480 1520 1560 1600 1640 1680 1720 1760 1800 1840
GPSWEEK
RMS of Helmert TransformationASIBEKBKGCOEDEOGOPIGEIGNLPTMUTNKGOLGRGAROBSGOSUTUPAWUT
Figure 5: Agreement (RMS of Helmert transformation) between each weekly LACs solution andthe weekly EPN combined solution.
Helmert residuals of the weekly individual solutions with respect to the combined solu-tion have in 2014 a mean RMS of 0.6 millimeters for the horizontal components and 2.4millimeters for the vertical component. A plot of the agreement between each weeklyLACs solution and the combined solution (see Fig. 5) is presented online at http://www.epnacc.wat.edu.pl and in the reports available from the EPN CB.
4.2 Troposphere
Beside station coordinates, the 16 LACs also submit zenith total delay (ZTD) parameterson a routine basis. The ZTDs are delivered with a sampling rate of 1 hour, on a weeklybasis but in daily files. Along with the ZTDs, tropospheric gradients are submitted sinceNovember 2013. The BKG has provided the EPN troposphere coordinator (TC) since2001. It has been very successful in developing the troposphere estimation and combina-tion from a Special Project into routine operation. In June 2014, Wolfgang Söhne, whoassumed the position for more than ten years, handed over the troposphere activities toRosa Pacione from the Italian Space Agency/Centro di Geodesia Spaziale (ASI/CGS).ASI/CGS started with its routine tropospheric combinations at GPS week 1800 (June2014).
The most important task of the new TC in 2014 was to implement scripts for the com-bination of the tropospheric solutions provided by LAC. The tropospheric combination isbased on a generalized least square method, following Pacione et al. 2011. The softwarecode was developed in 2008 and it is currently used also in the framework of the EU-METNET EIG GPS Water Vapour Programme (E–GVAP, http://egvap.dmi.dk). Theagreement between BKG and ASI combined tropospheric solutions, based on the data of
95
EPN Associate Analysis Center
the whole year 2013 and the entire EPN, is at a sub–millimeter level in term of bias and 1millimeter level in term of standard deviation. The format of the Tropospheric SummaryFiles has also been reviewed and simplified by removing some tables.
Thanks to the growing computation power, the individual LACs enlarged their networksin 2014. This way, almost all EPN stations are processed by at least four LACs whichimproves, for example, the outlier detection. On average 254 stations are processed bymore than three LACs, 8 by two LACs and only 5 by one LACs. In the last four years ofroutine operation (2011–2014), the weekly mean biases (see Fig. 6) are within 2 millimetersZTD level, while their standard deviations range between 1 to 2 millimeters (see Fig. 6)with a few outliers in the last period of routine operation. The jump in the standarddeviation time series (see Fig. 6) occurred at GPS week 1800 is related to the use of adifferent combination software starting from that GPS week.
Alongside the ZTD combination which gives insight into the agreement of the individualsolutions to each other, some inter–technique comparisons have been added to the website of the EPN Central Bureau. The time series of EPN ZTD differences with respect toradiosonde–derived ZTDs are computed for almost 100 stations. For the stations consid-ered, the horizontal distance between radiosonde and GNSS location is varying from lessthan 1 km up to 75 km. The standard deviation of the differences is between 4 and 20millimeters ZTD, with worse agreement if the distance is long. Moreover, for each EPNsite plots showing monthly mean of ZTD values are available.
4.3 Reprocessing
Currently the EPN working group on Reprocessing conducts a second reprocessing cam-paign, EPN–Repro2 realized in the IGb08 and it is coordinated by the Bavarian Academyof Sciences and Humanities (BEK). The analysis is being carried out on the EPN datafrom 1996 till 2013 by five analysis centers. It will include three independent solutionsobtained using Bernese 5.2, GAMIT 10.5 and GIPSY 6.2 for the entire EPN and the re-sults of two EPN subnetworks processed with Bernese GNSS Software v5.2. The analysisstrategy is very much consistent with the recent LAC guidelines for the routine process-ing of the EPN. The processing of the data is performed as a regional network withoutorbit, EOP and clock parameter estimation and relies completely on available reprocessedproducts. Due to the lack of reprocessed combined IGS products (2nd IGS Reprocessingcampaign), the reprocessed products provided by CODE and the preliminary reprocessedproducts by JPL are used.
In preparation of EPN–Repro2, a benchmark test with the different software packages,and based on the same data and network design, has shown good agreement betweenthe different solutions (Völksen et al. 2014). The completion of the EPN–Repro2 dailysolutions is expected for February 2014. First results of the combination of the differentresults will be presented at the next EUREF symposium in June 2015. The importance of
96
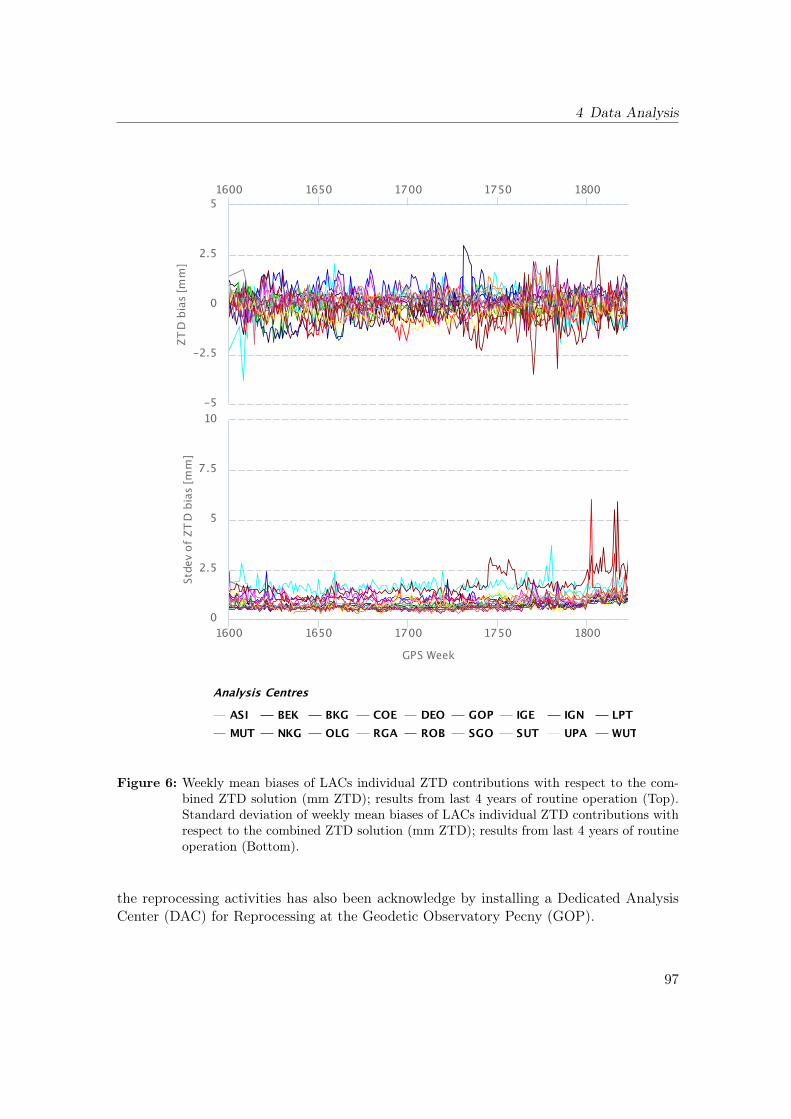
4 Data Analysis
GPS Week
ZTD
bias [
mm
]St
dev o
f ZTD
bias
[mm
]
ASI BEK BKG COE DEO GOP IGE IGN LPTMUT NKG OLG RGA ROB SGO SUT UPA WUT
Analysis Centres
1600 1650 1700 1750 1800
1600 1650 1700 1750 1800
-5
-2.5
0
2.5
5
0
2.5
5
7.5
10
Figure 6: Weekly mean biases of LACs individual ZTD contributions with respect to the com-bined ZTD solution (mm ZTD); results from last 4 years of routine operation (Top).Standard deviation of weekly mean biases of LACs individual ZTD contributions withrespect to the combined ZTD solution (mm ZTD); results from last 4 years of routineoperation (Bottom).
the reprocessing activities has also been acknowledge by installing a Dedicated AnalysisCenter (DAC) for Reprocessing at the Geodetic Observatory Pecny (GOP).
97
EPN Associate Analysis Center
5 Densification of the IGS and EPN
Based on the EPN combined weekly SINEX solutions (back to mid–1996), a multi–yearEPN position and velocity solution is maintained as the densification of the IGS realiza-tion of the ITRS in Europe. This solution is computed with CATREF software (Altamimiet al. 2007) and updated each 15 weeks. Up to GPS week 1709, the multi–year solutionwas tied to IGS08, since that date the IGb08 was used. This reference frame alignmentis based on the minimum constraint approach and the consistency of the frame realiza-tion is checked. When EPN–Repro2 products will become available, the multi–year EPNsolution will be updated to be compliant with the latest standards. The EPN IGb08densification product files (including a discontinuity table and associated residual positiontime series) are available at ftp://epncb.oma.be/pub/station/coord/EPN. More detailscan be found in http://epncb.oma.be/_productsservices/coordinates.
The densification of the EPN aims at providing a dense continental–scale homogeneousstation position and velocity field to support the better realization of the ETRS89 andgeophysical modeling. This densification is done by the EPN Reference Frame Coordinator(A. Kenyeres), but actually a Working Group will be formed in 2015 to support the growingneeds of the densification activities. In that frame, EUREF combines the weekly SINEXsolutions provided by European countries for their dense national active GNSS networkswith the weekly EPN SINEX solution. Then, all available weekly combined solutions arestacked to obtain the consistent cumulative position/velocity solution. Both combinationsare done using the CATREF software using the same approach and parameters as for thegeneration of the EPN IGb08 densification ensuring full consistency from the global tolocal level. The total number of stations included in the EPN densification exceeded2500 as of December 2014. Two contributions (IGN, France and BIGF, UK) are globalsolutions and therefore the EPN densification shall be considered as a global solution. Thedensification products will be an essential contribution to several groups and projects asthe IAG working group on “The integration of dense velocity field in the ITRF ”, EPOS(European Plate Observatory System) and EUPOS (European Positioning System). Thiswork is still in progress (see Kenyeres et al. 2014).
6 Stream and Product Dissemination
The availability of all EPN real–time streams and products at the three EUREF re-gional broadcasters located at ASI (http://euref-ip.asi.it:2101), BKG (http://www.euref-ip.net) and ROB (http://www.euref-ip.be/) continued to converge in 2014. Forthis purpose, the EPN CB compares on–line the status of each mountpoint at the threebroadcasters, so that the service providers, station managers and users can immediatelysee if an outage is caused by one of the casters or the stream provider. The aim is fullflexibility, so that every user is able to switch between the casters without loss of availabil-
98
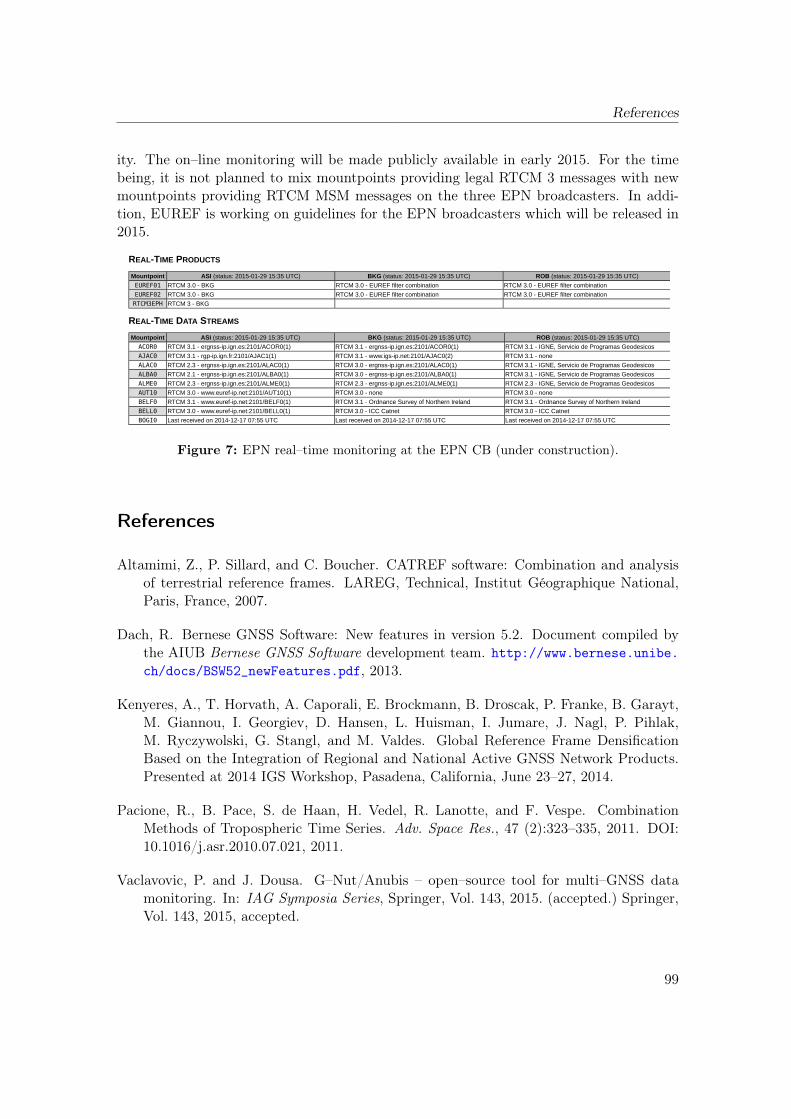
References
ity. The on–line monitoring will be made publicly available in early 2015. For the timebeing, it is not planned to mix mountpoints providing legal RTCM 3 messages with newmountpoints providing RTCM MSM messages on the three EPN broadcasters. In addi-tion, EUREF is working on guidelines for the EPN broadcasters which will be released in2015.
NETWORK & DATA > DATA ACCESS > REAL-TIME > PRODUCTS & DATA STREAMS
REAL-TIME PRODUCTS
Mountpoint ASI (status: 2015-01-29 15:35 UTC) BKG (status: 2015-01-29 15:35 UTC) ROB (status: 2015-01-29 15:35 UTC)
EUREF01 RTCM 3.0 - BKG RTCM 3.0 - EUREF filter combination RTCM 3.0 - EUREF filter combination
EUREF02 RTCM 3.0 - BKG RTCM 3.0 - EUREF filter combination RTCM 3.0 - EUREF filter combination
RTCM3EPH RTCM 3 - BKG
REAL-TIME DATA STREAMS
Mountpoint ASI (status: 2015-01-29 15:35 UTC) BKG (status: 2015-01-29 15:35 UTC) ROB (status: 2015-01-29 15:35 UTC)
ACOR0 RTCM 3.1 - ergnss-ip.ign.es:2101/ACOR0(1) RTCM 3.1 - ergnss-ip.ign.es:2101/ACOR0(1) RTCM 3.1 - IGNE, Servicio de Programas Geodesicos
AJAC0 RTCM 3.1 - rgp-ip.ign.fr:2101/AJAC1(1) RTCM 3.1 - www.igs-ip.net:2101/AJAC0(2) RTCM 3.1 - none
ALAC0 RTCM 2.3 - ergnss-ip.ign.es:2101/ALAC0(1) RTCM 3.0 - ergnss-ip.ign.es:2101/ALAC0(1) RTCM 3.1 - IGNE, Servicio de Programas Geodesicos
ALBA0 RTCM 2.1 - ergnss-ip.ign.es:2101/ALBA0(1) RTCM 3.0 - ergnss-ip.ign.es:2101/ALBA0(1) RTCM 3.1 - IGNE, Servicio de Programas Geodesicos
ALME0 RTCM 2.3 - ergnss-ip.ign.es:2101/ALME0(1) RTCM 2.3 - ergnss-ip.ign.es:2101/ALME0(1) RTCM 2.3 - IGNE, Servicio de Programas Geodesicos
AUT10 RTCM 3.0 - www.euref-ip.net:2101/AUT10(1) RTCM 3.0 - none RTCM 3.0 - none
BELF0 RTCM 3.1 - www.euref-ip.net:2101/BELF0(1) RTCM 3.1 - Ordnance Survey of Northern Ireland RTCM 3.1 - Ordnance Survey of Northern Ireland
BELL0 RTCM 3.0 - www.euref-ip.net:2101/BELL0(1) RTCM 3.0 - ICC Catnet RTCM 3.0 - ICC Catnet
BOGI0 Last received on 2014-12-17 07:55 UTC Last received on 2014-12-17 07:55 UTC Last received on 2014-12-17 07:55 UTC
BOR10 RTCM 2.3 - www.euref-ip.net:2101/BOR10(1) RTCM 2.3 - SRC PAS RTCM 2.3 - SRC PAS
BORJ0 RTCM 3.0 - BKG
BORJ1 RTCM 3.0 - www.euref-ip.net:2101/BORJ1(1) RTCM 3.0 - BKG Last received on 2014-12-05 02:05 UTC
BORR0 RTCM 3.0 - icverva.icv.gva.es:2101/RTBO1(1) RTCM 3.0 - ICVRTCM 3 - Ant Descriptor-Protected-Cartographic Institute ofValencia
BRST0 RTCM 3.0 - BRST0 rgp-ip.ign.fr:2101/BRST1(1) RTCM 3.0 - www.igs-ip.net:2101/BRST0(2) RTCM 3.1 - none
BRUX0 Last received on 2014-11-18 12:05 UTC RTCM 3.0 - www.igs-ip.net:2101/BRUX0(2) Last received on 2014-11-18 12:05 UTC
BRUX1 Last received on 2014-11-18 12:05 UTC
BRUX7 Last received on 2014-11-20 14:05 UTC
BSCN0 RTCM 3.0 - rgp-ip.ign.fr:2101/BSCN1(1) RTCM 3.0 - rgp-ip.ign.fr:2101/BSCN1(1) RTCM 3.1 - none
BUCU0 RTCM 3.0 - www.euref-ip.net:2101/BUCU0(1) RTCM 3.0 - TU Bucharest RTCM 3.0 - TU Bucharest
BUTE0 RTCM 3.0 - /BUTE0(1) RTCM 3.0 - Budapest University RTCM 3.0 - Budapest University
BZRG0 Never received RTCM 2.3 - www.igs-ip.net:2101/BZRG0(2) RTCM 2 - 9600
CACE0 RTCM 2.3 - ergnss-ip.ign.es:2101/CACE0(1) RTCM 2.3 - ergnss-ip.ign.es:2101/CACE0(1) RTCM 2.3 - IGNE, Servicio de Programas Geodesicos
CANT0 RTCM 3.1 - ergnss-ip.ign.es:2101/CANT0(1) RTCM 3.0 - ergnss-ip.ign.es:2101/CANT0(1) RTCM 3.1 - IGNE, Servicio de Programas Geodesicos
CANT1 RTCM 2.3 - ergnss-ip.ign.es:2101/CANT1(1)
Figure 7: EPN real–time monitoring at the EPN CB (under construction).
References
Altamimi, Z., P. Sillard, and C. Boucher. CATREF software: Combination and analysisof terrestrial reference frames. LAREG, Technical, Institut Géographique National,Paris, France, 2007.
Dach, R. Bernese GNSS Software: New features in version 5.2. Document compiled bythe AIUB Bernese GNSS Software development team. http://www.bernese.unibe.ch/docs/BSW52_newFeatures.pdf, 2013.
Kenyeres, A., T. Horvath, A. Caporali, E. Brockmann, B. Droscak, P. Franke, B. Garayt,M. Giannou, I. Georgiev, D. Hansen, L. Huisman, I. Jumare, J. Nagl, P. Pihlak,M. Ryczywolski, G. Stangl, and M. Valdes. Global Reference Frame DensificationBased on the Integration of Regional and National Active GNSS Network Products.Presented at 2014 IGS Workshop, Pasadena, California, June 23–27, 2014.
Pacione, R., B. Pace, S. de Haan, H. Vedel, R. Lanotte, and F. Vespe. CombinationMethods of Tropospheric Time Series. Adv. Space Res., 47 (2):323–335, 2011. DOI:10.1016/j.asr.2010.07.021, 2011.
Vaclavovic, P. and J. Dousa. G–Nut/Anubis – open–source tool for multi–GNSS datamonitoring. In: IAG Symposia Series, Springer, Vol. 143, 2015. (accepted.) Springer,Vol. 143, 2015, accepted.
99
EPN Associate Analysis Center
Völksen, C., A. Araszkiewicz, R. Pacione, B. Pace, and K. Szafranek. The Benchmark Testof the EPN–Repro2 campaign. Presented at EUREF Symposium, Vilnius, Lithuania,June 3–7, 2014.
Weber, G. and L. Mervart. The BKG Ntrip Client (BNC) Report on EUREF Symposium2007 in London. Mitteilungen des Bundesamtes fuer Kartographie und Geodaesie,Band 42, Frankfurt, 2009.
100
SIRGAS Regional NetworkAssociate Analysis CenterTechnical Report 2014
Laura Sánchez
Deutsches Geodätisches Forschungsinstitutder Technischen Universität München (DGFI–TUM)Alfons–Goppel–Str. 11, 80539 Munich, GermanyE–mail: [email protected]
1 Introduction
The IGS Regional Network Associate Analysis Center for SIRGAS (IGS RNAAC SIR)was established in June 1996 under the responsibility of the Deutsches GeodätischesForschungsinstitut (Seemüller and Drewes 1998), since January 2015 integrated into theTechnische Universität München. The main objective of the IGS RNAAC SIR is thepermanent analysis of the SIRGAS reference frame. The present activities of the IGSRNAAC SIR concentrate on (Sánchez 2014)
• the computation of loosely constrained weekly solutions for further combinations ofthe network (e.g., integration into the IGS polyhedron, computation of cumulativesolutions, etc.). These solutions are weekly delivered to the IGS in SINEX format tobe combined together with those generated by the other IGS Global and RegionalAnalysis Centers. They are named sirwwww7.snx (wwww stands for the GPS week);
• weekly station positions aligned to the same reference frame in which the IGSGNSS orbits are given, i.e., the IGS reference frame. These positions are appliedas reference values for surveying applications in Latin America. Their name issiryyPwwww.crd (yy indicates the last two digits of the year).
• multi–year solutions providing station positions and constant velocities to estimatethe kinematics of the reference frame and as support for applications requiring time–dependent coordinates. They are identified by SIRyyPnn.SNX (nn being the numberof the cumulative solution computed in one year).
101
SIRGAS Associate Analysis Center
2 The SIRGAS reference frame
The SIRGAS reference frame was regularly computed by the IGS RNAAC SIR as onlyone common network until August 31, 2008 (GPS week 1495) (Seemüller et al. 2012).Afterwards, due to the increasing number of stations (about 400 in December 2014),different sub–networks were defined and, at present, the analysis strategy is based on thecombination of individual solutions including (Brunini et al. 2012)
• one core network (SIRGAS–C) composed of a set of geographically well–distributedand consistently reliable reference stations (Fig. 1). The main objective of theSIRGAS–C network is to ensure the long–term stability of the reference frame, andit is understood as the primary densification of the ITRF in Latin America and theCaribbean.
• national reference networks (SIRGAS–N) realizing densifications of the core network(Fig. 1). The central purpose of these densifications is to provide accessibility tothe reference frame at national and local levels and to facilitate its extension byassimilating new reference stations (mainly those installed by the national agenciesresponsible for the local reference networks).
3 SIRGAS analysis centers
The SIRGAS–C network is processed by DGFI–TUM as IGS RNAAC SIR. The SIRGAS–N networks are computed by the SIRGAS Local Processing Centers, which operate underthe responsibility of national Latin American organizations. At present, the SIRGASLocal Processing Centers are:
• CEPGE: Centro de Procesamiento de Datos GNSS del Ecuador, Instituto GeográficoMilitar (Ecuador)
• CNPDG–UNA: Centro Nacional de Procesamiento de Datos GNSS, UniversidadNacional (Costa Rica)
• CPAGS–LUZ: Centro de Procesamiento y Análisis GNSS SIRGAS de la Universidaddel Zulia (Venezuela)
• IBGE: Instituto Brasileiro de Geografia e Estatistica (Brazil)
• IGAC: Instituto Geográfico Agustín Codazzi (Colombia)
• IGM–Cl: Instituto Geográfico Militar (Chile)
• IGN–Ar: Instituto Geográfico Nacional (Argentina)
102
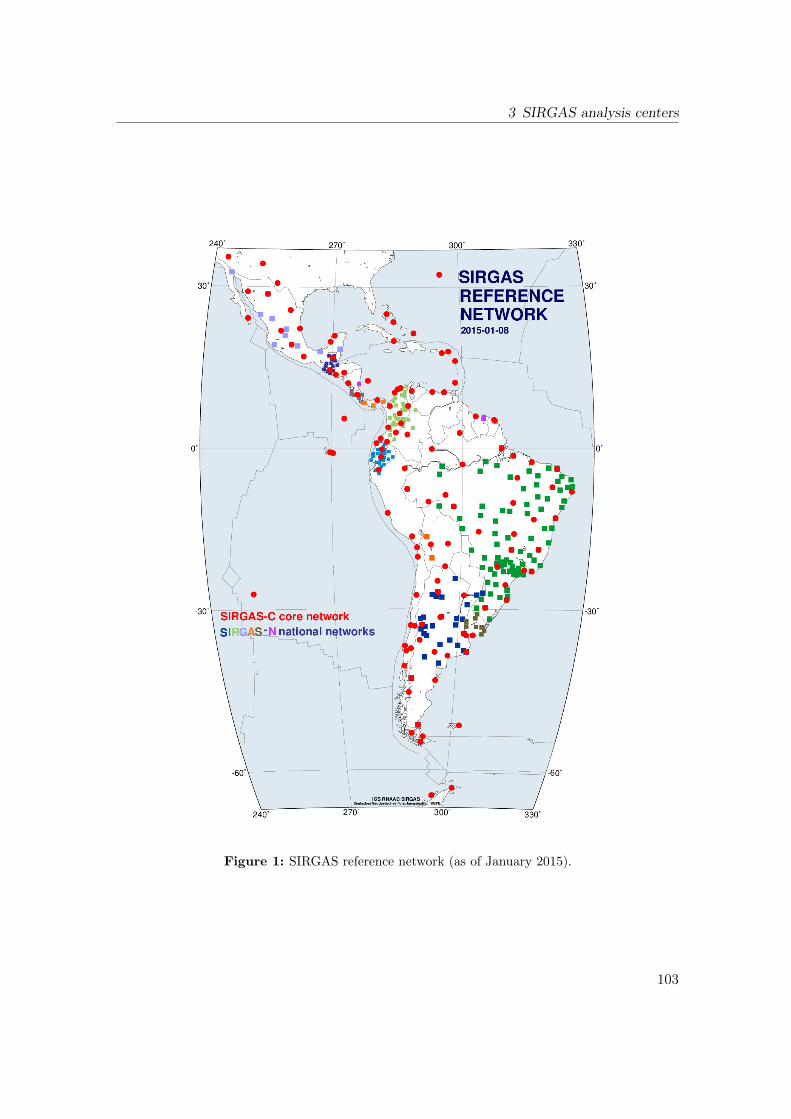
3 SIRGAS analysis centers
Figure 1: SIRGAS reference network (as of January 2015).
103
SIRGAS Associate Analysis Center
• INEGI: Instituto Nacional de Estadística y Geografía (México)
• SGM: Servicio Geográfico Militar (Uruguay)
These processing centers deliver loosely constrained weekly solutions for the SIRGAS–Nnational networks, which are combined with the SIRGAS–C core network to get homoge-neous precision for station positions and velocities. The individual solutions are combinedby the SIRGAS Combination Centers currently operated by DGFI–TUM (Sánchez et al.2012) and IBGE (Costa et al. 2012).
4 Routine processing of the SIRGAS reference frame
The SIRGAS processing centers follow unified standards for the computation of the looselyconstrained solutions (Sánchez et al. 2013). These standards are generally based on theconventions outlined by the IERS and the GNSS–specific guidelines defined by the IGS;with the exception that in the individual SIRGAS solutions the satellite orbits and clocksas well as the Earth orientation parameters (EOP) are fixed to the final weekly IGSvalues (SIRGAS does not compute these parameters), and positions for all stations areconstrained to ±1m (to generate the loosely constrained solutions in SINEX format).INEGI (Mexico) and IGN–Ar (Argentina) employ the software GAMIT/GLOBK (Herringet al. 2010); the other local processing centers use the Bernese GPS Software Ver. 5.2(Dach et al. 2007, 2013).
5 New processing standards for the SIRGAS reference frame
Since January 2014, the SIRGAS processing centers apply the standards of the IERSConventions 2010 (Petit and Luzum 2010) and the characteristics specified by the IGS forthe second reprocessing of the IGS global network. The main changes with respect to theprevious processing strategy are (Sánchez et al. 2015):
• Reference frame: IGS08/IGb08 (Rebischung et al. 2012)
• Antenna phase center model: igs08.atx (Schmid 2011)
• Tropospheric zenith delay modelling based on the Vienna Mapping Function 1(VMF1, Böhm et al. 2006) with a priori values (∼dry part) from the gridded coef-ficients provided by J. Böhm at http://ggosatm.hg.tuwien.ac.at/DELAY/GRID/VMFG and refinement through the computation of partial derivatives with 2–hourintervals within the network adjustment
• Tidal corrections for solid Earth tides, permanent tide, and solid Earth pole tide asdescribed by Petit and Luzum 2010. The ocean tidal loading is reduced with the
104
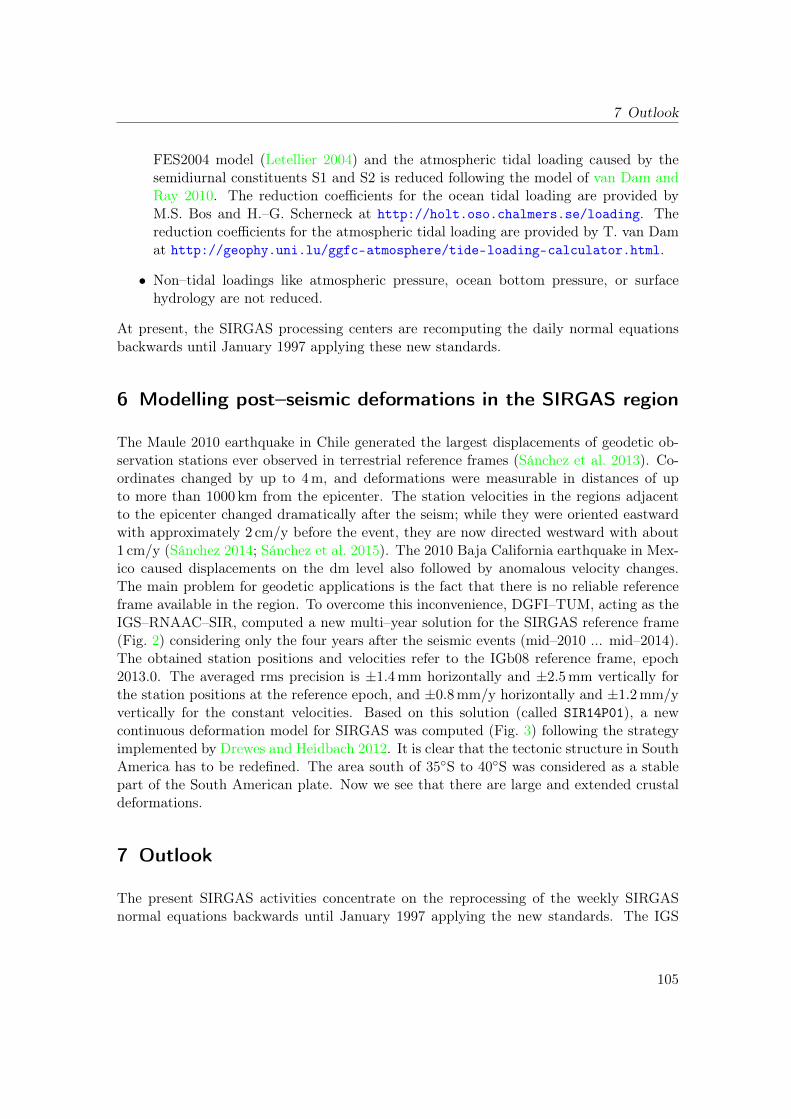
7 Outlook
FES2004 model (Letellier 2004) and the atmospheric tidal loading caused by thesemidiurnal constituents S1 and S2 is reduced following the model of van Dam andRay 2010. The reduction coefficients for the ocean tidal loading are provided byM.S. Bos and H.–G. Scherneck at http://holt.oso.chalmers.se/loading. Thereduction coefficients for the atmospheric tidal loading are provided by T. van Damat http://geophy.uni.lu/ggfc-atmosphere/tide-loading-calculator.html.
• Non–tidal loadings like atmospheric pressure, ocean bottom pressure, or surfacehydrology are not reduced.
At present, the SIRGAS processing centers are recomputing the daily normal equationsbackwards until January 1997 applying these new standards.
6 Modelling post–seismic deformations in the SIRGAS region
The Maule 2010 earthquake in Chile generated the largest displacements of geodetic ob-servation stations ever observed in terrestrial reference frames (Sánchez et al. 2013). Co-ordinates changed by up to 4m, and deformations were measurable in distances of upto more than 1000 km from the epicenter. The station velocities in the regions adjacentto the epicenter changed dramatically after the seism; while they were oriented eastwardwith approximately 2 cm/y before the event, they are now directed westward with about1 cm/y (Sánchez 2014; Sánchez et al. 2015). The 2010 Baja California earthquake in Mex-ico caused displacements on the dm level also followed by anomalous velocity changes.The main problem for geodetic applications is the fact that there is no reliable referenceframe available in the region. To overcome this inconvenience, DGFI–TUM, acting as theIGS–RNAAC–SIR, computed a new multi–year solution for the SIRGAS reference frame(Fig. 2) considering only the four years after the seismic events (mid–2010 ... mid–2014).The obtained station positions and velocities refer to the IGb08 reference frame, epoch2013.0. The averaged rms precision is ±1.4mm horizontally and ±2.5mm vertically forthe station positions at the reference epoch, and ±0.8mm/y horizontally and ±1.2mm/yvertically for the constant velocities. Based on this solution (called SIR14P01), a newcontinuous deformation model for SIRGAS was computed (Fig. 3) following the strategyimplemented by Drewes and Heidbach 2012. It is clear that the tectonic structure in SouthAmerica has to be redefined. The area south of 35◦S to 40◦S was considered as a stablepart of the South American plate. Now we see that there are large and extended crustaldeformations.
7 Outlook
The present SIRGAS activities concentrate on the reprocessing of the weekly SIRGASnormal equations backwards until January 1997 applying the new standards. The IGS
105
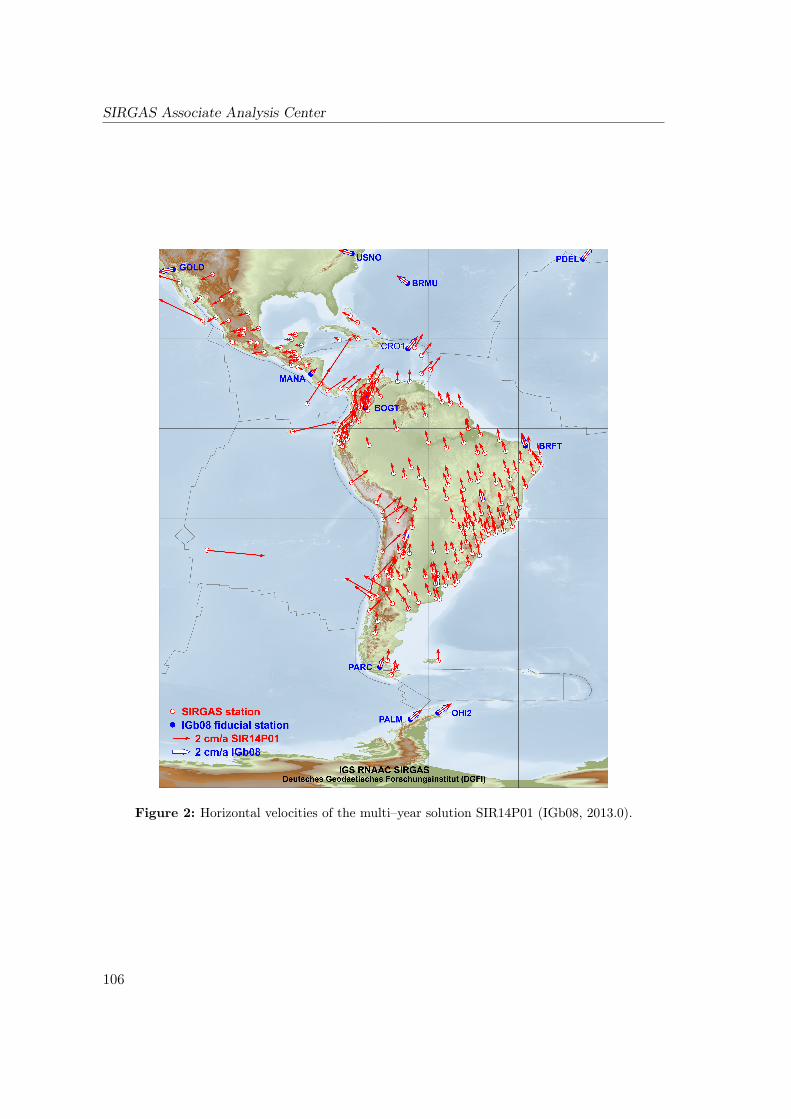
SIRGAS Associate Analysis Center
Figure 2: Horizontal velocities of the multi–year solution SIR14P01 (IGb08, 2013.0).
106
7 Outlook
Figure 3: Post–seismic deformation model after the 2010 earthquakes in Latin America.
107
SIRGAS Associate Analysis Center
RNAAC SIR takes care of the computations from 1997 until August 2008, when thefirst SIRGAS Local Processing Centers started operating. From September 2008 untilDecember 2013, the reprocessing includes the combination of the individual (reprocessed)solutions delivered by the SIRGAS Local Processing Centers for the SIRGAS–N nationalnetworks. Once the reprocessing is completed, a cumulative solution for the SIRGASreference frame including time series analysis and seismic effects shall be computed.
8 Acknowledgements
The operational infrastructure and results described in this report are only possible thanksto the active participation of many Latin American and Caribbean colleagues, who not onlymake the measurements of the stations available, but also operate SIRGAS analysis centersprocessing the observational data on a routine basis. This support and that providedby the International Association of Geodesy (IAG) and the Pan–American Institute forGeography and History (PAIGH) is highly appreciated. More details about the activitiesand new challenges of SIRGAS, as well as institutions and colleagues working on can befound at www.sirgas.org.
References
Böhm, J., B. Werl, and H. Schuh. Troposphere mapping functions for GPS and verylong baseline interferometry from European Center for Medium–Range WeatherForecasts operational analysis data. J. Geophys. Res., 111, B02406, 2006.DOI:10.1029/2005JB003629
Brunini, C., L. Sánchez, H. Drewes, S.M.A. Costa, V. Mackern, W. Martinez,W. Seemüller, and A.L. Da Silva. Improved analysis strategy and accessibility ofthe SIRGAS Reference Frame. In: S. Kenyon, M.C. Pacino, and U. Marti (Eds.).Geodesy for Planet Earth, IAG Symposia, 136:3–10, 2012.
Costa, S.M.A., A.L. Silva, and J.A. Vaz. Report on the SIRGAS–CON combined solu-tion by IBGE Analysis Center. Geodesy for Planet Earth, 136:853–857, 2012. DOI:10.1007/978–3–642–20338–1_107
Dach, R., U. Hugentobler, P. Fridez, and M. Meindl (Eds.). Bernese GPS Software Version5.0 (User Manual). Astronomical Institute, University of Bern, 2007.
Dach, R. Bernese GPS Software: New features in version 5.2. Astronomical Institute,University of Bern, 2013. Available at http://www.bernese.unibe.ch.
Drewes, H. and O. Heidbach. The 2009 horizontal velocity field for South America and
108
References
the Caribbean. In: S. Kenyon, M.C. Pacino, and U. Marti (Eds.). Geodesy for PlanetEarth, IAG Symposia 136:657–664, 2012. DOI:10.1007/978–3–642–20338–1_81
Herring, T.A., R.W. King, and S.C. Mcclusky. Introduction to GAMIT/GLOBK, Release10.4. Massachusetts Institue of Technology, 2010. Available at http://www-gpsg.mit.edu/~simon/gtgk/Intro_GG.pdf.
Letellier, T. Etude des ondes de marée sur les plateux continentaux. Thèse doctorale, Uni-versité de Toulouse III, Ecole Doctorale des Sciences de l’Univers, de l’Environnementet de l’Espace, 2004.
Petit, G. and B. Luzum (Eds.). IERS Conventions (2010). IERS Technical Note, 36. Verlagdes Bundesamtes für Kartographie und Geodäsie, Frankfurt a.M., 2010.
Rebischung, P., J. Griffiths, J. Ray, R. Schmid, X. Collilieux, and B. Garayt. IGS08:the IGS realization of ITRF2008. GPS Solutions, 16(4):483–494, 2012. DOI:10.1007/s10291–011–0248–2.
Sánchez, L., H. Drewes, C. Brunini, and M.V. Mackern. SIRGAS core network stability.IAG Symposia 143 (in press), 2015.
Sánchez, L., W. Seemüller, H. Drewes, L. Mateo, G. González, A. Silva, J. Pampillón,W. Martinez, V. Cioce, D. Cisneros, and S. Cimbaro. Long–term stability of the SIR-GAS Reference Frame and episodic station movements caused by the seismic activityin the SIRGAS Region. In: Z. Altamimi and X. Collilieux (Eds.): Reference Framesfor Applications in Geosciences, IAG Symposia, 138:153–161, 2013. DOI:10.1007/978–3–642–32998–2_24
Sánchez, L., W. Seemüller, and M. Seitz. Combination of the weekly solutions deliv-ered by the SIRGAS Processing Centers for the SIRGAS–CON Reference Frame. In:S. Kenyon, M.C. Pacino, and U. Marti (Eds.), Geodesy for Planet Earth, IAG Sym-posia 136:845–851, 2012. DOI:10.1007/978–3–642–20338–1_106
Sánchez, L. IGS Regional Network Associate Analysis Center for SIRGAS (IGS RNAACSIR). Report of activities 2013. International GNSS Service Technical Report 2013,pp.103–114, 2014.
Schmid, R. Upcoming switch to IGS08/igs08.atx – Details on igs08.atx. IGSMAIL–6355(http://igs.org/pipermail/igsmail/2011/006347.html), 2011.
Seemüller, W. and H. Drewes. Annual report 1997 of the RNAAC SIRGAS. In: IGS 1997Technical Reports, 173–174, IGS CB, JPL Pasadena, 1998.
Seemüller, W., M. Seitz, L. Sánchez, and H. Drewes. The new multi–year position andvelocity solution SIR09P01 of the IGS Regional Network Associate Analysis Center(IGS RNAAC SIR). In: S. Kenyon, M.C. Pacino, and U. Marti (Eds.). Geodesyfor Planet Earth, IAG Symposia 136:877–883, 2012. DOI:10.1007/978–3–642–20338–1_110.
109
SIRGAS Associate Analysis Center
van Dam, T. and R. Ray. S1 and S2 atmospheric tide loading effects for geode-tic applications. 2010. Data set accessed 2013–06–01 at http://geophy.uni.lu/ggfc-atmosphere/tide-loading-calculator.html.
110
Part III
Data Centers
111

Infrastructure CommitteeTechnical Report 2014
Ignacio Nacho Romero
ESA/ESOC, GermanyE–mail: [email protected]
1 Summary of Activities in 2014
The infrastructure committee consists of the members listed in Tab. 1. The IC broadlyparticipated and helped organize the IGS workshop 2014 in Pasadena, coordinating oneposter session, one presentation session and two splinter sessions. We produced the RINEX3 transition plan drafts and revised it as need after all the inputs, and got it approvedin the December 2014 GB meeting. We helped to monitor adherence to the RINEX 2.11standard in the IGS data centers; no evolution of the RINEX 2.11 format is allowed andthus no data from Beidou, etc should be present in those files. We helped to promote theuse of RINEX 3 data using the specified “long names”.
Table 1: Current Members: re–appointed in December 2013 for terms up to December 2015
Name Affiliation
Carine Bruyninx ROBLou Estey UNAVCOGary Johnston GANacho Romero (Chairman) ESOCMike Schmidt NRCanAxel Ruelke BKG
2 Activity plan in 2015
• Continued IGS workshop 2014 recommendations implementation:
– Implementation of the RINEX 3 transition plan (as detailed below)
113
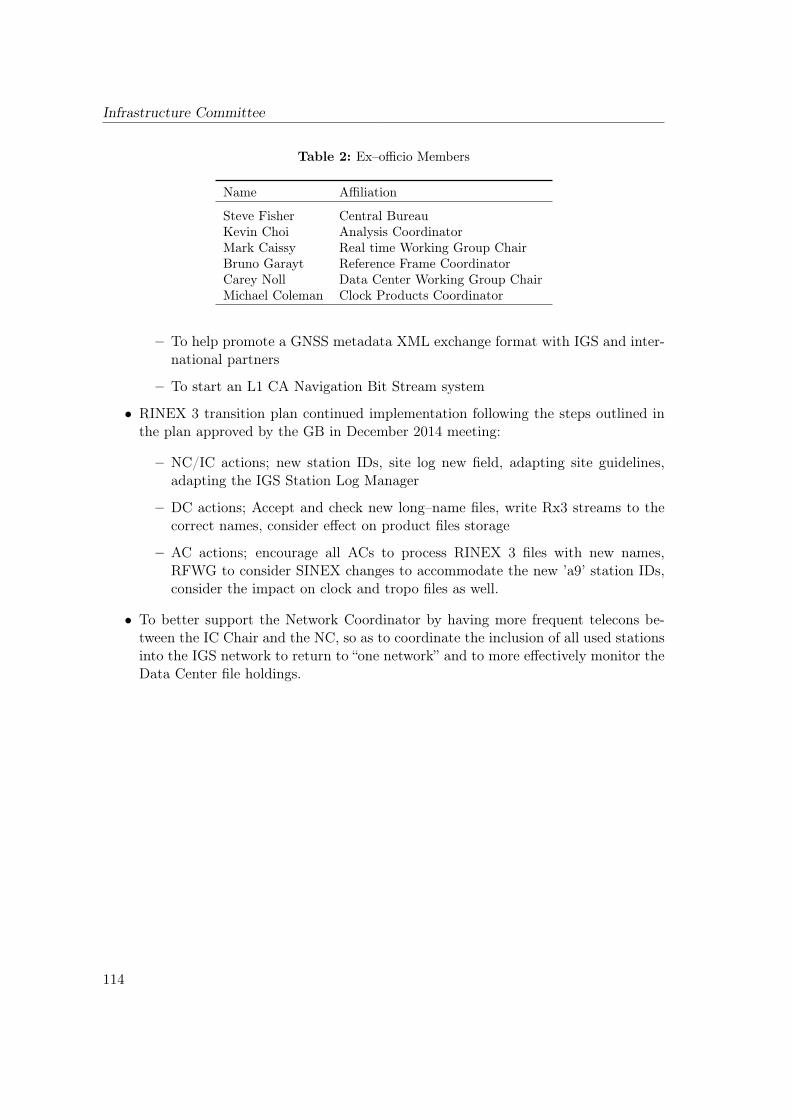
Infrastructure Committee
Table 2: Ex–officio Members
Name Affiliation
Steve Fisher Central BureauKevin Choi Analysis CoordinatorMark Caissy Real time Working Group ChairBruno Garayt Reference Frame CoordinatorCarey Noll Data Center Working Group ChairMichael Coleman Clock Products Coordinator
– To help promote a GNSS metadata XML exchange format with IGS and inter-national partners
– To start an L1 CA Navigation Bit Stream system
• RINEX 3 transition plan continued implementation following the steps outlined inthe plan approved by the GB in December 2014 meeting:
– NC/IC actions; new station IDs, site log new field, adapting site guidelines,adapting the IGS Station Log Manager
– DC actions; Accept and check new long–name files, write Rx3 streams to thecorrect names, consider effect on product files storage
– AC actions; encourage all ACs to process RINEX 3 files with new names,RFWG to consider SINEX changes to accommodate the new ’a9’ station IDs,consider the impact on clock and tropo files as well.
• To better support the Network Coordinator by having more frequent telecons be-tween the IC Chair and the NC, so as to coordinate the inclusion of all used stationsinto the IGS network to return to “one network” and to more effectively monitor theData Center file holdings.
114
CDDIS Global Data CenterTechnical Report 2014
C. Noll
NASA Goddard Space Flight CenterCode 690.1, Greenbelt, MD 20771, USAE-mail: [email protected]
1 Introduction
The Crustal Dynamics Data Information System (CDDIS) is NASA’s data archive andinformation service supporting the international space geodesy community. For over30 years, the CDDIS has provided continuous, long term, public access to the data(mainly GNSS–Global Navigation Satellite System, SLR–Satellite Laser Ranging, VLBI–Very Long Baseline Interferometry, and DORIS–Doppler Orbitography and Radioposition-ing Integrated by Satellite) and products derived from these data required for a varietyof science observations, including the determination of a global terrestrial reference frameand geodetic studies in plate tectonics, earthquake displacements, volcano monitoring,Earth orientation, and atmospheric angular momentum, among others. The specializednature of the CDDIS lends itself well to enhancement to accommodate diverse data setsand user requirements. The CDDIS is one of NASA’s Earth Observing System Dataand Information System (EOSDIS) Distributed Active Archive Centers (DAACs); EOS-DIS data centers serve a diverse user community and are tasked to provide facilities tosearch and access science data and products. The CDDIS is also a regular member of theInternational Council for Science (ICSU) World Data System (WDS).
The CDDIS serves as one of the primary data centers and core components for the geo-metric services established under the International Association of Geodesy (IAG), an or-ganization that promotes scientific cooperation and research in geodesy on a global scale.The system has supported the International GNSS Service (IGS) as a global data centersince 1992. The CDDIS activities within the IGS during 2014 are summarized below; thisreport also includes any recent changes or enhancements made to the CDDIS.
115
CDDIS Data Center
2 System Description
The CDDIS archive of IGS data and products are accessible worldwide through anonymousftp (ftp://cddis.gsfc.nasa.gov). The CDDIS has recently implemented web–basedaccess to the archive (http://cddis.gsfc.nasa.gov/archive). The CDDIS is locatedat NASA’s Goddard Space Flight Center (GSFC) and is available to users 24 hours perday, seven days per week.
The CDDIS computer system is fully redundant with the primary and secondary/failoversystem. Each system utilizes a distributed functionality (incoming, outgoing, processing,database, and map servers) and is configured with a local backup system as well as afull backup system located in a third building at GSFC. The archive is equipped with amulti–Tbyte RAID storage system and is scaled to accommodate future growth. All ftpand web access is performed on the outgoing server. Data centers, stations, and analysiscenters push files to the CDDIS incoming server. Processing of incoming files for the on–line archive is performed in a separate environment that also includes a database serverfor managing metadata extracted from incoming data.
3 Archive Content
As a global data center for the IGS, the CDDIS is responsible for archiving and providingaccess to GNSS data from the global IGS network as well as the products derived fromthe analyses of these data in support of both operational and working group/pilot projectactivities. The CDDIS archive is approximately 11.7 Tbytes in size of which 11 Tbytes(95%) is devoted to GNSS data, products (710 Gbytes), and ancillary information. Alldata and products are accessible through subdirectories of ftp://cddis.gsfc.nasa.gov/gnss (a symbolic link to ftp://cddis.gsfc.nasa.gov/gps).
3.1 GNSS Tracking Data
3.1.1 Operational Data Archive
The user community has access to GNSS data available through the on–line global datacenter archives of the IGS. Over 50 operational and regional IGS data centers and stationoperators make data (observation, navigation, and meteorological) available in RINEX for-mat to the CDDIS from selected receivers on a daily, hourly, and sub–hourly basis. TheCDDIS also accesses the archives of the other three IGS global data centers, Scripps Insti-tution of Oceanography (SIO) in California, the Institut Géographique National (IGN) inFrance, and the Korea Astronomy and Space Science Institute (KASI) to retrieve (or re-ceive) data holdings not routinely transmitted to the CDDIS by an operational or regionaldata center. Tab. 1 summarizes the types of IGS operational GNSS data sets archived at
116
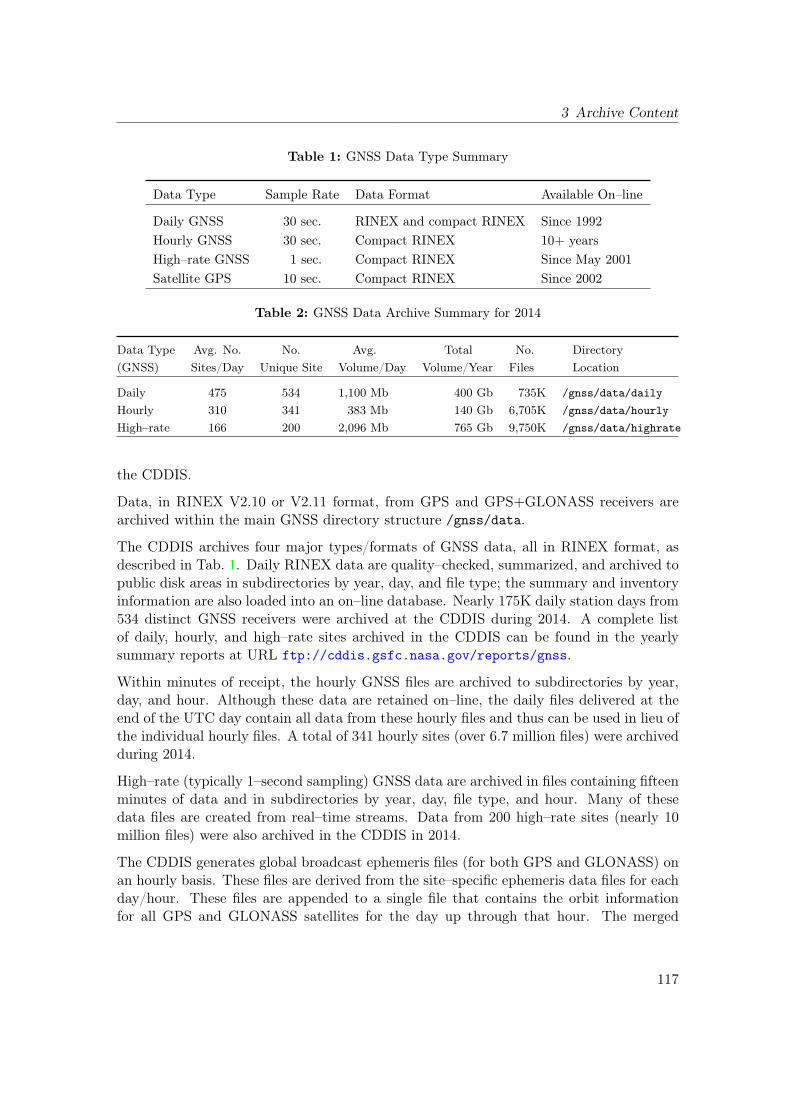
3 Archive Content
Table 1: GNSS Data Type Summary
Data Type Sample Rate Data Format Available On–line
Daily GNSS 30 sec. RINEX and compact RINEX Since 1992Hourly GNSS 30 sec. Compact RINEX 10+ yearsHigh–rate GNSS 1 sec. Compact RINEX Since May 2001Satellite GPS 10 sec. Compact RINEX Since 2002
Table 2: GNSS Data Archive Summary for 2014
Data Type Avg. No. No. Avg. Total No. Directory(GNSS) Sites/Day Unique Site Volume/Day Volume/Year Files Location
Daily 475 534 1,100 Mb 400 Gb 735K /gnss/data/dailyHourly 310 341 383 Mb 140 Gb 6,705K /gnss/data/hourlyHigh–rate 166 200 2,096 Mb 765 Gb 9,750K /gnss/data/highrate
the CDDIS.
Data, in RINEX V2.10 or V2.11 format, from GPS and GPS+GLONASS receivers arearchived within the main GNSS directory structure /gnss/data.
The CDDIS archives four major types/formats of GNSS data, all in RINEX format, asdescribed in Tab. 1. Daily RINEX data are quality–checked, summarized, and archived topublic disk areas in subdirectories by year, day, and file type; the summary and inventoryinformation are also loaded into an on–line database. Nearly 175K daily station days from534 distinct GNSS receivers were archived at the CDDIS during 2014. A complete listof daily, hourly, and high–rate sites archived in the CDDIS can be found in the yearlysummary reports at URL ftp://cddis.gsfc.nasa.gov/reports/gnss.
Within minutes of receipt, the hourly GNSS files are archived to subdirectories by year,day, and hour. Although these data are retained on–line, the daily files delivered at theend of the UTC day contain all data from these hourly files and thus can be used in lieu ofthe individual hourly files. A total of 341 hourly sites (over 6.7 million files) were archivedduring 2014.
High–rate (typically 1–second sampling) GNSS data are archived in files containing fifteenminutes of data and in subdirectories by year, day, file type, and hour. Many of thesedata files are created from real–time streams. Data from 200 high–rate sites (nearly 10million files) were also archived in the CDDIS in 2014.
The CDDIS generates global broadcast ephemeris files (for both GPS and GLONASS) onan hourly basis. These files are derived from the site–specific ephemeris data files for eachday/hour. These files are appended to a single file that contains the orbit informationfor all GPS and GLONASS satellites for the day up through that hour. The merged
117
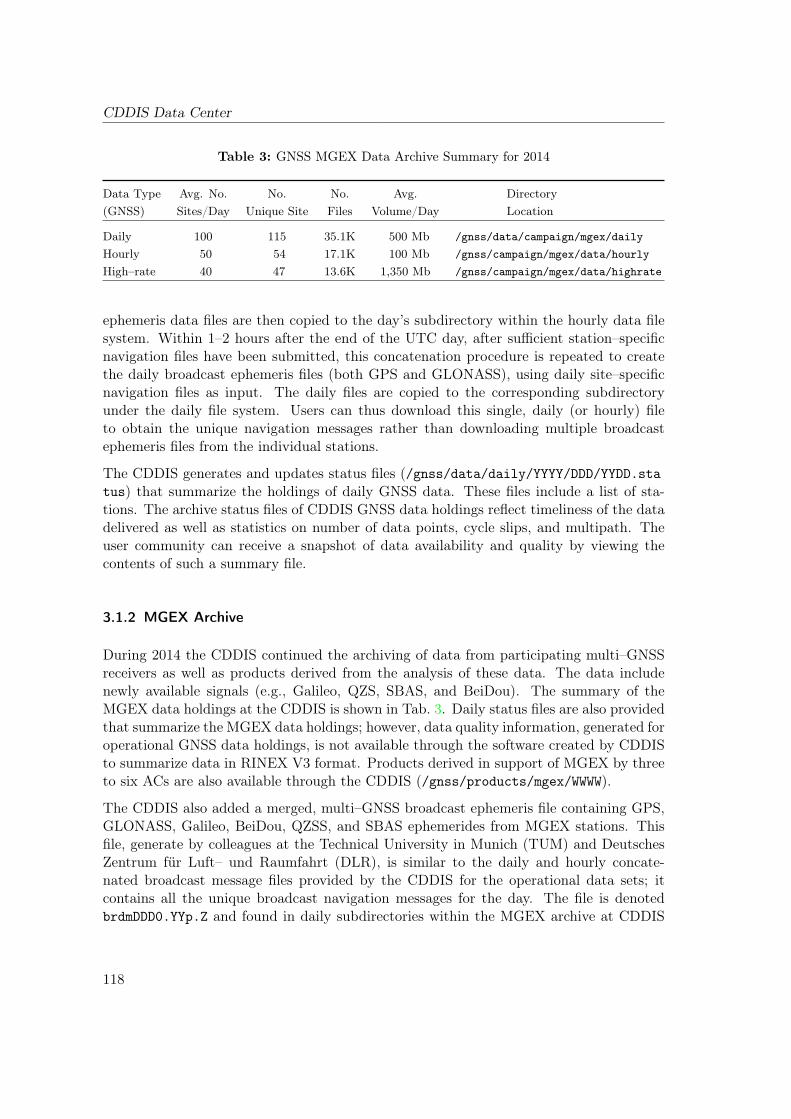
CDDIS Data Center
Table 3: GNSS MGEX Data Archive Summary for 2014
Data Type Avg. No. No. No. Avg. Directory(GNSS) Sites/Day Unique Site Files Volume/Day Location
Daily 100 115 35.1K 500 Mb /gnss/data/campaign/mgex/dailyHourly 50 54 17.1K 100 Mb /gnss/campaign/mgex/data/hourlyHigh–rate 40 47 13.6K 1,350 Mb /gnss/campaign/mgex/data/highrate
ephemeris data files are then copied to the day’s subdirectory within the hourly data filesystem. Within 1–2 hours after the end of the UTC day, after sufficient station–specificnavigation files have been submitted, this concatenation procedure is repeated to createthe daily broadcast ephemeris files (both GPS and GLONASS), using daily site–specificnavigation files as input. The daily files are copied to the corresponding subdirectoryunder the daily file system. Users can thus download this single, daily (or hourly) fileto obtain the unique navigation messages rather than downloading multiple broadcastephemeris files from the individual stations.
The CDDIS generates and updates status files (/gnss/data/daily/YYYY/DDD/YYDD.status) that summarize the holdings of daily GNSS data. These files include a list of sta-tions. The archive status files of CDDIS GNSS data holdings reflect timeliness of the datadelivered as well as statistics on number of data points, cycle slips, and multipath. Theuser community can receive a snapshot of data availability and quality by viewing thecontents of such a summary file.
3.1.2 MGEX Archive
During 2014 the CDDIS continued the archiving of data from participating multi–GNSSreceivers as well as products derived from the analysis of these data. The data includenewly available signals (e.g., Galileo, QZS, SBAS, and BeiDou). The summary of theMGEX data holdings at the CDDIS is shown in Tab. 3. Daily status files are also providedthat summarize the MGEX data holdings; however, data quality information, generated foroperational GNSS data holdings, is not available through the software created by CDDISto summarize data in RINEX V3 format. Products derived in support of MGEX by threeto six ACs are also available through the CDDIS (/gnss/products/mgex/WWWW).
The CDDIS also added a merged, multi–GNSS broadcast ephemeris file containing GPS,GLONASS, Galileo, BeiDou, QZSS, and SBAS ephemerides from MGEX stations. Thisfile, generate by colleagues at the Technical University in Munich (TUM) and DeutschesZentrum für Luft– und Raumfahrt (DLR), is similar to the daily and hourly concate-nated broadcast message files provided by the CDDIS for the operational data sets; itcontains all the unique broadcast navigation messages for the day. The file is denotedbrdmDDD0.YYp.Z and found in daily subdirectories within the MGEX archive at CDDIS
118
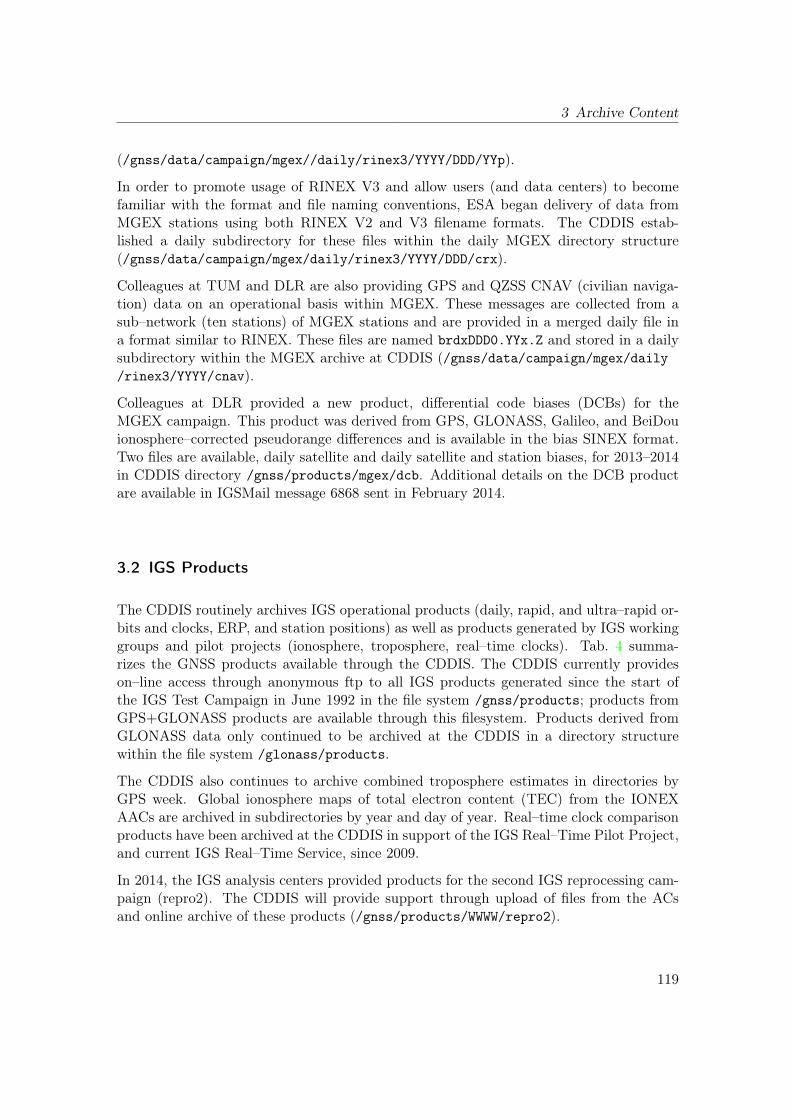
3 Archive Content
(/gnss/data/campaign/mgex//daily/rinex3/YYYY/DDD/YYp).
In order to promote usage of RINEX V3 and allow users (and data centers) to becomefamiliar with the format and file naming conventions, ESA began delivery of data fromMGEX stations using both RINEX V2 and V3 filename formats. The CDDIS estab-lished a daily subdirectory for these files within the daily MGEX directory structure(/gnss/data/campaign/mgex/daily/rinex3/YYYY/DDD/crx).
Colleagues at TUM and DLR are also providing GPS and QZSS CNAV (civilian naviga-tion) data on an operational basis within MGEX. These messages are collected from asub–network (ten stations) of MGEX stations and are provided in a merged daily file ina format similar to RINEX. These files are named brdxDDD0.YYx.Z and stored in a dailysubdirectory within the MGEX archive at CDDIS (/gnss/data/campaign/mgex/daily/rinex3/YYYY/cnav).
Colleagues at DLR provided a new product, differential code biases (DCBs) for theMGEX campaign. This product was derived from GPS, GLONASS, Galileo, and BeiDouionosphere–corrected pseudorange differences and is available in the bias SINEX format.Two files are available, daily satellite and daily satellite and station biases, for 2013–2014in CDDIS directory /gnss/products/mgex/dcb. Additional details on the DCB productare available in IGSMail message 6868 sent in February 2014.
3.2 IGS Products
The CDDIS routinely archives IGS operational products (daily, rapid, and ultra–rapid or-bits and clocks, ERP, and station positions) as well as products generated by IGS workinggroups and pilot projects (ionosphere, troposphere, real–time clocks). Tab. 4 summa-rizes the GNSS products available through the CDDIS. The CDDIS currently provideson–line access through anonymous ftp to all IGS products generated since the start ofthe IGS Test Campaign in June 1992 in the file system /gnss/products; products fromGPS+GLONASS products are available through this filesystem. Products derived fromGLONASS data only continued to be archived at the CDDIS in a directory structurewithin the file system /glonass/products.
The CDDIS also continues to archive combined troposphere estimates in directories byGPS week. Global ionosphere maps of total electron content (TEC) from the IONEXAACs are archived in subdirectories by year and day of year. Real–time clock comparisonproducts have been archived at the CDDIS in support of the IGS Real–Time Pilot Project,and current IGS Real–Time Service, since 2009.
In 2014, the IGS analysis centers provided products for the second IGS reprocessing cam-paign (repro2). The CDDIS will provide support through upload of files from the ACsand online archive of these products (/gnss/products/WWWW/repro2).
119
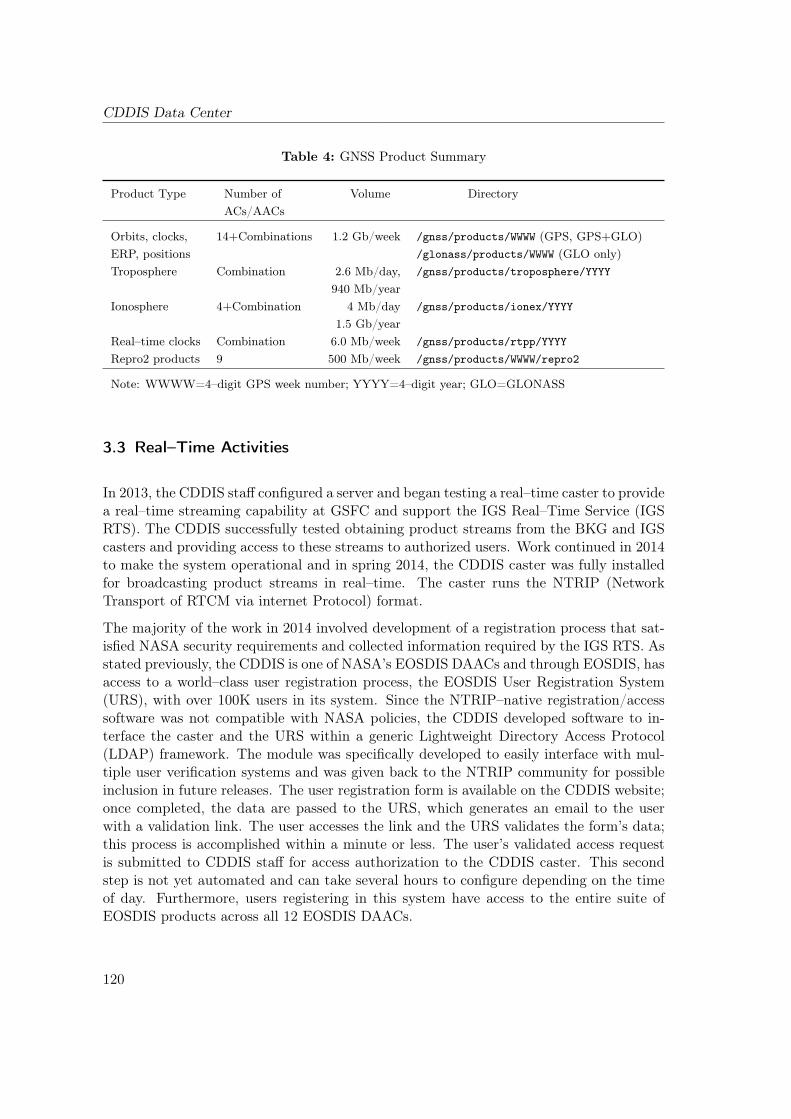
CDDIS Data Center
Table 4: GNSS Product Summary
Product Type Number of Volume DirectoryACs/AACs
Orbits, clocks, 14+Combinations 1.2 Gb/week /gnss/products/WWWW (GPS, GPS+GLO)ERP, positions /glonass/products/WWWW (GLO only)Troposphere Combination 2.6 Mb/day, /gnss/products/troposphere/YYYY
940 Mb/yearIonosphere 4+Combination 4 Mb/day /gnss/products/ionex/YYYY
1.5 Gb/yearReal–time clocks Combination 6.0 Mb/week /gnss/products/rtpp/YYYYRepro2 products 9 500 Mb/week /gnss/products/WWWW/repro2
Note: WWWW=4–digit GPS week number; YYYY=4–digit year; GLO=GLONASS
3.3 Real–Time Activities
In 2013, the CDDIS staff configured a server and began testing a real–time caster to providea real–time streaming capability at GSFC and support the IGS Real–Time Service (IGSRTS). The CDDIS successfully tested obtaining product streams from the BKG and IGScasters and providing access to these streams to authorized users. Work continued in 2014to make the system operational and in spring 2014, the CDDIS caster was fully installedfor broadcasting product streams in real–time. The caster runs the NTRIP (NetworkTransport of RTCM via internet Protocol) format.
The majority of the work in 2014 involved development of a registration process that sat-isfied NASA security requirements and collected information required by the IGS RTS. Asstated previously, the CDDIS is one of NASA’s EOSDIS DAACs and through EOSDIS, hasaccess to a world–class user registration process, the EOSDIS User Registration System(URS), with over 100K users in its system. Since the NTRIP–native registration/accesssoftware was not compatible with NASA policies, the CDDIS developed software to in-terface the caster and the URS within a generic Lightweight Directory Access Protocol(LDAP) framework. The module was specifically developed to easily interface with mul-tiple user verification systems and was given back to the NTRIP community for possibleinclusion in future releases. The user registration form is available on the CDDIS website;once completed, the data are passed to the URS, which generates an email to the userwith a validation link. The user accesses the link and the URS validates the form’s data;this process is accomplished within a minute or less. The user’s validated access requestis submitted to CDDIS staff for access authorization to the CDDIS caster. This secondstep is not yet automated and can take several hours to configure depending on the timeof day. Furthermore, users registering in this system have access to the entire suite ofEOSDIS products across all 12 EOSDIS DAACs.
120
4 System Usage
Initially, the CDDIS caster is providing access to product streams from both the BKGand IGS casters. Data streams have also been tested, provided through JPL for receiversin NASA’s Global GPS Network. This network of roughly seventy globally distributed,geodetic quality, dual frequency receivers, will add 1Hz data streams to those currentavailable from the IGS RTS.
Once the CDDIS caster is operational, the system will serve as a third primary casterfor the IGS RTS, thus providing a more robust topology with redundancy and increasedreliability for the service. User registration, however, for all three casters is unique; there-fore current users of the casters located at the IGS and BKG will be required to registerthrough the CDDIS registration process in order to use the CDDIS caster.
The CDDIS has also developed software to capture real–time data streams into fifteen–minute high–rate files. This capability requires further testing as the CDDIS caster be-comes operational and data streams from real–time stations are added.
3.4 Supporting Information
Daily status files of GNSS data holdings, reflecting timeliness of the data delivered aswell as statistics on number of data points, cycle slips, and multipath, continue to begenerated by the CDDIS. By accessing these files, the user community can receive a quicklook at a day’s data availability and quality by viewing a single file. The daily status filesare available through the web at URL ftp://cddis.gsfc.nasa.gov/reports/gnss. Thedaily status files are also archived in the daily GNSS data directories.
In preparation for the analysis center’s second reprocessing campaign, the CDDIS de-veloped site–specific reports detailing missing data. Station operators and operationaldata centers can consult these lists (ftp://cddis.gsfc.nasa.gov/gnss/data/daily/reports/missing) and if available, supply missing files to the CDDIS for inclusion inthe global data center archives.
Ancillary information to aid in the use of GNSS data and products are also accessiblethrough the CDDIS. Weekly and yearly summaries of IGS tracking data (daily, hourly,and high–rate) archived at the CDDIS are generated on a routine basis. These summariesare accessible through the web at URL ftp://cddis.gsfc.nasa.gov/reports/gnss. TheCDDIS also maintains an archive of and indices to IGS Mail, Report, Station, and otherIGS–related messages.
4 System Usage
Fig. 1 summarizes the usage of the CDDIS for the retrieval of GNSS data and productsin 2014. This figure illustrates the number and volume of GNSS files retrieved by theuser community during 2014, categorized by type (daily, hourly, high–rate, MGEX data,
121
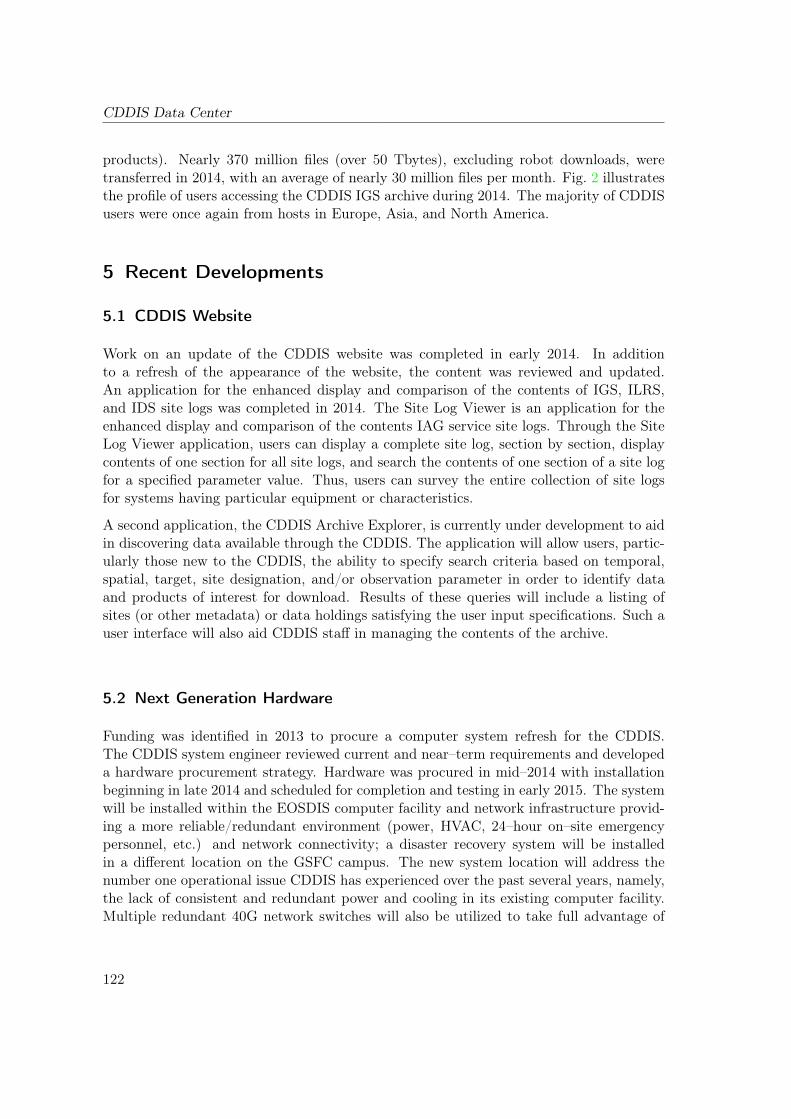
CDDIS Data Center
products). Nearly 370 million files (over 50 Tbytes), excluding robot downloads, weretransferred in 2014, with an average of nearly 30 million files per month. Fig. 2 illustratesthe profile of users accessing the CDDIS IGS archive during 2014. The majority of CDDISusers were once again from hosts in Europe, Asia, and North America.
5 Recent Developments
5.1 CDDIS Website
Work on an update of the CDDIS website was completed in early 2014. In additionto a refresh of the appearance of the website, the content was reviewed and updated.An application for the enhanced display and comparison of the contents of IGS, ILRS,and IDS site logs was completed in 2014. The Site Log Viewer is an application for theenhanced display and comparison of the contents IAG service site logs. Through the SiteLog Viewer application, users can display a complete site log, section by section, displaycontents of one section for all site logs, and search the contents of one section of a site logfor a specified parameter value. Thus, users can survey the entire collection of site logsfor systems having particular equipment or characteristics.
A second application, the CDDIS Archive Explorer, is currently under development to aidin discovering data available through the CDDIS. The application will allow users, partic-ularly those new to the CDDIS, the ability to specify search criteria based on temporal,spatial, target, site designation, and/or observation parameter in order to identify dataand products of interest for download. Results of these queries will include a listing ofsites (or other metadata) or data holdings satisfying the user input specifications. Such auser interface will also aid CDDIS staff in managing the contents of the archive.
5.2 Next Generation Hardware
Funding was identified in 2013 to procure a computer system refresh for the CDDIS.The CDDIS system engineer reviewed current and near–term requirements and developeda hardware procurement strategy. Hardware was procured in mid–2014 with installationbeginning in late 2014 and scheduled for completion and testing in early 2015. The systemwill be installed within the EOSDIS computer facility and network infrastructure provid-ing a more reliable/redundant environment (power, HVAC, 24–hour on–site emergencypersonnel, etc.) and network connectivity; a disaster recovery system will be installedin a different location on the GSFC campus. The new system location will address thenumber one operational issue CDDIS has experienced over the past several years, namely,the lack of consistent and redundant power and cooling in its existing computer facility.Multiple redundant 40G network switches will also be utilized to take full advantage of
122
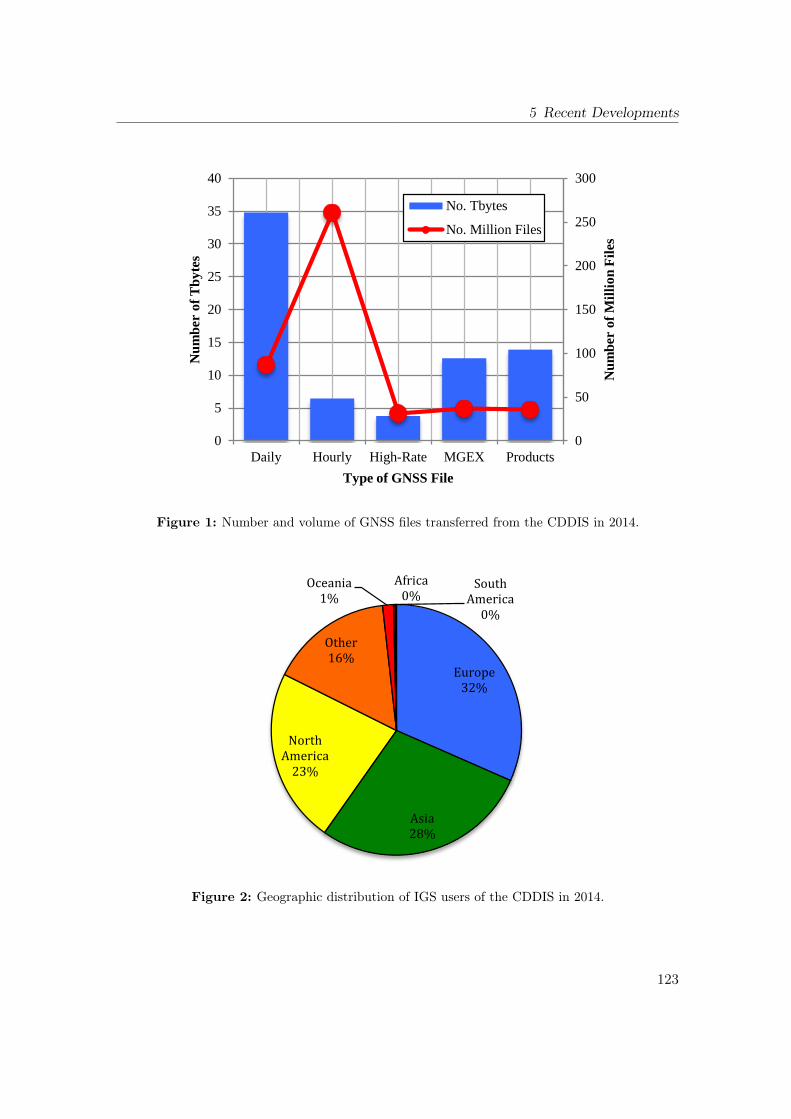
5 Recent Developmentsinclude a listing of sites (or other metadata) or data holdings satisfying the user input specifications. Such a user interface will also aid CDDIS staff in managing the contents of the archive.
Figure 1: Number and volume of GNSS files transferred from the CDDIS in 2014.
Figure 2: Geographic distribution of IGS users of the CDDIS in 2014.
5.2 Next Generation Hardware Funding was identified in 2013 to procure a computer system refresh for the CDDIS. The CDDIS system engineer reviewed current and near-term requirements and developed a hardware procurement strategy. Hardware was procured in mid-2014 with installation beginning in late 2014 and scheduled for completion and testing in early 2015. The system will be installed within the EOSDIS computer facility and network infrastructure providing a more reliable/redundant environment (power, HVAC, 24-hour on-site emergency personnel, etc.) and network connectivity; a disaster recovery system will be installed in a different location on the GSFC campus. The new system location will address the number one operational issue CDDIS has experienced over the past several years, namely, the lack of consistent and redundant power and cooling in its existing computer facility. Multiple redundant 40G network switches will also be utilized to take full advantage of a high-performance network infrastructure by utilizing fully redundant network paths for all outgoing and incoming streams along with dedicated 10G network connections between its primary operations and its backup operations. The CDDIS will also transition approximately 85% of its operation services over to virtual machine (VM) technology for both multiple instance services in a load balancing configuration which will allow additional instances to be increased or decreased due to demand and will allow maintenance (patching, upgrades, etc.) to proceed without interruption to the user or any downtime. CDDIS will be utilizing a large (XX Tbyte) storage system to easily accommodate future growth of the archive.
5.3 Metadata Developments The CDDIS has recently made modifications to the metadata extracted from incoming data and product files pushed to its archive. These enhancements have facilitated cross discipline data discovery by providing information about CDDIS archive holdings to other data portals such as Earth Observing System (EOS) Clearinghouse (ECHO) and future integration into the Global Geodetic Observing System (GGOS) portal. The staff has begun a metadata evolution effort, re-designing the metadata extracted from incoming data and adding information that will better support EOSDIS applications such as ECHO and the metrics collection effort.
0
50
100
150
200
250
300
0
5
10
15
20
25
30
35
40
Daily Hourly High-Rate MGEX Products
Num
ber
of M
illio
n Fi
les
Num
ber
of T
byte
s
Type of GNSS File
No. Tbytes
No. Million Files
Europe 32%
Asia 28%
North America
23%
Other 16%
Oceania 1%
South America
0%
Africa 0%
Figure 1: Number and volume of GNSS files transferred from the CDDIS in 2014.include a listing of sites (or other metadata) or data holdings satisfying the user input specifications. Such a user interface will also aid CDDIS staff in managing the contents of the archive.
Figure 1: Number and volume of GNSS files transferred from the CDDIS in 2014.
Figure 2: Geographic distribution of IGS users of the CDDIS in 2014.
5.2 Next Generation Hardware Funding was identified in 2013 to procure a computer system refresh for the CDDIS. The CDDIS system engineer reviewed current and near-term requirements and developed a hardware procurement strategy. Hardware was procured in mid-2014 with installation beginning in late 2014 and scheduled for completion and testing in early 2015. The system will be installed within the EOSDIS computer facility and network infrastructure providing a more reliable/redundant environment (power, HVAC, 24-hour on-site emergency personnel, etc.) and network connectivity; a disaster recovery system will be installed in a different location on the GSFC campus. The new system location will address the number one operational issue CDDIS has experienced over the past several years, namely, the lack of consistent and redundant power and cooling in its existing computer facility. Multiple redundant 40G network switches will also be utilized to take full advantage of a high-performance network infrastructure by utilizing fully redundant network paths for all outgoing and incoming streams along with dedicated 10G network connections between its primary operations and its backup operations. The CDDIS will also transition approximately 85% of its operation services over to virtual machine (VM) technology for both multiple instance services in a load balancing configuration which will allow additional instances to be increased or decreased due to demand and will allow maintenance (patching, upgrades, etc.) to proceed without interruption to the user or any downtime. CDDIS will be utilizing a large (XX Tbyte) storage system to easily accommodate future growth of the archive.
5.3 Metadata Developments The CDDIS has recently made modifications to the metadata extracted from incoming data and product files pushed to its archive. These enhancements have facilitated cross discipline data discovery by providing information about CDDIS archive holdings to other data portals such as Earth Observing System (EOS) Clearinghouse (ECHO) and future integration into the Global Geodetic Observing System (GGOS) portal. The staff has begun a metadata evolution effort, re-designing the metadata extracted from incoming data and adding information that will better support EOSDIS applications such as ECHO and the metrics collection effort.
0
50
100
150
200
250
300
0
5
10
15
20
25
30
35
40
Daily Hourly High-Rate MGEX Products
Num
ber
of M
illio
n Fi
les
Num
ber
of T
byte
s
Type of GNSS File
No. Tbytes
No. Million Files
Europe 32%
Asia 28%
North America
23%
Other 16%
Oceania 1%
South America
0%
Africa 0%
Figure 2: Geographic distribution of IGS users of the CDDIS in 2014.
123
CDDIS Data Center
a high–performance network infrastructure by utilizing fully redundant network paths forall outgoing and incoming streams along with dedicated 10G network connections betweenits primary operations and its backup operations. The CDDIS will also transition approx-imately 85% of its operation services over to virtual machine (VM) technology for bothmultiple instance services in a load balancing configuration which will allow additional in-stances to be increased or decreased due to demand and will allow maintenance (patching,upgrades, etc.) to proceed without interruption to the user or any downtime. CDDIS willbe utilizing a large (XX Tbyte) storage system to easily accommodate future growth ofthe archive.
5.3 Metadata Developments
The CDDIS has recently made modifications to the metadata extracted from incomingdata and product files pushed to its archive. These enhancements have facilitated crossdiscipline data discovery by providing information about CDDIS archive holdings to otherdata portals such as Earth Observing System (EOS) Clearinghouse (ECHO) and futureintegration into the Global Geodetic Observing System (GGOS) portal. The staff hasbegun a metadata evolution effort, re–designing the metadata extracted from incomingdata and adding information that will better support EOSDIS applications such as ECHOand the metrics collection effort.
The CDDIS has implemented Digital Object Identifiers (DOIs) to select IGS data sets(daily GNSS data). DOIs can provide easier access to CDDIS data holdings and allowresearchers to cite these data holdings in publications. Landing pages are available foreach of the DOIs created for CDDIS data products and linked to description pages onthe CDDIS website; an example of a typical DOI description (or landing) page, for dailyHatanaka–compressed GNSS data files, can be viewed at: http://cddis.gsfc.nasa.gov/Data_and_Derived_Products/GNSS/daily_gnss_d.html. DOIs will be assigned toadditional GNSS data and product sets in the near future.
6 Publications
The CDDIS staff attended several conferences during 2014 and presented papers on orconducted demos of their activities within the IGS, including:
C. Noll, P. Michael, N. Pollack, L. Tyahla, “Supporting GGOS through the Crustal Dy-namics Data Information System”, Abstract EGU2014–7174 presented at 2014 EGU Gen-eral Assembly, Vienna Austria, 28 Apr.–02 May.
C. Noll, F. Boler, H. Habrich. “Data Centers: Status and Progress”, presented at IGS20th Anniversary Workshop, Pasadena CA, 23–27 Jun.
124
7 Future Plans
C. Noll, P. Michael, “Recent Developments at the CDDIS”, presented at IGS 20th An-niversary Workshop, Pasadena CA, 23–27 Jun.
P. Michael, C. Noll, J. Roark. “CDDIS Real–Time Developments”, presented at IGS20th Anniversary Workshop, Pasadena CA, 23–27 Jun.
C. Noll, P. Michael, N. Pollack. “Recent Developments in Space Geodesy Data Discoveryat the CDDIS”, Abstract IN11C–3623 presented at 2014 Fall Meeting, AGU, San Fran-cisco, Calif., 15–19 Dec.
P. Michael, C. Noll, J. Roark. “CDDIS Near Real–Time Data for Geodesy Based Ap-plications”, Abstract IN43C-3709 presented at 2014 Fall Meeting, AGU, San Francisco,Calif., 15–19 Dec.
Electronic versions of these and other publications can be accessed through the CD-DIS on–line documentation page on the web at URL http://cddis.gsfc.nasa.gov/Publications/Presentations.html.
7 Future Plans
The CDDIS will continue to support the IGS MGEX. The experiment is an excellentopportunity to prepare the data centers for archive of data in RINEX V3. The CDDISwill coordinate with the Infrastructure Committee, the Data Center Working Group, andother IGS data centers to develop a transition plan and introduce RINEX V3 data intothe “operational” GNSS data directory structure, making it easier for users to access thesedata.
The CDDIS plans to make its real–time caster operational in the coming year as partof the IGS Real–Time Service. CDDIS staff will work with the IGS to identify stationsfor streaming to its caster. Future activities in the real–time area include capturing thestreams for generation of 15–minute high–rate files for archive. This capability requiresfurther testing as the CDDIS caster becomes operational and data streams from real–timestations are added. The CDDIS staff will need to develop a revised interface software tothe EOSDIS’ next generation URS (version 4). The staff will also automate the processof adding users to the CDDIS caster configuration files.
CDDIS has traditionally used ftp for delivery of data for the archive from both data centersand analysis centers. While this has worked well over the years, transition to the newsystem provides an opportune time time to look at updating this method to a web–basedapproach that can utilize the EOSDIS URS infrastructure. CDDIS will investigate thebest methods to incorporate a web–based approach that will continue to allow suppliersto use existing scripts without significant modification but also tie authentication into theURS.
125
CDDIS Data Center
8 Contact Information
To obtain more information about the CDDIS IGS archive of data and products, contact:
Ms. Carey E. Noll Phone: +1–301–614–6542Manager, CDDIS Fax: +1–301–614–6015Code 690.1 E–mail: [email protected] GSFC WWW: http://cddis.gsfc.nasa.govGreenbelt, MD 20771, USA Website: http://cddis.nasa.gov
9 Acknowledgments
The author would like to thank the CDDIS contractor staff, Patrick Michael, Mau-rice Dube, Nathan Pollack, and Rebecca Limbacher (Science Systems and Applications,Inc./SSAI), Lori Tyahla (Stinger Ghaffarian Technologies/SGT), and James Roark (AD-NET Systems). The recognition and success of the CDDIS in many international programscan be directly attributed to the continued dedicated, consistent, professional, and timelysupport of its staff.
References
Noll, C. The Crustal Dynamics Data Information System: A resource to support scientificanalysis using space geodesy Advances in Space Research, 45(12):1421–1440, 2010.ISSN: 0273–1177, DOI: 10.1016/j.asr.2010.01.018.
Noll, C., Y. Bock, H. Habrich, and A. Moore. Development of data infrastructure tosupport scientific analysis for the International GNSS Service. Journal of Geodesy, 83(3–4):309–325, 2009. DOI: 10.1007/s00190–008–0245–6.
126

Part IV
Working Groups, Pilot Projects
127

Antenna Working GroupTechnical Report 2014
R. Schmid
Deutsches Geodätisches Forschungsinstitutder Technische Universität München (DGFI-TUM)Alfons-Goppel-Str. 11, 80539 München, GermanyE-mail: [email protected]
1 North reference point (NRP)
As outlined in IGSMAIL-6987, the Antenna Working Group elaborated a definition ofthe so-called north reference point (NRP) that was added to the IGS file antenna.gra(available at ftp://igs.org/pub/station/general) at the end of October 2014. TheNRP designates the element of the antenna that has to be oriented toward the northdirection. There are four major features:
• MMI: man-machine interface
• NOM: north orientation mark (placed on antenna by manufacturer)
• RXC: receiver connector (connect antenna to external receiver)
• UNK: unknown
If a north orientation mark (NOM) is present and can be clearly identified, it will usuallybe selected to be the NRP. If not, in most cases a receiver connector (RXC) or a man-machine interface (MMI) can serve as the NRP instead. If none of the four major featuresis applicable, antenna.gra provides twelve secondary features and connector designationsin order to define the azimuthal antenna orientation.
A considerable amount of time had to be spent on the compilation of the NRP definitionsfor all antenna types registered in antenna.gra in accordance with the phase center cor-rections contained in igs08_wwww.atx on the one hand and further calibrations performedby the IGS calibration institutions on the other hand. In some cases, the NRP definitionhad to be harmonized between different institutions. The NRP designator was added both
129
Antenna Working Group
to the individual antenna.gra sketches and to the machine-readable section at the end ofthe file.
At the beginning of January 2015, antenna.gra contained 201 different antenna types.For 189 of them, one of the major features was applicable (NOM: 87, MMI: 45, RXC: 43,UNK: 14). Help on identifying the NRP of outdated or uncalibrated equipment (antennatypes with NRP = UNK) is greatly appreciated.
2 Updates and content of the antenna phase center model
Table 1 lists 11 updates of the absolute IGS antenna phase center model igs08_wwww.atxthat were released in 2014. Eight of them are related to changes of the satellite constel-lation, and three times an update of the model was released, when new receiver antennacalibrations became available. Further details on all model changes can be found in thecorresponding IGSMAILs whose numbers are also given in Tab. 1.
Table 2 gives an overview of the data sets contained in the IGS phase center model. Thenumbers refer to igs08_1822.atx that was released in December 2014. For GPS andGLONASS, there are 83 and 92 file entries, respectively. These numbers are bigger thanthe number of actual satellites, as certain satellites were assigned with different PRN codesor almanac slots, respectively.
At the IGS Workshop 2014 in Pasadena, it was recommended to adopt conventional phasecenter offset (PCO) values for Galileo, BeiDou and QZSS satellite antennas taking intoaccount the IGS-conventional axis definition related to the yaw-steering attitude mode.A draft version of igs08_wwww.atx including the new GNSS already exists. It will bepublished together with a paper on GNSS satellite geometry and attitude models. Forthe time being, conventional PCO values can be found on the web pages of the IGSMulti-GNSS Experiment (http://www.igs.org/mgex).
Apart from the satellite antennas, the IGS model meanwhile contains phase center calibra-tion values for 264 different receiver antenna types. 85 of them are certain combinationsof an antenna and a radome, whereas the remaining 179 antenna types are not covered bya radome. As Tab. 2 shows, igs08_1822.atx contains, among others, 126 absolute robotcalibrations and 90 converted field calibrations.
As elevation- and azimuth-dependent calibration values down to 0◦ elevation are manda-tory for new or upgraded IGS stations, altogether 163 different antenna types (126 ROBOT+ 34 COPIED + 3 CONVERTED) are currently approved for installation. The remaining101 types (90 FIELD + 11 CONVERTED) are no longer allowed, but their calibration val-ues are still necessary for existing installations (see Sect. 3) as well as for reprocessingpurposes.
130
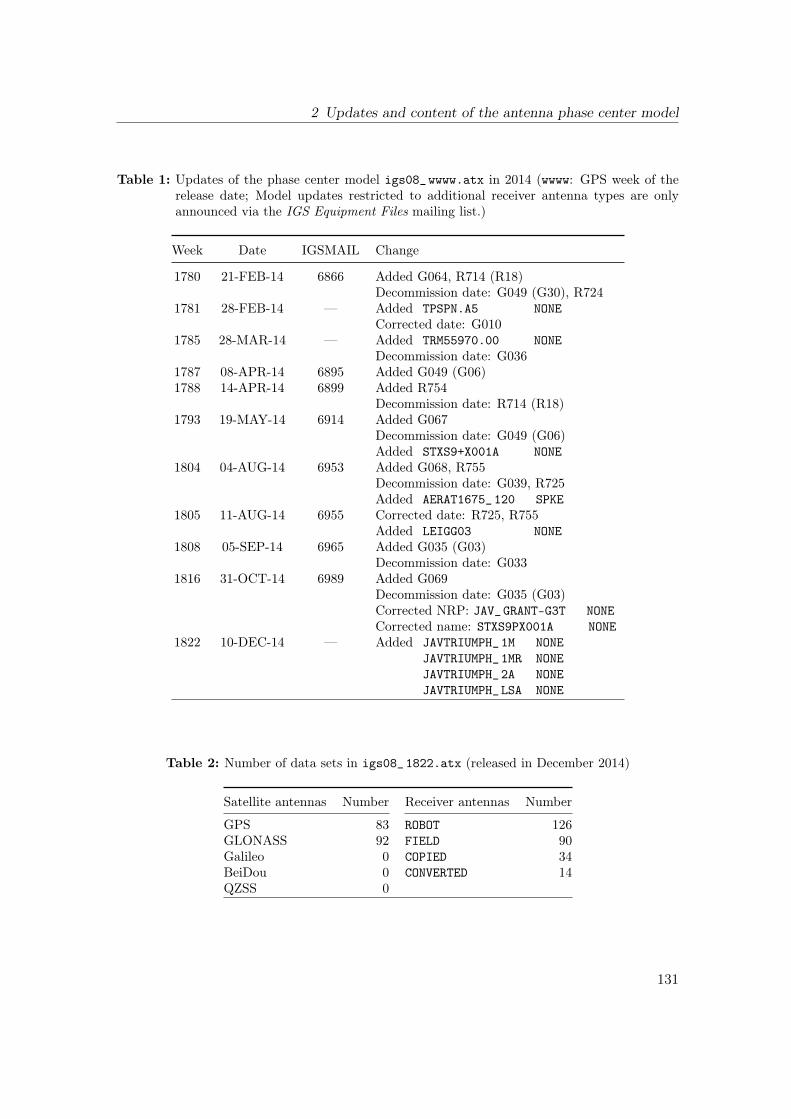
2 Updates and content of the antenna phase center model
Table 1: Updates of the phase center model igs08_wwww.atx in 2014 (wwww: GPS week of therelease date; Model updates restricted to additional receiver antenna types are onlyannounced via the IGS Equipment Files mailing list.)
Week Date IGSMAIL Change
1780 21-FEB-14 6866 Added G064, R714 (R18)Decommission date: G049 (G30), R724
1781 28-FEB-14 — Added TPSPN.A5 NONECorrected date: G010
1785 28-MAR-14 — Added TRM55970.00 NONEDecommission date: G036
1787 08-APR-14 6895 Added G049 (G06)1788 14-APR-14 6899 Added R754
Decommission date: R714 (R18)1793 19-MAY-14 6914 Added G067
Decommission date: G049 (G06)Added STXS9+X001A NONE
1804 04-AUG-14 6953 Added G068, R755Decommission date: G039, R725Added AERAT1675_120 SPKE
1805 11-AUG-14 6955 Corrected date: R725, R755Added LEIGG03 NONE
1808 05-SEP-14 6965 Added G035 (G03)Decommission date: G033
1816 31-OCT-14 6989 Added G069Decommission date: G035 (G03)Corrected NRP: JAV_GRANT-G3T NONECorrected name: STXS9PX001A NONE
1822 10-DEC-14 — Added JAVTRIUMPH_1M NONEJAVTRIUMPH_1MR NONEJAVTRIUMPH_2A NONEJAVTRIUMPH_LSA NONE
Table 2: Number of data sets in igs08_1822.atx (released in December 2014)
Satellite antennas Number Receiver antennas Number
GPS 83 ROBOT 126GLONASS 92 FIELD 90Galileo 0 COPIED 34BeiDou 0 CONVERTED 14QZSS 0
131
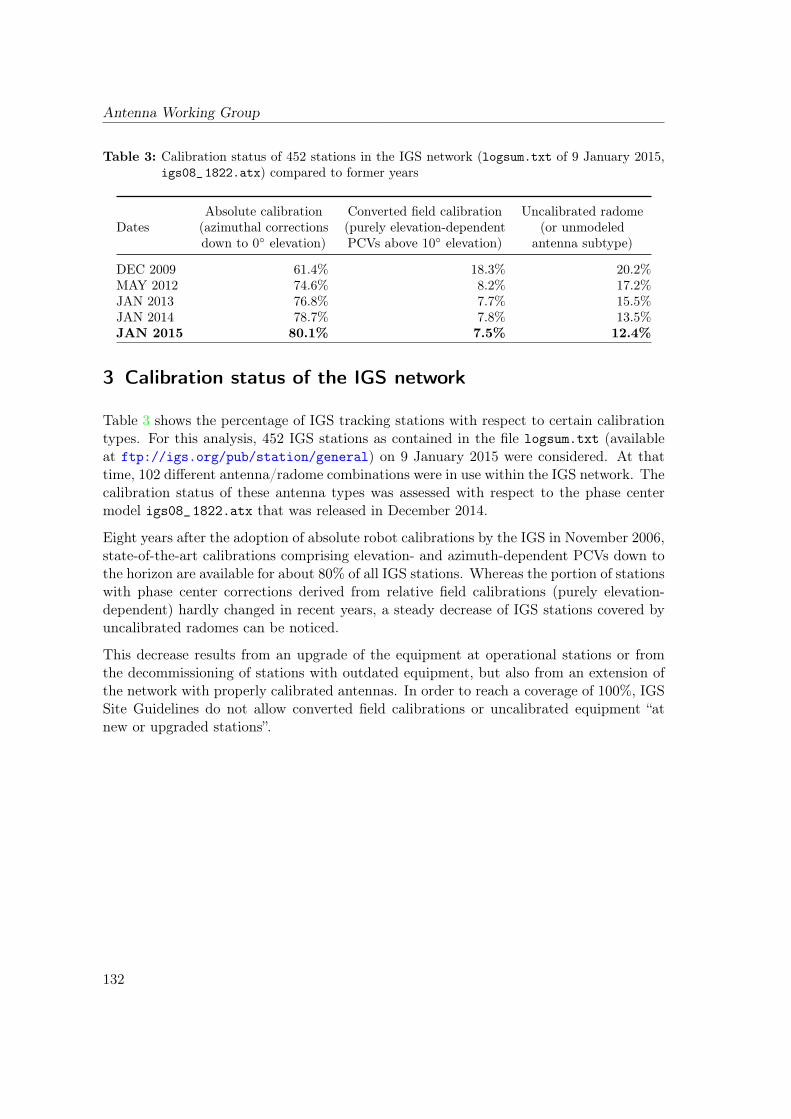
Antenna Working Group
Table 3: Calibration status of 452 stations in the IGS network (logsum.txt of 9 January 2015,igs08_1822.atx) compared to former years
DatesAbsolute calibration Converted field calibration Uncalibrated radome(azimuthal corrections (purely elevation-dependent (or unmodeleddown to 0◦ elevation) PCVs above 10◦ elevation) antenna subtype)
DEC 2009 61.4% 18.3% 20.2%MAY 2012 74.6% 8.2% 17.2%JAN 2013 76.8% 7.7% 15.5%JAN 2014 78.7% 7.8% 13.5%JAN 2015 80.1% 7.5% 12.4%
3 Calibration status of the IGS network
Table 3 shows the percentage of IGS tracking stations with respect to certain calibrationtypes. For this analysis, 452 IGS stations as contained in the file logsum.txt (availableat ftp://igs.org/pub/station/general) on 9 January 2015 were considered. At thattime, 102 different antenna/radome combinations were in use within the IGS network. Thecalibration status of these antenna types was assessed with respect to the phase centermodel igs08_1822.atx that was released in December 2014.
Eight years after the adoption of absolute robot calibrations by the IGS in November 2006,state-of-the-art calibrations comprising elevation- and azimuth-dependent PCVs down tothe horizon are available for about 80% of all IGS stations. Whereas the portion of stationswith phase center corrections derived from relative field calibrations (purely elevation-dependent) hardly changed in recent years, a steady decrease of IGS stations covered byuncalibrated radomes can be noticed.
This decrease results from an upgrade of the equipment at operational stations or fromthe decommissioning of stations with outdated equipment, but also from an extension ofthe network with properly calibrated antennas. In order to reach a coverage of 100%, IGSSite Guidelines do not allow converted field calibrations or uncalibrated equipment “atnew or upgraded stations”.
132
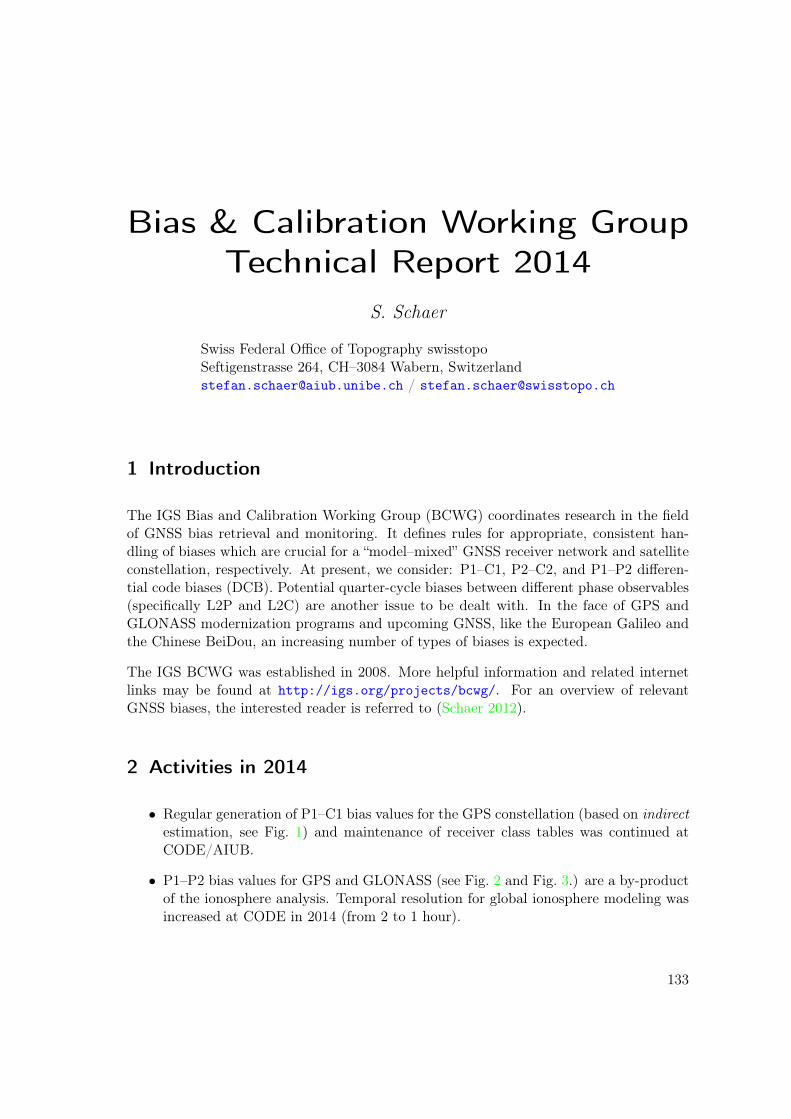
Bias & Calibration Working GroupTechnical Report 2014
S. Schaer
Swiss Federal Office of Topography swisstopoSeftigenstrasse 264, CH–3084 Wabern, [email protected] / [email protected]
1 Introduction
The IGS Bias and Calibration Working Group (BCWG) coordinates research in the fieldof GNSS bias retrieval and monitoring. It defines rules for appropriate, consistent han-dling of biases which are crucial for a “model–mixed” GNSS receiver network and satelliteconstellation, respectively. At present, we consider: P1–C1, P2–C2, and P1–P2 differen-tial code biases (DCB). Potential quarter-cycle biases between different phase observables(specifically L2P and L2C) are another issue to be dealt with. In the face of GPS andGLONASS modernization programs and upcoming GNSS, like the European Galileo andthe Chinese BeiDou, an increasing number of types of biases is expected.
The IGS BCWG was established in 2008. More helpful information and related internetlinks may be found at http://igs.org/projects/bcwg/. For an overview of relevantGNSS biases, the interested reader is referred to (Schaer 2012).
2 Activities in 2014
• Regular generation of P1–C1 bias values for the GPS constellation (based on indirectestimation, see Fig. 1) and maintenance of receiver class tables was continued atCODE/AIUB.
• P1–P2 bias values for GPS and GLONASS (see Fig. 2 and Fig. 3.) are a by-productof the ionosphere analysis. Temporal resolution for global ionosphere modeling wasincreased at CODE in 2014 (from 2 to 1 hour).
133
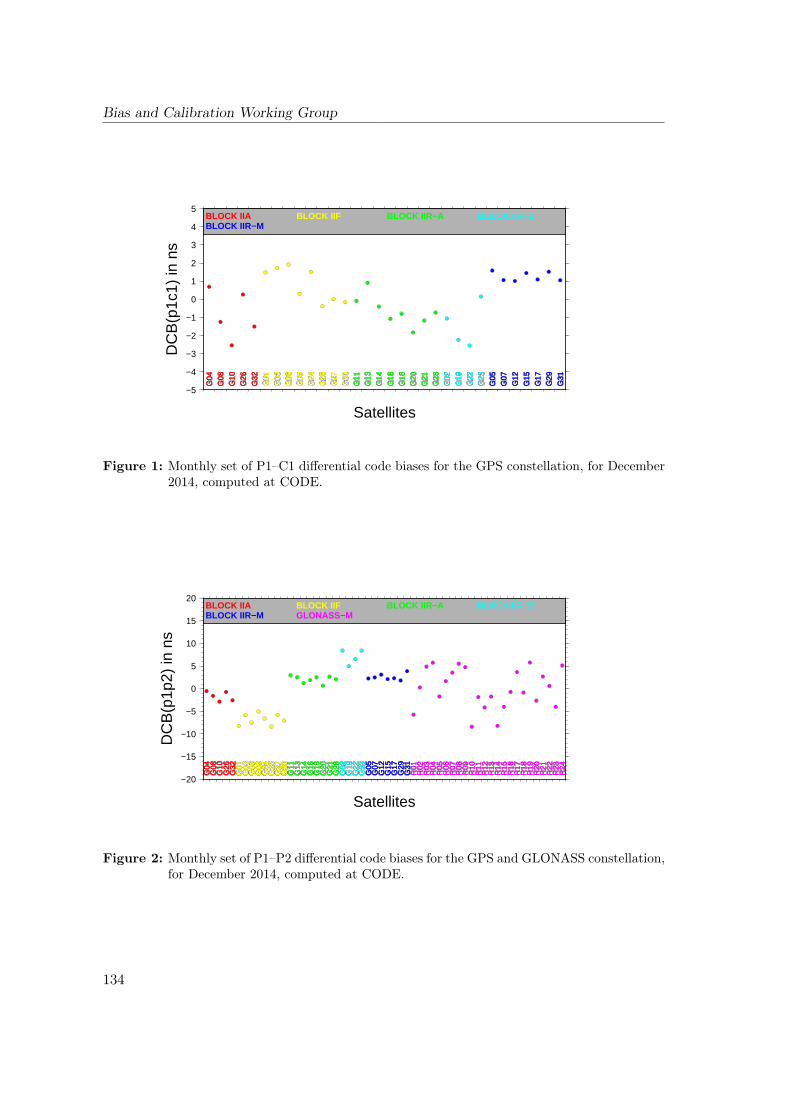
Bias and Calibration Working Group
−5
−4
−3
−2
−1
0
1
2
3
4
5
DC
B(p
1c1)
in n
s
Satellites
G04
G08
G10
G26
G32
G01
G03
G06
G09
G24
G25
G27
G30
G11
G13
G14
G16
G18
G20
G21
G28
G02
G19
G22
G23
G05
G07
G12
G15
G17
G29
G31
G04
G08
G10
G26
G32
G01
G03
G06
G09
G24
G25
G27
G30
G11
G13
G14
G16
G18
G20
G21
G28
G02
G19
G22
G23
G05
G07
G12
G15
G17
G29
G31
BLOCK IIA BLOCK IIF BLOCK IIR−A BLOCK IIR−BBLOCK IIR−M
Figure 1: Monthly set of P1–C1 differential code biases for the GPS constellation, for December2014, computed at CODE.
−20
−15
−10
−5
0
5
10
15
20
DC
B(p
1p2)
in n
s
Satellites
G04
G08
G10
G26
G32
G01
G03
G06
G09
G24
G25
G27
G30
G11
G13
G14
G16
G18
G20
G21
G28
G02
G19
G22
G23
G05
G07
G12
G15
G17
G29
G31
R01
R02
R03
R04
R05
R06
R07
R08
R09
R10
R11
R12
R13
R14
R15
R16
R17
R18
R19
R20
R21
R22
R23
R24
G04
G08
G10
G26
G32
G01
G03
G06
G09
G24
G25
G27
G30
G11
G13
G14
G16
G18
G20
G21
G28
G02
G19
G22
G23
G05
G07
G12
G15
G17
G29
G31
R01
R02
R03
R04
R05
R06
R07
R08
R09
R10
R11
R12
R13
R14
R15
R16
R17
R18
R19
R20
R21
R22
R23
R24
BLOCK IIA BLOCK IIF BLOCK IIR−A BLOCK IIR−BBLOCK IIR−M GLONASS−M
Figure 2: Monthly set of P1–P2 differential code biases for the GPS and GLONASS constellation,for December 2014, computed at CODE.
134
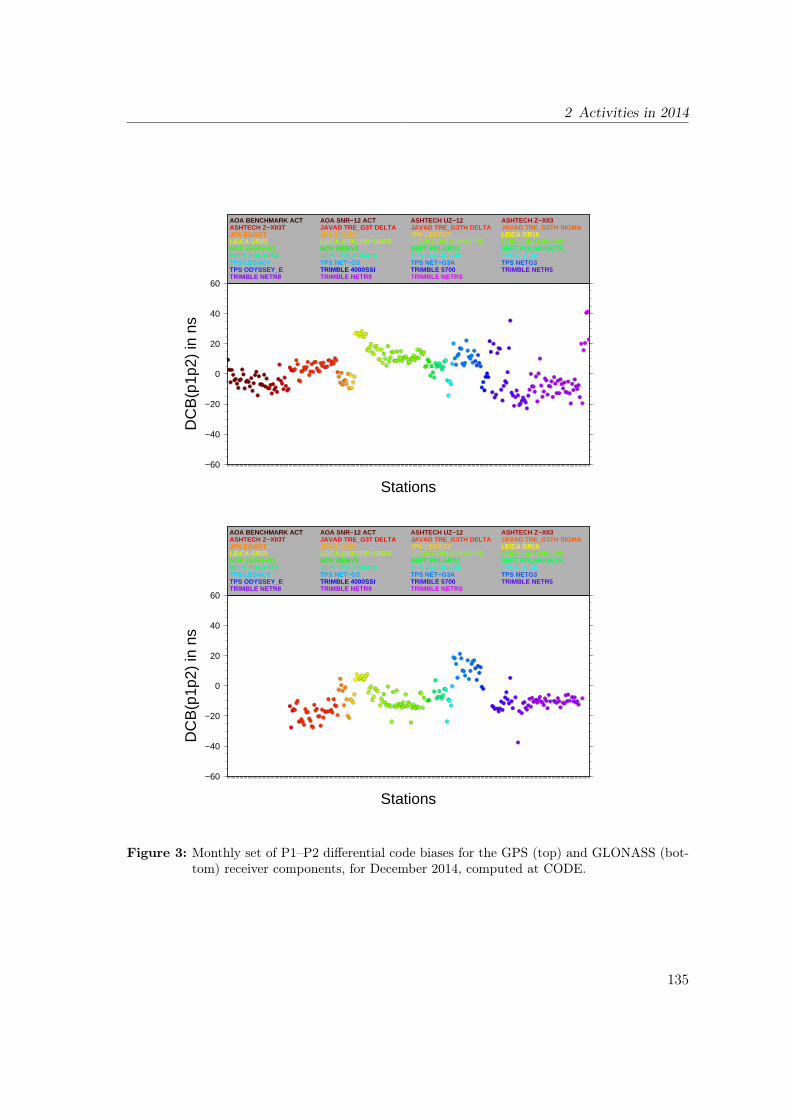
2 Activities in 2014
−60
−40
−20
0
20
40
60
DC
B(p
1p2)
in n
s
Stations
AOA BENCHMARK ACT AOA SNR−12 ACT ASHTECH UZ−12 ASHTECH Z−XII3ASHTECH Z−XII3T JAVAD TRE_G3T DELTA JAVAD TRE_G3TH DELTA JAVAD TRE_G3TH SIGMAJPS EGGDT JPS E_GGD JPS LEGACY LEICA GR10LEICA GR25 LEICA GRX1200+GNSS LEICA GRX1200GGPRO LEICA GRX1200PRONOV OEM4−G2 NOV OEMV3 SEPT POLARX2 SEPT POLARX3ETRSEPT POLARX4 SEPT POLARX4TR TPS EUROCARD TPS E_GGDTPS LEGACY TPS NET−G3 TPS NET−G3A TPS NETG3TPS ODYSSEY_E TRIMBLE 4000SSI TRIMBLE 5700 TRIMBLE NETR5TRIMBLE NETR8 TRIMBLE NETR9 TRIMBLE NETRS
Figure 3: Monthly set of P1–P2 differential code biases for the GPS (top) and GLONASS (bot-tom) receiver components, for December 2014, computed at CODE.
135
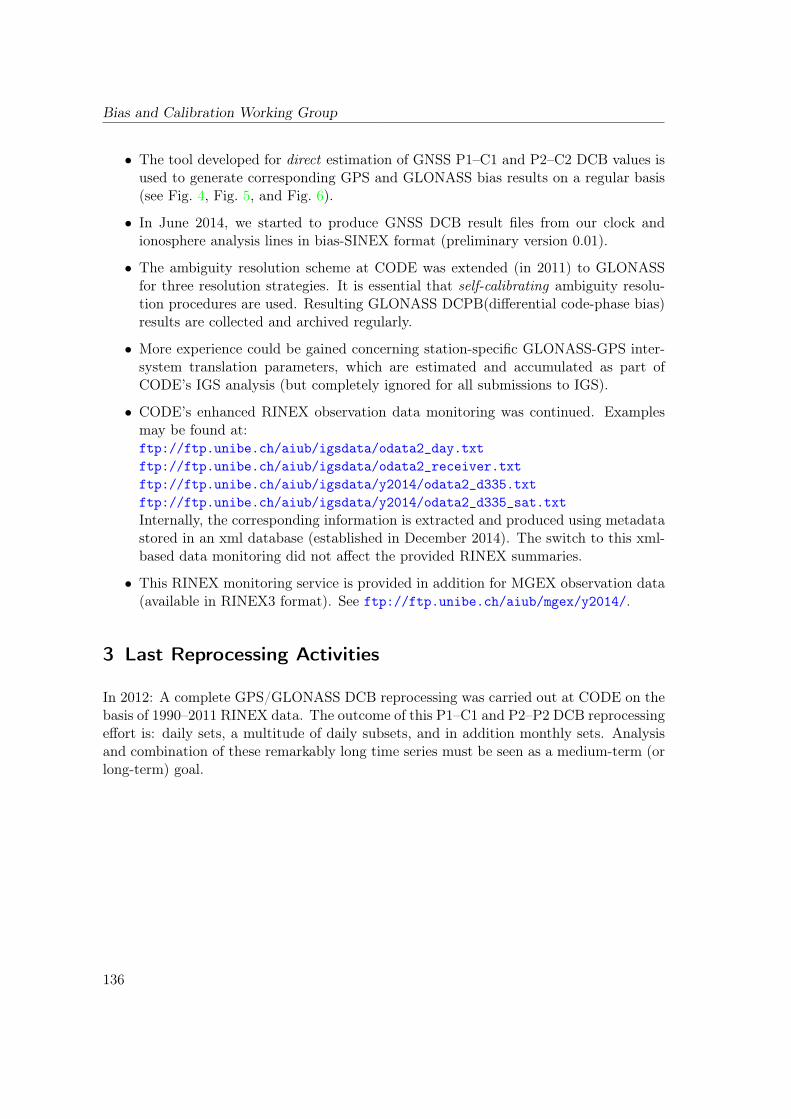
Bias and Calibration Working Group
• The tool developed for direct estimation of GNSS P1–C1 and P2–C2 DCB values isused to generate corresponding GPS and GLONASS bias results on a regular basis(see Fig. 4, Fig. 5, and Fig. 6).
• In June 2014, we started to produce GNSS DCB result files from our clock andionosphere analysis lines in bias-SINEX format (preliminary version 0.01).
• The ambiguity resolution scheme at CODE was extended (in 2011) to GLONASSfor three resolution strategies. It is essential that self-calibrating ambiguity resolu-tion procedures are used. Resulting GLONASS DCPB(differential code-phase bias)results are collected and archived regularly.
• More experience could be gained concerning station-specific GLONASS-GPS inter-system translation parameters, which are estimated and accumulated as part ofCODE’s IGS analysis (but completely ignored for all submissions to IGS).
• CODE’s enhanced RINEX observation data monitoring was continued. Examplesmay be found at:ftp://ftp.unibe.ch/aiub/igsdata/odata2_day.txtftp://ftp.unibe.ch/aiub/igsdata/odata2_receiver.txtftp://ftp.unibe.ch/aiub/igsdata/y2014/odata2_d335.txtftp://ftp.unibe.ch/aiub/igsdata/y2014/odata2_d335_sat.txtInternally, the corresponding information is extracted and produced using metadatastored in an xml database (established in December 2014). The switch to this xml-based data monitoring did not affect the provided RINEX summaries.
• This RINEX monitoring service is provided in addition for MGEX observation data(available in RINEX3 format). See ftp://ftp.unibe.ch/aiub/mgex/y2014/.
3 Last Reprocessing Activities
In 2012: A complete GPS/GLONASS DCB reprocessing was carried out at CODE on thebasis of 1990–2011 RINEX data. The outcome of this P1–C1 and P2–P2 DCB reprocessingeffort is: daily sets, a multitude of daily subsets, and in addition monthly sets. Analysisand combination of these remarkably long time series must be seen as a medium-term (orlong-term) goal.
136
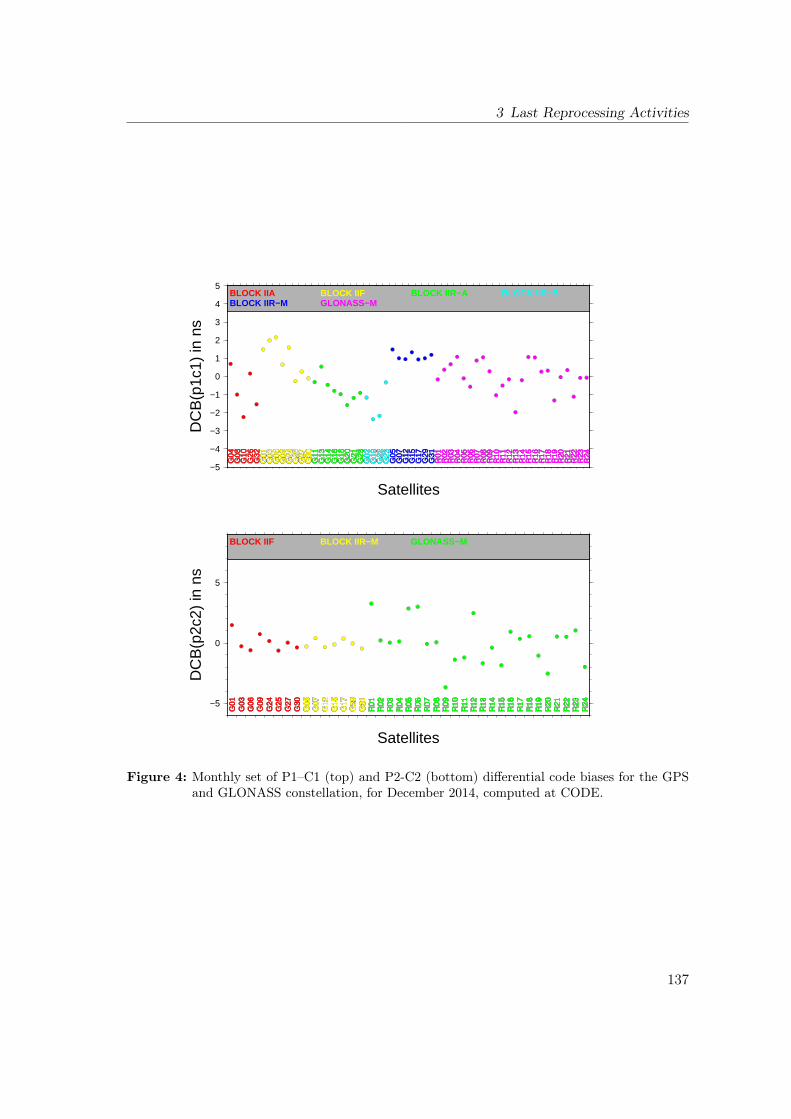
3 Last Reprocessing Activities
−5
−4
−3
−2
−1
0
1
2
3
4
5
DC
B(p
1c1)
in n
s
Satellites
G04
G08
G10
G26
G32
G01
G03
G06
G09
G24
G25
G27
G30
G11
G13
G14
G16
G18
G20
G21
G28
G02
G19
G22
G23
G05
G07
G12
G15
G17
G29
G31
R01
R02
R03
R04
R05
R06
R07
R08
R09
R10
R11
R12
R13
R14
R15
R16
R17
R18
R19
R20
R21
R22
R23
R24
G04
G08
G10
G26
G32
G01
G03
G06
G09
G24
G25
G27
G30
G11
G13
G14
G16
G18
G20
G21
G28
G02
G19
G22
G23
G05
G07
G12
G15
G17
G29
G31
R01
R02
R03
R04
R05
R06
R07
R08
R09
R10
R11
R12
R13
R14
R15
R16
R17
R18
R19
R20
R21
R22
R23
R24
BLOCK IIA BLOCK IIF BLOCK IIR−A BLOCK IIR−BBLOCK IIR−M GLONASS−M
−5
0
5
DC
B(p
2c2)
in n
s
Satellites
G01
G03
G06
G09
G24
G25
G27
G30
G05
G07
G12
G15
G17
G29
G31
R01
R02
R03
R04
R05
R06
R07
R08
R09
R10
R11
R12
R13
R14
R15
R16
R17
R18
R19
R20
R21
R22
R23
R24
G01
G03
G06
G09
G24
G25
G27
G30
G05
G07
G12
G15
G17
G29
G31
R01
R02
R03
R04
R05
R06
R07
R08
R09
R10
R11
R12
R13
R14
R15
R16
R17
R18
R19
R20
R21
R22
R23
R24
BLOCK IIF BLOCK IIR−M GLONASS−M
Figure 4: Monthly set of P1–C1 (top) and P2-C2 (bottom) differential code biases for the GPSand GLONASS constellation, for December 2014, computed at CODE.
137
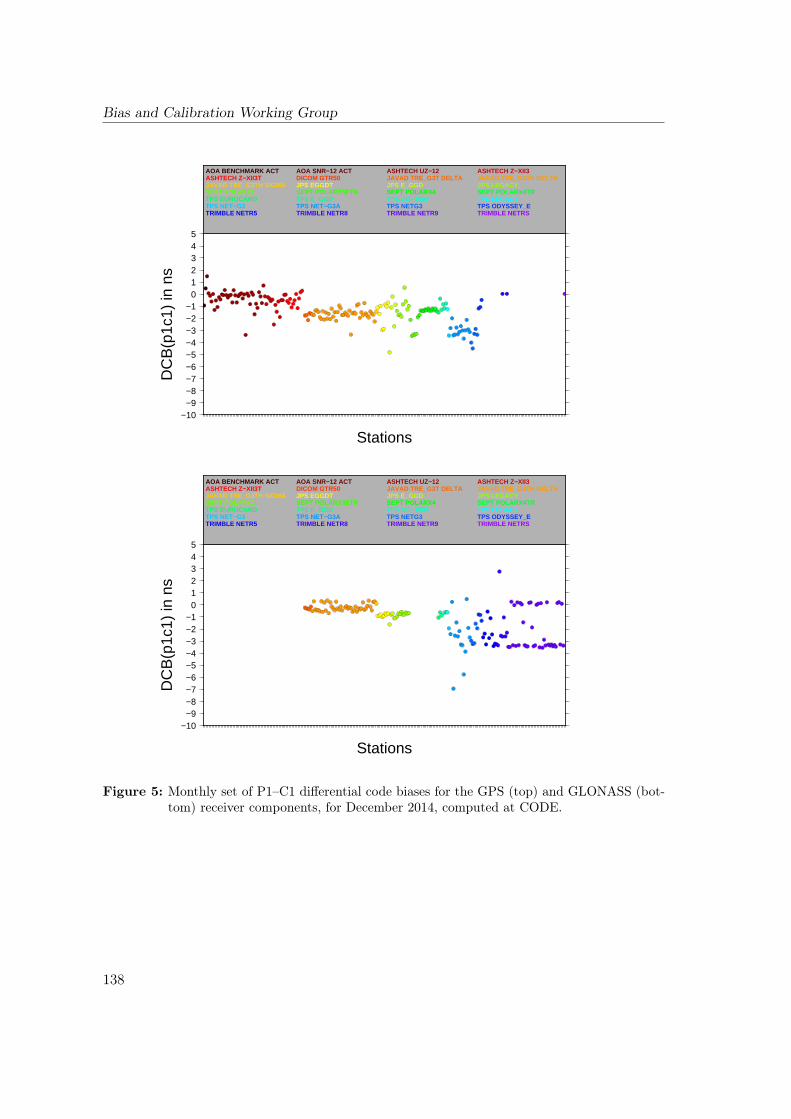
Bias and Calibration Working Group
−10−9−8−7−6−5−4−3−2−1
012345
DC
B(p
1c1)
in n
s
Stations
AOA BENCHMARK ACT AOA SNR−12 ACT ASHTECH UZ−12 ASHTECH Z−XII3ASHTECH Z−XII3T DICOM GTR50 JAVAD TRE_G3T DELTA JAVAD TRE_G3TH DELTAJAVAD TRE_G3TH SIGMA JPS EGGDT JPS E_GGD JPS LEGACYSEPT POLARX2 SEPT POLARX3ETR SEPT POLARX4 SEPT POLARX4TRTPS EUROCARD TPS E_GGD TPS GB−1000 TPS LEGACYTPS NET−G3 TPS NET−G3A TPS NETG3 TPS ODYSSEY_ETRIMBLE NETR5 TRIMBLE NETR8 TRIMBLE NETR9 TRIMBLE NETRS
Figure 5: Monthly set of P1–C1 differential code biases for the GPS (top) and GLONASS (bot-tom) receiver components, for December 2014, computed at CODE.
138
3 Last Reprocessing Activities
−7
−6
−5
−4
−3
−2
−1
0
1
2
3
DC
B(p
2c2)
in n
s
Stations
JAVAD TRE_G3T DELTA JAVAD TRE_G3TH DELTA LEICA GR10 LEICA GR25LEICA GRX1200+GNSS SEPT POLARX3ETR SEPT POLARX4 SEPT POLARX4TRTPS NET−G3 TPS NET−G3A TPS NETG3 TRIMBLE NETR5TRIMBLE NETR8 TRIMBLE NETR9 TRIMBLE NETRS
−7
−6
−5
−4
−3
−2
−1
0
1
2
3
DC
B(p
2c2)
in n
s
Stations
JAVAD TRE_G3T DELTA JAVAD TRE_G3TH DELTA LEICA GR10 LEICA GR25LEICA GRX1200+GNSS SEPT POLARX3ETR SEPT POLARX4 SEPT POLARX4TRTPS NET−G3 TPS NET−G3A TPS NETG3 TRIMBLE NETR5TRIMBLE NETR8 TRIMBLE NETR9 TRIMBLE NETRS
Figure 6: Monthly set of P2–C2 differential code biases for the GPS (top) and GLONASS (bot-tom) receiver components, for December 2014, computed at CODE.
139
Bias and Calibration Working Group
References
Schaer, S. Activities of IGS Bias and Calibration Working Group. In: Meindl, M., R. Dach,Y. Jean (Eds): IGS Technical Report 2011, Astronomical Institute, University of Bern,July 2012, pp. 139–154.
Schaer, S. Activities of IGS Bias and Calibration Working Group. In: R. Dach and Y. Jean(Eds): IGS Technical Report 2013, Astronomical Institute, University of Bern, May2014, pp. 137–143.
140
Data Center Working GroupTechnical Report 2014
C. Noll
NASA Goddard Space Flight CenterCode 690.1, Greenbelt, MD 20771, USAE-mail: [email protected]
1 Introduction
The IGS Data Center Working Group (DCWG) was established in 2002. The DCWGtackles many of the problems facing the IGS data centers as well as develops new ideasto aid users both internal and external to the IGS. The direction of the IGS has changedsince its start in 1992 and many new working groups, projects, data sets, and productshave been created and incorporated into the service since that time. The DCWG wasformed to revisit the requirements of data centers within the IGS and to address issuesrelevant to effective operation of all IGS data centers, operational, regional, and global.
2 Recent Activities
The DCWG met in conjunction with the Multi–GNSS Experiment (MGEX) WorkingGroup during the 2014 IGS Workshop in Pasadena, CA in June 2014. The main issuesdiscussed at this DCWG splinter meeting revolved around supporting RINEX V3 andintegrating the MGEX archive of data in RINEX V3 format into the operational IGSarchives at the DCs. Two main topics were addressed: merging RINEX V3 data into thearchives and accepting data using the new RINEX V3 filename format.
The current parallel structure found at the DCs supporting MGEX limits the motivationof the ACs to switch to the RINEX V3 format. Integration of the two data archives willpromote use of multi–GNSS data and the new format. The MGEX Working Group hassuggested development of a transition plan for adding the MGEX data, and hence RINEXV3 data, to the operational archives. Participants agreed that members of the IGS infras-tructure (DCs, the IC, ACs, etc.) should develop this transition plan. It was proposed
141
Data Center Working Group
to include three six–month phases: a preparation phase, followed by an implementationphase and a finalization phase, with full integration of RINEX V3 into the archives by theend of 2015. RINEX V2 for MGEX stations and stations capable of generating RINEXV3 would end at this time.
Those ACs attending the DCWG meeting agreed to utilize the filename convention spec-ified in the RINEX V3 documentation. The DCs, however, will need software tools tocreate these new filenames from RINEX V2 filenames until stations and receiver manu-facturers can create the new filenames directly. Tools also need to be made available tothe DCs for data QC and metadata extraction as well as tools for the ACs and users toconvert RINEX V3 to RINEX V2.
The RINEX V3 format should also address navigation files. The current format docu-mentation specifies one file per station for observation data; therefore, the format shouldspecify one file per station that includes navigation messages from all GNSS constellations.A tool may need to be developed for this capability rather than depend upon generationin the receiver.
The following recommendations were generated from the June 2014 DCWG meeting:
1. Develop a transition plan that will integrate RINEX V3, including the V3 filenameconvention, into the operational IGS archives by the end of 2015. (IC, DCs, ACs,MGEX WG)– Progress: The IGS Infrastructure Committee has drafted this transition plan forcomment. The plan works toward the “one network one archive” concept, mergingthe RINEX V2 and V3 files currently maintained in separate structures at the datacenters, into one archive structure. The IC has recommended the IGS GoverningBoard provide guidance on next steps.
2. Provide software tools that DCs can use to continue to provide needed QC andmetadata extraction enabling creation of data status information.– Progress: Possible tools have been discussed but not identified for general usethrough the IGS infrastructure.
3. Provide software tools to support data conversion (e.g., RINEX V3 to RINEX V2.RINEX V3 filename creation) that both DCs and ACs can use.– Progress: The transition plan has identified the need for these tools.
The above recommendations reiterate those from the 2012 IGS Analysis Workshop:
1. The DCs recommend continuing the efforts by the Infrastructure Committee andthe RINEX WG to agree on new file names.
– Progress: The new filename convention is included in the RINEX V3 transitionplan. To date, RINEX V3 data utilized in support of MGEX are archived at datacenters (CDDIS and IGN) in separate directory structures. To improve/encouragedata access and usage, the RINEX V3 transition plan states the DCs will use the
142
3 Future Plans
new filenames and incorporate RINEX V3 data within the operational directorystructure.
2. Until the RINEX V3 filename convention is finalized, separate directories for distin-guishing between files created from streams and by receivers will be established byall DCs.
– Progress: The DCWG has not addressed this recommendation to archive of high–rate files from real–time streams vs. receivers. However, the RINEX V3 filenameconvention has been finalized and is included in the latest RINEX V3 documentation.With the adoption of the proposals outlined in the RINEX V3 transition plan,stream–created data will be clearly identified by filename.
3. All DCs explore transition options for a follow on compression scheme to replaceUNIX “compress” as early as possible.
– Progress: IGS users reported to DCs that the decompression tools for UNIXcompress (“.Z”) is an outdated method for data compression. It is recommendedthat the IGS infrastructure change to a standard compression format as early aspossible. Plans for transition from UNIX compress to another compression scheme,e.g., gzip, will be coordinated with testing of RINEX V3 data flow.
3 Future Plans
One topic discussed at the IGS Infrastructure Committee meeting at the 2014 IGS Work-shop involved metadata, particularly in the area of site logs. The IGS CB has introducedthe Site Log Manager System, which is utilized at the IGS Central Bureau for handlingIGS site logs and provides a basis for promoting the transmission of these logs in XML for-mat. An XML/database management approach to site logs provides several advantages,such as rapid update of site log contents, utilization of consistent information across datacenters, and availability of more accurate station metadata. The IGS CB and UNAVCO,in conjunction with the DCWG, are proposing email discussions and/or telecons to allowparticipants in this effort to collaborate and plan for a way forward in design, develop-ment, and implementation of a shared geodesy XML schema, possibly utilizing the site logschema developed at SOPAC, for site information. If feasible the group would like to planfor future meetings on this collaboration, perhaps in conjunction with community–heldmeetings (e.g., EGU, AGU, IGS workshops, etc.).
The DCWGwill also work with the IGS DCs to implement the recommendations developedduring the 2012 and 2014 workshops. In particular, the DCWG will work with the MGEXWorking Group and the Infrastructure Committee to finalize the RINEX V3 TransitionPlan and work toward implementing the plan itself. Additional topics the WG hopes toaddress follow.
143
Data Center Working Group
• Support of the IGS Infrastructure Committee: A major focus of the DCWG willbe to support the IC in its various activities to coordinate the resolution of issuesrelated to the IGS components. These activities will address recommendations fromrecent IGS Workshops including assessment and monitoring of station performanceand data quality, generating metrics on these data.
• RINEX file naming convention: The DCWG will work with the IC and the RINEXWG on implementation of the new IGS RINEX file naming convention.
• Data center harmonization: The working group will consider methodologies for en-suring key data sets are available at all GDCs.
• Compression: As per a recommendation from past IGS workshops, the DCWGwill develop a plan for the introduction of a new compression scheme into the IGSinfrastructure by evaluating tests of available tools, surveying the IGS infrastructure,making a recommendation on a new IGS compression scheme, and coordinatingrecommendations with the IC to develop implementation schedule. Ideally, the newcompression scheme will be made part of the RINEX V3 file naming implementation.
• Next meeting: A meeting of the DCWG is planned for the next IGS workshop in2016.
4 Membership
• Carey Noll (NASA GSFC/USA), Chair• Yehuda Bock (SIO/USA)• Fran Boler (UNAVCO)• Ludwig Combrinck (HRAO/South Africa)• Bruno Garayt (IGN/France)• Kevin Choi (NOAA/USA), ex–officio• Heinz Habrich (BKG/Germany)• Michael Moore (GA/Australia) (tbc)• Ruth Neilan (JPL/USA), ex–officio• Markus Ramatschi (GFZ/Germany)• Nacho Romero (ESA/Germany)• Mike Schmidt (NRCan/Canada)• Giovanni Sella (NOAA/USA)• Grigory Steblov (RDAAC/Russia)• Dave Stowers (JPL/USA)
144
Ionosphere Working GroupTechnical Report 2014
A. Krankowski1 I. Cherniak1, I. Zakharenkova1,R. Langley2, M. D. Butala3, A. Komjathy3,
T. F. Runge3, B. D. Wilson3, X. Pi3, A. J. Mannucci3,M. Hernandez–Pajares4, P. Vergados3,
1 Space Radio–Diagnostics Research CenterUniversity of Warmia and Mazury in Olsztyn, Poland (SRRC/UWM)
2 Geodesy and Geomatics Engineering, University of New Brunswick, Canada3 Jet Propulsion Laboratory, California Institute of Technology4 IONSAT, Universitat Politecnica de Catalunya (UPC), Barcelona, Spain
1 Introduction
The Ionosphere Working group started the routine generation of the combined IonosphereVertical Total Electron Content (TEC) maps in June 1998. This has been the main ac-tivity so far performed by the four IGS Ionosphere Associate Analysis Centers (IAACs):CODE (Center for Orbit Determination in Europe, Astronomical Institute, University ofBerne, Switzerland), ESOC (European Space Operations Center of ESA, Darmstadt, Ger-many), JPL (Jet Propulsion Laboratory, Pasadena, California, U.S.A), and UPC (Tech-nical University of Catalonia, Barcelona, Spain). Independent computation of rapid andfinal VTEC maps are used by each analysis center: Each IAAC compute the rapid and fi-nal TEC maps independently and with different approaches including the additional usageof GLONASS data in the case of CODE.
2 Membership
The members of the ionosphere working group are listed in Tab. 1. Dr. Reza Ghoddousi–Fard, from the Canadian Geodetic Survey of Natural Resources Canada (NRCan), hassolicited to be a member of the IGS Ionosphere WG. Taking into account that all of
145
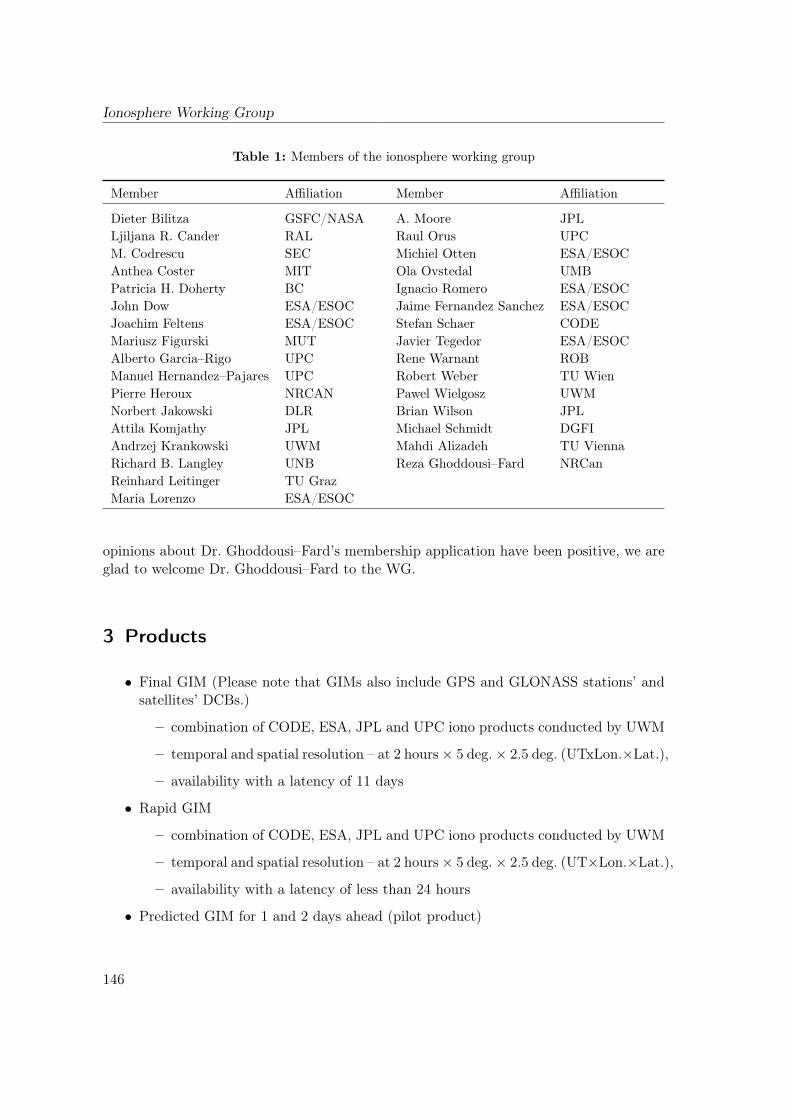
Ionosphere Working Group
Table 1: Members of the ionosphere working group
Member Affiliation Member Affiliation
Dieter Bilitza GSFC/NASA A. Moore JPLLjiljana R. Cander RAL Raul Orus UPCM. Codrescu SEC Michiel Otten ESA/ESOCAnthea Coster MIT Ola Ovstedal UMBPatricia H. Doherty BC Ignacio Romero ESA/ESOCJohn Dow ESA/ESOC Jaime Fernandez Sanchez ESA/ESOCJoachim Feltens ESA/ESOC Stefan Schaer CODEMariusz Figurski MUT Javier Tegedor ESA/ESOCAlberto Garcia–Rigo UPC Rene Warnant ROBManuel Hernandez–Pajares UPC Robert Weber TU WienPierre Heroux NRCAN Pawel Wielgosz UWMNorbert Jakowski DLR Brian Wilson JPLAttila Komjathy JPL Michael Schmidt DGFIAndrzej Krankowski UWM Mahdi Alizadeh TU ViennaRichard B. Langley UNB Reza Ghoddousi–Fard NRCanReinhard Leitinger TU GrazMaria Lorenzo ESA/ESOC
opinions about Dr. Ghoddousi–Fard’s membership application have been positive, we areglad to welcome Dr. Ghoddousi–Fard to the WG.
3 Products
• Final GIM (Please note that GIMs also include GPS and GLONASS stations’ andsatellites’ DCBs.)
– combination of CODE, ESA, JPL and UPC iono products conducted by UWM
– temporal and spatial resolution – at 2 hours× 5 deg.× 2.5 deg. (UTxLon.×Lat.),
– availability with a latency of 11 days
• Rapid GIM
– combination of CODE, ESA, JPL and UPC iono products conducted by UWM
– temporal and spatial resolution – at 2 hours× 5 deg.× 2.5 deg. (UT×Lon.×Lat.),
– availability with a latency of less than 24 hours
• Predicted GIM for 1 and 2 days ahead (pilot product)
146
6 Announcements after IGS Workshop 2014, Pasadena, USA
– combination of ESA and UPC iono products conducted by ESA
– temporal and spatial resolution – at 2 hours× 5 deg.× 2.5 deg. (UTxLon.×Lat.),
4 Key accomplishments
• IGS Global ionosphere predicted products for 1 and 2 days ahead (pilot product).These new IGS products are currently based on predicted ionosphere maps preparedby UPC and ESA.
• IGS Global ionosphere maps with 1 hour time resolution. These new IGS productsare currently based on ionosphere maps prepared by UPC, ESA and CODE.
• IGS Global Ionosphere Maps (GIMs) now include differential code biases (DCBs)for GLONASS satellites.
• The pilot phase of the new IGS ionospheric product – TEC fluctuation maps
5 Recommendations after IGS Workshop 2014, Pasadena,USA
• Higher temporal resolution of IGS combined GIMs – the IAACs (UPC, JPL, ESAand CODE) agreed on providing their maps in IONEX format, with a resolution of1 hour from 2015.
• Starting a new potential official product – TEC fluctuation maps using ROTI overthe Northern Hemisphere to monitor the dynamic of oval irregularities (carried outby UWM; Krankowski), JPL (Pi) and UPC (Hernandez–Pajares) in the future to bestarted as official/routine product after performance evaluation period (beginning2015).
• Close cooperation with National Central University from Taiwan regarding usageof occultation measurements from Formosat/Cosmic mission for future validation ofIGS GIMs.
• Cooperation with IRI COSPAR group for improving IRI TEC.
6 Announcements after IGS Workshop 2014, Pasadena, USA
• Natural Resources Canada (NRCan) is resuming the activities on global VTECmodelling. After a performance evaluation period, NRCan can again become anIAAC (Reza Ghoddousi–Fard, April 2015).
147
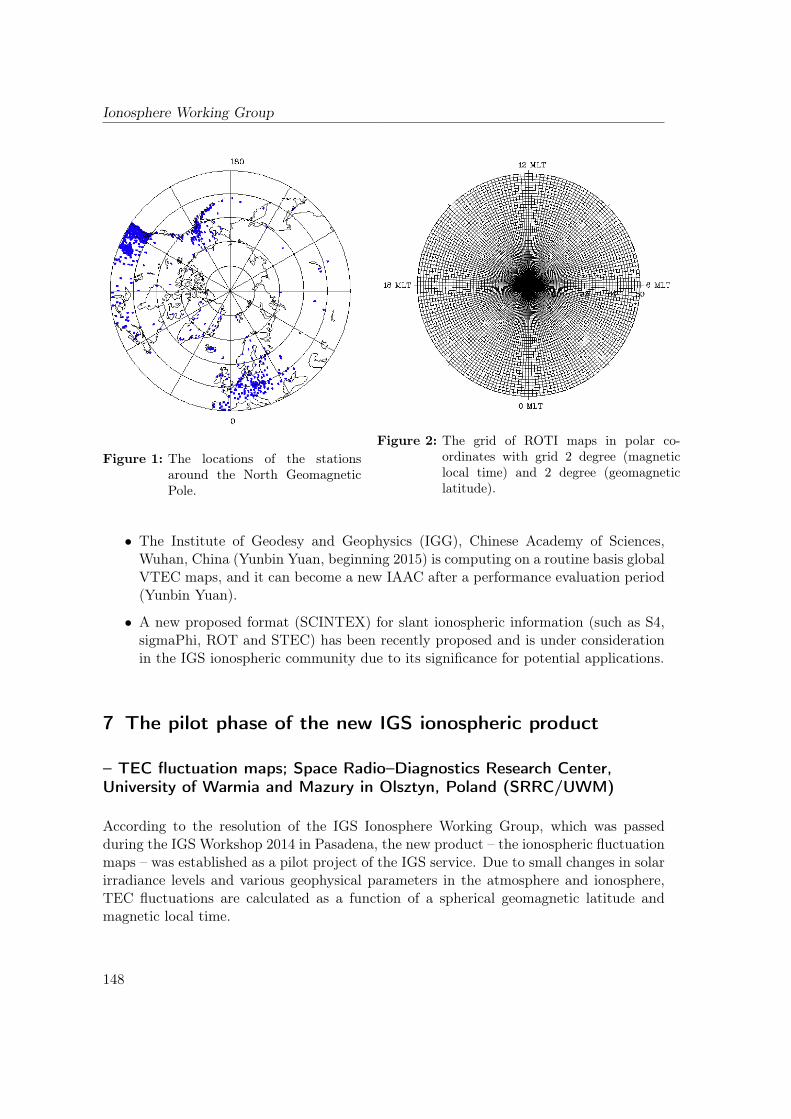
Ionosphere Working Group
Figure 1: The locations of the stationsaround the North GeomagneticPole.
Figure 2: The grid of ROTI maps in polar co-ordinates with grid 2 degree (magneticlocal time) and 2 degree (geomagneticlatitude).
• The Institute of Geodesy and Geophysics (IGG), Chinese Academy of Sciences,Wuhan, China (Yunbin Yuan, beginning 2015) is computing on a routine basis globalVTEC maps, and it can become a new IAAC after a performance evaluation period(Yunbin Yuan).
• A new proposed format (SCINTEX) for slant ionospheric information (such as S4,sigmaPhi, ROT and STEC) has been recently proposed and is under considerationin the IGS ionospheric community due to its significance for potential applications.
7 The pilot phase of the new IGS ionospheric product
– TEC fluctuation maps; Space Radio–Diagnostics Research Center,University of Warmia and Mazury in Olsztyn, Poland (SRRC/UWM)
According to the resolution of the IGS Ionosphere Working Group, which was passedduring the IGS Workshop 2014 in Pasadena, the new product – the ionospheric fluctuationmaps – was established as a pilot project of the IGS service. Due to small changes in solarirradiance levels and various geophysical parameters in the atmosphere and ionosphere,TEC fluctuations are calculated as a function of a spherical geomagnetic latitude andmagnetic local time.
148
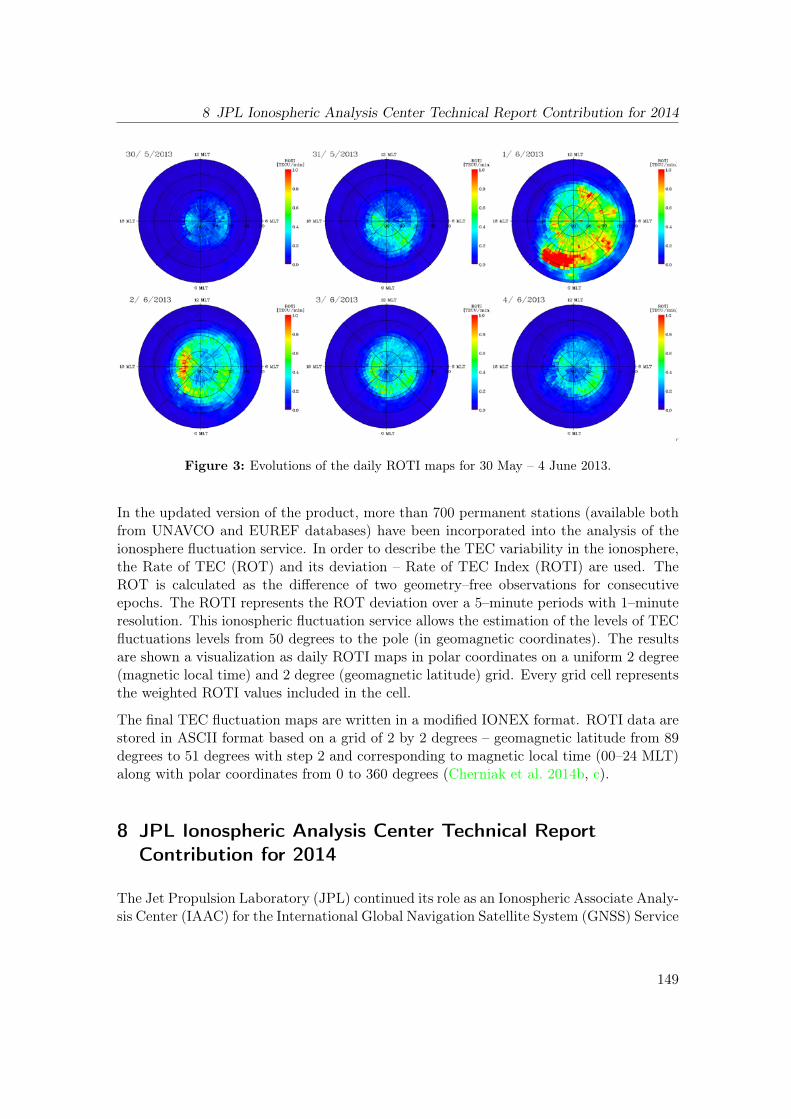
8 JPL Ionospheric Analysis Center Technical Report Contribution for 2014
Figure 3: Evolutions of the daily ROTI maps for 30 May – 4 June 2013.
In the updated version of the product, more than 700 permanent stations (available bothfrom UNAVCO and EUREF databases) have been incorporated into the analysis of theionosphere fluctuation service. In order to describe the TEC variability in the ionosphere,the Rate of TEC (ROT) and its deviation – Rate of TEC Index (ROTI) are used. TheROT is calculated as the difference of two geometry–free observations for consecutiveepochs. The ROTI represents the ROT deviation over a 5–minute periods with 1–minuteresolution. This ionospheric fluctuation service allows the estimation of the levels of TECfluctuations levels from 50 degrees to the pole (in geomagnetic coordinates). The resultsare shown a visualization as daily ROTI maps in polar coordinates on a uniform 2 degree(magnetic local time) and 2 degree (geomagnetic latitude) grid. Every grid cell representsthe weighted ROTI values included in the cell.
The final TEC fluctuation maps are written in a modified IONEX format. ROTI data arestored in ASCII format based on a grid of 2 by 2 degrees – geomagnetic latitude from 89degrees to 51 degrees with step 2 and corresponding to magnetic local time (00–24 MLT)along with polar coordinates from 0 to 360 degrees (Cherniak et al. 2014b, c).
8 JPL Ionospheric Analysis Center Technical ReportContribution for 2014
The Jet Propulsion Laboratory (JPL) continued its role as an Ionospheric Associate Analy-sis Center (IAAC) for the International Global Navigation Satellite System (GNSS) Service
149
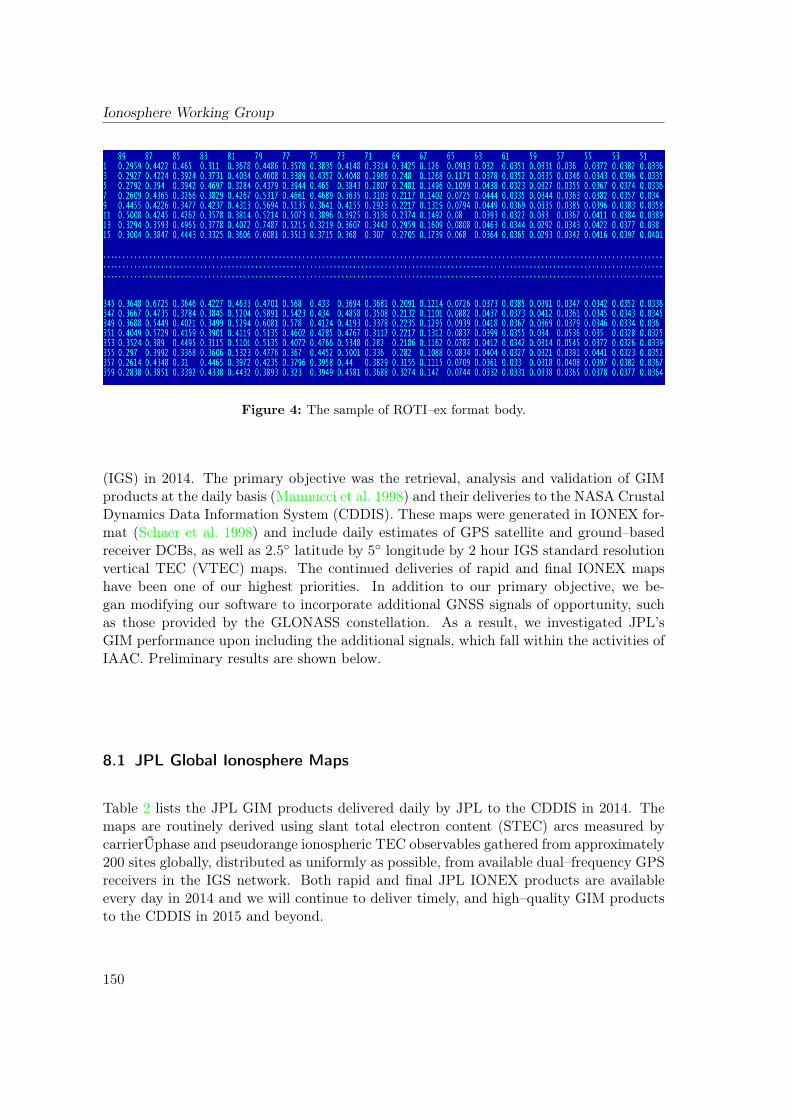
Ionosphere Working Group
Figure 4: The sample of ROTI–ex format body.
(IGS) in 2014. The primary objective was the retrieval, analysis and validation of GIMproducts at the daily basis (Mannucci et al. 1998) and their deliveries to the NASA CrustalDynamics Data Information System (CDDIS). These maps were generated in IONEX for-mat (Schaer et al. 1998) and include daily estimates of GPS satellite and ground–basedreceiver DCBs, as well as 2.5◦ latitude by 5◦ longitude by 2 hour IGS standard resolutionvertical TEC (VTEC) maps. The continued deliveries of rapid and final IONEX mapshave been one of our highest priorities. In addition to our primary objective, we be-gan modifying our software to incorporate additional GNSS signals of opportunity, suchas those provided by the GLONASS constellation. As a result, we investigated JPL’sGIM performance upon including the additional signals, which fall within the activities ofIAAC. Preliminary results are shown below.
8.1 JPL Global Ionosphere Maps
Table 2 lists the JPL GIM products delivered daily by JPL to the CDDIS in 2014. Themaps are routinely derived using slant total electron content (STEC) arcs measured bycarrierŰphase and pseudorange ionospheric TEC observables gathered from approximately200 sites globally, distributed as uniformly as possible, from available dual–frequency GPSreceivers in the IGS network. Both rapid and final JPL IONEX products are availableevery day in 2014 and we will continue to deliver timely, and high–quality GIM productsto the CDDIS in 2015 and beyond.
150
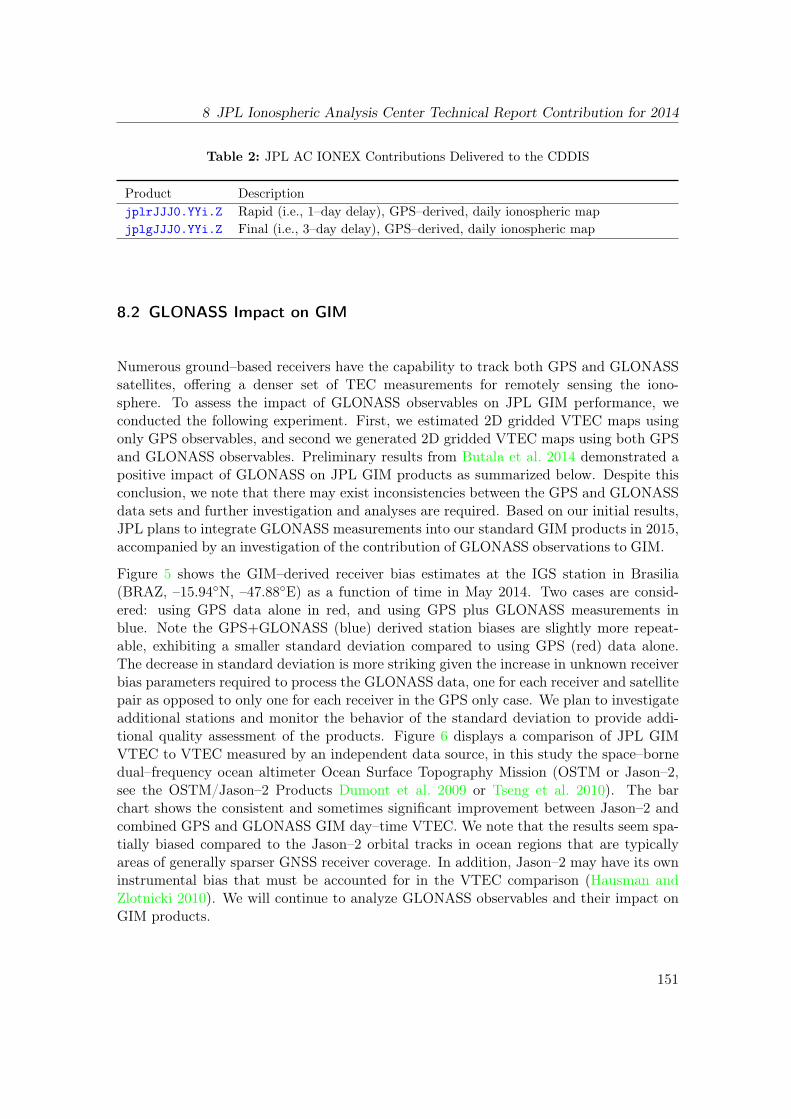
8 JPL Ionospheric Analysis Center Technical Report Contribution for 2014
Table 2: JPL AC IONEX Contributions Delivered to the CDDIS
Product DescriptionjplrJJJ0.YYi.Z Rapid (i.e., 1–day delay), GPS–derived, daily ionospheric mapjplgJJJ0.YYi.Z Final (i.e., 3–day delay), GPS–derived, daily ionospheric map
8.2 GLONASS Impact on GIM
Numerous ground–based receivers have the capability to track both GPS and GLONASSsatellites, offering a denser set of TEC measurements for remotely sensing the iono-sphere. To assess the impact of GLONASS observables on JPL GIM performance, weconducted the following experiment. First, we estimated 2D gridded VTEC maps usingonly GPS observables, and second we generated 2D gridded VTEC maps using both GPSand GLONASS observables. Preliminary results from Butala et al. 2014 demonstrated apositive impact of GLONASS on JPL GIM products as summarized below. Despite thisconclusion, we note that there may exist inconsistencies between the GPS and GLONASSdata sets and further investigation and analyses are required. Based on our initial results,JPL plans to integrate GLONASS measurements into our standard GIM products in 2015,accompanied by an investigation of the contribution of GLONASS observations to GIM.
Figure 5 shows the GIM–derived receiver bias estimates at the IGS station in Brasilia(BRAZ, –15.94◦N, –47.88◦E) as a function of time in May 2014. Two cases are consid-ered: using GPS data alone in red, and using GPS plus GLONASS measurements inblue. Note the GPS+GLONASS (blue) derived station biases are slightly more repeat-able, exhibiting a smaller standard deviation compared to using GPS (red) data alone.The decrease in standard deviation is more striking given the increase in unknown receiverbias parameters required to process the GLONASS data, one for each receiver and satellitepair as opposed to only one for each receiver in the GPS only case. We plan to investigateadditional stations and monitor the behavior of the standard deviation to provide addi-tional quality assessment of the products. Figure 6 displays a comparison of JPL GIMVTEC to VTEC measured by an independent data source, in this study the space–bornedual–frequency ocean altimeter Ocean Surface Topography Mission (OSTM or Jason–2,see the OSTM/Jason–2 Products Dumont et al. 2009 or Tseng et al. 2010). The barchart shows the consistent and sometimes significant improvement between Jason–2 andcombined GPS and GLONASS GIM day–time VTEC. We note that the results seem spa-tially biased compared to the Jason–2 orbital tracks in ocean regions that are typicallyareas of generally sparser GNSS receiver coverage. In addition, Jason–2 may have its owninstrumental bias that must be accounted for in the VTEC comparison (Hausman andZlotnicki 2010). We will continue to analyze GLONASS observables and their impact onGIM products.
151
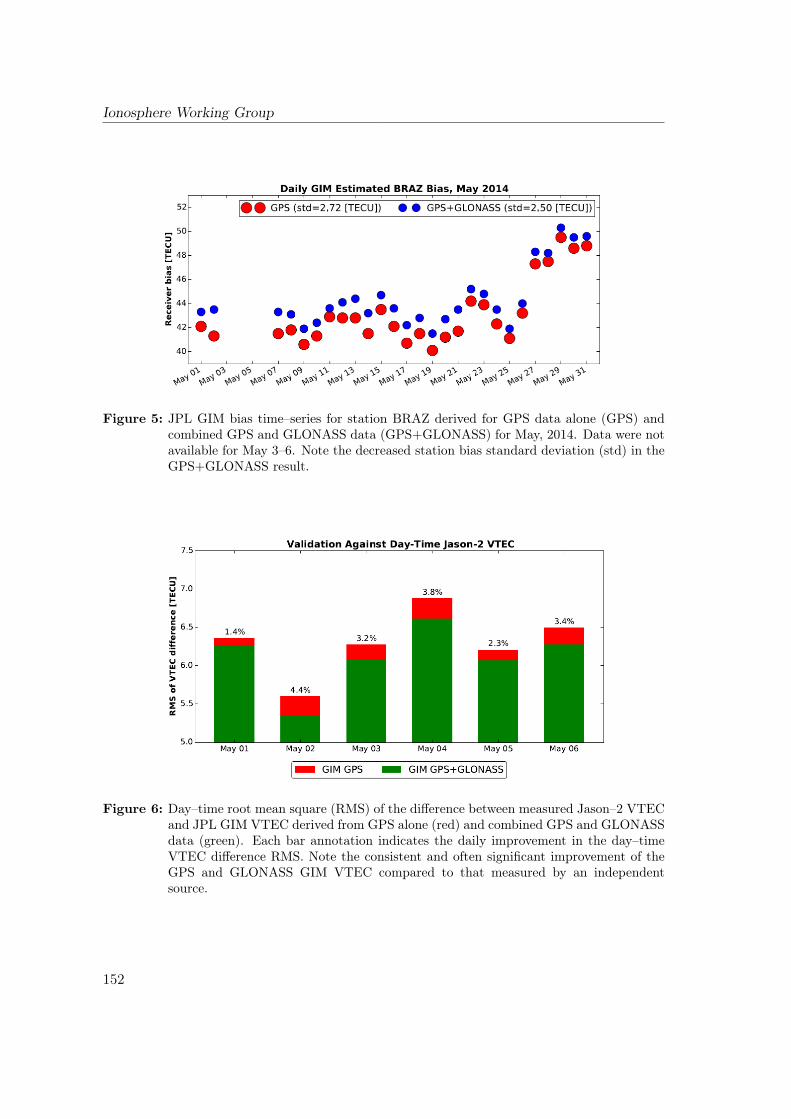
Ionosphere Working Group
Figure 5: JPL GIM bias time–series for station BRAZ derived for GPS data alone (GPS) andcombined GPS and GLONASS data (GPS+GLONASS) for May, 2014. Data were notavailable for May 3–6. Note the decreased station bias standard deviation (std) in theGPS+GLONASS result.
Figure 6: Day–time root mean square (RMS) of the difference between measured Jason–2 VTECand JPL GIM VTEC derived from GPS alone (red) and combined GPS and GLONASSdata (green). Each bar annotation indicates the daily improvement in the day–timeVTEC difference RMS. Note the consistent and often significant improvement of theGPS and GLONASS GIM VTEC compared to that measured by an independentsource.
152
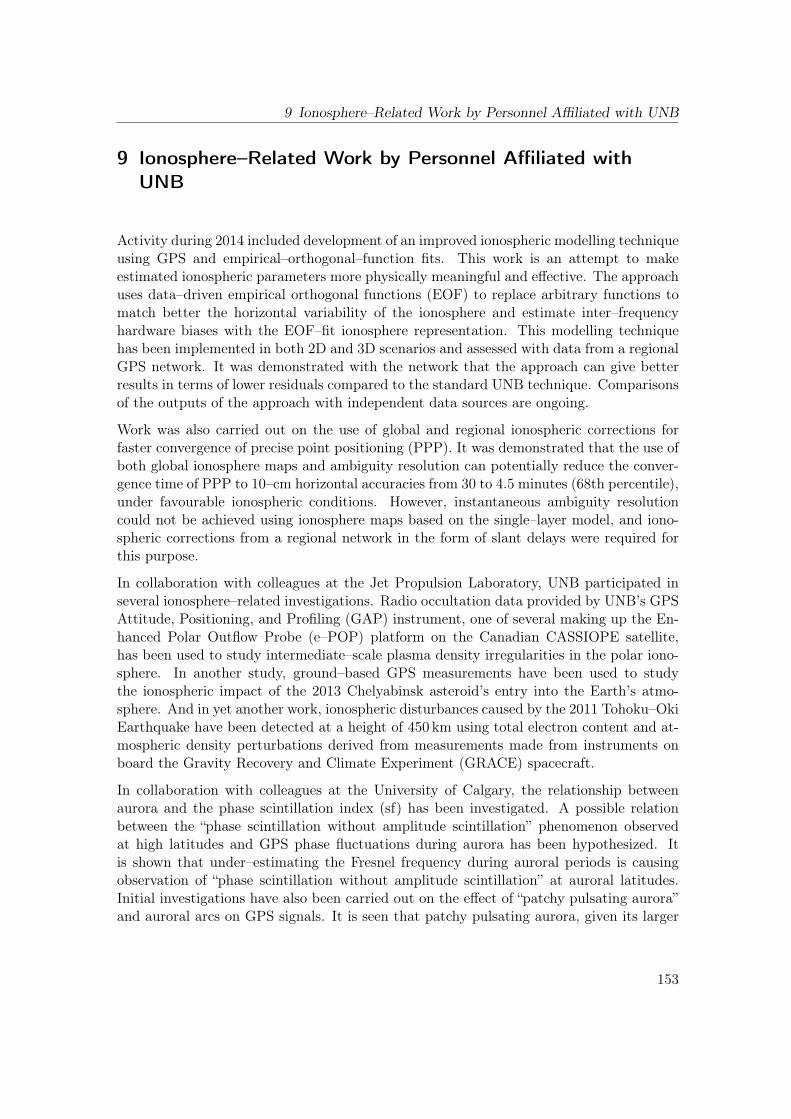
9 Ionosphere–Related Work by Personnel Affiliated with UNB
9 Ionosphere–Related Work by Personnel Affiliated withUNB
Activity during 2014 included development of an improved ionospheric modelling techniqueusing GPS and empirical–orthogonal–function fits. This work is an attempt to makeestimated ionospheric parameters more physically meaningful and effective. The approachuses data–driven empirical orthogonal functions (EOF) to replace arbitrary functions tomatch better the horizontal variability of the ionosphere and estimate inter–frequencyhardware biases with the EOF–fit ionosphere representation. This modelling techniquehas been implemented in both 2D and 3D scenarios and assessed with data from a regionalGPS network. It was demonstrated with the network that the approach can give betterresults in terms of lower residuals compared to the standard UNB technique. Comparisonsof the outputs of the approach with independent data sources are ongoing.
Work was also carried out on the use of global and regional ionospheric corrections forfaster convergence of precise point positioning (PPP). It was demonstrated that the use ofboth global ionosphere maps and ambiguity resolution can potentially reduce the conver-gence time of PPP to 10–cm horizontal accuracies from 30 to 4.5 minutes (68th percentile),under favourable ionospheric conditions. However, instantaneous ambiguity resolutioncould not be achieved using ionosphere maps based on the single–layer model, and iono-spheric corrections from a regional network in the form of slant delays were required forthis purpose.
In collaboration with colleagues at the Jet Propulsion Laboratory, UNB participated inseveral ionosphere–related investigations. Radio occultation data provided by UNB’s GPSAttitude, Positioning, and Profiling (GAP) instrument, one of several making up the En-hanced Polar Outflow Probe (e–POP) platform on the Canadian CASSIOPE satellite,has been used to study intermediate–scale plasma density irregularities in the polar iono-sphere. In another study, ground–based GPS measurements have been used to studythe ionospheric impact of the 2013 Chelyabinsk asteroid’s entry into the Earth’s atmo-sphere. And in yet another work, ionospheric disturbances caused by the 2011 Tohoku–OkiEarthquake have been detected at a height of 450 km using total electron content and at-mospheric density perturbations derived from measurements made from instruments onboard the Gravity Recovery and Climate Experiment (GRACE) spacecraft.
In collaboration with colleagues at the University of Calgary, the relationship betweenaurora and the phase scintillation index (sf) has been investigated. A possible relationbetween the “phase scintillation without amplitude scintillation” phenomenon observedat high latitudes and GPS phase fluctuations during aurora has been hypothesized. Itis shown that under–estimating the Fresnel frequency during auroral periods is causingobservation of “phase scintillation without amplitude scintillation” at auroral latitudes.Initial investigations have also been carried out on the effect of “patchy pulsating aurora”and auroral arcs on GPS signals. It is seen that patchy pulsating aurora, given its larger
153
Ionosphere Working Group
spatial extent, affects GPS signals in a more pronounced manner than auroral arcs.
10 Publications 2014
1. Banville, S., P. Collins, W. Zhang, R.B. Langley, Global and Regional IonosphericCorrections for Faster PPP Convergence, NAVIGATION: Journal of the Institute of Nav-igation, 61(2):115–124, doi:10.1002/navi.57.
2. Bilitza, D., Altadill, D., Zhang, Y., Mertens, Ch., Truhlik, V., Richards, P., McKin-nell, L–A, Reinisch, B., 2014, The International Reference Ionosphere 2012 – a model ofinternational collaboration. J. of Space Weather and Space Clim, Vol. 4, AO7, 2014.
3. Cherniak, Iu., Zakharenkova, I.E., Dzubanov, D., Krankowski, A., 2014a, Analysisof the ionosphere/plasmasphere electron content variability during strong geomagneticstorm, Advances in Space Research, 54(4):586–594, 2014.
4. Cherniak, Iu., Krankowski, A., Zakharenkova, I.E., 2014b, Observation of the iono-spheric irregularities over the Northern Hemisphere: Methodology and Service, RadioScience, 49:653–662, 2014, DOI: 10.1002/2014RS005433.
5. Cherniak, Iu., Zakharenkova, I.E., Krankowski, A., 2014c, The approaches for theionosphere irregularities modeling on the base of ROTI mapping, Earth, Planets andSpace (EPS) 66:165, 2014, doi:10.1186/s40623-014-0165-z
6. Frappart, F., N. Roussel, R. Biancale, J.J. Martinez–Benjamin, F. Mercier, F. Pérosanz,J. Garate–Pasquin, J. Martin–Davila, B. Perez–Gomez, C. Gracia–Gomez, R. Lopez–Bravo, A. Tapia–Gomez, J. Gili–Ripoll, M. Hernandez–Pajares, M. Salazar–Lino, P. Bon-nefond, I. Valles–Casanova, 2015, The 2013 Ibiza calibration campaign of Jason–2 andSaral altimeters, Marine Geodesy, in press.
7. Gulyaeva, T.L., Arikan, F., Hernandez–Pajares, M., and Veselovsky, I.S., 2014, North–south components of the annual asymmetry in the ionosphere. Radio Science, 49(7):485–496.
8. Hernández–Pajares, M., Ã. Aragón–Ángel, P. Defraigne, N. Bergeot, R. Prieto–Cerdeira,and A. García-Rigo, 2014, Distribution and mitigation of higher–order ionospheric ef-fects on precise GNSS processing, J. Geophys. Res.: Solid Earth, 119(4):3823–3837,doi:10.1002/2013JB010568.
9. Li, Z., Yuan, Y., Wang, N., Hernandez-Pajares, M., and Huo, X., 2014, SHPTS: towardsa new method for generating precise global ionospheric TEC map based on sphericalharmonic and generalized trigonometric series functions. Journal of Geodesy, 89(4):331–345.
10. Limberger, M., Liang, W., Schmidt, M., Dettmering, D., Hernández-Pajares, M., andHugentobler, U., 2014, Correlation studies for B–spline modeled F2 Chapman parameters
154
11 Presentations/Posters/Meeting Proceedings 2014
obtained from FORMOSAT–3/COSMIC data. Ann. Geophys, 32:1533–1545.
11. Monte, E., Hernandez-Pajares, M., 2014, Occurrence of solar flares viewed with GPS:Statistics and fractal nature, Journal of Geophysical Research: Space Physics, 119(11):9216–9227.
12. Yang, Y.-M., A. Komjathy, R.B. Langley, P. Vergados, M.D. Butala, and A.J. Man-nucci, The 2013 Chelyabinsk Meteor Ionospheric Impact Studied Using GPS Measure-ments, Radio Science, 49(5):341–350, doi:10.1002/2013RS005344. Paper featured on issuecover.
13. Yang, Y.-M., X. Meng, A. Komjathy, O. Verkholyadova, R.B. Langley, B.T. Tsuru-tani, and A.J. Mannucci, 2014, Tohoku-Oki Earthquake Caused Major Ionospheric Dis-turbances at 450 km Altitude over Alaska, Radio Science, 49(12):1206–1213.
14. Zakharenkova, I., Cherniak, Iu., Krankowski, A., Shagimuratov, I.I., 2014a, Cross–hemisphere comparison of mid–latitude ionospheric variability during 1996–2009: Julius-ruh vs. Hobart, 2014, Advances in Space Research, 53(2):175–189.
15. Zakharenkova, I.E., Cherniak, Iu., Krankowski, A., Shagimuratov, I.I., 2014b, VerticalTEC representation by IRI 2012 and IRI Plas models for European midlatitudes, Advancesin Space Research, 55(8):2070–2076.
16. Zhang, W., A. Komjathy, S. Banville, and R.B. Langley, Ionospheric Modeling UsingGPS: Greater Fidelity Using a 3D Approach, GPS World, 25(2):59–65.
11 Presentations/Posters/Meeting Proceedings 2014
1. Mushini, S. E. Donovan, P.T. Jayachandran, R. Langley, P. Prikryl, and E. Spanswick,“On the Relation Between Auroral ”Scintillation“ and ”Phase Without Amplitude" Scintil-lation: Initial Investigations, Canadian Association of Physicists Division of Atmosphericand Space Physics Winter Workshop, Fredericton, NB, 19–21 February 2014.
2. Krankowski A., Cherniak Iu., Zakharenkova I., 2014, Current and future IGS Iono WGactivities, Workshop “Ionospheric research and applications at the ICTP and East Europe”ICTP Telecommunications/ICT for Development Laboratory (T/ICT4D), 25 April 2014,Trieste, Italy, (solicited).
3. Krankowski A., Cherniak Iu., Zakharenkova I.E., 2014, GNSS monitoring of the iono-spheric irregularities over the Northern Hemisphere for Space Weather applications, XIGeneral Assembly of the EUG, Vienna, Austria, 27 April – 02 May 2014
4. Rothkaehl H., Krankowski A., Morawski M., Atamaniuk B., Zakharenkova I.E, Cher-niak Iu., 2014, New advanced netted ground based and topside radio diagnostics for SpaceWeather Program, XI General Assembly of the EUG, Vienna, Austria, 27 April – 02 May2014
155
Ionosphere Working Group
5. Shagimuratov I.I., Cherniak Iu., Zakharenkova I.E., Ephishov I., Krankowski A.,Radievsky A., 2014, The mapping of ionospheric TEC for central Russian and Euro-pean regions on the base of GPS and GLONASS measurements, XI General Assembly ofthe EUG, Vienna, Austria, 27 April – 02 May 2014
6. Krankowski A., Cherniak Iu., Zakharenkova I., 2014, Current and future IGS Iono WGactivities, new IGS iono product – monitoring of TEC fluctuations, IGS Workshop 2014,June 23–27, 2014, Pasadena, California, USA, (solicited).
7. Krankowski A., Rothkaehl H., Cherniak Iu., Zakharenkova I., Otmianowska–MazurK., Soida M., 2014, LOFAR as new advanced radio diagnostics tools for Space WeatherProgram, IGS Workshop 2014, June 23–27, 2014, Pasadena, California, USA.
8. Cherniak Iu., Krankowski A.,Zakharenkova I., 2014, Observation of the ionosphericirregularities over the Northern Hemisphere: Methodology and Service, IGS Workshop2014, June 23–27, 2014, Pasadena, California, USA.
9. Cherniak Iu., Krankowski A., Zakharenkova I., Shagimuratov I., 2014, Validation ofthe IRI model by multiinstrumental radiophysical observations, 40th COSPAR ScientificAssembly, August 02–10, 2014. Moscow, Russia, (solicited).
10. Cherniak Iu., Krankowski A., Zakharenkova I., Shagimuratov I., 2014, The develop-ment of approaches for ionosphere irregularities modeling on the base of GNSS data, 40thCOSPAR Scientific Assembly, August 02–10, 2014. Moscow, Russia.
11. Gordon, J., A. Yau, R. Langley, and P. Bernhardt, “First Results from the RadioscienceInstruments on CASSIOPE/e–POP,” presentation to 40th COSPAR Scientific Assembly,Moscow, 2–10 August 2014, abstract #C1.3–21–14.
12. Zakharenkova I., Cherniak Iu., Krankowski A., Shagimuratov I., 2014, Analysis ofthe TEC representation by IRI model, 40th COSPAR Scientific Assembly, August 02–10,2014. Moscow, Russia, (solicited).
13. Rothkaehl H., Krankowski A., Morawski M., 2014, New Advanced radio tools formonitoring and diagnostics near plasma environment, 2014, 31st URSI General Assem-bly and Scientific Symposium (31st URSI GASS), 16–23 August 2014, Beijing, China,(solicited).
14. Zakharenkova I., Cherniak Iu., Krankowski A., Shagimuratov I., 2014, Estimationof the Plasmaspheric Electron Content on the Base of FORMOSAT–3/COSMIC POD–Antennas Measurements, 2014, 31st URSI General Assembly and Scientific Symposium(31st URSI GASS), 16–23 August 2014, Beijing, China, (solicited).
15. Mushini, S.C., E. Donovan, P.T. Jayachandran, R.B. Langley, P. Prikryl, and E.Spanswick, “On the Relation between Auroral ”Scintillation“ and ”Phase without Am-plitude“ Scintillation: Initial Investigations,” Proceedings of the XXXIst URSI GeneralAssembly and Scientific Symposium, Beijing, 16–23 August 2014, doi: 10.1109/URSI-
156
11 Presentations/Posters/Meeting Proceedings 2014
GASS.2014.6929726.
16. Shume, E.B., A. Komjathy, R.B. Langley, O. Verkhoglyadova, M. Butala, and A.J.Mannucci, “Phase Scintillation Estimates in the Polar Ionosphere Inferred from RadioOccultation on Board CASSIOPE: A Summary,” Proceedings of the 27th InternationalTechnical Meeting of The Satellite Division of the Institute of Navigation (ION GNSS+2014), Tampa, Florida, 8–12 September 2014, pp. 1138–1141.
17. Yang, Y–M. (Oscar), A. Komjathy, X. Meng, R.B. Langley, M. Butala, E.B. Shume,and A.J. Mannucci, “Space–Based Remote Sensing of Natural–Hazard–Induced Ionosphere–Thermosphere Perturbations,” Proceedings of the 27th International Technical Meeting ofThe Satellite Division of the Institute of Navigation (ION GNSS+ 2014), Tampa, Florida,8–12 September 2014, pp. 1473–1477.
18. Rothkaehl H., Krankowski A., 2014, Space Weather and Ionosphere Investigationsin the Frame of LOFAR Program, 11th European Space Weather Week, Liege, Belgium,November 17 – 21, 2014
19. Cherniak Iu., Zakharenkova I., Krankowski A., Shagimuratov I., 2014, The IonosphereIrregularities Modeling on the base of ROTI Mapping, 11th European Space WeatherWeek, Liege, Belgium, November 17 – 21, 2014
20. Cherniak Iu., Zakharenkova I., Krankowski A., Shagimuratov I., 2014, Monitoringand Modeling of Ionosphere Irregularities Caused By Space Weather Activity on the Baseof GNSS Measurements, AGU Fall Meeting 2014, San Francisco, USA, 15–19 December2014
21. Komjathy, A., A. Romero–Wolf, O. Verkhoglyadova, Y.–M. Yang, X. Meng, R.B. Lan-gley, and J. Foster, “CubeSat for Natural–Hazard Estimation With Ionospheric Sciences(CNEWS): A Concept Development to Aid Tsunami Early Warning Systems,” posterpresented at American Geophysical Union, Fall Meeting 2014, San Francisco, CA, 15–19December 2014, abstract #NH31C–3868.
22. Mushini S., E. Donovan, P. Jayachandran, R.B. Langley, P. Prikryl, E. Spanswick,and B. Jackel, “On the Effect of ”Patchy“ Aurora and Auroral Arcs on GPS Signals: InitialInvestigations,” poster presented at American Geophysical Union, Fall Meeting 2014, SanFrancisco, CA, 15–19 December 2014, abstract #SA13A–3971.
23. Shume E., A. Komjathy, R.B. Langley, O. Verkhoglyadova, M. Butala, and A. Man-nucci, “Intermediate Scale Plasma Density Irregularities in the Polar Ionosphere Inferredfrom Radio Occultation,” poster presented at American Geophysical Union, Fall Meeting2014, San Francisco, CA, 15–19 December 2014, abstract #SA13B–3987.
24. Butala. M. D., A. Komjathy, T. F. Runge, B. D. Wilson, X. Pi, and A. J. Man-nucci. Evaluating the Impact of GLONASS-Derived TEC Measurements on JPL GIMand JPL/USC GAIM, IGS Workshop 2014, June 23–27, Pasadena, California, USA.
157
Ionosphere Working Group
12 Theses and Dissertations 2014
Banville, S., Improved Convergence for GNSS Precise Point Positioning. Ph.D. disser-tation, Department of Geodesy and Geomatics Engineering, Technical Report No. 294,University of New Brunswick, Fredericton, New Brunswick, Canada, 269 pp.
13 Plan for activities in 2015
The following actions to be considered:
• Higher temporal resolution of IGS GIMs – 1 hour, combination conducted by UWMto be started as official/routine product (April 2015)
• Starting a new official/operational product – TEC fluctuation changes over NorthPole to study the dynamic of oval irregularities (carried out by UWM to be startedas official/routine product after performance evaluation period (Spring of 2015).
• The new IAAC from the Natural Resources Canada (NRCan) (Reza Ghoddousi–Fard, end of March 2015)
• Cooperation with IRI COSPAR group
Future improvements are determined by users’ requirements (number of users has signifi-cantly increased during the last 16 years).
References
Butala, M.D., A. Komjathy, T.F. Runge, B.D. Wilson, X. Pi, and A.J. Mannucci. Evaluat-ing the Impact of GLONASS-Derived TEC Measurements on JPL GIM and JPL/USCGAIM. IGS Workshop 2014, June 23-27, Pasadena, California, USA, 2014.
Cherniak, Iu., A. Krankowski, and I.E. Zakharenkova. Observation of the ionosphericirregularities over the Northern Hemisphere: Methodology and Service. Radio Science49:653–662, 2014b. DOI: 10.1002/2014RS005433.
Cherniak, Iu., I.E. Zakharenkova, and A. Krankowski. The approaches for the ionosphereirregularities modeling on the base of ROTI mapping. Earth, Planets and Space (EPS)66:165, 2014c. DOI:10.1186/s40623–014–0165–z
Dumont, J.P., V. Rosmorduc, N. Picot, E. Bronner, S. Desai, H. Bonekamp, J. Figa, J. Lil-libridge, R. Scharroo. OSTM/Jason–2 Products Handbook. Available online: http://www.ospo.noaa.gov/Products/documents/J2_handbook_v1-8_no_rev.pdf.
158
References
Hausman, J. and V. Zlotnicki. Sea State Bias in Radar Altimetry Revisited. MarineGeodesy, 33(S1):336-347, 2010. DOI: 10.1080/01490419.2010.487804.
Mannucci, A.J., B.D. WilsonD. N. Yuan, C.H. Ho, U.J. Lindqwister, T.F. Runge. A globalmapping technique for GPS-derived ionospheric total electron content measurements.Radio Science, 33(3):565-582, 1998.
Schaer, S., W. Gurtner, and J. Feltens. IONEX: The IONosphere Map EXchange FormatVersion 1. Proceedings of the IGS AC Workshop, Germany, February 9–11, 1998.
Tseng, K.-H., C.K. Shum, Y. Yi, C. Dai, H. Lee, D. Bilitza, A. Komjathy, C.Y. Kuo,J. Ping, and M. Schmidt. Regional Validation of Jason–2 Dual-Frequency IonosphereDelays. Marine Geodesy, 33(S1):272–284, 2010.
159

Ionosphere Working Group
160
Multi–GNSS Working GroupTechnical Report 2014
O. Montenbruck, P. Steigenberger
DLR, German Space Operations CenterOberpfaffenhofen82234 Wessling, GermanyE–mail: [email protected]
1 Introduction
The Multi–GNSS Working Group (MGWG) has been established by the IGS to build upexperience in the use of new satellite navigation systems and modernized signals. As partof this task, the MGWG coordinates the performance of the Multi–GNSS Experiment(MGEX) which comprises the build–up of a new network of sensor stations, the char-acterization of the user equipment and space segment, the development of new conceptsand data processing tools, and, finally, the generation of early data products. MGEX isconsidered as a preparatory step for a future multi–GNSS pilot service that will integratethe new constellations into the established IGS product and service portfolio. A list ofcurrent MGWG members and their respective contributions is given in Tab. 1.
2 Network
The MGEX network has continued to grow from approximately 90 stations at the begin-ning of 2014 to roughly 110 stations at the end of the year (Fig. 1). This has mainlybeen achieved through a large number of new stations contributed by Geoscience Aus-tralia (GA). These stations now offer a notably improved coverage of BeiDou and QZSStracking in the Asia–Pacific region. Roughly 70 stations of the MGEX network providemulti–GNSS real–time data streams that can be accessed through BKG’s MGEX caster(http://mgex.igs-ip.net/). About ten sites of the MGEX network are equipped withhydrogen maser clocks that offer access to a highly–stable time scale for GNSS systemcharacterization as well as orbit and clock product generation.
161
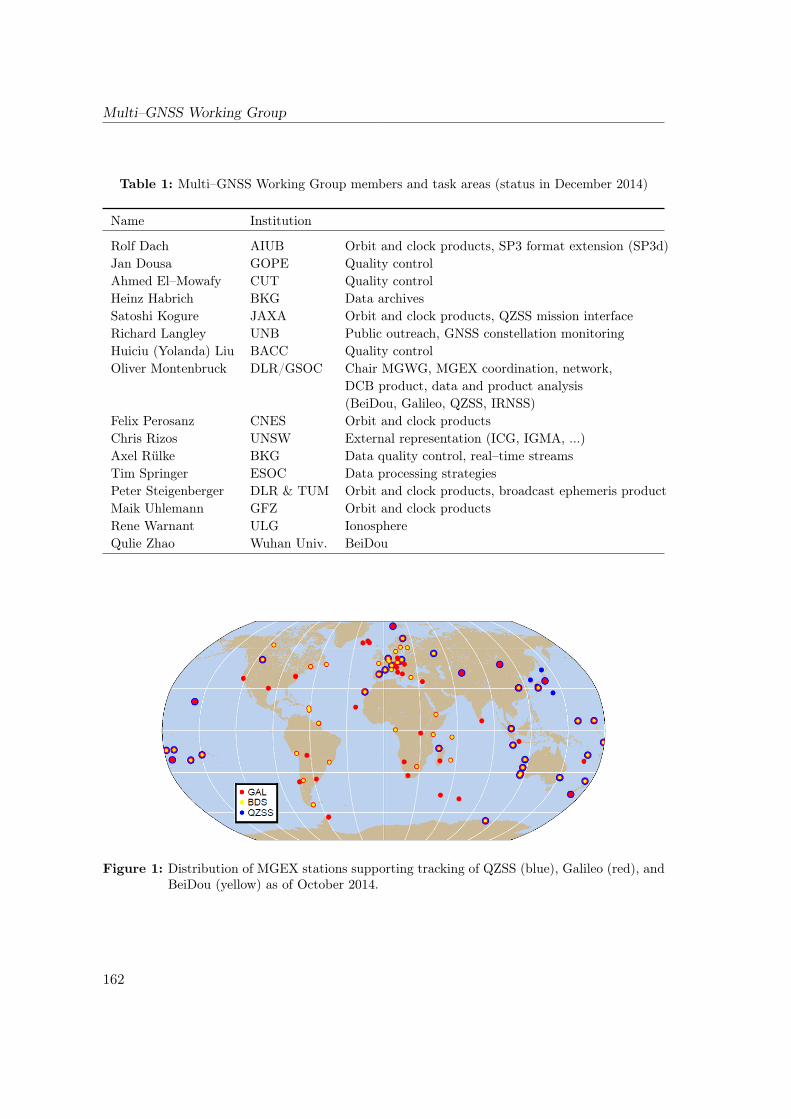
Multi–GNSS Working Group
Table 1: Multi–GNSS Working Group members and task areas (status in December 2014)
Name Institution
Rolf Dach AIUB Orbit and clock products, SP3 format extension (SP3d)Jan Dousa GOPE Quality controlAhmed El–Mowafy CUT Quality controlHeinz Habrich BKG Data archivesSatoshi Kogure JAXA Orbit and clock products, QZSS mission interfaceRichard Langley UNB Public outreach, GNSS constellation monitoringHuiciu (Yolanda) Liu BACC Quality controlOliver Montenbruck DLR/GSOC Chair MGWG, MGEX coordination, network,
DCB product, data and product analysis(BeiDou, Galileo, QZSS, IRNSS)
Felix Perosanz CNES Orbit and clock productsChris Rizos UNSW External representation (ICG, IGMA, ...)Axel Rülke BKG Data quality control, real–time streamsTim Springer ESOC Data processing strategiesPeter Steigenberger DLR & TUM Orbit and clock products, broadcast ephemeris productMaik Uhlemann GFZ Orbit and clock productsRene Warnant ULG IonosphereQulie Zhao Wuhan Univ. BeiDou
Figure 1: Distribution of MGEX stations supporting tracking of QZSS (blue), Galileo (red), andBeiDou (yellow) as of October 2014.
162
3 Products
Despite rapid progress in the deployment of the new Indian Regional Navigation SatelliteSystem (IRNSS), none of the MGEX stations is presently hosting IRNSS–capable receivers.Further efforts need to be made to deploy such receivers as a prerequisite for familiarizationwith this system and for the generation of early IRNSS products.
To avoid a divergence of MGEX and legacy–IGS data holdings, a RINEX 3 transition planhas been prepared under the lead of the IGS Infrastructure Committee (IC) and releasedby the IGS Governing Board (GB) in December 2014. The transition plan provides theframework for migrating to RINEX–3 as the primary data format and the use of RINEX–3–style long file names, while making provisions (e.g. converters) to support the old RINEX 2format for stations and/or analysis centers that are not able to adapt to the new standards.Implementation of the transition plan is foreseen for 2015, after which a harmonized IGSdata archive with full multi–GNSS support will be available.
For quality control (QC) of multi–GNSS RINEX 3 files, various tools have been preparedwithin the frame of the “quality control task force”. These tools, which were presentedat the IGS Workshop (Rülke et al. 2014), include Anubis (developed by the GeodeticObservatory Pecny), BQC (developed by the Beijing Aerospace Control Center) and theBNC tool of BKG. Selected QC analyses have, furthermore, been conducted by CurtinUniversity (El-Mowafy 2014a, b, 2015a, b).
3 Products
Precise orbit and clock products supporting various subsets of old and new GNSSs arecontributed by various MGEX analysis centers (ACs) including AIUB, CNES/CLS, GFZ,JAXA, TUM, and Wuhan University. Supported constellations include Galileo, QZSS,and, since early 2014 also BeiDou. No IRNSS support is available, though, due to the lackof corresponding GNSS monitoring stations.
For Galileo IOV, a good internal consistency of solutions from different ACs has beendemonstrated (Prange et al. 2014a; Steigenberger et al. 2014b). Day–boundary overlaps,orbit fits and comparisons between ACs demonstrate a precision of about 10 cm for orbitproducts based on 3–day data arcs. However, systematic errors of up to ±20 cm can beclearly recognized from satellite laser ranging measurements as well as clock analyses. Dueto the exceptional stability of the hydrogen masers operated by most of the IOV satel-lites, radial orbit determination errors can be recognized from periodic variations in theestimated clock offsets. These radial errors, which affected all solutions in the same man-ner, could ultimately be traced to the use of a standalone CODE solar radiation pressure(SRP) model. While highly successful for GPS satellites with near–cubic satellite bodies,the original CODE model with one–per–rev parameters is unable to fully account for theradiation pressure of a stretched cuboid. Use of a dedicated a priori model (Montenbrucket al. 2014e) was found to remove the orbit–periodic errors in the Galileo orbit determi-nation and result in a reduction of peak errors by up to a factor of four. As an alternative
163
Multi–GNSS Working Group
to the cuboid a priori model, the consideration of twice–per–rev terms in an extendedversion of the CODE model has been proposed by AIUB to mitigate SRP induced orbitmodeling errors. As part of the MGEX AC coordination, efforts will be made to arriveat a harmonized, or at least consistent, formulation of SRP perturbations in the Galileoorbit modeling.
For QZSS, orbit and clock products continue to be delivered by JAXA and TUM. Dif-ferences between the two products amount to roughly 1.3 m (3D rms; Steigenberger andKogure 2014). An improved agreement is usually obtained during periods of yaw–steeringattitude, while a moderate degradation can be observed in orbit–normal mode. Consistentmodeling of these attitude modes as well as the associated solar radiation pressure effectshas been identified as a prerequisite for further improvements of the orbit quality.
For BeiDou precise orbit and clock products are routinely generated and distributed byWuhan University and GFZ since early 2014 based on data of the MGEX network (Denget al. 2014). In addition, past data of Wuhan University have been made available for2013. As of mid–2014, roughly 50 stations of the MGEX network contributed BeiDouobservations, however, many of these stations are outside the visibility range of the satel-lites in inclined geosynchronous orbit (IGSO) and geostationary orbit (GEO) and support“only” orbit determination of satellites in medium altitude Earth orbit (MEO). For theMEO and IGSO orbits a consistency at the few–decimeter level is achieved for the GFZand Wuhan University orbit products (Fig. 2). For GEO satellites, in contrast, substan-tially larger errors at the 1 to 10 m level are encountered. In particular, the along–trackcomponent is difficult to determine due to the static viewing geometry of these satellites.As a possible means to cope with these problems, the combined processing of GNSS andSLR observations has been suggested, but no practical experience has been gained sofar.
As a contribution to improved BDS orbit determination, phase center offsets and variationsfor the BeiDou MEO and IGSO satellites have been estimated by ESOC from MGEX ob-servations (Dilssner et al. 2014). Use of theses corrections for routine orbit determinationand product generation is presently under consideration by the MGEX ACs.
Complementary to the precise orbit and clock products, TUM & DLR continue to providedaily multi–GNSS broadcast ephemeris files for GPS, GLONASS, Galileo, BeiDou, QZSS,and Satellite Based Augmentation Systems (SBAS). Continued efforts are made to fur-ther improve the consistency of this product and to cope with receiver/firmware specificdiscrepancies in the decoded ephemerides of different stations. A systematic performancecomparison of broadcast versus precise ephemerides for legacy and new constellations hasbeen presented in Montenbruck et al. 2014e.
Finally, a multi–GNSS differential code bias (DCB) product covering all observed signalsand tracking modes of GPS, GLONASS, Galileo, and BeiDou is provided by DLR foruse within the MGEX project. The DCBs are based on daily averages of ionosphere–corrected pseudorange observations (Montenbruck et al. 2014b) and include both satellite
164
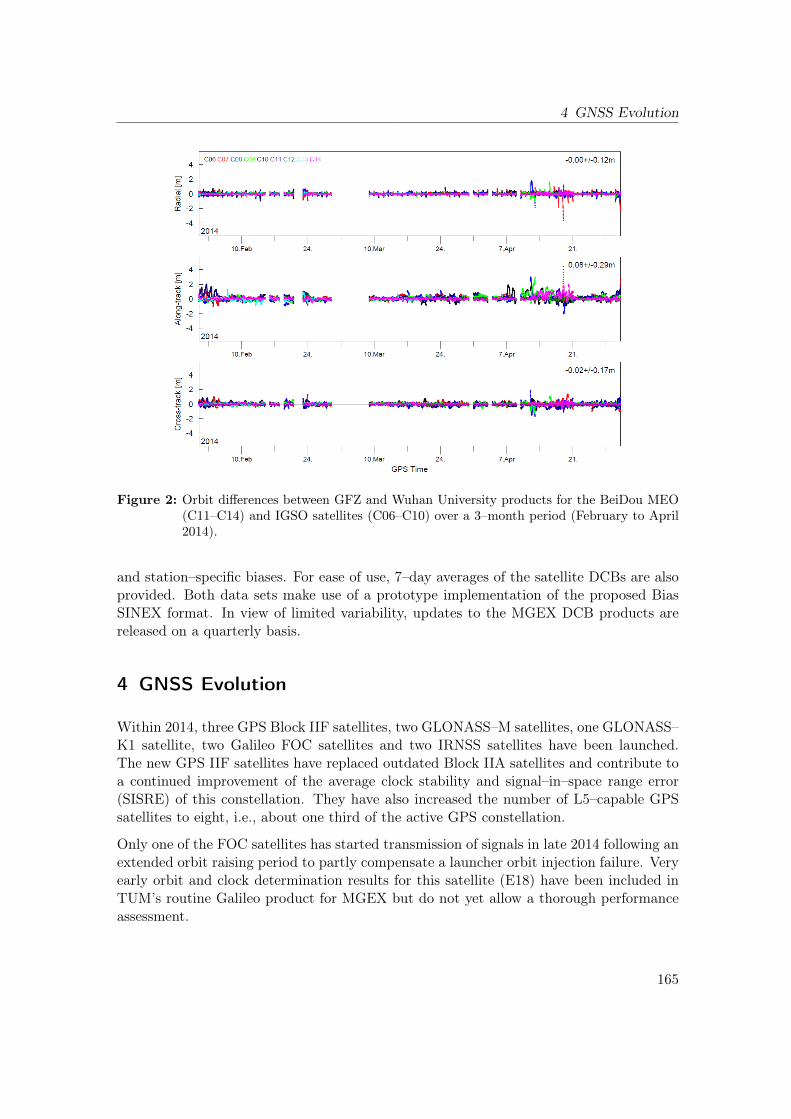
4 GNSS Evolution
Figure 2: Orbit differences between GFZ and Wuhan University products for the BeiDou MEO(C11–C14) and IGSO satellites (C06–C10) over a 3–month period (February to April2014).
and station–specific biases. For ease of use, 7–day averages of the satellite DCBs are alsoprovided. Both data sets make use of a prototype implementation of the proposed BiasSINEX format. In view of limited variability, updates to the MGEX DCB products arereleased on a quarterly basis.
4 GNSS Evolution
Within 2014, three GPS Block IIF satellites, two GLONASS–M satellites, one GLONASS–K1 satellite, two Galileo FOC satellites and two IRNSS satellites have been launched.The new GPS IIF satellites have replaced outdated Block IIA satellites and contribute toa continued improvement of the average clock stability and signal–in–space range error(SISRE) of this constellation. They have also increased the number of L5–capable GPSsatellites to eight, i.e., about one third of the active GPS constellation.
Only one of the FOC satellites has started transmission of signals in late 2014 following anextended orbit raising period to partly compensate a launcher orbit injection failure. Veryearly orbit and clock determination results for this satellite (E18) have been included inTUM’s routine Galileo product for MGEX but do not yet allow a thorough performanceassessment.
165
Multi–GNSS Working Group
Despite the release of a first open service signal ICD for IRNSS, no public GNSS obser-vations are presently available for this constellation. Orbit determination is thus limitedto satellite laser ranging measurements. Analyses of Montenbruck et al. 2015 indicate aSISRE of the IRNSS navigation message of several meters, which is mostly consistent withthe broadcast user range accuracy.
In late April 2014, the GPS control segment has started the routine generation and trans-mission of CNAV messages by most of the GPS Block IIR–M and IIF satellites. Theseoffer a better continuity than the legacy LNAV message, but can only achieve an equalor better SISRE performance when uploaded on a daily basis (Steigenberger et al. 2015).Such daily uploads are routinely performed from the beginning of 2015 onwards. Com-bined CNAV/LNAV ephemerides files including GPS and QZSS are provided by TUM &DLR. They are based on a subset of 10 stations of the MGEX network and updated on adaily basis.
5 Standardization
The Multi–GNSS WG has contributed to further evolve the RINEX 3 standard in closeinteraction with other IGS working groups. Among others, a proposal for the incorporationof IRNSS observation data and navigation messages has be developed, which is underreview for the upcoming 3.03 version of RINEX.
For the modeling of antenna phase center offsets and variations an agreement has beenreached by the MGWG and the Antenna WG, to harmonize the axis convention of thesatellite body frame (+z in boresight direction, ±y–axis along solar panel rotation axis) forold and new constellations. Where applicable, the positive x–axis is chosen in such a waythat the +x panel is sunlit during nominal yaw steering. A dedicated report identifying thespacecraft axis in manufacturer and IGS convention and providing antenna and reflectorcoordinates is under preparation and shall be released in the first quarter of 2015 alongwith a new multi–GNSS ANTEX file.
6 Public Outreach
The MGEX website (http://igs.org/mgex) has been migrated to the new IGS webportal and is now presented in a new layout. While efforts continue to provide up–to–date information to all MGEX users, frequent updates of the web pages can no longer besupported due to the introduction of a new contents management system and the shortageof IGS Central Bureau staff.
Achievements of the MGEX project have been advertised in various overview papersand magazine articles (Montenbruck et al. 2014g, h) as well as numerous conference and
166
References
workshop presentations (including Asia–Oceania Regional Workshop on GNSS, Phuket;COSPAR, Moscow; CSNC, Nanjing; EGU, Vienna; ENC, Rotterdam; EUREF, Vilnius;FIG Congress, Kuala Lumpur; Geodätische Woche, Berlin; IEEE Workshop on Asia–Pacific Satellite Navigation and Positioning, Brisbane; PNT, Washington; REFAG, Lux-embourg). Most notably, the achievements and status of the MGEX project were high-lighted in numerous presentations of MGWG members during the IGS Workshop inPasadena.
Acronyms and Abbreviations
AIUB Astronomisches Institut der Unversität BernBACC Beijing Aerospace Control CenterBKG Bundesamt für Kartographie und GeodäsieCLS Collecte Localisation SatellitesCNES Centre National d’Etudes SpatialesCONGO Cooperative Network for GNSS ObservationCUT Curtin University of TechnologyDLR Deutsches Zentrum für Luft– und RaumfahrtESA European Space AgencyESOC European Space Operations CenterGA Geoscience AustraliaGFZ Deutsches GeoForschungsZentrumGOPE Geodetic Observatory PecnýGSOC German Space Operations CenterIAPG Institute of Astronomical and Physical GeodesyJAXA Japan Aerospace Exploration AgencyMGM–net Multi–GNSS Monitoring NetworkREGINA REseau GNSS pour l’IGS et la NavigationRTCM Radio Technical Commission for Maritime ServicesTUD TU DelftTUM Technische Universität MünchenULG Université de LiègeUNB University of New BrunswickUNSW University of New South Wales
References
Arnold, D., R. Dach, G. Beutler, S. Schaer, M. Meindl, S. Lutz, K. Sosnica, and A. Jäggi.Impact of GNSS Orbit Modelling on Reference Frame Parameters. IAG Commission1 Symposium 2014: Reference Frames for Applications in Geosciences, REFAG 2014,Luxembourg, 2014.
167
Multi–GNSS Working Group
Beutler, G., R. Dach, U. Hugentobler, O. Montenbruck, G. Weber, and E. Brockmann.GLONASS April – What Went Wrong? GPS World, 25(7):14–16, 2014a.
Beutler, G., R. Dach, O. Montenbruck, U. Hugentobler, G. Weber, and E. Brockmann.GLONASS and Multi–GNSS in the IGS: Lessons learned from GLONASS ServiceDisruptions. 13th Meeting of the National Space–Based Positioning, Navigation, andTiming (PNT) Advisory Board, 3–4 June 2014, Washington DC, 2014b.
Beutler, G., R. Dach, O. Montenbruck, U. Hugentobler, and G. Weber. Multi–GNSS andReal–time Service in the IGS. 13th Meeting of the National Space–Based Positioning,Navigation, and Timing (PNT) Advisory Board, 3–4 June 2014, Washington DC,2014c.
Dach, R., O. Montenbruck, and L. Prange. Status of the IGS–MGEX Project. EUREFSymposium – EUREF 2014, 3–7 June 2014, Vilnius, Lithuania, 2014.
Deng, Z., Q. Zhao, T. Springer, L. Prange, and M. Uhlemann. Orbit and Clock Determi-nation – BeiDou. IGS Workshop 2014, 23–27 June 2014, Pasadena, CA, 2014.
Dilssner, F., T. Springer, E. Schönemann, W. Enderle. Estimation of Satellite An-tenna Phase Center Corrections for BeiDou. IGS Workshop 2014, 23–27 June 2014,Pasadena, CA, 2014.
El-Mowafy, A. GNSS Multi–frequency Receiver Single–Satellite Measurement ValidationMethod. GPS Solutions, 18(4):553–561, 2014a. DOI 10.1007/s10291–013–0352–6.
El.Mowafy A. Quality Monitoring of BeiDou GEO/IGSO/MEO Satellite ObservationsIEEE Workshop on Asia–Pacific Satellite Navigation and Positioning, 27–28 February,Brisbane, QLD, 2014b.
El-Mowafy, A. and C. Hu. Validation of BeiDou Observations. Journal of Geodesy, 8(2):155–168, 2014. DOI 10.1515/jag–2013–0027
El-Mowafy, A. Diagnostic Tools Using a Multi–Constellation Single–Receiver Single–Satellite Data Validation Method. Journal of Navigation, 68(1):196–214, 2015a. DOI10.1017/S0373463314000526.
El-Mowafy, A. Estimation of Multi–Constellation GNSS Observation Stochastic PropertiesUsing a Single–Receiver Data Validation Method. Survey Review, 47(341):99–108,2015b. DOI 10.1179/1752270614Y.0000000100.
Hugentobler, U., O. Montenbruck, and P. Steigenberger. Radiation Pressure Modelling forPrecise Orbit Determination of the Galileo IOV Satellites. 40th COSPAR ScientificAssembly, 2–10 Aug. 2014, Moscow, 2014.
Liu, H., G. Tang, D. Imparato, H. Cui, B. Song, and C. Rizos. New Multi–GNSS DataQuality Checking Toolkit. European Navigation Conference, April 2014, Rotterdam,2014.
168
References
Montenbruck, O.. Preparing for the Future – The IGS in a Multi–GNSS World. IGSWorkshop 2014, 23–27 June 2014, Pasadena, CA, 2014a.
Montenbruck, O.. The IGS Multi–GNSS Experiment (MGEX). IGS Workshop 2014,23–27 June 2014, Pasadena, CA, 2014b.
Montenbruck, O., Multi-GNSS Biases. IGS Workshop 2014, 23–27 June 2014, Pasadena,CA, 2014c.
Montenbruck, O., A. Hauschild, and P. Steigenberger. Differential Code Bias Estimationusing Multi–GNSS Observations and Global Ionosphere Maps. ION InternationalTechnical Meeting, Jan. 2014, San Diego, 2014a.
Montenbruck, O., A. Hauschild, and P. Steigenberger. Differential Code Bias Estimationusing Multi–GNSS Observations and Global Ionosphere Maps. Journal of the ION,61(3):191–201, 2014b. DOI 10.1002/navi.64.
Montenbruck, O., U. Hugentobler, and P. Steigenberger. Recent Progress of the IGSMulti–GNSS Experiment (MGEX). China Satellite Navigation Conference, CSNC2014, May, Nanjiing, China, 2014c.
Montenbruck, O., P. Steigenberger, and A. Hauschild. Differential Code Bias Estimationfor New Signals and Constellations. IGS Workshop 2014, June 2014, Pasadena, CA,2014d.
Montenbruck O. Steigenberger P., Hauschild A. Broadcast vs. Precise Ephemerides: aMulti–GNSS Perspective. GPS Solutions, 19(2):321–333, 2014e. DOI 10.1007/s10291–014–0390–8.
Montenbruck, O., P. Steigenberger, and U. Hugentobler. Enhanced Solar Radiation Pres-sure Modeling for Galileo Satellites. Journal of Geodesy, 89(3):283–297, 2014f. DOI10.1007/s00190–014–0774–0.
Montenbruck, O., P. Steigenberger, R. Khachikyan, G. Weber, R.B. Langley, L. Mervart,and U. Hugentobler. IGS–MGEX: Preparing the Ground for Multi–ConstellationGNSS Science. Inside GNSS, 9(1):42–49, 2014g.
Montenbruck, O., P. Steigenberger, R. Khachikyan, G. Weber, R.B. Langley, L. Mervart,U. Hugentobler. IGS–MGEX, on prépare le terrain pour les sciences et techniquesGNSS multi–constellation. XYZ, 140:35–42, 2014h.
Montenbruck, O., P. Steigenberger, and S. Riley. Orbit Determination and BroadcastEphemeris Assessment. ION International Technical Meeting, 26–28 Jan. 2015, DanaPoint, CA, 2015.
Nadarajah, N., P. Teunissen, J.M. Sleewaegen, and O. Montenbruck. The Mixed–ReceiverBeiDou Inter–Satellite–Type Bias and its Impact on RTK Positioning. GPS Solutions,2014. DOI 10.1007/s10291–014–0392–6.
169
Multi–GNSS Working Group
Prange, L., R. Dach, S. Lutz, and S. Schaer. IGS–related multi–GNSS activities at CODE.ENC–GNSS 2014, Rotterdam, 15–17 April 2014, The Netherlands, 2014a.
Prange, L., P. Steigenberger, M. Uhlemann, S. Loyer, and T. Springer. Orbit and ClockDetermination – Galileo. IGS Workshop, 23–27 June 2014, Pasadena, CA, 2014b.
Rizos, C.. Multi–GNSS Measurement Biases: How the IGS’s MGEX Can Address SuchChallenges. IEEEWorkshop on Asia–Pacific Satellite Navigation & Positioning, 26–28February 2014, Brisbane, Australia, 2014a.
Rizos, C.. The IGS in a Multi–GNSS World. XXVth FIG Congress, 16–21 June 2014,Kuala Lumpur, Malaysia, 2014b.
Rizos, C.. Activities in Multi–GNSS and Real–Time Service. 6th Asia–Oceania RegionalWorkshop on GNSS, 9–11 October 2014, Phuket, Thailand, 2014c.
Rizos, C. and R.E. Neilan. The IGS in its 20th Anniversary Year: New GNSS ActivitiesRelated to MGEX and the Real–Time Service. 9th Meeting of the UN’s InternationalCommittee on GNSS (ICG), 9–14 November 2014, Prague, Czech Republic, 2014.
Rülke A., B. Garayt , J. Dousa, C. Noll, H. Habrich, P. Neumaier, P. Vaclavovic. MGEXnetwork and observation data. IGS Workshop, 23–27 June 2014, Pasadena, CA, 2014.
Steigenberger, P. and S. Kogure. Orbit and Clock Determination. IGS Workshop 2014,June 2014, Pasadena, CA, 2014a.
Steigenberger, P., U. Hugentobler, S. Loyer, F. Perosanz, L. Prange, R. Dach, M. Uhle-mann, G. Gendt, and O. Montenbruck. Galileo Orbit and Clock Quality of the IGSMulti–GNSS Experiment. Advances in Space Research, 55 (1):269–281, 2015. DOI10.1016/j.asr.2014.06.030
Steigenberger, P., O. Montenbruck, and U. Hugentobler. GIOVE–B Solar Radiation Pres-sure Modeling for Precise Orbit Determination. Advances in Space Research, 2014b.DOI 10.1016/j.asr.2014.12.009.
Steigenberger, P., O. Montenbruck, and U. Hessels. Performance Evaluation of the EarlyCNAV Navigation Message. ION International Technical Meeting, 26–28 Jan. 2015,Dana Point, CA, 2015.
Uhlemann, M. and M. Fritsche. Multi–GNSS Orbit and Clock Products of the GFZAnalysis Centre. Geodätische Woche, 7–9 October 2014, Berlin, Germany, 2014.
White, R. and R.B. Langley. Assessing the Preliminary Performance Impact of IncludingGalileo Observables into a Precise Point Positioning Processing Scheme. IGS Work-shop, 23–27 June 2014, Pasadena, CA, 2014.
170
Real–Time ServiceTechnical Report 2014
Loukis Agrotis1, Mark Caissy2,Axel Ruelke3, Steve Fisher4
1 ESA/ESOC2 Natural Resources Canada3 BKG4 NASA/Jet Propulsion Laboratory
1 Introduction
The International GNSS Service (IGS) Real-time Service is a GNSS orbit and clock cor-rection service that enables precise point positioning (PPP) at worldwide scales. TheRTS products enable applications such as scientific testing, geophysical monitoring, haz-ard detection and warning, weather forecasting, time synchronization, GNSS constellationmonitoring, imagery control and many other public-benefit applications.
The RTS is made possible through partnerships with Natural Resources Canada (NRCan),the German Federal Agency for Cartography and Geodesy (BKG), and the EuropeanSpace Agency’s Space Operations Center in Darmstadt, Germany (ESA/ESOC). Supportis provided by 160 station operators, multiple data centers, and 10 analysis centers aroundthe world. The service has been available since April 2013, after transitioning from ahighly successful Pilot Project which allowed the development, prototyping and testing ofthe different elements of the Real Time infrastructure.
The International GNSS Service (IGS) has ensured open access, high–quality GNSS dataproducts since 1994. These products enable access to the definitive global reference framefor scientific, educational, and commercial applications – a tremendous benefit to thepublic. Through the Real-time Service (RTS), the IGS extends its capability to supportapplications requiring real-time access to IGS products.
171
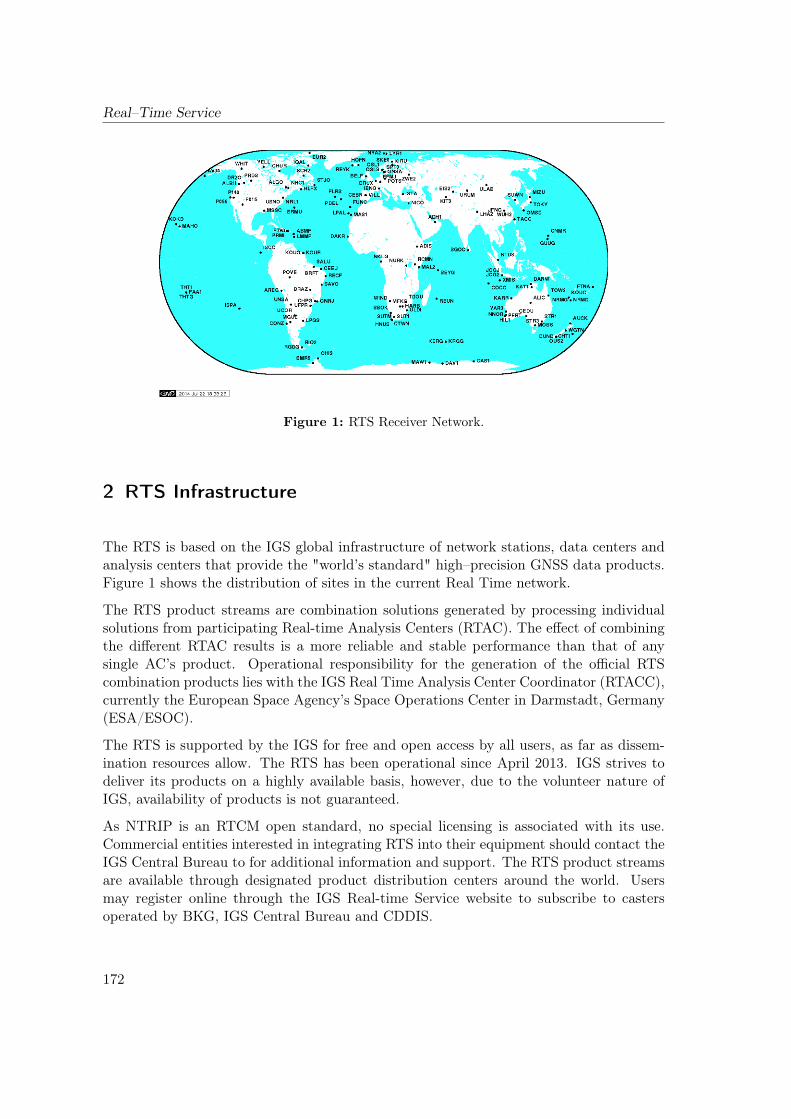
Real–Time Service
Figure 1: RTS Receiver Network.
2 RTS Infrastructure
The RTS is based on the IGS global infrastructure of network stations, data centers andanalysis centers that provide the "world’s standard" high–precision GNSS data products.Figure 1 shows the distribution of sites in the current Real Time network.
The RTS product streams are combination solutions generated by processing individualsolutions from participating Real-time Analysis Centers (RTAC). The effect of combiningthe different RTAC results is a more reliable and stable performance than that of anysingle AC’s product. Operational responsibility for the generation of the official RTScombination products lies with the IGS Real Time Analysis Center Coordinator (RTACC),currently the European Space Agency’s Space Operations Center in Darmstadt, Germany(ESA/ESOC).
The RTS is supported by the IGS for free and open access by all users, as far as dissem-ination resources allow. The RTS has been operational since April 2013. IGS strives todeliver its products on a highly available basis, however, due to the volunteer nature ofIGS, availability of products is not guaranteed.
As NTRIP is an RTCM open standard, no special licensing is associated with its use.Commercial entities interested in integrating RTS into their equipment should contact theIGS Central Bureau to for additional information and support. The RTS product streamsare available through designated product distribution centers around the world. Usersmay register online through the IGS Real-time Service website to subscribe to castersoperated by BKG, IGS Central Bureau and CDDIS.
172
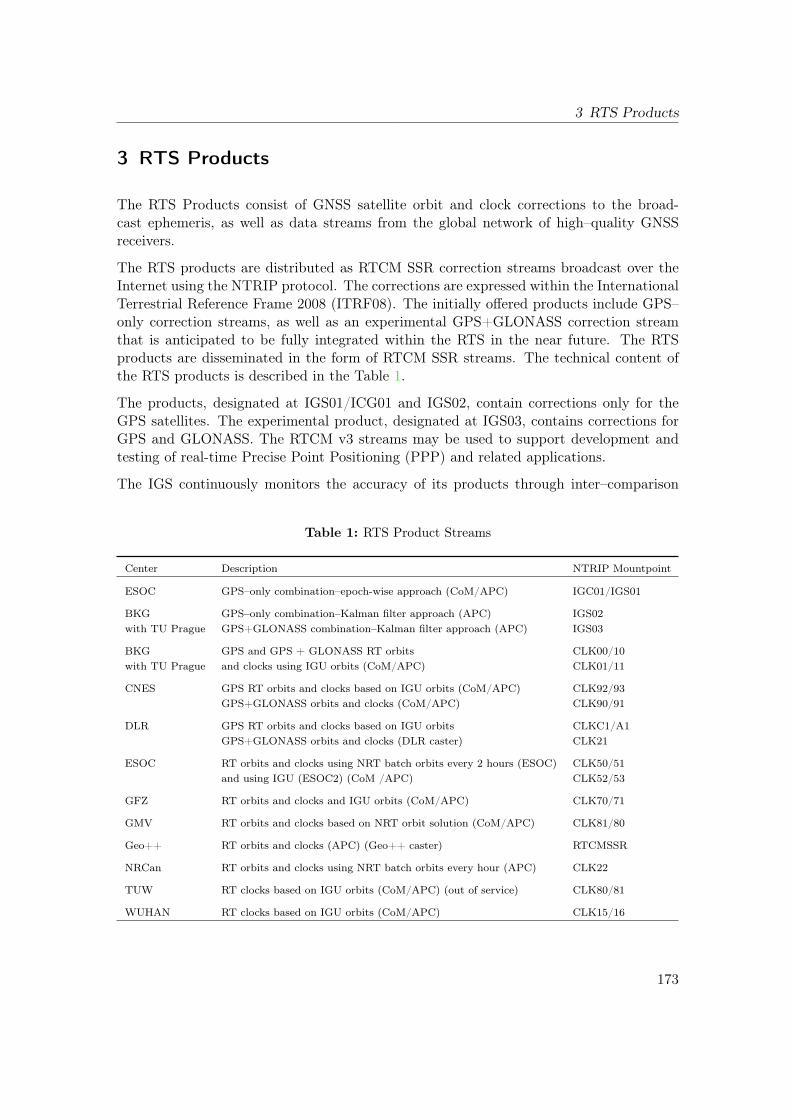
3 RTS Products
3 RTS Products
The RTS Products consist of GNSS satellite orbit and clock corrections to the broad-cast ephemeris, as well as data streams from the global network of high–quality GNSSreceivers.
The RTS products are distributed as RTCM SSR correction streams broadcast over theInternet using the NTRIP protocol. The corrections are expressed within the InternationalTerrestrial Reference Frame 2008 (ITRF08). The initially offered products include GPS–only correction streams, as well as an experimental GPS+GLONASS correction streamthat is anticipated to be fully integrated within the RTS in the near future. The RTSproducts are disseminated in the form of RTCM SSR streams. The technical content ofthe RTS products is described in the Table 1.
The products, designated at IGS01/ICG01 and IGS02, contain corrections only for theGPS satellites. The experimental product, designated at IGS03, contains corrections forGPS and GLONASS. The RTCM v3 streams may be used to support development andtesting of real-time Precise Point Positioning (PPP) and related applications.
The IGS continuously monitors the accuracy of its products through inter–comparison
Table 1: RTS Product Streams
Center Description NTRIP Mountpoint
ESOC GPS–only combination–epoch-wise approach (CoM/APC) IGC01/IGS01
BKG GPS–only combination–Kalman filter approach (APC) IGS02with TU Prague GPS+GLONASS combination–Kalman filter approach (APC) IGS03
BKG GPS and GPS + GLONASS RT orbits CLK00/10with TU Prague and clocks using IGU orbits (CoM/APC) CLK01/11
CNES GPS RT orbits and clocks based on IGU orbits (CoM/APC) CLK92/93GPS+GLONASS orbits and clocks (CoM/APC) CLK90/91
DLR GPS RT orbits and clocks based on IGU orbits CLKC1/A1GPS+GLONASS orbits and clocks (DLR caster) CLK21
ESOC RT orbits and clocks using NRT batch orbits every 2 hours (ESOC) CLK50/51and using IGU (ESOC2) (CoM /APC) CLK52/53
GFZ RT orbits and clocks and IGU orbits (CoM/APC) CLK70/71
GMV RT orbits and clocks based on NRT orbit solution (CoM/APC) CLK81/80
Geo++ RT orbits and clocks (APC) (Geo++ caster) RTCMSSR
NRCan RT orbits and clocks using NRT batch orbits every hour (APC) CLK22
TUW RT clocks based on IGU orbits (CoM/APC) (out of service) CLK80/81
WUHAN RT clocks based on IGU orbits (CoM/APC) CLK15/16
173
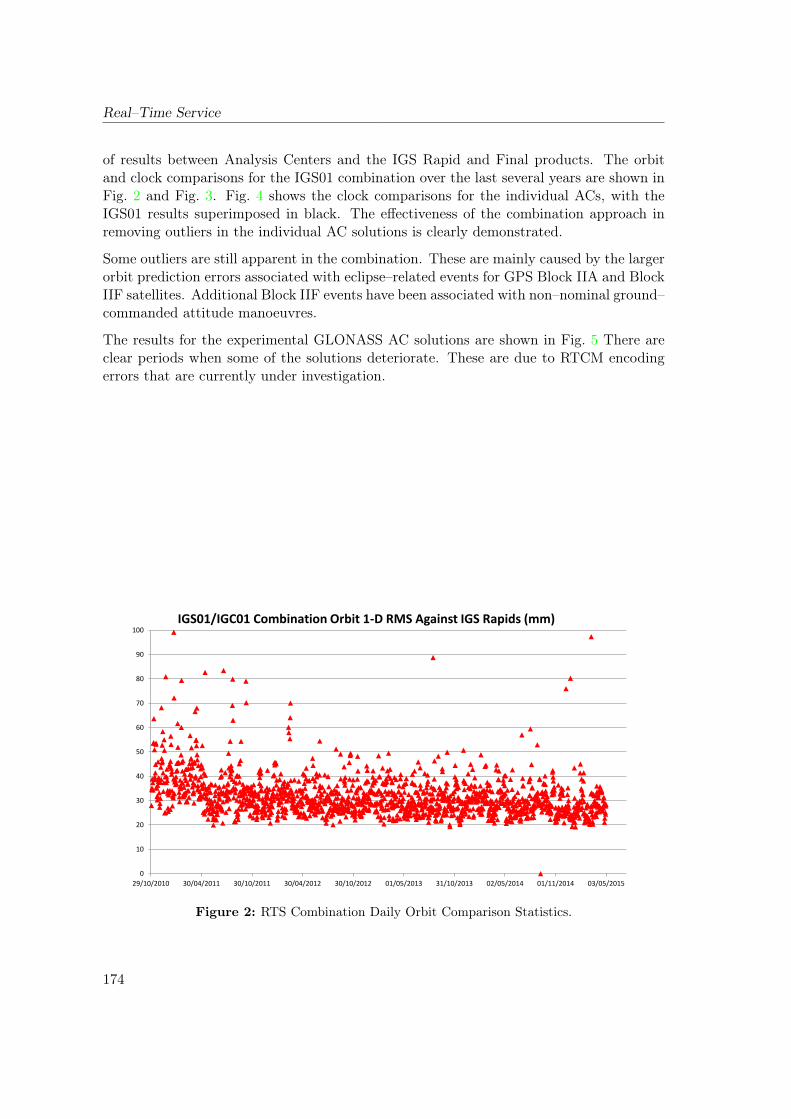
Real–Time Service
of results between Analysis Centers and the IGS Rapid and Final products. The orbitand clock comparisons for the IGS01 combination over the last several years are shown inFig. 2 and Fig. 3. Fig. 4 shows the clock comparisons for the individual ACs, with theIGS01 results superimposed in black. The effectiveness of the combination approach inremoving outliers in the individual AC solutions is clearly demonstrated.
Some outliers are still apparent in the combination. These are mainly caused by the largerorbit prediction errors associated with eclipse–related events for GPS Block IIA and BlockIIF satellites. Additional Block IIF events have been associated with non–nominal ground–commanded attitude manoeuvres.
The results for the experimental GLONASS AC solutions are shown in Fig. 5 There areclear periods when some of the solutions deteriorate. These are due to RTCM encodingerrors that are currently under investigation.
0
10
20
30
40
50
60
70
80
90
100
29/10/2010 30/04/2011 30/10/2011 30/04/2012 30/10/2012 01/05/2013 31/10/2013 02/05/2014 01/11/2014 03/05/2015
IGS01/IGC01 Combination Orbit 1-D RMS Against IGS Rapids (mm)
Figure 2: RTS Combination Daily Orbit Comparison Statistics.
174
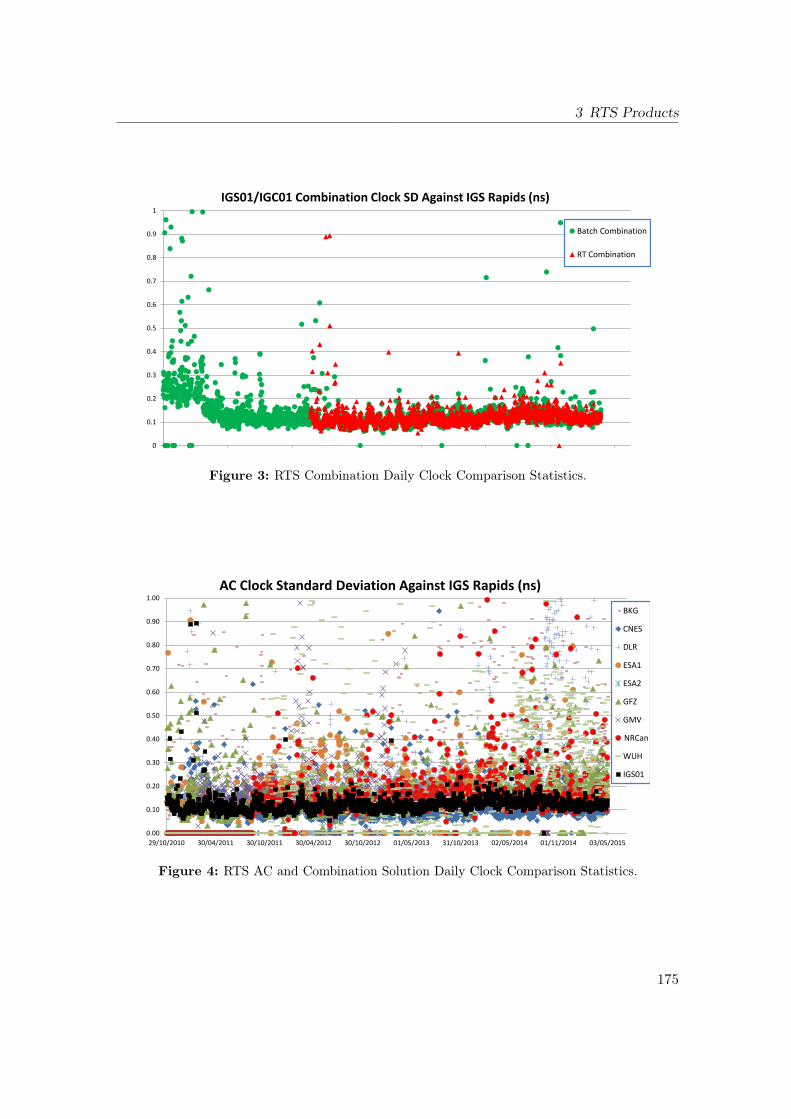
3 RTS Products
0
0.1
0.2
0.3
0.4
0.5
0.6
0.7
0.8
0.9
1
20/07/2008 20/07/2009 20/07/2010 20/07/2011 19/07/2012 19/07/2013 19/07/2014 19/07/2015
IGS01/IGC01 Combination Clock SD Against IGS Rapids (ns)
Batch Combination
RT Combination
Figure 3: RTS Combination Daily Clock Comparison Statistics.
0.00
0.10
0.20
0.30
0.40
0.50
0.60
0.70
0.80
0.90
1.00
29/10/2010 30/04/2011 30/10/2011 30/04/2012 30/10/2012 01/05/2013 31/10/2013 02/05/2014 01/11/2014 03/05/2015
AC Clock Standard Deviation Against IGS Rapids (ns)
BKG
CNES
DLR
ESA1
ESA2
GFZ
GMV
NRCan
WUH
IGS01
Figure 4: RTS AC and Combination Solution Daily Clock Comparison Statistics.
175
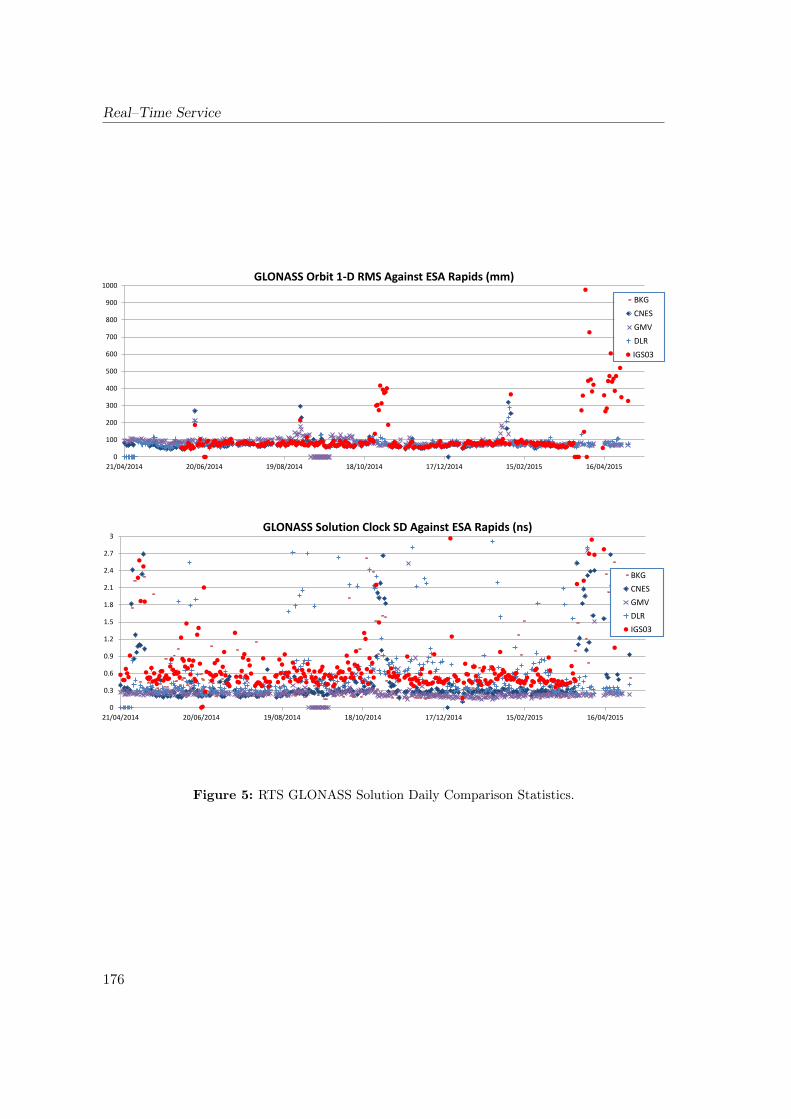
Real–Time Service
0
100
200
300
400
500
600
700
800
900
1000
21/04/2014 20/06/2014 19/08/2014 18/10/2014 17/12/2014 15/02/2015 16/04/2015
GLONASS Orbit 1-D RMS Against ESA Rapids (mm)
BKG
CNES
GMV
DLR
IGS03
21/04/2014 20/06/2014 19/08/2014 18/10/2014 17/12/2014 15/02/2015 16/04/2015
0
0.3
0.6
0.9
1.2
1.5
1.8
2.1
2.4
2.7
3
21/04/2014 20/06/2014 19/08/2014 18/10/2014 17/12/2014 15/02/2015 16/04/2015
GLONASS Solution Clock SD Against ESA Rapids (ns)
BKG
CNES
GMV
DLR
IGS03
Figure 5: RTS GLONASS Solution Daily Comparison Statistics.
176
4 References
4 References
Caissy, M., L. Agrotis. The IGS Real–Time Service. IGS Workshop, Pasadena, California,June 2014.
Caissy, M., L. Agrotis, G. Weber, M. Hernandez–Pajares, U. Hugentobler. The Interna-tional GNSS Real–Time Service. (2012, June) GPS World, pp. 52–58.
Agrotis, L., M. Caissy, G. Weber, M. Ge, K. MacLeod, M. Hernandez–Pajares. IGS Real–time Infrastructure: From Pilot Project to Operational Service, presented at PPP–RTKand Open Standards Symposium, Frankfurt, March 2012.
Caissy, M., L. Agrotis. Real–Time Working Group and Real–Time Pilot Project, IGS2011 Technical Report (http://igscb.jpl.nasa.gov/overview/pubs.html).
Caissy, M., G. Weber, L. Agrotis, G. Wübena, M. Hernandez–Pajares. The IGS Real–timePilot Project–The Development of Real-time IGS Correction Products for Precise PointPositioning, presented at EGU, Vienna, April 2011.
Weber, G., L. Mervart, L. Agrotis, A. Stürze. Real–time Combination of GNSS Orbit andClock Correctors for Precise Point Positioning presented at IUGG/IAG General Assembly,Melbourne, July 2011.
Agrotis, L., P. Alfaro Sanz, J. Dow, R. Zandbergen, D. Svehla, A. Ballereau. ESOC’sRETINA System and the Generation of the IGS RT Combination, IGS Workshop, New-castle, June 2010.
Weber, G. and L. Mervart. Real–time Combination of GNSS Orbit and Clock CorrectionStreams Using a Kalman Filter Approach, ION GNSS, 2010.
Weber, G., D. Dettmering, H. Gebhard, R. Kalafus. Networked Transport of RTCM viaInternet Protocol (Ntrip), IP–Streaming for Real–Time GNSS Applications, ION GNSS,2005.
For more information, please visit the RTS website (http://rts.igs.org).
177

Real–Time Service
178
Reference Frame Working GroupTechnical Report 2014
P. Rebischung1, B. Garayt2, Z. Altamimi1
1 IGN LAREG, Univ Paris Diderot, Sorbonne Paris Cité5 rue Thomas Mann, 75205 Paris Cedex 13, FranceE–mail: [email protected]
2 IGN SGN
1 Introduction
Besides a continuous quality monitoring of the IGS SINEX combination products, themain activity of the Reference Frame Working Group in 2014 was the preparation of theIGS contribution to ITRF2014, which will consist of daily combinations of the AC SINEXsolutions from the IGS 2nd reprocessing campaign (repro2). After an overview of theoperational IGS SINEX combination results in 2014 (Sect. 2) and a brief review of thecurrent status of the IGb08 Reference Frame (Sect. 3), this report will finally presentresults from preliminary combinations of the AC repro2 SINEX solutions (Sect. 4).
2 Recent IGS SINEX combination results
Figure 1 shows the RMS of the Analysis Center (AC) station position residuals from thedaily IGS SINEX combinations of year 2014, i.e. the global level of agreement betweenthe AC and IGS combined station positions once reference frame differences have beenremoved. Except a bump in GFZ’s RMS during weeks 1807–1820 due to an issue in theimplementation of the 2nd order ionospheric corrections, the overall tendency over 2014was an improvement of the inter–AC agreement achieved through successive updates ofthe AC’s analysis strategies listed below.
• On week 1803, MIT started using their repro2 settings for their operational products,leading to slightly lower RMS in all three components.
179
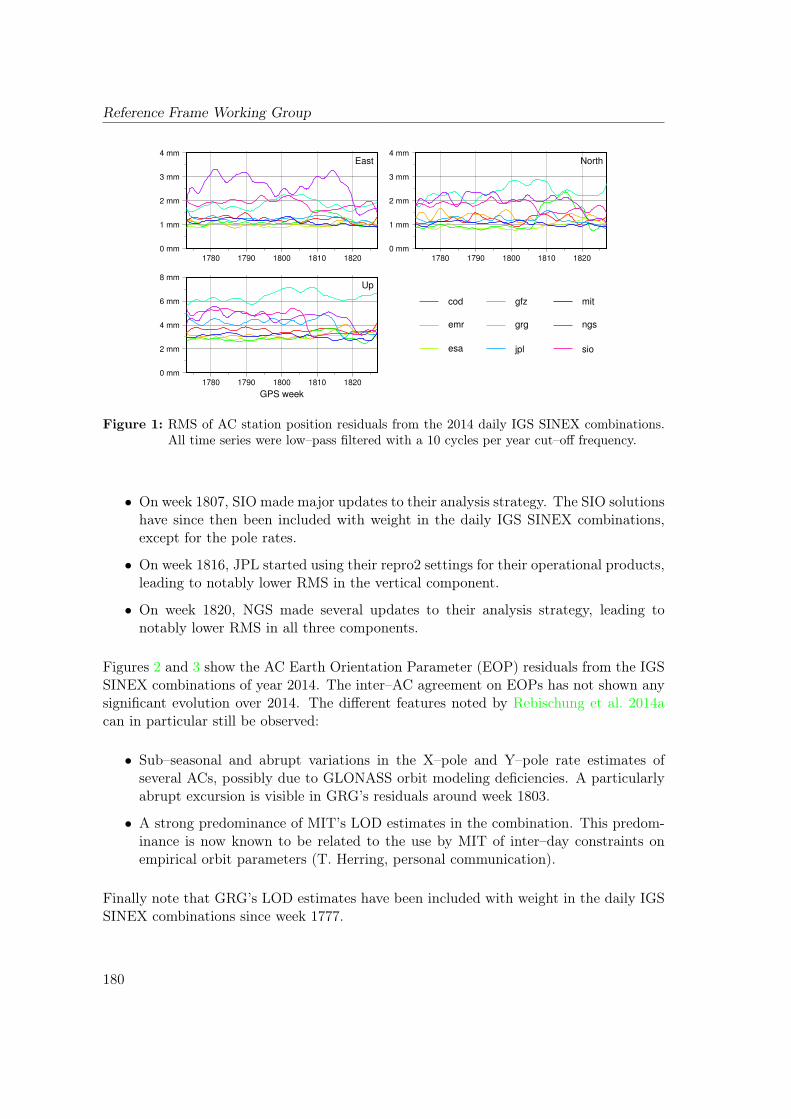
Reference Frame Working Group
0 mm
1 mm
2 mm
3 mm
4 mm
1780 1790 1800 1810 18200 mm
1 mm
2 mm
3 mm
4 mm
1780 1790 1800 1810 1820
0 mm
2 mm
4 mm
6 mm
8 mm
1780 1790 1800 1810 1820
GPS week
East North
Up
cod
emr
esa
gfz
grg
jpl
mit
ngs
sio
Figure 1: RMS of AC station position residuals from the 2014 daily IGS SINEX combinations.All time series were low–pass filtered with a 10 cycles per year cut–off frequency.
• On week 1807, SIO made major updates to their analysis strategy. The SIO solutionshave since then been included with weight in the daily IGS SINEX combinations,except for the pole rates.
• On week 1816, JPL started using their repro2 settings for their operational products,leading to notably lower RMS in the vertical component.
• On week 1820, NGS made several updates to their analysis strategy, leading tonotably lower RMS in all three components.
Figures 2 and 3 show the AC Earth Orientation Parameter (EOP) residuals from the IGSSINEX combinations of year 2014. The inter–AC agreement on EOPs has not shown anysignificant evolution over 2014. The different features noted by Rebischung et al. 2014acan in particular still be observed:
• Sub–seasonal and abrupt variations in the X–pole and Y–pole rate estimates ofseveral ACs, possibly due to GLONASS orbit modeling deficiencies. A particularlyabrupt excursion is visible in GRG’s residuals around week 1803.
• A strong predominance of MIT’s LOD estimates in the combination. This predom-inance is now known to be related to the use by MIT of inter–day constraints onempirical orbit parameters (T. Herring, personal communication).
Finally note that GRG’s LOD estimates have been included with weight in the daily IGSSINEX combinations since week 1777.
180
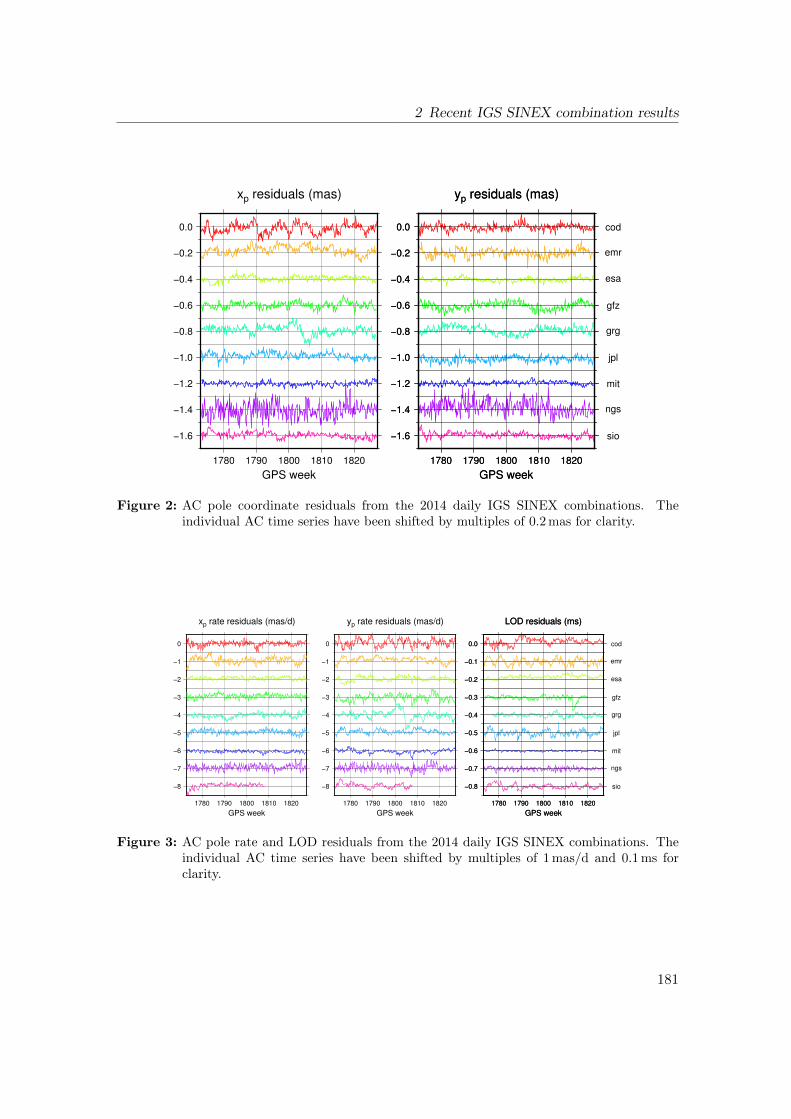
2 Recent IGS SINEX combination results
−1.6
−1.4
−1.2
−1.0
−0.8
−0.6
−0.4
−0.2
0.0
1780 1790 1800 1810 1820
GPS week
xp residuals (mas)
−1.6
−1.4
−1.2
−1.0
−0.8
−0.6
−0.4
−0.2
0.0
1780 1790 1800 1810 1820
GPS week
yp residuals (mas)
cod
emr
esa
gfz
grg
jpl
mit
ngs
sio−1.6
−1.4
−1.2
−1.0
−0.8
−0.6
−0.4
−0.2
0.0
1780 1790 1800 1810 1820
GPS week
yp residuals (mas)
Figure 2: AC pole coordinate residuals from the 2014 daily IGS SINEX combinations. Theindividual AC time series have been shifted by multiples of 0.2mas for clarity.
−8
−7
−6
−5
−4
−3
−2
−1
0
1780 1790 1800 1810 1820
GPS week
xp rate residuals (mas/d)
−8
−7
−6
−5
−4
−3
−2
−1
0
1780 1790 1800 1810 1820
GPS week
yp rate residuals (mas/d)
−0.8
−0.7
−0.6
−0.5
−0.4
−0.3
−0.2
−0.1
0.0
1780 1790 1800 1810 1820
GPS week
LOD residuals (ms)
cod
emr
esa
gfz
grg
jpl
mit
ngs
sio−0.8
−0.7
−0.6
−0.5
−0.4
−0.3
−0.2
−0.1
0.0
1780 1790 1800 1810 1820
GPS week
LOD residuals (ms)
Figure 3: AC pole rate and LOD residuals from the 2014 daily IGS SINEX combinations. Theindividual AC time series have been shifted by multiples of 1mas/d and 0.1ms forclarity.
181
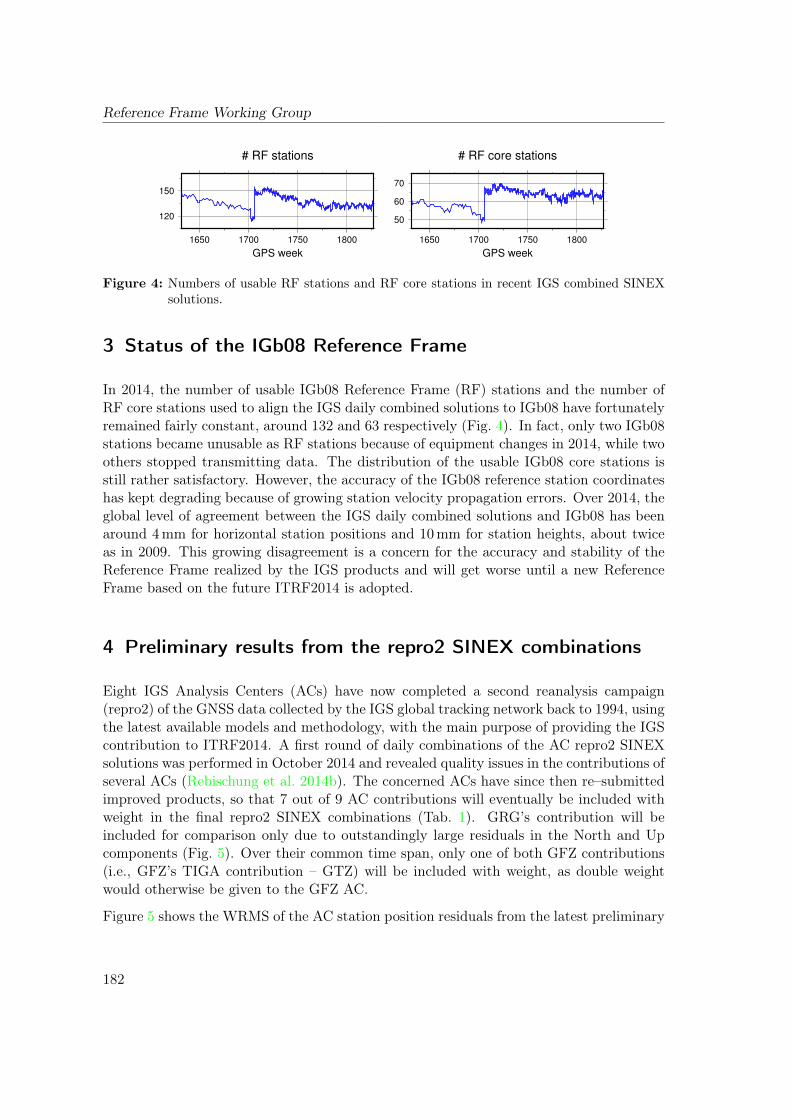
Reference Frame Working Group
120
150
1650 1700 1750 1800
GPS week
# RF stations
50
60
70
1650 1700 1750 1800
GPS week
# RF core stations
Figure 4: Numbers of usable RF stations and RF core stations in recent IGS combined SINEXsolutions.
3 Status of the IGb08 Reference Frame
In 2014, the number of usable IGb08 Reference Frame (RF) stations and the number ofRF core stations used to align the IGS daily combined solutions to IGb08 have fortunatelyremained fairly constant, around 132 and 63 respectively (Fig. 4). In fact, only two IGb08stations became unusable as RF stations because of equipment changes in 2014, while twoothers stopped transmitting data. The distribution of the usable IGb08 core stations isstill rather satisfactory. However, the accuracy of the IGb08 reference station coordinateshas kept degrading because of growing station velocity propagation errors. Over 2014, theglobal level of agreement between the IGS daily combined solutions and IGb08 has beenaround 4mm for horizontal station positions and 10mm for station heights, about twiceas in 2009. This growing disagreement is a concern for the accuracy and stability of theReference Frame realized by the IGS products and will get worse until a new ReferenceFrame based on the future ITRF2014 is adopted.
4 Preliminary results from the repro2 SINEX combinations
Eight IGS Analysis Centers (ACs) have now completed a second reanalysis campaign(repro2) of the GNSS data collected by the IGS global tracking network back to 1994, usingthe latest available models and methodology, with the main purpose of providing the IGScontribution to ITRF2014. A first round of daily combinations of the AC repro2 SINEXsolutions was performed in October 2014 and revealed quality issues in the contributions ofseveral ACs (Rebischung et al. 2014b). The concerned ACs have since then re–submittedimproved products, so that 7 out of 9 AC contributions will eventually be included withweight in the final repro2 SINEX combinations (Tab. 1). GRG’s contribution will beincluded for comparison only due to outstandingly large residuals in the North and Upcomponents (Fig. 5). Over their common time span, only one of both GFZ contributions(i.e., GFZ’s TIGA contribution – GTZ) will be included with weight, as double weightwould otherwise be given to the GFZ AC.
Figure 5 shows the WRMS of the AC station position residuals from the latest preliminary
182
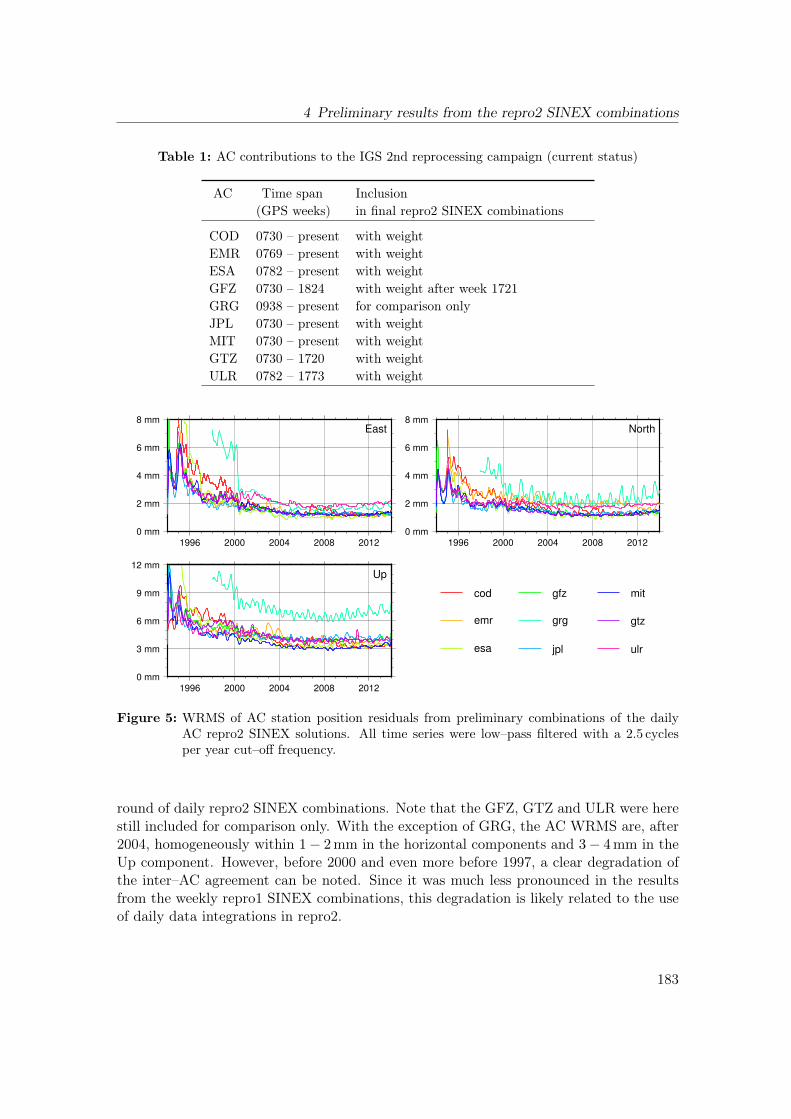
4 Preliminary results from the repro2 SINEX combinations
Table 1: AC contributions to the IGS 2nd reprocessing campaign (current status)
AC Time span Inclusion(GPS weeks) in final repro2 SINEX combinations
COD 0730 – present with weightEMR 0769 – present with weightESA 0782 – present with weightGFZ 0730 – 1824 with weight after week 1721GRG 0938 – present for comparison onlyJPL 0730 – present with weightMIT 0730 – present with weightGTZ 0730 – 1720 with weightULR 0782 – 1773 with weight
0 mm
2 mm
4 mm
6 mm
8 mm
1996 2000 2004 2008 20120 mm
2 mm
4 mm
6 mm
8 mm
1996 2000 2004 2008 2012
0 mm
3 mm
6 mm
9 mm
12 mm
1996 2000 2004 2008 2012
East North
Up
cod
emr
esa
gfz
grg
jpl
mit
gtz
ulr
Figure 5: WRMS of AC station position residuals from preliminary combinations of the dailyAC repro2 SINEX solutions. All time series were low–pass filtered with a 2.5 cyclesper year cut–off frequency.
round of daily repro2 SINEX combinations. Note that the GFZ, GTZ and ULR were herestill included for comparison only. With the exception of GRG, the AC WRMS are, after2004, homogeneously within 1− 2mm in the horizontal components and 3− 4mm in theUp component. However, before 2000 and even more before 1997, a clear degradation ofthe inter–AC agreement can be noted. Since it was much less pronounced in the resultsfrom the weekly repro1 SINEX combinations, this degradation is likely related to the useof daily data integrations in repro2.
183
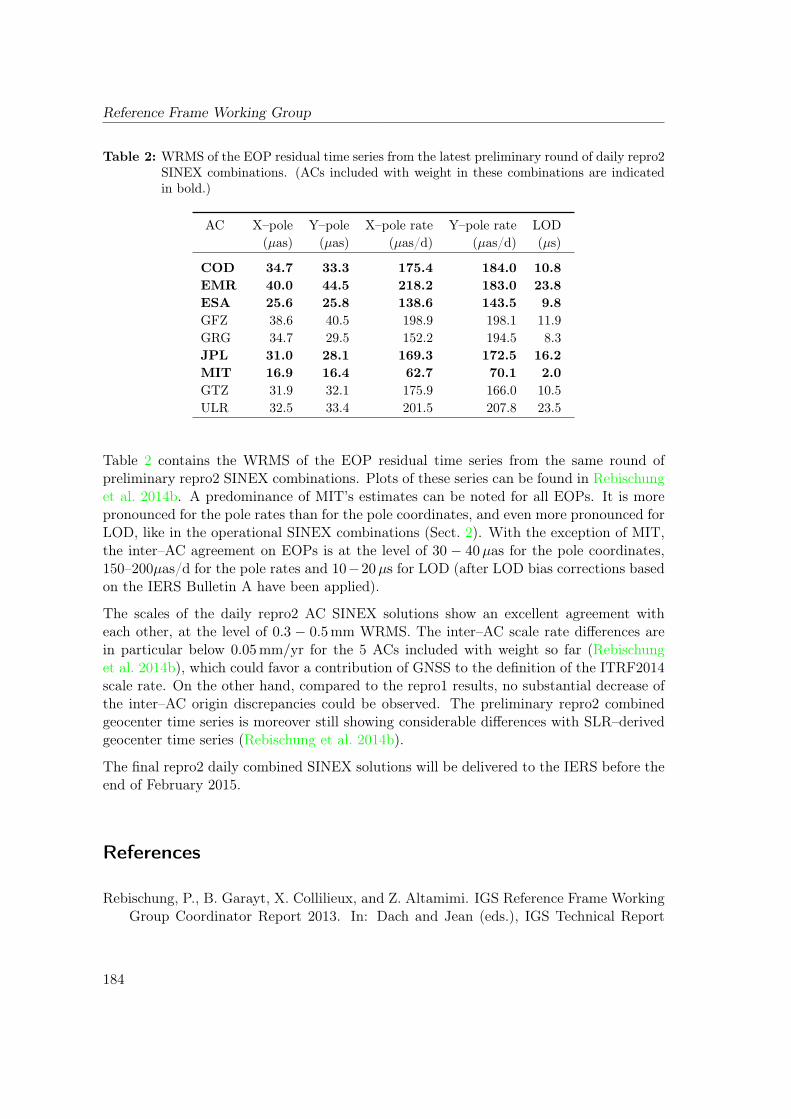
Reference Frame Working Group
Table 2: WRMS of the EOP residual time series from the latest preliminary round of daily repro2SINEX combinations. (ACs included with weight in these combinations are indicatedin bold.)
AC X–pole Y–pole X–pole rate Y–pole rate LOD(µas) (µas) (µas/d) (µas/d) (µs)
COD 34.7 33.3 175.4 184.0 10.8EMR 40.0 44.5 218.2 183.0 23.8ESA 25.6 25.8 138.6 143.5 9.8GFZ 38.6 40.5 198.9 198.1 11.9GRG 34.7 29.5 152.2 194.5 8.3JPL 31.0 28.1 169.3 172.5 16.2MIT 16.9 16.4 62.7 70.1 2.0GTZ 31.9 32.1 175.9 166.0 10.5ULR 32.5 33.4 201.5 207.8 23.5
Table 2 contains the WRMS of the EOP residual time series from the same round ofpreliminary repro2 SINEX combinations. Plots of these series can be found in Rebischunget al. 2014b. A predominance of MIT’s estimates can be noted for all EOPs. It is morepronounced for the pole rates than for the pole coordinates, and even more pronounced forLOD, like in the operational SINEX combinations (Sect. 2). With the exception of MIT,the inter–AC agreement on EOPs is at the level of 30 − 40µas for the pole coordinates,150–200µas/d for the pole rates and 10−20µs for LOD (after LOD bias corrections basedon the IERS Bulletin A have been applied).
The scales of the daily repro2 AC SINEX solutions show an excellent agreement witheach other, at the level of 0.3 − 0.5mm WRMS. The inter–AC scale rate differences arein particular below 0.05mm/yr for the 5 ACs included with weight so far (Rebischunget al. 2014b), which could favor a contribution of GNSS to the definition of the ITRF2014scale rate. On the other hand, compared to the repro1 results, no substantial decrease ofthe inter–AC origin discrepancies could be observed. The preliminary repro2 combinedgeocenter time series is moreover still showing considerable differences with SLR–derivedgeocenter time series (Rebischung et al. 2014b).
The final repro2 daily combined SINEX solutions will be delivered to the IERS before theend of February 2015.
References
Rebischung, P., B. Garayt, X. Collilieux, and Z. Altamimi. IGS Reference Frame WorkingGroup Coordinator Report 2013. In: Dach and Jean (eds.), IGS Technical Report
184
References
2013, International GNSS Service, pp. 165–171, 2014a.ftp://igs.org/pub/resource/pubs/2013_techreport.pdf
Rebischung, P., B. Garayt, X. Collilieux, and Z. Altamimi. The IGS contribution toITRF2013. AGU Fall Meeting 2014, San Francisco, 15–19 Dec., 2014b.http://acc.igs.org/trf/Rebischung-AGU2014.ppt
185

Reference Frame Working Group
186
Tide Gauge BenchmarkMonitoring Working Group
Technical Report 2014
T. Schöne, R. Bingley, Z. Deng, J. Griffiths, H. Habrich,A. Hunegnaw, M. Jia, M. King, M. Merrifield,G. Mitchum, R. Neilan, C. Noll, E. Prouteau,
L. Sánchez, N. Teferle, D. Thaller, P. Tregoning,S. Williams, G. Wöppelmann, P. Woodworth
Introduction
In support of climate and sea level related studies and organizations concerned herewith,the Tide Gauge Benchmark Monitoring Working Group (TIGA–WG) of the IGS providesvertical geocentric positions, vertical motion and displacements of GNSS stations at ornear tide gauges. To a large extend the TIGA–WG uses the infrastructure and expertiseof the IGS.
The main aims of the TIGA Working Group are:
• Maintain a global virtual continuous GNSS@TG network.
• Compute precise coordinates and velocities of GNSS stations at or near tide gaugeswith a significant delay to allow as many as possible stations to participate. Providea combined solution as the TIGA official product.
• Study the impacts of corrections and new models on the GNSS processing of thevertical coordinate. Encourage other groups to establish complementary sensors toimprove the GNSS results, e.g., absolute gravity sites.
• Provide advice to new applications and installations.
For the year 2014, the TIGA–WG has continued with the reprocessing of the TIGA net-work, which was in parallel to the repro2 campaign of the IGS. Nearly 800 GNSS@TG
187
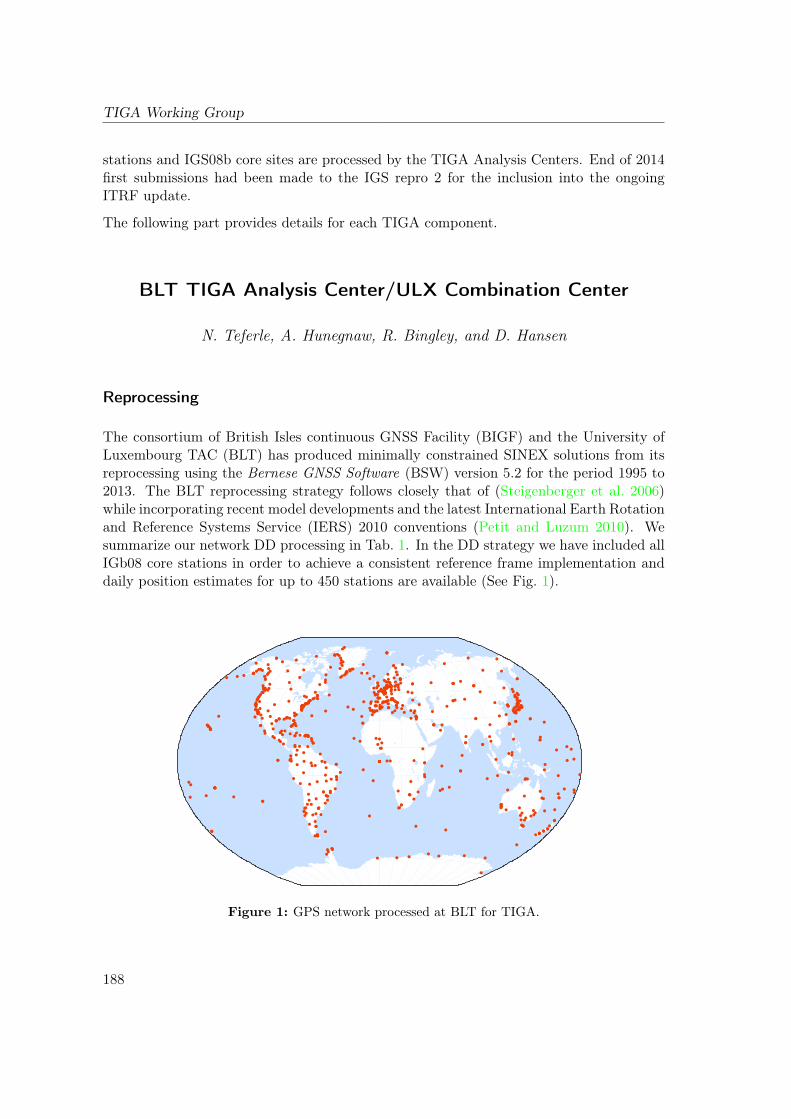
TIGA Working Group
stations and IGS08b core sites are processed by the TIGA Analysis Centers. End of 2014first submissions had been made to the IGS repro 2 for the inclusion into the ongoingITRF update.
The following part provides details for each TIGA component.
BLT TIGA Analysis Center/ULX Combination Center
N. Teferle, A. Hunegnaw, R. Bingley, and D. Hansen
Reprocessing
The consortium of British Isles continuous GNSS Facility (BIGF) and the University ofLuxembourg TAC (BLT) has produced minimally constrained SINEX solutions from itsreprocessing using the Bernese GNSS Software (BSW) version 5.2 for the period 1995 to2013. The BLT reprocessing strategy follows closely that of (Steigenberger et al. 2006)while incorporating recent model developments and the latest International Earth Rotationand Reference Systems Service (IERS) 2010 conventions (Petit and Luzum 2010). Wesummarize our network DD processing in Tab. 1. In the DD strategy we have included allIGb08 core stations in order to achieve a consistent reference frame implementation anddaily position estimates for up to 450 stations are available (See Fig. 1).
Figure 1: GPS network processed at BLT for TIGA.
188
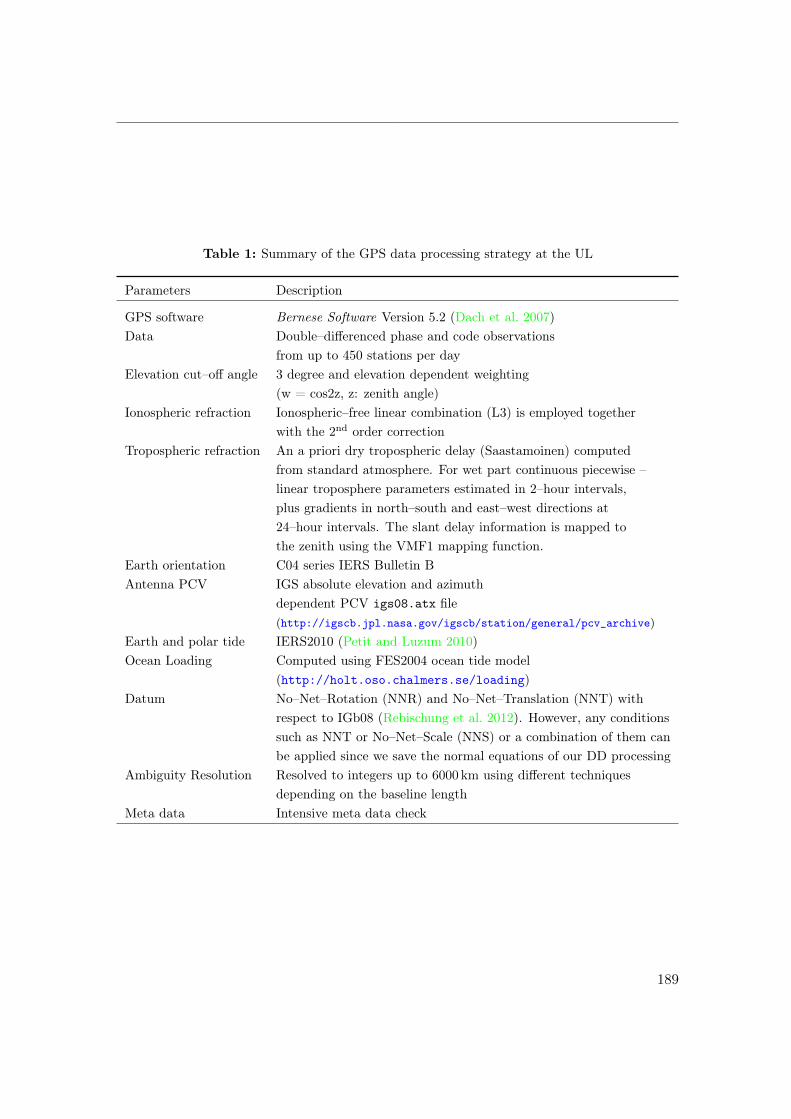
Table 1: Summary of the GPS data processing strategy at the UL
Parameters Description
GPS software Bernese Software Version 5.2 (Dach et al. 2007)Data Double–differenced phase and code observations
from up to 450 stations per dayElevation cut–off angle 3 degree and elevation dependent weighting
(w = cos2z, z: zenith angle)Ionospheric refraction Ionospheric–free linear combination (L3) is employed together
with the 2nd order correctionTropospheric refraction An a priori dry tropospheric delay (Saastamoinen) computed
from standard atmosphere. For wet part continuous piecewise –linear troposphere parameters estimated in 2–hour intervals,plus gradients in north–south and east–west directions at24–hour intervals. The slant delay information is mapped tothe zenith using the VMF1 mapping function.
Earth orientation C04 series IERS Bulletin BAntenna PCV IGS absolute elevation and azimuth
dependent PCV igs08.atx file(http://igscb.jpl.nasa.gov/igscb/station/general/pcv_archive)
Earth and polar tide IERS2010 (Petit and Luzum 2010)Ocean Loading Computed using FES2004 ocean tide model
(http://holt.oso.chalmers.se/loading)Datum No–Net–Rotation (NNR) and No–Net–Translation (NNT) with
respect to IGb08 (Rebischung et al. 2012). However, any conditionssuch as NNT or No–Net–Scale (NNS) or a combination of them canbe applied since we save the normal equations of our DD processing
Ambiguity Resolution Resolved to integers up to 6000 km using different techniquesdepending on the baseline length
Meta data Intensive meta data check
189
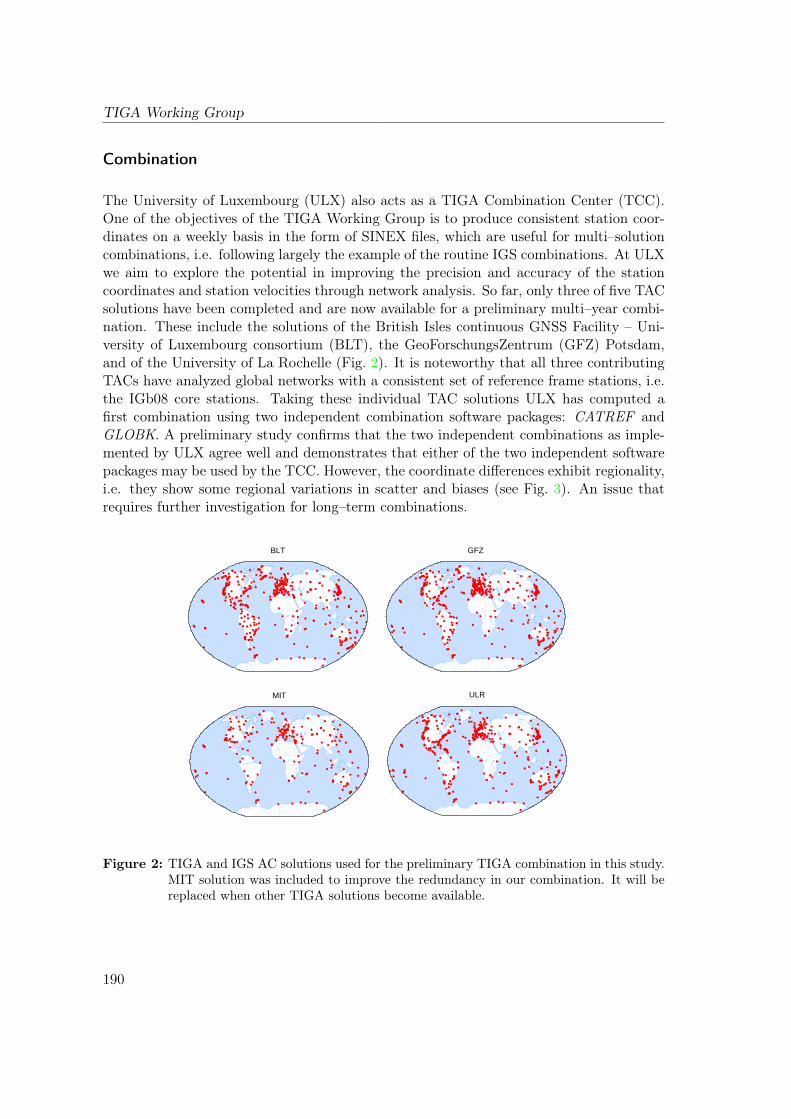
TIGA Working Group
Combination
The University of Luxembourg (ULX) also acts as a TIGA Combination Center (TCC).One of the objectives of the TIGA Working Group is to produce consistent station coor-dinates on a weekly basis in the form of SINEX files, which are useful for multi–solutioncombinations, i.e. following largely the example of the routine IGS combinations. At ULXwe aim to explore the potential in improving the precision and accuracy of the stationcoordinates and station velocities through network analysis. So far, only three of five TACsolutions have been completed and are now available for a preliminary multi–year combi-nation. These include the solutions of the British Isles continuous GNSS Facility – Uni-versity of Luxembourg consortium (BLT), the GeoForschungsZentrum (GFZ) Potsdam,and of the University of La Rochelle (Fig. 2). It is noteworthy that all three contributingTACs have analyzed global networks with a consistent set of reference frame stations, i.e.the IGb08 core stations. Taking these individual TAC solutions ULX has computed afirst combination using two independent combination software packages: CATREF andGLOBK. A preliminary study confirms that the two independent combinations as imple-mented by ULX agree well and demonstrates that either of the two independent softwarepackages may be used by the TCC. However, the coordinate differences exhibit regionality,i.e. they show some regional variations in scatter and biases (see Fig. 3). An issue thatrequires further investigation for long–term combinations.
BLT GFZ
ULRMIT
Figure 2: TIGA and IGS AC solutions used for the preliminary TIGA combination in this study.MIT solution was included to improve the redundancy in our combination. It will bereplaced when other TIGA solutions become available.
190
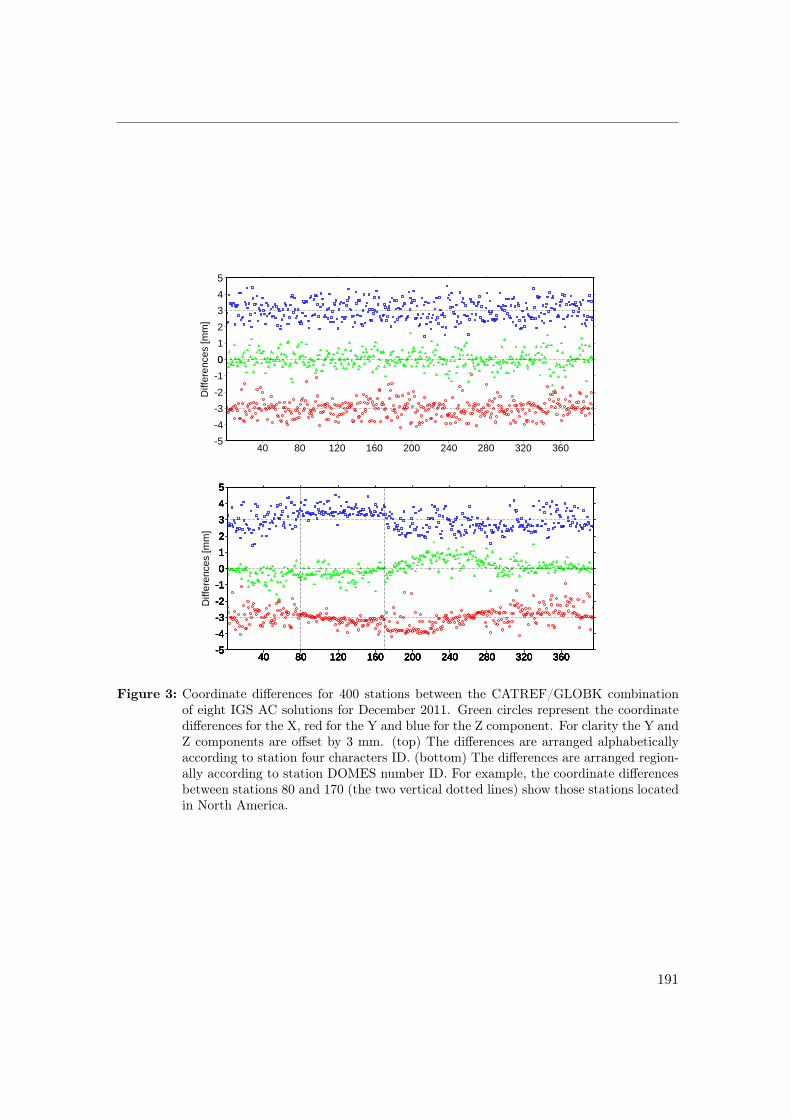
0
Diff
eren
ces
[mm
]
-5
-4
-3
-2
-1
0
1
2
3
4
5
40 80 120 160 200 240 280 320 360
0
Diff
eren
ces
[mm
]
-5
-4
-3
-2
-1
0
1
2
3
4
5
40 80 120 160 200 240 280 320 360-5
-4
-3
-2
-1
0
1
2
3
4
5
40 80 120 160 200 240 280 320 360-5
-4
-3
-2
-1
0
1
2
3
4
5
40 80 120 160 200 240 280 320 360-5
-4
-3
-2
-1
0
1
2
3
4
5
40 80 120 160 200 240 280 320 360-5
-4
-3
-2
-1
0
1
2
3
4
5
40 80 120 160 200 240 280 320 360-5
-4
-3
-2
-1
0
1
2
3
4
5
40 80 120 160 200 240 280 320 360
Figure 3: Coordinate differences for 400 stations between the CATREF/GLOBK combinationof eight IGS AC solutions for December 2011. Green circles represent the coordinatedifferences for the X, red for the Y and blue for the Z component. For clarity the Y andZ components are offset by 3 mm. (top) The differences are arranged alphabeticallyaccording to station four characters ID. (bottom) The differences are arranged region-ally according to station DOMES number ID. For example, the coordinate differencesbetween stations 80 and 170 (the two vertical dotted lines) show those stations locatedin North America.
191
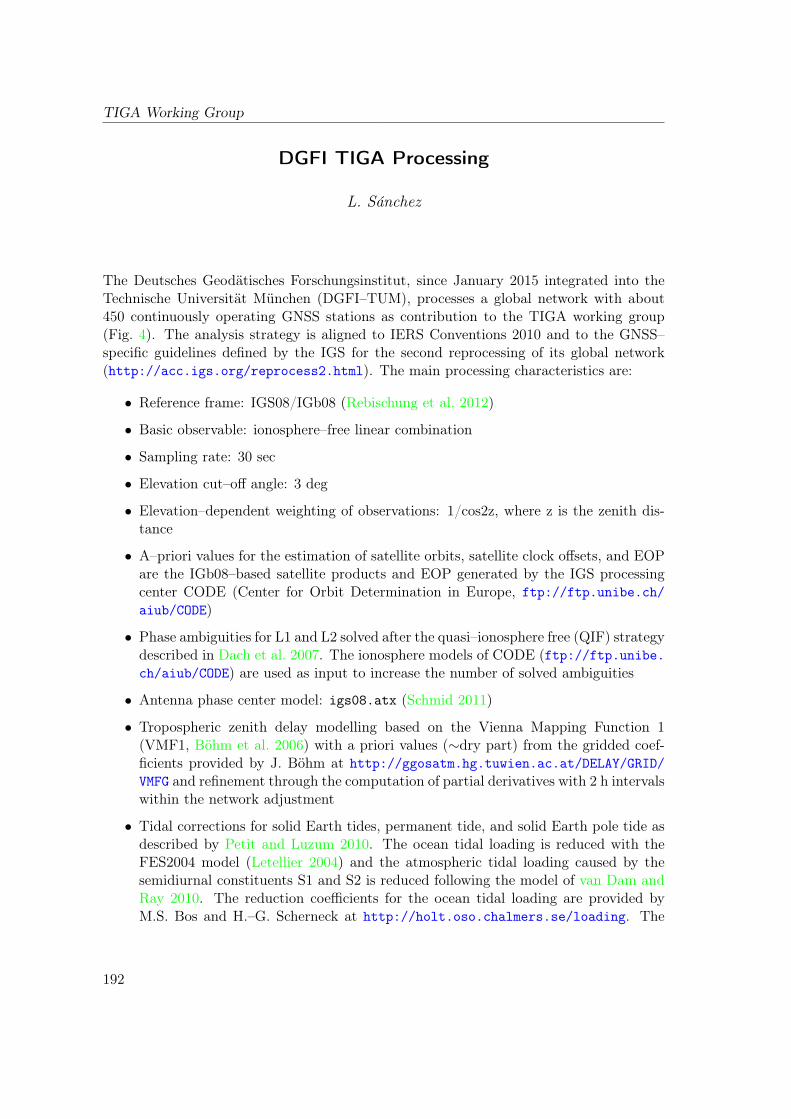
TIGA Working Group
DGFI TIGA Processing
L. Sánchez
The Deutsches Geodätisches Forschungsinstitut, since January 2015 integrated into theTechnische Universität München (DGFI–TUM), processes a global network with about450 continuously operating GNSS stations as contribution to the TIGA working group(Fig. 4). The analysis strategy is aligned to IERS Conventions 2010 and to the GNSS–specific guidelines defined by the IGS for the second reprocessing of its global network(http://acc.igs.org/reprocess2.html). The main processing characteristics are:
• Reference frame: IGS08/IGb08 (Rebischung et al. 2012)
• Basic observable: ionosphere–free linear combination
• Sampling rate: 30 sec
• Elevation cut–off angle: 3 deg
• Elevation–dependent weighting of observations: 1/cos2z, where z is the zenith dis-tance
• A–priori values for the estimation of satellite orbits, satellite clock offsets, and EOPare the IGb08–based satellite products and EOP generated by the IGS processingcenter CODE (Center for Orbit Determination in Europe, ftp://ftp.unibe.ch/aiub/CODE)
• Phase ambiguities for L1 and L2 solved after the quasi–ionosphere free (QIF) strategydescribed in Dach et al. 2007. The ionosphere models of CODE (ftp://ftp.unibe.ch/aiub/CODE) are used as input to increase the number of solved ambiguities
• Antenna phase center model: igs08.atx (Schmid 2011)
• Tropospheric zenith delay modelling based on the Vienna Mapping Function 1(VMF1, Böhm et al. 2006) with a priori values (∼dry part) from the gridded coef-ficients provided by J. Böhm at http://ggosatm.hg.tuwien.ac.at/DELAY/GRID/VMFG and refinement through the computation of partial derivatives with 2 h intervalswithin the network adjustment
• Tidal corrections for solid Earth tides, permanent tide, and solid Earth pole tide asdescribed by Petit and Luzum 2010. The ocean tidal loading is reduced with theFES2004 model (Letellier 2004) and the atmospheric tidal loading caused by thesemidiurnal constituents S1 and S2 is reduced following the model of van Dam andRay 2010. The reduction coefficients for the ocean tidal loading are provided byM.S. Bos and H.–G. Scherneck at http://holt.oso.chalmers.se/loading. The
192
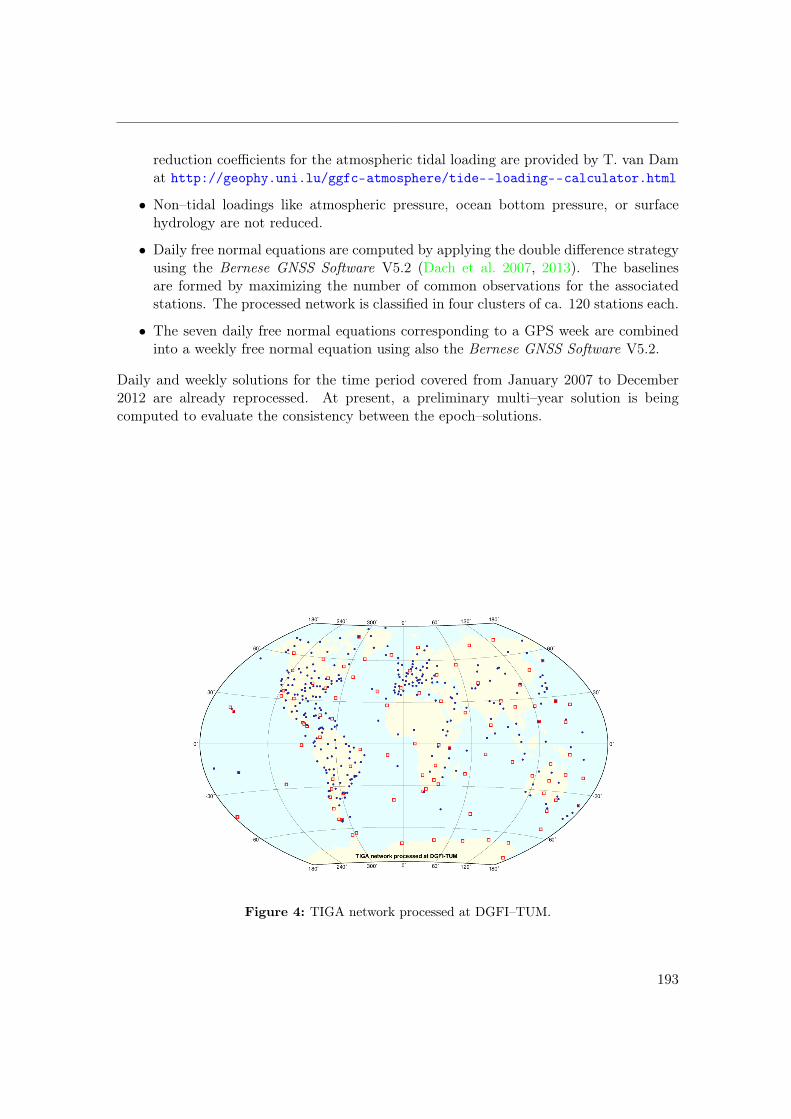
reduction coefficients for the atmospheric tidal loading are provided by T. van Damat http://geophy.uni.lu/ggfc-atmosphere/tide--loading--calculator.html
• Non–tidal loadings like atmospheric pressure, ocean bottom pressure, or surfacehydrology are not reduced.
• Daily free normal equations are computed by applying the double difference strategyusing the Bernese GNSS Software V5.2 (Dach et al. 2007, 2013). The baselinesare formed by maximizing the number of common observations for the associatedstations. The processed network is classified in four clusters of ca. 120 stations each.
• The seven daily free normal equations corresponding to a GPS week are combinedinto a weekly free normal equation using also the Bernese GNSS Software V5.2.
Daily and weekly solutions for the time period covered from January 2007 to December2012 are already reprocessed. At present, a preliminary multi–year solution is beingcomputed to evaluate the consistency between the epoch–solutions.
Figure 4: TIGA network processed at DGFI–TUM.
193
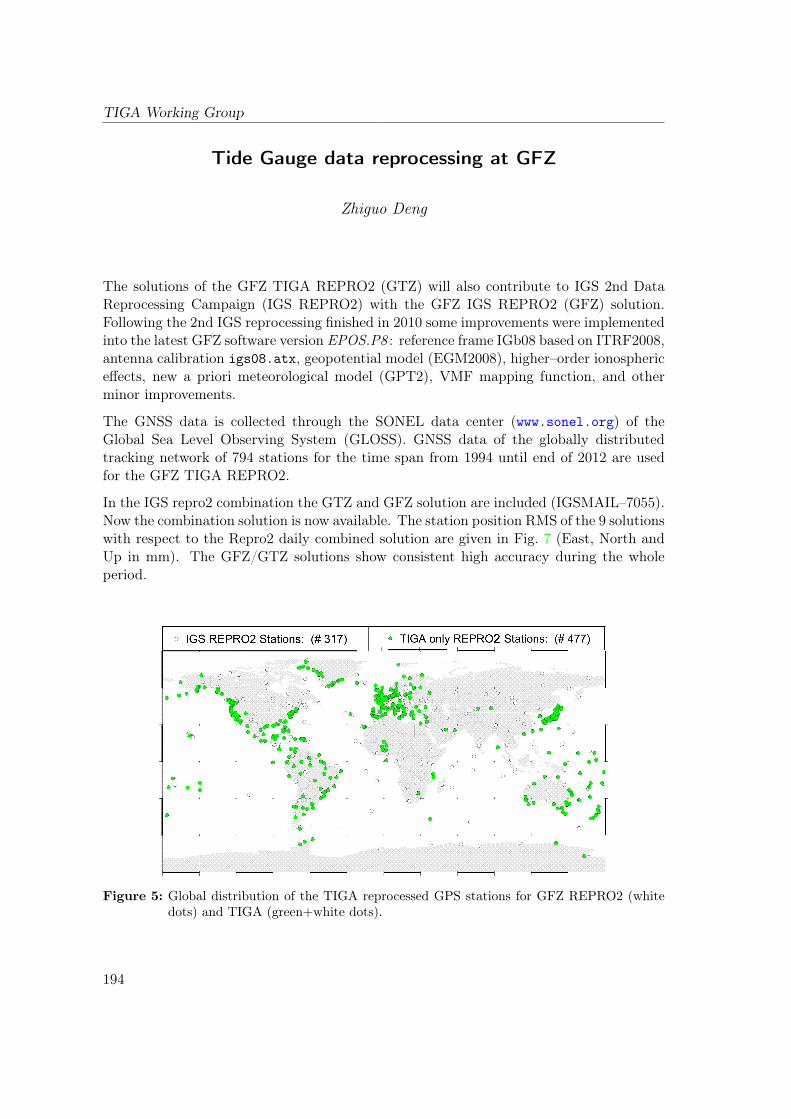
TIGA Working Group
Tide Gauge data reprocessing at GFZ
Zhiguo Deng
The solutions of the GFZ TIGA REPRO2 (GTZ) will also contribute to IGS 2nd DataReprocessing Campaign (IGS REPRO2) with the GFZ IGS REPRO2 (GFZ) solution.Following the 2nd IGS reprocessing finished in 2010 some improvements were implementedinto the latest GFZ software version EPOS.P8 : reference frame IGb08 based on ITRF2008,antenna calibration igs08.atx, geopotential model (EGM2008), higher–order ionosphericeffects, new a priori meteorological model (GPT2), VMF mapping function, and otherminor improvements.
The GNSS data is collected through the SONEL data center (www.sonel.org) of theGlobal Sea Level Observing System (GLOSS). GNSS data of the globally distributedtracking network of 794 stations for the time span from 1994 until end of 2012 are usedfor the GFZ TIGA REPRO2.
In the IGS repro2 combination the GTZ and GFZ solution are included (IGSMAIL–7055).Now the combination solution is now available. The station position RMS of the 9 solutionswith respect to the Repro2 daily combined solution are given in Fig. 7 (East, North andUp in mm). The GFZ/GTZ solutions show consistent high accuracy during the wholeperiod.
Figure 5: Global distribution of the TIGA reprocessed GPS stations for GFZ REPRO2 (whitedots) and TIGA (green+white dots).
194
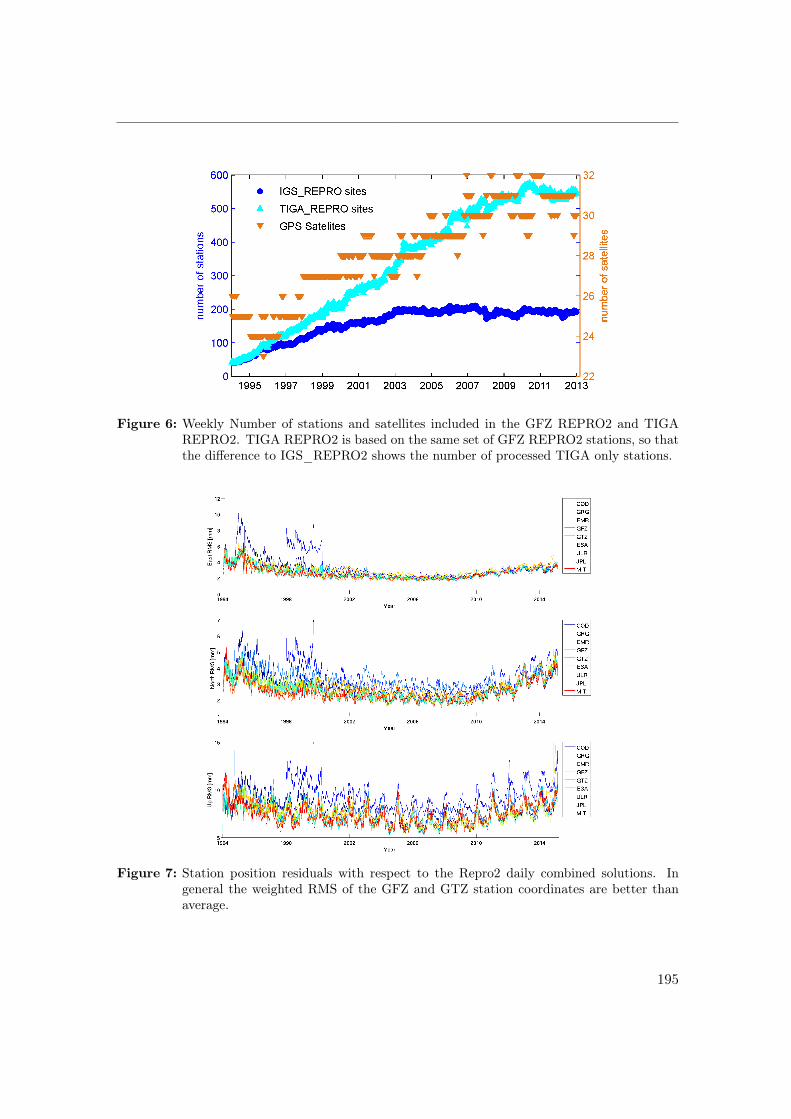
Figure 6: Weekly Number of stations and satellites included in the GFZ REPRO2 and TIGAREPRO2. TIGA REPRO2 is based on the same set of GFZ REPRO2 stations, so thatthe difference to IGS_REPRO2 shows the number of processed TIGA only stations.
Figure 7: Station position residuals with respect to the Repro2 daily combined solutions. Ingeneral the weighted RMS of the GFZ and GTZ station coordinates are better thanaverage.
195
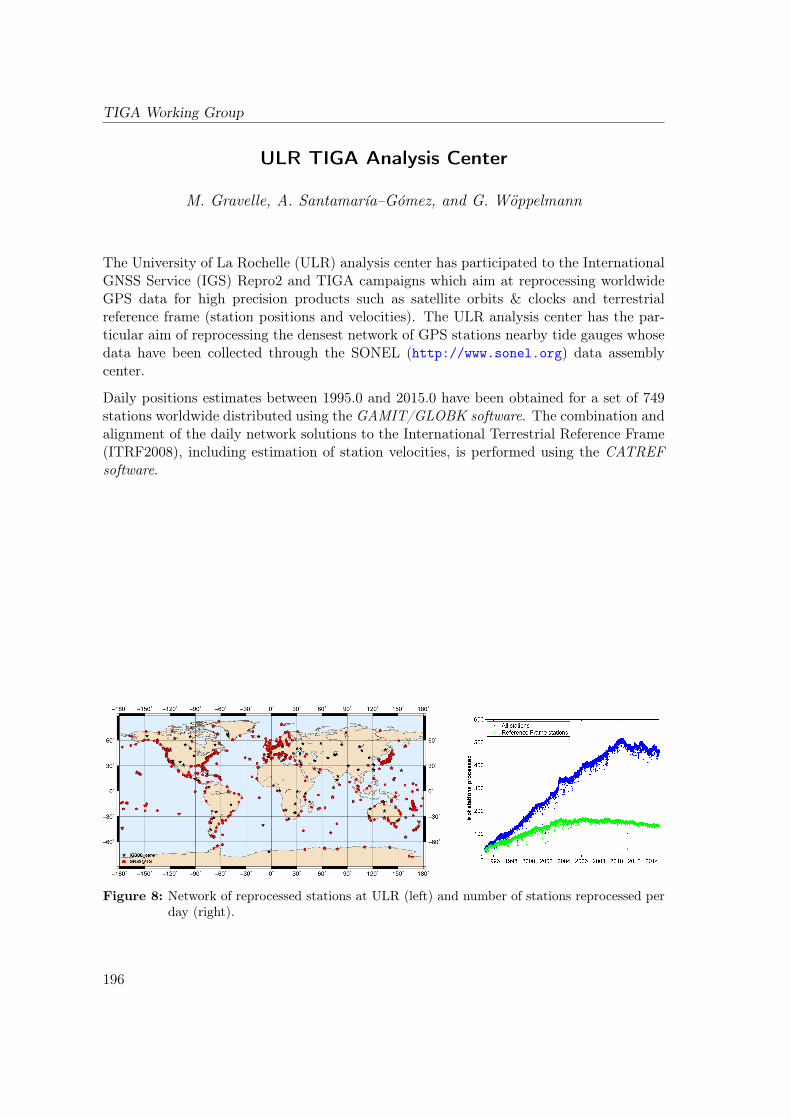
TIGA Working Group
ULR TIGA Analysis Center
M. Gravelle, A. Santamaría–Gómez, and G. Wöppelmann
The University of La Rochelle (ULR) analysis center has participated to the InternationalGNSS Service (IGS) Repro2 and TIGA campaigns which aim at reprocessing worldwideGPS data for high precision products such as satellite orbits & clocks and terrestrialreference frame (station positions and velocities). The ULR analysis center has the par-ticular aim of reprocessing the densest network of GPS stations nearby tide gauges whosedata have been collected through the SONEL (http://www.sonel.org) data assemblycenter.
Daily positions estimates between 1995.0 and 2015.0 have been obtained for a set of 749stations worldwide distributed using the GAMIT/GLOBK software. The combination andalignment of the daily network solutions to the International Terrestrial Reference Frame(ITRF2008), including estimation of station velocities, is performed using the CATREFsoftware.
Figure 8: Network of reprocessed stations at ULR (left) and number of stations reprocessed perday (right).
196
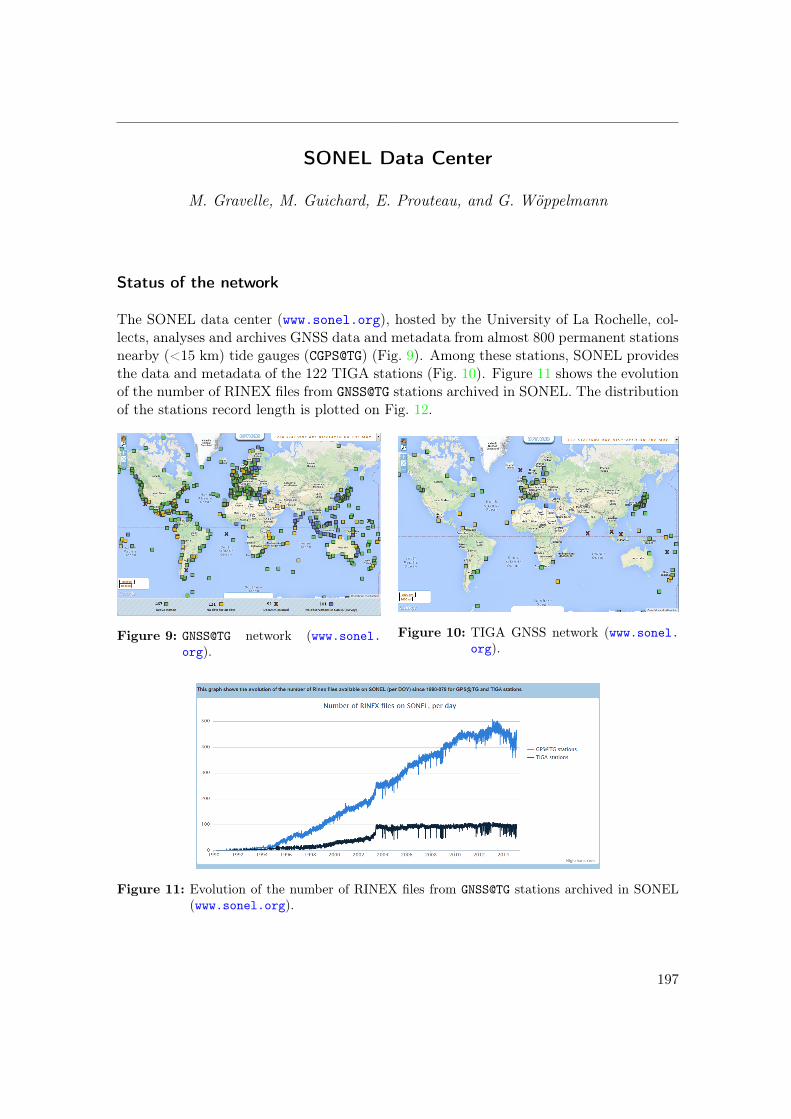
SONEL Data Center
M. Gravelle, M. Guichard, E. Prouteau, and G. Wöppelmann
Status of the network
The SONEL data center (www.sonel.org), hosted by the University of La Rochelle, col-lects, analyses and archives GNSS data and metadata from almost 800 permanent stationsnearby (<15 km) tide gauges (CGPS@TG) (Fig. 9). Among these stations, SONEL providesthe data and metadata of the 122 TIGA stations (Fig. 10). Figure 11 shows the evolutionof the number of RINEX files from GNSS@TG stations archived in SONEL. The distributionof the stations record length is plotted on Fig. 12.
Figure 9: GNSS@TG network (www.sonel.org).
Figure 10: TIGA GNSS network (www.sonel.org).
Figure 11: Evolution of the number of RINEX files from GNSS@TG stations archived in SONEL(www.sonel.org).
197
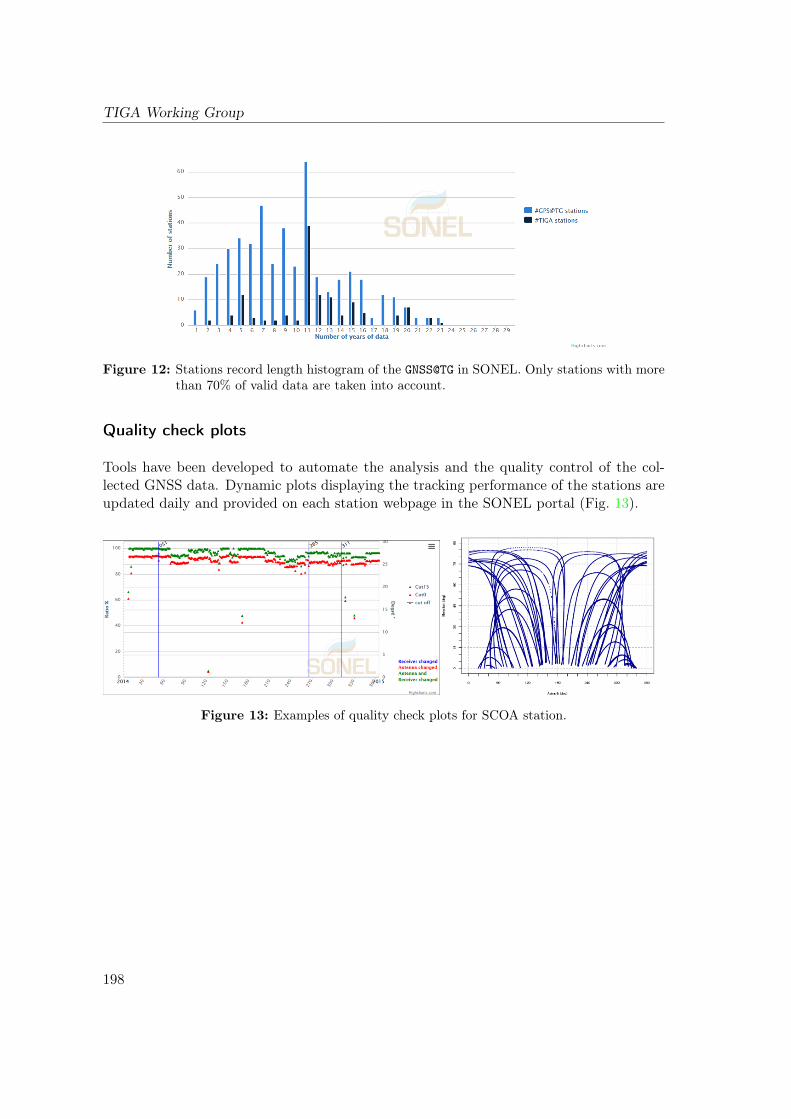
TIGA Working Group
Figure 12: Stations record length histogram of the GNSS@TG in SONEL. Only stations with morethan 70% of valid data are taken into account.
Quality check plots
Tools have been developed to automate the analysis and the quality control of the col-lected GNSS data. Dynamic plots displaying the tracking performance of the stations areupdated daily and provided on each station webpage in the SONEL portal (Fig. 13).
Figure 13: Examples of quality check plots for SCOA station.
198
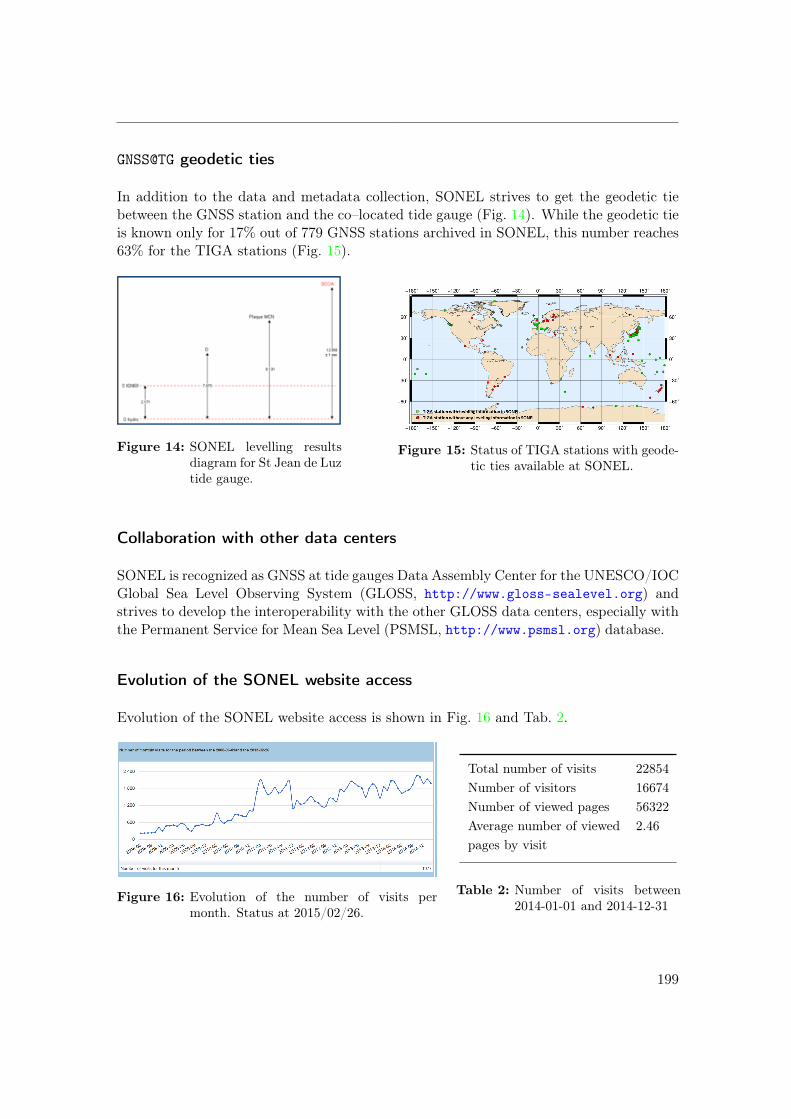
GNSS@TG geodetic ties
In addition to the data and metadata collection, SONEL strives to get the geodetic tiebetween the GNSS station and the co–located tide gauge (Fig. 14). While the geodetic tieis known only for 17% out of 779 GNSS stations archived in SONEL, this number reaches63% for the TIGA stations (Fig. 15).
Figure 14: SONEL levelling resultsdiagram for St Jean de Luztide gauge.
Figure 15: Status of TIGA stations with geode-tic ties available at SONEL.
Collaboration with other data centers
SONEL is recognized as GNSS at tide gauges Data Assembly Center for the UNESCO/IOCGlobal Sea Level Observing System (GLOSS, http://www.gloss-sealevel.org) andstrives to develop the interoperability with the other GLOSS data centers, especially withthe Permanent Service for Mean Sea Level (PSMSL, http://www.psmsl.org) database.
Evolution of the SONEL website access
Evolution of the SONEL website access is shown in Fig. 16 and Tab. 2.
Figure 16: Evolution of the number of visits permonth. Status at 2015/02/26.
Total number of visits 22854Number of visitors 16674Number of viewed pages 56322Average number of viewed 2.46pages by visit
Table 2: Number of visits between2014-01-01 and 2014-12-31
199
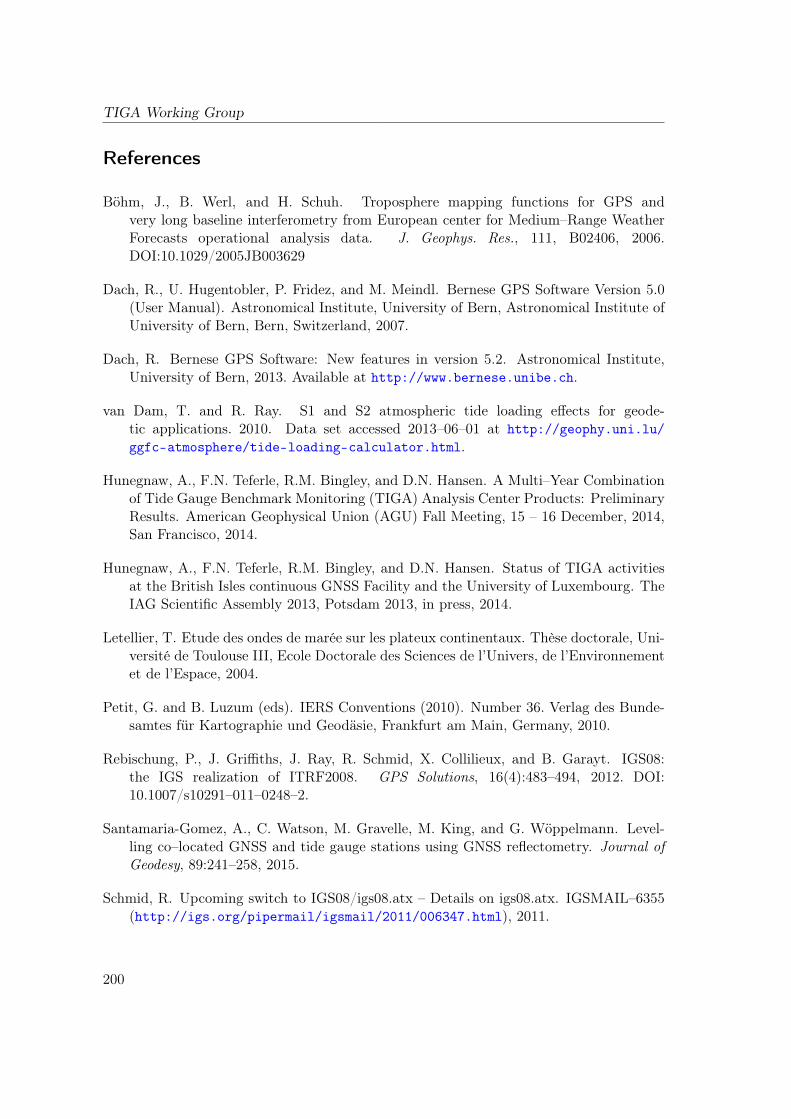
TIGA Working Group
References
Böhm, J., B. Werl, and H. Schuh. Troposphere mapping functions for GPS andvery long baseline interferometry from European center for Medium–Range WeatherForecasts operational analysis data. J. Geophys. Res., 111, B02406, 2006.DOI:10.1029/2005JB003629
Dach, R., U. Hugentobler, P. Fridez, and M. Meindl. Bernese GPS Software Version 5.0(User Manual). Astronomical Institute, University of Bern, Astronomical Institute ofUniversity of Bern, Bern, Switzerland, 2007.
Dach, R. Bernese GPS Software: New features in version 5.2. Astronomical Institute,University of Bern, 2013. Available at http://www.bernese.unibe.ch.
van Dam, T. and R. Ray. S1 and S2 atmospheric tide loading effects for geode-tic applications. 2010. Data set accessed 2013–06–01 at http://geophy.uni.lu/ggfc-atmosphere/tide-loading-calculator.html.
Hunegnaw, A., F.N. Teferle, R.M. Bingley, and D.N. Hansen. A Multi–Year Combinationof Tide Gauge Benchmark Monitoring (TIGA) Analysis Center Products: PreliminaryResults. American Geophysical Union (AGU) Fall Meeting, 15 – 16 December, 2014,San Francisco, 2014.
Hunegnaw, A., F.N. Teferle, R.M. Bingley, and D.N. Hansen. Status of TIGA activitiesat the British Isles continuous GNSS Facility and the University of Luxembourg. TheIAG Scientific Assembly 2013, Potsdam 2013, in press, 2014.
Letellier, T. Etude des ondes de marée sur les plateux continentaux. Thèse doctorale, Uni-versité de Toulouse III, Ecole Doctorale des Sciences de l’Univers, de l’Environnementet de l’Espace, 2004.
Petit, G. and B. Luzum (eds). IERS Conventions (2010). Number 36. Verlag des Bunde-samtes für Kartographie und Geodäsie, Frankfurt am Main, Germany, 2010.
Rebischung, P., J. Griffiths, J. Ray, R. Schmid, X. Collilieux, and B. Garayt. IGS08:the IGS realization of ITRF2008. GPS Solutions, 16(4):483–494, 2012. DOI:10.1007/s10291–011–0248–2.
Santamaria-Gomez, A., C. Watson, M. Gravelle, M. King, and G. Wöppelmann. Level-ling co–located GNSS and tide gauge stations using GNSS reflectometry. Journal ofGeodesy, 89:241–258, 2015.
Schmid, R. Upcoming switch to IGS08/igs08.atx – Details on igs08.atx. IGSMAIL–6355(http://igs.org/pipermail/igsmail/2011/006347.html), 2011.
200
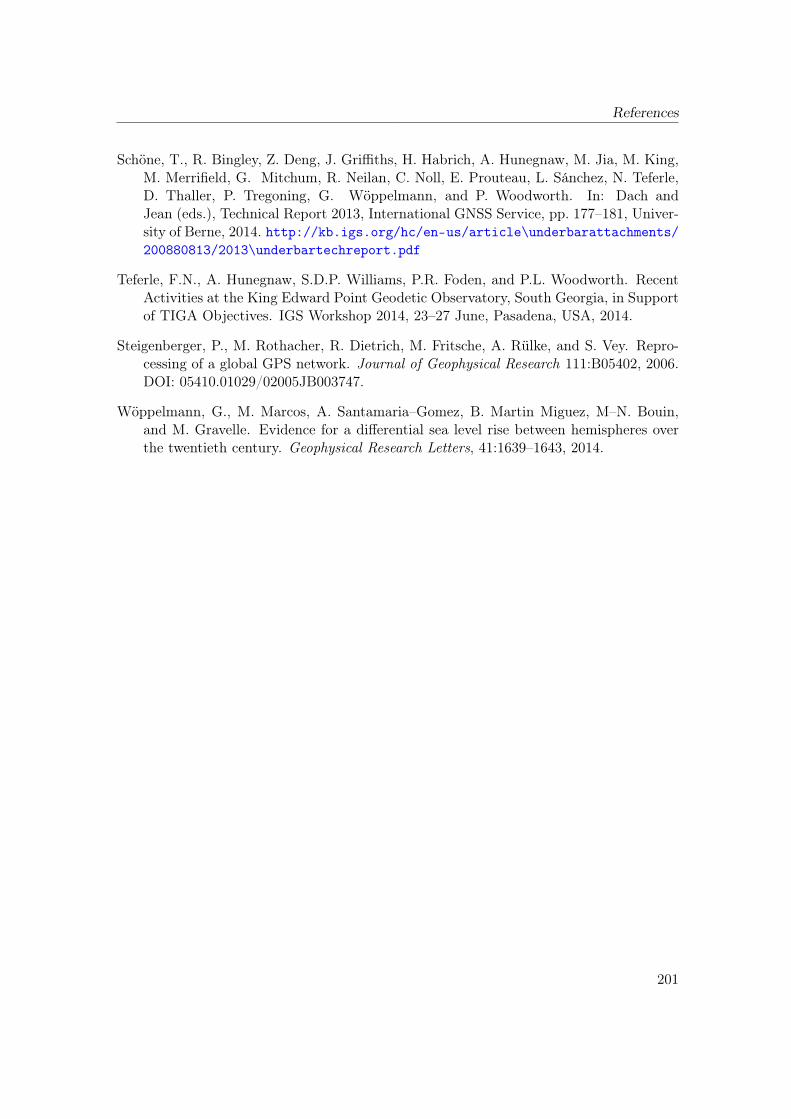
References
Schöne, T., R. Bingley, Z. Deng, J. Griffiths, H. Habrich, A. Hunegnaw, M. Jia, M. King,M. Merrifield, G. Mitchum, R. Neilan, C. Noll, E. Prouteau, L. Sánchez, N. Teferle,D. Thaller, P. Tregoning, G. Wöppelmann, and P. Woodworth. In: Dach andJean (eds.), Technical Report 2013, International GNSS Service, pp. 177–181, Univer-sity of Berne, 2014. http://kb.igs.org/hc/en-us/article\underbarattachments/200880813/2013\underbartechreport.pdf
Teferle, F.N., A. Hunegnaw, S.D.P. Williams, P.R. Foden, and P.L. Woodworth. RecentActivities at the King Edward Point Geodetic Observatory, South Georgia, in Supportof TIGA Objectives. IGS Workshop 2014, 23–27 June, Pasadena, USA, 2014.
Steigenberger, P., M. Rothacher, R. Dietrich, M. Fritsche, A. Rülke, and S. Vey. Repro-cessing of a global GPS network. Journal of Geophysical Research 111:B05402, 2006.DOI: 05410.01029/02005JB003747.
Wöppelmann, G., M. Marcos, A. Santamaria–Gomez, B. Martin Miguez, M–N. Bouin,and M. Gravelle. Evidence for a differential sea level rise between hemispheres overthe twentieth century. Geophysical Research Letters, 41:1639–1643, 2014.
201
TIGA Working Group
Appendix A. TIGA Working Group Members in 2014
Name Entity Host Institution Country
Guy Wöppelmann TAC, TNC, TDC University La Rochelle FranceLaura Sánchez TAC DGFI Munich GermanyHeinz Habrich TAC BGK, Frankfurt GermanyMinghai Jia GeoScience Australia AustraliaPaul Tregoning ANU AustraliaZhiguo Deng TAC GFZ Potsdam GermanyDaniela Thaller Combination BGK, Frankfurt GermanyNorman Teferle TAC/Combination University of Luxembourg LuxembourgRichard Bingley TAC University of Nottingham UKRuth Neilan IGS Central Bureau ex officio USAJake Griffith IGS AC coordinator ex officio USACarey Noll TDC CDDIS, NASA USATilo Schöne Chair TIGA–WG GFZ Potsdam GermanySimon Williams PSMSL PSMSL, NOC Liverpool UKGary Mitchum GLOSS GE (current chair) University of SouthFlorida USAMark Merrifield GLOSS GE (past chair) UHSLC, Hawaii USAMatt King University of Tasmania Australia
202
Troposphere Working GroupTechnical Report 2014
C. Hackman, S. M. Byram
United States Naval Observatory3450 Massachusetts Avenue NorthwestWashington DC 20392, USATel: +1–202–762–1444E–mail: [email protected]
1 Introduction
The IGS Troposphere Working Group (IGS TWG) was founded in 1998. The United StatesNaval Observatory (USNO) assumed chairmanship of the WG as well as responsibility forproducing IGS Final Troposphere Estimates (IGS FTE) in 2011.
Dr. Christine Hackman chairs the IGS TWG. Dr. Sharyl Byram oversees production ofthe IGS FTEs. IGS FTEs are produced within the USNO Earth Orientation DepartmentGPS Analysis Division, which also hosts the USNO IGS Analysis Center.
The IGS TWG is comprised of approximately 50 members (cf. Appendix A.). A revisedcharter approved by the IGS Governing Board at the close of 2011 is shown in AppendixB.
2 IGS Final Troposphere Product Generation/Usage 2014
USNO produces IGS Final Troposphere Estimates for nearly all of the stations of theIGS network. Each 24–hr site result file provides five–minute–spaced estimates of totaltroposphere zenith path delay (ZPD), north, and east gradient components, with thegradient components used to compensate for tropospheric asymmetry.
IGS Final Troposphere estimates are generated via Bernese GPS Software 5.0 (Dach et al.2007) using precise point positioning (PPP; Zumberge et al. 1997) and the GMF mappingfunction (Boehm et al. 2006) with IGS Final satellite orbits/clocks and earth orientation
203
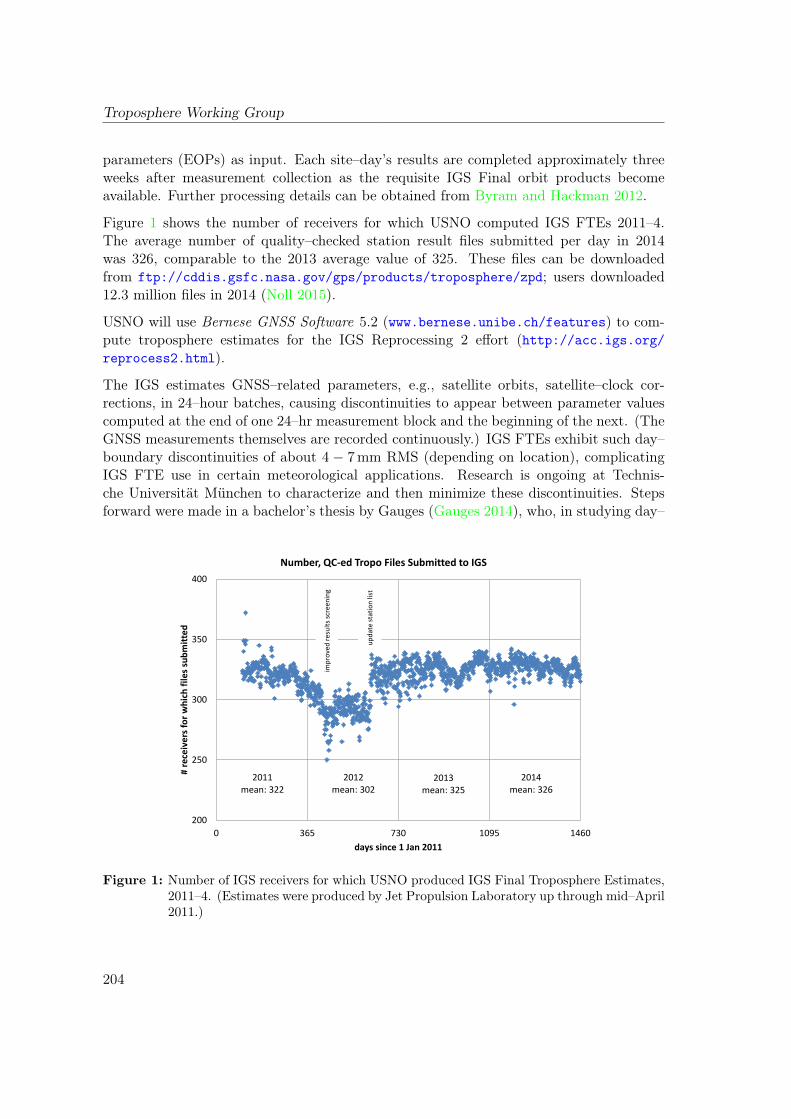
Troposphere Working Group
parameters (EOPs) as input. Each site–day’s results are completed approximately threeweeks after measurement collection as the requisite IGS Final orbit products becomeavailable. Further processing details can be obtained from Byram and Hackman 2012.
Figure 1 shows the number of receivers for which USNO computed IGS FTEs 2011–4.The average number of quality–checked station result files submitted per day in 2014was 326, comparable to the 2013 average value of 325. These files can be downloadedfrom ftp://cddis.gsfc.nasa.gov/gps/products/troposphere/zpd; users downloaded12.3 million files in 2014 (Noll 2015).
USNO will use Bernese GNSS Software 5.2 (www.bernese.unibe.ch/features) to com-pute troposphere estimates for the IGS Reprocessing 2 effort (http://acc.igs.org/reprocess2.html).
The IGS estimates GNSS–related parameters, e.g., satellite orbits, satellite–clock cor-rections, in 24–hour batches, causing discontinuities to appear between parameter valuescomputed at the end of one 24–hr measurement block and the beginning of the next. (TheGNSS measurements themselves are recorded continuously.) IGS FTEs exhibit such day–boundary discontinuities of about 4 − 7mm RMS (depending on location), complicatingIGS FTE use in certain meteorological applications. Research is ongoing at Technis-che Universität München to characterize and then minimize these discontinuities. Stepsforward were made in a bachelor’s thesis by Gauges (Gauges 2014), who, in studying day–
200
250
300
350
400
0 365 730 1095 1460
# re
ceiv
ers
fo
r w
hic
h f
iles
sub
mit
ted
days since 1 Jan 2011
Number, QC-ed Tropo Files Submitted to IGS
2011 mean: 322
2012 mean: 302
2013 mean: 325
2014 mean: 326
imp
rove
d r
esu
lts
scre
enin
g
up
dat
e st
atio
n li
st
Figure 1: Number of IGS receivers for which USNO produced IGS Final Troposphere Estimates,2011–4. (Estimates were produced by Jet Propulsion Laboratory up through mid–April2011.)
204
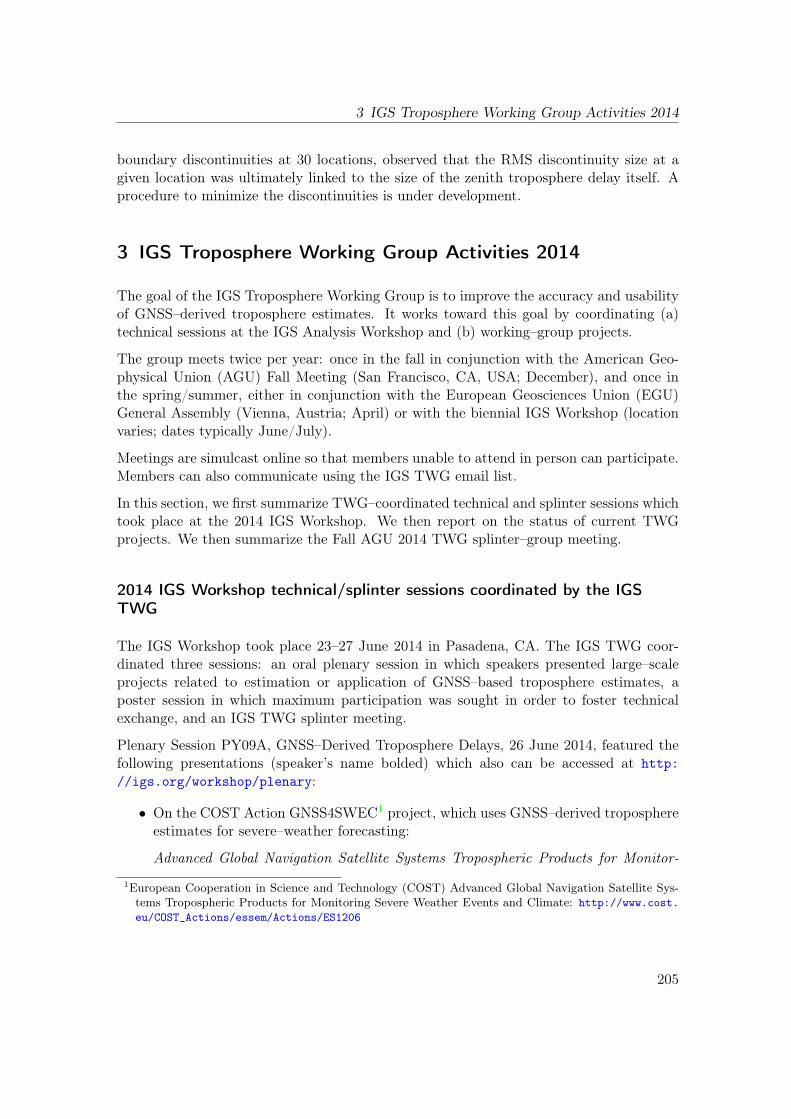
3 IGS Troposphere Working Group Activities 2014
boundary discontinuities at 30 locations, observed that the RMS discontinuity size at agiven location was ultimately linked to the size of the zenith troposphere delay itself. Aprocedure to minimize the discontinuities is under development.
3 IGS Troposphere Working Group Activities 2014
The goal of the IGS Troposphere Working Group is to improve the accuracy and usabilityof GNSS–derived troposphere estimates. It works toward this goal by coordinating (a)technical sessions at the IGS Analysis Workshop and (b) working–group projects.
The group meets twice per year: once in the fall in conjunction with the American Geo-physical Union (AGU) Fall Meeting (San Francisco, CA, USA; December), and once inthe spring/summer, either in conjunction with the European Geosciences Union (EGU)General Assembly (Vienna, Austria; April) or with the biennial IGS Workshop (locationvaries; dates typically June/July).
Meetings are simulcast online so that members unable to attend in person can participate.Members can also communicate using the IGS TWG email list.
In this section, we first summarize TWG–coordinated technical and splinter sessions whichtook place at the 2014 IGS Workshop. We then report on the status of current TWGprojects. We then summarize the Fall AGU 2014 TWG splinter–group meeting.
2014 IGS Workshop technical/splinter sessions coordinated by the IGSTWG
The IGS Workshop took place 23–27 June 2014 in Pasadena, CA. The IGS TWG coor-dinated three sessions: an oral plenary session in which speakers presented large–scaleprojects related to estimation or application of GNSS–based troposphere estimates, aposter session in which maximum participation was sought in order to foster technicalexchange, and an IGS TWG splinter meeting.
Plenary Session PY09A, GNSS–Derived Troposphere Delays, 26 June 2014, featured thefollowing presentations (speaker’s name bolded) which also can be accessed at http://igs.org/workshop/plenary:
• On the COST Action GNSS4SWEC1 project, which uses GNSS–derived troposphereestimates for severe–weather forecasting:
Advanced Global Navigation Satellite Systems Tropospheric Products for Monitor-
1European Cooperation in Science and Technology (COST) Advanced Global Navigation Satellite Sys-tems Tropospheric Products for Monitoring Severe Weather Events and Climate: http://www.cost.eu/COST_Actions/essem/Actions/ES1206
205
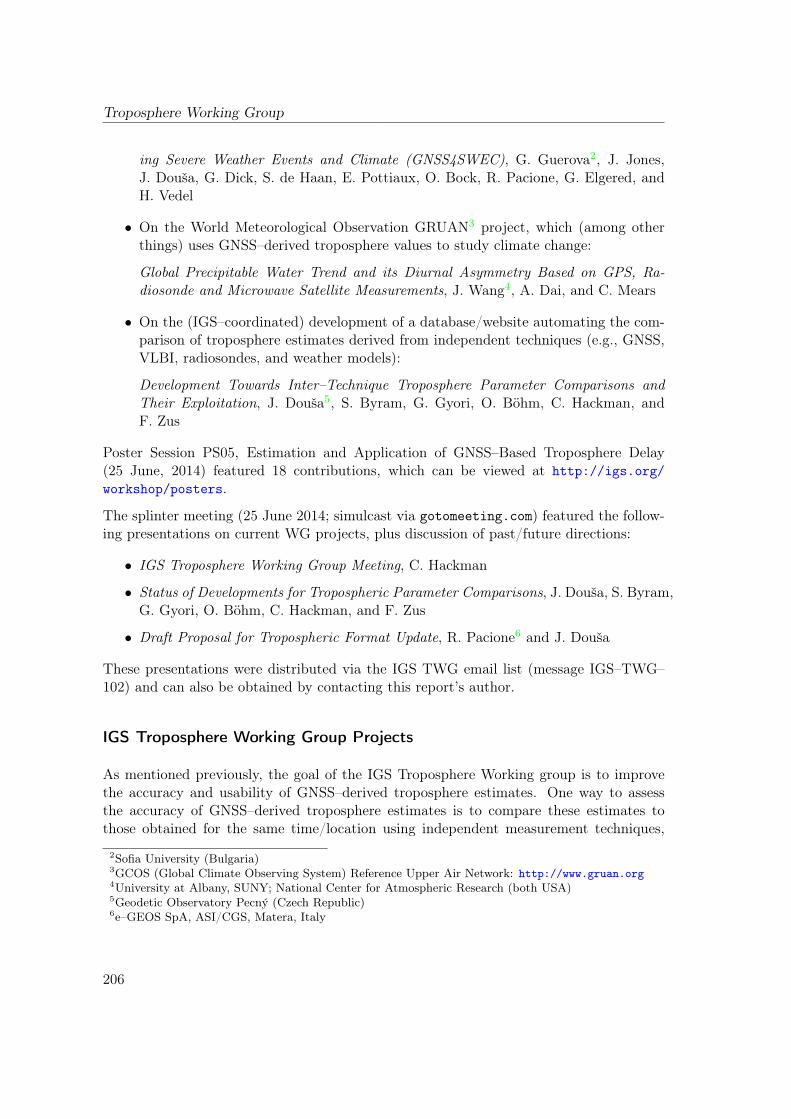
Troposphere Working Group
ing Severe Weather Events and Climate (GNSS4SWEC), G. Guerova2, J. Jones,J. Douša, G. Dick, S. de Haan, E. Pottiaux, O. Bock, R. Pacione, G. Elgered, andH. Vedel
• On the World Meteorological Observation GRUAN3 project, which (among otherthings) uses GNSS–derived troposphere values to study climate change:
Global Precipitable Water Trend and its Diurnal Asymmetry Based on GPS, Ra-diosonde and Microwave Satellite Measurements, J. Wang4, A. Dai, and C. Mears
• On the (IGS–coordinated) development of a database/website automating the com-parison of troposphere estimates derived from independent techniques (e.g., GNSS,VLBI, radiosondes, and weather models):
Development Towards Inter–Technique Troposphere Parameter Comparisons andTheir Exploitation, J. Douša5, S. Byram, G. Gyori, O. Böhm, C. Hackman, andF. Zus
Poster Session PS05, Estimation and Application of GNSS–Based Troposphere Delay(25 June, 2014) featured 18 contributions, which can be viewed at http://igs.org/workshop/posters.
The splinter meeting (25 June 2014; simulcast via gotomeeting.com) featured the follow-ing presentations on current WG projects, plus discussion of past/future directions:
• IGS Troposphere Working Group Meeting, C. Hackman
• Status of Developments for Tropospheric Parameter Comparisons, J. Douša, S. Byram,G. Gyori, O. Böhm, C. Hackman, and F. Zus
• Draft Proposal for Tropospheric Format Update, R. Pacione6 and J. Douša
These presentations were distributed via the IGS TWG email list (message IGS–TWG–102) and can also be obtained by contacting this report’s author.
IGS Troposphere Working Group Projects
As mentioned previously, the goal of the IGS Troposphere Working group is to improvethe accuracy and usability of GNSS–derived troposphere estimates. One way to assessthe accuracy of GNSS–derived troposphere estimates is to compare these estimates tothose obtained for the same time/location using independent measurement techniques,
2Sofia University (Bulgaria)3GCOS (Global Climate Observing System) Reference Upper Air Network: http://www.gruan.org4University at Albany, SUNY; National Center for Atmospheric Research (both USA)5Geodetic Observatory Pecný (Czech Republic)6e–GEOS SpA, ASI/CGS, Matera, Italy
206
3 IGS Troposphere Working Group Activities 2014
e.g., VLBI (Very Long Baseline Interferometry), DORIS (Doppler Orbitography and Ra-diopositioning Integrated by Satellite), radiosondes, or from numerical weather models.
The IGS TWG has therefore since 2012 been coordinating the creation of a database/websiteto automatically and continuously perform such comparisons.
Dr. Jan Douša, Geodetic Observatory Pecny (GOP; Czech Republic) has been spearhead-ing the development of the database (Douša and Gyori 2013; Gyori and Douša 2015),with contributions from other scientists at GOP and at GeoForschungsZentrum (GFZ;Germany). This database is nearly complete: it already can (and does) download andcompare troposphere values from a wide variety of sources, compensating for horizontaland vertical separation of measurement locations. Development of the website by whichusers can view/access the values is underway as well, with USNO augmenting initial GOPefforts. USNO has also begun contributing to database development, as well as the sourc-ing of auxiliary databases/servers.
In 2014, a grant proposal, Automated Intra– and Inter–technique Troposphere EstimateComparisons, made to the Kontakt II Czech–US research partnership by Dr. Douša withsupporting documents authored by WG chair C. Hackman, was funded.
This funding supports, in addition to other items, travel to the US for joint US–Czechwork on the database/website. Dr. Douša thus worked with USNO scientists on furtherwebsite/database development during a Kontakt II funded USNO site visit 2–14 Nov2014. Such short, focused co–work visits enable large steps forward, e.g., the installationof a second database at USNO, familiarization of USNO staff with database features, andUSNO–GOP joint work on designing interface structure.
Fig. 2 illustrates how the user interface to the website/database might appear. Com-pletion of this project is expected in 2016. This system has received interest from cli-matologists/meteorologists, e.g., those associated with the GRUAN and COST ActionGNSS4SWEC projects, as it will simplify quality–comparison and perhaps acquisition ofdata used as input to their studies.
The IGS Troposphere Working group is also supporting a project to standardize thetropo_sinex format in which troposphere delay values are disseminated and exchanged.At issue is the fact that different geodetic communities (e.g., VLBI, GNSS) have modi-fied the format in slightly different ways since the format’s introduction in 1997. To takeone simple and relatively benign example, text strings STDEV and STDDEV are usedto denote standard deviation in the GNSS and VLBI communities respectively. Suchfile–format inconsistencies hamper inter–technique comparisons.
This project, spearheaded by IGS Troposphere WG members R. Pacione and J. Douša,is being conducted within the COST Action GNSS4SWEC Working Group 3. ThisCOST WG consists of representatives from a variety of IAG (International Association ofGeodesy) organizations and other communities; its work is further supported by the EU-
207
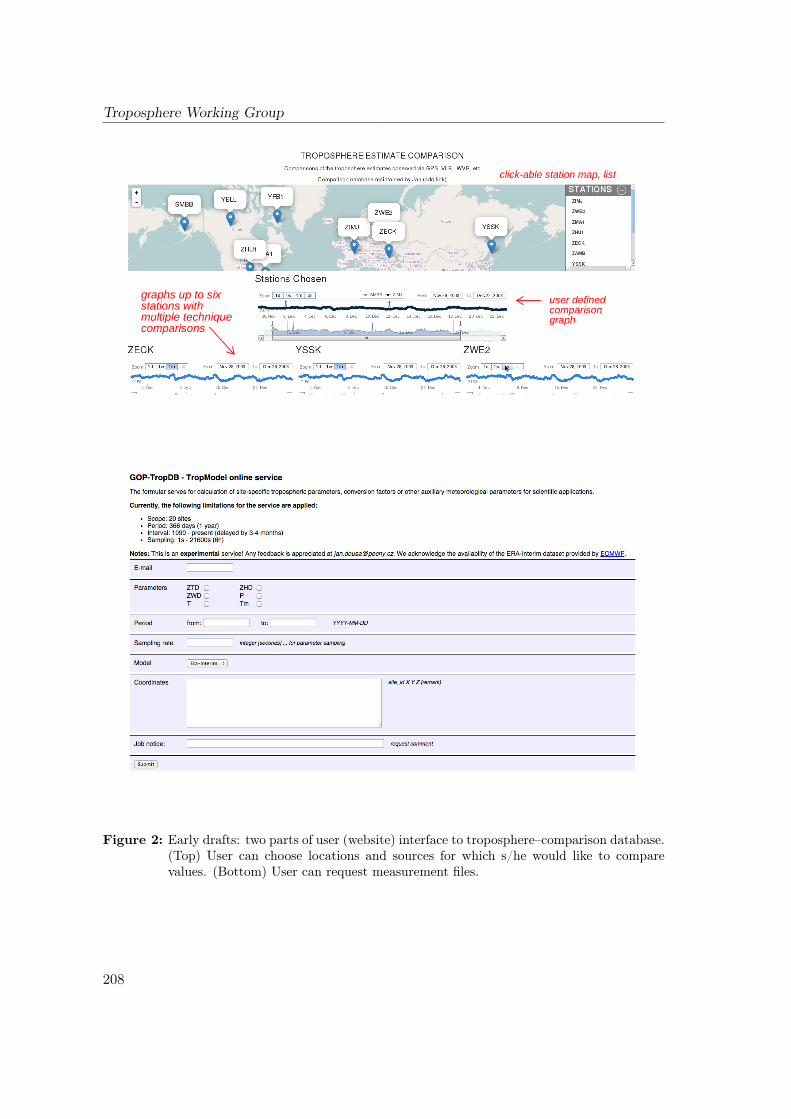
Troposphere Working Group
click-able station map, list
graphs up to six stations with multiple technique comparisons
user defined comparison graph
Figure 2: Early drafts: two parts of user (website) interface to troposphere–comparison database.(Top) User can choose locations and sources for which s/he would like to comparevalues. (Bottom) User can request measurement files.
208
3 IGS Troposphere Working Group Activities 2014
REF Technical Working Group7 as well as E–GVAP8 expert teams. The WG is currentlydefining in detail a format able to accommodate both troposphere values and the metadata(e.g., antenna height, local pressure values) required for further analysis/interpretation ofthe troposphere estimates.
IGS Troposphere Working Group Meeting, 16 December 2014, SanFrancisco, CA (simulcast via gotomeeting.com)
This meeting featured status reports on WG projects, a report from the GNSS4SWECteam, research–paper contributions by groups unable to attend, and a discussion of troposphere–estimate day–boundary discontinuities.
The presentations and papers were distributed via the IGS TWG email list (messageIGS–TWG–115), and can also be obtained by contacting this report’s author.
• Presentations:
– IGS Troposphere Working Group Meeting, C. Hackman
– GNSS4SWEC Update – G. Guerova and the GNSS4SWEC team
• Discussion: cause & amelioration of day–boundary discontinuities in IGS Final Tro-posphere Estimates, based partly on results presented in Gauges 2014.
• Publications contributed to the meeting:
– J. Böhm, G. Möller, M. Schindelegger, G. Pain, and R. Weber. “Developmentof an improved empirical model for slant delays in the troposphere (GPT2w),”GPS Solutions, DOI 10.1007/s10291–014–0403–7, 2014. (MATLAB source codehere: http://ggosatm.hg.tuwien.ac.at/DELAY/SOURCE/GPT2w)
– B. Federici, I. Ferrando, and D. Sguerso. “GM24P: GNSS monitoring to predictpotential precipitation,” Community Protection Expo, 9–11 December 2014,Genoa IT, 2014. [email protected]
– L. Morel, E. Pottiaux, F. Durand, F. Fund, K. Boniface, P. Sergio de OliveiraJunior, and J. Van Baelan. “Validity and behaviour of tropospheric gradientsestimated by GPS in Corsica,” Advances in Space Research, 55:135–149, 2015.http://dx/doi/org/10.1016/j.asr.2014.10.004
7http://www.euref.eu/euref_twg.html8EUMETNET EIG GNSS Water Vapour Programme; http://egvap.dmi.dk
209
Troposphere Working Group
4 How to Obtain Further Information
• IGS Final Troposphere Estimates can be downloaded from: ftp://cddis.gsfc.nasa.gov/gps/products/troposphere/zpd
• For technical questions regarding them, please contact Dr. Sharyl Byram at [email protected] or Dr. Christine Hackman, [email protected].
• To learn more about the IGS Troposphere Working Group, you may:
– contact Dr. Christine Hackman at [email protected]
– visit its website (under development): http://igs.org/projects-working-groups/twg, and/or
– subscribe to its email list: http://igscb.jpl.nasa.gov/mailman/listinfo/igs-twg
5 Acknowledgements
Development of the troposphere–comparison database/website is supported by KON-TAKT II project number LH14089. The IGS Central Bureau is thanked for allowinguse of its gotomeeting.com subscription.
References
Byram, S. and C. Hackman. Computation of the IGS Final Troposphere Product by theUSNO. IGS Workshop 2012, Olstzyn, Poland, 2012.
Boehm, J., A. Niell, P. Tregoning, and H. Schuh. Global Mapping Function (GMF): A NewEmpirical Mapping Function Based on Numerical Weather Model Data. GeophysicalResearch Letters, 33(7):L07304, 2006.
Dach, R., U. Hugentobler, P. Fridez, and M. Meindl. Bernese GPS Software Version 5.0(User Manual). Astronomical Institute, University of Bern, Astronomical Institute ofUniversity of Bern, Bern, Switzerland, 2007.
Douša, J., S. Byram, G. Gyori, O. Böhm, C. Hackman, and F. Zus. Development TowardsInter–technique Troposphere Parameter Comparisons and Their Exploitation. IGSWorkshop 2014, Pasadena CA, 2014.
Douša, J. and G. Gyori. Database for Tropospheric Product Evaluations – ImplementationAspects. Geoinformatics, 10:39–52, 2013.
210
References
Gauges, R. Validierung der mit GPS geschätzen Troposphärenparameter des IGS, (Valida-tion of IGS GPS–Estimated Troposphere Parameters). Bachelor’s thesis, TechnischeUniversität München, Munich, Germany, 2014.
Gyori, G. and J. Douša. GOP–TropDB Developments for Tropospheric Product Eval-uation and Monitoring – Design, Functionality and Initial Results. IAG SymposiaSeries, 143 (in press), Springer, 2015.
Noll, C. Personal Communication. NASA Goddard Space Flight Center, http://cddis.gsfc.nasa.gov, 2015.
Zumberge, J.F., M.B. Heflin, D.C. Jefferson, M.M. Watkins, and F.H. Webb. Precise PointPositioning for the Efficient and Robust Analysis of GPS Data from Large Networks.J. Geophys. Res., 102(B3):5005–17, 1997.
211
Troposphere Working Group
Appendix A. IGS Troposphere Working Group Members
Last Name First Name Institution Country
Ahmed Furqan Universite du Luxembourg LuxembourgAmirkhani Mohammad Islamic Azad Univ. Tehran IranBar–Sever Yoaz Jet Propulsion Laboratory (JPL) USABevis Mike Ohio State University USABosser Pierre ENSG/DPTS FranceBock Olivier IGN–LAREG FranceBoehm Johannes TU Wien AustriaBosy Jaroslaw Institute of Geodesy and Poland
Geoinformatics; Wroclaw Universityof Environmental and Life Sciences
Braun John UCAR USAByram Sharyl USNO USAByun Sung JPL USACalori Andrea Univ. Roma, La Sapienza ItalyCao Wei Univ. New Brunswick CanadaChen Junping Shanghai Astronomical Observatory ChinaColosimo Gabriele Univ. Roma, La Sapienza ItalyCrespi Mattia Univ. Roma, La Sapienza ItalyDeng Zhiguo GFZ GermanyDick Galina GFZ GermanyDouša Jan GOP PolandDrummond Paul Trimble USAGhoddousi–Fard Reza Natural Resources Canada CanadaGuerova Guergana Univ. Sofia BulgariaGutman Seth NOAA USAHackman Christine USNO USAHeinkelmann Robert GFZ GermanyHerring Tom MIT USAHilla Steve NGS/NOAA USAHobiger Thomas Onsala Space Observatory; Sweden
Chalmers Univ. of TechnologyJones Jonathan Met Office UK UKLangley Richard Univ. New Brunswick CanadaLeandro Rodrigo Hemisphere GNSS USALeighton Jon 3vGeomatics Canada/UKLiu George Hong Kong Polytechnic University Hong KongMelachroinos Stavros Geoscience Australia AustraliaMoeller Gregor TU Wien Austria
212
Appendix A. IGS Troposphere Working Group Members
Moore Angelyn JPL USANegusini Monia Inst. Radioastronomy (IRA); Italy
Nat’l. Inst. Astrophysics (INAF)Nordman Maaria Finnish Geodetic Inst. FinlandPacione Rosa ASI/CGS ItalyPalamartchouk Kirill Univ. Newcastle UKPenna Nigel Univ. Newcastle UKPerosanz Felix CNES FrancePottiaux Eric Royal Obs Belgium BelgiumPrikryl Paul Communications Research Canada
Centre, CanadaRocken Chris GPS Solutions USARoggenbuck Ole BKG GermanyRohm Witold Univ. Wroclaw PolandRomero Nacho Canary Advanced Solutions SpainSantos Marcelo Univ. New Brunswick CanadaSchaer Stefan AIUB SwitzerlandSchoen Steffen Inst. Erdmessung, Leibniz Germany
Univ. HannoverSguerso Domenico Lab. Geodesy, Geomatics, Italy
GIS; Univ. GenoaSoudarin Laurent Collecte Localisation Satellites FranceTeferle Norman Universite du Luxembourg LuxembourgTracey Jeffrey USNO USAvan der Marel Hans TU Delft NetherlandsWang Junhong UCAR/NCAR USAWillis Pascal Inst. de Physique du Globe France
de ParisXu Zong–qiu Liaoning TU ChinaZhang Shoujian Wuhan Univ. China
213
Troposphere Working Group
Appendix B. IGS Troposphere Working Group Charter
IGS TROPOSPHERE WORKING GROUP CHARTER
GNSS can make important contributions to meteorology, climatology and other environ-mental disciplines through its ability to estimate troposphere parameters. Along withthe continued contributions made by the collection and analysis of ground–based receivermeasurements, the past decade has also seen new contributions made by space–basedGNSS receivers, e.g., those on the COSMIC/FORMOSAT mission [1]. The IGS thereforecontinues to sanction the existence of a Troposphere Working Group (TWG).
The primary goals of the IGS TWG are to:
• Assess/improve the accuracy/precision of IGS GNSS–based troposphere estimates.
• Improve the usability of IGS troposphere estimates.
o Confer with outside agencies interested in the use of IGS products.
o Assess which new estimates should be added as “official” IGS products, andwhich, if any, official troposphere product sets should be discontinued.
• Provide and maintain expertise in troposphere–estimate techniques, issues and ap-plications.
Science background
The primary troposphere products generated from ground–based GNSS data are estimatesof total zenith path delay and north/east troposphere gradient. Ancillary measurementsof surface pressure and temperature allow the extraction of precipitable water vapor fromthe total zenith path delay.
Water vapor, a key element in the hydrological cycle, is an important atmosphere green-house gas. Monitoring long–term changes in its content and distribution is essential forstudying climate change. The inhomogeneous and highly variable distribution of the at-mospheric water vapor also makes it a key input to weather forecasting.
Water vapor distribution is incompletely observed by conventional systems such as ra-diosondes and remote sensing. However, ground– and space–based GNSS techniques pro-vide complementary coverage of this quantity. Ground–based GNSS observations producecontinuous estimates of vertically integrated water vapor content with high temporal res-olution over a global distribution of land–based locations; coverage is limited over theoceans (where there is no land). Conversely, water vapor can be estimated from space–borne GNSS receivers using ray tracing techniques, in which case solutions with high ver-tical resolution (laterally integrated over few hundred kilometers) and good oceanic/land
214
Appendix B. IGS Troposphere Working Group Charter
coverage are obtained; these solutions however are discontinuous in geographic locationand time.
Be it resolved that the IGS troposphere WG will:
• Support those IGS analysis centers providing official IGS troposphere products.
• Increase awareness/usage of IGS troposphere products by members of the atmo-spheric, meteorology and climate–change communities. Solicit the input and in-volvement of such agencies.
• Create new IGS troposphere products as needed (as determined by consultation withthe potential user community).
• Determine the uncertainty of IGS troposphere estimates through comparison of so-lutions with those obtained from independent techniques, or through other meansas appropriate.
• Promote synergy between space–based and ground–based GNSS techniques throughinteraction with researchers in both fields.
Reference
[1] Schreiner, W., C. Rocken, S. Sokolovskiy, S. Syndergaard, and D. Hunt, Estimates ofthe precision of GPS radio occultations from the COSMIC/FORMOSAT–3 mission, GRL34, L04808, doi:10.1029/2006GL027557, 2007.
[2] Teke, K., J. Böhm, T. Nilsson, H. Schuh, P. Steigenberger, R. Dach, R. Heinkelmann,P. Willis, R. Haas, S. García–Espada, T. Hobiger, R. Ichikawa, and S. Shimizu, Multi–technique comparison of troposphere zenith delays and gradients during CONT08, J Geod,85:395–413, DOI 10.1007/s00190–010–0434–y, 2011.
215

Troposphere Working Group
216


IGS IS a ServIce of:
InternatIonal aSSocIatIon of GeodeSy
InternatIonal UnIon of GeodeSy and GeophySIcS
InternatIonal coUncIl for ScIence
World data SyStem
IGS Central BureauJet ProPulSIon LABORATORY MS 238-540PaSadena, Ca 91109 uSa Phone: +1 (818) 354-2077 Fax: +1 (818) 354-8545 httP://[email protected]
EDITORaStronomIcal InStItUte UnIverSIty of Bern
Related Documents


