Technical Notes of the Provincial Product Accounts Province of Palawan

Welcome message from author
This document is posted to help you gain knowledge. Please leave a comment to let me know what you think about it! Share it to your friends and learn new things together.
Transcript
Technical Notes of the Provincial Product AccountsProvince of Palawan
PSA Complex, East Avenue, Diliman, Quezon City, Philippines 1101 Telephone: (632) 938-5267 www.psa.gov.ph
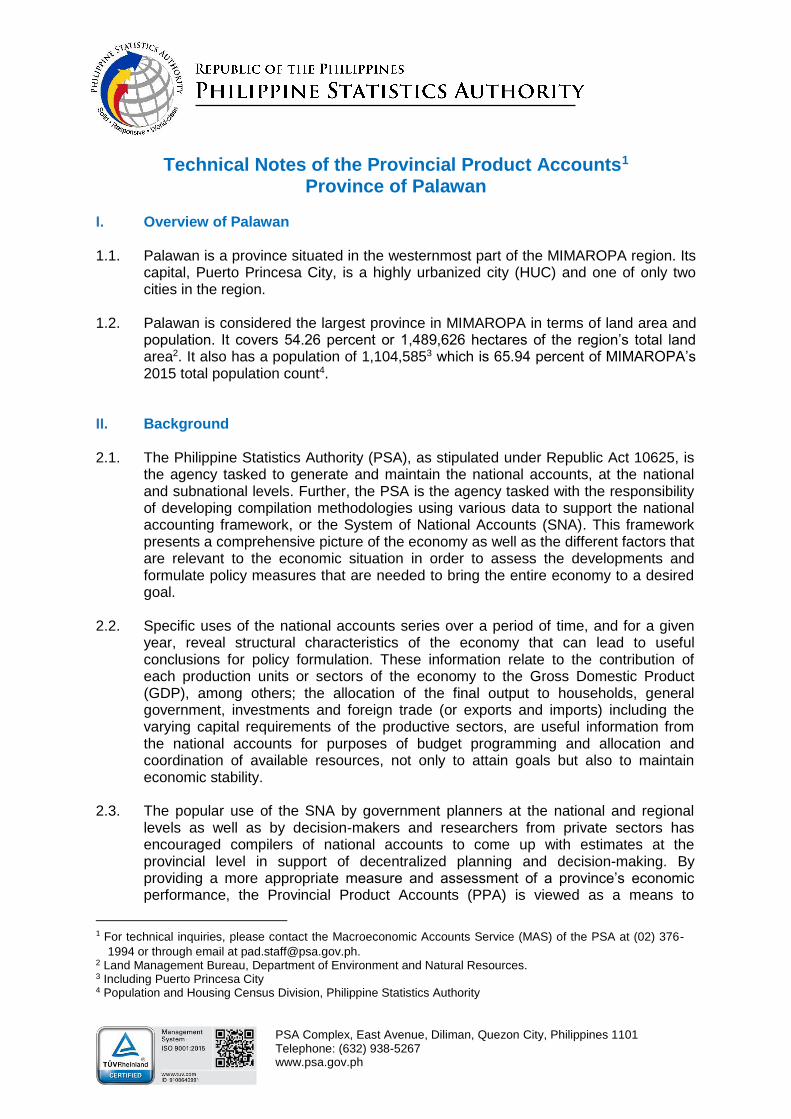
Technical Notes of the Provincial Product Accounts1 Province of Palawan
I. Overview of Palawan
1.1. Palawan is a province situated in the westernmost part of the MIMAROPA region. Its
capital, Puerto Princesa City, is a highly urbanized city (HUC) and one of only two cities in the region.
1.2. Palawan is considered the largest province in MIMAROPA in terms of land area and population. It covers 54.26 percent or 1,489,626 hectares of the region’s total land area2. It also has a population of 1,104,5853 which is 65.94 percent of MIMAROPA’s 2015 total population count4.
II. Background
2.1. The Philippine Statistics Authority (PSA), as stipulated under Republic Act 10625, is
the agency tasked to generate and maintain the national accounts, at the national and subnational levels. Further, the PSA is the agency tasked with the responsibility of developing compilation methodologies using various data to support the national accounting framework, or the System of National Accounts (SNA). This framework presents a comprehensive picture of the economy as well as the different factors that are relevant to the economic situation in order to assess the developments and formulate policy measures that are needed to bring the entire economy to a desired goal.
2.2. Specific uses of the national accounts series over a period of time, and for a given
year, reveal structural characteristics of the economy that can lead to useful conclusions for policy formulation. These information relate to the contribution of each production units or sectors of the economy to the Gross Domestic Product (GDP), among others; the allocation of the final output to households, general government, investments and foreign trade (or exports and imports) including the varying capital requirements of the productive sectors, are useful information from the national accounts for purposes of budget programming and allocation and coordination of available resources, not only to attain goals but also to maintain economic stability.
2.3. The popular use of the SNA by government planners at the national and regional
levels as well as by decision-makers and researchers from private sectors has encouraged compilers of national accounts to come up with estimates at the provincial level in support of decentralized planning and decision-making. By providing a more appropriate measure and assessment of a province’s economic performance, the Provincial Product Accounts (PPA) is viewed as a means to
1 For technical inquiries, please contact the Macroeconomic Accounts Service (MAS) of the PSA at (02) 376-
1994 or through email at [email protected]. 2 Land Management Bureau, Department of Environment and Natural Resources. 3 Including Puerto Princesa City 4 Population and Housing Census Division, Philippine Statistics Authority
2 | P a g e
strengthen the planning and decision-making of provincial policymakers and stakeholders in crafting more informed economic policies. As such, the demand of having subnational level estimates for the National Accounts of the Philippines (NAP) has increased.
2.4. Recognizing the potential of the PPA in determining the economic impact of
Palawan’s commitment to the Brunei-Darussalam-Indonesia-Malaysia-Philippines East ASEAN Growth Area (BIMP-EAGA) initiative, different government institutions collaborated to develop the PPA of the province.
2.5. The development of the PPA for the Province of Palawan is spearheaded by the
PSA Central Office (PSA-CO) through the Macroeconomic Accounts Service (MAS). The PSA-CO collaborated with the PSA Regional Statistical Services Office (RSSO) of MIMAROPA as well as with the PSA Provincial Statistics Office (PSO) of Palawan for coordination with the Local Government Units (LGUs), and regional and provincial line agencies. The PSA also provided the technical assistance to the Provincial Government of Palawan, particularly the Provincial Planning and Development Office (PPDO), to facilitate the collection of data to be utilized in the estimation and compilation of the PPA. The PSA also partnered with the Mindanao Development Authority (MinDA) in relation to Palawan’s participation to the BIMP-EAGA.
III. Activities towards PPA compilation
3.1. In 2015, the BIMP-EAGA initiative called for the need to compile the PPA of the
province of Palawan. Through the initiative of MinDA, a training on the SNA was conducted in Davao City. Likewise, the Provincial Government of Palawan expressed its interest in developing the PPA for the province and sought the technical guidance of the PSA to generate the PPA estimates.
3.2. It was in 2016 when the PSA included the compilation of the PPA of Palawan among
its developmental programs. Initial activities were immediately conducted by the PSA, in coordination with its provincial counterparts. As an initial activity, the staffs from PPDO Palawan together with the staff from MinDA were briefed on the data needs in the compilation of the PPA. A series of discussions were conducted with them on the data sources and the data collection strategies from source agencies and institutions. A discussion on the overview of the concepts and methodologies was also included for them to appreciate the need of relevant data and how these data are used for each specific industry in the economy.
3.3. The prime preliminary activity undertaken in the compilation of the PPA of Palawan
was the conduct of the “Training/Workshop on the Assessment of Data towards the Compilation of the PPA of Palawan.” in Palawan on 15-17 February 2017. The activity was attended by the technical staff of the PSA Central Office and the PSA regional and provincial staff, as well as representatives from concerned agencies and local government units. This was followed through with an Update Briefing/Workshop held in August 2017, in coordination with the PPDO Palawan, to validate the preliminary estimates of the provincial accounts.
3.4. As a culminating activity, the PSA released the PPA results through a dissemination
forum held in Palawan on October 2017. Officials and staff from the PSA CO, RSSO of MIMAROPA, and PSO of Palawan attended the dissemination forum. Representatives from the Provincial Government Office of Palawan and the PPDO and selected City Planning and Development Offices (CPDO) of Palawan also participated in the activity. Local news outlets in radio, newspaper, television, and
3 | P a g e
other forms of media as well as industry, government, and academe stakeholders and data users were also invited to the event.
3.5. The highlight of the dissemination forum was the presentation of PSA National Statistician Lisa Grace S. Bersales, Ph.D on the results and highlights of the Gross Provincial Product of Palawan for the years 2014 to 2016. The PPDO Palawan also presented their analyses and policies in response to the results of the PPA.
IV. PPA Compilation Processes
4.1. The available data in the province including those that are available in the region,
with specific data for Palawan, were collected and validated and provided to the PSA for further review and assessment. After which, a list of additional data was prepared by the PSA and forwarded to Palawan for collection and consolidation. Financial statements for government, electricity and water were also available in the province and submitted to PSA for translation into SNA variables required for the Gross Value Added (GVA) estimates of concerned industries.
4.2. In addition to the available provincial data, special processing was done for the province of Palawan on the results of the 2015 Census of Philippine Business and Industries (CPBI). Data available from the 2015 CPBI include number of establishments, gross revenue, compensation, employment, cost data by type of cost, depreciation and indirect taxes.
4.3. Based on the assessment of the consolidated provincial data, the data requirements
for the PPA compilation were not completely fulfilled. To address the data gaps, PSA technical staff identified proxy indicators for each of the industries.
4.4. List of data sources evaluated for the compilation of the PPA of Palawan is presented
in Annex A.
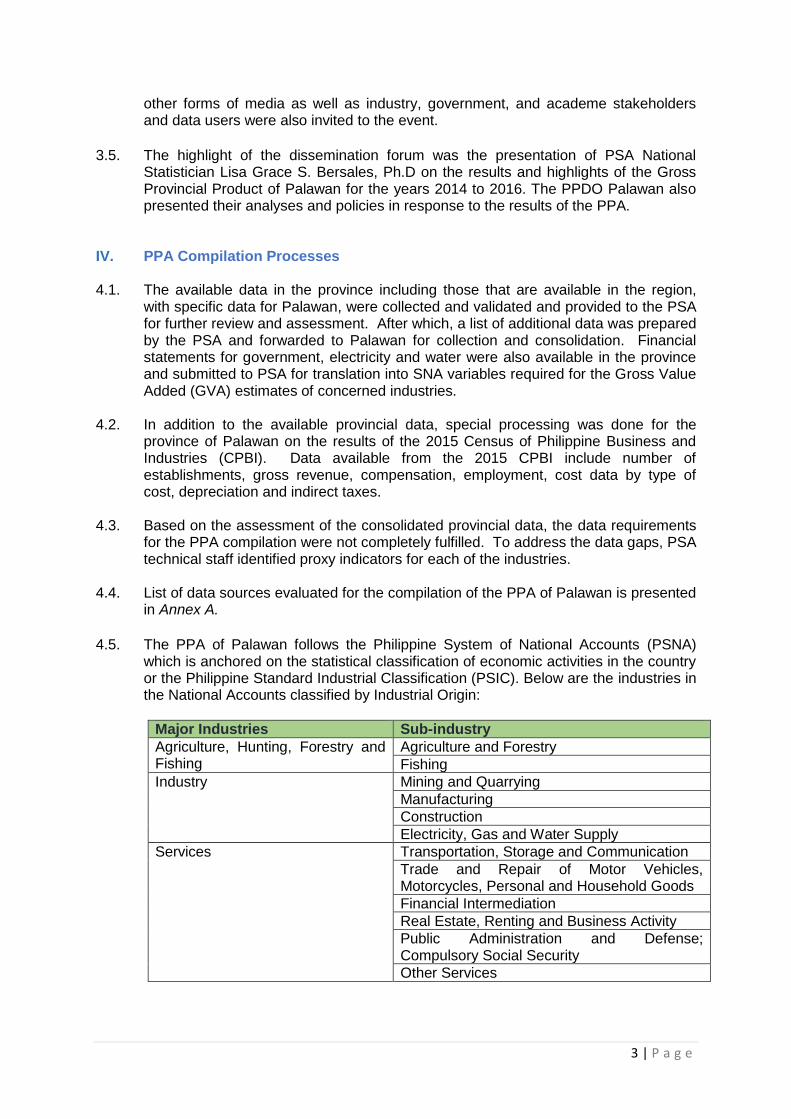
4.5. The PPA of Palawan follows the Philippine System of National Accounts (PSNA) which is anchored on the statistical classification of economic activities in the country or the Philippine Standard Industrial Classification (PSIC). Below are the industries in the National Accounts classified by Industrial Origin:
Major Industries Sub-industry
Agriculture, Hunting, Forestry and Fishing
Agriculture and Forestry
Fishing
Industry Mining and Quarrying
Manufacturing
Construction
Electricity, Gas and Water Supply
Services Transportation, Storage and Communication
Trade and Repair of Motor Vehicles, Motorcycles, Personal and Household Goods
Financial Intermediation
Real Estate, Renting and Business Activity
Public Administration and Defense; Compulsory Social Security
Other Services
4 | P a g e
4.6. The general methodologies adopted were mostly based on the following approaches: a. Production Approach
GVA = Gross Output (GO) less Intermediate Consumption(IC); and
b. Gross Value Added Ratio (GVAr) Approach GVA = Gross Output multiplied by the GVAr. 4.7. Given the methodologies, the levels of estimates were directly linked to the estimates
for the region. This means that the level of estimated GVA for the province should be in proportion to the estimated GVA of MIMAROPA. Said procedure was maintained in the final GVA estimates for purposes of comparability with the regional level estimates.
4.8. In the compilation of preliminary estimates for each industry, consultation between the PSA and data producers were conducted to further check the consistencies of the provincial data with other indicators as well as to validate resulting estimates of the PPA in terms of the levels, structures and growth rates.
V. Conceptual Framework 5.1. The compilation of the PSNA is based on the concepts and classifications of the
accounting framework formulated by the international community of national accounts experts. Besides providing the planners and decision makers with an appropriate tool for policy making, the PSNA also provides a framework for the development of the statistical system of a country as it identifies existing data gaps and weaknesses and provides a check for consistency of the statistical reporting system.
5.2. The SNA is a widely recognized powerful tool for monitoring the performance of the economy. It consists of a coherent, consistent and integrated set of macroeconomic accounts, balance sheets and tables based on internationally agreed concepts, definitions and accounting rules. It provides a comprehensive framework for the systematic and integrated recording of the transactions of the economy as a whole.
5.3. In the PSNA, the GDP is compiled through the production, expenditure, and income approaches. Although conceptually the GDP compiled using the three approaches should be equal, this does not happen because of various data sources with varying degrees of reliability as well as the varying degrees of validity of the assumptions used in the estimation process.
5.4. The GDP for the Province of Palawan is compiled through the production approach considering the availability of data at the industry level. The PPA is a term used to denote the Gross Provincial Domestic Product which refers to the aggregate of the gross value added (GVA) or income from each industry or economic activity of the provincial economy.
5.5. Using the production approach, the GDP is based on the concept of GVA. The GVA refers to the unduplicated value of goods and services produced in any given period of time. There are two important variables in the computation of the GVA by industry,: gross output and intermediate consumption. These are defined as follows:
1. Gross output – is the value of goods and services produced by producers such
as industries, households and government. The output can either be: i) sold; ii)
5 | P a g e
disposed of or intended to be sold/disposed of in the markets; iii) retained for own final consumption; or iv) used for further production process.
2. Intermediate consumption – is the value of goods and services consumed as
inputs in the production process.
The Gross Value Added – is the unduplicated measure of output and is obtained by deducting from the value of output the value of intermediate inputs. GVA is composed of compensation, depreciation, indirect taxes paid net of subsidies received and the operating surplus, which is the payment to the producer as entrepreneur.
5.6. GDP is computed as the aggregate of the GVAs of all resident producers. The concept of residence, however, is not based on nationality or legal criteria. An institutional unit is said to be a resident unit of a country when it has a center of economic interest in the economic territory of that country – that is when it engages for an extended period (one year or more being taken as a practical guide) in economic activities of this territory.
5.7. For simplicity of the PPA compilation as in the case of Palawan, the economic territory refers for to the geographic territory of the province. The residence of Palawan refers to the residence of individual persons which is determined by that of the household of which they form part and not by their place of work. All members of the same household have the same residence as the household itself, even though they may cross borders to work or otherwise spend periods of time outside the province of Palawan or abroad. If they work and reside outside the province of Palawan or abroad long enough that they acquire a center of economic interest in the area outside of Palawan, they cease to be members of the original households of Palawan.
5.8. The GDP for the total economy of Palawan or the Gross Provincial Domestic Product for the province also refers to the measure of the provinces’ output of final goods and services for an accounting period in terms of its market value. When this is expressed at current prices, this represents the total peso value of the production of the total goods and services produced in the province. When valued at constant prices, say at base year 2000, the influence of price changes is eliminated and this now represents the overall value of the overall index of the physical volume of goods and services produced in the province. Thus, the GDP at constant prices provides an overall picture of the total volume of goods and services produced by the economy for the certain period.
6 | P a g e
VI. Most recent results
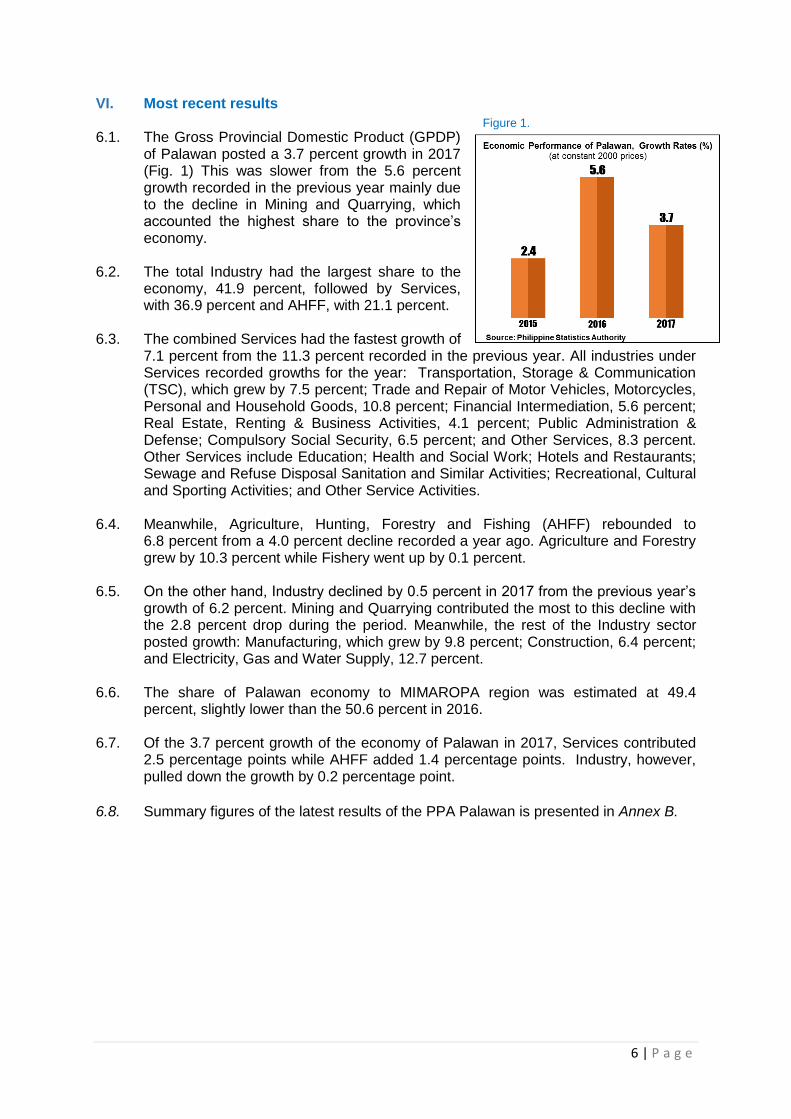
6.1. The Gross Provincial Domestic Product (GPDP) of Palawan posted a 3.7 percent growth in 2017 (Fig. 1) This was slower from the 5.6 percent growth recorded in the previous year mainly due to the decline in Mining and Quarrying, which accounted the highest share to the province’s economy.
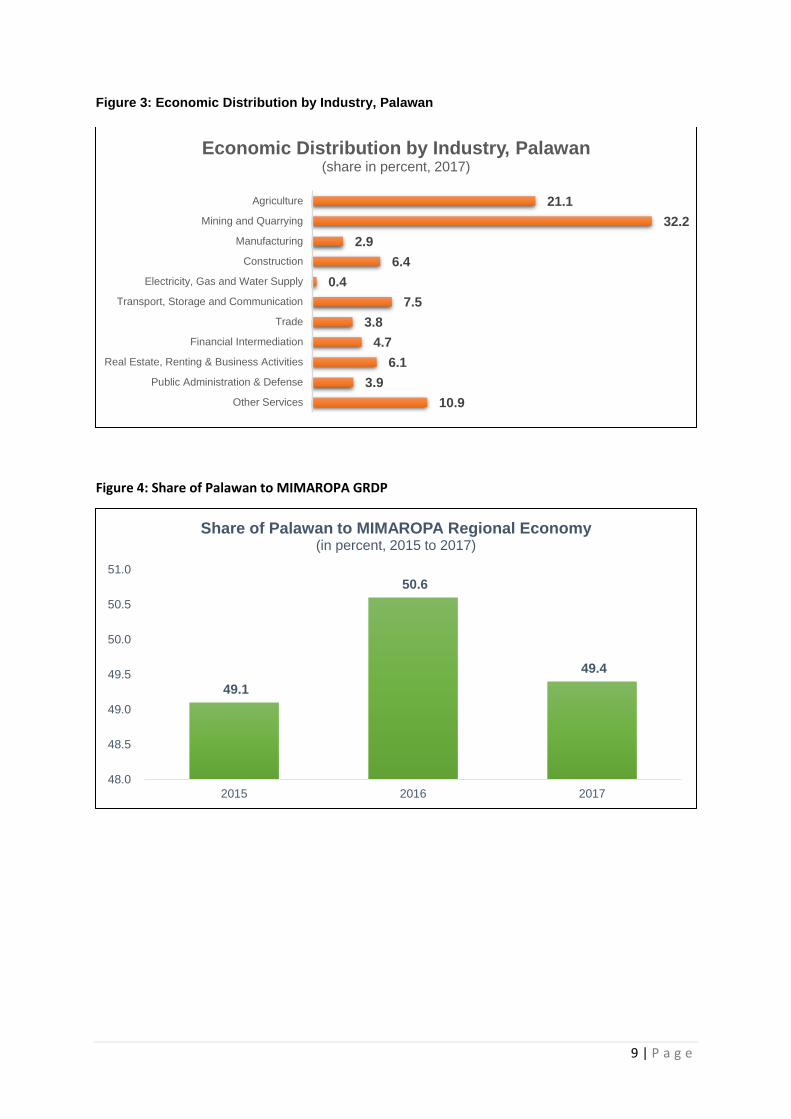
6.2. The total Industry had the largest share to the economy, 41.9 percent, followed by Services, with 36.9 percent and AHFF, with 21.1 percent.
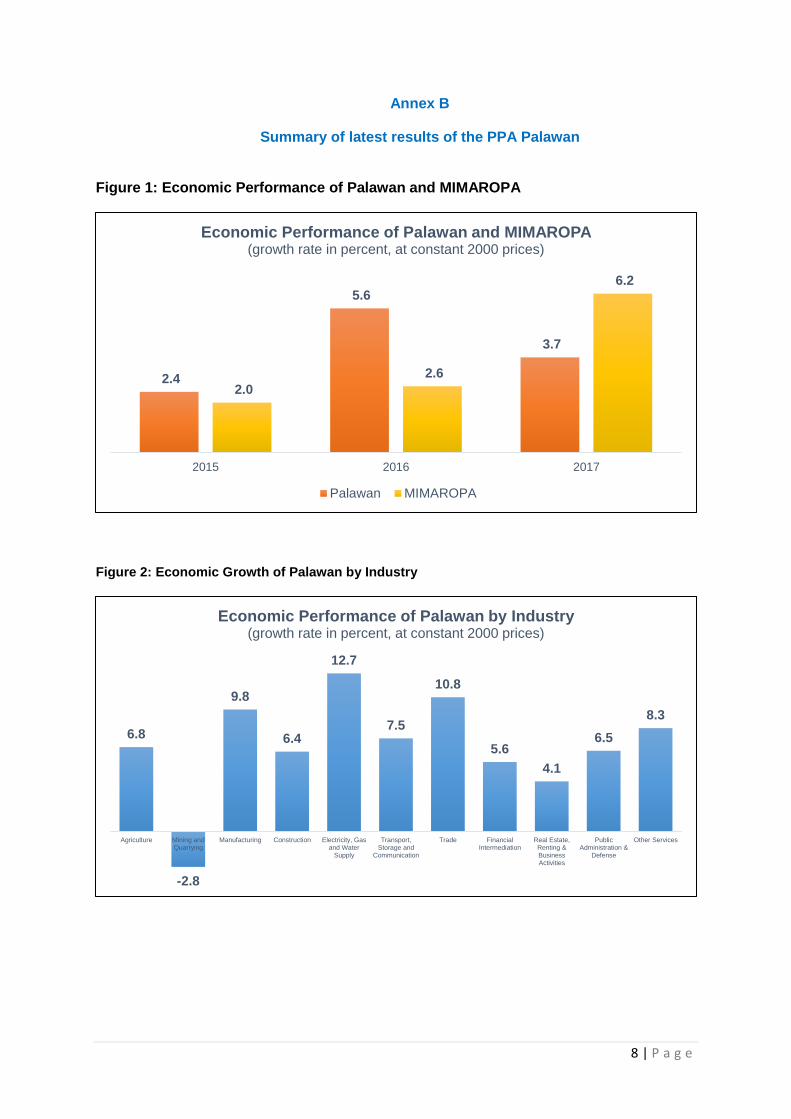
6.3. The combined Services had the fastest growth of 7.1 percent from the 11.3 percent recorded in the previous year. All industries under Services recorded growths for the year: Transportation, Storage & Communication (TSC), which grew by 7.5 percent; Trade and Repair of Motor Vehicles, Motorcycles, Personal and Household Goods, 10.8 percent; Financial Intermediation, 5.6 percent; Real Estate, Renting & Business Activities, 4.1 percent; Public Administration & Defense; Compulsory Social Security, 6.5 percent; and Other Services, 8.3 percent. Other Services include Education; Health and Social Work; Hotels and Restaurants; Sewage and Refuse Disposal Sanitation and Similar Activities; Recreational, Cultural and Sporting Activities; and Other Service Activities.
6.4. Meanwhile, Agriculture, Hunting, Forestry and Fishing (AHFF) rebounded to 6.8 percent from a 4.0 percent decline recorded a year ago. Agriculture and Forestry grew by 10.3 percent while Fishery went up by 0.1 percent.
6.5. On the other hand, Industry declined by 0.5 percent in 2017 from the previous year’s growth of 6.2 percent. Mining and Quarrying contributed the most to this decline with the 2.8 percent drop during the period. Meanwhile, the rest of the Industry sector posted growth: Manufacturing, which grew by 9.8 percent; Construction, 6.4 percent; and Electricity, Gas and Water Supply, 12.7 percent.
6.6. The share of Palawan economy to MIMAROPA region was estimated at 49.4 percent, slightly lower than the 50.6 percent in 2016.
6.7. Of the 3.7 percent growth of the economy of Palawan in 2017, Services contributed 2.5 percentage points while AHFF added 1.4 percentage points. Industry, however, pulled down the growth by 0.2 percentage point.
6.8. Summary figures of the latest results of the PPA Palawan is presented in Annex B.
Figure 1.
7 | P a g e
Annex A
List of Data Sources
BANGKO SENTRAL NG PILIPINAS (BSP)
BUREAU OF CUSTOMS (BOC)
BUREAU OF INTERNAL REVENUE (BIR)
BUREAU OF LOCAL GOVERNMENT FINANCE
CIVIL AVIATION AUTHORITY OF THE PHILIPPINES
COMMISSION ON AUDIT (COA)
DEPARTMENT OF AGRICULTURE (DA)
DEPARTMENT OF BUDGET AND MANAGEMENT (DBM)
DEPARTMENT OF ENERGY (DOE)
DEPARTMENT OF PUBLIC WORKS AND HIGHWAYS (DPWH)
DEPARTMENT OF TOURISM (DOT)
FOREST MANAGEMENT BUREAU (FMB) - DENR
INDUSTRY ASSOCIATIONS
INSURANCE COMMISSION
LAND TRANSPORTATION OFFICE (LTO)
LOCAL WATER UTILITIES ADMINISTRATION (LWUA)
MARITIME INDUSTRY AUTHORITY (MARINA)
MINES AND GEOSCIENCES BUREAU (MGB)
NATIONAL ELECTRIFICATION ADMINISTRATION (NEA)
NATIONAL POWER CORPORATION (NPC)
NATIONAL TELECOMMUNICATIONS COMMISSION (NTC)
PHILIPPINE PORTS AUTHORITY (PPA)
PHILIPPINE STATISTICS AUTHORITY (PSA)
PROVINCIAL/CITY PLANNING AND DEVELOPMENT OFFICES (PPDO/CPDOS)
8 | P a g e
Annex B
Summary of latest results of the PPA Palawan Figure 1: Economic Performance of Palawan and MIMAROPA
Figure 2: Economic Growth of Palawan by Industry
2.4
5.6
3.7
2.0
2.6
6.2
2015 2016 2017
Economic Performance of Palawan and MIMAROPA(growth rate in percent, at constant 2000 prices)
Palawan MIMAROPA
6.8
-2.8
9.8
6.4
12.7
7.5
10.8
5.6
4.1
6.5
8.3
Agriculture Mining andQuarrying
Manufacturing Construction Electricity, Gasand Water
Supply
Transport,Storage and
Communication
Trade FinancialIntermediation
Real Estate,Renting &BusinessActivities
PublicAdministration &
Defense
Other Services
Economic Performance of Palawan by Industry(growth rate in percent, at constant 2000 prices)
9 | P a g e
Figure 3: Economic Distribution by Industry, Palawan
Figure 4: Share of Palawan to MIMAROPA GRDP
21.1
32.2
2.9
6.4
0.4
7.5
3.8
4.7
6.1
3.9
10.9
Agriculture
Mining and Quarrying
Manufacturing
Construction
Electricity, Gas and Water Supply
Transport, Storage and Communication
Trade
Financial Intermediation
Real Estate, Renting & Business Activities
Public Administration & Defense
Other Services
Economic Distribution by Industry, Palawan(share in percent, 2017)
49.1
50.6
49.4
48.0
48.5
49.0
49.5
50.0
50.5
51.0
2015 2016 2017
Share of Palawan to MIMAROPA Regional Economy(in percent, 2015 to 2017)
10 | P a g e
PRODUCTION ACCOUNTS DIVISION
MACROECONOMIC ACCOUNTS SERVICE
PHILIPPINE STATISTICS AUTHORITY
LISA GRACE S. BERSALES Ph.D. Undersecretary
National Statistician and Civil Registrar General
JOSIE B. PEREZ ROSALINDA P. BAUTISTA DANIEL A. ARIASO, Sr. Assistant Secretary
Deputy National Statistician
Censuses and Technical
Coordination Office
(Director II)
Officer-in-Charge
Sectoral Statistics Office
Assistant Secretary
Deputy National Statistician
Civil Registration and Central
Support Office
VIVIAN R. ILARINA
Assistant National Statistician
Macroeconomic Accounts Service
FLORANDE S. POLISTICO
Chief
Production Accounts Division
SECTOR SPECIALISTS
Agriculture, Hunting, Forestry, and Fishery Cynthia P. Donato
Industry
Mining and Quarrying Jomar S. Garachico
Manufacturing Faith Hyacinth M. Balisacan
Construction Dean Joseph A. Villanueva
Electricity, Gas and Water Chelo M. Nuyda
Services
Transportation, Storage,
and Communication Christian Patrick E. Vinculado
Trade and Repair of Motor Vehicles,
Motorcycles, Personal and
Household Goods Anne Pauline M. Genavia
Financial Intermediation Christian Patrick E. Vinculado
Real Estate, Renting, and Business
Activities Aaron Paolo B. Uy
Other Services Kristy Ann G. Meguiso
Public Administration and Defense Gerald Junne L. Clariño
Related Documents