Technical Memorandum SOUTH SHORE COASTAL WATERSHEDS 2006 DWM WATER QUALITY MONITORING DATA December 2012 Jamie Carr and Matthew Reardon Massachusetts Department of Environmental Protection Division of Watershed Management DWM Control Number CN 235.1 COMMONWEALTH OF MASSACHUSETTS EXECUTIVE OFFICE OF ENERGY AND ENVIRONMENTAL AFFAIRS Richard K. Sullivan Jr., Secretary MASSACHUSETTS DEPARTMENT OF ENVIRONMENTAL PROTECTION Kenneth L. Kimmell, Commissioner BUREAU OF RESOURCE PROTECTION Bethany Card, Assistant Commissioner DIVISION OF WATERSHED MANAGEMENT

Welcome message from author
This document is posted to help you gain knowledge. Please leave a comment to let me know what you think about it! Share it to your friends and learn new things together.
Transcript

Technical Memorandum
SOUTH SHORE COASTAL WATERSHEDS 2006DWM WATER QUALITY MONITORING DATA
December 2012
Jamie Carr and Matthew ReardonMassachusetts Department of Environmental Protection
Division of Watershed ManagementDWM Control Number CN 235.1
COMMONWEALTH OF MASSACHUSETTSEXECUTIVE OFFICE OF ENERGY AND ENVIRONMENTAL AFFAIRS
Richard K. Sullivan Jr., SecretaryMASSACHUSETTS DEPARTMENT OF ENVIRONMENTAL PROTECTION
Kenneth L. Kimmell, CommissionerBUREAU OF RESOURCE PROTECTION
Bethany Card, Assistant CommissionerDIVISION OF WATERSHED MANAGEMENT

2
Table of ContentsIntroduction.................................................................................................................................................... 3Project Objectives ......................................................................................................................................... 3Sampling Plan ............................................................................................................................................... 3Field and Analytical Methods ........................................................................................................................ 6Quality Assurance and Quality Control ......................................................................................................... 6Station Observations..................................................................................................................................... 7Sampling Issues and Coordinator Notes ....................................................................................................13Survey Conditions ....................................................................................................................................... 13Water Quality Data......................................................................................................................................17References.................................................................................................................................................. 51Appendix 1: 2006 Data Symbols and Qualifiers ........................................................................................ 52
List of Tables and FiguresTable 1. MassDEP DWM 2006 South Shore Coastal Watersheds sampling station descriptions andsampling matrix ............................................................................................................................................. 4Table 2. 2006 Field observations from MassDEP DWM surveys ................................................................ 7Table 3. Total monthly precipitation in 2006 and monthly average precipitation total for 1981 to 2010 atPlymouth Municipal Airport weather station ............................................................................................... 14Table 4. USGS gage stations used to estimate the hydrological conditions in the South Shore CoastalWatersheds during the 2006 DWM water quality surveys and the estimated 7Q10 flows for each gage. .14Table 5: Precipitation and discharge........................................................................................................... 15Table 6: 2006 wet-weather sample determination..................................................................................... 16Table 7. 2006 MassDEP South Shore Coastal Watersheds water quality data ........................................ 17Table 8. 2006 MassDEP South Shore Coastal Watersheds E. coli geometric means of samples ........... 35Table 9: 2006 MassDEP South Shore Coastal Watersheds in-situ attended multi-probe data ................ 36Table 10. 2006 MassDEP South Shore Coastal Watersheds summary of unattended probe temperaturedata ............................................................................................................................................................. 44Table 11. 2006 MassDEP South Shore Coastal Watersheds summary of unattended probe dissolvedoxygen data................................................................................................................................................. 47Figure 1. MassDEP, DWM 2006 Monitoring Station Locations in the South Shore Coastal Watersheds... 5

South Coastal Watershed 2006 Water Quality Technical MemorandumDWM CN 235.1 3
Introduction
The South Shore Coastal Watersheds water quality survey was conducted in 2006, as part of the Division ofWatershed Management (DWM) monitoring. Consistent with the DWM’s general approach to watershedmonitoring to meet defined programmatic objectives, water quality surveys were conducted during the monthsof June, July, August, September, and October. This technical memorandum is designed to present finalDWM generated water quality monitoring data for use in watershed assessment reports and for reporting datato outside groups. Results of biomonitoring are reported in separate memoranda.
Project Objectives
The results of the 2006 South Coastal water quality monitoring are factored into regulatory actions takenby MassDEP and the US EPA, are incorporated into DWM’s water quality assessment reports, and areused to update Sections 305(b) and 303(d) reporting elements of the Clean Water Act. Additionally,these data are used in the development of Total Maximum Daily Loads (TMDLs) to address waters notattaining water quality standards and to aid in the development of National Pollutant DischargeElimination System (NPDES) permits.
The specific objectives of the 2006 South Shore Coastal Watersheds monitoring were as follows:
Provide biological and habitat data to document the status of benthic and fish communities overtime (trend monitoring).
Provide biological, habitat, and dissolved oxygen, temperature, and chemical data to DWM’sEnvironmental Monitoring and Assessment Program to be used in making Aquatic Life andAesthetics use assessments required by Section 305(b) of the Clean Water Act; provide data forother informational needs of Massachusetts regulatory agencies.
Provide quality assured fecal coliform and E. coli bacteria data for the purpose of assessingPrimary and Secondary Contact Recreation uses.
Sampling Plan
Information pertaining to station location, rationale and objectives is available in South CoastalWatershed: Sampling and Analysis Plan 2006 (Carr 2006). For a description of the DWM’s generalapproach to watershed monitoring, see the MADEP, DWM QAPP for Surface Water Monitoring andAssessment, 2005-2009 (MassDEP 2005a).
Samples for total phosphorus, total nitrogen, ammonia-nitrogen, total suspended solids (TSS), color, turbidity,bacteria counts (fecal coliform and E. coli) as well as dissolved oxygen and other field measurements wereobtained from a total of seventeen (17) stations. Water quality surveys (grab samples and in-situmeasurements) were conducted on the following dates: June 20th, June 21st (the first survey was split into twodays: one for bacteria-only conducted June 20th, and one for all other parameters conducted the next day onJune 21st, subsequent surveys were collected concurrently on one day), July 6th, August 2nd, September 6th,and October 11th. Additionally, continuous temperature and dissolved oxygen monitoring with unattendedmetered probes was carried out for a minimum duration of 24 hours at 17 sites. Total unattended probedeployment duration varied by sampling station. The maximum deployment duration of unattended probesacross all sampling stations was 121 hours. Two to five separate deployments of unattended probes wereconducted over the sampling season depending on the sampling station. Table 1 and Figure 1 provide detailsand locations of the 2006 sampling sites.

South Coastal Watershed 2006 Water Quality Technical MemorandumDWM CN 235.1 4
Table 1. MassDEP DWM 2006 South Shore Coastal Watersheds sampling station descriptions andsampling matrix
River/Stream Station Monitoring Site Description (sample type*)French Stream FS101 Below Rockland WWTP, Rockland (1,2,3,4)French Stream FS102 Summer Street Bridge, Rockland, MA (1,2,3,4,5,7)Drinkwater River DW101 Circuit Street Bridge, Hanover, MA (1,2,3,4,5)Indian Head River IH102A Cross/State Street, Hanover/Hanson, MA (1,2,3,4,5)Iron Mine Brook IM101 Broadway Road Hanover, MA (1,2,3,4,5,7)North River NR103 Route 53 Bridge, Hanover/Pembroke, MA (1,2,3,4)Third Herring Brook TH02 River Street crossing, Norwell/Hanover, MA (1,2,3,4,5)First Herring Brook FH02 Grove Street crossing, Scituate, MA (1,2,3,4,5)Herring River HR01 New Driftway Road Bridge, Scituate, MA (1,2,3,4,5)South River SR102A Route 3A (Main Street) Bridge, Marshfield, MA (1,2,3,4,5,7)South River SR103 Temple Street Crossing, Duxbury, MA (1,2,3,4)Green Harbor River GH01 Upstream side of Route 101 Bridge, Marshfield, MA (1,2,3,4)Jones River JR102A Downstream of Elm Street Bridge, Kingston, MA (1,2,3,4,5,7)Eel River ER02 Downstream Russell Mills Road, Plymouth, MA (1,2,3,4,5,6)
Eel River ER01 At Nature Conservancy driveway off Long Pond Road, belowreclaimed bogs, Plymouth (1,2,3,4,6)
Eel River ER015 At old dam upstream of inlet to Russell Mill Pond, Plymouth(5,6,7)
Unnamed Tributary to Eel River ER04A Downstream Clifford Road Bridge, Plymouth, MA (1,2,3,4,6)
Unnamed Tributary to Eel River ER06 At dirt road crossing within Pine Hills development South ofSandwich Road, Plymouth (5,6,7)
Town Brook TB01 Downstream of Spring Street, Plymouth, MA (1,2,3,4,5)
Second Herring Brook SH02 Downstream of Norris Reservation Walking path, off of DoverStreet, Norwell, MA (5)
*1 – attended multi-probe (DO, temperature, pH, conductance), 2 – nutrients,color,turbidity, 3 – bacteriasamples, 4 – unattended continuous dissolved oxygen and temperature, 5 – Rapid BioassessmentProtocol (RBP) III and habitat assessment (reported in a separate memoranda), 6 – fish population(reported in a separate memoranda). 7 – periphyton (reported in a separate memoranda)
.

South Coastal Watershed 2006 Water Quality Technical MemorandumDWM CN 235.1 5
Figure 1. MassDEP, DWM 2006 Monitoring Station Locations in the South Shore Coastal Watersheds

South Coastal Watershed 2006 Water Quality Technical MemorandumDWM CN 235.1 6
Field and Analytical Methods
Procedures used for water sampling and sample handling are described in the Sample CollectionTechniques for DWM Surface Water Quality Monitoring SOP (MassDEP 2004a). The Wall ExperimentStation(WES) in Lawrence, MA supplied all sample bottles and field preservatives, which were preparedaccording to the WES Laboratory Quality Assurance Plan and Standard Operating Procedures(MassDEP 2001). Procedures for multi-probe calibration and deployment are described in Water QualityMulti-probe Data Collection (MassDEP 2005b) and Multi-probe Deployments for Unattended Logging(MassDEP 2004b).
Wade-in grab samples were collected and sent to Wall Experiment Station (WES) in Lawrence, MA wherethey were analyzed for low-level total phosphorus (TP), total nitrogen (TN), ammonia as nitrogen (NH3-N)and total suspended solids (TSS). E. coli and fecal coliform bacteria samples were analyzed atEnvirotech Laboratories Inc. in Sandwich, MA. Apparent color, true color and turbidity were analyzed atthe DWM laboratory in Worcester, MA. In- situ parameters were measured using a multi-probe includeddissolved oxygen, percent saturation, pH, conductivity, temperature, and total dissolved solids.
Concurrent with the collection of water quality samples, site characteristics and sampling conditions wererecorded on DWM field sheets. Riparian vegetation, observed uses, potential pollution sources, thepresence/absence of objectionable deposits (trash, debris and scum), the extent ofperiphyton/algae/aquatic plant growth within the sampling reach, and sampling conditions were all notedat each station (Table 2).
Quality Assurance and Quality Control
Monitoring data collected from the South Shore Coastal Watersheds have met the specific programmaticdata quality objectives (DQOs) outlined in the applicable quality assurance project plan (MassDEP 2005).Quality assurance for watershed monitoring by the DWM is provided to ensure implementation of aneffective and efficient sampling design, and to provide data to meet specific data quality objectives.For all water quality surveys, quality control samples (field blanks and duplicates) were taken at aminimum of one each per analyte per crew per survey.
DWM quality assurance and database management staff reviewed laboratory data reports and all multi-probe data. The data were validated and finalized per appropriate data validation procedures as outlinedin DWM Water Quality Data Validation Process (Summary) (MassDEP 2012a). Detailed data validationprocedures for laboratory data, attended multi-probe data and unattended multi-probe data wereconducted using appropriate procedures (MassDEP 2012b, MassDEP 2012c, MassDEP 2012d). Acomplete summary of the review process for all 2006 DWM data is provided in the Water Quality DataValidation Report for Year 2006 Project Data (MassDEP 2007). Appendix 1 of this technicalmemorandum contains definitions for all data qualifiers (MassDEP 2007).

South Coastal Watershed 2006 Water Quality Technical MemorandumDWM CN 235.1 7
Station Observations
Station observations were recorded on field sheets for each survey by a DWM investigator. Station observations are described below in Table 2 for each DWMsampling event (MassDEP 2006).
Table 2. 2006 Field observations from MassDEP DWM surveysSite Date Odor Water Clarity Aquatic
Plants Periphyton FloatingScum
ObjectionableDeposits Comments
DW101 6/20/2006 None Clear Unobservable Unobservable No NoDW101 6/21/2006 None Clear Unobservable Unobservable No NoDW101 7/6/2006 None Clear Unobservable Blank No NoDW101 8/2/2006 None Slightly Turbid Unobservable Unobservable No NoDW101 9/6/2006 None Slightly Turbid Unobservable Unobservable No NoDW101 10/11/2006 None Slightly Turbid Unobservable Unobservable No No
Site Date Odor Water Clarity AquaticPlants Periphyton Floating
ScumObjectionable
Deposits Comments
ER01 6/20/2006 None Clear None Sparse Yes No Scum: Pollen/dust blanketsER01 6/21/2006 None Clear Sparse None No NoER01 7/6/2006 None Clear None Moderate Yes No Scum: Foam. Pollen/dust blankets.ER01 8/2/2006 None Clear Sparse Sparse Yes No Scum: FoamER01 9/6/2006 None Clear None None No NoER01 10/11/2006 None Clear Sparse None No No
Site Date Odor Water Clarity AquaticPlants Periphyton Floating
ScumObjectionable
Deposits Comments
ER02 6/20/2006 Fishy, Musty ModeratelyTurbid Unobservable Unobservable Yes No Scum: Pollen/dust blankets
ER02 6/21/2006 None ModeratelyTurbid None None No No
ER02 7/6/2006 None Slightly Turbid None Moderate Yes YesScum: Foam. Pollen/dust blankets.Obj. Deposits: Trash. Rusty bike onbank, old tire.
ER02 8/2/2006 None Slightly Turbid None None Yes Yes Scum: Foam. Obj. Deposits: Trash
ER02 9/6/2006 None Slightly Turbid None None No Yes Obj. Deposits: Trash. Some on bothbanks.
ER02 10/11/2006 None Slightly Turbid None Sparse Yes Yes Plants: Some trash on LHB. Scum:Natural foam
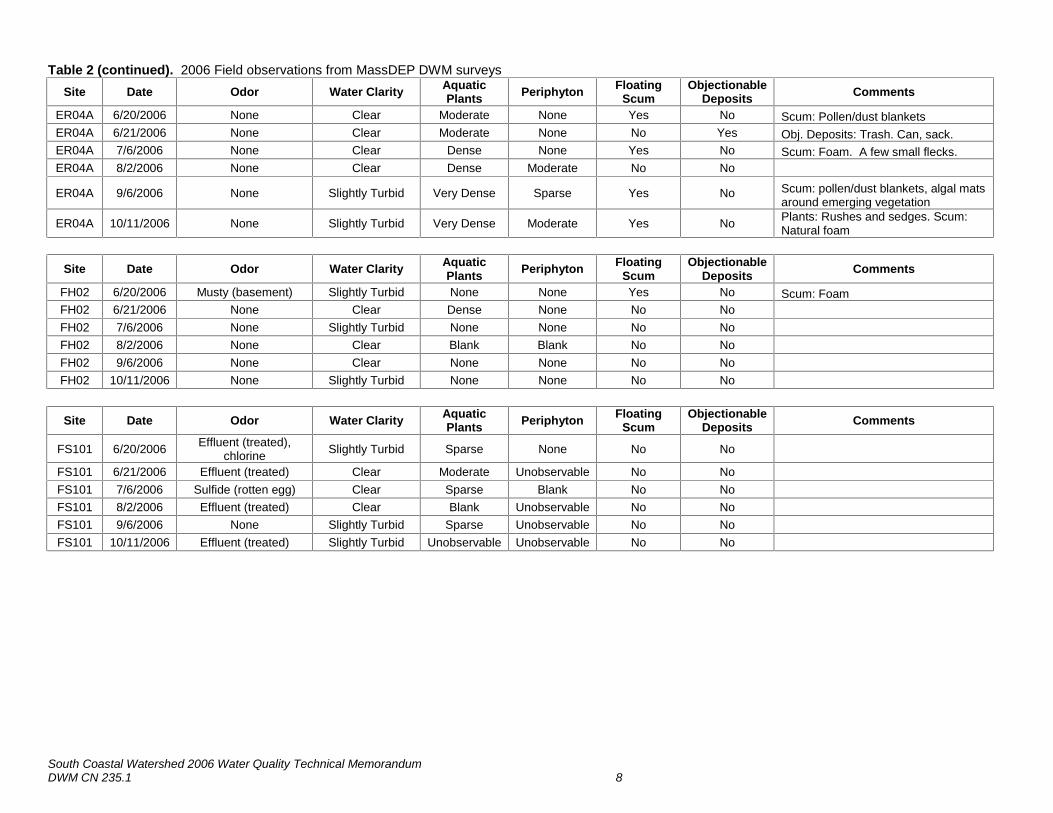
South Coastal Watershed 2006 Water Quality Technical MemorandumDWM CN 235.1 8
Table 2 (continued). 2006 Field observations from MassDEP DWM surveysSite Date Odor Water Clarity Aquatic
Plants Periphyton FloatingScum
ObjectionableDeposits Comments
ER04A 6/20/2006 None Clear Moderate None Yes No Scum: Pollen/dust blanketsER04A 6/21/2006 None Clear Moderate None No Yes Obj. Deposits: Trash. Can, sack.ER04A 7/6/2006 None Clear Dense None Yes No Scum: Foam. A few small flecks.ER04A 8/2/2006 None Clear Dense Moderate No No
ER04A 9/6/2006 None Slightly Turbid Very Dense Sparse Yes No Scum: pollen/dust blankets, algal matsaround emerging vegetation
ER04A 10/11/2006 None Slightly Turbid Very Dense Moderate Yes No Plants: Rushes and sedges. Scum:Natural foam
Site Date Odor Water Clarity AquaticPlants Periphyton Floating
ScumObjectionable
Deposits Comments
FH02 6/20/2006 Musty (basement) Slightly Turbid None None Yes No Scum: FoamFH02 6/21/2006 None Clear Dense None No NoFH02 7/6/2006 None Slightly Turbid None None No NoFH02 8/2/2006 None Clear Blank Blank No NoFH02 9/6/2006 None Clear None None No NoFH02 10/11/2006 None Slightly Turbid None None No No
Site Date Odor Water Clarity AquaticPlants Periphyton Floating
ScumObjectionable
Deposits Comments
FS101 6/20/2006 Effluent (treated),chlorine Slightly Turbid Sparse None No No
FS101 6/21/2006 Effluent (treated) Clear Moderate Unobservable No NoFS101 7/6/2006 Sulfide (rotten egg) Clear Sparse Blank No NoFS101 8/2/2006 Effluent (treated) Clear Blank Unobservable No NoFS101 9/6/2006 None Slightly Turbid Sparse Unobservable No NoFS101 10/11/2006 Effluent (treated) Slightly Turbid Unobservable Unobservable No No
South Coastal Watershed 2006 Water Quality Technical MemorandumDWM CN 235.1 9
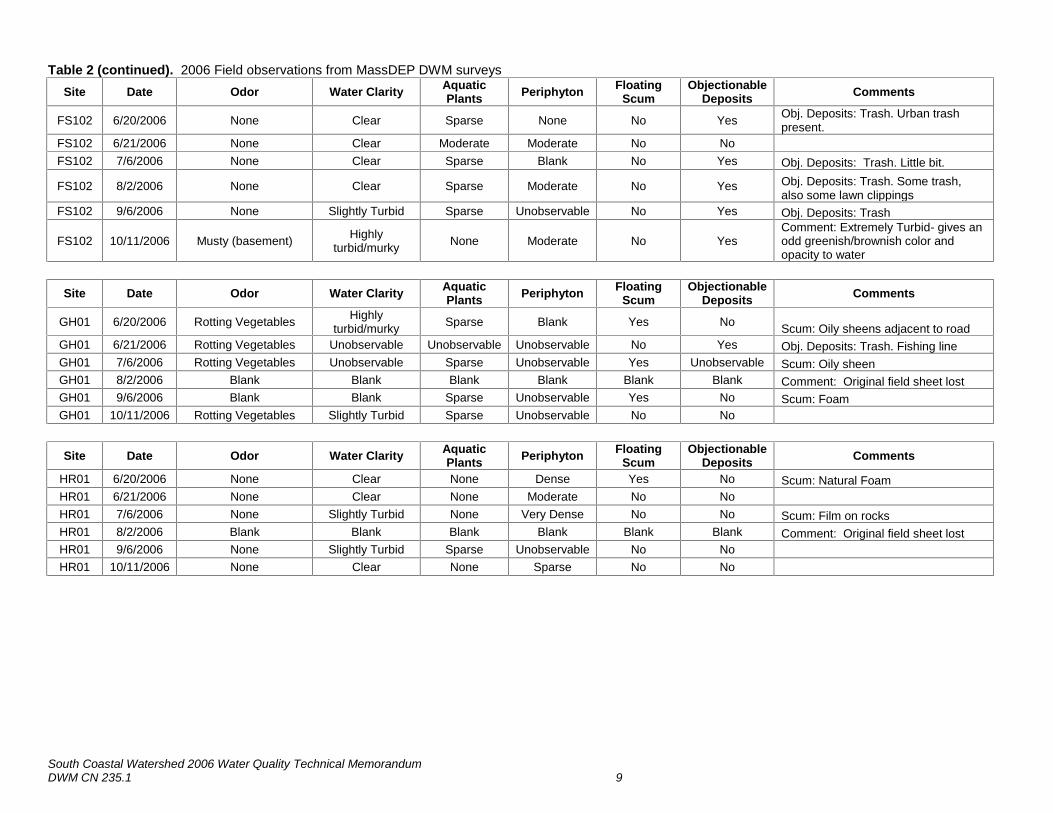
Table 2 (continued). 2006 Field observations from MassDEP DWM surveysSite Date Odor Water Clarity Aquatic
Plants Periphyton FloatingScum
ObjectionableDeposits Comments
FS102 6/20/2006 None Clear Sparse None No Yes Obj. Deposits: Trash. Urban trashpresent.
FS102 6/21/2006 None Clear Moderate Moderate No NoFS102 7/6/2006 None Clear Sparse Blank No Yes Obj. Deposits: Trash. Little bit.
FS102 8/2/2006 None Clear Sparse Moderate No Yes Obj. Deposits: Trash. Some trash,also some lawn clippings
FS102 9/6/2006 None Slightly Turbid Sparse Unobservable No Yes Obj. Deposits: Trash
FS102 10/11/2006 Musty (basement) Highlyturbid/murky None Moderate No Yes
Comment: Extremely Turbid- gives anodd greenish/brownish color andopacity to water
Site Date Odor Water Clarity AquaticPlants Periphyton Floating
ScumObjectionable
Deposits Comments
GH01 6/20/2006 Rotting Vegetables Highlyturbid/murky Sparse Blank Yes No Scum: Oily sheens adjacent to road
GH01 6/21/2006 Rotting Vegetables Unobservable Unobservable Unobservable No Yes Obj. Deposits: Trash. Fishing lineGH01 7/6/2006 Rotting Vegetables Unobservable Sparse Unobservable Yes Unobservable Scum: Oily sheenGH01 8/2/2006 Blank Blank Blank Blank Blank Blank Comment: Original field sheet lostGH01 9/6/2006 Blank Blank Sparse Unobservable Yes No Scum: FoamGH01 10/11/2006 Rotting Vegetables Slightly Turbid Sparse Unobservable No No
Site Date Odor Water Clarity AquaticPlants Periphyton Floating
ScumObjectionable
Deposits Comments
HR01 6/20/2006 None Clear None Dense Yes No Scum: Natural FoamHR01 6/21/2006 None Clear None Moderate No NoHR01 7/6/2006 None Slightly Turbid None Very Dense No No Scum: Film on rocksHR01 8/2/2006 Blank Blank Blank Blank Blank Blank Comment: Original field sheet lostHR01 9/6/2006 None Slightly Turbid Sparse Unobservable No NoHR01 10/11/2006 None Clear None Sparse No No

South Coastal Watershed 2006 Water Quality Technical MemorandumDWM CN 235.1 10
Table 2 (continued). 2006 Field observations from MassDEP DWM surveysSite Date Odor Water Clarity Aquatic
Plants Periphyton FloatingScum
ObjectionableDeposits Comments
IH102A 6/20/2006 Fishy, Musty Clear Moderate None Yes No Scum: Foam
IH102A 6/21/2006 Effluent (treated) Clear Dense Sparse Yes No Scum: Foam. Minimal amount, likelynatural.
IH102A 7/6/2006 Effluent (treated) Slightly Turbid Unobservable Unobservable Yes No Scum: FoamIH102A 8/2/2006 Effluent (treated) Slightly Turbid Moderate Sparse Yes No Scum: Foam
IH102A 9/6/2006 Musty (basement) Slightly Turbid Blank Unobservable Yes Yes Scum: Some foam in eddies. Obj.Deposits: Some trash.
IH102A 10/11/2006 Effluent (treated) Clear None None Yes YesScum: Small amounts of foam ineddies Obj. Deposits: Some trashfrom partying.
Site Date Odor Water Clarity AquaticPlants Periphyton Floating
ScumObjectionable
Deposits Comments
IM101 6/20/2006 None Clear None None No NoIM101 6/21/2006 None Slightly Turbid None Sparse No NoIM101 7/6/2006 None Clear None Blank No NoIM101 8/2/2006 None Clear Blank Blank No NoIM101 9/6/2006 None Clear None Moderate No NoIM101 10/11/2006 None Clear None Sparse No No
Site Date Odor Water Clarity AquaticPlants Periphyton Floating
ScumObjectionable
Deposits Comments
JR102A 6/20/2006 None Slightly Turbid Moderate Moderate Yes No Scum: Pollen/dust blankets.
JR102A 6/21/2006 None ModeratelyTurbid Very Dense None Yes No Scum: Foam
JR102A 7/6/2006 Musty (basement) ModeratelyTurbid Very Dense Unobservable Yes No Plants: Submerged grasses. Scum:
Foam.
JR102A 8/2/2006 None Clear Very Dense None Yes No Plants: Millfoil, grassy strands. Scum:Pollen/dust blankets
JR102A 9/6/2006 None Clear Very Dense Dense Yes No Plants: Millfoil, potamogeton? Scum:A little yellow foam
JR102A 10/11/2006 None Clear Very Dense Dense Yes No Plants: millfoil, long grassy plants.Scum: Natural foam

South Coastal Watershed 2006 Water Quality Technical MemorandumDWM CN 235.1 11
Table 2 (continued). 2006 Field observations from MassDEP DWM surveysSite Date Odor Water Clarity Aquatic
Plants Periphyton FloatingScum
ObjectionableDeposits Comments
NR103 6/20/2006 None Slightly Turbid Unobservable Unobservable No NoNR103 6/21/2006 Musty (basement) Slightly Turbid Sparse Sparse No NoNR103 7/6/2006 None Slightly Turbid Sparse Unobservable No NoNR103 8/2/2006 Blank Slightly Turbid Blank Blank No NoNR103 9/6/2006 None Slightly Turbid Sparse Unobservable No NoNR103 10/11/2006 None Clear Sparse Moderate No No
Site Date Odor Water Clarity AquaticPlants Periphyton Floating
ScumObjectionable
Deposits Comments
SR102A 6/20/2006 None Clear None Moderate Yes No Scum: FoamSR102A 6/21/2006 None Slightly Turbid Moderate Moderate Yes Yes Scum: FoamSR102A 7/6/2006 None Clear Sparse Sparse Yes No Scum: FoamSR102A 8/2/2006 Musty (basement) Clear Sparse Moderate Yes No Scum: FoamSR102A 9/6/2006 Blank Clear Sparse None No NoSR102A 10/11/2006 None Slightly Turbid Sparse Sparse No No
Site Date Odor Water Clarity AquaticPlants Periphyton Floating
ScumObjectionable
Deposits Comments
SR103 6/20/2006 None Clear Sparse Sparse Yes No Scum: Foam
SR103 6/21/2006 None ModeratelyTurbid Blank Sparse Yes Yes Scum: Foam. Obj. Deposits: Trash.
Fishing lines and buoys.
SR103 7/6/2006 Rotting Vegetables ModeratelyTurbid Sparse Sparse Yes No Scum: Foam
SR103 8/2/2006 Blank Blank Blank Blank Blank Blank Comment: Original field sheet lostSR103 9/6/2006 None Clear Sparse Unobservable No No
SR103 10/11/2006 Sulfide (rotten egg) Slightly Turbid Unobservable Unobservable Yes NoScum: Oily Sheen noted upstream oflow head dam. Foam justdownstream of dam.

South Coastal Watershed 2006 Water Quality Technical MemorandumDWM CN 235.1 12
Table 2 (continued). 2006 Field observations from MassDEP DWM surveysSite Date Odor Water Clarity Aquatic
Plants Periphyton FloatingScum
ObjectionableDeposits Comments
TB01 6/20/2006 None Clear Very Dense Moderate Yes Yes
Plants: Millfoil, pickerel weed,potamogeton, Najas? Scum:pollen/dust blankets. Obj. Deposits:Trash. glass bottle, old plastic bits
TB01 6/21/2006 None Clear Dense None No No
TB01 7/6/2006 None Clear Very Dense Unobservable No No Plants: Millfoil, potamogeton sp., otherpond species
TB01 8/2/2006 None Slightly Turbid Very Dense None Yes No Scum: Dirty foam build up on surfaceclinging to plants, pollen dust blankets
TB01 9/6/2006 None Slightly Turbid Very Dense None Yes No Plants: Millfoil, potamogeton. Scum:Foam
TB01 10/11/2006 None Slightly Turbid Very Dense None Yes NoPlants: Millfoil, potamogetons, othersubmerged plants. Scum: Naturalfoam
Site Date Odor Water Clarity AquaticPlants Periphyton Floating
ScumObjectionable
Deposits Comments
TH02 6/20/2006 None Clear Sparse None No NoTH02 6/21/2006 None Slightly Turbid Moderate Sparse No NoTH02 7/6/2006 None Clear Unobservable Blank No NoTH02 8/2/2006 None Slightly Turbid Blank Blank Yes No Scum: FoamTH02 9/6/2006 None Slightly Turbid Sparse Moderate No No
TH02 10/11/2006 None Slightly Turbid None Sparse No Yes Obj. Deposits: Someone dumped abike in the stream off of the bridge.
South Coastal Watershed 2006 Water Quality Technical MemorandumDWM CN 235.1 13
Sampling Issues and Coordinator NotesSome field sheet observations are qualitative and subject to the interpretation of individual sampling crew members;particularly observations of light trash and foam noted on many field sheets. These observations, though accurate, areliteral interpretations of the field sheet categories and are not indicative of levels of objectionable deposits or foam severeenough to impair the Aesthetics uses for the majority of these waters.
At station DW101, Drinkwater River, the water color was generally so dark that substrate, plant, and periphyton fieldswere usually recorded as “unobservable” (Table 2). Station HR01, Herring River, appeared to be a completely freshwaterstation during spring reconnaissance and during initial surveys. However, a salt water influence was indicated at thesampling location by high conductivity readings observed in the later surveys. Station GH01, Green Harbor River, proveddifficult to sample due to the tide gates immediately below the station and the increased water velocity that sometimesoccurred at that location.
Survey ConditionsStream discharge and precipitation information were collected and analyzed to determine hydrologic conditions leading upto and during the water quality sampling events. Precipitation data collected during the survey period in 2006 weredownloaded from the National Oceanic and Atmospheric Administration (NOAA), National Climatic Data Center (NCDC)for the Plymouth: Plymouth Municipal Airport weather station (NOAA 2012a). The precipitation totals on the water qualitysurvey dates and the five days prior to the survey dates were extracted from the records. In addition, the Plymouthweather station’s monthly precipitation totals for 2006 and the monthly average of total precipitation for the period 1981 to2010 were downloaded to determine if precipitation amounts in 2006 were above or below normal (NOAA 2012b) (Table3).
Stream discharge data from the Indian Head River at Hanover stream gage (01105730) and the Jones River stream gage(01105870) in Kingston were downloaded from the USGS (Table 4) (USGS 2012a). In addition, the 7Q10 for each gagestation was calculated using USGS StreamStats (Table 4). The entire period of record for each USGS gage station wasdownloaded and the average daily discharge values on the water quality survey dates and the five days prior to thesurvey dates were extracted from these records. The percent of time that the average daily discharge on the extracteddates was equaled or exceeded during the entire period of record for the gage was calculated to put the discharge valueinto historical perspective. These percent exceeded values as well as the actual precipitation and discharge data aresummarized and presented in Table 5. Additionally, this review was used to determine whether the data wererepresentative of “wet” or “dry weather” sampling conditions (see Table 6).

South Coastal Watershed 2006 Water Quality Technical MemorandumDWM CN 235.1 14
Table 3. Total monthly precipitation in 2006 and monthly average precipitation total for 1981 to 2010 at PlymouthMunicipal Airport weather station (NOAA 2012a).
Month2006
Precipitation (in)Monthly Average Precipitation
(1981-2010) (in.)
2006 Precipitation as Percent ofMonthly Average Precipitation
(1981-2010)January 6.83 3.69 185%February 1.47 3.6 41%March 0.38 5.25 7%April 2.22 4.64 48%May 7.86 3.69 213%June 11.48 3.95 291%July 1.62 3.49 46%August 6.34 3.79 167%September 2.22 3.92 57%October 5.02 4.08 123%November 6.61 4.66 142%December 2.47 4.39 56%
Table 4. USGS gage stations used to estimate the hydrological conditions in the South Shore CoastalWatersheds during the 2006 DWM water quality surveys and the estimated 7Q10 flows for each gage.(USGS 2012a) (USGS 2012b).
Station Name Latitude, LongitudePeriod ofRecord
7Q10(cfs) Remarks
01105730 IndianHead River AtHanover, MA
42°06’02",70°49’23" 1966 toPresent 1.66
Some regulation by mills and byWampatuck, Indian Head, Maquan, andother ponds upstream.
1105870 Jones Riverat Kingston, MA 41°59'27",70°44'03"
August1966 topresent
4.02
Flow regulated by pond upstream. Flowaffected at times by wastage from SilverLake. Surface flow may be affected byground water that enters from or movesinto adjacent basins. Occasionalbackwater from tidal surge.

South Coastal Watershed 2006 Water Quality Technical MemorandumDWM CN 235.1 15
Table 5: Precipitation and discharge-The precipitation totals (inches) and daily average discharge (cubic feet persecond) on the water quality survey dates and the five days prior to the survey dates as well as the discharge as thepercent of the period of record exceeded by a given discharge . Percent exceeded is percent of time that the dischargewas equaled or exceeded during the period of record for the stream gage. Shaded dates indicate the deployment ofmulti-probes and large bold dates indicate collection of water samples (USGS 2012a) (NOAA 2012b).
Precipitation(in) Discharge (cfs ) (% exceeded) Discharge (cfs ) (% exceeded)
DatePlymouth
Municipal Airport01105730 Indian Head River at
Hanover, MA1105870 Jones River at Kingston,
MA5/10/2006 0.1 154 (11%) 72 (12%)5/11/2006 0.02 141 (13%) 68 (14%)5/12/2006 0.33 96 (22%) 60 (17%)5/13/2006 2.4 234 (6%) 94 (8%)5/14/2006 0.91 721 (3%) 207 (4%)5/15/2006 0.15 789 (3%) 221 (3%)5/16/2006 0.98 541 (4%) 209 (3%)5/17/2006 0 358 (4%) 196 (4%)6/11/2006 0.01 305 (5%) 185 (4%)6/12/2006 0 216 (7%) 156 (4%)6/13/2006 0 158 (11%) 130 (5%)6/14/2006 0 127 (15%) 112 (6%)6/15/2006 0.44 132 (14%) 111 (6%)6/16/2006 0 132 (14%) 111 (6%)6/17/2006 0.08 99 (21%) 104 (7%)6/18/2006 0 83 (26%) 96 (8%)6/19/2006 0 68 (33%) 88 (9%)6/20/2006 0.13 59 (39%) 82 (10%)6/21/2006 0.01 56 (41%) 74 (12%)
7/1/2006 0 289 (5%) 107 (6%)7/2/2006 0 173 (9%) 99 (7%)7/3/2006 0 121 (16%) 92 (8%)7/4/2006 T 111 (18%) 85 (10%)7/5/2006 0.09 124 (15%) 78 (11%)7/6/2006 0.33 101 (20%) 74 (12%)
7/23/2006 T 66 (34%) 39 (32%)7/24/2006 0 49 (46%) 40 (31%)7/25/2006 0.01 39 (55%) 37 (35%)7/26/2006 0 34 (60%) 33 (40%)7/27/2006 0 31 (63%) 30 (45%)7/28/2006 0.03 29 (65%) 29 (46%)7/29/2006 0.02 27 (67%) 29 (46%)7/30/2006 0 25 (69%) 28 (48%)7/31/2006 0 22 (73%) 27 (50%)
8/1/2006 0 21 (74%) 26 (52%)8/2/2006 0.04 19 (76%) 25 (53%)

South Coastal Watershed 2006 Water Quality Technical MemorandumDWM CN 235.1 16
Precipitation(in) Discharge (cfs ) (% exceeded) Discharge (cfs ) (% exceeded)
DatePlymouth
Municipal Airport01105730 Indian Head River at
Hanover, MA1105870 Jones River at Kingston,
MA8/31/2006 0 34 (60%) 30 (45%)
9/1/2006 0 28 (66%) 27 (50%)9/2/2006 0.01 25 (69%) 25 (53%)9/3/2006 0.17 25 (69%) 24 (55%)9/4/2006 0 26 (68%) 25 (53%)9/5/2006 0.09 25 (69%) 25 (53%)9/6/2006 0.11 28 (66%) 25 (53%)
9/22/2006 0 25 (69%) 18 (68%)9/23/2006 0.02 20 (75%) 16 (73%)9/24/2006 0.07 18 (77%) 14 (79%)9/25/2006 0 17 (78%) 16 (73%)9/26/2006 0.01 16 (80%) 15 (76%)9/27/2006 0 14 (82%) 14 (79%)10/6/2006 0 16 (80%) 14 (79%)10/7/2006 0 14 (82%) 14 (79%)10/8/2006 0 13 (84%) 12 (84%)10/9/2006 0.01 12 (85%) 12 (84%)
10/10/2006 0.01 12 (85%) 11 (87%)10/11/2006 0.54 11 (87%) 11 (87%)
It is the practice of DWM to define a “wet-weather” sample as one that was collected at a location that received at least0.5 inches of rainfall within the 72 hours antecedent to sample collection as evidenced by a corresponding increase instreamflow condition. All water quality sampling dates were determined to be considered “dry weather samples”. Table 6details the determination of wet or dry weather conditions for water quality sampling dates.
Table 6: 2006 wet-weather sample determination
SampleCollection
Date
72 hourantecedent
precipitation*(in)
Water Quality Station
6/20/2006 0.08 No samples considered to be “wet-weather” samples
6/21/2006 0.13 No samples considered to be “wet-weather” samples
7/6/2006 0.09 No samples considered to be “wet-weather” samples
8/2/2006 0 No samples considered to be “wet-weather” samples
9/6/2006 0.26 No samples considered to be “wet-weather” samples
10/11/2066 0.02 No samples considered to be “wet-weather” samples* note antecedent precipitation was 72 hours antecedent to the day of sampling (not including day of sampling).

South Coastal Watershed 2006 Water Quality Technical MemorandumDWM CN 235.1 17
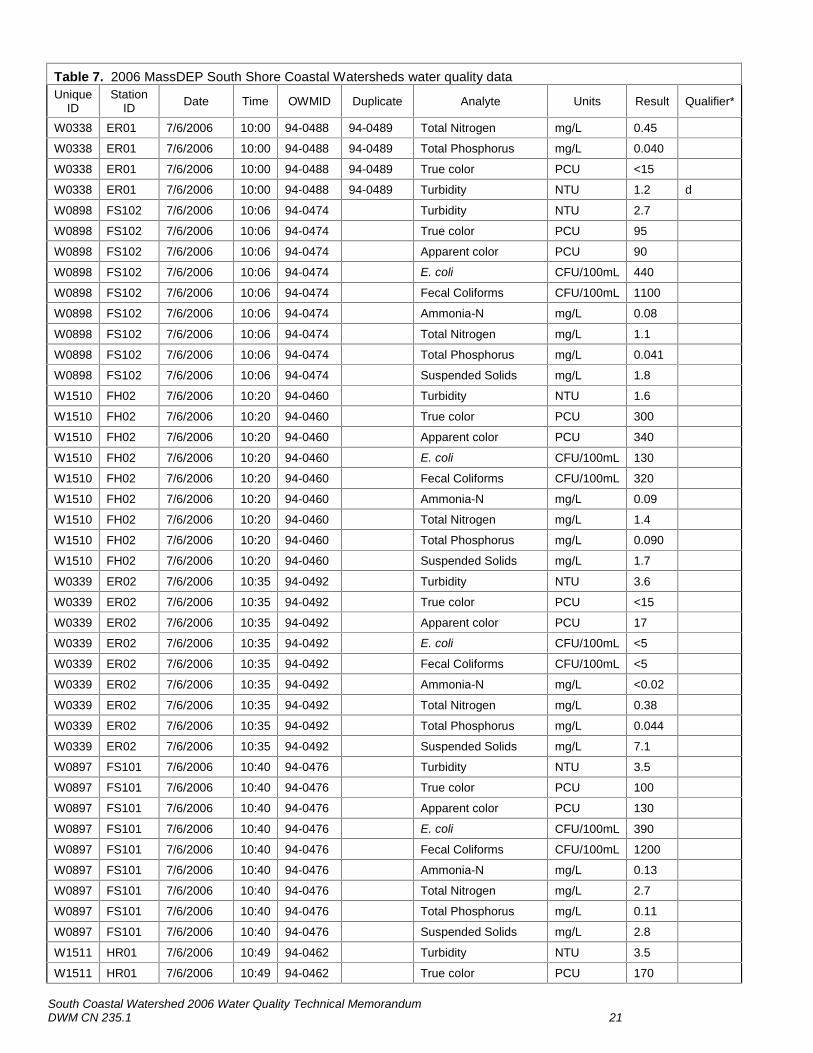
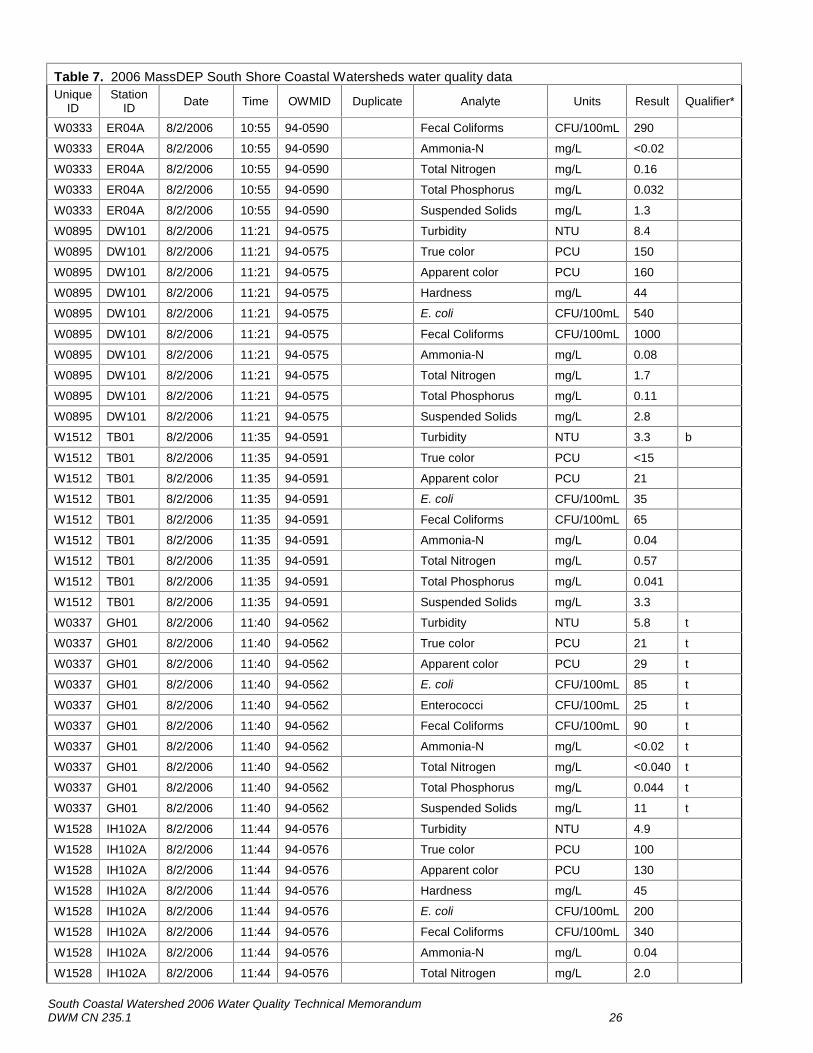
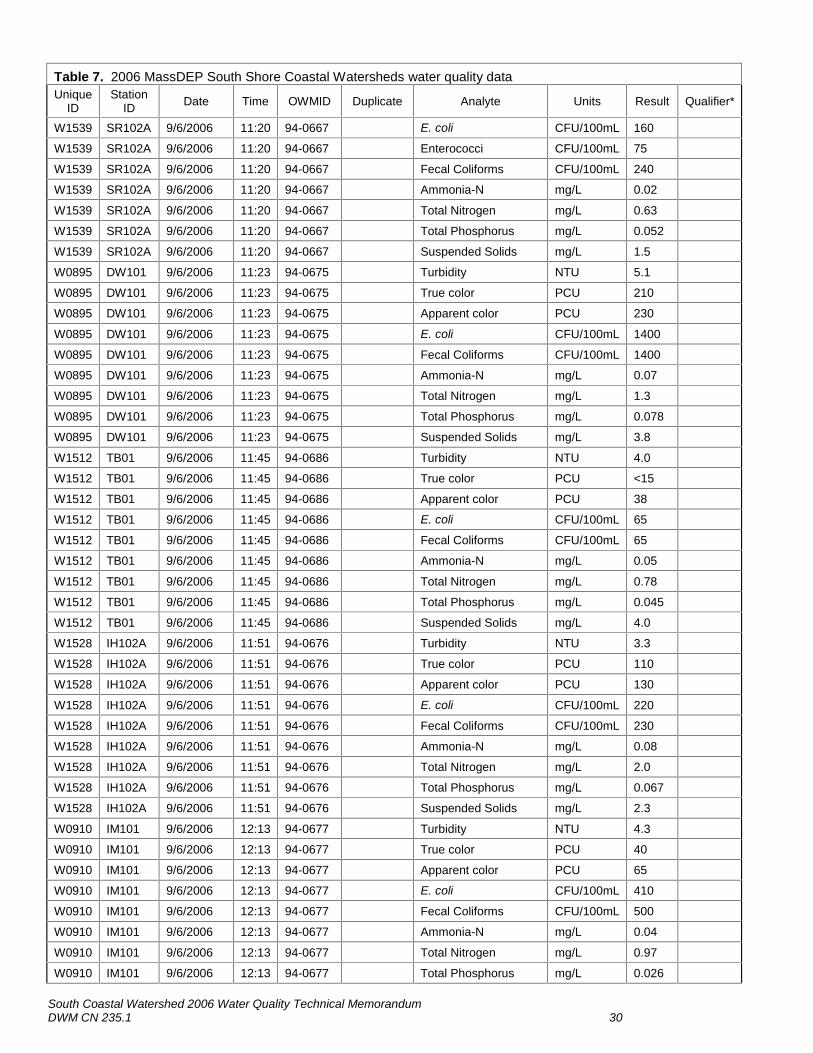
Water Quality DataAll MassDEP DWM water quality data are managed and maintained in the Water Quality Data Access Database. Tables7, 8, 9 and 10 below are 2006 data for the South Shore Coastal River Watersheds. Table 8 presents the geometric meanof the E. coli samples. The procedures used to accept, accept with qualification or censor data are based on the DWMSOP for data validation and usability (MassDEP 2012a), and are in addition to separate quality assurance activities andlaboratory validation steps undertaken by WES. Data qualifiers are listed in Appendix 1.
Table 7. 2006 MassDEP South Shore Coastal Watersheds water quality dataUnique
IDStation
ID Date Time OWMID Duplicate Analyte Units Result Qualifier*
W0338 ER01 6/20/2006 10:00 94-0316 E. coli CFU/100mL 20 e
W0338 ER01 6/20/2006 10:00 94-0316 Fecal Coliforms CFU/100mL 15 e
W0898 FS102 6/20/2006 10:17 94-0308 E. coli CFU/100mL 380
W0898 FS102 6/20/2006 10:17 94-0308 Fecal Coliforms CFU/100mL 390
W1510 FH02 6/20/2006 10:20 94-0300 E. coli CFU/100mL 120
W1510 FH02 6/20/2006 10:20 94-0300 Fecal Coliforms CFU/100mL 130
W0339 ER02 6/20/2006 10:25 94-0317 E. coli CFU/100mL <5
W0339 ER02 6/20/2006 10:25 94-0317 Fecal Coliforms CFU/100mL <5
W1511 HR01 6/20/2006 10:38 94-0301 E. coli CFU/100mL 100
W1511 HR01 6/20/2006 10:38 94-0301 Enterococci CFU/100mL 110
W1511 HR01 6/20/2006 10:38 94-0301 Fecal Coliforms CFU/100mL 560
W0333 ER04A 6/20/2006 10:40 94-0318 E. coli CFU/100mL 60
W0333 ER04A 6/20/2006 10:40 94-0318 Fecal Coliforms CFU/100mL 100
W0897 FS101 6/20/2006 10:44 94-0309 E. coli CFU/100mL 120
W0897 FS101 6/20/2006 10:44 94-0309 Fecal Coliforms CFU/100mL 180
W1539 SR102A 6/20/2006 11:02 94-0302 E. coli CFU/100mL 110
W1539 SR102A 6/20/2006 11:02 94-0302 Enterococci CFU/100mL 75
W1539 SR102A 6/20/2006 11:02 94-0302 Fecal Coliforms CFU/100mL 190
W0895 DW101 6/20/2006 11:04 94-0310 E. coli CFU/100mL 150
W0895 DW101 6/20/2006 11:04 94-0310 Fecal Coliforms CFU/100mL 320
W1512 TB01 6/20/2006 11:10 94-0319 E. coli CFU/100mL 45
W1512 TB01 6/20/2006 11:10 94-0319 Fecal Coliforms CFU/100mL 130
W1528 IH102A 6/20/2006 11:20 94-0311 E. coli CFU/100mL 80
W1528 IH102A 6/20/2006 11:20 94-0311 Fecal Coliforms CFU/100mL 150
W0337 GH01 6/20/2006 11:28 94-0303 E. coli CFU/100mL 60
W0337 GH01 6/20/2006 11:28 94-0303 Enterococci CFU/100mL 10
W0337 GH01 6/20/2006 11:28 94-0303 Fecal Coliforms CFU/100mL 60
W0910 IM101 6/20/2006 11:38 94-0312 E. coli CFU/100mL 150
W0910 IM101 6/20/2006 11:38 94-0312 Fecal Coliforms CFU/100mL 290
W1524 JR102A 6/20/2006 11:45 94-0320 94-0321 E. coli CFU/100mL 70
W1524 JR102A 6/20/2006 11:45 94-0320 94-0321 Fecal Coliforms CFU/100mL 95
W1509 TH02 6/20/2006 11:50 94-0313 94-0314 E. coli CFU/100mL 110
W1509 TH02 6/20/2006 11:50 94-0313 94-0314 Fecal Coliforms CFU/100mL 190
W0921 SR103 6/20/2006 11:55 94-0304 E. coli CFU/100mL 45
W0921 SR103 6/20/2006 11:55 94-0304 Fecal Coliforms CFU/100mL 70

South Coastal Watershed 2006 Water Quality Technical MemorandumDWM CN 235.1 18
Table 7. 2006 MassDEP South Shore Coastal Watersheds water quality dataUnique
IDStation
ID Date Time OWMID Duplicate Analyte Units Result Qualifier*
W0917 NR103 6/20/2006 12:21 94-0305 94-0306 E. coli CFU/100mL 35
W0917 NR103 6/20/2006 12:21 94-0305 94-0306 Fecal Coliforms CFU/100mL 55
W0338 ER01 6/21/2006 9:55 94-0343 Turbidity NTU 0.6
W0338 ER01 6/21/2006 9:55 94-0343 True color PCU <15
W0338 ER01 6/21/2006 9:55 94-0343 Apparent color PCU <15
W0338 ER01 6/21/2006 9:55 94-0343 Ammonia-N mg/L <0.02
W0338 ER01 6/21/2006 9:55 94-0343 Total Nitrogen mg/L 0.42
W0338 ER01 6/21/2006 9:55 94-0343 Total Phosphorus mg/L 0.032
W0338 ER01 6/21/2006 9:55 94-0343 Suspended Solids mg/L 3.1
W0898 FS102 6/21/2006 10:02 94-0323 Turbidity NTU 1.6
W0898 FS102 6/21/2006 10:02 94-0323 True color PCU 75
W0898 FS102 6/21/2006 10:02 94-0323 Apparent color PCU 110
W0898 FS102 6/21/2006 10:02 94-0323 Ammonia-N mg/L 0.04
W0898 FS102 6/21/2006 10:02 94-0323 Total Nitrogen mg/L 1.0
W0898 FS102 6/21/2006 10:02 94-0323 Total Phosphorus mg/L 0.024
W0898 FS102 6/21/2006 10:02 94-0323 Suspended Solids mg/L 1.4
W0339 ER02 6/21/2006 10:23 94-0345 Turbidity NTU 2.3
W0339 ER02 6/21/2006 10:23 94-0345 True color PCU <15
W0339 ER02 6/21/2006 10:23 94-0345 Apparent color PCU 24
W0339 ER02 6/21/2006 10:23 94-0345 Ammonia-N mg/L <0.02
W0339 ER02 6/21/2006 10:23 94-0345 Total Nitrogen mg/L 0.24
W0339 ER02 6/21/2006 10:23 94-0345 Total Phosphorus mg/L 0.022
W0339 ER02 6/21/2006 10:23 94-0345 Suspended Solids mg/L 6.4
W0897 FS101 6/21/2006 10:45 94-0324 Turbidity NTU 3.1
W0897 FS101 6/21/2006 10:45 94-0324 True color PCU 70
W0897 FS101 6/21/2006 10:45 94-0324 Apparent color PCU 110
W0897 FS101 6/21/2006 10:45 94-0324 Ammonia-N mg/L 0.09
W0897 FS101 6/21/2006 10:45 94-0324 Total Nitrogen mg/L 3.3
W0897 FS101 6/21/2006 10:45 94-0324 Total Phosphorus mg/L 0.097
W0897 FS101 6/21/2006 10:45 94-0324 Suspended Solids mg/L 2.6
W0333 ER04A 6/21/2006 10:50 94-0347 Turbidity NTU 2.8
W0333 ER04A 6/21/2006 10:50 94-0347 True color PCU 27
W0333 ER04A 6/21/2006 10:50 94-0347 Apparent color PCU 29
W0333 ER04A 6/21/2006 10:50 94-0347 Ammonia-N mg/L 0.03
W0333 ER04A 6/21/2006 10:50 94-0347 Total Nitrogen mg/L 0.20
W0333 ER04A 6/21/2006 10:50 94-0347 Total Phosphorus mg/L 0.041
W0333 ER04A 6/21/2006 10:50 94-0347 Suspended Solids mg/L 2.2
W0895 DW101 6/21/2006 11:23 94-0325 Turbidity NTU 5.8
W0895 DW101 6/21/2006 11:23 94-0325 True color PCU 140
W0895 DW101 6/21/2006 11:23 94-0325 Apparent color PCU 140
W0895 DW101 6/21/2006 11:23 94-0325 Ammonia-N mg/L 0.12
W0895 DW101 6/21/2006 11:23 94-0325 Total Nitrogen mg/L 1.5

South Coastal Watershed 2006 Water Quality Technical MemorandumDWM CN 235.1 19
Table 7. 2006 MassDEP South Shore Coastal Watersheds water quality dataUnique
IDStation
ID Date Time OWMID Duplicate Analyte Units Result Qualifier*
W0895 DW101 6/21/2006 11:23 94-0325 Total Phosphorus mg/L 0.075
W0895 DW101 6/21/2006 11:23 94-0325 Suspended Solids mg/L 6.3
W1512 TB01 6/21/2006 11:24 94-0349 Turbidity NTU 1.8
W1512 TB01 6/21/2006 11:24 94-0349 True color PCU 17
W1512 TB01 6/21/2006 11:24 94-0349 Apparent color PCU 25
W1512 TB01 6/21/2006 11:24 94-0349 Ammonia-N mg/L 0.10
W1512 TB01 6/21/2006 11:24 94-0349 Total Nitrogen mg/L 0.99
W1512 TB01 6/21/2006 11:24 94-0349 Total Phosphorus mg/L 0.033
W1512 TB01 6/21/2006 11:24 94-0349 Suspended Solids mg/L 1.7
W1528 IH102A 6/21/2006 11:48 94-0326 Turbidity NTU 4.3
W1528 IH102A 6/21/2006 11:48 94-0326 True color PCU 75
W1528 IH102A 6/21/2006 11:48 94-0326 Apparent color PCU 120
W1528 IH102A 6/21/2006 11:48 94-0326 Ammonia-N mg/L 0.07
W1528 IH102A 6/21/2006 11:48 94-0326 Total Nitrogen mg/L 1.8
W1528 IH102A 6/21/2006 11:48 94-0326 Total Phosphorus mg/L 0.085
W1528 IH102A 6/21/2006 11:48 94-0326 Suspended Solids mg/L 4.2
W1524 JR102A 6/21/2006 12:08 94-0351 Turbidity NTU 3.8
W1524 JR102A 6/21/2006 12:08 94-0351 True color PCU 60
W1524 JR102A 6/21/2006 12:08 94-0351 Apparent color PCU 68
W1524 JR102A 6/21/2006 12:08 94-0351 Ammonia-N mg/L 0.06
W1524 JR102A 6/21/2006 12:08 94-0351 Total Nitrogen mg/L 0.71
W1524 JR102A 6/21/2006 12:08 94-0351 Total Phosphorus mg/L 0.059
W1524 JR102A 6/21/2006 12:08 94-0351 Suspended Solids mg/L 3.9
W0910 IM101 6/21/2006 12:15 94-0327 Turbidity NTU 5.2
W0910 IM101 6/21/2006 12:15 94-0327 True color PCU 110
W0910 IM101 6/21/2006 12:15 94-0327 Apparent color PCU 200
W0910 IM101 6/21/2006 12:15 94-0327 Ammonia-N mg/L 0.08
W0910 IM101 6/21/2006 12:15 94-0327 Total Nitrogen mg/L 1.4
W0910 IM101 6/21/2006 12:15 94-0327 Total Phosphorus mg/L 0.030
W0910 IM101 6/21/2006 12:15 94-0327 Suspended Solids mg/L 4.1
W0917 NR103 6/21/2006 12:45 94-0328 Turbidity NTU 2.7
W0917 NR103 6/21/2006 12:45 94-0328 True color PCU 75
W0917 NR103 6/21/2006 12:45 94-0328 Apparent color PCU 110
W0917 NR103 6/21/2006 12:45 94-0328 Ammonia-N mg/L 0.07
W0917 NR103 6/21/2006 12:45 94-0328 Total Nitrogen mg/L 1.2
W0917 NR103 6/21/2006 12:45 94-0328 Total Phosphorus mg/L 0.065
W0917 NR103 6/21/2006 12:45 94-0328 Suspended Solids mg/L 2.6
W0337 GH01 6/21/2006 12:46 94-0353 Turbidity NTU 12.0
W0337 GH01 6/21/2006 12:46 94-0353 True color PCU 60
W0337 GH01 6/21/2006 12:46 94-0353 Apparent color PCU 120
W0337 GH01 6/21/2006 12:46 94-0353 Ammonia-N mg/L 0.26
W0337 GH01 6/21/2006 12:46 94-0353 Total Nitrogen mg/L 0.34

South Coastal Watershed 2006 Water Quality Technical MemorandumDWM CN 235.1 20
Table 7. 2006 MassDEP South Shore Coastal Watersheds water quality dataUnique
IDStation
ID Date Time OWMID Duplicate Analyte Units Result Qualifier*
W0337 GH01 6/21/2006 12:46 94-0353 Total Phosphorus mg/L 0.10
W0337 GH01 6/21/2006 12:46 94-0353 Suspended Solids mg/L 26
W1539 SR102A 6/21/2006 13:31 94-0355 Turbidity NTU 3.3
W1539 SR102A 6/21/2006 13:31 94-0355 True color PCU 90
W1539 SR102A 6/21/2006 13:31 94-0355 Apparent color PCU 110
W1539 SR102A 6/21/2006 13:31 94-0355 Ammonia-N mg/L 0.09
W1539 SR102A 6/21/2006 13:31 94-0355 Total Nitrogen mg/L 0.87
W1539 SR102A 6/21/2006 13:31 94-0355 Total Phosphorus mg/L 0.091
W1539 SR102A 6/21/2006 13:31 94-0355 Suspended Solids mg/L 4.0
W1509 TH02 6/21/2006 13:40 94-0329 Turbidity NTU 4.9
W1509 TH02 6/21/2006 13:40 94-0329 True color PCU 170
W1509 TH02 6/21/2006 13:40 94-0329 Apparent color PCU 210
W1509 TH02 6/21/2006 13:40 94-0329 Ammonia-N mg/L 0.20
W1509 TH02 6/21/2006 13:40 94-0329 Total Nitrogen mg/L 1.4
W1509 TH02 6/21/2006 13:40 94-0329 Total Phosphorus mg/L 0.070
W1509 TH02 6/21/2006 13:40 94-0329 Suspended Solids mg/L 7.7
W0921 SR103 6/21/2006 14:04 94-0357 94-0358 Ammonia-N mg/L 0.02
W0921 SR103 6/21/2006 14:04 94-0357 94-0358 Apparent color PCU ## d
W0921 SR103 6/21/2006 14:04 94-0357 94-0358 Suspended Solids mg/L 4.7
W0921 SR103 6/21/2006 14:04 94-0357 94-0358 Total Nitrogen mg/L 0.63
W0921 SR103 6/21/2006 14:04 94-0357 94-0358 Total Phosphorus mg/L 0.064
W0921 SR103 6/21/2006 14:04 94-0357 94-0358 True color PCU 80
W0921 SR103 6/21/2006 14:04 94-0357 94-0358 Turbidity NTU 2.6
W1511 HR01 6/21/2006 14:10 94-0330 Turbidity NTU 2.7
W1511 HR01 6/21/2006 14:10 94-0330 True color PCU 100
W1511 HR01 6/21/2006 14:10 94-0330 Apparent color PCU 180
W1511 HR01 6/21/2006 14:10 94-0330 Ammonia-N mg/L 0.05
W1511 HR01 6/21/2006 14:10 94-0330 Total Nitrogen mg/L 0.94
W1511 HR01 6/21/2006 14:10 94-0330 Total Phosphorus mg/L 0.064
W1511 HR01 6/21/2006 14:10 94-0330 Suspended Solids mg/L 3.2
W1510 FH02 6/21/2006 14:45 94-0331 94-0332 Ammonia-N mg/L 0.09
W1510 FH02 6/21/2006 14:45 94-0331 94-0332 Apparent color PCU 280
W1510 FH02 6/21/2006 14:45 94-0331 94-0332 Suspended Solids mg/L 1.1
W1510 FH02 6/21/2006 14:45 94-0331 94-0332 Total Nitrogen mg/L 1.2
W1510 FH02 6/21/2006 14:45 94-0331 94-0332 Total Phosphorus mg/L 0.061
W1510 FH02 6/21/2006 14:45 94-0331 94-0332 True color PCU ## d
W1510 FH02 6/21/2006 14:45 94-0331 94-0332 Turbidity NTU 0.9
W0338 ER01 7/6/2006 10:00 94-0488 94-0489 Ammonia-N mg/L <0.02
W0338 ER01 7/6/2006 10:00 94-0488 94-0489 Apparent color PCU <15
W0338 ER01 7/6/2006 10:00 94-0488 94-0489 E. coli CFU/100mL 35
W0338 ER01 7/6/2006 10:00 94-0488 94-0489 Fecal Coliforms CFU/100mL 65
W0338 ER01 7/6/2006 10:00 94-0488 94-0489 Suspended Solids mg/L 1.9
South Coastal Watershed 2006 Water Quality Technical MemorandumDWM CN 235.1 21
Table 7. 2006 MassDEP South Shore Coastal Watersheds water quality dataUnique
IDStation
ID Date Time OWMID Duplicate Analyte Units Result Qualifier*
W0338 ER01 7/6/2006 10:00 94-0488 94-0489 Total Nitrogen mg/L 0.45
W0338 ER01 7/6/2006 10:00 94-0488 94-0489 Total Phosphorus mg/L 0.040
W0338 ER01 7/6/2006 10:00 94-0488 94-0489 True color PCU <15
W0338 ER01 7/6/2006 10:00 94-0488 94-0489 Turbidity NTU 1.2 d
W0898 FS102 7/6/2006 10:06 94-0474 Turbidity NTU 2.7
W0898 FS102 7/6/2006 10:06 94-0474 True color PCU 95
W0898 FS102 7/6/2006 10:06 94-0474 Apparent color PCU 90
W0898 FS102 7/6/2006 10:06 94-0474 E. coli CFU/100mL 440
W0898 FS102 7/6/2006 10:06 94-0474 Fecal Coliforms CFU/100mL 1100
W0898 FS102 7/6/2006 10:06 94-0474 Ammonia-N mg/L 0.08
W0898 FS102 7/6/2006 10:06 94-0474 Total Nitrogen mg/L 1.1
W0898 FS102 7/6/2006 10:06 94-0474 Total Phosphorus mg/L 0.041
W0898 FS102 7/6/2006 10:06 94-0474 Suspended Solids mg/L 1.8
W1510 FH02 7/6/2006 10:20 94-0460 Turbidity NTU 1.6
W1510 FH02 7/6/2006 10:20 94-0460 True color PCU 300
W1510 FH02 7/6/2006 10:20 94-0460 Apparent color PCU 340
W1510 FH02 7/6/2006 10:20 94-0460 E. coli CFU/100mL 130
W1510 FH02 7/6/2006 10:20 94-0460 Fecal Coliforms CFU/100mL 320
W1510 FH02 7/6/2006 10:20 94-0460 Ammonia-N mg/L 0.09
W1510 FH02 7/6/2006 10:20 94-0460 Total Nitrogen mg/L 1.4
W1510 FH02 7/6/2006 10:20 94-0460 Total Phosphorus mg/L 0.090
W1510 FH02 7/6/2006 10:20 94-0460 Suspended Solids mg/L 1.7
W0339 ER02 7/6/2006 10:35 94-0492 Turbidity NTU 3.6
W0339 ER02 7/6/2006 10:35 94-0492 True color PCU <15
W0339 ER02 7/6/2006 10:35 94-0492 Apparent color PCU 17
W0339 ER02 7/6/2006 10:35 94-0492 E. coli CFU/100mL <5
W0339 ER02 7/6/2006 10:35 94-0492 Fecal Coliforms CFU/100mL <5
W0339 ER02 7/6/2006 10:35 94-0492 Ammonia-N mg/L <0.02
W0339 ER02 7/6/2006 10:35 94-0492 Total Nitrogen mg/L 0.38
W0339 ER02 7/6/2006 10:35 94-0492 Total Phosphorus mg/L 0.044
W0339 ER02 7/6/2006 10:35 94-0492 Suspended Solids mg/L 7.1
W0897 FS101 7/6/2006 10:40 94-0476 Turbidity NTU 3.5
W0897 FS101 7/6/2006 10:40 94-0476 True color PCU 100
W0897 FS101 7/6/2006 10:40 94-0476 Apparent color PCU 130
W0897 FS101 7/6/2006 10:40 94-0476 E. coli CFU/100mL 390
W0897 FS101 7/6/2006 10:40 94-0476 Fecal Coliforms CFU/100mL 1200
W0897 FS101 7/6/2006 10:40 94-0476 Ammonia-N mg/L 0.13
W0897 FS101 7/6/2006 10:40 94-0476 Total Nitrogen mg/L 2.7
W0897 FS101 7/6/2006 10:40 94-0476 Total Phosphorus mg/L 0.11
W0897 FS101 7/6/2006 10:40 94-0476 Suspended Solids mg/L 2.8
W1511 HR01 7/6/2006 10:49 94-0462 Turbidity NTU 3.5
W1511 HR01 7/6/2006 10:49 94-0462 True color PCU 170

South Coastal Watershed 2006 Water Quality Technical MemorandumDWM CN 235.1 22
Table 7. 2006 MassDEP South Shore Coastal Watersheds water quality dataUnique
IDStation
ID Date Time OWMID Duplicate Analyte Units Result Qualifier*
W1511 HR01 7/6/2006 10:49 94-0462 Apparent color PCU 240
W1511 HR01 7/6/2006 10:49 94-0462 E. coli CFU/100mL 130
W1511 HR01 7/6/2006 10:49 94-0462 Enterococci CFU/100mL 180
W1511 HR01 7/6/2006 10:49 94-0462 Fecal Coliforms CFU/100mL 280
W1511 HR01 7/6/2006 10:49 94-0462 Ammonia-N mg/L 0.09
W1511 HR01 7/6/2006 10:49 94-0462 Total Nitrogen mg/L 1.1
W1511 HR01 7/6/2006 10:49 94-0462 Total Phosphorus mg/L 0.074
W1511 HR01 7/6/2006 10:49 94-0462 Suspended Solids mg/L 2.8
W0333 ER04A 7/6/2006 11:05 94-0494 Turbidity NTU 2.6
W0333 ER04A 7/6/2006 11:05 94-0494 True color PCU 24
W0333 ER04A 7/6/2006 11:05 94-0494 Apparent color PCU 28
W0333 ER04A 7/6/2006 11:05 94-0494 E. coli CFU/100mL 120
W0333 ER04A 7/6/2006 11:05 94-0494 Fecal Coliforms CFU/100mL 190
W0333 ER04A 7/6/2006 11:05 94-0494 Ammonia-N mg/L <0.02
W0333 ER04A 7/6/2006 11:05 94-0494 Total Nitrogen mg/L 0.22
W0333 ER04A 7/6/2006 11:05 94-0494 Total Phosphorus mg/L 0.054
W0333 ER04A 7/6/2006 11:05 94-0494 Suspended Solids mg/L 1.6
W0895 DW101 7/6/2006 11:18 94-0478 Turbidity NTU 6.4
W0895 DW101 7/6/2006 11:18 94-0478 True color PCU 280
W0895 DW101 7/6/2006 11:18 94-0478 Apparent color PCU 360
W0895 DW101 7/6/2006 11:18 94-0478 E. coli CFU/100mL 600
W0895 DW101 7/6/2006 11:18 94-0478 Fecal Coliforms CFU/100mL 900
W0895 DW101 7/6/2006 11:18 94-0478 Ammonia-N mg/L 0.15
W0895 DW101 7/6/2006 11:18 94-0478 Total Nitrogen mg/L 1.7
W0895 DW101 7/6/2006 11:18 94-0478 Total Phosphorus mg/L 0.12
W0895 DW101 7/6/2006 11:18 94-0478 Suspended Solids mg/L 6.4
W1512 TB01 7/6/2006 11:40 94-0496 Turbidity NTU 2.6
W1512 TB01 7/6/2006 11:40 94-0496 True color PCU <15
W1512 TB01 7/6/2006 11:40 94-0496 Apparent color PCU 16
W1512 TB01 7/6/2006 11:40 94-0496 E. coli CFU/100mL 380
W1512 TB01 7/6/2006 11:40 94-0496 Fecal Coliforms CFU/100mL 800
W1512 TB01 7/6/2006 11:40 94-0496 Ammonia-N mg/L 0.08
W1512 TB01 7/6/2006 11:40 94-0496 Total Nitrogen mg/L 0.84
W1512 TB01 7/6/2006 11:40 94-0496 Total Phosphorus mg/L 0.047
W1512 TB01 7/6/2006 11:40 94-0496 Suspended Solids mg/L 3.1
W1539 SR102A 7/6/2006 11:42 94-0464 Turbidity NTU 4.7
W1539 SR102A 7/6/2006 11:42 94-0464 True color PCU 160
W1539 SR102A 7/6/2006 11:42 94-0464 Apparent color PCU 210
W1539 SR102A 7/6/2006 11:42 94-0464 E. coli CFU/100mL 180
W1539 SR102A 7/6/2006 11:42 94-0464 Enterococci CFU/100mL 180
W1539 SR102A 7/6/2006 11:42 94-0464 Fecal Coliforms CFU/100mL 210
W1539 SR102A 7/6/2006 11:42 94-0464 Ammonia-N mg/L 0.13

South Coastal Watershed 2006 Water Quality Technical MemorandumDWM CN 235.1 23
Table 7. 2006 MassDEP South Shore Coastal Watersheds water quality dataUnique
IDStation
ID Date Time OWMID Duplicate Analyte Units Result Qualifier*
W1539 SR102A 7/6/2006 11:42 94-0464 Total Nitrogen mg/L 0.89
W1539 SR102A 7/6/2006 11:42 94-0464 Total Phosphorus mg/L 0.10
W1539 SR102A 7/6/2006 11:42 94-0464 Suspended Solids mg/L 5.2
W1528 IH102A 7/6/2006 11:48 94-0480 Turbidity NTU 4.7
W1528 IH102A 7/6/2006 11:48 94-0480 True color PCU 230
W1528 IH102A 7/6/2006 11:48 94-0480 Apparent color PCU 240
W1528 IH102A 7/6/2006 11:48 94-0480 E. coli CFU/100mL 250
W1528 IH102A 7/6/2006 11:48 94-0480 Fecal Coliforms CFU/100mL 310
W1528 IH102A 7/6/2006 11:48 94-0480 Ammonia-N mg/L 0.13
W1528 IH102A 7/6/2006 11:48 94-0480 Total Nitrogen mg/L 1.7
W1528 IH102A 7/6/2006 11:48 94-0480 Total Phosphorus mg/L 0.12
W1528 IH102A 7/6/2006 11:48 94-0480 Suspended Solids mg/L 4.2
W0910 IM101 7/6/2006 12:10 94-0482 Turbidity NTU 10.5
W0910 IM101 7/6/2006 12:10 94-0482 True color PCU 260
W0910 IM101 7/6/2006 12:10 94-0482 Apparent color PCU 280
W0910 IM101 7/6/2006 12:10 94-0482 E. coli CFU/100mL 260
W0910 IM101 7/6/2006 12:10 94-0482 Fecal Coliforms CFU/100mL 390
W0910 IM101 7/6/2006 12:10 94-0482 Ammonia-N mg/L 0.10
W0910 IM101 7/6/2006 12:10 94-0482 Total Nitrogen mg/L 1.4
W0910 IM101 7/6/2006 12:10 94-0482 Total Phosphorus mg/L 0.062
W0910 IM101 7/6/2006 12:10 94-0482 Suspended Solids mg/L 6.7
W0337 GH01 7/6/2006 12:13 94-0466 Turbidity NTU 35.5 t
W0337 GH01 7/6/2006 12:13 94-0466 True color PCU 250 t
W0337 GH01 7/6/2006 12:13 94-0466 Apparent color PCU 340 t
W0337 GH01 7/6/2006 12:13 94-0466 E. coli CFU/100mL 150 t
W0337 GH01 7/6/2006 12:13 94-0466 Enterococci CFU/100mL 110 t
W0337 GH01 7/6/2006 12:13 94-0466 Fecal Coliforms CFU/100mL 280 t
W0337 GH01 7/6/2006 12:13 94-0466 Ammonia-N mg/L 0.48 t
W0337 GH01 7/6/2006 12:13 94-0466 Total Nitrogen mg/L 2.0 t
W0337 GH01 7/6/2006 12:13 94-0466 Total Phosphorus mg/L 0.13 t
W0337 GH01 7/6/2006 12:13 94-0466 Suspended Solids mg/L 23 t
W1509 TH02 7/6/2006 12:36 94-0484 94-0485 Ammonia-N mg/L 0.22 r
W1509 TH02 7/6/2006 12:36 94-0484 94-0485 Apparent color PCU 320 r
W1509 TH02 7/6/2006 12:36 94-0484 94-0485 E. coli CFU/100mL 180 r
W1509 TH02 7/6/2006 12:36 94-0484 94-0485 Fecal Coliforms CFU/100mL 280 r
W1509 TH02 7/6/2006 12:36 94-0484 94-0485 Suspended Solids mg/L 6.7 r
W1509 TH02 7/6/2006 12:36 94-0484 94-0485 Total Nitrogen mg/L 1.9 r
W1509 TH02 7/6/2006 12:36 94-0484 94-0485 Total Phosphorus mg/L 0.092 r
W1509 TH02 7/6/2006 12:36 94-0484 94-0485 True color PCU 280 d, r
W1509 TH02 7/6/2006 12:36 94-0484 94-0485 Turbidity NTU 6.7 r
W1524 JR102A 7/6/2006 12:40 94-0498 Turbidity NTU 4.9
W1524 JR102A 7/6/2006 12:40 94-0498 True color PCU 85

South Coastal Watershed 2006 Water Quality Technical MemorandumDWM CN 235.1 24
Table 7. 2006 MassDEP South Shore Coastal Watersheds water quality dataUnique
IDStation
ID Date Time OWMID Duplicate Analyte Units Result Qualifier*
W1524 JR102A 7/6/2006 12:40 94-0498 Apparent color PCU 110
W1524 JR102A 7/6/2006 12:40 94-0498 E. coli CFU/100mL 330
W1524 JR102A 7/6/2006 12:40 94-0498 Fecal Coliforms CFU/100mL 740
W1524 JR102A 7/6/2006 12:40 94-0498 Ammonia-N mg/L 0.08
W1524 JR102A 7/6/2006 12:40 94-0498 Total Nitrogen mg/L 0.82
W1524 JR102A 7/6/2006 12:40 94-0498 Total Phosphorus mg/L 0.069
W1524 JR102A 7/6/2006 12:40 94-0498 Suspended Solids mg/L 3.8
W0921 SR103 7/6/2006 12:55 94-0468 94-0469 Ammonia-N mg/L 0.07
W0921 SR103 7/6/2006 12:55 94-0468 94-0469 Apparent color PCU 210 d
W0921 SR103 7/6/2006 12:55 94-0468 94-0469 E. coli CFU/100mL 40
W0921 SR103 7/6/2006 12:55 94-0468 94-0469 Fecal Coliforms CFU/100mL 80
W0921 SR103 7/6/2006 12:55 94-0468 94-0469 Suspended Solids mg/L 6.4
W0921 SR103 7/6/2006 12:55 94-0468 94-0469 Total Nitrogen mg/L 0.74
W0921 SR103 7/6/2006 12:55 94-0468 94-0469 Total Phosphorus mg/L 0.091
W0921 SR103 7/6/2006 12:55 94-0468 94-0469 True color PCU 130
W0921 SR103 7/6/2006 12:55 94-0468 94-0469 Turbidity NTU 8.0
W0917 NR103 7/6/2006 13:35 94-0472 Turbidity NTU 3.7
W0917 NR103 7/6/2006 13:35 94-0472 True color PCU 190
W0917 NR103 7/6/2006 13:35 94-0472 Apparent color PCU 200
W0917 NR103 7/6/2006 13:35 94-0472 E. coli CFU/100mL 80
W0917 NR103 7/6/2006 13:35 94-0472 Fecal Coliforms CFU/100mL 160
W0917 NR103 7/6/2006 13:35 94-0472 Ammonia-N mg/L 0.12
W0917 NR103 7/6/2006 13:35 94-0472 Total Nitrogen mg/L 1.4
W0917 NR103 7/6/2006 13:35 94-0472 Total Phosphorus mg/L 0.092
W0917 NR103 7/6/2006 13:35 94-0472 Suspended Solids mg/L 2.5
W0898 FS102 8/2/2006 9:49 94-0573 Turbidity NTU 1.6
W0898 FS102 8/2/2006 9:49 94-0573 True color PCU 50
W0898 FS102 8/2/2006 9:49 94-0573 Apparent color PCU 60
W0898 FS102 8/2/2006 9:49 94-0573 E. coli CFU/100mL 310
W0898 FS102 8/2/2006 9:49 94-0573 Fecal Coliforms CFU/100mL 390
W0898 FS102 8/2/2006 9:49 94-0573 Ammonia-N mg/L 0.04
W0898 FS102 8/2/2006 9:49 94-0573 Total Nitrogen mg/L 0.86
W0898 FS102 8/2/2006 9:49 94-0573 Total Phosphorus mg/L 0.022
W0898 FS102 8/2/2006 9:49 94-0573 Suspended Solids mg/L <1.0
W0338 ER01 8/2/2006 9:50 94-0586 94-0587 Ammonia-N mg/L <0.02
W0338 ER01 8/2/2006 9:50 94-0586 94-0587 Apparent color PCU 18
W0338 ER01 8/2/2006 9:50 94-0586 94-0587 E. coli CFU/100mL 70
W0338 ER01 8/2/2006 9:50 94-0586 94-0587 Fecal Coliforms CFU/100mL 110
W0338 ER01 8/2/2006 9:50 94-0586 94-0587 Suspended Solids mg/L 1.9
W0338 ER01 8/2/2006 9:50 94-0586 94-0587 Total Nitrogen mg/L 0.35
W0338 ER01 8/2/2006 9:50 94-0586 94-0587 Total Phosphorus mg/L 0.037
W0338 ER01 8/2/2006 9:50 94-0586 94-0587 True color PCU 16

South Coastal Watershed 2006 Water Quality Technical MemorandumDWM CN 235.1 25
Table 7. 2006 MassDEP South Shore Coastal Watersheds water quality dataUnique
IDStation
ID Date Time OWMID Duplicate Analyte Units Result Qualifier*
W0338 ER01 8/2/2006 9:50 94-0586 94-0587 Turbidity NTU 0.8 b
W1510 FH02 8/2/2006 10:00 94-0559 Turbidity NTU 2.5
W1510 FH02 8/2/2006 10:00 94-0559 True color PCU 320
W1510 FH02 8/2/2006 10:00 94-0559 Apparent color PCU 340
W1510 FH02 8/2/2006 10:00 94-0559 E. coli CFU/100mL 40
W1510 FH02 8/2/2006 10:00 94-0559 Fecal Coliforms CFU/100mL 45
W1510 FH02 8/2/2006 10:00 94-0559 Ammonia-N mg/L 0.14
W1510 FH02 8/2/2006 10:00 94-0559 Total Nitrogen mg/L 3.3 r
W1510 FH02 8/2/2006 10:00 94-0559 Total Phosphorus mg/L 0.37 r
W1510 FH02 8/2/2006 10:00 94-0559 Suspended Solids mg/L 37 r
W1511 HR01 8/2/2006 10:17 94-0560 Turbidity NTU 4.4
W1511 HR01 8/2/2006 10:17 94-0560 True color PCU 50
W1511 HR01 8/2/2006 10:17 94-0560 Apparent color PCU 65
W1511 HR01 8/2/2006 10:17 94-0560 E. coli CFU/100mL 140
W1511 HR01 8/2/2006 10:17 94-0560 Enterococci CFU/100mL 290
W1511 HR01 8/2/2006 10:17 94-0560 Fecal Coliforms CFU/100mL 140
W1511 HR01 8/2/2006 10:17 94-0560 Ammonia-N mg/L 0.08
W1511 HR01 8/2/2006 10:17 94-0560 Total Nitrogen mg/L 1.0
W1511 HR01 8/2/2006 10:17 94-0560 Total Phosphorus mg/L 0.073
W1511 HR01 8/2/2006 10:17 94-0560 Suspended Solids mg/L 3.5
W0897 FS101 8/2/2006 10:27 94-0574 Turbidity NTU 6.1
W0897 FS101 8/2/2006 10:27 94-0574 True color PCU 150
W0897 FS101 8/2/2006 10:27 94-0574 Apparent color PCU 200
W0897 FS101 8/2/2006 10:27 94-0574 E. coli CFU/100mL 700
W0897 FS101 8/2/2006 10:27 94-0574 Fecal Coliforms CFU/100mL 1300
W0897 FS101 8/2/2006 10:27 94-0574 Ammonia-N mg/L 0.10
W0897 FS101 8/2/2006 10:27 94-0574 Total Nitrogen mg/L 6.3
W0897 FS101 8/2/2006 10:27 94-0574 Total Phosphorus mg/L 0.20
W0897 FS101 8/2/2006 10:27 94-0574 Suspended Solids mg/L 4.0
W0339 ER02 8/2/2006 10:30 94-0589 Turbidity NTU 0.8 b
W0339 ER02 8/2/2006 10:30 94-0589 True color PCU <15
W0339 ER02 8/2/2006 10:30 94-0589 Apparent color PCU <15
W0339 ER02 8/2/2006 10:30 94-0589 E. coli CFU/100mL <5
W0339 ER02 8/2/2006 10:30 94-0589 Fecal Coliforms CFU/100mL <5
W0339 ER02 8/2/2006 10:30 94-0589 Ammonia-N mg/L <0.02
W0339 ER02 8/2/2006 10:30 94-0589 Total Nitrogen mg/L 0.15
W0339 ER02 8/2/2006 10:30 94-0589 Total Phosphorus mg/L 0.018
W0339 ER02 8/2/2006 10:30 94-0589 Suspended Solids mg/L 1.1
W0333 ER04A 8/2/2006 10:55 94-0590 Turbidity NTU 1.8 b
W0333 ER04A 8/2/2006 10:55 94-0590 True color PCU 19
W0333 ER04A 8/2/2006 10:55 94-0590 Apparent color PCU 26
W0333 ER04A 8/2/2006 10:55 94-0590 E. coli CFU/100mL 180
South Coastal Watershed 2006 Water Quality Technical MemorandumDWM CN 235.1 26
Table 7. 2006 MassDEP South Shore Coastal Watersheds water quality dataUnique
IDStation
ID Date Time OWMID Duplicate Analyte Units Result Qualifier*
W0333 ER04A 8/2/2006 10:55 94-0590 Fecal Coliforms CFU/100mL 290
W0333 ER04A 8/2/2006 10:55 94-0590 Ammonia-N mg/L <0.02
W0333 ER04A 8/2/2006 10:55 94-0590 Total Nitrogen mg/L 0.16
W0333 ER04A 8/2/2006 10:55 94-0590 Total Phosphorus mg/L 0.032
W0333 ER04A 8/2/2006 10:55 94-0590 Suspended Solids mg/L 1.3
W0895 DW101 8/2/2006 11:21 94-0575 Turbidity NTU 8.4
W0895 DW101 8/2/2006 11:21 94-0575 True color PCU 150
W0895 DW101 8/2/2006 11:21 94-0575 Apparent color PCU 160
W0895 DW101 8/2/2006 11:21 94-0575 Hardness mg/L 44
W0895 DW101 8/2/2006 11:21 94-0575 E. coli CFU/100mL 540
W0895 DW101 8/2/2006 11:21 94-0575 Fecal Coliforms CFU/100mL 1000
W0895 DW101 8/2/2006 11:21 94-0575 Ammonia-N mg/L 0.08
W0895 DW101 8/2/2006 11:21 94-0575 Total Nitrogen mg/L 1.7
W0895 DW101 8/2/2006 11:21 94-0575 Total Phosphorus mg/L 0.11
W0895 DW101 8/2/2006 11:21 94-0575 Suspended Solids mg/L 2.8
W1512 TB01 8/2/2006 11:35 94-0591 Turbidity NTU 3.3 b
W1512 TB01 8/2/2006 11:35 94-0591 True color PCU <15
W1512 TB01 8/2/2006 11:35 94-0591 Apparent color PCU 21
W1512 TB01 8/2/2006 11:35 94-0591 E. coli CFU/100mL 35
W1512 TB01 8/2/2006 11:35 94-0591 Fecal Coliforms CFU/100mL 65
W1512 TB01 8/2/2006 11:35 94-0591 Ammonia-N mg/L 0.04
W1512 TB01 8/2/2006 11:35 94-0591 Total Nitrogen mg/L 0.57
W1512 TB01 8/2/2006 11:35 94-0591 Total Phosphorus mg/L 0.041
W1512 TB01 8/2/2006 11:35 94-0591 Suspended Solids mg/L 3.3
W0337 GH01 8/2/2006 11:40 94-0562 Turbidity NTU 5.8 t
W0337 GH01 8/2/2006 11:40 94-0562 True color PCU 21 t
W0337 GH01 8/2/2006 11:40 94-0562 Apparent color PCU 29 t
W0337 GH01 8/2/2006 11:40 94-0562 E. coli CFU/100mL 85 t
W0337 GH01 8/2/2006 11:40 94-0562 Enterococci CFU/100mL 25 t
W0337 GH01 8/2/2006 11:40 94-0562 Fecal Coliforms CFU/100mL 90 t
W0337 GH01 8/2/2006 11:40 94-0562 Ammonia-N mg/L <0.02 t
W0337 GH01 8/2/2006 11:40 94-0562 Total Nitrogen mg/L <0.040 t
W0337 GH01 8/2/2006 11:40 94-0562 Total Phosphorus mg/L 0.044 t
W0337 GH01 8/2/2006 11:40 94-0562 Suspended Solids mg/L 11 t
W1528 IH102A 8/2/2006 11:44 94-0576 Turbidity NTU 4.9
W1528 IH102A 8/2/2006 11:44 94-0576 True color PCU 100
W1528 IH102A 8/2/2006 11:44 94-0576 Apparent color PCU 130
W1528 IH102A 8/2/2006 11:44 94-0576 Hardness mg/L 45
W1528 IH102A 8/2/2006 11:44 94-0576 E. coli CFU/100mL 200
W1528 IH102A 8/2/2006 11:44 94-0576 Fecal Coliforms CFU/100mL 340
W1528 IH102A 8/2/2006 11:44 94-0576 Ammonia-N mg/L 0.04
W1528 IH102A 8/2/2006 11:44 94-0576 Total Nitrogen mg/L 2.0

South Coastal Watershed 2006 Water Quality Technical MemorandumDWM CN 235.1 27
Table 7. 2006 MassDEP South Shore Coastal Watersheds water quality dataUnique
IDStation
ID Date Time OWMID Duplicate Analyte Units Result Qualifier*
W1528 IH102A 8/2/2006 11:44 94-0576 Total Phosphorus mg/L 0.11
W1528 IH102A 8/2/2006 11:44 94-0576 Suspended Solids mg/L 3.1
W0910 IM101 8/2/2006 12:08 94-0577 Turbidity NTU 4.1
W0910 IM101 8/2/2006 12:08 94-0577 True color PCU 80
W0910 IM101 8/2/2006 12:08 94-0577 Apparent color PCU 55
W0910 IM101 8/2/2006 12:08 94-0577 Hardness mg/L 83
W0910 IM101 8/2/2006 12:08 94-0577 E. coli CFU/100mL 230
W0910 IM101 8/2/2006 12:08 94-0577 Fecal Coliforms CFU/100mL 760
W0910 IM101 8/2/2006 12:08 94-0577 Ammonia-N mg/L 0.04
W0910 IM101 8/2/2006 12:08 94-0577 Total Nitrogen mg/L 1.5
W0910 IM101 8/2/2006 12:08 94-0577 Total Phosphorus mg/L 0.020
W0910 IM101 8/2/2006 12:08 94-0577 Suspended Solids mg/L 1.3
W1524 JR102A 8/2/2006 12:18 94-0592 Turbidity NTU 5.3 b
W1524 JR102A 8/2/2006 12:18 94-0592 True color PCU 49
W1524 JR102A 8/2/2006 12:18 94-0592 Apparent color PCU 70
W1524 JR102A 8/2/2006 12:18 94-0592 E. coli CFU/100mL 75
W1524 JR102A 8/2/2006 12:18 94-0592 Fecal Coliforms CFU/100mL 290
W1524 JR102A 8/2/2006 12:18 94-0592 Ammonia-N mg/L 0.02
W1524 JR102A 8/2/2006 12:18 94-0592 Total Nitrogen mg/L 0.76
W1524 JR102A 8/2/2006 12:18 94-0592 Total Phosphorus mg/L 0.043
W1524 JR102A 8/2/2006 12:18 94-0592 Suspended Solids mg/L 1.6
W0921 SR103 8/2/2006 12:25 94-0563 94-0564 Ammonia-N mg/L 0.03
W0921 SR103 8/2/2006 12:25 94-0563 94-0564 Apparent color PCU 100 d
W0921 SR103 8/2/2006 12:25 94-0563 94-0564 E. coli CFU/100mL 130
W0921 SR103 8/2/2006 12:25 94-0563 94-0564 Fecal Coliforms CFU/100mL 170
W0921 SR103 8/2/2006 12:25 94-0563 94-0564 Suspended Solids mg/L 8.6
W0921 SR103 8/2/2006 12:25 94-0563 94-0564 Total Nitrogen mg/L 0.61
W0921 SR103 8/2/2006 12:25 94-0563 94-0564 Total Phosphorus mg/L 0.070
W0921 SR103 8/2/2006 12:25 94-0563 94-0564 True color PCU 60
W0921 SR103 8/2/2006 12:25 94-0563 94-0564 Turbidity NTU 5.6
W1509 TH02 8/2/2006 12:28 94-0578 94-0579 Ammonia-N mg/L 0.10
W1509 TH02 8/2/2006 12:28 94-0578 94-0579 Apparent color PCU 200
W1509 TH02 8/2/2006 12:28 94-0578 94-0579 E. coli CFU/100mL 250
W1509 TH02 8/2/2006 12:28 94-0578 94-0579 Fecal Coliforms CFU/100mL 500
W1509 TH02 8/2/2006 12:28 94-0578 94-0579 Hardness mg/L 38
W1509 TH02 8/2/2006 12:28 94-0578 94-0579 Suspended Solids mg/L ## d
W1509 TH02 8/2/2006 12:28 94-0578 94-0579 Total Nitrogen mg/L 1.5
W1509 TH02 8/2/2006 12:28 94-0578 94-0579 Total Phosphorus mg/L 0.069
W1509 TH02 8/2/2006 12:28 94-0578 94-0579 True color PCU 150
W1509 TH02 8/2/2006 12:28 94-0578 94-0579 Turbidity NTU 8.2
W0917 NR103 8/2/2006 12:59 94-0566 Turbidity NTU 4.3
W0917 NR103 8/2/2006 12:59 94-0566 True color PCU 80

South Coastal Watershed 2006 Water Quality Technical MemorandumDWM CN 235.1 28
Table 7. 2006 MassDEP South Shore Coastal Watersheds water quality dataUnique
IDStation
ID Date Time OWMID Duplicate Analyte Units Result Qualifier*
W0917 NR103 8/2/2006 12:59 94-0566 Apparent color PCU 90
W0917 NR103 8/2/2006 12:59 94-0566 E. coli CFU/100mL 45
W0917 NR103 8/2/2006 12:59 94-0566 Fecal Coliforms CFU/100mL 170
W0917 NR103 8/2/2006 12:59 94-0566 Ammonia-N mg/L 0.06
W0917 NR103 8/2/2006 12:59 94-0566 Total Nitrogen mg/L 1.2
W0917 NR103 8/2/2006 12:59 94-0566 Total Phosphorus mg/L 0.069
W0917 NR103 8/2/2006 12:59 94-0566 Suspended Solids mg/L 1.5
W1539 SR102A 8/2/2006 ** 94-0561 Turbidity NTU 3.2
W1539 SR102A 8/2/2006 ** 94-0561 True color PCU 70
W1539 SR102A 8/2/2006 ** 94-0561 Apparent color PCU 90
W1539 SR102A 8/2/2006 ** 94-0561 E. coli CFU/100mL 70
W1539 SR102A 8/2/2006 ** 94-0561 Enterococci CFU/100mL 160
W1539 SR102A 8/2/2006 ** 94-0561 Fecal Coliforms CFU/100mL 130
W1539 SR102A 8/2/2006 ** 94-0561 Ammonia-N mg/L 0.03
W1539 SR102A 8/2/2006 ** 94-0561 Total Nitrogen mg/L 0.63
W1539 SR102A 8/2/2006 ** 94-0561 Total Phosphorus mg/L 0.071
W1539 SR102A 8/2/2006 ** 94-0561 Suspended Solids mg/L 1.6
W0898 FS102 9/6/2006 10:14 94-0673 Turbidity NTU 6.9
W0898 FS102 9/6/2006 10:14 94-0673 True color PCU 80
W0898 FS102 9/6/2006 10:14 94-0673 Apparent color PCU 90
W0898 FS102 9/6/2006 10:14 94-0673 E. coli CFU/100mL 860
W0898 FS102 9/6/2006 10:14 94-0673 Fecal Coliforms CFU/100mL 1300
W0898 FS102 9/6/2006 10:14 94-0673 Ammonia-N mg/L <0.02
W0898 FS102 9/6/2006 10:14 94-0673 Total Nitrogen mg/L 0.84
W0898 FS102 9/6/2006 10:14 94-0673 Total Phosphorus mg/L 0.030
W0898 FS102 9/6/2006 10:14 94-0673 Suspended Solids mg/L 4.5
W0338 ER01 9/6/2006 10:15 94-0681 94-0682 Ammonia-N mg/L <0.02
W0338 ER01 9/6/2006 10:15 94-0681 94-0682 Apparent color PCU 31 d
W0338 ER01 9/6/2006 10:15 94-0681 94-0682 E. coli CFU/100mL 75
W0338 ER01 9/6/2006 10:15 94-0681 94-0682 Fecal Coliforms CFU/100mL 85
W0338 ER01 9/6/2006 10:15 94-0681 94-0682 Suspended Solids mg/L 3.6
W0338 ER01 9/6/2006 10:15 94-0681 94-0682 Total Nitrogen mg/L 0.32
W0338 ER01 9/6/2006 10:15 94-0681 94-0682 Total Phosphorus mg/L 0.038
W0338 ER01 9/6/2006 10:15 94-0681 94-0682 True color PCU 24
W0338 ER01 9/6/2006 10:15 94-0681 94-0682 Turbidity NTU 1.1
W1510 FH02 9/6/2006 10:20 94-0665 Turbidity NTU 1.3
W1510 FH02 9/6/2006 10:20 94-0665 True color PCU 280
W1510 FH02 9/6/2006 10:20 94-0665 Apparent color PCU 320
W1510 FH02 9/6/2006 10:20 94-0665 E. coli CFU/100mL 400
W1510 FH02 9/6/2006 10:20 94-0665 Fecal Coliforms CFU/100mL 480
W1510 FH02 9/6/2006 10:20 94-0665 Ammonia-N mg/L 0.06
W1510 FH02 9/6/2006 10:20 94-0665 Total Nitrogen mg/L 1.0

South Coastal Watershed 2006 Water Quality Technical MemorandumDWM CN 235.1 29
Table 7. 2006 MassDEP South Shore Coastal Watersheds water quality dataUnique
IDStation
ID Date Time OWMID Duplicate Analyte Units Result Qualifier*
W1510 FH02 9/6/2006 10:20 94-0665 Total Phosphorus mg/L 0.063
W1510 FH02 9/6/2006 10:20 94-0665 Suspended Solids mg/L 8.0
W0339 ER02 9/6/2006 10:42 94-0684 Turbidity NTU 3.0
W0339 ER02 9/6/2006 10:42 94-0684 True color PCU 17
W0339 ER02 9/6/2006 10:42 94-0684 Apparent color PCU 22
W0339 ER02 9/6/2006 10:42 94-0684 E. coli CFU/100mL <5
W0339 ER02 9/6/2006 10:42 94-0684 Fecal Coliforms CFU/100mL <5
W0339 ER02 9/6/2006 10:42 94-0684 Ammonia-N mg/L <0.02
W0339 ER02 9/6/2006 10:42 94-0684 Total Nitrogen mg/L 0.29
W0339 ER02 9/6/2006 10:42 94-0684 Total Phosphorus mg/L 0.030
W0339 ER02 9/6/2006 10:42 94-0684 Suspended Solids mg/L 4.4
W0897 FS101 9/6/2006 10:46 94-0674 Turbidity NTU 4.1
W0897 FS101 9/6/2006 10:46 94-0674 True color PCU 55
W0897 FS101 9/6/2006 10:46 94-0674 Apparent color PCU 65
W0897 FS101 9/6/2006 10:46 94-0674 E. coli CFU/100mL 1200
W0897 FS101 9/6/2006 10:46 94-0674 Fecal Coliforms CFU/100mL 1600
W0897 FS101 9/6/2006 10:46 94-0674 Ammonia-N mg/L 0.06
W0897 FS101 9/6/2006 10:46 94-0674 Total Nitrogen mg/L 7.9
W0897 FS101 9/6/2006 10:46 94-0674 Total Phosphorus mg/L 0.17
W0897 FS101 9/6/2006 10:46 94-0674 Suspended Solids mg/L 2.4
W1511 HR01 9/6/2006 10:50 94-0666 Turbidity NTU 4.6 t
W1511 HR01 9/6/2006 10:50 94-0666 True color PCU 24 t
W1511 HR01 9/6/2006 10:50 94-0666 Apparent color PCU 31 t
W1511 HR01 9/6/2006 10:50 94-0666 E. coli CFU/100mL 720 t
W1511 HR01 9/6/2006 10:50 94-0666 Enterococci CFU/100mL 840 t
W1511 HR01 9/6/2006 10:50 94-0666 Fecal Coliforms CFU/100mL 1500 t
W1511 HR01 9/6/2006 10:50 94-0666 Ammonia-N mg/L **
W1511 HR01 9/6/2006 10:50 94-0666 Total Nitrogen mg/L **
W1511 HR01 9/6/2006 10:50 94-0666 Total Phosphorus mg/L 0.048 t
W1511 HR01 9/6/2006 10:50 94-0666 Suspended Solids mg/L 5.8 t
W0333 ER04A 9/6/2006 11:05 94-0685 Turbidity NTU 1.4
W0333 ER04A 9/6/2006 11:05 94-0685 True color PCU 19
W0333 ER04A 9/6/2006 11:05 94-0685 Apparent color PCU 27
W0333 ER04A 9/6/2006 11:05 94-0685 E. coli CFU/100mL 150
W0333 ER04A 9/6/2006 11:05 94-0685 Fecal Coliforms CFU/100mL 220
W0333 ER04A 9/6/2006 11:05 94-0685 Ammonia-N mg/L <0.02
W0333 ER04A 9/6/2006 11:05 94-0685 Total Nitrogen mg/L 0.14
W0333 ER04A 9/6/2006 11:05 94-0685 Total Phosphorus mg/L 0.021
W0333 ER04A 9/6/2006 11:05 94-0685 Suspended Solids mg/L <1.0
W1539 SR102A 9/6/2006 11:20 94-0667 Turbidity NTU 2.5
W1539 SR102A 9/6/2006 11:20 94-0667 True color PCU 70
W1539 SR102A 9/6/2006 11:20 94-0667 Apparent color PCU 90
South Coastal Watershed 2006 Water Quality Technical MemorandumDWM CN 235.1 30
Table 7. 2006 MassDEP South Shore Coastal Watersheds water quality dataUnique
IDStation
ID Date Time OWMID Duplicate Analyte Units Result Qualifier*
W1539 SR102A 9/6/2006 11:20 94-0667 E. coli CFU/100mL 160
W1539 SR102A 9/6/2006 11:20 94-0667 Enterococci CFU/100mL 75
W1539 SR102A 9/6/2006 11:20 94-0667 Fecal Coliforms CFU/100mL 240
W1539 SR102A 9/6/2006 11:20 94-0667 Ammonia-N mg/L 0.02
W1539 SR102A 9/6/2006 11:20 94-0667 Total Nitrogen mg/L 0.63
W1539 SR102A 9/6/2006 11:20 94-0667 Total Phosphorus mg/L 0.052
W1539 SR102A 9/6/2006 11:20 94-0667 Suspended Solids mg/L 1.5
W0895 DW101 9/6/2006 11:23 94-0675 Turbidity NTU 5.1
W0895 DW101 9/6/2006 11:23 94-0675 True color PCU 210
W0895 DW101 9/6/2006 11:23 94-0675 Apparent color PCU 230
W0895 DW101 9/6/2006 11:23 94-0675 E. coli CFU/100mL 1400
W0895 DW101 9/6/2006 11:23 94-0675 Fecal Coliforms CFU/100mL 1400
W0895 DW101 9/6/2006 11:23 94-0675 Ammonia-N mg/L 0.07
W0895 DW101 9/6/2006 11:23 94-0675 Total Nitrogen mg/L 1.3
W0895 DW101 9/6/2006 11:23 94-0675 Total Phosphorus mg/L 0.078
W0895 DW101 9/6/2006 11:23 94-0675 Suspended Solids mg/L 3.8
W1512 TB01 9/6/2006 11:45 94-0686 Turbidity NTU 4.0
W1512 TB01 9/6/2006 11:45 94-0686 True color PCU <15
W1512 TB01 9/6/2006 11:45 94-0686 Apparent color PCU 38
W1512 TB01 9/6/2006 11:45 94-0686 E. coli CFU/100mL 65
W1512 TB01 9/6/2006 11:45 94-0686 Fecal Coliforms CFU/100mL 65
W1512 TB01 9/6/2006 11:45 94-0686 Ammonia-N mg/L 0.05
W1512 TB01 9/6/2006 11:45 94-0686 Total Nitrogen mg/L 0.78
W1512 TB01 9/6/2006 11:45 94-0686 Total Phosphorus mg/L 0.045
W1512 TB01 9/6/2006 11:45 94-0686 Suspended Solids mg/L 4.0
W1528 IH102A 9/6/2006 11:51 94-0676 Turbidity NTU 3.3
W1528 IH102A 9/6/2006 11:51 94-0676 True color PCU 110
W1528 IH102A 9/6/2006 11:51 94-0676 Apparent color PCU 130
W1528 IH102A 9/6/2006 11:51 94-0676 E. coli CFU/100mL 220
W1528 IH102A 9/6/2006 11:51 94-0676 Fecal Coliforms CFU/100mL 230
W1528 IH102A 9/6/2006 11:51 94-0676 Ammonia-N mg/L 0.08
W1528 IH102A 9/6/2006 11:51 94-0676 Total Nitrogen mg/L 2.0
W1528 IH102A 9/6/2006 11:51 94-0676 Total Phosphorus mg/L 0.067
W1528 IH102A 9/6/2006 11:51 94-0676 Suspended Solids mg/L 2.3
W0910 IM101 9/6/2006 12:13 94-0677 Turbidity NTU 4.3
W0910 IM101 9/6/2006 12:13 94-0677 True color PCU 40
W0910 IM101 9/6/2006 12:13 94-0677 Apparent color PCU 65
W0910 IM101 9/6/2006 12:13 94-0677 E. coli CFU/100mL 410
W0910 IM101 9/6/2006 12:13 94-0677 Fecal Coliforms CFU/100mL 500
W0910 IM101 9/6/2006 12:13 94-0677 Ammonia-N mg/L 0.04
W0910 IM101 9/6/2006 12:13 94-0677 Total Nitrogen mg/L 0.97
W0910 IM101 9/6/2006 12:13 94-0677 Total Phosphorus mg/L 0.026

South Coastal Watershed 2006 Water Quality Technical MemorandumDWM CN 235.1 31
Table 7. 2006 MassDEP South Shore Coastal Watersheds water quality dataUnique
IDStation
ID Date Time OWMID Duplicate Analyte Units Result Qualifier*
W0910 IM101 9/6/2006 12:13 94-0677 Suspended Solids mg/L 1.6
W1524 JR102A 9/6/2006 12:15 94-0687 Turbidity NTU 3.5
W1524 JR102A 9/6/2006 12:15 94-0687 True color PCU 41
W1524 JR102A 9/6/2006 12:15 94-0687 Apparent color PCU 60
W1524 JR102A 9/6/2006 12:15 94-0687 E. coli CFU/100mL 190
W1524 JR102A 9/6/2006 12:15 94-0687 Fecal Coliforms CFU/100mL 260
W1524 JR102A 9/6/2006 12:15 94-0687 Ammonia-N mg/L <0.02
W1524 JR102A 9/6/2006 12:15 94-0687 Total Nitrogen mg/L 0.69
W1524 JR102A 9/6/2006 12:15 94-0687 Total Phosphorus mg/L 0.027
W1524 JR102A 9/6/2006 12:15 94-0687 Suspended Solids mg/L 1.1
W0921 SR103 9/6/2006 12:25 94-0669 94-0670 Ammonia-N mg/L 0.02
W0921 SR103 9/6/2006 12:25 94-0669 94-0670 Apparent color PCU 90
W0921 SR103 9/6/2006 12:25 94-0669 94-0670 E. coli CFU/100mL 110
W0921 SR103 9/6/2006 12:25 94-0669 94-0670 Fecal Coliforms CFU/100mL 150
W0921 SR103 9/6/2006 12:25 94-0669 94-0670 Suspended Solids mg/L 2.4
W0921 SR103 9/6/2006 12:25 94-0669 94-0670 Total Nitrogen mg/L 0.46
W0921 SR103 9/6/2006 12:25 94-0669 94-0670 Total Phosphorus mg/L 0.043
W0921 SR103 9/6/2006 12:25 94-0669 94-0670 True color PCU 75
W0921 SR103 9/6/2006 12:25 94-0669 94-0670 Turbidity NTU 2.4
W0917 NR103 9/6/2006 13:05 94-0672 Turbidity NTU 2.6 t
W0917 NR103 9/6/2006 13:05 94-0672 True color PCU 80 t
W0917 NR103 9/6/2006 13:05 94-0672 Apparent color PCU 85 t
W0917 NR103 9/6/2006 13:05 94-0672 E. coli CFU/100mL 1200 t
W0917 NR103 9/6/2006 13:05 94-0672 Fecal Coliforms CFU/100mL 1500 t
W0917 NR103 9/6/2006 13:05 94-0672 Ammonia-N mg/L 0.02 t
W0917 NR103 9/6/2006 13:05 94-0672 Total Nitrogen mg/L 1.0 t
W0917 NR103 9/6/2006 13:05 94-0672 Total Phosphorus mg/L 0.045 t
W0917 NR103 9/6/2006 13:05 94-0672 Suspended Solids mg/L 2.9 t
W1509 TH02 9/6/2006 13:39 94-0678 94-0679 Ammonia-N mg/L 0.10
W1509 TH02 9/6/2006 13:39 94-0678 94-0679 Apparent color PCU 240
W1509 TH02 9/6/2006 13:39 94-0678 94-0679 E. coli CFU/100mL 320 e
W1509 TH02 9/6/2006 13:39 94-0678 94-0679 Fecal Coliforms CFU/100mL 300 e
W1509 TH02 9/6/2006 13:39 94-0678 94-0679 Suspended Solids mg/L 4.8
W1509 TH02 9/6/2006 13:39 94-0678 94-0679 Total Nitrogen mg/L 1.2
W1509 TH02 9/6/2006 13:39 94-0678 94-0679 Total Phosphorus mg/L 0.058
W1509 TH02 9/6/2006 13:39 94-0678 94-0679 True color PCU 220
W1509 TH02 9/6/2006 13:39 94-0678 94-0679 Turbidity NTU 6.2
W0338 ER01 10/11/2006 9:52 94-0736 94-0737 Ammonia-N mg/L <0.02
W0338 ER01 10/11/2006 9:52 94-0736 94-0737 E. coli CFU/100mL 20 e
W0338 ER01 10/11/2006 9:52 94-0736 94-0737 Fecal Coliforms CFU/100mL 10 e
W0338 ER01 10/11/2006 9:52 94-0736 94-0737 Suspended Solids mg/L 2.0
W0338 ER01 10/11/2006 9:52 94-0736 94-0737 Total Nitrogen mg/L 0.40

South Coastal Watershed 2006 Water Quality Technical MemorandumDWM CN 235.1 32
Table 7. 2006 MassDEP South Shore Coastal Watersheds water quality dataUnique
IDStation
ID Date Time OWMID Duplicate Analyte Units Result Qualifier*
W0338 ER01 10/11/2006 9:52 94-0736 94-0737 Total Phosphorus mg/L 0.034
W0898 FS102 10/11/2006 9:58 94-0728 E. coli CFU/100mL 45
W0898 FS102 10/11/2006 9:58 94-0728 Fecal Coliforms CFU/100mL 90
W0898 FS102 10/11/2006 9:58 94-0728 Ammonia-N mg/L 0.02
W0898 FS102 10/11/2006 9:58 94-0728 Total Nitrogen mg/L 1.2
W0898 FS102 10/11/2006 9:58 94-0728 Total Phosphorus mg/L 0.031
W0898 FS102 10/11/2006 9:58 94-0728 Suspended Solids mg/L 11
W1510 FH02 10/11/2006 10:09 94-0720 E. coli CFU/100mL 10
W1510 FH02 10/11/2006 10:09 94-0720 Fecal Coliforms CFU/100mL 15
W1510 FH02 10/11/2006 10:09 94-0720 Ammonia-N mg/L <0.02
W1510 FH02 10/11/2006 10:09 94-0720 Total Nitrogen mg/L 0.80
W1510 FH02 10/11/2006 10:09 94-0720 Total Phosphorus mg/L 0.043
W1510 FH02 10/11/2006 10:09 94-0720 Suspended Solids mg/L 1.1
W0339 ER02 10/11/2006 10:15 94-0739 E. coli CFU/100mL <5
W0339 ER02 10/11/2006 10:15 94-0739 Fecal Coliforms CFU/100mL <5
W0339 ER02 10/11/2006 10:15 94-0739 Ammonia-N mg/L <0.02
W0339 ER02 10/11/2006 10:15 94-0739 Total Nitrogen mg/L 0.72
W0339 ER02 10/11/2006 10:15 94-0739 Total Phosphorus mg/L 0.070
W0339 ER02 10/11/2006 10:15 94-0739 Suspended Solids mg/L 10
W1511 HR01 10/11/2006 10:29 94-0721 E. coli CFU/100mL 75
W1511 HR01 10/11/2006 10:29 94-0721 Enterococci CFU/100mL 40
W1511 HR01 10/11/2006 10:29 94-0721 Fecal Coliforms CFU/100mL 120
W1511 HR01 10/11/2006 10:29 94-0721 Ammonia-N mg/L 0.09
W1511 HR01 10/11/2006 10:29 94-0721 Total Nitrogen mg/L 0.58
W1511 HR01 10/11/2006 10:29 94-0721 Total Phosphorus mg/L 0.034
W1511 HR01 10/11/2006 10:29 94-0721 Suspended Solids mg/L 2.4
W0333 ER04A 10/11/2006 10:35 94-0740 E. coli CFU/100mL 15
W0333 ER04A 10/11/2006 10:35 94-0740 Fecal Coliforms CFU/100mL 20
W0333 ER04A 10/11/2006 10:35 94-0740 Ammonia-N mg/L <0.02
W0333 ER04A 10/11/2006 10:35 94-0740 Total Nitrogen mg/L 0.14
W0333 ER04A 10/11/2006 10:35 94-0740 Total Phosphorus mg/L 0.023
W0333 ER04A 10/11/2006 10:35 94-0740 Suspended Solids mg/L 1.1
W0897 FS101 10/11/2006 10:42 94-0729 E. coli CFU/100mL 50
W0897 FS101 10/11/2006 10:42 94-0729 Fecal Coliforms CFU/100mL 130
W0897 FS101 10/11/2006 10:42 94-0729 Ammonia-N mg/L 0.05
W0897 FS101 10/11/2006 10:42 94-0729 Total Nitrogen mg/L 9.9
W0897 FS101 10/11/2006 10:42 94-0729 Total Phosphorus mg/L 0.21
W0897 FS101 10/11/2006 10:42 94-0729 Suspended Solids mg/L 2.3
W1539 SR102A 10/11/2006 10:55 94-0722 E. coli CFU/100mL 180
W1539 SR102A 10/11/2006 10:55 94-0722 Enterococci CFU/100mL 85
W1539 SR102A 10/11/2006 10:55 94-0722 Fecal Coliforms CFU/100mL 180
W1539 SR102A 10/11/2006 10:55 94-0722 Ammonia-N mg/L <0.02

South Coastal Watershed 2006 Water Quality Technical MemorandumDWM CN 235.1 33
Table 7. 2006 MassDEP South Shore Coastal Watersheds water quality dataUnique
IDStation
ID Date Time OWMID Duplicate Analyte Units Result Qualifier*
W1539 SR102A 10/11/2006 10:55 94-0722 Total Nitrogen mg/L 0.78
W1539 SR102A 10/11/2006 10:55 94-0722 Total Phosphorus mg/L 0.079
W1539 SR102A 10/11/2006 10:55 94-0722 Suspended Solids mg/L 6.2
W1512 TB01 10/11/2006 11:00 94-0741 E. coli CFU/100mL 150
W1512 TB01 10/11/2006 11:00 94-0741 Fecal Coliforms CFU/100mL 170
W1512 TB01 10/11/2006 11:00 94-0741 Ammonia-N mg/L 0.06
W1512 TB01 10/11/2006 11:00 94-0741 Total Nitrogen mg/L 0.95
W1512 TB01 10/11/2006 11:00 94-0741 Total Phosphorus mg/L 0.038
W1512 TB01 10/11/2006 11:00 94-0741 Suspended Solids mg/L 2.9
W0337 GH01 10/11/2006 11:18 94-0723 E. coli CFU/100mL 10 t
W0337 GH01 10/11/2006 11:18 94-0723 Enterococci CFU/100mL <5 t
W0337 GH01 10/11/2006 11:18 94-0723 Fecal Coliforms CFU/100mL 10 t
W0337 GH01 10/11/2006 11:18 94-0723 Ammonia-N mg/L **
W0337 GH01 10/11/2006 11:18 94-0723 Total Nitrogen mg/L **
W0337 GH01 10/11/2006 11:18 94-0723 Total Phosphorus mg/L 0.054 t
W0337 GH01 10/11/2006 11:18 94-0723 Suspended Solids mg/L 10 t
W0895 DW101 10/11/2006 11:20 94-0730 E. coli CFU/100mL >1600
W0895 DW101 10/11/2006 11:20 94-0730 Fecal Coliforms CFU/100mL >1600
W0895 DW101 10/11/2006 11:20 94-0730 Ammonia-N mg/L <0.02
W0895 DW101 10/11/2006 11:20 94-0730 Total Nitrogen mg/L 1.2
W0895 DW101 10/11/2006 11:20 94-0730 Total Phosphorus mg/L 0.041
W0895 DW101 10/11/2006 11:20 94-0730 Suspended Solids mg/L 1.4
W1524 JR102A 10/11/2006 11:30 94-0742 E. coli CFU/100mL 20
W1524 JR102A 10/11/2006 11:30 94-0742 Fecal Coliforms CFU/100mL 25
W1524 JR102A 10/11/2006 11:30 94-0742 Ammonia-N mg/L <0.02
W1524 JR102A 10/11/2006 11:30 94-0742 Total Nitrogen mg/L 0.74
W1524 JR102A 10/11/2006 11:30 94-0742 Total Phosphorus mg/L 0.021
W1524 JR102A 10/11/2006 11:30 94-0742 Suspended Solids mg/L <1.0
W1528 IH102A 10/11/2006 11:41 94-0731 E. coli CFU/100mL 75
W1528 IH102A 10/11/2006 11:41 94-0731 Fecal Coliforms CFU/100mL 150
W1528 IH102A 10/11/2006 11:41 94-0731 Ammonia-N mg/L 0.05
W1528 IH102A 10/11/2006 11:41 94-0731 Total Nitrogen mg/L 2.5
W1528 IH102A 10/11/2006 11:41 94-0731 Total Phosphorus mg/L 0.043
W1528 IH102A 10/11/2006 11:41 94-0731 Suspended Solids mg/L 1.1
W0921 SR103 10/11/2006 11:46 94-0724 94-0725 Ammonia-N mg/L <0.02
W0921 SR103 10/11/2006 11:46 94-0724 94-0725 E. coli CFU/100mL 120
W0921 SR103 10/11/2006 11:46 94-0724 94-0725 Fecal Coliforms CFU/100mL 210
W0921 SR103 10/11/2006 11:46 94-0724 94-0725 Suspended Solids mg/L 22
W0921 SR103 10/11/2006 11:46 94-0724 94-0725 Total Nitrogen mg/L 1.2
W0921 SR103 10/11/2006 11:46 94-0724 94-0725 Total Phosphorus mg/L 0.22
W0910 IM101 10/11/2006 11:59 94-0732 E. coli CFU/100mL 5
W0910 IM101 10/11/2006 11:59 94-0732 Fecal Coliforms CFU/100mL 20
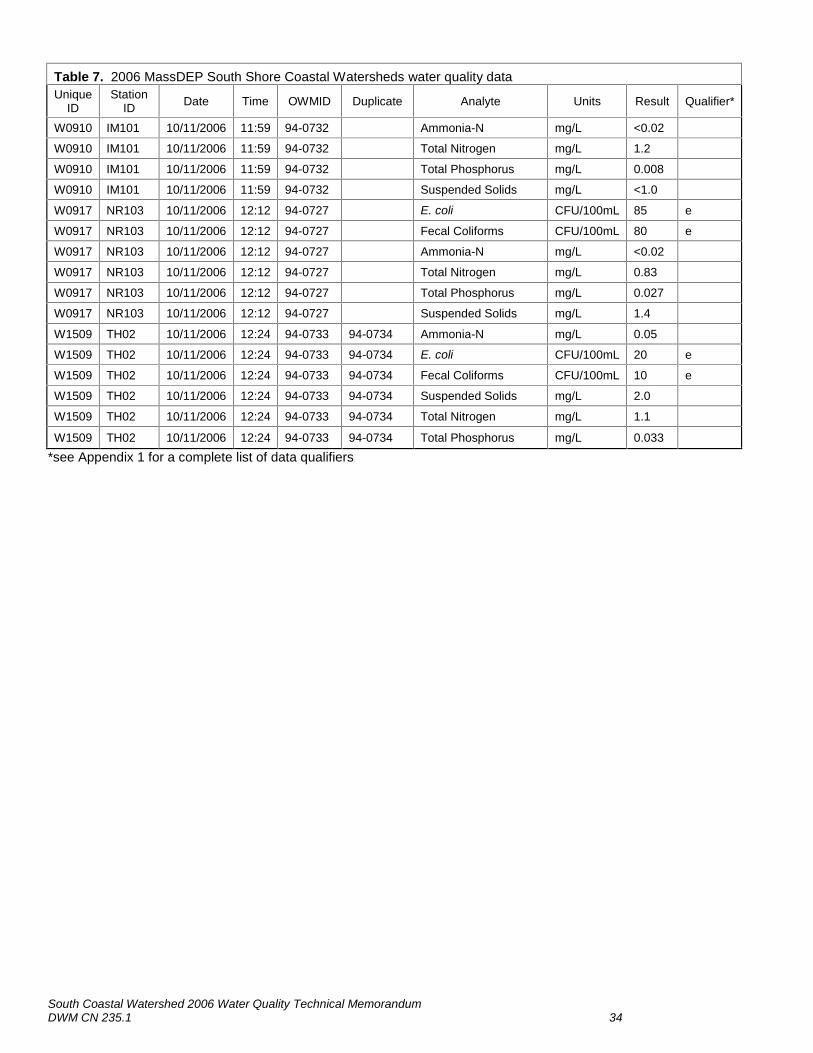
South Coastal Watershed 2006 Water Quality Technical MemorandumDWM CN 235.1 34
Table 7. 2006 MassDEP South Shore Coastal Watersheds water quality dataUnique
IDStation
ID Date Time OWMID Duplicate Analyte Units Result Qualifier*
W0910 IM101 10/11/2006 11:59 94-0732 Ammonia-N mg/L <0.02
W0910 IM101 10/11/2006 11:59 94-0732 Total Nitrogen mg/L 1.2
W0910 IM101 10/11/2006 11:59 94-0732 Total Phosphorus mg/L 0.008
W0910 IM101 10/11/2006 11:59 94-0732 Suspended Solids mg/L <1.0
W0917 NR103 10/11/2006 12:12 94-0727 E. coli CFU/100mL 85 e
W0917 NR103 10/11/2006 12:12 94-0727 Fecal Coliforms CFU/100mL 80 e
W0917 NR103 10/11/2006 12:12 94-0727 Ammonia-N mg/L <0.02
W0917 NR103 10/11/2006 12:12 94-0727 Total Nitrogen mg/L 0.83
W0917 NR103 10/11/2006 12:12 94-0727 Total Phosphorus mg/L 0.027
W0917 NR103 10/11/2006 12:12 94-0727 Suspended Solids mg/L 1.4
W1509 TH02 10/11/2006 12:24 94-0733 94-0734 Ammonia-N mg/L 0.05
W1509 TH02 10/11/2006 12:24 94-0733 94-0734 E. coli CFU/100mL 20 e
W1509 TH02 10/11/2006 12:24 94-0733 94-0734 Fecal Coliforms CFU/100mL 10 e
W1509 TH02 10/11/2006 12:24 94-0733 94-0734 Suspended Solids mg/L 2.0
W1509 TH02 10/11/2006 12:24 94-0733 94-0734 Total Nitrogen mg/L 1.1
W1509 TH02 10/11/2006 12:24 94-0733 94-0734 Total Phosphorus mg/L 0.033*see Appendix 1 for a complete list of data qualifiers

South Coastal Watershed 2006 Water Quality Technical MemorandumDWM CN 235.1 35
Table 8. 2006 MassDEP South Shore Coastal Watersheds E. coli geometric means of samples
Unique ID Station ID Waterbody Geomean (CFU/100 mL)W0895 DW101 Drinkwater River 642
W0338 ER01 Eel River 37
W0339 ER02 Eel River 2
W0333 ER04A Unnamed Tributary 78
W0895 FH02 Drinkwater River 76
W0895 FS101 Drinkwater River 288
W0895 FS102 Drinkwater River 289
W0895 GH01 Drinkwater River 53
W0895 HR01 Drinkwater River 158
W1528 IH102A Indian Head River 146
W0897 IM101 French Stream 113
W1524 JR102A Jones River 92
W0917 NR103 North River 105
W1539 SR102A South River 132
W0895 SR103 Drinkwater River 79
W1512 TB01 Town Brook 90
W1509 TH02 Third Herring Brook 126

South Coastal Watershed 2006 Water Quality Technical MemorandumDWM CN 235.1 36
Table 9: 2006 MassDEP South Shore Coastal Watersheds in-situ attended multi-probe data
StationID
UniqueID Waterbody OWMID Date Time
Sam
ple
Dep
th(m
eter
s)
Dep
th Q
ualif
iers
*
Tem
pera
ture
(deg
. C)
Tem
pera
ture
Qua
lifie
rs*
pH (S
U)
pH Q
ualif
iers
*
Spec
ifiic
Con
duct
ivity
(uS/
cm)
Spec
ific
Con
duct
ivity
Qua
lifie
rs*
Tota
l Dis
solv
edSo
lids
(mg/
l)To
tal D
isso
lved
Solid
s Q
ualif
iers
*D
isso
lved
Oxy
gen
(mg/
l)D
isso
lved
Oxy
gen
Qua
lifie
rs*
Satu
ratio
n (%
)
Satu
ratio
nQ
ualif
iers
*
DW101 W0895 Drinkwater River 94-0387 6/16/2006 11:03 AM 0.7 15.2 -- -- -- 7.2 73DW101 W0895 Drinkwater River 94-0388 6/19/2006 10:46 AM 0.1 18.4 -- -- -- 7.1 77DW101 W0895 Drinkwater River 94-0336 6/21/2006 11:28 AM 0.5 18.1 6.3 344 220 7.3 78DW101 W0895 Drinkwater River 94-0479 7/6/2006 11:31 AM 0.7 18.8 6.2 289 185 5.9 64DW101 W0895 Drinkwater River 94-0507 7/28/2006 11:53 AM 0.5 22.1 -- -- -- 6.3 i 73 iDW101 W0895 Drinkwater River 94-0508 7/31/2006 10:50 AM 0.6 20.3 -- -- -- 6.4 72DW101 W0895 Drinkwater River 94-0569 8/2/2006 11:30 AM 0.4 23.2 6.4 368 235 4.4 52DW101 W0895 Drinkwater River 94-0621 9/1/2006 12:11 PM 0.4 15.9 -- -- -- 8.1 83DW101 W0895 Drinkwater River 94-0622 9/5/2006 11:20 AM 0.3 16.2 -- -- -- 7.8 80DW101 W0895 Drinkwater River 94-0605 9/6/2006 11:30 AM 0.5 i, s 16.8 6.4 321 206 6.8 72
DW101 W0895 Drinkwater River 94-0711 10/11/2006 11:27 AM 0.3 12.3 6.5 395 253 6.8 65ER01 W0338 Eel River 94-0362 5/15/2006 9:39 AM -- 11.5 -- -- -- 9.0 83ER01 W0338 Eel River 94-0363 5/17/2006 9:53 AM -- 13.6 -- -- -- 9.9 98ER01 W0338 Eel River 94-0423 6/19/2006 2:35 PM 0.1 20.8 -- -- -- 10.1 ##ER01 W0338 Eel River 94-0424 6/21/2006 9:19 AM 0.2 14.1 -- -- -- 9.4 92ER01 W0338 Eel River 94-0344 6/21/2006 10:08 AM 0.2 15.3 6.1 83 54 10.6 ##
ER01 W0338 Eel River 94-0491 7/6/2006 10:07 AM 0.2 14.3 6.1 80 52 10.0 97ER01 W0338 Eel River 94-0543 7/31/2006 1:04 PM 0.1 18.4 -- -- -- 11.0 ##ER01 W0338 Eel River 94-0581 8/2/2006 10:04 AM 0.1 18.3 6.1 61 40 10.0 ##ER01 W0338 Eel River 94-0544 8/2/2006 11:38 AM 0.2 20.0 -- -- -- 10.1 ##ER01 W0338 Eel River 94-0657 9/5/2006 1:59 PM 0.1 16.2 -- -- -- 11.3 ##ER01 W0338 Eel River 94-0658 9/6/2006 9:51 AM 0.2 15.5 -- -- -- 7.7 79
ER01 W0338 Eel River 94-0609 9/6/2006 10:19 AM 0.4 15.6 6.0 81 53 8.9 89ER01 W0338 Eel River 94-0701 9/22/2006 11:30 AM 0.1 13.2 -- -- -- 10.5 ##ER01 W0338 Eel River 94-0702 9/27/2006 12:15 PM 0.1 13.7 -- -- -- 10.8 ##ER01 W0338 Eel River 94-0715 10/11/2006 9:55 AM 0.1 12.3 5.9 81 53 9.0 84
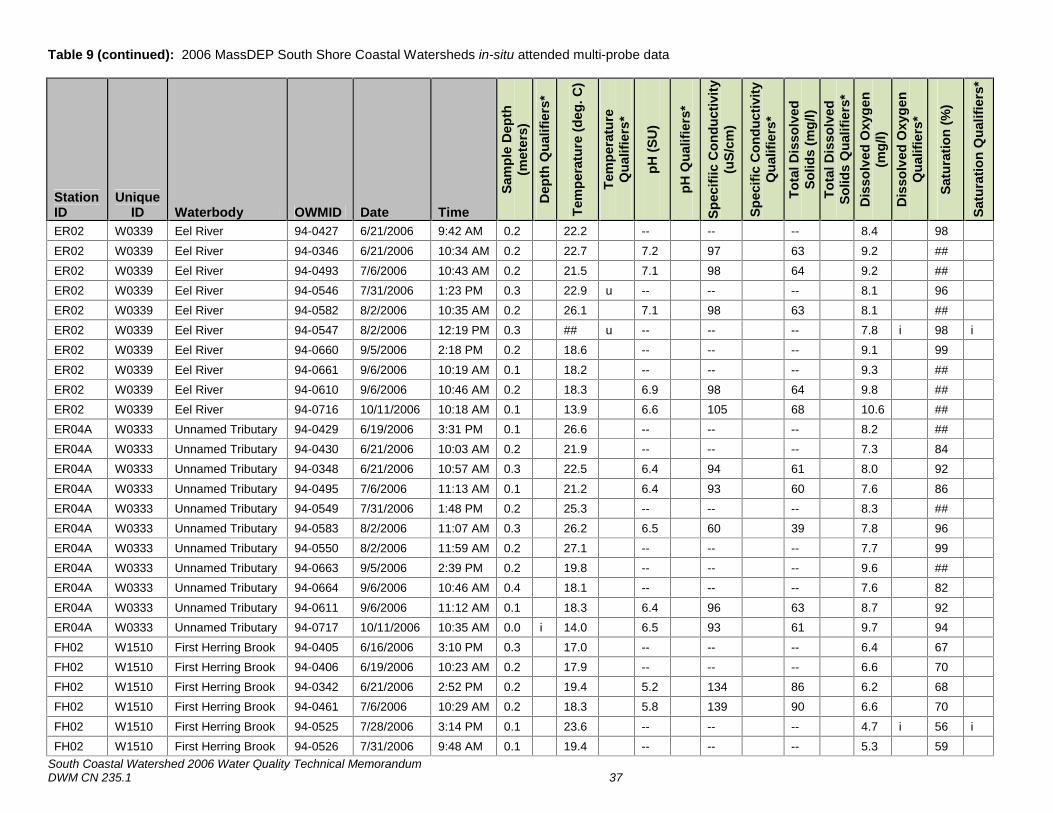
Table 9 (continued): 2006 MassDEP South Shore Coastal Watersheds in-situ attended multi-probe data
South Coastal Watershed 2006 Water Quality Technical MemorandumDWM CN 235.1 37
StationID
UniqueID Waterbody OWMID Date Time
Sam
ple
Dep
th(m
eter
s)D
epth
Qua
lifie
rs*
Tem
pera
ture
(deg
. C)
Tem
pera
ture
Qua
lifie
rs*
pH (S
U)
pH Q
ualif
iers
*
Spec
ifiic
Con
duct
ivity
(uS/
cm)
Spec
ific
Con
duct
ivity
Qua
lifie
rs*
Tota
l Dis
solv
edSo
lids
(mg/
l)To
tal D
isso
lved
Solid
s Q
ualif
iers
*D
isso
lved
Oxy
gen
(mg/
l)D
isso
lved
Oxy
gen
Qua
lifie
rs*
Satu
ratio
n (%
)
Satu
ratio
n Q
ualif
iers
*
ER02 W0339 Eel River 94-0427 6/21/2006 9:42 AM 0.2 22.2 -- -- -- 8.4 98
ER02 W0339 Eel River 94-0346 6/21/2006 10:34 AM 0.2 22.7 7.2 97 63 9.2 ##ER02 W0339 Eel River 94-0493 7/6/2006 10:43 AM 0.2 21.5 7.1 98 64 9.2 ##ER02 W0339 Eel River 94-0546 7/31/2006 1:23 PM 0.3 22.9 u -- -- -- 8.1 96ER02 W0339 Eel River 94-0582 8/2/2006 10:35 AM 0.2 26.1 7.1 98 63 8.1 ##ER02 W0339 Eel River 94-0547 8/2/2006 12:19 PM 0.3 ## u -- -- -- 7.8 i 98 iER02 W0339 Eel River 94-0660 9/5/2006 2:18 PM 0.2 18.6 -- -- -- 9.1 99
ER02 W0339 Eel River 94-0661 9/6/2006 10:19 AM 0.1 18.2 -- -- -- 9.3 ##ER02 W0339 Eel River 94-0610 9/6/2006 10:46 AM 0.2 18.3 6.9 98 64 9.8 ##ER02 W0339 Eel River 94-0716 10/11/2006 10:18 AM 0.1 13.9 6.6 105 68 10.6 ##ER04A W0333 Unnamed Tributary 94-0429 6/19/2006 3:31 PM 0.1 26.6 -- -- -- 8.2 ##ER04A W0333 Unnamed Tributary 94-0430 6/21/2006 10:03 AM 0.2 21.9 -- -- -- 7.3 84ER04A W0333 Unnamed Tributary 94-0348 6/21/2006 10:57 AM 0.3 22.5 6.4 94 61 8.0 92
ER04A W0333 Unnamed Tributary 94-0495 7/6/2006 11:13 AM 0.1 21.2 6.4 93 60 7.6 86ER04A W0333 Unnamed Tributary 94-0549 7/31/2006 1:48 PM 0.2 25.3 -- -- -- 8.3 ##ER04A W0333 Unnamed Tributary 94-0583 8/2/2006 11:07 AM 0.3 26.2 6.5 60 39 7.8 96ER04A W0333 Unnamed Tributary 94-0550 8/2/2006 11:59 AM 0.2 27.1 -- -- -- 7.7 99ER04A W0333 Unnamed Tributary 94-0663 9/5/2006 2:39 PM 0.2 19.8 -- -- -- 9.6 ##ER04A W0333 Unnamed Tributary 94-0664 9/6/2006 10:46 AM 0.4 18.1 -- -- -- 7.6 82
ER04A W0333 Unnamed Tributary 94-0611 9/6/2006 11:12 AM 0.1 18.3 6.4 96 63 8.7 92ER04A W0333 Unnamed Tributary 94-0717 10/11/2006 10:35 AM 0.0 i 14.0 6.5 93 61 9.7 94FH02 W1510 First Herring Brook 94-0405 6/16/2006 3:10 PM 0.3 17.0 -- -- -- 6.4 67FH02 W1510 First Herring Brook 94-0406 6/19/2006 10:23 AM 0.2 17.9 -- -- -- 6.6 70FH02 W1510 First Herring Brook 94-0342 6/21/2006 2:52 PM 0.2 19.4 5.2 134 86 6.2 68FH02 W1510 First Herring Brook 94-0461 7/6/2006 10:29 AM 0.2 18.3 5.8 139 90 6.6 70
FH02 W1510 First Herring Brook 94-0525 7/28/2006 3:14 PM 0.1 23.6 -- -- -- 4.7 i 56 iFH02 W1510 First Herring Brook 94-0526 7/31/2006 9:48 AM 0.1 19.4 -- -- -- 5.3 59
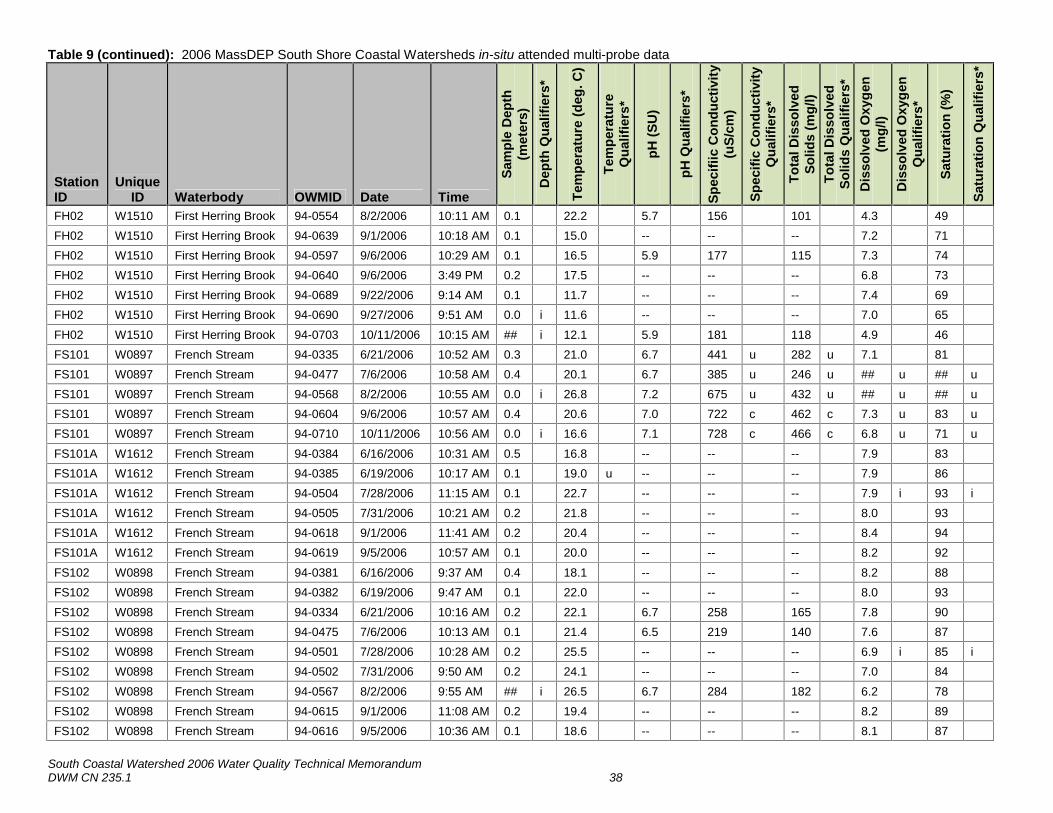
Table 9 (continued): 2006 MassDEP South Shore Coastal Watersheds in-situ attended multi-probe data
South Coastal Watershed 2006 Water Quality Technical MemorandumDWM CN 235.1 38
StationID
UniqueID Waterbody OWMID Date Time
Sam
ple
Dep
th(m
eter
s)D
epth
Qua
lifie
rs*
Tem
pera
ture
(deg
. C)
Tem
pera
ture
Qua
lifie
rs*
pH (S
U)
pH Q
ualif
iers
*
Spec
ifiic
Con
duct
ivity
(uS/
cm)
Spec
ific
Con
duct
ivity
Qua
lifie
rs*
Tota
l Dis
solv
edSo
lids
(mg/
l)To
tal D
isso
lved
Solid
s Q
ualif
iers
*D
isso
lved
Oxy
gen
(mg/
l)D
isso
lved
Oxy
gen
Qua
lifie
rs*
Satu
ratio
n (%
)
Satu
ratio
n Q
ualif
iers
*
FH02 W1510 First Herring Brook 94-0554 8/2/2006 10:11 AM 0.1 22.2 5.7 156 101 4.3 49FH02 W1510 First Herring Brook 94-0639 9/1/2006 10:18 AM 0.1 15.0 -- -- -- 7.2 71FH02 W1510 First Herring Brook 94-0597 9/6/2006 10:29 AM 0.1 16.5 5.9 177 115 7.3 74FH02 W1510 First Herring Brook 94-0640 9/6/2006 3:49 PM 0.2 17.5 -- -- -- 6.8 73FH02 W1510 First Herring Brook 94-0689 9/22/2006 9:14 AM 0.1 11.7 -- -- -- 7.4 69FH02 W1510 First Herring Brook 94-0690 9/27/2006 9:51 AM 0.0 i 11.6 -- -- -- 7.0 65
FH02 W1510 First Herring Brook 94-0703 10/11/2006 10:15 AM ## i 12.1 5.9 181 118 4.9 46FS101 W0897 French Stream 94-0335 6/21/2006 10:52 AM 0.3 21.0 6.7 441 u 282 u 7.1 81FS101 W0897 French Stream 94-0477 7/6/2006 10:58 AM 0.4 20.1 6.7 385 u 246 u ## u ## uFS101 W0897 French Stream 94-0568 8/2/2006 10:55 AM 0.0 i 26.8 7.2 675 u 432 u ## u ## uFS101 W0897 French Stream 94-0604 9/6/2006 10:57 AM 0.4 20.6 7.0 722 c 462 c 7.3 u 83 uFS101 W0897 French Stream 94-0710 10/11/2006 10:56 AM 0.0 i 16.6 7.1 728 c 466 c 6.8 u 71 u
FS101A W1612 French Stream 94-0384 6/16/2006 10:31 AM 0.5 16.8 -- -- -- 7.9 83FS101A W1612 French Stream 94-0385 6/19/2006 10:17 AM 0.1 19.0 u -- -- -- 7.9 86FS101A W1612 French Stream 94-0504 7/28/2006 11:15 AM 0.1 22.7 -- -- -- 7.9 i 93 iFS101A W1612 French Stream 94-0505 7/31/2006 10:21 AM 0.2 21.8 -- -- -- 8.0 93FS101A W1612 French Stream 94-0618 9/1/2006 11:41 AM 0.2 20.4 -- -- -- 8.4 94FS101A W1612 French Stream 94-0619 9/5/2006 10:57 AM 0.1 20.0 -- -- -- 8.2 92
FS102 W0898 French Stream 94-0381 6/16/2006 9:37 AM 0.4 18.1 -- -- -- 8.2 88FS102 W0898 French Stream 94-0382 6/19/2006 9:47 AM 0.1 22.0 -- -- -- 8.0 93FS102 W0898 French Stream 94-0334 6/21/2006 10:16 AM 0.2 22.1 6.7 258 165 7.8 90FS102 W0898 French Stream 94-0475 7/6/2006 10:13 AM 0.1 21.4 6.5 219 140 7.6 87FS102 W0898 French Stream 94-0501 7/28/2006 10:28 AM 0.2 25.5 -- -- -- 6.9 i 85 iFS102 W0898 French Stream 94-0502 7/31/2006 9:50 AM 0.2 24.1 -- -- -- 7.0 84
FS102 W0898 French Stream 94-0567 8/2/2006 9:55 AM ## i 26.5 6.7 284 182 6.2 78FS102 W0898 French Stream 94-0615 9/1/2006 11:08 AM 0.2 19.4 -- -- -- 8.2 89FS102 W0898 French Stream 94-0616 9/5/2006 10:36 AM 0.1 18.6 -- -- -- 8.1 87
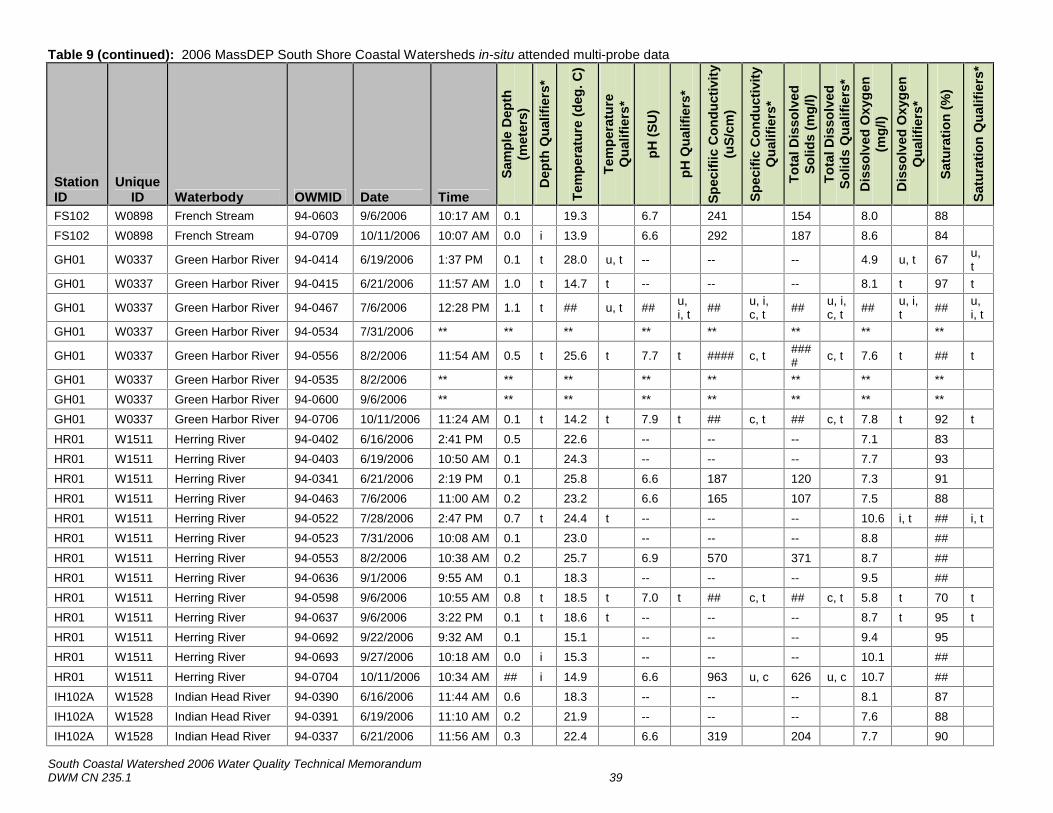
Table 9 (continued): 2006 MassDEP South Shore Coastal Watersheds in-situ attended multi-probe data
South Coastal Watershed 2006 Water Quality Technical MemorandumDWM CN 235.1 39
StationID
UniqueID Waterbody OWMID Date Time
Sam
ple
Dep
th(m
eter
s)D
epth
Qua
lifie
rs*
Tem
pera
ture
(deg
. C)
Tem
pera
ture
Qua
lifie
rs*
pH (S
U)
pH Q
ualif
iers
*
Spec
ifiic
Con
duct
ivity
(uS/
cm)
Spec
ific
Con
duct
ivity
Qua
lifie
rs*
Tota
l Dis
solv
edSo
lids
(mg/
l)To
tal D
isso
lved
Solid
s Q
ualif
iers
*D
isso
lved
Oxy
gen
(mg/
l)D
isso
lved
Oxy
gen
Qua
lifie
rs*
Satu
ratio
n (%
)
Satu
ratio
n Q
ualif
iers
*
FS102 W0898 French Stream 94-0603 9/6/2006 10:17 AM 0.1 19.3 6.7 241 154 8.0 88FS102 W0898 French Stream 94-0709 10/11/2006 10:07 AM 0.0 i 13.9 6.6 292 187 8.6 84
GH01 W0337 Green Harbor River 94-0414 6/19/2006 1:37 PM 0.1 t 28.0 u, t -- -- -- 4.9 u, t 67 u,t
GH01 W0337 Green Harbor River 94-0415 6/21/2006 11:57 AM 1.0 t 14.7 t -- -- -- 8.1 t 97 t
GH01 W0337 Green Harbor River 94-0467 7/6/2006 12:28 PM 1.1 t ## u, t ## u,i, t ## u, i,
c, t ## u, i,c, t ## u, i,
t ## u,i, t
GH01 W0337 Green Harbor River 94-0534 7/31/2006 ** ** ** ** ** ** ** **
GH01 W0337 Green Harbor River 94-0556 8/2/2006 11:54 AM 0.5 t 25.6 t 7.7 t #### c, t #### c, t 7.6 t ## t
GH01 W0337 Green Harbor River 94-0535 8/2/2006 ** ** ** ** ** ** ** **GH01 W0337 Green Harbor River 94-0600 9/6/2006 ** ** ** ** ** ** ** **GH01 W0337 Green Harbor River 94-0706 10/11/2006 11:24 AM 0.1 t 14.2 t 7.9 t ## c, t ## c, t 7.8 t 92 t
HR01 W1511 Herring River 94-0402 6/16/2006 2:41 PM 0.5 22.6 -- -- -- 7.1 83HR01 W1511 Herring River 94-0403 6/19/2006 10:50 AM 0.1 24.3 -- -- -- 7.7 93HR01 W1511 Herring River 94-0341 6/21/2006 2:19 PM 0.1 25.8 6.6 187 120 7.3 91HR01 W1511 Herring River 94-0463 7/6/2006 11:00 AM 0.2 23.2 6.6 165 107 7.5 88HR01 W1511 Herring River 94-0522 7/28/2006 2:47 PM 0.7 t 24.4 t -- -- -- 10.6 i, t ## i, tHR01 W1511 Herring River 94-0523 7/31/2006 10:08 AM 0.1 23.0 -- -- -- 8.8 ##
HR01 W1511 Herring River 94-0553 8/2/2006 10:38 AM 0.2 25.7 6.9 570 371 8.7 ##HR01 W1511 Herring River 94-0636 9/1/2006 9:55 AM 0.1 18.3 -- -- -- 9.5 ##HR01 W1511 Herring River 94-0598 9/6/2006 10:55 AM 0.8 t 18.5 t 7.0 t ## c, t ## c, t 5.8 t 70 tHR01 W1511 Herring River 94-0637 9/6/2006 3:22 PM 0.1 t 18.6 t -- -- -- 8.7 t 95 tHR01 W1511 Herring River 94-0692 9/22/2006 9:32 AM 0.1 15.1 -- -- -- 9.4 95HR01 W1511 Herring River 94-0693 9/27/2006 10:18 AM 0.0 i 15.3 -- -- -- 10.1 ##
HR01 W1511 Herring River 94-0704 10/11/2006 10:34 AM ## i 14.9 6.6 963 u, c 626 u, c 10.7 ##IH102A W1528 Indian Head River 94-0390 6/16/2006 11:44 AM 0.6 18.3 -- -- -- 8.1 87IH102A W1528 Indian Head River 94-0391 6/19/2006 11:10 AM 0.2 21.9 -- -- -- 7.6 88IH102A W1528 Indian Head River 94-0337 6/21/2006 11:56 AM 0.3 22.4 6.6 319 204 7.7 90
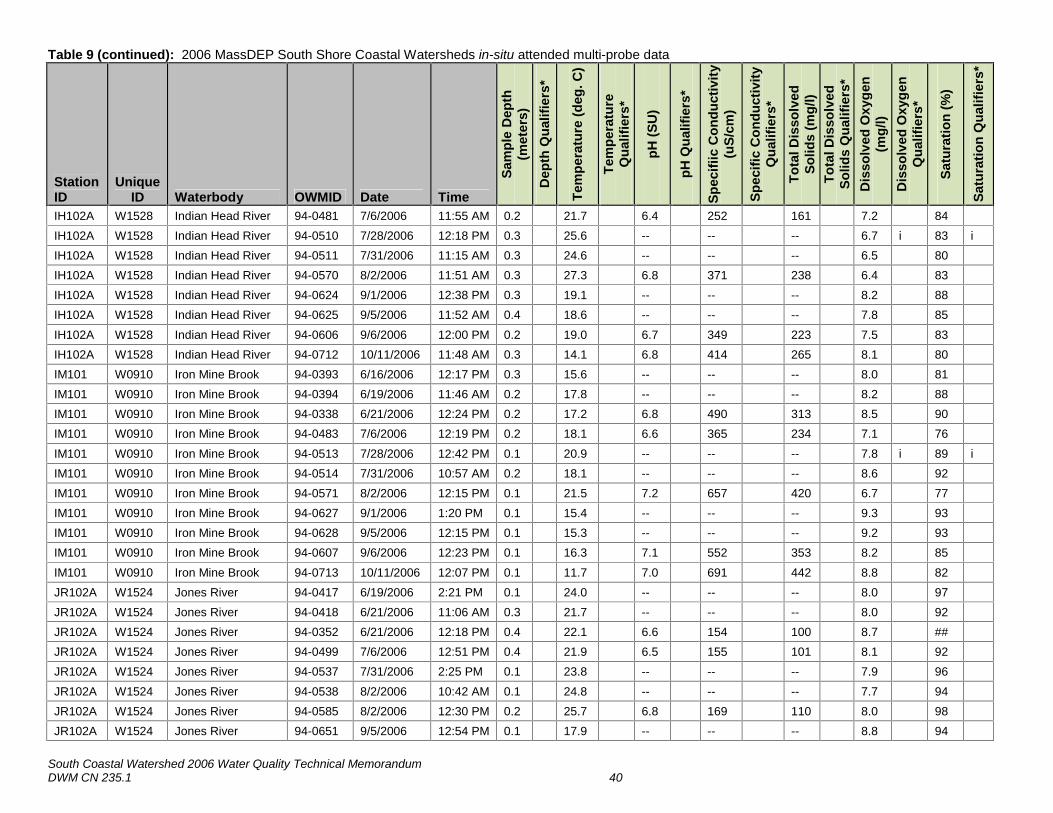
Table 9 (continued): 2006 MassDEP South Shore Coastal Watersheds in-situ attended multi-probe data
South Coastal Watershed 2006 Water Quality Technical MemorandumDWM CN 235.1 40
StationID
UniqueID Waterbody OWMID Date Time
Sam
ple
Dep
th(m
eter
s)D
epth
Qua
lifie
rs*
Tem
pera
ture
(deg
. C)
Tem
pera
ture
Qua
lifie
rs*
pH (S
U)
pH Q
ualif
iers
*
Spec
ifiic
Con
duct
ivity
(uS/
cm)
Spec
ific
Con
duct
ivity
Qua
lifie
rs*
Tota
l Dis
solv
edSo
lids
(mg/
l)To
tal D
isso
lved
Solid
s Q
ualif
iers
*D
isso
lved
Oxy
gen
(mg/
l)D
isso
lved
Oxy
gen
Qua
lifie
rs*
Satu
ratio
n (%
)
Satu
ratio
n Q
ualif
iers
*
IH102A W1528 Indian Head River 94-0481 7/6/2006 11:55 AM 0.2 21.7 6.4 252 161 7.2 84IH102A W1528 Indian Head River 94-0510 7/28/2006 12:18 PM 0.3 25.6 -- -- -- 6.7 i 83 iIH102A W1528 Indian Head River 94-0511 7/31/2006 11:15 AM 0.3 24.6 -- -- -- 6.5 80IH102A W1528 Indian Head River 94-0570 8/2/2006 11:51 AM 0.3 27.3 6.8 371 238 6.4 83IH102A W1528 Indian Head River 94-0624 9/1/2006 12:38 PM 0.3 19.1 -- -- -- 8.2 88IH102A W1528 Indian Head River 94-0625 9/5/2006 11:52 AM 0.4 18.6 -- -- -- 7.8 85
IH102A W1528 Indian Head River 94-0606 9/6/2006 12:00 PM 0.2 19.0 6.7 349 223 7.5 83IH102A W1528 Indian Head River 94-0712 10/11/2006 11:48 AM 0.3 14.1 6.8 414 265 8.1 80IM101 W0910 Iron Mine Brook 94-0393 6/16/2006 12:17 PM 0.3 15.6 -- -- -- 8.0 81IM101 W0910 Iron Mine Brook 94-0394 6/19/2006 11:46 AM 0.2 17.8 -- -- -- 8.2 88IM101 W0910 Iron Mine Brook 94-0338 6/21/2006 12:24 PM 0.2 17.2 6.8 490 313 8.5 90IM101 W0910 Iron Mine Brook 94-0483 7/6/2006 12:19 PM 0.2 18.1 6.6 365 234 7.1 76
IM101 W0910 Iron Mine Brook 94-0513 7/28/2006 12:42 PM 0.1 20.9 -- -- -- 7.8 i 89 iIM101 W0910 Iron Mine Brook 94-0514 7/31/2006 10:57 AM 0.2 18.1 -- -- -- 8.6 92IM101 W0910 Iron Mine Brook 94-0571 8/2/2006 12:15 PM 0.1 21.5 7.2 657 420 6.7 77IM101 W0910 Iron Mine Brook 94-0627 9/1/2006 1:20 PM 0.1 15.4 -- -- -- 9.3 93IM101 W0910 Iron Mine Brook 94-0628 9/5/2006 12:15 PM 0.1 15.3 -- -- -- 9.2 93IM101 W0910 Iron Mine Brook 94-0607 9/6/2006 12:23 PM 0.1 16.3 7.1 552 353 8.2 85
IM101 W0910 Iron Mine Brook 94-0713 10/11/2006 12:07 PM 0.1 11.7 7.0 691 442 8.8 82JR102A W1524 Jones River 94-0417 6/19/2006 2:21 PM 0.1 24.0 -- -- -- 8.0 97JR102A W1524 Jones River 94-0418 6/21/2006 11:06 AM 0.3 21.7 -- -- -- 8.0 92JR102A W1524 Jones River 94-0352 6/21/2006 12:18 PM 0.4 22.1 6.6 154 100 8.7 ##JR102A W1524 Jones River 94-0499 7/6/2006 12:51 PM 0.4 21.9 6.5 155 101 8.1 92JR102A W1524 Jones River 94-0537 7/31/2006 2:25 PM 0.1 23.8 -- -- -- 7.9 96
JR102A W1524 Jones River 94-0538 8/2/2006 10:42 AM 0.1 24.8 -- -- -- 7.7 94JR102A W1524 Jones River 94-0585 8/2/2006 12:30 PM 0.2 25.7 6.8 169 110 8.0 98JR102A W1524 Jones River 94-0651 9/5/2006 12:54 PM 0.1 17.9 -- -- -- 8.8 94

Table 9 (continued): 2006 MassDEP South Shore Coastal Watersheds in-situ attended multi-probe data
South Coastal Watershed 2006 Water Quality Technical MemorandumDWM CN 235.1 41
StationID
UniqueID Waterbody OWMID Date Time
Sam
ple
Dep
th(m
eter
s)D
epth
Qua
lifie
rs*
Tem
pera
ture
(deg
. C)
Tem
pera
ture
Qua
lifie
rs*
pH (S
U)
pH Q
ualif
iers
*
Spec
ifiic
Con
duct
ivity
(uS/
cm)
Spec
ific
Con
duct
ivity
Qua
lifie
rs*
Tota
l Dis
solv
edSo
lids
(mg/
l)To
tal D
isso
lved
Solid
s Q
ualif
iers
*D
isso
lved
Oxy
gen
(mg/
l)D
isso
lved
Oxy
gen
Qua
lifie
rs*
Satu
ratio
n (%
)
Satu
ratio
n Q
ualif
iers
*
JR102A W1524 Jones River 94-0652 9/6/2006 12:04 PM 0.1 17.9 -- -- -- 8.9 96JR102A W1524 Jones River 94-0613 9/6/2006 12:18 PM 0.1 17.9 6.7 77 u 50 u 9.5 ##JR102A W1524 Jones River 94-0719 10/11/2006 11:34 AM 0.1 13.6 6.7 213 138 10.5 ##NR103 W0917 North River 94-0396 6/16/2006 12:53 PM 1.0 19.4 -- -- -- 5.8 64NR103 W0917 North River 94-0397 6/19/2006 12:08 PM 0.4 24.0 -- -- -- 5.5 67NR103 W0917 North River 94-0339 6/21/2006 12:54 PM 0.4 23.8 6.3 274 176 4.6 55
NR103 W0917 North River 94-0473 7/6/2006 1:48 PM 0.7 22.6 6.5 230 150 6.1 71NR103 W0917 North River 94-0516 7/28/2006 1:41 PM 0.6 26.8 -- -- -- 5.1 i 64 iNR103 W0917 North River 94-0517 7/31/2006 11:16 AM 0.5 25.1 -- -- -- 4.3 54NR103 W0917 North River 94-0558 8/2/2006 1:06 PM 0.6 28.6 6.6 323 210 5.2 67NR103 W0917 North River 94-0630 9/1/2006 2:09 PM 0.2 19.6 -- -- -- 7.7 84NR103 W0917 North River 94-0602 9/6/2006 1:08 PM 0.7 t 19.2 t 6.5 t 531 u, t 345 u, t 6.3 t 68 t
NR103 W0917 North River 94-0631 9/6/2006 2:32 PM 0.3 19.6 -- -- -- 5.9 65NR103 W0917 North River 94-0695 9/22/2006 10:03 AM 0.3 15.1 -- -- -- 6.6 66NR103 W0917 North River 94-0696 9/27/2006 11:03 AM 0.2 15.7 -- -- -- 7.0 71NR103 W0917 North River 94-0708 10/11/2006 12:18 PM 0.0 i 13.6 6.5 662 431 6.6 64SR102A W1539 South River 94-0365 5/15/2006 12:43 PM -- 10.3 -- -- -- 9.9 90SR102A W1539 South River 94-0366 5/17/2006 10:43 AM -- 11.7 -- -- -- 9.3 u 88 u
SR102A W1539 South River 94-0408 6/19/2006 12:12 PM 0.2 23.9 -- -- -- 7.3 88SR102A W1539 South River 94-0409 6/21/2006 12:31 PM 0.3 23.0 -- -- -- 7.4 87SR102A W1539 South River 94-0356 6/21/2006 1:41 PM 0.4 23.1 6.5 186 121 8.0 93SR102A W1539 South River 94-0465 7/6/2006 11:55 AM 0.1 22.2 6.4 180 117 7.5 86SR102A W1539 South River 94-0531 7/31/2006 1:01 PM 0.2 25.1 -- -- -- 7.1 88SR102A W1539 South River 94-0532 8/2/2006 9:36 AM 0.2 25.2 -- -- -- 6.7 83
SR102A W1539 South River 94-0555 8/2/2006 11:12 AM 0.2 25.9 6.6 236 154 7.2 88SR102A W1539 South River 94-0645 9/1/2006 3:13 PM 0.3 19.1 -- -- -- 8.5 92SR102A W1539 South River 94-0599 9/6/2006 11:25 AM 0.1 18.4 6.5 228 148 8.5 90

Table 9 (continued): 2006 MassDEP South Shore Coastal Watersheds in-situ attended multi-probe data
South Coastal Watershed 2006 Water Quality Technical MemorandumDWM CN 235.1 42
StationID
UniqueID Waterbody OWMID Date Time
Sam
ple
Dep
th(m
eter
s)D
epth
Qua
lifie
rs*
Tem
pera
ture
(deg
. C)
Tem
pera
ture
Qua
lifie
rs*
pH (S
U)
pH Q
ualif
iers
*
Spec
ifiic
Con
duct
ivity
(uS/
cm)
Spec
ific
Con
duct
ivity
Qua
lifie
rs*
Tota
l Dis
solv
edSo
lids
(mg/
l)To
tal D
isso
lved
Solid
s Q
ualif
iers
*D
isso
lved
Oxy
gen
(mg/
l)D
isso
lved
Oxy
gen
Qua
lifie
rs*
Satu
ratio
n (%
)
Satu
ratio
n Q
ualif
iers
*
SR102A W1539 South River 94-0646 9/6/2006 1:31 PM 0.3 19.0 -- -- -- 8.1 88SR102A W1539 South River 94-0705 10/11/2006 11:01 AM 0.1 14.2 6.4 225 146 9.1 89SR103 W0921 South River 94-0368 5/15/2006 1:16 PM -- 10.6 -- -- -- 6.7 60SR103 W0921 South River 94-0369 5/17/2006 11:11 AM -- 12.5 -- -- -- 6.0 58SR103 W0921 South River 94-0411 6/19/2006 12:50 PM 0.7 25.3 -- -- -- 5.1 63SR103 W0921 South River 94-0412 6/21/2006 1:13 PM 0.9 24.6 -- -- -- 5.2 u 64 u
SR103 W0921 South River 94-0360 6/21/2006 2:15 PM 0.4 25.1 6.2 178 116 5.6 68SR103 W0921 South River 94-0471 7/6/2006 1:09 PM 0.3 22.9 6.0 178 115 2.9 34SR103 W0921 South River 94-0528 7/31/2006 12:33 PM 0.8 24.6 -- -- -- 3.4 u 41 uSR103 W0921 South River 94-0529 8/2/2006 10:05 AM 0.7 26.2 -- -- -- 2.7 34SR103 W0921 South River 94-0557 8/2/2006 12:34 PM 0.2 27.6 6.2 214 139 3.1 39SR103 W0921 South River 94-0642 9/1/2006 2:44 PM 0.5 19.1 -- -- -- 5.6 61
SR103 W0921 South River 94-0601 9/6/2006 12:30 PM 0.2 19.0 6.0 200 130 4.9 53SR103 W0921 South River 94-0643 9/6/2006 1:55 PM 0.4 19.5 -- -- -- 4.9 55SR103 W0921 South River 94-0698 9/22/2006 10:55 AM 0.2 15.8 -- -- -- 4.5 45SR103 W0921 South River 94-0699 9/27/2006 11:35 AM 0.1 15.6 -- -- -- 3.2 32SR103 W0921 South River 94-0707 10/11/2006 11:49 AM 0.2 13.0 6.3 259 168 2.5 24TB01 W1512 Town Brook 94-0420 6/19/2006 1:49 PM 0.6 24.6 -- -- -- 8.4 ##
TB01 W1512 Town Brook 94-0421 6/21/2006 10:32 AM 0.6 22.5 -- -- -- 8.4 99TB01 W1512 Town Brook 94-0350 6/21/2006 11:34 AM 0.2 22.9 6.8 146 95 9.1 ##TB01 W1512 Town Brook 94-0497 7/6/2006 11:49 AM 0.3 22.8 6.8 140 91 8.8 ##TB01 W1512 Town Brook 94-0540 7/31/2006 12:41 PM 0.4 24.5 -- -- -- 8.3 ##TB01 W1512 Town Brook 94-0541 8/2/2006 11:16 AM 0.3 26.8 -- -- -- 7.6 97TB01 W1512 Town Brook 94-0584 8/2/2006 11:45 AM 0.3 27.0 6.8 146 95 8.2 ##
TB01 W1512 Town Brook 94-0654 9/5/2006 1:35 PM 0.2 19.1 -- -- -- 9.1 ##TB01 W1512 Town Brook 94-0655 9/6/2006 11:20 AM 0.5 19.3 -- -- -- 9.0 99TB01 W1512 Town Brook 94-0612 9/6/2006 11:41 AM 0.2 19.2 6.7 157 102 9.6 ##

Table 9 (continued): 2006 MassDEP South Shore Coastal Watersheds in-situ attended multi-probe data
South Coastal Watershed 2006 Water Quality Technical MemorandumDWM CN 235.1 43
StationID
UniqueID Waterbody OWMID Date Time
Sam
ple
Dep
th(m
eter
s)D
epth
Qua
lifie
rs*
Tem
pera
ture
(deg
. C)
Tem
pera
ture
Qua
lifie
rs*
pH (S
U)
pH Q
ualif
iers
*
Spec
ifiic
Con
duct
ivity
(uS/
cm)
Spec
ific
Con
duct
ivity
Qua
lifie
rs*
Tota
l Dis
solv
edSo
lids
(mg/
l)To
tal D
isso
lved
Solid
s Q
ualif
iers
*D
isso
lved
Oxy
gen
(mg/
l)D
isso
lved
Oxy
gen
Qua
lifie
rs*
Satu
ratio
n (%
)
Satu
ratio
n Q
ualif
iers
*
TB01 W1512 Town Brook 94-0718 10/11/2006 11:03 AM 0.1 14.8 6.7 168 109 10.5 ##TH02 W1509 Third Herring Brook 94-0399 6/16/2006 2:06 PM 0.7 18.6 -- -- -- 7.6 83TH02 W1509 Third Herring Brook 94-0400 6/19/2006 11:19 AM 0.3 21.1 -- -- -- 7.7 88TH02 W1509 Third Herring Brook 94-0340 6/21/2006 1:48 PM 0.3 22.2 6.6 283 181 7.5 87TH02 W1509 Third Herring Brook 94-0487 7/6/2006 12:45 PM 0.3 21.0 6.4 250 160 7.0 80TH02 W1509 Third Herring Brook 94-0519 7/28/2006 2:12 PM 0.3 25.2 -- -- -- 6.8 i 84 i
TH02 W1509 Third Herring Brook 94-0520 7/31/2006 10:36 AM 0.2 22.4 -- -- -- 7.1 84TH02 W1509 Third Herring Brook 94-0572 8/2/2006 12:38 PM 0.2 25.3 6.8 353 226 6.0 74TH02 W1509 Third Herring Brook 94-0633 9/1/2006 1:42 PM 0.1 18.2 -- -- -- 8.5 91TH02 W1509 Third Herring Brook 94-0608 9/6/2006 12:46 PM 0.2 17.8 6.7 328 210 8.0 86TH02 W1509 Third Herring Brook 94-0634 9/6/2006 2:54 PM 0.1 18.5 -- -- -- 8.3 90TH02 W1509 Third Herring Brook 94-0714 10/11/2006 12:27 PM 0.2 13.0 6.8 380 243 8.5 82
*see Appendix 1 for a complete list of data qualifiers

South Coastal Watershed 2006 Water Quality Technical MemorandumDWM CN 235.1 44
Table 10. 2006 MassDEP South Shore Coastal Watersheds summary of unattended probe temperature data
For purposes of summarizing the unattended probe data in this technical memorandum, selected statistics for eachstation and dates of visit are shown. While the data used to calculate the statistics may have been qualified for variousreasons (representativeness, inaccuracy, method not followed, etc.), these data are generally considered acceptable forstatistical purposes. Censored data were not used in these calculations. For more detailed information about qualifieddata points for a given station visit, refer to the final data files that have undergone quality assurance/quality control review(available from MassDEP upon request). (“-- ” = No data (i.e., data not taken/not required))
UniqueID
StationID Water Body OWMID
StartDate
Tem
pera
ture
Dep
loym
ent
Dur
atio
n (H
ours
)
Ave
rage
(deg
. C)
Max
imum
(deg
. C)
Mea
n of
the
Dai
ly M
axim
um(d
eg. C
)
Am
ount
of T
ime
> 20
deg
. C(H
ours
)
Perc
enta
ge o
f Tim
e >
20 d
eg.
C (%
)
Ave
rage
Dai
ly A
mou
nt o
fTi
me
> 20
deg
. C (H
ours
)
Am
ount
of T
ime
> 28
.3 d
eg. C
(Hou
rs)
Ave
rage
Dai
ly A
mou
nt o
fTi
me
> 28
.3 d
eg. C
(Hou
rs)
W0895 DW101 DrinkwaterRiver 94-0386 6/16/2006 71.3 17.9 20.2 19.5 4.1 6% 2.1 0.0 0.0
W0895 DW101 DrinkwaterRiver 94-0506 7/28/2006 70.8 22.3 23.8 23.3 67.1 95% 24.0 0.0 0.0
W0895 DW101 DrinkwaterRiver 94-0620 9/01/2006 95.0 16.5 17.8 17.1 0.0 0% 0.0 0.0 0.0
W0338 ER01 Eel River 94-0361 -- -- -- -- -- -- -- -- --
W0338 ER01 Eel River 94-0422 6/19/2006 42.5 15.7 21.0 21.0 5.3 13% 3.1 0.0 0.0
W0338 ER01 Eel River 94-0542 7/31/2006 46.5 18.8 22.1 22.1 10.8 23% 9.7 0.0 0.0
W0338 ER01 Eel River 94-0656 9/05/2006 19.8 15.9 16.5 -- 0.0 0% -- 0.0 --
W0338 ER01 Eel River 94-0700 9/22/2006 120.5 14.6 17.1 16.1 0.0 0% 0.0 0.0 0.0
W0339 ER02 Eel River 94-0425 6/19/2006 42.5 22.9 25.0 24.9 42.4 100% 24.0 0.0 0.0
W0339 ER02 Eel River 94-0545 7/31/2006 46.8 24.6 26.5 26.5 46.6 100% 24.0 0.0 0.0
W0339 ER02 Eel River 94-0659 9/05/2006 19.8 18.1 18.6 -- 0.0 0% -- 0.0 --
W0333 ER04A UnnamedTributary 94-0428 6/19/2006 42.5 23.8 27.0 26.7 42.4 100% 24.0 0.0 0.0
W0333 ER04A UnnamedTributary 94-0548 7/31/2006 46.0 25.9 28.8 28.8 45.9 100% 24.0 3.7 3.7
W0333 ER04A UnnamedTributary 94-0662 9/05/2006 19.8 19.0 20.1 -- 3.1 16% -- 0.0 --
W1510 FH02 First HerringBrook 94-0370 6/16/2006 67.0 17.4 19.3 18.7 0.0 0% 0.0 0.0 0.0
W1510 FH02 First HerringBrook 94-0524 7/28/2006 66.3 22.1 24.3 23.6 60.4 91% 24.0 0.0 0.0
W1510 FH02 First HerringBrook 94-0638 9/01/2006 125.3 16.5 18.0 17.1 0.0 0% 0.0 0.0 0.0
W1510 FH02 First HerringBrook 94-0688 9/22/2006 120.5 14.6 17.9 16.3 0.0 0% 0.0 0.0 0.0
W1612 FS101A FrenchStream 94-0383 6/16/2006 71.5 18.8 21.2 20.7 12.0 17% 5.4 0.0 0.0
W1612 FS101A FrenchStream 94-0503 7/28/2006 71.0 22.1 23.2 22.8 71.0 100% 24.0 0.0 0.0
W1612 FS101A FrenchStream 94-0617 9/01/2006 95.0 19.8 21.1 20.4 34.6 36% 7.7 0.0 0.0
W0898 FS102 FrenchStream 94-0380 6/16/2006 72.0 21.9 27.1 25.8 54.5 76% 17.1 0.0 0.0
W0898 FS102 FrenchStream 94-0500 7/28/2006 71.3 26.0 28.5 27.9 71.3 100% 24.0 3.8 1.9

Table 10 (continued). 2006 MassDEP South Shore Coastal Watersheds summary of unattended temperature probe data
South Coastal Watershed 2006 Water Quality Technical MemorandumDWM CN 235.1 45
UniqueID
StationID Water Body OWMID
StartDate
Tem
pera
ture
Dep
loym
ent
Dur
atio
n (H
ours
)
Ave
rage
(deg
. C)
Max
imum
(deg
. C)
Mea
n of
the
Dai
ly M
axim
um(d
eg. C
)
Am
ount
of T
ime
> 20
deg
. C(H
ours
)
Perc
enta
ge o
f Tim
e >
20 d
eg.
C (%
)
Ave
rage
Dai
ly A
mou
nt o
fTi
me
> 20
deg
. C (H
ours
)
Am
ount
of T
ime
> 28
.3 d
eg. C
(Hou
rs)
Ave
rage
Dai
ly A
mou
nt o
fTi
me
> 28
.3 d
eg. C
(Hou
rs)
W0898 FS102 FrenchStream 94-0614 9/01/2006 95.3 18.7 20.6 19.3 11.1 12% 2.3 0.0 0.0
W0337 GH01 GreenHarbor River 94-0533 -- -- -- -- -- -- -- -- --
W0337 GH01 GreenHarbor River 94-0413 6/19/2006 0.0 -- -- -- -- -- -- --
W1511 HR01 Herring River 94-0401 6/16/2006 62.0 23.0 25.8 -- 60.7 98% -- 0.0 --
W1511 HR01 Herring River 94-0521 7/28/2006 0.0 -- -- -- -- -- -- --
W1511 HR01 Herring River 94-0635 9/01/2006 0.0 -- -- -- -- -- -- --
W1511 HR01 Herring River 94-0691 9/22/2006 120.5 16.4 19.1 18.4 0.0 0% 0.0 0.0 0.0
W1528 IH102A Indian HeadRiver 94-0389 6/16/2006 71.3 21.1 25.2 24.0 50.8 71% 15.7 0.0 0.0
W1528 IH102A Indian HeadRiver 94-0509 7/28/2006 70.5 26.1 27.7 27.6 70.5 100% 24.0 0.0 0.0
W1528 IH102A Indian HeadRiver 94-0623 9/01/2006 95.0 18.6 20.0 19.0 0.0 0% 0.0 0.0 0.0
W0910 IM101 Iron MineBrook 94-0392 6/16/2006 71.3 17.1 20.3 19.8 3.4 5% 1.7 0.0 0.0
W0910 IM101 Iron MineBrook 94-0512 7/28/2006 70.0 20.3 22.4 21.6 42.2 60% 15.5 0.0 0.0
W0910 IM101 Iron MineBrook 94-0626 9/01/2006 94.5 15.8 17.2 16.5 0.0 0% 0.0 0.0 0.0
W1524 JR102A Jones River 94-0416 6/19/2006 44.5 22.6 24.5 23.9 44.5 100% 24.0 0.0 0.0
W1524 JR102A Jones River 94-0536 7/31/2006 44.0 23.8 25.2 25.2 44.0 100% 24.0 0.0 0.0
W1524 JR102A Jones River 94-0650 9/05/2006 23.0 17.8 18.2 -- 0.0 0% -- 0.0 --
W0917 NR103 North River 94-0395 6/16/2006 71.0 21.7 24.6 23.6 59.0 83% 18.5 0.0 0.0
W0917 NR103 North River 94-0515 7/28/2006 69.3 27.0 28.5 28.5 69.2 100% 24.0 3.9 2.0
W0917 NR103 North River 94-0629 9/01/2006 120.0 18.8 20.5 19.6 12.8 11% 1.5 0.0 0.0
W0917 NR103 North River 94-0694 9/22/2006 120.8 17.2 18.9 18.2 0.0 0% 0.0 0.0 0.0
W1539 SR102A South River 94-0364 5/15/2006 45.8 10.8 11.6 11.2 0.0 0% 0.0 0.0 0.0
W1539 SR102A South River 94-0407 6/19/2006 48.3 23.7 25.8 25.7 48.3 100% 24.0 0.0 0.0
W1539 SR102A South River 94-0530 7/31/2006 44.3 25.2 27.1 27.1 44.2 100% 24.0 0.0 0.0
W1539 SR102A South River 94-0644 9/01/2006 118.0 18.2 19.6 18.8 0.0 0% 0.0 0.0 0.0
W0921 SR103 South River 94-0367 5/15/2006 45.8 11.1 12.5 11.7 0.0 0% 0.0 0.0 0.0
W0921 SR103 South River 94-0410 6/19/2006 48.0 24.3 27.1 26.9 48.0 100% 24.0 0.0 0.0
W0921 SR103 South River 94-0527 7/31/2006 45.3 25.9 27.5 27.5 45.2 100% 24.0 0.0 0.0
W0921 SR103 South River 94-0641 9/01/2006 119.0 18.4 20.9 19.3 8.6 7% 2.1 0.0 0.0
W0921 SR103 South River 94-0697 9/22/2006 120.5 16.6 18.7 17.6 0.0 0% 0.0 0.0 0.0
W1512 TB01 Town Brook 94-0419 6/19/2006 44.5 23.4 25.2 24.6 44.4 100% 24.0 0.0 0.0
W1512 TB01 Town Brook 94-0539 7/31/2006 46.5 25.6 27.0 27.0 46.4 100% 24.0 0.0 0.0
W1512 TB01 Town Brook 94-0653 9/05/2006 21.5 19.3 19.6 -- 0.0 0% -- 0.0 --

Table 10 (continued). 2006 MassDEP South Shore Coastal Watersheds summary of unattended temperature probe data
South Coastal Watershed 2006 Water Quality Technical MemorandumDWM CN 235.1 46
UniqueID
StationID Water Body OWMID
StartDate
Tem
pera
ture
Dep
loym
ent
Dur
atio
n (H
ours
)
Ave
rage
(deg
. C)
Max
imum
(deg
. C)
Mea
n of
the
Dai
ly M
axim
um(d
eg. C
)
Am
ount
of T
ime
> 20
deg
. C(H
ours
)
Perc
enta
ge o
f Tim
e >
20 d
eg.
C (%
)
Ave
rage
Dai
ly A
mou
nt o
fTi
me
> 20
deg
. C (H
ours
)
Am
ount
of T
ime
> 28
.3 d
eg. C
(Hou
rs)
Ave
rage
Dai
ly A
mou
nt o
fTi
me
> 28
.3 d
eg. C
(Hou
rs)
W1509 TH02 Third HerringBrook 94-0398 6/16/2006 68.8 19.6 21.7 21.1 29.9 44% 9.4 0.0 0.0
W1509 TH02 Third HerringBrook 94-0518 7/28/2006 68.3 24.3 27.3 26.9 68.3 100% 24.0 0.0 0.0
W1509 TH02 Third HerringBrook 94-0632 9/01/2006 121.0 17.4 19.9 18.2 0.0 0% 0.0 0.0 0.0

South Coastal Watershed 2006 Water Quality Technical MemorandumDWM CN 235.1 47
Table 11. 2006 MassDEP South Shore Coastal Watersheds summary of unattended probe dissolved oxygen data
For purposes of summarizing the unattended probe data in this technical memorandum, selected statistics for each station and dates of visit are shown. While thedata used to calculate the statistics may have been qualified for various reasons (representativeness, inaccuracy, method not followed, etc.), these data aregenerally considered acceptable for statistical purposes. Censored data were not used in these calculations. For more detailed information about qualified datapoints for a given station visit, refer to the final data files that have undergone quality assurance/quality control review (available from MassDEP upon request).(“-- ” = No data (i.e., data not taken/not required))
StationID
UniqueID
WaterBody OWMID Start Date
Dep
loym
ent D
urat
ion
(Hou
rs)
Ave
rage
Dis
solv
edO
xyge
n(m
g/L)
Min
imum
Dis
solv
ed O
xyge
n(m
g/L)
Am
ount
of T
ime
< 3.
0 m
g/L
(Hou
rs)
Am
ount
of T
ime
< 5.
0 m
g/L
(Hou
rs)
Perc
enta
ge o
f Tim
e <
5.0
mg/
L(%
)
Am
ount
of T
ime
< 6.
0 m
g/L
(Hou
rs)
Ave
rage
Dai
ly A
mou
nt o
fTi
me
< 3.
0 m
g/L
(Hou
rs)
Ave
rage
Dai
ly A
mou
nt o
fTi
me
< 5.
0 m
g/L
(Hou
rs)
Ave
rage
Dai
ly A
mou
nt o
fTi
me
< 6.
0 m
g/L
(Hou
rs)
Ave
rage
Sat
urat
ion
(%)
Min
imum
Sat
urat
ion
(%)
Max
imum
Sat
urat
ion
(%)
W0895 DW101 DrinkwaterRiver 94-0386 06/16/2006 71.3 7.1 6.6 0.0 0.0 0% 0.0 0.0 0.0 0.0 76 74 79
W0895 DW101 DrinkwaterRiver 94-0506 07/28/2006 70.8 6.3 5.9 0.0 0.0 0% 1.6 0.0 0.0 0.4 74 69 78
W0895 DW101 DrinkwaterRiver 94-0620 09/01/2006 95.0 7.8 7.4 0.0 0.0 0% 0.0 0.0 0.0 0.0 80 77 85
W0338 ER01 Eel River 94-0361 -- -- -- -- -- -- -- -- -- -- -- -- -- --
W0338 ER01 Eel River 94-0422 06/19/2006 42.5 7.9 6.5 0.0 0.0 0% 0.0 0.0 0.0 0.0 82 63 113
W0338 ER01 Eel River 94-0542 07/31/2006 46.5 7.8 5.3 0.0 0.0 0% 14.6 0.0 0.0 7.2 85 56 121
W0338 ER01 Eel River 94-0656 09/05/2006 19.8 7.1 5.1 0.0 0.0 0% 8.6 -- -- -- 73 51 117
W0338 ER01 Eel River 94-0700 09/22/2006 120.5 7.3 5.0 0.0 0.0 0% 42.4 0.0 0.0 9.4 73 50 122
W0339 ER02 Eel River 94-0425 06/19/2006 42.5 8.5 8.1 0.0 0.0 0% 0.0 0.0 0.0 0.0 100 99 102
W0339 ER02 Eel River 94-0545 07/31/2006 46.8 8.0 7.5 0.0 0.0 0% 0.0 0.0 0.0 0.0 97 93 102
W0339 ER02 Eel River 94-0659 09/05/2006 19.8 8.9 8.8 0.0 0.0 0% 0.0 -- -- -- 95 94 97
W0333 ER04A UnnamedTributary 94-0428 06/19/2006 42.5 7.2 6.3 0.0 0.0 0% 0.0 0.0 0.0 0.0 87 72 101
W0333 ER04A UnnamedTributary 94-0548 07/31/2006 46.0 7.5 5.6 0.0 0.0 0% 3.9 0.0 0.0 0.0 94 69 114
W0333 ER04A UnnamedTributary 94-0662 09/05/2006 19.8 8.1 6.3 0.0 0.0 0% 0.0 -- -- -- 88 66 108
W1510 FH02 First HerringBrook 94-0370 06/16/2006 67.0 6.7 6.3 0.0 0.0 0% 0.0 0.0 0.0 0.0 71 68 74

Table 10 (continued). 2006 MassDEP South Shore Coastal Watersheds summary of unattended probe dissolved oxygen data
South Coastal Watershed 2006 Water Quality Technical MemorandumDWM CN 235.1 48
StationID
UniqueID
WaterBody OWMID Start Date
Dep
loym
ent D
urat
ion
(Hou
rs)
Ave
rage
Dis
solv
edO
xyge
n(m
g/L)
Min
imum
Dis
solv
ed O
xyge
n(m
g/L)
Am
ount
of T
ime
< 3.
0 m
g/L
(Hou
rs)
Am
ount
of T
ime
< 5.
0 m
g/L
(Hou
rs)
Perc
enta
ge o
f Tim
e <
5.0
mg/
L(%
)
Am
ount
of T
ime
< 6.
0 m
g/L
(Hou
rs)
Ave
rage
Dai
ly A
mou
nt o
fTi
me
< 3.
0 m
g/L
(Hou
rs)
Ave
rage
Dai
ly A
mou
nt o
fTi
me
< 5.
0 m
g/L
(Hou
rs)
Ave
rage
Dai
ly A
mou
nt o
fTi
me
< 6.
0 m
g/L
(Hou
rs)
Ave
rage
Sat
urat
ion
(%)
Min
imum
Sat
urat
ion
(%)
Max
imum
Sat
urat
ion
(%)
W1510 FH02 First HerringBrook 94-0524 07/28/2006 66.3 4.7 4.5 0.0 62.9 95% 66.2 0.0 24.0 24.0 55 53 58
W1510 FH02 First HerringBrook 94-0638 09/01/2006 125.3 6.7 6.3 0.0 0.0 0% 0.0 0.0 0.0 0.0 68 66 73
W1510 FH02 First HerringBrook 94-0688 09/22/2006 120.5 6.7 6.0 0.0 0.0 0% 0.0 0.0 0.0 0.0 66 62 73
W1612 FS101A FrenchStream 94-0383 06/16/2006 71.3 7.5 6.7 0.0 0.0 0% 0.0 0.0 0.0 0.0 81 74 90
W1612 FS101A FrenchStream 94-0503 07/28/2006 71.0 7.5 6.5 0.0 0.0 0% 0.0 0.0 0.0 0.0 87 76 96
W1612 FS101A FrenchStream 94-0617 09/01/2006 95.0 7.8 7.1 0.0 0.0 0% 0.0 0.0 0.0 0.0 86 77 94
W0898 FS102 FrenchStream 94-0380 06/16/2006 72.0 8.0 7.2 0.0 0.0 0% 0.0 0.0 0.0 0.0 92 89 97
W0898 FS102 FrenchStream 94-0500 07/28/2006 71.3 6.9 5.8 0.0 0.0 0% 1.2 0.0 0.0 0.0 86 73 92
W0898 FS102 FrenchStream 94-0614 09/01/2006 95.3 7.9 7.3 0.0 0.0 0% 0.0 0.0 0.0 0.0 85 80 93
W0337 GH01 Green HarborRiver 94-0533 -- -- -- -- -- -- -- -- -- -- -- -- -- --
W0337 GH01 Green HarborRiver 94-0413 06/19/2006 0.0 -- -- -- -- -- -- -- -- -- -- -- --
W1511 HR01 Herring River 94-0401 06/16/2006 0.0 -- -- -- -- -- -- -- -- -- -- -- --
W1511 HR01 Herring River 94-0521 07/28/2006 0.0 -- -- -- -- -- -- -- -- -- -- -- --
W1511 HR01 Herring River 94-0635 09/01/2006 0.0 -- -- -- -- -- -- -- -- -- -- -- --
W1511 HR01 Herring River 94-0691 09/22/2006 0.0 -- -- -- -- -- -- -- -- -- -- -- --
W1528 IH102A Indian HeadRiver 94-0389 06/16/2006 71.3 7.7 6.9 0.0 0.0 0% 0.0 0.0 0.0 0.0 87 83 92
W1528 IH102A Indian HeadRiver 94-0509 07/28/2006 70.5 6.4 6.0 0.0 0.0 0% 0.0 0.0 0.0 0.0 80 75 87
W1528 IH102A Indian HeadRiver 94-0623 09/01/2006 95.0 7.7 7.4 0.0 0.0 0% 0.0 0.0 0.0 0.0 83 80 89
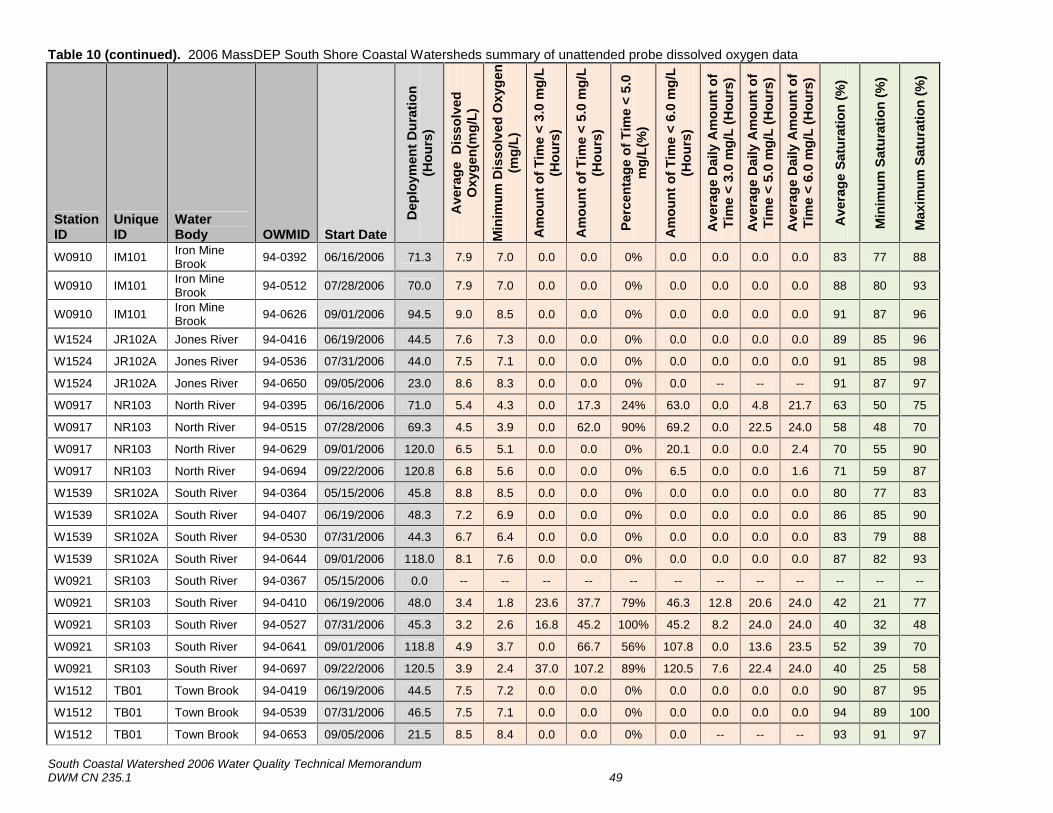
Table 10 (continued). 2006 MassDEP South Shore Coastal Watersheds summary of unattended probe dissolved oxygen data
South Coastal Watershed 2006 Water Quality Technical MemorandumDWM CN 235.1 49
StationID
UniqueID
WaterBody OWMID Start Date
Dep
loym
ent D
urat
ion
(Hou
rs)
Ave
rage
Dis
solv
edO
xyge
n(m
g/L)
Min
imum
Dis
solv
ed O
xyge
n(m
g/L)
Am
ount
of T
ime
< 3.
0 m
g/L
(Hou
rs)
Am
ount
of T
ime
< 5.
0 m
g/L
(Hou
rs)
Perc
enta
ge o
f Tim
e <
5.0
mg/
L(%
)
Am
ount
of T
ime
< 6.
0 m
g/L
(Hou
rs)
Ave
rage
Dai
ly A
mou
nt o
fTi
me
< 3.
0 m
g/L
(Hou
rs)
Ave
rage
Dai
ly A
mou
nt o
fTi
me
< 5.
0 m
g/L
(Hou
rs)
Ave
rage
Dai
ly A
mou
nt o
fTi
me
< 6.
0 m
g/L
(Hou
rs)
Ave
rage
Sat
urat
ion
(%)
Min
imum
Sat
urat
ion
(%)
Max
imum
Sat
urat
ion
(%)
W0910 IM101 Iron MineBrook 94-0392 06/16/2006 71.3 7.9 7.0 0.0 0.0 0% 0.0 0.0 0.0 0.0 83 77 88
W0910 IM101 Iron MineBrook 94-0512 07/28/2006 70.0 7.9 7.0 0.0 0.0 0% 0.0 0.0 0.0 0.0 88 80 93
W0910 IM101 Iron MineBrook 94-0626 09/01/2006 94.5 9.0 8.5 0.0 0.0 0% 0.0 0.0 0.0 0.0 91 87 96
W1524 JR102A Jones River 94-0416 06/19/2006 44.5 7.6 7.3 0.0 0.0 0% 0.0 0.0 0.0 0.0 89 85 96
W1524 JR102A Jones River 94-0536 07/31/2006 44.0 7.5 7.1 0.0 0.0 0% 0.0 0.0 0.0 0.0 91 85 98
W1524 JR102A Jones River 94-0650 09/05/2006 23.0 8.6 8.3 0.0 0.0 0% 0.0 -- -- -- 91 87 97
W0917 NR103 North River 94-0395 06/16/2006 71.0 5.4 4.3 0.0 17.3 24% 63.0 0.0 4.8 21.7 63 50 75
W0917 NR103 North River 94-0515 07/28/2006 69.3 4.5 3.9 0.0 62.0 90% 69.2 0.0 22.5 24.0 58 48 70
W0917 NR103 North River 94-0629 09/01/2006 120.0 6.5 5.1 0.0 0.0 0% 20.1 0.0 0.0 2.4 70 55 90
W0917 NR103 North River 94-0694 09/22/2006 120.8 6.8 5.6 0.0 0.0 0% 6.5 0.0 0.0 1.6 71 59 87
W1539 SR102A South River 94-0364 05/15/2006 45.8 8.8 8.5 0.0 0.0 0% 0.0 0.0 0.0 0.0 80 77 83
W1539 SR102A South River 94-0407 06/19/2006 48.3 7.2 6.9 0.0 0.0 0% 0.0 0.0 0.0 0.0 86 85 90
W1539 SR102A South River 94-0530 07/31/2006 44.3 6.7 6.4 0.0 0.0 0% 0.0 0.0 0.0 0.0 83 79 88
W1539 SR102A South River 94-0644 09/01/2006 118.0 8.1 7.6 0.0 0.0 0% 0.0 0.0 0.0 0.0 87 82 93
W0921 SR103 South River 94-0367 05/15/2006 0.0 -- -- -- -- -- -- -- -- -- -- -- --
W0921 SR103 South River 94-0410 06/19/2006 48.0 3.4 1.8 23.6 37.7 79% 46.3 12.8 20.6 24.0 42 21 77
W0921 SR103 South River 94-0527 07/31/2006 45.3 3.2 2.6 16.8 45.2 100% 45.2 8.2 24.0 24.0 40 32 48
W0921 SR103 South River 94-0641 09/01/2006 118.8 4.9 3.7 0.0 66.7 56% 107.8 0.0 13.6 23.5 52 39 70
W0921 SR103 South River 94-0697 09/22/2006 120.5 3.9 2.4 37.0 107.2 89% 120.5 7.6 22.4 24.0 40 25 58
W1512 TB01 Town Brook 94-0419 06/19/2006 44.5 7.5 7.2 0.0 0.0 0% 0.0 0.0 0.0 0.0 90 87 95
W1512 TB01 Town Brook 94-0539 07/31/2006 46.5 7.5 7.1 0.0 0.0 0% 0.0 0.0 0.0 0.0 94 89 100
W1512 TB01 Town Brook 94-0653 09/05/2006 21.5 8.5 8.4 0.0 0.0 0% 0.0 -- -- -- 93 91 97

Table 10 (continued). 2006 MassDEP South Shore Coastal Watersheds summary of unattended probe dissolved oxygen data
South Coastal Watershed 2006 Water Quality Technical MemorandumDWM CN 235.1 50
StationID
UniqueID
WaterBody OWMID Start Date
Dep
loym
ent D
urat
ion
(Hou
rs)
Ave
rage
Dis
solv
edO
xyge
n(m
g/L)
Min
imum
Dis
solv
ed O
xyge
n(m
g/L)
Am
ount
of T
ime
< 3.
0 m
g/L
(Hou
rs)
Am
ount
of T
ime
< 5.
0 m
g/L
(Hou
rs)
Perc
enta
ge o
f Tim
e <
5.0
mg/
L(%
)
Am
ount
of T
ime
< 6.
0 m
g/L
(Hou
rs)
Ave
rage
Dai
ly A
mou
nt o
fTi
me
< 3.
0 m
g/L
(Hou
rs)
Ave
rage
Dai
ly A
mou
nt o
fTi
me
< 5.
0 m
g/L
(Hou
rs)
Ave
rage
Dai
ly A
mou
nt o
fTi
me
< 6.
0 m
g/L
(Hou
rs)
Ave
rage
Sat
urat
ion
(%)
Min
imum
Sat
urat
ion
(%)
Max
imum
Sat
urat
ion
(%)
W1509 TH02 Third HerringBrook 94-0398 06/16/2006 68.5 7.7 7.3 0.0 0.0 0% 0.0 0.0 0.0 0.0 85 84 87
W1509 TH02 Third HerringBrook 94-0518 07/28/2006 68.3 6.8 6.3 0.0 0.0 0% 0.0 0.0 0.0 0.0 82 80 85
W1509 TH02 Third HerringBrook 94-0632 09/01/2006 121.0 8.4 7.8 0.0 0.0 0% 0.0 0.0 0.0 0.0 88 85 93

South Coastal Watershed 2006 Water Quality Technical MemorandumDWM CN 235.1 51
References
Carr, J. 2006. CN 235.0. South Coastal Watershed: Sampling and Analysis Plan 2006. Massachusetts Department ofEnvironmental Protection, Division of Watershed Management. Worcester, MA.
MassDEP. 2001. Laboratory Quality Assurance Plan and Standard Operating Procedures. Massachusetts Department ofEnvironmental Protection, Division of Environmental Analysis, Senator William X. Wall Experiment Station. Lawrence,MA.
MassDEP. 2004a. CN 1.21 - Sample Collection Techniques for DWM Surface Water Quality Monitoring SOP. December2004. Massachusetts Department of Environmental Protection, Division of Watershed Management. Worcester, MA.
MassDEP 2004b. CN 4.4 - Multi-probe Deployments for Unattended Logging Data Collection. November 2004.Massachusetts Department of Environmental Protection, Division of Watershed Management. Worcester, MA
MassDEP. 2005a. CN 225.0 - QUALITY ASSURANCE PROGRAM PLAN, Surface Water Monitoring & Assessment,MassDEP-Division of Watershed Management, 2005-2009. April 2005. Massachusetts Department of EnvironmentalProtection, Division of Watershed Management. Worcester, MA.
MassDEP. 2005b. CN 4.21 - Water Quality Multiprobe Data Collection. September 2005. Massachusetts Department ofEnvironmental Protection, Division of Watershed Management. Worcester, MA.
MassDEP. 2006. Open File. DWM Water quality river field sheets 2006. Massachusetts Department of EnvironmentalProtection, Division of Watershed Management. Worcester, MA.
MassDEP 2007. CN 300.0 – DATA VALIDATION REPORT for Year 2006 Project Data. Massachusetts Department ofEnvironmental Protection, Division of Watershed Management. Worcester, MA.
MassDEP. 2012a. CN 56.15 - DWM Water Quality Data Validation Process (Summary). May 2012. MassachusettsDepartment of Environmental Protection, Division of Watershed Management. Worcester, MA.
MassDEP. 2012b. CN 56.6 - DWM Water Quality Data Processing and Validation – Laboratory Data (Draft). May 2012.Massachusetts Department of Environmental Protection, Division of Watershed Management. Worcester, MA.
MassDEP. 2012c. CN 56.4 – File Processing and Data Validation for Attended Water Quality Probe Data (Draft). May2012. Massachusetts Department of Environmental Protection, Division of Watershed Management. Worcester, MA.
MassDEP. 2012d. CN 56.5 – File Processing and Data Validation for Unattended Water Quality Probe Data (Draft). May2012. Massachusetts Department of Environmental Protection, Division of Watershed Management. Worcester, MA.
NOAA. 2012a. [Online]. Precipitation Data. September 2012. National Oceanic and Atmospheric Administration, NationalClimatic Data Center. Asheville, NC. http://www.ncdc.noaa.gov/oa/ncdc.html
NOAA. 2012b. [Online]. 1981–2010 U.S. Normals Data. November 2012. National Oceanic and AtmosphericAdministration, National Climatic Data Center. Asheville, NC. http://gis.ncdc.noaa.gov/map/cdo/?thm=themeNormals
USGS. 2012a. [Online]. Discharge Data from Real-time Gage Stations. November 2012. United States GeologicalService. Reston, VA. http://www.usgs.gov/
USGS. 2012b. [Online].StreamStats National Data-Collection Station Information. November 2012. United StatesGeological Service. Reston, VA. http://streamstatsags.cr.usgs.gov/gages/viewer15.htm?stabbr=GAGES
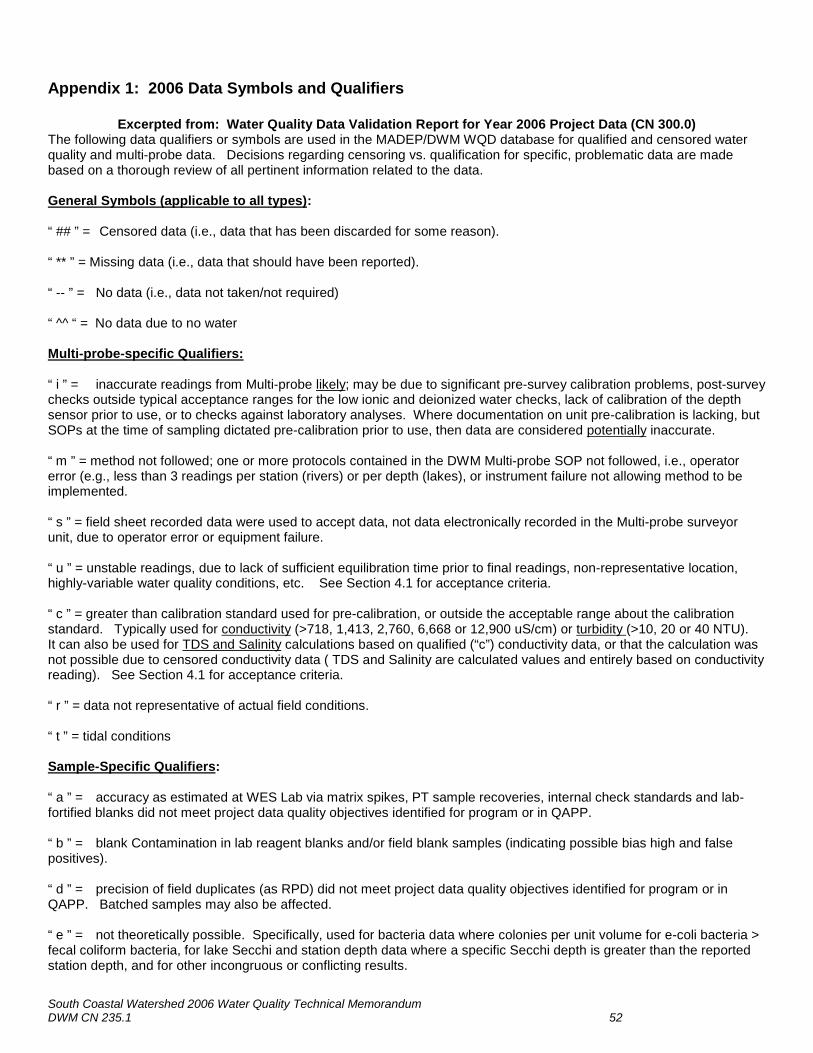
South Coastal Watershed 2006 Water Quality Technical MemorandumDWM CN 235.1 52
Appendix 1: 2006 Data Symbols and Qualifiers
Excerpted from: Water Quality Data Validation Report for Year 2006 Project Data (CN 300.0)The following data qualifiers or symbols are used in the MADEP/DWM WQD database for qualified and censored waterquality and multi-probe data. Decisions regarding censoring vs. qualification for specific, problematic data are madebased on a thorough review of all pertinent information related to the data.
General Symbols (applicable to all types):
“ ## ” = Censored data (i.e., data that has been discarded for some reason).
“ ** ” = Missing data (i.e., data that should have been reported).
“ -- ” = No data (i.e., data not taken/not required)
“ ^^ “ = No data due to no water
Multi-probe-specific Qualifiers:
“ i ” = inaccurate readings from Multi-probe likely; may be due to significant pre-survey calibration problems, post-surveychecks outside typical acceptance ranges for the low ionic and deionized water checks, lack of calibration of the depthsensor prior to use, or to checks against laboratory analyses. Where documentation on unit pre-calibration is lacking, butSOPs at the time of sampling dictated pre-calibration prior to use, then data are considered potentially inaccurate.
“ m ” = method not followed; one or more protocols contained in the DWM Multi-probe SOP not followed, i.e., operatorerror (e.g., less than 3 readings per station (rivers) or per depth (lakes), or instrument failure not allowing method to beimplemented.
“ s ” = field sheet recorded data were used to accept data, not data electronically recorded in the Multi-probe surveyorunit, due to operator error or equipment failure.
“ u ” = unstable readings, due to lack of sufficient equilibration time prior to final readings, non-representative location,highly-variable water quality conditions, etc. See Section 4.1 for acceptance criteria.
“ c ” = greater than calibration standard used for pre-calibration, or outside the acceptable range about the calibrationstandard. Typically used for conductivity (>718, 1,413, 2,760, 6,668 or 12,900 uS/cm) or turbidity (>10, 20 or 40 NTU).It can also be used for TDS and Salinity calculations based on qualified (“c”) conductivity data, or that the calculation wasnot possible due to censored conductivity data ( TDS and Salinity are calculated values and entirely based on conductivityreading). See Section 4.1 for acceptance criteria.
“ r ” = data not representative of actual field conditions.
“ t ” = tidal conditions
Sample-Specific Qualifiers:
“ a ” = accuracy as estimated at WES Lab via matrix spikes, PT sample recoveries, internal check standards and lab-fortified blanks did not meet project data quality objectives identified for program or in QAPP.
“ b ” = blank Contamination in lab reagent blanks and/or field blank samples (indicating possible bias high and falsepositives).
“ d ” = precision of field duplicates (as RPD) did not meet project data quality objectives identified for program or inQAPP. Batched samples may also be affected.
“ e ” = not theoretically possible. Specifically, used for bacteria data where colonies per unit volume for e-coli bacteria >fecal coliform bacteria, for lake Secchi and station depth data where a specific Secchi depth is greater than the reportedstation depth, and for other incongruous or conflicting results.

South Coastal Watershed 2006 Water Quality Technical MemorandumDWM CN 235.1 53
“ f ” = frequency of quality control duplicates did not meet data quality objectives identified for program or in QAPP.
“ h ” = holding time violation (usually indicating possible bias low)
“ j ” = ‘estimated’ value; used for lab-related issues where certain lab QC criteria are not met and re-testing is notpossible (as identified by the WES lab only). Also used to report sample data where the sample concentration is lessthan the ‘reporting’ limit or RDL and greater than the method detection limit or MDL (mdl< x <rdl). Also used to notewhere values have been reported at levels less than the mdl.
“ m ” = method SOP not followed, only partially implemented or not implemented at all, due to complications with samplematrix (e.g., sediment in sample, floc formation), lab error (e.g., cross-contamination between samples), additional stepstaken by the lab to deal with matrix complications, lost/unanalyzed samples, and missing data.
“ p ” = samples not preserved per SOP or analytical method requirements.
“ r ” = samples collected may not be representative of actual field conditions, including the possibility of “outlier” dataand flow-limited conditions (e.g., pooled).
“ t ” = tidal conditions
Related Documents

![MEMORANDUM OPINION GRANTING TRUSTEE’S MOTION FOR SUMMARY ... v. Coastal... · Summary Judgment on April 29, 2016 [Doc. # 27] (―Plaintiff‘s Motion for Summary Judgment‖), and](https://static.cupdf.com/doc/110x72/5b6069397f8b9ac1478bc65b/memorandum-opinion-granting-trustees-motion-for-summary-v-coastal.jpg)