HUNTER MABON ANDERS SJÖBERG TECHNICAL MANUAL 2017 EDITION

Welcome message from author
This document is posted to help you gain knowledge. Please leave a comment to let me know what you think about it! Share it to your friends and learn new things together.
Transcript

HUNTER MABON ANDERS SJÖBERG
TECHNICAL MANUAL2017 EDITION
This manual describes the initial construction and continuous development of the non-verbal ability test Matrigma. The content is presented in chronological order according to the stages of the development work and norm updates.
In Part 1, it is outlined how General Mental Ability (GMA) research conducted between the early 20th century and the present have influenced the view of GMA tests in general and the development of tests based on matrices in particular.
Second, in Part 2 the predictive validity of GMA tests for job performance is discussed and the rational behind the use of Matrigma for personnel selection purposes is outlined.
The following section, Part 3, describes the initial construction process and the first analyses of Matrigma.
In Part 4, the continuous development work leading to the current version of Matrigma is described and Part 5 describes the work of norm updates.
The last section in the manual, Part 6, outlines the areas of use for Matrigma and provide guidelines for interpretation of test scores.
Copyright © 2017 Assessio International AB.
Editing and psychometrics: Cicek Svensson, Sofia Sjöberg and Anders Sjöberg
Graphic design: Johan Larsson and Lina Strand
ISBN: 978-91-7418-357-3
Article number: 006-110
Unauthorized copying strictly prohibited.
All duplication, complete or partial, of the content in this manual without the permission of Assessio International AB is prohibited in accordance with the Swedish Act (1960:729) on Copyright in Literary and Artistic Works. The prohibition regards all forms of duplication and all forms of media, such as printing, copying, digitalization, tape-recording etc.

1 | 35
Content
Content ..................................................................................................................... 1
Part 1 .............................................................................................................................................................. 3
Theoretical background ............................................................................................ 3
Part 2 ............................................................................................................................................................... 5
The predictive validity of GMA tests ............................................................................ 5
Part 3 ............................................................................................................................................................... 7
The initial construction of Matrigma .......................................................................... 7
The tryout version ........................................................................................................................................................................... 7
Analysis ................................................................................................................................................................................................ 7
Evidence of reliability .................................................................................................................................................................. 10
Evidence of validity — Relationships with other test scores ........................................................................................ 11
The utility of Matrigma ................................................................................................................................................................ 11
Part 4 ............................................................................................................................................................. 14
Further development of Matrigma ........................................................................... 14
Data collection .............................................................................................................................................................................. 14
Analysis of form A and B ......................................................................................................................................... 14
Evidence of reliability .............................................................................................................................................. 16
Stability of test scores ............................................................................................................................................ 17
Evidence of validity ...................................................................................................................................................................... 17
Matrigma and other test scores ............................................................................................................................ 18
Matrigma and gender, age and educational level ............................................................................................................ 19
Evidence based on the relationship with job performance .......................................................................................... 19
Managerial job performance ................................................................................................................................. 19
Job performance of call center advisors ............................................................................................................. 20
Job performance of bank employees ................................................................................................................... 21
Job performance of retail employees .................................................................................................................. 22
Meta-analysis of criterion-related validity ........................................................................................................................... 22
Revision of Matrigma 2016 ........................................................................................................................................................ 23
Version A, B, C, D and E........................................................................................................................................... 23
Par t 5 ............................................................................................................................................................. 26
Norm updates ......................................................................................................... 26

2 | 35
June 2011 ................................................................................................................................................................. 26
November 2015 ....................................................................................................................................................... 26
May 2016 .................................................................................................................................................................. 27
Part 6 ............................................................................................................................................................ 29
Instructions for use and interpretation ..................................................................... 29
Areas of use ..................................................................................................................................................................................... 29
Administration and scoring ...................................................................................................................................................... 29
Requirements for testing ........................................................................................................................................................... 29
Information to the respondent before testing .................................................................................................................. 30
Presentation and interpretation of results ......................................................................................................................... 30
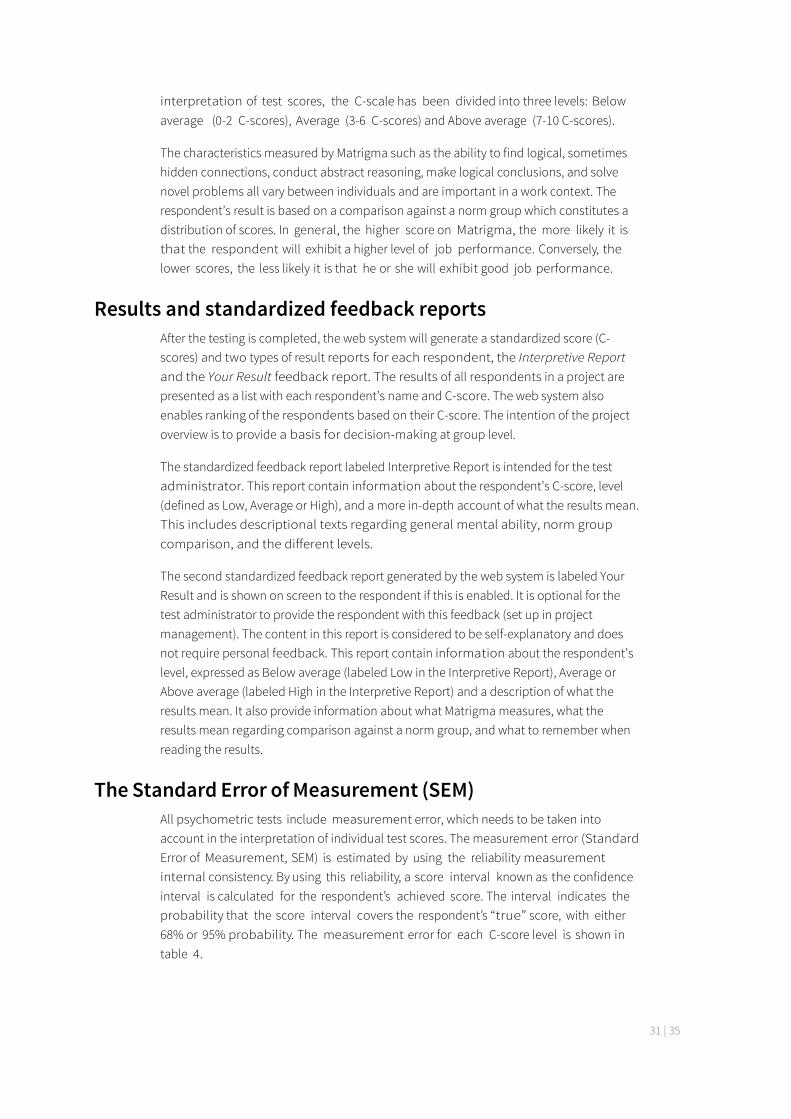
Results and standardized feedback reports ...................................................................................................................... 31
The Standard Error of Measurement (SEM) ........................................................................................................................ 31
References .............................................................................................................. 32
Appendix ................................................................................................................. 34

3 | 35
Part 1
Theoretical background
During the slightly more than one hundred years that theories regarding the nature of intelligence have been presented, researchers and theorists have tried to measure this factor. In the 1880s (see Jensen, 1998) Francis Galton, a younger cousin to Charles Darwin, studied the differences between people in what he argued to be intellectual capacity. Galton measured relatively simple functions such as reaction time and sensory discrimination, i.e., the ability to distinguish between different sensory impressions, and adopted the general concept “mental ability” as the basic notion of all cognitive processes. He concluded that there were several individual differences in this ability and argued that these differences were due to hereditary factors, which has been confirmed in later studies (Jensen, 1998).
Charles Edward Spearman (1863-1945), an English psychologist, defined a two-factor theory that consisted of a general intelligence factor and several specific factors. Spearman (1904) assumed that each measured factor consists of two components: a general one and a specific one for the ability required to solve a problem (for example, numerical problems). When Spearman studied different indicators of intelligence (the first of which was school grades) he found that all of these have a positive correlation with one another, and that all indicators were positively correlated with the assumed general factor. This general factor found by Spearman expressed the common information found in the indicators. This way, Spearman’s model provided empirical support to Galton’s notion of a basic “mental ability”. Spearman was the first to analyse test data (through what would later be called factor analysis), and his two-factor model constituted the first structural intelligence model. Spearman’s general factor, the g factor, has constantly been topical and criticized throughout the last hundred years of intelligence research. It would not be an understatement to claim that the g factor is the most studied psychological phenomenon in the history of psychology, and its non-existence the most falsified hypothesis.
Recognized and prominent researchers like Cattell, Thurstone and Guilford have all been skeptical about the generalizable nature of the g factor. New statistical models and theories were invented to repudiate the g factor. However, empirical studies have shown that the g factor can be exhibited more or less in all types of tests included in a cognitive test battery, which confirms its existence. The g factor has been found to be generalizable in all test batteries (Thorndike, 1987), regardless of which factor model is used to identify it (Jensen, 1998, p.82-83). The g factor can be found everywhere where problems are to be solved.
The question is how the g factor is best measured. We find the answer in Spearman’s theoretical points of reference. First and foremost; the g factor is not related to any
4 | 35
specific type of problem solving (in tests: items). A near infinite variation of items is capable of measuring g, since the general factor is present in all types of problem solving. Spearman refers to this as “indifferences of the indicator”, meaning that items that hold verbal, spatial or numerical information all measure the g factor. Secondly; if we first categorize items as different types of problem solving (for example, verbal, spatial and numerical) and then analyse them in a factor analysis, we see that the items (regardless of type) that best capture the g factor are the ones that challenge the ability to see hidden connections, fill in gaps where information is missing, grasp the relationship between different objects and find points of similarity among figures that differ from one another. This is the types of problem solving referred to by Spearman as “eduction of relations and correlates”.
These items have in common that they are based on both inductive and deductive problem solving, and require that the individual is able to manipulate symbols, words or numbers mentally into a logical coherence. This is different from pure knowledge items, such as memorizing vocabulary or writing the multiplication table, as the latter measure learnt ability which provides a considerably worse measurement of the g factor.
In order to measure the g factor, Spearman developed a test that was completely non-verbal. The items included in the test were based on simple geometrical figures. He called it a matrix relation test.
After having conducted factor analyses of these figures, along with other measurements of power of deduction, it was found that they displayed a high loading of the g factor (Fortes, 1930; Line, 1931). This meant that he had invented a test that was less susceptible to cultural differences, and based on perceptual logical reasoning. This type of test is characterized by only loading in the g factor, and that it more or less does not display any loading in specific factors, such as spatial or numerical factors. This suggests that the matrix correlation test defines the g factor in an adequate way.
Spearman’s matrix relation test was further developed by one of his students, psychologist John C. Raven, together with British geneticist Lionel Penrose. They adapted the theory into a matrix form (Penrose & Raven, 1936). The figures in the matrix form was two-dimensional, i.e., they comprised horizontal and vertical transformations simultaneously (Jensen, 1998). Raven was in charge of the publication of the first Progressive Matrix Test, its subsequent improvements and further development (Raven, 1947, 1960). Raven’s Progressive Matrices (RPM) has since become the best known matrix test (Jensen, 1998). The construction of the figures could in principle be altered infinitely, and a great number of items have been developed.
RPM consists of a number of matrices, within which the figures are transformed according to certain logical principles, i.e., progressive changes in pattern, size, details etc. Each item has an empty cell at the bottom right corner, and the test person’s assignment is to complete the matrix by choosing the alternative that best follows the logical principle.
There are six alternatives to choose from. The test can be administered individually or in groups, and is often given as a ‘power test’, i.e., with a generous or non-existing time limit to complete the test.
5 | 35
Part 2
The predictive validity of GMA tests Research from Europe and North America has clearly shown that General Mental Ability (GMA) tests, in a superiorly cost-efficient way, predict how people will perform in the workplace (Schmidt & Hunter, 1992; Schmidt, Hunter & Outerbridge, 1986; Salgado & Anderson, 2003). However, despite these unequivocal findings, GMA tests are rarely used by employers in the Nordic countries. One reason for this is that research up until the 1980s displayed conflicting findings in terms of the predictive power of GMA tests in work-related contexts.
In the mid 1970s, researchers John Hunter and Frank Schmidt were assigned to analyse all published validation studies in the United States that described the correlation between scores on GMA tests and job performance. Hunter and Schmidt found early on that the conflicting results mentioned above were due to the published studies being based on very small random samples. In other words, these studies were not generalizable. After making corrections for small sample sizes and restriction of range in g, which the tests in the studies were often influenced by, a completely different picture emerged regarding the connection between GMA test scores and job performance. Unlike previous analyses, the new results showed that GMA test scores predicted job performance to the same extent regardless of type of profession (Schmidt, Hunter & Pearlman, 1981). In other words, tests that measure GMA are generalizable for different types of work. This is contrary to the general belief that GMA tests are only viable for certain types of work (and thus, not for others), which is postulated in the ‘situation-specific theory’ that has been prevailing for the last 40 years.
The next step in Hunter and Schmidt’s analysis was to examine whether the complexity of a work assignment had a moderating effect on the correlation between test scores and job performance. The existing hypothesis was that test scores have a greater predictive validity if the complexity of the work assignments is high. This is in line with Spearman’s point of reference that a higher complexity of a test item leads to more of the g factor being involved in solving the problem. In order to analyse this, they compiled the results from 425 validation studies (N=32124), in which the correlation between the General Aptitude Test Battery (GATB) and job performance was studied. Job performance was measured by having the employee’s supervisor to evaluate his or her performance.
The different types of professions included in the studies were divided into five categories based on their level of complexity, where 1 indicated low complexity (e.g., an assembly line) and 5 indicated high complexity (e.g., researchers and senior managers). The middle category, category 3, is made up of professions with average complexity and constitutes 63% of all jobs on the U.S. labor market (e.g., assistants, administrators and people supervising technological systems). The first results,

6 | 35
published in 1984 (Hunter & Hunter, 1984) were controversial. The hypothesis that complexity in work assignments has an effect on predictive validity proved to be true. It was also found that GMA test scores predict job performance in even the least complex professions and that the predictive power increased with the complexity of work assignments.
In recent years, new methods have been developed to more effectively correct for restriction of range, which has further strengthened the evidence of the predictive validity of GMA tests. By using a meta-analytic approach, the general predictive validity of GMA tests has been estimated to be .39 for the least complex professions and .73 for the most complex professions (Le & Schmidt, 2006). For professions of average complexity (where the largest number of workers are active), predictive validity is estimated at .66. In table 1, the results from Le and Schmidt (2006) are presented, which regards the connection between the g factor and job performance, divided according to degree of complexity in the profession. Based on the findings presented above, the following conclusions may be drawn: (1) the g factor predicts job performance across professions and (2) the effectiveness of testing the g factor increases with the complexity of a profession.
However, what happens with the predictive validity when someone has learnt their job, i.e., when experience come into the picture?
First of all, the connection between the g factor and job performance has to be compared with the connection between work experience and job performance. Hunter and Hunter (1984) showed that the generalizable connection between work experience and job performance is only .18. McDaniel (1985) even found that the connection between the g factor and job performance increased with work experience. This increase was not substantial, but we can come to the fairly certain conclusion that the predictive validity of the g factor at least does not decrease as work experience increases, and that work experience does not have nearly the predictive validity of GMA tests in terms of predicting job performance. GMA tests are, at a low estimate, 200% more effective at predicting job performance, compared to work experience. This is just one comparison between GMA tests and other methods currently used for hiring employees. For comparisons with more methods, see Sjöberg, Sjöberg, and Forssén (2006).
Complexity p
Very high .73
High .74
Average .66
Low .56
Very low .39
Table 1. Correlation between the g factor and job performance, divided according to degree of complexity in the profession.
Note: p =Probability; Source. Hunter, J. E., Schmidt, F. L., & Le, H. (2006). Implications of direct and indirect range restriction for meta- analysis methods and findings, Journal of Applied Psychology, 91, 3, 594-612.
7 | 35
Part 3
The initial construction of Matrigma
The tryout version In total, 33 matrix items were developed for the first tryout version of Matrigma. The items were presented in order of anticipated level of difficulty. The tryout version was administered to students at the faculty of economics at Stockholm University (N=78) in the spring of year 2007. The age of the participants varied between 21 and 47 years (M=26.2; SD=5.73); 61 women and 16 men participated in the study (information missing for 2 individuals). In addition, a number of these university students (n=61) also completed the GMA section of the PJP screening instrument (Sjöberg, Sjöberg, & Forssén, 2006). The GMA section of the PJP screening instrument consists of three subtests: (1) Analogies, (2) Number series and (3) Logical series. In the PJP manual (Sjöberg, Sjöberg, & Forssén, 2006) there is documentation supporting that these three subtests co-vary positively with the g factor, as well as documentation supporting the reliability of the measurement.
Analysis As a first step, items were analysed with the Item Response Theory, IRT, approach. The benefits of using IRT instead of Classical Test Theory, CTT, in item analysis are as follows: (1) shorter tests can be assessed in a more reliable way compared with longer ones, and (2) it is not necessary to have a representative random sample to estimate the difficulty level and other characteristics of an item. This means that, unlike CTT, it is possible to estimate the reliability of the test person at the same time as assessing the reliability of an item. A third benefit is that it is possible to assess local reliability, i.e., reliability in relation to the person’s (or the group’s) level of g.
One-parameter IRT, known as Rasch scaling, was used in all analyses. Moreover, the RUMM2020 computer program was used to estimate difficulty and reliability. In the first step, items lacking variation (where everyone or no one had chosen the correct answer) were removed. In the second step, all 33 items were ranked according to level of difficulty, by means of the first difficulty parameter (Location).
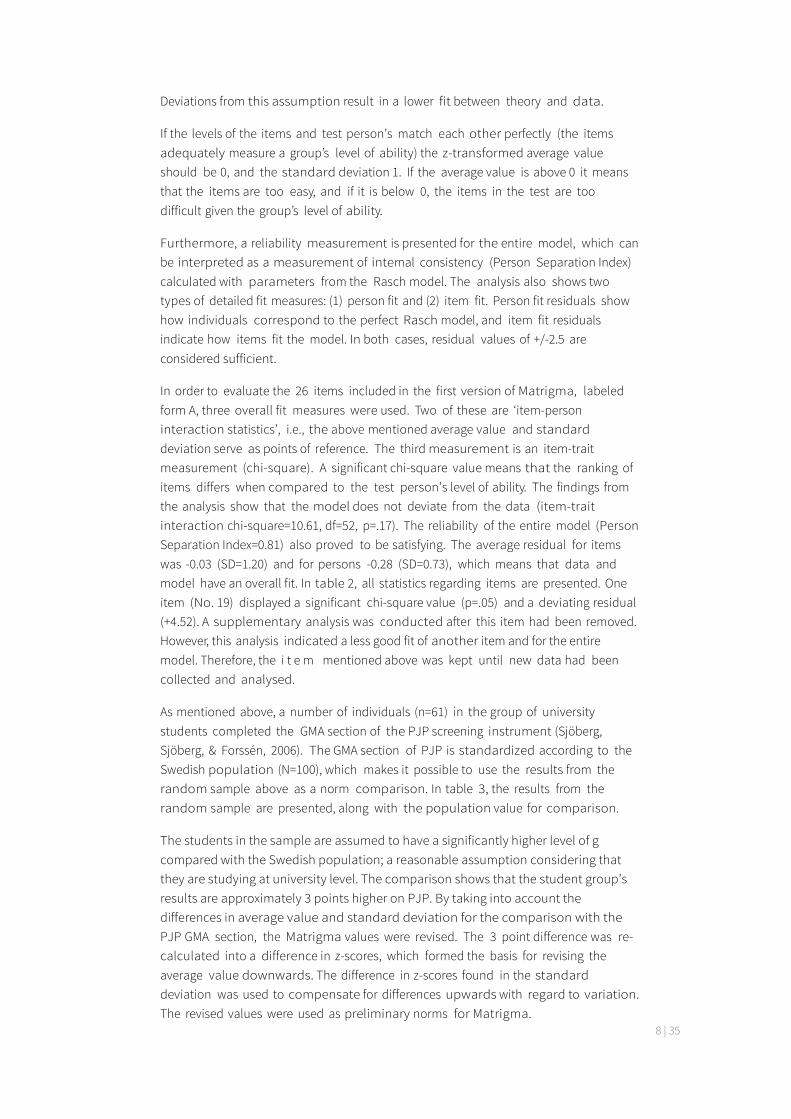
In the third step, items measuring the exact same level of difficulty were removed. If two items had the same level of difficulty, the one with the lowest reliability was removed. In total, 7 items were removed after the analysis. In table 2, the parameter estimates for the 26 items included in the first version of Matrigma are presented. Table 2 shows, in the following order, difficulty (Location), Standard Error for respective item (SE) and chi-square (ChiSq) with subsequent significance test. In order for a test to be perfect, the Rasch model assumes that each item measures an exact level of an individual’s underlying level of ability. This means that each item can be ranked according to difficulty, and that an individual with a given level of ability only manages to solve the items that match his/her capacity, i.e., that the most difficult item solved by the individual measures exactly the individual’s level of ability.
8 | 35
Deviations from this assumption result in a lower fit between theory and data.
If the levels of the items and test person’s match each other perfectly (the items adequately measure a group’s level of ability) the z-transformed average value should be 0, and the standard deviation 1. If the average value is above 0 it means that the items are too easy, and if it is below 0, the items in the test are too difficult given the group’s level of ability.
Furthermore, a reliability measurement is presented for the entire model, which can be interpreted as a measurement of internal consistency (Person Separation Index) calculated with parameters from the Rasch model. The analysis also shows two types of detailed fit measures: (1) person fit and (2) item fit. Person fit residuals show how individuals correspond to the perfect Rasch model, and item fit residuals indicate how items fit the model. In both cases, residual values of +/-2.5 are considered sufficient.
In order to evaluate the 26 items included in the first version of Matrigma, labeled form A, three overall fit measures were used. Two of these are ‘item-person interaction statistics’, i.e., the above mentioned average value and standard deviation serve as points of reference. The third measurement is an item-trait measurement (chi-square). A significant chi-square value means that the ranking of items differs when compared to the test person’s level of ability. The findings from the analysis show that the model does not deviate from the data (item-trait interaction chi-square=10.61, df=52, p=.17). The reliability of the entire model (Person Separation Index=0.81) also proved to be satisfying. The average residual for items was -0.03 (SD=1.20) and for persons -0.28 (SD=0.73), which means that data and model have an overall fit. In table 2, all statistics regarding items are presented. One item (No. 19) displayed a significant chi-square value (p=.05) and a deviating residual (+4.52). A supplementary analysis was conducted after this item had been removed. However, this analysis indicated a less good fit of another item and for the entire model. Therefore, the i t e m mentioned above was kept until new data had been collected and analysed.
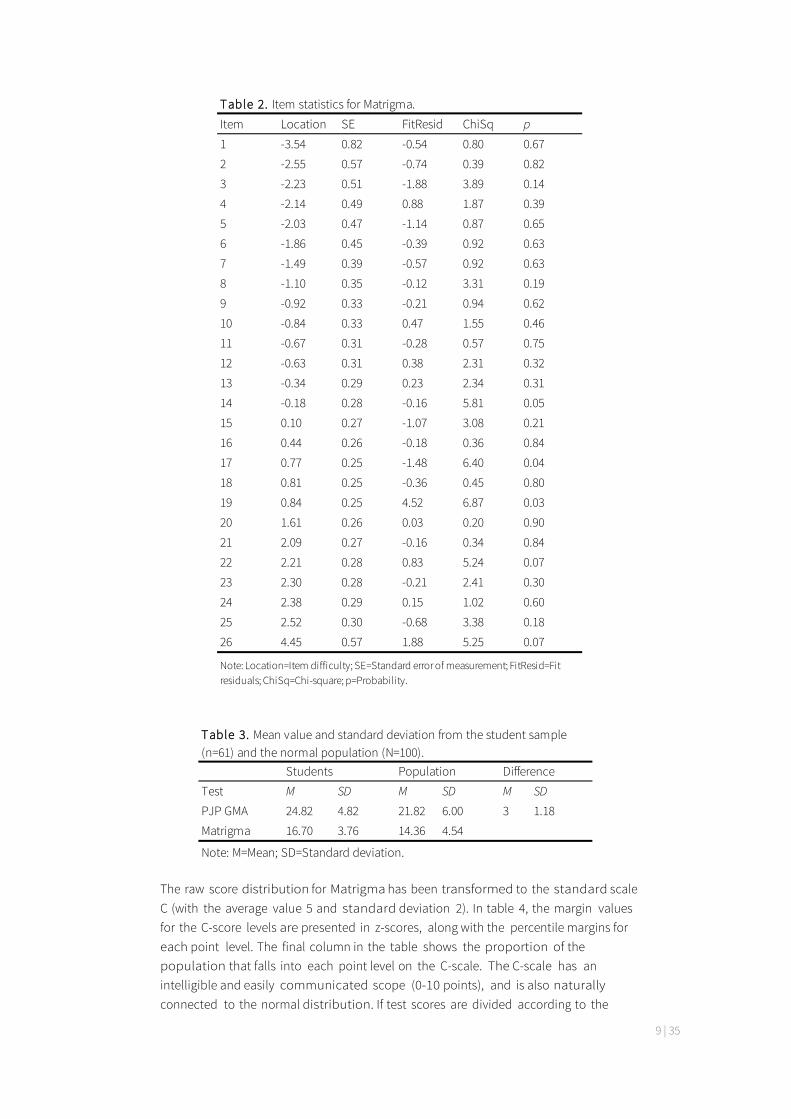
As mentioned above, a number of individuals (n=61) in the group of university students completed the GMA section of the PJP screening instrument (Sjöberg, Sjöberg, & Forssén, 2006). The GMA section of PJP is standardized according to the Swedish population (N=100), which makes it possible to use the results from the random sample above as a norm comparison. In table 3, the results from the random sample are presented, along with the population value for comparison.
The students in the sample are assumed to have a significantly higher level of g compared with the Swedish population; a reasonable assumption considering that they are studying at university level. The comparison shows that the student group’s results are approximately 3 points higher on PJP. By taking into account the differences in average value and standard deviation for the comparison with the PJP GMA section, the Matrigma values were revised. The 3 point difference was re-calculated into a difference in z-scores, which formed the basis for revising the average value downwards. The difference in z-scores found in the standard deviation was used to compensate for differences upwards with regard to variation. The revised values were used as preliminary norms for Matrigma.
9 | 35
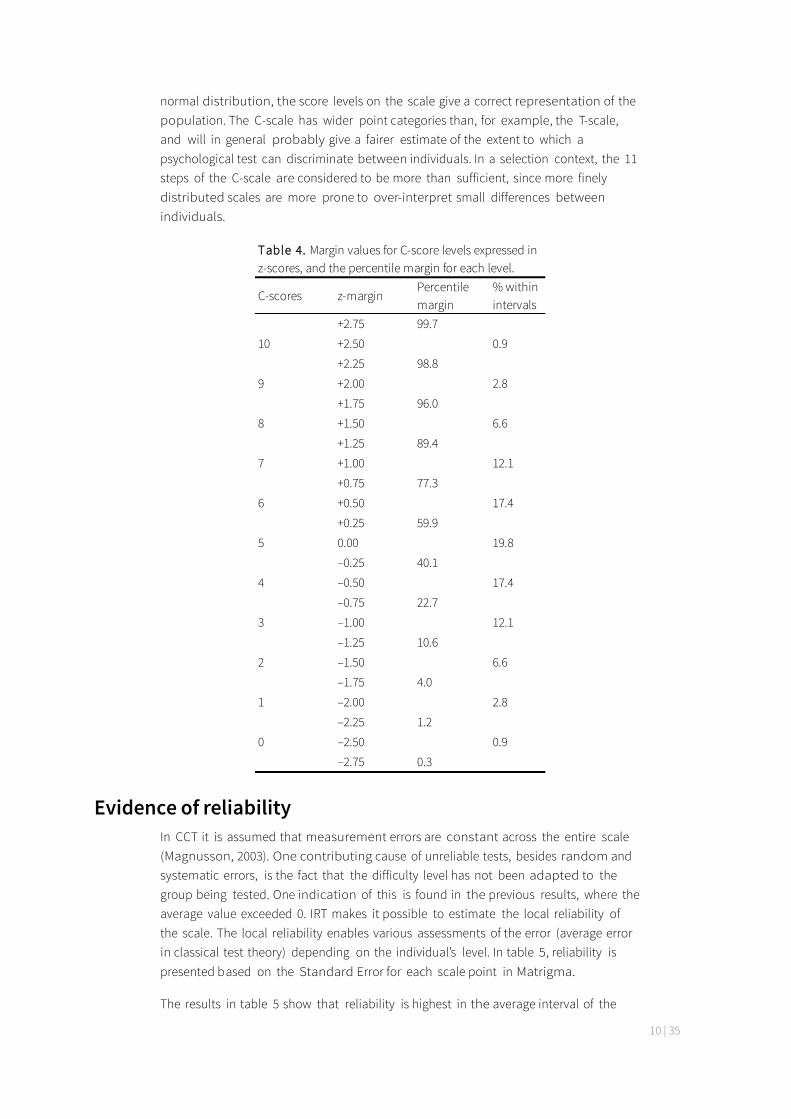
The raw score distribution for Matrigma has been transformed to the standard scale C (with the average value 5 and standard deviation 2). In table 4, the margin values for the C-score levels are presented in z-scores, along with the percentile margins for each point level. The final column in the table shows the proportion of the population that falls into each point level on the C-scale. The C-scale has an intelligible and easily communicated scope (0-10 points), and is also naturally connected to the normal distribution. If test scores are divided according to the
Item Location SE FitResid ChiSq p
1 -3.54 0.82 -0.54 0.80 0.67
2 -2.55 0.57 -0.74 0.39 0.82
3 -2.23 0.51 -1.88 3.89 0.14
4 -2.14 0.49 0.88 1.87 0.39
5 -2.03 0.47 -1.14 0.87 0.65
6 -1.86 0.45 -0.39 0.92 0.63
7 -1.49 0.39 -0.57 0.92 0.63
8 -1.10 0.35 -0.12 3.31 0.19
9 -0.92 0.33 -0.21 0.94 0.62
10 -0.84 0.33 0.47 1.55 0.46
11 -0.67 0.31 -0.28 0.57 0.75
12 -0.63 0.31 0.38 2.31 0.32
13 -0.34 0.29 0.23 2.34 0.31
14 -0.18 0.28 -0.16 5.81 0.05
15 0.10 0.27 -1.07 3.08 0.21
16 0.44 0.26 -0.18 0.36 0.84
17 0.77 0.25 -1.48 6.40 0.04
18 0.81 0.25 -0.36 0.45 0.80
19 0.84 0.25 4.52 6.87 0.03
20 1.61 0.26 0.03 0.20 0.90
21 2.09 0.27 -0.16 0.34 0.84
22 2.21 0.28 0.83 5.24 0.07
23 2.30 0.28 -0.21 2.41 0.30
24 2.38 0.29 0.15 1.02 0.60
25 2.52 0.30 -0.68 3.38 0.18
26 4.45 0.57 1.88 5.25 0.07
Table 2. Item statistics for Matrigma.
Note: Location=Item difficulty; SE=Standard error of measurement; FitResid=Fit residuals; ChiSq=Chi-square; p=Probability.
Test M SD M SD M SD
PJP GMA 24.82 4.82 21.82 6.00 3 1.18
Matrigma 16.70 3.76 14.36 4.54
Note: M=Mean; SD=Standard deviation.
Table 3. Mean value and standard deviation from the student sample (n=61) and the normal population (N=100).
Students Population Difference
10 | 35
normal distribution, the score levels on the scale give a correct representation of the population. The C-scale has wider point categories than, for example, the T-scale, and will in general probably give a fairer estimate of the extent to which a psychological test can discriminate between individuals. In a selection context, the 11 steps of the C-scale are considered to be more than sufficient, since more finely distributed scales are more prone to over-interpret small differences between individuals.
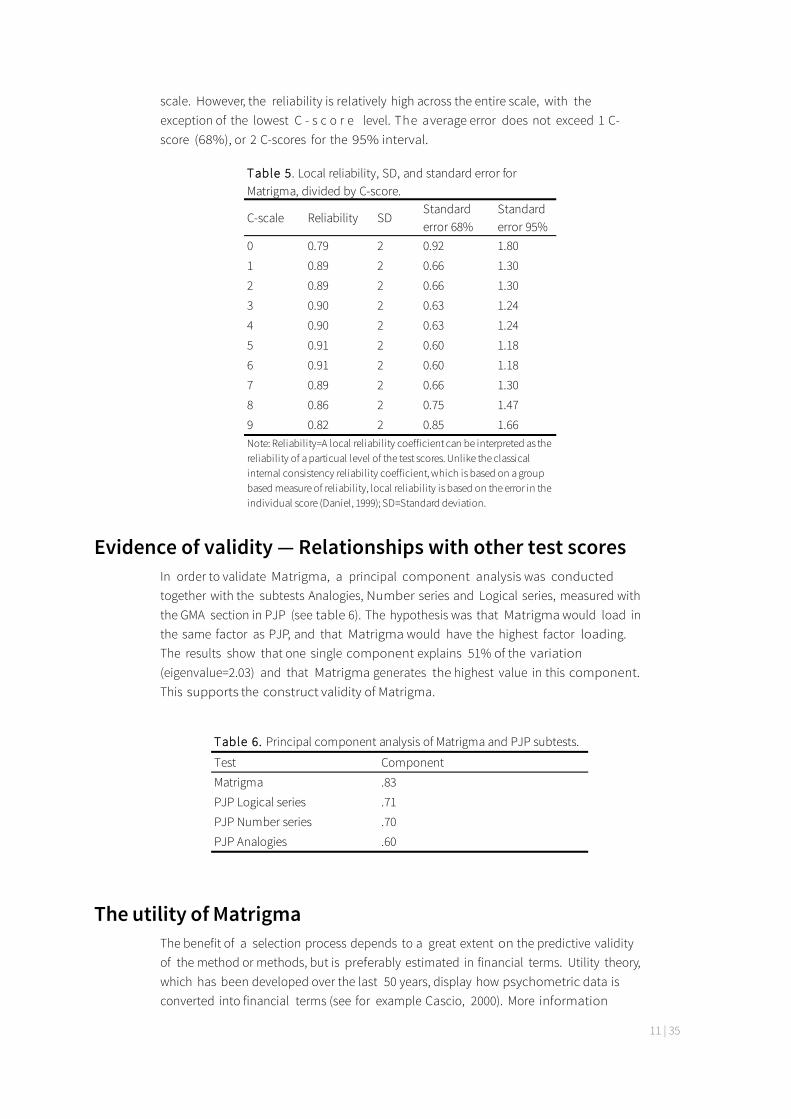
Evidence of reliability In CCT it is assumed that measurement errors are constant across the entire scale (Magnusson, 2003). One contributing cause of unreliable tests, besides random and systematic errors, is the fact that the difficulty level has not been adapted to the group being tested. One indication of this is found in the previous results, where the average value exceeded 0. IRT makes it possible to estimate the local reliability of the scale. The local reliability enables various assessments of the error (average error in classical test theory) depending on the individual’s level. In table 5, reliability is presented based on the Standard Error for each scale point in Matrigma.
The results in table 5 show that reliability is highest in the average interval of the
C-scores z-marginPercentile margin
% within intervals
+2.75 99.7
10 +2.50 0.9
+2.25 98.8
9 +2.00 2.8
+1.75 96.0
8 +1.50 6.6
+1.25 89.4
7 +1.00 12.1
+0.75 77.3
6 +0.50 17.4
+0.25 59.9
5 0.00 19.8
–0.25 40.1
4 –0.50 17.4
–0.75 22.7
3 –1.00 12.1
–1.25 10.6
2 –1.50 6.6
–1.75 4.0
1 –2.00 2.8
–2.25 1.2
0 –2.50 0.9
–2.75 0.3
Table 4. Margin values for C-score levels expressed in z-scores, and the percentile margin for each level.
11 | 35
scale. However, the reliability is relatively high across the entire scale, with the exception of the lowest C - s c o r e level. The average error does not exceed 1 C-score (68%), or 2 C-scores for the 95% interval.
Evidence of validity — Relationships with other test scores In order to validate Matrigma, a principal component analysis was conducted together with the subtests Analogies, Number series and Logical series, measured with the GMA section in PJP (see table 6). The hypothesis was that Matrigma would load in the same factor as PJP, and that Matrigma would have the highest factor loading. The results show that one single component explains 51% of the variation (eigenvalue=2.03) and that Matrigma generates the highest value in this component. This supports the construct validity of Matrigma.
The utility of Matrigma The benefit of a selection process depends to a great extent on the predictive validity of the method or methods, but is preferably estimated in financial terms. Utility theory, which has been developed over the last 50 years, display how psychometric data is converted into financial terms (see for example Cascio, 2000). More information
C-scale Reliability SDStandard error 68%
Standard error 95%
0 0.79 2 0.92 1.80
1 0.89 2 0.66 1.30
2 0.89 2 0.66 1.30
3 0.90 2 0.63 1.24
4 0.90 2 0.63 1.24
5 0.91 2 0.60 1.18
6 0.91 2 0.60 1.18
7 0.89 2 0.66 1.30
8 0.86 2 0.75 1.47
9 0.82 2 0.85 1.66
Table 5. Local reliability, SD, and standard error for Matrigma, divided by C-score.
Note: Reliability=A local reliability coefficient can be interpreted as the reliability of a particual level of the test scores. Unlike the classical internal consistency reliability coefficient, which is based on a group based measure of reliability, local reliability is based on the error in the individual score (Daniel, 1999); SD=Standard deviation.
Test Component
Matrigma .83
PJP Logical series .71
PJP Number series .70
PJP Analogies .60
Table 6. Principal component analysis of Matrigma and PJP subtests.
12 | 35
about how utility theory may be applied in practice on empirical data is presented in the PJP manual (Sjöberg, Sjöberg, & Forssén, 2006). A general framework that may be applied is shown below:
The classical ‘Brogden-Cronbach-Glaser model’ argues the following:
∆u = Ns x rsy x SDy x λ/φ - Ns x c/φ
where ∆u is the marginal utility of a new selection process, Ns is the number of
selected candidates, rxy is the correlation between predictor and criteria (or rather,
the i n c r e a s e i n predictive validity compared with previous selection m e t h o d s a n d / o r processes), SDy is the standard deviation of job performance expressed in
financial terms, φ is the selection ratio, λ is a function of φ and c is the cost per person for the new process. Marginal utility is for one year, and should be increased depending on the actual or estimated length of employment for the new employees.
With the above calculations, a company or an organization may calculate the financial profit from using Matrigma in their selection process. Some companies have access to empirical data needed to calculate utility, while other companies may apply the rules of thumb available from previous, comprehensive studies in the field. Information about the number of applicants, selection ratio and for how long people in the specific type of position tend to stay (tenure) is often known or can be estimated with high precision. This information, together with information on the validity (estimated at 0.66 for professions of average complexity according to the meta-study presented in table 1), and the cost of new (and possible previous) selection processes, gives very good prerequisites for calculating approximate financial utility.
It is usually more difficult to determine the standard deviation SDy of job performance and the validity of the current selection process. The classical assumption in the case of SDy is that the value corresponds to 0.4 x salary, while the current selection validity based on, for example, an unstructured interview, probably does not exceed .30. For a selection process that applies Matrigma and includes an unstructured interview, the increased validity is .66 – .30 = .36. The better (more valid) the existing selection methods are, the less the increase in validity from using more methods will be.
Let’s look at a specific example:
New employees in a service position have a salary of € 20,000 per year, which gives an SDy of € 8,000. New employees usually stay for 18 months. The company has
1,200 applicants per year, and selects 288 of these. The proportion selected is called the selection ratio. In this case the selection ratio is 24% (expressed in φ-value 0.24) which gives a λ/φ-value of 1.30 on the Naylor-Shine table (Sjöberg, Sjöberg, & Forssén, 2006; Mabon, 2005; Cascio, 2000). The cost of a Matrigma test is € 10 per person, which is marked as a cost increase per person. It is of course possible to argue that the incremental cost is negative, since other, more expensive processes are eliminated. Nevertheless, we have chosen to include this information in the calculation. We are now able to calculate the marginal utility by using the BCG formula and multiplying the first part of the equation by 1.5, in order to include the length of employment (18 months):

13 | 35
∆u = 288 x .33 x 8000 x 1.30 x 1.5 – 1200 x 10
= 1 482 624 – 12 000
= € 1 470 624
Based on the assumptions above, all of which are based on direct or indirect empirical data, the company will achieve a substantial financial profit by using Matrigma to improve the validity of their selection process. The cost of the test is less than 1% of the potential profit from introducing Matrigma in the selection process.
14 | 35
Part 4
Further development of Matrigma Taking into account the results from the tryout version (form A), a parallel version of Matrigma was developed: form B. The items in form B was developed by applying the corresponding logic behind each and every item in form A, thus item 1 until 26. Besides the construction of parallel items, four new item pairs were developed. The new item pairs were developed with the intention to be slightly more difficult, thus to assess higher ability levels. In total, the new version of Matrigma consisted of two parallel versions, form A and form B respectively, with 30 items each.
Data collection Data (N=352) was collected via Assessio’s web platform. All respondents had taken part in the assessment process for selection purposes. The greater part of respondents used Swedish instructions (n=238), and the remaining respondents had Norwegian (n=63) or Finnish (n=51) instructions. Results from a t-test between the language groups showed non-significant differences, location (p>.05), indicating that the respondents could be treated as one group.
The respondents completed both versions, thus in total 60 items. However, results provided were only based on the tryout version which consisted of 26 items and interpreted applying the preliminary norms (see part 3, Analysis). The sample consisted of 149 women and 203 men. The average age was 41 years (SD=10). Nine respondents had completed elementary school, 34 respondents had completed a two-year high school education, 55 respondents had completed a 3-4 year high school education, 66 respondents had completed less than three years of higher education studies, 172 respondents had completed more than three years of higher education studies and 16 respondents had completed some form of graduate school education. The distribution of background variables in comparison with the Swedish population of 2009 (www.scb.se) is presented in table A1 in the Appendix.
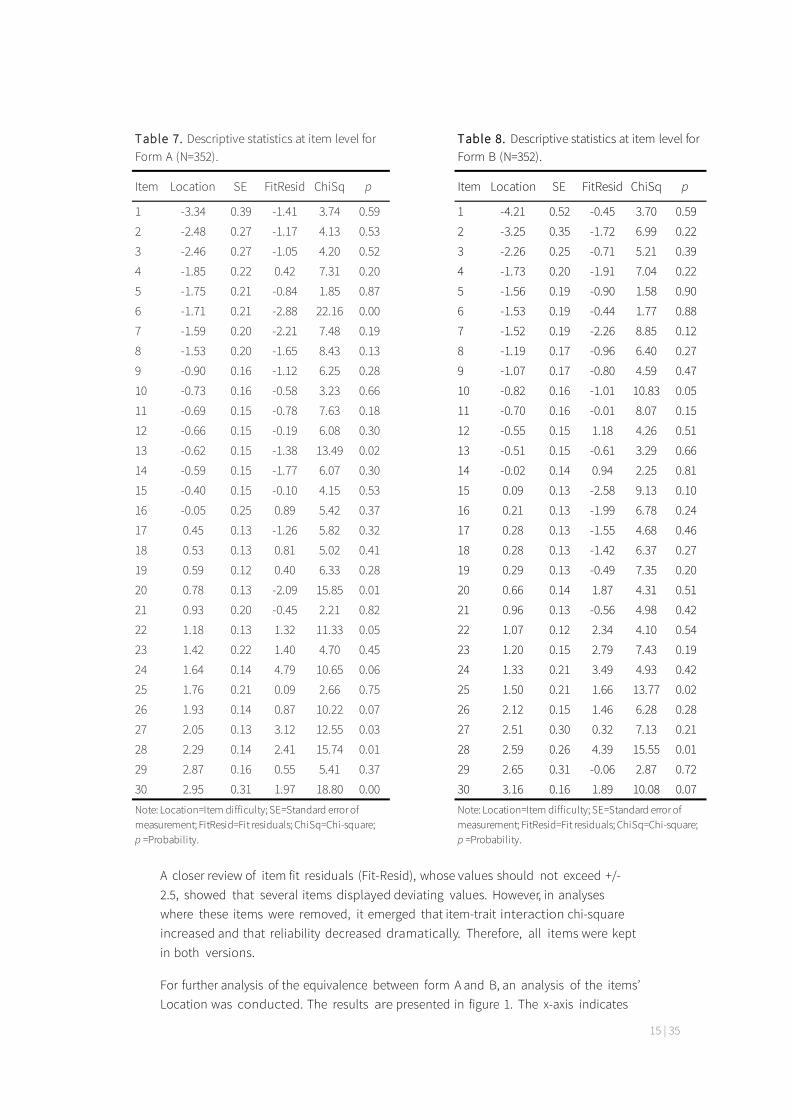
Analysis of form A and B The initial analyses showed that one of the new item pairs should be removed due to insufficient reliability. The same analyses were applied for form B as for form A, with an additional analysis investigating whether form A and B are parallel. In table 7 and 8, descriptive statistics at item level for forms A and B are presented.
The results from the analysis show that form A deviates significantly from data (item-trait interaction chi-square=238.90, df=150, p=0.001). Form B displayed similar results (item-trait interaction chi-square=190.58, df=150, p=.01).
15 | 35
A closer review of item fit residuals (Fit-Resid), whose values should not exceed +/- 2.5, showed that several items displayed deviating values. However, in analyses where these items were removed, it emerged that item-trait interaction chi-square increased and that reliability decreased dramatically. Therefore, all items were kept in both versions.
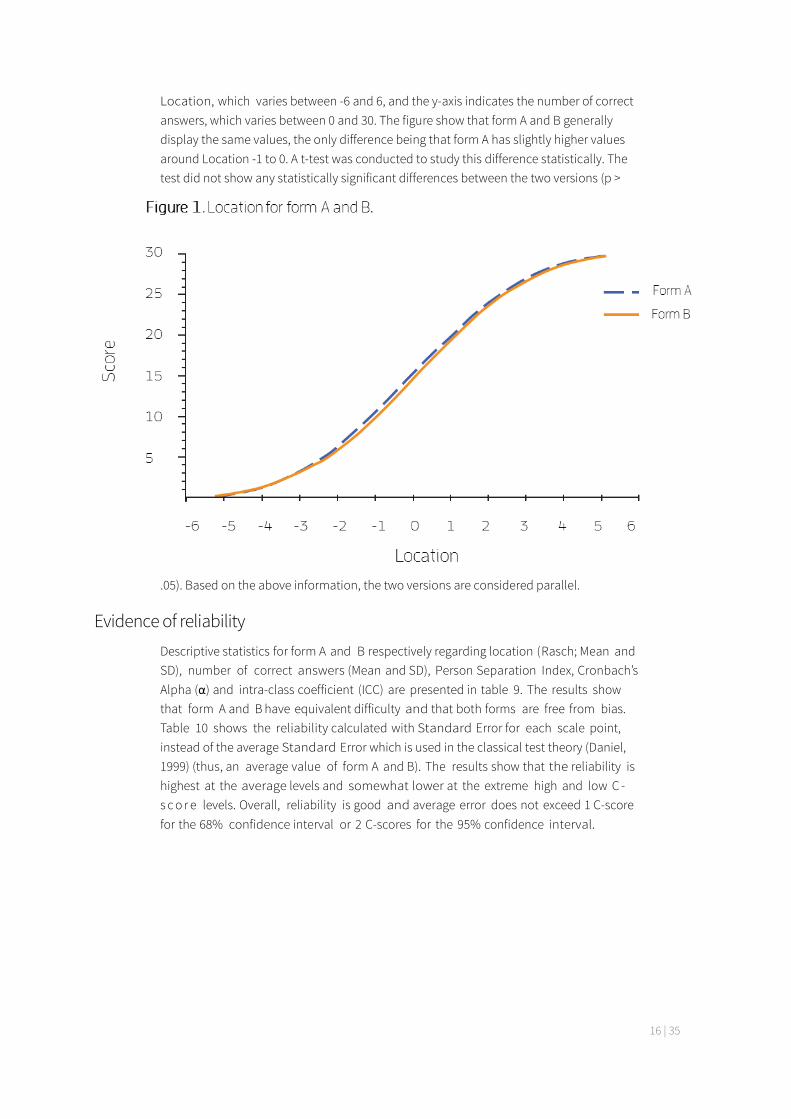
For further analysis of the equivalence between form A and B, an analysis of the items’ Location was conducted. The results are presented in figure 1. The x-axis indicates
Item Location SE FitResid ChiSq p Item Location SE FitResid ChiSq p
1 -3.34 0.39 -1.41 3.74 0.59 1 -4.21 0.52 -0.45 3.70 0.59
2 -2.48 0.27 -1.17 4.13 0.53 2 -3.25 0.35 -1.72 6.99 0.22
3 -2.46 0.27 -1.05 4.20 0.52 3 -2.26 0.25 -0.71 5.21 0.39
4 -1.85 0.22 0.42 7.31 0.20 4 -1.73 0.20 -1.91 7.04 0.22
5 -1.75 0.21 -0.84 1.85 0.87 5 -1.56 0.19 -0.90 1.58 0.90
6 -1.71 0.21 -2.88 22.16 0.00 6 -1.53 0.19 -0.44 1.77 0.88
7 -1.59 0.20 -2.21 7.48 0.19 7 -1.52 0.19 -2.26 8.85 0.12
8 -1.53 0.20 -1.65 8.43 0.13 8 -1.19 0.17 -0.96 6.40 0.27
9 -0.90 0.16 -1.12 6.25 0.28 9 -1.07 0.17 -0.80 4.59 0.47
10 -0.73 0.16 -0.58 3.23 0.66 10 -0.82 0.16 -1.01 10.83 0.05
11 -0.69 0.15 -0.78 7.63 0.18 11 -0.70 0.16 -0.01 8.07 0.15
12 -0.66 0.15 -0.19 6.08 0.30 12 -0.55 0.15 1.18 4.26 0.51
13 -0.62 0.15 -1.38 13.49 0.02 13 -0.51 0.15 -0.61 3.29 0.66
14 -0.59 0.15 -1.77 6.07 0.30 14 -0.02 0.14 0.94 2.25 0.81
15 -0.40 0.15 -0.10 4.15 0.53 15 0.09 0.13 -2.58 9.13 0.10
16 -0.05 0.25 0.89 5.42 0.37 16 0.21 0.13 -1.99 6.78 0.24
17 0.45 0.13 -1.26 5.82 0.32 17 0.28 0.13 -1.55 4.68 0.46
18 0.53 0.13 0.81 5.02 0.41 18 0.28 0.13 -1.42 6.37 0.27
19 0.59 0.12 0.40 6.33 0.28 19 0.29 0.13 -0.49 7.35 0.20
20 0.78 0.13 -2.09 15.85 0.01 20 0.66 0.14 1.87 4.31 0.51
21 0.93 0.20 -0.45 2.21 0.82 21 0.96 0.13 -0.56 4.98 0.42
22 1.18 0.13 1.32 11.33 0.05 22 1.07 0.12 2.34 4.10 0.54
23 1.42 0.22 1.40 4.70 0.45 23 1.20 0.15 2.79 7.43 0.19
24 1.64 0.14 4.79 10.65 0.06 24 1.33 0.21 3.49 4.93 0.42
25 1.76 0.21 0.09 2.66 0.75 25 1.50 0.21 1.66 13.77 0.02
26 1.93 0.14 0.87 10.22 0.07 26 2.12 0.15 1.46 6.28 0.28
27 2.05 0.13 3.12 12.55 0.03 27 2.51 0.30 0.32 7.13 0.21
28 2.29 0.14 2.41 15.74 0.01 28 2.59 0.26 4.39 15.55 0.01
29 2.87 0.16 0.55 5.41 0.37 29 2.65 0.31 -0.06 2.87 0.72
30 2.95 0.31 1.97 18.80 0.00 30 3.16 0.16 1.89 10.08 0.07
Table 8. Descriptive statistics at item level for Form B (N=352).
Note: Location=Item difficulty; SE=Standard error of measurement; FitResid=Fit residuals; ChiSq=Chi-square; p =Probability.
Table 7. Descriptive statistics at item level for Form A (N=352).
Note: Location=Item difficulty; SE=Standard error of measurement; FitResid=Fit residuals; ChiSq=Chi-square; p =Probability.
16 | 35
Location, which varies between -6 and 6, and the y-axis indicates the number of correct answers, which varies between 0 and 30. The figure show that form A and B generally display the same values, the only difference being that form A has slightly higher values around Location -1 to 0. A t-test was conducted to study this difference statistically. The test did not show any statistically significant differences between the two versions (p >
.05). Based on the above information, the two versions are considered parallel.
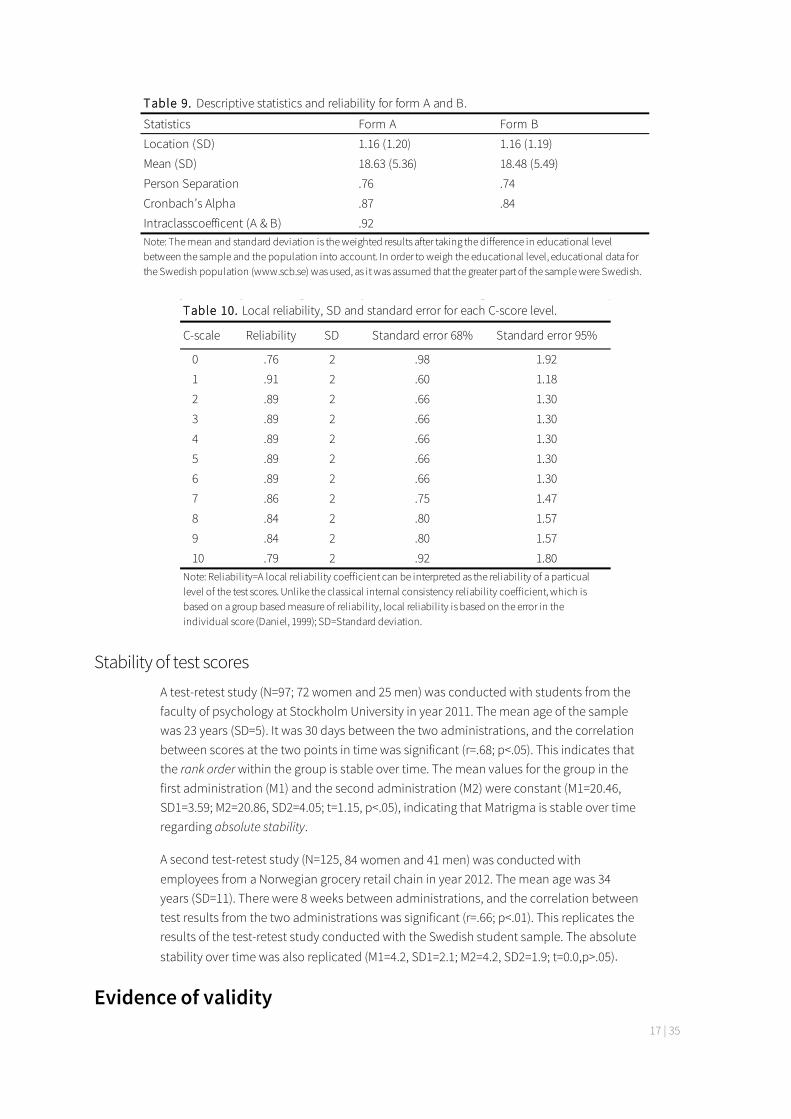
Evidence of reliability Descriptive statistics for form A and B respectively regarding location (Rasch; Mean and SD), number of correct answers (Mean and SD), Person Separation Index, Cronbach’s Alpha (α) and intra-class coefficient (ICC) are presented in table 9. The results show that form A and B have equivalent difficulty and that both forms are free from bias. Table 10 shows the reliability calculated with Standard Error for each scale point, instead of the average Standard Error which is used in the classical test theory (Daniel, 1999) (thus, an average value of form A and B). The results show that the reliability is highest at the average levels and somewhat lower at the extreme high and low C -s c o r e levels. Overall, reliability is good and average error does not exceed 1 C-score for the 68% confidence interval or 2 C-scores for the 95% confidence interval.
17 | 35
Stability of test scores A test-retest study (N=97; 72 women and 25 men) was conducted with students from the faculty of psychology at Stockholm University in year 2011. The mean age of the sample was 23 years (SD=5). It was 30 days between the two administrations, and the correlation between scores at the two points in time was significant (r=.68; p<.05). This indicates that the rank order within the group is stable over time. The mean values for the group in the first administration (M1) and the second administration (M2) were constant (M1=20.46, SD1=3.59; M2=20.86, SD2=4.05; t=1.15, p<.05), indicating that Matrigma is stable over time regarding absolute stability.
A second test-retest study (N=125, 84 women and 41 men) was conducted with employees from a Norwegian grocery retail chain in year 2012. The mean age was 34 years (SD=11). There were 8 weeks between administrations, and the correlation between test results from the two administrations was significant (r=.66; p<.01). This replicates the results of the test-retest study conducted with the Swedish student sample. The absolute stability over time was also replicated (M1=4.2, SD1=2.1; M2=4.2, SD2=1.9; t=0.0,p>.05).
Evidence of validity
Statistics Form A Form B
Location (SD) 1.16 (1.20) 1.16 (1.19)
Mean (SD) 18.63 (5.36) 18.48 (5.49)
Person Separation .76 .74
Cronbach’s Alpha .87 .84
Intraclasscoefficent (A & B)
Table 9. Descriptive statistics and reliability for form A and B.
.92Note: The mean and standard deviation is the weighted results after taking the difference in educational level between the sample and the population into account. In order to weigh the educational level, educational data for the Swedish population (www.scb.se) was used, as it was assumed that the greater part of the sample were Swedish.
C-scale Reliability SD Standard error 68% Standard error 95%
0 .76 2 .98 1.92
1 .91 2 .60 1.18
2 .89 2 .66 1.30
3 .89 2 .66 1.30
4 .89 2 .66 1.30
5 .89 2 .66 1.30
6 .89 2 .66 1.30
7 .86 2 .75 1.47
8 .84 2 .80 1.57
9 .84 2 .80 1.57
10 .79 2 .92 1.80
Table 10. Local reliability, SD and standard error for each C-score level.
Note: Reliability=A local reliability coefficient can be interpreted as the reliability of a particual level of the test scores. Unlike the classical internal consistency reliability coefficient, which is based on a group based measure of reliability, local reliability is based on the error in the individual score (Daniel, 1999); SD=Standard deviation.
18 | 35
Evidence of validity based on relationships with other variables address questions about the degree to which the relationships are consistent with the construct(s) underlying the proposed test interpretation(s). External variables may include measures of some criteria that the test is expected to predict (e.g, job performance), as well as relationships with other tests scores hypothesized to measure the same constructs. Categorical variables, including group membership variables, may become relevant when the underlying theory of a proposed test use suggests that group differences should be present or absent.
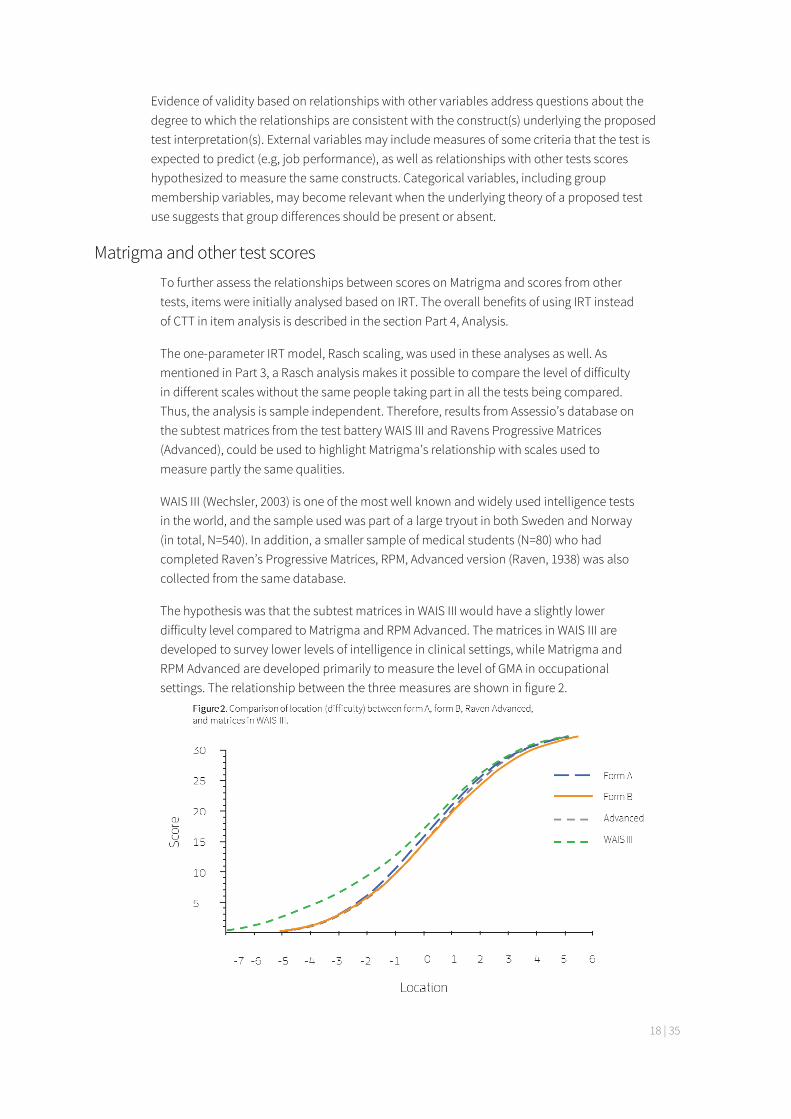
Matrigma and other test scores To further assess the relationships between scores on Matrigma and scores from other tests, items were initially analysed based on IRT. The overall benefits of using IRT instead of CTT in item analysis is described in the section Part 4, Analysis.
The one-parameter IRT model, Rasch scaling, was used in these analyses as well. As mentioned in Part 3, a Rasch analysis makes it possible to compare the level of difficulty in different scales without the same people taking part in all the tests being compared. Thus, the analysis is sample independent. Therefore, results from Assessio’s database on the subtest matrices from the test battery WAIS III and Ravens Progressive Matrices (Advanced), could be used to highlight Matrigma’s relationship with scales used to measure partly the same qualities.
WAIS III (Wechsler, 2003) is one of the most well known and widely used intelligence tests in the world, and the sample used was part of a large tryout in both Sweden and Norway (in total, N=540). In addition, a smaller sample of medical students (N=80) who had completed Raven’s Progressive Matrices, RPM, Advanced version (Raven, 1938) was also collected from the same database.
The hypothesis was that the subtest matrices in WAIS III would have a slightly lower difficulty level compared to Matrigma and RPM Advanced. The matrices in WAIS III are developed to survey lower levels of intelligence in clinical settings, while Matrigma and RPM Advanced are developed primarily to measure the level of GMA in occupational settings. The relationship between the three measures are shown in figure 2.
19 | 35
Results show that RPM Advanced and Matrigma form A and B have the same level of difficulty. However, the matrices in WAIS III have, as expected, a somewhat lower difficulty, especially at the lower levels of GMA.
The correlation between Matrigma and RPM Advanced was also estimated for a sample of managers (N=54) in Canada. RPM Advanced and Matrigma was administered under controlled circumstances during one day of assessment in year 2012. The correlation proved to be significantly different from zero (r=.63; p<.05). This supports the claim that RPM Advanced and Matrigma measure the same latent construct: g.
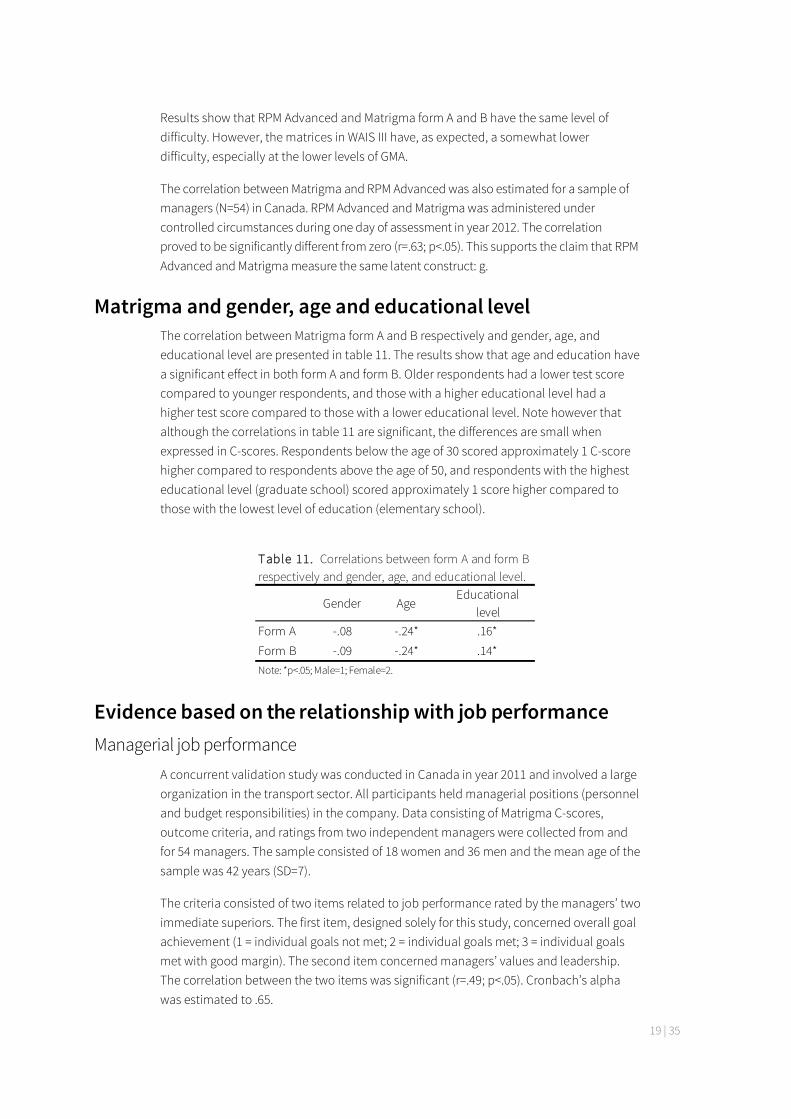
Matrigma and gender, age and educational level The correlation between Matrigma form A and B respectively and gender, age, and educational level are presented in table 11. The results show that age and education have a significant effect in both form A and form B. Older respondents had a lower test score compared to younger respondents, and those with a higher educational level had a higher test score compared to those with a lower educational level. Note however that although the correlations in table 11 are significant, the differences are small when expressed in C-scores. Respondents below the age of 30 scored approximately 1 C-score higher compared to respondents above the age of 50, and respondents with the highest educational level (graduate school) scored approximately 1 score higher compared to those with the lowest level of education (elementary school).
Evidence based on the relationship with job performance Managerial job performance
A concurrent validation study was conducted in Canada in year 2011 and involved a large organization in the transport sector. All participants held managerial positions (personnel and budget responsibilities) in the company. Data consisting of Matrigma C-scores, outcome criteria, and ratings from two independent managers were collected from and for 54 managers. The sample consisted of 18 women and 36 men and the mean age of the sample was 42 years (SD=7).
The criteria consisted of two items related to job performance rated by the managers’ two immediate superiors. The first item, designed solely for this study, concerned overall goal achievement (1 = individual goals not met; 2 = individual goals met; 3 = individual goals met with good margin). The second item concerned managers’ values and leadership. The correlation between the two items was significant (r=.49; p<.05). Cronbach’s alpha was estimated to .65.
Gender AgeEducational
levelForm A -.08 -.24* .16*
Form B -.09 -.24* .14*
Table 11. Correlations between form A and form B respectively and gender, age, and educational level.
Note: *p<.05; Male=1; Female=2.
20 | 35
Concurrent validation studies may result in an underestimation of actual validity since it is reasonable to assume that the organization has not hired its staff randomly. It is therefore highly likely that the variation in performance amongst existing staff is limited.
Another reason for underestimation of validity is the presence of measurement error in the ratings of job performance. Since this study only include one rater per manager, it is not possible to evaluate the reliability of the job performance ratings.
A large-scale meta-analysis arrived at an average reliability of .52 for performance ratings of the type used in this study (Viswesvaran, Ones & Schmidt, 1996). This reliability estimate was applied to this study. To adjust for the above, the variation in the norm group (SD=2) was compared to the 54 managers included in the validation study (SD=1.86). By dividing 1.86 by 2.00 the restriction of range for the study sample was estimated (u=.93). This value may be used to adjust for the limited variation in the study at hand, since the test is intended for respondents applying for managerial positions rather than those who are already managers in the company.
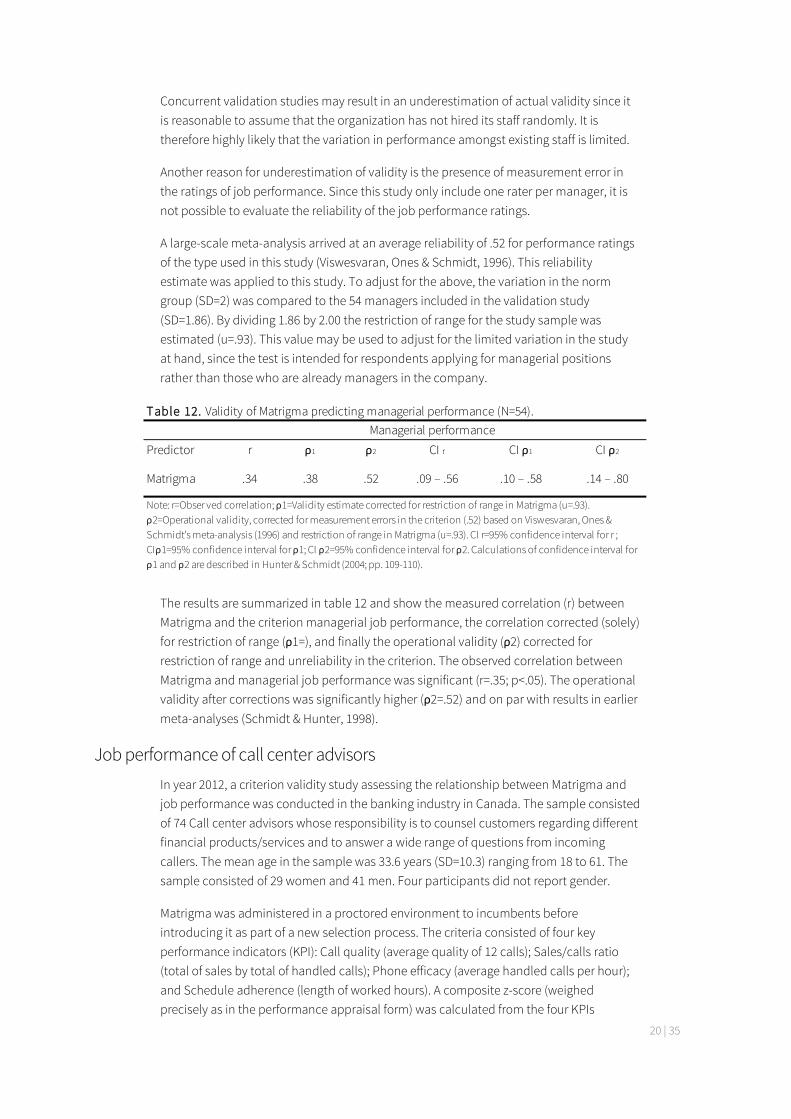
The results are summarized in table 12 and show the measured correlation (r) between Matrigma and the criterion managerial job performance, the correlation corrected (solely) for restriction of range (ρ1=), and finally the operational validity (ρ2) corrected for restriction of range and unreliability in the criterion. The observed correlation between Matrigma and managerial job performance was significant (r=.35; p<.05). The operational validity after corrections was significantly higher (ρ2=.52) and on par with results in earlier meta-analyses (Schmidt & Hunter, 1998).
Job performance of call center advisors In year 2012, a criterion validity study assessing the relationship between Matrigma and job performance was conducted in the banking industry in Canada. The sample consisted of 74 Call center advisors whose responsibility is to counsel customers regarding different financial products/services and to answer a wide range of questions from incoming callers. The mean age in the sample was 33.6 years (SD=10.3) ranging from 18 to 61. The sample consisted of 29 women and 41 men. Four participants did not report gender.
Matrigma was administered in a proctored environment to incumbents before introducing it as part of a new selection process. The criteria consisted of four key performance indicators (KPI): Call quality (average quality of 12 calls); Sales/calls ratio (total of sales by total of handled calls); Phone efficacy (average handled calls per hour); and Schedule adherence (length of worked hours). A composite z-score (weighed precisely as in the performance appraisal form) was calculated from the four KPIs
Predictor r ρ1 ρ2 CI r CI ρ1 CI ρ2
Matrigma .34 .38 .52 .09 – .56 .10 – .58 .14 – .80
Note: r=Obser ved correlation; ρ1=Validity estimate corrected for restriction of range in Matrigma (u=.93). ρ2=Operational validity, corrected for measurement errors in the criterion (.52) based on Viswesvaran, Ones & Schmidt’s meta-analysis (1996) and restriction of range in Matrigma (u=.93). CI r=95% confidence interval for r ; CIρ1=95% confidence interval for ρ1; CI ρ2=95% confidence interval for ρ2. Calculations of confidence interval for ρ1 and ρ2 are described in Hunter & Schmidt (2004; pp. 109-110).
Table 12. Validity of Matrigma predicting managerial performance (N=54).Managerial performance

21 | 35
(M=0.03, SD=0.59).
The correlation between Matrigma and the global composite score was significant (r=.44, p.001, n=56). Note that the n of 56 is due to the lack of complete KPI data.
An independent t-test was conducted between the groups that did and did not attain their performance objectives for each KPI (see table 13). There were statistically significant differences between the two groups for three out of the four KPIs. The effect size of the differences between the groups are represented as correlation coefficients (r).
Job performance of bank employees A concurrent validity study was conducted in an Indonesian bank in year 2012. The study sample consisted of 279 bank collectors. The key responsibility of a bank collector is to handle overdue credits with cardholders. Criterion data was collected in the form of performance ratings assessed by the collectors’ managers. The performance rating consisted of a number of items relating to job performance: How well the collector adapted to the company culture and how often the collector demonstrated a number of critical competencies. See table 14 for observed (r) and operational (p) validity.
Key Performance Indicators
M SD M SD Df t p r
Call Quality 3.95 2.14 5.13 1.91 72 -2.44 .02 .28
Sales/Call Ratio 3.97 2.23 4.97 1.87 72 -2.07 .04 .24
Schedule Adherence 4.04 2.08 5.07 2.05 72 -2.08 .04 .24
Phone Efficacy 4.27 2.22 5.13 1.51 72 -1.78 .09 .20
Perf o rman ce o bj ecti v es n o t ach i ev ed
Perf o rman ce o bj ecti v es ach i ev ed
Note: M=Mean value; SD=Standard deviation; Df=Degrees of freedom; t=T-value; p=Probability; r=Effect size.
Table 13. Descriptive statistics, group differences and effect sizes for KPI results of call center advisors (N=74).
Performance measure/ Competency r pOverall performance .19 .28Model for behavior .16 .24Action if leaving .26 .38Exemplifies culture .15 .22Trustwor thiness .24 .35Work ethic .22 .32Following procedures .16 .24Dependability .21 .31Negotiation .24 .35Intrapersonal skills .28 .41Work attitudes .23 .34Vigilance .18 .26Professionalism .22 .32Achievement orientation .20 .29Competitive .21 .31Stress tolerance .26 .38Mean (for Competencies) .21 .31
Table 14. Observed and operational validity of Matrigma predicting performance of bank collectors in an Indonesian bank (N=279).
Note: r=Observed correlation, ρ=Operational validity corrected for measurement error in the criterion (.52) based on Viswesvaran, Ones & Schmidt’s meta-analysis (1996) and restriction of range in Matrigma (u=.96).

22 | 35
Job performance of retail employees To investigate the criterion related validity in a Norwegian setting, Matrigma was administered to 101 incumbents in a Norwegian grocery retail chain in year 2012. The criteria used was supervisory ratings of job performance (N=36). The rating scale for job performance consisted of 11 items measuring task and contextual performance (α=.91).
In this study, a source of bias in the performance ratings between the different raters was found. The variation between the raters was considered to represent a systematic measurement error due to the fact that managers only can compare individuals within each workplace. Therefore managers that rated more than two employees were analysed using within group standardized scores. This means that each unit (manager) was treated as a separate sample in the analysis. The within-standardized scores for each unit were then used as the criteria in the analysis.
As mentioned, one reason for why this type of studies may underestimate validity is due to unreliability in the observed performance rating. In this study, the performance ratings are produced by one manager making it impossible to estimate the reliability of the ratings. In order to overcome this obstacle and to be able to take the reliability into account, the average estimate from the two large scale meta-analyses (Salgado & Anderson, 2003; Viswesvaran, Ones, & Schmidt, 1996) in this field was used to correct the reliability of the performance ratings. This average reliability was .52 (Viswesvaran, Ones & Schmidt, 1996). It was not possible to estimate the restriction of range in the Matrigma score, therefore this bias was not corrected for in the operational validity estimate. The observed correlation between Matrigma C-score and the criteria was significant (r=.21; p<.05), and given the low complexity nature of the job (Salgado & Anderson, 2003) the operational validity (p), corrected for the criteria unreliability was satisfactory (p=.30; p<.05).
Meta-analysis of criterion-related validity In order to provide an overview of the criterion-related validity of Matrigma the following section provide results from a meta-analysis based on the studies presented in this manual. The meta-analysis was analysed by following the meta-analytic procedures recommended by Hunter and Schmidt (2006). The relationship between the scores on Matrigma and job performance was individually corrected for the statistical artifacts due to restriction of range and unreliability in the criteria. The estimates used for correction of range restriction were retrieved from two of the validity studies (see part 4. Managerial job performance and Job performance of retail employees). As reliabilities for rater agreement of supervisory performance ratings were not available in the studies included in the dataset, the average meta-analytic estimate of .52 (Salgado & Anderson, 2003; Viswesvaran, Ones, & Schmidt, 1996) was used as the reliability estimates for supervisory performance ratings across all four validity coefficients.
As table 16 shows, the mean observed correlation (r) based on a total sample size of N=490 was .25. Correcting this coefficient for unreliability in the criterion increased this value to .36. Thus, based on the primary studies reported in this manual the population based operational validity of Matrigma is estimated to .36.

23 | 35
Revision of Matrigma 2016 Due to the significant increase in the number of conducted assessments, in total 46 297, between year 2011 and 2015, the items in form A and B respectively were heavily exposed. This gave rise to the need for additional items and versions of Matrigma. Therefore, in the beginning of year 2015, it was decided to revise Matrigma by replacing the existing form A and B and to expand the number of parallel versions. This work was done in the conjunction with the upcoming release of Assessio’s new web platform, Ascend by Assessio.
This resulted in the construction of new items parallel to the existing form A and B. In total five new versions, A, B, C, D and E respectively was developed, thus in total 150 items were constructed, reviewed, piloted, analysed and placed in order of difficulty. Note that the new items, including response alternatives, were mainly based on the same logic as the items in form A and B respectively. In some items only minor changes were made in the construction of a new item. Thus, the main property of each item, the item content, logic behind the item, and response alternatives was kept intact.
The five new versions, A thru E, were implemented in the new platform as pilot versions with norms from previous form A and B. It was decided to collect data on the new versions, make a thorough psychometric evaluation of the versions and to use this data to compute new norms. This work is described in part 5, May 2016.
Version A, B, C, D and E In total, 4 606 respondents completed the new revised Matrigma (five versions, A thru E). The main part of respondents were administered Matrigma as part of a selection process. The sample is described further in the Norm updates section (see part 5, May 2016) while descriptive statistics for version A, B, C, D and E respectively are presented in table 17.
k N r r op
Matrigma 4 490 .25 .36
Table 16. Meta-analysis for Matrigma and job performance.
Note: k=number of correlations; N=sample size; r =sample size weighted mean
observed correlation; rop=operational validity corrected for the attenuating effects of measurement error in the dependent variable. The restriction of range estimate was retrieved from primary studies presented in part 4.
Version n M SD α ICC
A 931 19.07 4.35 .81
B 899 18.78 4.59 .83
C 924 18.94 4.94 .85
D 906 18.53 4.54 .81
E 946 18.73 4.41 .80
Total 4 606 18.77 4.60 .82 .97
Table 17. Descriptive statistics for version A, B, C, D and E.
Note: M=Mean; SD=Standard deviation; α=Cronbach’s alpha; ICC=Intraclass coefficient.
24 | 35
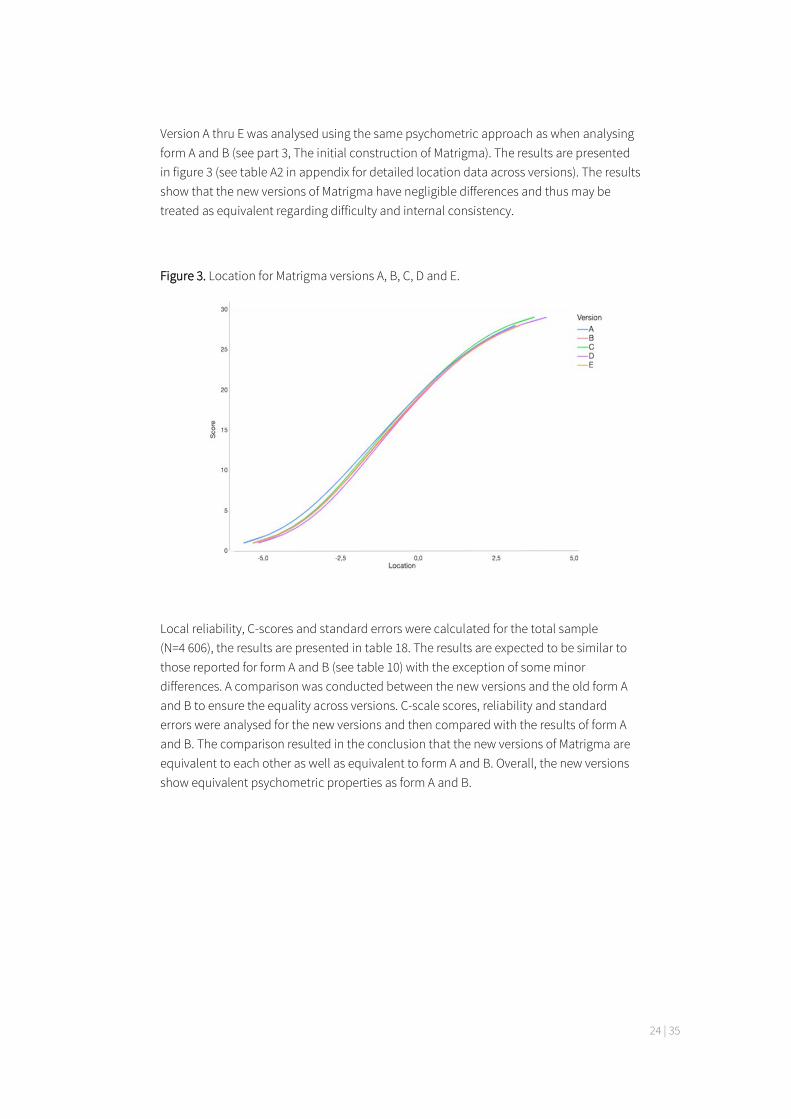
Version A thru E was analysed using the same psychometric approach as when analysing form A and B (see part 3, The initial construction of Matrigma). The results are presented in figure 3 (see table A2 in appendix for detailed location data across versions). The results show that the new versions of Matrigma have negligible differences and thus may be treated as equivalent regarding difficulty and internal consistency.
Figure 3. Location for Matrigma versions A, B, C, D and E.
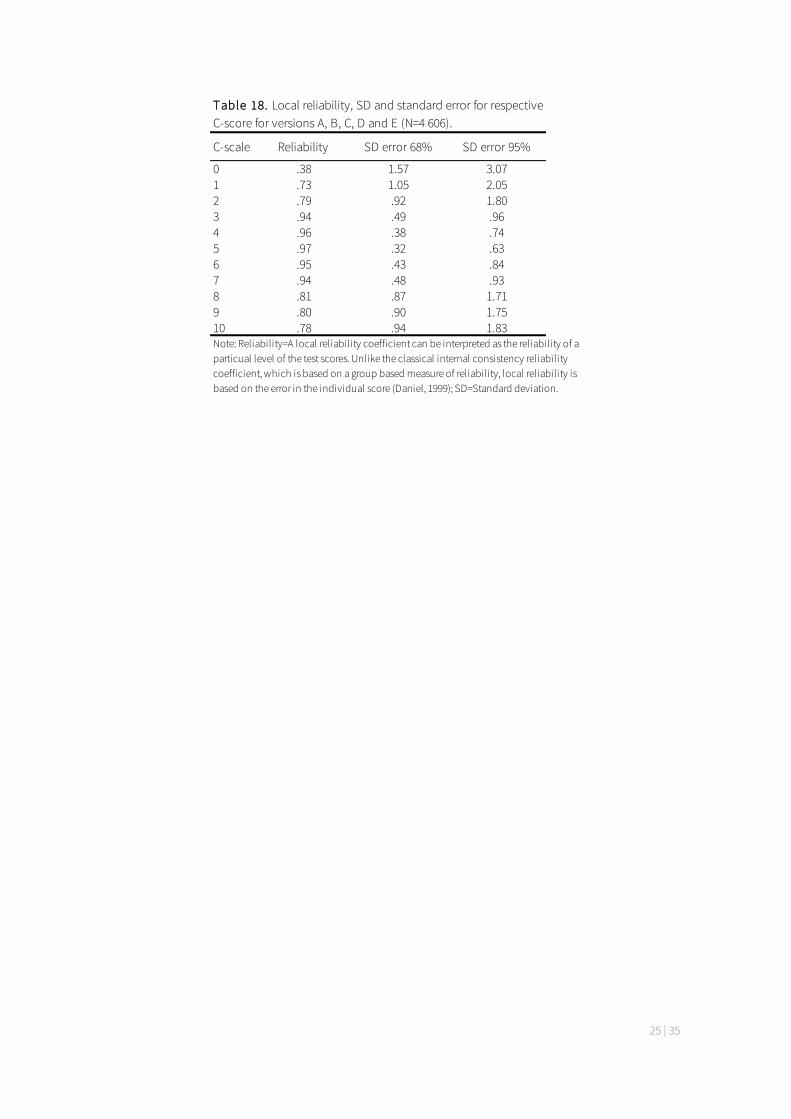
Local reliability, C-scores and standard errors were calculated for the total sample (N=4 606), the results are presented in table 18. The results are expected to be similar to those reported for form A and B (see table 10) with the exception of some minor differences. A comparison was conducted between the new versions and the old form A and B to ensure the equality across versions. C-scale scores, reliability and standard errors were analysed for the new versions and then compared with the results of form A and B. The comparison resulted in the conclusion that the new versions of Matrigma are equivalent to each other as well as equivalent to form A and B. Overall, the new versions show equivalent psychometric properties as form A and B.
25 | 35
C-scale Reliability SD error 68% SD error 95%
0 .38 1.57 3.071 .73 1.05 2.052 .79 .92 1.803 .94 .49 .964 .96 .38 .745 .97 .32 .636 .95 .43 .847 .94 .48 .938 .81 .87 1.719 .80 .90 1.7510 .78 .94 1.83
Table 18. Local reliability, SD and standard error for respective C-score for versions A, B, C, D and E (N=4 606).
Note: Reliability=A local reliability coefficient can be interpreted as the reliability of a particual level of the test scores. Unlike the classical internal consistency reliability coefficient, which is based on a group based measure of reliability, local reliability is based on the error in the individual score (Daniel, 1999); SD=Standard deviation.
26 | 35
Par t 5
Norm updates The initial sample of N=352, described in Part 4, Data Collection was used as a general norm group until they were replaced with the norm groups described below.
June 2011 At this point it was decided to update the norm group. During the time period 2009-2010, 5 916 respondents completed Matrigma in relation to assessment processes for selection purposes. The majority used Swedish instructions (n=4 175), and the remaining respondents used Norwegian (n=744), English (n=516), Finnish (n=275) or other languages (n=206). The respondents completed form A or B, plus five additional items, thus a total of 35 items. Only the 30 items were scored and used as basis for interpretation of results; the last five were included in form C and D and were remained under further evaluation. The group consisted of 2 589 women and 3 327 men. The mean age of the group was 37 years (SD=9.8). Among the group, 116 respondents had completed compulsory school, 496 had two years of upper-secondary school, 830 had 3–4 years of upper secondary school, 1 565 had post-secondary education of at least three years, 2 718 had more than three years of post-secondary education, and six people had some kind of postgraduate education. In comparison with reported mean values and standard deviation (see table 9), the norms for Matrigma changed marginally (mean=18.71; SD=4.66). These norm values were implemented in the Assessio web platform in June 2011.
November 2015 Due to the significant increase in market interest in Matrigma a large number of assessments were collected between 2011 and 2015. This data was added to the existing norm group (described above under the title June 2011) for the purpose of recalculating and updating the norm. In total, the previous data and the new data collected between 2011 and 2015 (all collected from the Assessio web platform) consisted of 46 297 respondents. 50% of the respondents completed form A and 50% completed form B and all were assessed for selection purposes.
The frequency of administered language versions are presented in table 19, the majority used Swedish instructions (n=24 204). The group consisted of 18 513 women and 27 784 men and the mean age of the group was 36 years (SD=10). Among the group, 2% of the respondents had completed compulsory school, 9% had two years of upper-secondary school, 14% had 3–4 years of upper secondary school, 27% had post-secondary education of at least three years, 47,5% had more than three years of post-secondary education, and 0,5% of the respondents had a postgraduate education. In comparison with the previously reported mean values and standard deviations (see table 9) and the section Norm updates June 2011), the current norm for Matrigma was marginally higher in mean value and lower in standard deviation. These values were M=19.09 and SD=3.91.

27 | 35
The correlation between scores on Matrigma and gender, age, and educational level are presented in table 20. The results show that age and education have a significant correlation with scores on Matrigma. Older respondents had a lower Matrigma score compared to younger respondents, and those with a higher educational level had a higher score compared to those with a lower educational level. Even though the correlations in table 20 are significant for age and educational level, the differences are small when expressed in C-scores. Respondents below the age of 30 scored approximately 1 C-score higher compared to respondents older than 50 years, and those with the highest educational level (graduate school) scored approximately 1 C-score higher compared to respondents with the lowest level of education (compulsory school).
May 2016 As mentioned, in connection with development and implementation of the new versions of Matrigma in the new web platform Ascend by Assessio during 2015 (see part 4, Revision of Matrigma 2016) it was decided to collect new norm data. Due to the popularity of Matrigma, this data collection was done swiftly. This provided the opportunity to implement new norms at the beginning of May 2016.
As previously, the main part of the respondents were assessed with Matrigma in relation to a selection process. The total sample (N=4 606) is described in table 21 according to age, gender and educational level. The mean score for the sample was 18.77 with a
Language n
Swedish 24204
English 9530
Norwegian 3961
Finnish 1838
Spanish 1448
French (Canadian) 1377
Other languages 982
Thai 595
Lithuanian 575
German 512
English (Australia) 455
Danish 438
Russian 382
Total 46297
Table 19. Distribution of language versions in November 2015 norm group (N=46 297) ordered by size.
Gender Age Educational level
Matrigma -.07* -.17* .15*
Table 20. Correlations between scores on Matrigma and gender, age and educational level (November 2015 norm group, N=46 297).
Note: *p<.05; Male=1; Female=2.
28 | 35
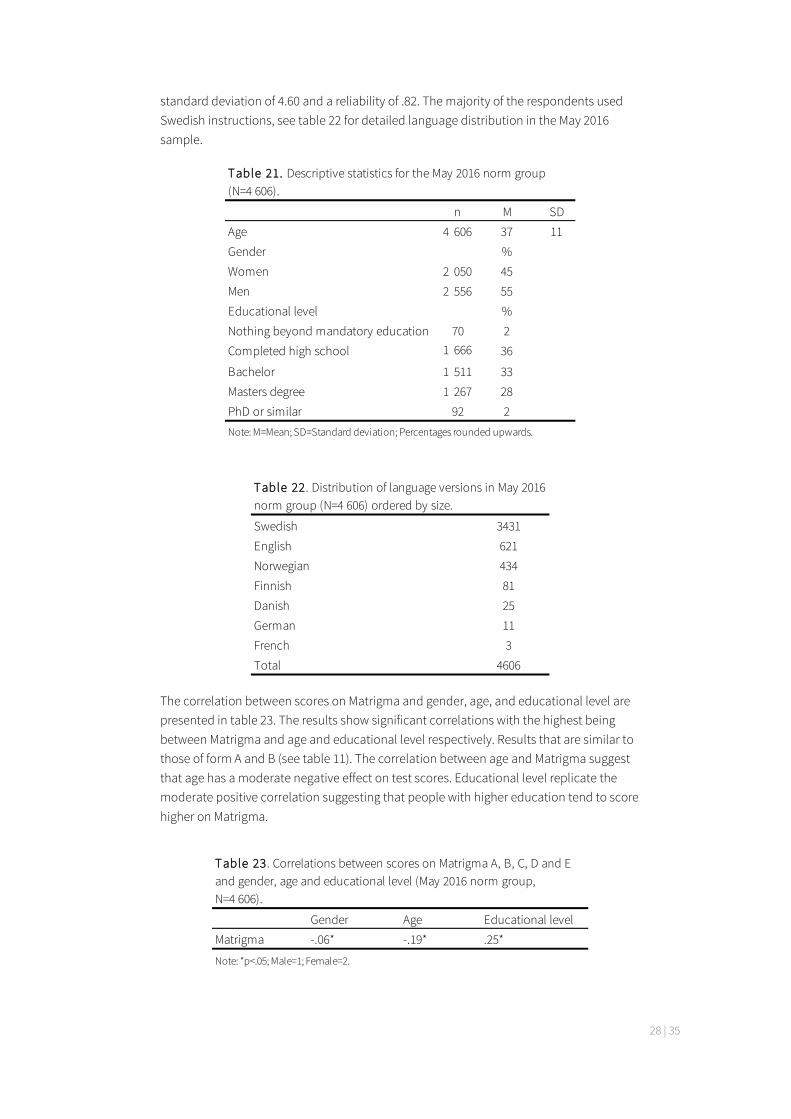
standard deviation of 4.60 and a reliability of .82. The majority of the respondents used Swedish instructions, see table 22 for detailed language distribution in the May 2016 sample.
The correlation between scores on Matrigma and gender, age, and educational level are presented in table 23. The results show significant correlations with the highest being between Matrigma and age and educational level respectively. Results that are similar to those of form A and B (see table 11). The correlation between age and Matrigma suggest that age has a moderate negative effect on test scores. Educational level replicate the moderate positive correlation suggesting that people with higher education tend to score higher on Matrigma.
n M SD
Age 4 606 37 11
Gender %
Women 2 050 45
Men 2 556 55
Educational level %
Nothing beyond mandatory education 70 2
Completed high school 1 666 36
Bachelor 1 511 33
Masters degree 1 267 28
PhD or similar 92 2
Table 21. Descriptive statistics for the May 2016 norm group (N=4 606).
Note: M=Mean; SD=Standard deviation; Percentages rounded upwards.
Swedish 3431
English 621
Norwegian 434
Finnish 81
Danish 25
German 11
French 3
Total 4606
Table 22. Distribution of language versions in May 2016 norm group (N=4 606) ordered by size.
Gender Age Educational level
Matrigma -.06* -.19* .25*
Table 23. Correlations between scores on Matrigma A, B, C, D and E and gender, age and educational level (May 2016 norm group, N=4 606).
Note: *p<.05; Male=1; Female=2.

29 | 35
Part 6
Instructions for use and interpretation
Areas of use Matrigma is developed to be used for selection in workplace assessment. The qualities measured are universally important and impact job performance in all professions, therefore Matrigma is applicable for any position, and all industries and businesses. Matrigma may be used for professions at all levels and in all lines of work, preferably as a first step in the selection process. Matrigma is not intended to be used in a development context such as; manager and employee development, career guidance, team building, coaching etc., or for use within a clinical context.
Administration and scoring Matrigma is available via Ascend by Assessio and/or integrations. The respondent completes the items shown on the screen (maximum time limit is 40 minutes) and the web system compute raw scores scores, converts raw scores into standardized scores, generate results, and provides standardized feedback reports. The use of Matrigma requires a trained test administrator. The test administrator may choose to either administer Matrigma remotely, giving the respondent access by sending a link to the respondent via e-mail, or to administer Matrigma supervised on-site. It is recommended that Matrigma is administered under supervised conditions. If the respondent has completed Matrigma unsupervised, it is recommended that the respondent is re-tested under supervised conditions or that the test score is supplemented with results from an additional GMA test.
Requirements for testing The requirements for administration and conditions of testing are:
• A 40 minute time frame for responding to Matrigma. The time limit is applied in the web system; when the time limit has been reached the test will end and the respondent’s results saved, even if the respondent has not responded to all items. This is a fairly generous amount of time to answer all the items in Matrigma, a respondent may nevertheless have the need of the full time. Therefore the following requirements needs fulfillment.
• Basic reading comprehension – all instructions needed for the respondent to complete the test are available on the screen throughout the testing. Although the instructions aim to be simple and straightforward they nevertheless require a basic level of reading comprehension.
• To ensure that the respondent do not suffer from any form of impairment that is likely to have a negative effect on the test result. This may include but is not limited to perceptual, visual and/or cognitive impairments.
• A non-distracting environment - public environments, such as internet cafés,

30 | 35
public transportation, are not suitable for taking Matrigma.
• A personal computer - it is not recommended to use a tablet, smartphone or similar device as Matrigma has been visually adapted and developed for administration on a full sized computer screen. Therefore using other devices may affect the test result.
• Basic computer skills - the respondent must be able to use a mouse and or keyboard in order to complete Matrigma. The test administrator should ensure that the technical aspects do not increase the test difficulty for the respondent, as this would have a negative effect on the result.
• An internet connection – needs to be stable and reliable for the full duration of the testing to ensure a valid result.
• It is the test administrator’s responsibility to ensure that the above requirements are fulfilled.
Information to the respondent before testing If Matrigma is to be administered unsupervised, thus remotely, the test administrator set this up in the web system. The test administrator thus need the e-mail address the respondent. In the set up process, the test administrator will be provided with an e-mail template containing a link to the test and some basic information. This e-mail is editable; the test administrator may thus insert specific information for a single or group of respondents. It is strongly recommended that the e-mail to the candidate include information about:
1. The purpose of testing.
2. What type of test Matrigma is and why it is being used in the present context.
3. How Matrigma will be administered and what is required for completing the test (see Requirements for testing, part 6).
4. How the results will be used and saved, by whom and for how long.
5. The respondents’ right to choose whether the test score should be used as part of the information the respondent wishes to provide about him or herself for the selection process.
6. If feedback will be provided, and if so; when, in what format (standardized on screen, personal feedback face-to-face, over the phone), and what the feedback will contain.
7. Contact details to the test administrator
More information about the rights and obligations of test distributors, test administrators and candidates are to be found in international guidelines for testing (e.g., www.intestcom.org, www.efpa.eu/professional-development, www.iso.org/standard/56436.html) a n d i s o f t e n provided by national psychologists’ associations.
Presentation and interpretation of results Results are presented on a standard scale, known as the C-scale (see table 4), which makes it possible to compare candidates. The C-scale ranges from 0 to 10 C-scores, has a mean of 5 and a standard deviation of 2. In order to facilitate the
31 | 35
interpretation of test scores, the C-scale has been divided into three levels: Below average (0-2 C-scores), Average (3-6 C-scores) and Above average (7-10 C-scores).
The characteristics measured by Matrigma such as the ability to find logical, sometimes hidden connections, conduct abstract reasoning, make logical conclusions, and solve novel problems all vary between individuals and are important in a work context. The respondent’s result is based on a comparison against a norm group which constitutes a distribution of scores. In general, the higher score on Matrigma, the more likely it is that the respondent will exhibit a higher level of job performance. Conversely, the lower scores, the less likely it is that he or she will exhibit good job performance.
Results and standardized feedback reports After the testing is completed, the web system will generate a standardized score (C-scores) and two types of result reports for each respondent, the Interpretive Report and the Your Result feedback report. The results of all respondents in a project are presented as a list with each respondent’s name and C-score. The web system also enables ranking of the respondents based on their C-score. The intention of the project overview is to provide a basis for decision-making at group level.
The standardized feedback report labeled Interpretive Report is intended for the test administrator. This report contain information about the respondent’s C-score, level (defined as Low, Average or High), and a more in-depth account of what the results mean. This includes descriptional texts regarding general mental ability, norm group comparison, and the different levels.
The second standardized feedback report generated by the web system is labeled Your Result and is shown on screen to the respondent if this is enabled. It is optional for the test administrator to provide the respondent with this feedback (set up in project management). The content in this report is considered to be self-explanatory and does not require personal feedback. This report contain information about the respondent’s level, expressed as Below average (labeled Low in the Interpretive Report), Average or Above average (labeled High in the Interpretive Report) and a description of what the results mean. It also provide information about what Matrigma measures, what the results mean regarding comparison against a norm group, and what to remember when reading the results.
The Standard Error of Measurement (SEM) All psychometric tests include measurement error, which needs to be taken into account in the interpretation of individual test scores. The measurement error (Standard Error of Measurement, SEM) is estimated by using the reliability measurement internal consistency. By using this reliability, a score interval known as the confidence interval is calculated for the respondent’s achieved score. The interval indicates the probability that the score interval covers the respondent’s “true” score, with either 68% or 95% probability. The measurement error for each C-score level is shown in table 4.
32 | 35
References Daniel, M. H. (1999). Behind the scenes: Using new measurement for psychology on DAS and KAIT. In S. E. Embretson & S. L. Hershberger (Eds.), The new rules of measurements. What every psychologist and educator should know (pp. 37-64). Hillsdale, NJ: Erlbaum.
Fortes, M. (1930). A new application of the theory of neogenesis to the problems of mental testing. Doctoral dissertation, University of London.
Hunter, J. E., & Hunter, R. F. (1984). Validity and utility of alternate predictors of job performance. Psychological Bulletin, 96, 72–98.
Hunter, J. E., Schmidt, F. L., & Le, H. (2006). Implications of direct and indirect range restriction for meta analysis methods and findings, Journal of Applied Psychology, 91, 3, 594-612.
Jensen, A. R. (1998). The g Factor. The science of Mental Ability. Westport, CT: Praeger Publisher.
Le, H., & Schmidt, F. L., (2006). Correcting for Indirect range restriction in meta-analysis: testing a new meta-analytic procedure. Psychological Methods, 11, 416–438.
Line, W. (1931). The growth of visual perception in children. British Journal of Psychology, Monograph Supplements, 15.
Mabon, H. (2014). Arbetspsykologisk testning. Om urvalsmetoder i arbetslivet. Stockholm: Assessio International AB.
Magnusson, D. (2003). Testteori. Stockholm: Psykologiförlaget.
McDaniel, M. A. (1985). The evaluation of a causal model of job performance: The interrelationships of general mental ability, job experience, and job performance. Unpublished doctoral dissertation, George Washington University.
Penrose, L. S., & Raven, J. C. (1936). A new series of perceptual tests: Preliminary communication. British Journal of Medica Psychology, 16, 97–104.
Raven, J. C. (1938). Progressive Matrices: A Perceptual Test of Intelligence, 1938, Individual Form. London: H. K. Lewis.
Raven, J. C. (1947). Coloured Progressive Matrices. London: H. K. Lewis.
Raven, J. C. (1960). Guide to the Standard Progressive Matrices. London: H. K. Lewis.
Saldago, J. F., & Anderson, N. (2003). Validity generalisation of GMA tests across countries in the European Community. European Journal of Work and Organizational Psychology, 12(1), 1–17.
Schmidt, F. L., & Hunter, J. E. (1992). Development of casual models of processes determining job performance. Current Directions in Psychological Science, 1, 89–92.
Schmidt, F. L., Hunter, J. E., & Outerbridge, A. N. (1986). The impact of job

33 | 35
experience and ability on job knowledge, work sample performance, and supervisory ratings of job performance. Journal of Applied Psychology, 64, 609–439.
Schmidt, F. L., Hunter, J. E., & Pearlman, K. (1981). Task differences and validity of aptitude tests in selection: A red herring. Journal of Applied Psychology, 66, 166-185.
Sjöberg, A., Sjöberg, S., & Forssén, K. (2006). Predicting Job Performance. Manual. Stockholm: Assessio.
Spearman, C. (1904). General intelligence: Objectively determined and measured. American Journal of Psychology, 15, 201–292.
Thorndike, R. L. (1987). Stability of factor loadings. Person. individ. Diff., 8(4), 585–586.
Viswesvaran, C., Ones, D. S., & Schmidt, F. L. (1996). Comparative Analysis of the Reliability of Job Performance Ratings. Journal of Applied Psychology, 81(5), 557-574.

34 | 35
Appendix
Age group Norm group Population
16-30 years 15,00 % 31,00 %
31-40 years 34,00 % 21,00 %
41-50 years 32,00 % 22,00 %
51-63 years 19,00 % 26,00 %
Gender Norm group Population
Women 42,00 % 49,00 %
Men 58,00 % 51,00 %
Educational level Norm group Population
Elementary school 3,00 % 17,00 %
Elementary school and 2-year high school 10,00 % 25,00 %
Elementary school and 3-4 year high school 15,00 % 24,00 %
Less than 3 years of higher education 19,00 % 14,00 %
3 years or more of higher education 49,00 % 19,00 %
Graduate school education 4,00 % 1,00 %
Table A1. Distribution of age, gender, and educational level of the initial norm group (N=352) applied between year 2009 and 2010, compared with the Swedish population.
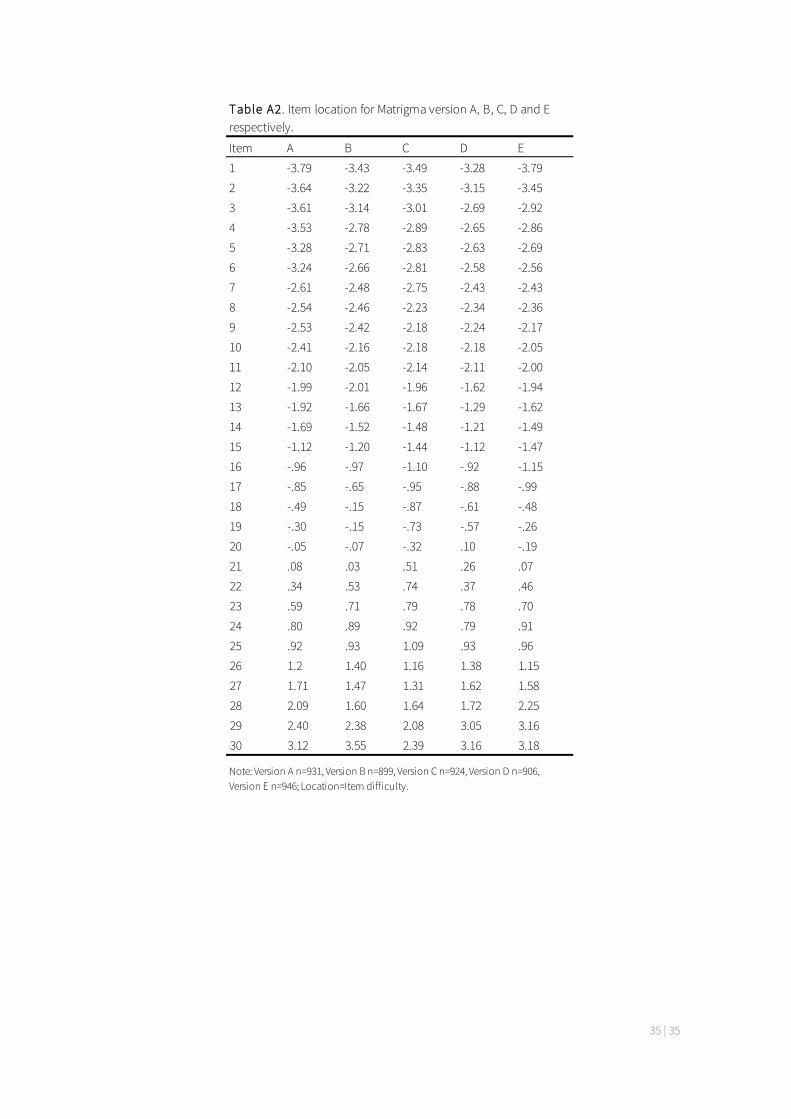
35 | 35
Item A B C D E
1 -3.79 -3.43 -3.49 -3.28 -3.79
2 -3.64 -3.22 -3.35 -3.15 -3.45
3 -3.61 -3.14 -3.01 -2.69 -2.92
4 -3.53 -2.78 -2.89 -2.65 -2.86
5 -3.28 -2.71 -2.83 -2.63 -2.69
6 -3.24 -2.66 -2.81 -2.58 -2.56
7 -2.61 -2.48 -2.75 -2.43 -2.43
8 -2.54 -2.46 -2.23 -2.34 -2.36
9 -2.53 -2.42 -2.18 -2.24 -2.17
10 -2.41 -2.16 -2.18 -2.18 -2.05
11 -2.10 -2.05 -2.14 -2.11 -2.00
12 -1.99 -2.01 -1.96 -1.62 -1.94
13 -1.92 -1.66 -1.67 -1.29 -1.62
14 -1.69 -1.52 -1.48 -1.21 -1.49
15 -1.12 -1.20 -1.44 -1.12 -1.47
16 -.96 -.97 -1.10 -.92 -1.15
17 -.85 -.65 -.95 -.88 -.99
18 -.49 -.15 -.87 -.61 -.48
19 -.30 -.15 -.73 -.57 -.26
20 -.05 -.07 -.32 .10 -.19
21 .08 .03 .51 .26 .07
22 .34 .53 .74 .37 .46
23 .59 .71 .79 .78 .70
24 .80 .89 .92 .79 .91
25 .92 .93 1.09 .93 .96
26 1.2 1.40 1.16 1.38 1.15
27 1.71 1.47 1.31 1.62 1.58
28 2.09 1.60 1.64 1.72 2.25
29 2.40 2.38 2.08 3.05 3.16
30 3.12 3.55 2.39 3.16 3.18
Table A2. Item location for Matrigma version A, B, C, D and E respectively.
Note: Version A n=931, Version B n=899, Version C n=924, Version D n=906, Version E n=946; Location=Item difficulty.
Related Documents