1 http://dx.doi.org/10.7896/j.1512 Studies in Agricultural Economics 117 (2015) xx-xx Introduction Organic agriculture (OA) seeks to combine tradition, innovation and science to benefit the environment and promote fair relationships and a good quality of life for all involved. This production system is intended to sustain the health of soils, ecosystems and people. It relies on ecological processes, biodiversity and cycles adapted to local condi- tions rather than the use of chemical inputs that can have adverse effects (IFOAM, 2015). Ramesh et al. (2005) noted that the benefits of OA to the developed nations include environmental protection, bio- diversity enhancement, reduced energy use and CO 2 emis- sions. These have been enhanced by providing aid payments to organic farmers and premiums for organic products. For developing countries which are largely exporters of organic products, the benefits of OA lie in sustainable resource use, increased crop yields without over-reliance on costly exter- nal inputs, and environment and biodiversity protection. For these countries in particular, depletion and degradation of land and water resources pose serious challenges to the pro- duction of sufficient food and other agricultural products to sustain livelihoods and meet the needs of urban populations. Studies that focus on OA are therefore relevant because agriculture has a substantial impact on natural resources that must be better managed to supply sustainable ecosystem services, particularly in the light of climate change (Lakner et al., 2012). Although OA is a common practice in many areas of the developing world, certification of OA is relatively recent (Bouagnimbeck, 2013; Paull, 2013a, b). Certified OA is underpinned by the principles of health, ecology, fairness and care (IFOAM, no date). Certification bodies evaluate operations according to different organic standards and can be formally recognised by more than one authoritative body. The label of a given certification body, therefore, informs the consumer of the type of recognition granted to the certifica- tion body. There are other categories of standards such as international voluntary standards, national mandatory stand- ards and local voluntary standards (FAO, 2015). Organics certification generally predates the 1972 found- ing of IFOAM, the International Foundation for Organic Agriculture (Paull, 2010). In Australia, for example, there has been active and structured advocacy of OA since 1944 but organics certification only started in 1987 (Paull, 2008; 2013a). Certification is based on a pledge by certified farm- ers (operators) to comply with standards which are pro- duced and enforced by both private institutions and govern- ments and which originate mostly in developed countries (Latruffe and Nauges, 2014). The UK Soil Association has its own standards although Council Regulation 2092/91 of the European Union (EU) is in force in the EU. Countries such as Australia, Canada, Japan and the USA have their national standards (Mayen et al. 2009). Given the many standards, there are certainly some differences; neverthe- less, these standards recognise the organic principles. For the purpose of this study, organic practices are recognised so long as they are certified by a national or international organic certifying body. The OA applicant usually completes a questionnaire at the start of the certification process. Where the land has been cultivated, applicants are granted in-conversion status. When this period (usually between two and five years, depending on the crop or livestock) elapses, full organic status may be granted. After the first inspection, there is an annual inspection to ensure compliance. Farmers are expected to ensure that farm facilities and production methods conform to the standards, and maintain extensive records detailing the farm history and current set-up. Keeping written day- to-day farming and marketing records covering all activities (which must be available for inspection at any time) forms an integral part of OA. A written annual production plan would usually be submitted. The difference between the observed output and what is attainable is technical efficiency (TE) (Farrell, 1957). TE and productivity of agriculture are fundamental for food security and poverty reduction (POST, 2006). The increase in TE pro- vides an opportunity for farmers to increase output using the same level of resources (Beltrán-Esteve and Reig-Martínez, 2014). This has led to a plethora of studies in agricultural efficiency. Studies focusing on conventional agriculture (CA) have demonstrated variations in mean technical effi- Justice G. DJOKOTO* Technical efficiency of organic agriculture: a quantitative review This article examines the variations in mean technical efficiency estimates in organic agriculture and the factors that explain the observed variations. A three-stage process was employed in data collection. Firstly, journals on organic agriculture and related disciplines were identified and searched. Secondly, several publishers’ websites and databases, namely Cambridge Journals, Elsevier, Emerald, Oxford University Press, Sage, Taylor and Francis, and Wiley, among others, were covered. Databases included AgEcon Search, CAB Abstracts, DOAJ, EBSCOhost, Google Scholar and ScienceDirect. Thirdly, the reference lists of studies found in the first and second stages were searched to identify additional literature. In all, 42 studies constituting 109 observations covering the period 2002-2014 were found. Unlike existing literature on technical efficiency quantitative reviews in agriculture, this article employs a battery of tests to select the appropriate solution for multiple obser- vations from the same primary study, as well as the appropriate functional form for the selected fractional regression model. The mean technical efficiency of organic agriculture for the period of study and the effects of other study characteristics are thoroughly discussed. Keywords: Fractional regression, meta-regression, organic agriculture, quantitative review, technical efficiency. * Central University College, P.O. Box DS 2310, Dansoman, Accra, Ghana. [email protected]; ORCID ID: 0000-0002-2159-2944

Welcome message from author
This document is posted to help you gain knowledge. Please leave a comment to let me know what you think about it! Share it to your friends and learn new things together.
Transcript

1
http://dx.doi.org/10.7896/j.1512 Studies in Agricultural Economics 117 (2015) xx-xx
IntroductionOrganic agriculture (OA) seeks to combine tradition,
innovation and science to benefit the environment and promote fair relationships and a good quality of life for all involved. This production system is intended to sustain the health of soils, ecosystems and people. It relies on ecological processes, biodiversity and cycles adapted to local condi-tions rather than the use of chemical inputs that can have adverse effects (IFOAM, 2015).
Ramesh et al. (2005) noted that the benefits of OA to the developed nations include environmental protection, bio-diversity enhancement, reduced energy use and CO2 emis-sions. These have been enhanced by providing aid payments to organic farmers and premiums for organic products. For developing countries which are largely exporters of organic products, the benefits of OA lie in sustainable resource use, increased crop yields without over-reliance on costly exter-nal inputs, and environment and biodiversity protection. For these countries in particular, depletion and degradation of land and water resources pose serious challenges to the pro-duction of sufficient food and other agricultural products to sustain livelihoods and meet the needs of urban populations. Studies that focus on OA are therefore relevant because agriculture has a substantial impact on natural resources that must be better managed to supply sustainable ecosystem services, particularly in the light of climate change (Lakner et al., 2012).
Although OA is a common practice in many areas of the developing world, certification of OA is relatively recent (Bouagnimbeck, 2013; Paull, 2013a, b). Certified OA is underpinned by the principles of health, ecology, fairness and care (IFOAM, no date). Certification bodies evaluate operations according to different organic standards and can be formally recognised by more than one authoritative body. The label of a given certification body, therefore, informs the consumer of the type of recognition granted to the certifica-tion body. There are other categories of standards such as international voluntary standards, national mandatory stand-ards and local voluntary standards (FAO, 2015).
Organics certification generally predates the 1972 found-
ing of IFOAM, the International Foundation for Organic Agriculture (Paull, 2010). In Australia, for example, there has been active and structured advocacy of OA since 1944 but organics certification only started in 1987 (Paull, 2008; 2013a). Certification is based on a pledge by certified farm-ers (operators) to comply with standards which are pro-duced and enforced by both private institutions and govern-ments and which originate mostly in developed countries (Latruffe and Nauges, 2014). The UK Soil Association has its own standards although Council Regulation 2092/91 of the European Union (EU) is in force in the EU. Countries such as Australia, Canada, Japan and the USA have their national standards (Mayen et al. 2009). Given the many standards, there are certainly some differences; neverthe-less, these standards recognise the organic principles. For the purpose of this study, organic practices are recognised so long as they are certified by a national or international organic certifying body.
The OA applicant usually completes a questionnaire at the start of the certification process. Where the land has been cultivated, applicants are granted in-conversion status. When this period (usually between two and five years, depending on the crop or livestock) elapses, full organic status may be granted. After the first inspection, there is an annual inspection to ensure compliance. Farmers are expected to ensure that farm facilities and production methods conform to the standards, and maintain extensive records detailing the farm history and current set-up. Keeping written day-to-day farming and marketing records covering all activities (which must be available for inspection at any time) forms an integral part of OA. A written annual production plan would usually be submitted.
The difference between the observed output and what is attainable is technical efficiency (TE) (Farrell, 1957). TE and productivity of agriculture are fundamental for food security and poverty reduction (POST, 2006). The increase in TE pro-vides an opportunity for farmers to increase output using the same level of resources (Beltrán-Esteve and Reig-Martínez, 2014). This has led to a plethora of studies in agricultural efficiency. Studies focusing on conventional agriculture (CA) have demonstrated variations in mean technical effi-
Justice G. DJOKOTO*
Technical efficiency of organic agriculture: a quantitative reviewThis article examines the variations in mean technical efficiency estimates in organic agriculture and the factors that explain the observed variations. A three-stage process was employed in data collection. Firstly, journals on organic agriculture and related disciplines were identified and searched. Secondly, several publishers’ websites and databases, namely Cambridge Journals, Elsevier, Emerald, Oxford University Press, Sage, Taylor and Francis, and Wiley, among others, were covered. Databases included AgEcon Search, CAB Abstracts, DOAJ, EBSCOhost, Google Scholar and ScienceDirect. Thirdly, the reference lists of studies found in the first and second stages were searched to identify additional literature. In all, 42 studies constituting 109 observations covering the period 2002-2014 were found. Unlike existing literature on technical efficiency quantitative reviews in agriculture, this article employs a battery of tests to select the appropriate solution for multiple obser-vations from the same primary study, as well as the appropriate functional form for the selected fractional regression model. The mean technical efficiency of organic agriculture for the period of study and the effects of other study characteristics are thoroughly discussed.
Keywords: Fractional regression, meta-regression, organic agriculture, quantitative review, technical efficiency.
* Central University College, P.O. Box DS 2310, Dansoman, Accra, Ghana. [email protected]; ORCID ID: 0000-0002-2159-2944
Justice G. Djokoto
2
ciency (MTE) (the sample’s average) over time (Thiam et al., 2001; Bravo-Ureta et al., 2007; Ogundari and Brummer, 2011; Ogundari, 2014). Additionally, study attributes such as methodology, product and location have explained the observed differences. Therefore, some questions come to the fore in respect of OA. Firstly, how has MTE in OA varied over time? Secondly, what factors explain the variations in reported MTE in OA? Thirdly, do these factors influence MTE of OA similarly as CA?
Since a single study will not resolve a major issue in science, meta-analysis provides an effective alternative for assessing the generalisability of research in science (Hunter and Schmidt, 1990). Thiam et al. (2001), Bravo-Ureta et al. (2007), Moreira Lopez and Bravo-Ureta (2009), Ogun-dari and Brümmer (2011), Iliyasu et al. (2014) and Ogun-dari (2014) conducted meta-regression on TE in agriculture which focused on CA. However, this article assesses the var-iations in reported MTE in OA. It also investigates the roles of other factors in explaining the variations in reported MTE and identifies the similarities and differences in the effect of these factors on MTE of OA.
Only Ogundari (2014) used a fractional regression model (FRM) and selected the logit functional form without any statistical test as Papke and Wooldrige (1996) did. In this article, batteries of tests were employed to select the appro-priate functional form for the selected FRM. The contribu-tion of multiple observations from the same primary study to the metadata set in meta-regression is a common occur-rence with its associated biases to the metadata set. Ogundari (2014) used sample weighted regression (WR) a priori. In this article, a solution was chosen based upon a set of sta-tistical tests such as the goodness-of-functional form tests (Ramalho et al., 2010; 2011).
MethodologyMeta-analysis
Pooling together these studies for further investiga-tion constitutes meta-analysis. Quantitative review allows researchers to combine results of several homogenous stud-ies into a unified analysis that provides an overall estimate of interest for further discussion (Sterne, 2009). A general model for carrying out meta-analysis is to relate a key (dependent) variable to some characteristics that are believed to explain that variable (Alston et al., 2000). With reference to the present study, MTE from the primary study is consid-ered as the dependent variable, while study attributes; meth-odological characteristics, product and regional groups, and publishing outlet and quality are taken as explanatory vari-ables. In accomplishing TE meta-analysis, various MTEs are extracted from the studies reviewed. The corresponding study characteristics are identified and the resulting meta-data set is fitted to a model. Multiple observations on MTE reported in a study constitute observations; otherwise, each primary study constitutes one observation.
Data
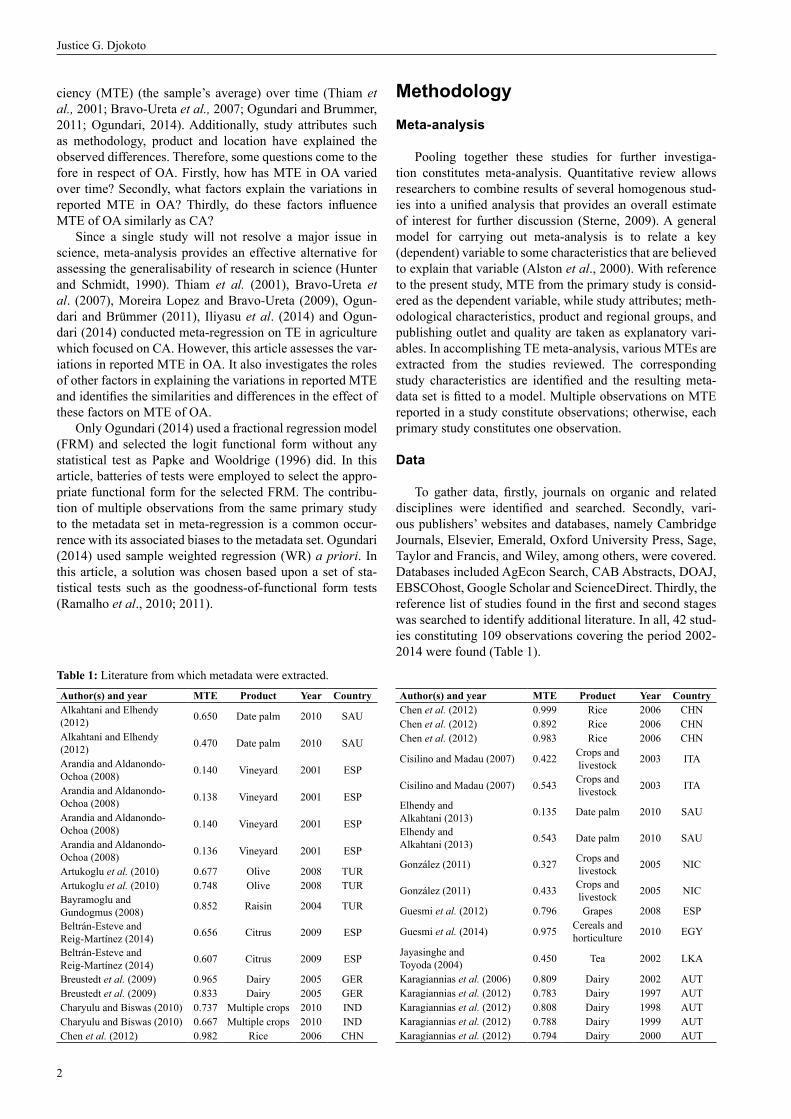
To gather data, firstly, journals on organic and related disciplines were identified and searched. Secondly, vari-ous publishers’ websites and databases, namely Cambridge Journals, Elsevier, Emerald, Oxford University Press, Sage, Taylor and Francis, and Wiley, among others, were covered. Databases included AgEcon Search, CAB Abstracts, DOAJ, EBSCOhost, Google Scholar and ScienceDirect. Thirdly, the reference list of studies found in the first and second stages was searched to identify additional literature. In all, 42 stud-ies constituting 109 observations covering the period 2002-2014 were found (Table 1).
Table 1: Literature from which metadata were extracted.
Author(s) and year MTE Product Year CountryAlkahtani and Elhendy (2012) 0.650 Date palm 2010 SAU
Alkahtani and Elhendy (2012) 0.470 Date palm 2010 SAU
Arandia and Aldanondo-Ochoa (2008) 0.140 Vineyard 2001 ESP
Arandia and Aldanondo-Ochoa (2008) 0.138 Vineyard 2001 ESP
Arandia and Aldanondo-Ochoa (2008) 0.140 Vineyard 2001 ESP
Arandia and Aldanondo-Ochoa (2008) 0.136 Vineyard 2001 ESP
Artukoglu et al. (2010) 0.677 Olive 2008 TURArtukoglu et al. (2010) 0.748 Olive 2008 TURBayramoglu and Gundogmus (2008) 0.852 Raisin 2004 TUR
Beltrán-Esteve and Reig-Martínez (2014) 0.656 Citrus 2009 ESP
Beltrán-Esteve and Reig-Martínez (2014) 0.607 Citrus 2009 ESP
Breustedt et al. (2009) 0.965 Dairy 2005 GERBreustedt et al. (2009) 0.833 Dairy 2005 GERCharyulu and Biswas (2010) 0.737 Multiple crops 2010 INDCharyulu and Biswas (2010) 0.667 Multiple crops 2010 INDChen et al. (2012) 0.982 Rice 2006 CHN
Author(s) and year MTE Product Year CountryChen et al. (2012) 0.999 Rice 2006 CHNChen et al. (2012) 0.892 Rice 2006 CHNChen et al. (2012) 0.983 Rice 2006 CHN
Cisilino and Madau (2007) 0.422 Crops and livestock 2003 ITA
Cisilino and Madau (2007) 0.543 Crops and livestock 2003 ITA
Elhendy and Alkahtani (2013) 0.135 Date palm 2010 SAU
Elhendy and Alkahtani (2013) 0.543 Date palm 2010 SAU
González (2011) 0.327 Crops and livestock 2005 NIC
González (2011) 0.433 Crops and livestock 2005 NIC
Guesmi et al. (2012) 0.796 Grapes 2008 ESP
Guesmi et al. (2014) 0.975 Cereals and horticulture 2010 EGY
Jayasinghe and Toyoda (2004) 0.450 Tea 2002 LKA
Karagiannias et al. (2006) 0.809 Dairy 2002 AUTKaragiannias et al. (2012) 0.783 Dairy 1997 AUTKaragiannias et al. (2012) 0.808 Dairy 1998 AUTKaragiannias et al. (2012) 0.788 Dairy 1999 AUTKaragiannias et al. (2012) 0.794 Dairy 2000 AUT

Technical efficiency of organic agriculture: a quantitative review
3
Author(s) and year MTE Product Year CountryKaragiannias et al. (2012) 0.770 Dairy 2001 AUTKaragiannias et al. (2012) 0.756 Dairy 2002 AUTKramol et al. (2015) 0.416 Vegetables 2008 THAKramol et al. (2015) 0.220 Vegetables 2008 THAKumbhakar et al. (2009) 0.796 Dairy 1998 FINKumbhakar et al. (2009) 0.798 Dairy 1998 FINKumbhakar et al. (2009) 0.759 Dairy 1998 FINLakner (2009) 0.640 Dairy 2005 GERLakner et al. (2012) 0.740 Grass 2005 GER
Lakner et al. (2014) 0.825 Crops and livestock 2006 CHE
Lakner et al. (2014) 0.772 Crops and livestock 2006 AUT
Lakner et al. (2014) 0.847 Crops and livestock 2006 GER
Lakner et al. (2014) 0.579 Crops and livestock 2006 CHE
Lakner et al. (2014) 0.532 Crops and livestock 2006 AUT
Lakner et al. (2014) 0.564 Crops and livestock 2006 GER
Larsen and Foster (2005) 0.440 Multiple crops 2002 SWE
Latruffe and Nauges (2014) 0.850 Cereals and oil seeds 2006 FRA
Latruffe and Nauges (2014) 0.790 Other field crops 2006 FRA
Latruffe and Nauges (2014) 0.800 Fruits and vegetables 2006 FRA
Latruffe and Nauges (2014) 0.850 Horticulture 2006 FRA
Latruffe and Nauges (2014) 0.720 Wine with origin 2006 FRA
Latruffe and Nauges (2014) 0.630 Fruits and vegetables 2006 FRA
Latruffe and Nauges (2014) 0.750 Permanent crops 2006 FRA
Latruffe and Nauges (2014) 0.900 Multiple crops 2006 FRALohr and Park (2006) 0.713 Multiple crops 1997 USALohr and Park (2006) 0.722 Multiple crops 1997 USALohr and Park (2006) 0.789 Multiple crops 1997 USALohr and Park (2006) 0.847 Multiple crops 1997 USALohr and Park (2006) 0.660 Multiple crops 1997 USALohr and Park (2007) 0.787 Multiple crops 1997 USALohr and Park (2007) 0.856 Multiple crops 1997 USALohr and Park (2007) 0.805 Multiple crops 1997 USALohr and Park (2007) 0.812 Multiple crops 1997 USALohr and Park (2007) 0.801 Multiple crops 1997 USALohr and Park (2007) 0.764 Multiple crops 1997 USA
Author(s) and year MTE Product Year CountryLohr and Park (2010) 0.581 Multiple crops 1997 USALohr and Park (2010) 0.588 Multiple crops 1997 USALohr and Park (2010) 0.592 Multiple crops 1997 USALohr and Park (2010) 0.560 Multiple crops 1997 USAMadau (2007) 0.831 Multiple crops 2002 ITAMayen et al. (2010) 0.817 Dairy 2005 USAMayen et al. (2010) 0.770 Dairy 2005 USANastis et al. (2012) 0.420 Alfalfa 2008 GRCNastis et al. (2012) 0.540 Alfalfa 2008 GRCOnumah et al. (2013) 0.800 Cocoa 2011 GHAOnumah et al. (2013) 0.590 Cocoa 2011 GHAOude Lansink et al. (2002) 0.910 Multiple crops 1997 FINOude Lansink et al. (2002) 0.860 Multiple crops 1997 FINOude Lansink et al. (2002) 0.880 Livestock 1997 FINOude Lansink et al. (2002) 0.930 Livestock 1997 FINPark and Lohr (2010) 0.716 Multiple crops 2008 USAPark and Lohr (2010) 0.727 Multiple crops 2008 USAPark and Lohr (2010) 0.725 Multiple crops 2008 USAPark and Lohr (2010) 0.735 Multiple crops 2008 USAPechrová and Vlašicová (2013) 0.790 Cereals and
oil seeds 2008 CZE
Poudel et al. (2011) 0.890 Coffee 2010 NPL
Serra and Goodwin (2009) 0.940 Cereals and oil seeds 2002 ESP
Sipiläinen et al. (2008) 0.658 Multiple crops 1996 FINSipiläinen et al. (2008) 0.664 Multiple crops 1997 FINSipiläinen et al. (2008) 0.697 Multiple crops 1998 FINSipiläinen et al. (2008) 0.598 Multiple crops 1994 FINSipiläinen et al. (2008) 0.646 Multiple crops 1999 FINSipiläinen et al. (2008) 0.651 Multiple crops 2000 FINSipiläinen et al. (2008) 0.690 Multiple crops 2001 FINSipiläinen et al. (2008) 0.631 Multiple crops 2002 FINSipiläinen et al. (2008) 0.654 Multiple crops 1995 FINSongsrirote and Singhapreecha (2007) 0.866 Multiple crops 2006 THA
Tiedemann and Latacz-Lohmann (2013) 0.928 Multiple crops 2007 GER
Toro-Mujica et al. (2011) 0.660 Sheep 2008 ESPTzouvelekas et al. (2001a) 0.716 Olive 1996 GRCTzouvelekas et al. (2001b) 0.691 Olive 1996 GRCTzouvelekas et al. (2002a) 0.683 Olive 1996 GRCTzouvelekas et al. (2002a) 0.746 Cotton 1996 GRCTzouvelekas et al. (2002a) 0.760 Raisin 1996 GRCTzouvelekas et al. (2002a) 0.680 Grapes 1996 GRCTzouvelekas et al. (2002b) 0.845 Wheat 1999 GRC
Model
Consider
y = f (x) (1)
where y is MTE and x is vector of covariates;
ORGONLY, ORGMEAT, DATAYEAR, DATASIZE, SFA, DEA, CS, CD, TL, TERMS, CRS, VRS, CAOS, OFC,
FAV, NEH, PC, MC, DAIRY, LIVESTOCK, NAMERICA, CAMERICA, ASIA, EUROPEM, SCAND, JOURNAL, IF
Models for TE meta-analysis have quite a number of dummy variables constituting the total number of variables: Thiam et al. (2001), 10 out of 13; Bravo-Ureta et al. (2007), 12 out of 13; Ogundari and Brummer (2011), 10 out of 14; Ogundari (2014), 14 out of 17. These references are evidence
of the importance of dummy variables in TE meta-analysis models. Dummy variables are useful in capturing factors that determine the study-to-study variation in the MTE (Nelson and Kennedy, 2009). Therefore, the multiplicity of dummy variables in the TE meta-analysis model specified above and described below is relevant. Fears of not obtaining robust estimates may be attenuated by the battery of tests employed in the model selection to be described shortly. The statisti-cal insignificance of dummies may have research and policy implications. Thus, the high number of predictors, 27, used in the estimation model is important and represents one of the highest in agricultural TE meta-analysis.
The output-oriented MTE which is the dependent vari-able is defined as the simple average of the computed tech-nical efficiencies of primary studies. ORGONLY represents studies that considered only organic data as opposed those that used organic and conventional sub-samples. ORGONLY took 1 and 0 otherwise. The coefficient of this variable may

Justice G. Djokoto
4
be positive or negative. ORGMETA represents studies that used metafrontier production function. ORGMETA is 1 and 0 otherwise. Since metafrontiers are farther from the group or primary frontier, the coefficient of ORGMETA is hypoth-esised to be negatively signed.
Year of data (DATAYEAR) refers to the year in which the data were collected in the case of cross-sectional data. For panel and time series data, the terminal year was used to represent year of data. However, where the MTE reported pertains to a specific year, that was taken as the DATAYEAR. It is anticipated that with time technology will improve, therefore the coefficient of DATAYEAR should be positively signed. DATASIZE is the number of observations in the pri-mary study. Increased sample size generally produces more efficient estimates. This efficient estimate may not neces-sarily be high or low. Thus, the sign of the coefficient for DATASIZE may be positive or negative. SFA represents sto-chastic frontier estimation: SFA = 1 and 0 otherwise (DEA, distance functions). DEA stands for the non-parametric approach Data Envelopment Analysis. This dummy takes the value 1 for DEA and 0 otherwise (SFA and distance func-tions). Owing to the nature of the error term, the coefficient of the variable SFA should be positively signed. Data type (CS) represents cross-sectional data. CS = 1 and 0 otherwise (panel data). Moreira Lopez and Bravo-Ureta (2009) and Ogundari (2014) reported conflicting results on the sign of the coefficient of this variable. Thus, the sign of the coef-ficient may be negative or positive.
Functional forms employed in the estimations of TE in the primary study were observed to be Cobb-Douglas (CD), translog (TL) and non-functional forms. CD = 1 and 0 oth-erwise (translog; TL and non-functional forms). Also, TL = 1 and 0 otherwise (non-functional forms and CD). Bravo-Ureta et al. (2007) and Moreira Lopez and Bravo-Ureta (2009) have shown that MTE computed from CD functions are higher than those from TL. Thus the coefficient of CD is hypoth-esised to be positive. The number of explanatory variables in the TE estimation model of the primary study is TERMS. Since TE is estimated as part of the residual from production functions (not in the case of DEA), an increased number of TERMS should improve the fit of the model thereby reduc-ing the residual. This would likely result in lower TE, hence MTE. Therefore, the coefficient of TERMS is hypothesised to be negative. Returns-to-scale may be constant (CRS) or vari-able (VRS): CRS = 1 for CRS, and 0 otherwise; VRS = 1 for VRS and 0 otherwise. The reference is studies that reported MTE of CRS and VRS plus distance functions or unspecified RTS. CRS and VRS were captured for only DEA, and hence the dummies are equal to 0 in the case of other methods to calculate efficiency. Nevertheless, how these variables are expected to influence MTE is unclear; thus, no a priori expec-tations have been formulated for them.
The studies found during the literature search contained several products and product groups. These have been clas-sified into groups such as cereals, oil seeds and protein seeds (CAOS); other field crops (OFC); fruits and vegetables (FAV); horticultural crops (NEH); permanent crops (PC); multiple crops (MC); dairy (DAIRY); livestock (non-dairy) (LIVESTOCK). One dummy for each of these products was specified. The reference category was mixed products (live-
stock and crops). Owing to the categorisations, the influence of these on MTE is unclear and therefore no a priori signs were formulated.
Studies included in the metadata covered diverse geo-graphical areas. NAMERICA represented North America, CAMERICA represented Central America, EUROPEM represented mainland Europe and SCAND was used to cap-ture Scandinavian countries. The control group was Africa. Owing to different geographical influences, the sign of the coefficients could not be stated a priori.
The method of dissemination of studies was considered. The dummy JOURNALS is set to 1 for academic journals, and 0 otherwise (conference papers, working papers among others). Finally, the quality of outlet, measured by the ISI impact factor (IF) was considered. The 2013 IF was used as proxy for journal quality. Where the dissemination outlet did not have an impact factor, that study was given IF of zero and those with impact factors had IF with a numerical index. Since journal quality relates more to the reliability of results than size of statistic, the sign of the coefficient IF may be positive or negative.
Estimation procedure
Ordinary least squares (OLS) and Tobit procedures are commonly used in TE meta-regression. With OLS, many predicted values would fall outside the unit interval. Although the Tobit procedure ensures that the predicted val-ues lie within the unit interval, a censored data generation process (DGP) is assumed contrary to the fractional DGP for technical efficiency. Appropriately, fractional regression model (FRM) is employed in this article and specified as:
E (y | x) = G( xθ ) (2)
where y is the dependent variable (MTE) and x are vari-ables of the nature descried above. The conditional expected mean of y given x is E (y | x). G (·) is some nonlinear function satisfying 0 ≤ G(·) ≤ 1 and θ is a vector of parameters to be estimated.
Papke and Wooldridge (1996) proposed logit and probit, respectively specified as:
logit:
(3.1)
with partial effect;
(3.2)
and probit:
G( xθ ) = Φ( xθ ) (4.1)
with partial effect;
(4.2)
However, Ramalho et al. (2010, 2011) noted that, the logit and probit are most sensitive to covariates when the

Technical efficiency of organic agriculture: a quantitative review
5
mean of TEs (of DEA in particular) are around 0.5. What if that was not the case? They then showed that the other two models behaved differently:loglog:
(5.1)
with partial effect:
(5.2)
and cloglog:
(6.1)
with partial effect:
(6.2)
Indeed, failure to test the latter two could result in mis-specification. Following from these, all four functional forms were estimated.
Tests and model selection
In the absence of a priori theoretical formulation of the appropriate functional form for the FRM, statistical methods of selection offer a viable alternative. Also, the second objec-tive of meta-analysis is to identify the determinants of vari-ability in MTE and this study seeks to achieve this. Further-more, Papke and Wooldridge (1996) and Ogundari (2014) used logit functional form without justification save that this is commonly used. Since MTE meta-regression models could well follow functional forms other than logit, selec-tion from a number of model specifications is an appropriate econometric exercise.
This selection was accomplished by three tests: Ramsey RESET test, goodness-of-functional form tests (GOFF-1 and GOFF-2) and non-nested P test (Davidson and MacKinnon, 1981). The RESET test examines the presence of mis-spec-ification in the model. Unlike the usual hypothesis test, the RESET, GOFF1 and GOFF2 tests note that the model is free of mis-specification if the null hypothesis cannot be rejected. The goodness-of-functional form tests, test for how well the data fit the functional form specified1. It is possible that more than one model would be selected by the RESET and goodness-of-functional form tests. Therefore, the P test pro-vides an opportunity for one-on-one tests using the selected models from the first two stages as alternative hypotheses.
Some studies contributed more than one observation to the metadata set. Espey et al. (1997) noted this could bias standard errors and hence invalidate hypothesis tests. Their solution to the problem requires limiting multiple observa-tions from the same study to five. Stanley (2008) proposed averaging these multiple observations to one. These recom-mendations would further limit the organic TE metadata set. An approach that keeps all multiple observations from a study in the metadata set is weighted regression (WR). Ogundari 1 See Ramalho et al. (2010) for details on type 1 and type 2 GOFF tests; formulation, testing and distributional assumptions.
(2014) weighted the MTE by the sample size of the primary study. Perhaps a better weighting approach is to weight the MTE by the number of observations contributed by each primary study to the metadata. Jarrell and Stanley (1990) employed dummy variables to control for the number of data points contributed by primary studies to the metadata. This and the WR approaches were implemented to address the bias identified by Espey et al. (1997). The models from these two approaches were subjected to the tests described above. Further, robust standard errors were computed. Despite the barrage of estimations and tests, these were necessary to arrive at a reliable model to be discussed.
Results and discussionSummary statistics
The studies composing the metadata are almost equally split between SFA models on one the hand and DEA and distance function models on the other hand (Table 2). The metadata are composed of 74 MTEs obtained from organic-only studies, five of which were computed with respect to a metafrontier. The use of cross-sectional data (CS) was popu-lar among researchers of OA technical efficiency. This may have arisen from the ease and lower cost of collection, unlike
Table 2: Summary statistics of dummy measured variables.
Number PercentageNature of study ORGONLY 35 32.1
Comparative 74 67.9Method of comparison
ORGMETA 5 4.6Non-frontier approach 104 95.4
Model SFA 59 54.1DEA 40 36.7DF 10 9.2
Data structure CS 79 72.5PL 30 27.5
Functional form CD 23 21.1TL 45 41.3Non-functional 41 37.6
Returns-to-scale CRS 10 9.2VRS 19 17.4SFA and DDF, unspecified 80 73.4
Products CAOS 11 10.1OFC 3 2.8FAV 13 11.9NEH 3 2.8PC 11 10.1MC 37 33.9DAIRY 15 13.8LIVESTOCK 3 2.6CROPS and LIVESTOCK 13 11.9
Country
NAMERICA 21 19.3CAMERICA 2 1.8ASIA 18 16.5EUROPEM 48 44.0SCAND 17 15.6AFRICA 3 2.8
Publication outlet JOURNAL 68 62.4Others 41 37.6
Source: own composition

Justice G. Djokoto
6
panel data. The largest share of observations corresponded to MC farming type. About 60 per cent of the metadata was con-tributed from studies in Europe (EUROPEM and SCAND).
The time path of the MTE shows that MTE rose from 1994 (0.598) to 1997 (0.859) (Figure 1). MTE witnessed wide fluctuations with a gentle declining trend.
The average MTE (AMTE) of 0.696 (Table 3) implies organic producers could on average increase output by about 30 per cent without any increase in input use. Both the simple AMTE and the weighted AMTE (0.685) are within the range of 0.680 and 0.784 found for previous studies. The earliest data employed in the studies were collected in 1994, close to the latest data year of 1997 for Thiam et al. (2001). This is a reflection of the relatively recent nature of certified OA (Paull, 2008, 2013). For the 34 observations extracted from journals with an ISI 2013 impact factor, the lowest impact factor was 0.33 with a peak of 3.19 (Table 3). It must be noted however that the impact factors are related to different disciplines and not all studies had an ISI impact factor.
Choice of multiple observation amelioration approach
The RESET test was statistically significant for all func-tional forms for the sample size-weighted and multiple obser-vation controlled models, implying mis-specification and therefore unsuitable for further use in this article (data not shown). At least one functional form could not be rejected by the RESET test (Table 4). Thus, the number of observations-weighted approach is preferred to the other two.
Model selection
From Table 4, all functional forms are mis-specified except the logit functional form. Similarly, at least one of the GOFF tests, GOFF2 showed that the logit functional form is well fitted to the data. Since only the logit passes both RESET and GOFF2 tests, there is no need for comparison with any other functional form.
Discussion of selected estimated model
The selected logit model produced an R2 type measure of 0.670 implying the explanatory variables accounted for about 67 per cent of the variability in the MTE (Table 5). The residual degree of freedom of 82 arose from the 27 explanatory variables. In the literature, Ogundari (2014) employed the highest number of explanatory variables in TE meta-regression in agriculture, 17. The 27 explanatory vari-ables therefore constitute a departure from previous stud-ies. The statistical insignificance of the constant term may have arisen from the high number of explanatory variables employed, suggesting the adequacy of the explanatory vari-ables employed in the model. The explanatory variables can be categorised into four groups: methodological, products, region and dissemination. Except the dissemination, at least two coefficients and marginal effects are statistically signifi-cant. Despite the numerous variables, no correlation coef-ficient above 0.6 was found.
Despite the declining trend of MTE over time (Figure 1), the parameters of DATAYEAR are positive and statistically insignificant. The recognition of other factors that influ-ence MTE may have caused a change of sign from a nega-tive to positive. The statistically insignificant parameters imply MTE for OA have not increased significantly over the period. The finding of a non-increasing MTE over time for organic agriculture is not different from the earlier conclu-sions of Thiam et al. (2001) and Iliyasu et al. (2014) for CA. Indeed, in the literature, multi-country meta-analysis of TE has shown either stagnation or decline in MTE over time. Since an individual country study (Ogundari and Brummer, 2011) has shown a positive change in MTE over time, the effect of good performers in TE may have been masked by those of poor performers.
While studies using organic data only constituted 32 per cent of the metadata set, the positive and statistically signifi-
1995
1994
1996
1997
1998
1999
2000
2001
2002
2003
2004
2005
2006
2007
2008
2009
2010
2011
0.8
0.6
0.4
0.2
1.0
0.0
Mea
n te
chni
cal e
ffici
ency
Figure 1: Global organic mean technical efficiency time path (1994-2011).Source: metadata
Table 3: Summary statistics of scale measured variables.
MTE DATASIZE TERMS DATAYEAR IFN 109 109 109 109 109Minimum 0.135 18 2 1994 0.33Maximum 0.999 1717 40 2011 3.19Simple mean 0.696 176 10 2003 1.60Weighted mean 0.685 - - - -Standard deviation 0.190 227 9.00 4.90 0.90
Source: own composition
Table 4: Specification tests of number of observations-weighted regression estimation.
Logit Probit Loglog CloglogRESET† 2.579** 3.458*** 6.510*** 4.164**GOFF1† 3.212** 3.263*** - 4.401**GOFF2 2.558** 3.651*** 6.919*** -P-testH1Logit - 4.041*** 10.479*** 0.399**H1Probit 3.166** - 9.314*** 0.508**H1Loglog 0.012** 2.078*** - 0.045**H1Cloglog 5.340** 6.662*** 13.564*** -
***,**,* represent levels of significance of 1%, 5% and 10% respectively; † H1: model is mis-specified Source: own composition

Technical efficiency of organic agriculture: a quantitative review
7
cant coefficient and marginal effect show that these studies produced higher MTE than those that used both organic and conventional data (Tables 2 and 5). It must be noted that the latter contains MTEs that are measured with respect to the meta-frontier, which is farther from the group frontier thus, producing lower values of MTE. Although the magnitude of the coefficient and marginal effect of ORGMETA are not sta-tistically different from zero, the negative sign of the param-eter confirms this explanation. The statistical insignificance also implies that differences between the two sets of MTEs are statistically immaterial.
The infinitesimal value of the parameters of DATASIZE suggests little influence of this variable on MTE. Moreover, the parameters are statistically insignificant. Thus, control-ling for the other 26 explanatory variables, the observed dif-ferences in size of study sample did not influence MTE. Since certified OA is recent and the certification process constitutes a barrier that prevents farmers from signing-on, fewer farm-ers participate, unlike conventional production. Therefore smaller numbers of farmers and consequently small samples for studies would result. The resulting sample sizes, although seemingly adequate, did not influence the size of the MTE.
For conventional studies, the conclusions of Thiam et al. (2001) and Bravo-Ureta et al. (2007) are consistent with the finding of this study while those of Moreira Lopez and Bravo-Ueta (2009) and Ogundari and Brummer (2011) are not.
The estimated parameters of SFA imply MTE estimated from stochastic frontier models are higher than those esti-mated from DEA and distance functions. Also, for DEA, MTE estimated from DEA are lower than those from dis-tance functions. The result found for DEA vs. SFA is intui-tive. Theoretically, the error term in SFA is composed such that not all the error in the SFA model is attributable to TE, and hence TE calculated with SFA does not capture noise and thus is always higher than TE calculated with DEA. Ili-yasu et al. (2014), however, found a negative sign for the SFA variable while Thiam et al. (2001) showed a statisti-cally insignificant parameter. Following from the results of the SFA and DEA, MTEs from distance functions are higher than those of DEA but lower than those of SFA. This result is enlightening as none of the previous studies considered distance functions as variables except Ogundari (2014), who combined distance functions and non-functional forms with translog and Cobb-Douglas functions but found no statistical difference between these.
The statistically significant parameters of CS imply that MTE estimated from cross-sectional data are higher than those estimated from panel data. Cross-sectional data cap-tures TE at a point in time. On the other hand, panel data represent both point-in-time and point-over-time situations. Thus, at points in time, TEs estimated may be increasing. However, other factors in the model and related to panel data studies may have created a negative pressure over time within the panel environment thereby resulting in a lower MTE for panel data MTEs. While this finding is consistent with the theoretical assertion of Greene (1993), Thiam et al. (2001), Bravo-Ureta et al. (2007) and Moreira Lopez and Bravo-Ureta (2009) found the opposite. No reasons were however assigned for the departure from the theoretical position. Ogundari (2014), however, reported a parameter statistically not different from zero. The multi-dimensional representation of panel data requires disentangling the effect of the two dimensions in arriving at appropriate conclusions. Also, the cost of gathering this is higher than for cross-sec-tional data. These points notwithstanding, the choice of data structure should be informed by the objectives of the study.
The negatively signed coefficients of CD and TL imply that the reference, DEA and distance functions produce higher MTEs. It must be recalled that together DEA and dis-tance functions constitute the reference category. Since DEA MTEs were earlier found to be lower than SFA, the MTEs of distance functions certainly have overshadowed the effect of MTEs from DEA to produce this finding. While previous studies showed MTE from translog are higher than those from Cobb-Douglas functions (Bravo-Ureta, 2007; Moreira Lopez and Bravo-Ureta, 2009), recent studies provide contrary evi-dence, that is, translog functional forms generate lower MTEs than MTEs estimated from Cobb-Douglas functions (Iliyasu et al., 2014; Ogundari, 2014). Since Ogundari (2014) used a logit fractional regression model, his conclusions corroborate that of this study. This shows another similarity in the results from conventional and organic data estimations.
Table 5: Selected logit estimation results.
Coeffi-cients
Robust SE
Marginal effects
dy/dx Delta method SE
DATAYEAR 0.096*** 0.075 0.016*** 0.012ORGONLY 0.997*** 0.438 0.163*** 0.069ORGMETA -0.286*** 0.334 -0.047*** 0.055DATASIZE 0.001*** 0.001 0.000*** 0.000SFA 1.908*** 0.693 0.312*** 0.114DEA -2.814*** 1.122 -0.460*** 0.181CS 1.263*** 0.462 0.207*** 0.072CD -3.577*** 0.542 -0.585*** 0.088TL -4.059*** 0.871 -0.663*** 0.138TERMS -0.006*** 0.018 -0.001*** 0.003CRS -0.848*** 0.283 -0.139*** 0.046VRS -1.033*** 0.411 -0.169*** 0.068CAOS -0.578*** 0.526 -0.094*** 0.086OFC -0.244*** 0.739 -0.040*** 0.121FAV 1.507*** -0.535 -0.246*** 0.087NEH 1.840*** -0.709 0.301*** -0.114PC -1.079*** 0.505 -0.176*** 0.081MC -0.567*** 0.324 -0.093*** 0.053DAIRY -0.085*** 0.494 -0.014*** 0.081LIVESTOCK -0.394*** 0.787 -0.064*** 0.128NAMERICA -1.435*** 0.850 -0.235*** 0.139CAMERICA -3.085*** 0.696 -0.504*** 0.108ASIA 0.568*** 0.484 0.093*** 0.079EUROPEM 0.119*** 0.692 0.019*** 0.113SCAND 0.250*** 1.135 0.041*** 0.185JOURNAL 0.569*** 0.375 0.093*** 0.061IF -0.006*** 0.107 -0.001*** 0.018CONSTANT -190.9*** 150.7 - -
Model propertiesR2-type measure 0.669No. of observations 109Residual d.f. 82Deviance 12.1
***,**,* represent levels of significance of 1%, 5% and 10% respectively Source: own composition

Justice G. Djokoto
8
By construction, the TL has more than twice the number of terms of CD. Thus, the negative sign of TERMS is con-sistent with the negative sign of TL. Therefore, for organic studies there is a tendency for estimation models with a high number of terms to yield lower estimates of TE. Research-ers should therefore be mindful of decisions on inclusion of explanatory variables in the production function. This find-ing for OA differs from those of CA.
The coefficients of CRS and VRS are negative and statisti-cally significant. These results are expected as the sign of DEA was earlier found to be negative. In line with the explanation for DEA, MTE estimated with both reported CRS and VRS are lower than those of unreported CRS, VRS, SFA and distance functions. Since the reference group includes DEA MTEs for which the returns-to-scale have not been reported, the concordance of the signs of DEA and VRS cum CRS param-eters implies that the MTEs from unreported returns-to-scale similarly follow the behaviour of DEA MTEs with reported returns-to-scale. Since the sizes of the marginal effects are similar, it is most likely that their effects via magnitudes will be similar. Thus, for the organic metadata used in this study, in as much as the choice of returns-to-scale in estimating tech-nical efficiency in DEA environment influences MTE, these effects of CRS and VRS on MTE are similar. These results bring up some important points. Firstly, to a limited extent, the behaviour of VRS and CRS DEA towards MTE may be generalised even if returns-to-scale is unknown. Secondly, there is no apparent difference in the effect of CRS and VRS on MTE. These results on returns-to-scale are rare since none of the previous studies reported the effect of returns-to-scale on MTE. Although the results follow the direction of DEA, it provides empirical evidence, at least for this organic metadata, that CRS and VRS models influence MTE in a similar fashion.
The coefficients of all product groups are negatively signed implying that, generally, there is the tendency that MTE of these organic product groups are lower than those of the reference group, crops and livestock. The statistical significance of MC, although weak, shows the general high risk associated with crop farming. The statistical significance of the parameters of these variables suggests the relatively risky nature of these products.
The parameters of DAIRY and LIVESTOCK are statisti-cally insignificant from zero, signifying statistical parity in the MTEs of these product groups with those of the control. Since some of the crop products groups have statistically significant negative parameters, there is a tacit pointer to the seemingly strong positive influence of livestock and related products on MTE. The greater MTE of crops and livestock combination is particularly instructive. The finding of Ponisio et al. (2015) that agricultural diversification within the organic system significantly reduced yield gaps between organic and conventional production suggests that organic producers should consider agricultural diversification. These findings are inconsistent with some previous studies on conventional agriculture. However, Bravo-Ureta et al. (2007) showed that for both developed and developing countries, animal pro-duction enterprises posted higher MTE, while Thiam et al. (2001) found a neutral effect of products on MTE.
The results for CAMERICA and NAMERICA imply MTE of organic production in these regions are lower than those in
Africa. Thus differences in climatic conditions may explain the differences in MTE. However, production practices for specific products captured for countries (regions) in the metadata may be important. Certified organic production is certainly more developed in the US than in Africa. However, as noted by Paull (2008; 2013a, b), uncertified organic pro-duction predates recent certifications. In Ghana for example, many cocoa farmers have relied on no-chemical production for so long and are essentially de facto organic produc-ers (Afari-Sefa et al., 2010). Thus, application of certified organic practices should not be that difficult to implement. The literature on CA has shown that largely Africa has pro-duced lower MTEs compared to other regions, especially North America and Europe.
The statistical insignificance of the parameters of JOUR-NAL implies indifference between MTEs from studies pub-lished in journals and those in sources other than journals. These points to statistical parity in estimated MTE of organic agricultural operations. The finding of this study is however inconsistent with that of Ogundari (2014) who showed that studies published as journal articles showed higher MTE than those presented in working papers, conference proceed-ings and theses. Organic agriculture MTEs are indistinguish-able based on the quality of journals in which it is published. Unlike publishing outlet, the findings of organic agriculture are consistent with those of conventional agriculture (Ogun-dari, 2014).
ConclusionsThe study examined the variations in MTE estimates in
organic agriculture and the factors that explain the observed variations using fractional regression modelling. The meta-data consisting of 42 studies and 109 observations revealed TE, on average, which did not increase overtime. The non-increasing MTE over time implies efforts at developing OA have not reflected positively on global MTE on average. Generally, there is a need to re-invigorate efforts at increas-ing productivity of organic inputs. Specifically, further improvements in more responsive breeding stock and plant-ing materials, increased availability and use of more diverse fertilising materials and crop protection products would be needed. While stakeholders’ support is important in this direction for crops in particular, special attention should be given to fruits and vegetables, other horticultural crops and permanent crops.
The numbers of factors that account for variability in the MTEs vary for OA compared to CA while in some cases they influence MTEs in similar fashion. To further eluci-date the findings of this article, more individual country TE meta-analyses in agriculture and specifically for OA and those that assess the role of distance functions and returns-to-scale on MTE would be useful. While policy makers may discriminate between journal and other sources on the one hand and between ‘quality’ journals and ‘non-quality’ journals on the other, the results for technical efficiency are unlikely to be different since MTEs from studies published in journals and those in sources other than journals do not differ statistically.

Technical efficiency of organic agriculture: a quantitative review
9
ReferencesAfari-Sefa, V.S., Gockowski, J., Agyeman, N.F. and Dziwornu,
A.K. (2010): Economic cost-benefit analysis of certified sus-tainable cocoa production in Ghana, in Proceedings of the 3rd African Association of Agricultural Economists (AAAE) and 48th Agricultural Economists Association of South Africa (AE-ASA) Conference, 19-23.
Alkahtani, S.H. and Elhendy, A.M. (2012): Organic and conven-tional date farm efficiency estimation, and its determents at Ri-yadh province, Kingdom of Saudi Arabia, in C.S. Brebbia and T.-S. Chon (eds), Environmental Impact. Ashurst, UK: WIT Press, 219-230. http://dx.doi.org/10.2495/eid120201
Alston, J.M., Maandrra, M.C., Pardey P.G. and Wyatt, T.J. (2000): Research returns redux: A meta-analysis of the re-turns to agricultural R&D. The Australian Journal of Agricul-tural and Resource Economics 44 (2): 185-215. http://dx.doi.org/10.1111/1467-8489.00107
Arandia, A. and Aldanondo-Ochoa, A. (2008): Social versus private efficiency: A comparison of conventional and organic farming systems in vineyard production. Paper presented at the EAAE International Congress, Gent, Belgium, 26-29 August 2008.
Artukoglu, M.M., Olgun, A. and Adanacıoglu, H. (2010): The ef-ficiency analysis of organic and conventional olive farms: Case of Turkey. Agricultural Economics (Czech) 56, 89-96.
Bayramoglu, Z. and Gundogmus, E. (2008): Cost efficiency on organic farming: A comparison between organic and conven-tional raisin-producing households in Turkey. Spanish Journal of Agricultural Research 6, 3-11. http://dx.doi.org/10.5424/sjar/2008061-289
Beltrán-Esteve, M. and Reig-Martínez, E. (2014): Comparing conventional and organic citrus grower efficiency in Spain. Agricultural Systems 129, 115-123. http://dx.doi.org/10.1016/j.agsy.2014.05.014
Bouagnimbeck, H. (2013): Latest developments in organic farming in Africa, in H. Willer, J. Lernoud and L. Kilcher (eds), The World of Organic Agriculture: Statistics and Emerging Trends 2013. Frick, Switzerland: FiBL and Bonn: IFOAM, 164-168.
Bravo-Ureta, B.E., Solís, D., López, V.H.M., Maripani, J.F., Thiam, A. and Rivas, T. (2007): Technical efficiency in farming: A meta-regression analysis. Journal of Productivity Analysis 27, 57-72. http://dx.doi.org/10.1007/s11123-006-0025-3
Breustedt, G., Tiedemann, T. and Latacz-Lohman, U. (2009): What is my optimal technology? A metafrontier approach using Data Envelopment Analysis for the choice between conventional and organic farming. Paper presented at the IAAE Conference, Bei-jing, China, 16-22 August 2009.
Charyulu, D.K. and Biswas, S. (2010): Economics and efficiency of organic farming vis-à-vis conventional farming in India. W.P. No. 2010-04-03. Ahmedabad: Indian Institute of Management.
Chen, Y., Xin, J., Zhang, X., Zhao, J. and Chien, H. (2012): Evolu-tion of technical efficiency scores from conventional to organic production: a case study of China’s paddy rice farmers in Wu-chang City. Journal of Organic Systems 7, 20-29.
Cisilino, F. and Madau, F.A. (2007): Organic and Conventional Farming: a Comparison Analysis through the Italian FADN. Paper presented at the I Mediterranean Conference of Agro-Food Social Scientists. 103rd EAAE Seminar ‘Adding Value to the Agro-Food Supply Chain in the Future Euromediterranean Space’. Barcelona, Spain, 23-25 April 2007.
Davidson, R. and MacKinnon, J.G. (1981): Several tests for model specification in the presence of alternative hypotheses. Econo-metrica, 49, 781-793. http://dx.doi.org/10.2307/1911522
Elhendy, A.M., and Alkahtani, S.H. (2013): The resource use effi-ciency of conventional and organic date farms in Saudi Arabia: a Data Envelopment Analysis approach. Journal of Animal and
Plant Sciences 23, 596-602.Espey, M., Espey, J. and Shaw, W.D. (1997): Price elasticity of resi-
dential demand for water: A meta-analysis. Water Resources Re-search 33, 1369-1374. http://dx.doi.org/10.1029/97WR00571
FAO (2015) Organic agriculture: What is behind an organic label? [www document]. http://www.fao.org/organicag/oa-faq/oa-faq3/en/ (Accessed 14 July 2015).
Farrell, M.J. (1957): The measurement of productive efficiency. Journal of the Royal Statistical Society. Series A (General) 120, 253-290. http://dx.doi.org/10.2307/2343100
González, C.A.Z. (2011): Technical efficiency of organic fertilizer in small farms of Nicaragua: 1998-2005. African Journal of Business Management 5, 967-973.
Greene, W.H. (1993): The econometric approach to efficiency analysis, in H.O. Fried, C.A.K. Lovell and S.S. Schmidt (eds), The Measurement of Productive Efficiency: Techniques and Applications. Oxford: Oxford University Press, 68-119.
Guesmi, B., Serra, T., Radwan, R. and Gil, J.M. (2014): Efficiency of Egyptian Organic Agriculture: a Local Maximum Likelihood Approach. Paper presented at the EAAE Congress ‘Agri-Food and Rural Innovations for Healthier Societies’, Ljubljana, Slo-venia, 26-29 August 2014.
Guesmi, B., Serra, T., Kallas, Z. and Gil Roig, J.M. (2012): The productive efficiency of organic farming: The case of grape sector in Catalonia. Spanish Journal of Agricultural Research 10, 552-566. http://dx.doi.org/10.5424/sjar/2012103-462-11
Hunter, J.E., and Schmidt, F.L. (1990): Dichotomization of con-tinuous variables: The implications for meta-analysis. Jour-nal of Applied Psychology 75 (3), 334-349. http://dx.doi.org/10.1037/0021-9010.75.3.334
IFOAM (no date): Principles of Organic Agriculture. Bonn: IFOAM.IFOAM (2015): Definition of organic agriculture [www docu-
ment]. http://www.ifoam.bio/en/organic-landmarks/definition-organic-agriculture (Accessed 14 July 2015).
Iliyasu, A., Mohamed, Z.A., Ismail, M.M. and Abdullah, A.M. (2014): A meta-analysis of technical efficiency in aquaculture. Journal of Applied Aquaculture 26, 329-339. http://dx.doi.org/10.1080/10454438.2014.959829
Jarrell, S.B. and Stanley, T.D. (1990): A meta-analysis of the union-nonunion wage gap. Industrial and Labour Relations Review 44, 54-67. http://dx.doi.org/10.1177/001979399004400104
Jayasinghe, J.M.J.K. and Toyoda, T. (2004): Technical efficiency of organic tea smallholding sector in Sri Lanka: a stochastic fron-tier analysis. International Journal of Agricultural Resources, Governance and Ecology 3, 252-265. http://dx.doi.org/10.1504/IJARGE.2004.006039
Karagiannias, G., Salhofer K. and Sinabell F. (2006): Technical ef-ficiency of conventional and organic farms: Some evidence for milk production. 16th Annual Meeting of the Austrian Society of Agricultural Economics: ‘Rural Businesses and Agricultural Economics on New Paths’, Wien, Austria, 28-29 September 2006.
Karagiannias, G., Salhofer, K. and Sinabell, F. (2012): Scale ef-ficiency in organic and conventional dairy farming. Paper pre-sented at the First Italian Association of Agricultural and Ap-plied Economics Congress, Trento, Italy, 4-5 June 2012.
Kramol, P., Villano, R., Kristiansen, P. and Fleming, E. (2015): Productivity differences between organic and other vegetable farming systems in northern Thailand. Renewable Agriculture and Food Systems 30 (2), 154-169. http://dx.doi.org/10.1017/S1742170513000288
Kumbhakar, S.C., Tsionas, E.G. and Sipiläinen, T. (2009): Joint es-timation of technology choice and technical efficiency: an ap-plication to organic and conventional dairy farming. Journal of Productivity Analysis 31, 151-161. http://dx.doi.org/10.1007/s11123-008-0081-y

Justice G. Djokoto
10
Lakner, S. (2009): Technical efficiency of organic milk-farms in Germany – The role of subsidies and of regional factors. Pa-per presented at the IAAE Conference, Beijing, China, 16-22 August 2009.
Lakner, S., Kirchweger, S., Hoop, D., Brümmer, B. and Kantel-hardt, J. (2014): Technical Efficiency of Organic Farming in the Alpine Region – the Impact of Farm Structures and Policies. Paper presented at the EAAE Congress ‘Agri-Food and Rural Innovations for Healthier Societies’, Ljubljana, Slovenia, 26-29 August 2014.
Lakner, S., von Cramon-Taubadel, S. and Brümmer, B. (2012): Technical efficiency of organic pasture farming in Germany: The role of location economics and of specific knowledge. Journal for Renewable Agriculture and Food Systems 27, 228-241. http://dx.doi.org/10.1017/S1742170511000330
Larsen, K. and Foster, K. (2005): Technical efficiency among or-ganic and conventional farms in Sweden 2000-2002: A coun-terfactual and self-selection analysis. Paper presented at the American Agricultural Economics Association Annual Meet-ing, Providence RI, 24-27 July 2005.
Latruffe, L. and Nauges, C. (2014): Technical efficiency and conversion to organic farming: the case of France. European Review of Agricultural Economics 41, 227-253. http://dx.doi.org/10.1093/erae/jbt024
Lohr, L. and Park, T. (2010): Local Selling Decisions and the Tech-nical Efficiency of Organic Farms. Sustainability 2, 189-203. http://dx.doi.org/10.3390/su2010189
Lohr, L. and Park, T.A. (2006): Technical efficiency of US organic farmers: The complementary roles of soil management tech-niques and farm experience. Agricultural and Resource Eco-nomics Review 35, 327-338.
Lohr, L. and Park, T.A. (2007): Efficiency analysis for organic ag-ricultural producers: The role of soil-improving inputs. Jour-nal of Environmental Management 83, 25-33. http://dx.doi.org/10.1016/j.jenvman.2006.01.001
Madau, F.A. (2007): Technical efficiency in organic and conven-tional farming: Evidence from Italian cereal farms. Agricultural Economics Review 8, 5-21.
Mayen, C.D., Balagtas, J.V. and Alexander, C.E. (2010): Technolo-gy adoption and technical efficiency: Organic and conventional dairy farms in the United States. American Journal of Agricul-tural Economics 92, 181-195. http://dx.doi.org/10.1093/ajae/aap018
Moreira López, V.H. and Bravo-Ureta, B.E. (2009): A study of dairy farm technical efficiency using meta-regression: An international perspective. Chilean Journal of Agricul-tural Research 69, 214-223. http://dx.doi.org/10.4067/S0718-58392009000200011
Nastis, S.A., Papanagiotou, E. and Zamanidis, S. (2012): Produc-tive efficiency of subsidized organic alfalfa farms. Journal of Agricultural and Resource Economics 37 (2), 280-288.
Nelson, J.P. and Kennedy, P.E. (2009): The use (and abuse) of meta-analysis in environmental and natural resource economics: an assessment. Environmental and Resource Economics 42 (3), 345-377. http://dx.doi.org/10.1007/s10640-008-9253-5
Ogundari, K. (2014): The paradigm of agricultural efficiency and its implication on food security in Africa: What does meta-analysis reveal? World Development 64, 690-702. http://dx.doi.org/10.1016/j.worlddev.2014.07.005
Ogundari, K. and Brummer, B. (2011): Technical efficiency of Ni-gerian agriculture: A meta-regression analysis. Outlook on Ag-riculture 40, 171-180. http://dx.doi.org/10.5367/oa.2011.0038
Onumah, J.A., Onumah, E.E., Al-Hassan, R.M. and Brümmer, B. (2013): Meta-frontier analysis of organic and conventional co-coa production in Ghana. Agricultural Economics (Czech) 59, 271-280.
Oude Lansink, A., Pietola, K. and Bäckman, S. (2002): Efficiency and productivity of conventional and organic farms in Finland 1994-1997. European Review of Agricultural Economics 29, 51-65. http://dx.doi.org/10.1093/erae/29.1.51
Papke, L.E. and Wooldridge, J.M. (1996): Econometric meth-ods for fractional response variables with an application to 401(k) plan participation rates. Journal of Applied Eco-nomics 11, 619-632. http://dx.doi.org/10.1002/(SICI)1099-1255(199611)11:6<619::AID-JAE418>3.0.CO;2-1
Park, T.A. and Lohr, L. (2010): Assessing the Technical and Alloca-tive Efficiency of U.S. Organic Producers. Journal of Agricul-tural and Applied Economics 42, 247-259.
Paull, J. (2008): The lost history of organic farming in Australia. Journal of Organic Systems, 3, 2-17.
Paull, J. (2010): From France to the World: The International Fed-eration of Organic Agriculture Movements (IFOAM). Journal of Social Research and Policy 1, 93-102.
Paull, J. (2013a): Editorial: The organics iceberg and the tyranny of organic certification. Journal of Organic Systems 8 (2), 2-5.
Paull, J. (2013b): A history of the organic agriculture movement in Australia, in B. Mascitelli and A. Lobo (eds), Organics in the Global Food Chain. Ballarat, Australia: Connor Court Publish-ing, 37-60.
Pechrová, M. and Vlašicová, E. (2013). Technical Efficiency of Organic and Biodynamic Farms in the Czech Republic. Agris on-line Papers in Economics and Informatics 5, 143-152.
Ponisio, L.C., M’Gonigle, L.K., Mace, K.C., Palomino, J., de Valpine, P. and Kremen, C. (2015): Diversification practices reduce organic to conventional yield gap. Proceedings of the Royal Society of London B: Biological Sciences 282 (1799), 20141396.
POST (2006): Food security in developing countries, postnote no. 274. London: Parliamentary Office of Science and Technology.
Poudel, K.L., Yamamoto, N. and Sugimoto, Y. (2011): Comparing technical efficiency of organic and conventional coffee farms in Nepal using data envelopment analysis (DEA) approach. Paper presented at the 85th Annual Conference of the Agricultural Economics Society, Coventry, UK, 18‐20 April 2011.
Ramalho, E.A., Ramalho, J.J.S. and Henriques, P.D. (2010): Frac-tional regression models for second stage DEA efficiency analyses. Journal of Productivity Analysis 34, 239-255. http://dx.doi.org/10.1007/s11123-010-0184-0
Ramalho, E.A., Ramalho, J.J. and Murteira, J.M. (2011): Alterna-tive estimating and testing empirical strategies for fractional regression models. Journal of Economic Surveys 25, 19-68. http://dx.doi.org/10.1111/j.1467-6419.2009.00602.x
Ramesh, P., Singh, M. and Rao, A.S. (2005): Organic farming: Its relevance to the Indian context. Current Science 88, 561-568.
Serra, T. and Goodwin, B.K. (2009): The efficiency of Spanish ar-able crop organic farms, a local maximum likelihood approach. Journal of Productivity Analysis 31 (2), 113-124. http://dx.doi.org/10.1007/s11123-008-0124-4
Sipiläinen, T., Marklund, P.-O. and Huhtala, A. (2008): Efficiency in agricultural production of biodiversity: Organic vs. conven-tional practices. Paper presented at the 107th EAAE Seminar ‘Modeling of Agricultural and Rural Development Policies’, Sevilla, Spain, 29 January - 1 February 2008.
Songsrirote, N. and Singhapreecha, C. (2007): Technical efficiency and its determinants on conventional and certified organic yas-mine rice farms in Yosothon Province. Thammasat Economic Journal 25, 96-133.
Stanley, T.D. (2008): Meta‐regression methods for detecting and estimating empirical effects in the presence of publication selec-tion. Oxford Bulletin of Economics and Statistics 70, 103-127.
Sterne, J.A.C. (2009): Meta-analysis in Stata: An updated collec-tion from the Stata journal. College Station TX: Stata Press.

Technical efficiency of organic agriculture: a quantitative review
11
Tzouvelekas, V., Pantzios, C.J. and Fotopoulos, C. (2001a): Eco-nomic efficiency in organic farming: evidence from cotton farms in Viotia, Greece. Journal of Agricultural and Applied Economics 33, 35-48.
Tzouvelekas, V., Pantzios, C.J. and Fotopoulos, C. (2001b): Techni-cal efficiency of alternative farming systems: the case of Greek organic and conventional olive-growing farms. Food Policy 26, 549-569. http://dx.doi.org/10.1016/S0306-9192(01)00007-0
Tzouvelekas, V., Pantzios, C.J. and Fotopoulos, C. (2002a): Empir-ical evidence of technical efficiency levels in Greek organic and conventional farms. Agricultural Economics Review 3, 49-60.
Tzouvelekas, V., Pantzios, C.J. and Fotopoulos, C. (2002b): Meas-uring multiple and single factor technical efficiency in organic farming: The case of Greek wheat farms. British Food Journal 104, 591-609. http://dx.doi.org/10.1108/00070700210425967
Thiam, A., Bravo‐Ureta, B.E. and Rivas, T.E. (2001): Techni-cal efficiency in developing country agriculture: A meta‐analysis. Agricultural Economics 25, 235-243. http://dx.doi.org/10.1111/j.1574-0862.2001.tb00204.x
Tiedemann, T., and Latacz‐Lohmann, U. (2013): Production risk and technical efficiency in organic and conventional agricul-ture – the case of arable farms in Germany. Journal of Agri-cultural Economics 64, 73-96. http://dx.doi.org/10.1111/j.1477-9552.2012.00364.x
Toro-Mujica, P., García, A., Gómez-Castro, A.G., Acero, R., Perea, J., Rodríguez-Estévez, V. and Vera, R. (2011): Technical effi-ciency and viability of organic dairy sheep farming systems in a traditional area for sheep production in Spain. Small Ruminant Research 100, 89-95. http://dx.doi.org/10.1016/j.smallrum-res.2011.06.008
Related Documents