Technical Committee - 12 September 2018 Attachments 7.0. Presentations........................................................................................................2 7.0.1. YEPT Science Advisor report to ORC & OM Aug 2018.....................................2 8.1. Minutes.................................................................................................................5 8.1.1. Minutes of Technical Committee 1 Aug 2018....................................................5 11.2. State of the Environment: Surface Water Quality in Otago (2006-2017)..........11 11.2.1. State of the Environment Surface Water Quality in Otago............................11 11.2.2. 2018 Updated SoE 6 A tables RO version..................................................249

Welcome message from author
This document is posted to help you gain knowledge. Please leave a comment to let me know what you think about it! Share it to your friends and learn new things together.
Transcript

Technical Committee - 12 September 2018 Attachments
7.0. Presentations........................................................................................................2
7.0.1. YEPT Science Advisor report to ORC & OM Aug 2018.....................................2
8.1. Minutes.................................................................................................................5
8.1.1. Minutes of Technical Committee 1 Aug 2018....................................................5
11.2. State of the Environment: Surface Water Quality in Otago (2006-2017)..........11
11.2.1. State of the Environment Surface Water Quality in Otago............................11
11.2.2. 2018 Updated SoE 6 A tables RO version..................................................249

August 2018
Quarterly report to Otago Regional Council and Otago Museum
Trudi Webster, Conservation Science Advisor, Yellow-eyed Penguin Trust
Key activities:
1. Research particularly around marine and terrestrial impacts on hoiho. 2. Monitoring and delivery of optimal species management. 3. Informing relevant policy and submissions. 4. Scientific representation in different forums. 5. Specific Otago Museum related tasks. 6. Other relevant science activities. 7. Public and media relations. 8. Building relationships with key stakeholders and visiting key sites.
1. Research
• Extensive use of the literature review (“The Pathway ahead for hoiho Te ara whakamua”) detailing terrestrial and marine threats to further research objectives and recommendations.
• Continued research into mosquito monitoring (larvae and adults); and control and prevention options (including disruption of habitat, exclusion/deterrence, or direct targeting). Site visits to Otapahi and Okia Reserves to examine habitat and sample pools for mosquito larvae.
• Further research planned using the multibeam echosounder (MBES) to map benthic habitat off Otago Peninsula within the foraging range of hoiho in collaboration with University of Otago’s School of Surveying and Marine Science.
• A long-term collaboration with Otago Polytechnic continues and progress has been made on development of a station for the remote monitoring and weighing of hoiho. This project has been selected as a finalist for the NZ Design Institute Best Awards.
• A summary of set net mitigation options and their likely effectiveness for hoiho has been produced, based on a full report on mitigation options for Southern Seabird Solutions.
• Craig MacDonnell (Surveying Dept, University of Otago) has completed analysis of drone surveys of Okia Reserve. Modelling has been carried out to look at future sensitivity of the reserve to various sea level change projections.
• Contribute to Penguin Research Group meetings at the Zoology Department, University of Otago led by Prof. Phil Seddon and Assoc. Prof. Yolanda van Heezik.
• Liaison with students and facilitation of aspects of their various research projects: o Emily Tidey (Surveying, Otago) – benthic habitat. o Kathryn Johnson (Massey) – barracouta injuries in hoiho. o Ian McDowall (Product Design, Otago Polytechnic) – remote monitoring system. o Hannah Mello (Marine Science, Otago) – bryozoans. o Craig MacDonnell (Surveying, Otago) – drone imaging. o Mel Young (Zoology, Otago) – diet and foraging.
• Collaboration with Dr Mark Payne, Technical University in Denmark and analysis of remote sensing data (particularly sea surface temperature) continues.
2. Monitoring and optimal species management
• A document highlighting critical disease issues and emphasizing management options was refined based on feedback from stakeholders, and was used as the basis of a technical meeting.
• Continued revision of the management response (alongside DOC) for diphtheritic stomatitis ahead of next season. A protocol for dealing with diphtheria details experience and training, monitoring, assessment, treatment and data collection. Two different treatment options are recommended - antibiotics and/or lesion removal depending on operational capability.
• Development of an action plan for malaria to prepare for future events (particularly given the likelihood of increased events due to climate change). A new plan comprises four main parts: environment and vector monitoring, mosquito prevention, monitoring / screening of birds, and treatment (prophylactic and infection).
• Development of an unexplained mortality response plan which is split into different levels of response based on the severity of the event. Level 1 is a small-scale event involving few birds, level 2 is a medium-scale event where necropsy results have been confirmed, and level 3 is a large scale event involving multiple birds in a defined area. The plan includes coordinated habitat searches, communication, defined roles and responsibilities, media response, data collection, testing of birds and the environment, and follow-up analysis / debrief.
• Preparation for the upcoming field season includes planning for monitoring and conservation management work at different locations (Otago, Catlins and Rakiura) and funding applications.
• Ongoing advice on monitoring and species management and support to various organisations.
3. Policy, permits and submissions
• Attendance at a joint strategic direction workshop for the Hoiho Governance Group and Hoiho Technical Group to discuss vision and objectives.
• Work with DOC, MPI and TRoNT to prioritise immediate conservation management and research recommendations to be achieved this season (Interim Action Plan for 2018/19) and develop a longer term Hoiho Threat Management and Recovery Plan mandated under the Fisheries and Conservation Acts.
• Attendance at a DOC Conservation Services Programme workshop to discuss the indirect effects of fishing on hoiho including benthic degradation and competition effects.
• Continued liaison with fishing industry representatives and liaison officers, Fisheries NZ and local fishermen. A group has been established (“collective wisdom”) to understand risks to hoiho and discuss options for mitigating risk from set-net fisheries.
• Feedback provided on this year’s CSP annual plan which includes a project on hoiho population and tracking, observing commercial fisheries and identification of seabirds.
4. Scientific representation in different forums
• Member of the Hoiho Technical Group tasked with developing a recovery plan for hoiho. Membership of the group spans four organisations: MPI, DOC, TRoNT & YEPT.
• Representation of the Trust at the Conservation Services Programme technical working group. • Attendance at the NZ Federation of Commercial Fishermen conference and presentation on
“YEPT and working with industry”. • Attendance at the Birds NZ conference and presentation on “Characterisation of benthic
foraging habitat for hoiho”. Joint authorship with Emily Tidey (Surveying, University of Otago). • Revised Oamaru Penguin symposium abstract for inclusion in the NZ Journal of Zoology.

• Presentation on hoiho lifecycle, distribution, abundance and threats at the fisheries liaison group meeting.
• Presentation at the YEP symposium “Disease in hoiho and preparation for future events” • Scientific input at various conservation management forums (e.g. DOC, YEPT Conservation
management committee). • Collaboration with researchers (University of Otago, Massey University, Otago Polytechnic). • Continued liaison with vets at Massey, DOC, Dunedin Wildlife Hospital and rehab groups. • Membership of the Australasian Seabird Group, Ornithological Society of New Zealand and
World Seabird Union.
5. Specific Otago Museum related tasks
• Identification guide created for the common penguin species in New Zealand. • Information provided for the OM annual report. • Hoiho advocacy mount used by the Trust sent for conservation treatment. • Historical data and papers on hoiho donated by John Darby with permission for future use.
6. Other science related activities
• Simultaneous Otago Canyon bird surveys and habitat / prey mapping using NIWAs fish stock assessment echosounder and the University of Otago’s multibeam echosounder.
• Analysis has been completed by Matt Desmond (University of Otago/TRoNT) which examines benthic habitat off YEPTs Tavora reserve using the multibeam echosounder.
• Presentation at NZ Marine Sciences Society: Rayment, Lalas, Loh, Parker, Rexer-Huber & Webster. Seasonal variation in diversity & distribution of seabirds over the Otago canyons
7. Public and media relations
• Contributions to social media posts. • Interview with the ODT about southern right whales around Otago.
8. Stakeholders and site visits
• Building and establishing relationships with the YEP community and wider conservation and science communities. New stakeholder contacts:
o Southern Monitoring Services Ltd o Mosquito Consulting Services Ltd o Department of Conservation o Fisheries New Zealand (Ministry for Primary Industries) o Te Rūnanga o Ngāi Tahu o Fisheries Inshore New Zealand o Fishermen
• Continued site visits to YEPT reserves, and other relevant locations. New locations include: o Wildbase, Massey University

Technical Committee - 1 August 2018 Page 1 of 6
Minutes of a meeting of the Technical Committee held in the ORC Council Chambers at Philip Laing House,
Dunedin on Wednesday 1 August 2018, commencing at 1:31 pm
1. APOLOGIESNo apologies were advised.
2. LEAVE OF ABSENCENo leave of absence was advised.
3. ATTENDANCE
MembershipCr Andrew Noone (Chairperson)Cr Ella Lawton (Deputy Chairperson)Cr Graeme BellCr Doug BrownCr Michael DeakerCr Carmen HopeCr Trevor KemptonCr Michael LawsCr Sam NeillCr Gretchen RobertsonCr Bryan ScottCr Stephen Woodhead
WelcomeCr Noone welcomed Councillors, media, members of the public and staff to the meeting.
Sarah Gardner (Chief Executive)Nick Donnelly (Director Corporate Services)Tanya Winter (Director Policy, Planning and Resource Management)Michele Poole (Acting Director Stakeholder Engagement)Gavin Palmer (Director Engineering, Hazards and Science)Scott MacLean (Director Environmental Monitoring and Operations)Sally Giddens (Director People and Safety)Ian McCabe (Executive Officer)Lauren McDonald (Committee Secretary) Staff in attendanceChris Valentine (Manager Engineering) - Item 11.1Jean-Luc Payan (Acting Manager Science) - Item 11.1Sharon Hornblow (Natural Hazards Analyst) - Item 11.1Frederika Mourot (Groundwater Scientist) Item 11.2

Technical Committee - 1 August 2018 Page 2 of 6
4. CONFIRMATION OF AGENDA
Resolution
That Item 11.2 - Lower Waitaki Plains Aquifer report to be taken as first item following on the agenda following Public Forum
Moved: Cr NooneSeconded: Cr HopeCARRIED
5. CONFLICT OF INTERESTNo conflicts of interest were advised.
6. PUBLIC FORUM
Lower Waitaki Plains Aquifer Report
Speaker - Bridget Irving (Counsel) Lower Waitaki Irrigation Company. In attendance: Richard Plunket, Elizabeth Soal and John Borrie.
Ms Irving advised the comments on the Lower Waitaki Plains Aquifer report (Item 11.2 of the agenda) were preliminary until the report was able to be comprehensively reviewed.
She outlined the concerns as:
the report not addressing what the environmental consequence of increasing nitrogen level as it moves down the aquifer
do not believe there were any significant surface water bodies adversely affected, i.e. nitrates in drinking water.
E. coli in drinking water not addressed through the existing Plan Change 6A framework/rules.
further discussion with Council needed regarding the regulatory framework for nitrogen levels and potential sources of E. coli
Ms Irving responded to points of clarification from councillors.
Public Forum concluded at 1:46 pm.
7. PRESENTATIONSNo presentations were held.
Technical Committee - 1 August 2018 Page 3 of 6
8. CONFIRMATION OF MINUTES
Resolution
That the minutes of the meeting held on 13 June 2018 be received and confirmed as a true and accurate record.
Moved: Cr HopeSeconded: Cr KemptonCARRIED
9. ACTIONS (Status report on the resolutions of the Technical Committee)No current items for action.
10. MATTERS FOR COUNCIL DECISIONNil
11. MATTERS FOR NOTING
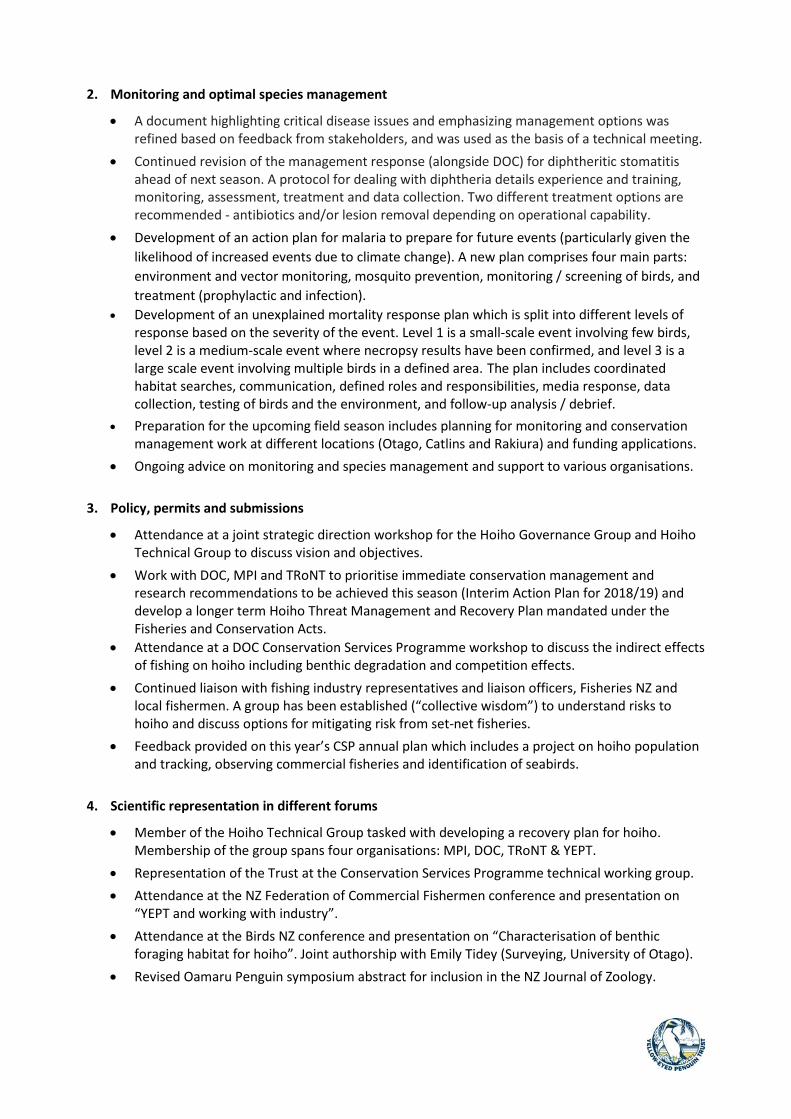
11.2. Lower Waitaki Plains Aquifer
In attendance: Ms Frederika Mourot (Groundwater Scientist, GNS Science), Dr Jean-Luc Payan (Acting Manager Resource Science).
The report provided an overview of the 18-month qualitative investigation for the Lower Waitaki Plains Aquifer, to provide guidance on nutrient management. The technical report highlighted the outcomes of the groundwater quality monitoring and analysis.
Ms Mourot provided comment on the overall report and advised the nitrate trends were not included in the report but that statistical testing had been completed to confirm the trend as stable. She advised the report focused on water quality (nitrogen concentrations and E. coli) and confirmed the concentrations of nitrates had stabilised but that E. coli levels had frequently exceeded the allowable level in Drinking Water Standards. She commented on the need for better understanding of the connection of the water bodies through monitoring.
Dr Payan provided an overview of the conclusions of the report and advised further studies would be required to progress the knowledge on the aquifer (especially for nitrogen and E. coli sources). Mrs Gardener confirmed it was Council's role to protect drinking water quality at source and that in the correspondence with the community advice had been provided on bore maintenance.
Discussion was held on the consequences of the nitrate levels in the aquifer, compliance monitoring and working with the community to address the water quality issues in the Lower Waitaki Plains.
Technical Committee - 1 August 2018 Page 4 of 6
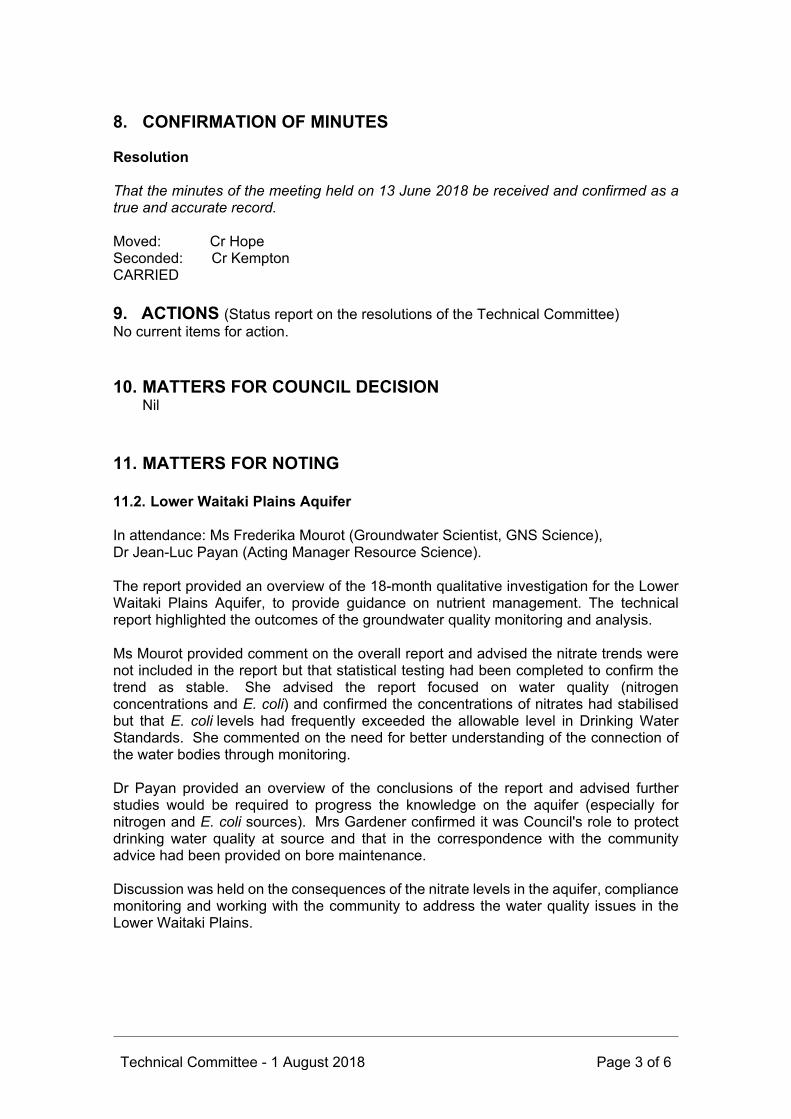
Resolution
1. This report be received;2. The findings presented in the report "Lower Waitaki Plains Aquifer Summary of the
Groundwater Quality Monitoring (July 2016 - January 2018)" be noted.
Moved: Cr WoodheadSeconded: Cr BrownCARRIED
Resolution
That the meeting be adjourned at 2:06 pm.
Moved: Cr NooneSeconded: Cr NeillCARRIED
11.1. Director's Report on Progress
The meeting reconvened at 3:09 pm.
The report detailed the study on the time incursion of Lindavia intermedia (lake snow), Leith Flood Protection Scheme, air quality monitors, Central Otago Stock Truck Effluent Sites (STEDs) and the Rees Dart River natural hazards.
A request was made for an invitation to be extended to councillors to attend the next Lake Snow experts workshop as observers. Discussion held on the PM2.5 air quality monitoring and how measurements recorded.
Resolution
That the report be noted.
Moved: Cr HopeSeconded: Cr LawtonCARRIED

Technical Committee - 1 August 2018 Page 5 of 6
11.3. Lake Hayes RestorationThe report outlined the development of the ORC programme to improve the water quality in Lake Hayes, which suffers from periodic algal blooms caused by accumulated phosphorous in lake bed sediments. The two components to work noted as; improving the quality of water entering Lake Hayes from Mill Creek and addressing the historic accumulation of nutrients in lake sediments. Dr Palmer advised the tabled report focused on the second aspect of the remediation programme for Lake Hayes with three intervention options identified by ORC to address the water quality problems attributable to legacy nutrients within lake sediments.
Discussion was held on the staff recommendations of the three remediation options identified:
1. Augment inflow to the lake with water from the Arrow irrigation scheme (flushing)
2. Cap and bind the phosphorus in the bed sediments (capping)3. Enhance vertical mixing of the water column to prevent development of
unmixed layers of water and anoxic conditions (destratification)
A motion was tabled to replace staff recommendation b) of the report for "Council to approve public consultation on the three outlined remediation options".
That staff develop options for consideration by Council on the remediation of Lake Hayes including a comprehensive description and assessment of benefits effectiveness, precedents risks, costs, implementation and timelines and funding.
A request was made for the Friends of Lake Hayes (FOLH) to be kept informed in regard to the remediation options being considered. Dr Palmer confirmed he would provide the report recommendations to FOLH.
A concern was expressed that the Castalia Report on Lakes Hayes was a very technical report and needed to be re-framed for public consumption.
Resolution
That the consultant report by Castalia be re-framed into a more public intelligible document.
Moved: Cr LawsSeconded: Cr HopeCARRIED

Technical Committee - 1 August 2018 Page 6 of 6
Resolution
a) This report is received and noted.b) That staff develop options for consideration by Council on the remediation of Lake
Hayes including a comprehensive description and assessment of benefits effectiveness, precedents risks, costs, implementation and timelines and funding.
.Moved: Cr DeakerSeconded: Cr LawtonCARRIED
12. NOTICES OF MOTIONNo Notices of Motion were advised.
13. CLOSURE
The meeting was declared closed at 3:37 pm.
Chairperson

State of the Environment Surface Water Quality in Otago
2006 to 2017
Manuherikia River at Ophir Catlins River at Houipapa
Dunstan Creek at Beattie Road Kakanui River at Clifton Falls

Otago Regional Council
Private Bag 1954, Dunedin 9054
70 Stafford Street, Dunedin 9016
Phone 03 474 0827
Fax 03 479 0015
Freephone 0800 474 082
www.orc.govt.nz
© Copyright for this publication is held by the Otago Regional Council. This publication may be
reproduced in whole or in part, provided the source is fully and clearly acknowledged.
ISBN [get from Comms Team]
Report writer: Adam Uytendaal; Rachel Ozanne, Resource Scientists
Reviewed by: Dean Olsen, Manager, Resource Science
Published

State of the Environment – Surface Water Quality in Otago 2006 to 2017 i
Executive summary
This report summarises compliance with Schedule 15 of the Regional Plan: Water for Otago (Water
Plan), National Policy Statement for Freshwater Management 2014 (NPS-FM 2014) National Objectives
Framework (NOF) attribute bands, and state and trends of water quality across Otago Regional
Council’s State of Environment (SoE) lake, river and stream monitoring sites for the period July 2006
to June 2017.
SoE surface water quality reporting helps identify areas in Otago where land-use and land management
practices are putting pressure on water quality and river ecosystem health.
The report provides a detailed review of water quality state and trends across the region and is an
update on the 5-yearly report that covered the period 2006 to 2011 (Ozanne, 2012).
The report has been split into ‘water quality reporting regions’ that follow logical catchment and
geographical boundaries and align closely with Schedule 15 (Water Plan) Receiving Water Group water
management zones. The reporting regions include:
• North Otago;
• Dunedin / Southern Coastal;
• Taieri;
• Upper Clutha;
• Middle Clutha / Central Otago;
• Lower Clutha / Pomahaka;
• Otago Lakes.
To best represent current conditions, state analysis is based on water quality samples collected over a
five year period running from July 2012 to June 2017. Trend analysis was carried out on data collected
over an eleven year period running July 2006 to June 2017. An eleven year period was required to
provide adequate data for robust trend analysis.
Up to June 2013, Otago Regional Council (ORC) collected surface water quality samples on a bi-monthly
basis. From July 2013, sampling frequency increased to monthly sampling in line with current good
practice approaches to routine water quality sampling in New Zealand.
Long-term SoE lake monitoring sites consist of a mix of lake-outlet (lakes Wanaka, Wakatipu and
Hawea) and lake-shore (lakes Dunstan, Johnson, Onslow, Waihola and Tuakitoto) sampling sites. More
detailed lake monitoring occurs at a subset of these lakes as part of ORC’s Trophic Lake Sampling
Program. The results of the Trophic Lake Sampling Program are presented independently of this report.
Assessments of riverine ecological health are based solely on aquatic macroinvertebrates collected
from 36 river and stream sites across the region. Results are analysed and presented for the period
running January 2011 to July 2017.
Data analysis includes an assessment of spatial variation on a region-wide basis against compliance
with Schedule 15 (Water Plan) limits; National Objectives Framework (NOF) bands; and national water
quality guidelines (ANZECC) along with an assessment of water quality trends. Included are regional
rankings of sites to allow for a wider regional context of site specific water quality.
ii State of the Environment – Surface Water Quality in Otago 2006 to 2017
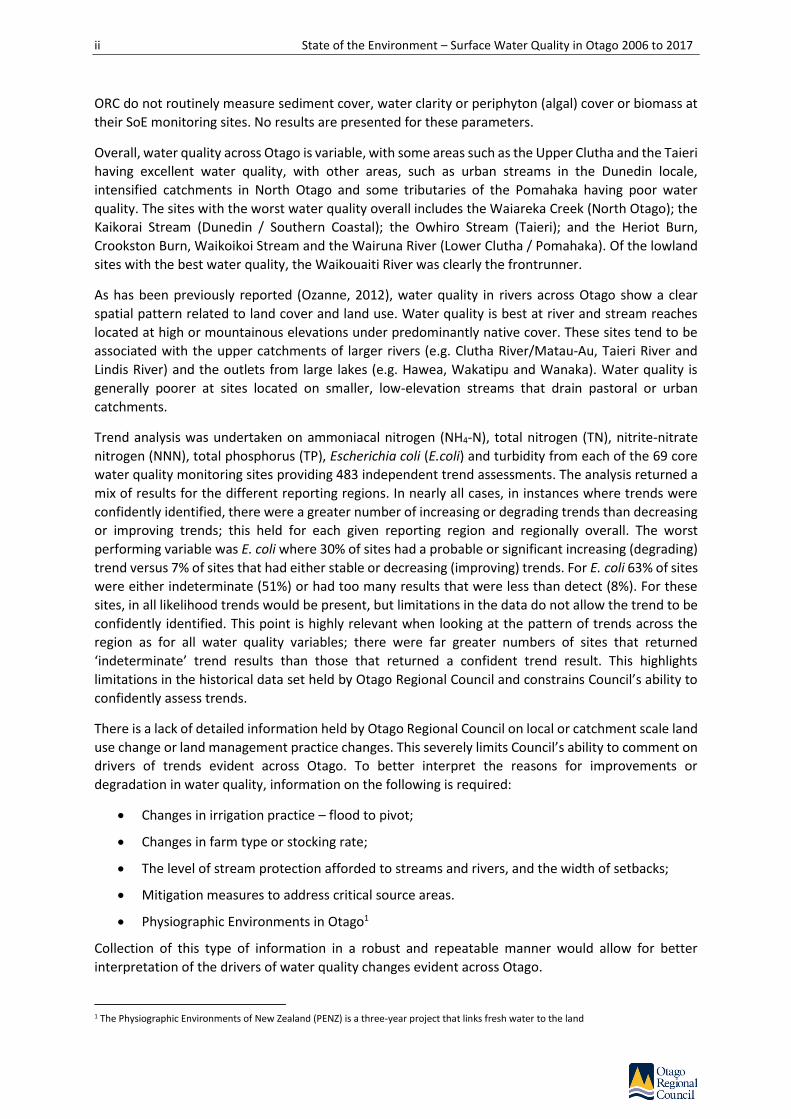
ORC do not routinely measure sediment cover, water clarity or periphyton (algal) cover or biomass at
their SoE monitoring sites. No results are presented for these parameters.
Overall, water quality across Otago is variable, with some areas such as the Upper Clutha and the Taieri
having excellent water quality, with other areas, such as urban streams in the Dunedin locale,
intensified catchments in North Otago and some tributaries of the Pomahaka having poor water
quality. The sites with the worst water quality overall includes the Waiareka Creek (North Otago); the
Kaikorai Stream (Dunedin / Southern Coastal); the Owhiro Stream (Taieri); and the Heriot Burn,
Crookston Burn, Waikoikoi Stream and the Wairuna River (Lower Clutha / Pomahaka). Of the lowland
sites with the best water quality, the Waikouaiti River was clearly the frontrunner.
As has been previously reported (Ozanne, 2012), water quality in rivers across Otago show a clear
spatial pattern related to land cover and land use. Water quality is best at river and stream reaches
located at high or mountainous elevations under predominantly native cover. These sites tend to be
associated with the upper catchments of larger rivers (e.g. Clutha River/Matau‐Au, Taieri River and
Lindis River) and the outlets from large lakes (e.g. Hawea, Wakatipu and Wanaka). Water quality is
generally poorer at sites located on smaller, low-elevation streams that drain pastoral or urban
catchments.
Trend analysis was undertaken on ammoniacal nitrogen (NH4-N), total nitrogen (TN), nitrite-nitrate
nitrogen (NNN), total phosphorus (TP), Escherichia coli (E.coli) and turbidity from each of the 69 core
water quality monitoring sites providing 483 independent trend assessments. The analysis returned a
mix of results for the different reporting regions. In nearly all cases, in instances where trends were
confidently identified, there were a greater number of increasing or degrading trends than decreasing
or improving trends; this held for each given reporting region and regionally overall. The worst
performing variable was E. coli where 30% of sites had a probable or significant increasing (degrading)
trend versus 7% of sites that had either stable or decreasing (improving) trends. For E. coli 63% of sites
were either indeterminate (51%) or had too many results that were less than detect (8%). For these
sites, in all likelihood trends would be present, but limitations in the data do not allow the trend to be
confidently identified. This point is highly relevant when looking at the pattern of trends across the
region as for all water quality variables; there were far greater numbers of sites that returned
‘indeterminate’ trend results than those that returned a confident trend result. This highlights
limitations in the historical data set held by Otago Regional Council and constrains Council’s ability to
confidently assess trends.
There is a lack of detailed information held by Otago Regional Council on local or catchment scale land
use change or land management practice changes. This severely limits Council’s ability to comment on
drivers of trends evident across Otago. To better interpret the reasons for improvements or
degradation in water quality, information on the following is required:
• Changes in irrigation practice – flood to pivot;
• Changes in farm type or stocking rate;
• The level of stream protection afforded to streams and rivers, and the width of setbacks;
• Mitigation measures to address critical source areas.
• Physiographic Environments in Otago1
Collection of this type of information in a robust and repeatable manner would allow for better
interpretation of the drivers of water quality changes evident across Otago.
1 The Physiographic Environments of New Zealand (PENZ) is a three-year project that links fresh water to the land

State of the Environment – Surface Water Quality in Otago 2006 to 2017 iii
Contents Executive summary ................................................................................................................................... i
1. Introduction ............................................................................................................................... 1
1.1. Otago’s rivers and lakes ............................................................................................... 1
1.2. State of Environment monitoring and reporting ............................................................ 1
1.2.1. Overall objectives ............................................................................................. 1
1.2.2. Long-term SoE monitoring sites ....................................................................... 2
1.2.3. What we measure............................................................................................. 6
1.2.4. Schedule 15 (Water Plan) limits ....................................................................... 6
1.2.5. National Objective Framework (NOF) Attribute Bands under the NPS-FM (2014) ............................................................................................................... 8
1.2.6. General Water Quality Guidelines ..................................................................11
1.2.7. Data analysis and presentation ......................................................................12
1.2.8. Land Use capability ........................................................................................16
2. Water quality of Otago ............................................................................................................18
2.1. North Otago river catchments overview .....................................................................18
2.1.1. North Otago river and land cover characteristics ...........................................20
2.1.2. North Otago water quality ...............................................................................23
2.2. Dunedin/Southern coastal river catchments overview ...............................................40
2.2.1. Dunedin /Southern coastal river and land cover characteristics ....................41
2.2.2. Dunedin /Southern coastal water quality ........................................................44
2.3. Taieri ...........................................................................................................................63
2.3.1. Taieri River and land cover characteristics ....................................................64
2.3.2. Taieri water quality .........................................................................................67
2.4. Upper Clutha ...............................................................................................................86
2.4.1. Upper Clutha geographical and land cover characteristics ............................86
2.4.2. Upper Clutha water quality .............................................................................89
2.5. Middle Clutha / Central Otago ..................................................................................105
2.5.1. Middle Clutha / Central Otago geographical and land cover characteristics 105
2.5.2. Middle Clutha / Central Otago water quality .................................................108
2.6. Lower Clutha / Pomahaka ........................................................................................124
2.6.1. Lower Clutha / Pomahaka geographical and land cover characteristics .....124
2.6.2. Lower Clutha / Pomahaka water quality .......................................................127
2.7. Otago Lakes..............................................................................................................144
2.7.1. Water quality and trophic status of Otago Lakes monitored as part of the long-term SoE monitoring program ......................................................................146
3. Summary and Conclusions ...................................................................................................172
References ...........................................................................................................................................176
Appendix A – Site metadata .................................................................................................................178
Appendix B – NPSFM (2014) NOF Attribute Tables ............................................................................182
Appendix C – River SoE sites with continuous flow recorders .............................................................191
Appendix D – Land Cover Descriptions (LCDB4) ................................................................................192
Appendix E – Regional boxplot summary ............................................................................................194
Appendix F – River Environment Classification System (REC) ...........................................................204

iv State of the Environment – Surface Water Quality in Otago 2006 to 2017
Appendix G – Water quality regional ranking tables ............................................................................206
Appendix H – Comparison of Schedule 15 (Water Plan) E. coli limits to the 2017 amended NPSFM (2014) NOF Swimmability limits. ...........................................................................................214
List of figures
Figure 1: Location of long-term State of Environment river monitoring sites covered in this report. (For Group 4 see Figure 2) ............................................................................................................................................... 4
Figure 2: Location of long-term State of Environment lake monitoring sites covered in this report. ............................................................................................................................................... 5
Figure 3: Summary of symbols used for trend result summary tables. ............................................................................................................................................... 16
Figure 4: Increasing limitations to use and decreasing versatility of use from LUC Class 1 to LUC Class 8. Source: Figure 2, page 9, Lynn et al. (2009). ............................................................................................................................................... 17
Figure 5: Map showing broad land cover categories of the North Otago reporting region based on the LCDB Version 4 database. ............................................................................................................................................... 22
Figure 6: Boxplot summary of NH4-N concentrations at SoE monitoring sites throughout North Otago. The red dashed line corresponds to the lowland ANZECC guideline of 0.021 mg/L. ............................................................................................................................................... 27
Figure 7: Nitrite/nitrate nitrogen (NNN) concentrations at SoE monitoring sites throughout North Otago. The red dashed line corresponds to the lowland ANZECC guideline of 0.444 mg/L. ............................................................................................................................................... 29
Figure 8: Boxplot summary of TN concentrations at SoE monitoring sites throughout North Otago. The red dashed line corresponds to the lowland ANZECC guideline of 0.614 mg/L. ............................................................................................................................................... 30
Figure 9: Boxplot summary of Dissolved Reactive Phosphorus (DRP) concentrations at SoE monitoring sites throughout North Otago. The red dashed line corresponds to the lowland ANZECC guideline for DRP of 0.010 mg/L. ............................................................................................................................................... 32
Figure 10: Boxplot summary of TP concentrations at SoE monitoring sites throughout North Otago. The red dashed line corresponds to the lowland ANZECC guideline for TP of 0.033 mg/L. ............................................................................................................................................... 33
Figure 11: Boxplot summary of E coli concentrations at SoE monitoring sites throughout North Otago. The amber line corresponds to the amber alert level of 260 CFU/100ml; the red line to the red alert level of 550 CFU/100ml. ............................................................................................................................................... 35
Figure 12: Boxplot summary of Turbidity at SoE monitoring sites throughout North Otago. The red dashed line corresponds to the lowland ANZECC guideline for Turbidity of 5.6 NTU.

State of the Environment – Surface Water Quality in Otago 2006 to 2017 v
............................................................................................................................................... 36
Figure 13: Boxplot summary of Macroinvertebrate Community Index (MCI) scores at SoE monitoring sites throughout North Otago where macroinvertebrate samples are routinely collected. Above the blue line corresponds to the ‘Excellent’ quality threshold; between the orange and blue line the ‘Good’ quality threshold; betwene the red and orange line ‘Poor’ quality threshold; below the red line the ‘Degraded’ threshold. ............................................................................................................................................... 38
Figure 14: Map showing broad land cover categories of the Dunedin/Southern coastal reporting region based on the LCDB4 databse. ............................................................................................................................................... 43
Figure 15: Boxplot summary of NH4-N concentrations at SoE monitoring sites throughout the Dunedin/Southern coastal reporting region. The red dashed line corresponds to the lowland ANZECC guideline for NH4-N of 0.021 mg/L. ............................................................................................................................................... 48
Figure 16: Nitrite/nitrate nitrogen (NNN) concentrations at SoE monitoring sites throughout the Dunedin/Southern coastal reporting region. The red dashed line corresponds to the lowland ANZECC guideline for NNN of 0.444 mg/L. ............................................................................................................................................... 50
Figure 17: Boxplot summary of TN concentrations at SoE monitoring sites throughout the Dunedin/southern coastal reporting region. The red dashed line corresponds to the lowland ANZECC guideline for TN of 0.614 mg/L. ............................................................................................................................................... 51
Figure 18: Boxplot summary of Dissolved Reactive Phosphorus (DRP) concentrations at SoE monitoring sites throughout the Dunedin/Southern coastal reporting region. Full scale. The red dashed line corresponds to the lowland ANZECC guideline for DRP of 0.010 mg/L. ............................................................................................................................................... 53
Figure 19: Boxplot summary of TP concentrations at SoE monitoring sites throughout the Dunedin/Southern coastal reporting region. The red dashed line corresponds to the lowland ANZECC guideline for TP of 0.033 mg/L. ............................................................................................................................................... 54
Figure 20: Boxplot summary of E coli concentrations at SoE monitoring sites throughout the Dunedin/Southern coastal reporting region. The amber line corresponds to the amber alert level of 260 CFU/100ml; the red line to the red alert level of 550 CFU/100ml. ............................................................................................................................................... 56
Figure 21: Boxplot summary of turbidity at SoE monitoring sites throughout the Dunedin/Southern coastal reporting region. The red dashed line corresponds to the lowland ANZECC guideline for Turbidity of 5.6 NTU. ............................................................................................................................................... 58
Figure 22: The Kaikorai Stream at Brighton Road monitoring site. ............................................................................................................................................... 60
Figure 23: Boxplot summary of Macroinvertebrate Community Index (MCI) scores at SoE monitoring sites throughout North Otago where macroinvertebrate samples are routinely collected. Above the blue line corresponds to the ‘Excellent’ quality threshold; between the orange

vi State of the Environment – Surface Water Quality in Otago 2006 to 2017
and blue line the ‘Good’ quality threshold; between the red and orange line ‘Poor’ quality threshold; below the red line the ‘Degraded’ threshold. ............................................................................................................................................... 60
Figure 24: The Taieri Scroll Plain. ............................................................................................................................................... 64
Figure 25: Map showing broad land cover categories of the Taieri reporting region based on the LCDB4 databse. ............................................................................................................................................... 66
Figure 26: Boxplot summary of NH4-N concentrations at SoE monitoring sites throughout the Taieri. Full scale. The red dashed line corresponds to the ANZECC lowland guideline for NH4-N of 0.021 mg/L; the blue dashed line the upland guideline of 0.010 mg/L. ............................................................................................................................................... 72
Figure 27: Nitrite/nitrate nitrogen (NNN) concentrations at SoE monitoring sites throughout the Taieri. The red dashed line corresponds to the ANZECC lowland guideline for NNN of 0.444 mg/L; the blue dashed line the upland guideline of 0.167 mg/L. ............................................................................................................................................... 74
Figure 28: Boxplot summary of TN concentrations at SoE monitoring sites throughout the Taieri. The red dashed line corresponds to the ANZECC lowland guideline for TN of 0.614 mg/L; the blue dashed line the upland guideline of 0.295 mg/L. ............................................................................................................................................... 75
Figure 29: Boxplot summary of Dissolved Reactive Phosphorus (DRP) concentrations at SoE monitoring sites throughout the Taieri. Full scale. The red dashed line corresponds to the ANZECC lowland guideline for DRP of 0.010 mg/L; the blue dashed line the upland guideline of 0.009 mg/L. ............................................................................................................................................... 77
Figure 30: Boxplot summary of TP concentrations at SoE monitoring sites throughout the Taieri. The red dashed line corresponds to the ANZECC lowland guideline for TP of 0.033 mg/L; the blue dashed line the upland guideline of 0.026 mg/L. ............................................................................................................................................... 78
Figure 31: Boxplot summary of E coli concentrations at SoE monitoring sites throughout the Taieri. The amber line corresponds to the amber alert level of 260 CFU/100ml; the red line to the red alert level of 550 CFU/100ml. ............................................................................................................................................... 80
Figure 32: Boxplot summary of Turbidity at SoE monitoring sites throughout the Taieri. The red dashed line corresponds to the ANZECC lowland guideline for Turbidity of 5.6 NTU; the blue dashed line the upland guideline of 4.1 NTU. ............................................................................................................................................... 81
Figure 33: Boxplot summary of Macroinvertebrate Community Index (MCI) scores at SoE monitoring sites throughout North Otago where macroinvertebrate samples are routinely collected. Above the blue line corresponds to the ‘Excellent’ quality threshold; between the orange and blue line the ‘Good’ quality threshold; betwene the red and orange line ‘Poor’ quality threshold; below the red line the ‘Degraded’ threshold. ............................................................................................................................................... 83
Figure 34: Map showing broad land cover categories of the Upper Clutha reporting region based on

State of the Environment – Surface Water Quality in Otago 2006 to 2017 vii
the LCDB4 databse. ............................................................................................................................................... 88
Figure 35: Comparison of in-stream NH4-N concentrations upstream and downstream of the Project Shotover Waste Water Treatment Plant. ............................................................................................................................................... 89
Figure 36: Boxplot summary of NH4-N concentrations at SoE monitoring sites throughout Upper Clutha. The blue dashed line corresponds to the upland ANZECC NH4-N guideline of 0.010 mg/L. ............................................................................................................................................... 94
Figure 37: Nitrite/nitrate nitrogen (NNN) concentrations at SoE monitoring sites throughout Upper Clutha. The blue dashed line corresponds to the upland ANZECC guideline for NNN of 0.167 mg/L. ............................................................................................................................................... 95
Figure 38: Boxplot summary of TN concentrations at SoE monitoring sites throughout Upper Clutha. The blue dashed line corresponds to the upland ANZECC (2000) guideline for TN of 0.295 mg/L. ............................................................................................................................................... 96
Figure 39: Boxplot summary of Dissolved Reactive Phosphorus (DRP) concentrations at SoE monitoring sites throughout Upper Clutha. The blue dashed line corresponds to the upland ANZECC (2000) guideline for DRP of 0.009 mg/L. ............................................................................................................................................... 97
Figure 40: Boxplot summary of TP concentrations at SoE monitoring sites throughout Upper Clutha. The blue dashed line corresponds to the upland ANZECC (2000) guideline for TP of 0.026 mg/L. ............................................................................................................................................... 98
Figure 41: Boxplot summary of E coli concentrations at SoE monitoring sites throughout Upper Clutha. The amber line corresponds to the amber alert level of 260 CFU/100ml; the red line to the red alert level of 550 CFU/100ml. ............................................................................................................................................... 99
Figure 42: Boxplot summary of Turbidity at SoE monitoring sites throughout Upper Clutha. The blue dashed line corresponds to the upland ANZECC (2000) guideline for Turbidity of 4.1 NTU. ............................................................................................................................................... 100
Figure 43: Boxplot summary of Macroinvertebrate Community Index (MCI) scores at SoE monitoring sites throughout North Otago where macroinvertebrate samples are routinely collected. Above the blue line corresponds to the ‘Excellent’ quality threshold; between the orange and blue line the ‘Good’ quality threshold; betwene the red and orange line ‘Poor’ quality threshold; below the red line the ‘Degraded’ threshold. ............................................................................................................................................... 102
Figure 44: Map showing broad land cover categories of the Middle Clutha / Central Otago reporting region based on the LCDB4 databse. ............................................................................................................................................... 107
Figure 45: Boxplot summary of NH4-N concentrations at SoE monitoring sites throughout Middle Clutha / Central Otago. The red dashed line corresponds to the ANZECC lowland
viii State of the Environment – Surface Water Quality in Otago 2006 to 2017
guideline for NH4-N of 0.021 mg/L; the blue dashed line the upland guideline of 0.010 mg/L. ............................................................................................................................................... 112
Figure 46: Nitrite/nitrate nitrogen (NNN) concentrations at SoE monitoring sites throughout Middle Clutha / Central Otago . The red dashed line corresponds to the ANZECC lowland guideline for NNN of 0.444 mg/L; the blue dashed line the upland guideline of 0.167 mg/L ............................................................................................................................................... 113
Figure 47: Boxplot summary of TN concentrations at SoE monitoring sites throughout Middle Clutha / Central Otago. The red dashed line corresponds to the ANZECC lowland guideline for TN of 0.614 mg/L; the blue dashed line the upland guideline of 0.295 mg/L. ............................................................................................................................................... 115
Figure 48: Boxplot summary of Dissolved Reactive Phosphorus (DRP) concentrations at SoE monitoring sites throughout Middle Clutha / Central Otago. The red dashed line corresponds to the ANZECC lowland guideline for DRP of 0.010 mg/L; the blue dashed line the upland guideline of 0.009 mg/L. ............................................................................................................................................... 116
Figure 49: Boxplot summary of TP concentrations at SoE monitoring sites throughout Middle Clutha / Central Otago. The red dashed line corresponds to the ANZECC lowland guideline for TP of 0.033 mg/L; the blue dashed line the upland guideline of 0.026 mg/L. ............................................................................................................................................... 117
Figure 50: Boxplot summary of E. coli concentrations at SoE monitoring sites throughout Middle Clutha / Central Otago. The amber line corresponds to the amber alert level of 260 CFU/100ml; the red line to the red alert level of 550 CFU/100ml. ............................................................................................................................................... 119
Figure 51: Boxplot summary of Turbidity at SoE monitoring sites throughout Middle Clutha / Central Otago. The red dashed line corresponds to the ANZECC lowland guideline for Turbidity of 5.6 NTU; the blue dashed line the upland guideline of 4.1 NTU. ............................................................................................................................................... 120
Figure 52: Boxplot summary of Macroinvertebrate Community Index (MCI) scores at SoE monitoring sites throughout the Middle Clutha / Central Otago reporting region where macroinvertebrate samples are routinely collected. Above the blue line corresponds to the ‘Excellent’ quality threshold; between the orange and blue line the ‘Good’ quality threshold; betwene the red and orange line ‘Poor’ quality threshold; below the red line the ‘Degraded’ threshold. ............................................................................................................................................... 122
Figure 53: Map showing broad land cover categories of the Lower Clutha / Pomahaka reporting region based on the LCDB4 databse. ............................................................................................................................................... 126
Figure 54: Boxplot summary of NH4-N concentrations at SoE monitoring sites throughout Lower Clutha / Pomahaka. The blue dashed line corresponds to the upland ANZECC NH4-N guideline of 0.010 mg/L. The red dashed line corresponds to the lowland ANZECC guideline of 0.021 mg/L.

State of the Environment – Surface Water Quality in Otago 2006 to 2017 ix
............................................................................................................................................... 131
Figure 55: Nitrite/nitrate nitrogen (NNN) concentrations at SoE monitoring sites throughout Lower Clutha / Pomahaka. The red dashed line corresponds to the ANZECC lowland guideline for NNN of 0.444 mg/L; the blue dashed line the upland guideline of 0.167 mg/L. ............................................................................................................................................... 133
Figure 56: Boxplot summary of TN concentrations at SoE monitoring sites throughout Lower Clutha / Pomahaka. The red dashed line corresponds to the ANZECC lowland guideline for TN of 0.614 mg/L; the blue dashed line the upland guideline of 0.295 mg/L. ............................................................................................................................................... 134
Figure 57: Boxplot summary of Dissolved Reactive Phosphorus (DRP) concentrations at SoE monitoring sites throughout Lower Clutha / Pomahaka. Full scale. The red dashed line corresponds to the ANZECC lowland guideline for DRP of 0.010 mg/L; the blue dashed line the upland guideline of 0.009 mg/L. ............................................................................................................................................... 136
Figure 58: Boxplot summary of TP concentrations at SoE monitoring sites throughout Lower Clutha / Pomahaka. The red dashed line corresponds to the ANZECC lowland guideline for TP of 0.033 mg/L; the blue dashed line the upland guideline of 0.026 mg/L. ............................................................................................................................................... 137
Figure 59: Boxplot summary of E coli concentrations at SoE monitoring sites throughout Lower Clutha / Pomahaka. The amber line corresponds to the amber alert level of 260 CFU/100ml; the red line to the red alert level of 550 CFU/100ml. ............................................................................................................................................... 138
Figure 60: Boxplot summary of Turbidity at SoE monitoring sites throughout Lower Clutha / Pomahaka. The red dashed line corresponds to the ANZECC lowland guideline for Turbidity of 5.6 NTU; the blue dashed line the upland guideline of 4.1 NTU. ............................................................................................................................................... 139
Figure 61: Boxplot summary of Macroinvertebrate Community Index (MCI) scores at SoE monitoring sites throughout the Lower Clutha / Pomahaka reporting region where macroinvertebrate samples are routinely collected. Above the blue line corresponds to the ‘Excellent’ quality threshold; between the orange and blue line the ‘Good’ quality threshold; betwene the red and orange line ‘Poor’ quality threshold; below the red line the ‘Degraded’ threshold. ............................................................................................................................................... 141
Figure 62: Lake Onslow and surrounds. Photo courtesy N. Manning, ORC. ............................................................................................................................................... 145
Figure 63: Distribution of lake area (top) and elevation (bottom) of 63 lakes that are larger than 10 ha in the Otago region. ............................................................................................................................................... 146
Figure 64: Lake Hayes. Photo courtesy N. Manning, ORC ............................................................................................................................................... 147
Figure 65: Ammoniacal nitrogen concentrations in Lake Johnson. The dashed green line corresponds to the Schedule 15 (Water Plan) limit for RWG 4. ............................................................................................................................................... 148

x State of the Environment – Surface Water Quality in Otago 2006 to 2017
Figure 66: Lake Wakatipu and the Frankton Arm. Photo courtesy N. Manning, ORC. ............................................................................................................................................... 151
Figure 67: Lake Wanaka and the Stevenson Arm. Photo courtesy N. Manning, ORC. ............................................................................................................................................... 153
Figure 68: Lake Hawea from the neck. Photo courtesy N. Manning, ORC. ............................................................................................................................................... 157
Figure 69: Comparison of TLI4 versus TLI3. The 1:1 line is shown. Note the regression fit between TLI4 and TLI3 is almost inditnguishalble to the 1:1 line reflecting almost perfect agreement. Reproduced from Verburg et al., (2010). ............................................................................................................................................... 157
Figure 70: Boxplot summary of Chlorophyll a concentrations at lake SoE monitoring sites throughout Otago. ............................................................................................................................................... 158
Figure 71: Boxplot summary of the Trophic Lake chlorophyll a index at lake SoE monitoring sites throughout Otago. ............................................................................................................................................... 159
Figure 72: Boxplot summary of TP concentrations at lake SoE monitoring sites throughout Otago. ............................................................................................................................................... 161
Figure 73: Boxplot summary of the Trophic Lake phosphorus index at lake SoE monitoring sites throughout Otago. ............................................................................................................................................... 162
Figure 74: Boxplot summary of Total Nitrogen concentrations at lake SoE monitoring sites throughout Otago. ............................................................................................................................................... 163
Figure 75: Boxplot summary of the Trophic Lake nitrogen index at lake SoE monitoring sites throughout Otago. ............................................................................................................................................... 164
Figure 76: Total nitrogen concentrations in Lake Johnson. The blue circle encompasses a signifcant period of nitrogen enrichment for Lake Johnson that occurred early in 2013. ............................................................................................................................................... 164
Figure 77: Lake Hawea. Photo courtesy N. Manning, ORC. ............................................................................................................................................... 165
Figure 78: Boxplot summary of the Trophic Lake Index 3 (TLI3) at lake SoE monitoring sites throughout Otago. ............................................................................................................................................... 166
List of tables
Table 1: ‘Table 15.1’ of the Water Plan ‘Characteristics of good quality water’

State of the Environment – Surface Water Quality in Otago 2006 to 2017 xi
............................................................................................................................................... 7
Table 2: ‘Table 15.2’ of the Water Plan. Receiving water numerical standards by surface water catchment group for good quality water (five-year, 80th percentiles, when flows are at or below median flow). ............................................................................................................................................... 7
Table 3: Relevant general water quality guidelines referenced in this report. ............................................................................................................................................... 12
Table 4: LUC Class descriptions (Lynn et al. 2009). ............................................................................................................................................... 17
Table 5: Characteristics of the North Otago reporting region ( 220,280 hectares). Source of flow, Land Cover Area and Land-use Capability. ............................................................................................................................................... 21
Table 6: 80th percentile values for water quality variables identified in Schedule 15. Values are calculated from samples taken when flows are below median flow. The orange cells show where the 80th percentile exceeds the Schedule 15 limit. ............................................................................................................................................... 24
Table 7: NOF compliance summary for Nitrate (estimated from NNN). Included are median and 95th percentile values for the period July 2012 to June 2017 and the corresponding NOF attribute bands. ............................................................................................................................................... 25
Table 8: NOF compliance summary for NH4-N. Included are median and maximum values for the period July 2012 to June 2017 and the corresponding NOF attribute bands. ............................................................................................................................................... 25
Table 9: NOF compliance summary for E. coli for the the period July 2012 to June 2017. The overall grading band is determined by the lowest (worst) ranked Numeric Attribute State as it relates to the four. ............................................................................................................................................... 26
Table 10: Trend summary of Ammonical Nitrogen (NH4-N) concentrations for the North Otago reporting region. ............................................................................................................................................... 28
Table 11: Trend summary of Nitrite/nitrate nitrogen (NNN) concentrations for the North Otago reporting region. ............................................................................................................................................... 29
Table 12: Trend summary of TN concentrations for the North Otago reporting region. ............................................................................................................................................... 31
Table 13: Trend summary of Dissolved Reactiver Phosphorus (DRP) concentrations for the North Otago reporting region. ............................................................................................................................................... 32
Table 14: Trend summary of TP concentrations for the North Otago reporting region. ............................................................................................................................................... 34
xii State of the Environment – Surface Water Quality in Otago 2006 to 2017
Table 15: Trend summary of E. coli concentrations for the North Otago reporting region. ............................................................................................................................................... 35
Table 16: Trend summary of Turbidity levels for the North Otago reporting region. ............................................................................................................................................... 37
Table 17: Trend summary for the North Otago reporting region. ............................................................................................................................................... 39
Table 18: Characteristics of the Dunedin/Southern coastal reporting region (309,642 hectares). Source of flow, Land Cover Area and Land-use Capability. ............................................................................................................................................... 42
Table 19: 80th percentile values for water quality variables identified in Schedule 15 for the Dunedin/Southern coastal reporting region. Values are calculated from samples taken when flows are below median flow. The orange cells show where the 80th percentile exceeds the Schedule 15 limit. Numbers underlined in italics have lower limits under Schedule 15. ............................................................................................................................................... 45
Table 20: NOF compliance summary for Nitrate (estimated from NNN) toxicity for the Dunedin/Southern coastal reporting region. Included are median and 95th percentile values for the the period July 2012 to June 2017 and the corresponding NOF attribute band. ............................................................................................................................................... 46
Table 21: NOF compliance summary for NH4-N toxicity for the Dunedin/Southern coastal reporting region. Included are median and maximum values for the the period July 2012 to June 2017 and the corresponding NOF attribute band. ............................................................................................................................................... 46
Table 22: NOF compliance summary for E. coli for the the period July 2012 to June 2017. The overall grading band is determined by the lowest (worst) ranked Numeric Attribute State as it relates to the four separate states. ............................................................................................................................................... 47
Table 23: Trend summary of ammonical nitrogen concentrations for the Dunedin/Southern coastal reporting region. ............................................................................................................................................... 49
Table 24: Trend summary of nitrate/nitrite nitrogen (NNN) concentrations for the Dunedin/Southern coastal reporting region. ............................................................................................................................................... 50
Table 25: Trend summary of Total Nitrogen (TN) concentrations for the Dunedin/Southern coastal reporting region. ............................................................................................................................................... 52
Table 26: Trend summary of Dissolved Reactive Phosphorus (DRP) concentrations for the Dunedin/Southern coastal reporting region. ............................................................................................................................................... 53
Table 27: Trend summary of TP concentrations for the Dunedin/Southern coastal reporting region. ...............................................................................................................................................

State of the Environment – Surface Water Quality in Otago 2006 to 2017 xiii
55
Table 28: Trend summary of E. coli concentrations for the Dunedin/Southern coastal reporting region. ............................................................................................................................................... 57
Table 29: Trend summary of turbidity levels for the Dunedin/Southern coastal reporting region. ............................................................................................................................................... 58
Table 30: Trend summary for the Dunedin/Southern coastal reporting region ............................................................................................................................................... 62
Table 31: Characteristics of the Taieri reporting region. Source of flow, Land Cover Area and Land-use Capability. ............................................................................................................................................... 65
Table 32: 80th percentile values for water quality variables identified in Schedule 15 for the Taieri. Values are calculated from samples taken when flows are below median flow. The orange cells show where the 80th percentile exceeds the Schedule 15 limit. ............................................................................................................................................... 68
Table 33: NOF compliance summary for Nitrate (estimated from NNN) toxicity for the Taieri reporting region. Included are median and 95th percentile values for the the period July 2012 to June 2017 and the corresponding NOF attribute band. ............................................................................................................................................... 69
Table 34: NOF compliance summary for NH4-N. Included are median and maximum values for the the period July 2012 to June 2017 and the corresponding NOF attribute band. ............................................................................................................................................... 70
Table 35: NOF compliance summary for E. coli for the the period July 2012 to June 2017. The overall grading band is determined by the lowest (worst) ranked Numeric Attribute State as it relates to the four separate states. ............................................................................................................................................... 71
Table 36: Trend summary of ammonical nitrogen concentrations for the Taieri reporting region. ............................................................................................................................................... 73
Table 37: Trend summary of nitrite/nitrate nitrogen (NNN) concentrations for the Taieri reporting region. ............................................................................................................................................... 74
Table 38: Trend summary of TN concentrations for the Taieri reporting region. ............................................................................................................................................... 76
Table 39: Trend summary of Dissolved Reactive Phosphorus (DRP) concentrations for the Taieri reporting region. ............................................................................................................................................... 77
Table 40: Trend summary of TP concentrations for the Taieri reporting region. ............................................................................................................................................... 79
Table 41: Trend summary of Escerichia coli (E. coli) concentrations for the Taieri reporting region.

xiv State of the Environment – Surface Water Quality in Otago 2006 to 2017
............................................................................................................................................... 80
Table 42: Trend summary of Turbidity levels for the Taieri reporting region. ............................................................................................................................................... 82
Table 43: Trend summary for the Taieri reporting region. ............................................................................................................................................... 85
Table 44: Zone characteristics of the Upper Clutha reporting region. Land cover area and land-use capability. ............................................................................................................................................... 87
Table 45: 80th percentile values for water quality variables identified in Schedule 15. Values are calculated from samples taken when flows are below median flow. The orange cells show where the 80th percentile exceeds the Schedule 15 limit. Numbers underlined in italics have lower limits under Schedule 15. ............................................................................................................................................... 90
Table 46: NOF compliance summary for Nitrate (estimated from NNN). Included are median and 95th percentile values for the the period July 2012 to June 2017 and the corresponding NOF attribute band. ............................................................................................................................................... 91
Table 47: NOF compliance summary for NH4-N. Included are median and maximum values for the the period July 2012 to June 2017 and the corresponding NOF attribute band. ............................................................................................................................................... 92
Table 48: NOF compliance summary for E. coli for the the period July 2012 to June 2017. The overall grading band is determined by the lowest (worst) ranked Numeric Attribute State as it relates to the four separate states. ............................................................................................................................................... 93
Table 49: Trend summary of ammonical nitrogen concentrations for the Upper Clutha reporting region. ............................................................................................................................................... 95
Table 50: Trend summary of nitrite/nitrate nitrogen (NNN) concentrations for the Upper Clutha reporting region. ............................................................................................................................................... 96
Table 51: Trend summary of TN concentrations for the Upper Clutha reporting region. ............................................................................................................................................... 97
Table 52: Trend summary of Dissolved Reactive Phosphorus concentrations for the Upper Clutha reporting region. ............................................................................................................................................... 98
Table 53: Trend summary of TP concentrations for the Upper Clutha reporting region. ............................................................................................................................................... 99
Table 54: Trend summary of Escerichia coli concentrations for the Upper Clutha reporting region. ............................................................................................................................................... 100

State of the Environment – Surface Water Quality in Otago 2006 to 2017 xv
Table 55: Trend summary of turbidity levels for the Upper Clutha reporting region. ............................................................................................................................................... 101
Table 56: Trend summary for the Upper Clutha reporting region. ............................................................................................................................................... 104
Table 57: Zone characteristics of the Middle Clutha / Central Otago reporting region. Land cover area and land-use capability. ............................................................................................................................................... 106
Table 58: 80th percentile values for water quality variables identified in Schedule 15. Values are calculated from samples taken when flows are below median flow. The orange cells show where the 80th percentile exceeds the Schedule 15 limit. ............................................................................................................................................... 109
Table 59: NOF compliance summary for Nitrate (estimated from NNN). Included are median and 95th percentile values for the the period July 2012 to June 2017 and the corresponding NOF attribute band. ............................................................................................................................................... 109
Table 60: NOF compliance summary for NH4-N. Included are median and maximum values for the the period July 2012 to June 2017 and the corresponding NOF attribute band. ............................................................................................................................................... 110
Table 61: NOF compliance summary for E. coli for the the period July 2012 to June 2017. The overall grading band is determined by the lowest (worst) ranked Numeric Attribute State as it relates to the four separate states. ............................................................................................................................................... 111
Table 62: Trend summary of NH4-N concentrations for the Middle Clutha reporting region. ............................................................................................................................................... 112
Table 63: Trend summary of nitrite/nitrate nitrogen (NNN) concentrations for the Middle Clutha reporting region. ............................................................................................................................................... 114
Table 64: Trend summary of TN concentrations for the Middle Clutha reporting region. ............................................................................................................................................... 115
Table 65: Trend summary of Dissolved Reactive Phosphorus (DRP) concentrations for the Middle Clutha reporting region. ............................................................................................................................................... 117
Table 66: Trend summary of TP concentrations for the Middle Clutha reporting region. ............................................................................................................................................... 118
Table 67: Trend summary of Escerichia coli (E. coli) concentrations for the Middle Clutha reporting region. ............................................................................................................................................... 119
Table 68: Trend summary of Turbidity levels for the Middle Clutha reporting region. ............................................................................................................................................... 121

xvi State of the Environment – Surface Water Quality in Otago 2006 to 2017
Table 69: Trend summary for the Middle Clutha reporting region. ............................................................................................................................................... 123
Table 70: Zone characteristics of the Lower Clutha reporting region. Source of flow, land cover area and land-use capability class. ............................................................................................................................................... 125
Table 71: 80th percentile values for water quality variables identified in Schedule 15. Values are calculated from samples taken when flows are below median flow. The orange cells show where the 80th percentile exceeds the Schedule 15 limit. Numbers underlined in italics have lower limits under Schedule 15. ............................................................................................................................................... 128
Table 72: NOF compliance summary for Nitrate (estimated from NNN). Included are median and 95th percentile values for the the period July 2012 to June 2017 and the corresponding NOF attribute band. ............................................................................................................................................... 129
Table 73: NOF compliance summary for NH4-N. Included are median and maximum values for the the period July 2012 to June 2017 and the corresponding NOF attribute band. ............................................................................................................................................... 129
Table 74: NOF compliance summary for E. coli for the the period July 2012 to June 2017. The overall grading band is determined by the lowest (worst) ranked Numeric Attribute State as it relates to the four separate states. ............................................................................................................................................... 130
Table 75: Trend summary of NH4-N concentrations for the Lower Clutha / Pomahaka reporting region. ............................................................................................................................................... 132
Table 76: Trend summary of Nitrite/Nitate Nitrogen (NNN) concentrations for the Lower Clutha / Pomahaka reporting region. ............................................................................................................................................... 133
Table 77: Trend summary of TN concentrations for the Lower Clutha / Pomahaka reporting region. ............................................................................................................................................... 135
Table 78: Trend summary of Dissolved Reactive Phosphorus (DRP) concentrations for the Lower Clutha / Pomahaka reporting region. ............................................................................................................................................... 136
Table 79: Trend summary of TP concentrations for the Lower Clutha / Pomahaka reporting region. ............................................................................................................................................... 138
Table 80: Trend summary of Escerichia coli (E. coli) levels for the Lower Clutha/Pomahaka reporting region. ............................................................................................................................................... 139
Table 81: Trend summary of Turbidity levels for the Lower Clutha / Pomahaka reporting region. ............................................................................................................................................... 140
Table 82: Trend summary for the Lower Clutha / Pomahaka reporting region. ...............................................................................................................................................

State of the Environment – Surface Water Quality in Otago 2006 to 2017 xvii
143
Table 83: Characteristics of lakes currently monitored by ORC. The ‘Natural’ landcover is a combination of the Bare, Indigenous Forest, Tussock, Scrub, Wetland and Miscellaneous classes of the River Environment Classification (REC). Table sourced from Milne et al., (2017). ............................................................................................................................................... 145
Table 84: 80th percentile values for ammonical nitrogen and comparison to limits identified in Schedule 15. The orange cells show where the 80th percentile exceeds the Schedule 15 limit. ............................................................................................................................................... 148
Table 85: 80th percentile values for E. coli and comparison to limits identified in Schedule 15. The orange cells show where the 80th percentile exceeds the Schedule 15 limit. ............................................................................................................................................... 149
Table 86: 80th percentile values for TP and comparison to limits identified in Schedule 15. The orange cells show where the 80th percentile exceeds the Schedule 15 limit. ............................................................................................................................................... 150
Table 87: 80th percentile values for TN and comparison to limits identified in Schedule 15. The orange cells show where the 80th percentile exceeds the Schedule 15 limit. ............................................................................................................................................... 150
Table 88: 80th percentile values for turbidity and comparison to limits identified in Schedule 15. The orange cells show where the 80th percentile exceeds the Schedule 15 limit. ............................................................................................................................................... 151
Table 89: NOF lake compliance summary for Chlorophyll a. Included are median and maximum values for the period July 2012 to June 2017 and the corresponding NOF attribute band. ............................................................................................................................................... 152
Table 90: NOF lake compliance summary for TN. Included are median values for the period July 2012 to June 2017 and the corresponding NOF attribute band. ............................................................................................................................................... 153
Table 91: NOF lake compliance summary for TP. Included are median values for the period July 2012 to June 2017 and the corresponding NOF attribute band. ............................................................................................................................................... 154
Table 92: NOF lake compliance summary for E. coli for the the period July 2012 to June 2017. The overall grading band is determined by the lowest (worst) ranked Numeric Attribute State as it relates to the four separate states. ............................................................................................................................................... 155
Table 93: Summary of water quality concentrations and Secchi disk depths corresonding to different lake trophic levels. ............................................................................................................................................... 156
Table 94: Summary of average TLI3 scores for SoE monitored lakes ordered from lowest to highest. ............................................................................................................................................... 166

xviii State of the Environment – Surface Water Quality in Otago 2006 to 2017
Table 95: Trend summary for the SoE monitored lakes ............................................................................................................................................... 170
Table 96: Regional trend summary for all ORC and NIWA SoE monitoring sites across Otago. The table includes trend results for lake monitoring sites. ............................................................................................................................................... 172
Table 97: Regional trend summary for all ORC and NIWA SoE monitoring sites across Otago. The table includes trend results for lake monitoring sites. ............................................................................................................................................... 173
Table 98: Regional summary of percentage of trend analysis that were unable to be confidently idenitifed versus those that were. ............................................................................................................................................... 173

State of the Environment – Surface Water Quality in Otago 2006 to 2017 1
1. Introduction
1.1. Otago’s rivers and lakes
The Otago region covers a land area of 32,000 km2: from the Waitaki River in the north to Brothers
Point in the south, and inland to Lake Wakatipu, Queenstown, Hawea, Haast Pass and Lindis Pass.
The distinctive and characteristic landscape of Otago includes the Southern Alps and alpine lakes; large
high country stations; dry central areas, with tussock grassland and tors; and dramatic coastlines
around the Otago Peninsula and the Catlins. Lowland pasture country is common in the west. The
character of the region’s water bodies is diverse, reflecting the variation in environmental conditions
throughout the region.
The Clutha River/Mata-Au drains much of the Otago region. Its catchment area totals 21,000 km2, and
75% of the total flow of the river at Balclutha comes from the outflows of Lakes Hawea, Wanaka and
Wakatipu. Larger rivers feeding into the Clutha catchment include the Cardrona, Lindis, Shotover,
Nevis, Fraser, Manuherikia, Teviot, Pomahaka, Waitahuna and Waiwera rivers.
The Clutha and its principal tributary, the Kawarau River, pass through gorges, two of which are
dammed for hydro-electricity generation. One of the larger tributaries of the Clutha, in its lower
reaches, is the Pomahaka River, which rises in the mountains above Tapanui.
The second largest catchment in Otago is the Taieri River (5,060 km2). It rises in the uplands of Central
Otago and meanders among the block mountain ranges before passing through an incised gorge and
crossing the Taieri Plain, where it joins the waters of the Lake Waipori and Waihola catchments and
becomes tidal before making its way through another gorge to the sea at Taieri Mouth.
Other significant Otago rivers drain the coastal hills in catchments of varying character. In the north,
the Kakanui, Waianakarua, Shag and Waikouaiti rivers rise in high country and pass through mainly dry
downlands. The Tokomairiro River, which flows through Milton, south of Dunedin, drains rolling
country between the Taieri and Clutha catchments. Rivers to the south of Otago, particularly the
Catlins area, emerge from wetter, often forested hills.
The environmental context in which Otago’s water bodies exist is characterised by high rainfall in the
Southern Alps and occasional very low rainfall in the semi-arid central Otago valleys. Despite the large
water volumes in the region, parts of Otago are among the driest areas in New Zealand. Several rivers
are characterised as ‘water-short’, including the Lindis, Manuherikia, Taieri, Shag and Kakanui rivers
and their tributaries (Regional Plan: Water 2004).
1.2. State of Environment monitoring and reporting
1.2.1. Overall objectives
River water quality sampling is carried out across New Zealand for many purposes. Water quality
measurements help in our understanding of ecosystem health and also provide important information
on the suitability of rivers and streams for specific uses, such as irrigation, stock watering, recreation
and mahinga kai (food gathering) (DWQ NEMS, 2017).
Otago Regional Council (ORC) operates a long-term State of Environment (SoE) water quality
monitoring network in lakes, rivers and streams throughout the region. Its objectives include providing
information that underpins SoE reporting according to obligations under s35 of the Resource
Management Act (1991). This monitoring is important as it improves the efficiency of Council policy
initiatives and strategies, provides information on the effectiveness of Council’s plans, as well as

2 State of the Environment – Surface Water Quality in Otago 2006 to 2017
helping to identify the large-scale and/or cumulative impact of contaminants associated with varying
land uses and disturbance regimes.
To meet Council’s reporting obligations under s35 of the Resource Management Act (1991), ORC
provides annual summaries of monitoring site compliance with the Water Plan as well as more detailed
analysis of general state and long-term trends every 5 years. ORC conducted the last analysis of general
state and trends (for the period 2006 to 2011) in 2012. The primary aim of this report is to repeat this
analysis.
To best represent current conditions, state analysis is based on water quality samples collected over a
five year period running from July 2012 to June 2017. Trend analysis was carried out on data collected
over an eleven year period running July 2006 to June 2017. An eleven year period was required to
provide adequate data for robust trend analysis. A total of 60 river and stream monitoring sites and 9
lake shore and lake outlet monitoring sites are included in the analysis.
Up to June 2013, Otago Regional Council (ORC) collected surface water quality samples on a bi-monthly
basis. From July 2013, sampling frequency increased to monthly sampling in line with current good
practice approaches to routine water quality sampling in New Zealand.
Long-term SoE lake monitoring sites consist of a mix of lake-outlet (lakes Wanaka, Wakatipu and
Hawea) and lake-shore (lakes Dunstan, Hayes, Johnson, Onslow, Waihola and Tuakitoto) sampling
sites. More detailed lake monitoring occurs at a subset of these lakes as part of ORC’s Trophic Lake
Sampling Program. The results of the Trophic Lake Sampling Program are presented independently of
this report.
Assessments of riverine ecological health are based on aquatic macroinvertebrate collected (only)
from 362 river and stream sites across the region. Results are analysed and presented for the period
running January 2011 to July 2017.
The aims of this report are to:
o Report on the state of water quality and ecology indicators in rivers, streams and lakes across
sub-regions and water management zones of Otago;
o Assess the spatial variation of water quality on a region-wide basis against compliance with
Schedule 15 (Water Plan) limits; National Objectives Framework (NOF) bands; and national
water quality guidelines (ANZECC);
o Identify significant trends in water quality. I.e. are water quality indicators degrading or
improving over time?
o Meet Council’s RMA obligations on reporting on State of the Environment of Otago’s rivers
and lakes.
1.2.2. Long-term SoE monitoring sites
The ORC SoE water quality programme has 52 core river and stream water quality monitoring sites
spread throughout Otago. NIWA, until recently, monitored 8 sites in the Otago region as part of the
National River Water Quality Network (NRWQN). These 60 river sampling sites span a range of
geographical, source of flow and catchment land uses types. Figure 1 shows the location of the river
2 Otago regional Council currently collect annual macroinvertebrate samples from 29 sites; NIWA collect annual macroinvertebrate samples from 7 sites in Otago. This brings the total number of sites with more than 5 years of macroinvertebrate samples to 36.

State of the Environment – Surface Water Quality in Otago 2006 to 2017 3
and stream monitoring sites covered in this report. Included in Figure 1 are the Receiving Water group
boundaries identified in ORC’s Water Plan.
ORC also monitors 9 lake sites. Long-term SoE lake monitoring sites consist of a mix of lake-outlet (lakes
Wanaka, Wakatipu and Hawea) and lake-shore (lakes Dunstan, Hayes, Johnson, Onslow, Waihola and
Tuakitoto) sampling sites. Figure 2 shows the location of the long-term SoE lake monitoring sites
covered in this report. More detailed lake monitoring occurs at a subset of these lakes as part of ORC’s
Trophic Lake Sampling Program. The results of Trophic Lake Sampling Program are presented
independently of this report.
Appendix A provides site metadata information for all sites; including the reporting or geographical
region; ORC SoE reporting name; location (Easting/Northing); the Water Plan Receiving Water group
(RWG); the River Environment Classification (REC) class; the Freshwater Environments of New Zealand
(FENZ) class; the organisation responsible for sampling the site (ORC or NIWA); the site elevation; and
if the site is classed as an ANZECC Upland (> 150m ASL) or Lowland site (< 150m ASL).

4 State of the Environment – Surface Water Quality in Otago 2006 to 2017
Figure 1: Location of long-term State of Environment river monitoring sites covered in this report. (For Group 4 see Figure 2)

State of the Environment – Surface Water Quality in Otago 2006 to 2017 5
Figure 2: Location of long-term State of Environment lake monitoring sites covered in this
report.

6 State of the Environment – Surface Water Quality in Otago 2006 to 2017
1.2.3. What we measure
Water quality parameters routinely measured at SoE monitoring sites include the following field-based
measurements:
▪ Turbidity (NTU)
▪ Dissolved oxygen (mg/l)
▪ Conductivity (S/cm)
▪ pH
▪ Water temperature (oC)
Water samples are collected at each site and kept in chilled containers while being freighted overnight
to the laboratory and analysed for total and dissolved nutrients (nitrogen and phosphorus), suspended
solids, and faecal bacteria (as E. coli).
Nitrite-nitrate nitrogen (NNN) and dissolved reactive phosphorus (DRP) are dissolved inorganic forms
of the nutrients nitrogen (N) and phosphorus (P) respectively. N and P are the two key nutrients
required for growth of plants and algae. DRP includes phosphate. Although numerous other forms of
nitrogen and phosphorus exist and are commonly referred to in the field of water quality (e.g., organic
and particulate forms), it is the dissolved forms that are most readily available for uptake by plants and
are thus most relevant for assessing effects on nuisance growths in rivers. The terms total nitrogen
(TN) and total phosphorus (TP) refer to the sum total of all forms of N and P respectively in a sample.
TN and TP are most relevant for assessments in lakes and coastal waters. At sufficiently elevated
concentrations, nitrate and ammonia forms of nitrogen have toxic effects on aquatic biota (and on
humans in the case of nitrate). This effect is independent of their significance as plant nutrients
(Norton, 2012).
Visual periphyton cover and biomass estimates (as chlorophyll-a); visual clarity (as black disk sighting
distance) and fine deposited sediment cover are not currently taken. No results are presented for these
parameters.
1.2.4. Schedule 15 (Water Plan) limits
The Water Plan was approved on 26 March 2014 and made provision for controlling contaminants and
sediment coming off rural properties into waterways from runoff, leaching and drains (non-point
sources). The rules covering these areas aim to ensure good quality water in rivers, lakes, wetlands
and aquifers.
Schedule 15 (Water Plan) describes and sets out the characteristics, contaminant concentration limits,
and targets for good quality surface water in Otago rivers and lakes, as required by the National Policy
Statement for Freshwater Management. Table 15.1 and Table 15.2 of the Water Plan (water quality)
are reproduced as Table 1 and Table 2 below.

State of the Environment – Surface Water Quality in Otago 2006 to 2017 7
Table 1: ‘Table 15.1’ of the Water Plan ‘Characteristics of good quality water’
Characteristic Description
Clarity Water is clear: able to easily and clearly see the bed when standing in knee-deep water. Naturally occurring scums and foams only.
Colour Water is colour-free, however, some rivers are naturally tannin-stained e.g. The Catlin, Taieri, Waitahuna and Tokomairiro Rivers.
Algae Healthy levels of algae:
▪ Do not cover more than 30% of the bed. ▪ Strands are less than 20 mm in length. ▪ No slime on the surface of the water.
Sediment Riffles and runs are free of obvious mud and silt deposits.
Walking across a riffle or run should not produce an obvious plume.
However, some rivers are naturally high in sediment e.g. the Dart and Shotover Rivers.
Smell Water is odourless, however, water in some wetlands may have a naturally earthy smell.
Bank Functioning riparian margins:
▪ Vegetation is healthy and not stripped bare.
▪ Banks are stable with no obvious livestock disturbance.
Table 2 summarises the Schedule 15 (Water Plan) numerical limits (or numerical objectives under the
NPSFM, 2014 nomenclature) for acceptable water quality for all receiving water ‘Groups’ throughout
catchments in the Otago region. The receiving water numerical limits (outlined in Table 2) are applied
as five-year, 80th percentiles, when flows are at or below median flow at the relevant flow reference
site.
Table 2: ‘Table 15.2’ of the Water Plan. Receiving water numerical standards by surface water
catchment group for good quality water (five-year, 80th percentiles, when flows are at or below
median flow).
Schedule 153
NNN
(mg/L)
DRP
(mg/L)
NH4-N
(mg/L)
E. coli (CFU/100
ml)
Turbidity NTU
TN
(mg/L)
TP
(mg/L)
Group 1 0.444 0.026 0.10 260 5
Group 2 0.075 0.010 0.10 260 5
Group 3 0.075 0.005 0.01 50 3
Group 4 0.10 126 5 0.55 0.033
Group 5 0.01 10 3 0.10 0.005
Field data is not collected to assess SoE site compliance against the Schedule 15 (Water Plan) narratives
for ‘Characteristics of Good Water Quality’ as outlined in Table 1. A review of the ORC SoE monitoring
3 NNN = oxides of nitrogen or nitrate/nitrite- nitrogen; DRP= dissolved reactive phosphorus; NH4-N = Ammonical nitrogen; E. coli = faecal bacteria levels measured as E. coli in colony forming units (CFU) / 100ml; TN = total nitrogen; TP = total phosphorus
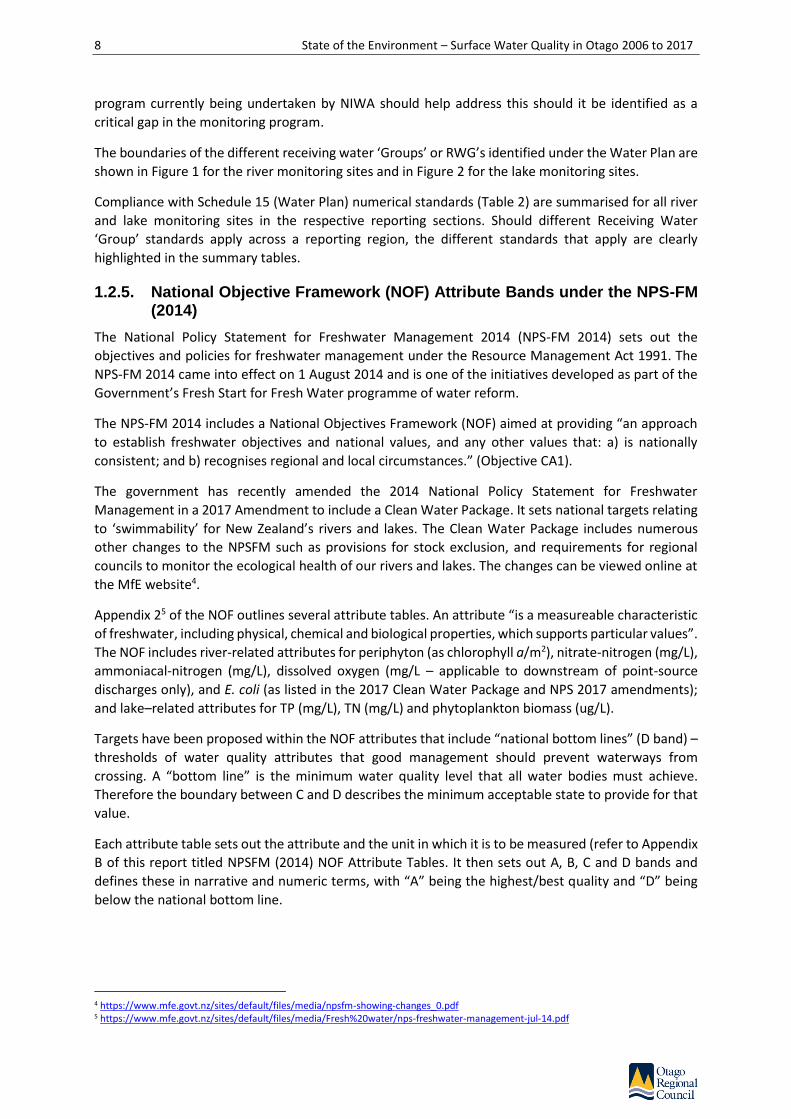
8 State of the Environment – Surface Water Quality in Otago 2006 to 2017
program currently being undertaken by NIWA should help address this should it be identified as a
critical gap in the monitoring program.
The boundaries of the different receiving water ‘Groups’ or RWG’s identified under the Water Plan are
shown in Figure 1 for the river monitoring sites and in Figure 2 for the lake monitoring sites.
Compliance with Schedule 15 (Water Plan) numerical standards (Table 2) are summarised for all river
and lake monitoring sites in the respective reporting sections. Should different Receiving Water
‘Group’ standards apply across a reporting region, the different standards that apply are clearly
highlighted in the summary tables.
1.2.5. National Objective Framework (NOF) Attribute Bands under the NPS-FM (2014)
The National Policy Statement for Freshwater Management 2014 (NPS-FM 2014) sets out the
objectives and policies for freshwater management under the Resource Management Act 1991. The
NPS-FM 2014 came into effect on 1 August 2014 and is one of the initiatives developed as part of the
Government’s Fresh Start for Fresh Water programme of water reform.
The NPS-FM 2014 includes a National Objectives Framework (NOF) aimed at providing “an approach
to establish freshwater objectives and national values, and any other values that: a) is nationally
consistent; and b) recognises regional and local circumstances.” (Objective CA1).
The government has recently amended the 2014 National Policy Statement for Freshwater
Management in a 2017 Amendment to include a Clean Water Package. It sets national targets relating
to ‘swimmability’ for New Zealand’s rivers and lakes. The Clean Water Package includes numerous
other changes to the NPSFM such as provisions for stock exclusion, and requirements for regional
councils to monitor the ecological health of our rivers and lakes. The changes can be viewed online at
the MfE website4.
Appendix 25 of the NOF outlines several attribute tables. An attribute “is a measureable characteristic
of freshwater, including physical, chemical and biological properties, which supports particular values”.
The NOF includes river-related attributes for periphyton (as chlorophyll a/m2), nitrate-nitrogen (mg/L),
ammoniacal-nitrogen (mg/L), dissolved oxygen (mg/L – applicable to downstream of point-source
discharges only), and E. coli (as listed in the 2017 Clean Water Package and NPS 2017 amendments);
and lake–related attributes for TP (mg/L), TN (mg/L) and phytoplankton biomass (ug/L).
Targets have been proposed within the NOF attributes that include “national bottom lines” (D band) –
thresholds of water quality attributes that good management should prevent waterways from
crossing. A “bottom line” is the minimum water quality level that all water bodies must achieve.
Therefore the boundary between C and D describes the minimum acceptable state to provide for that
value.
Each attribute table sets out the attribute and the unit in which it is to be measured (refer to Appendix
B of this report titled NPSFM (2014) NOF Attribute Tables. It then sets out A, B, C and D bands and
defines these in narrative and numeric terms, with “A” being the highest/best quality and “D” being
below the national bottom line.
4 https://www.mfe.govt.nz/sites/default/files/media/npsfm-showing-changes_0.pdf 5 https://www.mfe.govt.nz/sites/default/files/media/Fresh%20water/nps-freshwater-management-jul-14.pdf
State of the Environment – Surface Water Quality in Otago 2006 to 2017 9
Escherichia coli Attribute – primary contact recreation
Microbial pathogens such as Campylobacter in fresh water primarily come from faecal contamination.
It is difficult to detect pathogens in water samples obtained from freshwater sites. Methods for
detecting and identifying viruses or parasites are either very difficult and/or expensive. Because of this,
the main approach for assessing the presence of pathogens is to use ‘indicator organisms’ – organisms
whose presence in the water is an indication of faecal contamination and therefore the potential that
other pathogens might be present. E.coli are bacteria commonly found in the gut of warm blooded
animals. E. coli survives outside the body and can survive for up to four to six weeks in fresh water
making it a useful indicator of faecal presence and therefore of disease-causing organisms that may be
present in faecal matter. E. coli is relatively straightforward and inexpensive to measure. MfE (2017).
The NPS (2014) defines attribute states for primary contact recreation based on E. coli levels as a faecal
indicator to assess the risk of pathogenic infection from contact with water. “Primary contact” means
people’s contact with fresh water that involves immersion in water, including swimming.
Compulsory national values in the NPSFM (2014) for Human Health for Recreation state that “In a
healthy waterbody, people are able to connect with the water through a range of activities such as
swimming, waka, boating, fishing, mahinga kai and water-skiing, in a range of different flows.
Matters to take into account for a healthy waterbody for human use include pathogens, clarity,
deposited sediment, plant growth (from macrophytes to periphyton to phytoplankton), cyanobacteria
and other toxicants.”
There are many factors that can affect whether a water body is suitable for swimming, such as water
clarity, but the government has decided that swimmability will be assessed on potential health risks.
This will be determined by E. coli concentrations (faecal indicator bacteria sourced from warm-blooded
animals) in rivers; and toxic algae bio-volumes in lakes. A swimmable river is one with low levels of E.
coli and a swimmable lake is one with low levels of toxic algae.
Clean Water Package 2017 - National Swimmability Targets
The government has recently amended the 2014 National Policy Statement for Freshwater
Management (NPSFM). It sets national targets relating to ‘swimmability’ for New Zealand’s rivers and
lakes. The Clean Water Package included numerous other changes to the NPSFM such as provisions
for stock exclusion, and requirements for regional councils to monitor the ecological health of our
rivers and lakes. The changes can be viewed online at the MfE website6.
The Government has set a national target of making 90 percent of New Zealand’s rivers (fourth order
or greater) and lakes (with perimeters greater than 1.5 km) swimmable by 2040. The stream order
describes the relative size of streams. Streams with no tributaries are “first order”, streams with two
first order tributaries are second order, and with two second order tributaries arethird order and so
on. Examples of fourth order streams in the Dunedin locale include the Water of Leith alongside the
University of Otago, the Silverstream at Mosgiel and the Kaikorai Stream at State Highway 1. The
Manuherikia River at Alexandra is seventh order and Otago’s biggest river, the Clutha at Balclutha, is
eighth order. Around 90 percent of New Zealand’s catchments flow into rivers that are fourth order or
bigger (MfE website).
The NPSFM grading proposals are based on a grading system that uses four statistical measures of
E.coli concentrations when assessing river swimmability; and one statistical measure for toxic algae
bio-volumes when assessing lake swimmability. The four statistical measures of river E.coli data are
6 https://www.mfe.govt.nz/sites/default/files/media/npsfm-showing-changes_0.pdf
10 State of the Environment – Surface Water Quality in Otago 2006 to 2017
presented in the E. coli attribute table in Appendix B. As stated in the footnote to the table, “Attribute
state must be determined by satisfying all numeric attribute states”.
Otago Regional Council has set targets for E. coli for the region in The Water Plan under Schedule 15
(Water Plan) (Table 2). Comparison of Schedule 15 (Water Plan) limits of E. coli data collected
throughout the region from the State of Environment monitoring network to the 4 separate statistical
tests within the NPSFM has shown (Appendix H):
• That the E. coli limits set in Schedule 15 (Water Plan) for Receiving Water Group 3 (Upper
Clutha upstream of the Southern Great Lakes) provides compliance against the four separate
statistical tests in the NPSFM and as a minimum, will provide a blue (A grade) or green (B grade)
swimmability category. The minimum requirement is a yellow or C grade.
• With the exception of some catchments in the Pomahaka catchment, the E. coli limits set in
Schedule 15 (Water Plan) for Receiving Water Group 1 and 2 (that covers the remainder of the
Otago region), will provide good compliance against the four separate statistical tests in the
NPSFM, and as a minimum, will provide a blue (A grade), green (B grade) or in some cases an
yellow (C grade) category. The yellow, C grade category being the minimum requirement.
• For Receiving Water Groups 4 and 5 that relate to the lakes throughout Otago, the E. coli limits
set in Schedule 15 (Water Plan) provides compliance against the four separate statistical tests
in the NPSFM and as a minimum, will provide a blue (A grade) or green (B grade) swimmability
category. The minimum requirement is a yellow or C grade.
In the case of the Pomahaka catchment, monitoring sites in some catchments return high 95th
percentiles at all flows, even though they may be compliant with the Schedule 15 (Water Plan) limit.
This is believed to be due to effluent storage issues and a prevalence of mole and tile drains through
areas of the catchment resulting in very high E. coli peaks under high flow conditions and elevated E.
coli concentrations at low to moderate flows. ORC are working actively throughout the Pomahaka
catchment with groups such as the Pomahaka Watercare Trust, the Landcare Trust and the Clutha
Development Trust to address water quality issues. A large part of this effort is focused on improving
bacterial water quality.
Toxicity and the Nitrate and Ammonia Attributes
The NOF nitrate and ammonia attributes help assess chronic toxicity risk for aquatic animals. Chronic
exposure typically includes a biological response of relatively slow progress and long continuance,
often affecting a life stage (Hickey, 2013). Such a response may be reduced growth rate or reduced
gonad development when compared to optimum growth conditions (a control). It does not relate to
acute toxicity effects that result in the death of an animal. The narratives for each ammonia and nitrate
attribute band are included in Appendix B of this report titled NPSFM (2014) NOF Attribute Tables.
Regime shifts and the Total Phosphorus, Total Nitrogen and Phytoplankton
(Trophic state) attributes for lakes
The NOF TN and TP attributes aim to manage against the risk of increased and excessive growth of
algae and plants arising from elevated levels of nutrients above natural background levels.
Similarly the phytoplankton (Trophic state) attribute provides bands to assess the risk against ‘lake
ecological communities undergoing a regime shift to a persistent, degraded state, due to impacts of
elevated nutrients leading to excessive algal and/or plant growth, as well as from losing oxygen in
bottom waters of deep lakes’ (NPSFM, 2014). The TN and TP attribute states are listed in Appendix B.

State of the Environment – Surface Water Quality in Otago 2006 to 2017 11
Reporting against NOF Attributes
Compliance of dissolved oxygen and periphyton biomass against attribute bands could not be assessed
because there is presently insufficient monitoring data.
For rivers, where adequate monitoring data existed for E. coli, NNN and NH4-N concentrations, NOF
attribute states were calculated at each monitoring site and presented in summary tables in each
respective reporting region section.
For lakes, where adequate monitoring data existed for TP, TN and phytoplankton (chlorophyll a)
concentrations, NOF attribute states were calculated and presented in tables in the ‘Otago Lakes’
reporting section.
1.2.6. General Water Quality Guidelines
Environmental guidelines are often used to describe the general state of a natural resource, even
though they may not be directly applicable in a regulatory context.
Table 3 outlines several relevant ‘trigger values’ and guidelines that are included in graphical
summaries throughout this report. The various trigger values, guidelines and limits are discussed in the
following paragraphs.
The ANZECC (2000) guidelines are used to indicate environmental conditions in “baseline” (essentially
unaffected) or “pseudo-baseline” (lightly impacted) catchments (Davies-Colley, 2000). The ‘trigger’
values are based on water quality conditions taken from sites from the NIWA National River Water
Quality Monitoring Network (NRWQMN) (Davies-Colley, 2000). The trigger values relate to 80th
percentile or 20th percentile values for the data range taken from the NRWQMN.
In the development of the ANZECC (2000) trigger values, Davies-Colley (2000) states: ‘running medians
of water quality data measured in monitoring programmes may be compared with these trigger values.
If the median value of a water quality variable for a particular site exceeds the trigger value, then it is
intended to “trigger” a response on the part of water managers, which might be to initiate special
sampling or carry out an investigation of reasons for the degraded water quality.’
The development of Schedule 15 (Water Plan) numerical limits were based, in part, on the ANZECC
guidelines. The difference being that the adopted Schedule 15 (Water Plan) limits are assessed as 80th
percentiles at times that flows are below median flow for the reference river flow site in question.
ANZECC (2000) on the other hand compares median values at all flows to the suggested trigger values.
Hay et al. (2006) identified several limits for the protection of trout fisheries in their report ‘Water
quality guidelines to maintain trout fishery values’. The report was produced on behalf of Horizons
Regional Council in the development of their One Plan.
The MfE/MoH (2003) ‘microbiological water quality guidelines for marine and freshwater areas’ are
used extensively to assess ‘risk’ in relation to contact recreation and exposure to bacteria present in
aquatic environments. The RMA (1991) outlines a dissolved oxygen saturation limit for the protection
of trout fisheries.

12 State of the Environment – Surface Water Quality in Otago 2006 to 2017
Table 3: Relevant general water quality guidelines referenced in this report.
Variable7 Trigger / Limit Source
NH4-N – ANZECC Lowland 0.021 mg/L ANZECC (2000)
NH4-N – ANZECC Upland 0.010 mg/L ANZECC (2000)
DIN/NNN – ANZECC Lowland 0.444 mg/L ANZECC (2000)
DIN/NNN – ANZECC Upland 0.167 mg/L ANZECC (2000)
TN – ANZECC Lowland 0.614 mg/L ANZECC (2000)
TN – ANZECC Upland 0.295 mg/L ANZECC (2000)
DRP – ANZECC Lowland 0.010 mg/L ANZECC (2000)
DRP – ANZECC Upland 0.009 mg/L ANZECC (2000)
TP – ANZECC Lowland 0.033 mg/L ANZECC (2000)
TP – ANZECC Upland 0.026 mg/L ANZECC (2000)
Turbidity – ANZECC Lowland < 5.6 NTU ANZECC (2000)
Turbidity – ANZECC Upland < 4.1 NTU ANZECC (2000)
E. coli – Contact recreation (health) Red alert > 550 (CFU/100ml) MfE/MoH (2003)
E. coli – Contact recreation (health) Amber alert > 260 (CFU/100ml) MfE/MoH (2003)
MCI ‘Outstanding’ trout fishery; Excellent quality > 120 Hay and Hayes (2006); Stark and Maxted (2007)
MCI ‘Significant’ trout fishery; Good quality > 100 Hay and Hayes (2006); Stark and Maxted (2007)
MCI Poor quality >80 Stark and Maxted (2007)
MCI Degraded quality <80 Stark and Maxted (2007)
1.2.7. Data analysis and presentation
Box plots have been used throughout the report to summarise water quality data. The sites are
ordered from right to left in ascending order based on distance from the sea along the river channel
and north to south for the differing river catchments that may be included across a reporting region.
7 TN = total nitrogen; TP = total phosphorus; NNN = oxides of nitrogen or nitrate/nitrite- nitrogen; DRP= dissolved reactive phosphorus; E. coli = faecal bacteria levels measured as E. coli in colony forming units (CFU) / 100ml; MCI = Macroinvertebrate Community Index.
Box plots graph data as a box representing statistical values. The lower boundary of each box indicates
the 25th percentile, a line within the box marks the median, and the higher boundary of each box indicates
the 75th percentile. The line at the end of the whiskers (error bars) above and below the box indicate the
95th and 5th percentiles respectively.
INCLUDE BOXPLOT EXAMPLE FROM TT
State of the Environment – Surface Water Quality in Otago 2006 to 2017 13
Numerous sites had insufficient data to allow for robust trend analysis of some water quality
parameters. The two main reasons being too many observations returned from the laboratory that
were below method detection level; and sites with intermittent observations over the 11 year analysis
period; or a combination of the two. The trend analysis for NH4-Nis a good example of this where
many sites across Otago frequently have NH4-N concentrations that are below the laboratory detection
level. Should this occur then the trend analysis summary tables list the result as “<DL” reflecting that
too many observations were received from the laboratory that were below detection level.
For future analysis and reporting, the occurrence of this will be markedly lower due to improvements
in laboratory method detection levels that have occurred in recent years.
Compliance against Schedule 15 (Water Plan) limits; NPSFM (2014) NOF attribute bands; and box plot
summaries that include generic water quality guidelines are based on the last 5 years of data to best
represent current conditions whilst maintaining an adequate number of data points to calculate the
required statistics.
Trend analysis
Trend analysis of environmental monitoring data is important because environmental features may
exhibit trends which indicate particular issues are changing over time. For example, if bacteria levels
are increasing or decreasing at a particular site, the cause and significance of these changes may need
to be identified.
In this report trend analysis was carried out using the Time Trends (V6.30) software (Jowett
Consulting). The approach takes into account a number of challenges and limitations that exist with
the long-term SoE data set held by ORC. Such challenges include:
• Changes in laboratory supplier over the analysis period that can introduce ‘step changes’ in the data set. This was evident for TP and DRP with a change in laboratory supplier that occurred mid-2011;
• Changes in method Detection Levels (DL) for a given analyte over time;
• Changes in sampling frequency, bimonthly pre 2013, monthly post 2013;
• The availability of flow data for all sites to allow consistent flow adjustment of trends for flow effected variables (eg turbidity, E. coli and TP). At present ORC measures flow continuously at 25 of the 60 SoE river monitoring sites;
• Intermittent periods of sampling for some sites (eg. monthly for twelve months, then no sampling for three years, then bi-monthly for three years and then monthly);
• Rounding of laboratory results resulting in very little variation between sampling dates for sites with very low nutrient levels (eg. Lake Hawea Outflow and DRP).
These challenges are not atypical of long-term New Zealand regional council SoE data sets.
For future analysis, improvements in laboratory detection levels and commitment from ORC to move from bi-monthly to monthly sampling in 2013 will remove some of these confounding factors.
Trend analysis employed either a Mann-Kendall or Seasonal Kendall trend test. Both trend analysis
methods are non-parametric and calculate the Kendall Statistic. Mann-Kendall is used when there is
no seasonal trend in the data, so that data values in a season are compared with all other seasons. The
Seasonal Kendall test is used when there is seasonality in the data, so that data values are only
compared within the season. If Mann-Kendall is used with seasonally varying data, it will be less likely
to determine a significant trend than the Seasonal Kendall. Mann-Kendall is more powerful if there is
no seasonal variation because it makes more comparisons (Jowett, 2017).

14 State of the Environment – Surface Water Quality in Otago 2006 to 2017
A Kruskal-Wallis (non-parametric ANOVA) test was applied to the data to test for seasonality. If the
Kruskal-Wallis test showed statistically significant seasonality, then a Seasonal Kendall trend test was
used. If there was no seasonality present in the data, a Mann-Kendall trend test was used.
To estimate the strength of trends over time, a Sen slope estimator was used. This non-parametric
approach involves computing slopes for all the pairs of ordinal time points and then using the median
of these slopes as an estimate of the overall slope. As such, it is insensitive to outliers and can handle
a moderate number of values below the detection limit and missing values.
The Sen slope can be used to estimate Percent Annual Change (PAC). A trend with a PAC of greater
than 1% per year was considered meaningful.
All sites had monthly data from January 2013. Prior to this date, for ORC managed SoE sites, samples
were collected on a bi-monthly basis. For ORC data, so as to not bias the analysis, a bi-monthly sampling
period was chosen for the whole data record to avoid biasing the analysis to the latter part of the
period. July was used as the ‘start’ month, i.e. the sampling interval was bi-monthly for Jul-Aug; Sept-
Oct, Nov-Dec; etc. over the ten year analysis period.
Cumulative sum analysis in Time Trends (V6.30) identified significant step changes in TP and DRP data
that occurred mid-2011. This date coincides with ORC changing their laboratory service provider and
is evidence of a step-change brought on by this change. The presence of a step change mid-way
through the time-series data (July 2006 to June 2017) significantly affected the trend analysis for these
two variables and introduced a significant number of ‘decreasing’ trends that were driven by
laboratory step changes as opposed to environmental changes. To control for this, trend analysis for
TP and DRP was undertaken on data collected from August 2011 to June 2017.
The majority of ORC’s SoE monitoring sites do not have flow recorders located at the monitoring site.
It is therefore not possible to obtain accurate estimates of flow for all SoE sites. 25 sites have
continuous flow recorders located in a proximity that allows for accurate estimates of flow to be made
at the water quality sample site. Flow adjustment in the trend analysis was undertaken at these sites.
All other sites were not flow adjusted. Appendix C lists the ORC SoE sites that have flow recorders and
that flow adjustment of trends was possible.
A number of variables had differing method detection levels (DL) over the trend analysis time period.
This introduced a bias towards detecting false ‘decreasing’ trends where the detection level was
reduced over time. To control for this all measurements that were below the highest method detection
level were made to be equal to that method detection level. For example, DRP had a historic DL of
0.004 mg/L; recently this was reduced to 0.001 mg/L. This introduced a significant bias of detecting
false decreasing trends towards the latter period of the times series. To control for this all observations
in the data set that were < 0.004 mg/L were made equal to 0.004 mg/L. This was done after
consultation with Jowett Consulting, the creator of the Time Trends software.
Trend analysis was carried out on 7 core water quality variables, these being NH4-N; NNN; TN; DRP; TP;
Turbidity and E. coli. Analysis was carried out on data collected at 60 river sites and 9 lake shore/outlet
sites giving a total of 490 individual trend analysis. For each individual analysis, time series plots were
examined to assess if the following was evident:
• Step changes in the time series due to analytical methods or laboratory changes;
• Spurious results affecting the analysis;
• The extent of patchy or missing data;

State of the Environment – Surface Water Quality in Otago 2006 to 2017 15
• The presence of rounding or resolution effecting the capacity to detect variation in the time series (DRP being an example for sites with very low concentrations);
• ‘Indeterminate’ trends or obvious anomalies in data series effecting results;
• Excessive numbers of results below laboratory detection level (as is the case for NH4-N at many sites).
Taking these factors into account, and with the time-series plots on hand, the existence of a trend in
the time series was assessed based on both the Kendall statistic P-value and the probability of the Sen
slope being less than or greater than zero, that is the confidence interval of the slope does not straddle
zero (or no slope/no change over time).
The strength or ‘significance’ of the trend was assessed as being SIGNIFICANT or PROBABLE based on
the following -
• Should the Kendall statistic P-value be <0.05; the Probability that the Sen Slope is less than or greater than 0 be 1.0 to 0.95; and the Percent Annual Change in the Sen Slope is > 1%; label “SIGNIFICANT”;
• Should the Kendall statistic P-value be 0.05 to 0.10; the Probability that the Sen Slope is less than or greater than 0 be 0.9 to 0.95; and the Percent Annual Change in the Sen Slope is > 1%; label “PROBABLE”;
• Where the P-value is > 0.10 and the Probability > 0.5 but less < 0.9, and the trend is obviously not ‘Stable’ over time; and the analysis is limited by power, identify as INDETERMINATE or “?” in the trend summary tables. In this case a trend is likely present but the data set does not allow this to be confidently identified. With more observations, a trend may become evident over time but at this stage, confidence is low.
• Where the P-value ~ 1; the Probability ~ 0.5; and the Sen Slope ~ 0; label “STABLE”. This identifies that there is no trend evident in the times series and apart from typical seasonal and temporal variation, the overall trend is flat or ‘stable’ over time.
• Where there is not enough data, such as > 40% of samples returned a result from the laboratory that was ‘less than detect’, or there are other constraints/limitations in the data such as lo ow numbers if observations, highlight as “NOT ENOUGH DATA” or “<DL” in the trend summary tables.
So in summary, the analysis was broken down according to the following ‘trend’ categories (also refer
to Figure 3):
SIGNIFICANT – A trend has been confidently identified, has a significant P-value < 0.05 and the Probability that the slope confidence intervals do not cross 0 is very high at > 0.95. Time-series plot shows an obvious trend. PROBABLE – It is highly probable that a trend is present but the P-value for the Kendall statistic is > 0.05 but < 0.10. There is a high Probability that the trend line slope is positive or negative at > 0.90. The Timeseries plot shows evidence that a trend is present. STABLE – There no discernible change over time and the time series plots reflect a this. The Sen slope is ~ 0, the P-value is high (approaching 1) and the Probability is close to 0.5. Also the confidence intervals around the slope are very close to 0.

16 State of the Environment – Surface Water Quality in Otago 2006 to 2017
INDETERMINATE (STABLE/NO CHANGE) – There is no obvious trend but with more data a trend may become evident. The statistics do not reflect a ‘stable trend’ nor a ‘significant’ or ‘probable’ trend. NOT ENOUGH DATA – Where the data is patchy, limited by too many non-detects or missing data (> 40% of observations).
Trends have been summarised in table form as outlined in Figure 3.
Symbol Trend result
↑↑↑ Increasing Significant
↑↑ Increasing Probable
→ Stable
↓↓ Decreasing Probable
↓↓↓ Decreasing Significant
? Indeterminate / Not Enough Data
< DL More than 40% of data below detection level
Figure 3: Summary of symbols used for trend result summary tables.
1.2.8. Land Use capability
The LUC8 is a system in use in New Zealand since the 1950s that classifies all of New Zealand’s rural
land into one of eight classes, based on its physical characteristics and attributes. The LUC maps are
created to represent the potential uses of a "unit" of land. They are measured using various indicators,
although the most common are five physical factors (rock type, soil type, slope, erosion degree and
type, and vegetation). Class 1 land is the most versatile and can be used for a wide range of land uses.
Class 8 land has a lot of physical limitations; it may be extremely steep, and not generally suitable for
arable, pastoral or commercial forestry use. Land use capability maps must not be confused with land
use maps. The former shows the potential uses (usually in relation to farming) whilst the latter shows
the actual use for the land at the present time.
8 https://www.landcareresearch.co.nz/publications/books/luc

State of the Environment – Surface Water Quality in Otago 2006 to 2017 17
Figure 4: Increasing limitations to use and decreasing versatility of use from LUC Class 1 to
LUC Class 8. Source9: Figure 2, page 9, Lynn et al. (2009).
Table 4: LUC Class descriptions (Lynn et al. 2009).
LUC Class LUC Description
Class 1 Versatile arable land for multiple land-uses
Class 2 Arable land with only slight physical limitations to land-uses
Class 3 Arable land with moderate physical limitation to land-uses
Class 4 Arable land with severe physical limitation to land-uses
Class 5 High-producing land for pasture or forestry with minimal physical limitations
Class 6 Moderate-producing pastoral or forestry with moderate physical limitations
Class 7 Low-producing land for pastoral or forestry with severe physical limitations
Class 8 Severe to extreme physical limitations, unsuitable for arable, pastoral or forestry land-uses
River /Town/Lake River open water and urban areas unsuitable for arable land-uses, pasture or forestry.
9 https://www.landcareresearch.co.nz/__data/assets/pdf_file/0017/50048/luc_handbook.pdf

18 State of the Environment – Surface Water Quality in Otago 2006 to 2017
2. Water quality of Otago Due to the size of the Otago region, discussion of water quality characteristics, state and trends has
been separated into logical geographical and catchment areas. The different regions identified in this
report being:
o North Otago
o Dunedin / Southern Coastal
o Taieri
o Upper Clutha
o Middle Clutha (including the Manuherikia catchment)
o Lower Clutha / Pomahaka
o Lakes
Each section includes a brief introduction of the general characteristics of the reporting region
including dominant land-use, river characteristics, land vegetation cover information and a Land Use
Capability (LUC) summary.
Following a summary of general characteristics of the reporting region in question, the state and trends
of water quality are discussed for each region in relation to:
• Compliance with Schedule 15 (Water Plan) numerical limits;
• The NPSFM (2014) NOF attribute bands for water quality parameters that data is available to
assess against the NOF;
• Box plot summaries of key water quality variables with inclusion of ANZECC general water
quality guidelines;
• The results of the trend analysis.
Appendix E shows Otago wide boxplot summaries of key water quality variables discussed in regional
reporting section and Appendix G provides a ranking of site ‘medians’. The Otago wide summaries help
put individual sites and the wider reporting regions into an Otago wide context.
2.1. North Otago river catchments overview
The North Otago reporting region spans an area of 2202 km2 (220208 hectares) and encompasses parts
of the lower Waitaki Plains (Welcome Creek); the Kakanui catchment that includes the Kakanui River,
Kauru River and Waiareka Creek; the Waianakarua Stream and Trotters Creek with catchments that
drain independently to the sea; and to the south, the Shag River.
The Kakanui River catchment has an area of 894 km2. The catchment is bordered by the Kakanui
Mountains and Pisgah Spur to the west and south and is separated from the Waitaki catchment to the
north by rolling hill country. The main tributaries of the Kakanui River are the Kauru River (catchment
area 143 km2), Island Stream (122 km2) and Waiareka Creek (213 km2) (Ozanne and Wilson, 2013).
From its source in the Kakanui Mountains, the Kakanui River flows north-east for about 40 km, through
gorges incised in rolling or downland country, before emerging onto plains at Clifton. It then flows
south-eastwards at a gentler gradient through highly developed pastures to be joined further down
the widening valley by the broad, gravel-bedded Kauru River (Ozanne and Wilson, 2013).
The Kakanui River’s water resource is heavily used for irrigation. In recent times concern has been
expressed about agricultural intensification and subsequent degradation of the water quality. Over the
tate of the Environment – Surface Water Quality in Otago 2006 to 2017 19
past twenty years, land use in the Kakanui catchment has intensified. The lower Kakanui River and
Waiareka Creek are dominated by a mixture of beef/sheep/deer/cropping and, in recent times, dairy
farming, particularly since the introduction of irrigation water into the Waiareka Creek catchment by
the NOIC irrigation scheme. This is in contrast to land use in the Kauru and upper Kakanui which are
typified by red tussock, native forest, plantation forestry or pasture for red deer, sheep and beef. The
water quality in the alluvial gravels of the Kauru River and the main-stem Kakanui River, particularly
upstream of Gemmels Crossing, is influenced by groundwater surface water interaction. There is very
little groundwater surface water interaction in Waiareka Creek (Ozanne and Wilson, 2013).
During February 2002, the North Otago Downlands Water Company (now North Otago Irrigation
Company Ltd or NOIC) was granted a resource consent by Environment Canterbury to take 8 cumecs
(8000 L/s) of water from the Waitaki River and use the water for spray and trickle irrigation across the
Waiareka Creek, Kakanui River and Island Stream catchments in Otago. The NOIC scheme pumps water
from the Waitaki River up to a head pond near Ngapara. The water is then gravity fed into the Waiareka
Valley. Pressurised water is delivered to the farm gate via NOIC’s piped network. Some water is also
discharged into the Waiareka Creek. NOIC currently delivers over 4 cumecs (4000 L/s) of water to
approximately 14,000ha10. A condition of ORC Consent 2001.658 was for the irrigation company to
maintain a minimum flow of at least 100 L/s in Waiareka Creek at its confluence with the Kakanui River.
In 2011, ORC initiated a ten-month water quality sampling programme to gain a better understanding
of water quality and ecological values in the Kakanui catchment. The results of the study are reported
in Ozanne and Wilson (2013). An additional intensive water quality sampling program was carried out
between April 2014 and April 2017. The aim of the more recent study was to better understand
groundwater-surface water interactions in the catchment. The data from this study being used to
develop a groundwater- surface water quality model that will support Otago Regional Council in
identifying a sustainable nitrogen leaching threshold for the Kakanui Catchment to meet Schedule 15
(Water Plan) limits and protect the values of the Kakanui Estuary.
The Waianakarua River is a small river with a catchment area of 262 km2 which rises in the Horse Range
and Kakanui Mountains in North Otago. Much of the catchment consists of extensively grazed
grasslands and scrub, native forest and plantation forestry. However, the intensification of land use in
the lower catchment, with two dairy farms operating near the mouth of the river and proposals for
further intensification of land use in areas upstream of State Highway 1 (SH1), has previously been
identified as having the capacity to affect water quality in the lower part of the river (Olsen, 2013).
Previously ORC have undertaken and reported on an intensive catchment study of the Wainakarua
River (Olsen, 2013).
The Shag River catchment covers an area of 550 km2. The Shag River is a medium sized river with its
headwaters originating on the south-western slopes of Kakanui Peak in the Kakanui Mountains. From
here it flows 90km in a south-easterly direction past the township of Palmerston before entering the
Pacific Ocean to the south of Shag Point. The Shag River supports high values including a high diversity
of native fish, habitat for waterfowl, and regionally significant trout and whitebait fisheries. The Shag
catchment is dominated by extensive agriculture and forestry with some short-rotation cropping in the
lower catchment. There is currently no dairy farming in the Shag catchment, although some farms are
used for dairy support (Olsen, 2014).
In parts of the Shag River catchment, Oceana Gold Ltd. operates a hard-rock goldmine at Macraes Flat.
The mining operation includes several open pit mines as well as underground mining. The Macraes
open pit mine has been in operation since 1990. Overall the Macraes gold mining operation has
produced over 3 million ounces of gold to date. Within the Shag River catchment, the existing mine
10 http://www.noic.co.nz/docs/NOIC%202015%20FAQ.pdf

20 State of the Environment – Surface Water Quality in Otago 2006 to 2017
operation discharges water and associated contaminants to the Deepdell Creek catchment (Olsen,
2014). This current report does not consider the effects of the mining operation on Shag River water
quality. The operation of the Oceana Gold Macraes Flat gold mine is covered by numerous consents
that include extensive monitoring and reporting requirements. Reports on the results of the
monitoring are available on request through Oceana Gold.
2.1.1. North Otago river and land cover characteristics
Table 5 summarises characteristics of the North Otago reporting region based on the River
Environment Classification (refer Appendix F for a detailed overview of the REC); land-cover (based on
the Land Cover Database Version 4; condensed with the approach summarised in Appendix D); and
the Land Use Capability (LUC) classes (see Section 1.2.8 for the LUC definition).
According to the River Environment Classification (REC), The North Otago reporting region is
dominated by rivers and streams with catchments that receive very low rainfall (less than 500mm
annual average rainfall) and are predominantly Cool/Dry low elevation rivers (63%) and Cool/Dry Hill
rivers (34%) (Table 5). The predominantly dry climate combined with significant areas of low relief land
typical of the lower Waitaki Plains (Welcome Creek); the Kakanui River and Waiareka Creek
catchments; and the lower Shag River catchment, provides opportunity for irrigation and provide for
areas of cropping (total cropping area 2.7 % or approximately 6000 hectares; Table 5, Figure 5). More
intensive land-uses associated with irrigated pasture and cropping can add pressure to water resources
and water quality.
The predominant land cover throughout the North Otago reporting region is high producing grassland
(51%). High producing grassland reflects areas that are actively managed and grazed for wool, lamb,
beef, dairy or deer production (Table 5, Appendix D). This land cover dominates the Kakanui and Shag
River catchments (Figure 5).
The upper reaches of the Kakanui, Wainakarua and Shag River catchments sit in the Kakanui Mountains
and Horse Range. These areas have LUC classes of 6 and greater and are less suitable for intensive
grazing. These areas are dominated by low producing grassland, production forestry and native cover.
A significant proportion of the upper Wainakarua catchment is dominated by native cover (Figure 5).
‘Low Producing Grassland’ includes exotic and indigenous grasslands grazed for wool, sheep or beef
and are usually found on steep hill country (Appendix D). These low intensity land-uses typically leach
low levels of nutrients and provide for good water quality.
Rivers with low water yield (those on dry areas) have reduced dilution and flushing capacity. They tend
to be more susceptible to elevated nutrients should intensive land-uses fall within their catchments.

tate of the Environment – Surface Water Quality in Otago 2006 to 2017 21
Table 5: Characteristics of the North Otago reporting region ( 220,280 hectares). Source of
flow, Land Cover Area and Land-use Capability.
Source of flow (REC) Land Cover Area (LCDB4) Land-use Capability
Class (LUC)
Cool-Dry / Hill 34.1%
Cool-Dry / Low-Elevation 62.5%
Cool-Dry / Mountain 0.7%
Cool-Wet / Lake 0.1%
Cool-Wet / Mountain 2.6%
Cropping 2.7%
High producing grassland 50.5%
Low producing grassland 20.9%
Native Cover 15.1%
Orchards/Vineyards 0.04%
Plantation forestry 7.9%
Unaccounted 2.1%
Urban areas 0.8%
Class 2 8.2%
Class 3 19.1%
Class 4 19.5%
Class 5 0.1%
Class 6 39.3%
Class 7 11.5%
Class 8 0.7%
River 1.2%
Town 0.4%

22 State of the Environment – Surface Water Quality in Otago 2006 to 2017
Figure 5: Map showing broad land cover categories of the North Otago reporting region based
on the LCDB Version 4 database.
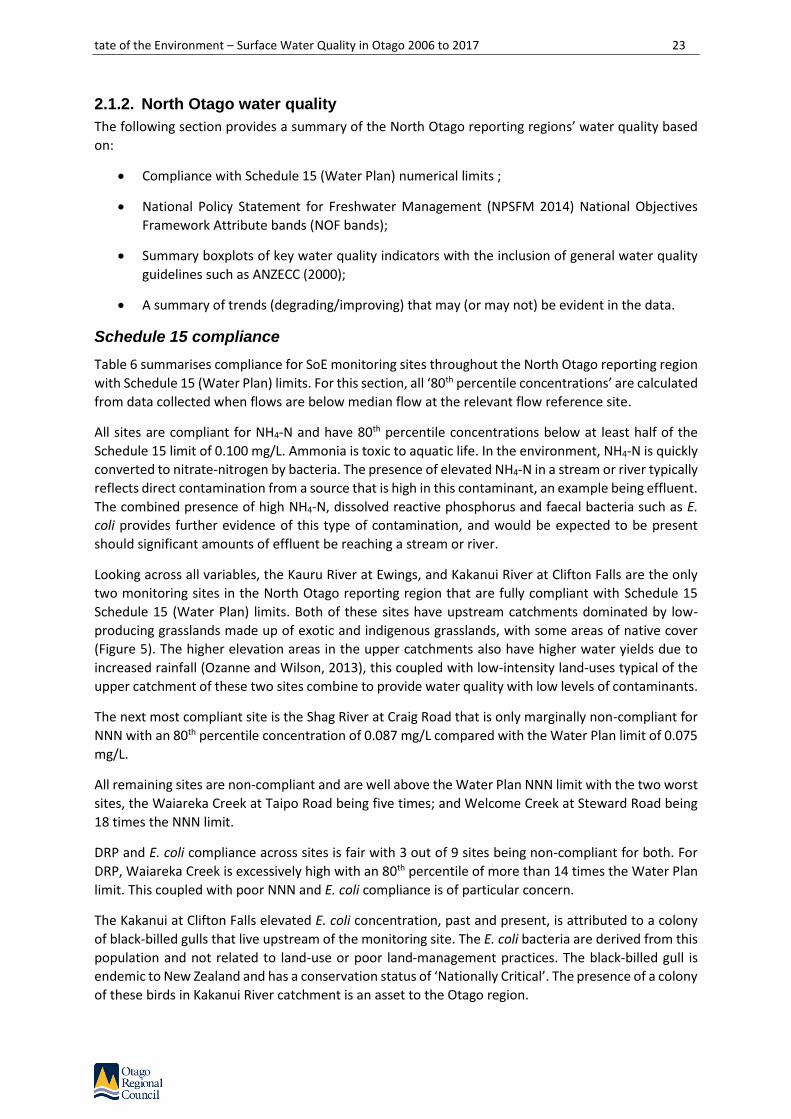
tate of the Environment – Surface Water Quality in Otago 2006 to 2017 23
2.1.2. North Otago water quality
The following section provides a summary of the North Otago reporting regions’ water quality based
on:
• Compliance with Schedule 15 (Water Plan) numerical limits ;
• National Policy Statement for Freshwater Management (NPSFM 2014) National Objectives
Framework Attribute bands (NOF bands);
• Summary boxplots of key water quality indicators with the inclusion of general water quality
guidelines such as ANZECC (2000);
• A summary of trends (degrading/improving) that may (or may not) be evident in the data.
Schedule 15 compliance
Table 6 summarises compliance for SoE monitoring sites throughout the North Otago reporting region
with Schedule 15 (Water Plan) limits. For this section, all ‘80th percentile concentrations’ are calculated
from data collected when flows are below median flow at the relevant flow reference site.
All sites are compliant for NH4-N and have 80th percentile concentrations below at least half of the
Schedule 15 limit of 0.100 mg/L. Ammonia is toxic to aquatic life. In the environment, NH4-N is quickly
converted to nitrate-nitrogen by bacteria. The presence of elevated NH4-N in a stream or river typically
reflects direct contamination from a source that is high in this contaminant, an example being effluent.
The combined presence of high NH4-N, dissolved reactive phosphorus and faecal bacteria such as E.
coli provides further evidence of this type of contamination, and would be expected to be present
should significant amounts of effluent be reaching a stream or river.
Looking across all variables, the Kauru River at Ewings, and Kakanui River at Clifton Falls are the only
two monitoring sites in the North Otago reporting region that are fully compliant with Schedule 15
Schedule 15 (Water Plan) limits. Both of these sites have upstream catchments dominated by low-
producing grasslands made up of exotic and indigenous grasslands, with some areas of native cover
(Figure 5). The higher elevation areas in the upper catchments also have higher water yields due to
increased rainfall (Ozanne and Wilson, 2013), this coupled with low-intensity land-uses typical of the
upper catchment of these two sites combine to provide water quality with low levels of contaminants.
The next most compliant site is the Shag River at Craig Road that is only marginally non-compliant for
NNN with an 80th percentile concentration of 0.087 mg/L compared with the Water Plan limit of 0.075
mg/L.
All remaining sites are non-compliant and are well above the Water Plan NNN limit with the two worst
sites, the Waiareka Creek at Taipo Road being five times; and Welcome Creek at Steward Road being
18 times the NNN limit.
DRP and E. coli compliance across sites is fair with 3 out of 9 sites being non-compliant for both. For
DRP, Waiareka Creek is excessively high with an 80th percentile of more than 14 times the Water Plan
limit. This coupled with poor NNN and E. coli compliance is of particular concern.
The Kakanui at Clifton Falls elevated E. coli concentration, past and present, is attributed to a colony
of black-billed gulls that live upstream of the monitoring site. The E. coli bacteria are derived from this
population and not related to land-use or poor land-management practices. The black-billed gull is
endemic to New Zealand and has a conservation status of ‘Nationally Critical’. The presence of a colony
of these birds in Kakanui River catchment is an asset to the Otago region.

24 State of the Environment – Surface Water Quality in Otago 2006 to 2017
Table 6: 80th percentile values for water quality variables identified in Schedule 15. Values
are calculated from samples taken when flows are below median flow. The orange cells show where the
80th percentile exceeds the Schedule 15 limit.
Variable NNN NH4-N DRP E. coli Turbidity
Schedule 15 limit when flows < median flow 0.075 mg/L 0.100 mg/L 0.010 mg/L 260 CFU 5.00 NTU
SoE reporting name
Welcome Creek at Steward Road 1.400 0.020 0.033 454 0.73
Kakanui River at Clifton Falls Bridge 0.037 0.009 0.003 324 0.63
Kauru River at Ewings 0.025 0.009 0.004 138 0.42
Kakanui River at McCones 0.187 0.022 0.004 160 0.76
Waiareka Creek at Taipo Road 0.410 0.039 0.140 460 1.80
Waianakarua River at Browns 0.248 0.007 0.007 130 0.40
Trotters Creek at Mathesons 0.228 0.016 0.008 120 2.16
Shag River at Craig Road 0.086 0.007 0.006 138 0.55
Shag River at Goodwood Pump 0.260 0.011 0.011 240 0.70
Nitrate and ammonia toxicity and NOF compliance
It is important to note that the NOF nitrate and NH4-N attributes focus on protection of ecosystem
health and life supporting capacity by providing protection against toxicity effects. Toxicity effects
occur if concentrations of these contaminants reach high levels (refer Section 1.2.5). It is important to
realise that toxicity effects occur at concentrations far greater than those that stimulate algal growth
and eutrophication11 effects. The limits identified in the Water Plan for NNN and the generic ANZECC
trigger levels discussed in the following section, are more closely aligned with those necessary to guard
against eutrophication of our waterways.
NOF attribute bands for nitrate are summarised in Table 7. With the exception of Welcome and
Waiareka creeks, all sites are in the “A band”. If a site falls in the A band then there is “unlikely to be
[toxicity] effects even for sensitive species”. This shows, for these sites at current concentrations, there
to be a high level of protection against nitrate toxicity.
Both elevated median and 95th percentile nitrate concentrations push Welcome Creek into the ‘B’
band, for Waiareka Creek, the 95th percentile concentration is also in the B band; however for this site,
the median concentration is more than half that of the A band cutoff of 1.0 mg/L. Based on nitrate
concentration peaks (95th percentile concentrations), both sites can be categorised as being in the “B
band” for the NOF nitrate attribute. The B-band reflects an environment that may have “some growth
effect on up to 5% of species” in regards to a chronic nitrate toxicity effect (Appendix B). This provides
for a good level of protection with some minor effects on growth rate of the most sensitive species
(Hickey, 2013).
NOF attribute bands for NH4-N are summarised in Table 8. With the exception of Waiareka Creek and
the 95th percentile NH4-N concentration, all sites are graded as being in the “A band” and reflect an
environment where there is “no observed [toxicity] effect on any species tested” and provide a 99%
species protection level (Appendix B), being the highest protection banding. The 95th percentile NH4-N
concentration for Waiareka Creek pushes this site into the “B band”. The B band reflects an
11 Eutrophication is the term used to describe enrichment of a water body with nutrients, usually an excess amount of nutrients that induces growth of plants and algae to nuisance levels.

tate of the Environment – Surface Water Quality in Otago 2006 to 2017 25
environment where NH4-N concentrations “start impacting occasionally on the 5% most sensitive
species” (Appendix B).
Both the A and B bands provide a good level of protection against toxicity effects and in the case of
nitrate and NH4-N, it is highly unlikely that there would be any chronic toxicity effects on aquatic
species present at these sites.
Table 7: NOF compliance summary for Nitrate (estimated from NNN). Included are median and
95th percentile values for the period July 2012 to June 2017 and the corresponding NOF attribute bands.
Variable Nitrate as NNN NOF Band
SoE reporting name Median (mg/L)
95th Percentile
(mg/L) Median 95th
Percentile
Welcome Creek at Steward Road 1.463 2.146 B B
Kakanui River at Clifton Falls Bridge 0.018 0.091 A A
Kauru River at Ewings 0.013 0.079 A A
Kakanui River at McCones 0.267 0.600 A A
Waiareka Creek at Taipo Road 0.480 1.747 A B
Waianakarua River at Browns 0.193 0.520 A A
Trotters Creek at Mathesons 0.560 1.432 A A
Shag River at Craig Road 0.104 0.496 A A
Shag River at Goodwood Pump 0.219 0.649 A A
Table 8: NOF compliance summary for NH4-N. Included are median and maximum values for the
period July 2012 to June 2017 and the corresponding NOF attribute bands.
Variable Ammoniacal nitrogen
(unadjusted) NOF Band
SoE reporting name Median (mg/L)
Maximum (mg/L)
Median Maximum
Welcome Creek at Steward Road 0.008 0.024 A A
Kakanui River at Clifton Falls Bridge 0.005 0.018 A A
Kauru River at Ewings 0.004 0.011 A A
Kakanui River at McCones 0.007 0.019 A A
Waiareka Creek at Taipo Road 0.024 0.106 A B
Waianakarua River at Browns 0.005 0.014 A A
Trotters Creek at Mathesons 0.012 0.025 A A
Shag River at Craig Road 0.005 0.011 A A
Shag River at Goodwood Pump 0.006 0.016 A A

26 State of the Environment – Surface Water Quality in Otago 2006 to 2017
E. coli, swimmability and NOF compliance
Table 9 summarises compliance for E. coli against the four statistical tests of the NOF E. coli attribute.
With the exception of Waiareka Creek, and to a lesser extent Welcome Creek, all sites have a high level
of compliance and return an A (blue) or green (B) attribute state. This is a great result for the North
Otago reporting region and shows sites to have good water quality in regards to swimmability. The
high 95th percentile for Welcome Creek pushes it into the upper C band; the threshold from a C band
to a D band is 1200 CFU/100ml (Appendix B) so Welcome Creek, should E. coli peaks increase, will go
from an acceptable C band to an unacceptable D band.
Waiareka Creek fails all attribute states returning a ‘D’ band for all. This aligns with Waiareka Creek
failing Schedule 15 (Water Plan) E. coli compliance (Table 6) and highlights issues with bacterial
contamination in the catchment.
The overall attribute state is based on the worst grading with the national bottom line being an orange
“D” band; all sites must return a minimum of a “C” band.
Table 9: NOF compliance summary for E. coli for the the period July 2012 to June 2017. The
overall grading band is determined by the lowest (worst) ranked Numeric Attribute State as it relates to
the four.
Numeric Attribute State Overall attribute
state
Site
Median grade
(CFU/100ml)
95th percentile
grade (CFU/100ml
)
% over 260
CFU/100ml grade (%)
% over 540
CFU/100ml grade (%)
Grading attribute
state
Overall Pass/Fai
l
Welcome Creek at Steward Road
A (50) C (1156) A (14%) C (11%) C PASS
Kakanui River at Clifton Falls Bridge
A (70) B (818) B (23%) A (5%) B PASS
Kauru River at Ewings
A (42) A (393) A (10%) A (3%) A PASS
Kakanui River at McCones
A (88) A (454) A (12%) A (3%) A PASS
Waiareka Creek at Taipo Road
D (230) D (1595) D (40%) D (24%) D FAIL
Waianakarua River at Browns
A (33) A (308) A (5%) A (2%) A PASS
Trotters Creek at Mathesons
A (80) B (708) A (19%) B (7%) B PASS
Shag River at Craig Road
A (48) A (445) A (9%) A (2%) A PASS
Shag River at Goodwood Pump
A (66) A (308) A (10%) A (2%) A PASS

tate of the Environment – Surface Water Quality in Otago 2006 to 2017 27
Ammoniacal nitrogen
With the exception of the Waiareka Creek, NH4-N concentrations are low across all North Otago SoE
monitoring sites, with median and most 95th percentile values being well below the ANZECC trigger
level of 0.021 mg/L (Figure 6). In Waiareka Creek NH4-N are mildly elevated above ANZECC (2000)
trigger levels and reflect some enrichment of NH4-N above typical natural background levels.
Ammoniacal nitrogen trend analysis (Table 10) reveals significant increasing trends for both the
Waiareka Creek and Trotters Creek monitoring sites. These two sites also have the highest NH4-N
concentrations of the North Otago reporting regions.
Figure 6: Boxplot summary of NH4-N concentrations at SoE monitoring sites throughout North
Otago. The red dashed line corresponds to the lowland ANZECC guideline of 0.021 mg/L.
Am
mo
nia
ca
l N
itro
ge
n (
mg
/L)
Welco
me
Cre
ek a
t Ste
war
d Roa
d
Kak
anui R
iver
at C
lifto
n Fal
ls B
ridge
Kau
ru R
iver
at E
wings
Kak
anui R
iver
at M
cCon
es
Waiar
eka
Cre
ek a
t Taipo
Roa
d
Waian
akar
ua R
iver
at B
rowns
Trotte
rs C
reek
at M
athe
sons
Sha
g River
at C
raig R
oad
Sha
g River
at G
oodw
ood
Pum
p0.000
0.025
0.050
0.075
0.100
0.125
0.150

28 State of the Environment – Surface Water Quality in Otago 2006 to 2017
Table 10: Trend summary of Ammonical Nitrogen (NH4-N) concentrations for the North Otago
reporting region. Si
te
We
lco
me
Cre
ek
at
Stew
ard
Ro
ad
Kak
anu
i Riv
er a
t C
lifto
n F
alls
Bri
dge
Kau
ru R
iver
at
Ewin
gs
Kak
anu
i Riv
er a
t M
cCo
nes
Wai
arek
a C
reek
at
Taip
o R
oad
Wai
anak
aru
a R
iver
at
Bro
wn
s
Tro
tte
rs C
reek
at
Mat
hes
on
s
Shag
Riv
er a
t C
raig
R
oad
Shag
Riv
er a
t G
oo
dw
oo
d P
um
p
Am
mo
nia
cal
Nit
roge
n
< DL < DL < DL < DL ↑↑↑ < DL ↑↑↑ < DL < DL
Nitrite/Nitrate nitrogen
Nitrite/nitrate nitrogen levels are elevated above the ANZECC trigger level of 0.444 mg/L for three sites
across the North Otago reporting region, including Welcome Creek (the highest), Waiareka Creek
(second highest) and Trotters Creek (Figure 7). This aligns with Schedule 15 (Water Plan) ‘non-
compliance’ for these three sites.
On a regional standing, Welcome Stream has very elevated levels of NNN with the second highest
median concentration for the wider Otago region (Appendix E). Welcome Creek is a spring-fed stream
located in the lower Waitaki Plains and lies in an area where groundwater is known to be enriched
with nitrate (Rajanayaka, 2012).
Nitrite/nitrate nitrogen trend analysis (Table 11) reveals significant increasing trends for three sites
including Waiareka and Trotters creeks, and the Kakanui River at McCones.

tate of the Environment – Surface Water Quality in Otago 2006 to 2017 29
Figure 7: Nitrite/nitrate nitrogen (NNN) concentrations at SoE monitoring sites throughout
North Otago. The red dashed line corresponds to the lowland ANZECC guideline of 0.444 mg/L.
Table 11: Trend summary of Nitrite/nitrate nitrogen (NNN) concentrations for the North Otago
reporting region.
Site
Wel
com
e C
ree
k at
St
ewar
d R
oad
Kak
anu
i Riv
er a
t C
lifto
n F
alls
Bri
dge
Kau
ru R
iver
at
Ewin
gs
Kak
anu
i Riv
er a
t M
cCo
nes
Wai
arek
a C
reek
at
Taip
o R
oad
Wai
anak
aru
a R
iver
at
Bro
wn
s
Tro
tte
rs C
reek
at
Mat
hes
on
s
Shag
Riv
er a
t C
raig
R
oad
Shag
Riv
er a
t G
oo
dw
oo
d P
um
p
Nit
rite
/
Nit
rate
N
itro
gen
? ? → ↑↑↑ ↑↑↑ ? ↑↑↑ ? ↓↓
Nitrite
/Nitra
te N
itro
ge
n (
mg
/L)
Welco
me
Cre
ek a
t Ste
war
d Roa
d
Kak
anui R
iver
at C
lifto
n Fal
ls B
ridge
Kau
ru R
iver
at E
wings
Kak
anui R
iver
at M
cCon
es
Waiar
eka
Cre
ek a
t Taipo
Roa
d
Waian
akar
ua R
iver
at B
rowns
Trotte
rs C
reek
at M
athe
sons
Sha
g River
at C
raig R
oad
Sha
g River
at G
oodw
ood
Pum
p0.00
0.50
1.00
1.50
2.00
2.50
3.00

30 State of the Environment – Surface Water Quality in Otago 2006 to 2017
Total Nitrogen
Total nitrogen concentrations follow similar patters to nitrite/nitrate nitrogen (NNN) for the North
Otago reporting region, with concentrations elevated above the ANZECC trigger level of 0.614 mg/L
for three sites, including Welcome Creek (second highest), Waiareka Creek (highest), and Trotters
Creek (Figure 8). Waiareka Creek has higher TN concentrations than Welcome Creek, being the
opposite of that seen for NNN. This reflects the difference in NH4-N contribution to the TN pool
between the two sites with the high NH4-N of Waiareka Creek elevating the TN above that of Welcome
Stream.
TN trend analysis (Table 12) follows a similar pattern as NNN, with increasing trends for three sites,
including significant increasing trends for the Waiareka and Trotters creeks; and a probable increasing
trend for the Kakanui River at McCones.
When considering effects on sensitive downstream receiving environments, such as estuarine and lake
environments, we are typically more interested in TN than NNN due to the extended water residence
times in these environments. This increases the opportunity for nutrient cycling and conversion of
organic nutrients or organic nitrogen that typically aren’t readily available for plant and algal growth,
into inorganic nutrients, or in the case of nitrogen, NNN, that are readily available for algal and plant
growth.
Figure 8: Boxplot summary of TN concentrations at SoE monitoring sites throughout North
Otago. The red dashed line corresponds to the lowland ANZECC guideline of 0.614 mg/L.
To
tal N
itro
ge
n (
mg
/L)
Welco
me
Cre
ek a
t Ste
war
d Roa
d
Kak
anui R
iver
at C
lifto
n Fal
ls B
ridge
Kau
ru R
iver
at E
wings
Kak
anui R
iver
at M
cCon
es
Waiar
eka
Cre
ek a
t Taipo
Roa
d
Waian
akar
ua R
iver
at B
rowns
Trotte
rs C
reek
at M
athe
sons
Sha
g River
at C
raig R
oad
Sha
g River
at G
oodw
ood
Pum
p0.00
1.00
2.00
3.00
4.00
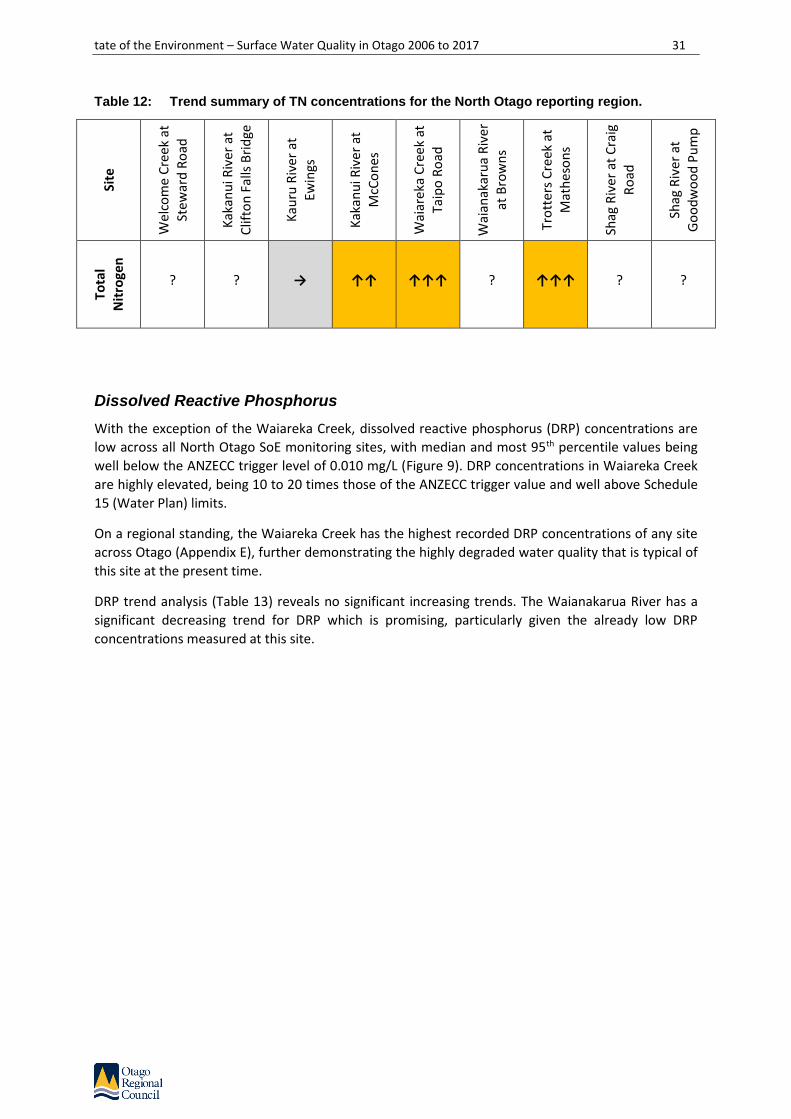
tate of the Environment – Surface Water Quality in Otago 2006 to 2017 31
Table 12: Trend summary of TN concentrations for the North Otago reporting region. Si
te
We
lco
me
Cre
ek
at
Stew
ard
Ro
ad
Kak
anu
i Riv
er a
t C
lifto
n F
alls
Bri
dge
Kau
ru R
iver
at
Ewin
gs
Kak
anu
i Riv
er a
t M
cCo
nes
Wai
arek
a C
reek
at
Taip
o R
oad
Wai
anak
aru
a R
iver
at
Bro
wn
s
Tro
tte
rs C
reek
at
Mat
hes
on
s
Shag
Riv
er a
t C
raig
R
oad
Shag
Riv
er a
t G
oo
dw
oo
d P
um
p
Tota
l N
itro
gen
? ? → ↑↑ ↑↑↑ ? ↑↑↑ ? ?
Dissolved Reactive Phosphorus
With the exception of the Waiareka Creek, dissolved reactive phosphorus (DRP) concentrations are
low across all North Otago SoE monitoring sites, with median and most 95th percentile values being
well below the ANZECC trigger level of 0.010 mg/L (Figure 9). DRP concentrations in Waiareka Creek
are highly elevated, being 10 to 20 times those of the ANZECC trigger value and well above Schedule
15 (Water Plan) limits.
On a regional standing, the Waiareka Creek has the highest recorded DRP concentrations of any site
across Otago (Appendix E), further demonstrating the highly degraded water quality that is typical of
this site at the present time.
DRP trend analysis (Table 13) reveals no significant increasing trends. The Waianakarua River has a
significant decreasing trend for DRP which is promising, particularly given the already low DRP
concentrations measured at this site.

32 State of the Environment – Surface Water Quality in Otago 2006 to 2017
Figure 9: Boxplot summary of Dissolved Reactive Phosphorus (DRP) concentrations at SoE
monitoring sites throughout North Otago. The red dashed line corresponds to the lowland ANZECC
guideline for DRP of 0.010 mg/L.
Table 13: Trend summary of Dissolved Reactiver Phosphorus (DRP) concentrations for the
North Otago reporting region.
Site
Wel
com
e C
ree
k at
St
ewar
d R
oad
Kak
anu
i Riv
er a
t C
lifto
n F
alls
Bri
dge
Kau
ru R
iver
at
Ewin
gs
Kak
anu
i Riv
er a
t M
cCo
nes
Wai
arek
a C
reek
at
Taip
o R
oad
Wai
anak
aru
a R
iver
at
Bro
wn
s
Tro
tte
rs C
reek
at
Mat
hes
on
s
Shag
Riv
er a
t C
raig
R
oad
Shag
Riv
er a
t G
oo
dw
oo
d P
um
p
Dis
solv
ed
Re
acti
ve
Ph
osp
ho
rus
? < DL < DL < DL ? ↓↓↓ ? ? ?
Dis
so
lve
d R
ea
ctive
Ph
osp
ho
rus (
mg
/L)
Welco
me
Cre
ek a
t Ste
war
d Roa
d
Kak
anui R
iver
at C
lifto
n Fal
ls B
ridge
Kau
ru R
iver
at E
wings
Kak
anui R
iver
at M
cCon
es
Waiar
eka
Cre
ek a
t Taipo
Roa
d
Waian
akar
ua R
iver
at B
rowns
Trotte
rs C
reek
at M
athe
sons
Sha
g River
at C
raig R
oad
Sha
g River
at G
oodw
ood
Pum
p0.00
0.05
0.10
0.15
0.20
0.25
0.30

tate of the Environment – Surface Water Quality in Otago 2006 to 2017 33
Total Phosphorus
With the exception of Waiareka Creek, and to a limited extent Welcome Creek, TP concentrations are
low across all North Otago SoE monitoring sites, with median and most 95th percentile values being
well below the ANZECC trigger level of 0.033 mg/L (Figure 10).
The high concentrations of DRP in Waiareka Creek contribute to the TP pool at this site, and result in
highly elevated TP concentrations. TP concentrations in Waiareka Creek are 5 to 10 times those of the
ANZECC trigger value.
With the exception of the Dart River that carries a very high sediment and associated particulate
phosphorus load, on a regional standing, the Waiareka Creek has the highest recorded TP
concentrations of any site across Otago that can be attributed to anthropogenic (human) sources
(Appendix E), again demonstrating the degraded water quality that is typical of this site at the present
time.
TP trend analysis (Table 14) reveals a number of significant increasing (degrading) trends, including the
Kauru at Ewings, Trotters Creek and the Shag River at Craig Road. ORC do not have information on
changes in land-use or land management practices so it is not possible to comment on the cause of
the degrading trends at these sites.
Figure 10: Boxplot summary of TP concentrations at SoE monitoring sites throughout North
Otago. The red dashed line corresponds to the lowland ANZECC guideline for TP of 0.033 mg/L.
To
tal P
ho
sp
ho
rus (
mg
/L)
Welco
me
Cre
ek a
t Ste
war
d Roa
d
Kak
anui R
iver
at C
lifto
n Fal
ls B
ridge
Kau
ru R
iver
at E
wings
Kak
anui R
iver
at M
cCon
es
Waiar
eka
Cre
ek a
t Taipo
Roa
d
Waian
akar
ua R
iver
at B
rowns
Trotte
rs C
reek
at M
athe
sons
Sha
g River
at C
raig R
oad
Sha
g River
at G
oodw
ood
Pum
p0.00
0.10
0.20
0.30
0.40

34 State of the Environment – Surface Water Quality in Otago 2006 to 2017
Table 14: Trend summary of TP concentrations for the North Otago reporting region. Si
te
We
lco
me
Cre
ek
at
Stew
ard
Ro
ad
Kak
anu
i Riv
er a
t C
lifto
n F
alls
Bri
dge
Kau
ru R
iver
at
Ewin
gs
Kak
anu
i Riv
er a
t M
cCo
nes
Wai
arek
a C
reek
at
Taip
o R
oad
Wai
anak
aru
a R
iver
at
Bro
wn
s
Tro
tte
rs C
reek
at
Mat
hes
on
s
Shag
Riv
er a
t C
raig
R
oad
Shag
Riv
er a
t G
oo
dw
oo
d P
um
p
Tota
l P
ho
sph
oru
s
? ? ↑↑↑ ? ? ? ↑↑↑ ↑↑↑ ?
Escherichia coli
E.coli concentrations are relatively low across the majority of sites for the North Otago reporting
region. The exceptions being peak concentrations (95th percentiles; represented by the upper whiskers
on the Figure 11 boxplots) for Welcome Creek, the Kakanui River at Clifton Falls, Waiareka Creek and
Trotters Creek (Figure 11). The 95th percentile concentrations at these sites are above the red alert
level of 550 CFU/100ml and represent an unacceptable risk to human health at such times.
Swimmability and compliance of E. coli concentrations for the North Otago reporting region with The
Water Plan and NPSFM NOF attribute limits are discussed in the previous section.
Waiareka Creek has the worst bacterial water quality for the North Otago reporting region with both
elevated median and peak concentrations. This shows bacteria levels at this site to typically be above
guideline levels and poses an unacceptable risk to human health for primary contact recreation (full
immersion) activities. Previous discussion of compliance with the NOF E. coli attribute placed the
Waiareka Creek in the orange (D band), or exceeding the national bottom line.
As discussed previously, bacterial levels at the Kakanui at Clifton Falls is naturally elevated due to the
presence of a black-billed gull colony located upstream of the monitoring site (Ozanne and Wilson,
2013). There are no appropriate interventions or mitigation measures available that can reduce
bacteria sourced from the gull colony.
E. coli trend analysis (Table 15) reveals a number of significant increasing (degrading) trends for some
sites, including the Kakanui at McCones, Waiareka Creek, the Waianakarua River and Trotters Creek.
The degrading trends for the Kakanui at McCones and Waianakarua River are of concern given the
currently good bacterial water quality at these two sites. The Waianakarua River has the lowest
recorded bacterial levels for the North Otago reporting region.
ORC do not have information on changes in land-use or land management practices so it is not possible
to comment on the cause of the degrading trends at these sites.
Looking across Otago, The North Otago reporting region has bacterial water quality that is midway
across reporting regions (Appendix E).

tate of the Environment – Surface Water Quality in Otago 2006 to 2017 35
Figure 11: Boxplot summary of E coli concentrations at SoE monitoring sites throughout North
Otago. The amber line corresponds to the amber alert level of 260 CFU/100ml; the red line to the red
alert level of 550 CFU/100ml.
Table 15: Trend summary of E. coli concentrations for the North Otago reporting region.
Site
Wel
com
e C
ree
k at
St
ewar
d R
oad
Kak
anu
i Riv
er a
t C
lifto
n F
alls
Bri
dge
Kau
ru R
iver
at
Ewin
gs
Kak
anu
i Riv
er a
t M
cCo
nes
Wai
arek
a C
reek
at
Taip
o R
oad
Wai
anak
aru
a R
iver
at
Bro
wn
s
Tro
tte
rs C
reek
at
Mat
hes
on
s
Shag
Riv
er a
t C
raig
R
oad
Shag
Riv
er a
t G
oo
dw
oo
d P
um
p
Esce
rich
ia
coli ? ? ? ↑↑↑ ↑↑↑ ↑↑↑ ↑↑↑ ? ?
Esch
erich
ia c
oli
(CF
U/1
00
ml)
Welco
me
Cre
ek a
t Ste
war
d Roa
d
Kak
anui R
iver
at C
lifto
n Fal
ls B
ridge
Kau
ru R
iver
at E
wings
Kak
anui R
iver
at M
cCon
es
Waiar
eka
Cre
ek a
t Taipo
Roa
d
Waian
akar
ua R
iver
at B
rowns
Trotte
rs C
reek
at M
athe
sons
Sha
g River
at C
raig R
oad
Sha
g River
at G
oodw
ood
Pum
p0
500
1000
1500
2000

36 State of the Environment – Surface Water Quality in Otago 2006 to 2017
Turbidity
Turbidity levels are low across all North Otago SoE monitoring sites with median and 95th percentile
values being well below the ANZECC lowland guideline value of 5.6 NTU (Figure 12). The exception is
Waiareka Creek, which returns elevated turbidity levels when compared to other monitoring sites.
Turbidity trend analysis (Table 16) reveals significant increasing trends for both the Kauru River and
Waiareka Creek monitoring sites. The Kauru River has very low turbidity levels and the increasing trend
is of concern. The elevated turbidity levels of Waiareka Creek, combined with a significant increasing
trend, are of particular concern. The Waianakarua River returned a ‘probable’ increasing trend and
warrants further scrutiny of monitoring data as it comes to hand.
Figure 12: Boxplot summary of Turbidity at SoE monitoring sites throughout North Otago. The
red dashed line corresponds to the lowland ANZECC guideline for Turbidity of 5.6 NTU.
Tu
rbid
ity (
NT
U)
Welco
me
Cre
ek a
t Ste
war
d Roa
d
Kak
anui R
iver
at C
lifto
n Fal
ls B
ridge
Kau
ru R
iver
at E
wings
Kak
anui R
iver
at M
cCon
es
Waiar
eka
Cre
ek a
t Taipo
Roa
d
Waian
akar
ua R
iver
at B
rowns
Trotte
rs C
reek
at M
athe
sons
Sha
g River
at C
raig R
oad
Sha
g River
at G
oodw
ood
Pum
p0.0
5.0
10.0
15.0
20.0
25.0
30.0
35.0

tate of the Environment – Surface Water Quality in Otago 2006 to 2017 37
Table 16: Trend summary of Turbidity levels for the North Otago reporting region. Si
te
We
lco
me
Cre
ek
at
Stew
ard
Ro
ad
Kak
anu
i Riv
er a
t C
lifto
n F
alls
Bri
dge
Kau
ru R
iver
at
Ewin
gs
Kak
anu
i Riv
er a
t M
cCo
nes
Wai
arek
a C
reek
at
Taip
o R
oad
Wai
anak
aru
a R
iver
at
Bro
wn
s
Tro
tte
rs C
reek
at
Mat
hes
on
s
Shag
Riv
er a
t C
raig
R
oad
Shag
Riv
er a
t G
oo
dw
oo
d P
um
p
Turb
idit
y
? ? ↑↑↑ ? ↑↑↑ ↑↑ ? ? ?
Stream Health and the Macroinvertebrate Community Index
Macroinvertebrate Community Index (MCI) scores provide an integrated indicator of the general state
of water quality and aquatic ecosystem health at a site.
Figure 13 summarises MCI scores for sites monitored for aquatic macroinvertebrates throughout the
North Otago reporting region. The summary includes annual samples, where available, collected from
2008 to 2017 (8 years).
There is considerable variation in MCI scores across monitoring sites that follow similar patterns to key
water quality indicators. Sites with good water quality, such as the Kakanui at Clifton Falls, the Kauru
at Ewings, and the Waianakarua at Browns return the highest scores with an MCI of over 100, reflecting
a macroinvertebrate community representative of water in ‘good’ condition. In a regional context
(refer to regional boxplot summaries for MCI in Appendix E), the Kauru at Ewings is in the top three of
all Otago sites monitored for MCI.
The remaining sites, with the exception of the Waiareka Creek, return MCI scores between 80 and 100.
This reflects stream health in ‘poor’ condition with a macroinvertebrate community that has reduced
numbers of pollution sensitive taxa and a prevalence of pollution tolerant taxa.
The Waiareka Creek site returns an MCI score in a much ‘degraded’ state and well below the red
‘degraded’ band threshold of 80. This follows the degraded nature of overall water quality at this site
but is also a reflection of the soft substrate. In a regional context (Appendix E), the Waiareka Creek has
the second lowest MCI scores for sites across Otago, and is only very slightly above the Kaikorai Stream.
Recent amendments to the NPSFM require councils to actively investigate reasons for a site returning
an MCI below 80 (Policy CB3). The low MCI score for Waiareka Creek has been reported on previously
by Ozanne and Wilson (2013).
By way of contrast for the North Otago reporting region, the Kauru at Ewings returns a median MCI
that is equal first on a regional basis with Dunstan Creek; contrast this with the Waiareka Creek that
returns median MCI that is ranked as the second worst for the region (Appendix G).
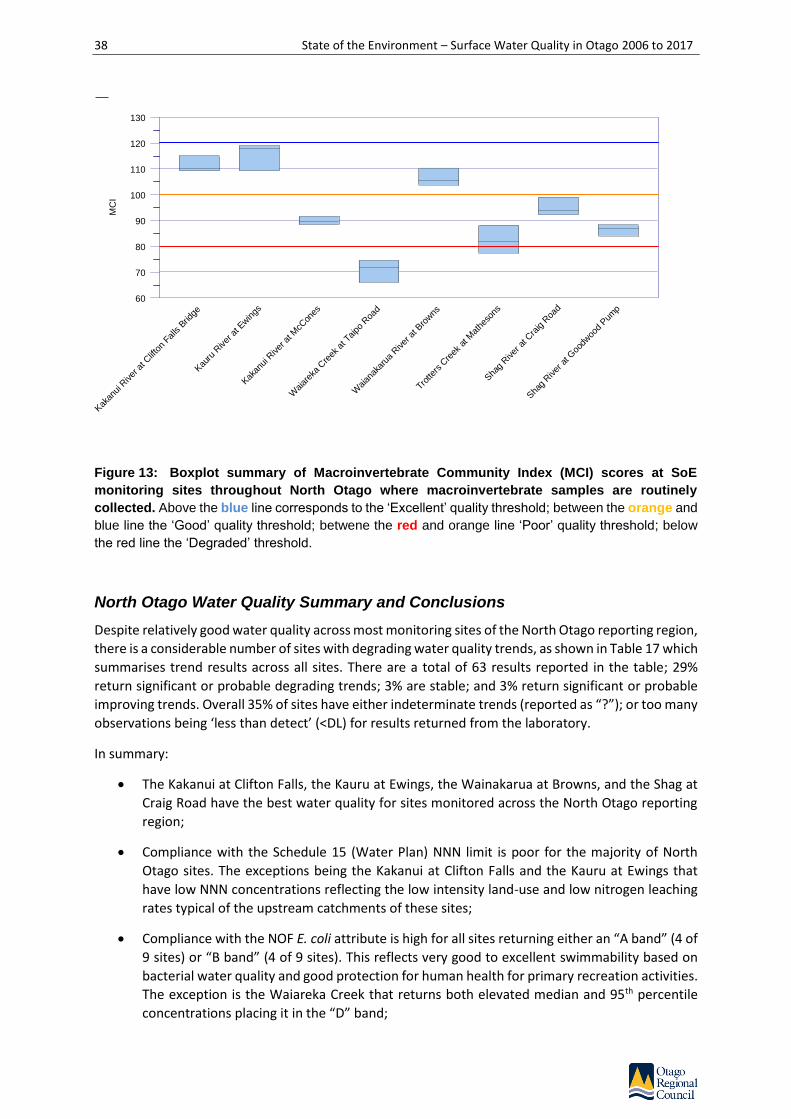
38 State of the Environment – Surface Water Quality in Otago 2006 to 2017
Figure 13: Boxplot summary of Macroinvertebrate Community Index (MCI) scores at SoE
monitoring sites throughout North Otago where macroinvertebrate samples are routinely
collected. Above the blue line corresponds to the ‘Excellent’ quality threshold; between the orange and
blue line the ‘Good’ quality threshold; betwene the red and orange line ‘Poor’ quality threshold; below
the red line the ‘Degraded’ threshold.
North Otago Water Quality Summary and Conclusions
Despite relatively good water quality across most monitoring sites of the North Otago reporting region,
there is a considerable number of sites with degrading water quality trends, as shown in Table 17 which
summarises trend results across all sites. There are a total of 63 results reported in the table; 29%
return significant or probable degrading trends; 3% are stable; and 3% return significant or probable
improving trends. Overall 35% of sites have either indeterminate trends (reported as “?”); or too many
observations being ‘less than detect’ (<DL) for results returned from the laboratory.
In summary:
• The Kakanui at Clifton Falls, the Kauru at Ewings, the Wainakarua at Browns, and the Shag at
Craig Road have the best water quality for sites monitored across the North Otago reporting
region;
• Compliance with the Schedule 15 (Water Plan) NNN limit is poor for the majority of North
Otago sites. The exceptions being the Kakanui at Clifton Falls and the Kauru at Ewings that
have low NNN concentrations reflecting the low intensity land-use and low nitrogen leaching
rates typical of the upstream catchments of these sites;
• Compliance with the NOF E. coli attribute is high for all sites returning either an “A band” (4 of
9 sites) or “B band” (4 of 9 sites). This reflects very good to excellent swimmability based on
bacterial water quality and good protection for human health for primary recreation activities.
The exception is the Waiareka Creek that returns both elevated median and 95th percentile
concentrations placing it in the “D” band;
MC
I
Kak
anui R
iver
at C
lifto
n Fal
ls B
ridge
Kau
ru R
iver
at E
win
gs
Kak
anui R
iver
at M
cCon
es
Waiar
eka
Cre
ek a
t Taipo
Roa
d
Waian
akar
ua R
iver
at B
rowns
Trotte
rs C
reek
at M
athe
sons
Sha
g River
at C
raig R
oad
Sha
g River
at G
oodw
ood
Pum
p
60
70
80
90
100
110
120
130

tate of the Environment – Surface Water Quality in Otago 2006 to 2017 39
• Water quality and instream health (based on MCI) of the Waiareka Creek is highly degraded.
This is likely a combination of soft substrate along with generally poor water quality (and
significant degrading trends for the majority of water quality parameters measured at this site.
The Waiareka Creek discharges to the Kakanui Estuary and has been identified as a significant
source of nutrient loading to the estuary in past studies (Ozanne and Wilson, 2013).
Previous reports have identified land-use intensification as a driver of poor water quality in the Kakanui
River and Waiareka Creek catchments (Ozanne and Wilson, 2013). Presently, ORC do not collect
detailed information on land-use, land management practices or changes in either of the two that
allow for inference as to the drivers of degrading or improving trends in water quality.
A targeted catchment study is currently underway in the Waiareka Creek catchment. This work will
help to identify hotspots in the catchment and ideally should help isolate the causes of already
degraded and deteriorating water quality.
Table 17: Trend summary for the North Otago reporting region.
Site
Am
mo
nia
cal
Nit
roge
n
Nit
rite
/Nit
rate
N
itro
gen
Tota
l Nit
roge
n
Dis
solv
ed
Rea
ctiv
e P
ho
sph
oru
s
Tota
l P
ho
sph
oru
s
Esch
eric
hia
co
li
Turb
idit
y
Welcome Creek at Steward Road
< DL ? ? ? ? ? ?
Kakanui River at Clifton Falls Bridge
< DL ? ? < DL ? ? ?
Kauru River at Ewings < DL → → < DL ↑↑↑ ? ↑↑↑
Kakanui River at McCones
< DL ↑↑↑ ↑↑ < DL ? ↑↑↑ ?
Waiareka Creek at Taipo Road
↑↑↑ ↑↑↑ ↑↑↑ ? ? ↑↑↑ ↑↑↑
Waianakarua River at Browns
< DL ? ? ↓↓↓ ? ↑↑↑ ↑↑
Trotters Creek at Mathesons
↑↑↑ ↑↑↑ ↑↑↑ ? ↑↑↑ ↑↑↑ ?
Shag River at Craig Road < DL ? ? ? ↑↑↑ ? ?
Shag River at Goodwood Pump
< DL ↓↓ ? ? ? ? ?

40 State of the Environment – Surface Water Quality in Otago 2006 to 2017
2.2. Dunedin/Southern coastal river catchments overview
The Dunedin/Southern Coastal reporting region spans an area of 3096 km2 (309642 hectares)
encompassing the catchments of the Waikouaiti River to the north; Lindsays Creek, the Leith Stream
and the Kaikorai Stream in the Dunedin City area; and the Tokomairiro, Owaka and Catlins rivers to the
south.
The Waikouaiti catchment area covers 421 km2, the river has two main branches, the ‘North Branch’
and ‘South Branch’. The North Branch has a catchment area of 283 km2 and the South Branch a
catchment area of 86 km2. The remaining 52 km2 includes the area downstream of the confluence of
the two main branches along with the Waikouaiti Estuary. The headwaters of the north branch
originate in the Macraes Flat area, whereas the south branch drains the northern slopes of the Silver
Peaks. The Waikouaiti Estuary is both locally and regionally significant and is listed as a significant
wetland in Schedule 9 of the Regional Plan: Water. The estuary contains Otago’s largest salt marsh.
The estuary is a high use estuary that is valued for its cultural, recreational, scientific and aesthetic
appeal, with rich biodiversity, shellfish collection, bathing, white-baiting, fishing, boating, surfing, and
walking values. In the Otago Regional Plan: Water, the Waikouaiti Estuary is listed as a coastal
protection area with Kai Tahu cultural and spiritual values (Robertson et al., 2017a). The health of the
upper estuary is affected by nutrient and sediment input, intensity and duration of low flows, and
frequency and size of flushing flows.
The Leith Stream catchment covers an area of 42 km2. The headwaters of the Leith Stream originate
at the saddle between Mount Cargill and Swampy Hill and flow for 12 km in a south-easterly direction
to discharge direct to the Otago Harbour, Dunedin. The total fall in the river is approximately 365 m
and, for a considerable distance, the Leith flows in a narrow valley with steep slopes rising to the hills,
Mount Cargill (elevation 680 m) to the east, Flagstaff Hill (668 m) and Swampy Spur (665 m) to the
west. There are numerous tributary streams to the Leith, the principal of which are West Branch,
Morrison’s, Cedar, Nichol’s and Ross Creeks entering the true right bank; and Cargill, Pine Hill and
Lindsays Creeks entering on the true left bank (ORC, 2008). Lindsays Creek is the main tributary of the
Leith Stream, with headwaters draining the upper eastern slopes of Mount Cargill. Lindsays Creek flows
for 7 km to its junction with the Leith Stream at the Dunedin Botanical Gardens, approximately 2 km
upstream of the mouth of the Leith Stream and the Otago Harbour. Significant areas of the lower
catchment of the Leith Stream and Lindsays Creek flow through urban areas of the Dunedin City. Both
the Leith Stream and Lindsays Creek are prone to sudden extreme floods due to the character of their
catchment areas (ORC, 2008).
The Kaikorai Stream has a total catchment area of 55 km2 and flows in a south westerly direction for
approximately 15 km down the Kaikorai Valley into Kaikorai Estuary, where it discharges to the Pacific
Ocean near Waldronville (approximately 10 km south of the Dunedin city centre). The headwaters
originate in the Kaikorai Hills to the north; and to the west lie Abbot’s Hill, the Chain Hills and Saddle
Hill. The catchment includes the western flanks of Dunedin city and all of Green Island. The remaining
area includes the communities of Fairfield and Waldronville (ORC, 2008). Fraser’s Stream is a major
tributary of the Kaikorai Stream and the Dunedin City Council discharges up to 560 litres per second of
high-quality water from the Mt Grand Water Treatment Plant to MacLeod’s Creek (a tributary of
Fraser’s Stream). This flow significantly improves the water quality and instream values of the Kaikorai
Stream downstream of the discharge point (ORC, 2008).
The Tokomairiro River is located about 48 km south-west of Dunedin and has a catchment area of 403
km2. The catchment has indistinct boundaries, with no dividing mountain ranges between it and
neighbouring catchments. It is bordered to the east by tributaries of the Waihola-Waipori wetland
complex (including Meggat Burn and Boundary Creek) and a number of coastal tributaries (including

tate of the Environment – Surface Water Quality in Otago 2006 to 2017 41
Akatore Creek). The Waitahuna River borders the catchment to the north, while to the west; it is
bordered by tributaries of Lake Tuakitoto (such as Lovells Creek) and Rocky Valley Creek. The
Tokomairiro River enters the Pacific Ocean south of Toko Mouth (Olsen, 2013b).
The Catlins River catchment covers an area of 415 km2 that includes its main tributary, the Owaka
River. Both rivers discharge to the Catlins Estuary (or Catlins Lake) (Robertson et al., 2017b). The river’s
source is to the west of Mt Rosebery, 15 km southwest of Clinton where the headwaters flow from the
Beresford Range to the south-west, and the Rata Range to the north-east. The river flows south-
eastward for 42 km where it meets the Catlins Lake and shares an estuary with the Owaka River. The
Catlins Lake discharges to the Pacific Ocean at Pounawea, 28 km south of Balclutha. The Owaka River
is 30 km long and flows south-east. Its source is on the slopes of Mt Rosebery. The Catlins rivers’ are
recognised for many natural values, including high fish and macroinvertebrate diversity, rare fish, trout
spawning and rearing habitat and a significant presence of eels (Ozanne, 2011).
2.2.1. Dunedin /Southern coastal river and land cover characteristics
Table 18 summarises characteristics of the Dunedin /Southern coastal reporting region based on the
River Environment Classification (refer Appendix F for a detailed overview of the REC); land-cover
(based on the Land Cover Database Version 4; condensed with the approach summarised in Appendix
D); and the Land Use Capability (LUC) classes (see Section 2.0 for the LUC definition).
According to the River Environment Classification (REC), The Dunedin/Southern coastal reporting
region is dominated by rivers and streams that are predominantly Cool/Dry low elevation rivers (73%)
and Cool/Dry Hill rivers (9%). Cool/Wet Hill Rivers (4%) and Cool/Wet low elevation rivers (12%) also
feature widely (Table 18).
The predominant land cover throughout the Dunedin/Southern coastal reporting region is high
producing grassland (62%) that reflect areas actively managed and grazed for wool, lamb, beef, dairy
or deer production (Table 18, Appendix D). This land cover dominates the Dunedin/Southern coastal
reporting region (Figure 14). Areas of forestry (16%) and native cover (15%) are also widespread. Of all
the areas covered in this report, the Dunedin/Southern coastal reporting region has the highest
percentage cover of urban areas (2%). There is a significant proportion of LUC Class 6 land throughout
the Dunedin/Southern coastal reporting region (47%). Class 6 land represents land that is steeper and
less suited to arable land uses and more suitable to forestry.
The Waikouaiti catchment is an agricultural dominated catchment with high producing grasslands that
support primarily extensive sheep and beef farming. Some dairy production (total of 750 milking cows)
is occurring in the lower catchment bordering the estuary and is aided by irrigation from the main stem
of the river (Robertson et al., 2017a).
The Leith Stream catchment has an upper catchment covered in indigenous hardwoods, production
forest, manuka/kanuka, and native grassland. While in the lower catchment the bottom and side
slopes of the valley are occupied to a large degree by streets and buildings, parks and open spaces
(ORC, 2008).
The upper catchment of the Kaikorai Stream is dominated by a mix of kanuka/manuka scrubland and
native forest; as well as areas of high producing grassland. The lower catchment has similar
characteristics to the Leith Stream in as much as it flows through urban and industrial areas (Kaikorai
Valley) before entering the Kaikorai Estuary and discharging to the Pacific Ocean at Waldronville.
The Tokomairiro Plains comprise sheep and beef farming as well as some cropping. Dairy conversion
from sheep and beef has occurred over the past decade and there are currently 19 dairy farms in the
catchment. Much of the hill country surrounding the Tokomairiro Plain has a high proportion of
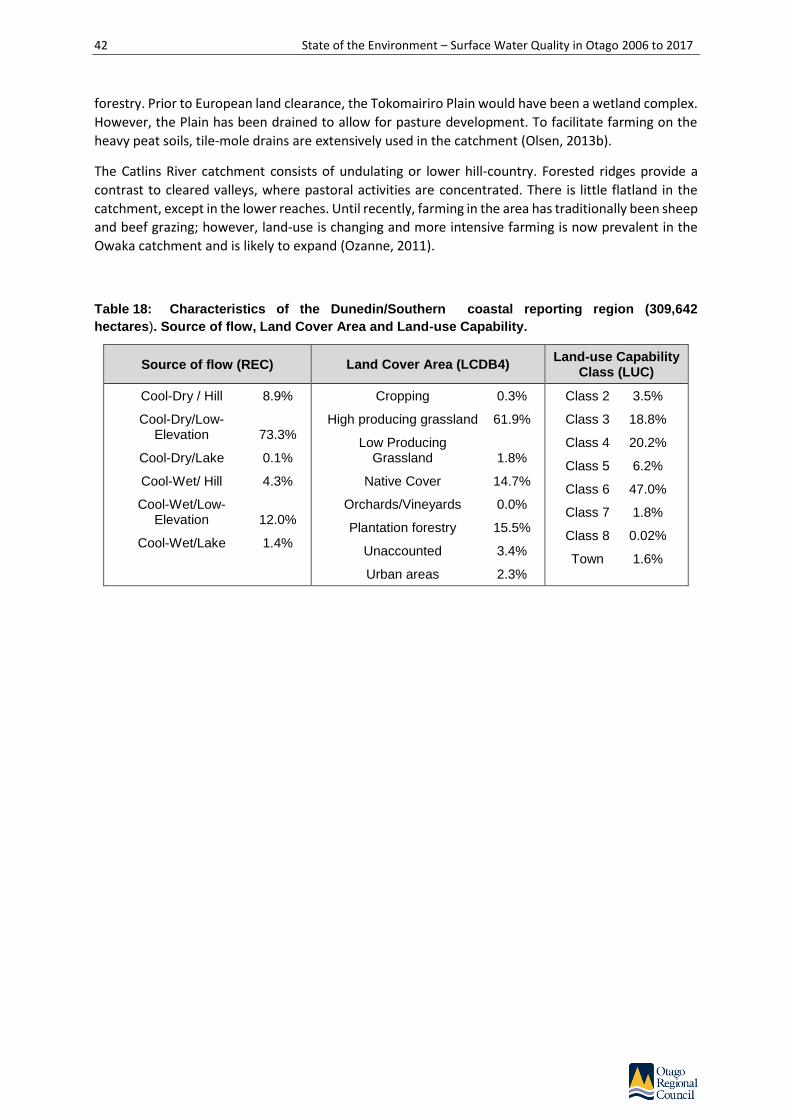
42 State of the Environment – Surface Water Quality in Otago 2006 to 2017
forestry. Prior to European land clearance, the Tokomairiro Plain would have been a wetland complex.
However, the Plain has been drained to allow for pasture development. To facilitate farming on the
heavy peat soils, tile-mole drains are extensively used in the catchment (Olsen, 2013b).
The Catlins River catchment consists of undulating or lower hill-country. Forested ridges provide a
contrast to cleared valleys, where pastoral activities are concentrated. There is little flatland in the
catchment, except in the lower reaches. Until recently, farming in the area has traditionally been sheep
and beef grazing; however, land-use is changing and more intensive farming is now prevalent in the
Owaka catchment and is likely to expand (Ozanne, 2011).
Table 18: Characteristics of the Dunedin/Southern coastal reporting region (309,642
hectares). Source of flow, Land Cover Area and Land-use Capability.
Source of flow (REC) Land Cover Area (LCDB4) Land-use Capability
Class (LUC)
Cool-Dry / Hill 8.9%
Cool-Dry/Low-Elevation 73.3%
Cool-Dry/Lake 0.1%
Cool-Wet/ Hill 4.3%
Cool-Wet/Low-Elevation 12.0%
Cool-Wet/Lake 1.4%
Cropping 0.3%
High producing grassland 61.9%
Low Producing Grassland 1.8%
Native Cover 14.7%
Orchards/Vineyards 0.0%
Plantation forestry 15.5%
Unaccounted 3.4%
Urban areas 2.3%
Class 2 3.5%
Class 3 18.8%
Class 4 20.2%
Class 5 6.2%
Class 6 47.0%
Class 7 1.8%
Class 8 0.02%
Town 1.6%
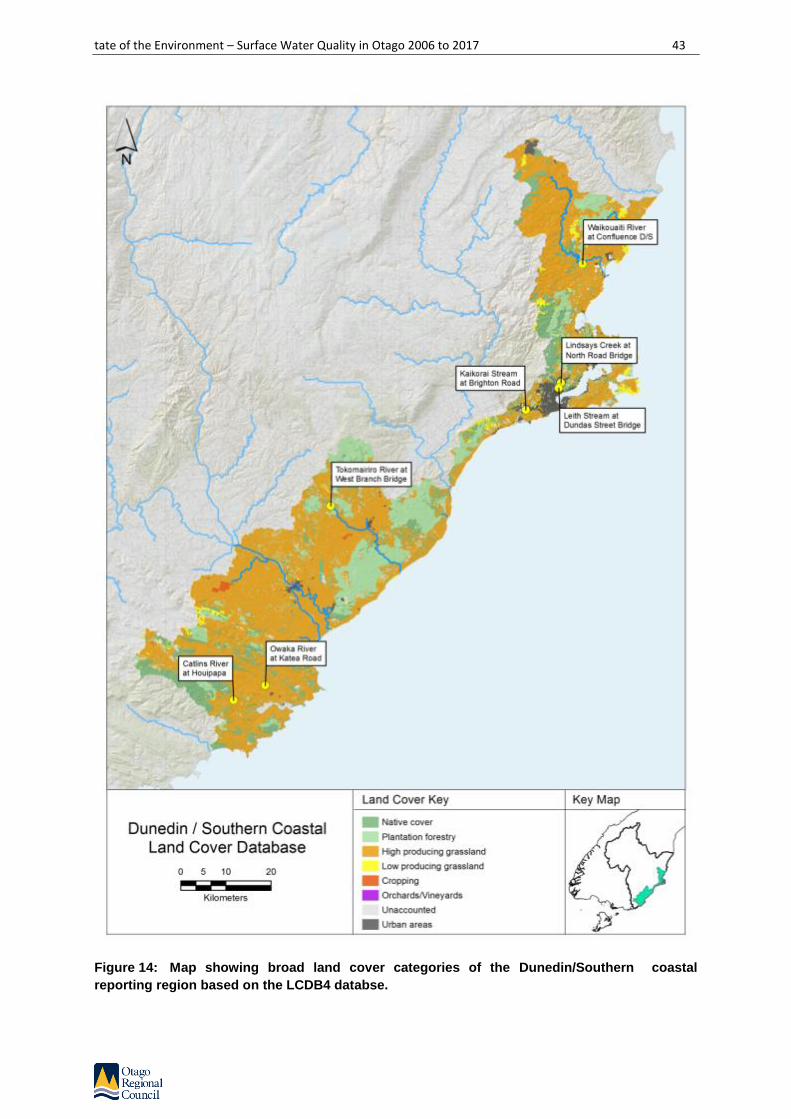
tate of the Environment – Surface Water Quality in Otago 2006 to 2017 43
Figure 14: Map showing broad land cover categories of the Dunedin/Southern coastal
reporting region based on the LCDB4 databse.

44 State of the Environment – Surface Water Quality in Otago 2006 to 2017
2.2.2. Dunedin /Southern coastal water quality
The following section provides a summary of the Dunedin/Southern coastal reporting region water
quality based on:
• Compliance with Schedule 15 (Water Plan) numerical limits;
• National Policy Statement for Freshwater Management (NPSFM 2014) National Objectives
Framework Attribute bands (NOF bands);
• Summary boxplots of key water quality indicators with the inclusion of general water quality
guidelines such as ANZECC (2000);
• A summary of trends (degrading/improving) that may (or may not) be evident in the data.
Schedule 15 compliance
Table 19 summarises compliance for SoE monitoring sites throughout the Dunedin/Southern coastal
reporting region with Schedule 15 (Water Plan) limits. For this section, all ‘80th percentile
concentrations’ are calculated from data collected when flows at the relevant flow reference site are
below median flow.
All sites are compliant for NH4-N and have 80th percentile concentrations below one-quarter of the
Schedule 15 limit of 0.100 mg/L. Ammonia is toxic to aquatic life. In the environment, NH4-N is quickly
converted to nitrate-nitrogen by bacteria. The presence of elevated NH4-N in a stream or river typically
reflects direct contamination from a source that is high in this contaminant, an example being effluent.
The combined presence of high NH4-N, dissolved reactive phosphorus and faecal bacteria such as E.
coli provides further evidence of this type of contamination, and would be expected to be present
should significant amounts of effluent be reaching a stream or river.
Looking across all variables, the Waikouaiti River and Catlins River monitoring sites are the only two
sites that are fully compliant with Schedule 15 (Water Plan) limits. The catchment upstream of the
Catlins River monitoring site is dominated by native vegetation, production forestry and some limited
high producing grassland (Figure 14). Native vegetation and production forest typically leach very low
level of nutrients and would help this site in meeting the Water Plan limits. The Waikouaiti River
monitoring site returns very low 80th percentile concentrations for all The Water Plan water quality
variables showing an excellent level of compliance. This is very positive given the highly sensitive
estuarine downstream receiving environment. Also worth noting for the Waikouaiti catchment are the
lower Schedule 15 (Water Plan) limits for RWG 2 under The Water Plan (Table 19), with an NNN limit
of 0.075 mg/L as opposed to 0.444 mg/L for RWG 1; and a DRP limit of 0.010 mg/L as opposed to 0.026
mg/L.
The Tokomairiro River and Kaikorai Streams are the next most compliant sites being compliant for
nutrients and turbidity. They fail the Schedule 15 (Water Plan) E. coli limits.
The Owaka River returns very high 80th percentiles for NNN, around three times the Schedule 15
(Water Plan) limit. DRP 80th percentiles are close to being non-compliant, returning an 80th percentile
of 0.025 mg/L compared with the Schedule 15 (Water Plan) limit of 0.026 mg/L.
With the exception of the Waikouaiti River and to a limited extent the Catlins River, E. coli compliance
for the Dunedin/Southern coastal reporting region is very poor, with all remaining sites being non-
compliant.

tate of the Environment – Surface Water Quality in Otago 2006 to 2017 45
Table 19: 80th percentile values for water quality variables identified in Schedule 15 for the
Dunedin/Southern coastal reporting region. Values are calculated from samples taken when flows
are below median flow. The orange cells show where the 80th percentile exceeds the Schedule 15 limit.
Numbers underlined in italics have lower limits under Schedule 15.
Variable NNN NH4-N DRP E. coli Turbidity
Schedule 15 limit when flows < median flow
0.444 mg/L
0.075 mg/L 0.100 mg/L
0.026 mg/L
0.010 mg/L 260 CFU 5.0 NTU
SoE reporting name
Waikouaiti River at Confluence D/S 0.015 0.013 0.003 80 1.11
Lindsays Creek at North Road Bridge 0.664 0.023 0.024 1004 3.32
Leith Stream at Dundas Street Bridge 0.470 0.014 0.028 626 2.22
Kaikorai Stream at Brighton Road 0.232 0.014 0.012 916 2.92
Tokomairiro River at West Branch Bdg 0.272 0.016 0.015 288 2.94
Owaka River at Katea Road 1.200 0.022 0.025 380 2.70
Catlins River at Houipapa 0.420 0.016 0.016 250 4.00
Nitrate and ammonia toxicity and NOF compliance
NOF attribute bands for nitrate are summarised in Table 20. With the exception of the Owaka River,
all sites are in the “A band”. If a site falls in the A band then there is “unlikely to be [toxicity] effects
even for sensitive species”. This shows, for these sites at current concentrations, there to be a high
level of protection against nitrate toxicity.
Both elevated median and 95th percentile nitrate concentrations push the Owaka River into the ‘B’
band. The B-band reflects an environment that may have “some growth effect on up to 5% of species”
in regards to a chronic nitrate toxicity effect (Appendix B). This provides for a good level of protection
with some minor effects on growth rate of the most sensitive species (Hickey, 2013).
NOF attribute bands for NH4-N are summarised in Table 21. For median concentrations, all sites fall
within the ‘A’ band. This shows a good level of protection against ammonia toxicity effects for typical
concentrations encountered in the rivers and streams. Concentration ‘peaks’ (maximum recorded
values) push a number of sites into the ‘B’ band, including the Leith and Kaikorai Streams, and the
Catlins River. If a site falls in the ‘A’ band then there is “no observed [toxicity] effect on any species
tested”. The A band provides a 99% species protection level (Appendix B), being the highest protection
banding. The B band reflects an environment where NH4-N concentrations “start impacting
occasionally on the 5% most sensitive species” (Appendix B). For the sites with high peak
concentrations, there may be a chance of chronic ammonia toxicity effects on the most sensitive
species at times that concentrations are elevated at these sites.
Both the A and B bands provide a good level of protection against toxicity effects and in the case of
nitrate and NH4-N, it is highly unlikely that there would be any chronic toxicity effects on aquatic
species present at these sites.

46 State of the Environment – Surface Water Quality in Otago 2006 to 2017
Table 20: NOF compliance summary for Nitrate (estimated from NNN) toxicity for the
Dunedin/Southern coastal reporting region. Included are median and 95th percentile values for the
the period July 2012 to June 2017 and the corresponding NOF attribute band.
Variable Nitrate as NNN NOF Band
SoE reporting name Median (mg/L)
95th Percentile
(mg/L) Median 95th
Percentile
Waikouaiti River at Confluence D⁄S 0.012 0.316 A A
Lindsays Creek at North Road Bridge 0.692 1.221 A A
Leith Stream at Dundas Street Bridge 0.508 0.891 A A
Kaikorai Stream at Brighton Road 0.293 0.783 A A
Tokomairiro River at West Branch Bdg 0.307 0.901 A A
Owaka River at Katea Road 1.173 1.908 B B
Catlins River at Houipapa 0.435 0.779 A A
Table 21: NOF compliance summary for NH4-N toxicity for the Dunedin/Southern coastal
reporting region. Included are median and maximum values for the the period July 2012 to June 2017
and the corresponding NOF attribute band.
Variable Ammoniacal nitrogen
(unadjusted) NOF Band
SoE reporting name Median (mg/L)
Maximum (mg/L)
Median Maximum
Waikouaiti River at Confluence D⁄S 0.005 0.020 A A
Lindsays Creek at North Road Bridge 0.011 0.039 A A
Leith Stream at Dundas Street Bridge 0.010 0.056 A B
Kaikorai Stream at Brighton Road 0.010 0.095 A B
Tokomairiro River at West Branch Bdg 0.010 0.027 A A
Owaka River at Katea Road 0.013 0.034 A A
Catlins River at Houipapa 0.014 0.119 A B
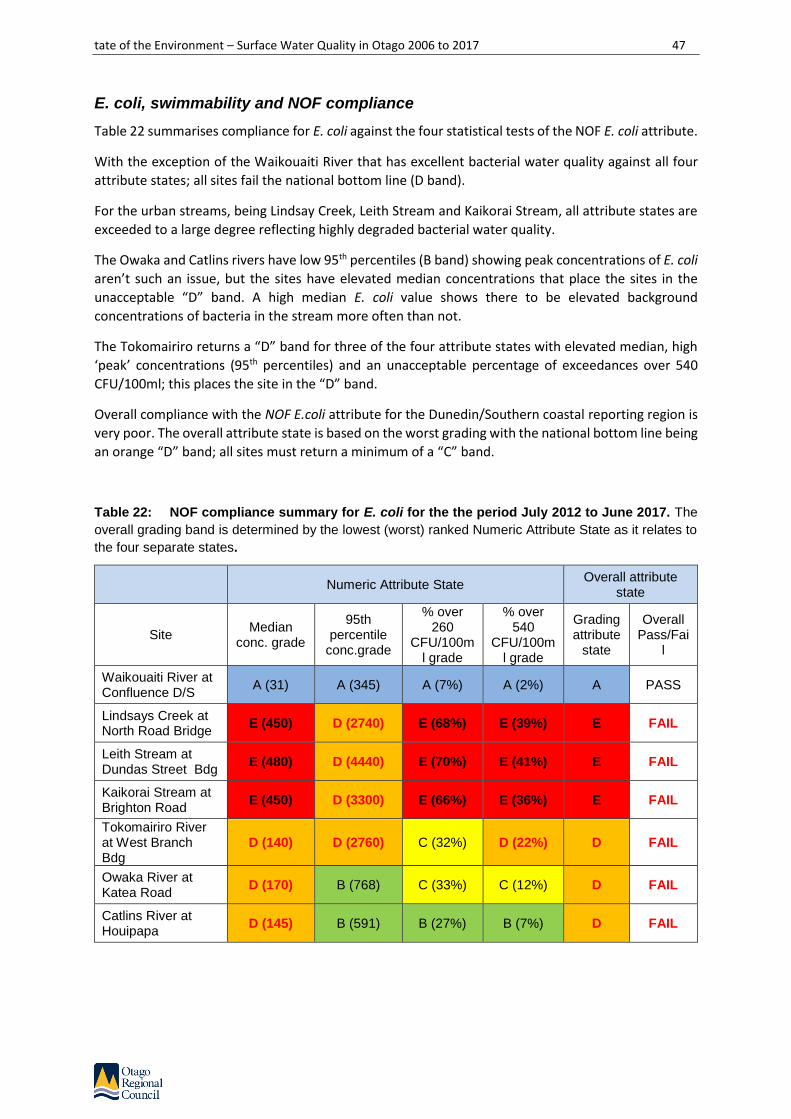
tate of the Environment – Surface Water Quality in Otago 2006 to 2017 47
E. coli, swimmability and NOF compliance
Table 22 summarises compliance for E. coli against the four statistical tests of the NOF E. coli attribute.
With the exception of the Waikouaiti River that has excellent bacterial water quality against all four
attribute states; all sites fail the national bottom line (D band).
For the urban streams, being Lindsay Creek, Leith Stream and Kaikorai Stream, all attribute states are
exceeded to a large degree reflecting highly degraded bacterial water quality.
The Owaka and Catlins rivers have low 95th percentiles (B band) showing peak concentrations of E. coli
aren’t such an issue, but the sites have elevated median concentrations that place the sites in the
unacceptable “D” band. A high median E. coli value shows there to be elevated background
concentrations of bacteria in the stream more often than not.
The Tokomairiro returns a “D” band for three of the four attribute states with elevated median, high
‘peak’ concentrations (95th percentiles) and an unacceptable percentage of exceedances over 540
CFU/100ml; this places the site in the “D” band.
Overall compliance with the NOF E.coli attribute for the Dunedin/Southern coastal reporting region is
very poor. The overall attribute state is based on the worst grading with the national bottom line being
an orange “D” band; all sites must return a minimum of a “C” band.
Table 22: NOF compliance summary for E. coli for the the period July 2012 to June 2017. The
overall grading band is determined by the lowest (worst) ranked Numeric Attribute State as it relates to
the four separate states.
Numeric Attribute State Overall attribute
state
Site Median
conc. grade
95th percentile
conc.grade
% over 260
CFU/100ml grade
% over 540
CFU/100ml grade
Grading attribute
state
Overall Pass/Fai
l
Waikouaiti River at Confluence D/S
A (31) A (345) A (7%) A (2%) A PASS
Lindsays Creek at North Road Bridge
E (450) D (2740) E (68%) E (39%) E FAIL
Leith Stream at Dundas Street Bdg
E (480) D (4440) E (70%) E (41%) E FAIL
Kaikorai Stream at Brighton Road
E (450) D (3300) E (66%) E (36%) E FAIL
Tokomairiro River at West Branch Bdg
D (140) D (2760) C (32%) D (22%) D FAIL
Owaka River at Katea Road
D (170) B (768) C (33%) C (12%) D FAIL
Catlins River at Houipapa
D (145) B (591) B (27%) B (7%) D FAIL

48 State of the Environment – Surface Water Quality in Otago 2006 to 2017
Ammoniacal nitrogen
With the exception of the Catlin River at Houipapa, NH4-N concentrations are low across all
Dunedin/Southern coastal SoE monitoring sites, with median and 75th percentile (represented by the
upper boundary of the ‘box’ in the boxplots) being below the ANZECC trigger level of 0.021 mg/L
(Figure 15). In the Catlins River NH4-N are elevated above ANZECC (2000) trigger levels and reflect some
enrichment of NH4-N above typical natural background levels.
Trend analysis results (Table 10) reveal no significant increasing or decreasing trends for NH4-N. The
very low concentrations in the Waikouaiti River return too many ‘<DL’ (less than laboratory detection
level) values for a meaningful trend analysis to be carried out. There is a stable trend for Lindsays Creek
reflecting no change over time. Trend results for all remaining sites are indeterminate.
Figure 15: Boxplot summary of NH4-N concentrations at SoE monitoring sites throughout the
Dunedin/Southern coastal reporting region. The red dashed line corresponds to the lowland
ANZECC guideline for NH4-N of 0.021 mg/L.
Am
monia
cal N
itro
gen (
mg/L
)
Waiko
uaiti R
iver
at C
onflu
ence
D/S
Lind
says
Cre
ek a
t Nor
th R
oad
Brid
ge
Leith
Stre
am a
t Dun
das Stre
et B
ridge
Kai
kora
i Stre
am a
t Brig
hton
Roa
d
Tokom
airir
o River
at W
est B
ranc
h Brid
ge
Owak
a River
at K
atea
Roa
d
Cat
lins
River
at H
ouipap
a
0.00
0.02
0.04
0.06
0.08
0.10
0.12

tate of the Environment – Surface Water Quality in Otago 2006 to 2017 49
Table 23: Trend summary of ammonical nitrogen concentrations for the Dunedin/Southern
coastal reporting region.
Site
Wai
kou
aiti
Riv
er a
t C
on
flu
ence
D⁄S
Lin
dsa
ys C
reek
at
No
rth
Ro
ad B
rid
ge
Leit
h S
trea
m a
t D
un
das
Str
eet
Bri
dge
Kai
kora
i Str
eam
at
Bri
ghto
n R
oad
Toko
mai
riro
Riv
er a
t
We
st B
ran
ch B
rid
ge
Ow
aka
Riv
er a
t
Kat
ea
Ro
ad
Cat
lins
Riv
er a
t H
ou
ipap
a
Am
mo
nia
cal
Nit
roge
n
< DL → ? ? ? ? ?
Nitrite/Nitrate nitrogen
Nitrite/nitrate nitrogen (NNN) levels are elevated above the ANZECC trigger level of 0.444 mg/L for
Lindsays Creek and the Owaka River; and to a lesser extent, the Leith Stream and Catlins River (Figure
16). This aligns with Schedule 15 (Water Plan) ‘non-compliance’ for three of four of these sites. All
other sites have NNN concentrations that are typically below the ANZECC lowland trigger value.
On a regional standing, the Owaka River has quite elevated levels of NNN (Appendix E), being
comparable to catchments in the Pomahaka River that have previously been identified as having high
NNN levels due to land-use effects on water quality (ORC, 2011). By contrast, the Waikouaiti River
returns very low concentrations of NNN which is an excellent result for this site.
Nitrite/nitrate nitrogen trend analysis (Table 24) reveals a significant decreasing trend for NNN in the
Waikouaiti River. This is an excellent result given the already low levels of NNN at this site (Figure 16)
and provides confidence for ongoing protection of instream values against eutrophication that may
occur should NNN increase; also further safeguarding the downstream Waikouaiti Estuary from effects
of elevated NNN loads.
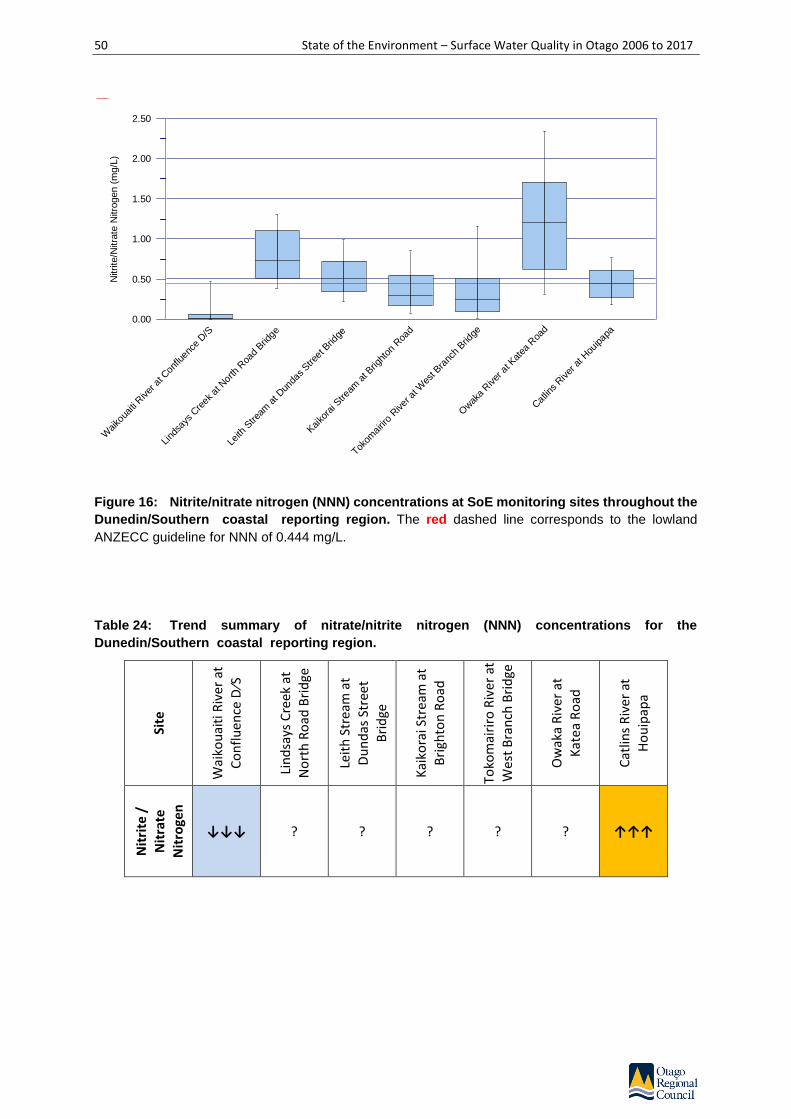
50 State of the Environment – Surface Water Quality in Otago 2006 to 2017
Figure 16: Nitrite/nitrate nitrogen (NNN) concentrations at SoE monitoring sites throughout the
Dunedin/Southern coastal reporting region. The red dashed line corresponds to the lowland
ANZECC guideline for NNN of 0.444 mg/L.
Table 24: Trend summary of nitrate/nitrite nitrogen (NNN) concentrations for the
Dunedin/Southern coastal reporting region.
Site
Wai
kou
aiti
Riv
er a
t C
on
flu
ence
D⁄S
Lin
dsa
ys C
reek
at
No
rth
Ro
ad B
rid
ge
Leit
h S
trea
m a
t D
un
das
Str
eet
Bri
dge
Kai
kora
i Str
eam
at
Bri
ghto
n R
oad
Toko
mai
riro
Riv
er a
t
Wes
t B
ran
ch B
rid
ge
Ow
aka
Riv
er a
t
Kat
ea
Ro
ad
Cat
lins
Riv
er a
t H
ou
ipap
a
Nit
rite
/
Nit
rate
N
itro
gen
↓↓↓ ? ? ? ? ? ↑↑↑
Nitrite
/Nitra
te N
itro
gen (
mg/L
)
Waiko
uaiti R
iver
at C
onflu
ence
D/S
Lind
says
Cre
ek a
t Nor
th R
oad
Brid
ge
Leith
Stre
am a
t Dun
das Stre
et B
ridge
Kai
kora
i Stre
am a
t Brig
hton
Roa
d
Tokom
airir
o River
at W
est B
ranc
h Brid
ge
Owak
a River
at K
atea
Roa
d
Cat
lins
River
at H
ouipap
a
0.00
0.50
1.00
1.50
2.00
2.50

tate of the Environment – Surface Water Quality in Otago 2006 to 2017 51
Total Nitrogen
Total nitrogen concentrations follow similar patters to nitrite/nitrate nitrogen (NNN) for the
Dunedin/Southern coastal reporting region, with median concentrations elevated above the ANZECC
trigger level of 0.614 mg/L for TN for four sites, including Lindsays Creek and the Owaka River; and to
a lesser extent, the Leith Stream and Catlins River.
TN concentrations are almost directly comparable to NNN concentrations for all sites reflecting a high
contribution of inorganic N to the TN pool.
Total nitrogen trend analysis (Table 25) follows similar patterns as NNN, with a significant decreasing
trend for the Waikouaiti River. This is an excellent result given the already low levels of TN at this site
(Figure 16).
When considering effects on sensitive downstream receiving environments, such as estuarine and lake
environments, we are typically more interested in TN than NNN due to the extended water residence
times increasing the opportunity for nutrient cycling and conversion of organic nutrients or organic
nitrogen that typically aren’t readily available for plant and algal growth, into inorganic nutrients, or in
the case of nitrogen, NNN, that is readily available for algal and plant growth.
Figure 17: Boxplot summary of TN concentrations at SoE monitoring sites throughout the
Dunedin/southern coastal reporting region. The red dashed line corresponds to the lowland
ANZECC guideline for TN of 0.614 mg/L.
Tota
l N
itro
gen (
mg/L
)
Waiko
uaiti R
iver
at C
onflu
ence
D/S
Lind
says
Cre
ek a
t Nor
th R
oad
Brid
ge
Leith
Stre
am a
t Dun
das Stre
et B
ridge
Kai
kora
i Stre
am a
t Brig
hton
Roa
d
Tokom
airir
o River
at W
est B
ranc
h Brid
ge
Owak
a River
at K
atea
Roa
d
Cat
lins
River
at H
ouipap
a
0.00
0.50
1.00
1.50
2.00
2.50
3.00
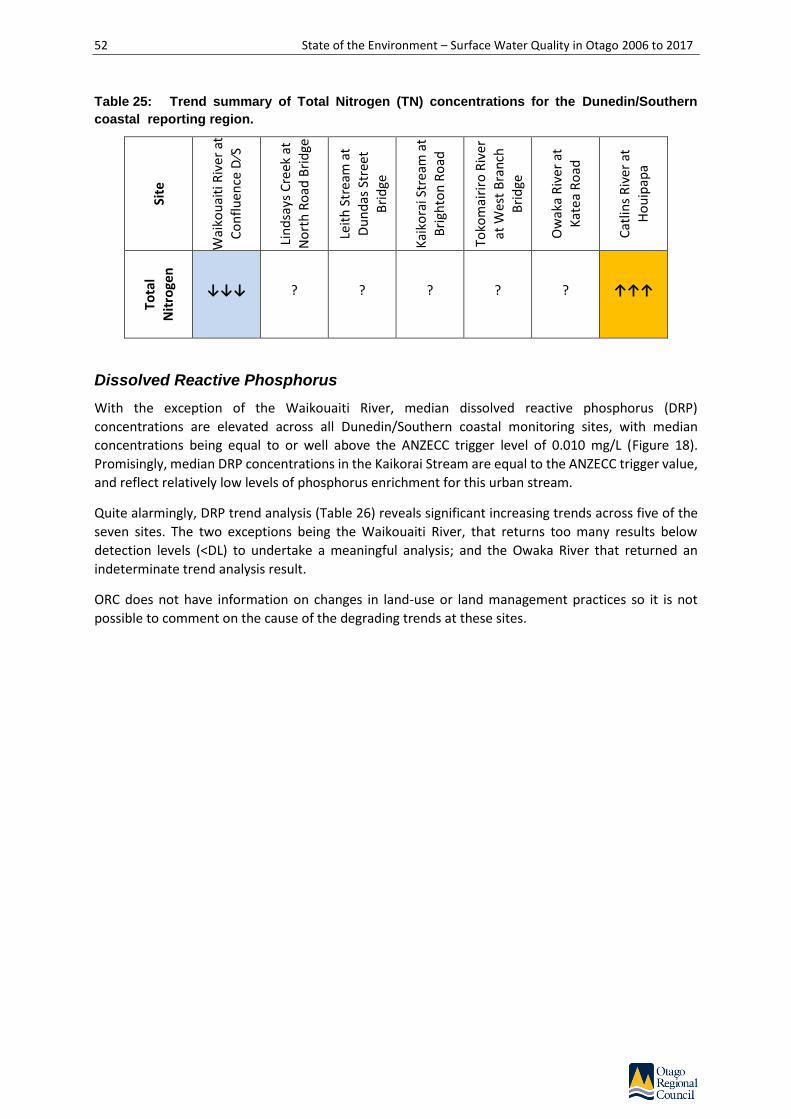
52 State of the Environment – Surface Water Quality in Otago 2006 to 2017
Table 25: Trend summary of Total Nitrogen (TN) concentrations for the Dunedin/Southern
coastal reporting region.
Site
Wai
kou
aiti
Riv
er a
t C
on
flu
ence
D⁄S
Lin
dsa
ys C
reek
at
No
rth
Ro
ad B
rid
ge
Leit
h S
trea
m a
t D
un
das
Str
eet
Bri
dge
Kai
kora
i Str
eam
at
Bri
ghto
n R
oad
Toko
mai
riro
Riv
er
at W
est
Bra
nch
Bri
dge
Ow
aka
Riv
er a
t
Kat
ea
Ro
ad
Cat
lins
Riv
er a
t H
ou
ipap
a
Tota
l N
itro
gen
↓↓↓ ? ? ? ? ? ↑↑↑
Dissolved Reactive Phosphorus
With the exception of the Waikouaiti River, median dissolved reactive phosphorus (DRP)
concentrations are elevated across all Dunedin/Southern coastal monitoring sites, with median
concentrations being equal to or well above the ANZECC trigger level of 0.010 mg/L (Figure 18).
Promisingly, median DRP concentrations in the Kaikorai Stream are equal to the ANZECC trigger value,
and reflect relatively low levels of phosphorus enrichment for this urban stream.
Quite alarmingly, DRP trend analysis (Table 26) reveals significant increasing trends across five of the
seven sites. The two exceptions being the Waikouaiti River, that returns too many results below
detection levels (<DL) to undertake a meaningful analysis; and the Owaka River that returned an
indeterminate trend analysis result.
ORC does not have information on changes in land-use or land management practices so it is not
possible to comment on the cause of the degrading trends at these sites.
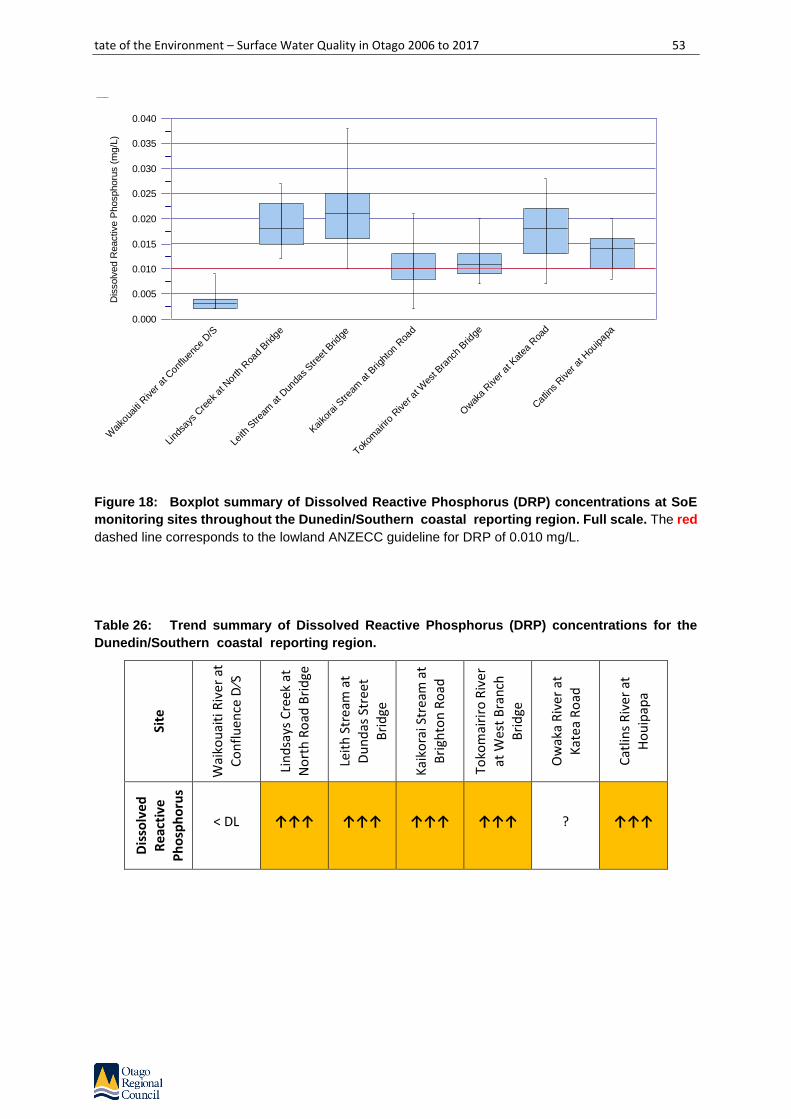
tate of the Environment – Surface Water Quality in Otago 2006 to 2017 53
Figure 18: Boxplot summary of Dissolved Reactive Phosphorus (DRP) concentrations at SoE
monitoring sites throughout the Dunedin/Southern coastal reporting region. Full scale. The red
dashed line corresponds to the lowland ANZECC guideline for DRP of 0.010 mg/L.
Table 26: Trend summary of Dissolved Reactive Phosphorus (DRP) concentrations for the
Dunedin/Southern coastal reporting region.
Site
Wai
kou
aiti
Riv
er a
t C
on
flu
ence
D⁄S
Lin
dsa
ys C
reek
at
No
rth
Ro
ad B
rid
ge
Leit
h S
trea
m a
t D
un
das
Str
eet
Bri
dge
Kai
kora
i Str
eam
at
Bri
ghto
n R
oad
Toko
mai
riro
Riv
er
at W
est
Bra
nch
Bri
dge
Ow
aka
Riv
er a
t
Kat
ea
Ro
ad
Cat
lins
Riv
er a
t H
ou
ipap
a
Dis
solv
ed
Rea
ctiv
e P
ho
sph
oru
s
< DL ↑↑↑ ↑↑↑ ↑↑↑ ↑↑↑ ? ↑↑↑
Dis
solv
ed R
eactive P
hosphoru
s (
mg/L
)
Waiko
uaiti R
iver
at C
onflu
ence
D/S
Lind
says
Cre
ek a
t Nor
th R
oad
Brid
ge
Leith
Stre
am a
t Dun
das Stre
et B
ridge
Kai
kora
i Stre
am a
t Brig
hton
Roa
d
Tokom
airir
o River
at W
est B
ranc
h Brid
ge
Owak
a River
at K
atea
Roa
d
Cat
lins
River
at H
ouipap
a
0.000
0.005
0.010
0.015
0.020
0.025
0.030
0.035
0.040
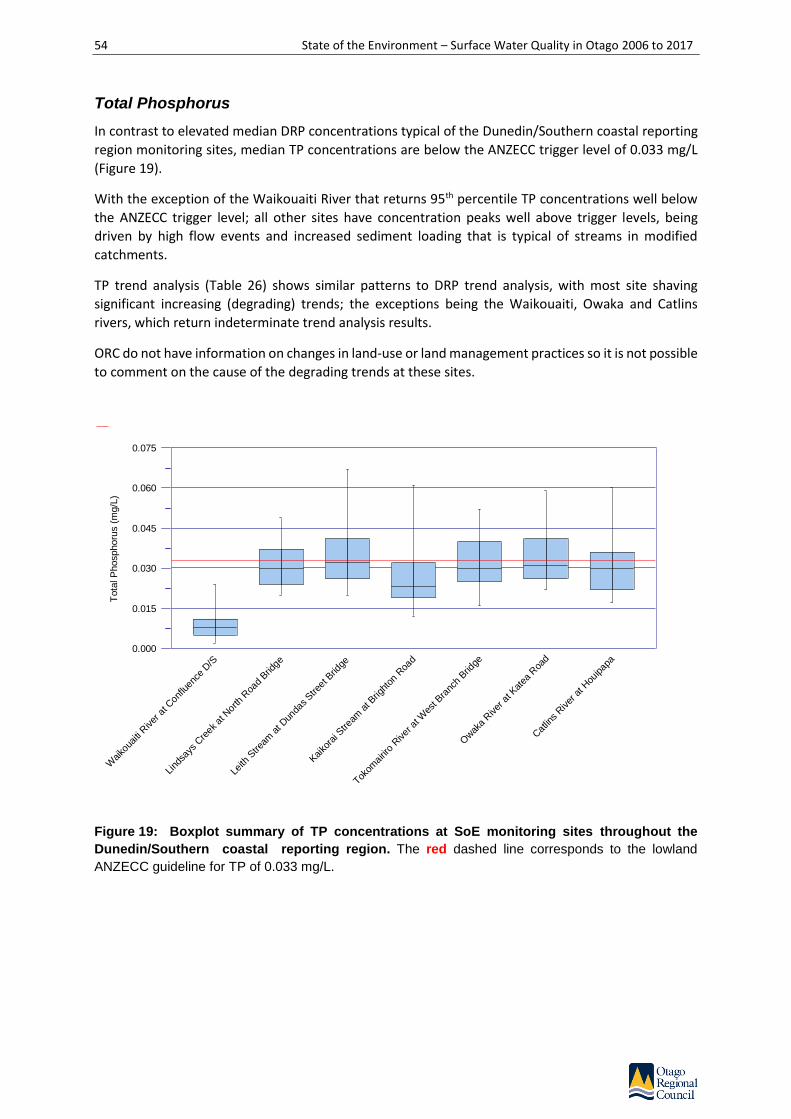
54 State of the Environment – Surface Water Quality in Otago 2006 to 2017
Total Phosphorus
In contrast to elevated median DRP concentrations typical of the Dunedin/Southern coastal reporting
region monitoring sites, median TP concentrations are below the ANZECC trigger level of 0.033 mg/L
(Figure 19).
With the exception of the Waikouaiti River that returns 95th percentile TP concentrations well below
the ANZECC trigger level; all other sites have concentration peaks well above trigger levels, being
driven by high flow events and increased sediment loading that is typical of streams in modified
catchments.
TP trend analysis (Table 26) shows similar patterns to DRP trend analysis, with most site shaving
significant increasing (degrading) trends; the exceptions being the Waikouaiti, Owaka and Catlins
rivers, which return indeterminate trend analysis results.
ORC do not have information on changes in land-use or land management practices so it is not possible
to comment on the cause of the degrading trends at these sites.
Figure 19: Boxplot summary of TP concentrations at SoE monitoring sites throughout the
Dunedin/Southern coastal reporting region. The red dashed line corresponds to the lowland
ANZECC guideline for TP of 0.033 mg/L.
Tota
l P
hosphoru
s (
mg/L
)
Waiko
uaiti R
iver
at C
onflu
ence
D/S
Lind
says
Cre
ek a
t Nor
th R
oad
Brid
ge
Leith
Stre
am a
t Dun
das Stre
et B
ridge
Kai
kora
i Stre
am a
t Brig
hton
Roa
d
Tokom
airir
o River
at W
est B
ranc
h Brid
ge
Owak
a River
at K
atea
Roa
d
Cat
lins
River
at H
ouipap
a
0.000
0.015
0.030
0.045
0.060
0.075
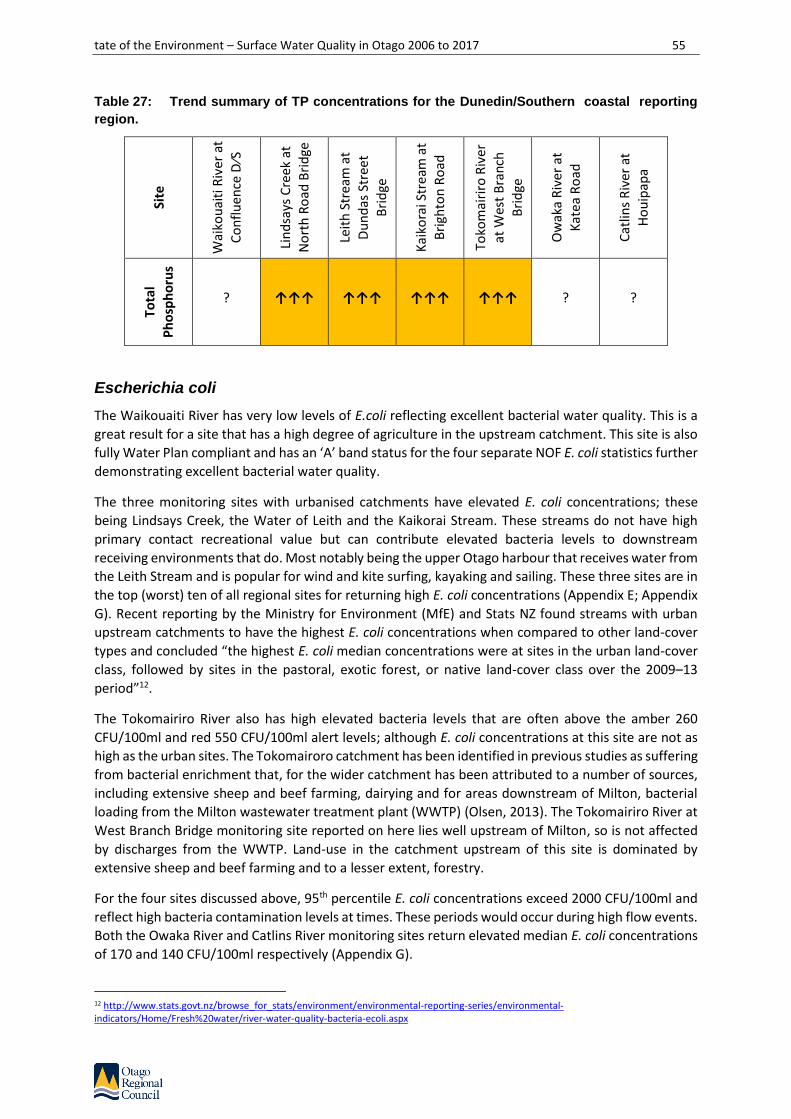
tate of the Environment – Surface Water Quality in Otago 2006 to 2017 55
Table 27: Trend summary of TP concentrations for the Dunedin/Southern coastal reporting
region.
Site
Wai
kou
aiti
Riv
er a
t C
on
flu
ence
D⁄S
Lin
dsa
ys C
reek
at
No
rth
Ro
ad B
rid
ge
Leit
h S
trea
m a
t D
un
das
Str
eet
Bri
dge
Kai
kora
i Str
eam
at
Bri
ghto
n R
oad
Toko
mai
riro
Riv
er
at W
est
Bra
nch
Bri
dge
Ow
aka
Riv
er a
t
Kat
ea
Ro
ad
Cat
lins
Riv
er a
t H
ou
ipap
a
Tota
l P
ho
sph
oru
s
? ↑↑↑ ↑↑↑ ↑↑↑ ↑↑↑ ? ?
Escherichia coli
The Waikouaiti River has very low levels of E.coli reflecting excellent bacterial water quality. This is a
great result for a site that has a high degree of agriculture in the upstream catchment. This site is also
fully Water Plan compliant and has an ‘A’ band status for the four separate NOF E. coli statistics further
demonstrating excellent bacterial water quality.
The three monitoring sites with urbanised catchments have elevated E. coli concentrations; these
being Lindsays Creek, the Water of Leith and the Kaikorai Stream. These streams do not have high
primary contact recreational value but can contribute elevated bacteria levels to downstream
receiving environments that do. Most notably being the upper Otago harbour that receives water from
the Leith Stream and is popular for wind and kite surfing, kayaking and sailing. These three sites are in
the top (worst) ten of all regional sites for returning high E. coli concentrations (Appendix E; Appendix
G). Recent reporting by the Ministry for Environment (MfE) and Stats NZ found streams with urban
upstream catchments to have the highest E. coli concentrations when compared to other land-cover
types and concluded “the highest E. coli median concentrations were at sites in the urban land-cover
class, followed by sites in the pastoral, exotic forest, or native land-cover class over the 2009–13
period”12.
The Tokomairiro River also has high elevated bacteria levels that are often above the amber 260
CFU/100ml and red 550 CFU/100ml alert levels; although E. coli concentrations at this site are not as
high as the urban sites. The Tokomairoro catchment has been identified in previous studies as suffering
from bacterial enrichment that, for the wider catchment has been attributed to a number of sources,
including extensive sheep and beef farming, dairying and for areas downstream of Milton, bacterial
loading from the Milton wastewater treatment plant (WWTP) (Olsen, 2013). The Tokomairiro River at
West Branch Bridge monitoring site reported on here lies well upstream of Milton, so is not affected
by discharges from the WWTP. Land-use in the catchment upstream of this site is dominated by
extensive sheep and beef farming and to a lesser extent, forestry.
For the four sites discussed above, 95th percentile E. coli concentrations exceed 2000 CFU/100ml and
reflect high bacteria contamination levels at times. These periods would occur during high flow events.
Both the Owaka River and Catlins River monitoring sites return elevated median E. coli concentrations
of 170 and 140 CFU/100ml respectively (Appendix G).
12 http://www.stats.govt.nz/browse_for_stats/environment/environmental-reporting-series/environmental-indicators/Home/Fresh%20water/river-water-quality-bacteria-ecoli.aspx

56 State of the Environment – Surface Water Quality in Otago 2006 to 2017
E. coli trend analysis (Table 28) returns significant trends for two sites only. These being an improving
(decreasing trend) for the Owaka River and a degrading (increasing) trend for Lindsays Creek. The
improving trend for the Owaka River is promising, particularly given the history of poor water quality
across the wider catchment (Ozanne, 2011). All remaining sites have ‘indeterminate’ trends.
ORC do not have information on changes in land-use or land management practices so it is not possible
to comment on the cause of the degrading trends at these sites.
Looking across Otago, the Dunedin/Southern coastal reporting region, with the exception of the
Waikouaiti River, has quite poor bacterial water quality (Appendix E).
Figure 20: Boxplot summary of E coli concentrations at SoE monitoring sites throughout the
Dunedin/Southern coastal reporting region. The amber line corresponds to the amber alert level of
260 CFU/100ml; the red line to the red alert level of 550 CFU/100ml.
Escherichia
coli
(CF
U/1
00m
l)
Waiko
uaiti R
iver
at C
onflu
ence
D/S
Lind
says
Cre
ek a
t Nor
th R
oad
Brid
ge
Leith
Stre
am a
t Dun
das Stre
et B
ridge
Kai
kora
i Stre
am a
t Brig
hton
Roa
d
Tokom
airir
o River
at W
est B
ranc
h Brid
ge
Owak
a River
at K
atea
Roa
d
Cat
lins
River
at H
ouipap
a
0
250
500
750
1000
1250
1500
1750
2000

tate of the Environment – Surface Water Quality in Otago 2006 to 2017 57
Table 28: Trend summary of E. coli concentrations for the Dunedin/Southern coastal
reporting region.
Site
Wai
kou
aiti
Riv
er a
t C
on
flu
ence
D⁄S
Lin
dsa
ys C
reek
at
No
rth
Ro
ad B
rid
ge
Leit
h S
trea
m a
t D
un
das
Str
eet
Bri
dge
Kai
kora
i Str
eam
at
Bri
ghto
n R
oad
Toko
mai
riro
Riv
er
at W
est
Bra
nch
Bri
dge
Ow
aka
Riv
er a
t
Kat
ea
Ro
ad
Cat
lins
Riv
er a
t H
ou
ipap
a
Esce
rich
ia
coli ? ↑↑↑ ? ? ? ↓↓↓ ?
Turbidity
Turbidity levels are low across all Dunedin/Southern coastal monitoring sites with median and 75th
percentile values (shown as the upper boundary of the box in the boxplots in Figure 21) being well
below the ANZECC lowland guideline level of 5.6 NTU. Again with the exception of the Waikouaiti River,
95th percentile turbidity levels exceed the ANZECC lowland trigger levels at times, but are still very low
when compared across the region (Appendix E).
Turbidity trend analysis (Table 29) reveals a significant decreasing trend for the Owaka River. This aligns
with the decreasing trend for E. coli and again, is a promising result for this monitoring site. Previous
intensive surveys of the Owaka River catchment identified high levels of deposited sediment
throughout the catchment (Ozanne, 2011). The decreasing trend in turbidity would reflect a long-term
reduction in sediment load being transported down the river and should help to improve issues of
sedimentation.
The Tokomairiro River returned a probable increasing (degrading) trend for turbidity and warrants
further scrutiny as more monitoring data comes to hand.

58 State of the Environment – Surface Water Quality in Otago 2006 to 2017
Figure 21: Boxplot summary of turbidity at SoE monitoring sites throughout the
Dunedin/Southern coastal reporting region. The red dashed line corresponds to the lowland
ANZECC guideline for Turbidity of 5.6 NTU.
Table 29: Trend summary of turbidity levels for the Dunedin/Southern coastal reporting
region.
Site
Wai
kou
aiti
Riv
er a
t C
on
flu
ence
D⁄S
Lin
dsa
ys C
reek
at
No
rth
Ro
ad B
rid
ge
Leit
h S
trea
m a
t D
un
das
Str
eet
Bri
dge
Kai
kora
i Str
eam
at
Bri
ghto
n R
oad
Toko
mai
riro
Riv
er
at W
est
Bra
nch
Bri
dge
Ow
aka
Riv
er a
t
Kat
ea
Ro
ad
Cat
lins
Riv
er a
t H
ou
ipap
a
Turb
idit
y
? ? ? ? ↑↑ ↓↓↓ ?
Turb
idity (
NT
U)
Waiko
uaiti R
iver
at C
onflu
ence
D/S
Lind
says
Cre
ek a
t Nor
th R
oad
Brid
ge
Leith
Stre
am a
t Dun
das Stre
et B
ridge
Kai
kora
i Stre
am a
t Brig
hton
Roa
d
Tokom
airir
o River
at W
est B
ranc
h Brid
ge
Owak
a River
at K
atea
Roa
d
Cat
lins
River
at H
ouipap
a
0.0
2.5
5.0
7.5
10.0
12.5

tate of the Environment – Surface Water Quality in Otago 2006 to 2017 59
Stream Health and the Macroinvertebrate Community Index
Macroinvertebrate Community Index (MCI) scores provide an integrated indicator of the general state
of water quality and aquatic ecosystem health at a site.
Figure 23 summarises MCI scores for sites monitored for aquatic macroinvertebrates throughout the
Dunedin/southern coastal reporting region. The summary includes annual samples collected from
2008 to 2017 (8 years) where available. Not all sites monitored for water quality have macro-
invertebrate samples taken. In the case of the Dunedin/Southern coastal reporting region, the Owaka
River is such a site.
There is considerable variation in MCI scores across monitoring sites that, to a limited extent follow
similar patterns to key water quality indicators.
MCI results for the Waikouaiti River monitoring site should be treated with caution. For a number of
years the location of the site was 1.5 km downstream of the water quality monitoring site and located
in a river reach affected intermittently by salt wedge intrusion from the estuary. At such times the
freshwater macro-invertebrate community would be impacted intermittently by elevated salinities.
From early 2017, the bio-monitoring site was moved upstream to the same location as the water
quality monitoring site. However, the MCI score for 2017 was still very low at 83. The reasons for the
low MCI remain unclear. For March 2017, during bio-monitoring, site assessments for the Waikouaiti
River downstream (D/S) of the confluence show habitat to be marginal for invertebrates with some
smothering of the bed by fine sediment and sand; also present is a moderate to high cover of
periphyton (approximately 50% bed cover; ORC unpublished data). These factors would negatively
impact the MCI and may explain the low scores for this site for the 2017 sampling round.
The highest scores recorded were for the Tokomairiro River and Catlins River monitoring sites with
MCI’s typically being above 110 representing a community in ‘good’ health. These two sites rank in the
top five of all sites monitored for MCI across Otago (Appendix G), and show overall water and habitat
quality to be supporting the existence of a healthy invertebrate community.
The three urban streams, despite having comparable water quality returned very different MCI scores.
The Leith Stream and Lindsays Creek returned MCI scores around 90, with the Leith Stream having
moderately higher MCI scores than Lindsays Creek (Figure 23), reflecting a stream with an invertebrate
community in ‘poor’ health, a result not unexpected for these two sites. The big difference lies
between these two sites and the Kaikorai Stream that returns very low MCI scores, with a median of
68. This reflects an invertebrate community in an extremely degraded state.
In a regional context (Appendix E), the Kaikorai Stream has the lowest MCI scores for sites across Otago
and sits well below the ‘degraded’ threshold of 80. The measured core water quality variables show
the Kaikorai Stream to have better water quality than the Leith Stream and Lindsays Creek. Despite
this, the invertebrate community is severely impacted. Stream assessments carried out as part of the
bio-monitoring program of 2017 show deposited sediment levels to be low and invertebrate habitat
diversity to be high. However, habitat availability for Ephemeroptera/Plecoptera/Trichoptera (EPT)
taxa that return high MCI scores was very low, with their preferred riffle/run habitat being absent from
the site (Figure 22). This combined with high algal cover (99% stream bed cover for the 2017 sampling)
would negatively affect MCI scores. However, this does not necessarily explain the extremely low MCI
for this site and suggests other stressors to be impacting the site. Given the high degree of industrial
activity upstream of the monitoring site, it is likely that stormwater as well as intermittent discharges
of contaminants adversely affect the invertebrate community.

60 State of the Environment – Surface Water Quality in Otago 2006 to 2017
Recent amendments to the NPSFM require councils to actively investigate reasons for a site returning
an MCI below 80 (Policy CB3). The low MCI score for the Kaikorai Stream has been reported on
previously (ORC, 2008).
Figure 22: The Kaikorai Stream at Brighton Road monitoring site.
Figure 23: Boxplot summary of Macroinvertebrate Community Index (MCI) scores at SoE
monitoring sites throughout North Otago where macroinvertebrate samples are routinely
collected. Above the blue line corresponds to the ‘Excellent’ quality threshold; between the orange and
blue line the ‘Good’ quality threshold; between the red and orange line ‘Poor’ quality threshold; below
the red line the ‘Degraded’ threshold.
MC
I
Waiko
uaiti R
iver
at C
onflu
ence
D/S
Lind
says
Cre
ek a
t Nor
th R
oad
Brid
ge
Leith
Stre
am a
t Dun
das Stre
et B
ridge
Kaiko
rai S
tream
at B
right
on R
oad
Tokom
airir
o River
at W
est B
ranc
h Brid
ge
Cat
lins River
at H
ouipap
a60
70
80
90
100
110
120
130

tate of the Environment – Surface Water Quality in Otago 2006 to 2017 61
Dunedin/Southern coastal Water Quality Summary and Conclusions
Across the Dunedin/Southern coastal reporting region there are a considerable number of sites with
degrading water quality trends, as shown in Table 30, which summarises trend results across all sites.
There are a total of 49 results reported in the table; 27% return significant or probable degrading
trends; 2% are stable; and 8% return significant or probable improving trends. Overall 63% of sites
have either indeterminate trends (reported as “?”); or too many observations being ‘less than detect’
(<DL) for results returned from the laboratory.
Phosphorus is by far the worst performing variable with five of seven sites having increasing
(degrading) trends for DRP. The reasons for this are unclear, particulalry given the differences in land
cover upstream of the monitoring sites in question, with the the local Dunedin City sites having a high
degree of urbanisation versus the rural sites with a prevalence of extensive sheep and beef. These land
cover types would have very different sources and transport mechanisms for DRP.
The Waikouaiti River monitoring site returned the best water quality for all measured variables
(excluding MCI). This combined with decreasing trends for NNN and TN, and many results as being ‘less
than detection level’ for NH4-N and DRP, shows risk of eutrophication to be low. The low E. coli levels
(full ‘A’ grade compliance under the NOF E. coli attribute) is an excellent result. This is good news for
the Waikouaiti River and the vulnerable estuary downstream in relation to nutrient and bacteria
loading.
Water quality for the Tokomairiro and Catlins rivers was generally moderate to good, with some minor
exceedances of ANZECC trigger values for nutrients. Both sites had good MCI scores above 110
representing an invertebrate community in ‘good’ health. These two sites rank in the top five of all
sites monitored for MCI across Otago (Appendix G), and show overall water and habitat quality to be
supporting the existence of a healthy invertebrate community. Elevated E. coli concentrations are the
biggest challenge for the Tokomairiro site.
In the case of the Owaka River, in a regional context, the river is quite eutrophic, with it being ranked
in the top 5% of sites for elevated NNN and TN concentrations, sitting midway for DRP and TP and in
the top 25% for elevated E. coli. River health is fair with MCI’s fluctuating between 80 and 90 (the
higher the better). The NPSFM identifies an MCI bottom line of 80. River physical habitat is poor to fair
(ORC unpublished data). The high nitrogen load leaving the Owaka River catchment and entering the
downstream estuary and Catlins Lake poses a significant eutrophication risk to these sensitive
downstream receiving environments. What is promising is a decreasing (improving) trend in both E.
coli and turbidity for the Owaka River monitoring site.
In summary:
• The Waikouaiti River has the best water quality for sites monitored across the
Dunedin/Southern coastal reporting region;
• The Owaka River has poor water quality and is particularly enriched with NNN. There is
evidence of an improving trend for E. coli and turbidity for this site;
• Compliance with the NOF E. coli attribute for ‘median’ concentrations is poor for all sites with
the exception of the Waikouaiti River; with 6 out of 7 sites failing the national bottom line; 4
of the 7 are in the “E” band and 2 of the 7 in the “D” band. This reflects unacceptable levels of
E. coli for more than half of samples taken at these sites;
• Water quality and instream health (based on MCI) of the Kaikorai Stream is highly degraded.
Further investigation for the reasons driving this is needed.
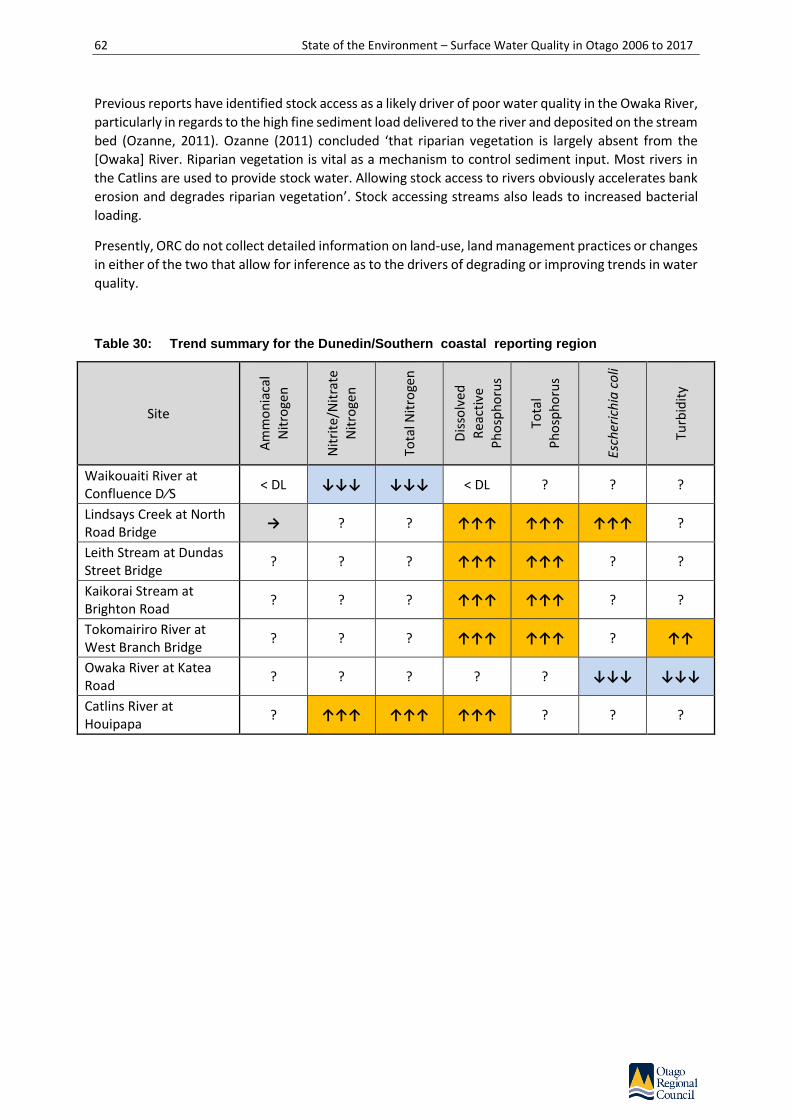
62 State of the Environment – Surface Water Quality in Otago 2006 to 2017
Previous reports have identified stock access as a likely driver of poor water quality in the Owaka River,
particularly in regards to the high fine sediment load delivered to the river and deposited on the stream
bed (Ozanne, 2011). Ozanne (2011) concluded ‘that riparian vegetation is largely absent from the
[Owaka] River. Riparian vegetation is vital as a mechanism to control sediment input. Most rivers in
the Catlins are used to provide stock water. Allowing stock access to rivers obviously accelerates bank
erosion and degrades riparian vegetation’. Stock accessing streams also leads to increased bacterial
loading.
Presently, ORC do not collect detailed information on land-use, land management practices or changes
in either of the two that allow for inference as to the drivers of degrading or improving trends in water
quality.
Table 30: Trend summary for the Dunedin/Southern coastal reporting region
Site
Am
mo
nia
cal
Nit
roge
n
Nit
rite
/Nit
rate
N
itro
gen
Tota
l Nit
roge
n
Dis
solv
ed
Rea
ctiv
e P
ho
sph
oru
s
Tota
l P
ho
sph
oru
s
Esch
eric
hia
co
li
Turb
idit
y
Waikouaiti River at Confluence D⁄S
< DL ↓↓↓ ↓↓↓ < DL ? ? ?
Lindsays Creek at North Road Bridge
→ ? ? ↑↑↑ ↑↑↑ ↑↑↑ ?
Leith Stream at Dundas Street Bridge
? ? ? ↑↑↑ ↑↑↑ ? ?
Kaikorai Stream at Brighton Road
? ? ? ↑↑↑ ↑↑↑ ? ?
Tokomairiro River at West Branch Bridge
? ? ? ↑↑↑ ↑↑↑ ? ↑↑
Owaka River at Katea Road
? ? ? ? ? ↓↓↓ ↓↓↓
Catlins River at Houipapa
? ↑↑↑ ↑↑↑ ↑↑↑ ? ? ?

tate of the Environment – Surface Water Quality in Otago 2006 to 2017 63
2.3. Taieri
The Taieri River catchment has an area of 5650 km2 and is Otago’s second largest catchment after the
Clutha River/Mata-Au. The Taieri River originates in the Lammerlaw and Lammermoor Ranges (1150
m above sea level) and the Rock and Pillar Ranges (1450 m above sea level) of Central Otago. From
here it meanders in a north-easterly direction across the Upper Taieri River Scroll Plain, a unique
wetland system with nationally and regionally significant values.
The Upper Taieri River Scroll Plain (Figure 24) is a large natural wetland in the centre of the Maniototo
and Styx Basins, with nationally and regionally significant landscape and biodiversity values. A scroll
plain is a flood plain with a meandering river that changes its course during flooding, leaving ox-bow
lakes and depressions that hold water for varying periods of time. The Upper Taieri River Scroll Plain is
New Zealand’s best example of such a meandering river. The Styx Basin wetlands consist of a scroll-
plain landform of meanders, oxbows, old braids, backwaters and cut-offs, stretching from near Paerau
to Canadian Hut. The area includes the 136 ha Serpentine Wildlife Management Reserve. The
Maniototo Basin Wetlands, downstream of the Styx Wetlands, are of similar landform. They include
the 37.5 ha Eden Creek Wildlife Management Reserve and the 44 ha Halls Road Wildlife Management
Reserve. The Taieri Lake Wetlands lie adjacent to the Taieri River, downstream of the Maniototo
Wetlands. They encompass part of the 187 ha Taieri Lake Recreation Reserve.
The Upper Taieri has two major catchments that are greater than 1000 km2 in size; the Logan Burn that
originates in the Rock and Pillar and Lammermoors ranges; and the Kye Burn that originates in the Ida
Range and Kakanui Mountains. The Ida Range and Kakanui Mountains have the highest elevations in
the catchment and are snow-capped for several months. Mount Ida is 1691 m above sea level and
Mount Pisgah in the Kakanui Range is 1643 m above sea level. To the east, the Rock and Pillar Range,
a prominent feature in the catchment, divides the Upper Taieri and the Strath Taieri. The Taieri River
collects tributaries from its western, northern and eastern slopes. The range extends north-east from
the Lammermoors for about 45 km, is about 20 km in width and reaches 1450 m above sea level at
Summit Rock (Kitto, 2012).
Many tributaries from the surrounding ranges flow through gorges and down alluvial fans on the
Maniototo Plain to the Taieri River, including the Linn Burn and Totara Creek, from Rough Ridge, in the
west; the Logan Burn, Sow Burn and Pig Burn, from the Rock and Pillar Range, in the south; the Wether
Burn and Hog Burn, from the Ida Range, in the north; and the Kye Burn, from the Ida Range, in the
north, and the Swin Burn, from the Kakanui Mountains, in the north-east (Kitto, 2012).
From the Maniototo, the river passes through an incised gorge and crosses the Taieri Plain, where it
joins the waters of the Lake Waipori and Waihola catchments and becomes tidal before making its way
through another gorge to the sea at Taieri Mouth. Rainfall throughout the Taieri catchment is highly
variable and is especially low in Central Otago due to the rain shadow effect of the Alps.
The river flows for a total length of 318 km to reach the Pacific Ocean 30 km south of Dunedin.

64 State of the Environment – Surface Water Quality in Otago 2006 to 2017
Figure 24: The Taieri Scroll Plain.
2.3.1. Taieri River and land cover characteristics
Table 31 summarises characteristics of the Taieri River reporting region based on the River
Environment Classification (refer Appendix F for a detailed overview of the REC); land-cover (based on
the Land Cover Database Version 4; condensed with the approach summarised in Appendix D); and
the Land Use Capability (LUC) classes (see Section 2.0 for the LUC definition).
According to the River Environment Classification (REC), The Taieri River reporting region is dominated
by rivers and streams with catchments that receive very low rainfall (less than 500 mm annual average
rainfall) and are predominantly Cool/Dry low elevation rivers (19%) and Cool/Dry Hill rivers (65%)
(Table 31).
The predominantly dry climate combined with significant areas of low relief land typical of the Upper
Taieri Plain, the Maniototo Plain and the Strath Taieri Plain provides good opportunities for irrigation.
More intensive land-uses associated with irrigated pasture can add pressure to water resources and
water quality.
The predominant land cover throughout the Taieri River reporting region is high producing grassland
(49%). High producing grassland represents areas that are actively managed and grazed for wool, lamb,
beef, dairy or deer production (Table 31, Appendix D).
The upper reaches of the Logan Burn sit in the Lammerlaw and Lammermoor Ranges to the west and
the Rock and Pillar Range to the east; the upper reaches of the Kye Burn catchment sit in the Ida Range
and Kakanui Mountains to the east. These areas are steep and represent the high percentage of Class
6 (37%) and Class 7 (21%) land present in the Taieri catchment (Table 31, Appendix D). These areas
have moderate to severe physical limitations for arable cropping activity and are dominated by low
producing grassland and native cover. A significant proportion of the upper Taieri catchment in the
Lammerlaw, Lammermoor and Rock and Pillar Ranges are dominated by native cover (Figure 25). The
total area of native cover area in the catchment is 29% or 1650 km2. ‘Low Producing Grassland’ includes
exotic and indigenous grasslands, grazed for wool, sheep or beef and are usually found on steep hill

tate of the Environment – Surface Water Quality in Otago 2006 to 2017 65
country (Appendix D). There is approximately 740 km2 of low producing grassland throughout the
Taieri catchment. These low intensity land-uses leach low levels of nutrients and provide for good
water quality.
This contrasts with the Upper Taieri Plain, the Maniototo Plain, the Strath Taieri Plain and the lower
Taieri Plain that are low relief areas of Class 2, 3 and 4 land making up a total of 38% or 2170 km2 of
the total catchment area. These classes of land are more suited to arable cropping and intensive land
use.
The Upper Taieri is one of the driest, coldest and hottest areas in New Zealand. Maximum
temperatures over 30ºC are common in summer, and minimum temperatures of minus 15oC have
been recorded near Naseby in the north of the Taieri River catchment. Throughout the catchment
Patearoa has the lowest mean annual rainfall of 396 mm per year. In contrast, Dansey’s Pass, which is
influenced by orographic rainfall from the east, has a mean annual rainfall of 758 mm. The lowest
rainfall experienced in any year was 262 mm, recorded at Patearoa in 1997. All sites tend to experience
their lowest mean monthly rainfall during winter and early spring. The highest rainfall months occur in
December, while Dansey’s Pass gets most of its annual rain in summer, between November and
February (Kitto, 2012).
Rivers with low water yield (those on dry areas) have reduced dilution and flushing capacity. They tend
to be more susceptible to elevated nutrients should intensive land-uses fall within their catchments.
A report recently compiled by Ozanne (2017) provides a good summary of the water quality and
surrounding catchment land-use of Lakes Waihola and Waipori located in the lower Taieri reporting
region. Most of the farming in the vicinity of Lake Waipori on the Lower Taieri Plain takes place on
poorly drained soils that would not be possible without the construction of extensive artificial drainage
(pumped drainage schemes such as the Main Drain) to lower the underlying groundwater table
(Ozanne, 2017).
Table 31: Characteristics of the Taieri reporting region. Source of flow, Land Cover Area and
Land-use Capability.
Source of flow (REC) Land Cover Area (LCDB4) Land-use Capability
Class (LUC)
Cool-Dry / Hill 65.1%
Cool-Dry/Low-Elevation 18.8%
Cool-Dry/Lake 0.5%
Cool-Dry/ Mountain 4.1%
Cool-Wet/ Hill 4.2%
Cool-Wet/Low-Elevation 0.1%
Cropping 0.3%
High producing grassland 49.3%
Low Producing Grassland 13.0%
Native Cover 29.1%
Orchards/Vineyards 0.02%
Plantation forestry 6.0%
Unaccounted 2.1%
Urban areas 0.3%
Class 1 0.5%
Class 2 1.3%
Class 3 10.2%
Class 4 26.7%
Class 5 0.6%
Class 6 37.3%
Class 7 21.0%
Class 8 1.6%
Lake 0.5%
The Taieri reporting region covers 570 578 hectares

66 State of the Environment – Surface Water Quality in Otago 2006 to 2017
Figure 25: Map showing broad land cover categories of the Taieri reporting region based on
the LCDB4 databse.

tate of the Environment – Surface Water Quality in Otago 2006 to 2017 67
2.3.2. Taieri water quality
The following section provides a summary of the Taieri reporting region water quality based on:
• Compliance against Schedule 15 (Water Plan) water quality limits;
• National Policy Statement for Freshwater Management (NPSFM 2014) National Objectives
Framework Attribute bands (NOF bands);
• Summary boxplots of key water quality indicators with the inclusion of general water quality
guidelines such as ANZECC (2000);
• A summary of trends (degrading/improving) that may (or may not) be evident in the data.
Schedule 15 compliance
Table 32 summarises compliance for SoE monitoring sites throughout the Taieri River reporting region
with Schedule 15 (Water Plan) limits. For this section, all ‘80th percentile concentrations’ are calculated
from data collected when flows at the relevant flow reference site are at or below median flow.
There are a total 15 SoE monitoring sites throughout the Taieri River reporting zone with a good spread
of sites across main-stem river and tributary stream sites from the upper to lower catchment. NIWA
currently monitor two sites in the Taieri River, the Taieri River at Tiroiti and Sutton Stream at SH87
(Appendix A). Historically NIWA monitored the Taieri River at Outram, but in recent years monitoring
of this site has been taken over by ORC.
The Owhiro Stream in the lower Taieri catchment has the worst level of compliance against Schedule
15 (Water Plan) limits of any site across the Taieri River reporting region and in fact, the wider Otago
region. This site fails all Schedule 15 (Water Plan) limits (Figure 25).
For remaining sites, all are compliant for NH4-N and have 80th percentile concentrations below at least
one-quarter of the Schedule 15 limit of 0.100 mg/L (Table 32). Ammonia is toxic to aquatic life. In the
environment, NH4-N is quickly converted to nitrate-nitrogen by bacteria. The presence of elevated
NH4-N in a stream or river typically reflects direct contamination from a source that is high in this
contaminant, an example being effluent. The combined presence of high NH4-N, dissolved reactive
phosphorus and faecal bacteria such as E. coli provides further evidence of this type of contamination,
and would be expected to be present should significant amounts of effluent be reaching a stream or
river.
Looking across all variables, 4 sites are fully compliant with Schedule 15 (Water Plan) limits, these sites
being the Taieri River at Stonehenge, Deep Stream at SH87, the Taieri River at Outram and the Waipori
River at Waipori Falls Reserve.
Generally all sites across the Taieri River catchment return low concentrations of NNN that are well
below the Schedule 15 (Water Plan) limit of 0.075 mg/L. The exceptions being the Silver Stream and
Owhiro Stream; both located in the lower Taieri catchment. The Silver Stream flows through Mosgiel
and is influenced to some extent by the Mosgiel township. The Owhiro Stream has areas of intensive
agriculture in its catchment that would increase NNN concentrations in the stream. The very low
concentrations of NNN for the remaining sites throughout the catchment is very promising as the levels
are very low and would be limiting both algae and cyanobacteria (phormidium) growth in the streams.
The elevated NNN concentrations in the Silver Stream combined with the very low DRP concentrations
provide ideal conditions for phormidium as this species of cyanobacteria can outcompete other algae
in streams where these conditions prevail. Should NNN concentrations become elevated above
0.150 mg/L at other sites, then phormidium growth may become more of a risk.

68 State of the Environment – Surface Water Quality in Otago 2006 to 2017
E. coli compliance across sites is moderate with 8 sites failing and 7 sites passing the Schedule 15
(Water Plan) 80th percentile limit of 260 CFU/100ml. Stock access levels are high throughout the
catchment and may be contributing to the elevated E. coli concentrations measured at some sites.
Table 32: 80th percentile values for water quality variables identified in Schedule 15 for the
Taieri. Values are calculated from samples taken when flows are below median flow. The orange cells
show where the 80th percentile exceeds the Schedule 15 limit.
Variable NNN NH4-N DRP E. coli Turbidity
Schedule 15 limit when flows < median flow 0.075 mg/L 0.100 mg/L 0.010 mg/L 260 CFU 5.00 NTU
SoE reporting name
Taieri River at Linnburn 0.004 0.010 0.005 304 1.58
Taieri River at Stonehenge 0.008 0.009 0.009 156 2.16
Taieri River at Waipiata 0.016 0.014 0.047 480 3.38
Kye Burn at SH85 Bridge 0.030 0.011 0.006 294 1.62
Taieri River at Tiroiti 0.033 0.007 0.019 330 4.27
Taieri River at Sutton 0.020 0.013 0.014 512 2.78
Sutton Stream at SH87 0.008 0.009 0.006 308 2.07
Nenthorn Stream at Mt Stoker Road 0.002 0.019 0.017 68 1.80
Deep Stream at SH87 0.001 0.010 0.005 178 1.10
3 O'Clock Stream at Hindon 0.051 0.007 0.004 33 0.85
Taieri River at Outram 0.039 0.009 0.009 130 3.40
Silver Stream at Taieri Depot 0.360 0.015 0.007 230 2.10
Owhiro Stream at Riverside Road 0.340 0.140 0.048 870 21.00
Taieri River at Allanton Bridge 0.048 0.022 0.015 466 5.34
Waipori River at Waipori Falls Rsv 0.014 0.007 0.003 45 1.85

tate of the Environment – Surface Water Quality in Otago 2006 to 2017 69
Nitrate and ammonia toxicity and NOF compliance
NOF attribute bands for nitrate (measured as NNN) and NH4-N toxicity (Table 33 and Table 34
respectively) show excellent protection levels against toxicity risk for all Taieri monitoring sites with all
sites returning an ‘A’ band (highest level of protection) for NNN and all sites returning an ‘A’ band for
NH4-N; with the exception of the Owhiro Stream that returns a ‘B’ band for NH4-N.
The elevated median and maximum concentrations for NH4-N for the Owhiro Stream push this site up
into the B-band with the upper thresholds of < 0.03 and < 0.05 mg/L for the median and maximum
NH4-N concentrations. The ‘B’ band still provides for a good level of protection against ammonia
toxicity but ‘starts impacting occasionally on the 5% most sensitive species’ (Appendix B). Some
species of freshwater mollusc can be sensitive to ammonia toxicity.
Table 33: NOF compliance summary for Nitrate (estimated from NNN) toxicity for the Taieri
reporting region. Included are median and 95th percentile values for the the period July 2012 to June
2017 and the corresponding NOF attribute band.
Variable Nitrate as NNN NOF Band
SoE reporting name Median (mg/L)
95th Percentile
(mg/L) Median 95th
Percentile
Taieri River at Linnburn Runs Road 0.003 0.009 A A
Taieri River at Stonehenge 0.007 0.045 A A
Taieri River at Waipiata 0.019 0.075 A A
Kye Burn at SH85 Bridge 0.039 0.134 A A
Taieri River at Tiroiti 0.035 0.106 A A
Taieri River at Sutton 0.032 0.175 A A
Sutton Stream at SH87 0.010 0.114 A A
Nenthorn Stream at Mt Stoker Road 0.001 0.028 A A
Deep Stream at SH87 0.001 0.118 A A
3 O'Clock Stream at Hindon 0.038 0.121 A A
Taieri River at Outram 0.059 0.230 A A
Silver Stream at Taieri Depot 0.330 0.553 A A
Owhiro Stream at Riverside Road 0.367 0.831 A A
Taieri River at Allanton Bridge 0.067 0.235 A A
Waipori River at Waipori Falls Rsv. 0.003 0.009 A A
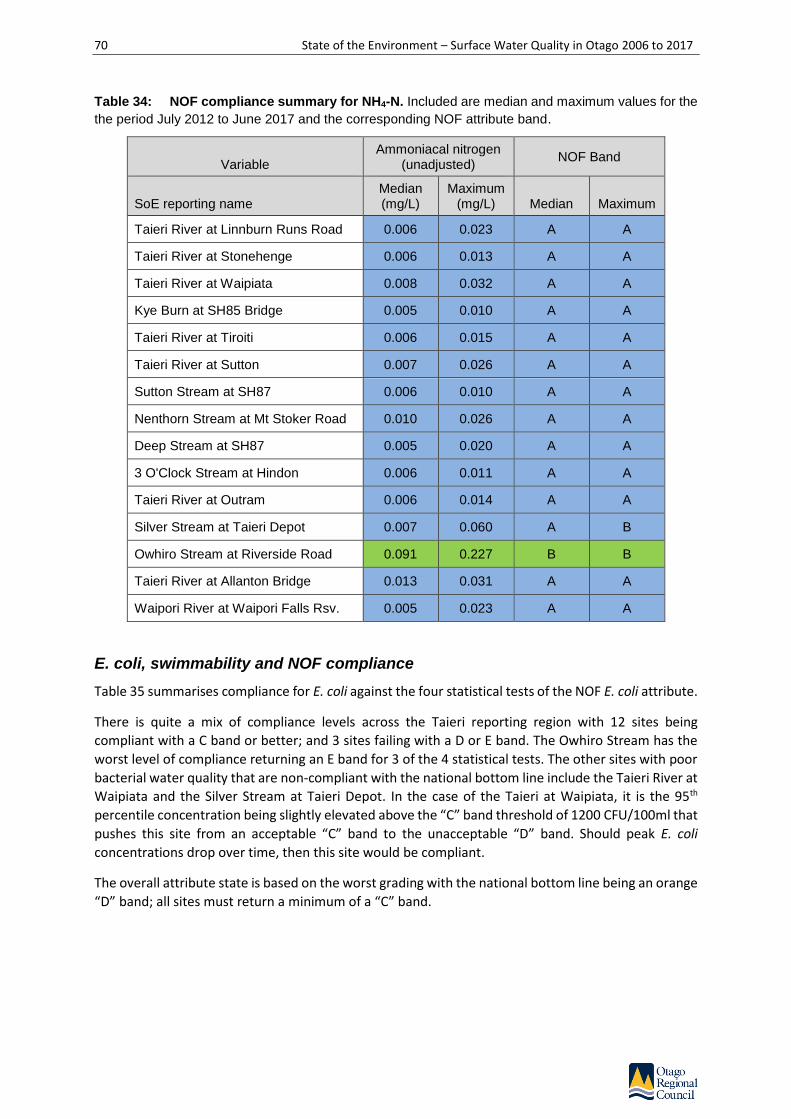
70 State of the Environment – Surface Water Quality in Otago 2006 to 2017
Table 34: NOF compliance summary for NH4-N. Included are median and maximum values for the
the period July 2012 to June 2017 and the corresponding NOF attribute band.
Variable Ammoniacal nitrogen
(unadjusted) NOF Band
SoE reporting name Median (mg/L)
Maximum (mg/L) Median Maximum
Taieri River at Linnburn Runs Road 0.006 0.023 A A
Taieri River at Stonehenge 0.006 0.013 A A
Taieri River at Waipiata 0.008 0.032 A A
Kye Burn at SH85 Bridge 0.005 0.010 A A
Taieri River at Tiroiti 0.006 0.015 A A
Taieri River at Sutton 0.007 0.026 A A
Sutton Stream at SH87 0.006 0.010 A A
Nenthorn Stream at Mt Stoker Road 0.010 0.026 A A
Deep Stream at SH87 0.005 0.020 A A
3 O'Clock Stream at Hindon 0.006 0.011 A A
Taieri River at Outram 0.006 0.014 A A
Silver Stream at Taieri Depot 0.007 0.060 A B
Owhiro Stream at Riverside Road 0.091 0.227 B B
Taieri River at Allanton Bridge 0.013 0.031 A A
Waipori River at Waipori Falls Rsv. 0.005 0.023 A A
E. coli, swimmability and NOF compliance
Table 35 summarises compliance for E. coli against the four statistical tests of the NOF E. coli attribute.
There is quite a mix of compliance levels across the Taieri reporting region with 12 sites being
compliant with a C band or better; and 3 sites failing with a D or E band. The Owhiro Stream has the
worst level of compliance returning an E band for 3 of the 4 statistical tests. The other sites with poor
bacterial water quality that are non-compliant with the national bottom line include the Taieri River at
Waipiata and the Silver Stream at Taieri Depot. In the case of the Taieri at Waipiata, it is the 95th
percentile concentration being slightly elevated above the “C” band threshold of 1200 CFU/100ml that
pushes this site from an acceptable “C” band to the unacceptable “D” band. Should peak E. coli
concentrations drop over time, then this site would be compliant.
The overall attribute state is based on the worst grading with the national bottom line being an orange
“D” band; all sites must return a minimum of a “C” band.

tate of the Environment – Surface Water Quality in Otago 2006 to 2017 71
Table 35: NOF compliance summary for E. coli for the the period July 2012 to June 2017. The
overall grading band is determined by the lowest (worst) ranked Numeric Attribute State as it relates to
the four separate states.
Numeric Attribute State Overall attribute
state
Site
Median grade
(CFU/100ml)
95th percentile
grade (CFU/100ml
)
% over 260
CFU/100ml grade (%)
% over 540
CFU/100ml grade (%)
Grading attribute
state
Overall Pass/Fai
l
Taieri River at Linnburn Runs Rd.
A (43) B (894) B (24%) B (9%) B PASS
Taieri River at Stonehenge
A (41) A (405) A (7%) A (3%) A PASS
Taieri River at Waipiata
A (74) D (1250) B (25%) C (13%) D FAIL
Kye Burn at SH85 Bridge
A (29) A (500) A (14%) A (2%) A PASS
Taieri River at Tiroiti
A (104) B (703) A (18%) B (5%) B PASS
Taieri River at Sutton
A (105) B (766) B (21%) C (10%) C PASS
Sutton Stream at SH87
A (122) C (1072) B (22%) B (9%) C PASS
Nenthorn Stream at Mt Stoker Road
A (22) A (105) A (3%) A (0%) A PASS
Deep Stream at SH87
A (54) A (315) A (8%) A (0%) A PASS
3 O'Clock Stream at Hindon
A (13) A (130) A (4%) A (2%) A PASS
Taieri River at Outram
A (63) C (1055) A (14%) B (7%) C PASS
Silver Stream at Taieri Depot
D (145) D (2190) B (25%) B (9%) D FAIL
Owhiro Stream at Riverside Road
E (650) D (4805) E (81%) E (57%) E FAIL
Taieri River at Allanton Bridge
A (120) B (834) B (25%) C (10%) C PASS
Waipori River at Waipori Falls Rsv.
A (13) A (54) A (0%) A (0%) A PASS

72 State of the Environment – Surface Water Quality in Otago 2006 to 2017
Ammoniacal nitrogen
With the exception of the Owhiro Stream, NH4-N concentrations are low across all Taieri reporting
region SoE monitoring sites, with median and 75th percentile (represented by the upper boundary of
the ‘box’ in the boxplots) being below the ANZECC trigger level of 0.021 mg/L (Figure 26). In the Owhiro
Stream NH4-N are elevated above ANZECC (2000) trigger levels and reflect some enrichment of NH4-N
above typical natural background levels. On a regional scale, the Owhiro Stream returns the highest
NH4-N concentrations of any SoE monitoring site across Otago (Appendix E).
Trend analysis results (Table 36) reveals a number of increasing (degrading) trends for NH4-N. With the
Taieri River at Tiroiti, the Owhiro Stream (already with elevated NH4-N concentrations), and the Taieri
River at Allanton all having significant degrading trends.
At 10 of the 15 monitoring sites, the very low concentrations return too many ‘<DL’ (less than
laboratory detection level) results for a meaningful trend analysis to be carried out.
There is a stable trend for Sutton Stream with no change over time. Trend results for the Taieri River
at Outram are indeterminate.
Figure 26: Boxplot summary of NH4-N concentrations at SoE monitoring sites throughout the
Taieri. Full scale. The red dashed line corresponds to the ANZECC lowland guideline for NH4-N of
0.021 mg/L; the blue dashed line the upland guideline of 0.010 mg/L.
Am
mo
nia
ca
l N
itro
ge
n (
mg
/L)
Taier
i River
at L
innb
urn
Taier
i River
at S
tone
heng
e
Taier
i River
at W
aipi
ata
Kye
Bur
n at
SH85
Brid
ge
Taier
i River
at T
iroiti
Taier
i River
at S
utto
n
Sut
ton
Stre
am a
t SH87
Nen
thor
n Stre
am a
t Mt S
toke
r Roa
d
Dee
p Stre
am a
t SH87
3 O'C
lock
Stre
am a
t Hindo
n
Taier
i River
at O
utra
m
Silv
er S
tream
at T
aier
i Dep
ot
Owhiro
Stre
am a
t River
side
Roa
d
Taier
i River
at A
llant
on B
ridge
Waipo
ri River
at W
aipo
ri Fal
ls R
sv
0.00
0.05
0.10
0.15
0.20

tate of the Environment – Surface Water Quality in Otago 2006 to 2017 73
Table 36: Trend summary of ammonical nitrogen concentrations for the Taieri reporting
region. Si
te
Taie
ri R
iver
at
Lin
nb
urn
Taie
ri R
iver
at
Sto
neh
enge
Taie
ri R
iver
at
Wai
pia
ta
Kye
Bu
rn a
t SH
85
Bri
dge
Taie
ri R
iver
at
Tiro
iti
Taie
ri R
iver
at
Sutt
on
Sutt
on
Str
eam
at
SH8
7
Nen
tho
rn S
trea
m a
t M
t St
oke
r R
oad
Dee
p S
trea
m a
t SH
87
3 O
'Clo
ck S
trea
m a
t H
ind
on
Taie
ri R
iver
at
Ou
tram
Silv
er
Stre
am a
t Ta
ieri
Dep
ot
Ow
hir
o S
trea
m a
t R
iver
sid
e R
oad
Taie
ri R
iver
at
Alla
nto
n B
rid
ge
Wai
po
ri R
iver
at
Wai
po
ri F
alls
Rsv
Am
mo
nia
cal
Nit
roge
n
< DL
< DL
< DL
< DL
↑ ↑ ↑
< DL
→ < DL
< DL
< DL
? <
DL
↑ ↑ ↑
↑ ↑ ↑
< DL
Nitrite/Nitrate nitrogen
Nitrite/nitrate nitrogen (NNN) concentrations are very low across all Taieri reporting region monitoring
sites with the exception of the Owhiro Stream that has 75th and 95th percentile concentrations above
the ANZECC (2000) lowland trigger value of 0.444 mg/L. The Silver Stream has a median concentration
well below, and a 75th percentile (represented by the upper box boundary) equal to the lowland trigger
value of 0.444 mg/L reflecting some mild NNN enrichment (Figure 27).
All other sites have NNN concentrations that are well below the ANZECC upland trigger value of 0.167
mg/L reflecting very low levels of NNN - which is an excellent result.
On a regional standing, the Taieri River reporting zone has very low NNN concentrations comparable
to the pristine monitoring sites of the Upper Clutha (Appendix G) which is an excellent result for
catchment.
Of some concern is the NNN trend analysis (Table 37) that reveals a number of significant increasing
(degrading) trends for NNN including the Taieri at Stonehenge, the Taieri at Sutton and the Taieri at
Allanton. The Taieri at Tiroiti returns a probable increasing (degrading) trend. This is of particular
concern given the current low NNN concentrations that are typically recorded at these sites. Increasing
NNN concentration could increase the risk of toxic phormidium growth and nuisance algal blooms.
A number of tributary streams, namely the Sutton Stream, the 3’Oclock Stream and the Waipori River
return significant decreasing (improving) trends (Table 37).

74 State of the Environment – Surface Water Quality in Otago 2006 to 2017
Figure 27: Nitrite/nitrate nitrogen (NNN) concentrations at SoE monitoring sites throughout the
Taieri. The red dashed line corresponds to the ANZECC lowland guideline for NNN of 0.444 mg/L; the
blue dashed line the upland guideline of 0.167 mg/L.
Table 37: Trend summary of nitrite/nitrate nitrogen (NNN) concentrations for the Taieri
reporting region.
Site
Taie
ri R
iver
at
Lin
nb
urn
Taie
ri R
iver
at
Sto
neh
enge
Taie
ri R
iver
at
Wai
pia
ta
Kye
Bu
rn a
t SH
85
Bri
dge
Taie
ri R
iver
at
Tiro
iti
Taie
ri R
iver
at
Sutt
on
Sutt
on
Str
eam
at
SH8
7
Nen
tho
rn S
trea
m a
t M
t St
oke
r R
oad
Dee
p S
trea
m a
t SH
87
3 O
'Clo
ck S
trea
m a
t H
ind
on
Taie
ri R
iver
at
Ou
tram
Silv
er
Stre
am a
t Ta
ieri
Dep
ot
Ow
hir
o S
trea
m a
t R
iver
sid
e R
oad
Taie
ri R
iver
at
Alla
nto
n B
rid
ge
Wai
po
ri R
iver
at
Wai
po
ri F
alls
Rsv
NN
N
< DL
↑ ↑ ↑
? ? ↑ ↑
↑ ↑ ↑
↓ ↓ ↓
< DL
< DL
↓ ↓ ↓
? ? ? ↑ ↑ ↑
↓ ↓ ↓
Nitri
te/N
itra
te N
itro
ge
n (
mg
/L)
Taier
i River
at L
innb
urn
Taier
i River
at S
tone
heng
e
Taier
i River
at W
aipi
ata
Kye
Bur
n at
SH85
Brid
ge
Taier
i River
at T
iroiti
Taier
i River
at S
utto
n
Sut
ton
Stre
am a
t SH87
Nen
thor
n Stre
am a
t Mt S
toke
r Roa
d
Dee
p Stre
am a
t SH87
3 O'C
lock
Stre
am a
t Hindo
n
Taier
i River
at O
utra
m
Silv
er S
tream
at T
aier
i Dep
ot
Owhiro
Stre
am a
t River
side
Roa
d
Taier
i River
at A
llant
on B
ridge
Waipo
ri River
at W
aipo
ri Fal
ls R
sv
0.00
0.20
0.40
0.60
0.80
1.00
1.20
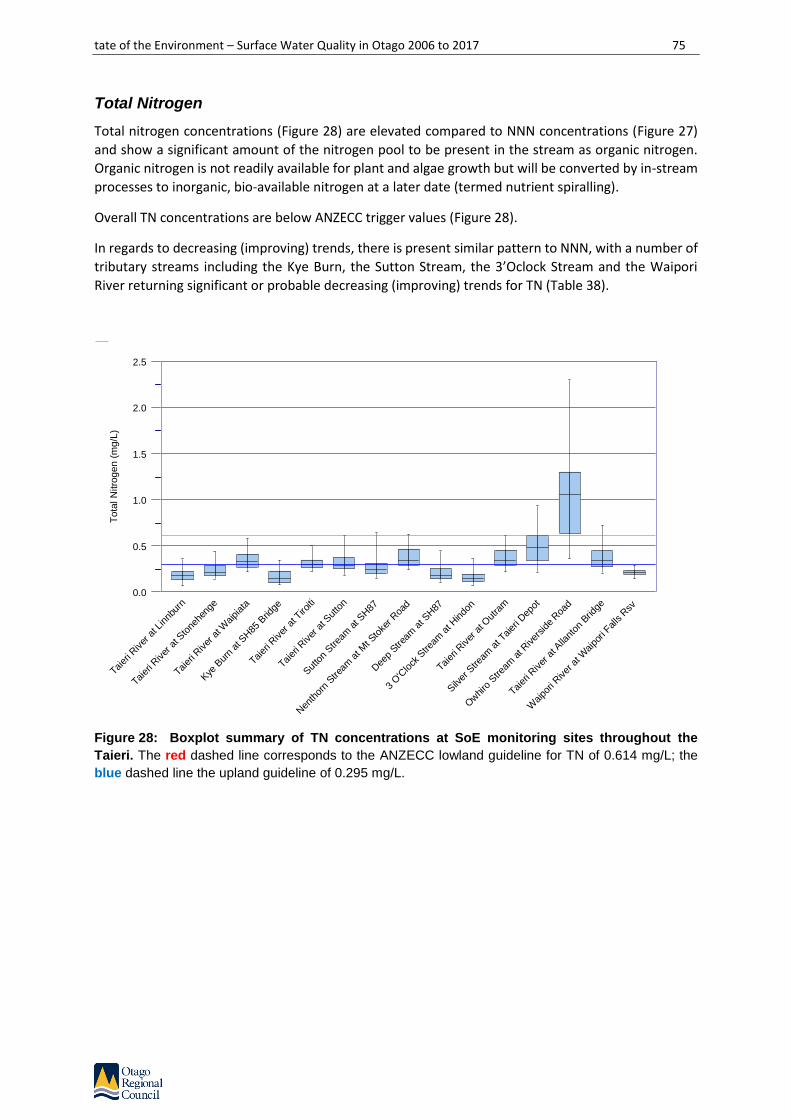
tate of the Environment – Surface Water Quality in Otago 2006 to 2017 75
Total Nitrogen
Total nitrogen concentrations (Figure 28) are elevated compared to NNN concentrations (Figure 27)
and show a significant amount of the nitrogen pool to be present in the stream as organic nitrogen.
Organic nitrogen is not readily available for plant and algae growth but will be converted by in-stream
processes to inorganic, bio-available nitrogen at a later date (termed nutrient spiralling).
Overall TN concentrations are below ANZECC trigger values (Figure 28).
In regards to decreasing (improving) trends, there is present similar pattern to NNN, with a number of
tributary streams including the Kye Burn, the Sutton Stream, the 3’Oclock Stream and the Waipori
River returning significant or probable decreasing (improving) trends for TN (Table 38).
Figure 28: Boxplot summary of TN concentrations at SoE monitoring sites throughout the
Taieri. The red dashed line corresponds to the ANZECC lowland guideline for TN of 0.614 mg/L; the
blue dashed line the upland guideline of 0.295 mg/L.
To
tal N
itro
ge
n (
mg
/L)
Taier
i River
at L
innb
urn
Taier
i River
at S
tone
heng
e
Taier
i River
at W
aipi
ata
Kye
Bur
n at
SH85
Brid
ge
Taier
i River
at T
iroiti
Taier
i River
at S
utto
n
Sut
ton
Stre
am a
t SH87
Nen
thor
n Stre
am a
t Mt S
toke
r Roa
d
Dee
p Stre
am a
t SH87
3 O'C
lock
Stre
am a
t Hindo
n
Taier
i River
at O
utra
m
Silv
er S
tream
at T
aier
i Dep
ot
Owhiro
Stre
am a
t River
side
Roa
d
Taier
i River
at A
llant
on B
ridge
Waipo
ri River
at W
aipo
ri Fal
ls R
sv
0.0
0.5
1.0
1.5
2.0
2.5

76 State of the Environment – Surface Water Quality in Otago 2006 to 2017
Table 38: Trend summary of TN concentrations for the Taieri reporting region. it
e
Taie
ri R
iver
at
Lin
nb
urn
Taie
ri R
iver
at
Sto
neh
enge
Taie
ri R
iver
at
Wai
pia
ta
Kye
Bu
rn a
t SH
85
Bri
dge
Taie
ri R
iver
at
Tiro
iti
Taie
ri R
iver
at
Sutt
on
Sutt
on
Str
eam
at
SH8
7
Nen
tho
rn S
trea
m a
t M
t St
oke
r R
oad
Dee
p S
trea
m a
t SH
87
3 O
'Clo
ck S
trea
m a
t H
ind
on
Taie
ri R
iver
at
Ou
tram
Silv
er
Stre
am a
t Ta
ieri
Dep
ot
Ow
hir
o S
trea
m a
t R
iver
sid
e R
oad
Taie
ri R
iver
at
Alla
nto
n B
rid
ge
Wai
po
ri R
iver
at
Wai
po
ri F
alls
Rsv
Tota
l Nit
roge
n
↑ ↑
→ ? ↓ ↓
? ? ↓ ↓ ↓
? ? ↓ ↓
? ? ? ? ↓ ↓ ↓
Dissolved Reactive Phosphorus
Dissolved Reactive Phosphorus (DRP) concentrations are elevated across a number of sites throughout
the Taieri River reporting region (Figure 29). In the upper catchment, the Taieri at Waipiata returns
very high DRP concentrations. This is concerning as any increase in nitrogen concentration that are
currently low, alongside the elevated DRP will result in significant increases in algal growth rate and a
high risk of problematic algal blooms. The Taieri at Waipiata and the Owhiro Stream are in the top 10
sites for all of Otago for elevated DRP concentrations (Appendix E). In the upper catchment, the Taieri
River at Tiroiti, the Taieri River at Sutton and the Nenthorn Stream all return elevated DRP
concentrations above ANZECC upland trigger values. In the lower catchment, besides the Owhiro
Stream that has already been discussed, the Taieri at Allanton has DRP concentrations above ANZECC
(2000) trigger values. In the case of the Taieri at Allanton, the very low NNN concentrations at this site
would result in strong nitrogen limitation of algae and plant growth. Given the elevated DRP at this
site, it is important that NNN concentrations remain low or the risk of problematic algae growth will
increase significantly.
The Taieri at Outram returns a significant decreasing (improving) trend whereas the Taieri at Allanton
returns a significant increasing (degrading) trend (Table 39). The cause of the increase in DRP
concentrations between Outram and Allanton is unclear. This could be changes in land-use or land-
management practices, or it could be another stream discharging to the Taieri upstream of Allanton,
such as the Silver Stream, which also returns a significant increasing (degrading) trend for DRP. Three
of 15 sites return significant decreasing (improving) trends and include the Taieri at Tiroiti, the Sutton
Stream and the Taieri at Outram. Three sites of 15 return a stable trend or no change over time.
Only two sites have too many ‘<DL’ results to allow a robust trend analysis to be carried out, these
sites include the top-most Taieri River site, the Taieri at Linnburn; and in the lower catchment, the
Waipori River. Both these sites have very low DRP concentrations.
ORC does not have detailed information on changes in land-use or land management practices that
would allow comment to be made on the cause of the degrading or improving trends at these sites.

tate of the Environment – Surface Water Quality in Otago 2006 to 2017 77
Figure 29: Boxplot summary of Dissolved Reactive Phosphorus (DRP) concentrations at SoE
monitoring sites throughout the Taieri. Full scale. The red dashed line corresponds to the ANZECC
lowland guideline for DRP of 0.010 mg/L; the blue dashed line the upland guideline of 0.009 mg/L.
Table 39: Trend summary of Dissolved Reactive Phosphorus (DRP) concentrations for the
Taieri reporting region.
Site
Taie
ri R
iver
at
Lin
nb
urn
Taie
ri R
iver
at
Sto
neh
enge
Taie
ri R
iver
at
Wai
pia
ta
Kye
Bu
rn a
t SH
85
Bri
dge
Taie
ri R
iver
at
Tiro
iti
Taie
ri R
iver
at
Sutt
on
Sutt
on
Str
eam
at
SH8
7
Nen
tho
rn S
trea
m a
t M
t St
oke
r R
oad
Dee
p S
trea
m a
t SH
87
3 O
'Clo
ck S
trea
m a
t H
ind
on
Taie
ri R
iver
at
Ou
tram
Silv
er
Stre
am a
t Ta
ieri
Dep
ot
Ow
hir
o S
trea
m a
t R
iver
sid
e R
oad
Taie
ri R
iver
at
Alla
nto
n B
rid
ge
Wai
po
ri R
iver
at
Wai
po
ri F
alls
Rsv
DR
P
< DL
↑ ↑ ↑
? → ↓ ↓ ↓
? ↓ ↓ ↓
? → → ↓ ↓ ↓
↑ ↑ ↑
? ↑ ↑
< DL
Dis
so
lve
d R
ea
ctive
Ph
osp
ho
rus (
mg
/L)
Taier
i River
at L
innb
urn
Taier
i River
at S
tone
heng
e
Taier
i River
at W
aipi
ata
Kye
Bur
n at
SH85
Brid
ge
Taier
i River
at T
iroiti
Taier
i River
at S
utto
n
Sut
ton
Stre
am a
t SH87
Nen
thor
n Stre
am a
t Mt S
toke
r Roa
d
Dee
p Stre
am a
t SH87
3 O'C
lock
Stre
am a
t Hindo
n
Taier
i River
at O
utra
m
Silv
er S
tream
at T
aier
i Dep
ot
Owhiro
Stre
am a
t River
side
Roa
d
Taier
i River
at A
llant
on B
ridge
Waipo
ri River
at W
aipo
ri Fal
ls R
sv
0.00
0.01
0.02
0.03
0.04
0.05
0.06
0.07
0.08

78 State of the Environment – Surface Water Quality in Otago 2006 to 2017
Total Phosphorus
Total phosphorus concentrations across the Taieri reporting region (Figure 30) follow similar patterns
to DRP with sites generally being below ANZECC trigger values. The exception being the Taieri at
Waipiata and the Owhiro Stream, that return elevated TP levels.
The majority of sites return median TP concentrations well below the ANZECC trigger values for upland
and lowland sites, with the exception of the Taieri at Tiroiti and Taieri at Sutton that have median TP
concentrations above the ANZECC upland trigger value of 0.026 mg/L that is applicable to these two
sites.
TP trend analysis (Table 40) returned indeterminate trends for all sites.
Figure 30: Boxplot summary of TP concentrations at SoE monitoring sites throughout the
Taieri. The red dashed line corresponds to the ANZECC lowland guideline for TP of 0.033 mg/L; the
blue dashed line the upland guideline of 0.026 mg/L.
To
tal P
ho
sp
ho
rus (
mg
/L)
Taier
i River
at L
innb
urn
Taier
i River
at S
tone
heng
e
Taier
i River
at W
aipi
ata
Kye
Bur
n at
SH85
Brid
ge
Taier
i River
at T
iroiti
Taier
i River
at S
utto
n
Sut
ton
Stre
am a
t SH87
Nen
thor
n Stre
am a
t Mt S
toke
r Roa
d
Dee
p Stre
am a
t SH87
3 O'C
lock
Stre
am a
t Hindo
n
Taier
i River
at O
utra
m
Silv
er S
tream
at T
aier
i Dep
ot
Owhiro
Stre
am a
t River
side
Roa
d
Taier
i River
at A
llant
on B
ridge
Waipo
ri River
at W
aipo
ri Fal
ls R
sv
0.00
0.05
0.10
0.15
0.20
0.25

tate of the Environment – Surface Water Quality in Otago 2006 to 2017 79
Table 40: Trend summary of TP concentrations for the Taieri reporting region. Si
te
Taie
ri R
iver
at
Lin
nb
urn
Taie
ri R
iver
at
Sto
neh
enge
Taie
ri R
iver
at
Wai
pia
ta
Kye
Bu
rn a
t SH
85
Bri
dge
Taie
ri R
iver
at
Tiro
iti
Taie
ri R
iver
at
Sutt
on
Sutt
on
Str
eam
at
SH8
7
Nen
tho
rn S
trea
m a
t M
t St
oke
r R
oad
Dee
p S
trea
m a
t SH
87
3 O
'Clo
ck S
trea
m a
t H
ind
on
Taie
ri R
iver
at
Ou
tram
Silv
er
Stre
am a
t Ta
ieri
Dep
ot
Ow
hir
o S
trea
m a
t R
iver
sid
e R
oad
Taie
ri R
iver
at
Alla
nto
n B
rid
ge
Wai
po
ri R
iver
at
Wai
po
ri F
alls
Rsv
Tota
l Ph
osp
ho
rus
? ? ? ? ? ? ? ? ? ? ? ? ? ? ?
Escherichia coli
Figure 31 shows E. coli concentrations for all SoE monitoring sites across the Taieri River reporting
region. All sites have median and 75th percentile (upper bound of boxplots) equal to or below the
amber alert level of 260 CFU/100ml; the exception is the Owhiro Stream that has highly elevated
bacteria levels with a median and 75th percentile levels well above the red alert level of
550 CFU/100ml. The Owhiro also returns a significant increasing (degrading) trend (Table 41) showing
this already heavily degraded site with respect to bacterial water quality, to be getting worse.
Nearly all sites return elevated 95th percentile concentrations (shown as the upper whisker in the
boxplots) well above the red alert level. These peaks typically occur during times of elevated flow when
surface runoff from the catchment transports bacteria to the stream and river sites. Having elevated
bacteria levels during such times in a farmed catchment is not uncommon.
The Taieri River at Stonehenge, the Kyeburn, Nenthorn, 3 O’clock and Deep streams, and the Waipori
River all have very low E. coli concentrations with 95th percentiles well below the 550 CFU/100ml red
alert threshold. This shows these sites to have excellent bacterial water quality, even at times of
elevated flow.
Trend analysis returns some concerning results with 6 of 15 sites having a significant or probable
increasing (degrading) trend for E. coli. These sites include the upper catchment Taieri River sites at
Linnburn, Stonehenge, Waipiata and Sutton, and the Taieri River at Allanton in the lower catchment.
The other degrading trend is found in the Owhiro Stream (discussed previously).

80 State of the Environment – Surface Water Quality in Otago 2006 to 2017
Figure 31: Boxplot summary of E coli concentrations at SoE monitoring sites throughout the
Taieri. The amber line corresponds to the amber alert level of 260 CFU/100ml; the red line to the red
alert level of 550 CFU/100ml.
Table 41: Trend summary of Escerichia coli (E. coli) concentrations for the Taieri reporting
region.
Site
Taie
ri R
iver
at
Lin
nb
urn
Taie
ri R
iver
at
Sto
neh
enge
Taie
ri R
iver
at
Wai
pia
ta
Kye
Bu
rn a
t SH
85
Bri
dge
Taie
ri R
iver
at
Tiro
iti
Taie
ri R
iver
at
Sutt
on
Sutt
on
Str
eam
at
SH8
7
Nen
tho
rn S
trea
m a
t M
t St
oke
r R
oad
Dee
p S
trea
m a
t SH
87
3 O
'Clo
ck S
trea
m a
t H
ind
on
Taie
ri R
iver
at
Ou
tram
Silv
er
Stre
am a
t Ta
ieri
Dep
ot
Ow
hir
o S
trea
m a
t R
iver
sid
e R
oad
Taie
ri R
iver
at
Alla
nto
n B
rid
ge
Wai
po
ri R
iver
at
Wai
po
ri F
alls
Rsv
E. c
oli ↑
↑ ↑
↑ ↑
↑ ↑ ↑
? ? ↑ ↑
? → ? ? ? <
DL
↑ ↑ ↑
↑ ↑ ↑
?
Esch
eri
ch
ia c
oli (
CF
U/1
00
ml)
Taier
i River
at L
innb
urn
Taier
i River
at S
tone
heng
e
Taier
i River
at W
aipi
ata
Kye
Bur
n at
SH85
Brid
ge
Taier
i River
at T
iroiti
Taier
i River
at S
utto
n
Sut
ton
Stre
am a
t SH87
Nen
thor
n Stre
am a
t Mt S
toke
r Roa
d
Dee
p Stre
am a
t SH87
3 O'C
lock
Stre
am a
t Hindo
n
Taier
i River
at O
utra
m
Silv
er S
tream
at T
aier
i Dep
ot
Owhiro
Stre
am a
t River
side
Roa
d
Taier
i River
at A
llant
on B
ridge
Waipo
ri River
at W
aipo
ri Fal
ls R
sv
0
250
500
750
1000
1250
1500
1750
2000

tate of the Environment – Surface Water Quality in Otago 2006 to 2017 81
Turbidity
Turbidity levels for SoE monitoring sites across the Taieri River reporting region are typically low (Figure
32) with 9 of the 15 sites monitored having turbidity concentrations that are well below the ANZECC
upland and lowland guideline trigger levels of 4.1 NTU and 5.6 NTU respectively. The exceptions to this
are the Kye Burn and Taieri at Tiroiti and Taieri at Sutton in the upper catchment; and the Taieri River
at Outram, Owhiro Stream and to a lesser extent, the Taieri at Allanton in the lower catchment. These
sites have turbidity levels that are often above guideline levels. In fact the Owhiro Stream returns the
highest median turbidity for all Otago SoE sites (Appendix G).
For the Kyeburn, Taieri River at Tiroiti and the Taieri River at Sutton, historic gold workings have been
hypothesised as affecting instream turbidity and suspended sediment levels (Kitto, 2012).
Trend analysis (Table 42) shows a number of sites to have significant and probable increasing
(degrading) trends for turbidity, these being the Taieri River at Tiroiti and Sutton Stream at SH87 in the
upper catchment; and the Taieri at Outram, Owhiro Stream and Taieri at Allanton in the lower
catchment. The reasons for these trends is not evident as ORC do not have detailed information on
changes in land-use or land management practices, so it is not possible to comment on the cause of
the degrading trends at these sites.
Two sites have probable or significant decreasing (improving) trends for turbidity; this includes the
Nenthorn Stream that already has very low turbidity; and the Waipori River.
Figure 32: Boxplot summary of Turbidity at SoE monitoring sites throughout the Taieri. The red
dashed line corresponds to the ANZECC lowland guideline for Turbidity of 5.6 NTU; the blue dashed
line the upland guideline of 4.1 NTU.
Tu
rbid
ity (
NT
U)
Taier
i River
at L
innb
urn
Taier
i River
at S
tone
heng
e
Taier
i River
at W
aipi
ata
Kye
Bur
n at
SH85
Brid
ge
Taier
i River
at T
iroiti
Taier
i River
at S
utto
n
Sut
ton
Stre
am a
t SH87
Nen
thor
n Stre
am a
t Mt S
toke
r Roa
d
Dee
p Stre
am a
t SH87
3 O'C
lock
Stre
am a
t Hindo
n
Taier
i River
at O
utra
m
Silv
er S
tream
at T
aier
i Dep
ot
Owhiro
Stre
am a
t River
side
Roa
d
Taier
i River
at A
llant
on B
ridge
Waipo
ri River
at W
aipo
ri Fal
ls R
sv
0
10
20
30
40
50
60
70

82 State of the Environment – Surface Water Quality in Otago 2006 to 2017
Table 42: Trend summary of Turbidity levels for the Taieri reporting region. Si
te
Taie
ri R
iver
at
Lin
nb
urn
Taie
ri R
iver
at
Sto
neh
enge
Taie
ri R
iver
at
Wai
pia
ta
Kye
Bu
rn a
t SH
85
Bri
dge
Taie
ri R
iver
at
Tiro
iti
Taie
ri R
iver
at
Sutt
on
Sutt
on
Str
eam
at
SH8
7
Nen
tho
rn S
trea
m a
t M
t St
oke
r R
oad
Dee
p S
trea
m a
t SH
87
3 O
’Clo
ck S
trea
m a
t H
ind
on
Taie
ri R
iver
at
Ou
tram
Silv
er
Stre
am a
t Ta
ieri
Dep
ot
Ow
hir
o S
trea
m a
t R
iver
sid
e R
oad
Taie
ri R
iver
at
Alla
nto
n B
rid
ge
Wai
po
ri R
iver
at
Wai
po
ri F
alls
Rsv
Turb
idit
y
? ? ? ? ↑ ↑ ↑
? ↑ ↑
↓ ↓
? ? ↑ ↑ ↑
? ↑ ↑ ↑
↑ ↑ ↑
↓ ↓ ↓
Stream Health and the Macroinvertebrate Community Index
Macroinvertebrate Community Index (MCI) scores provide an integrated indicator of the general state
of water quality and aquatic ecosystem health at a site.
Figure 33 summarises MCI scores for sites monitored for aquatic macroinvertebrates throughout the
Taieri River reporting region. The summary includes annual samples collected from 2008 to 2017
(8 years) where data is available. Not all sites monitored for water quality have macro-invertebrate
samples taken. Of the 15 sites monitored for water quality, 6 sites are sampled annually for macro-
invertebrates.
MCI scores are somewhat comparable across sites with five of the six monitored sites returning
comparable MCI scores that fall between 100 and 115; reflecting a macroinvertebrate community in
‘good’ condition. The exception is the Silver Stream monitoring site that returns a score of around 90,
representing a macroinvertebrate community in ‘poor’ condition.
In a regional context, with the exception of the Silver Stream that is degraded, the Taieri River reporting
region macroinvertebrate monitoring sites generally rank favourably against sites across Otago
(Appendix G), and show overall water and habitat quality to be supporting the existence of a healthy
invertebrate community.

tate of the Environment – Surface Water Quality in Otago 2006 to 2017 83
Figure 33: Boxplot summary of Macroinvertebrate Community Index (MCI) scores at SoE
monitoring sites throughout North Otago where macroinvertebrate samples are routinely
collected. Above the blue line corresponds to the ‘Excellent’ quality threshold; between the orange and
blue line the ‘Good’ quality threshold; betwene the red and orange line ‘Poor’ quality threshold; below
the red line the ‘Degraded’ threshold.
MC
I
Kye
Bur
n at
SH85
Brid
ge
Taier
i River
at T
iroiti
Sut
ton
Stre
am a
t SH87
Taier
i River
at O
utra
m
Silv
er S
tream
at T
aier
i Dep
ot
Waipo
ri River
at W
aipo
ri Fal
ls R
sv
70
80
90
100
110
120
130
84 State of the Environment – Surface Water Quality in Otago 2006 to 2017
Taieri Water Quality Summary and Conclusions
Across the Taieri River reporting region there are a moderate number of sites with degrading water
quality trends, as shown in Table 43, which summarises trend results across all sites. There are a total
of 105 results reported in the table; 22% return significant or probable degrading trends; 5% are stable;
and 11% return significant or probable improving trends. Overall 62% of sites have either
indeterminate trends (reported as “?”); or too many observations being ‘less than detect’ (<DL) for
results returned from the laboratory.
Despite relatively good bacterial water quality throughout the reporting region, E. coli is the worst
performing variable with six of 15 sites having increasing (degrading) trends for E. coli. The reasons for
this are unclear, but could be due to changes in irrigation practices as some types of irrigation, such as
flood or border-dyke irrigation, have been identified in the past as a signifcant contributor to elevated
E. coli levels instream (Kitto, 2012). Having accurate information on changes in land management
practice, in particular irrigation practices, would help in identifying drivers of change evident with some
water quality variables.
In summary:
• Risk to ammonia and nitrate toxicity is negligible across the Taieri River reporting region;
• Swimmability and E. coli bacteria levels are moderate with four of 15 sites failing the national
bottom line. For the most part, Swimmability and bacterial water quality is good;
• The Owhiro Stream in the lower Taieri catchment has the worst level of compliance against
Water Plan limits of any site across the Taieri River reporting region and in fact, the wider
Otago region. This is the only site across the region that fails all Water Plan limits;
• The Owhiro Stream has the highest median E. coli and turbidity levels of all Otago SoE
monitoring sites;
• Nitrite/nitrate nitrogen concentrations in the Taieri River are some of the lowest of those
measured across Otago;
• Total Nitrogen concentrations are moderate across the Taieri River reporting region. This
combined with the very low NNN concentrations shows organic nitrogen to dominate the TN
pool;
• Dissolved Reactive Phosphorus concentraitons are elevated at more sites than not. This
combined with the very low NNN concentrations shows that at most sites, algal growth would
be very strongly nitrogen limited;
• For the Taieri River where macroinvertebrate monitoring takes place, Macroinvertebrate
Community Health estimated by the MCI is typically good; the exception is the Silver Stream
that has a macroinvertbrate community in ‘poor’ health.

tate of the Environment – Surface Water Quality in Otago 2006 to 2017 85
Table 43: Trend summary for the Taieri reporting region.
Site
Am
mo
nia
cal
Nit
roge
n
Nit
rite
/Nit
rate
N
itro
gen
Tota
l Nit
roge
n
Dis
solv
ed
R
eact
ive
Ph
osp
ho
rus
Tota
l
Ph
osp
ho
rus
Esch
eric
hia
co
li
Turb
idit
y
Taieri River at Linnburn < DL < DL ↑↑ < DL ? ↑↑↑ ?
Taieri River at Stonehenge
< DL ↑↑↑ → ↑↑↑ ? ↑↑ ?
Taieri River at Waipiata < DL ? ? ? ? ↑↑↑ ?
Kye Burn at SH85 Bridge < DL ? ↓↓ → ? ? ?
Taieri River at Tiroiti ↑↑↑ ↑↑ ? ↓↓↓ ? ? ↑↑↑
Taieri River at Sutton < DL ↑↑↑ ? ? ? ↑↑ ?
Sutton Stream at SH87 → ↓↓↓ ↓↓↓ ↓↓↓ ? ? ↑↑
Nenthorn Stream at Mt Stoker Road
< DL < DL ? ? ? → ↓↓
Deep Stream at SH87 < DL < DL ? → ? ? ?
3 O'Clock Stream at Hindon
< DL ↓↓↓ ↓↓ → ? ? ?
Taieri River at Outram ? ? ? ↓↓↓ ? ? ↑↑↑
Silver Stream at Taieri Depot
< DL ? ? ↑↑↑ ? < DL ?
Owhiro Stream at Riverside Road
↑↑↑ ? ? ? ? ↑↑↑ ↑↑↑
Taieri River at Allanton Bridge
↑↑↑ ↑↑↑ ? ↑↑ ? ↑↑↑ ↑↑↑
Waipori River at Waipori Falls Rsv
< DL ↓↓↓ ↓↓↓ < DL ? ? ↓↓↓

86 State of the Environment – Surface Water Quality in Otago 2006 to 2017
2.4. Upper Clutha
The Clutha River/Mata-Au originates in the headwaters of lakes Wakatipu, Wanaka and Hawea and
drains much of the Otago region with a catchment area totalling 21 022 km2. The Clutha River is the
second longest river in New Zealand and the longest river in the South Island flowing for a total distance
of 322 km from its furthest point to the north-west in the headwaters of the Makarora River, to where
it discharges downstream of Balclutha to the Pacific Ocean. The Clutha River has a mean annual flow
of 575 m3/s. 75% of the total river flow measured at Balclutha upstream of where the river meets the
Pacific Ocean, comes from the combined outflows of lakes Wakatipu, Wanaka and Hawea (Ozanne,
2012; LAWA13).
The Upper Clutha reporting region encapsulates (from upstream to downstream by confluence) the
Makarora River (745 km2), Matukituki River (801 km2), Hunter River (1473 km2), Cardrona River (347
km2), Luggate Creek (123 km2), Lindis River (1039 km2), Dart River (631 km2), Rees River (405 km2),
Shotover River (1091 km2) and Mill Creek (14 km2). The iconic Southern Great Lakes, Lake Wakatipu,
Lake Wanaka and Lake Hawea are central to the region. Of these larger lakes, Wanaka and Wakatipu
are unimpounded and Hawea is regulated (LAWA).
The Clutha and its principal tributary, the Kawarau River, pass through gorges, two of which are
dammed for hydro‐electricity generation forming lakes Dunstan and Roxsburgh, with lakes Roxsburgh
being downstream of the Upper Clutha reporting region.
The headwaters of the catchment are predominantly in rugged, steep terrain with the highest point,
Mt. Aspiring, reaching 3027 m. Numerous headwater streams such as the Dart River and Matukituki
River originate along the eastern boundary of the Southern Alps and are fed by permanent glaciers
(LAWA).
2.4.1. Upper Clutha geographical and land cover characteristics
Table 44 summarises characteristics of the Upper Clutha reporting region based on the River
Environment Classification (refer Appendix F for a detailed overview of the REC); land-cover (based on
the Land Cover Database Version 4; condensed with the approach summarised in Appendix D); and
the Land Use Capability (LUC) classes (see Section 2.0 for the LUC definition). The Upper Clutha
reporting region covers an area of 11974 km2 representing approximately 57% of the total Clutha
River/Mata-Au catchment.
According to the River Environment Classification (REC), rivers and streams of the Upper Clutha
reporting region cover a broad range of river types with cool/wet (36.9%) and cool/extremely wet
(9.9%) rivers being a significant contributor to total river length throughout the region. The REC classes
wet rivers as having a mean annual rainfall of 500 mm to 1500 mm; extremely wet rivers are classed
as having a mean annual rainfall greater than 1500 mm. Water yields from these streams and rivers is
high. This is the highest percentage of wet and extremely wet rivers of any region covered in this
report. Also of significance is the proportion of glacial fed (6.9%) and lake fed (23.5%) rivers (Table 44).
The predominant land cover throughout the Upper Clutha reporting region is native cover (63%, 7544
km2) followed by low producing grassland (14.7%, 1760 km2). ‘Low producing grassland’ includes
“exotic and indigenous grasslands, grazed for wool, sheep or beef. Usually found on steep hill country”
(Table 44, Appendix D). The high proportion of native cover in the upper catchments of the large lakes
falls in areas of high to very high rain and snowfall. This provides large volumes flowing from pristine
catchments of exceptional quality that feeds the Southern Great Lakes.
13 https://www.lawa.org.nz/explore-data/otago-region/river-quality/clutha-river/

tate of the Environment – Surface Water Quality in Otago 2006 to 2017 87
LUC Class 6 to 8 lands dominate the Upper Clutha reporting region with 86.7% (10381 km2) of the total
land area made of this steep terrain typical of the mountain ranges surrounding the Southern Great
Lakes.
Table 44: Zone characteristics of the Upper Clutha reporting region. Land cover area and land-
use capability.
Source of flow (REC) Land Cover Area (LCDB4) Land-use Capability
Class (LUC)
Cool-Dry / Hill 13.2%
Cool-Dry / Low-Elevation 3.5%
Cool-Dry / Lake 15.0%
Cool-Dry / Mountain 2.7%
Cool-Wet / Glacial-Mountain 0.02%
Cool-Wet / Hill 7.3%
Cool-Wet / Low-Elevation 1.2%
Cool-Wet / Lake 7.6%
Cool-Wet / Mountain 22.0%
Cool-Extremely-Wet / Glacial-Mountain 6.7%
Cool-Extremely-Wet / Hill 3.2%
Cool-Extremely-Wet / Low-Elevation 0.1%
Cool-Extremely-Wet / Lake 0.9%
Cool-Extremely-Wet / Mountain 16.7%
Cropping 0.2%
High producing grassland 6.0%
Low Producing Grassland 14.7%
Native Cover 63.1%
Orchards/Vineyards 0.2%
Plantation forestry 0.6%
Unaccounted 14.8%
Urban areas 0.3%
Class 2 0.3%
Class 3 2.3%
Class 4 4.0%
Class 5 0.4%
Class 6 19.0%
Class 7 34.4%
Class 8 33.3%
Lake 5.5%
The Upper Clutha reporting region covers 1 197 398 hectares

88 State of the Environment – Surface Water Quality in Otago 2006 to 2017
Figure 34: Map showing broad land cover categories of the Upper Clutha reporting region
based on the LCDB4 databse.

tate of the Environment – Surface Water Quality in Otago 2006 to 2017 89
2.4.2. Upper Clutha water quality
The following section provides a summary of the Upper Clutha reporting region water quality based
on:
• Compliance against Schedule 15 (Water Plan) water quality limits;
• National Policy Statement for Freshwater Management (NPSFM 2014) National Objectives
Framework Attribute bands (NOF bands);
• Summary boxplots of key water quality indicators with the inclusion of general water quality
guidelines such as ANZECC (2000);
• A summary of trends (degrading/improving) that may (or may not) be evident in the data.
Schedule 15 compliance
Table 45 summarises compliance for SoE monitoring sites throughout the Upper Clutha reporting
region with Schedule 15 (Water Plan) limits. For this section, all ‘80th percentile concentrations’ are
calculated from data collected when flows at the relevant flow reference site are below median flow.
There are a number of SoE monitoring sites in the Upper Clutha reporting region that fall in RWG 3
(Figure 1). These sites have the most stringent water quality limits under Schedule 15 (Water Plan) and
are delineated in Table 45 as underlined numbers in italics.
All sites in RWG2 are compliant with respect to the Schedule 15 (Water Plan) NH4-N limit of 0.100
mg/L. For the RWG 3 sites, a number fail the more stringent Schedule 15 (Water Plan) limit of 0.010
mg/L, including the Dart, Matukituki and Kawarau rivers. In the case of the Dart and Matukituki rivers,
the upstream catchments are relatively untouched and elevated NH4-N would in all likelihood be
derived from natural sources. In the case of the Kawarau, the Project Shotover WWTP discharging to
the Shotover River appears to elevate NH4-N concentrations downstream, as shown by Figure 35 that
compares two SoE sampling sites upstream of Project Shotover to the non-compliant SoE monitoring
site downstream.
Figure 35: Comparison of in-stream NH4-N concentrations upstream and downstream of the
Project Shotover Waste Water Treatment Plant.
Am
monia
cal N
itro
gen (
mg/L
)
Lake Wakatipu Outflow Shotover River at Bowens Peak Kawarau River at Chards0.000
0.005
0.010
0.015
0.020
0.025
0.030
0.035
Upstream Downstream
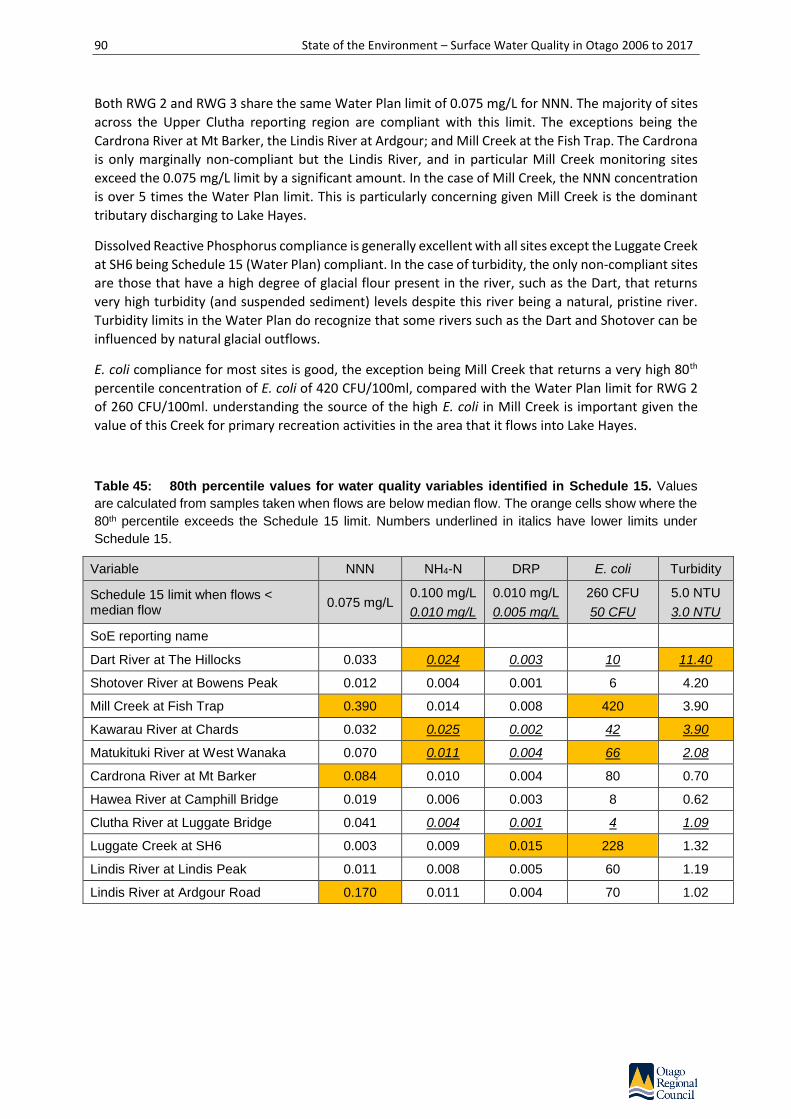
90 State of the Environment – Surface Water Quality in Otago 2006 to 2017
Both RWG 2 and RWG 3 share the same Water Plan limit of 0.075 mg/L for NNN. The majority of sites
across the Upper Clutha reporting region are compliant with this limit. The exceptions being the
Cardrona River at Mt Barker, the Lindis River at Ardgour; and Mill Creek at the Fish Trap. The Cardrona
is only marginally non-compliant but the Lindis River, and in particular Mill Creek monitoring sites
exceed the 0.075 mg/L limit by a significant amount. In the case of Mill Creek, the NNN concentration
is over 5 times the Water Plan limit. This is particularly concerning given Mill Creek is the dominant
tributary discharging to Lake Hayes.
Dissolved Reactive Phosphorus compliance is generally excellent with all sites except the Luggate Creek
at SH6 being Schedule 15 (Water Plan) compliant. In the case of turbidity, the only non-compliant sites
are those that have a high degree of glacial flour present in the river, such as the Dart, that returns
very high turbidity (and suspended sediment) levels despite this river being a natural, pristine river.
Turbidity limits in the Water Plan do recognize that some rivers such as the Dart and Shotover can be
influenced by natural glacial outflows.
E. coli compliance for most sites is good, the exception being Mill Creek that returns a very high 80th
percentile concentration of E. coli of 420 CFU/100ml, compared with the Water Plan limit for RWG 2
of 260 CFU/100ml. understanding the source of the high E. coli in Mill Creek is important given the
value of this Creek for primary recreation activities in the area that it flows into Lake Hayes.
Table 45: 80th percentile values for water quality variables identified in Schedule 15. Values
are calculated from samples taken when flows are below median flow. The orange cells show where the
80th percentile exceeds the Schedule 15 limit. Numbers underlined in italics have lower limits under
Schedule 15.
Variable NNN NH4-N DRP E. coli Turbidity
Schedule 15 limit when flows < median flow
0.075 mg/L 0.100 mg/L
0.010 mg/L
0.010 mg/L
0.005 mg/L
260 CFU
50 CFU
5.0 NTU
3.0 NTU
SoE reporting name
Dart River at The Hillocks 0.033 0.024 0.003 10 11.40
Shotover River at Bowens Peak 0.012 0.004 0.001 6 4.20
Mill Creek at Fish Trap 0.390 0.014 0.008 420 3.90
Kawarau River at Chards 0.032 0.025 0.002 42 3.90
Matukituki River at West Wanaka 0.070 0.011 0.004 66 2.08
Cardrona River at Mt Barker 0.084 0.010 0.004 80 0.70
Hawea River at Camphill Bridge 0.019 0.006 0.003 8 0.62
Clutha River at Luggate Bridge 0.041 0.004 0.001 4 1.09
Luggate Creek at SH6 0.003 0.009 0.015 228 1.32
Lindis River at Lindis Peak 0.011 0.008 0.005 60 1.19
Lindis River at Ardgour Road 0.170 0.011 0.004 70 1.02

tate of the Environment – Surface Water Quality in Otago 2006 to 2017 91
Nitrate and ammonia toxicity and NOF compliance
NOF attribute bands for nitrate (measured as NNN) and NH4-N toxicity (Table 46 and Table 47
respectively) show excellent protection levels against toxicity risk for all Upper Clutha SoE monitoring
sites, with all sites returning an ‘A’ band (highest level of protection) for NNN; and all sites returning
an ‘A’ band for NH4-N. There is present some slightly elevated NH4-N concentrations in the Dart River
at times that are approaching the upper ‘A’ band boundary of 0.05 mg/L. As discussed previously, the
Dart River catchment is predominantly a native catchment so elevated NH4-N is sourced from natural
sources.
Table 46: NOF compliance summary for Nitrate (estimated from NNN). Included are median and
95th percentile values for the the period July 2012 to June 2017 and the corresponding NOF attribute
band.
Variable Nitrate as NNN NOF Band
SoE reporting name Median (mg/L)
95th Percentile
(mg/L) Median 95th
Percentile
Dart River at The Hillocks 0.021 0.037 A A
Shotover River at Bowens Peak 0.015 0.030 A A
Mill Creek at Fish Trap 0.317 0.452 A A
Kawarau River at Chards 0.024 0.032 A A
Matukituki River at West Wanaka 0.048 0.074 A A
Cardrona River at Mt Barker 0.056 0.127 A A
Hawea River at Camphill Bridge 0.013 0.023 A A
Clutha River at Luggate Bridge 0.033 0.043 A A
Luggate Creek at SH6 0.002 0.016 A A
Lindis River at Lindis Peak 0.019 0.072 A A
Lindis River at Ardgour Road 0.064 0.144 A A
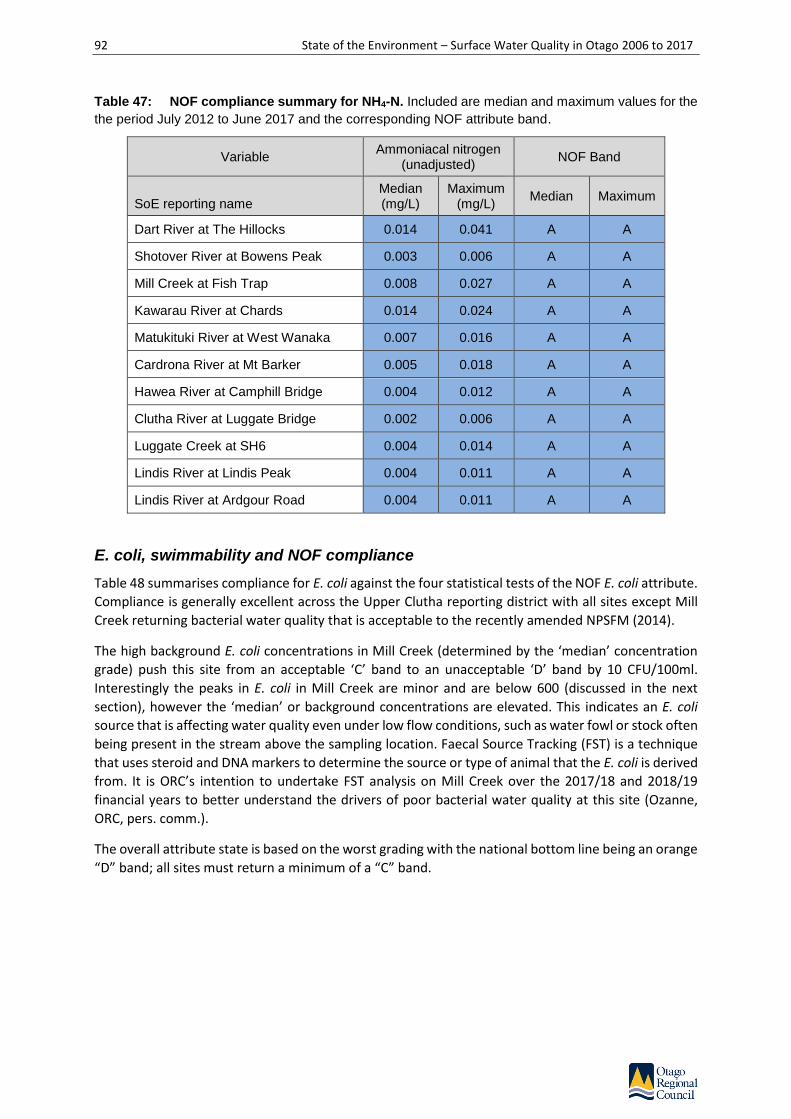
92 State of the Environment – Surface Water Quality in Otago 2006 to 2017
Table 47: NOF compliance summary for NH4-N. Included are median and maximum values for the
the period July 2012 to June 2017 and the corresponding NOF attribute band.
Variable Ammoniacal nitrogen
(unadjusted) NOF Band
SoE reporting name Median (mg/L)
Maximum (mg/L)
Median Maximum
Dart River at The Hillocks 0.014 0.041 A A
Shotover River at Bowens Peak 0.003 0.006 A A
Mill Creek at Fish Trap 0.008 0.027 A A
Kawarau River at Chards 0.014 0.024 A A
Matukituki River at West Wanaka 0.007 0.016 A A
Cardrona River at Mt Barker 0.005 0.018 A A
Hawea River at Camphill Bridge 0.004 0.012 A A
Clutha River at Luggate Bridge 0.002 0.006 A A
Luggate Creek at SH6 0.004 0.014 A A
Lindis River at Lindis Peak 0.004 0.011 A A
Lindis River at Ardgour Road 0.004 0.011 A A
E. coli, swimmability and NOF compliance
Table 48 summarises compliance for E. coli against the four statistical tests of the NOF E. coli attribute.
Compliance is generally excellent across the Upper Clutha reporting district with all sites except Mill
Creek returning bacterial water quality that is acceptable to the recently amended NPSFM (2014).
The high background E. coli concentrations in Mill Creek (determined by the ‘median’ concentration
grade) push this site from an acceptable ‘C’ band to an unacceptable ‘D’ band by 10 CFU/100ml.
Interestingly the peaks in E. coli in Mill Creek are minor and are below 600 (discussed in the next
section), however the ‘median’ or background concentrations are elevated. This indicates an E. coli
source that is affecting water quality even under low flow conditions, such as water fowl or stock often
being present in the stream above the sampling location. Faecal Source Tracking (FST) is a technique
that uses steroid and DNA markers to determine the source or type of animal that the E. coli is derived
from. It is ORC’s intention to undertake FST analysis on Mill Creek over the 2017/18 and 2018/19
financial years to better understand the drivers of poor bacterial water quality at this site (Ozanne,
ORC, pers. comm.).
The overall attribute state is based on the worst grading with the national bottom line being an orange
“D” band; all sites must return a minimum of a “C” band.

tate of the Environment – Surface Water Quality in Otago 2006 to 2017 93
Table 48: NOF compliance summary for E. coli for the the period July 2012 to June 2017. The
overall grading band is determined by the lowest (worst) ranked Numeric Attribute State as it relates to
the four separate states.
Numeric Attribute State Overall attribute
state
Site
Median grade
(CFU/100ml)
95th percentile
grade (CFU/100ml
)
% over 260
CFU/100ml grade (%)
% over 540
CFU/100ml grade (%)
Grading attribute
state
Overall Pass/Fai
l
Dart River at The Hillocks
A (8) A (340) A (10%) A (4%) A Pass
Shotover River at Bowens Peak
A (4) A (55.4) A (0%) A (0%) A Pass
Mill Creek at Fish Trap
D (140) B (593) B (29%) B (7%) D FAIL
Kawarau River at Chards
A (7) A (95) A (0%) A (0%) A Pass
Matukituki River at West Wanaka
A (23) C (1200) A (15%) B (7%) C Pass
Cardrona River at Mt Barker
A (38) A (276) A (5%) A (3%) A Pass
Hawea River at Camphill Bridge
A (2) A (32) A (2%) A (0%) A Pass
Clutha River at Luggate Bridge
A (1) A (22) A (0%) A (0%) A Pass
Luggate Creek at SH6
A (25) A (364) A (5%) A (2%) A Pass
Lindis River at Lindis Peak
A A A A A Pass
Lindis River at Ardgour Road
A A A A A Pass
Ammoniacal nitrogen
With the exception of the Kawarau River at Chards, NH4-N concentrations are relatively low across all
Upper Clutha reporting region SoE monitoring sites; with median concentrations being below the
ANZECC upland trigger level of 0.010 mg/L (Figure 36).
For the Dart River and Mill Creek monitoring sites, the 75th percentile (represented by the upper
boundary of the ‘box’ in the boxplots) exceeds the upland ANZECC trigger level of 0.010 mg/L; but
overall concentrations are still relatively low, and do not pose any real concerns. As discussed
previously, the Dart River catchment is dominated by native vegetation cover and is in pristine
condition. The elevated concentrations in this catchment are in all likelihood derived from natural
sources such as the decomposition or breakdown of organic vegetation matter.
On a regional scale, the Dart and Mill Creek have median concentrations that are pretty typical of
Otago’s rivers (Appendix E and Appendix G). The Kawarau River by contrast has a slightly elevated
median concentration that is double that of the Dart River. This monitoring site also returns the only
significant increasing (degrading) trend for NH4-N for the Upper Clutha reporting region. As discussed

94 State of the Environment – Surface Water Quality in Otago 2006 to 2017
briefly in the section summarising compliance with the Water Plan limits, water quality monitoring
upstream of the Project Shotover WWTP returns NH4-N concentrations that are very low, whereas the
downstream monitoring site on the Kawarau River at Chards shows an enrichment of NH4-N (Figure
35).
At eight of the 11 monitoring sites, the very low concentrations typical of the sites, return too many
‘<DL’ (less than laboratory detection level) for a meaningful trend analysis to be carried out.
Figure 36: Boxplot summary of NH4-N concentrations at SoE monitoring sites throughout
Upper Clutha. The blue dashed line corresponds to the upland ANZECC NH4-N guideline of 0.010
mg/L.
Am
monia
cal N
itro
gen (
mg/L
)
Dar
t River
at T
he H
illoc
ks
Sho
tove
r River
at B
owen
s Pea
k
Mill C
reek
at F
ish
Trap
Kaw
arau
River
at C
hard
s
Mat
ukitu
ki R
iver
at W
est W
anak
a
Car
dron
a River
at M
t Bar
ker
Haw
ea R
iver
at C
amph
ill B
ridge
Cluth
a River
at L
ugga
te B
ridge
Lugg
ate
Cre
ek a
t SH6
Lind
is R
iver
at L
indis Pea
k
Lind
is R
iver
at A
rdgo
ur R
oad
0.00
0.01
0.02
0.03
0.04
0.05
0.06
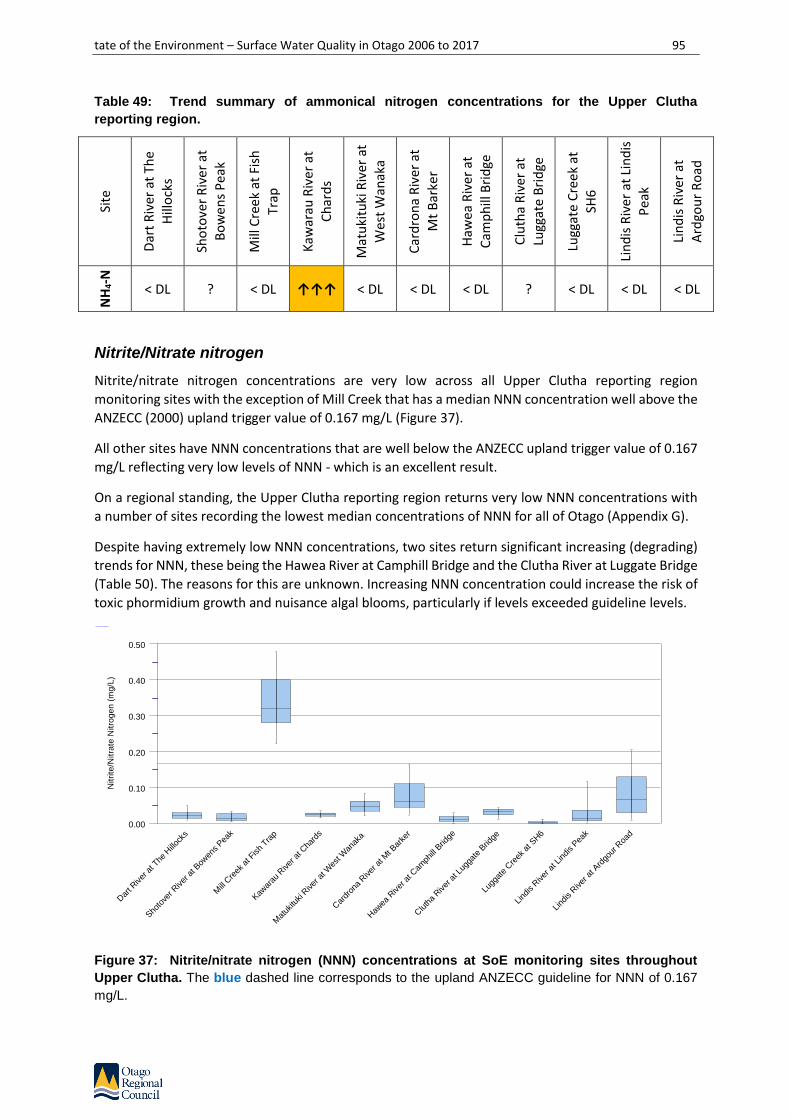
tate of the Environment – Surface Water Quality in Otago 2006 to 2017 95
Table 49: Trend summary of ammonical nitrogen concentrations for the Upper Clutha
reporting region. Si
te
Dar
t R
iver
at
The
Hill
ock
s
Sho
tove
r R
iver
at
Bo
wen
s P
eak
Mill
Cre
ek a
t Fi
sh
Trap
Kaw
arau
Riv
er a
t C
har
ds
Mat
uki
tuki
Riv
er a
t
We
st W
anak
a
Car
dro
na
Riv
er a
t
Mt
Bar
ker
Haw
ea
Riv
er a
t C
amp
hill
Bri
dge
Clu
tha
Riv
er a
t Lu
ggat
e B
rid
ge
Lugg
ate
Cre
ek
at
SH6
Lin
dis
Riv
er a
t Li
nd
is
Pea
k
Lin
dis
Riv
er a
t A
rdgo
ur
Ro
ad
NH
4-N
< DL ? < DL ↑↑↑ < DL < DL < DL ? < DL < DL < DL
Nitrite/Nitrate nitrogen
Nitrite/nitrate nitrogen concentrations are very low across all Upper Clutha reporting region
monitoring sites with the exception of Mill Creek that has a median NNN concentration well above the
ANZECC (2000) upland trigger value of 0.167 mg/L (Figure 37).
All other sites have NNN concentrations that are well below the ANZECC upland trigger value of 0.167
mg/L reflecting very low levels of NNN - which is an excellent result.
On a regional standing, the Upper Clutha reporting region returns very low NNN concentrations with
a number of sites recording the lowest median concentrations of NNN for all of Otago (Appendix G).
Despite having extremely low NNN concentrations, two sites return significant increasing (degrading)
trends for NNN, these being the Hawea River at Camphill Bridge and the Clutha River at Luggate Bridge
(Table 50). The reasons for this are unknown. Increasing NNN concentration could increase the risk of
toxic phormidium growth and nuisance algal blooms, particularly if levels exceeded guideline levels.
Figure 37: Nitrite/nitrate nitrogen (NNN) concentrations at SoE monitoring sites throughout
Upper Clutha. The blue dashed line corresponds to the upland ANZECC guideline for NNN of 0.167
mg/L.
Nitrite
/Nitra
te N
itro
ge
n (
mg
/L)
Dar
t River
at T
he H
illoc
ks
Sho
tove
r River
at B
owen
s Pea
k
Mill C
reek
at F
ish
Trap
Kaw
arau
River
at C
hard
s
Mat
ukitu
ki R
iver
at W
est W
anak
a
Car
dron
a River
at M
t Bar
ker
Haw
ea R
iver
at C
amph
ill B
ridge
Cluth
a River
at L
ugga
te B
ridge
Lugg
ate
Cre
ek a
t SH6
Lind
is R
iver
at L
indis Pea
k
Lind
is R
iver
at A
rdgo
ur R
oad
0.00
0.10
0.20
0.30
0.40
0.50

96 State of the Environment – Surface Water Quality in Otago 2006 to 2017
Table 50: Trend summary of nitrite/nitrate nitrogen (NNN) concentrations for the Upper Clutha
reporting region. Si
te
Dar
t R
iver
at
The
Hill
ock
s
Sho
tove
r R
iver
at
Bo
wen
s P
eak
Mill
Cre
ek a
t Fi
sh
Trap
Kaw
arau
Riv
er a
t
Ch
ard
s
Mat
uki
tuki
Riv
er a
t
We
st W
anak
a
Car
dro
na
Riv
er a
t
Mt
Bar
ker
Haw
ea
Riv
er a
t C
amp
hill
Bri
dge
Clu
tha
Riv
er a
t Lu
ggat
e B
rid
ge
Lugg
ate
Cre
ek
at
SH6
Lin
dis
Riv
er a
t Li
nd
is
Pea
k
Lin
dis
Riv
er a
t A
rdgo
ur
Ro
ad
NN
N
? ? ? ? ? ? ↑↑↑ ↑↑↑ < DL ? ?
Total Nitrogen
Total nitrogen concentrations (Figure 38) are slightly elevated compared to NNN concentrations
(Figure 37) and show a significant amount of the nitrogen pool to be present in the stream as organic
nitrogen. Organic nitrogen is not readily available for plant and algae growth but will be converted by
in-stream processes to inorganic, bio-available nitrogen at a later date.
Overall TN concentrations are very low across the Upper Clutha reporting region and are well below
the ANZECC upland trigger value of 0.295 mg/L; with the exception of Mill Creek that is well above this
threshold (Figure 38). On a regional scale, the Upper Clutha reporting region returns eight sites with
the lowest recorded median TN concentrations for Otago, reflecting the pristine nature of water
quality for the majority of sites monitored. In regards to trends, there is present two sites with
increasing (degrading) trends; these sites being the Kawarau at Chards and the Clutha at Luggate (Table
38). In the case of the Kawarau, the increasing trend in NH4-N that forms part of the TN pool may be
driving the increasing trend at this site. In the case of the Clutha River at Chards, the significant
increasing trend in NNN may be driving the increase in TN.
Figure 38: Boxplot summary of TN concentrations at SoE monitoring sites throughout Upper
Clutha. The blue dashed line corresponds to the upland ANZECC (2000) guideline for TN of 0.295
mg/L.
To
tal N
itro
ge
n (
mg
/L)
Dar
t River
at T
he H
illoc
ks
Sho
tove
r River
at B
owen
s Pea
k
Mill C
reek
at F
ish
Trap
Kaw
arau
River
at C
hard
s
Mat
ukitu
ki R
iver
at W
est W
anak
a
Car
dron
a River
at M
t Bar
ker
Haw
ea R
iver
at C
amph
ill B
ridge
Cluth
a River
at L
ugga
te B
ridge
Lugg
ate
Cre
ek a
t SH6
Lind
is R
iver
at L
indis Pea
k
Lind
is R
iver
at A
rdgo
ur R
oad
0.00
0.25
0.50
0.75
1.00
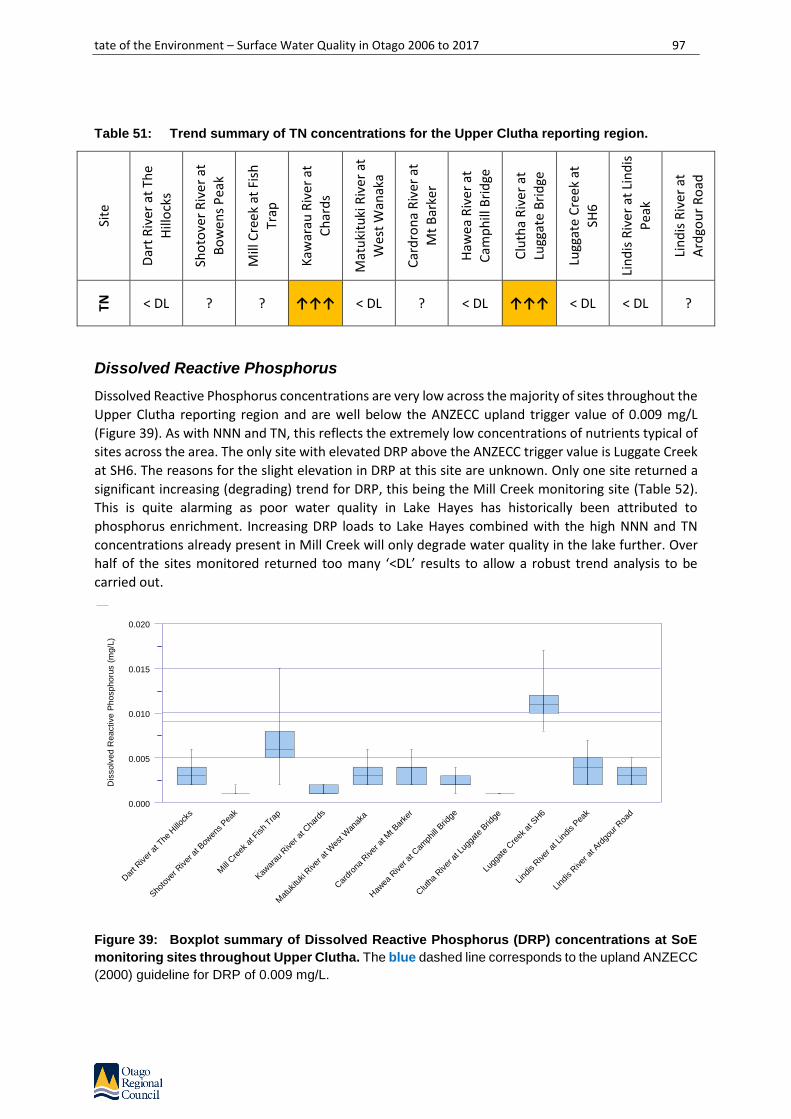
tate of the Environment – Surface Water Quality in Otago 2006 to 2017 97
Table 51: Trend summary of TN concentrations for the Upper Clutha reporting region.
Site
Dar
t R
iver
at
The
Hill
ock
s
Sho
tove
r R
iver
at
Bo
wen
s P
eak
Mill
Cre
ek a
t Fi
sh
Trap
Kaw
arau
Riv
er a
t
Ch
ard
s
Mat
uki
tuki
Riv
er a
t W
est
Wan
aka
Car
dro
na
Riv
er a
t
Mt
Bar
ker
Haw
ea
Riv
er a
t C
amp
hill
Bri
dge
Clu
tha
Riv
er a
t
Lugg
ate
Bri
dge
Lugg
ate
Cre
ek
at
SH6
Lin
dis
Riv
er a
t Li
nd
is
Pea
k
Lin
dis
Riv
er a
t A
rdgo
ur
Ro
ad
TN
< DL ? ? ↑↑↑ < DL ? < DL ↑↑↑ < DL < DL ?
Dissolved Reactive Phosphorus
Dissolved Reactive Phosphorus concentrations are very low across the majority of sites throughout the
Upper Clutha reporting region and are well below the ANZECC upland trigger value of 0.009 mg/L
(Figure 39). As with NNN and TN, this reflects the extremely low concentrations of nutrients typical of
sites across the area. The only site with elevated DRP above the ANZECC trigger value is Luggate Creek
at SH6. The reasons for the slight elevation in DRP at this site are unknown. Only one site returned a
significant increasing (degrading) trend for DRP, this being the Mill Creek monitoring site (Table 52).
This is quite alarming as poor water quality in Lake Hayes has historically been attributed to
phosphorus enrichment. Increasing DRP loads to Lake Hayes combined with the high NNN and TN
concentrations already present in Mill Creek will only degrade water quality in the lake further. Over
half of the sites monitored returned too many ‘<DL’ results to allow a robust trend analysis to be
carried out.
Figure 39: Boxplot summary of Dissolved Reactive Phosphorus (DRP) concentrations at SoE
monitoring sites throughout Upper Clutha. The blue dashed line corresponds to the upland ANZECC
(2000) guideline for DRP of 0.009 mg/L.
Dis
so
lve
d R
ea
ctive
Ph
osp
ho
rus (
mg
/L)
Dar
t River
at T
he H
illoc
ks
Sho
tove
r River
at B
owen
s Pea
k
Mill C
reek
at F
ish
Trap
Kaw
arau
River
at C
hard
s
Mat
ukitu
ki R
iver
at W
est W
anak
a
Car
dron
a River
at M
t Bar
ker
Haw
ea R
iver
at C
amph
ill B
ridge
Cluth
a River
at L
ugga
te B
ridge
Lugg
ate
Cre
ek a
t SH6
Lind
is R
iver
at L
indis Pea
k
Lind
is R
iver
at A
rdgo
ur R
oad
0.000
0.005
0.010
0.015
0.020

98 State of the Environment – Surface Water Quality in Otago 2006 to 2017
Table 52: Trend summary of Dissolved Reactive Phosphorus concentrations for the Upper
Clutha reporting region.
Site
Dar
t R
iver
at
The
Hill
ock
s
Sho
tove
r R
iver
at
Bo
wen
s P
eak
Mill
Cre
ek a
t Fi
sh
Trap
Kaw
arau
Riv
er a
t C
har
ds
Mat
uki
tuki
Riv
er a
t
We
st W
anak
a
Car
dro
na
Riv
er a
t
Mt
Bar
ker
Haw
ea
Riv
er a
t
Cam
ph
ill B
rid
ge
Clu
tha
Riv
er a
t Lu
ggat
e B
rid
ge
Lugg
ate
Cre
ek
at
SH6
Lin
dis
Riv
er a
t Li
nd
is
Pea
k
Lin
dis
Riv
er a
t A
rdgo
ur
Ro
ad
DR
P
< DL ? ↑↑↑ ? < DL < DL < DL ? ? < DL < DL
Total Phosphorus
Patterns in TP concentrations across the Upper Clutha reporting region (Figure 40) are quite different
to those of DRP, with a number of rivers with glaciers in their upper catchment resulting in high
sediment load from glacial flour, such as the Dart and Shotover rivers. These sites return extremely
high TP concentrations at times due to the high sediment loads and associated phosphorus that is
bound to these naturally derived sediments. This can be regarded as an anomaly and one that is a
natural process. The Kawarau River at Chards site is downstream of the Shotover and is influenced by
the elevated sediment load discharged from the Shotover during winter snow melt and high flow
events.
TP trend analysis (Table 53) returned a significant decreasing (improving) trend for the Dart River. A
probable increasing (degrading) trend is present for the Luggate Creek. All other trends are
indeterminate with the exception of one ‘<DL’.
Figure 40: Boxplot summary of TP concentrations at SoE monitoring sites throughout Upper
Clutha. The blue dashed line corresponds to the upland ANZECC (2000) guideline for TP of 0.026
mg/L.
To
tal P
ho
sp
ho
rus (
mg
/L)
Dar
t River
at T
he H
illoc
ks
Sho
tove
r River
at B
owen
s Pea
k
Mill C
reek
at F
ish
Trap
Kaw
arau
River
at C
hard
s
Mat
ukitu
ki R
iver
at W
est W
anak
a
Car
dron
a River
at M
t Bar
ker
Haw
ea R
iver
at C
amph
ill B
ridge
Cluth
a River
at L
ugga
te B
ridge
Lugg
ate
Cre
ek a
t SH6
Lind
is R
iver
at L
indis Pea
k
Lind
is R
iver
at A
rdgo
ur R
oad
0.00
0.05
0.10
0.15
0.20
0.25
0.30

tate of the Environment – Surface Water Quality in Otago 2006 to 2017 99
Table 53: Trend summary of TP concentrations for the Upper Clutha reporting region. Si
te
Dar
t R
iver
at
The
Hill
ock
s
Sho
tove
r R
iver
at
Bo
wen
s P
eak
Mill
Cre
ek a
t Fi
sh
Trap
Kaw
arau
Riv
er a
t C
har
ds
Mat
uki
tuki
Riv
er a
t W
est
Wan
aka
Car
dro
na
Riv
er a
t
Mt
Bar
ker
Haw
ea
Riv
er a
t C
amp
hill
Bri
dge
Clu
tha
Riv
er a
t
Lugg
ate
Bri
dge
Lugg
ate
Cre
ek
at
SH6
Lin
dis
Riv
er a
t Li
nd
is
Pea
k
Lin
dis
Riv
er a
t A
rdgo
ur
Ro
ad
TP
↓↓↓ ? ? ? ? ? < DL ? ↑↑ ? ?
Escherichia coli
Figure 41 shows E. coli concentrations for all SoE monitoring sites across the Upper Clutha reporting
region. All sites have median and 75th percentile (upper bound of boxplots) concentrations well below
the amber alert level of 260 CFU/100ml; the exception is Mill Creek that has a 75th percentile that
exceeds the amber alert level of 260 CFU/100ml but remains below the red alert level of
550 CFU/100ml. This shows E. coli levels across all sites except Mill Creek to be low and of good quality.
Trend analysis returns some concerning results with four of 11 sites having a significant or probable
increasing (degrading) trend for E. coli. These sites include the Dart, Shotover, Kawarau and Cardrona
rivers; all sites that typically return very low concentrations of E. coli and have good bacterial water
quality. All other trends are indeterminate, with the exception of one ‘<DL’ for the Hawea River at
Camphill Bridge.
Figure 41: Boxplot summary of E coli concentrations at SoE monitoring sites throughout Upper
Clutha. The amber line corresponds to the amber alert level of 260 CFU/100ml; the red line to the red
alert level of 550 CFU/100ml.
Esch
erich
ia c
oli
(CF
U/1
00
ml)
Dar
t River
at T
he H
illoc
ks
Sho
tove
r River
at B
owen
s Pea
k
Mill C
reek
at F
ish
Trap
Kaw
arau
River
at C
hard
s
Mat
ukitu
ki R
iver
at W
est W
anak
a
Car
dron
a River
at M
t Bar
ker
Haw
ea R
iver
at C
amph
ill B
ridge
Cluth
a River
at L
ugga
te B
ridge
Lugg
ate
Cre
ek a
t SH6
Lind
is R
iver
at L
indis Pea
k
Lind
is R
iver
at A
rdgo
ur R
oad
0
250
500
750
1000
1250

100 State of the Environment – Surface Water Quality in Otago 2006 to 2017
Table 54: Trend summary of Escerichia coli concentrations for the Upper Clutha reporting
region.
Site
Dar
t R
iver
at
The
Hill
ock
s
Sho
tove
r R
iver
at
Bo
wen
s P
eak
Mill
Cre
ek a
t Fi
sh
Trap
Kaw
arau
Riv
er a
t C
har
ds
Mat
uki
tuki
Riv
er a
t W
est
Wan
aka
Car
dro
na
Riv
er a
t
Mt
Bar
ker
Haw
ea
Riv
er a
t C
amp
hill
Bri
dge
Clu
tha
Riv
er a
t
Lugg
ate
Bri
dge
Lugg
ate
Cre
ek
at
SH6
Lin
dis
Riv
er a
t Li
nd
is
Pea
k
Lin
dis
Riv
er a
t A
rdgo
ur
Ro
ad
E. c
oli
↑↑↑ ↑↑ ? ↑↑↑ ? ↑↑ < DL ? ? ? ?
Turbidity
Turbidity levels for SoE monitoring sites across the Upper Clutha reporting region, with the exception
of sites affected by high sediment loads from glacial flour, are typically low (Figure 42) with nine of the
11 sites monitored having median turbidity levels that are well below the ANZECC upland guideline
trigger level of 4.1 NTU. The exceptions to this are the Dart and Shotover Rivers that return some
exceptionally high turbidity levels at times of high flow (Appendix G).
Trend analysis (Table 55) shows a high number of sites to have significant and probable increasing
(degrading) trends for turbidity, these being the Shotover River, Mill Creek, Kawarau River, Matukituki
River, Hawea River and Luggate Creek. The catchments of these monitoring sites are very diverse with
little commonality to explain the drivers of the increasing trends.
Figure 42: Boxplot summary of Turbidity at SoE monitoring sites throughout Upper Clutha. The
blue dashed line corresponds to the upland ANZECC (2000) guideline for Turbidity of 4.1 NTU.
Tu
rbid
ity (
NT
U)
Dar
t River
at T
he H
illoc
ks
Sho
tove
r River
at B
owen
s Pea
k
Mill C
reek
at F
ish
Trap
Kaw
arau
River
at C
hard
s
Mat
ukitu
ki R
iver
at W
est W
anak
a
Car
dron
a River
at M
t Bar
ker
Haw
ea R
iver
at C
amph
ill B
ridge
Cluth
a River
at L
ugga
te B
ridge
Lugg
ate
Cre
ek a
t SH6
Lind
is R
iver
at L
indis Pea
k
Lind
is R
iver
at A
rdgo
ur R
oad
0
10
20
30
40
50
60
70
80
90
100
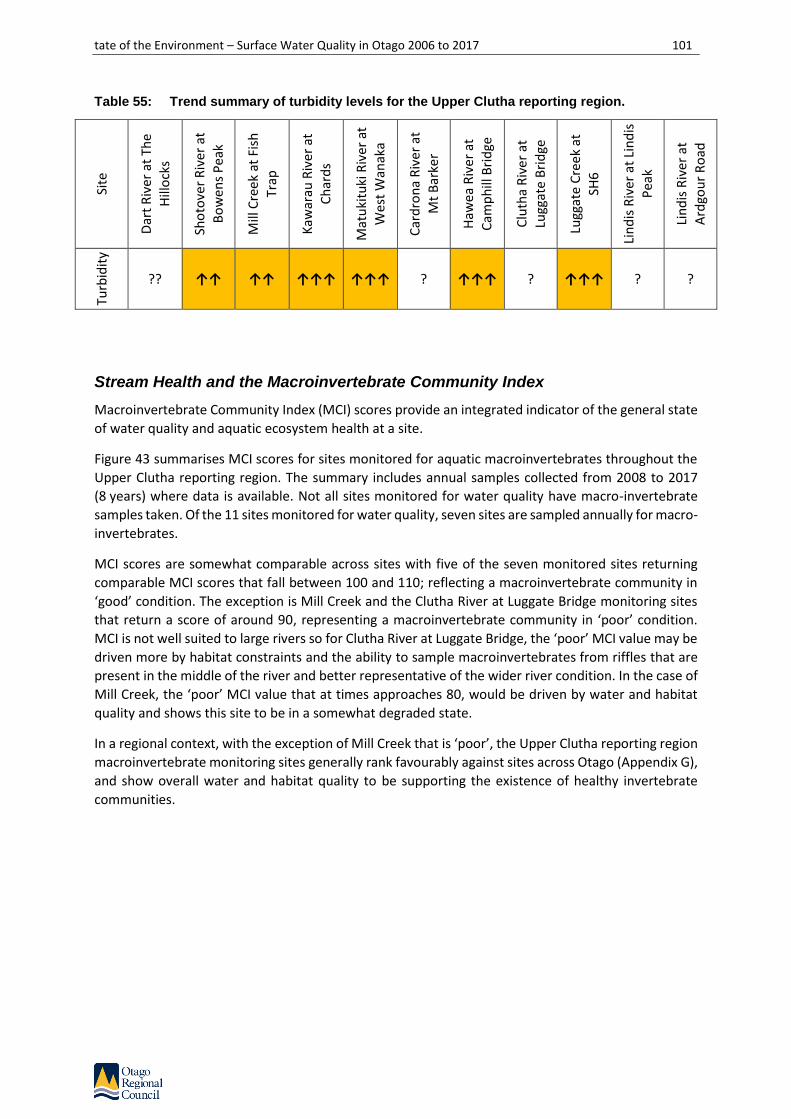
tate of the Environment – Surface Water Quality in Otago 2006 to 2017 101
Table 55: Trend summary of turbidity levels for the Upper Clutha reporting region. Si
te
Dar
t R
iver
at
The
Hill
ock
s
Sho
tove
r R
iver
at
Bo
wen
s P
eak
Mill
Cre
ek a
t Fi
sh
Trap
Kaw
arau
Riv
er a
t
Ch
ard
s
Mat
uki
tuki
Riv
er a
t
We
st W
anak
a
Car
dro
na
Riv
er a
t
Mt
Bar
ker
Haw
ea
Riv
er a
t C
amp
hill
Bri
dge
Clu
tha
Riv
er a
t
Lugg
ate
Bri
dge
Lugg
ate
Cre
ek
at
SH6
Lin
dis
Riv
er a
t Li
nd
is
Pea
k
Lin
dis
Riv
er a
t
Ard
gou
r R
oad
Turb
idit
y
?? ↑↑ ↑↑ ↑↑↑ ↑↑↑ ? ↑↑↑ ? ↑↑↑ ? ?
Stream Health and the Macroinvertebrate Community Index
Macroinvertebrate Community Index (MCI) scores provide an integrated indicator of the general state
of water quality and aquatic ecosystem health at a site.
Figure 43 summarises MCI scores for sites monitored for aquatic macroinvertebrates throughout the
Upper Clutha reporting region. The summary includes annual samples collected from 2008 to 2017
(8 years) where data is available. Not all sites monitored for water quality have macro-invertebrate
samples taken. Of the 11 sites monitored for water quality, seven sites are sampled annually for macro-
invertebrates.
MCI scores are somewhat comparable across sites with five of the seven monitored sites returning
comparable MCI scores that fall between 100 and 110; reflecting a macroinvertebrate community in
‘good’ condition. The exception is Mill Creek and the Clutha River at Luggate Bridge monitoring sites
that return a score of around 90, representing a macroinvertebrate community in ‘poor’ condition.
MCI is not well suited to large rivers so for Clutha River at Luggate Bridge, the ‘poor’ MCI value may be
driven more by habitat constraints and the ability to sample macroinvertebrates from riffles that are
present in the middle of the river and better representative of the wider river condition. In the case of
Mill Creek, the ‘poor’ MCI value that at times approaches 80, would be driven by water and habitat
quality and shows this site to be in a somewhat degraded state.
In a regional context, with the exception of Mill Creek that is ‘poor’, the Upper Clutha reporting region
macroinvertebrate monitoring sites generally rank favourably against sites across Otago (Appendix G),
and show overall water and habitat quality to be supporting the existence of healthy invertebrate
communities.

102 State of the Environment – Surface Water Quality in Otago 2006 to 2017
Figure 43: Boxplot summary of Macroinvertebrate Community Index (MCI) scores at SoE
monitoring sites throughout North Otago where macroinvertebrate samples are routinely
collected. Above the blue line corresponds to the ‘Excellent’ quality threshold; between the orange and
blue line the ‘Good’ quality threshold; betwene the red and orange line ‘Poor’ quality threshold; below
the red line the ‘Degraded’ threshold.
Upper Clutha Water Quality Summary
Across the Upper Clutha reporting region there are a moderate number of sites with degrading water
quality trends, as shown in Table 56, which summarises trend results across all sites. There are a total
of 77 results reported in the table; 22% return significant or probable degrading trends; and 1% return
significant or probable improving trends. Overall 77% of sites have either indeterminate trends
(reported as “?”); or too many observations being ‘less than detect’ (<DL) for results returned from the
laboratory.
Turbidity is the worst performing indicator with six of 11 sites returning a degrading trend. The reasons
for this are unclear as ORC do not collect any information on changes in land use or land management
practices that would allow for confident assessment of drivers of increased turbidity and sediment in
our waterways.
Despite relatively good bacterial water quality throughout the reporting region, E. coli is the second
worst performing variable with four of 11 sites having increasing (degrading) trends. Again the reasons
for this are unclear, particularly given the disparity between sites with degrading turbidity and E. coli
trends with an increase in one possibly correlating with an increase in the other as sediment and E. coli
follow similar flow paths to streams and rivers. Only two sites have a degrading trend in both; the
Shotover at Bowens and the Kawarau at Chards. As discussed earlier with NH4-N and the Kawarau River
monitoring site, there is a chance that Project Shotover is influencing E. coli levels downstream in the
Kawarau River. Either way, for the four sites with degrading E. coli trends, the actual E. coli levels
instream are very low and well below any alert levels that would impact on contact recreation value.
As stated previously, having accurate information on changes in land use and land management
practice would help in identifying drivers of change evident with some water quality variables.
MC
I
Sho
tove
r River
at B
owen
s Pea
k
Mill C
reek
at F
ish
Trap
Kaw
arau
River
at C
hard
s
Car
dron
a River
at M
t Bar
ker
Cluth
a River
at L
ugga
te B
ridge
Lugg
ate
Cre
ek a
t SH6
Lind
is R
iver
at A
rdgo
ur R
oad
70
80
90
100
110
120
130

tate of the Environment – Surface Water Quality in Otago 2006 to 2017 103
In summary:
• For the majority of sites across the Upper Clutha reporting region, water quality is excellent
and the best in Otago;
• Bacterial water quality is excellent across all sites, with the exception of Mill Creek;
• Mill Creek has elevated NNN and TN, as well as significant increasing trends in DRP; has
elevated background E. coli concentrations that fail the national bottom line; and a
macroinvertebrate community in ‘poor’ condition reflecting an overall degraded state in
regards to water quality;
• The Kawarau River at Chards appears to be influenced by slight ammonia enrichment coming
from the Project Shotover WWTP;
• The Cardrona River shows some enrichment of NNN in the lower reaches, likely linked to
slightly enirched groundwater contributing to surface flows in the lower reaches. The
enrichment of groundwater with nitrogen comes from more intensive land-use asociated with
irrigation in the lower Cardrona. These areas leach higher amounts of N than low-intensity,
non-irrigated land.
As has been previously reported (Ozanne, 2012), water quality in rivers across Otago show a clear
spatial pattern related to land cover. Water quality is best at river and stream reaches located at high
or mountainous elevations under predominantly native cover. These sites tend to be associated with
the upper catchments of larger rivers (e.g. Clutha River/Matau‐Au, Taieri River and Lindis River) and
the outlets from large lakes (e.g. Hawea, Wakatipu and Wanaka).
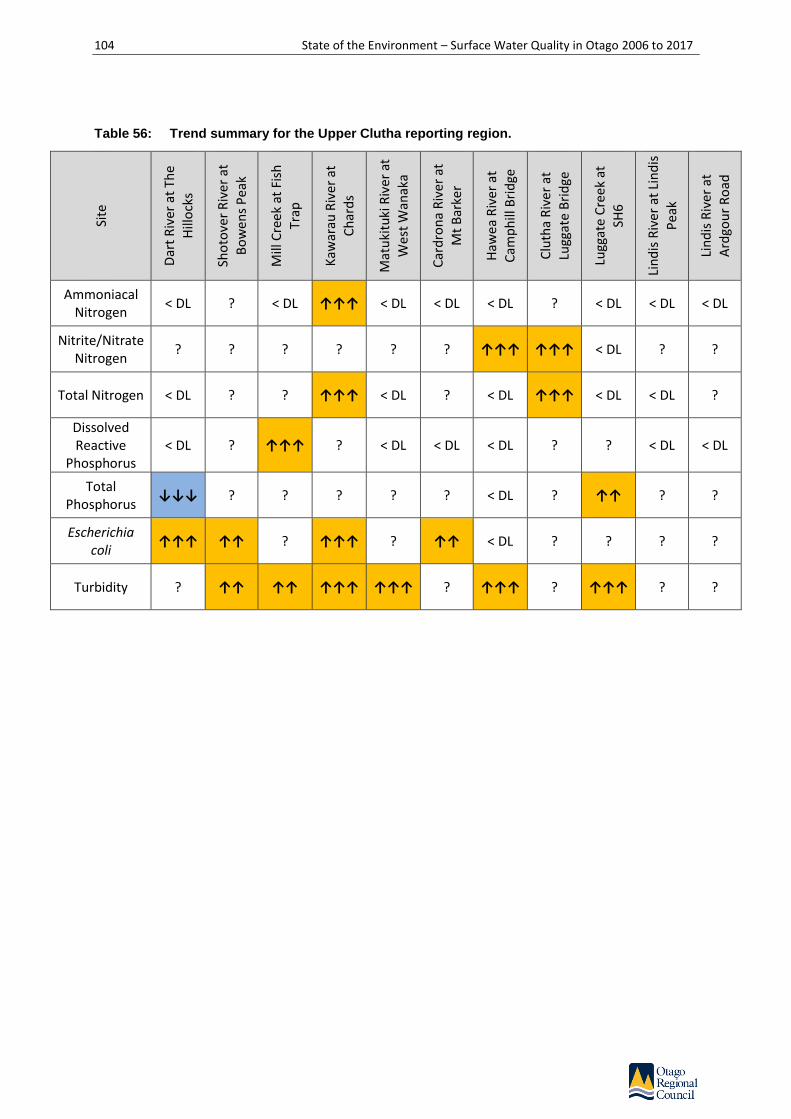
104 State of the Environment – Surface Water Quality in Otago 2006 to 2017
Table 56: Trend summary for the Upper Clutha reporting region.
Site
Dar
t R
iver
at
The
Hill
ock
s
Sho
tove
r R
iver
at
Bo
wen
s P
eak
Mill
Cre
ek a
t Fi
sh
Trap
Kaw
arau
Riv
er a
t
Ch
ard
s
Mat
uki
tuki
Riv
er a
t
We
st W
anak
a
Car
dro
na
Riv
er a
t
Mt
Bar
ker
Haw
ea
Riv
er a
t C
amp
hill
Bri
dge
Clu
tha
Riv
er a
t
Lugg
ate
Bri
dge
Lugg
ate
Cre
ek
at
SH6
Lin
dis
Riv
er a
t Li
nd
is
Pea
k
Lin
dis
Riv
er a
t A
rdgo
ur
Ro
ad
Ammoniacal Nitrogen
< DL ? < DL ↑↑↑ < DL < DL < DL ? < DL < DL < DL
Nitrite/Nitrate Nitrogen
? ? ? ? ? ? ↑↑↑ ↑↑↑ < DL ? ?
Total Nitrogen < DL ? ? ↑↑↑ < DL ? < DL ↑↑↑ < DL < DL ?
Dissolved Reactive
Phosphorus < DL ? ↑↑↑ ? < DL < DL < DL ? ? < DL < DL
Total Phosphorus
↓↓↓ ? ? ? ? ? < DL ? ↑↑ ? ?
Escherichia coli
↑↑↑ ↑↑ ? ↑↑↑ ? ↑↑ < DL ? ? ? ?
Turbidity ? ↑↑ ↑↑ ↑↑↑ ↑↑↑ ? ↑↑↑ ? ↑↑↑ ? ?

tate of the Environment – Surface Water Quality in Otago 2006 to 2017 105
2.5. Middle Clutha / Central Otago
The Middle Clutha reporting region runs from the outflow of Lake Dunstan at the township of Clyde,
downstream to the small settlement of Beaumont, where State Highway 8 crosses the Clutha River /
Mata-Au. The Middle Clutha reporting region includes the catchments of the Fraser River (327 km2),
the Manuherikia River (3033 km2; the largest tributary by catchment area of the Clutha River Mata-
Au), the Teviot River (332 km2) and the Benger Burn (131 km2). The Middle Clutha reporting region, in
contrast to the Upper Clutha reporting region, is dominated by rivers and streams with relatively broad
valleys dissected by rolling, block mountains ranging from 1000 m to 1600 m above sea level (LAWA).
The Manuherikia River is the largest catchment of the Middle Clutha reporting region covering over
94% of the reporting region’s catchment area. The Manuherikia River flows for approximately 64 km
and has a catchment area of 3033 km2. The catchment includes two major depressions, the
Manuherikia Valley and the Ida Valley. These are connected by the Pool Burn Gorge. The Manuherikia
catchment is one of the driest in New Zealand, and irrigation water is in high demand (Kitto, 2011).
The river’s headwaters originate in the Hawkdun and Saint Bathans Ranges and Dunstan Mountains,
before flowing in a south-west direction to join the Clutha River at the township of Alexandra. The
climate of the Manuherikia catchment is considered to be the most continental type in the country
and is characterised by cold winters and warm dry summers. The Manuherikia valley floor is classified
as semi-arid as it receives between 350 mm and 500 mm rainfall (Olsen et al., 2016).
2.5.1. Middle Clutha / Central Otago geographical and land cover characteristics
Table 57 summarises characteristics of the Middle Clutha reporting region based on the River
Environment Classification (refer Appendix F for a detailed overview of the REC); land-cover (based on
the Land Cover Database Version 4; condensed with the approach summarised in Appendix D); and
the Land Use Capability (LUC) classes (see Section 2.0 for the LUC definition). The Middle Clutha
reporting region covers an area of 3214 km2 representing approximately 15% of the total Clutha
River/Mata-Au catchment.
According to the River Environment Classification (REC), rivers and streams of the Middle Clutha
reporting region are dominated by cool-dry/hill (69.3%) and cool-dry/low elevation (20.1%) rivers that
receive very low rainfall (less than 500mm annual average rainfall).
The predominant land cover throughout the Middle Clutha reporting region is low producing grassland
(43%, 1382 km2) followed by near-equal parts of high producing grassland (27%, 868 km2) and native
cover (23%, 739 km2). ‘Low producing grassland’ includes “exotic and indigenous grasslands, grazed
for wool, sheep or beef. Usually found on steep hill country” (Table 57, Appendix D). Orchards are
prevalent along the river terraces of the Clutha River/Mata-Au in the vicinity or Earnscleugh,
Roxhburgh and Ettrick (Figure 44).
There is an interesting mix of LUC class land through the Middle Clutha reporting region, dominated
largely by land characteristics of the Manuherikia catchment and the ranges to the east and west of
Roxburgh. Areas of relatively flat, rolling LUC Class 3 and 4 land (20%, 643 km2) exists through the
Manuherikia and Ida Valleys. These areas are where the majority of irrigation occurs through the
Middle Clutha reporting region. This contrasts with steeper LUC Class 6 and 7 land (77%, 2484 km2)
that is typical of the ranges bordering the Clutha River/Mata-Au around Roxburgh and the ranges
encircling the Manuherikia catchment.
The Manuherikia River catchment, the largest of the Middle Clutha reporting region at over 94% of the
reporting region land area, has a dominant land-use of agriculture, with pasture grasslands dominating

106 State of the Environment – Surface Water Quality in Otago 2006 to 2017
the catchment (Figure 44). The level of production (agricultural intensity) is largely dependent on the
availability of water for irrigation, with high producing pastures mainly found at lower elevations in the
Manuherikia and Ida Valleys where irrigation predominates (Olsen et al., 2016).
The original vegetation of the Manuherikia catchment can still be seen in many of the headwater
tributaries and in parts above Falls Dam where tussock grassland dominates the river and creek
terraces with snow tussock occupying the higher mountain faces. There has been a relatively small
amount of land use change in the Manuherikia catchment over the period 1996-2012, with the
majority of this change being the conversion of low producing grassland to high producing exotic
grassland (68 ha) and harvest of exotic forest (44 ha), of which almost half was converted to high
producing exotic grassland (18 ha) (Olsen et al., 2016).
Table 57: Zone characteristics of the Middle Clutha / Central Otago reporting region. Land
cover area and land-use capability.
Source of flow (REC) Land Cover Area (LCDB4) Land-use Capability
Class (LUC)
Cool-Dry / Hill 69.3%
Cool-Dry/Low-Elevation
20.1%
Cool-Dry/Lake 1.3%
Cool-Dry/ Mountain 2.3%
Cool-Wet/ Hill 1.3%
Cool-Wet/Lake 1.7%
Cool-Wet/ Mountain 4.3%
Cropping 0.4%
High producing grassland 26.6%
Low Producing Grassland 42.9%
Native Cover 23.3%
Orchards/Vineyards 1.0%
Plantation forestry 1.8%
Unaccounted 3.5%
Urban areas 0.4%
Class 2 0.1%
Class 3 6.9%
Class 4 13.1%
Class 5 0.01%
Class 6 41.4%
Class 7 35.9%
Class 8 1.8%
Lake 0.4%
River 0.5%
Town 0.1%
The Middle Clutha / Central Otago Reporting Region covers 321 416 hectares

tate of the Environment – Surface Water Quality in Otago 2006 to 2017 107
Figure 44: Map showing broad land cover categories of the Middle Clutha / Central Otago
reporting region based on the LCDB4 databse.

108 State of the Environment – Surface Water Quality in Otago 2006 to 2017
2.5.2. Middle Clutha / Central Otago water quality
The following section provides a summary of the Middle Clutha reporting region water quality based
on:
• Compliance against Schedule 15 (Water Plan) water quality limits;
• National Policy Statement for Freshwater Management (NPSFM 2014) National Objectives
Framework Attribute bands (NOF bands);
• Summary boxplots of key water quality indicators with the inclusion of general water quality
guidelines such as ANZECC (2000);
• A summary of trends (degrading/improving) that may (or may not) be evident in the data.
There are a total 7 SoE monitoring sites throughout the Middle Clutha reporting zone with a good
spread of sites across main-stem river and tributary stream sites from the upper to lower catchment.
NIWA currently monitors one site, being the Clutha River at Millers Flat.
Schedule 15 compliance
Table 58 summarises compliance for SoE monitoring sites throughout the Middle Clutha reporting
region with Schedule 15 (Water Plan) limits. For this section, all ‘80th percentile concentrations’ are
calculated from data collected when flows at the relevant flow reference site are below median flow.
All SoE monitoring sites in the Middle Clutha reporting region fall in Receiving Water Group (RWG) 2
(refer Figure 1 for RWG boundaries).
Three of the 7 Middle Clutha monitoring sites are fully compliant with the Schedule 15 (Water Plan)
limits, these sites being Dunstan Creek, Fraser River and the Clutha River at Millers Flat. Of the seven
sites, Thomsons Creek has the worst level of compliance, with exceedances for NNN (over two times
the limit of 0.075 mg/L); very high exceedances for DRP (over seven times the limit of 0.010 mg/L); and
very high exceedances for E. coli (over four times the limit of 260 CFU/100ml). Compliance wise, Benger
Burn is a close second, with similar exceedances for NNN, DRP and E. coli (Table 58).
All sites are compliant with respect to the Water Plan NH4-N limit of 0.100 mg/L. Overall, compliance
is generally excellent for NNN, with the exception of Thomsons Creek and Benger Burn (Table 58).
DRP is the worst performing water quality variable with respect to Schedule 15 limits, with four of the
seven sites exceeding the 80th percentile limit of 0.010 mg/L (Table 58).

tate of the Environment – Surface Water Quality in Otago 2006 to 2017 109
Table 58: 80th percentile values for water quality variables identified in Schedule 15. Values
are calculated from samples taken when flows are below median flow. The orange cells show where the
80th percentile exceeds the Schedule 15 limit.
Variable NNN NH4-N DRP E. coli Turbidity
Schedule 15 limit when flows < median flow 0.075 mg/L 0.100 mg/L 0.010 mg/L 260 CFU 5.00 NTU
SoE reporting name
Dunstan Creek at Beattie Road 0.052 0.008 0.005 82 0.93
Manuherikia River at Ophir 0.067 0.019 0.037 320 3.70
Thomsons Creek at SH85 0.178 0.024 0.077 1100 5.60
Manuherikia River at Galloway 0.025 0.010 0.018 170 2.80
Benger Burn at SH8 0.200 0.014 0.024 960 2.10
Fraser River at Marshall Road 0.048 0.005 0.004 44 1.11
Clutha River at Millers Flat 0.040 0.004 0.001 18 2.32
Nitrate and ammonia toxicity and NOF compliance
NOF attribute bands for nitrate (measured as NNN) and NH4-N toxicity (Table 59 and Table 60
respectively) show excellent protection levels against toxicity risk for all Middle Clutha monitoring sites
with all sites returning an ‘A’ band (highest level of protection) for NNN and all sites returning an ‘A’
band for NH4-N; with the exception of Thomsons Creek that returns a ‘B’ band for the maximum
recorded concentration of NH4-N.
The elevated maximum concentrations for NH4-N for Thomsons Creek push this site up into the B-band
by marginally exceeding the upper maximum concentration threshold of 0.05 mg/L for the A- band.
The ‘B’ band still provides for a good level of protection against ammonia toxicity but ‘starts impacting
occasionally on the 5% most sensitive species’ (Appendix B). Some species of freshwater mollusc can
be sensitive to ammonia toxicity.
Table 59: NOF compliance summary for Nitrate (estimated from NNN). Included are median and
95th percentile values for the the period July 2012 to June 2017 and the corresponding NOF attribute
band.
Variable Nitrate as NNN NOF Band
SoE reporting name Median (mg/L)
95th Percentile
(mg/L) Median 95th
Percentile
Dunstan Creek at Beattie Road 0.041 0.136 A A
Manuherikia River at Ophir 0.053 0.190 A A
Thomsons Creek at SH85 0.132 0.421 A A
Manuherikia River at Galloway 0.030 0.175 A A
Benger Burn at SH8 0.276 1.057 A A
Fraser River at Marshall Road 0.026 0.043 A A
Clutha River at Millers Flat 0.028 0.057 A A

110 State of the Environment – Surface Water Quality in Otago 2006 to 2017
Table 60: NOF compliance summary for NH4-N. Included are median and maximum values for the
the period July 2012 to June 2017 and the corresponding NOF attribute band.
Variable Ammoniacal nitrogen
(unadjusted) NOF Band
SoE reporting name Median (mg/L)
Maximum (mg/L) Median Maximum
Dunstan Creek at Beattie Road 0.006 0.024 A A
Manuherikia River at Ophir 0.009 0.037 A A
Thomsons Creek at SH85 0.009 0.055 A B
Manuherikia River at Galloway 0.006 0.020 A A
Benger Burn at SH8 0.010 0.023 A A
Fraser River at Marshall Road 0.004 0.009 A A
Clutha River at Millers Flat 0.003 0.008 A A
E. coli, swimmability and NOF compliance
Table 61 summarises compliance for E. coli against the four statistical tests of the NOF E. coli attribute.
Compliance is moderate across the Middle Clutha reporting district with four of the seven sites
returning bacterial water quality that is acceptable to the recently amended NPSFM (2014). Two sites,
Dunstan Creek and the Clutha River at Millers Flat have excellent bacterial water quality with an ‘A’
band for the four statistical tests.
Three sites fail the national bottom line including the Manuherikia at Ophir, Thomsons Creek and the
Benger Burn. Thomsons Creek is the worst performing site with three of the four statistical tests
returning a highly degraded ‘E’ band. The remaining statistical test returns a ‘D’ band that still exceeds
the national bottom line. The Benger Burn returns a ‘D’ band for all tests and therefore fails the
national bottom line. Both Thomsons Creek and the Benger Burn would have limited recreational value
given the small size and relative inaccessibility of the streams. However both are 4th order streams and
therefore the NOF E. coli attribute limits apply.
In the case of the Manuherikia at Ophir, the high background E. coli concentrations represented by a
high ‘median’ value push this site from an acceptable ‘C’ band to an unacceptable ‘D’ band. The
Manuherikia River at Ophir is an important river with high primary contact recreation value. The failure
of this site in relation to the NOF E. coli attribute is disappointing, and warrants further work to
determine the source of bacteria. The monitoring site is in the immediate vicinity of both the outflow
of the bacteria enriched Thomsons Creek and Omakau Waste Water Treatment Plant that discharges
treated sewage direct to the Manuherikia River. Both of these sources are significant contributors of
bacteria to the Manuherikia River and could be leading to the elevated background concentrations of
E. coli.
The overall attribute state is based on the worst grading with the national bottom line being an orange
“D” band; all sites must return a minimum of a “C” band.

tate of the Environment – Surface Water Quality in Otago 2006 to 2017 111
Table 61: NOF compliance summary for E. coli for the the period July 2012 to June 2017. The
overall grading band is determined by the lowest (worst) ranked Numeric Attribute State as it relates to
the four separate states.
Numeric Attribute State Overall attribute
state
Site
Median grade
(CFU/100ml)
95th percentile
grade (CFU/100ml
)
% over 260
CFU/100ml grade (%)
% over 540
CFU/100ml grade (%)
Grading attribute
state
Overall Pass/Fai
l
Dunstan Creek at Beattie Road
A (27) A (392) A (5%) A (3%) A PASS
Manuherikia River at Ophir
A (96) C (1194) B (26%) C (12%) C PASS
Thomsons Creek at SH85
E (310) D (1705) E (51%) E (33%) E FAIL
Manuherikia River at Galloway
A (44) B (770) A (13%) B (8%) B PASS
Benger Burn at SH8
D (175) D (7450) D (38%) D (23%) D FAIL
Fraser River at Marshall Road
A (18) B (736) A (7%) B (6%) B PASS
Clutha River at Millers Flat
A (12) A (61) A (0%) A (0%) A PASS
Ammoniacal nitrogen
Of the sites included in the Middle Clutha reporting region, Dunstan Creek, Thomsons Creek and the
Manuherikia at Ophir are classed as ‘Upland’ sites according to the ANZECC (2000) altitude cut-off
of 150 m. The remaining sites are classed as ‘lowland’ sites.
Generally sites throughout the Manuherikia, being Dunstan, Thomsons and the two mainstem
Manuherikia monitoring sites, show a slight elevation of NH4-N above background concentrations. Of
the three upland sites, only the median concentration of NH4-N for the Manuherikia at Ophir exceeds
the ANZECC upland trigger value. However this site is only slightly elevated above the threshold. All
remaining sites have median concentrations below the ANZECC trigger values, with the Fraser and
Clutha river sites having concentrations at near natural background levels.
At five of the seven monitoring sites, the very low concentrations typical of the sites return too many
‘<DL’ (less than laboratory detection level) results for a meaningful trend analysis to be carried out.
The two remaining sites return an indeterminate trend result (Table 62).
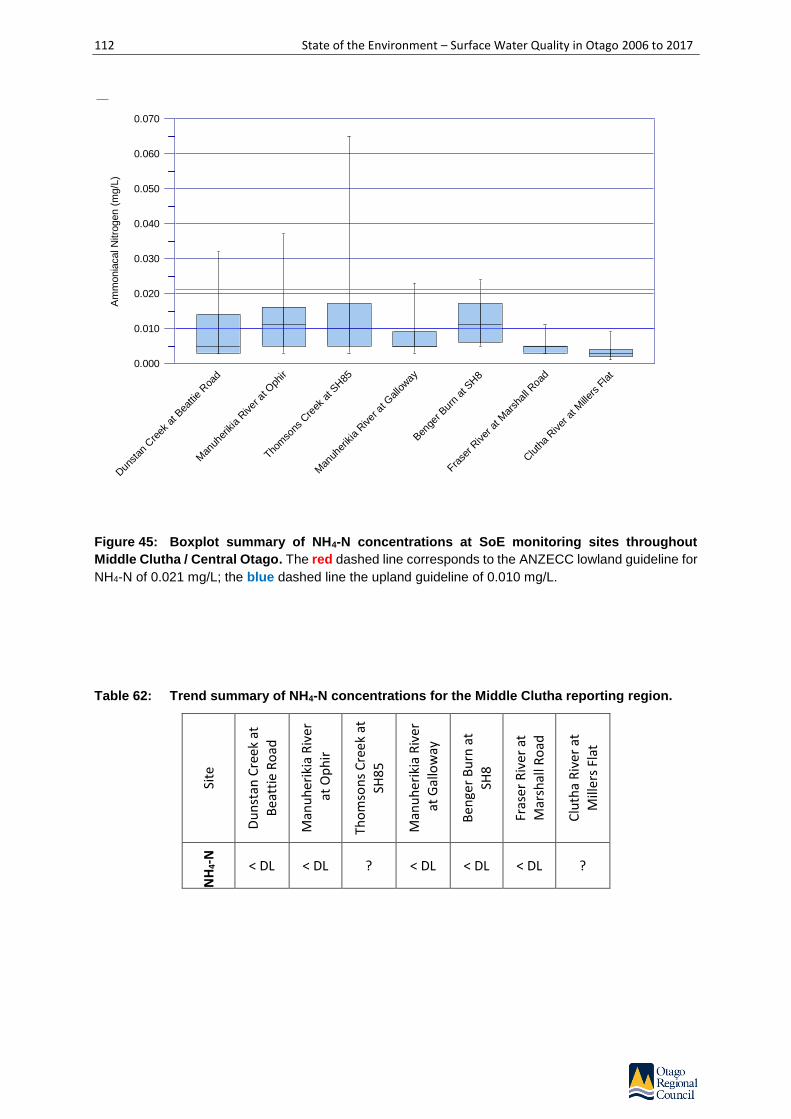
112 State of the Environment – Surface Water Quality in Otago 2006 to 2017
Figure 45: Boxplot summary of NH4-N concentrations at SoE monitoring sites throughout
Middle Clutha / Central Otago. The red dashed line corresponds to the ANZECC lowland guideline for
NH4-N of 0.021 mg/L; the blue dashed line the upland guideline of 0.010 mg/L.
Table 62: Trend summary of NH4-N concentrations for the Middle Clutha reporting region.
Site
Du
nst
an C
reek
at
Bea
ttie
Ro
ad
Man
uh
erik
ia R
iver
at
Op
hir
Tho
mso
ns
Cre
ek a
t SH
85
Man
uh
erik
ia R
iver
at
Gal
low
ay
Ben
ger
Bu
rn a
t
SH8
Fras
er R
iver
at
Mar
shal
l Ro
ad
Clu
tha
Riv
er a
t M
iller
s Fl
at
NH
4-N
< DL < DL ? < DL < DL < DL ?
Am
monia
cal N
itro
gen (
mg/L
)
Dun
stan
Cre
ek a
t Bea
ttie
Roa
d
Man
uher
ikia
River
at O
phir
Thom
sons
Cre
ek a
t SH85
Man
uher
ikia
River
at G
allo
way
Ben
ger B
urn
at S
H8
Frase
r River
at M
arsh
all R
oad
Clu
tha
River
at M
iller
s Fl
at0.000
0.010
0.020
0.030
0.040
0.050
0.060
0.070
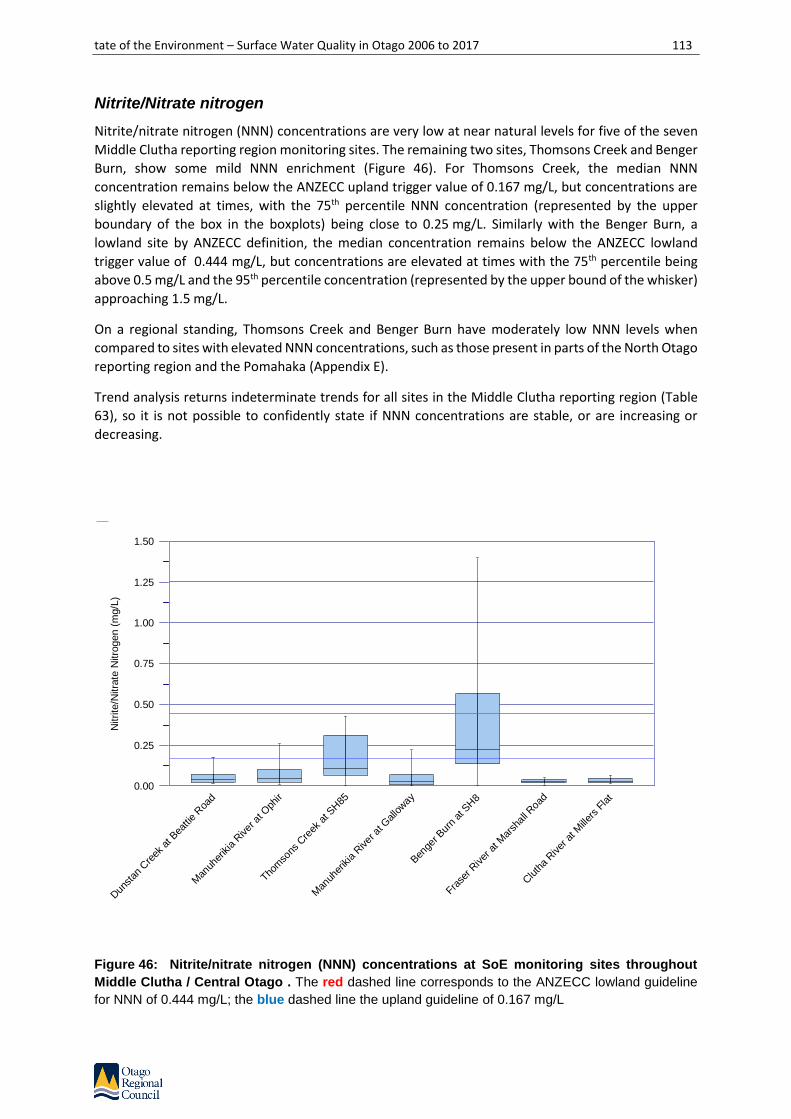
tate of the Environment – Surface Water Quality in Otago 2006 to 2017 113
Nitrite/Nitrate nitrogen
Nitrite/nitrate nitrogen (NNN) concentrations are very low at near natural levels for five of the seven
Middle Clutha reporting region monitoring sites. The remaining two sites, Thomsons Creek and Benger
Burn, show some mild NNN enrichment (Figure 46). For Thomsons Creek, the median NNN
concentration remains below the ANZECC upland trigger value of 0.167 mg/L, but concentrations are
slightly elevated at times, with the 75th percentile NNN concentration (represented by the upper
boundary of the box in the boxplots) being close to 0.25 mg/L. Similarly with the Benger Burn, a
lowland site by ANZECC definition, the median concentration remains below the ANZECC lowland
trigger value of 0.444 mg/L, but concentrations are elevated at times with the 75th percentile being
above 0.5 mg/L and the 95th percentile concentration (represented by the upper bound of the whisker)
approaching 1.5 mg/L.
On a regional standing, Thomsons Creek and Benger Burn have moderately low NNN levels when
compared to sites with elevated NNN concentrations, such as those present in parts of the North Otago
reporting region and the Pomahaka (Appendix E).
Trend analysis returns indeterminate trends for all sites in the Middle Clutha reporting region (Table
63), so it is not possible to confidently state if NNN concentrations are stable, or are increasing or
decreasing.
Figure 46: Nitrite/nitrate nitrogen (NNN) concentrations at SoE monitoring sites throughout
Middle Clutha / Central Otago . The red dashed line corresponds to the ANZECC lowland guideline
for NNN of 0.444 mg/L; the blue dashed line the upland guideline of 0.167 mg/L
Nitrite
/Nitra
te N
itro
gen (
mg/L
)
Dun
stan
Cre
ek a
t Bea
ttie
Roa
d
Man
uher
ikia
River
at O
phir
Thom
sons
Cre
ek a
t SH85
Man
uher
ikia
River
at G
allo
way
Ben
ger B
urn
at S
H8
Frase
r River
at M
arsh
all R
oad
Clu
tha
River
at M
iller
s Fl
at0.00
0.25
0.50
0.75
1.00
1.25
1.50
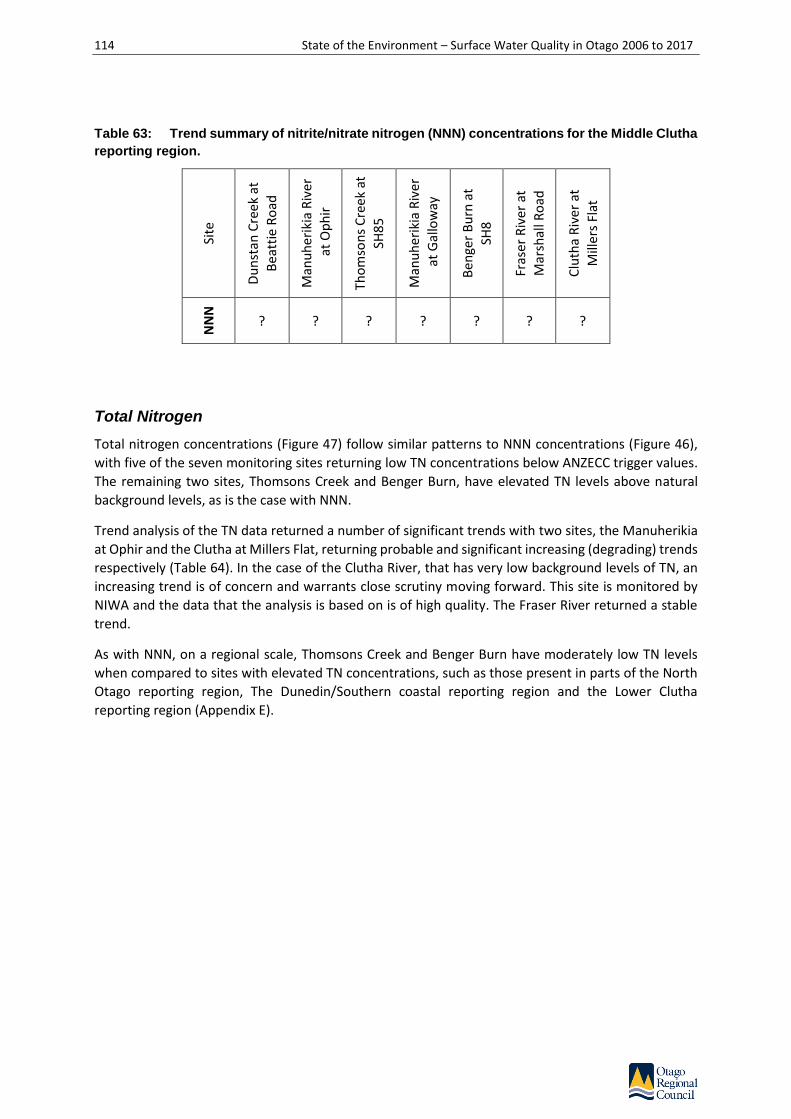
114 State of the Environment – Surface Water Quality in Otago 2006 to 2017
Table 63: Trend summary of nitrite/nitrate nitrogen (NNN) concentrations for the Middle Clutha
reporting region.
Site
Du
nst
an C
reek
at
Bea
ttie
Ro
ad
Man
uh
erik
ia R
iver
at
Op
hir
Tho
mso
ns
Cre
ek a
t SH
85
Man
uh
erik
ia R
iver
at
Gal
low
ay
Ben
ger
Bu
rn a
t
SH8
Fras
er R
iver
at
Mar
shal
l Ro
ad
Clu
tha
Riv
er a
t M
iller
s Fl
at
NN
N
? ? ? ? ? ? ?
Total Nitrogen
Total nitrogen concentrations (Figure 47) follow similar patterns to NNN concentrations (Figure 46),
with five of the seven monitoring sites returning low TN concentrations below ANZECC trigger values.
The remaining two sites, Thomsons Creek and Benger Burn, have elevated TN levels above natural
background levels, as is the case with NNN.
Trend analysis of the TN data returned a number of significant trends with two sites, the Manuherikia
at Ophir and the Clutha at Millers Flat, returning probable and significant increasing (degrading) trends
respectively (Table 64). In the case of the Clutha River, that has very low background levels of TN, an
increasing trend is of concern and warrants close scrutiny moving forward. This site is monitored by
NIWA and the data that the analysis is based on is of high quality. The Fraser River returned a stable
trend.
As with NNN, on a regional scale, Thomsons Creek and Benger Burn have moderately low TN levels
when compared to sites with elevated TN concentrations, such as those present in parts of the North
Otago reporting region, The Dunedin/Southern coastal reporting region and the Lower Clutha
reporting region (Appendix E).

tate of the Environment – Surface Water Quality in Otago 2006 to 2017 115
Figure 47: Boxplot summary of TN concentrations at SoE monitoring sites throughout Middle
Clutha / Central Otago. The red dashed line corresponds to the ANZECC lowland guideline for TN of
0.614 mg/L; the blue dashed line the upland guideline of 0.295 mg/L.
Table 64: Trend summary of TN concentrations for the Middle Clutha reporting region.
Site
Du
nst
an C
reek
at
Bea
ttie
Ro
ad
Man
uh
erik
ia R
iver
at
Op
hir
Tho
mso
ns
Cre
ek a
t SH
85
Man
uh
erik
ia R
iver
at
Gal
low
ay
Ben
ger
Bu
rn a
t
SH8
Fras
er R
iver
at
Mar
shal
l Ro
ad
Clu
tha
Riv
er a
t M
iller
s Fl
at
TN
? ↑↑ ? ? ? → ↑↑↑
Tota
l N
itro
gen (
mg/L
)
Dun
stan
Cre
ek a
t Bea
ttie
Roa
d
Man
uher
ikia
River
at O
phir
Thom
sons
Cre
ek a
t SH85
Man
uher
ikia
River
at G
allo
way
Ben
ger B
urn
at S
H8
Frase
r River
at M
arsh
all R
oad
Clu
tha
River
at M
iller
s Fl
at0.00
0.25
0.50
0.75
1.00
1.25
1.50
1.75
2.00
2.25

116 State of the Environment – Surface Water Quality in Otago 2006 to 2017
Dissolved Reactive Phosphorus
Dissolved Reactive Phosphorus (DRP) concentrations are very low at three of the Middle Clutha
monitoring sites, these sites being Dunstan Creek, the Fraser River and the Clutha River at Millers Flat
(Figure 48). The remaining sites show moderate to high levels of DRP, with the most enriched site being
Thomsons Creek. This site has very high concentrations of DRP well above those that would be seen in
slightly impacted sites. On a regional scale, Thomsons Creek sits in the top ten of sites with elevated
DRP concentrations (Appendix G).
Trend analysis of the DRP data set returns only one significant increasing (degrading) trend, that being
for the Manuherikia at Galloway. This site currently has moderate DRP concentrations with a median
slightly above the ANZECC lowland trigger value of 0.010 mg/L. Kitto (2012) identified increasing trends
for DRP at this site as well as highly elevated nutrients in many of the Manuherikia tributary streams.
Over 2017 and 2018, ORC are undertaking a detailed study of the Thomsons Creek catchment that will
allow identification of hotspots and assessment of reasons for the elevated DRP.
Figure 48: Boxplot summary of Dissolved Reactive Phosphorus (DRP) concentrations at SoE
monitoring sites throughout Middle Clutha / Central Otago. The red dashed line corresponds to the
ANZECC lowland guideline for DRP of 0.010 mg/L; the blue dashed line the upland guideline of 0.009
mg/L.
Dis
solv
ed R
eactive P
hosphoru
s (
mg/L
)
Dun
stan
Cre
ek a
t Bea
ttie
Roa
d
Man
uher
ikia
River
at O
phir
Thom
sons
Cre
ek a
t SH85
Man
uher
ikia
River
at G
allo
way
Ben
ger B
urn
at S
H8
Frase
r River
at M
arsh
all R
oad
Clu
tha
River
at M
iller
s Fl
at0.000
0.025
0.050
0.075
0.100
0.125
0.150
0.175
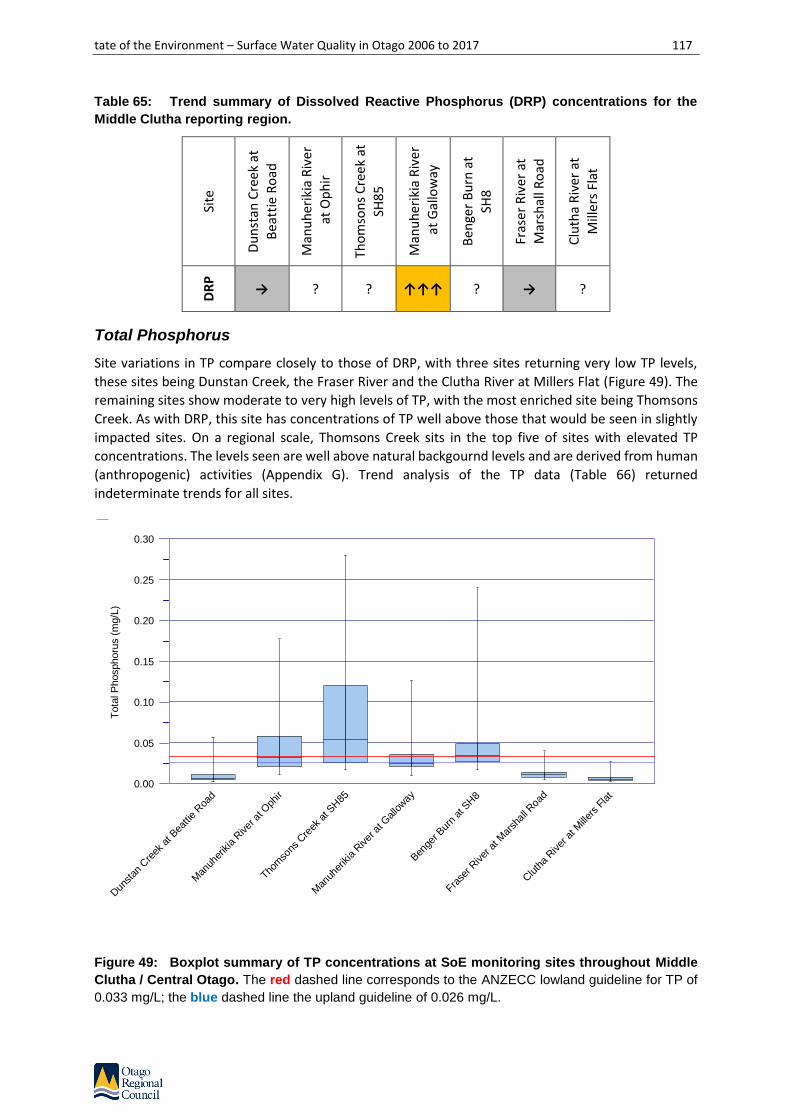
tate of the Environment – Surface Water Quality in Otago 2006 to 2017 117
Table 65: Trend summary of Dissolved Reactive Phosphorus (DRP) concentrations for the
Middle Clutha reporting region.
Site
Du
nst
an C
reek
at
Bea
ttie
Ro
ad
Man
uh
erik
ia R
iver
at
Op
hir
Tho
mso
ns
Cre
ek a
t SH
85
Man
uh
erik
ia R
iver
at
Gal
low
ay
Ben
ger
Bu
rn a
t
SH8
Fras
er R
iver
at
Mar
shal
l Ro
ad
Clu
tha
Riv
er a
t M
iller
s Fl
at
DR
P
→ ? ? ↑↑↑ ? → ?
Total Phosphorus
Site variations in TP compare closely to those of DRP, with three sites returning very low TP levels,
these sites being Dunstan Creek, the Fraser River and the Clutha River at Millers Flat (Figure 49). The
remaining sites show moderate to very high levels of TP, with the most enriched site being Thomsons
Creek. As with DRP, this site has concentrations of TP well above those that would be seen in slightly
impacted sites. On a regional scale, Thomsons Creek sits in the top five of sites with elevated TP
concentrations. The levels seen are well above natural backgournd levels and are derived from human
(anthropogenic) activities (Appendix G). Trend analysis of the TP data (Table 66) returned
indeterminate trends for all sites.
Figure 49: Boxplot summary of TP concentrations at SoE monitoring sites throughout Middle
Clutha / Central Otago. The red dashed line corresponds to the ANZECC lowland guideline for TP of
0.033 mg/L; the blue dashed line the upland guideline of 0.026 mg/L.
Tota
l P
hosphoru
s (
mg/L
)
Dun
stan
Cre
ek a
t Bea
ttie
Roa
d
Man
uher
ikia
River
at O
phir
Thom
sons
Cre
ek a
t SH85
Man
uher
ikia
River
at G
allo
way
Ben
ger B
urn
at S
H8
Frase
r River
at M
arsh
all R
oad
Clu
tha
River
at M
iller
s Fl
at0.00
0.05
0.10
0.15
0.20
0.25
0.30

118 State of the Environment – Surface Water Quality in Otago 2006 to 2017
Table 66: Trend summary of TP concentrations for the Middle Clutha reporting region.
Site
Du
nst
an C
reek
at
Bea
ttie
Ro
ad
Man
uh
erik
ia R
iver
at
Op
hir
Tho
mso
ns
Cre
ek a
t SH
85
Man
uh
erik
ia R
iver
at
Gal
low
ay
Ben
ger
Bu
rn a
t
SH8
Fras
er R
iver
at
Mar
shal
l Ro
ad
Clu
tha
Riv
er a
t M
iller
s Fl
at
TP
? ? ? ? ? ? ?
Escherichia coli
Figure 50 shows E. coli concentrations at SoE monitoring sites across the Middle Clutha reporting
region. Four of the seven sites return low levels of E. coli, with median and 75th percentile (upper
boundary of the box on the boxplots) concentrations being well below the amber alert level of 260
CFU/100ml; these sites being Dunstan Creek, the Manuherikia at Galloway, Fraser River and the Clutha
River at Millers Flat. The remaining three sites have varying levels of elevated E. coli concentrations
with numbers being above the amber alert level. In the case of Thomsons Creek, E. coli levels are
typically above the red alert level of 550 CFU/100ml.
Interestingly the Manuherikia at Galloway located well downstream of Ophir has better bacterial water
quality than the Manuherikia at Ophir. This may reflect the influence of the Omakau Waste Water
Treatment plant discharge and Thomson’s Creek on the bacteria levels at the Ophir site.
Trend analysis of the E. coli data shows two of the seven sites to have significant increasing (degrading)
trends (Table 67). One of these sites, Dunstan Creek, currently has very good water quality so an
increasing trend is disappointing. The remaining site, the Manuherikia at Ophir currently has marginal
bacterial water quality. An increasing trend at this site is alarming given the high primary contact
recreation interest on the river in this area. Increasing A trend of increasing levels of bacteria at this
site given that already has elevated E. coli above the national bottom line is of concern.
A positive result is a significant decreasing trend in E. coli for Thomsons Creek. This is a good result
given the already elevated concentrations at this site.
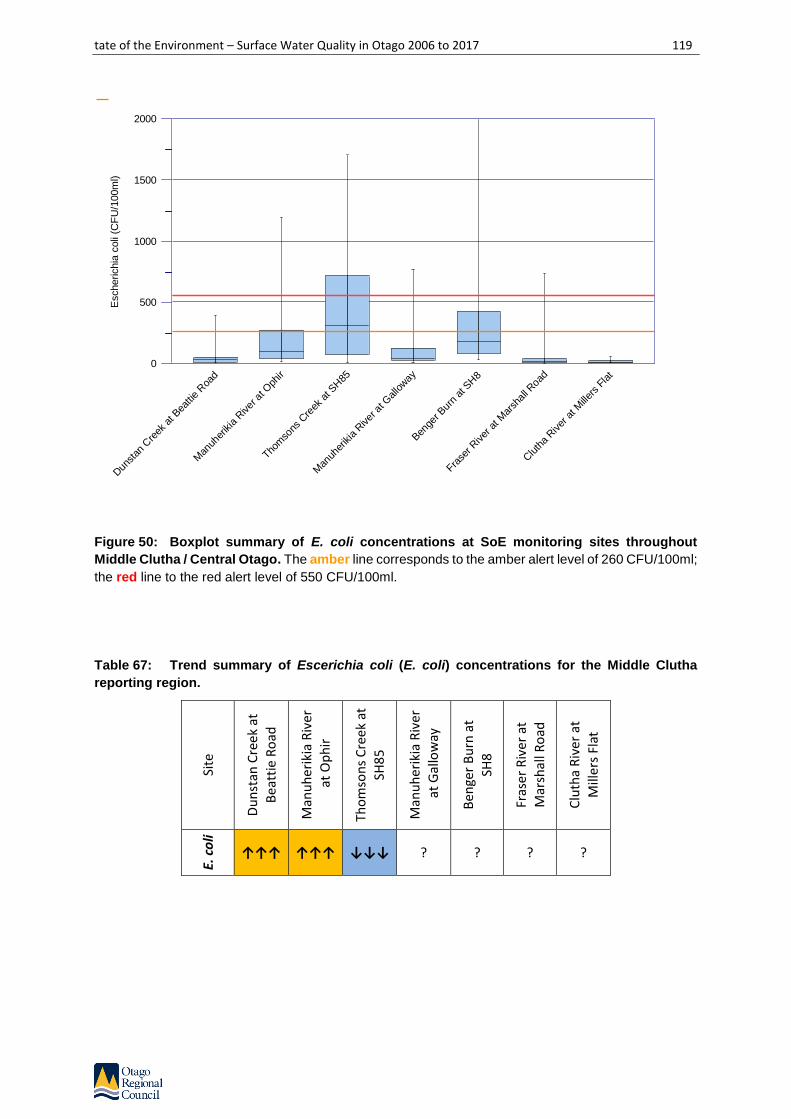
tate of the Environment – Surface Water Quality in Otago 2006 to 2017 119
Figure 50: Boxplot summary of E. coli concentrations at SoE monitoring sites throughout
Middle Clutha / Central Otago. The amber line corresponds to the amber alert level of 260 CFU/100ml;
the red line to the red alert level of 550 CFU/100ml.
Table 67: Trend summary of Escerichia coli (E. coli) concentrations for the Middle Clutha
reporting region.
Site
Du
nst
an C
reek
at
Bea
ttie
Ro
ad
Man
uh
erik
ia R
iver
at
Op
hir
Tho
mso
ns
Cre
ek a
t SH
85
Man
uh
erik
ia R
iver
a
t G
allo
way
Ben
ger
Bu
rn a
t
SH8
Fras
er R
iver
at
Mar
shal
l Ro
ad
Clu
tha
Riv
er a
t
Mill
ers
Flat
E. c
oli
↑↑↑ ↑↑↑ ↓↓↓ ? ? ? ?
Escherichia
coli
(CF
U/1
00m
l)
Dun
stan
Cre
ek a
t Bea
ttie
Roa
d
Man
uher
ikia
River
at O
phir
Thom
sons
Cre
ek a
t SH85
Man
uher
ikia
River
at G
allo
way
Ben
ger B
urn
at S
H8
Frase
r River
at M
arsh
all R
oad
Clu
tha
River
at M
iller
s Fl
at0
500
1000
1500
2000
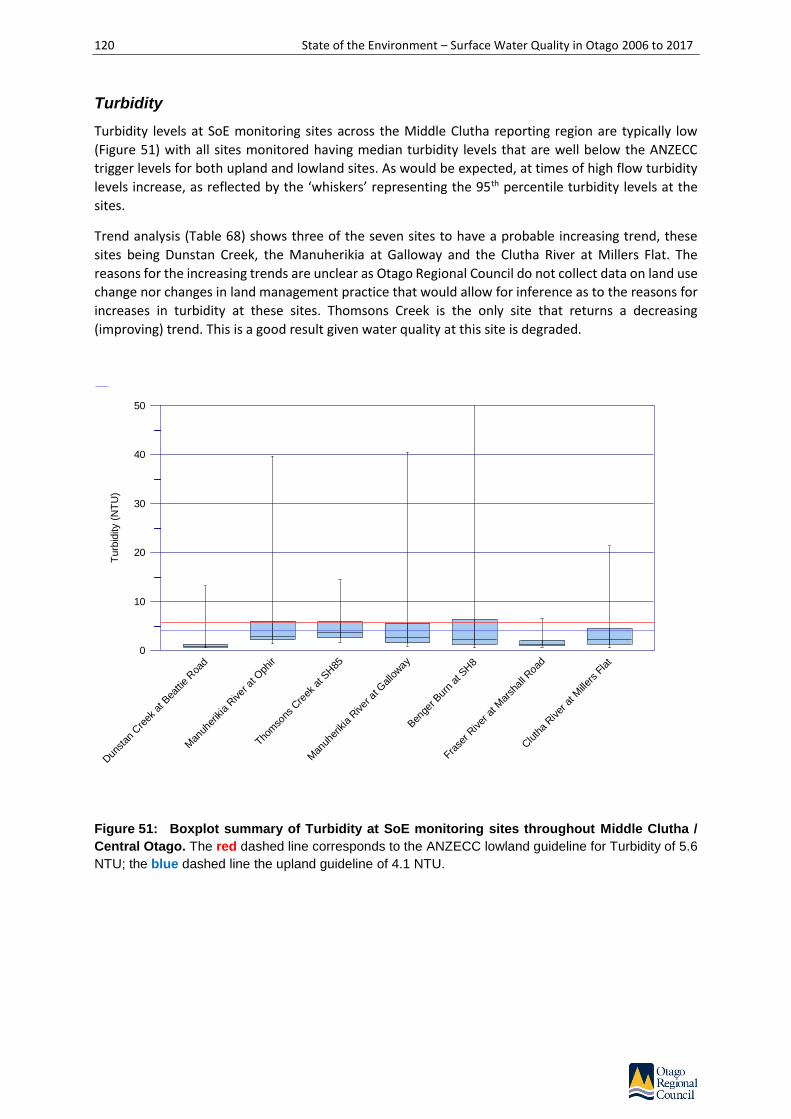
120 State of the Environment – Surface Water Quality in Otago 2006 to 2017
Turbidity
Turbidity levels at SoE monitoring sites across the Middle Clutha reporting region are typically low
(Figure 51) with all sites monitored having median turbidity levels that are well below the ANZECC
trigger levels for both upland and lowland sites. As would be expected, at times of high flow turbidity
levels increase, as reflected by the ‘whiskers’ representing the 95th percentile turbidity levels at the
sites.
Trend analysis (Table 68) shows three of the seven sites to have a probable increasing trend, these
sites being Dunstan Creek, the Manuherikia at Galloway and the Clutha River at Millers Flat. The
reasons for the increasing trends are unclear as Otago Regional Council do not collect data on land use
change nor changes in land management practice that would allow for inference as to the reasons for
increases in turbidity at these sites. Thomsons Creek is the only site that returns a decreasing
(improving) trend. This is a good result given water quality at this site is degraded.
Figure 51: Boxplot summary of Turbidity at SoE monitoring sites throughout Middle Clutha /
Central Otago. The red dashed line corresponds to the ANZECC lowland guideline for Turbidity of 5.6
NTU; the blue dashed line the upland guideline of 4.1 NTU.
Turb
idity (
NT
U)
Dun
stan
Cre
ek a
t Bea
ttie
Roa
d
Man
uher
ikia
River
at O
phir
Thom
sons
Cre
ek a
t SH85
Man
uher
ikia
River
at G
allo
way
Ben
ger B
urn
at S
H8
Frase
r River
at M
arsh
all R
oad
Clu
tha
River
at M
iller
s Fl
at0
10
20
30
40
50

tate of the Environment – Surface Water Quality in Otago 2006 to 2017 121
Table 68: Trend summary of Turbidity levels for the Middle Clutha reporting region.
Site
Du
nst
an C
reek
at
Bea
ttie
Ro
ad
Man
uh
erik
ia R
iver
at
Op
hir
Tho
mso
ns
Cre
ek a
t SH
85
Man
uh
erik
ia R
iver
at
Gal
low
ay
Ben
ger
Bu
rn a
t
SH8
Fras
er R
iver
at
Mar
shal
l Ro
ad
Clu
tha
Riv
er a
t M
iller
s Fl
at
Turb
idit
y
↑↑ ? ↓↓↓ ↑↑ ? ? ↑↑
Stream Health and the Macroinvertebrate Community Index
Macroinvertebrate Community Index (MCI) scores provide an integrated indicator of the general state
of water quality and aquatic ecosystem health at a site.
Figure 52 summarises MCI scores for sites monitored for aquatic macroinvertebrates throughout the
Middle Clutha reporting region. The summary includes annual samples collected from 2008 to 2017
(8 years) where data is available. Not all sites monitored for water quality have macro-invertebrate
samples taken. Of the seven sites monitored for water quality, three sites are sampled annually for
macro-invertebrates.
Dunstan Creek returns the highest MCI score for the rivers monitored across the Middle Clutha
reporting region, and in fact on a regional standing, is equal first for the highest median MCI score of
118 (Appendix G). This shows the macroinvertebrate community to be in excellent health with overall
water quality conditions supporting a diverse and pollution sensitive macroinvertebrate community.
The Manuherikia at Ophir has an MCI score that reflects a macroinvertebrate community in ‘good’
condition. This shows the slightly degraded water quality at this site not to be impacting too heavily
on the macroinvertebrate community.
The Clutha River at Millers Flat has a low MCI score below 90. MCI is not well suited to large rivers so
for the Clutha River at Miller Flat, the ‘poor’ MCI value may be driven more by habitat constraints and
the ability to sample macroinvertebrates from riffles representative of the wider river.

122 State of the Environment – Surface Water Quality in Otago 2006 to 2017
Figure 52: Boxplot summary of Macroinvertebrate Community Index (MCI) scores at SoE
monitoring sites throughout the Middle Clutha / Central Otago reporting region where
macroinvertebrate samples are routinely collected. Above the blue line corresponds to the
‘Excellent’ quality threshold; between the orange and blue line the ‘Good’ quality threshold; betwene
the red and orange line ‘Poor’ quality threshold; below the red line the ‘Degraded’ threshold.
Middle Clutha Water Quality Summary
Across the Middle Clutha reporting region there are a moderate number of sites with degrading water
quality trends, as shown in Table 69, which summarises trend results across all sites. There are a total
of 49 results reported in the table; 16% return significant or probable degrading trends; and 4% return
significant or probable improving trends; 6% return stable trends. Overall 74% of sites have either
indeterminate trends (reported as “?”); or too many observations being ‘less than detect’ (<DL) for
results returned from the laboratory.
Water quality across the Manuherikia catchment is variable, as was found by the Kitto (2012) study,
with impacted water quality in the tributary streams of the Manuherikia likely impacting on the water
quality of the main-stem river.
As stated previously, having accurate information on changes in land use and land management
practice would help in identifying the reasons for degarded water quality and drivers of change evident
with some water quality variables.
MC
I
Dun
stan
Cre
ek a
t Bea
ttie
Roa
d
Man
uher
ikia
River
at O
phir
Clu
tha
River
at M
iller
s Fl
at70
80
90
100
110
120
130

tate of the Environment – Surface Water Quality in Otago 2006 to 2017 123
In summary:
• For four of seven sites monitored across the Middle Clutha reporting region, water quality is
excellent overall. These sites include Dunstan Creek, the Manuherikia at Galloway, Fraser River
and the Clutha at Millers Flat;
• Bacterial water quality is excellent in Dunstan Creek, the Manuherikia at Galloway, Fraser River
and the Clutha at Millers Flat. The remaining three sites, Thomsons Creek, the Manuherikia at
Galloway, and Benger Burn, all fail the national bottom line for E. coli and have unnaceptable
bacterial water quality. Thomsons Creek is particulalry degraded;
• Thomsons Creek, and to a lesser extent Benger Burn, have degraded water quality, returning
elevated levels of phosphorus, nitrogen and bacteria;
• The Manuherikia at Ophir appears to be influenced by treated sewage being discharged from
the Omakau WWTP. Further work is needed to understand the effects of this discharge on the
river receiving environment;
• Water quality improves in the Manuherikia River as one travels downstream from Ophir to
Galloway.
Table 69: Trend summary for the Middle Clutha reporting region.
Site
Du
nst
an C
reek
at
Bea
ttie
Ro
ad
Man
uh
erik
ia R
iver
at O
ph
ir
Tho
mso
ns
Cre
ek a
t SH
85
Man
uh
erik
ia R
iver
at G
allo
way
Ben
ger
Bu
rn a
t
SH8
Fras
er R
iver
at
Mar
shal
l Ro
ad
Clu
tha
Riv
er a
t
Mill
ers
Flat
Ammoniacal Nitrogen
< DL < DL ? < DL < DL < DL ?
Nitrite/Nitrate Nitrogen
? ? ? ? ? ? ?
Total Nitrogen ? ↑↑ ? ? ? → ↑↑↑
Dissolved Reactive
Phosphorus → ? ? ↑↑↑ ? → ?
Total Phosphorus
? ? ? ? ? ? ?
Escherichia coli
↑↑↑ ↑↑↑ ↓↓↓ ? ? ? ?
Turbidity ↑↑ ? ↓↓↓ ↑↑ ? ? ↑↑

124 State of the Environment – Surface Water Quality in Otago 2006 to 2017
2.6. Lower Clutha / Pomahaka
The Lower Clutha/Pomahaka reporting region runs from the small settlement of Beaumont, where
State Highway 8 crosses the Clutha River/Mata-Au, downstream to the Pacific Ocean where the Clutha
River/Mata-Au discharges to the sea near Balclutha. The Lower Clutha/Pomahaka reporting region
includes the catchments of the Tuapeka River (249 km2), Pomahaka River (2060 km2), Waipahi River
(339 km2), Waiwera River (208 km2) and the Waitahuna River (406 km2). The Lower Clutha/Pomahaka
reporting region, in contrast to the Upper and Middle Clutha reporting regions, is dominated by alluvial
plains, rolling hill country and lowlands.
The Pomahaka River is the largest catchment of the Lower Clutha/Pomahaka reporting region covering
over 57% of the reporting area’s 3600 km2. The upper reaches of the Pomahaka catchment are steep
and dominated by tussock, while the lower reaches are primarily flowing through pastoral rolling hill
country. The headwaters originate in the Umbrella Range and flow in a south-west direction to its
junction with the Clutha River/Mata-Au near Clydevale. A small section of the Pomahaka catchment,
the Kaiwera Stream, is not within the Otago Region. The Pomahaka catchment climate is considered
mild, with consistent rainfall throughout the year. Annual rainfall for the Pomahaka catchment
generally varies from around 700 mm in the low altitude parts of the catchment to 1400 mm in the
Blue Mountains and Umbrella Mountains. This rainfall contributes to higher river flows in the
Pomahaka, including, in particular, numerous flushing flows. The lowest flow recorded in the
Pomahaka River at Glenken (upper catchment) was 0.8 m3/s, while the maximum discharge recorded
at the same site was 480 m3/s. The Pomahaka River typically experiences about eight flushing flows
each year. These larger flows are important for removing algae, flushing nutrients and moving
sediment. Streams with a low frequency of flushing flows are susceptible to algal proliferations,
particularly if they contain high nutrient levels. Relative to North or Central Otago streams, the
Pomahaka River has a high frequency of flushing flows. Soil profiles vary primarily by topography and
elevation, with the rolling hill country of the lower catchment being dominated by insoluble organic,
pallic and grey soils, and the more mountainous areas of the catchment having primarily semi-arid
soils. The river supports a regionally significant brown trout fishery (ORC, 2011).
2.6.1. Lower Clutha / Pomahaka geographical and land cover characteristics
Table 70 summarises characteristics of the Lower Clutha/Pomahaka reporting region based on the
River Environment Classification (refer Appendix F for a detailed overview of the REC); land-cover
(based on the Land Cover Database Version 4; condensed with the approach summarised in Appendix
D); and the Land Use Capability (LUC) classes (see Section 2.0 for the LUC definition). The Lower
Clutha/Pomahaka reporting region covers an area of 3600 km2 representing approximately 17% of the
total Clutha River/Mata-Au catchment.
According to the River Environment Classification (REC), rivers and streams of the Lower
Clutha/Pomahaka reporting region are dominated by cool-dry/hill (10.9%) and cool-dry/low elevation
(77.9%) rivers that receive low rainfall (less than 500 mm annual average rainfall). Cool/wet hill (6.8%)
and cool/wet low elevation (2.7%) rivers and streams are also a feature of the reporting region and are
typical of areas of the Pomahaka catchment.
The predominant land cover throughout the Lower Clutha/Pomahaka reporting region is high
producing grassland (72.4%, 2606 km2) followed by plantation forestry (12.8%, 461 km2) and native
cover (8.7%, 313 km2) (Table 70, Figure 53). ‘High producing grassland’ includes “land that is intensively
managed and grazed for wool, lamb, beef, and dairy or deer production” (Appendix D).
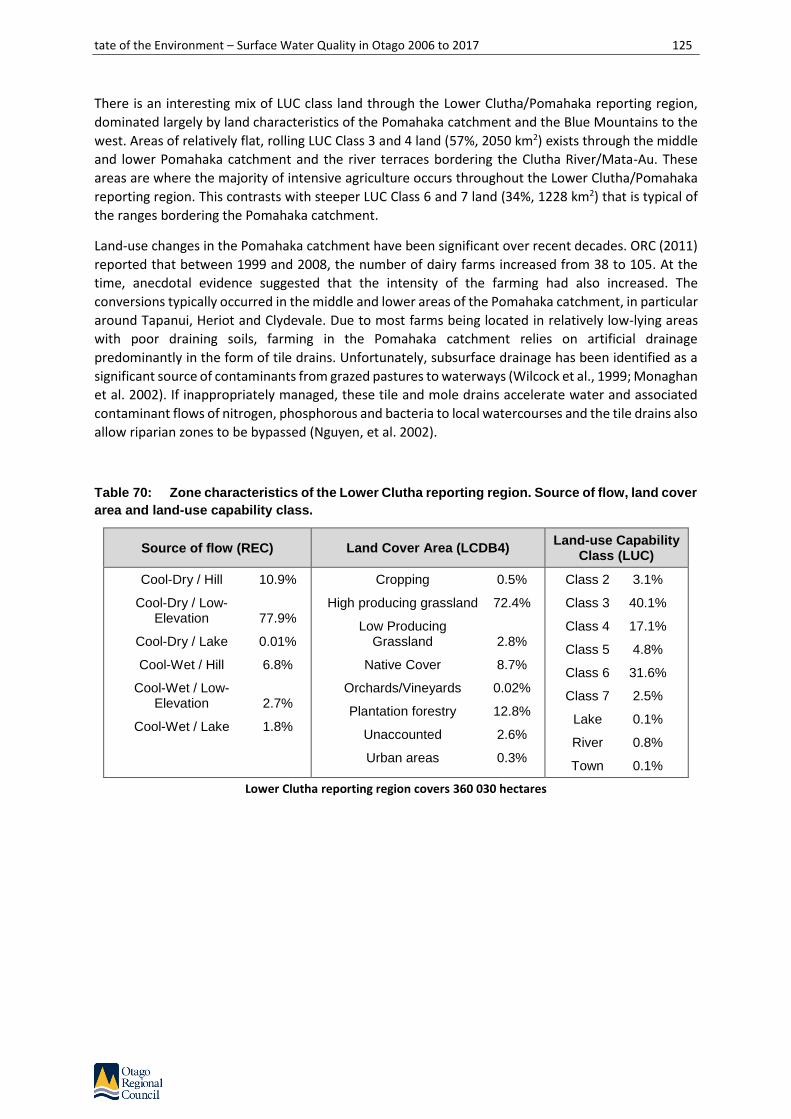
tate of the Environment – Surface Water Quality in Otago 2006 to 2017 125
There is an interesting mix of LUC class land through the Lower Clutha/Pomahaka reporting region,
dominated largely by land characteristics of the Pomahaka catchment and the Blue Mountains to the
west. Areas of relatively flat, rolling LUC Class 3 and 4 land (57%, 2050 km2) exists through the middle
and lower Pomahaka catchment and the river terraces bordering the Clutha River/Mata-Au. These
areas are where the majority of intensive agriculture occurs throughout the Lower Clutha/Pomahaka
reporting region. This contrasts with steeper LUC Class 6 and 7 land (34%, 1228 km2) that is typical of
the ranges bordering the Pomahaka catchment.
Land-use changes in the Pomahaka catchment have been significant over recent decades. ORC (2011)
reported that between 1999 and 2008, the number of dairy farms increased from 38 to 105. At the
time, anecdotal evidence suggested that the intensity of the farming had also increased. The
conversions typically occurred in the middle and lower areas of the Pomahaka catchment, in particular
around Tapanui, Heriot and Clydevale. Due to most farms being located in relatively low-lying areas
with poor draining soils, farming in the Pomahaka catchment relies on artificial drainage
predominantly in the form of tile drains. Unfortunately, subsurface drainage has been identified as a
significant source of contaminants from grazed pastures to waterways (Wilcock et al., 1999; Monaghan
et al. 2002). If inappropriately managed, these tile and mole drains accelerate water and associated
contaminant flows of nitrogen, phosphorous and bacteria to local watercourses and the tile drains also
allow riparian zones to be bypassed (Nguyen, et al. 2002).
Table 70: Zone characteristics of the Lower Clutha reporting region. Source of flow, land cover
area and land-use capability class.
Source of flow (REC) Land Cover Area (LCDB4) Land-use Capability
Class (LUC)
Cool-Dry / Hill 10.9%
Cool-Dry / Low-Elevation 77.9%
Cool-Dry / Lake 0.01%
Cool-Wet / Hill 6.8%
Cool-Wet / Low-Elevation 2.7%
Cool-Wet / Lake 1.8%
Cropping 0.5%
High producing grassland 72.4%
Low Producing Grassland 2.8%
Native Cover 8.7%
Orchards/Vineyards 0.02%
Plantation forestry 12.8%
Unaccounted 2.6%
Urban areas 0.3%
Class 2 3.1%
Class 3 40.1%
Class 4 17.1%
Class 5 4.8%
Class 6 31.6%
Class 7 2.5%
Lake 0.1%
River 0.8%
Town 0.1%
Lower Clutha reporting region covers 360 030 hectares

126 State of the Environment – Surface Water Quality in Otago 2006 to 2017
Figure 53: Map showing broad land cover categories of the Lower Clutha / Pomahaka reporting
region based on the LCDB4 databse.
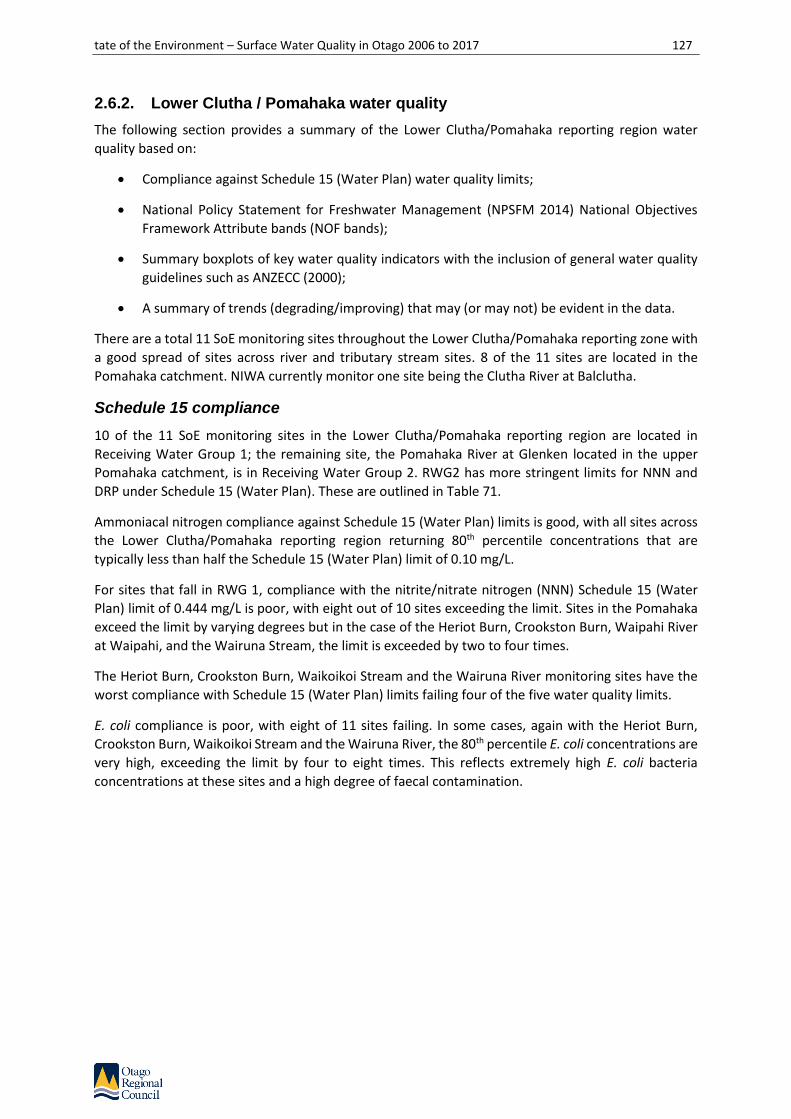
tate of the Environment – Surface Water Quality in Otago 2006 to 2017 127
2.6.2. Lower Clutha / Pomahaka water quality
The following section provides a summary of the Lower Clutha/Pomahaka reporting region water
quality based on:
• Compliance against Schedule 15 (Water Plan) water quality limits;
• National Policy Statement for Freshwater Management (NPSFM 2014) National Objectives
Framework Attribute bands (NOF bands);
• Summary boxplots of key water quality indicators with the inclusion of general water quality
guidelines such as ANZECC (2000);
• A summary of trends (degrading/improving) that may (or may not) be evident in the data.
There are a total 11 SoE monitoring sites throughout the Lower Clutha/Pomahaka reporting zone with
a good spread of sites across river and tributary stream sites. 8 of the 11 sites are located in the
Pomahaka catchment. NIWA currently monitor one site being the Clutha River at Balclutha.
Schedule 15 compliance
10 of the 11 SoE monitoring sites in the Lower Clutha/Pomahaka reporting region are located in
Receiving Water Group 1; the remaining site, the Pomahaka River at Glenken located in the upper
Pomahaka catchment, is in Receiving Water Group 2. RWG2 has more stringent limits for NNN and
DRP under Schedule 15 (Water Plan). These are outlined in Table 71.
Ammoniacal nitrogen compliance against Schedule 15 (Water Plan) limits is good, with all sites across
the Lower Clutha/Pomahaka reporting region returning 80th percentile concentrations that are
typically less than half the Schedule 15 (Water Plan) limit of 0.10 mg/L.
For sites that fall in RWG 1, compliance with the nitrite/nitrate nitrogen (NNN) Schedule 15 (Water
Plan) limit of 0.444 mg/L is poor, with eight out of 10 sites exceeding the limit. Sites in the Pomahaka
exceed the limit by varying degrees but in the case of the Heriot Burn, Crookston Burn, Waipahi River
at Waipahi, and the Wairuna Stream, the limit is exceeded by two to four times.
The Heriot Burn, Crookston Burn, Waikoikoi Stream and the Wairuna River monitoring sites have the
worst compliance with Schedule 15 (Water Plan) limits failing four of the five water quality limits.
E. coli compliance is poor, with eight of 11 sites failing. In some cases, again with the Heriot Burn,
Crookston Burn, Waikoikoi Stream and the Wairuna River, the 80th percentile E. coli concentrations are
very high, exceeding the limit by four to eight times. This reflects extremely high E. coli bacteria
concentrations at these sites and a high degree of faecal contamination.

128 State of the Environment – Surface Water Quality in Otago 2006 to 2017
Table 71: 80th percentile values for water quality variables identified in Schedule 15. Values
are calculated from samples taken when flows are below median flow. The orange cells show where the
80th percentile exceeds the Schedule 15 limit. Numbers underlined in italics have lower limits under
Schedule 15.
Variable NNN NH4-N DRP E. coli Turbidity
Schedule 15 limit when flows < median flow
0.444 mg/L
0.075 mg/L 0.100 mg/L
0.026 mg/L
0.010 mg/L 260 CFU 5.0 NTU
SoE reporting name
Pomahaka River at Glenken 0.032 0.012 0.010 508 2.44
Heriot Burn at Park Hill Road 1.576 0.036 0.052 2180 5.90
Crookston Burn at Kelso Road 1.604 0.036 0.045 2000 5.04
Waikoikoi Stream at Hailes Bridge 0.448 0.023 0.038 1140 5.64
Waipahi River at Cairns Peak 0.742 0.035 0.019 884 8.16
Waipahi River at Waipahi 1.174 0.016 0.021 218 2.64
Wairuna River at Millar Road 1.268 0.059 0.100 1220 11.62
Pomahaka River at Burkes Ford 0.564 0.018 0.014 156 3.36
Waiwera at Maws Farm 0.858 0.020 0.031 380 3.92
Waitahuna at Tweeds Bridge 0.132 0.015 0.018 388 4.00
Clutha River at Balclutha 0.101 0.005 0.002 101 3.77
Nitrate and ammonia toxicity and NOF compliance
NOF attribute bands for nitrate (measured as NNN) and NH4-N toxicity (Table 72 and Table 73
respectively) provide good protection against toxicity risk for all Lower Clutha/Pomahaka monitoring
sites with four of 11 sites returning an ‘A’ band (highest level of protection), and seven of 11 sites
returning a ‘B’ band for NNN. The B-band reflects an environment that may have “some growth effect
on up to 5% of species” in regards to a chronic nitrate toxicity effect (Appendix B). This provides for a
good level of protection with some minor effects on growth rate of the most sensitive species (Hickey,
2013). So despite elevated NNN concentrations at a number of Pomahaka River tributary sites, the risk
of nitrate toxicity effects on in-stream biota remains relatively low.
In the case of NH4-N, seven of 11 sites return an ‘A’ band, and four of 11 sites return a ‘B’ band. The ‘B’
band still provides for a good level of protection against ammonia toxicity but ‘starts impacting
occasionally on the 5% most sensitive species’ (Appendix B). Some species of freshwater mollusc can
be sensitive to ammonia toxicity.

tate of the Environment – Surface Water Quality in Otago 2006 to 2017 129
Table 72: NOF compliance summary for Nitrate (estimated from NNN). Included are median and
95th percentile values for the the period July 2012 to June 2017 and the corresponding NOF attribute
band.
Variable Nitrate as NNN NOF Band
SoE reporting name Median (mg/L)
95th Percentile
(mg/L) Median 95th
Percentile
Pomahaka River at Glenken 0.050 0.298 A A
Heriot Burn at Park Hill Road 1.320 2.156 B B
Crookston Burn at Kelso Road 1.333 2.265 B B
Waikoikoi Stream at Hailes Bridge 0.742 2.192 A B
Waipahi River at Cairns Peak 0.788 1.658 A B
Waipahi River at Waipahi 1.068 2.073 B B
Wairuna River at Millar Road 1.306 3.047 B B
Pomahaka River at Burkes Ford 0.558 1.452 A A
Waiwera at Maws Farm 0.872 2.019 A B
Waitahuna at Tweeds Bridge 0.184 0.779 A A
Clutha River at Balclutha 0.063 0.190 A A
Table 73: NOF compliance summary for NH4-N. Included are median and maximum values for the
the period July 2012 to June 2017 and the corresponding NOF attribute band.
Variable Ammoniacal nitrogen
(unadjusted) NOF Band
SoE reporting name Median (mg/L)
Maximum (mg/L) Median Maximum
Pomahaka River at Glenken 0.007 0.014 A A
Heriot Burn at Park Hill Road 0.029 0.070 A B
Crookston Burn at Kelso Road 0.053 0.143 B B
Waikoikoi Stream at Hailes Bridge 0.028 0.080 A B
Waipahi River at Cairns Peak 0.022 0.048 A A
Waipahi River at Waipahi 0.011 0.039 A A
Wairuna River at Millar Road 0.048 0.187 B B
Pomahaka River at Burkes Ford 0.013 0.043 A A
Waiwera at Maws Farm 0.013 0.034 A A
Waitahuna at Tweeds Bridge 0.011 0.026 A A
Clutha River at Balclutha 0.003 0.014 A A

130 State of the Environment – Surface Water Quality in Otago 2006 to 2017
E. coli, swimmability and NOF compliance
Table 74 summarises compliance for E. coli against the four statistical tests of the NOF E. coli attribute.
The lower Clutha/Pomahaka reporting region returns the worst NOF E. coli compliance of any reporting
region across Otago. With 10 of the 11 sites failing the NPSFM (2014) NOF national bottom line and
returning a ‘D’ band or worse, an ‘E’ band.
The Heriot Burn, Crookston Burn, Waikoikoi Stream, Waipiahi River at Cairns and the Wairuna River at
Millers Road have excessive levels of E. coli and fail all tests by a significant margin when compared to
the acceptable ‘C’ band threshold (Appendix B). In recent years significant work has been occurring by
catchment groups and the community in these catchments, in efforts to improve bacterial water
quality.
The only site with acceptable bacterial water quality is the Clutha River at Balclutha that is fully
compliant with ‘A’ bands for the four individual tests.
The overall attribute state is based on the worst grading with the national bottom line being an orange
‘D’ band; all sites must return a minimum of a ‘C’ band.
Table 74: NOF compliance summary for E. coli for the the period July 2012 to June 2017. The
overall grading band is determined by the lowest (worst) ranked Numeric Attribute State as it relates to
the four separate states.
Numeric Attribute State Overall attribute
state
Site Median grade
(CFU/100ml)
95th percentile
grade (CFU/100ml)
% over 260
CFU/100ml grade
(%)
% over 540
CFU/100ml grade
(%)
Grading attribute
state
Overall Pass/Fai
l
Pomahaka River at Glenken
D (210) D (2465) D (43%) D (20%) D FAIL
Heriot Burn at Park Hill Road
E (600) D (5695) E (74%) E (48%) E FAIL
Crookston Burn at Kelso Road
E (500) D (7890) E (74%) E (46%) E FAIL
Waikoikoi Stream at Hailes Bridge
E (590) D (14285) E (8%) E (52%) E FAIL
Waipahi River at Cairns Peak
D (235) D (5980) D (45%) E (31%) E FAIL
Waipahi River at Waipahi
A (120) D (4400) B (23%) C (15%) D FAIL
Wairuna River at Millar Road
E (620) D (6000) E (69%) E (52%) E FAIL
Pomahaka River at Burkes Ford
A (92) D (5240) B (28%) C (18%) D FAIL
Waiwera at Maws Farm
D (190) D (1385) D (38%) C (17%) D FAIL
Waitahuna at Tweeds Bridge
E (290) D (4450) E (51%) C (18%) E FAIL
Clutha River at Balclutha
A (32) A (447) A (9%) A (4%) A PASS
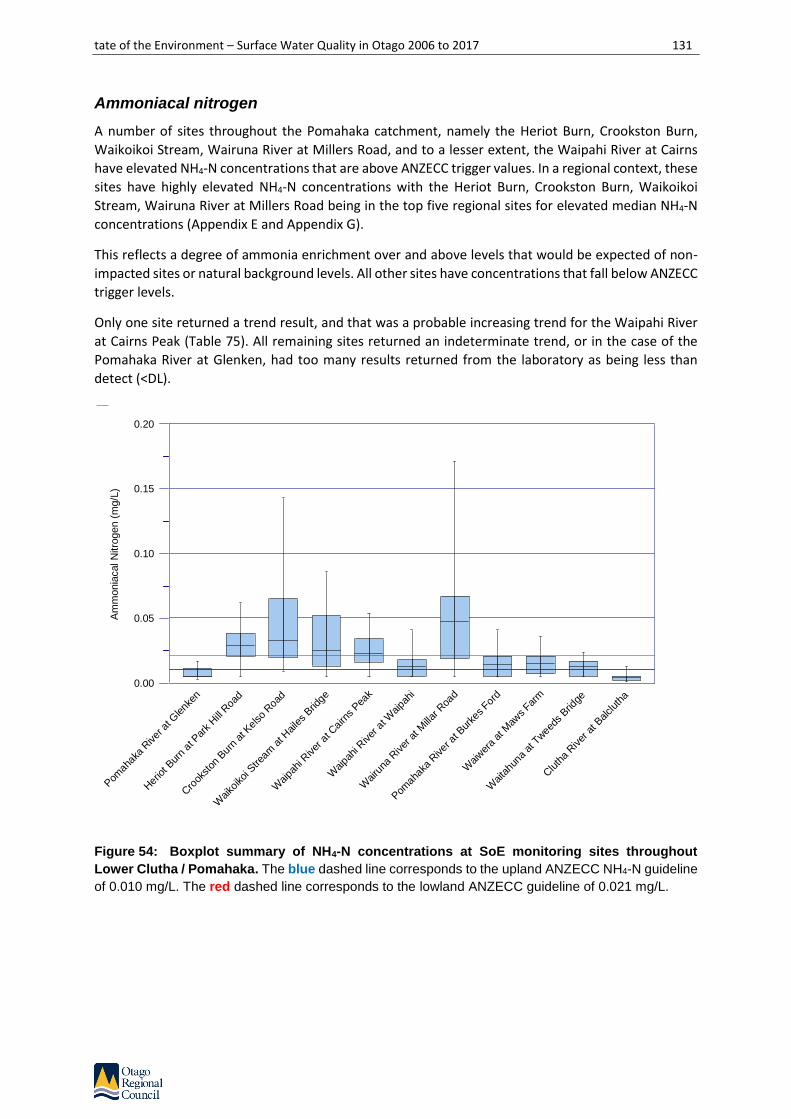
tate of the Environment – Surface Water Quality in Otago 2006 to 2017 131
Ammoniacal nitrogen
A number of sites throughout the Pomahaka catchment, namely the Heriot Burn, Crookston Burn,
Waikoikoi Stream, Wairuna River at Millers Road, and to a lesser extent, the Waipahi River at Cairns
have elevated NH4-N concentrations that are above ANZECC trigger values. In a regional context, these
sites have highly elevated NH4-N concentrations with the Heriot Burn, Crookston Burn, Waikoikoi
Stream, Wairuna River at Millers Road being in the top five regional sites for elevated median NH4-N
concentrations (Appendix E and Appendix G).
This reflects a degree of ammonia enrichment over and above levels that would be expected of non-
impacted sites or natural background levels. All other sites have concentrations that fall below ANZECC
trigger levels.
Only one site returned a trend result, and that was a probable increasing trend for the Waipahi River
at Cairns Peak (Table 75). All remaining sites returned an indeterminate trend, or in the case of the
Pomahaka River at Glenken, had too many results returned from the laboratory as being less than
detect (<DL).
Figure 54: Boxplot summary of NH4-N concentrations at SoE monitoring sites throughout
Lower Clutha / Pomahaka. The blue dashed line corresponds to the upland ANZECC NH4-N guideline
of 0.010 mg/L. The red dashed line corresponds to the lowland ANZECC guideline of 0.021 mg/L.
Am
monia
cal N
itro
gen (
mg/L
)
Pom
ahak
a River
at G
lenk
en
Her
iot B
urn
at P
ark
Hill R
oad
Cro
okst
on B
urn
at K
elso
Roa
d
Waiko
ikoi
Stre
am a
t Haile
s Brid
ge
Waipa
hi R
iver
at C
airn
s Pea
k
Waipa
hi R
iver
at W
aipa
hi
Wairu
na R
iver
at M
illar
Roa
d
Pom
ahak
a River
at B
urke
s For
d
Waiwer
a at
Maw
s Far
m
Waita
huna
at T
wee
ds B
ridge
Clu
tha
River
at B
alclut
ha
0.00
0.05
0.10
0.15
0.20

132 State of the Environment – Surface Water Quality in Otago 2006 to 2017
Table 75: Trend summary of NH4-N concentrations for the Lower Clutha / Pomahaka reporting
region.
Site
Po
mah
aka
Riv
er
at G
len
ken
Her
iot
Bu
rn
at P
ark
Hill
Ro
ad
Cro
oks
ton
Bu
rn
at K
els
o R
oad
Wai
koik
oi S
trea
m
at H
aile
s B
rid
ge
Wai
pah
i Riv
er
at C
airn
s P
eak
Wai
pah
i Riv
er
at W
aip
ahi
Wai
run
a R
iver
at
Mill
ar R
oad
Po
mah
aka
Riv
er
at B
urk
es F
ord
Wai
we
ra
at M
aws
Farm
Wai
tah
un
a
at T
wee
ds
Bri
dge
Clu
tha
Riv
er
at B
alcl
uth
a
NH
4-N
< DL ? ? ? ↑↑ ? ? ? ? ? ?
Nitrite/Nitrate nitrogen
Eight of the 11 sites monitored in the Lower Clutha/Pomahaka reporting region have elevated NNN
levels with median concentrations above ANZECC (2000) trigger levels. In the case of the Pomahaka
catchment monitoring sites, namely the Heriot Burn, Crookston Burn, Waikoikoi Stream, Wairuna River
and the Waipiahi River; and next door to the Pomahaka catchment, the Waiwera River, NNN
concentrations are some of the highest recorded across Otago (Appendix E and Appendix G). This
reflects a high degree of NNN enrichment over and above levels that would be expected of non-
impacted sites or natural background levels.
Only the upper Pomahaka River monitoring site at Glenken, the Waitahuna River on the opposite side
of the Clutha to the Pomahaka, and the Clutha River at Balclutha have median NNN concentrations
below ANZECC trigger levels.
Trend analysis returned two increasing (degrading) trends for NNN, this being a probable increasing
trend for the Heriot Burn; and a significant increasing trend for the Waipahi River at Cairns. As stated
previously, ORC do not have information on changes in land-use or land management practices that
allows for inference as to the reasons for degraded water quality or the cause of the degrading trends
at these sites.
All remaining sites returned an indeterminate trend (Table 75).
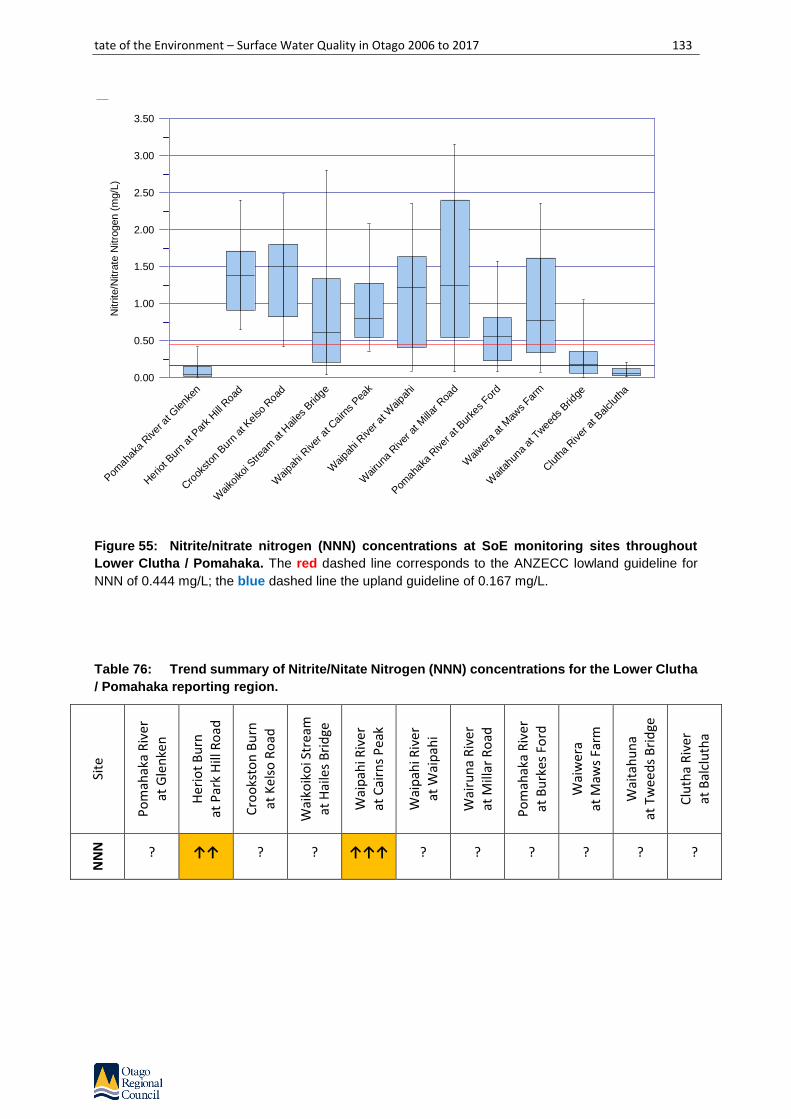
tate of the Environment – Surface Water Quality in Otago 2006 to 2017 133
Figure 55: Nitrite/nitrate nitrogen (NNN) concentrations at SoE monitoring sites throughout
Lower Clutha / Pomahaka. The red dashed line corresponds to the ANZECC lowland guideline for
NNN of 0.444 mg/L; the blue dashed line the upland guideline of 0.167 mg/L.
Table 76: Trend summary of Nitrite/Nitate Nitrogen (NNN) concentrations for the Lower Clutha
/ Pomahaka reporting region.
Site
Po
mah
aka
Riv
er
at G
len
ken
Her
iot
Bu
rn
at P
ark
Hill
Ro
ad
Cro
oks
ton
Bu
rn
at K
els
o R
oad
Wai
koik
oi S
trea
m
at H
aile
s B
rid
ge
Wai
pah
i Riv
er
at C
airn
s P
eak
Wai
pah
i Riv
er
at W
aip
ahi
Wai
run
a R
iver
at
Mill
ar R
oad
Po
mah
aka
Riv
er
at B
urk
es F
ord
Wai
wer
a
at M
aws
Farm
Wai
tah
un
a
at T
wee
ds
Bri
dge
Clu
tha
Riv
er
at B
alcl
uth
a
NN
N
? ↑↑ ? ? ↑↑↑ ? ? ? ? ? ?
Nitrite
/Nitra
te N
itro
gen (
mg/L
)
Pom
ahak
a River
at G
lenk
en
Her
iot B
urn
at P
ark
Hill R
oad
Cro
okst
on B
urn
at K
elso
Roa
d
Waiko
ikoi
Stre
am a
t Haile
s Brid
ge
Waipa
hi R
iver
at C
airn
s Pea
k
Waipa
hi R
iver
at W
aipa
hi
Wairu
na R
iver
at M
illar
Roa
d
Pom
ahak
a River
at B
urke
s For
d
Waiwer
a at
Maw
s Far
m
Waita
huna
at T
wee
ds B
ridge
Clu
tha
River
at B
alclut
ha
0.00
0.50
1.00
1.50
2.00
2.50
3.00
3.50
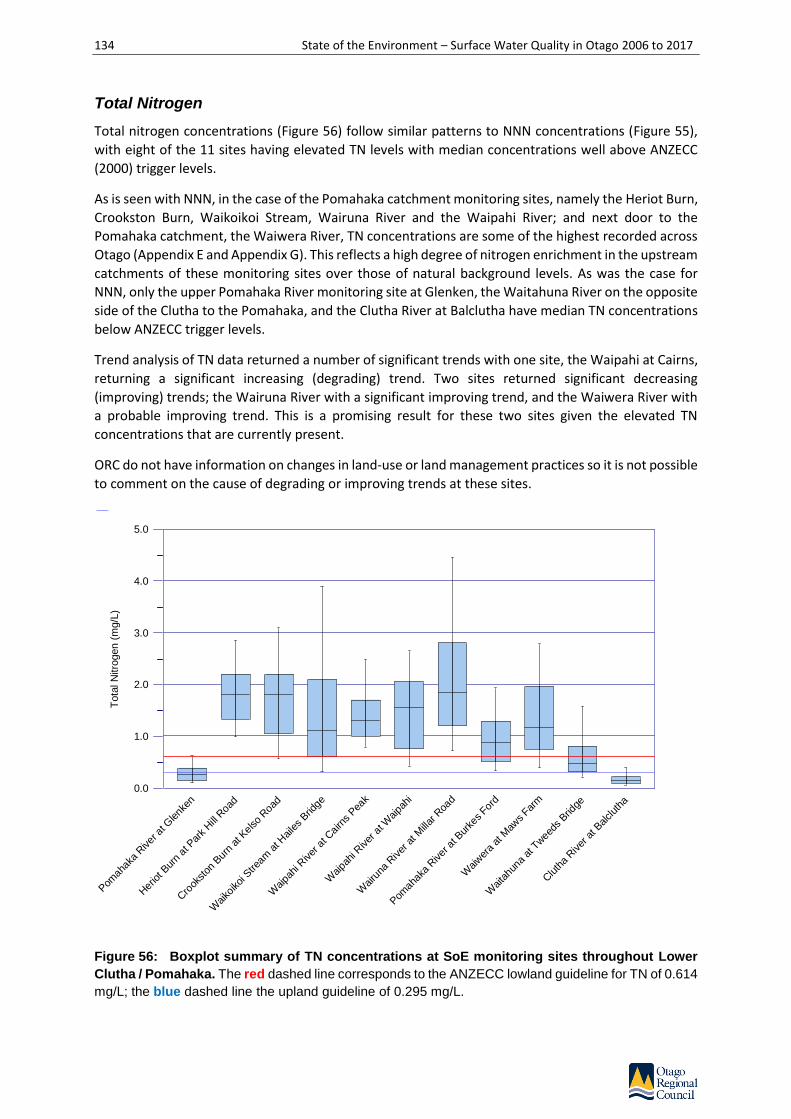
134 State of the Environment – Surface Water Quality in Otago 2006 to 2017
Total Nitrogen
Total nitrogen concentrations (Figure 56) follow similar patterns to NNN concentrations (Figure 55),
with eight of the 11 sites having elevated TN levels with median concentrations well above ANZECC
(2000) trigger levels.
As is seen with NNN, in the case of the Pomahaka catchment monitoring sites, namely the Heriot Burn,
Crookston Burn, Waikoikoi Stream, Wairuna River and the Waipahi River; and next door to the
Pomahaka catchment, the Waiwera River, TN concentrations are some of the highest recorded across
Otago (Appendix E and Appendix G). This reflects a high degree of nitrogen enrichment in the upstream
catchments of these monitoring sites over those of natural background levels. As was the case for
NNN, only the upper Pomahaka River monitoring site at Glenken, the Waitahuna River on the opposite
side of the Clutha to the Pomahaka, and the Clutha River at Balclutha have median TN concentrations
below ANZECC trigger levels.
Trend analysis of TN data returned a number of significant trends with one site, the Waipahi at Cairns,
returning a significant increasing (degrading) trend. Two sites returned significant decreasing
(improving) trends; the Wairuna River with a significant improving trend, and the Waiwera River with
a probable improving trend. This is a promising result for these two sites given the elevated TN
concentrations that are currently present.
ORC do not have information on changes in land-use or land management practices so it is not possible
to comment on the cause of degrading or improving trends at these sites.
Figure 56: Boxplot summary of TN concentrations at SoE monitoring sites throughout Lower
Clutha / Pomahaka. The red dashed line corresponds to the ANZECC lowland guideline for TN of 0.614
mg/L; the blue dashed line the upland guideline of 0.295 mg/L.
Tota
l N
itro
gen (
mg/L
)
Pom
ahak
a River
at G
lenk
en
Her
iot B
urn
at P
ark
Hill R
oad
Cro
okst
on B
urn
at K
elso
Roa
d
Waiko
ikoi
Stre
am a
t Haile
s Brid
ge
Waipa
hi R
iver
at C
airn
s Pea
k
Waipa
hi R
iver
at W
aipa
hi
Wairu
na R
iver
at M
illar
Roa
d
Pom
ahak
a River
at B
urke
s For
d
Waiwer
a at
Maw
s Far
m
Waita
huna
at T
wee
ds B
ridge
Clu
tha
River
at B
alclut
ha
0.0
1.0
2.0
3.0
4.0
5.0

tate of the Environment – Surface Water Quality in Otago 2006 to 2017 135
Table 77: Trend summary of TN concentrations for the Lower Clutha / Pomahaka reporting
region.
Site
Po
mah
aka
Riv
er
at G
len
ken
Her
iot
Bu
rn
at P
ark
Hill
Ro
ad
Cro
oks
ton
Bu
rn
at K
els
o R
oad
Wai
koik
oi S
trea
m
at H
aile
s B
rid
ge
Wai
pah
i Riv
er
at C
airn
s P
eak
Wai
pah
i Riv
er
at W
aip
ahi
Wai
run
a R
iver
at
Mill
ar R
oad
Po
mah
aka
Riv
er
at B
urk
es F
ord
Wai
we
ra
at M
aws
Farm
Wai
tah
un
a
at T
wee
ds
Bri
dge
Clu
tha
Riv
er
at B
alcl
uth
a
TN
? ? ? ? ↑↑↑ ? ↓↓↓ ? ↓↓ ? ?
Dissolved Reactive Phosphorus
Dissolved Reactive Phosphorus (DRP) concentrations exceed ANZECC (2000) trigger values at nine of
the 11 monitoring sites across the Lower Clutha/Pomahaka reporting region and (Figure 57). In the
case of the Heriot Burn, Crookston Burn, Waikoikoi Stream and Wairuna River, concentrations are
highly elevated above those of non-impacted sites, with these streams sitting in the top six sites across
Otago for elevated DRP (Appendix G). The patterns in DRP follow those of NNN and TN, with the same
sites returning elevated concentrations for all.
Trend analysis of DRP data returns four increasing (degrading) trends; these being a significant
degrading trend for the Pomahaka at Glenken, a site currently with good water quality; significant
degrading trends for the Waikoikoi and Waitahuna rivers; and a probable degrading trend for the
Waipahi River at Cairns.
A significant decreasing (improving) trend was returned for the Clutha River at Balclutha, a site
currently with excellent water quality.
ORC do not have information on changes in land-use or land management practices so it is not possible
to comment on the cause of the degrading trends at these sites.

136 State of the Environment – Surface Water Quality in Otago 2006 to 2017
Figure 57: Boxplot summary of Dissolved Reactive Phosphorus (DRP) concentrations at SoE
monitoring sites throughout Lower Clutha / Pomahaka. Full scale. The red dashed line corresponds
to the ANZECC lowland guideline for DRP of 0.010 mg/L; the blue dashed line the upland guideline of
0.009 mg/L.
Table 78: Trend summary of Dissolved Reactive Phosphorus (DRP) concentrations for the
Lower Clutha / Pomahaka reporting region.
Site
Po
mah
aka
Riv
er
at G
len
ken
Her
iot
Bu
rn
at P
ark
Hill
Ro
ad
Cro
oks
ton
Bu
rn
at K
els
o R
oad
Wai
koik
oi S
trea
m
at H
aile
s B
rid
ge
Wai
pah
i Riv
er
at C
airn
s P
eak
Wai
pah
i Riv
er
at W
aip
ahi
Wai
run
a R
iver
at
Mill
ar R
oad
Po
mah
aka
Riv
er
at B
urk
es F
ord
Wai
wer
a
at M
aws
Farm
Wai
tah
un
a
at T
wee
ds
Bri
dge
Clu
tha
Riv
er
at B
alcl
uth
a
DR
P
↑↑↑ ? ? ↑↑↑ ↑↑ ? ? ? ? ↑↑↑ ↓↓↓
Dis
solv
ed R
eactive P
hosphoru
s (
mg/L
)
Pom
ahak
a River
at G
lenk
en
Her
iot B
urn
at P
ark
Hill R
oad
Cro
okst
on B
urn
at K
elso
Roa
d
Waiko
ikoi
Stre
am a
t Haile
s Brid
ge
Waipa
hi R
iver
at C
airn
s Pea
k
Waipa
hi R
iver
at W
aipa
hi
Wairu
na R
iver
at M
illar
Roa
d
Pom
ahak
a River
at B
urke
s For
d
Waiwer
a at
Maw
s Far
m
Waita
huna
at T
wee
ds B
ridge
Clu
tha
River
at B
alclut
ha
0.000
0.025
0.050
0.075
0.100
0.125
0.150

tate of the Environment – Surface Water Quality in Otago 2006 to 2017 137
Total Phosphorus
As was seen with DRP, TP concentrations exceed ANZECC (2000) trigger values at nine of the 11
monitoring sites across the Lower Clutha/Pomahaka reporting region (Figure 58); although the median
TP for the Pomahaka at Burkes Ford is only marginally above the ANZECC lowland trigger level of 0.033
mg/L. The Wairuna River returns the second highest median TP concentration of all Otago sites, second
to the Waiareka Creek in North Otago (Appendix G).
Trend analysis of TP data returns two increasing (degrading) trends; these being a probable increasing
trend for the Pomahaka at Glenken (as was the case with DRP) and the Heriot Burn. All remaining sites
return ‘indeterminate’ trends with the exception of the Waipahi at Cairns which is stable (Table 79).
Figure 58: Boxplot summary of TP concentrations at SoE monitoring sites throughout Lower
Clutha / Pomahaka. The red dashed line corresponds to the ANZECC lowland guideline for TP of 0.033
mg/L; the blue dashed line the upland guideline of 0.026 mg/L.
Tota
l P
hosphoru
s (
mg/L
)
Pom
ahak
a River
at G
lenk
en
Her
iot B
urn
at P
ark
Hill R
oad
Cro
okst
on B
urn
at K
elso
Roa
d
Waiko
ikoi
Stre
am a
t Haile
s Brid
ge
Waipa
hi R
iver
at C
airn
s Pea
k
Waipa
hi R
iver
at W
aipa
hi
Wairu
na R
iver
at M
illar
Roa
d
Pom
ahak
a River
at B
urke
s For
d
Waiwer
a at
Maw
s Far
m
Waita
huna
at T
wee
ds B
ridge
Clu
tha
River
at B
alclut
ha
0.00
0.05
0.10
0.15
0.20
0.25

138 State of the Environment – Surface Water Quality in Otago 2006 to 2017
Table 79: Trend summary of TP concentrations for the Lower Clutha / Pomahaka reporting
region.
Site
Po
mah
aka
Riv
er
at G
len
ken
Her
iot
Bu
rn
at P
ark
Hill
Ro
ad
Cro
oks
ton
Bu
rn
at K
els
o R
oad
Wai
koik
oi S
trea
m
at H
aile
s B
rid
ge
Wai
pah
i Riv
er
at C
airn
s P
eak
Wai
pah
i Riv
er
at W
aip
ahi
Wai
run
a R
iver
at
Mill
ar R
oad
Po
mah
aka
Riv
er
at B
urk
es F
ord
Wai
we
ra
at M
aws
Farm
Wai
tah
un
a
at T
wee
ds
Bri
dge
Clu
tha
Riv
er
at B
alcl
uth
a
TP
↑↑ ↑↑ ? ? → ? ? ? ? ? ?
Escherichia coli
As discussed previously with the NOF E. coli compliance, many sites monitored across the Lower
Clutha/Pomahaka reporting region have elevated E. coli concentrations with four sites being in the top
five sites regionally for elevated E. coli levels, these sites again being the Heriot Burn, Crookston Burn,
Waikoikoi Stream and the Wairuna River (Appendix G).
Trend analysis returned probable degrading trends for the Pomahaka at Glenken, the Heriot Burn and
the Waitahuna River. Probable improving trends were evident for the Waipahi at Cairns and the
Waiwera at Maws Farm (Table 80).
Figure 59: Boxplot summary of E coli concentrations at SoE monitoring sites throughout Lower
Clutha / Pomahaka. The amber line corresponds to the amber alert level of 260 CFU/100ml; the red
line to the red alert level of 550 CFU/100ml.
Escherichia
coli
(CF
U/1
00m
l)
Pom
ahak
a River
at G
lenk
en
Her
iot B
urn
at P
ark
Hill R
oad
Cro
okst
on B
urn
at K
elso
Roa
d
Waiko
ikoi
Stre
am a
t Haile
s Brid
ge
Waipa
hi R
iver
at C
airn
s Pea
k
Waipa
hi R
iver
at W
aipa
hi
Wairu
na R
iver
at M
illar
Roa
d
Pom
ahak
a River
at B
urke
s For
d
Waiwer
a at
Maw
s Far
m
Waita
huna
at T
wee
ds B
ridge
Clu
tha
River
at B
alclut
ha
0
1500
3000
4500
6000
7500
9000
10500
12000
13500
15000
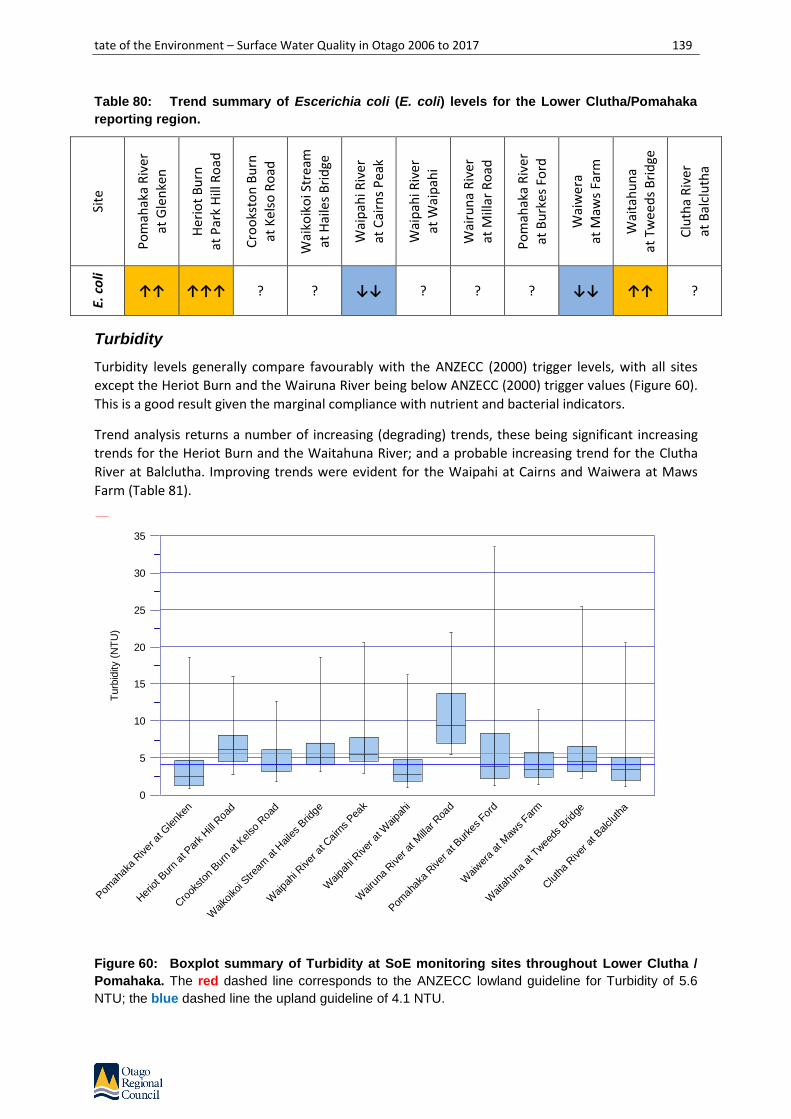
tate of the Environment – Surface Water Quality in Otago 2006 to 2017 139
Table 80: Trend summary of Escerichia coli (E. coli) levels for the Lower Clutha/Pomahaka
reporting region.
Site
Po
mah
aka
Riv
er
at G
len
ken
Her
iot
Bu
rn
at P
ark
Hill
Ro
ad
Cro
oks
ton
Bu
rn
at K
els
o R
oad
Wai
koik
oi S
trea
m
at H
aile
s B
rid
ge
Wai
pah
i Riv
er
at C
airn
s P
eak
Wai
pah
i Riv
er
at W
aip
ahi
Wai
run
a R
iver
at
Mill
ar R
oad
Po
mah
aka
Riv
er
at B
urk
es F
ord
Wai
we
ra
at M
aws
Farm
Wai
tah
un
a
at T
wee
ds
Bri
dge
Clu
tha
Riv
er
at B
alcl
uth
a
E. c
oli
↑↑ ↑↑↑ ? ? ↓↓ ? ? ? ↓↓ ↑↑ ?
Turbidity
Turbidity levels generally compare favourably with the ANZECC (2000) trigger levels, with all sites
except the Heriot Burn and the Wairuna River being below ANZECC (2000) trigger values (Figure 60).
This is a good result given the marginal compliance with nutrient and bacterial indicators.
Trend analysis returns a number of increasing (degrading) trends, these being significant increasing
trends for the Heriot Burn and the Waitahuna River; and a probable increasing trend for the Clutha
River at Balclutha. Improving trends were evident for the Waipahi at Cairns and Waiwera at Maws
Farm (Table 81).
Figure 60: Boxplot summary of Turbidity at SoE monitoring sites throughout Lower Clutha /
Pomahaka. The red dashed line corresponds to the ANZECC lowland guideline for Turbidity of 5.6
NTU; the blue dashed line the upland guideline of 4.1 NTU.
Turb
idity (
NT
U)
Pom
ahak
a River
at G
lenk
en
Her
iot B
urn
at P
ark
Hill R
oad
Cro
okst
on B
urn
at K
elso
Roa
d
Waiko
ikoi
Stre
am a
t Haile
s Brid
ge
Waipa
hi R
iver
at C
airn
s Pea
k
Waipa
hi R
iver
at W
aipa
hi
Wairu
na R
iver
at M
illar
Roa
d
Pom
ahak
a River
at B
urke
s For
d
Waiwer
a at
Maw
s Far
m
Waita
huna
at T
wee
ds B
ridge
Clu
tha
River
at B
alclut
ha
0
5
10
15
20
25
30
35

140 State of the Environment – Surface Water Quality in Otago 2006 to 2017
Table 81: Trend summary of Turbidity levels for the Lower Clutha / Pomahaka reporting region. Si
te
Po
mah
aka
Riv
er
at G
len
ken
Her
iot
Bu
rn
at P
ark
Hill
Ro
ad
Cro
oks
ton
Bu
rn
at K
els
o R
oad
Wai
koik
oi S
trea
m
at H
aile
s B
rid
ge
Wai
pah
i Riv
er
at C
airn
s P
eak
Wai
pah
i Riv
er
at W
aip
ahi
Wai
run
a R
iver
at
Mill
ar R
oad
Po
mah
aka
Riv
er
at B
urk
es F
ord
Wai
we
ra
at M
aws
Farm
Wai
tah
un
a
at T
wee
ds
Bri
dge
Clu
tha
Riv
er
at B
alcl
uth
a
Turb
idit
y
? ↑↑↑ ? ? ↓↓ ? ? ? ↓↓↓ ↑↑↑ ↑↑
Stream Health and the Macroinvertebrate Community Index
Macroinvertebrate Community Index (MCI) scores provide an integrated indicator of the general state
of water quality and aquatic ecosystem health at a site.
Figure 61 summarises MCI scores for sites monitored for aquatic macroinvertebrates throughout the
Lower Clutha/Pomahaka reporting region. The summary includes annual samples collected from 2008
to 2017 (eight years) where data is available. Not all sites monitored for water quality have macro-
invertebrate samples taken. Of the 11 sites monitored for water quality, six sites are sampled annually
for macro-invertebrates.
The Waitahuna River returns the highest MCI scores for sites monitored across the Lower
Clutha/Pomahaka reporting region with MCI’s exceeding 120, representing a macroinvertebrate
community in excellent health. Based on the median MCI, this site is ranked fifth highest of all Otago
sites (Appendix G), where the higher the value the better the result.
The remaining sites have mixed MCI scores, with the Waipahi River at Cairns retuning MCI scores
typically around 110. This site is ranked ninth regionally for median MCI’s.
The remaining sites have MCI’s that are representative of macroinvertebrate communities in poor
health, with the Heriot Burn, Waipahi River at Waipahi, the Wairuna River and Waiwera at Maws Farm
all having MCI scores below 100, with the latter three site having MCI’s below 90. These results follow
similar patterns to other water quality indicators.

tate of the Environment – Surface Water Quality in Otago 2006 to 2017 141
Figure 61: Boxplot summary of Macroinvertebrate Community Index (MCI) scores at SoE
monitoring sites throughout the Lower Clutha / Pomahaka reporting region where
macroinvertebrate samples are routinely collected. Above the blue line corresponds to the
‘Excellent’ quality threshold; between the orange and blue line the ‘Good’ quality threshold; betwene
the red and orange line ‘Poor’ quality threshold; below the red line the ‘Degraded’ threshold.
MC
I
Her
iot B
urn
at P
ark
Hill R
oad
Waipa
hi R
iver
at C
airn
s Pea
k
Waipa
hi R
iver
at W
aipa
hi
Wairu
na R
iver
at M
illar
Roa
d
Waiwer
a at
Maw
s Far
m
Waita
huna
at T
wee
ds B
ridge
70
80
90
100
110
120
130
140

142 State of the Environment – Surface Water Quality in Otago 2006 to 2017
Lower Clutha / Pomahaka Water Quality Summary
Across the Lower Clutha/Pomahaka reporting region there are a moderate number of sites with
degrading water quality trends, as shown in Table 82, which summarises trend results across all sites.
There are a total of 77 results reported in the table; 21% return significant or probable degrading
trends; and 9% return significant or probable improving trends; 1% return stable trends. Overall 69%
of sites have either indeterminate trends (reported as “?”); or too many observations being ‘less than
detect’ (<DL) for results returned from the laboratory.
Water quality at SoE monitoring sites across the Lower Clutha/Pomahaka reporting region is typically
degraded, as was found by previous State of Environment monitoring reports published by ORC
(Ozanne, 2012).
Previous work has identified water quality in the lower Pomahaka catchment to be degrading for a
number of years, while land use has intensified. The Pomahaka catchment has poor draining pallic
soils, which has resulted in tile-and mole drainage being installed to improve grazing land-use. The
deterioration in water quality has been largely caused by the management practices employed on this
tile-and-mole drainage network (ORC, 2010; 2011). The results presented here summarise monitoring
results collected over the last five years, and trend results over the last 11 years. ORC are working
actively throughout the Pomahaka catchment with groups such as the Pomahaka Watercare Trust, the
Landcare Trust and the Clutha Development Trust to address water quality issues. A large part of this
effort is focused on improving bacterial water quality. Recent work by landowners across a number of
these catchments is likely resulting in improvements to overall water quality that aren’t currently being
reflected in this data set.
As stated previously, having accurate information on changes in land use and land management
practice would help in identifying drivers of change evident with some water quality variables.
In summary:
• For two of 11 sites monitored across the Lower Clutha/Pomahaka reporting region, water
quality is excellent. These two sites are the upper Pomahaka River at Glenken, and the Clutha
River at Balclutha. All remaining sites have varying degrees of degraded water quality;
• Bacterial water quality is severely degraded at nearly all monitoring sites with 10 of the 11
sites failing the NPSFM (2014) national bottom line. A number of sites return the worst bacteria
levels of all sites monitored across Otago;
• Heriot Burn, Crookston Burn, Waikoikoi Stream and the Wairuna River monitoring sites are the
worst performing sites of the Lower Clutha/Pomahaka reporting region. On a regional
standing, these sites are in the top five for degraded water quality (Appendix E and Appendix
G);
• Water quality degrades from the upper Pomhaka River at Glenken to the lower Pomahaka
River at Burkes Ford. In the case of the Pomahaka, as identified from prevoius studies, it
appears that degraded water quality in the tributary streams impacts on water quality of the
main-stem river.

tate of the Environment – Surface Water Quality in Otago 2006 to 2017 143
Table 82: Trend summary for the Lower Clutha / Pomahaka reporting region. Si
te
Po
mah
aka
Riv
er
at G
len
ken
Her
iot
Bu
rn
at P
ark
Hill
Ro
ad
Cro
oks
ton
Bu
rn
at K
els
o R
oad
Wai
koik
oi S
trea
m
at H
aile
s B
rid
ge
Wai
pah
i Riv
er
at C
airn
s P
eak
Wai
pah
i Riv
er
at W
aip
ahi
Wai
run
a R
iver
at M
illar
Ro
ad
Po
mah
aka
Riv
er
at B
urk
es F
ord
Wai
we
ra
at M
aws
Farm
Wai
tah
un
a
at T
wee
ds
Bri
dge
Clu
tha
Riv
er
at B
alcl
uth
a
Ammoniacal Nitrogen
< DL ? ? ? ↑↑ ? ? ? ? ? ?
Nitrite/Nitrate Nitrogen
? ↑↑ ? ? ↑↑↑ ? ? ? ? ? ?
Total Nitrogen ? ? ? ? ↑↑↑ ? ↓↓↓ ? ↓↓ ? ?
Dissolved Reactive
Phosphorus ↑↑↑ ? ? ↑↑↑ ↑↑ ? ? ? ? ↑↑↑ ↓↓↓
Total Phosphorus
↑↑ ↑↑ ? ? → ? ? ? ? ? ?
Escherichia coli
↑↑ ↑↑↑ ? ? ↓↓ ? ? ? ↓↓ ↑↑ ?
Turbidity ? ↑↑↑ ? ? ↓↓ ? ? ? ↓↓↓ ↑↑↑ ↑↑

144 State of the Environment – Surface Water Quality in Otago 2006 to 2017
2.7. Otago Lakes
Otago has some of New Zealand’s largest and most pristine lakes, which are a recreational haven for
boaties, fishermen, tourists, and swimmers. Some also provide hydro-electric power and support
Otago’s agricultural industries with water for irrigation14. The lakes of Otago are diverse, ranging from
lowland, shallow coastal lagoons such as Tomahawk Lagoon and Lake Waihola to the deep, glacial
Southern Great Lakes that include the iconic Lakes Wanaka, Wakatipu and Hawea.
There are 63 lakes in Otago that are 10 hectares in size or larger (Figure 63; Milne et al., 2017). Of the
63 lakes, ORC monitors nine on a monthly basis as part of their core, long-term State of Environment
monitoring program. These lakes being Lake Wanaka, Lake Wakatipu, Lake Hawea, Lake Dunstan, Lake
Hayes, Lake Johnson, Lake Onslow, Lake Waihola and Lake Tuakitoto. Figure 2 (located at the beginning
of the report) shows the geographical location of the SoE monitored lakes; Table 83 summarises the
main characteristics of the lakes.
Overall, the characteristics of the nine lakes monitored as part of the long-term SoE program
incorporate a range of (Table 83; Milne et al., 2017):
• sizes and depths, from very shallow lakes through to several of the deepest (and largest) lakes
in the country;
• lake types and elevations – from high country glacial lakes to reservoirs and lowland coastal
lakes;
• natural and pastoral landcover combinations in the upstream catchments; and
• trophic states on the Trophic Lake Index (TLI) scale, from microtrophic to supertrophic.
The nine lakes included in the program provide a good representation of lake types and lake catchment
land-uses across Otago (Milne et al., 2017).
Long-term SoE lake monitoring sites consist of a mix of lake-outlet (lakes Wanaka, Wakatipu and
Hawea) and lake-shore (lakes Dunstan, Hayes, Johnson, Onslow, Waihola and Tuakitoto) sampling
sites. Shore sites are usually affected by littoral shallow water conditions, including local nutrient run
off, and sediment disturbance. Nutrient concentrations are usually higher and phytoplankton and
zooplankton species composition and abundance usually differ from mid-lake monitoring sites.
Moreover, Secchi depth measurements cannot be made at shore sites (Milne et al., 2017). To address
this ORC undertakes a more detailed ‘Trophic Lake Sampling Program’ (TLSP) that focusses on mid-
water, boat based sampling with a more comprehensive suite of water quality measurements
(including Secchi depth), as well as depth profiles of dissolved oxygen and temperature (amongst other
variables). This work is carried out on a subset of these lakes.
The results of TLSP work carried out in recent years are presented independently of this report. For
examples see Ozanne (2009) for TLSP work carried out on Wanaka, Wakatipu, Hayes, Johnson and
Onslow between the years 2006 to 2008; and Ozanne (2017) for TLSP work carried out on lakes
Waihola and Waipori between the years 2014 and 2016. At present, detailed TLSP work is underway
on lakes Wanaka, Hawea, Wakatipu, Hayes and Onslow.
A number of ORC publications exist that provide detailed summaries of the characteristics of Otago’s
monitored lakes, namely Ozanne (2009; 2017).
14 https://www.lawa.org.nz/explore-data/otago-region/lakes/

tate of the Environment – Surface Water Quality in Otago 2006 to 2017 145
Figure 62: Lake Onslow and surrounds. Photo courtesy N. Manning, ORC.
While there are numerous other lakes in Otago that could be monitored, most are small (< 10 ha), with
many located within or near conservation areas where pressures are low and access for regular water
quality monitoring is difficult (e.g., Diamond Lake, Moke Lake and Lakes Alta, Dispute, Harris,
Kirkpatrick, Luna, Lochnagar and Sylvan). The remaining lakes are manmade, including reservoirs of
small to moderate size (e.g., Fraser’s Dam, Falls Dam, Butcher’s Dam, Blue Lake, Poolburn Reservoir,
West Eweburn Dam, Manorburn Dam, Greenland Reservoir, Loganburn Reservoir and Lake
Mahinerangi) that support water/power supply and/or recreational values (Milne et al., 2017).
Despite small and shallow lakes being more common in Otago (Figure 63), the townships of
Queenstown, Wanaka, Hawea and Cromwell are all located adjacent to large and popular lakes.
Therefore, it is appropriate that the proportion of large (and deep) lakes among those that are
monitored exceeds their proportion of all lakes in the region (Milne et al., 2017).
Table 83: Characteristics of lakes currently monitored by ORC. The ‘Natural’ landcover is a
combination of the Bare, Indigenous Forest, Tussock, Scrub, Wetland and Miscellaneous classes of the
River Environment Classification (REC). Table sourced from Milne et al., (2017).
Lake
Maximum
depth
(m)
Surface
area (ha)
Elevation
(m) TLI
Upstream landcover (%)
Lake type Natural Pasture
Hawea 384 15 171 334 1.6 97.1 0.2 Glacial
Wanaka 311 19 886 278 2.1 96.0 1.0 Glacial
Wakatipu 380 29 542 317 1.9 94.1 2.0 Glacial
Hayes 33 274 335 4.9 54.3 42.0 Glacial
Johnson 27 26 334 5.0 97.6 0.4 Glacial
Dunstan 30 2 282 149 2.2 95.1 1.0 Reservoir
Onslow 9.5 1 125 678 3.9 93.1 5.0 Reservoir
Tuakitoto 3 130 15 4.9 9.7 80.0 Riverine
Waihola 2.2 604 5 4.5 46.0 29.0 Riverine

146 State of the Environment – Surface Water Quality in Otago 2006 to 2017
Figure 63: Distribution of lake area (top) and elevation (bottom) of 63 lakes that are larger than
10 ha in the Otago region. Monitored lakes (Table 83) are indicated by red triangles. Note the
logarithmic scale for the top plot. Figure reproduced from Milne et al., (2017).
2.7.1. Water quality and trophic status of Otago Lakes monitored as part of the long-term SoE monitoring program
The following section provides a summary of the Otago lakes’ water quality based on:
• Compliance against Schedule 15 (Water Plan) water quality limits;
• National Policy Statement for Freshwater Management (NPSFM 2014) National Objectives
Framework Attribute bands (NOF bands);
• Summary boxplots of chlorophyll a, TP, TN and the Trophic Lake Index.
Trophic status is a common method for describing the health of lakes and an indicator of how much
growth or productivity occurs in the lake, productivity being directly related to the availability of
nutrients. Lakes in pristine condition typically have very low nutrient and algal biomass levels. As lakes
become more enriched due to changes in land-use and land management practices, lake nutrient levels
and algal productivity increases, lakes become murky and there health is compromised.
The Schedule 15 (Water Plan) water quality limits and the NPSFM (2014) NOF attributes, with the
exception of bacterial water quality (E. coli levels), focus on keeping nutrients and algal biomass at
trophic levels that maintain healthy lake ecosystems and support the life supporting capacity of lakes.
1
10
100
1000
10000
100000
0 20 40 60
0
500
1000
1500
2000
0 20 40 60
Lake
are
a (h
a)El
evat
ion
(m
)

tate of the Environment – Surface Water Quality in Otago 2006 to 2017 147
Figure 64: Lake Hayes. Photo courtesy N. Manning, ORC
Schedule 15 compliance
The Water Plan lake water quality limits (Receiving Water Groups 4 and 5; Table 2) identify different
limits for Otago’s large, microtrophic15 Great Southern Lakes and all other lake across the region. This
was done in recognition that the Great Southern Lakes need added protection for their pristine, iconic
status and under present conditions have extremely low levels of nutrients and algal productivity. The
Great Southern lakes fall within RWG 5, whereas all other lakes are RWG 4.
Note, for the purpose of this report, Lake Dunstan has been assessed against the more stringent RWG
5 limits. In ORC’s Water Plan, Lake Dunstan, along with Lake Roxburgh, sits in the rivers RWG 2.
Table 84 (NH4-N), Table 85 (E. coli), Table 86 (TP), Table 87 (TN), and Table 88 (turbidity) summarises
compliance against Schedule 15 (Water Plan) limits that relate to lake Receiving Water Groups 4 and
5 for all SoE lake monitoring sites. Compliance is based on a comparison of 80th percentile
concentrations for a given variable against the Schedule 15 (Water Plan) limits for the respective
RWG’s.
With the exception of Lake Johnson, all sites are compliant with Schedule 15 (Water Plan) limits for
NH4-N and have 80th percentile concentrations below the 0.010 mg/L limit for RWG 5 lakes and 0.100
mg/L for RWG 4 lakes. In the case of Lake Johnson, summer thermal stratification results in anoxia (no
oxygen) in the bottom waters (hypolimnion) of this lake. During such times, NH4-N concentrations build
up. At the onset of winter, the surface waters of the lake cool to a point that the lake becomes fully
mixed. This results in increased concentrations of NH4-N in the surface water over July, August and
September. This is illustrated in Figure 65 that shows the high concentrations recorded in surface
waters during the winter turnover period. This phenomena results in high 80th percentile
concentrations of NH4-N and non-compliance with the Schedule 15 (Water Plan) RWG 4 limit of 0.100
mg/L. High ammonia concentrations are a concern as ammonia is toxic to aquatic life, particularly at
times of elevated pH. In the case of Lake Johnson, the maximum recorded concentration 0.560 mg/L
recorded in August 2014 (Figure 65) places the site in lower end of the NOF ‘C’ band for ammonia
toxicity. This band provides for an 80% species protection level and reflects an increased chance of
15 ‘Microtrophic’ is a term given to lakes with extremely low nutrient concentrations, very low algal productivity levels and very good water clarity

148 State of the Environment – Surface Water Quality in Otago 2006 to 2017
chronic toxicity effects (not acute) for sensitive species during times of concentration peaks. For other
years the concentration peaks are less pronounced and the NOF attribute band would be a ‘B’ band.
Figure 65: Ammoniacal nitrogen concentrations in Lake Johnson. The dashed green line
corresponds to the Schedule 15 (Water Plan) limit for RWG 4.
Table 84: 80th percentile values for ammonical nitrogen and comparison to limits identified in
Schedule 15. The orange cells show where the 80th percentile exceeds the Schedule 15 limit.
SoE reporting name RWG NH4-N
limit (80th percentile)
NH4-N 80th percentile
Pass/Fail
Lake Wanaka Outflow 5 0.010 0.006 Pass
Lake Hawea Outflow 5 0.010 0.005 Pass
Lake Dunstan at Dead Man’s Pt 5 0.010 0.005 Pass
Lake Wakatipu Outflow 5 0.010 0.005 Pass
Lake Hayes at Bendemeer Bay 4 0.100 0.033 Pass
Lake Johnson at Sth Beach huts 4 0.100 0.188 Fail
Lake Onslow at Boat Ramp 4 0.100 0.010 Pass
Lake Waihola at jetty 4 0.100 0.015 Pass
Lake Tuakitoto at Outlet 4 0.100 0.064 Pass
Compliance against the E. coli Schedule 15 (Water Plan) limit is good across all sites with the exception
of Lake Tuakitoto (Table 85). This site fails as the 80th percentile concentration of E. coli is 180
CFU/100ml and above the Water Plan limit of 126 CFU/100ml. Lake Tuakitoto is renowned for its
birdlife due to the high value fringing wetlands surrounding the lake, the elevated E. coli levels could
be sourced from birds.
0.00
0.10
0.20
0.30
0.40
0.50
0.60
No
v-2
01
2
Jan
-20
13
Mar
-20
13
May
-20
13
Jul-
20
13
Sep
-20
13
No
v-2
01
3
Jan
-20
14
Mar
-20
14
May
-20
14
Jul-
20
14
Sep
-20
14
No
v-2
01
4
Jan
-20
15
Mar
-20
15
May
-20
15
Jul-
20
15
Sep
-20
15
No
v-2
01
5
Jan
-20
16
Mar
-20
16
May
-20
16
Jul-
20
16
Sep
-20
16
No
v-2
01
6
Jan
-20
17
Mar
-20
17
May
-20
17
Jul-
20
17
Am
mo
nia
cal n
itro
gen
(m
g/L
)

tate of the Environment – Surface Water Quality in Otago 2006 to 2017 149
Table 85: 80th percentile values for E. coli and comparison to limits identified in Schedule 15.
The orange cells show where the 80th percentile exceeds the Schedule 15 limit.
SoE reporting name RWG E. coli
limit (80th percentile)
E. coli 80th percentile
Pass/Fail
Lake Wanaka Outflow 5 10 1.6 Pass
Lake Hawea Outflow 5 10 1.0 Pass
Lake Dunstan at Dead Man’s Pt 5 10 4.0 Pass
Lake Wakatipu Outflow 5 10 4.9 Pass
Lake Hayes at Bendemeer Bay 4 126 15 Pass
Lake Johnson at Sth Beach huts 4 126 10 Pass
Lake Onslow at Boat Ramp 4 126 3.3 Pass
Lake Waihola at jetty 4 126 81 Pass
Lake Tuakitoto at Outlet 4 126 180 Fail
Compliance against the TP Schedule 15 (Water Plan) limit is very poor for RWG 4 lakes with all failing.
In the case of Lake Johnson and Tuakitoto, TP 80th percentiles are three to four times the Schedule 15
(Water Plan) limit. This reflects high levels of phosphorus enrichment at these lakes well above those
identified in the plan. Assessing TP compliance for RWG 5 lakes is difficult due to a laboratory method
detection limit of 0.004 mg/L being close to the Schedule 15 (Water Plan) limit of 0.005 mg/L. Added
to this is the reporting of TP from the laboratory to be provided to three significant figures only (0.001).
This causes numerous results to be either <0.004 mg/L, 0.004 mg/L or 0.005 mg/L for the microtrophic
lakes. And when calculating an 80th percentile for Wanaka, Hawea and Wakatipu, returns a number
equal to the Schedule 15 (Water Plan) limit. The TP concentrations for these lakes are likely much lower
than 0.005 mg/L. As demonstrated by work presently underway as part of the Trophic Lake Sampling
Program, that is sending samples for phosphorus analysis to a laboratory that offers detection limits
of 0.001 mg/L. For samples taken over the last twelve months, the 80th percentile concentrations are
closer to 0.001 mg/L (ORC unpublished data) as opposed to 0.005 mg/L, as calculated from the data
set used in this report.

150 State of the Environment – Surface Water Quality in Otago 2006 to 2017
Table 86: 80th percentile values for TP and comparison to limits identified in Schedule 15. The
orange cells show where the 80th percentile exceeds the Schedule 15 limit.
SoE reporting name RWG TP limit
(80th percentile)
TP 80th percentile
Pass/Fail
Lake Wanaka Outflow 5 0.005 0.00516 Pass
Lake Hawea Outflow 5 0.005 0.005 Pass
Lake Dunstan at Dead Man’s Pt 5 0.005 0.009 Fail
Lake Wakatipu Outflow 5 0.005 0.005 Pass
Lake Hayes at Bendemeer Bay 4 0.033 0.057 Fail
Lake Johnson at Sth Beach huts 4 0.033 0.090 Fail
Lake Onslow at Boat Ramp 4 0.033 0.037 Fail
Lake Waihola at jetty 4 0.033 0.079 Fail
Lake Tuakitoto at Outlet 4 0.033 0.144 Fail
Compliance against the TN Schedule 15 (Water Plan) limit is slightly better for RWG 4 lakes than was
the case for TP, with 3 of 5 lakes failing (Table 87). Again Lake Johnson and Lake Tuakitoto are the two
worst lakes compliance wise with 80th percentile TN concentrations being at least twice that of the
Schedule 15 (Water Plan) limit of 0.55 mg/L TN. This combined with the high TP concentrations for
these two lakes shows both lakes are nutrient enriched and eutrophic.
For RWG 5 lakes, TN compliance is good with all lakes 80th percentile concentrations being well below
the Schedule 15 (Water Plan) limit of 0.10 mg/L (Table 87).
Table 87: 80th percentile values for TN and comparison to limits identified in Schedule 15. The
orange cells show where the 80th percentile exceeds the Schedule 15 limit.
SoE reporting name RWG TN limit
(80th percentile)
TN 80th percentile
Pass/Fail
Lake Wanaka Outflow 5 0.100 0.080 Pass
Lake Hawea Outflow 5 0.100 0.050 Pass
Lake Dunstan at Dead Man’s Pt 5 0.100 0.084 Pass
Lake Wakatipu Outflow 5 0.100 0.080 Pass
Lake Hayes at Bendemeer Bay 4 0.550 0.430 Pass
Lake Johnson at Sth Beach huts 4 0.550 1.200 Fail
Lake Onslow at Boat Ramp 4 0.550 0.290 Pass
Lake Waihola at jetty 4 0.550 0.664 Fail
Lake Tuakitoto at Outlet 4 0.550 1.416 Fail
16 NOTE: the detection level for TP is 0.004 mg/L and the resolution is 0.001 mg/L. The actual concentrations of TP in Wakatipu, Wanaka and Hayes are likely well below the Schedule 15 limits but the limitations with laboratory detection limits do not allow us to recognise this.

tate of the Environment – Surface Water Quality in Otago 2006 to 2017 151
Compliance against the Schedule 15 (Water Plan) limit for turbidity (Table 88) is excellent for the RWG
5 lakes with 80th percentile turbidity levels being less than one-third of the limit. This reflects the good
levels of water clarity and low turbidity typical of lakes Wanaka, Hawea, Wakatipu and Dunstan.
In the case of the RWG 4 lakes, Lake Waihola and Lake Tuakitoto return 80th percentiles for turbidity
two to three times the Schedule 15 (Water Plan) limit of 5.0 NTU (Table 88). Both these lakes are very
shallow and susceptible to sediment resuspension from wind-driven waves. At such times turbidity
levels become elevated and may remain so for a number of days. This could be argued as being a
natural characteristic of very shallow lakes. The challenge is identifying the drivers of elevated
turbidity, is it sediment resuspension, high algal biomass in the water column, or both?
Table 88: 80th percentile values for turbidity and comparison to limits identified in Schedule
15. The orange cells show where the 80th percentile exceeds the Schedule 15 limit.
SoE reporting name RWG Turbidity limit (80th
percentile)
Turbidity 80th percentile
Pass/Fail
Lake Wanaka Outflow 5 3.0 0.6 Pass
Lake Hawea Outflow 5 3.0 0.7 Pass
Lake Dunstan at Dead Man’s Pt 5 3.0 1.2 Pass
Lake Wakatipu Outflow 5 3.0 0.7 Pass
Lake Hayes at Bendemeer Bay 4 5.0 2.2 Pass
Lake Johnson at Sth Beach huts 4 5.0 6.0 Fail
Lake Onslow at Boat Ramp 4 5.0 5.7 Fail
Lake Waihola at jetty 4 5.0 18.5 Fail
Lake Tuakitoto at Outlet 4 5.0 12.5 Fail
Figure 66: Lake Wakatipu and the Frankton Arm. Photo courtesy N. Manning, ORC.
NOF compliance
The NPS FM (2014) NOF attributes for lakes cover algal biomass (Chla), TN, TP, E. coli, and
cyanobacteria. The Chla, TN and TP attributes focus on managing the life supporting capacity of lakes
and guarding against eutrophication and algal blooms that impact on lake ecological communities. The
E. coli and cyanobacteria attributes focus on managing risk to human health for people undertaking
primary contact (full immersion) activities.
ORC do not routinely measure cyanobacteria as part of their SoE monitoring program so no assessment
is made as to compliance against the NOF cyanobacteria bio-volume attribute. Historically, with the
rare exceptions for Lake Hayes, Lake Tuakitoto and Lake Waihola, cyanobacteria levels across the SoE
lakes monitored are very low.

152 State of the Environment – Surface Water Quality in Otago 2006 to 2017
Table 89 summarises compliance for the algal biomass (chlorophyll a) NOF attribute. Lakes in RWG 5
record very low levels of algal biomass with median and maximum concentrations being at least half
of the upper ‘A’ band threshold. This reflects chla concentrations in these lakes to provide for ‘lake
ecological communities that are healthy and resilient, similar to natural reference conditions’
(Appendix B).
For the remaining lakes the level of compliance varies. Lake Johnson fails the national bottom line with
a median Chla concentration above the national bottom line of 12 ug/L. Maximum’s for Lake Johnson
are elevated but are below the national bottom line of 60 ug/L. The ‘D’ band rating for this lake reflects
Chla or algal biomass levels that threaten lake ecological communities and pose an unacceptable risk
of a regime shift to a persistent, degraded state (see Appendix B for NOF band definitions for Chla).
Median and maximum Chla concentrations for Lake Hayes and Lake Waihola are both elevated and
place these two lakes into a ‘C’ band. This reflects chla biomass levels that are ‘moderately impacted
by additional plant and algae growth arising from nutrient levels that are elevated well above natural,
reference conditions’ (Appendix B).
Interestingly, Lake Tuakitoto that typically returns very high TN and TP concentrations has quite low
algal biomass levels (Chla concentrations) that place it in the ‘B’ band. The ‘B’ band narrative states
that the Chla levels provide for ‘lake ecological communities that are slightly impacted by additional
plant and algae growth’ (Appendix B).
For Lake Onslow, the median Chla concentration of 2.2 ug/L edges this lake from being in the ‘A’ band
to being in a ‘B’ band. The maximum Chla concentration for this lake has it sitting well within the ‘A’
band.
Table 89: NOF lake compliance summary for Chlorophyll a. Included are median and maximum
values for the period July 2012 to June 2017 and the corresponding NOF attribute band.
Variable Chlorophyll a NOF Band
SoE reporting name Median (ug/L)
Maximum (ug/L)
Median Band
Maximum Band
Lake Wanaka Outflow 1.0 1.5 A A
Lake Hawea Outflow 0.9 1.3 A A
Lake Dunstan at Dead Man’s Pt 1.1 1.6 A A
Lake Wakatipu Outflow 1.0 1.8 A A
Lake Hayes at Bendemeer Bay 10.8 30.2 C C
Lake Johnson at Sth Beach huts 14.1 45.4 D C
Lake Onslow at Boat Ramp 2.2 3.9 B A
Lake Waihola at jetty 7.5 25.6 C C
Lake Tuakitoto at Outlet 4.8 17.2 B B

tate of the Environment – Surface Water Quality in Otago 2006 to 2017 153
Table 90 summarises compliance for the total TN NOF attribute. Lakes in RWG 5 record very low levels
of TN with median concentrations being at least half of the upper ‘A’ band threshold. This reflects TN
concentrations in these lakes to provide for ‘lake ecological communities that are healthy and resilient,
similar to natural reference conditions’ (Appendix B). Lake Onslow, Lake Hayes and Lake Waihola have
median TN concentrations that place these lakes in the ‘B’ band . Lake Hayes and Lake Onslow both
seasonally stratify, compared to the shallow Lake Waihola that is permanently mixed (polymictic).
Seasonally stratified and polymictic lakes have different TN thresholds for the NOF TN attribute
(Appendix B). Lake Johnson and Lake Tuakitoto have median TN concentrations that place them in the
‘D’ band and therefore fail the national bottom line. This reflects an unacceptable level of nitrogen
enrichment that poses a high risk of a permanent regime shift to an undesirable algal dominated state
and one that would threaten the ecological communities of these lakes.
Table 90: NOF lake compliance summary for TN. Included are median values for the period July
2012 to June 2017 and the corresponding NOF attribute band.
SoE reporting name Lake type
Total Nitrogen (mg/L)
Median (mg/L) Band
Lake Wanaka Outflow Seasonally stratified 0.064 A
Lake Hawea Outflow Seasonally stratified 0.038 A
Lake Dunstan at Dead Man’s Pt Seasonally stratified 0.065 A
Lake Wakatipu Outflow Seasonally stratified 0.066 A
Lake Hayes at Bendemeer Bay Seasonally stratified 0.319 B
Lake Johnson at Sth. Beach huts Seasonally stratified 0.881 D
Lake Onslow at Boat Ramp Seasonally stratified 0.248 B
Lake Waihola at jetty Polymictic 0.492 B
Lake Tuakitoto at Outlet Polymictic 1.024 D
Figure 67: Lake Wanaka and the Stevenson Arm. Photo courtesy N. Manning, ORC.
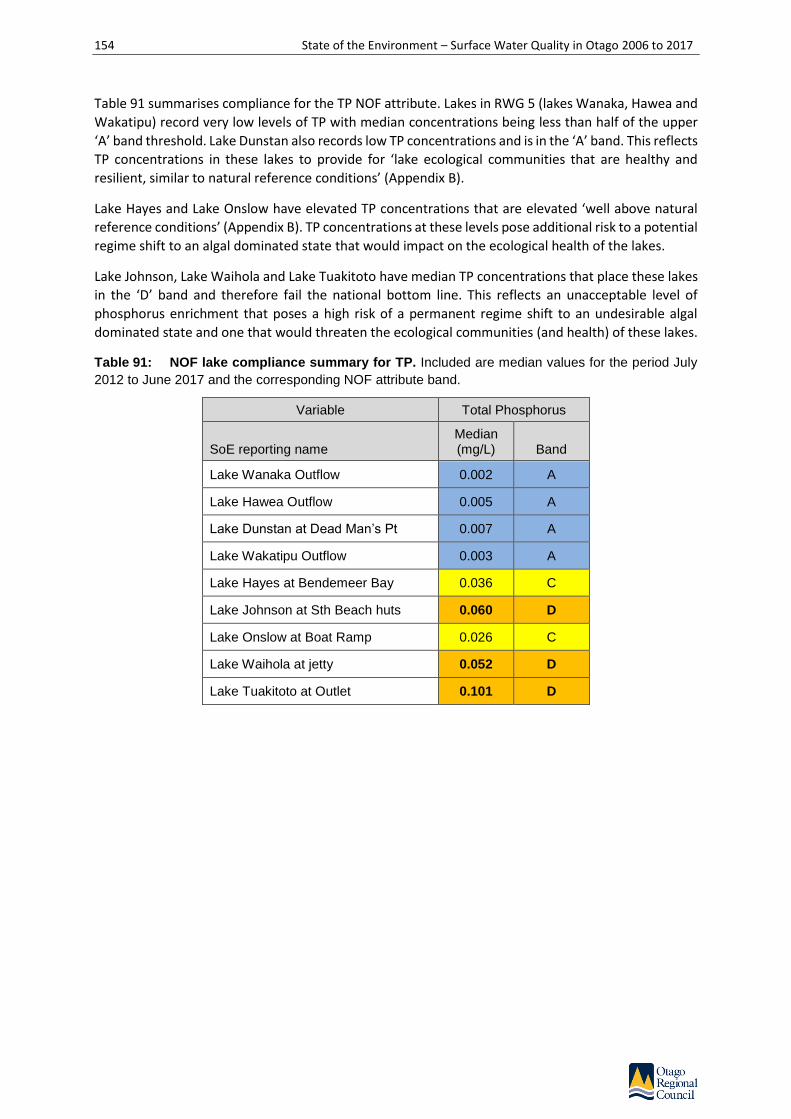
154 State of the Environment – Surface Water Quality in Otago 2006 to 2017
Table 91 summarises compliance for the TP NOF attribute. Lakes in RWG 5 (lakes Wanaka, Hawea and
Wakatipu) record very low levels of TP with median concentrations being less than half of the upper
‘A’ band threshold. Lake Dunstan also records low TP concentrations and is in the ‘A’ band. This reflects
TP concentrations in these lakes to provide for ‘lake ecological communities that are healthy and
resilient, similar to natural reference conditions’ (Appendix B).
Lake Hayes and Lake Onslow have elevated TP concentrations that are elevated ‘well above natural
reference conditions’ (Appendix B). TP concentrations at these levels pose additional risk to a potential
regime shift to an algal dominated state that would impact on the ecological health of the lakes.
Lake Johnson, Lake Waihola and Lake Tuakitoto have median TP concentrations that place these lakes
in the ‘D’ band and therefore fail the national bottom line. This reflects an unacceptable level of
phosphorus enrichment that poses a high risk of a permanent regime shift to an undesirable algal
dominated state and one that would threaten the ecological communities (and health) of these lakes.
Table 91: NOF lake compliance summary for TP. Included are median values for the period July
2012 to June 2017 and the corresponding NOF attribute band.
Variable Total Phosphorus
SoE reporting name Median (mg/L) Band
Lake Wanaka Outflow 0.002 A
Lake Hawea Outflow 0.005 A
Lake Dunstan at Dead Man’s Pt 0.007 A
Lake Wakatipu Outflow 0.003 A
Lake Hayes at Bendemeer Bay 0.036 C
Lake Johnson at Sth Beach huts 0.060 D
Lake Onslow at Boat Ramp 0.026 C
Lake Waihola at jetty 0.052 D
Lake Tuakitoto at Outlet 0.101 D

tate of the Environment – Surface Water Quality in Otago 2006 to 2017 155
Table 92 summarises compliance for E. coli against the four statistical tests to determine the NOF
attribute band. With the exception of Lake Tuakitoto, all lake monitoring sites have a high level of
compliance and return an ‘A’ band (blue) attribute state. This is a great result and shows the lake
monitoring sites to have good water quality in regards to swimmability and E. coli concentrations. Lake
Tuakitoto has elevated peak concentrations with a 95th percentile of 575 CFU/100ml. This places this
lake in the ‘B’ band which is still compliant with the NPS FM Swimmability guidelines.
Table 92: NOF lake compliance summary for E. coli for the the period July 2012 to June 2017.
The overall grading band is determined by the lowest (worst) ranked Numeric Attribute State as it relates
to the four separate states.
Numeric Attribute State (NOF Band) Overall attribute
state
Site
Median E. coli
(CFU/100ml)
95th percentile
E. coli (CFU/100ml
)
% over 260
CFU/100m
% over 540
CFU/100ml
Grading attribute
state
Overall Pass/Fai
l
Lake Wanaka Outflow
1 (A) 28 (A) 0% (A) 0% (A) A Pass
Lake Hawea Outflow
1 (A) 2 (A) 0% (A) 0% (A) A Pass
Lake Dunstan at Dead Man’s Pt
2 (A) 28 (A) 1% (A) 1% (A) A Pass
Lake Wakatipu Outflow
1 (A) 16 (A) 0% (A) 0% (A) A Pass
Lake Hayes at Bendemeer Bay
2 (A) 97 (A) 2% (A) 0% (A) A Pass
Lake Johnson at Sth Beach huts
2 (A) 36 (A) 0% (A) 0% (A) A Pass
Lake Onslow at Boat Ramp
1 (A) 21 (A) 0% (A) 0% (A) A Pass
Lake Waihola at jetty
26 (A) 185 (A) 2% (A) 2% (A) A Pass
Lake Tuakitoto at Outlet
61 (A) 885 (B) 14% (A) 8% (A) B Pass
The Trophic Lake Index and trophic status of lakes monitored as part of the long-
term SoE program
In its simplest terms, the trophic state of a lake can be defined as the life-supporting capacity per unit
volume of a lake (Burns, et al., 2000). Trophic state provides a measure of the nutrient status and
productivity of a body of water (Burns et al., 2000). Water quality information on nutrients (TN and
TP), algal productivity (estimated from chlorophyll a concentration) and, if available, water clarity (as
Secchi depth17) is used to calculate a Trophic Lake Index (TLI) score for each of these parameters; and
is then summarised into a single overall TLI score for the lake. The calculations follow a standard set of
17 Secchi depth is the depth of disappearance that a 20 cm diameter disc painted in black and white quadrants is lost from view when lowered over the side of a boat.

156 State of the Environment – Surface Water Quality in Otago 2006 to 2017
protocols developed by Burns et al., (2000) for New Zealand that are based loosely on the Carlson
Trophic State Index employed overseas but adapted to New Zealand conditions.
The overall TLI score is categorised into seven trophic states (Table 93) indicating progressively more
nutrient enrichment, more algal productivity and reduced water clarity (Hamill, 2006).
Total nitrogen and total phosphorous are nutrients that stimulate algae and plant growth. They are
often called the ‘growth limiting nutrients’ when referring to aquatic ecosystems. Large amounts of
these nutrients encourage the growth of algae which can lead to poor water quality, unhealthy
fluctuations in dissolved oxygen and reduced clarity.
Table 93: Summary of water quality concentrations and Secchi disk depths corresonding to
different lake trophic levels.
Lake Type Trophic
Lake Index (TLI)
Chla (ug/L)
TP (mg/L)
TN (mg/L)
Secchi depth (m)*
Ultra-microtrophic 0.0 - 1.0 0.13 - 0.33 0.0008 - 0.0018 0.016 -
0.034 33 - 25
Microtrophic 1.0 - 2.0 0.33 - 0.82 0.0018 - 0.0041 0.034 -
0.073 25 - 15
Oligotrophic 2.0 - 3.0 0.82 - 2.0 0.0041 - 0.009 0.073 -
0.157 15 - 7
Mesotrophic 3.0 - 4.0 2.0 - 5.0 0.009 - 0.020 0.157 -
0.337 7 - 2.8
Eutrophic 4.0 - 5.0 5.0 - 12 0.020 - 0.043 0.337 -
0.725 2.8 - 1.1
Supertrophic 5.0 - 6.0 12 - 31 0.043 - 0.096 0.725 -
1.558 1.1 - 0.4
Hypertrophic 6.0 - 7.0 > 31 > 0.096 > 1.558 < 0.4
*NOTE: Secchi depth is not used in the calculation of the TLI for the lake shore based SoE monitoring results.
The TLI gives an indication of lake water quality. Each range of numbers translates into a scientific
description as explained below (Burns et al., 2000; Ozanne, 2009; LAWA18):
• Microtrophic lakes are clear and blue with very extremely low levels of nutrients and algae;
• Oligotrophic lakes are clear and blue, with low levels of nutrients and algae;
• Mesotrophic lakes have moderate levels of nutrients and algae;
• Eutrophic lakes are green and murky, with higher amounts of nutrients and algae;
• Supertrophic lakes are fertile and saturated in phosphorus and nitrogen, and have very high
algae growth with problematic algal blooms at times;
• Hypertrophic lakes are highly fertile and supersaturated in phosphorus and nitrogen. They are
rarely suitable for recreation and habitat for desirable aquatic species is limited.
18 https://www.lawa.org.nz/learn/factsheets/lake-trophic-level-index/
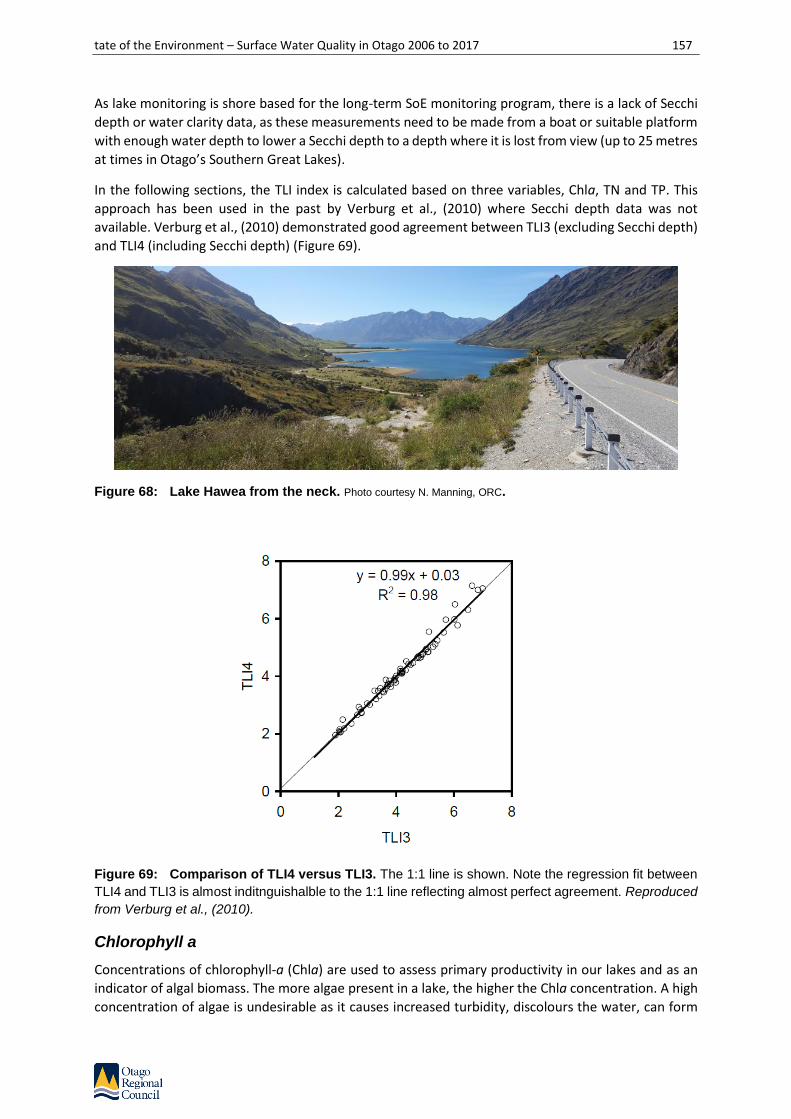
tate of the Environment – Surface Water Quality in Otago 2006 to 2017 157
As lake monitoring is shore based for the long-term SoE monitoring program, there is a lack of Secchi
depth or water clarity data, as these measurements need to be made from a boat or suitable platform
with enough water depth to lower a Secchi depth to a depth where it is lost from view (up to 25 metres
at times in Otago’s Southern Great Lakes).
In the following sections, the TLI index is calculated based on three variables, Chla, TN and TP. This
approach has been used in the past by Verburg et al., (2010) where Secchi depth data was not
available. Verburg et al., (2010) demonstrated good agreement between TLI3 (excluding Secchi depth)
and TLI4 (including Secchi depth) (Figure 69).
Figure 68: Lake Hawea from the neck. Photo courtesy N. Manning, ORC.
Figure 69: Comparison of TLI4 versus TLI3. The 1:1 line is shown. Note the regression fit between
TLI4 and TLI3 is almost inditnguishalble to the 1:1 line reflecting almost perfect agreement. Reproduced
from Verburg et al., (2010).
Chlorophyll a
Concentrations of chlorophyll-a (Chla) are used to assess primary productivity in our lakes and as an
indicator of algal biomass. The more algae present in a lake, the higher the Chla concentration. A high
concentration of algae is undesirable as it causes increased turbidity, discolours the water, can form

158 State of the Environment – Surface Water Quality in Otago 2006 to 2017
surface scums, drives large fluctuations in dissolved oxygen and pH that causes stress on aquatic
animals, and can lead to odours. Some species of algae, particularly cyanobacteria (blue-green algae)
can produce toxins that are a significant human health issue. Elevated algae in a lake is driven by
increases in nitrogen and phosphorus, the growth limiting nutrients.
Figure 70 and Figure 71 summarise Chla concentrations (ug/L) and the Trophic Lake Index for Chla
(TLIc) for all SoE monitored lakes. The figures highlight extreme differences in chlorophyll a
concentrations typical of Otago lakes, with the iconic Southern Great Lakes, Wanaka, Hawea, Wakatipu
and Dunstan, recording extremely low concentrations of Chla due to their pristine condition, with very
low levels of nutrients that results in very low levels of algal productivity. The median concentration
for these four lakes is typically around 1 ug/L; and the maximum concentration is below 2 ug/L. This
places the lakes in the ‘oligotrophic’ TLIc.
This contrasts with Lake Hayes and Lake Johnson that have medians of 11 and 14 ug/L; and maximums
of 30 and 45 ug/L respectively. These are the most productive of the 9 lakes sampled by ORC, and have
both sitting in the hypertrophic to supertrophic TLIc bands (Figure 71). This reflects a high degree of
enrichment with the lakes displaying a very high algal biomass that would impact on the overall water
quality and ecosystem health of the lakes.
Lake Onslow has slightly elevated algal biomass levels when compared to Wanaka, Hawea and
Wakatipu and is classed as ‘mesotrophic’. Lake Waihola and Lake Tuakitoto sit midway between the
Lake Onslow and lake Hayes and Johnson. Lake Tuakitoto is interesting as previous work has identified
the high densities of kakahi (freshwater mussels) living in the lake as exerting high algae grazing rates
that limit the algal biomass. This certainly appears to be the case and is discussed in more detail in the
following sections.
Figure 70: Boxplot summary of Chlorophyll a concentrations at lake SoE monitoring sites
throughout Otago.
Ch
loro
ph
yll
a (
ug
⁄L)
Lake
Wan
aka
Out
flow
Lake
Haw
ea O
utflo
w
Lake
Dun
stan
at D
ead
Man
s Poi
nt
Lake
Wak
atipu
Out
flow
Lake
Hay
es a
t Ben
dem
eer B
ay
Lake
Joh
nson
at S
outh
Bea
ch h
uts
Lake
Ons
low a
t Boa
t Ram
p
Lake
Waiho
la a
t jet
ty
Lake
Tua
kito
to a
t Out
let
0
10
20
30
40
50
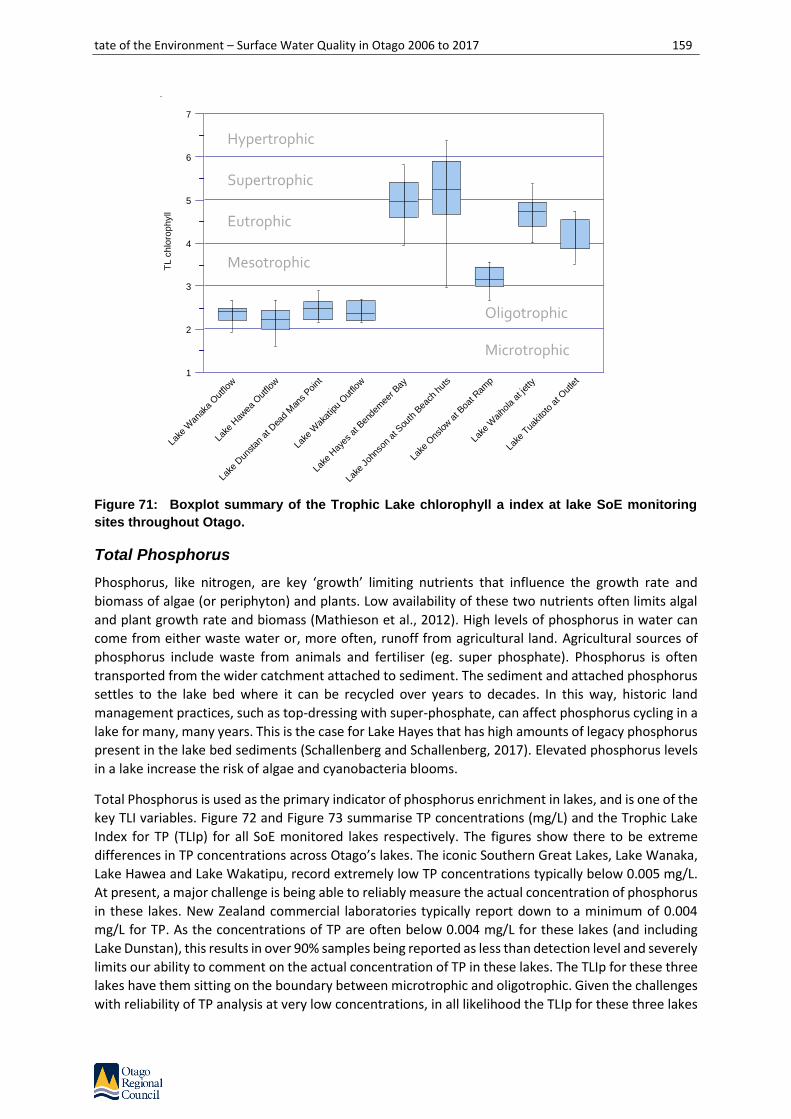
tate of the Environment – Surface Water Quality in Otago 2006 to 2017 159
Figure 71: Boxplot summary of the Trophic Lake chlorophyll a index at lake SoE monitoring
sites throughout Otago.
Total Phosphorus
Phosphorus, like nitrogen, are key ‘growth’ limiting nutrients that influence the growth rate and
biomass of algae (or periphyton) and plants. Low availability of these two nutrients often limits algal
and plant growth rate and biomass (Mathieson et al., 2012). High levels of phosphorus in water can
come from either waste water or, more often, runoff from agricultural land. Agricultural sources of
phosphorus include waste from animals and fertiliser (eg. super phosphate). Phosphorus is often
transported from the wider catchment attached to sediment. The sediment and attached phosphorus
settles to the lake bed where it can be recycled over years to decades. In this way, historic land
management practices, such as top-dressing with super-phosphate, can affect phosphorus cycling in a
lake for many, many years. This is the case for Lake Hayes that has high amounts of legacy phosphorus
present in the lake bed sediments (Schallenberg and Schallenberg, 2017). Elevated phosphorus levels
in a lake increase the risk of algae and cyanobacteria blooms.
Total Phosphorus is used as the primary indicator of phosphorus enrichment in lakes, and is one of the
key TLI variables. Figure 72 and Figure 73 summarise TP concentrations (mg/L) and the Trophic Lake
Index for TP (TLIp) for all SoE monitored lakes respectively. The figures show there to be extreme
differences in TP concentrations across Otago’s lakes. The iconic Southern Great Lakes, Lake Wanaka,
Lake Hawea and Lake Wakatipu, record extremely low TP concentrations typically below 0.005 mg/L.
At present, a major challenge is being able to reliably measure the actual concentration of phosphorus
in these lakes. New Zealand commercial laboratories typically report down to a minimum of 0.004
mg/L for TP. As the concentrations of TP are often below 0.004 mg/L for these lakes (and including
Lake Dunstan), this results in over 90% samples being reported as less than detection level and severely
limits our ability to comment on the actual concentration of TP in these lakes. The TLIp for these three
lakes have them sitting on the boundary between microtrophic and oligotrophic. Given the challenges
with reliability of TP analysis at very low concentrations, in all likelihood the TLIp for these three lakes
TL
ch
loro
ph
yll
Lake
Wan
aka
Out
flow
Lake
Haw
ea O
utflo
w
Lake
Dun
stan
at D
ead
Man
s Poi
nt
Lake
Wak
atipu
Out
flow
Lake
Hay
es a
t Ben
dem
eer B
ay
Lake
Joh
nson
at S
outh
Bea
ch h
uts
Lake
Ons
low a
t Boa
t Ram
p
Lake
Waiho
la a
t jet
ty
Lake
Tua
kito
to a
t Out
let
1
2
3
4
5
6
7
Hypertrophic
Supertrophic
Eutrophic
Mesotrophic
Oligotrophic
Microtrophic
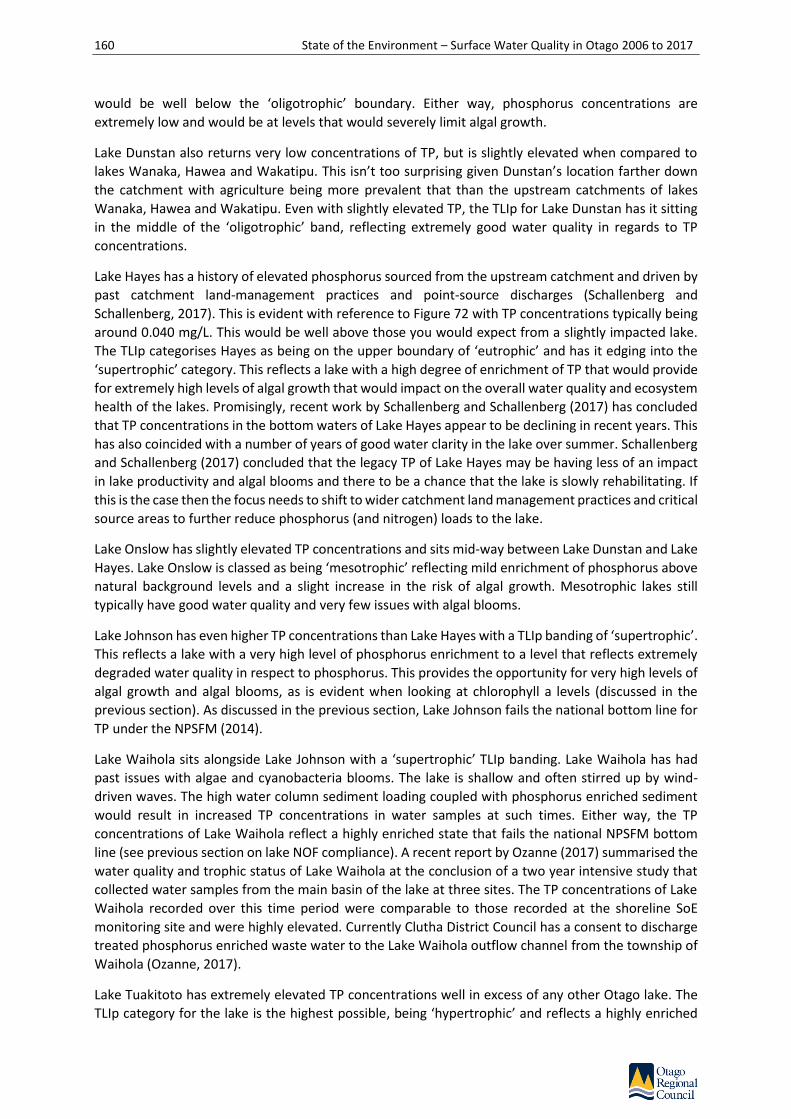
160 State of the Environment – Surface Water Quality in Otago 2006 to 2017
would be well below the ‘oligotrophic’ boundary. Either way, phosphorus concentrations are
extremely low and would be at levels that would severely limit algal growth.
Lake Dunstan also returns very low concentrations of TP, but is slightly elevated when compared to
lakes Wanaka, Hawea and Wakatipu. This isn’t too surprising given Dunstan’s location farther down
the catchment with agriculture being more prevalent that than the upstream catchments of lakes
Wanaka, Hawea and Wakatipu. Even with slightly elevated TP, the TLIp for Lake Dunstan has it sitting
in the middle of the ‘oligotrophic’ band, reflecting extremely good water quality in regards to TP
concentrations.
Lake Hayes has a history of elevated phosphorus sourced from the upstream catchment and driven by
past catchment land-management practices and point-source discharges (Schallenberg and
Schallenberg, 2017). This is evident with reference to Figure 72 with TP concentrations typically being
around 0.040 mg/L. This would be well above those you would expect from a slightly impacted lake.
The TLIp categorises Hayes as being on the upper boundary of ‘eutrophic’ and has it edging into the
‘supertrophic’ category. This reflects a lake with a high degree of enrichment of TP that would provide
for extremely high levels of algal growth that would impact on the overall water quality and ecosystem
health of the lakes. Promisingly, recent work by Schallenberg and Schallenberg (2017) has concluded
that TP concentrations in the bottom waters of Lake Hayes appear to be declining in recent years. This
has also coincided with a number of years of good water clarity in the lake over summer. Schallenberg
and Schallenberg (2017) concluded that the legacy TP of Lake Hayes may be having less of an impact
in lake productivity and algal blooms and there to be a chance that the lake is slowly rehabilitating. If
this is the case then the focus needs to shift to wider catchment land management practices and critical
source areas to further reduce phosphorus (and nitrogen) loads to the lake.
Lake Onslow has slightly elevated TP concentrations and sits mid-way between Lake Dunstan and Lake
Hayes. Lake Onslow is classed as being ‘mesotrophic’ reflecting mild enrichment of phosphorus above
natural background levels and a slight increase in the risk of algal growth. Mesotrophic lakes still
typically have good water quality and very few issues with algal blooms.
Lake Johnson has even higher TP concentrations than Lake Hayes with a TLIp banding of ‘supertrophic’.
This reflects a lake with a very high level of phosphorus enrichment to a level that reflects extremely
degraded water quality in respect to phosphorus. This provides the opportunity for very high levels of
algal growth and algal blooms, as is evident when looking at chlorophyll a levels (discussed in the
previous section). As discussed in the previous section, Lake Johnson fails the national bottom line for
TP under the NPSFM (2014).
Lake Waihola sits alongside Lake Johnson with a ‘supertrophic’ TLIp banding. Lake Waihola has had
past issues with algae and cyanobacteria blooms. The lake is shallow and often stirred up by wind-
driven waves. The high water column sediment loading coupled with phosphorus enriched sediment
would result in increased TP concentrations in water samples at such times. Either way, the TP
concentrations of Lake Waihola reflect a highly enriched state that fails the national NPSFM bottom
line (see previous section on lake NOF compliance). A recent report by Ozanne (2017) summarised the
water quality and trophic status of Lake Waihola at the conclusion of a two year intensive study that
collected water samples from the main basin of the lake at three sites. The TP concentrations of Lake
Waihola recorded over this time period were comparable to those recorded at the shoreline SoE
monitoring site and were highly elevated. Currently Clutha District Council has a consent to discharge
treated phosphorus enriched waste water to the Lake Waihola outflow channel from the township of
Waihola (Ozanne, 2017).
Lake Tuakitoto has extremely elevated TP concentrations well in excess of any other Otago lake. The
TLIp category for the lake is the highest possible, being ‘hypertrophic’ and reflects a highly enriched

tate of the Environment – Surface Water Quality in Otago 2006 to 2017 161
state. The TP concentrations are more than double the NPSFM bottom line (see previous section on
lake NOF compliance). As is the case with Lake Waihola, Lake Tuakitoto is a shallow lake that can
experience sediment resuspension from wind-driven waves. This would affect TP concentrations at the
outflow at such times. Despite this the lake remains highly enriched well above levels that would be
expected of a shallow lake with a catchment dominated by native vegetation. Shallow New Zealand
lakes have in the past been identified as having higher TP concentrations than deeper lakes. For
example, Verburg et al., (2000) reported on water quality for 112 lakes throughout New Zealand and
found shallow lakes (<10m depth) to have TP concentrations of 0.078 mg/L; this compares to the
average TP concentration of deeper lakes of 0.018 mg/L. The average TP concentration of Lake
Tuakitoto for the period July 2012 to June 2017 was 0.098 mg/L, with TP peaks reaching 0.200 mg/L.
A previous report by Ozanne (2014) on water quality across the Lake Tuakitoto catchment identified
elevated TP concentrations on a number of the catchment streams. There are presently no point-
source discharges that would help explain the highly enriched state of the lake. From the Ozanne
(2014) report it is highly likely that the phosphorus present in the sediments in Lake Tuakitoto is a
legacy of past and present catchment land management practices.
Figure 72: Boxplot summary of TP concentrations at lake SoE monitoring sites throughout
Otago.
To
tal P
ho
sp
ho
rus (
mg
⁄L)
Lake
Wan
aka
Out
flow
Lake
Haw
ea O
utflo
w
Lake
Dun
stan
at D
ead
Man
s Poi
nt
Lake
Wak
atipu
Out
flow
Lake
Hay
es a
t Ben
dem
eer B
ay
Lake
Joh
nson
at S
outh
Bea
ch h
uts
Lake
Ons
low a
t Boa
t Ram
p
Lake
Waiho
la a
t jet
ty
Lake
Tua
kito
to a
t Out
let
0.000
0.020
0.040
0.060
0.080
0.100
0.120
0.140

162 State of the Environment – Surface Water Quality in Otago 2006 to 2017
Figure 73: Boxplot summary of the Trophic Lake phosphorus index at lake SoE monitoring
sites throughout Otago.
Total Nitrogen
Total Nitrogen (TN) is used as the primary indicator of nitrogen enrichment in lakes, and is one of the
key TLI variables. TN is the sum of all nitrogen forms, including NH4-N, nitrate and nitrite nitrogen
(NNN), and organic nitrogen from plant tissues and algae. Nitrogen, like phosphorus, are key ‘growth’
limiting nutrients that influence the growth rate and biomass of algae (or periphyton) and plants. Low
availability of these two nutrients often limits algal growth rate (Mathieson et al., 2012). High levels of
nitrogen in water can come from waste-water or, more often, sub-surface flows, groundwater inputs
and surface run-off from agricultural land.
Figure 74 and Figure 75 summarise TN concentrations (mg/L) and the Trophic Lake Index for TN (TLIn)
respectively for all SoE monitored lakes.
TN concentrations follow a very similar pattern to TP, with the Southern Great Lakes returning
extremely low levels of TN that place these lakes in the microtrophic to oligotrophic TLIn band. Lake
Hawea returns the lowest TN concentration of all lakes and has a significantly lower TLIn, straddling
the ultra-microtrophic TLIn band. This would be some of the lowest recorded TN concentrations for a
New Zealand lake. The Lake Hawea catchment is relatively free of intensive land-use and is dominated
by native vegetation cover. This lake provides an excellent reference lake to assess what water quality
would be like under near-natural conditions. The slightly elevated TN concentrations of Lake Wanaka
and Wakatipu compare closely with those recorded for Lake Dunstan, and place these lakes in the
microtrophic to oligotrophic band, reflecting excellent water quality in relation to TN concentrations.
Lake Hayes and Lake Onslow have TN concentrations that are 4 to 5 times higher than the Southern
Great Lakes but still relatively low when compared to the remaining lakes monitored across Otago
(Figure 74). Lake Hayes is classed as meso to eutrophic with respect to TLIn. This compares to the
eutrophic to supertrophic TLIp banding of Lake Hayes. Bayer etal., (2008) and Ozanne (2012) reported
TL
ph
osp
ho
rus
Lake
Wan
aka
Out
flow
Lake
Haw
ea O
utflo
w
Lake
Dun
stan
at D
ead
Man
s Poi
nt
Lake
Wak
atipu
Out
flow
Lake
Hay
es a
t Ben
dem
eer B
ay
Lake
Joh
nson
at S
outh
Bea
ch h
uts
Lake
Ons
low a
t Boa
t Ram
p
Lake
Waiho
la a
t jet
ty
Lake
Tua
kito
to a
t Out
let
1
2
3
4
5
6
7
Mesotrophic
Oligotrophic
Microtrophic
Hypertrophic
Supertrophic
Eutrophic

tate of the Environment – Surface Water Quality in Otago 2006 to 2017 163
on nutrient ratios in Lake Hayes and found the lake to be nitrogen limited in relation to overall available
nutrients and algal growth. The difference between the TLIn and TLIp for Lake hayes supports this also.
Based on this, further increases in nitrogen in Lake Hayes would stimulate algal growth and elevate
the risk of problematic algae blooms considerably.
Verburg et al., (2010) found average TN concentrations for deeper lakes across New Zealand to be
0.309 mg/L. This compares with an average TN concentration of 0.334 mg/L for Lake Hayes and 0.239
mg/L for Lake Onslow showing TN concentrations to be about ‘average’ for deep New Zealand lakes.
Lake Johnson is highly enriched with TN and returns the highest concentrations of all monitored lakes
across Otago, with a maximum TN of 2.4 mg/L being recorded in March 2014 (Figure 76). Interestingly,
in April 2013, TN concentrations in Lake Johnson increased markedly over a twelve month period.
What caused this ‘spike’ in TN remains unknown, as the surrounding catchment has no obvious point
source discharges, inflows, or farming activities that could cause such a jump in TN. Concentrations
have reduced since this time but are still elevated when compared to levels present in the lake prior
to 2013.
Lake Waihola has quite low TN concentrations for a lowland, shallow lake returning an average TN
concentration of 0.49 mg/L for the period July 2012 to June 2017; and a ‘mesotrophic’ TLIn band. This
compares favourably with the New Zealand ‘shallow lake’ average reported by Verburg et al., (2000)
of 1.09 mg/L TN, and shoes on average, that Lake Waihola has relatively low levels of TN.
Lake Tuakitoto has TN levels comparable to Lake Johnson with an average TN concentration of 1.00
mg/L and a TLIn band of ‘supertrophic’. This combined with its ‘supertrophic’ status for TP shows the
lake to possess a highly enriched nutrient environment.
Figure 74: Boxplot summary of Total Nitrogen concentrations at lake SoE monitoring sites
throughout Otago.
To
tal N
itro
ge
n (
mg
⁄L)
Lake
Wan
aka
Out
flow
Lake
Haw
ea O
utflo
w
Lake
Dun
stan
at D
ead
Man
s Poi
nt
Lake
Wak
atipu
Out
flow
Lake
Hay
es a
t Ben
dem
eer B
ay
Lake
Joh
nson
at S
outh
Bea
ch h
uts
Lake
Ons
low a
t Boa
t Ram
p
Lake
Waiho
la a
t jet
ty
Lake
Tua
kito
to a
t Out
let
0.00
0.25
0.50
0.75
1.00
1.25
1.50

164 State of the Environment – Surface Water Quality in Otago 2006 to 2017
Figure 75: Boxplot summary of the Trophic Lake nitrogen index at lake SoE monitoring sites
throughout Otago.
Figure 76: Total nitrogen concentrations in Lake Johnson. The blue circle encompasses a
signifcant period of nitrogen enrichment for Lake Johnson that occurred early in 2013.
TL
nitro
ge
n
Lake
Wan
aka
Out
flow
Lake
Haw
ea O
utflo
w
Lake
Dun
stan
at D
ead
Man
s Poi
nt
Lake
Wak
atipu
Out
flow
Lake
Hay
es a
t Ben
dem
eer B
ay
Lake
Joh
nson
at S
outh
Bea
ch h
uts
Lake
Ons
low a
t Boa
t Ram
p
Lake
Waiho
la a
t jet
ty
Lake
Tua
kito
to a
t Out
let
0
1
2
3
4
5
6
7
0.00
0.50
1.00
1.50
2.00
2.50
3.00
19
97
19
98
19
99
20
00
20
01
20
02
20
03
20
04
20
05
20
06
20
07
20
08
20
09
20
10
20
11
20
12
20
13
20
14
20
15
20
16
20
17
Tota
l nit
roge
n (
mg
/L)
Hypertrophic
Supertrophic
Eutrophic
Mesotrophic
Oligotrophic
Microtrophic
Ultra-microtrophic

tate of the Environment – Surface Water Quality in Otago 2006 to 2017 165
Figure 77: Lake Hawea. Photo courtesy N. Manning, ORC.
Trophic Lake Index 3 – TLI3
TLI3 provides a summary of the overall trophic lake index of a lake based on the integrated scores for
TLI (chla), TLI (TP) and TLI (TN). A more detailed discussion of the TLI3 is provided in the introduction
to this report section. Table 94 provides a summary of TLI3 scores across lakes with lakes ordered from
the lowest (cleanest) to the highest (most enriched). The TLI3 bands are based on those listed in Table
93. Figure 78 provides boxplot summaries of the annual TLI3 scores for the 9 SoE monitored lakes.
It is important to consider the limitations of TLI3 estimates for Wanaka, Hawea, Wakatipu and Dunstan
that are affected by many data points being ‘less than detect’. This artificially inflates the TLI scores, as
the estimates do not take into account that many samples returned lower than measureable
concentrations of chlorophyll a, phosphorus and nitrogen. Additionally, samples for all lakes covered
in this chapter have samples collected from outflow and shoreline monitoring sites. These sites can be
impacted by edge effects, such as disturbance of shoreline areas by waves generated from wind and
boat-wake, as well as localised concentrations of algae in the shallows of a lake shore that can occur
under certain conditions, such as when wind is blowing onto the shore. Samples may therefore not be
representative of overall lake condition. This highlights the value of sampling lake water quality at mid-
lake sampling stations – although at significantly higher cost and effort. This sampling is occurring at
present on lakes Wanaka, Hawea, Wakatipu and Hayes. The results will provide accurate estimates of
TLI and also allow for incorporation of water clarity (Secchi depth) into the TLI calculation (TLI4).
Overall the TLI3 analysis presented here does provide a representative summary of lake nutrient status
and productivity levels and aligns well with our understanding of the health of each lake.
Hawea returns the lowest overall TLI3, due to very low TLIc and TLIn scores. Wanaka and Wakatipu
follow on from Hawea and are directly comparable to one another. The slight increase in TLIn for these
two lakes places the TLI3 score on the boundary of micro and oligotrophic. This TLI3 score represents
lakes with exceptionally good water quality. The slightly higher TLIp score for Lake Dunstan increases
the TLI3 to be in the middle of the oligotrophic band; a trophic level representing extremely good water
quality, with low nutrients and low algal productivity levels. Lake Onslow is slightly enriched compared
to these 4 lakes with higher TLIc, TLIp and TLIn scores giving it an overall ‘mesotrophic’ banding.
Mesotrophic lakes still have good water quality and are healthy, but are typically more productive than
oligotrophic lakes. Lake Hayes and Lake Waihola are both productive lakes with increased levels of
nutrients and algae over those that would be expected under natural or near natural conditions. Both
lakes have issues with episodic algal blooms. Lake Johnson and Lake Tuakitoto are classed as
supertrophic, a dubious banding reflecting a highly enriched lake environment. Supertrophic lakes are
fertile and saturated in phosphorus and nitrogen, and have very high algae growth with problematic
algal blooms at times.

166 State of the Environment – Surface Water Quality in Otago 2006 to 2017
Table 94: Summary of average TLI3 scores for SoE monitored lakes ordered from lowest to
highest.
Lake Average TLI 3 2006 to 2017
TLI3 band
Hawea 1.88 Microtrophic
Wakatipu 2.03 Oligotrophic
Wanaka 2.08 Oligotrophic
Dunstan 2.40 Oligotrophic
Onslow 3.76 Mesotrophic
Hayes 4.57 Eutrophic
Waihola 4.87 Eutrophic
Tuakitoto 5.24 Supertrophic
Johnson 5.25 Supertrophic
Figure 78: Boxplot summary of the Trophic Lake Index 3 (TLI3) at lake SoE monitoring sites
throughout Otago.
Trend analysis
Table 95 summarises trend results for water quality parameters monitored as part of the lakes SoE
monitoring program. For discrete water quality parameters, there are a total of 81 results reported in
the table; 12% return significant or probable degrading trends; 4% are stable; and 6% return significant
TL
I3
Lake
Wan
aka
Out
flow
Lake
Haw
ea O
utflo
w
Lake
Dun
stan
at D
ead
Man
s Poi
nt
Lake
Wak
atipu
Out
flow
Lake
Hay
es a
t Ben
dem
eer B
ay
Lake
Joh
nson
at S
outh
Bea
ch h
uts
Lake
Ons
low a
t Boa
t Ram
p
Lake
Waiho
la a
t jet
ty
Lake
Tua
kito
to a
t Out
let
1
2
3
4
5
6
7
Oligotrophic
Microtrophic
Hypertrophic
Supertrophic
Eutrophic
Mesotrophic

tate of the Environment – Surface Water Quality in Otago 2006 to 2017 167
or probable improving trends. Overall 26% of sites have indeterminate trends (reported as “?”). Of the
81, 39 (48%) had too many results returned from the laboratory that were less than detection levels.
This is driven by historic method detection levels that need to be applied across the entire time-series
to eliminate the calculation of false trends (See Section 1.2.7 for a more detailed explanation). For the
current analysis period, this severely limits our capacity to detect trends at sites with low levels of
nutrients and chlorophyll a, as is typical of lakes Wanaka, Hawea, Wakatipu and Dunstan. Improved
laboratory techniques and lower method detection levels that have become available in recent years
will help eliminate this for future analysis, particularly with respect to NNN, TN and Chla. Method
detection limits for phosphorus, both DRP and TP, still result in the majority of results being returned
from the laboratory as below detection level (<DL). There is a considerable challenge for laboratories
to develop and offer IANZ accredited, improved detection levels for phosphorus in water.
For both Lake Wanaka and Lake Hawea, there are significant increasing trends for turbidity. The
reasons for this are unknown but are of concern, particularly given the high intrinsic value of water
clarity in these two lakes. There is a chance that the trend may be due to changes in laboratory service
providers over the time period analysed. Different laboratories use different turbidity measuring
equipment that doesn’t necessarily return comparable results. This is particularly the case at the
extremely low turbidity levels (< 0.5 NTU) typical of these lakes.
Of the lakes monitored, Lake Johnson returns three significant and three probable increasing trends
for the 9 trend analyses. This shows Lake Johnson, which is already supertrophic with severely
degraded water quality, to be getting worse over time.
There is a probable increasing trend for NNN in Lake Hawea. This is of concern given the extreme low
nutrient levels typical of this lake. Current TN levels are the lowest of all lakes monitored and have it
classed as ‘microtrophic’ (Figure 75), the second lowest possible trophic level for nitrogen. The source
of increasing NNN is unknown. The sampling site is located at the dam wall in the vicinity of the Hawea
township. To confidently identify if the source of increasing NNN is derived from the wider catchment
or the area directly adjacent to the sampling location is difficult. The Trophic Lake Monitoring Program
(TLMP) currently underway has an offshore monitoring site. The data collected as part of the TLMP will
allow comparison of open-water water quality to shore-based water quality data. If the two compare
closely then the trend is likely more driven by an overall shift in NNN concentrations in the lake.
Lake Tuakitoto returns significant increasing (degrading) trends for NH4-N and dissolved reactive
phosphorus. These two forms of nutrients may be entering the lake from the catchment or they could
be released from lake sediments under anoxic conditions (internal loading). Both are bio-available for
plant and algae growth and ongoing increases in their concentrations will increase the risk of significant
algal blooms. Presently Lake Tuakitoto is classed as supertrophic for nitrogen and hypertrophic for
phosphorus reflecting the highly enriched nutrient environment of the lake. Despite extremely high
nutrient concentrations being recorded in the lake, the algal biomass levels are relatively low,
particularly when compared to lakes Johnson, Hayes and Waihola. Previous studies identified the
resident kakahi (freshwater mussel) population to have the capacity to filter the entire lake volume
once every 32 hours (Ogilvie and Mitchell, 1995). The Ogilvie and Michell (1995) Lake Tuakitoto mussel
study concluded “mussel grazing may account for the observed suppression of chlorophyll-a
concentrations to about 10 % of those predicted by phosphorus-chlorophyll relationships in this lake…
These results suggest that Hyridella [kakahi] has potential as a biomanipulation tool for control of
phytoplankton in eutrophic lakes”.
Of concern is that in recent years a reduction in the mussel population has been recorded, with a
resulting reduction in algal filtration rate (Ozanne 2014). Either way, the kakahi population in Lake

168 State of the Environment – Surface Water Quality in Otago 2006 to 2017
Tuakitoto is extremely important in controlling algal biomass in this lake19 and does explain the
supressed algal biomass when compared to other lakes of a similar, highly enriched nutrient status.
Protection and management of the kakahi population is a top priority, as the loss of this alga bio-
control would lead to increased algal biomass and the possibility of a switch to a highly undesirable
turbid, phytoplankton dominated state. Despite the degrading trends in Lake Tuakitoto for NH4-N and
DRP, trend analysis for E. coli returned a significant decreasing (improving) trend (Table 95). The
reasons for this are unclear and may be driven by shifts in waterfowl numbers or reduced stock access
to the lake.
For TP, Lake Hayes returned a probable decreasing (improving) trend. This is a very encouraging result
given the issue of legacy phosphorus release from lake bed sediments fuelling algal blooms in the lake
in past. Any reduction in phosphorus concentration overall is encouraging. As more data comes to
hand, revisiting the trend analysis will hopefully provide more certainty as to the significance of the
improving trend.
Significant decreasing (improving) trends were also recorded for Lake Onslow and TP and turbidity.
The reduction in TP has also increased the TN/TP ratio reflecting stronger potential P-limitation of algal
growth. The reduction in both turbidity and TP points towards a reduction in particulates as driving the
trends.
NNN concentrations in the Lake Wanaka outflow have been dropping significantly overtime. This is in
contrast to the Lake Hawea NNN trend that returned a probable increasing trend. The Lake Wanaka
outflow sampling site is located adjacent to the Stevenson Arm and integrates all localised and
catchment scale land-uses in the area, including any effects of Wanaka township. As with Lake Hawea,
there is a chance localised land-use effects could influence the nutrient levels recorded at this site.
Either way, having a significant decreasing trend for NNN is a good result.
Trend analysis of the TLI water quality variables and the overall summary TLI3 index score return some
interesting results. A total of 36 trends are presented for the TLI (Table 95). 29 of 36 (81%) are
indeterminate; 4 (11%) return decreasing or improving trends; and 3 (8%) return increasing or
degrading trends.
The results of the analysis for lakes Wanaka, Hawea, Dunstan and Wakatipu need to be treated with
caution as the calculation of individual TLI numbers for Chla, TP and TN are heavily confounded by the
presence of numerous laboratory data records of being less than detection level or “< DL”.
The high number of indeterminate trends is in part due to the analysis being carried out on annual
average TLI numbers. This provides a total of 11 independent TLI estimates over the 11 years of
sampling and is therefore a limited data set for carrying out trend analysis.
Of concern is the significant increasing trend for TLIn for Lake Hawea. As discussed previously, due to
the location of the sampling site it is difficult to confidently conclude if this represents and overall
increase in TLIn for the lake or is impacted by localised activities in the vicinity of the sampling site. The
current boat-based Trophic Lake Sampling program will better inform the veracity of the shoreline
sampling site for Lake Hawea and how representative this is of overall lake water quality.
Lake Dunstan returned a significant increasing trend for TLIc or chlorophyll a. This needs to be treetd
with caution given the high number of chla samples submitted to the laboratory for this lake that
returned “<DL” results. Lower chlorophyll a detection levels offered in recent years will remove this
limitation in future analysis.
19 http://www.stuff.co.nz/nelson-mail/news/81130292/unlocking-secrets-to-saving-our-native-freshwater-mussels

tate of the Environment – Surface Water Quality in Otago 2006 to 2017 169
Lake Wakatipu returned three significant decreasing (improving) trends; two for TLIn and TLIp; and
one for TLI3. The improving trends for TLIn and TLIp would combine to provide the improvement in
TLI3. Despite this there was a probable increasing (degrading) trend for TLIc. As discussed, the high
number of “<DL’s” for the Great Southern Lakes does reduce the reliability of the trend analysis.
Lake Onslow returned a significant decreasing (improving) trend for TLIp which is promising. Currently
the TLIp for Onslow is elevated and sitting in the eutrophic band. Any improvement in this will be
welcome.

170 State of the Environment – Surface Water Quality in Otago 2006 to 2017
Table 95: Trend summary for the SoE monitored lakes
Site
Lake W
an
aka
Outflo
w
Lake H
aw
ea
Outflo
w
Lake D
unsta
n a
t
Dead M
ans P
oin
t
Lake W
akatipu
Outflo
w
Lake H
ayes a
t
Ben
dem
eer
Bay
Lake J
oh
nson a
t
South
Beach h
uts
Lake O
nslo
w a
t
Boat
Ra
mp
Lake W
aih
ola
at
jetty
Lake T
uakitoto
at
Outlet
Escherichia coli
< DL < DL < DL < DL < DL ↑↑↑ < DL ?? ↓↓↓
Ammoniacal Nitrogen
< DL < DL < DL < DL < DL < DL < DL < DL ↑↑↑
Nitrite/Nitrate Nitrogen
?? ↑↑ → ↓↓↓ < DL < DL < DL < DL ??
Total Nitrogen < DL < DL < DL < DL ?? ↑↑↑ ?? ?? ??
Dissolved Reactive
Phosphorus < DL < DL < DL < DL → ?? < DL → ↑↑↑
Total Phosphorus
< DL < DL < DL < DL ↓↓ ↑↑ ↓↓↓ ?? ??
TN/TP < DL ?? ?? ?? ↑↑↑ ↑↑ ↑↑↑ ?? ??
Turbidity ↑↑↑ ↑↑↑ ?? ?? ?? ↑↑ ↓↓↓ ?? ??
Chlorophyll a < DL < DL < DL < DL ?? ↑↑↑ < DL < DL < DL
TLI chlorophyll
?? ?? ↑↑↑ ↑↑ ?? ?? ?? ?? ??
TLI phosphorus
?? ?? ?? ↓↓↓ ?? ?? ↓↓↓ ?? ??
TLI nitrogen
?? ↑↑↑ ?? ↓↓↓ ?? ?? ?? ?? ??
TLI3 ?? ?? ?? ↓↓↓ ?? ?? ?? ?? ??
Otago Lakes’ Water Quality Summary and Conclusions
The lakes monitored as part of the SoE lake monitoring program incorporate a range of:
• sizes and depths, from very shallow lakes through to several of the deepest (and largest) lakes
in the country;
tate of the Environment – Surface Water Quality in Otago 2006 to 2017 171
• lake types and elevations – from high country glacial lakes to reservoirs and lowland coastal
lakes;
• natural and pastoral landcover combinations in the upstream catchments; and
• trophic states on the Trophic Lake Index (TLI) scale, from microtrophic to supertrophic.
The nine lakes included in the SoE program provide a good representation of lake types and lake
catchment land-uses across Otago (Milne et al., 2017).
Analysis of water quality data from the monitoring program returns some stark contrasts across the
lakes with the Southern Great Lakes and Lake Dunstan having exceptionally good water quality. The
remaining lakes have water quality of varying degrees of nutrient enrichment and algal productivity.
In relation to Schedule 15 (Water Plan) compliance:
• Lake Johnson fails for NH4-N;
• Lake Tuakitoto fails for E. coli;
• Lake Johnson, Tuakitoto and Waihola fail for TN; and
• Lake Johnson, Tuakitoto, Waihola and Onslow fail for turbidity.
In relation to the national bottom lines in the NPSFM (2014) for lakes;
• Lake Johnson fails for chlorophyll a, TN and TP;
• Lake Tuakitoto fails for TN and TP;
• Lake Waihola fails for TP.
In relation to compliance with the NPSFM (2014) E. coli swimmability attribute, all lakes return an A
band for all attribute states with the exception of Lake Tuakitoto, which returns a B band for one. This
reflects good to excellent bacterial water quality and a high level of protection for primary contact
activities across all monitored lakes in regards to bacterial contact risk. Note, this is for E. coli only, NOT
cyanobacteria. As ORC do not routinely measure cyanobacteria abundance and associated bio-
volumes, it is not possible to comment on Swimmability against the lake cyanobacteria attribute.
TLI scores span all bands from Microtrophic to Supertrophic with lakes, based on the TLI3 being
ordered as
• MICROTROPHIC Hawea < OLIGOTROPHIC Wakatipu < Wanaka < Dunstan < MESOTROPHIC
Onslow < EUTROPHIC Hayes < Waihola < SUPERTROPHIC Tuakitoto < Johnson.
The historic data series for the SoE lake monitoring sites, particularly for the Southern Great Lakes
Wanaka, Wakatipu and Hawea; and Lake Dunstan, has very high numbers of “less than detects”
reflecting nutrient and algal concentrations below those that are able to be measured by the
laboratory. This severely limits some analysis that can be carried out on the data; as well as artificially
increasing the perception of elevated nutrient and algal concentrations over what is actually present.
Improved laboratory techniques that have been made available in recent years will eliminate this for
future analysis.
The Trophic Lake Sampling program that is currently underway on lakes Wanaka, Hawea, Wakatipu
and Hayes will provide an accurate estimate of the actual TLI of these lakes and will be free of “ less
than detects” for TN and Chla further increasing the accuracy and validity of the TLI estimate.

172 State of the Environment – Surface Water Quality in Otago 2006 to 2017
3. Summary and Conclusions
Overall, water quality across Otago is variable, with some areas such as the Upper Clutha and the Taieri
having excellent water quality, with other areas, such as urban streams in the Dunedin locale,
intensified catchments in North Otago and some tributaries of the Pomahaka having poor water
quality.
As has been previously reported (Ozanne, 2012), water quality in rivers across Otago show a clear
spatial pattern related to land cover and land use. Water quality is best at river and stream reaches
located at high or mountainous elevations under predominantly native cover. These sites tend to be
associated with the upper catchments of larger rivers (e.g. Clutha River/Matau‐Au, Taieri River and
Lindis River) and the outlets from large lakes (e.g. Hawea, Wakatipu and Wanaka).
Trend analysis returned a mix of results for the different reporting regions. In nearly all cases, in
instances where trends were able to be confidently identified, there were a greater number of
increasing or degrading trends than decreasing or improving trends for a given reporting region and
overall, as shown in Table 96 and Table 97. The worst performing variable was E. coli where 30% of
sites had a probable or significant increasing (degrading) trend versus 7% of sites that had either stable
or decreasing (improving) trends (Table 97). For E. coli 63% of sites were either indeterminate (51%)
or had too many results that were less than detect (8%). For these sites, in all likelihood trends would
be present, but limitations in the data do not allow the trend to be confidently identified. This point is
highly relevant when looking at the pattern of trends across the region as for all water quality variables,
there were far greater numbers of sites that returned ‘indeterminate’ or ‘<DL’ results than those that
returned a confident trend result (Table 98). This highlights the severe limitations in the historical data
set and constrains Council’s ability to confidently assess trends.
Table 96: Regional trend summary for all ORC and NIWA SoE monitoring sites across Otago.
The table includes trend results for lake monitoring sites.
Trend direction /
significance NH4-N NNN TN DRP TP E. coli Turbidity
Indeterminate 19 40 39 28 52 35 38
Increasing Significant
7 10 8 12 7 15 14
Increasing Probable
1 3 3 2 3 6 10
Stable 2 2 3 5 1 1 0
Decreasing Probable
0 1 3 0 0 2 2
Decreasing Significant
0 5 4 5 2 2 5
< DL 40 8 9 17 4 8 0
Total 69 69 69 69 69 69 69

tate of the Environment – Surface Water Quality in Otago 2006 to 2017 173
Table 97: Regional trend summary for all ORC and NIWA SoE monitoring sites across Otago.
The table includes trend results for lake monitoring sites.
Trend direction
NH4-N NNN TN DRP TP E. coli Turbidity
Indeterminate 28% 58% 57% 41% 75% 51% 55%
Increasing 12% 19% 16% 20% 14% 30% 35%
Stable 3% 3% 4% 7% 1% 1% 0%
Decreasing 0% 9% 10% 7% 3% 6% 10%
< DL 58% 12% 13% 25% 6% 12% 0%
Total 69 69 69 69 69 69 69
Table 98: Regional summary of percentage of trend analysis that were unable to be confidently
idenitifed versus those that were.
Trend direction NH4-N NNN TN DRP TP E. coli Turbidity
Data limited to confidently identify trends
85% 69% 70% 66% 82% 63% 55%
Trend confidently identified
15% 31% 30% 34% 18% 37% 45%
The weaknesses in historic SoE data held by ORC are due to a number of unavoidable challenges and
limitations. These weaknesses limit our capacity to undertake robust trend analysis. The reasons for
these limitations include:
• Changes in laboratory supplier over the analysis period that can introduce ‘step changes’ in the data set. This was evident for TP and DRP for the change in laboratory supplier that occurred mid-2011;
• Changes in method Detection Levels (DL) for a given analyte over time;
• Changes in sampling frequency, bimonthly pre 2013, monthly post 2013;
• The availability of flow data for all sites to allow consistent flow adjustment of trends for flow effected variables (eg suspended solids, E. coli and TP). At present ORC measures flow continuously at 25 of the 60 SoE river monitoring sites;
• Intermittent periods of sampling for some sites (eg. monthly for twelve months, then no sampling for three years, then bi-monthly for three years and then monthly);
• Rounding of laboratory results resulting in very little variation between sampling dates for sites with very low nutrient levels (eg. Lake Hawea Outflow).
These challenges are not atypical of long-term regional council SoE data sets. Improvements in laboratory detection levels and commitment from ORC to move from bi-monthly to monthly sampling in 2013 will remove some of these confounding factors in future analysis.
In nearly all cases, sites that have been identified as being degraded in previous reports and targeted
catchment studies remain degraded. There is evident very little change in the pattern of water quality

174 State of the Environment – Surface Water Quality in Otago 2006 to 2017
throughout Otago from the previous 5 yearly SoE report published in 2012, nor from annual SoE
updates provided in recent years.
The lack of detailed information on local or catchment scale land use change or land management
practice changes severely limits our ability to comment on drivers of trends evident in the data set. To
better interpret the reasons for improvements or degradation in water quality, information on the
following is required:
• Changes in irrigation practice – flood to pivot;
• Changes to farm type or stocking rate;
• The level of stream protection afforded to streams and rivers, and the width of setbacks;
• Mitigation measures to address critical source areas.
Collection of this type of information in a robust and repeatable manner would allow for better
interpretation of the drivers of water quality changes evident across Otago. The lack of this information
severely limits ORC’s capacity to comment on drivers of water quality change.
Monitoring by ORC is focused on the collection of numeric information on a limited number of water
quality variables that is focussed heavily on nutrients and bacteria. Very little integrated information
is collected that allows for confident assessments of overall stream and river health. For example,
visual periphyton cover and biomass estimates (as chlorophyll-a); visual clarity (as black disk sighting
distance) and fine deposited sediment cover are not measured. This limits our ability to comment on
the overall effects of high nutrients and bacteria, or elevated turbidity on the overall health of a river
or stream. Currently ecosystem health assessment is limited to the Macroinvertebrate Community
Index (MCI) that is measured at limited number of SoE monitoring sites.
During 2017, Otago Regional Council commissioned an independent review of their river and lake State
of Environment monitoring programs by NIWA. The scope of the NIWA review included:
• Assessment of the appropriateness of the river monitoring network;
• Critique of the lake monitoring program;
• Variables, or lack thereof, measured across the river and lake monitoring programs;
• Linkages between river and lake monitoring (and other domains such as estuaries);
• Key out-of-stream pressures (land use/land management) to measure to better interpret state
and change sin water quality and ecological health.
The review found the existing program to over-represent pastoral sites and under-represent natural
sites, with few sites present in RWG 3. The program also strongly focusses on water quality and would
benefit from the inclusion of additional measures of ecosystem health across a greater number of
(wadeable) sites, including:
• Monthly assessments of periphyton cover;
• Annual monitoring of macroinvertebrates; and
• Annual assessments of stream habitat.

tate of the Environment – Surface Water Quality in Otago 2006 to 2017 175
Additional recommendations included:
• Monthly assessments of periphyton biomass and deposited sediment cover at a selection of
sites, with both current and potential future land use pressures considered when identifying
these sites;
• Supplementing the existing annual biomonitoring programme with continuous measurements
of water temperature and dissolved oxygen for periods of 1-2 weeks during the warmest
months of year, prioritising monitoring at sites with poor riparian shading; and
• Making estimates of flow at the time of sampling (‘flow stamping’) at all water quality sites
that lack regular flow monitoring.
In the case of the lake monitoring program, the NIWA review that the lakes monitored by ORC covered
a range of depths, lake type, trophic state, and upstream catchment landcover. It was concluded that
while more of the 60+ lakes in Otago could be monitored, a higher priority is to establish representative
open water monitoring sites across the monitored lakes, where possible.
The review recommended:
• Ongoing monitoring of open water sites on Lakes Wakatipu, Wanaka and Hawea;
• Establishing an open water monitoring site on each of Lake Onslow and Lake Tuakitoto that is
monitored monthly for at least two years to verify the monitoring results obtained from outlet
monitoring to date; and
• Reducing the return interval for monitoring open water sites on Lakes Waihola and Waipori
from 10 to 5 years to improve the ability for timely detection of changes in lake condition.
It was also concluded that while monitoring lake shore sites in bays or outlets is not recommended as
a replacement for monitoring open water sites, shore sampling is preferred to no sampling at all.
The findings of the NIWA review align with some of the limitations in the current program identified
in this report. Should the findings be incorporated into the ORC SoE monitoring program, then future
analysis and reporting would greatly benefit.

176 State of the Environment – Surface Water Quality in Otago 2006 to 2017
References
Bayer T., Schallenberg M., Martin C.E. (2008). Investigation of nutrient limitation status and nutrient
pathways in Lake Hayes, Otago, New Zealand: A case study for integrates lake assessment. New
Zealand Journal of Marine and Freshwater Research 42: 285-295
Burns, N.M., Bryers, G., Bowman, E. (2000). Protocols for monitoring trophic levels of New Zealand
lakes and reservoirs. Ministry for the Environment, Wellington, New Zealand. 130 pp.
Hamill, K. (2006). Snapshot of Lake Water Quality in New Zealand. Prepared for the Ministry for the
Environment by Opus International Consultants. MfE. 59 pp.
Hickey, C. W. (2013). Updating nitrate toxicity effects on freshwater aquatic species. NIWA report
prepared for the Ministry of Building, Innovation and Employment, NIWA: 39 pp.
Kitto, J. (2011). Water quality and ecosystem health in the Manuherikia catchment. Otago Regional
Council. 65 pp.
Kitto, J. (2012) Water quality effects on instream values in the Upper Taieri. Otago Regional Council.
57 pp.
Lynn, I. H., Manderson, A. K., Page, M. J., Harmsworth, G. R., Eyles, G. O., Douglas, G. B., Mackay, A.D.,
Newsome, P. J. (2009). Land Use Capability Survey Handbook – a New Zealand handbook for the
classification of land. AgResearch, Hamilton; Landcare Research, Lincoln; GNS Science, Lower Hutt.
Mathieson, F., Quinn, J., Hickey, C. (2012). Review of the New Zealand in-stream plant and nutrient
guidelines and development of an extended decision making framework. Phases 1 and 2 final report.
Prepared for the Ministry of Science and Innovation Envirolink fund. No. HAM2012-081, NIWA.
Milne, J., Whitehead, A., Verburg, P. (2017). Review of Otago Regional Council's State of the
Environment monitoring programmes. River and lake water quality and ecology. NIWA Client Report
No: 2017287WN. NIWA Project ORC17302. 108 pp.
Ministry for the Environment. (2017). Swimming categories for E. coli in the Clean Water package: A
summary of the categories and their relationship to human health risk from swimming. Wellington:
Ministry for the Environment.
Monaghan, R.M., Smith, L.C. (2004). Minimising surface water pollution resulting from farm-dairy
effluent application to mole-pipe drained soils. II. The contribution of preferential flow of effluent to
whole-farm pollutant losses in subsurface drainage from a West Otago dairy farm. New Zealand
Journal of Agricultural Research, Vol. 47:417-428.
Nguyen, M.L, Eynon-Richards, N., Barnett, J. (2002) Nitrogen removal by a seepage wetland
intercepting surface and subsurface flows from a diary catchment in Waikato. In: Dairy farm soil
management (Eds L. Currie and P. Loganathan). Occasional Report No 15. Fertilizer and Lime Research
Centre. Massey University. Palmerston North.
Norton E. (2012) "Proposed Hurunui and Waiau River Regional Plan and Proposed Plan Change 3 to
the Canterbury Natural Resources Regional Plan. Implications for Water Quality. Section 42A Report",
NIWA, Christchurch.
Ogilvie, S., Mitchell, S. (1995). A model of mussel filtration in a shallow New Zealand lake, with
reference to eutrophication control. Archives of Hydrobiology 133 (4): 471-481.

tate of the Environment – Surface Water Quality in Otago 2006 to 2017 177
Olsen, D. (2013). Water quality study: Waianakarua River catchment. Otago Regional Council. 57pp.
Olsen, D. (2013b). Water quality in the Tokomairiro catchment: Trends and comparison with water
quality standards. Otago Regional Council. 69pp.
Olsen, D. (2014). Shag River / Waihemo catchment: water quality and ecosystem. Otago Regional
Council. 88 pp.
Olsen, D., Xiaofeng, L, Ravenscroft, P. (2016) Management flows for aquatic ecosystems in the
Manuherikia River and Dunstan Creek. Otago Regional Council. 105 pp.
ORC (2008). Surface Water Quality: The Water of Leith and Lindsays Creek; Kaikorai Stream; Waitati
River and Carey’s Creek. Otago Regional Council. 82 pp.
ORC (2009). Otago lakes’ trophic status: Lake Hayes, Lake Johnson, Lakes Onslow, Lake Wakatipu and
Lake Wanaka. Otago Regional Council. 141 pp.
ORC (2010). Patterns of Water Quality in the Pomahaka Catchment. Otago regonal Council short
report. 8pp.
ORC (2011). Effects of land use on water quality in the Pomahaka catchment. Otago Regional Council.
69 pp.
Ozanne, R. (2011). Water quality and ecological health for rivers in the Catlins area. Otago Regional
Council. 56 pp.
Ozanne, R. (2012). State of the environment: Surface water quality in Otago. 2006 to 2011. Otago
Regional Council. 91 pp.
Ozanne, R., Wilson, S. (2013). Kakanui River Water Quality Report. Otago Regional Council. 95 pp.
Ozanne, R. (2014). Water quality and ecosystem health in the Lake Tuakitoto catchment. Otago
Regional Council. 75 pp.
Ozanne, R. (2017). Lake Waipori and Lake Waihola Trophic Level Status. Otago Regional Council. 63 pp.
Rajanayaka, C. (2012) Lower Waitaki Groundwater Quality Investigation. Prepared for Lower Waitaki
Irrigation Company. Report No. C12108/1. Aqualinc Research Ltd. 60pp.
Robertson, B., Robertson, B., Stevens, L. (2017a). Waikouaiti Estuary. Fine Scale Monitoring 2016/17.
Report prepared for Otago Regional Council. Wriggle Ltd. 45 pp.
Robertson, B., Robertson, B., Stevens, L. (2017b). Catlins Estuary. Fine Scale Monitoring 2016/17.
Report prepared for Otago Regional Council. Wriggle Ltd. 40 pp.
Schallenberg, M., Schallenberg, L. (2017). Lake Hayes Restoration and Monitoring Plan. Prepared for
the Friends of Lake Hayes Society Inc. Hydrsphere Research. May 2017. 52 pp.
Verburg, P., Hamill, K., Unwin, M., Abell, J. (2010). Lake water quality in New Zealand 2010: Status and
trends. NIWA Client Report: HAM2010-107. 53 pp.
Wilcock, R.J., Nagels, J.W., Rodda, H.J.E., O’Conner, M.B., Thorrold, B.S., Barnett, J.W. (1999) Water
quality of a lowland stream in a New Zealand dairy farming catchment. New Zealand Journal of Marine
and Freshwater Research. 33:683-696.

178 State of the Environment – Surface Water Quality in Otago 2006 to 2017
Appendix A – Site metadata
Reporting region
SoE reporting name Easting Northing River/Lake ORC RWG
REC class
FENZ class
ORC / NIWA
Elevation (mASL)
Upland /
Lowland
North Otago
Welcome Creek at Steward Road 1447988 5023090 River 2 CD/L/P A ORC 18 Lowland
Kakanui River at Clifton Falls Bridge 1422937 5011060 River 2 CD/H/P C ORC 91 Lowland
Kauru River at Ewings 1421935 5002223 River 2 CD/H/P C ORC 104 Lowland
Kakanui River at McCones 1433513 4995180 River 2 CD/H/P C ORC 7 Lowland
Waiareka Creek at Taipo Road 1433510 4997780 River 2 CD/L/P A ORC 12 Lowland
Waianakarua River at Browns 1430610 4986676 River 2 CD/H/P C ORC 7 Lowland
Trotters Creek at Mathesons 1430827 4971209 River 2 CD/L/P A ORC 6 Lowland
Shag River at Craig Road 1417203 4967124 River 2 CD/H/P G ORC 28 Lowland
Shag River at Goodwood Pump 1424508 4961853 River 2 CD/L/P G ORC 7 Lowland
Dunedin / Southern Coastal
Waikouaiti River at Confluence D/S 1412607 4945796 River 2 CD/H/P G ORC 4 Lowland
Lindsays Creek at North Road Bridge 1407755 4919443 River 1 CD/L/U G ORC 27 Lowland
Leith Stream at Dundas Street Bridge 1407297 4918262 River 1 CW/L/U G ORC 16 Lowland
Kaikorai Stream at Brighton Road 1400015 4913355 River 1 CD/L/U G ORC 4 Lowland
Tokomairiro River at West Branch Bdge 1356633 4892026 River 1 CD/L/P G ORC 31 Lowland
Owaka River at Katea Road 1342116 4852225 River 1 CW/L/P G ORC 10 Lowland
Catlins River at Houipapa 1335133 4848930 River 1 CW/L/P G ORC 21 Lowland

State of the Environment – Surface Water Quality in Otago 2006 to 2017 179
Reporting region
SoE reporting name Easting Northing River/Lake ORC RWG
REC class FENZ class
NIWA/ORC Elevation (mASL)
Upland / Lowland
Taieri
Taieri River at Linnburn Runs Road 1351010 4958393 River 2 CD/H/N H ORC 560 Upland
Taieri River at Stonehenge 1361322 4976302 River 2 CD/H/N D ORC 381 Upland
Taieri River at Waipiata 1376400 4991252 River 2 CD/H/P D ORC 354 Upland
Kye Burn at SH85 Bridge 1384708 4996733 River 2 CD/H/P C ORC 376 Upland
Taieri River at Tiroiti 1385941 4984856 River 2 CD/H/P C NIWA 315 Upland
Taieri River at Sutton 1376859 4949913 River 2 CD/H/P G ORC 184 Upland
Sutton Stream at SH87 1373364 4946708 River 2 CD/H/P G NIWA 221 Upland
Nenthorn Stream at Mt Stoker Road 1385683 4948654 River 2 CD/H/P G ORC 245 Upland
Deep Stream at SH87 1370377 4935501 River 2 CD/H/P G ORC 342 Upland
3 O'Clock Stream at Hindon 1392681 4935632 River 2 CD/H/P G ORC 111 Lowland
Taieri River at Outram 1385927 4918942 River 2 CD/H/P G NIWA 15 Lowland
Silver Stream at Taieri Depot 1392170 4916608 River 2 CD/L/P G ORC 12 Lowland
Owhiro Stream at Riverside Road 1389614 4913325 River 2 CD/L/P A ORC 5 Lowland
Taieri River at Allanton Bridge 1387685 4912202 River 2 CD/H/P A ORC 1 Lowland
Waipori River at Waipori Falls Reserve 1372537 4909488 River 2 CD/Lk/N G ORC 12 Lowland
Upper Clutha
Dart River at The Hillocks 1230044 5031514 River 3 CX/GM/N C ORC 346 Upland
Shotover River at Bowens Peak 1262216 5009225 River 2 CW/M/N E NIWA 330 Upland
Mill Creek at Fish Trap 1269921 5012135 River 2 CD/H/P D ORC 330 Upland
Kawarau River at Chards 1274430 5008034 River 3 CW/Lk/N E NIWA 327 Upland
Matukituki River at West Wanaka 1282005 5049680 River 3 CX/GM/N E ORC 277 Upland
Cardrona River at Mt Barker 1292623 5037476 River 2 CD/H/N D ORC 393 Upland
Hawea River at Camphill Bridge 1302363 5049022 River 2 CX/Lk/N E ORC 313 Upland
Clutha River at Luggate Bridge 1305473 5040410 River 3 CX/Lk/N E NIWA 271 Upland
Luggate Creek at SH6 1304632 5038216 River 2 CW/M/N D ORC 282 Upland
Lindis River at Lindis Peak 1323545 5039400 River 2 CD/H/N D ORC 357 Upland
Lindis River at Ardgour Road 1314455 5023467 River 2 CD/H/N D ORC 234 Upland

180 State of the Environment – Surface Water Quality in Otago 2006 to 2017
Spatial area name
SoE reporting name Easting Northing River/Lake ORC RWG
REC class FENZ class
NIWA/ORC Elevation (mASL)
Upland / Lowland
Middle Clutha / Central Otago
Dunstan Creek at Beattie Road 1344753 5018685 River 2 CD/M/N D ORC 429 Upland
Manuherikia River at Ophir 1331884 4999082 River 2 CD/H/P D ORC 298 Upland
Thomsons Creek at SH85 1331613 4999632 River 2 CD/H/P D ORC 297 Upland
Manuherikia River at Galloway 1319790 4985701 River 2 CD/H/P D ORC 143 Lowland
Benger Burn at SH8 1317447 4939327 River 2 CD/H/P C ORC 72 Lowland
Fraser River at Marshall Road 1314057 4983106 River 2 CD/M/P D ORC 140 Lowland
Clutha River at Millers Flat 1320354 4936929 River 2 CW/Lk/N E NIWA 66 Lowland
Lower Clutha /
Pomahaka
Pomahaka River at Glenken 1300423 4913601 River 2 CD/H/P G ORC 172 Upland
Heriot Burn at Park Hill Road 1306049 4913250 River 1 CD/L/P A ORC 149 Lowland
Crookston Burn at Kelso Road 1307953 4910330 River 1 CD/L/P A ORC 142 Lowland
Waikoikoi Stream at Hailes Bridge 1307309 4896680 River 1 CD/L/P A ORC 108 Lowland
Waipahi River at Cairns Peak 1309698 4866864 River 1 CD/L/P G ORC 219 Upland
Waipahi River at Waipahi 1310329 4887179 River 1 CD/L/P G ORC 106 Lowland
Wairuna River at Millar Road 1315641 4887960 River 1 CD/L/P G ORC 97 Lowland
Pomahaka River at Burkes Ford 1321675 4893104 River 1 CD/L/P A ORC 49 Lowland
Waiwera at Maws Farm 1334153 4881621 River 1 CD/L/P G ORC 36 Lowland
Waitahuna at Tweeds Bridge 1344378 4897887 River 1 CD/L/P G ORC 87 Lowland
Clutha River at Balclutha 1349274 4874447 River 1 CW/Lk/P E NIWA 6 Lowland

State of the Environment – Surface Water Quality in Otago 2006 to 2017 181
Lake SoE metadata
Spatial area name SoE reporting name Easting Northing River/Lake ORC RWG
NIWA/ORC Elevation (mASL)
Upland / Lowland
Upper Clutha Lake Wanaka Outflow 1294718 5047186 Lake 5 ORC 275 Upland
Lake Hawea Outflow 1302520 5053536 Lake 5 ORC 346 Upland
Lake Dunstan at Dead Man’s Point 1302216 5005918 Lake 5 ORC 198 Upland
Lake Wakatipu Outflow 1263310 5005041 Lake 5 ORC 308 Upland
Lake Hayes at Bendemeer Bay 1270123 5010533 Lake 4 ORC 331 Upland
Lake Johnson at South Beach huts 1263618 5007424 Lake 4 ORC 397 Upland
Middle Clutha / Central Otago Lake Onslow at Boat Ramp 1334382 4950057 Lake 4 ORC 685 Upland
Taieri Lake Waihola at jetty 1375024 4899520 Lake 4 ORC 1 Lowland
Dunedin / Southern Coastal Lake Tuakitoto at Outlet 1355609 4874931 Lake 4 ORC 2 Lowland

182 State of the Environment – Surface Water Quality in Otago 2006 to 2017
Appendix B – NPSFM (2014) NOF Attribute Tables
Periphyton NOF attribute table

State of the Environment – Surface Water Quality in Otago 2006 to 2017 183
Nitrate NOF attribute table
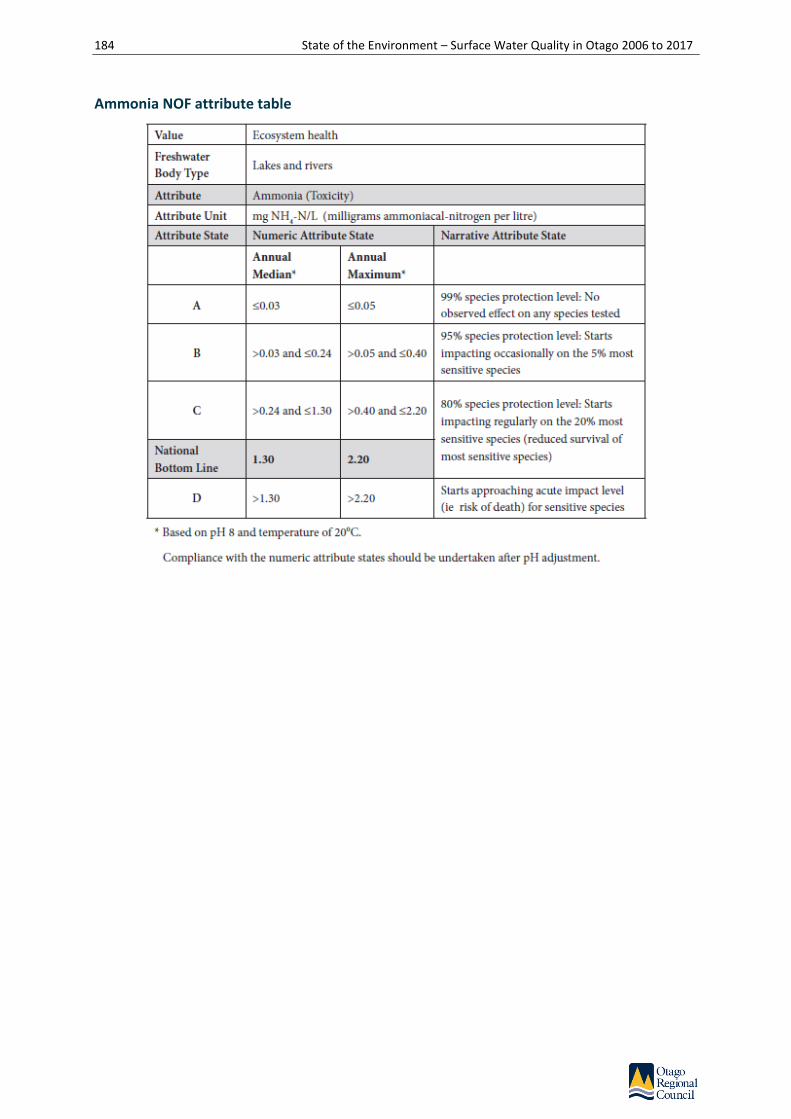
184 State of the Environment – Surface Water Quality in Otago 2006 to 2017
Ammonia NOF attribute table

State of the Environment – Surface Water Quality in Otago 2006 to 2017 185
Dissolved Oxygen NOF attribute table
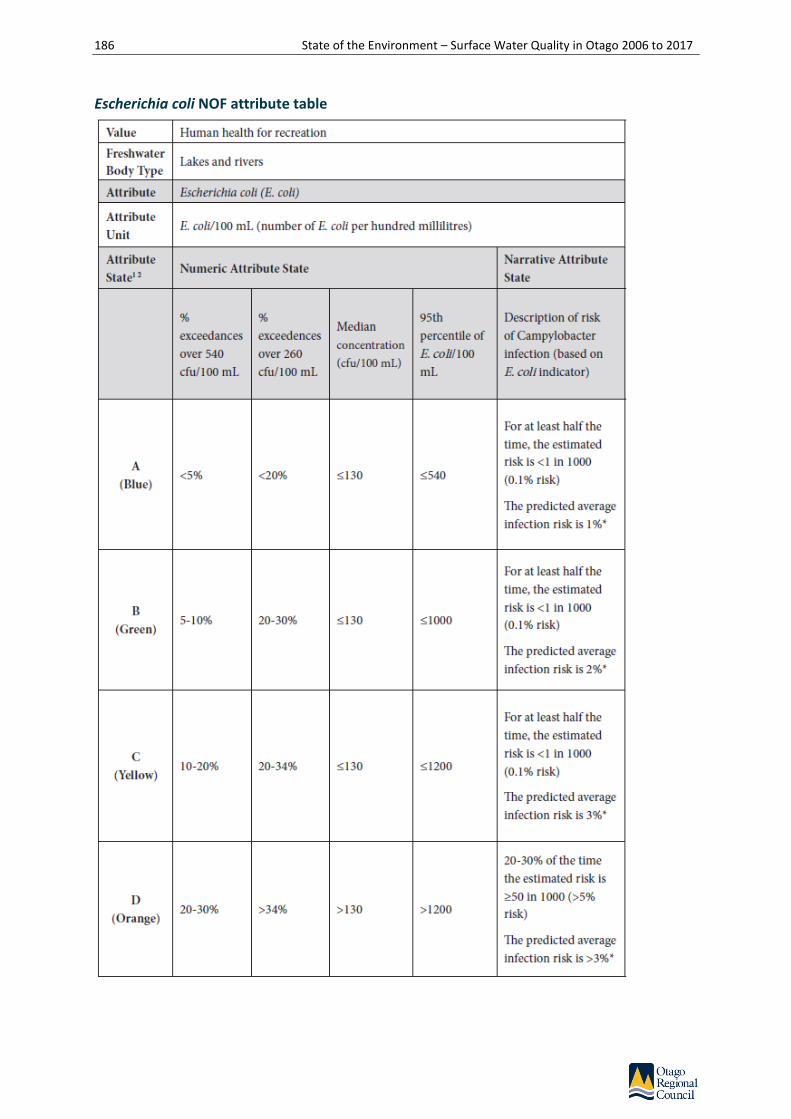
186 State of the Environment – Surface Water Quality in Otago 2006 to 2017
Escherichia coli NOF attribute table
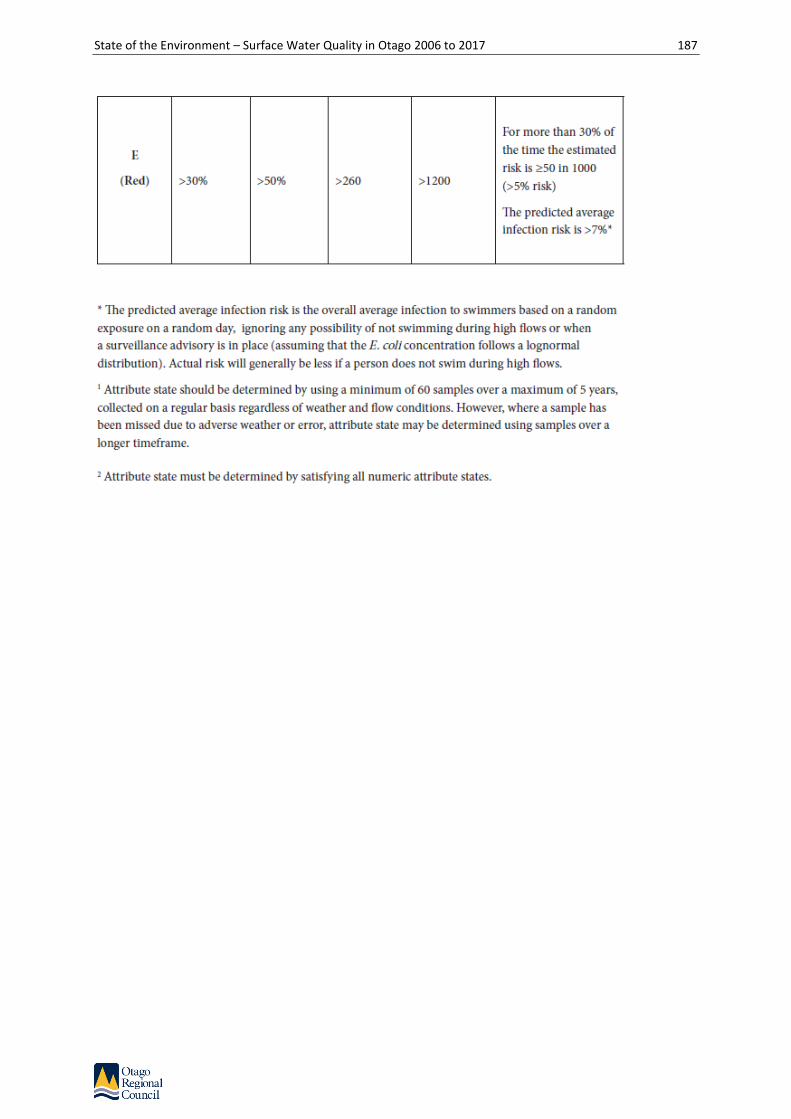
State of the Environment – Surface Water Quality in Otago 2006 to 2017 187

188 State of the Environment – Surface Water Quality in Otago 2006 to 2017
Total Nitrogen (Lakes) NOF attribute table
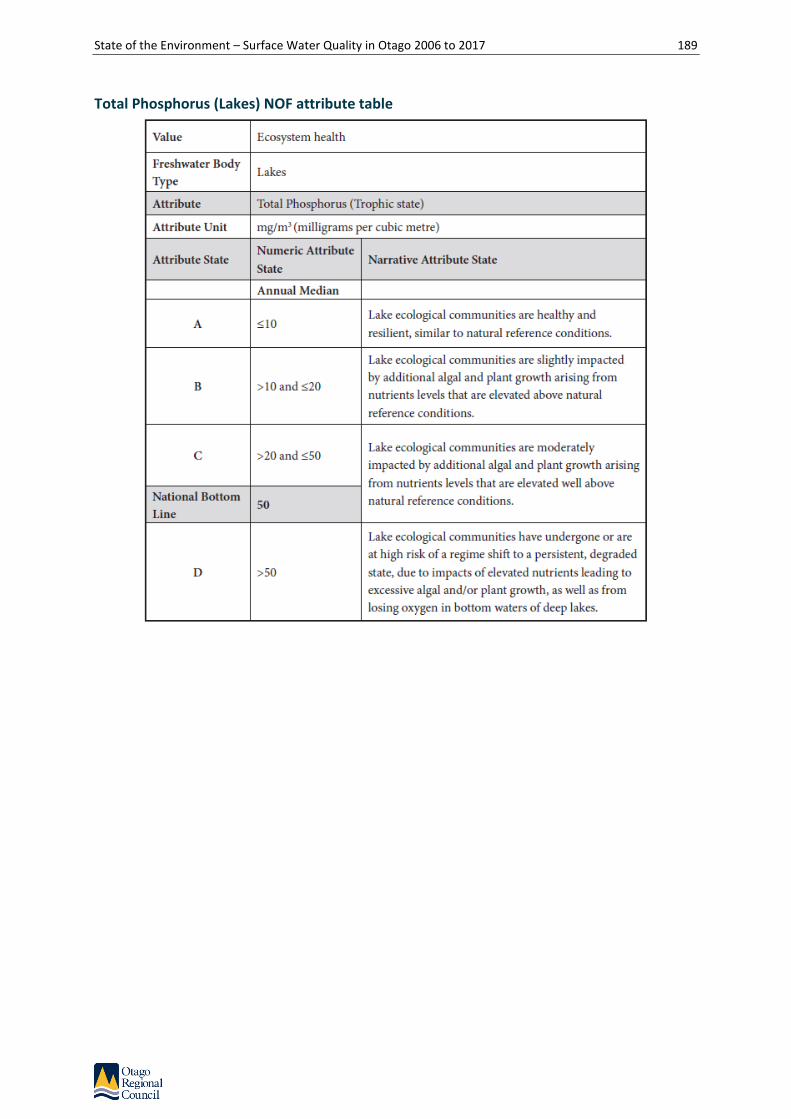
State of the Environment – Surface Water Quality in Otago 2006 to 2017 189
Total Phosphorus (Lakes) NOF attribute table

190 State of the Environment – Surface Water Quality in Otago 2006 to 2017
Phytoplankton (Lakes) NOF attribute table

State of the Environment – Surface Water Quality in Otago 2006 to 2017 191
Appendix C – River SoE sites with continuous flow recorders
Otago Regional Council State of Environment monitoring sites with continuous flow recorders
• Benger Burn at SH8
• Cardrona River at Mt Barker
• Catlins River at Houipapa
• Dart River at The Hillocks
• Kakanui River at Clifton Falls Bridge
• Leith Stream at Dundas Street Bridge
• Lindis River at Ardgour Road
• Lindis River at Lindis Peak
• Manuherikia River at Ophir
• Matukituki River at West Wanaka
• Mill Creek at Fish Trap
• Pomahaka River at Burkes Ford
• Pomahaka River at Glenken
• Shag River at Craig Road
• Shotover River at Bowens Peak
• Silver Stream at Taieri Depot
• Taieri River at Outram
• Taieri River at Sutton
• Taieri River at Tiroiti
• Taieri River at Waipiata
• Tokomairiro River at West Branch Bridge
• Waianakarua River at Browns
• Waikouaiti River at Confluence D/S
• Waitahuna at Tweeds Bridge
• Waiwera at Maws Farm

192 State of the Environment – Surface Water Quality in Otago 2006 to 2017
Appendix D – Land Cover Descriptions (LCDB4)
Table D -1: LCDB4 land cover categories and summary principle land cover categories. SOURCE: The principal land cover categories have been adapted from
Thompson et al 2003 and Walker et al 2007. (Thompson S, Grüner I, Gapare N, Ministry for the Environment 2003. New Zealand Land Cover Database Version
2, Illustrated Guide to Target Classes. Walker S, Ciegaard E, Grove P, Lloyd K, Myers S, Park T, Porteous T 2007. Guide for the Users of the Threatened
Environment Classification Version 1.1, August 2007. Landcare Research Manaaki Whenua (p 35). Adapted from the approach taken by Hawke’s Bay Regional
Council.
Principal land-cover category LCDB4 Land-use Category Name Comment
Native Cover Broadleaved Indigenous Hardwoods Depleted Grassland Fernland Herbaceous Freshwater Vegetation Herbaceous Saline Vegetation Indigenous Forest Manuka and/or Kanuka Matagouri or Grey Scrub Sub Alpine Shrubland Tall Tussock Grassland
These LCDB4 land-use categories have all been classified as indigenous (Walker et al 2007). The assessment whether a land cover class is indigenous or exotic is based on a subjective examination of vegetation cover and whether it is mainly exotic or indigenous. Many of the cover classes, such as depleted grassland, contain a mixture of exotic and indigenous species (Walker et al 2007). For the purposes of this report, depleted grassland has been classified as indigenous.
Plantation forestry Deciduous Hardwoods Exotic Forest Forest - Harvested
As well as including willow and poplar species, deciduous hardwoods have been included in this category, as this class, also includes planted exotic hardwoods (Thompson et al 2003)
High producing grassland High Producing Exotic Grassland Land that is intensively managed and grazed for wool, lamb, beef, dairy or deer production.
Low producing grassland Low Producing Grassland Exotic and indigenous grasslands, grazed for wool, sheep or beef. Usually found on steep hill country.
Orchards/Vineyards Orchard, Vineyard or Other Perennial Crop Land used for perennial vines, areas cultivated less than annually and tree crops such as pip,

State of the Environment – Surface Water Quality in Otago 2006 to 2017 193
Principal land-cover category LCDB4 Land-use Category Name Comment
stone and citrus fruit, olives and nuts as well as climbing plants such as berries, and kiwifruit.
Cropping Short-rotation Cropland Includes land used for cereal, root, annual seed and annual vegetable crops, hops, strawberries, flower crops and open ground nurseries.
Urban areas Built-up Area (settlement) Transport Infrastructure Urban Parkland/Open Space Surface Mine or Dump
Surfaces with high run off rates. Includes land associated with hard urban manmade surfaces, infrastructure and mown grass, and bare surfaces associated with gravel pits, quarries and dumps.
Unaccounted, <1% of total catchment area Estuarine Open Water Gorse and/or Broom Gravel or Rock Lake or Pond Landslide Mixed Exotic Shrubland River Sand or Gravel
These categories have not been included in the land-use summary tables in this report. They account for less than 1% of total catchment area and are perceived to have little or no contribution to eutrophication of water bodies.

194 State of the Environment – Surface Water Quality in Otago 2006 to 2017
Appendix E – Regional boxplot summary
Ammoniacal Nitrogen
Am
mo
nia
ca
l N
itro
ge
n (
mg
/L)
Wel
com
e Cre
ek a
t Ste
war
d Roa
d
Kak
anui
River
at C
lifto
n Fal
ls B
ridge
Kau
ru R
iver
at E
wings
Kak
anui
River
at M
cCon
es
Wai
arek
a Cre
ek a
t Taipo
Roa
d
Wai
anak
arua
River
at B
rowns
Trotte
rs C
reek
at M
athe
sons
Sha
g River
at C
raig R
oad
Sha
g River
at G
oodw
ood
Pum
p
Wai
koua
iti R
iver
at C
onflu
ence
D/S
Lind
says
Cre
ek a
t Nor
th R
oad
Brid
ge
Leith
Stre
am a
t Dun
das Stre
et B
ridge
Kaiko
rai S
tream
at B
right
on R
oad
Tokom
airir
o River
at W
est B
ranc
h Brid
ge
Owak
a River
at K
atea
Roa
d
Cat
lins River
at H
ouip
apa
Taier
i River
at L
innb
urn
Taier
i River
at S
tone
heng
e
Taier
i River
at W
aipi
ata
Kye
Bur
n at
SH85
Brid
ge
Taier
i River
at T
iroiti
Taier
i River
at S
utto
n
Sut
ton
Stream
at S
H87
Nen
thor
n Stre
am a
t Mt S
toke
r Roa
d
Dee
p Stre
am a
t SH87
3 O
'Clo
ck S
tream
at H
indo
n
Taier
i River
at O
utra
m
Silv
er S
tream
at T
aier
i Dep
ot
Owhiro
Stre
am a
t River
side
Roa
d
Taier
i River
at A
llant
on B
ridge
Wai
pori
River
at W
aipo
ri Fal
ls R
sv
Dar
t River
at T
he H
illock
s
Sho
tove
r River
at B
owen
s Pea
k
Mill C
reek
at F
ish
Trap
Kaw
arau
River
at C
hard
s
Mat
ukitu
ki R
iver
at W
est W
anak
a
Car
dron
a River
at M
t Bar
ker
Haw
ea R
iver
at C
amph
ill B
ridge
Cluth
a River
at L
ugga
te B
ridge
Lugg
ate
Cre
ek a
t SH6
Lind
is R
iver
at L
indis
Pea
k
Lind
is R
iver
at A
rdgo
ur R
oad
Dun
stan
Cre
ek a
t Bea
ttie
Roa
d
Man
uher
ikia R
iver
at O
phir
Thom
sons
Cre
ek a
t SH85
Man
uher
ikia R
iver
at G
alloway
Ben
ger B
urn
at S
H8
Frase
r River
at M
arsh
all R
oad
Cluth
a River
at M
iller
s Fla
t
Pom
ahak
a River
at G
lenk
en
Her
iot B
urn
at P
ark Hill R
oad
Cro
okston
Bur
n at
Kelso
Roa
d
Wai
koikoi S
tream
at H
ailes Brid
ge
Wai
pahi
River
at C
airn
s Pea
k
Wai
pahi
River
at W
aipa
hi
Wai
runa
River
at M
illar R
oad
Pom
ahak
a River
at B
urke
s Fo
rd
Wai
wer
a at
Maw
s Fa
rm
Wai
tahu
na a
t Twee
ds B
ridge
Cluth
a River
at B
alclut
ha0.000
0.020
0.040
0.060
0.080
0.100
0.120
0.140
0.160
0.180
0.200
Upper Clutha Taieri Dunedin / South
Coast North Otago Middle Clutha
Lower Clutha / Pomahaka

State of the Environment – Surface Water Quality in Otago 2006 to 2017 195
Nitrite/Nitrate Nitrogen
Nitri
te/N
itra
te N
itro
ge
n (
mg
/L)
Wel
com
e Cre
ek a
t Ste
war
d Roa
d
Kak
anui
River
at C
lifto
n Fal
ls B
ridge
Kau
ru R
iver
at E
wings
Kak
anui
River
at M
cCon
es
Wai
arek
a Cre
ek a
t Taipo
Roa
d
Wai
anak
arua
River
at B
rowns
Trotte
rs C
reek
at M
athe
sons
Sha
g River
at C
raig R
oad
Sha
g River
at G
oodw
ood
Pum
p
Wai
koua
iti R
iver
at C
onflu
ence
D/S
Lind
says
Cre
ek a
t Nor
th R
oad
Brid
ge
Leith
Stre
am a
t Dun
das Stre
et B
ridge
Kaiko
rai S
tream
at B
right
on R
oad
Tokom
airir
o River
at W
est B
ranc
h Brid
ge
Owak
a River
at K
atea
Roa
d
Cat
lins River
at H
ouip
apa
Taier
i River
at L
innb
urn
Taier
i River
at S
tone
heng
e
Taier
i River
at W
aipi
ata
Kye
Bur
n at
SH85
Brid
ge
Taier
i River
at T
iroiti
Taier
i River
at S
utto
n
Sut
ton
Stream
at S
H87
Nen
thor
n Stre
am a
t Mt S
toke
r Roa
d
Dee
p Stre
am a
t SH87
3 O
'Clo
ck S
tream
at H
indo
n
Taier
i River
at O
utra
m
Silv
er S
tream
at T
aier
i Dep
ot
Owhiro
Stre
am a
t River
side
Roa
d
Taier
i River
at A
llant
on B
ridge
Wai
pori
River
at W
aipo
ri Fal
ls R
sv
Dar
t River
at T
he H
illock
s
Sho
tove
r River
at B
owen
s Pea
k
Mill C
reek
at F
ish
Trap
Kaw
arau
River
at C
hard
s
Mat
ukitu
ki R
iver
at W
est W
anak
a
Car
dron
a River
at M
t Bar
ker
Haw
ea R
iver
at C
amph
ill B
ridge
Cluth
a River
at L
ugga
te B
ridge
Lugg
ate
Cre
ek a
t SH6
Lind
is R
iver
at L
indis
Pea
k
Lind
is R
iver
at A
rdgo
ur R
oad
Dun
stan
Cre
ek a
t Bea
ttie
Roa
d
Man
uher
ikia R
iver
at O
phir
Thom
sons
Cre
ek a
t SH85
Man
uher
ikia R
iver
at G
alloway
Ben
ger B
urn
at S
H8
Frase
r River
at M
arsh
all R
oad
Cluth
a River
at M
iller
s Fla
t
Pom
ahak
a River
at G
lenk
en
Her
iot B
urn
at P
ark Hill R
oad
Cro
okston
Bur
n at
Kelso
Roa
d
Wai
koikoi S
tream
at H
ailes Brid
ge
Wai
pahi
River
at C
airn
s Pea
k
Wai
pahi
River
at W
aipa
hi
Wai
runa
River
at M
illar R
oad
Pom
ahak
a River
at B
urke
s Fo
rd
Wai
wer
a at
Maw
s Fa
rm
Wai
tahu
na a
t Twee
ds B
ridge
Cluth
a River
at B
alclut
ha0.000
0.500
1.000
1.500
2.000
2.500
3.000
3.500
Upper Clutha Taieri Dunedin / South
Coast North Otago Middle Clutha
Lower Clutha / Pomahaka

196 State of the Environment – Surface Water Quality in Otago 2006 to 2017
Total Nitrogen
To
tal N
itro
ge
n (
mg
/L)
Wel
com
e Cre
ek a
t Ste
war
d Roa
d
Kak
anui
River
at C
lifto
n Fal
ls B
ridge
Kau
ru R
iver
at E
wings
Kak
anui
River
at M
cCon
es
Wai
arek
a Cre
ek a
t Taipo
Roa
d
Wai
anak
arua
River
at B
rowns
Trotte
rs C
reek
at M
athe
sons
Sha
g River
at C
raig R
oad
Sha
g River
at G
oodw
ood
Pum
p
Wai
koua
iti R
iver
at C
onflu
ence
D/S
Lind
says
Cre
ek a
t Nor
th R
oad
Brid
ge
Leith
Stre
am a
t Dun
das Stre
et B
ridge
Kaiko
rai S
tream
at B
right
on R
oad
Tokom
airir
o River
at W
est B
ranc
h Brid
ge
Owak
a River
at K
atea
Roa
d
Cat
lins River
at H
ouip
apa
Taier
i River
at L
innb
urn
Taier
i River
at S
tone
heng
e
Taier
i River
at W
aipi
ata
Kye
Bur
n at
SH85
Brid
ge
Taier
i River
at T
iroiti
Taier
i River
at S
utto
n
Sut
ton
Stream
at S
H87
Nen
thor
n Stre
am a
t Mt S
toke
r Roa
d
Dee
p Stre
am a
t SH87
3 O
'Clo
ck S
tream
at H
indo
n
Taier
i River
at O
utra
m
Silv
er S
tream
at T
aier
i Dep
ot
Owhiro
Stre
am a
t River
side
Roa
d
Taier
i River
at A
llant
on B
ridge
Wai
pori
River
at W
aipo
ri Fal
ls R
sv
Dar
t River
at T
he H
illock
s
Sho
tove
r River
at B
owen
s Pea
k
Mill C
reek
at F
ish
Trap
Kaw
arau
River
at C
hard
s
Mat
ukitu
ki R
iver
at W
est W
anak
a
Car
dron
a River
at M
t Bar
ker
Haw
ea R
iver
at C
amph
ill B
ridge
Cluth
a River
at L
ugga
te B
ridge
Lugg
ate
Cre
ek a
t SH6
Lind
is R
iver
at L
indis
Pea
k
Lind
is R
iver
at A
rdgo
ur R
oad
Dun
stan
Cre
ek a
t Bea
ttie
Roa
d
Man
uher
ikia R
iver
at O
phir
Thom
sons
Cre
ek a
t SH85
Man
uher
ikia R
iver
at G
alloway
Ben
ger B
urn
at S
H8
Frase
r River
at M
arsh
all R
oad
Cluth
a River
at M
iller
s Fla
t
Pom
ahak
a River
at G
lenk
en
Her
iot B
urn
at P
ark Hill R
oad
Cro
okston
Bur
n at
Kelso
Roa
d
Wai
koikoi S
tream
at H
ailes Brid
ge
Wai
pahi
River
at C
airn
s Pea
k
Wai
pahi
River
at W
aipa
hi
Wai
runa
River
at M
illar R
oad
Pom
ahak
a River
at B
urke
s Fo
rd
Wai
wer
a at
Maw
s Fa
rm
Wai
tahu
na a
t Twee
ds B
ridge
Cluth
a River
at B
alclut
ha0.000
0.500
1.000
1.500
2.000
2.500
3.000
3.500
4.000
4.500
Upper Clutha Taieri Dunedin / South
Coast North Otago Middle Clutha
Lower Clutha / Pomahaka

State of the Environment – Surface Water Quality in Otago 2006 to 2017 197
Dissolved Reactive Phosphorus
Dis
so
lve
d R
ea
ctive
Ph
osp
ho
rus (
mg
/L)
Wel
com
e Cre
ek a
t Ste
war
d Roa
d
Kak
anui
River
at C
lifto
n Fal
ls B
ridge
Kau
ru R
iver
at E
wings
Kak
anui
River
at M
cCon
es
Wai
arek
a Cre
ek a
t Taipo
Roa
d
Wai
anak
arua
River
at B
rowns
Trotte
rs C
reek
at M
athe
sons
Sha
g River
at C
raig R
oad
Sha
g River
at G
oodw
ood
Pum
p
Wai
koua
iti R
iver
at C
onflu
ence
D/S
Lind
says
Cre
ek a
t Nor
th R
oad
Brid
ge
Leith
Stre
am a
t Dun
das Stre
et B
ridge
Kaiko
rai S
tream
at B
right
on R
oad
Tokom
airir
o River
at W
est B
ranc
h Brid
ge
Owak
a River
at K
atea
Roa
d
Cat
lins River
at H
ouip
apa
Taier
i River
at L
innb
urn
Taier
i River
at S
tone
heng
e
Taier
i River
at W
aipi
ata
Kye
Bur
n at
SH85
Brid
ge
Taier
i River
at T
iroiti
Taier
i River
at S
utto
n
Sut
ton
Stream
at S
H87
Nen
thor
n Stre
am a
t Mt S
toke
r Roa
d
Dee
p Stre
am a
t SH87
3 O
'Clo
ck S
tream
at H
indo
n
Taier
i River
at O
utra
m
Silv
er S
tream
at T
aier
i Dep
ot
Owhiro
Stre
am a
t River
side
Roa
d
Taier
i River
at A
llant
on B
ridge
Wai
pori
River
at W
aipo
ri Fal
ls R
sv
Dar
t River
at T
he H
illock
s
Sho
tove
r River
at B
owen
s Pea
k
Mill C
reek
at F
ish
Trap
Kaw
arau
River
at C
hard
s
Mat
ukitu
ki R
iver
at W
est W
anak
a
Car
dron
a River
at M
t Bar
ker
Haw
ea R
iver
at C
amph
ill B
ridge
Cluth
a River
at L
ugga
te B
ridge
Lugg
ate
Cre
ek a
t SH6
Lind
is R
iver
at L
indis
Pea
k
Lind
is R
iver
at A
rdgo
ur R
oad
Dun
stan
Cre
ek a
t Bea
ttie
Roa
d
Man
uher
ikia R
iver
at O
phir
Thom
sons
Cre
ek a
t SH85
Man
uher
ikia R
iver
at G
alloway
Ben
ger B
urn
at S
H8
Frase
r River
at M
arsh
all R
oad
Cluth
a River
at M
iller
s Fla
t
Pom
ahak
a River
at G
lenk
en
Her
iot B
urn
at P
ark Hill R
oad
Cro
okston
Bur
n at
Kelso
Roa
d
Wai
koikoi S
tream
at H
ailes Brid
ge
Wai
pahi
River
at C
airn
s Pea
k
Wai
pahi
River
at W
aipa
hi
Wai
runa
River
at M
illar R
oad
Pom
ahak
a River
at B
urke
s Fo
rd
Wai
wer
a at
Maw
s Fa
rm
Wai
tahu
na a
t Twee
ds B
ridge
Cluth
a River
at B
alclut
ha0.000
0.025
0.050
0.075
0.100
0.125
0.150
0.175
0.200
0.225
0.250
0.275
0.300
Upper Clutha Taieri Dunedin / South
Coast North Otago Middle Clutha
Lower Clutha / Pomahaka

198 State of the Environment – Surface Water Quality in Otago 2006 to 2017
Total Phosphorus
To
tal P
ho
sp
ho
rus (
mg
/L)
Wel
com
e Cre
ek a
t Ste
war
d Roa
d
Kak
anui
River
at C
lifto
n Fal
ls B
ridge
Kau
ru R
iver
at E
wings
Kak
anui
River
at M
cCon
es
Wai
arek
a Cre
ek a
t Taipo
Roa
d
Wai
anak
arua
River
at B
rowns
Trotte
rs C
reek
at M
athe
sons
Sha
g River
at C
raig R
oad
Sha
g River
at G
oodw
ood
Pum
p
Wai
koua
iti R
iver
at C
onflu
ence
D/S
Lind
says
Cre
ek a
t Nor
th R
oad
Brid
ge
Leith
Stre
am a
t Dun
das Stre
et B
ridge
Kaiko
rai S
tream
at B
right
on R
oad
Tokom
airir
o River
at W
est B
ranc
h Brid
ge
Owak
a River
at K
atea
Roa
d
Cat
lins River
at H
ouip
apa
Taier
i River
at L
innb
urn
Taier
i River
at S
tone
heng
e
Taier
i River
at W
aipi
ata
Kye
Bur
n at
SH85
Brid
ge
Taier
i River
at T
iroiti
Taier
i River
at S
utto
n
Sut
ton
Stream
at S
H87
Nen
thor
n Stre
am a
t Mt S
toke
r Roa
d
Dee
p Stre
am a
t SH87
3 O
'Clo
ck S
tream
at H
indo
n
Taier
i River
at O
utra
m
Silv
er S
tream
at T
aier
i Dep
ot
Owhiro
Stre
am a
t River
side
Roa
d
Taier
i River
at A
llant
on B
ridge
Wai
pori
River
at W
aipo
ri Fal
ls R
sv
Dar
t River
at T
he H
illock
s
Sho
tove
r River
at B
owen
s Pea
k
Mill C
reek
at F
ish
Trap
Kaw
arau
River
at C
hard
s
Mat
ukitu
ki R
iver
at W
est W
anak
a
Car
dron
a River
at M
t Bar
ker
Haw
ea R
iver
at C
amph
ill B
ridge
Cluth
a River
at L
ugga
te B
ridge
Lugg
ate
Cre
ek a
t SH6
Lind
is R
iver
at L
indis
Pea
k
Lind
is R
iver
at A
rdgo
ur R
oad
Dun
stan
Cre
ek a
t Bea
ttie
Roa
d
Man
uher
ikia R
iver
at O
phir
Thom
sons
Cre
ek a
t SH85
Man
uher
ikia R
iver
at G
alloway
Ben
ger B
urn
at S
H8
Frase
r River
at M
arsh
all R
oad
Cluth
a River
at M
iller
s Fla
t
Pom
ahak
a River
at G
lenk
en
Her
iot B
urn
at P
ark Hill R
oad
Cro
okston
Bur
n at
Kelso
Roa
d
Wai
koikoi S
tream
at H
ailes Brid
ge
Wai
pahi
River
at C
airn
s Pea
k
Wai
pahi
River
at W
aipa
hi
Wai
runa
River
at M
illar R
oad
Pom
ahak
a River
at B
urke
s Fo
rd
Wai
wer
a at
Maw
s Fa
rm
Wai
tahu
na a
t Twee
ds B
ridge
Cluth
a River
at B
alclut
ha0.000
0.025
0.050
0.075
0.100
0.125
0.150
0.175
0.200
0.225
0.250
0.275
0.300
0.325
0.350
0.375
0.400
Upper Clutha Taieri Dunedin / South
Coast North Otago Middle Clutha
Lower Clutha / Pomahaka
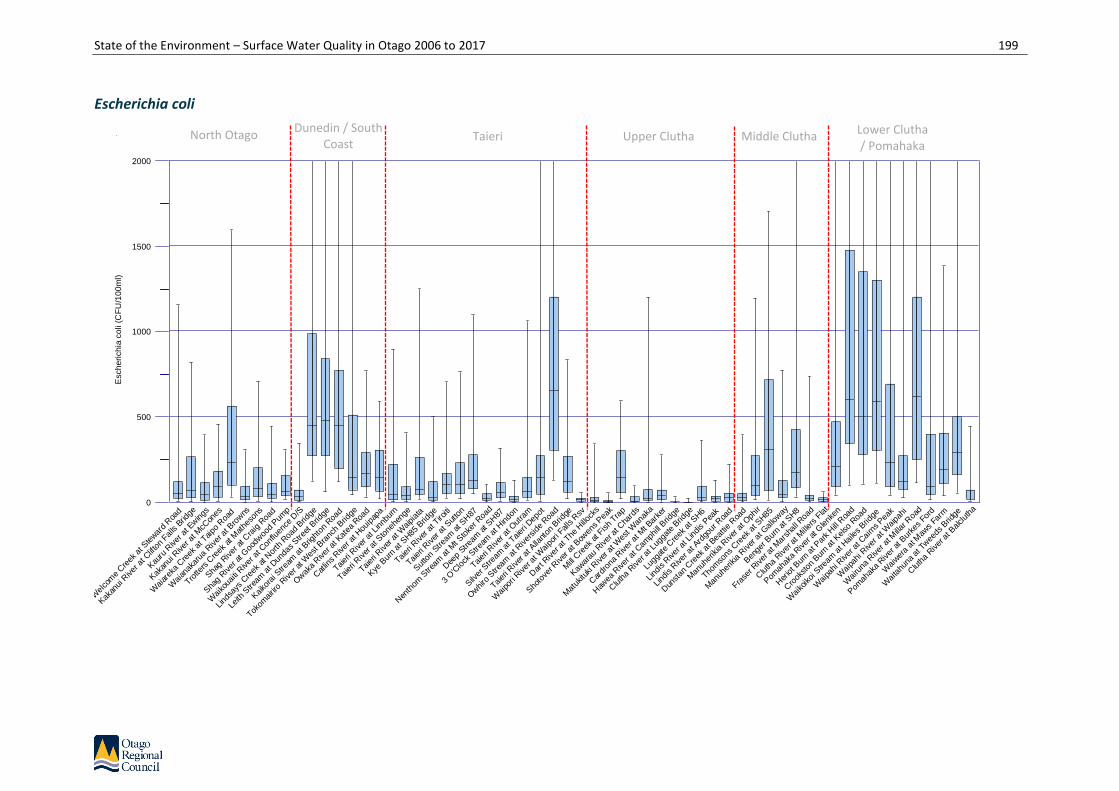
State of the Environment – Surface Water Quality in Otago 2006 to 2017 199
Escherichia coli
Esch
eri
ch
ia c
oli (
CF
U/1
00
ml)
Wel
com
e Cre
ek a
t Ste
war
d Roa
d
Kak
anui
River
at C
lifto
n Fal
ls B
ridge
Kau
ru R
iver
at E
wings
Kak
anui
River
at M
cCon
es
Wai
arek
a Cre
ek a
t Taipo
Roa
d
Wai
anak
arua
River
at B
rowns
Trotte
rs C
reek
at M
athe
sons
Sha
g River
at C
raig R
oad
Sha
g River
at G
oodw
ood
Pum
p
Wai
koua
iti R
iver
at C
onflu
ence
D/S
Lind
says
Cre
ek a
t Nor
th R
oad
Brid
ge
Leith
Stre
am a
t Dun
das Stre
et B
ridge
Kaiko
rai S
tream
at B
right
on R
oad
Tokom
airir
o River
at W
est B
ranc
h Brid
ge
Owak
a River
at K
atea
Roa
d
Cat
lins River
at H
ouip
apa
Taier
i River
at L
innb
urn
Taier
i River
at S
tone
heng
e
Taier
i River
at W
aipi
ata
Kye
Bur
n at
SH85
Brid
ge
Taier
i River
at T
iroiti
Taier
i River
at S
utto
n
Sut
ton
Stream
at S
H87
Nen
thor
n Stre
am a
t Mt S
toke
r Roa
d
Dee
p Stre
am a
t SH87
3 O
'Clo
ck S
tream
at H
indo
n
Taier
i River
at O
utra
m
Silv
er S
tream
at T
aier
i Dep
ot
Owhiro
Stre
am a
t River
side
Roa
d
Taier
i River
at A
llant
on B
ridge
Wai
pori
River
at W
aipo
ri Fal
ls R
sv
Dar
t River
at T
he H
illock
s
Sho
tove
r River
at B
owen
s Pea
k
Mill C
reek
at F
ish
Trap
Kaw
arau
River
at C
hard
s
Mat
ukitu
ki R
iver
at W
est W
anak
a
Car
dron
a River
at M
t Bar
ker
Haw
ea R
iver
at C
amph
ill B
ridge
Cluth
a River
at L
ugga
te B
ridge
Lugg
ate
Cre
ek a
t SH6
Lind
is R
iver
at L
indis
Pea
k
Lind
is R
iver
at A
rdgo
ur R
oad
Dun
stan
Cre
ek a
t Bea
ttie
Roa
d
Man
uher
ikia R
iver
at O
phir
Thom
sons
Cre
ek a
t SH85
Man
uher
ikia R
iver
at G
alloway
Ben
ger B
urn
at S
H8
Frase
r River
at M
arsh
all R
oad
Cluth
a River
at M
iller
s Fla
t
Pom
ahak
a River
at G
lenk
en
Her
iot B
urn
at P
ark Hill R
oad
Cro
okston
Bur
n at
Kelso
Roa
d
Wai
koikoi S
tream
at H
ailes Brid
ge
Wai
pahi
River
at C
airn
s Pea
k
Wai
pahi
River
at W
aipa
hi
Wai
runa
River
at M
illar R
oad
Pom
ahak
a River
at B
urke
s Fo
rd
Wai
wer
a at
Maw
s Fa
rm
Wai
tahu
na a
t Twee
ds B
ridge
Cluth
a River
at B
alclut
ha0
500
1000
1500
2000
Upper Clutha Taieri Dunedin / South
Coast North Otago Middle Clutha
Lower Clutha / Pomahaka

200 State of the Environment – Surface Water Quality in Otago 2006 to 2017
Turbidity
Tu
rbid
ity (
NT
U)
Wel
com
e Cre
ek a
t Ste
war
d Roa
d
Kak
anui
River
at C
lifto
n Fal
ls B
ridge
Kau
ru R
iver
at E
wings
Kak
anui
River
at M
cCon
es
Wai
arek
a Cre
ek a
t Taipo
Roa
d
Wai
anak
arua
River
at B
rowns
Trotte
rs C
reek
at M
athe
sons
Sha
g River
at C
raig R
oad
Sha
g River
at G
oodw
ood
Pum
p
Wai
koua
iti R
iver
at C
onflu
ence
D/S
Lind
says
Cre
ek a
t Nor
th R
oad
Brid
ge
Leith
Stre
am a
t Dun
das Stre
et B
ridge
Kaiko
rai S
tream
at B
right
on R
oad
Tokom
airir
o River
at W
est B
ranc
h Brid
ge
Owak
a River
at K
atea
Roa
d
Cat
lins River
at H
ouip
apa
Taier
i River
at L
innb
urn
Taier
i River
at S
tone
heng
e
Taier
i River
at W
aipi
ata
Kye
Bur
n at
SH85
Brid
ge
Taier
i River
at T
iroiti
Taier
i River
at S
utto
n
Sut
ton
Stream
at S
H87
Nen
thor
n Stre
am a
t Mt S
toke
r Roa
d
Dee
p Stre
am a
t SH87
3 O
'Clo
ck S
tream
at H
indo
n
Taier
i River
at O
utra
m
Silv
er S
tream
at T
aier
i Dep
ot
Owhiro
Stre
am a
t River
side
Roa
d
Taier
i River
at A
llant
on B
ridge
Wai
pori
River
at W
aipo
ri Fal
ls R
sv
Dar
t River
at T
he H
illock
s
Sho
tove
r River
at B
owen
s Pea
k
Mill C
reek
at F
ish
Trap
Kaw
arau
River
at C
hard
s
Mat
ukitu
ki R
iver
at W
est W
anak
a
Car
dron
a River
at M
t Bar
ker
Haw
ea R
iver
at C
amph
ill B
ridge
Cluth
a River
at L
ugga
te B
ridge
Lugg
ate
Cre
ek a
t SH6
Lind
is R
iver
at L
indis
Pea
k
Lind
is R
iver
at A
rdgo
ur R
oad
Dun
stan
Cre
ek a
t Bea
ttie
Roa
d
Man
uher
ikia R
iver
at O
phir
Thom
sons
Cre
ek a
t SH85
Man
uher
ikia R
iver
at G
alloway
Ben
ger B
urn
at S
H8
Frase
r River
at M
arsh
all R
oad
Cluth
a River
at M
iller
s Fla
t
Pom
ahak
a River
at G
lenk
en
Her
iot B
urn
at P
ark Hill R
oad
Cro
okston
Bur
n at
Kelso
Roa
d
Wai
koikoi S
tream
at H
ailes Brid
ge
Wai
pahi
River
at C
airn
s Pea
k
Wai
pahi
River
at W
aipa
hi
Wai
runa
River
at M
illar R
oad
Pom
ahak
a River
at B
urke
s Fo
rd
Wai
wer
a at
Maw
s Fa
rm
Wai
tahu
na a
t Twee
ds B
ridge
Cluth
a River
at B
alclut
ha0.00
10.00
20.00
30.00
40.00
50.00
60.00
Upper Clutha Taieri Dunedin / South
Coast North Otago Middle Clutha
Lower Clutha / Pomahaka

State of the Environment – Surface Water Quality in Otago 2006 to 2017 201
Macroinvertebrate Community Index
MC
I
Kak
anui
River
at C
lifto
n Fal
ls B
ridge
Kau
ru R
iver
at E
wings
Kak
anui
River
at M
cCon
es
Wai
arek
a Cre
ek a
t Taipo
Roa
d
Wai
anak
arua
River
at B
rowns
Trotte
rs C
reek
at M
athe
sons
Sha
g River
at C
raig R
oad
Sha
g River
at G
oodw
ood
Pum
p
Wai
koua
iti R
iver
at C
onflu
ence
D/S
Lind
says
Cre
ek a
t Nor
th R
oad
Brid
ge
Leith
Stre
am a
t Dun
das Stre
et B
ridge
Kaiko
rai S
tream
at B
right
on R
oad
Tokom
airir
o River
at W
est B
ranc
h Brid
ge
Cat
lins River
at H
ouip
apa
Kye
Bur
n at
SH85
Brid
ge
Taier
i River
at T
iroiti
Sut
ton
Stream
at S
H87
Taier
i River
at O
utra
m
Silv
er S
tream
at T
aier
i Dep
ot
Wai
pori
River
at W
aipo
ri Fal
ls R
sv
Sho
tove
r River
at B
owen
s Pea
k
Mill C
reek
at F
ish
Trap
Kaw
arau
River
at C
hard
s
Car
dron
a River
at M
t Bar
ker
Cluth
a River
at L
ugga
te B
ridge
Lugg
ate
Cre
ek a
t SH6
Lind
is R
iver
at A
rdgo
ur R
oad
Dun
stan
Cre
ek a
t Bea
ttie
Roa
d
Man
uher
ikia R
iver
at O
phir
Cluth
a River
at M
iller
s Fla
t
Her
iot B
urn
at P
ark Hill R
oad
Wai
pahi
River
at C
airn
s Pea
k
Wai
pahi
River
at W
aipa
hi
Wai
runa
River
at M
illar R
oad
Wai
wer
a at
Maw
s Fa
rm
Wai
tahu
na a
t Twee
ds B
ridge
60
70
80
90
100
110
120
130
Upper Clutha Taieri Dunedin / South Coast North Otago Middle Clutha Lower Clutha / Pomahaka

202 State of the Environment – Surface Water Quality in Otago 2006 to 2017
Percent EPT Taxa
%E
PT
Ta
xa
Kak
anui
River
at C
lifto
n Fal
ls B
ridge
Kau
ru R
iver
at E
wings
Kak
anui
River
at M
cCon
es
Wai
arek
a Cre
ek a
t Taipo
Roa
d
Wai
anak
arua
River
at B
rowns
Trotte
rs C
reek
at M
athe
sons
Sha
g River
at C
raig R
oad
Sha
g River
at G
oodw
ood
Pum
p
Wai
koua
iti R
iver
at C
onflu
ence
D/S
Lind
says
Cre
ek a
t Nor
th R
oad
Brid
ge
Leith
Stre
am a
t Dun
das Stre
et B
ridge
Kaiko
rai S
tream
at B
right
on R
oad
Tokom
airir
o River
at W
est B
ranc
h Brid
ge
Cat
lins River
at H
ouip
apa
Kye
Bur
n at
SH85
Brid
ge
Taier
i River
at T
iroiti
Sut
ton
Stream
at S
H87
Taier
i River
at O
utra
m
Silv
er S
tream
at T
aier
i Dep
ot
Wai
pori
River
at W
aipo
ri Fal
ls R
sv
Sho
tove
r River
at B
owen
s Pea
k
Mill C
reek
at F
ish
Trap
Kaw
arau
River
at C
hard
s
Car
dron
a River
at M
t Bar
ker
Cluth
a River
at L
ugga
te B
ridge
Lugg
ate
Cre
ek a
t SH6
Lind
is R
iver
at A
rdgo
ur R
oad
Dun
stan
Cre
ek a
t Bea
ttie
Roa
d
Man
uher
ikia R
iver
at O
phir
Cluth
a River
at M
iller
s Fla
t
Her
iot B
urn
at P
ark Hill R
oad
Wai
pahi
River
at C
airn
s Pea
k
Wai
pahi
River
at W
aipa
hi
Wai
runa
River
at M
illar R
oad
Wai
wer
a at
Maw
s Fa
rm
Wai
tahu
na a
t Twee
ds B
ridge
0
20
40
60
80
100
Upper Clutha Taieri Dunedin / South Coast North Otago Middle Clutha Lower Clutha / Pomahaka
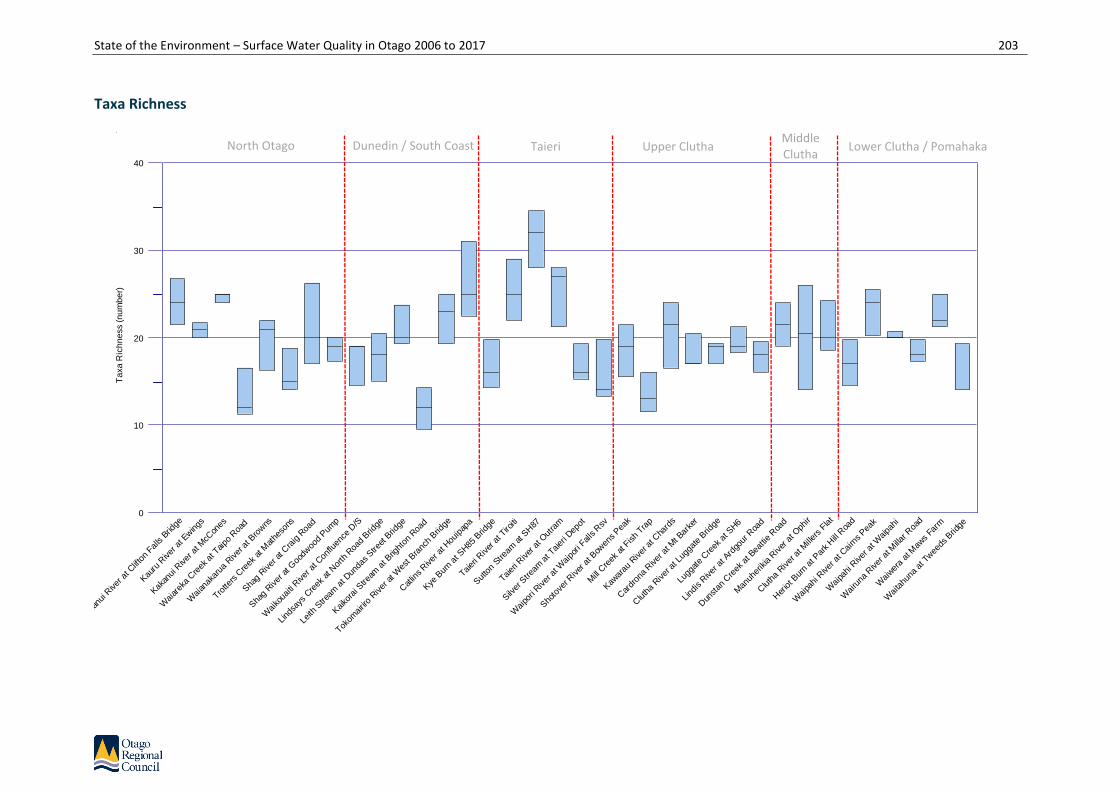
State of the Environment – Surface Water Quality in Otago 2006 to 2017 203
Taxa Richness T
axa
Ric
hn
ess (
nu
mb
er)
Kak
anui
River
at C
lifto
n Fal
ls B
ridge
Kau
ru R
iver
at E
wings
Kak
anui
River
at M
cCon
es
Wai
arek
a Cre
ek a
t Taipo
Roa
d
Wai
anak
arua
River
at B
rowns
Trotte
rs C
reek
at M
athe
sons
Sha
g River
at C
raig R
oad
Sha
g River
at G
oodw
ood
Pum
p
Wai
koua
iti R
iver
at C
onflu
ence
D/S
Lind
says
Cre
ek a
t Nor
th R
oad
Brid
ge
Leith
Stre
am a
t Dun
das Stre
et B
ridge
Kaiko
rai S
tream
at B
right
on R
oad
Tokom
airir
o River
at W
est B
ranc
h Brid
ge
Cat
lins River
at H
ouip
apa
Kye
Bur
n at
SH85
Brid
ge
Taier
i River
at T
iroiti
Sut
ton
Stream
at S
H87
Taier
i River
at O
utra
m
Silv
er S
tream
at T
aier
i Dep
ot
Wai
pori
River
at W
aipo
ri Fal
ls R
sv
Sho
tove
r River
at B
owen
s Pea
k
Mill C
reek
at F
ish
Trap
Kaw
arau
River
at C
hard
s
Car
dron
a River
at M
t Bar
ker
Cluth
a River
at L
ugga
te B
ridge
Lugg
ate
Cre
ek a
t SH6
Lind
is R
iver
at A
rdgo
ur R
oad
Dun
stan
Cre
ek a
t Bea
ttie
Roa
d
Man
uher
ikia R
iver
at O
phir
Cluth
a River
at M
iller
s Fla
t
Her
iot B
urn
at P
ark Hill R
oad
Wai
pahi
River
at C
airn
s Pea
k
Wai
pahi
River
at W
aipa
hi
Wai
runa
River
at M
illar R
oad
Wai
wer
a at
Maw
s Fa
rm
Wai
tahu
na a
t Twee
ds B
ridge
0
10
20
30
40
Upper Clutha Taieri Dunedin / South Coast North Otago Middle Clutha
Lower Clutha / Pomahaka
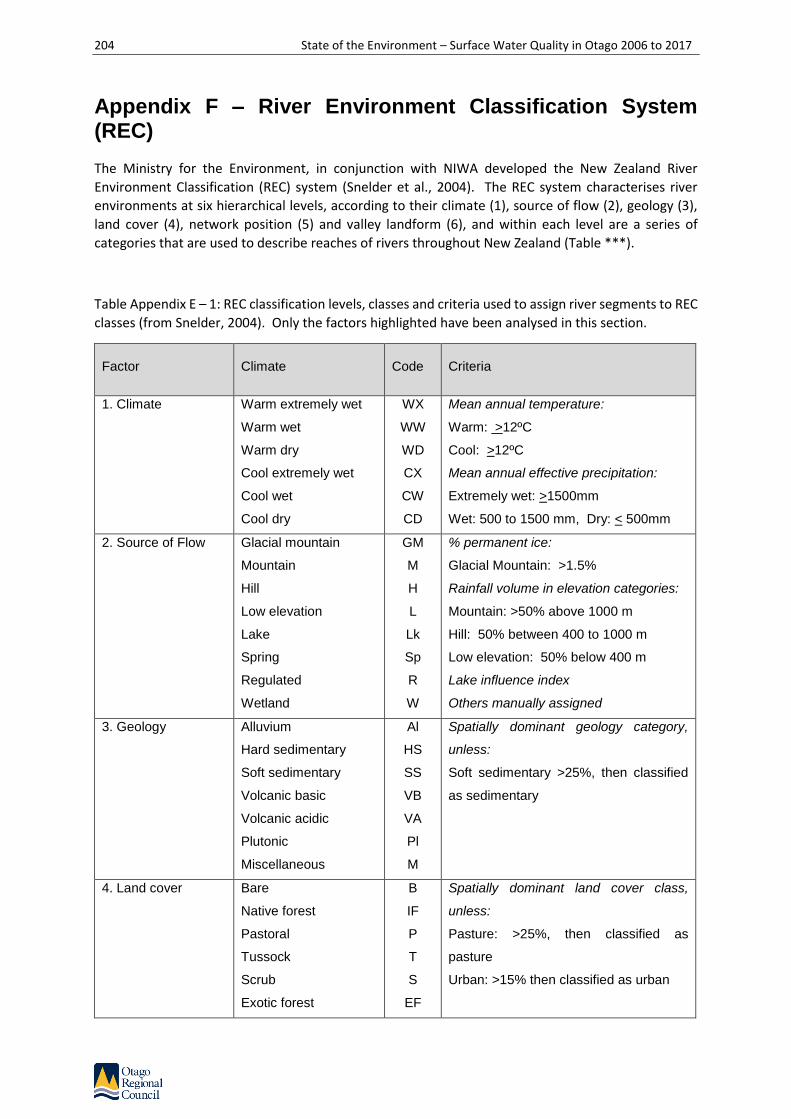
204 State of the Environment – Surface Water Quality in Otago 2006 to 2017
Appendix F – River Environment Classification System (REC)
The Ministry for the Environment, in conjunction with NIWA developed the New Zealand River
Environment Classification (REC) system (Snelder et al., 2004). The REC system characterises river
environments at six hierarchical levels, according to their climate (1), source of flow (2), geology (3),
land cover (4), network position (5) and valley landform (6), and within each level are a series of
categories that are used to describe reaches of rivers throughout New Zealand (Table ***).
Table Appendix E – 1: REC classification levels, classes and criteria used to assign river segments to REC
classes (from Snelder, 2004). Only the factors highlighted have been analysed in this section.
Factor Climate Code Criteria
1. Climate Warm extremely wet
Warm wet
Warm dry
Cool extremely wet
Cool wet
Cool dry
WX
WW
WD
CX
CW
CD
Mean annual temperature:
Warm: >12ºC
Cool: >12ºC
Mean annual effective precipitation:
Extremely wet: >1500mm
Wet: 500 to 1500 mm, Dry: < 500mm
2. Source of Flow Glacial mountain
Mountain
Hill
Low elevation
Lake
Spring
Regulated
Wetland
GM
M
H
L
Lk
Sp
R
W
% permanent ice:
Glacial Mountain: >1.5%
Rainfall volume in elevation categories:
Mountain: >50% above 1000 m
Hill: 50% between 400 to 1000 m
Low elevation: 50% below 400 m
Lake influence index
Others manually assigned
3. Geology Alluvium
Hard sedimentary
Soft sedimentary
Volcanic basic
Volcanic acidic
Plutonic
Miscellaneous
Al
HS
SS
VB
VA
Pl
M
Spatially dominant geology category,
unless:
Soft sedimentary >25%, then classified
as sedimentary
4. Land cover Bare
Native forest
Pastoral
Tussock
Scrub
Exotic forest
B
IF
P
T
S
EF
Spatially dominant land cover class,
unless:
Pasture: >25%, then classified as
pasture
Urban: >15% then classified as urban

State of the Environment – Surface Water Quality in Otago 2006 to 2017 205
Wetland
Urban
W
U
5. Network position Low order
Middle order
High order
L
M
H
Stream Order:
Low: 1 and 2
Medium: 3 and 4
High: >5
6. Valley landform High gradient
Medium gradient
Low gradient
H
M
L
Valley slope:
High: >0.04
Medium: 0.02 to 0.04
Low: <0.02
Only factors 1 and 2 are included in the REC summaries of this report.
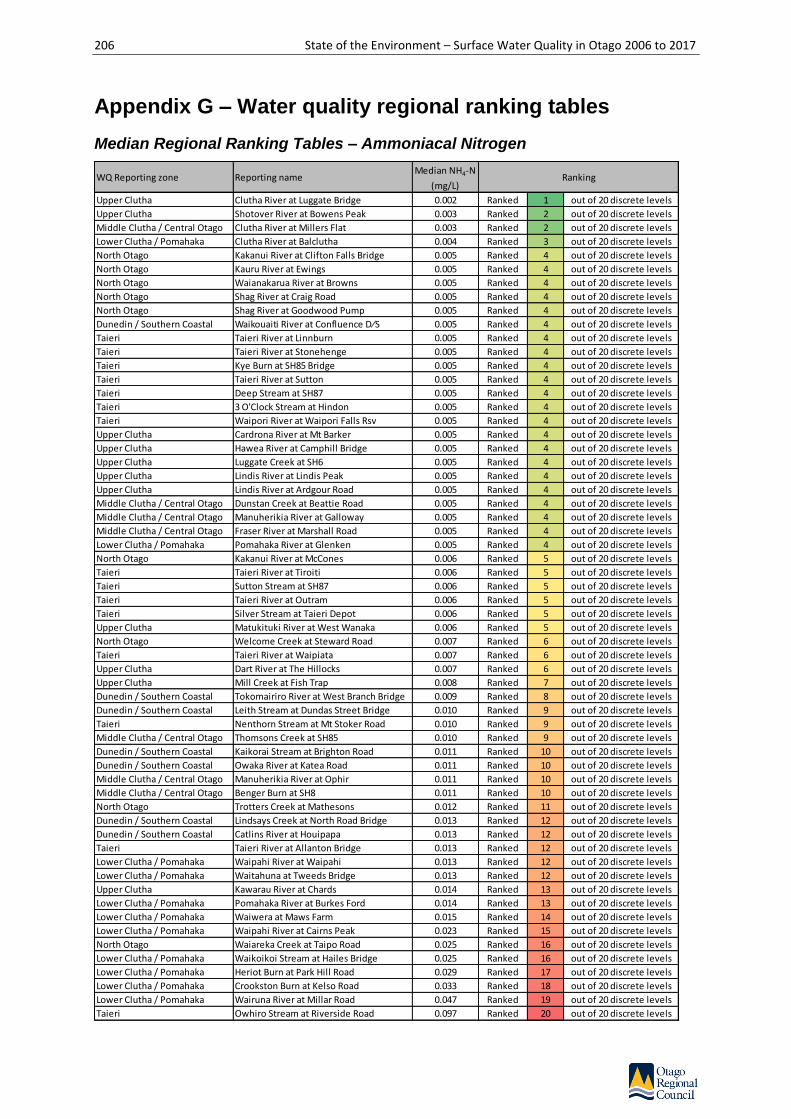
206 State of the Environment – Surface Water Quality in Otago 2006 to 2017
Appendix G – Water quality regional ranking tables
Median Regional Ranking Tables – Ammoniacal Nitrogen
WQ Reporting zone Reporting nameMedian NH4-N
(mg/L)
Upper Clutha Clutha River at Luggate Bridge 0.002 Ranked 1 out of 20 discrete levels
Upper Clutha Shotover River at Bowens Peak 0.003 Ranked 2 out of 20 discrete levels
Middle Clutha / Central Otago Clutha River at Millers Flat 0.003 Ranked 2 out of 20 discrete levels
Lower Clutha / Pomahaka Clutha River at Balclutha 0.004 Ranked 3 out of 20 discrete levels
North Otago Kakanui River at Clifton Falls Bridge 0.005 Ranked 4 out of 20 discrete levels
North Otago Kauru River at Ewings 0.005 Ranked 4 out of 20 discrete levels
North Otago Waianakarua River at Browns 0.005 Ranked 4 out of 20 discrete levels
North Otago Shag River at Craig Road 0.005 Ranked 4 out of 20 discrete levels
North Otago Shag River at Goodwood Pump 0.005 Ranked 4 out of 20 discrete levels
Dunedin / Southern Coastal Waikouaiti River at Confluence D⁄S 0.005 Ranked 4 out of 20 discrete levels
Taieri Taieri River at Linnburn 0.005 Ranked 4 out of 20 discrete levels
Taieri Taieri River at Stonehenge 0.005 Ranked 4 out of 20 discrete levels
Taieri Kye Burn at SH85 Bridge 0.005 Ranked 4 out of 20 discrete levels
Taieri Taieri River at Sutton 0.005 Ranked 4 out of 20 discrete levels
Taieri Deep Stream at SH87 0.005 Ranked 4 out of 20 discrete levels
Taieri 3 O'Clock Stream at Hindon 0.005 Ranked 4 out of 20 discrete levels
Taieri Waipori River at Waipori Falls Rsv 0.005 Ranked 4 out of 20 discrete levels
Upper Clutha Cardrona River at Mt Barker 0.005 Ranked 4 out of 20 discrete levels
Upper Clutha Hawea River at Camphill Bridge 0.005 Ranked 4 out of 20 discrete levels
Upper Clutha Luggate Creek at SH6 0.005 Ranked 4 out of 20 discrete levels
Upper Clutha Lindis River at Lindis Peak 0.005 Ranked 4 out of 20 discrete levels
Upper Clutha Lindis River at Ardgour Road 0.005 Ranked 4 out of 20 discrete levels
Middle Clutha / Central Otago Dunstan Creek at Beattie Road 0.005 Ranked 4 out of 20 discrete levels
Middle Clutha / Central Otago Manuherikia River at Galloway 0.005 Ranked 4 out of 20 discrete levels
Middle Clutha / Central Otago Fraser River at Marshall Road 0.005 Ranked 4 out of 20 discrete levels
Lower Clutha / Pomahaka Pomahaka River at Glenken 0.005 Ranked 4 out of 20 discrete levels
North Otago Kakanui River at McCones 0.006 Ranked 5 out of 20 discrete levels
Taieri Taieri River at Tiroiti 0.006 Ranked 5 out of 20 discrete levels
Taieri Sutton Stream at SH87 0.006 Ranked 5 out of 20 discrete levels
Taieri Taieri River at Outram 0.006 Ranked 5 out of 20 discrete levels
Taieri Silver Stream at Taieri Depot 0.006 Ranked 5 out of 20 discrete levels
Upper Clutha Matukituki River at West Wanaka 0.006 Ranked 5 out of 20 discrete levels
North Otago Welcome Creek at Steward Road 0.007 Ranked 6 out of 20 discrete levels
Taieri Taieri River at Waipiata 0.007 Ranked 6 out of 20 discrete levels
Upper Clutha Dart River at The Hillocks 0.007 Ranked 6 out of 20 discrete levels
Upper Clutha Mill Creek at Fish Trap 0.008 Ranked 7 out of 20 discrete levels
Dunedin / Southern Coastal Tokomairiro River at West Branch Bridge 0.009 Ranked 8 out of 20 discrete levels
Dunedin / Southern Coastal Leith Stream at Dundas Street Bridge 0.010 Ranked 9 out of 20 discrete levels
Taieri Nenthorn Stream at Mt Stoker Road 0.010 Ranked 9 out of 20 discrete levels
Middle Clutha / Central Otago Thomsons Creek at SH85 0.010 Ranked 9 out of 20 discrete levels
Dunedin / Southern Coastal Kaikorai Stream at Brighton Road 0.011 Ranked 10 out of 20 discrete levels
Dunedin / Southern Coastal Owaka River at Katea Road 0.011 Ranked 10 out of 20 discrete levels
Middle Clutha / Central Otago Manuherikia River at Ophir 0.011 Ranked 10 out of 20 discrete levels
Middle Clutha / Central Otago Benger Burn at SH8 0.011 Ranked 10 out of 20 discrete levels
North Otago Trotters Creek at Mathesons 0.012 Ranked 11 out of 20 discrete levels
Dunedin / Southern Coastal Lindsays Creek at North Road Bridge 0.013 Ranked 12 out of 20 discrete levels
Dunedin / Southern Coastal Catlins River at Houipapa 0.013 Ranked 12 out of 20 discrete levels
Taieri Taieri River at Allanton Bridge 0.013 Ranked 12 out of 20 discrete levels
Lower Clutha / Pomahaka Waipahi River at Waipahi 0.013 Ranked 12 out of 20 discrete levels
Lower Clutha / Pomahaka Waitahuna at Tweeds Bridge 0.013 Ranked 12 out of 20 discrete levels
Upper Clutha Kawarau River at Chards 0.014 Ranked 13 out of 20 discrete levels
Lower Clutha / Pomahaka Pomahaka River at Burkes Ford 0.014 Ranked 13 out of 20 discrete levels
Lower Clutha / Pomahaka Waiwera at Maws Farm 0.015 Ranked 14 out of 20 discrete levels
Lower Clutha / Pomahaka Waipahi River at Cairns Peak 0.023 Ranked 15 out of 20 discrete levels
North Otago Waiareka Creek at Taipo Road 0.025 Ranked 16 out of 20 discrete levels
Lower Clutha / Pomahaka Waikoikoi Stream at Hailes Bridge 0.025 Ranked 16 out of 20 discrete levels
Lower Clutha / Pomahaka Heriot Burn at Park Hill Road 0.029 Ranked 17 out of 20 discrete levels
Lower Clutha / Pomahaka Crookston Burn at Kelso Road 0.033 Ranked 18 out of 20 discrete levels
Lower Clutha / Pomahaka Wairuna River at Millar Road 0.047 Ranked 19 out of 20 discrete levels
Taieri Owhiro Stream at Riverside Road 0.097 Ranked 20 out of 20 discrete levels
Ranking

State of the Environment – Surface Water Quality in Otago 2006 to 2017 207
Median Regional Ranking Tables – Nitrite/nitrate nitrogen (NNN)
WQ Reporting zone Reporting nameMedian NNN
(mg/L)
Taieri Nenthorn Stream at Mt Stoker Road 0.001 Ranked 1 out of 51 discrete levels
Taieri Deep Stream at SH87 0.001 Ranked 1 out of 51 discrete levels
Upper Clutha Luggate Creek at SH6 0.002 Ranked 2 out of 51 discrete levels
Taieri Taieri River at Linnburn 0.003 Ranked 3 out of 51 discrete levels
Taieri Taieri River at Stonehenge 0.006 Ranked 4 out of 51 discrete levels
Taieri Sutton Stream at SH87 0.007 Ranked 5 out of 51 discrete levels
Dunedin / Southern Coastal Waikouaiti River at Confluence D⁄S 0.009 Ranked 6 out of 51 discrete levels
North Otago Kauru River at Ewings 0.011 Ranked 7 out of 51 discrete levels
Upper Clutha Hawea River at Camphill Bridge 0.011 Ranked 7 out of 51 discrete levels
Taieri Waipori River at Waipori Falls Rsv 0.013 Ranked 8 out of 51 discrete levels
Upper Clutha Shotover River at Bowens Peak 0.014 Ranked 9 out of 51 discrete levels
Upper Clutha Lindis River at Lindis Peak 0.015 Ranked 10 out of 51 discrete levels
North Otago Kakanui River at Clifton Falls Bridge 0.017 Ranked 11 out of 51 discrete levels
Taieri Taieri River at Waipiata 0.017 Ranked 11 out of 51 discrete levels
Taieri Taieri River at Sutton 0.021 Ranked 12 out of 51 discrete levels
Upper Clutha Dart River at The Hillocks 0.022 Ranked 13 out of 51 discrete levels
Upper Clutha Kawarau River at Chards 0.025 Ranked 14 out of 51 discrete levels
Middle Clutha / Central Otago Manuherikia River at Galloway 0.027 Ranked 15 out of 51 discrete levels
Middle Clutha / Central Otago Clutha River at Millers Flat 0.027 Ranked 15 out of 51 discrete levels
Middle Clutha / Central Otago Fraser River at Marshall Road 0.029 Ranked 16 out of 51 discrete levels
Taieri Kye Burn at SH85 Bridge 0.032 Ranked 17 out of 51 discrete levels
Upper Clutha Clutha River at Luggate Bridge 0.032 Ranked 17 out of 51 discrete levels
Taieri Taieri River at Tiroiti 0.033 Ranked 18 out of 51 discrete levels
Taieri 3 O'Clock Stream at Hindon 0.033 Ranked 18 out of 51 discrete levels
Middle Clutha / Central Otago Dunstan Creek at Beattie Road 0.037 Ranked 19 out of 51 discrete levels
Lower Clutha / Pomahaka Pomahaka River at Glenken 0.043 Ranked 20 out of 51 discrete levels
Upper Clutha Matukituki River at West Wanaka 0.046 Ranked 21 out of 51 discrete levels
Middle Clutha / Central Otago Manuherikia River at Ophir 0.046 Ranked 21 out of 51 discrete levels
Taieri Taieri River at Outram 0.052 Ranked 22 out of 51 discrete levels
Lower Clutha / Pomahaka Clutha River at Balclutha 0.052 Ranked 22 out of 51 discrete levels
Taieri Taieri River at Allanton Bridge 0.060 Ranked 23 out of 51 discrete levels
Upper Clutha Cardrona River at Mt Barker 0.061 Ranked 24 out of 51 discrete levels
Upper Clutha Lindis River at Ardgour Road 0.066 Ranked 25 out of 51 discrete levels
North Otago Shag River at Craig Road 0.078 Ranked 26 out of 51 discrete levels
Middle Clutha / Central Otago Thomsons Creek at SH85 0.105 Ranked 27 out of 51 discrete levels
Lower Clutha / Pomahaka Waitahuna at Tweeds Bridge 0.173 Ranked 28 out of 51 discrete levels
North Otago Waianakarua River at Browns 0.181 Ranked 29 out of 51 discrete levels
North Otago Shag River at Goodwood Pump 0.215 Ranked 30 out of 51 discrete levels
Middle Clutha / Central Otago Benger Burn at SH8 0.225 Ranked 31 out of 51 discrete levels
North Otago Kakanui River at McCones 0.250 Ranked 32 out of 51 discrete levels
Dunedin / Southern Coastal Tokomairiro River at West Branch Bridge 0.250 Ranked 32 out of 51 discrete levels
Dunedin / Southern Coastal Kaikorai Stream at Brighton Road 0.295 Ranked 33 out of 51 discrete levels
Upper Clutha Mill Creek at Fish Trap 0.320 Ranked 34 out of 51 discrete levels
Taieri Silver Stream at Taieri Depot 0.330 Ranked 35 out of 51 discrete levels
Taieri Owhiro Stream at Riverside Road 0.340 Ranked 36 out of 51 discrete levels
North Otago Waiareka Creek at Taipo Road 0.410 Ranked 37 out of 51 discrete levels
Dunedin / Southern Coastal Catlins River at Houipapa 0.435 Ranked 38 out of 51 discrete levels
North Otago Trotters Creek at Mathesons 0.440 Ranked 39 out of 51 discrete levels
Dunedin / Southern Coastal Leith Stream at Dundas Street Bridge 0.505 Ranked 40 out of 51 discrete levels
Lower Clutha / Pomahaka Pomahaka River at Burkes Ford 0.560 Ranked 41 out of 51 discrete levels
Lower Clutha / Pomahaka Waikoikoi Stream at Hailes Bridge 0.615 Ranked 42 out of 51 discrete levels
Dunedin / Southern Coastal Lindsays Creek at North Road Bridge 0.725 Ranked 43 out of 51 discrete levels
Lower Clutha / Pomahaka Waiwera at Maws Farm 0.770 Ranked 44 out of 51 discrete levels
Lower Clutha / Pomahaka Waipahi River at Cairns Peak 0.800 Ranked 45 out of 51 discrete levels
Dunedin / Southern Coastal Owaka River at Katea Road 1.200 Ranked 46 out of 51 discrete levels
Lower Clutha / Pomahaka Waipahi River at Waipahi 1.220 Ranked 47 out of 51 discrete levels
Lower Clutha / Pomahaka Wairuna River at Millar Road 1.250 Ranked 48 out of 51 discrete levels
Lower Clutha / Pomahaka Heriot Burn at Park Hill Road 1.370 Ranked 49 out of 51 discrete levels
North Otago Welcome Creek at Steward Road 1.400 Ranked 50 out of 51 discrete levels
Lower Clutha / Pomahaka Crookston Burn at Kelso Road 1.500 Ranked 51 out of 51 discrete levels
Ranking

208 State of the Environment – Surface Water Quality in Otago 2006 to 2017
Median Regional Ranking Tables – Total Nitrogen
WQ Reporting zone Reporting nameMedian Total
N (mg/L)
Upper Clutha Shotover River at Bowens Peak 0.053 Ranked 1 out of 46 discrete levels
Upper Clutha Hawea River at Camphill Bridge 0.055 Ranked 2 out of 46 discrete levels
Upper Clutha Luggate Creek at SH6 0.055 Ranked 2 out of 46 discrete levels
Upper Clutha Lindis River at Lindis Peak 0.062 Ranked 3 out of 46 discrete levels
Upper Clutha Clutha River at Luggate Bridge 0.068 Ranked 4 out of 46 discrete levels
Upper Clutha Dart River at The Hillocks 0.075 Ranked 5 out of 46 discrete levels
Upper Clutha Matukituki River at West Wanaka 0.081 Ranked 6 out of 46 discrete levels
Upper Clutha Kawarau River at Chards 0.088 Ranked 7 out of 46 discrete levels
Middle Clutha / Central Otago Clutha River at Millers Flat 0.088 Ranked 7 out of 46 discrete levels
Middle Clutha / Central Otago Dunstan Creek at Beattie Road 0.110 Ranked 8 out of 46 discrete levels
Middle Clutha / Central Otago Fraser River at Marshall Road 0.110 Ranked 8 out of 46 discrete levels
North Otago Kakanui River at Clifton Falls Bridge 0.120 Ranked 9 out of 46 discrete levels
North Otago Kauru River at Ewings 0.120 Ranked 9 out of 46 discrete levels
Taieri Kye Burn at SH85 Bridge 0.140 Ranked 10 out of 46 discrete levels
Upper Clutha Cardrona River at Mt Barker 0.140 Ranked 10 out of 46 discrete levels
Lower Clutha / Pomahaka Clutha River at Balclutha 0.144 Ranked 11 out of 46 discrete levels
Taieri 3 O'Clock Stream at Hindon 0.145 Ranked 12 out of 46 discrete levels
Upper Clutha Lindis River at Ardgour Road 0.150 Ranked 13 out of 46 discrete levels
Dunedin / Southern Coastal Waikouaiti River at Confluence D⁄S 0.170 Ranked 14 out of 46 discrete levels
Taieri Taieri River at Linnburn Runs Road 0.180 Ranked 15 out of 46 discrete levels
Taieri Deep Stream at SH87 0.180 Ranked 15 out of 46 discrete levels
Taieri Taieri River at Stonehenge 0.210 Ranked 16 out of 46 discrete levels
Taieri Waipori River at Waipori Falls Reserve 0.210 Ranked 16 out of 46 discrete levels
Middle Clutha / Central Otago Manuherikia River at Galloway 0.220 Ranked 17 out of 46 discrete levels
North Otago Shag River at Craig Road 0.230 Ranked 18 out of 46 discrete levels
Taieri Sutton Stream at SH87 0.239 Ranked 19 out of 46 discrete levels
Lower Clutha / Pomahaka Pomahaka River at Glenken 0.260 Ranked 20 out of 46 discrete levels
North Otago Waianakarua River at Browns 0.290 Ranked 21 out of 46 discrete levels
Taieri Taieri River at Sutton 0.290 Ranked 21 out of 46 discrete levels
Middle Clutha / Central Otago Manuherikia River at Ophir 0.290 Ranked 21 out of 46 discrete levels
Taieri Taieri River at Tiroiti 0.300 Ranked 22 out of 46 discrete levels
Taieri Taieri River at Waipiata 0.330 Ranked 23 out of 46 discrete levels
Taieri Taieri River at Outram 0.339 Ranked 24 out of 46 discrete levels
Taieri Taieri River at Allanton Bridge 0.340 Ranked 25 out of 46 discrete levels
Taieri Nenthorn Stream at Mt Stoker Road 0.345 Ranked 26 out of 46 discrete levels
North Otago Shag River at Goodwood Pump 0.370 Ranked 27 out of 46 discrete levels
North Otago Waiareka Creek at Taipo Road 0.380 Ranked 28 out of 46 discrete levels
Taieri Silver Stream at Taieri Depot 0.480 Ranked 29 out of 46 discrete levels
Lower Clutha / Pomahaka Waitahuna at Tweeds Bridge 0.480 Ranked 29 out of 46 discrete levels
Dunedin / Southern Coastal Kaikorai Stream at Brighton Road 0.505 Ranked 30 out of 46 discrete levels
Upper Clutha Mill Creek at Fish Trap 0.505 Ranked 30 out of 46 discrete levels
Middle Clutha / Central Otago Thomsons Creek at SH85 0.540 Ranked 31 out of 46 discrete levels
Dunedin / Southern Coastal Tokomairiro River at West Branch Bridge 0.550 Ranked 32 out of 46 discrete levels
North Otago Trotters Creek at Mathesons 0.600 Ranked 33 out of 46 discrete levels
Dunedin / Southern Coastal Catlins River at Houipapa 0.635 Ranked 34 out of 46 discrete levels
Middle Clutha / Central Otago Benger Burn at SH8 0.660 Ranked 35 out of 46 discrete levels
Dunedin / Southern Coastal Leith Stream at Dundas Street Bridge 0.670 Ranked 36 out of 46 discrete levels
Lower Clutha / Pomahaka Pomahaka River at Burkes Ford 0.880 Ranked 37 out of 46 discrete levels
Dunedin / Southern Coastal Lindsays Creek at North Road Bridge 0.925 Ranked 38 out of 46 discrete levels
Taieri Owhiro Stream at Riverside Road 1.060 Ranked 39 out of 46 discrete levels
Lower Clutha / Pomahaka Waikoikoi Stream at Hailes Bridge 1.105 Ranked 40 out of 46 discrete levels
Lower Clutha / Pomahaka Waiwera at Maws Farm 1.180 Ranked 41 out of 46 discrete levels
North Otago Kakanui River at McCones 1.300 Ranked 42 out of 46 discrete levels
Dunedin / Southern Coastal Owaka River at Katea Road 1.300 Ranked 42 out of 46 discrete levels
Lower Clutha / Pomahaka Waipahi River at Cairns Peak 1.300 Ranked 42 out of 46 discrete levels
North Otago Welcome Creek at Steward Road 1.545 Ranked 43 out of 46 discrete levels
Lower Clutha / Pomahaka Waipahi River at Waipahi 1.550 Ranked 44 out of 46 discrete levels
Lower Clutha / Pomahaka Heriot Burn at Park Hill Road 1.800 Ranked 45 out of 46 discrete levels
Lower Clutha / Pomahaka Crookston Burn at Kelso Road 1.800 Ranked 45 out of 46 discrete levels
Lower Clutha / Pomahaka Wairuna River at Millar Road 1.855 Ranked 46 out of 46 discrete levels
Ranking
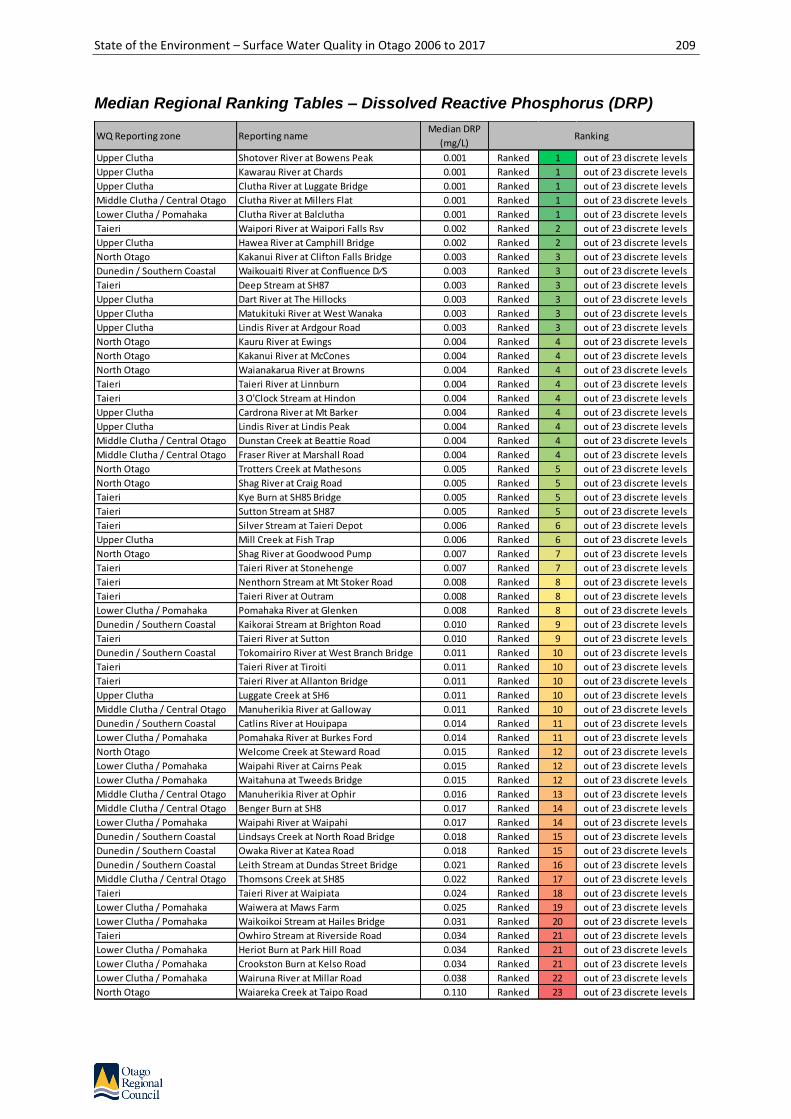
State of the Environment – Surface Water Quality in Otago 2006 to 2017 209
Median Regional Ranking Tables – Dissolved Reactive Phosphorus (DRP)
WQ Reporting zone Reporting nameMedian DRP
(mg/L)
Upper Clutha Shotover River at Bowens Peak 0.001 Ranked 1 out of 23 discrete levels
Upper Clutha Kawarau River at Chards 0.001 Ranked 1 out of 23 discrete levels
Upper Clutha Clutha River at Luggate Bridge 0.001 Ranked 1 out of 23 discrete levels
Middle Clutha / Central Otago Clutha River at Millers Flat 0.001 Ranked 1 out of 23 discrete levels
Lower Clutha / Pomahaka Clutha River at Balclutha 0.001 Ranked 1 out of 23 discrete levels
Taieri Waipori River at Waipori Falls Rsv 0.002 Ranked 2 out of 23 discrete levels
Upper Clutha Hawea River at Camphill Bridge 0.002 Ranked 2 out of 23 discrete levels
North Otago Kakanui River at Clifton Falls Bridge 0.003 Ranked 3 out of 23 discrete levels
Dunedin / Southern Coastal Waikouaiti River at Confluence D⁄S 0.003 Ranked 3 out of 23 discrete levels
Taieri Deep Stream at SH87 0.003 Ranked 3 out of 23 discrete levels
Upper Clutha Dart River at The Hillocks 0.003 Ranked 3 out of 23 discrete levels
Upper Clutha Matukituki River at West Wanaka 0.003 Ranked 3 out of 23 discrete levels
Upper Clutha Lindis River at Ardgour Road 0.003 Ranked 3 out of 23 discrete levels
North Otago Kauru River at Ewings 0.004 Ranked 4 out of 23 discrete levels
North Otago Kakanui River at McCones 0.004 Ranked 4 out of 23 discrete levels
North Otago Waianakarua River at Browns 0.004 Ranked 4 out of 23 discrete levels
Taieri Taieri River at Linnburn 0.004 Ranked 4 out of 23 discrete levels
Taieri 3 O'Clock Stream at Hindon 0.004 Ranked 4 out of 23 discrete levels
Upper Clutha Cardrona River at Mt Barker 0.004 Ranked 4 out of 23 discrete levels
Upper Clutha Lindis River at Lindis Peak 0.004 Ranked 4 out of 23 discrete levels
Middle Clutha / Central Otago Dunstan Creek at Beattie Road 0.004 Ranked 4 out of 23 discrete levels
Middle Clutha / Central Otago Fraser River at Marshall Road 0.004 Ranked 4 out of 23 discrete levels
North Otago Trotters Creek at Mathesons 0.005 Ranked 5 out of 23 discrete levels
North Otago Shag River at Craig Road 0.005 Ranked 5 out of 23 discrete levels
Taieri Kye Burn at SH85 Bridge 0.005 Ranked 5 out of 23 discrete levels
Taieri Sutton Stream at SH87 0.005 Ranked 5 out of 23 discrete levels
Taieri Silver Stream at Taieri Depot 0.006 Ranked 6 out of 23 discrete levels
Upper Clutha Mill Creek at Fish Trap 0.006 Ranked 6 out of 23 discrete levels
North Otago Shag River at Goodwood Pump 0.007 Ranked 7 out of 23 discrete levels
Taieri Taieri River at Stonehenge 0.007 Ranked 7 out of 23 discrete levels
Taieri Nenthorn Stream at Mt Stoker Road 0.008 Ranked 8 out of 23 discrete levels
Taieri Taieri River at Outram 0.008 Ranked 8 out of 23 discrete levels
Lower Clutha / Pomahaka Pomahaka River at Glenken 0.008 Ranked 8 out of 23 discrete levels
Dunedin / Southern Coastal Kaikorai Stream at Brighton Road 0.010 Ranked 9 out of 23 discrete levels
Taieri Taieri River at Sutton 0.010 Ranked 9 out of 23 discrete levels
Dunedin / Southern Coastal Tokomairiro River at West Branch Bridge 0.011 Ranked 10 out of 23 discrete levels
Taieri Taieri River at Tiroiti 0.011 Ranked 10 out of 23 discrete levels
Taieri Taieri River at Allanton Bridge 0.011 Ranked 10 out of 23 discrete levels
Upper Clutha Luggate Creek at SH6 0.011 Ranked 10 out of 23 discrete levels
Middle Clutha / Central Otago Manuherikia River at Galloway 0.011 Ranked 10 out of 23 discrete levels
Dunedin / Southern Coastal Catlins River at Houipapa 0.014 Ranked 11 out of 23 discrete levels
Lower Clutha / Pomahaka Pomahaka River at Burkes Ford 0.014 Ranked 11 out of 23 discrete levels
North Otago Welcome Creek at Steward Road 0.015 Ranked 12 out of 23 discrete levels
Lower Clutha / Pomahaka Waipahi River at Cairns Peak 0.015 Ranked 12 out of 23 discrete levels
Lower Clutha / Pomahaka Waitahuna at Tweeds Bridge 0.015 Ranked 12 out of 23 discrete levels
Middle Clutha / Central Otago Manuherikia River at Ophir 0.016 Ranked 13 out of 23 discrete levels
Middle Clutha / Central Otago Benger Burn at SH8 0.017 Ranked 14 out of 23 discrete levels
Lower Clutha / Pomahaka Waipahi River at Waipahi 0.017 Ranked 14 out of 23 discrete levels
Dunedin / Southern Coastal Lindsays Creek at North Road Bridge 0.018 Ranked 15 out of 23 discrete levels
Dunedin / Southern Coastal Owaka River at Katea Road 0.018 Ranked 15 out of 23 discrete levels
Dunedin / Southern Coastal Leith Stream at Dundas Street Bridge 0.021 Ranked 16 out of 23 discrete levels
Middle Clutha / Central Otago Thomsons Creek at SH85 0.022 Ranked 17 out of 23 discrete levels
Taieri Taieri River at Waipiata 0.024 Ranked 18 out of 23 discrete levels
Lower Clutha / Pomahaka Waiwera at Maws Farm 0.025 Ranked 19 out of 23 discrete levels
Lower Clutha / Pomahaka Waikoikoi Stream at Hailes Bridge 0.031 Ranked 20 out of 23 discrete levels
Taieri Owhiro Stream at Riverside Road 0.034 Ranked 21 out of 23 discrete levels
Lower Clutha / Pomahaka Heriot Burn at Park Hill Road 0.034 Ranked 21 out of 23 discrete levels
Lower Clutha / Pomahaka Crookston Burn at Kelso Road 0.034 Ranked 21 out of 23 discrete levels
Lower Clutha / Pomahaka Wairuna River at Millar Road 0.038 Ranked 22 out of 23 discrete levels
North Otago Waiareka Creek at Taipo Road 0.110 Ranked 23 out of 23 discrete levels
Ranking
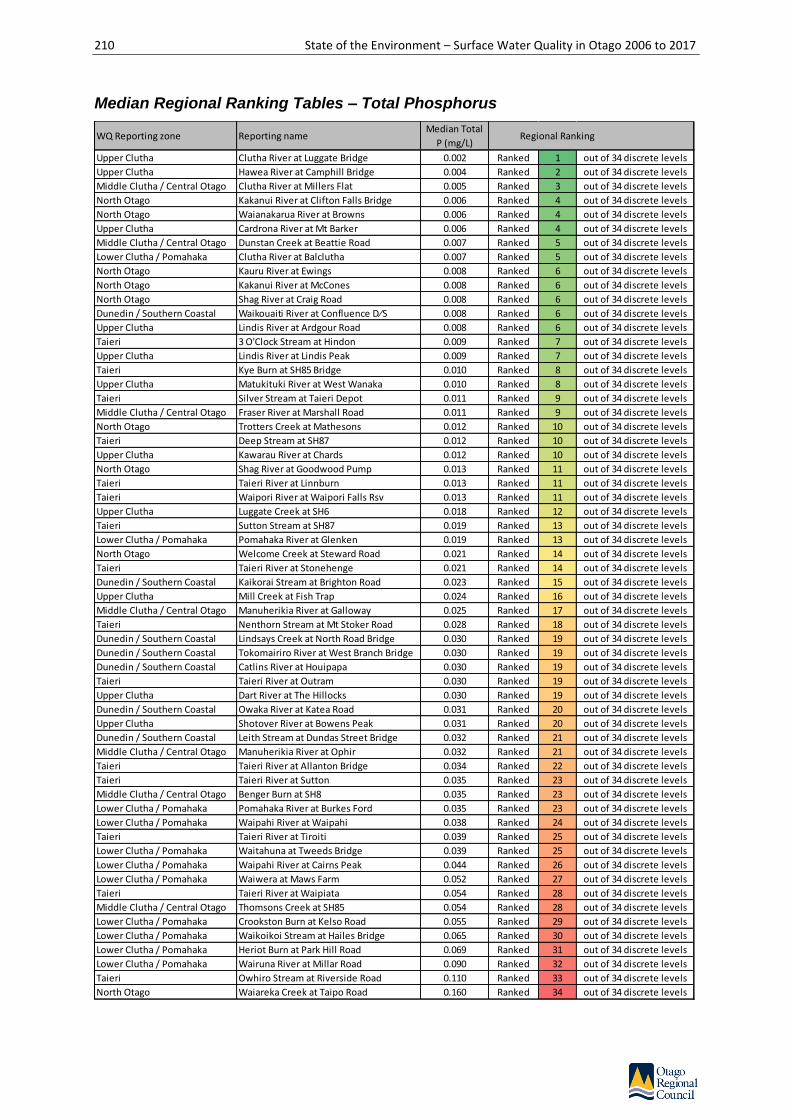
210 State of the Environment – Surface Water Quality in Otago 2006 to 2017
Median Regional Ranking Tables – Total Phosphorus
WQ Reporting zone Reporting nameMedian Total
P (mg/L)Regional Ranking
Upper Clutha Clutha River at Luggate Bridge 0.002 Ranked 1 out of 34 discrete levels
Upper Clutha Hawea River at Camphill Bridge 0.004 Ranked 2 out of 34 discrete levels
Middle Clutha / Central Otago Clutha River at Millers Flat 0.005 Ranked 3 out of 34 discrete levels
North Otago Kakanui River at Clifton Falls Bridge 0.006 Ranked 4 out of 34 discrete levels
North Otago Waianakarua River at Browns 0.006 Ranked 4 out of 34 discrete levels
Upper Clutha Cardrona River at Mt Barker 0.006 Ranked 4 out of 34 discrete levels
Middle Clutha / Central Otago Dunstan Creek at Beattie Road 0.007 Ranked 5 out of 34 discrete levels
Lower Clutha / Pomahaka Clutha River at Balclutha 0.007 Ranked 5 out of 34 discrete levels
North Otago Kauru River at Ewings 0.008 Ranked 6 out of 34 discrete levels
North Otago Kakanui River at McCones 0.008 Ranked 6 out of 34 discrete levels
North Otago Shag River at Craig Road 0.008 Ranked 6 out of 34 discrete levels
Dunedin / Southern Coastal Waikouaiti River at Confluence D⁄S 0.008 Ranked 6 out of 34 discrete levels
Upper Clutha Lindis River at Ardgour Road 0.008 Ranked 6 out of 34 discrete levels
Taieri 3 O'Clock Stream at Hindon 0.009 Ranked 7 out of 34 discrete levels
Upper Clutha Lindis River at Lindis Peak 0.009 Ranked 7 out of 34 discrete levels
Taieri Kye Burn at SH85 Bridge 0.010 Ranked 8 out of 34 discrete levels
Upper Clutha Matukituki River at West Wanaka 0.010 Ranked 8 out of 34 discrete levels
Taieri Silver Stream at Taieri Depot 0.011 Ranked 9 out of 34 discrete levels
Middle Clutha / Central Otago Fraser River at Marshall Road 0.011 Ranked 9 out of 34 discrete levels
North Otago Trotters Creek at Mathesons 0.012 Ranked 10 out of 34 discrete levels
Taieri Deep Stream at SH87 0.012 Ranked 10 out of 34 discrete levels
Upper Clutha Kawarau River at Chards 0.012 Ranked 10 out of 34 discrete levels
North Otago Shag River at Goodwood Pump 0.013 Ranked 11 out of 34 discrete levels
Taieri Taieri River at Linnburn 0.013 Ranked 11 out of 34 discrete levels
Taieri Waipori River at Waipori Falls Rsv 0.013 Ranked 11 out of 34 discrete levels
Upper Clutha Luggate Creek at SH6 0.018 Ranked 12 out of 34 discrete levels
Taieri Sutton Stream at SH87 0.019 Ranked 13 out of 34 discrete levels
Lower Clutha / Pomahaka Pomahaka River at Glenken 0.019 Ranked 13 out of 34 discrete levels
North Otago Welcome Creek at Steward Road 0.021 Ranked 14 out of 34 discrete levels
Taieri Taieri River at Stonehenge 0.021 Ranked 14 out of 34 discrete levels
Dunedin / Southern Coastal Kaikorai Stream at Brighton Road 0.023 Ranked 15 out of 34 discrete levels
Upper Clutha Mill Creek at Fish Trap 0.024 Ranked 16 out of 34 discrete levels
Middle Clutha / Central Otago Manuherikia River at Galloway 0.025 Ranked 17 out of 34 discrete levels
Taieri Nenthorn Stream at Mt Stoker Road 0.028 Ranked 18 out of 34 discrete levels
Dunedin / Southern Coastal Lindsays Creek at North Road Bridge 0.030 Ranked 19 out of 34 discrete levels
Dunedin / Southern Coastal Tokomairiro River at West Branch Bridge 0.030 Ranked 19 out of 34 discrete levels
Dunedin / Southern Coastal Catlins River at Houipapa 0.030 Ranked 19 out of 34 discrete levels
Taieri Taieri River at Outram 0.030 Ranked 19 out of 34 discrete levels
Upper Clutha Dart River at The Hillocks 0.030 Ranked 19 out of 34 discrete levels
Dunedin / Southern Coastal Owaka River at Katea Road 0.031 Ranked 20 out of 34 discrete levels
Upper Clutha Shotover River at Bowens Peak 0.031 Ranked 20 out of 34 discrete levels
Dunedin / Southern Coastal Leith Stream at Dundas Street Bridge 0.032 Ranked 21 out of 34 discrete levels
Middle Clutha / Central Otago Manuherikia River at Ophir 0.032 Ranked 21 out of 34 discrete levels
Taieri Taieri River at Allanton Bridge 0.034 Ranked 22 out of 34 discrete levels
Taieri Taieri River at Sutton 0.035 Ranked 23 out of 34 discrete levels
Middle Clutha / Central Otago Benger Burn at SH8 0.035 Ranked 23 out of 34 discrete levels
Lower Clutha / Pomahaka Pomahaka River at Burkes Ford 0.035 Ranked 23 out of 34 discrete levels
Lower Clutha / Pomahaka Waipahi River at Waipahi 0.038 Ranked 24 out of 34 discrete levels
Taieri Taieri River at Tiroiti 0.039 Ranked 25 out of 34 discrete levels
Lower Clutha / Pomahaka Waitahuna at Tweeds Bridge 0.039 Ranked 25 out of 34 discrete levels
Lower Clutha / Pomahaka Waipahi River at Cairns Peak 0.044 Ranked 26 out of 34 discrete levels
Lower Clutha / Pomahaka Waiwera at Maws Farm 0.052 Ranked 27 out of 34 discrete levels
Taieri Taieri River at Waipiata 0.054 Ranked 28 out of 34 discrete levels
Middle Clutha / Central Otago Thomsons Creek at SH85 0.054 Ranked 28 out of 34 discrete levels
Lower Clutha / Pomahaka Crookston Burn at Kelso Road 0.055 Ranked 29 out of 34 discrete levels
Lower Clutha / Pomahaka Waikoikoi Stream at Hailes Bridge 0.065 Ranked 30 out of 34 discrete levels
Lower Clutha / Pomahaka Heriot Burn at Park Hill Road 0.069 Ranked 31 out of 34 discrete levels
Lower Clutha / Pomahaka Wairuna River at Millar Road 0.090 Ranked 32 out of 34 discrete levels
Taieri Owhiro Stream at Riverside Road 0.110 Ranked 33 out of 34 discrete levels
North Otago Waiareka Creek at Taipo Road 0.160 Ranked 34 out of 34 discrete levels

State of the Environment – Surface Water Quality in Otago 2006 to 2017 211
Median Regional Ranking Tables – Escerichia coli (CFU/100ml)
WQ Reporting zone Reporting nameMedian E. coli
(CFU/100ml)
Upper Clutha Clutha River at Luggate Bridge 1 Ranked 1 out of 54 discrete levels
Upper Clutha Hawea River at Camphill Bridge 2 Ranked 2 out of 54 discrete levels
Upper Clutha Shotover River at Bowens Peak 4 Ranked 3 out of 54 discrete levels
Upper Clutha Kawarau River at Chards 7 Ranked 4 out of 54 discrete levels
Upper Clutha Dart River at The Hillocks 8 Ranked 5 out of 54 discrete levels
Middle Clutha / Central Otago Clutha River at Millers Flat 12 Ranked 6 out of 54 discrete levels
Taieri 3 O'Clock Stream at Hindon 13 Ranked 7 out of 54 discrete levels
Taieri Waipori River at Waipori Falls Rsv 13 Ranked 7 out of 54 discrete levels
Middle Clutha / Central Otago Fraser River at Marshall Road 18 Ranked 8 out of 54 discrete levels
Taieri Nenthorn Stream at Mt Stoker Road 22 Ranked 9 out of 54 discrete levels
Upper Clutha Lindis River at Lindis Peak 22 Ranked 9 out of 54 discrete levels
Upper Clutha Matukituki River at West Wanaka 23 Ranked 10 out of 54 discrete levels
Upper Clutha Lindis River at Ardgour Road 24 Ranked 11 out of 54 discrete levels
Upper Clutha Luggate Creek at SH6 25 Ranked 12 out of 54 discrete levels
Middle Clutha / Central Otago Dunstan Creek at Beattie Road 27 Ranked 13 out of 54 discrete levels
Taieri Kye Burn at SH85 Bridge 29 Ranked 14 out of 54 discrete levels
Dunedin / Southern Coastal Waikouaiti River at Confluence D⁄S 31 Ranked 15 out of 54 discrete levels
Lower Clutha / Pomahaka Clutha River at Balclutha 32 Ranked 16 out of 54 discrete levels
North Otago Waianakarua River at Browns 33 Ranked 17 out of 54 discrete levels
Upper Clutha Cardrona River at Mt Barker 38 Ranked 18 out of 54 discrete levels
Taieri Taieri River at Stonehenge 41 Ranked 19 out of 54 discrete levels
North Otago Kauru River at Ewings 42 Ranked 20 out of 54 discrete levels
Taieri Taieri River at Linnburn 43 Ranked 21 out of 54 discrete levels
Middle Clutha / Central Otago Manuherikia River at Galloway 44 Ranked 22 out of 54 discrete levels
North Otago Shag River at Craig Road 48 Ranked 23 out of 54 discrete levels
North Otago Welcome Creek at Steward Road 50 Ranked 24 out of 54 discrete levels
Taieri Deep Stream at SH87 54 Ranked 25 out of 54 discrete levels
Taieri Taieri River at Outram 61 Ranked 26 out of 54 discrete levels
North Otago Shag River at Goodwood Pump 66 Ranked 27 out of 54 discrete levels
North Otago Kakanui River at Clifton Falls Bridge 70 Ranked 28 out of 54 discrete levels
Taieri Taieri River at Waipiata 74 Ranked 29 out of 54 discrete levels
North Otago Trotters Creek at Mathesons 80 Ranked 30 out of 54 discrete levels
North Otago Kakanui River at McCones 88 Ranked 31 out of 54 discrete levels
Lower Clutha / Pomahaka Pomahaka River at Burkes Ford 92 Ranked 32 out of 54 discrete levels
Middle Clutha / Central Otago Manuherikia River at Ophir 96 Ranked 33 out of 54 discrete levels
Taieri Taieri River at Tiroiti 104 Ranked 34 out of 54 discrete levels
Taieri Taieri River at Sutton 105 Ranked 35 out of 54 discrete levels
Taieri Taieri River at Allanton Bridge 120 Ranked 36 out of 54 discrete levels
Lower Clutha / Pomahaka Waipahi River at Waipahi 120 Ranked 36 out of 54 discrete levels
Taieri Sutton Stream at SH87 128 Ranked 37 out of 54 discrete levels
Dunedin / Southern Coastal Tokomairiro River at West Branch Bridge 140 Ranked 38 out of 54 discrete levels
Taieri Silver Stream at Taieri Depot 140 Ranked 38 out of 54 discrete levels
Upper Clutha Mill Creek at Fish Trap 140 Ranked 38 out of 54 discrete levels
Dunedin / Southern Coastal Catlins River at Houipapa 145 Ranked 39 out of 54 discrete levels
Dunedin / Southern Coastal Owaka River at Katea Road 170 Ranked 40 out of 54 discrete levels
Middle Clutha / Central Otago Benger Burn at SH8 175 Ranked 41 out of 54 discrete levels
Lower Clutha / Pomahaka Waiwera at Maws Farm 190 Ranked 42 out of 54 discrete levels
Lower Clutha / Pomahaka Pomahaka River at Glenken 210 Ranked 43 out of 54 discrete levels
North Otago Waiareka Creek at Taipo Road 230 Ranked 44 out of 54 discrete levels
Lower Clutha / Pomahaka Waipahi River at Cairns Peak 235 Ranked 45 out of 54 discrete levels
Lower Clutha / Pomahaka Waitahuna at Tweeds Bridge 290 Ranked 46 out of 54 discrete levels
Middle Clutha / Central Otago Thomsons Creek at SH85 310 Ranked 47 out of 54 discrete levels
Dunedin / Southern Coastal Lindsays Creek at North Road Bridge 450 Ranked 48 out of 54 discrete levels
Dunedin / Southern Coastal Kaikorai Stream at Brighton Road 450 Ranked 48 out of 54 discrete levels
Dunedin / Southern Coastal Leith Stream at Dundas Street Bridge 480 Ranked 49 out of 54 discrete levels
Lower Clutha / Pomahaka Crookston Burn at Kelso Road 500 Ranked 50 out of 54 discrete levels
Lower Clutha / Pomahaka Waikoikoi Stream at Hailes Bridge 590 Ranked 51 out of 54 discrete levels
Lower Clutha / Pomahaka Heriot Burn at Park Hill Road 600 Ranked 52 out of 54 discrete levels
Lower Clutha / Pomahaka Wairuna River at Millar Road 620 Ranked 53 out of 54 discrete levels
Taieri Owhiro Stream at Riverside Road 650 Ranked 54 out of 54 discrete levels
Ranking

212 State of the Environment – Surface Water Quality in Otago 2006 to 2017
Median Regional Ranking Tables – Turbidity (NTU)
WQ Reporting zone Reporting name
Median
Turbidity
(NTU)
Regional Ranking
North Otago Kauru River at Ewings 0.4 Ranked 1 out of 57 discrete levels
Upper Clutha Hawea River at Camphill Bridge 0.4 Ranked 2 out of 57 discrete levels
North Otago Waianakarua River at Browns 0.5 Ranked 3 out of 57 discrete levels
North Otago Kakanui River at Clifton Falls Bridge 0.5 Ranked 4 out of 57 discrete levels
North Otago Shag River at Craig Road 0.6 Ranked 5 out of 57 discrete levels
North Otago Shag River at Goodwood Pump 0.6 Ranked 6 out of 57 discrete levels
Taieri 3 O'Clock Stream at Hindon 0.6 Ranked 7 out of 57 discrete levels
North Otago Welcome Creek at Steward Road 0.7 Ranked 8 out of 57 discrete levels
North Otago Kakanui River at McCones 0.7 Ranked 9 out of 57 discrete levels
Middle Clutha / Central Otago Dunstan Creek at Beattie Road 0.8 Ranked 10 out of 57 discrete levels
Dunedin / Southern Coastal Waikouaiti River at Confluence D⁄S 0.9 Ranked 11 out of 57 discrete levels
Taieri Deep Stream at SH87 0.9 Ranked 12 out of 57 discrete levels
Upper Clutha Clutha River at Luggate Bridge 0.9 Ranked 13 out of 57 discrete levels
Upper Clutha Luggate Creek at SH6 1.0 Ranked 14 out of 57 discrete levels
Upper Clutha Cardrona River at Mt Barker 1.0 Ranked 15 out of 57 discrete levels
Taieri Nenthorn Stream at Mt Stoker Road 1.3 Ranked 16 out of 57 discrete levels
Middle Clutha / Central Otago Fraser River at Marshall Road 1.3 Ranked 16 out of 57 discrete levels
Upper Clutha Lindis River at Lindis Peak 1.3 Ranked 17 out of 57 discrete levels
Upper Clutha Lindis River at Ardgour Road 1.4 Ranked 18 out of 57 discrete levels
Taieri Sutton Stream at SH87 1.4 Ranked 19 out of 57 discrete levels
Taieri Taieri River at Linnburn 1.5 Ranked 20 out of 57 discrete levels
Taieri Taieri River at Stonehenge 1.5 Ranked 21 out of 57 discrete levels
Taieri Silver Stream at Taieri Depot 1.6 Ranked 22 out of 57 discrete levels
Taieri Kye Burn at SH85 Bridge 1.6 Ranked 23 out of 57 discrete levels
Taieri Waipori River at Waipori Falls Rsv 1.7 Ranked 24 out of 57 discrete levels
North Otago Trotters Creek at Mathesons 1.8 Ranked 25 out of 57 discrete levels
North Otago Waiareka Creek at Taipo Road 1.9 Ranked 26 out of 57 discrete levels
Upper Clutha Matukituki River at West Wanaka 2.1 Ranked 27 out of 57 discrete levels
Middle Clutha / Central Otago Benger Burn at SH8 2.2 Ranked 28 out of 57 discrete levels
Dunedin / Southern Coastal Leith Stream at Dundas Street Bridge 2.3 Ranked 29 out of 57 discrete levels
Middle Clutha / Central Otago Clutha River at Millers Flat 2.3 Ranked 30 out of 57 discrete levels
Lower Clutha / Pomahaka Pomahaka River at Glenken 2.5 Ranked 31 out of 57 discrete levels
Middle Clutha / Central Otago Manuherikia River at Galloway 2.6 Ranked 32 out of 57 discrete levels
Dunedin / Southern Coastal Tokomairiro River at West Branch Bridge 2.8 Ranked 33 out of 57 discrete levels
Dunedin / Southern Coastal Owaka River at Katea Road 2.8 Ranked 33 out of 57 discrete levels
Dunedin / Southern Coastal Lindsays Creek at North Road Bridge 2.8 Ranked 34 out of 57 discrete levels
Middle Clutha / Central Otago Manuherikia River at Ophir 2.8 Ranked 34 out of 57 discrete levels
Lower Clutha / Pomahaka Waipahi River at Waipahi 2.9 Ranked 35 out of 57 discrete levels
Dunedin / Southern Coastal Kaikorai Stream at Brighton Road 3.0 Ranked 36 out of 57 discrete levels
Taieri Taieri River at Waipiata 3.3 Ranked 37 out of 57 discrete levels
Upper Clutha Mill Creek at Fish Trap 3.4 Ranked 38 out of 57 discrete levels
Lower Clutha / Pomahaka Waiwera at Maws Farm 3.4 Ranked 39 out of 57 discrete levels
Lower Clutha / Pomahaka Clutha River at Balclutha 3.4 Ranked 40 out of 57 discrete levels
Dunedin / Southern Coastal Catlins River at Houipapa 3.6 Ranked 41 out of 57 discrete levels
Middle Clutha / Central Otago Thomsons Creek at SH85 3.7 Ranked 42 out of 57 discrete levels
Upper Clutha Kawarau River at Chards 3.8 Ranked 43 out of 57 discrete levels
Lower Clutha / Pomahaka Pomahaka River at Burkes Ford 3.9 Ranked 44 out of 57 discrete levels
Taieri Taieri River at Outram 4.1 Ranked 45 out of 57 discrete levels
Taieri Taieri River at Sutton 4.1 Ranked 46 out of 57 discrete levels
Lower Clutha / Pomahaka Crookston Burn at Kelso Road 4.2 Ranked 47 out of 57 discrete levels
Lower Clutha / Pomahaka Waitahuna at Tweeds Bridge 4.6 Ranked 48 out of 57 discrete levels
Taieri Taieri River at Allanton Bridge 4.6 Ranked 49 out of 57 discrete levels
Taieri Taieri River at Tiroiti 4.9 Ranked 50 out of 57 discrete levels
Lower Clutha / Pomahaka Waikoikoi Stream at Hailes Bridge 5.1 Ranked 51 out of 57 discrete levels
Lower Clutha / Pomahaka Waipahi River at Cairns Peak 5.5 Ranked 52 out of 57 discrete levels
Lower Clutha / Pomahaka Heriot Burn at Park Hill Road 6.1 Ranked 53 out of 57 discrete levels
Lower Clutha / Pomahaka Wairuna River at Millar Road 9.5 Ranked 54 out of 57 discrete levels
Upper Clutha Shotover River at Bowens Peak 11.1 Ranked 55 out of 57 discrete levels
Upper Clutha Dart River at The Hillocks 13.0 Ranked 56 out of 57 discrete levels
Taieri Owhiro Stream at Riverside Road 18.0 Ranked 57 out of 57 discrete levels

State of the Environment – Surface Water Quality in Otago 2006 to 2017 213
Median Regional Ranking Tables – MCI (Unitless)
WQ Reporting zone Reporting nameMedian MCI
(Unitless)
North Otago Kauru River at Ewings 118.0 Ranked 1 out of 33 discrete levels
Middle Clutha / Central Otago Dunstan Creek at Beattie Road 118.0 Ranked 1 out of 33 discrete levels
Dunedin / Southern Coastal Tokomairiro River at West Branch Bridge 113.9 Ranked 2 out of 33 discrete levels
North Otago Kakanui River at Clifton Falls Bridge 113.6 Ranked 3 out of 33 discrete levels
Dunedin / Southern Coastal Catlins River at Houipapa 112.0 Ranked 4 out of 33 discrete levels
Lower Clutha / Pomahaka Waitahuna at Tweeds Bridge 111.4 Ranked 5 out of 33 discrete levels
Taieri Taieri River at Outram 109.6 Ranked 6 out of 33 discrete levels
Taieri Waipori River at Waipori Falls Rsv 108.6 Ranked 7 out of 33 discrete levels
Upper Clutha Luggate Creek at SH6 108.4 Ranked 8 out of 33 discrete levels
Lower Clutha / Pomahaka Waipahi River at Cairns Peak 108.3 Ranked 9 out of 33 discrete levels
Upper Clutha Cardrona River at Mt Barker 107.6 Ranked 10 out of 33 discrete levels
Taieri Taieri River at Tiroiti 107.1 Ranked 11 out of 33 discrete levels
Middle Clutha / Central Otago Manuherikia River at Ophir 106.1 Ranked 12 out of 33 discrete levels
North Otago Waianakarua River at Browns 105.6 Ranked 13 out of 33 discrete levels
Taieri Kye Burn at SH85 Bridge 105.0 Ranked 14 out of 33 discrete levels
Upper Clutha Shotover River at Bowens Peak 104.2 Ranked 15 out of 33 discrete levels
Upper Clutha Lindis River at Ardgour Road 103.2 Ranked 16 out of 33 discrete levels
Taieri Sutton Stream at SH87 100.3 Ranked 17 out of 33 discrete levels
Upper Clutha Kawarau River at Chards 99.5 Ranked 18 out of 33 discrete levels
North Otago Shag River at Craig Road 98.7 Ranked 19 out of 33 discrete levels
Upper Clutha Clutha River at Luggate Bridge 93.1 Ranked 20 out of 33 discrete levels
Lower Clutha / Pomahaka Heriot Burn at Park Hill Road 92.9 Ranked 21 out of 33 discrete levels
North Otago Kakanui River at McCones 90.0 Ranked 22 out of 33 discrete levels
Dunedin / Southern Coastal Leith Stream at Dundas Street Bridge 90.0 Ranked 22 out of 33 discrete levels
Lower Clutha / Pomahaka Waipahi River at Waipahi 90.0 Ranked 22 out of 33 discrete levels
Dunedin / Southern Coastal Lindsays Creek at North Road Bridge 89.5 Ranked 23 out of 33 discrete levels
Taieri Silver Stream at Taieri Depot 89.4 Ranked 24 out of 33 discrete levels
Dunedin / Southern Coastal Waikouaiti River at Confluence D⁄S 88.6 Ranked 25 out of 33 discrete levels
Lower Clutha / Pomahaka Wairuna River at Millar Road 87.8 Ranked 26 out of 33 discrete levels
North Otago Trotters Creek at Mathesons 87.4 Ranked 27 out of 33 discrete levels
Upper Clutha Mill Creek at Fish Trap 86.7 Ranked 28 out of 33 discrete levels
North Otago Shag River at Goodwood Pump 86.0 Ranked 29 out of 33 discrete levels
Middle Clutha / Central Otago Clutha River at Millers Flat 85.0 Ranked 30 out of 33 discrete levels
Lower Clutha / Pomahaka Waiwera at Maws Farm 84.5 Ranked 31 out of 33 discrete levels
North Otago Waiareka Creek at Taipo Road 71.7 Ranked 32 out of 33 discrete levels
Dunedin / Southern Coastal Kaikorai Stream at Brighton Road 68.3 Ranked 33 out of 33 discrete levels
Ranking

214 State of the Environment – Surface Water Quality in Otago 2006 to 2017
Appendix H – Comparison of Schedule 15 (Water Plan) E. coli limits to the 2017 amended NPSFM (2014) NOF Swimmability limits.
The government has recently amended the 2014 National Policy Statement for Freshwater
Management (NPSFM). It sets national targets relating to ‘swimmability’ for New Zealand’s rivers and
lakes. The Clean Water Package includes numerous other changes to the NPSFM such as provisions for
stock exclusion, and requirements for regional councils to monitor the ecological health of our rivers
and lakes. The changes can be viewed online at the MfE website20.
The Government has set a national target of making 90 percent of New Zealand’s rivers (fourth order
or greater) and lakes (with perimeters greater than 1.5 km) swimmable by 2040. The stream order
describes the relative size of streams. Streams with no tributaries are “first order”, streams with two
first order tributaries are second order, and with two second order tributaries are third order and so
on. Examples of fourth order streams in the Dunedin locale include the Water of Leith alongside the
University of Otago, Silverstream at Mosgiel and the Kaikorai Stream at State Highway 1. The
Manuherikia River at Alexandra is seventh order and Otago’s biggest river, the Clutha at Balclutha, is
eighth order. Around 90 percent of New Zealand’s catchments flow into rivers that are fourth order or
bigger (MfE website).
The NPSFM grading proposals are based on a “sophisticated” grading system that uses four statistical
measures of E.coli concentrations when assessing river swimmability; and one statistical measure for
toxic algae bio-volumes when assessing lake swimmability. The four statistical measures of river E.coli
data are presented in the E. coli attribute table in Appendix H Table 1; and Appendix H Table 3. As
stated in the footnote to the Appendix H Table 3, “Attribute state must be determined by satisfying all
numeric attribute states”.
Otago Regional Council has set targets for E. coli for the region in Schedule 15 (Water Plan) (Appendix
H Table 2). A key question for Council is whether the Schedule 15 (Water Plan) limits for E. coli for each
Receiving Water Group (RWG) meet the requirements or ‘bottom line acceptable state’ of the NPSFM
(2014).
For each ORC State of Environment monitoring site, it is possible to calculate both the Schedule 15
(Water Plan) 80th percentile E. coli concentrations when flows are at or below median flow (at the
relevant flow reference site); as well as the four separate NOF E.coli attribute statistics that are
calculated from E. coli data collected at all flows (summarised in Appendix H Table 1). These values can
then be compared, as illustrated in Appendix H Figures 1 through 4. Using regression analysis, it is
possible to predict the ‘likely’ NOF E. coli attribute state for each RWG under Scehdule 15. This has
been done based on the regression relationships shown in Appendix H Figures 1 through 4 and
presented in Appendix H Table 2.
Comparison of Schedule 15 (Water Plan) limits to the 4 separate statistical tests within the NPSFM has
shown (Appendix H Table 2):
• That the E. coli limits set in Schedule 15 (Water Plan) for Receiving Water Group 3 (Upper
Clutha upstream of the Southern Great Lakes) provides compliance against the four separate
statistical tests in the NPSFM and as a minimum, will provide a blue (A grade) swimmability
category. The minimum requirement is a yellow or C grade.
20 https://www.mfe.govt.nz/sites/default/files/media/npsfm-showing-changes_0.pdf

State of the Environment – Surface Water Quality in Otago 2006 to 2017 215
• With the exception of some catchments in the Pomahaka catchment, the E. coli limits set in
Schedule 15 (Water Plan) for Receiving Water Group 1 and 2 (that covers the remainder of the
Otago region), will provide good compliance against the four separate statistical tests in the
NPSFM, and as a minimum, will provide a blue (A grade), green (B grade) or in some cases an
yellow (C grade) category. The yellow, C grade category being the minimum requirement.\
• For Receiving Water Groups 4 and 5 that relate to the lakes throughout Otago, the E. coli limits
set in Schedule 15 (Water Plan) provides compliance against the four separate statistical tests
in the NPSFM and as a minimum, will provide a blue (A grade) or green (B grade) swimmability
category. The minimum requirement is a yellow or C grade.
In the case of the Pomahaka catchment, monitoring sites in some catchments return high 95th
percentiles at all flows, even though they may be compliant with the Schedule 15 (Water Plan) limit.
This is believed to be due to effluent storage issues and a prevalence of mole and tile drains through
areas of the catchment resulting in very high E. coli peaks under high flow conditions and elevated E.
coli concentrations at low to moderate flows. The sub-catchments this relates to include the Heriot
Burn, Crookston Burn, Waikoikoi Stream, Wairuna River and the lower Waipahi River. These sites have
been excluded from the regression analysis described above, as they are outliers in the data set and
have unique circumstances that differ from the wider Otago Region. To address issues of high E. coli in
these catchments, ORC are working actively throughout the Pomahaka catchment with groups such as
the Pomahaka Watercare Trust, the Landcare Trust and the Clutha Development Trust to address
water quality issues. A large part of this effort is focused on improving bacterial water quality.
Appendix H Table 1: NPSFM (2014) NOF E. coli attribute states.
Attribute state Median
concentration (CFU/100ml)
95th percentile (CFU/100ml)
% Exceedances over 260
CFU/100ml
% Exceedances over 540
CFU/100ml
A (Blue) <= 130 <= 540 < 20% < 5%
B (Green) <= 130 <= 1000 20 - 30% 5 - 10%
C (Yellow) <= 130 <= 1200 20 - 34% 10 - 20%
D (Orange - Exceeded)
> 130 >1200 > 34% 20 - 30%
E (Red - Exceeded)
> 260 > 1200 > 50% > 30%
Appendix H Table 2: Predicted states for NOF E. coli attributes states when compared to the Plan
Schedule 15 (Water Plan) E. coli limits for the different RWG’s.
ORC Schedule 15 Receiving Water Group
(RWG)
ORC Schedule 15 limit 80th
percentile less median flow
Estimated median all
flows
Estimated 95th
percentile all flows
Estimated % exceedances
> 260 all flows
Estimated % exceedances
> 540 all flows
Group 1/2 260 (A) 89 (C) 1104 (A) 18% (B/C) 10%
Group 3 50 (A) 10 (A) 261 (A) 6% (A) 2%
Group 4 126 (A) 39 (B) 566 (A) 10% (A/B) 5%
Group 5 10 (A) 1 (A) 101 (A) 3% (A) 0%
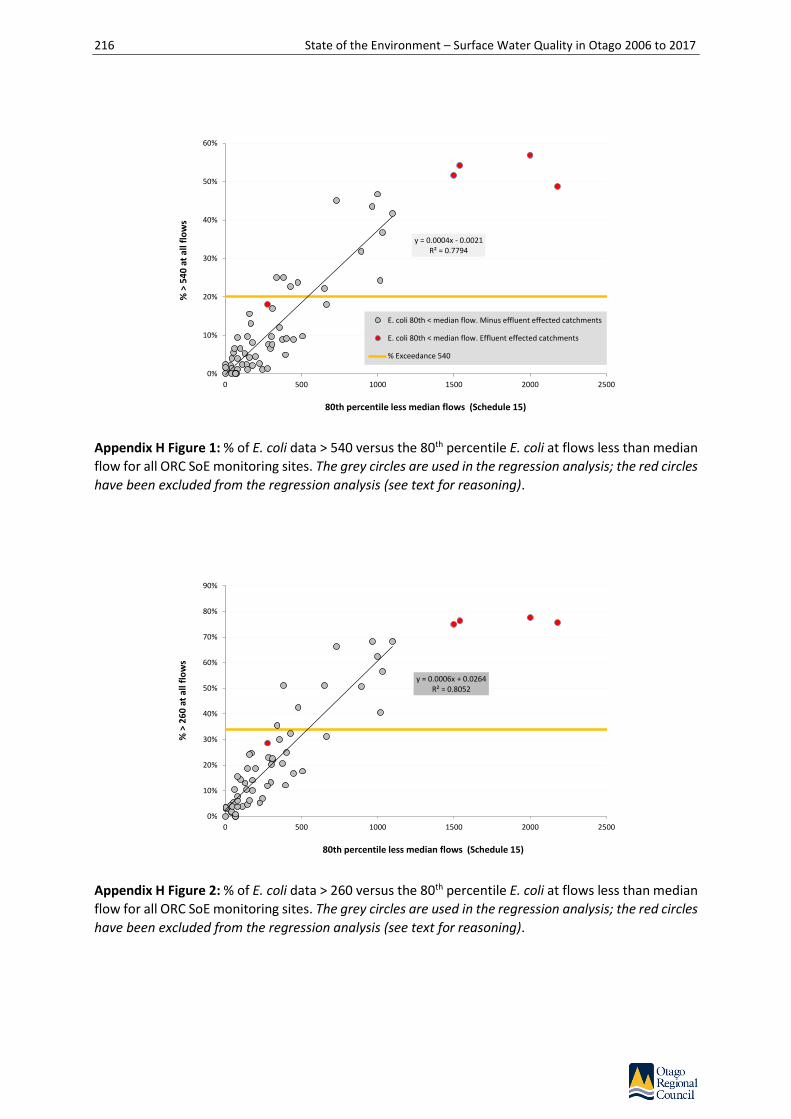
216 State of the Environment – Surface Water Quality in Otago 2006 to 2017
Appendix H Figure 1: % of E. coli data > 540 versus the 80th percentile E. coli at flows less than median
flow for all ORC SoE monitoring sites. The grey circles are used in the regression analysis; the red circles
have been excluded from the regression analysis (see text for reasoning).
Appendix H Figure 2: % of E. coli data > 260 versus the 80th percentile E. coli at flows less than median
flow for all ORC SoE monitoring sites. The grey circles are used in the regression analysis; the red circles
have been excluded from the regression analysis (see text for reasoning).
y = 0.0004x - 0.0021R² = 0.7794
0%
10%
20%
30%
40%
50%
60%
0 500 1000 1500 2000 2500
% >
54
0 a
t al
l flo
ws
80th percentile less median flows (Schedule 15)
E. coli 80th < median flow. Minus effluent effected catchments
E. coli 80th < median flow. Effluent effected catchments
% Exceedance 540
y = 0.0006x + 0.0264R² = 0.8052
0%
10%
20%
30%
40%
50%
60%
70%
80%
90%
0 500 1000 1500 2000 2500
% >
26
0 a
t al
l flo
ws
80th percentile less median flows (Schedule 15)

State of the Environment – Surface Water Quality in Otago 2006 to 2017 217
Appendix H Figure 3: 95th percentile E. coli at all flows versus the 80th percentile E. coli at flows less
than median flow for ORC SoE monitoring sites. The grey circles are used in the regression analysis; the
red circles have been excluded from the regression analysis (see text for reasoning).
Appendix H Figure 4: Median E. coli at all flows versus the 80th percentile E. coli at less than median
flow for all ORC SoE monitoring sites. The grey circles are used in the regression analysis; the red circles
have been excluded from the regression analysis (see text for reasoning).
y = 4.0134x + 60.451R² = 0.5145
0
2000
4000
6000
8000
10000
12000
0 500 1000 1500 2000 2500
95
th p
erce
nti
le a
t al
l flo
ws
80th percentile less median flows (Schedule 15)
y = 0.3786x - 9.0765R² = 0.7947
0
100
200
300
400
500
600
700
800
900
0 500 1000 1500 2000 2500
Med
ian
at
all f
low
s
80th percentile less median flows (Schedule 15)

218 State of the Environment – Surface Water Quality in Otago 2006 to 2017
Appendix H Table 3: NPSFM (2014) NOF E. coli attribute states.

Appendix 1– Update on Schedule 15 tables for the period 1 July 2013 to 30 June 2018
RIVERS: 80th percentile values for water quality variables identified in Schedule 15. Values are calculated from samples taken when flows are below median flow. The orange cells show where the 80th percentile exceeds the Schedule 15 limit. Numbers underlined in italics have lower limits under Schedule 15.
North Otago
Variable NNN NH4-N DRP E. coli Turbidity6A limit when flows < median flow 0.075 mg/L 0.100 mg/L 0.010 mg/L 260 CFU 5.00 NTUSoE reporting nameWelcome Creek at Steward Road 1.400 0.018 0.029 992 0.905Kakanui River at Clifton Falls Bridge 0.036 0.011 0.004 992 0.755Kauru River at Ewings 0.026 0.008 0.005 251 0.460Kakanui River at McCones 0.289 0.022 0.004 233 0.900Waiareka Creek at Taipo Road 0.338 0.042 0.223 609 1.800Waianakarua River at Browns 0.247 0.008 0.006 291 0.547Trotters Creek at Mathesons 0.309 0.024 0.007 187 2.370Shag River at Craig Road 0.131 0.007 0.005 145 0.550Shag River at Goodwood Pump 0.285 0.011 0.011 215 0.790
Dunedin / Southern coastal
Variable NNN NH4-N DRP E. coli Turbidity0.444 mg/L 0.026 mg/L
6A limit when flows < median flow 0.075 mg/L 0.100 mg/L 0.010 mg/L 260 CFU 5.0 NTU
SoE reporting nameWaikouaiti River at Confluence D/S 0.012 0.012 0.003 55 1.179Lindsays Creek at North Road Bridge 0.650 0.024 0.027 926 3.370Leith Stream at Dundas Street Bridge 0.445 0.018 0.033 588 2.270Kaikorai Stream at Brighton Road 0.240 0.014 0.013 840 2.750Tokomairiro River at West Branch Bdg 0.322 0.018 0.015 234 2.770Owaka River at Katea Road 1.200 0.019 0.023 400 2.350Catlins River at Houipapa 0.418 0.016 0.018 250 3.770
Middle Clutha / Central Otago
Variable NNN NH4-N DRP E. coli Turbidity6A limit when flows < median flow 0.075 mg/L 0.100 mg/L 0.010 mg/L 260 CFU 5.00 NTUSoE reporting nameDunstan Creek at Beattie Road 0.052 0.008 0.005 83 1.101Manuherikia River at Ophir 0.051 0.020 0.039 358 2.840Thomsons Creek at SH85 0.119 0.025 0.098 1100 5.580Manuherikia River at Galloway 0.022 0.011 0.019 212 2.830Benger Burn at SH8 0.267 0.014 0.021 1058 1.880Fraser River at Marshall Road 0.049 0.006 0.004 70 0.950Clutha River at Millers Flat 0.042 0.004 0.001 23 1.732

Taieri
Variable NNN NH4-N DRP E. coli Turbidity6A limit when flows < median flow 0.075 mg/L 0.100 mg/L 0.010 mg/L 260 CFU 5.00 NTUSoE reporting name Taieri River at Linnburn 0.007 0.009 0.006 1050 1.740Taieri River at Stonehenge 0.007 0.009 0.009 181 1.982Taieri River at Waipiata 0.021 0.014 0.046 475 2.900Kye Burn at SH85 Bridge 0.038 0.010 0.006 345 1.570Taieri River at Tiroiti 0.031 0.014 0.022 197 3.570Taieri River at Sutton 0.040 0.016 0.015 447 2.740Sutton Stream at SH87 0.008 0.009 0.006 370 1.738Nenthorn Stream at Mt Stoker Road 0.003 0.020 0.019 88 1.851Deep Stream at SH87 0.001 0.007 0.003 206 1.0793 O'Clock Stream at Hindon 0.053 0.009 0.005 40 0.834Taieri River at Outram 0.041 0.011 0.012 94 2.360Silver Stream at Taieri Depot 0.387 0.017 0.007 300 1.965Owhiro Stream at Riverside Road 0.367 0.147 0.048 836 21.650Taieri River at Allanton Bridge 0.063 0.021 0.014 412 5.560Waipori River at Waipori Falls Rsv 0.021 0.007 0.003 50 1.812
Upper Clutha
Variable NNN NH4-N DRP E. coli Turbidity0.100 mg/L 0.010 mg/L 260 CFU 5.0 NTU
6A limit when flows < median flow 0.075 mg/L 0.010 mg/L 0.005 mg/L 50 CFU 3.0 NTUSoE reporting name Dart River at The Hillocks 0.032 0.017 0.003 14 ExemptShotover River at Bowens Peak 0.015 0.003 0.001 4 ExemptMill Creek at Fish Trap 0.393 0.014 0.008 425 4.110Kawarau River at Chards 0.031 0.025 0.002 31 2.894Matukituki River at West Wanaka 0.069 0.010 0.004 65 ExemptCardrona River at Mt Barker 0.083 0.011 0.004 212 0.924Hawea River at Camphill Bridge 0.019 0.006 0.003 11 0.550Clutha River at Luggate Bridge 0.043 0.004 0.001 5 0.954Luggate Creek at SH6 0.003 0.009 0.015 282 1.430Lindis River at Lindis Peak 0.014 0.007 0.005 69 1.600Lindis River at Ardgour Road 0.131 0.011 0.004 70 1.418
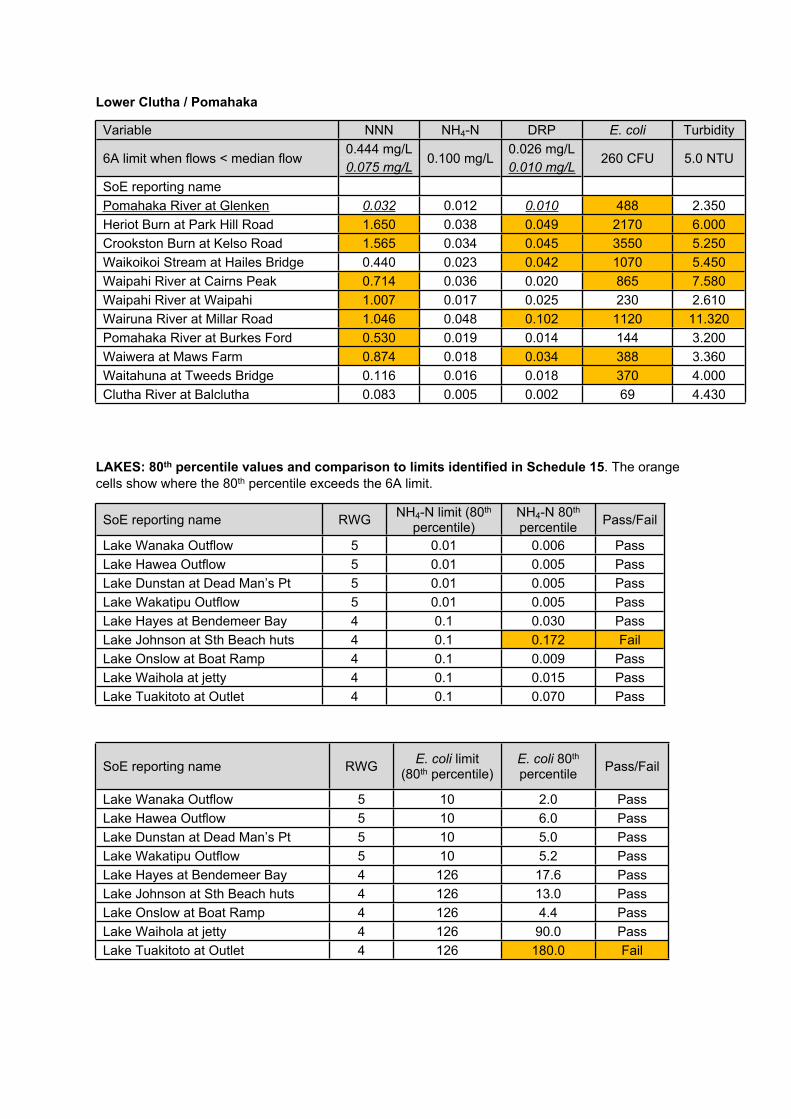
Lower Clutha / Pomahaka
Variable NNN NH4-N DRP E. coli Turbidity0.444 mg/L 0.026 mg/L
6A limit when flows < median flow 0.075 mg/L 0.100 mg/L 0.010 mg/L 260 CFU 5.0 NTU
SoE reporting name Pomahaka River at Glenken 0.032 0.012 0.010 488 2.350Heriot Burn at Park Hill Road 1.650 0.038 0.049 2170 6.000Crookston Burn at Kelso Road 1.565 0.034 0.045 3550 5.250Waikoikoi Stream at Hailes Bridge 0.440 0.023 0.042 1070 5.450Waipahi River at Cairns Peak 0.714 0.036 0.020 865 7.580Waipahi River at Waipahi 1.007 0.017 0.025 230 2.610Wairuna River at Millar Road 1.046 0.048 0.102 1120 11.320Pomahaka River at Burkes Ford 0.530 0.019 0.014 144 3.200Waiwera at Maws Farm 0.874 0.018 0.034 388 3.360Waitahuna at Tweeds Bridge 0.116 0.016 0.018 370 4.000Clutha River at Balclutha 0.083 0.005 0.002 69 4.430
LAKES: 80th percentile values and comparison to limits identified in Schedule 15. The orange cells show where the 80th percentile exceeds the 6A limit.
SoE reporting name RWG NH4-N limit (80th percentile)
NH4-N 80th percentile Pass/Fail
Lake Wanaka Outflow 5 0.01 0.006 PassLake Hawea Outflow 5 0.01 0.005 PassLake Dunstan at Dead Man’s Pt 5 0.01 0.005 PassLake Wakatipu Outflow 5 0.01 0.005 PassLake Hayes at Bendemeer Bay 4 0.1 0.030 PassLake Johnson at Sth Beach huts 4 0.1 0.172 FailLake Onslow at Boat Ramp 4 0.1 0.009 PassLake Waihola at jetty 4 0.1 0.015 PassLake Tuakitoto at Outlet 4 0.1 0.070 Pass
SoE reporting name RWG E. coli limit (80th percentile)
E. coli 80th percentile Pass/Fail
Lake Wanaka Outflow 5 10 2.0 PassLake Hawea Outflow 5 10 6.0 PassLake Dunstan at Dead Man’s Pt 5 10 5.0 PassLake Wakatipu Outflow 5 10 5.2 PassLake Hayes at Bendemeer Bay 4 126 17.6 PassLake Johnson at Sth Beach huts 4 126 13.0 PassLake Onslow at Boat Ramp 4 126 4.4 PassLake Waihola at jetty 4 126 90.0 PassLake Tuakitoto at Outlet 4 126 180.0 Fail

SoE reporting name RWG TP limit (80th percentile)
TP 80th percentile Pass/Fail
Lake Wanaka Outflow 5 0.005 0.0051 PassLake Hawea Outflow 5 0.005 0.004 PassLake Dunstan at Dead Man’s Pt 5 0.005 0.009 FailLake Wakatipu Outflow 5 0.005 0.005 PassLake Hayes at Bendemeer Bay 4 0.033 0.056 FailLake Johnson at Sth Beach huts 4 0.033 0.089 FailLake Onslow at Boat Ramp 4 0.033 0.036 FailLake Waihola at jetty 4 0.033 0.078 FailLake Tuakitoto at Outlet 4 0.033 0.144 Fail
SoE reporting name RWG TN limit (80th percentile)
TN 80th percentile Pass/Fail
Lake Wanaka Outflow 5 0.1 0.080 PassLake Hawea Outflow 5 0.1 0.049 PassLake Dunstan at Dead Man’s Pt 5 0.1 0.090 PassLake Wakatipu Outflow 5 0.1 0.080 PassLake Hayes at Bendemeer Bay 4 0.55 0.430 PassLake Johnson at Sth Beach huts 4 0.55 1.200 FailLake Onslow at Boat Ramp 4 0.55 0.290 PassLake Waihola at jetty 4 0.55 0.670 FailLake Tuakitoto at Outlet 4 0.55 1.452 Fail
SoE reporting name RWG Turbidity limit (80th percentile)
Turbidity 80th percentile Pass/Fail
Lake Wanaka Outflow 5 3.0 0.6 PassLake Hawea Outflow 5 3.0 0.7 PassLake Dunstan at Dead Man’s Pt 5 3.0 1.2 PassLake Wakatipu Outflow 5 3.0 0.7 PassLake Hayes at Bendemeer Bay 4 5.0 2.2 PassLake Johnson at Sth Beach huts 4 5.0 6.0 FailLake Onslow at Boat Ramp 4 5.0 5.7 FailLake Waihola at jetty 4 5.0 18.5 FailLake Tuakitoto at Outlet 4 5.0 12.5 Fail
1 NOTE: the detection level for TP is 0.004 mg/L and the resolution is 0.001 mg/L. The actual concentrations of TP in Wakatipu, Wanaka and Hayes are likely well below the Schedule 15 limits but the limitations with laboratory detection limits do not allow us to recognise this.
Related Documents