EUROPEAN COMMISSION Technical analysis of past and on-going projects 1 July 2016 Technical analysis of past and on-going projects Contract ENER C2/2014-642 / S12.698798 “Support to R&D strategy in the area of SET Plan activities in smart grids and energy storage” Deliverable D3.2 by TECHNOFI (coordinator), EASE, EDSO, ENTSO-E, RSE and VITO Author: Technofi Quality check: ENTSO-E, EDSO, EASE, RSE, VITO Due delivery date: 22 July 2016

Welcome message from author
This document is posted to help you gain knowledge. Please leave a comment to let me know what you think about it! Share it to your friends and learn new things together.
Transcript

EUROPEAN COMMISSION Technical analysis of past and on-going projects
1 July 2016
Technical analysis of past and on-going projects
Contract ENER C2/2014-642 / S12.698798
“Support to R&D strategy in the area of SET Plan activities in smart grids and energy storage”
Deliverable D3.2
by
TECHNOFI (coordinator), EASE, EDSO, ENTSO-E, RSE and VITO
Author: Technofi
Quality check: ENTSO-E, EDSO, EASE, RSE, VITO
Due delivery date: 22 July 2016

EUROPEAN COMMISSION Technical analysis of past and on-going projects
2 July 2016
Table of contents
EXECUTIVE SUMMARY ........................................... 14
INTRODUCTION .................................................... 15
1. Background .................................................................................. 15
2. The Monitoring Methodology ........................................................ 15
2.1 Overview of the five-step methodology ..................................................15
2.2 The database of R&I projects and achievements (steps 1 to 3) .................16
2.2.1 Initial selection of projects ................................................................................ 16
2.2.2 Questionnaires addressed to project coordinators .......................................... 17
2.2.3 Construction and processing of the database ................................................... 18
2.3 Assessment of the coverage of the current roadmap and recommendations for the new roadmap (steps 4 and 5) .........................................................18
2.4 Comparison with R&I activities carried out in non-European countries .......19
2.4.1 Selection of projects .......................................................................................... 19
2.4.2 Analyses ............................................................................................................. 20
2.5 Methodological challenges and mitigation actions ....................................21
3. How to read this document .......................................................... 22
3.1 Terminology .......................................................................................22
3.2 Projects and achievements’ id codes .....................................................22
3.3 Organisation of the report ....................................................................23
3.4 Visual identity of the monitoring exercise ...............................................24
3.4.1 Text .................................................................................................................... 24
3.4.2 Types of charts .................................................................................................. 24
3.4.3 Pie and bar chart colours ................................................................................... 24
3.4.4 Colour code for coverage analysis ..................................................................... 24
EUROPEAN COMMISSION Technical analysis of past and on-going projects
3 July 2016
Part I TRANSMISSION ....................................... 26
4. The portfolio of R&I projects in relation with the transmission activities of the Roadmap, and related achievements......................... 26
4.1 Assumptions ruling the portfolio selection ..............................................26
4.2 The portfolio of transmission projects ....................................................26
4.3 The corresponding achievements in transmission ....................................27
4.3.1 Methodology reminder ..................................................................................... 27
4.3.2 Overview of achievements in transmission ...................................................... 28
5. Transmission Cluster 1: Grid Architecture .................................... 33
5.1 Features of achievements in Cluster 1 ...................................................33
5.1.1 Descriptive features .......................................................................................... 33
5.1.2 Projective features (next steps) ........................................................................ 35
5.2 Coverage analysis of Cluster 1 with past and ongoing projects .................37
5.2.1 T1 “Definition of scenarios for pan-European network expansion” ................. 37
5.2.2 T2 “Planning methodology for future pan-European transmission system” .... 39
5.2.3 T14 “Increasing public acceptance of the transmission infrastructure” ........... 41
5.3 Recommendations for the new R&I roadmap ..........................................42
6. Transmission Cluster 2: Power technologies ................................ 42
6.1 Features of achievements in Cluster 2 ...................................................42
6.1.1 Descriptive features .......................................................................................... 42
6.1.2 Projective features (next steps) ........................................................................ 44
6.2 Coverage analysis of Cluster 2 with past and ongoing projects .................45
6.2.1 T3 “Demonstration of power technology to increase network flexibility and
operation means” .............................................................................................. 45
6.2.2 T4 “Demonstration of novel network architectures”........................................ 48
6.2.3 T5 “Interfaces for large-scale demonstration of renewable integration”......... 49
6.3 Recommendations for the new R&I roadmap ..........................................51
7. Transmission Cluster 3: Network operation .................................. 51
7.1 Features of achievements in Cluster 3 ...................................................51
7.1.1 Descriptive features .......................................................................................... 51
7.1.2 Projective features (next steps) ........................................................................ 53
7.2 Coverage analysis of Cluster 3 with past and ongoing projects .................55
7.2.1 T6 “Innovative tools and methods to observe and control the pan-European
network” ............................................................................................................ 55
EUROPEAN COMMISSION Technical analysis of past and on-going projects
4 July 2016
7.2.2 T7 “Innovative tools and methods for coordinated operation with stability
margin evaluation” ............................................................................................ 57
7.2.3 T8 “Improved training tools and methods to ensure better coordination at the
regional and pan-European levels” ................................................................... 59
7.2.4 T9 “Innovative tools and approaches for pan-European network reliability
assessment”....................................................................................................... 60
7.3 Recommendations for the new R&I roadmap ..........................................62
8. Transmission Cluster 4: Market design ......................................... 62
8.1 Descriptive features of achievements in Cluster 4 ...................................62
8.1.1 Descriptive features .......................................................................................... 62
8.1.2 Projective features (next steps) ........................................................................ 64
8.2 Coverage analysis of Cluster 4 with past and ongoing projects .................66
8.2.1 T10 “Advanced pan-European market tools for ancillary services and balancing,
including active demand management” ........................................................... 66
8.2.2 T11 “Advanced tools for capacity allocation and congestion management” ... 68
8.2.3 T12 “Tools and market mechanisms for ensuring system adequacy and
efficiency in electric systems integrating very large amounts of RES generation”
........................................................................................................................... 70
8.3 Recommendations for the new R&I roadmap ..........................................71
9. Transmission Cluster 5: Asset management ................................. 71
9.1 Features of achievements in Cluster 5 ...................................................71
9.1.1 Descriptive features .......................................................................................... 71
9.1.2 Projective features (next steps) ........................................................................ 73
9.2 Coverage analysis of Cluster 5 with past and ongoing projects .................74
9.2.1 T15 “Developing approaches to determine and maximise the lifetime of critical
power components for existing and future networks” ..................................... 74
9.2.2 T16 “Development and validation of tools which optimize asset maintenance
at the system level, based on quantitative cost/benefit analysis” ................... 76
9.2.3 T17 “Demonstrations of new asset management approaches at EU level” ..... 77
9.3 Recommendations for the new R&I roadmap ..........................................77
10. Conclusion for Transmission ......................................................... 78
EUROPEAN COMMISSION Technical analysis of past and on-going projects
5 July 2016
Part II DISTRIBUTION ......................................... 79
11. The portfolio of R&I projects in relation with the DSO activities of the Roadmap ...................................................................................... 79
11.1 Assumptions ruling the portfolio selection ..............................................79
11.2 The portfolio of distribution projects ......................................................79
11.3 The corresponding achievements in distribution ......................................80
11.3.1 Methodology reminder ..................................................................................... 80
11.3.2 Overview of achievements in distribution ........................................................ 80
12. Distribution Cluster 1: Integration of smart customers ................ 84
12.1 Features of achievements in Cluster 1 ...................................................84
12.1.1 Descriptive features .......................................................................................... 84
12.1.2 Projective features (next steps) ........................................................................ 86
12.2 Coverage analysis of Cluster 1 with past and ongoing projects .................87
12.2.1 D1 “Active Demand for increased network flexibility” ..................................... 87
12.2.2 D2 “Enabling maximum energy efficiency in new or refurbished urban districts
using smart distribution grids” .......................................................................... 90
12.3 Recommendations for the new R&I roadmap ..........................................93
13. Distribution Cluster 2: Integration of DER and new uses .............. 93
13.1 Features of achievements in Cluster 2 ...................................................93
13.1.1 Descriptive features .......................................................................................... 93
13.1.2 Projective features (next steps) ........................................................................ 96
13.2 Coverage analysis of Cluster 2 with past and ongoing projects .................98
13.2.1 D3 “Integration of DER at low voltage” ............................................................. 98
13.2.2 D4 “Integration of DER at medium voltage / high voltage” ............................ 103
13.2.3 D5 “Integration of storage in network management” .................................... 106
13.2.4 D6 “Integration of infrastructure to host Electrical Vehicles” ........................ 111
13.3 Recommendations for the new R&I roadmap ........................................ 113
14. Distribution Cluster 3: Network operations ................................ 114
14.1 Features of achievements in Cluster 3 ................................................. 114
14.1.1 Descriptive features ........................................................................................ 114
14.1.2 Projective features (next steps) ...................................................................... 115
14.2 Coverage analysis of Cluster 3 with past and ongoing projects ............... 117
14.2.1 D7 “Monitoring and control of LV networks” ................................................. 117
14.2.2 D8 “Automation and control of MV networks”............................................... 120
14.2.3 D9 “Network management methodologies for network operation” .............. 123

EUROPEAN COMMISSION Technical analysis of past and on-going projects
6 July 2016
14.2.4 D10 “Smart metering data utilisation” ............................................................ 125
14.3 Recommendations for the new R&I roadmap ........................................ 127
15. Distribution Cluster 4: Network planning and asset management 127
15.1 Features of achievements in Cluster 4 ................................................. 127
15.1.1 Descriptive features ........................................................................................ 127
15.1.2 Projective features (next steps) ...................................................................... 129
15.2 Coverage analysis of Cluster 4 with past and ongoing projects ............... 130
15.2.1 D11: “New Planning approaches for distribution networks” .......................... 130
15.2.1 D12 “Novel approaches to asset management” ............................................. 131
15.3 Recommendations for the new R&I roadmap ........................................ 133
16. Distribution Cluster 5: Market design ......................................... 133
16.1 Features of achievements in Cluster 5 ................................................. 133
16.1.1 Descriptive features ........................................................................................ 133
16.1.2 Projective features (next steps) ...................................................................... 135
16.2 Coverage analysis of Cluster 5 with past and ongoing projects ............... 136
16.2.1 D13: “Novel approaches for market design” .................................................. 136
16.1 Recommendations for the new R&I roadmap ........................................ 138
17. Conclusion for distribution ......................................................... 139
Part III JOINT TSO & DSO ACTIVITIES................ 140
18. The portfolio of R&I projects in relation with the TSO/ DSO activities
of the Roadmap ................................................................................ 140
18.1 Assumptions ruling the portfolio selection ............................................ 140
18.2 The portfolio of transmission/distribution projects ................................. 140
19. Joint TSO/DSO cluster ................................................................ 141
19.1 Descriptive features of achievements in the joint TSO/DSO cluster.......... 141
19.1.1 Overview of achievements in the joint TSO/DSO cluster ................................ 141
19.1.2 The joint TSO/DSO cluster per Functional Objective ...................................... 142
19.2 Projective features of achievements in the joint TSO/DSO cluster ........... 143
19.3 Coverage analysis of the joint TSO/DSO cluster with past and ongoing projects
...................................................................................................... 146
19.3.1 TD1 “Increased observability of the distribution system for transmission
network management and control” ................................................................ 146

EUROPEAN COMMISSION Technical analysis of past and on-going projects
7 July 2016
19.3.2 TD2 “The integration of demand side management at DSO level into TSO
operations” ...................................................................................................... 147
19.3.3 TD3 “Ancillary services provided through DSOs” ............................................ 149
19.3.4 TD4 “Improved defence and restoration plan” ............................................... 151
19.3.5 TD5 “Methodologies for scaling-up and replicating” ...................................... 152
19.4 Recommendations for the new R&I roadmap ........................................ 153
20. Conclusion for joint transmission and distribution activities ...... 154
Part IV COMPARISON WITH NON-EUROPEAN
SELECTED PROJECTS .............................. 155
21. The selected portfolio of non-European R&I projects ................. 155
21.1 Reminder: project selection ............................................................... 155
21.2 Overview of the selected portfolio ....................................................... 156
22. R&I achievements from selected non-European projects in
transmission .................................................................................... 158
22.1 Features of achievements from selected non-European projects in
transmission .................................................................................... 158
22.1.1 Descriptive features of achievements ............................................................. 158
22.1.2 Projective features of achievements ............................................................... 160
22.2 Description of each project of the selected portfolio .............................. 162
22.2.1 From the USA .................................................................................................. 162
22.2.2 From China ...................................................................................................... 167
22.2.3 From Japan ...................................................................................................... 170
22.3 Recommendations and final remarks for R&I policy makers .................... 172
23. R&I achievements in distribution ............................................... 173
23.1 Features of achievements from selected non-European projects in distribution ...................................................................................................... 173
23.1.1 Descriptive features of achievements ............................................................. 173
23.1.1 Projective features of achievements ............................................................... 176
23.2 Description of each project of the selected portfolio .............................. 177
23.2.1 From the USA .................................................................................................. 177
23.2.2 From Canada ................................................................................................... 180
23.2.3 From Australia ................................................................................................. 181
23.2.4 From Japan ...................................................................................................... 182
23.2.5 From India ....................................................................................................... 182
EUROPEAN COMMISSION Technical analysis of past and on-going projects
8 July 2016
23.3 Recommendations and final remarks for R&I policy makers .................... 183
GENERAL CONCLUSION ....................................... 185
GLOSSARY ......................................................... 186
Generic terms related to the R&I roadmaps ..................................... 186
Specific terms adopted for this monitoring report ............................ 186
ANNEXES ........................................................... 188
24. R&I achievements’ description of the reviewed projects ............ 188
24.1 Transmission achievements ................................................................ 188
24.2 Distribution achievements .................................................................. 196
24.3 Transmission/distribution achievements ............................................... 205
25. Description of projects’ budgets ................................................. 209
25.1 Projects’ budgets related to transmission activities ................................ 209
25.2 Projects’ budgets related to distribution activities .................................. 211
25.3 Projects’ budgets related to transmission/distribution activities ............... 213

EUROPEAN COMMISSION Technical analysis of past and on-going projects
9 July 2016
Table of illustrations
Table 1: Methodological challenges of the monitoring approach and mitigation actions ..21
Table 2: Colour codes used in the charts .................................................................24
Table 3: Colour codes used in the coverage assessment of FOs’ tasks of the EEGI Roadmap
..........................................................................................................................25
Table 4: Portfolio of projects source of achievements in transmission ..........................26
Table 5: Descriptive features in transmission ...........................................................28
Table 6: Portfolio of projects source of achievements in distribution ............................79
Table 7: Descriptive features in distribution .............................................................80
Table 8: Portfolio of projects in transmission/distribution ......................................... 140
Table 9: Methodology followed to select the portfolio of non-European projects .......... 155
Table 10: Selected portfolio of non-European projects ............................................. 156
Table 11: Detailed description of achievements related to transmission activities of each
project reviewed as provided by project coordinators .............................................. 188
Table 12: Detailed description of achievements related to distribution activities of each
project reviewed as provided by project coordinators .............................................. 196
Table 13: Detailed description of achievements related to transmission/distribution
activities of each project reviewed as provided by project coordinators ..................... 205
Table 14: Description of projects’ budgets related to transmission activities ............... 209
Table 15: Description of projects’ budgets related to distribution activities ................. 211
Table 16: Description of projects’ budgets related to transmission/distribution activities
........................................................................................................................ 213
Figure 1: Construction of the database of R&I projects and achievements ....................17
Figure 2: Example of the sequence of sections in a given cluster ................................23
Figure 3: The portfolio of achievements in transmission per cluster (left: overall; middle:
completed; right: expected)...................................................................................28
Figure 4: Number of achievements per cluster in transmission ...................................29
Figure 5: Typology of achievements in transmission..................................................29
Figure 6: Evolution of the maturity of achievements measured in TRL units (left: average
per cluster; right: per cluster for the completed in blue and for the expected in grey) ...30
Figure 7: Implementation and next step actions carried out for completed achievements in
transmission ........................................................................................................31
Figure 8: Next steps as seen by project coordinators in transmission ..........................32
Figure 9: portfolio of achievements in Cluster 1 (left: overall; middle: completed; right:
expected) ............................................................................................................33
Figure 10: Typology of achievements in Cluster 1 in transmission ...............................34

EUROPEAN COMMISSION Technical analysis of past and on-going projects
10 July 2016
Figure 11: Evolution of the maturity of achievements contributing to Cluster 1 measured
in TRL units (blue: TRL input, grey: TRL output). ......................................................35
Figure 12: Next steps as seen by project coordinators in T1. ......................................36
Figure 13: Next steps as seen by project coordinators in T14. ....................................37
Figure 14: Next steps as seen by project coordinators in T2. ......................................37
Figure 15: The portfolio of achievements in Cluster 2 (left: overall; middle: completed;
right: expected) ...................................................................................................43
Figure 16: Typology of achievements in Cluster 2 in transmission ...............................43
Figure 17: Evolution of the maturity of achievements contributing to Cluster 2 measured
in TRL units .........................................................................................................44
Figure 18: Next steps as seen by project coordinators in T3 .......................................45
Figure 19: Next steps as seen by project coordinators in T4 .......................................45
Figure 20: Next steps as seen by project coordinators in T5 .......................................45
Figure 21: The portfolio of achievements in Cluster 3 (left: overall; middle: completed;
right: expected) ...................................................................................................51
Figure 22: Typology of achievements in Cluster 3 in transmission ...............................52
Figure 23: Evolution of the maturity of achievements contributing to Cluster 3 measured
in TRL units .........................................................................................................53
Figure 24: Next steps as seen by project coordinators in T6 .......................................54
Figure 25: Next steps as seen by project coordinators in T7 .......................................54
Figure 26: Next steps as seen by project coordinators in T9 .......................................55
Figure 27: The portfolio of achievements in Cluster 4 (left: overall; middle: completed;
right: expected) ...................................................................................................63
Figure 28: Typology of achievements in Cluster 4 in transmission ...............................63
Figure 29: Evolution of the maturity of achievements contributing to Cluster 4 measured
in TRL units .........................................................................................................64
Figure 30: Next steps as seen by project coordinators in T10 .....................................65
Figure 31: Next steps as seen by project coordinators in T11 .....................................65
Figure 32: Next steps as seen by project coordinators in T12 .....................................65
Figure 33: The portfolio of achievements in Cluster 5 (left: overall; middle: completed;
right: expected) ...................................................................................................71
Figure 34: Typology of achievements in Cluster 5 in transmission ...............................72
Figure 35: Evolution of the maturity of achievements contributing to Cluster 5 measured
in TRL units .........................................................................................................73
Figure 36: Next steps as seen by project coordinators in T15 .....................................74
Figure 37: Next steps as seen by project coordinators in T16 .....................................74
Figure 38: Next steps as seen by project coordinators in T17 .....................................74
Figure 39: The portfolio of achievements in distribution per cluster (left: overall; middle:
completed; right: expected)...................................................................................81
Figure 40: Number of achievements per cluster in distribution ...................................81
EUROPEAN COMMISSION Technical analysis of past and on-going projects
11 July 2016
Figure 41: Typology of achievements in distribution ..................................................82
Figure 42: Evolution of the maturity of achievements measured in TRL units (left: average
per cluster; right: per cluster for the completed in blue and for the expected in grey) ...82
Figure 43: Implementation actions carried out for completed achievements in distribution
..........................................................................................................................83
Figure 44: Next steps as seen by project coordinators in distribution ..........................83
Figure 45: The portfolio of achievements in Cluster 1 (left: overall; middle: completed;
right: expected) ...................................................................................................84
Figure 46: Typology of achievements in Cluster 1 in distribution .................................85
Figure 47: Evolution of the maturity of achievements contributing to Cluster 1 of
distribution measured in TRL units ..........................................................................85
Figure 48: Next steps as seen by project coordinators in D1 ......................................86
Figure 49: Next steps as seen by project coordinators in D2 ......................................86
Figure 50: The portfolio of achievements in Cluster 2 (left: overall; middle: completed;
right: expected) ...................................................................................................94
Figure 51: Typology of achievements in Cluster 2 in distribution .................................94
Figure 52: Evolution of the maturity of achievements contributing to Cluster 2 of
distribution measured in TRL units ..........................................................................95
Figure 53: Next steps as seen by project coordinators in D3 ......................................96
Figure 54: Next steps as seen by project coordinators in D4 ......................................97
Figure 55: Next steps as seen by project coordinators in D5 ......................................97
Figure 56: Next steps as seen by project coordinators in D6 ......................................98
Figure 57: The portfolio of achievements in Cluster 3 (left: overall; middle: completed;
right: expected) ................................................................................................. 114
Figure 58: Typology of achievements in Cluster 3 in distribution ............................... 114
Figure 59: Evolution of the maturity of achievements contributing to Cluster 3 of
distribution measured in TRL units ........................................................................ 115
Figure 60: Next steps as seen by project coordinators in D7 .................................... 116
Figure 61: Next steps as seen by project coordinators in D8 .................................... 116
Figure 62: Next steps as seen by project coordinators in D9 .................................... 116
Figure 63: Next steps as seen by project coordinators in D10 .................................. 117
Figure 64: The portfolio of achievements in Cluster 4 (left: overall; middle: completed;
right: expected) ................................................................................................. 128
Figure 65: Typology of achievements in Cluster 4 in distribution ............................... 128
Figure 66: Evolution of the maturity of achievements contributing to Cluster 4 of
distribution measured in TRL units ........................................................................ 129
Figure 67: Next steps as seen by project coordinators in D11 .................................. 129
Figure 68: Next steps as seen by project coordinators in D12 .................................. 130
Figure 69: The portfolio of achievements in Cluster 5 (left: overall; middle: completed;
right: expected) ................................................................................................. 134
EUROPEAN COMMISSION Technical analysis of past and on-going projects
12 July 2016
Figure 70: Typology of achievements in Cluster 5 in distribution ............................... 134
Figure 71: Evolution of the maturity of achievements contributing to Cluster 5 of
distribution measured in TRL units ........................................................................ 135
Figure 72: Next steps as seen by project coordinators in D13 .................................. 136
Figure 73: Number of achievements in the joint TSO/DSO cluster ............................. 141
Figure 74: Typology of achievements in the joint TSO/DSO cluster ........................... 141
Figure 75: Evolution of the maturity of achievements measured in TRL units (left: average;
right: completed in blue and expected in grey) ....................................................... 142
Figure 76: The portfolio of achievements in the joint TSO/DSO cluster (left: overall; middle:
completed; right: expected)................................................................................. 142
Figure 77: Typology of achievements per Functional Objective in the joint TSO/DSO cluster.
........................................................................................................................ 143
Figure 78: Evolution of the maturity of achievements contributing to the joint TSO/DSO
cluster measured in TRL units .............................................................................. 143
Figure 79: Implementations actions carried out for completed achievements in the joint
TSO/DSO cluster ................................................................................................ 143
Figure 80: Next steps as seen by project coordinators in the joint TSO/DSO cluster .... 144
Figure 81: Next steps as seen by project coordinators in TD1................................... 145
Figure 82: Next steps as seen by project coordinators in TD2................................... 145
Figure 83: Next steps as seen by project coordinators in TD3................................... 145
Figure 84: Next steps as seen by project coordinators in TD4................................... 145
Figure 85: Next steps as seen by project coordinators in TD5................................... 145
Figure 86: Achievements of non-European projects related in relation with each
transmission cluster (left), compared to the achievements of R&I projects in Europe (right)
........................................................................................................................ 158
Figure 87: Typology of achievements from non-European R&I projects in transmission
(left), compared to the achievements of R&I projects in Europe ............................... 159
Figure 88: Evolution of the maturity of achievements from non-European projects
measured in TRL units (left), compared to the achievements of R&I projects in Europe
(right) ............................................................................................................... 160
Figure 89: Implementation for non-European completed achievements in transmission
(left), compared to completed achievements of R&I projects in Europe (right) ........... 161
Figure 90: Implementation actions carried out for achievements from non-European R&I
projects in transmission (left), compared to the achievements of R&I projects in Europe
(right) ............................................................................................................... 161
Figure 91: Achievements of non-European projects related in relation with each distribution
cluster (left), compared to the achievements of R&I projects in Europe (right) ........... 174
Figure 92: Typology of achievements from non-European R&I projects in distribution (left),
compared to the achievements of R&I projects in Europe ........................................ 174
Figure 93: Evolution of the maturity of achievements from non-European projects related
to distribution activities measured in TRL units (left), compared to the achievements of R&I
projects in Europe (right) .................................................................................... 175

EUROPEAN COMMISSION Technical analysis of past and on-going projects
13 July 2016
Figure 94: Implementation for non-European completed achievements in distribution (left),
compared to completed achievements of R&I projects in Europe (right) .................... 176
Figure 95: Implementation actions carried out for achievements from non-European R&I
projects in distribution (left), compared to the achievements of R&I projects in Europe
(right) ............................................................................................................... 176

EUROPEAN COMMISSION Technical analysis of past and on-going projects
14 July 2016
EXECUTIVE SUMMARY
The present document, the Technical analysis of past and on-going projects, displays a
thorough monitoring of a sample of 177 projects (123 European projects, either funded at
national or EC level and 54 international projects, i.e. funded and carried out outside
Europe). The analyses of the projects presented in this report are one of the two key
processes for the drafting of the Final 10 year ETIP SNET R&I roadmap covering 2016-25
(RIR). The monitoring process has been used to specify the future R&I activities to be
undertaken during 2016-2025 and make sure that the specified R&I activities correspond
to research and innovation work which was not (or partially) covered at the time of
analysing the projects.
The monitoring methodology is based on a five-step approach:
Selection of the projects to be monitored, so as to set up a database with no (or
low) statistical bias;
Data collection from each considered project (based on a common template and
interviews) and construction of the database of results (the analysis has been
carried out in terms of achievements, i.e. a specific result for a given project);
Description of achievements in terms of descriptive features (clusters and functional
objectives addressed, typology, input and output TRLs) and projective features
(foreseen implementation and next steps) so as to provide the main trends in terms
of knowledge coverage and progress;
Coverage analysis of the previous EEGI 2013-2022 R&I roadmap with the set of
achievements available in the data base;
Recommendations in terms of evolutions as an input to the specifications of the R&I
activities of the RIR.
In complement to this five-step analysis, the monitoring of international projects has been
used to detect the main differences in terms of coverage between R&I activities carried in
Europe and outside Europe so as to provide recommendations for policy makers, i.e.:
R&I activities where Europe is leading and which are not (or partially) addressed
outside Europe;
And, on the contrary, R&I activities carried out outside Europe for which the existing
knowledge in Europe is below the international state-of-the-art.
The analyses are presented in a systematic way in four different parts:
The three first part are dedicated to the monitoring of the transmission (part I),
distribution (part II), joint transmission-distribution activities (part III);
And, a fourth part (IV) for the international projects.
EUROPEAN COMMISSION Technical analysis of past and on-going projects
15 July 2016
INTRODUCTION
1. Background
The present report is part of the monitoring activity carried out in Work Package 3 of the
Grid+Storage service contract “Analysing the ongoing R&I activities on grids, grid
connected storage and other energy networks at national, EU and world level”.
Monitoring activities are pivotal to the project since they provide a dynamic picture of
research and innovation (R&I) activities related to smart grids and energy storage
integration.
A first monitoring report (deliverable D3.1) was published in June 2015. Its aim was to
support the topic selection of the implementation plan 2016-2018 of the current EEGI R&I
roadmap. The main projects with European added value were monitored to demonstrate
that the topics selected for the implementation 2016-2018 (i.e. identified as mid-term
research and innovation needs), were not already covered by past or ongoing projects in
Europe. This report has covered 54 R&I projects.
The present document corresponds to the deliverable D3.2 of the contract. It aims at
supporting the construction of the new 10-year R&I roadmap (for the period 2016-2025)
by assessing for completed, on-going and planned projects in Europe, the scope of the R&I
activities, i.e. the coverage of the R&I activities (the results of the completed and ongoing
projects as well as the expected outputs of the planned projects) specified in the previous
EEGI 2013-2022 roadmap. This gap-like analysis is key to specify the new R&I activities
to be listed in the new 2016-2015 roadmap:
R&I activities which have not been addressed in completed and ongoing projects
are specified again in the new integrated roadmap;
R&I activities which have been partially addressed in completed and ongoing
projects are specified again in the new integrated roadmap with the relevant
modifications.
To implement the monitoring of such a large number of projects (123 projects in Europe,
and 54 projects outside Europe), the Grid+Storage partners have elaborated a robust
methodology based on interviews of project coordinators. This “monitoring methodology”
is described in the next section.
2. The Monitoring Methodology
2.1 Overview of the five-step methodology
The monitoring methodology is built upon five successive steps, with a specific focus on
the achievements of the projects (i.e. the different results of the projects):
1. Identification of the scope: the projects to be selected for monitoring.
Which nature? Which origin? Which features?
2. Data collection from each considered project and construction of the
achievements’ database.
Which type of data constitute the minimal necessary inputs to extract
meaningful statements in terms of coverage with regard to the EEGI 2013-
2022 roadmap?
3. Description of achievements in terms of a few features.
To which extent are achievements the appropriate description level to provide
high level information on coverage status and trends?
EUROPEAN COMMISSION Technical analysis of past and on-going projects
16 July 2016
4. Coverage analysis of the EEGI 2013-2022 R&I roadmap by these
achievements.
How to identify functional objective per functional objective the coverage
provided by the project achievements?
5. Recommendations in terms of evolutions of the future R&I roadmap.
Which evolutions should result from the coverage analysis and the
characterisation of the portfolio achievements?
The coverage analyses for each functional objective have been performed on a selected
portfolio of European projects, i.e. projects financed at national level and by the European
Commission (EC). Selected projects carried out outside Europe (mainly North-America,
China and Japan), have also been assessed in order to appraise the main differences
between the storage integration activities conducted outside Europe and in Europe and
therefore detect R&I activities not covered in Europe which could become strategic for
European players.
2.2 The database of R&I projects and achievements (steps 1 to 3)
2.2.1 Initial selection of projects
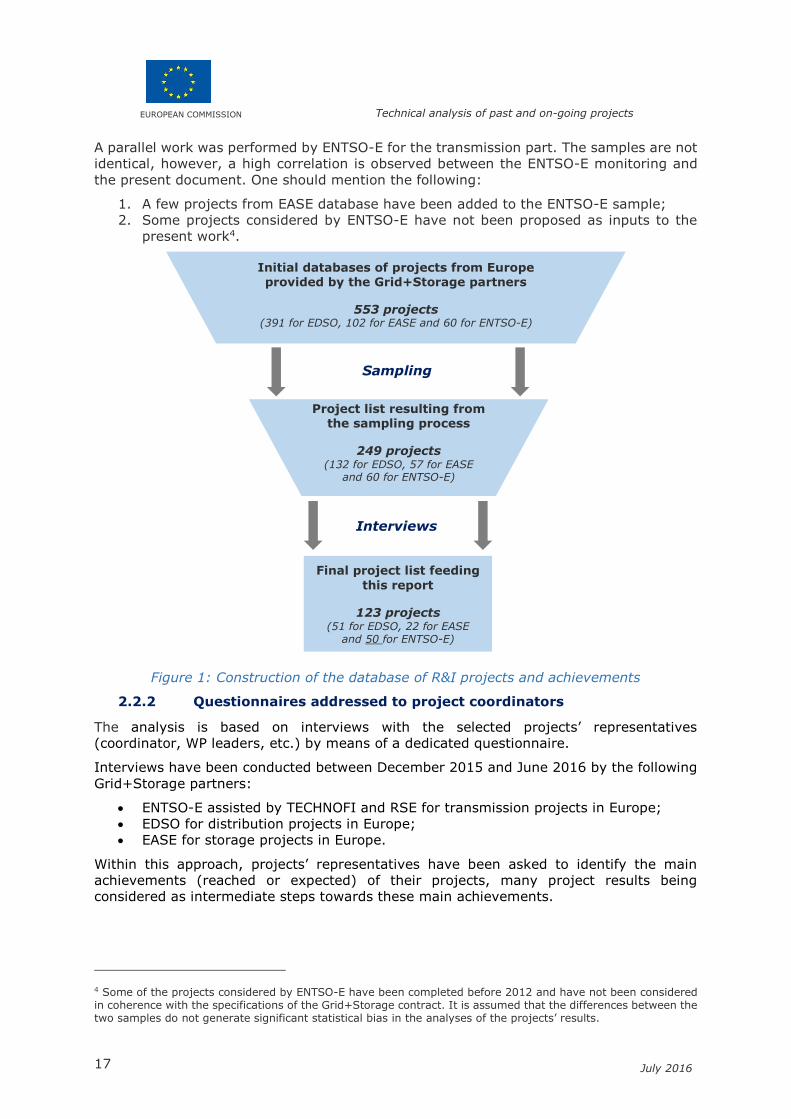
The database of projects subject to the present monitoring exercise is constructed as
presented on Figure 1 below. Regarding projects running in Europe (the main scope of this
report), the initial databases of projects have been provided by the Grid+Storage partners
and more especially the three associations (ENTSO-E, EDSO and EASE)1,2. For EDSO and
EASE, the sampling was performed with the following criteria:
budget (project with insufficient budget to reach ambitious goals were not
selected3);
coverage of functional objectives;
funding schemes (national or European);
available information (projects with insufficient info are not retained);
geographical coverage (the number of Member States was used as a proxy);
projects addressing specific technologies with no system integration component
(mainly recharge technologies for storage) are not eligible;
redundant projects (i.e. addressing similar topics such as VPP, etc. or sometimes
the same project , cf. Smart Grids In France and Linky) are sorted out (keep the
projects with the widest scope);
elimination of national projects with the same scope (roll out of smart meters for
instance) when there is no geographical specificity;
projects with no obvious R&I component or addressing well-known applications
(e.g. with lead-acid batteries) are not considered;
for projects proposed by EDSO and where no EDSO member were involved, only
projects with a real added-value, compared to the selected projects in which EDSO
members were involved, were selected (typically ICT projects, i.e. connection with
DG Connect and countries not covered).
1 There was some overlap between the three databases. For example, projects related to joint transmission and distribution activities were included both in EDSO and ENTSO-E databases. 2 The associations complemented their databases with other available databases, especially the comprehensive database of the JRC in order to check that no European and national projects of importance (in the time frame set by the Grid+Storage contract) were omitted. When selecting projects in the JRC database, the same criteria for selection as in the present report were applied. In addition, since the available information in the database of the JRC is not comprehensive enough for the needs of the present exercise, it was completed by further inquiries with inputs from e.g. the GRID+ database for some of the completed projects. 3 Projects with a small budget (order of magnitude of 100 k€) are, most of the time, not considered when deemed too academic with no real life application(s).
EUROPEAN COMMISSION Technical analysis of past and on-going projects
17 July 2016
A parallel work was performed by ENTSO-E for the transmission part. The samples are not
identical, however, a high correlation is observed between the ENTSO-E monitoring and
the present document. One should mention the following:
1. A few projects from EASE database have been added to the ENTSO-E sample;
2. Some projects considered by ENTSO-E have not been proposed as inputs to the
present work4.
Figure 1: Construction of the database of R&I projects and achievements
2.2.2 Questionnaires addressed to project coordinators
The analysis is based on interviews with the selected projects’ representatives
(coordinator, WP leaders, etc.) by means of a dedicated questionnaire.
Interviews have been conducted between December 2015 and June 2016 by the following
Grid+Storage partners:
ENTSO-E assisted by TECHNOFI and RSE for transmission projects in Europe;
EDSO for distribution projects in Europe;
EASE for storage projects in Europe.
Within this approach, projects’ representatives have been asked to identify the main
achievements (reached or expected) of their projects, many project results being
considered as intermediate steps towards these main achievements.
4 Some of the projects considered by ENTSO-E have been completed before 2012 and have not been considered in coherence with the specifications of the Grid+Storage contract. It is assumed that the differences between the two samples do not generate significant statistical bias in the analyses of the projects’ results.
Initial databases of projects from Europe provided by the Grid+Storage partners
553 projects (391 for EDSO, 102 for EASE and 60 for ENTSO-E)
Interviews
Project list resulting from the sampling process
249 projects (132 for EDSO, 57 for EASE
and 60 for ENTSO-E)
Final project list feeding
this report
123 projects (51 for EDSO, 22 for EASE
and 50 for ENTSO-E)
Sampling
EUROPEAN COMMISSION Technical analysis of past and on-going projects
18 July 2016
The questionnaire included the following questions:
At project level:
o TSOs and DSOs involved5;
o Addressed clusters and functional objectives;
o Objectives of the project;
o Total budget and if relevant, part of public funding and funding source;
o Start and end dates;
o List of main project achievements, “completed” or “expected” (for ongoing
projects);
o Summary of the interview;
For each achievement:
o Type:
1. Methodology,
2. Software,
3. Hardware,
4. Database,
5. Policy, regulation, market,
6. Other;
o Short description;
o Related functional objectives;
o Input and output Technology Readiness Level (TRL);
o Status of implementation as of 2016;
o If relevant, characterization of the next steps following the achievements:
1. Further research,
2. Further development,
3. Demonstration,
4. Deployment.
Around half of projects in the list of 249 projects resulting from the sampling step have not
been interviewed (Figure 1). In some cases, the project coordinator could not be reached
or was not available for an interview. In total, 123 interviews have been carried out,
resulting in the same number of completed questionnaires.
2.2.3 Construction and processing of the database
The database of projects and achievements has been built on the 123 collected
questionnaires. Intensive processing has been made to ensure a sufficient level of quality,
completeness and consistency of all questionnaires.
An automatic processing of the questionnaires has been set up to collect quantitative
information for statistical purposes.
Questionnaires have also been analysed one by one to assess how each individual project
and related achievements contribute to the coverage of the existing roadmap (cf. next
section).
2.3 Assessment of the coverage of the current roadmap and
recommendations for the new roadmap (steps 4 and 5)
For each functional objective (FO), the contributions from completed and ongoing projects
have been listed. European projects and national projects have been addressed separately.
5 In some of the projects provided by EASE, no network operators were (are) involved.
EUROPEAN COMMISSION Technical analysis of past and on-going projects
19 July 2016
This thorough review has resulted in the appraisal of the coverage of each functional
objective: have the specific R&I activities (tasks) foreseen for this FO been tackled by those
projects? Have they been addressed in a sufficient manner so that no more work is needed
in this area? Or have they been addressed only in a partial manner, leading to continue
the work in this area?
This detailed “coverage analysis”, complementing a global statistical analysis of the
achievements’ features, is used to provide recommendations about the content of each FO
of the new R&I roadmap.
2.4 Comparison with R&I activities carried out in non-European
countries
Projects from non-European countries have also been monitored to position the ongoing
and planned research work with respect to the proposed R&I roadmap and to underline the
European added value of the proposed objectives. Partners in charge of this international
review were VITO (for distribution-related projects) and RSE (for transmission-related
projects).
2.4.1 Selection of projects
For distribution-related projects
The following sources were used to come up with an initial list of projects: the DOE energy
storage database for projects in the US, Japan and China, and the IEASA database for
projects in India. Only the projects which received RD&D Funding were considered for
further investigation as these projects are supposed to have innovative aspects. In addition
projects from the Clean Energy Fund Program for projects in Canada and storage projects
funded by ARENA for projects in Australia were added to the list.
From these projects, only the projects with storage at distribution level where considered
for further investigation, leading to a list of about 60 projects.
Out of these projects, only the projects with information on expected or realized
achievements were finally reviewed.
Other reasons for omitting certain projects were:
the relevance of the project (e.g. projects which didn’t cover any functional DSO
objectives),
de-commissioned projects,
projects with an unclear status,
test centres for education purpose only, and
projects which were very similar to other projects already reviewed.
This finally led to a review of a total of 20 projects (2 Australian, 4 Canadian, 3 Indian, 1
Japanese and 10 US projects). In the end no Chinese projects have been reviewed as it
was difficult to find information in English.
For transmission-related projects
Due to the different degrees of information available, the selection of R&I grid and grid
connected storage projects relevant to transmission in US, China and Japan was
accomplished in different ways depending on the involved country. The same criteria for
omitting projects from the selection were used as in the case of distribution-related
storage. Mostly, for each country similar projects with lower innovation and/or performance
compared to other projects already reviewed were ruled out from the selection.
EUROPEAN COMMISSION Technical analysis of past and on-going projects
20 July 2016
US: The transmission projects co-financed by the U.S. Department of Energy (DOE)
were analysed first. Concerning the “SGIG (Smart Grid Investment Grant)” projects,
starting from the comprehensive 2013 Progress Report, the most updated
documentation available about the single projects was taken into consideration. The
selection process started from the projects with the highest budgets, but then it
was also verified that no significant project covering the transmission Functional
Objectives was missing from the selection. Then all projects from the “Smart Grid
Demonstration Program” (including “Smart Grid Regional Demonstrations” and
“Energy Storage Demonstrations”: were analysed and the projects relevant to
transmission were selected.
CHINA: The DOE energy storage database was analysed and all projects relevant
to transmission were selected for further investigation. Then, starting from some
publicly available presentations of projects by the biggest Chinese utility State Grid
Corporation of China (SGCC) (e.g., “SGCC Developments, Challenges,
Opportunities & Prospects of Smart Grid in China”) it was possible to retrieve the
information available on the SGCC website. Based on this an in-depth literature
search concerning SGCC was carried out in order to find significant projects related
to the transmission Functional Objectives.
JAPAN: The DOE energy storage database was analysed and all projects relevant to
transmission were selected for further investigation. Then, also in this case further
sources of information were some publicly available presentations (e.g., Tetsuji
Tomita: “Policies and regulation for electricity storage in Japan” and Satoshi
Morozumi – NEDO: “Japanese Island Grid Experience”.
As a result, out of 56 projects analysed, 34 projects were selected for the final review: 13
US, 12 Chinese and 9 Japanese.
2.4.2 Analyses
The same questionnaire template has been used for those projects, to allow comparative
analyses with the projects conducted in Europe. However, the analyses have been carried
out with a different objective (compared with the ones for European projects): the coverage
(of the previous EEGI 2013-2022 roadmap) in terms of generated knowledge by these
projects has not been assessed. Instead, attention has been focussed on the main
differences between the coverage of the whole EEGI 2013-2022 roadmap and the coverage
of these international projects so as to detect:
R&I activities where Europe is leading and which are not (or partially) addressed
outside Europe;
And, on the contrary, R&I activities carried out outside Europe for which the
existing knowledge in Europe is below the international state-of-the-art.
These first analyses should help policy makers in Europe to sketch a policy for international
R&I collaborations.
EUROPEAN COMMISSION Technical analysis of past and on-going projects
21 July 2016
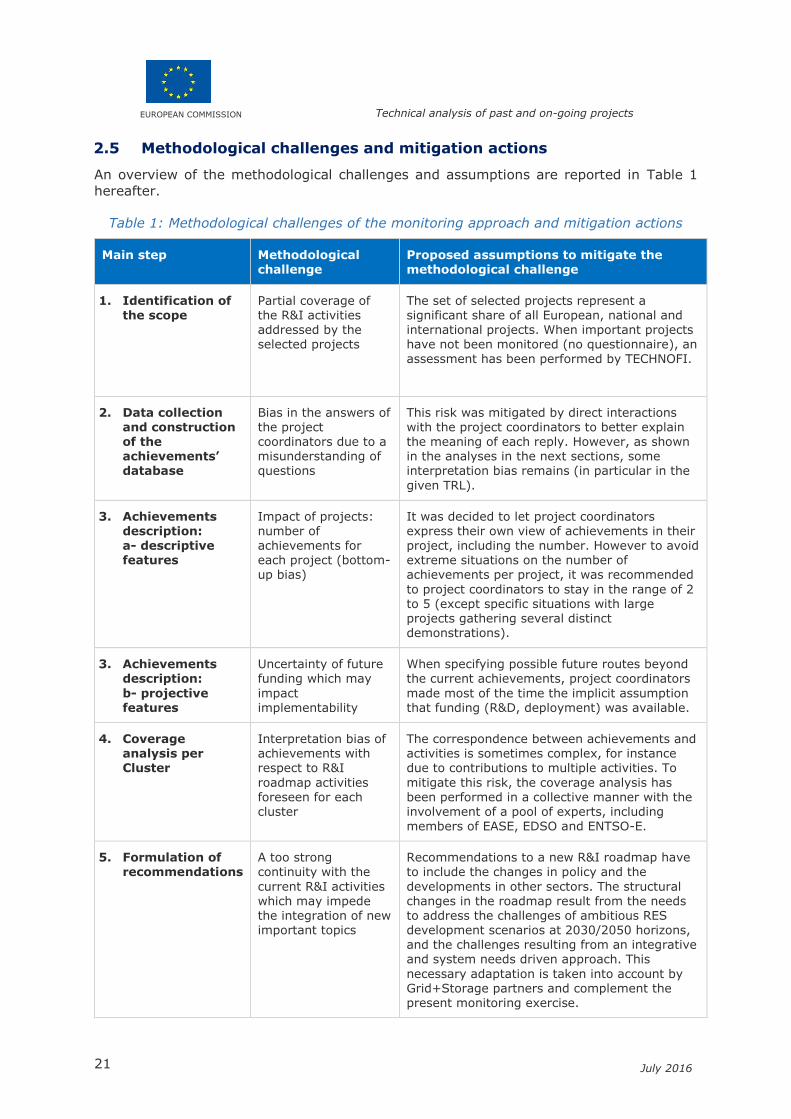
2.5 Methodological challenges and mitigation actions
An overview of the methodological challenges and assumptions are reported in Table 1
hereafter.
Table 1: Methodological challenges of the monitoring approach and mitigation actions
Main step Methodological challenge
Proposed assumptions to mitigate the methodological challenge
1. Identification of the scope
Partial coverage of the R&I activities addressed by the selected projects
The set of selected projects represent a significant share of all European, national and international projects. When important projects have not been monitored (no questionnaire), an
assessment has been performed by TECHNOFI.
2. Data collection and construction of the achievements’ database
Bias in the answers of the project coordinators due to a misunderstanding of questions
This risk was mitigated by direct interactions with the project coordinators to better explain the meaning of each reply. However, as shown in the analyses in the next sections, some interpretation bias remains (in particular in the
given TRL).
3. Achievements description: a- descriptive features
Impact of projects: number of achievements for each project (bottom-up bias)
It was decided to let project coordinators express their own view of achievements in their project, including the number. However to avoid extreme situations on the number of achievements per project, it was recommended
to project coordinators to stay in the range of 2 to 5 (except specific situations with large projects gathering several distinct demonstrations).
3. Achievements description:
b- projective features
Uncertainty of future funding which may
impact implementability
When specifying possible future routes beyond the current achievements, project coordinators
made most of the time the implicit assumption that funding (R&D, deployment) was available.
4. Coverage analysis per Cluster
Interpretation bias of achievements with respect to R&I
roadmap activities foreseen for each cluster
The correspondence between achievements and activities is sometimes complex, for instance due to contributions to multiple activities. To
mitigate this risk, the coverage analysis has been performed in a collective manner with the involvement of a pool of experts, including
members of EASE, EDSO and ENTSO-E.
5. Formulation of recommendations
A too strong continuity with the
current R&I activities which may impede the integration of new important topics
Recommendations to a new R&I roadmap have to include the changes in policy and the
developments in other sectors. The structural changes in the roadmap result from the needs to address the challenges of ambitious RES development scenarios at 2030/2050 horizons, and the challenges resulting from an integrative and system needs driven approach. This
necessary adaptation is taken into account by Grid+Storage partners and complement the present monitoring exercise.
EUROPEAN COMMISSION Technical analysis of past and on-going projects
22 July 2016
3. How to read this document
3.1 Terminology
A detailed terminology is presented in the Glossary section: it include a series of generic
terms related to the previous R&I roadmap (the EEGI 2013-2022 roadmap) such as
Functional Objective (FO), Cluster as a set of Functional Objectives organizing the R&I
Roadmap, Achievement as any output of a project that contributes to the scope of the
EEGI 2013-2022 roadmap. Achievements might be either “completed” or “expected”.
Achievements are also characterized by descriptive and projective features. Descriptive
features include information for achievement categorization (Clusters, Functional
Objectives and typology) as well as an estimation of the maturity (measured in TRL units
at the beginning and at the end of the project). The typology of achievements include six
predefined types: 1. Methodology, 2. Software, 3. Hardware, 4. Database, 5. Policy,
regulation, market, 6. Other.
Projective features include an information on the status of implementation as of 2016
as well as a characterization of the next steps. The possible next steps are further
research (FRes), further development (FDev), demonstration (Dem), deployment
(Depl) or a combination of these options.
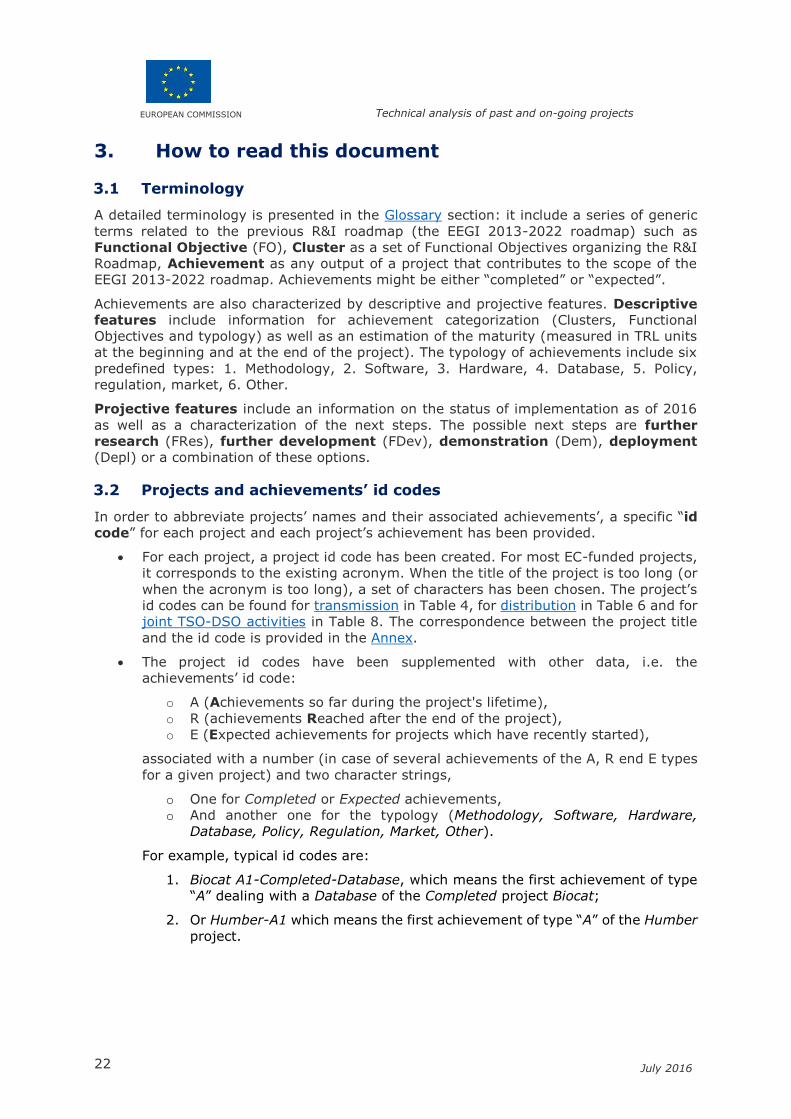
3.2 Projects and achievements’ id codes
In order to abbreviate projects’ names and their associated achievements’, a specific “id
code” for each project and each project’s achievement has been provided.
For each project, a project id code has been created. For most EC-funded projects,
it corresponds to the existing acronym. When the title of the project is too long (or
when the acronym is too long), a set of characters has been chosen. The project’s
id codes can be found for transmission in Table 4, for distribution in Table 6 and for
joint TSO-DSO activities in Table 8. The correspondence between the project title
and the id code is provided in the Annex.
The project id codes have been supplemented with other data, i.e. the
achievements’ id code:
o A (Achievements so far during the project's lifetime),
o R (achievements Reached after the end of the project),
o E (Expected achievements for projects which have recently started),
associated with a number (in case of several achievements of the A, R end E types
for a given project) and two character strings,
o One for Completed or Expected achievements,
o And another one for the typology (Methodology, Software, Hardware,
Database, Policy, Regulation, Market, Other).
For example, typical id codes are:
1. Biocat A1-Completed-Database, which means the first achievement of type
“A” dealing with a Database of the Completed project Biocat;
2. Or Humber-A1 which means the first achievement of type “A” of the Humber
project.

EUROPEAN COMMISSION Technical analysis of past and on-going projects
23 July 2016
The first type of id code has been used to present the progress in terms of maturity for
each achievement (input and output TRL) 6 whereas the second one has been used to
display the projective features of each achievement7. All information given in the id codes
is summarized in Annex together with the full title of the project and a short description of
the achievement.
3.3 Organisation of the report
The report is organized in four main parts:
Part I: monitoring of projects relative to transmission network R&I activities,
Part II: monitoring of projects relative to joint transmission and distribution R&I
activities,
Part III: monitoring of projects relative to distribution activities,
Part IV: review of projects outside Europe.
The first three parts are structured in a similar manner. Each of them includes three types
of chapters:
An introductory chapter presenting the R&I projects and giving an overview of the
corresponding achievements;
One chapter per cluster (5 chapters in each of the transmission and distribution
parts, 1 chapter for the joint TSO&DSO part). Such chapters are structured as
shown in Figure 2:
o The descriptive and projective features of the achievements are presented;
o For each functional objective, a review of the related achievements is carried
out and the coverage of the FO is assessed;
o Recommendations for the new R&I roadmap are given;
A concluding chapter.
Figure 2: Example of the sequence of sections in a given cluster
Part IV about projects outside Europe is structured in the same way, but comparative
analyses with the projects from Europe are carried out instead of a detailed description of
individual projects and achievements.
6 transmission (cluster 1-Figure 11, cluster 2-Figure 17, cluster 3-Figure 23, cluster 4-Figure 29 and cluster 5-Figure 35), distribution (cluster 1-Figure 47, cluster 2-Figure 52, cluster 3-Figure 59, cluster 4-Figure 66 and cluster 5-Figure 71) and joint TSO and DSO activities (Figure 78). 7 transmission (T1-Figure 12, T14-Figure 13, T2-Figure 14, T3-Figure 18, T4-Figure 19, T5-Figure 20, T6-Figure 24, T7-Figure 25, T9-Figure 26, T10-Figure 30, T11-Figure 31, T12-Figure 32, T15-Figure 36, T16-Figure 37 and T17-Figure 38), distribution (D1-Figure 48, D2-Figure 49, D3-Figure 53, D4-Figure 54, D5-Figure 55, D6-Figure 56, D7-Figure 60, D8-Figure 61, D9-Figure 62, D10-Figure 63, D11-Figure 67, D12-Figure 68 and D13-Figure 72) and joint TSO-DSO activities (TD1-Figure 81, TD2-Figure 82, TD3-Figure 83, TD4-Figure 84 and TD5-Figure 85).
EUROPEAN COMMISSION Technical analysis of past and on-going projects
24 July 2016
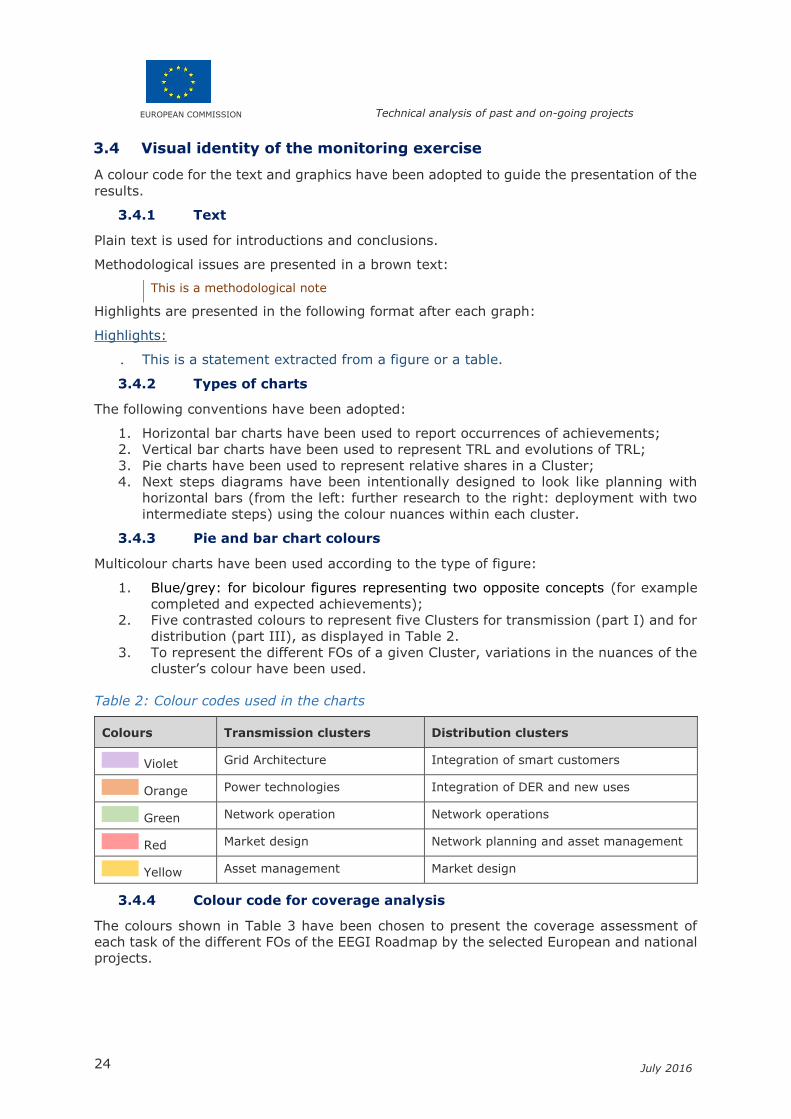
3.4 Visual identity of the monitoring exercise
A colour code for the text and graphics have been adopted to guide the presentation of the
results.
3.4.1 Text
Plain text is used for introductions and conclusions.
Methodological issues are presented in a brown text:
This is a methodological note
Highlights are presented in the following format after each graph:
Highlights:
. This is a statement extracted from a figure or a table.
3.4.2 Types of charts
The following conventions have been adopted:
1. Horizontal bar charts have been used to report occurrences of achievements;
2. Vertical bar charts have been used to represent TRL and evolutions of TRL;
3. Pie charts have been used to represent relative shares in a Cluster;
4. Next steps diagrams have been intentionally designed to look like planning with
horizontal bars (from the left: further research to the right: deployment with two
intermediate steps) using the colour nuances within each cluster.
3.4.3 Pie and bar chart colours
Multicolour charts have been used according to the type of figure:
1. Blue/grey: for bicolour figures representing two opposite concepts (for example
completed and expected achievements);
2. Five contrasted colours to represent five Clusters for transmission (part I) and for
distribution (part III), as displayed in Table 2.
3. To represent the different FOs of a given Cluster, variations in the nuances of the
cluster’s colour have been used.
Table 2: Colour codes used in the charts
Colours Transmission clusters Distribution clusters
Violet Grid Architecture Integration of smart customers
Orange Power technologies Integration of DER and new uses
Green Network operation Network operations
Red Market design Network planning and asset management
Yellow Asset management Market design
3.4.4 Colour code for coverage analysis
The colours shown in Table 3 have been chosen to present the coverage assessment of
each task of the different FOs of the EEGI Roadmap by the selected European and national
projects.

EUROPEAN COMMISSION Technical analysis of past and on-going projects
25 July 2016
Table 3: Colour codes used in the coverage assessment of FOs’ tasks of the EEGI Roadmap
Colours Coverage assessment of FOs’ tasks
Green Very well covered
Yellow Partially covered
Red Minor coverage or not covered at all
EUROPEAN COMMISSION Technical analysis of past and on-going projects
26 July 2016
Part I TRANSMISSION
4. The portfolio of R&I projects in relation with the
transmission activities of the Roadmap, and related
achievements
4.1 Assumptions ruling the portfolio selection
The methodology of monitoring is described in the introduction. Here, the main
assumptions ruling the selection of the projects which were retained in the portfolio are
reminded.
The above assumptions allow the selection of a representative sample a projects among
all recent R&I transmission projects to carry out the coverage analysis of each FO.
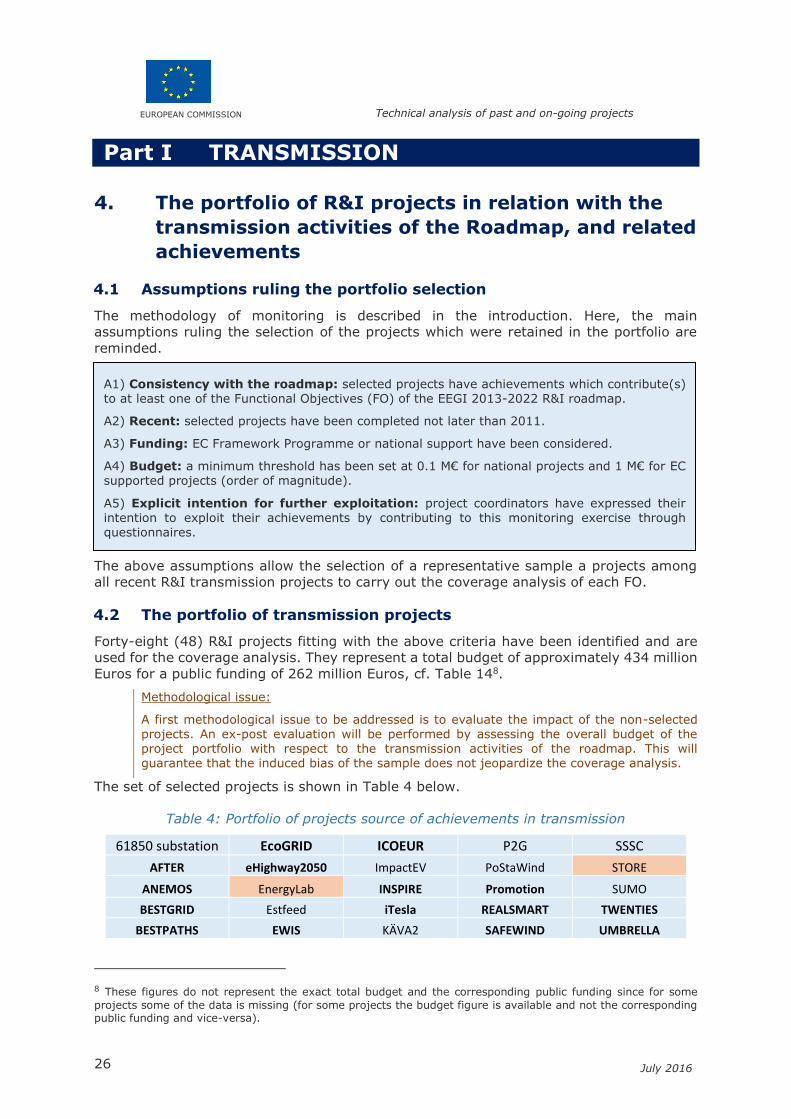
4.2 The portfolio of transmission projects
Forty-eight (48) R&I projects fitting with the above criteria have been identified and are
used for the coverage analysis. They represent a total budget of approximately 434 million
Euros for a public funding of 262 million Euros, cf. Table 148.
Methodological issue:
A first methodological issue to be addressed is to evaluate the impact of the non-selected projects. An ex-post evaluation will be performed by assessing the overall budget of the project portfolio with respect to the transmission activities of the roadmap. This will guarantee that the induced bias of the sample does not jeopardize the coverage analysis.
The set of selected projects is shown in Table 4 below.
Table 4: Portfolio of projects source of achievements in transmission
61850 substation EcoGRID ICOEUR P2G SSSC
AFTER eHighway2050 ImpactEV PoStaWind STORE
ANEMOS EnergyLab INSPIRE Promotion SUMO
BESTGRID Estfeed iTesla REALSMART TWENTIES
BESTPATHS EWIS KÄVA2 SAFEWIND UMBRELLA
8 These figures do not represent the exact total budget and the corresponding public funding since for some
projects some of the data is missing (for some projects the budget figure is available and not the corresponding public funding and vice-versa).
A1) Consistency with the roadmap: selected projects have achievements which contribute(s) to at least one of the Functional Objectives (FO) of the EEGI 2013-2022 R&I roadmap.
A2) Recent: selected projects have been completed not later than 2011.
A3) Funding: EC Framework Programme or national support have been considered.
A4) Budget: a minimum threshold has been set at 0.1 M€ for national projects and 1 M€ for EC supported projects (order of magnitude).
A5) Explicit intention for further exploitation: project coordinators have expressed their intention to exploit their achievements by contributing to this monitoring exercise through questionnaires.

EUROPEAN COMMISSION Technical analysis of past and on-going projects
27 July 2016
Class_project FutureFlow LIFE Elia-RTE SAMREL VENTOTENE
Concept2025 GARPUR Market4RES SECONOMICS WAMPAC_Elering
DevMarketModelling GridTech MERGE SmartNet WAMPAC_Eles
DSR Humber MIGRATE SmartSub
eBADGE HyUNDER OPTIMATE SOSPO
NB: As explained in the section 3.2, due to practical reasons id codes were used as
references in order to abbreviate projects’ names all along the document.
The colour code for each project acronym corresponds to the source that has provided the filled-in questionnaires (EU projects are displayed in bold text while projects funded at
national level are displayed in plain text):
EASE ENTSO-E
4.3 The corresponding achievements in transmission
4.3.1 Methodology reminder
Through direct questions to the project coordinators, it was possible to identify a number
of achievements for each project and to characterize each achievement first according to
some key descriptive features, viz.
- To which cluster and functional objective does it contribute?
- What is its typology (nature)?
- What is its estimated impact on a maturity scale (TRL)?
and second, to some projective features on next steps as seen by the projects’
coordinators:
- Is any implementation foreseen?
- If yes, through which route?
Methodological issue:
Available data on the descriptive and projective features presented some inconsistencies that have been corrected as much as possible (direct correction or exclusion from the sample) to avoid erroneous conclusions.
Definition of an achievement:
Achievements correspond to the lowest scale of our analysis and are generated by a
completed (or on-going) project.
An achievement is a project result which can be one project deliverable, or a part of a
project deliverable, or an aggregation of various project deliverables.
The formulation of the appropriate level for each achievement was under the
responsibility of the project coordinator who is in the best position to select a few
(typically 3-5) achievements synthesizing the key project results.
EUROPEAN COMMISSION Technical analysis of past and on-going projects
28 July 2016
The information provided by coordinators have been considered as the best source of information to characterize an achievement. The potential bias due to the large variety of project coordinators should thus be rather limited on the descriptive features. However, the conclusions that could be drawn from the processing of projective features may be subject to such interpretation bias on
future exploitation routes.
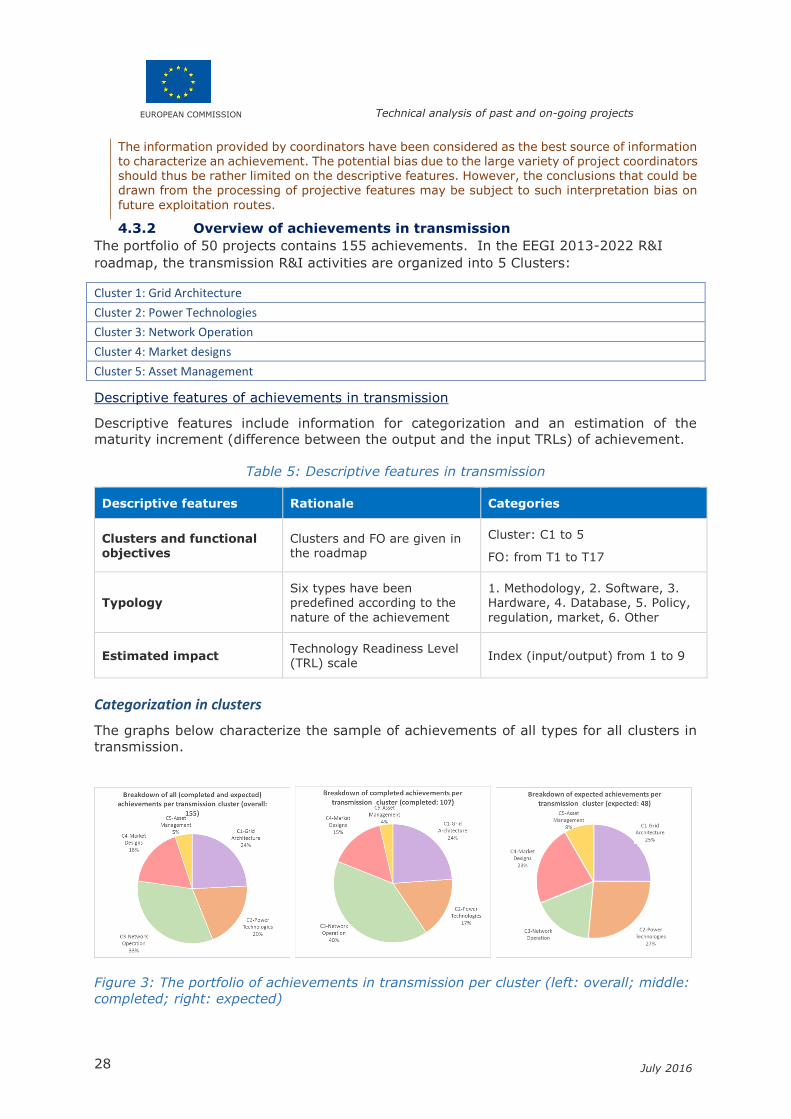
4.3.2 Overview of achievements in transmission
The portfolio of 50 projects contains 155 achievements. In the EEGI 2013-2022 R&I
roadmap, the transmission R&I activities are organized into 5 Clusters:
Cluster 1: Grid Architecture
Cluster 2: Power Technologies
Cluster 3: Network Operation
Cluster 4: Market designs
Cluster 5: Asset Management
Descriptive features of achievements in transmission
Descriptive features include information for categorization and an estimation of the
maturity increment (difference between the output and the input TRLs) of achievement.
Table 5: Descriptive features in transmission
Descriptive features Rationale Categories
Clusters and functional objectives
Clusters and FO are given in the roadmap
Cluster: C1 to 5
FO: from T1 to T17
Typology Six types have been predefined according to the
nature of the achievement
1. Methodology, 2. Software, 3. Hardware, 4. Database, 5. Policy,
regulation, market, 6. Other
Estimated impact Technology Readiness Level (TRL) scale
Index (input/output) from 1 to 9
Categorization in clusters
The graphs below characterize the sample of achievements of all types for all clusters in
transmission.
Figure 3: The portfolio of achievements in transmission per cluster (left: overall; middle:
completed; right: expected)

EUROPEAN COMMISSION Technical analysis of past and on-going projects
29 July 2016
Highlights:
. When considering all achievements (completed and expected), it is observed that
the most addressed clusters over the considered time period are clusters C3 (33%
of the sample) and C1 (24% of sample) while the C2 cluster amounts to 20% of
the achievements. The less addressed cluster is asset management with a share of
only 5%.
. There is a time dimension in the above figure: for instance, when considering
separately the completed achievements from the on-going ones, asset
management achievements represent different shares (8% of expected vs 4% of
completed). This is visible in Figure 4 which highlights the evolutions in time per
cluster.
Figure 4: Number of achievements per cluster in transmission
Typology of achievements
The breakdown per type is provided in the figure below.
Figure 5: Typology of achievements in transmission
Highlights:
. Most achievements are, by far, related to methodology and software issues, the
third category being the hardware achievements.
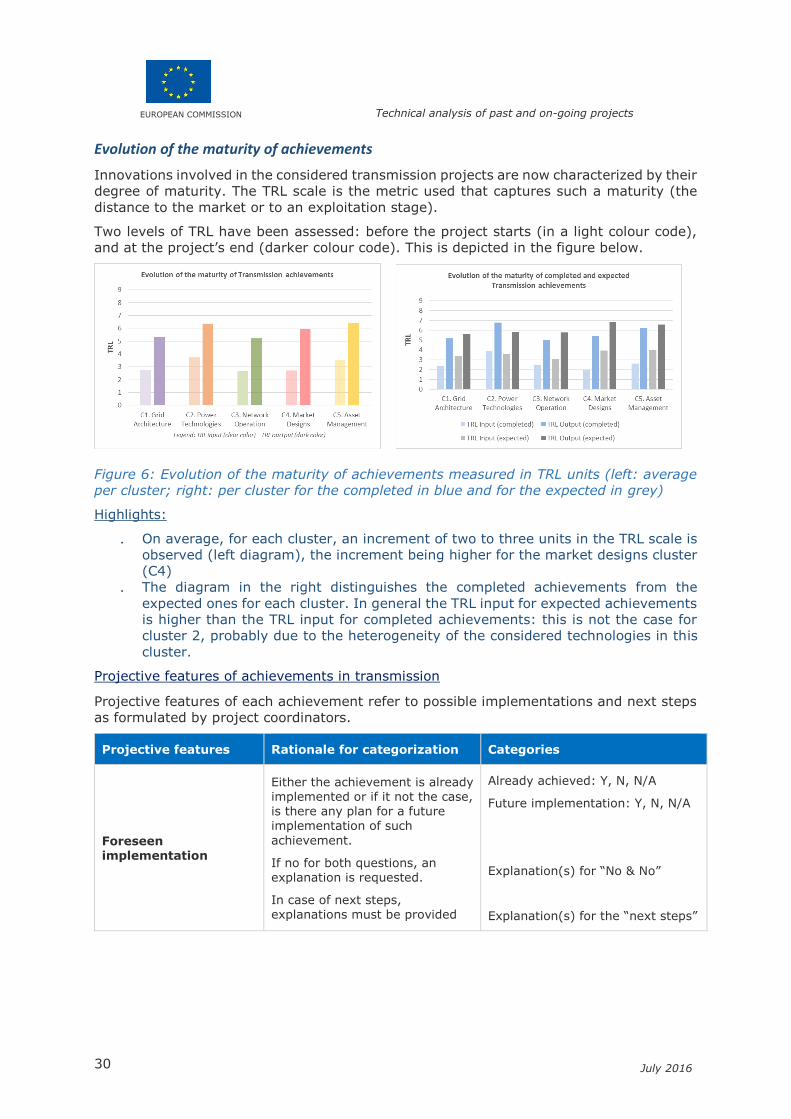
EUROPEAN COMMISSION Technical analysis of past and on-going projects
30 July 2016
Evolution of the maturity of achievements
Innovations involved in the considered transmission projects are now characterized by their
degree of maturity. The TRL scale is the metric used that captures such a maturity (the
distance to the market or to an exploitation stage).
Two levels of TRL have been assessed: before the project starts (in a light colour code),
and at the project’s end (darker colour code). This is depicted in the figure below.
Figure 6: Evolution of the maturity of achievements measured in TRL units (left: average
per cluster; right: per cluster for the completed in blue and for the expected in grey)
Highlights:
. On average, for each cluster, an increment of two to three units in the TRL scale is
observed (left diagram), the increment being higher for the market designs cluster
(C4)
. The diagram in the right distinguishes the completed achievements from the
expected ones for each cluster. In general the TRL input for expected achievements
is higher than the TRL input for completed achievements: this is not the case for
cluster 2, probably due to the heterogeneity of the considered technologies in this
cluster.
Projective features of achievements in transmission
Projective features of each achievement refer to possible implementations and next steps
as formulated by project coordinators.
Projective features Rationale for categorization Categories
Foreseen implementation
Either the achievement is already implemented or if it not the case, is there any plan for a future
implementation of such
achievement.
If no for both questions, an explanation is requested.
In case of next steps, explanations must be provided
Already achieved: Y, N, N/A
Future implementation: Y, N, N/A
Explanation(s) for “No & No”
Explanation(s) for the “next steps”

EUROPEAN COMMISSION Technical analysis of past and on-going projects
31 July 2016
Route for the next steps
Next steps include further
research (FRes), further development (FDev), demonstration (Dem), deployment (Depl) or a mix of these options
12 different combinations can be encountered:
One and only one of the
following: FRes, FDev, Dem, Depl (4)
Two of them: FResFDev, FResDem, FResDepl, FDev, Dem, FDevDepl, DemDepl (6)
Three of them: RDD or DDD
(2)
Next steps with regard to achievements’ implementation
The graph below is based on 84% of the completed achievements (92 of 110 completed
achievements) which constitutes a representative sample. Expected achievements are not
included in this analysis.
Figure 7: Implementation and next step actions carried out for completed achievements in
transmission
Highlights:
. More than one third of the completed achievements have already resulted in an
implementation action.
. From the analysed questionnaires, it may occur that implementation actions are
foreseen but have not started yet: in such situations they are accounted for in the
“next steps” diagrams.
The diagram below details the project coordinators intentions with regard to the next steps
(either further research, further development, demonstration or deployment).
Methodological issue:
In the computation, it has been considered that one achievement could generate next steps for strictly more than one type of “next step”: for example, if one achievement contributes to both further research and demonstration, it is then counted twice, once for further research
and once for demonstration.
Project coordinators have been consulted with three options to be ticked out of the four possible options (further research, further development, demonstration or deployment).
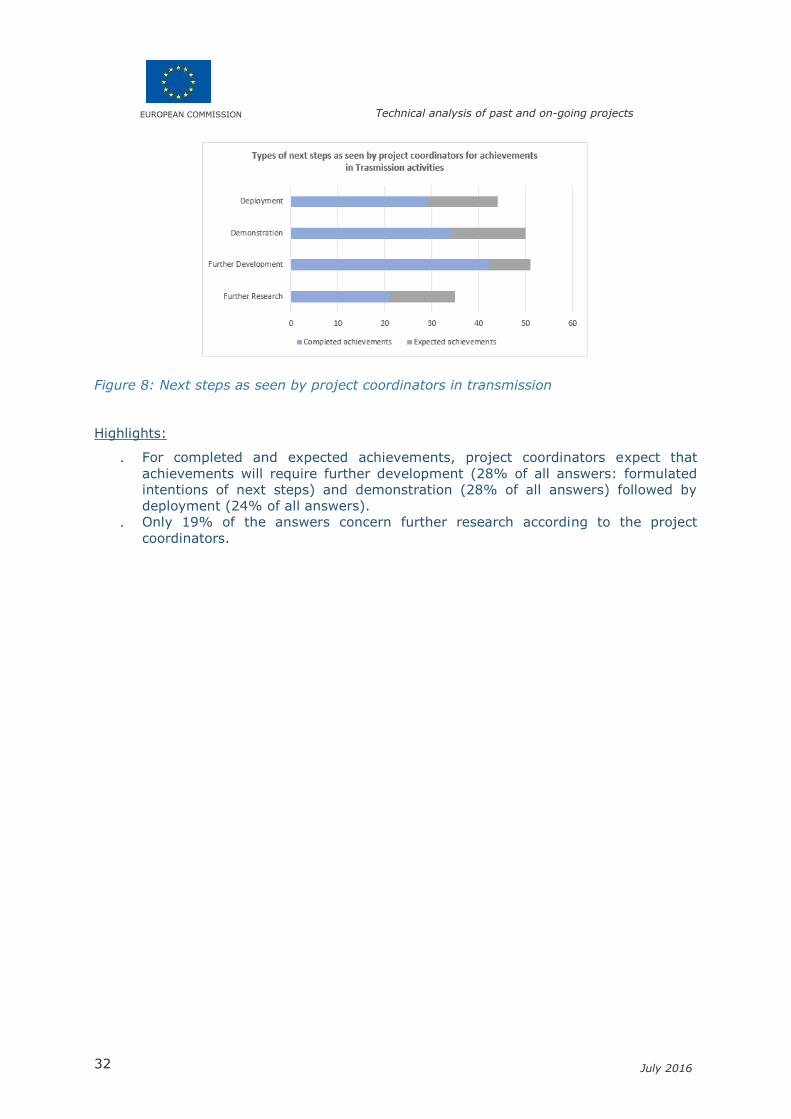
EUROPEAN COMMISSION Technical analysis of past and on-going projects
32 July 2016
Figure 8: Next steps as seen by project coordinators in transmission
Highlights:
. For completed and expected achievements, project coordinators expect that
achievements will require further development (28% of all answers: formulated
intentions of next steps) and demonstration (28% of all answers) followed by
deployment (24% of all answers).
. Only 19% of the answers concern further research according to the project
coordinators.

EUROPEAN COMMISSION Technical analysis of past and on-going projects
33 July 2016
5. Transmission Cluster 1: Grid Architecture
Cluster 1 is organized into 3 Functional Objectives: T1, T2 and T14.
T1. Definition of scenarios for pan-European network expansion
T2. Planning methodology for future pan-European transmission system
T14. Towards increasing public acceptance of transmission infrastructure
5.1 Features of achievements in Cluster 1
5.1.1 Descriptive features
Categorization in functional objectives
The graphs below characterize the completed (25) and expected (12) achievements of
cluster 1 (the purple colour is dedicated to Cluster 1).
Figure 9: portfolio of achievements in Cluster 1 (left: overall; middle: completed; right:
expected)
Highlights:
. The first diagram in the left provides the overall number of achievements in this
cluster.
. When comparing the two other diagrams with first one (overall number of
achievements), one can detect some variations in the relative number of
achievements contributing to each Functional Objective: for instance, T14
represents the highest share of achievements for expected achievements but one
should have in mind that the sample of expected achievements is about 1/3 of the
overall sample (12 out of 37).
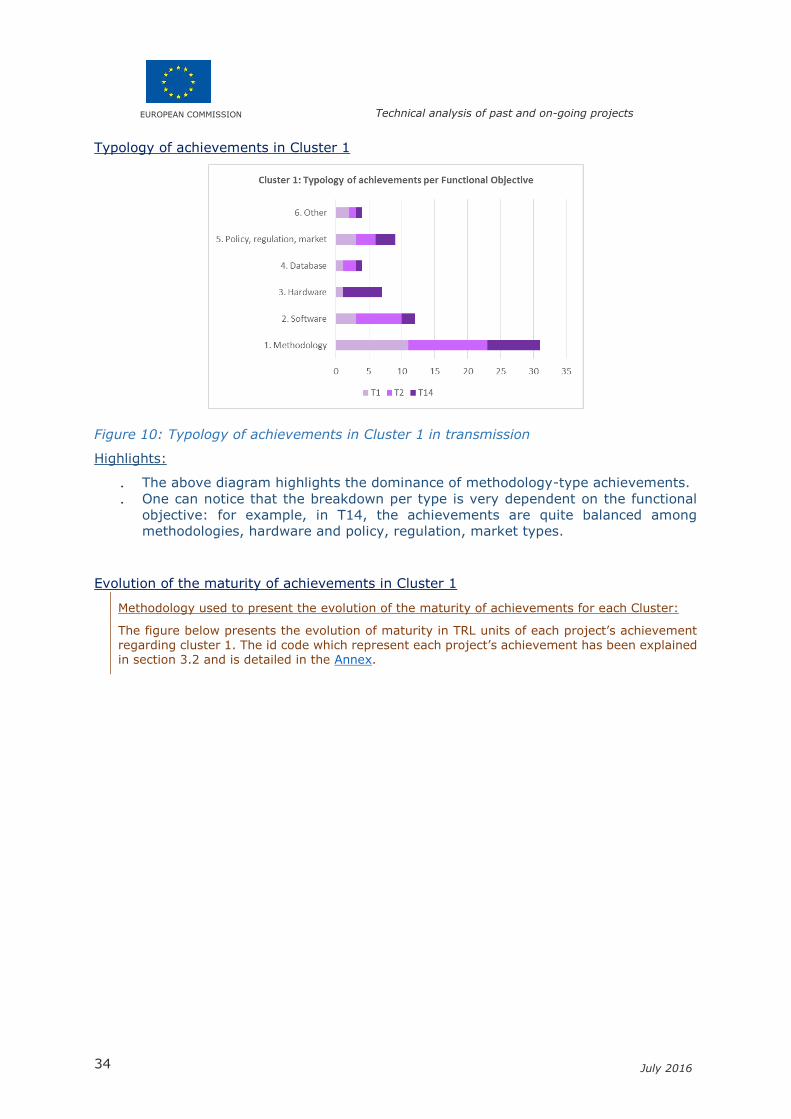
EUROPEAN COMMISSION Technical analysis of past and on-going projects
34 July 2016
Typology of achievements in Cluster 1
Figure 10: Typology of achievements in Cluster 1 in transmission
Highlights:
. The above diagram highlights the dominance of methodology-type achievements.
. One can notice that the breakdown per type is very dependent on the functional
objective: for example, in T14, the achievements are quite balanced among
methodologies, hardware and policy, regulation, market types.
Evolution of the maturity of achievements in Cluster 1
Methodology used to present the evolution of the maturity of achievements for each Cluster:
The figure below presents the evolution of maturity in TRL units of each project’s achievement regarding cluster 1. The id code which represent each project’s achievement has been explained in section 3.2 and is detailed in the Annex.
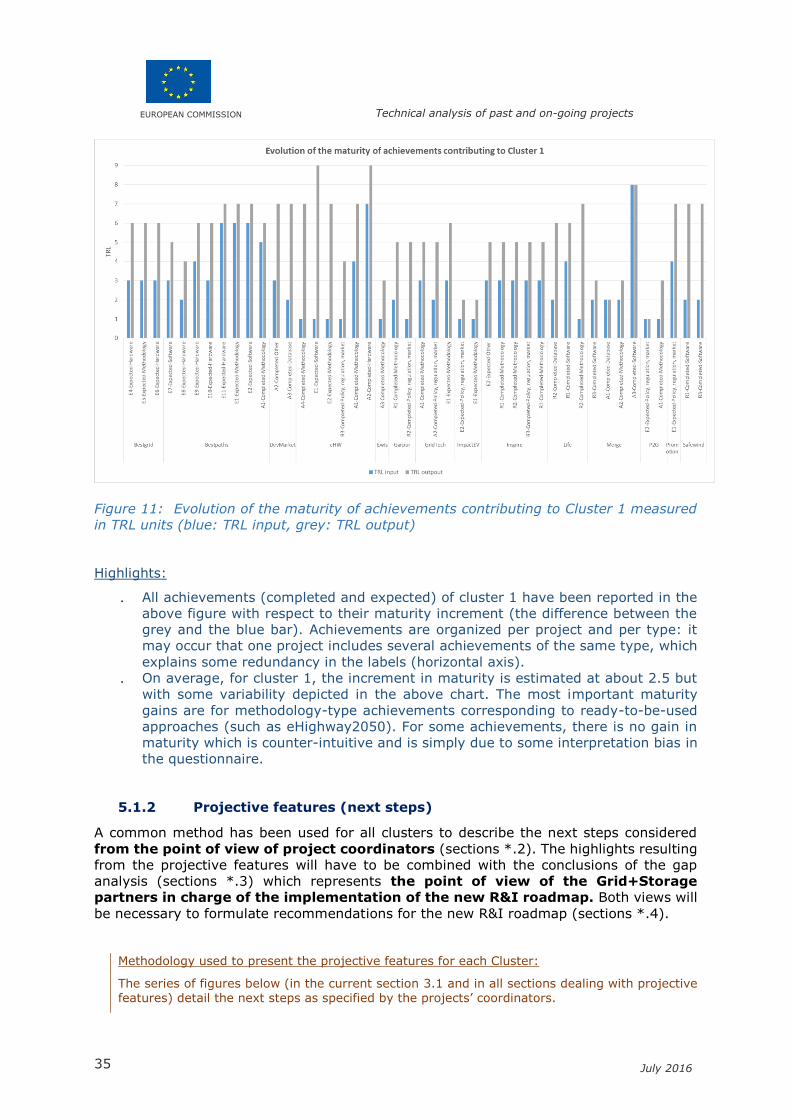
EUROPEAN COMMISSION Technical analysis of past and on-going projects
35 July 2016
Figure 11: Evolution of the maturity of achievements contributing to Cluster 1 measured
in TRL units (blue: TRL input, grey: TRL output)
Highlights:
. All achievements (completed and expected) of cluster 1 have been reported in the
above figure with respect to their maturity increment (the difference between the
grey and the blue bar). Achievements are organized per project and per type: it
may occur that one project includes several achievements of the same type, which
explains some redundancy in the labels (horizontal axis).
. On average, for cluster 1, the increment in maturity is estimated at about 2.5 but
with some variability depicted in the above chart. The most important maturity
gains are for methodology-type achievements corresponding to ready-to-be-used
approaches (such as eHighway2050). For some achievements, there is no gain in
maturity which is counter-intuitive and is simply due to some interpretation bias in
the questionnaire.
5.1.2 Projective features (next steps)
A common method has been used for all clusters to describe the next steps considered
from the point of view of project coordinators (sections *.2). The highlights resulting
from the projective features will have to be combined with the conclusions of the gap
analysis (sections *.3) which represents the point of view of the Grid+Storage
partners in charge of the implementation of the new R&I roadmap. Both views will
be necessary to formulate recommendations for the new R&I roadmap (sections *.4).
Methodology used to present the projective features for each Cluster:
The series of figures below (in the current section 3.1 and in all sections dealing with projective features) detail the next steps as specified by the projects’ coordinators.

EUROPEAN COMMISSION Technical analysis of past and on-going projects
36 July 2016
- Each figure on the left provides an estimation of the number of future actions that would be needed to complement/continue/demonstrate/deploy the achievements contributing to the functional objective.
- Each figure on the right provides a detailed view of the considered achievements9 in a pre-
roadmap view (for four main possible future stages from “further research” to “deployment”). - The colour code that was used refer to the colour of the cluster for the completed
achievements in that cluster (purple colour for Cluster 1, etc.), while the grey colour refers to the expected achievements as seen by project coordinators.
Each pair of figures allows to highlight some key features on future R&I necessary actions from the point of view of the project coordinators having contributed to a given functional objective. Such conclusions result directly from an analysis of:
- The total number of achievements in the functional objective; - The split between completed and expected achievements;
- The split between the four types of next steps considered for the completed (resp. expected achievements);
- The relative contribution of each project in the considered functional objective.
From the data collected in cluster 1 for each Functional Objective (T1, T2, T14) one can
formulate the following highlights:
. Next steps for achievements in T1 are well balanced, whereas for achievements in
T2 and T14 efforts for further research appear as less intensive.
. In T14 next steps for demonstration are dominant, while in T2 three “next steps”
are quite balanced: development, demonstration and deployment.
. Expected achievements represent about 25% of all considered achievements.
Figure 12: Next steps as seen by project coordinators in T1
9 For the id code of achievement: see section 3.2 and Annex.
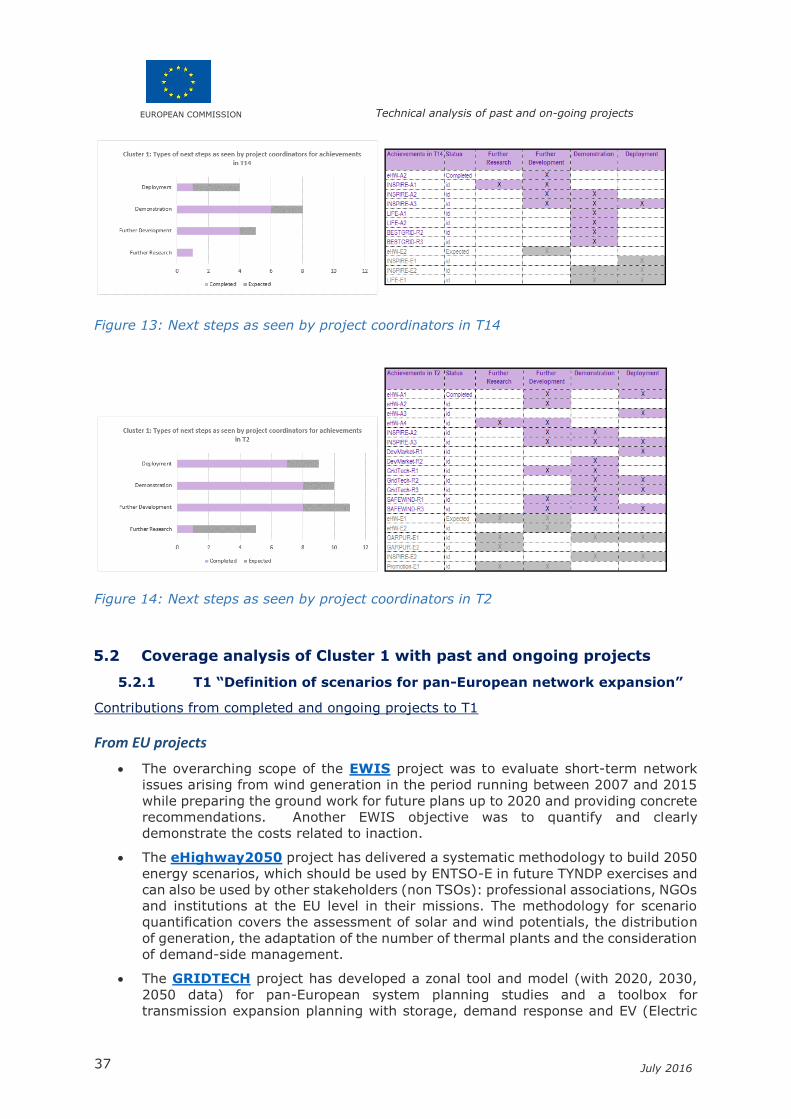
EUROPEAN COMMISSION Technical analysis of past and on-going projects
37 July 2016
Figure 13: Next steps as seen by project coordinators in T14
Figure 14: Next steps as seen by project coordinators in T2
5.2 Coverage analysis of Cluster 1 with past and ongoing projects
5.2.1 T1 “Definition of scenarios for pan-European network expansion”
Contributions from completed and ongoing projects to T1
From EU projects
The overarching scope of the EWIS project was to evaluate short-term network
issues arising from wind generation in the period running between 2007 and 2015
while preparing the ground work for future plans up to 2020 and providing concrete
recommendations. Another EWIS objective was to quantify and clearly
demonstrate the costs related to inaction.
The eHighway2050 project has delivered a systematic methodology to build 2050
energy scenarios, which should be used by ENTSO-E in future TYNDP exercises and
can also be used by other stakeholders (non TSOs): professional associations, NGOs
and institutions at the EU level in their missions. The methodology for scenario
quantification covers the assessment of solar and wind potentials, the distribution
of generation, the adaptation of the number of thermal plants and the consideration
of demand-side management.
The GRIDTECH project has developed a zonal tool and model (with 2020, 2030,
2050 data) for pan-European system planning studies and a toolbox for
transmission expansion planning with storage, demand response and EV (Electric

EUROPEAN COMMISSION Technical analysis of past and on-going projects
38 July 2016
Vehicles).
The MERGE project has identified and prepared solutions for the operational
problems that will be caused on the electric grid, to the generation sub-system and
to its commercial operation as a result of progressively increasing deployment of
EV. Different scenarios on EV deployment have been considered and a tool used by
the TSO to perform grid planning has been developed.
The ongoing GARPUR project is developing a new reliability management approach
and criteria (RMAC) for the pan-European electric power system. Such new RMAC
should be implemented in priority to grid planning activities and notably incorporate
the possibility of using demand-side management to secure system operations.
From national projects
The Baltic TSOs Elering, Litgrid and AST have developed long-term energy scenarios
for the region and developed a methodology, database and market models for
increasing market modelling capacity. Further improvements and expansions of
the methodology are needed to also include, for example, flow-based allocation for
transport capacities assessment.
Elering, in its double role of both electricity and gas TSO, is investigating the
feasibility of Power to Gas (P2G) systems in Estonia. In principle P2G systems
would be able to encourage RES-E penetration, by using the possible excess in RES-
E production and the CO2 captured from traditional power systems in order to
produce methane to be injected in the gas network or used as automotive fuel.
Studying the financial viability of such systems and enlarging the study at European
scale is needed.
Elering is also studying the impact of electric and gas vehicles and developed a
methodology to evaluate the impact of electric transport on grid operation. Link
with high-speed train, involving neighbouring countries, needs to be further
explored.
Assessment of the coverage of T1
The EEGI roadmap 2013-2020 had foreseen the following specific tasks in the functional
objective T1. The left-hand traffic-light colours correspond to the estimated coverage of
each of these tasks by the above-described projects, according to the colour code defined
in Table 3.
T1a. To define pan-European network expansion scenarios, identify maximum
volume of RES and DER for pan-European network, and analyse a
combination of electricity and gas.
T1b. To identify investments required to achieve the 2050 vision with different
decarbonisation scenarios of generation mix, storage, and demand mix.
T1c. To develop methods for integrating transmission systems with growing
amounts of RES based generation, considering optimal rates of storage
needed at the pan-European level.
T1d. To provide an offshore grid design: optimisation methods for grid capacity,
technology, and topology considering wind power characteristics (i.e., low
capacity factor).
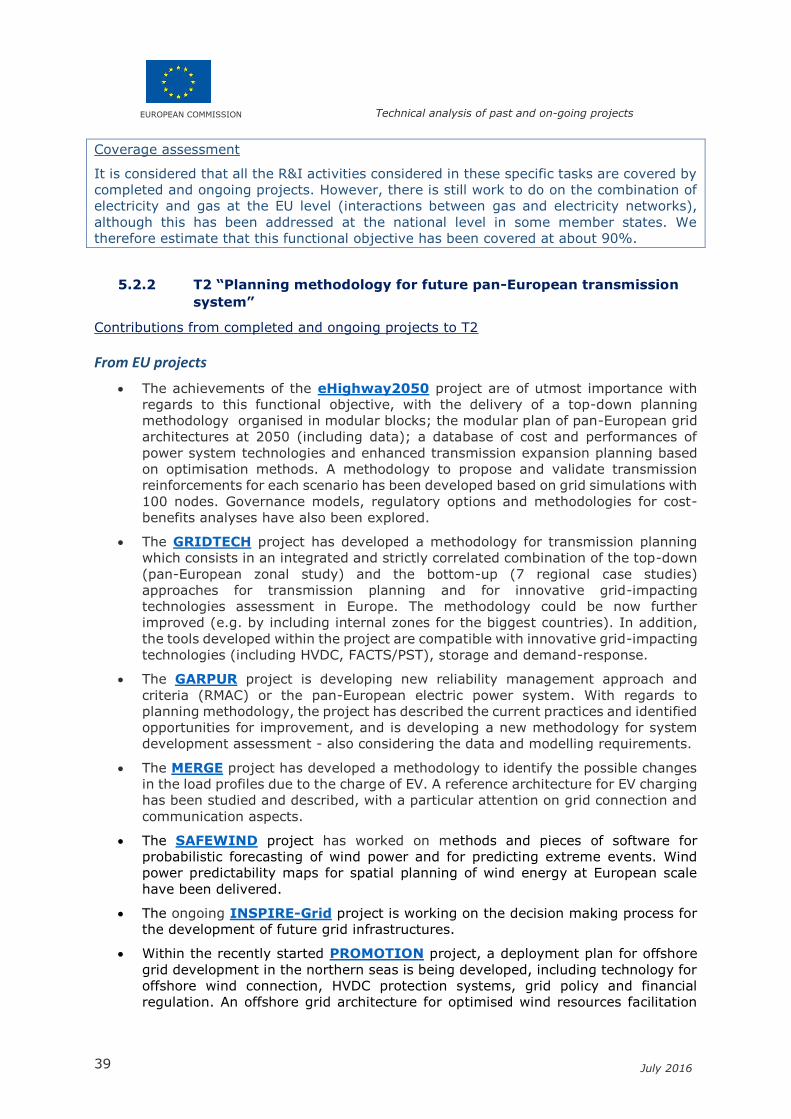
EUROPEAN COMMISSION Technical analysis of past and on-going projects
39 July 2016
Coverage assessment
It is considered that all the R&I activities considered in these specific tasks are covered by
completed and ongoing projects. However, there is still work to do on the combination of
electricity and gas at the EU level (interactions between gas and electricity networks),
although this has been addressed at the national level in some member states. We
therefore estimate that this functional objective has been covered at about 90%.
5.2.2 T2 “Planning methodology for future pan-European transmission
system”
Contributions from completed and ongoing projects to T2
From EU projects
The achievements of the eHighway2050 project are of utmost importance with
regards to this functional objective, with the delivery of a top-down planning
methodology organised in modular blocks; the modular plan of pan-European grid
architectures at 2050 (including data); a database of cost and performances of
power system technologies and enhanced transmission expansion planning based
on optimisation methods. A methodology to propose and validate transmission
reinforcements for each scenario has been developed based on grid simulations with
100 nodes. Governance models, regulatory options and methodologies for cost-
benefits analyses have also been explored.
The GRIDTECH project has developed a methodology for transmission planning
which consists in an integrated and strictly correlated combination of the top-down
(pan-European zonal study) and the bottom-up (7 regional case studies)
approaches for transmission planning and for innovative grid-impacting
technologies assessment in Europe. The methodology could be now further
improved (e.g. by including internal zones for the biggest countries). In addition,
the tools developed within the project are compatible with innovative grid-impacting
technologies (including HVDC, FACTS/PST), storage and demand-response.
The GARPUR project is developing new reliability management approach and
criteria (RMAC) or the pan-European electric power system. With regards to
planning methodology, the project has described the current practices and identified
opportunities for improvement, and is developing a new methodology for system
development assessment - also considering the data and modelling requirements.
The MERGE project has developed a methodology to identify the possible changes
in the load profiles due to the charge of EV. A reference architecture for EV charging
has been studied and described, with a particular attention on grid connection and
communication aspects.
The SAFEWIND project has worked on methods and pieces of software for
probabilistic forecasting of wind power and for predicting extreme events. Wind
power predictability maps for spatial planning of wind energy at European scale
have been delivered.
The ongoing INSPIRE-Grid project is working on the decision making process for
the development of future grid infrastructures.
Within the recently started PROMOTION project, a deployment plan for offshore
grid development in the northern seas is being developed, including technology for
offshore wind connection, HVDC protection systems, grid policy and financial
regulation. An offshore grid architecture for optimised wind resources facilitation
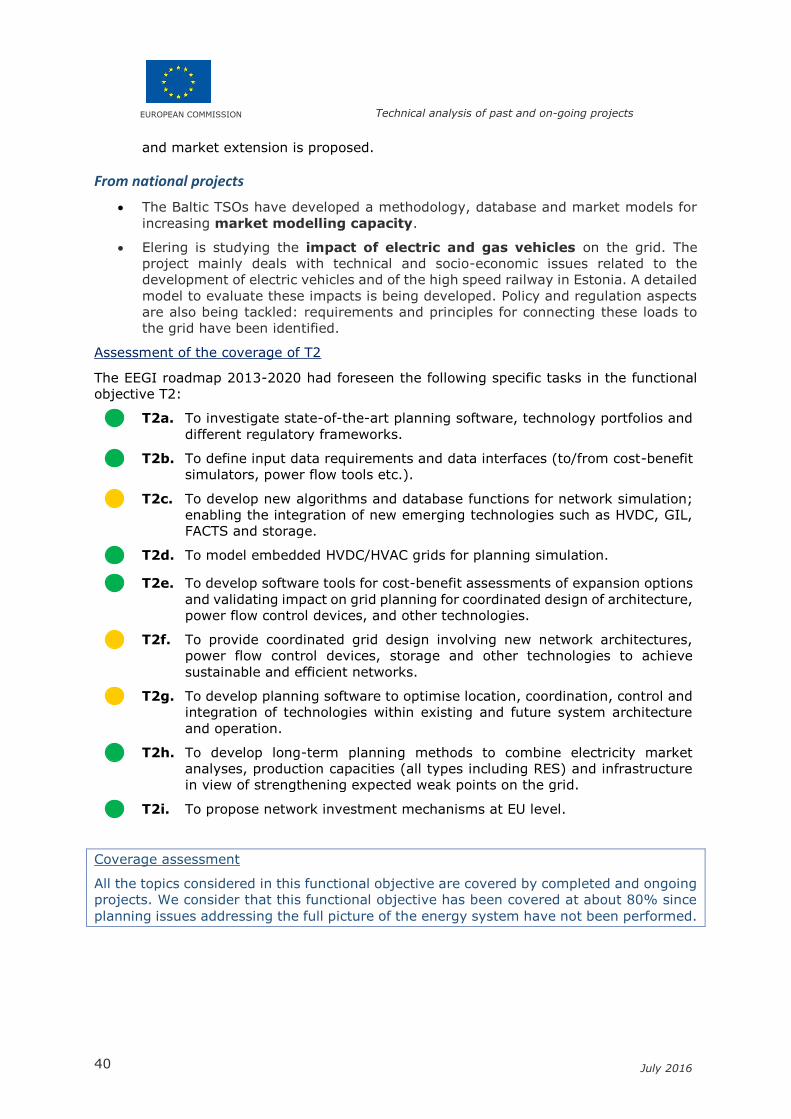
EUROPEAN COMMISSION Technical analysis of past and on-going projects
40 July 2016
and market extension is proposed.
From national projects
The Baltic TSOs have developed a methodology, database and market models for
increasing market modelling capacity.
Elering is studying the impact of electric and gas vehicles on the grid. The
project mainly deals with technical and socio-economic issues related to the
development of electric vehicles and of the high speed railway in Estonia. A detailed
model to evaluate these impacts is being developed. Policy and regulation aspects
are also being tackled: requirements and principles for connecting these loads to
the grid have been identified.
Assessment of the coverage of T2
The EEGI roadmap 2013-2020 had foreseen the following specific tasks in the functional
objective T2:
T2a. To investigate state-of-the-art planning software, technology portfolios and
different regulatory frameworks.
T2b. To define input data requirements and data interfaces (to/from cost-benefit
simulators, power flow tools etc.).
T2c. To develop new algorithms and database functions for network simulation;
enabling the integration of new emerging technologies such as HVDC, GIL,
FACTS and storage.
T2d. To model embedded HVDC/HVAC grids for planning simulation.
T2e. To develop software tools for cost-benefit assessments of expansion options
and validating impact on grid planning for coordinated design of architecture,
power flow control devices, and other technologies.
T2f. To provide coordinated grid design involving new network architectures,
power flow control devices, storage and other technologies to achieve
sustainable and efficient networks.
T2g. To develop planning software to optimise location, coordination, control and
integration of technologies within existing and future system architecture
and operation.
T2h. To develop long-term planning methods to combine electricity market
analyses, production capacities (all types including RES) and infrastructure
in view of strengthening expected weak points on the grid.
T2i. To propose network investment mechanisms at EU level.
Coverage assessment
All the topics considered in this functional objective are covered by completed and ongoing
projects. We consider that this functional objective has been covered at about 80% since
planning issues addressing the full picture of the energy system have not been performed.

EUROPEAN COMMISSION Technical analysis of past and on-going projects
41 July 2016
5.2.3 T14 “Increasing public acceptance of the transmission
infrastructure”
Contributions from completed and ongoing projects to T14
From EU projects
The BEST GRID project, gathering TSOs and environmental NGOs, aimed at
improving local public acceptance for grids by applying best practices in
participation and transparency in pilot projects, speeding up permitting procedures
while respecting environmental protection standards in pilot projects and supporting
implementation of best practices in future electricity grid projects of common
interest (PCIs). Two handbooks have been delivered, about “Public Participation and
Transparency in Power Grid Planning” and "Protecting Nature in Power Grid
Planning”. The project has also published the most valuable lessons learned and
overall recommendations, e.g. the collaboration between TSOs and NGOs should be
pursued regarding nature protection and grid development, provided that NGOs can
be funded for that purpose.
The ongoing INSPIRE-Grid project is aimed at enhancing stakeholders’
participation in the development of future grid infrastructures. Stakeholders'
concerns and needs have been mapped and methodologies for stakeholders’
engagement have been assessed. An online Geographical Information System
(webGIS) has been developed to allow users to access relevant information about
a new power line and the crossed area through a geographical interface.
Within the ongoing LIFE Elia-RTE project, guidelines on “vegetation mapping of
powerline corridors in forests” have been delivered, and a cost-benefit analysis on
alternative vegetation management in forest corridors has been carried out. The
project will also deliver policy recommendations on the integration of biodiversity
preservation into the vegetation management under overhead electrical lines.
The TWENTIES project, focused on wind integration issues, and addressed public
acceptance concerns.
With the modular plan of pan-European grid architectures at 2050, the
eHighway2050 project has also contributed to this functional objective.
The BEST PATHS demonstrations aiming at increasing the pan-European
transmission network capacity and the system flexibility also take into account
public acceptance issues.
Assessment of the coverage of T14
The EEGI roadmap 2013-2020 had foreseen the following specific tasks in the functional
objective T14:
T14a. To investigate public perception of the power infrastructure and to improve
the relationship between TSOs and the public with valuable feedback and
signals in both directions.
T14b. To contribute to developing and/or updating European guidelines on good
practice in transparency, public engagement, and the permit process.
T14c. To produce guidelines for the construction of overhead power lines with
reduced visual and environmental effects compared to existing construction
guidelines and to ensure these guidelines are applicable across Europe.
T14d. To analyse new technologies with reduced visibility of conductors, using
coatings and nano-technologies.
EUROPEAN COMMISSION Technical analysis of past and on-going projects
42 July 2016
T14e. To propose new tower designs for overhead power lines with less visual
effect, audible noise, and EMF and in some cases, also with reduced sag of
overhead lines.
T14f. To develop methodologies and software to evaluate bird collisions, human
and animal exposure to EMF, audible noises, etc., and reduction of effects.
T14g. To provide methods for physical protection of the grid infrastructures
against potential dangers: natural catastrophes, terrorism, cyber-attacks,
etc.
Coverage assessment
The above-mentioned projects have broadly contributed to these specific tasks. However,
there is still no specific work on environmental impacts due to, for example, coating and
nanotechnologies, audible noise and electric and magnetic fields (EMF). In addition, there
is still work to do on natural catastrophes and on extending the results to the EU level. It
is therefore considered than one third (30%) on this functional objective has been covered
by projects’ achievements; ongoing work should allow covering one additional third.
5.3 Recommendations for the new R&I roadmap
The high degree of coverage in this cluster, especially in T1, T2 will push for reorganizing
the current Cluster 1. Planning tools and methodologies still need to be further developed
so as to fully account for the full picture of flexibility options, e.g. new technologies (such
as storage), demand-response, etc. T14 being less covered, the actions not yet covered or
partially covered might be distributed to the new cluster dealing with modernization of the
network (new C1) since public acceptance (and stakeholder involvement) and
environmental impact assessments still remain an issue.
6. Transmission Cluster 2: Power technologies
Cluster 2 is organized into 3 Functional Objectives: T3, T4 and T5.
T3. Demonstration of power technology to increase network flexibility and operation means
T4. Demonstration of novel network architectures
T5. Interfaces for large-scale demonstration of renewable integration
6.1 Features of achievements in Cluster 2
6.1.1 Descriptive features
Categorization in functional objectives
The graphs below characterize the completed (18) and expected (13) achievements of the
monitored projects of cluster 2 (a brown orange colour was dedicated to Cluster 2). The
first diagram on the left details the overall number of achievements in this cluster, while
the two diagrams on the right show some variations in the relative number of achievements
contributing to each Functional Objective.

EUROPEAN COMMISSION Technical analysis of past and on-going projects
43 July 2016
Figure 15: The portfolio of achievements in Cluster 2 (left: overall; middle: completed;
right: expected)
Highlights:
. T3 was clearly the most important functional objective on the completed sample,
but is only in 2nd position when considering the expected achievements.
. T5 is marginal in the subset of expected achievements but represents almost 25%
of the completed ones.
. T4 is by far the most important in terms of expected achievements as seen by
project coordinators.
. The sample of expected achievements represents more than 30%3 of the overall
sample (13 out of 31).
Typology of achievements in Cluster 2
Figure 16: Typology of achievements in Cluster 2 in transmission
Highlights:
. In Cluster 2, hardware type achievements are dominant, immediately followed by
software and methodology.
. Database (resp. policy, regulation, market) are marginally (resp. not) represented.

EUROPEAN COMMISSION Technical analysis of past and on-going projects
44 July 2016
Evolution of the maturity of achievements in Cluster 2
Figure 17: Evolution of the maturity of achievements contributing to Cluster 2 measured
in TRL units
Highlights:
. In the above table most of achievements present a maturity increment of 2 to 3
units in the TRL scale.
. Some projects coordinators however consider a higher maturity gain in the
achievements of their project (e.g. EcoGRID, SSSC, SUMO).
6.1.2 Projective features (next steps)
Following the same methodology described in section 3.1, and from the data gathered for
each functional objective (T3, T4, T5) the following highlights can be formulated:
. T3 appears as the most active FO in terms of next steps while T5 is the less active.
. In T3, the SUMO and HUMBER projects have a need for demonstration (3 types of
“next steps” each).
. The next step “deployment” is the most quoted in T3 and T5 while the “further
research” route appears as not necessary for achievements in these two FOs.
. In T4, the “research” route is addressed by the expected achievements of the
MIGRATE project.

EUROPEAN COMMISSION Technical analysis of past and on-going projects
45 July 2016
Figure 18: Next steps as seen by project coordinators in T3
Figure 19: Next steps as seen by project coordinators in T4
Figure 20: Next steps as seen by project coordinators in T5
6.2 Coverage analysis of Cluster 2 with past and ongoing projects
6.2.1 T3 “Demonstration of power technology to increase network
flexibility and operation means”
Contributions from completed and ongoing projects to T3
From EU projects
The TWENTIES project, with six different demonstrations, addressed the removal
of several barriers preventing the electric system from welcoming more wind
electricity, and wind electricity from contributing more to the electric system. The

EUROPEAN COMMISSION Technical analysis of past and on-going projects
46 July 2016
full scale demonstrations aim at proving the benefits of novel technologies (most of
them available from manufacturers) coupled with innovative system management
approaches. Combinations of methodologies, software and hardware devices
allowed the consortium bringing answers to the following questions:
− What are the valuable contributions that intermittent wind generation and
flexible loads can bring to system services? For this, tools and methodologies
to allow wind generation smart control to deliver system services were
developed, as well as a centralised control/co-optimisation software across
the value chain (wind, CHPs, local generation and load) to obtain cost
efficient system services and wind balancing (inter- and intraday energy
markets/ancillary services).
− What should the network operators implement to allow for offshore wind
development? Secure architecture and controls for meshed HDVC network,
a circuit breaker technology adapted to secure meshed HVDC offshore
networks as well as storm controllers for offshore wind farms were
developed and demonstrated.
− How to give more flexibility to the transmission grid? It was demonstrated
that adequate coordination mechanisms between Dynamic Line Rating
(DLR), Power Flow Controlling Devices and Wide Area Monitoring Systems
(WAMS) bring more flexibility to the electric system within affordable capital
and operational costs.
The ongoing BEST PATHS project aims at developing novel network technologies
to increase the pan-European transmission network capacity and the electricity
system flexibility. It addresses the following questions:
− What are the routes to move from HVDC lines to HVDC grids? Control
strategies to improve the interaction between HVDC links and wind turbine
generators are proposed. Interoperability standards of multi-terminal VSC
HVDC are developed. The performance of coupled VSC units from different
manufacturers is tested based on a full scale, hardware-in-the-loop test
setup involving worldwide market leaders. New multilevel VSC converter and
operations strategies integrating XLPE submarine and land cables, HTLS DC
conductors, DC insulators and DC fault management systems are
demonstrated. Finally, a methodology for high performance upgrading of
existing DC links is being provided.
− What are the new promising capacity upgrading techniques for the existing
AC parts of the network? For repowering existing AC overhead lines (OHL),
innovative HTLS conductors, DLR systems, tower design and field work are
developed.
− How replicable are the promising demonstrations results within the entire
pan-European electricity system? The manufacturing of new (MgB2)
superconducting cables and a technology to integrate DC superconducting
links within an AC meshed network (design, manufacturing and grid
operations) are being proposed.
The ICOEUR project has developed, implemented and upgraded low voltage large-
scale WAMS which have been put in operation by several TSOs worldwide.
The EcoGRID EU project has developed and demonstrated, on a large scale, a real-
time market concept for active user participation in order to reduce the need for
costly flexibility on the production side. The project has delivered a database
collecting the results obtained by the field implementation.
The PROMOTION project is working on demonstrating innovative offshore
converter topology. It is also developing and demonstrating HVDC grid protection
systems (software and hardware).

EUROPEAN COMMISSION Technical analysis of past and on-going projects
47 July 2016
From national projects
In Denmark, the project Concept2025 for the management of the future electricity
system developed a methodology for active power grid control in relation with the
issue of how the power grid can efficiently ensure that the traded electricity is
transported.
The Italian VENTOTENE* project is realising a pilot project that involve
500kW/600kWh lithium-ion battery that will be integrated with diesel generators
that provide electricity to the island and will store electricity for use during demand
peaks. A methodology is being developed to operate batteries in parallel with diesel
generators and renewables.
In Spain, the objective of the STORE* project is to demonstrate the technical and
economic viability of large-scale energy storage systems (electrochemical storage,
flywheel, ultracapacitor) in island environments. A methodology to provide inertia
and active power for primary regulation is being developed, validating technology's
ability to prevent outages due to unforeseen faults in generation units, as well as
assistance in continuously stabilising voltage.
In Great Britain, the ongoing Humber Smartzone Pilot Project aims to develop
and demonstrate a proof of concept to provide flexible enhanced boundary capacity
using a combination of wide area monitoring, predictive ratings and dynamic
security analysis. It will deliver tools to monitor and predict the thermal capacity of
a circuit, an application to estimate and predict thermal capacity margin in a region
and a decision support system to coordinate plant and equipment maximising the
utilisation of the network.
In Slovenia, with the ongoing SUMO project a system for real-time and short-term
forecast assessment of power grid operating limits is being developed. Methods and
software tools are developed for evaluating DTR in real time and with a temporal
horizon of 3 hours ahead. The allowable current is computed using air temperature,
wind speed and direction, air pressure, global solar irradiation, air humidity and
precipitation. An alarm system for extreme weather conditions (such as lightning,
high winds, extreme air temperatures and heavy precipitations) that could lead to
powerline outages is being implemented.
Also in Italy, the CLASS* project is studying the integration and operation of liquid
and compressed air storage system (LAES and CAES) in conventional power plants.
It addresses:
− the integration of CAES/LAES systems in conventional power plants that will
be competitive from economic and energy points of view;
− reliability of materials used in CAES/LAES critical components and in heat
exchange and storage components;
− an increase of CAES/LAES efficiency through the study of innovative and
advanced configurations;
− the critical points of the relevant control system;
− the synergies between conventional power plants and CAES/LAES systems.
Note: Projects marked with an * do not count any TSO on board. They have been provided by EASE
members.
Assessment of the coverage of T3
The EEGI roadmap 2013-2020 had foreseen the following specific tasks in the functional
objective T3:

EUROPEAN COMMISSION Technical analysis of past and on-going projects
48 July 2016
T3a. To demonstrate the degree to which transfer capacity can be increased at
the cross-border level and present new operating schemes available through
the implementation of different approaches and technologies, to investigate
all possible technical solutions within the domain of each application, and to
perform cost-benefit analyses of different case studies.
T3b. To demonstrate power flow control devices that offer increased flexibility
with respect to energy flow across multiple transmission zones and borders.
T3c. To demonstrate controllable offshore and onshore solutions for vendor-
independent, HVDC multi-terminal networks used to coordinate power flow,
frequency control, protection, and communications requirements.
T3d. To implement solutions for wide-area monitoring (WAM) systems and
demonstrate how to utilise such information in a coordinated manner during
operations.
T3e. To investigate the influence of parallel routing of DC and AC lines on the
same tower or parallel paths in order to facilitate existing infrastructure
paths in an optimal manner.
Coverage assessment
Completed projects have allowed covering about half of the tasks within this functional
objective. Ongoing projects should allow covering an additional share of 30%. There is still
a need for a multi-vendor installation regarding HVDC multi-terminal networks. More work
should also be done at the EU level on WAMS and PMU coordination. In addition, issues
related to the utilisation of DC lines within an AC grid using the same infrastructure have
yet to be covered.
6.2.2 T4 “Demonstration of novel network architectures”
Contributions from completed and ongoing projects to T4
From EU projects
Within the BEST PATHS project, novel network architectures are tested in terms
of routes to move from HVDC lines to HVDC grids. Three demonstrations contribute
to this objective: 1. HVDC links in offshore wind farms and offshore
interconnections; 2. HVDC-VSC multivendor interoperability; and 3. Upgrading
multi-terminal HVDC links using innovative components.
The PROMOTION project contributes to this functional objective by working on
innovative offshore converter topology.
The recently started MIGRATE project is addressing the issues resulting from the
extremely high penetrations of Power Electronics (PE) in several areas of the HVAC
pan-European transmission system. In terms of novel network architectures, the
project is working on KPIs to measure the distance to instability under different PE
scenarios, new parameters (retuned controllers) for a few types of instabilities
(generic test cases), new control strategies for transmission networks operated at
100% PE, the adaptation of existing protection schemes, new protection schemes
in transmission networks and power quality analyses.
From national projects
In Spain, the “220 kV SSSC device for power flow control” project aimed at
designing, constructing, setting up in operation and testing a SSSC (Static
EUROPEAN COMMISSION Technical analysis of past and on-going projects
49 July 2016
Synchronous Series Compensator) device to prevent overload situations in the
Spanish 220 kV transmission grid due to boosting RES distributed penetration. This
is the first ever implementation of a key FACTS device such the SSSC in the
European transmission system. It includes power electronics components (VSC,
protection system); control methodology; coupling transformer.
Assessment of the coverage of T4
The EEGI roadmap 2013-2020 had foreseen the following specific tasks in the functional
objective T4:
T4a. To demonstrate new power technologies on a large scale (including new
materials), such as HVDC VSC, superconductivity, energy storage, fault
current limiters, and other promising technologies for joint management of
onshore and offshore networks.
T4b. To validate various technology options to increase transmission capacity
through selective reinforcement or implementation of an ultra-high-voltage
transmission system (Super Grid) or DC backbone.
T4c. To propose new schemes to extend synchronous areas in the pan-European
grid and connect these with back-to-back HVDC to increase their utilisation
and reduce the complexity of balancing, planning, and operation.
T4d. To do research on the devices and concepts required to materialise multi-
terminal DC grids that can cope with current system needs and sources, such
as offshore generation.
T4e. To coordinate offshore networks interconnected with various control areas,
load-frequency control, DC voltage control, and other technologies required
for DC (VSC) networks.
T4f. To implement HVDC solutions to enhance reliability – bi-polar or mono-polar
DC schemes.
T4g. To determine standard DC voltage. Since VSC technologies eliminate the
need for transformers, investment and maintenance costs will be reduced
significantly. Weight and space are cost drivers, particularly for offshore
installations.
Coverage assessment
Completed projects have allowed covering about 15% of these tasks. The big European
projects which are ongoing should allow covering 40% more. There is still work to do on
fault current limiters and other promising technologies, ultra-high voltage, extension of
synchronous areas and their connection with back-to-back HVDC, methods for coordinating
load frequency control in off-shore networks, reliability and standard DC voltage.
6.2.3 T5 “Interfaces for large-scale demonstration of renewable
integration”
Contributions from completed and ongoing projects to T5
From EU projects
The TWENTIES project has worked on the valuable contributions that intermittent
wind generation can bring to system services. It has been shown that aggregating
wind production with flexible loads at large scale within appropriate regulatory
schemes leads to a more secure and efficient electricity system having high
EUROPEAN COMMISSION Technical analysis of past and on-going projects
50 July 2016
scalability potential. The project has delivered a centralised control and co-
optimisation across the value chain (wind, CHPs, local generation and load) for cost
efficient system services and wind balancing (inter- and intraday energy
markets/ancillary services provided by VPP mobilisation and control of local assets).
The HyUNDER* project aimed at providing a joint assessment of the European
potential for large scale underground hydrogen storage to ensure network reliability
and flexibility and compensate the fluctuating renewable. While short term energy
storage can be met by small decentralized storage systems, mid to long term
electricity storage technologies are still lagging behind. The project has delivered a
database with the assessment of the potential, the actors and relevant business
cases for large scale and seasonal storage of renewable electricity by hydrogen
underground storage in Europe.
The BEST PATHS project contributes to this functional objective with the
demonstration of HVDC links in offshore wind farms and offshore interconnections.
Control strategies to manage the interactions between HVDC links and wind turbine
generators are being designed and tested.
From national projects
The Spanish 220 kV SSSC device for power flow control project contributes to
this functional objective with a control system methodology.
The Danish project Concept2025 developed a methodology for intelligent resource
activation and control. Secure and internationally standardised communication
using IEC 61850 between DER and DSO, TSO, BRP has been demonstrated, and is
now going into a final design/specification phase.
The Spanish STORE* project is also contributing to this functional objective.
Note: Projects marked with an * do not count any TSO on board. They have been provided by EASE members.
Assessment of the coverage of T5
The EEGI roadmap 2013-2020 had foreseen the following specific tasks in the functional
objective T5:
T5a. To validate the contribution of RES to voltage and frequency control,
balancing using VPP.
T5b. To monitor and control the network in order to avoid large-scale intra-zone
oscillations.
T5c. To validate integration scenarios where the network becomes more user-
friendly and copes with variable generation from RES.
T5d. To demonstrate various technologies for deploying energy mix from
conventional and renewable resources to stakeholders.
Coverage assessment
This functional objective has been widely covered by completed projects 80% of the task
are assessed as covered. Ongoing projects should complement this coverage by 10%.
Regarding the monitoring and control of the network in order to avoid large-scale intra-
zone oscillations, a large EU-level demonstration project is still necessary.

EUROPEAN COMMISSION Technical analysis of past and on-going projects
51 July 2016
6.3 Recommendations for the new R&I roadmap
Coverage rates in this Cluster 2 of transmission appear heterogeneous, due to the wide
spectrum of involved technologies in that cluster. This is one reason that has motivated
the change of organisation of the transmission roadmap by ENTSO-E: from an action driven
roadmap to a challenge-oriented roadmap with a systemic dimension and close to the
system needs.
To that purpose, in the new roadmap the actions related to the previous Cluster 2 on power
technologies will not appear any longer in a dedicated cluster. Two clusters should address
new technologies: a cluster dealing with the modernisation of the network where new
materials, new devices (such as storage) should help improve the performance of the
transmission system and another cluster dealing with flexibility options (DLR, power
electronics, etc.).
7. Transmission Cluster 3: Network operation
Cluster 3 is organized into 4 Functional Objectives: T6, T7, T8 and T9.
T6. Innovative tools and methods to observe and control the pan-European network
T7. Innovative tools and methods for coordinated operation with stability margin evaluation
T8. Improved training tools and methods to ensure better coordination at the regional and pan-European levels
T9. Innovative tools and approaches for pan-European network reliability assessment
7.1 Features of achievements in Cluster 3
7.1.1 Descriptive features
Categorization in functional objectives
The graphs below characterize the completed (43) and expected (8) achievements of the
projects’ results of cluster 3 (a light green colour was used for Cluster 3). As for previous
clusters, the first diagram on the left details the overall number of achievements in this
cluster, while the two diagrams on the right show the evolutions (completed vs expected)
in the relative number of achievements contributing to each Functional Objective
Figure 21: The portfolio of achievements in Cluster 3 (left: overall; middle: completed;
right: expected)
Highlights:
. Cluster 3 is the most populated cluster in terms of achievements, especially for
completed achievements. However only 8 out of 51 refer to expected achievements.

EUROPEAN COMMISSION Technical analysis of past and on-going projects
52 July 2016
. There is no particular distortion in the general balance in the three diagrams: T7
and T6 are representing the same share (slightly above 40%) while T9 represents
less than 20% of the sample.
Typology of achievements in Cluster 3
Figure 22: Typology of achievements in Cluster 3 in transmission
Highlights:
. Software type achievements followed by the methodology type are the most quoted
in Cluster 3.
. No (or very marginal) mention of database, policy, regulation, market in that
cluster.
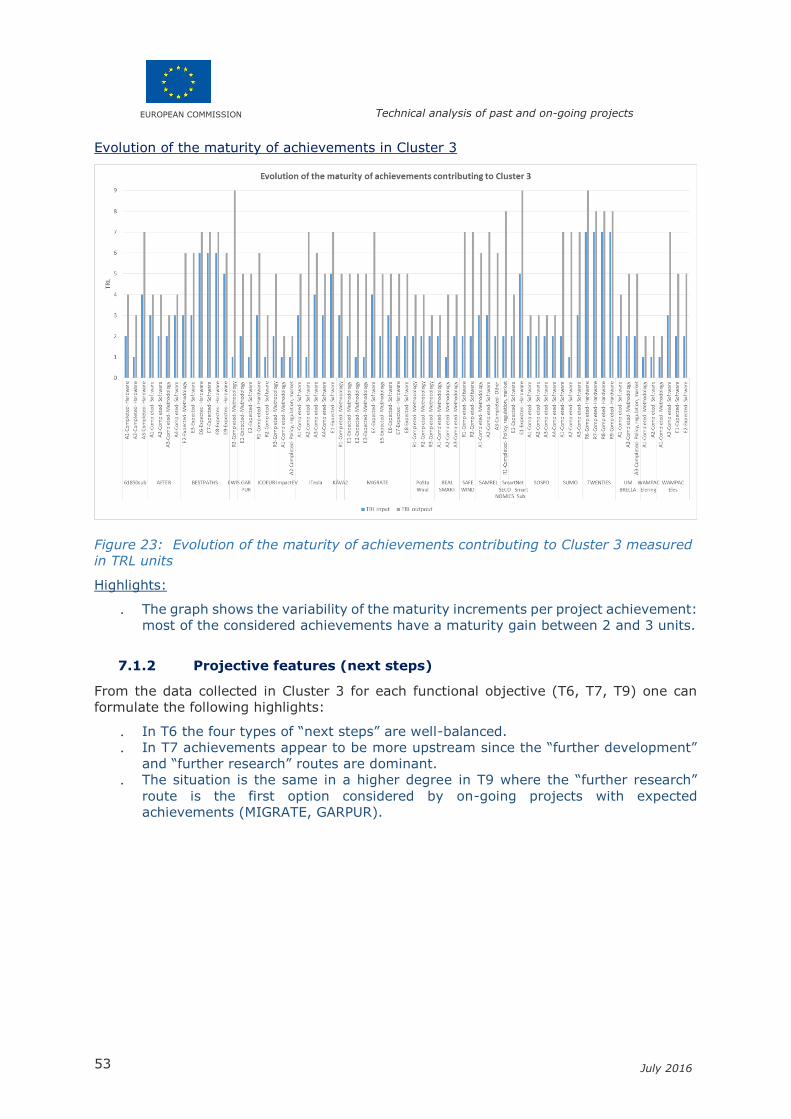
EUROPEAN COMMISSION Technical analysis of past and on-going projects
53 July 2016
Evolution of the maturity of achievements in Cluster 3
Figure 23: Evolution of the maturity of achievements contributing to Cluster 3 measured
in TRL units
Highlights:
. The graph shows the variability of the maturity increments per project achievement:
most of the considered achievements have a maturity gain between 2 and 3 units.
7.1.2 Projective features (next steps)
From the data collected in Cluster 3 for each functional objective (T6, T7, T9) one can
formulate the following highlights:
. In T6 the four types of “next steps” are well-balanced.
. In T7 achievements appear to be more upstream since the “further development”
and “further research” routes are dominant.
. The situation is the same in a higher degree in T9 where the “further research”
route is the first option considered by on-going projects with expected
achievements (MIGRATE, GARPUR).
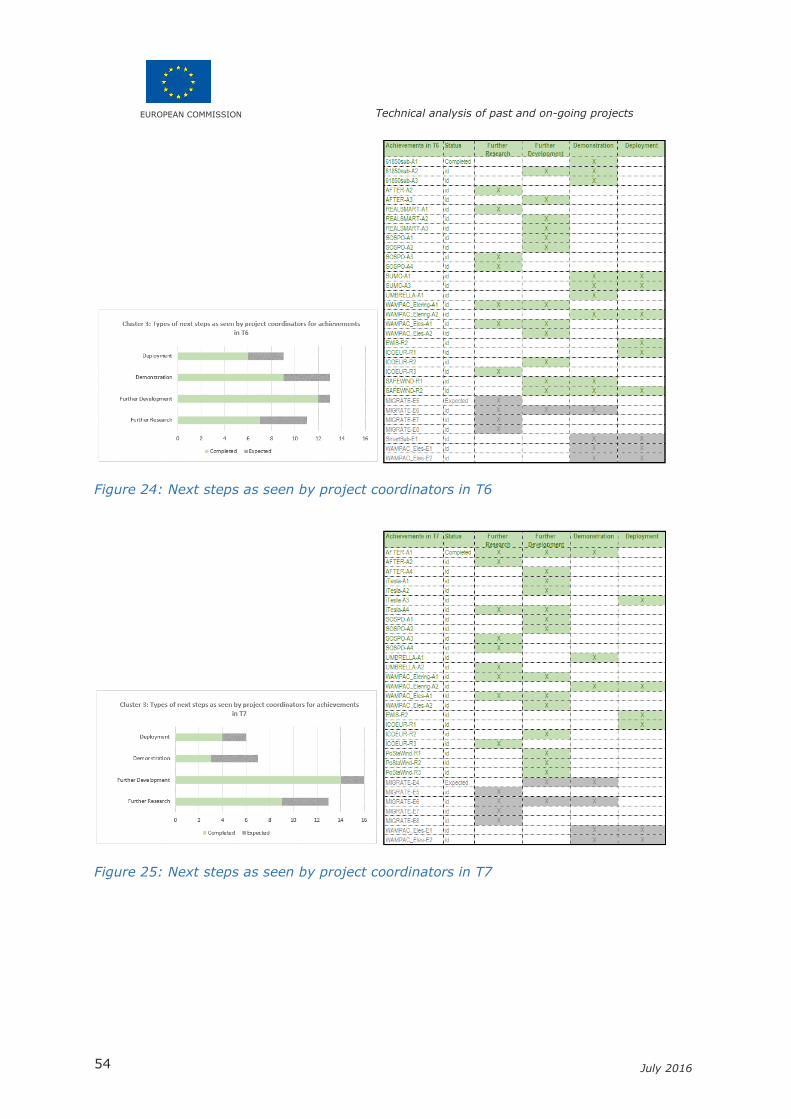
EUROPEAN COMMISSION Technical analysis of past and on-going projects
54 July 2016
Figure 24: Next steps as seen by project coordinators in T6
Figure 25: Next steps as seen by project coordinators in T7
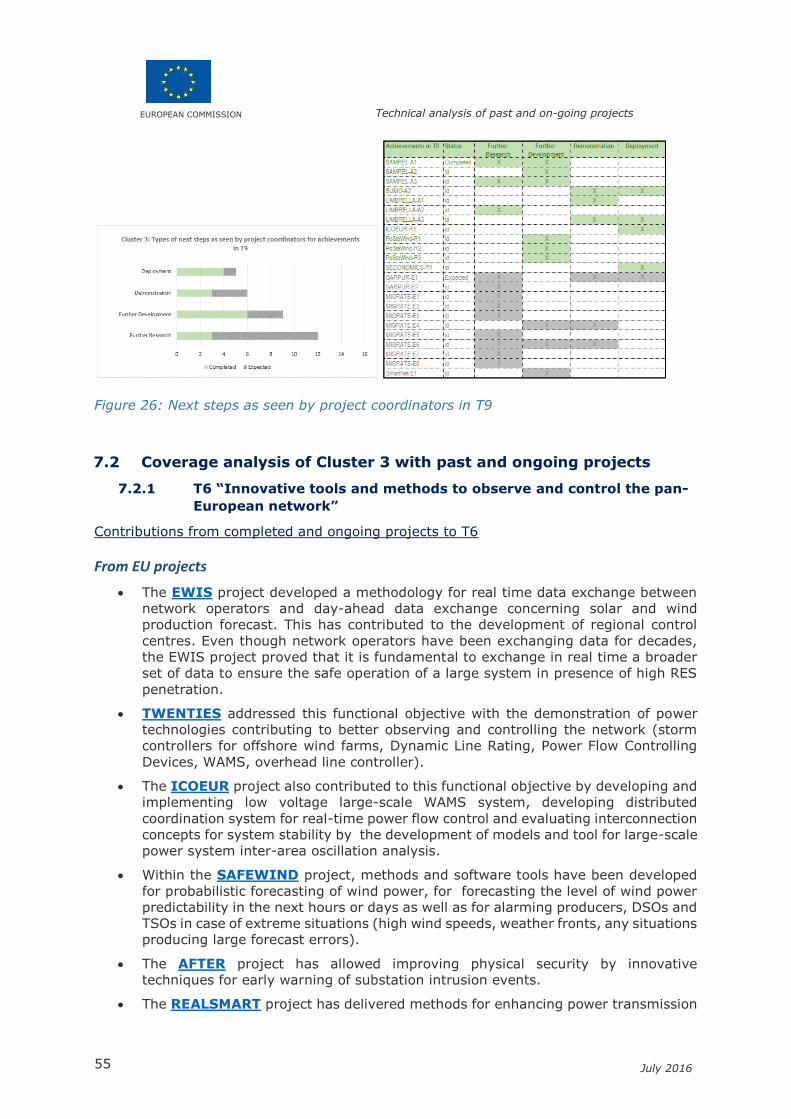
EUROPEAN COMMISSION Technical analysis of past and on-going projects
55 July 2016
Figure 26: Next steps as seen by project coordinators in T9
7.2 Coverage analysis of Cluster 3 with past and ongoing projects
7.2.1 T6 “Innovative tools and methods to observe and control the pan-
European network”
Contributions from completed and ongoing projects to T6
From EU projects
The EWIS project developed a methodology for real time data exchange between
network operators and day-ahead data exchange concerning solar and wind
production forecast. This has contributed to the development of regional control
centres. Even though network operators have been exchanging data for decades,
the EWIS project proved that it is fundamental to exchange in real time a broader
set of data to ensure the safe operation of a large system in presence of high RES
penetration.
TWENTIES addressed this functional objective with the demonstration of power
technologies contributing to better observing and controlling the network (storm
controllers for offshore wind farms, Dynamic Line Rating, Power Flow Controlling
Devices, WAMS, overhead line controller).
The ICOEUR project also contributed to this functional objective by developing and
implementing low voltage large-scale WAMS system, developing distributed
coordination system for real-time power flow control and evaluating interconnection
concepts for system stability by the development of models and tool for large-scale
power system inter-area oscillation analysis.
Within the SAFEWIND project, methods and software tools have been developed
for probabilistic forecasting of wind power, for forecasting the level of wind power
predictability in the next hours or days as well as for alarming producers, DSOs and
TSOs in case of extreme situations (high wind speeds, weather fronts, any situations
producing large forecast errors).
The AFTER project has allowed improving physical security by innovative
techniques for early warning of substation intrusion events.
The REALSMART project has delivered methods for enhancing power transmission
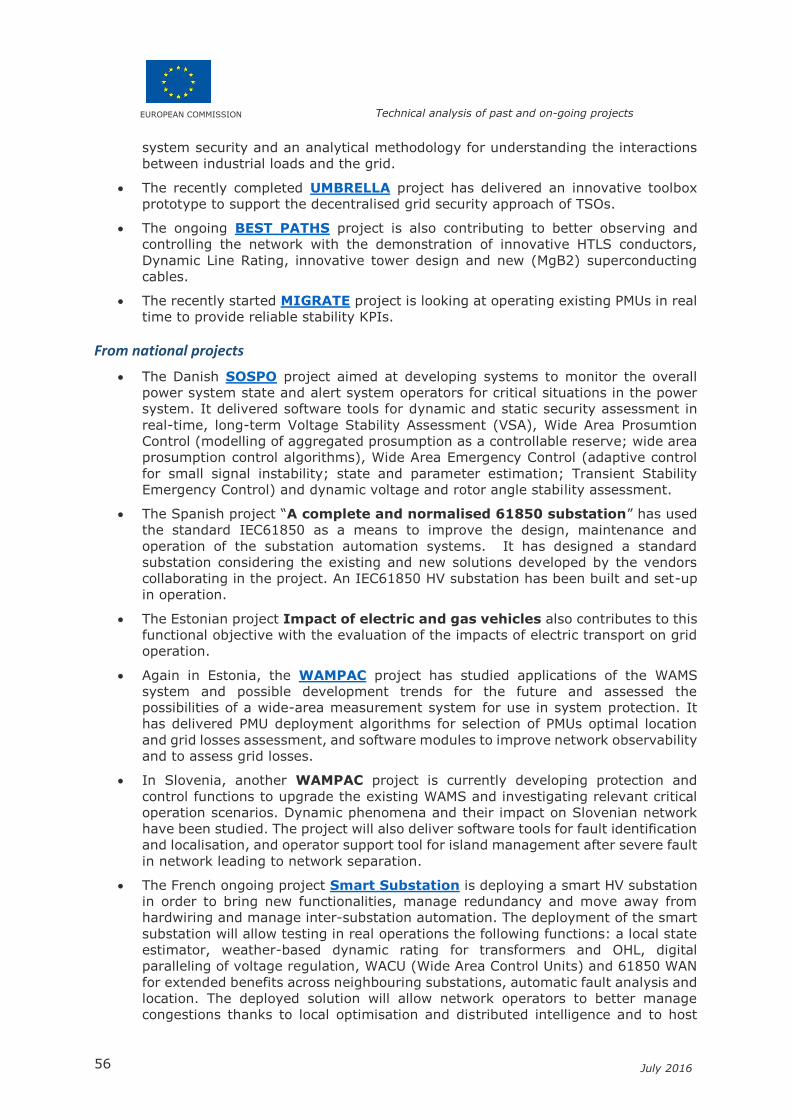
EUROPEAN COMMISSION Technical analysis of past and on-going projects
56 July 2016
system security and an analytical methodology for understanding the interactions
between industrial loads and the grid.
The recently completed UMBRELLA project has delivered an innovative toolbox
prototype to support the decentralised grid security approach of TSOs.
The ongoing BEST PATHS project is also contributing to better observing and
controlling the network with the demonstration of innovative HTLS conductors,
Dynamic Line Rating, innovative tower design and new (MgB2) superconducting
cables.
The recently started MIGRATE project is looking at operating existing PMUs in real
time to provide reliable stability KPIs.
From national projects
The Danish SOSPO project aimed at developing systems to monitor the overall
power system state and alert system operators for critical situations in the power
system. It delivered software tools for dynamic and static security assessment in
real-time, long-term Voltage Stability Assessment (VSA), Wide Area Prosumtion
Control (modelling of aggregated prosumption as a controllable reserve; wide area
prosumption control algorithms), Wide Area Emergency Control (adaptive control
for small signal instability; state and parameter estimation; Transient Stability
Emergency Control) and dynamic voltage and rotor angle stability assessment.
The Spanish project “A complete and normalised 61850 substation” has used
the standard IEC61850 as a means to improve the design, maintenance and
operation of the substation automation systems. It has designed a standard
substation considering the existing and new solutions developed by the vendors
collaborating in the project. An IEC61850 HV substation has been built and set-up
in operation.
The Estonian project Impact of electric and gas vehicles also contributes to this
functional objective with the evaluation of the impacts of electric transport on grid
operation.
Again in Estonia, the WAMPAC project has studied applications of the WAMS
system and possible development trends for the future and assessed the
possibilities of a wide-area measurement system for use in system protection. It
has delivered PMU deployment algorithms for selection of PMUs optimal location
and grid losses assessment, and software modules to improve network observability
and to assess grid losses.
In Slovenia, another WAMPAC project is currently developing protection and
control functions to upgrade the existing WAMS and investigating relevant critical
operation scenarios. Dynamic phenomena and their impact on Slovenian network
have been studied. The project will also deliver software tools for fault identification
and localisation, and operator support tool for island management after severe fault
in network leading to network separation.
The French ongoing project Smart Substation is deploying a smart HV substation
in order to bring new functionalities, manage redundancy and move away from
hardwiring and manage inter-substation automation. The deployment of the smart
substation will allow testing in real operations the following functions: a local state
estimator, weather-based dynamic rating for transformers and OHL, digital
paralleling of voltage regulation, WACU (Wide Area Control Units) and 61850 WAN
for extended benefits across neighbouring substations, automatic fault analysis and
location. The deployed solution will allow network operators to better manage
congestions thanks to local optimisation and distributed intelligence and to host

EUROPEAN COMMISSION Technical analysis of past and on-going projects
57 July 2016
more renewables such as wind power.
Assessment of the coverage of T6
The EEGI roadmap 2013-2020 had foreseen the following specific tasks in the functional
objective T6:
T6a. To assess and validate the performance of intelligent local sensors and data
processing equipment (with sensor manufacturers) against the requirements
of state estimation and dynamic simulation.
T6b. To develop a toolbox to increase awareness of pan-European
operation/optimisation vs. local and regional approaches.
T6c. To develop local state models with a sufficient level of intelligence at the
substation level and to use this valuable information with state estimators
and dynamic simulation tools. These models will be aggregated for assessing
the observability and controllability at the pan-European level.
T6d. To increase observability and improve state estimation accuracy (both
steady-state and dynamic) through adequate modelling (including not only
modelling protection and system automatic schemes to some extent, but
also by merging transmission and distribution models).
T6e. To exploit the information provided by forecasts of variable generation and
flexible demand for observability and controllability purposes.
T6f. To increase network controllability by proposing methods and tools for
optimal and coordinated use of flexible equipment such as FACTS, PSTs and
HVDC links, resulting in safe and cost-effective system operations (e.g.,
maximising the global social welfare).
Coverage assessment
We estimate that completed projects have covered about 60% of those specific tasks. An
additional 20% should be covered by ongoing projects. Local state models still need to be
aggregated for assessing observability and controllability at the pan-European level. There
is still some work to do on flexible demand forecast at the TSO level.
7.2.2 T7 “Innovative tools and methods for coordinated operation with
stability margin evaluation”
Contributions from completed and ongoing projects to T7
From EU projects
TWENTIES delivered a centralised control and co-optimisation across the value
chain (wind, CHPs, local generation and load) for cost efficient system services and
wind balancing (inter- and intraday energy markets/ancillary services provided by
VPP mobilisation and control of local assets). Demonstrations of Dynamic Line
Rating systems, Power Flow Controlling Devices and WAMS brought solutions to
increase the existing network capacity and flexibility at affordable investment costs,
while ensuring that stability and security margins remain within acceptable ranges
and promoting regional coordination approaches to increase the network flexibility.
AFTER delivered methods and tools for global vulnerability analysis and risk
assessment of power systems, physical security improvement by innovative
techniques for early warning of substation intrusion events, advanced defence of
EUROPEAN COMMISSION Technical analysis of past and on-going projects
58 July 2016
power system operation following severe grid outages by innovative defence plans
techniques and a software tool for system restoration after major disruptions by
adaptive and efficient restoration plans.
The data exchange methodology developed by the EWIS project contributes to this
functional objective.
The ICOEUR project also contributed to this functional objective.
The recently finished iTesla project aimed at improving network operations with a
new security assessment tool able to cope with increasingly uncertain operating
conditions and take advantage of the growing flexibility of the grid. The developed
toolbox supports the decision making process for network operation from two-days
ahead to real time, based on three main features:
− provide a risk-based assessment taking into account the different sources of
uncertainties (in particular intermittent power generation), the probabilities
of contingencies and the possible failures of corrective actions;
− perform accurate security assessment taking into account the dynamics of
the system using time-domain simulations;
− provide operators with relevant proposals of preventive and curative actions
to keep the system in a secure state.
1. The toolbox will allow TSOs to address network simulations of their own system, of
coordinated regional systems or of the whole Pan-European system. Further
developments will be necessary to make it a fully operational toolbox for system
operators and to demonstrate in economic and operational terms the added value
of the iTesla concept.
The recently finished UMBRELLA project has provides a toolbox prototype for TSOs
to ensure secure grid operation in future electricity networks with high penetration
of intermittent renewables. It enables TSOs to act in a coordinated European target
system where regional strategies converge to ensure the best possible use of the
European electricity infrastructure. Risk-based security assessment methods,
deterministic and probabilistic approaches have been developed.
The ongoing BEST PATHS project is also contributing to this functional objective.
The recently started MIGRATE project will deliver recommendations on network
connection code. There is no existing methodology providing guidance on how to
implement mitigation measures when facing PE generated instabilities during
operations. Mitigation measures to address stability issues when operating a
transmission network with high PE penetration will be proposed. Recommendations
on network connection code implementation will also be proposed.
From national projects
The Finnish KÄVA2 project developed a methodology to estimate probability-based
security levels, in order to increase the knowledge and understanding of probability-
based security in planning and operation.
In Finland, Norway and Sweden, the PoStaWind project studied wind power
integration in the Nordic transmission system (inter-area power oscillation,
synthetic inertia from wind farms, transient reactive power).
The Danish SOSPO project, the WAMPAC project in Estonia and the other
WAMPAC in Slovenia are also contributing to this functional objective.
EUROPEAN COMMISSION Technical analysis of past and on-going projects
59 July 2016
Assessment of the coverage of T7
The EEGI roadmap 2013-2020 had foreseen the following specific tasks in the functional
objective T7:
T7a. To assess the effectiveness of control actions that deliver the right level of
reliability while facing uncertainties from the large-scale deployment of RES
and market integration.
T7b. To develop approaches for optimal provisioning, dimensioning and sourcing
of reserves together with local and/or regional distribution in order to
maintain security of supply; to deliver dynamic management of system
reserves at regional and pan-European levels.
T7c. To implement stochastic approaches to critical optimisation variables (larger
dispersions around the deterministic values obtained from the current steady
state simulation tools) in order to cope adequately with uncertainties.
T7d. To facilitate converging policies for operational planning and to support the
harmonisation of operating rules across Europe.
T7e. To propose data exchange procedures for adequate system simulation; to
identify critical contingencies and to assess residual risks while taking into
account effectiveness and availability of control actions and automatic
protection schemes while identifying action paths to be implemented.
T7f. To enable real-time detection of instabilities and prevent limit transgression
in transmission systems and to develop new approaches to coordinate
defence and restoration plans.
Coverage assessment
The specific tasks in this functional objective have all been tackled by past and ongoing
projects. We assess that 80% of the tasks have been covered, while 10% should be
covered by ongoing projects. There is still some work to do on new approaches to
coordinate defence and restoration plans.
7.2.3 T8 “Improved training tools and methods to ensure better
coordination at the regional and pan-European levels”
Contributions from completed and ongoing projects to T8
Within our project database, no achievement (past nor expected) is linked to this functional
objective.
Assessment of the coverage of T8
The EEGI roadmap 2013-2020 had foreseen the following specific tasks in the functional
objective T8:
T8a. To deliver real-time simulation of the entire interconnected European power
system for training purposes.
T8b. To train dispatchers to reproduce and understand large-scale incidents.
T8c. To provide training and certification to operators on a validated European
power system model and to improve emergency response procedures.
EUROPEAN COMMISSION Technical analysis of past and on-going projects
60 July 2016
T8d. To make the dispatching training simulation facility available to other
operators, such as power plant operators and distribution network operators
in order to improve the network interfaces between transmission/generation
and transmission/distribution.
T8e. To develop and test common procedures for emergency scenarios.
T8f. To enable operator training by specifying the training simulator of the future,
including the validation of critical algorithms.
T8g. To enable experimentation on what future training should include and who
should be involved in order to learn and test the benefits of coordination
mechanisms in stable and critical situations.
T8h. To establish, validate, and deliver default data to fill all the gaps in such a
way that simulations are realistic enough for the targeted use.
Coverage assessment
The coverage of these specific tasks was not assessed since no project linked to this
functional objective was found in the questionnaires filled in by the project
coordinators10. However, ENTSO-E in its R&D monitoring report 2015 considers that 21%
of this functional objective is covered. According to ENTSO-E, further R&I work should
be conducted for:
• RT8a, where a simulation of the entire interconnected European power system
is needed;
• T8b, where there is still work to do on the training.
• T8d, for which the training facility is not available yet.
• T8c, T8e, T8f, T8g and T8h which have not been addressed yet.
7.2.4 T9 “Innovative tools and approaches for pan-European network
reliability assessment”
Contributions from completed and ongoing projects to T9
From EU projects
With the SECONOMICS project, a toolkit to security policy-makers seeking to
understand their policy alternatives and the potential impact of their decisions has
been developed. Recommendations for a policy framework for comparing the effect
of different security regulations have been delivered.
The low voltage large-scale WAMS developed within the ICOEUR project also
contributes to this functional objective.
The UMBRELLA project has developed risk-based security assessment methods
and recommendations to ENTSO-E regarding TSO and Regional Security
Coordination Initiatives (RSCI) rules for business processes and data exchange.
The ongoing GARPUR project is developing new reliability management approach
and criteria (RMAC) for the pan-European electric power system, which should
10 Project coordinators have chosen themselves the functional objectives linked to the achievements in their projects. They may have overlooked this functional objective. Some projects considered in the ENTSO-E R&D monitoring report 2015 are not in the Grid+Storage database, like for instance the PEGASE project for which the interview of the coordinator could not be performed in due time.
EUROPEAN COMMISSION Technical analysis of past and on-going projects
61 July 2016
− be aware of the spatial-temporal variation of the probabilities of exogenous
threats and take into account the socio-economic impact of its decisions,
− explicitly take into account corrective control measures and their probability
of failure,
− incorporate the possibility of using demand-side management to secure
system operations,
− cover both normal threats, as well as low-probability high-impact threats,
− cover the multiple decision making contexts and timescales (long term
planning, mid-term & asset management, short-term planning to real-time
operation),
− take into account the multi-agent and multi-area nature of the organisation
of the pan-European electric power system (several TSOs, DSOs, MOs,
regulatory regimes, etc.).
The project is also developing a prototype software tool (the GARPUR Quantification
Platform) to evaluate the socio-economic impact of the new RMAC. The GQP will
include the modelling of TSO decision-making processes in day-ahead and intraday
and of TSO short-term reliability management candidate decisions.
The recently started SmartNet project aims at providing architectures for
optimised interaction between TSOs and DSOs in managing the exchange of
information for the acquisition of ancillary services (reserve and balancing, voltage
regulation, congestion management) from distributed resources (DSM, scattered
generation), both at national level and in a cross-border context. A software tool
for such optimised architectures is being developed.
From national projects
In Norway, Denmark and Finland, the SAMREL methodology provides an
integration of the power market simulator (EMPS) and a newly developed
methodology for reliability and interruption cost assessment (OPAL) with power flow
models. Such an integration is required to provide a comprehensive and consistent
approach for security of electricity supply analysis. A methodology for the chain of
analyses from power market analysis to reliability of supply analysis, a prototype
tool for security of supply and vulnerability analysis, tested on a regional, national
and Nordic level, and the evaluation and grouping of power market scenarios have
been delivered.
The KÄVA2, PoStaWind and Impact of electric and gas vehicles projects also
contribute to this functional objective.
Assessment of the coverage of T9
The EEGI roadmap 2013-2020 had foreseen the following specific tasks in the functional
objective T9:
T9a. To evaluate the current performance of the (N-1) criteria security principles
and the required level of reliability from the customer’s perspective.
T9b. To identify the possible options for replacing (or complementing) the current
reliability principles using a system approach to be used in different aspects
of TSO business: grid development, markets, reserve planning, etc.
T9c. To define the additional information to be exchanged and the additional
coordination needed to support deployment and to ensure effective and
sufficient security margins during operation and operational planning.
T9d. To provide an appropriate approach to risk assessment for the evaluated
criteria based on probabilistic analyses which takes correlations in the power
system.
EUROPEAN COMMISSION Technical analysis of past and on-going projects
62 July 2016
T9e. To develop indicators for the evaluated criteria for network operators to help
them make decisions for preventive and curative actions.
Coverage assessment
We consider here that past achievements cover around half (50%) of these specific tasks.
Ongoing projects should allow covering one additional quarter (25%) with no clear view on
the application of the new reliability principles by the TSOs. In addition, there is a need for
further work on information exchanges.
7.3 Recommendations for the new R&I roadmap
Coverage ratios are rather high for T6 and T7, but lower for T8 and T9. Here again the
network operations actions referring to various challenges motivated ENTSO-E to
redispatch them into clusters dealing with the network security or to its flexibility. The
challenges mentioned for each cluster should be coherent with the specifications of the
integrated roadmap, e.g. storage as a new flexibility option or demand response as a way
to achieve a customer centric power system. Regarding security, the ever increasing share
of renewables calls for R&I work regarding ancillary services provided by RES as well as
defence and restoration plans involving RES.
8. Transmission Cluster 4: Market design
Cluster 4 is organized into 3 Functional Objectives: T10, T11 and T12.
T10. Advanced pan-European market tools for ancillary services and balancing, including active demand management
T11. Advanced tools for capacity allocation and congestion management
T12. Tools and market mechanisms for ensuring system adequacy and efficiency in electric systems integrating very large amounts of RES generation
8.1 Descriptive features of achievements in Cluster 4
8.1.1 Descriptive features
Categorization in functional objectives
The graphs below characterize the completed (16) and expected (11) achievements of the
projects’ results of cluster 3 (a salmon colour is used for Cluster 4). Again, comparing the
first diagram on the left with the two on the right allows detecting some evolutions in the
relative number of achievements contributing to each Functional Objective.

EUROPEAN COMMISSION Technical analysis of past and on-going projects
63 July 2016
Figure 27: The portfolio of achievements in Cluster 4 (left: overall; middle: completed;
right: expected)
Highlights:
. Cluster 4 is clearly subject to evolutions when comparing the respective share of
completed and expected achievements. Expected achievements represent 11 units
out of a total of 27 which is significant compared to the other clusters.
. About half of the completed achievements belong to T10.
. For the expected achievement, the distribution is more balanced with shares in the
range of 30-40% with an increasing relative share of T12.
Typology of achievements in Cluster 4
Figure 28: Typology of achievements in Cluster 4 in transmission
Highlights:
. Achievements in this cluster consist mainly in software and methodologies, while
the “policy, regulation and market” type slightly emerges which is consistent with
the R&I activities to be addressed in the cluster.
. Database and hardware types remain marginal.

EUROPEAN COMMISSION Technical analysis of past and on-going projects
64 July 2016
Evolution of the maturity of achievements in Cluster 4
Figure 29: Evolution of the maturity of achievements contributing to Cluster 4 measured
in TRL units
Highlights:
. The same remarks as for the previous clusters on the average maturity gain applies
here.
. One should however notice the important maturity step resulting from the
OPTIMATE achievements (software, methodology, database).
. The Estfeed and EcoGRID achievements present similar features in the maturity
scale.
8.1.2 Projective features (next steps)
From the available data for each functional objective (T10, T11, T12), one can formulate
the following highlights:
. The relative share of the expected achievements compared to the whole Cluster
achievements appears higher in Cluster 4 than in previous Clusters (more grey vs.
salmon colour)
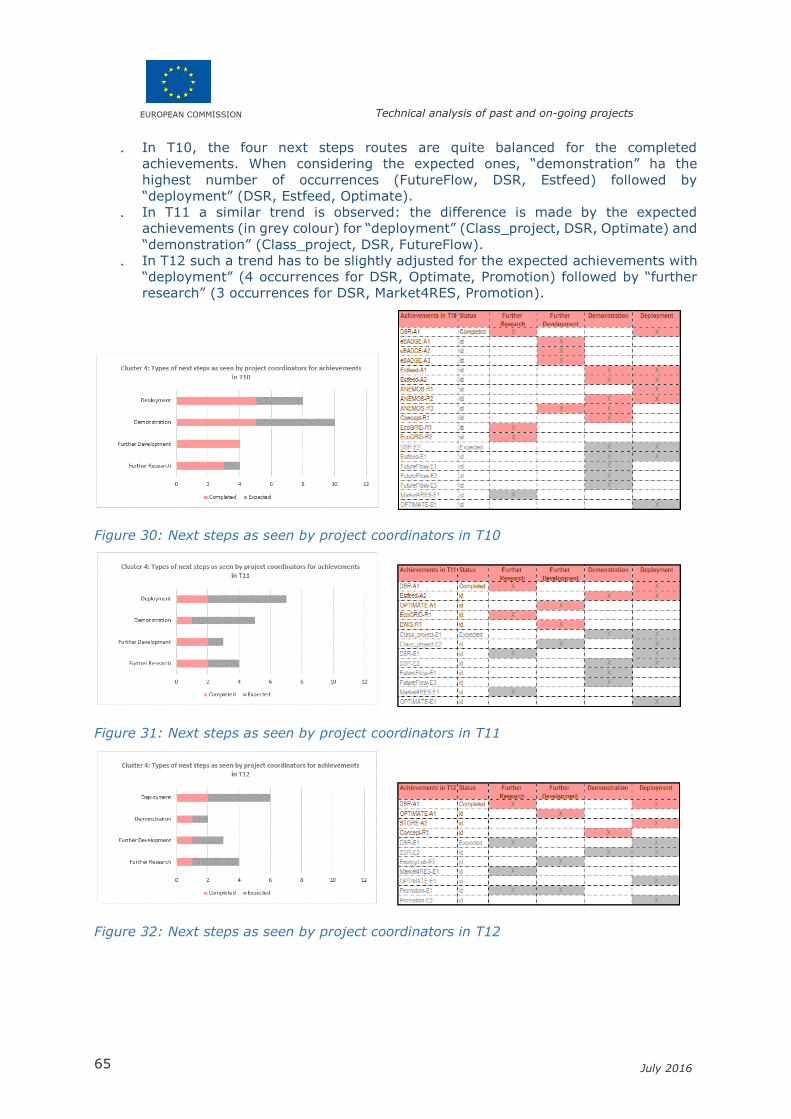
EUROPEAN COMMISSION Technical analysis of past and on-going projects
65 July 2016
. In T10, the four next steps routes are quite balanced for the completed
achievements. When considering the expected ones, “demonstration” ha the
highest number of occurrences (FutureFlow, DSR, Estfeed) followed by
“deployment” (DSR, Estfeed, Optimate).
. In T11 a similar trend is observed: the difference is made by the expected
achievements (in grey colour) for “deployment” (Class_project, DSR, Optimate) and
“demonstration” (Class_project, DSR, FutureFlow).
. In T12 such a trend has to be slightly adjusted for the expected achievements with
“deployment” (4 occurrences for DSR, Optimate, Promotion) followed by “further
research” (3 occurrences for DSR, Market4RES, Promotion).
Figure 30: Next steps as seen by project coordinators in T10
Figure 31: Next steps as seen by project coordinators in T11
Figure 32: Next steps as seen by project coordinators in T12
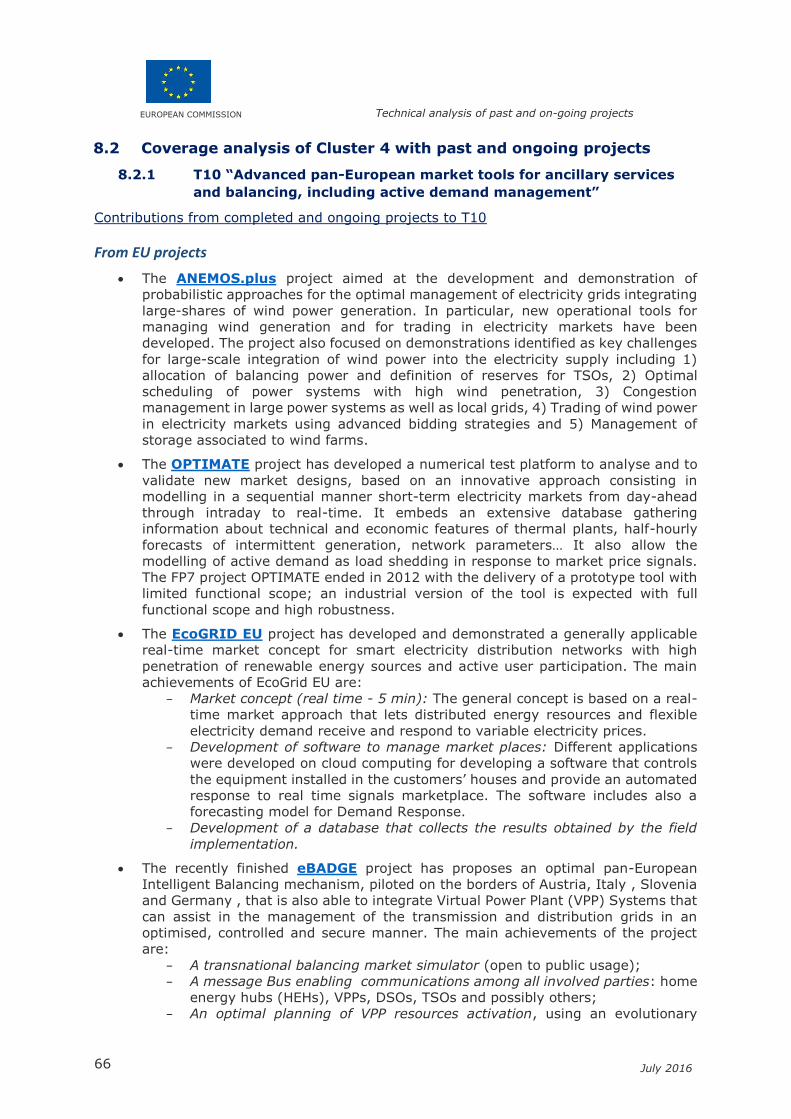
EUROPEAN COMMISSION Technical analysis of past and on-going projects
66 July 2016
8.2 Coverage analysis of Cluster 4 with past and ongoing projects
8.2.1 T10 “Advanced pan-European market tools for ancillary services
and balancing, including active demand management”
Contributions from completed and ongoing projects to T10
From EU projects
The ANEMOS.plus project aimed at the development and demonstration of
probabilistic approaches for the optimal management of electricity grids integrating
large-shares of wind power generation. In particular, new operational tools for
managing wind generation and for trading in electricity markets have been
developed. The project also focused on demonstrations identified as key challenges
for large-scale integration of wind power into the electricity supply including 1)
allocation of balancing power and definition of reserves for TSOs, 2) Optimal
scheduling of power systems with high wind penetration, 3) Congestion
management in large power systems as well as local grids, 4) Trading of wind power
in electricity markets using advanced bidding strategies and 5) Management of
storage associated to wind farms.
The OPTIMATE project has developed a numerical test platform to analyse and to
validate new market designs, based on an innovative approach consisting in
modelling in a sequential manner short-term electricity markets from day-ahead
through intraday to real-time. It embeds an extensive database gathering
information about technical and economic features of thermal plants, half-hourly
forecasts of intermittent generation, network parameters… It also allow the
modelling of active demand as load shedding in response to market price signals.
The FP7 project OPTIMATE ended in 2012 with the delivery of a prototype tool with
limited functional scope; an industrial version of the tool is expected with full
functional scope and high robustness.
The EcoGRID EU project has developed and demonstrated a generally applicable
real-time market concept for smart electricity distribution networks with high
penetration of renewable energy sources and active user participation. The main
achievements of EcoGrid EU are:
− Market concept (real time - 5 min): The general concept is based on a real-
time market approach that lets distributed energy resources and flexible
electricity demand receive and respond to variable electricity prices.
− Development of software to manage market places: Different applications
were developed on cloud computing for developing a software that controls
the equipment installed in the customers’ houses and provide an automated
response to real time signals marketplace. The software includes also a
forecasting model for Demand Response.
− Development of a database that collects the results obtained by the field
implementation.
The recently finished eBADGE project has proposes an optimal pan-European
Intelligent Balancing mechanism, piloted on the borders of Austria, Italy , Slovenia
and Germany , that is also able to integrate Virtual Power Plant (VPP) Systems that
can assist in the management of the transmission and distribution grids in an
optimised, controlled and secure manner. The main achievements of the project
are:
− A transnational balancing market simulator (open to public usage);
− A message Bus enabling communications among all involved parties: home
energy hubs (HEHs), VPPs, DSOs, TSOs and possibly others;
− An optimal planning of VPP resources activation, using an evolutionary

EUROPEAN COMMISSION Technical analysis of past and on-going projects
67 July 2016
algorithm.
The ongoing Market4RES project is working on recommendations for the
implementation of policy, legislation and regulation across the renewable energy
sector, based on qualitative and quantitative analyses. In particular, different
design options for demand response (both explicit and implicit) have been studied
and assessed, and the impacts on electricity markets outcomes of a large-scale
deployment of demand response have been quantified with the OPTIMATE tool.
Regarding balancing, the project has also studied different aspects of the balancing
market design, including procurement of balancing services and calculation of
imbalance prices. Different options for the procurement of balancing capacity have
been subject to a quantitative analysis.
The recently started FutureFlow project is designing and testing comprehensive
techno-economic models for open and non-discriminatory access of advanced
consumers and distributed generators to a Regional Platform for ancillary/balancing
and redispatching services. In particular, the project will deliver a prototype
demand response (DR) and distributed generation (DG) flexibility aggregation
platform (or VPP), based on an innovative software solution able to deliver secure
and reliable frequency restoration reserves with automatic activation (aFRR) offers
to the TSOs. This innovative approach allows for a seamless integration of the biding
part on the one side, together with the automatic execution of the aFRR services
on the other side.
From national projects
The Danish project Concept2025 investigated several issues touching different
aspects for managing the system with very high variable RES (wind) penetration,
such as active power control, balancing, information exchange, flexible load, DER.
In Estonia, the ongoing DSR project has identified the demand-side response (DSR)
potential for Estonia and studied the opportunity to use DSR as a source of
flexibility. The study outcomes represent a base on which a competitive market for
demand management could be implemented. The future expected achievements
are related to the development of a market model for DSR and software solutions
for concretely manage DSR aggregation.
Again in Estonia, the Estfeed open software platform (managed by the TSO) is
being developed for energy consumptions monitoring and management from
customer perspective, capable to interact with grids and to provide data feeds to
service providers for an efficient use of energy.
Assessment of the coverage of T10
The EEGI roadmap 2013-2020 had foreseen the following specific tasks in the functional
objective T10:
T10a. To model aggregated RES/DER, flexible conventional generation,
demand and storage systems to be used for market design, market
mechanisms, and simulation tools for planning and operation purposes.
T10b. To design market mechanisms for incentivising both the maximisation
of the provision of ancillary services (including aggregated RES,
cogeneration and high-efficiency production, demand, storage, etc.) and
the minimisation of the use of ancillary services. The aim is to harmonise
the requirements of provider licences with supervision, control, and
recording of services provided.
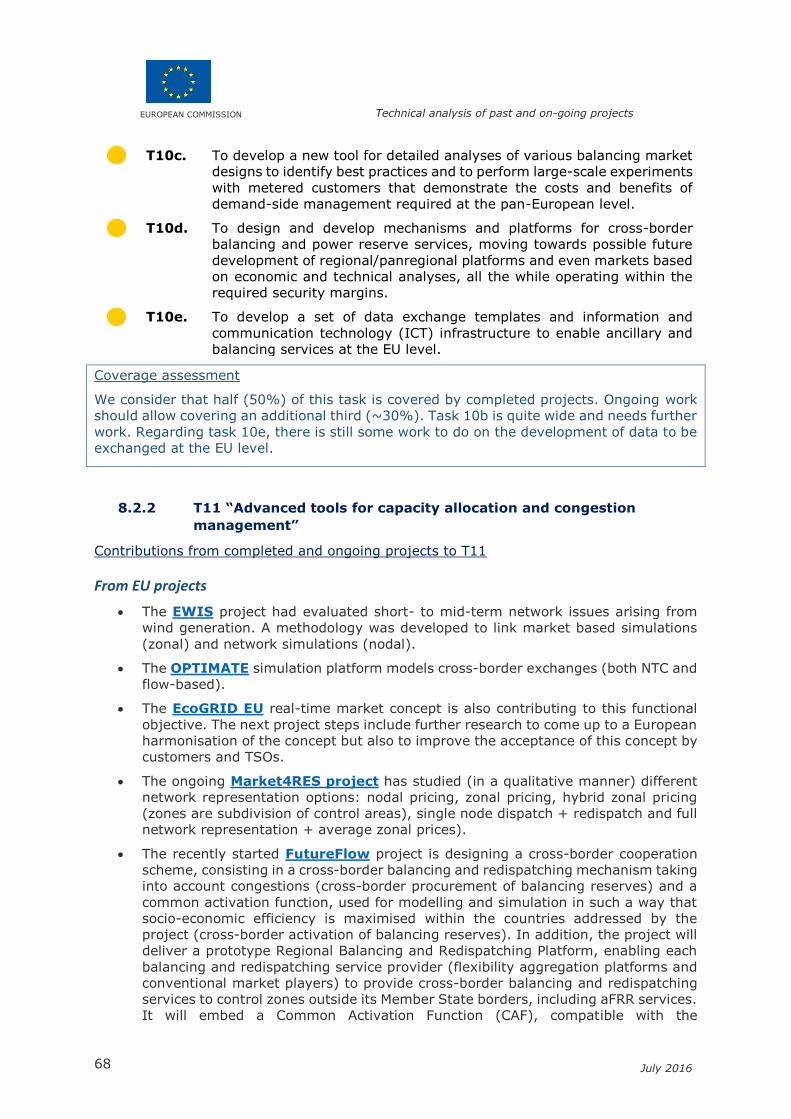
EUROPEAN COMMISSION Technical analysis of past and on-going projects
68 July 2016
T10c. To develop a new tool for detailed analyses of various balancing market
designs to identify best practices and to perform large-scale experiments
with metered customers that demonstrate the costs and benefits of
demand-side management required at the pan-European level.
T10d. To design and develop mechanisms and platforms for cross-border
balancing and power reserve services, moving towards possible future
development of regional/panregional platforms and even markets based
on economic and technical analyses, all the while operating within the
required security margins.
T10e. To develop a set of data exchange templates and information and
communication technology (ICT) infrastructure to enable ancillary and
balancing services at the EU level.
Coverage assessment
We consider that half (50%) of this task is covered by completed projects. Ongoing work
should allow covering an additional third (~30%). Task 10b is quite wide and needs further
work. Regarding task 10e, there is still some work to do on the development of data to be
exchanged at the EU level.
8.2.2 T11 “Advanced tools for capacity allocation and congestion
management”
Contributions from completed and ongoing projects to T11
From EU projects
The EWIS project had evaluated short- to mid-term network issues arising from
wind generation. A methodology was developed to link market based simulations
(zonal) and network simulations (nodal).
The OPTIMATE simulation platform models cross-border exchanges (both NTC and
flow-based).
The EcoGRID EU real-time market concept is also contributing to this functional
objective. The next project steps include further research to come up to a European
harmonisation of the concept but also to improve the acceptance of this concept by
customers and TSOs.
The ongoing Market4RES project has studied (in a qualitative manner) different
network representation options: nodal pricing, zonal pricing, hybrid zonal pricing
(zones are subdivision of control areas), single node dispatch + redispatch and full
network representation + average zonal prices).
The recently started FutureFlow project is designing a cross-border cooperation
scheme, consisting in a cross-border balancing and redispatching mechanism taking
into account congestions (cross-border procurement of balancing reserves) and a
common activation function, used for modelling and simulation in such a way that
socio-economic efficiency is maximised within the countries addressed by the
project (cross-border activation of balancing reserves). In addition, the project will
deliver a prototype Regional Balancing and Redispatching Platform, enabling each
balancing and redispatching service provider (flexibility aggregation platforms and
conventional market players) to provide cross-border balancing and redispatching
services to control zones outside its Member State borders, including aFRR services.
It will embed a Common Activation Function (CAF), compatible with the
EUROPEAN COMMISSION Technical analysis of past and on-going projects
69 July 2016
requirements of several Network Codes: each TSO connected to this Regional
Platform will then be able to perform its activities (including aFRR) by using the
offers from generators and consumers possibly located in the control area of
another TSO also connected to the Regional Balancing and Redispatching Platform.
From national projects
In Slovenia, the ongoing SUMO project deals with methods and software to
evaluate dynamic thermal rating (DTR) in real time and with a temporal horizon of
3 hours ahead (15, 30 45, 60, 120, 180 minutes ahead). The weather information
is integrated with current measurements, short-term load flow forecasts, and the
day ahead congestion forecasts (from ENTSO-E). In addition, fast methods are
developed to evaluate N-1 loading of the elements. In this case, beside weather
data, are also used: live measurements of power nodal injections across power grid,
live topology data, day-ahead congestion forecasts, hourly production, demand and
transit forecasts. The method developed is accurate enough for TSO purposes, and
very fast (1-2 minutes to obtain the response).
The Estonian DSR, the Spanish STORE* and the Italian CLASS* and VENTOTENE*
projects are also contributing to this functional objective.
Note: Projects marked with an * do not count any TSO on board. They have been provided by EASE members.
Assessment of the coverage of T11
The EEGI roadmap 2013-2020 had foreseen the following specific tasks in the functional
objective T11:
T11a. To investigate interactions between system operations and dynamic
capacity and reserve allocation methods at the regional and pan-European
levels to cope with uncertainties from RES and load and system
disturbances.
T11b. To model strategies in view of improved congestion management and to
analyse the possibility of more efficient options, if any exist, for the pan-
European electricity market.
T11c. To expand flow-based market coupling in areas with interdependent flows,
based on successful experience.
T11d. To develop an algorithm for computing potential extra capacities in real
time or as closely as possible, considering security criteria without the
need for counter-trading issues.
T11e. To perform risk-benefit analyses and develop an interface using the
Congestion Management Module (CMM).
Coverage assessment
In our views, only 20% of the tasks in this functional objective are covered by past project
achievements. Ongoing projects should allow covering an additional 20%. Most of the
activities in this functional objective need further work at EU level. In particular, the
possibility of more efficient options for congestion management have to be analysed for
the pan-European electricity market.
EUROPEAN COMMISSION Technical analysis of past and on-going projects
70 July 2016
8.2.3 T12 “Tools and market mechanisms for ensuring system adequacy
and efficiency in electric systems integrating very large amounts
of RES generation”
Contributions from completed and ongoing projects to T12
From EU projects
The OPTIMATE simulation platform allows testing and comparing new market
designs which may allow integrating massive flexible generation dispersed in
several regional power markets.
In relation with long-term markets, the ongoing Market4RES project is issuing
recommendations about the effects of RES support schemes, capacity remuneration
mechanisms, participation of demand in long-term markets, long-term cross-border
products, etc.
The recently started PROMOTION project, focused on offshore grid development
in the northern seas, will deliver recommendations for policies and market
mechanisms in order to boost investment in offshore HVDC systems.
From national projects
The Danish Concept2025 as well as the Estonian DSR project are also contributing
to this functional objective.
In Denmark, the ongoing EnergyLab Nordhavn* project is developing new
business models for renewable energy integration. The project utilizes
Copenhagen’s Nordhavn (Northern harbour) as a full-scale smart city energy lab
and demonstrates how electricity and heating, energy-efficient buildings and
electric transport can be integrated into an intelligent, flexible and optimized energy
system. The energy storage components of the project are thermal storage and
electrochemical storage in large batteries as well as batteries of electric vehicles.
Note: Projects marked with an * do not count any TSO on board. They have been provided by EASE members.
Assessment of the coverage of T12
The EEGI roadmap 2013-2020 had foreseen the following specific tasks in the functional
objective T12:
T12a. To design market mechanisms that allow participation of RES (active and
reactive power control), storage devices, and conventional generation shift
to ensure system adequacy and efficiency.
T12b. To design investment incentive regimes that promote conventional and RES
generation flexibility, new transmission capacity, and to foster storage
systems.
T12c. To design grid tariff mechanisms for active demand-side management to
correlate the load curve and RES integration.
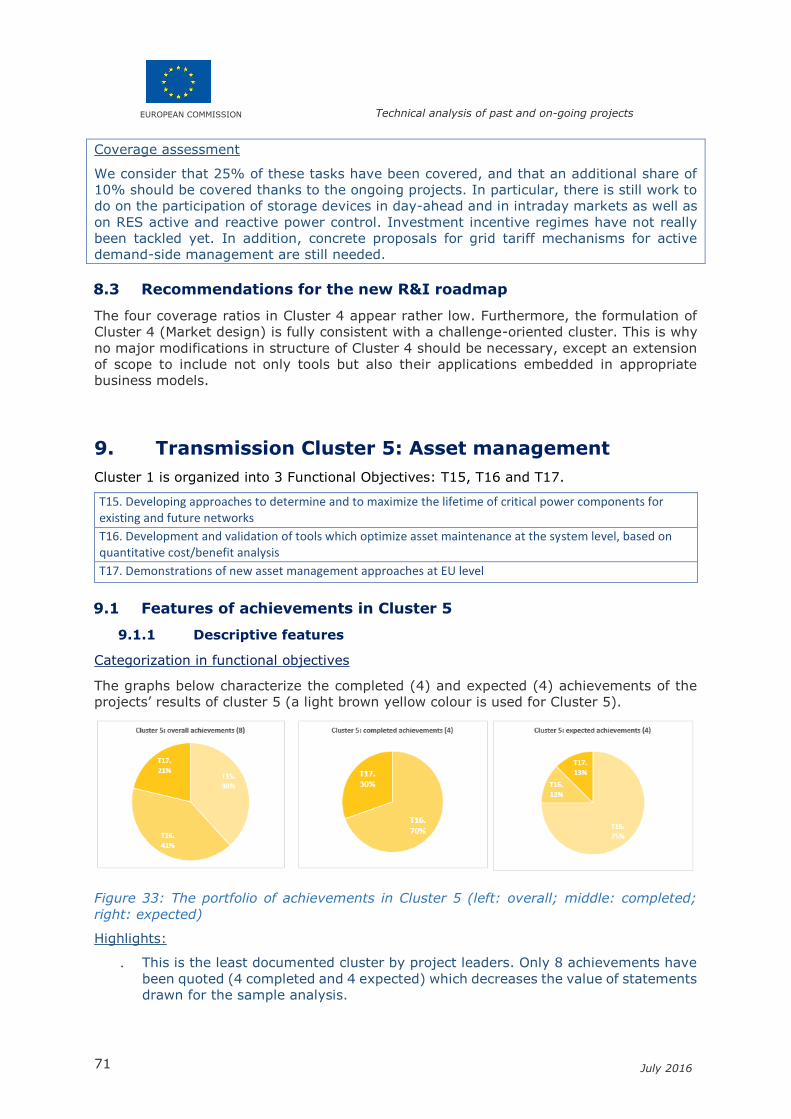
EUROPEAN COMMISSION Technical analysis of past and on-going projects
71 July 2016
Coverage assessment
We consider that 25% of these tasks have been covered, and that an additional share of
10% should be covered thanks to the ongoing projects. In particular, there is still work to
do on the participation of storage devices in day-ahead and in intraday markets as well as
on RES active and reactive power control. Investment incentive regimes have not really
been tackled yet. In addition, concrete proposals for grid tariff mechanisms for active
demand-side management are still needed.
8.3 Recommendations for the new R&I roadmap
The four coverage ratios in Cluster 4 appear rather low. Furthermore, the formulation of
Cluster 4 (Market design) is fully consistent with a challenge-oriented cluster. This is why
no major modifications in structure of Cluster 4 should be necessary, except an extension
of scope to include not only tools but also their applications embedded in appropriate
business models.
9. Transmission Cluster 5: Asset management
Cluster 1 is organized into 3 Functional Objectives: T15, T16 and T17.
T15. Developing approaches to determine and to maximize the lifetime of critical power components for existing and future networks
T16. Development and validation of tools which optimize asset maintenance at the system level, based on quantitative cost/benefit analysis
T17. Demonstrations of new asset management approaches at EU level
9.1 Features of achievements in Cluster 5
9.1.1 Descriptive features
Categorization in functional objectives
The graphs below characterize the completed (4) and expected (4) achievements of the
projects’ results of cluster 5 (a light brown yellow colour is used for Cluster 5).
Figure 33: The portfolio of achievements in Cluster 5 (left: overall; middle: completed;
right: expected)
Highlights:
. This is the least documented cluster by project leaders. Only 8 achievements have
been quoted (4 completed and 4 expected) which decreases the value of statements
drawn for the sample analysis.
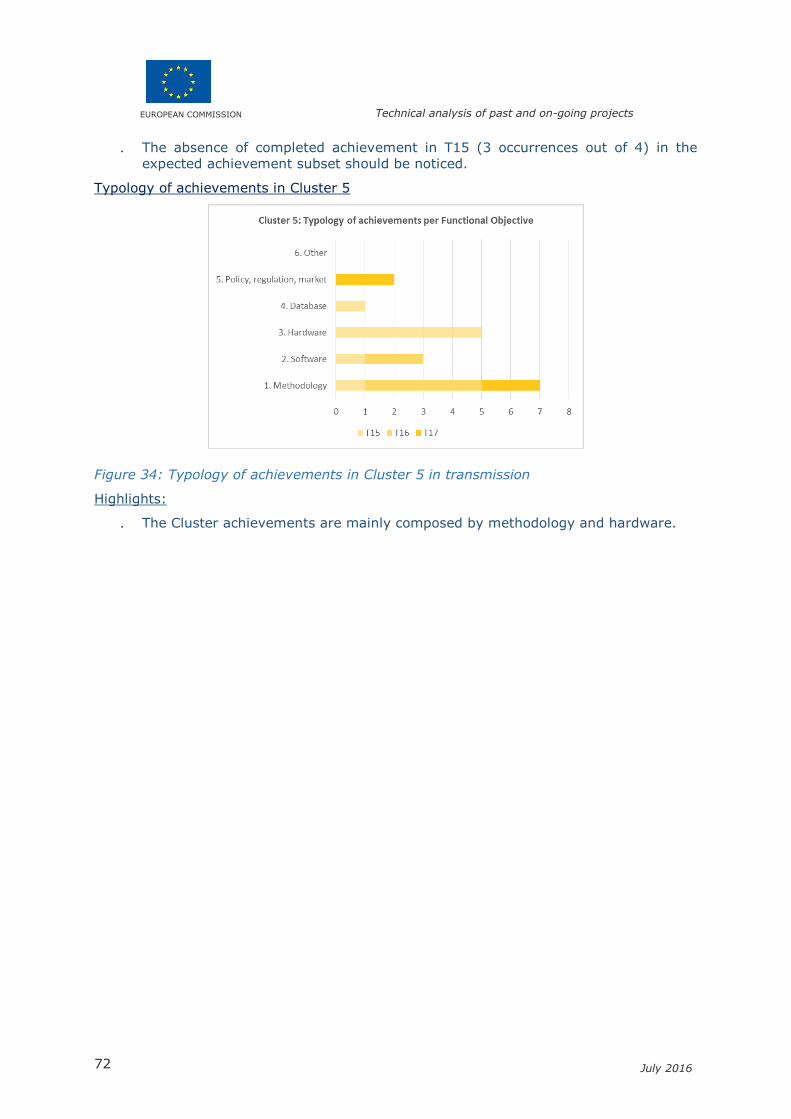
EUROPEAN COMMISSION Technical analysis of past and on-going projects
72 July 2016
. The absence of completed achievement in T15 (3 occurrences out of 4) in the
expected achievement subset should be noticed.
Typology of achievements in Cluster 5
Figure 34: Typology of achievements in Cluster 5 in transmission
Highlights:
. The Cluster achievements are mainly composed by methodology and hardware.

EUROPEAN COMMISSION Technical analysis of past and on-going projects
73 July 2016
Evolution of the maturity of achievements in Cluster 5
Figure 35: Evolution of the maturity of achievements contributing to Cluster 5 measured
in TRL units
Highlights:
. The variability of maturity gains in Cluster 5 appears on average as lower as the
one observed in the previous clusters. A gain of 5 is claimed by one achievements
of SECECONIMICS, while some achievements of GARPUR, Life and SmartSub
reaches an increment value of 4.
9.1.2 Projective features (next steps)
From the available data for each functional objective (T15, T16, T17), one can formulate
the following highlights:
. Achievements in Cluster 5 are mainly concentrated in T16 and T17.
. In T15 only two expected achievements of the Smart Substation project (SmartSub)
are quoted.
. It is difficult to draw trends due to the limited size of the Cluster 5 sample.

EUROPEAN COMMISSION Technical analysis of past and on-going projects
74 July 2016
Figure 36: Next steps as seen by project coordinators in T15
Figure 37: Next steps as seen by project coordinators in T16
Figure 38: Next steps as seen by project coordinators in T17
9.2 Coverage analysis of Cluster 5 with past and ongoing projects
9.2.1 T15 “Developing approaches to determine and maximise the
lifetime of critical power components for existing and future
networks”
Contributions from completed and ongoing projects to T15
From EU projects
Two of the BEST PATHS demonstrations are touching upon this functional
objective: the upgrade of multi-terminal HVDC links using innovative components,
and the innovative repowering of AC corridors.

EUROPEAN COMMISSION Technical analysis of past and on-going projects
75 July 2016
From national projects
The French ongoing project Smart Substation is addressing this topic. Asset
management functions will be tested in real operations, such as:
− monitoring of bushings: GE's intellix BMT 300 solution installed on a three
phase transformer (monitoring of bushings),
− analysis of dissolved gases,
− monitoring of temperatures and pressures of SF6 in the breakers,
− monitoring of inlet and outlet temperatures of heat exchanger,
− monitoring of the thermal state of the transformer with infra-red cameras,
− monitoring of the torque of electric motors for disconnectors, breakers and
the auxiliaries (pumps and fans).
The construction of databases for long term analysis is performed by using the
latest IT technologies (IoT, BigData).
Assessment of the coverage of T15
The EEGI roadmap 2013-2020 had foreseen the following specific tasks in the functional
objective T15:
T15a. To identify the parameters (climate conditions, operating conditions,
potential for hardware and software, among others) that affect the life span
of components.
T15b. To establish evaluation/estimation protocols for component statuses that
are comparable across TSOs with in-depth analyses and shared
experiences.
T15c. To develop a methodology to determine and expand the life span of
components, including conventional components (conductor, insulator,
tower, breaker, etc.) and new components, such as power electronic
devices and digital devices.
T15d. To propose dedicated, intelligent monitoring and analysis of results from
equipment operation.
T15e. If necessary, specify new measurement devices and associated ICT
systems.
T15f. To assess the environmental effects (noise, leakage, etc.) and safety for
workers or nearby inhabitants (especially in the case of failure), considering
the ageing processes and technical obsolescence.
T15g. To validate the added value of individual lifetime assessment compared to
an average assessment of several similar components based on generic
parameters (age of equipment, switching steps, etc.).
T15h. To assess the benefits of partially renewing small components (joints, etc.)
or adding new protective layers (paint coating) to extend life span. A
methodology is to be developed that assesses the capability of each
component to be partially repaired or where the coating is to be replaced.
T15i. To develop new ways of detecting component failure based on failure
models.

EUROPEAN COMMISSION Technical analysis of past and on-going projects
76 July 2016
Coverage assessment
We assess that less than 10% of the tasks have been covered. Ongoing projects should
allow covering very few more. There is work to do on the lifespan of power lines, on
evaluation/estimation protocols for component statuses, on methodologies to expand the
lifespan of components, on monitoring and analysis of the results from equipment
operation, on new measurement device specifications, on environmental and workers’
safety issues, etc.
9.2.2 T16 “Development and validation of tools which optimize asset
maintenance at the system level, based on quantitative
cost/benefit analysis”
Contributions from completed and ongoing projects to T16
From EU projects
The contribution of the SECONOMICS project is in developing and furthering the
state of the art in modelling security problems in a technological and socio economic
context and then applying state of the art risk assessments and analysis of the
social context to develop optimal policies.
The ongoing GARPUR project designs a probabilistic reliability management
approach which covers the multiple decision making contexts and timescales (long-
term planning, mid-term & asset management, short-term planning to real-time
operation). Regarding asset management, the project is working on finding the right
a balance between the money invested in asset management to reduce the failure
rates of the grid components, and the resulting reliability at the system level.
Description of current practices and identification of opportunities for improvement
have been delivered, and new methodologies (mid-term) outage scheduling
probabilistic assessment and (long-term) maintenance policy probabilistic
assessment are being developed, while keeping the data/modelling requirements in
mind.
The ongoing LIFE Elia-RTE project, aiming at creating green corridors under
overhead electrical lines in wooded areas in Belgium and France, is also taking into
account asset management issues and is therefore contributing to this functional
objective.
From national projects
The Finnish KÄVA2 project is contributing to this functional objective. A
methodology has been developed to evaluate components' failure rates for asset
management.
Assessment of the coverage of T16
The EEGI roadmap 2013-2020 had foreseen the following specific tasks in the functional
objective T16:
EUROPEAN COMMISSION Technical analysis of past and on-going projects
77 July 2016
T16a. To define methods and tools to optimise asset management at the system
level. The proposed methodology provides an assessment of the costs and
benefits of different asset management strategies. The methodology
proposes a risk-based approach at the system level, including interactions
between equipment, effects on security and the quality of supply, and on
environmental and safety constraints. The organisation of maintenance
work and availability of spare parts (supply chain, quantity of spare parts,
and location) are parts of the global optimisation challenge.
T16b. To provide tools for dynamic management of outage planning and
maintenance schedules.
Coverage assessment
It is considered that around 30% of these tasks are being covered. Some work is ongoing
but most of the tasks have not been addressed yet.
9.2.3 T17 “Demonstrations of new asset management approaches at EU
level”
Contributions from completed and ongoing projects to T17
From EU projects
The SECONOMICS and LIFE Elia-RTE projects are contributing to this functional
objective.
Assessment of the coverage of T17
The EEGI roadmap 2013-2020 had foreseen the following specific tasks in the functional
objective T17:
T17a. To utilise embedded ICT to monitor individual assets and to define a method
of supervision based on this information at the system level for several
TSOs in parallel.
T17b. To implement robotics for problem detection as well as to intervene in
hostile environments and avoid the need for human maintenance. These
include UAV to inspect overhead lines and robots that move while ‘grabbing’
the conductors.
T17c. To implement maintenance activities with the network ‘on’, especially for
DC equipment.
T17d. To propose scaling-up and replication rules for new asset management
approaches at the pan-European level.
Coverage assessment
It appears that most of the activities considered in this functional objectives are not
covered yet, or even not addressed.
9.3 Recommendations for the new R&I roadmap
Coverage ratios in this cluster when analysing project achievements are very low. Some
reorganization is necessary.
EUROPEAN COMMISSION Technical analysis of past and on-going projects
78 July 2016
It is recommended, as decided by ENTSO-E, to combine all R&I activities related to Asset
Management in a single functional objective included in a new cluster dealing with network
modernization.
10. Conclusion for Transmission
ENTSO-E, with the support of the Grid+Storage partners, decided to modify the general
organisation of the new R&I roadmap, going from a point of view driven by actions and
R&I activities to a point of view driven by challenges for the transmission system at the
pan-European level.
More specifically the previous Cluster 1 to 5 are modified as follow11:
• EXPAND the previous Cluster 1 “Grid Architecture” into a new Cluster 1
“Modernization of the Network” enriched by asset management issues (integration
of the old cluster 5) and R&I activities dealing with new materials and power
technologies.
• REMOVE the previous Cluster 2 due to the change of perspectives from an activity-
driven roadmap to a challenge-oriented roadmap. Some of the R&I activities
previously covered in this cluster are now distributed in the new Cluster 1 (cf.
above) and the new Cluster 3 “Power System Flexibility”.
• SPLIT the previous Cluster 3 “Network Operation” into the new Cluster 2 “Security
and system stability” and the new Cluster 3 “Power System Flexibility” in order to
be coherent with the specifications of the integrated roadmap, e.g. storage as a
new flexibility option or demand response as a way to achieve a customer centric
power system. Regarding security, the ever increasing share of renewables calls for
R&I work regarding ancillary services provided by RES as well as defence and
restoration plans involving RES.
• EXPAND the previous Cluster 4 “Market designs” to the new Cluster 4 “Economic
Efficiency of Power System” taking into account not only tools, but also market
applications and business models.
• INTEGRATE the previous Cluster 5 “Asset Management” into the new Cluster 1
“Modernization of the Network” as a functional objective, together with three other
functional objectives dealing with optimal grid design, new materials and
technologies as well as public acceptance.
• CREATE a new cluster 5 “ICT and Digitization of Power System” mainly to address
three key topics: big data, IoT (Internet of Things) and cybersecurity.
11 Five types of modifications/updates are made: SPLIT, REMOVE, EXPAND, INTEGRATE, and CREATE.

EUROPEAN COMMISSION Technical analysis of past and on-going projects
79 July 2016
Part II DISTRIBUTION
11. The portfolio of R&I projects in relation with the
DSO activities of the Roadmap
11.1 Assumptions ruling the portfolio selection
The same five assumptions as the ones presented in section 4.1 (consistency with the
roadmap, recent, funding, budget, explicit intention for further exploitation) have been
used. As a result a representative sample a projects among all recent R&I distribution
projects was built.
Methodological issue:
It should be noticed that some projects may appear in Part I and Part II or in Part II and Part
III or in Part I and in Part III. This apparent double counting is due to the fact that some the source of information for projects at the interface of transmission and distribution may be ENTSO-E, EDSO or EASE.
11.2 The portfolio of distribution projects
Preliminary remark about the portfolio of projects
Out of the set of 132 projects which were considered as a representative sample and
selected for analysis, only 51 have been monitored. Some important projects may not have
been monitored, for example for the D6 functional objective (Integration of infrastructure
to host electrical vehicles), the COTEVOS and Green eMotion projects. For each FO, when
such missing projects were detected, they were accounted for in the coverage analysis but
not reported in the present document since no questionnaire was provided by the projects’
coordinators
The 51 analysed projects represent a total budget of approximately 783 million Euros for
a public funding of 245 million Euros, cf.
Table 1512.
Table 6: Portfolio of projects source of achievements in distribution
ADDRESS DNAT HyUNDER METER_ON Smart_Storage
ADVANCED DRIP IGREENGrid NiceGrid Smart_Toruń
Alia2 E-DeMa INCREASE NINES SOGRID
Ampacity Electrogas INGRID OPEN_NODE SOLENN
ATENEA EnergyLab Isernia PlanGridEV stoRE (Denmark)
BIENVENU Evora Judenburg PRICE STORE (Spain)
BioCat FINSENY Life Factory Proaktives STORY
CAES_Larne FLEXe LINKY Puglia TILOS
CHPCOM G4V Local PV-KWK TRANSFORM
Control Gigha LODIS Smart Grid Vendée UPGRID
12 As for transmission, these figures do not represent the exact total budget and the corresponding public funding since for some projects some of the data is missing (for some projects the budget figure is available and not the corresponding public funding and vice-versa).
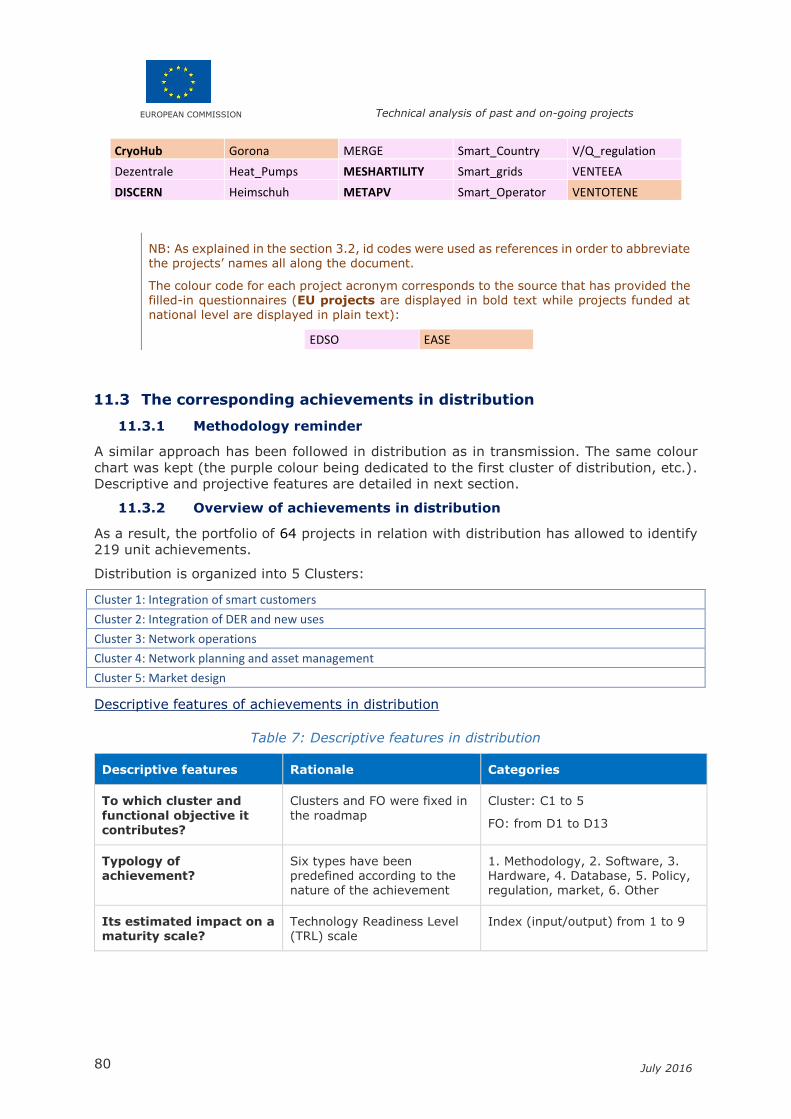
EUROPEAN COMMISSION Technical analysis of past and on-going projects
80 July 2016
CryoHub Gorona MERGE Smart_Country V/Q_regulation
Dezentrale Heat_Pumps MESHARTILITY Smart_grids VENTEEA
DISCERN Heimschuh METAPV Smart_Operator VENTOTENE
NB: As explained in the section 3.2, id codes were used as references in order to abbreviate the projects’ names all along the document.
The colour code for each project acronym corresponds to the source that has provided the filled-in questionnaires (EU projects are displayed in bold text while projects funded at national level are displayed in plain text):
EDSO EASE
11.3 The corresponding achievements in distribution
11.3.1 Methodology reminder
A similar approach has been followed in distribution as in transmission. The same colour
chart was kept (the purple colour being dedicated to the first cluster of distribution, etc.).
Descriptive and projective features are detailed in next section.
11.3.2 Overview of achievements in distribution
As a result, the portfolio of 64 projects in relation with distribution has allowed to identify
219 unit achievements.
Distribution is organized into 5 Clusters:
Cluster 1: Integration of smart customers
Cluster 2: Integration of DER and new uses
Cluster 3: Network operations
Cluster 4: Network planning and asset management
Cluster 5: Market design
Descriptive features of achievements in distribution
Table 7: Descriptive features in distribution
Descriptive features Rationale Categories
To which cluster and
functional objective it
contributes?
Clusters and FO were fixed in
the roadmap
Cluster: C1 to 5
FO: from D1 to D13
Typology of achievement?
Six types have been predefined according to the nature of the achievement
1. Methodology, 2. Software, 3. Hardware, 4. Database, 5. Policy, regulation, market, 6. Other
Its estimated impact on a maturity scale?
Technology Readiness Level (TRL) scale
Index (input/output) from 1 to 9
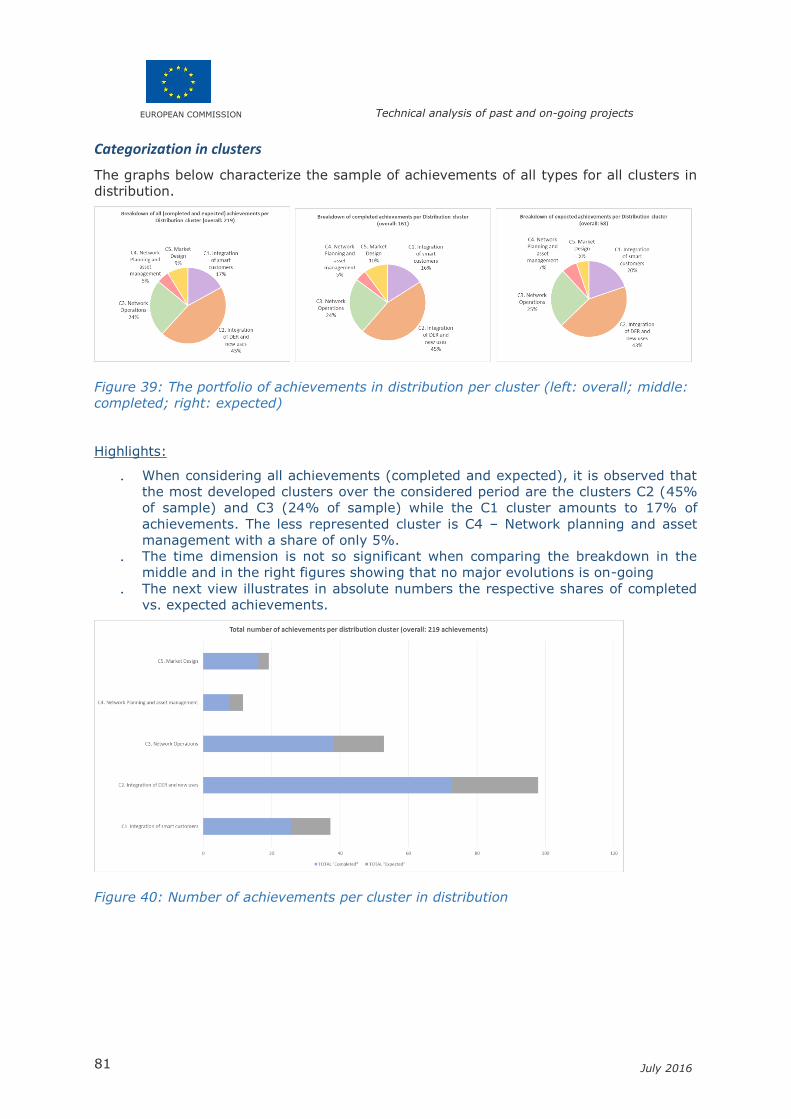
EUROPEAN COMMISSION Technical analysis of past and on-going projects
81 July 2016
Categorization in clusters
The graphs below characterize the sample of achievements of all types for all clusters in
distribution.
Figure 39: The portfolio of achievements in distribution per cluster (left: overall; middle:
completed; right: expected)
Highlights:
. When considering all achievements (completed and expected), it is observed that
the most developed clusters over the considered period are the clusters C2 (45%
of sample) and C3 (24% of sample) while the C1 cluster amounts to 17% of
achievements. The less represented cluster is C4 – Network planning and asset
management with a share of only 5%.
. The time dimension is not so significant when comparing the breakdown in the
middle and in the right figures showing that no major evolutions is on-going
. The next view illustrates in absolute numbers the respective shares of completed
vs. expected achievements.
Figure 40: Number of achievements per cluster in distribution

EUROPEAN COMMISSION Technical analysis of past and on-going projects
82 July 2016
Typology of achievements
Figure 41: Typology of achievements in distribution
Highlights:
. Unlike transmission, the hardware type of achievement is leading in distribution.
Policy, regulation, market are also more quoted than in transmission.
. For methodology, software and database the shares appear in distribution similar
to transmission
Evolution of the maturity of achievements
Figure 42: Evolution of the maturity of achievements measured in TRL units (left: average
per cluster; right: per cluster for the completed in blue and for the expected in grey)
Highlights:
. For cluster C2, C4, C5, an increment of about two units in the TRL scale is observed
(left diagram), the increment being higher for the Integration of smart customer
Cluster (C1) and Network operations Cluster (C3)
. The diagram in the right distinguishes the completed achievements from the
expected ones for each cluster. In general the TRL input for expected achievements
is higher than the TRL input for completed achievements: this is however not the
case for the cluster 5 (this might be an effect of the reduced size of C5).
. In this diagram typical TRL of completed achievements range from 3+ to 6 (resp.
input, output, blue bars) while typical TRL of expected achievements range from
3.5 to 7 (resp. input, output, grey bars).
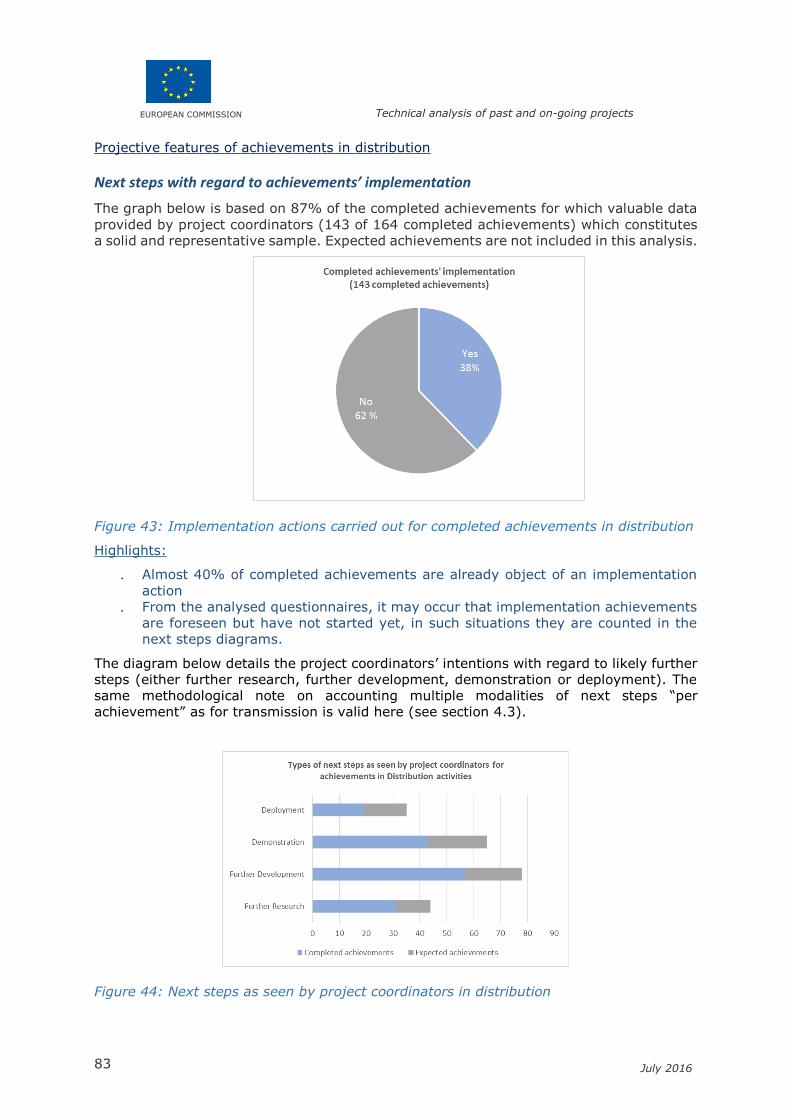
EUROPEAN COMMISSION Technical analysis of past and on-going projects
83 July 2016
Projective features of achievements in distribution
Next steps with regard to achievements’ implementation
The graph below is based on 87% of the completed achievements for which valuable data
provided by project coordinators (143 of 164 completed achievements) which constitutes
a solid and representative sample. Expected achievements are not included in this analysis.
Figure 43: Implementation actions carried out for completed achievements in distribution
Highlights:
. Almost 40% of completed achievements are already object of an implementation
action
. From the analysed questionnaires, it may occur that implementation achievements
are foreseen but have not started yet, in such situations they are counted in the
next steps diagrams.
The diagram below details the project coordinators’ intentions with regard to likely further
steps (either further research, further development, demonstration or deployment). The
same methodological note on accounting multiple modalities of next steps “per
achievement” as for transmission is valid here (see section 4.3).
Figure 44: Next steps as seen by project coordinators in distribution
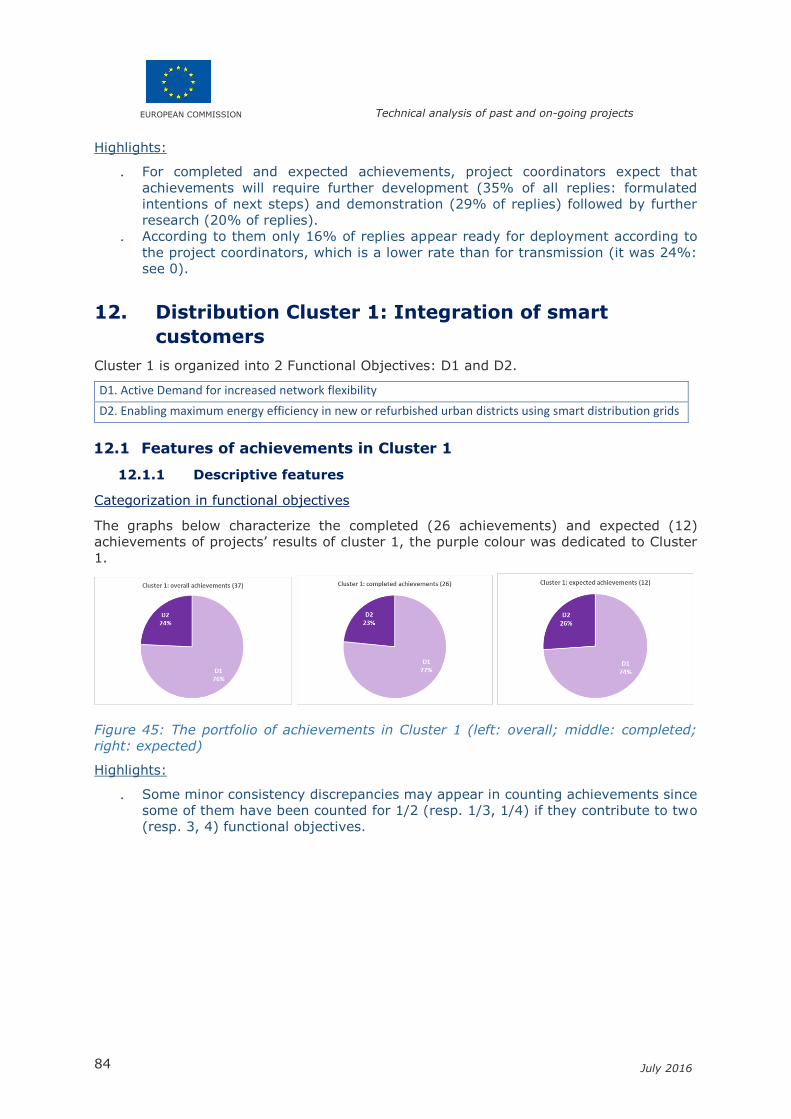
EUROPEAN COMMISSION Technical analysis of past and on-going projects
84 July 2016
Highlights:
. For completed and expected achievements, project coordinators expect that
achievements will require further development (35% of all replies: formulated
intentions of next steps) and demonstration (29% of replies) followed by further
research (20% of replies).
. According to them only 16% of replies appear ready for deployment according to
the project coordinators, which is a lower rate than for transmission (it was 24%:
see 0).
12. Distribution Cluster 1: Integration of smart
customers
Cluster 1 is organized into 2 Functional Objectives: D1 and D2.
D1. Active Demand for increased network flexibility
D2. Enabling maximum energy efficiency in new or refurbished urban districts using smart distribution grids
12.1 Features of achievements in Cluster 1
12.1.1 Descriptive features
Categorization in functional objectives
The graphs below characterize the completed (26 achievements) and expected (12)
achievements of projects’ results of cluster 1, the purple colour was dedicated to Cluster
1.
Figure 45: The portfolio of achievements in Cluster 1 (left: overall; middle: completed;
right: expected)
Highlights:
. Some minor consistency discrepancies may appear in counting achievements since
some of them have been counted for 1/2 (resp. 1/3, 1/4) if they contribute to two
(resp. 3, 4) functional objectives.
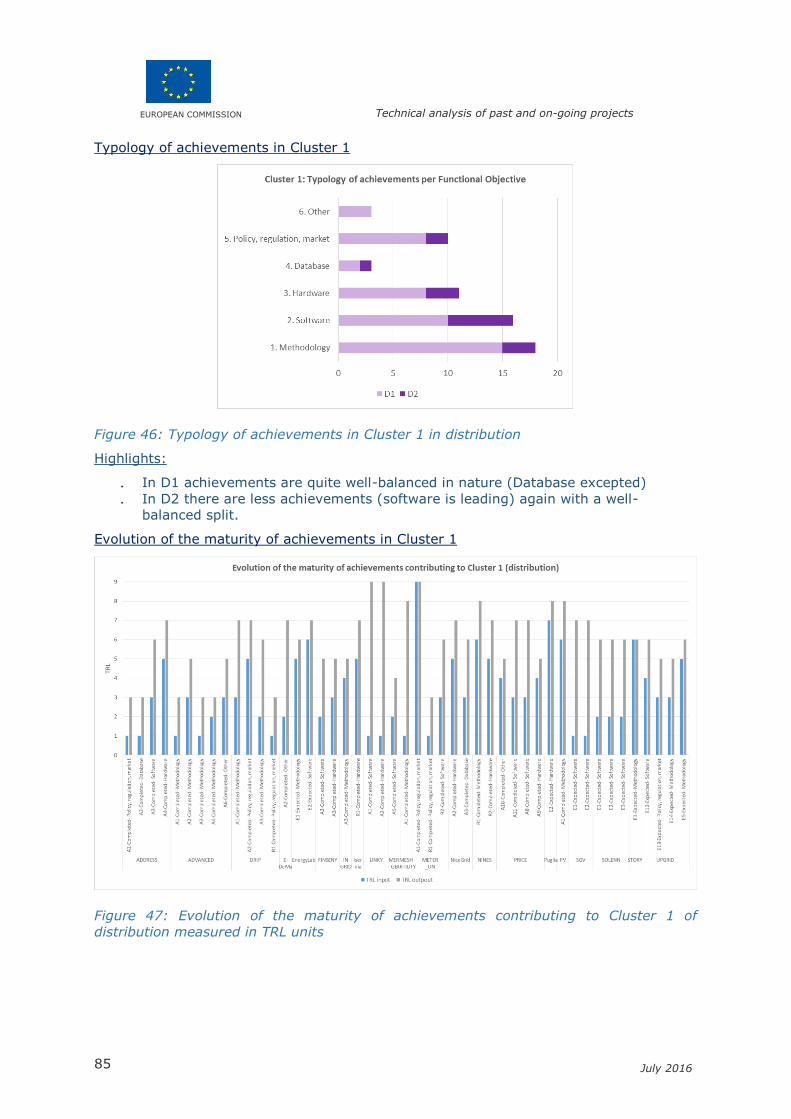
EUROPEAN COMMISSION Technical analysis of past and on-going projects
85 July 2016
Typology of achievements in Cluster 1
Figure 46: Typology of achievements in Cluster 1 in distribution
Highlights:
. In D1 achievements are quite well-balanced in nature (Database excepted)
. In D2 there are less achievements (software is leading) again with a well-
balanced split.
Evolution of the maturity of achievements in Cluster 1
Figure 47: Evolution of the maturity of achievements contributing to Cluster 1 of
distribution measured in TRL units
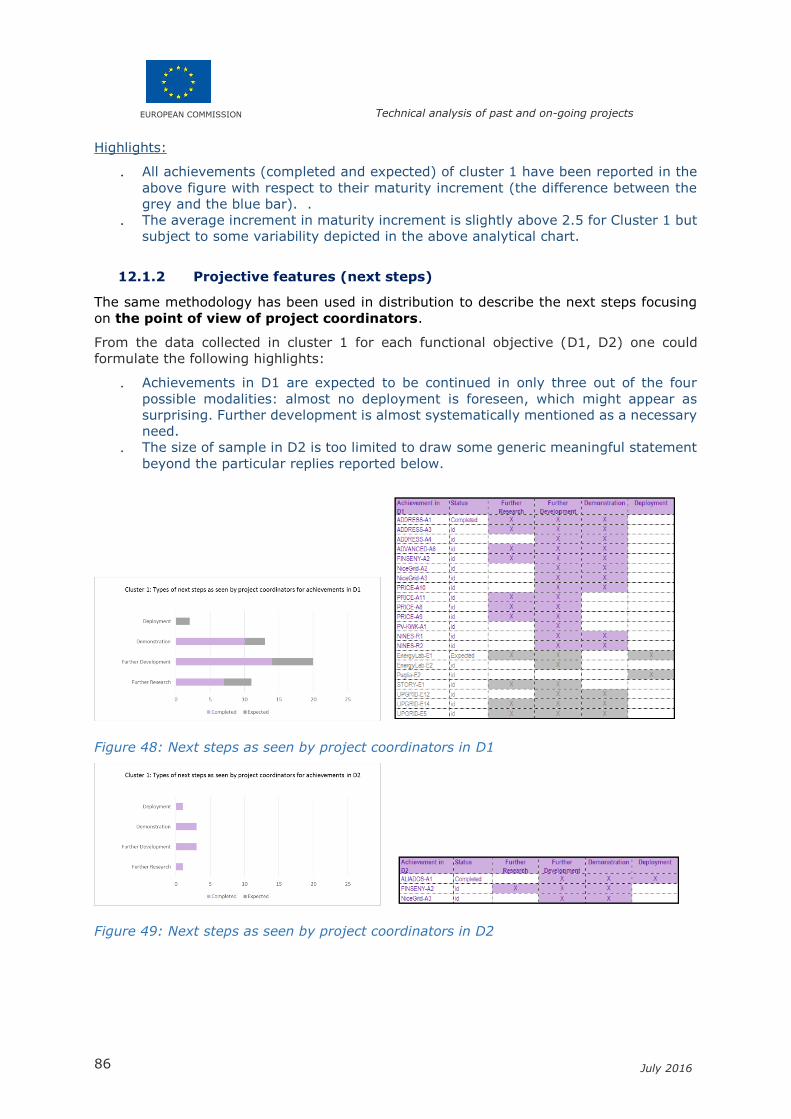
EUROPEAN COMMISSION Technical analysis of past and on-going projects
86 July 2016
Highlights:
. All achievements (completed and expected) of cluster 1 have been reported in the
above figure with respect to their maturity increment (the difference between the
grey and the blue bar). .
. The average increment in maturity increment is slightly above 2.5 for Cluster 1 but
subject to some variability depicted in the above analytical chart.
12.1.2 Projective features (next steps)
The same methodology has been used in distribution to describe the next steps focusing
on the point of view of project coordinators.
From the data collected in cluster 1 for each functional objective (D1, D2) one could
formulate the following highlights:
. Achievements in D1 are expected to be continued in only three out of the four
possible modalities: almost no deployment is foreseen, which might appear as
surprising. Further development is almost systematically mentioned as a necessary
need.
. The size of sample in D2 is too limited to draw some generic meaningful statement
beyond the particular replies reported below.
Figure 48: Next steps as seen by project coordinators in D1
Figure 49: Next steps as seen by project coordinators in D2

EUROPEAN COMMISSION Technical analysis of past and on-going projects
87 July 2016
12.2 Coverage analysis of Cluster 1 with past and ongoing projects
12.2.1 D1 “Active Demand for increased network flexibility”
Contributions from completed and ongoing projects to D1
From EU projects
The ADDRESS project targeted the active participation of small and commercial
consumers in power system markets and provision of services to the different power
system participants. The project delivered:
− Market design to facilitate demand side management: market-based
proposals and economic analysis;
− Questionnaires to validate social acceptance and customers' commitment:
Different questionnaires completed during the field test period
(pre/during/post trials);
− Aggregator toolbox: Full validation of aggregator functionality and 'core
business model' through the validation of the Aggregator Toolbox
functionality;
− Technical validation of the proposed solutions and prototypes for the Home
System: Validation of home system communication; Validation of equipment
operation; Collection and processing of metering information.
The METER ON project worked on supporting the development and deployment of
advanced metering infrastructures in Europe. In particular exchange and interaction
were carried out with the most representative projects carried out within the smart
metering field in Europe (21 EU projects analysed – 15 countries covered). After
the end of the project, a set of recommendations to the most important
stakeholders and a toolkit to manage economic data were delivered.
The goal of the ADVANCED project was to increase the understanding on how to
deploy efficiently Active Demand (AD). An omni-comprehensive (holistic) view of
all the components that intervene in the value chain was developed. The main
project’s achievements include: A target matrix to know what and how should be
measured; Validated and operationalised KPIs both at pilot and household level;
Qualitative & Quantitative surveys; Actionable framework. The project also
concluded that AD has highest potential if network expansion is driven by load
growth and is used in highly utilised urban networks which are already constrained.
The DRIP project carried out a technical, ecological and economic evaluation for
the industrial customers of the flexibility potential that is available in its energy
consuming processes. Potential benefits for the customer according to external
conditions and inputs (external weather conditions, market prices, balancing prices,
etc.) and for energy retailers as well as TSOs and DSOs (e.g. network stability at
peak feed-in of RES) were demonstrated. DRIP provided a novel approach to the
flexibility of industrial customers by means of an exhaustive analysis based on
processes. New business opportunities have been identified for the adequate trading
of Demand Response resources in the market. New tools and techniques have been
developed to determine, quantify and certify demand response resources in the
industrial production. A roadmap for the implementation of Demand Response has
been provided to industrial customers and policy makers to promote the active
participation of DR resources into the European electricity market.
The MERGE project developed simulation tools to be used by TSOs, DSOs and
Market operators to assess the impact of increased EV penetration at distribution
level, transmission level and also generation and market operation.
The FINSENY project’s objective was to demonstrate how open Future Internet
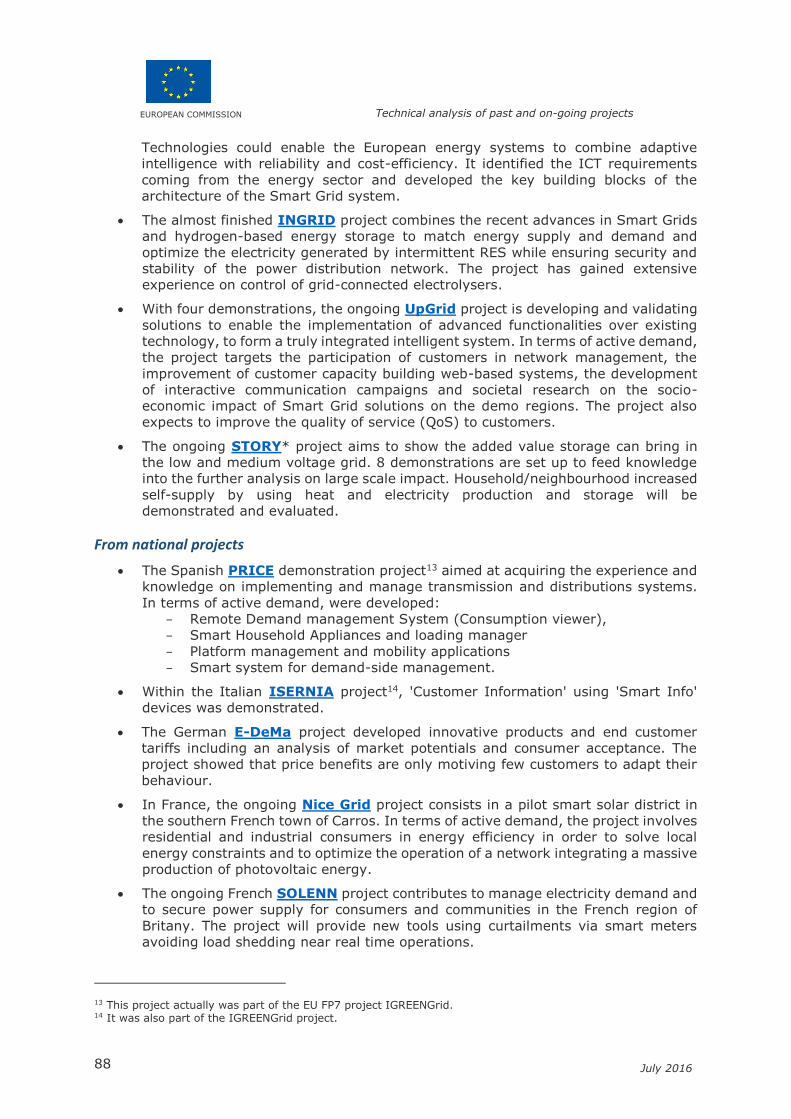
EUROPEAN COMMISSION Technical analysis of past and on-going projects
88 July 2016
Technologies could enable the European energy systems to combine adaptive
intelligence with reliability and cost-efficiency. It identified the ICT requirements
coming from the energy sector and developed the key building blocks of the
architecture of the Smart Grid system.
The almost finished INGRID project combines the recent advances in Smart Grids
and hydrogen-based energy storage to match energy supply and demand and
optimize the electricity generated by intermittent RES while ensuring security and
stability of the power distribution network. The project has gained extensive
experience on control of grid-connected electrolysers.
With four demonstrations, the ongoing UpGrid project is developing and validating
solutions to enable the implementation of advanced functionalities over existing
technology, to form a truly integrated intelligent system. In terms of active demand,
the project targets the participation of customers in network management, the
improvement of customer capacity building web-based systems, the development
of interactive communication campaigns and societal research on the socio-
economic impact of Smart Grid solutions on the demo regions. The project also
expects to improve the quality of service (QoS) to customers.
The ongoing STORY* project aims to show the added value storage can bring in
the low and medium voltage grid. 8 demonstrations are set up to feed knowledge
into the further analysis on large scale impact. Household/neighbourhood increased
self-supply by using heat and electricity production and storage will be
demonstrated and evaluated.
From national projects
The Spanish PRICE demonstration project13 aimed at acquiring the experience and
knowledge on implementing and manage transmission and distributions systems.
In terms of active demand, were developed:
− Remote Demand management System (Consumption viewer),
− Smart Household Appliances and loading manager
− Platform management and mobility applications
− Smart system for demand-side management.
Within the Italian ISERNIA project14, 'Customer Information' using 'Smart Info'
devices was demonstrated.
The German E-DeMa project developed innovative products and end customer
tariffs including an analysis of market potentials and consumer acceptance. The
project showed that price benefits are only motiving few customers to adapt their
behaviour.
In France, the ongoing Nice Grid project consists in a pilot smart solar district in
the southern French town of Carros. In terms of active demand, the project involves
residential and industrial consumers in energy efficiency in order to solve local
energy constraints and to optimize the operation of a network integrating a massive
production of photovoltaic energy.
The ongoing French SOLENN project contributes to manage electricity demand and
to secure power supply for consumers and communities in the French region of
Britany. The project will provide new tools using curtailments via smart meters
avoiding load shedding near real time operations.
13 This project actually was part of the EU FP7 project IGREENGrid. 14 It was also part of the IGREENGrid project.

EUROPEAN COMMISSION Technical analysis of past and on-going projects
89 July 2016
The other ongoing French Smart Grid Vendée project is implementing a Web
portal for energy shaving purposes.
In Poland, the ongoing Smart Torun project includes the development of an
application to remote communicate with meters and the preparation of special
systems for the operation and management of the network. 92,600 smart meters
are being deployed. Smart grid lighting with energy-saving lamps operated by
dedicated software are being implemented.
In Scotland, the ongoing NINES project aims to address some of the most pressing
energy challenges Shetland currently faces by allowing small scale renewable
generation to play a much more significant role in meeting the islands’ energy
needs. The NINES project consists various elements totalling to an estimated
150MWh of energy storage and one of these elements is the installation of the
Quantum space and water heating system being installed in up to 750 homes.
Within the ongoing Portuguese Dynamic Network Access Tariffs project, an
analysis of the periods of highest network congestion has been carried out. The
project expects to see how customers react to the dynamic pricing scheme. A cost-
benefit analysis of such pricing scheme will be carried out. If proved beneficial, it
should allow decreasing peak hour consumption, in order to lower the need to invest
in grid expansion.
In Italy, the ongoing Puglia Active Network project is deploying 'Smart Info'
devices to provide customer with information to enable demand response
strategies.
In Denmark, the ongoing EnergyLab Nordhavn* project is developing new
business models for renewable energy integration. The project utilizes
Copenhagen’s Nordhavn (Northern harbour) as a full-scale smart city energy lab
and demonstrates how electricity and heating, energy-efficient buildings and
electric transport can be integrated into an intelligent, flexible and optimized energy
system.
The goal of the ongoing German PV-KWK* project is to develop optimised system
solutions that create the most effective combination of photovoltaics and CHP
plant/heat pump systems, open up synergies, and are suitable for multiple
applications in buildings. Another aim is the optimisation of load control for electrical
appliances and the use of energy storage in pure solar systems through to intelligent
incorporation of eMobility.
Note: Projects marked with an * do not count TSOs nor DSOs on board. They have been provided by EASE members.
Assessment of the coverage of D1
The EEGI roadmap 2013-2020 had foreseen the following specific tasks in the functional
objective D1:
D1a. Scientific:
Systems/solutions for demand modelling and forecasting
Solutions for demand aggregation and implementation of Virtual Power
Plants combined with local energy management
Power market modelling to size the benefits of massive deployment of AD
in distribution networks

EUROPEAN COMMISSION Technical analysis of past and on-going projects
90 July 2016
Optimal sizing for medium/large scale demonstration (generic topic)
D1b. Technology:
Smart Metering Infrastructure to measure energy consumption and apply
time-of use tariffs
Devices enabling visualization and control of consumers’ consumption
using the latest technology (e.g. In-Home displays...)
Smart Energy management boxes, smart plugs, smart appliances,
interfaces for load control and solutions to communicate with consumers
and with the smart appliances in the domestic environment
A communication infrastructure to support the whole system interoperable
and standard solutions enabling AD
D1c. Market and regulation:
Application of time-of use/dynamic tariffs and real time prices
Definition of appropriate incentives to motivate consumers to participate
in AD
Coverage assessment
Completed and ongoing projects have covered about 50% of this functional objective’s
tasks. Only one scientific task concerning demand modelling and forecasting has been well-
covered. There is still work to do for several subjects such as demand aggregation, VPPs,
smart metering, smart appliances, time-of-use tariffs and incentives for customers. On the
other hand, power market simulations in order to measure the benefits of massive
deployment of AD in MV and LV networks should be addressed more intensively.
12.2.2 D2 “Enabling maximum energy efficiency in new or refurbished
urban districts using smart distribution grids”
Contributions from completed and ongoing projects to D2
From EU projects
The IEE project MESHARTILITY aimed at the development of solutions and tools
facilitating exchange of energy data between energy utilities and local authorities
in order to support the development of Sustainable Energy Action Plans (SEAPs) to
be submitted under the Covenant of Mayors. An Open Data Platform for the
Sustainable Energy Action Plans has been set up. The energy data issues explored
included data ownership, access to data, quality of data, regular update of data,
approach (if any) to top-down and bottom-up data correlation.
The TRANSFORM project aimed to define a methodology process to identify the
measures to be put in place in order to enable the European cities to move toward
a more sustainable and efficient energy system. A handbook to pave the way toward
a Smart City was delivered. Although smart grids measures (such as advanced
automation and control functionalities, RES integration, EV recharge
infrastructures, customer awareness technologies…) have been identified as crucial
in the transformation process toward a Smart City, there are still important barriers
that hamper the implementation of the smart grids measures, notably the lack of
regulatory framework and financial, Legal and business model issues.
The METER ON and FINSENY projects have also contributed to this functional

EUROPEAN COMMISSION Technical analysis of past and on-going projects
91 July 2016
objective.
From national projects
The Spanish Alia2 project tested storage solutions for renewable generation plants.
The development of three building management systems (module, cabinet and
container) was achieved during the project. The new solution represents a reliable
alternative source of electricity in case of supply failure at hospitals, trains, shopping
centres, etc.
The ongoing French Nice Grid smart solar district pilot project contributes to this
functional objective with the involvement of residential and industrial consumers in
energy efficiency in order to solve local energy constraints.
The other ongoing French SOLENN project which aims at contributing to manage
electricity demand and to secure power supply for consumers and communities in
the French region of Britany also contributes to this functional objective. The project
is developing solutions to provide volunteer customers with own and collective
electric data in order to develop new Energy Efficiency dynamics. It will also provide
local communities with an IT tool helping the definition and implementation of local
energy policies.
In France, the roll-out of the Linky smart meters is ongoing (35 million of units).
The smart meter will support bi-directional communications in order to automate
meter-reading, improve grid management, prevent fraud, while improving demand
response and paving the way for smart grids roll-out.
By developing tools devoted to techno-economic analysis in order to help decision
making, the ongoing French Smart Grid Vendée project is contributing to this
functional objective.
Note: Projects marked with an * do not count TSOs nor DSOs on board. They have been provided by EASE members.
Assessment of the coverage of D2
The EEGI roadmap 2013-2020 had foreseen the following specific tasks in the functional
objective D2:
D2a. Scientific:
Advanced energy management systems to enable load/production
forecasting and active customer participation taking advantage of an
automated metering infrastructure
Measuring customer awareness and customer willingness to go for energy
sobriety
Optimizing energy networks at district levels
Analysing possibilities of interaction between gas, electricity and heat
networks.
D2b. Technology:
New approaches to size and operate distribution networks in districts,
with new architectures, considering “city master planning”, limiting the
sizing of physical infrastructure and taking into account boundary
conditions such as available space.
EUROPEAN COMMISSION Technical analysis of past and on-going projects
92 July 2016
Development of tools to design and sizing this kind of integrated energy
networks.
Multilevel system operation of a distribution network
Secondary substation with an islanding capability of parts of a district to
be activated in emergency situations
The district covering several neighbouring secondary substations on the
same feeder (active approach taking into account demand side
management and local storage, use of power electronics to facilitate grid
integration (voltage management, fault current management) ;
The feeder connected to the district and other loads of a city where the
energy management system simultaneously responds to the needs coming
from the network and ensures local operation of the feeder (optimal split
of total load between primary substations)
Interfaces to enable two way communication between DSO’s/TSO’s central
systems, Home automation and energy management systems
Web portals, in-home displays and Smartphone apps
Smart Plugs and voltage clamps
Smart appliances
Solutions for direct load control
Smart Energy boxes
D2c. Market:
Regulatory recommendations in order to enable customer participation in
electricity markets
Mapping of privacy and data protection issues and strategies/solutions to
mitigate risks
Market models for ESCOs, aggregators at district level
D2d. Social:
Understanding customer behaviour at district level with interdependence
between several activities
Change customer behaviour through price or other signals that favour
energy sobriety
Customer acceptance of the various technologies
Coverage assessment
It is considered that this FO has been covered at about 50%. In particular, there are three
tasks which have been less tackled by EU and national projects concerning technological
(the feeder and real-time EMS relation), market (models for ESCOs and aggregators) and
social (customer behaviour) issues at the district level.

EUROPEAN COMMISSION Technical analysis of past and on-going projects
93 July 2016
12.3 Recommendations for the new R&I roadmap
The R&I activities specified in Cluster 1 have been addressed in many projects, which has
resulted in a good coverage for both functional objectives (around 50%). However, there
are still many topics to be dealt with to promote active demand (AD) and make it a usable
flexibility option for DSOs as well as a source of new business models -and revenues- for
(new) market players. For instance, power market modelling to size the benefits of massive
deployment of AD in distribution networks is still needed. Energy efficiency in new or
refurbished urban districts using smart distribution grids is a major issue in Europe:
understanding customer behaviour will help to promote new energy demand schemes.
For the new roadmap, it is recommended to keep Cluster 1 “Integration of smart customers
and buildings”15 with the two existing functional objectives (FOs) since they represent
major challenges for the stakeholders of distribution networks. New R&I activities should
be promoted in the FO dealing with AD so as to foster end-consumers’ participation in the
retail electricity markets, and enable the provision of system services for network flexibility
(e.g. the real-time optimisation of power flows at distribution level) and possible
transmission level (system services provided to TSOs through DSOs). For the second FO,
R&I activities should focus on the deployment of smart grid technologies in urban areas in
order to reach the goals set by the EC in terms of energy efficiency in buildings (and
empower end customers).
Furthermore, as explained in the new roadmap, it is also recommended to specify the R&I
topics of each FO in terms of cross-cutting challenges (instead of their characteristics, i.e.
scientific, technology, market and regulation, social) so as to improve the readability of
the functional objectives and more generally of projects addressing these cross-cutting
challenges (i.e. a matrix structure where on the one side there are the clusters/FOs and
on the other side cross-cutting challenges). The cross-cutting challenges cover R&I
activities related to the upgrading of the network, the Power system flexibility, the
Power system reliability, ICT and digitalization, Market design, and the DSOs
regulatory environment.
13. Distribution Cluster 2: Integration of DER and new
uses
Cluster 1 is organized into 4 Functional Objectives: D3, D4, D5 and D6.
D3. Integration of DER at low voltage
D4. Integration of DER at medium voltage / high voltage
D5. Integration of storage in network management
D6. Integration of infrastructure to host Electrical Vehicles
13.1 Features of achievements in Cluster 2
13.1.1 Descriptive features
Categorization in functional objectives
The graphs below characterize the completed (72 achievements) and expected (25
achievements) achievements of projects’ results of cluster 2, the orange colour was
dedicated to Cluster 2.
15 The titles of the cluster and the D2 functional objectives should be slightly changed to make the connection to energy efficiency policies in buildings more explicit.
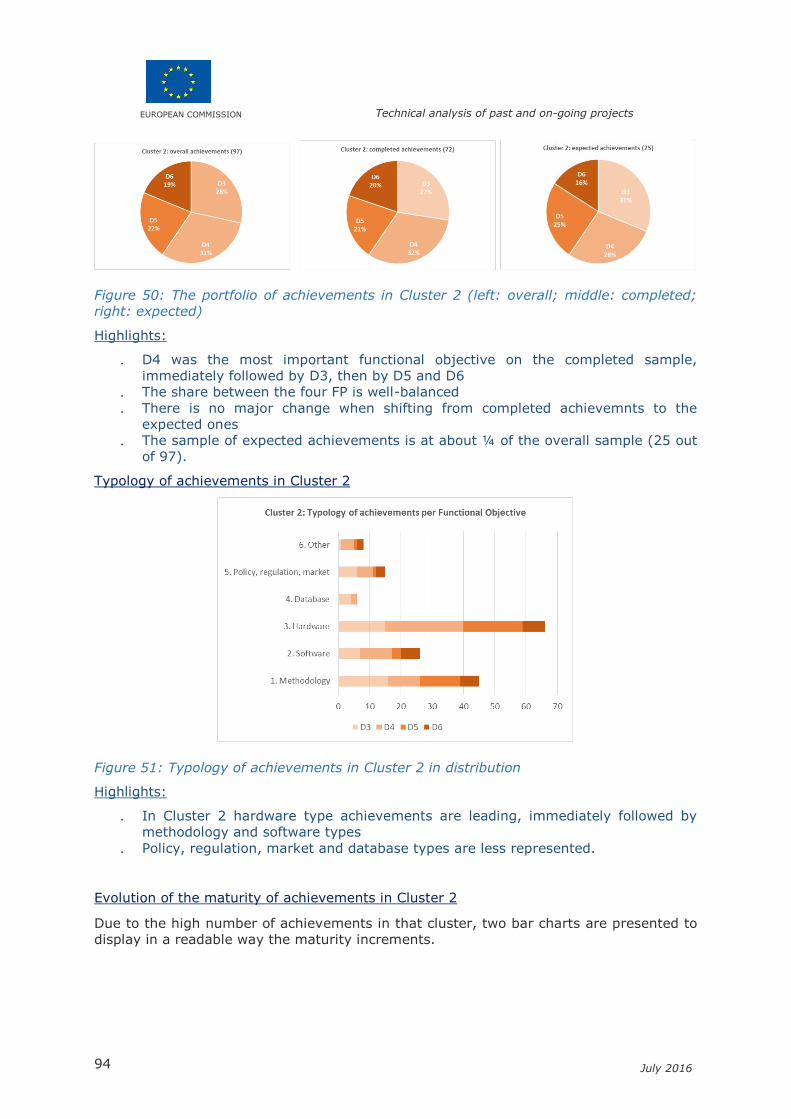
EUROPEAN COMMISSION Technical analysis of past and on-going projects
94 July 2016
Figure 50: The portfolio of achievements in Cluster 2 (left: overall; middle: completed;
right: expected)
Highlights:
. D4 was the most important functional objective on the completed sample,
immediately followed by D3, then by D5 and D6
. The share between the four FP is well-balanced
. There is no major change when shifting from completed achievemnts to the
expected ones
. The sample of expected achievements is at about ¼ of the overall sample (25 out
of 97).
Typology of achievements in Cluster 2
Figure 51: Typology of achievements in Cluster 2 in distribution
Highlights:
. In Cluster 2 hardware type achievements are leading, immediately followed by
methodology and software types
. Policy, regulation, market and database types are less represented.
Evolution of the maturity of achievements in Cluster 2
Due to the high number of achievements in that cluster, two bar charts are presented to
display in a readable way the maturity increments.

EUROPEAN COMMISSION Technical analysis of past and on-going projects
95 July 2016
Figure 52: Evolution of the maturity of achievements contributing to Cluster 2 of
distribution measured in TRL units
Highlights:
. In the two above tables most of achievements present a maturity increment of 2 to
3 units in the TRL scale.
. Some projects coordinators however consider a higher maturity gain in the
achievements of their project, some zero gain situation are also presented but
probably resulting from an interpretation bias from project coordinator.
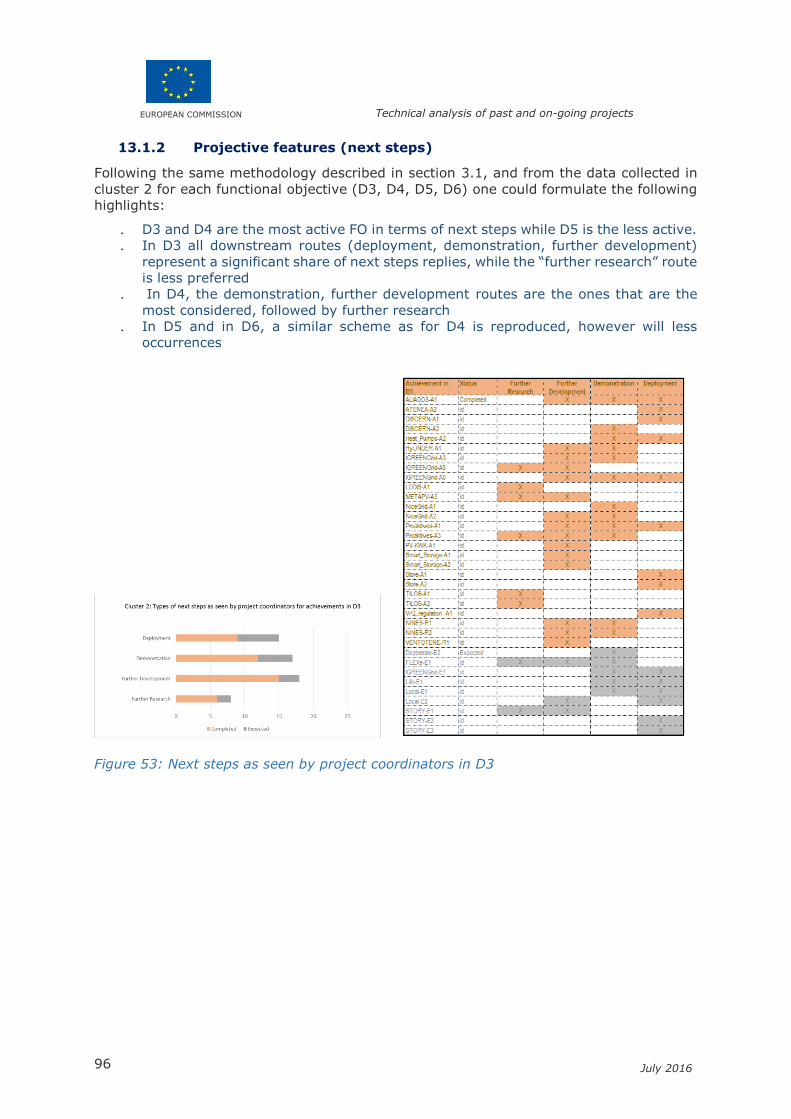
EUROPEAN COMMISSION Technical analysis of past and on-going projects
96 July 2016
13.1.2 Projective features (next steps)
Following the same methodology described in section 3.1, and from the data collected in
cluster 2 for each functional objective (D3, D4, D5, D6) one could formulate the following
highlights:
. D3 and D4 are the most active FO in terms of next steps while D5 is the less active.
. In D3 all downstream routes (deployment, demonstration, further development)
represent a significant share of next steps replies, while the “further research” route
is less preferred
. In D4, the demonstration, further development routes are the ones that are the
most considered, followed by further research
. In D5 and in D6, a similar scheme as for D4 is reproduced, however will less
occurrences
Figure 53: Next steps as seen by project coordinators in D3
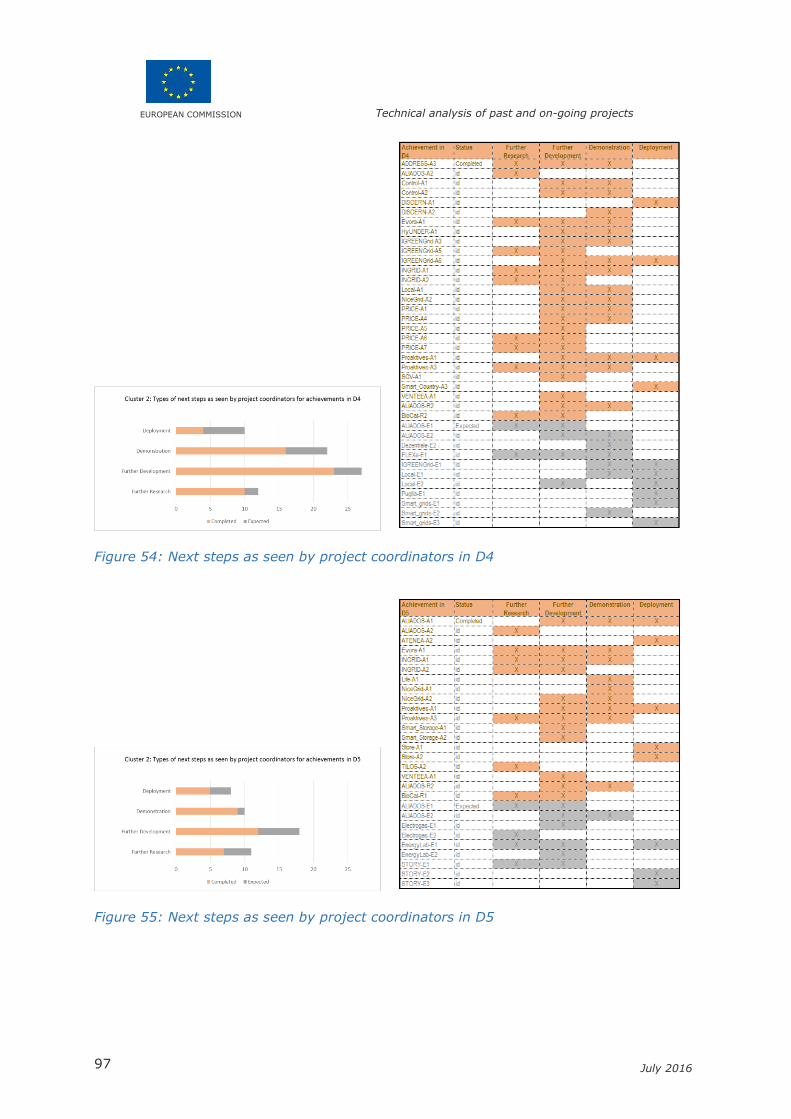
EUROPEAN COMMISSION Technical analysis of past and on-going projects
97 July 2016
Figure 54: Next steps as seen by project coordinators in D4
Figure 55: Next steps as seen by project coordinators in D5

EUROPEAN COMMISSION Technical analysis of past and on-going projects
98 July 2016
Figure 56: Next steps as seen by project coordinators in D6
13.2 Coverage analysis of Cluster 2 with past and ongoing projects
13.2.1 D3 “Integration of DER at low voltage”
Contributions from completed and ongoing projects to D3
From EU projects
The ADDRESS project targeted the active participation of small and commercial
consumers in power system markets and provision of services to the different power
system participants. With a database of questionnaires to validate social acceptance
and customers' commitment, the project has contributed to this functional
objective.
The metaPV project has demonstrated the provision of electrical benefits from
photovoltaics (PV) on a large scale. Additional benefits for active grid support from
PV have been demonstrated at two sites: a residential/urban area of 128
households with 4 kWp each, and an industrial zone of 31 PV systems with 200 kWp
each. A methodology was developed to increase the grid capacity by 50% against
10% of the costs (via distributed control of the PV inverters). A software was
developed to control the PV inverters connected to the DNS-system of the DSO.
The aim of the recently finished DISCERN project was the enhancement of
electricity networks through use of distributed intelligence. The project has
developed novel software tools and methodologies, a database for the facilitation
of knowledge sharing on cost-effective technological solutions through field-tests
and simulations and has contributed to standardisation activities. The field trials
undertaken during the project have been used both to test innovative Smart Grid
solutions and to evaluate the applicability of the DISCERN methodology and tools
in the development phases of a Smart Grid project. The use of the material
developed within DISCERN, such as Use Cases, SGAM representations and
catalogues of functional and non-functional requirements, has promoted and
supported discussions amongst DSOs and between DSOs and vendors, allowing
efficient communication and elicitation of requirements.
The recently finished IGREENGrid project’s focus was on increasing the hosting
capacity for Distributed Renewable Energy Sources (DRES) in power distribution
grids without compromising the reliability or jeopardizing the quality of supply. The
project has notably delivered guidelines for future massive integration of DRES,
which should improve the current European regulation framework to foster DRES
integration.
The HyUNDER* project aimed at providing a joint assessment of the European
potential for large scale underground hydrogen storage to ensure network reliability
EUROPEAN COMMISSION Technical analysis of past and on-going projects
99 July 2016
and flexibility and compensate the fluctuating RES. While short term energy storage
can be met by small decentralized storage systems, mid to long term electricity
storage technologies are still lagging behind. The project has delivered a database
with the assessment of the potential, the actors and relevant business cases for
large scale and seasonal storage of renewable electricity by hydrogen underground
storage in Europe.
The ongoing INCREASE project is focused on the management of RES in low and
medium voltage networks by implementation of smart (three-phase grid-
connected) inverters. Relevant solutions are being delivered to address grid stability
confronted with instable generation flows from PV.
The ongoing TILOS project is developing a smart microgrid on the remote island of
Tilos in Greece. The project is developing software tools to forecast RES and load
and will deliver policy recommendations for the distinction of storage technologies
in the Greek regulation and the permission to run islands diesel-free.
The main objective of the ongoing Life Factory Microgrid* project is to
demonstrate that microgrids are the electricity generation solution for industry in
terms of environmental impact, especially in areas with a high share of RES. The
proposed approach involves a first full-scale demonstration of a microgrid in a
factory in Peralta (Navarra, Spain), where near 80% of electricity comes from
renewable intermittent sources. The project shall validate energy management
strategies capable of using or storing all produced renewable energy.
The ongoing STORY* project aims to show the added value storage can bring in
the low and medium voltage grid. Eight demonstrations are set up to feed
knowledge into the further analysis on large scale impact. The eight demonstration
cases have each different local / small-scale storage concepts and technologies,
covering industrial and residential environments. These demonstrations feed into a
large-scale impact assessment, with the central question being: “What could be the
added value of storage in the electricity distribution grid?”. Expected achievements
are notably the demonstration and evaluation of a household/neighbourhood
increased self-supply by using heat and electricity production and storage; medium
scale battery system introduced in the distribution network and in industrial
environments; a CAES unit.
From national projects
The Spanish Alia2 project tested storage solutions for renewable generation plants.
The development of three building management systems (module, cabinet and
container) was achieved during the project.
The Spanish ATENEA Microgrid* project developed of a microgrid for industrial
applications that operates in on- and off-grid modes and is used as test bench for
new technologies, generation, storage and control systems. In order to manage the
plant in a proper way, a Control and Energy Management Systems and a SCADA
have been developed, implemented and tested. Furthermore, tools (ICTs) for smart
management of LV networks are envisaged within the project.
In Czech Republic, the LODIS (Czech abbreviation for Local Management of
Distribution Grid) focused on the integration of DER at local level and elimination of
overflow of surplus energy (local peak shaving and reduction of losses). It delivered
an intelligent data concentrator and a software to use it. A scheme allowing
absorption of surplus of generated energy (PV) at the local level through load
management has been delivered too. However, these solutions require full roll out
of smart meters which is not expected in near future in Czech Republic.
EUROPEAN COMMISSION Technical analysis of past and on-going projects
100 July 2016
Again in Czech Republic, the V/Q regulation project delivered an advanced
software allowing voltage regulation through reactive power. The tested solution is
relevant for deployment and is expected to meet its goal by enhancing the capacity
of the grid to integrate additional DER.
In Denmark, within the stoRE project, pumped hydro trading in day-ahead market
was modelled, and a modelling software to use pumped hydro in the balancing
market was developed.
The Italian VENTOTENE* project realised a pilot project that involved 500kW,
600kWh lithium-ion battery to be integrated with diesel generators providing
electricity to the island and to store electricity for use during demand peaks. A
methodology has been developed for designing new hybrid generation assets.
In Denmark again, the overall objective of the recently finished BioCat* project
was to design, engineer and construct a commercial-scale power-to-gas facility and
demonstrate its capabilities to provide energy storage services to the Danish energy
system.
In Scotland, the ongoing Gigha* project consists installing 1.26 MWh of vanadium
redox flow batteries (VRB) specifically to store power from the wind turbines. The
project will deliver knowledge on how to operate a grid-connected VRB in
conjunction with wind turbines in island mode. Opportunity for the project has been
created by the limitation imposed to a wind turbines by grid constraints (output of
the turbine is restricted to 225kW rather than its designed 330kW output): to
release the full potential of the turbine researching and prototyping an innovative
Energy Storage System were needed. This innovative solution to an increasingly
common problem will allow a behind the meter flow battery to store any excess
power and release this power when the wind drops and the capacity on the grid is
available. This is the first battery of this type to be installed at this size in a working
capacity. It will provide valuable insight into the technology and its real world
implementation. However regulatory barriers will need to be overcome: a clear
definition of Energy storage, especially at regulation level, is still missing and it
creates an obstacle also to the market of energy storage.
In Scotland again, the ongoing NINES project aims to address some of the most
pressing energy challenges Shetland currently faces by allowing small scale
renewable generation to play a much more significant role in meeting the islands’
energy needs. The main components of Shetland’s Smart Grid under NINES are:
− Sophisticated modelling (related to planning, operation, residents’
interaction with energy systems, and the impact of implementing innovative
energy technology);
− Demand Side Management: installation of new “smart” water and space
heating in 234 homes providing the ability for the grid to cope at peak times
when more energy is being generated than used; smart heating systems to
provide flexible and cost-effective heating for individual households; 4MW of
thermal storage connected to the existing district heating system, allowing
the expansion of the district heating system to supply up to 300 more homes
and 30 more businesses;
− A large-scale battery energy storage system to provide energy storage and
help balance the energy supply and demand;
− An Active Network Management system, to provide the information flows
and control needed on the network to make these new technologies and
arrangements work.
By utilising the grid capacity freed up by the measures above, increased connection
of renewable generation – approximately 10MW – has been facilitated. The
generators connect under a new ‘flexible’ connection agreement, which allows their

EUROPEAN COMMISSION Technical analysis of past and on-going projects
101 July 2016
output to be reduced at times when the system cannot accommodate their full
output.
The ongoing French Nice Grid project is experimenting local and temporary
islanding and reconnection of a subnetwork energized through storage and solar
generation. It also seek to optimize the operation of a network integrating a massive
production of photovoltaic energy.
In Germany, the ongoing “Dezentrale Netzintelligenz” project also contributes
to this functional objective.
The other ongoing German PV-KWK* project is exploring new optimized strategies
and solutions for compatible PV Energy Management Systems (EMS), choosing a
few of them exemplary and evaluating them in a field test. Possibilities of intelligent
coupling of photovoltaic systems with CHP (combined heat and power) plants and
heat pump heating systems are being explored. Expansion and optimisation of EMS
as well as drafting open interface standards are the first achievements of the
project.
Again in Germany, the ongoing Proaktives Verteilnetz project aims at delivering:
− reliable state estimation and forecasting of the distribution (based on a small
number of measuring points and use of environmental data (e.g. weather),
− conceptual and technical design of the traffic light concept (especially the
yellow light phase),
− safe and non-discriminatory coordination of network and market actors,
− utilization of flexibility for the distribution grid, as an alternative to avoid
unnecessary network expansion.
In particular the definition of operation mode for "yellow traffic light-phase" and a
market model for flexibilities in yellow light phase have been delivered.
The ongoing Danish Local Energy Storage project is developing a local power
storage solution based on a new electronic power conversion and control concept
and commercial batteries. The aim is to enable higher production of grid connected
renewable power and giving the user full advantage of own power production and
simultaneously stabilize low voltage feeder lines.
In Denmark again, the ongoing project “DSO challenges from introduction of
heat pumps” will result in recommendations for integration of heat pumps in
existing distribution grid, which otherwise risk to be overloaded. The
recommendations will be based on analysis of comprehensive data from LV grids
with many heat pumps. The project will also develop new heat pump technology
that can in fact help to improve future grid operation. A model to forecast the impact
of mass uptake of heat pumps on LV grids has been delivered, as well as a power
electronics algorithm to prevent overload of LV grid with many heat pumps.
The ongoing Dutch Smart Storage project’s objective is to gain operational
experience with local, distributed electricity storage within low voltage grids. The
first result of the project was the development of the Smart Storage Unit (SSU),
which is part of the greater Smart Storage System (SSS), and currently in operation
as electricity storage system.
The ongoing Finnish FLEXe project’s aim is to create novel technological and
business concepts enhancing the radical transition from the current energy systems
towards sustainable systems. FLEXe combines smartness, flexibility, environmental
performance and economic success with customer acceptance and engagement.
The project has delivered an optimal heat system component design (to be installed
for instance by customers at smart homes with wind or solar connection). It also
expects to deliver a methodology for optimized and secured integration and
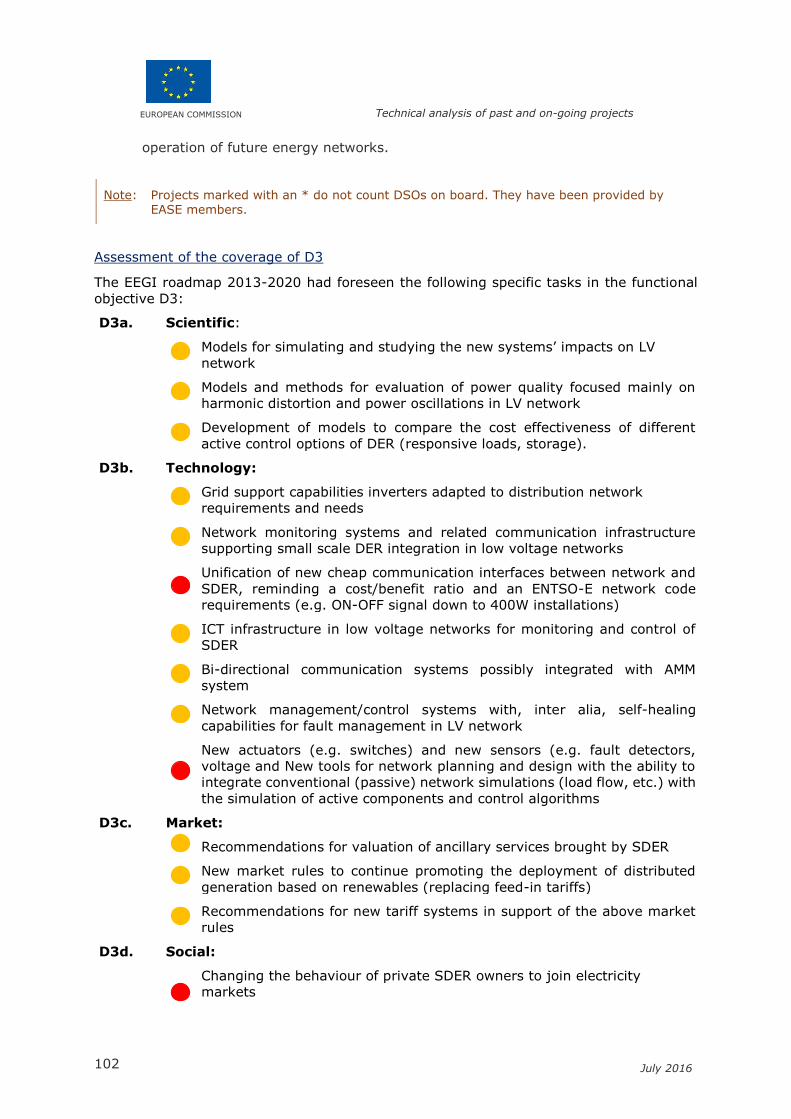
EUROPEAN COMMISSION Technical analysis of past and on-going projects
102 July 2016
operation of future energy networks.
Note: Projects marked with an * do not count DSOs on board. They have been provided by EASE members.
Assessment of the coverage of D3
The EEGI roadmap 2013-2020 had foreseen the following specific tasks in the functional
objective D3:
D3a. Scientific:
Models for simulating and studying the new systems’ impacts on LV
network
Models and methods for evaluation of power quality focused mainly on
harmonic distortion and power oscillations in LV network
Development of models to compare the cost effectiveness of different
active control options of DER (responsive loads, storage).
D3b. Technology:
Grid support capabilities inverters adapted to distribution network
requirements and needs
Network monitoring systems and related communication infrastructure
supporting small scale DER integration in low voltage networks
Unification of new cheap communication interfaces between network and
SDER, reminding a cost/benefit ratio and an ENTSO-E network code
requirements (e.g. ON-OFF signal down to 400W installations)
ICT infrastructure in low voltage networks for monitoring and control of
SDER
Bi-directional communication systems possibly integrated with AMM
system
Network management/control systems with, inter alia, self-healing
capabilities for fault management in LV network
New actuators (e.g. switches) and new sensors (e.g. fault detectors,
voltage and New tools for network planning and design with the ability to
integrate conventional (passive) network simulations (load flow, etc.) with
the simulation of active components and control algorithms
D3c. Market:
Recommendations for valuation of ancillary services brought by SDER
New market rules to continue promoting the deployment of distributed
generation based on renewables (replacing feed-in tariffs)
Recommendations for new tariff systems in support of the above market
rules
D3d. Social:
Changing the behaviour of private SDER owners to join electricity
markets
EUROPEAN COMMISSION Technical analysis of past and on-going projects
103 July 2016
Coverage assessment
Several tasks of this FO have a minor coverage regarding technological aspects, for
instance, the unification of new cheap communication interfaces between network and
SDER; and the development of new tools for network planning such as actuators and
sensors. In addition, there is still important work to do in order to integrate private SDER
into the electricity markets. The coverage assessment of this functional objective has been
estimated at 40 %.
13.2.2 D4 “Integration of DER at medium voltage / high voltage”
Contributions from completed and ongoing projects to D4
From EU projects
With an aggregator toolbox (full validation of aggregator functionality and 'core
business model'), the ADDRESS project contributed to this functional objective.
The HyUNDER* project as well as the recently finished DISCERN and IGREENGrid
projects have also contributed to this functional objective.
The almost finished INGRID project aims at demonstrating the efficient usage of
safe, high-density, solid-state hydrogen storage systems for power supply and
demand balancing within active power distribution grids with high penetration of
intermittent Distributed Generation (RES in particular). The main project innovation
is combining hydrogen solid-storage systems with Smart Grid cutting-edge ICT-
based active network control technologies for balancing highly variable power
supply and demand in a scenario of high penetration of RES. The INGRID Energy
Management System (EMS) is based on the multi-carrier hub paradigm for
modelling the behaviour of the entire plant. An optimiser, built upon this model and
based on genetic algorithm, is responsible for elaborating the optimal power flow
inside the plant, every hour. Indeed, the EMS is able to merge and harmonise the
contrasting requirements coming from the DSO, in terms of expected power
consumption profile, and the ones linked to the actual business of the plant. In this
way, the INGRID plant is able to chase its own profit, providing ancillary services
to the grid at the same time.
From national projects
The Spanish Alia2 project tested storage solutions for renewable generation plants.
In particular, black-start based on batteries for small-hydro plants was tested. The
project partners expect to develop a new product with 1MW capacity and to
integrate it in grids and in generation plants (PV and wind). Services to small
industries, neighbourhoods, EV recharging and induction furnaces are also
envisaged.
The Spanish PRICE project demonstrated:
− MV/LV dispatch prototype & Distribution Management System for DG;
− Static synchronous compensators (STATCOM) installation in a MV and LV
grid for renewable integration and distributed generation dispatch.
− State Estimator algorithm & voltage control algorithm.
In Italy, the ISERNIA project demonstrated voltage regulation by remote control
of DER and storage (Li-ion battery) using centralised control system, and island
detection device.
EUROPEAN COMMISSION Technical analysis of past and on-going projects
104 July 2016
The French VENTEEA demonstration project16 was focused on improving the
integration of large wind energy in distribution networks by the use of battery
storage systems.
In Denmark, the project “Control and regulation of modern distribution
system studied two issues in distribution systems:
− Normal Operation Optimization to model the load optimal response to
electricity price, power system constraint impacts;
− Control Strategies in Abnormal Operations to derive an islanding detection
method, propose control and protection schemes for a varying status power
system.
In Portugal, the Storage in Evora project consisted in an MV Storage system
demonstrator, connecting Li-ion batteries to the MV grid to improve voltage quality
and energy management. Islanding mode in grid operation has been explored
within the project.
The Belgian project “Smart grids: Back End Systems” consisted in the segmented
roll-out of smart meters and associated systems. It delivered:
− The implementation of operating management systems with full roll-out in
operating centres,
− The roll-out of the new operations to the DSO field crew,
− Automatic wind curtailment and load shedding.
Next project steps should include:
− The integration of DSM as system reserve (DSO/TSO) to allow MV customers
to participate via aggregators in the TSO’s balancing mechanism,
− The integration of storage, including for providing ancillary services,
− The integration of the outage management for LV networks.
In Spain, the Gorona del Viento El Hierro project’s aim was to pave the way to
reach 60-80% of the energy consumption of the El Hierro island covered by
renewable sources. The project has designed, developed, constructed and put in
service a system Hydrowind able to cover the electrical demand in the island,
turning this island into a territory electrically supplied by renewable energies in a
high percentage. The system is composed by two water tanks, a wind farm, a
hydroelectric power station, a pump station and a power diesel plant. The
Hydrowind plant transforms an intermittent source of energy into a controlled
supply of electricity, maximizing the utilization of the wind power. In terms of
software tools the project carried out a simulation of the system, stability studies
and energy studies, and an Automatic Generation Control (AGC) of the plant. The
objective of reaching 60-80% consumption of the island covered with RES was not
achieved due to some control systems that should be improved. The project
achieved around 50% during the summer period.
In Austria, the Smart Grid Judenburg aimed at reducing connection costs for new
DG installations (hydro plants) connected to the MV network by means of a
centralised controller.
The other Austrian Smart LV Grid – Heimschuh project aimed at reducing
connection costs for new DG installations (rooftop PV panels, private households)
connected to the LV network by means of an On-Load Tap Changer (OLTC) installed
at secondary substation level to regulate voltage profile on LV network and increase
capacity for the network to connect increasing amounts of PV at a reduced cost
instead of resorting network reinforcements.
16 It was also part of the EU FP7 project IGREENGrid.
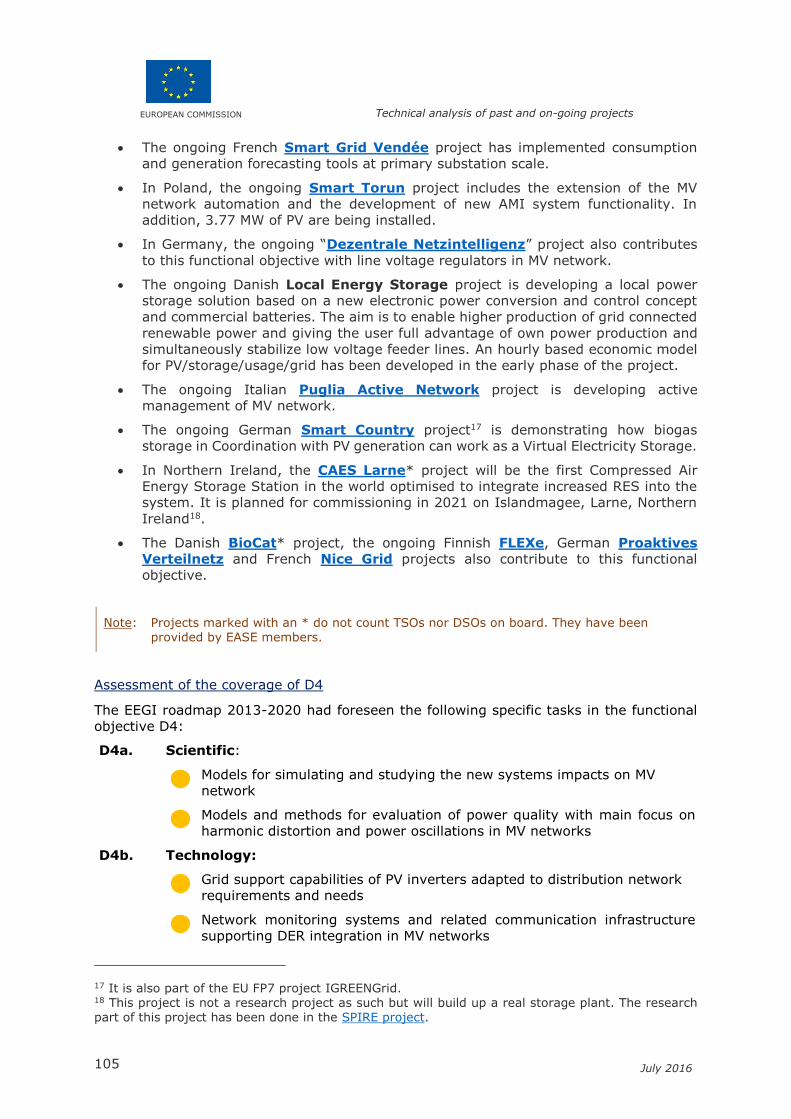
EUROPEAN COMMISSION Technical analysis of past and on-going projects
105 July 2016
The ongoing French Smart Grid Vendée project has implemented consumption
and generation forecasting tools at primary substation scale.
In Poland, the ongoing Smart Torun project includes the extension of the MV
network automation and the development of new AMI system functionality. In
addition, 3.77 MW of PV are being installed.
In Germany, the ongoing “Dezentrale Netzintelligenz” project also contributes
to this functional objective with line voltage regulators in MV network.
The ongoing Danish Local Energy Storage project is developing a local power
storage solution based on a new electronic power conversion and control concept
and commercial batteries. The aim is to enable higher production of grid connected
renewable power and giving the user full advantage of own power production and
simultaneously stabilize low voltage feeder lines. An hourly based economic model
for PV/storage/usage/grid has been developed in the early phase of the project.
The ongoing Italian Puglia Active Network project is developing active
management of MV network.
The ongoing German Smart Country project17 is demonstrating how biogas
storage in Coordination with PV generation can work as a Virtual Electricity Storage.
In Northern Ireland, the CAES Larne* project will be the first Compressed Air
Energy Storage Station in the world optimised to integrate increased RES into the
system. It is planned for commissioning in 2021 on Islandmagee, Larne, Northern
Ireland18.
The Danish BioCat* project, the ongoing Finnish FLEXe, German Proaktives
Verteilnetz and French Nice Grid projects also contribute to this functional
objective.
Note: Projects marked with an * do not count TSOs nor DSOs on board. They have been provided by EASE members.
Assessment of the coverage of D4
The EEGI roadmap 2013-2020 had foreseen the following specific tasks in the functional
objective D4:
D4a. Scientific:
Models for simulating and studying the new systems impacts on MV
network
Models and methods for evaluation of power quality with main focus on
harmonic distortion and power oscillations in MV networks
D4b. Technology:
Grid support capabilities of PV inverters adapted to distribution network
requirements and needs
Network monitoring systems and related communication infrastructure
supporting DER integration in MV networks
17 It is also part of the EU FP7 project IGREENGrid. 18 This project is not a research project as such but will build up a real storage plant. The research part of this project has been done in the SPIRE project.

EUROPEAN COMMISSION Technical analysis of past and on-going projects
106 July 2016
Unification of new cheap communication interfaces between network and
SDER, reminding a cost/benefit ratio and ENTSO-E requirements (e.g. ON-
OFF signal down to 400W installations)
ICT infrastructure in medium voltage networks for monitoring and control
of DER
Network management/control systems with, inter alia, self-healing
capabilities for fault management in MV network
New actuators (e.g. switches) and new sensors (e.g. fault detectors,
voltage and current sensors) for MV network, leading to new protection
and control strategies
New tools for network planning and design with the ability to integrate
conventional (passive) network simulations (load flow, etc.) with the
simulation of active components and control algorithms
D4c. Market:
Recommendations for valuation of ancillary services brought by DER
New market rules to continue promoting deployment of DER based on
renewables (replacing feed-in tariffs)
Recommendations for new tariff systems in support of the above market
rules
D4d. Social:
Training to increase the skills of dispatchers
Coverage assessment
The assessment of FO D4 has led to an estimate of coverage at 40%. The contribution of
ongoing EU and national projects’ expected results will allow the increase of the coverage
up to 50 %. There is only one critical point that has not been addressed concerning the
unification of new inexpensive communication interfaces between network and SDER at
MV/HV level, which is in agreement with the work effected at LV level as indicated in the
previous FO (D3).
13.2.3 D5 “Integration of storage in network management”
Contributions from completed and ongoing projects to D5
From EU projects
The almost finished INGRID project aims at demonstrating the efficient usage of
safe, high-density, solid-state hydrogen storage systems for power supply and
demand balancing within active power distribution grids with high penetration of
intermittent Distributed Generation (RES in particular). The scientific and
technological objectives were:
− To effectively integrate larger yet decentralized, fluctuating renewable
energy sources (within the 30-50% penetration level) without compromising
grid reliability and security, based on effective rapid and safe hydrogen-
based energy storage and on the delivery of solutions capable to timely and
instantaneously accept and manage any RES fluctuation and variability;
− To design and make available advanced ICT monitoring and control tools
aimed at simulating, managing, monitoring, controlling power dispatching in

EUROPEAN COMMISSION Technical analysis of past and on-going projects
107 July 2016
compliance with the power request of the grid, allowing a correct balance
between variable energy supply and demand;
− To demonstrate the usage of an innovative hydrogen solid-state storage
technology, as safe and high-density energy storage systems, to be
integrated in a closed loop coupled with water electrolysers and fuel cell
systems with the objective of achieving a highly efficient regenerative loop
(larger than 50-60%) with a reasonable cost;
− To perform a limited demonstrative scaled-down test case in Puglia region
for assessing the storage system’ high balancing capabilities in presence of
high variable electricity demand consisting in a small pilot version of a green
urban mobility system integrating conventional public transport designed to
be self-sustainable and increase the environmental sustainability.
The ongoing STORY* project aims to show the added value storage can bring in
the low and medium voltage grid. Eight demonstrations are set up to feed
knowledge into the further analysis on large scale impact. The storage technologies
involved are thermal storage, electrochemical and CAES. The main challenge is to
demonstrate and evaluate innovative approaches for thermal and electrical energy
storage systems and to find affordable and reliable solutions that lead to an
increased electricity self-supply. STORY is about showing the added value storage
can bring for a flexible, secure and sustainable energy system. The demonstrations
therefore compose the key activity on which all further analysis builds. Each of the
demonstrations brings a different technology, context or business case.
The ongoing TILOS project is developing policy recommendations for the distinction
of storage technologies in the Greek regulation and the permission to run islands
diesel-free. The existing regulatory framework for hybrid power stations in the non-
interconnected island part of Greece has been built upon the technology of pumped
hydro, missing essential elements with regards to battery storage operation and
requirements. Battery storage could provide a valuable asset for the island DSO in
terms of ancillary services and should thus be treated accordingly. At the same
time, the local regulation does not allow for completely diesel-free operation of an
island grid which is also challenged in the context of the project.
The ongoing Life Factory Microgrid* project will provide experience feedback on
the operation of Zn-Br flow battery technology.
The recently started CryoHub project is developing Cryogenic Energy Storage
(CES) in form of liquid air at Refrigerated Warehouses as an Interactive Hub to
integrate energy in industrial food refrigeration and to enhance power grid
sustainability. The intention is to use cheap, off-peak electricity to convert air into
a liquid, which can then be stored over a long period of time in a storage vessel.
Turning the liquid back to gas, by removing it from the store and applying heat to
it, will produce a huge increase in volume and pressure – enough to power a turbine
to generate electricity which can then be supplied back to the grid.
From national projects
In Italy, the ISERNIA project implemented of storage facility (Li-ion battery) on
real network.
The other Italian VENTOTENE* project realised a pilot project that involved 500kW,
600kWh lithium-ion battery to be integrated with diesel generators providing
electricity to the island and to store electricity for use during demand peaks. New
power electronics control rules have been designed.
The Spanish Alia2 project tested storage solutions for renewable generation plants
(design and manufacture of a 150 kW, lithium-ion storage system). One of its

EUROPEAN COMMISSION Technical analysis of past and on-going projects
108 July 2016
technological innovations is a concept called the battery pack, which has a cooling
unit incorporated into a modular system where the lithium-ion cells are inserted. It
also includes protection systems for the components and overall is able to reach
the required level of voltage and capacity. A control module which manages the
system has also been developed; it will guide the interfaces with other modules and
external grids. This new solution should allow the provision of grid services to DSOs
and TSOs.
The Spanish ATENEA Microgrid* project developed of a microgrid for industrial
applications that operates in on- and off-grid modes and is used as test bench for
new technologies, generation, storage and control systems. The technologies tested
include power generation systems but most important many different energy
storage systems (ESS) such as advanced batteries or supercapacitors.
The French VENTEEA demonstration project addressed the network constraints
created by wind turbines. Some services were made possible through the Venteea
battery storage system (2 MW / 1,3 MWh), facilitation the integration of the wind
energy on the network. One of these services is the short-term power smoothing,
avoiding too strong and too fast variations of the power injected on the network.
The storage plays the role of "buffer" to the variations and improves the quality of
supply. Another service relates to the energy surplus management, in case injection
of the whole wind generation into the network would lead to heavy constraints on
the network. The stored surplus of production would be delivered later, once the
risk of constraint disappears.
In Portugal, the Storage in Evora project consisted in an MV Storage system
demonstrator, connecting Li-ion batteries to the MV grid to improve voltage quality
and energy management.
In Denmark, the overall objective of the recently finished BioCat* project was to
design, engineer and construct a commercial-scale power-to-gas facility and
demonstrate its capabilities to provide energy storage services to the Danish energy
system. Five key components of Power-to-Gas Facility are used in the project:
− Hydrogen Production Unit: advanced alkaline electrolyser;
− Methanation System: a biological methanation system located at the
wastewater treatment plant Avedøre south of Copenhagen;
− Gas Injection: 4-bar gas distribution grid operated by HMN Naturgas A/S;
− Heat Recycling: in on-site buildings and for sludge pre-heating;
− Ancillary Services: frequency regulation to Danish power grid.
The facility also acts as a demonstrator of the technical capability and economic
viability of oxygen and heat recycling in the on-site wastewater operations. An
optimized trading strategy mimicking the intermittent nature of wind and solar
energy production has been developed in order to maximize economic value
capture.
The ongoing French Nice Grid project is experimenting local and temporary
islanding and reconnection of a subnetwork energized through storage and solar
generation. It also seek to optimize the operation of a network integrating a massive
production of photovoltaic energy.
The specific aims of the ongoing Danish EnergyLab Nordhavn* project EnergyLab
Nordhavn is to develop new innovative business models, new energy technologies
and intelligent operating solutions, such as integrated and flexible energy markets,
coordinated operation of electricity and heating systems, energy storage, energy-
efficient buildings—subject to immediate optimization in relation to energy
markets—and technologies offering flexible switching between energy sources. The
aim is for tomorrow's sustainable, densely populated energy-efficient cities all over
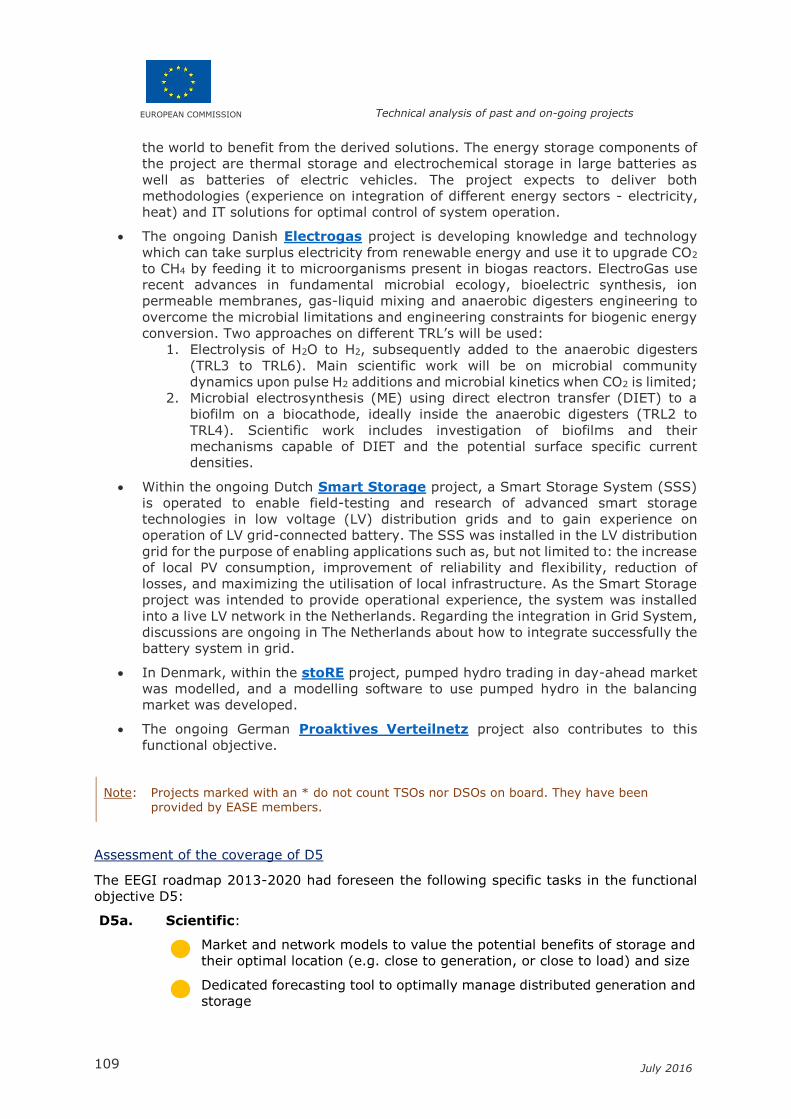
EUROPEAN COMMISSION Technical analysis of past and on-going projects
109 July 2016
the world to benefit from the derived solutions. The energy storage components of
the project are thermal storage and electrochemical storage in large batteries as
well as batteries of electric vehicles. The project expects to deliver both
methodologies (experience on integration of different energy sectors - electricity,
heat) and IT solutions for optimal control of system operation.
The ongoing Danish Electrogas project is developing knowledge and technology
which can take surplus electricity from renewable energy and use it to upgrade CO2
to CH4 by feeding it to microorganisms present in biogas reactors. ElectroGas use
recent advances in fundamental microbial ecology, bioelectric synthesis, ion
permeable membranes, gas-liquid mixing and anaerobic digesters engineering to
overcome the microbial limitations and engineering constraints for biogenic energy
conversion. Two approaches on different TRL’s will be used:
1. Electrolysis of H2O to H2, subsequently added to the anaerobic digesters
(TRL3 to TRL6). Main scientific work will be on microbial community
dynamics upon pulse H2 additions and microbial kinetics when CO2 is limited;
2. Microbial electrosynthesis (ME) using direct electron transfer (DIET) to a
biofilm on a biocathode, ideally inside the anaerobic digesters (TRL2 to
TRL4). Scientific work includes investigation of biofilms and their
mechanisms capable of DIET and the potential surface specific current
densities.
Within the ongoing Dutch Smart Storage project, a Smart Storage System (SSS)
is operated to enable field-testing and research of advanced smart storage
technologies in low voltage (LV) distribution grids and to gain experience on
operation of LV grid-connected battery. The SSS was installed in the LV distribution
grid for the purpose of enabling applications such as, but not limited to: the increase
of local PV consumption, improvement of reliability and flexibility, reduction of
losses, and maximizing the utilisation of local infrastructure. As the Smart Storage
project was intended to provide operational experience, the system was installed
into a live LV network in the Netherlands. Regarding the integration in Grid System,
discussions are ongoing in The Netherlands about how to integrate successfully the
battery system in grid.
In Denmark, within the stoRE project, pumped hydro trading in day-ahead market
was modelled, and a modelling software to use pumped hydro in the balancing
market was developed.
The ongoing German Proaktives Verteilnetz project also contributes to this
functional objective.
Note: Projects marked with an * do not count TSOs nor DSOs on board. They have been provided by EASE members.
Assessment of the coverage of D5
The EEGI roadmap 2013-2020 had foreseen the following specific tasks in the functional
objective D5:
D5a. Scientific:
Market and network models to value the potential benefits of storage and
their optimal location (e.g. close to generation, or close to load) and size
Dedicated forecasting tool to optimally manage distributed generation and
storage
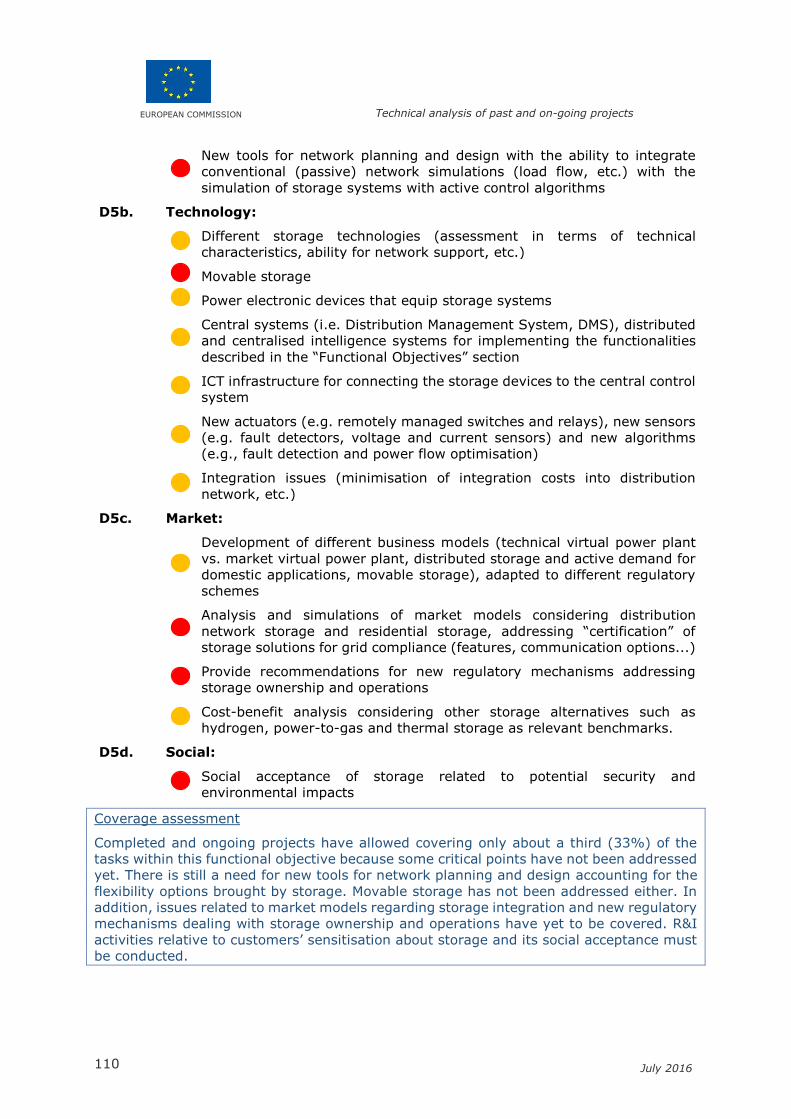
EUROPEAN COMMISSION Technical analysis of past and on-going projects
110 July 2016
New tools for network planning and design with the ability to integrate
conventional (passive) network simulations (load flow, etc.) with the
simulation of storage systems with active control algorithms
D5b. Technology:
Different storage technologies (assessment in terms of technical
characteristics, ability for network support, etc.)
Movable storage
Power electronic devices that equip storage systems
Central systems (i.e. Distribution Management System, DMS), distributed
and centralised intelligence systems for implementing the functionalities
described in the “Functional Objectives” section
ICT infrastructure for connecting the storage devices to the central control
system
New actuators (e.g. remotely managed switches and relays), new sensors
(e.g. fault detectors, voltage and current sensors) and new algorithms
(e.g., fault detection and power flow optimisation)
Integration issues (minimisation of integration costs into distribution
network, etc.)
D5c. Market:
Development of different business models (technical virtual power plant
vs. market virtual power plant, distributed storage and active demand for
domestic applications, movable storage), adapted to different regulatory
schemes
Analysis and simulations of market models considering distribution
network storage and residential storage, addressing “certification” of
storage solutions for grid compliance (features, communication options...)
Provide recommendations for new regulatory mechanisms addressing
storage ownership and operations
Cost-benefit analysis considering other storage alternatives such as
hydrogen, power-to-gas and thermal storage as relevant benchmarks.
D5d. Social:
Social acceptance of storage related to potential security and
environmental impacts
Coverage assessment
Completed and ongoing projects have allowed covering only about a third (33%) of the
tasks within this functional objective because some critical points have not been addressed
yet. There is still a need for new tools for network planning and design accounting for the
flexibility options brought by storage. Movable storage has not been addressed either. In
addition, issues related to market models regarding storage integration and new regulatory
mechanisms dealing with storage ownership and operations have yet to be covered. R&I
activities relative to customers’ sensitisation about storage and its social acceptance must
be conducted.
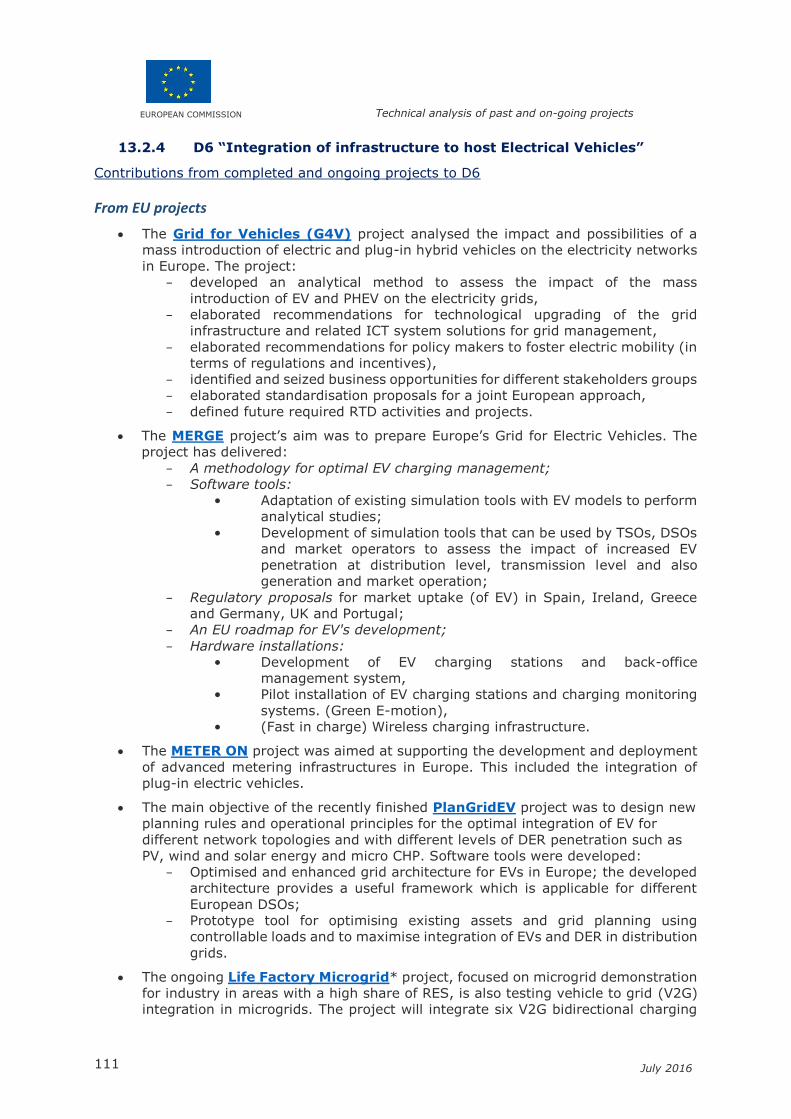
EUROPEAN COMMISSION Technical analysis of past and on-going projects
111 July 2016
13.2.4 D6 “Integration of infrastructure to host Electrical Vehicles”
Contributions from completed and ongoing projects to D6
From EU projects
The Grid for Vehicles (G4V) project analysed the impact and possibilities of a
mass introduction of electric and plug-in hybrid vehicles on the electricity networks
in Europe. The project:
− developed an analytical method to assess the impact of the mass
introduction of EV and PHEV on the electricity grids,
− elaborated recommendations for technological upgrading of the grid
infrastructure and related ICT system solutions for grid management,
− elaborated recommendations for policy makers to foster electric mobility (in
terms of regulations and incentives),
− identified and seized business opportunities for different stakeholders groups
− elaborated standardisation proposals for a joint European approach,
− defined future required RTD activities and projects.
The MERGE project’s aim was to prepare Europe’s Grid for Electric Vehicles. The
project has delivered:
− A methodology for optimal EV charging management;
− Software tools:
• Adaptation of existing simulation tools with EV models to perform
analytical studies;
• Development of simulation tools that can be used by TSOs, DSOs
and market operators to assess the impact of increased EV
penetration at distribution level, transmission level and also
generation and market operation;
− Regulatory proposals for market uptake (of EV) in Spain, Ireland, Greece
and Germany, UK and Portugal;
− An EU roadmap for EV's development;
− Hardware installations:
• Development of EV charging stations and back-office
management system,
• Pilot installation of EV charging stations and charging monitoring
systems. (Green E-motion),
• (Fast in charge) Wireless charging infrastructure.
The METER ON project was aimed at supporting the development and deployment
of advanced metering infrastructures in Europe. This included the integration of
plug-in electric vehicles.
The main objective of the recently finished PlanGridEV project was to design new
planning rules and operational principles for the optimal integration of EV for
different network topologies and with different levels of DER penetration such as
PV, wind and solar energy and micro CHP. Software tools were developed:
− Optimised and enhanced grid architecture for EVs in Europe; the developed
architecture provides a useful framework which is applicable for different
European DSOs;
− Prototype tool for optimising existing assets and grid planning using
controllable loads and to maximise integration of EVs and DER in distribution
grids.
The ongoing Life Factory Microgrid* project, focused on microgrid demonstration
for industry in areas with a high share of RES, is also testing vehicle to grid (V2G)
integration in microgrids. The project will integrate six V2G bidirectional charging

EUROPEAN COMMISSION Technical analysis of past and on-going projects
112 July 2016
points for electric vehicles and one 50 kW fast charge point.
From national projects
Within the Italian ISERNIA project, EV charging stations were installed.
The French BIENVENU project is experimenting a solution for the integration of
EVs in residential buildings (controlled charging solution adapted to the parking lots
as well as car sharing solution of EVs). The project expects to optimise EV charging
in collective housing, taking into account both EV needs and the impact on the
distribution network.
Within the Italian ongoing Puglia Active Network project, recharging
infrastructure for Electric Vehicles are being installed.
The ongoing German Proaktives Verteilnetz project also contributes to this
functional objective.
Note: Projects marked with an * do not count TSOs nor DSOs on board. They have been
provided by EASE members.
Assessment of the coverage of D6
The EEGI roadmap 2013-2020 had foreseen the following specific tasks in the functional
objective D6:
D6a. Scientific:
Network modelling and optimization tools in the presence of massive
integration of EVs
Optimization tools for power flow calculation capable of simulating the
active behaviour of on board battery chargers with advanced control
algorithms (e.g. implementing V2G dispatch strategies)
D6b. Technology:
Development of EV charging infrastructures (for EV charging in public
and private areas)
Development of centralized remote management system enabling smart
grids integration of EV charging infrastructures, supporting business-to-
customers and business-to-business relationships and ensuring easy and
secure payments for customers
Smart EV charging solutions in accordance to energy availability and
network constraints and electricity prices
Development of standard charging solutions to ensure interoperability and
recharging of current and future vehicles generation
Fast, very fast, and inductive recharge
V2G technology solutions
D6c. Market:
Creation of a common marketplace in order to provide common services
across EU and in particular enabling roaming services
Definition of business models for electric mobility
EUROPEAN COMMISSION Technical analysis of past and on-going projects
113 July 2016
Recommendations for tariff schemes and incentives to promote optimized
charging and facilitate customer engagement
Regulatory recommendations to support electric mobility market
penetration
Market mechanisms for V2G
D6d. Social:
Understanding of costumer behaviour and social acceptance
Coverage assessment
On a scientific point of view, network modelling and optimisation tools have been developed
with a satisfactory maturity, whereas for technologies (D6b) there is still a significant gap
to reach applicable results, notably in terms of the development of centralized remote
management systems and smart EV charging solutions accounting for energy availability
and network constraints as well as electricity prices. Market aspects have been touched
but research activities are still needed for the creation of a common market place.
Therefore, the coverage of this functional objective is estimated at around 40%.
13.3 Recommendations for the new R&I roadmap
As for Cluster 1, the R&I activities specified in the four FOs have been addressed in many
projects, which has resulted in a good coverage of Cluster 2 (around 40%). However, there
are still missing knowledge blocks for each FO. For the integration of EVs (D6), there are
no answers regarding the “market place” and the associated standardised infrastructures
which could allow citizens to travel across the EU. For storage (D5), for instance, market
players still need a clear regulatory framework for storage ownership and operations. For
the integration of DER at both the MV and LV levels, there is still a lack of integrate solutions
(both hardware and software) to increase the penetration of DER, covering the full range
of encountered combinations between generation portfolios and network topologies, while
complying with power quality limits and keeping the network within its stability limits.
For the new roadmap, it is recommended to keep Cluster 2 and to expand the scope of R&I
activities with one additional FO covering the connections with other energy networks. The
new name of the cluster should be “Integration of DER and EV, storage, other networks”.
The scope of D6 should also be extended to cover not only issues related to the integration
of EVs, but also all issues related to the electrification of (public) transport. For the other
FOs, the remaining gaps in terms of coverage should be filled in by re-specifying the non-
covered R&I activities19.
19 As explained for Cluster 1, it is also recommended to specify the R&I activities of each FO in terms of cross-cutting challenges: upgrading of the network, Power system flexibility, Power system reliability, ICT and digitalization, Market design, and DSOs regulatory environment.

EUROPEAN COMMISSION Technical analysis of past and on-going projects
114 July 2016
14. Distribution Cluster 3: Network operations
Cluster 1 is organized into 4 Functional Objectives: D7, D8, D9 and D10.
D7. Monitoring and control of LV networks
D8. Automation and control of MV networks
D9. Network management methodologies for network operation
D10. Smart metering data utilisation
14.1 Features of achievements in Cluster 3
14.1.1 Descriptive features
Categorization in functional objectives
The graphs below characterize the completed (38 achievements) and expected (15
achievements) achievements of projects’ results of cluster 3, the purple colour was
dedicated to Cluster 3.
Figure 57: The portfolio of achievements in Cluster 3 (left: overall; middle: completed;
right: expected)
Highlights:
. Cluster 3 includes four FO that are quite well-balanced in term of achievements.
. There is no major distortion in the general balance in the three diagrams, except
for D9 and D10 when moving from the completed to the expected achievements.
Typology of achievements in Cluster 3
Figure 58: Typology of achievements in Cluster 3 in distribution

EUROPEAN COMMISSION Technical analysis of past and on-going projects
115 July 2016
Highlights:
. The profile of the breakdown per nature indicates that the Software type
achievements followed by the hardware type and the methodology type are the
most quoted in Cluster 3.
. Mentions of policy, regulation, market and of database types remain limited in that
cluster.
Evolution of the maturity of achievements in Cluster 3
Figure 59: Evolution of the maturity of achievements contributing to Cluster 3 of
distribution measured in TRL units
Highlights:
. The graph shows the high variability of the maturity increments per project
achievement in Cluster 3 of Distribution: several of the considered achievements
have a maturity gain strictly higher than 3 units.
. This is consistent with the average maturity increment of the Cluster which is the
highest compared to the other average maturity increments in distribution clusters
(almost 3 TRL units: see section 11.3).
14.1.2 Projective features (next steps)
From the data collected in Cluster 3 for each functional objective (D7, D8, D9, D10) one
could formulate the following highlights:
. In D7 the most preferred routes are demonstration and further development.
. In D8 the three downstream routes are the most quoted: further development,
demonstration and deployment, the further research route is marginal.
. In D9, as for D7, the most preferred routes are demonstration and further
development.
. In D10, the three upstream routes are the most quoted: further research, further
development, demonstration, while the deployment option is never mentioned.
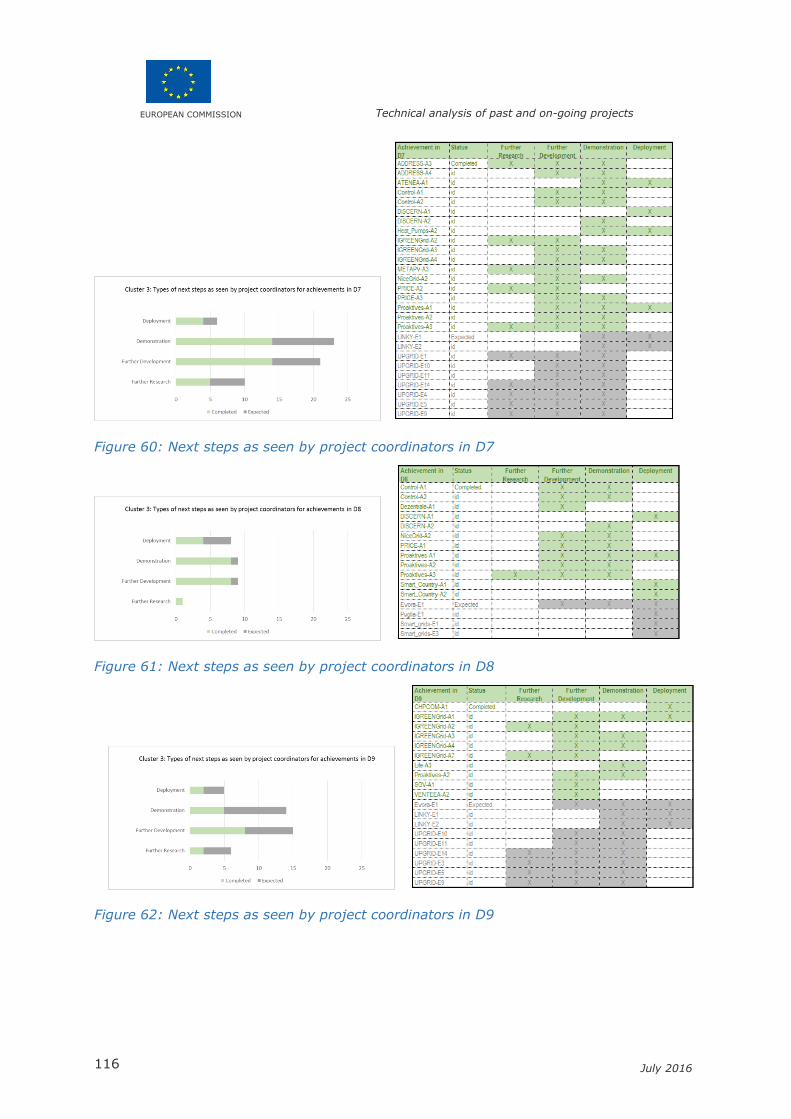
EUROPEAN COMMISSION Technical analysis of past and on-going projects
116 July 2016
Figure 60: Next steps as seen by project coordinators in D7
Figure 61: Next steps as seen by project coordinators in D8
Figure 62: Next steps as seen by project coordinators in D9
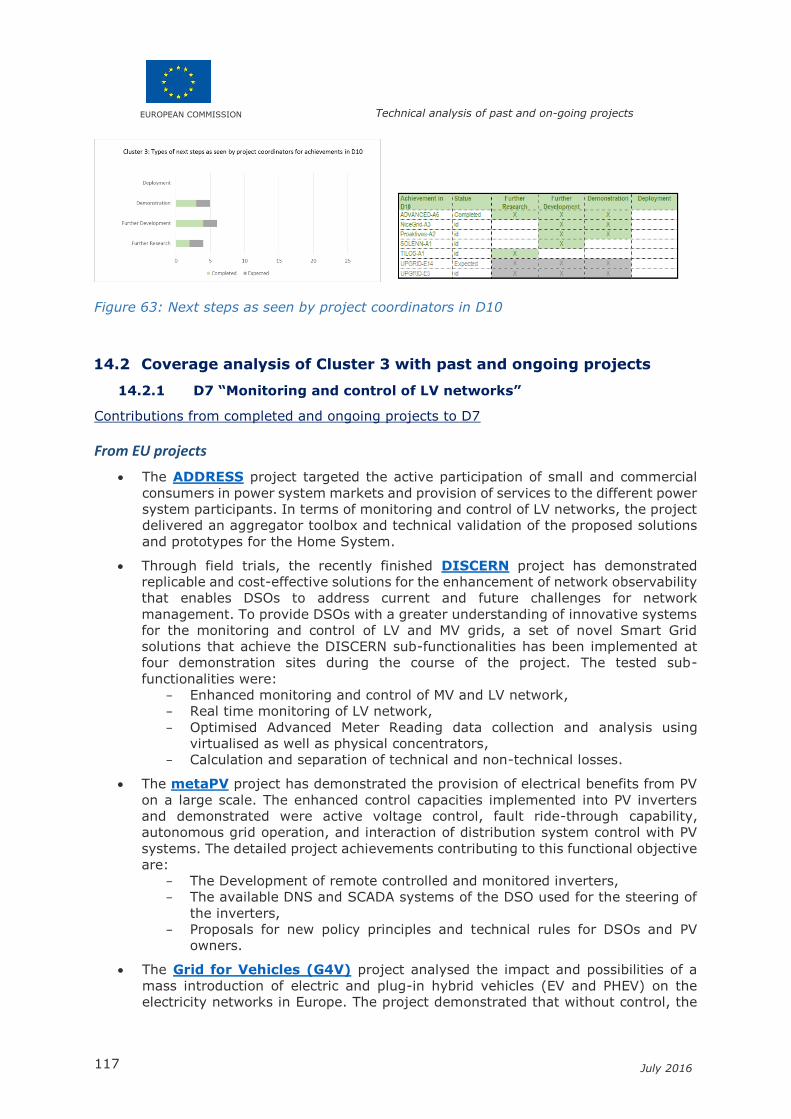
EUROPEAN COMMISSION Technical analysis of past and on-going projects
117 July 2016
Figure 63: Next steps as seen by project coordinators in D10
14.2 Coverage analysis of Cluster 3 with past and ongoing projects
14.2.1 D7 “Monitoring and control of LV networks”
Contributions from completed and ongoing projects to D7
From EU projects
The ADDRESS project targeted the active participation of small and commercial
consumers in power system markets and provision of services to the different power
system participants. In terms of monitoring and control of LV networks, the project
delivered an aggregator toolbox and technical validation of the proposed solutions
and prototypes for the Home System.
Through field trials, the recently finished DISCERN project has demonstrated
replicable and cost-effective solutions for the enhancement of network observability
that enables DSOs to address current and future challenges for network
management. To provide DSOs with a greater understanding of innovative systems
for the monitoring and control of LV and MV grids, a set of novel Smart Grid
solutions that achieve the DISCERN sub-functionalities has been implemented at
four demonstration sites during the course of the project. The tested sub-
functionalities were:
− Enhanced monitoring and control of MV and LV network,
− Real time monitoring of LV network,
− Optimised Advanced Meter Reading data collection and analysis using
virtualised as well as physical concentrators,
− Calculation and separation of technical and non-technical losses.
The metaPV project has demonstrated the provision of electrical benefits from PV
on a large scale. The enhanced control capacities implemented into PV inverters
and demonstrated were active voltage control, fault ride-through capability,
autonomous grid operation, and interaction of distribution system control with PV
systems. The detailed project achievements contributing to this functional objective
are:
− The Development of remote controlled and monitored inverters,
− The available DNS and SCADA systems of the DSO used for the steering of
the inverters,
− Proposals for new policy principles and technical rules for DSOs and PV
owners.
The Grid for Vehicles (G4V) project analysed the impact and possibilities of a
mass introduction of electric and plug-in hybrid vehicles (EV and PHEV) on the
electricity networks in Europe. The project demonstrated that without control, the
EUROPEAN COMMISSION Technical analysis of past and on-going projects
118 July 2016
charge of EVs can have significant impacts on the use of generation plants and
increase network constraints.
The Open Node project’s goal was the design and development of an Open
Common Reference Architecture (both in hardware and software aspects) for the
inner parts of the distribution grid, namely the smart Secondary Substation Nodes
(SSN). A prototype to concentrate measurements (smart metering) for the
secondary substation and a metering management collector (MMC) were developed.
The IGREENGrid project has carried out a study for improving the DRES hosting
capacity in European distribution grids by using smart grid solutions. Scalability and
replicability analysis have been applied to the most promising solutions. An
economic analysis of most promising solutions for DRES integration has been
carried out.
With the ongoing UpGrid project, the improvement of the monitoring and
controllability of LV and MV grids is expected, as a way to anticipate technical
problems associated with large scale integration of DER, bringing also end users
closer to system operation and planning. In terms of monitoring and control of LV
networks, the project expects to achieve a sound LV network representation, to
improve operations and maintenance of LV grid, to integration and process meter
events in the Outage Management System (OMS) within SCADA systems, to deploy
Multiservice PRIME subnetwork and to develop LV grid remote control operation
over Smart Metering PRIME infrastructure.
From national projects
The Spanish ATENEA Microgrid* project developed of a microgrid for industrial
applications that operates in on- and off-grid modes and is used as test bench for
new technologies, generation, storage and control systems. In order to manage the
plant in a proper way, a Control and Energy Management Systems and a SCADA
have been developed, implemented and tested. Furthermore, tools (ICTs) for smart
management of LV networks are envisaged within the project.
The Danish project “Control and regulation of modern distribution system has
also contributed to this function objective with a Normal Operation Optimization
model and Abnormal/Emergency Operations Control Strategies.
The ongoing French Nice Grid project seeks to optimize the operation of a network
integrating a massive production of photovoltaic energy.
In France, the roll-out of the Linky smart meters is ongoing (35 million of units).
The smart meter will support bi-directional communications in order to automate
meter-reading, improve grid management, prevent fraud, while improving demand
response and paving the way for smart grids roll-out.
In Denmark, the ongoing project “DSO challenges from introduction of heat
pumps” has delivered a model to forecast the impact of mass uptake of heat pumps
on LV grids and a power electronics algorithm to prevent overload of LV grid with
many heat pumps.
The ongoing Polish Smart Torun project also contributes to this functional objective
with the distribution network automation and metering infrastructure deployment.
The Spanish PRICE demonstration project has also contributed to this functional
objective.
With grid state estimation, the ongoing German Proaktives Verteilnetz project
also contributes to this functional objective.
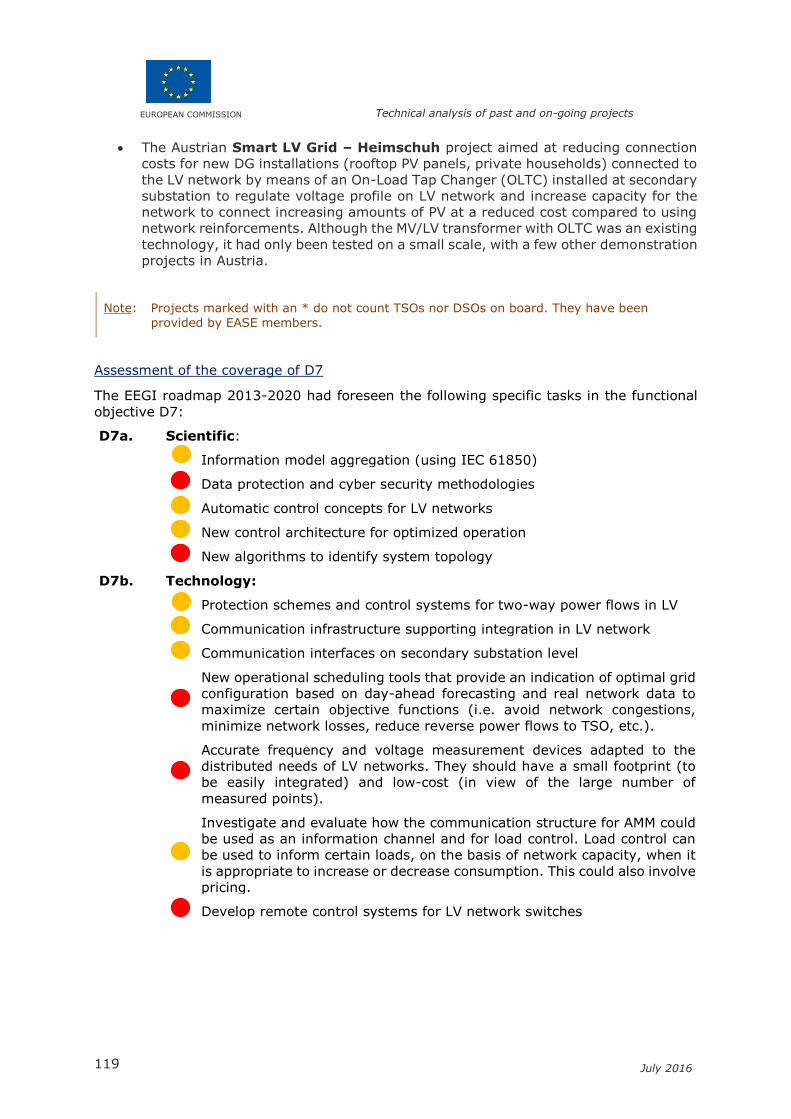
EUROPEAN COMMISSION Technical analysis of past and on-going projects
119 July 2016
The Austrian Smart LV Grid – Heimschuh project aimed at reducing connection
costs for new DG installations (rooftop PV panels, private households) connected to
the LV network by means of an On-Load Tap Changer (OLTC) installed at secondary
substation to regulate voltage profile on LV network and increase capacity for the
network to connect increasing amounts of PV at a reduced cost compared to using
network reinforcements. Although the MV/LV transformer with OLTC was an existing
technology, it had only been tested on a small scale, with a few other demonstration
projects in Austria.
Note: Projects marked with an * do not count TSOs nor DSOs on board. They have been
provided by EASE members.
Assessment of the coverage of D7
The EEGI roadmap 2013-2020 had foreseen the following specific tasks in the functional
objective D7:
D7a. Scientific:
Information model aggregation (using IEC 61850)
Data protection and cyber security methodologies
Automatic control concepts for LV networks
New control architecture for optimized operation
New algorithms to identify system topology
D7b. Technology:
Protection schemes and control systems for two-way power flows in LV
Communication infrastructure supporting integration in LV network
Communication interfaces on secondary substation level
New operational scheduling tools that provide an indication of optimal grid
configuration based on day-ahead forecasting and real network data to
maximize certain objective functions (i.e. avoid network congestions,
minimize network losses, reduce reverse power flows to TSO, etc.).
Accurate frequency and voltage measurement devices adapted to the
distributed needs of LV networks. They should have a small footprint (to
be easily integrated) and low-cost (in view of the large number of
measured points).
Investigate and evaluate how the communication structure for AMM could
be used as an information channel and for load control. Load control can
be used to inform certain loads, on the basis of network capacity, when it
is appropriate to increase or decrease consumption. This could also involve
pricing.
Develop remote control systems for LV network switches
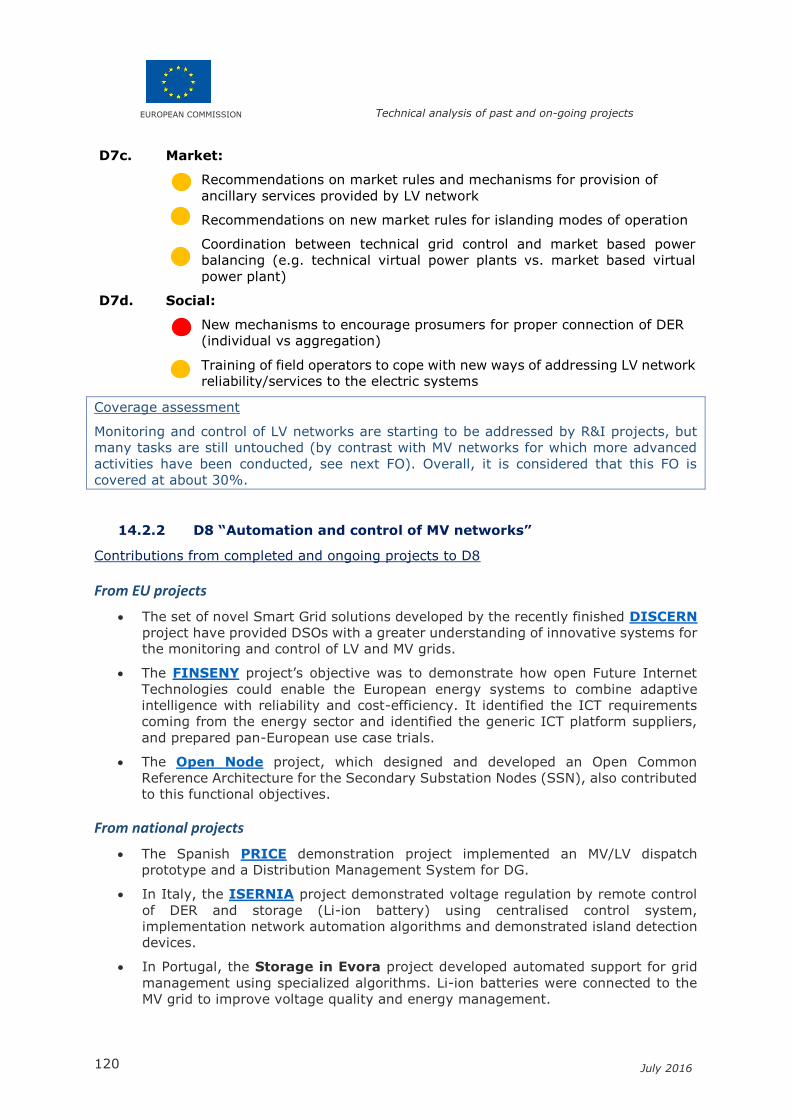
EUROPEAN COMMISSION Technical analysis of past and on-going projects
120 July 2016
D7c. Market:
Recommendations on market rules and mechanisms for provision of
ancillary services provided by LV network
Recommendations on new market rules for islanding modes of operation
Coordination between technical grid control and market based power
balancing (e.g. technical virtual power plants vs. market based virtual
power plant)
D7d. Social:
New mechanisms to encourage prosumers for proper connection of DER
(individual vs aggregation)
Training of field operators to cope with new ways of addressing LV network
reliability/services to the electric systems
Coverage assessment
Monitoring and control of LV networks are starting to be addressed by R&I projects, but
many tasks are still untouched (by contrast with MV networks for which more advanced
activities have been conducted, see next FO). Overall, it is considered that this FO is
covered at about 30%.
14.2.2 D8 “Automation and control of MV networks”
Contributions from completed and ongoing projects to D8
From EU projects
The set of novel Smart Grid solutions developed by the recently finished DISCERN
project have provided DSOs with a greater understanding of innovative systems for
the monitoring and control of LV and MV grids.
The FINSENY project’s objective was to demonstrate how open Future Internet
Technologies could enable the European energy systems to combine adaptive
intelligence with reliability and cost-efficiency. It identified the ICT requirements
coming from the energy sector and identified the generic ICT platform suppliers,
and prepared pan-European use case trials.
The Open Node project, which designed and developed an Open Common
Reference Architecture for the Secondary Substation Nodes (SSN), also contributed
to this functional objectives.
From national projects
The Spanish PRICE demonstration project implemented an MV/LV dispatch
prototype and a Distribution Management System for DG.
In Italy, the ISERNIA project demonstrated voltage regulation by remote control
of DER and storage (Li-ion battery) using centralised control system,
implementation network automation algorithms and demonstrated island detection
devices.
In Portugal, the Storage in Evora project developed automated support for grid
management using specialized algorithms. Li-ion batteries were connected to the
MV grid to improve voltage quality and energy management.
EUROPEAN COMMISSION Technical analysis of past and on-going projects
121 July 2016
In Austria, the Smart Grid Judenburg aimed at reducing connection costs for new
DG installations (hydro plants) connected to the MV network. It also demonstrated
deployment of centralised control system for regulating voltage profile by
controlling reactive power control of hydro generators. Simulation studies were used
to determine a reduced number of nodes for real time measurements from meter
data and RTUs using GPRS communication system. The allocation of set points to
the generators was accomplished using manual instructions, however, if required,
further capacity for connecting more DG could be achieved by implementing an
automated control.
The Danish project “Control and regulation of modern distribution system has
also contributed to this functional objective with a Normal Operation Optimization
model and Abnormal/Emergency Operations Control Strategies.
The ongoing French Nice Grid project seeks to optimize the operation of a network
integrating a massive production of photovoltaic energy.
In Poland, the ongoing Smart Torun project includes the extension of the MV
network automation and the development of new AMI system functionality.
In Germany, the “Dezentrale Netzintelligenz” project is using automated
secondary substations to reduce/shorten outages in the grid and a regional
controller to monitor and control a part of the MV grid.
The Belgian project “Smart grids: Back End Systems” also contributed to this
functional objective, with the following actions:
− segmented roll-out of smart meters,
− building of the necessary back-end systems for data acquisition and
monitoring,
− implementation of SCADA and Telecontrol for the network,
− tests to avoid faults,
− automatic load transfer (curtailment),
− response to Blackouts,
− optimal solution for several feeders,
− connection actions at LV to improve the controllability of the network.
The ongoing German Smart Country project has developed active voltage
regulator for MV network to a product manufactured in series and implemented a
wide area control in further primary substations.
The other ongoing German Smart Operator project is aimed at the development
of a Smart Operator working as an autonomous controlling and switching point in
the grid, detecting and coordinating the electricity supply and demand, and
coordinating the voltage quality. It directly controls the intelligent grid components
- developed inside the project: local grid transformers, LV circuit breakers, battery
storages, E-mobility charging stations and via another interface, the "Home Energy
Controller" smart domestic appliances of households.
The ongoing Italian Puglia Active Network project is developing active
management of MV network.
With grid state estimation, the ongoing German Proaktives Verteilnetz project
also contributes to this functional objective.
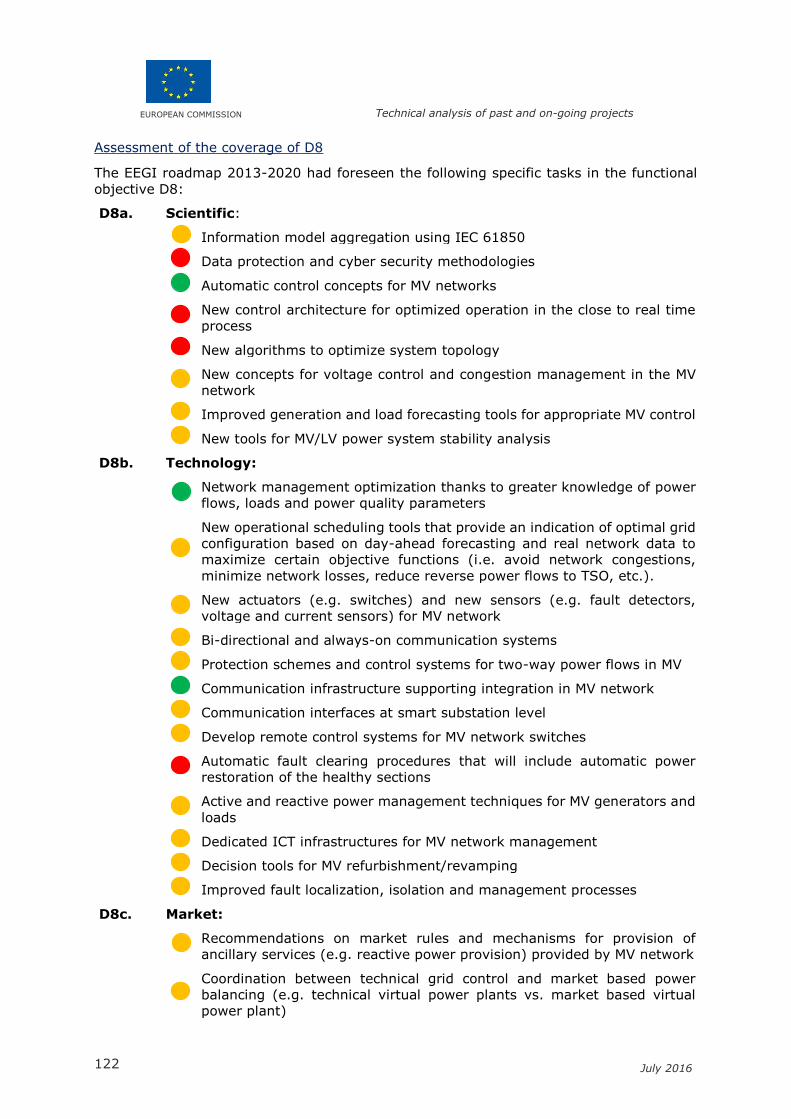
EUROPEAN COMMISSION Technical analysis of past and on-going projects
122 July 2016
Assessment of the coverage of D8
The EEGI roadmap 2013-2020 had foreseen the following specific tasks in the functional
objective D8:
D8a. Scientific:
Information model aggregation using IEC 61850
Data protection and cyber security methodologies
Automatic control concepts for MV networks
New control architecture for optimized operation in the close to real time
process
New algorithms to optimize system topology
New concepts for voltage control and congestion management in the MV
network
Improved generation and load forecasting tools for appropriate MV control
New tools for MV/LV power system stability analysis
D8b. Technology:
Network management optimization thanks to greater knowledge of power
flows, loads and power quality parameters
New operational scheduling tools that provide an indication of optimal grid
configuration based on day-ahead forecasting and real network data to
maximize certain objective functions (i.e. avoid network congestions,
minimize network losses, reduce reverse power flows to TSO, etc.).
New actuators (e.g. switches) and new sensors (e.g. fault detectors,
voltage and current sensors) for MV network
Bi-directional and always-on communication systems
Protection schemes and control systems for two-way power flows in MV
Communication infrastructure supporting integration in MV network
Communication interfaces at smart substation level
Develop remote control systems for MV network switches
Automatic fault clearing procedures that will include automatic power
restoration of the healthy sections
Active and reactive power management techniques for MV generators and
loads
Dedicated ICT infrastructures for MV network management
Decision tools for MV refurbishment/revamping
Improved fault localization, isolation and management processes
D8c. Market:
Recommendations on market rules and mechanisms for provision of
ancillary services (e.g. reactive power provision) provided by MV network
Coordination between technical grid control and market based power
balancing (e.g. technical virtual power plants vs. market based virtual
power plant)
EUROPEAN COMMISSION Technical analysis of past and on-going projects
123 July 2016
D8d. Social:
Training of field operators to cope with new ways of addressing MV network
reliability/services to the electric systems
Coverage assessment
Most of the tasks in this FO have been tackled. However some remain almost untouched,
regarding for instance data protection, cyber security methodologies, control architecture
for optimized operation close to real time, algorithms to optimize system topology and
automatic fault clearing procedures. By contrast, automatic control concepts for MV
networks and related technology-oriented activities like network management optimization
and communication infrastructure supporting integration in MV network, are well
developed.
Overall, it is considered that half (50%) of the tasks in this FO are covered.
14.2.3 D9 “Network management methodologies for network operation”
Contributions from completed and ongoing projects to D9
From EU projects
The recently finished IGREENGrid project has also contributed to this functional
objective. A repository to collect operating data from different sources has been set
up.
The ongoing Life Factory Microgrid* project is developing strategies for a
microgrid with 3 storage technologies and V2G. This microgrid will test and validate
different energy management strategies, generating 160,000 kWh/year free of
greenhouse gases, avoiding at the same time the emission of 96 Tm of CO2 thanks
to the management of dispatchable loads and the use of electric vehicles. The
project also aims at offering ancillary services (voltage and frequency control) to
the distribution grid, contributing to grid stability, and reducing the need of
generation reserve capacity (gas combined cycles, fuel, or carbon generators).
The ongoing UpGrid project is contributing to this functional objective, in particular
with the development of functional specification of LV dispatch and the deployment
of tools to support LV operation of field crews.
From national projects
The Spanish ATENEA Microgrid* project developed of a microgrid for industrial
applications that operates in on- and off-grid modes and is used as test bench for
new technologies, generation, storage and control systems. A Microgrids & Energy
Management Strategies Simulation Platform has been developed to simulate,
control and operate the plant and the whole system is part of the methodology to
design and develop microgrids proposed by the project.
The Danish CHPCOM (Combined Heat and Power Communication) project analysed,
developed and demonstrated through practical experience, the use of international
Smart Grid related data communication standards, specifically IEC 61850 and IEC
62351 for IT security. CHPCOM focused on distributed generation, specifically CHPs
and their business partners. The main project achievement consists in TSO/DSO
system integration communications, including security keys, for CHP power plant
management.
The French VENTEEA project also contributed to this functional objective.
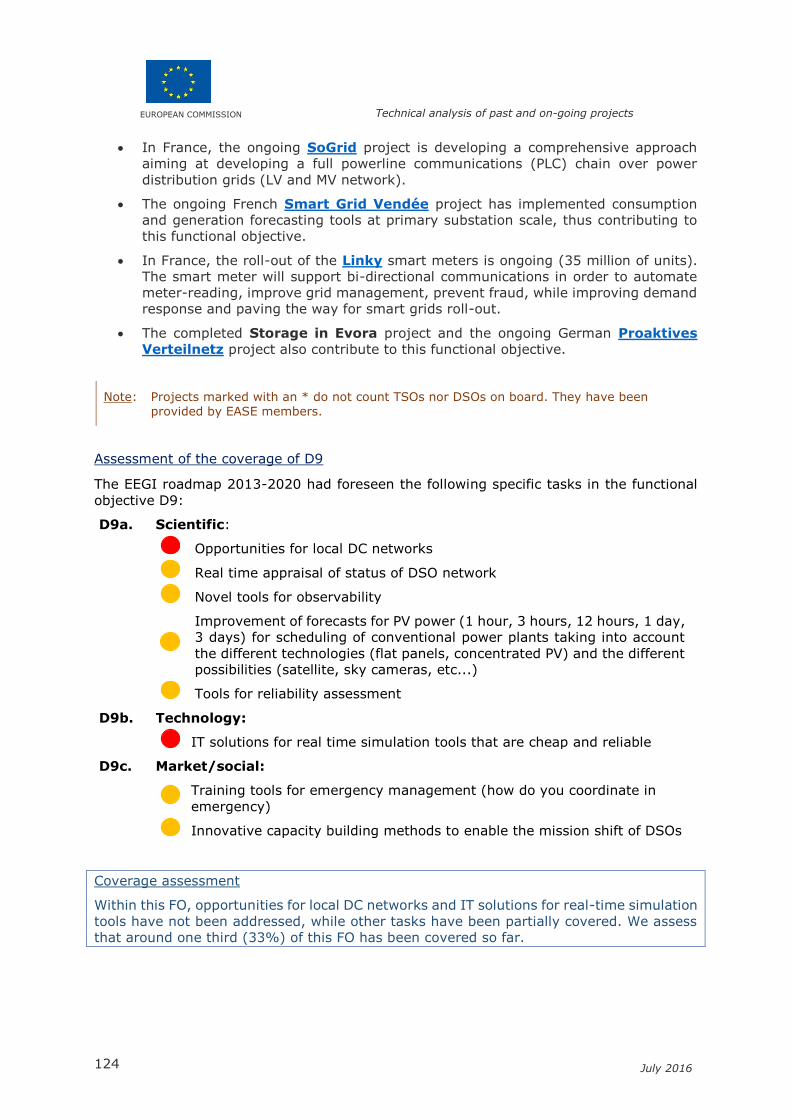
EUROPEAN COMMISSION Technical analysis of past and on-going projects
124 July 2016
In France, the ongoing SoGrid project is developing a comprehensive approach
aiming at developing a full powerline communications (PLC) chain over power
distribution grids (LV and MV network).
The ongoing French Smart Grid Vendée project has implemented consumption
and generation forecasting tools at primary substation scale, thus contributing to
this functional objective.
In France, the roll-out of the Linky smart meters is ongoing (35 million of units).
The smart meter will support bi-directional communications in order to automate
meter-reading, improve grid management, prevent fraud, while improving demand
response and paving the way for smart grids roll-out.
The completed Storage in Evora project and the ongoing German Proaktives
Verteilnetz project also contribute to this functional objective.
Note: Projects marked with an * do not count TSOs nor DSOs on board. They have been provided by EASE members.
Assessment of the coverage of D9
The EEGI roadmap 2013-2020 had foreseen the following specific tasks in the functional
objective D9:
D9a. Scientific:
Opportunities for local DC networks
Real time appraisal of status of DSO network
Novel tools for observability
Improvement of forecasts for PV power (1 hour, 3 hours, 12 hours, 1 day,
3 days) for scheduling of conventional power plants taking into account
the different technologies (flat panels, concentrated PV) and the different
possibilities (satellite, sky cameras, etc...)
Tools for reliability assessment
D9b. Technology:
IT solutions for real time simulation tools that are cheap and reliable
D9c. Market/social:
Training tools for emergency management (how do you coordinate in
emergency)
Innovative capacity building methods to enable the mission shift of DSOs
Coverage assessment
Within this FO, opportunities for local DC networks and IT solutions for real-time simulation
tools have not been addressed, while other tasks have been partially covered. We assess
that around one third (33%) of this FO has been covered so far.
EUROPEAN COMMISSION Technical analysis of past and on-going projects
125 July 2016
14.2.4 D10 “Smart metering data utilisation”
Contributions from completed and ongoing projects to D10
From EU projects
The ADDRESS project targeted the active participation of small and commercial
consumers in power system markets and provision of services to the different power
system participants. With a database of questionnaires to validate social acceptance
and customers' commitment, the project has contributed to this functional
objective. The developed platforms and mechanisms should allow DSOs and end
users to use smart metering data to improve energy efficiency and demand
management.
The ADVANCED project aimed at increasing the understanding on how to deploy
efficiently Active Demand (AD). A target matrix was developed to know what should
be measured and how. This matrix explains which are the variables to take into
account to build large scale AD programs. Qualitative and quantitative surveys were
carried out.
The METER ON project worked on supporting the development and deployment of
advanced metering infrastructures in Europe. In particular exchange and interaction
were carried out with the most representative projects carried out within the smart
metering field in Europe (21 EU projects analysed – 15 countries covered). After
the end of the project, a set of recommendations to the most important
stakeholders and a toolkit to manage economic data were delivered.
The ongoing UpGrid project contributes to this functional objective, notably
through the improvement of quality of service (QoS) to customers.
The Open Node project and the ongoing TILOS project are also contributing to
this functional objective.
From national projects
The ongoing French Nice Grid project, by involving consumers in energy efficiency
in order to solve local energy constraints, contributed to this functional objective.
The ongoing French SOLENN project contributes to manage electricity demand and
to secure power supply for consumers and communities in the French region of
Britany. The project has already organized the roll-out of 10,000 smart meters and
consumers’ recruitment. It also intends to provide new tools using curtailments via
smart meters avoiding load shedding near real time operations.
In France, the roll-out of the Linky smart meters is ongoing (35 million of units).
The smart meter will support bi-directional communications in order to automate
meter-reading, improve grid management, prevent fraud, while improving demand
response and paving the way for smart grids roll-out.
The ongoing German Proaktives Verteilnetz project also contributes to this
functional objective.
Note: Projects marked with an * do not count TSOs nor DSOs on board. They have been provided by EASE members.
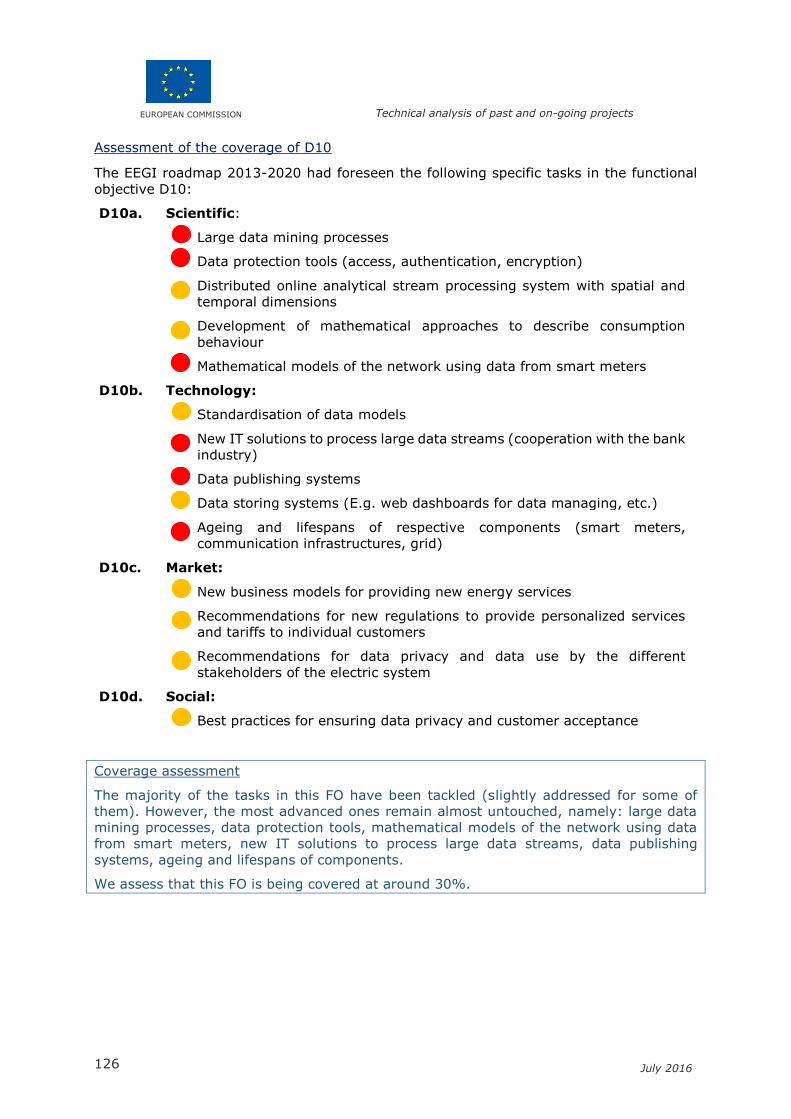
EUROPEAN COMMISSION Technical analysis of past and on-going projects
126 July 2016
Assessment of the coverage of D10
The EEGI roadmap 2013-2020 had foreseen the following specific tasks in the functional
objective D10:
D10a. Scientific:
Large data mining processes
Data protection tools (access, authentication, encryption)
Distributed online analytical stream processing system with spatial and
temporal dimensions
Development of mathematical approaches to describe consumption
behaviour
Mathematical models of the network using data from smart meters
D10b. Technology:
Standardisation of data models
New IT solutions to process large data streams (cooperation with the bank
industry)
Data publishing systems
Data storing systems (E.g. web dashboards for data managing, etc.)
Ageing and lifespans of respective components (smart meters,
communication infrastructures, grid)
D10c. Market:
New business models for providing new energy services
Recommendations for new regulations to provide personalized services
and tariffs to individual customers
Recommendations for data privacy and data use by the different
stakeholders of the electric system
D10d. Social:
Best practices for ensuring data privacy and customer acceptance
Coverage assessment
The majority of the tasks in this FO have been tackled (slightly addressed for some of
them). However, the most advanced ones remain almost untouched, namely: large data
mining processes, data protection tools, mathematical models of the network using data
from smart meters, new IT solutions to process large data streams, data publishing
systems, ageing and lifespans of components.
We assess that this FO is being covered at around 30%.
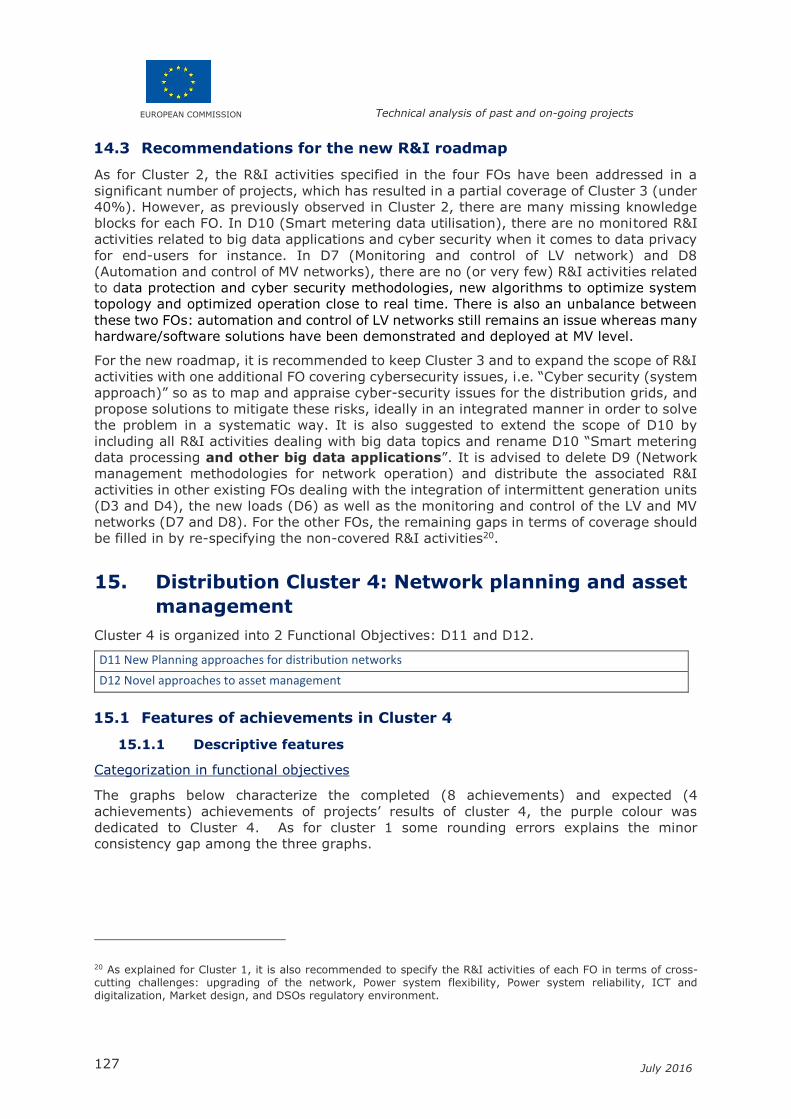
EUROPEAN COMMISSION Technical analysis of past and on-going projects
127 July 2016
14.3 Recommendations for the new R&I roadmap
As for Cluster 2, the R&I activities specified in the four FOs have been addressed in a
significant number of projects, which has resulted in a partial coverage of Cluster 3 (under
40%). However, as previously observed in Cluster 2, there are many missing knowledge
blocks for each FO. In D10 (Smart metering data utilisation), there are no monitored R&I
activities related to big data applications and cyber security when it comes to data privacy
for end-users for instance. In D7 (Monitoring and control of LV network) and D8
(Automation and control of MV networks), there are no (or very few) R&I activities related
to data protection and cyber security methodologies, new algorithms to optimize system
topology and optimized operation close to real time. There is also an unbalance between
these two FOs: automation and control of LV networks still remains an issue whereas many
hardware/software solutions have been demonstrated and deployed at MV level.
For the new roadmap, it is recommended to keep Cluster 3 and to expand the scope of R&I
activities with one additional FO covering cybersecurity issues, i.e. “Cyber security (system
approach)” so as to map and appraise cyber-security issues for the distribution grids, and
propose solutions to mitigate these risks, ideally in an integrated manner in order to solve
the problem in a systematic way. It is also suggested to extend the scope of D10 by
including all R&I activities dealing with big data topics and rename D10 “Smart metering
data processing and other big data applications”. It is advised to delete D9 (Network
management methodologies for network operation) and distribute the associated R&I
activities in other existing FOs dealing with the integration of intermittent generation units
(D3 and D4), the new loads (D6) as well as the monitoring and control of the LV and MV
networks (D7 and D8). For the other FOs, the remaining gaps in terms of coverage should
be filled in by re-specifying the non-covered R&I activities20.
15. Distribution Cluster 4: Network planning and asset
management
Cluster 4 is organized into 2 Functional Objectives: D11 and D12.
D11 New Planning approaches for distribution networks
D12 Novel approaches to asset management
15.1 Features of achievements in Cluster 4
15.1.1 Descriptive features
Categorization in functional objectives
The graphs below characterize the completed (8 achievements) and expected (4
achievements) achievements of projects’ results of cluster 4, the purple colour was
dedicated to Cluster 4. As for cluster 1 some rounding errors explains the minor
consistency gap among the three graphs.
20 As explained for Cluster 1, it is also recommended to specify the R&I activities of each FO in terms of cross-cutting challenges: upgrading of the network, Power system flexibility, Power system reliability, ICT and digitalization, Market design, and DSOs regulatory environment.
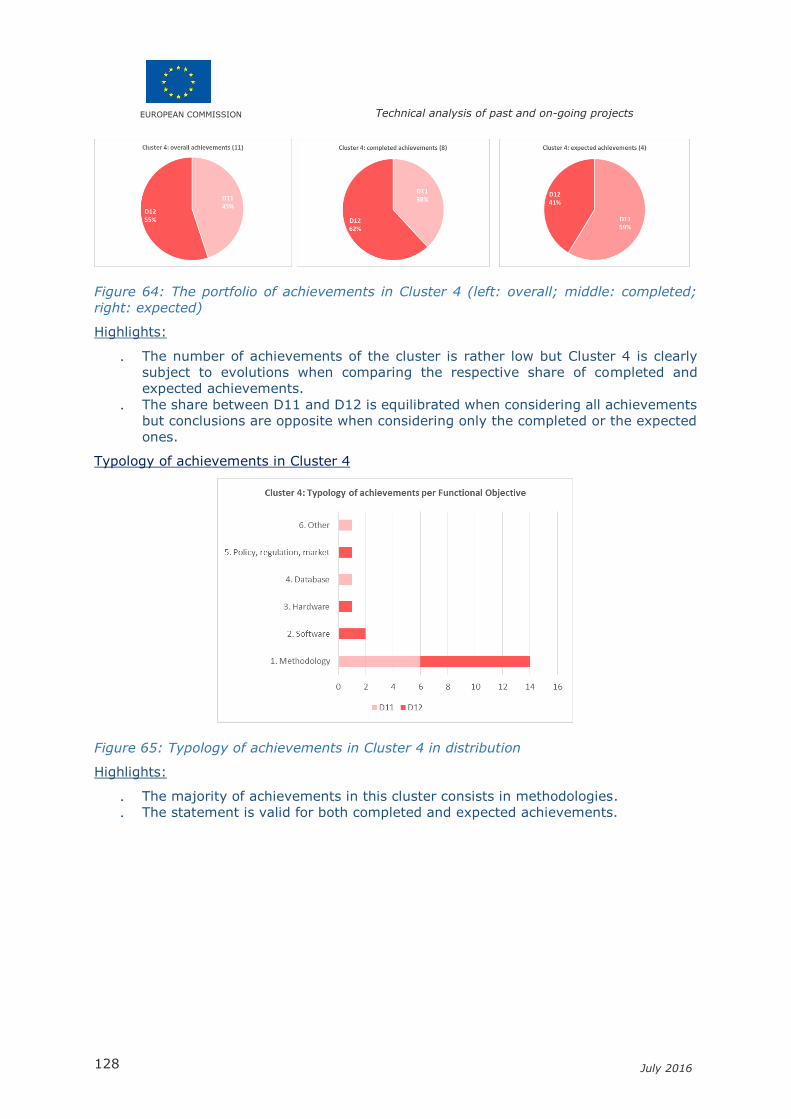
EUROPEAN COMMISSION Technical analysis of past and on-going projects
128 July 2016
Figure 64: The portfolio of achievements in Cluster 4 (left: overall; middle: completed;
right: expected)
Highlights:
. The number of achievements of the cluster is rather low but Cluster 4 is clearly
subject to evolutions when comparing the respective share of completed and
expected achievements.
. The share between D11 and D12 is equilibrated when considering all achievements
but conclusions are opposite when considering only the completed or the expected
ones.
Typology of achievements in Cluster 4
Figure 65: Typology of achievements in Cluster 4 in distribution
Highlights:
. The majority of achievements in this cluster consists in methodologies.
. The statement is valid for both completed and expected achievements.
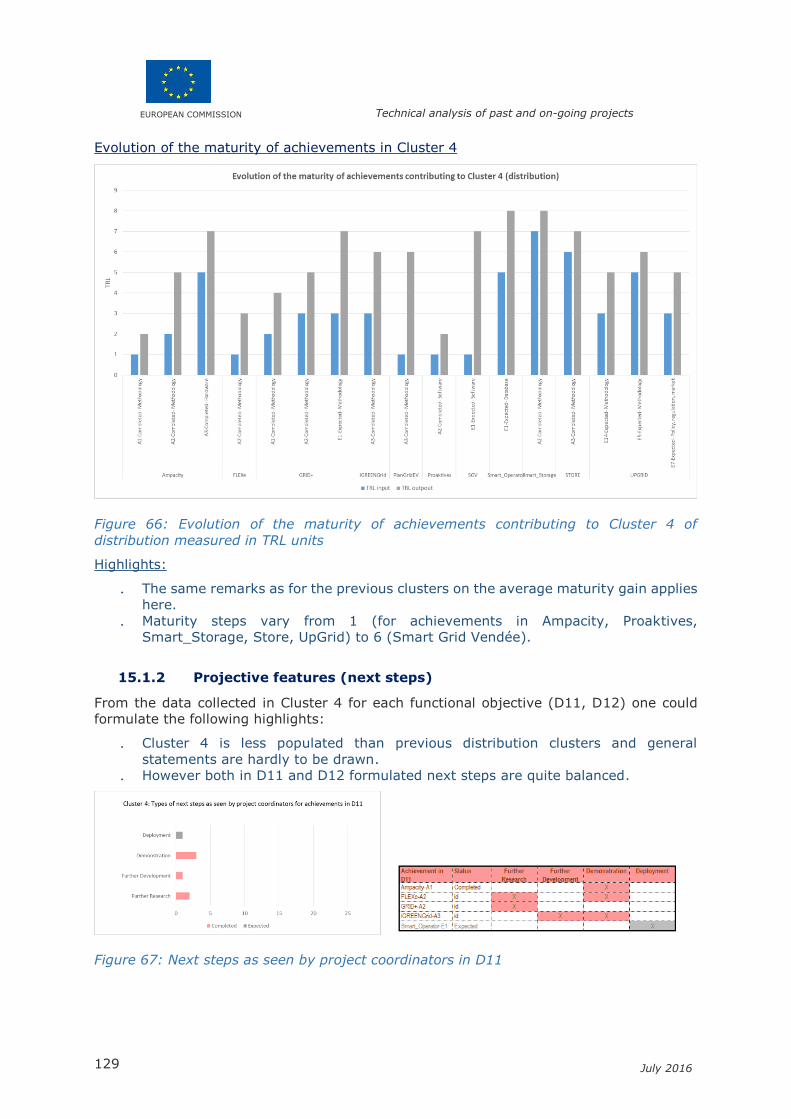
EUROPEAN COMMISSION Technical analysis of past and on-going projects
129 July 2016
Evolution of the maturity of achievements in Cluster 4
Figure 66: Evolution of the maturity of achievements contributing to Cluster 4 of
distribution measured in TRL units
Highlights:
. The same remarks as for the previous clusters on the average maturity gain applies
here.
. Maturity steps vary from 1 (for achievements in Ampacity, Proaktives,
Smart_Storage, Store, UpGrid) to 6 (Smart Grid Vendée).
15.1.2 Projective features (next steps)
From the data collected in Cluster 4 for each functional objective (D11, D12) one could
formulate the following highlights:
. Cluster 4 is less populated than previous distribution clusters and general
statements are hardly to be drawn.
. However both in D11 and D12 formulated next steps are quite balanced.
Figure 67: Next steps as seen by project coordinators in D11
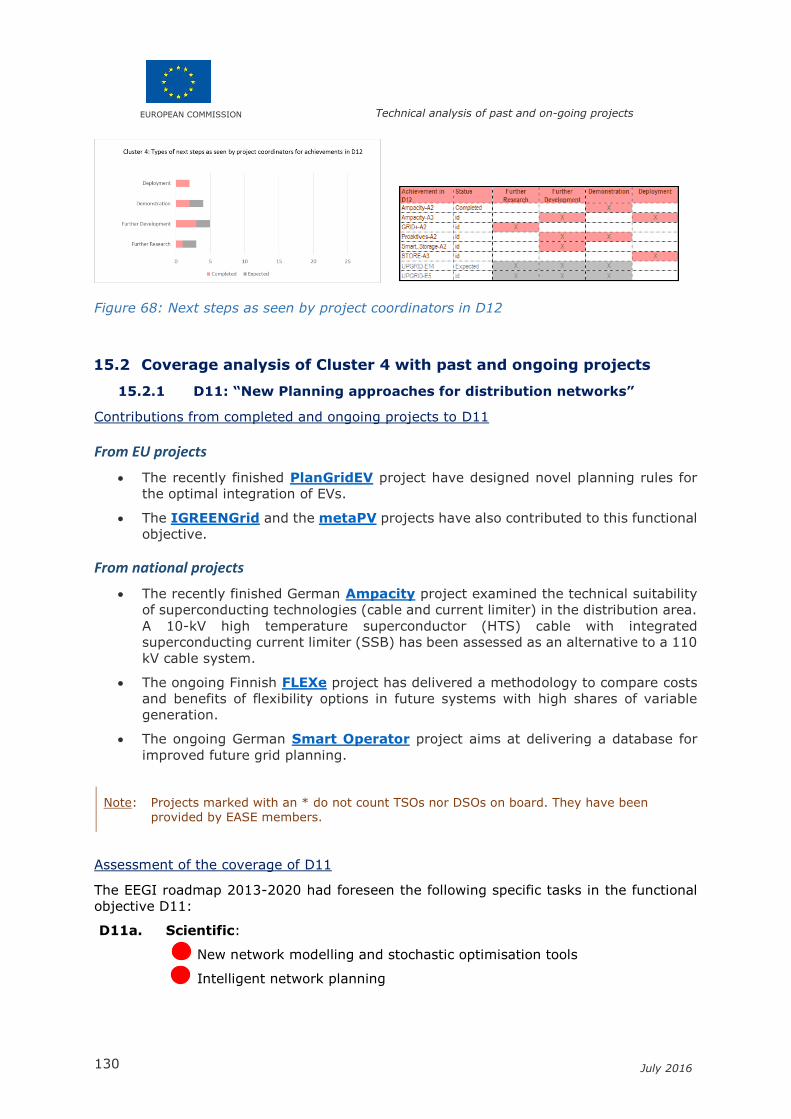
EUROPEAN COMMISSION Technical analysis of past and on-going projects
130 July 2016
Figure 68: Next steps as seen by project coordinators in D12
15.2 Coverage analysis of Cluster 4 with past and ongoing projects
15.2.1 D11: “New Planning approaches for distribution networks”
Contributions from completed and ongoing projects to D11
From EU projects
The recently finished PlanGridEV project have designed novel planning rules for
the optimal integration of EVs.
The IGREENGrid and the metaPV projects have also contributed to this functional
objective.
From national projects
The recently finished German Ampacity project examined the technical suitability
of superconducting technologies (cable and current limiter) in the distribution area.
A 10-kV high temperature superconductor (HTS) cable with integrated
superconducting current limiter (SSB) has been assessed as an alternative to a 110
kV cable system.
The ongoing Finnish FLEXe project has delivered a methodology to compare costs
and benefits of flexibility options in future systems with high shares of variable
generation.
The ongoing German Smart Operator project aims at delivering a database for
improved future grid planning.
Note: Projects marked with an * do not count TSOs nor DSOs on board. They have been
provided by EASE members.
Assessment of the coverage of D11
The EEGI roadmap 2013-2020 had foreseen the following specific tasks in the functional
objective D11:
D11a. Scientific:
New network modelling and stochastic optimisation tools
Intelligent network planning
EUROPEAN COMMISSION Technical analysis of past and on-going projects
131 July 2016
Simulation tools giving indication of DSOs of where to connect new
generators on the basis of different criteria
D11b. Technology:
System integration of new power technologies and impact on network
planning
Active distribution network
Dynamic rating
Micro grids
Standardisation of technologies and infrastructures
D11c. Market/social:
Streamlined permitting procedures
New ways of preventing/minimising public opposition to network
investments, integrating if appropriate in decision processes
Organisation of public consultation
D11d. Social:
New mechanisms to encourage clients in the perception of benefits and
repercussions of new systems
Coverage assessment
Most of the scientific and technology-oriented tasks have not been addressed yet. In terms
of social activities, mechanisms to facilitate the positive perception of new systems have
not been developed so far. Overall we consider that 20% of this FO have been covered.
15.2.1 D12 “Novel approaches to asset management”
Contributions from completed and ongoing projects to D12
From EU projects
The ongoing UpGrid project is contributing to this functional objective.
From national projects
The ongoing French Smart Grid Vendée project is also contributing to this
functional objective.
With experience feedback on operation of LV grid-connected battery, the ongoing
Dutch Smart Storage project contributes to this functional objective.
In Spain, the objective of the STORE* project was to demonstrate the technical
and economic viability of large-scale energy storage systems (electrochemical
storage, flywheel, ultracapacitor) in island environments. Cost reduction was
observed for of electrical system in islands.
The ongoing German Proaktives Verteilnetz project also contributes to this
functional objective.

EUROPEAN COMMISSION Technical analysis of past and on-going projects
132 July 2016
The recently finished German Ampacity project examined the technical suitability
of superconducting technologies (cable and current limiter) in the distribution area.
Field tests were carried out in real grid operation, proof of reliable working both in
normal operation and also in fault cases.
Note: Projects marked with an * do not count TSOs nor DSOs on board. They have been
provided by EASE members.
Assessment of the coverage of D12
The EEGI roadmap 2013-2020 had foreseen the following specific tasks in the functional
objective D12:
D12a. Scientific:
Ageing modelling under real network conditions, with the arrival of DER,
EV, and storage
Change in asset management with new environment (DER, AD, EV,
storage, etc.)
Conditional and risk-based maintenance models
Real time compensation system to avoid expensive grid upgrades
Algorithms to identify system topology
Enhancing efficiency in day-to-day grid operation
Appropriate levels of operational control vs. planning measures
D12b. Technology:
How to provide conditional and risk-based maintenance with new IT
solutions
New IT systems and solutions that make use of large new quantities of
data and are used for conditional and risk-based maintenance purposes
New systems for field components wear and tear monitoring in order to
“predict” failures
Oil level in transformer oil pits and SF6 level in switchgear improving
maintenance effectiveness and reduces environmental risks
D12c. Market/Social:
Capacity building methodologies including :
Methods for training of operators
Innovative methodologies to educate maintenance operators to
new digital era
Innovative methods for training of new required skills
Education issues of operators
Change of skills of operators
Change of technology era from Analogue to Digital
Active customer with impact on energy efficiency
EUROPEAN COMMISSION Technical analysis of past and on-going projects
133 July 2016
Coverage assessment
Some tasks in this FO have not been addressed so far. In terms of scientific activities,
ageing modelling under real network conditions, change in asset management with new
environment and real-time compensation system remain almost untouched. Regarding
technology-oriented activities, big data solutions for conditional and risk-based
maintenance purposes and systems for failure prediction have not been tackled. Other
tasks have been addressed but the observed coverage is partial. We therefore consider
that around 30% of the FO has been covered so far.
15.3 Recommendations for the new R&I roadmap
Contrarily to the previous clusters, the coverage of Cluster 4 is rather low (25%). The low
coverage of D12 (20%) shows that there is an urgent need to develop the next generation
of planning tools able to account for the fast evolving environment of distribution networks
(storage, active demand, new loads, power electronics, etc.). In addition, DSOs still need
to deploy new IT systems and solutions that make use of large quantities of data for
conditional and risk-based maintenance purposes.
It is recommended to keep Cluster 4 as it is (with two FOs) since both planning and asset
management issues need to be further investigated. An emphasis should be put on the
need for new planning approaches and simulation environments able to cope with the full
complexity of the distribution networks (the title of D12 could be modified, e.g. “New
planning approaches and tools”). For the other FOs, the remaining gaps in terms of
coverage should be filled in by re-specifying the non-covered R&I activities21.
16. Distribution Cluster 5: Market design
Cluster 4 is organized into 1 Functional Objective: D13.
D13. Novel approaches for market design
16.1 Features of achievements in Cluster 5
16.1.1 Descriptive features
Categorization in functional objectives
The graphs below characterize the completed (16 achievements) and expected (3
achievements) achievements of projects’ results of cluster 5. There is only one Functional
Objective D13 in that cluster.
21 As explained for Cluster 1, it is also recommended to specify the R&I activities of each FO in terms of cross-cutting challenges: upgrading of the network, Power system flexibility, Power system reliability, ICT and digitalization, Market design, and DSOs regulatory environment.
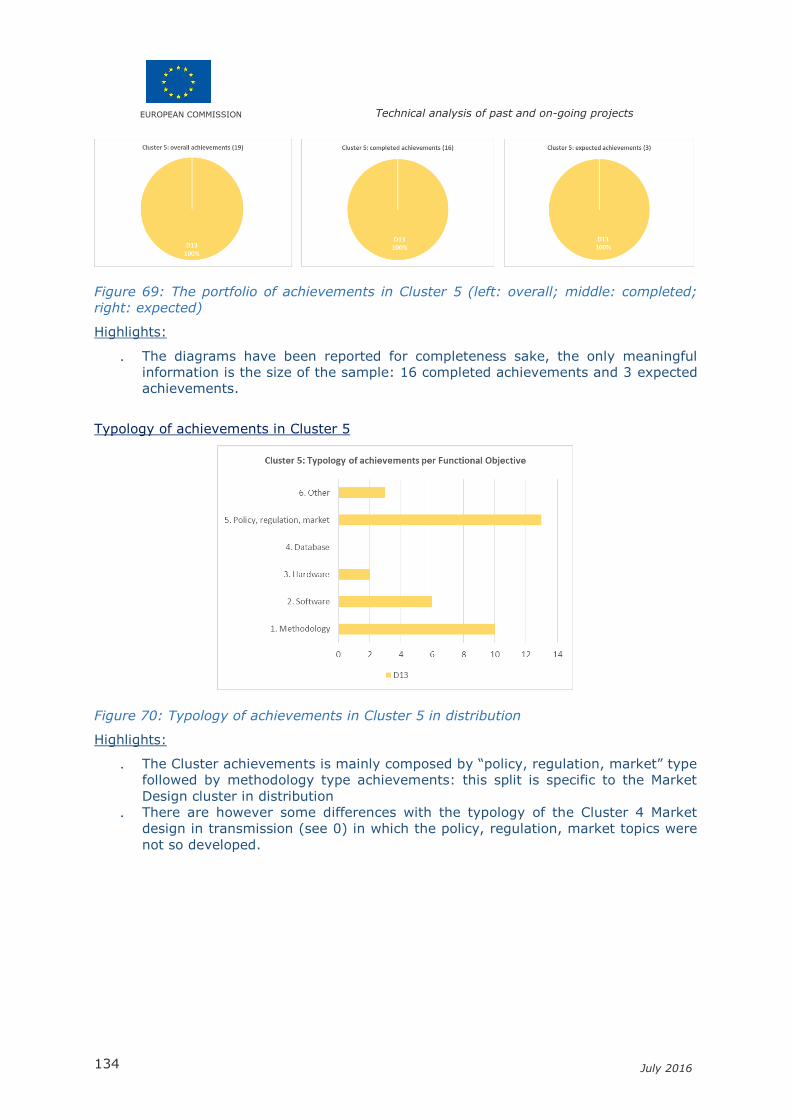
EUROPEAN COMMISSION Technical analysis of past and on-going projects
134 July 2016
Figure 69: The portfolio of achievements in Cluster 5 (left: overall; middle: completed;
right: expected)
Highlights:
. The diagrams have been reported for completeness sake, the only meaningful
information is the size of the sample: 16 completed achievements and 3 expected
achievements.
Typology of achievements in Cluster 5
Figure 70: Typology of achievements in Cluster 5 in distribution
Highlights:
. The Cluster achievements is mainly composed by “policy, regulation, market” type
followed by methodology type achievements: this split is specific to the Market
Design cluster in distribution
. There are however some differences with the typology of the Cluster 4 Market
design in transmission (see 0) in which the policy, regulation, market topics were
not so developed.

EUROPEAN COMMISSION Technical analysis of past and on-going projects
135 July 2016
Evolution of the maturity of achievements in Cluster 5
Figure 71: Evolution of the maturity of achievements contributing to Cluster 5 of
distribution measured in TRL units
Highlights:
. The variability of maturity gains in Cluster 5 appears as lower as the one observed
in the previous clusters.
. No increment is however observed for some achievements in METER_ON (A1 to A4)
and one achievement in Proaktives: this might result from an interpretation bias in
the questionnaire.
16.1.2 Projective features (next steps)
From the data collected in Cluster 5 in functional objective D13 one could formulate the
following highlights:
. Next steps include in a quite balanced way the downstream routes that are further
development, demonstration and deployment, further research option being less
represented
. Next steps for Expected achievements are only mentioned by the UPGRID project.
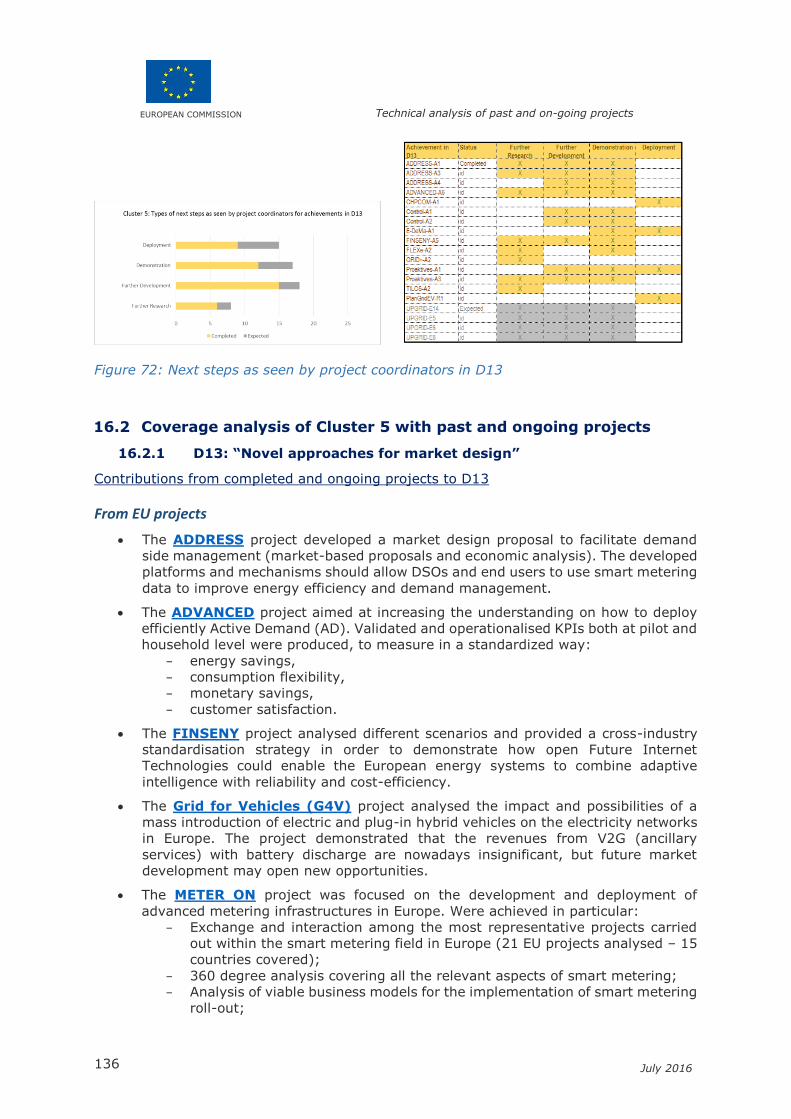
EUROPEAN COMMISSION Technical analysis of past and on-going projects
136 July 2016
Figure 72: Next steps as seen by project coordinators in D13
16.2 Coverage analysis of Cluster 5 with past and ongoing projects
16.2.1 D13: “Novel approaches for market design”
Contributions from completed and ongoing projects to D13
From EU projects
The ADDRESS project developed a market design proposal to facilitate demand
side management (market-based proposals and economic analysis). The developed
platforms and mechanisms should allow DSOs and end users to use smart metering
data to improve energy efficiency and demand management.
The ADVANCED project aimed at increasing the understanding on how to deploy
efficiently Active Demand (AD). Validated and operationalised KPIs both at pilot and
household level were produced, to measure in a standardized way:
− energy savings,
− consumption flexibility,
− monetary savings,
− customer satisfaction.
The FINSENY project analysed different scenarios and provided a cross-industry
standardisation strategy in order to demonstrate how open Future Internet
Technologies could enable the European energy systems to combine adaptive
intelligence with reliability and cost-efficiency.
The Grid for Vehicles (G4V) project analysed the impact and possibilities of a
mass introduction of electric and plug-in hybrid vehicles on the electricity networks
in Europe. The project demonstrated that the revenues from V2G (ancillary
services) with battery discharge are nowadays insignificant, but future market
development may open new opportunities.
The METER ON project was focused on the development and deployment of
advanced metering infrastructures in Europe. Were achieved in particular:
− Exchange and interaction among the most representative projects carried
out within the smart metering field in Europe (21 EU projects analysed – 15
countries covered);
− 360 degree analysis covering all the relevant aspects of smart metering;
− Analysis of viable business models for the implementation of smart metering
roll-out;

EUROPEAN COMMISSION Technical analysis of past and on-going projects
137 July 2016
− Adaptation of the project workflow based on the expectations of the
stakeholders’ community, including the analysis of compliance to
EU/148/2012 minimum functionalities and viable Business Models.
The main objective of the recently finished PlanGridEV project has designed new
planning rules and operational principles for the optimal integration of EV, and
provided a roadmap and recommendations for innovation, regulation and policies
in this area.
The ongoing UpGrid project is contributing to this functional objective, in particular
thanks to the identification of investment alternatives for UpGrid innovative
concepts, the assessment of optimal business models for market participants, and
societal research on the socio-economic impact of Smart Grid solutions on the demo
regions.
The policy recommendations that will be delivered by the ongoing TILOS project
will also contribute to this functional objective, notably in terms of ancillary
services provided by battery storage.
From national projects
The German E-DeMa project analysed processes for the integration and control of
DER. A Marketplace system, including all relevant market roles, was developed and
operated, together with innovative products and end customer tariffs, and new
value chains and business processes were tested.
The Danish project “Control and regulation of modern distribution system has
also contributed to this function objective with a Normal Operation Optimization
model and Abnormal/Emergency Operations Control Strategies.
With a methodology to compare costs and benefits of flexibility options in future
systems with high shares of variable generation, the ongoing Finnish FLEXe project
contributes to this functional objective.
The completed Danish CHPCOM project as well as the German recently finished
Ampacity and ongoing Proaktives Verteilnetz projects also contribute to this
functional objective.
Note: Projects marked with an * do not count TSOs nor DSOs on board. They have been provided by EASE members.
Assessment of the coverage of D13
The EEGI roadmap 2013-2020 had foreseen the following specific tasks in the functional
objective D13:
D13a. Scientific/Technology:
Simulation of new market designs in order to assess benefits and costs of
the studied scenarios based on innovative numerical simulation platforms
which go beyond the existing ones (modelling in particular demand
response and storage)
D13b. Market/Regulatory:
New business models for providing new energy services and
recommendation of new tariff systems
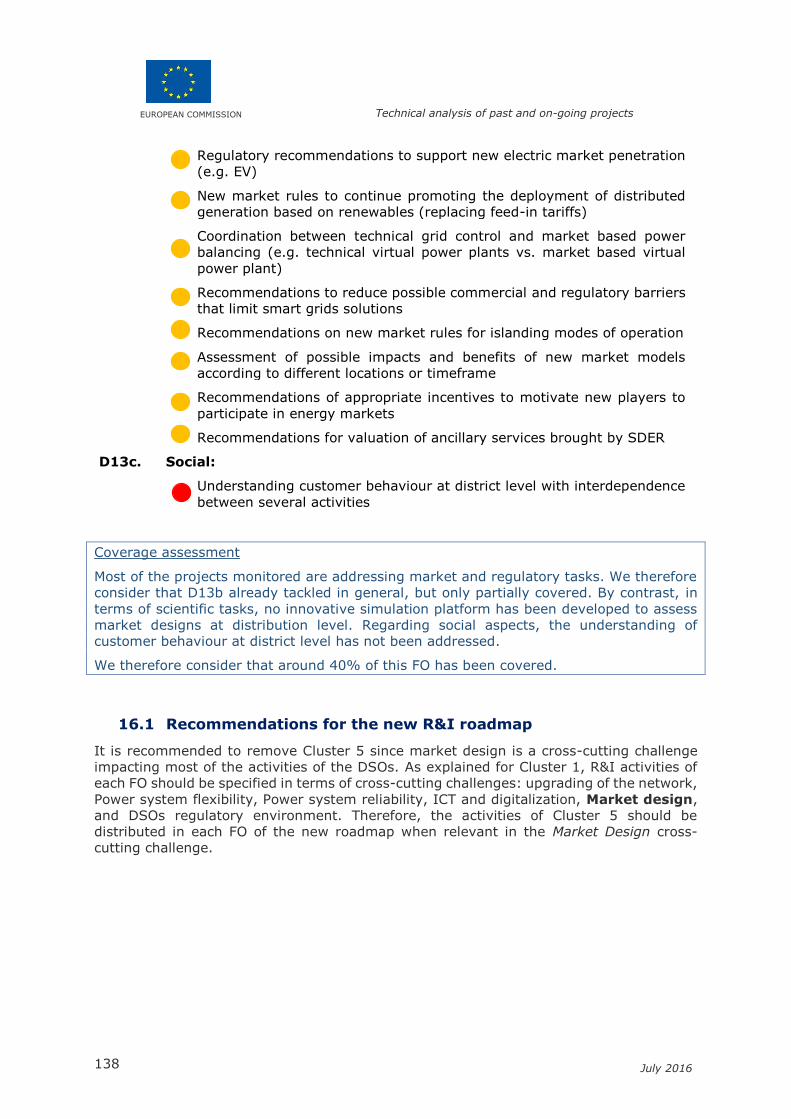
EUROPEAN COMMISSION Technical analysis of past and on-going projects
138 July 2016
Regulatory recommendations to support new electric market penetration
(e.g. EV)
New market rules to continue promoting the deployment of distributed
generation based on renewables (replacing feed-in tariffs)
Coordination between technical grid control and market based power
balancing (e.g. technical virtual power plants vs. market based virtual
power plant)
Recommendations to reduce possible commercial and regulatory barriers
that limit smart grids solutions
Recommendations on new market rules for islanding modes of operation
Assessment of possible impacts and benefits of new market models
according to different locations or timeframe
Recommendations of appropriate incentives to motivate new players to
participate in energy markets
Recommendations for valuation of ancillary services brought by SDER
D13c. Social:
Understanding customer behaviour at district level with interdependence
between several activities
Coverage assessment
Most of the projects monitored are addressing market and regulatory tasks. We therefore
consider that D13b already tackled in general, but only partially covered. By contrast, in
terms of scientific tasks, no innovative simulation platform has been developed to assess
market designs at distribution level. Regarding social aspects, the understanding of
customer behaviour at district level has not been addressed.
We therefore consider that around 40% of this FO has been covered.
16.1 Recommendations for the new R&I roadmap
It is recommended to remove Cluster 5 since market design is a cross-cutting challenge
impacting most of the activities of the DSOs. As explained for Cluster 1, R&I activities of
each FO should be specified in terms of cross-cutting challenges: upgrading of the network,
Power system flexibility, Power system reliability, ICT and digitalization, Market design,
and DSOs regulatory environment. Therefore, the activities of Cluster 5 should be
distributed in each FO of the new roadmap when relevant in the Market Design cross-
cutting challenge.

EUROPEAN COMMISSION Technical analysis of past and on-going projects
139 July 2016
17. Conclusion for distribution
Contrarily to the transmission clusters, four of the distribution clusters have been kept
(Cluster 5 has been deleted since it is a cross-cutting challenge) in the new roadmap22.
Few FOs have been added and deleted: the contents of the remaining FOs have been
modified based upon the respective estimated coverages. A second dimension has been
included in the description of the distribution network R&I activities for each FO: they have
been specified in terms of cross-cutting challenges23.
In summary, the previous Clusters 1 to 5 have been modified as follow24:
• EXPAND Cluster 1 “Integration of smart customers” by enlarging the scope of the
FO dealing with AD so as to foster end-consumers’ participation in the retail
electricity markets, and enable the provision of system services for network
flexibility.
• EXPAND Cluster 2 “Integration of DER and new uses”: CREATE one additional FO
covering the connections with other energy networks and enlarge the scope of the
FO related to the integration of EVs (electrification of -public- transport).
• EXPAND and INTEGRATE Cluster 3 “Network Operations”: CREATE one additional
FO covering cybersecurity issues, i.e. “Cyber security (system approach)” and
EXPAND the scope of R&I activities related to smart meters by including all R&I
activities dealing with big data topics, i.e. “Smart metering data processing and
other big data applications”. DELETE the FO dealing with “Network management
methodologies for network operation” and INTEGRATE the associated R&I
activities in other existing FOs.
• EXPAND Cluster 4 “Network planning and asset management” by enlarging the
scope of the FO related to planning.
• REMOVE Cluster 5 “Market design”, since market design is a cross-cutting
challenge impacting most of the activities of the DSOs, and INTEGRATE the
activities of Cluster 5 in each FO of the new roadmap when relevant in the Market
Design cross-cutting challenge.”
22 D2.6, Final 10 year EEGI R&I roadmap covering 2016-25, July 2016 (www.gridplusstorage.eu). 23 Cross-cutting challenges: upgrading of the network, Power system flexibility, Power system reliability, ICT and digitalization, Market design, and DSOs regulatory environment. 24 Five types of modifications/updates are made: SPLIT, REMOVE, EXPAND, INTEGRATE, and CREATE.

EUROPEAN COMMISSION Technical analysis of past and on-going projects
140 July 2016
Part III JOINT TSO & DSO ACTIVITIES
18. The portfolio of R&I projects in relation with the
TSO/ DSO activities of the Roadmap
18.1 Assumptions ruling the portfolio selection
The same five assumptions as the ones presented in section 4.1 (consistency with the
roadmap, recent, funding, budget, explicit intention for further exploitation) have been
used. As a result a representative sample a projects among all recent R&I
transmission/distribution projects was built.
Methodological issue:
It should be noticed that some projects may appear in Part I and Part II or in Part II and Part
III or in Part I and in Part III. This apparent double counting is due to the fact that some the sources of information for projects at the interface of transmission and distribution may be ENTSO-E, EDSO or EASE.
18.2 The portfolio of transmission/distribution projects
Twenty-six (26) R&I projects have been identified and are used for the coverage analysis.
They represent a total budget of approximately 264 million Euros for a public funding of
122 million Euros, cf. Table 1425.
Table 8: Portfolio of projects in transmission/distribution
61850 substation Belgium East Loop EnergyLab NiceGrid Smart_grids
ADVANCED BESTPATHS Estfeed PROBA SmartNet
AES_Netherlands Cell Controller GREDOR RealValue
AES-KBS CHPCOM GridTech SAFEWIND
Alia2 DSR INCREASE SECONOMICS
ATENEA E-DeMa INGRID Smart Grid Vendée
NB: As explained in the section 3.2, id codes were used to abbreviate projects’ names all along the document.
The colour code for each project acronym corresponds to the source that has provided the filled-in questionnaires (EU projects are displayed in bold text while projects funded at national level are displayed in plain text):
EDSO EASE ENTSO-E
25 These figures do not represent the exact total budget and the corresponding public funding since for some
projects some of the data is missing (for some projects the budget figure is available and not the corresponding public funding and vice-versa).

EUROPEAN COMMISSION Technical analysis of past and on-going projects
141 July 2016
19. Joint TSO/DSO cluster
There is a unique cluster gathering all these activities: the joint TSO/DSO cluster is
organized into five Functional Objectives: TD1, TD2, TD3, TD4, TD5.
TD1. Increased observability of the distribution system for transmission network management and control
TD2. The integration of demand side management at DSO level into TSO operations
TD3. Ancillary services provided through DSOs
TD4. Improved defence and restoration plan
TD5. Methodologies for scaling-up and replicating
An overview in terms of achievements is first given overall, then in a second stage a view
per functional objective is proposed.
19.1 Descriptive features of achievements in the joint TSO/DSO cluster
19.1.1 Overview of achievements in the joint TSO/DSO cluster
42 achievements have been counted in the joint TSO/DSO cluster with the following split
in 29 that have been completed and 13 expected.
Figure 73: Number of achievements in the joint TSO/DSO cluster
Most of achievements in the cluster consists in software or in methodologies.
Figure 74: Typology of achievements in the joint TSO/DSO cluster
NB: It should be noted that achievements that contribute to 2 or more FO have been counted separately in each FO which explains some differences in the sums.
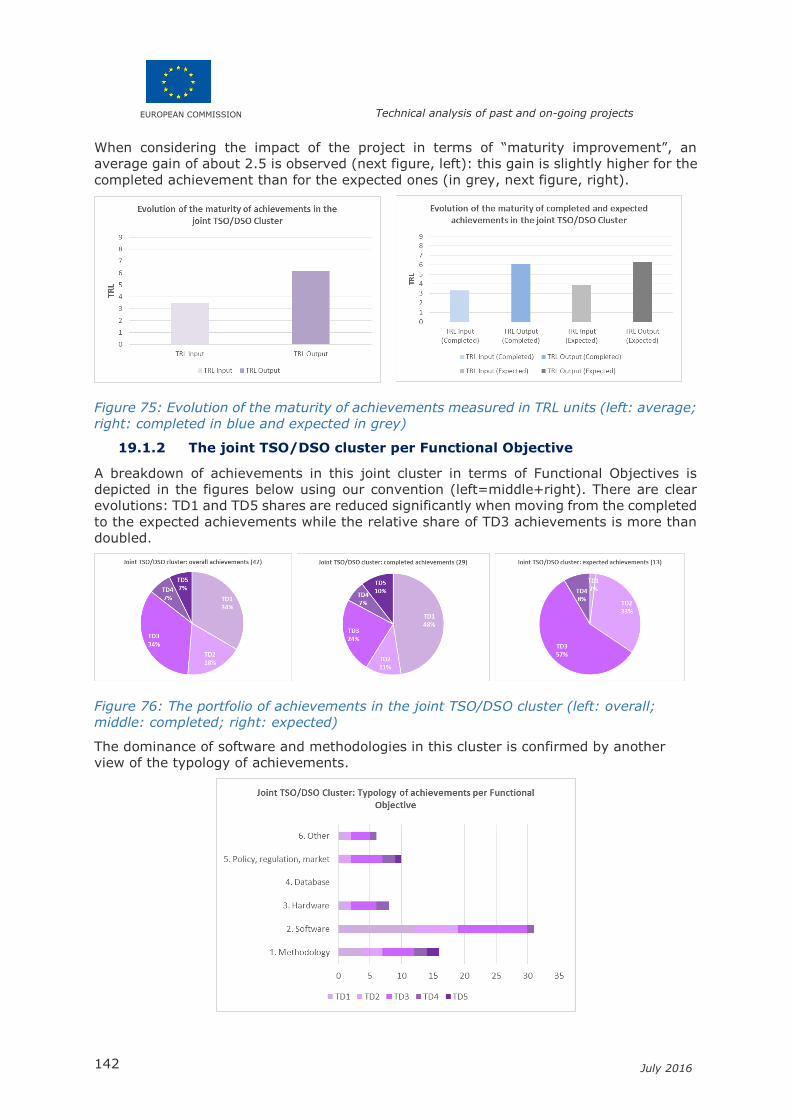
EUROPEAN COMMISSION Technical analysis of past and on-going projects
142 July 2016
When considering the impact of the project in terms of “maturity improvement”, an
average gain of about 2.5 is observed (next figure, left): this gain is slightly higher for the
completed achievement than for the expected ones (in grey, next figure, right).
Figure 75: Evolution of the maturity of achievements measured in TRL units (left: average;
right: completed in blue and expected in grey)
19.1.2 The joint TSO/DSO cluster per Functional Objective
A breakdown of achievements in this joint cluster in terms of Functional Objectives is
depicted in the figures below using our convention (left=middle+right). There are clear
evolutions: TD1 and TD5 shares are reduced significantly when moving from the completed
to the expected achievements while the relative share of TD3 achievements is more than
doubled.
Figure 76: The portfolio of achievements in the joint TSO/DSO cluster (left: overall;
middle: completed; right: expected)
The dominance of software and methodologies in this cluster is confirmed by another
view of the typology of achievements.
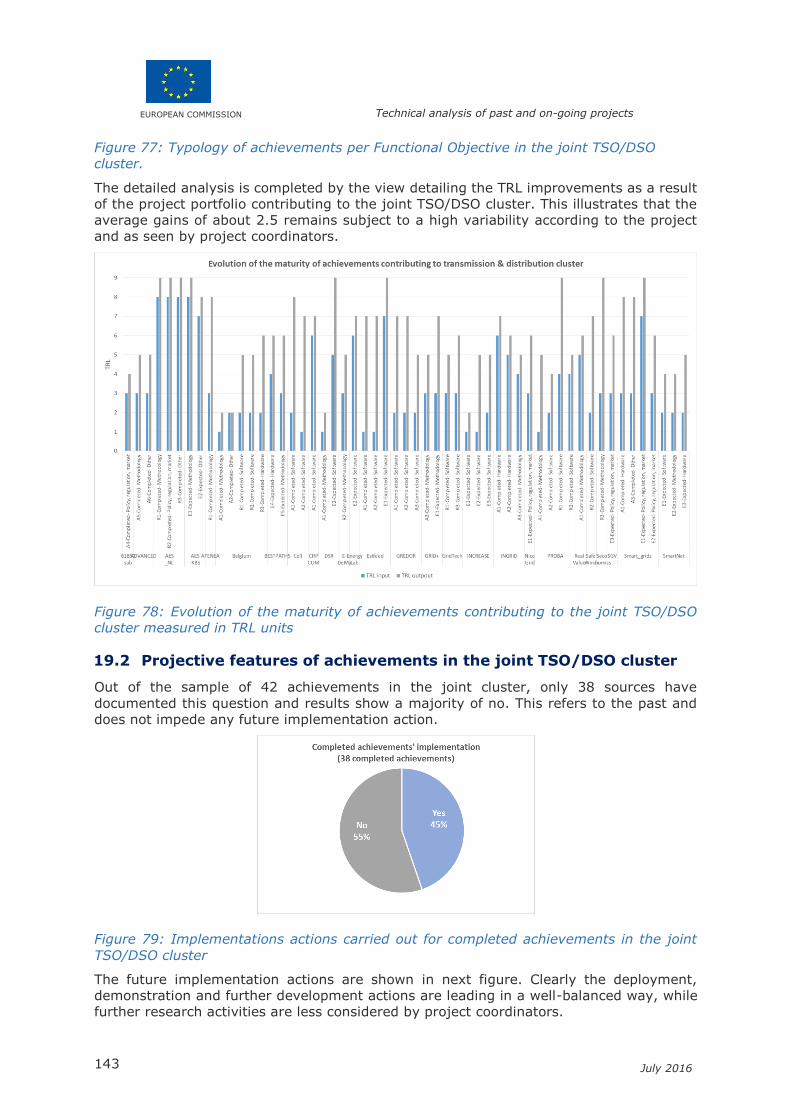
EUROPEAN COMMISSION Technical analysis of past and on-going projects
143 July 2016
Figure 77: Typology of achievements per Functional Objective in the joint TSO/DSO
cluster.
The detailed analysis is completed by the view detailing the TRL improvements as a result
of the project portfolio contributing to the joint TSO/DSO cluster. This illustrates that the
average gains of about 2.5 remains subject to a high variability according to the project
and as seen by project coordinators.
Figure 78: Evolution of the maturity of achievements contributing to the joint TSO/DSO
cluster measured in TRL units
19.2 Projective features of achievements in the joint TSO/DSO cluster
Out of the sample of 42 achievements in the joint cluster, only 38 sources have
documented this question and results show a majority of no. This refers to the past and
does not impede any future implementation action.
Figure 79: Implementations actions carried out for completed achievements in the joint
TSO/DSO cluster
The future implementation actions are shown in next figure. Clearly the deployment,
demonstration and further development actions are leading in a well-balanced way, while
further research activities are less considered by project coordinators.
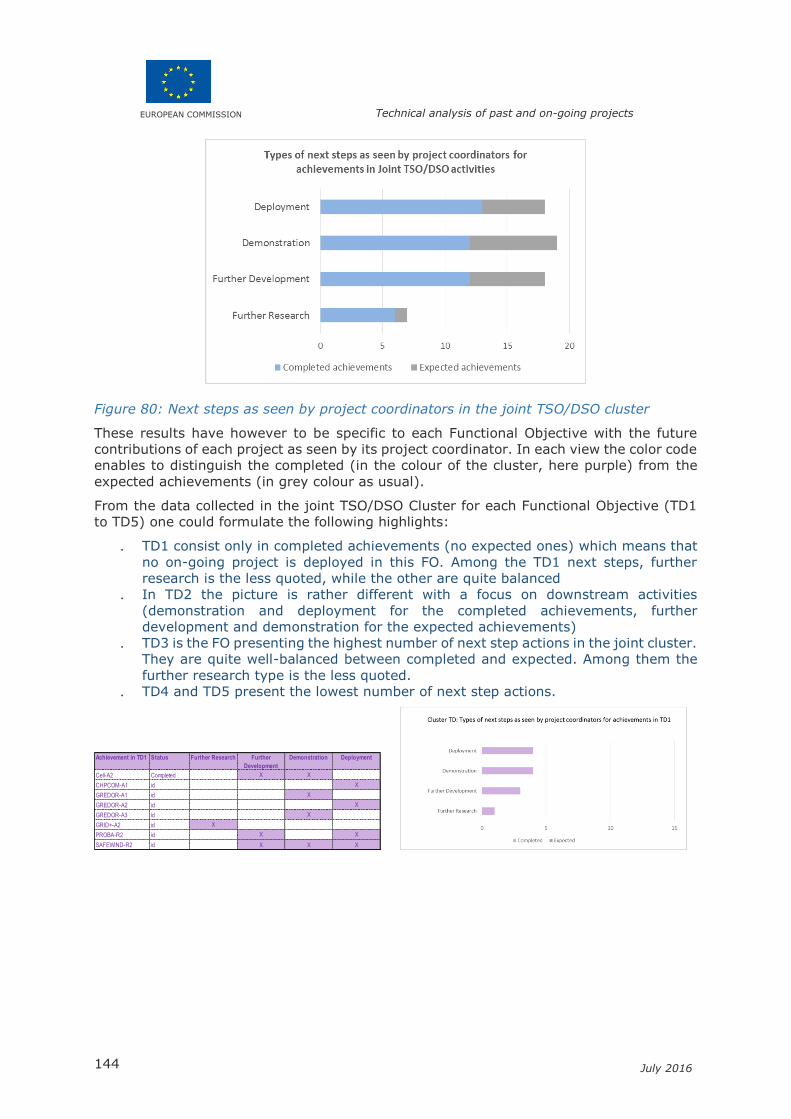
EUROPEAN COMMISSION Technical analysis of past and on-going projects
144 July 2016
Figure 80: Next steps as seen by project coordinators in the joint TSO/DSO cluster
These results have however to be specific to each Functional Objective with the future
contributions of each project as seen by its project coordinator. In each view the color code
enables to distinguish the completed (in the colour of the cluster, here purple) from the
expected achievements (in grey colour as usual).
From the data collected in the joint TSO/DSO Cluster for each Functional Objective (TD1
to TD5) one could formulate the following highlights:
. TD1 consist only in completed achievements (no expected ones) which means that
no on-going project is deployed in this FO. Among the TD1 next steps, further
research is the less quoted, while the other are quite balanced
. In TD2 the picture is rather different with a focus on downstream activities
(demonstration and deployment for the completed achievements, further
development and demonstration for the expected achievements)
. TD3 is the FO presenting the highest number of next step actions in the joint cluster.
They are quite well-balanced between completed and expected. Among them the
further research type is the less quoted.
. TD4 and TD5 present the lowest number of next step actions.
Achievement in TD1 Status Further Research Further
Development
Demonstration Deployment
Cell-A2 Completed X X
CHPCOM-A1 id X
GREDOR-A1 id X
GREDOR-A2 id X
GREDOR-A3 id X
GRID+-A2 id X
PROBA-R2 id X X
SAFEWIND-R2 id X X X
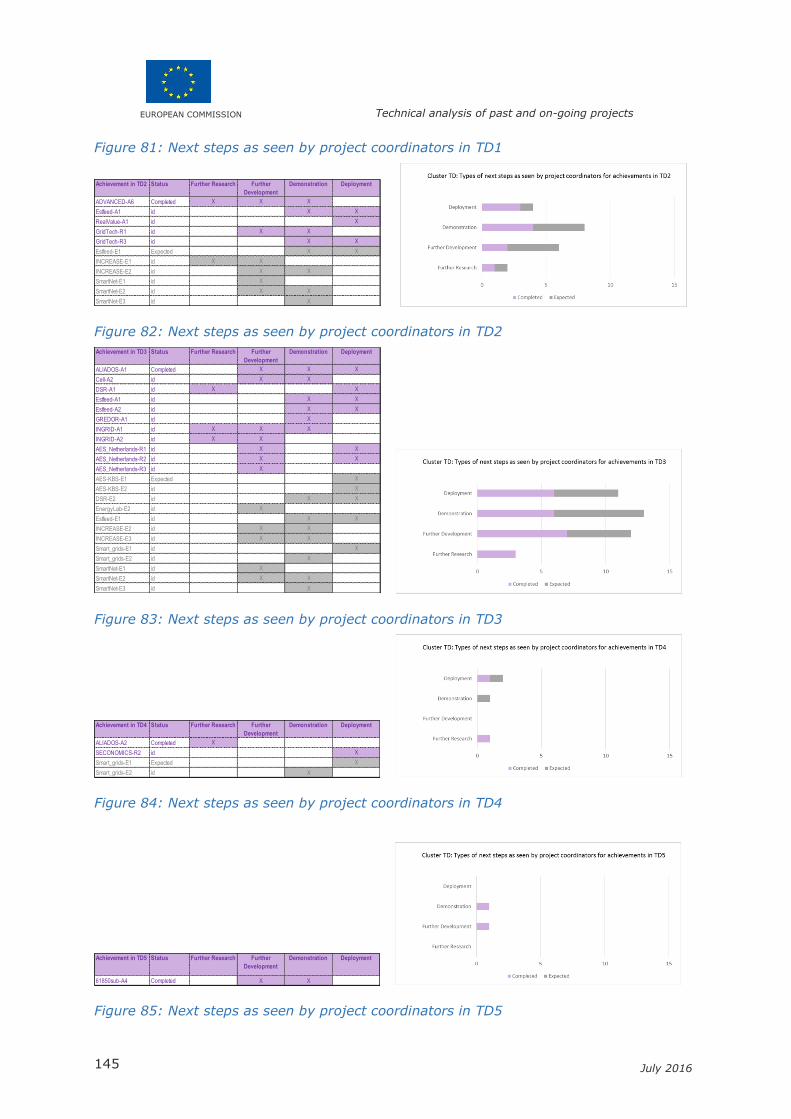
EUROPEAN COMMISSION Technical analysis of past and on-going projects
145 July 2016
Figure 81: Next steps as seen by project coordinators in TD1
Figure 82: Next steps as seen by project coordinators in TD2
Figure 83: Next steps as seen by project coordinators in TD3
Figure 84: Next steps as seen by project coordinators in TD4
Figure 85: Next steps as seen by project coordinators in TD5
Achievement in TD2 Status Further Research Further
Development
Demonstration Deployment
ADVANCED-A6 Completed X X X
Estfeed-A1 id X X
RealValue-A1 id X
GridTech-R1 id X X
GridTech-R3 id X X
Estfeed-E1 Expected X X
INCREASE-E1 id X X
INCREASE-E2 id X X
SmartNet-E1 id X
SmartNet-E2 id X X
SmartNet-E3 id X
Achievement in TD3 Status Further Research Further
Development
Demonstration Deployment
ALIADOS-A1 Completed X X X
Cell-A2 id X X
DSR-A1 id X X
Estfeed-A1 id X X
Estfeed-A2 id X X
GREDOR-A1 id X
INGRID-A1 id X X X
INGRID-A2 id X X
AES_Netherlands-R1 id X X
AES_Netherlands-R2 id X X
AES_Netherlands-R3 id X
AES-KBS-E1 Expected X
AES-KBS-E2 id X
DSR-E2 id X X
EnergyLab-E2 id X
Estfeed-E1 id X X
INCREASE-E2 id X X
INCREASE-E3 id X X
Smart_grids-E1 id X
Smart_grids-E2 id X
SmartNet-E1 id X
SmartNet-E2 id X X
SmartNet-E3 id X
Achievement in TD4 Status Further Research Further
Development
Demonstration Deployment
ALIADOS-A2 Completed X
SECONOMICS-R2 id X
Smart_grids-E1 Expected X
Smart_grids-E2 id X
Achievement in TD5 Status Further Research Further
Development
Demonstration Deployment
61850sub-A4 Completed X X
EUROPEAN COMMISSION Technical analysis of past and on-going projects
146 July 2016
19.3 Coverage analysis of the joint TSO/DSO cluster with past and
ongoing projects
19.3.1 TD1 “Increased observability of the distribution system for
transmission network management and control”
Contributions from completed and ongoing projects to TD1
From EU projects
Within the SAFEWIND project, methods and software tools have been developed
to assess the level of predictability of wind generation for the next hours and for
warning and alarming producers, DSOs and TSOs in case of difficult extreme
situations (high wind speeds, weather fronts, any situations producing large
forecast errors, …).
From national projects
The Danish Cell Controller Pilot Project built up a software application able to
coordinate distributed energy resources (DER) for control purpose in normal grid
operation and support ancillary services from DSO. The main two project
achievements are an online field data monitoring system and an online automatic
grid controller.
The Danish CHPCOM (Combined Heat and Power Communication) project analysed,
developed and demonstrated through practical experience, the use of international
Smart Grid related data communication standards, specifically IEC 61850 and IEC
62351 for IT security. CHPCOM focused on distributed generation, specifically CHPs
and their business partners. The main project achievement consists in TSO/DSO
system integration communications, including security keys, for CHP power plant
management.
Within the Belgium east loop active network management project, a
methodology was developed to determine the theoretical maximum feasible
capacity of new generation that could be connected to the East Loop, following
different principle of access and different utilization factors. The project
implemented software tools for the automatic centralized curtailment of generators
in case of congestion in HV network or in HV/MV transformers, and installed a
directional overcurrent protection device that disconnects the generator in case of
problem on the transformer.
In Belgium, the PROBA project focused on the development of a methodology to
assess the risks (from the Tso point of view) of accepting the connection of a new
distributed generation (DG) unit. The project delivered a probabilistic method based
on a quasi-systematic search of the space of uncertainties. A software tool
supporting the methodology was developed to assess risk indices and thermal
constraints on Elia grid and/or TSO/DSO interface due to the connection of a new
DG unit on one hand and risk indices related to the produced power of the DG unit.
Software tools for the localization of congestions in HV/MV transformers and in HV
grid were also developed.
Again in Belgium, the ongoing GREDOR project aims at redesigning in an integrated
way the whole decision chain used for managing distribution networks in order to
perform active network management optimally (i.e., maximisation of social
welfare). The project has delivered a market design tool for modelling the
interaction between the users of the grid and the DSO in presence of DER and DSR,
an optimal investment strategies tool for distribution expansion planning in
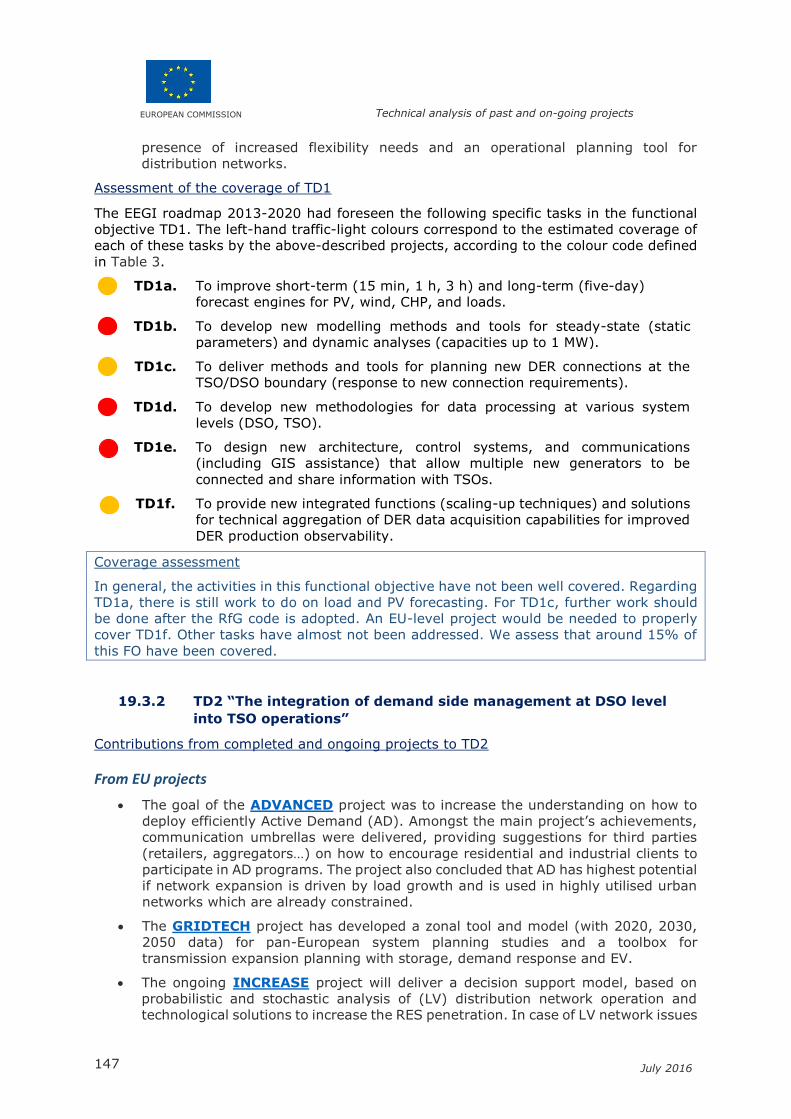
EUROPEAN COMMISSION Technical analysis of past and on-going projects
147 July 2016
presence of increased flexibility needs and an operational planning tool for
distribution networks.
Assessment of the coverage of TD1
The EEGI roadmap 2013-2020 had foreseen the following specific tasks in the functional
objective TD1. The left-hand traffic-light colours correspond to the estimated coverage of
each of these tasks by the above-described projects, according to the colour code defined
in Table 3.
TD1a. To improve short-term (15 min, 1 h, 3 h) and long-term (five-day)
forecast engines for PV, wind, CHP, and loads.
TD1b. To develop new modelling methods and tools for steady-state (static
parameters) and dynamic analyses (capacities up to 1 MW).
TD1c. To deliver methods and tools for planning new DER connections at the
TSO/DSO boundary (response to new connection requirements).
TD1d. To develop new methodologies for data processing at various system
levels (DSO, TSO).
TD1e. To design new architecture, control systems, and communications
(including GIS assistance) that allow multiple new generators to be
connected and share information with TSOs.
TD1f. To provide new integrated functions (scaling-up techniques) and solutions
for technical aggregation of DER data acquisition capabilities for improved
DER production observability.
Coverage assessment
In general, the activities in this functional objective have not been well covered. Regarding
TD1a, there is still work to do on load and PV forecasting. For TD1c, further work should
be done after the RfG code is adopted. An EU-level project would be needed to properly
cover TD1f. Other tasks have almost not been addressed. We assess that around 15% of
this FO have been covered.
19.3.2 TD2 “The integration of demand side management at DSO level
into TSO operations”
Contributions from completed and ongoing projects to TD2
From EU projects
The goal of the ADVANCED project was to increase the understanding on how to
deploy efficiently Active Demand (AD). Amongst the main project’s achievements,
communication umbrellas were delivered, providing suggestions for third parties
(retailers, aggregators…) on how to encourage residential and industrial clients to
participate in AD programs. The project also concluded that AD has highest potential
if network expansion is driven by load growth and is used in highly utilised urban
networks which are already constrained.
The GRIDTECH project has developed a zonal tool and model (with 2020, 2030,
2050 data) for pan-European system planning studies and a toolbox for
transmission expansion planning with storage, demand response and EV.
The ongoing INCREASE project will deliver a decision support model, based on
probabilistic and stochastic analysis of (LV) distribution network operation and
technological solutions to increase the RES penetration. In case of LV network issues

EUROPEAN COMMISSION Technical analysis of past and on-going projects
148 July 2016
(congestion, overvoltage, undervoltage), the model will support DSOs to decide
between new investments into LV network or exploration of other solutions such as
PV curtailment and demand-side management (DSM).
The main aim of the ongoing RealValue project is to demonstrate how small scale
energy storage systems (e.g. Smart Electric Thermal Storage Systems ‘SETS’) can
provide benefits to the whole electricity supply chain, from generation and
distribution, through to wholesale markets and suppliers and ultimately to the end
consumer. To achieve this aim RealValue will provide an innovative means to
mitigate the challenges associated with, and maximise the value of clean energy
from renewable sources. The sectors interested in the project process are:
− Generation: Efficient Dispatch of Generation; Renewable Energy Integration;
Minimise Installed Capacity;
− Transmission: Quality of Supply; Security of Supply; Distribution Network
Capital Expenditure;
− Wholesale: Price Arbitrage; Ancillary Services; System Flexibility;
− Supply: Demand-Side Management; Collective Purchasing; Tariff
Development;
− Societal: Energy Affordability; Carbon Reduction; Market Design.
The recently started SmartNet project aims at providing architectures for
optimised interaction between TSOs and DSOs in managing the exchange of
information for the acquisition of ancillary services (reserve and balancing, voltage
regulation, congestion management) from distributed resources (DSM, scattered
generation), both at national level and in a cross-border context. A software tool
for such optimised architectures is being developed.
From national projects
In Estonia, the Estfeed open software platform (managed by the TSO) is being
developed for energy consumptions monitoring and management from customer
perspective, capable to interact with grids and to provide data feeds to service
providers for an efficient use of energy.
The French Nice Grid26 and Smart Grid Vendée projects are distribution-oriented
but are also involving the French TSO. From the TSO’s point of view, the main
expected achievements lie in the economic and market design aspects about the
use of DER (from storage devices, RES producers and consumers) as flexibility
sources for the TSOs.
Assessment of the coverage of TD2
The EEGI roadmap 2013-2020 had foreseen the following specific tasks in the functional
objective TD2:
TD2a. To define demand requirements and data required by TSOs for the pan-
European planning tool.
TD2b. To demonstrate active customer involvement with indirect feedback
(provided post-consumption) and direct feedback (real time) and suitable
operations designed to achieve a reduction in peak demand (10%–15%).
TD2c. To model customer/load behaviour and segmentation and quantify the
degree of flexibility provided by distribution networks (e.g., through
reconfiguration or other methods).
26 It is also part of the EU FP7 project Grid4EU coordinated by ErDF (now Enedis) within which Nice Grid is the French demonstrator (DEMO6).
EUROPEAN COMMISSION Technical analysis of past and on-going projects
149 July 2016
Coverage assessment
Projects are addressing the various tasks in this FO, but still at a preliminary stage. We
therefore consider that around 20% of the FO is covered.
19.3.3 TD3 “Ancillary services provided through DSOs”
Contributions from completed and ongoing projects to TD3
From EU projects
The model delivered by the ongoing INCREASE project will support DSOs to decide
between new investments into LV network or exploration of available ancillary
services such as PV curtailment and demand-side management (DSM). Decisions
are made based on large set of metrics (technical and economical parameters). In
case of adequate operation of the LV network, the possibilities for provision of the
available PV and DSM active power as the reserve for TSO are observed. The
amount of available reserve for TSO is provided in probabilistic form. Main
achievement of the tool development will be optimal decision for reliable (long term)
operation of the LV network and observation of potential amounts of ancillary
services that could be offered to TSO from distributed renewable energy sources
(DRES) and DSM.
The ongoing INGRID project is combining the recent advances in Smart Grids and
hydrogen-based energy storage to match energy supply and demand in a context
of increasing variable RES. The project has delivered improved electrolyser
technology, improved solid state hydrogen storage devices and materials, and
experience feedback on control of grid-connected electrolysers. The INGRID Energy
Management System (EMS) is based on the multi-carrier hub paradigm for
modelling the behaviour of the entire plant. An optimiser, built upon this model and
based on genetic algorithm, is responsible for elaborating the optimal power flow
inside the plant, every hour. Indeed, the EMS is able to merge and harmonise the
contrasting requirements coming from the DSO in terms of expected power
consumption profile, and the ones linked to the actual business of the plant. In this
way, the INGRID plant is able to chase its own profit, providing ancillary services
to the grid at the same time. The results of the optimisation phase feed a Decision
Support System (DSS) which allows its users to send the desired set points to the
plant devices.
The recently started SmartNet project is developing a software tool for optimised
architecture(s) for TSO-DSO interaction to allow participation to ancillary services
market by distributed resources. Through an in-depth analysis and a simulation in
a lab-environment, answers are sought for the following questions:
− Which ancillary services could be provided from distribution to the whole
system (via transmission)?
− Which optimised modalities could be adopted for managing the network at
the TSO-DSO interface and what monitoring and control signals could be
exchanged to carry out a coordinated action?
− How the architectures of real time markets (in particular balancing markets)
could be consequently revised?
− What information has to be exchanged and how (ICT) for the coordination
on the distribution-transmission border, starting from monitoring aspects,
to guarantee observability and control of distributed generation, flexible
demand and storage systems?
− Which implications could the above issues have on the ongoing market
EUROPEAN COMMISSION Technical analysis of past and on-going projects
150 July 2016
coupling process that is going to be extended to real-time markets in the
next years, according to the draft Network Code on Electricity Balancing by
ENTSO-E?
From national projects
The Spanish Alia2 project tested storage solutions for renewable generation plants.
The development of three building management systems (module, cabinet and
container) was achieved during the project. The new solution should allow the
provision of grid services to DSOs and TSOs.
From the TSO’s point of view, the French Nice Grid and Smart Grid Vendée
projects main achievements lie in the economic and market design aspects about
the use of DER as flexibility sources for the TSOs (ancillary services, tertiary
reserve).
The Danish Cell Controller Pilot Project built up a software application able to
coordinate distributed energy resources (DER) for control purpose in normal grid
operation and support ancillary services from DSO.
Again in Denmark, the ongoing EnergyLab Nordhavn* project intends to show
how electricity and heating, energy-efficient buildings and electric transport can be
integrated into an intelligent and optimized energy system.
Within the Belgian project “Smart grids: Back End Systems” consisting in the
segmented roll-out of smart meters and associated systems, the automatic
curtailment of wind and automatic load shedding, the integration of DSM as system
reserve (DSO/TSO) and the integration of storage (including ancillary services
provided by storage solutions) have been implemented.
In Estonia, the ongoing DSR project has identified the demand-side response (DSR)
potential for Estonia and studied the opportunity to use DSR as a source of
flexibility. The Estfeed open software platform (managed by the TSO) is being
developed for energy consumptions monitoring and management from customer
perspective, capable to interact with grids and to provide data feeds to service
providers for an efficient use of energy.
The AES projects in the Netherlands and in Northern Ireland consist in 10 MW
battery systems installed in the distribution grid to balance supply and demand by
providing Primary, Secondary & Tertiary Reserve. The advanced battery based
storage arrays are designed to deliver reliable power and improve flexibility of the
transmission systems.
The ongoing Belgian project GREDOR is also addressing this functional objective.
A specific tool has been developed: DSIMA is an open-source testbed to simulate
interaction models governing the exchange of flexibility services located within a
distribution network. The testbed is an agent-based system in which the DSO, the
TSO, producers and retailers take their decisions based on mixed-integer linear
programs. Three interaction models are considered: “Unrestricted” access: Let the
grid users access to the network without restriction, “Restricted” access: Restrict
the grid users so that no problems can occur and “Flexible” access: Let the users
produce/consume as they wish but if they are in the flexible range, they are obliged
to propose flexibility services to the DSO.
Note: Projects marked with an * do not count TSOs nor DSOs on board. They have been provided by EASE members.
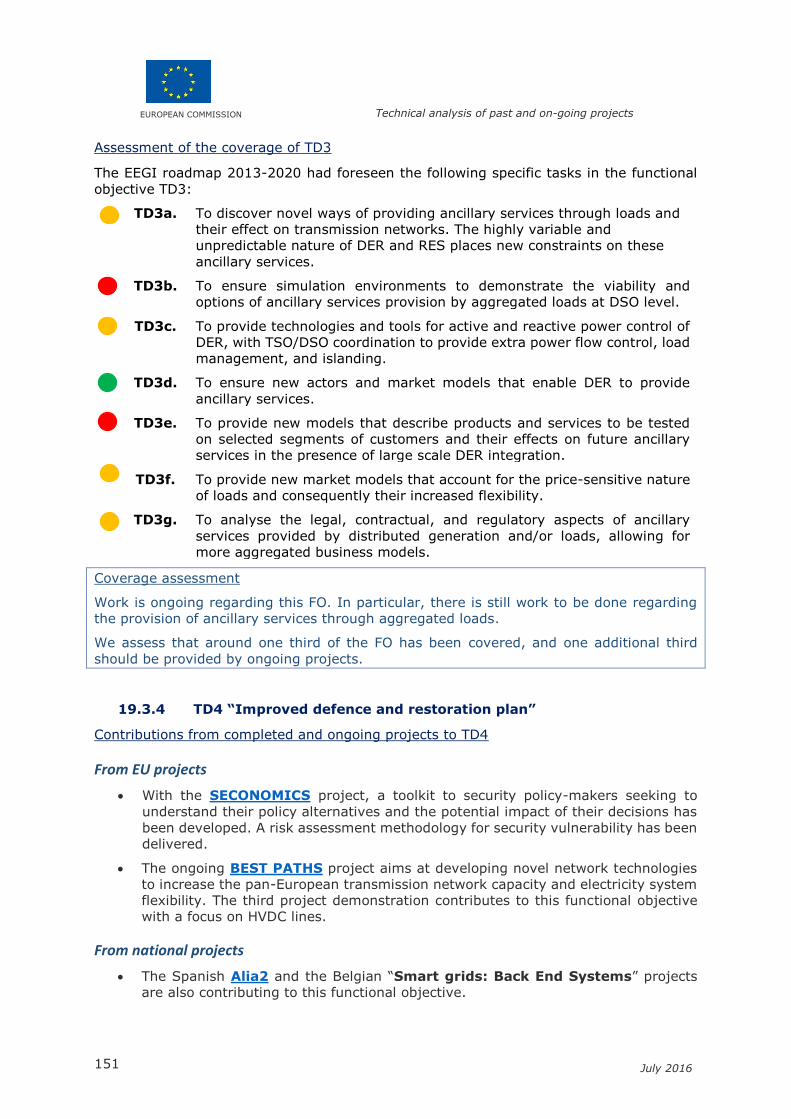
EUROPEAN COMMISSION Technical analysis of past and on-going projects
151 July 2016
Assessment of the coverage of TD3
The EEGI roadmap 2013-2020 had foreseen the following specific tasks in the functional
objective TD3:
TD3a. To discover novel ways of providing ancillary services through loads and
their effect on transmission networks. The highly variable and
unpredictable nature of DER and RES places new constraints on these
ancillary services.
TD3b. To ensure simulation environments to demonstrate the viability and
options of ancillary services provision by aggregated loads at DSO level.
TD3c. To provide technologies and tools for active and reactive power control of
DER, with TSO/DSO coordination to provide extra power flow control, load
management, and islanding.
TD3d. To ensure new actors and market models that enable DER to provide
ancillary services.
TD3e. To provide new models that describe products and services to be tested
on selected segments of customers and their effects on future ancillary
services in the presence of large scale DER integration.
TD3f. To provide new market models that account for the price-sensitive nature
of loads and consequently their increased flexibility.
TD3g. To analyse the legal, contractual, and regulatory aspects of ancillary
services provided by distributed generation and/or loads, allowing for
more aggregated business models.
Coverage assessment
Work is ongoing regarding this FO. In particular, there is still work to be done regarding
the provision of ancillary services through aggregated loads.
We assess that around one third of the FO has been covered, and one additional third
should be provided by ongoing projects.
19.3.4 TD4 “Improved defence and restoration plan”
Contributions from completed and ongoing projects to TD4
From EU projects
With the SECONOMICS project, a toolkit to security policy-makers seeking to
understand their policy alternatives and the potential impact of their decisions has
been developed. A risk assessment methodology for security vulnerability has been
delivered.
The ongoing BEST PATHS project aims at developing novel network technologies
to increase the pan-European transmission network capacity and electricity system
flexibility. The third project demonstration contributes to this functional objective
with a focus on HVDC lines.
From national projects
The Spanish Alia2 and the Belgian “Smart grids: Back End Systems” projects
are also contributing to this functional objective.

EUROPEAN COMMISSION Technical analysis of past and on-going projects
152 July 2016
Assessment of the coverage of TD4
The EEGI roadmap 2013-2020 had foreseen the following specific tasks in the functional
objective TD4:
TD4a. To develop simulation tools and methods that detect weaknesses in the
system with respect to reconnecting DER and storage systems.
TD4b. To develop simulation tools and methods of assessing the risk of
breakdowns during reconnection.
TD4c. To develop simulation tools for interactive system restoration, including
advanced forecast tools developed in TD1 for wind, solar PV, and other
variable RES.
TD4d. To address regulatory and technical challenges that implement restoration
plans at the pan-European level.
TD4e. To investigate the contribution of DER for system restoration and its
contribution to immediate power reserves; this is relevant from the TSO
perspective (e.g., black start capability and coordination of wind turbine
generators). This will be assessed considering efficacy and cost-
effectiveness when compared to the traditional or usual black-start
approach.
TD4f. To investigate the impact of micro-grids and islanding capabilities.
TD4g. To train operators about the evolution of national regulatory schemes in
order to foster coordination efforts.
Coverage assessment
Most of the topics considered in this FO are not addressed yet or only very partially. Micro-
grids and islanding capabilities have been addressed by completed and ongoing projects
but wider tests are needed. Furthermore there is still work to do on training.
We therefore consider that around 15% of this FO have been covered by the R&I activities
so far.
19.3.5 TD5 “Methodologies for scaling-up and replicating”
Contributions from completed and ongoing projects to TD5
From EU projects
No EU R&I project has been reported here. It is however important to mention the
coordination and support action (CSA) Grid+ which has delivered a methodology
to assess the scalability and replicability of smart grid solutions.
From national projects
The Spanish project “A complete and normalised 61850 substation” has used
the standard IEC 61850 as a means to improve the design, maintenance and
operation of the substation automation systems. It has designed a standard
substation considering the existing and new solutions developed by the vendors
collaborating in the project. Application Guides, Software Tools and Migration
Strategies for the Implementation of the IEC 61850 Standard have been delivered.
The Spanish ATENEA Microgrid* project has delivered a methodology for the
design and the deployment of microgrids.
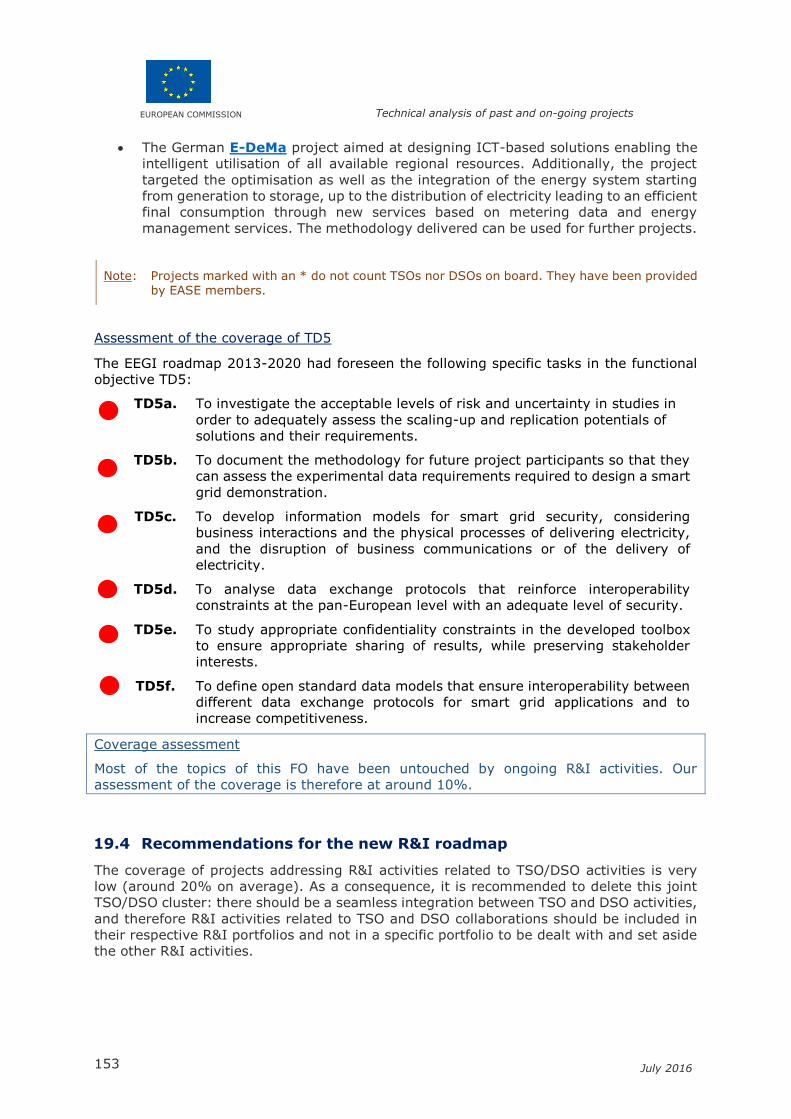
EUROPEAN COMMISSION Technical analysis of past and on-going projects
153 July 2016
The German E-DeMa project aimed at designing ICT-based solutions enabling the
intelligent utilisation of all available regional resources. Additionally, the project
targeted the optimisation as well as the integration of the energy system starting
from generation to storage, up to the distribution of electricity leading to an efficient
final consumption through new services based on metering data and energy
management services. The methodology delivered can be used for further projects.
Note: Projects marked with an * do not count TSOs nor DSOs on board. They have been provided by EASE members.
Assessment of the coverage of TD5
The EEGI roadmap 2013-2020 had foreseen the following specific tasks in the functional
objective TD5:
TD5a. To investigate the acceptable levels of risk and uncertainty in studies in
order to adequately assess the scaling-up and replication potentials of
solutions and their requirements.
TD5b. To document the methodology for future project participants so that they
can assess the experimental data requirements required to design a smart
grid demonstration.
TD5c. To develop information models for smart grid security, considering
business interactions and the physical processes of delivering electricity,
and the disruption of business communications or of the delivery of
electricity.
TD5d. To analyse data exchange protocols that reinforce interoperability
constraints at the pan-European level with an adequate level of security.
TD5e. To study appropriate confidentiality constraints in the developed toolbox
to ensure appropriate sharing of results, while preserving stakeholder
interests.
TD5f. To define open standard data models that ensure interoperability between
different data exchange protocols for smart grid applications and to
increase competitiveness.
Coverage assessment
Most of the topics of this FO have been untouched by ongoing R&I activities. Our
assessment of the coverage is therefore at around 10%.
19.4 Recommendations for the new R&I roadmap
The coverage of projects addressing R&I activities related to TSO/DSO activities is very
low (around 20% on average). As a consequence, it is recommended to delete this joint
TSO/DSO cluster: there should be a seamless integration between TSO and DSO activities,
and therefore R&I activities related to TSO and DSO collaborations should be included in
their respective R&I portfolios and not in a specific portfolio to be dealt with and set aside
the other R&I activities.

EUROPEAN COMMISSION Technical analysis of past and on-going projects
154 July 2016
20. Conclusion for joint transmission and distribution
activities
The joint TSO/DSO Cluster has been REMOVED and the activities related to the five
functional objectives have been INTEGRATED as follows27.
• FO TD1 (Increased observability of the distribution system for transmission network
management and control) has been integrated in the new FO T5 (Grid observability)
of Cluster 2 (Power system flexibility) for TSOs and in the new FOs D4 (System
integration of medium DER) and D9 (Automation and control of MV network) of
Clusters 2 (Integration of DER and EV, storage, other networks) and 3 (Network
operations) respectively, for DSOs.
• FO TD2 (The integration of demand side management at DSO level into TSO
operations) has been integrated in the new FO T11 (Demand response) of Cluster
3 (Security and system stability) for TSOs and the amended FO D1 (Active demand
response) of Cluster 1 (Integration of smart customers and buildings) for DSOs.
• FO TD3 (Ancillary services provided through DSOs) has been integrated in the new
FO T9 (Enhanced ancillary services) of Cluster 3 (Security and system stability) for
TSOs.
• FO TD4 (Improved defence and restoration plans) has been integrated in the new
FO T8 (Reliability and resilience) of Cluster 2 (Power system flexibility) for TSOs.
• FO TD5 (Methodologies for scaling-up and replicating) has not been integrated in
the new roadmap.
27 A detailed mapping of this integration is provided in D2.6.

EUROPEAN COMMISSION Technical analysis of past and on-going projects
155 July 2016
Part IV COMPARISON WITH NON-EUROPEAN
SELECTED PROJECTS
21. The selected portfolio of non-European R&I
projects
21.1 Reminder: project selection
The methodology of monitoring is described in the introduction (2.4). Here, the main
assumptions for the selection of the projects which were retained in the portfolio are
reminded.
Table 9: Methodology followed to select the portfolio of non-European projects
Transmission Distribution
USA -Projects’ sources: U.S. Department of
Energy (DOE), SGIG (Smart Grid
Investment Grant) projects (2013 Progress
Report) and projects from the “Smart Grid
Demonstration Program” (including “Smart
Grid Regional Demonstrations” and
“Energy Storage Demonstrations”). -
Selection process: projects with the
highest budgets and verification that no
significant project covering the TSO
Functional Objectives was missing from the
selection.
CHINA -Projects’ sources: DOE energy
storage database and State Grid
Corporation of China (SGCC). -Selection
process: all projects relevant to
transmission and related to TSO Functional
Objectives were selected for further
investigation.
JAPAN -Projects’ sources: DOE energy
storage database and some publicly
available presentations (e.g., Tetsuji
Tomita: “Policies and regulation for
electricity storage in Japan” and Satoshi
Morozumi – NEDO: “Japanese Island Grid
Experience”. –Selection process: all
projects relevant for transmission were
selected for further investigation.
As a result, out of 56 projects analysed, 34
projects were selected for the final review:
13 US, 12 Chinese and 9 Japanese.
Projects’ sources: DOE energy storage
database for projects in the USA and
Japan, the IEASA database for projects in
India, the Clean Energy Fund Program for
projects in Canada and storage projects
funded by ARENA for projects in Australia.
From data bases, only the projects with a
storage component at distribution level
were considered for further investigation,
leading to a list of about 60 projects.
Out of these projects, only the projects
with significant information on expected or
realized achievements were finally
reviewed.
Other reasons for omitting certain projects
were:
the relevance of the project (e.g.
projects which didn’t cover any
distrution functional objectives),
de-commissioned projects,
projects with an unclear status,
and, projects which were very
similar to other projects already
reviewed.
This finally led to a review of a total of 20
projects (2 Australian, 4 Canadian, 3
Indian, 1 Japanese and 10 US projects).
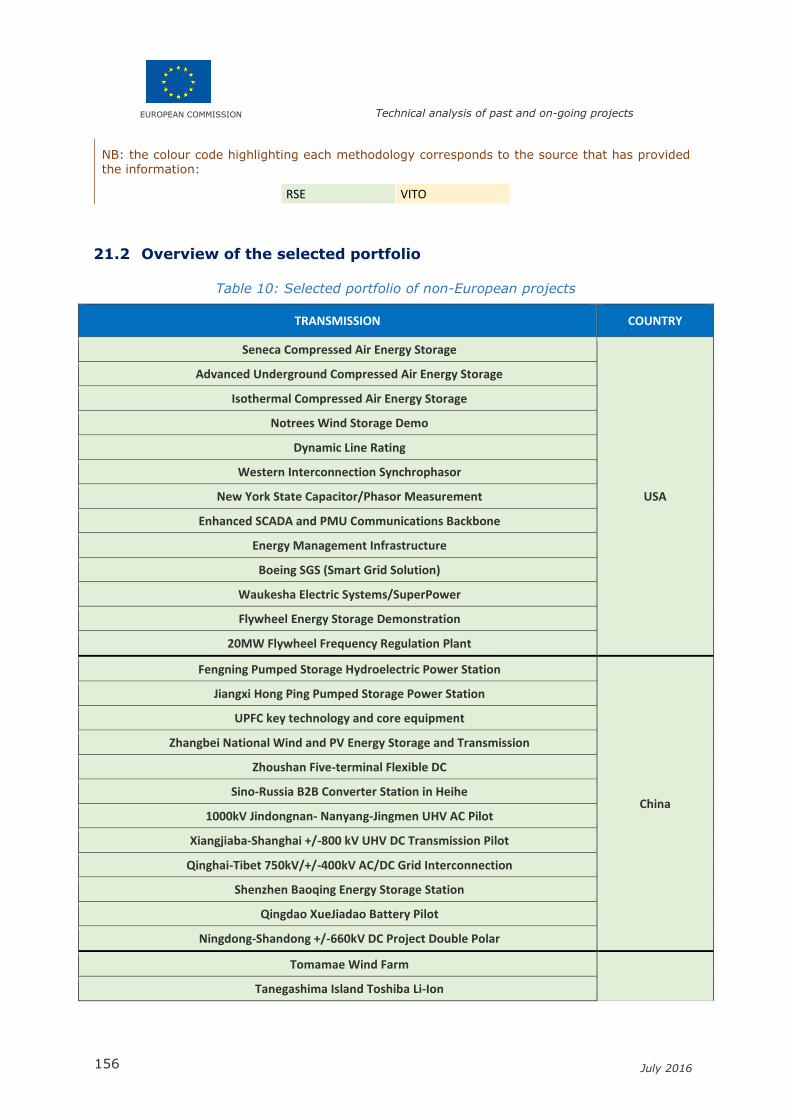
EUROPEAN COMMISSION Technical analysis of past and on-going projects
156 July 2016
NB: the colour code highlighting each methodology corresponds to the source that has provided the information:
RSE VITO
21.2 Overview of the selected portfolio
Table 10: Selected portfolio of non-European projects
TRANSMISSION COUNTRY
Seneca Compressed Air Energy Storage
USA
Advanced Underground Compressed Air Energy Storage
Isothermal Compressed Air Energy Storage
Notrees Wind Storage Demo
Dynamic Line Rating
Western Interconnection Synchrophasor
New York State Capacitor/Phasor Measurement
Enhanced SCADA and PMU Communications Backbone
Energy Management Infrastructure
Boeing SGS (Smart Grid Solution)
Waukesha Electric Systems/SuperPower
Flywheel Energy Storage Demonstration
20MW Flywheel Frequency Regulation Plant
Fengning Pumped Storage Hydroelectric Power Station
China
Jiangxi Hong Ping Pumped Storage Power Station
UPFC key technology and core equipment
Zhangbei National Wind and PV Energy Storage and Transmission
Zhoushan Five-terminal Flexible DC
Sino-Russia B2B Converter Station in Heihe
1000kV Jindongnan- Nanyang-Jingmen UHV AC Pilot
Xiangjiaba-Shanghai +/-800 kV UHV DC Transmission Pilot
Qinghai-Tibet 750kV/+/-400kV AC/DC Grid Interconnection
Shenzhen Baoqing Energy Storage Station
Qingdao XueJiadao Battery Pilot
Ningdong-Shandong +/-660kV DC Project Double Polar
Tomamae Wind Farm
Tanegashima Island Toshiba Li-Ion
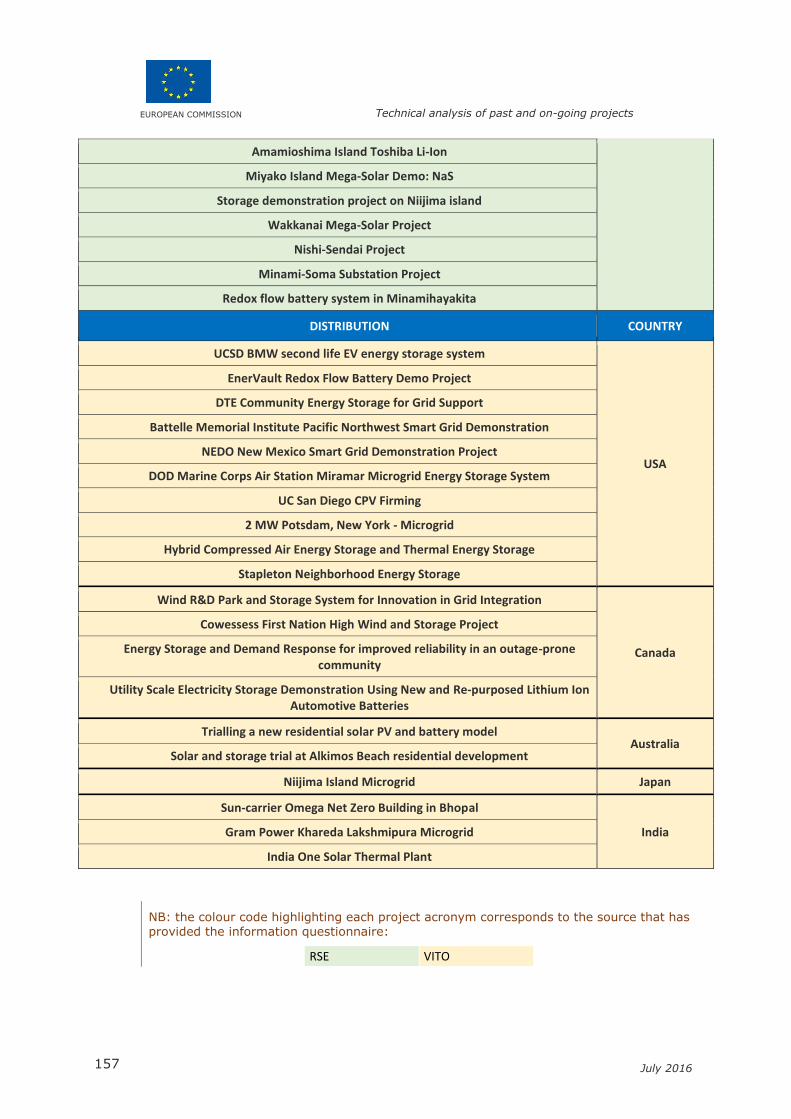
EUROPEAN COMMISSION Technical analysis of past and on-going projects
157 July 2016
Amamioshima Island Toshiba Li-Ion
Miyako Island Mega-Solar Demo: NaS
Storage demonstration project on Niijima island
Wakkanai Mega-Solar Project
Nishi-Sendai Project
Minami-Soma Substation Project
Redox flow battery system in Minamihayakita
DISTRIBUTION COUNTRY
UCSD BMW second life EV energy storage system
USA
EnerVault Redox Flow Battery Demo Project
DTE Community Energy Storage for Grid Support
Battelle Memorial Institute Pacific Northwest Smart Grid Demonstration
NEDO New Mexico Smart Grid Demonstration Project
DOD Marine Corps Air Station Miramar Microgrid Energy Storage System
UC San Diego CPV Firming
2 MW Potsdam, New York - Microgrid
Hybrid Compressed Air Energy Storage and Thermal Energy Storage
Stapleton Neighborhood Energy Storage
Wind R&D Park and Storage System for Innovation in Grid Integration
Canada
Cowessess First Nation High Wind and Storage Project
Energy Storage and Demand Response for improved reliability in an outage-prone community
Utility Scale Electricity Storage Demonstration Using New and Re-purposed Lithium Ion Automotive Batteries
Trialling a new residential solar PV and battery model Australia
Solar and storage trial at Alkimos Beach residential development
Niijima Island Microgrid Japan
Sun-carrier Omega Net Zero Building in Bhopal
India Gram Power Khareda Lakshmipura Microgrid
India One Solar Thermal Plant
NB: the colour code highlighting each project acronym corresponds to the source that has provided the information questionnaire:
RSE VITO
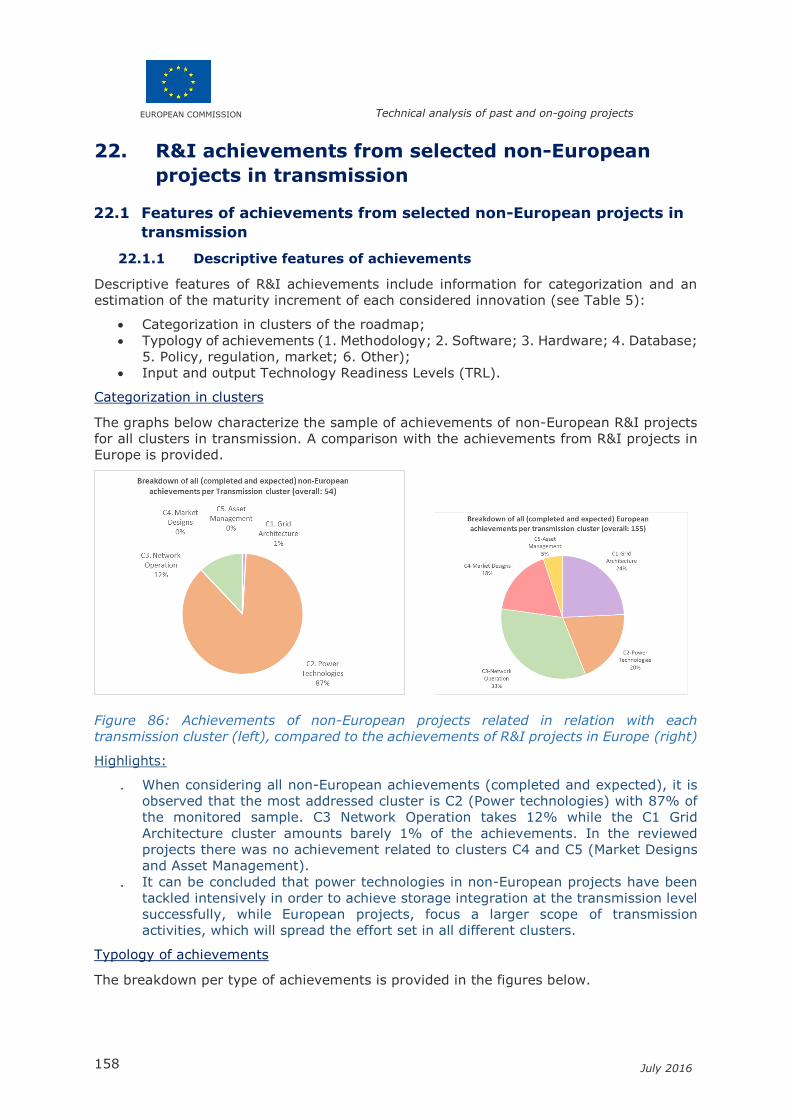
EUROPEAN COMMISSION Technical analysis of past and on-going projects
158 July 2016
22. R&I achievements from selected non-European
projects in transmission
22.1 Features of achievements from selected non-European projects in
transmission
22.1.1 Descriptive features of achievements
Descriptive features of R&I achievements include information for categorization and an
estimation of the maturity increment of each considered innovation (see Table 5):
Categorization in clusters of the roadmap;
Typology of achievements (1. Methodology; 2. Software; 3. Hardware; 4. Database;
5. Policy, regulation, market; 6. Other);
Input and output Technology Readiness Levels (TRL).
Categorization in clusters
The graphs below characterize the sample of achievements of non-European R&I projects
for all clusters in transmission. A comparison with the achievements from R&I projects in
Europe is provided.
Figure 86: Achievements of non-European projects related in relation with each
transmission cluster (left), compared to the achievements of R&I projects in Europe (right)
Highlights:
. When considering all non-European achievements (completed and expected), it is
observed that the most addressed cluster is C2 (Power technologies) with 87% of
the monitored sample. C3 Network Operation takes 12% while the C1 Grid
Architecture cluster amounts barely 1% of the achievements. In the reviewed
projects there was no achievement related to clusters C4 and C5 (Market Designs
and Asset Management).
. It can be concluded that power technologies in non-European projects have been
tackled intensively in order to achieve storage integration at the transmission level
successfully, while European projects, focus a larger scope of transmission
activities, which will spread the effort set in all different clusters.
Typology of achievements
The breakdown per type of achievements is provided in the figures below.

EUROPEAN COMMISSION Technical analysis of past and on-going projects
159 July 2016
Figure 87: Typology of achievements from non-European R&I projects in transmission
(left), compared to the achievements of R&I projects in Europe
Highlights:
. Non-European achievements address hardware topics principally, while European
projects concern methodology and software issues mostly; and then, in a third
place, achievements related to hardware aspects.
. There were no results at all linked to database, policy, regulation and market
categories in the monitored non-European projects, which is in agreement with the
addressed clusters, as shown before (Figure 86).
Evolution of the maturity of achievements
Innovations involved in the considered transmission projects could be characterized by
their degree of maturity. The TRL is the metric used that captures such maturity (and the
distance to the market or to an exploitation stage).
We have assessed two levels of TRL: inputs before the project starts (in a clear colour
code), and at the project end (darker colour). This is depicted in the figure hereafter, with
again a comparison with the achievements from R&I projects in Europe.

EUROPEAN COMMISSION Technical analysis of past and on-going projects
160 July 2016
Figure 88: Evolution of the maturity of achievements from non-European projects
measured in TRL units (left), compared to the achievements of R&I projects in Europe
(right)
Highlights:
. On average, for each addressed cluster of non-European projects, an increment of
three to four units in the TRL scale is observed (left diagrams), the increment being
higher for the Network Operation cluster (C3).
. C1 and C3’s achievements having reached a TRL of 9 are ready to be tested in
operational environments. As we can see on the charts of the right, none of the
clusters of the European achievements (completed or expected) is at the highest
readiness level.
. The lowest TRL for a non-European cluster belongs to C2 Power Technologies with
a remarkable (above) 8, even if it is the cluster which comprises 87% of the
monitored sample.
22.1.2 Projective features of achievements
Projective features of each achievement refer to possible implementations and next steps
as formulated by expert members of the Grid+Storage consortium. RSE was the partner
in charge of the evaluation for non-European projects related to transmission. Non-
European achievements’ implementation and their further steps have been determined by
RSE’s experts as follows:
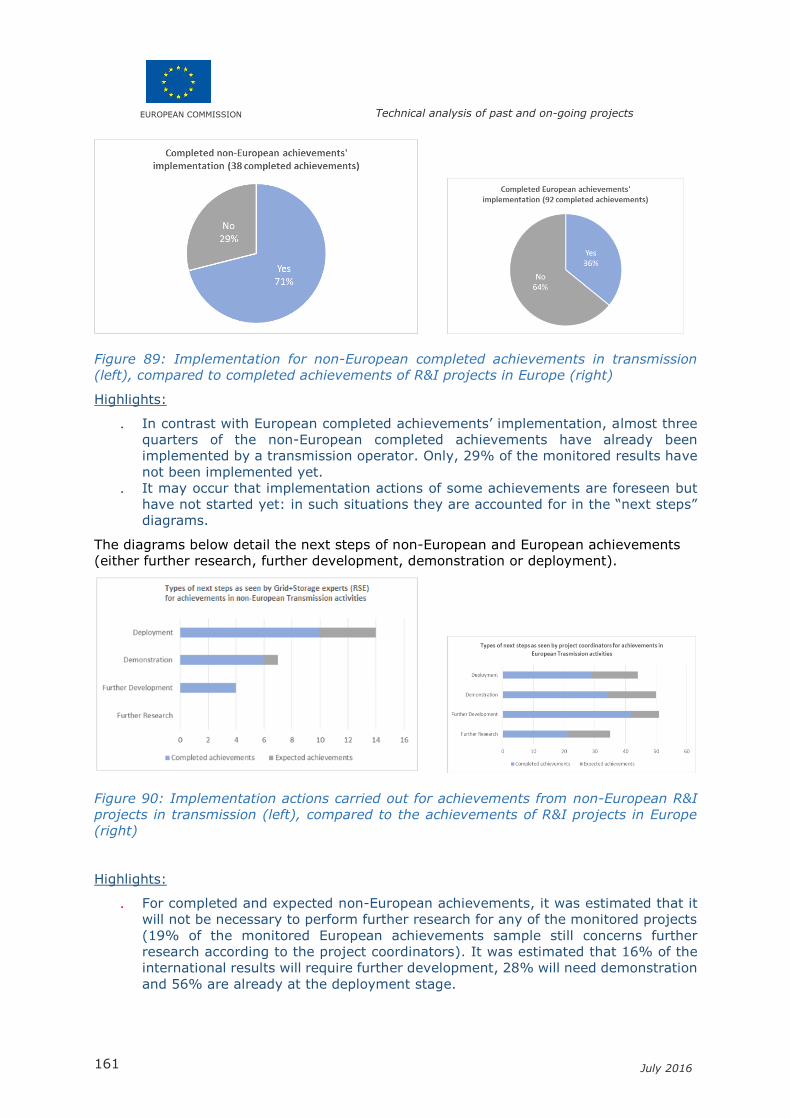
EUROPEAN COMMISSION Technical analysis of past and on-going projects
161 July 2016
Figure 89: Implementation for non-European completed achievements in transmission
(left), compared to completed achievements of R&I projects in Europe (right)
Highlights:
. In contrast with European completed achievements’ implementation, almost three
quarters of the non-European completed achievements have already been
implemented by a transmission operator. Only, 29% of the monitored results have
not been implemented yet.
. It may occur that implementation actions of some achievements are foreseen but
have not started yet: in such situations they are accounted for in the “next steps”
diagrams.
The diagrams below detail the next steps of non-European and European achievements
(either further research, further development, demonstration or deployment).
Figure 90: Implementation actions carried out for achievements from non-European R&I
projects in transmission (left), compared to the achievements of R&I projects in Europe
(right)
Highlights:
. For completed and expected non-European achievements, it was estimated that it
will not be necessary to perform further research for any of the monitored projects
(19% of the monitored European achievements sample still concerns further
research according to the project coordinators). It was estimated that 16% of the
international results will require further development, 28% will need demonstration
and 56% are already at the deployment stage.

EUROPEAN COMMISSION Technical analysis of past and on-going projects
162 July 2016
22.2 Description of each project of the selected portfolio
22.2.1 From the USA
13 transmission projects from the USA have been monitored.
Seneca Compressed Air Energy Storage (DOE/New York State Electric & Gas).
The aim of this project was to build an advanced compressed air energy storage
(CAES) plant with a rated capacity of 150 MW using an existing 4.5 million cubic
foot underground salt cavern. The plant was designed to have the capacity to
operate 16 hours a day and to provide energy arbitrage for approximately 2,300-
2,500 hours each year. The plant should have been tied to NYSEG’s cross-state 230
kV/345 kV transmission system that feeds major metropolitan centres in Central
New York. The market price forecasting and dispatch modelling completed during
the project indicated that the CAES technologies would operate at only 10 to 20%
capacity factors. The output was limited by the night time transmission system
capability. The plant operating profiles tended to be patterned after the operational
duty cycle of a natural gas fired peaking unit. Given that the capital cost of this plant
was estimated at two to three times the cost of a simple cycle natural gas
combustion turbine, in all but six years of the 30 years of the study period, the total
market revenues received from plant operation would be less than the total revenue
requirement of the plant. As a result, it was recommended that NYSEG should not
proceed with further development of the Seneca CAES project. However, this
conclusion is site-specific and may not necessarily indicate that CAES plants cannot
be profitable in other places in New York State or in the world.
Advanced Underground Compressed Air Energy Storage (DOE/Pacific Gas and
Electric Company). Pacific Gas and Electric Company’s (PG&E) advanced
underground, Compressed Air Energy Storage demonstration project is intended to
validate the design, performance and reliability of a CAES plant rated at
approximately 300MW with up to 10 hours of storage. The CAES demonstration
project is scoped to test the suitability of a porous rock formation as the storage
reservoir in California, and demonstrate the technological improvements in the
design of such plants. Porous rock formations are much more plentiful than the salt
domes now used by the two operational plants in Alabama and Germany. If this
geology is proven viable, this technology has the potential to be replicated
throughout California and elsewhere in the United States. The project is also
differentiated by its potential use of a new CAES plant design that is much more
efficient than the first generation Alabama and German designs. The final aims of
the plant are to integrate intermittent renewable resources, maintain emergency
spinning/non-spinning reserve and allow volt-ampere reactive/voltage support.
Phase 1 of the project, i.e., reservoir feasibility including site control, reservoir
performance, economic viability, and environmental impacts is currently funded. It
is envisioned that in the 4th Quarter of 2015 a decision will be made on whether to
move forward with seeking the required regulatory approvals to proceed to Phase 2
(commercial plant engineering, procurement and construction, and commissioning).
Isothermal Compressed Air Energy Storage (DOE/SustainX). The project
developed and demonstrated a MW-scale Energy Storage System that employs
compressed air as the storage medium. An isothermal compressed air energy
storage (ICAESTM) system rated for 1.5 MW was demonstrated in a full-scale
prototype unit. The system is designed for a 20-year lifetime. The use of proprietary
methods for isothermal gas cycling and staged gas expansion implemented using
industrially mature, readily-available components can yield breakthrough cost-
effectiveness. The ICAES approach uses an electrically driven mechanical system to
raise air to high pressure for storage in low-cost pressure vessels, pipeline, or lined-
rock cavern. This air is later expanded through the same mechanical system to drive
EUROPEAN COMMISSION Technical analysis of past and on-going projects
163 July 2016
the electric motor as a generator. The approach incorporates two key efficiency-
enhancing innovations: (1) isothermal (constant temperature) gas cycling, which is
achieved by mixing liquid with air (via spray or foam) to exchange heat with air
undergoing compression or expansion; and (2) a novel, staged gas-expansion
scheme that allows the drivetrain to operate at constant power while still allowing
the stored gas to work over its entire pressure range. SustainX’s ICAES power and
energy can be scaled independently, enabling an optimized solution for any
application. The power needs of a project can be met in MW increments by selecting
the number of ICAES compressor/expander modules. Similarly, energy can be
optimized by sizing the volume of pipe-type air storage to the specific needs of a
project.
Notrees Wind Storage Demo (DOE/ERCOT). The objective of the Notrees Wind
Storage Demonstration Project is to validate that energy storage increases the value
and practical application of intermittent wind generation and is commercially viable
at utility scale. The project incorporates both new and existing technologies and
techniques to evaluate the performance and potential of wind energy storage. In
addition, it could serve as a model for others to adopt and replicate. The Project is
installing an advanced battery energy storage system (BESS) with a capacity of 36
MW/24 MWh to optimally dispatch energy production from the wind farm. This
optimization will help energy storage operators capture energy arbitrage, improve
grid stability, and demonstrate renewable firming value. Additional CO2 reduction
benefits are anticipated, as energy storage will eliminate the need for fossil-fuel-
based secondary generation. The BESS selected for the project is Xtreme Power’s
36-MW/24-MWh Dynamic Power Resource™ (DPR) advanced lead-acid unit.
Building construction was completed and all battery/PCS (Power Conditioning
System) units were put in place. The BESS completed commercial operation testing.
Integrated Module Testing was also carried out. The Notrees Wind Storage
Demonstration Project provided FRRS (Fast-Responding Regulation Service) service
to ERCOT interconnection through a two-year pilot program. The project provides
32 MW of FRRS Up capacity and 30 MW of FRRS-Down capacity. Initial results
showed good FRRS service capability. The final documentation is yet not available.
Dynamic Line Rating (DOE/ Oncor). The project developed and deployed an
extensive and advanced DLR (Dynamic Line Rating)28 installation to demonstrate
that DLR technology is capable of resolving many transmission capacity constraint
problems with a system that is reliable, safe and very cost competitive. The
integrated dynamic Line Rating (iDLR) collects transmission line parameters at
remote locations on the lines, calculates the real-time line rating based on the
equivalent conductor temperature, ambient temperature and influence of wind and
solar radiation on the stringing section, transmits the data to the Transmission
Energy Management System, validates its integrity and passes it on to Oncor and
ERCOT (Electric Reliability Council of Texas) respective system operations. The iDLR
system operates in parallel with all other system status telemetry collected through
ERCOT Supervisory Control and Data Acquisition (SCADA) employed across the
company. Real-time transmission line capacities were observed above ambient-
adjusted ratings by 8%-12% for 138 kV lines and by 6%-14% for 345 kV lines 84%-
91% of the time. As evidence of the extensibility of DLR technology, Oncor has
deployed an additional twelve DLR devices in the Odessa-Midland region of Texas
and incorporated them in the iDLR system operating telemetry feed.
28 IDLR (Integrated Dynamic Line Rating) is Oncor’s designation for real time ratings that account for the full
impact of ambient temperature, solar radiation, and wind variations and integrating the data into the system’s status telemetry for operations. DLR refers to the determination of a line rating based on real-time parameters
EUROPEAN COMMISSION Technical analysis of past and on-going projects
164 July 2016
Western Interconnection Synchrophasor Program (DOE/Peak Reliability). The
main objectives of the Western Interconnection Synchrophasor Program (WISP)
were to improve electric system reliability and enable better grid integration of
renewable resources. The project installed or upgraded 584 Phasor Measurement
Units (PMUs), 77 Phasor Data Concentrators (PDCs), a wide-area communications
network to support PMU data transfer, information technology infrastructure and
advanced transmission software. The developed advanced transmission applications
have enabled angle and frequency monitoring; post-mortem analysis; voltage and
voltage stability monitoring; oscillation energy and mode meter monitoring; reactive
reserves monitoring and device control; model baselining, validation, and
improvement; path loading and congestion management techniques. Together,
these systems increase grid operators’ visibility into bulk power system conditions
in near-real time, enable earlier detection of problems that threaten grid stability or
cause cascading outages and facilitate sharing of information with neighbouring
control areas.
New York State Capacitor/Phasor Measurement Project (DOE/New York
Independent System Operator, Inc.). The project main objectives were to improve
electric service reliability and power stability and to reduce costs associated with
line losses. Phasor measurement units (PMUs), Phasor Data Concentrators (PDCs)
and smart grid-enabled capacitors were deployed along with new software to assist
in determining real‐time grid stability margins. The project has improved the New
York Independent System Operator (NYISO) grid operators’ visibility into and across
New York’s bulk power systems, allowing them to monitor in near‐real time and
enabling earlier detection of disturbances that could result in instabilities or outages.
In addition, the NYISO is working on sharing synchrophasor data with neighbouring
regional control areas. Capacitor banks (compatible with the advanced monitoring
and control capabilities provided by the PMUs and advanced applications) further
improve the ability of the NYISO and the NYCA (New York Control Area) TOs to
regulate transmission voltage.
Enhanced SCADA and PMU Communications Backbone Project (DOE/
American Transmission Company LLC). The project deployed new fibre optic
transmission communications infrastructure across American Transmission
Company’s (ATC) Wisconsin footprint. The interconnection of the new fibre
segments integrated a total of 149 substations within ATC data communications and
collection networks and expanded ATC data transfer capability. ATC interconnected
new substation fibre optic segments with pre-existing leased fibre optic cable or
cable capacity for a more integrated and reliable communications system. The
leased fibre is also connected with pre-existing optical fibre ground wire (OPGW).
The project deployed new OPGW to complete the fibre optic backbone network.
These capabilities have been enhanced by installing satellite communication links
that transmit electric transmission system operating data to the communications
satellites and back to ATC’s system control centres. In addition to reduced operating
and maintenance costs, the project enabled improved communications network
reliability and increased bandwidth. The results are fewer unplanned outages,
increased ability to maintain visibility of the grid's behaviour in near-real time, better
physical security at substations and the ability to remotely monitor and control.

EUROPEAN COMMISSION Technical analysis of past and on-going projects
165 July 2016
Energy Management Infrastructure Project (DOE/ Georgia System Operations
Corporation, Inc.). The objective of the project was to install or upgrade the
infrastructure necessary to support smart grid applications deployed by Georgia
System Operations Corporation’s (GSOC) rural electric distribution cooperatives to
increase the reliability, security, interoperability and efficiency of their distribution
systems. The project implemented advanced analysis software for improved
monitoring, planning and electricity cost analysis. GSOC upgraded both the
hardware and Energy Control System (ECS) software so that it is now capable of
implementing the latest security technologies, has an open communications
platform that allows for implementation of future industry standard protocols and
interfaces with new Smart Grid devices. The communications infrastructure was also
improved by adding a dual‐path fibre network between the primary and backup
control centres, updating its telecom internet routing equipment and upgrading its
Gateway routers to accommodate the new ECS’s increased data capacity
requirements. The improvements to wide‐area monitoring, visualization and control
system capabilities enable GSOC to rapidly analyse operations across its entire
transmission system and automatically communicate information about disruptions
or changes in power flow on the grid to its member electric cooperatives.
Boeing SGS (Smart Grid Solution) (DOE/ The Boeing Company). Boeing and its
partner, PJM Interconnection, teamed to bring advanced “defense-grade”
technologies for cyber security to the US regional power grid through demonstration
in PJM’s energy management environment. Under this cooperative project with the
Department of Energy, Boeing and PJM have developed and demonstrated a host of
technologies specifically tailored to the needs of PJM and the electric sector as a
whole. The team has demonstrated to the energy industry a combination of
processes, techniques and technologies that have been successfully implemented in
the commercial, defence, and intelligence communities to identify, mitigate and
continuously monitor the cyber security of critical systems. Guided by the results of
a Cyber Security Risk‐Based Assessment completed, the Boeing‐PJM team has
completed multiple iterations, i.e. multiple cyber security solutions have been
validated across a variety of controls including: Application Security, Enhanced
Malware Detection, Security Incident and Event Management (SIEM) Optimization,
Continuous Vulnerability Monitoring, SCADA Monitoring/Intrusion Detection,
Operational Resiliency, Cyber Range simulations and hands on cyber security
personnel training. All of the developed and demonstrated solutions are suitable for
replication across the electric sector and /or the energy sector as a whole.
Waukesha Electric Systems/SuperPower (DOE/ SuperPower [formerly
Waukesha Electric Systems]). The project is aimed at developing the key
technologies necessary to produce a Fault Current Limiting (FCL) Second Generation
(2G) High Temperature Superconducting (HTS) transformer commercial prototype.
The proposed 28MVA Utility Transformer will occupy approximately 50% of the
physical size/weight of a conventional transformer, lower power consumption
through reduction of losses, and increase the reliability of the Nation's Grid.
SuperPower (formerly Waukesha Electric Systems) and its partners originally
intended to design, develop, manufacture, install, and demonstrate a Smart Grid
compatible Fault Current Limiting (FCL) Superconducting transformer on a live grid
utility host site. However, when the transformer manufacturer decided to leave the
project, the team effort was refocused to develop the key technologies necessary
to produce a FCL Second Generation (2G) High Temperature Superconducting (HTS)
transformer commercial prototype. The technology portfolio includes a completed
FCL HTS transformer design, proven integrated FCL operation, 2G conductor
bonding to a stronger substrate material, 2G conductor to bushing terminations, AC
loss mitigation and improved 2G conductor performance, piece lengths and cost

EUROPEAN COMMISSION Technical analysis of past and on-going projects
166 July 2016
improvements. As of October 2015, the prototype FCL HTS transformer design is
complete, the integrated FCL operation has been tested and validated using a
winding design created for a commercial superconducting FCL transformer. A 2G
conductor bonding to a stiffer substrate has been perfected for long lengths and the
2G conductor to bushing termination technology has been developed. The 2G
conductor performance and piece lengths have doubled without the loss of high-end
current carrying capacity, resulting in the expected conductor cost benefits. AC loss
mitigation techniques have been tested and more are being developed in an attempt
to reduce the heat load generated by the fields surrounding the windings inside of
the transformer during operation.
Flywheel Energy Storage Demonstration (DOE/ Amber Kinetics). The project
aimed at developing a flywheel system from sub-scale research prototype (5kWh)
to full-scale mechanical flywheel battery (25kWh) and will conduct both a
commercial-scale and a utility-scale demonstration. The goal is to deliver a cost-
effective prototype flywheel system that can be grid connected and electrically
charged and discharged. The system will have built-in sensing components that can
determine frequency and voltage characteristics of the grid and can override the
grid signal to manage the amount of electricity discharged. The project will improve
the traditional flywheel system by engineering breakthroughs in three areas,
resulting in higher efficiency and radically reduced cost: magnetic bearings, low-
cost rotor, and high-efficiency motor generator. This technology can also be used
to optimize existing infrastructure. The commercial-scale 25 kWh system underwent
basic functional qualification testing before being installed, sequentially, at the
company’s outdoor test site for full-speed field-testing. Field demonstrations
confirmed that the system met major design specifications. Low-cost manufacturing
techniques of flywheel rotors using high strength steel wire was confirmed. Balance
of system costs (bearings, motor, vacuum vessel, power electronics) make up the
majority of the cost of an anticipated commercial system. The product is now at the
stage of final development and testing. Future Plans are to complete development
and testing of the commercial-scale flywheel system, activate and test one or more
flywheel systems and connect the systems to the utility grid for Metrics and Benefits
data collection and reporting.
20MW Flywheel Frequency Regulation Plant (DOE/ Beacon Power). The project
aimed to demonstrate the technical, cost and environmental advantages of fast
response flywheel-based frequency regulation to grid operators and to reduce the
cost of development of a 20 MW flywheel-based energy storage facility compared
with that previously incurred by Beacon Power Corporation in the development of
the flywheel-based energy storage facility in Stephentown, NY. Hazle Spindle. LLC
(plant owner/operator) designed, built, commissioned, and operates a utility-scale
20 MW flywheel energy storage plant in Hazle Township, Pennsylvania (the Hazle
Facility) using flywheel technology developed by its affiliate, Beacon Power, LLC
(Beacon Power). To achieve its 20 MW capacity, the Hazle Facility is comprised of
two hundred of Beacon Power’s 100 kilowatt (kW)/25 kilowatt hour (kWh) flywheels
connected in parallel. The Hazle Facility can fully respond to a signal from PJM in
less than 2 seconds. The Hazle Facility has successfully demonstrated its technical,
cost and environmental benefits to the PJM grid. Average performance score of 97%
and average availability of 98% in providing frequency regulation services were
achieved. The cost of developing the Hazle Facility (around $53 million) was
approximately 38% less than the cost of developing a 20 MW flywheel-based energy
storage facility using Beacon Power, LLC flywheel technology in Stephentown, NY
(approximately $69 million). The Future plans are to monitor performance (primarily
maximum capacity, availability and performance scores, which affect revenues) as
well as maintenance cost to assure maximum profitability.
EUROPEAN COMMISSION Technical analysis of past and on-going projects
167 July 2016
22.2.2 From China
12 transmission projects from China have been monitored.
Fengning Pumped Storage Power Station (State Grid Xinyuan Company – State
Grid Corporation of China). The project is aimed at building a Pumped Storage
hydroelectric Power Station with 3.6GW installed capacity, which is to be the world’s
largest pumped storage facility to date. The first phase will install 6 reversible pump
turbine units, each with a capacity of 300MW, which totals 3.6GW. The designed
annual power generation is 3.424TWh with 4.565TWh of corresponding pumped
water. Upon its completion, the station will be connected to Beijing-Tianjin-North
Hebei grid with two 500kV lines for peak shaving, frequency modulation, phase
modulation and emergency backup. It will also be used as large-capacity power
storage for the system, which will play an important role to accelerate scaled
development of wind power, solar power and other RES in northern Hebei, meet the
need for grid peak shaving, maintain the safe and stable operation of the grid,
enhance power supply quality and the economy of grid operation.
Jiangxi Hong Ping Pumped Storage Power Station (SGCC). The pumped
storage hydroelectric power station bears the tasks of peak shaving, valley filling,
frequency modulation, phase modulation and accident reserve. The power station
construction can meet the needs of the fast-growing power, optimize the power
structure and satisfy the increasing peak load of the power grid. In addition, it is
helpful for power grid's operation security and stabilization. In order to match the
rapid development of the nuclear power, wind power, solar, and other renewable
energy, SGCC plans to reach 21 GW by 2015, and 41GW by 2020.
UPFC key technology and core equipment (State Grid Smart Grid Research
Institute). The project aimed at developing Unified Power Flow Controller (UPFC)
technology, which is an advanced technology in flexible AC transmission. Flexible
AC transmission technology allows the three main electrical parameters (voltage,
line impedance and power angle) that affect flow distribution in power system to
adjust quickly in accordance with system needs to greatly improve the system
stability and reliability. This technology is an important means to achieve economic
safety and comprehensive control of the power system. UPFC can flexibly control
system power flow, maximize grid transmission capacity and improve system
stability. It is the stabilizer of grid operation and multiplier of grid transmission. A
UPFC converter valve, valve prototype and laminated distributed control and
protection system for the 220kV grid based on modular multilevel, were developed.
Platforms for UPFC converter valve equivalent synthetic test, high-capacity
hardware-in-loop simulation test and multi-timescale hybrid real-time simulation
test were built up. State Grid Smart Grid Research Institute will speed up the
achievement transformation and application of UPFC technologies to serve the
construction of smart grid and to promote the development of high-end equipment
and technology.
Zhangbei National Wind and PV Energy Storage and Transmission (SGCC).
The project aimed at demonstrating a stable solution for transferring large amounts
of predictable, dependable and dispatchable renewable electricity to the national
transmission grid on an unprecedented scale. In addition, the project is focused on
using battery energy storage to enable interactive management of the electric
power grid (also with frequency regulation and voltage support). The 216 MW
Zhangbei National Energy Storage and Transmission Demonstration Project was put
into operation in 2011 and includes wind turbine generation (100 MW), solar PV
generation (40 MW), battery power storage (20 MW to 36 MW) and intelligent
transmission technologies. SGCC chose the BYD Company’s lithium-ion iron-
phosphate battery technology because of its superior service life (projected to be
EUROPEAN COMMISSION Technical analysis of past and on-going projects
168 July 2016
20-years), since the use of phosphates avoids the cost and environmental concerns
of the use of cobalt and since batteries have higher current or peak-power ratings
than typical lithium-ion technologies. In 2014 the project grew to include 500 MW
of installed wind capacity, 100 MW of installed solar PV capacity and 110 MW of
energy storage.
Zhoushan Five-terminal Flexible DC (SGCC). The main aim of this VSC (Voltage
Source Converter)-HVDC demonstration project was to bring to operation the
technological advantages of flexible DC transmission in island power supply, i.e.,
the improvement of power system stability, dynamic reactive power repertory,
power quality, system's accommodating capability of clean energy, and distribution
grid's reliability and flexibility. In 2014 the ±200kV five-terminal flexible DC
transmission system was officially put into operation, which featured the highest
level of voltage, largest number of terminals and biggest capacity for single terminal
among world's multi-terminal flexible DC transmission projects. Through the
construction of the Zhoushan multi-terminal flexible DC demonstration project,
SGCC has comprehensively acquired the set design for system digital simulation,
converter electrical design, equipment parameter selection, and coordination control
protection strategy. Breakthroughs have been achieved in HV large-capacity
converter valve (400 MW) and HVDC submarine cable. The company successfully
developed flexible DC converter valve with the largest capacity and DC submarine
cable with the highest voltage in China, and accomplished system test despite of
many core technical difficulties in dynamic simulation experiment and joint
operation and commissioning of the multi-terminal flexible DC control protection
system.
Sino-Russia B2B Converter Station in Heihe (SGCC). The project aims at
putting in operation a DC transmission station equipped with a back-to-back
converter, with a transmission capacity of 750MW, in order to transport clean power
purchased by SGCC from Russia to China. It is SGCC’s first international DC
transmission project. After some issues of exceedingly high voltage in the AC system
in situations of low load during the first phase of trial operation, the system
successfully passed the first tests of the second trial phase.
1000kV Jindongnan- Nanyang-Jingmen UHV AC Pilot (SGCC). The project
aimed at installing a UHVAC transmission system connecting 640 km lines at 1100
kV, with transforming capacity of 6000MVA. The equipment is in stable operation.
It represents a major breakthrough in China’s long-distance, large-capacity, low-
cost UHV power transmission core technology and the domestic production of power
transmission equipment. Through the project’s practice, China has established a
first-class UHV research system, mastered the core technology and formed a set of
standards on UHV AC power transmission. The project has also upgraded the
manufacture industry of power facilities, trained and nurtured a team of
technological and managing experts and validated the technical feasibility,
equipment reliability, system safety and environmental friendliness in the UHV AC
transmission.
Xiangjiaba-Shanghai +/-800 kV UHV DC Transmission Pilot (SGCC). The
project aimed at installing a +/-800 kV UHV DC transmission system. By the end of
the project it was the world's most advanced UHV DC transmission project with the
highest capacity (6400 MW), longest distance (1907 km), most-advanced
technology and highest voltage. It's a world-class innovative achievement made by
China in the field of energy (thanks to the 800kV, 4500A, 1.8GW thyristor valves
that SGCC invented) and represents the highest level of the DC transmission
technology in the world. Its operation signified the full access into the era of UHV
AC and DC hybrid power grid in China. It will provide 32TWh clean energy to
EUROPEAN COMMISSION Technical analysis of past and on-going projects
169 July 2016
Shanghai per year. The completion of the project validates the technical feasibility,
equipment reliability, system safety and environmental friendliness in the UHV
transmission. It is for SGCC another significant achievement after the successful
operation of the UHV AC pilot project. It was the first UHV DC link to go into
commercial operation.
Qinghai-Tibet 750kV/+/-400kV AC/DC Grid Interconnection (SGCC). The
Qinghai-Tibet Grid Interconnection project is composed of the Xining-Riyue
Mountain-Wulan- Gomud 750kV AC project and the Gomud- Lhasa +/-400 kV DC
power transmission project and other auxiliary projects. The project is a
transmission project with the highest altitude and the largest construction scale in
an alpine region in the world. Through this project, the Tibet grid will be
interconnected with the northwest grid. The power lines have been operated since
December 2011.
Shenzhen Baoqing Energy Storage Station (China Southern Power Grid). The
project is the key research platform and test pilot project and key technical project
for generation peak load shaving of Southern Power Grid Company’s Twelfth Five-
year Plan. The planned construction capacity is 10MW, 20 sets of 500kW energy
storage subsystems. The project consists of 2 periods. For the 1st period, 5 MW was
the target. On Jan. 23, 2011, grid connected operation was enabled. It became the
first national MW level battery energy storage station. In 2014, the Storage Station
was upgraded and became capable of charging or discharging over 12 Mega-Watt-
hours or 3 Mega-Watts for 4 hours off or onto the grid. The station is based on
Lithium Iron-phosphate batteries from BYD technology. Its main function is peak
load shaving. It will discharge in case of a peak period for the main transformer and
charge in case of low load for the main transformer each day to improve the load
rate and reduce the difference between peak load and low load of the main
transformer. At the same time, the station can allow peaking modulation, voltage
reactive power control, black start functions.
Qingdao XueJiadao Battery Pilot (SGCC). The Xuejiadao intelligent charging for
the storage integration demonstration power plant in Shandong is currently the
world's largest, most versatile and strongest electric vehicle charging station. Its
aims are to implement the national energy development strategy, accelerate the
construction of a strong intelligence network, provide system services, economic
and social development. Lithium Iron Phosphate Batteries are used for a 7 MW
storage facility. The project was put into trial operation on July 11, 2011, for
charging electric buses, cars, and a centralized energy storage connected to one of
the electric vehicle charging station. By the end of May 2013, the Xuejiadao
demonstration power plant had safely operated during 695 days.
Ningdong-Shandong +/-660kV DC Project Double Polar (SGCC). This project
is the most recent development in UHV DC systems: on the 11th of January 2016,
the construction of a UHV DC line from Zhundong in Xinjiang to Huainan in Anhui
started (3,324 kilometres with a maximum transmission capacity of 12 GW). This
line positions Xinjiang to become China’s power and energy supply hub in the future.
This new line will be about 1000 km longer and will operate at a higher rating
(±1100 kV vs ±800 kV) than the previous longest one which runs from Jiuquan to
Xiangtan.
EUROPEAN COMMISSION Technical analysis of past and on-going projects
170 July 2016
22.2.3 From Japan
9 transmission projects from Japan have been monitored.
Tomamae Wind Farm (J-Power). The Tomamae Wind Villa Power Plant continues
to be one of the world’s largest vanadium redox flow battery energy storage
installations and, at the time of commissioning in 2000, was Japan’s first and largest
wind power plant. In 2005, Sumitomo Electric International (Osaka, Japan) was
contracted to install a vanadium flow battery system at the existing 30.6 MW
Tomamae Wind Villa on the island of Hokkaido, Japan. The primary intent of the
battery system was to provide “wind smoothing” for the wind power plant. The
facility has operated well since January 2005, sometimes performing over 50
charge-discharge cycles per hour. By acting as a rapid source and sink for the
variable wind energy production, this facility has smoothened the ramping rates of
the wind farm’s output with respect to the rest of the island’s grid by reducing the
peaks and valleys of the wind farm energy output. The environmental impact has
been considered by burying the power cables and installing transformers in the
turbine towers. The energy storage facility is configured with 16 modules rated at
250 kW each, which gives the entire facility a 4 MW rated power with 6 MWh of
storage (90 minutes).
Tanegashima Island Toshiba Li-Ion (Kyushu Electric Power Co., Inc.). Toshiba
Corporation has delivered a battery energy storage system integrating the
company's SCiB™, a Lithium-ion Titanate secondary battery, to Kyushu Electric
Power Co., Inc., for a demonstration project to allow the penetration of high share
of renewable energy sources on remote islands. The system has been installed in a
substation on the Tanegashima Island, and will be used to demonstrate the
integration and optimum control of battery energy storage systems deployed to
manage frequency regulation and maintain stable power supply on remote islands,
which are increasingly turning to renewable energy sources. The demonstration
program is going to run for three years until the end of 2016.The maximum output
and capacity of the system are 3MW and 1,161MWh respectively. The system
integrates a Toshiba's SCiB™ lithium-ion secondary battery, which is known for its
long-life and excellent performance: support for over 10,000 charge-discharge
cycles; rapid charging and discharging; high level reliability and operational safety.
Amamioshima Island Toshiba Li-Ion (Kyushu Electric Power Co., Inc.). Toshiba
Corporation has delivered a battery energy storage system integrating the
company's SCiB™, a Lithium-ion Titanate secondary battery, to Kyushu Electric
Power Co., Inc., for a demonstration project to allow the penetration of high share
of renewable energy sources on remote islands. The system has been installed in a
substation on the Amamoioshima Island, and will be used to demonstrate the
integration and optimum control of battery energy storage systems deployed to
manage frequency regulation and maintain stable power supply on remote islands.
The demonstration program is going to run for three years to the end of 2016. The
maximum output and capacity of the system are 2MW and 774kWh respectively.
The system integrates a Toshiba's SCiB™ lithium-ion secondary battery, which is
known for its long-life and excellent performance: support for over 10,000 charge-
discharge cycles; rapid charging and discharging; high level reliability and
operational safety.
Miyako Island Mega-Solar Demo: NaS (METI/Okinawa Electric Power Company).
The project aimed at understanding what impacts the widespread introduction of
solar power generation, whose output fluctuates widely, would have on the power
transmission and distribution network and at verifying the control function that
benefits grid stabilization using secondary batteries. The system utilizes 8 sets of
0.5 MW NaS batteries (combined with 4MW solar panels). In addition, a 100kW Li-
EUROPEAN COMMISSION Technical analysis of past and on-going projects
171 July 2016
ion secondary battery was installed. The 4MW NaS and 100kW Li-ion cells are
connected with the transmission grid of Okinawa Electric Power Co Inc and the
distribution grid, respectively. The following functions were demonstrated:
o Smoothing‐Out Effect of PV Output Power;
o Smoothing‐Out Effect of Frequency;
o Scheduled Operation of PV;
o Optimal Control Hierarchy Using Test‐use Power Distribution Lines.
Storage demonstration project on Niijima island (Takaoka Toko Co. Ltd.).
Takaoka Toko Co. Ltd. has selected Saft’s Intensium Max 20 M Medium power Li-
ion containerised battery system to provide energy storage for a demonstration
microgrid project - aimed at expanding the installation of renewable energy using
systems - on the remote Japanese island of Niijima in the Tokyo prefecture. The
ESS (Energy Storage System) will ensure operations such as ramp and frequency
smoothing for Takaoka Toko Co., Ltd. – a subsidiary of Tokyo Electric Power
Company (TEPCO). The demonstration project on NiiJima Island will comprise diesel
generators, solar panels and wind power installations working in various
combinations to optimize the usage of renewable energy resources. For an
experimental period of 5 years, this project has as its principal objective to highlight
the technical challenges (such as expected electric power quality and grid
management) that need to be addressed when renewable energies – especially wind
generation – are associated with electric power systems and to study the related
solutions. The small area and population of around 3,000 people of the Niijima
Island make it the perfect location for such a demonstration project as a miniature
model of Japan in anticipation for 2030. The ESS will comprise one of Saft’s well
proven Intensium Max 20 M Medium Power containerised Li-ion battery systems,
modified to offer a nominal storage capacity of 520 kWh and 1 MW peak power
output. The battery will operate in combination with Takaoka-Toko’s intelligent
control systems that enable large amounts of wind and other renewable energy
based power to be integrated into diesel powered grids, ensuring system stability
and smooth control of the gensets. The use cases to be demonstrated are the
following: Frequency Regulation; Microgrid Capability; Onsite Renewable
Generation Shifting; Ramping; Renewables Capacity Firming. The installation and
commissioning of the Saft ESS is expected to be completed in 2016.
Wakkanai Mega-Solar Project (NEDO/HEPCO). The mega-solar demonstration
project named "Verification of Grid Stabilization with Large-scale PV Power
Generation systems" began in 2006 at Wakkanai on Hokkaido Island, the
northernmost city of Japan and was completed in 2010. NEDO, New Energy and
Industrial Technology Development Organization of Japan, financed this project and
HEPCO, Hokkaido Electric Power Co., Inc managed the project. NEDO funded a 5
MW PV and 1.5 (1.0+0.5) MW NaS battery which is connected to the utility’s
(HEPCO’s) 33kV power grid. The NaS battery smoothens the fluctuations of PV
generation within its limit of power and energy capacities. For more efficient and
effective operation of the NaS battery, several control algorithms for smoothing the
PV output and for scheduled operation using solar radiation forecast were developed
and tested. Meteorological equipment were also installed in and around the power
plant, and the observed data was used for solar radiation forecasts. The control
method could reduce the maximum fluctuation width in periods of less than 1 min
from 33.6% to 3.2% and, over less than 30 min, from 65.1% to 12.4%. Thus, it
became possible to continuously reduce output fluctuations in the suitable SOC
(State of Charge) of the NaS battery by changing the control mode appropriately in
charge and discharge time. The following use cases were demonstrated: frequency
regulation, electric energy time shift and electric supply capacity.
Nishi-Sendai Project (New Energy Promotion Council [NEPC]). The aim of the

EUROPEAN COMMISSION Technical analysis of past and on-going projects
172 July 2016
Nishi-Sendai project, in the Miyagi prefecture, north of Fukushima was to regulate
frequency changes caused by power output fluctuations. The project was supported
by the New Energy Promotion Council (NEPC) under its “FY2014 project". A 40MW-
20MWh lithium-ion Battery Energy Storage System was delivered in 2014 by
Toshiba to Tohoku Electric Power Company. Tohoku-Electric Power Co Inc.
announced on February 20, 2015, that it had started commercial operation of the
large-size storage battery system installed at the Nishi-Sendai Transformer Station.
Tohoku-Electric Power will check the improvements of the effects of the battery
system on the adjustment of frequency by automatically controlling the
charge/discharge of the storage battery at the "Central Power Supply Direction
Center" and combining the frequency adjustment function, which has been provided
mainly by thermal power plants, and the storage battery system. The company
plans to continue the verification test until the end of 2017. This is the first time
that such a large-scale battery system has been installed for a power grid in Japan.
During the verification tests, Tohoku-Electric Power will (1) perform the
development of frequency control algorithms combining the storage battery system
and thermal power generator, (2) check the effects on the improvement of
frequency adjustment, (3) verify the effects on penetration of renewable energy,
(4) measure the charge/discharge levels of the rechargeable battery, losses made
at the time of charging/discharging, battery estimated lifetime, etc.
Minami-Soma Substation Project (New Energy Promotion Council [NEPC]). The
Minami-Soma Substation Project aims at verifying the improvement of supply-
demand balance with large-capacity power storage systems. The project is
supported by the New Energy Promotion Council (NEPC) under its “FY2014 project".
Tohoku Electric Power Company has deployed the BESS in a power transmission
substation in Minami-Soma, on Japan’s east coast in the Fukushima prefecture. The
battery energy storage system (BESS) started to operate in February 2016. The
40MW-40MWh lithium-ion BESS is one of the largest BESS in the world.
Redox flow battery system in Minamihayakita (METI). The aim of the project
is to study the installation and utilization of large scale batteries in electricity grid
substations so as to manage the integration of renewable energies, as well as to
develop the technology to optimally control and manage such batteries. Hokkaido
Electric Power Co., Inc (HEPCO) and Sumitomo Electric Industries, Ltd. collaborated
to install a 60 MWh redox flow battery in the Minamihayakita substation on the
island of Hokkaido. These companies also developed the battery control and
management technology. The installation of the redox flow battery-based energy
storage system with a rated output of 15MW was completed in December 2015. The
project was, at the time it was first announced in August 2013, the largest of its
kind in the world. The redox flow battery storage system was built and installed by
Sumitomo Electric Industries (SEI). The Minamihayakita substation is located close
to Japan’s biggest solar power station to date, a 111MW facility in the town of Abira
which was also connected to the grid in December 2015.
22.3 Recommendations and final remarks for R&I policy makers
In general, the analyses presented above show that R&I projects carried out outside Europe
at transmission level have reached much higher TRL levels than in Europe, for similar R&I
activities. This tends to suggest that the funding mechanisms and the associated policies
are focused on the deployment and market uptake of new technologies by the market
makers (network operators) and the market players.
Regarding projects with no storage component, the following specific remarks can be
made:

EUROPEAN COMMISSION Technical analysis of past and on-going projects
173 July 2016
A significant effort (in the US) is made to install, test and validate the use of PMUs
for network operations. Hundreds of PMUs have been deployed and are now
operational. This deployment is done with the upgrade of the hardware and software
layers for communications (with an emphasis on communication protocols and
standards);
China has already installed, tested, validated and operated large-capacity UHV
power transmission core technologies (both for AC and DC). This has allowed
Chinese players to develop and upgrade their manufacturing capabilities for power
components, and to gather R&I knowledge in the associated fields (training of
operators, tests of equipment reliability and system safety, etc.).
For projects with a storage component, the following specific remarks can be made:
Some major efforts are still made in the US on storage technologies which are not
the main focus of R&I activities in Europe: CAES (system services) and flywheels
(frequency control) with demonstrators at industrial scale;
Demonstration projects related to BESS integration address the same issues as in
Europe but at a larger scale (the batteries have capacities of several tens of MW -
one system over 100 MW in China-);
Japan is probably the most advanced country in terms R&I activities relative to the
use and integration of BESS in transmission networks: several technologies have
been tested (redox flow, Li-ion, NaS) at an industrial scale for different system
services.
R&I policies in Europe for storage integration should focus on large scale demonstrations
which can be replicated rapidly in the power system. Emphasis should be put on developing
knowledge which can be exported: design, simulations, and integration devices. Regarding
equipment, especially BESS manufacturers, Asian and American players have a clear lead
time.
23. R&I achievements in distribution
23.1 Features of achievements from selected non-European projects in
distribution
23.1.1 Descriptive features of achievements
Descriptive features of R&I achievements include information for categorization and an
estimation of the maturity increment of each considered innovation (see Table 5):
Categorization in clusters of the roadmap;
Typology of achievements (1. Methodology; 2. Software; 3. Hardware; 4. Database;
5. Policy, regulation, market; 6. Other);
Input and output Technology Readiness Levels (TRL).
Categorization in clusters
The graphs below characterize the sample of achievements of non-European R&I projects
for all clusters in distribution. A comparison with the achievements from R&I projects in
Europe is provided.

EUROPEAN COMMISSION Technical analysis of past and on-going projects
174 July 2016
Figure 91: Achievements of non-European projects related in relation with each distribution
cluster (left), compared to the achievements of R&I projects in Europe (right)
Highlights:
. Regarding non-European achievements per cluster on the left chart, it is noticed
that the most addressed cluster of distribution activities is C2 (Integration of DER
and new uses) with 90% of the monitored sample. In second place, C1 (Integration
of smart customers) represents 12% and then, C5 (Market design) amounts hardly
2% of the achievements reviewed. Clusters C3 and C4 do not have any achievement
among the sample.
. Most of the non-European projects reviewed are related to distributed storage and
renewables integration at MV and LV levels: these activities are directly linked to
cluster 2.
. For European achievements, C2 is also the most addressed cluster with 45%,
followed by C3 with 24% and C1 with 17%.
Typology of achievements
The different types of achievements generated by the non-European and European projects
are provided in the figures below.
Figure 92: Typology of achievements from non-European R&I projects in distribution
(left), compared to the achievements of R&I projects in Europe
Highlights:
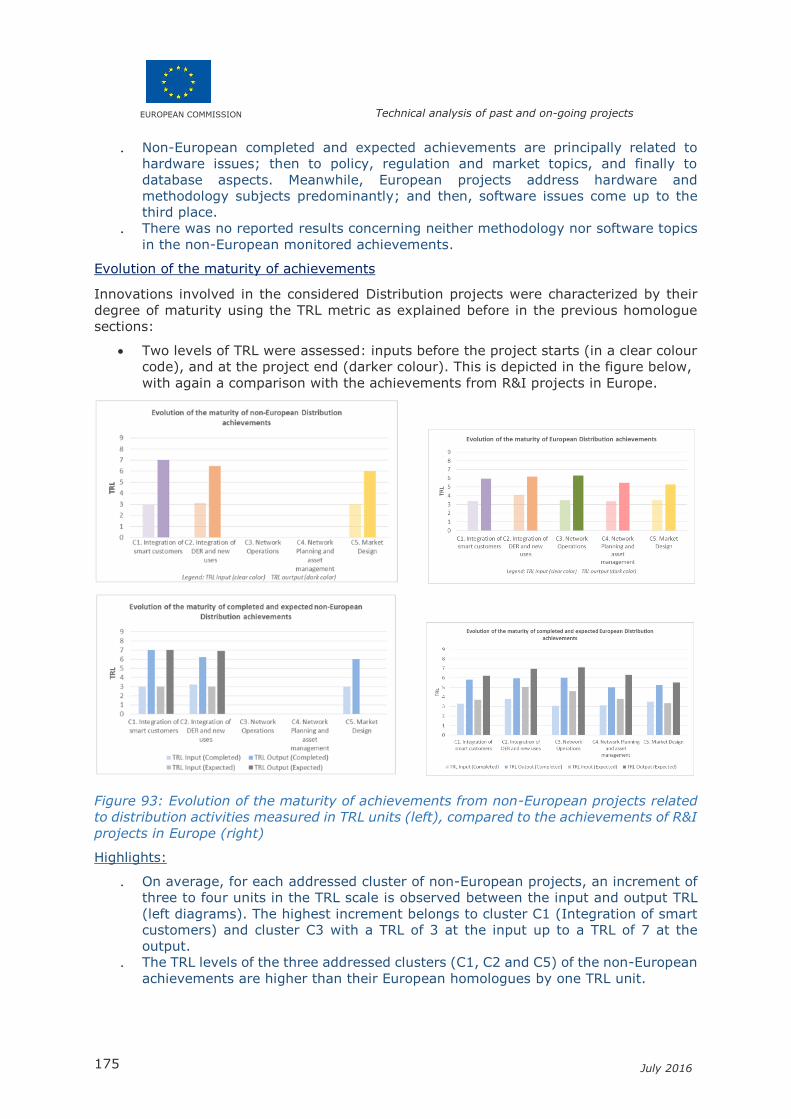
EUROPEAN COMMISSION Technical analysis of past and on-going projects
175 July 2016
. Non-European completed and expected achievements are principally related to
hardware issues; then to policy, regulation and market topics, and finally to
database aspects. Meanwhile, European projects address hardware and
methodology subjects predominantly; and then, software issues come up to the
third place.
. There was no reported results concerning neither methodology nor software topics
in the non-European monitored achievements.
Evolution of the maturity of achievements
Innovations involved in the considered Distribution projects were characterized by their
degree of maturity using the TRL metric as explained before in the previous homologue
sections:
Two levels of TRL were assessed: inputs before the project starts (in a clear colour
code), and at the project end (darker colour). This is depicted in the figure below,
with again a comparison with the achievements from R&I projects in Europe.
Figure 93: Evolution of the maturity of achievements from non-European projects related
to distribution activities measured in TRL units (left), compared to the achievements of R&I
projects in Europe (right)
Highlights:
. On average, for each addressed cluster of non-European projects, an increment of
three to four units in the TRL scale is observed between the input and output TRL
(left diagrams). The highest increment belongs to cluster C1 (Integration of smart
customers) and cluster C3 with a TRL of 3 at the input up to a TRL of 7 at the
output.
. The TRL levels of the three addressed clusters (C1, C2 and C5) of the non-European
achievements are higher than their European homologues by one TRL unit.

EUROPEAN COMMISSION Technical analysis of past and on-going projects
176 July 2016
23.1.1 Projective features of achievements
As explained previously, projective features of each achievement refer to possible
implementations and next steps as considered by expert members of the Grid+Storage
consortium. For non-European projects concerning distribution activities, VITO was the
partner in charge of the analysis of non-European achievements’ implementation and their
further steps.
Figure 94: Implementation for non-European completed achievements in distribution (left),
compared to completed achievements of R&I projects in Europe (right)
Highlights:
. It is shown that only 20% of the completed non-European achievements regarding
distribution activities have been implemented versus a 38% of their European
equivalent.
. It may occur that implementation actions of some achievements are foreseen but
have not started yet: in such situations they are accounted for in the “next steps”
diagrams.
The graphics below show the further steps of non-European and European achievements
(either further research, further development, demonstration or deployment) in order to
be implemented.
Figure 95: Implementation actions carried out for achievements from non-European R&I
projects in distribution (left), compared to the achievements of R&I projects in Europe
(right)
Highlights:
. For the majority of the non-European achievements, further project’s steps were
considered to be demonstration and deployment, principally. Only about 7 % of the
non-European monitored sample was considered to require further research.
EUROPEAN COMMISSION Technical analysis of past and on-going projects
177 July 2016
. In contrast, regarding the European achievements’ next steps expressed by project
coordinators; deployment (which is the step before implementation) obtained the
lowest number of answers with 16% of the total monitored sample. In addition,
further research for European achievements obtained a significant 20% of the
answers. Most of the project coordinators’ answers corresponded to further
development and demonstration as next steps for their achievements.
23.2 Description of each project of the selected portfolio
23.2.1 From the USA
10 distribution projects from the USA have been monitored.
UCSD BMW second life EV energy storage system (Privately funded-PG&E). A
second life battery system has been installed at the BMW Technology Office (USA
BMW) of North America in Mountain View. It consists of a 100 kW inverter and 8
used battery packs from former MINI E EVs, once driving on California roads; a total
of 240kWh lithium iron phosphate battery housed in a shipping container. The
system is used for multiple use cases, e.g. Demand Response programs, Peak
Demand Shaving, and Photo-Voltaic Energy Storage, and Uninterruptable Power
Supply for power outages. The system is fully integrated into an advanced building
energy management system, and is connected to a 100 kW solar array as well as a
network of EV charging stations, including several DC fast charging stations.
EnerVault Redox Flow Battery Demo Project (Federal/National Office of
Electricity and Reliability – RD&D). This project demonstrated an iron-chromium
redox flow battery system in combination with an intermittent, renewable energy
source (PV). The project used EnerVault’s long duration system to reduce demand
charges and enhance the performance of a 150 kWp AC dual-axis tracking
photovoltaic system to power a large 260 kW irrigation pump.
DTE Community Energy Storage for Grid Support (Federal/National American
Recovery and Reinvestment Act of 2009 - RD&D). The project entails the
implementation of 1-MW of distributed Li-ion energy storage on a distribution circuit
in the DTE Energy service area. 18 S&C Electric (S&C) supplied 25kW/50kWh CES
(community energy storage) units were installed, a 500kW Li-ion battery storage
device was integrated with a 500 kW solar system together with two repurposed
(secondary use) energy storage systems using Fiat Chrysler Automobile (FCA) 500e
EV batteries. The first CES unit was installed at the DTE Energy Training and
Development Center in Westland, MI for installation training, verification of work
and operational procedures, and engineering design documentation. The remaining
17 CES units and the 500 kW battery are installed on a distribution circuit designated
as TRINITY 9342 located near Monroe, MI. The repurposed batteries were installed
at DTE Energy headquarter and at Next Energy Center in Detroit. This project
successfully used DNP3 protocol through the DERMS (Distributed Energy Resource
Management System) to test 23 use cases. These use cases range from testing
communication to individual CES units to testing of aggregation of all batteries
based on distribution circuit model commands and dispatching due to high locational
marginal pricing (LMP).
Battelle Memorial Institute Pacific Northwest Smart Grid Demonstration
(Federal/National American Recovery and Reinvestment Act of 2009 – RD&D). PGE’s
Salem Smart Power Center (SSPC) is an Energy Storage Facility in Salem, Oregon.
The project has a 5 MW, 1.25 MWh storage resource designed to increase
distribution system reliability, aid renewable resource integration and decrease
peak-price risk. The PGE’s Salem Smart Power project is associated with the Pacific
Northwest Smart Grid Demonstration Project test phase which began in September
EUROPEAN COMMISSION Technical analysis of past and on-going projects
178 July 2016
2012. Portland General Electric (PGE) installed a microgrid that will allow about 500
business and retail customers to maintain power during blackouts. They employed
energy storage as the backbone of the microgrid, with a 5-megawatt lithium-ion
battery system installed at the PGE substation in Salem, Oregon. The energy
storage is used as a way to transition to operation detached from the grid. The
battery responds to an outage by supplying electricity to all residential, commercial,
and industrial customers for 15–20 minutes — ample time to start standby power—
six customer-owned distributed diesel generators—and synchronize them on the
line. Once the feeder is isolated from the utility grid, the generators start up, and
the circuit becomes an islanded microgrid.
NEDO New Mexico Smart Grid Demonstration Project. Photovoltaic systems
provide a significant portion of the power supply and account for up to 75% of the
energy at the Los Alamos site. Because the output of photovoltaic systems vary with
weather conditions, large-scale stationary batteries and demand response have
been used to control the power flow of the distribution system and ensure quality.
In Los Alamos County, a demonstration was conducted of a smart grid system to
regulate the introduction of 1MW of solar power into a power distribution feeder
system with a total demand of approximately 2-5MW. More specifically, this included
testing the operation of a microgrid that can absorb fluctuations in solar power
generation through a 1.8MW-level storage battery system; testing coordinated
operations between HEMS and the power grid to absorb surplus solar power
generation in residential-level storage batteries placed in prototype smart-houses;
and testing residential demand-response with the participation of about 900
households. The project demonstrated technologies that successfully absorbed the
variations in power output resulting from the massive introduction of renewable
energy (PV) to deliver consistent power flow at the edges of the microgrid by using
EMS in conjunction with NaS and lead storage batteries to control the fluctuations.
DOD Marine Corps Air Station Miramar Microgrid Energy Storage System
(Environmental Security Technology Certification Program [ESCTP]). Primus Power,
was awarded a contract by Raytheon’s Integrated Defense Systems (IDS) business
to deliver and support an electrical energy storage system for a microgrid at the
Marine Corps Air Station (MCAS) in Miramar, California. At MCAS Miramar a Primus
Power 250 kW - 1 MWh Primus EnergyPodTM (a Zn/Br flow battery-based ESS) has
been integrated with an existing 230 kW photovoltaic system. The combined
microgrid system will demonstrate several capabilities including reducing peak
electrical demand typically experienced in weekday afternoons and providing power
to critical military systems when grid power is not available. Microgrid control
technologies coupled with Miramar’s infrastructure will provide energy security,
islanding capability, and reduced costs. Success is being defined by the ability to
peak shave and island a building circuit for 72 hours. Prior to installing the system,
the National Renewable Energy Laboratory conducted testing of the power
electronics and controls at the Energy Systems Integration Facility (ESIF) to
characterize system behaviour and troubleshoot control settings. Performance data
is currently being collected for total energy stored and peak power offset. The
demonstration to “island” a building circuit is currently taking place (Spring/Summer
of 2016).
UC San Diego CPV Firming (California Energy Commission). Maxwell Technologies
has collaborated on a California Energy Commission funded, two-phase program to
demonstrate the cost and efficiency benefits of combining an energy storage system
with Soitec’s Concentrix™ CPV technology. Maxwell has been awarded a $1.39
million contract by the California Energy Commission’s Research and Development
program to fund design and integrate an ultracapacitor-based energy storage
system with Soitec’s CPV system located on the campus of UC San Diego and a

EUROPEAN COMMISSION Technical analysis of past and on-going projects
179 July 2016
second commercial scale system at Soitec’s solar power plant in Southern California.
The integrated systems also take advantage of other technology advances, including
solar forecasting and predictive energy control, to maximize the benefit of
incorporating ultracapacitor energy storage. Ultracapacitors are energy storage
devices that charge rapidly from any electrical energy source and discharge their
stored energy on demand. In combination with a photovoltaic system, their function
will be to act as a standby reservoir of electrical energy to mitigate the variability
of solar energy generation. This “firming” of the output of a utility scale commercial
CPV system is intended to reduce demand on the electric grid to fill in short-term
solar “valleys” to maintain a facility’s electricity output. In addition to reducing the
variability of a solar power plant, integrated ultracapacitor-CPV systems will benefit
public utility customers by reducing investment in utility generation capacity to meet
transient peak power demand.
2 MW Potsdam, New York – Microgrid (Federal/National Government – RD&D).
Potsdam was the epicentre for a 1998 ice storm that left 130,000 people in the
region without power. Now, National Grid (Potsdam’s utility provider), General
Electric, Clarkson University, and the National Renewable Energy Laboratory (NREL)
are partnering to make sure severe weather events like the 1998 ice storm will not
have such drastic effects again, by building what could be the nation’s largest
municipal microgrid. The microgrid will use local renewable resources as much as
possible. The proposal calls for 3 MW of combined heat and power generators, 2
MW of solar PV, 2 MW of storage, and 900 kW or more of hydropower. A $1.2 million
grant from the DOE’s Office of Electricity Delivery and Energy Reliability and a
$300,000 investment from GE will be used to develop an enhanced microgrid control
system (eMCS). The control system will keep the town’s electricity on for several
days if the main power station goes down, and will also help National Grid better
integrate distributed energy resources into the grid. The microgrid will normally
operate in a grid-connected mode. The eMCS will also be used to maximize the
operating revenue of any individuals who have their own distributed generation
systems. While studies are still being conducted, the hope is that during an extreme
event when the main grid goes down, the microgrid will operate in island mode and
use energy storage to help power essential services for up to two weeks.
Hybrid Compressed Air Energy Storage and Thermal Energy Storage
(California Energy Commission). A team of engineers from the UCLA Henry Samueli
School of Engineering and Applied Science, in partnership with Southern California
Edison, has received a $1.62 million grant from the California Energy Commission
to build a hybrid energy storage system that stores energy harvested from
intermittently productive renewable sources such as solar panels and wind farms,
then releases that energy into the grid when demand is high. The energy system
under development is a hybrid of compressed air energy storage and thermal energy
storage technologies. Although compressed air has long been used in energy
storage, this system will use a state-of-the-art, high-temperature storage unit to
enhance storage capacity and economic viability. This innovative technology offers
the potential for a highly efficient, ultra-low-cost zero-carbon emission solution for
storing intermittent renewables. Current estimated cost of energy for this unit is
about $100 / kWh. The technology will be built on the Cal Poly Pomona campus
and will be operated in conjunction with Southern California Edison.
Stapleton Neighborhood Energy Storage (Colorado Public Utilities Commission
[PUC]). Xcel Energy filed proposals on two solar-storage projects with regulators in
Colorado. The two projects, one in the Stapleton neighbourhood in Denver and the
other at the new Panasonic complex near Denver International Airport, will test the
use of batteries as well as the operation of “microgrid” power systems. At the
Panasonic test site, Xcel will install a utility-scale solar power system and one large

EUROPEAN COMMISSION Technical analysis of past and on-going projects
180 July 2016
battery. The Panasonic project will have the capability to be operated as a microgrid,
which can provide backup power in emergencies, as well as connected to the
regional grid. At the second project, known as the Stapleton project, Xcel will install
six batteries at customer’s homes that already have rooftop solar power systems
installed. Additional batteries will be installed on Xcel’s feeder powerline in that area.
This feeder line supports more than 330 rooftop solar installations which can supply
up to 18.5 percent of the power line’s capacity, one of the highest levels of solar
penetration on Xcel’s grid in the state. Up to six battery storage systems of multiple
sizes will be deployed at strategic locations along the distribution feeder line.
23.2.2 From Canada
4 distribution projects from Canada have been monitored.
Wind R&D Park and Storage System for Innovation in Grid Integration
(Clean Energy Fund program [CEF]). The Wind Energy Institute of Canada has
developed and operates a Wind Energy R&D Park and Storage System for Innovation
in Grid Integration (Wind R&D Park), which consists of 10 MW of wind power and a
1 MW/2 MWh battery energy storage system (BESS). One of the objectives of the
project is using electricity storage to optimize the benefit of wind power to the
electrical grid system. Currently the storage system is being used to time-shift
electricity. Possible future services for the battery are: Wind Prediction Firming;
Voltage Support; Transmission loss reduction; Reduce Output Volatility; Demand
Charge Management; Ancillary Services (including frequency regulation, load
following, spinning reserve, supplemental –secondary- reserve, and/or backup
supply). The Na-NiCl2 storage technology which was chosen has shown excellent
charge/discharge cycles although it has just begun its operation and any results are
only preliminary.
Cowessess First Nation High Wind and Storage Project (Natural Resources
Canada’s Clean Energy Fund). This project involves installing an 800-kW wind
turbine and 1000-kWh lithium-ion battery storage system on Cowessess First
Nation (CFN) land 2-km southeast of Regina, Saskatchewan. The intent is to
demonstrate a wind-storage system that can harness wind power and provide a
more continuous and predictable output for on-grid and perhaps off-grid
applications. The successful demonstration would prove this system as a model for
other First Nation’s communities across Canada. The wind-storage system could
reduce wind volatility by as much as 70%, and the response to load changes would
be very fast. Hence, the system could be used to control wind power ramping rates
and add more predictability to the turbine’s power output. If connected to the grid,
the system could command a better electrical rate because the battery could be
charged during off-peak periods and dispatched during the morning, noon, and
evening peak times. Furthermore, the system could potentially act as a stand-alone
unit to provide service to remote off-grid communities given sufficient storage.
Energy Storage and Demand Response for improved reliability in an
outage-prone community (Natural Resources Canada’s Clean Energy Fund). BC
Hydro’s Golden substation (GDN) supplies power to the town of Golden and
surrounding areas (including the community of Field) via four radial feeders. Field
has 155 BC Hydro residential and commercial accounts. The electricity supply for
Field is provided by a single 25 kV, 55 km long distribution feeder, which is prone
to frequent power outages of significant duration. In order to mitigate reliability
issues at Field, BC Hydro evaluated alternatives such as battery storage and diesel
generation. Because the cleaner battery option was preferred, BC Hydro put forward
the project for funding consideration through the Clean Energy Fund (CEF). The
project was awarded $5.98M to install a 1 MW battery energy storage system
(BESS) in order to provide clean back-up power and enhance customer supply
EUROPEAN COMMISSION Technical analysis of past and on-going projects
181 July 2016
reliability for the community of Field. BC Hydro selected both the battery and system
integrator through a Request for Proposal (RFP) process. NGK Insulators’ sodium-
sulphur (NaS) battery was selected because it met performance and cost criteria.
S&C Electric was chosen because of its previous experience with sodium sulphur
BESS installations. On July 11, 2013, the BESS became operational and started
delivering clean, back-up power. The system has since been providing benefits by
delivering a clean source of back-up electricity during power outages and reducing
the overall demand of Golden substation during on-peak hours. As of January 2015,
the BESS in Field has provided 76 hours of back-up power to the community of
Field. This is equivalent to a reduction of 11,455 customer hours lost (CHL).
Utility Scale Electricity Storage Demonstration Using New and Re-purposed
Lithium Ion Automotive Batteries (Natural Resources Canada’s Clean Energy
Fund). During nights, a large amount of wind energy is generated in Ontario, but
not used. The idea of a storage system is to stockpile the energy generated during
off-peak, low-demand hours and delivering it to homes and buildings during peak,
high-demand hours. As the province seeks to up its renewable energy production,
the need for a large-scale energy storage system becomes urgent. Moreover,
energy storage could provide a means of delaying substation upgrades and
transmission line extensions, as well as reducing the need for building new
generation. Electrovaya will be developing an energy storage system in partnership
with Hydro One. The project will produce a state-of-the-art 1.1 MWh lithium-ion
battery system. The new energy storage technology, Lithium Ion Super Polymer
batteries, have a number of advantages including high energy density and the
battery has a built-in converter. With Electrovaya, Hydro One, Toronto Hydro and
a number of other companies sponsoring the project, Ryerson was enlisted to
conduct the research on the battery for one year (currently ongoing). Once that
year is over, that battery will be sent back to its manufacturers who can then decide
to test it at other locations. The battery was delivered in early October 2015 and is
the object of a research project aimed at correcting problems from the city’s
electricity grid. The 1.1 megawatt-hour battery is connected to the City of Toronto’s
electricity grid, and supplies stored energy to the building during peak hours. During
off-peak hours, it will capture excess energy from the grid and store it for later use.
The battery bank is also expected to power 200 houses in the area for five hours
per day.
23.2.3 From Australia
2 distribution projects from Australia have been monitored.
Trialling a new residential solar PV and battery model (ARENA [Australian
Renewable Energy Agency]). This project involves Queensland energy provider
Ergon Retail undertaking a pilot demonstration to test a commercial and operational
model for providing grid-connected solar photovoltaic (PV) and battery storage
systems to residential customers. The demonstration will involve installing and
testing 33 systems in Cannonvale, Toowoomba and Townsville. Ergon Retail will be
trialling a new business model for providing grid-connected PV and battery systems
to residential customers which involves installing the system at the customer’s
premises but retaining ownership and charging the customer a fixed service fee.
Ergon Retail will aim to optimise the different value streams available from the PV
and battery system, such as minimisation of customers’ electricity bills, reducing
Ergon Retail’s wholesale market risk, revenue from the provision of network
demand side management services to the network business to reduce network peak
demand, and any other possible revenue sources (e.g. related to grid support). The
pilot demonstration will draw on real customer and operational experiences to
provide a deeper understanding of the costs and benefits of the model. The
systems, which will consist of a 4.9kW SunPower PV array and a 12kWh/5kW
EUROPEAN COMMISSION Technical analysis of past and on-going projects
182 July 2016
Sunverge battery storage and control system, are expected to be installed and
commissioned by the end of 2015. They will be operated and tested for a period of
12 months with the demonstration expected to be completed by the end of 2016.
Solar and storage trial at Alkimos Beach residential development (ARENA
[Australian Renewable Energy Agency]). This project involves developing, deploying
and testing the commercial feasibility of a new energy retail model. It will combine
community scale battery energy storage, high penetration solar photovoltaics (PV)
and energy management within a new residential development at Alkimos Beach in
Western Australia. There are currently no existing tariffs to allow community energy
storage to discharge onto electricity networks. There is also a need to better
understand the level of electricity supply reliability provided by a combination of
renewable energy generation and enabling products when compared with traditional
poles and wires. A centralised battery will provide customers with the benefits and
incentives of stand-alone storage without requiring on-site installation and
maintenance. The project will:
o design, manufacture and install a fully contained lithium ion energy storage
system of approximately 250 kilowatts peak / 1.1 megawatt-hours;
o install an Energy Smart Home Package in at least 100 homes; and
o develop and test at least three new electricity retail products.
The central 1.1 megawatt-hour (MWh) of lithium ion battery storage has already
been installed in two shipping containers in the suburb.
23.2.4 From Japan
1 distribution projects from Japan has been monitored.
Niijima Island Microgrid29. Tokyo Electric Power Company (TEPCO) will conduct
a microgrid demonstration project on a remote Japanese island, incorporating solar,
storage, wind and diesel. Saft has been awarded its first energy storage system
contract in Japan to supply a containerized 520 kWh/1 MW lithium-ion battery
system for the Niijima Island Microgrid project conducted by Takaoka Toko Co., Ltd.
– a subsidiary of Tokyo Electric Power Company (TEPCO). The demonstration
project will comprise diesel generators, solar panels and wind power installations
working in various combinations to optimize the usage of renewable energy
resource. The battery will operate in combination with Takaoka-Toko’s intelligent
control system that enables large amounts of wind and other renewable energy
based power to be integrated into diesel powered grids, ensuring system stability
and smooth control of the gensets. The program will investigate the use of energy
storage for various applications in the microgrid setting. The demonstration site is
currently under construction.
23.2.5 From India
3 distribution projects from India have been monitored.
Sun-carrier Omega Net Zero Building in Bhopal. India's rapid rate of growth in
the recent past has resulted in a significant energy deficit. As a result, an increasing
number of industries, commercial complexes, residential units, and agricultural
facilities have had to resort to captive power generation. In this context, diesel
generators have been the single largest source of captive power, as also the single
largest source of green-house gases. Since buildings consume almost 29% of all
energy consumed, investing in net-zero energy systems for buildings is an idea
29 This microgrid project has also been reported in the non-European transmission projects since it is led by a transmission network operator. The small area and population of around 3,000 people of the Niijima Island make it the perfect location for such a demonstration project as a miniature model of Japan.

EUROPEAN COMMISSION Technical analysis of past and on-going projects
183 July 2016
whose time has come. The SunCarrier Omega Net Zero Energy Building (NZEB), is
an example of how organizations that can, to go beyond adopting the best in energy
conservation technologies, and augmenting the energy supply by implementing
'green' energy systems that leverage nature's abundance of solar energy.
The project entailed the Integration of a large capacity energy storage system, the
Cellcube FB 10-100. In addition to its ability to store up to 100 kWh of energy per
unit, it also functions as an effective energy management system. Excess energy
produced during the day by the SC 260 is stored in the Cellcube, which in turn
supplies energy during the night hours, and during monsoon days when the sun
does not shine.
Gram Power Khareda Lakshmipura Microgrid. Gram Power's microgrid is
powered by a centralized array of solar panels which collect the sun's energy and
convert it to DC electricity. Surplus solar DC energy is stored in a battery array,
providing users with energy even during peak usage times and night. DC electricity
from the solar array and batteries is converted via an AC inverter. Gram Power sells
electricity in units of rupees (Rs) an hour. Prices compare favourably with the
government supply. The first microgrid installed was the Gram Power Khareda
Lakshmipura Microgrid incorporating a 40 kW Lead-acid Battery. Currently at least
30 more villages have a Gram Power microgrid. In July 2012, India experienced the
worst blackout in modern history. At least 20 states lost power in three huge grid
failures covering an area home to more than 700 million people. In one tiny village
in very rural Rajasthan, where the Gram Power Khareda Lakshmipura Microgrid is
located, the lights stayed on.
India One Solar Thermal Plant (Indian Ministry of New and Renewable Energy
Sources [MNRE]/ the German Ministry for Environment, Nature Conservation and
Nuclear Safety [BMU through GIZ]). In 2011 the World Renewal Spiritual Trust
initiated the design, development and installation of “India One”, a 1 MW solar
thermal power plant with 16 hours storage for continuous operation. This research
project uses the in-house developed 60 m2 parabolic dish and features an innovative
thermal storage for night operation. The 60 m2 dish is a proven technology and is
based upon 15 years of experience with the parabolic concentrator with fixed focus.
The concentrated solar power plant (CSP) generates heat and power for a campus
of 25,000 people.
23.3 Recommendations and final remarks for R&I policy makers
In general, the analyses presented above show that R&I projects carried out outside Europe
at distribution level have reached roughly the same TRL levels as in Europe, for similar R&I
activities. As for non-European transmission projects, most of the funding seems to be
dedicated to the deployment and market uptake of (new) technologies by the market
makers (network operators) and the market players. However, the TRL level reached and
the envisaged next steps for the projects show that more R&I projects are needed before
industrial deployments can be envisaged.
For projects with a storage component, the following specific remarks can be made:
There is a significant effort (especially in the US) to test and qualify the use of
second life batteries (from EVs) for stationary applications in distribution networks;
Ultracapacitor-based energy storage systems are being tested;
Many of the projects (North-America, India, Australia) are relative to microgrids
where the storage devices are used in islanding mode to help power essential
services.

EUROPEAN COMMISSION Technical analysis of past and on-going projects
184 July 2016
R&I activities in Europe relative to the integration of storage in distribution networks are
at the state-of-the-art level. R&I policies in Europe should encourage the export of this
know-how.
EUROPEAN COMMISSION Technical analysis of past and on-going projects
185 July 2016
GENERAL CONCLUSION
The analyses presented in this monitoring report have allowed the specifications of the
future R&I activities to be undertaken during 2016-2025.
Recommendations have been made for the structure of the new roadmap:
ENTSO-E, with the support of the Grid+Storage partners, decided to modify the
general organisation of the new R&I roadmap, going from a point of view driven by
actions and R&I activities to a point of view driven by challenges for the
transmission system at the pan-European level;
The Grid+Storage partners decided to keep the structure of the previous roadmap
with slight modifications mainly relative to the description of the functional
objectives in terms of cross-cutting challenges (similar to the challenges for
transmission);
The joint TSO/DSO R&I activities were removed and integrated in the transmission
and distribution activities, respectively, when relevant.
For international projects:
for transmission R&I activities, the analyses showed that R&I projects carried out
outside Europe have reached much higher TRL levels than in Europe, for similar R&I
activities. This tends to suggest that the funding mechanisms and the associated
policies are focused on the deployment and market uptake of new technologies by
the market makers (network operators) and the market players.
for distribution R&I activities, the analyses showed that, on the one hand, R&I
projects carried out outside Europe level have reached roughly the same TRL levels
as in Europe, for similar R&I activities, and on the other hand, R&I activities in
Europe relative to the integration of storage in distribution networks are at the
state-of-the-art level.

EUROPEAN COMMISSION Technical analysis of past and on-going projects
186 July 2016
GLOSSARY
Generic terms related to the R&I roadmaps
EEGI European Electricity Grid Initiative
R&I Research and Innovation
EEGI roadmap 2013-2022
Current R&I roadmap, framework for the present monitoring report
R&I roadmap 2016-2025
This is the Grid+Storage roadmap, notably based on the recommendations provided
by the present monitoring report.
DSO Distribution System operator
TSO Transmission System operator
FO Functional Objective
Cluster Set of Functional Objectives organizing the R&I Roadmap
Ti Identification of a Functional Objective in the transmission part of the roadmap, i is an index varying from 1 to 17.
Dj Identification of a Functional Objective in the distribution part of the roadmap, j is an index varying from 1 to 13
TDk Identification of a Functional Objective in the joint TSO/DSO cluster in the roadmap, k is an index varying from 1 to 5
Specific terms adopted for this monitoring report
Achievement An output of a project that contributes to the R&I roadmap. Achievements are
characterized by be either “completed” or “expected”.
Achievements correspond to the lowest scale for our analysis generated by a completed (or on-going) project. They are typically either identically to one project deliverable, or a part of a project deliverable, or an aggregation of various project deliverables. The formulation of the appropriate level for each achievement was under the responsibility of the project coordinator who is in the best position to select a few (typically 3-5) achievements synthesizing the key project results.
Achievements are characterized by descriptive and projective features.
Descriptive feature
Descriptive features include information for achievement categorization (in Clusters,
in Functional Objective, in typology of achievement) as well as an estimation of the maturity increment of each considered innovation (measured in TRL units). Typology of achievements include six predefined types: 1. Methodology, 2. Software, 3.
Hardware, 4. Database, 5. Policy, regulation, market, 6. Other.
Projective feature
They include an information on status of implementation as of 2016 as well as a characterization of the next steps. Next steps could include further research (FRes), further development (FDev), demonstration (Dem), deployment (Depl) or a mix of these options
EUROPEAN COMMISSION Technical analysis of past and on-going projects
187 July 2016
Implementation
Characterization of an achievement. Either the achievement is already implemented or if it not the case, it refers to the plan for a future implementation of such achievement (next steps)
Res Characterization of next steps: the implementation plan includes further research
Dev Characterization of next steps: the implementation plan includes further development
Dem Characterization of next steps: the implementation plan includes demonstration
Depl Characterization of next steps: the implementation plan includes deployment.
TRL Technology Readiness Level

EUROPEAN COMMISSION Technical analysis of past and on-going projects
188 July 2016
ANNEXES
24. R&I achievements’ description of the reviewed
projects
24.1 Transmission achievements
Table 11 below presents the list of analyzed R&I achievements related to transmission.
NB: As explained in the section 3.2, id codes were used to abbreviate projects’ names all along the document.
The colour code for each project acronym corresponds to the source that has provided the filled-in questionnaires (EU projects are displayed in bold text while projects funded at
national level are displayed in plain text):
EASE ENTSO-E
Table 11: Detailed description of achievements related to transmission activities of each
project reviewed as provided by project coordinators
Projects Achievements Achievement description
Name Id code Name Id code Name
220 kV SSSC device for
power flow control
SSSC
R1 Completed 3. Hardware VSC + protection of power electronics
(thyristor and breaker by-pass)
R2 Completed 1. Methodology Control system methodology
R3 Completed 3. Hardware Series coupling transformer
A complete and
normalized 61850
substation
61850sub
A1 Completed 3. Hardware Substation Automation System (SAS)
multivendor interoperable laboratory test bench.
A2 Completed 3. Hardware Control and centralization (IEC61850) field box
for the process bus.
A3 Completed 3. Hardware IEC61850 Remote Input Output (RIO) IEC61850
communications in EHV Substations. On site demonstration.
A4 Completed 5. Policy,
regulation, market
EPRI61850: Application Guides, Software Tools and Migration Strategies for the
Implementation of the IEC 61850 Standard
AFTER AFTER
A1 Completed 2. Software Method and tool for global vulnerability analysis and risk assessment of Power
Systems
A2 Completed 2. Software Physical security improvement, by innovative
techniques for early warning of substation intrusion events
A3 Completed 1. Methodology Advanced defence of power system operation following severe grid outages, by innovative
defence plans techniques

EUROPEAN COMMISSION Technical analysis of past and on-going projects
189 July 2016
A4 Completed 2. Software SW tool for system restoration after major
disruptions, by adaptive and efficient restoration plans
ANEMOS.PLUS
ANEMOS
R1 Completed 2. Software Methods & SW for definition of reserves
requirements based on probabilistic forecasts for the current day and for day ahead.
R2 Completed 2. Software Methods & SW for the optimal scheduling of
power systems with high penetration
R3 Completed 2. Software Methods & SW for short-term probabilistic
forecasting of wind power.
BEST PATHS BESTPATHS
E1 Expected 2. Software Demo1: control strategies to manage the
interactions between HVDC links and wind turbine generators
E2 Expected 1. Methodology Demo 2: interoperability standards of multi-
terminal VSC HVDC
E3 Expected 2. Software Demo 2: Test methodology to measure the
performance of coupled VSC units from different manufacturers
E4 Expected 3. Hardware
Demo 3: new multilevel VSC converter and operations strategies integrating XLPE submarine and land cables, HTLS DC
conductors, DC insulators and DC fault management systems
E5 Expected 1. Methodology Demo 3: Methodology for high performance
upgrading of existing DC links
E6 Expected 3. Hardware Demo 4: innovative HTLS conductors for
repowering existing AC OHL
E7 Expected 2. Software Demo 4: Insulated cross-arms for AC OHL
E8 Expected 3. Hardware Demo 4: innovative Dynamic Line Rating for
repowering existing AC OHL
E9 Expected 3. Hardware Demo 4: innovative tower design and field
work (live-line working) for repowering existing AC OHL
E10 Expected 3. Hardware Demo 5: Manufacturing of new (MgB2)
superconducting cables
E11 Expected 3. Hardware
Demo 5: Technology to integrate DC superconducting links within an AC meshed
network (design, manufacturing and grid operations)
BESTGRID BESTGRID
R1 Completed 1. Methodology Handbook "Public Participation and
Transparency in Power Grid Planning"
R2 Completed 1. Methodology Handbook "Protecting Nature in Power Grid
Planning"
R3 Completed 5. Policy,
regulation, market
Final report of the project, summarizing experiences the consortium made and
including overall recommendation and ten of the most valuable lessons learned
Class project Class_project
E1 Expected 1. Methodology How to operate CAES/LAES in connection with
conventional power plants
E2 Expected 3. Hardware Development of materials and components for
CAES/LAES
Concept for Management of the Future
Electricity System
Concept
R1 Completed 1. Methodology Efficient power balancing
R2 Completed 1. Methodology Active power grid control
R3 Completed 1. Methodology Intelligent resource activation and control
Development of market
DevMarket R1 Completed 1. Methodology Methodology for increasing market modelling
capacity
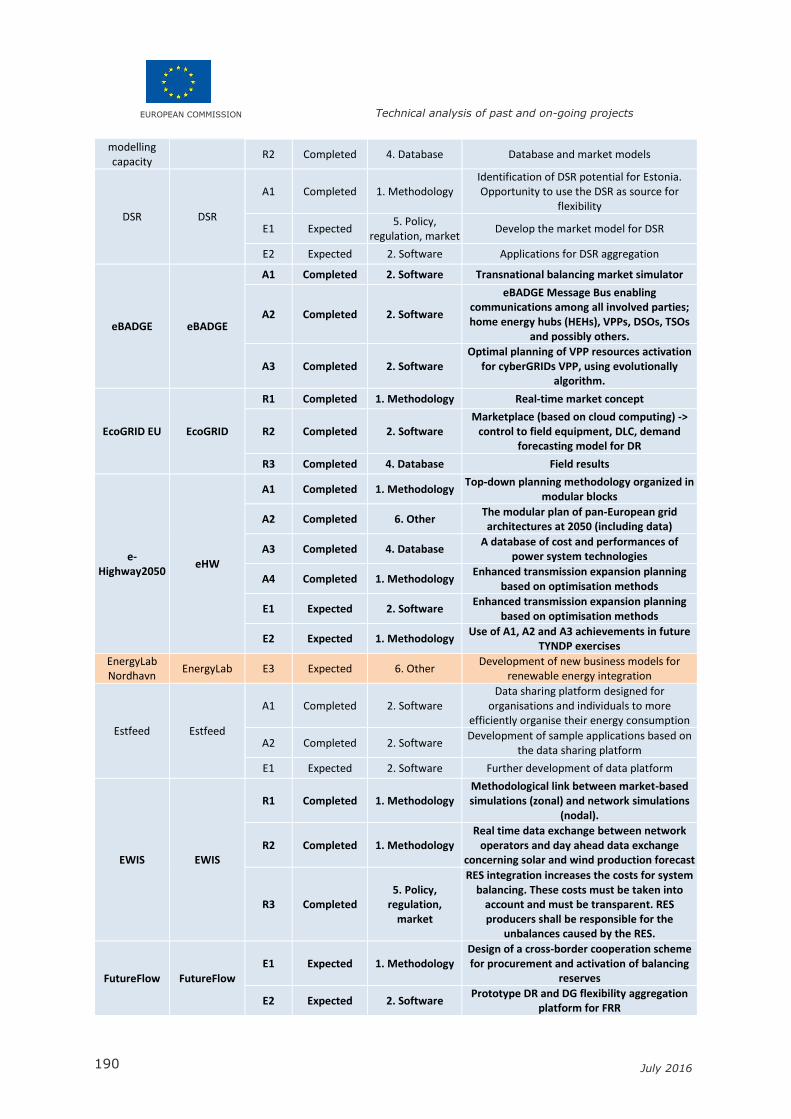
EUROPEAN COMMISSION Technical analysis of past and on-going projects
190 July 2016
modelling capacity
R2 Completed 4. Database Database and market models
DSR DSR
A1 Completed 1. Methodology Identification of DSR potential for Estonia. Opportunity to use the DSR as source for
flexibility
E1 Expected 5. Policy,
regulation, market Develop the market model for DSR
E2 Expected 2. Software Applications for DSR aggregation
eBADGE eBADGE
A1 Completed 2. Software Transnational balancing market simulator
A2 Completed 2. Software
eBADGE Message Bus enabling communications among all involved parties; home energy hubs (HEHs), VPPs, DSOs, TSOs
and possibly others.
A3 Completed 2. Software Optimal planning of VPP resources activation
for cyberGRIDs VPP, using evolutionally algorithm.
EcoGRID EU EcoGRID
R1 Completed 1. Methodology Real-time market concept
R2 Completed 2. Software Marketplace (based on cloud computing) ->
control to field equipment, DLC, demand forecasting model for DR
R3 Completed 4. Database Field results
e-Highway2050
eHW
A1 Completed 1. Methodology Top-down planning methodology organized in
modular blocks
A2 Completed 6. Other The modular plan of pan-European grid architectures at 2050 (including data)
A3 Completed 4. Database A database of cost and performances of
power system technologies
A4 Completed 1. Methodology Enhanced transmission expansion planning
based on optimisation methods
E1 Expected 2. Software Enhanced transmission expansion planning
based on optimisation methods
E2 Expected 1. Methodology Use of A1, A2 and A3 achievements in future
TYNDP exercises
EnergyLab Nordhavn
EnergyLab E3 Expected 6. Other Development of new business models for
renewable energy integration
Estfeed Estfeed
A1 Completed 2. Software Data sharing platform designed for
organisations and individuals to more efficiently organise their energy consumption
A2 Completed 2. Software Development of sample applications based on
the data sharing platform
E1 Expected 2. Software Further development of data platform
EWIS EWIS
R1 Completed 1. Methodology Methodological link between market-based simulations (zonal) and network simulations
(nodal).
R2 Completed 1. Methodology Real time data exchange between network
operators and day ahead data exchange concerning solar and wind production forecast
R3 Completed 5. Policy,
regulation, market
RES integration increases the costs for system balancing. These costs must be taken into
account and must be transparent. RES producers shall be responsible for the
unbalances caused by the RES.
FutureFlow FutureFlow E1 Expected 1. Methodology
Design of a cross-border cooperation scheme for procurement and activation of balancing
reserves
E2 Expected 2. Software Prototype DR and DG flexibility aggregation
platform for FRR

EUROPEAN COMMISSION Technical analysis of past and on-going projects
191 July 2016
E3 Expected 2. Software Prototype Regional Balancing and
Redispatching Platform
GARPUR GARPUR
E1 Expected 1. Methodology
Development of new, probabilistic reliability approach and criteria (RMAC) encompassing
the three key activities at different time scales (power system operation, asset management,
system development)
E2 Expected 2. Software Development of a prototype quantification
platform to evaluate the socio-economic impact of the new RMAC
GREDOR GREDOR
A1 Completed 2. Software Market design tool for modelling the
interaction between the users of the grid and the DSO in presence of DER and DSR.
A2 Completed 2. Software Optimal investment strategies tool for
distribution expansion planning in presence of increased flexibility needs
A3 Completed 2. Software Operational planning tool for distribution
networks
GridTech GridTech
R1 Completed 2. Software Zonal tool and model (with 2020, 2030, 2050
data) for pan-European system planning studies
R2 Completed 1. Methodology Integrated top-down/bottom-up approach for
transmission planning and grid-impacting technologies assessment
R3 Completed 2. Software Toolbox for transmission expansion planning
with storage, DSM/DR, EV
Humber Smartzone
Pilot Project Humber
A1 Completed 3. Hardware Tools to monitor and predict thermal capacity
of a circuit
A2 Completed 2. Software Application to estimate and predict thermal
capacity margin in a region
A3 Completed 2. Software Decision support system to coordinate plant and equipment maximizing the utilization of
the network
HyUNDER HyUNDER A1 Completed 4. Database
Assessment of the potential, the actors and relevant business cases for large scale and
seasonal storage of renewable electricity by hydrogen underground storage in Europe
ICOEUR ICOEUR
R1 Completed 3. Hardware Development and implementation of low
voltage large-scale WAMS system
R2 Completed 2. Software Development of distributed coordination system for real-time power flow control
R3 Completed 1. Methodology
Evaluation of interconnection concepts for system stability by the development of
models and tool for large-scale power system inter-area oscillation analysis
Impact of electric and gas vehicles
ImpactEV
A1 Completed 1. Methodology Methodology to evaluate the impact of electric transport on grid operation and first analyses
focused on the high speed railway.
A2 Completed 5. Policy,
regulation, market
Identification of requirements/principles for connecting the electric transport loads to the
system
E1 Expected 1. Methodology Complete model for assessing the impact of
electric vehicles and high speed railway on the grid.
E2 Expected 5. Policy,
regulation, market
Cost benefit analysis related to both gas and electric vehicles, considering also socio-
economic aspects. Policy recommendations and suggestion to identify new environmental
national targets.

EUROPEAN COMMISSION Technical analysis of past and on-going projects
192 July 2016
INSPIRE-Grid INSPIRE
A1 Completed 4. Database Stakeholders' map
A2 Completed 1. Methodology Assessment methodologies for stakeholder’s'
engagement (MCA, LCA, WebGIS)
A3 Completed 2. Software Participatory WebGIS
E1 Expected 1. Methodology Final Handbook
E2 Expected 5. Policy,
regulation, market
Synthesis and recommendations
iTesla iTesla
A1 Completed 2. Software The iTesla toolbox
A2 Completed 2. Software The iTesla platform
A3 Completed 2. Software The Rapid tool
A4 Completed 2. Software The iTesla Power Systems Library (iPSL)
E1 Expected 2. Software Validated iTesla toolbox
KÄVA2 KÄVA2
R1 Completed 1. Methodology Estimation of probability-based security levels
R2 Completed 1. Methodology Evaluation of components' failure rates for
asset management
LIFE Elia LIFE
A1 Completed 1. Methodology Guidelines on "vegetation mapping of
powerline corridors in forests"
A2 Completed 1. Methodology CBA on alternative vegetation management in
forest corridors
E1 Expected 5. Policy,
regulation, market
Integration of biodiversity preservation into the vegetation management
Market4RES Market4RES E1 Expected 5. Policy,
regulation, market
Recommendations for the implementation of policy, legislation and regulation across the
renewable energy sector, based on qualitative and quantitative analyses
MERGE MERGE
A1 Completed 1. Methodology
Methodology to assess the variations in the load curve due to the EV development,
considering different future scenarios and different users’ behaviours in terms of
charging (dumb Vs smart charging).
A2 Completed 3. Hardware
Identification of a high level architecture that allows an effective connection of the vehicles
to the grid and an effective communication among all the involved actors.
A3 Completed 1. Methodology Forecasts and scenarios on EV diffusion in
different countries in 2020 and 2025.
R1 Completed 1. Methodology
Integration of EV data (from results A1 and A3) in a tool used by the TSO to perform grid
planning. Inclusion of EV impact on grid planning methodology.
R2 Completed 5. Policy,
regulation, market
Recommendations for needed changes in regulation activity in order to develop e-mobility with the identified architecture
(result A2).
MIGRATE MIGRATE
E1 Expected 1. Methodology KPIs to measure the distance to instability
under different PE scenarios
E2 Expected 1. Methodology New parameters (retuned controllers) for a few types of instabilities (generic test cases)
E3 Expected 1. Methodology Recommendations on network connection
code
E4 Expected 2. Software Existing PMUs have been operated in real
time to provide reliable stability KPIs
E5 Expected 1. Methodology New control strategies for transmission
networks operated at 100% PE
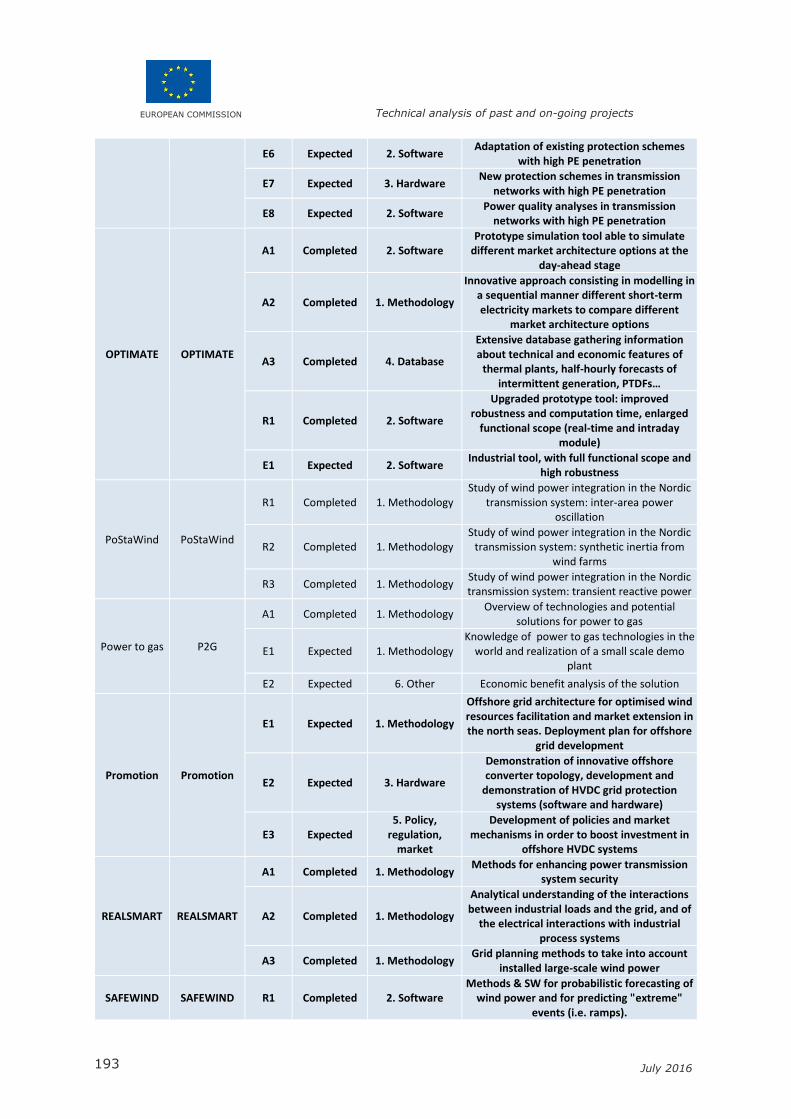
EUROPEAN COMMISSION Technical analysis of past and on-going projects
193 July 2016
E6 Expected 2. Software Adaptation of existing protection schemes
with high PE penetration
E7 Expected 3. Hardware New protection schemes in transmission
networks with high PE penetration
E8 Expected 2. Software Power quality analyses in transmission
networks with high PE penetration
OPTIMATE OPTIMATE
A1 Completed 2. Software Prototype simulation tool able to simulate
different market architecture options at the day-ahead stage
A2 Completed 1. Methodology
Innovative approach consisting in modelling in a sequential manner different short-term electricity markets to compare different
market architecture options
A3 Completed 4. Database
Extensive database gathering information about technical and economic features of
thermal plants, half-hourly forecasts of intermittent generation, PTDFs…
R1 Completed 2. Software
Upgraded prototype tool: improved robustness and computation time, enlarged
functional scope (real-time and intraday module)
E1 Expected 2. Software Industrial tool, with full functional scope and
high robustness
PoStaWind PoStaWind
R1 Completed 1. Methodology Study of wind power integration in the Nordic
transmission system: inter-area power oscillation
R2 Completed 1. Methodology Study of wind power integration in the Nordic
transmission system: synthetic inertia from wind farms
R3 Completed 1. Methodology Study of wind power integration in the Nordic transmission system: transient reactive power
Power to gas P2G
A1 Completed 1. Methodology Overview of technologies and potential
solutions for power to gas
E1 Expected 1. Methodology Knowledge of power to gas technologies in the
world and realization of a small scale demo plant
E2 Expected 6. Other Economic benefit analysis of the solution
Promotion Promotion
E1 Expected 1. Methodology
Offshore grid architecture for optimised wind resources facilitation and market extension in the north seas. Deployment plan for offshore
grid development
E2 Expected 3. Hardware
Demonstration of innovative offshore converter topology, development and
demonstration of HVDC grid protection systems (software and hardware)
E3 Expected 5. Policy,
regulation, market
Development of policies and market mechanisms in order to boost investment in
offshore HVDC systems
REALSMART REALSMART
A1 Completed 1. Methodology Methods for enhancing power transmission
system security
A2 Completed 1. Methodology
Analytical understanding of the interactions between industrial loads and the grid, and of
the electrical interactions with industrial process systems
A3 Completed 1. Methodology Grid planning methods to take into account
installed large-scale wind power
SAFEWIND SAFEWIND R1 Completed 2. Software Methods & SW for probabilistic forecasting of
wind power and for predicting "extreme" events (i.e. ramps).

EUROPEAN COMMISSION Technical analysis of past and on-going projects
194 July 2016
R2 Completed 2. Software
Methods & SW for predicting the level of predictability for the next hours and for warning and alarming in case of difficult extreme situations (high wind speeds,
weather fronts, any situations producing large forecast errors, …) for producers or DSOs and
TSOs
R3 Completed 2. Software Wind power predictability maps for spatial planning of wind energy at European scale
SAMREL - Security of electricity supply -
analysis tools
SAMREL
A1 Completed 1. Methodology A methodology for the chain of analyses from power market analysis to reliability of supply
analysis
A2 Completed 2. Software Prototype tool for security of supply and
vulnerability analysis tested on a regional, national and Nordic level
A3 Completed 6. Other PhD in evaluation and grouping of power
market scenarios
SECONOMICS SECONOMICS
R1 Completed 5. Policy,
regulation, market Policy framework for comparing the effect of
different security regulations
R2 Completed 1. Methodology Risk assessment methodology for security
vulnerability
R3 Completed 2. Software Toolkit for simulating different security policy
models
Smart Substation
SmartSub E1 Expected 3. Hardware Deployment of a smart HV substation
E2 Expected 4. Database Data management for asset management
SmartNet SmartNet
E1 Expected 2. Software SW for optimized architecture(s) for TSO-DSO interaction to allow participation to ancillary services market by resources in distribution
E2 Expected 1. Methodology
Analyses on optimized architecture(s) for TSO-DSO interaction to allow participation to ancillary services market by resources in
distribution
E3 Expected 3. Hardware 3 national pilots on monitoring and on
flexibility resources in distribution
SOSPO PMU/WAMS
Early Warning Systems
SOSPO
A1 Completed 2. Software Dynamic and static security assessment in real-time. Long-term Voltage Stability Assessment
(VSA)
A2 Completed 2. Software
Wide Area Prosumption Control: Modelling aggregated prosumption as a controllable reserve; Wide area prosumption control
algorithms
A3 Completed 2. Software
Wide Area Emergency Control: Adaptive control for small signal instability; state and
parameter estimation; Transient Stability Emergency Control
A4 Completed 2. Software Dynamic voltage and rotor angle stability
assessment
STORE STORE A1 Completed 1. Methodology
Provision of inertia and active power for primary regulation, validating technology's
ability to prevent outages due to unforeseen faults in GENERATION UNITS, as well as
assistance in continuously stabilise voltage
A2 Completed 1. Methodology Reinforcing the system and improving the
quality of supply.
SUMO SUMO A1 Completed 2. Software Development of methods and software for
evaluating and forecasting Dynamic Line Ratings
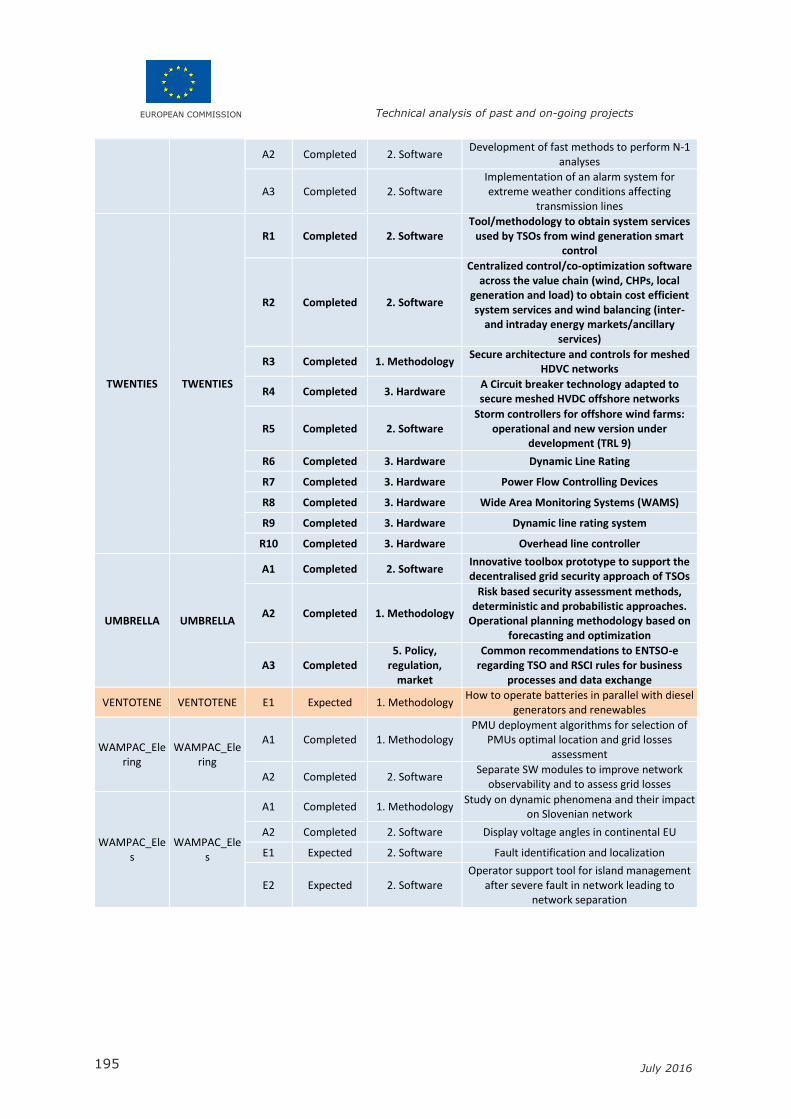
EUROPEAN COMMISSION Technical analysis of past and on-going projects
195 July 2016
A2 Completed 2. Software Development of fast methods to perform N-1
analyses
A3 Completed 2. Software Implementation of an alarm system for extreme weather conditions affecting
transmission lines
TWENTIES TWENTIES
R1 Completed 2. Software Tool/methodology to obtain system services
used by TSOs from wind generation smart control
R2 Completed 2. Software
Centralized control/co-optimization software across the value chain (wind, CHPs, local
generation and load) to obtain cost efficient system services and wind balancing (inter-
and intraday energy markets/ancillary services)
R3 Completed 1. Methodology Secure architecture and controls for meshed
HDVC networks
R4 Completed 3. Hardware A Circuit breaker technology adapted to secure meshed HVDC offshore networks
R5 Completed 2. Software Storm controllers for offshore wind farms:
operational and new version under development (TRL 9)
R6 Completed 3. Hardware Dynamic Line Rating
R7 Completed 3. Hardware Power Flow Controlling Devices
R8 Completed 3. Hardware Wide Area Monitoring Systems (WAMS)
R9 Completed 3. Hardware Dynamic line rating system
R10 Completed 3. Hardware Overhead line controller
UMBRELLA UMBRELLA
A1 Completed 2. Software Innovative toolbox prototype to support the decentralised grid security approach of TSOs
A2 Completed 1. Methodology
Risk based security assessment methods, deterministic and probabilistic approaches.
Operational planning methodology based on forecasting and optimization
A3 Completed 5. Policy,
regulation, market
Common recommendations to ENTSO-e regarding TSO and RSCI rules for business
processes and data exchange
VENTOTENE VENTOTENE E1 Expected 1. Methodology How to operate batteries in parallel with diesel
generators and renewables
WAMPAC_Elering
WAMPAC_Elering
A1 Completed 1. Methodology PMU deployment algorithms for selection of
PMUs optimal location and grid losses assessment
A2 Completed 2. Software Separate SW modules to improve network
observability and to assess grid losses
WAMPAC_Eles
WAMPAC_Eles
A1 Completed 1. Methodology Study on dynamic phenomena and their impact
on Slovenian network
A2 Completed 2. Software Display voltage angles in continental EU
E1 Expected 2. Software Fault identification and localization
E2 Expected 2. Software Operator support tool for island management
after severe fault in network leading to network separation

EUROPEAN COMMISSION Technical analysis of past and on-going projects
196 July 2016
24.2 Distribution achievements
Table 12 below presents the list of analyzed R&I achievements related to distribution.
NB: As explained in the section 3.2, id codes were used to abbreviate projects’ names all along the document.
The colour code for each project acronym corresponds to the source that has provided the filled-in questionnaires (EU projects are displayed in bold text while projects funded at national level are displayed in plain text):
EDSO EASE
Table 12: Detailed description of achievements related to distribution activities of each
project reviewed as provided by project coordinators
Projects Achievements Achievement description
Name Id code Code Status Typology
ADDRESS ADDRESS
A1 Completed 5. Policy,
regulation, market
Market design to facilitate demand-side management: market-based proposals and
economic analysis
A2 Completed 4. Database
Questionnaires to validate social acceptance and customers' commitment. Different
questionnaires will be completed out during the field test period (pre/during/post trials).
A3 Completed 2. Software
Aggregator toolbox. Full validation of aggregator’s functionality and 'core business
model' through the validation of the Aggregator Toolbox functionality.
A4 Completed 3. Hardware
Technical validation of the proposed solutions and prototypes for the Home System.
Validation of home system communication, Validation of equipment operation and the
Collection and processing of metering information.
ADVANCED ADVANCED
A1 Completed 1. Methodology Target matrix to determine what the
quantities to be measured
A2 Completed 1. Methodology Validated and operationalised KPIs both at
pilot and household level
A3 Completed 1. Methodology Qualitative & Quantitative surveys
A4 Completed 1. Methodology Actionable framework
A6 Completed 6. Other AD Potential
ALIADOS Alia2
A1 Completed 3. Hardware 3 Building management systems (BMS):
module, cabinet and container
A2 Completed 2. Software Black-start based on batteries for small-hydro
plants.
A3 Completed 1. Methodology Work method for manufacturing of modules in
Vitoria plant
R1 Completed 3. Hardware Improvements on the storage system. New generation with double power density and
taking up less space.
R2 Completed 3. Hardware New cylindrical version of energy storage
solution with reduced mobility and stationary (up to 400V) at home.
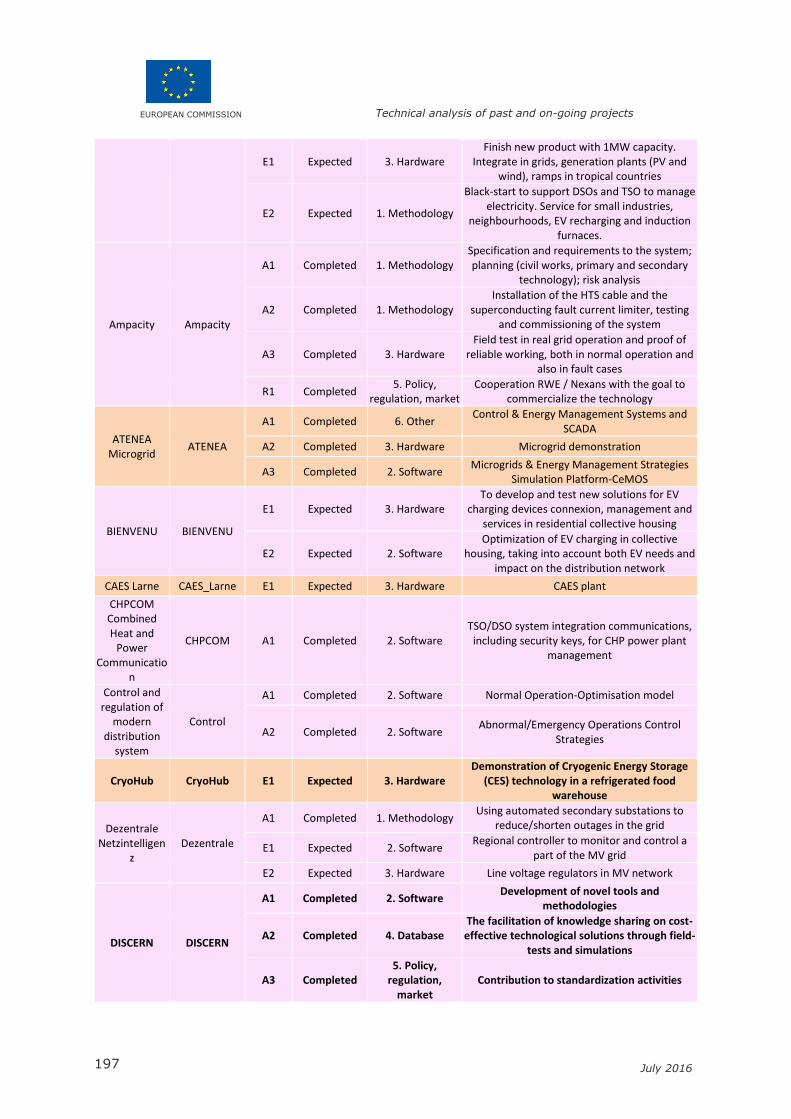
EUROPEAN COMMISSION Technical analysis of past and on-going projects
197 July 2016
E1 Expected 3. Hardware Finish new product with 1MW capacity.
Integrate in grids, generation plants (PV and wind), ramps in tropical countries
E2 Expected 1. Methodology
Black-start to support DSOs and TSO to manage electricity. Service for small industries,
neighbourhoods, EV recharging and induction furnaces.
Ampacity Ampacity
A1 Completed 1. Methodology Specification and requirements to the system; planning (civil works, primary and secondary
technology); risk analysis
A2 Completed 1. Methodology Installation of the HTS cable and the
superconducting fault current limiter, testing and commissioning of the system
A3 Completed 3. Hardware Field test in real grid operation and proof of
reliable working, both in normal operation and also in fault cases
R1 Completed 5. Policy,
regulation, market Cooperation RWE / Nexans with the goal to
commercialize the technology
ATENEA Microgrid
ATENEA
A1 Completed 6. Other Control & Energy Management Systems and
SCADA
A2 Completed 3. Hardware Microgrid demonstration
A3 Completed 2. Software Microgrids & Energy Management Strategies
Simulation Platform-CeMOS
BIENVENU BIENVENU
E1 Expected 3. Hardware To develop and test new solutions for EV
charging devices connexion, management and services in residential collective housing
E2 Expected 2. Software Optimization of EV charging in collective
housing, taking into account both EV needs and impact on the distribution network
CAES Larne CAES_Larne E1 Expected 3. Hardware CAES plant
CHPCOM Combined Heat and
Power Communicatio
n
CHPCOM A1 Completed 2. Software TSO/DSO system integration communications,
including security keys, for CHP power plant management
Control and regulation of
modern distribution
system
Control
A1 Completed 2. Software Normal Operation-Optimisation model
A2 Completed 2. Software Abnormal/Emergency Operations Control
Strategies
CryoHub CryoHub E1 Expected 3. Hardware Demonstration of Cryogenic Energy Storage
(CES) technology in a refrigerated food warehouse
Dezentrale Netzintelligen
z Dezentrale
A1 Completed 1. Methodology Using automated secondary substations to
reduce/shorten outages in the grid
E1 Expected 2. Software Regional controller to monitor and control a
part of the MV grid
E2 Expected 3. Hardware Line voltage regulators in MV network
DISCERN DISCERN
A1 Completed 2. Software Development of novel tools and
methodologies
A2 Completed 4. Database The facilitation of knowledge sharing on cost-effective technological solutions through field-
tests and simulations
A3 Completed 5. Policy,
regulation, market
Contribution to standardization activities
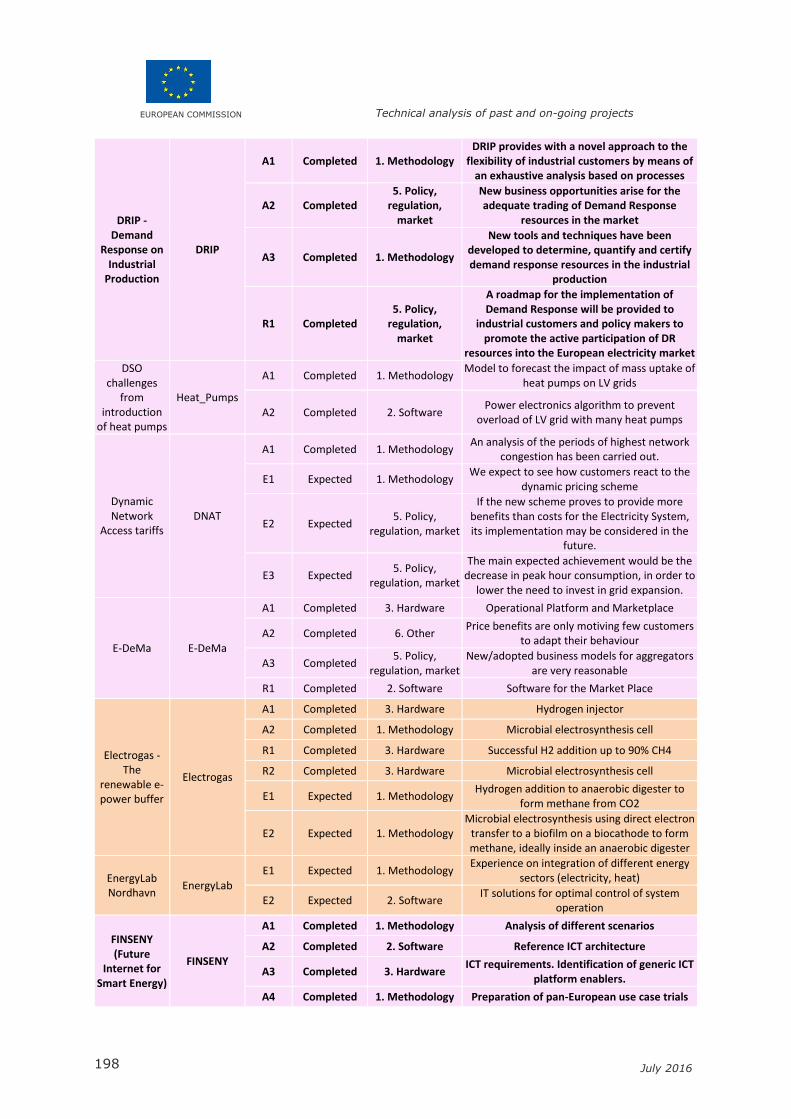
EUROPEAN COMMISSION Technical analysis of past and on-going projects
198 July 2016
DRIP - Demand
Response on Industrial
Production
DRIP
A1 Completed 1. Methodology DRIP provides with a novel approach to the
flexibility of industrial customers by means of an exhaustive analysis based on processes
A2 Completed 5. Policy,
regulation, market
New business opportunities arise for the adequate trading of Demand Response
resources in the market
A3 Completed 1. Methodology
New tools and techniques have been developed to determine, quantify and certify demand response resources in the industrial
production
R1 Completed 5. Policy,
regulation, market
A roadmap for the implementation of Demand Response will be provided to
industrial customers and policy makers to promote the active participation of DR
resources into the European electricity market
DSO challenges
from introduction
of heat pumps
Heat_Pumps
A1 Completed 1. Methodology Model to forecast the impact of mass uptake of
heat pumps on LV grids
A2 Completed 2. Software Power electronics algorithm to prevent
overload of LV grid with many heat pumps
Dynamic Network
Access tariffs DNAT
A1 Completed 1. Methodology An analysis of the periods of highest network
congestion has been carried out.
E1 Expected 1. Methodology We expect to see how customers react to the
dynamic pricing scheme
E2 Expected 5. Policy,
regulation, market
If the new scheme proves to provide more benefits than costs for the Electricity System, its implementation may be considered in the
future.
E3 Expected 5. Policy,
regulation, market
The main expected achievement would be the decrease in peak hour consumption, in order to
lower the need to invest in grid expansion.
E-DeMa E-DeMa
A1 Completed 3. Hardware Operational Platform and Marketplace
A2 Completed 6. Other Price benefits are only motiving few customers
to adapt their behaviour
A3 Completed 5. Policy,
regulation, market New/adopted business models for aggregators
are very reasonable
R1 Completed 2. Software Software for the Market Place
Electrogas - The
renewable e-power buffer
Electrogas
A1 Completed 3. Hardware Hydrogen injector
A2 Completed 1. Methodology Microbial electrosynthesis cell
R1 Completed 3. Hardware Successful H2 addition up to 90% CH4
R2 Completed 3. Hardware Microbial electrosynthesis cell
E1 Expected 1. Methodology Hydrogen addition to anaerobic digester to
form methane from CO2
E2 Expected 1. Methodology Microbial electrosynthesis using direct electron
transfer to a biofilm on a biocathode to form methane, ideally inside an anaerobic digester
EnergyLab Nordhavn
EnergyLab
E1 Expected 1. Methodology Experience on integration of different energy
sectors (electricity, heat)
E2 Expected 2. Software IT solutions for optimal control of system
operation
FINSENY (Future
Internet for Smart Energy)
FINSENY
A1 Completed 1. Methodology Analysis of different scenarios
A2 Completed 2. Software Reference ICT architecture
A3 Completed 3. Hardware ICT requirements. Identification of generic ICT
platform enablers.
A4 Completed 1. Methodology Preparation of pan-European use case trials
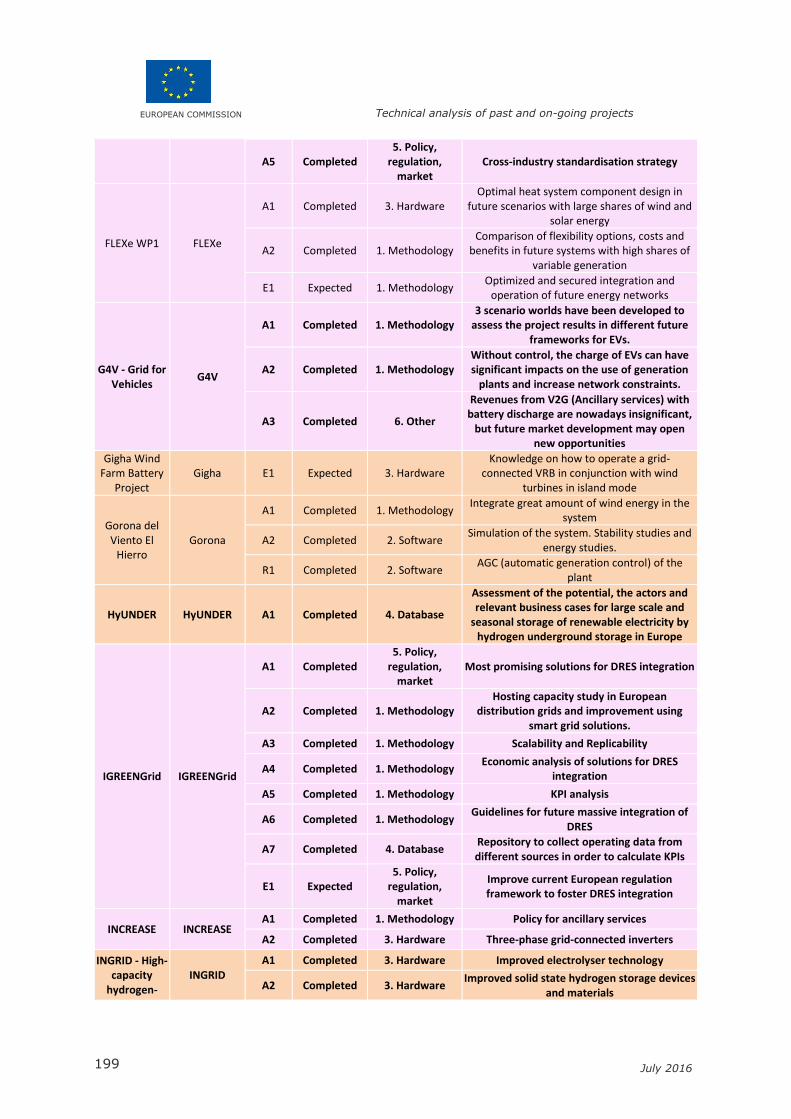
EUROPEAN COMMISSION Technical analysis of past and on-going projects
199 July 2016
A5 Completed 5. Policy,
regulation, market
Cross-industry standardisation strategy
FLEXe WP1 FLEXe
A1 Completed 3. Hardware Optimal heat system component design in
future scenarios with large shares of wind and solar energy
A2 Completed 1. Methodology Comparison of flexibility options, costs and
benefits in future systems with high shares of variable generation
E1 Expected 1. Methodology Optimized and secured integration and
operation of future energy networks
G4V - Grid for Vehicles
G4V
A1 Completed 1. Methodology 3 scenario worlds have been developed to
assess the project results in different future frameworks for EVs.
A2 Completed 1. Methodology Without control, the charge of EVs can have significant impacts on the use of generation
plants and increase network constraints.
A3 Completed 6. Other
Revenues from V2G (Ancillary services) with battery discharge are nowadays insignificant,
but future market development may open new opportunities
Gigha Wind Farm Battery
Project Gigha E1 Expected 3. Hardware
Knowledge on how to operate a grid-connected VRB in conjunction with wind
turbines in island mode
Gorona del Viento El
Hierro Gorona
A1 Completed 1. Methodology Integrate great amount of wind energy in the
system
A2 Completed 2. Software Simulation of the system. Stability studies and
energy studies.
R1 Completed 2. Software AGC (automatic generation control) of the
plant
HyUNDER HyUNDER A1 Completed 4. Database
Assessment of the potential, the actors and relevant business cases for large scale and
seasonal storage of renewable electricity by hydrogen underground storage in Europe
IGREENGrid IGREENGrid
A1 Completed 5. Policy,
regulation, market
Most promising solutions for DRES integration
A2 Completed 1. Methodology Hosting capacity study in European
distribution grids and improvement using smart grid solutions.
A3 Completed 1. Methodology Scalability and Replicability
A4 Completed 1. Methodology Economic analysis of solutions for DRES
integration
A5 Completed 1. Methodology KPI analysis
A6 Completed 1. Methodology Guidelines for future massive integration of
DRES
A7 Completed 4. Database Repository to collect operating data from different sources in order to calculate KPIs
E1 Expected 5. Policy,
regulation, market
Improve current European regulation framework to foster DRES integration
INCREASE INCREASE A1 Completed 1. Methodology Policy for ancillary services
A2 Completed 3. Hardware Three-phase grid-connected inverters
INGRID - High-capacity
hydrogen-INGRID
A1 Completed 3. Hardware Improved electrolyser technology
A2 Completed 3. Hardware Improved solid state hydrogen storage devices
and materials
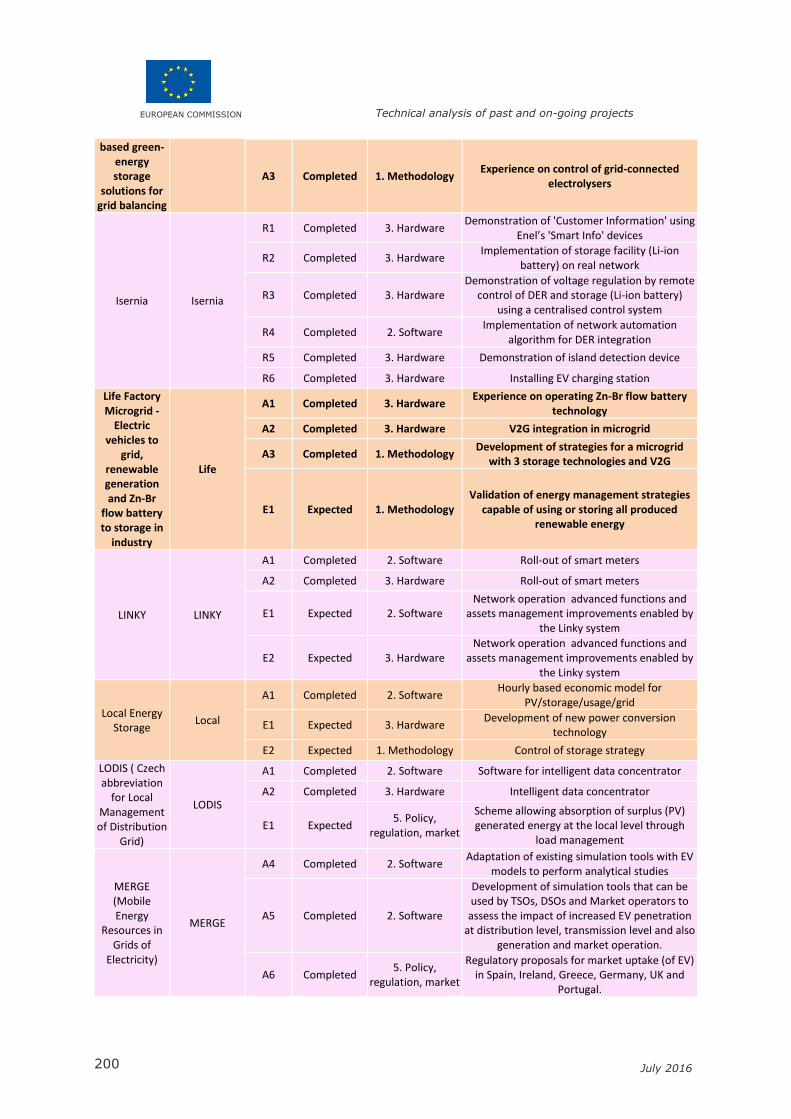
EUROPEAN COMMISSION Technical analysis of past and on-going projects
200 July 2016
based green-energy storage
solutions for grid balancing
A3 Completed 1. Methodology Experience on control of grid-connected
electrolysers
Isernia Isernia
R1 Completed 3. Hardware Demonstration of 'Customer Information' using
Enel’s 'Smart Info' devices
R2 Completed 3. Hardware Implementation of storage facility (Li-ion
battery) on real network
R3 Completed 3. Hardware Demonstration of voltage regulation by remote
control of DER and storage (Li-ion battery) using a centralised control system
R4 Completed 2. Software Implementation of network automation
algorithm for DER integration
R5 Completed 3. Hardware Demonstration of island detection device
R6 Completed 3. Hardware Installing EV charging station
Life Factory Microgrid -
Electric vehicles to
grid, renewable generation and Zn-Br
flow battery to storage in
industry
Life
A1 Completed 3. Hardware Experience on operating Zn-Br flow battery
technology
A2 Completed 3. Hardware V2G integration in microgrid
A3 Completed 1. Methodology Development of strategies for a microgrid
with 3 storage technologies and V2G
E1 Expected 1. Methodology Validation of energy management strategies
capable of using or storing all produced renewable energy
LINKY LINKY
A1 Completed 2. Software Roll-out of smart meters
A2 Completed 3. Hardware Roll-out of smart meters
E1 Expected 2. Software Network operation advanced functions and
assets management improvements enabled by the Linky system
E2 Expected 3. Hardware Network operation advanced functions and
assets management improvements enabled by the Linky system
Local Energy Storage
Local
A1 Completed 2. Software Hourly based economic model for
PV/storage/usage/grid
E1 Expected 3. Hardware Development of new power conversion
technology
E2 Expected 1. Methodology Control of storage strategy
LODIS ( Czech abbreviation
for Local Management of Distribution
Grid)
LODIS
A1 Completed 2. Software Software for intelligent data concentrator
A2 Completed 3. Hardware Intelligent data concentrator
E1 Expected 5. Policy,
regulation, market
Scheme allowing absorption of surplus (PV) generated energy at the local level through
load management
MERGE (Mobile Energy
Resources in Grids of
Electricity)
MERGE
A4 Completed 2. Software Adaptation of existing simulation tools with EV
models to perform analytical studies
A5 Completed 2. Software
Development of simulation tools that can be used by TSOs, DSOs and Market operators to
assess the impact of increased EV penetration at distribution level, transmission level and also
generation and market operation.
A6 Completed 5. Policy,
regulation, market
Regulatory proposals for market uptake (of EV) in Spain, Ireland, Greece, Germany, UK and
Portugal.
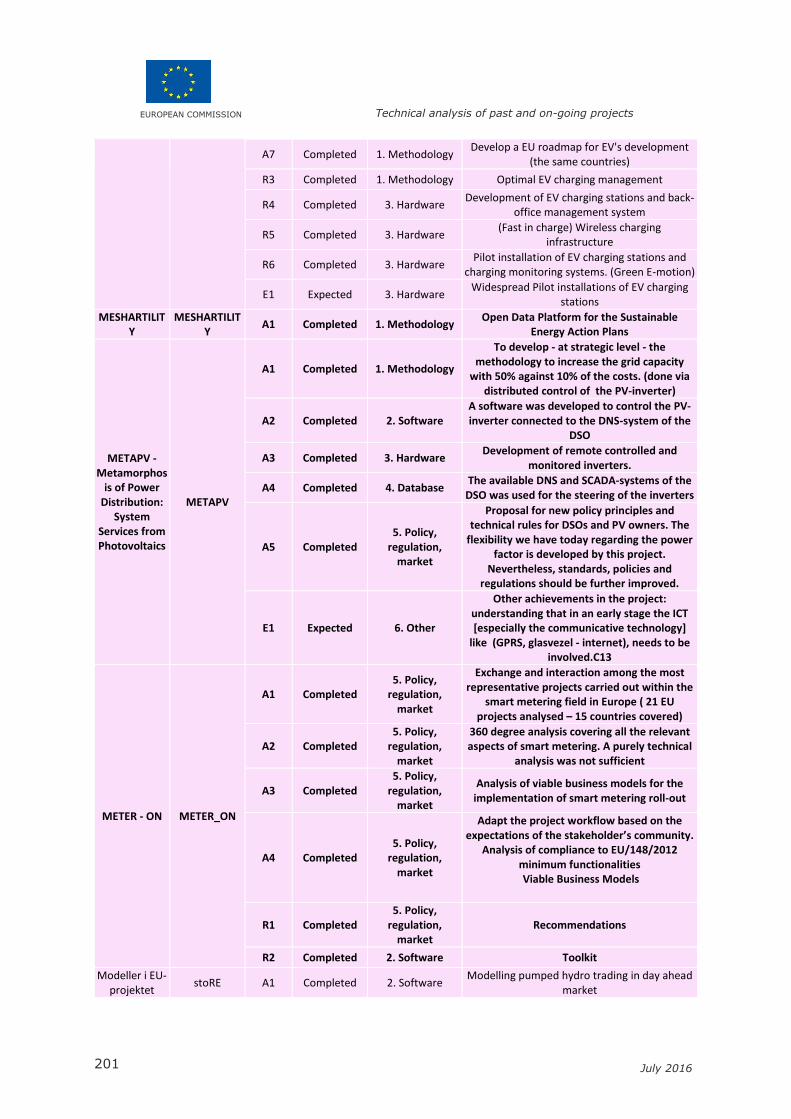
EUROPEAN COMMISSION Technical analysis of past and on-going projects
201 July 2016
A7 Completed 1. Methodology Develop a EU roadmap for EV's development
(the same countries)
R3 Completed 1. Methodology Optimal EV charging management
R4 Completed 3. Hardware Development of EV charging stations and back-
office management system
R5 Completed 3. Hardware (Fast in charge) Wireless charging
infrastructure
R6 Completed 3. Hardware Pilot installation of EV charging stations and
charging monitoring systems. (Green E-motion)
E1 Expected 3. Hardware Widespread Pilot installations of EV charging
stations
MESHARTILITY
MESHARTILITY
A1 Completed 1. Methodology Open Data Platform for the Sustainable
Energy Action Plans
METAPV - Metamorphos
is of Power Distribution:
System Services from Photovoltaics
METAPV
A1 Completed 1. Methodology
To develop - at strategic level - the methodology to increase the grid capacity
with 50% against 10% of the costs. (done via distributed control of the PV-inverter)
A2 Completed 2. Software A software was developed to control the PV-inverter connected to the DNS-system of the
DSO
A3 Completed 3. Hardware Development of remote controlled and
monitored inverters.
A4 Completed 4. Database The available DNS and SCADA-systems of the
DSO was used for the steering of the inverters
A5 Completed 5. Policy,
regulation, market
Proposal for new policy principles and technical rules for DSOs and PV owners. The
flexibility we have today regarding the power factor is developed by this project.
Nevertheless, standards, policies and regulations should be further improved.
E1 Expected 6. Other
Other achievements in the project: understanding that in an early stage the ICT [especially the communicative technology]
like (GPRS, glasvezel - internet), needs to be involved.C13
METER - ON METER_ON
A1 Completed 5. Policy,
regulation, market
Exchange and interaction among the most representative projects carried out within the
smart metering field in Europe ( 21 EU projects analysed – 15 countries covered)
A2 Completed 5. Policy,
regulation, market
360 degree analysis covering all the relevant aspects of smart metering. A purely technical
analysis was not sufficient
A3 Completed 5. Policy,
regulation, market
Analysis of viable business models for the implementation of smart metering roll-out
A4 Completed 5. Policy,
regulation, market
Adapt the project workflow based on the expectations of the stakeholder’s community.
Analysis of compliance to EU/148/2012 minimum functionalities Viable Business Models
R1 Completed 5. Policy,
regulation, market
Recommendations
R2 Completed 2. Software Toolkit
Modeller i EU-projektet
stoRE A1 Completed 2. Software Modelling pumped hydro trading in day ahead
market

EUROPEAN COMMISSION Technical analysis of past and on-going projects
202 July 2016
stoRE af økonomien i
ellagre A2 Completed 2. Software
Developing modelling software to use pump hydro in the balancing market
Nice Grid NiceGrid
A1 Completed 3. Hardware Experiment local and temporary islanding and
reconnexion of a subnetwork energised through storage and solar generation
A2 Completed 3. Hardware Optimize the operation of a network integrating a massive production of
photovoltaic energy
A3 Completed 4. Database Involve the consumer in energy efficiency in
order to solve local energy constraints
Northern Isles New Energy
Solutions (NINES)
NINES
R1 Completed 1. Methodology
Active Network Management has pushed energy supply towards low carbon emissions by allowing the maximum possible amount of renewable generation to be connected thus
reducing the amount of fossil fuel consumption
R2 Completed 3. Hardware
Significant insight into the installation and operation of MW scale batteries and provision
of high quality research data for SSE Future Networks
OPEN NODE OPEN_NODE A1 Completed 3. Hardware
Prototype to concentrate measurements (smart metering) for the Secondary
substation.
A2 Completed 2. Software MMC (Metering management collector)
PlanGridEV PlanGridEV
A1 Completed 2. Software
Optimised and enhanced grid architecture for EVs in Europe; the developed architecture
provides a useful framework which is applicable for different European DSOs
A2 Completed 2. Software
Prototype tool for optimising existing assets and grid planning using controllable loads and
to maximise integration of EVs and DER in distribution grids
A3 Completed 1. Methodology Novel planning rules for EVs in smart grids
R1 Completed 5. Policy,
regulation, market
Roadmap and recommendations for innovation, regulation and policies
Power-to-Gas via Biological
Catalysis (P2G-BioCat)
BioCat
A1 Completed 4. Database Interactive pricing and planning model for
project in DK
R1 Completed 1. Methodology Biological conversion of CO2 and hydrogen to
methane
R2 Completed 3. Hardware Equipment for the method mentioned in R1
R3 Completed 5. Policy,
regulation, market Market pricing required for cash flow positive
operation of system integrated at WWTP
PRICE PRICE
A1 Completed 2. Software MV/LV dispatch prototype & Distribution
Mgmt. System for DG
A2 Completed 2. Software Energy balance web
A3 Completed 3. Hardware Energy balance system & SCADA tool
A4 Completed 3. Hardware STATCOM MV
A5 Completed 3. Hardware STATCOM LV
A6 Completed 3. Hardware Scaled grid
A7 Completed 6. Other State Estimator algorithm & voltage control
algorithm
A8 Completed 2. Software Remote Demand management System
(Consumption viewer)
A9 Completed 3. Hardware Smart Household Appliances and loading
manager

EUROPEAN COMMISSION Technical analysis of past and on-going projects
203 July 2016
A10 Completed 6. Other Platform management and mobility
applications
A11 Completed 2. Software Smart system for on demand-side management
Proaktives Verteilnetz
Proaktives
A1 Completed 1. Methodology Definition of operation mode for "yellow traffic
light-phase"
A2 Completed 2. Software Grid State estimation
A3 Completed 6. Other Market model for flexibilities in yellow light
phase
Puglia Active Network
Puglia
E1 Expected 3. Hardware Active management of MV network
E2 Expected 3. Hardware Deployment of 'Smart Info' devices to provide customer with information to enable demand
response strategies
E3 Expected 3. Hardware Installing recharging infrastructure for Electric
Vehicles
PV-KWK / Intelligent
energy management solutions and photovoltaic
combined systems for optimized
electricity and heat
generation in the house
PV-KWK A1 Completed 1. Methodology Expansion and optimisation of energy
management solutions as well as drafting open interface standards
Smart Country Smart_Countr
y
A1 Completed 3. Hardware Active voltage regulator for medium voltage
A2 Completed 3. Hardware Wide area control is implemented in further
primary substations
A3 Completed 3. Hardware Effective biogas storage
Smart Grid Judenburg
Judenburg A1 Completed 3. Hardware Demonstration of voltage regulation by remote control of DG using centralised control system
Smart Grid Vendée
SGV
A1 Completed 2. Software Implementation of consumptions and generation forecasting tool at primary
substation scale
E1 Expected 2. Software Implementation of a Web portal for energy
shaving purpose
E2 Expected 2. Software Tools devoted to technico-economic analysis in
order to help decision making
Smart grids: Back End Systems
Smart_grids
A1 Completed 3. Hardware Implementation of operating management
systems. Full roll-out in our operating centres.
A2 Completed 3. Hardware Roll-out of the new operations to the field crew
A3 Completed 6. Other Automatic curtailment of wind and automatic
load shedding
E1 Expected 5. Policy,
regulation, market Integration of DSM as system reserve
(DSO/TSO)
E2 Expected 5. Policy,
regulation, market Integration of storage, including the ancillary
services provided by storage solutions
E3 Expected 6. Other Integration of the outage management for LV
networks
Smart LV Grid - Heimschuh
Heimschuh R1 Completed 3. Hardware Demonstration of voltage regulation using
OLTC at secondary substation
Smart Operator
Smart_ Operator
A1 Completed 3. Hardware Smart Operator concept validated
E1 Expected 4. Database Improved future grid planning
Smart Storage Smart_ A1 Completed 3. Hardware Development of storage system

EUROPEAN COMMISSION Technical analysis of past and on-going projects
204 July 2016
Storage A2 Completed 1. Methodology
Experience on operation of LV grid-connected battery
Smart Toruń Smart_ Toruń
A1 Completed 3. Hardware PV installation (3,77 MW peak power)
A2 Completed 3. Hardware Smart meters installation (92 600)
A3 Completed 3. Hardware Automation of the power grid (56 MV with
remote control, 86 radio-controlled switches)
SOGRID SOGRID E1 Expected 3. Hardware To develop and test "full PLC" of “3D
generation" on the LV and MV network (Cenelec-A band and FCC band)
SOLENN SOLENN
A1 Completed 6. Other First, roll-out of 10 000 smart meters and
recruiting
E1 Expected 2. Software
Develop solutions to provide volunteer customers with own and collective electric data
in order to develop a new Energy Efficiency dynamics
E2 Expected 2. Software Provide local communities with an IT tool
helping the definition and implementation of local energy politics
E3 Expected 2. Software Provide new tools using curtailments via smart meters avoiding load shedding near real time
operations
Storage in Evora
Evora
A1 Completed 3. Hardware MV Storage system demonstrator
E1 Expected 2. Software Automated support for grid management using
specialized algorithms
E2 Expected 1. Methodology Explore islanding mode in grid operation
STORE STORE A3 Completed 1. Methodology Cost reduction of electrical system in islands
STORY STORY
E1 Expected 1. Methodology
Demonstration and evaluation of a household/neighbourhood increased self-
supply by using heat and electricity production and storage
E2 Expected 3. Hardware Medium scale battery system introduced in the distribution network and in industrial
environments
E3 Expected 3. Hardware CAES unit
TILOS TILOS
A1 Completed 2. Software Forecasting of RES and load demand
A2 Completed 5. Policy,
regulation, market
Policy recommendations for the distinction of storage technologies in the Greek regulation and the permission to run islands diesel-free
TRANSFORM TRANSFORM R1 Completed 1. Methodology Handbook to pave the way toward a Smart
City
UPGRID UPGRID
E1 Expected 1. Methodology Increase the observability and control of LV
grid.
E2 Expected 1. Methodology Functional specification of LV dispatch
E3 Expected 2. Software Deployment of tools to support LV operation
of field crews
E4 Expected 1. Methodology Improvement in Operations and Maintenance
of LV grid
E5 Expected 1. Methodology Improvement of QoS to customers
E6 Expected 5. Policy,
regulation, market
Evaluation of incentive and market framework in demo regions
E7 Expected 5. Policy,
regulation, market
Identification of investment alternatives for UPGRID innovative concepts
E8 Expected 1. Methodology Assessment of optimal business models for
market participants

EUROPEAN COMMISSION Technical analysis of past and on-going projects
205 July 2016
E9 Expected 2. Software Integration and processing of meter events in
the OMS (Outage Management System). Within SCADA system
E10 Expected 3. Hardware Deployment of Multiservice PRIME
subnetwork
E11 Expected 2. Software Development of LV grid remote control operation over Smart Metering PRIME
infrastructure
E12 Expected 2. Software Improvement of customer capacity building
web-based systems
E13 Expected 5. Policy,
regulation, market
Development of interactive communication campaigns
E14 Expected 1. Methodology Societal research on the socio-economic
impact of Smart Grid solutions on the demo regions
V/Q regulation
V/Q_regulation
A1 Completed 2. Software Advanced SW allowing voltage regulation
through reactive power
E1 Expected 2. Software
Tested solution is relevant for deployment and is expected to meet its goal – enhance the
capacity of the grid to integrate additional DER through voltage regulation via management of
reactive power
VENTEEA VENTEEA
A1 Completed 3. Hardware New functions for a better management of the integration of the renewable energies on the
MV network
A2 Completed 1. Methodology Assess the impact of the renewable energies on power quality, protection coordination,
security of people
VENTOTENE VENTOTENE
A1 Completed 2. Software Co-designing of new power electronics control
rules
R1 Completed 1. Methodology Methodology for designing new hybrid
generation assets
24.3 Transmission/distribution achievements
Erreur ! Référence non valide pour un signet. below presents the list of analyzed R&I
achievements related to both distribution and transmission.
NB: As explained in the section 3.2, id codes were used to abbreviate projects’ names all along the document.
The colour code for each project acronym corresponds to the source that has provided the
filled-in questionnaires (EU projects are displayed in bold text while projects funded at national level are displayed in plain text):
EDSO EASE ENTSO-E
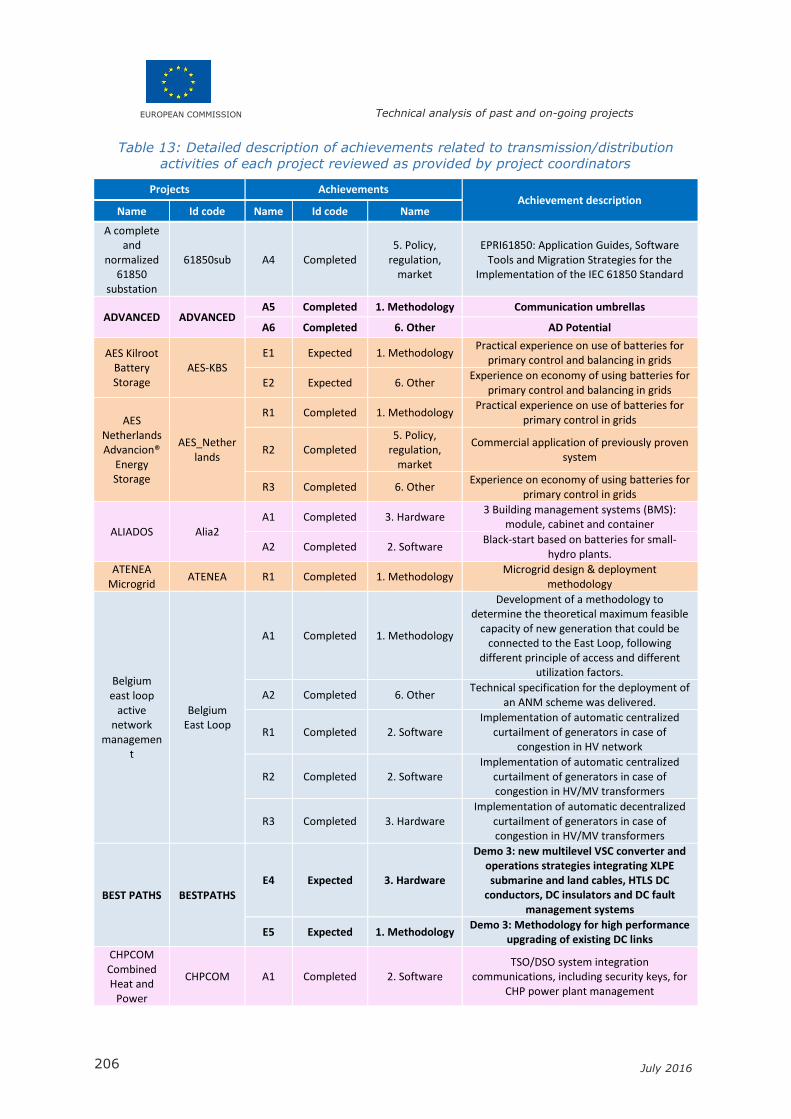
EUROPEAN COMMISSION Technical analysis of past and on-going projects
206 July 2016
Table 13: Detailed description of achievements related to transmission/distribution
activities of each project reviewed as provided by project coordinators
Projects Achievements Achievement description
Name Id code Name Id code Name
A complete and
normalized 61850
substation
61850sub A4 Completed 5. Policy,
regulation, market
EPRI61850: Application Guides, Software Tools and Migration Strategies for the
Implementation of the IEC 61850 Standard
ADVANCED ADVANCED A5 Completed 1. Methodology Communication umbrellas
A6 Completed 6. Other AD Potential
AES Kilroot Battery Storage
AES-KBS E1 Expected 1. Methodology
Practical experience on use of batteries for primary control and balancing in grids
E2 Expected 6. Other Experience on economy of using batteries for
primary control and balancing in grids
AES Netherlands Advancion®
Energy Storage
AES_Netherlands
R1 Completed 1. Methodology Practical experience on use of batteries for
primary control in grids
R2 Completed 5. Policy,
regulation, market
Commercial application of previously proven system
R3 Completed 6. Other Experience on economy of using batteries for
primary control in grids
ALIADOS Alia2 A1 Completed 3. Hardware
3 Building management systems (BMS): module, cabinet and container
A2 Completed 2. Software Black-start based on batteries for small-
hydro plants.
ATENEA Microgrid
ATENEA R1 Completed 1. Methodology Microgrid design & deployment
methodology
Belgium east loop
active network
management
Belgium East Loop
A1 Completed 1. Methodology
Development of a methodology to determine the theoretical maximum feasible
capacity of new generation that could be connected to the East Loop, following
different principle of access and different utilization factors.
A2 Completed 6. Other Technical specification for the deployment of
an ANM scheme was delivered.
R1 Completed 2. Software Implementation of automatic centralized
curtailment of generators in case of congestion in HV network
R2 Completed 2. Software Implementation of automatic centralized
curtailment of generators in case of congestion in HV/MV transformers
R3 Completed 3. Hardware Implementation of automatic decentralized
curtailment of generators in case of congestion in HV/MV transformers
BEST PATHS BESTPATHS
E4 Expected 3. Hardware
Demo 3: new multilevel VSC converter and operations strategies integrating XLPE submarine and land cables, HTLS DC
conductors, DC insulators and DC fault management systems
E5 Expected 1. Methodology Demo 3: Methodology for high performance
upgrading of existing DC links
CHPCOM Combined Heat and
Power
CHPCOM A1 Completed 2. Software TSO/DSO system integration
communications, including security keys, for CHP power plant management
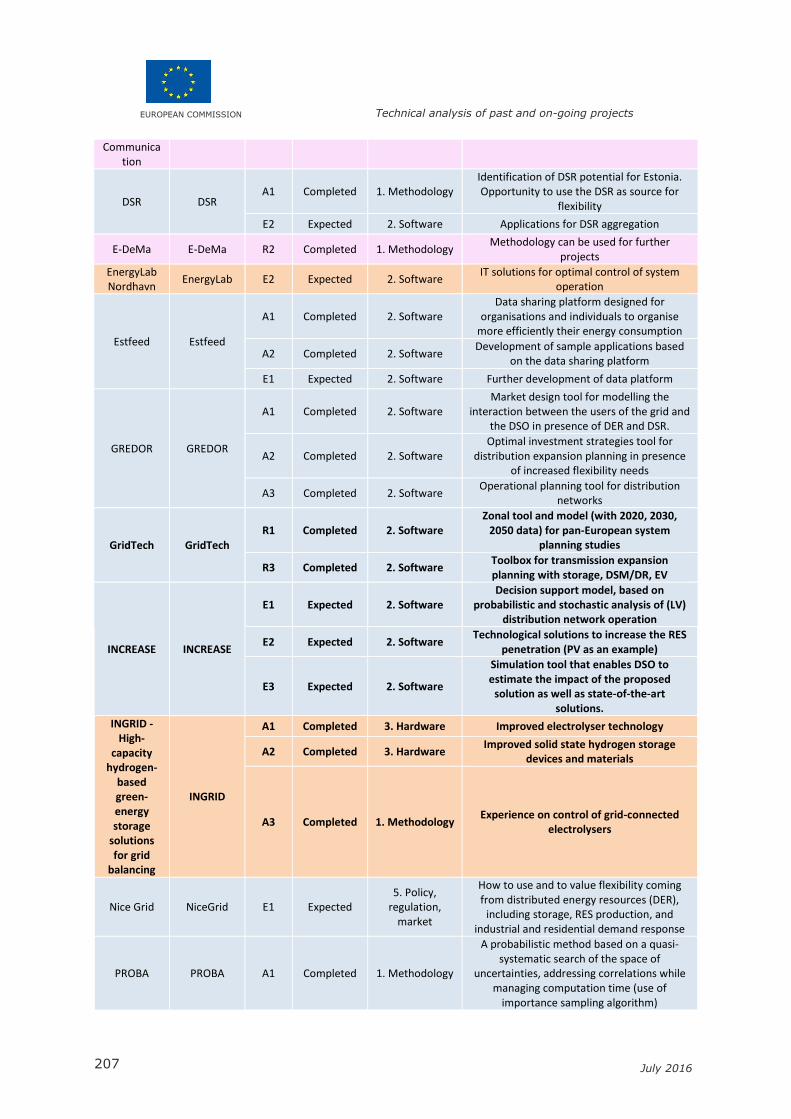
EUROPEAN COMMISSION Technical analysis of past and on-going projects
207 July 2016
Communication
DSR DSR A1 Completed 1. Methodology
Identification of DSR potential for Estonia. Opportunity to use the DSR as source for
flexibility
E2 Expected 2. Software Applications for DSR aggregation
E-DeMa E-DeMa R2 Completed 1. Methodology Methodology can be used for further
projects
EnergyLab Nordhavn
EnergyLab E2 Expected 2. Software IT solutions for optimal control of system
operation
Estfeed Estfeed
A1 Completed 2. Software Data sharing platform designed for
organisations and individuals to organise more efficiently their energy consumption
A2 Completed 2. Software Development of sample applications based
on the data sharing platform
E1 Expected 2. Software Further development of data platform
GREDOR GREDOR
A1 Completed 2. Software Market design tool for modelling the
interaction between the users of the grid and the DSO in presence of DER and DSR.
A2 Completed 2. Software Optimal investment strategies tool for
distribution expansion planning in presence of increased flexibility needs
A3 Completed 2. Software Operational planning tool for distribution
networks
GridTech GridTech R1 Completed 2. Software
Zonal tool and model (with 2020, 2030, 2050 data) for pan-European system
planning studies
R3 Completed 2. Software Toolbox for transmission expansion planning with storage, DSM/DR, EV
INCREASE INCREASE
E1 Expected 2. Software Decision support model, based on
probabilistic and stochastic analysis of (LV) distribution network operation
E2 Expected 2. Software Technological solutions to increase the RES
penetration (PV as an example)
E3 Expected 2. Software
Simulation tool that enables DSO to estimate the impact of the proposed
solution as well as state-of-the-art solutions.
INGRID - High-
capacity hydrogen-
based green-energy storage
solutions for grid
balancing
INGRID
A1 Completed 3. Hardware Improved electrolyser technology
A2 Completed 3. Hardware Improved solid state hydrogen storage
devices and materials
A3 Completed 1. Methodology Experience on control of grid-connected
electrolysers
Nice Grid NiceGrid E1 Expected 5. Policy,
regulation, market
How to use and to value flexibility coming from distributed energy resources (DER),
including storage, RES production, and industrial and residential demand response
PROBA PROBA A1 Completed 1. Methodology
A probabilistic method based on a quasi-systematic search of the space of
uncertainties, addressing correlations while managing computation time (use of
importance sampling algorithm)
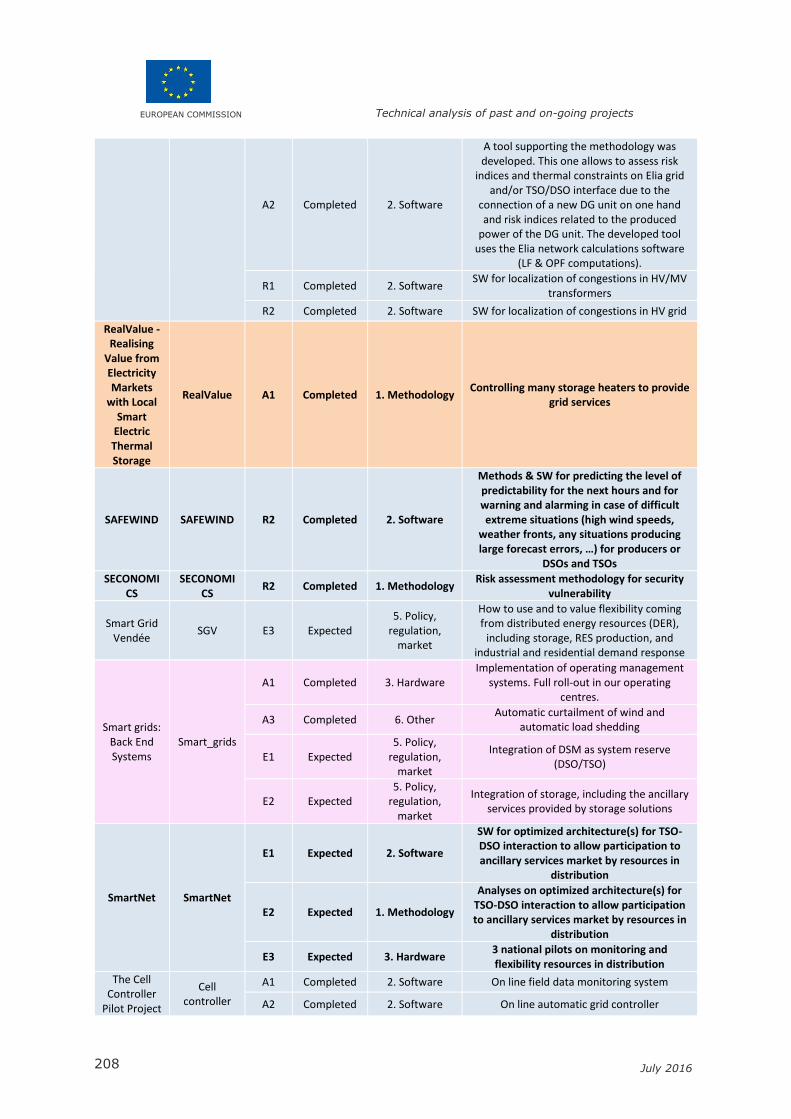
EUROPEAN COMMISSION Technical analysis of past and on-going projects
208 July 2016
A2 Completed 2. Software
A tool supporting the methodology was developed. This one allows to assess risk
indices and thermal constraints on Elia grid and/or TSO/DSO interface due to the
connection of a new DG unit on one hand and risk indices related to the produced
power of the DG unit. The developed tool uses the Elia network calculations software
(LF & OPF computations).
R1 Completed 2. Software SW for localization of congestions in HV/MV
transformers
R2 Completed 2. Software SW for localization of congestions in HV grid
RealValue - Realising
Value from Electricity Markets
with Local Smart
Electric Thermal Storage
RealValue A1 Completed 1. Methodology Controlling many storage heaters to provide
grid services
SAFEWIND SAFEWIND R2 Completed 2. Software
Methods & SW for predicting the level of predictability for the next hours and for warning and alarming in case of difficult extreme situations (high wind speeds,
weather fronts, any situations producing large forecast errors, …) for producers or
DSOs and TSOs
SECONOMICS
SECONOMICS
R2 Completed 1. Methodology Risk assessment methodology for security
vulnerability
Smart Grid Vendée
SGV E3 Expected 5. Policy,
regulation, market
How to use and to value flexibility coming from distributed energy resources (DER),
including storage, RES production, and industrial and residential demand response
Smart grids: Back End Systems
Smart_grids
A1 Completed 3. Hardware Implementation of operating management
systems. Full roll-out in our operating centres.
A3 Completed 6. Other Automatic curtailment of wind and
automatic load shedding
E1 Expected 5. Policy,
regulation, market
Integration of DSM as system reserve (DSO/TSO)
E2 Expected 5. Policy,
regulation, market
Integration of storage, including the ancillary services provided by storage solutions
SmartNet SmartNet
E1 Expected 2. Software
SW for optimized architecture(s) for TSO-DSO interaction to allow participation to ancillary services market by resources in
distribution
E2 Expected 1. Methodology
Analyses on optimized architecture(s) for TSO-DSO interaction to allow participation to ancillary services market by resources in
distribution
E3 Expected 3. Hardware 3 national pilots on monitoring and flexibility resources in distribution
The Cell Controller
Pilot Project
Cell controller
A1 Completed 2. Software On line field data monitoring system
A2 Completed 2. Software On line automatic grid controller
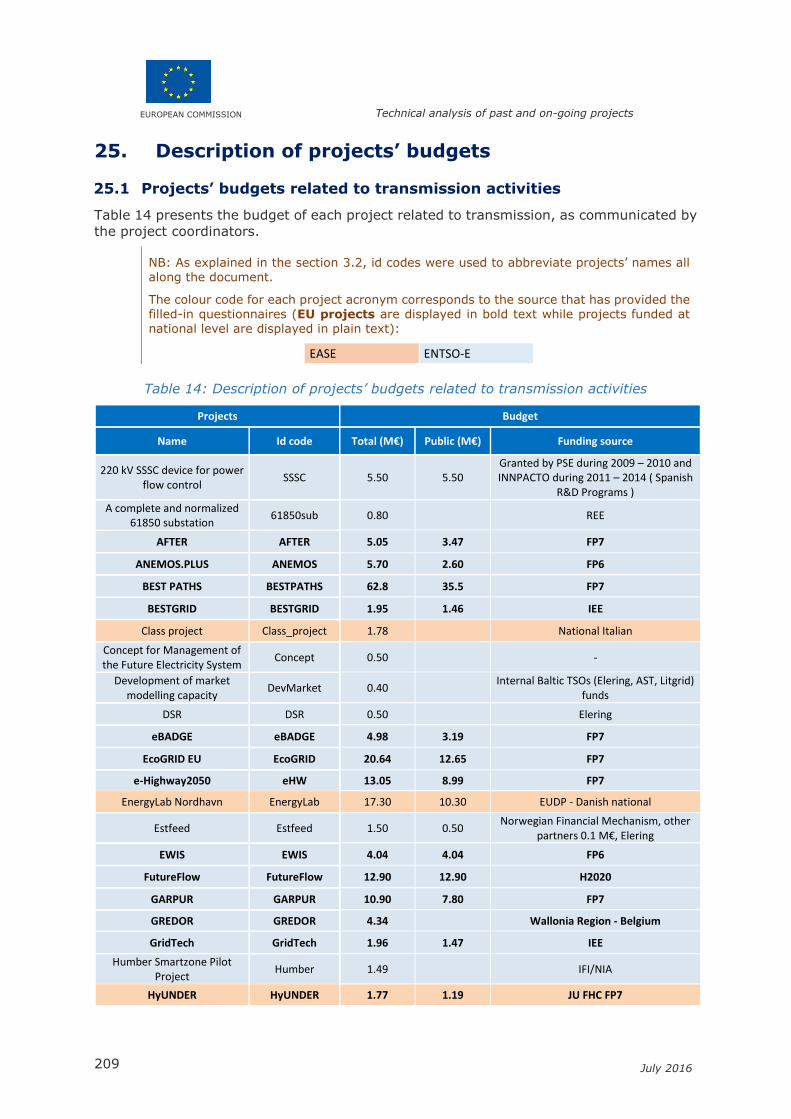
EUROPEAN COMMISSION Technical analysis of past and on-going projects
209 July 2016
25. Description of projects’ budgets
25.1 Projects’ budgets related to transmission activities
Table 14 presents the budget of each project related to transmission, as communicated by
the project coordinators.
NB: As explained in the section 3.2, id codes were used to abbreviate projects’ names all along the document.
The colour code for each project acronym corresponds to the source that has provided the filled-in questionnaires (EU projects are displayed in bold text while projects funded at national level are displayed in plain text):
EASE ENTSO-E
Table 14: Description of projects’ budgets related to transmission activities
Projects Budget
Name Id code Total (M€) Public (M€) Funding source
220 kV SSSC device for power flow control
SSSC 5.50 5.50 Granted by PSE during 2009 – 2010 and INNPACTO during 2011 – 2014 ( Spanish
R&D Programs )
A complete and normalized 61850 substation
61850sub 0.80 REE
AFTER AFTER 5.05 3.47 FP7
ANEMOS.PLUS ANEMOS 5.70 2.60 FP6
BEST PATHS BESTPATHS 62.8 35.5 FP7
BESTGRID BESTGRID 1.95 1.46 IEE
Class project Class_project 1.78 National Italian
Concept for Management of the Future Electricity System
Concept 0.50 -
Development of market modelling capacity
DevMarket 0.40 Internal Baltic TSOs (Elering, AST, Litgrid) funds
DSR DSR 0.50 Elering
eBADGE eBADGE 4.98 3.19 FP7
EcoGRID EU EcoGRID 20.64 12.65 FP7
e-Highway2050 eHW 13.05 8.99 FP7
EnergyLab Nordhavn EnergyLab 17.30 10.30 EUDP - Danish national
Estfeed Estfeed 1.50 0.50 Norwegian Financial Mechanism, other
partners 0.1 M€, Elering
EWIS EWIS 4.04 4.04 FP6
FutureFlow FutureFlow 12.90 12.90 H2020
GARPUR GARPUR 10.90 7.80 FP7
GREDOR GREDOR 4.34 Wallonia Region - Belgium
GridTech GridTech 1.96 1.47 IEE
Humber Smartzone Pilot Project
Humber 1.49 IFI/NIA
HyUNDER HyUNDER 1.77 1.19 JU FHC FP7
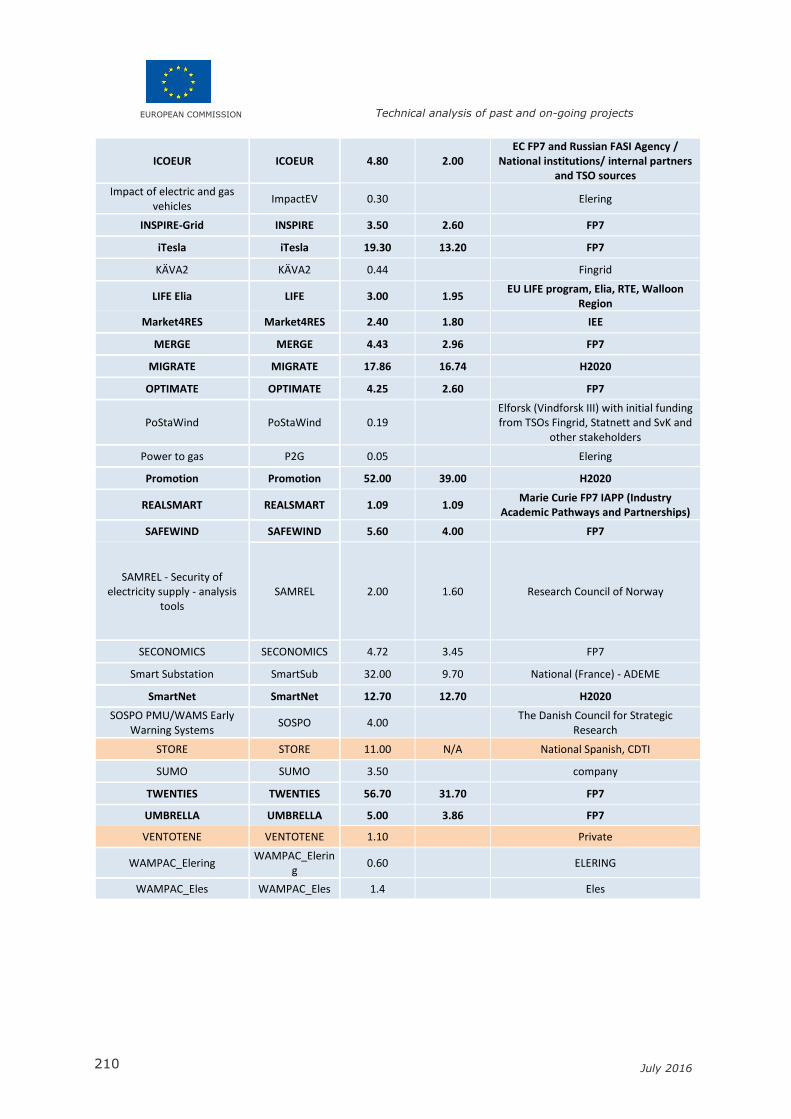
EUROPEAN COMMISSION Technical analysis of past and on-going projects
210 July 2016
ICOEUR ICOEUR 4.80 2.00 EC FP7 and Russian FASI Agency /
National institutions/ internal partners and TSO sources
Impact of electric and gas vehicles
ImpactEV 0.30 Elering
INSPIRE-Grid INSPIRE 3.50 2.60 FP7
iTesla iTesla 19.30 13.20 FP7
KÄVA2 KÄVA2 0.44 Fingrid
LIFE Elia LIFE 3.00 1.95 EU LIFE program, Elia, RTE, Walloon
Region
Market4RES Market4RES 2.40 1.80 IEE
MERGE MERGE 4.43 2.96 FP7
MIGRATE MIGRATE 17.86 16.74 H2020
OPTIMATE OPTIMATE 4.25 2.60 FP7
PoStaWind PoStaWind 0.19 Elforsk (Vindforsk III) with initial funding from TSOs Fingrid, Statnett and SvK and
other stakeholders
Power to gas P2G 0.05 Elering
Promotion Promotion 52.00 39.00 H2020
REALSMART REALSMART 1.09 1.09 Marie Curie FP7 IAPP (Industry
Academic Pathways and Partnerships)
SAFEWIND SAFEWIND 5.60 4.00 FP7
SAMREL - Security of electricity supply - analysis
tools SAMREL 2.00 1.60 Research Council of Norway
SECONOMICS SECONOMICS 4.72 3.45 FP7
Smart Substation SmartSub 32.00 9.70 National (France) - ADEME
SmartNet SmartNet 12.70 12.70 H2020
SOSPO PMU/WAMS Early Warning Systems
SOSPO 4.00 The Danish Council for Strategic Research
STORE STORE 11.00 N/A National Spanish, CDTI
SUMO SUMO 3.50 company
TWENTIES TWENTIES 56.70 31.70 FP7
UMBRELLA UMBRELLA 5.00 3.86 FP7
VENTOTENE VENTOTENE 1.10 Private
WAMPAC_Elering WAMPAC_Elerin
g 0.60 ELERING
WAMPAC_Eles WAMPAC_Eles 1.4 Eles

EUROPEAN COMMISSION Technical analysis of past and on-going projects
211 July 2016
25.2 Projects’ budgets related to distribution activities
Table 15 presents the budget of each project related to distribution, as communicated by
the project coordinators.
NB: As explained in the section 3.2, id codes were used to abbreviate projects’ names all along the document.
The colour code for each project acronym corresponds to the source that has provided the
filled-in questionnaires (EU projects are displayed in bold text while projects funded at national level are displayed in plain text):
EDSO EASE
Table 15: Description of projects’ budgets related to distribution activities
Projects Budget
Name Id code Total (M€) Public (M€) Funding source
ADDRESS ADDRESS 16.00 9.00 FP7-ENERGY ENERGY-2007-7.1-01
ADVANCED ADVANCED 4.10 2.72 FP7-ENERGY ENERGY 2012-7.1.3
ALIADOS ALIA2 4.60 1.86 ETORGAI Regional funding
Ampacity Ampacity 15.50 6.70 National funding scheme (German
BMWi)
ATENEA Microgrid ATENEA 3.10 3.10 Regional Government/FEDER
BIENVENU BIENVENU 10.00 4.00 ADEME
CAES Larne CAES_Larne 12.93 6.47 PCI EU
CHPCOM Combined Heat and Power Communication
CHPCOM 2.04 1.48 ForskEL, Energinet.dk
Control and regulation of modern distribution system
Control 0.67 0.63 ForskEL, Energinet.dk
CryoHub CryoHub 8.33 7.05 H2020-LCE-2015-3
Dezentrale Netzintelligenz Dezentrale 1.00
DISCERN DISCERN 7.90 4.70 FP7-ENERGY ENERGY
DRIP - Demand Response on Industrial Production
DRIP 0.99 0.49 EU (LIFE+ 2011)
DSO challenges from introduction of heat pumps
Heat_Pumps 1.34 0.89 ForskEL, Energinet.dk
Dynamic Network Access tariffs
DNAT N/A 1.00 The pilot costs are expected to be recovered through network tariffs
E-DeMa E-DeMa 7.2 2.8 BMWi (German Minestry)
Electrogas - The renewable e-power buffer
Electrogas 3.50 National Danish
EnergyLab Nordhavn EnergyLab 17.30 10.30 EUDP - Danish national
FINSENY (Future Internet for Smart Energy)
FINSENY 9.13 5.18 FP7-2011-ICT-FI / FI.ICT-2011.1.8
FLEXe WP1 FLEXe 3.00 1.65 TEKES national funding
G4V - Grid for Vehicles G4V 3.76 2.54 EU (FP7)
Gigha Wind Farm Battery Project
Gigha 4.50 Department of Energy & Climate Change
- UK
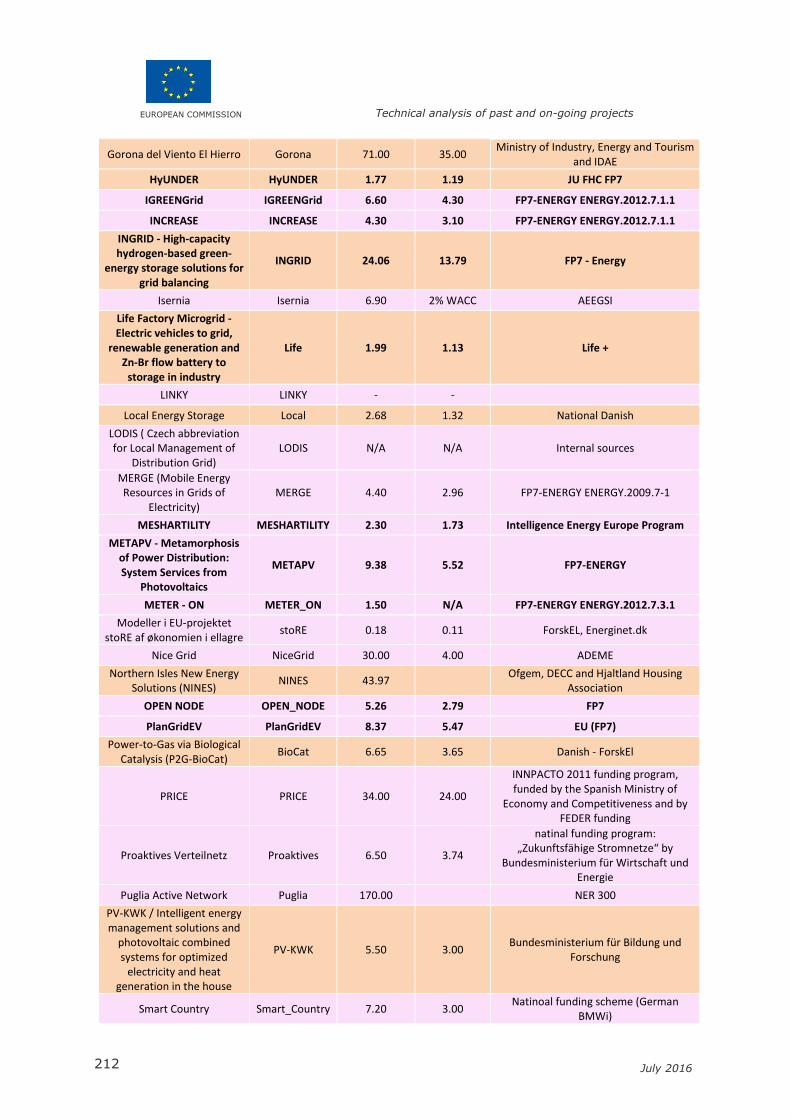
EUROPEAN COMMISSION Technical analysis of past and on-going projects
212 July 2016
Gorona del Viento El Hierro Gorona 71.00 35.00 Ministry of Industry, Energy and Tourism
and IDAE
HyUNDER HyUNDER 1.77 1.19 JU FHC FP7
IGREENGrid IGREENGrid 6.60 4.30 FP7-ENERGY ENERGY.2012.7.1.1
INCREASE INCREASE 4.30 3.10 FP7-ENERGY ENERGY.2012.7.1.1
INGRID - High-capacity hydrogen-based green-
energy storage solutions for grid balancing
INGRID 24.06 13.79 FP7 - Energy
Isernia Isernia 6.90 2% WACC AEEGSI
Life Factory Microgrid - Electric vehicles to grid,
renewable generation and Zn-Br flow battery to
storage in industry
Life 1.99 1.13 Life +
LINKY LINKY - -
Local Energy Storage Local 2.68 1.32 National Danish
LODIS ( Czech abbreviation for Local Management of
Distribution Grid) LODIS N/A N/A Internal sources
MERGE (Mobile Energy Resources in Grids of
Electricity) MERGE 4.40 2.96 FP7-ENERGY ENERGY.2009.7-1
MESHARTILITY MESHARTILITY 2.30 1.73 Intelligence Energy Europe Program
METAPV - Metamorphosis of Power Distribution: System Services from
Photovoltaics
METAPV 9.38 5.52 FP7-ENERGY
METER - ON METER_ON 1.50 N/A FP7-ENERGY ENERGY.2012.7.3.1
Modeller i EU-projektet stoRE af økonomien i ellagre
stoRE 0.18 0.11 ForskEL, Energinet.dk
Nice Grid NiceGrid 30.00 4.00 ADEME
Northern Isles New Energy Solutions (NINES)
NINES 43.97 Ofgem, DECC and Hjaltland Housing Association
OPEN NODE OPEN_NODE 5.26 2.79 FP7
PlanGridEV PlanGridEV 8.37 5.47 EU (FP7)
Power-to-Gas via Biological Catalysis (P2G-BioCat)
BioCat 6.65 3.65 Danish - ForskEl
PRICE PRICE 34.00 24.00
INNPACTO 2011 funding program, funded by the Spanish Ministry of
Economy and Competitiveness and by FEDER funding
Proaktives Verteilnetz Proaktives 6.50 3.74
natinal funding program: „Zukunftsfähige Stromnetze“ by
Bundesministerium für Wirtschaft und Energie
Puglia Active Network Puglia 170.00 NER 300
PV-KWK / Intelligent energy management solutions and
photovoltaic combined systems for optimized
electricity and heat generation in the house
PV-KWK 5.50 3.00 Bundesministerium für Bildung und
Forschung
Smart Country Smart_Country 7.20 3.00 Natinoal funding scheme (German
BMWi)
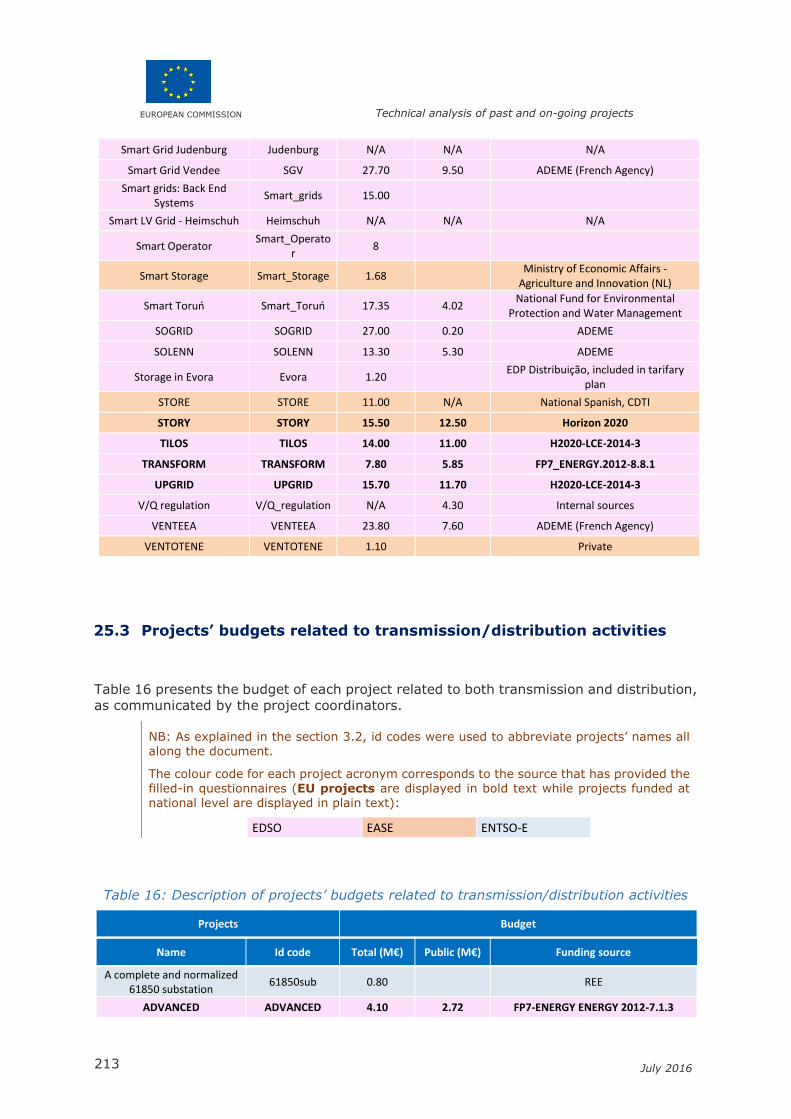
EUROPEAN COMMISSION Technical analysis of past and on-going projects
213 July 2016
Smart Grid Judenburg Judenburg N/A N/A N/A
Smart Grid Vendee SGV 27.70 9.50 ADEME (French Agency)
Smart grids: Back End Systems
Smart_grids 15.00
Smart LV Grid - Heimschuh Heimschuh N/A N/A N/A
Smart Operator Smart_Operato
r 8
Smart Storage Smart_Storage 1.68 Ministry of Economic Affairs - Agriculture and Innovation (NL)
Smart Toruń Smart_Toruń 17.35 4.02 National Fund for Environmental
Protection and Water Management
SOGRID SOGRID 27.00 0.20 ADEME
SOLENN SOLENN 13.30 5.30 ADEME
Storage in Evora Evora 1.20 EDP Distribuição, included in tarifary plan
STORE STORE 11.00 N/A National Spanish, CDTI
STORY STORY 15.50 12.50 Horizon 2020
TILOS TILOS 14.00 11.00 H2020-LCE-2014-3
TRANSFORM TRANSFORM 7.80 5.85 FP7_ENERGY.2012-8.8.1
UPGRID UPGRID 15.70 11.70 H2020-LCE-2014-3
V/Q regulation V/Q_regulation N/A 4.30 Internal sources
VENTEEA VENTEEA 23.80 7.60 ADEME (French Agency)
VENTOTENE VENTOTENE 1.10 Private
25.3 Projects’ budgets related to transmission/distribution activities
Table 16 presents the budget of each project related to both transmission and distribution,
as communicated by the project coordinators.
NB: As explained in the section 3.2, id codes were used to abbreviate projects’ names all along the document.
The colour code for each project acronym corresponds to the source that has provided the filled-in questionnaires (EU projects are displayed in bold text while projects funded at national level are displayed in plain text):
EDSO EASE ENTSO-E
Table 16: Description of projects’ budgets related to transmission/distribution activities
Projects Budget
Name Id code Total (M€) Public (M€) Funding source
A complete and normalized 61850 substation
61850sub 0.80 REE
ADVANCED ADVANCED 4.10 2.72 FP7-ENERGY ENERGY 2012-7.1.3
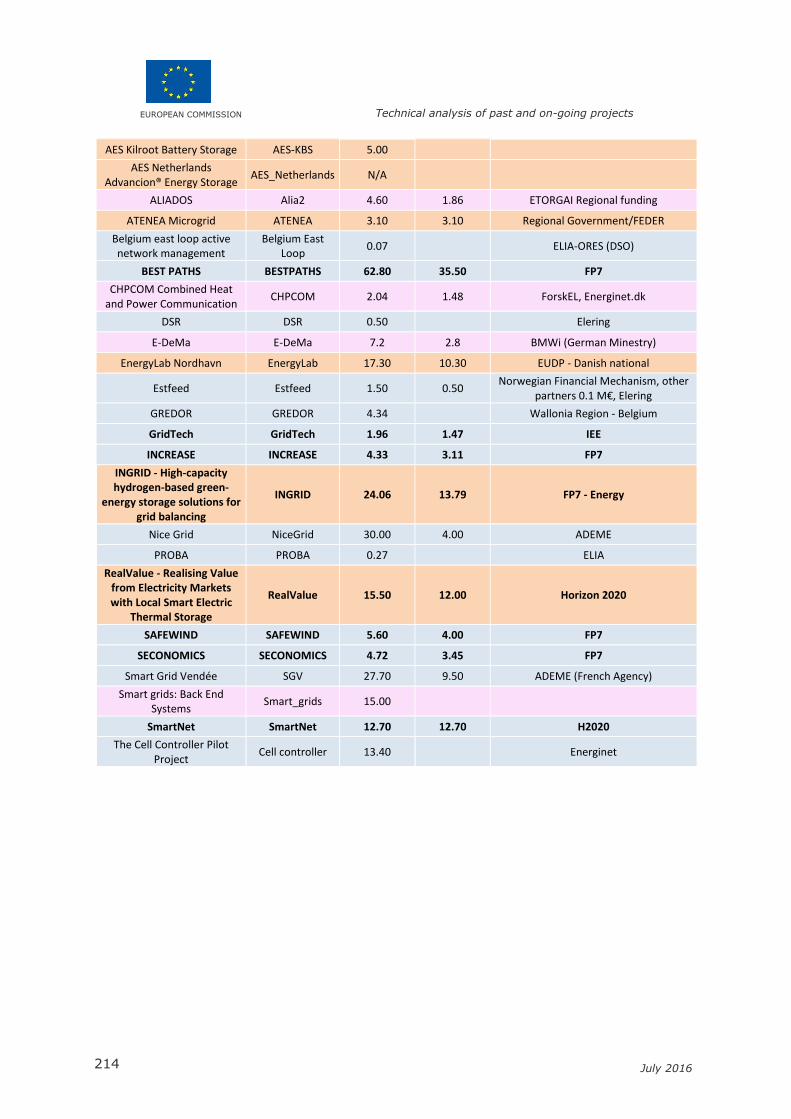
EUROPEAN COMMISSION Technical analysis of past and on-going projects
214 July 2016
AES Kilroot Battery Storage AES-KBS 5.00
AES Netherlands Advancion® Energy Storage
AES_Netherlands N/A
ALIADOS Alia2 4.60 1.86 ETORGAI Regional funding
ATENEA Microgrid ATENEA 3.10 3.10 Regional Government/FEDER
Belgium east loop active network management
Belgium East Loop
0.07 ELIA-ORES (DSO)
BEST PATHS BESTPATHS 62.80 35.50 FP7
CHPCOM Combined Heat and Power Communication
CHPCOM 2.04 1.48 ForskEL, Energinet.dk
DSR DSR 0.50 Elering
E-DeMa E-DeMa 7.2 2.8 BMWi (German Minestry)
EnergyLab Nordhavn EnergyLab 17.30 10.30 EUDP - Danish national
Estfeed Estfeed 1.50 0.50 Norwegian Financial Mechanism, other
partners 0.1 M€, Elering
GREDOR GREDOR 4.34 Wallonia Region - Belgium
GridTech GridTech 1.96 1.47 IEE
INCREASE INCREASE 4.33 3.11 FP7
INGRID - High-capacity hydrogen-based green-
energy storage solutions for grid balancing
INGRID 24.06 13.79 FP7 - Energy
Nice Grid NiceGrid 30.00 4.00 ADEME
PROBA PROBA 0.27 ELIA
RealValue - Realising Value from Electricity Markets with Local Smart Electric
Thermal Storage
RealValue 15.50 12.00 Horizon 2020
SAFEWIND SAFEWIND 5.60 4.00 FP7
SECONOMICS SECONOMICS 4.72 3.45 FP7
Smart Grid Vendée SGV 27.70 9.50 ADEME (French Agency)
Smart grids: Back End Systems
Smart_grids 15.00
SmartNet SmartNet 12.70 12.70 H2020
The Cell Controller Pilot Project
Cell controller 13.40 Energinet
Related Documents