technica l analysis CONTINUED…

Technical analysis CONTINUED…. MEANING OF A MOVING AVERAGE Statistically speaking, a simple average is defined as the summation of the values of the.
Dec 30, 2015
Welcome message from author
This document is posted to help you gain knowledge. Please leave a comment to let me know what you think about it! Share it to your friends and learn new things together.
Transcript

technical analysisCONTINUED…


MEANING OF A MOVING AVERAGE
Statistically speaking, a simple average is defined as the summation of the values of the various observations, divided by the number of observations. Thus:
SIMPLE AVERAGE = Sum of values of n observations / n
Thus if we have, say, 20 days of price data, the sum of the prices of these twenty days divided by 20 will give us the simple average price.
Now, on the 21 SI day we have another price data. In order to compute afresh the 20-day average price, we need to exclude the 1 SI day's price and include in its place the price of the 21 SI day. Similarly, in order to compute average price of 20 days on the 22nd day, we need to exclude the 1 SI and 2nd day's prices and include the 21 st and 22nd day's prices. And so on, as new data comes in, we 'move' one day such that the most recent data is included. Accordingly you would observe that when we want to compute a 20 day moving average, we are effectively considering the price data of the most recent 20 days.
Similarly, therefore, if one wants to compute, say, the moving average of 50 days, price data of the most recent 50 days will be averaged, the process of inclusion of new data and exclusion of old data remaining the same as explained above. Chart 4.01 depicts the movement of the Sensex along with its 34-day moving average (34 DMA). You would observe that moving average is 'superimposed' on the price chart. Also, considering the computation process of a moving average, it is obvious that the 5-day moving average will reflect more recent price data than would a 50-day moving average.
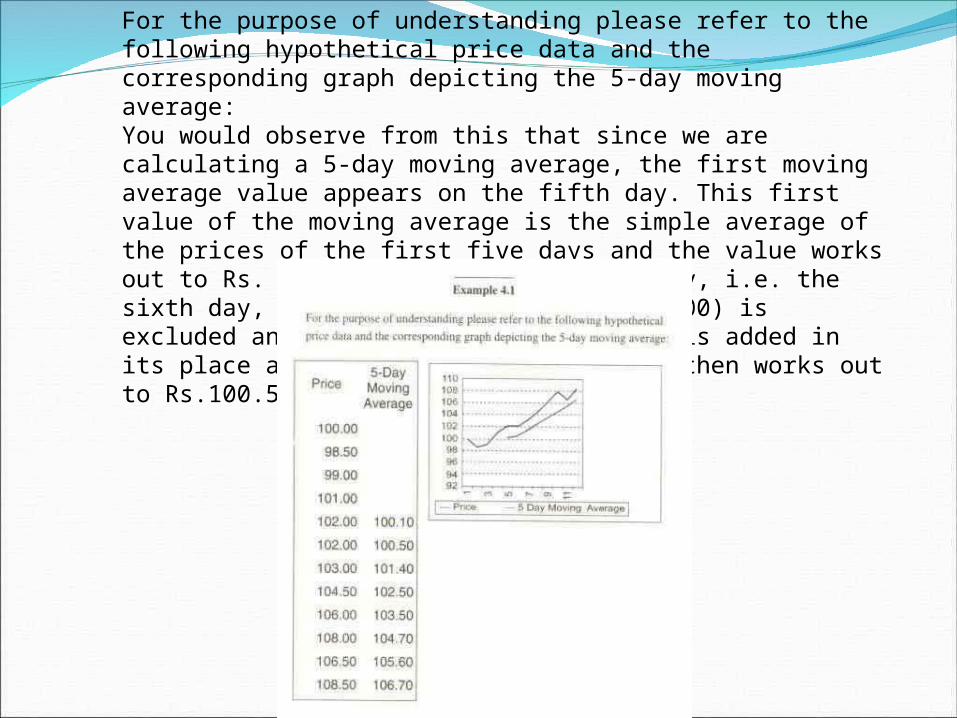
For the purpose of understanding please refer to the following hypothetical price data and the corresponding graph depicting the 5-day moving average: You would observe from this that since we are calculating a 5-day moving average, the first moving average value appears on the fifth day. This first value of the moving average is the simple average of the prices of the first five days and the value works out to Rs. 100.10. On the subsequent day, i.e. the sixth day, the first day's price (Rs. 100) is excluded and the sixth day's (Rs. 102) is added in its place and the value of the average then works out to Rs.100.50

How Moving Averages Help in Studying Price ,Behavior
While a moving average is essentially a derivation from the price data, it is very useful in understalllding the behavior of prices. One important use of moving averages is that they can help in identifying the ongoing trend of prices. Since any moving average has a tendency of smoothening out the seemingly erratic daily price fluctuations, it affords a clearer picture of the underlying trend of prices.
If we take a shorter period moving average, say a 5-day moving average (usually referred to as 5 DMA), it will indicate the short term trend of prices. Similarly, if we take a medium term period such as 30 days, then a 30 DMA will tell us the direction of the intermediate trend. Likewise, a long term moving average such as 200 DMA will highlight the long-term, or primary, trend of prices.
50 DMA and 200 DMA are widely followed by technical analysts to identify and interpret the intermediate (medium term) and primary or long term trends, respectively.
The second important use of moving averages is to determine the support and resistance levels, or ,areas. Thus short term traders who are following, say, a 5-day moving average, would observe that price tends to find support, or resistance as the case may be, near its 5 DMA value.
Similarly, long term investors using price charts for decision making, will observe that prices tend to find support, or face resistance, near their 200 DMA.
Since they can also help identify a change in trend, the third important use of a moving average is that it actually helps a trader or investor to enter or exit a trade. Details of the methods of using this tool are given in the ensuing section.

Methods of Using Moving Averages for Trading or Investing
Since moving averages can tell us when a trend has changed direction, they are the bases of many trend-following trading methods.
In a trending market, i.e. when markets are in a clear up trend or down trend, moving average based trades will generate highly profitable results, and do so with relative safety.
As a corollary, moving average based trades will not be profitable in non-trending markets, i.e. when markets are moving sideways.
It is important to point out here that the trend reversal price patterns we studied earlier in Chapter 3 are the key for identifying reversals. Moving averages, on the other hand are additional evidence of a trend change and may be treated as supportive evidence.
Method 1: Price Crossing Above or Below a Moving Average
A simple way of using the moving average is to buy when the price rises above its defined period's moving average, and sell when it falls below the moving average. It is obvious that shorter the moving average period, the more the prices will have a tendency to fluctuate, or oscillate, above and below it. Hence, it is advisable for traders and investors to take a medium term period moving average for this purpose.
Medium term traders may take a period of more than 20 days while Investors may prefer a period of 50 days or more.
General observation has been that the medium term trend of the Sensex (BSE 30 Index) is adequately captured by its 34-day moving average. This means that the medium term - or, intermediate - trend of the Sensex is bullish (positive) so long as the Sensex remains above its 34-day moving average, and bearish (weak) when it remains below its 34-day moving average (Chart 4.01).
Practical Hint
Enter the trade the day after the Sensex breaks out beyond its 34 DMA and goes beyond the high, or low as the case may be, of the signal day. Thus:
• If a buy signal is generated today the strategy should be to buy tomorrow if today's high is surpassed.
• Similarly, if a sell signal is generated today, then the strategy would be to sell tomorrow if today's low is broken.
This sort of 'filtering' will greatly reduce the number of 'false signals', which such a method may generate. Thus, let's Suppose you get a buy signal today as prices go above the defined period's movingaverage. Now using the filtering technique, you would actually buy tomorrow only if today's high is surpassed. This will give you an idea whether the market is 'really comfortable' with the new higher prices and whether there is a sustainable buying momentum. Conversely, let's say you get a sell signal today as prices go below the defined period's moving average. Using the filtering technique, you would actually sell tomorrow and that too only if today's low is broken. This will give you an idea whether the market is really comfortable with the new lower prices, and whether there really is a sustained selling pressure
METHOD 2 : TRADING THE SLOPE OF MOVING AVERAGE
Trading the slope method tries to overcome one of the drawbacks of the moving average tool - namely, that it does not lead to profitable deals in non-trending markets.
The slope, or steepness, of a moving average line can suggest whether the price is trending or simply moving sideways. If the moving average line is going up steeply, it indicates a strong up trend while if it is falling steeply it suggests a strong down trend. In such cases, trades in the direction of the moving average line will be profitable But if the moving average line is turning flat, i.e. growing more horizontal rather than sloping steeply upward or downwards, it indicates a range bound or non-trending price movement and tells the trader not to trade for the time being. A major advantage of such a method is that it keeps you in the trend for a longer time. Chart 4.02 of Hindustan Petroleum (HPCL) depicts the use of this method.

METHOD 3 : THE TWO MOVING AVERAGE CROSSOVER METHOD.
So far we have considered trading signals when the price crosses over the moving average. Most technical analysts, however, typically use more than one moving average on the price charts. Usually, two moving averages are used and their crossover is considered as a signal for entering or exiting a trade. One of the two moving averages is a shorter period moving average and the other a longer period one. Thus you may decide to use, say,S DMA as the short period moving average and 20 DMA as the longer period moving average. Alternatively, if your time frame for trading or investing is longer, you may decide to use 50 DMA as the short period moving average and 200 DMA as the longer period moving average.
How Trading Signals are Generated Using the Crossover Method Since one of the moving averages selected is of a shorter term and the other one of a longer term, it is obvious that the shorter term moving average will change faster and the longer term moving average will be slower to change. Periodically, the values of these two moving averages will intersect or cross each other. The intersection, or crossing over, is considered as a signal for entering or exiting a trade:
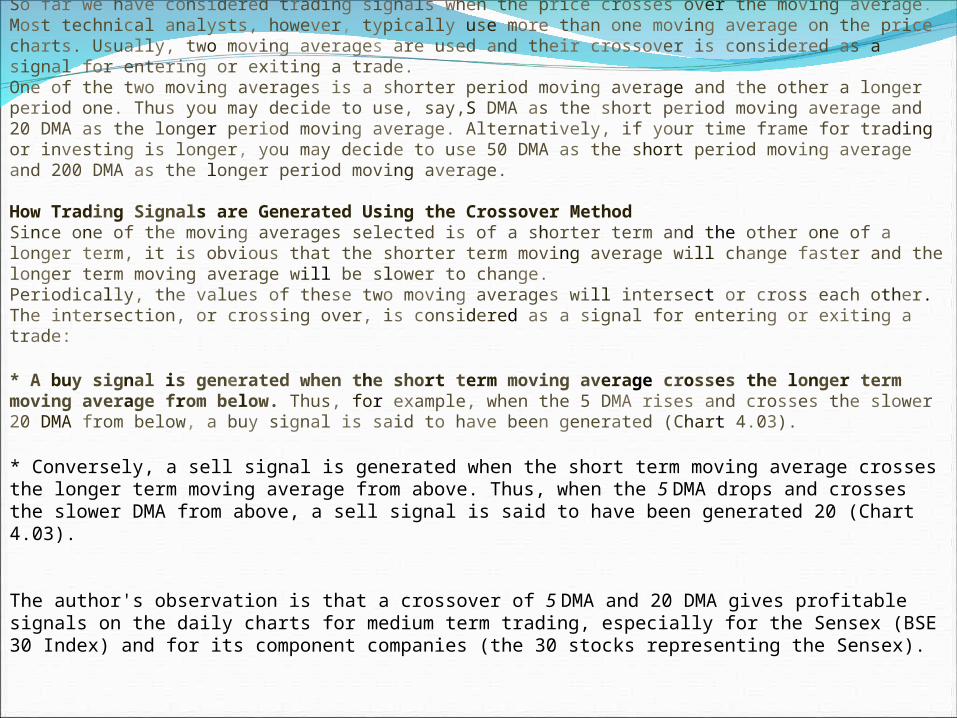
* A buy signal is generated when the short term moving average crosses the longer term moving average from below. Thus, for example, when the 5 DMA rises and crosses the slower 20 DMA from below, a buy signal is said to have been generated (Chart 4.03).
* Conversely, a sell signal is generated when the short term moving average crosses the longer term moving average from above. Thus, when the 5 DMA drops and crosses the slower DMA from above, a sell signal is said to have been generated 20 (Chart 4.03).
The author's observation is that a crossover of 5 DMA and 20 DMA gives profitable signals on the daily charts for medium term trading, especially for the Sensex (BSE 30 Index) and for its component companies (the 30 stocks representing the Sensex).
PRACTICAL HINT
Enter the trade on break out of the high, or low as the case may be, on the day after the crossover signal is generated. As explained in Method 1 earlier, this sort of filtering is useful in reducing the number of false signals. Such filtering helps to test whether the market is really comfortable with the new prices after the signal has been generated.
WHICH TYPE OF MOVING AVERAGE TO USE
Moving averages may be of different types depending on how they are computed. The most common ones are :
•SIMPLE MOVING AVERAGE•EXPONENTIAL MOVING AVERAGE•WEIGHTED MOVING AVERAGE
Example 4.1 at the start of this chapter is based on a simple moving average. However, most price charting software has the facility of plotting all three types of moving averages. The author's experience has been that exponential moving averages give better results, since they smoothen the simple averages. Developed by John Bollinger, Bollinger bands attempt to capture the volatility of a security's price movements, using a moving average as the base.
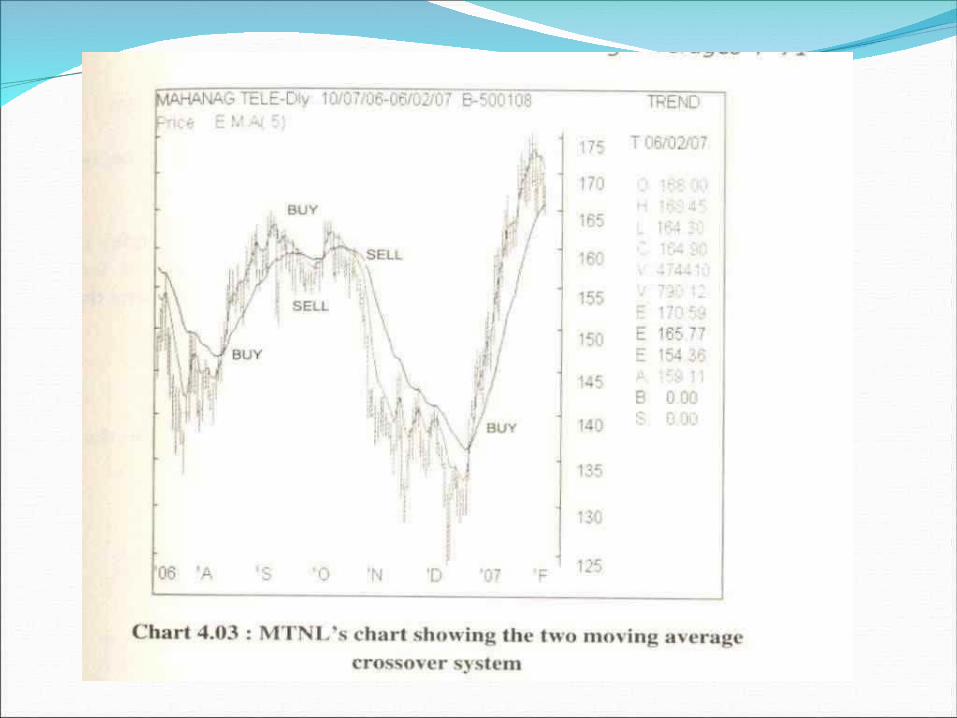
BOLLINGER BANDSBollinger bands consist of three lines. One is a pre-defined moving average and the other two are the upper and lower bands of the moving average line. The upper and lower bands are usually calculated as two standard deviations from the moving average line above and below the moving average line itself.
The standard parameter used by John Bollinger was to use a 20-day simple moving average with a standard deviation of two. Chart 4.04 shows a price chart with the Bollinger bands superimposed upon it. Bollinger bands inform a trader about periods of high and low price volatility. Volatility of a security means the extent of fluctuations in its price over a period of time. If the range of fluctuations is high, then the security is considered as more volatile, and vice versa.

Knowing the volatility of a security can help you anticipate whether its subsequent price move will be smaller or larger. Thus when a security's price is moving in a narrow range (low volatility), the Bollinger bands will narrow down. This would suggest that prices are consolidating before a bigger move ahead. Conversely, when the Bollinger bands are more widely separated, it indicates that the security has recently been volatile and a cooling-off may be likely.
HOW TO USE BOLLINGER BANDS
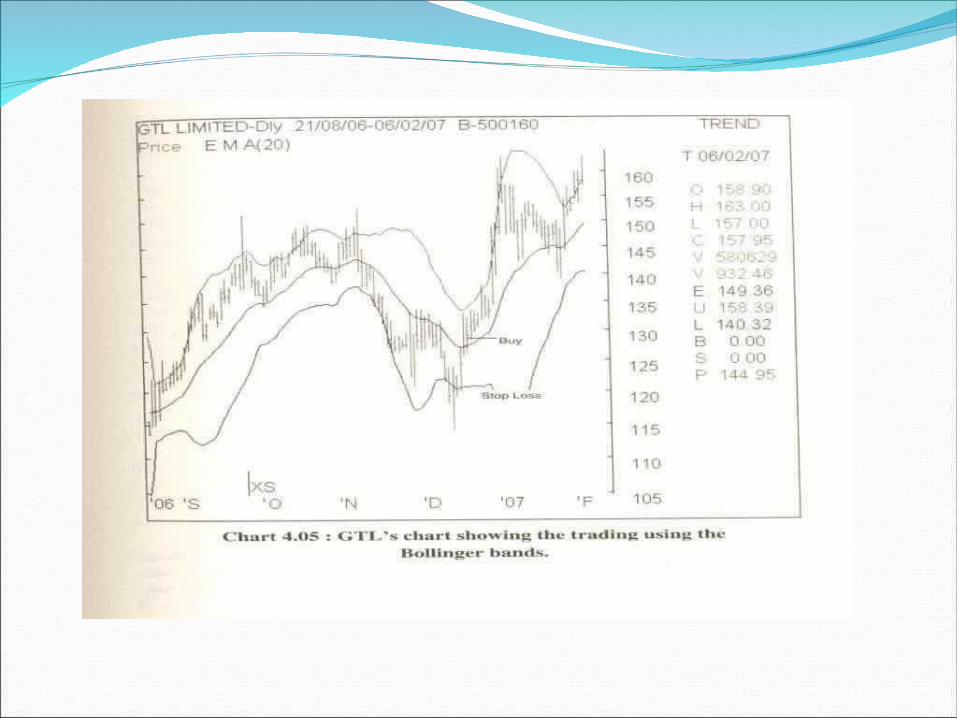
For using Bollinger bands effectively, the upper and lower bands are important. Thus when the price touches the upper or lower band after having remained between the bands for some time, it suggests that the market is turning in that direction. If the price rises above the upper band, it indicates that it's now headed higher and buying may be initiated. Conversely, if the price falls below the lower band, it's an indication that it is now headed lower and selling, or short-selling, may be initiated. Many traders use the middle line (the moving average line) as the trigger line for initiating a buy or a sell. The logic is that during up moves or down moves prices have a tendency to find resistance / support at the middle line and so when the middle line 'barrier' is broken it alerts the trader of a likely change in the market sentiment. Thus, if the price was, say, in a down trend and then closes above the middle line, the aggressive trader may initiate a buy position with a stop loss just below the lower band, and then wait for the price to break out above the upper band. Once the price moves above the upper band, the trader can add to his buy position, expecting the market to become more volatile with an upward bias. Chart 4.05 depicts this phenomenon.
THE FIBONACCI RELEVANCE
"1.618 is often referred to as the 'Golden ratio' or the 'Divine ratio'" Ancient Wisdom - The Fibonacci Number Series In the year 1202, Leonardo Fibonacci discovered an interesting number series while observing rabbits breed. This discovery was further studied and tracked by other observers in later years and has been found to have relevance in many facets of nature.
This number series, called the Fibonacci number series, is derived by adding the previous two numbers to arrive at the next one.
0 1 1 2 3 5 8 13 21 34 55 89 144 233 , AND SO ON. Every number in the series is the summation of the previous two numbers. For example, the number 55 is the summation of 21 and 34. Similarly, 144 is the summation of 55 and 89, and so on.
This number series is found to occur in many natural phenomena. The Fibonacci number, and their ratios, are found in many plants, flowers, leaf arrangements, vegetables and fruits. Moreover, it has been observed that even our own galaxy, the Milky Way, follows this number series.
Even the human anatomy is full of Fibonacci numbers or ratios. The core human body has five outlets (two hands, two legs and one head), and each outlet has five other outlets. For instance, the hards and legs culminate in five, in turn, fingers (including the thumb). The head has five 'outlets' in the form of two nostrils, two ears and one mouth.
It should be pointed out that the occurrence of Fibonacci numbers and ratios is not a universal law but instances of its occurrences are large enough that they cannot be ignored.
The Fibonacci number series also has certain interesting relationships and characteristics: 1. The ratio of each number to its previous number tends towards 1.618. For instance, 89 divided by 55 gives 1.618. This Fibonacci ratio, (namely 1.618), is called the divine ratio or the golden ratio. 2. The ratio of each number to its succeeding number tends towards 0.618. Taking the example of 89 again, 89 divided by 144 gives 0.618, and so on. 3. The ratio of each number to its second succeeding number tends towards 0.382. Taken example of 89 again, 89 divided by 233 is 0.382, and so on.
Use of Fibonacci Numbers and Ratios in Technical Analysis
•Fibonacci numbers are used while defining moving average periods. Thus, instead of taking, say, a 30-day moving average, one may as well use a 34 (Fibonacci) days moving average. Or, instead of a 20-day moving average, one may use the moving average of 21 (Fibonacci) days.
•The second use is in defining market turning points. It is usually found (though not always) that an up or down trend often reverses on Fibonacci days. Thus, if the markets have been falling for a few days, one can expect a reversal on, say, the 51h day or the 81h day.
•The proponents of the Elliot Wave Theory, a more recent branch of technical analysis, extensively use Fibonacci numbers and ratios.
•Fibonacci ratios are used by technical analysts in the retracement theory for determining possible support and resistance areas more of this in the succeeding pages of this chapter.
Using Fibonacci Numbers for Defining Moving Average Periods
In Chapter 4 we discussed the concept and use of moving averages. Many technical analysts use the Fibonacci number series while defining the periods to use in moving averages:
•Thus for short term periods, traders may use 3-day, 5-day, 8-day or 13-day moving averages.
•For medium term periods, one may use 2l-day, 34-day and 55 day moving averages.
•For longer time frames, one may use 89-day, 1 44-day or 233-day moving averages.
Here it is important to mention that the fact of using a Fibonacci number for constructing a moving average does not necessarily suggest a more effective outcome in terms of profitability. However, a general observation has been that using the Fibonacci number 'may' be more useful.
You would remember that in Chapter 4 we noted that the Sensex shows good medium term direction when it is above or below its 34 DMA. This does not however mean that it will be significantly more effective than a 35- or 40-day moving average. Chart 5.01 illustrates a two moving average system using Fibonacci numbers.
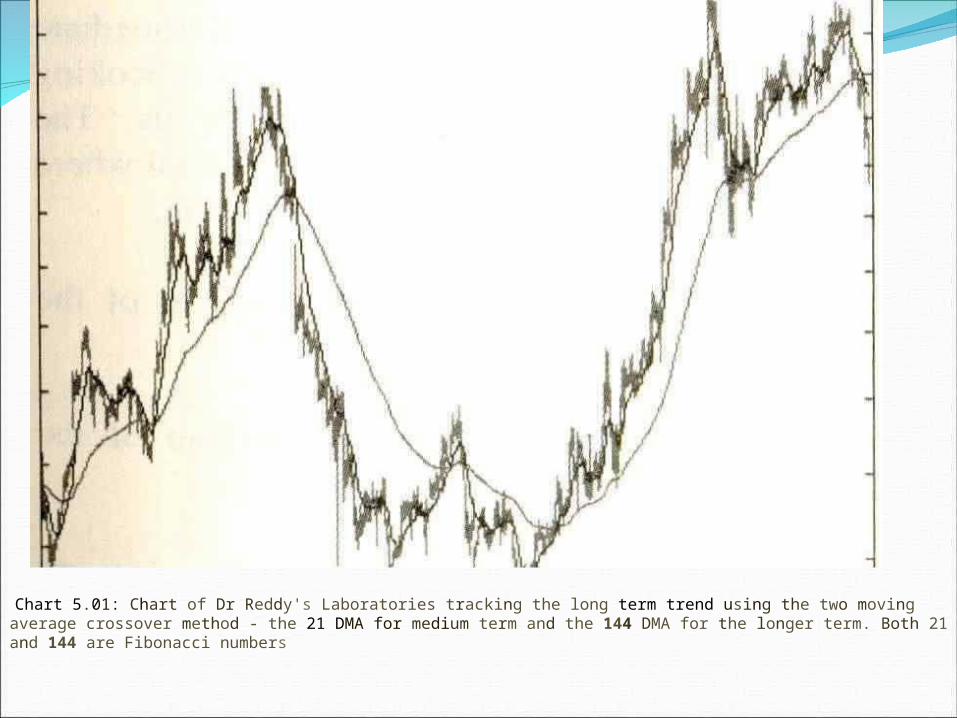
Chart 5.01: Chart of Dr Reddy's Laboratories tracking the long term trend using the two moving average crossover method - the 21 DMA for medium term and the 144 DMA for the longer term. Both 21 and 144 are Fibonacci numbers

USING FIBONACCI RATIOS IN RETRACEMENT THEORY
THE RETRACENT THEORY
As discussed in this chapter the retracement theory seeks to identify the likely levels from where prices may retrace their path. The basics of trend analysis hold that any price move - whether up or down - will have intermittent corrections. As you would recall from Chapter 2, corrections are small price movements which are counter to the main trend. Many a time the trader faces a dilemma as to the extent of the correction. It is here that the retracement theory comes handy.
Retracement levels in an up trend
Suppose that the price trend is up. Now, after making an intermediate peak (high), prices start falling (correction) because of profit booking by some players who may have bought at lower levels. The retracement theory suggests the following three price levels till where the price might retrace (in this case, fall) during the correction:
The first level is a 38.20% correction, or retracement, of the original price move.
The second level is a 50% correction or retracement of the original price move.
The third (and important) level is a 61.80% correction, or retracement, of the original price move.
You might have observed that the first and third retracement percentages are Fibonacci ratios.
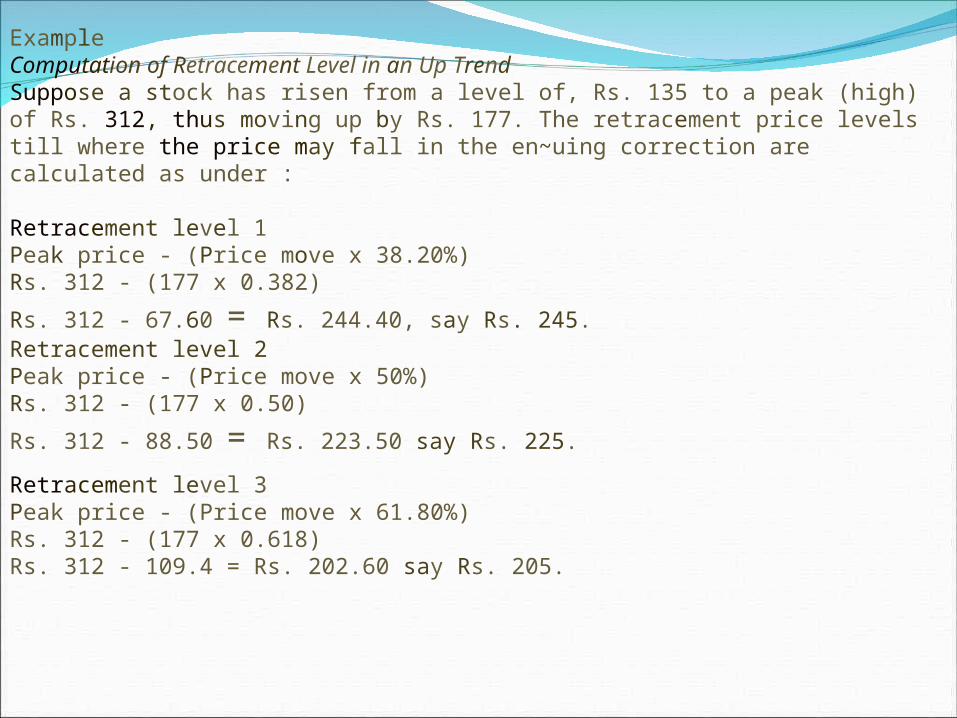
Example Computation of Retracement Level in an Up Trend Suppose a stock has risen from a level of, Rs. 135 to a peak (high) of Rs. 312, thus moving up by Rs. 177. The retracement price levels till where the price may fall in the en~uing correction are calculated as under :
Retracement level 1 Peak price - (Price move x 38.20%) Rs. 312 - (177 x 0.382)
Rs. 312 - 67.60 = Rs. 244.40, say Rs. 245. Retracement level 2Peak price - (Price move x 50%) Rs. 312 - (177 x 0.50)
Rs. 312 - 88.50 = Rs. 223.50 say Rs. 225.
Retracement level 3 Peak price - (Price move x 61.80%) Rs. 312 - (177 x 0.618) Rs. 312 - 109.4 = Rs. 202.60 say Rs. 205.
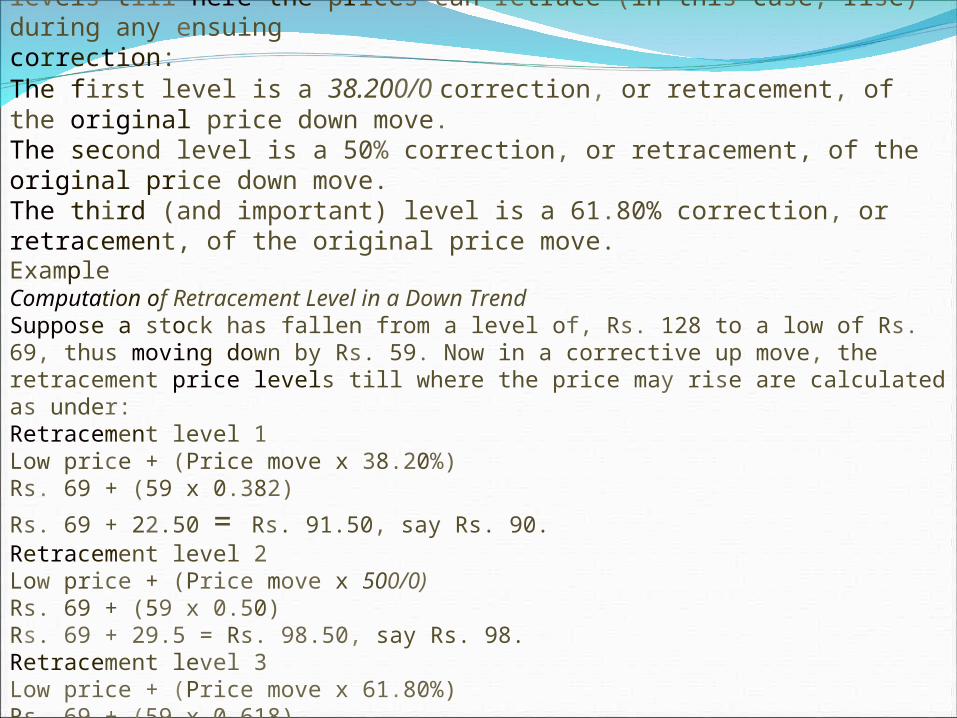
The retracement theory suggests the following three price levels till here the prices can retrace (in this case, rise) during any ensuing correction: The first level is a 38.200/0 correction, or retracement, of the original price down move. The second level is a 50% correction, or retracement, of the original price down move. The third (and important) level is a 61.80% correction, or retracement, of the original price move. Example Computation of Retracement Level in a Down Trend Suppose a stock has fallen from a level of, Rs. 128 to a low of Rs. 69, thus moving down by Rs. 59. Now in a corrective up move, the retracement price levels till where the price may rise are calculated as under: Retracement level 1 Low price + (Price move x 38.20%) Rs. 69 + (59 x 0.382)
Rs. 69 + 22.50 = Rs. 91.50, say Rs. 90. Retracement level 2 Low price + (Price move x 500/0) Rs. 69 + (59 x 0.50) Rs. 69 + 29.5 = Rs. 98.50, say Rs. 98. Retracement level 3 Low price + (Price move x 61.80%) Rs. 69 + (59 x 0.618) Rs. 69 + 36.40 = Rs. 105.40, say Rs. 105.
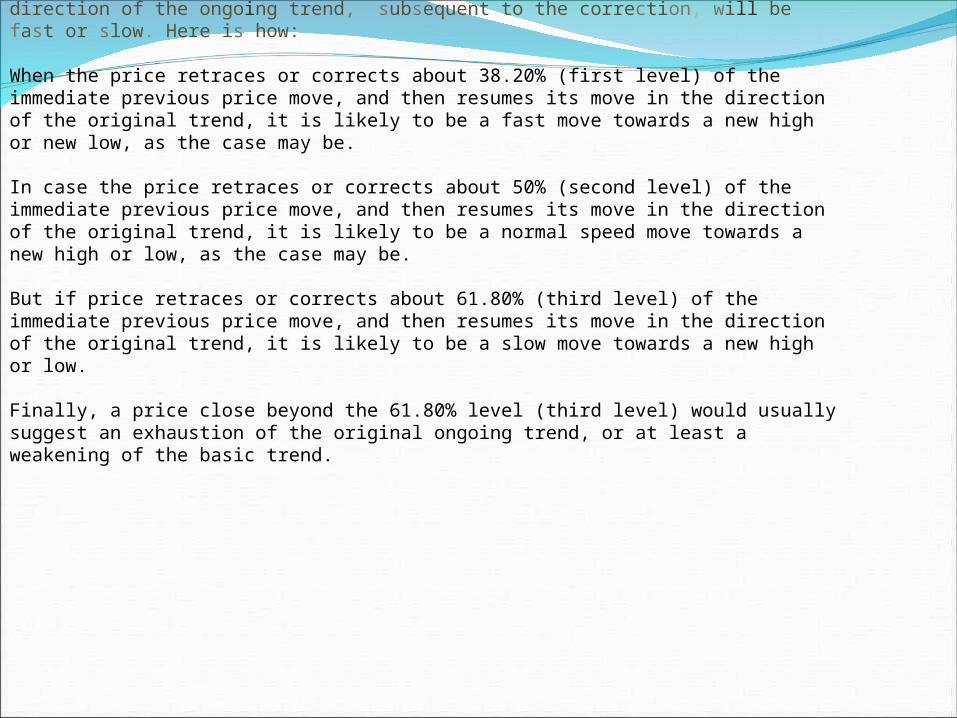
It has been observed that the extent of correction or retracement can be used to predict whether the resumption of the price movement in the direction of the ongoing trend, subsequent to the correction, will be fast or slow. Here is how:
When the price retraces or corrects about 38.20% (first level) of the immediate previous price move, and then resumes its move in the direction of the original trend, it is likely to be a fast move towards a new high or new low, as the case may be.
In case the price retraces or corrects about 50% (second level) of the immediate previous price move, and then resumes its move in the direction of the original trend, it is likely to be a normal speed move towards a new high or low, as the case may be.
But if price retraces or corrects about 61.80% (third level) of the immediate previous price move, and then resumes its move in the direction of the original trend, it is likely to be a slow move towards a new high or low.
Finally, a price close beyond the 61.80% level (third level) would usually suggest an exhaustion of the original ongoing trend, or at least a weakening of the basic trend.
Related Documents