Welcome message from author
This document is posted to help you gain knowledge. Please leave a comment to let me know what you think about it! Share it to your friends and learn new things together.
Transcript

___________________________________________________________________________________________________ Technical Advisory Board Prof. Dr. Hans Peter Nachtnebel, Professor Emeritus,
Institute of Water Management, Hydrology and Hydraulic Engineering, University of Natural Resources and Life Sciences, Austria
Prof. Dr. Hafiz Muminjanov, Agriculture Officer, Food and Agriculture Organization of the United Nations (FAO), Italy & Professor, Tajik Agrarian University, Tajikistan
Prof. Dr. Uygun Aksoy, Retired Professor, Faculty of Agriculture, Ege University, Turkey
Dr. Ahmad Mahdavi, Professor Emeritus, University of Tehran, Iran
Dr. Walter Fernandes, Director, North Eastern Social Research Centre, India
Prof. Dr. Gordana Đurić, Professor, Faculty of Agriculture, University of Banja Luka, BiH
Editor-in-Chief Prof. Dr. G. Poyyamoli, Retired Professor, Dept. of
Ecology & Environmental Sciences, Pondicherry University, India & Adjunct Faculty, JSS Academy of Higher Education& Research, Mysuru, India
Executive Editor Dr. Hasrat Arjjumend, Senior Fellow, Centre for
International Sustainable Development Law, Canada & Founder President, The Grassroots Institute, Canada
Associate Editor Dr. Maja Manojlovic, Assistant Professor & Head,
Department of Ecology and Environmental Protection, University of Banja Luka, Bosnia and Herzegovina (BiH)
___________________________________________________________________________________________________ Editorial Board Dr. Suren N. Kulshreshtha, Professor, Department of
Agricultural and Resource Economics, University of Saskatchewan & Adjunct Professor, Department of Natural Resources Sciences, McGill University, Canada
Dr. Simon J. Lambert, Associate Professor, Department of Indigenous Studies, University of Saskatchewan, Canada
Dr. Corrine Cash, Professor, Faculty of Climate and Environment, St. Francis Xavier University, Canada
Dr. Jason MacLean, Assistant Professor, Faculty of Law, University of New Brunswick, Canada
Charlie Greg Sark (Mi'kmaq-Settler), Assistant Professor, School of Climate Change & Adaptation, University of Prince Edward Island, Canada
Dr. Yuliya Rashchupkina, Assistant Professor, Political Science Department and the School of Climate Change, University of Prince Edward Island, Canada
Dr. Marcos Frommel, International Consultant, Oxfam (Canada)/ INNOVACT II (European Union), Uruguay/Argentina
Dr. Tetiana Fedoniuk, Professor & Head, Department of Forest Ecology and Life Safety, Polissia National University, Ukraine
Dr. Evgeniya Kopitsa, Associate Professor, Department of Environmental Law, Yaroslav Mudryi National Law University, Ukraine
Dr. Anastasiia Zymaroieva, Associate Professor, Educational and Research Center for Ecology and Environmental Protection, Polissia National University, Ukraine
Dr. Nadiia Yorkina, Associate Professor, Department of Ecology, General Biology & Environmental
Management, Bogdan Khmelnitsky Melitopol State Pedagogical University, Ukraine
Dr. Marius Warg Næss, Research Professor, Norwegian Institute for Cultural Heritage Research, Norway
Dr. Mihaela Stet, Senior Lecturer, Department of Electrical, Electronics and Computer Engineering, Technical University of Cluj Napoca, Romania
Dr. Radoslaw Jjanusz Walkowiiak, Biologist, International Equisetological Association, Poland
Dr. Mahani Haji Hamdan, Senior Assistant Professor & Director, Institute of Policy Studies, Universiti Brunei Darussalam, Brunei
Dr. Shafi Noor Islam, Senior Assistant Professor, Dept. of Geography, Environment and Development Studies, University of Brunei Darussalam, Brunei
Dr. Wenresti G. Gallardo, Associate Professor, Department of Marine Science and Fisheries. Sultan Qaboos University, Sultanate of Oman
Dr. G. Prabhakara Rao, Senior Scientist, Rubber Research Institute, India
Dr. Omprakash Madguni, Assistant Professor, Indian Institute of Forest management, India
Dr. Y. Vasudeva Rao, Assistant Professor, Department of Soil Science & Agricultural Chemistry, Visva-Bharati, India
Dr. Santosh Kumar, Professor of Public Policy & Dean, School of Liberal Arts & Management Studies, P.P. Savani University, India
Dr. Sanjay-Swami, Professor, School of Natural Resource Management, Central Agricultural University Imphal, India
Dr. Lun Yin, Professor & Director, Center for Biodiversity and Indigenous Knowledge, Southwest Forestry University, China
Grassroots Journal of Natural Resources ISSN 2581-6853 | CODEN GJNRA9
Dr. Md. Sirajul Islam, Professor, Department of Environmental Science and Resource Management, Mawlana Bhashani Science and Technology University, Bangladesh
Dr. Syed Hafizur Rahman, Professor, Department of Environmental Sciences, Jahangirnagar University, Bangladesh
Dr. Muhammad Aslam Ali, Professor, Department of Environmental Science, Bangladesh Agricultural University, Bangladesh
Dr. Md. Mujibor Rahman, Professor, Environmental Science Discipline, Khulna University, Bangladesh
Dr. Shahidul Islam, Associate Professor, Department of Geography and Environmental Studies, University of Chittagong, Bangladesh
Dr. Dragojla Golub, Associate Professor, Deprtment of Biology and Department of Ecology and Environment Protection, University of Banja Luka, Bosnia and Herzegovina
Dr. Vesna Rajčević, Associate Professor, Department of Physical Geography and Geology, University of Banja Luka, Bosnia and Herzegovina
Dr. Muhamed Katica, Associate Professor, Department of Pathological Physiology, Veterinary Faculty, University of Sarajevo, BiH
Dr. Grujica Vico, Associate Professor, Department of Agroeconomy and Rural Development, University of East Sarajevo, Bosnia and Herzegovina
Dr. Vesna Tunguz, Associate Professor, Department of Plant Production, University of East Sarajevo, Bosnia and Herzegovina
Dr. Nikola Boskovic, Associate Professor, Department of General Economics and Economic Development, University of Kragujevac, Serbia
Jiban Shrestha, Scientist, Nepal Agricultural Research Council, National Plant Breeding and Genetics Research Centre, Nepal
Dr. Prasanthi Gunawardena, Professor of Environmental Economics, Department of Forestry and Environmental Science, University of Sri Jayewardenepura, Sri Lanka
Dr. Nishan Sakalasooriya, Senior Lecturer of Geography and Development Studies, Department of Geography, University of Kelaniya, Sri Lanka
Dr. T. Mathiventhan, Senior Lecturer & Head, Department of Botany, Eastern University, Sri Lanka
Dr. A.G. Amarasinghe, Senior Lecturer & Head, Dept. of Geography, University of Kelaniya, Sri Lanka
Dr. Mokbul Morshed Ahmad, Associate Professor, Department of Development and Sustainability, SERD, Asian Institute of Technology, Thailand
Prof. Dr. Juan M. Pulhin, Professor & UP Scientist III, Department of Social Forestry & Forest Governance & UPLB Interdisciplinary Studies Center for Integrated Natural Resources & Environment Management, University of the Philippines Los Baños, Philippines
Prof. Dr. Anirudh Singh, Professor of Renewable Energy & Dean, School of Science & Technology, The University of Fiji, Fiji
Prof. Dr. Engin Nurlu, Professor & Head, Department of Landscape Architecture, Faculty of Agriculture, Ege University, Turkey
Prof. Dr. Kürşat Demiryürek, Professor, Department of Agricultural Economics, Faculty of Agriculture, Ondokuz Mayıs University, Turkey
Dr. Zornitsa Stoyanova, Associated Professor & Chairwoman of Business Faculty General Assembly
& Deputy Head, Natural Resources Economics Department, Business Faculty, University of National and World Economy, Bulgaria
Dr. Fauziah Shahul Hamid, Associate Professor, Institute of Biological Sciences, Faculty of Science, University of Malaya, Malaysia
Prof. Dr. Sampson Umenne, Full Professor, Dept. of Architecture & Spatial Planning, Faculty of Natural Resources and Spatial Sciences, Namibia University of Science and Technology, Namibia
Dr. M. Surabuddin Mondal, Assistant Professor, Department of Surveying Engineering, Wollega University, Ethiopia
Dr. Firuza B. Mustafa, Associate Professor, Dept. of Geography, & Deputy Dean, Faculty of Arts & Social Sciences, University of Malaya, Malaysia
Dr. Safiah Yusmah binti Dato' M. Yusoff, Associate Professor, Geography Department, Faculty of Arts and Social Sciences, University of Malaya, Malaysia
Dr. Chandradeo Bokhoree (Sanjeev), Associate Professor & Head, School of Sustainable Development and Tourism, University of Technology, Mauritius
Prof. Dr. Yousef Nazzal, Professor & Chair, College of Natural and Health Sciences, Zayed University, UAE
Prof. Dr. Waleed Mohamed Reyad Hamza, Professor of Aquatic Ecology, Department of Biology, College of Science, United Arab Emirates University, UAE
Dr. Naeema Al Hosani, Associate Professor & Chair, Geography and Urban Sustainability Department, United Arab Emirates University, UAE
Dr. Manar Bani Mfarrej, Assistant Professor, College of Natural and Health Sciences, Zayed University, United Arab Emirates
Grassroots Journal of Natural Resources ISSN 2581-6853 | CODEN GJNRA9
www.grassrootsjournals.org/gjnr Volume 4 Issue 3 (September 2021)

Coordinated and published by the Grassroots Institute, the Grassroots Journal of Natural
Resources (GJNR) is an international journal dedicated to the latest advancements in natural
resources throughout the world. The goal of this journal is to provide a platform for scientists,
social scientists, policy analysts, managers and practitioners (on all academic and professional
levels) all over the world to promote, discuss and share various new issues and developments
in different arenas of natural resources.
Published by:
The Grassroots Institute 548 Jean Talon Ouest
Montreal, Quebec Canada H3N 1R5
Contact:
Dr. Hasrat Arjjumend
Executive & Managing Editor
Copyright without Restrictions
Grassroots Journal of Natural Resources allows the author(s) to hold the copyright without
restrictions and will retain publishing rights without restrictions. The submitted papers are
assumed to contain no proprietary material unprotected by patent or patent application;
responsibility for technical content and for protection of proprietary material rests solely with
the author(s) and their organizations and is not the responsibility of our journal or its editorial
staff. The main (first/corresponding) author is responsible for ensuring that the article has been
seen and approved by all the other authors. It is the responsibility of the author to obtain all
necessary copyright release permissions for the use of any copyrighted materials in the
manuscript prior to the submission. Further information about the Copyright Policy of the
journal can be referred on the website link https://grassrootsjournals.org/credibility-
compliance.php#Copyright Grassroots Journal of Natural Resources by The Grassroots Institute is
licensed under a Creative Commons Attribution 4.0 International License based on a work
at www.grassrootsjournals.org
Grassroots Journal of Natural Resources ISSN 2581-6853 | CODEN GJNRA9
Grassroots Journal of Natural Resources. This work is licensed under the Creative
Commons Attribution International License (CC BY 4.0).
http://creativecommons.org/licenses/by/4.0/
Grassroots Journal of Natural Resources ISSN 2581-6853 | CODEN GJNRA9
ARTICLES INCLUDED IN
Volume 4 Issue 3 (September 2021)
M-00238 Globalization, Greed and Glocal Ecology: A Psychological Perspective By: Olena Khrushch
1-12
M-00239 Farmers’ Trait Preferences for Varietal Replacement: A study to boost rice productivity in Odisha, India By: Sk Mosharaf Hossain
13-23
M-00240 Adoption of Renewable Energy Technologies and Energy Source Choice of Households By: Seble Mulugeta, Amenu Leta
24-33
M-00241 Application of Introduced Representatives of Lonicera pileata Oliv. in Landscaping of the Right-Bank Forest-Steppe of Ukraine By: Liudmyla Varlashchenko, Anatolii Balabak, Valentyna Mamchur, Valentyn Polishchuk
34-41
M-00242 Agroforestry Practices for Climate Change Adaptation and its Contribution to Farmers’ Income By: Raju Prasad Bhandari, Rajeev Joshi, Deepa Paudel
42-51
M-00243 Assessment of the Ecological Risks of Landslide Damages in the Carpathian Region By: Dmytro Kasiyanchuk, Liudmyla Shtohryn
52-61
M-00244 Articulating Fragrant Agarwood Formation as an Outcome of the Interaction between the Insect Zeuzera conferta and Aquilaria trees – A Review By: Arup Khakhlari, Supriyo Sen
62-78
M-00245 Ecosystem Approach in Dealing with Invasive Alien Species: International, European and Ukrainian Experience of Legal Regulation By: Yevhenii Suietnov, Elbis Tulina
79-93
Grassroots Journal of Natural Resources. This work is licensed under the Creative
Commons Attribution International License (CC BY 4.0).
http://creativecommons.org/licenses/by/4.0/

M-00246 Biomass Production and Nutrient Accumulation by Natural Rubber (Hevea brasiliensis Wild. Ex A. Juss.) Müell. Arg. Clones in a Humid Tropical Area in South India By: Kannattuvadakkethil Krishnankutty Ambily, Arumugham Ulaganathan
94-110
M-00247 The Potential Role of the Artificial Intelligence in Combating Climate Change and Natural Resources Management: Political, Legal and Ethical Challenges By: Olena Lozo, Oleksii Onishchenko
111-131
M-00248 Detection of Land Use Land Cover Changes Using Remote Sensing and GIS Techniques in a Secondary City in Bangladesh By: Md. Lutfor Rahman, Syed Hafizur Rahman
132-146
M-00249 Assessing Local Vulnerability to Climate Change by Using Livelihood Vulnerability Index: A Case Study of Dipang Watershed in Central Himalaya Region of Nepal By: Kapil Dhungana, Harish Bahadur Chand, Dinesh Bhandari, Abhishek Kumar, Sanjay Singh, Ramesh Bohara
147-163
M-00250 Assessment of Temporal Variation of Water Quality Parameters and the Trophic State Index in a Subtropical Water Reservoir of Bangladesh By: Md. Sirajul Islam, Yousuf Ali, Md. Humayun Kabir, Rofi Md. Zubaer, Nowara Tamanna Meghla, Mausumi Rehnuma, Mir Md. Mozammal Hoque
164-184
M-00251 Comprehensive Overview of REDD+ in India: Status, Opportunities and Challenges By: Harish Bahadur Chand, Sanjay Singh, Abhishek Kumar, Anil Kumar Kewat, Roshan Bhatt, Ramesh Bohara
185-200
Grassroots Journal of Natural Resources. This work is licensed under the Creative
Commons Attribution International License (CC BY 4.0).
http://creativecommons.org/licenses/by/4.0/
Globalization, Greed and Glocal Ecology: A Psychological Perspective
Olena Khrushch Department of General and Clinical Psychology, Vasyl Stefanyk Precarpathian National University, Ivano-
Frankivsk, Ukraine. Email: [email protected] ǀ ORCID: 0000-0002-5126-444X
Abstract Evidently, a globalized society causes global environmental
crises. Undoubtedly, survival of human life on the planet Earth
is threatened. Is there any connection between globalization,
environmental crises and psychological manifestations? What
are the psychological perspectives linking the ecological
damages from local to the global scale? This article explores
such intricate relationships and discusses the implications. The
underlying principal cause is human’s unending greed to acquire
maximum materials and power to control the planet and entire
humanity. The greed is believed to be a bottomless pit which
exhausts the person in an endless effort to satisfy the need
without ever reaching satisfaction. The greedy people are
supposed to have biological, psychological and sociological
drives. Evidently, global destruction of the ecosystems and
natural environment are directly or indirectly linked to
unprecedented chronic human greed and self-indulgence.
Undoubtedly, unencumbered chronic greed of a few elite
institutions led by top capitalists has put the entire planet in
havoc and infiltrated widespread sufferings at the global scale.
Conclusively, psychological basis of environmental problems
has a sociological and socio-historical scope within the frame of
globalization. Psychological account of the environmental
crisis is explained subsequently in this article followed by a case
study of deforestation of Carpathian Mountains staged by a
greedy Austrian man.
Keywords Greed; Globalization; Ecological impact; Psychological
perspective; Environmental destruction
How to cite this paper: Khrushch, O. (2021). Globalization, Greed and Glocal Ecology: A
Psychological Perspective. Grassroots Journal of
Natural Resources, 4(3): 1-12. Doi:
https://doi.org/10.33002/nr2581.6853.040301
Received: 28 July 2021
Reviewed: 18 August 2021
Provisionally Accepted: 20 August 2021
Revised: 25 August 2021
Finally Accepted: 31 August 2021
Published: 30 September 2021
Copyright © 2021 by author(s)
This work is licensed under the Creative
Commons Attribution International
License (CC BY 4.0).
http://creativecommons.org/licenses/by/4.0/
Grassroots Journal of Natural Resources, Vol.4 No.3 (September 2021) ISSN 2581-6853 | CODEN: GJNRA9 | Published by The Grassroots Institute
Website: http://grassrootsjournals.org/gjnr | Main Indexing: Web of Science
M – 00238 | Review Article
ISSN 2581-6853 | 4(3) Sep 2021

Grassroots Journal of Natural Resources, Vol.4, No.3 (September 2021), p.1-12 | ISSN 2581-6853 | CODEN GJNRA9
Doi: https://doi.org/10.33002/nr2581.6853.040301
2 Olena Khrushch
Introduction: The Globalization
In the modern world, the telecommunications and global economic freedom have changed the landscape of
people’s movements across the borders and world regions (Arnett, 2002). In the book “The Battle in Seattle,
1999”, The Economist magazine writes that exports manifested in world gross domestic product (WGDP)
grew from 8% in 1950 to 26% by 1998, and global travels increased by 700% since 1960 (Held, 1998).
Began in 19902, globalization is known to be a complex process having varying pace and direction
ascertained by different factors such as economic, social, and environmental determinants. The
environmental definition of the globalization reveals that the globalization should be considered as a process
of resulting environmental crises caused by global environmental externalities (e.g., pollution) (Ilić and
Hafner, 2015). Hence, a globalized society causes global environmental crises. As a result, survival of
human life on the planet Earth is threatened (Ilić and Hafner, 2015). Is there any connection between
globalization, environmental crises and psychological manifestations? What are the psychological
perspectives linking the ecological damages from local to the global scale? This article will explore such
intricate relationships and discuss the implications. Arnett (2002) articulates that psychology explores
indirectly the globalization in terms of psychological theory, research on acculturation, identity, and other
implications.
Greed
Amid the complexity of the human behaviour, the psychology explores greed as causative agent for
environmental destruction by economic externalities. Robertson (2013) defines the greed as one
psychological phenomenon characterized with the selfish quest to possess objects, people, wealth,
substances, status, appreciation, power, or attention beyond the extent required for basic human comfort.
To simply put, Webster (2013) defined the greed as an excessive desire for more. It manifests a state of
insatiability exhibiting quest for obtaining preferred goods. Scientists have further described the greed
beyond mere accumulation and opined that greed may be characterized by causing potentially negative
consequences that emanate from one’s own actions. Apparently, an excessive desire for something is usually
at the expense of others (Mussel and Hewig, 2013). Certain scientists attributed trait greed shares with other
dark traits like psychopathy and machiavellianism (Furnham et al., 2013; Moshagen et al., 2018). Another
scholar, D’Souza (1995), classified the greed as the direct outcome of dissatisfaction, emptiness, and
discontentment. He argued further that an act of filling emptiness and discontentment, the greedy individual
acts to acquire more resources, admiration and power, often at the cost of the comfort, livelihood and
happiness of other individuals (D’Souza, 1995). As a result, greed comprises an ability to cause profound
human suffering. Fromm (1939) quoted famously, “Greed is a bottomless pit which exhausts the person in
an endless effort to satisfy the need without ever reaching satisfaction”. According to D’Souza (1995), greed
has a potential to cause sufferings at (local) community level as well as global (wider) level. At the global
level, possible outcomes of greed and self-indulgence are manifested in the form of wars, extreme poverty,
social instability, invasions, massacres, over-population, economic crises and climate change (D’Souza,
1995).
It is interesting to understand the epistemology of greed and acquisitiveness. The greedy people are
supposed to have biological, psychological and sociological drives (D’Souza, 1995). The American
Psychiatric Association (APA) articulated that greed is closely associated with biological and psychological
disorders such as Narcissistic Personality Disorder (NPD), substance addiction, behavioral addiction,
Obsessive-Compulsive Personality Disorder (OCPD) and Anti-Social Personality Disorder (ASPD) (Angres
and Bettinardi-Angres, 2008; American Psychiatric Association, 2000). Can we relate these disorders with
the state of addiction? The research on addiction suggests that disturbed balance of neurotransmitters and
hormones (e.g., dopamine) can be attributed to substance addictions (Salamone, 1992; Crews, Zou and Qin,
2011; Kauer and Malenka, 2007). Psychiatrists established that behavioral or soft addictions have
neurobiological correlation to dopamine (Di Chiara and Bassareo, 2007; Girault and Greengard, 2004;
Brewer and Potenza, 2008). Camarena et al. (2001) and Denys, Zohar and Westenberg (2004) have created

Grassroots Journal of Natural Resources, Vol.4, No.3 (September 2021), p.1-12 | ISSN 2581-6853 | CODEN GJNRA9
Doi: https://doi.org/10.33002/nr2581.6853.040301
3 Olena Khrushch
an evidence linking Obsessive-Compulsive Personality Disorder (OCPD), dopamine and serotonin
hormonal regulation. Anti-Social Personality Disorder (ASPD) is found being caused by high testosterone
and low serotonin levels in human body (Black, 2007; Sjöberg et al., 2007). Famous psychologists, Freud
and Maslow, recognized greed as a mental disorder and they strongly correlated the greed with narcissism
and meta-pathology (Schultz and Schultz, 2004; Freud, 1914). Narcissistic Personality Disorder (NPD) is
also believed to be primarily a psychological problem originated in an individual generally through negative
childhood attachment styles (Groopman and Cooper, 1995), though inheritance and sociological factors also
contribute to its development (Schulze et al., 2013). Usually, majority of individuals suffering from NPD
does not seek any solution as they do not treat this problem a, illness (Golomb, 1995). To understand the
concept of greed and acquisitive behavior, psychoanalyses reckons that there is a strong correlation between
early negative attachment styles and acquisitive behavior (Nikelly, 2006).
Beyond medico-psychiatric analysis, phenomenon of globalization can be linked with the greed through the
capitalism, which is master driver for self-interests and the quest for profits. The force of capitalism demands
the use of advertising bombardment for goods and services, and massive advertising leads to high
competition, envy and acquisitiveness (Lasch, 1991; Holbrook, 1987). Paradoxically, in a capitalistic
society, narcissism and self-interests are admired rather than rejected. Nikelly (2006) argues that vast
economic and social inequalities in a society lead to severe problems of mental and physical health that
develop gradually into mental disorders and addictions.
Environment
A “common heritage of mankind” is the tag used for the environment. The environmental issues are
increasingly the cross-boundary and global issues, since it is impossible for one national alone to tackle
these problems (Basler, 2011). The globalization is a process considered manifesting local and global
environmental crises at massive scale; therefore, the problems emanating from the global economic crisis
are now beyond the scope of national and regional frameworks. They are evidently global. Expanded
especially after 1991, globalization brought in growth of international trade and financial surges, coupled
with extended cooperation among countries and innovations in the sphere of science and technology.
However, it has brought in enormous environmental destruction wherever it has occurred (D’Souza, 1995).
Ilić and Hafner (2015) identified main causes of environmental problems to be the industrial production,
development of traffic, growth of energy production, development of technics and technology,
unprecedented exploitation of natural resources, and chemical contamination of soil and foods. Today,
civilizational development has inevitably caused the gradual emergence of global warming and climate
change on the planet (Ilić and Hafner, 2015).
In November 2013, the World Economic Forum commissioned a Global Risks Perception Survey (GRPS)
involving 1,000 experts of economics, society, geopolitics, environment, and technology (Schwab, 2014).
This GRPS identified 3 out of 10 top risks pertaining to environment: water crises, failure of climate change
mitigation and adaptation, and extreme weather events. So, explicitly, the environment occupies one-third
space among all the consequences that come up from globalization process. An overwhelming scientific
literature clearly spelts out that the climate change occurs primarily due to surge of greenhouse gases
produced as a result of anthropogenic activities (Change, 1996). It is known from many decades that
greenhouse gases are emitted from industries, transport vehicles, combustion engines, and deforestation.
But the world has failed mitigating climate change (Olivier, Peters and Janssens-Maenhout, 2012). More of
this mitigation failure is attributed to free market capitalism carried over by excessive consumerism and
corporate profits (Newell and Paterson, 2010; Klein, 2011). Precise example of greenhouse gases and
resulting climate change is of developed road traffic. In other words, globalization, as a planetary process
(Siriner et al., 2011), has catalyzed the development of traffic. The transport infrastructure has, in turn,
created a series of environmental problems, e.g., increased air pollution, high noise levels, taking up space,
and unabated release of harmful and hazardous substances. In particular, traffic vehicles are mostly
dependent on oil, which builds 14% of emissions into the atmosphere containing harmful gases that affect
Grassroots Journal of Natural Resources, Vol.4, No.3 (September 2021), p.1-12 | ISSN 2581-6853 | CODEN GJNRA9
Doi: https://doi.org/10.33002/nr2581.6853.040301
4 Olena Khrushch
human health (Radić Jovanović et al., 2012). Thus, application of modern technology greatly contributes to
global warming and increased emission of harmful gases. The global warming is a problem of ecological
nature and disturbs vital functions of the planet Earth. Cited examples are the chief drivers of the resource
use and exploitation, which directly spoil environmental quality and create significant environmental
problems. The resource depletion beyond a threshold diminishes its ability to regenerate, brings thereby
threatening with disappearance of resources (Ilić and Hafner, 2015).
For our daily life, globalization is perceived having far-reaching consequences. Is it boon or bane having
faster access to technologies, effective communication networks, and bountiful innovations? There is a
simple equation: development of technics and technology leads to industry evolution, development and
proliferation, which adversely affects the environment. A stark example of technological advancement
affecting the environment is the green revolution in agriculture. In a bid to accomplish higher agricultural
production and protect the plants against pests and diseases, toxic chemicals are dosed into cropfields
causing the contamination of whole agroecosystem. Notably, the use of chemicals to destroy weeds and
other unwanted plants disturbs the balance in the agroecosystem. The food products obtained after the
application of toxic chemicals in agriculture are proved to be very harmful to human health (Ilić and Hafner,
2015). As discussed above, the climate change is caused by anonymous human activities. To understand
better the climate change, discussing weather variations seems important. Of late, weather’s extreme events
are observed more frequently. Heat waves, cold waves, and significant unseasonal and unusual tropical
cyclones cause immense damages. The direct effects of extreme weather events can include famines,
landslides, floods, draughts, and large-scale destruction of property and the ecosystem. According to the
Intergovernmental Panel on Climate Change (IPCC), economic cost of extreme weather events has risen
since 1980 (Meehl et al., 2000). IPCC and countless scientists have attributed extreme weather to human-
induced temperature rise and greenhouse effects (Hansen et al., 2000).
Nothing has caused faster apparent impact than the water scarcity, which is supposed primarily caused by
over-utilization of water, climate change, increased pollution (Postel, 1997). This is a global problem now
and can be attributed to either physical water scarcity or economic water scarcity. Economic water scarcity
is connected to human greed and tendency to grab the resources. It is triggered by poor water management,
corrupt governments, lack of property rights, bureaucratic inertia, overconsumption, and shortage of
infrastructure investment (United Nations, 2006; Zetland, 2011). The water scarcity ultimately leads to the
food insecurity. As the economists articulate, food insecurity is a product of the land degradation, global
water crises, land grabbing, agricultural diseases, climate change, political corruption, and infringement of
food sovereignty. Explicitly, almost all of the causes are directly attributed to corporate control and political
powers that take over lands for the sake of profits. Amon all these causes, land grabbing typically can be
traced within countries and transboundary. Internationally, wealthy countries and powers purchase and
acquire land in poorer countries in the name of corporate agriculture or industrialization. Blas and England
(2008) informed that several middle eastern and western powers were involved in grabbing land in backward
African countries. Similarly, political corruption in Sub-Saharan Africa has caused massive famines (Cunny
and Hill, 1999). When we look behind, it is observed that the negative impacts of globalization on the
environment overtake the positive ones. As explained in preceding para, the environmental destruction is
not confined to national boundaries, rather it is transboundary and export oriented. Economic demand in
one rich country induces the export of natural resources from poor or developing countries. For example,
massive deforestation is going on in Ukrainian and Romanian Carpathians to export the wood to EU
countries. Likewise, in Australia, about 90% of native forest trees is exported, thus destroying the natural
heritage of Australia.1 Moreover, according to WWF, the process of civilization and globalization has
engulfed one-half of the forests once covered the Earth (Ilić and Hafner, 2015).
A discussion on how global environmental governance addresses the transboundary environmental damages
is necessary. There must be an international body to address global problems and risks related to the
1 https://www.bushheritage.org.au/who-we-are/our-challenge/land-clearing
Grassroots Journal of Natural Resources, Vol.4, No.3 (September 2021), p.1-12 | ISSN 2581-6853 | CODEN GJNRA9
Doi: https://doi.org/10.33002/nr2581.6853.040301
5 Olena Khrushch
environment, national conflicts, the global economy, geopolitics, and global political issues. Despite a
number of global institutions i.e., World Bank, United Nations, International Monetary Fund, International
Criminal Court, World Wildlife Fund, World Trade Organization, G-8, and North Atlantic Treaty
Organization, exist, the greed-caused global environmental problems are not addressed adequately. Barnett
and Duvall (2005) described this as the main reason behind failure of global governance to be attributed to
power struggles between the developed countries being controlled by the global financial sector. Evidently,
global destruction of the ecosystems and natural environment are directly or indirectly linked to
unprecedented chronic human greed and self-indulgence. Undoubtedly, unencumbered chronic greed of a
few elite institutions led by top capitalists has put the entire planet in havoc and infiltrated widespread
sufferings at the global scale. In the same fashion, the greed is manifested at the community level too, as it
causes same destruction at the local level (D’Souza 1995).
Conclusively, psychological basis of environmental problems has a sociological and socio-historical scope
within the frame of globalization. With this backdrop, it is noted that globalization occurs in all areas of life,
primarily in the economic, political, cultural, and psychological spheres (Smrečnik, 2002). Nevertheless,
the environmental crisis refers to the global “invasion” on ecosystems, that is, the man’s immoral behavior
towards nature (Malešević, 2004). Psychological account of the environmental crisis is explained
subsequently.
Psychology of Environmental Destruction
An interplay of varied human behaviours cumulatively acting as drivers is responsible for the degradation
of ecological components in the nature. It is the complex attitude of man to nature that has caused the
destruction of forest resources, exploitation of ores and minerals, and extinction of countless species of flora
and fauna. The energy consumption for industrial purposes has multiplied in less than a decade. Scholars
predict that non-renewable energy sources, such as oil, will completely disappear by the end of the 21st
century (Malešević, 2004). Truly articulated that man is the only creature on Earth who is destroying own
survival through consumptive and destructive attitude towards nature. In Davies’ opinion, economics is the
discipline that describes the way in which humans interact with the nature while ensuring the production
and reproduction, which means that there is no environmental issue independent of economic relations
(Davies, 2006). Since the advent of industrial society, it emphasized on maximum exploitation of nature
and the environment, in order to extract maximum profits, while morality is usually ignored. With such
exploitative attitudes of greedy humans, the significant destruction of nature occurs. Considering this
background, Lomborg (2009) advocates for a radical change in the values and systems. Some call that Earth
can be saved by promoting and imposing a spiritual dimension of environmental culture, which includes
knowledge and habits, acceptance of norms about natural and social environment, adopted values, attitudes
and beliefs, health care norms, and norms for quality of life (Koković, 2010).
According to Steg and Vlek (2009), “environmental behavior is driven by any or combination of three key
factors: motivational factors (i.e., perceived costs and benefits, moral, and normative concerns and affect),
contextual factors, and habitual behavior”. More elaborate views are given by Stern (2000) who identified
“four causal variables for a given environmental behavior: attitudinal factors; contextual forces; personal
capabilities; and habit or routine behaviors”. Steve Taylor, in his book Back to Sanity2, suggests that human
beings may be collectively suffering from a psychological disorder (‘humania’), and their reckless abuse of
the environment is one of the foremost evidences (Taylor, 2014). He quoted the example of the Indigenous
people how they have been consistently appalled by American white people’s lack of respect for the natural
world, and a systematic abuse of nature by them. Taylor (2014) further quotes Chief Seattle comparing the
white man, over 150 years ago, to “a stranger who comes in the night and takes from the land whatever he
needs”. Having a great foresight, Chief Seattle warned then US President Franklin Pearce that his people
2 http://www.amazon.com/Back-To-Sanity-Healing-
Madness/dp/1848505477/ref=pd_sim_b_1?ie=UTF8&refRID=0JK02F53603SMK1JT7GK

Grassroots Journal of Natural Resources, Vol.4, No.3 (September 2021), p.1-12 | ISSN 2581-6853 | CODEN GJNRA9
Doi: https://doi.org/10.33002/nr2581.6853.040301
6 Olena Khrushch
"will devour the Earth and leave behind only a desert" (Taylor, 2014). Taylor (2014) has described
psychological causes of human’s abusive and exploitative attitude to nature. He explained two main
psychological factors. The first, “over-developed sense of ego” is the intensified sense of individuality. He
explained it by differentiating between western so-called “civilised” peoples and the nature-loving tribal
Indigenous peoples. The Indigenous cultures have polytheistic diversity liked world visions. Usually, the
Indigenous peoples do not exist as self-centric person, selfish being and egoist individuals. They reflect a
collective and community identity embedded with their land. Taylor (2014) quotes the anthropologist
Silberbauer who explained features of G/wi people of the Kalahari Desert of Africa. G/wi people bears an
identity grossly ‘group-referenced’ rather than individual; resultantly, these Indigenous individuals identify
themselves representing their kin or community group instead of their solitary identity (Silberbauer, 1994).
Similarly, Boydell (2001) elaborated the Indigenous peoples of Fiji having a concept of “self-embedded-in-
community [which] contrasts with the western value of individualism with its idea of the self as separate
and separating from others”. Such collective values underlie Indigenous peoples’ strong belongingness to
their land. They attribute their life to the land. The Fijian anthropologist Ravuva (1983) exclaimed that
Fijian’s attachment to their vanua or land is “an extension of the concept of self. To most Fijians the idea
of parting with one’s vanua or land is tantamount to parting with one’s life”. On the contrary, modern
societies are full of heightened sense of individuality that sows duality and separation inherently. It cages
our souls within our own egos. In the words of Taylor (2014), “we perceive nature as something other that
we see natural phenomena as objects which we are entitled to use for our own devices”.
Next is the ‘de-sacralised’ vision of nature is the modern man’s inability to sense the natural processes. Our
vision in the childhood has intense vividness and a liveliness, but our adulthood changes the perceptions of
the world to become de-sensitised and automatic. It means the world transforms to a shadowy, one-
dimensional place full of material and source of materialism. In the eyes of Aboriginal people, we the
modern society lose the ability to dream natural being around us. It ultimately pushes us to treat natural
phenomena as objects. Implications of this vision transformation from childhood to adulthood leads humans
not to have any qualms about abusing and exploiting the natural world, tearing up its surface in search of
resources and polluting it with our waste (Taylor, 2014). Thus, this psychological interpretation tends to
change our dilemma even more dismal. To suggest a solution to this psychological problem, Taylor (2014)
adds that “only sure way of ensuring our survival as a species would be for us to undergo a psychological
shift – specifically, to transcend our sense of separateness and regain a sense of connection to nature and a
"sacralised" vision of the natural world”.
Case Study of Forest Destruction in Romanian and Ukrainian Carpathians
Not only in Carpathian Mountains, but in entire eastern Europe, the primary forests were existing in large
areas. Some of the areas still have these primary forests. However, deforestation in Carpathian areas is
rampant under the nose of the EU and domestic law enforcement agencies.
Lehermayr, Reinhart and Kaiser (2020) exposes, “Quantum of destruction of is horrific: 40 tree trunks every
minute, 2400 every hour, 28,800 every shift. Virgin forests in Central-Eastern Europe are the last remaining
ones on the continent, yet they are being mercilessly torn down. Part of this multi-billion Euro industry is a
mafia-like system; Austrian timber companies are right at the heart of it”. According to Lehermayr,
Reinhart and Kaiser (2020), insatiable hunger for wood of an Austrian man, Gerald Schweighofer, has
caused massive destruction in Carpathian Mountains of Ukraine and Romania. An environmental journalism
group, Addendum3, investigated and exposed the forest destruction performed by Austrian company,
Schweighofer, in Carpathian areas. Many governments including Romania and Poland have strictly
monitored the activities of this Austrian company because of serious suspicion of involvement in the illegal
logging of the last remaining primary forests in Eastern Europe. After the Addendum ran a campaign against
3 https://www.addendum.org/
Grassroots Journal of Natural Resources, Vol.4, No.3 (September 2021), p.1-12 | ISSN 2581-6853 | CODEN GJNRA9
Doi: https://doi.org/10.33002/nr2581.6853.040301
7 Olena Khrushch
Schweighofer, it has been removed from prestigious Forest Stewardship Council4 (FSC) certification of
sustainably produced timber. An FSC investigation report claimed a “clear and convincing evidence” that
Schweighofer was “involved systematically […] directly and indirectly, in the trade of timber which has
been harvested and/or handled in violation of existing laws and regulations” (Lehermayr, Reinhart and
Kaiser, 2020). Today, Gerald Schweighofer has a palace like home in central Vienna, and after 2002 he sold
his sawmills in Austria to build vastly bigger structures in Romania. The Romanian politicians welcomed
him, and he now has more than 3000 staff, a turnover of 762 million Euros and 5 factories in the country,
producing pellets and sawn, glued and profiled timber supplied throughout the world (Lehermayr, Reinhart
and Kaiser, 2020). With annual turnover of more than 2 billion Euros, Kronospan is another company, which
is world’s biggest manufacturer of wood-based panels supplying to Ikea. Operating jointly with Swiss
Krono, the Kaindls5 is one of the main players in the Carpathians. Perhaps the Egger is largest global
concern having 18 sites in 8 different countries.
The Global Forest Watch6 has estimated that 317,000 hectares of Romanian forest were lost to logging
between 2001 and 2017. Since 2003, nearly 260 million Romanian trees have cleared. About 38.6 million
cubic metres of timber was taken from Carpathian forests between 2014 and 2018 (Lehermayr, Reinhart
and Kaiser, 2020). It is articulated that half of these trees were in national parks or conservation areas. The
forest utilisation plans of Romania permitted just 18 million cubic metres of wood, which means total
amount felled was twice the legal limit. Remaining 20 million cubic metres of timber was actually extracted
by mafia timber (Lehermayr, Reinhart and Kaiser, 2020).
Describing the process of stealing the timber right at the site of operation, Mihail Hanzu, a qualified forestry
engineer who used to be Forestry Inspector for a municipality near Sibiu, told to Addendum, “It was a whole
system, from the mayor to my colleagues in the forestry department. I found more than 50 ways they were
going about their fraud. The most common one was by deliberately understating the volumes. They mark a
tree for felling. Write in the documents that it measures 18 metres, even if it actually measures 40, and that
it has a diameter of 25 centimetres, even if it is actually 50. There is a great deal of money in that difference,
and that money flows into their system. The municipality issues a licence for the logging, the companies
sell the timber to middlemen, who store it in their timber yards and later deliver it to the sawmills along
with all the necessary legal declarations” (Lehermayr, Reinhart and Kaiser, 2020). In the words of David
Gehl from the Environmental Investigation Agency (EIA), a US NGO investigating the predatory
exploitation of nature throughout the world, “While the deforestation of the Amazon rainforest has been
horrifying people for years, hardly anyone realises that Europe contains remnants of virgin forests that are
just as important. The fact that the majority of these are on our doorstep, in the Carpathians, and are under
threat remains an untold story.” The EIA reports spot Schweighofer for having been the “biggest receiver
of illegal timber” and having “lied about the source of its products for more than 10 years”. Schweighofer
receives timber from various sources, including Slovakia, the Czech Republic, Ukraine. Johannes Zahnen,
a forestry expert with the WWF, pointed out that 2013 EU Timber Regulation7 has failed addressing cross-
boundary deforestation, though it was supposed to stop the illegal timber trade in the EU region (Lehermayr,
Reinhart and Kaiser, 2020).
Ukraine is an important timber supplier country. The Ukrainian railway reaches directly to the doors of the
Schweighofer and Egger factories in Rădăuți, north of Romania. An environmental
organisation Earthsight8 discovered in 2018 that Schweighofer alone was receiving 80 railway wagons
every day from Ukraine. In Hungary, Kaindl family has opened a new chipboard factory right on border
with Ukraine. In the Ukrainian Carpathians, one can witness bald forestlands. “In order to keep the timber
well below the market price, foreign companies were willing to make payments to letter-box companies
4 https://fsc.org/en/about-us 5 https://www.addendum.org/holzmafia/kaindl-kronospan/ 6 https://www.globalforestwatch.org/ 7 https://ec.europa.eu/environment/eutr2013/index_en.htm 8 https://www.earthsight.org.uk/
Grassroots Journal of Natural Resources, Vol.4, No.3 (September 2021), p.1-12 | ISSN 2581-6853 | CODEN GJNRA9
Doi: https://doi.org/10.33002/nr2581.6853.040301
8 Olena Khrushch
registered in Belize and Panama in the name of his wife,” says Tara Ganesh from Earthsight (Earthsight,
2018a). “The head of the forestry authority is accused of having pocketed bribes from four timber companies
to the tune of 13.6 million Euros between 2011 and 2014” (Earthsight, 2018a). The Earthsight (2018a)
reported that “ghost trains” having false papers and full loads of logs find their way across the border with
Romania at night. A forestry director was caught red-handed offering police officers $10,000 “tribute
money” to turn a blind eye to illegal logging activities. Since only Ukrainian firewood and sawn wood can
be exported, exports of such woods are on rise. There is a trick in this too. Higher quality timber is
deliberately declared a lower grade wood, purely falsely. The greedy criminal system behind such nexus is
so strong that it engages into corruption various actors at all levels – from lawyers to bankers, and from
forestry directors to customs and state railway officials. The WWF inspected 149 sites over 18 months and
estimated that as much as 1.4 million cubic metres of timber is being illegally felled in the Ukrainian
Carpathians alone each year, compared with 4 million cubic metres of official harvesting (Earthsight, 2018b,
2018c). Anonymous sources in the government reiterated, “The forest control system in Ukraine is not
functioning properly. There are fundamental problems with how felling licences are being issued in Ukraine,
in particular as regards approvals for sanitary felling. It should be unthinkable that an enterprise is in charge
of issuing a felling licence for its own operations, which is currently the case for all sanitary felling”
(Earthsight, 2018a). The EU is by far the largest destination for Ukrainian wood exports, representing 70
per cent of the total. EU purchases have been rising rapidly, breaking 1 billion Euro in 2017. Earthsight
estimates that at least 40 per cent of this wood was harvested or traded illegally (Earthsight, 2018a).
Conclusion
What is overall learning from the analytical account of this interrelationship of the greed, globalization and
environmental catastrophe? The greed of acquiring resources, money, materials and power is very common
and not restricted to one or two persons. Sometimes, the whole society is psychologically sick. Everyone
wants to gain one benefit or the other in a chain of nexus. Yet, the champions of greedy society are
undoubtedly the top capitalists operating the global institutions and controlling the chains of globalization
down the line. Hence, the implications of greed are not only economic, but also social, psychological and,
ultimately, environmental. So-called civilized world has damaged the planet most; this is witnessed when
comparison is done with already existing examples of infringed and threatened Indigenous societies. There
can be series of theoretical recommendations to address the greed syndrome by a human at psychological
level. However, it might be futile exercise, as the human learns from his/her mistakes and its grave
implications.
References
American Psychiatric Association (Ed.) (2000). Diagnostic and statistical manual of mental disorders:
DSM-IV-TR®. Washington, DC: American Psychiatric Publishing, Inc.
Angres, D.H. and Bettinardi-Angres, K. (2008). The disease of addiction: Origins, treatment, and recovery.
Disease-a-Month, 54(10): 696-721. DOI: https://doi.org/10.1016/j.disamonth.2008.07.002
Arnett, J.J. (2002). The Psychology of Globalization. American Psychologist, 57(10): 774–783. DOI:
https://doi.org/10.1037//0003-066X.57.10.774.
Barnett, M.N. and Duvall, R. (Eds.) (2005). Power in global governance (Vol. 98). Cambridge: Cambridge
University Press.
Baslar, K. (2011). The Concept of the Common Heritage of Mankind in International Law. The Netherlands:
Kluwer Law.
Bernard, H. and Gerlach, S. (1998). Does the Term Structure Predict Recessions?: the International
Evidence (No. 1892). Centre for Economic Policy Research, London, UK.
Black, D.W. (2007). Antisocial Personality Disorder. Corsini Encyclopedia of Psychology, 4th edition.
London: Wiley, 19 January 2010.
Blas, J. and England, A. (2008). Arable land, the new gold rush, African and poor countries cautioned. Afrik
News, 20 August 2008.
Grassroots Journal of Natural Resources, Vol.4, No.3 (September 2021), p.1-12 | ISSN 2581-6853 | CODEN GJNRA9
Doi: https://doi.org/10.33002/nr2581.6853.040301
9 Olena Khrushch
Boydell, S. (2001). Philosophical Perception of Pacific Property: Land as a Communal Asset in Fiji. Pacific
Rim Real Estate Society, January 2004, p.21.
Brewer, J.A. and Potenza, M.N. (2008). The neurobiology and genetics of impulse control disorders:
relationships to drug addictions. Biochemical Pharmacology, 75(1): 63-75. DOI:
https://dx.doi.org/10.1016%2Fj.bcp.2007.06.043
Camarena, B., Rinetti, G., Cruz, C., Hernández, S., de la Fuente, J.R. and Nicolini, H. (2001). Association
study of the serotonin transporter gene polymorphism in obsessive–compulsive disorder. The
International Journal of Neuropsychopharmacology, 4(03): 269-272. DOI:
https://doi.org/10.1017/s1461145701002516
Change, I.C. (1996). The science of climate change. Second Assessment Report of the Intergovernmental
Panel on Climate Change. Cambridge: Cambridge University Press.
Crews, F.T., Zou, J. and Qin, L. (2011). Induction of innate immune genes in brain create the neurobiology
of addiction. Brain, Behavior and Immunity, 25: S4-S12. DOI:
https://doi.org/10.1016/j.bbi.2011.03.003
Cunny, F.C. and Hill, R.B. (1999). Famine, Conflict, and Response: A Basic Guide (pp. 117-126). West
Hartford: Kumarian Press.
D’Souza, J. (1995). Greed: Crises, Causes, and Solutions. International Journal of Humanities and Social
Science, 5(7): 1-6.
Davies, J. (2006). Capitalism as an environmental issue. Blog, available at:
http://www.gocatgo.com/texts/capenv.html
Denys, D., Zohar, J. and Westenberg, H.G. (2004). The role of dopamine in obsessive compulsive disorder:
preclinical and clinical evidence. The Journal of Clinical Psychiatry, 65: 11-17. Available online at:
https://pubmed.ncbi.nlm.nih.gov/15554783/
Di Chiara, G. and Bassareo, V. (2007). Reward system and addiction: what dopamine does and doesn’t do.
Current Opinion in Pharmacology, 7(1): 69-76. DOI: https://doi.org/10.1016/j.coph.2006.11.003
Earthsight (2018a). Complicit in Corruption: How billion-dollar firms and EU governments are failing
Ukraine’s forests. July 2018. Available online at: https://fe8a03e2-1131-44e7-a06a-
fb468c2a30d4.filesusr.com/ugd/624187_673e3aa69ed84129bdfeb91b6aa9ec17.pdf
Earthsight (2018b). Ukraine PM announces crackdown on illegal logging and timber corruption. News, 18
July 2018. Available online at: https://www.earthsight.org.uk/news/investigation/ukraine-pm-
crackdown-illegal-logging-timber-complicit-corruption
Earthsight (2018c). Fate of Ukraine’s forests hangs in the balance, as new reports confirm the scale of illegal
logging and timber corruption. New, 23 November 2018. Available online at:
https://www.earthsight.org.uk/news/press-release/complicit-corruption/ukraine-fate-forests-in-
balance-new-report-confirms-scale-illegal-logging
Freud, S. (1914). On narcissism: An introduction. In: J. Strachey et al. (Trans.), The Standard Edition of the
Complete Psychological Works of Sigmund Freud, Volume XIV. London: Hogarth Press.
Fromm, E. (1939). Selfishness and self-love. Psychiatry, 2(4): 507-523.
Furnham, A., Richards, S.C. and Paulhus, D.L. (2013). The dark triad of personality: A 10 year review.
Social And Personality Psychology Compass, 7: 199–216. DOI: https://doi.org/10.1111/spc3.12018.
Girault, J.A. and Greengard, P. (2004). The neurobiology of dopamine signaling. Archives of Neurology,
61(5): 641-644. DOI: https://doi.org/10.1001/archneur.61.5.641
Golomb, E. (1995). Trapped in The Mirror. New York: Harper Collins.
Groopman, L.C. and Cooper, A.M. (1995). Narcissistic personality disorder. Washington, DC: Gabbard
GO. & American Psychiatric Press, Inc., pp.2327-2343.
Hansen, J., Sato, M., Ruedy, R., Lacis, A. and Oinas, V. (2000). Global warming in the twenty first century:
An alternative scenario. Proceedings of the National Academy of Sciences, 97(18): 9875-9880.
Held, D. (1998). Democratization and globalization. In: D. Archibugi, D. Held and M. Ko¨hler (Eds.), Re-
imagining political community (pp.11–27). Stanford, CA: Stanford University Press.
Holbrook, M.B. (1987). Mirror, mirror, on the wall, what's unfair in the reflections on advertising? Journal
of Marketing, 51(3).
Grassroots Journal of Natural Resources, Vol.4, No.3 (September 2021), p.1-12 | ISSN 2581-6853 | CODEN GJNRA9
Doi: https://doi.org/10.33002/nr2581.6853.040301
10 Olena Khrushch
Ilić, I. and Hafner, P. (2015). Environmental Aspects of the Process of Globalization – Negative
Implications and Crisis. Facta Universitatis Series: Economics and Organization, 12(2): 109-120.
Available online at: https://core.ac.uk/download/pdf/228550099.pdf
Kauer, J.A. and Malenka, R.C. (2007). Synaptic plasticity and addiction. Nature Reviews Neuroscience,
8(11): 844-858. DOI: https://doi.org/10.1038/nrn2234
Klein, N. (2011). Capitalism vs. the Climate. The Nation, 9 November 2011. Available online at:
https://www.thenation.com/article/archive/capitalism-vs-climate/
Koković, D. (2010). Ecology as a way of life. Svarog, Independent University of Banja Luka, No.:1
Lasch, C. (1991). The culture of narcissism: American life in an age of diminishing expectations. New York:
WW Norton & Company.
Lehermayr, C., Reinhart, S. and Kaiser, J. (2020). Timber mafia and deforestation in Romania. Blog, 6
April 2020. Osservatorio Balcani e Caucaso Transeuropa, Trento (TN), Italy. Available online at:
https://www.balcanicaucaso.org/eng/Areas/Romania/Timber-mafia-and-deforestation-in-Romania-
200194
Lomborg, B. (2009). Global crises, global solutions. New York, USA: Cambridge University Press.
Malešević K. (2004). Man against himself - visits from social ecology. Belgrade: Samizdat 92.
Meehl, G.A., Zwiers, F., Evans, J., Knutson, T., Mearns, L. and Whetton, P. (2000). Trends in extreme
weather and climate events: Issues related to modeling extremes in projections of future climate
change. Bulletin of the American Meteorological Society, 81(3): 427-436. Available online at:
https://journals.ametsoc.org/view/journals/bams/81/3/1520-
0477_2000_081_0427_tiewac_2_3_co_2.xml
Moshagen, M., Hilbig, B.E. and Zettler, I. (2018). The dark core of personality. Psychological Review, 125:
656–688. DOI: https://doi.org/10.1037/rev0000111.
Mussel, P. and Hewig, J. (2016). The life and times of individuals scoring high and low on dispositional
greed. Journal of Research in Personality, 64: 52–60. DOI: https://doi.org/10.1016/j.jrp.2016.07.002.
Newell, P. and Paterson, M. (2010). Climate capitalism: global warming and the transformation of the global
economy. Cambridge: Cambridge University Press.
Nikelly, A. (2006). The pathogenesis of greed: Causes and consequences. International Journal of Applied
Psychoanalytic Studies, 3(1): 65-78. DOI: https://doi.org/10.1002/aps.50.
Olivier, J.G., Peters, J.A. and Janssens-Maenhout, G. (2012). Trends in global CO2 emissions 2012 report.
PBL Netherlands Environmental Assessment Agency.
Postel, S. (1997). Last oasis: facing water scarcity. New York: WW Norton & Company.
Radić Jovanović, D., Ignjatović, M., Vlajković, M. and Đarmati, D., (2012). The impact of transport on the
environment and human health. Sanitary Ecology Society, Belgrade.
Ravuva, A. (1983). Vaka I Taukei: The Fijian Way of Life. Java: Institute of Pacific Studies, University of
South Pacific, p.7.
Robertson, A.F. (2013). Greed: Gut feelings, growth, and history. New Jersey: John Wiley & Sons.
Salamone, J.D. (1992). Complex motor and sensorimotor functions of striatal and accumbensdopamine:
involvement in instrumental behavior processes. Psychopharmacology, 107(2-3): 160-174.
Schultz, D. and Schultz, S. (2004). Theories of personality. Noida, India: Cengage Learning.
Schulze, L., Dziobek, I., Vater, A., Heekeren, H.R., Bajbouj, M., Renneberg, B., Heuser, I. and Roepke, S.
(2013). Gray matter abnormalities in patients with narcissistic personality disorder. Journal of
Psychiatric Research, 47(10): 1363-1369. DOI: https://doi.org/10.1016/j.jpsychires.2013.05.017
Silberbauer, G.B. (1994). A Sense of Place. In: Burch, E.S. and Ellanna, L.J. (Eds.), Key Issues in Hunter-
Gatherer Research, Oxford: Berg, p. 131.
Siriner, I. and Nenička, L. (2011). Globalisation: Dimensions and Impacts. International Journal of Politics
and Economics - IJOPEC, London.
Sjöberg, R.L., Ducci, F., Barr, C.S., Newman, T.K., Dell'Osso, L., Virkkunen, M. and Goldman, D. (2007).
A nonadditive interaction of a functional MAO-A VNTR and testosterone predicts antisocial
behavior. Neuropsychopharmacology, 33(2): 425-430. DOI:
https://dx.doi.org/10.1038%2Fsj.npp.1301417

Grassroots Journal of Natural Resources, Vol.4, No.3 (September 2021), p.1-12 | ISSN 2581-6853 | CODEN GJNRA9
Doi: https://doi.org/10.33002/nr2581.6853.040301
11 Olena Khrushch
Smrečnik, T. (2002), Social Ecology - basic themes and theoretical perspective. Faculty of Security Studies,
Belgrade.
Steg, L. and Vlek, C. (2009). Encouraging pro-environmental behavior: An integrative review and research
agenda. J. Environ. Psychol., 29: 309–317. DOI: https://doi.org/10.1016/j.jenvp.2008.10.004
Stern, P. (2000). Toward a coherent theory of environmentally significant behavior. J. Soc. Issues, 56: 407–
424. DOI: https://doi.org/10.1111%2F0022-4537.00175 also available online at: https://www.uni-
goettingen.de/de/document/download/2170a4cf4ce55cbdfb2856011a8930bb.pdf/08_stern_2000.pdf
Taylor, S. (2014). Ecocide: The Psychology of Environmental Destruction: Why Can't We Live in Harmony
with the Rest of Nature? Psychology Today, June 18, 2014. Available online at:
https://www.psychologytoday.com/us/blog/out-the-darkness/201406/ecocide-the-psychology-
environmental-destruction
The Battle in Seattle (1999). The Economist, 353(8147): 21–23.
United Nations (2006). Water: a shared responsibility (Vol. 2). UN-HABITAT, Nairobi.
Webster, M. (2013). Merriam-Webster online dictionary. Connecticut, USA: Webster
Zetland, D. (2011). The end of abundance: economic solutions to water scarcity. Navi Mumbai, India:
Aguanomics Press.
Grassroots Journal of Natural Resources, Vol.4, No.3 (September 2021), p.1-12 | ISSN 2581-6853 | CODEN GJNRA9
Doi: https://doi.org/10.33002/nr2581.6853.040301
12 Olena Khrushch
Author’ Declarations and Essential Ethical Compliances
Author’s Contributions (in accordance with ICMJE criteria for authorship)
This article is 100% contributed by the sole author. He conceived and designed the research or analysis,
collected the data, contributed to data analysis & interpretation, wrote the article, performed critical revision
of the article/paper, edited the article, and supervised and administered the field work.
Funding
No funding was available for the research conducted for and writing of this paper.
Research involving human bodies (Helsinki Declaration)
Has this research used human subjects for experimentation? No
Research involving animals (ARRIVE Checklist)
Has this research involved animal subjects for experimentation? No
Research involving Plants
During the research, the author followed the principles of the Convention on Biological Diversity and
the Convention on the Trade in Endangered Species of Wild Fauna and Flora.
Research on Indigenous Peoples and/or Traditional Knowledge
Has this research involved Indigenous Peoples as participants or respondents? No
PRISMA (Preferred Reporting Items for Systematic Reviews and Meta-Analyses)
Has author complied with PRISMA standards? Yes
Competing Interests/Conflict of Interest
Author has no competing financial, professional, or personal interests from other parties or in publishing
this manuscript.
Rights and Permissions
Open Access. This article is licensed under a Creative Commons Attribution 4.0 International License,
which permits use, sharing, adaptation, distribution and reproduction in any medium or format, as long as
you give appropriate credit to the original author(s) and the source, provide a link to the Creative Commons
license, and indicate if changes were made. The images or other third-party material in this article are
included in the article's Creative Commons license, unless indicated otherwise in a credit line to the material.
If material is not included in the article's Creative Commons license and your intended use is not permitted
by statutory regulation or exceeds the permitted use, you will need to obtain permission directly from the
copyright holder. To view a copy of this license, visit http://creativecommons.org/licenses/by/4.0/.
Farmers’ Trait Preferences for Varietal Replacement: A study to boost
rice productivity in Odisha, India
Sk Mosharaf Hossain Department of Agricultural Economics, Institute of Agriculture Science, Siksha O Anusandhan (Deemed to be
University), Bhubaneswar, India. Email: [email protected] | ORCID: 0000-0002-1164-4229
Abstract The average age of the popular rice varieties being grown in
the state of Odisha is higher than the stipulated 10-year
timeframe. This is an obstacle to productivity enhancement
through varietal replacement. Farmers in Odisha growing
these varieties have expressed their desired traits for
replacement of these long-grown varieties. The desired
characters of an ideal variety have been mapped for major
older varieties. Since varietal fitment and farmer’s choice vary
widely between rice eco logies, the research outcomes were
compartmentalized between medium and lowland. Thus, these
research outcomes will be crucially helpful for breeding
program to develop varieties that match evinced expectation of
the farmers. The ranking of trait preferences will also augment
the varietal research program to the exact needs of the rice
growers in the state. Rice productivity in Odisha is one of the
least in the country. Replacement of existing older varieties
with a high yielder as per farmers’ choice is a strategic way to
boost the productivity. The findings with regard to current
varietal landscape, farmers’ trait preferences are crucially
important for augmenting rice productivity and strengthening
food security in the state.
Keywords Varietal replacement; Food security; Varietal landscape
How to cite this paper: Hossain, S.M. (2021).
Farmers’ Trait Preferences for Varietal
Replacement: A study to boost rice productivity
in Odisha, India. Grassroots Journal of Natural
Resources, 4(3): 13-23. Doi:
https://doi.org/10.33002/nr2581.6853.040302
Received: 05 June 2021
Reviewed: 12 July 2021
Provisionally Accepted: 15 July 2021
Revised: 28 July 2021
Finally Accepted: 11 August 2021
Published: 30 September 2021
Copyright © 2021 by author(s)
This work is licensed under the Creative
Commons Attribution International
License (CC BY 4.0).
http://creativecommons.org/licenses/by/4.0/
Grassroots Journal of Natural Resources, Vol.4 No.3 (September 2021) ISSN 2581-6853 | CODEN: GJNRA9 | Published by The Grassroots Institute
Website: http://grassrootsjournals.org/gjnr | Main Indexing: Web of Science
M – 00239 | Research Article
ISSN 2581-6853 | 4(3) Sep 2021
Grassroots Journal of Natural Resources, Vol.4, No.3 (September 2021), p.13-23 | ISSN 2581-6853 | CODEN GJNRA9
Doi: https://doi.org/10.33002/nr2581.6853.040302
14 Sk Mosharaf Hossain
Introduction
The productivity enhancement of rice, being the staple food, overarches the food security program in a state
like Odisha. The rice productivity in Odisha is stagnating at 2.04 tons per ha1 throwing enormous challenge to
feed 45 million people in the state. Substantial increment of rice productivity assumes greater significance
among policy makers that results in new agriculture initiatives in the state, directed towards boosting rice yield.
Plant breeders across several research institutes are relentlessly engaged in developing new rice varieties,
which primarily focus on yield improvement. But research gap exists with respect to the link between rice
growers and breeders. Numbers of high yielding varieties (HYVs) are being intensively grown in the states
of India, but many of them are quite old (more than 10 years) that require a replacement. A farmer considers
a range of parameters other than yield while replacing the old variety by a new variety. Thus, the farmer’s
preferences are of paramount importance and to be included sufficiently in new variety development
strategy (Dar et al., 2014). In the current breeding program specific to the state of Odisha, many a times,
breeders develop and release varieties without taking a broad cognizance of farmers’ preferences. Though
with a ‘push’ extension mechanism those varieties are adopted by farmers, to some extent, in a short run,
but not accepted in the long run. Because of this very reason, those newly developed varieties soon become
redundant in the seed system of the state and farmers hardly get the varieties of their choice. This scenario
not only inefficiently utilizes resources at breeding program but also jeopardizes state’s ambition to attain
food security through varietal replacement. The concept of participatory plant breeding (PPB) with larger
say of farmers is increasingly being adopted worldwide (Ceccarelli and Grando, 2009). This is more relevant
in context of Odisha where participation of farmers in plant breeding program is largely negligible.
Keeping in mind this issue and extent of problems, present study was conducted in Odisha to produce
evidence-based critical inputs that can strategically strengthen existing breeding program with farmers’
choice and preferences. The specific objectives of the study were as follows:
I. To generate ecology wise current varietal landscape of Odisha to comprehend varietal spread across
regions in Odisha;
II. To analyse farmers’ desired traits in the varieties to replace currently grown older varieties; and
III. To prioritize farmers’ preference of traits in selecting a new variety.
Methodology
This study was conducted during Kharif2 season of 2018-19 in 12 districts of Odisha in two main rice
ecologies, viz. lowland and upland. Among the 30 districts of the state, 12 districts were selected in such a
way that represent both upland and lowland districts. Total 8 districts fall under upland belt and 4 under
lowland areas. From each district, 4 blocks were selected randomly following SRSWOR3 method and 15
farmers from each block were chosen in random manner. Thus, total sample size was 720 comprising of
480 farmers from upland districts and 240 from lowland districts. Mobile smartphone-based data collection
tool, ‘Kobo’4 was used to gather data through a pre-tested questionnaire by well-trained 20 field
investigators. Collected data were monitored and verified on daily basis to ensure highest possible level of
accuracy.
To attain first and second objective as explained in ‘Introduction’ part above, descriptive statistics were
used. For prioritization of trait preference in new varieties, Garrett’s ranking tool was employed. As against
the simple frequency distribution, Garrett’s ranking tool arranges the constraints based on their severity as
perceived by the respondents (Zalkuwi et al., 2015). The percent position of each rank was converted into
1 Directorate of Economics and Statistics, DAC&FW, 2020 2 Kharif season, also known as wet season, starts in June and ends in October. 3 Simple random sampling without replacement. 4 A widely used mobile based data collection tool (https://www.kobotoolbox.org/).

Grassroots Journal of Natural Resources, Vol.4, No.3 (September 2021), p.13-23 | ISSN 2581-6853 | CODEN GJNRA9
Doi: https://doi.org/10.33002/nr2581.6853.040302
15 Sk Mosharaf Hossain
scores using Garrett’s table. For each constraint, scores of individual respondents were added together and
were divided by total number of respondents for whom scores were added. Thus, mean score for each
constraint was ranked by arranging them in descending order.
Where,
Rij is the rank given for ith item by jth individual,
Nij is the number of items ranked by the jth individual.
Results And Discussion
Farmers’ profile
Respondents were profiled based on key parameters separately for two ecologies. Their characteristics are
described as below:
Below poverty line: In lowland districts, 62.92% respondents were below poverty line (BPL) category,
whereas 74.58% were in BPL category in upland belt.
Caste: The prevalence of other backward caste (OBC) was more (77.08%) in lowland districts compared to
that of upland areas (36.88%). There were no scheduled tribe (ST) found in lowland areas, but in upland
districts the STs were 50.42%. The scheduled caste (SC) representation in lowland was only 9.58%, while
in lower upland areas it was 6.04% (Table 1).
Gender: The respondents were gender-segregated, and it was found that, in upland areas, 57.71% were
males with 70% males in low land districts.
Age and Education: The mean age of farmers was 47 and 42 years, respectively, in lowland and upland
districts. Table 1 further reveals that education level of respondents from lowland belt is little higher than
upland region.
Categories of Farmers: As usual proportion of marginal farmers having land size of less than 1 ha was high in
both the ecologies. Marginal farmers constitute 61.67% and 56.67%, respectively, in lowland and upland regions.
Table 1. Distribution of respondents over important socio-economic parameters
Ecology No %
Lowland 240 100
Non-BPL (Below Poverty Line) 89 37.08
BPL 151 62.92
General 30 12.50
OBC (Other backward Caste) 185 77.08
SC (Scheduled Caste) 23 9.58
Other 2 0.83
Male 168 70.00
Female 72 30.00
Marginal (less than 1ha) 148 61.67
Medium (4-10 ha) 6 2.50

Grassroots Journal of Natural Resources, Vol.4, No.3 (September 2021), p.13-23 | ISSN 2581-6853 | CODEN GJNRA9
Doi: https://doi.org/10.33002/nr2581.6853.040302
16 Sk Mosharaf Hossain
Ecology No %
Semi Medium (2-4 ha) 19 7.92
Small (1-2 ha) 67 27.92
Mean Age (years) 47
Mean education years 8
Upland-Medium 480 100.00
Non-BPL 122 25.42
BPL 358 74.58
General 32 6.67
OBC 177 36.88
SC 29 6.04
ST (Scheduled Tribe) 242 50.42
Male 277 57.71
Female 203 42.29
Large (more than 10 ha) 2 0.42
Marginal (less than 1ha) 272 56.67
Medium (4-10 ha) 5 1.04
Semi Medium (2-4 ha) 44 9.17
Small (1-2 ha) 157 32.71
Mean Age (years) 42
Mean education years 6
Current varietal landscape
Lowland districts
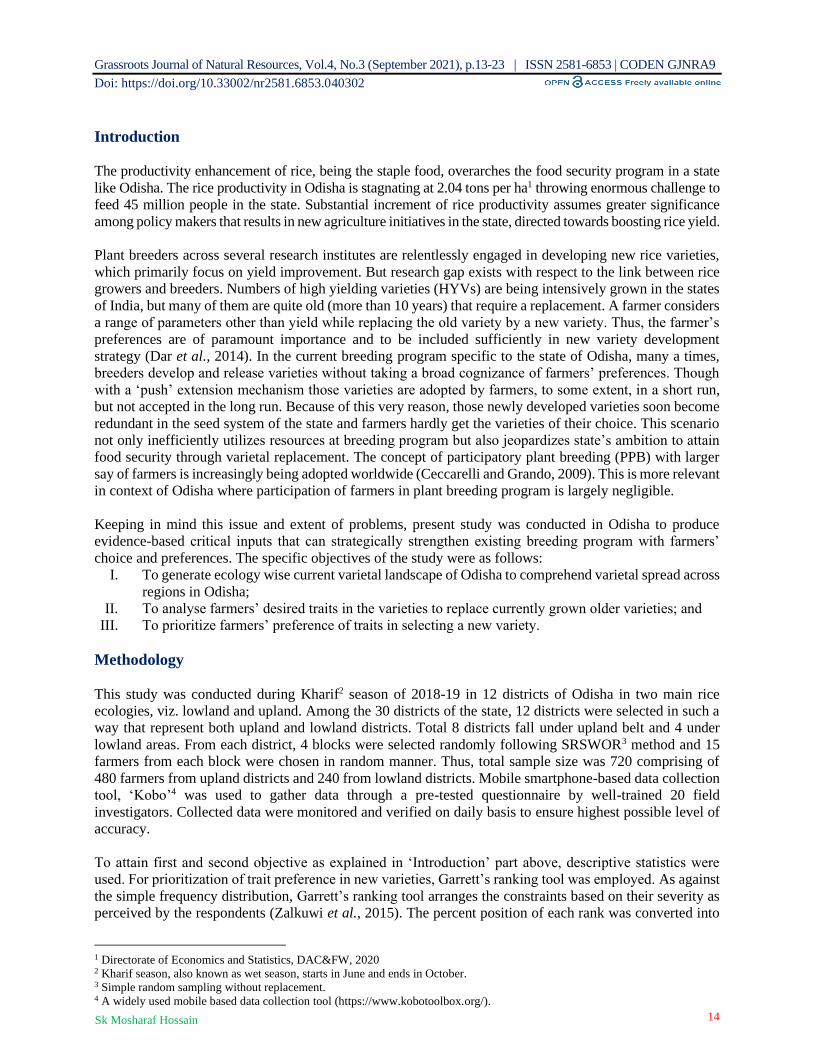
This study is aimed at creating a varietal landscape for both lowland and upland districts. The analysis
revealed that Pooja5, Swarna6, Swarna sub-17, CR 10188, CR 10099 and Kalachampa10 Sarala were the main
varieties preferred and grown by farmers in lowland districts during the wet season. In terms of spread,
25.83% farmers have grown Pooja, closely followed by Swarna (24.58%) and Swarna sub-1 (21.67%). In
fact, these three varieties together were grown by 72.08% of all farmers. The other reported varieties like
CR 1009 (4.58%), CR 1018 (5.83%) and Bina dhan 1111 (5.00%) were also grown by some of the farmers.
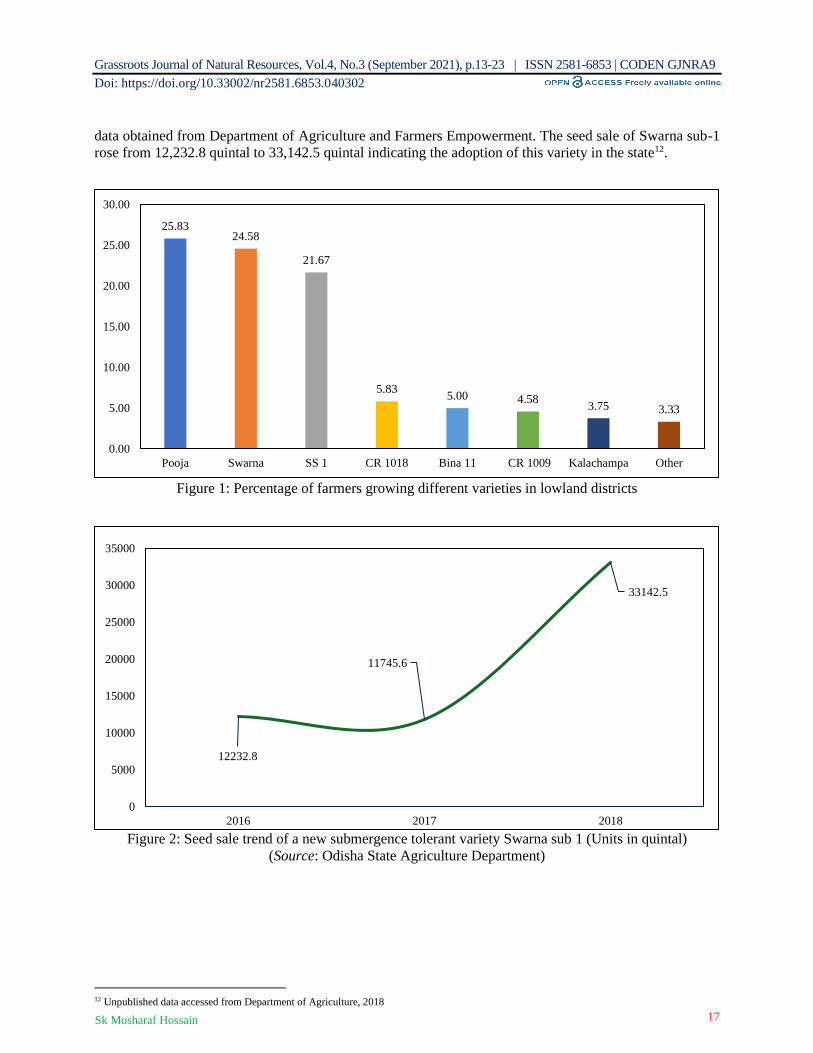
Swarna sub-1, a recent breeding innovation as a submergence tolerant variety, has gained popularity among
farmers. This is corroborated by the seed sale trend of Swarna sub-1 as evident from secondary seed sale
5 A late maturing rice variety for lowlands 6 A widely grown variety in eastern India, matures in 135 days 7 A submergence tolerant variant of Swarna, popular in flood prone areas of eastern India. 8 Also known as Gayatri, a long duration bold grained variety 9 A long duration variety, suitable for waterlogged conditions 10 A long duration, semi-dwarf variety, grown in rainfed and irrigated shallow lowland 11 A medium duration variety, suitable for both wet and dry season. More details about these varieties are available at
https://www.rkbodisha.in/rice-varieties-of-odisha
Grassroots Journal of Natural Resources, Vol.4, No.3 (September 2021), p.13-23 | ISSN 2581-6853 | CODEN GJNRA9
Doi: https://doi.org/10.33002/nr2581.6853.040302
17 Sk Mosharaf Hossain
data obtained from Department of Agriculture and Farmers Empowerment. The seed sale of Swarna sub-1
rose from 12,232.8 quintal to 33,142.5 quintal indicating the adoption of this variety in the state12.
Figure 1: Percentage of farmers growing different varieties in lowland districts
Figure 2: Seed sale trend of a new submergence tolerant variety Swarna sub 1 (Units in quintal)
(Source: Odisha State Agriculture Department)
12 Unpublished data accessed from Department of Agriculture, 2018
25.8324.58
21.67
5.835.00 4.58
3.75 3.33
0.00
5.00
10.00
15.00
20.00
25.00
30.00
Pooja Swarna SS 1 CR 1018 Bina 11 CR 1009 Kalachampa Other
12232.8
11745.6
33142.5
0
5000
10000
15000
20000
25000
30000
35000
2016 2017 2018
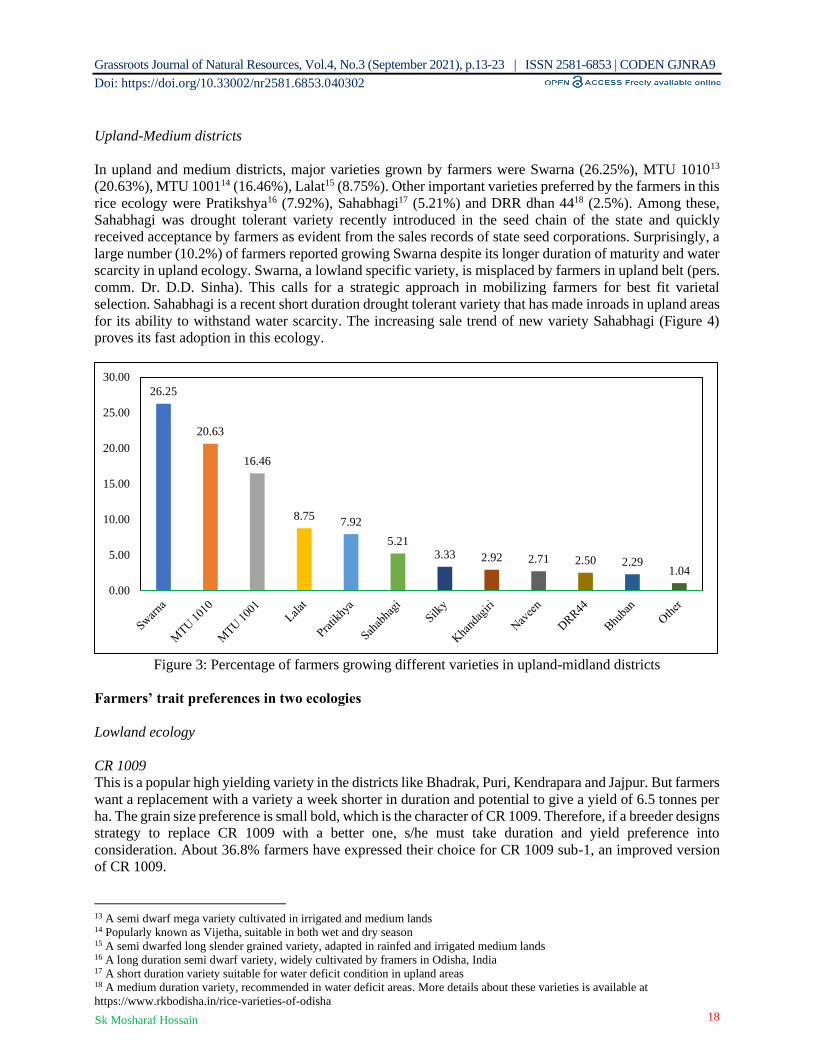
Grassroots Journal of Natural Resources, Vol.4, No.3 (September 2021), p.13-23 | ISSN 2581-6853 | CODEN GJNRA9
Doi: https://doi.org/10.33002/nr2581.6853.040302
18 Sk Mosharaf Hossain
Upland-Medium districts
In upland and medium districts, major varieties grown by farmers were Swarna (26.25%), MTU 101013
(20.63%), MTU 100114 (16.46%), Lalat15 (8.75%). Other important varieties preferred by the farmers in this
rice ecology were Pratikshya16 (7.92%), Sahabhagi17 (5.21%) and DRR dhan 4418 (2.5%). Among these,
Sahabhagi was drought tolerant variety recently introduced in the seed chain of the state and quickly
received acceptance by farmers as evident from the sales records of state seed corporations. Surprisingly, a
large number (10.2%) of farmers reported growing Swarna despite its longer duration of maturity and water
scarcity in upland ecology. Swarna, a lowland specific variety, is misplaced by farmers in upland belt (pers.
comm. Dr. D.D. Sinha). This calls for a strategic approach in mobilizing farmers for best fit varietal
selection. Sahabhagi is a recent short duration drought tolerant variety that has made inroads in upland areas
for its ability to withstand water scarcity. The increasing sale trend of new variety Sahabhagi (Figure 4)
proves its fast adoption in this ecology.
Figure 3: Percentage of farmers growing different varieties in upland-midland districts
Farmers’ trait preferences in two ecologies
Lowland ecology
CR 1009
This is a popular high yielding variety in the districts like Bhadrak, Puri, Kendrapara and Jajpur. But farmers
want a replacement with a variety a week shorter in duration and potential to give a yield of 6.5 tonnes per
ha. The grain size preference is small bold, which is the character of CR 1009. Therefore, if a breeder designs
strategy to replace CR 1009 with a better one, s/he must take duration and yield preference into
consideration. About 36.8% farmers have expressed their choice for CR 1009 sub-1, an improved version
of CR 1009.
13 A semi dwarf mega variety cultivated in irrigated and medium lands 14 Popularly known as Vijetha, suitable in both wet and dry season 15 A semi dwarfed long slender grained variety, adapted in rainfed and irrigated medium lands 16 A long duration semi dwarf variety, widely cultivated by framers in Odisha, India 17 A short duration variety suitable for water deficit condition in upland areas 18 A medium duration variety, recommended in water deficit areas. More details about these varieties is available at
https://www.rkbodisha.in/rice-varieties-of-odisha
26.25
20.63
16.46
8.757.92
5.213.33 2.92 2.71 2.50 2.29
1.04
0.00
5.00
10.00
15.00
20.00
25.00
30.00

Grassroots Journal of Natural Resources, Vol.4, No.3 (September 2021), p.13-23 | ISSN 2581-6853 | CODEN GJNRA9
Doi: https://doi.org/10.33002/nr2581.6853.040302
19 Sk Mosharaf Hossain
Figure 4: Seed sale trend of a new drought tolerant variety Sahbhagi (unit in quintal)
Source: State agriculture department
Pooja
Pooja is a 150-day popular variety suitable for low lying areas. Current yield potential of this variety is 5
tonnes per ha. As a substitute of this variety, farmers prefer a variety of same duration having yield potential
of 5.83 ton with medium slender grain size. Therefore, any breeding program aims to bring a substitute of
Pooja must focus, inter alia, on yield and grain size.
Kalachampa
Farmers in coastal belt of Odisha are growing Kalachampa (160 days) for quite a long time. Though the
variety promises a yield of 6.5 ton per ha, but farmers reported an average yield of 5 ton from this variety.
So, farmers expect this variety to be having minimum yield bearing ability of 6.15 ton per ha and it should
come with medium slender grain size.
Lalat
Lalat is a short duration variety (120 days) grown in both the ecologies, but not preferred in areas where
prolonged inundation is a problem. Farmers who cultivate this variety in lowland areas want to replace with
a variety having a maturity in about 130 days. Lalat yields around 4.5 ton/ha. However, in a replacement
variety, farmers want minimum yield of 5 tons per ha with a medium slender grain size. Like other varieties,
height is not a factor for farmers if yield, duration and grain size choices are met.
Sarala
This is a long duration variety (160 days) widely grown in coastal areas of Odisha having an average yield
of 4 tons per ha. Farmers in the region prefer to replace this variety if any variety with 150-days duration
can give a yield of 6.22 ton per ha.
Upland and medium land ecology
Swarna
This is one of most popular and widely grown varieties in Odisha. This variety matures in 135 days and
yields 5 tons per ha. In low lying coastal region, farmers will prefer a replacement with a variety maturing
in 145 days and yielding 5.87 ton with medium slender grain quality. Crop height is not a matter of important
3762
4533.8
5261.4
0
1000
2000
3000
4000
5000
6000
2016 2017 2018
Grassroots Journal of Natural Resources, Vol.4, No.3 (September 2021), p.13-23 | ISSN 2581-6853 | CODEN GJNRA9
Doi: https://doi.org/10.33002/nr2581.6853.040302
20 Sk Mosharaf Hossain
consideration for the farmers. Swarna sub-1 is relatively new in the seed chain and gaining increasing
acceptance among farming community of coastal area, as 63% of sampled Swarna growers facing frequent
flash floods think Swarna sub 1 is a perfect replacement.
MTU 1001
This mega variety is strongly preferred by farmers in medium high land districts. MTU 1001 has the duration
of 130 days with average yield of 5 tons per ha. Farmers growing this variety now prefer a variety having
slightly less duration (124 days) and giving a yield of 5.34 ton per ha.
MTU 1010
Farmers growing this variety in medium high land areas prefer a replacement of 116-days variety that can
produce average yield of 5.7 ton per ha. Preferred grain size is medium slender and crop height is a redundant
factor.
Khandagiri
This is a short duration (90 days) variety suitable for upland ecology. Duration wise, this is accepted by
farmers; but its average yield is quite low (3 tons per ha). Farmers need a substitute variety with same
duration but with higher yield (3.92 ton per ha) and medium slender grain quality.
Bhuban
Bhuban is another variety grown in medium upland districts of Odisha. It attains maturity in 135 days with
yield capacity of 4 ton per ha. But farmers are ready to replace this if a variety with less duration (115 days)
with yield potential of 5.2 ton per ha is available.
Naveen
This 120-days variety is widely cultivated by farmers in upland and medium high land districts of Odisha.
For its replacement, farmers will prefer a comparatively shorter duration variety (115 days) with yield
capacity of 5.2 ton per ha and preferred medium slender grain size.
Pratikhya
This short duration (135 days) variety is currently yielding 4 ton per ha in upland districts. A modification
in duration (125 days), medium slender grain size and a yield of 5.4 ton per ha will be strong replacement
traits accepted by farmers.
Varietal replacement
The major rice varieties being grown by farmers in Odisha in the cropping seasons are older than 10 years
indicating a sluggish varietal replacement rate in the state. Maturity duration, expected yield, grain quality,
plant height, resistance to major diseases and pests are key considerations for a farmer in adopting a variety.
However, a variation in respect of trait preferences is observed between two rice growing ecologies. While
a longer duration variety is sought in lowlands, a relatively shorter maturity variety is preferred by farmers
in medium lands. The farmers-preferred traits are critically important as it helps breeding strategy to be
more contextual and in line with choices and preferences of rice growers. Below is the description of the
result of different varieties in two different ecologies.
Grain size as a varietal trait
Farmers consider grain size as an important criterion for varietal replacement. It has been observed that
medium slender grain is mostly favoured by farmers in both the ecologies. In lowland districts, 81% farmers
want medium slender grain in new variety. Similarly, 75% farmers demand medium slender grain in new
variety in upland and medium land region.
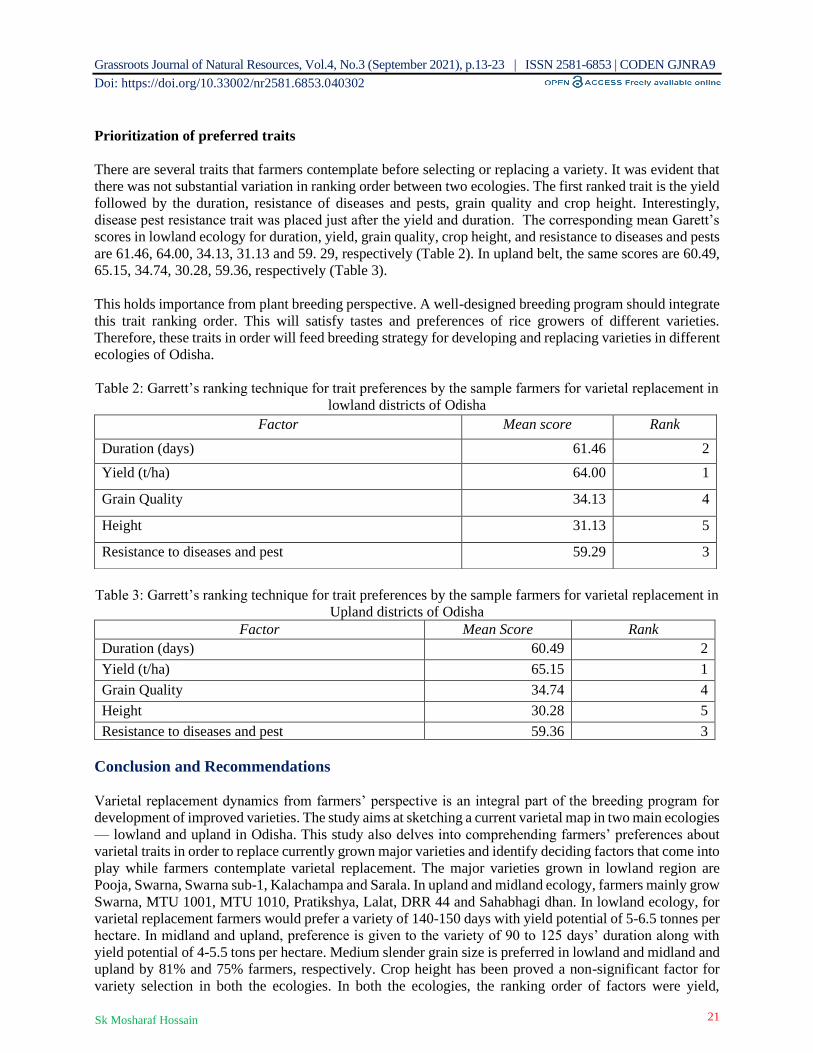
Grassroots Journal of Natural Resources, Vol.4, No.3 (September 2021), p.13-23 | ISSN 2581-6853 | CODEN GJNRA9
Doi: https://doi.org/10.33002/nr2581.6853.040302
21 Sk Mosharaf Hossain
Prioritization of preferred traits
There are several traits that farmers contemplate before selecting or replacing a variety. It was evident that
there was not substantial variation in ranking order between two ecologies. The first ranked trait is the yield
followed by the duration, resistance of diseases and pests, grain quality and crop height. Interestingly,
disease pest resistance trait was placed just after the yield and duration. The corresponding mean Garett’s
scores in lowland ecology for duration, yield, grain quality, crop height, and resistance to diseases and pests
are 61.46, 64.00, 34.13, 31.13 and 59. 29, respectively (Table 2). In upland belt, the same scores are 60.49,
65.15, 34.74, 30.28, 59.36, respectively (Table 3).
This holds importance from plant breeding perspective. A well-designed breeding program should integrate
this trait ranking order. This will satisfy tastes and preferences of rice growers of different varieties.
Therefore, these traits in order will feed breeding strategy for developing and replacing varieties in different
ecologies of Odisha.
Table 2: Garrett’s ranking technique for trait preferences by the sample farmers for varietal replacement in
lowland districts of Odisha
Table 3: Garrett’s ranking technique for trait preferences by the sample farmers for varietal replacement in
Upland districts of Odisha
Factor Mean Score Rank
Duration (days) 60.49 2
Yield (t/ha) 65.15 1
Grain Quality 34.74 4
Height 30.28 5
Resistance to diseases and pest 59.36 3
Conclusion and Recommendations
Varietal replacement dynamics from farmers’ perspective is an integral part of the breeding program for
development of improved varieties. The study aims at sketching a current varietal map in two main ecologies
— lowland and upland in Odisha. This study also delves into comprehending farmers’ preferences about
varietal traits in order to replace currently grown major varieties and identify deciding factors that come into
play while farmers contemplate varietal replacement. The major varieties grown in lowland region are
Pooja, Swarna, Swarna sub-1, Kalachampa and Sarala. In upland and midland ecology, farmers mainly grow
Swarna, MTU 1001, MTU 1010, Pratikshya, Lalat, DRR 44 and Sahabhagi dhan. In lowland ecology, for
varietal replacement farmers would prefer a variety of 140-150 days with yield potential of 5-6.5 tonnes per
hectare. In midland and upland, preference is given to the variety of 90 to 125 days’ duration along with
yield potential of 4-5.5 tons per hectare. Medium slender grain size is preferred in lowland and midland and
upland by 81% and 75% farmers, respectively. Crop height has been proved a non-significant factor for
variety selection in both the ecologies. In both the ecologies, the ranking order of factors were yield,
Factor Mean score Rank
Duration (days) 61.46 2
Yield (t/ha) 64.00 1
Grain Quality 34.13 4
Height 31.13 5
Resistance to diseases and pest 59.29 3
Grassroots Journal of Natural Resources, Vol.4, No.3 (September 2021), p.13-23 | ISSN 2581-6853 | CODEN GJNRA9
Doi: https://doi.org/10.33002/nr2581.6853.040302
22 Sk Mosharaf Hossain
duration, resistance to disease and pest, grain size and crop height. These finding complements the efforts
of ongoing plant breeding research and food security programs.
References
Ceccarelli S. and Grando S. (2009). Participatory Plant Breeding. In: Carena M. (eds) Cereals
Handbook of Plant Breeding, vol 3. New York, NY: Springer. DOI: https://doi.org/10.1007/978-
0-387-72297-9_13
Dar, M.H., Singh, S., Singh, U.S. and Ismail, A.M. (2014). Stress tolerant rice varieties: Making headway
in India. SATSA Mukhapatra Ann. Tech., 18: 4–9.
GoI (2020). Agricultural Statistics at a Glance, Directorate of Economics and Statistics, Ministry of
Agriculture and Farmers’ Welfare, Government of India, New Delhi.
Zalkuwi, J., Singh, R., Bhattarai, M., Singh, O.P. and Rao, D. (2015). Analysis of Constraints Influencing
Sorghum Farmers Using Garrett’s Ranking Technique: A Comparative Study of India and Nigeria.
International Journal of Scientific Research and Management, 3(3): 2435-2440.

Grassroots Journal of Natural Resources, Vol.4, No.3 (September 2021), p.13-23 | ISSN 2581-6853 | CODEN GJNRA9
Doi: https://doi.org/10.33002/nr2581.6853.040302
23 Sk Mosharaf Hossain
Author’s Declarations and Essential Ethical Compliances
Author’s Contributions (in accordance with ICMJE criteria for authorship)
This article is 100% contributed by the sole author. He conceived and designed the research or analysis,
collected the data, contributed to data analysis & interpretation, wrote the article, performed critical revision
of the article/paper, edited the article, and supervised and administered the field work.
Funding
No funding was available for the research conducted for and writing of this paper.
Research involving human bodies (Helsinki Declaration)
Has this research used human subjects for experimentation? No
Research involving animals (ARRIVE Checklist)
Has this research involved animal subjects for experimentation? No
Research involving Plants
During the research, the author followed the principles of the Convention on Biological Diversity and
the Convention on the Trade in Endangered Species of Wild Fauna and Flora.
Research on Indigenous Peoples and/or Traditional Knowledge
Has this research involved Indigenous Peoples as participants or respondents? No
PRISMA (Preferred Reporting Items for Systematic Reviews and Meta-Analyses)
Has author complied with PRISMA standards? No
Competing Interests/Conflict of Interest
Author has no competing financial, professional, or personal interests from other parties or in publishing
this manuscript.
Rights and Permissions
Open Access. This article is licensed under a Creative Commons Attribution 4.0 International License,
which permits use, sharing, adaptation, distribution and reproduction in any medium or format, as long as
you give appropriate credit to the original author(s) and the source, provide a link to the Creative Commons
license, and indicate if changes were made. The images or other third-party material in this article are
included in the article's Creative Commons license, unless indicated otherwise in a credit line to the material.
If material is not included in the article's Creative Commons license and your intended use is not permitted
by statutory regulation or exceeds the permitted use, you will need to obtain permission directly from the
copyright holder. To view a copy of this license, visit http://creativecommons.org/licenses/by/4.0/.
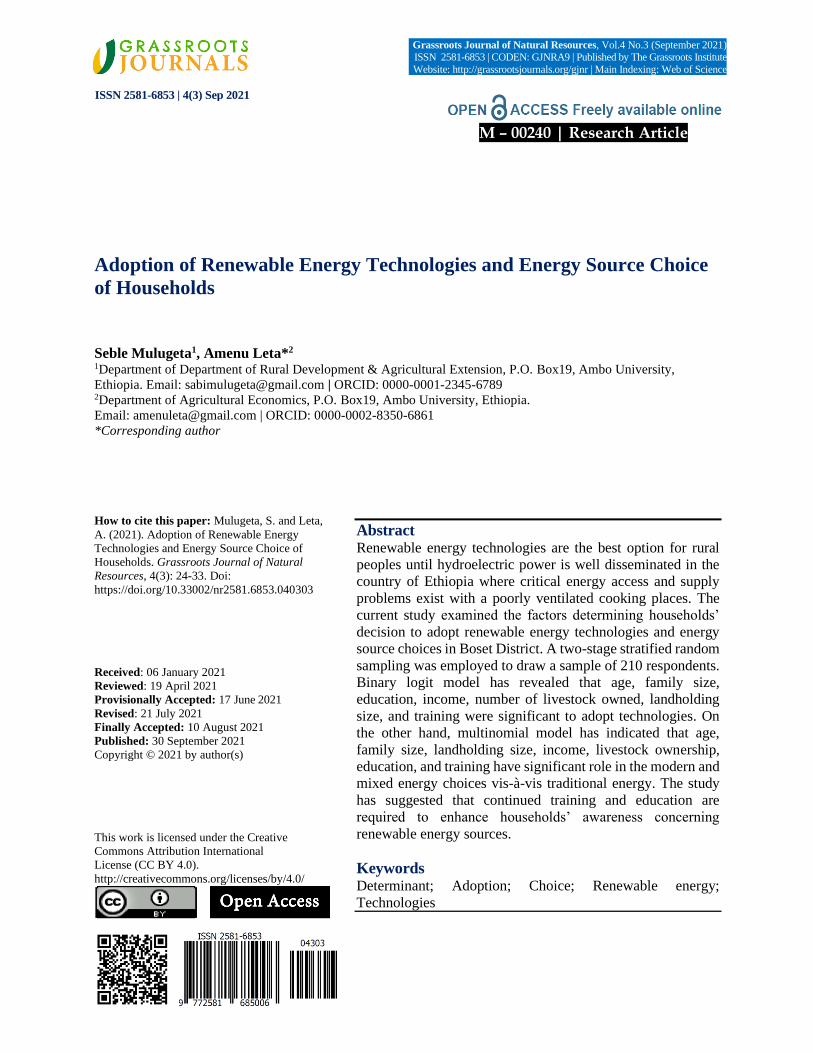
Adoption of Renewable Energy Technologies and Energy Source Choice
of Households
Seble Mulugeta1, Amenu Leta*2
1Department of Department of Rural Development & Agricultural Extension, P.O. Box19, Ambo University,
Ethiopia. Email: [email protected] | ORCID: 0000-0001-2345-6789 2Department of Agricultural Economics, P.O. Box19, Ambo University, Ethiopia.
Email: [email protected] | ORCID: 0000-0002-8350-6861
*Corresponding author
Abstract Renewable energy technologies are the best option for rural
peoples until hydroelectric power is well disseminated in the
country of Ethiopia where critical energy access and supply
problems exist with a poorly ventilated cooking places. The
current study examined the factors determining households’
decision to adopt renewable energy technologies and energy
source choices in Boset District. A two-stage stratified random
sampling was employed to draw a sample of 210 respondents.
Binary logit model has revealed that age, family size,
education, income, number of livestock owned, landholding
size, and training were significant to adopt technologies. On
the other hand, multinomial model has indicated that age,
family size, landholding size, income, livestock ownership,
education, and training have significant role in the modern and
mixed energy choices vis-à-vis traditional energy. The study
has suggested that continued training and education are
required to enhance households’ awareness concerning
renewable energy sources.
Keywords Determinant; Adoption; Choice; Renewable energy;
Technologies
How to cite this paper: Mulugeta, S. and Leta,
A. (2021). Adoption of Renewable Energy
Technologies and Energy Source Choice of
Households. Grassroots Journal of Natural
Resources, 4(3): 24-33. Doi:
https://doi.org/10.33002/nr2581.6853.040303
Received: 06 January 2021
Reviewed: 19 April 2021
Provisionally Accepted: 17 June 2021
Revised: 21 July 2021
Finally Accepted: 10 August 2021
Published: 30 September 2021
Copyright © 2021 by author(s)
This work is licensed under the Creative
Commons Attribution International
License (CC BY 4.0).
http://creativecommons.org/licenses/by/4.0/
Grassroots Journal of Natural Resources, Vol.4 No.3 (September 2021) ISSN 2581-6853 | CODEN: GJNRA9 | Published by The Grassroots Institute
Website: http://grassrootsjournals.org/gjnr | Main Indexing: Web of Science
M – 00240 | Research Article
ISSN 2581-6853 | 4(3) Sep 2021
Grassroots Journal of Natural Resources, Vol.4, No.3 (September 2021), p.24-33 | ISSN 2581-6853 | CODEN GJNRA9
Doi: https://doi.org/10.33002/nr2581.6853.040303
25 Seble Mulugeta, Amenu Leta
Introduction
Energy poverty at the household level is explained by lack of access to electricity and the reliance on the
traditional use of biomass for cooking (IEA, UNDP, and UNIDO, 2010). It is estimated that 1.4 billion
people all over the world have no access to electricity, with 85% of them are living in rural areas and 2.7
billion people (i.e., 40% of the global population) rely on traditional biomass energy for cooking (IEA,
2014). Over 620 and 730 million people in sub-Saharan African countries do not have access to electricity
and clean cooking facilities, respectively (IEA, 2014). It is projected that 1.2 billion people around the globe
will have no access to electricity, and traditional biomass is expected to be used by 2.8 billion people in the
year 2030 (IEA, 2014).
The women and children living in unventilated cooking places are vulnerable to critical health problems
such as pneumonia, chronic lung diseases, and lung cancer (WHO and UNDP, 2009; Hanawi et al., 2020;
Faller et al., 2020). Like many other developing countries, Ethiopia has been facing problems of critical
energy access and supply. It is estimated that only 23% of the country’s population has access to electricity,
of which 86% population is of urbanites and only 5% is of rural residents (GIZ, 2015). According to Dereje
(2013), traditional biomass energy sources such as firewood, dung cake, and agricultural residues are the
major energy source that accounts for more than 90% of the country’s energy supply. Resultantly, extensive
utilization of forest has led to the depletion of tree stock of the country by 15% (ENA, 2015).
Energy poverty exacerbates in the rural part of the country. Out of total rural residents in the country, more
than 95% meet their daily energy needs from unclean and traditional energy sources (GIZ, 2015). In the
study area, biomass energy source, especially firewood, constitutes the greater portion of domestic energy
supply for both rural and urban areas followed by dung and charcoal consumption (BDFEDO, 2019).
Ethiopia has endowed with abundant clean energy sources; however, their development and utilization
remained very low (Dawit, 2014). Different empirical studies have been conducted so far by Dawit (2008),
Alemu and Köhlin (2008), Yonas et al. (2013), Yonas et al. (2015) and Gebreegziabher et al. (2012) on the
determinants of households’ energy technology adoption and energy source choice in Ethiopia. The above-
mentioned studies have either focused on identifying factors that influence the adoption of energy
technologies or addressed the issue of household fuel choice focusing in urban areas.
Having large area and the population, access to the modern energy source is the major impediment in rural
parts of Ethiopia. Currently, renewable energy technologies are the best option for rural peoples until
hydroelectric power is well distributed in the country. Besides examining the determinant factors of
renewable energy source adoption, it is to investigate rural households’ energy source choice focusing
modern energy sources. Thus, this study was intended to fill the aforementioned gap by identifying factors
affecting renewable energy technology adoption and rural households’ energy source choice focusing on
the utilization of modern energy sources.
Material and Method
The study was conducted in East Shewa Zone of Boset district. The district covers an area of151,406.6 km2
and divided into 32 rural and 4 town kebeles. The total population accounts for 185,401 (111,572 male and
73,829 female) (BDFEDO, 2019). Boset has a one-season (‘Meher’) crop production cycle. Mixed
agriculture is a common economic activity in the district. The district is known for its renewable energy
source potential, especially solar energy. But, the energy source for the district is mainly from traditional
biomass; and, firewood constitutes a greater coverage of domestic energy supply both in rural and urban
areas (BDFEDO, 2019). This study was conducted in 2019-20.

Grassroots Journal of Natural Resources, Vol.4, No.3 (September 2021), p.24-33 | ISSN 2581-6853 | CODEN GJNRA9
Doi: https://doi.org/10.33002/nr2581.6853.040303
26 Seble Mulugeta, Amenu Leta
Study Design
Cross-sectional survey design was employed incorporating both quantitative and qualitative survey
methods. The data collected for this study included both primary and secondary data sources. The primary
data of the study was collected directly from technology adopters and non-adopters. The data was obtained
using the key informant interviews and focus group discussions. The secondary sources were Woreda’s
Finance and Economic Development and Energy Offices that provided access to renewable energy
technology reports and other documents. Quantitative data was collected directly from respondents using a
semi-structured questionnaire. Qualitative information of the study was obtained using interviews and focus
group discussions.
Sample Size Determination
The study used formula provided by Anderson et al. (2007 to determine required sample size.
)1())(()(
2
2
−−−−=e
qpzN
Where, p = Estimated characteristics of the target population proportion (expected prevalence), Za/2 = 95%
confidence level that corresponds to the value of 1.96, e = Proportion of sampling error tolerated at 0.05,
q=1-p. Based on the information provided by the District Finance and Economic Development Office, the
expected prevalence of technologies’ dissemination in the district is 15% (BDFEDO, 2019). Thus, using p
= 0.15, the value of q becomes 0.85; taking these numbers in the above formula, the sample size of the study
comes:
196)05.0(
)85.0)(15.0()96.1(2
2
==N
By considering 7% non-response rate, the total sample size was 196+14 = 210.
Sampling Technique
Two-stage sampling technique was employed to draw sample households. First, using information obtained
from Boset District Energy Office, major, medium, and lower technologies’ adopter kebeles were listed and
stratified accordingly. Then, from each stratum, two study kebeles were selected using a simple random
sampling method which resulted into a total of 6 kebeles. Finally, using the calculated sample size, all
randomly selected kebeles were included in the study with their total number of households. Study
participants from each kebele were included in the study using probability proportional to their size (PPS).
Each technology user and non-user was selected using a simple random sampling method.
Method of Data Analysis
The study employed both descriptive statistics and econometric model to analyze the collected data. To run
statistical analysis, data were coded and entered a computer program, i.e., SPSS package. Both binary logit
and multinomial model were employed to investigate the issue under question. Moreover, data collected
through key informant interviews and focus group discussions were analyzed using textual analysis.
Results and Discussion
The survey result shows that from a total sampled respondents about 193 (91.4%) respondents were male-
headed households and the remaining 18 (8.6%) respondents were female-headed households. The mean
age and family size of sample households were 41.98 and 5.52, respectively (Table 1).

Grassroots Journal of Natural Resources, Vol.4, No.3 (September 2021), p.24-33 | ISSN 2581-6853 | CODEN GJNRA9
Doi: https://doi.org/10.33002/nr2581.6853.040303
27 Seble Mulugeta, Amenu Leta
Table 1: Descriptive Statistics of Sample Respondents
Explanatory variables Minimum Maximum Mean Standard
Deviation
Age of HH head (Year) 18 67 41.98 10.39
Family size of HH(Number) 2 10 5.52 1.68
Category Total Number Percentage
Sex Female
Male
18
193
8.60
91.40
Out of the total of 210 sampled households, 123 respondents (58.6%) were found to be non-adopters, while
87 (41.4%) were the adopters of renewable energy technology (Table 2). This implies the majority of the
households were found to be non-adopters of renewable energy resources.
Table 1: Renewable Energy Technology Adoption of Sampled Households
Adoption Number of households Percent (%)
Non-adopter 123 58.6
Adopter 87 41.4
Total 210 100.0
Out of the total of 210 households, 37 (17.6%) of them utilize modern energy sources, while 50 (23.8%)
were users of both traditional and renewable energy technology as their main energy source. The remaining
123 (58.6%) were traditional energy source users (Table 3).
Table 2: Energy Source Choice of Households
Energy choice Frequency Percent (%)
Modern energy 37 17.6
Mixed energy 50 23.8
Traditional energy 123 58.6
Total 210 100.0
Econometric Model Results
Binary logistic model results:
Out of the total of ten (10) explanatory variables included into the model, seven (7) were found to determine
the renewable energy adoption decision of sample households (Table 4).
Table 3: Logistic Regression Result: Determinants of adoption of renewable energy technology
_adoption- Coef. Std. Err. Z P>Z Marginal Effect
_Isex_1 1.016705 .8179536 0.02 0.984 .0038569
Age -0.93594 .0229955 -2.69 0.007*** -.0154378
Family_ size -0.73747 .1000446 -2.24 0.025** -.071020
Education 1.39668 .1500088 3.11 0.002*** .0779177
Total_ land_ size 2.103738 .7582701 2.06 0.039** .1734479
Livestock _TLU 1.354025 .1454835 2.82 0.005*** .0706841
Ln_ income 2.651386 1.130436 2.29 0.022** .2274067
Amount_ credit .9999627 .0000821 -0.45 0.649 -8.70e-06

Grassroots Journal of Natural Resources, Vol.4, No.3 (September 2021), p.24-33 | ISSN 2581-6853 | CODEN GJNRA9
Doi: https://doi.org/10.33002/nr2581.6853.040303
28 Seble Mulugeta, Amenu Leta
_adoption- Coef. Std. Err. Z P>Z Marginal Effect
Distance_ market .981148 .0245233 -0.76 0.446 -.0044386
_Itraining_1 5.015261 2.434803 3.32 0.001*** .3474101
_cons .0002495 .0009812 -2.11 0.035 .476853
Source: Computed from own survey data (2019-20)
** And *** = significant at 5% and 1% level of significance, respectively.
Discussion on significant variables to the determinants of adoption of renewable energy technologies is
follows.
Age of Household Head:
The relationship between the age of the household head and the adoption of renewable energy technologies
has become negative and significant. The marginal effect with the value of 0.0154 implies that, keeping
other factors constant, as the age of the household head increases by one year the probability of adopting
renewable energy technology decreased by 0.0154 (1.54%). This might be because older people are more
reluctant to accept new technologies and prefer to keep on using something they are familiar with. This
result is similar to the studies conducted by Tigabu (2014).
Family Size:
The model result shows that family size affects adoption of renewable energy technology in a negative and
significant way. The marginal effect indicates that, assuming everything constant, as family size increases
by one unit the probability of adopting renewable energy technology decrease by 0.071 (7.1%). This may
be because households with large family size hinder adoption of new technologies. In other words,
household with larger family size means more labour available to collect free traditional fuels like firewood
and dung, which might make households reluctant to adopt energy technologies. The finding of this study
is in harmony with the finding of Yonas et al. (2015).
Education Level:
Education level of household was a significant determinant of adoption decision for renewable energy
technology of households. The marginal effect of 0.077 for education shows that, keeping other factors
constant, the probability of adopting renewable energy technologies increases by 7.7% for one grade
increment in the educational level of the household head. The finding of this study is in accord with the
previous works of Kabir (2013) and Iqbal (2013).
Total Land Size:
Total landholding of households was a positive and significant determinant affecting renewable
technologies’ adoption. The marginal effect value of total land size was 0.173 on the adoption of renewable
energy technologies. That means, keeping other things constant, the probability of adopting renewable
energy technologies increased by 17.3 percent as the landholding size of households increased by one
hectare. The study result is in harmony with the findings of Alemu and Köhlin (2009) and Iqbal (2013).
Livestock Holding (TLU):
Livestock holding has a positive and significant relationship with the adoption decision of households. The
marginal effect with a value of 0.07 indicates that, keeping other factors constant, as the livestock increases
by one unit the likelihood to adopt renewable energy technology increases by 7%. Livestock is a mean
through which households kept their wealth, especially in rural Ethiopia. So, households having large
livestock ownership tend to adopt new technologies. This result is similar to the findings of Iqbal (2013)
and Kabir (2013).

Grassroots Journal of Natural Resources, Vol.4, No.3 (September 2021), p.24-33 | ISSN 2581-6853 | CODEN GJNRA9
Doi: https://doi.org/10.33002/nr2581.6853.040303
29 Seble Mulugeta, Amenu Leta
Total Income:
Total annual income of households affects the adoption of renewable energy technology positively and
significantly. Households with high annual income were found to be more adopters of the technology than
those households with lower annual income. The marginal effect of income on the adoption decision of
households has a value of 0.227. This implies that, holding other factors constant, as the income level of a
household increases by one birr1 the probability of adopting the technology increases by 22.7 percent. A
similar finding was reported by Lay (2012) and Ouedraogo (2006).
Training:
Access of training on energy technology adoption was positively and significantly related to adoption of
renewable energy technology. The marginal effect of this variable is 0.347 implying that the probability of
renewable energy technology adoption for trained households increases by 34.7 percent as compared to
untrained households. The result of this study is similar to the finding of Abadi (2006).
Multinomial Logistic Model Results
This model estimates the effect of each covariate/variable on the energy choice of sampled households (That
is modern, mixed, and traditional). And traditional energy is used as a reference group (Table 5).
Table 4: Multinomial Logistic Result: Determinants of energy choice of sample households
Choice Modern Energy Mixed Energy
Variables Coef. dy/dx Z P>z Coef dy/dx Z P>z
Sex
Male
-1.220198 -.1589791 -1.19 0.234 .1624919 .0990379 0.13 0.898
Age -.0605755 -.002315 -1.90 0.058* -.064682 -.003376 -2.1 0.030**
Family
Size
-.2945361 -.0054745 -1.60 0.110 -.403639 -.026485 -2.2 0.026**
Education .4660993 .0179083 3.16 0.002** .4962204 .0258144 3.49 0.000**
Total land
size
.5773503 -.0049131 1.32 0.187 1.032406 .0791591 2.40 0.016**
Livestock
in TLU
.4133841 .0215668 3.28 0.001** .3524681 .0129972 2.82 0.005**
Amount
Credit
-.0001896 -.0000242 -1.47 0.141 .0000593 .000019 0.58 0.560
Distance to
Market
-.0449613 .0004865 -1.30 0.193 -.082000 -.006345 -2.4 0.016**
Training
Yes
1.194264 .0449281 2.00 0.046** 1.37473 .0812816 2.28 0.023**
Ln income 1.107211 .0247193 2.06 0.040** 1.453524 .0923552 2.73 0.006**
_cons -11.18369 .034212 -2.37 0.018 -14.1072 .05467 -2.8 0.004
Source: Computed from own survey data (2019- 2020)
Age of Household Head:
As depicted in the table 5, age of household head has negative and significant association with both modern
and mixed energy choices. The marginal effect of the household head on energy choice of households has
a value of -0.0023 and -0.0033 for modern and mixed energy choices, respectively. It indicates that,
assuming other factors constant, the choice of modern and mixed energy sources decreases by 0.23% and
1Ethiopian currency having values equivalent to USD 0.023
Grassroots Journal of Natural Resources, Vol.4, No.3 (September 2021), p.24-33 | ISSN 2581-6853 | CODEN GJNRA9
Doi: https://doi.org/10.33002/nr2581.6853.040303
30 Seble Mulugeta, Amenu Leta
0.33% for one year increment in the age of the household head compared to traditional energy sources. The
finding of this study is similar to the work of Waweru (2014).
Family Size:
For a mixed energy choice, family size has shown a negative and significant relationship. The marginal
effect, that is -0.026, shows that, keeping other factors constant, the probability of choosing a mixed energy
source decreases by 2.6% relatively, as one-unit increment in family size occurs. This may be due to free
labour availability to collect free traditional energy source or preparing food to all family members
requiring huge energy, which might not be satisfied either by modern or mixed energy sources that obliged
households to pursue using traditional energy sources. This study finding is similar to the work of Waweru
(2014).
Education:
The education has a positive and significant influence on both modern and mixed energy choices. The
marginal effect 0.0179 and 0.0258 of education for both the energy categories indicates that, keeping other
factors constant, the probability of choosing modern and mixed energy sources increases by 17.9 and
25.8%, respectively, relative to one-grade increment in education, compared to traditional energy sources.
The study finding is in line with the finding of Ouedraogo (2006).
Land Size:
For mixed energy choice, landholding size has shown a significant and positive relationship. The marginal
effect of landholding size on the choice of mixed energy source indicates that, assuming everything is
constant, an increase in landholding size increases the probability of choosing mixed energy as their main
energy source by 7.9% compared to traditional energy sources. The model result shows that landholding
size has direct relationship with the choice of energy sources. This study result is in agreement with the
findings of Alemu and Köhlin (2009).
Livestock Holding (TLU):
For both modern and mixed energy source choices, livestock ownership has shown a significant
relationship. The marginal effect of households’ livestock holding on the choice of modern and mixed
energy sources with a value of 0.0215 and 0.0129, respectively, indicates that, keeping other factors
constant, as a livestock holding in TLU increases by one unit the choice of modern and mixed energy as
main energy sources increases by 2.15% and 1.29%, respectively, compared to traditional energy sources.
Since livestock possession is one-way of keeping households’ wealth in rural Ethiopia, the study finding
confirms the energy ladder hypothesis of income/wealth that affects modern energy choice of households
(Heltberg, 2003).
Distance to Market:
An increase in the market distance led to a decrease in the probability of choosing mixed energy over
traditional energy sources. The marginal effect value of -0.006 indicates that, assuming everything constant,
the choice of the mixed energy source as the main fuel decreased by 0.6% for a one-kilometer increment
in the distance of the market centre.
Training:
It significantly determines both modern and mixed energy choices. The marginal effect of training for both
energy categories was 0.044 and 0.081, respectively. This implies that, keeping other factors constant, the
probability of choosing modern energy over traditional energy increased by 4.4% for trained households
compared to untrained households, and the likelihood of choosing mixed energy over traditional energy
increases by 8.1% for households who are provided with training compared to untrained one. This means
that households provided with training know more about the positive benefits of utilizing renewable energy

Grassroots Journal of Natural Resources, Vol.4, No.3 (September 2021), p.24-33 | ISSN 2581-6853 | CODEN GJNRA9
Doi: https://doi.org/10.33002/nr2581.6853.040303
31 Seble Mulugeta, Amenu Leta
technologies and modern energy sources, which motivate them to choose cleaner energy sources to meet
their daily energy needs.
Annual Income:
It significantly determines both modern and mixed energy choices. The marginal effect of annual income
on energy choice of households has a value of 0.0247 and 0.0923 for modern and mixed energy choices,
respectively. It indicates that, assuming other factors constant, the choice of modern and mixed energy
sources increases by 2.47% and 9.23% for one birr (Ethiopian currency) increment in income level of
households compared to traditional energy sources. The study finding concord with Alemu and Kolhin
(2008) and Ouedraogo (2006). Besides, the finding of this study proves the energy ladder hypothesis, which
confirms that, as the income level of a household increases, their preference to clean energy sources would
increase.
Conclusions
The finding of this study indicates that the major determining factors of renewable technology adoption
and modern energy source choice of rural households are age, family size, annual income, total landholding
size, livestock ownership (TLU), education, and training of the household head. These factors affect the
adoption decision and modern energy source choice of rural households one way or the other. Besides,
affordability and multi-purpose use of technologies were mentioned as major challenges for technologies’
adoption during focus group discussions. Based on the finding of the study, the following recommendations
are made. Stakeholders should strengthen and provide different educational opportunities like adult
education and training for rural households to make them more informed about the benefits of utilizing
cleaner energy sources. Concerned bodies should facilitate credit and subsidy schemes to make renewable
energy technologies affordable for the rural poor. Efforts should be made by concerned bodies so that
households engaged in different income generating activities, like irrigation schemes, to improve their
income level and thereby enhance adoption and utilization of modern energy sources and reduce energy
poverty at the household level. Due emphasis should be given by stakeholders for technological research
to revise and adjust renewable energy technologies’ limitations.
Acknowledgments
The authors are grateful to Boset District Office of Agriculture and Natural Resources along with
Development agent workers of the neighboring areas for providing the necessary data and logistics.
References
Abadi, T. (2006) Analysis of Social Economic and Institutional Issues Affecting Utilization of Rainwater
Harvesting Technology, Eastern Tigray, Ethiopia. MSc Thesis School of Graduate Studies of
Alemaya University.
Alemu, M. and Köhlin, G. (2008) Biomass Fuel Consumption and Dung Use as Manure Evidence from
Rural Households in the Amhara Region of Ethiopia. Addis Ababa. Environment for Development
Discussion Paper Series, 08-17.
Alemu, M. and Köhlin, G. (2009) Determinants of Household Fuel Choice in Major Cities in Ethiopia.
Working Papers in Economics No 399, University of Gothenburg, Sweden
Anderson, D., Sweeny, J., Williams, T., Freeman, J. and Shoesmith, E. (2007) Statistics for Business and
Economics. Thomons Learning.
BDFEDO (2019). Boset District Finance and Economic Development Office of Socio-Economic Profile of
Boset District. Unpublished document.

Grassroots Journal of Natural Resources, Vol.4, No.3 (September 2021), p.24-33 | ISSN 2581-6853 | CODEN GJNRA9
Doi: https://doi.org/10.33002/nr2581.6853.040303
32 Seble Mulugeta, Amenu Leta
Dawit, D. (2014) Assessment of Bio-Based Energy, Rural Livelihoods and Energy Security in Ethiopia.
Department of Economic and Technological Change Centre for Development Research.
Dawit, D. (2008) Estimating Household Energy Demand of Rural Ethiopia Using an Almost Ideal Demand
System (Aids). Addis Ababa University, Addis Ababa
Dereje, D. (2013) Ethiopia's Renewable Energy Power Potential and Development Opportunities. Ministry
of Water and Energy. Abu Dhabi, UAE.
ENA (2015). Renewable energy adoption. Available at:
http://www.ena.gov.et/en/index.php/environment/item/611 retrieved on November 30/2015
[Accessed on 15 May 2021].
Faller, E.M., Hernandez, M.T., Hernandez, A.M. and Gabriel, J.R.S. (2020). Emerging Roles of Pharmacist
in Global Health: An Exploratory Study on their Knowledge, Perception and Competency. Archives
of Pharmacy Practice, 11(1): 40-6.
Gebreegziabher, Z. (2012). Urban Energy Transition and Technology Adoption: The Case of Tigrai,
Northern Ethiopia. Energy Economics, 34: 410–418.
GIZ (2015). Eastern Africa Energy Resource Base: Overview of the determinants of renewable Energy
source and its Contribution to the Economy. Gesellschaft für Technische Zusammenarbeit (GIZ).
Hanawi, S.A., Saat, N.Z.M., Zulkafly, M., Hazlenah, H., Taibukahn, N.H., Yoganathan, D. and Low, F.J.
(2020). Impact of a Healthy Lifestyle on the Psychological Well-being of University Students.
International Journal of Pharmaceutical Research & Allied Sciences, 9(2): 1-7.
Heltberg, R. (2003). Household Fuel and Energy Use in Developing Countries. A Multicountry Study Draft
for discussion and Gas Policy Division of the World Bank.
IEA, UNDP and UNIDO (2010). Energy poverty, how to make modern energy access universal Special
early excerpt of the world energy outlook 2010 for the UN General Assembly on the Millennium
Development Goal.
IEA (2014). World Energy Outlook. International Energy Agency (2014), Paris, OECD.
Iqbal, S. (2013). Factors Leading to Adoption of Biogas Technology: A Case Study of District Faisalabad,
Punjab, Pakistan.
Kabir, H. (2013). Factors determinant of biogas adoption in Bangladesh.Department of Regional and Project
Planning, Justus-Liebig University of Giessen, Germany
Lay, J. (2012). Determinants of renewables in the energy transition: Evidence on solar home systems and
lighting fuel choice in Kenya. Hamburg Institute of International Economics, Germany.
Ouedraogo, B. (2006). Household Energy Preference for Cooking in Urban Ouagadougou, Burkina Faso.
Energy Policy, 34(18): 3787-3795.
Tigabu, A. (2014). Factors Affecting Adoption of Improved Cookstoves in Rural Areas: Evidence from
‘Mirt’ Injera Baking Stove (The Survey of Dembecha Woreda, Amhara Regional State, Ethiopia).
MA Thesis Submitted to the Department of Management, Mekele University.
Waweru D. (2014). Fuel in Kenya: An Analysis of Household Choices in Major Kenyan Cities. A Research
Thesis Submitted to the School of Economics in Partial Fulfilment of the requirements For the
Degree of Master of Economics (Econometrics) of Kenyatta University.
WHO and UNDP (2009). The Energy Access Situation in Developing Countries, A Review Focusing on
the Least Developed Countries and Sub-Saharan Africa. Available online at:
http://www.undp.org/energy [Accessed on 15 May 2021]
Yonas, A., Abebe, B., Köhlin, G. and Alemu, M. (2013). Household Fuel Choice in Urban Ethiopia; A
Random Effects Multinomial Logit Analysis, Discussion Paper Series, Environment for
Development (EfD) DP 13-12.
Yonas, A., Abebe, B., Köhlin, G. and Alemu M. (2015). Modeling Household Cooking Fuel Choice: a Panel
Multinomial Logit Approach. Working Papers in Economics No 632 ISSN. University of Gutenberg
school of Business, Economics, and Law.
Grassroots Journal of Natural Resources, Vol.4, No.3 (September 2021), p.24-33 | ISSN 2581-6853 | CODEN GJNRA9
Doi: https://doi.org/10.33002/nr2581.6853.040303
33 Seble Mulugeta, Amenu Leta
Authors’ Declarations and Essential Ethical Compliances
Authors’ Contributions (in accordance with ICMJE criteria for authorship)
Contribution Author 1 Author 2
Conceived and designed the research or analysis Yes Yes
Collected the data Yes No
Contributed to data analysis & interpretation Yes Yes
Wrote the article/paper Yes Yes
Critical revision of the article/paper Yes Yes
Editing of the article/paper Yes Yes
Supervision No Yes
Project Administration Yes Yes
Funding Acquisition Yes Yes
Overall Contribution Proportion (%) 60 40
Funding
No funding was available for the research conducted for and writing of this paper.
Research involving human bodies (Helsinki Declaration)
Has this research used human subjects for experimentation? No
Research involving animals (ARRIVE Checklist)
Has this research involved animal subjects for experimentation? No
Research involving Plants
During the research, the authors followed the principles of the Convention on Biological Diversity and
the Convention on the Trade in Endangered Species of Wild Fauna and Flora. Yes
Research on Indigenous Peoples and/or Traditional Knowledge
Has this research involved Indigenous Peoples as participants or respondents? No
(Optional) PRISMA (Preferred Reporting Items for Systematic Reviews and Meta-Analyses)
Have authors complied with PRISMA standards? No
Competing Interests/Conflict of Interest
Authors have no competing financial, professional, or personal interests from other parties or in publishing
this manuscript.
Rights and Permissions
Open Access. This article is licensed under a Creative Commons Attribution 4.0 International License,
which permits use, sharing, adaptation, distribution and reproduction in any medium or format, as long as
you give appropriate credit to the original author(s) and the source, provide a link to the Creative Commons
license, and indicate if changes were made. The images or other third-party material in this article are
included in the article's Creative Commons license, unless indicated otherwise in a credit line to the material.
If material is not included in the article's Creative Commons license and your intended use is not permitted
by statutory regulation or exceeds the permitted use, you will need to obtain permission directly from the
copyright holder. To view a copy of this license, visit http://creativecommons.org/licenses/by/4.0/.
Application of Introduced Representatives of Lonicera pileata Oliv. in
Landscaping of the Right-Bank Forest-Steppe of Ukraine
Liudmyla Varlashchenko*1, Anatolii Balabak2, Valentyna Mamchur3, Valentyn Polishchuk4 1Department of Horticulture, Uman National University of Horticulture, Uman, Chercassy region, Ukraine.
E-mail: [email protected] | ORCID: 0000-0002-1273-4250 2Department of Horticulture, Uman National University of Horticulture, Uman, Chercassy region, Ukraine.
E-mail: [email protected] | ORCID: 0000-0002-1016-4442 3Department of Forestry, Uman National University of Horticulture, Uman, Chercassy region, Ukraine.
E-mail: [email protected] | ORCID: 0000-0003-1579-4467 4Department of Horticulture, Uman National University of Horticulture, Uman, Chercassy region, Ukraine.
E-mail: [email protected] | ORCID: 0000-0001-8157-7028
*Corresponding author
Abstract This article deals with the possibilities to introduce the
ornamental shrub Lonicera pileata Oliv. belonging to
Caprifoliaceae Vent. family in the landscaping of the Right-Bank
Forest-Steppe of Ukraine. The representatives of Lonicera pileata
Oliv. (Cultivars Рileata, form Variegata and form Lemon Beauty)
endure winter well and adapt to new climatic conditions of the
planting site. The plants were found tolerant to shade, cold,
pruning, and urban ecological conditions with polluted air. It has
been revealed that, depending on the purpose of the landscaping
object, these shrubs can perform various functions: create
architectural and artistic image of the object; promote biological
land reclamation along with other plants; protect against dust and
noise; regulate moisture and temperature. Simultaneously, to
grow plants of Lonicera pileata Oliv. successfully, it is critical to
use farming techniques developed by the author scientists. When
the representatives of evergreen shrubs of Lonicera pileata Oliv.
are introduced in the landscaping of residential areas, they can be
used to decorate landscape-gardening objects with different
functional use creating landscape compositions in gardens and
parks, on the plots with different exposition and slopes, as anti-
erosion plants, in alpine landscapes, as freestanding shrubs or in
group plantations, at the background of lawns, in flowerbeds, in
alpine screen gardens, in rockeries, in freely growing and
trimmed hedges, and as ground-covering plants.
Keywords Urban environment; Vegetation period; Farming technique;
Decorative effect
How to cite this paper: Varlashchenko, L.,
Balabak, A., Mamchur, V. and Polishchuk, V. (2021).
Application of Introduced Representatives of
Lonicera pileata Oliv. in Landscaping of the Right-
Bank Forest-Steppe of Ukraine. Grassroots Journal
of Natural Resources, 4(3): 34-41. Doi:
https://doi.org/10.33002/nr2581.6853.040304
Received: 18 July 2021
Reviewed: 10 August 2021
Provisionally Accepted: 15 August 2021
Revised: 30 August 2021
Finally Accepted: 11 September 2021
Published: 30 September 2021
Copyright © 2021 by author(s)
This work is licensed under the Creative
Commons Attribution International
License (CC BY 4.0).
http://creativecommons.org/licenses/by/4.0/
Grassroots Journal of Natural Resources, Vol.4 No.3 (September 2021) ISSN 2581-6853 | CODEN: GJNRA9 | Published by The Grassroots Institute
Website: http://grassrootsjournals.org/gjnr | Main Indexing: Web of Science
M – 00241 | Research Article
ISSN 2581-6853 | 4(3) Sep 2021

Grassroots Journal of Natural Resources, Vol.4, No.3 (September 2021), p.34-41 | ISSN 2581-6853 | CODEN GJNRA9
Doi: https://doi.org/10.33002/nr2581.6853.040304
35 Liudmyla Varlashchenko, Anatolii Balabak, Valentyna Mamchur, Valentyn Polishchuk
Introduction
Enrichment of plant varieties with ornamental plants, especially those that do not require too much care and
adapt to extreme factors of changing climate, is an important task of solving current problems while
retaining biodiversity, effective use of plant resources and optimization of the state of green space. To
improve the structure and decorative effect of garden compositions in urban environment in Ukraine,
promising and less common plants belonging to the family Caprifoliaceae Vent. are helpful. One popular
genus of the family is Lonicera. There are over 200 species of Lonicera genus (also known as honeysuckle)
all over the world, only 30 species became widespread in ornamental gardening, landscaping of residential
areas, and landscape design, as described in “Flora of USSR” (Shyshkin, 1958; Karpun, 2004).
All species under Lonicera genus can be categorized into three types: upright plants, creepers and climber
plants. The upright standing plants are generally the shrubs having fruits not edible, round-shaped, red,
purple or orange berries arranged close to leaf axil. Lonicera pileata Oliv. is a species belonging to the
family Caprifoliaceous Vent. In the wild, it is widespread in the mountains of central and western China.
At the beginning of the 20th century, it was brought under cultivation. Due to their unusual look, the shrubs
became widespread all over Europe, especially in its western part, and later it entered Ukraine, but it got
acclimatized only in its southern part of the country (Levon and Kusnietsov, 2001; Hessayon, 2000).
The main usage of evergreen shrub Lonicera pileata Oliv. is ornamental decoration of open landscape
garden having different functional uses: concealing alpine landscapes, rockeries, creation of alpine screen
gardens, small group plantations, free growths and trimmed hedges, and organization of rest areas. However,
the value of this shrub Lonicera pileata Oliv. lies not only in the decorative uses but also in other functional
uses (Kucheriavyi, 2008). Plants of this species endure winter season very well and adapt to new climate
conditions at its site (Laptiev, 2001).
When new plants are introduced in landscape planning, plants adapt successfully and manifest high
biological durability. It means that these plants are not affected by late spring and early autumn frosts, and
winter frosts or droughts; and plants produce similar seeds that can ensure the availability of planting
material for next time. The utility of such plants is in growing and introducing ornamental plants in the
landscaping of residential areas in Ukraine. Therefore, the research on Lonicera pileata Oliv. is relevant and
it generates scientific and practical interest. Hence, the objective of this study is to explore the ecological
and biological properties of evergreen ornamental shrubs of Lonicera genus having utility in landscaping;
to define the regularities of all stages of introduction process; and to perform general analysis of farming
practices and care of Lonicera pileata Oliv. plantations. This research has been conducted in the
experimental plots of the Department of Landscape Gardening of Uman National University of Horticulture,
Ukraine. This research has introduced representatives of Lonicera pileata Oliv.: Pileata variety and
Variegata and Lemon Beauty forms were tested in this study. The scientific novelty of this research is that,
for the first time, a less common ornamental plant Lonicera pileata Oliv. from the family Caprifoliaceae
Vent. is introduced in the Right-Bank Forest-Steppe of Ukraine.
Materials and Methods
20 Lonicera pileata Oliv. shrubs were selected for the research, including 6 shrubs of form Variegata, 6
shrubs of form Lemon Beauty and 8 shrubs of cultivar Рileata. General scientific analysis, synthesis and
observation, and general biological research methods were followed to conduct this research. During the
experiment, observation was carried out over the period from 2017 to 2020 on the experimental plot at the
Department of Landscape Gardening, Uman National University of Horticulture. This methodology of
phenological observations was developed for botanical gardens to study the vegetation in the botanical
gardens of the USSR (1975). The selection of trees and shrubs for introducing the plants was based on the
methods developed by (Kochno and Kuznietsov, 2005). During the research on the growing of Lonicera
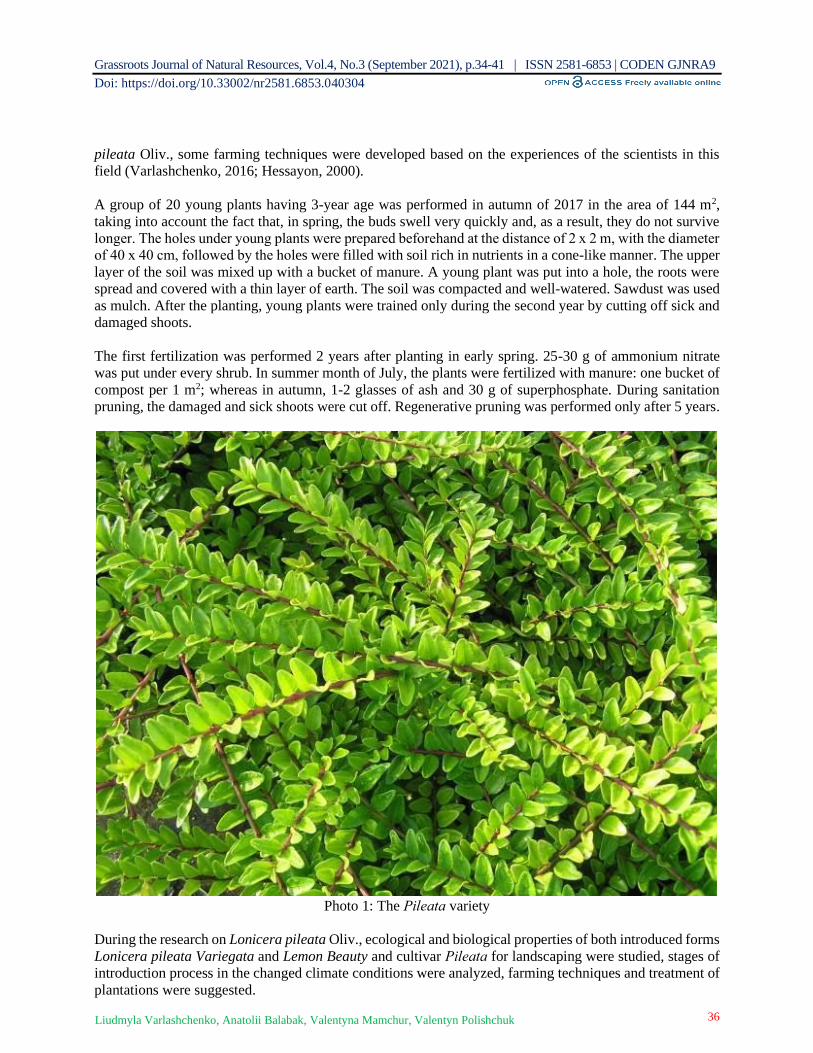
Grassroots Journal of Natural Resources, Vol.4, No.3 (September 2021), p.34-41 | ISSN 2581-6853 | CODEN GJNRA9
Doi: https://doi.org/10.33002/nr2581.6853.040304
36 Liudmyla Varlashchenko, Anatolii Balabak, Valentyna Mamchur, Valentyn Polishchuk
pileata Oliv., some farming techniques were developed based on the experiences of the scientists in this
field (Varlashchenko, 2016; Hessayon, 2000).
A group of 20 young plants having 3-year age was performed in autumn of 2017 in the area of 144 m2,
taking into account the fact that, in spring, the buds swell very quickly and, as a result, they do not survive
longer. The holes under young plants were prepared beforehand at the distance of 2 х 2 m, with the diameter
of 40 х 40 cm, followed by the holes were filled with soil rich in nutrients in a cone-like manner. The upper
layer of the soil was mixed up with a bucket of manure. A young plant was put into a hole, the roots were
spread and covered with a thin layer of earth. The soil was compacted and well-watered. Sawdust was used
as mulch. After the planting, young plants were trained only during the second year by cutting off sick and
damaged shoots.
The first fertilization was performed 2 years after planting in early spring. 25-30 g of ammonium nitrate
was put under every shrub. In summer month of July, the plants were fertilized with manure: one bucket of
compost per 1 m2; whereas in autumn, 1-2 glasses of ash and 30 g of superphosphate. During sanitation
pruning, the damaged and sick shoots were cut off. Regenerative pruning was performed only after 5 years.
Photo 1: The Рileata variety
During the research on Lonicera pileata Oliv., ecological and biological properties of both introduced forms
Lonicera pileata Variegata and Lemon Beauty and cultivar Рileata for landscaping were studied, stages of
introduction process in the changed climate conditions were analyzed, farming techniques and treatment of
plantations were suggested.
Grassroots Journal of Natural Resources, Vol.4, No.3 (September 2021), p.34-41 | ISSN 2581-6853 | CODEN GJNRA9
Doi: https://doi.org/10.33002/nr2581.6853.040304
37 Liudmyla Varlashchenko, Anatolii Balabak, Valentyna Mamchur, Valentyn Polishchuk
Results and Discussion
The analysis has shown that, among green vegetation of Uman National University of Horticulture, a
considerable percentage consists of ornamental trees and leafy shrubs, while evergreen plants are not
common in the landscaping of this territory. In 2017, 20 shrubs of Lonicera pileata Oliv. were planted on
the site of the experimental plot: 8 Pileata cultivars, 6 of Variegate form and 6 of Lemon Beauty form of
the shrub. Ecological and biological features of the shrubs were studied during the research period (2017-
2020). Lonicera pileata Oliv. cultivar Рileata is one of the rare varieties of the ornamental plants having
upright honeysuckle features. Originated in Japan, it is a low, evergreen or semi-evergreen wide-branched
shrub that grows to the height of 0.4-1.0 m. The leaves are small, 0.5-2 cm long, ovate, lance-shaped with
wedge-shaped basis, glossy, dark green on the surface and pale green on the reverse side, lightly hairy, and
arranged in pairs on the stems of short petioles. Fragrant flowers are arranged in pairs on upright flower
stalks having 0.5 cm length. Bilabiate corolla is tubular and cone-shaped, white with red coating, 0.8 cm
long, hairy on the outside or almost bare. Stamens and pistils are hairy and longer than corolla. Floral bracts
are awl-shaped, almost of the same length as ovary. Fruits are translucent, round-shaped berries, 0.5 cm
across, of amethyst or purple and velvet coloring. It blossoms in May–June and bears fruits in October. The
plant grows slowly, endures shade well, and reproduces vegetatively (Varlashchenko and Balabak, 2021;
Kohno and Kurdyuk,1994). It looks attractive in solitary and in group plantations.
Lonicera pileata Oliv. variegated form (Lonicera pileata Variegate) is evergreen dwarf shrub, 20 cm high
with small 1-2 cm long lance-shaped leaves, dark-green, glossy, opposite leaves, similar to boxwood leaves
(that quickly grow after cutting). If watered regularly, the shrub grows high; otherwise, it remains dwarf
and ground covering. It blossoms in the middle of May–June and produces beautiful fragrant white flowers.
Berries are elongated, 6 mm across, translucent, red or light blue-purple, early ripening (September–
October), and not edible. It reproduces by suckers, layers and grafts (Varlashchenko and Balabak, 2021;
Karpun, 2004).
In landscape design, Lonicera pileata Variegate looks nice and attractive in different compositions and is
the best alternative to boxwood (Bucsus sempervires L.). It grows quickly, endures easily the pruning and
training, grows well in the sun and in partial shadow, and is drought and cold resistant. The plant needs
covering during frosty winters without snow. It is planted in rockeries, shrub groups, and among coniferous
plantings (as a groundcover plant).
Lonicera pileata Oliv., form Lemon Beauty (shining honeysuckle), originates from Western China, and
grows in mountainous areas of provinces Sichuan and Yunnan. It has been in cultivation since 2008. It is
evergreen shrub in southern areas and semi-evergreen with partially deciduous leaves in northern areas. The
shrub may grow up to 1.2 m height and spread its dome-like crown up to 1.5 m in diameter. Stems are
covered with smooth scaled bark; shoots are thin, light brown with olive-green tint. Leaves are small, oval,
egg-shaped, glossy, light green with white edging (Varlashchenko and Balabak, 2021; Sikura and
Kapustyan, 2003).
The complicated characters of introduced plant were observed. The process of introducing a plant can be
roughly divided into three successive stages: the selection of plant to be introduced, testing of the plant, and
introduction of plant in the cultivation process (Laptiev, 2001). It is an important observation that there is a
difference in the phenological stages among different representatives of Lonicera pileata Oliv. genus during
the process of phylogenies. The absence of blossoms in the first year of growing the cultivar Рileata, form
Variegate, and form Lemon Beauty reduces the acclimatization feature of the introduced plants, though it is
not a crucial feature for determining the potential of the plants. This fact is caused by insufficient sun-
exposure of the habitat, physiological and ecological hardiness of the plants under conditions of the research
(Lapin, 2019).
Grassroots Journal of Natural Resources, Vol.4, No.3 (September 2021), p.34-41 | ISSN 2581-6853 | CODEN GJNRA9
Doi: https://doi.org/10.33002/nr2581.6853.040304
38 Liudmyla Varlashchenko, Anatolii Balabak, Valentyna Mamchur, Valentyn Polishchuk
Duration indices of vegetation period of the representatives of Lonicera pileata Oliv. in the town of Uman
are presented in table 1.
Table 1: Duration indices of vegetation period of the representatives of Lonicera pileata Oliv. in the
Right-Bank Forest-Steppe of Ukraine
№ Cultivar, forms Duration of Vegetation Period (days)
1. Рileata 196±15
2. Variegata 190±10
3. Lemon Beauty 194±12
The duration indices of the vegetation period show that all the investigated representatives of Lonicera
genus are suitable for growing and arranging compositions in the town of Uman. It is worth mentioning that
given shrubs undergo all phenological stages of development when introduced in the Right-Bank Forest-
Steppe of Ukraine and are characterized by the starting and final dates of flowering, stems growth,
blossoming, fruiting and ripening of fruits, etc. (Table 2).
Table 2: Phenological stages of growth and development of Lonicera pileata Oliv. in the Right-Bank
Forest-Steppe of Ukraine (from 2017 to 2020)
№ Cultivar, forms Dates of phonological stages of development Duration of
blossoming
(Days)
Buds swelling Buds breaking Leaves unfolding
1. Рileata 16.03–25.03 31.03–21.04 18.04–20.05 18.05–18.06
2. Variegata 12.03–21.03 25.03–17.04 14.04–17.05 15.05–19.06
3. Lemon Beauty 14.0 –24.03 28.03 – 20.04 15.04–18.05 16.05–17.06
On an average, the vegetation period of Lonicera pileata Oliv. representative during the research was 205.6
days. Form Lonicera pileata Variegata was recorded to have the shortest duration of vegetation period,
while cultivar Рileata had the longest period. Bud swelling and bud breaking are regarded to be the
beginning of the vegetation - trees or shrubs. Phenological observations over honeysuckle cultivar have
shown that breaking of reproductive buds takes place at an average daily temperature +7…10°С with sum
of effective temperatures 12…20°С (Table 2). Over the period of research, this stage took place in the
second half of March. The breaking of reproductive buds was not simultaneous: the buds on the lower shoots
opened earlier than those on the upper shoots.
In years having long winter thaws, lower reproductive buds that received more warmth from the soil surface
swelled and began to break. Under further fall of temperature, their development ceased, and they
successfully endured the fall of temperature. The breaking of flower buds depended on weather conditions
and lasted from 12 to 25 days. Flower-bud formation began when the sum of effective temperatures was
70–900С in the first half of April (Table 2). The duration of this phase depended on the temperature that
lasted 12–18 days.
The findings of the research have shown that in the Right-Bank Forest-Steppe of Ukraine the blossoming
of the representatives of Lonicera pileata Oliv., on an average, began on 15th–18th of May under the average
daily temperature 12-14°С and on sum of effective temperatures 170°С. The duration of blossoming lasted
30–33 days and depended, to the great extent, on the atmospheric temperature and humidity. Linear growth
of shoots began during massive blossoming and finished in dry years (2019, 2020) in the second half of
July, and under sufficient moistening (2018), at the beginning of August. It has been established that the
deviation of some dates of certain stages over the years of research depends on the climate and weather
indices of a particular year. The difference in the starting dates of certain phenological stages of all shrubs

Grassroots Journal of Natural Resources, Vol.4, No.3 (September 2021), p.34-41 | ISSN 2581-6853 | CODEN GJNRA9
Doi: https://doi.org/10.33002/nr2581.6853.040304
39 Liudmyla Varlashchenko, Anatolii Balabak, Valentyna Mamchur, Valentyn Polishchuk
depended on the time of blossoming, from 15th – 18th of May to 16th – 18th of June and complete ripening of
berries from 16th of September to 15th of October.
Winter hardiness of shrubs was determined visually, after analyzing the state of plants during and after the
winter. Frequent thaws caused damage to shrubs, resulting in freezing of shoots in 2019 and 2020. The
observations were generalized over three years, taking into account the character of freezing. It turned out
that one and the same representative in different years had different winter resistance. It is worth mentioning
that some shrubs froze under -23°С frost when there was no snow, but under considerable snow covering
frosts did not cause considerable damage to shrubs. In general, all introduced representatives of Lonicera
pileata Oliv. have a good level of acclimatization and they can be recommended for the introduction in the
landscaping of the Right-Bank Forest-Steppe of Ukraine.
Conclusions
The representatives of Lonicera pileata Oliv. have hard and inflexible stems sprawling on earth and easily
take roots when touching the soil. The pest and diseases rarely afflict the plants, but during cold and wet
summer, fungal infection may appear, such as powdery mildew, rust. Very often, juicy shoots can be
attacked by aphis (Aphidoidea), leaf moth (Cameraria ohridella) and red spiders (Purrhoris apterus). To
fight diseases, it is necessary to use systemic fungicides: Vectra, Topaz, and Hamiar. Inta-Vira, Akhtar and
Aktelika were used to fight pest. All plants grow well both in the sun and shade, on the sites protected
against wind, and on drained loamy soils with neutral pH. Performance of all farming techniques applied to
grow Lonicera pileata Oliv. ensures excellent decorative effect and durability of plantings. So, according
to ecological and biological features, the representatives of Lonicera pileata Oliv. can be grown as
decorative plants that are able to emphasize the uniqueness of a garden or a household plot. Dwarf shrubs
can be used in both landscape and panoramic compositions. Thick and dense crown of shrubs give any relief
a beautiful and noble look. However, to select introduced representatives of Lonicera pileata Oliv., Рileata
cultivar, Variegated form and shining honeysuckle form Lemon Beauty, it is necessary to take into account
their ornamental properties.
Introduced cultivars of Lonicera pileata Oliv., cultivars Рileata, Variegata and Lemon Beauty, were
researched. It has been established that their ecological and biological variable indices of decorative effect
(of shoots, leaves, crown shapes, flowers, and fruits) and resistance to environmental factors make their use
in the landscaping in the Right-Bank Forest-Steppe of Ukraine justifiable and suitable for introduction.
Performance of all farming techniques used to grow and care the evergreen shrubs of Lonicera pileata Oliv.
will provide with high decorative effect and improve their durability in the plantings having various
combinations: in flowerbeds, hedges, rockeries, alpine screen gardens, etc.
References
Hessayon, D.G. (2000). The tree and shrub expert (translated from Russian). Moscow, Klades-Bucs, p. 127.
Karpun, Yu.N. (2004). Fundamentals of plant introduction. Sochi. Hortus Botanicus, 2: 123.
Kochno, M.A. and Kuznietsov, S.I. (2005). Methodological recommendations on the selection of trees and
shrubs for the introduction of plants. Kyiv: Fitosotsiotsentr, p. 28.
Kohno, N.A and Kurdyuk, A.M. (1994). Theoretical bases and experience of introduction of woody plants
in Ukraine. Kiev: Science Opinion, p.185.
Kucheriavyi, V.P. (2008). Landscaping of residential areas: Textbook. 2d edition. Lviv: Svit, p. 456.
Lapin, P.F. (ed.) (2019). Methodology of phonological observations in botanical gardens of USSR. Moscow,
p. 27.
Laptiev, O.O. (2001). Introduction and acclimatization of plants with the basics of landscaping. Kyiv:
Phitosotsiotsentr, p.128.

Grassroots Journal of Natural Resources, Vol.4, No.3 (September 2021), p.34-41 | ISSN 2581-6853 | CODEN GJNRA9
Doi: https://doi.org/10.33002/nr2581.6853.040304
40 Liudmyla Varlashchenko, Anatolii Balabak, Valentyna Mamchur, Valentyn Polishchuk
Levon, F.M. and Kusnietsov, S.I. (2001). General Problems in urban landscape gardening in Ukraine.
Collection of research papers “Urban gardens and parks: past, present and future”. Lwiw, 115: 226–
230.
Shyshkin, B.K. (ed.) (1958). Genus 1401 Honeysuckle – Lonicera L. Flora of USSR, Vol. 23. Moscow:
Academy of Sciences of USSR, p.467–573.
Sikura, J.J. and Kapustyan, V.V. (2003). Introduction of plants (its importance for the development of
civilization, botanical science and conservation of plant biodiversity). Kyiv: Phytosocial Center, p.
280.
Varlashchenko, L.H. (2016). Ornamental type of honeysuckle (Lonicera L.) genus and prospects of its use
in the landscaping of the territories in the Right-Bank Forest-Steppe of Ukraine. Collection of
scientific papers of Uman National University of Horticultures, Issue 88. Part 1: Agricultural
Sciences: 298-305.
Varlashchenko, L.H. and Balabak A.F (2021). Use of ornamental shrubs Lonicera pileata Olif. for
landscaping. Topical issues, achievements, and innovations of fundamental and applied sciences.
Abstracts of X International Scientific and Practical Conference. Lisbon, Portugal. (09–12.03. 2021):
16-19.

Grassroots Journal of Natural Resources, Vol.4, No.3 (September 2021), p.34-41 | ISSN 2581-6853 | CODEN GJNRA9
Doi: https://doi.org/10.33002/nr2581.6853.040304
41 Liudmyla Varlashchenko, Anatolii Balabak, Valentyna Mamchur, Valentyn Polishchuk
Authors’ Declarations and Essential Ethical Compliances
Authors’ Contributions (in accordance with ICMJE criteria for authorship)
Contribution Author 1 Author 2 Author 3 Author 4
Conceived and designed the research or analysis Yes Yes Yes Yes
Collected the data Yes No No No
Contributed to data analysis & interpretation Yes Yes Yes Yes
Wrote the article/paper Yes Yes Yes Yes
Critical revision of the article/paper Yes Yes Yes Yes
Editing of the article/paper Yes Yes Yes Yes
Supervision No Yes No No
Project Administration Yes Yes Yes Yes
Funding Acquisition Yes Yes Yes Yes
Overall Contribution Proportion (%) 40 30 15 15
Funding
No funding was available for the research conducted for and writing of this paper.
Research involving human bodies (Helsinki Declaration)
Has this research used human subjects for experimentation? No
Research involving animals (ARRIVE Checklist)
Has this research involved animal subjects for experimentation? No
Research involving Plants
During the research, the authors followed the principles of the Convention on Biological Diversity and
the Convention on the Trade in Endangered Species of Wild Fauna and Flora.
Research on Indigenous Peoples and/or Traditional Knowledge
Has this research involved Indigenous Peoples as participants or respondents? No
(Optional) PRISMA (Preferred Reporting Items for Systematic Reviews and Meta-Analyses)
Have authors complied with PRISMA standards? No
Competing Interests/Conflict of Interest
Authors have no competing financial, professional, or personal interests from other parties or in publishing
this manuscript.
Rights and Permissions
Open Access. This article is licensed under a Creative Commons Attribution 4.0 International License,
which permits use, sharing, adaptation, distribution and reproduction in any medium or format, as long as
you give appropriate credit to the original author(s) and the source, provide a link to the Creative Commons
license, and indicate if changes were made. The images or other third-party material in this article are
included in the article's Creative Commons license, unless indicated otherwise in a credit line to the material.
If material is not included in the article's Creative Commons license and your intended use is not permitted
by statutory regulation or exceeds the permitted use, you will need to obtain permission directly from the
copyright holder. To view a copy of this license, visit http://creativecommons.org/licenses/by/4.0/.

Agroforestry Practices for Climate Change Adaptation and its
Contribution to Farmers’ Income
Raju Prasad Bhandari1, Rajeev Joshi*2, Deepa Paudel3 1Tribhuvan University, Institute of Forestry, Pokhara Campus, Post Box No. 43, Hariyo Kharka-15, Pokhara,
Gandaki province, Nepal. Email: [email protected] | ORCID: 0000-0001-6749-2490 2Forest Research Institute (Deemed to be) University, Dehradun-248195, Uttarakhand, India; Faculty of Forestry,
Amity Global Education (Lord Buddha College), CTEVT, Tokha -11, Kathmandu-44600, Nepal.
Email: [email protected] | ORCID: 0000-0003-1106-9911 3Tribhuvan University, Institute of Forestry, Pokhara Campus, Post Box No. 43, Hariyo Kharka- 15, Pokhara,
Gandaki province, Nepal. Email: [email protected] | ORCID: 0000-0002-6447-1026
*Corresponding author
Abstract Agroforestry practices offer a unique opportunity to address
climate change impacts while securing the livelihoods of the
rural communities. This study was carried out in Tillotama
municipality of Rupandehi district, Nepal. Agroforestry
system practices at the study site were identified through
reconnaissance survey and discussions with ward officials.
With 10% sampling intensity, purposive sampling was
adopted for the study using the structured questionnaire, key
informant interview, and field observation. For mean
comparison, one-way ANOVA and Least Significant
Difference (LSD) as post-hoc tests were carried out. Local
communities were adopting eight different types of
agroforestry practices under four agroforestry systems,
namely agri-silvicultural, silvo-pastoral, agro-silvopastoral
and silvi-fishery. The agroforestry system shared up to
50.54% of total households’ income, in which income from
agriculture was the highest. Agroforestry income was
dependent on the economic status of the households. Change
in cropping calendar was found as a major adaptation
strategy. Scaling up of agroforestry system and
commercialization of agroforestry products were
recommended.
Keywords Adaptation; Agroforestry; Climate change; Impacts; Income
How to cite this paper: Bhandari, R.P., Joshi,
R. and Paudel, D. (2021). Agroforestry Practices
for Climate Change Adaptation and its
Contribution to Farmers’ Income. Grassroots
Journal of Natural Resources, 4(3): 42-51. Doi:
https://doi.org/10.33002/nr2581.6853.040305
Received: 24 June 2021
Reviewed: 18 July 2021
Provisionally Accepted: 24 July 2021
Revised: 03 August 2021
Finally Accepted: 12 August 2021
Published: 30 September 2021
Copyright © 2021 by author(s)
This work is licensed under the Creative
Commons Attribution International
License (CC BY 4.0).
http://creativecommons.org/licenses/by/4.0/
Grassroots Journal of Natural Resources, Vol.4 No.3 (September 2021) ISSN 2581-6853 | CODEN: GJNRA9 | Published by The Grassroots Institute
Website: http://grassrootsjournals.org/gjnr | Main Indexing: Web of Science
M – 00242 | Research Article
ISSN 2581-6853 | 4(3) Sep 2021
Grassroots Journal of Natural Resources, Vol.4, No.3 (September 2021), p.42-51 | ISSN 2581-6853 | CODEN GJNRA9
Doi: https://doi.org/10.33002/nr2581.6853.040305
43 Raju Prasad Bhandari, Rajeev Joshi, Deepa Paudel
Introduction
Agroforestry is a climate-smart production system and is considered more resilient than mono-cropping
(Charles et al., 2014; Haile et al., 2019). It is one of the most experimented land-use systems across
landscapes and agro-ecological zones in Nepal (Nair, 2007; McCord et al., 2015). With food shortages and
increased threats of climate change, interest in agroforestry is gathering for its potential to address various
on-farm adaptation needs, and fulfill many roles in AFOLU (agriculture, forestry, and other land-use)
related mitigation pathways (Mbow et al., 2014). It can play a crucial role in improving resilience to
uncertain climates through micro-climate buffering and regulation of water flow (Stigter, 2015). When it
provides assets and income from carbon, wood energy, improved soil fertility, and enhancement of local
climate conditions, it provides ecosystem services and reduces human impacts on natural forests (Moreno
et al., 2018). Most of these are direct benefits for local adaptation while contributing to global efforts to
control atmospheric greenhouse gas concentrations (Rosenzweig and Tubiello, 2007). Furthermore,
agroforestry provides a particular example of a set of innovative practices that are designed to enhance
productivity in a way that often contributes to climate change mitigation through enhanced carbon
sequestration, and that can also strengthen the system's ability to adapt to adverse impacts of changing
climatic conditions (Verchot et al., 2007; Mbow et al., 2014).
Climate change is projected to affect agricultural and natural ecosystems around the world, and there is no
reason to expect that agroforestry systems will be spared (Luedeling et al., 2014). As the impacts of climate
change have become apparent around the world, adaptation has attracted increasing attention (Mimura et
al., 2015). With the world’s population increase, the need for more productive and sustainable use of the
land becomes more urgent. To meet the demand for food by 2050, world food production will have to
increase by over 60% (Mckenzie and Williams, 2015). But the shortfall in domestic cereals production in
the developing world was expected to widen from around 100 million tons in 1997 to around 190 million
tons in the year 2020 (Rosegrant et al., 2001; Verchot et al., 2007). In many regions of the world, there will
be limited ability for new varieties and increased fertilizer use to further increase the yields (Huang, Pray
and Rozelle, 2002; Balemi and Negisho, 2012).
Agroforestry systems include both traditional and modern land-use system dynamics, and ecologically
based natural resource management systems that diversify and sustain production in order to increase social,
economic, and environmental benefits for land users at all scales (Pandey, 2007). Agroforestry as a tree-
based system combines trees and/or shrubs, animals, and agronomic crops. It provides a particular example
of a set of innovations designed to enhance REDD+ through carbon substitution, carbon conservation, and
carbon sequestration in the agricultural landscape (Charles, Nzunda and Munishi, 2014). The rapid increase
in Earth’s surface temperature and changing precipitation pattern has resulted in direct implications to
multiple sectors and livelihood of communities (Rao and Leal Filho, 2015). The poorest and vulnerable
people are being affected the most (Mustafa, 2011). The data trend from 1975 to 2005 shows that the mean
annual temperature has increased by 0.06°C, while the mean rainfall has decreased by 3.7 mm (-3.2%) per
month per decade (MoE, 2012). Similarly, mean annual temperature is predicted to be increased between
1.3°C to 3.8°C by the 2060s and 1.8°C to 5.8°C by the 2090s while annual precipitation could reduce by
the range of 10 to 20 percent across the country Nepal (Joshi and Singh, 2020; MoE, 2010). Studies also
indicate that the observed warming trend is not uniform across the country. Agroforestry land-use
management is necessary for increasing soil carbon stocks and socio-economic development of farmers;
and the research on the carbon sequestration rate of agroforestry is necessary for making future policies and
strategies on the issue of climate change. However, there were limited research (Neupane and Thapa, 2001;
Regmi, 2003) carried out in the field of agroforestry, mostly focusing on soil fertility and local livelihood.
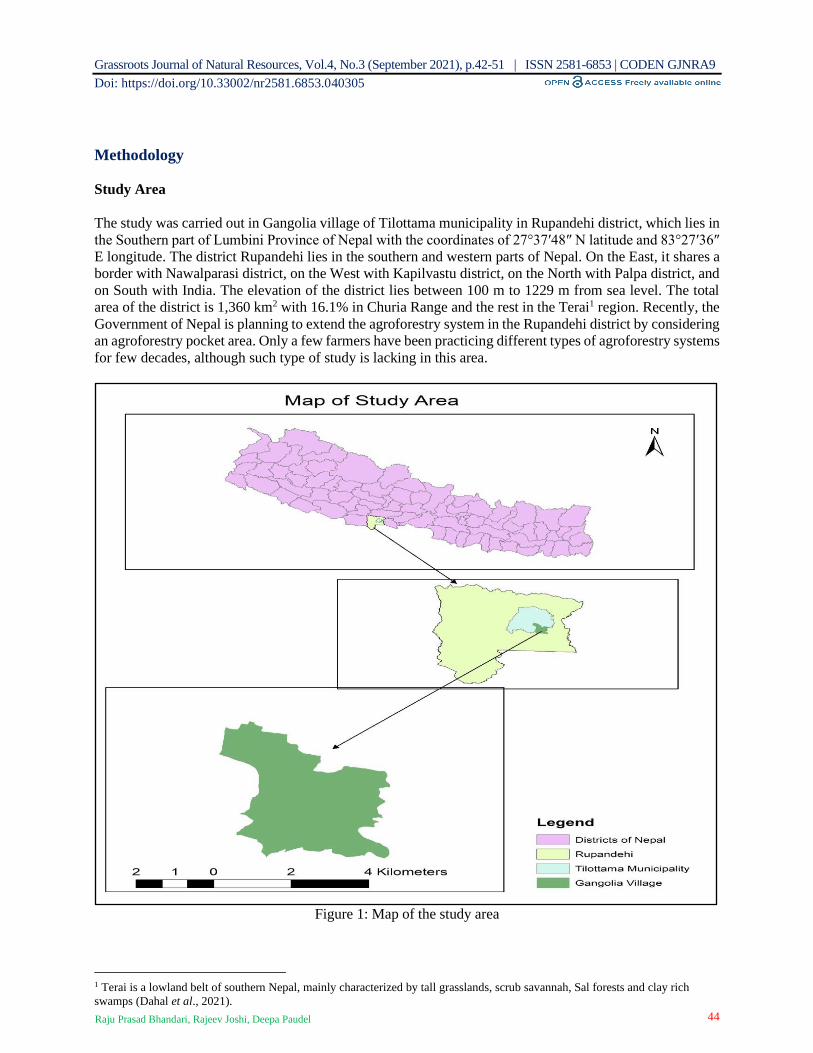
Grassroots Journal of Natural Resources, Vol.4, No.3 (September 2021), p.42-51 | ISSN 2581-6853 | CODEN GJNRA9
Doi: https://doi.org/10.33002/nr2581.6853.040305
44 Raju Prasad Bhandari, Rajeev Joshi, Deepa Paudel
Methodology
Study Area
The study was carried out in Gangolia village of Tilottama municipality in Rupandehi district, which lies in
the Southern part of Lumbini Province of Nepal with the coordinates of 27°37′48″ N latitude and 83°27′36″
E longitude. The district Rupandehi lies in the southern and western parts of Nepal. On the East, it shares a
border with Nawalparasi district, on the West with Kapilvastu district, on the North with Palpa district, and
on South with India. The elevation of the district lies between 100 m to 1229 m from sea level. The total
area of the district is 1,360 km2 with 16.1% in Churia Range and the rest in the Terai1 region. Recently, the
Government of Nepal is planning to extend the agroforestry system in the Rupandehi district by considering
an agroforestry pocket area. Only a few farmers have been practicing different types of agroforestry systems
for few decades, although such type of study is lacking in this area.
Figure 1: Map of the study area
1 Terai is a lowland belt of southern Nepal, mainly characterized by tall grasslands, scrub savannah, Sal forests and clay rich
swamps (Dahal et al., 2021).
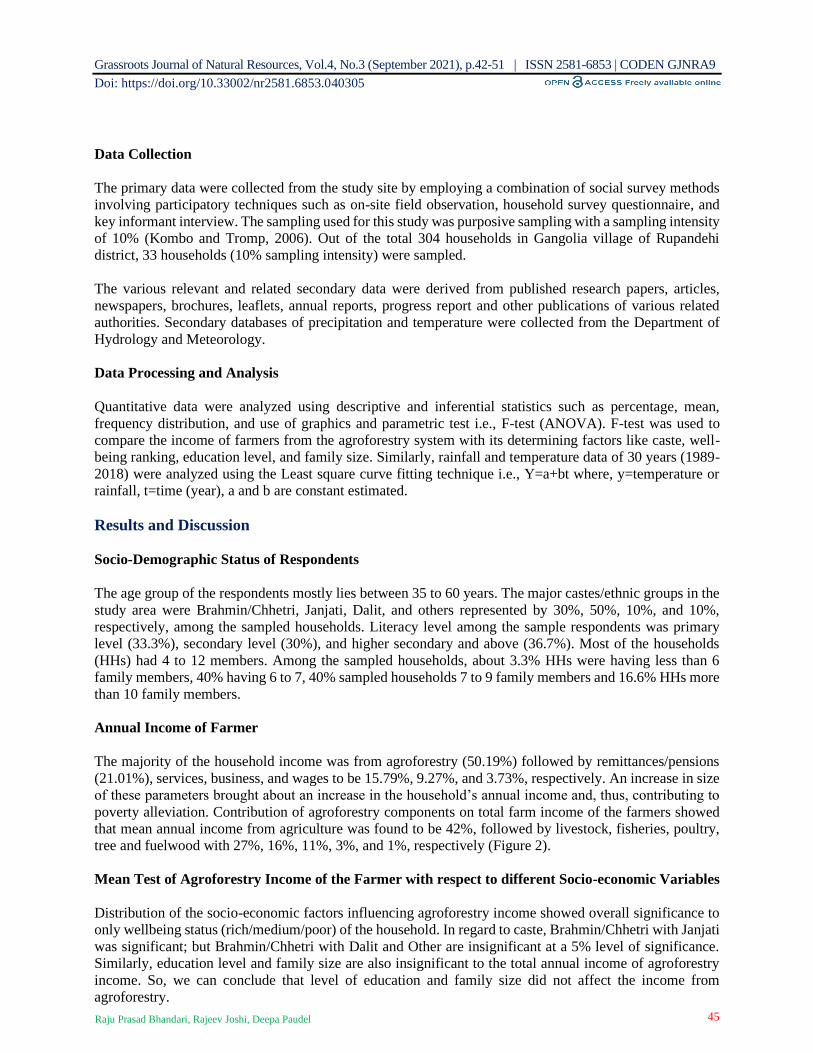
Grassroots Journal of Natural Resources, Vol.4, No.3 (September 2021), p.42-51 | ISSN 2581-6853 | CODEN GJNRA9
Doi: https://doi.org/10.33002/nr2581.6853.040305
45 Raju Prasad Bhandari, Rajeev Joshi, Deepa Paudel
Data Collection
The primary data were collected from the study site by employing a combination of social survey methods
involving participatory techniques such as on-site field observation, household survey questionnaire, and
key informant interview. The sampling used for this study was purposive sampling with a sampling intensity
of 10% (Kombo and Tromp, 2006). Out of the total 304 households in Gangolia village of Rupandehi
district, 33 households (10% sampling intensity) were sampled.
The various relevant and related secondary data were derived from published research papers, articles,
newspapers, brochures, leaflets, annual reports, progress report and other publications of various related
authorities. Secondary databases of precipitation and temperature were collected from the Department of
Hydrology and Meteorology.
Data Processing and Analysis
Quantitative data were analyzed using descriptive and inferential statistics such as percentage, mean,
frequency distribution, and use of graphics and parametric test i.e., F-test (ANOVA). F-test was used to
compare the income of farmers from the agroforestry system with its determining factors like caste, well-
being ranking, education level, and family size. Similarly, rainfall and temperature data of 30 years (1989-
2018) were analyzed using the Least square curve fitting technique i.e., Y=a+bt where, y=temperature or
rainfall, t=time (year), a and b are constant estimated.
Results and Discussion
Socio-Demographic Status of Respondents
The age group of the respondents mostly lies between 35 to 60 years. The major castes/ethnic groups in the
study area were Brahmin/Chhetri, Janjati, Dalit, and others represented by 30%, 50%, 10%, and 10%,
respectively, among the sampled households. Literacy level among the sample respondents was primary
level (33.3%), secondary level (30%), and higher secondary and above (36.7%). Most of the households
(HHs) had 4 to 12 members. Among the sampled households, about 3.3% HHs were having less than 6
family members, 40% having 6 to 7, 40% sampled households 7 to 9 family members and 16.6% HHs more
than 10 family members.
Annual Income of Farmer
The majority of the household income was from agroforestry (50.19%) followed by remittances/pensions
(21.01%), services, business, and wages to be 15.79%, 9.27%, and 3.73%, respectively. An increase in size
of these parameters brought about an increase in the household’s annual income and, thus, contributing to
poverty alleviation. Contribution of agroforestry components on total farm income of the farmers showed
that mean annual income from agriculture was found to be 42%, followed by livestock, fisheries, poultry,
tree and fuelwood with 27%, 16%, 11%, 3%, and 1%, respectively (Figure 2).
Mean Test of Agroforestry Income of the Farmer with respect to different Socio-economic Variables
Distribution of the socio-economic factors influencing agroforestry income showed overall significance to
only wellbeing status (rich/medium/poor) of the household. In regard to caste, Brahmin/Chhetri with Janjati
was significant; but Brahmin/Chhetri with Dalit and Other are insignificant at a 5% level of significance.
Similarly, education level and family size are also insignificant to the total annual income of agroforestry
income. So, we can conclude that level of education and family size did not affect the income from
agroforestry.
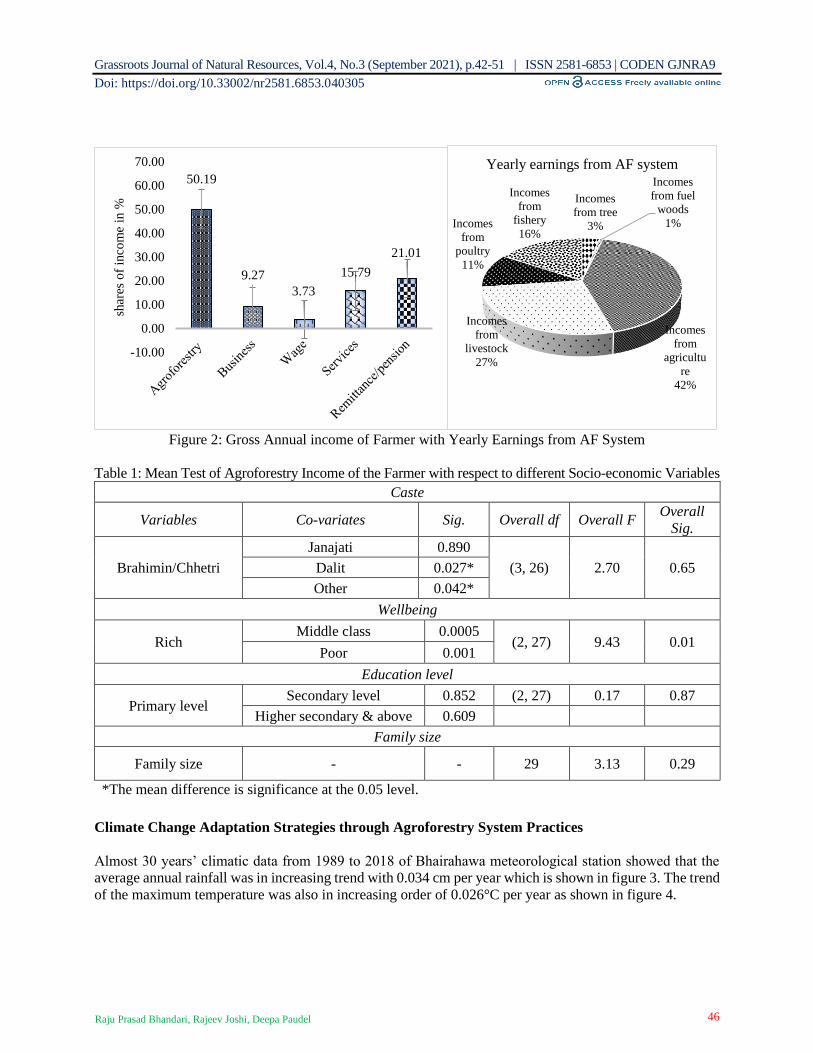
Grassroots Journal of Natural Resources, Vol.4, No.3 (September 2021), p.42-51 | ISSN 2581-6853 | CODEN GJNRA9
Doi: https://doi.org/10.33002/nr2581.6853.040305
46 Raju Prasad Bhandari, Rajeev Joshi, Deepa Paudel
Figure 2: Gross Annual income of Farmer with Yearly Earnings from AF System
Table 1: Mean Test of Agroforestry Income of the Farmer with respect to different Socio-economic Variables
Climate Change Adaptation Strategies through Agroforestry System Practices
Almost 30 years’ climatic data from 1989 to 2018 of Bhairahawa meteorological station showed that the
average annual rainfall was in increasing trend with 0.034 cm per year which is shown in figure 3. The trend
of the maximum temperature was also in increasing order of 0.026°C per year as shown in figure 4.
50.19
9.27
3.73
15.79
21.01
-10.00
0.00
10.00
20.00
30.00
40.00
50.00
60.00
70.00
shar
es o
f in
com
e in
%
Incomes
from tree
3%
Incomes
from fuel
woods
1%
Incomes
from
agricultu
re
42%
Incomes
from
livestock
27%
Incomes
from
poultry
11%
Incomes
from
fishery
16%
Yearly earnings from AF system
Caste
Variables Co-variates Sig. Overall df Overall F Overall
Sig.
Brahimin/Chhetri
Janajati 0.890
(3, 26) 2.70 0.65 Dalit 0.027*
Other 0.042*
Wellbeing
Rich Middle class 0.0005
(2, 27) 9.43 0.01 Poor 0.001
Education level
Primary level Secondary level 0.852 (2, 27) 0.17 0.87
Higher secondary & above 0.609
Family size
Family size - - 29 3.13 0.29
*The mean difference is significance at the 0.05 level.

Grassroots Journal of Natural Resources, Vol.4, No.3 (September 2021), p.42-51 | ISSN 2581-6853 | CODEN GJNRA9
Doi: https://doi.org/10.33002/nr2581.6853.040305
47 Raju Prasad Bhandari, Rajeev Joshi, Deepa Paudel
Figure 3: Average annual precipitation
Figure 4: Average annual temperature
Specific Adaptation Strategies’ Adopted at Households level
The strategies adopted by the farmers against climate change were found mainly in the form of using
chemical fertilizers and pesticides (25%), diversification of income-generating activities (27%),
agroforestry (18%), and changing the crop calendar (30%). Similar findings like crop-livestock
diversification and multiple cropping strategies were reported by several scholars (Assoumana et al., 2016;
Gebreeyesus, 2017; Mekuria and Mekonnen, 2018).
y = 0.0372x + 15.284
R² = 0.0959
0.0
2.0
4.0
6.0
8.0
10.0
12.0
14.0
16.0
18.0
20.01
98
9
199
0
199
1
199
2
199
3
199
4
199
5
199
6
199
7
199
8
199
9
200
0
200
1
200
2
200
3
200
4
200
5
200
6
200
7
200
8
200
9
201
0
201
1
201
2
201
3
201
4
201
5
201
6
201
7
201
8
Pre
cip
itat
ion (
cm)
Year
Average annual precipitation
y = 0.0185x - 18.189
y = 0.0262x - 20.804
0
5
10
15
20
25
30
35
40
1975 1980 1985 1990 1995 2000 2005 2010 2015 2020
tem
per
ature
(ºC
)
years
Annual Temperature
Av_min AV_max Linear (Av_min) Linear (AV_max)

Grassroots Journal of Natural Resources, Vol.4, No.3 (September 2021), p.42-51 | ISSN 2581-6853 | CODEN GJNRA9
Doi: https://doi.org/10.33002/nr2581.6853.040305
48 Raju Prasad Bhandari, Rajeev Joshi, Deepa Paudel
The respondents who practiced agroforestry experienced various benefits such as improved soil fertility rate
(32%), improved micro-climate (24%), increased catchment for pump set and boring (29%), and increased
wood products (15%), although these methods are not sufficient to control climate change effects.
Figure 5: Specific adaptation strategies adopted at household level
Conclusion and Recommendation
Agroforestry has a significant impact on the livelihood of people engaged in agriculture primarily and on
those who have low adaptive capacity. In the study area, trees on farmland were found as part of traditional
practices. Agroforestry shares about 50% of total HH’s income, in which the income from agriculture was
highest. Income from the agroforestry system was found highly dependent on the socio-economic status of
the households. The temperature has been increased by 0.026°C per year and rainfall by 0.04 cm per year.
Change in the cropping calendar was found as a major climate change adaptation strategy by the farmers.
Agroforestry is one of the best options to make the community more resilient from adverse impacts of
climate change through increased income and environmental services. Thus, the promotion of agroforestry
practices in private land should be emphasized by the government. The practice of agroforestry should be
done on a large scale to mitigate the adverse effects of climate change. Commercialization of agroforestry
products should be done to enhance the farmer’s income. To encourage the farmers to practice agroforestry
practices, they should be provided with capacity building, training, and information to make them aware of
the benefits of agroforestry.
Acknowledgement
We are grateful to Tribhuvan University’s Institute of Forestry, Office of Dean, Pokhara/ NORHED-
SUNREM project for assisting under Faculty Strategic Research Grant scheme. The authors would like to
acknowledge Ms. Sushma Bhattarai, Ms. Neeru Thapa, Mr. Prabin Pandit, Mr. Ajay Bhandari, and Mr.
Prasiddha Khadka for assisting in providing valuable sources of information for this study. The authors are
thankful to the local people of Gangolia village, Rupandehi district for their generous support during the
fieldwork.
2527
18
30
0
5
10
15
20
25
30
35
chemical fertilizers and
pesticides
Diversification of income
generating activities
Agroforestry Change in crop calendar
Grassroots Journal of Natural Resources, Vol.4, No.3 (September 2021), p.42-51 | ISSN 2581-6853 | CODEN GJNRA9
Doi: https://doi.org/10.33002/nr2581.6853.040305
49 Raju Prasad Bhandari, Rajeev Joshi, Deepa Paudel
References
Assoumana, B.T., Ndiaye, M., Puje, G., Diourte, M. and Graiser, T. (2016). Comparative assessment of
local farmers’ perceptions of meteorological events and adaptations strategies: Two Case Studies in
Niger Republic. Journal of Sustainable Development, 9(3): 118-135. DOI:
https://doi.org/10.5539/jsd.v9n3p118
Balemi, T. and Negisho, K. (2012). Management of soil phosphorus and plant adaptation mechanisms to
phosphorus stress for sustainable crop production: a review. Journal of Soil Science and Plant
Nutrition, 12(3): 547-562. DOI: https://dx.doi.org/10.4067/S0718-95162012005000015
Charles, R.L., Nzunda, E.F. and Munishi, P.K.T. (2014). Agroforestry as a resilient strategy in mitigating
climate change in Mwanga District, Kilimanjaro, Tanzania. Global Journal of Bilogy, Agriculture and
Health Sciences, 3: 11-17.
Dahal, B., Joshi, R., Poudel, B. and Panta, M. (2021). Community Forestry Governance in Federal System
of Nepal. Journal of Policy & Governance, 01(01): 30-45. DOI: https://doi.org/10.33002/jpg010103
Gebreeyesus, K.A. (2017). Impact of climate change on the agroecological innovation of coffee agroforestry
systems in Central Kenya (Doctoral dissertation, Montpellier SupAgro).
Haile, K.K., Tirivayi, N. and Tesfaye, W. (2019). Farmers’ willingness to accept payments for ecosystem
services on agricultural land: The case of climate-smart agroforestry in Ethiopia. Ecosystem
Services, 39: 100964. DOI: https://doi.org/10.1016/j.ecoser.2019.100964
Huang, J., Pray, C. and Rozelle, S. (2002). Enhancing the crops to feed the poor. Nature, 418(6898): 678-
684. DOI: https://doi.org/10.1038/nature01015
Joshi, R. and Singh, H. (2020). Carbon sequestration potential of disturbed and non-disturbed forest
ecosystem: A tool for mitigating climate change. African Journal of Environmental Science and
Technology, 14(11): 385-393. DOI: https://doi.org/10.5897/AJEST2020.2920
Kombo, D.K. and Tromp, D.L. (2006). Proposal and thesis writing: An introduction. Nairobi: Paulines
Publications Africa, 5(1): 814-30.
Luedeling, E., Kindt, R., Huth, N.I. and Koenig, K. (2014). Agroforestry systems in a changing climate-
challenges in projecting future performance. Current Opinion in Environmental Sustainability, 6: 1-7.
DOI: https://doi.org/10.1016/j.cosust.2013.07.013
Mbow, C., Smith, P., Skole, D., Duguma, L. and Bustamante, M. (2014). Achieving mitigation and
adaptation to climate change through sustainable agroforestry practices in Africa. Current Opinion in
Environmental Sustainability, 6: 8-14. DOI: https://doi.org/10.1016/j.cosust.2013.09.002
Mbow, C., Van Noordwijk, M., Luedeling, E., Neufeldt, H., Minang, P.A. and Kowero, G. (2014).
Agroforestry solutions to address food security and climate change challenges in Africa. Current
Opinion in Environmental Sustainability, 6: 61-67. DOI: https://doi.org/10.1016/j.cosust.2013.10.014
McCord, P.F., Cox, M., Schmitt-Harsh, M. and Evans, T. (2015). Crop diversification as a smallholder
livelihood strategy within semi-arid agricultural systems near Mount Kenya. Land Use Policy, 42:
738-750. DOI: https://doi.org/10.1016/j.landusepol.2014.10.012
McKenzie, F.C. and Williams, J. (2015). Sustainable food production: constraints, challenges and choices
by 2050. Food Security, 7(2): 221-233. DOI: https://doi.org/10.1007/s12571-015-0441-1
Mekuria, W. and Mekonnen, K. (2018). Determinants of crop–livestock diversification in the mixed farming
systems: evidence from central highlands of Ethiopia. Agriculture & Food Security, 7(1): 1-15.
Mimura, N., Pulwarty, R.S., Elshinnawy, I., Redsteer, M.H., Huang, H.Q., Nkem, J.N. and Kato, S. (2015).
Adaptation planning and implementation. In Climate Change 2014 Impacts, Adaptation and
Vulnerability: Part A: Global and Sectoral Aspects (pp. 869-898). Cambridge: Cambridge University
Press. DOI: https://doi.org/10.1017/CBO9781107415379.020
MoE (2010) National adaptation programme of action (NAPA) to climate change. Government of Nepal,
Ministry of Environment, Kathmandu, Nepal, Kathmandu
MoE (2012). Mountain Environment and Climate Change in Nepal: National Report prepared for the
International Conference of Mountain Countries on Climate Change, 5–6 April 2012, Kathmandu:
Ministry of Environment, Government of Nepal, 56 pp.

Grassroots Journal of Natural Resources, Vol.4, No.3 (September 2021), p.42-51 | ISSN 2581-6853 | CODEN GJNRA9
Doi: https://doi.org/10.33002/nr2581.6853.040305
50 Raju Prasad Bhandari, Rajeev Joshi, Deepa Paudel
Moreno, G., Aviron, S., Berg, S., Crous-Duran, J., Franca, A., de Jalón, S. G. and Burgess, P.J. (2018).
Agroforestry systems of high nature and cultural value in Europe: provision of commercial goods and
other ecosystem services. Agroforestry Systems, 92(4): 877-891. DOI:
https://doi.org/10.1007/s10457-017-0126-1
Mustafa, Z. (2011). Climate Change and Its Impact with Special Focus in Pakistan. Pakistan Engineering
Congress, Symposium, 33: 290.
Neupane, R.P. and Thapa, G.B. (2001). Impact of agroforestry intervention on soil fertility and farm income
under the subsistence farming system of the middle hills, Nepal. Agriculture, Ecosystems &
Environment, 84(2): 157-167. DOI: https://doi.org/10.1016/S0167-8809(00)00203-6
Pandey, D. (2007). Multifunctional agroforestry systems in India. Current Science, 92(4): 455-463.
Available online at http://www.jstor.org/stable/24097558 [accessed on 24 June 2021]
Nair, P.K.R. (2007). Agroforestry for sustainability of lower-input land-use systems. Journal of Crop
Improvement, 19(1-2): 25-47. DOI: https://doi.org/10.1300/J411v19n01_02
Rao, P. and Leal Filho, W. (2015). Local community perception of climate change and scientific validation:
a review of initiatives and perspectives in the Indian region. Climate Change in the Asia-Pacific
Region, 89-101. DOI: https://doi.org/10.1007/978-3-319-14938-7_6
Regmi, B.N. (2003). Contribution of agroforestry for rural livelihoods: A case of Dhading District, Nepal.
In: International Conference on Rural Livelihoods, Forests and Biodiversity, Bonn, Germany (pp. 19-
23).
Rosegrant, M.W., Paisner, M.S., Meijer, S. and Witcover, J. (2001). Global food projections to 2020:
Emerging trends and alternative futures. International Food Policy Research Institute, Washington,
USA, 206 pp.
Rosenzweig, C. and Tubiello, F.N. (2007). Adaptation and mitigation strategies in agriculture: an analysis
of potential synergies. Mitigation and Adaptation Strategies for Global Change, 12(5): 855-873. DOI:
https://doi.org/10.1007/s11027-007-9103-8
Stigter, K.C.J. (2015). Agroforestry and micro-climate change. Tree-crop Interactions: Agroforestry in a
Changing Climate, CABI, University of Nottingham, Malaysia, 509: 119-145.
Verchot, L.V., Van Noordwijk, M., Kandji, S., Tomich, T., Ong, C., Albrecht, A. and Palm, C. (2007).
Climate change: linking adaptation and mitigation through agroforestry. Mitigation and Adaptation
Strategies for Global Change, 12(5): 901-918. DOI: https://doi.org/10.1007/s11027-007-9105-6.

Grassroots Journal of Natural Resources, Vol.4, No.3 (September 2021), p.42-51 | ISSN 2581-6853 | CODEN GJNRA9
Doi: https://doi.org/10.33002/nr2581.6853.040305
51 Raju Prasad Bhandari, Rajeev Joshi, Deepa Paudel
Authors’ Declarations and Essential Ethical Compliances
Authors’ Contributions (in accordance with ICMJE criteria for authorship)
Contribution Author 1 Author 2 Author 3
Conceived and designed the research or analysis Yes Yes Yes
Collected the data Yes No No
Contributed to data analysis & interpretation Yes No Yes
Wrote the article/paper Yes Yes Yes
Critical revision of the article/paper No Yes No
Editing of the article/paper Yes Yes Yes
Supervision No Yes No
Project Administration Yes Yes Yes
Funding Acquisition Yes Yes Yes
Overall Contribution Proportion (%) 40 30 30
Funding
The funding was available for the research conducted for and writing of this paper from the Institute of
Forestry, Office of Dean, Pokhara under NORHED-SUNREM project (Faculty Strategic Research Grant
scheme).
Research involving human bodies (Helsinki Declaration)
Has this research used human subjects for experimentation? No
Research involving animals (ARRIVE Checklist)
Has this research involved animal subjects for experimentation? No
Research involving Plants
During the research, the authors followed the principles of the Convention on Biological Diversity and
the Convention on the Trade in Endangered Species of Wild Fauna and Flora. Yes
Research on Indigenous Peoples and/or Traditional Knowledge
Has this research involved Indigenous Peoples as participants or respondents? No
(Optional) PRISMA (Preferred Reporting Items for Systematic Reviews and Meta-Analyses)
Have authors complied with PRISMA standards? No
Competing Interests/Conflict of Interest
Authors have no competing financial, professional, or personal interests from other parties or in publishing
this manuscript.
Rights and Permissions
Open Access. This article is licensed under a Creative Commons Attribution 4.0 International License,
which permits use, sharing, adaptation, distribution and reproduction in any medium or format, as long as
you give appropriate credit to the original author(s) and the source, provide a link to the Creative Commons
license, and indicate if changes were made. The images or other third-party material in this article are
included in the article's Creative Commons license, unless indicated otherwise in a credit line to the material.
If material is not included in the article's Creative Commons license and your intended use is not permitted
by statutory regulation or exceeds the permitted use, you will need to obtain permission directly from the
copyright holder. To view a copy of this license, visit http://creativecommons.org/licenses/by/4.0/.
Assessment of the Ecological Risks of Landslide Damages in the
Carpathian Region
Dmytro Kasiyanchuk*1, Liudmyla Shtohryn2 1Department of Geotechnogenic Safety and Geoinformatics, Ivano-Frankivsk National Technical University of Oil
and Gas, Ukraine. Email: [email protected] | ORCID: 0000-0003-4761-5320 2Department of Geotechnogenic Safety and Geoinformatics, Ivano-Frankivsk National Technical University of Oil
and Gas, Ukraine. Email: [email protected] | ORCID: 0000-0001-8381-1236
*Corresponding author
Abstract The dynamism of the landslides within the Carpathian region of
Ukraine is because of the difficult engineering and geological
conditions. High landslide den sity and significant population
density contribute to the fact that environmental parameters
worsen and require rational management. Permanent natural
factors like clay flysch formation, fault tectonics, high seismic
activity, and dense network of rivers mostly facilitate the active
development of landslides in the Carpathian region. However, it
is triggered by extreme long-term precipitation. The numerical
parameters of population density, the landslide damage
coefficient, and the predictive range of landslide intensification
were selected to assess the ecological risk of damages in the
area. The landslide dam age coefficient characterizes the
tendency of the area to landslide development, considering all
the factors contributing to the landslides. Risk, as a
multifunctional calculated complex, includes the calculation of
damage, according to which we can assess the possibility of risk
for the human being while assuming the equal distribution of the
population within the study area. The integral components of the
risk are calculated based on the data gathered to assess the
growth of risks in the future, considering the area distribution
and predictive time series of the landslide intensification. This
analysis has identified engineering and geological areas having
the greatest risk to human life.
Keywords Ecological risk; Integrated risk; Landslides; Assessment;
Long-term prediction
How to cite this paper: Kasiyanchuk, D. and
Shtohryn, L. (2021). Assessment of the Ecological
Risks of Landslide Damages in the Carpathian
Region. Grassroots Journal of Natural Resources,
4(3): 52-61. Doi:
https://doi.org/10.33002/nr2581.6853.040306
Received: 24 May 2021
Reviewed: 28 June 2021
Provisionally Accepted: 30 June 2021
Revised: 31 August 2021
Finally Accepted: 02 September 2021
Published: 30 September 2021
Copyright © 2021 by author(s)
This work is licensed under the Creative
Commons Attribution International
License (CC BY 4.0).
http://creativecommons.org/licenses/by/4.0/
Grassroots Journal of Natural Resources, Vol.4 No.3 (September 2021) ISSN 2581-6853 | CODEN: GJNRA9 | Published by The Grassroots Institute
Website: http://grassrootsjournals.org/gjnr | Main Indexing: Web of Science
M – 00243 | Research Article
ISSN 2581-6853 | 4(3) Sep 2021

Grassroots Journal of Natural Resources, Vol.4, No.3 (September 2021), p.52-61 | ISSN 2581-6853 | CODEN GJNRA9
Doi: https://doi.org/10.33002/nr2581.6853.040306
53 Dmytro Kasiyanchuk, Liudmyla Shtohryn
Introduction
The development of landslides within the Carpathian region has a significant impact on the state of natural
and man-made safety and determines the search for new ways of forecasting to assess the risks of their
negative effects. The spread and expansion of the landslides affect the environment with a cardinal change
in the relief. Here, the extensive forest areas are being destroyed, the riverbeds are deforming. Besides, the
consequences of the landslide intensification cause meaningful economic and social losses to the local
population, roads and power lines. This occurs frequently in the fragile mountainous areas, where the
greatest landslide damages can be observed.
Academic studies of the scholars pay special attention to the issues of the risks of landslide intensification
and the needful early warning about the possible landslides in the mountainous areas. Bonnard, Forlati and
Scavia (2004) present the method of risk management and mitigation strategy regarding the landslide
consequences in the Alpine mountain valleys. Corominas et. al. (2014) recommended methodologies for
quantitative analyses of the landslide hazard, damage and risks at different spatial scales. They suggested to
adopt the managerial decisions for financial assessment of risks at the local and regional level. Abella and
van Westen (2007) specified a procedure for creating quantitative landslide risk maps submitted to the
national early warning system providing information about probable danger and the need of early evacuation
of people from the landslide prone areas.
Overview of the Area and Study Trends
High water and floods may develop in the rivers in the Carpathian region several times a year. The map of
engineering and geological areas of the study area is presented in figure 1. If the upper layer of soil contains
the previous moisture, the floods will provoke the development of landslides. The State Emergency Service
of Ukraine1 classified the last high water on 17-29 June 2020, which covered the western regions. It is like
a natural disaster at the state level. By the disasters, 349 populated localities and over 14,300homes were
flooded; 3,500 household buildings, 654 kilometers of roads and 266 bridges were completely damaged in
2020. According to the preliminary estimates, more than UAH 1,000 million were required to repair the
damaged facilities.2 There was an intensification of the landslides.
The spread and intensity of developing exogenous geologic processes, landslides in particular, are
influenced by the tectonic, seismic regime of the area, features of geological, geomorphological structure
and hydrogeological conditions. Area zoning is necessary to determine the patterns of spread and
development of exogenous geologic processes, landslides in particular. In Ukraine, the issue of
environmental safety is dealt with at the state level. The Law ‘On Basic Principles (Strategy) of the State
Environmental Policy of Ukraine for the Period up to 2030’3 (28.02.2019) was adopted in 2019. One of the
tasks of the law is “to reduce the environmental risks by minimizing its effects on the ecosystems, social
and economic development and the people’s health. There is an introduction of ecological risk management
based on a modelling in real-time with the involvement of the latest information technologies."
Relevant research papers of the different scholars, e.g., Rudko (1991), Rudko et al. (1999), Rudko and Erysh
(2006), Adamenko, Rudko and Kovalchuk (2000), Ivanyuta and Kaczynski (2012), Kasiyanchuk (2015,
2016), Bodnar (2015), and Klymchuk et al. (2008), are devoted to the prediction and assessment of the
natural disaster risk in order to understand dangerous geological processes.
1https://www.dsns.gov.ua/ 2http://komekolog.rada.gov.ua/uploads/documents/35969.pdf 3https://zakon.rada.gov.ua/laws/show/2697-19#Text
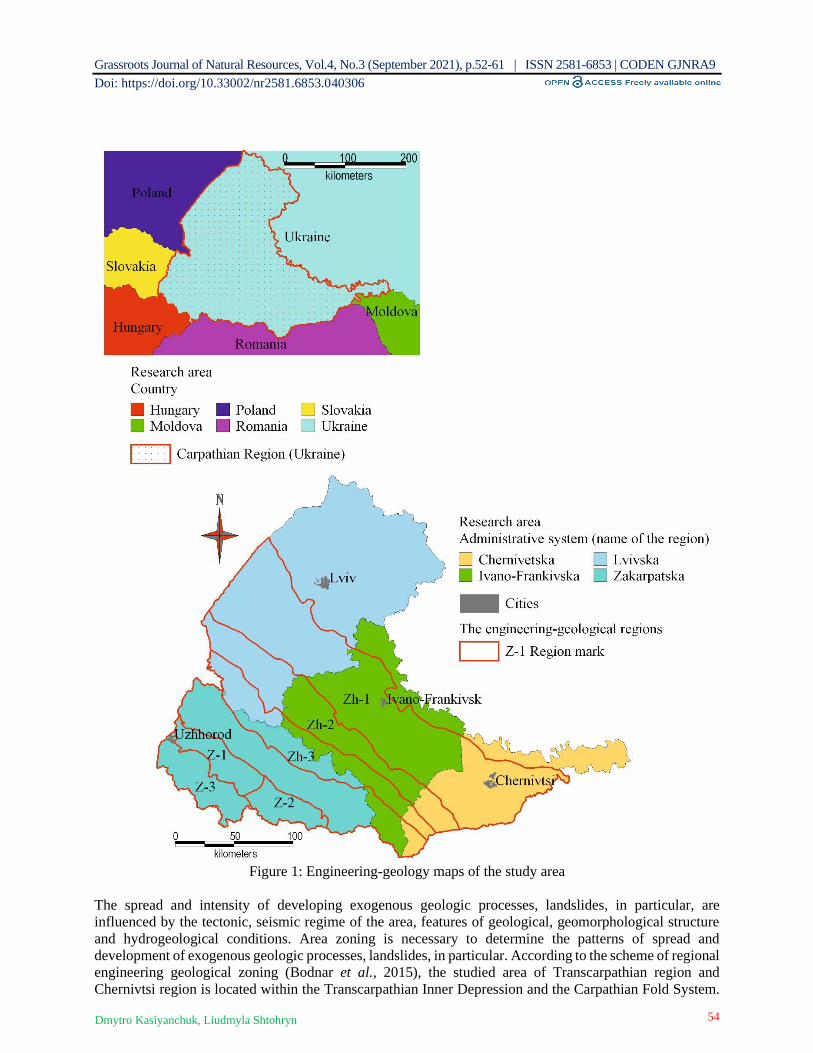
Grassroots Journal of Natural Resources, Vol.4, No.3 (September 2021), p.52-61 | ISSN 2581-6853 | CODEN GJNRA9
Doi: https://doi.org/10.33002/nr2581.6853.040306
54 Dmytro Kasiyanchuk, Liudmyla Shtohryn
Figure 1: Engineering-geology maps of the study area
The spread and intensity of developing exogenous geologic processes, landslides, in particular, are
influenced by the tectonic, seismic regime of the area, features of geological, geomorphological structure
and hydrogeological conditions. Area zoning is necessary to determine the patterns of spread and
development of exogenous geologic processes, landslides, in particular. According to the scheme of regional
engineering geological zoning (Bodnar et al., 2015), the studied area of Transcarpathian region and
Chernivtsi region is located within the Transcarpathian Inner Depression and the Carpathian Fold System.

Grassroots Journal of Natural Resources, Vol.4, No.3 (September 2021), p.52-61 | ISSN 2581-6853 | CODEN GJNRA9
Doi: https://doi.org/10.33002/nr2581.6853.040306
55 Dmytro Kasiyanchuk, Liudmyla Shtohryn
This area, because of the differences in individual areas regarding the geological and climatic conditions of
landslide development, was considered consisting of two separate regions: the Folded Carpathians and the
Precarpathian Depression.
Methodology
This study was performed using the Geographic Information System MapInfo. An engineering geological
zoning map with the contours of regions was drawn up. Since the studied region is characterized by zoning
from northwest to southeast, main engineering and geological units are located in the same direction. The
spatial database4included 2,339 landslides in Transcarpathian region and 1,119 landslides in Chernivtsi
region (3,458 landslides in total) (figure 2). Such data set offers a possibility to conduct full analysis to
assess risks based on an integrated time indicator. Nowadays, environmental risk modeling is performed
through several approaches. The calculation of risk as an environmental and economic component of losses
is basic tool. This article offers, for the first time, to expand and represent the principle, which would
consider not only one component (population - the number of shifts) but also a full-fledged basis for
developing a geo-information model based on spatial temporal analysis. This approach was implemented
through the proposed method of calculating the environmental risk from the perspective of the negative
effects of landslides.
Risk Assessment Technologies
The concept of ‘environmental risk’ defines the possibility of negative consequences that may arise because
of landslides as they affect the health and safety for two reasons: first, a threat to human life during the
landslide intensification; the second, huge economic losses with the destruction of the buildings, power
lines, roads, which are located in the areas affected by the displaced rocks. Assessment of the environmental
risk within the engineering and geological domain considers the registered landslides having special features
of engineering and geological conditions of developing with the differences in the temporal factors, mode
of landslide intensification(including the seismic activity), dynamic climatic factors such as annual
temperature, annual precipitation, groundwater levels (Davybida et al., 2018; Pona et al., 2016; Tymkiv et
al., 2019) and solar activity (Shtohryn et al., 2020), the influence of which is manifested indirectly through
the air circulation, precipitation, and temperature. To determine the extent to which the engineering and
geological regions, within the studied area, are covered by landslides, the ‘damage coefficient’ Ki,
considering the influence of the natural factors and the tendency of the area developing the specified
processes (Equation (1)), was used:
SiK Si i
= , (1)
Where Si is the area of landslides within the engineering and geological region; Si
is the area of
engineering and geological regions.
Transcarpathian Inner Depression covers an area of 5.58 thousand square kilometers. The landslides develop
in quaternary clay alluvial-diluvial deposits on the river slopes and in the weathered layer of volcanic rocks.
By the type of displacement, they are landslides of flow and landslides of sideslip (Velychko et al., 2019).
820 landslides were registered in total within an area of 74.7 square kilometers with the damage coefficient
of 1.4%, and a population density of 96.63 people per square kilometer within the depression. Average
values of the landslide characteristics are absolute marks of 416.5 meters and the longitudinal profile
steepness is 20.8°. The landslides have small dimensions: the length is 335.8 meters; the width is 339.3
4https://geoinf.kiev.ua/publikatsiyi/shchorichnyky/
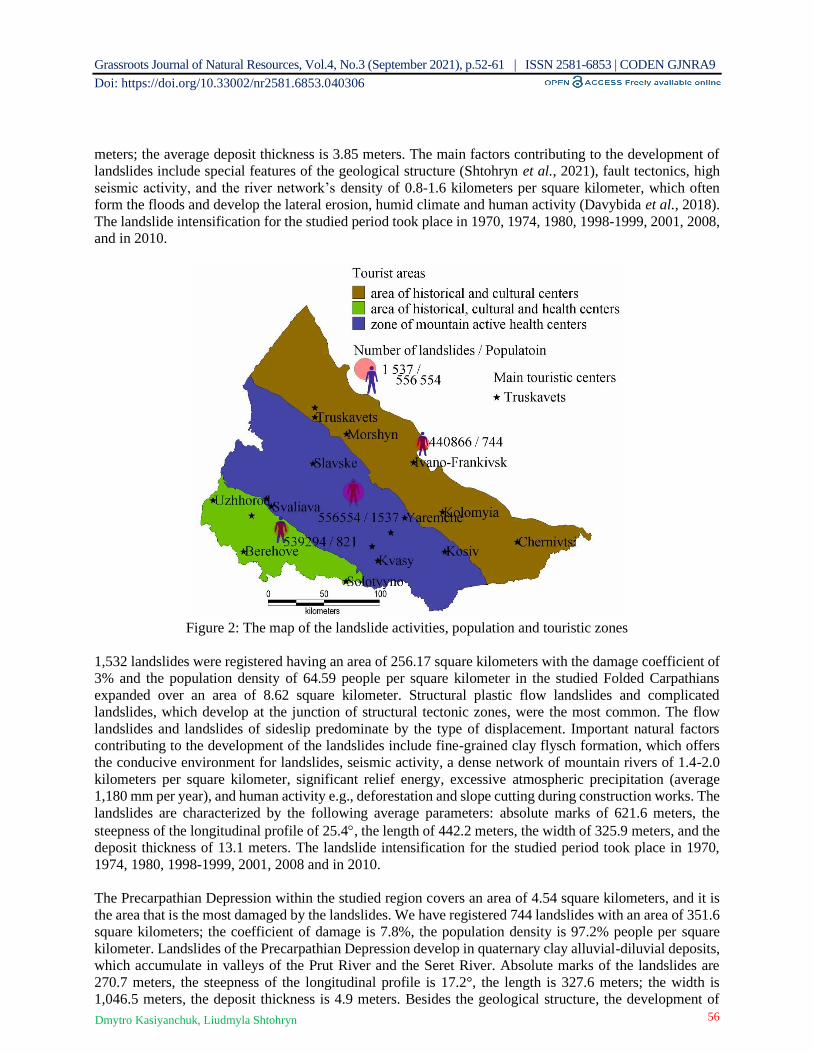
Grassroots Journal of Natural Resources, Vol.4, No.3 (September 2021), p.52-61 | ISSN 2581-6853 | CODEN GJNRA9
Doi: https://doi.org/10.33002/nr2581.6853.040306
56 Dmytro Kasiyanchuk, Liudmyla Shtohryn
meters; the average deposit thickness is 3.85 meters. The main factors contributing to the development of
landslides include special features of the geological structure (Shtohryn et al., 2021), fault tectonics, high
seismic activity, and the river network’s density of 0.8-1.6 kilometers per square kilometer, which often
form the floods and develop the lateral erosion, humid climate and human activity (Davybida et al., 2018).
The landslide intensification for the studied period took place in 1970, 1974, 1980, 1998-1999, 2001, 2008,
and in 2010.
Figure 2: The map of the landslide activities, population and touristic zones
1,532 landslides were registered having an area of 256.17 square kilometers with the damage coefficient of
3% and the population density of 64.59 people per square kilometer in the studied Folded Carpathians
expanded over an area of 8.62 square kilometer. Structural plastic flow landslides and complicated
landslides, which develop at the junction of structural tectonic zones, were the most common. The flow
landslides and landslides of sideslip predominate by the type of displacement. Important natural factors
contributing to the development of the landslides include fine-grained clay flysch formation, which offers
the conducive environment for landslides, seismic activity, a dense network of mountain rivers of 1.4-2.0
kilometers per square kilometer, significant relief energy, excessive atmospheric precipitation (average
1,180 mm per year), and human activity e.g., deforestation and slope cutting during construction works. The
landslides are characterized by the following average parameters: absolute marks of 621.6 meters, the
steepness of the longitudinal profile of 25.4, the length of 442.2 meters, the width of 325.9 meters, and the
deposit thickness of 13.1 meters. The landslide intensification for the studied period took place in 1970,
1974, 1980, 1998-1999, 2001, 2008 and in 2010.
The Precarpathian Depression within the studied region covers an area of 4.54 square kilometers, and it is
the area that is the most damaged by the landslides. We have registered 744 landslides with an area of 351.6
square kilometers; the coefficient of damage is 7.8%, the population density is 97.2% people per square
kilometer. Landslides of the Precarpathian Depression develop in quaternary clay alluvial-diluvial deposits,
which accumulate in valleys of the Prut River and the Seret River. Absolute marks of the landslides are
270.7 meters, the steepness of the longitudinal profile is 17.2°, the length is 327.6 meters; the width is
1,046.5 meters, the deposit thickness is 4.9 meters. Besides the geological structure, the development of
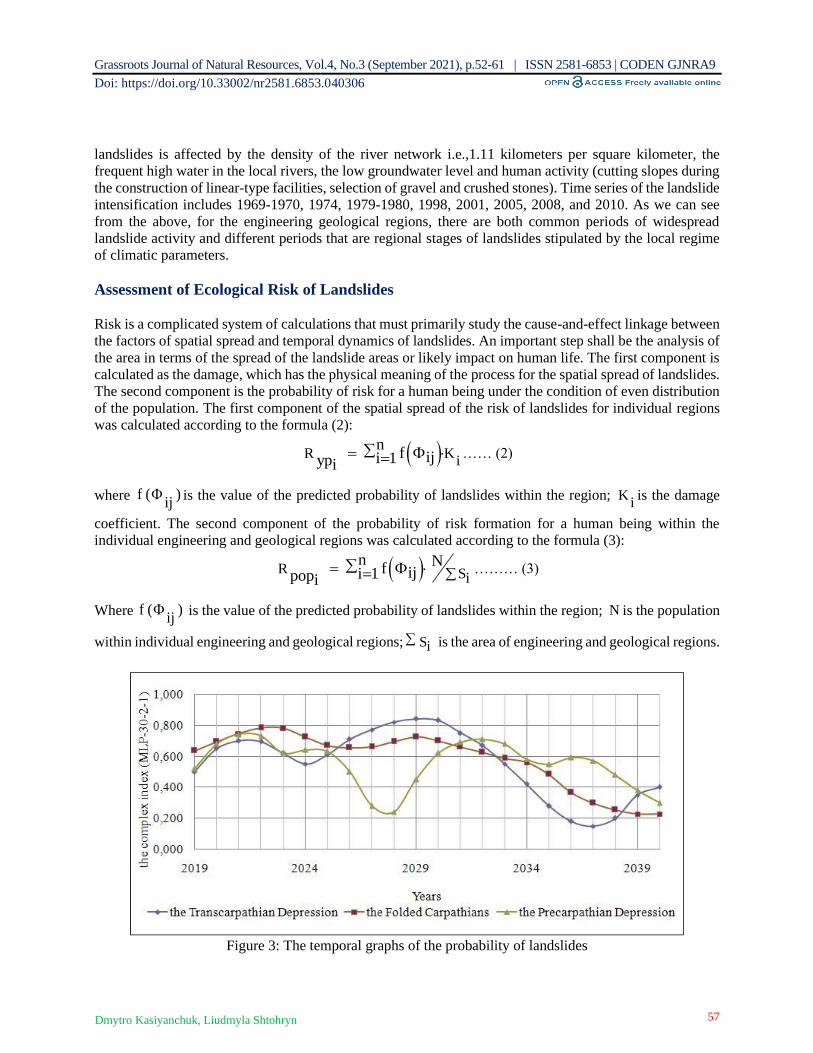
Grassroots Journal of Natural Resources, Vol.4, No.3 (September 2021), p.52-61 | ISSN 2581-6853 | CODEN GJNRA9
Doi: https://doi.org/10.33002/nr2581.6853.040306
57 Dmytro Kasiyanchuk, Liudmyla Shtohryn
landslides is affected by the density of the river network i.e.,1.11 kilometers per square kilometer, the
frequent high water in the local rivers, the low groundwater level and human activity (cutting slopes during
the construction of linear-type facilities, selection of gravel and crushed stones). Time series of the landslide
intensification includes 1969-1970, 1974, 1979-1980, 1998, 2001, 2005, 2008, and 2010. As we can see
from the above, for the engineering geological regions, there are both common periods of widespread
landslide activity and different periods that are regional stages of landslides stipulated by the local regime
of climatic parameters.
Assessment of Ecological Risk of Landslides
Risk is a complicated system of calculations that must primarily study the cause-and-effect linkage between
the factors of spatial spread and temporal dynamics of landslides. An important step shall be the analysis of
the area in terms of the spread of the landslide areas or likely impact on human life. The first component is
calculated as the damage, which has the physical meaning of the process for the spatial spread of landslides.
The second component is the probability of risk for a human being under the condition of even distribution
of the population. The first component of the spatial spread of the risk of landslides for individual regions
was calculated according to the formula (2):
( )R Ki
nf iji 1ypi
= = …… (2)
where f ( )ij
is the value of the predicted probability of landslides within the region; Kiis the damage
coefficient. The second component of the probability of risk formation for a human being within the
individual engineering and geological regions was calculated according to the formula (3):
( )R Si
n Nf iji 1popi
= = ……… (3)
Where f ( )ij
is the value of the predicted probability of landslides within the region; N is the population
within individual engineering and geological regions; Si is the area of engineering and geological regions.
Figure 3: The temporal graphs of the probability of landslides
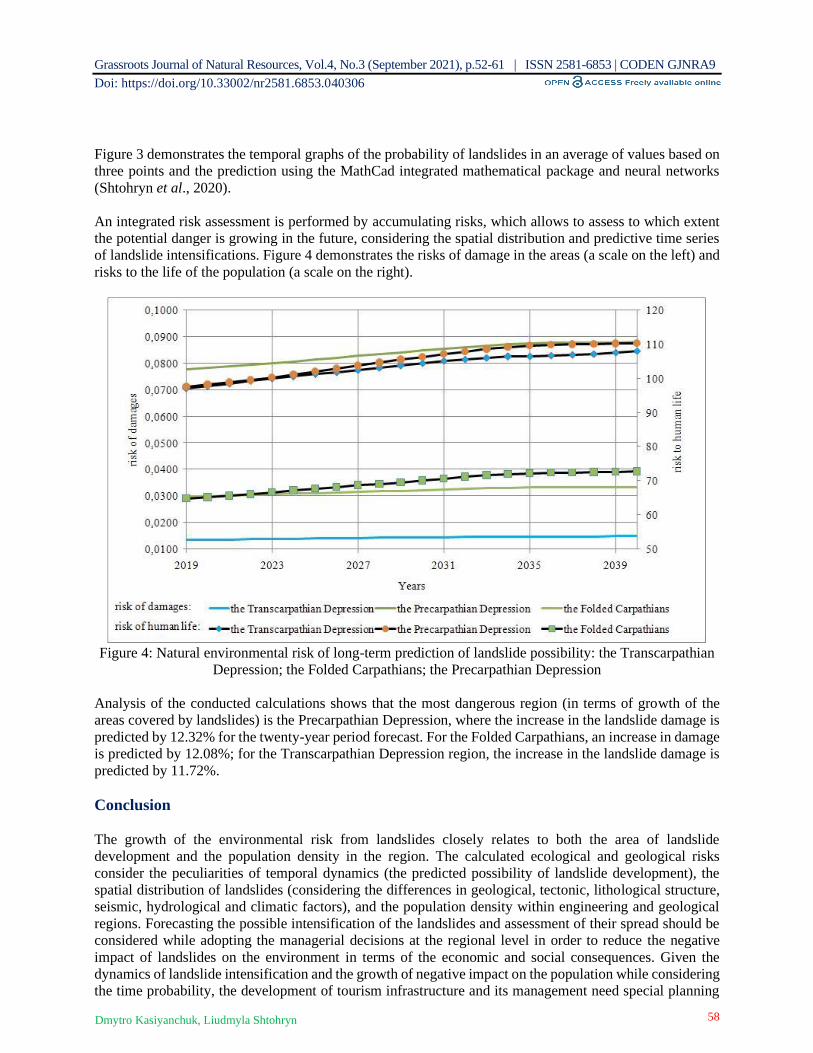
Grassroots Journal of Natural Resources, Vol.4, No.3 (September 2021), p.52-61 | ISSN 2581-6853 | CODEN GJNRA9
Doi: https://doi.org/10.33002/nr2581.6853.040306
58 Dmytro Kasiyanchuk, Liudmyla Shtohryn
Figure 3 demonstrates the temporal graphs of the probability of landslides in an average of values based on
three points and the prediction using the MathCad integrated mathematical package and neural networks
(Shtohryn et al., 2020).
An integrated risk assessment is performed by accumulating risks, which allows to assess to which extent
the potential danger is growing in the future, considering the spatial distribution and predictive time series
of landslide intensifications. Figure 4 demonstrates the risks of damage in the areas (a scale on the left) and
risks to the life of the population (a scale on the right).
Figure 4: Natural environmental risk of long-term prediction of landslide possibility: the Transcarpathian
Depression; the Folded Carpathians; the Precarpathian Depression
Analysis of the conducted calculations shows that the most dangerous region (in terms of growth of the
areas covered by landslides) is the Precarpathian Depression, where the increase in the landslide damage is
predicted by 12.32% for the twenty-year period forecast. For the Folded Carpathians, an increase in damage
is predicted by 12.08%; for the Transcarpathian Depression region, the increase in the landslide damage is
predicted by 11.72%.
Conclusion
The growth of the environmental risk from landslides closely relates to both the area of landslide
development and the population density in the region. The calculated ecological and geological risks
consider the peculiarities of temporal dynamics (the predicted possibility of landslide development), the
spatial distribution of landslides (considering the differences in geological, tectonic, lithological structure,
seismic, hydrological and climatic factors), and the population density within engineering and geological
regions. Forecasting the possible intensification of the landslides and assessment of their spread should be
considered while adopting the managerial decisions at the regional level in order to reduce the negative
impact of landslides on the environment in terms of the economic and social consequences. Given the
dynamics of landslide intensification and the growth of negative impact on the population while considering
the time probability, the development of tourism infrastructure and its management need special planning

Grassroots Journal of Natural Resources, Vol.4, No.3 (September 2021), p.52-61 | ISSN 2581-6853 | CODEN GJNRA9
Doi: https://doi.org/10.33002/nr2581.6853.040306
59 Dmytro Kasiyanchuk, Liudmyla Shtohryn
and scientific assessment. Engineering and geological conditions, combined with climate change, are crucial
in the assessment of risks to human life and critical infrastructure in the Carpathian region. Intensive
development of the tourism industry, poor planning and non-compliance with the requirements for
construction in complex engineering geological conditions require the assessment of solutions based on a
scientific approach that revolve around:
1. Understanding the risk as an ecological and economic basis for sustainable development of the
region;
2. Creating a forecast time model of life risk, as a basis for building a system to prevent the negative
consequences of the activation and development of landslides; and
3. Development of a geo-informational model of spatial forecast based on a time model of life risks
at the local level as a basis for sustainable development in the future.
References
Abella, E.A.C. and van Westen, C.J. (2007). Generation of a landslide risk index map for Cuba using spatial
multi-criteria evaluation. Landslides, 4: 311–325. DOI: https://doi.org/10.1007/s10346-007-0087-y
Adamenko, O.M., Rudko, G.I. and Kovalchuk, I.P. (2000). Fakel. Ecological geomorphology: textbook.
Bondar, M.O. (2015). Estimation of risks of dangerous geological processes. Bulletin of the Mykhailo
Ostrogradsky KrNU, 3(92): 123-128.
Bonnard, C., Forlati, F. and Scavia, C. (2004). Leiden: Balkema. Identification and mitigation of large
landslide risks in Europe. Advances in risk assessment.
Corominas, J., van Westen, C., Frattini, P., Cascini, L., Malet, J., Fotopoulou, S., Catani, F., Mavrouli, O.,
Pitilakis, K. and Winter, M. (2014). Recommendations for the quantitative analysis of landslide risk.
Bulletin of Engineering Geology and the Environment, 73(2): 209-
263.DOI: https://doi.org/10.10007/s100-013-0538-8.
Davybida, L., Kasiyanchuk, D., Shtohryn, L., Kuzmenko, E. and Tymkiv, M. (2018). Hydrogeological
Conditions and Natural Factors Forming the Regime of Groundwater Levels in the Ivano-Frankivsk
Region (Ukraine). Journal of Ecological Engineering, 19(6): 34-44.
DOI: https://doi.org/10.12911/22998993/91883
Ivanyuta, S.P. and Kaczynski, A.B. (2012). Ecological and natural-technogenic safety of Ukraine: regional
dimension of threats and risks: monography. NISD.
Kasiyanchuk, D., Chepurnyi, I., Chepurna, T. and Hurska, N. (2015). Methodology of quantitative
forecasting risk assessments of exogenous geological processes using GIS technology. 14th EAGE
International Conference on Geoinformatics - Theoretical and Applied Aspects, 13 May, Kyiv.
DOI: https://doi.org/10.3997/2214-4609.201412408
Kasiyanchuk, D., Kuzmenko, E., Chepurna, T. and Chepurnyj, I. (2016). Calculation of that environmental
and geological landslide risk estimate. Eastern-European Journal of Enterprise Technologies, 1(10):
18–25. DOI: https://doi.org/10.15587/1729-4061.2016.59687
Klymchuk, L.M., Blinov, P.V. and Velychko, V.F. (2008). Modern engineering and geological conditions
of Ukraine as a component of the safety of vital functions. VPC “Express”.
Law of Ukraine (2019). “On Basic Principles (Strategy) of the State Environmental Policy of Ukraine for
the Period up to 2030” № 2697-VIII, 28.02.2019. Available online:
https://zakon.rada.gov.ua/laws/show/2697-19#Text [Accessed 27 January 2021].
Law of Ukraine (2020). Information and analytical materials for the sitting of the Verkhovna Rada of
Ukraine Committee on Environmental Policy and Nature Management, №04-15/11-2020/94271,
02.07.2020. Available online: http://komekolog.rada.gov.ua/uploads/documents/35969.pdf
[Accessed 27 January 2021].
Pona, O., Shtogryn, L. and Kasianchuk, D. (2016). The analysis of the relationship between the phases of
the Moon and the occurrence of landslide. 15th EAGE International Conference on Geoinformatics -
Theoretical and Applied Aspects, 10 May, Kyiv.

Grassroots Journal of Natural Resources, Vol.4, No.3 (September 2021), p.52-61 | ISSN 2581-6853 | CODEN GJNRA9
Doi: https://doi.org/10.33002/nr2581.6853.040306
60 Dmytro Kasiyanchuk, Liudmyla Shtohryn
Rudko, G.I. (1991). Institute of Geological Sciences of the National Academy of Science of Ukraine.
Geodynamics and predictions of hazardous geological processes of the Carpathian region.
Rudko, G.I. and Erysh, I.F. (2006). Zadruga Landslides and other geodynamic processes of mountain-folded
regions of Ukraine (Crimea, Carpathians).
Rudko, G.I., Klimchuk, L.M. and Yakovlev, Ye.O. (1999). Scientific and methodical bases of forecasting
of ecological risk of dangerous geological processes in Transcarpathia in connection with their mass
activation. Mineral resources of Ukraine, 2: 42-45.
Shtohryn, L. and Anikeyev, S. (2021) Reflection of the activity of landslide processes in the regional
gravitational and magnetic fields (on the example of the Transcarpathian region). Geodynamics,
30(1): 65-77. DOI: https://doi.org/10.23939/jgd2021.01.065.
Shtohryn, L., Kasiyanchuk, D. and Kuzmenko, E. (2020). The problem of long-term prediction of landslide
processes within the Transcarpathian inner depression of the Carpathian region of Ukraine.
Carpathian Journal of Earth and Environmental Sciences, 15(1): 157–166.
DOI: https://doi.org/10.26471/cjees/2020/015/118
Tymkiv, M. and Kasiyanchuk, D. (2019). Research of Data Sequences of Groundwater Levels with Gaps.
Journal of Ecological Engineering, 20(3):141–151. DOI: https://doi.org/10.12911/22998993/99744
Velychko, V.F., Pyshna, N.G. and Bohatko, N.S. (2019). Information Yearbook on activation of hazardous
exogenous geological processes in Ukraine according to EGP monitoring. Kyiv, State Service of
Geology and Subsoil of Ukraine, State Scientific and Production Enterprise “State Information
Geological Fund of Ukraine”, 111. Available online:
https://geoinf.kiev.ua/publikatsiyi/shchorichnyky/ [Accessed 27 January 2021].
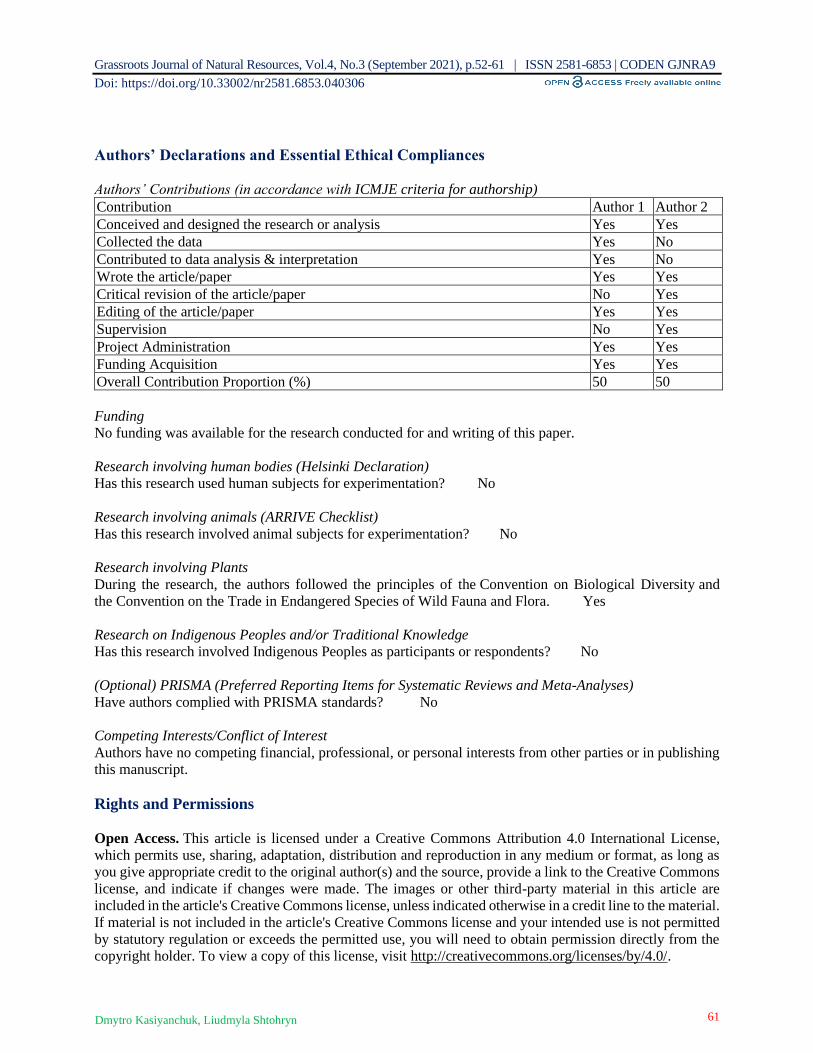
Grassroots Journal of Natural Resources, Vol.4, No.3 (September 2021), p.52-61 | ISSN 2581-6853 | CODEN GJNRA9
Doi: https://doi.org/10.33002/nr2581.6853.040306
61 Dmytro Kasiyanchuk, Liudmyla Shtohryn
Authors’ Declarations and Essential Ethical Compliances
Authors’ Contributions (in accordance with ICMJE criteria for authorship)
Contribution Author 1 Author 2
Conceived and designed the research or analysis Yes Yes
Collected the data Yes No
Contributed to data analysis & interpretation Yes No
Wrote the article/paper Yes Yes
Critical revision of the article/paper No Yes
Editing of the article/paper Yes Yes
Supervision No Yes
Project Administration Yes Yes
Funding Acquisition Yes Yes
Overall Contribution Proportion (%) 50 50
Funding
No funding was available for the research conducted for and writing of this paper.
Research involving human bodies (Helsinki Declaration)
Has this research used human subjects for experimentation? No
Research involving animals (ARRIVE Checklist)
Has this research involved animal subjects for experimentation? No
Research involving Plants
During the research, the authors followed the principles of the Convention on Biological Diversity and
the Convention on the Trade in Endangered Species of Wild Fauna and Flora. Yes
Research on Indigenous Peoples and/or Traditional Knowledge
Has this research involved Indigenous Peoples as participants or respondents? No
(Optional) PRISMA (Preferred Reporting Items for Systematic Reviews and Meta-Analyses)
Have authors complied with PRISMA standards? No
Competing Interests/Conflict of Interest
Authors have no competing financial, professional, or personal interests from other parties or in publishing
this manuscript.
Rights and Permissions
Open Access. This article is licensed under a Creative Commons Attribution 4.0 International License,
which permits use, sharing, adaptation, distribution and reproduction in any medium or format, as long as
you give appropriate credit to the original author(s) and the source, provide a link to the Creative Commons
license, and indicate if changes were made. The images or other third-party material in this article are
included in the article's Creative Commons license, unless indicated otherwise in a credit line to the material.
If material is not included in the article's Creative Commons license and your intended use is not permitted
by statutory regulation or exceeds the permitted use, you will need to obtain permission directly from the
copyright holder. To view a copy of this license, visit http://creativecommons.org/licenses/by/4.0/.

Articulating Fragrant Agarwood Formation as an Outcome of the Interaction
between the Insect Zeuzera conferta and Aquilaria trees – A Review
Arup Khakhlari*1, Supriyo Sen2 1Department of Biosciences, Assam Don Bosco University, Tapesia Campus, Sonapur, Assam, India.
Email: [email protected] | ORCID: https://orcid.org/0000-0003-4660-868X 2Department of Biosciences, Assam Don Bosco University, Tapesia Campus, Sonapur, Assam, India.
Email: [email protected]; [email protected] | ORCID ID: 0000-0002-3800-4942
*Corresponding author
Abstract Agarwood is the resinous infected wood obtained from Aquilaria species, which is a highly priced product in the flavour and
fragrance market. Its formation is a complex process of interaction
between the plant, insect, and microorganisms. Multiple studies
concerning the interaction of microorganisms with the Aquilaria
tree have been reported. However, the significant interaction
between the insect Zeuzera conferta Walker (Lepidoptera:
Cossidae) with Aquilaria has been overlooked, and only exiguous
studies have been accomplished. Considering the dearth of
available literature on this interesting phenomenon a review has
been attempted. The taxonomical and morphological descriptions
proffered by researchers and the insect life cycle are discussed. The
review lays emphasis on the chemical ecology of the interaction
between Z. conferta, Aquilaria and associating microorganisms
as a possible continuum operating in the form of complex chemical
signalling via release and sensing of Volatile Organic Compounds
(VOCs), Herbivore Induced Plant Volatiles (HIPVs) and Microbial
Volatile Organic Compounds (MVOCs). The review also
scrutinizes the future perspectives of understanding the interaction
in devising suitable management strategies to prevent uncontrolled
infestation and, simultaneously, develop artificial rearing
technology for the insect Z. conferta as a strategy for ensuring
sustainable livelihood of farmers dependent on agarwood
production.
Keywords Insecticides; Frass; Taxonomy; Artificial rearing; Interaction;
Lepidopteran
How to cite this paper: Khakhlari, A. and Sen,
S. (2021). Articulating Fragrant Agarwood
Formation as an Outcome of the Interaction
between the Insect Zeuzera conferta
and Aquilaria trees – A Review. Grassroots
Journal of Natural Resources, 4(3): 62-78. Doi:
https://doi.org/10.33002/nr2581.6853.040307
Received: 17 August 2021
Reviewed: 30 August 2021
Provisionally Accepted: 10 September 2021
Revised: 21 September 2021
Finally Accepted: 24 September 2021
Published: 30 September 2021
Copyright © 2021 by author(s)
This work is licensed under the Creative
Commons Attribution International
License (CC BY 4.0).
http://creativecommons.org/licenses/by/4.0/
Grassroots Journal of Natural Resources, Vol.4 No.3 (September 2021) ISSN 2581-6853 | CODEN: GJNRA9 | Published by The Grassroots Institute
Website: http://grassrootsjournals.org/gjnr | Main Indexing: Web of Science
M – 00244 | Review Article
ISSN 2581-6853 | 4(3) Sep 2021

Grassroots Journal of Natural Resources, Vol.4, No.3 (September 2021), p.62-78 | ISSN 2581-6853 | CODEN GJNRA9
Doi: https://doi.org/10.33002/nr2581.6853.040307
63 Arup Khakhlari, Supriyo Sen
Introduction
Zeuzera conferta Walker (Lepidoptera: Cossidae) is one of the principal insect pests that has been found to
associate with the Aquilaria trees. It is also known as Neurozera conferta Walker (Syazwan et al., 2019). It
belongs to the Class Insecta, Order Lepidoptera, and Family Cossidae in a systemic classification. It is
widely distributed in Southeast Asian countries, Eastern Himalayas, Sri Lanka, Bangladesh, Taiwan,
Andaman & Nicobar Islands and the Philippines. The insect is particularly prevalent in the agarwood
plantations of the north-eastern part of India, particularly in the state of Assam, and is known to influence
the formation of the rare resinous and fragrant agarwood by infesting Aquilaria trees. In fact, agarwood
from Assam is regarded as a high-quality material in the global agarwood market. The borer insect is known
locally as “Pukh” in Assamese and “Emphu” in Bodo languages, with both the terms meaning insect, which
is used as a general nomenclature by the cultivators, traders, and people conversant with the Aquilaria trees
in Assam. The Aquilaria trees, which belong to the Thymelaeaceae family, are commonly known as
Agarwood, Eaglewood, or Aloes wood besides various other regional names. Agarwood is the dark-
coloured resinous fragrant wood that has a high commercial value. Further, the formation of agarwood
involves a complex process of interaction between the plant, insect, and microorganisms. The process of
formation of agarwood is a defense response that is connected to this response to injury, created through
natural and artificial means. To prevent or to recover from the injury, the Aquilaria trees produce oleoresins
at the site of the injury as a product of plant defense response (Zhang et al., 2012). The site of the injury is
colonised further by microorganisms leading to the accumulation of the oleoresin which is called agarwood.
So far, a total of 19 insect pests have been recorded to associate with the Aquilaria trees belonging to 16
families and 5 orders of which the preponderance of the sap-sucker is found higher, followed by leaf
defoliators and lastly wood borers (Syazwan et al., 2019). However, the wood borer and the leaf defoliator
form the major pest of the Aquilaria trees causing a serious damage to the Aquilaria trees (Ong et al., 2014).
The larvae of the wood borer Z. conferta Walker (Figure 1) infest the woody stem of the Aquilaria trees and
facilitate subsequent microbial infections. The larvae make vertical tunnels inside the trunk of the Aquilaria
trees as they feed and move up spreading the microbial infection where the oleoresin accumulates (Kalita
et al., 2015). From brown streaks to dark brown and finally to black coloured wood are the changes that
occur in the healthy wood where the initial infestations occur. Successively, these lead to stunted and poor
development, formation of cankers on the trunk, swelling, symptoms of dieback on the top and outer
branches of the trees (Nath and Saikia, 2002). Subsequently, the scenario of a visible wound, stem
distortions, decayed branches, uneven and irregular trunk, and odoriferous dispenses evidence of agar
formation inside the tree. The incidence of Z. conferta is, however, not observed in all the Aquilaria trees
that are grown. Its selectiveness in infesting the Aquilaria trees is interesting, as significant differences are
being observed in the infestation process among the Aquilaria trees that are grown separately at a distance
of a few meters with one area being completely infested and the other area with none. These variations in
the infestation process have led the traders to practice artificial process of injury and induce infections
through physical, chemical, and biological means or by their combinations as a method of treatment in the
Aquilaria trees where insect incidence is not usually observed. However, the increase in commercial demand
and slow natural process of agarwood formation have also pressurized the traders to execute the process of
artificial infections (Chippa and Kaushik, 2017). Despite its success in producing agarwood through the
application of artificial techniques, the quality of the agarwood remains an issue and is found
incommensurate in comparison to naturally occurring ones (Kalita et al., 2015). Moreover, the price of the
agarwood, the durability of the fragrance, long shelf life, and the extent of the microbial attack are all found
to be higher in agarwood that is induced only after the insect (Z. conferta) infestation (Hoque et al., 2019).
Even with these evidence about the importance of the Z. conferta in the formation of agarwood, studies are
yet to elucidate its actual role. There is a possibility of insect- microorganism in relation which it might have
a role in the superior quality agarwood formation (Hoque et al., 2019). However, literature is deficient
concerning Z. conferta and, therefore, in the present review, efforts have been made to compile the
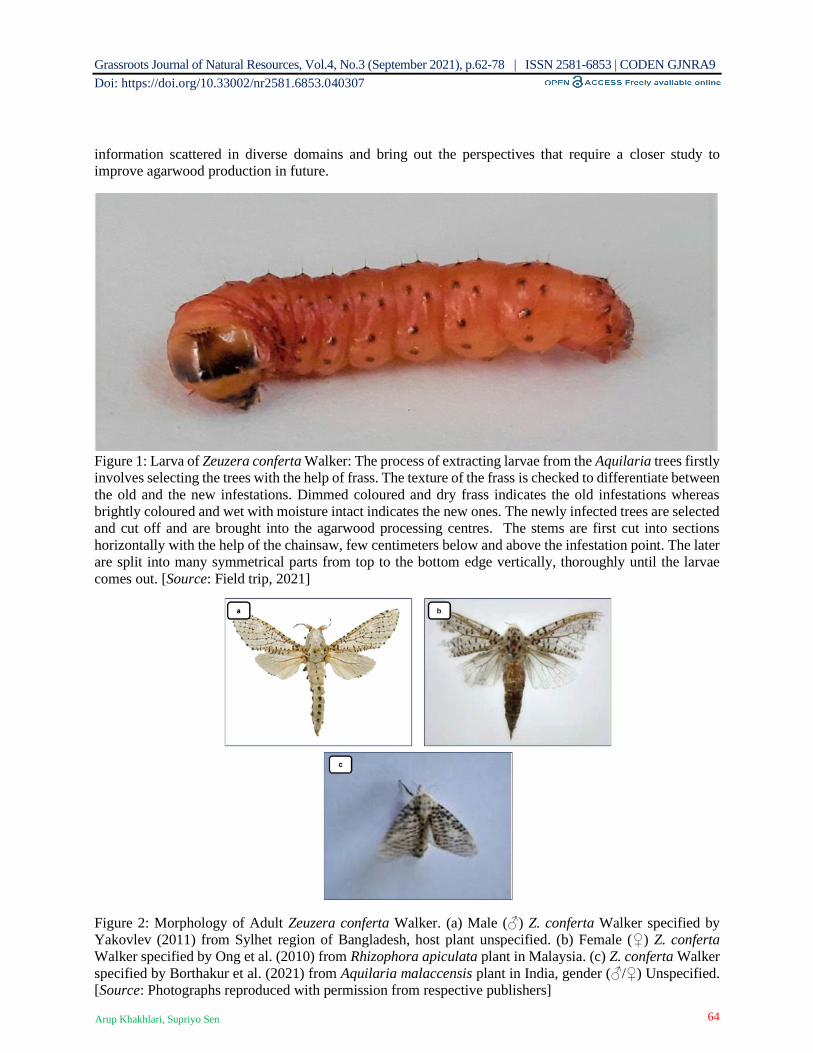
Grassroots Journal of Natural Resources, Vol.4, No.3 (September 2021), p.62-78 | ISSN 2581-6853 | CODEN GJNRA9
Doi: https://doi.org/10.33002/nr2581.6853.040307
64 Arup Khakhlari, Supriyo Sen
information scattered in diverse domains and bring out the perspectives that require a closer study to
improve agarwood production in future.
Figure 1: Larva of Zeuzera conferta Walker: The process of extracting larvae from the Aquilaria trees firstly
involves selecting the trees with the help of frass. The texture of the frass is checked to differentiate between
the old and the new infestations. Dimmed coloured and dry frass indicates the old infestations whereas
brightly coloured and wet with moisture intact indicates the new ones. The newly infected trees are selected
and cut off and are brought into the agarwood processing centres. The stems are first cut into sections
horizontally with the help of the chainsaw, few centimeters below and above the infestation point. The later
are split into many symmetrical parts from top to the bottom edge vertically, thoroughly until the larvae
comes out. [Source: Field trip, 2021]
Figure 2: Morphology of Adult Zeuzera conferta Walker. (a) Male (♂) Z. conferta Walker specified by
Yakovlev (2011) from Sylhet region of Bangladesh, host plant unspecified. (b) Female (♀) Z. conferta
Walker specified by Ong et al. (2010) from Rhizophora apiculata plant in Malaysia. (c) Z. conferta Walker
specified by Borthakur et al. (2021) from Aquilaria malaccensis plant in India, gender (♂/♀) Unspecified.
[Source: Photographs reproduced with permission from respective publishers]
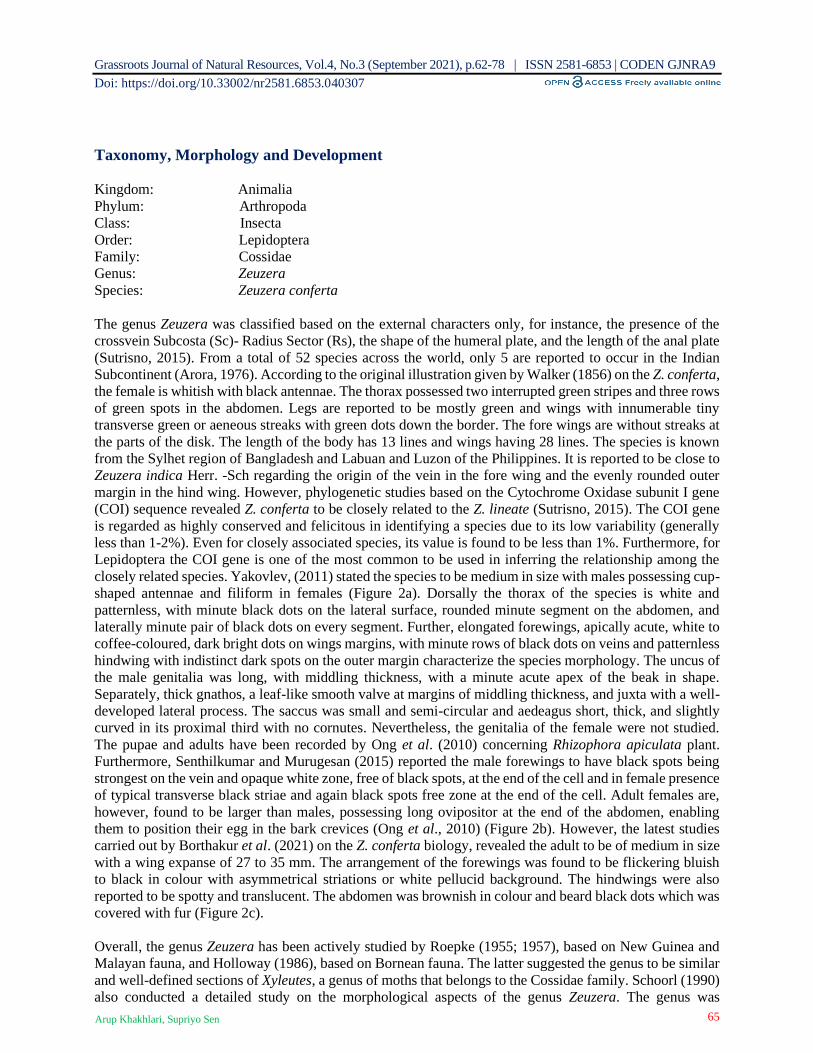
Grassroots Journal of Natural Resources, Vol.4, No.3 (September 2021), p.62-78 | ISSN 2581-6853 | CODEN GJNRA9
Doi: https://doi.org/10.33002/nr2581.6853.040307
65 Arup Khakhlari, Supriyo Sen
Taxonomy, Morphology and Development
Kingdom: Animalia
Phylum: Arthropoda
Class: Insecta
Order: Lepidoptera
Family: Cossidae
Genus: Zeuzera
Species: Zeuzera conferta
The genus Zeuzera was classified based on the external characters only, for instance, the presence of the
crossvein Subcosta (Sc)- Radius Sector (Rs), the shape of the humeral plate, and the length of the anal plate
(Sutrisno, 2015). From a total of 52 species across the world, only 5 are reported to occur in the Indian
Subcontinent (Arora, 1976). According to the original illustration given by Walker (1856) on the Z. conferta,
the female is whitish with black antennae. The thorax possessed two interrupted green stripes and three rows
of green spots in the abdomen. Legs are reported to be mostly green and wings with innumerable tiny
transverse green or aeneous streaks with green dots down the border. The fore wings are without streaks at
the parts of the disk. The length of the body has 13 lines and wings having 28 lines. The species is known
from the Sylhet region of Bangladesh and Labuan and Luzon of the Philippines. It is reported to be close to
Zeuzera indica Herr. -Sch regarding the origin of the vein in the fore wing and the evenly rounded outer
margin in the hind wing. However, phylogenetic studies based on the Cytochrome Oxidase subunit I gene
(COI) sequence revealed Z. conferta to be closely related to the Z. lineate (Sutrisno, 2015). The COI gene
is regarded as highly conserved and felicitous in identifying a species due to its low variability (generally
less than 1-2%). Even for closely associated species, its value is found to be less than 1%. Furthermore, for
Lepidoptera the COI gene is one of the most common to be used in inferring the relationship among the
closely related species. Yakovlev, (2011) stated the species to be medium in size with males possessing cup-
shaped antennae and filiform in females (Figure 2a). Dorsally the thorax of the species is white and
patternless, with minute black dots on the lateral surface, rounded minute segment on the abdomen, and
laterally minute pair of black dots on every segment. Further, elongated forewings, apically acute, white to
coffee-coloured, dark bright dots on wings margins, with minute rows of black dots on veins and patternless
hindwing with indistinct dark spots on the outer margin characterize the species morphology. The uncus of
the male genitalia was long, with middling thickness, with a minute acute apex of the beak in shape.
Separately, thick gnathos, a leaf-like smooth valve at margins of middling thickness, and juxta with a well-
developed lateral process. The saccus was small and semi-circular and aedeagus short, thick, and slightly
curved in its proximal third with no cornutes. Nevertheless, the genitalia of the female were not studied.
The pupae and adults have been recorded by Ong et al. (2010) concerning Rhizophora apiculata plant.
Furthermore, Senthilkumar and Murugesan (2015) reported the male forewings to have black spots being
strongest on the vein and opaque white zone, free of black spots, at the end of the cell and in female presence
of typical transverse black striae and again black spots free zone at the end of the cell. Adult females are,
however, found to be larger than males, possessing long ovipositor at the end of the abdomen, enabling
them to position their egg in the bark crevices (Ong et al., 2010) (Figure 2b). However, the latest studies
carried out by Borthakur et al. (2021) on the Z. conferta biology, revealed the adult to be of medium in size
with a wing expanse of 27 to 35 mm. The arrangement of the forewings was found to be flickering bluish
to black in colour with asymmetrical striations or white pellucid background. The hindwings were also
reported to be spotty and translucent. The abdomen was brownish in colour and beard black dots which was
covered with fur (Figure 2c).
Overall, the genus Zeuzera has been actively studied by Roepke (1955; 1957), based on New Guinea and
Malayan fauna, and Holloway (1986), based on Bornean fauna. The latter suggested the genus to be similar
and well-defined sections of Xyleutes, a genus of moths that belongs to the Cossidae family. Schoorl (1990)
also conducted a detailed study on the morphological aspects of the genus Zeuzera. The genus was
Grassroots Journal of Natural Resources, Vol.4, No.3 (September 2021), p.62-78 | ISSN 2581-6853 | CODEN GJNRA9
Doi: https://doi.org/10.33002/nr2581.6853.040307
66 Arup Khakhlari, Supriyo Sen
interpreted based on the presence of crossvein Sc-Rs, humeral plate triangular in shape and anal plate
comparatively long to short. Based on his hand cladogram, various characteristics believed to be
apomorphies of genus Zeuzera and its relationship within its genus were also presented. However, it was
felt that his study needed further assessment due to the growing evolution of understanding in the field of
study to testify its validity (Sutrisno, 2015).
The species of the Zeuzera mostly live as a larva in plants (Sutrisno, 2015). Eggs are laid by the female
moth chiefly in groups directly in cracks, crevices of the stem and larger branches of the host plant (Moaty
et al., 2019). A total of 180-250 eggs are laid by the single female Z. conferta in one batch with the size
ranging from 0.2 mm in length to 0.1 mm in breath (Borthakur et al., 2021). The caterpillars emerge out
from the egg after its development and are called first instars till it molts. It enters the second instars after
the molt and increases in size. Every stage of molting distinguishes another instar. Typically, a caterpillar
passes through a total of five instars as it eats and grows, wherein each instar its general appearance changes
from one to the next. According to Borthakur et al. (2021), the size of the larvae increased from 0.03 cm to
an average of 4.5±0.7 in length and from 0.02 cm to 0.06 cm in breath from first instars to fifth instars. The
change was also observed in the colour pattern of the larvae form light reddish pink to light pinkish from
first instars to fifth instars. Before entering the stage of the pupation, the matured larvae prepare the pupal
tunnel and also the exit hole near the bark surface. The pupa measured 1.9 to 2.5 cm in length and 0.05 cm
in breath and weighted 0.46 gm and completed its pupal period within 14-30 days and emerged out as an
adult moth. In conclusion, they reported that Z. conferta have two generations in a year that was also earlier
reported by Baksha and Islam (1999), with regards to Sonneratia apetala trees in Bangladesh.
Ecology and Interactions
Diversity of Hosts
Besides Aquilaria trees, the Z. conferta has a broad range of host of different families such as Sonneratia
apetala, S. alba, S. ovate of family Lythraceae, Aegiceras corniculatum of Myrsinaceae, Avicennia lanata,
A. marina, A. officinalis of Avicenniaceae, Ochroma lagopus of Bombacaceae, Eucalyptus deglupta of
Myrtaceae, Rhizophora apiculata, R. mucronata of Rhizophoracaea, Theobroma cacao of Sterculiaceae,
Coffea of Rubiaceae, Erythroxylum L. of Erythroxylaceae, Elettaria cardamomum of Zingiberaceae and
Tamarix indica of Tamaricaceae family (Islam, 2004; Yakovlev, 2011). The preferential habitat of the
majority of these host trees are coastal mangrove forest, moist, lowland with few from the tropical forest
(Ong et al., 2010; Senthilkumar and Murugesan, 2015). The larvae target the stems, trunks, twigs, and shoots
of the host plant for the infestation. The association of Z. conferta with S. apetala is extensively studied in
Bangladesh where the larva of Z. conferta is also termed as “bee hole borer”. The tree S. apetala is largely
utilized as a plantation species to construct a shelter belt along with the coastal areas and offshore islands
of Bangladesh. The larva is reported to bore in the barks and later make large, profuse, oval, and ramifying
tunnels in the stem rendering the tree to wind breakage. Later, the larvae and pupae of the Z. conferta are
found to be eaten by woodpeckers such as Dinopium benghalense and Picoides canicapillus and small black
ants (Islam, 2004). In Avicennia spp., the infestation by the larvae Z. conferta is reported to occur at an
interval of 7 years in natural mixed forest of Brazil (Vannucci, 2002). Few other host plants of the Z. conferta
includes Cocoa (Theobroma cacao), Balsa, Coca (Erythroxylum P. Br), and Barringtonia (Arora, 1976;
Schoorl, 1990). It is however interesting to note that with regards to these hosts of Z. conferta, only in
Aquilaria trees it is reported to have a productive role i.e., in the formation of resinous wood called as
agarwood.
Interactions: Insect-plant-microorganism
Plant and its biotic interactions in natural environment have diverse manifestations. In nature, plant interacts
with the insect by attracting pollinators for sexual reproduction on one side and, on the other, protecting
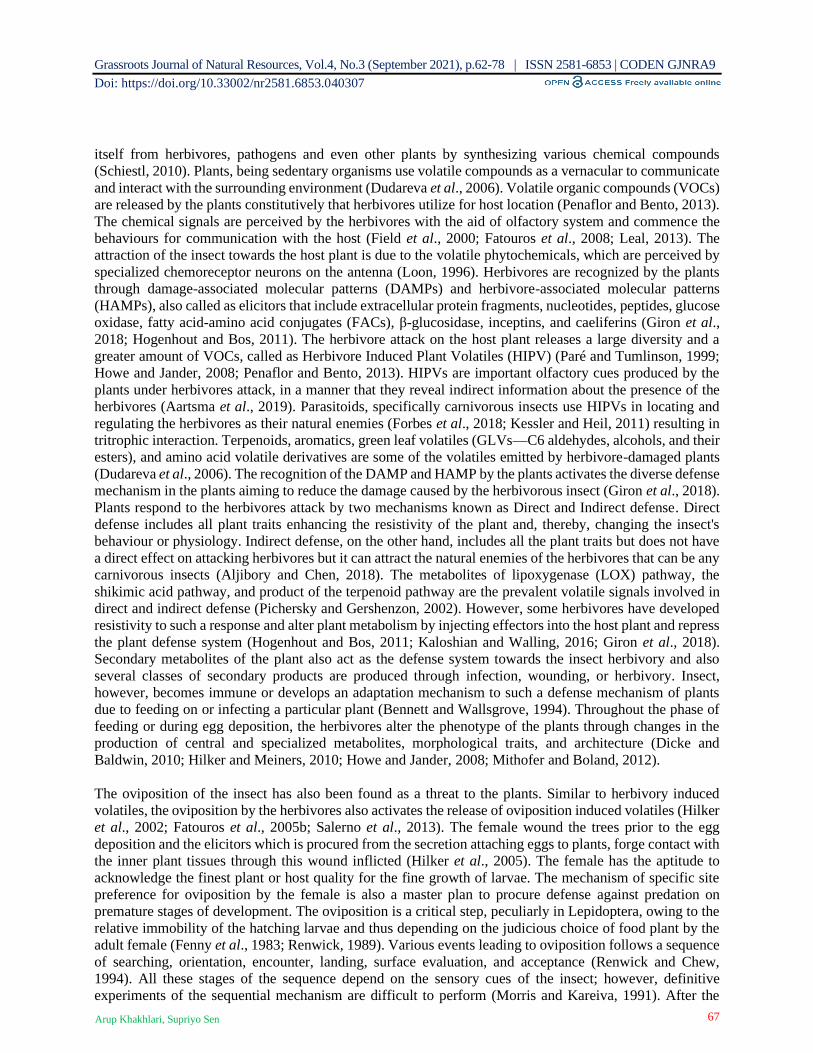
Grassroots Journal of Natural Resources, Vol.4, No.3 (September 2021), p.62-78 | ISSN 2581-6853 | CODEN GJNRA9
Doi: https://doi.org/10.33002/nr2581.6853.040307
67 Arup Khakhlari, Supriyo Sen
itself from herbivores, pathogens and even other plants by synthesizing various chemical compounds
(Schiestl, 2010). Plants, being sedentary organisms use volatile compounds as a vernacular to communicate
and interact with the surrounding environment (Dudareva et al., 2006). Volatile organic compounds (VOCs)
are released by the plants constitutively that herbivores utilize for host location (Penaflor and Bento, 2013).
The chemical signals are perceived by the herbivores with the aid of olfactory system and commence the
behaviours for communication with the host (Field et al., 2000; Fatouros et al., 2008; Leal, 2013). The
attraction of the insect towards the host plant is due to the volatile phytochemicals, which are perceived by
specialized chemoreceptor neurons on the antenna (Loon, 1996). Herbivores are recognized by the plants
through damage-associated molecular patterns (DAMPs) and herbivore-associated molecular patterns
(HAMPs), also called as elicitors that include extracellular protein fragments, nucleotides, peptides, glucose
oxidase, fatty acid-amino acid conjugates (FACs), β-glucosidase, inceptins, and caeliferins (Giron et al.,
2018; Hogenhout and Bos, 2011). The herbivore attack on the host plant releases a large diversity and a
greater amount of VOCs, called as Herbivore Induced Plant Volatiles (HIPV) (Paré and Tumlinson, 1999;
Howe and Jander, 2008; Penaflor and Bento, 2013). HIPVs are important olfactory cues produced by the
plants under herbivores attack, in a manner that they reveal indirect information about the presence of the
herbivores (Aartsma et al., 2019). Parasitoids, specifically carnivorous insects use HIPVs in locating and
regulating the herbivores as their natural enemies (Forbes et al., 2018; Kessler and Heil, 2011) resulting in
tritrophic interaction. Terpenoids, aromatics, green leaf volatiles (GLVs—C6 aldehydes, alcohols, and their
esters), and amino acid volatile derivatives are some of the volatiles emitted by herbivore-damaged plants
(Dudareva et al., 2006). The recognition of the DAMP and HAMP by the plants activates the diverse defense
mechanism in the plants aiming to reduce the damage caused by the herbivorous insect (Giron et al., 2018).
Plants respond to the herbivores attack by two mechanisms known as Direct and Indirect defense. Direct
defense includes all plant traits enhancing the resistivity of the plant and, thereby, changing the insect's
behaviour or physiology. Indirect defense, on the other hand, includes all the plant traits but does not have
a direct effect on attacking herbivores but it can attract the natural enemies of the herbivores that can be any
carnivorous insects (Aljibory and Chen, 2018). The metabolites of lipoxygenase (LOX) pathway, the
shikimic acid pathway, and product of the terpenoid pathway are the prevalent volatile signals involved in
direct and indirect defense (Pichersky and Gershenzon, 2002). However, some herbivores have developed
resistivity to such a response and alter plant metabolism by injecting effectors into the host plant and repress
the plant defense system (Hogenhout and Bos, 2011; Kaloshian and Walling, 2016; Giron et al., 2018).
Secondary metabolites of the plant also act as the defense system towards the insect herbivory and also
several classes of secondary products are produced through infection, wounding, or herbivory. Insect,
however, becomes immune or develops an adaptation mechanism to such a defense mechanism of plants
due to feeding on or infecting a particular plant (Bennett and Wallsgrove, 1994). Throughout the phase of
feeding or during egg deposition, the herbivores alter the phenotype of the plants through changes in the
production of central and specialized metabolites, morphological traits, and architecture (Dicke and
Baldwin, 2010; Hilker and Meiners, 2010; Howe and Jander, 2008; Mithofer and Boland, 2012).
The oviposition of the insect has also been found as a threat to the plants. Similar to herbivory induced
volatiles, the oviposition by the herbivores also activates the release of oviposition induced volatiles (Hilker
et al., 2002; Fatouros et al., 2005b; Salerno et al., 2013). The female wound the trees prior to the egg
deposition and the elicitors which is procured from the secretion attaching eggs to plants, forge contact with
the inner plant tissues through this wound inflicted (Hilker et al., 2005). The female has the aptitude to
acknowledge the finest plant or host quality for the fine growth of larvae. The mechanism of specific site
preference for oviposition by the female is also a master plan to procure defense against predation on
premature stages of development. The oviposition is a critical step, peculiarly in Lepidoptera, owing to the
relative immobility of the hatching larvae and thus depending on the judicious choice of food plant by the
adult female (Fenny et al., 1983; Renwick, 1989). Various events leading to oviposition follows a sequence
of searching, orientation, encounter, landing, surface evaluation, and acceptance (Renwick and Chew,
1994). All these stages of the sequence depend on the sensory cues of the insect; however, definitive
experiments of the sequential mechanism are difficult to perform (Morris and Kareiva, 1991). After the
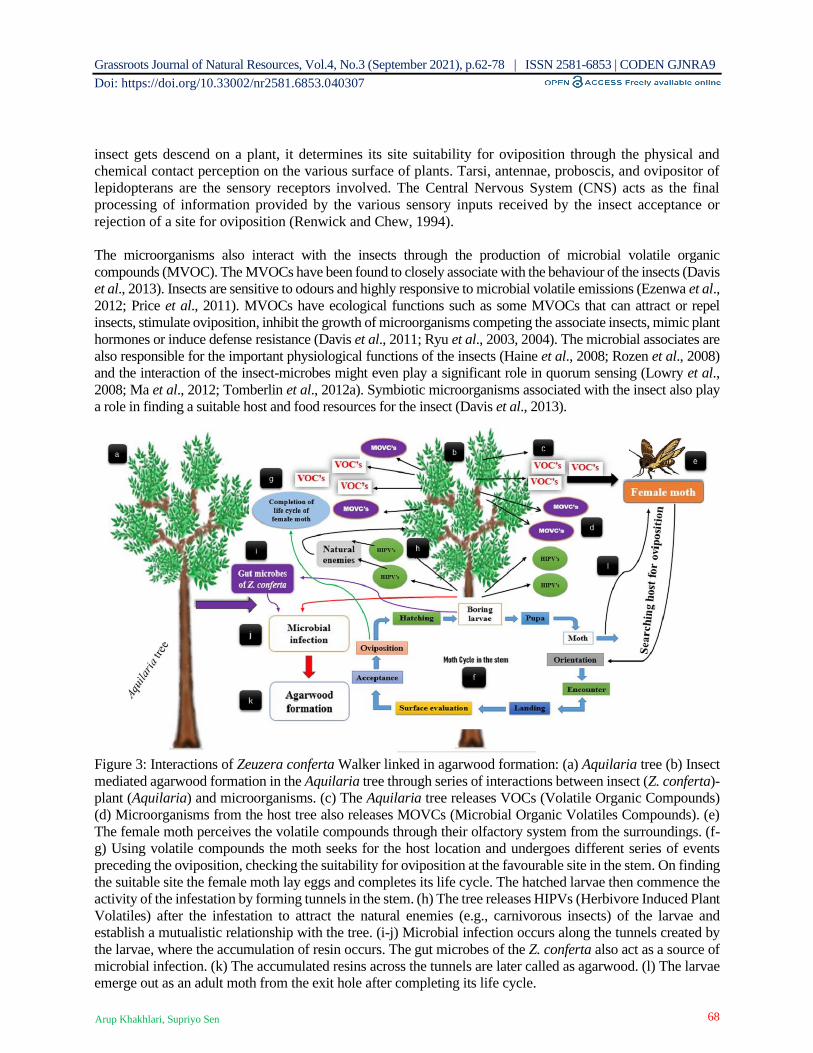
Grassroots Journal of Natural Resources, Vol.4, No.3 (September 2021), p.62-78 | ISSN 2581-6853 | CODEN GJNRA9
Doi: https://doi.org/10.33002/nr2581.6853.040307
68 Arup Khakhlari, Supriyo Sen
insect gets descend on a plant, it determines its site suitability for oviposition through the physical and
chemical contact perception on the various surface of plants. Tarsi, antennae, proboscis, and ovipositor of
lepidopterans are the sensory receptors involved. The Central Nervous System (CNS) acts as the final
processing of information provided by the various sensory inputs received by the insect acceptance or
rejection of a site for oviposition (Renwick and Chew, 1994).
The microorganisms also interact with the insects through the production of microbial volatile organic
compounds (MVOC). The MVOCs have been found to closely associate with the behaviour of the insects (Davis
et al., 2013). Insects are sensitive to odours and highly responsive to microbial volatile emissions (Ezenwa et al.,
2012; Price et al., 2011). MVOCs have ecological functions such as some MVOCs that can attract or repel
insects, stimulate oviposition, inhibit the growth of microorganisms competing the associate insects, mimic plant
hormones or induce defense resistance (Davis et al., 2011; Ryu et al., 2003, 2004). The microbial associates are
also responsible for the important physiological functions of the insects (Haine et al., 2008; Rozen et al., 2008)
and the interaction of the insect-microbes might even play a significant role in quorum sensing (Lowry et al.,
2008; Ma et al., 2012; Tomberlin et al., 2012a). Symbiotic microorganisms associated with the insect also play
a role in finding a suitable host and food resources for the insect (Davis et al., 2013).
Figure 3: Interactions of Zeuzera conferta Walker linked in agarwood formation: (a) Aquilaria tree (b) Insect
mediated agarwood formation in the Aquilaria tree through series of interactions between insect (Z. conferta)-
plant (Aquilaria) and microorganisms. (c) The Aquilaria tree releases VOCs (Volatile Organic Compounds)
(d) Microorganisms from the host tree also releases MOVCs (Microbial Organic Volatiles Compounds). (e)
The female moth perceives the volatile compounds through their olfactory system from the surroundings. (f-
g) Using volatile compounds the moth seeks for the host location and undergoes different series of events
preceding the oviposition, checking the suitability for oviposition at the favourable site in the stem. On finding
the suitable site the female moth lay eggs and completes its life cycle. The hatched larvae then commence the
activity of the infestation by forming tunnels in the stem. (h) The tree releases HIPVs (Herbivore Induced Plant
Volatiles) after the infestation to attract the natural enemies (e.g., carnivorous insects) of the larvae and
establish a mutualistic relationship with the tree. (i-j) Microbial infection occurs along the tunnels created by
the larvae, where the accumulation of resin occurs. The gut microbes of the Z. conferta also act as a source of
microbial infection. (k) The accumulated resins across the tunnels are later called as agarwood. (l) The larvae
emerge out as an adult moth from the exit hole after completing its life cycle.

Grassroots Journal of Natural Resources, Vol.4, No.3 (September 2021), p.62-78 | ISSN 2581-6853 | CODEN GJNRA9
Doi: https://doi.org/10.33002/nr2581.6853.040307
69 Arup Khakhlari, Supriyo Sen
Till date there is no scientific evidence and no experimental studies have been executed to explain about the
mechanism of interaction between the Aquilaria tree and Z. conferta. Moreover, meagre studies have been
accomplished on the biology of Z. conferta. Based on the analogous strategy of insect-plant interaction,
therefore, the insect Z. conferta, and Aquilaria tree might also trail a similar pattern of interaction (Figure
3a- l). The Aquilaria tree (Labelled a) might produce aroma related volatiles such as Volatile Organic
Compounds (VOCs) to attract the herbivore, Z. conferta (c) as the plant volatiles are the significant
molecules in the insect-host recognition (Qiao et al., 2012). The adult moth, Z. conferta then possibly detect
the signals of the various volatiles released by the Aquilaria trees through their olfactory system and receives
through the chemoreceptors (e). As VOCs possess the potential to trigger the behaviour of the insects, it
might stir up the adult Z. conferta to look for the host plant for the oviposition. On finding the host plant,
the adult female moth then undertakes various sequence of events preceding the oviposition in order to
confirm the suitability of the oviposition at a favourable site in the host plant (f). On obtaining the suitable
site the female moth lay eggs and completes its life cycle (g). The larvae which emerged from the eggs then
initiates the phase of infestation in the Aquilaria trees by chewing the wood. Throughout the period of
infestation, the larvae might inject various elicitors into the woody stem of the host plant. The host plant
then activates its diverse defense mechanism to combat the herbivory by synthesizing disparate secondary
metabolites and also releasing various HIPVs. The HIPVs are released by the Aquilaria trees to attract the
natural enemies of the Z. conferta and accordingly maintain a mutualistic relationship with the trees (h).
Hitherto, however there has been no literature available with reference to the natural enemies of the Z.
conferta. The injection of the elicitors represses the defense mechanism of the Aquilaria trees and the larvae
of Z. conferta might survive the phytochemicals released by the Aquilaria trees. The microorganisms present
in the tree might also emit the Microbial Volatile Organic Compounds (MOVCs) triggering the behaviour
of the insect Z. conferta (d). Fungi of the genera Fusarium and Lasiodiplodia have been reported to produce
two compounds, δ-lactones and mullein that releases an odour having the potential to act as an insect
attractant (Nago and Matsumoto, 1994). The interesting finding is that both these fungi are associated with
the Aquilaria trees (Mohamad et al. 2010; Chippa and Kaushik, 2017). Therefore, such microorganisms
might also be releasing the volatile compounds and alluring the insect Z. conferta towards the Aquilaria
trees. In a chemometric evaluation of interaction study carried out by Sen et al. (2017), between the
agarwood and fungus Fusarium, revealed the appearance of ecologically important semio-chemicals (e.g.,
Pheromones). Semio-chemicals are the organic compounds that have the potential to stimulate the activity
of organisms used by insects and other animals for the purpose of biological communications. The role of
semio-chemicals, however, in the fungal colonization in Aquilaria trees through the insect Z. conferta
intervention needs further investigation. Consequently, after the infestation of the larvae in the Aquilaria
tree, spiral, oval, or ring-shaped injury or wound (Figure 4a) is developed serving as the gateway for
initiation of microbial infection (Kalita et al., 2015) and the tree response to it by the formation of resinous
wood called agarwood along the zone of infestation as a mechanism of defense reaction (Figure 4c) (j-k).
The size of the tunnel increases as the larvae grow and also the metamorphosis from larva to pupa takes
place inside the tree. The pupa partially moves out from the exit hole before finally attaining its maturity as
a moth (Ong et al., 2010). The larvae then complete its life cycle and emerges out as adult moths through
the exit hole leaving the exuvia intact (l). However, the release of the HIPVs by the Aquilaria trees to attract
the natural enemies of the Z. conferta and to prey on it might debarred it from completing its life cycle.
Research carried out on the antennal and behaviour response of the Heortia vitessoides, one of the major
leaf defoliator pest of the Aquilaria tree also showed that the female moth was attracted to the volatiles of
the green leaves possessing the compounds such as nonanal, decanal, hexanal, and (Z)-3-hexenylacetate
rather than the dry leaves, forming the vital constituent for the minimal attraction of the insect (Qiao et al.,
2012; Syazwan et al., 2019). Finally, as the Aquilaria tree matures, it closes its exterior entry and exit hole
leaving a distinct lesion (Figure 4b).
The microorganisms present in the gut of the Z. conferta might also have an indispensable role in infecting
the Aquilaria trees as they are assigned with various significant roles in their host metabolism, physiology,
growth, reproduction (Breznak, 1982; Chen and Purcell, 1997; Lemke et al., 2003). The larvae might act as
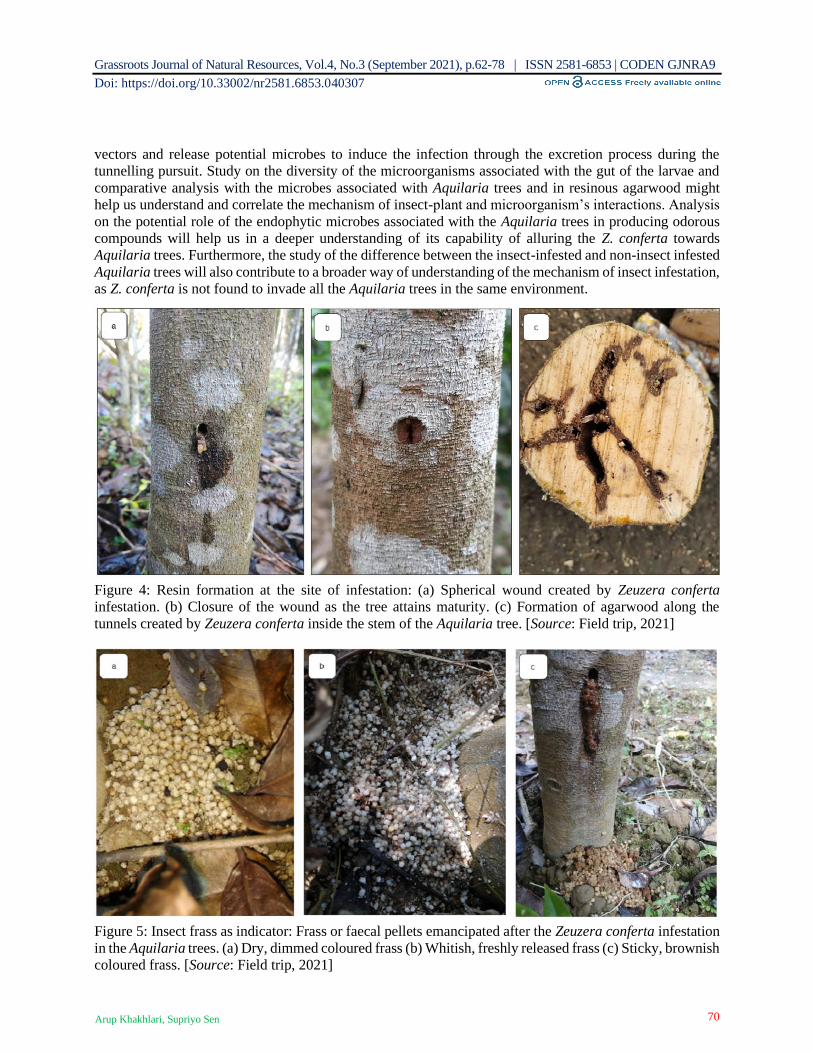
Grassroots Journal of Natural Resources, Vol.4, No.3 (September 2021), p.62-78 | ISSN 2581-6853 | CODEN GJNRA9
Doi: https://doi.org/10.33002/nr2581.6853.040307
70 Arup Khakhlari, Supriyo Sen
vectors and release potential microbes to induce the infection through the excretion process during the
tunnelling pursuit. Study on the diversity of the microorganisms associated with the gut of the larvae and
comparative analysis with the microbes associated with Aquilaria trees and in resinous agarwood might
help us understand and correlate the mechanism of insect-plant and microorganism’s interactions. Analysis
on the potential role of the endophytic microbes associated with the Aquilaria trees in producing odorous
compounds will help us in a deeper understanding of its capability of alluring the Z. conferta towards
Aquilaria trees. Furthermore, the study of the difference between the insect-infested and non-insect infested
Aquilaria trees will also contribute to a broader way of understanding of the mechanism of insect infestation,
as Z. conferta is not found to invade all the Aquilaria trees in the same environment.
Figure 4: Resin formation at the site of infestation: (a) Spherical wound created by Zeuzera conferta
infestation. (b) Closure of the wound as the tree attains maturity. (c) Formation of agarwood along the
tunnels created by Zeuzera conferta inside the stem of the Aquilaria tree. [Source: Field trip, 2021]
Figure 5: Insect frass as indicator: Frass or faecal pellets emancipated after the Zeuzera conferta infestation
in the Aquilaria trees. (a) Dry, dimmed coloured frass (b) Whitish, freshly released frass (c) Sticky, brownish
coloured frass. [Source: Field trip, 2021]

Grassroots Journal of Natural Resources, Vol.4, No.3 (September 2021), p.62-78 | ISSN 2581-6853 | CODEN GJNRA9
Doi: https://doi.org/10.33002/nr2581.6853.040307
71 Arup Khakhlari, Supriyo Sen
Present and Future Perspectives
Zeuzera conferta – a pest?
The association of the Z. conferta with the Aquilaria trees can be referred to as “necessary evil”. The
infestation by the borer in the young Aquilaria plants causes a major threat to its survival as the activity of
tunnelling by the borer damages the tissues of the plants. However, its desideratum cannot be ruled out, as
agarwood of good grades is obtained only when the trees are infested by it (Hoque et al., 2019). The damage
caused by the Z. conferta in Aquilaria trees is still considered as moderate level apart from the other 19
pests that are found to associate with the trees (Syazwan et al., 2019). The people familiar with the Aquilaria
habitats and plantations are very much cognizant of the necessity of its association with the Aquilaria trees.
Even people in the locality who are not directly associated with agarwood farming are also familiar with its
essentiality. Yet, the scientific knowledge of different mechanisms of formation of agarwood is unknown
to them.
Despite having a prominent role in assisting fine agarwood formation, it remains as a major drawback for
most of the Aquilaria cultivators owing to the damage it causes by infesting in the young Aquilaria plants
leading to the stunted growth and sometimes death of the plants. The term pest is reckoned for an insect or
a microbe in the agricultural practices if it interrupts the progression or the development of the plant
(Syazwan et al., 2019). The commencement of the infestation of the pest Z. conferta is observed in the plants
attaining 5 years, and maximum in the trees of age group 8-16 years and moderately above 16 years (Kalita
et al., 2015). The cultivators have, therefore, taken quite a few measures to protect the Aquilaria plants from
infestation by the Z. conferta. Some of the measures are (i) spraying of the insecticides on the surface of the
tree, (ii) spraying of the insecticides directly on the holes made by the borer on trees, (iii) killing of the
insect directly when found, and (iv) killing the female moth before oviposition. The measures taken are
performed seasonally based on the availability of the insects. The event of killing is intermittent as it is
performed only when the insects are found. However, the spraying of the insecticides is performed when
the rate of an infestation is found to be higher based on the observation. Few other management practices
that have hitherto been executed are trimming and removal of the infected branches, shutting off the hole
made by the insect with plasticine (liquid-based pesticides), and application of the granule-systemic based
pesticides (Syazwan et al., 2019). Pheromones, mass trapping, mating disruption, entomopathogenic fungi,
and nematodes are other control measures that have been successful in controlling the lepidopteran pest
(Ibrahim et al., 2019; Ong et al., 2010). The practise of spraying insecticides is carried out when the trees
are young and are heavily infested by Z. conferta. However, when the trees attain its maturity, the incidence
of the Z. conferta is not much of a concern and the practice of spraying insecticides lessens as the tree
becomes less vulnerable to breakage and damage. The insecticides used and their effectiveness in
controlling the incidence of Z. conferta is needed to be analysed in detail. However, the application of the
pesticides in controlling the incidence of the pest has become increasingly knotty due to concern about
human health hazards, environment and pest resistance (Atreya et al., 2012). Furthermore, the obscure
habitat of the larvae inside the trees and prolonged ovipositional period makes the chemical treatment less
successful (Shamseldean et al., 2009).
Frass
The frass of the Aquilaria trees acts as an indicator of the incidence of the Z. conferta (Figure 5). Frasses
are the excrement or the excreted pellets which are released by the larvae after feeding on their food source.
In wood borers the frass from the tunnelling activity is expelled out from the entry and exit hole on the
ground (Ong et al., 2010). The expelled frass helps the seeker, seeking the activity of Z. conferta in the
Aquilaria trees for confirmation about the infestation just by scrutinizing the presence or absence of the
frass on the ground surrounding the Aquilaria trees. The frass varies in shape and colour with some spherical
or oval in shape and white in colour and some wet sticky powdered with brownish appearance. In assessing

Grassroots Journal of Natural Resources, Vol.4, No.3 (September 2021), p.62-78 | ISSN 2581-6853 | CODEN GJNRA9
Doi: https://doi.org/10.33002/nr2581.6853.040307
72 Arup Khakhlari, Supriyo Sen
between the old and the new infestations by the Z. conferta, frass plays a prominent role through its
morphological appearance. Dry frass and dimmed coloured (Figure 5a) indicate old infestation, whereas
wet and bright coloured indicates the new ones (Figure 5b). According to the cultivators, the trees which
expels brownish coloured frass after the insect infestation produces a better grade of agarwood (Figure 5c).
Ants and spiders are later reported to occupy the abandoned stem to take refuge (Ong et al., 2010).
According to Reynold and Hunter (2004), frass also provides important source of nutrients in the soil system
increasing the diversity of the soil invertebrates. The deposition of the frass in the forest floor increased the
nitrogen content excessively. Collembola, fungal-feeding nematodes, bacterial-feeding nematodes, and
prostigmatid mites are some of the soil invertebrates that have significantly increased in the Southern
Appalachians due to the depositions of the frass in the forest floor (Reynolds et al., 2003). Careful
investigations on frass can lead to future diagnostic mechanisms on staging insect infestations leading to
agarwood resin formation. Biochemical, microbiological and image analysis of frass appear to be suitable
initial analytical candidates in this regard.
Artificial Rearing
The incidence of Z. conferta is not observed in all the Aquilaria trees that are cultivated. The incidence or the
prevalence of the pest attack in the Aquilaria trees is mostly observed in monocultures (Ong et al., 2014). The
practise of growing as monocultures by the farmers into small or a large-scale came into existence due to the
overexploitation outside of their natural habitat (Irianto et al., 2011). However, there are some regions where
the incidence of the insect is not observed despite being grown as monocultures or mix cultures. Owing to
those innumerable artificial techniques are applied for production of agarwood, as naturally the formation of
agarwood very much relies on the insect and microorganism’s interactions (Syazwan et al., 2019). Despite its
success in production of agarwood through artificial means, quality has always been a matter of concern for
the cultivators as the superior grades are only harvested from the insect infected ones (Kalita et al., 2015;
Hoque et al., 2019). The technique of artificially rearing the insect might be a key alternative to overcome this
hurdle. The artificially reared Z. conferta larvae can be introduced in the Aquilaria trees where the incidence
is not generally observed. Consequently, the larvae might select suitable site in the tree introduced and initiate
its tunnelling activity and execute its role in insect-plant and microorganism’s interaction leading to the
agarwood formation. The latest study carried out by Borthakur et al. (2021) on the life cycle of the Z. conferta
bestows hope of artificially rearing the insect and making it available in close proximity. This technique can
be an alternative source of livelihood and also helps in catalysing the production of quality agarwood,
generating more advantage to the cultivators. Moore and Navon (1966) were the first researchers to develop
artificial medium for the wood borers, specifically for the leopard moth, Zeuzera pyrina L. The artificial media
of their preparation comprised of a basal medium of three variants, composed of full fat soya meal (30.0 g),
sucrose (48.0 g), Brewer’s yeast (24.0 g), agar-agar flakes (24.0 g), nipagin (1.5 g), acetic acid 20% v/v (30.0
ml); sodium ascorbate 10% w/v (30.0 ml), pear bark homogenate (10 g/ 70 ml H2O), and distilled water. The
media was successful in raising the successive generation of the leopard moth considerably within a short
duration of 3-4 months than in nature where it takes a year. However, the artificially bred larvae were found
glabrous, and they differed in colour as compared to those developed in woods. Moreover, apart from the
laboratory conditions the rearing can also be tried in its natural state by providing the cambium portion of the
Aquilaria stem as the larvae depends on it as food source (Borthakur et al., 2021). Therefore, the introduction
of the larval stage of the Z. conferta at the right age of the Aquilaria plant might be a solution to the problem
of lack of insect incidence and also might be less susceptible to breakage and death as matured trees are less
vulnerable to pest (Ong et al., 2014).
Conclusion
Agarwood resin formation which is a unique phenomenon is still not clearly understood by science. The
study of the insect should secure equal eminence with other areas of research associated with Aquilaria
trees. The superior quality of agarwood garnered after the insect infestation makes the need to study the
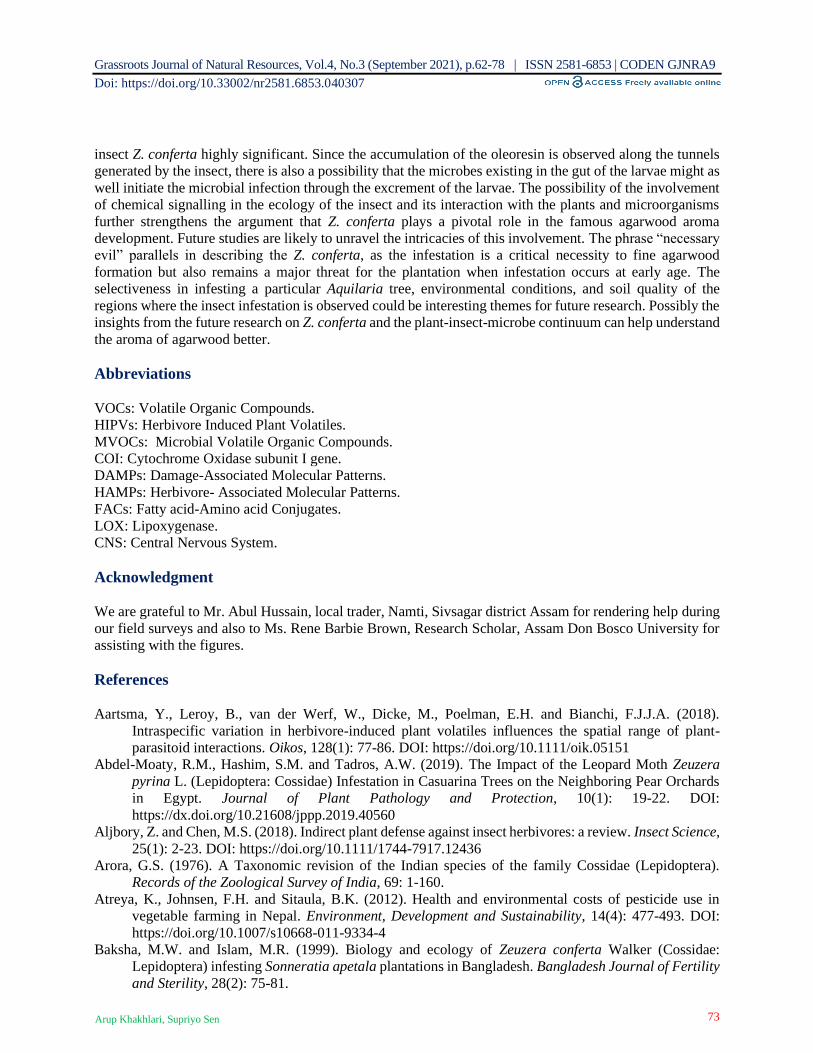
Grassroots Journal of Natural Resources, Vol.4, No.3 (September 2021), p.62-78 | ISSN 2581-6853 | CODEN GJNRA9
Doi: https://doi.org/10.33002/nr2581.6853.040307
73 Arup Khakhlari, Supriyo Sen
insect Z. conferta highly significant. Since the accumulation of the oleoresin is observed along the tunnels
generated by the insect, there is also a possibility that the microbes existing in the gut of the larvae might as
well initiate the microbial infection through the excrement of the larvae. The possibility of the involvement
of chemical signalling in the ecology of the insect and its interaction with the plants and microorganisms
further strengthens the argument that Z. conferta plays a pivotal role in the famous agarwood aroma
development. Future studies are likely to unravel the intricacies of this involvement. The phrase “necessary
evil” parallels in describing the Z. conferta, as the infestation is a critical necessity to fine agarwood
formation but also remains a major threat for the plantation when infestation occurs at early age. The
selectiveness in infesting a particular Aquilaria tree, environmental conditions, and soil quality of the
regions where the insect infestation is observed could be interesting themes for future research. Possibly the
insights from the future research on Z. conferta and the plant-insect-microbe continuum can help understand
the aroma of agarwood better.
Abbreviations
VOCs: Volatile Organic Compounds.
HIPVs: Herbivore Induced Plant Volatiles.
MVOCs: Microbial Volatile Organic Compounds.
COI: Cytochrome Oxidase subunit I gene.
DAMPs: Damage-Associated Molecular Patterns.
HAMPs: Herbivore- Associated Molecular Patterns.
FACs: Fatty acid-Amino acid Conjugates.
LOX: Lipoxygenase.
CNS: Central Nervous System.
Acknowledgment
We are grateful to Mr. Abul Hussain, local trader, Namti, Sivsagar district Assam for rendering help during
our field surveys and also to Ms. Rene Barbie Brown, Research Scholar, Assam Don Bosco University for
assisting with the figures.
References
Aartsma, Y., Leroy, B., van der Werf, W., Dicke, M., Poelman, E.H. and Bianchi, F.J.J.A. (2018).
Intraspecific variation in herbivore-induced plant volatiles influences the spatial range of plant-
parasitoid interactions. Oikos, 128(1): 77-86. DOI: https://doi.org/10.1111/oik.05151
Abdel-Moaty, R.M., Hashim, S.M. and Tadros, A.W. (2019). The Impact of the Leopard Moth Zeuzera
pyrina L. (Lepidoptera: Cossidae) Infestation in Casuarina Trees on the Neighboring Pear Orchards
in Egypt. Journal of Plant Pathology and Protection, 10(1): 19-22. DOI:
https://dx.doi.org/10.21608/jppp.2019.40560
Aljbory, Z. and Chen, M.S. (2018). Indirect plant defense against insect herbivores: a review. Insect Science,
25(1): 2-23. DOI: https://doi.org/10.1111/1744-7917.12436
Arora, G.S. (1976). A Taxonomic revision of the Indian species of the family Cossidae (Lepidoptera).
Records of the Zoological Survey of India, 69: 1-160.
Atreya, K., Johnsen, F.H. and Sitaula, B.K. (2012). Health and environmental costs of pesticide use in
vegetable farming in Nepal. Environment, Development and Sustainability, 14(4): 477-493. DOI:
https://doi.org/10.1007/s10668-011-9334-4
Baksha, M.W. and Islam, M.R. (1999). Biology and ecology of Zeuzera conferta Walker (Cossidae:
Lepidoptera) infesting Sonneratia apetala plantations in Bangladesh. Bangladesh Journal of Fertility
and Sterility, 28(2): 75-81.

Grassroots Journal of Natural Resources, Vol.4, No.3 (September 2021), p.62-78 | ISSN 2581-6853 | CODEN GJNRA9
Doi: https://doi.org/10.33002/nr2581.6853.040307
74 Arup Khakhlari, Supriyo Sen
Bennett, R.N. and Wallsgrove, R.M. (1994). Tansley Review No. 72 Secondary metabolites in plant defence
mechanisms. New Phytologist, 127(4): 617-633. DOI: https://doi.org/10.1111/j.1469-
8137.1994.tb02968.x
Borthakur, N.D., Borah, R.K., Dutta, B.K. and Jayaraj, R.S.C. (2021). Neurozerra conferta Walker.
(Beehole Borer) on Aquilaria malaccensis Lamk. in Assam. Indian Forester, 147(3): 276-280.
Breznak, J.A. (1982). Intestinal Microbiota of Termites and other Xylophagous Insects. Annual Review of
Microbiology, 36(1): 323-323. DOI: https://doi.org/10.1146/annurev.mi.36.100182.001543
Chen, D.Q. and Purcell, A. (1997). Occurrence and Transmission of Facultative Endosymbionts in
Aphids. Current Microbiology, 34: 220 -225. DOI: https://doi.org/10.1007/s002849900172.
Chhipa, H. and Kaushik, N. (2017). Fungal and Bacterial Diversity Isolated from Aquilaria malaccensis
Tree and Soil, Induces Agarospirol Formation within 3 Months after Artificial Infection. Frontiers in
Microbiology, 8: 1286. DOI: https://doi.org/10.3389/fmicb.2017.01286
Davis, T.S., Crippen, T.L., Hofstetter, R.W. and Tomberlin, J.K. (2013). Microbial Volatile Emissions as
Insect Semiochemicals. Journal of Chemical Ecology, 39(7): 840-859. DOI:
https://doi.org/10.1007/s10886-013-0306-z
Davis, T.S., Hofstetter, R.W., Foster, J.T., Foote, N.E. and Keim, P. (2011). Interactions between the yeast
Ogataea pini and filamentous fungi associated with the western pine beetle. Microbial Ecology, 61(3):
626-634. DOI: https://doi.org/10.1007/s00248-010-9773-8
Dicke, M. and Baldwin, I.T. (2010). The evolutionary context for herbivore-induced plant volatiles: beyond
the “cry for help.” Trends in Plant Science, 15(3): 167-175.
DOI: https://doi.org/10.1016/j.tplants.2009.12.002
Dudareva, N., Negre, F., Nagegowda, D.A. and Orlova, I. (2006). Plant volatiles: recent advances and future
perspectives. Critical Reviews Plant Sciences, 25(5): 417-440. DOI:
https://doi.org/10.1080/07352680600899973
Ezenwa, V.O., Gerardo, N.M., Inouye, D.W., Medina, M. and Xavier, J.B. (2012). Animal behavior and the
microbiome. Science, 338(6104): 198-199. DOI: https://doi.org/10.1126/science.1227412
Fatouros, N.E., Bukovinszkine’Kiss, G., Kalkers, L.A., Gamborena, R.S., Dicke, M. and Hilker, M.
(2005b). Oviposition–induced plant cues: do they arrest Trichogramma wasps during host location?
Entomologia Experimentalis et Applicata, 115(1): 207-215. DOI: https://doi.org/10.1111/j.1570-
7458.2005.00245.x
Fatouros, N.E., Dicke, M., Mumm, R., Meiners, T. and Hilker, M. (2008). Foraging behavior of egg
parasitoids exploiting chemical information. Behavioral Ecology, 19(3): 677-689. DOI:
https://doi.org/10.1093/beheco/arn011
Feeny, P., Rosenberry, L. and Carter, M. (1983). Chemical aspects of oviposition behavior in butterflies,
pp. 27-76. In: S. Ahmad (ed.). Herbivorous Insects: Host-Seeking Behavior and Mechanisms.
Academic Press, New York.
Field, L.M., Pickett, J.A. and Wadhams, L.J. (2008). Molecular studies in insect olfaction. Insect Molecular
Biology, 9(6): 545-551. DOI: https://doi.org/10.1046/j.1365-2583.2000.00221.x
Forbes, A.A., Bagley, R.K., Beer, M.A., Hippee, A.C. and Widmayer, H.A. (2018). Quantifying the
unquantifiable: why Hymenoptera – not Coleoptera – is the most speciose animal order. BMC
Ecology, 18: 21. DOI: https://doi.org/10.1101/274431
Giron, D., Dubreuil, G., Bennett, A., Dedeine, F., Dicke, M., Dyer, L.A., Erb, M., Harris, M.O., Huguet, E.,
Kaloshian, I., Kawakita, A., Vaamonde, C.L., Palmer, T.M., Petanidou, T., Poulsen, M., Salle, A.,
Simon, J.C., Terblanche, J.S., Thiery, D., Whiteman, N.K., Woods, H.A. and Pincebourde, S. (2018).
Promises and challenges in insect–plant interactions. Entomologia Experimentalis et Applicata,
166(5): 319-343. DOI: https://doi.org/10.1111/eea.12679
Haine, E.R., Moret, Y., Siva-Jothy, M.T. and Rolff, J. (2008). Antimicrobial defense and persistent infection
in insects. Science, 322(5905): 1257-1259. DOI: https://doi.org/10.1126/science.1165265
Hilker, M. and Meiners, T. (2010). How do plants “notice” attack by herbivorous arthropods? Biological
Reviews, 85(2): 267-80. DOI: https://doi.org/10.1111/j.1469-185x.2009.00100.x
Grassroots Journal of Natural Resources, Vol.4, No.3 (September 2021), p.62-78 | ISSN 2581-6853 | CODEN GJNRA9
Doi: https://doi.org/10.33002/nr2581.6853.040307
75 Arup Khakhlari, Supriyo Sen
Hilker, M., Kobs, C., Varama, M. and Schrank, K. (2002). Insect egg deposition induces Pinus to attract
egg parasitoids. Journal of Experimental Biology, 205(4): 455-461.
Hilker, M., Stein, C., Schroeder, R., Varama, M. and Mumm, R. (2005). Insect egg deposition induces
defense responses in Pinus sylvestris: characterization of the elicitor. Journal of Experimental
Biology, 208(10): 1849-1854. DOI: https://doi.org/10.1242/jeb.01578
Hogenhout, S.A. and Bos, J.I. (2011). Effector proteins that modulate plant-insect interactions. Current
Opinion in Plant Biology, 14(4): 422-428. DOI: https://doi.org/10.1016/j.pbi.2011.05.003
Holloway, J.D. (1986). The moths of Borneo part 1, key to families, Families Cossidae, Metarbelidae,
Ratardidae, Dugeonidae, Epipyropidae and Limcodidae. Malayan Nature Journal, 40: 1-166.
Hoque, M.N., Khan, M.M.H. and Mondal, M.F. (2019). Insect infested agarwood: A newly prized product
of agarwood market in Bangladesh. Fundamental and Applied Agriculture, 4(1): 689-692. DOI:
https://dx.doi.org/10.5455/faa.1693
Howe, G.A. and Jander, G. (2008). Plant immunity to insect herbivores. Annual Review of Plant Biology,
59(1): 41-66. DOI: https://doi.org/10.1146/annurev.arplant.59.032607.092825
Ibrahim, R., Alhamadi, S., Binnaser, Y.S. and Shawer, D. (2019). Seasonal prevalence and histopathology
of Beauveria bassiana infecting larvae of the leopard moth, Zeuzera pyrina L. (Lepidoptera:
Cossidae). Egyptian Journal of Biological Pest Control, 29(1): 65. DOI:
https://doi.org/10.1186/s41938-019-0161-5
Irianto, R.S.B., Santoso, E. and Sitepu, I.R. (2011). Pests that attack gaharu-yielding plants. In Proceedings
of Gaharu Workshop: Development of Gaharu Production Technology: A Forest Community-based
Empowerment. Forestry Research and Development Agency. Indonesia, pp. 89-93.
Islam, M.A. (2004). A monograph on Keora (Sonneratia apetala). Forestry and Wood technology
discipline. Project Thesis (Review Paper)
Kalita, J., Bhattacharyya, P.R., Deka Boruah, H.P., Unni, B.G., Lekhak, H. and Nath, S.C. (2015).
Association of Zeuzera conferta Walker on agarwood formation in Aquilaria malaccensis Lamk.
Asian Journal of Plant Science and Research, 5(1): 4-9.
Kaloshian, I. and Walling, L.L. (2016). Plant Immunity: Connecting the Dots Between Microbial and
Hemipteran Immune Responses. In: Czosnek H., Ghanim M. (eds) Management of Insect Pests
to Agriculture: Lessons Learned from Deciphering Their Genome, Transcriptome and Proteome.
Cham, Switzerland: Springer International Publishing, pp. 217-243. DOI:
http://doi.org/10.1007/978-3-319-24049-7_9
Kessler, A. and Heil, M. (2011). The multiple faces of indirect defences and their agents of natural selection.
Functional Ecology, 25(2): 348-357. DOI: https://doi.org/10.1111/j.1365-2435.2010.01818.x
Leal, W.S. (2013). Odorant reception in insects: roles of receptors, binding proteins, and degrading
enzymes. Annual Review of Entomology, 58: 373-391. DOI: https://doi.org/10.1146/annurev-ento-
120811-153635
Lemke, T., Stingl, U., Egert, M., Friedrich, M.W. and Brune, A. (2003). Physicochemical Conditions and
Microbial Activities in the Highly Alkaline Gut of the Humus-Feeding Larva of Pachnoda ephippiata
(Coleoptera: Scarabaeidae). Applied and Environmental Microbiology, 69(11): 6650-6658. DOI:
https://doi.org/10.1128/AEM.69.11.6650-6658.2003
Loon, J.J.A. (1996). Chemosensory basis of feeding and oviposition behaviour in herbivorous insects: a
glance at the periphery. Entomologia Experimentalis et Aplicata, 80(1): 7-13.
Lowery, C.A., Dickerson, T.J. and Janda, K.D. (2008). Interspecies and interkingdom communication
mediated by bacterial quorum sensing. Chemical Society Reviews, 37(7): 1337-1346. DOI:
https://doi.org/10.1039/b702781h
Ma, Q., Fonseca, A., Liu, W., Fields, A.T., Pimsler, M.L., Spindola, A.F., Tarone, A.M., Crippen, T.L.,
Tomberlin, J.K. and Wood, T.K. (2012). Proteus mirabilis interkingdom swarming signals attract
blow flies. The ISME Journal, 6: 1356-1366. DOI: https://dx.doi.org/10.1038%2Fismej.2011.210
Mithofer, A. and Boland, W. (2012). Plant defense against herbivores: chemical aspects. Annual Review of
Plant Biology, 63(1): 431-50. DOI: https://doi.org/10.1146/annurev-arplant-042110-103854
Grassroots Journal of Natural Resources, Vol.4, No.3 (September 2021), p.62-78 | ISSN 2581-6853 | CODEN GJNRA9
Doi: https://doi.org/10.33002/nr2581.6853.040307
76 Arup Khakhlari, Supriyo Sen
Mohamed, R., Jong, P.L. and Zali, M.S. (2010). Fungal diversity in wounded stems of Aquilaria
malaccensis. Fungal Diversity, 43(1): 67-74. DOI: http://dx.doi.org/10.1007/s13225-010-0039-z
Moore, I. and Navon, A. (1966). The rearing and some bionomics of the leopard moth, Zeuzera pyrina L.,
on an artificial medium. Entomophaga, 11(3): 285-296. DOI: https://doi.org/10.1007/BF02372963
Morris, W.F. and Kareiva, P.M. (1991). How insect herbivores find suitable host plants: the interplay
between random and non-random movement. In: Bernays EA (ed) Insect-plant interactions. CRC
Press, Baton Rouge, pp. 175-208.
Nago, H. and Matsumoto, M. (1994). An Ecological Role of Volatiles Produced by Lasiodiplodia
theobromae. Bioscience, Biotechnology and Biochemistry, 58(7): 1267-1272. DOI:
https://doi.org/10.1271/bbb.58.1267
Nath, S.C. and Saikia, N. (2002). Indigenous knowledge on utility and Utilitarian aspects of Aquilaria
malaccensis Lamk. in Northeast India. Indian Journal of Traditional Knowledge, 1 (1): 47-58.
Ong, S.P., Cheng, S., Chong, V.C. and Tan, Y.S. (2010). Pests of Planted Mangroves in Peninsular
Malaysia. Forest Research Institute Malaysia, Petaling Jaya, Cleartone Sdn Bhd, Selangor, pp 3-16.
Ong, S.P., Mohd Farid, A. and Lee, S.S. (2014). Pest and disease survey of Aquilaria sp. (karas) plantations
in Peninsular Malaysia. Proceedings of the Conference on Forestry and Forestry Products Research
2013. Kuala Lumpur, Kepong: Forest Research Institute Malaysia.
Paré, P.W. and Tumlinson, J.H. (1999). Plant volatiles as a defense against insect herbivores. Plant
Physiology, 121(2): 325-332. DOI: https://doi.org/10.1104/pp.121.2.325
Penaflor, M.F.G.V. and Bento, J.M.S. (2013). Herbivore-Induced Plant Volatiles to Enhance Biological
Control in Agriculture. Neotropical Entomology, 42(4): 331-343. DOI:
https://doi.org/10.1007/s13744-013-0147-z
Pichersky, E. and Gershenzon, J. (2002). The formation and function of plant volatiles: perfumes for
pollinator attraction and defense. Current Opinion in Plant Biology, 5(3): 237-243.
DOI: https://doi.org/10.1016/s1369-5266(02)00251-0
Price, P.W., Denno, R.F., Eubanks, M.D., Finke, D.L. and Kaplan, I. (2011). Insect ecology: behavior,
populations, and communities. Cambridge University Press, New York, 144(3): 336-337. DOI:
https://doi.org/10.1111/j.1570-7458.2012.01294.x
Qiao, H.L., Lu, P.F., Chen, J., Ma, W.S., Qin, R.M. and Li, X.M. (2012). Antennal and behavioural
responses of Heortia vitessoides females to host plant volatiles of Aquilaria sinensis. Entomology
Experimentalis et Aplicata, 143(3): 269-279. DOI: https://doi.org/10.1111/j.1570-
7458.2012.01264.x
Renwick, J.A.A. (1989). Chemical ecology of oviposition in phytophagous insects. Experientia, 45(3): 223-
28. DOI: https://doi.org/10.1007/BF01951807
Renwick, J.A.A. and Chew, F.S. (1994). Oviposition behaviour in Lepidoptera. Annual Review on
Entomology, 39(1): 377-400. DOI: https://doi.org/10.1146/annurev.en.39.010194.002113
Reynolds, B.C. and Hunter, M.D. (2004). Nutrient Cycling. In MD Lowman, In HB Rinker (eds), Forest
Canopies. Elsevier Press, Oxford, pp. 387-396. DOI: https://doi.org/10.1016/B978-012457553-
0/50025-3
Reynolds, B.C., Crossley, D.A. and Hunter, M.D. (2003). Responses of soil invertebrates to forest canopy
inputs along a productivity gradient. Pedobiologia, 47: 127-139.
Roepke, W. (1955). Notes and description of Cossidae from New Guinea (Lepidoptera: Heterocera).
Transaction of the Royal Entomological Society of London, 107(1-14): 281-288. DOI:
https://doi.org/10.1111/j.1365-2311.1955.tb00479.x
Roepke, W. (1957). The Cossidae of the Malayan Region (Lepidoptera: Heterocera). Verhandel Koninklijk-
Nederlandsch Instituut van Wetenschappen Amsterdam (Afdeeling Natuurkunde) (Tweede Reeks),
52(1): 1-60.
Rozen, D.E., Engelmoer, D.J.P. and Smiseth, P.T. (2008). Antimicrobial strategies in burying beetles
breeding on carrion. Proceedings of the National Academy of Sciences of the United States of
America, 105(46): 17890-17895. DOI: https://doi.org/10.1073/pnas.0805403105

Grassroots Journal of Natural Resources, Vol.4, No.3 (September 2021), p.62-78 | ISSN 2581-6853 | CODEN GJNRA9
Doi: https://doi.org/10.33002/nr2581.6853.040307
77 Arup Khakhlari, Supriyo Sen
Ryu, C-M., Farag, M.A., Hu, C-H., Reddy, M.S., Kloepper, J.W. and Pare, P.W. (2004). Bacterial volatiles
induce systematic resistance in Arabidopsis. Plant Physiology, 134(3): 881-882. DOI:
https://dx.doi.org/10.1104%2Fpp.103.026583
Ryu, C-M., Faragt, M.A., Hu, C-H., Reddy, M.S., Wei, H-X., Paré, P.W. and Kloepper, J.W. (2003).
Bacterial volatiles promote growth in Arabidopsis. Proceedings of the National Academy of Sciences
of the United States of America, 100(8): 4927-4932. DOI: https://doi.org/10.1073/pnas.0730845100
Salerno, G., De Santis, F., Iacovone, A., Bin, F. and Conti, E. (2013). Short-range cues mediate parasitoid
searching behavior on maize: the role of oviposition-induced plant synomones. Biological Control,
64(3): 247-254. DOI: https://doi.org/10.1016/j.biocontrol.2012.12.004
Schiestl, F.P. (2010). The evolution of floral scent and insect chemical communication. Ecology Letters,
13(5): 643-656. DOI: https://doi.org/10.1111/j.1461-0248.2010.01451.x
Schoorl, J.W. (Pim) Jr. (1990). Phylogenetic study on Cossidae (Lepidoptera: Ditrysia) based on external
adult morphology. Zoologische Verhandelingen, 263: 1-295.
Sen, S., Dehingia, M., Talukdar, N.C. and Khan, M. (2017). Chemometric analysis reveals links in the
formation of fragrant biomolecules during agarwood (Aquilaria malaccensis) and fungal interactions.
Scientific Reports, 14: 44406. DOI: https://doi.org/10.1038/srep44406
Senthilkumar, N. and Murugesan, S. (2015). Insect pests of important trees species in South India and their
management information. Institute of Forest Genetics and Tree Breeding (IFGTB), Indian Council of
Forestry Research & Education, Coimbatore, Tamil Nadu, pp 80-83.
Shamseldean, M.M., Hasanain, S.A. and Rezk, M.Z.A. (2009). Virulence of Entomopathogenic nematodes
against Lepidopterous pests of horticulture crops in Egypt. Proceedings of the 4th conference on
recent technologies in Agriculture “Challenges of Agriculture Modernization,” 1: 74-78.
Sutrisno, H. (2015). Molecular phylogeny of Indonesian Zeuzera (Lepidoptera: Cossidae) wood borer moths
based on CO I gene sequence. Journal of Species Research, 4(1): 49-56. DOI:
https://doi.org/10.12651/JSR.2015.4.1.049
Syazwan, S.A., Lee, S.Y., Ong, S.P. and Mohamed, R. (2019). Damaging Insect Pests and Diseases and
Their Threats to Agarwood Tree Plantations. Sains Malaysiana, 48(3): 497-507. DOI:
http://dx.doi.org/10.17576/jsm-2019-4803-02
Tomberlin, J.K., Byrd, J.H., Wallace, J.R. and Benbow, M.E. (2012). Assessment of decomposition studies
indicates need for standardized and repeatable methods in forensic entomology. Journal of Forensic
Research, 3(5): 147.
Vannucci, M. (2002). Indo-West Pacific Mangroves. In: de Lacerda L.D. (eds), Mangrove Ecosystems.
Environmental Science. Berlin, Heidelberg: Springer, pp. 123-215. DOI:
https://doi.org/10.1007/978-3-662-04713-2_3
Walker, F. (1856). List of the specimens of Lepidopterous insects in the collection of the British Museum.
British Museum, London, 7: 1509-1808
Yakovlev, R.V. (2011). Catalogue of the Family Cossidae of the Old World. Neue Entomologische
Nachrichten, 66: 1-129.
Zhang, X.L., Liu, Y.Y., Wei, J.H., Yang, Y., Zhang, Z., Huang, J.Q., Chen, H.Q. and Liu, Y.J. (2012).
Production of high-quality agarwood in Aquilaria sinensis trees via whole-tree agarwood-induction
technology. Chinese Chemical Letters, 23(6): 727-730. DOI:
https://doi.org/10.1016/j.cclet.2012.04.019
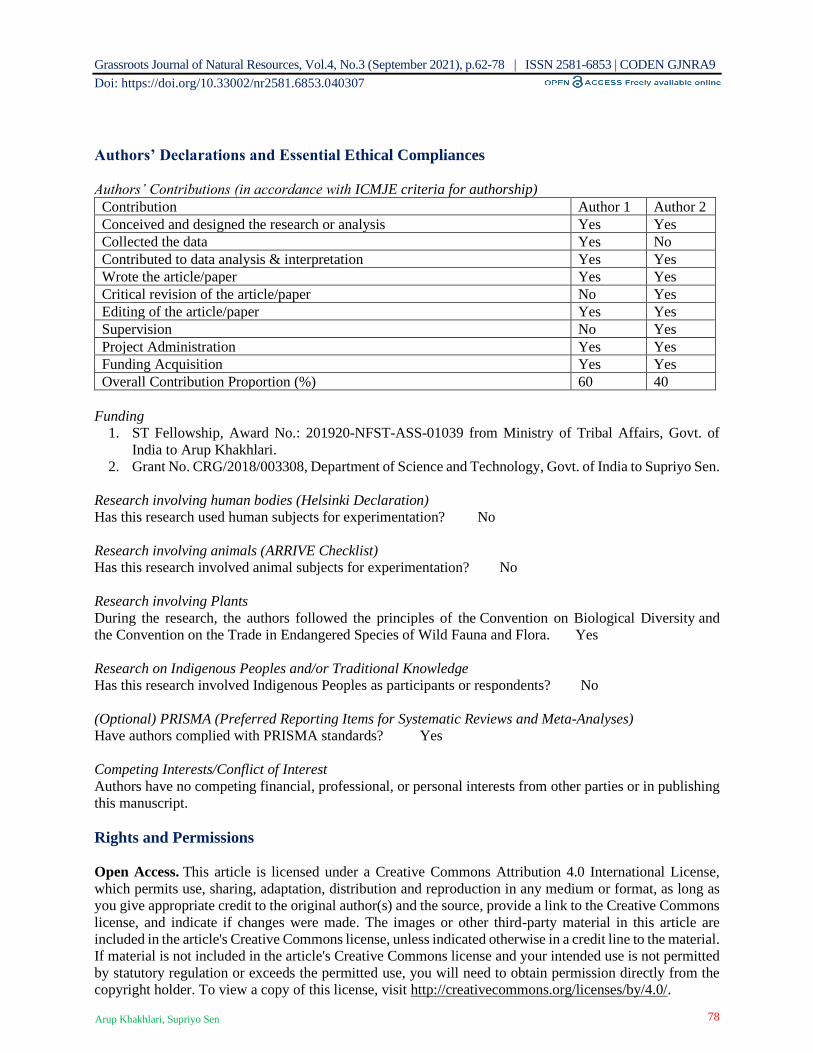
Grassroots Journal of Natural Resources, Vol.4, No.3 (September 2021), p.62-78 | ISSN 2581-6853 | CODEN GJNRA9
Doi: https://doi.org/10.33002/nr2581.6853.040307
78 Arup Khakhlari, Supriyo Sen
Authors’ Declarations and Essential Ethical Compliances
Authors’ Contributions (in accordance with ICMJE criteria for authorship)
Contribution Author 1 Author 2
Conceived and designed the research or analysis Yes Yes
Collected the data Yes No
Contributed to data analysis & interpretation Yes Yes
Wrote the article/paper Yes Yes
Critical revision of the article/paper No Yes
Editing of the article/paper Yes Yes
Supervision No Yes
Project Administration Yes Yes
Funding Acquisition Yes Yes
Overall Contribution Proportion (%) 60 40
Funding
1. ST Fellowship, Award No.: 201920-NFST-ASS-01039 from Ministry of Tribal Affairs, Govt. of
India to Arup Khakhlari.
2. Grant No. CRG/2018/003308, Department of Science and Technology, Govt. of India to Supriyo Sen.
Research involving human bodies (Helsinki Declaration)
Has this research used human subjects for experimentation? No
Research involving animals (ARRIVE Checklist)
Has this research involved animal subjects for experimentation? No
Research involving Plants
During the research, the authors followed the principles of the Convention on Biological Diversity and
the Convention on the Trade in Endangered Species of Wild Fauna and Flora. Yes
Research on Indigenous Peoples and/or Traditional Knowledge
Has this research involved Indigenous Peoples as participants or respondents? No
(Optional) PRISMA (Preferred Reporting Items for Systematic Reviews and Meta-Analyses)
Have authors complied with PRISMA standards? Yes
Competing Interests/Conflict of Interest
Authors have no competing financial, professional, or personal interests from other parties or in publishing
this manuscript.
Rights and Permissions
Open Access. This article is licensed under a Creative Commons Attribution 4.0 International License,
which permits use, sharing, adaptation, distribution and reproduction in any medium or format, as long as
you give appropriate credit to the original author(s) and the source, provide a link to the Creative Commons
license, and indicate if changes were made. The images or other third-party material in this article are
included in the article's Creative Commons license, unless indicated otherwise in a credit line to the material.
If material is not included in the article's Creative Commons license and your intended use is not permitted
by statutory regulation or exceeds the permitted use, you will need to obtain permission directly from the
copyright holder. To view a copy of this license, visit http://creativecommons.org/licenses/by/4.0/.

Ecosystem Approach in Dealing with Invasive Alien Species:
International, European and Ukrainian Experience of Legal Regulation
Yevhenii Suietnov*1, Elbis Tulina2 1Department of Environmental Law, Yaroslav Mudryi National Law University, Kharkiv, Ukraine.
Email: [email protected] | ORCID: 0000-0002-4094-444X 2Department of Environmental Law, Yaroslav Mudryi National Law University, Kharkiv, Ukraine.
Email: [email protected] | ORCID: 0000-0002-8780-5682
*Corresponding author
Abstract This article is devoted to highlighting the international,
European and Ukrainian experience encompassing legal
regulation dealing with the invasive alien species that represent
the second largest threat to global biodiversity, right after
habitat destruction. It has been proved that, at the international
level, primarily within the framework of the Convention on
Biological Diversity, the ecosystem approach is recognized as
the basis in dealing with such species. It is also gradually being
reflected in the regulatory framework of the European Union.
The provisions of the EU on nature protection and the relevant
regulations of the European Commission define invasive
species, which are prohibited from activities that may
contribute to their dissemination in the environment. In the
Ukrainian environmental law, a positive trend towards the
recognition of the ecosystem approach in dealing with invasive
alien species is observed primarily among national strategic
documents, while in current national environmental
legislation, these issues are regulated fragmentarily and
inconsistently, which indicates the need for its early reform.
Keywords Environmental law; Biological diversity; Invasive alien
species; Ecosystem; Ecosystem approach
How to cite this paper: Suietnov, Y. and Tulina,
E. (2021). Ecosystem Approach in Dealing with
Invasive Alien Species: International, European
and Ukrainian Experience of Legal Regulation.
Grassroots Journal of Natural Resources, 4(3): 79-93.
Doi: https://doi.org/10.33002/nr2581.6853.040308
Received: 29 June 2021
Reviewed: 31 July 2021
Provisionally Accepted: 10 August 2021
Revised: 17 August 2021
Finally Accepted: 22 August 2021
Published: 30 September 2021
Copyright © 2021 by author(s)
This work is licensed under the Creative
Commons Attribution International
License (CC BY 4.0).
http://creativecommons.org/licenses/by/4.0/
Grassroots Journal of Natural Resources, Vol.4 No.3 (September 2021) ISSN 2581-6853 | CODEN: GJNRA9 | Published by The Grassroots Institute
Website: http://grassrootsjournals.org/gjnr | Main Indexing: Web of Science
M – 00245 | Review Article
ISSN 2581-6853 | 4(3) Sep 2021

Grassroots Journal of Natural Resources, Vol.4, No.3 (September 2021), p.79-93 | ISSN 2581-6853 | CODEN GJNRA9
Doi: https://doi.org/10.33002/nr2581.6853.040308
80 Yevhenii Suietnov, Elbis Tulina
Introduction
One of the main environmental problems of today is the loss of biodiversity. Over the past 400 years 120
species of amphibians, 94 species of birds and 63 species of mammals have disappeared from the face of
the Earth due to unreasonable human activities. Although each of the extinct species is a final and
irreplaceable loss for the biosphere (evolution knows no turning back), many more of them are under the
threat of extinction (Danilov-Danil’jan, Losev, Reif, 2005).
There are various causes of biodiversity loss. According to the American biologist, naturalist and writer,
E. O. Wilson, they can be abbreviated as ‘HIPPO’, where the first letter means the most significant cause,
and the following letters are arranged accordingly as the significance of the factor decreases. The letter ‘H’
comes from ‘habitat’, so the primary reason for the reduction of biological resources is the destruction of
habitats of the organisms. The letter ‘I’ comes from ‘invasion’ and indicates the widespread impact of the
invasion of alien species, as the introduction of these species, even with good intentions, is a biological
contamination. Introduced from other parts of the world, some species are rapidly spreading and displacing
native species of ecosystems. The first ‘P’ letter means the third problem – ‘pollution’, while the second ‘P’
letter is associated with the ‘population’ of humans – with the overpopulation of the planet. The last letter
‘O’ indicates the ‘overexploitation’ of biological resources – the destruction of species by hunting and
fishing (Puzanova, 2010).
Thus, the second most important cause of biodiversity loss is the invasion of alien species. These are plants,
animals, or other organisms that are not native to an ecosystem but introduced largely through human action,
either deliberately or by accident. They can become competitors, predators, parasites, and hybridizers of
native plants and animals, ultimately threatening the survival of endemic species (The Ecology Book, 2019).
In 2014, the Global Invasive Species Database compiled a list of the invasive alien species (IAS) titled ‘100
of the World’s Worst Invasive Alien Species’ (Luque et al., 2014), which included the organisms that had
the greatest negative impact on human activities and native species. The list includes 56 animal species, 36
plant species, 5 fungal species and 3 microbial species, some of which are the European rabbit (Oryctolagus
cuniculus) and the cane toad (Rhinella marina) that caused significant damage to the endemic Australian
ecosystem.
Widely known examples of IAS are also the Nile perch (Lates niloticum), which was introduced into Lake
Victoria and caused the extinction of some 200 endemic fish species; the Caulerpa seaweed (Coulerpa
taxifolia) invaded the Mediterranean and severely damaged the endemic aquatic flora and fauna. The
introduction of the Polynesian rat into Easter Island is thought to have contributed to the deforestation of
that island, with severe consequences for the human populations (Krämer, 2021).
The IAS pose a threat to biodiversity and natural ecosystems of Ukraine. Today there are about 90 invasive
species reported, including over 40 transformer species. Generalist mollusk species have spread in the Sea
of Azov and the Black Sea (Mya arenaria, Anadara inaequivalvis), and such species as Deroceras
caucasicum and Krynickillus melanocephalus, as well as Arion lusitanicus slug, which is rapidly spreading
in Ukraine, are a cause of major concern for the country’s biodiversity. Among the common alien mammals
are the muskrat, American mink, and raccoon dog.1
Considering the negative impact that IAS have on biodiversity and ecosystems, an urgent need is the legal
regulation fighting against such species, based on the implementation of the ecosystem approach.
1 Sixth National Report of Ukraine on the Implementation of the Convention on Biological Diversity (English version), December
2018, 83. Available online: https://www.cbd.int/doc/nr/nr-06/ua-nr-06-en.pdf [Accessed on 25 June 2021]
Grassroots Journal of Natural Resources, Vol.4, No.3 (September 2021), p.79-93 | ISSN 2581-6853 | CODEN GJNRA9
Doi: https://doi.org/10.33002/nr2581.6853.040308
81 Yevhenii Suietnov, Elbis Tulina
The IAS are investigated by many scientists, that include Smith, Bazely, Yan (2000), Genovesi, Shine
(2004), Essl, Bacher, Roy (2019), Krämer (2021) and others. The ecosystem approach is developed by
Smith, Maltby (2003), Morgera (2015), Platjouw (2016), De Lucia (2019), etc. From legal standpoints, the
authors of this article also studied these issues in different contexts. However, it should be noted that
scientific research combining such areas as the legal regulation of the implementation of the ecosystem
approach and the prevention of the negative impact of IAS on the environment, unfortunately, has not been
carried out to date. Such a comprehensive study is relevant for national environmental legislation in the
context of the latest international legal norms, and is also promising for environmental and legal science in
general. Taking this into account, the purpose of this article is to highlight certain aspects of the
international, European and Ukrainian experience of legal regulation of the implementation of the ecosystem
approach in dealing with IAS.
IAS-Linked Ecosystem Approach in International and European Environmental Legislation
At the international level, there are many legal documents devoted to the conservation of biodiversity and
ecosystems, among which leading is the Convention on Biological Diversity2 (CBD), adopted in 1992,
having objectives to conserve biodiversity, the sustainable use of its components, and the fair and equitable
sharing of the benefits arising out of the utilization of genetic resources (Art. 1).
The CBD defines the terms ‘biological diversity’ (the variability among living organisms from all sources
including, inter alia, terrestrial, marine and other aquatic ecosystems and the ecological complexes of which
they are part) and ‘ecosystem’ (a dynamic complex of plant, animal, micro-organism communities and their
non-living environment interacting as a functional unit) (Art. 2). The CBD also establishes a number of
provisions for the protection and conservation of biodiversity and ecosystems, in particular: establish a
system of protected areas or areas where special measures need to be taken to conserve biodiversity; promote
the protection of ecosystems, natural habitats and the preservation of viable populations of species in the
wild; take measures to rehabilitate and restore degraded ecosystems; prevent the introduction of alien
species that threaten ecosystems, habitats or species, and control or destroy such alien species, etc. (Art. 8
a, d, f and h).
The key provisions of the ecosystem approach are reflected in the decisions of the meetings of the governing
body of the CBD – the Conference of the Parties (COP). At the First meeting (Nassau, Bahamas, 1994), it
was confirmed that the planet’s essential goods, ecological functions and services depend on a variety and
variability of genes, species, populations and ecosystems (para. 1 of Annex to Decision I/8)3, and at the
Second meeting (Jakarta, Indonesia, 1995), the ecosystem approach was recognized as the basis for action
under the CBD (Decision II/8).4 The Fifth meeting of the COP (Nairobi, Kenya, 2000) was of particular
importance for the development of the ecosystem approach, as it adopted Decision V/6,5 which contains a
description of the ecosystem approach, a list of its principles and practical recommendations for their
application (sections ‘A’, ‘B’ and ‘C’).
Thus, the ecosystem approach introduced by the CBD is a means of examining the relationships within
ecosystems with other systems and people for whom ecosystems are habitats and livelihoods. It involves
moving from a one-sided view of marketable species – for example, accessing forests solely as a source of
timber – to a multifaceted view, working on different spatio-temporal scales, using all available knowledge
2Convention on Biological Diversity (adopted on 5 June 1992). Available online: https://www.cbd.int/convention/text [Accessed
on 25 June 2021] 3 CBD (1994). Report of the First Meeting on the COP to the CBD (UNEP/CBD/COP/1/17). 4 CBD (1995). Report of the Second Meeting of the COP to the CBD (UNEP/CBD/COP/2/19). 5 CBD (2000). Report of the Fifth Meeting of the COP to the CBD (UNEP/CBD/COP/5/23).
Grassroots Journal of Natural Resources, Vol.4, No.3 (September 2021), p.79-93 | ISSN 2581-6853 | CODEN GJNRA9
Doi: https://doi.org/10.33002/nr2581.6853.040308
82 Yevhenii Suietnov, Elbis Tulina
and involving relevant stakeholders. This approach aims to ensure the long-term sustainability of
biodiversity and the significant development of today’s understanding of sustainable nature (Perelet, 2006).
Returning directly to IAS, it should be noted that at its Fourth meeting (Bratislava, Slovakia, 1998), the
COP invited the Subsidiary Body on Scientific, Technical and Technological Advice (SBSTTA) to develop
guidelines for the prevention of the introduction of alien species and mitigation of its consequences and
report on it at its Fifth meeting (section ‘C’ of Decision IV/1)6, and in Annex II to Decision IV/167 it
announced a comprehensive consideration of alien species as one of the items on its Sixth meeting.
In turn, at a meeting in Montreal (Canada), 2000, SBSTTA developed draft of the above guidelines,8 which
are fully reflected in the Annex to Decision V/8 of the COP.9 This Annex establishes a definition of the
terms ‘alien species’, which refers to a species that occurs outside its normal distribution, and ‘alien invasive
species’, an alien species that threatens ecosystems, natural habitats or species, and declares that all
measures to deal with IAS should be based on the ecosystem approach, in line with the relevant provisions
of the CBD and the decisions of the COP (Guiding principle 3 ‘Ecosystem approach’).
The most thorough provisions on IAS in general and the ecosystem approach as the basis in dealing with
such species, in particular, were enshrined in Decision VI/23 ‘Alien Species that Endanger Ecosystems,
Habitats or Species’,10 adopted at the Sixth meeting of the COP (the Hague, the Netherlands, 2002), and in
the Annex of which ‘Guiding Principles of Preventing Invasions and Mitigating the Influence of Alien
Species that Endanger Ecosystems, Habitats or Species’ are contained.
Decision VI/23 sets out the basic framework for the legal regulation of the prevention of the negative impact
of IAS on ecosystems. As stated in the Preamble to it, such species are a major threat to biodiversity,
especially in geographically and evolutionarily isolated ecosystems, such as small island developing States,
and that the risk may increase with the expansion of world trade, transport, tourism and climate change.
In accordance with the ‘Guiding Principles’, ‘alien species’ refers to a species, subspecies or lower taxon,
introduced outside its natural past or present distribution; includes any part, gametes, seeds, eggs, or
propagules of such species that might survive and subsequently reproduce, while ‘invasive alien species’
means an alien species whose introduction and/or spread threaten biological diversity (note 57). Some of
the measures envisaged by Decision VI/23 on the prevention of the harmful effects of IAS on ecosystems
can be proposed. So, in the process of implementing the ‘Guiding Principles’ and developing, reviewing
and implementing national strategies and action plans for biodiversity conservation in order to address
threats of IAS to the biodiversity, it is necessary to raise awareness among policy makers at all levels of
government and in the private sector, officials in quarantine, customs and other border services, as well as
among the general public, about the threats posed to biodiversity by IAS, goods and services provided by
ecosystems, and the means to deal with such threats, and interact with trading partners and neighboring
countries, at the regional level, and, as appropriate, with other countries to address the threats posed by IAS
to the biodiversity of ecosystems located in two or more countries and to migratory species, as well as to
address issues of common regional interest (paras ‘e’ and ‘g’ of part 10).
It also emphasizes that priority measures should consider the need to include IAS provisions in national
biodiversity strategies and action plans, as well as in sectoral and intersectoral policies, strategies and plans,
in order to take into account, the ecosystem approach and ensure the comprehensive implementation of
6 CBD (1998). Report of the Fourth Meeting of the COP to the CBD (UNEP/CBD/COP/4/27). 7 CBD (1998). Report of the Fourth Meeting of the COP to the CBD (UNEP/CBD/COP/4/27). 8 SBSTTA (2000). Item 3.4 of the Provisional Agenda. Alien Species: Guiding Principles for the Prevention, Introduction and
Mitigation of Impacts (UNEP/CBD/SBSTTA/5/5). 9 CBD (2000). Report of the Fifth Meeting of the COP to the CBD (UNEP/CBD/COP/5/23). 10 CBD (2002). Report of the Sixth Meeting of the COP to the CBD (UNEP/CBD/COP/6/20).
Grassroots Journal of Natural Resources, Vol.4, No.3 (September 2021), p.79-93 | ISSN 2581-6853 | CODEN GJNRA9
Doi: https://doi.org/10.33002/nr2581.6853.040308
83 Yevhenii Suietnov, Elbis Tulina
national strategies and IAS action plans in accordance with the calls set out in decision V/8 of the COP
(para. ‘d’ of part 12). A special place in Decision VI/23 is given to recommendations to facilitate research
and assessments on: the parameters of invasive species and the vulnerability of ecosystems and habitats to
IAS, and the impact of climate change on these parameters; measures to increase the capacity of ecosystems
to resist IAS and recover from their invasions; criteria for assessing the risks associated with the introduction
of IAS into biological diversity at the genetic, species and ecosystem levels (paras ‘a’, ‘g’ and ‘i’ of part
24). In addition, the application of these ‘Guiding Principles’ should pay due attention to the fact that
ecosystems are dynamic over time and, therefore, the natural distribution of species can change without
human intervention. One of the main guidelines is that measures to deal with IAS should be based
accordingly on the ecosystem approach described in Decision V/6 of the COP (Principle 3). Research on
IAS should include careful detection of IAS and documentation of: a) history and ecology of the invasion
(origin, routes of entry and time frame); b) biological characteristics of IAS; and c) the associated effects
on the ecosystem, species and genetic level, as well as the social and economic consequences and the nature
of their changes over time (Principle 5).
Thus, emphasis is placed on cooperation with relevant organizations, which will facilitate the further
implementation of Art. 8 h) of the CBD, including through the development of guidelines, sound methods
and pilot projects to address the threats posed by IAS to certain habitats, including means to enhance the
capacity of ecosystems to resist or recover from IAS (part 16).
Issues against IAS were discussed at almost all subsequent meetings of the COP to the CBD, in particular, the
Seventh (Decision VII/13), the Eighth (Decision VIII/27), the Tenth (Decision X/2), the Eleventh (Decision
XI/28), the Twelfth (Decision XII/17), the Thirteenth (Decision XIII/13) and the Fourteenth (Decision XIV/11)
meetings. For example, the Tenth meeting (Nagoya, Japan, 2010) approved the Strategic Plan for Biodiversity
2011-2020 ‘Living in harmony with nature’ and the Aichi Biodiversity Targets (Annex to Decision X/2).11 The
Plan contains a list of strategic objectives in this area, including taking measures to address the causes of
biodiversity loss, as well as reducing the direct burden on it (paras ‘a’ and ‘b’ of part 10). Targets 8 and 9 of
‘Strategic Objective B. Reduction of direct pressures on biodiversity and promotion of sustainable use’ envisage
that by 2020 environmental pollution, including from excess nutrients, should be brought to levels that do not
cause harm the functioning of ecosystems and biodiversity, and the identification and prioritization of IAS and
their distribution routes, priority species will be regulated or destroyed, and measures will be taken to regulate
movement routes to prevent their introduction and implementation.
Additionally, a number of acts have been developed to implement the CBD and to actively combat harmful
species at the international level, including: The Global Invasive Species Programme, 1999, The Global
Strategy on Invasive Alien Species, 2001, The European Strategy on Invasive Alien Species, 2002, etc. For
instance, the Global Strategy on Invasive Alien Species states that these species are currently recognized as
one of the greatest biological threats to the ecological and economic well-being of our planet, as IAS are
alien species whose creation and distribution threaten ecosystems, plant species or their habitats, harm the
economy or the environment (McNeely et al., 2001). That is why the European Strategy on Invasive Alien
Species states that transboundary and subregional cooperation is a priority, as many of these territories cross
the national borders. That is, ensuring the application of a precautionary approach to IAS decision-making
in accordance with international law, as part of a risk analysis that takes into account the possible effects on
internal biodiversity and ecosystem functions, and the need to promote an ecosystem approach as an
appropriate basis for assessing planned actions and policies applies to IAS (Genovesi and Shine, 2004).
At the regional level, common legal procedures ensure the control of pests and diseases that adversely affect
the condition of plants, animals, life and human health, in contrast to IAS that threaten biodiversity and
11 CBD (2011). Strategic Plan for Biodiversity 2011-2020 and the Aichi Biodiversity Targets. Decision X/2
(UNEP/CBD/COP/10/27).

Grassroots Journal of Natural Resources, Vol.4, No.3 (September 2021), p.79-93 | ISSN 2581-6853 | CODEN GJNRA9
Doi: https://doi.org/10.33002/nr2581.6853.040308
84 Yevhenii Suietnov, Elbis Tulina
ecosystem functions. The above document provides for a number of key actions, including: empowering
the competent authorities to take appropriate mitigation measures; revision of lists of species and
conservation strategies to ensure legal protection against IAS; make better use of existing legal measures
(for example, to control the spread of weeds); establishing responsibilities within reasonable limits for
landowners, users and relevant stakeholders to prevent or control the further spread of IAS, etc.
Since an ecosystem is a set of species of living organisms that have adapted to living in a certain
environment, that is why legal regulation and measures to regulate the negative impact of IAS on ecosystems
should be based on the main types of ecosystems. It will be recalled that the CBD distinguishes terrestrial,
marine and other aquatic ecosystems. The division into main types of ecosystems corresponds to the
thematic areas studied under the CBD. The use of these spatial units for analysis ensures consistent reporting
under the CBD and also allows for thematic, regional and global reviews. It is expected that countries will
use more detailed data on key typical ecosystems for practical purposes. Such a hierarchical ecosystem
allows for general reviews at different levels, both in individual countries and at the inter-State level. The
main types of ecosystems include: marine and coastal areas, forests, freshwater bodies, tundra, arid and sub-
humid lands, meadows, agricultural lands, and built-up lands, etc.12
It should be noted that issue of preserving ecosystems from IAS at the international level has been
consolidated not only in the CBD and decisions of its COP, but also in other important international
agreements. For example, the Framework Convention on the Protection and Sustainable Development of
the Carpathians,13 which in the context of implementing ecosystem approach has established certain
requirements for many spheres, including preservation and sustainable use of biological and landscape
diversity (Art. 5). Protocols to this Convention have been adopted in various years, which also reflect certain
aspects of the ecosystem approach, in particular the control of IAS. Thus, in the Protocol on Conservation
and Sustainable Use of Biological and Landscape Diversity14 IAS are recognized as the cause of
deterioration of quality and value of environmental functions, its degradation, their next definition is
provided (‘non-native species introduced intentionally or unintentionally outside their natural habitats where
they have settled, reproduced and disseminated in ways that harm the environment into which they have
been imported’) (Art. 2 f and j), and the Parties are obliged to cooperate in order to prevent the import,
control or destruction of IAS that threaten ecosystems, habitats or local species of the Carpathians (para. ‘b’
of Art. 1), prevention of their introduction or release (Art. 13), etc.
The regulatory framework for IAS is also being actively developed by the European Union, which is a Party
to the CBD and has certain obligations under Art. 8 h) to prevent the introduction of alien species that
endanger ecosystems, habitats or species. Thus, Council Directive 92/43/EEC of 21 May 1992 on the
Conservation of Natural Habitats and of Wild Fauna and Flora (the Habitats Directive)15 aims to promote
the maintenance of biodiversity, taking account of economic, social, cultural and regional requirements,
emphasizing the need to adopt provisions for additional measures for the re-introduction of certain natural
species of flora and fauna and the possible introduction of alien species.
12 CBD (2003a). Monitoring and indicators: designing national-level monitoring programmes and indicators.
(UNEP/CBD/SBSTTA/9/10). 13 The Framework Convention on the Protection and Sustainable Development of the Carpathians (signed on 22 May 2003).
Available online: http://www.carpathianconvention.org/text-of-the-convention.html [Accessed on 25 June 2021] 14 The Protocol on Conservation and Sustainable Use of Biological and Landscape Diversity to the Framework Convention on the
Protection and Sustainable Development of the Carpathians (adopted on 19 June 2008). Available online:
http://www.carpathianconvention.org/tl_files/carpathiancon/Downloads/01%20The%20Convention/1.1.2.1%20BiodiversityProto
colFinalsigned.pdf [Accessed on 25 June 2021] 15 Council Directive 92/43/EEC of 21 May 1992 on the conservation of natural habitats and of wild fauna and flora, OJ L 206,
22.7.1992, p. 7–50.

Grassroots Journal of Natural Resources, Vol.4, No.3 (September 2021), p.79-93 | ISSN 2581-6853 | CODEN GJNRA9
Doi: https://doi.org/10.33002/nr2581.6853.040308
85 Yevhenii Suietnov, Elbis Tulina
In support of the achievement of the aims of the Habitats Directive, as well as the Water Framework
Directive16, the Marine Strategy Framework Directive17 and the Birds Directive18, EU Regulation 1143/2014
of 22 October 2014 (on the prevention and management of the introduction and spread of invasive alien
species)19 approved the relevant requirements for risk assessment, procedures for measures to prevent the
penetration of IAS into the EU, rapid identification and removal of new IAS, management of species that
are already widespread in the EU, etc. The document states that a significant proportion of alien species can
become invasive and have a serious negative impact on biodiversity and related ecosystem services, as well
as other social and economic consequences that should be prevented. About 12,000 species in the EU and
other European countries are alien, of which about 10-15% are invasive.20 In accordance with this regulation,
a list of IAS for EU countries was subsequently adopted Commission Implementing Regulation (EU)
2016/1141 of 13 July 2016 adopting a list of invasive alien species of Union.21
It is worth noting that the EU Regulation 1143/2014 and its monitoring were discussed in detail by Krämer
(2021), in order to see, what lessons can be learnt from the cooperation and concertation of the different
states with regard to IAS. The author concludes that in order to reach results, within the EU or at
international level, close cooperation between neighbouring countries is necessary. It is not sufficient to
leave the implementation and effective application of international agreements or of EU legislation to the
goodwill of the countries concerned. The COP to the CBD as well as the European Commission will,
therefore, have to do more to ensure an effective application of the existing provisions (Krämer, 2021).
To date, a group of scientists was a comprehensive work on developing a list of invasive alien species likely
to threaten biodiversity and ecosystems in the European Union. They present these species highlighting the
potential negative impacts and the most likely biogeographic regions to be affected by these potential IAS.
Furthermore, researchers recommend conducting regular reviews of both the species rankings and future
potential IAS that could threaten the EU, as demanded by the EU Regulation (Roy et al., 2019). For this
purpose, dedicated species accounts should be considered and kept updated in the species data repository
formally endorsed by the EU Regulation i.e., EASIN – European Alien Species Information Network (Roy
et al., 2019).
Concluding the common review of international and European experience in the legal regulation of the
introduction of the ecosystem approach in the fight against IAS, it should be mentioned that an extraordinary
event in the field of EU biodiversity and ecosystems was the adoption on 20 May 2020 by the European
Commission (2020) of a new EU Biodiversity Strategy for 2030: Bringing nature back into our lives,22
which is called ‘the most ambitious environmental document in human history’ and according to which EU
countries seek not only to preserve their biodiversity and related ecosystem services, but also to become a
world leader in nature conservation and restoration for a decade (EU Biodiversity Strategy, 2020). The
Strategy contains specific commitments and actions to be implemented in the EU by 2030, including control
16 Directive 2000/60/EC of the European Parliament and of the Council of 23 October 2000 establishing a framework for
Community action in the field of water policy, OJ L 327, 22.12.2000, p. 1–73. 17 Directive 2008/56/EC of the European Parliament and of the Council of 17 June 2008 establishing a framework for community
action in the field of marine environmental policy, OJ L 164, 25.6.2008, p. 19–40. 18 Directive 2009/147/EC of the European Parliament and of the Council of 30 November 2009 on the conservation of wild birds,
OJ L 20, 26.1.2010, p. 7–25. 19 Regulation (EU) No. 1143/2014 of the European Parliament and of the Council of 22 October 2014 on the prevention and
management of the introduction and spread of invasive alien species, OJ L 317, 4.11.2014, p. 35–55. 20 Regulation (EU) No. 1143/2014 of the European Parliament and of the Council of 22 October 2014 on the prevention and
management of the introduction and spread of invasive alien species, OJ L 317, 4.11.2014, p. 35–55. 21 Commission Implementing Regulation (EU) 2016/1141 of 13 July 2016 adopting a list of invasive alien species of Union
concern pursuant to Regulation (EU) No 1143/2014 of the European Parliament and of the Council C/2016/4295, OJ L 189,
14.7.2016, p. 4–8. 22 Communication from the Commission to the European Parliament, the Council, the European Economic and Social Committee
and the Committee of the Regions EU Biodiversity Strategy for 2030 Bringing nature back into our lives, COM/2020/380 final

Grassroots Journal of Natural Resources, Vol.4, No.3 (September 2021), p.79-93 | ISSN 2581-6853 | CODEN GJNRA9
Doi: https://doi.org/10.33002/nr2581.6853.040308
86 Yevhenii Suietnov, Elbis Tulina
of IAS. It is noted that IAS can significantly undermine efforts to protect and restore nature, facilitate the
outbreak and spread of infectious diseases, posing a threat to humans and wildlife. Of the 1,872 species now
considered threatened in Europe, 354 are under threat from IAS. Without effective control measures, the
rate of invasion and the risks it brings to nature and health will continue to rise.23
Ecosystem Approach in dealing with IAS in the Environmental Legislation of Ukraine
The main problem in developing legal mechanisms to regulate the prevention of IAS in national legislation
is not taking into account all existing species of different ecosystems. The type of ecosystems to be invaded
include freshwater, marine, terrestrial, etc., and the type of invaders include plants, animals,
microorganisms, etc. In this context, it would be useful to give examples from some countries of the
introduction of an ecosystem approach to the regulation of IAS at the national level.
For example, one of the means of public awareness used in USA is a list of IAS called ‘The Dirty Dozen’,
which are some of the least desirable alien species in USA. Although these 12 species differ from each other
in many ways, they all have one thing in common: they cause problems to native species and ecosystems.
The species on this list represent many different organisms, a variety of ecosystems, and a wide geographical
range, from Hawaii to Florida and from Maine to California (Wittenberg and Cock, 2001).
The next example is Canada, which in pursuance of Art. 8 h) of the CBD, that, in 1995, developed the
Canadian Biodiversity Strategy, and in 2004, the Invasive Alien Strategy for Canada. Subsequently, the
national IAS strategy led to the development of two action plans for terrestrial IAS plants and plant pests
and aquatic IAS, respectively, as well as a national strategy for wildlife diseases (Smith, Bazely and Yan,
2013).
Particular attention needs to be paid to marine and freshwater ecosystems, which are considered very
vulnerable to the invasion of alien species. That is why international instruments relating to the aquatic
environment emphasize the need for precautionary measures related to the introduction of alien species
(Shine, Williams and Gündling, 2000). Geographically isolated ecosystems are particularly vulnerable to
invasive species. That is why it is necessary to cite the example of island States, for which the provision of
an ecosystem approach is extremely important for the conservation of all biological diversity. The IAS is a
major threat to the vulnerable marine, freshwater and terrestrial biodiversity of the Caribbean and to the
people whose livelihoods depend on it. The Caribbean States have recognized the need for a regional
strategy and have expressed interest in pooling their national efforts to implement Art. 8 h) of the CBD,
which will lead to the joint development of the Global Environment Facility (GEF) funded project entitled
‘Mitigation the Threats of Invasive Alien Species in the insular Caribbean’. The aim of the project is to
mitigate the threat to local biodiversity and the economy from IAS in the Caribbean islands, including
terrestrial, fresh and marine ecosystems (Krauss, 2010). Therefore, the legal framework should provide a
basis for regulating the invasion of alien species into any type of ecosystem, as well as for monitoring and
managing their use wherever this occurs. However, today the legal regulation of terrestrial ecosystems is
much broader than for coastal and marine environments or inland water ecosystems (Shine, Williams and
Gündling, 2000).
While exploring the foundations of legal regulation of this issue in Ukraine, it should be noted that Ukraine,
ratifying the CBD24 and other environmental treaties, has undertaken international legal obligations to
23 Communication from the Commission to the European Parliament, the Council, the European Economic and Social Committee
and the Committee of the Regions EU Biodiversity Strategy for 2030 Bringing nature back into our lives, COM/2020/380 final 24 Law of Ukraine (1994). On Ratification of the Convention on Biological Diversity, Law of Ukraine 257/94-VR of 29
November (1994), Verkhovna Rada of Ukraine, 1994. Available online: https://zakon.rada.gov.ua/laws/show/257/94-вр#Text
[Accessed on 25 June 2021]

Grassroots Journal of Natural Resources, Vol.4, No.3 (September 2021), p.79-93 | ISSN 2581-6853 | CODEN GJNRA9
Doi: https://doi.org/10.33002/nr2581.6853.040308
87 Yevhenii Suietnov, Elbis Tulina
preserve and restore natural ecosystems and the implementation of the ecosystem approach in national
environmental policy and law, including dealing with IAS. Ukraine also has certain obligations for the
conservation of biological diversity and natural ecosystems in the framework of the Association Agreement
with the European Union,25 including the implementation of the Habitats, Birds and Water Framework
Directive (Annex XXX). However, according to experts, in the light of the newly adopted EU Biodiversity
Strategy 2030, the full implementation of all objectives set by the Agreement will be insufficient to achieve
Ukraine’s indicators relevant in the EU after the adoption of the Strategy. Therefore, this document can be
considered without achieving indicators of which further European integration steps will be difficult to
imagine (EU Biodiversity Strategy, 2020).
The main strategic document of environmental orientation in Ukraine is the Law ‘On Basic Principles
(Strategy) of the State Environmental Policy of Ukraine for the period up to 2030’,26 which was adopted on
28 February 2019, and came into force on 1 January 2020. Adoption of this document was an important step
towards the formation of a modern national environmental policy, as it is aimed at reviewing its priority
tasks related to the signing of the Association Agreement between Ukraine and the EU, and ensuring gradual
approximation of environmental legislation with the EU directives. This Strategy should become a reference
point for further systematization of environmental legislation in the context of European integration
processes (Getman et al., 2019).
A comprehensive analysis of the provisions of the Strategy indicates that significant attention is paid in it
to the conservation and restoration of ecosystems and the implementation of the ecosystem approach, since
the ecosystem component is clearly manifested as the goal of the state environmental policy, as well as
among the expected results of its implementation, since in accordance with Section VI in 2030 year, Ukraine
must achieve such a level of balanced (sustainable) development, in which dependence on the use of non-
renewable natural resources and environmental pollution will be reduced to ecosystemically acceptable
levels.
The Strategy does not explicitly indicate the need to implement an ecosystem approach in dealing with IAS,
but it states that one of the tasks to reduce environmental risks in order to minimize their impact on
ecosystems (Objective 4) is the prevention of the spread of invasive species and the control of their
occurrence and distribution in natural ecosystems, including marine ones.
Thus, it can be assumed that the application of the ecosystem approach in the fight against IAS follows from
a broad formulation of the goal of the State environmental policy, which is based on the need to implement
this approach in all spheres of socio-economic development. Nevertheless, it is obvious that this wording
needs further clarification, which, incidentally, is stated in the recommendations of the parliamentary
hearings approved on January 14, 2020 on the topic: ‘Priorities of environmental policy of the Verkhovna
Rada of Ukraine for the next five years’,27 in which it is recommended that the relevant Ministry together
with the central executive authorities should consider the specification and clarification of the above Law,
mechanisms to ensure its implementation, as well as streamlining environmental legislation of Ukraine by
systematizing it for each of the natural resources with the ecosystem approach.
25 Association Agreement between the European Union and its Member States, of the one part, and Ukraine, of the other part,
Official Journal of the European Union L 161/3, 29.5.2014. Available online: https://eur-lex.europa.eu/legal-
content/EN/TXT/PDF/?uri=CELEX:22014A0529(01)&from=EN [Accessed on 25 June 2021] 26 Law of Ukraine (2019). On Basic Principles (Strategy) of the State Environmental Policy of Ukraine for the period up to 2030,
Law of Ukraine 2697-VIII of 28 February (2019), Verkhovna Rada of Ukraine, 2019. Available online:
https://zakon.rada.gov.ua/laws/show/2697-19#Text [Accessed on 25 June 2021] 27 Resolution of the Verkhovna Rada of Ukraine (2020). On the Recommendations of the Parliamentary Hearings on the Topic:
‘Priorities of the Environmental Policy of the Verkhovna Rada of Ukraine for the Next Five Years, Resolution of the Verkhovna
Rada of Ukraine 457-IX of 14 January (2020), Verkhovna Rada of Ukraine, 2020. Available online:
https://zakon.rada.gov.ua/laws/show/457-20#Text [Accessed on 25 June 2021]

Grassroots Journal of Natural Resources, Vol.4, No.3 (September 2021), p.79-93 | ISSN 2581-6853 | CODEN GJNRA9
Doi: https://doi.org/10.33002/nr2581.6853.040308
88 Yevhenii Suietnov, Elbis Tulina
Issues of IAS control, albeit briefly, are enshrined in the Concept of the National Biodiversity Conservation
Program for 2005-2025.28 It provides for measures to preserve flora and fauna, along with their groups,
complexes and ecosystems, and notes that the implementation of this Program will allow to recreate
degraded ecosystems, promote the conservation of endangered species, prevent the introduction of species
characteristic of other natural regions that may adversely effect on ecosystems, local species or public health.
The latest strategic document, which is likely to replace or supplement the previous one, should be the
Biodiversity Strategy to 2030, which is currently being developed and will be the basis for all environmental
decisions. This strategy will not only become a comprehensive document aimed at biodiversity conservation
but will also demonstrate a European approach to nature protection in Ukraine.29 The objectives of the
Strategy are: ensuring monitoring of the state of biodiversity in Ukraine; introduction of the concept of
ecosystem services; formation of an integrated approach to the conservation of species and the fulfillment
of international obligations for the conservation of biodiversity. We hope that due attention in the Strategy
is paid specifically to the issues of conservation and restoration of ecosystems and the implementation of
the ecosystem approach in dealing with IAS.
Equally important in this area is the draft order of the Cabinet of Ministers of Ukraine ‘On approval of the
National Strategy for the management of invasive alien species of flora and fauna in Ukraine until 2030’,30
designed to improve state environmental policy to prevent penetration and control of introduction of IAS
into natural ecosystems, destruction and mitigation (minimization) of adverse effects of such species on
natural ecosystems, economic activity and human health (Art. 2). Within this aim, the following objectives
and tasks are identified:
1. Raising awareness and scientific and methodological support of measures for the management of IAS.
Tasks within this objective:
- conducting special research on the ecological and biological properties of alien species and
identifying potential IAS;
- development of criteria for assigning species to the category of IAS and assessing the level of their
impacts on biodiversity, ecosystems, public health and economic activity;
- approval and periodic updating of lists of IAS by level of danger for local species, ecosystems and
human health by individual taxonomic units or their groups; and
- creation of a database on IAS by all taxonomic groups, etc.
2. Improving public policy, regulatory framework and institutional capacity to prevent the intrusion,
destruction, control of the introduction of IAS into natural ecosystems and mitigate (minimize) their adverse
effects. The following tasks are distinguished within this objective:
- taking into account in state strategic documents the issues of IAS management;
- formation of the regulatory framework for the effective prevention of penetration and control over
the spread of IAS, their destruction, minimizing the impact or mitigation of the consequences of
the invasion;
28 Order of the Cabinet of Ministers of Ukraine (2004). On Approval of the Concept of the National Biodiversity Conservation
Program for 2005-2025. Order of the Cabinet of Ministers of Ukraine 675-r of 29 September (2004), Verkhovna Rada of Ukraine,
2004. Available online: https://zakon.rada.gov.ua/laws/show/675-2004-р#Text [Accessed on 25 June 2021] 29 V Ukraini rozpochato rozrobku proiektu Stratehii okhorony bioriznomanittia do 2030 roku. Available online:
https://spilno.org/news/v-ukraini-rozpochato-rozrobku-proyektu-stratehii-okhorony-bioriznomanittya-do-2030-roku [Accessed on
25 June 2021] 30 Draft order of the Cabinet of Ministers of Ukraine (2019). On Approval of the National Strategy for the Management of
Invasive Alien Species of Flora and Fauna in Ukraine for the Period up to 2030. Official portal of the Ministry of Environmental
Protection and Natural Resources of Ukraine (2 May 2019). Available online: https://menr.gov.ua/news/33368.html [Accessed on
25 June 2021]

Grassroots Journal of Natural Resources, Vol.4, No.3 (September 2021), p.79-93 | ISSN 2581-6853 | CODEN GJNRA9
Doi: https://doi.org/10.33002/nr2581.6853.040308
89 Yevhenii Suietnov, Elbis Tulina
- approval of criteria for classifying species as IAS, assessment of their impact on biological
diversity and economic activity, public health, structural and functional organization of
ecosystems; and
- approval of lists of IAS, etc.
3. Development and implementation of practical measures to prevent the penetration, control of the spread,
destruction and mitigation of the effects of IAS invasion at the local and state levels, which provides for the
following tasks:
- development and approval of a system (plans) of measures to prevent the penetration, control of
the spread, destruction and mitigation of the consequences of the invasion of IAS at the local and
state levels; and
- development of measures to control the spread and control of IAS within the territories and objects
of the nature reserve fund in order to preserve the natural state of ecosystems, rare aboriginal
species and groups.
- determination of responsible executors for the implementation of such measures.
It is assumed that the achievement of the objectives of the National Strategy will be carried out in two stages:
the first – 2020-2023, and the second – 2023-2030. This Strategy will become a book of rules for the
treatment of IAS of flora and fauna in Ukraine. It will establish legal mechanisms for the management of
IAS, in particular, regulations, guidelines will be approved, as well as appropriate amendments to existing
regulations on agriculture, fisheries, forestry, hunting, housing and communal services, transport
infrastructure, natural reserve fund, veterinary medicine, quarantine and plant protection, sanitary and
epidemiological well-being of the population, customs.31
Thus, it is observed that the National Strategy provides the basic principles for preventing the negative
impact of IAS on biodiversity and ecosystems of Ukraine, and, therefore, its adoption will facilitate the
implementation of the CBD and other international and European instruments in this area into national
legislation. However, the National Strategy, essentially needs further refinement, taking into account the
ecosystem approach. Although among the national strategic documents, there is a positive trend towards the
recognition of the ecosystem approach in dealing with IAS, the situation with the recognition of this issue
at the level of current regulatory environmental legislation of Ukraine is much more complicated.
It should be noted that the key environmental law in Ukraine ‘On Environmental Protection’32 does not
contain any rules for the preservation and restoration of natural ecosystems, the introduction of an ecosystem
approach and the prevention of negative impacts of IAS on biodiversity and ecosystems. In addition,
according to this Law, the ecosystem is not recognized as an object of legal protection at all (Art. 5), just as
it not only lacks definitions, but also never mentions the words ‘ecosystem’ and ‘invasive alien species’,
which are a significant shortcoming that needs to be addressed as soon as possible. Such legal uncertainty
creates a significant barrier to the introduction of an ecosystem approach to IAS for all ecosystems, not to
mention the need to take into account certain features of legal regulation regarding their different types.
Also, the Land Code of Ukraine does not contain any legal norms on ecosystems33, although the ecosystem
definition of ‘land’ is enshrined in the Law of Ukraine ‘On Land Protection’34, according to which land is a
land surface with soils, minerals and other natural elements that are organically combined and function with
31 Minpryrody rozrobylo Natsionalnu stratehiiu shchodo povodzhennia z vydamy-vselentsiamy invaziinymy chuzhoridnymy
vydamy flory i fauny v Ukraini na period do 2030 roku. Available online: https://mepr.gov.ua/news/33369.html#:~:text=Інвазійні
[Accessed on 25 June 2021] 32 Law of Ukraine (1991). On Environmental Protection, Law of Ukraine 1264-XII of 25 June (1991), Verkhovna Rada of
Ukraine, 1991. Available online: https://zakon.rada.gov.ua/laws/main/1264-12#Text [Accessed on 25 June 2021] 33 Law of Ukraine (2001). Land Code of Ukraine, Law of Ukraine 2768-III of 25 October (2001), Verkhovna Rada of Ukraine,
2001. Available online: https://zakon.rada.gov.ua/laws/show/2768-14#Text [Accessed on 25 June 2021] 34 Law of Ukraine (2003). On Land Protection, Law of Ukraine 962-IV of 19 June (2003), Verkhovna Rada of Ukraine, 2003.
Available online: https://zakon.rada.gov.ua/laws/main/962-15#Text [Accessed on 25 June 2021]

Grassroots Journal of Natural Resources, Vol.4, No.3 (September 2021), p.79-93 | ISSN 2581-6853 | CODEN GJNRA9
Doi: https://doi.org/10.33002/nr2581.6853.040308
90 Yevhenii Suietnov, Elbis Tulina
it (Art. 1). Neither the ecosystem approach nor IAS are mentioned in the Water Code of Ukraine35, although
in the Procedure for state water monitoring36 significant attention has been paid to the protection of
ecosystems from the negative impact of IAS.
It would seem that the key role in this area should belong to floristic and faunal legislation, especially since
the list of activities related to environmental measures includes measures to prevent the introduction and
spread of alien plant species in natural ecosystems. Instead, in the Law of Ukraine ‘On Flora’37 there are no
references to the ecosystems or ecosystem approach, only the ecosystem definitions of ‘flora’ (the totality
of all plant species, as well as fungi and their groups in a given area) and ‘natural plant communities’ (a set
of plant species that grow within certain areas and are in close interaction with each other and with
environmental conditions). This Law provides a definition of ‘introduction’ (artificial introduction of a
species into the plant world outside its natural range) (Art. 3) and states that the requirements for the
introduction of wild plants are determined by the relevant Regulation, the responsibility for the development
and approval of which rests with the relevant Ministry (part 3 of Art. 33). In a very general way, the ban on
the introduction of IAS is provided for the legal protection and use of greenery in human settlements, as in
accordance with paragraphs 6 and 7 of Section IV of the Standard Rules for Landscaping a Settlements38 of
aboriginal flora and their decorative forms are used for landscaping such areas, while the use of plant IAS
is prohibited.
In contrast to the analyzed acts, the Forest Code of Ukraine39 shows some tendency to implement an
ecosystem approach, in connection with the implementation of some international acts.40 In Art. 1 of this
Code, the ecosystem definition of ‘forest’ is enshrined, which means a type of natural complexes
(ecosystem) combining mainly woody and shrubby vegetation with relevant soils, grasses, fauna,
microorganisms and other natural components that are interrelated, and linked in their development, affect
each other and the environment. In addition, this article was supplemented by ecosystem definitions of
natural forests (natural forest ecosystems), virgin forests (virgin forest ecosystems) and quasi-virgin forests
(conditionally virgin forest ecosystems) (parts 7-9). At the same time, only one article in the Code (Art. 85
‘Conservation of biodiversity in forests’) is devoted to the issue of combating IAS, according to which such
conservation is carried out by forest owners and permanent forest users at the genetic, species, population
and ecosystem levels by, in particular, prevention of genetic contamination of aboriginal species and
invasions of introduced species into natural ecosystems.
A similar situation can be traced with regard to faunal legislation. The Law of Ukraine ‘On Fauna’41 does
not contain a definition of ‘fauna’, but recognizes its ecosystem character, because not only objects of fauna
35 Law of Ukraine (1995). Water Code of Ukraine, Law of Ukraine 213/95-VR of 6 June (1995), Verkhovna Rada of Ukraine,
1995. Available online: https://zakon.rada.gov.ua/laws/main/213/95-вр#Text [Accessed on 25 June 2021] 36 Resolution of the Cabinet of Ministers of Ukraine (2018). On approval of the Procedure for the implementation of state
monitoring of waters, Resolution of the Cabinet of Ministers of Ukraine 758 of 19 September (2018), Verkhovna Rada of
Ukraine, 2018. Available online: https://zakon.rada.gov.ua/laws/show/758-2018-п#Text [Accessed on 25 June 2021] 37 Law of Ukraine (1999). On Flora, Law of Ukraine 591-XIV of 9 April (1999), Verkhovna Rada of Ukraine, 1999. Available
online: https://zakon.rada.gov.ua/laws/main/591-14#Text [Accessed on 25 June 2021] 38 Order of the Ministry of Regional Development, Construction, Housing and Communal Services of Ukraine (2017). On
Approval of the Model Rules for the Improvement of the Territory of a Settlement, Order of the Ministry of Regional
Development, Construction, Housing and Communal Services of Ukraine 310 of 27 November (2017), Verkhovna Rada of
Ukraine, 2017. Available online: https://zakon.rada.gov.ua/laws/show/z1529-17#Text [Accessed on 25 June 2021] 39 Law of Ukraine (1994). Forest Code of Ukraine, Law of Ukraine 3852-XII of 21 January (1994), Verkhovna Rada of Ukraine,
1994. Available online: https://zakon.rada.gov.ua/laws/main/3852-12#Text [Accessed on 25 June 2021] 40 Law of Ukraine (2017). On Amendments to Certain Legislative Acts of Ukraine on the Protection of Virgin Forests under the
Framework Convention for the Protection and Sustainable Development of the Carpathians, Law of Ukraine 2063-VIII of 23 May
(2017), Verkhovna Rada of Ukraine, 2017. Available online: https://zakon.rada.gov.ua/laws/show/2063-19#Text [Accessed on 25
June 2021] 41 Law of Ukraine (2001). On Fauna, Law of Ukraine 2894-III of 13 December (2001), Verkhovna Rada of Ukraine, 2001.
Available online: https://zakon.rada.gov.ua/laws/show/2894-14#Text [Accessed on 25 June 2021]
Grassroots Journal of Natural Resources, Vol.4, No.3 (September 2021), p.79-93 | ISSN 2581-6853 | CODEN GJNRA9
Doi: https://doi.org/10.33002/nr2581.6853.040308
91 Yevhenii Suietnov, Elbis Tulina
(wild animals, their parts and products of their vital activity), but also their habitat and migration routes are
under protection (Art. 3). Moreover, Art. 36 of this Law, which determines the content of wildlife protection,
stipulates that such protection provides a comprehensive approach to studying the state, development and
implementation of measures to protect and improve the ecological systems in which the wildlife is located
and is an integral part (part 2). At the same time, one of the ways to protect animals is to prevent the invasion
of alien species of wild animals and to take measures to prevent negative consequences in the event of their
accidental penetration (Article 37).
Certain reservations regarding IAS are also contained in the Law of Ukraine ‘On Aquaculture’.42 It provides
definitions of aquaculture objects (aquatic organisms used for breeding, keeping and cultivation in
aquaculture conditions), their introduction (activity on the introduction of aquatic organisms (introducers)
into water bodies (their parts) located outside their natural habitat) and alien species of aquatic organisms
(species or subspecies of aquatic biological resources that appear outside their natural range and outside the
zone of their natural potential distribution) (Art. 1). Also it imposes on aquaculture entities the obligation to
prevent unauthorized, including accidental, ingress of alien and non-native species into water bodies (parts
thereof) (part 2 of Art. 5), and in the case of use of these species in the field of aquaculture to ensure their
uncontrolled spread in new habitats, the absence of negative impact on the state of populations of local
species of aquatic biological resources and the conditions of functioning of aquatic ecosystems (part 1 of
Art. 20).
Conclusion
The study concludes that, at the international level, the ecosystem approach can rightly be considered as the
basis for combating IAS, which is explicitly stated in Decision VI/23 of the COP to the CBD. EU
environmental policy also aims to regulate the implementation of the ecosystem approach to the IAS, as
evidenced by the Biodiversity Strategy 2030, which pays due attention to the implementation of the
ecosystem approach to achieve its objectives, including the control of the IAS.
Having ratified the CBD, Ukraine has taken international legal obligations to preserve and restore natural
ecosystems and the implementation of the ecosystem approach in environmental policy and law. Analysis
of Ukrainian environmental legislation shows that a positive trend towards the recognition of the ecosystem
approach in dealing with IAS is observed primarily among national environmental strategic documents.
Also important in this area should be the Biodiversity Strategy until 2030 and the National Strategy for the
management of invasive alien species of flora and fauna in Ukraine until 2030, which are currently in the
process of development and approval.
In contrast to the specified strategic documents, in other acts of Ukrainian environmental legislation, in
particular in the Law of Ukraine ‘On Environmental Protection’ and resource legislation (Land, Water,
Forest Codes of Ukraine, as well as the laws of Ukraine ‘On Flora’, ‘On Fauna’, etc.), the issues of IAS
control on the basis of the implementation of the ecosystem approach are regulated in fragments and
inconsistently and therefore need significant reform.
References
Danilov-Danil’jan, V.I., Losev, K.S. and Rejf, I.E. (2005). Pered glavnym vyzovom civilizacii: Vzgljad iz
Rossii. Moscow: INFRA-M. Available online:
http://lit.lib.ru/r/rejf_i_e/peredglawnymwyzowomciwilizacii.shtml [Accessed on 25 June 2021]
42 Law of Ukraine (2012). On Aquaculture, Law of Ukraine 1593-VI 0f 18 September (2012), Verkhovna Rada of Ukraine, 2012.
Available online: https://zakon.rada.gov.ua/laws/main/5293-17#Text [Accessed on 25 June 2021]

Grassroots Journal of Natural Resources, Vol.4, No.3 (September 2021), p.79-93 | ISSN 2581-6853 | CODEN GJNRA9
Doi: https://doi.org/10.33002/nr2581.6853.040308
92 Yevhenii Suietnov, Elbis Tulina
European Commission (2020). EU Biodiversity Strategy to 2030: Returning Nature to Our Lives. Address
by the Commission to the European Parliament, the Council, the European Economic and Social
Committee and the Committee of the Regions (unofficial adapted translation into Ukrainian from
English O Osypenko; ed. and adapt. A. Kuzemko et al.). Chernivtsi: Druk Art, 2020, 36, 6.
Genovesi, P. and Shine, C. (2004). European strategy on invasive alien species. Nature and environment,
No. 137. Strasbourg: Council of Europe Publishing. Available online:
https://www.cbd.int/doc/external/cop-09/bern-01-en.pdf [Accessed on 25 June 2021]
Getman, A., (2019). Ekolohichne pravo. Kharkiv: Pravo, 552, p.57.
Krämer, L. (2021). Managing Invasive Alien Species by the European Union: Lessons Learnt [Online First],
IntechOpen, DOI: https://doi.org/10.5772/intechopen.94548.
Krauss, U. (2010). Invasive alien species management in St. Lucia and Caribbean partner countries. In Actes
du Colloque Biodiversité insulaire: la flore, la faune et l’homme dans les Petites Antilles, Martinique,
196–206, 196.
Luque, G., Bellard, C., Bertelsmeier, C., Bonnaud, E., Genovesi, P., Simberloff, D. and Courchamp, F.
(2013). The 100th of the world’s worst invasive alien species. Biological Invasions, 16(5): 981–985.
DOI: https://doi.org/10.1007/s10530-013- 0561-5.
McNeely, J.A., Mooney, H.A., Neville, L.E., Schei, P. and Waage, J.K. (2001). Global Strategy on Invasive
Alien Species. IUCN Gland, Switzerland, and Cambridge, UK, 50.
Perelet, R.A. (2006). Ekosistemnyiy podhod k upravleniyu prirodopolzovaniem i prirodoohrannoy
deyatelnostyu. Mechanism of Economic Regulation, 1: 36–53.
Puzanova, T.A. (2010). Jekologija: uchebnoe posobie. Moscow: ‘Izdatel’stvo ‘Jekonomika’, 287 p., 132–
133.
Roy, H., Bacher, S., Essl, F., Adriaens, T., Aldridge, D., Bishop, J., Blackburn, T., Branquart, E., Brodie,
J., Carboneras, C., Cottier-Cook, E., Copp, G., Dean, H., Eilenberg, J., Gallardo, B., Garcia, M.,
García‐Berthou, E., Genovesi, P., Hulme, P., Kenis, M., Kerckhof, F., Kettunen, M., Minchin, D.,
Nentwig, W., Nieto, A., Pergl, J., Pescott, O., M. Peyton, J., Preda, C., Roques, A., Rorke, S., Scalera,
R., Schindler, S., Schönrogge, K., Sewell, J., Solarz, W., Stewart, A., Tricarico, E., Vanderhoeven,
S., Velde, G., Vilà, M., Wood, C., Zenetos, A. and Rabitsch, W. (2018). Developing a list of invasive
alien species likely to threaten biodiversity and ecosystems in the European Union. Global Change
Biology, 25(3): 1032–1048. DOI: https://doi.org/10.1111/gcb.14527.
Shine, C., Williams, N. and Gundling, L. (2000). A Guide to Designing Legal and Institutional Frameworks
on Alien Invasive Species. IUCN, Gland, Switzerland Cambridge and Bonn, 138, 17–18.
Smith, A.L., Bazely, D.R. and Yan, N. (2013). Are legislative frameworks in Canada and Ontario up to the
task of addressing invasive alien species? Biological Invasions, 16(7): 1325–1344.
The Ecology Book (2019). Big Ideas Simply Explained. Foreword by T. Juniper. DK, 2019. 354 p., 270.
Wittenberg, R. and Cock, M.J.W. (eds.). (2001). Invasive alien species: a toolkit of best prevention and
management practices. CAB International, Wallingford, Oxon, UK, 228, 32–33.
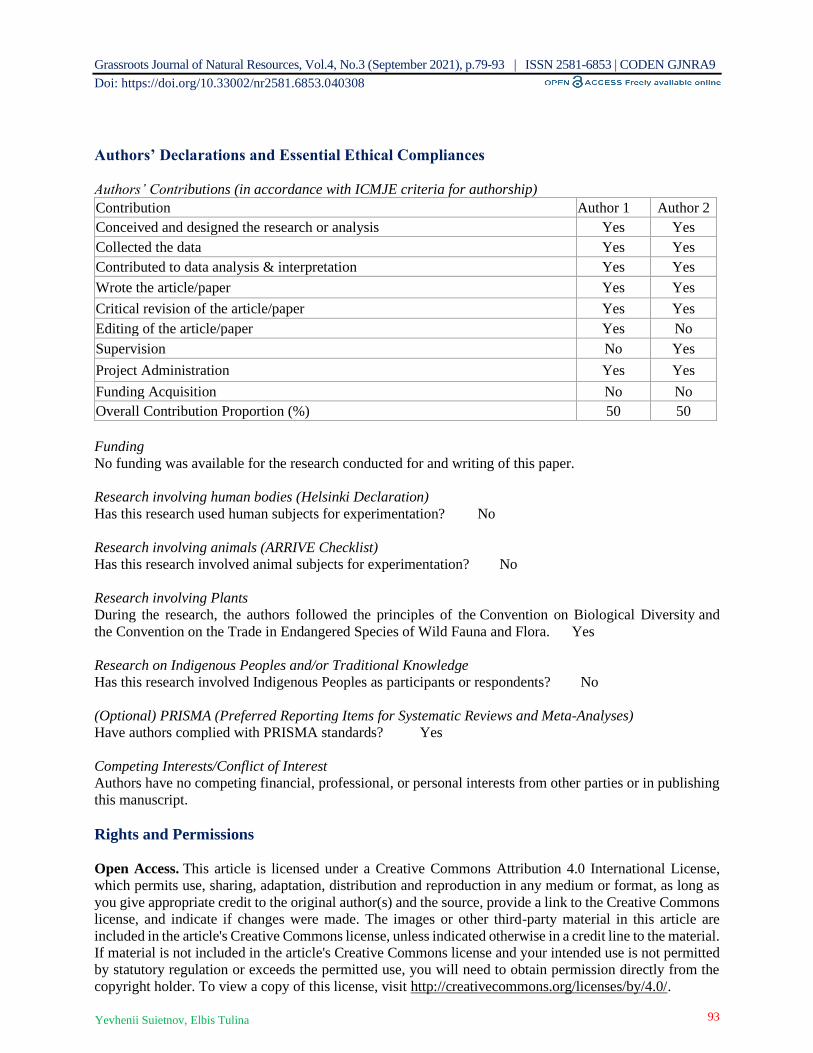
Grassroots Journal of Natural Resources, Vol.4, No.3 (September 2021), p.79-93 | ISSN 2581-6853 | CODEN GJNRA9
Doi: https://doi.org/10.33002/nr2581.6853.040308
93 Yevhenii Suietnov, Elbis Tulina
Authors’ Declarations and Essential Ethical Compliances
Authors’ Contributions (in accordance with ICMJE criteria for authorship)
Contribution Author 1 Author 2
Conceived and designed the research or analysis Yes Yes
Collected the data Yes Yes
Contributed to data analysis & interpretation Yes Yes
Wrote the article/paper Yes Yes
Critical revision of the article/paper Yes Yes
Editing of the article/paper Yes No
Supervision No Yes
Project Administration Yes Yes
Funding Acquisition No No
Overall Contribution Proportion (%) 50 50
Funding
No funding was available for the research conducted for and writing of this paper.
Research involving human bodies (Helsinki Declaration)
Has this research used human subjects for experimentation? No
Research involving animals (ARRIVE Checklist)
Has this research involved animal subjects for experimentation? No
Research involving Plants
During the research, the authors followed the principles of the Convention on Biological Diversity and
the Convention on the Trade in Endangered Species of Wild Fauna and Flora. Yes
Research on Indigenous Peoples and/or Traditional Knowledge
Has this research involved Indigenous Peoples as participants or respondents? No
(Optional) PRISMA (Preferred Reporting Items for Systematic Reviews and Meta-Analyses)
Have authors complied with PRISMA standards? Yes
Competing Interests/Conflict of Interest
Authors have no competing financial, professional, or personal interests from other parties or in publishing
this manuscript.
Rights and Permissions
Open Access. This article is licensed under a Creative Commons Attribution 4.0 International License,
which permits use, sharing, adaptation, distribution and reproduction in any medium or format, as long as
you give appropriate credit to the original author(s) and the source, provide a link to the Creative Commons
license, and indicate if changes were made. The images or other third-party material in this article are
included in the article's Creative Commons license, unless indicated otherwise in a credit line to the material.
If material is not included in the article's Creative Commons license and your intended use is not permitted
by statutory regulation or exceeds the permitted use, you will need to obtain permission directly from the
copyright holder. To view a copy of this license, visit http://creativecommons.org/licenses/by/4.0/.
Biomass Production and Nutrient Accumulation by Natural Rubber
(Hevea brasiliensis Wild. Ex A. Juss.) Müell. Arg. Clones in a Humid
Tropical Area in South India
Kannattuvadakkethil Krishnankutty Ambily*1, Arumugham Ulaganathan2 1Agronomy/Soils Division, Rubber Research Institute of India, Rubber Bard P.O, Kottayam, Kerala, India.
Email: [email protected] | ORCID: 0000-0002-8814-6463 2Agronomy/Soils Division, Rubber Research Institute of India, Rubber Bard P.O, Kottayam, Kerala, India.
Email: [email protected] | ORCID: 0000-0002-8814-6463
*Corresponding author
Abstract Natural rubber (Hevea brasiliensis Wild. Ex A. Juss.) Müell.
Arg. is an important commodity crop grown in world over for
industrial raw material rubber latex for various products, mainly
tyre manufacturing. Hevea propagation is through clones
evolved by breeding as cultivars with desired characters. This
article presented the biomass and nutrient accumulation of four
important Hevea clones viz. RRII 105, RRII 118, RRII 203 and
GT1 at 30 years age. Biomass and nutrient concentration of tree
components viz. trunk, branches, leaf and root were assessed by
uprooting the trees in the field and standing trees using
allometric equation. Among the different clones, RRII 118 and
GT1 recorded higher biomass compared to RRII 105 and RRII
203. Above-ground biomass (88-93 per cent) varied more than
below-ground biomass (7-11 per cent). The high yielding clones
had higher leaf and root biomass. Drought tolerant and timber
clones viz. RRII 118 and RRII 203 recorded higher K and high
yielding clone RRII 105 had higher Ca accumulation. Biomass
removal of these clones may lead to deficiency of K and Ca in
soil and hence needs the external supplements. The relation of
high Ca content and leaf disease of fungal origin is promising
for further studies. The higher accumulation of iron and
manganese indicated the tolerance of Hevea to these elements
and possibility of phytoremediation. The per cent contribution
of nutrients to total biomass varied less between clones and was
below 3 percent at the age of 30 years and this is evidence of
adjustments in proportions of nutrients in Hevea irrespective of
clonal variations.
Keywords Biomass; Nutrient accumulation; Tree components; Hevea clones
How to cite this paper: Ambily, K.K. and
Ulaganathan, A. (2021). Biomass Production and
Nutrient Accumulation by Natural Rubber (Hevea
brasiliensis Wild. Ex A. Juss.) Müell. Arg. Clones
in a Humid Tropical Area in South India. Grassroots
Journal of Natural Resources, 4(3): 94-110. Doi:
https://doi.org/10.33002/nr2581.6853.040309
Received: 25 June 2021
Reviewed: 28 July 2021
Provisionally Accepted: 31 July 2021
Revised: 19 August 2021
Finally Accepted: 27 August 2021
Published: 30 September 2021
Copyright © 2021 by author(s)
This work is licensed under the Creative
Commons Attribution International
License (CC BY 4.0).
http://creativecommons.org/licenses/by/4.0/
Grassroots Journal of Natural Resources, Vol.4 No.3 (September 2021) ISSN 2581-6853 | CODEN: GJNRA9 | Published by The Grassroots Institute
Website: http://grassrootsjournals.org/gjnr | Main Indexing: Web of Science
M – 00246 | Research Article
ISSN 2581-6853 | 4(3) Sep 2021
Grassroots Journal of Natural Resources, Vol.4, No.3 (September 2021), p.94-110 | ISSN 2581-6853 | CODEN GJNRA9
Doi: https://doi.org/10.33002/nr2581.6853.040309
95 Kannattuvadakkethil Krishnankutty Ambily, Arumugham Ulaganathan
Introduction
Natural rubber (NR) tree (Hevea brasiliensis Wild. Ex A. Juss.) Müell. Arg. is unique in the production of
natural rubber, and it contributes almost 99 per cent of the requirements of the natural rubber in the world
(Perron et al., 2021; Karunaichamy and Rajagopal, 2020). It is an important commercial source of natural
rubber latex (Hytonen et al., 2019) and is a forest tree species native to Brazil found in the Amazon River
basin (Rekha et al., 2016). It is included in family Euphorbiacea as a monocotyledon and growing in
perennial nature with long duration of 30-32 years. The rubber tree is a quick growing sturdy tree with a tall
trunk and thick canopy prevailing in tropical conditions. Rubber plants take 4 to 5 years for canopy closure
and grow to full sized trees in 15 to 20 years (Karthikakuttyamma, 1997). The harvesting crop is the latex
that flows from the bark of the tree by a systematic wounding called tapping. The productive economic life
of rubber trees (Joseph and Jacob, 2020) is around 25-30 years. After 30-32 years the trees are cut down
and replanted with new clones. Natural rubber (NR) is one of the major commodity crops in the economy
of India because of its huge industrial application of which the important ones are the tyre manufacturing
and export of value-added products (James et al., 2018). In India, NR cultivation and establishment of large
plantations were initiated more than one hundred years ago, and rubber cultivation is mainly confined (85
per cent) to the state of Kerala (Pradeep et al., 2020). Development of a clone is done by breeding
programme (Abraham and Mydin, 2020; Chandra et al., 2020) through the selection of the desired
characters. The clones are the modified versions of plants to improve latex, the economic produce of the
rubber tree, and other secondary characters like drought cold and disease tolerance. Propagation of the
rubber tree is vegetative through budding of the scion portion into the stock plant of the earlier raised
seedlings from sprouted seeds. The clones are used as the important planting material having different
varieties for rubber cultivation. Tree crops are more important for higher biomass production and nutrient
accumulation with long residence in the soil (Perron et al., 2021). The quantification of biomass, nutrient
reserve and partitioning characteristics of trees accounts towards the site productivity, plant activity and
nutrient pattern (Jing et al., 2020). Beside these, an understanding about the biomass production, partitioning
and nutrient accumulation in various plant parts has an important role in nutrient budgeting for the
development of crop growth models and crop response for evolving strategies to enhance productivity
(Hytonen et al., 2019). However, the accumulation for each nutrient is different. Primarily, certain nutrients
are rich in concentration in certain plant varieties in accordance with the plant activities. The clone-wise
biomass production and nutrient accumulation of rubber are useful in nutrient budgeting and in
understanding the nutrient requirements of different rubber clones, role of nutrients to improve crop
production, tolerance to biotic and abiotic stress, resistance to diseases, and wood properties of the trees.
Biomass and nutrient accumulation data can be helpful in selecting the clones to use soil reserve judiciously.
Biomass data is also very important in estimating carbon stock and carbon sequestration capacity and,
thereby, in ascertaining the carbon crediting. Biomass and nutrient budgeting in clone RRII 105 at 20 years
age in the traditional region of Kerala was reported by Karthikakuttyamma et al. (2004). The information
on biomass and nutrient accumulation in different rubber clones deserves more attention because the data
on this domain is scanty. The clones selected for the present study perform differently in terms of yield
potential, stress tolerance, disease resistance and wood properties.
In view of above, the present study was aimed at studying the biomass characteristics, nutrient partitioning
and nutrient accumulation in the four important clones of Hevea to know the variation between clones for
exploring further the possibility of selection of suitable clones. The hypothesis of the study is that the clones
selected have variability in biomass production, nutrient characteristics, nutrient partitioning, nutrient
accumulation and related plant properties.
Grassroots Journal of Natural Resources, Vol.4, No.3 (September 2021), p.94-110 | ISSN 2581-6853 | CODEN GJNRA9
Doi: https://doi.org/10.33002/nr2581.6853.040309
96 Kannattuvadakkethil Krishnankutty Ambily, Arumugham Ulaganathan
Materials and Methods
Site characteristics
The location of the study was the Central Experimental Station (CES) of The Rubber Research Institute of
India, Rubber Board located at Chethackal in Pathanamthitta district, the south-eastern district of Kerala (9o22
N and 76o50 E and 100 msl), India. The region received average annual rainfall of 3500 mm generally, with
mean minimum and maximum air temperature of 22.4o C and 30.8o C, respectively, under humid tropical
climate. The soil comes under the classification of clayey-skeletal, kaolinite, isothermic and Ustic
Kanhaplohumult is the international classification name of type of a soil with a depth of 100 cm (NBSS-LUP,
1999). The general soil nutrient status was high in organic carbon (2.52 per cent), medium in available P (14
mg kg-1 soil) and medium in available K (92.5 mg kg-1). The soil pH was 4.95, which is strongly the acidic.
Experimental design
Four important clones of natural rubber (Hevea brasiliensis) Müell. Arg., viz. RRII 105, RRII 118, RRII 203
and GT1, were selected for the study. The first three clones were evolved through breeding by the Rubber
Research Institute of India (RRII) and the fourth one was an Indonesian clone Gondang Tapen (GT) brought
to India under clone exchange programme. The clone RRII 105 is the popular clone included as the
category1(officially released for planting after small scale, large scale and multi-locational on-farm
evaluations) of the approved clone recommendations of the Rubber Board. It occupies 85 per cent of the total
area under cultivation in India. It is widely cultivated in the traditional belt (extending from Kanyakumari
district of Tamil Nadu state in the south through Kerala to Coorg district of Karnataka state in the north) and
non-traditional region in India (viz. North-Eastern, Konkan and Eastern region). Traditional regions are having
congenial agro-climatic conditions for rubber cultivation. In the non-traditional region, the soil is suitable but
the climatic constraints like severe drought, cold stress and wind events, are the limitations. The clones RRII
203 and GT 1 are included in category 11 (allowed for planting in 50 per cent of the total area along with
another 50 per cent under category 1 clones). RRII 118 is in category 111 (superior clones with proven merits
and limited for planting for the experimental purpose) as reported by Mydin et al. (2017). To evolve the clones
for the experiment, the seeds collected from the approved seed garden were germinated and seedlings were
raised. The bud patches of scion portion were grafted and multiplied to make plants of each clone for the
purpose of planting in the main field. The plants were grown through the immature phase (1-7 years), mature
phase (7th year onwards) and latex harvesting stage (7th or 8th year onwards) up to tree felling age at 30 years.
The trees were planted at a spacing of 4.9 m × 4.9 m in randomised block design (RBD) with 5 replications
during June-July 1985. All cultural operations including establishment of leguminous ground cover Pueraria
phaseoloides, regular weeding and spraying for disease management were followed uniformly as per the
recommendations of the Rubber Board (1980). Since this is a clone evaluation trial, the management practices
were identical for all the clones. Rubber has specific manurial practices for the immature phase (1-7 years after
planting) and a mature phase (from 5th year onwards). Accordingly, the plants were dosed with 10-10-4-105
NPKMg fertilizer mixture, viz. 225 g plant-1, three months after planting during September-October, 450 g
plant-1 (in two equal splits during April-May and September-October during 2nd year and 4th year), and 550 g
plant-1during 3rd year. From 5th year onwards, uniform fertilizer dose of 30:30:30 NPK by urea (65 kg), rock
phosphate (150 kg) and muriate of potash (150 kg) on per hectare basis for mature trees (recommended dose)
were applied annually in two equal splits during April-May and September-October, covering all clones in the
productive yielding phase up to 25 years. Thereafter, no fertilizer was given to all the clones when they reached
to tree felling stage at 30 years age.
Tree sampling and analysis
Two trees of four different clones at 30 years age in the same location of an experimental field of clone trial
were selected for the study. Trees were uprooted and total height and girth at 150 cm from the bud union

Grassroots Journal of Natural Resources, Vol.4, No.3 (September 2021), p.94-110 | ISSN 2581-6853 | CODEN GJNRA9
Doi: https://doi.org/10.33002/nr2581.6853.040309
97 Kannattuvadakkethil Krishnankutty Ambily, Arumugham Ulaganathan
were taken as the basal parameters. Trees were divided into four morphological units as tree components,
viz. trunk, branches, leaf (small twigs and petiole) and root in each clone. This was used for the biomass
estimation and nutrient accumulation of clones. To assess the biomass, fresh weight of each component was
recorded immediately after felling by using appropriate weighing balance in the field itself to avoid moisture
loss. Representative sub-samples were taken from each component that were oven-dried at 650C for 72
hours and the dry weights were recorded. Using this, the total dry biomass of trunk, branches, leaves, and
root of each clone was estimated. A portion of trunk, branches, leaves and roots were taken for chemical
analysis to know the variation in nutrient concentration of these components. The per cent content of major-
and micronutrients of all these components was estimated using a known quantity of the ground samples
dried at 105oC for constant weight by applying standard procedures, viz., nitrogen (N) estimation by micro-
kjeldhal method using acid digestion and distillation, phosphorus (P) estimation and potassium estimation
by stannous chloride method using spectrophotometer and direct reading flame photometry respectively.
The calcium (Ca), magnesium (Mg), and micronutrients, viz. zinc (Zn), copper (Cu), manganese (Mn) and
iron (Fe), were estimated by direct reading atomic absorption spectrophotometer.
To determine the biomass and nutrient accumulation in more trees, 10 replicates of standing trees of each
clone. Thus, total 40 trees were selected at the same location. Girth (trunk) at 150 cm from the basal bud
patch of the trees was recorded. Using the girth values, the aboveground biomass of these standing trees
was determined by the Shorrock’s equation (Shorrock et al., 1965). Total above ground dry biomass (kg)
was 0.002604(G) ^ 2.7826), where ‘G’ is the girth (trunk) at 150 cm, which was validated (Ambily et al.,
2012) for the rubber clones in India. Similar method of the estimation of biomass using allometric equation
was reported for the coniferous and broadleaved mixed forest in north-eastern China (He et al., 2018) and
among Poplar SRC clones (Dinko et al., 2017). The allometric equation for biomass estimation was also
reported in Olea europaea, L. Subsp. cuspidate in Mana Angetu forest (Kebede et al., 2018) and mountain
moist evergreen forest in Mozambique (Lisboa et al., 2018). Using the per cent contribution of biomass to
the components (trunk, branches and leaf) of the uprooted trees, the corresponding biomass of the tree
components in standing trees were estimated. Root biomass was around 10 per cent irrespective of the clones
in the uprooted trees. Hence, to estimate the root biomass of standing trees, the corresponding root dry
biomass per cent of uprooted trees of each clone were used. From this, the total biomass (above-ground +
root) of standing trees of clones were calculated. A portion of sub-samples were collected from trunk,
branches, leaves and roots of the standing trees (10 numbers each) of every clone to determine the nutrient
concentration as per the method used for the uprooted trees. Nutrient accumulation was worked out by
multiplying the nutrient concentration with dry biomass derived for the standing trees. Contributions of
nutrients to the total dry biomass of the tree in each clone were also calculated.
Statistical analysis
Data were statistically analysed by one way analysis of variance (ANOVA) to compare the growth
parameters, biomass, nutrient accumulation and distribution in plant components. Total nutrient
accumulation in whole tree basis and contribution of nutrients to total biomass were also compared between
clones using one-way ANOVA. When the data were significant at the 5 per cent significant (p<0.05) level,
a multiple comparison by Duncan multiple range test (DMRT) were performed to describe the significant
level of the clones for all parameters. All values shown are mean values for each clone. Means with different
letters are statistically different (p<0.05). All analyses were conducted by OP stat (Sheorm, 1998).
Results
Growth
Growth characteristics (Table 1) were significantly different (p<0.05) among Hevea clones. Height recorded
were 10.9 m for RRII 105 and 14.7, 14.8 and 15.3, respectively, for RRII 118, RRII 203 and GT 1. The

Grassroots Journal of Natural Resources, Vol.4, No.3 (September 2021), p.94-110 | ISSN 2581-6853 | CODEN GJNRA9
Doi: https://doi.org/10.33002/nr2581.6853.040309
98 Kannattuvadakkethil Krishnankutty Ambily, Arumugham Ulaganathan
RRII (p=0.0001) height was recorded of the clone RR 105, and the height of other three clones was on par.
Girth was higher (p=0001) in RRII 118 (146.8 cm) and GT 1 (138.7 cm) than in RRII 203 (111.8) cm and
RRII 105 (103.8 cm). Moreover, it was observed that the same ratio of girth and height, which comes to
1:10, was observed for each of the clones except RRII 203 (of which the ratio was recorded slightly higher,
i.e., 1:13 (p=0.0001)).
Table 1: Growth characteristics (Height, Girth, Girth: height ratio, Shoot: root ratio and Root: shoot ratio
of clones viz. RRII 105, RRII 118, RRII 203 and GT1. All values showed are mean values. Means with
different letters are significantly different (p<0.05).
Clone Height (m) Girth (cm) Girth: height ratio Shoot: root ratio Root: shoot ratio
RRII 105 10.9b 103.8d 1:10b 8.01c 0.12a
RRII 118 14.7a 146.8a 1: 10b 10.62a 0.09a
RRII 203 14.8a 111.8c 1:13a 12.06d 0.08a
GT1 15.3a 138.7b 1:11b 14.39b 0.07a
Biomass and partitioning
The variation in biomass was observed in the clones. The biomass production and the yield potential, as per
the approved classification (Saraswathyamma et al., 2000), were found different in four clones under study.
The growth characteristics of RRII 105 was observed with tall trunk having good branches along with strong
union. On the other hand, RRII 118 was a vigorous clone with short trunk having prominent branches like
trunk along with secondary branches. In RRII 203, the trunk was long and straight with well distributed and
balanced canopy; but in GT1, the trunk was upright and slightly kinked with main branch long and acute
angled along with light secondary branches. The yield potentials of the clones viz. RRII 105, RRII 118, RRII
203 and GT1 reported by Saraswathyamma et al. (2000) were 2400, 1164, 1818, and 1400 kg-1ha-1 per year.
It was observed that the high biomass accumulating clones was not good in yield.
Significant biomass difference (Figure 1) and biomass partitioning per cent to the total biomass (Figure 2)
in plant components were observed between clones. The total dry biomass was 1214.43, 2489.09, 1102.29
and 2055.58 kg/tree for the clone RRII 105, RRII 118, RRII 203 and GT 1, respectively. Among the clones,
RRII 118 and GT1 recorded higher biomass (p=0.0001) compared to RRII 105 and RRII 203.
Figure 1: Dry Biomass accumulation (kg tree-1) (Total, Shoot and in plant components (Trunk, Branches,
Leaf and Root) of clones (RRII 105, RRII 118, RRII 203 and GT1). All values showed are mean values.
Means with different letters are significantly different (p<0.05).

Grassroots Journal of Natural Resources, Vol.4, No.3 (September 2021), p.94-110 | ISSN 2581-6853 | CODEN GJNRA9
Doi: https://doi.org/10.33002/nr2581.6853.040309
99 Kannattuvadakkethil Krishnankutty Ambily, Arumugham Ulaganathan
The clone RRII 203 recorded higher (p=0.0001) biomass (709.76 kg tree-1) and per cent contribution
(64.13 %) in trunk and recorded less biomass (289.31 kg tree-1) and per cent contribution (26.14 %) in
branches, compared to the clone RRII 118. RRII 118 recorded less biomass (489.67 kg tree-1) and per cent
contribution (19.67 %) in trunk and higher (p=0001) biomass (1752 kg tree-1) and per cent contribution
(70.39 %) in branches. But GT 1 and RRII 105 recorded an equal distribution: around 40 per cent in trunk
and branches. Higher (p=0.0001) leaf dry matter was recorded in RRII 105 (54.17 kg tree-1) and lowest in
RRII 203 (18.81 kg tree-1). Higher per cent leaf dry matter was observed in RRII 105 (4.46%), whereas
other clones recorded leaf dry matter of less than 2 per cent. Root biomass was higher (p=0.0001) in RRII
118 (214 kg tree-1) and lower in RRII 203 (84.41 kg tree-1). However, the per cent contribution was higher
in RRII 105 (11.1), while other clones recorded less than 10 per cent contribution of root biomass. When
comparing the clones, 88-93 per cent shoot biomass and 7-11 per cent root biomass was observed at the age
of 30 years. Shoot to root ratio in RRII 203 (12.1), GT 1 (11.1), and RRII 118 (10.6) is higher (p=0.0001)
than RRII 105 (8.1).
Figure 2: Biomass partitioning (%) of tree components in clone, RRI 105 (a), RRII 118 (b), RRII 203 (c)
and GT 1(d). The data label denotes the per cent values of plant components in each clone.
Nutrient concentration
Nutrient concentration in tree components (Figure 3a-i) varied among different clones. Significant variation
(p=0.0001) in nutrient concentration in tree components and between clones except N concentration in
branches and Fe concentration in root were observed. Some indications such as high K (p=0.0001) in trunk,
branches and leaf of RRII 118 and trunk of RRII 203 and high Ca (p=0.0001) in trunk and branches of RRII
105 is to be investigated further. Because RRII 118 and RRII 203 were known drought tolerant clones and
RRII 105 is the popular high yielding clone, the difference in K and Ca content observed in these clones
may be related to drought tolerance and yield, respectively. Therefore, this is to be considered for detailed
studies to investigate whether there is any relation of these nutrients with the drought tolerance or yield. For
the micronutrients also, there was significantly higher (p=0.0001) variation in Mn and Fe concentration in
a b
c d

Grassroots Journal of Natural Resources, Vol.4, No.3 (September 2021), p.94-110 | ISSN 2581-6853 | CODEN GJNRA9
Doi: https://doi.org/10.33002/nr2581.6853.040309
100 Kannattuvadakkethil Krishnankutty Ambily, Arumugham Ulaganathan
leaf of different clones. The clone RRII 118 recorded the highest (p=0.0001) Fe and Mn content in leaf. The
clone RRII 105 also recorded higher (p=0.0001) Fe content in leaf. This is an indication of tolerance of
these nutrients in rubber. The detailed study of the role of nutrients in rubber will enlighten further.
Table 2: Nutrient accumulation (N, P, K, Ca, Mg, Zn, Cu, Fe and Mn) of clones viz. RRII 105, RRII 118,
RRII 203 and GT1 on per tree basis in kilogram per tree (kg/tree) All values showed are mean values.
Means with different letters are significantly different (p<0.05). Nutrient accumulation in plant
components (trunk, branches, leaf and root) in g/kg.
Clone &
Tissues)
Nutrient accumulation (kg/tree)
N P K Ca Mg Zn Cu Fe Mn
RRII105
(Trunk)
(Branch)
(Leaf)
(Root)
7.91b
(4.29)
(4.11)
(36.19)
(6.06)
0.59d
(0.36)
(0.33)
(2.68)
(0.09)
5.88d
(4.24)
(3.87)
(10.56)
(8.45)
14.79a
(12.74)
(15.14)
(5.63)
(1.84)
1.45c
(1.34)
(0.81)
(2.46)
(1.49)
0.03c
(0.02)
(0.02)
(0.15)
(0.03)
0.01c
(0.01)
(0.01)
(0.02)
(0.01)
0.04c
(0.29)
(0.18)
(0.83)
(0.48)
0.08b
(0.05)
(0.07)
(0.45)
(0.03)
RRII118
(Trunk)
(Branch)
(Leaf)
(Root)
9.79a
(3.84)
(3.21)
(38.58)
(4.71)
1.12a
(0.35)
(0.40)
(2.79)
(0.16)
26.29a
(6.83)
(7.23)
(18.62)
(12.41)
7.11c
(4.37)
(2.31)
(7.51)
(2.66)
3.8b
(1.89)
(1.39)
(2.51)
(1.68)
0.05a
(0.02)
(0.01)
(0.18)
(0.01)
0.03a
(0.05)
(0.01)
(0.12)
(0.02)
0.47b
(0.33)
(0.12)
(0.91)
(0.32)
0.21a
(0.04)
(0.11)
(0.78)
(0.03)
RRII203
(Trunk)
(Branch)
(Leaf)
(Root)
5.01c
(4.11)
(3.52)
(34.04)
(5.09)
0.84c
(0.71)
(0.52)
(2.41)
(0.14)
10.41b
(11.7)
(3.17)
(14.74)
(13.15)
3.24d
(3.19)
(1.81)
(9.59)
(3.21)
1.58c
(1.67)
(0.54)
(5.01)
(1.66)
0.02d
(0.15)
(0.01)
(0.11)
(0.02)
0.01c
(0.01)
(0.02)
(0.08)
(0.02)
0.04c
(0.48)
(0.14)
(0.63)
(0.42)
0.04c
(0.03)
(0.03)
(0.51)
(0.03)
GT1
(Trunk)
(Branch)
(Leaf)
(Root)
9.65a
(4.41)
(3.81)
(34.95)
(3.83)
1.02b
(0.55)
(0.24)
(2.57)
(0.!7)
7.55c
(4.89)
(1.38)
(11.93)
(7.61)
9.87b
(5.94)
(3.71)
(11.29)
(1.86)
4.07a
(3.06)
(1.11)
(3.32)
(1.23)
0.04b
(0.16)
(0.01)
(0.19)
(0.01)
0.02b
(0.01)
(0.01)
(0.04)
(0.02)
0.63a
(0.42)
(0.19)
(0.36)
(0.24)
0.03d
(0.41)
(0.06)
(0.19)
(0.03)
(Values in parenthesis represents the nutrient content of tissues (g/kg)
Nutrient accumulation
The major and micronutrient accumulation, except Fe in root, in tree components (Figure 4a-i) varied among
different clones. Of the major nutrients, viz. N, P and Mg accumulation in trunk was higher (p=0.0001) in
GT 1. Similarly, higher (p=0.0001) K and Ca accumulation in trunk was recorded in RRII 203 and RRII
105, respectively. In branches, the higher (p=0.0001) accumulation of all nutrients compared to other clones
was observed in RRII 118. Since the accumulation of nutrients is also a function of the biomass of
components, the large biomass of branches in RRII 118 contributes to the higher accumulation of
corresponding nutrients. In leaf, N, P and Mg were higher (p=0.0001) in RRII 105; whereas lower K and
Ca were observed in RRII 203. In root, RRII 118 recorded higher (p=0.0001) N, K, Ca and Mg. Among the
clones, micronutrients viz. Zn, Fe and Mn accumulation in trunk was higher in GT1. The Cu was lowest in
RRII 105. In branches, all micronutrient accumulation was higher (p=0.0001) in RRII 118. In leaf, Zn and
Fe were higher (p=0.0001) in RRII 105 with higher (p=0.0001) Cu in RRII 118. In root, Zn, Cu and Mn
were higher (p=0.0001) in RRII118 compared to other clones. The nutrient accumulation is related to the
biomass characteristics and nutrient concentration of the plant components, and both contribute to the
observed differences among the clones. The role of nutrients to plant activities is to be further studied.
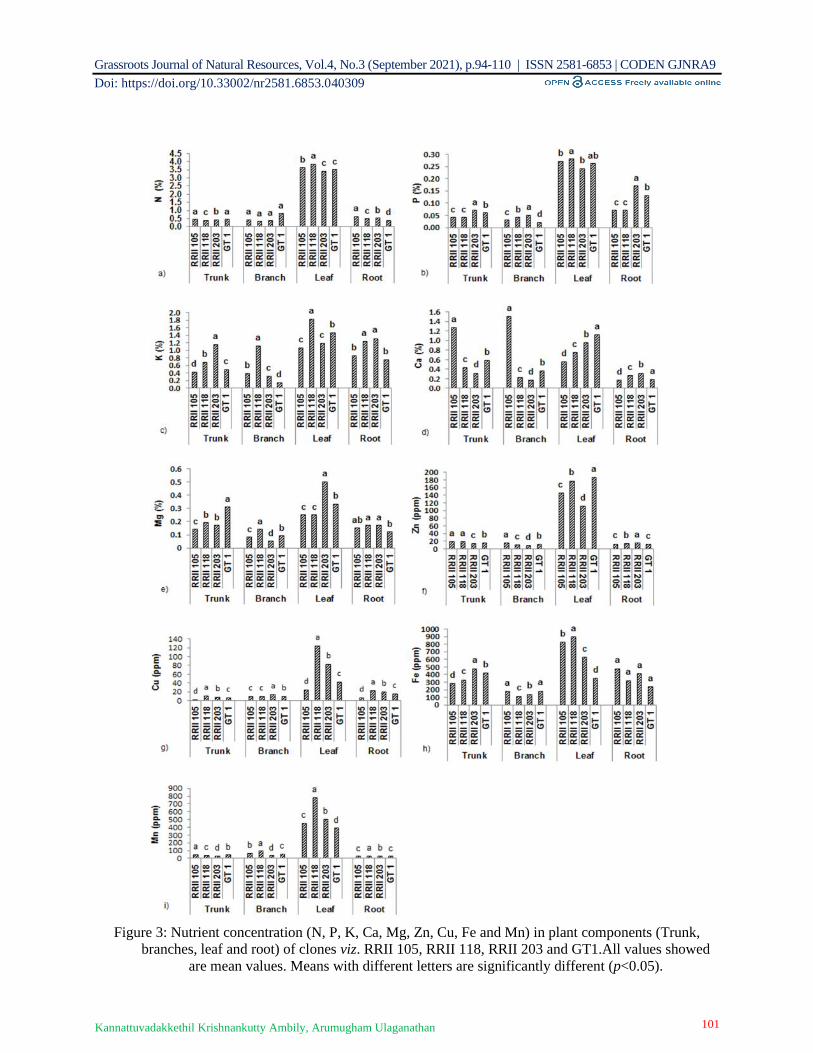
Grassroots Journal of Natural Resources, Vol.4, No.3 (September 2021), p.94-110 | ISSN 2581-6853 | CODEN GJNRA9
Doi: https://doi.org/10.33002/nr2581.6853.040309
101 Kannattuvadakkethil Krishnankutty Ambily, Arumugham Ulaganathan
Figure 3: Nutrient concentration (N, P, K, Ca, Mg, Zn, Cu, Fe and Mn) in plant components (Trunk,
branches, leaf and root) of clones viz. RRII 105, RRII 118, RRII 203 and GT1.All values showed
are mean values. Means with different letters are significantly different (p<0.05).

Grassroots Journal of Natural Resources, Vol.4, No.3 (September 2021), p.94-110 | ISSN 2581-6853 | CODEN GJNRA9
Doi: https://doi.org/10.33002/nr2581.6853.040309
102 Kannattuvadakkethil Krishnankutty Ambily, Arumugham Ulaganathan
Figure 4: Nutrient accumulation (N, P, K, Ca, Mg, Zn, Cu, Fe and Mn) in plant components (Trunk,
branches, leaf and root) of clones viz. RRII 105, RRII 118, RRII 203 and GT1.All values showed are mean
values. Means with different letters are significantly different (p<0.05).
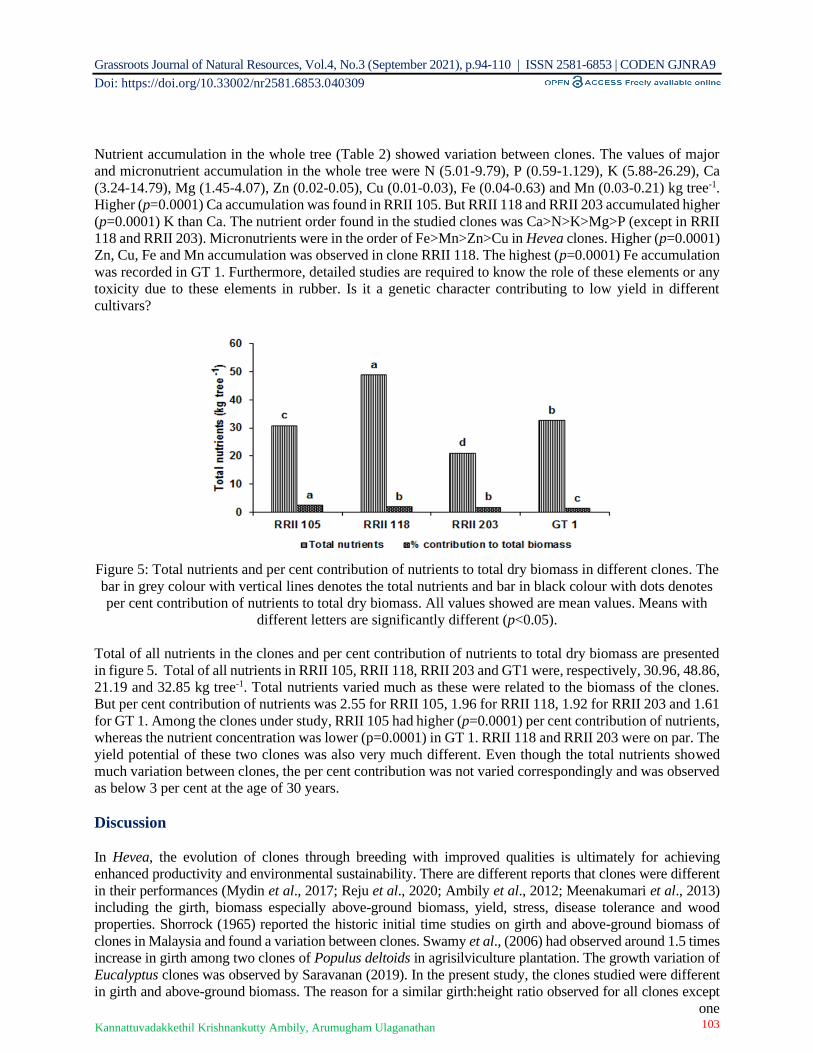
Grassroots Journal of Natural Resources, Vol.4, No.3 (September 2021), p.94-110 | ISSN 2581-6853 | CODEN GJNRA9
Doi: https://doi.org/10.33002/nr2581.6853.040309
103 Kannattuvadakkethil Krishnankutty Ambily, Arumugham Ulaganathan
Nutrient accumulation in the whole tree (Table 2) showed variation between clones. The values of major
and micronutrient accumulation in the whole tree were N (5.01-9.79), P (0.59-1.129), K (5.88-26.29), Ca
(3.24-14.79), Mg (1.45-4.07), Zn (0.02-0.05), Cu (0.01-0.03), Fe (0.04-0.63) and Mn (0.03-0.21) kg tree-1.
Higher (p=0.0001) Ca accumulation was found in RRII 105. But RRII 118 and RRII 203 accumulated higher
(p=0.0001) K than Ca. The nutrient order found in the studied clones was Ca>N>K>Mg>P (except in RRII
118 and RRII 203). Micronutrients were in the order of Fe>Mn>Zn>Cu in Hevea clones. Higher (p=0.0001)
Zn, Cu, Fe and Mn accumulation was observed in clone RRII 118. The highest (p=0.0001) Fe accumulation
was recorded in GT 1. Furthermore, detailed studies are required to know the role of these elements or any
toxicity due to these elements in rubber. Is it a genetic character contributing to low yield in different
cultivars?
Figure 5: Total nutrients and per cent contribution of nutrients to total dry biomass in different clones. The
bar in grey colour with vertical lines denotes the total nutrients and bar in black colour with dots denotes
per cent contribution of nutrients to total dry biomass. All values showed are mean values. Means with
different letters are significantly different (p<0.05).
Total of all nutrients in the clones and per cent contribution of nutrients to total dry biomass are presented
in figure 5. Total of all nutrients in RRII 105, RRII 118, RRII 203 and GT1 were, respectively, 30.96, 48.86,
21.19 and 32.85 kg tree-1. Total nutrients varied much as these were related to the biomass of the clones.
But per cent contribution of nutrients was 2.55 for RRII 105, 1.96 for RRII 118, 1.92 for RRII 203 and 1.61
for GT 1. Among the clones under study, RRII 105 had higher (p=0.0001) per cent contribution of nutrients,
whereas the nutrient concentration was lower (p=0.0001) in GT 1. RRII 118 and RRII 203 were on par. The
yield potential of these two clones was also very much different. Even though the total nutrients showed
much variation between clones, the per cent contribution was not varied correspondingly and was observed
as below 3 per cent at the age of 30 years.
Discussion
In Hevea, the evolution of clones through breeding with improved qualities is ultimately for achieving
enhanced productivity and environmental sustainability. There are different reports that clones were different
in their performances (Mydin et al., 2017; Reju et al., 2020; Ambily et al., 2012; Meenakumari et al., 2013)
including the girth, biomass especially above-ground biomass, yield, stress, disease tolerance and wood
properties. Shorrock (1965) reported the historic initial time studies on girth and above-ground biomass of
clones in Malaysia and found a variation between clones. Swamy et al., (2006) had observed around 1.5 times
increase in girth among two clones of Populus deltoids in agrisilviculture plantation. The growth variation of
Eucalyptus clones was observed by Saravanan (2019). In the present study, the clones studied were different
in girth and above-ground biomass. The reason for a similar girth:height ratio observed for all clones except
one

Grassroots Journal of Natural Resources, Vol.4, No.3 (September 2021), p.94-110 | ISSN 2581-6853 | CODEN GJNRA9
Doi: https://doi.org/10.33002/nr2581.6853.040309
104 Kannattuvadakkethil Krishnankutty Ambily, Arumugham Ulaganathan
clone being a timber clone with long straight trunk is found as a clone characteristic of Hevea. In the present
study, the root biomass was only slightly different as compared to the above-ground biomass, and the root
biomass was about 10 per cent irrespective of the clones. In earlier studies (Karthikakuttyamma, 1997), the
shoot to root ratio was reported to be 5.92 for the clone RRII 105 at 20 years age. Jessy (2008) reported that
the shoot to root ratio to be 4.81 for the clone PB 217 at 19 years age. The root to shoot ratios in these studies
were 0.17 and 0.21, respectively, which are different from the clones (0.1-0.12) at 30 years age used in the
present study. This indicated that there is age-wise difference existing in the shoot to root and root to shoot
ratios in rubber clones. Biomass partitioning of rubber is a species character as reported in other species where
the partitioning was in a different manner (Albaugh et al., 2006) having root to stem ratio of 0.7-0.5, 0.4 and
0.47 in Pinus taeda trees at three sites. Thus, shoot to root ratio is around 50 per cent in Pinus taeda trees.
Ludovici et al. (2002) reported that the root: stem ratio of 0.43 in loblolly pine was 30 per cent root and 70 per
cent shoot mass. In agrisilviculture plantations, the root to shoot ratio of Populus deltoids was different (0.2 to
0.35) between clones (Swamy et al. 2006). In rubber, a different pattern of partitioning was observed in the
present study. In Picea likiangensis, 14.8 per cent root biomass was reported at 32 years age in Southern China
(Davidson et al., 1999). The high biomass accumulated clones, viz. RRII 118 and GT 1, had lower yield
potential as reported in approved cultivar classification (Saraswathyamma et al., 2000). Therefore, the inverse
relation of biomass and yield was observed in clones of the present study.
The variation in biomass production, partitioning and per cent contribution to plant components of clones
was reported by many workers (Dinko et al., 2017; Swamy et al., 2006; Saravanan, 2019). Similar
observation of the higher branch biomass in the highest biomass accumulated clone was found in the hybrid
aspen (Populus tremula × P. tremuloides) clone (Hytonen et al., 2020). Variations in biomass partitioning
and per cent contribution to total biomass in clones was also found in Eucalyptus clones (Saravanan, 2019).
The clonal difference in nutrient concentration was reported in hybrid aspen (Populus tremula × P.
tremuloides) in Finland (Hytonen et al., 2020) and natural rubber Hevea in Thailand (Hytonen et al. 2019;
Hytonen et al., 2020) and was found different from the present study. This may be attributed as species and
location-wise difference. General order of macronutrient content of rubber tree observed (Karthikakuttyamma,
1997; Jessy, 2008) was Ca>N>K>Mg>P and the difference in the nutrient of two clones of the present study
can be attributed as a clonal character related to the different plant activities in these clones. The different
pattern of nutrient distribution in the tree Picea likiangensis in Southern China was reported by Liu et al.
(2004). Nagaraju et al. (1997) reported that the plant species differ in their nutrient elements in plant
components. Kleiber et al. (2019) have reported that the per cent nutrient content of Lime tree and Horse
chestnut tree differed in their health indicated the species specificity in nutrient pattern. In the present study,
there was variation in nutrient concentration in different plant components. The higher Ca in the trunk and
branches in the clone RRII 105, high K in all the plant components of clone RRII 118, high K in the trunk and
root of RRII 203 and high Ca and K in the leaf of clone GT1 may relate to different plant activities like yield
variation, drought tolerance, disease resistance and timber properties. Higher leaf K was reported as an index
of adaptation to drought stress in Hevea (Ambily et al., 2020). The observation of higher K in the clones of
the present study indicated the role of K in drought tolerant property in Hevea and can be further studied for
breeding for drought tolerant clones. The clone RRII 105 is a high yielding clone and RRII 118 and RRII 203
are drought tolerant. This may be a clone specific difference due to that the Ca content of plants is, to a large
extent, genetically controlled and little affected by the Ca supply in the root medium (Lungstrom and
Stjernqust, 1993). Higher Ca may be attributed as the higher plants often contain Ca in appreciable amounts.
Calcium is largely immobilized in cell walls and would be expected to accumulate with age (Lungstrom and
Stjernqust, 1993). It was reported (Fromm, 2010) that Ca and K application was beneficial for the formation
of wood in trees. The role of Ca and K is in cambial activity, xylem development and xylogenesis. The clones
already identified as timber clones had a high K in the present study; it is also somewhat related to the role of
K in wood formation in Hevea. The higher K content also relates to the drought tolerance and the observed
high leaf K and root K in RRII 118 and RRII 203 may be due to drought tolerant property of these clones. The
drought tolerant property of Hevea clones based on the physiological properties was reported by Neethu et al.

Grassroots Journal of Natural Resources, Vol.4, No.3 (September 2021), p.94-110 | ISSN 2581-6853 | CODEN GJNRA9
Doi: https://doi.org/10.33002/nr2581.6853.040309
105 Kannattuvadakkethil Krishnankutty Ambily, Arumugham Ulaganathan
(2021). Antony et al. (2018) reported that RRII 203 showed high K in leaf and root in the present study, which
had better performances in dry areas in Karnataka. This is also evidence of a relation of K and drought tolerant
properties of this clone. However, the clone RRII 105 with low K content was found as susceptible to more
leaf drying to drought stress also support the role of high K in drought tolerance of clones. As far as the leaf
diseases are considered, abnormal leaf fall and powdery mildew caused by Phytophthora palmivora and
Oidium hevea steinm, respectively, are the major crop loss resulting diseases in India (Mazlan et al., 2019).
Among the clones studied, the clone RRII 105 and GT1 were reported as resistant clones to phytophthora leaf
fall on prophylactic spraying (Edathil et al., 2000). In a recent report (Khompatara et al., 2019), Sargassum
polycystum, a seaweed extract, was found effective to increase resistance to the Phytophthora mediated leaf
fall disease in rubber seedlings. Bharat et al. (2018) reported that an alga, Sargassum polycystum, has the
elemental concentration of sodium (85.3 mg L-1), chlorine (75.02 mg L-1) and calcium (69 mg L-1) in higher
quantity and among this Ca was in appreciable quantity. This pointed out the role of Ca in controlling
Phytophthora leaf fall disease. The enhanced resistance may be due to high Ca content in these clones. Disease
control using chemical fertilizers usually have an adverse effect on the environment, soil and a reason for
toxicity of living beings associated (Khompatara et al., 2019). In consideration of these, the identification of
inherently resistant clones is more beneficial and easier as a control measure. Therefore, the observation of
high Ca in the clones can be a basis for the detailed study of the elemental role of Ca and further in the breeding
and selection of resistant clones. The nutrient order of macronutrient content of rubber clone RRII 105 and PB
217 observed was Ca>N>K>Mg>P (Karthikakuttyamma, 1997; Jessy, 2008). But the nutrient order in the
present study varied among clones even though clone RRII 105 and GT1 had similar order of macro nutrient
concentration. Similar order of nutrient elements was reported in orange trees (Mattos et al., 2003). Species
difference is evident as reported by Davidson et al. (1999) in the nutrient accumulation of the two species viz.,
Inga dens flora and Pollalesta discolor, in which nutrient order is N>K>Mg>P>Ca. This was different from
Hevea clones studied. Similar concentration pattern of Hevea clones except RRII 118 was reported in Apple
trees in Himachal Pradesh (Sharma and Bandari, 1995). Kumar et al. (2005) reported the nutrient concentration
in bamboo (Bambusa bambos) tree in a different manner from observed in Hevea.
Species difference was observed in the case of micronutrients also. The significant clonal difference in the
concentration of Zn and Cu was reported by Hytonen et al. (2020). In two tree species viz., Inga densiflora
and Pollalesta discolor, the micronutrient concentration was in the order of Mn>Fe>Zn>Cu (Davidson et
al., 1999), which was different from that observed in rubber. This may be attributed to the differences in the
uptake and metabolism, according to the requirement of the crops. Generally, Fe toxicity is happening when
Fe concentration exceeds 1,000 ppm. But in rubber, Fe concentration in the leaf itself was 899 ppm in clone
RRII 118 without toxicity symptoms. Mn is also very important in the sense that it is having biochemical
functions. Mn exceeding 160 ppm causes toxicity (Alejandio et al., 2020). In acidic soils high in manganese
availability, plants can take up considerable amounts of Mn so that levels in the order of 1,000 ppm Mn in
the dry matter are not uncommon (Alejandio et al., 2020). But when it exceeds 2,000 ppm, toxicity is often
observed. In the clone RRII 118, Mn concentration in the leaf was 780 ppm and in other three clones it
ranged from 387 to 499 ppm. Higher level of Fe and Mn in leaf in Hevea clones indicates that Hevea is
tolerant or accumulates these elements. Yan et al. (2020) reported the recent development of
phytoremediation, an eco-friendly technique for the removal of metal pollutants by growing plants having
ability to accumulate these elements. This indicated that the tolerance of higher Fe and Mn concentration in
Hevea may have the possibility for phytoremediation. The Zn and Cu concentration is comparatively less
in rubber. Usually, copper is taken up by plants in only a very small quantity. Pietrini et al. (2019) reported
that, in most of the plants, Cu is important in physiological functions in a concentration range of 3-20 ppm.
The nutrient requirement and role of nutrients is to be further explored in Hevea.
The total dry biomass (t/tree) in rubber tree in Thailand had 2.4, 0.2, 3.4, and 4.8 kg N, P, K, Ca, respectively,
and 380–700, 36–64, 530–980 and 750–1,360 kg per hectare basis (Hytonen et al., 2019). This was different
from the nutrient accumulation in plant components, total nutrients and per cent contribution of nutrients to
total dry biomass observed in Hevea. Usually in plant composition, C, H and O comes to around 94-99.5

Grassroots Journal of Natural Resources, Vol.4, No.3 (September 2021), p.94-110 | ISSN 2581-6853 | CODEN GJNRA9
Doi: https://doi.org/10.33002/nr2581.6853.040309
106 Kannattuvadakkethil Krishnankutty Ambily, Arumugham Ulaganathan
and nutrient composition is 0.5-6.0 per cent (Mills and Jones, 1996). In the present study, the nutrient
contribution was below 3 per cent and within this limit. The total nutrients and per cent contribution of
nutrients to total dry biomass in clones indicated that there were adjustments in the nutrient proportions as
a species characteristic of Hevea and related to the clonal characteristics like variation in growth, yield, and
disease and stress tolerance. This is to be further studied in detail to obtain confirmed results to relate the
biomass and nutrient accumulation with clonal characteristics. In the present study, clones were different in
biomass, nutrient concentration and nutrient accumulation. This is evidence of clonal variation in biomass
and nutrient accumulation in Hevea clones. The biomass and nutrient budget of the clone RRII 105 was
reported by Karthikakuttyamma et al. (2004), but the data for different clones is useful for the further
detailed study of the role of nutrients in rubber tree and for the nutrient management to clone-wise
recommendations judiciously for productivity enhancement and sustainability of rubber ecosystem.
Conclusion
The present study indicates that natural rubber (Hevea brasiliensis) clones differ in their biomass production
and nutrient accumulation. Biomass partitioning and nutrient distribution pattern was also varying in
different clones. Highest yielding clones (RRII 105 and RRII 203) recorded higher leaf and root biomass
compared to low yielding (RRII 118 and GT1) clones. The inverse relation of biomass and yield potential
was recorded in these clones. While above-ground biomass showed much variation, the below-ground
biomass not varied much and, irrespective of clones, about 10 per cent root biomass was observed. This was
found as a clone characteristic of Hevea. There were no characteristic variations in leaf concentration
between clones. High K content in the drought tolerant clones RRII 118 and RRII 203 may be related to
drought tolerance and timber properties. High Ca in high yielding clone RRII 105 is a relation of Ca to high
yield and high Ca in RRII 105 and GT 1 may be due to a tolerance to phytophthora leaf disease in Hevea.
The observed nutrient relation is pertinent in the relation of these nutrients in yield, wood properties, and
drought and disease tolerance. During biomass removal of these clones, there is a possibility of deficiency
of K and Ca in the soil. The per cent contribution of nutrients to total biomass varied less between clones
and was below 3 per cent at the age of 30 years for all clones and this is evidence of adjustments in
proportions of nutrients in Hevea. Higher accumulation of iron and manganese indicated that Hevea is
tolerant to these elements and is a potential for phytoremediation. Detailed study may provide more insight
into the relation of biomass and nutrient accumulation to various plant activities in rubber tree and different
clones of Hevea so as to utilize the soil reserves more efficiently and for further breeding to improved
varieties and selection of clones to increase the productivity of rubber.
Acknowledgements
The authors wish to express their gratitude to all the facilities provided by Rubber Research Institute of
India, Rubber Board, Kerala, India, and the services extended by the technical staff, analytical trainees and
supporting staff during field work and chemical analysis.
References
Albaugh, J.T., Allen, L.H. and Kress, W.L. (2006). Root and stem partitioning of Pinus taeda. Trees, 20:
176-185. DOI: http://dx.doi.org/10.1007/s00468-005-0024-4
Alejandro, S., Holler, S., Meier, B. and Peiter, E. (2020). Manganese in plants: From acquisition to
subcellular allocation. Frontiers of Plant Science, 11: 300. DOI:
https://doi.org/10.3389/fpls.2020.00300
Ambily, K.K., Meenakumari, T., Jessy, M.D., Ulaganathan, A. and Nair, N.U. (2012). Carbon sequestration
potential of RRII 400 series clones of Hevea brasiliensis. Rubber Science, 25(2):233-240.
Available online:
Grassroots Journal of Natural Resources, Vol.4, No.3 (September 2021), p.94-110 | ISSN 2581-6853 | CODEN GJNRA9
Doi: https://doi.org/10.33002/nr2581.6853.040309
107 Kannattuvadakkethil Krishnankutty Ambily, Arumugham Ulaganathan
http://www.rubberscience.in/download.php?id=8rhr6q20p55kufd9c22n1itng711 [Accessed on
22 August 2021]
Ambily, K.K., Mercy, M.A., Ravichandran, S. and Jessy, M.D. (2020) Leaf potassium content as an index
of adaptation to drought tolerance in Natural Rubber. Rubber Science, 33(2): 210-220. Available
online: http://rubberscience.in/download.php?id=6e5avr4bcqv9uv1cegj1sfn051869 [Accessed
on 22 August 2021]
Antony, D., Suryakumar, M. and Nazeer, M.A. (2018). Growth and yield performances of Hevea clones in
Karnataka. Rubber Science, 31(3): 208-216. Available online:
https://www.google.com/search?source=univ&tbm=isch&q [Accessed on 22 August 2021]
Bharat, B., Nimalraj, S., Mahendrakumar, M. and Perinbam, K. (2018). Biofertilizing efficiency of
Sargassum polycystum extract on growth and biochemical composition of Vigna radiate and
Vigna mungo. Asian Pacific Journal of Reproduction, 2008(7): 27-32. DOI:
https://doi.org/10.4103/2305-0500.220982
Chandra, U., Singh, R.P., Reju, M.J., Mydin, K.K. and Panda, D. (2020). Performances of new ortet selection
of Hevea brasiliensis in Meghalaya. Rubber Science, 33(2): 198-203. Available online:
http://rubberscience.in/download.php?id=n47cat5mifvq8jist29madbvs0867 [Accessed on 22
August 2021]
Davidson, R., Gagnon, D. and Mauffette, Y. (1999). Growth and mineral nutrition of the native trees
Pollalesta discolor and the N-fixing Inga densiflora in relation to the soil properties of a
degraded volcanic soil of the Ecuadorian Amazon. Plant & Soil, 208: 135-147. Available online:
http://www.jstor.org/stable/42949497 [Accessed on 22 August 2021]
Dinko, V., Davorin, K., Ivan, A., Tin, T., Ivana, P.V. and Zeljko, Z. (2017). Biomass yield and fuel
properties of different Poplar SRC clones. Croation Journal of Forest Engineering, 40(2): DOI:
https://doi.org/10.5552/crojfe.2019.678.
Edathil, T.T., Jacob, C.K. and Joseph, J. (2000). Leaf Diseases. In: Natural Rubber: Agro management and
crop processing. (Eds. P.J. George and C. Kuruvilla Jacob), Rubber Research Institute of Indi,
Kottayam, pp. 273-296. Available online:
https://www.researchgate.net/publication/281443022_ [Accessed on 22 August 2021]
Fromm, J. (2010). Wood formation of trees in relation to potassium and calcium nutrition. Tree Physiology,
30(9): 1140-1147. DOI: https://doi.org/10.1093/treephys/tpq024
He, H., Zang, C., Zhao, X., Fousseni, F., Wang, J., Dai, H., Yang, S. and Zho, Q. (2018). Allometric biomass
equation for 12 tree species in Coniferous and broadleaved mixed forests, North-eastern China.
PLos ONE, 13(1): e0186226. DOI: https://doi.org/10.1371/journal.pone.0186226
Hytonen, J., Egbert, B. and Anneli, V. (2020). Biomass allocation and nutrient content of hybrid aspen clone
grown on former agricultural land in Finland. Scandinavian Journal of Forest Research, 35(3-
4): 147-155. DOI: https://doi.org/10.1080/02827581.2020.1751269
Hytonen, J., Nurmi. J., Kaakkurivaara, N. and Kaakkurivaara, T. (2019). Rubber tree (Hevea brasiliensis)
biomass, nutrient content and heating values in southern Thailand. Forests, 10(638): 1-11. DOI:
https://doi.org/10.3390/f10080638
Jessy M.D. (2008). Phosphorous nutrioperiodism in rubber. Ph.D. Thesis, Kerala Agricultural University,
Trivandrum, India, p.170. Available online:
http://www.kau.in/sites/default/files/documents/hand_book_2013_0.pdf [Accessed on 23
August 2021]
Joseph, J. and Jacob, M.K. (2020). Preparation of quality sheets from ammonia preserved field latex. Rubber
Science, 33(2): 221-227. Available online:
http://rubberscience.in/download.php?id=u96gmtlhpjr2imdq04adjrfrj7870 [Accessed on 25
August 2021]
Karthikakuttyamma, M. (1997). Effect of continuous cultivation of rubber (Hevea brasiliensis) on soil
properties. PhD Thesis, Kerala Agricultural University, Trivandrum, India, 176p. Available
online: http://www.kau.in/sites/default/files/documents/hand_book_2013_0.pdf [Accessed on
29 August 2021]
Grassroots Journal of Natural Resources, Vol.4, No.3 (September 2021), p.94-110 | ISSN 2581-6853 | CODEN GJNRA9
Doi: https://doi.org/10.33002/nr2581.6853.040309
108 Kannattuvadakkethil Krishnankutty Ambily, Arumugham Ulaganathan
Karthikakuttyamma. M., Sathisha, G.C., Suresh, P.R. and Aiyer, R.S. (2004). Biomass production and
nutrient budgeting of Hevea brasiliensis in south India. Rubber Science, 17(2): 108-114.
Karunaichamy, K. and Rajagopal, R. (2020). Response of low frequency controlled upward tapping in the
yield stimulation in clone RRII 118. Rubber Science, 33(3): 275-283. Available online:
http://rubberscience.in/download.php?id=kps6btqb91tg5pu534nvh1npk4876 [Accessed on 28
August 2021]
Kebede, B. and Soromessa, T. (2018). Allometric equation for above-ground biomass estimation of Olea
europea. L. Subsp. Cuspidate in Mana Angetu Forest. Ecosystem Health and Sustainability, 4:
1-12. DOI: https://doi.org/10.1080/20964129.2018.1433951
Khompatara, K., Pettonkho, S., Kuyyogsuy, A., Deenamo, N. and Churngchow, N. (2019). Enhanced
resistance to leaf fall disease caused by Phytophthora palmivora in rubber tree seedlings by
Sargassum polycystum extract. Plants, 8(6): 168. DOI: https://doi.org/10.3390/Plants8060168.
Kleiber, T., Krzyzaniak, M., Swierk, D., Haenel, A. and Galecka, S. (2019). How does the content of
nutrients in soil affect the health status of trees in city parks? PLoS ONE, 14(9): DOI:
https://doi.org/10.1371/journal.Pone.0221514.
Kumar, B.M., Rajesh, G. and Suheesh, K.G. (2005). Above-ground biomass production and nutrient uptake
of thorny bamboo (Bambusa bamboo (L) in the home gardens of Thrissur, Kerala. Journal of
Tropical Agriculture, 43(1-2): 51-56. Available online:
http://jtropag.kau.in/index.php/ojs2/article/view/134 [Accessed on 27 August 2021]
Lisboa, S.N., Guedes, B.S., Ribeiro, N. and Sitoe, A. (2018). Biomass allometric equation and expansion
factor for a mountain moist evergreen forest in Mozambique. Carbon Balance and Management,
13(23): DOI: https://doi.org/10.1186/s13021-018-00111-7
Liu, X., Xu, H., Berninger, F., Luukkanen, O. and Li, C. (2004). Nutrient distribution in Picea likiangensis trees
growing in a plantation in West Sichuan, Southwest China. Silva Fennic, 38(3): 235-242. Available
online: http://elektra.helsinki.fi/se/s/0037-5330/38/3/nutrient.pdf [Accessed on 20 August 2021]
Ludovici, K.H., Stanley J.Z., and Richer, D.D. (2002). Modelling in situ pine root decomposition using data
from 60- year chronosequence. Canadian Journal of Forest Research, 32: 1675-1684. Available
online: https://www.srs.fs.usda.gov/pubs/ja/ja_ludovici003.pdf [Accessed on 20 August 2021]
Lungstrom, M., and Stjernquist, I. (1993). Factors toxic to beech (Fagus sylvatica L) seedlings in acid soils.
Plant and Soil, 157: 19-29. DOI: https://doi.org/10.1007/BF00038744
Mattos Jr., D., Quaggio, J.A., Cantarella, H. and Alva., A.K. (2003). Nutrient content of biomass
components of Hamlin Sweet Orange Trees. Scientia Agricola, 60(1): 155-160. DOI:
https://doi.org/10.1590/S0103-90162003000100023
Mazlan, S., Jaafar, N.M., Wahab, A., Sulaiman, Z., Rajandas, H. and Zulperi, D. (2019). Major diseases of
Rubber (Hevea brasiliensis) in Malaysia. Pertanika Journal of Scholarly Research Reviews,
5(2): 20-23.
Meenakumari, T., Jayasree, C.E., Gireesh, T., Reghu, C.P., Thomas, V. and Mydin, K.K. (2013). Variation
in Timber volume, wood properties of high yielding RRII 400 series clones of Hevea
brasiliensis. Rubber Science, 26(2): 238-249. Available online:
http://www.rubberscience.in/download.php?id=snc6npi1poq13jmq253sasot9059 [Accessed on
18 August 2021]
Mills, A.H. and Jones, Jr, B.J. (1996). Plant Analysis Handbook. ii. Athens, Georgia: Micro Macro
Publishing, Inc. No. 581.13 M657. Available online:
https://www.scirp.org/(S(351jmbntvnsjt1aadkposzje))/reference/ReferencesPapers.aspx?Refere
nceID=1396938 [Accessed on 22 August 2021]
Mydin, K.K., Meenakumari,T., Narayanan, C., Thomas, V., Gireesh, T., Suryakumar, M., Antony, D.,
Idikkula, S.P., A. Mandal., Dey, S.K., Das, G., Krishnan, B., Singh, M and Jacob, J. (2017).
Region-specific advisory on Hevea clones suited to traditional and non-traditional rubber
growing areas in India, Rubber Science, 30(2): 95-110.

Grassroots Journal of Natural Resources, Vol.4, No.3 (September 2021), p.94-110 | ISSN 2581-6853 | CODEN GJNRA9
Doi: https://doi.org/10.33002/nr2581.6853.040309
109 Kannattuvadakkethil Krishnankutty Ambily, Arumugham Ulaganathan
Nagaraju, A. and Prasad, K.S.S. (1997). Accumulation of major and trace elements in certain native plants
from a part of Nellore mica schist belt, Andhra Pradesh. Journal of the Indian Society of Soil
Science, 45(3): 596-599.
NBSS-LUP (1999). Resource soil survey and Mapping of Rubber growing soils of Kerala and Tamil Nadu.
National Bureau of Soil Survey and Land Use Planning (NBSS-LUP), Nagpur, India, 295p.
Petrini, F., Carnevale, M., Beni, C., Zacchim, M., Gallacci, F. and Santeangelo, E. (2019). Effect of different
copper levels on growth and morpho-physiological parameters in Giant Reed (Arundo donax.
L.) in semi–hydrophonic mesocosm experiment. Water, 11(1837): DOI:
https://doi.org/10.339/w11091837.
Pradeep, B., Jacob, J. and Annamalainathan, K. (2020). Current status and future prospects of mapping
rubber plantation in India. Rubber Science, 33(2): 127-139. Available online:
http://rubberscience.in/download.php?id=d8vnbjsu07erqqijei1eb0dkj7861 [Accessed on 02
August 2021]
Rekha, K., Nazeem, P.A., Venkatachalam, P., Jayasree, R., Sobha, S., Akshara, S.R., Mathew, S. and
Sushamakumari, S. (2016). Expression of stress tolerance in transgenic callus integrated with
osmotin gene in Hevea brasiliensis. Rubber Science, 29(2): 140-152. Available online:
http://www.rubberscience.in/download.php?id=bqnfkh3hcbd99oqo8t7pg3uc17706 [Accessed
on 03 August 2021]
Rubber Board (1980). Manuring of Rubber: Rubber Grower’s Companion. Rubber Board, Kottayam, India,
pp. 14-21. Available online: http://rubberboard.org.in/rbfilereader?fileid=349 [Accessed on 12
August 2021]
Saraswathyamma, C.K., Licy, J. and Marattukulam, J.G. (2000). Planting materials. In: Natural rubber:
Agro management and crop processing. (Eds.), P.J. George and C. Kuruvilla Jacob), Rubber
Research Institute of India, Kottayam, pp. 59-74. Available online: https://agris.fao.org/agris-
search/search.do?recordID=XF2015047224 [Accessed on 22 August 2021]
Saravanan, S. (2019). Dry matter production in Eucalyptus clones. International Journal of Agriculture,
Environment and Biotechnology, 12(4): 381-387. Available online:
https://www.indianjournals.com/ijor.aspx?target=ijor:ijaeb&volume=12&issue=4&article=014
[Accessed on 22 August 2021]
Sharma, J.C. and Bandari, A.R. (1995). Mineral Nutrient Status of Apple Orchards in Himachal Pradesh.
Journal of India Society of Soil Science, 43(2): 236-241. Available online:
https://www.semanticscholar.org/paper/Mineral-nutrient-status-of-apple-orchards-in-Shimla-
Awasthi-Bhutani/124f2d4d1664b6e7d1c7e946f9c919c092cae225 [Accessed on 26 August 2021]
Sheoram, O.P., Tonk, D.S., Kaushik, L.S., Hasija, R.C. and Pannu, R.S. (1998). Statistical Software Package
for Agricultural Research Workers. Recent Advances in information theory, Statistics &
Computer Applications by D.S. Hooda & R.C. Hasija Department of Mathematics Statistics,
CCS HAU, Hisar. p.139-143. DOI: https://doi.org/14.139.232.166/opstat/
Shorrocks, V.M. (1965). Mineral Nutrition, Growth and Nutrient Cycle of Hevea brasiliensis IV. Clonal
variation in girth with reference to shoot dry weight and nutrient requirements. Journal of Rubber
Research Institute of Malaya, 19(2): 93-97. Available online:
http://vitaldoc.lgm.gov.my:8060/vital/access/services/Download/vital1:24012/ARTICLE
[Accessed on 01 August 2021]
Shorrocks, V.M., Templeton, J.K and Iyer, G.C. (1965). Mineral Nutrition, Growth and Nutrient Cycle of
Hevea brasiliensis III. The relationship between girth and shoot dry weight. Journal of Rubber
Research Institute of Malaya, 19 (2): 85-92. Available online:
http://vitaldoc.lgm.gov.my:8060/vital/access/services/Download/vital1:24012/ARTICLE
[Accessed on 29 August 2021]
Yan, A., Wang, Y., Tan, S.N., Yousof, M.L.M., Ghosh, S. and Chen, Z. (2020). Phytoremediation: A
promising approach for revegetation of heavy – metal polluted land. Review. Frontiers of Plant
Science, 30: DOI: https://doi.org/10.3389/flps.2020.00359.

Grassroots Journal of Natural Resources, Vol.4, No.3 (September 2021), p.94-110 | ISSN 2581-6853 | CODEN GJNRA9
Doi: https://doi.org/10.33002/nr2581.6853.040309
110 Kannattuvadakkethil Krishnankutty Ambily, Arumugham Ulaganathan
Authors’ Declarations and Essential Ethical Compliances
Authors’ Contributions (in accordance with ICMJE criteria for authorship)
Contribution Author 1 Author 2
Conceived and designed the research or analysis Yes Yes
Collected the data Yes Yes
Contributed to data analysis & interpretation Yes Yes
Wrote the article/paper Yes No
Critical revision of the article/paper Yes Yes
Editing of the article/paper Yes No
Supervision No Yes
Project Administration Yes Yes
Funding Acquisition No No
Overall Contribution Proportion (%) 65 35
Funding
Common fund allotted to the Rubber Research Institute of India by Ministry of Commerce, Govt. of India
is used for this research work.
Research involving human bodies (Helsinki Declaration)
Has this research used human subjects for experimentation? No
Research involving animals (ARRIVE Checklist)
Has this research involved animal subjects for experimentation? No
Research involving Plants
During the research, the authors followed the principles of the Convention on Biological Diversity and
the Convention on the Trade in Endangered Species of Wild Fauna and Flora. Yes
Research on Indigenous Peoples and/or Traditional Knowledge
Has this research involved Indigenous Peoples as participants or respondents? No
(Optional) PRISMA (Preferred Reporting Items for Systematic Reviews and Meta-Analyses)
Have authors complied with PRISMA standards? Yes
Competing Interests/Conflict of Interest
Authors have no competing financial, professional, or personal interests from other parties or in publishing
this manuscript.
Rights and Permissions
Open Access. This article is licensed under a Creative Commons Attribution 4.0 International License,
which permits use, sharing, adaptation, distribution and reproduction in any medium or format, as long as
you give appropriate credit to the original author(s) and the source, provide a link to the Creative Commons
license, and indicate if changes were made. The images or other third-party material in this article are
included in the article's Creative Commons license, unless indicated otherwise in a credit line to the material.
If material is not included in the article's Creative Commons license and your intended use is not permitted
by statutory regulation or exceeds the permitted use, you will need to obtain permission directly from the
copyright holder. To view a copy of this license, visit http://creativecommons.org/licenses/by/4.0/.

The Potential Role of the Artificial Intelligence in Combating Climate Change
and Natural Resources Management: Political, Legal and Ethical Challenges
Olena Lozo*1, Oleksii Onishchenko2
1Department of Environmental Law, Yaroslav Mudryi National Law University, Kharkiv, Ukraine.
E-mail: [email protected]| ORCID: 0000-0002-2789-533X 2 Department of Environmental Law, Yaroslav Mudryi National Law University, Kharkiv, Ukraine.
E-mail: [email protected]| ORCID: 0000-0002-0369-9334
*Corresponding author
Abstract The aim of the article is to study the role of artificial
intelligence (AI) in solving current issues of climate change,
environmental protection and natural resources management.
The advantages and threats of using AI for the development
of political and legal parameters for ensuring the safe and
effective implementation of technological system, as well as
ensuring sustainable control over its functioning and
development trends, are analyzed. The relevance of the topic
is substantiated by the fact that the legislative basis in this
area is at the early stage of formation, while the scale of the
impact of AI on all the aspects of social life may be
impossible to accurately foresee. A special attention is paid
to the analysis of the legal regulation of these issues in the
context of European Union and Ukraine. The present work is
one of the few that addresses three issues: climate change, the
growing influence of artificial intelligence, and the
possibility of legal regulation of the use of AI to solve urgent
environmental problems without threatening the fundamental
human rights and freedoms.
Keywords Climate change; Artificial intelligence; Environmental policy;
EU law; Adaptation of Ukrainian legislation
How to cite this paper: Lozo, O. and
Onishchenko, O. (2021). The Potential Role of the
Artificial Intelligence in Combating Climate
Change and Natural Resources Management:
Political, Legal and Ethical Challenges. Grassroots
Journal of Natural Resources, 4(3): 111-131. Doi:
https://doi.org/10.33002/nr2581.6853.040310
Received: 01 July 2021
Reviewed: 29 July 2021
Provisionally Accepted: 05 August 2021
Revised: 29 August 2021
Finally Accepted: 03 September 2021
Published: 30 September 2021
Copyright © 2021 by author(s)
This work is licensed under the Creative
Commons Attribution International
License (CC BY 4.0).
http://creativecommons.org/licenses/by/4.0/
Grassroots Journal of Natural Resources, Vol.4 No.3 (September 2021) ISSN 2581-6853 | CODEN: GJNRA9 | Published by The Grassroots Institute
Website: http://grassrootsjournals.org/gjnr | Main Indexing: Web of Science
M – 00247 | Review Article
ISSN 2581-6853 | 4(3) Sep 2021
Grassroots Journal of Natural Resources, Vol.4, No.3 (September 2021), p.111-131 | ISSN 2581-6853 | CODEN GJNRA9
Doi: https://doi.org/10.33002/nr2581.6853.040310
112 Olena Lozo, Oleksii Onishchenko
Introduction
Climate change is among the most urgent global problems of the present. The founder of Microsoft Bill
Gates declared climate change the main threat to humanity after the COVID-19 pandemic, which can cause
even higher death rates (Gates, 2020).The United Nations Intergovernmental Panel on Climate Change
(IPCC) issued a Special Report in October 2018 about global warming, identifying its catastrophic
consequences, such as rising levels of seas and oceans, melting glaciers and flooding coastal areas and
islands, abnormal events such as hurricanes, floods, more frequent and intense droughts and storms,
desertification of land and a decrease in crop yields due to the depletion of water supplies, which, in turn,
will exacerbate regional tensions and conflicts (IPCC, 2018).
In order to avoid the extreme impacts of a 2°C global temperature rise, the IPCC calls for a 45% decrease
of greenhouse gas emissions by 2030 and 100% by 2050, which can be done only by unprecedented changes
in all aspects of social life. The case of the United States of America should be highlighted. It has the highest
carbon emission from transport (29%), energy (28%), industry (22%), commercial and residential
construction (12%), and agriculture (9%) (United States Environmental Protection Agency, 2020). Thus,
certain options of reducing negative consequences and adaptation to them were proposed by the joint effort
of experts and politicians (Mulvaney, 2019).
Several international negotiations on possible solutions of the climate change problem have taken place
together with the framework international laws have been adopted. In 1992, the United Nations Framework
Convention on Climate Change (UNFCCC) laid the foundation for international cooperation to minimize
extent of the climate change. In 1997, the Kyoto Protocol on the Reduction of Greenhouse Gas Emissions
was approved (United Nations, 1997). In 2015 the Paris Agreement was adopted (the first universal
instrument in order to transit to a low-carbon global economy), where from 2020 a global action plan was
fixed in order to limit the warming, which is a lot below 2°C (United Nations, 2015). In 2019, the World
Meteorological Organization published a report on state of the climate from the period of 2015 till 2019.It
clearly demonstrated that countries are not meeting their international commitments to reduce greenhouse
gas emissions, and climate change is happening faster than scientists have predicted (WMO, 2019).
The current search for the solution for the climate change, which is happening in information society (Raban,
Gordon and Geifman, 2011; Duff, 2015; Martins et al., 2019; Filippova, 2021), is impossible without the
development of cognitive bases and systemic technologies of AI, including the field of ecology,
environmental policy and law. The EU High-Level Expert Group on Artificial Intelligence declare that the
artificial intelligence is “a software (and possibly also hardware) systems designed by humans that, given a
complex goal, act in the physical or digital dimension by perceiving their environment through data
acquisition, interpreting the collected structured or unstructured data, reasoning on the knowledge, or
processing the information, derived from this data and deciding the best action(s) to take to achieve the
given goal. The AI systems can either use symbolic rules or learn a numeric model, and they can also adapt
their behavior by analyzing the environment which is affected by their previous actions”. Moreover, “AI
refers to systems that display intelligent behavior by analyzing their environment and taking actions with
some degree of autonomy to achieve specific goals. The AI-based systems can be purely software-based,
acting in the virtual world (e.g., voice assistants, image analysis software, search engines, speech and face
recognition systems) or the AI can be embedded in hardware devices (e.g., advanced robots, autonomous
cars, drones or Internet of Things applications)” (European Commission, 2019).
Considering the civilization significance of the AI and its growing role in solving the key problems facing
mankind nowadays, it is vitally important to legally define the status of AI for ensuring its effective
management system and regulate its functions. Legitimization of the AI as a new level of social organization
presupposes its unconditional control by the society with a continuous legal and technical correction of the
virtual reality, which has become its derivative. It is undisputable that AI should be trustworthy as it has
Grassroots Journal of Natural Resources, Vol.4, No.3 (September 2021), p.111-131 | ISSN 2581-6853 | CODEN GJNRA9
Doi: https://doi.org/10.33002/nr2581.6853.040310
113 Olena Lozo, Oleksii Onishchenko
enormous social impact and, thus, it is a matter of great importance that the use of AI is grounded on
fundamental human rights and values. It is also necessary to analyze the problem of climate change and the
way the AI technologies affect it. There are many different ways AI can be used for combating climate
change. However, a number of environmental, ethical and political issues arise. One of the key issues that
will be reviewed in this article is the need for an integral system of legislative acts that should regulate a
universal conceptual and categorical apparatus, fundamental principles and rules of the creation, testing,
implementation, application and closing of such projects and the establishment of legal responsibility for
possible negative consequences.
Methodology
This article presents an analysis of publications on various aspects of the AI use for combating climate
change and the implementation of behavioral models that optimize the relationship between humankind and
nature, minimizing the negative impact of AI. The examples of successful use of artificial intelligence to
deal with the urgent issues of climate change are provided. This is followed by an overview of the challenges
of AI use in the context of environmental protection, with an emphasis on those factors that directly affect
the climate, as well as the political and ethical issues related to the problem of climate change. This research
is based on the general scientific methods of analysis, systems approach, synergetic and modelling. Finally,
the issue of legal regulation of the AI use in the European Union and Ukraine and the development prospects
of legislation in this area are considered in detail. Particular scientific methods of specific sociological
research and comparative legal research were used in order to collect, analyze, and process the legal
information and to optimize the legislative regulation of the AI’s use for solving current environmental
issues.
Results and Discussion
Using the Artificial Intelligence to Tackle the Problem of Climate Change
The Artificial intelligence is considered the most important game-changing factor in global politics and
economics. The results of 2017 Geneva UN Artificial Intelligence Summit revealed that the AI may cause
positive changes to all aspects of human life. Additionally, it has been proposed to reorient AI’s application
options used for self-driving car, smart phones with voice and face recognition. This is seen as a means for
fundamental improvement of mankind supporting comprehensive actions to eradicate the lack of the food
and essential commodities, and to safeguard the natural environment (Muraleedharan, 2021). AI can predict
climate and provide global and individual weather reports more precisely by covering vast challenges such
as forecasting hurricanes, floods, droughts, simulation of former climatic situation and their social and
economic consequences. Recent research (Rasp, Pritchard and Gentine, 2018) showed that the artificial
intelligence and artificial neural networks successfully help in regulating difficult and local atmospheric
processes. For example, processes taking place at the origin and development of convective clouds and,
consequently, help with clarifying details, which ongoing models of climate metrics do not consider.
AI opens up some new possibilities for understanding the vast array of data obtained from many component
modellings of climate. Monteleoni et al. (2011) and McQuade and Monteleoni (2012) combine the predicted
situation of about 30 climate models the IPCC uses via computer learning algorithms. Improving the
accuracy of global climate simulations, the AI algorithms reduce and manage natural disaster (such as
extreme atmospheric events) risks, which are predicted to become more frequent and severe (McGovern et
al., 2017). Better forecasts are needed to develop effective climate policies, enable governments to adapt to
change and identify opportunities to cope with negative impacts. The AI algorithms increase preparedness
for environmental risks when quick and smart decisions are critical. The AI algorithms are used not only
for local natural events, but also for more global ones, as predicting coordination of the measures taken at
actual 2°C increase in global temperature. For example, Ise and Oba (2019) described the results of
Grassroots Journal of Natural Resources, Vol.4, No.3 (September 2021), p.111-131 | ISSN 2581-6853 | CODEN GJNRA9
Doi: https://doi.org/10.33002/nr2581.6853.040310
114 Olena Lozo, Oleksii Onishchenko
providing a neural network with global monthly temperatures over the past 30 years. The neural network
successfully predicts the changes of heat over the next 10 years with an accuracy of 97%. AI may also be
used to clarify the causes of climate change. Thus, in case of using satellite images, it is possible to identify
and map significant sources of CO2 emissions in countries that do not have reporting obligations.
One other sphere of using AI is managing droughts and other hydrological risks. UNESCO’s G-WADI
Geoserver application uses an artificial neural network (ANN) algorithm to obtain the value of precipitation
for current moment. This product is called ‘Precipitation Estimation from Remotely Sensed Information
using Artificial Neural Networks – Cloud Classification System’ (G-WADI PERSIANN-CCS). It is used
for informing, emergency planning and managing hydrological risks of natural causes. One can enter the
system by means of the iRain mobile application, which was designed to facilitate citizens’ participation to
collect local data for global rainfall monitoring (UNESCO, 2019). This application shows rainfall satellite
observations in real time, tracks extreme rainfall around the world, and gives local rainfall information by
using crowd sourcing data augmentation. AI can also be applied for demonstrating extreme weather effects
(Snow, 2019). In order to demonstrate comfortably visualized form for the community, experts at the
Montreal Institute for Learning Algorithms (MILA), Microsoft, and Conscient AI Labs used a GAN (a kind
of the AI) to model the probable looks of houses after damages by the sea level rise and more severe storms.
The plan includes launching an application in order to show people what their homes and neighborhoods
might look like in the future, with the various impacts of climate change.
Additionally, AI can be used for measuring and reducing CO2 emissions by optimizing existing systems.
Carbon Tracker, an independent financial analytical tank, tracks emissions from coal-fired power plants by
means of data, obtained from satellites, and convinces that such an industry is financially sub-optimal. This
technology can be used all over the world in places where monitoring is not carried out and there is no need
to obtain a permission. AI is also introducing new ways to measure the impact of factories by analyzing data
about local infrastructure and electricity being used. It is convenient for gas-fired power plants having no
readily measurable plumes like coal-fired power plants. Carbon Tracker is going to be used for analyzing
emissions for 4,000-5,000 power plants and is expected to create the largest data bank making information
publicly available. If a carbon tax is imposed in the future, Carbon Tracker can help set the price for
emissions and can find the emission producers.
Microsoft Company has found another solution by creating autonomous underwater data centers, which are
controlled by the artificial intelligence. Ocean is used for cooling, while energy of the waves is used for
powering (Roach, 2020). Also, the AI can accelerate research of nuclear fusion reactors, which could
provide a safe and carbon-free alternative to unsustainable power generation. The AI can regulate and
optimize energy consumption with smart buildings that use built-in sensors for energy efficient
consumption. Such energy consumption can be significantly reduced with the help of the AI, by taking into
account the predicted weather, building congestion and other environmental conditions to adjust the needs
of a local indoor infrastructure. Moreover, such buildings are capable of regulating the energy consumption
if low-carbon electricity is in short supply. These innovations are especially relevant to urban spaces, as
they are projected to ensure that at least 60% of the humanity in the world will live in such houses by 2050
and are extremely resource intensive. The AI is also used for optimizing electricity-required processes. One
of such cases is Google's Deep Mind artificial intelligence that helped organizations reduce their data
center’s energy consumption by 40% and to become more energy-efficient by cutting greenhouse gas
emissions. Further, the AI can be successfully used for the industrial emission control and waste
management. With the help of advanced learning tolls and intellectual networks, deviations from industry
standards and government regulations can be traced. For example, IoT technology has been implemented in
some industrial plants, connected with low temperature keeping devices.
Other similar AI-powered Earth applications are iNaturalist and eBirds, which gather information from a
wide range of experts on species’ populations, ecosystems, and the ways of migration. These products are

Grassroots Journal of Natural Resources, Vol.4, No.3 (September 2021), p.111-131 | ISSN 2581-6853 | CODEN GJNRA9
Doi: https://doi.org/10.33002/nr2581.6853.040310
115 Olena Lozo, Oleksii Onishchenko
important for improving the findings and saving of freshwater and marine ecosystems. Intelligent
agricultural solutions are also worth mentioning. Namely, the agricultural technology startup PEAT in
Berlin created the Plantix application, which detects probable problems in soil. American companies
AWhere and FarmShots use self-learning program in conjunction with satellites to obtain weather forecast,
to investigate crop resilience, and to assess farms for disease and pests.
It is noteworthy that AI is already being used to optimize clean energy development. In the Amazon Basin,
hydroelectric dam constructors usually develop one dam at a time without a long-term strategy. A group of
experts created an AI simulation to find dam sites that can produce the lowest greenhouse gas emissions.
The AI model has identified more complex and surprising set of proposals for reducing greenhouse gas
emissions than ever before (Cornell University, 2019). In the current situation of more than one billion
people having no electricity, the AI can help with electricity supply by giving the possibility to use it and
organizing zero-carbon electrification by means of isolated micro-grids (Ritchie, 2019). In 2019, AI and
machine learning experts published a document titled “Tackling Climate Change with Machine Learning”
(Rolnick et al., 2019). The authors of the report were consulted by renowned experts (Hao, 2019). The
document suggests 13 areas in which machine learning can be deployed: electricity systems, transportation,
buildings and cities, industry, farms and forests, carbon dioxide removal, climate prediction, societal
impacts, solar engineering, individual action, collective decisions, education, finance. Several points from
the report are considered as under:
▪ Improving energy forecasts and collecting infrastructure data is especially relevant to the transition
for more renewable energy sources. The AI can identify construction marks and properties from
satellite data to use computer self-learning program to detect how much energy is consumed at the
city level. These techniques can determine buildings to be upgraded in order to make them more
effective.
▪ Creation of the new materials. Machine learning accelerates the development of materials that store,
collect and use energy more efficiently by researching new chemical structures with the properties
which are required. The AI can take into account all limits, look through all known materials and
combinations and suggest the best available variation. For example, Airbus has developed a new
3D printed aircraft detail which is not as heavy as the original one, but requires less raw materials,
and is stronger, and also reduces CO2 emissions during flight (Autodesk, 2016).
▪ Optimization of cargo delivery routes and supply chain. Machine learning can help to find the ways
to combine as many cargoes as possible and to minimize overall travel and some emissions. Better
forecasts of supply and demand for goods may reduce wastage during their production and
transportation.
▪ Advancing electric vehicles. The AI can improve battery management (charging life and fill-up
times) and optimize the transportation system due to more environmentally friendly driving and
cars’ use for reducing carbon footprint.
▪ Improving tracking of deforestation. The satellite images and programming products may process
information оn tree cover loss on a much larger scale as well as chainsaw sound detection algorithms
may cause the law enforcement agencies to stop illegal activities faster.
The AI is already a common thing in our daily lives, and it is already beneficial for environmental
management. All of the abovementioned examples are only some of many possible ways AI can drive
the transition to green sustainable development. With the growing demand for automating solutions to
environmental problems, it is the obligation of the government, private and public organizations to fund
research and development associated with such technologies and ensure standardization, which is
required for their production and application. However, the AI is not the only universal method of
combating climate change. Nevertheless, while technology is undoubtedly helping generate solutions
to the climate change problem, it is not a magic wand and requires joint international action, taken by
climate, technical and AI experts as well as politicians, engineers, AI specialists, entrepreneurs and
Grassroots Journal of Natural Resources, Vol.4, No.3 (September 2021), p.111-131 | ISSN 2581-6853 | CODEN GJNRA9
Doi: https://doi.org/10.33002/nr2581.6853.040310
116 Olena Lozo, Oleksii Onishchenko
governments. By tracking environmental impacts and linking them to human performance, the AI may
be of a high importance for designing, implementing and enforcing environmental laws, regulations and
policies.
Problematic Aspects of Using Artificial Intelligence in the Context of Environmental Protection
The Artificial intelligence can and must help create more nature-friendly and sustainable environment as
well as combat climate change. However, this potentiality raises some questions related to ecological,
political and ethical issues (Coeckelbergh, 2020b).
The problem of materials and energy consumption. Machine AI learning requires a large amount of data,
and energy that is used to process it and store. Some computing types use more power than others. According
to the study by the University of Massachusetts, single NLP (natural-language-processing) model can emit
the equivalent of about 300,000 kg of carbon dioxide, which is five times more than a car produces in its
lifetime (Strubell, Ganesh and McCallum, 2019; Matheson, 2020). Although AI has a great potential to
minimize consumption and make grid-related efficiency optimized, it will still be a major consumer of
electricity. According to research, data centers now require more than 2% of the world's electricity (Pearce,
2018), and scientists predict that, by 2025, this amount is expected to grow between 8% and 21% (Andrae
and Edler, 2015; Andrae, 2017; Giles, 2019). A study by Belkhir and Elmeligi (2018) indicates that the
estimated global footprint in 2020 may be compared to the impact of the aviation industry and greater than
that of Japan (the fifth largest pollutant in the world).
In response to criticism, data centers were transformed into more efficient form and now they run, at least
partly, from renewable energy sources. Google, Amazon and Microsoft have begun investing in renewable
energy and AI to improve energy efficiency. The introduction of AI server farms powered by renewable
resources, the development of general-purpose artificial intelligence neural networks, and more are the ways
researchers are reducing their carbon footprint (Gent, 2020). But is this investment sufficient to offset the
impact of these technologies on the environment and climate at all levels? The vast majority of big
companies still relies on fossil fuels and is not subject to environmental control in the pursuit of efficiency.
For example, the report from the “Green Peace Clicking Clean” revealed that all of the major streaming
companies, namely, Amazon Prime, HBO and Netflix use less than 22% renewable energy. And Northern
Virginia, being the base for the largest number of data centers on the planet, is operated by a utility company
with only 1% of its electricity coming from renewable sources (Cook et al., 2017). With the appearance of
wasteful cryptocurrency mining (Hern, 2018) and 5G networks forced on realizing the Internet of Things,
data and traffic collection is already accelerating (Hazas et al., 2016). Moreover, production of electrical
devices requires not only big energy expenditure but also intensive mining of raw materials, the same as
plastic used for producing devices and its packaging.
The artificial intelligence and the fossil fuel industry. Some large tech companies are selling their carbon-
intensive AI services designed to do easier and more efficient oil and resource production. Amazon attracts
new clients through programs such as Predicting the Next Oil Field in Seconds with Machine Learning.
Microsoft hosted “Empowering Oil & Gas with AI” (Microsoft News Center, 2018) and Google Cloud
works with companies in fossil fuel field. C3 IoT, an artificial intelligence actor, that initially helped drive
the transformation to a renewable energy society, is now helping major oil and gas companies accelerate
fossil fuel extraction (C3 AI, 2019). The Guardian recently explored the role of large technologies in
supporting the fossil fuel market, highlighting that the huge recourses technology companies are investing
into actions that oppose climate legislation and advocate climate change denial (Kirchgaessner, 2019).
Non-transparency of information. When researchers and policymakers tried to account for the impact of
technology on climate, they faced the problem of extremely small amount of available information. The
authors of the Greenpeace report (Cook et al., 2017) say that very few companies are revealing new metrics

Grassroots Journal of Natural Resources, Vol.4, No.3 (September 2021), p.111-131 | ISSN 2581-6853 | CODEN GJNRA9
Doi: https://doi.org/10.33002/nr2581.6853.040310
117 Olena Lozo, Oleksii Onishchenko
concerning the use of dirty and clean energy. Amazon WebServices serve nearly 50% of the global cloud
services market. The report stated that the company remained “almost completely opaque about the energy
footprint of its massive operations.” This gives millions of organizations using AWS the ability to measure
and report their own energy and carbon footprint. This non-transparency not only makes it difficult to hold
large companies accountable, but also creates a critical barrier for efficient energy in all fields where digital
technology is used.
As the AI has to be more ecologically responsible and safe for the climate it is required to increase awareness
among its users and data working specialists to support additional method surveys, which will make an
ecosystem of energy around the AI more visible. Wolff-Anthony, Kanding and Selvan (2020) have
suggested that energy and carbon print have to be showed together with usual producing standards. Among
the ethical problems of AI use, it is the lack of privacy and protection of data security, lack of clarity about
responsibility, lack of ability, and irreproachability. The ethical principles were suggested and discussed by
scientists (Floridi et al., 2018; Dignum, 2019; Coeckelbergh, 2020a). Special consultation organizations
flagged, for example, collaboration of experts in the AI and professional community (e.g., IEEE), which
performed according to the global initiation in ethics. These problems have to be solved, no matter how the
artificial intelligence can be used, including improving situation with climate change. Many reports
emphasize that humans need to be responsible for self-learning systems. Thus, nowadays, the focus on the
way the machine learning can produce or exacerbate the desired results for specific individuals and groups
- the effect which is of high importance to the ethics of machines in general (Guzman, 2021). It is worth
mentioning that some of the use of AI in environmental sphere can cause certain political problems, some
of which are further reviewed.
Political issues regarding freedom and behavior change. The AI can “nudge” people to behave more
climate-friendly, leading to a change in the “architecture of choice” (Thaler and Sunstein, 2008). Climate
nudging can become the basis for improving the environmental situation in the world. However, nudging
while maintaining freedom of choice does not save autonomy and rationality of people. But it is quite
questionable whether society is willing to pay such a big price for the sake of the probable environmental
benefits.
Using the AI to control humanity. To solve the climate change problem, it is proposed to establish a “green
government” which, with the help of the AI, may manage humanity and regulate countries and individuals
to achieve climate goals. This looks like a direct threat to human rights and freedoms. However, there are
examples of States that have managed to introduce environmental regulation, which, to some extent,
introduces certain limitation to improve the climate change situation, but leaves enough freedom. To give
the exact definitions for “to some extent”, “enough” and “middle” is a complicated issue when democracy
determines the way of life. Especially at the global level when one deals with significant differences in
understanding what are the fundamental rights and reference points for different countries. Therefore, States
will have to face the challenge of human freedom and learn to combine nudging and governance. However,
it may result in the situation when some States tackle climate change, while others ignore the problem. This
directly leads to the global and intergenerational justice.
Political issues related to the global and intergenerational justice are also noteworthy. Globally, not
everyone is under the threat of climate change, and one generation can be affected by the effects of climate
change caused by a previous generation. The COMEST report shows that “failure to act can be disastrous,
but responses to climate change that are not well organized, with ethical implications, can destroy entire
communities, create new paradigms of inequality and uneven distribution, and make even more vulnerable
those people who have already been torn away by other man-made political and ideological struggles”
(COMEST, 2010). It means that the climate AI interventions need to be more than ethical and take into
account the principles of justice when influencing different societies, people of different age, countries and
cultures in light of political considerations.
Grassroots Journal of Natural Resources, Vol.4, No.3 (September 2021), p.111-131 | ISSN 2581-6853 | CODEN GJNRA9
Doi: https://doi.org/10.33002/nr2581.6853.040310
118 Olena Lozo, Oleksii Onishchenko
The Anthropocene problem. One of the reasons for climate change is associated with the desire of modern
man to control everything, which was a consequence of such a planetary state as the “Anthropocene”
(Crutzen, 2006). Climate change may be considered as a result of strong human grasp on the planet. Instead
of increasing planetary control by using AI, it would be more reasonable to reduce the pressure when
implementing existing technologies. Additionally, one should consider how climate policy may incorporate
the necessary technologies. In this respect, a study by Dobbe and Whittaker (2019) deserves attention, which
provides recommendations for launching and improving technology-oriented climate policies and climate-
sensitive technology policies. Mandate transparency means that the regulators must force all actors to
achieve clear and transparent documentation concerning energy and carbon emission.
Account for the “full-stack supply chain”. In an essay by Crawford and Joler (2018) and a large-scale map
“Anatomy of an AI System” examined one Amazon Echo and highlighted the natural and human resources,
which are needed to design, manufacture, keep and at the end get rid of this simple facility. The results were
not entirely optimistic. The attention should be paid not only to the possible efficiency but also to the
accompanying effects. There is a danger that efforts to improve efficiency in the field of computing may
result not in improving the climate, but in increasing dependency on it (Coulombel et al., 2019). Relative
efficiency is definitely important, but for practical energy metering absolute values are required.
Making “non-energy policy” analysis standard practice. A study of non-energy sectors led Selby, Cox and
Royston (2016) to conclude that the AI policy proposals in non-energy sectors often fail to account for
climate impacts. Therefore, when the AI is used by usual policy domains, its impact on ecology and
environment may be counted as a regular policy instrument.
Implementation of technology regulation and new ecological transactions policy. Given the impact of
technology on climate, the integration of climate technology and policy is urgent and ongoing.
Restriction of AI using to speed up fossil fuel extraction. According to researchers McGlade and Ekins
(2015), “one third of the oil reserves, a half of gas reserves and more than 80% of current coal reserves must
remain unused from 2010 to 2050 to reach the 2°C target.” Therefore, a legal regulation is needed to restrict
the use of AI for the extraction of fossil fuels. If AI is implemented to neutralize the climate change, one
should check and be sure that the positive impact of AI on the environment outweighs the negative one. In
this aspect, two points should be considered to deal with a number of objections against AI use. The Allen
Institute has proposed certification (Stein, 2020) of the artificial intelligence techniques, differing carbon-
neutral from non-carbon neutral AI. However, it is important that these labels are not “green washing”,
which happens with some other eco-certification regimes (Vos, 2009). Standards can influence the design
and deployment of specific AI systems through product certification and serve to disseminate the AI best
practices, as in the case of cyber security or environmental sustainability. The “data exchange” approach is
to span the exchange of data used in climate computer programs. For example, for the electricity sector, the
countries may lead to minimum duplication of tasks associated with climate by using AI as a repository of
open data on electricity (St. John, 2018). Centralizing these steps will allow to access data more efficiently
while avoiding prohibitive costs and minimizing the impact on the AI learning environment.
Despite the growing awareness of the climate change problem, sufficiently effective solutions, needed to
reduce carbon emissions, has not been found yet. Thus, AI is expected to enable the development of some
climate strategies without a corrosive carbon budget. However, it is worth recognizing that the use of AI
also generates negative impacts on the environment. The AI technology is still extremely energy consuming
and material intensive, and the corporations, responsible for this, provide little information about the
ecological footprint of their activities. It is also worth mentioning problems such as danger of data’s
confidentiality protection, distribution of responsibilities, explaining ability, justness, etc. Additionally,
political problems related to human freedoms, global justice and fairness between generations, the impact
Grassroots Journal of Natural Resources, Vol.4, No.3 (September 2021), p.111-131 | ISSN 2581-6853 | CODEN GJNRA9
Doi: https://doi.org/10.33002/nr2581.6853.040310
119 Olena Lozo, Oleksii Onishchenko
of the AI on people’s behavior (up to the idea of using direct coercion), as well as the problem of the
“anthropogenic” are of a great concern.
Not only companies and rulers are responsible. Until consumers are buying new devices and using oil-
powered transport, all economics will stay the way they are. Therefore, it is necessary to develop the climate-
friendly AI, making all technological processes more efficient while meeting environmental and climate
protection priorities. This will definitely transform everyday life, which will lead to the transformation of
economy and society. Special attention should be given to increasing climate awareness among the AI users
and technicians, and make the ecosystem of the AI energy and materials transparent.
To address a number of challenges in this area, researchers propose a technology-oriented climate policy
strategy and a climate-sensitive technology policy. Recognizing the limitations of the AI should not lead to
the exclusion of its use where it is needed to solve complex climate problems. Some tech companies are
investing in the machine algorithms to create new AI products for combating climate change. The machine
learning systems can improve the ability to display and understand the size and value of underground oil
and gas reservoirs, which makes it easier to develop these resources at a lower cost. The AI is also used for
developing principally new fuels (Kates-Harbeck, Svyatkovskiy and Tang, 2019). The same logic applies
not only to traditional hydrocarbons, but also to new options for the supply of non-hydrocarbon energy. The
implementation of AI products is of high importance for achieving Sustainable Development Goals and
support democratic processes and social rights. Additionally, the AI technologies are the most important
means of achieving the goals of the European Green Deal. It is noteworthy, that users and developers should
check first and be sure that results obtained from the AI are understandable and verifiable, unbiased and
trustworthy. As well, as a new technology, AI should withstand tests and initial unprofitability.
Legal Regulation of AI Use in the EUand Ukraine
For the effective, understandable and safe use of AI, an integral system of legislative acts is needed. Such
acts would regulate a single conceptual and categorical apparatus, fundamental principles and rules for the
creation, testing, implementation, application and closure of such projects, the establishment of legal
responsibility for possible negative consequences and the procedure for compensation for possible damage.
First studies and activities devoted to various features and peculiarities of the AI and law appeared in the
1970s-1980s. Anne Gardner’s thesis “Artificial intelligence approach to legal reasoning” (Gardner, 1984)
is a remarkable work in this field. In addition to individual studies, the scientific cooperation in this area
emerged. In 1987, the first International Conference on the Artificial Intelligence and Law took place. In
1991, the International Association for Artificial Intelligence and Law was established. In 1992, publishing
of “Artificial Intelligence and Law” was started (Rissland, Ashley and Loui, 2003). However, the legal
framework in this area has begun to form only recently in the most progressive countries, where the rapid
development of information technologies is taking place and requires appropriate regulation. For example,
in countries of East Asia, the EU and the United States of America. Notably, the most efficient legal
measures in this area are being taken in the European Union.
The AI products and services are the object of many areas of law, including privacy, data security, product
liability, intellectual property, and antitrust laws. In addition, these areas of law are expected to be modified
according to the new circumstances connected with the AI. As the AI is a principally new technical
application and the diligence on legal risks has not become a commonplace yet, the efforts to comply require
non-standard approach and the drive to understand what society needs at the moment. A sign of acceptance
of exceptional capabilities of AI is the creation of regulatory framework on the AI, which some leading
businesses are actually demanding. For now, the proposals are grouped as principles and guidelines, but a
regulatory framework should merge to be followed. Progress towards building the structure is taking place
fast, though in slightly different ways for different industries and in different jurisdictions (Mitchell et al.,
Grassroots Journal of Natural Resources, Vol.4, No.3 (September 2021), p.111-131 | ISSN 2581-6853 | CODEN GJNRA9
Doi: https://doi.org/10.33002/nr2581.6853.040310
120 Olena Lozo, Oleksii Onishchenko
2020). Despite the fact that AI is used in various fields, there should be a single legislative foundation for
all with further industry development. Unified legislation should establish a regime for the creation and use
of AI, which ensures human rights, protection of confidentiality, compliance with all ethical standards, open
access to information on the impact of AI on humans and the environment.
The European Parliament Resolution on Civil Law Rules on Robotics. On February 16, 2017, the European
Parliament adopted a resolution on legislative initiative, according to which a number of legislative and
non-legal initiatives concerning construction, operation, and application of robots and artificial intelligence
was advised to the European Commission. The Resolution, among other things, encouraged the European
Commission to adopt a proposal for a legislative instrument, that would provide civil law rules on the
responsibility of robots and AI, “to propose common Union definitions of cyber physical systems,
autonomous systems, smart autonomous robots and their subcategories” a special EU agency for robotics
and artificial intelligence prepared a charter which includes a code of conduct for robotics engineers, a code
for research ethics committees at reviewing robotics, protocols and model licenses for designers.
Additionally, the Commission is addressed to “create a specific legal status for robots in the long run, so
that at least the most sophisticated autonomous robots could be established as having the status of electronic
persons responsible for making good any damage they may cause, and possibly applying electronic
personality to cases where robots make autonomous decisions or otherwise interact with third parties
independently”.
The Resolution highlights the need for legal regulation in order to create predictable and clear conditions
for enterprises to develop their own projects and plan their own business models; ensure that control over
the setting of legal standards is maintained so that the EU and member States are not forced to adapt and
live by standards set by other States. The document emphasizes that such regulations “should not influence
the processes of research, innovation and development” and that future regulatory initiatives about
construction and use of robots and AI “do not restrict innovation in the field”. The Resolution can be divided
into several main blocks: social, economic, ethical and legal issues and issues with the development of
robotics and AI; regulation of the development and use of robotics at the present stage; requirements for
standardization in the development of relevant technologies; issues of controlling how actors make their
decisions concerning using robotics and AI technologies; creation of an institutionalized control system in
the field of robotics and artificial intelligence; issues of civil liability concerning the development and use
of robotics and AI; ensuring the protection of personal data exploitation and application of robotics and AI.
It is worth noting that the Resolution is one of the first real steps towards legislative consolidation of
standards for the development and use of AI. Despite the fact that Resolution is advisory in nature, it
provides an opportunity to form an idea of what will underlie the rules that will regulate the relevant activity
in the near future (European Parliament, 2017).
In 2018, the European Commission adopted the Artificial Intelligence for Europe (Communication), by
which the approach of the EU to harnessing and addressing the AI was contoured (European Commission,
2018a). From 2014 to 2017, the EU invested € 1.1 billion in the AI research and innovation through the
Horizon 2020 program. The Communication highlights that AI is being created and used on the grounds of
the EU values and fundamental rights. It also revises existing safety and civil liability regulations. The
Commission later released a further communication and adopted a plan based on the initial communication
in 2018 (European Commission, 2018b, 2018c).
In 2019, the European Commission published Ethics Guidelines for Trustworthy Artificial Intelligence,
which sets out a framework for developing and using the trusted AI (European Commission, 2019a). The
guidelines set out requests that AI must respond to be considered trustworthy. The set of assessments is
intended to help verify meeting each of the key requirements: human agency and oversight, privacy and
data governance, robustness and safety, diversity, nondiscrimination and fairness, societal and
environmental well-being, transparency, accountability. The AI must “respect fundamental rights,
Grassroots Journal of Natural Resources, Vol.4, No.3 (September 2021), p.111-131 | ISSN 2581-6853 | CODEN GJNRA9
Doi: https://doi.org/10.33002/nr2581.6853.040310
121 Olena Lozo, Oleksii Onishchenko
applicable regulation and core principles and values, ensuring an ethical purpose and be technically sound
and reliable, since even with good intentions, lack of technological prowess can lead to unintended harm”.
These Guidelines, together with the General Data Protection Regulation, give to the EU the possibility to
establish high standards for business in the EU and possibly worldwide.
The European Commission also created the Robotics and Artificial Intelligence Unit, which aims to develop
a competitive robotics and artificial intelligence industry in Europe. In April 2018, the EU member States
signed a Declaration of Cooperation on Artificial Intelligence to develop a European approach to AI
(European Commission, 2018b). In February 2020, the European Commission (2020b, 2020c) published
the “White Paper on Artificial Intelligence: a European approach to excellence and trust”, which outlines
and identifies the standard form of the regulatory framework. The aim of the book is to seek information
and suggestions for the creating a common EU field for AI regulation. Due to the high-level nature of AI
White Paper, the following important questions remain unanswered: 1. The exact legal violations, which AI
Whitepaper is intended to eliminate, are not clearly stated; 2. It is suggested to divide AI applications into
high and low risk categories, but very often companies do not know which category is applied until this
happens; 3. There is a significant risk of regulatory overlap with existing laws that are already applied to
many AI technologies (for example, GDPR).
The Commission's report on safety and liability implications of the AI, the Internet of Things and robotics
has been published, which gives more information on the gaps the Commission has detected in existing laws
(European Commission, 2020a). The Commission Report identified legal gaps, which include security risks
due to connectivity and openness of AI systems; a certain autonomy of the AI decisions; the need of neural
and accurate data for the AI training; the complexity of products, systems and of value chains; the opacity
of operating systems; gaps in product liability laws; general fault-based liability rules, which don't fit
autonomously deciding the AI systems (Feindor-Schmidt, 2020).If the White Paper is implemented,
companies will have to deal with a number of challenges. However, there are some positive outcomes. The
White Paper states that AI may be a benefit for society and ensuring AI coherence in the EU can reduce
compliance with the requirements that companies currently face due to different requirements from one EU
member state to another (Mitchell et al., 2020).
After identifying the gaps, the EU intends to release a comprehensive AI legislative package that will include
new rules for those who create and implement the AI. A part of this package may include 3 resolutions
adopted by the European Parliament on October 20, 2020: Framework (Basis) for ethical aspects of artificial
intelligence, robotics and related technologies; civil liability regime for artificial intelligence and intellectual
property rights for the development of artificial intelligence technologies, the Framework of ethical aspects
of artificial intelligence, robotics and related technologies; the Civil liability regime for artificial intelligence
and the intellectual property rights for the development of artificial intelligence technologies (European
Parliament, 2020a, 2020b, 2020c).
It is also necessary to emphasize the huge role of civil society organizations (CSOs) in the creation and use
of AI technologies. The White Paper on AI states that the European AI governance framework should
guarantee the maximum participation of all stakeholders (including civil society organizations), as well as
mandatory consultations with them on the implementation and further development of the structure
(European Commission, 2020b). The CSOs should be aware of the AI potential to create new social
problems in the future. By taking up the challenge now and tackling these issues, civil society organizations
can play a key role: in leading the debate about developing AI while minimizing the risks of harm to society;
in consultations and decision-making on the formation of the AI regulatory framework; in ensuring the
ability of CSOs in the future to solve any problems that cannot be avoided. The CSOs can identify
algorithmic bias issues for companies and organizations that implement new algorithms, as well as for those
who are responsible for developing relevant new laws and regulations.

Grassroots Journal of Natural Resources, Vol.4, No.3 (September 2021), p.111-131 | ISSN 2581-6853 | CODEN GJNRA9
Doi: https://doi.org/10.33002/nr2581.6853.040310
122 Olena Lozo, Oleksii Onishchenko
The EU does not have a unified AI regulation system yet. However, there are various laws that are related
to the development and implementation of artificial intelligence technologies. These laws include, but are
not limited to, intellectual property law, data protection law, consumer protection or product liability laws,
computer misuse laws, and human rights laws. At the same time, a number of Resolutions and AI White
Paper have already been adopted, which highlight the main problematic issues that require regulation and
provide a roadmap, according to which the EU legislation maybe formed. Given the ambitious pace of
development in this area, it can be predicted that the EU will be one of the first to create a legislative
foundation, which will subsequently be implemented by other countries, including Ukraine.
Analyzing the state of legal consolidation of the application and implementation of the AI in Ukraine, it
may be concluded that such legislation is only in its infancy. The process of digitalization in various spheres
has actively begun. Thus, the government faces the task of consolidating at the legislative level the strategy
of formation and implementation of principally new technology transformation. It should be noted that, in
2018, the government approved the concept for the formation of Ukraine's digital economy and society for
2018-2020 and the formulation of a phased plan for its functioning (Parliament of Ukraine, 2018), and in
2020 the government approved the Concept for the development of artificial intelligence in Ukraine
(Parliament of Ukraine, 2020). As the Minister of Digital Transformation points out, “Ukraine has a great
potential in the field of artificial intelligence. We have the largest number of companies developing artificial
intelligence technologies in Eastern Europe. Companies in the field of AI with Ukrainian roots have already
acquired international corporations such as Snap, Google, Rakuten. Therefore, we are now working to create
favorable conditions for AI to become one of the key drivers of digital transformation and overall growth
of Ukraine's economy. After all, developing the field of artificial intelligence, we ensure the competitiveness
of Ukraine in the international market” (Fedorov, 2020).
In December 2020, the Cabinet of Ministers of Ukraine approved the Concept for the Development of
Artificial Intelligence in Ukraine with a plan for its implementation until 2030. According to the Concept,
artificial intelligence is an organized set of information technologies by using which it is possible to a)
perform complex tasks with the help of a system of scientific research methods and algorithms for
processing information that was obtained or independently created, as well as b) create and use with the
help of their own knowledge bases, decision-making models, algorithms and identify ways to achieve the
objectives. Algorithms for processing information are obtained or independently created during the work,
as well working with information and identify ways to achieve the objectives.
The goal of the Concept is to define the priority areas and basic objectives of the further use of the artificial
intelligence products to meet the rights and legitimate interests of individuals and legal entities, building a
competitive national economy, improving public administration a significant component of the development
of socio-economic, scientific and technical, defense, legal and other activities in areas of national
importance.
Ukraine, which is a member of the Special Committee on Artificial Intelligence at the Council of Europe,
joined the Recommendation of the Council on Artificial Intelligence of the Organization for Economic Co-
operation and Development in 2019 (OECD, 2019). The Concept enshrines the basis of further
implementation and using of AI, compliance with which fully meets the requirements of the Organization
for Economic Cooperation and Development on AI, including: development and use of AI systems only
subject to the rule of law, fundamental human and civil rights and freedoms, values, as well as providing
appropriate guarantees when using such technologies; compliance of the activity and algorithm of solutions
of artificial intelligence systems with the requirements of the legislation on personal data protection, as well
as observance of the constitutional right of everyone to not interfere in personal and family life in connection
with the processing of personal data; ensuring transparency and responsible disclosure of information about
artificial intelligence systems; reliable and safe operation of artificial intelligence systems throughout their
life cycle and implementation on an ongoing basis of their assessment and management of potential risks;

Grassroots Journal of Natural Resources, Vol.4, No.3 (September 2021), p.111-131 | ISSN 2581-6853 | CODEN GJNRA9
Doi: https://doi.org/10.33002/nr2581.6853.040310
123 Olena Lozo, Oleksii Onishchenko
placing on organizations and individuals who develop, implement or use artificial intelligence systems,
responsibility for their proper functioning in accordance with these principles.
Priority areas, in which the tasks of State policy for the development of artificial intelligence are
implemented, are identified as the following: education and vocational training, science, economics, cyber
security, information security, defense, public administration, legal regulation and ethics, justice. It is
noteworthy that there is no environment-related area in the given list. Although almost every area, to some
extent, affects the state of the environment, this issue needs further legislative clarification.
To achieve the goal in the field of legal regulation and ethics, the Concept identifies the following tasks:
implementation in the legislation of Ukraine of the norms enshrined in 2019 “Recommendation of the
Council on Artificial Intelligence” by OECD, subject to ethical standards set out in Recommendation CM /
Rec (2020) 1 of the Committee of Ministers to member States on the human rights impacts of algorithmic
systems, approved in April 2020 by the Committee of Ministers of the Council of Europe; elaboration of
the issue of compliance of the legislation of Ukraine with the guiding principles established by the Council
of Europe on the further implementation and use of AI technologies and its harmonization with the European
one; ensuring the functioning and operation of technical committees of standardization in accordance with
the requirements of relevant standards concerning AI; ensuring cooperation between the relevant Technical
Committees of Ukraine and international subcommittees of standardization ISO / IEC JTC 1 / SC 42
Artificial Intelligence on the joint development of standards in the field of artificial intelligence; support for
initiatives to create organizational forms of cooperation between interested legal entities and individuals in
the field of AI; formulation of a Code of Ethics for artificial intelligence with the participation of a wide
range of stakeholders.
Despite the fact that the first specialized normative act was adopted in Ukraine only in 2020, Ukrainian
scientists have already begun to consider the problems of legal regulation of the use of AI in various areas
of law and analyze EU norms in this area. Noteworthy scholar is O. E. Radutnyi, who studies criminal
liability and legal personality of AI. He notes that in the future the Criminal Code of Ukraine will be
supplemented by a section on the responsibility of "electronic person (identity)" for criminal offenses and
thus defined AI as a subject of legal relations. According to this scholar, reflections on the liability of the
AI makes sense only if humanity retains control over it (Radutnyi, 2018). In turn, N. Martsenko, studying
the legal regime of AI in civil law, notes that understanding AI and work as a subject of civil law seems
inexpedient and may cause the ambiguity in law. The use of definition “electronic person” in EU regulations,
in author’s opinion, seems premature, as the spread of this concept in the field of law does not provide a
holistic legal understanding of its legal status, civil liability, user protection, data protection. The author also
determines that it is more appropriate to understand work and AI as an object of civil rights. Consequently,
the regulation of civil liability at the level of consumer relations gives grounds to consider AI as a product
(commodity) (Martsenko, 2019). Researchers that study the prospects of legal regulation of artificial
intelligence note that European Parliament resolutions serve as a kind of beacon, by highlighting those areas
that require legislative regulation, and identifying prospects for such regulation not only at EU level but also
for many countries, including Ukraine. The development of certain European legal standards for robotics
and AI will contribute to the development of the relevant industry and ensure respect for human rights in
the formation of new social relations with the participation of autonomous devices (Pozova, 2017).
It should be noted that in Ukraine the AI technologies are using in a test mode, including its use for
improving the environmental situation. But, unfortunately, in Ukraine the legislative regulation concerning
using of AI is absent; as well there are too few scientific works that would consider the issues of legal
regulation of AI in environmental protection and could become the foundation for the creation of relevant
legislation. Therefore, decisive action is needed, which will be of great importance for ensuring human
rights in the implementation and exploitation of the artificial intelligence technology, environmental safety
requirements and ensuring the sustainable transformation to benefit situation for the country. Taking into

Grassroots Journal of Natural Resources, Vol.4, No.3 (September 2021), p.111-131 | ISSN 2581-6853 | CODEN GJNRA9
Doi: https://doi.org/10.33002/nr2581.6853.040310
124 Olena Lozo, Oleksii Onishchenko
account the course of Ukraine towards European integration, it is obvious that it is the EU standards in this
area that will be the initial reference point for the corresponding norms of Ukrainian legislation.
Thus, the use of AI must be properly regulated by law for the benefit of the whole society. Even the
legislative definition of the concept of “artificial intelligence” already opens up access to new areas and
industries. However, it should be noted that primary norms, which require legal consolidation are the norms
for ensuring human rights in the use of AI and the procedure for using AI for environmental purposes, taking
into account the principles of expediency and efficiency.
Concluding Remarks
The Artificial Intelligence is an innovative technology that is expected to improve society, business and
states. It can help find the solutions for ongoing global problems, including climate change and ecological
degradation, at the same time protecting democracy and fighting crime. A human-centered approach to the
AI should focus on that AI is designed, implemented, treated and controlled, provided fundamental human
rights are respected. The Treaties of the European Union and Charter of Fundamental Rights of the European
Union provide respect for people dignity, when a human enjoys a unique and inalienable moral status. At
the same time environmental issues and a balanced attitude that ensures the prosperity of mankind in next
decades and centuries are taken into account (Madiega, 2019).
There are various ways AI can be used to combat climate change, such as collecting and using data on
temperature and carbon emissions, natural and ecological disasters, demonstrating how extreme weather
effects on human environment, improving forecasts and energy management, processing endangered
species data, transforming the transport landscape for reducing carbon emissions, tracking deforestation and
industrial carbon emissions, tracking the ocean ecosystem, predicting periods of dehydration, ensuring
precision agriculture, contributing to smart recycling, helping carbon capture and geoengineering, at the
same time convincing consumers to be more environmentally conscious.
However, the use of the AI raises various problems concerning negative influence on the nature, which
requires careful consideration. The AI technologies consume a lot of electricity and materials, accelerate the
fossil fuels extraction and overuse environmentally friendly amounts of minerals, while companies provide
little information about their ecological footprint. It is also noteworthy to highlight such issues as a threat to
private information and other data protection. The political problems concern human freedoms, the impact
of the AI on people’s behavior (up to the idea of using direct enforcement), the problem of global justice
and fairness between generations as well as the problem of the “Anthropocene”.
From an institutional point of view, there is a need for constant interaction between technological
development, political and public debate. It is due to the fact that all people make a certain contribution to
climate change and have to take responsibility for the future of the planet by changing their way of life. The
integral system of legislative acts is required for the effective and safe use of the AI for environmental and
other purposes. Such acts will regulate a single conceptual and categorical apparatus, fundamental principles
and rules for the creation, testing, implementation, application and closure of such projects, the
establishment of legal responsibility for possible negative consequences and the procedure for compensation
for damage. The AI products and services are the subject to many areas of the law, including privacy, data
security, product liability, intellectual property, and antitrust laws. In addition, these areas of the law are
expected to be modified according to the new circumstances connected with AI. As AI is a principally new
technical application and comprehensive legal risk assessment has not become the common place, the efforts
to comply require non-standard approach and the drive to understand what society needs at the moment. As
a sign of acceptance of the exceptional capabilities of AI, some leading businesses are demanding the
adoption of the efficient regulatory framework.

Grassroots Journal of Natural Resources, Vol.4, No.3 (September 2021), p.111-131 | ISSN 2581-6853 | CODEN GJNRA9
Doi: https://doi.org/10.33002/nr2581.6853.040310
125 Olena Lozo, Oleksii Onishchenko
The EU does not have a unified AI regulation system; however, a number of resolutions and the AI White
Paper have already been adopted, which highlights the main problematic issues that require regulation and
provides a roadmap that will be used for the future formation of the EU legislation. According to the pace
of development in this area, it can be predicted that the EU will be one of the first creators of a legislative
foundation, which will subsequently be implemented by other countries, including Ukraine. In turn, Ukraine
has made first legal steps in this area. However, there is no AI use legislation. Moreover, little legal scientific
research that would consider the issues of legal regulation of the AI in environmental protection and could
become the foundation for the creation of relevant legislation has been made yet. Thus, it is a decisive action
that may require long time towards ensuring human rights-based approach to the development, deployment
and use of AI in Ukraine in order to meet environmental safety requirements and achieve sustainable
development. Taking into account Ukrainian course towards European integration, it is obvious that the EU
standards will be a foundation for this area and serve as initial point for the corresponding norms of
Ukrainian legislation in the future. This will allow Ukraine to move forward in reducing its carbon footprint
and combating climate change.
References
Andrae, A. (2017). Total Consumer Power Consumption Forecast. Conference: Nordic Digital Business
Summit. Available online:
https://www.researchgate.net/publication/320225452_Total_Consumer_Power_Consumption_Fore
cast [Accessed on 21 June 2021].
Andrae, A. and Edler, T. (2015). On Global Electricity Usage of Communication Technology: Trends to
2030. Challenges, 6(1): 117-157. DOI: https://doi.org/10.3390/challe6010117
Autodesk (2016). Reimagining the future of air travel. Available online:
https://www.autodesk.com/customer-stories/airbus [Accessed on 21 June 2021].
Belkhir, L. and Elmeligi, A. (2018). Assessing ICT global emissions footprint: Trends to 2040 &
Recommendations. Journal of Cleaner Production, 177: 448-463. DOI:
https://doi.org/10.1016/j.jclepro.2017.12.239.
C3 AI (2019). Baker Hughes, a GE company and C3.ai Announce Joint Venture, June 24, 2019. Available
online: https://c3.ai/baker-hughes-and-c3-ai-announce-joint-venture-to-deliver-ai-solutions
[Accessed on 21 June 2021].
Coeckelbergh, M. (2020a). AI Ethics. Cambridge, MA: MIT Press Essential Knowledge series, pp. 167-
183.
Coeckelbergh, M. (2020b). AI for climate: freedom, justice, and other ethical and political challenges. AI
and Ethics, 1(1): 67-72. DOI: https://doi.org/10.1007/s43681-020-00007-2.
COMEST (2010). The ethical implications of global climate change. Available online:
http://www.gci.org.uk/Documents/UNESCO_COMEST_.pdf [Accessed on 21 June 2021].
Cook, G., Lee, J., Tsai, T., Kong, A., Deans, J., Johnson, B. and Jardim, E. (2017). Clicking Clean: Who is
winning the race to build a green internet. Greenpeace Report. Available online: https://www.actu-
environnement.com/media/pdf/news-28245-clicking-clean-2017.pdf [Accessed on 21 June 2021].
Cornell University (2019). AI helps reduce Amazon hydropower dams' carbon footprint. Science Daily,
September 19, 2019. Available online: www.sciencedaily.com/releases/2019/09/190919134703.htm
[Accessed on 21 June 2021].
Coulombel, N., Boutueil, V., Liu, L., Viguié, V. and Yin, B. (2019). Substantial rebound effects in urban
ridesharing: Simulating travel decisions in Paris, France. Transportation Research Part D: Transport
and Environment, 71: 110-126. DOI: https://doi.org/10.1016/j.trd.2018.12.006.
Crawford, K. and Joler, V. (2018). Anatomy of an AI System: The Amazon Echo as an anatomical map of
human labor, data and planetary resources. Available online: https://anatomyof.ai [Accessed on 21
June 2021].
Crutzen, P.J. (2006). The “Anthropocene”. In: Ehlers E. and Krafft T. (eds), Earth System Science in the
Anthropocene. Berlin, Heidelberg: Springer. DOI: https://doi.org/10.1007/3-540-26590-2_3.
Grassroots Journal of Natural Resources, Vol.4, No.3 (September 2021), p.111-131 | ISSN 2581-6853 | CODEN GJNRA9
Doi: https://doi.org/10.33002/nr2581.6853.040310
126 Olena Lozo, Oleksii Onishchenko
Dignum, V. (2019). Responsible Artificial Intelligence: How to Develop and Use AI in a Responsible Way.
Artificial Intelligence: Foundations, Theory, and Algorithms. Cham.: Springer. DOI:
https://doi.org/10.1007/978-3-030-30371-6_5.
Dobbe, R. and Whittake, M. (2019). AI and Climate Change: How they’re connected, and what we can do
about it. AI Now Institute, October 17, 2019. Available online:
https://medium.com/@AINowInstitute/ai-and-climate-change-how-theyre-connected-and-what-we-
can-do-about-it-6aa8d0f5b32c [Accessed on 21 June 2021].
Duff, A.S. (2015). Information Society. International Encyclopedia of the Social & Behavioral Sciences
(Second Edition). London: Elsevier, pp.83-89. DOI: https://doi.org/10.1016/B978-0-08-097086-
8.95017-7.
European Commission (2018a). EU Declaration on Cooperation on Artificial Intelligence. Available
online: https://ec.europa.eu/jrc/communities/en/node/1286/document/eu-declaration-cooperation-
artificial-intelligence [Accessed on 22 June 2021].
European Commission (2018b). Communication from the Commission to the European Parliament, the
European Council, the Council, the European Economic and Social Committee and the Committee
of the Regions. Artificial Intelligence for Europe. Brussels, 25 April 2018. Available online:
https://eur-lex.europa.eu/legal-content/EN/TXT/?uri=COM%3A2018%3A237%3AFIN[Accessed
on 22 June 2021].
European Commission (2018c). Communication from the Commission to the European Parliament, the
European Council, the Council, the European Economic and Social Committee and the Committee
of the Regions. Coordinated Plan on Artificial Intelligence, Brussels, 7 December 2018 COM (2018)
795 final. Available online: https://eur-lex.europa.eu/legal-
content/EN/TXT/?uri=CELEX%3A52018DC0795[Accessed on 22 June 2021].
European Commission (2019). A definition of Artificial Intelligence: main capabilities and scientific
disciplines. Available online: https://ec.europa.eu/digital-single-market/en/news/definition-
artificial-intelligence-main-capabilities-and-scientific-disciplines [Accessed on 21 June 2021].
European Commission (2019a). Ethics guidelines for trustworthy AI. Available online: https://digital-
strategy.ec.europa.eu/en/library/ethics-guidelines-trustworthy-ai [Accessed 22 June 2021].
European Commission (2020a). Robotics and Artificial Intelligence (Unit A.1). Available online:
https://ec.europa.eu/digital-single-market/en/content/robotics-and-artificial-intelligence-innovation-
and-excellence-unit-a1 [Accessed 22 June 2021].
European Commission (2020b). White Paper on Artificial Intelligence: a European approach to excellence
and trust of 19 February 2020. Available online: https://ec.europa.eu/info/publications/white-paper-
artificial-intelligence-european-approach-excellence-and-trust_en [Accessed on 21 June 2021].
European Commission (2020c). Commission Report on safety and liability implications of AI, the Internet
of Things and Robotics of 19 February 2020. Available online:
https://ec.europa.eu/info/publications/commission-report-safety-and-liability-implications-ai-
internet-things-and-robotics-0_en [Accessed on 22 June 2021].
European Parliament (2017). Resolution of 16 February 2017 with recommendations to the Commission
on Civil Law Rules on Robotics. Available online:
https://www.europarl.europa.eu/doceo/document/TA-8-2017-0051_EN.html [Accessed on 21 June
2021].
European Parliament (2020a). Resolution of 20 October 2020 on intellectual property rights for the
development of artificial intelligence technologies. Available online:
https://www.europarl.europa.eu/doceo/document/TA-9-2020-0277_EN.html [Accessed on 22 June
2021].
European Parliament (2020b). Resolution of 20 October 2020 with recommendations to the Commission
on a framework of ethical aspects of artificial intelligence, robotics and related technologies.
Available online: https://www.europarl.europa.eu/doceo/document/TA-9-2020-0275_EN.html
[Accessed on 22 June 2021].
Grassroots Journal of Natural Resources, Vol.4, No.3 (September 2021), p.111-131 | ISSN 2581-6853 | CODEN GJNRA9
Doi: https://doi.org/10.33002/nr2581.6853.040310
127 Olena Lozo, Oleksii Onishchenko
European Parliament (2020c). Resolution of 20 October 2020 with recommendations to the Commission
on a civil liability regime for artificial intelligence. Available online:
https://www.europarl.europa.eu/doceo/document/TA-9-2020-0276_EN.html [Accessed on 22 June
2021].
Fedorov, M. (2020). By developing the sphere of artificial intelligence, we ensure Ukraine's
competitiveness on the international market. December 2, 2020. Available online:
https://www.kmu.gov.ua/news/mihajlo-fedorov-rozvivayuchi-sferu-shtuchnogo-intelektu-mi-
zabezpechuyemo-konkurentospromozhnist-ukrayini-na-mizhnarodnomu-rinku [Accessed on 21
June 2021].
Feindor-Schmidt, U. (2020). Regulation of Artificial Intelligence in Europe - What’s in the pipeline?
Lexology, December 1, 2020. Available online:
https://www.lexology.com/library/detail.aspx?g=d9f74ab9-139c-49e1-9d82-70de718af80f
[Accessed on 22 June 2021].
Filippova, A. (2021). Current security issues in the information society. SHS Web of Conferences, 109, n.
01014. DOI: https://doi.org/10.1051/shsconf/202110901014.
Floridi, L., Cowls, J., Beltrametti, M., Chatila, R., Chazerand, P., Dignum, V., Luetge, C., Madelin, R.,
Pagallo, U., Rossi, F., Schafer, B., Valcke, P. and Vayena, E. (2018). AI4People—An Ethical
Framework for a Good AI Society: Opportunities, Risks, Principles, and Recommendations. Minds
and Machines, 28(4): 689-707. DOI: https://doi.org/10.1007/s11023-018-9482-5.
Gardner, A.V.D.L. (1984). An artificial intelligence approach to legal reasoning. Thesis (Ph.D.), Stanford
University. The MIT Press, p. 239.
Gates, B. (2020). ‘COVID-19 is awful. Climate change could be worse’ The blog of Bill Gates, August 04,
2020. Available online: https://www.gatesnotes.com/Energy/Climate-and-COVID-19 [Accessed on
22 June 2021].
Gent, E. (2020). This ‘Once-For-All’ Neural Network Could Slash AI’s Carbon Footprint. SingularityHub,
May 4, 2020. Available online: https://singularityhub.com/2020/05/04/this-once-for-all-neural-
network-could-slash-ais-carbon-footprint/ [Accessed on 21 June 2021].
Giles, M. (2019). Is AI the Next Big Climate-Change Threat? We Haven’t a Clue. MIT Technology Review,
July 29, 2019. Available online: https://www.technologyreview.com/2019/07/29/663/ai-computing-
cloud-computing-microchips/ [Accessed on 21 June 2021].
Guzman, A. (2021). Race After Technology: Abolitionist Tools for the New Jim Code. Information,
Communication & Society, 24:13, 1989-1990. DOI:
https://doi.org/10.1080/1369118X.2020.1844269.
Hao, K. (2019). Here are 10 ways AI could help fight climate change. MIT Technology Review, June 20,
2019. Available online: https://www.technologyreview.com/2019/06/20/134864/ai-climate-change-
machine-learning/ [Accessed 21 June 2021].
Hazas, M., Morley, J., Bates, O. and Friday, A. (2016). Are there limits to growth in data traffic?: On time
use, data generation and speed. Proceedings of the Second Workshop on Computing within Limits,
14: 1–5. DOI: https://doi.org/10.1145/2926676.2926690.
Hern, A. (2018). Bitcoin’s Energy Usage Is Huge – We Can’t Afford to Ignore It. The Guardian, January
17, 2018. Available online: https://perma.cc/2X2H-CF9V [Accessed on 21 June 2021].
IPCC (Intergovernmental Panel on Climate Change) (2018). An IPCC special report on the impacts of
global warming of 1.5°C. Available online: https://www.ipcc.ch/sr15/ [Accessed on 21 June 2021].
Ise, T. and Oba, Y. (2019) Forecasting Climatic Trends Using Neural Networks: An Experimental Study
Using Global Historical Data. Frontiers in Robotics and AI, 6:32. DOI:
https://doi.org/10.3389/frobt.2019.00032.
Kates-Harbeck, J., Svyatkovskiy, A. and Tang, W. (2019). Predicting disruptive instabilities in controlled
fusion plasmas through deep learning. Nature, 568: 526-531. DOI: https://doi.org/10.1038/s41586-
019-1116-4.
Kirchgaessner, S. (2019). Revealed: Google made large contributions to climate change deniers. The
Guardian, October 11, 2019. Available online:
Grassroots Journal of Natural Resources, Vol.4, No.3 (September 2021), p.111-131 | ISSN 2581-6853 | CODEN GJNRA9
Doi: https://doi.org/10.33002/nr2581.6853.040310
128 Olena Lozo, Oleksii Onishchenko
https://amp.theguardian.com/environment/2019/oct/11/google-contributions-climate-change-
deniers?__twitter_impression=true [Accessed on 21 June 2021].
Madiega, T. (2019). EU guidelines on ethics in artificial intelligence: Context and implementation.
European Parliamentary Research Service, pp. 1-13. Available online:
https://www.europarl.europa.eu/RegData/etudes/BRIE/2019/640163/EPRS_BRI(2019)640163_EN
.pdf [Accessed on 22 June 2021].
Martins, N.R.B., Angelica, A., Chakravarthy, K., Svidinenko, Y., Boehm, F.J., Opris, I., Lebedev, M.A.,
Swan, M., Garan, S.A., Rosenfeld, J.V., Hogg, T. and Freitas, R.A. (2019). Human Brain/Cloud
Interface. Frontiers in Neuroscience, 13:112. DOI: https://doi.org/10.3389/fnins.2019.00112.
Martsenko, N. (2019) Legal regime of artificial intelligence in civil law. Aktualʹni problemy pravoznavstva,
4: 91-98. Available online: http://dspace.wunu.edu.ua/handle/316497/38382 [Accessed on 22 June
2021].
Matheson, R. (2020). Reducing the carbon footprint of artificial intelligence. MIT News, April 23, 2020.
Available online: https://news.mit.edu/2020/artificial-intelligence-ai-carbon-footprint-0423
[Accessed on 21 June 2021].
McGlade, C. and Ekins, P. (2015). The geographical distribution of fossil fuels unused when limiting global
warming to 2°C. Nature, 517: 187-190. DOI: https://doi.org/10.1038/nature14016.
McGovern, A., Elmore, K., Gagne, D., Haupt, S., Karstens, C., Lagerquist, R., Smith, T. and Williams, J.
(2017). Using Artificial Intelligence to Improve Real-Time Decision-Making for High-Impact
Weather. Bulletin of the American Meteorological Society, 98(10): 2073-2090. DOI:
https://doi.org/10.1175/BAMS-D-16-0123.1
McQuade, S. and Monteleoni, C. (2012). Global Climate Model Tracking Using Geospatial
Neighborhoods. Proceedings of the AAAI Conference on Artificial Intelligence, 26 (1): 335-341.
Microsoft News Center (2018). Microsoft demonstrates the power of AI and Cloud to Oil and Gas players,
at ADIPEC 2018. November 12, 2018. Available online: https://news.microsoft.com/en-
xm/2018/11/12/microsoft-demonstrates-the-power-of-ai-and-cloud-to-oil-and-gas-players-at-
adipec-2018/ [Accessed on 21 June 2021].
Mitchell, A., Dokei, T., Hickman, T. and Albagli, D. (2020). Regulation of Artificial Intelligence in Europe
and Japan. White & Case LLP, August 24, 2020. Available online:
https://www.whitecase.com/publications/insight/regulation-artificial-intelligence-europe-and-japan
[Accessed on 22 June 2021].
Monteleoni, C., Schmidt, G., Saroha, S. and Asplund, E. (2011). Tracking climate models. Statistical
Analysis and Data Mining. The ASA Data Science Journal, 4(4): 372-392. DOI:
https://doi.org/10.1002/sam.10126
Mulvaney, K. (2019). Climate change report card: These countries are reaching targets. National
Geographic, September 19, 2019. Available online:
https://www.nationalgeographic.com/environment/article/climate-change-report-card-co2-
emissions [Accessed on 21 June 2021].
Muraleedharan, S. (2021). Role of Artificial Intelligence in Environmental Sustainability. EcoMENA,
January 30, 2021. Available online: https://www.ecomena.org/artificial-intelligence-environmental-
sustainability/ [Accessed on 21 June 2021].
OECD (2019). Recommendation of the Council on Artificial Intelligence. OECD Legal Instruments.
Available online: https://legalinstruments.oecd.org/api/print?ids=648&lang=en [Accessed on 22
June 2021].
Parliament of Ukraine (2018). On approval of the Concept of development of the digital economy and
society of Ukraine for 2018-2020 and approval of the action plan for its implementation. Available
online: https://www.kmu.gov.ua/npas/pro-shvalennya-koncepciyi-rozvitku-cifrovoyi-ekonomiki-ta-
suspilstva-ukrayini-na-20182020-roki-ta-zatverdzhennya-planu-zahodiv-shodo-yiyi-realizaciyi
[Accessed 22 June 2021].
Grassroots Journal of Natural Resources, Vol.4, No.3 (September 2021), p.111-131 | ISSN 2581-6853 | CODEN GJNRA9
Doi: https://doi.org/10.33002/nr2581.6853.040310
129 Olena Lozo, Oleksii Onishchenko
Parliament of Ukraine (2020). The concept of artificial intelligence development in Ukraine. Available
online: https://zakon.rada.gov.ua/laws/show/1556-2020-%D1%80#Text [Accessed 22 on June
2021].
Pearce, F. (2018). Energy Hogs: Can World’s Huge Data Centers Be Made More Efficient? Yale
Environment 360, April 3, 2018. Available online: https://perma.cc/J2H3-EL75 [Accessed on 21
June 2021].
Pozova, D. (2017). Prospects of legal regulation of artificial intelligence under EU legislation. Chasopys
tsyvilistyky, 27: 116-120.
Raban, D., Gordon, A. and Geifman, D. (2011). The Information Society. Information, Communication &
Society, 14(3): 375-399. DOI: https://doi.org/10.1080/1369118X.2010.542824
Radutnyi, A. (2018). Subjectivity of artificial intelligence in criminal law. Pravo Ukrayiny, 1: 123-136.
Rasp, S., Pritchard, M. and Gentine, P. (2018). Deep learning to represent sub-grid processes in climate
models. Proceedings of the National Academy of Sciences, 115(39): 9684-9689. DOI:
https://doi.org/10.1073/pnas.1810286115.
Rissland, E., Ashley K. and Loui R., (2003). AI and Law: A fruitful synergy. Artificial Intelligence,150 (1-
2): 1-15.DOI: https://doi.org/10.1016/S0004-3702(03)00122-X.
Ritchie, H. (2019). Number of People in the World Without Electricity Falls Below One Billion. Our World
in Data, January 18, 2019. Available online: https://ourworldindata.org/number-of-people-in-the-
world-without-electricity-access-falls-below-one-billion [Accessed on 21 June 2021].
Roach, J. (2020). Microsoft finds underwater datacenters are reliable, practical and use energy sustainably.
September 14, 2020. Available online: https://news.microsoft.com/innovation-stories/project-natick-
underwater-datacenter/ [Accessed on 21 June 2021].
Rolnick, D., Donti, L. P., Kaack, H. L., Kochanski, K., Lacoste, A., Sankaran, K., Slavin Ross, A.,
Milojevic-Dupont, N., Jaques, N., Waldman-Brown, A., Luccioni, A., Maharaj, T., Sherwin, D.E.,
Mukkavilli, S.K., Kording, K.P., Gomes, C., Ng, A.Y., Hassabis, D., Platt, J.C., Creutzig, F., Chayes,
J. and Bengio, Y. (2019). Tackling Climate Change with Machine Learning. Available online:
https://arxiv.org/abs/1906.05433 [Accessed on 21 June 2021].
Selby, J., Cox, E. and Royston, S. (2016). Impact of Non-energy Policies on Energy Systems. UK Energy
Research Centre, London, November 2016. Available online:
https://ukerc.ac.uk/publications/impact-of-non-energy-policies-on-energy-systems/ [Accessed on 21
June 2021].
Snow, J. (2019). How artificial intelligence can tackle climate change. National Geographic, July 18, 2019.
Available online: https://www.nationalgeographic.com/environment/2019/07/artificial-intelligence-
climate-change/ [Accessed on 21 June 2021].
St. John, J., (2018). Texas Takes a Big Step in Improving Access to Smart Meter Data. Greentechmedia,
February 6, 2018. Available online: https://perma.cc/G4ZJ-L4LT [Accessed on 21 June 2021].
Stein, A.L. (2020). Artificial Intelligence and Climate. Yale Journal on Regulation, 37(3): 890-939.
Strubell, E., Ganesh, A. and McCallum, A. (2019). Energy and Policy Considerations for Deep Learning
in NLP. Available online: https://arxiv.org/abs/1906.02243 [Accessed on 21 June 2021].
Thaler, R. and Sunstein, C. (2008). Nudge: Improving Decisions About Health, Wealth and Happiness.
New York: Yale University Press, p. 293.
UNESCO (2019a). An Integrated System for Global Real-time Precipitation Observation using PDIR.
Available online: http://en.unesco.org/news/irain-newmobile-app-promote-citizen-science-
andsupport-water-management [Accessed on 21 June 2021].
UNESCO (2019b). Artificial intelligence for sustainable development: challenges and opportunities for
UNESCO’s science and engineering programmes. UNESCO Digital Library. Available online:
https://unesdoc.unesco.org/ark:/48223/pf0000368028.locale=en [Accessed on 21 June 2021].
United Nations (1992). Framework Convention on Climate Change. Available online:
https://www.un.org/ru/documents/decl_conv/conventions/climate_framework_conv.shtml
[Accessed on 21 June 2021].
Grassroots Journal of Natural Resources, Vol.4, No.3 (September 2021), p.111-131 | ISSN 2581-6853 | CODEN GJNRA9
Doi: https://doi.org/10.33002/nr2581.6853.040310
130 Olena Lozo, Oleksii Onishchenko
United Nations (1997). Kyoto Protocol to the United Nations Framework Convention on Climate Change.
Available online: https://www.un.org/ru/documents/decl_conv/conventions/kyoto.shtml [Accessed
on 21 June 2021].
United Nations (2015). The Paris Agreement. Available online:
https://www.un.org/ru/climatechange/paris-agreement [Accessed on 21 June 2021].
United States Environmental Protection Agency (2020). Sources of Greenhouse Gas Emissions. Available
online: https://www.epa.gov/ghgemissions/sources-greenhouse-gas-emissions [Accessed 21 June
2021].
Vos, J. (2009). Actions Speak Louder than Words: Greenwashing in Corporate America. Notre Dame
Journal of Law. Ethics & Public Policy, 23(2): 673-697.
WMO (World Meteorological Organization) (2019). The Global Climate in 2015–2019. Available online:
https://library.wmo.int/index.php?lvl=notice_display&id=21522#.YNb_cmgzbIU [Accessed on 22
June 2021].
Wolff-Anthony, L., Kanding, B. and Selvan, R. (2020). Carbon tracker: Tracking and Predicting the Carbon
Footprint of Training Deep Learning Models. Available online: https://arxiv.org/abs/2007.03051
[Accessed on 21 June 2021].
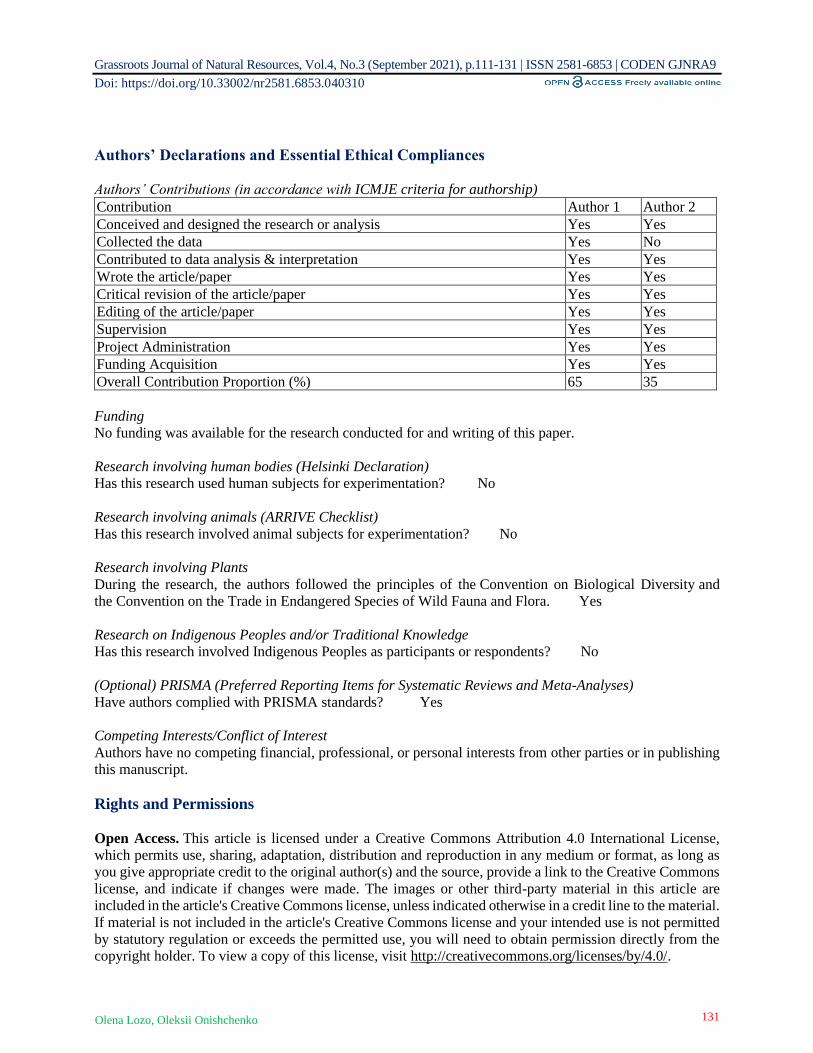
Grassroots Journal of Natural Resources, Vol.4, No.3 (September 2021), p.111-131 | ISSN 2581-6853 | CODEN GJNRA9
Doi: https://doi.org/10.33002/nr2581.6853.040310
131 Olena Lozo, Oleksii Onishchenko
Authors’ Declarations and Essential Ethical Compliances
Authors’ Contributions (in accordance with ICMJE criteria for authorship)
Contribution Author 1 Author 2
Conceived and designed the research or analysis Yes Yes
Collected the data Yes No
Contributed to data analysis & interpretation Yes Yes
Wrote the article/paper Yes Yes
Critical revision of the article/paper Yes Yes
Editing of the article/paper Yes Yes
Supervision Yes Yes
Project Administration Yes Yes
Funding Acquisition Yes Yes
Overall Contribution Proportion (%) 65 35
Funding
No funding was available for the research conducted for and writing of this paper.
Research involving human bodies (Helsinki Declaration)
Has this research used human subjects for experimentation? No
Research involving animals (ARRIVE Checklist)
Has this research involved animal subjects for experimentation? No
Research involving Plants
During the research, the authors followed the principles of the Convention on Biological Diversity and
the Convention on the Trade in Endangered Species of Wild Fauna and Flora. Yes
Research on Indigenous Peoples and/or Traditional Knowledge
Has this research involved Indigenous Peoples as participants or respondents? No
(Optional) PRISMA (Preferred Reporting Items for Systematic Reviews and Meta-Analyses)
Have authors complied with PRISMA standards? Yes
Competing Interests/Conflict of Interest
Authors have no competing financial, professional, or personal interests from other parties or in publishing
this manuscript.
Rights and Permissions
Open Access. This article is licensed under a Creative Commons Attribution 4.0 International License,
which permits use, sharing, adaptation, distribution and reproduction in any medium or format, as long as
you give appropriate credit to the original author(s) and the source, provide a link to the Creative Commons
license, and indicate if changes were made. The images or other third-party material in this article are
included in the article's Creative Commons license, unless indicated otherwise in a credit line to the material.
If material is not included in the article's Creative Commons license and your intended use is not permitted
by statutory regulation or exceeds the permitted use, you will need to obtain permission directly from the
copyright holder. To view a copy of this license, visit http://creativecommons.org/licenses/by/4.0/.

Detection of Land Use Land Cover Changes Using Remote Sensing and
GIS Techniques in a Secondary City in Bangladesh
Md. Lutfor Rahman1, Syed Hafizur Rahman*2 1Department of Environmental Sciences, Jahangirnagar University, Dhaka-1342, Bangladesh.
Email: [email protected] | ORCID: https://orcid.org/0000-0002-4289-313X 2Professor, Department of Environmental Sciences, Jahangirnagar University, Dhaka-1342, Bangladesh.
Email: [email protected] | ORCID: https://orcid.org/0000-0003-0112-9124
*Corresponding author
Abstract This study aims at classifying land use land cover (LULC)
patterns and detect changes in a 'secondary city' (Savar Upazila)
in Bangladesh for 30 years i.e., from 1990 to 2020. Two distinct
sets of Landsat satellite imagery, such as Landsat Thematic
Mapper (TM) 1990 and Landsat 7 ETM+ 2020, were collected
from the United States Geological Survey (USGS) website. Using
ArcMap 10.3, the maximum likelihood algorithm was used to
perform a supervised classification methodology. The error
matrix and Kappa Kat were done to measure the mapping
accuracy. Both images were classified into six separate classes:
Cropland, Barren land, Built-up area, Vegetation, Waterbody,
and Wetlands. From 1990 to 2020, Cropland, Barren land,
Waterbody, and Wetlands have been decreased by 30.63%,
11.26%, 23.54%, and 21.89%, respectively. At the same time, the
Built-up area and Vegetation have been increased by 161.16%
and 5.77%, respectively. The research revealed that unplanned
urbanization had been practiced in the secondary city indicated
by the decreases in Cropland, Barren land, Wetland, and
Waterbody, which also showed direct threats to food security and
freshwater scarcity. An increase in Vegetation (mostly homestead
vegetation) indicates some environment awareness programs that
encourage people to maintain homestead and artificial gardens.
The study argues for the sustainable planning of a secondary city
for a developing country's future development.
Keywords LULC; Savar City; Urbanization; Spatial changes; ArcGIS
Introduction
How to cite this paper: Rahman, M.L. and
Rahman, S.H. (2021). Detection of Land Use
Land Cover Changes Using Remote Sensing and
GIS Techniques in a Secondary City in
Bangladesh. Grassroots Journal of Natural
Resources, 4(3): 132-146. Doi:
https://doi.org/10.33002/nr2581.6853.040311
Received: 13 June 2021
Reviewed: 30 June 2021
Provisionally Accepted: 05 July 2021
Revised: 21 July 2021
Finally Accepted: 28 July 2021
Published: 30 September 2021
Copyright © 2021 by author(s)
This work is licensed under the Creative
Commons Attribution International
License (CC BY 4.0).
http://creativecommons.org/licenses/by/4.0/
Grassroots Journal of Natural Resources, Vol.4 No.3 (September 2021) ISSN 2581-6853 | CODEN: GJNRA9 | Published by The Grassroots Institute
Website: http://grassrootsjournals.org/gjnr | Main Indexing: Web of Science
M – 00248 | Research Article
ISSN 2581-6853 | 4(3) Sep 2021
Grassroots Journal of Natural Resources, Vol.4, No.3 (September 2021), p.132-146 | ISSN 2581-6853 | CODEN GJNRA9
Doi: https://doi.org/10.33002/nr2581.6853.040311
133 Md. Lutfor Rahman, Syed Hafizur Rahman
Land use land cover (LULC) is a distinct concept, but often, it is used interchangeably (Dimyati et al., 1996;
Fonji and Taff, 2014; Rawat and Kumar, 2015; Hu et al., 2019; Spruce et al., 2020). Land use is described
what people do with the landscape environment for economic activities such as agriculture, commerce,
settlement, and recreation; the land cover represents the physical landscapes of the ground surface, including
crops, buildings, soil, water, grassland, and forest (Anderson et al., 1976; Pilon, Howarth and Bullock.,
1988; Rawat and Kumar, 2015; Rai et al., 2017).
A secondary city in developing countries is an urban area where the population ranges from 100,000 to less
than 750,000 (Davis, 1955; Rondinelli, 1983; Goodall, 1987; UN-HABITAT, 2008; World Bank, 2008). As
reported by the World Bank, about 40% of the world's population resides in secondary cities. Secondary
cities form a vital part of a growing global system that substantially impacts countries' economic
development in the future (World Bank, 2009; Roberts and Hohmann, 2015). The secondary cities represent
diverse population dynamics, infrastructure growth, and financial activities and struggle to manage urban
development and environmental issues (Roberts and Hohmann, 2015; McEvoy et al., 2014; Roberts, 2014;
Marais, Nel and Donaldson, 2016). However, each county’s city system has taken a significant role in
neighboring cities of a primary city or metropolitan area (World Bank, 2008).
The land use pattern represents the socio-economic condition of a country. Two factors directly or indirectly
affect the land use land cover (LULC) change: anthropogenic and natural activities. The anthropogenic
activities, such as population growth, urbanization, economic, technologies, culture, and religion (Lambin
et al., 2001; Coppin et al., 2004; Wang, Wu and Yang, 2014; Yesmin et al., 2014), are the factors that alter
the land use land cover (LULC). The knowledge of land use land cover (LULC) change is a new concern
for making the best selection, planning, restoration, and maintenance of natural resources (Homer et al.,
2007; Ahmed and Ahmed, 2012; Jensen, 2014). So, the land use/cover change assessment is essential for
environmental management to understand the landscape dynamics over time better.
Satellite results are now suited and helpful for land use land cover (LULC) transition assessment studies.
Integrating the two technologies, i.e., remote sensing and GIS, help understand the environmental process
and analyze a considerable extent of spatial data (Milla, Lorenzo, and Brown, 2005). This data has an
unprecedented advantage over the ground survey method of remote sensing due to its wide-area coverage
and effectiveness in map isolated or data-poor areas (Baban, 1999). Remote Sensing (RS) and Geographical
Information System (GIS) techniques are more effective than conventional approaches because they offer
high resolution, informative, precise, and up-to-date information to investigate landform shift in less time
at a reduced cost and with greater precision (Jensen, 1983; Kachhwala, 1985; Jenson and Cowen, 1999;
Belal and Moghanm, 2011).
In the context of Bangladesh, a large body of literature is available on land use land cover (LULC) changes,
using RS and GIS techniques at national, regional, and local levels (Dewan, Yamaguchi and Rahman, 2012;
Al Mamun, 2013; Islam et al., 2014; Haque and Basak, 2017; Parvin et al., 2017; Rai et al., 2017; Bhuiyan
et al., 2019; Xu et al., 2020). Several studies are found on land use land cover (LULC) change by using
satellite images on Savar Upazila in the local context. These studies included the impact of ribbon
development on land use along the Dhaka-Aricha highway in the context of the dynamics of the land price,
land use transformation, and assessment of land-use change (Chowdhaury, 1990; Rashid, 2003; Sharif and
Esa, 2013; Hasan, Hossain and Ahmad, 2017; Rahman, Rashid and Iqbal, 2021). Savar was a river-bound
rural area in 1951, but it transformed into a modern road networked city by 2001 and has been rapidly
growing as a secondary city in Bangladesh since 1949 (Rashid, 2003). Savar Upazila is the neighboring city
of the northwest of the capital Dhaka city at about 24 kilometers. Besides the tannery and readymade
garment industries, the country's Export Processing Zone (EPZ) exists here. The transformation of Savar
Upazila from rural to suburban and urban was also revealed by the study on land use change and land value
in the Savar municipality (Chowdhaury, 1990; Masud, 2008; Amin, 2009). Savar municipality has

Grassroots Journal of Natural Resources, Vol.4, No.3 (September 2021), p.132-146 | ISSN 2581-6853 | CODEN GJNRA9
Doi: https://doi.org/10.33002/nr2581.6853.040311
134 Md. Lutfor Rahman, Syed Hafizur Rahman
significant changes in the settlements that affect rural-urban migration and land price value (Rashid, 2003;
Sharif and Esa, 2013; Rahman, Rashid and Iqbal, 2021). One of the recent studies was conducted by using
CORONA 1953, SRDI Map 1992, and Landsat 8-OLI 2016 images and categorized the pictures into four
classes, such as agricultural lands, homestead vegetation, settlement, and water bodies, where the increase
of territory and homestead vegetation, and reduction of farmlands and water bodies were observed (Rahman,
Rashid and Iqbal, 2021).
This study is different from the previous research conducted in this area between 1953 and 2015, classifying
images only into four environmental elements. There is no assessment of the conversion matrix. This study's
main objective is to derive land use land cover (LULC) changes category wise and to detect the conversion
matrix taking the place of a secondary city (Savar Upazila) by using remote sensing and GIS techniques
(with data representing for 30 years period, i.e., 1990 to 2020).
The following critical questions regarding land use land cover (LULC) change in Savar Upazila were
addressed: (1) what are the major categories and status of land use land cover (LULC); (2) what are the net
gains and losses; (3) what are the primary land use land cover (LULC) conversions from 1990 to 2020? To
address these questions, the primary land use/cover categories were classified, and land use land cover
(LULC) was quantified at the local scale using analysis of 30 m resolution Landsat imageries representing
30 years interval (1990–2020). Post-Classification Comparison (PCC) method was used to detect the land
use land cover (LULC) conversion matrix. The findings accruing from data analysis of land use land cover
(LULC) changes in Savar Upazila, Dhaka, Bangladesh, were evaluated.
Study Area
The secondary city, Savar, is an Upazila of Dhaka district, Bangladesh, located at 23.8583° N latitude and
90.2667° E longitude (Figure 1). According to the Bangladesh census, it had a population of 1,387,426
(BBS, 2014) in 2011. The study area is 28,593 hectares (ha) or about 285 square kilometers. Savar Upazila
consists of 12 unions and one municipality. The elevation of the land increases from the east to the west.
Different rivers surround this area.
The Dhalashwari River has a significant influence on the study area for agriculture and other socio-economic
activities. The region has a subtropical monsoon climate. The mean annual precipitation is high, about 2,882
mm, mainly from June to September (Choudhury, 1999). The physiographic units are the terraces in the east
and flood plains in the west. So, the river deposits of the flood plain soil are common in this area.
Material and Methods
Data acquisition and land use land cover (LULC) classification
The 30 m resolution Thematic Mapper (TM) 1990 and Enhanced Thematic Mapper Plus (ETM+) 2020
Landsat images were used in the research. They were gathered from the USGS Earth Explorer website
(www.earthexplorer.usgs.gov). The photos were taken in February since it used to be the dry season when
the sky was clear, and the images are selected based on the absence of cloud cover. The temporal shifts in
water bodies are minimal during this period. Multiple atmospheric and topographical conditions may create
data variances when multi-date imagery from various sources is used (Mondal et al., 2015). As a result,
radiometric adjustments were used in this work, besides an atmospheric correction. Ground control points
were obtained to rectify the 2020 image during fieldwork conducted in February 2021. Ten ground control
points, mostly major road junctions, were created using Google Earth images from 2021 to improve
georeferenced accuracy. In ArcMap 10.3, the 1990 image was co-registered with the 2020 image. Both
images were projected using a 30 m resolution with a UTM coordinate system (UTM-WGS 1984 Zone 46).

Grassroots Journal of Natural Resources, Vol.4, No.3 (September 2021), p.132-146 | ISSN 2581-6853 | CODEN GJNRA9
Doi: https://doi.org/10.33002/nr2581.6853.040311
135 Md. Lutfor Rahman, Syed Hafizur Rahman
Figure 1: Location of the study area map of Savar Upazila, Dhaka, Bangladesh.
Table 1: Characteristics of Landsat satellite images data used for the study
Satellite name Sensor id Row/ Path Data acquisition date Resolution Source
Landsat 5 TM 137, 44 24/02/1990 30 m USGS
Landsat 7 ETM+ 137, 44 28/02/2020 30 m USGS
First and foremost, an appropriate categorization method for the study area is required to categorize satellite
images. As a result, various types of LULC classes were identified using a modified classification method
(FAO, 2011). The per-pixel supervised classifications were used, which categorize satellite imagery pixels
with the same or comparable spectral reflectance characteristics. In the ArcMap version 10.3, the supervised
classification method was used the maximum likelihood algorithm to determine the land use land cover
(LULC) for the 1990 and 2020 Landsat imagery. The raster layer was added, then composited all bands
and produced a False Color Composite (FCC). Some indices such as Normalized Difference Built-up Index
(NDBI), Normalized Difference Vegetation Index (NDVI), and Normalized Difference Water Index
(NDWI) have been created for better classification of the images. Based on field observations, Google
Maps and the different combinations of band images help distinguish the other land use land cover (LULC)
in the pictures. Fifty pixels were captured for each training site and produced a signature file for each land
use land cover (LULC). Then the image classification was carried out by applying the maximum likelihood
classifier tool for each satellite image. The following steps were included in the approach to create LULC
maps from satellite images in this study: data acquisition, classification scheme, classification of the
satellite image, classified image, final LULC maps and accuracy assessment (Figure 2). In the study area,
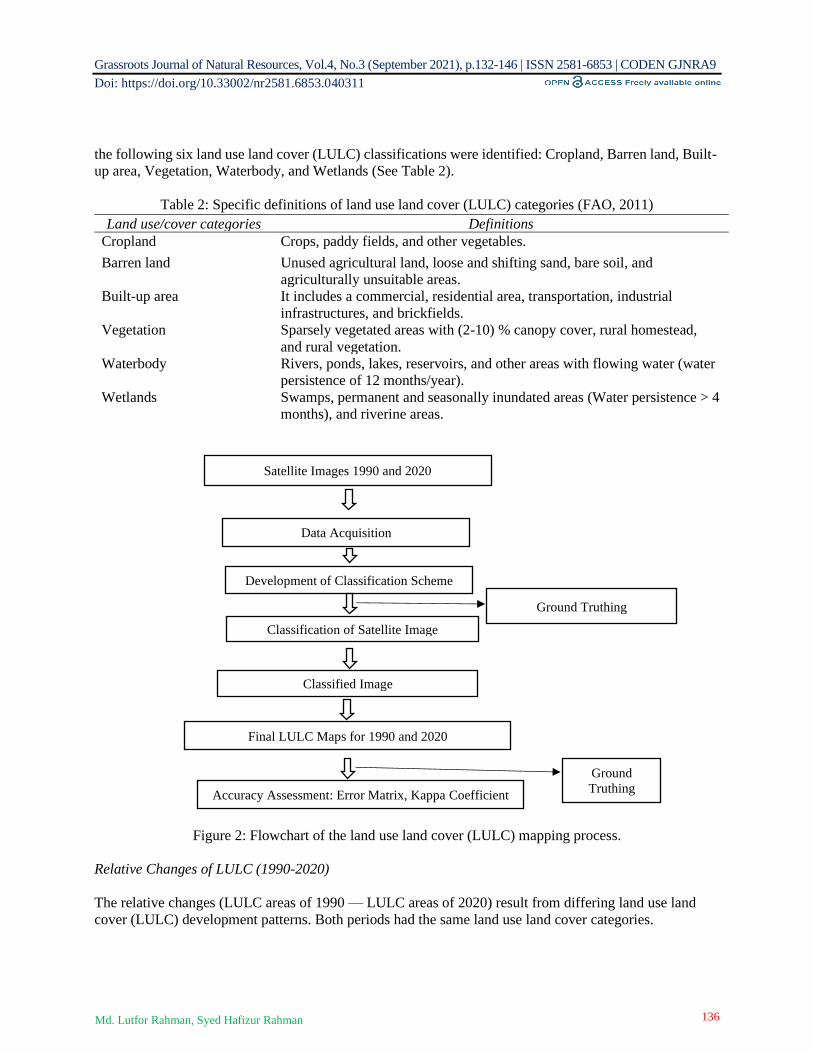
Grassroots Journal of Natural Resources, Vol.4, No.3 (September 2021), p.132-146 | ISSN 2581-6853 | CODEN GJNRA9
Doi: https://doi.org/10.33002/nr2581.6853.040311
136 Md. Lutfor Rahman, Syed Hafizur Rahman
the following six land use land cover (LULC) classifications were identified: Cropland, Barren land, Built-
up area, Vegetation, Waterbody, and Wetlands (See Table 2).
Table 2: Specific definitions of land use land cover (LULC) categories (FAO, 2011)
Figure 2: Flowchart of the land use land cover (LULC) mapping process.
Relative Changes of LULC (1990-2020)
The relative changes (LULC areas of 1990 — LULC areas of 2020) result from differing land use land
cover (LULC) development patterns. Both periods had the same land use land cover categories.
Land use/cover categories Definitions
Cropland Crops, paddy fields, and other vegetables.
Barren land Unused agricultural land, loose and shifting sand, bare soil, and
agriculturally unsuitable areas.
Built-up area It includes a commercial, residential area, transportation, industrial
infrastructures, and brickfields.
Vegetation Sparsely vegetated areas with (2-10) % canopy cover, rural homestead,
and rural vegetation.
Waterbody Rivers, ponds, lakes, reservoirs, and other areas with flowing water (water
persistence of 12 months/year).
Wetlands Swamps, permanent and seasonally inundated areas (Water persistence > 4
months), and riverine areas.
Classification of Satellite Image
Satellite Images 1990 and 2020
Data Acquisition
Classified Image
Development of Classification Scheme
Ground Truthing
Final LULC Maps for 1990 and 2020
Accuracy Assessment: Error Matrix, Kappa Coefficient
Ground
Truthing
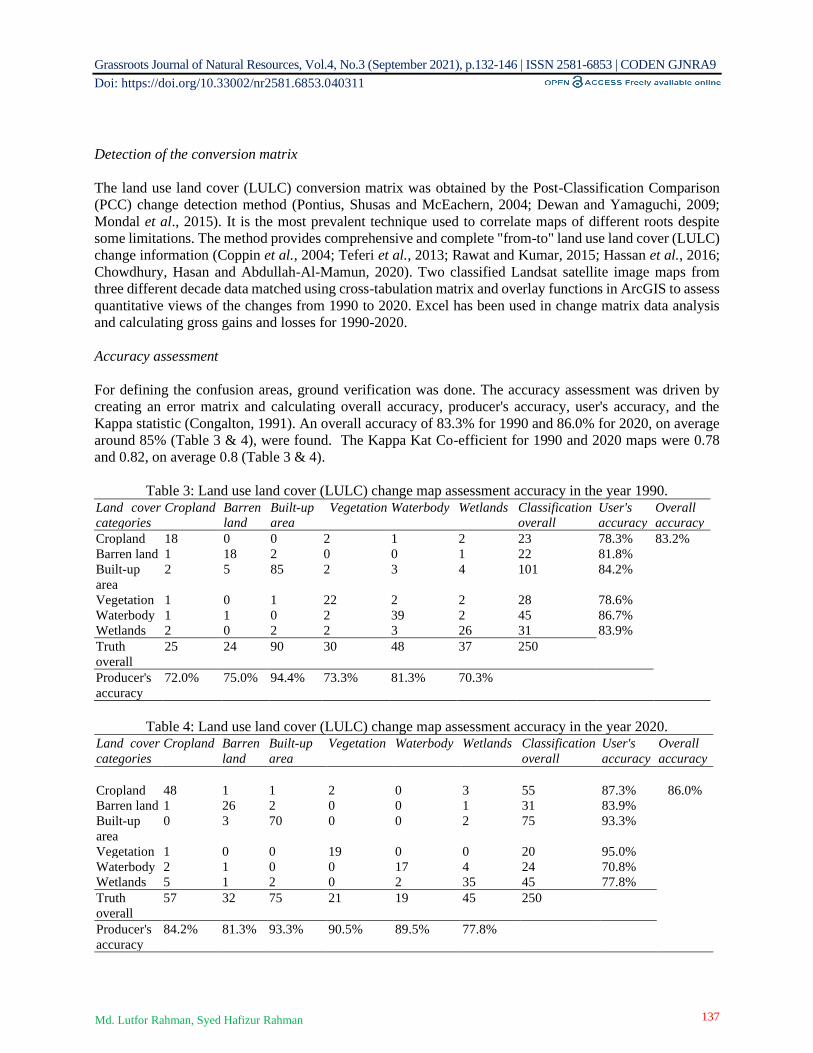
Grassroots Journal of Natural Resources, Vol.4, No.3 (September 2021), p.132-146 | ISSN 2581-6853 | CODEN GJNRA9
Doi: https://doi.org/10.33002/nr2581.6853.040311
137 Md. Lutfor Rahman, Syed Hafizur Rahman
Detection of the conversion matrix
The land use land cover (LULC) conversion matrix was obtained by the Post-Classification Comparison
(PCC) change detection method (Pontius, Shusas and McEachern, 2004; Dewan and Yamaguchi, 2009;
Mondal et al., 2015). It is the most prevalent technique used to correlate maps of different roots despite
some limitations. The method provides comprehensive and complete "from-to" land use land cover (LULC)
change information (Coppin et al., 2004; Teferi et al., 2013; Rawat and Kumar, 2015; Hassan et al., 2016;
Chowdhury, Hasan and Abdullah-Al-Mamun, 2020). Two classified Landsat satellite image maps from
three different decade data matched using cross-tabulation matrix and overlay functions in ArcGIS to assess
quantitative views of the changes from 1990 to 2020. Excel has been used in change matrix data analysis
and calculating gross gains and losses for 1990-2020.
Accuracy assessment
For defining the confusion areas, ground verification was done. The accuracy assessment was driven by
creating an error matrix and calculating overall accuracy, producer's accuracy, user's accuracy, and the
Kappa statistic (Congalton, 1991). An overall accuracy of 83.3% for 1990 and 86.0% for 2020, on average
around 85% (Table 3 & 4), were found. The Kappa Kat Co-efficient for 1990 and 2020 maps were 0.78
and 0.82, on average 0.8 (Table 3 & 4).
Table 3: Land use land cover (LULC) change map assessment accuracy in the year 1990. Land cover
categories
Cropland Barren
land
Built-up
area
Vegetation Waterbody Wetlands Classification
overall
User's
accuracy
Overall
accuracy
Cropland 18 0 0 2 1 2 23 78.3% 83.2%
Barren land 1 18 2 0 0 1 22 81.8%
Built-up
area
2 5 85 2 3 4 101 84.2%
Vegetation 1 0 1 22 2 2 28 78.6%
Waterbody 1 1 0 2 39 2 45 86.7%
Wetlands 2 0 2 2 3 26 31 83.9%
Truth
overall
25 24 90 30 48 37 250
Producer's
accuracy
72.0% 75.0% 94.4% 73.3% 81.3% 70.3%
Table 4: Land use land cover (LULC) change map assessment accuracy in the year 2020. Land cover
categories
Cropland Barren
land
Built-up
area
Vegetation Waterbody Wetlands Classification
overall
User's
accuracy
Overall
accuracy
Cropland 48 1 1 2 0 3 55 87.3% 86.0%
Barren land 1 26 2 0 0 1 31 83.9%
Built-up
area
0 3 70 0 0 2 75 93.3%
Vegetation 1 0 0 19 0 0 20 95.0%
Waterbody 2 1 0 0 17 4 24 70.8%
Wetlands 5 1 2 0 2 35 45 77.8%
Truth
overall
57 32 75 21 19 45 250
Producer's
accuracy
84.2% 81.3% 93.3% 90.5% 89.5% 77.8%
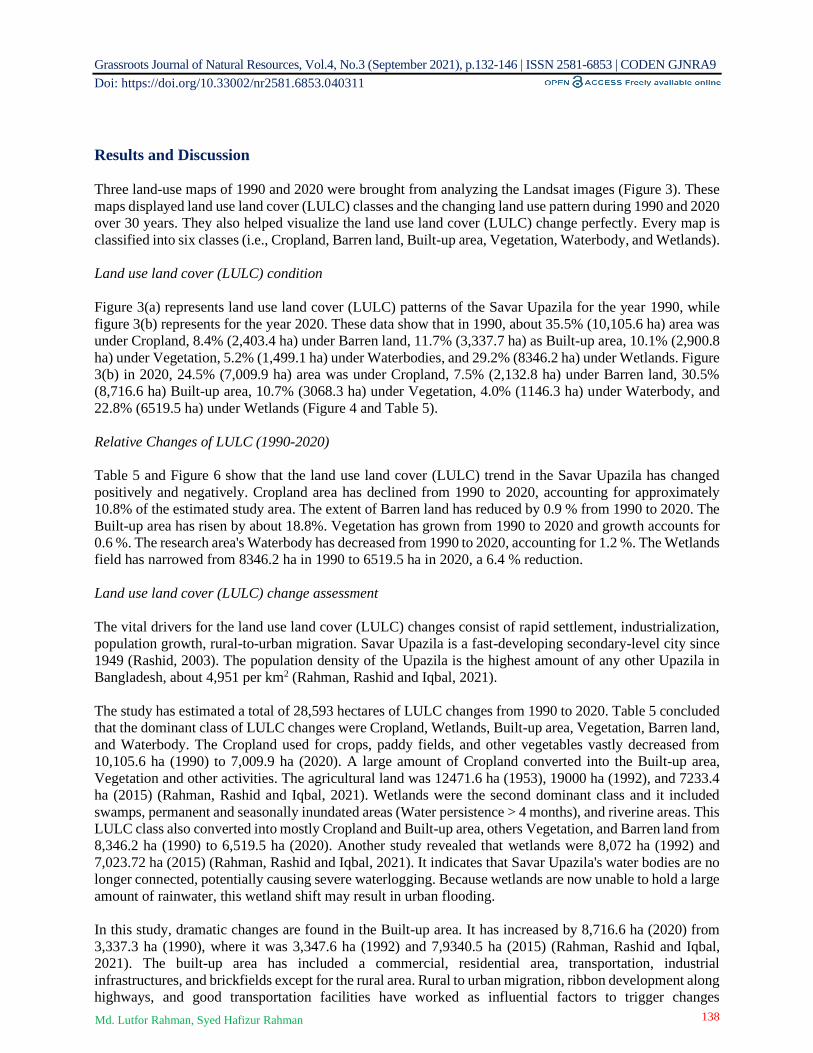
Grassroots Journal of Natural Resources, Vol.4, No.3 (September 2021), p.132-146 | ISSN 2581-6853 | CODEN GJNRA9
Doi: https://doi.org/10.33002/nr2581.6853.040311
138 Md. Lutfor Rahman, Syed Hafizur Rahman
Results and Discussion
Three land-use maps of 1990 and 2020 were brought from analyzing the Landsat images (Figure 3). These
maps displayed land use land cover (LULC) classes and the changing land use pattern during 1990 and 2020
over 30 years. They also helped visualize the land use land cover (LULC) change perfectly. Every map is
classified into six classes (i.e., Cropland, Barren land, Built-up area, Vegetation, Waterbody, and Wetlands).
Land use land cover (LULC) condition
Figure 3(a) represents land use land cover (LULC) patterns of the Savar Upazila for the year 1990, while
figure 3(b) represents for the year 2020. These data show that in 1990, about 35.5% (10,105.6 ha) area was
under Cropland, 8.4% (2,403.4 ha) under Barren land, 11.7% (3,337.7 ha) as Built-up area, 10.1% (2,900.8
ha) under Vegetation, 5.2% (1,499.1 ha) under Waterbodies, and 29.2% (8346.2 ha) under Wetlands. Figure
3(b) in 2020, 24.5% (7,009.9 ha) area was under Cropland, 7.5% (2,132.8 ha) under Barren land, 30.5%
(8,716.6 ha) Built-up area, 10.7% (3068.3 ha) under Vegetation, 4.0% (1146.3 ha) under Waterbody, and
22.8% (6519.5 ha) under Wetlands (Figure 4 and Table 5).
Relative Changes of LULC (1990-2020)
Table 5 and Figure 6 show that the land use land cover (LULC) trend in the Savar Upazila has changed
positively and negatively. Cropland area has declined from 1990 to 2020, accounting for approximately
10.8% of the estimated study area. The extent of Barren land has reduced by 0.9 % from 1990 to 2020. The
Built-up area has risen by about 18.8%. Vegetation has grown from 1990 to 2020 and growth accounts for
0.6 %. The research area's Waterbody has decreased from 1990 to 2020, accounting for 1.2 %. The Wetlands
field has narrowed from 8346.2 ha in 1990 to 6519.5 ha in 2020, a 6.4 % reduction.
Land use land cover (LULC) change assessment
The vital drivers for the land use land cover (LULC) changes consist of rapid settlement, industrialization,
population growth, rural-to-urban migration. Savar Upazila is a fast-developing secondary-level city since
1949 (Rashid, 2003). The population density of the Upazila is the highest amount of any other Upazila in
Bangladesh, about 4,951 per km2 (Rahman, Rashid and Iqbal, 2021).
The study has estimated a total of 28,593 hectares of LULC changes from 1990 to 2020. Table 5 concluded
that the dominant class of LULC changes were Cropland, Wetlands, Built-up area, Vegetation, Barren land,
and Waterbody. The Cropland used for crops, paddy fields, and other vegetables vastly decreased from
10,105.6 ha (1990) to 7,009.9 ha (2020). A large amount of Cropland converted into the Built-up area,
Vegetation and other activities. The agricultural land was 12471.6 ha (1953), 19000 ha (1992), and 7233.4
ha (2015) (Rahman, Rashid and Iqbal, 2021). Wetlands were the second dominant class and it included
swamps, permanent and seasonally inundated areas (Water persistence > 4 months), and riverine areas. This
LULC class also converted into mostly Cropland and Built-up area, others Vegetation, and Barren land from
8,346.2 ha (1990) to 6,519.5 ha (2020). Another study revealed that wetlands were 8,072 ha (1992) and
7,023.72 ha (2015) (Rahman, Rashid and Iqbal, 2021). It indicates that Savar Upazila's water bodies are no
longer connected, potentially causing severe waterlogging. Because wetlands are now unable to hold a large
amount of rainwater, this wetland shift may result in urban flooding.
In this study, dramatic changes are found in the Built-up area. It has increased by 8,716.6 ha (2020) from
3,337.3 ha (1990), where it was 3,347.6 ha (1992) and 7,9340.5 ha (2015) (Rahman, Rashid and Iqbal,
2021). The built-up area has included a commercial, residential area, transportation, industrial
infrastructures, and brickfields except for the rural area. Rural to urban migration, ribbon development along
highways, and good transportation facilities have worked as influential factors to trigger changes
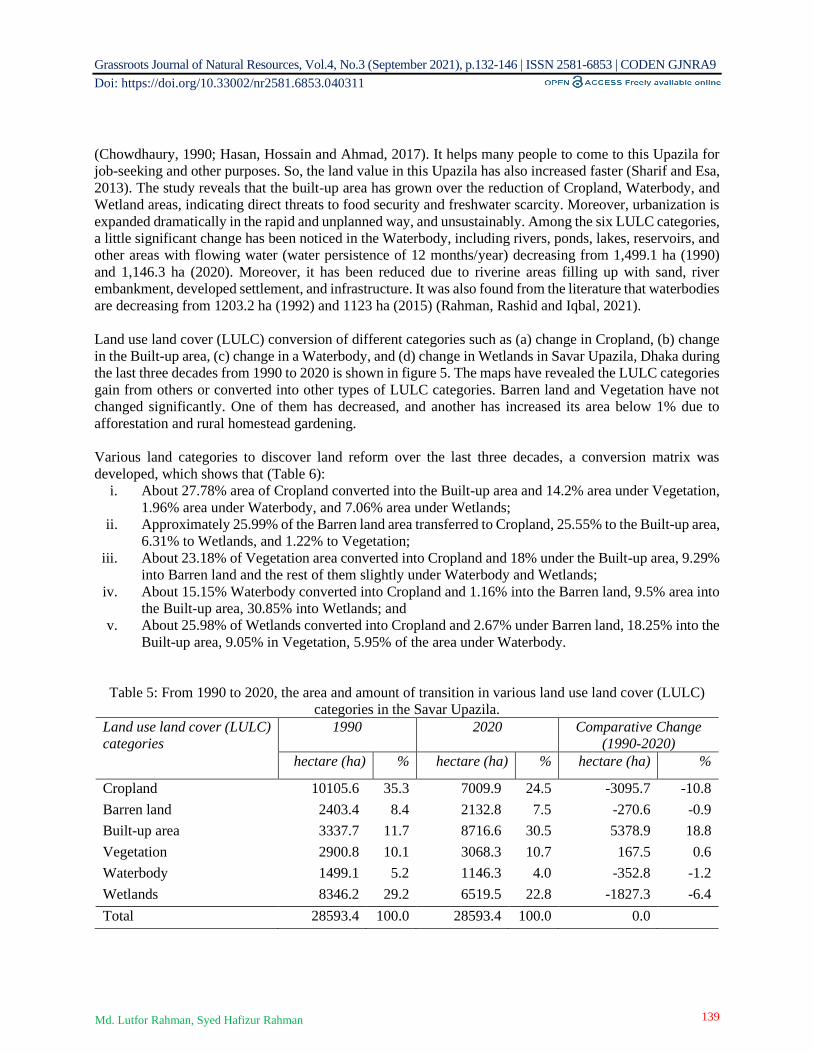
Grassroots Journal of Natural Resources, Vol.4, No.3 (September 2021), p.132-146 | ISSN 2581-6853 | CODEN GJNRA9
Doi: https://doi.org/10.33002/nr2581.6853.040311
139 Md. Lutfor Rahman, Syed Hafizur Rahman
(Chowdhaury, 1990; Hasan, Hossain and Ahmad, 2017). It helps many people to come to this Upazila for
job-seeking and other purposes. So, the land value in this Upazila has also increased faster (Sharif and Esa,
2013). The study reveals that the built-up area has grown over the reduction of Cropland, Waterbody, and
Wetland areas, indicating direct threats to food security and freshwater scarcity. Moreover, urbanization is
expanded dramatically in the rapid and unplanned way, and unsustainably. Among the six LULC categories,
a little significant change has been noticed in the Waterbody, including rivers, ponds, lakes, reservoirs, and
other areas with flowing water (water persistence of 12 months/year) decreasing from 1,499.1 ha (1990)
and 1,146.3 ha (2020). Moreover, it has been reduced due to riverine areas filling up with sand, river
embankment, developed settlement, and infrastructure. It was also found from the literature that waterbodies
are decreasing from 1203.2 ha (1992) and 1123 ha (2015) (Rahman, Rashid and Iqbal, 2021).
Land use land cover (LULC) conversion of different categories such as (a) change in Cropland, (b) change
in the Built-up area, (c) change in a Waterbody, and (d) change in Wetlands in Savar Upazila, Dhaka during
the last three decades from 1990 to 2020 is shown in figure 5. The maps have revealed the LULC categories
gain from others or converted into other types of LULC categories. Barren land and Vegetation have not
changed significantly. One of them has decreased, and another has increased its area below 1% due to
afforestation and rural homestead gardening.
Various land categories to discover land reform over the last three decades, a conversion matrix was
developed, which shows that (Table 6):
i. About 27.78% area of Cropland converted into the Built-up area and 14.2% area under Vegetation,
1.96% area under Waterbody, and 7.06% area under Wetlands;
ii. Approximately 25.99% of the Barren land area transferred to Cropland, 25.55% to the Built-up area,
6.31% to Wetlands, and 1.22% to Vegetation;
iii. About 23.18% of Vegetation area converted into Cropland and 18% under the Built-up area, 9.29%
into Barren land and the rest of them slightly under Waterbody and Wetlands;
iv. About 15.15% Waterbody converted into Cropland and 1.16% into the Barren land, 9.5% area into
the Built-up area, 30.85% into Wetlands; and
v. About 25.98% of Wetlands converted into Cropland and 2.67% under Barren land, 18.25% into the
Built-up area, 9.05% in Vegetation, 5.95% of the area under Waterbody.
Table 5: From 1990 to 2020, the area and amount of transition in various land use land cover (LULC)
categories in the Savar Upazila.
Land use land cover (LULC)
categories
1990 2020 Comparative Change
(1990-2020)
hectare (ha) % hectare (ha) % hectare (ha) %
Cropland 10105.6 35.3 7009.9 24.5 -3095.7 -10.8
Barren land 2403.4 8.4 2132.8 7.5 -270.6 -0.9
Built-up area 3337.7 11.7 8716.6 30.5 5378.9 18.8
Vegetation 2900.8 10.1 3068.3 10.7 167.5 0.6
Waterbody 1499.1 5.2 1146.3 4.0 -352.8 -1.2
Wetlands 8346.2 29.2 6519.5 22.8 -1827.3 -6.4
Total 28593.4 100.0 28593.4 100.0 0.0
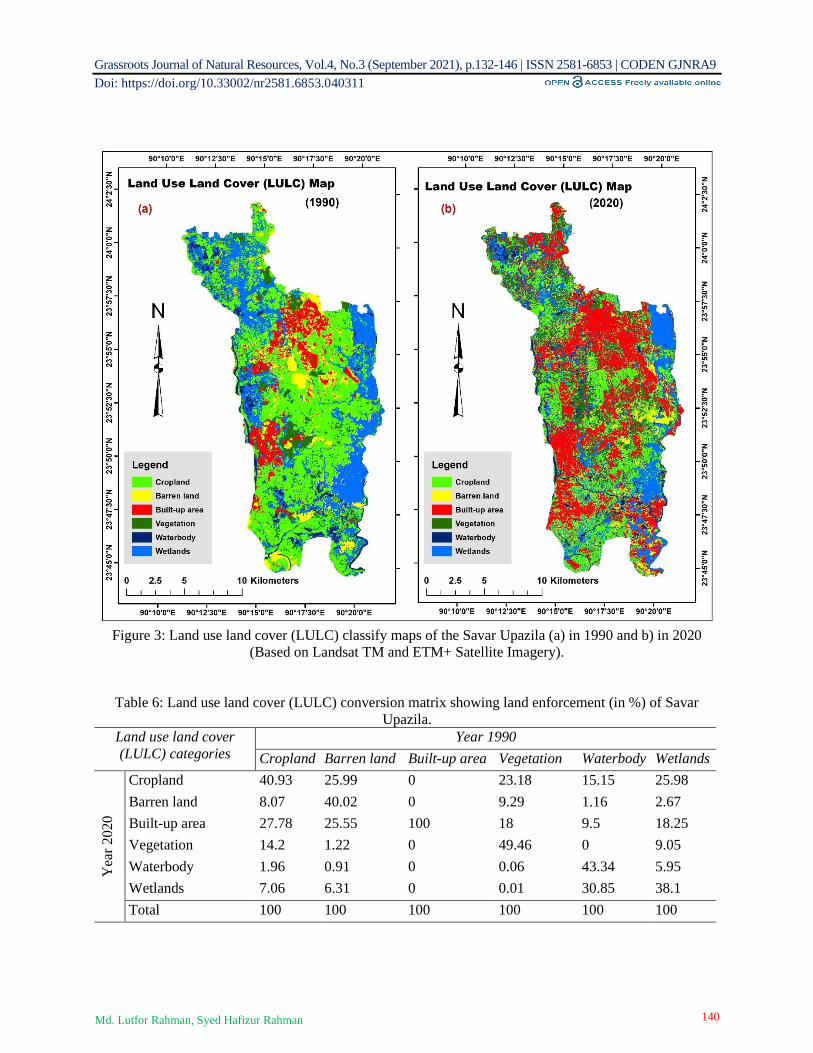
Grassroots Journal of Natural Resources, Vol.4, No.3 (September 2021), p.132-146 | ISSN 2581-6853 | CODEN GJNRA9
Doi: https://doi.org/10.33002/nr2581.6853.040311
140 Md. Lutfor Rahman, Syed Hafizur Rahman
Figure 3: Land use land cover (LULC) classify maps of the Savar Upazila (a) in 1990 and b) in 2020
(Based on Landsat TM and ETM+ Satellite Imagery).
Table 6: Land use land cover (LULC) conversion matrix showing land enforcement (in %) of Savar
Upazila.
Land use land cover
(LULC) categories
Year 1990
Cropland Barren land Built-up area Vegetation Waterbody Wetlands
Yea
r 2
020
Cropland 40.93 25.99 0 23.18 15.15 25.98
Barren land 8.07 40.02 0 9.29 1.16 2.67
Built-up area 27.78 25.55 100 18 9.5 18.25
Vegetation 14.2 1.22 0 49.46 0 9.05
Waterbody 1.96 0.91 0 0.06 43.34 5.95
Wetlands 7.06 6.31 0 0.01 30.85 38.1
Total 100 100 100 100 100 100
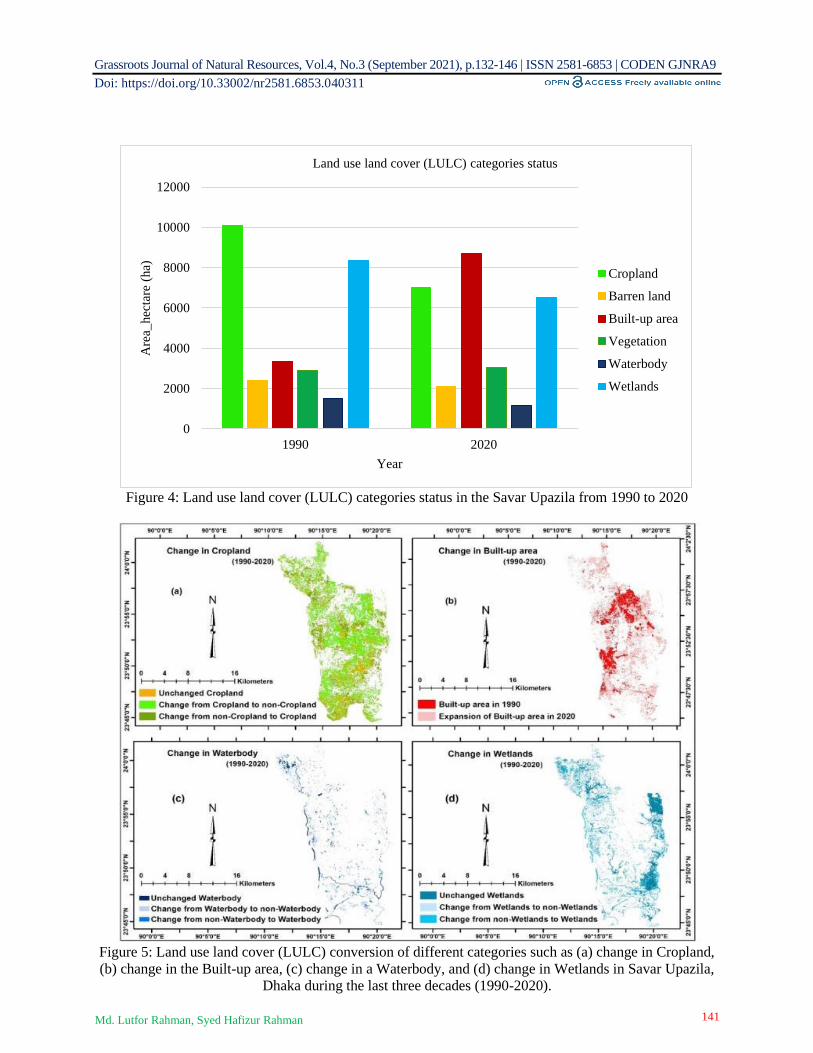
Grassroots Journal of Natural Resources, Vol.4, No.3 (September 2021), p.132-146 | ISSN 2581-6853 | CODEN GJNRA9
Doi: https://doi.org/10.33002/nr2581.6853.040311
141 Md. Lutfor Rahman, Syed Hafizur Rahman
Figure 4: Land use land cover (LULC) categories status in the Savar Upazila from 1990 to 2020
Figure 5: Land use land cover (LULC) conversion of different categories such as (a) change in Cropland,
(b) change in the Built-up area, (c) change in a Waterbody, and (d) change in Wetlands in Savar Upazila,
Dhaka during the last three decades (1990-2020).
0
2000
4000
6000
8000
10000
12000
1990 2020
Are
a_hec
tare
(ha)
Year
Land use land cover (LULC) categories status
Cropland
Barren land
Built-up area
Vegetation
Waterbody
Wetlands
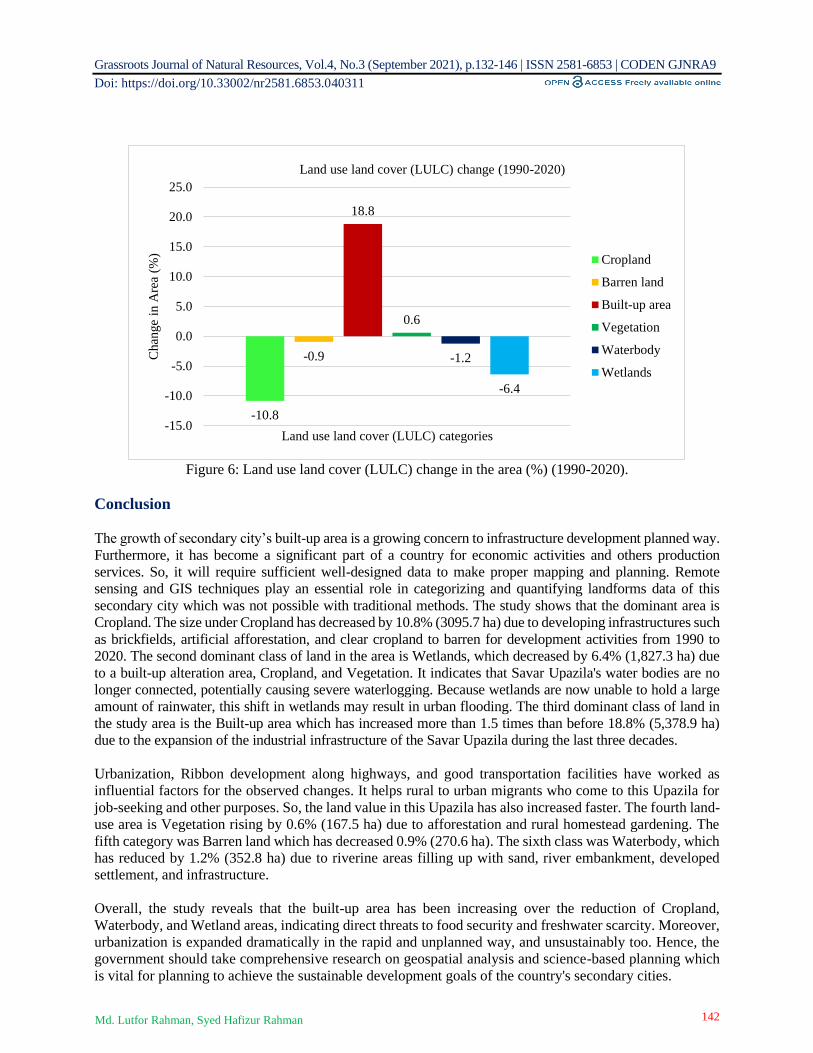
Grassroots Journal of Natural Resources, Vol.4, No.3 (September 2021), p.132-146 | ISSN 2581-6853 | CODEN GJNRA9
Doi: https://doi.org/10.33002/nr2581.6853.040311
142 Md. Lutfor Rahman, Syed Hafizur Rahman
Figure 6: Land use land cover (LULC) change in the area (%) (1990-2020).
Conclusion
The growth of secondary city’s built-up area is a growing concern to infrastructure development planned way.
Furthermore, it has become a significant part of a country for economic activities and others production
services. So, it will require sufficient well-designed data to make proper mapping and planning. Remote
sensing and GIS techniques play an essential role in categorizing and quantifying landforms data of this
secondary city which was not possible with traditional methods. The study shows that the dominant area is
Cropland. The size under Cropland has decreased by 10.8% (3095.7 ha) due to developing infrastructures such
as brickfields, artificial afforestation, and clear cropland to barren for development activities from 1990 to
2020. The second dominant class of land in the area is Wetlands, which decreased by 6.4% (1,827.3 ha) due
to a built-up alteration area, Cropland, and Vegetation. It indicates that Savar Upazila's water bodies are no
longer connected, potentially causing severe waterlogging. Because wetlands are now unable to hold a large
amount of rainwater, this shift in wetlands may result in urban flooding. The third dominant class of land in
the study area is the Built-up area which has increased more than 1.5 times than before 18.8% (5,378.9 ha)
due to the expansion of the industrial infrastructure of the Savar Upazila during the last three decades.
Urbanization, Ribbon development along highways, and good transportation facilities have worked as
influential factors for the observed changes. It helps rural to urban migrants who come to this Upazila for
job-seeking and other purposes. So, the land value in this Upazila has also increased faster. The fourth land-
use area is Vegetation rising by 0.6% (167.5 ha) due to afforestation and rural homestead gardening. The
fifth category was Barren land which has decreased 0.9% (270.6 ha). The sixth class was Waterbody, which
has reduced by 1.2% (352.8 ha) due to riverine areas filling up with sand, river embankment, developed
settlement, and infrastructure.
Overall, the study reveals that the built-up area has been increasing over the reduction of Cropland,
Waterbody, and Wetland areas, indicating direct threats to food security and freshwater scarcity. Moreover,
urbanization is expanded dramatically in the rapid and unplanned way, and unsustainably too. Hence, the
government should take comprehensive research on geospatial analysis and science-based planning which
is vital for planning to achieve the sustainable development goals of the country's secondary cities.
-10.8
-0.9
18.8
0.6
-1.2
-6.4
-15.0
-10.0
-5.0
0.0
5.0
10.0
15.0
20.0
25.0
Chan
ge
in A
rea
(%)
Land use land cover (LULC) categories
Land use land cover (LULC) change (1990-2020)
Cropland
Barren land
Built-up area
Vegetation
Waterbody
Wetlands
Grassroots Journal of Natural Resources, Vol.4, No.3 (September 2021), p.132-146 | ISSN 2581-6853 | CODEN GJNRA9
Doi: https://doi.org/10.33002/nr2581.6853.040311
143 Md. Lutfor Rahman, Syed Hafizur Rahman
References
Ahmed, B. and Ahmed, R. (2012). Modeling urban land cover growth dynamics using multirole satellite
images: A case study of Dhaka, Bangladesh. ISPRS International Journal of Geo-Information, 1(1):
3–31. DOI: https://doi.org/10.3390/ijgi1010003.
Al-Mamun, A. (2013). Identification and Monitoring the Change of Land Use Pattern Using Remote
Sensing and GIS: A Case Study of Dhaka City. IOSR Journal of Mechanical and Civil Engineering,
6(2): 20–28. DOI: https://doi.org/10.9790/1684-0622028.
Amin, M.S.R. (2009). A Study on the Land Value of Savar Municipality', Department of Urban and
Regional Planning, Bangladesh University of Engineering and Technology. Available online at:
http://lib.buet.ac.bd:8080/xmlui/bitstream/handle/123456789/2997/Full%20Thesis%20.pdf?sequenc
e=1 [Accessed on 23 July 2021]
Anderson, J. R., Hardy, E. E., Roach, J. T., and Witmer R.E. (1976). Land Use and Land Cover
Classification System for Use with Remote Sensor Data. U S Geol Surv, Prof Pap.
Baban, S.M.J. (1999). Use of remote sensing and geographical information systems in developing lake
management strategies. Hydrobiologia. DOI: https://doi.org/10.1007/978-94-017-3282-6_20.
BBS (2014). Population & Housing Census-2011. Bangladesh Bureau of Statistics, Government of
Bangladesh, Dhaka.
Belal, A. and Moghanm, F.S. (2011). Detecting urban growth using remote sensing and GIS techniques in
Al Gharbiya governorate, Egypt. The Egyptian Journal of Remote Sensing and Space Science, 14(2):
73–79. DOI: https://doi.org/10.1016/j.ejrs.2011.09.001.
Bhuiyan, M.M.H., Islam, K., Islam, K.N. and Jashimuddin, M. (2019). Monitoring dynamic land-use change
in rural-urban transition: a case study from Hathazari Upazila, Bangladesh. Geology, Ecology, and
Landscapes, 3(4): 247–257. DOI: https://doi.org/10.1080/24749508.2018.1556034.
Chowdhaury, M.M.R. (1990). Land Use Transformation in Savar; A Case Study of Sub-Urban Changes.
Department of Urban and Regional Planning, Bangladesh University of Engineering and Technology.
Available at:
http://lib.buet.ac.bd:8080/xmlui/bitstream/handle/123456789/2121/Full%20%20Thesis%20.pdf?seq
uence=1&isAllowed=y [Accessed on 10 December 2016]
Choudhury, A.M. (1999). Changes in Land Use / Land Cover Within the Indo Gangetic Plain Region :
Bangladesh. Workshop on Indo Gangetic Plain, SASCOM, India.
Chowdhury, M., Hasan, M.E. and Abdullah-Al-Mamun, M.M. (2020). Land use/land cover change
assessment of Halda watershed using remote sensing and GIS. Egyptian Journal of Remote Sensing
and Space Science, 23(1): 63–75. DOI: https://doi.org/10.1016/j.ejrs.2018.11.003.
Congalton, R.G. (1991). A review of assessing the accuracy of classifications of remotely sensed data. Remote
Sensing of Environment, 37(1): 35–46. DOI: https://doi.org/10.1016/0034-4257(91)90048-B.
Coppin, P., Jonckheere, J., Nackaerts, K., Muys, B. and Lambin, E. (2004). Digital change detection
methods in ecosystem monitoring: A review. International Journal of Remote Sensing, 25(9): 1565–
1596. DOI: https://doi.org/10.1080/0143116031000101675.
Davis, K. (1955). The origins and growth of urbanization in the world. American Journal of Sociology,
60(5): 429–437.
Dewan, A.M. and Yamaguchi, Y. (2009). Land use and land cover change in Greater Dhaka, Bangladesh:
Using remote sensing to promote sustainable urbanization. Applied Geography, 29(3): 390–401. DOI:
https://doi.org/10.1016/j.apgeog.2008.12.005.
Dewan, A.M., Yamaguchi, Y. and Rahman, M.Z. (2012). Dynamics of land use/cover changes and the
analysis of landscape fragmentation in Dhaka Metropolitan, Bangladesh. Geo Journal, 77(3): 315–
330. DOI: https://doi.org/10.1007/s10708-010-9399-x.
Dimyati, M., Mizuno, K., Kobayashi, S. and Kitamura, T. (1996). An analysis of land use/cover change
using the combination of MSS landsat and land use map—a case study in yogyakarta, indonesia.
International Journal of Remote Sensing, 17(5): 931–944. DOI: doi: 10.1080/01431169608949056.
FAO (2011). Land cover classification for ecosystem accounting Prepared. Meta, (3): 1–29.

Grassroots Journal of Natural Resources, Vol.4, No.3 (September 2021), p.132-146 | ISSN 2581-6853 | CODEN GJNRA9
Doi: https://doi.org/10.33002/nr2581.6853.040311
144 Md. Lutfor Rahman, Syed Hafizur Rahman
Fonji, S.F. and Taff, G.N. (2014). Using satellite data to monitor land-use land-cover change in North-
eastern Latvia. SpringerPlus, 3(1): 1–15. DOI: https://doi.org/10.1186/2193-1801-3-61.
Goodall, B. (1987). The Penguin Dictionary of Human Geography. London: Penguin Group.
Hassan, Z., Shabbir, R., Ahmad, S.S., Aziz, N., Butt, A. and Erum, S. (2016). Dynamics of land use and
land cover change (LULCC) using geospatial techniques: a case study of Islamabad Pakistan.
SpringerPlus, 5(812), 1–11. DOI: https://doi.org/10.1186/s40064-016-2414-z.
Hasan, M.M., Hossain, S.M.N. and Ahmad, T. (2017). Impact of Ribbon Development on Land Use along
Dhaka Aricha Highway. The Case of Savar Upazila. Journal of Settlements and Spatial Planning,
8(1): 1–9. DOI: https://doi.org/10.24193/jssp.2017.1.01.
Haque, M.I. and Basak, R. (2017). Land cover change detection using GIS and remote sensing techniques:
A Spatio-temporal study on Tanguar Haor, Sunamganj, Bangladesh. Egyptian Journal of Remote
Sensing and Space Science, 20(2): 251–263. DOI: https://doi.org/10.1016/j.ejrs.2016.12.003.
Homer, C.D., Jon, F., Joyce, C., Michael, H., Larson, N., Charles, M., Alexa, V.D. and Wickham, J. (2007).
Completion of the 2001 National Land Cover Database for the conterminous United States.
Photogrammetric Engineering and Remote Sensing, 73(4): 337–341.
Hu, Y., Batunacun, Zhen, L. and Zhuang, D. (2019). Assessment of Land-Use and Land-Cover Change in
Guangxi, China. Scientific Reports, 9(1): 1–13. DOI: https://doi.org/10.1038/s41598-019-38487-w.
Islam, M.S., Shahabuddin, A., Kamal, M.M. and Ahmed, R. (2014). Wetlands of Dhaka City: It's Past and
Present Scenario. Journal of Life and Earth Science, 7, 83–90. DOI:
https://doi.org/10.3329/jles.v7i0.20126.
Jensen, J. (1983). Urban/Suburban Land Use Analysis. American Society of Photogrammetry, 2: 1571–
1666.
Jensen, J.R. (2014). Remote sensing of the environment: an earth resource perspective, second edition.
Harlow, England: Pearson Education Limited.
Jenson, J.R. and Cowen, D.C. (1999). Remote Sensing of Urban/Suburban Infrastructure and Socio-
Economic Attributes. Photogrammetric Engineering & Remote Sensing, 65(5): 6111–622. DOI:
https://doi.org/10.1097/00006982-200206000-00019.
Lambina, E.F., Turnerb, B.L., Geista, H.J., Agbolac, S.B., Angelsend, A., Brucee, J.W., Coomesf, O.T.,
Dirzog, R., Fischerh, G., Folkei, C., Georgej, P.S., Homewoodk, K., Imbernonl, J., Leemansm, R.,
Lin, X., Morano, E.F., Mortimorep, M., Ramakrishnanq, P.S., Richardsr, J.F., Skaaness, H., Steffent,
W., Stoneu, G.D., Svedinv, U., Veldkampw, T.A., Vogelx, C. and Xu, J. (2001). The causes of land-
use and land-cover change: Moving beyond the myths. Global Environmental Change, 11(4): 261–
269. DOI: https://doi.org/10.1016/S0959-3780(01)00007-3.
Marais, L., Nel, E. and Donaldson, R. (2016). Secondary Cities and Development. London: Routledge.
Masud, M.B. (2008). Land-use change in Savar Municipality: 1974-2001 (in press), Jahangirnagar
University, Savar, Dhaka.
McEvoy, D., Ahmed, I., Trundle, A., Sang, L.T., Diem, N.N., Suu, L.T.T., Quoc, T.B., Mallick, F.H.,
Rahman, R., Rahman, A., Mukherjee, N. and Nishat A. (2014). In support of urban adaptation: a
participatory assessment process for secondary cities in Vietnam and Bangladesh. Climate and
Development, 6(3), 205–215. DOI: https://doi.org/10.1080/17565529.2014.886991.
Milla, K.A., Lorenzo, A. and Brown, C. (2005). GIS, GPS, and remote sensing technologies in extension
services: Where to start, what to know. Journal of Extension, 43(3): 1–8.
(https://archives.joe.org/joe/2005june/a6.php)
Mondal, M.S., Sharma, N., Kappas, M. and Garg, P.K. (2015). Critical assessment of land use land cover
dynamics using multi-temporal satellite images. Environments, 2(1): 61–90. DOI:
https://doi.org/10.3390/environments2010061.
Parvin, G.A., Ali, M.H., Fujita, K., Abedin, M.A., Habiba, U. and Shaw, R. (2017). Land Use Change in
Southwestern Coastal Bangladesh: Consequence to Food and Water Supply. In: Banba M., Shaw R.
(eds) Land Use Management in Disaster Risk Reduction. Disaster Risk Reduction (Methods,
Approaches and Practices). Springer, Tokyo, pp 381-401. DOI: https://doi.org/10.1007/978-4-431-
56442-3_20.
Grassroots Journal of Natural Resources, Vol.4, No.3 (September 2021), p.132-146 | ISSN 2581-6853 | CODEN GJNRA9
Doi: https://doi.org/10.33002/nr2581.6853.040311
145 Md. Lutfor Rahman, Syed Hafizur Rahman
Pilon, P.G., Howarth, P.J., and Bullock, R.A. (1988). An enhanced classification approach to change
detection in semi-arid environments. Photogrammetric Engineering & Remote Sensing, 54: 1709–
1716.
Pontius, R.G., Shusas, E. and McEachern, M. (2004). Detecting important categorical land changes while
accounting for persistence. Agriculture, Ecosystems and Environment, 101(2–3): 251–268. DOI:
https://doi.org/10.1016/j.agee.2003.09.008.
Rahman, H., Rashid, S. and Iqbal, M. (2021). Assessment of Land Use Change in Environmental Elements
Available in the Upazila (Sub-District) SRDI Map: A Case Study of Savar Upazila of Dhaka District.
International Research Journal of Modernization in Engineering Technology and Science, (06): 728–
737. DOI: https://doi.org/10.3844/ajessp.2021.64.74
Rai, R., Zhang, Y., Paudel, B., Li, S. and Khanal, N. (2017). A synthesis of studies on land use and land
cover dynamics during 1930–2015 in Bangladesh. Sustainability, 9(10): 1–20. DOI:
https://doi.org/10.3390/su9101866.
Rashid, M.S. (2003). A study of land transformation in Savar Upazila, Bangladesh, 1915-2001: an integrated
approach using remote sensing, census, map and field data. Durham University. Available at:
https://ethos.bl.uk/OrderDetails.do?uin=uk.bl.ethos.268634 [Accessed on 12 June 2021].
Rawat, J.S. and Kumar, M. (2015). Monitoring land use/cover change using remote sensing and GIS
techniques: A case study of Hawalbagh block, district Almora, Uttarakhand, India. Egyptian Journal
of Remote Sensing and Space Science, 18(1): 77–84. DOI: https://doi.org/10.1016/j.ejrs.2015.02.002.
Roberts, B.H. (2014). Managing Systems of Secondary Cities: Policy Responses in International
Development. London: Cities Alliance/UNOPS.
Roberts, B.H. and Hohmann, R.P. (2015). Secondary Cities : Managing Urban Land Governance Systems
Full. World Bank Conference on Land and Poverty 2014: Integrating Land Governance into the Post
2015 Agenda: Harnessing Synergies for Implementation and Monitoring Impact (March 2014).
Rondinelli, D.A. (1983). Dynamics of growth of secondary cities in developing countries. Geographical
Review, 73(1): 42–57. DOI: https://doi.org/10.2307/214394.
Sharif, M.S. and Esa, A.J. (2014). Dynamics of Land Price and Land Use Change: A Case of Savar
Municipality, Bangladesh. Journal of South Asian Studies, 2(1): 83–89.
(https://esciencepress.net/journals/index.php/JSAS/article/view/226/276)
Spruce, J., Bolten, J., Mohammed, I.N., Srinivasan, R. and Lakshmi, V. (2020). Mapping Land Use Land
Cover Change in the Lower Mekong Basin from 1997 to 2010. Frontiers in Environmental Science,
8(March): 21. DOI: https://doi.org/10.3389/fenvs.2020.00021.
Teferi, E., Bewket, W., Uhlenbrook, S. and Wenninger, J. (2013). Understanding recent land use and land
cover dynamics in the source region of the Upper Blue Nile, Ethiopia: Spatially explicit statistical
modeling of systematic transitions, Agriculture, Ecosystems and Environment, 165: 98–117. DOI:
https://doi.org/10.1016/j.agee.2012.11.007.
UN-HABITAT (2008). State of the World City 2008/2009. Virginia: Earthscan.
World Bank (2008). World Development Report 2009: Reshaping Economic Geography. Washinton D.C.:
The World Bank
World Bank (2009). Systems of Cities Integrating National and Local Policies Connecting Institutions and
Infrastructures. Washington, DC: The World Bank.
Wang, S., Wu, B. and Yang, P. (2014). Assessing the changes in land use and ecosystem services in an oasis
agricultural region of Yanqi Basin, Northwest China. Environmental Monitoring and Assessment, 186: 8343–8357. DOI: https://doi.org/10.1007/s10661-014-4009-x.
Xu, X., Shrestha, S., Gilani, H., Gumma, M.K., Siddiqui, B.N. and Jain, A.K. (2020). Dynamics and drivers
of land use and land cover changes in Bangladesh. Regional Environmental Change, 20(54): 1 –11.
DOI: https://doi.org/10.1007/s10113-020-01650-5.
Yesmin, R., Mohiuddin, A.S.M., Uddin, M.J. and Shahid, M.A. (2014). Land use and land cover change
detection at Mirzapur Union of Gazipur District of Bangladesh using remote sensing and GIS
technology. IOP Conference Series: Earth and Environmental Science, 20(012055): 1–9. DOI:
https://doi.org/10.1088/1755-1315/20/1/012055.

Grassroots Journal of Natural Resources, Vol.4, No.3 (September 2021), p.132-146 | ISSN 2581-6853 | CODEN GJNRA9
Doi: https://doi.org/10.33002/nr2581.6853.040311
146 Md. Lutfor Rahman, Syed Hafizur Rahman
Authors’ Declarations and Essential Ethical Compliances
Authors’ Contributions (in accordance with ICMJE criteria for authorship)
Contribution Author 1 Author 2
Conceived and designed the research or analysis Yes Yes
Collected the data Yes No
Contributed to data analysis & interpretation Yes No
Wrote the article/paper Yes No
Critical revision of the article/paper No Yes
Editing of the article/paper No Yes
Supervision No Yes
Project Administration No Yes
Funding Acquisition No Yes
Overall Contribution Proportion (%) 50 50
Funding
No funding was available for the research conducted for and writing of this paper.
Research involving human bodies (Helsinki Declaration)
Has this research used human subjects for experimentation? No
Research involving animals (ARRIVE Checklist)
Has this research involved animal subjects for experimentation? No
Research involving Plants
During the research, the authors followed the principles of the Convention on Biological Diversity and
the Convention on the Trade in Endangered Species of Wild Fauna and Flora.
Research on Indigenous Peoples and/or Traditional Knowledge
Has this research involved Indigenous Peoples as participants or respondents? No
(Optional) PRISMA (Preferred Reporting Items for Systematic Reviews and Meta-Analyses)
Have authors complied with PRISMA standards? No
Competing Interests/Conflict of Interest
Authors have no competing financial, professional, or personal interests from other parties or in publishing
this manuscript.
Rights and Permissions
Open Access. This article is licensed under a Creative Commons Attribution 4.0 International License,
which permits use, sharing, adaptation, distribution and reproduction in any medium or format, as long as
you give appropriate credit to the original author(s) and the source, provide a link to the Creative Commons
license, and indicate if changes were made. The images or other third-party material in this article are
included in the article's Creative Commons license, unless indicated otherwise in a credit line to the material.
If material is not included in the article's Creative Commons license and your intended use is not permitted
by statutory regulation or exceeds the permitted use, you will need to obtain permission directly from the
copyright holder. To view a copy of this license, visit http://creativecommons.org/licenses/by/4.0/.
Assessing Local Vulnerability to Climate Change by Using Livelihood
Vulnerability Index: A Case Study of Dipang Watershed in Central
Himalaya Region of Nepal
Kapil Dhungana1, Harish Bahadur Chand*2, Dinesh Bhandari3, Abhishek Kumar4, Sanjay Singh5,
Ramesh Bohara6 1Institute of Forestry, Pokhara, Nepal. Email: [email protected] | ORCID: 0000-0003-2062-7866 2Forest Research Institute, India. Email: [email protected] | ORCID: 0000-0002-3098-152X 3Institute of Forestry, Tribhuwan University, Nepal. Email: [email protected] | ORCID: 0000-0003-1758-0059 4Forest Research Institute, India. Email: [email protected] | ORCID: 0000-0002-4666-3438 5Indian Council of Forestry Research and Education, India.
Email: [email protected] | ORCID: 0000-0003-4668-7808 6Sahid Bishnu-Dhani Memorial Polytechnic Institute, Nepal.
Email: [email protected] | ORCID: 0000-0002-0586-2748
*Corresponding author
Abstract The current study uses the livelihood vulnerability index (LVI) and the
Intergovernmental Panel on Climate Change livelihood vulnerability
index (IPCC-LVI) approaches to assess household’s livelihood
vulnerability in the Dipang watershed located in the Central Himalayan
region of Nepal. Primary data was collected through various
participatory rural appraisal (PRA) tools such as direct observation, key
informant interviews (KIIs), focus group discussions (FGDs) and
household surveys. Similarly, data on climatic variables were collected
from the nearby meteorological station over 30 years (1987-2018). The
mean annual average temperature increased by 0.036°C while the
average rainfall decreased by 2.30 mm. Respondents perceived a similar
trend of rising temperatures, decreasing rainfall intensity, dryness in the
atmosphere, and dwindling water sources. The overall LVI score
(0.416) indicated that the households are vulnerable to climate change.
Food (0.642) and natural disasters and climate variability (0.566) were
the most vulnerable among all contributing factors. Similarly, the overall
LVI-IPCC score (0.104) indicated that the households were moderately
vulnerable due to high exposure (0.566), sensitivity (0.448), and low
adaptive capacity (0.334). The study findings suggest an urgent need to
reduce high exposure to climate risks, improved livelihood strategies,
and boost agricultural productivity and health in the watershed area.
Keywords Vulnerability assessment; Climatic variables; Exposure; Sensitivity;
Adaptive capacity
How to cite this paper: Dhungana, K., Chand,
H.B., Bhandari, D., Kumar, A., Singh, S. and
Bohara, R. (2021). Assessing Local Vulnerability to
Climate Change by Using Livelihood Vulnerability
Index: A Case Study of Dipang Watershed in
Central Himalaya Region of Nepal. Grassroots
Journal of Natural Resources, 4(3): 147-163. Doi:
https://doi.org/10.33002/nr2581.6853.040312
Received: 09 July 2021
Reviewed: 31 July 2021
Provisionally Accepted: 11 August 2021
Revised: 27 August 2021
Finally Accepted: 31 August 2021
Published: 30 September 2021
Copyright © 2021 by author(s)
This work is licensed under the Creative
Commons Attribution International
License (CC BY 4.0).
http://creativecommons.org/licenses/by/4.0/
Grassroots Journal of Natural Resources, Vol.4 No.3 (September 2021) ISSN 2581-6853 | CODEN: GJNRA9 | Published by The Grassroots Institute
Website: http://grassrootsjournals.org/gjnr | Main Indexing: Web of Science
M – 00249 | Research Article
ISSN 2581-6853 | 4(3) Sep 2021
Grassroots Journal of Natural Resources, Vol.4, No.3 (September 2021), p.147-163 | ISSN 2581-6853 | CODEN GJNRA9
Doi: https://doi.org/10.33002/nr2581.6853.040312
148 Kapil Dhungana, Harish Bahadur Chand, Dinesh Bhandari, Abhishek Kumar, Sanjay Singh, Ramesh Bohara
Introduction
Climate change is widely regarded as the most devastating threat to human well-being in recent history. The
global average temperature has risen by 0.7°C over the last century and is expected to rise by another 1.1-
6.4°C by the end of the twenty-first century (IPCC, 2013). Similarly, global average precipitation has
increased by 2% over the same time and is expected to increase (IPCC, 2013). Climate change and its
variability endangers various geophysical, biological, and socio-economic systems, impacting negatively
the biodiversity (Chand et al., 2018; Sintayehu, 2018; Soni and Ansari, 2017), food security (Fanzo et al.,
2017; FAO, 2018), water resources (Chhetri et al., 2018; Versini et al., 2016), economics (Hallegatte et al.,
2018), health (Butler, 2018) and social equality (Denton et al., 2014).
Climate change is expected to have serious ecological, economic, and social consequences in South Asia,
particularly in areas where livelihoods rely on the use of natural resources (Mishra et al., 2019). The Hindu
Kush Himalayan region is extremely vulnerable to climate change due to its diverse geological and climatic
conditions (Gertlitz et al., 2017; Gupta et al., 2019; Wester et al., 2019). Among them, Nepal is the fourth
most vulnerable country in the world to climate change (Eckstein et al., 2018). Nepal is vulnerable to many
natural disasters such as illnesses, floods, and landslides, with an average of 900 natural disasters claiming
lives and endangering livelihoods each year (MoHA, 2009). As a result, over 1.9 million people are
projected to be extremely vulnerable, with another 10 million facing the increased risks (MoEnv, 2010).
Nepal, a developing country, is especially vulnerable to the consequences of climate change due to its
exposure and sensitivity to climate extremes and its low adaptation capability (Kates, 2000).
Vulnerability assessment has proven to be a useful tool in assessing vulnerable systems to develop
appropriate climate change policies (Schroth et al., 2016). Vulnerability assessment refers to a wide range
of methods for systematically integrating and investigating the interactions between humans and their
physical and social environments (Hahn et al., 2009). Vulnerability assessment is widely used in various
research applications that include ecology, environmental health, sustainability, poverty alleviation,
livelihood, development, and hazard and impact assessment for climate change (Füssel, 2007). The
Livelihood Vulnerability Index (LVI) is useful for understanding climate change vulnerability. It provides
a framework for analyzing the key components of livelihoods and the contextual factors that influence them
(Adu et al., 2017). The LVI uses various indicators to assess exposure to natural disasters, climate
variability, and household social and economic characteristics that influence their adaptive capacity and
current health, food, and water resource characteristics that influence their sensitivity to climate change
impacts. It has also been useful in factoring in biophysical and socio-economic components for better
adaptation and mitigation measures and decision making (Panda and Amaratunga, 2016).
There is new and stronger evidence of climate change impacts on unique and vulnerable systems such as
mountain communities and ecosystems, with increasing levels of negative impacts as temperature rise
(Zemp et al., 2009). Dipang watershed is a part of the lake cluster of Phewa Lake, a designated Ramsar site.
The watershed not only provides freshwater for agriculture and domestic use, but it also provides varieties
of ecosystem services (Tognetti et al., 2017). These watershed services include provisioning services
(irrigating water supply, fish supply, timber, fuel wood, food, medicine, and handicraft), regulatory services
(climate regulation, disease regulation, and water purification) and cultural services (aesthetic and scenic
beauty, recreational and tourism, educational resource service and festivals) (MoFE, 2018). However, the
watershed is facing difficulties as a result of climatic and anthropogenic activities. Residents of the
watershed rely on watershed services to support their livelihoods. Climate change is likely to influence these
people's livelihoods. Moreover, limited studies exist regarding climate change vulnerability assessment at
the watershed level in Nepal. Against this backdrop, the current study attempts to analyze the climatic
variable trends and assess the livelihood vulnerability of the households using the LVI and LVI-IPCC
approaches in the watershed. The study will provide government organizations and local policymakers with
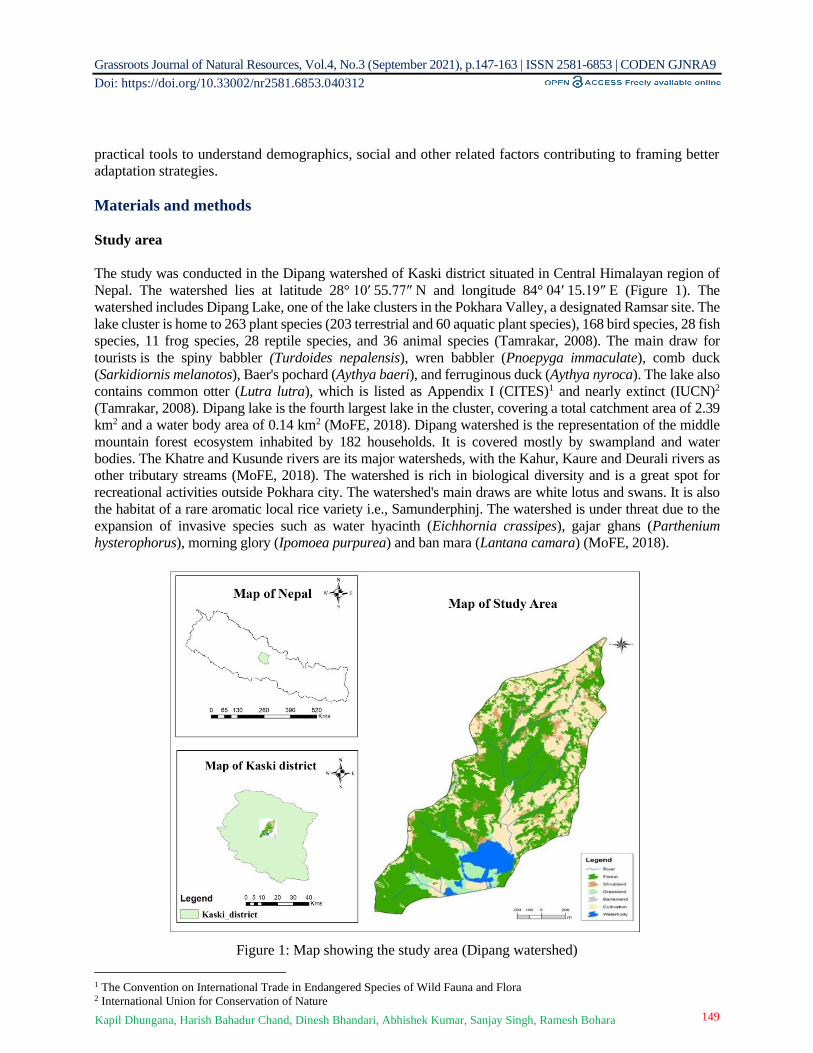
Grassroots Journal of Natural Resources, Vol.4, No.3 (September 2021), p.147-163 | ISSN 2581-6853 | CODEN GJNRA9
Doi: https://doi.org/10.33002/nr2581.6853.040312
149 Kapil Dhungana, Harish Bahadur Chand, Dinesh Bhandari, Abhishek Kumar, Sanjay Singh, Ramesh Bohara
practical tools to understand demographics, social and other related factors contributing to framing better
adaptation strategies.
Materials and methods
Study area
The study was conducted in the Dipang watershed of Kaski district situated in Central Himalayan region of
Nepal. The watershed lies at latitude 28° 10′ 55.77″ N and longitude 84° 04′ 15.19″ E (Figure 1). The
watershed includes Dipang Lake, one of the lake clusters in the Pokhara Valley, a designated Ramsar site. The
lake cluster is home to 263 plant species (203 terrestrial and 60 aquatic plant species), 168 bird species, 28 fish
species, 11 frog species, 28 reptile species, and 36 animal species (Tamrakar, 2008). The main draw for
tourists is the spiny babbler (Turdoides nepalensis), wren babbler (Pnoepyga immaculate), comb duck
(Sarkidiornis melanotos), Baer's pochard (Aythya baeri), and ferruginous duck (Aythya nyroca). The lake also
contains common otter (Lutra lutra), which is listed as Appendix I (CITES)1 and nearly extinct (IUCN)2
(Tamrakar, 2008). Dipang lake is the fourth largest lake in the cluster, covering a total catchment area of 2.39
km2 and a water body area of 0.14 km2 (MoFE, 2018). Dipang watershed is the representation of the middle
mountain forest ecosystem inhabited by 182 households. It is covered mostly by swampland and water
bodies. The Khatre and Kusunde rivers are its major watersheds, with the Kahur, Kaure and Deurali rivers as
other tributary streams (MoFE, 2018). The watershed is rich in biological diversity and is a great spot for
recreational activities outside Pokhara city. The watershed's main draws are white lotus and swans. It is also
the habitat of a rare aromatic local rice variety i.e., Samunderphinj. The watershed is under threat due to the
expansion of invasive species such as water hyacinth (Eichhornia crassipes), gajar ghans (Parthenium
hysterophorus), morning glory (Ipomoea purpurea) and ban mara (Lantana camara) (MoFE, 2018).
Figure 1: Map showing the study area (Dipang watershed)
1 The Convention on International Trade in Endangered Species of Wild Fauna and Flora 2 International Union for Conservation of Nature
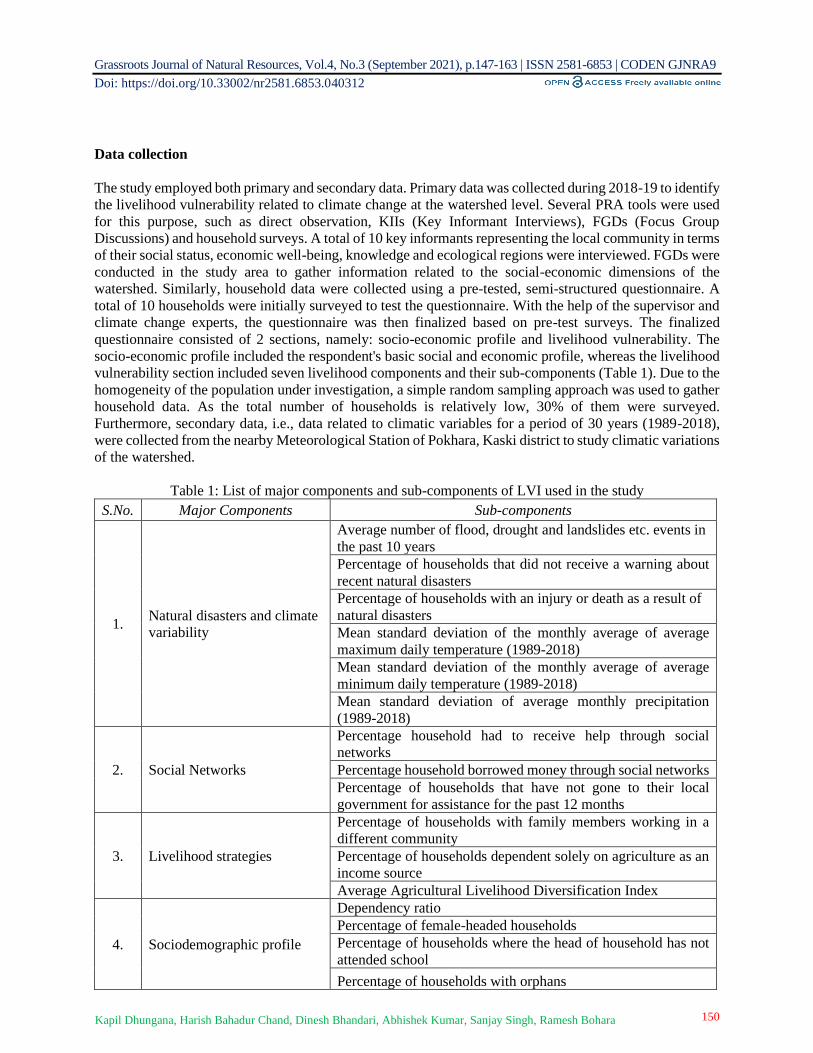
Grassroots Journal of Natural Resources, Vol.4, No.3 (September 2021), p.147-163 | ISSN 2581-6853 | CODEN GJNRA9
Doi: https://doi.org/10.33002/nr2581.6853.040312
150 Kapil Dhungana, Harish Bahadur Chand, Dinesh Bhandari, Abhishek Kumar, Sanjay Singh, Ramesh Bohara
Data collection
The study employed both primary and secondary data. Primary data was collected during 2018-19 to identify
the livelihood vulnerability related to climate change at the watershed level. Several PRA tools were used
for this purpose, such as direct observation, KIIs (Key Informant Interviews), FGDs (Focus Group
Discussions) and household surveys. A total of 10 key informants representing the local community in terms
of their social status, economic well-being, knowledge and ecological regions were interviewed. FGDs were
conducted in the study area to gather information related to the social-economic dimensions of the
watershed. Similarly, household data were collected using a pre-tested, semi-structured questionnaire. A
total of 10 households were initially surveyed to test the questionnaire. With the help of the supervisor and
climate change experts, the questionnaire was then finalized based on pre-test surveys. The finalized
questionnaire consisted of 2 sections, namely: socio-economic profile and livelihood vulnerability. The
socio-economic profile included the respondent's basic social and economic profile, whereas the livelihood
vulnerability section included seven livelihood components and their sub-components (Table 1). Due to the
homogeneity of the population under investigation, a simple random sampling approach was used to gather
household data. As the total number of households is relatively low, 30% of them were surveyed.
Furthermore, secondary data, i.e., data related to climatic variables for a period of 30 years (1989-2018),
were collected from the nearby Meteorological Station of Pokhara, Kaski district to study climatic variations
of the watershed.
Table 1: List of major components and sub-components of LVI used in the study
S.No. Major Components Sub-components
1. Natural disasters and climate
variability
Average number of flood, drought and landslides etc. events in
the past 10 years
Percentage of households that did not receive a warning about
recent natural disasters
Percentage of households with an injury or death as a result of
natural disasters
Mean standard deviation of the monthly average of average
maximum daily temperature (1989-2018)
Mean standard deviation of the monthly average of average
minimum daily temperature (1989-2018)
Mean standard deviation of average monthly precipitation
(1989-2018)
2. Social Networks
Percentage household had to receive help through social
networks
Percentage household borrowed money through social networks
Percentage of households that have not gone to their local
government for assistance for the past 12 months
3. Livelihood strategies
Percentage of households with family members working in a
different community
Percentage of households dependent solely on agriculture as an
income source
Average Agricultural Livelihood Diversification Index
4. Sociodemographic profile
Dependency ratio
Percentage of female-headed households
Percentage of households where the head of household has not
attended school
Percentage of households with orphans

Grassroots Journal of Natural Resources, Vol.4, No.3 (September 2021), p.147-163 | ISSN 2581-6853 | CODEN GJNRA9
Doi: https://doi.org/10.33002/nr2581.6853.040312
151 Kapil Dhungana, Harish Bahadur Chand, Dinesh Bhandari, Abhishek Kumar, Sanjay Singh, Ramesh Bohara
S.No. Major Components Sub-components
5. Water
Percentage of households reported having water availability
problem
Percentage of households that utilize a natural water source
6. Food
Percentage of households dependent solely on the family farm
for food
Percentage of household struggle to find food support for whole
year
Average Crop Diversity Index
Percentage of households that do not save crops
Percentage of households that do not save seeds
7. Health
Average time to the health facility
Percentage of households with a family member with chronic
illness
Percentage of household with members missed school/work in
past two weeks
Climatic variability trend analysis
To find a linear trend in the data, simple linear regression was used. Equation 1 depicts the linear trend
between time-series data (y) and time (t).
Y= a+bt …………………………………………1
where, y= temperature or rainfall, t= time (year), 'a' and 'b' are constants estimated by the principle of least
squares.
Vulnerability analysis
LVI approach
The livelihood vulnerability index developed by Hahn et al. (2009) was adopted to assess the risk derived
from climate variability. This approach consists of seven major components, i.e., natural disaster and climate
variability, social networks, livelihood strategies, socio-demographic profile, water, food and health. Each
major component has several sub-components, and each sub-component contributes equally to the overall
index. The sub-components were developed based on a review of the relevant literature and consultation
with experts, as shown in Table 1. A balanced weighted approach was followed for the LVI calculation
(Sullivan, 2002; Pandey and Jha, 2012). To standardize each sub-component, equation 2 was used:
IndexSb= 𝑆𝐶−𝑆𝑚𝑖𝑛
𝑆𝑚𝑎𝑥−𝑆𝑚𝑖𝑛……………………………………2
where, Sb = original sub-component or indicator value for the watershed
Smax and Smin = the maximum and minimum sub-component values determined using all the sub-component
values from the communities.
After standardization, the value of each major component was calculated using equation 3.
Mb = ∑ −𝐼𝑛𝑑𝑒𝑥
𝑆𝑏𝑖0𝑖=1
𝑛……………………………………………3
where, Mb = one of the seven major components for the watershed
IndexSbi= the sub-component value of indicator belonging to major component for the watershed.
n = the number of sub-components in each major component
The watershed level LVI was calculated as the weighted average of the seven major components as in
equation 4, i.e.,

Grassroots Journal of Natural Resources, Vol.4, No.3 (September 2021), p.147-163 | ISSN 2581-6853 | CODEN GJNRA9
Doi: https://doi.org/10.33002/nr2581.6853.040312
152 Kapil Dhungana, Harish Bahadur Chand, Dinesh Bhandari, Abhishek Kumar, Sanjay Singh, Ramesh Bohara
LVIb = ∑ −𝑊𝑀𝑖𝑀𝑏𝑖
7𝑖=1
∑ −𝑊𝑀𝑖7𝑖=1
…………………………………….…...4
where, LVIb = the Livelihood Vulnerability Index for the watershed.
𝑊𝑀𝑖 = the weight of major component i, decided by the number of sub-components in the major component.
𝑀𝑏𝑖 = the value of the ith major component in the watershed
The LVI was scaled from 0 (least vulnerable) to 1 (most vulnerable). The index below 0.5 was interpreted
as not vulnerable, while above 0.5 was interpreted as vulnerable (Hahn et al., 2009).
LVI-IPCC approach
LVI-IPCC approach incorporates the IPCC vulnerability definition. The IPCC definition characterizes
vulnerability (to climate change) as a function of a system's exposure and sensitivity to climatic stimuli and
its capacity to adapt to their (adverse) effects, which corresponds to outcome (or endpoint) vulnerability. In
this approach, seven major components were classified into three categories, i.e., exposure, sensitivity and
adaptive capacity. The exposure index contained natural disasters and climate variability, the sensitivity
index contained food, water and health, and the adaptive capacity index contained socio-demographic
profile, livelihood strategies and social networks. Each of these three categories of IPCC factors was
calculated based on the equation:
CFb=∑ WMiMbin
i=0
∑ WMini=1
………………………………………………5
Where, CFb is an IPCC-defined contributing factor (exposure, sensitivity, adaptive capacity) for watershed
b, Mbiis the major component for Watershed indexed by i, WMi is the weight of each major component,
and n is the number of major components in each contributing factor.
Once exposure, sensitivity, and adaptive capacity were calculated, the three contributing factors were
combined using the following equation:
LVI – IPCCb = (eb-ab)*Sb……………………………………….6
where, LVI–IPCCb is the LVI for watershed 'b' expressed using the IPCC vulnerability framework, 'e' is the
calculated exposure score, 'a' is the calculated adaptive capacity score and 's' is the calculated sensitivity
score for the watershed. The LVI – IPCC was scaled from -1 (least vulnerable) to +1 (most vulnerable) as
follows:
Table 1: Categories for LVI-IPCC Scale
S.N. Vulnerability class LVI
1 Very high 0.61-1
2 High 0.21-0.60
3 Moderate 0.20-(-0.19)
4 Less (-0.20)-(-.60)
5 Very less (-0.61)-(-1)
Source: IPCC (2001)
Results and Discussion
Socio-demographic characteristics of the respondents
Most of the respondents were males (84.21%), and a few were females (15.79%). The respondents belonged
to three categories of castes, namely upper caste Brahmin/Chettri (45.61%), scheduled castes (35.09%) and
scheduled tribes (19.30%). Most of the respondents were older than 50 years (56.14%), while only 12.28%
of the respondents were less than 30 years. Agriculture (85.96%) was the major occupation of the

Grassroots Journal of Natural Resources, Vol.4, No.3 (September 2021), p.147-163 | ISSN 2581-6853 | CODEN GJNRA9
Doi: https://doi.org/10.33002/nr2581.6853.040312
153 Kapil Dhungana, Harish Bahadur Chand, Dinesh Bhandari, Abhishek Kumar, Sanjay Singh, Ramesh Bohara
respondents, followed by services (7.02%) and business (3.51%). In terms of educational attainment, the
majority of respondents (50.88%) had completed 10th grade, followed by illiterates (30.33%), intermediate
level (7.02%), and graduates and above (1.75%). Only 3.51% of all households had enough food from
agriculture for the whole year, while the majority had adequate food for 3-6 months (49.12%), followed by
9-12 months (28.07%), and 6-9 months (19.03%). Table 3 shows the respondent's socio-demographic
characteristics.
Table 3: Socio-demographic characteristics of the respondents
S.N. Characteristics of the respondents Frequency Percentage (%)
1 Gender Male 48 84.21
Female 9 15.79
2 Caste Schedule caste 20 35.09
Scheduled Tribe 11 19.30
Brahmin/Chettri 26 45.61
3 Major Occupation Agriculture 49 85.96
Services 4 7.02
Business 2 3.52
Others 2 3.51
4 Age <30 years 7 12.28
31-50 years 18 31.58
>50 years 32 56.14
5 Education Illiterate 19 33.33
Up to 10th grade 29 50.88
Intermediate level 4 7.02
Graduation and more 1 1.75
6 Food sufficiency from agriculture 3-6 month 28 49.12
6-9 month 11 19.30
9-12 month 16 28.07
> 12 month 2 3.51
Climatic data trend
Temperature
The analysis revealed that the mean annual maximum temperature, minimum temperature and average
temperature have increased by 0.04, 0.03 and 0.04ºC per year, respectively (Figure 2). The mean annual
maximum temperature was recorded highest in 2009 and the mean annual minimum temperature in 2006.
The trend of the maximum temperature of the watershed is less than that of the overall Gandaki province
(0.078ºC per year) and Nepal (0.054ºC per year) (Upadhayaya and Baral, 2020). The result of the trend
analysis is similar to the findings of Karki et al. (2020) who recorded the mean annual temperature,
minimum temperature and average temperature and accounted an increase in temperature by 0.04, 0.02 and
0.03ºC per year, respectively. This might be due to the topo-climatic environment of the watershed, which
is in between the Terai3 and Himalayan regions of the country.
3 Lands lying at the foot of a watershed/Himalayas

Grassroots Journal of Natural Resources, Vol.4, No.3 (September 2021), p.147-163 | ISSN 2581-6853 | CODEN GJNRA9
Doi: https://doi.org/10.33002/nr2581.6853.040312
154 Kapil Dhungana, Harish Bahadur Chand, Dinesh Bhandari, Abhishek Kumar, Sanjay Singh, Ramesh Bohara
Figure 2: Temperature trend of the Dipang watershed
Precipitation
The average annual rainfall from 1989 to 2018 was estimated to be 3,907.85 mm. The average annual
rainfall was found maximum in 1998 (4,879) and minimum in 2009 (2,716.8 mm). The average annual
rainfall was found to be decreasing at the rate of 2.30 mm per year. The data showed large inter-annual
rainfall variability, as shown in Figure 3. The decreasing rainfall trend in the country is quite evident in
many studies (DHM, 2017). The decreasing rainfall trend can adversely impact agricultural productivity
and food security (Lamichhane et al., 2020), eventually impacting the well-being of agriculture dependent
communities.
Perception on changes in climatic variables and its perceived impacts
There has been a shift in climatic circumstances, according to the majority of the respondents. Based on
their observations and personal experiences, the individuals perceived that the climate patterns had altered.
82.4% of respondents perceived an increase in temperature; none stated it was cooler than before, while 7%
indicated there had been no change in the temperature, and 10.6 percent had no idea about the temperature
rise/fall. Similarly, 66.7% of respondents reported a decrease in rainfall, 17% reported an increase in rainfall,
and the rest reported that rainfall had remained constant. Figure 4 depicts the impression of a shift in climatic
variables.
61.4% of the respondents perceived that dryness in weather has increased, while 26.32% responded that
dryness has decreased and 5.26% responded that there has been no change in dryness over the 30 years
(1989-2018). Similarly, 78.9 % of the respondents expressed their views that the intensity of rainfall has
decreased, 14% perceived it has increased, and 7.1% had no idea about the intensity of rainfall. Regarding
water sources, 42.10%, 35%, and 17.5% of the respondents perceived a decrease, an increase, and no
change, respectively. Figure 5 depicts respondent's perception of changes in climate trends.
y = 0.0369x + 26.409R² = 0.3183
y = 0.0358x + 15.098R² = 0.2856
y = 0.0363x + 20.754R² = 0.3597
0
5
10
15
20
25
301
98
9
19
90
19
91
19
92
19
93
19
94
19
95
19
96
19
97
19
98
19
99
20
00
20
01
20
02
20
03
20
04
20
05
20
06
20
07
20
08
20
09
20
10
20
11
20
12
20
13
20
14
20
15
20
16
20
17
20
18
Tem
per
ature
Deg
ree
Cel
cius
Year
Temperature Trend of Dipang watershed
Max. Temp. Min. Temp. Avg. Temp.
Linear ( Max. Temp.) Linear (Min. Temp.) Linear (Avg. Temp.)
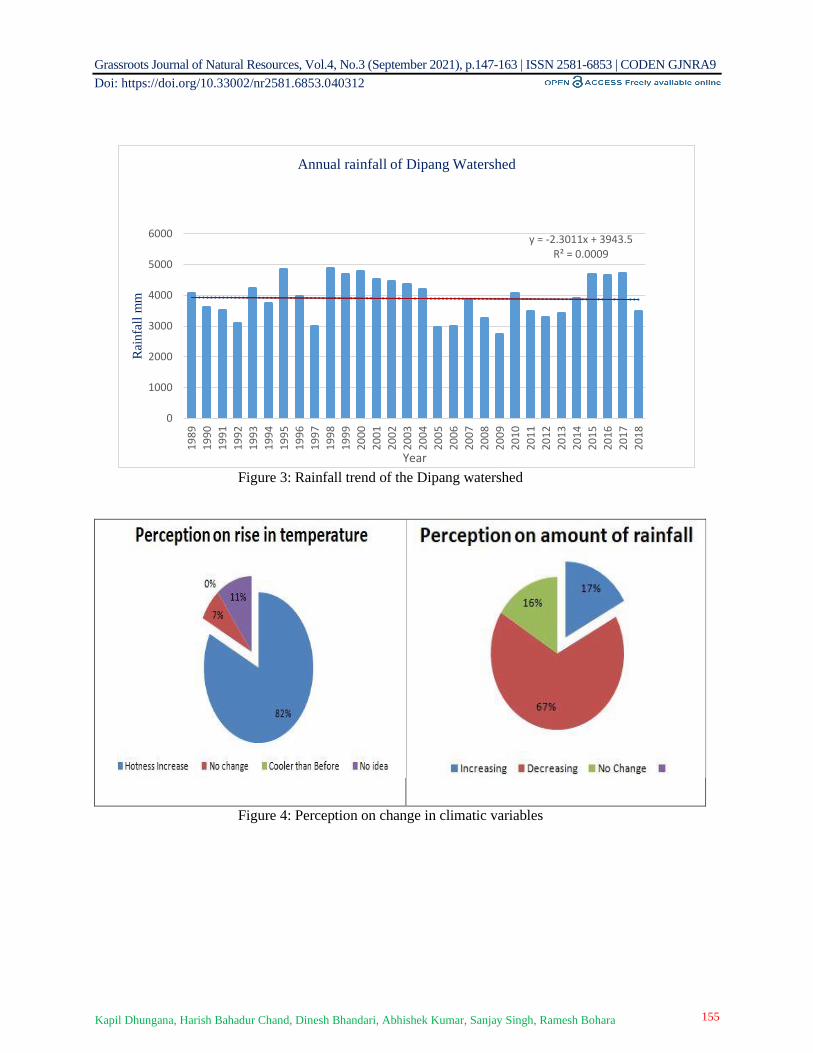
Grassroots Journal of Natural Resources, Vol.4, No.3 (September 2021), p.147-163 | ISSN 2581-6853 | CODEN GJNRA9
Doi: https://doi.org/10.33002/nr2581.6853.040312
155 Kapil Dhungana, Harish Bahadur Chand, Dinesh Bhandari, Abhishek Kumar, Sanjay Singh, Ramesh Bohara
Figure 3: Rainfall trend of the Dipang watershed
Figure 4: Perception on change in climatic variables
y = -2.3011x + 3943.5R² = 0.0009
0
1000
2000
3000
4000
5000
6000
19
89
19
90
19
91
19
92
19
93
19
94
19
95
19
96
19
97
19
98
19
99
20
00
20
01
20
02
20
03
20
04
20
05
20
06
20
07
20
08
20
09
20
10
20
11
20
12
20
13
20
14
20
15
20
16
20
17
20
18
Rai
nfa
ll m
m
Year
Annual rainfall of Dipang Watershed

Grassroots Journal of Natural Resources, Vol.4, No.3 (September 2021), p.147-163 | ISSN 2581-6853 | CODEN GJNRA9
Doi: https://doi.org/10.33002/nr2581.6853.040312
156 Kapil Dhungana, Harish Bahadur Chand, Dinesh Bhandari, Abhishek Kumar, Sanjay Singh, Ramesh Bohara
Figure 5: People perception of change in climatic trend
Livelihood vulnerability index analysis
The values of the main components and sub-components contributing to LVI of the watershed are presented
in table 3, along with its composite values. A higher index value score signifies higher vulnerability and
vice-versa. The overall result showed low household livelihood vulnerability (0.416) in the study area. Out
of the seven major components undertaken for the study, households were highly vulnerable to food (0.642)
and natural disasters and climate variability (0.566) components. All other components, i.e., water (0.241),
socio-demographic profile (0.276), livelihood strategies (0.306), social networking (0.420) and health
(0.460), showed low household vulnerability.
Figure 6: LVI scores of the major components
26%
67%
42%
61%
18%
35%
12%16%
23%
0%
10%
20%
30%
40%
50%
60%
70%
Dryness Rainfall Water Source
Perception on change in climatic trend
Decreasing Increasing Don’t Know
0.0
0.2
0.4
0.6
0.8Socio-demographic Value
Health
Water
Livelihood StrategiesNatural Disaster and Climate
Variability
Social Networks
Food
LVI of Major Components
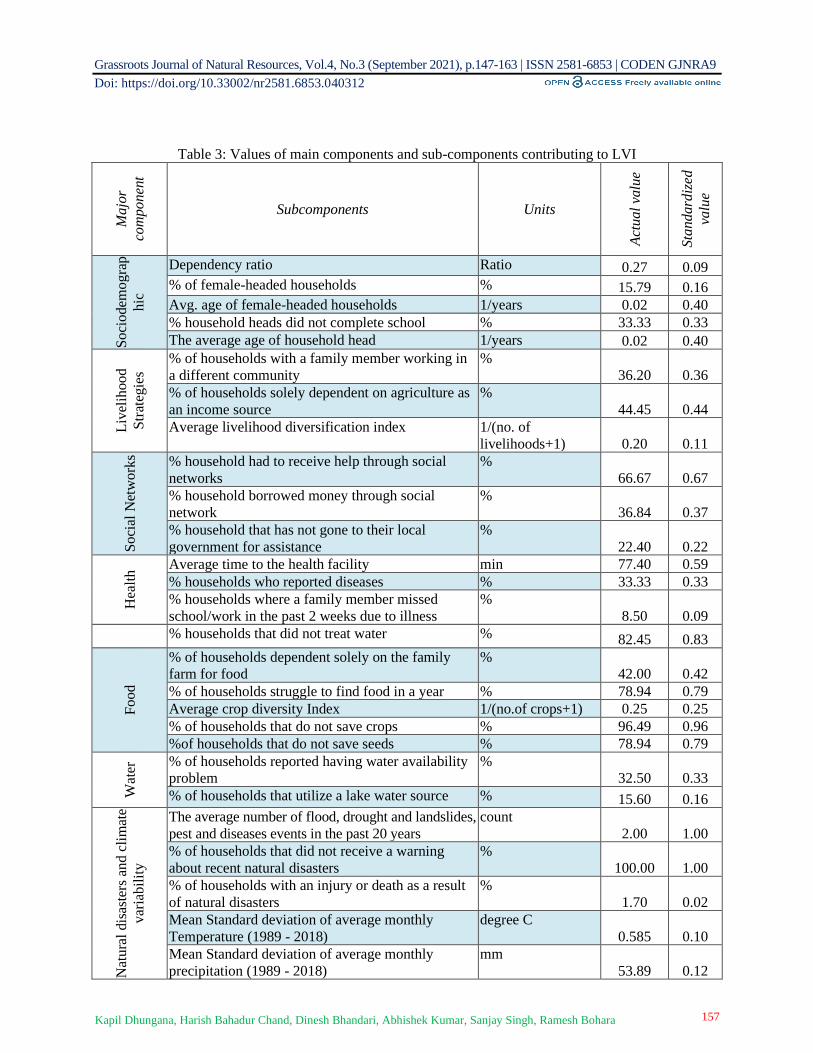
Grassroots Journal of Natural Resources, Vol.4, No.3 (September 2021), p.147-163 | ISSN 2581-6853 | CODEN GJNRA9
Doi: https://doi.org/10.33002/nr2581.6853.040312
157 Kapil Dhungana, Harish Bahadur Chand, Dinesh Bhandari, Abhishek Kumar, Sanjay Singh, Ramesh Bohara
Table 3: Values of main components and sub-components contributing to LVI
Ma
jor
com
po
nen
t
Subcomponents Units
Act
ual
valu
e
Sta
nd
ard
ized
valu
e
So
cio
dem
og
rap
hic
Dependency ratio Ratio 0.27 0.09
% of female-headed households % 15.79 0.16
Avg. age of female-headed households 1/years 0.02 0.40
% household heads did not complete school % 33.33 0.33
The average age of household head 1/years 0.02 0.40
Liv
elih
ood
Str
ateg
ies
% of households with a family member working in
a different community
%
36.20 0.36
% of households solely dependent on agriculture as
an income source
%
44.45 0.44
Average livelihood diversification index 1/(no. of
livelihoods+1) 0.20 0.11
Soci
al N
etw
ork
s % household had to receive help through social
networks
%
66.67 0.67
% household borrowed money through social
network
%
36.84 0.37
% household that has not gone to their local
government for assistance
%
22.40 0.22
Hea
lth Average time to the health facility min 77.40 0.59
% households who reported diseases % 33.33 0.33
% households where a family member missed
school/work in the past 2 weeks due to illness
%
8.50 0.09 % households that did not treat water % 82.45 0.83
Food
% of households dependent solely on the family
farm for food
%
42.00 0.42
% of households struggle to find food in a year % 78.94 0.79
Average crop diversity Index 1/(no.of crops+1) 0.25 0.25
% of households that do not save crops % 96.49 0.96
%of households that do not save seeds % 78.94 0.79
Wat
er % of households reported having water availability
problem
%
32.50 0.33
% of households that utilize a lake water source % 15.60 0.16
Nat
ura
l dis
aste
rs a
nd
cli
mat
e
var
iabil
ity
The average number of flood, drought and landslides,
pest and diseases events in the past 20 years
count
2.00 1.00
% of households that did not receive a warning
about recent natural disasters
%
100.00 1.00
% of households with an injury or death as a result
of natural disasters
%
1.70 0.02
Mean Standard deviation of average monthly
Temperature (1989 - 2018)
degree C
0.585 0.10
Mean Standard deviation of average monthly
precipitation (1989 - 2018)
mm
53.89 0.12

Grassroots Journal of Natural Resources, Vol.4, No.3 (September 2021), p.147-163 | ISSN 2581-6853 | CODEN GJNRA9
Doi: https://doi.org/10.33002/nr2581.6853.040312
158 Kapil Dhungana, Harish Bahadur Chand, Dinesh Bhandari, Abhishek Kumar, Sanjay Singh, Ramesh Bohara
% of households reporting the change in
temperature in the last 20 years
%
87 0.87
% of households reporting the change in
precipitation in the last 20 years: 85 percent
%
85 0.85
The food component (0.642) contributed to the highest household vulnerability. Food produced from
agriculture has only been sufficient for a few months of sustenance, and only a few households have been
able to store food and seeds from agricultural operations. Natural disasters and climate variability consisted
of high household livelihood vulnerability (0.566). A similar study conducted in the Moma and Mabote
districts of Mozambique (Hahn et al., 2009) reflected the lower index values of natural disasters and climate
variability compared to this study. The higher values are the results of the perception of change in climatic
parameters, incidences of frequent natural disasters such as floods, droughts and landslides and lack of early
warning system.
The lowest value for LVI was found for the water component, as most households have access to water
round the year. The availability of water from the lake has not been affected by climate change, which
indicates the increase in the water area in the lake during the last decade (MoFE, 2018). The lower values
of the socio-demographic profile of the study area were consistent with the findings of the study carried out
in Lete and Kunjo village of Mustang, Nepal (Urthody and Larsen, 2010), Melamchi River Valley,
Sindhupalchowk, Nepal (Sujakhu et al., 2019) and Ghana (Baffoe and Matsuda, 2017). As people have job
opportunities in other communities and nearby city, and are diversifying income sources, the study found
alternate livelihood strategies have been adopted in the area because the livelihood strategies index is low,
which is similar to the findings obtained in Moma and Mabote districts of Mozambique (Hahn et al., 2009).
The social networks component value (0.420) is similar to the study conducted by Urothody and Larsen
(2010), which can be attributed to different cooperatives and sub-village development committees and better
linkage with the local government. The value of the health index of the study (0.46) is the same as the health
index of Nariva wetland (0.46), but higher than Caroni wetland (0.36) (Shah et al., 2013). No water is treated
for drinking purposes in the study area. This situation can outrage water-borne diseases in the upcoming
years as the lake water has been adequately unnoticed for management by government agencies. The results
revealed that the vulnerability indices of the major components ranged from 0.241 (water) to 0.642 (food).
The graphical presentation of livelihood vulnerability indices is shown in figure 6.
LVI-IPCC
The LVI-IPCC was computed by grouping the seven major components into three categories: exposure,
sensitivity, and adaptive capacity. Exposure was made up of only one major component score, while
sensitivity and adaptive capacity comprised the aggregated scores of three major components each.
According to the LVI-IPCC vulnerability scale, the overall household LVI was moderately vulnerable
(0.104). This was similar to the findings from Langtang Valley, Nepal (Nepal et al., 2019) and Lower Niumi
and Kombo South district, Gambia (Amuzu, 2018), where households were moderately vulnerable with the
values of 0.098, 0.023 and 0.02, respectively. The average values of factors contributing to the IPCC-LVI
were 0.334, 0.448 and 0.566 for adaptive capacity, sensitivity and exposure, respectively. This indicates that
the study area is more exposed to climate change and has a lower adaptive capacity. The graphical
representation of the different contributing components to LVI-IPCC is given in figure 7.
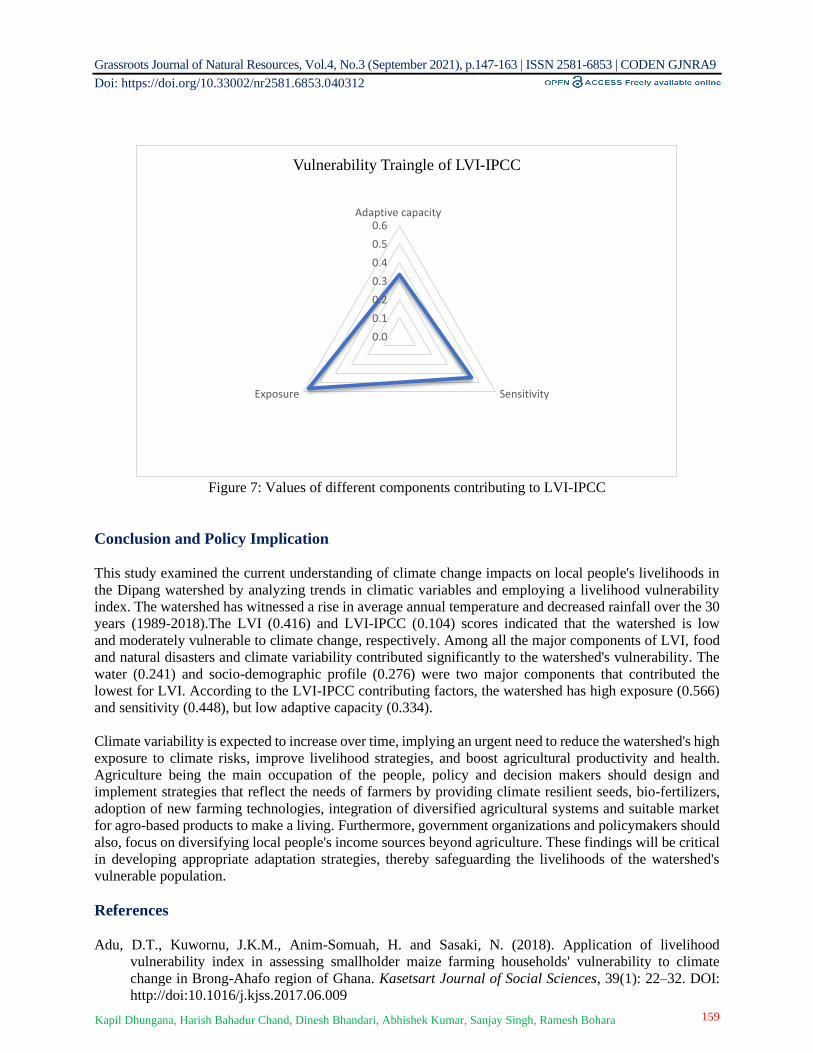
Grassroots Journal of Natural Resources, Vol.4, No.3 (September 2021), p.147-163 | ISSN 2581-6853 | CODEN GJNRA9
Doi: https://doi.org/10.33002/nr2581.6853.040312
159 Kapil Dhungana, Harish Bahadur Chand, Dinesh Bhandari, Abhishek Kumar, Sanjay Singh, Ramesh Bohara
Figure 7: Values of different components contributing to LVI-IPCC
Conclusion and Policy Implication
This study examined the current understanding of climate change impacts on local people's livelihoods in
the Dipang watershed by analyzing trends in climatic variables and employing a livelihood vulnerability
index. The watershed has witnessed a rise in average annual temperature and decreased rainfall over the 30
years (1989-2018).The LVI (0.416) and LVI-IPCC (0.104) scores indicated that the watershed is low
and moderately vulnerable to climate change, respectively. Among all the major components of LVI, food
and natural disasters and climate variability contributed significantly to the watershed's vulnerability. The
water (0.241) and socio-demographic profile (0.276) were two major components that contributed the
lowest for LVI. According to the LVI-IPCC contributing factors, the watershed has high exposure (0.566)
and sensitivity (0.448), but low adaptive capacity (0.334).
Climate variability is expected to increase over time, implying an urgent need to reduce the watershed's high
exposure to climate risks, improve livelihood strategies, and boost agricultural productivity and health.
Agriculture being the main occupation of the people, policy and decision makers should design and
implement strategies that reflect the needs of farmers by providing climate resilient seeds, bio-fertilizers,
adoption of new farming technologies, integration of diversified agricultural systems and suitable market
for agro-based products to make a living. Furthermore, government organizations and policymakers should
also, focus on diversifying local people's income sources beyond agriculture. These findings will be critical
in developing appropriate adaptation strategies, thereby safeguarding the livelihoods of the watershed's
vulnerable population.
References
Adu, D.T., Kuwornu, J.K.M., Anim-Somuah, H. and Sasaki, N. (2018). Application of livelihood
vulnerability index in assessing smallholder maize farming households' vulnerability to climate
change in Brong-Ahafo region of Ghana. Kasetsart Journal of Social Sciences, 39(1): 22–32. DOI:
http://doi:10.1016/j.kjss.2017.06.009
0.0
0.1
0.2
0.3
0.4
0.5
0.6Adaptive capacity
SensitivityExposure
Vulnerability Traingle of LVI-IPCC
Grassroots Journal of Natural Resources, Vol.4, No.3 (September 2021), p.147-163 | ISSN 2581-6853 | CODEN GJNRA9
Doi: https://doi.org/10.33002/nr2581.6853.040312
160 Kapil Dhungana, Harish Bahadur Chand, Dinesh Bhandari, Abhishek Kumar, Sanjay Singh, Ramesh Bohara
Amuzu, J. (2018). Households' Livelihood Vulnerability to Climate Change and Climate Variability: A Case
Study of the Coastal Zone, The Gambia. Journal of Environment and Earth Science, 8(1): 35-46.
Available online:
https://www.researchgate.net/publication/322860803_Households'_Livelihood_Vulnerability_to_Cl
imate_Change_and_Climate_Variability_A_Case_Study_of_the_Coastal_Zone_The_Gambia
[Accessed on 26 May 2021].
Baffoe, G. and Matsuda, H. (2017). An Empirical Assessment of Households Livelihood Vulnerability: The
Case of Rural Ghana. Social Indicators Research: An International and Interdisciplinary Journal for
Quality-of-Life Measurement, 140(3): 1225-1257. DOI: http://doi:10.1007/s11205-017-1796-9
Butler, C.D. (2018). Climate Change, Health and Existential Risks to Civilization: A Comprehensive
Review (1989–2013). International Journal of Environmental Research and Public Health, 15(10):
2266. DOI: http://doi:10.3390/ijerph15102266
Chand, H.B., Singh, H. and Chhetri, R. (2018). Carbon Sequestration Potential in Sahid Smriti Community
Forest: A Case study of Terai Region of Nepal. International Conference on Agriculture and Allied
Sciences: The Productivity, Food Security and Ecology, Kolkata, India. Available online:
https://www.researchgate.net/publication/329962107_Carbon_Sequestration_Potential_in_Sahid_S
mriti_Community_Forest_A_Case_Study_of_Terai_Region_of_Nepal [Accessed on 26 May 2021].
Chhetri, R., Ganguly, S., Chand, H.B., Adhikari, S., Raut, R. and Sharma, B. (2018). Vulnerability
Assessment of Climate Change Impacts on Water Resources at Community Level in Hilly Areas of
Nepal. Journal of Energy Research and Environmental Technology, 5(2): 30-34. Available online:
https://www.researchgate.net/publication/329962345_Vulnerability_Assessment_of_Climate_Chan
ge_Impacts_on_Water_Resources_at_Community_Level_in_Hilly_Areas_of_Nepal [Accessed on
12 May 2021].
Denton, F., Wilbanks, T.J., Abeysinghe, A.C., Burton, I., Gao, Q., Lemos, M.C., Masui, T., O'Brien, K.L.
and Warner, K. (2014). Climate-resilient pathways: adaptation, mitigation, and sustainable
development. In: Climate Change 2014: Impacts, Adaptation, and Vulnerability. Part A: Global and
Sectoral Aspects. Contribution of Working Group II to the Fifth Assessment Report of the
Intergovernmental Panel on Climate Change. New York, USA: Cambridge University Press, pp.
1101-1131. Available online: https://www.ipcc.ch/site/assets/uploads/2018/02/WGIIAR5-
Chap20_FINAL.pdf [Accessed on 23 May 2021].
Fanzo, J., McLaren, R., Davis, C. and Choufani, J. (2017). Climate change and variability: What are the
risks for nutrition, diets, and food systems? IFPRI discussion papers 1645, International Food Policy
Research Institute (IFPRI), New York, USA. Available online:
http://ebrary.ifpri.org/utils/getfile/collection/p15738coll2/id/131228/filename/131439.pdf [Accessed
on 23 May 2021].
FAO (2018). The future of food and agriculture: Alternative pathways to 2050. Food and Agriculture
Organization of the United Nations, Rome, Italy. Available online:
http://www.fao.org/3/I8429EN/i8429en.pdf [Accessed on 23 May 2021].
Füssel, H.M. (2007). Adaptation planning for climate change: concepts, assessment approaches, and key
lessons. Sustainability Science, 2(2): 265–275. DOI: http://doi:10.1007/s11625-007-0032-y
Gerlitz, J.Y., Macchi, M., Brooks, N., Pandey, R., Banerjee, S. and Jha, S.K. (2016). The Multidimensional
Livelihood Vulnerability Index – An instrument to measure livelihood vulnerability to change in the
Hindu Kush Himalayas. Climate and Development, 9(2): 124–140. DOI:
http://doi:10.1080/17565529.2016.1145099
Eckstein, D., Hutfils, M.L. and Winges, M. (2018). Global Climate Risk Index: who suffer most from
extreme weather events? Weather related loss event in 2017 and 1998 to 2017. Global Climate Risk
Index 2019, German Watch, Bonn, Germany. Available online:
https://germanwatch.org/sites/default/files/Global%20Climate%20Risk%20Index%202019_2.pdf
[Accessed on March 2021].
Gupta, A.K., Negi, M., Nandy, S., Alatalo, J.M., Singh, V. and Pandey, R. (2019). Assessing the
vulnerability of socio-environmental systems to climate change along an altitude gradient in the
Grassroots Journal of Natural Resources, Vol.4, No.3 (September 2021), p.147-163 | ISSN 2581-6853 | CODEN GJNRA9
Doi: https://doi.org/10.33002/nr2581.6853.040312
161 Kapil Dhungana, Harish Bahadur Chand, Dinesh Bhandari, Abhishek Kumar, Sanjay Singh, Ramesh Bohara
Indian Himalayas. Ecological Indicators, 106: 105512. DOI:
http://doi:10.1016/j.ecolind.2019.105512
Hahn, M.B., Riederer, A.M. and Foster, S.O. (2009). The Livelihood Vulnerability Index: A pragmatic
approach to assessing risks from climate variability and change—A case study in Mozambique.
Global Environmental Change, 19(1): 74-88. DOI: https://doi.org/10.1016/j.gloenvcha.2008.11.002
Hallegatte, S., Fay, M. and Barbier, E.B. (2018). Poverty and climate change: introduction. Environment
and Development Economics, 23(03): 217–233. DOI: http://doi:10.1017/s1355770x18000141
Mishra, A., Appadurai, A.N., Choudhury, D., Regmi, B.R., Kelkar, U., Alam, M., Chaudhary, P., Mu, S.S.,
Ahmed, A.U., Lotia, H., Fu, C., Namgyel, T. and Sharma, U. (2019). Adaptation to Climate Change
in the Hindu Kush Himalaya: Stronger Action Urgently Needed. The Hindu Kush Himalaya
Assessment, 457–490. DOI: http://doi:10.1007/978-3-319-92288-1_13
IPCC (2001). Climate Change 2001: Impacts, Adaptation, and Vulnerability. Contribution of Working
Group II to the Third Assessment Report of the Intergovernmental Panel on Climate Change. UK:
Cambridge University Press, UK. Available online:
https://www.ipcc.ch/site/assets/uploads/2018/03/WGII_TAR_full_report-2.pdf [Accessed on 15
March 2021].
IPCC (2013). Climate change 2013 – the physical science basis. In: Contribution of Working Group I to
the Fifth Assessment Report of the Intergovernmental Panel on Climate Change. Cambridge
University Press, Cambridge, United Kingdom and New York, NY, USA, pp. 1535 DOI:
http://doi:10.1017/CBO9781107415324
Karki, R., Hasson, S. ul, Gerlitz, L., Talchabhadel, R., Schickhoff, U., Scholten, T. and Böhner, J.
(2019). Rising mean and extreme near surface air temperature across Nepal. International Journal of
Climatology. DOI: http://doi:10.1002/joc.6344
Kates, R. W. (2000). Cautionary Tales: Adaptation and the Global Poor. Climatic Change, 45(1), 5–
17. DOI: http://doi:10.1023/a:1005672413880
Lamichhane, P., Miller, K. K., Hadjikakou, M. and Bryan, B. A. (2020). Resilience of smallholder cropping
to climatic variability. Science of The Total Environment, 719: 137464.
DOI: http://10.1016/j.scitotenv.2020.137464
Tognetti, R., Mugnozza, G. S. and Hofer, T. (2017). Mountain Watersheds and Ecosystem Services:
Balancing multiple demands of forest management in head-watersheds. European Forest Institute,
Finland. Available online: https://efi.int/sites/default/files/files/publication-bank/2018/tr_101.pdf
[Accessed 25 May 2021].
MoEnv (2010). National Environmental and Economic Development Study for Climate Change. Ministry
of Environment, Amman, Jordan. Available online:
https://unfccc.int/files/adaptation/application/pdf/jordanneeds.pdf [Accessed on 12 March 2021].
MoFE (2018). Integrated Lake Basin Management Plan of Lake Cluster of Pokhara Valley, Nepal (2018–
2023). Ministry of Forests and Environment, Kathmandu, Nepal, 271pp. Available online:
http://d2ouvy59p0dg6k.cloudfront.net/downloads/integrated_lake_basin_management_plan_of_lake
_cluster_of_pokhara_valley__nepal__2018_202_1.pdf [Accessed on 25 May 2021].
MoHA (2009). Government of Nepal and Disaster Preparedness Network (DPNet). Nepal Disaster Report
2009: The Hazardscape and Vulnerability, Kathmandu, Nepal. Available online:
http://www.dpnet.org.np/public/uploads/files/Nepal%20Disaster%20Report%202009%202018-10-
06%2006-29-11.pdf [Accessed on 25 May 2021].
DHM (2017). Observed Climate Trend Analysis in the Districts and Physiographic Regions of Nepal (1971-
2014). Department of Hydrology and Meteorology, Nepal. Available online:
https://www.dhm.gov.np/uploads/climatic/467608975Observed%20Climate%20Trend%20Analysis
%20Report_2017_Final.pdf [Accessed on 23 May 2021].
Nepal, A., MAndal R.A., Pradhananga, S. and Khana, S. (2019). Assessing climate variability in Langtang
Valley using Livelihood Vulnerability Index. Journal of Aquatic Science and Marine Biology, 2(1):
10-15. Available online: https://www.sryahwapublications.com/journal-of-aquatic-science-and-
marine-biology/pdf/v2-i1/3.pdf [Accessed on 15 March 2021].

Grassroots Journal of Natural Resources, Vol.4, No.3 (September 2021), p.147-163 | ISSN 2581-6853 | CODEN GJNRA9
Doi: https://doi.org/10.33002/nr2581.6853.040312
162 Kapil Dhungana, Harish Bahadur Chand, Dinesh Bhandari, Abhishek Kumar, Sanjay Singh, Ramesh Bohara
Panda, A. and Amaratunga, D. (2016). Making cities resilient to disasters: "New" ten essentials. 6th
International Conference on Building Resilience 2016, Massey University and the University of
Auckland, New Zealand. Available online:
https://www.researchgate.net/publication/309395693_MAKING_CITIES_RESILIENT_TO_DISAS
TERS_NEW_TEN_ESSENTIALS [Accessed on 15 March 2021].
Pandey, R. and Jha, S. (2011). Climate vulnerability index - measure of climate change vulnerability to
communities: a case of rural Lower Himalaya, India. Mitigation and Adaptation Strategies for Global
Change, 17(5): 487–506. DOI: http://doi:10.1007/s11027-011-9338-2
Schroth, G., Läderach, P., Martinez-Valle, A.I., Bunn, C. and Jassogne, L. (2016). Vulnerability to climate
change of cocoa in West Africa: Patterns, opportunities and limits to adaptation. Science of The Total
Environment, 556: 231–241. DOI: http://doi:10.1016/j.scitotenv.2016.03.024
Shah, K.U., Dulal, H.B., Johnson, C. and Baptiste, A. (2013). Understanding livelihood vulnerability to
climate change: Applying the livelihood vulnerability index in Trinidad and Tobago. Geoforum, 47:
125–137. DOI: http://doi:10.1016/j.geoforum.2013.04.004
Sintayehu, D.W. (2018). Impact of climate change on biodiversity and associated key ecosystem services
in Africa: a systematic review. Ecosystem Health and Sustainability, 4(9): 225–239. DOI:
http://doi:10.1080/20964129.2018.1530054
Soni, D.K. and Ansari, F. (2017). Climate change and biodiversity; impacts, vulnerability and mitigation in
Indian perspective: A review. Journal of Applied and Natural Science, 9(1), 632-638. Available
online: https://core.ac.uk/download/pdf/158353442.pdf [Accessed on 12 June 2021].
Sujakhu, N.M., Ranjitkar, S., He, J., Schmidt-Vogt, D., Su, Y. and Xu, J. (2019). Assessing the livelihood
vulnerability of rural indigenous households to climate changes in Central Nepal,
Himalaya. Sustainability, 11(10): 2977.DOI: http://doi:10.3390/su11102977
Sullivan, C. (2002). Calculating a Water Poverty Index. World Development, 30(7): 1195-2010. Available
online: https://www.ircwash.org/sites/default/files/Sullivan-2002-Water_0.pdf [Accessed on 22
March 2021].
Tamrakar R. (2008). Status and Biodiversity of Lakes and Ponds of Lekhnath Municipality. Thesis for the
partial fulfillment of Bachelors Degree, Institute of Forestry, Tribhuwan University, Pokhara, Nepal.
Upadhayaya, R.P. and Baral, M.P. (2020). Trends of Climate Change in Some Selected Districts of Western
Nepal. Janapriya Journal of Interdisciplinary Studies, 9(1): 148-158. DOI:
https://doi.org/10.3126/jjis.v9i1.35284
Urothody, A.A. and Larsen, H.O. (2010). Measuring climate change vulnerability: a comparison of two
indexes. Banko Janakari, 20(1): 9-16. DOI: https://doi.org/10.3126/banko.v20i1.3503
Versini, P.A., Pouget, L., McEnnis, S., Custodio, E. and Escaler, I. (2016). Climate change impact on water
resources availability: case study of the Llobregat River basin (Spain). Hydrological Sciences
Journal, 61(14): 2496–2508. DOI: http://doi:10.1080/02626667.2016.1154556
Wester, P., Mshra, A., Mukherji, A. and Shrestha, A.B. (2019). The Hindu Kush Himalaya Assessment:
mountains, climate change, sustainability and people. Springer Nature Switzerland AG, Cham.
Available online: https://lib.icimod.org/record/34383 [Accessed on 15 May 2021].
Zemp, M., Hoelzle, M. and Haeberli, W. (2009). Six decades of glacier mass-balance observations: a review
of the worldwide monitoring network. Annals of Glaciology, 50(50), 101–111. DOI:
http://doi:10.3189/172756409787769591.

Grassroots Journal of Natural Resources, Vol.4, No.3 (September 2021), p.147-163 | ISSN 2581-6853 | CODEN GJNRA9
Doi: https://doi.org/10.33002/nr2581.6853.040312
163 Kapil Dhungana, Harish Bahadur Chand, Dinesh Bhandari, Abhishek Kumar, Sanjay Singh, Ramesh Bohara
Authors’ Declarations and Essential Ethical Compliances
Authors’ Contributions (in accordance with ICMJE criteria for authorship)
Contribution Author 1 Author 2 Author 3 Author 4 Author 5 Author 6
Conceived and designed the research or analysis Yes Yes Yes Yes Yes Yes
Collected the data Yes No No No No No
Contributed to data analysis & interpretation Yes Yes Yes Yes Yes Yes
Wrote the article/paper Yes Yes Yes Yes Yes Yes
Critical revision of the article/paper Yes Yes Yes Yes Yes Yes
Editing of the article/paper Yes Yes Yes Yes Yes Yes
Supervision Yes Yes Yes Yes Yes No
Project Administration Yes No No No No No
Funding Acquisition No No No No No No
Overall Contribution Proportion (%) 20 20 15 15 15 15
Funding
No funding was available for the research conducted for and writing of this paper.
Research involving human bodies (Helsinki Declaration)
Has this research used human subjects for experimentation? No
Research involving animals (ARRIVE Checklist)
Has this research involved animal subjects for experimentation? No
Research involving Plants
During the research, the authors followed the principles of the Convention on Biological Diversity and
the Convention on the Trade in Endangered Species of Wild Fauna and Flora. Yes
Research on Indigenous Peoples and/or Traditional Knowledge
Has this research involved Indigenous Peoples as participants or respondents? No
(Optional) PRISMA (Preferred Reporting Items for Systematic Reviews and Meta-Analyses)
Have authors complied with PRISMA standards? Yes
Competing Interests/Conflict of Interest
Authors have no competing financial, professional, or personal interests from other parties or in publishing
this manuscript.
Rights and Permissions
Open Access. This article is licensed under a Creative Commons Attribution 4.0 International License,
which permits use, sharing, adaptation, distribution and reproduction in any medium or format, as long as
you give appropriate credit to the original author(s) and the source, provide a link to the Creative Commons
license, and indicate if changes were made. The images or other third-party material in this article are
included in the article's Creative Commons license, unless indicated otherwise in a credit line to the material.
If material is not included in the article's Creative Commons license and your intended use is not permitted
by statutory regulation or exceeds the permitted use, you will need to obtain permission directly from the
copyright holder. To view a copy of this license, visit http://creativecommons.org/licenses/by/4.0/.

Assessment of Temporal Variation of Water Quality Parameters and the
Trophic State Index in a Subtropical Water Reservoir of Bangladesh
Md. Sirajul Islam*1, Yousuf Ali2, Md. Humayun Kabir3, Rofi Md. Zubaer4, Nowara Tamanna
Meghla5, Mausumi Rehnuma6, Mir Md. Mozammal Hoque7 1Department of Environmental Science and Resource Management, Mawlana Bhashani Science and Technology
University, Tangail-1902, Bangladesh. Email: [email protected] | ORCID: 0000-0002-7560-9334 2Department of Environmental Science and Resource Management, Mawlana Bhashani Science and Technology
University, Tangail-1902, Bangladesh. Email: [email protected] | ORCID: 0000-0003-3429-2622 3Department of Environmental Science and Resource Management, Mawlana Bhashani Science and Technology
University, Tangail-1902, Bangladesh. Email: [email protected] | ORCID: 0000-0002-2351-6275 4Department of Environmental Science and Resource Management, Mawlana Bhashani Science and Technology
University, Tangail-1902, Bangladesh. Email: [email protected] | ORCID: 0000-0003-2196-4901 5Department of Environmental Science and Resource Management, Mawlana Bhashani Science and Technology
University, Tangail-1902, Bangladesh. Email: [email protected] | ORCID: 0000-0001-7399-4446 6Department of Environmental Science and Resource Management, Mawlana Bhashani Science and Technology
University, Tangail-1902, Bangladesh. Email: [email protected] | ORCID: 0000-0003-4257-104X 7Department of Environmental Science and Resource Management, Mawlana Bhashani Science and Technology
University, Tangail-1902, Bangladesh. Email: [email protected] | ORCID: 0000-0001-9108-7735
*Corresponding author
Abstract This study was conducted to determine the suitability of water
quality for fisheries management in Kaptai Lake from February 2019
to January 2020. Results showed that the temperature, transparency,
TDS, pH, DO, EC, alkalinity and hardness were 20.9 to 31.8°C, 17
to 303 cm, 40 to 105 mg/L, 6.82 to 7.96, 6.1 to 7.65 mg/L, 75.33 to
172.33 µS/cm, 37 to 83 mg/L and 35 to 190 mg/L, respectively.
However, nutrients as NH3, NO3-, NO2
-, PO43- and SO4
2- were 0.01 to
0.05, 0.03 to 2.21, 36 to 96, 0.01 to 0.04 and 0.3 to 1.9 mg/L,
respectively. Chlorophyll a and trophic state index (TSI) were 0.70
to 2.12 µg/L and 27.43 to 37.79, respectively. Study revealed that
SO42-, DO and TDS were higher than the standard of ECR. On the
other hand, NH3, NO3-, NO2
-, PO4
3-, temperature, transparency, pH,
EC, total hardness, total alkalinity, Chlorophyll a and TSI were
within the standard levels. Concentrations of NO3-, NO2
-, PO4
3-,
Chlorophyll a and TSI (CHL) showed no significant variation with
seasons. Conversely, TDS, transparency, EC, alkalinity, hardness,
and SO42- were lower in monsoon compared to pre-monsoon and
post-monsoon seasons. Besides, temperature, NH3, DO and TSI
(SD) were higher in monsoon season. Results concluded that the
Kaptai Lake is in mesotrophic condition with TSI (CHL) less than
40, and prominently there was a positive relationship between
Chlorophyll a and Trophic State Index (TSI). In this regard, major
nutrients and Chlorophyll a concentration in the Kaptai Lake may
have an impact on the aquatic environment.
Keywords Seasonal variation; Water quality; Dissolved nutrient;
Chlorophyll a; Kaptai Lake; Bangladesh
How to cite this paper: Islam, M.S., Ali, Y.,
Kabir, M.H., Zubaer, R.M., Meghla, N.T.,
Rehnuma, M. and Hoque, M.M.M. (2021).
Assessment of Temporal Variation of Water
Quality Parameters and the Trophic State Index in
a Subtropical Water Reservoir of Bangladesh.
Grassroots Journal of Natural Resources, 4(3):
164-184. Doi:
https://doi.org/10.33002/nr2581.6853.040313
Received: 03 July 2021
Reviewed: 30 July 2021
Provisionally Accepted: 10 August 2021
Revised: 25 August 2021
Finally Accepted: 31 August 2021
Published: 30 September 2021
Copyright © 2021 by author(s)
This work is licensed under the Creative
Commons Attribution International
License (CC BY 4.0).
http://creativecommons.org/licenses/by/4.0/
Grassroots Journal of Natural Resources, Vol.4 No.3 (September 2021) ISSN 2581-6853 | CODEN: GJNRA9 | Published by The Grassroots Institute
Website: http://grassrootsjournals.org/gjnr | Main Indexing: Web of Science
M – 00250 | Research Article
ISSN 2581-6853 | 4(3) Sep 2021
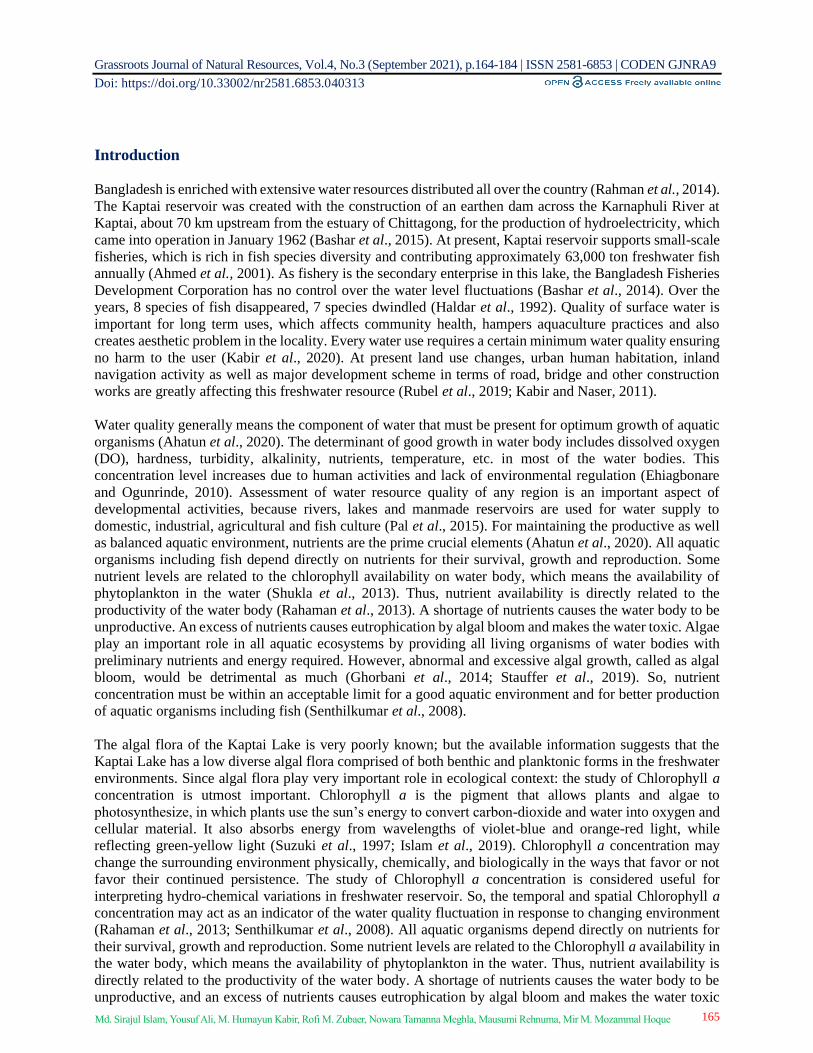
Grassroots Journal of Natural Resources, Vol.4, No.3 (September 2021), p.164-184 | ISSN 2581-6853 | CODEN GJNRA9
Doi: https://doi.org/10.33002/nr2581.6853.040313
165 Md. Sirajul Islam, Yousuf Ali, M. Humayun Kabir, Rofi M. Zubaer, Nowara Tamanna Meghla, Mausumi Rehnuma, Mir M. Mozammal Hoque
Introduction
Bangladesh is enriched with extensive water resources distributed all over the country (Rahman et al., 2014).
The Kaptai reservoir was created with the construction of an earthen dam across the Karnaphuli River at
Kaptai, about 70 km upstream from the estuary of Chittagong, for the production of hydroelectricity, which
came into operation in January 1962 (Bashar et al., 2015). At present, Kaptai reservoir supports small-scale
fisheries, which is rich in fish species diversity and contributing approximately 63,000 ton freshwater fish
annually (Ahmed et al., 2001). As fishery is the secondary enterprise in this lake, the Bangladesh Fisheries
Development Corporation has no control over the water level fluctuations (Bashar et al., 2014). Over the
years, 8 species of fish disappeared, 7 species dwindled (Haldar et al., 1992). Quality of surface water is
important for long term uses, which affects community health, hampers aquaculture practices and also
creates aesthetic problem in the locality. Every water use requires a certain minimum water quality ensuring
no harm to the user (Kabir et al., 2020). At present land use changes, urban human habitation, inland
navigation activity as well as major development scheme in terms of road, bridge and other construction
works are greatly affecting this freshwater resource (Rubel et al., 2019; Kabir and Naser, 2011).
Water quality generally means the component of water that must be present for optimum growth of aquatic
organisms (Ahatun et al., 2020). The determinant of good growth in water body includes dissolved oxygen
(DO), hardness, turbidity, alkalinity, nutrients, temperature, etc. in most of the water bodies. This
concentration level increases due to human activities and lack of environmental regulation (Ehiagbonare
and Ogunrinde, 2010). Assessment of water resource quality of any region is an important aspect of
developmental activities, because rivers, lakes and manmade reservoirs are used for water supply to
domestic, industrial, agricultural and fish culture (Pal et al., 2015). For maintaining the productive as well
as balanced aquatic environment, nutrients are the prime crucial elements (Ahatun et al., 2020). All aquatic
organisms including fish depend directly on nutrients for their survival, growth and reproduction. Some
nutrient levels are related to the chlorophyll availability on water body, which means the availability of
phytoplankton in the water (Shukla et al., 2013). Thus, nutrient availability is directly related to the
productivity of the water body (Rahaman et al., 2013). A shortage of nutrients causes the water body to be
unproductive. An excess of nutrients causes eutrophication by algal bloom and makes the water toxic. Algae
play an important role in all aquatic ecosystems by providing all living organisms of water bodies with
preliminary nutrients and energy required. However, abnormal and excessive algal growth, called as algal
bloom, would be detrimental as much (Ghorbani et al., 2014; Stauffer et al., 2019). So, nutrient
concentration must be within an acceptable limit for a good aquatic environment and for better production
of aquatic organisms including fish (Senthilkumar et al., 2008).
The algal flora of the Kaptai Lake is very poorly known; but the available information suggests that the
Kaptai Lake has a low diverse algal flora comprised of both benthic and planktonic forms in the freshwater
environments. Since algal flora play very important role in ecological context: the study of Chlorophyll a
concentration is utmost important. Chlorophyll a is the pigment that allows plants and algae to
photosynthesize, in which plants use the sun’s energy to convert carbon-dioxide and water into oxygen and
cellular material. It also absorbs energy from wavelengths of violet-blue and orange-red light, while
reflecting green-yellow light (Suzuki et al., 1997; Islam et al., 2019). Chlorophyll a concentration may
change the surrounding environment physically, chemically, and biologically in the ways that favor or not
favor their continued persistence. The study of Chlorophyll a concentration is considered useful for
interpreting hydro-chemical variations in freshwater reservoir. So, the temporal and spatial Chlorophyll a
concentration may act as an indicator of the water quality fluctuation in response to changing environment
(Rahaman et al., 2013; Senthilkumar et al., 2008). All aquatic organisms depend directly on nutrients for
their survival, growth and reproduction. Some nutrient levels are related to the Chlorophyll a availability in
the water body, which means the availability of phytoplankton in the water. Thus, nutrient availability is
directly related to the productivity of the water body. A shortage of nutrients causes the water body to be
unproductive, and an excess of nutrients causes eutrophication by algal bloom and makes the water toxic
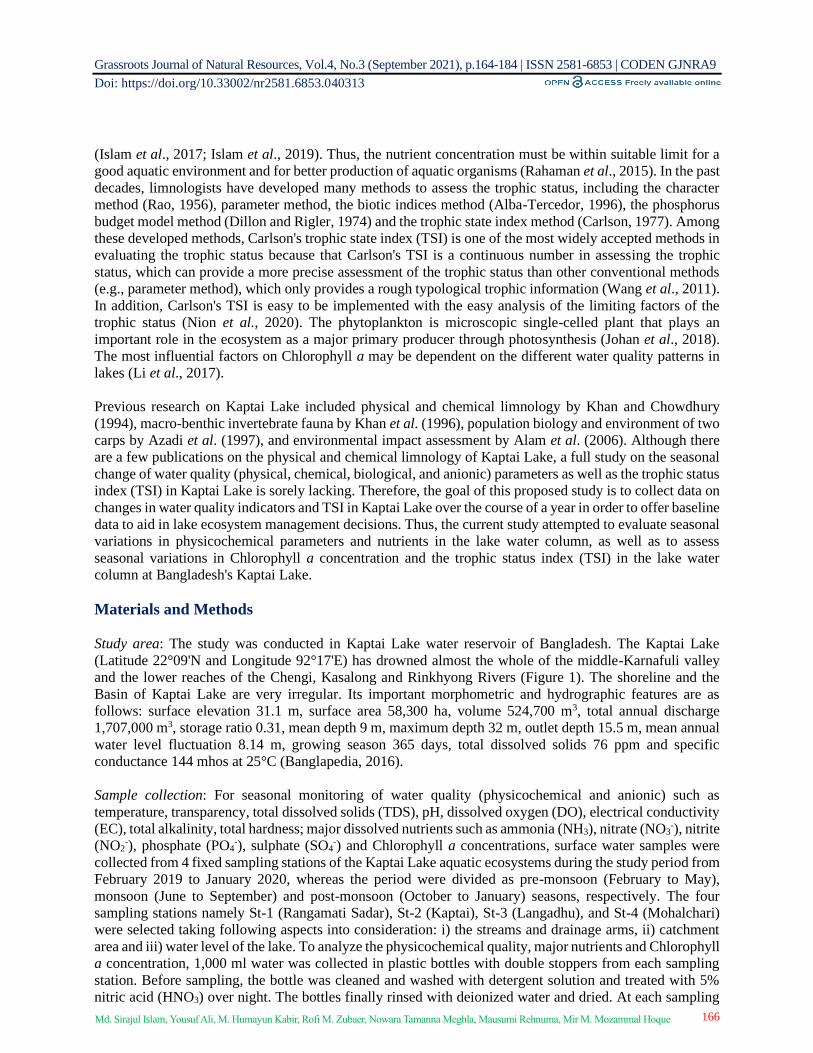
Grassroots Journal of Natural Resources, Vol.4, No.3 (September 2021), p.164-184 | ISSN 2581-6853 | CODEN GJNRA9
Doi: https://doi.org/10.33002/nr2581.6853.040313
166 Md. Sirajul Islam, Yousuf Ali, M. Humayun Kabir, Rofi M. Zubaer, Nowara Tamanna Meghla, Mausumi Rehnuma, Mir M. Mozammal Hoque
(Islam et al., 2017; Islam et al., 2019). Thus, the nutrient concentration must be within suitable limit for a
good aquatic environment and for better production of aquatic organisms (Rahaman et al., 2015). In the past
decades, limnologists have developed many methods to assess the trophic status, including the character
method (Rao, 1956), parameter method, the biotic indices method (Alba-Tercedor, 1996), the phosphorus
budget model method (Dillon and Rigler, 1974) and the trophic state index method (Carlson, 1977). Among
these developed methods, Carlson's trophic state index (TSI) is one of the most widely accepted methods in
evaluating the trophic status because that Carlson's TSI is a continuous number in assessing the trophic
status, which can provide a more precise assessment of the trophic status than other conventional methods
(e.g., parameter method), which only provides a rough typological trophic information (Wang et al., 2011).
In addition, Carlson's TSI is easy to be implemented with the easy analysis of the limiting factors of the
trophic status (Nion et al., 2020). The phytoplankton is microscopic single-celled plant that plays an
important role in the ecosystem as a major primary producer through photosynthesis (Johan et al., 2018).
The most influential factors on Chlorophyll a may be dependent on the different water quality patterns in
lakes (Li et al., 2017).
Previous research on Kaptai Lake included physical and chemical limnology by Khan and Chowdhury
(1994), macro-benthic invertebrate fauna by Khan et al. (1996), population biology and environment of two
carps by Azadi et al. (1997), and environmental impact assessment by Alam et al. (2006). Although there
are a few publications on the physical and chemical limnology of Kaptai Lake, a full study on the seasonal
change of water quality (physical, chemical, biological, and anionic) parameters as well as the trophic status
index (TSI) in Kaptai Lake is sorely lacking. Therefore, the goal of this proposed study is to collect data on
changes in water quality indicators and TSI in Kaptai Lake over the course of a year in order to offer baseline
data to aid in lake ecosystem management decisions. Thus, the current study attempted to evaluate seasonal
variations in physicochemical parameters and nutrients in the lake water column, as well as to assess
seasonal variations in Chlorophyll a concentration and the trophic status index (TSI) in the lake water
column at Bangladesh's Kaptai Lake.
Materials and Methods
Study area: The study was conducted in Kaptai Lake water reservoir of Bangladesh. The Kaptai Lake
(Latitude 22°09'N and Longitude 92°17'E) has drowned almost the whole of the middle-Karnafuli valley
and the lower reaches of the Chengi, Kasalong and Rinkhyong Rivers (Figure 1). The shoreline and the
Basin of Kaptai Lake are very irregular. Its important morphometric and hydrographic features are as
follows: surface elevation 31.1 m, surface area 58,300 ha, volume 524,700 m3, total annual discharge
1,707,000 m3, storage ratio 0.31, mean depth 9 m, maximum depth 32 m, outlet depth 15.5 m, mean annual
water level fluctuation 8.14 m, growing season 365 days, total dissolved solids 76 ppm and specific
conductance 144 mhos at 25°C (Banglapedia, 2016).
Sample collection: For seasonal monitoring of water quality (physicochemical and anionic) such as
temperature, transparency, total dissolved solids (TDS), pH, dissolved oxygen (DO), electrical conductivity
(EC), total alkalinity, total hardness; major dissolved nutrients such as ammonia (NH3), nitrate (NO3-), nitrite
(NO2-), phosphate (PO4
-), sulphate (SO4-) and Chlorophyll a concentrations, surface water samples were
collected from 4 fixed sampling stations of the Kaptai Lake aquatic ecosystems during the study period from
February 2019 to January 2020, whereas the period were divided as pre-monsoon (February to May),
monsoon (June to September) and post-monsoon (October to January) seasons, respectively. The four
sampling stations namely St-1 (Rangamati Sadar), St-2 (Kaptai), St-3 (Langadhu), and St-4 (Mohalchari)
were selected taking following aspects into consideration: i) the streams and drainage arms, ii) catchment
area and iii) water level of the lake. To analyze the physicochemical quality, major nutrients and Chlorophyll
a concentration, 1,000 ml water was collected in plastic bottles with double stoppers from each sampling
station. Before sampling, the bottle was cleaned and washed with detergent solution and treated with 5%
nitric acid (HNO3) over night. The bottles finally rinsed with deionized water and dried. At each sampling

Grassroots Journal of Natural Resources, Vol.4, No.3 (September 2021), p.164-184 | ISSN 2581-6853 | CODEN GJNRA9
Doi: https://doi.org/10.33002/nr2581.6853.040313
167 Md. Sirajul Islam, Yousuf Ali, M. Humayun Kabir, Rofi M. Zubaer, Nowara Tamanna Meghla, Mausumi Rehnuma, Mir M. Mozammal Hoque
station, the sampling bottles were rinsed at least three times before sampling was done. Pre-prepared
sampling bottles were immersed about 10 cm below the surface water. After sampling, the bottles were
screwed carefully and marked with the respective identification number. Then the samples were kept frozen
(-20°C) until analysis (within 48 hrs.) to avoid further contamination (Senthilkumar et al., 2008; Rahaman
et al., 2013).
Figure 1: Map showing the study area at Kaptai Lake in Bangladesh (Banglapedia, 2016).
Sample analysis: The physicochemical parameters were analyzed in the laboratory of the Department of
Environmental Science and Resource Management of the Mawlana Bhashani Science and Technology
University. Temperature and pH were determined by the thermometer and digital pH meter, respectively.
Buffer solution containing pH 7.0 was used to calibrate the digital pH meter. The Secchi disc was used to
determine the transparency of water. The DO was determined by digital DO meter where sodium
thiosulphate (0.025N) was used as a reagent. The EC and TDS were determined by EC and TDS meter,
respectively. Total alkalinity (TA) and total hardness (TH) were determined by using titration technique.
For the determination of dissolved nutrient concentrations, the water samples were prepared for ionic test
followed by APHA (2005) using chromatographic (Shimadzu Ion Chromatograph, HIC-10-A, Japan)
analysis in the Laboratory of the Bangladesh Fisheries Research Institute (BFRI), Mymensingh. After
instrumental measurements, the values of ions including ammonia (NH3-N), nitrate (NO3-N), nitrite (NO2-
N), phosphate (PO4-P) and sulphate (SO4) were calculated using computer aided tools. The Chlorophyll a
of water samples was analyzed by 90% acetone method in the Biochemistry and Molecular Biology
Laboratory of the Mawlana Bhashani Science and Technology University.

Grassroots Journal of Natural Resources, Vol.4, No.3 (September 2021), p.164-184 | ISSN 2581-6853 | CODEN GJNRA9
Doi: https://doi.org/10.33002/nr2581.6853.040313
168 Md. Sirajul Islam, Yousuf Ali, M. Humayun Kabir, Rofi M. Zubaer, Nowara Tamanna Meghla, Mausumi Rehnuma, Mir M. Mozammal Hoque
Statistical analysis: The data were assembled and set out in appropriate form and were subjected to statistical
analysis. The Statistical Package for Social Sciences (SPSS version 16.0) was used to present and interpret
the collected data. Pearson’s correlation matrix was used to examine specific relationships among the
parameters studied.
Results and Discussion
Physiochemical water quality
Temperature: Water temperature is critical since it is an important environmental quality metric that must
be measured. By doing so, we can see the characteristics of the water such as the chemical, biological, and
physical properties of the water. Water temperature is an important factor in determining whether a body of
water is acceptable for aquatic ecosystem (Kabir et al., 2020). During the monsoon, the highest temperature
(31.8°C) was recorded at St-3, while the lowest temperature (20.9°C) was recorded at St-1 during the post-
monsoon (Figure 2). The highest mean temperature 31.1°C was found in monsoon and the lowest 21.12°C
was found in post-monsoon (Table 1). Bashar et al. (2015) discovered that the average water temperature
in Kaptai Lake ranged from 21.04 to 31.52°C, with a maximum of 31.5°C in September and a minimum of
21.04°C in January. According to Meghla et al. (2013) the temperature of Turag River water was 30.95,
32.36 and 17.75°C during the pre-monsoon, monsoon, and post-monsoon seasons, respectively. This may
be attributed to different collection timings and seasonal influences (Srivastava and Kanungo, 2013).
Figure 2: The temperature at various sampling stations during different seasons
Transparency: Water transparency changes can affect essential features of aquatic ecosystems, influencing
the use of critical habitats or resources and resulting in phenotypic divergence. Changes in the availability
of vital resources as a result of habitat productivity changes could have an impact on resource utilization
and, as a consequence, population divergence (Islam et al., 2015a). The water transparency of the four
stations was within the range of 17 to 303 cm. The highest transparency 303 cm was found at St-2 during
post-monsoon and the lowest transparency 17 cm was found at St-4 during monsoon (Figure 3). On an
average the highest transparency 303 cm was found in post-monsoon and the lowest transparency 17 cm
was found in monsoon season (Table 1). The limit of Secchi disc visibility in Kaptai Lake was found to vary
throughout the year, with high visibility in the winter and low visibility during the dry season. The inflow
of suspended matter and silt from hill streams triggers a rapid increase in turbidity. During the monsoon
0
5
10
15
20
25
30
35
St-1 St-2 St-3 St-4
Tem
per
ature
(°C
)
Sampling Stations
Pre-moonson Moonson Post-monsoon
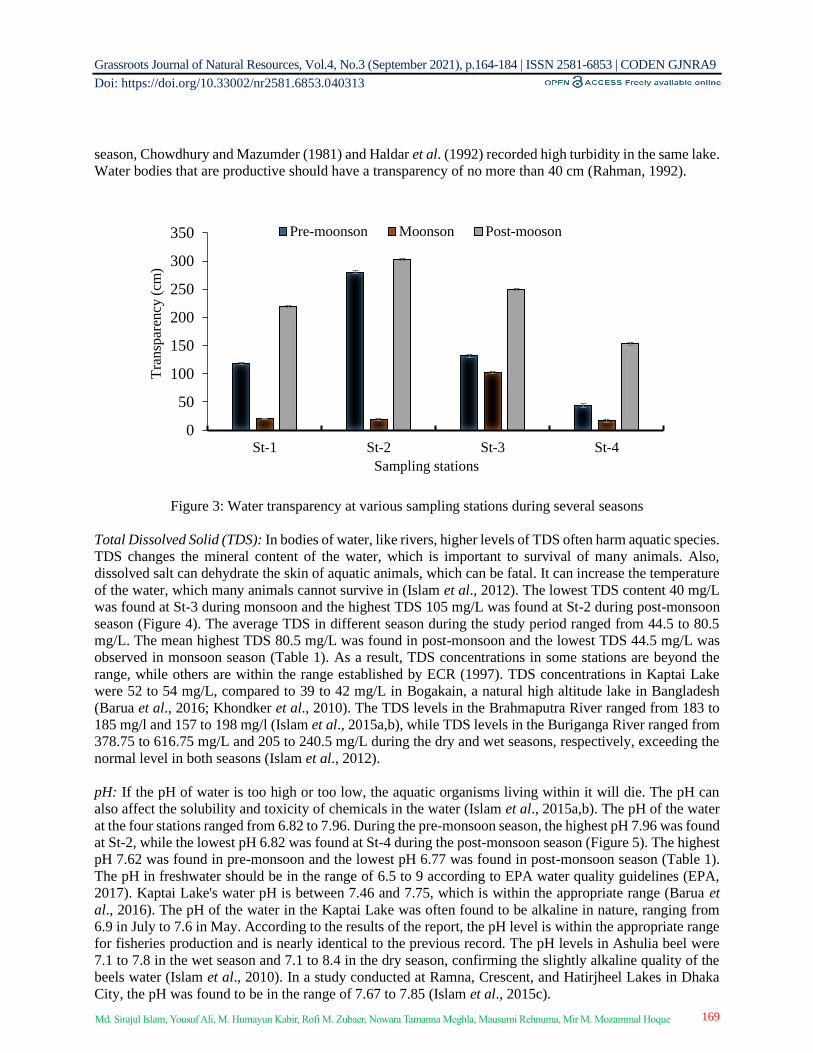
Grassroots Journal of Natural Resources, Vol.4, No.3 (September 2021), p.164-184 | ISSN 2581-6853 | CODEN GJNRA9
Doi: https://doi.org/10.33002/nr2581.6853.040313
169 Md. Sirajul Islam, Yousuf Ali, M. Humayun Kabir, Rofi M. Zubaer, Nowara Tamanna Meghla, Mausumi Rehnuma, Mir M. Mozammal Hoque
season, Chowdhury and Mazumder (1981) and Haldar et al. (1992) recorded high turbidity in the same lake.
Water bodies that are productive should have a transparency of no more than 40 cm (Rahman, 1992).
Figure 3: Water transparency at various sampling stations during several seasons
Total Dissolved Solid (TDS): In bodies of water, like rivers, higher levels of TDS often harm aquatic species.
TDS changes the mineral content of the water, which is important to survival of many animals. Also,
dissolved salt can dehydrate the skin of aquatic animals, which can be fatal. It can increase the temperature
of the water, which many animals cannot survive in (Islam et al., 2012). The lowest TDS content 40 mg/L
was found at St-3 during monsoon and the highest TDS 105 mg/L was found at St-2 during post-monsoon
season (Figure 4). The average TDS in different season during the study period ranged from 44.5 to 80.5
mg/L. The mean highest TDS 80.5 mg/L was found in post-monsoon and the lowest TDS 44.5 mg/L was
observed in monsoon season (Table 1). As a result, TDS concentrations in some stations are beyond the
range, while others are within the range established by ECR (1997). TDS concentrations in Kaptai Lake
were 52 to 54 mg/L, compared to 39 to 42 mg/L in Bogakain, a natural high altitude lake in Bangladesh
(Barua et al., 2016; Khondker et al., 2010). The TDS levels in the Brahmaputra River ranged from 183 to
185 mg/l and 157 to 198 mg/l (Islam et al., 2015a,b), while TDS levels in the Buriganga River ranged from
378.75 to 616.75 mg/L and 205 to 240.5 mg/L during the dry and wet seasons, respectively, exceeding the
normal level in both seasons (Islam et al., 2012).
pH: If the pH of water is too high or too low, the aquatic organisms living within it will die. The pH can
also affect the solubility and toxicity of chemicals in the water (Islam et al., 2015a,b). The pH of the water
at the four stations ranged from 6.82 to 7.96. During the pre-monsoon season, the highest pH 7.96 was found
at St-2, while the lowest pH 6.82 was found at St-4 during the post-monsoon season (Figure 5). The highest
pH 7.62 was found in pre-monsoon and the lowest pH 6.77 was found in post-monsoon season (Table 1).
The pH in freshwater should be in the range of 6.5 to 9 according to EPA water quality guidelines (EPA,
2017). Kaptai Lake's water pH is between 7.46 and 7.75, which is within the appropriate range (Barua et
al., 2016). The pH of the water in the Kaptai Lake was often found to be alkaline in nature, ranging from
6.9 in July to 7.6 in May. According to the results of the report, the pH level is within the appropriate range
for fisheries production and is nearly identical to the previous record. The pH levels in Ashulia beel were
7.1 to 7.8 in the wet season and 7.1 to 8.4 in the dry season, confirming the slightly alkaline quality of the
beels water (Islam et al., 2010). In a study conducted at Ramna, Crescent, and Hatirjheel Lakes in Dhaka
City, the pH was found to be in the range of 7.67 to 7.85 (Islam et al., 2015c).
0
50
100
150
200
250
300
350
St-1 St-2 St-3 St-4
Tra
nsp
aren
cy (
cm)
Sampling stations
Pre-moonson Moonson Post-mooson

Grassroots Journal of Natural Resources, Vol.4, No.3 (September 2021), p.164-184 | ISSN 2581-6853 | CODEN GJNRA9
Doi: https://doi.org/10.33002/nr2581.6853.040313
170 Md. Sirajul Islam, Yousuf Ali, M. Humayun Kabir, Rofi M. Zubaer, Nowara Tamanna Meghla, Mausumi Rehnuma, Mir M. Mozammal Hoque
Figure 4: The TDS concentrations at various sampling stations during different seasons
Figure 5: The pH at various sampling stations during different seasons
Dissolved Oxygen (DO): DO is one of the most important indicators of water quality. It is essential for the
survival of fish and other aquatic organisms. Oxygen dissolves in surface water due to the aerating action
of winds. Oxygen is also introduced into the water as a byproduct of aquatic plant photosynthesis. When
dissolved oxygen becomes too low, fish and other aquatic organisms cannot survive (Islam et al., 2017).
The DO of the water at the four stations ranged from 6.1 to 7.65 mg/L. During the pre-monsoon season, St-
1 had the lowest DO content of 6.1 mg/L, while during the monsoon season; St-3 had the highest DO content
of 7.60 mg/L (Figure 6). During the study period, the average DO of the different stations ranged from 6.35
to 7.21 mg/L. Adequate DO is needed to maintain good water quality, aquatic organism endurance, and
microorganism putrefaction of waste (Islam et al., 2010; Rahman et al., 2012). For fisheries, the optimal
DO concentrations ranged from 4 to 6 mg/L (Boyd, 1998), below which most aquatic species will perish.
0
20
40
60
80
100
120
St-1 St-2 St-3 St-4
TD
S (
mg/L
)
Sampling stations
Pre-monsson Monsson Post-monsson
0
1
2
3
4
5
6
7
8
9
St-1 St-2 St-3 St-4
pH
Sampling stations
Pre-monsoon Monsson Post-monsoon
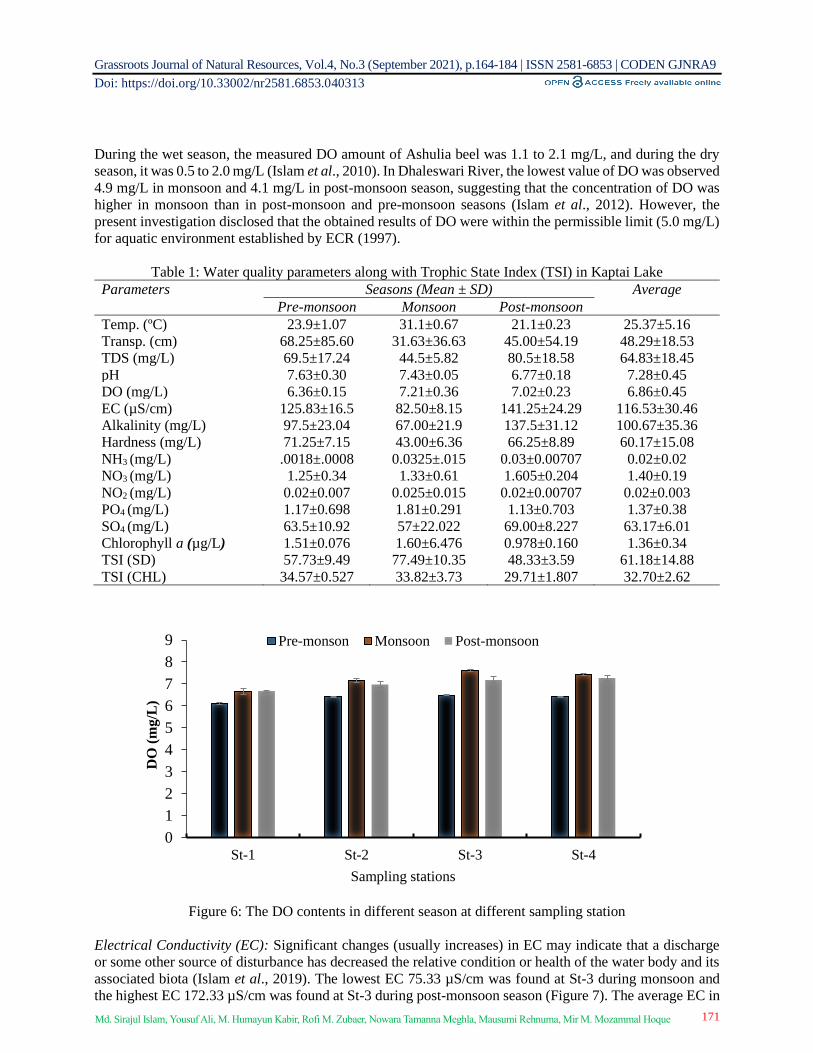
Grassroots Journal of Natural Resources, Vol.4, No.3 (September 2021), p.164-184 | ISSN 2581-6853 | CODEN GJNRA9
Doi: https://doi.org/10.33002/nr2581.6853.040313
171 Md. Sirajul Islam, Yousuf Ali, M. Humayun Kabir, Rofi M. Zubaer, Nowara Tamanna Meghla, Mausumi Rehnuma, Mir M. Mozammal Hoque
During the wet season, the measured DO amount of Ashulia beel was 1.1 to 2.1 mg/L, and during the dry
season, it was 0.5 to 2.0 mg/L (Islam et al., 2010). In Dhaleswari River, the lowest value of DO was observed
4.9 mg/L in monsoon and 4.1 mg/L in post-monsoon season, suggesting that the concentration of DO was
higher in monsoon than in post-monsoon and pre-monsoon seasons (Islam et al., 2012). However, the
present investigation disclosed that the obtained results of DO were within the permissible limit (5.0 mg/L)
for aquatic environment established by ECR (1997).
Table 1: Water quality parameters along with Trophic State Index (TSI) in Kaptai Lake
Parameters Seasons (Mean ± SD) Average
Pre-monsoon Monsoon Post-monsoon
Temp. (ºC) 23.9±1.07 31.1±0.67 21.1±0.23 25.37±5.16
Transp. (cm) 68.25±85.60 31.63±36.63 45.00±54.19 48.29±18.53
TDS (mg/L) 69.5±17.24 44.5±5.82 80.5±18.58 64.83±18.45
pH 7.63±0.30 7.43±0.05 6.77±0.18 7.28±0.45
DO (mg/L) 6.36±0.15 7.21±0.36 7.02±0.23 6.86±0.45
EC (µS/cm) 125.83±16.5 82.50±8.15 141.25±24.29 116.53±30.46
Alkalinity (mg/L) 97.5±23.04 67.00±21.9 137.5±31.12 100.67±35.36
Hardness (mg/L) 71.25±7.15 43.00±6.36 66.25±8.89 60.17±15.08
NH3 (mg/L) .0018±.0008 0.0325±.015 0.03±0.00707 0.02±0.02
NO3 (mg/L) 1.25±0.34 1.33±0.61 1.605±0.204 1.40±0.19
NO2 (mg/L) 0.02±0.007 0.025±0.015 0.02±0.00707 0.02±0.003
PO4 (mg/L) 1.17±0.698 1.81±0.291 1.13±0.703 1.37±0.38
SO4 (mg/L) 63.5±10.92 57±22.022 69.00±8.227 63.17±6.01
Chlorophyll a (µg/L) 1.51±0.076 1.60±6.476 0.978±0.160 1.36±0.34
TSI (SD) 57.73±9.49 77.49±10.35 48.33±3.59 61.18±14.88
TSI (CHL) 34.57±0.527 33.82±3.73 29.71±1.807 32.70±2.62
Figure 6: The DO contents in different season at different sampling station
Electrical Conductivity (EC): Significant changes (usually increases) in EC may indicate that a discharge
or some other source of disturbance has decreased the relative condition or health of the water body and its
associated biota (Islam et al., 2019). The lowest EC 75.33 µS/cm was found at St-3 during monsoon and
the highest EC 172.33 µS/cm was found at St-3 during post-monsoon season (Figure 7). The average EC in
0
1
2
3
4
5
6
7
8
9
St-1 St-2 St-3 St-4
DO
(m
g/L
)
Sampling stations
Pre-monson Monsoon Post-monsoon
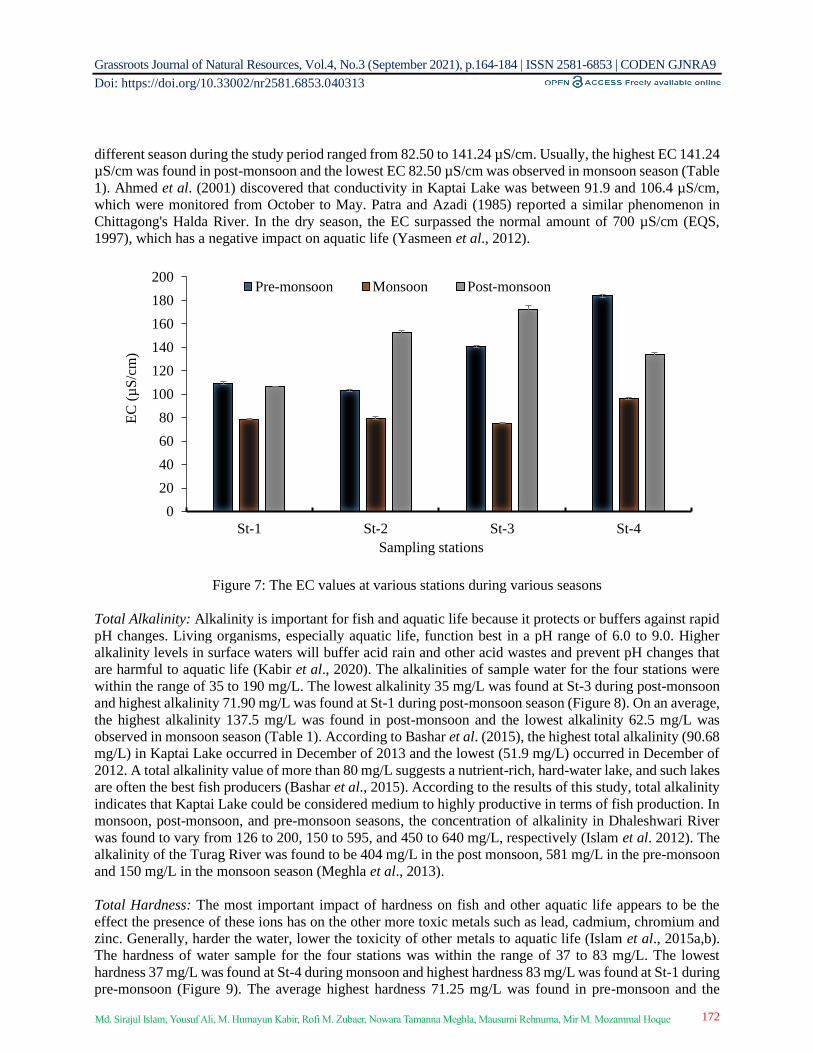
Grassroots Journal of Natural Resources, Vol.4, No.3 (September 2021), p.164-184 | ISSN 2581-6853 | CODEN GJNRA9
Doi: https://doi.org/10.33002/nr2581.6853.040313
172 Md. Sirajul Islam, Yousuf Ali, M. Humayun Kabir, Rofi M. Zubaer, Nowara Tamanna Meghla, Mausumi Rehnuma, Mir M. Mozammal Hoque
different season during the study period ranged from 82.50 to 141.24 µS/cm. Usually, the highest EC 141.24
µS/cm was found in post-monsoon and the lowest EC 82.50 µS/cm was observed in monsoon season (Table
1). Ahmed et al. (2001) discovered that conductivity in Kaptai Lake was between 91.9 and 106.4 µS/cm,
which were monitored from October to May. Patra and Azadi (1985) reported a similar phenomenon in
Chittagong's Halda River. In the dry season, the EC surpassed the normal amount of 700 µS/cm (EQS,
1997), which has a negative impact on aquatic life (Yasmeen et al., 2012).
Figure 7: The EC values at various stations during various seasons
Total Alkalinity: Alkalinity is important for fish and aquatic life because it protects or buffers against rapid
pH changes. Living organisms, especially aquatic life, function best in a pH range of 6.0 to 9.0. Higher
alkalinity levels in surface waters will buffer acid rain and other acid wastes and prevent pH changes that
are harmful to aquatic life (Kabir et al., 2020). The alkalinities of sample water for the four stations were
within the range of 35 to 190 mg/L. The lowest alkalinity 35 mg/L was found at St-3 during post-monsoon
and highest alkalinity 71.90 mg/L was found at St-1 during post-monsoon season (Figure 8). On an average,
the highest alkalinity 137.5 mg/L was found in post-monsoon and the lowest alkalinity 62.5 mg/L was
observed in monsoon season (Table 1). According to Bashar et al. (2015), the highest total alkalinity (90.68
mg/L) in Kaptai Lake occurred in December of 2013 and the lowest (51.9 mg/L) occurred in December of
2012. A total alkalinity value of more than 80 mg/L suggests a nutrient-rich, hard-water lake, and such lakes
are often the best fish producers (Bashar et al., 2015). According to the results of this study, total alkalinity
indicates that Kaptai Lake could be considered medium to highly productive in terms of fish production. In
monsoon, post-monsoon, and pre-monsoon seasons, the concentration of alkalinity in Dhaleshwari River
was found to vary from 126 to 200, 150 to 595, and 450 to 640 mg/L, respectively (Islam et al. 2012). The
alkalinity of the Turag River was found to be 404 mg/L in the post monsoon, 581 mg/L in the pre-monsoon
and 150 mg/L in the monsoon season (Meghla et al., 2013).
Total Hardness: The most important impact of hardness on fish and other aquatic life appears to be the
effect the presence of these ions has on the other more toxic metals such as lead, cadmium, chromium and
zinc. Generally, harder the water, lower the toxicity of other metals to aquatic life (Islam et al., 2015a,b).
The hardness of water sample for the four stations was within the range of 37 to 83 mg/L. The lowest
hardness 37 mg/L was found at St-4 during monsoon and highest hardness 83 mg/L was found at St-1 during
pre-monsoon (Figure 9). The average highest hardness 71.25 mg/L was found in pre-monsoon and the
0
20
40
60
80
100
120
140
160
180
200
St-1 St-2 St-3 St-4
EC
(µ
S/c
m)
Sampling stations
Pre-monsoon Monsoon Post-monsoon
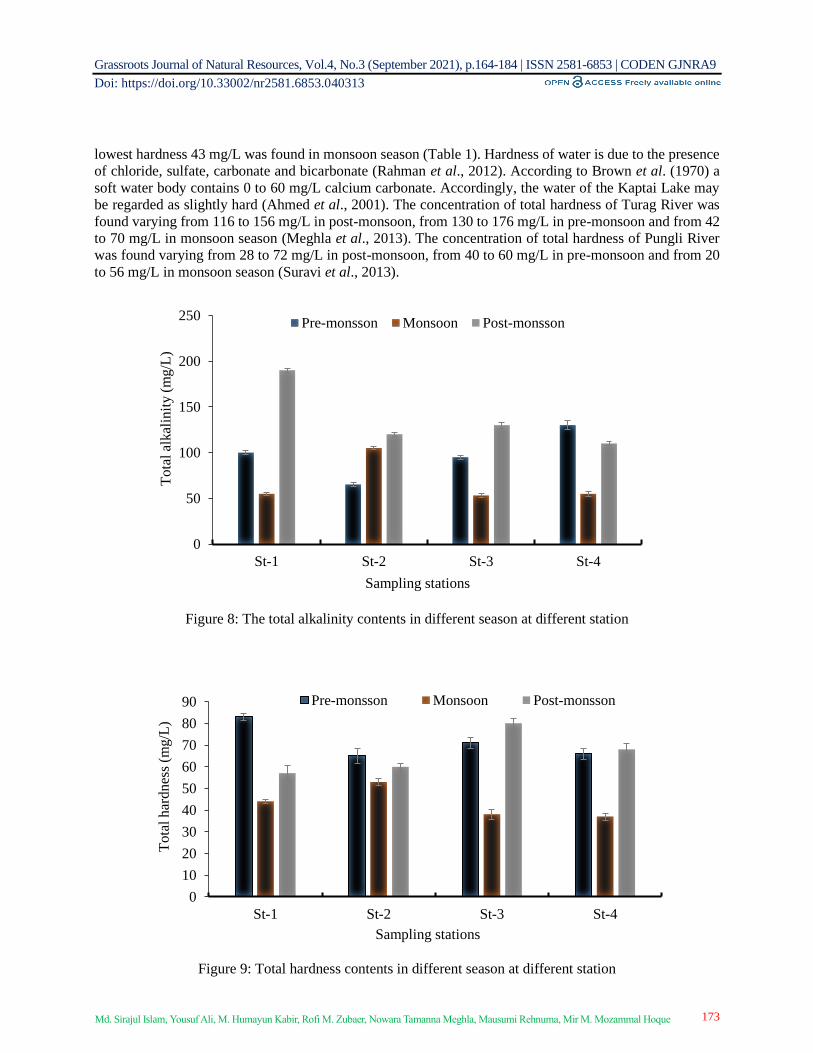
Grassroots Journal of Natural Resources, Vol.4, No.3 (September 2021), p.164-184 | ISSN 2581-6853 | CODEN GJNRA9
Doi: https://doi.org/10.33002/nr2581.6853.040313
173 Md. Sirajul Islam, Yousuf Ali, M. Humayun Kabir, Rofi M. Zubaer, Nowara Tamanna Meghla, Mausumi Rehnuma, Mir M. Mozammal Hoque
lowest hardness 43 mg/L was found in monsoon season (Table 1). Hardness of water is due to the presence
of chloride, sulfate, carbonate and bicarbonate (Rahman et al., 2012). According to Brown et al. (1970) a
soft water body contains 0 to 60 mg/L calcium carbonate. Accordingly, the water of the Kaptai Lake may
be regarded as slightly hard (Ahmed et al., 2001). The concentration of total hardness of Turag River was
found varying from 116 to 156 mg/L in post-monsoon, from 130 to 176 mg/L in pre-monsoon and from 42
to 70 mg/L in monsoon season (Meghla et al., 2013). The concentration of total hardness of Pungli River
was found varying from 28 to 72 mg/L in post-monsoon, from 40 to 60 mg/L in pre-monsoon and from 20
to 56 mg/L in monsoon season (Suravi et al., 2013).
Figure 8: The total alkalinity contents in different season at different station
Figure 9: Total hardness contents in different season at different station
0
50
100
150
200
250
St-1 St-2 St-3 St-4
Tota
l al
kal
init
y (
mg/L
)
Sampling stations
Pre-monsson Monsoon Post-monsson
0
10
20
30
40
50
60
70
80
90
St-1 St-2 St-3 St-4
To
tal
har
dn
ess
(mg/L
)
Sampling stations
Pre-monsson Monsoon Post-monsson
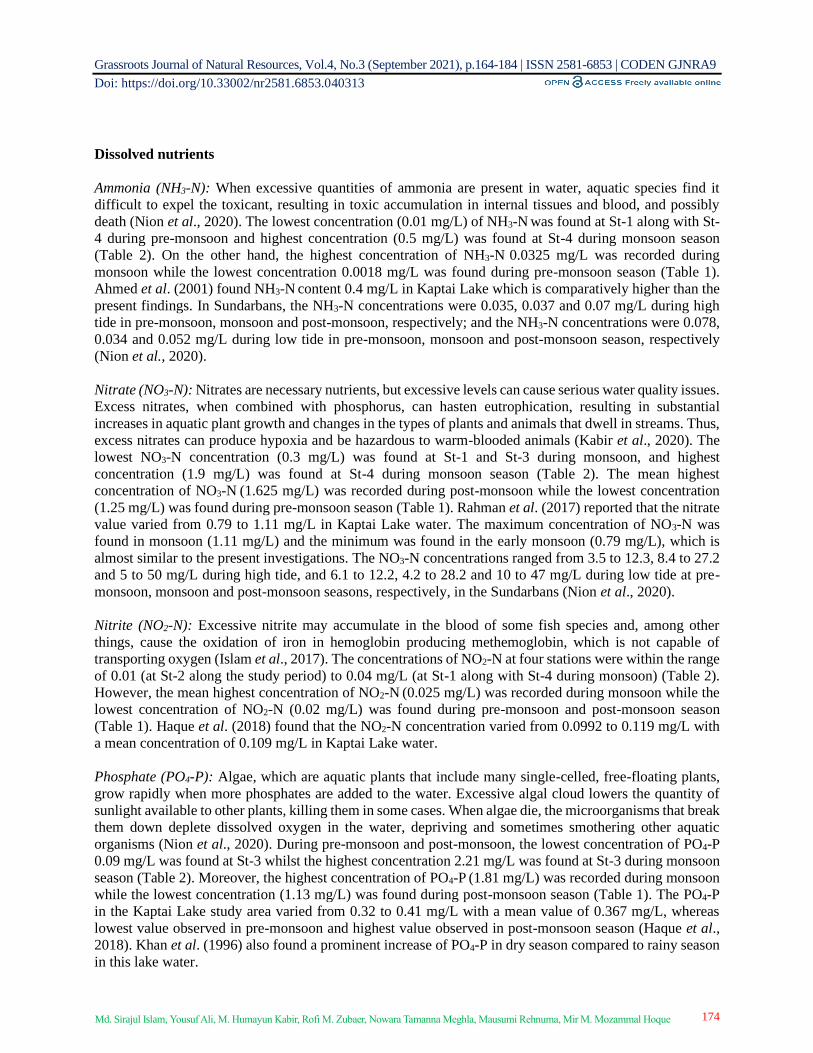
Grassroots Journal of Natural Resources, Vol.4, No.3 (September 2021), p.164-184 | ISSN 2581-6853 | CODEN GJNRA9
Doi: https://doi.org/10.33002/nr2581.6853.040313
174 Md. Sirajul Islam, Yousuf Ali, M. Humayun Kabir, Rofi M. Zubaer, Nowara Tamanna Meghla, Mausumi Rehnuma, Mir M. Mozammal Hoque
Dissolved nutrients
Ammonia (NH3-N): When excessive quantities of ammonia are present in water, aquatic species find it
difficult to expel the toxicant, resulting in toxic accumulation in internal tissues and blood, and possibly
death (Nion et al., 2020). The lowest concentration (0.01 mg/L) of NH3-N was found at St-1 along with St-
4 during pre-monsoon and highest concentration (0.5 mg/L) was found at St-4 during monsoon season
(Table 2). On the other hand, the highest concentration of NH3-N 0.0325 mg/L was recorded during
monsoon while the lowest concentration 0.0018 mg/L was found during pre-monsoon season (Table 1).
Ahmed et al. (2001) found NH3-N content 0.4 mg/L in Kaptai Lake which is comparatively higher than the
present findings. In Sundarbans, the NH3-N concentrations were 0.035, 0.037 and 0.07 mg/L during high
tide in pre-monsoon, monsoon and post-monsoon, respectively; and the NH3-N concentrations were 0.078,
0.034 and 0.052 mg/L during low tide in pre-monsoon, monsoon and post-monsoon season, respectively
(Nion et al., 2020).
Nitrate (NO3-N): Nitrates are necessary nutrients, but excessive levels can cause serious water quality issues.
Excess nitrates, when combined with phosphorus, can hasten eutrophication, resulting in substantial
increases in aquatic plant growth and changes in the types of plants and animals that dwell in streams. Thus,
excess nitrates can produce hypoxia and be hazardous to warm-blooded animals (Kabir et al., 2020). The
lowest NO3-N concentration (0.3 mg/L) was found at St-1 and St-3 during monsoon, and highest
concentration (1.9 mg/L) was found at St-4 during monsoon season (Table 2). The mean highest
concentration of NO3-N (1.625 mg/L) was recorded during post-monsoon while the lowest concentration
(1.25 mg/L) was found during pre-monsoon season (Table 1). Rahman et al. (2017) reported that the nitrate
value varied from 0.79 to 1.11 mg/L in Kaptai Lake water. The maximum concentration of NO3-N was
found in monsoon (1.11 mg/L) and the minimum was found in the early monsoon (0.79 mg/L), which is
almost similar to the present investigations. The NO3-N concentrations ranged from 3.5 to 12.3, 8.4 to 27.2
and 5 to 50 mg/L during high tide, and 6.1 to 12.2, 4.2 to 28.2 and 10 to 47 mg/L during low tide at pre-
monsoon, monsoon and post-monsoon seasons, respectively, in the Sundarbans (Nion et al., 2020).
Nitrite (NO2-N): Excessive nitrite may accumulate in the blood of some fish species and, among other
things, cause the oxidation of iron in hemoglobin producing methemoglobin, which is not capable of
transporting oxygen (Islam et al., 2017). The concentrations of NO2-N at four stations were within the range
of 0.01 (at St-2 along the study period) to 0.04 mg/L (at St-1 along with St-4 during monsoon) (Table 2).
However, the mean highest concentration of NO2-N (0.025 mg/L) was recorded during monsoon while the
lowest concentration of NO2-N (0.02 mg/L) was found during pre-monsoon and post-monsoon season
(Table 1). Haque et al. (2018) found that the NO2-N concentration varied from 0.0992 to 0.119 mg/L with
a mean concentration of 0.109 mg/L in Kaptai Lake water.
Phosphate (PO4-P): Algae, which are aquatic plants that include many single-celled, free-floating plants,
grow rapidly when more phosphates are added to the water. Excessive algal cloud lowers the quantity of
sunlight available to other plants, killing them in some cases. When algae die, the microorganisms that break
them down deplete dissolved oxygen in the water, depriving and sometimes smothering other aquatic
organisms (Nion et al., 2020). During pre-monsoon and post-monsoon, the lowest concentration of PO4-P
0.09 mg/L was found at St-3 whilst the highest concentration 2.21 mg/L was found at St-3 during monsoon
season (Table 2). Moreover, the highest concentration of PO4-P (1.81 mg/L) was recorded during monsoon
while the lowest concentration (1.13 mg/L) was found during post-monsoon season (Table 1). The PO4-P
in the Kaptai Lake study area varied from 0.32 to 0.41 mg/L with a mean value of 0.367 mg/L, whereas
lowest value observed in pre-monsoon and highest value observed in post-monsoon season (Haque et al.,
2018). Khan et al. (1996) also found a prominent increase of PO4-P in dry season compared to rainy season
in this lake water.
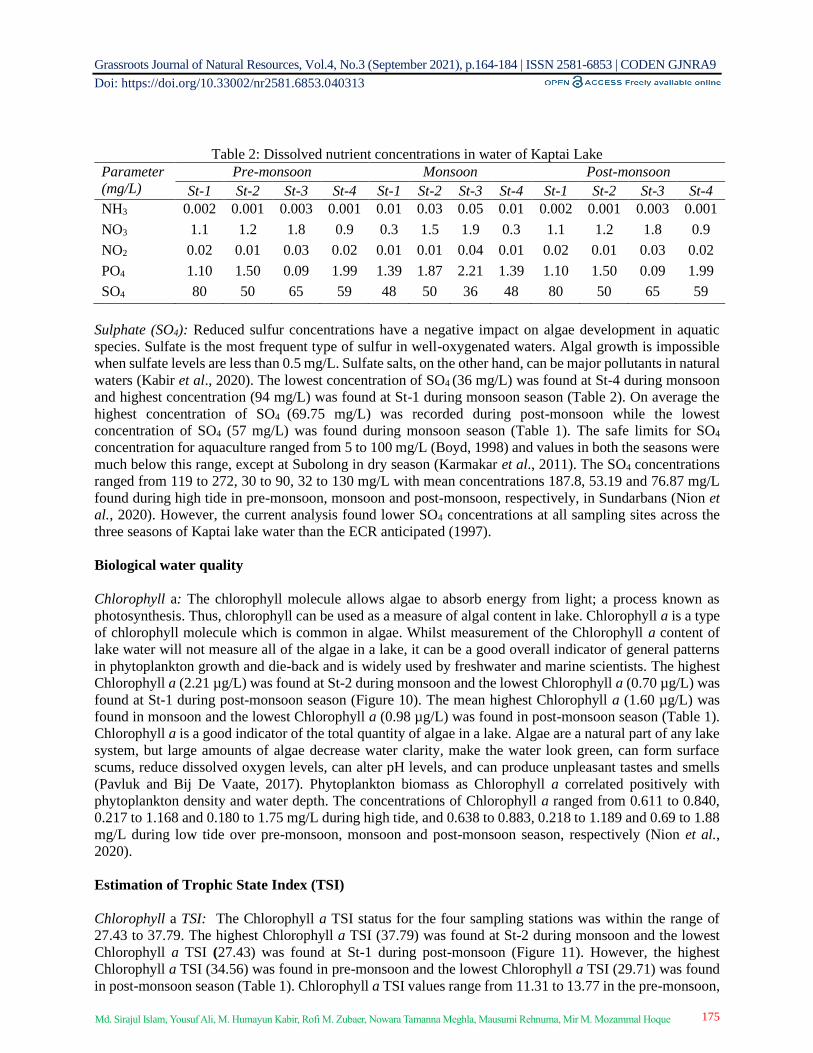
Grassroots Journal of Natural Resources, Vol.4, No.3 (September 2021), p.164-184 | ISSN 2581-6853 | CODEN GJNRA9
Doi: https://doi.org/10.33002/nr2581.6853.040313
175 Md. Sirajul Islam, Yousuf Ali, M. Humayun Kabir, Rofi M. Zubaer, Nowara Tamanna Meghla, Mausumi Rehnuma, Mir M. Mozammal Hoque
Table 2: Dissolved nutrient concentrations in water of Kaptai Lake
Parameter
(mg/L)
Pre-monsoon Monsoon Post-monsoon
St-1 St-2 St-3 St-4 St-1 St-2 St-3 St-4 St-1 St-2 St-3 St-4
NH3 0.002 0.001 0.003 0.001 0.01 0.03 0.05 0.01 0.002 0.001 0.003 0.001
NO3 1.1 1.2 1.8 0.9 0.3 1.5 1.9 0.3 1.1 1.2 1.8 0.9
NO2 0.02 0.01 0.03 0.02 0.01 0.01 0.04 0.01 0.02 0.01 0.03 0.02
PO4 1.10 1.50 0.09 1.99 1.39 1.87 2.21 1.39 1.10 1.50 0.09 1.99
SO4 80 50 65 59 48 50 36 48 80 50 65 59
Sulphate (SO4): Reduced sulfur concentrations have a negative impact on algae development in aquatic
species. Sulfate is the most frequent type of sulfur in well-oxygenated waters. Algal growth is impossible
when sulfate levels are less than 0.5 mg/L. Sulfate salts, on the other hand, can be major pollutants in natural
waters (Kabir et al., 2020). The lowest concentration of SO4 (36 mg/L) was found at St-4 during monsoon
and highest concentration (94 mg/L) was found at St-1 during monsoon season (Table 2). On average the
highest concentration of SO4 (69.75 mg/L) was recorded during post-monsoon while the lowest
concentration of SO4 (57 mg/L) was found during monsoon season (Table 1). The safe limits for SO4
concentration for aquaculture ranged from 5 to 100 mg/L (Boyd, 1998) and values in both the seasons were
much below this range, except at Subolong in dry season (Karmakar et al., 2011). The SO4 concentrations
ranged from 119 to 272, 30 to 90, 32 to 130 mg/L with mean concentrations 187.8, 53.19 and 76.87 mg/L
found during high tide in pre-monsoon, monsoon and post-monsoon, respectively, in Sundarbans (Nion et
al., 2020). However, the current analysis found lower SO4 concentrations at all sampling sites across the
three seasons of Kaptai lake water than the ECR anticipated (1997).
Biological water quality
Chlorophyll a: The chlorophyll molecule allows algae to absorb energy from light; a process known as
photosynthesis. Thus, chlorophyll can be used as a measure of algal content in lake. Chlorophyll a is a type
of chlorophyll molecule which is common in algae. Whilst measurement of the Chlorophyll a content of
lake water will not measure all of the algae in a lake, it can be a good overall indicator of general patterns
in phytoplankton growth and die-back and is widely used by freshwater and marine scientists. The highest
Chlorophyll a (2.21 µg/L) was found at St-2 during monsoon and the lowest Chlorophyll a (0.70 µg/L) was
found at St-1 during post-monsoon season (Figure 10). The mean highest Chlorophyll a (1.60 µg/L) was
found in monsoon and the lowest Chlorophyll a (0.98 µg/L) was found in post-monsoon season (Table 1).
Chlorophyll a is a good indicator of the total quantity of algae in a lake. Algae are a natural part of any lake
system, but large amounts of algae decrease water clarity, make the water look green, can form surface
scums, reduce dissolved oxygen levels, can alter pH levels, and can produce unpleasant tastes and smells
(Pavluk and Bij De Vaate, 2017). Phytoplankton biomass as Chlorophyll a correlated positively with
phytoplankton density and water depth. The concentrations of Chlorophyll a ranged from 0.611 to 0.840,
0.217 to 1.168 and 0.180 to 1.75 mg/L during high tide, and 0.638 to 0.883, 0.218 to 1.189 and 0.69 to 1.88
mg/L during low tide over pre-monsoon, monsoon and post-monsoon season, respectively (Nion et al.,
2020).
Estimation of Trophic State Index (TSI)
Chlorophyll a TSI: The Chlorophyll a TSI status for the four sampling stations was within the range of
27.43 to 37.79. The highest Chlorophyll a TSI (37.79) was found at St-2 during monsoon and the lowest
Chlorophyll a TSI (27.43) was found at St-1 during post-monsoon (Figure 11). However, the highest
Chlorophyll a TSI (34.56) was found in pre-monsoon and the lowest Chlorophyll a TSI (29.71) was found
in post-monsoon season (Table 1). Chlorophyll a TSI values range from 11.31 to 13.77 in the pre-monsoon,
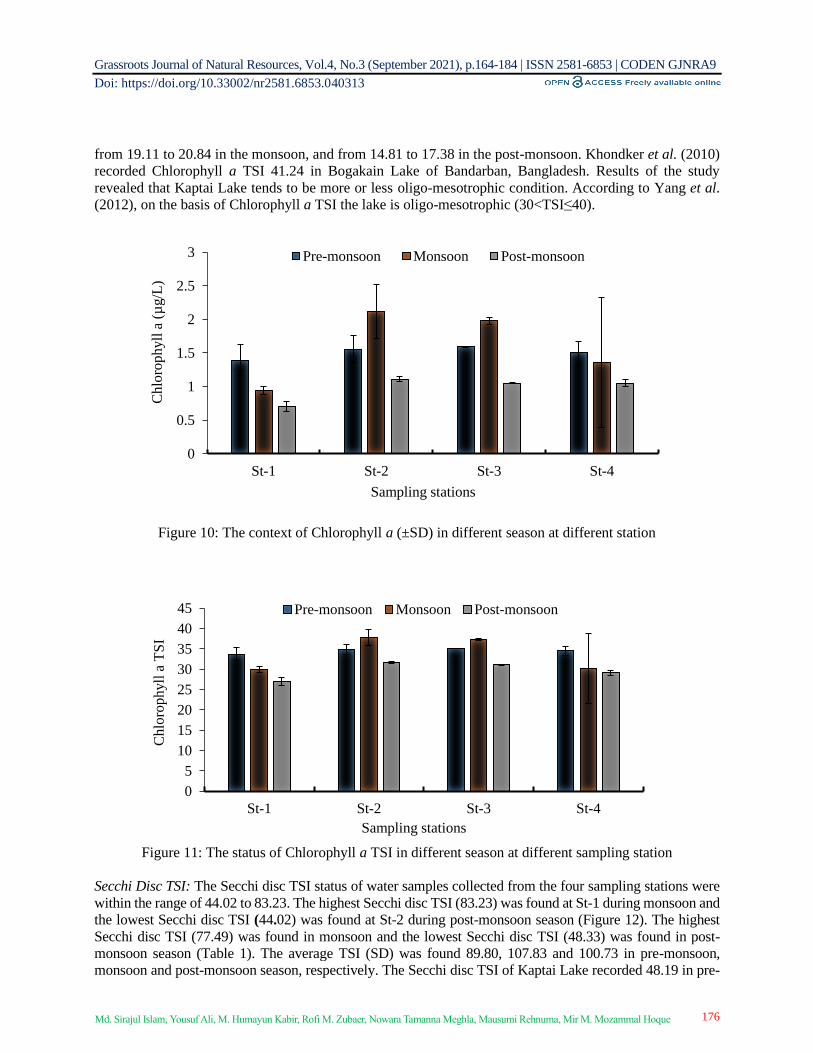
Grassroots Journal of Natural Resources, Vol.4, No.3 (September 2021), p.164-184 | ISSN 2581-6853 | CODEN GJNRA9
Doi: https://doi.org/10.33002/nr2581.6853.040313
176 Md. Sirajul Islam, Yousuf Ali, M. Humayun Kabir, Rofi M. Zubaer, Nowara Tamanna Meghla, Mausumi Rehnuma, Mir M. Mozammal Hoque
from 19.11 to 20.84 in the monsoon, and from 14.81 to 17.38 in the post-monsoon. Khondker et al. (2010)
recorded Chlorophyll a TSI 41.24 in Bogakain Lake of Bandarban, Bangladesh. Results of the study
revealed that Kaptai Lake tends to be more or less oligo-mesotrophic condition. According to Yang et al.
(2012), on the basis of Chlorophyll a TSI the lake is oligo-mesotrophic (30<TSI≤40).
Figure 10: The context of Chlorophyll a (±SD) in different season at different station
Figure 11: The status of Chlorophyll a TSI in different season at different sampling station
Secchi Disc TSI: The Secchi disc TSI status of water samples collected from the four sampling stations were
within the range of 44.02 to 83.23. The highest Secchi disc TSI (83.23) was found at St-1 during monsoon and
the lowest Secchi disc TSI (44.02) was found at St-2 during post-monsoon season (Figure 12). The highest
Secchi disc TSI (77.49) was found in monsoon and the lowest Secchi disc TSI (48.33) was found in post-
monsoon season (Table 1). The average TSI (SD) was found 89.80, 107.83 and 100.73 in pre-monsoon,
monsoon and post-monsoon season, respectively. The Secchi disc TSI of Kaptai Lake recorded 48.19 in pre-
0
0.5
1
1.5
2
2.5
3
St-1 St-2 St-3 St-4
Chlo
rop
hyll
a (
µg/L
)
Sampling stations
Pre-monsoon Monsoon Post-monsoon
0
5
10
15
20
25
30
35
40
45
St-1 St-2 St-3 St-4
Ch
loro
phyll
a T
SI
Sampling stations
Pre-monsoon Monsoon Post-monsoon
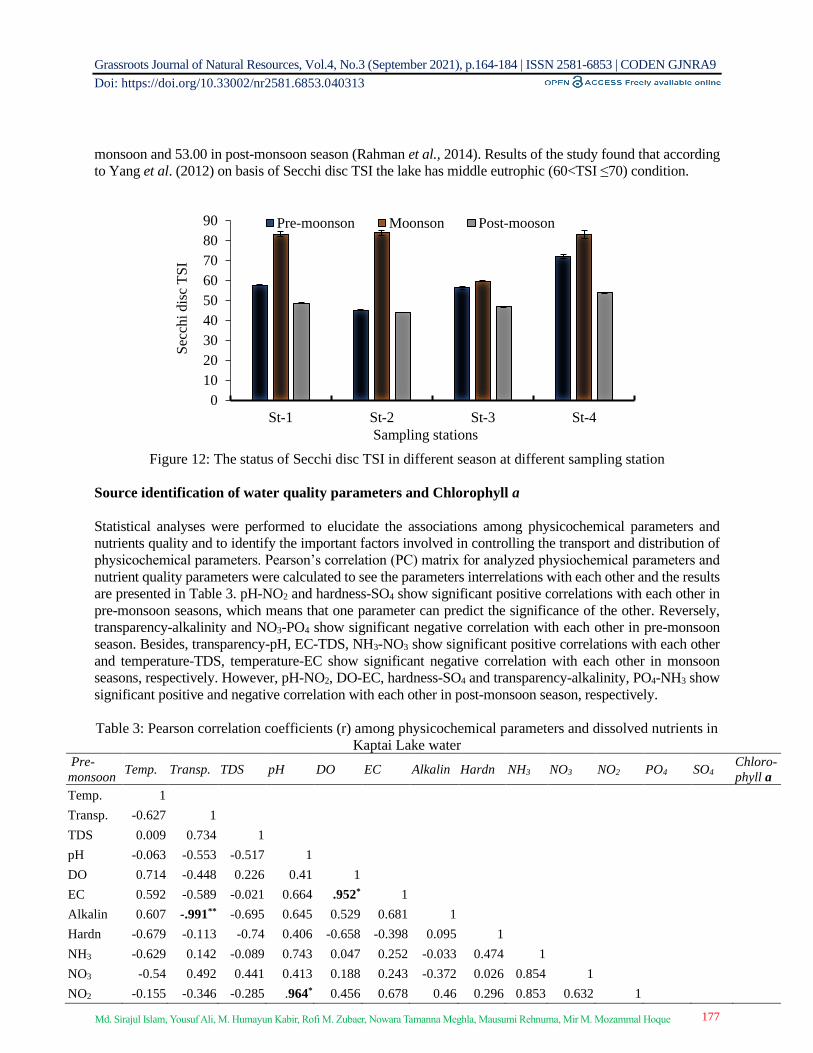
Grassroots Journal of Natural Resources, Vol.4, No.3 (September 2021), p.164-184 | ISSN 2581-6853 | CODEN GJNRA9
Doi: https://doi.org/10.33002/nr2581.6853.040313
177 Md. Sirajul Islam, Yousuf Ali, M. Humayun Kabir, Rofi M. Zubaer, Nowara Tamanna Meghla, Mausumi Rehnuma, Mir M. Mozammal Hoque
monsoon and 53.00 in post-monsoon season (Rahman et al., 2014). Results of the study found that according
to Yang et al. (2012) on basis of Secchi disc TSI the lake has middle eutrophic (60<TSI ≤70) condition.
Figure 12: The status of Secchi disc TSI in different season at different sampling station
Source identification of water quality parameters and Chlorophyll a
Statistical analyses were performed to elucidate the associations among physicochemical parameters and
nutrients quality and to identify the important factors involved in controlling the transport and distribution of
physicochemical parameters. Pearson’s correlation (PC) matrix for analyzed physiochemical parameters and
nutrient quality parameters were calculated to see the parameters interrelations with each other and the results
are presented in Table 3. pH-NO2 and hardness-SO4 show significant positive correlations with each other in
pre-monsoon seasons, which means that one parameter can predict the significance of the other. Reversely,
transparency-alkalinity and NO3-PO4 show significant negative correlation with each other in pre-monsoon
season. Besides, transparency-pH, EC-TDS, NH3-NO3 show significant positive correlations with each other
and temperature-TDS, temperature-EC show significant negative correlation with each other in monsoon
seasons, respectively. However, pH-NO2, DO-EC, hardness-SO4 and transparency-alkalinity, PO4-NH3 show
significant positive and negative correlation with each other in post-monsoon season, respectively.
Table 3: Pearson correlation coefficients (r) among physicochemical parameters and dissolved nutrients in
Kaptai Lake water Pre-
monsoon Temp. Transp. TDS pH DO EC Alkalin Hardn NH3 NO3 NO2 PO4 SO4
Chloro-
phyll a
Temp. 1
Transp. -0.627 1
TDS 0.009 0.734 1
pH -0.063 -0.553 -0.517 1
DO 0.714 -0.448 0.226 0.41 1
EC 0.592 -0.589 -0.021 0.664 .952* 1
Alkalin 0.607 -.991** -0.695 0.645 0.529 0.681 1
Hardn -0.679 -0.113 -0.74 0.406 -0.658 -0.398 0.095 1
NH3 -0.629 0.142 -0.089 0.743 0.047 0.252 -0.033 0.474 1
NO3 -0.54 0.492 0.441 0.413 0.188 0.243 -0.372 0.026 0.854 1
NO2 -0.155 -0.346 -0.285 .964* 0.456 0.678 0.46 0.296 0.853 0.632 1
0
10
20
30
40
50
60
70
80
90
St-1 St-2 St-3 St-4
Sec
chi
dis
c T
SI
Sampling stations
Pre-moonson Moonson Post-mooson
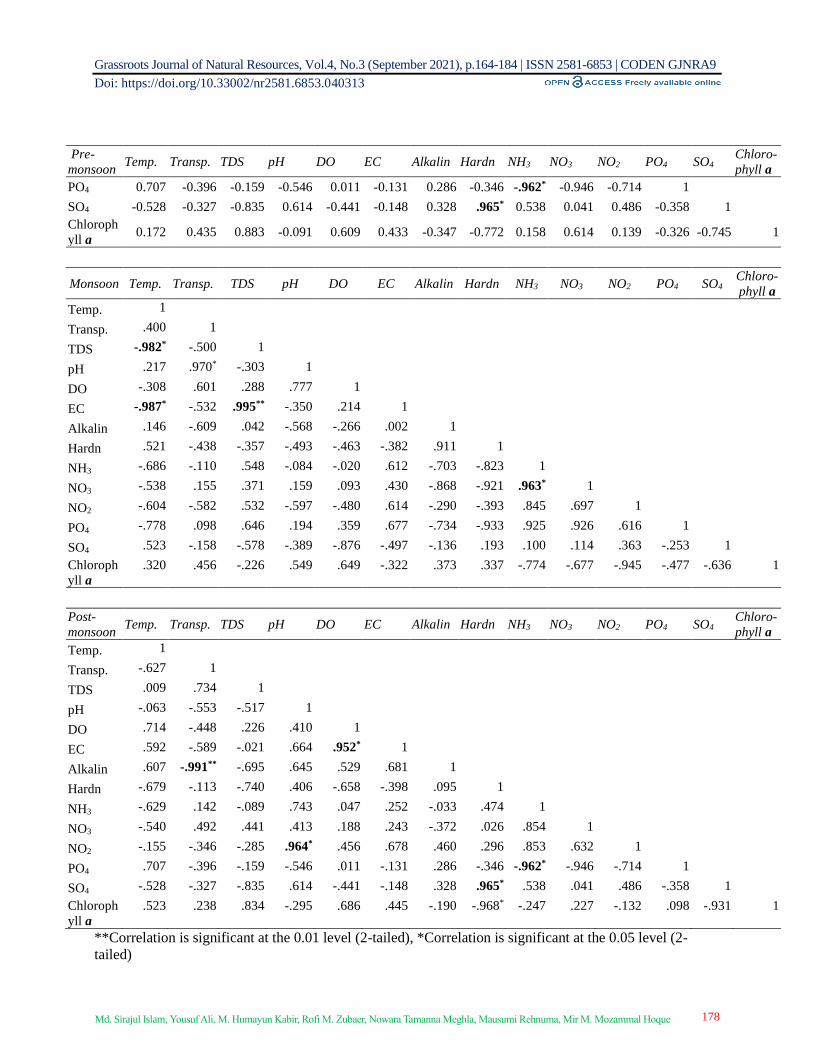
Grassroots Journal of Natural Resources, Vol.4, No.3 (September 2021), p.164-184 | ISSN 2581-6853 | CODEN GJNRA9
Doi: https://doi.org/10.33002/nr2581.6853.040313
178 Md. Sirajul Islam, Yousuf Ali, M. Humayun Kabir, Rofi M. Zubaer, Nowara Tamanna Meghla, Mausumi Rehnuma, Mir M. Mozammal Hoque
Pre-
monsoon Temp. Transp. TDS pH DO EC Alkalin Hardn NH3 NO3 NO2 PO4 SO4
Chloro-
phyll a
PO4 0.707 -0.396 -0.159 -0.546 0.011 -0.131 0.286 -0.346 -.962* -0.946 -0.714 1
SO4 -0.528 -0.327 -0.835 0.614 -0.441 -0.148 0.328 .965* 0.538 0.041 0.486 -0.358 1
Chloroph
yll a 0.172 0.435 0.883 -0.091 0.609 0.433 -0.347 -0.772 0.158 0.614 0.139 -0.326 -0.745 1
Monsoon Temp. Transp. TDS pH DO EC Alkalin Hardn NH3 NO3 NO2 PO4 SO4 Chloro-
phyll a
Temp. 1 Transp. .400 1 TDS -.982* -.500 1 pH .217 .970* -.303 1 DO -.308 .601 .288 .777 1 EC -.987* -.532 .995** -.350 .214 1 Alkalin .146 -.609 .042 -.568 -.266 .002 1 Hardn .521 -.438 -.357 -.493 -.463 -.382 .911 1 NH3 -.686 -.110 .548 -.084 -.020 .612 -.703 -.823 1 NO3 -.538 .155 .371 .159 .093 .430 -.868 -.921 .963* 1 NO2 -.604 -.582 .532 -.597 -.480 .614 -.290 -.393 .845 .697 1 PO4 -.778 .098 .646 .194 .359 .677 -.734 -.933 .925 .926 .616 1 SO4 .523 -.158 -.578 -.389 -.876 -.497 -.136 .193 .100 .114 .363 -.253 1
Chloroph
yll a
.320 .456 -.226 .549 .649 -.322 .373 .337 -.774 -.677 -.945 -.477 -.636 1
Post-
monsoon Temp. Transp. TDS pH DO EC Alkalin Hardn NH3 NO3 NO2 PO4 SO4
Chloro-
phyll a
Temp. 1
Transp. -.627 1
TDS .009 .734 1
pH -.063 -.553 -.517 1
DO .714 -.448 .226 .410 1
EC .592 -.589 -.021 .664 .952* 1
Alkalin .607 -.991** -.695 .645 .529 .681 1
Hardn -.679 -.113 -.740 .406 -.658 -.398 .095 1
NH3 -.629 .142 -.089 .743 .047 .252 -.033 .474 1
NO3 -.540 .492 .441 .413 .188 .243 -.372 .026 .854 1
NO2 -.155 -.346 -.285 .964* .456 .678 .460 .296 .853 .632 1
PO4 .707 -.396 -.159 -.546 .011 -.131 .286 -.346 -.962* -.946 -.714 1
SO4 -.528 -.327 -.835 .614 -.441 -.148 .328 .965* .538 .041 .486 -.358 1
Chloroph
yll a
.523 .238 .834 -.295 .686 .445 -.190 -.968* -.247 .227 -.132 .098 -.931 1
**Correlation is significant at the 0.01 level (2-tailed), *Correlation is significant at the 0.05 level (2-
tailed)
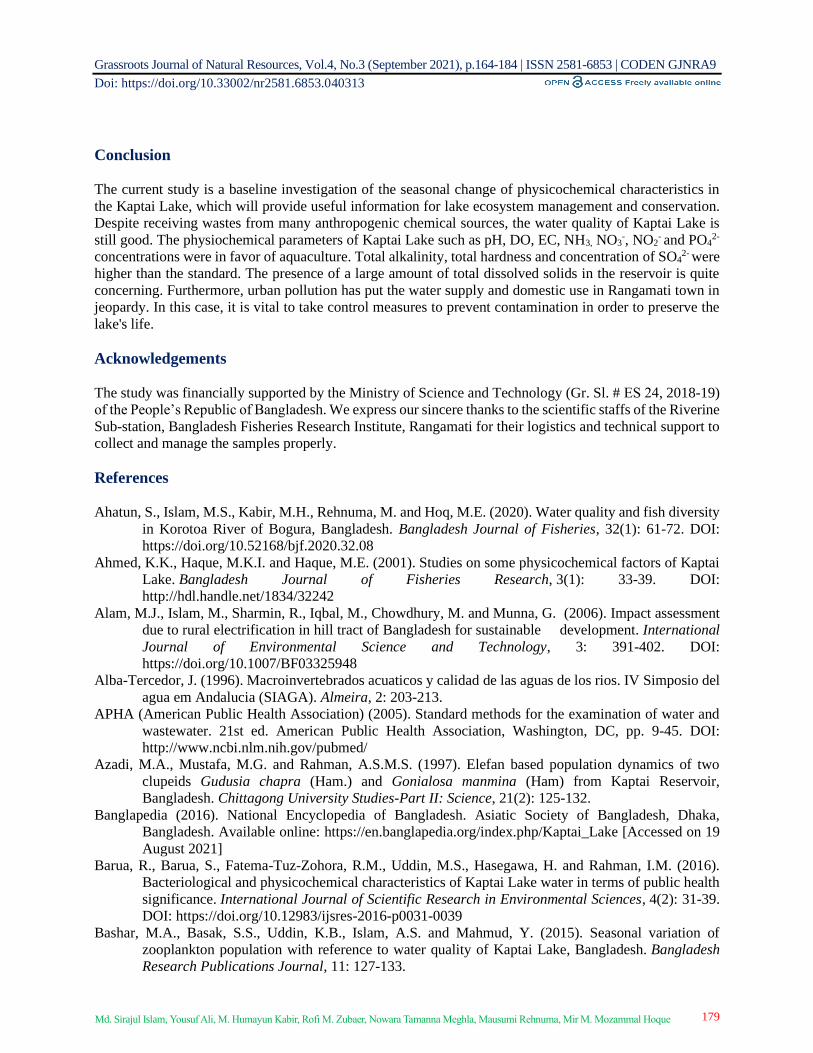
Grassroots Journal of Natural Resources, Vol.4, No.3 (September 2021), p.164-184 | ISSN 2581-6853 | CODEN GJNRA9
Doi: https://doi.org/10.33002/nr2581.6853.040313
179 Md. Sirajul Islam, Yousuf Ali, M. Humayun Kabir, Rofi M. Zubaer, Nowara Tamanna Meghla, Mausumi Rehnuma, Mir M. Mozammal Hoque
Conclusion
The current study is a baseline investigation of the seasonal change of physicochemical characteristics in
the Kaptai Lake, which will provide useful information for lake ecosystem management and conservation.
Despite receiving wastes from many anthropogenic chemical sources, the water quality of Kaptai Lake is
still good. The physiochemical parameters of Kaptai Lake such as pH, DO, EC, NH3, NO3-, NO2
- and PO42-
concentrations were in favor of aquaculture. Total alkalinity, total hardness and concentration of SO42- were
higher than the standard. The presence of a large amount of total dissolved solids in the reservoir is quite
concerning. Furthermore, urban pollution has put the water supply and domestic use in Rangamati town in
jeopardy. In this case, it is vital to take control measures to prevent contamination in order to preserve the
lake's life.
Acknowledgements
The study was financially supported by the Ministry of Science and Technology (Gr. Sl. # ES 24, 2018-19)
of the People’s Republic of Bangladesh. We express our sincere thanks to the scientific staffs of the Riverine
Sub-station, Bangladesh Fisheries Research Institute, Rangamati for their logistics and technical support to
collect and manage the samples properly.
References
Ahatun, S., Islam, M.S., Kabir, M.H., Rehnuma, M. and Hoq, M.E. (2020). Water quality and fish diversity
in Korotoa River of Bogura, Bangladesh. Bangladesh Journal of Fisheries, 32(1): 61-72. DOI:
https://doi.org/10.52168/bjf.2020.32.08
Ahmed, K.K., Haque, M.K.I. and Haque, M.E. (2001). Studies on some physicochemical factors of Kaptai
Lake. Bangladesh Journal of Fisheries Research, 3(1): 33-39. DOI:
http://hdl.handle.net/1834/32242
Alam, M.J., Islam, M., Sharmin, R., Iqbal, M., Chowdhury, M. and Munna, G. (2006). Impact assessment
due to rural electrification in hill tract of Bangladesh for sustainable development. International
Journal of Environmental Science and Technology, 3: 391-402. DOI:
https://doi.org/10.1007/BF03325948
Alba-Tercedor, J. (1996). Macroinvertebrados acuaticos y calidad de las aguas de los rios. IV Simposio del
agua em Andalucia (SIAGA). Almeira, 2: 203-213.
APHA (American Public Health Association) (2005). Standard methods for the examination of water and
wastewater. 21st ed. American Public Health Association, Washington, DC, pp. 9-45. DOI:
http://www.ncbi.nlm.nih.gov/pubmed/
Azadi, M.A., Mustafa, M.G. and Rahman, A.S.M.S. (1997). Elefan based population dynamics of two
clupeids Gudusia chapra (Ham.) and Gonialosa manmina (Ham) from Kaptai Reservoir,
Bangladesh. Chittagong University Studies-Part II: Science, 21(2): 125-132.
Banglapedia (2016). National Encyclopedia of Bangladesh. Asiatic Society of Bangladesh, Dhaka,
Bangladesh. Available online: https://en.banglapedia.org/index.php/Kaptai_Lake [Accessed on 19
August 2021]
Barua, R., Barua, S., Fatema-Tuz-Zohora, R.M., Uddin, M.S., Hasegawa, H. and Rahman, I.M. (2016).
Bacteriological and physicochemical characteristics of Kaptai Lake water in terms of public health
significance. International Journal of Scientific Research in Environmental Sciences, 4(2): 31-39.
DOI: https://doi.org/10.12983/ijsres-2016-p0031-0039
Bashar, M.A., Basak, S.S., Uddin, K.B., Islam, A.S. and Mahmud, Y. (2015). Seasonal variation of
zooplankton population with reference to water quality of Kaptai Lake, Bangladesh. Bangladesh
Research Publications Journal, 11: 127-133.
Grassroots Journal of Natural Resources, Vol.4, No.3 (September 2021), p.164-184 | ISSN 2581-6853 | CODEN GJNRA9
Doi: https://doi.org/10.33002/nr2581.6853.040313
180 Md. Sirajul Islam, Yousuf Ali, M. Humayun Kabir, Rofi M. Zubaer, Nowara Tamanna Meghla, Mausumi Rehnuma, Mir M. Mozammal Hoque
Bashar, M.A., Basak, S.S., Uddin, K.B., Islam, A.S. and Mahmud, Y. (2015). Changing trends of
physicochemical parameters in Kaptai Lake of Bangladesh. Research in Agriculture, Livestock and
Fisheries, 2(2): 319-327.
Bashar, M.A., Basak, S.S., Uddin, K.B., Islam, A.S., Mahmud, Y., Goutham-Bharathi, M.P. and Simon,
K.D. (2014). Development of Indian major carp fry raising techniques in creeks of Kaptai Lake,
Bangladesh. World Journal of Fish and Marine Sciences, 6(6): 532-536.
Boyd, C.E. (1998). Water quality for pond aquaculture. Alabama: International Center for Aquaculture and
Aquatic Environments, Auburn University, pp. 37.
Brown, E., Skougstad, M.W. and Fishman, M.J. (1970). Methods for collection and analysis of water
samples for dissolved minerals and gases. U.S. Geological Survey, U.S. Dept. of Interior,
Washington, DC, pp. 166.
Carlson, R.E. (1977). A trophic state index for lakes. Limnology and Oceanography, 22: 361-369.
Chowdhury, S.H. and Mazumder, A. (1981). Limnology of Lake Kaptai I. Physicochemical features,
Bangladesh. Zoology, 9(1): 59-72.
Dillon, P.J. and Rigler, F.H. (1974). The phosphorus-chlorophyll relationship in lakes. Limnology and
Oceanography, 19:767-773.
ECR (Environment Conservation Rules) (1997). Environment conservation rules. Bangladesh: Ministry of
Environment and Forest, Government of the People’s Republic of Bangladesh, pp. 22-24.
Ehiagbonare, J.E. and Ogunrinde, Y.O. (2010). Physicochemical analysis of fish pond water in Okada and
its environs, Nigeria. African Journal of Biotechnology, 9(36): 5922-5928.
EPA (Environmental Protection Agency) (2017). Water quality standards handbook. EPA office of Water
Science and Technology, Washington DC, pp. 14-27.
EQS (Environmental Quality Standards) (1997). Environmental quality standard. Bangladesh: Bangladesh
Gazette, Registered. Department of Environment, Ministry of Environment and Forest, Government
of the People’s Republic of Bangladesh, pp. 205-208.
Ghorbani, M., Mirbagheri, S.A, Hassani, A.H., Nouri, J. and Monavari, S.M. (2014). Algal bloom in aquatic
ecosystems- an overview. Current World Environment, 9(1): 105-108. DOI:
http://dx.doi.org/10.12944/CWE.9.1.15
Haldar, G.C., Mazid, M.A. and Ahmed, K.K. (1992). Limnology and primary production of Kaptai Lake,
Bangladesh. In: Reservoir Fisheries of Asia (ed. S.S. De Silva). Proceedings of the 2nd Asian
reservoir fisheries workshop held in Hangzhou, People's Republic of China, pp. 2-11.
Haque, M.A., Nabi, M.R.U., Billah, M.M., Asif, A.A., Rezowan, M., Mondal, M.A.I., Siddiqui, A.A.M.,
Mahmud, S.S. and Khan, M.R. (2018). Effect of water parameters on temporal distribution and
abundance of zooplankton at Kaptai Lake reservoir, Rangamati, Bangladesh. Asian Journal of
Medical and Biological Research, 4(4): 389-399.
Islam, M.S., Datta, T., Ema, I.J., Kabir, M.H. and Meghla, N.T. (2015a). Investigation of water quality from
the Brahmaputra River in Sherpur district. Bangladesh Journal of Scientific Research, 28(1): 35-
41. DOI: https://doi.org/10.3329/bjsr.v28i1.26242
Islam, M.S., Imran, M.H., Rimu, S.H., Kabir, M.H. and Suravi (2019). Water quality monitoring of
aquaculture hatchery in Mymensingh region of Bangladesh. Bangladesh Journal of Environmental
Science, 36: 15-22. Available online: https://environmentalexplore.com/best-research-paper-on-
bangladesh/ [Accessed on 22 July 2021]
Islam, M.S., Islam, M.A., Islam, M.J., Kabir, M.H. and Meghla, N.T. (2015b). Status of water quality in the
Tista River at Kaunia point and its impact on aquatic environment. Journal of Environmental
Science and Natural Resources, 8(1): 29-33. DOI: https:// doi.org/10.3329/jesnr.v8i1.24660
Islam, M.S., Meghla, N.T., Suravi and Sultana, N. (2012). Status of water quality in the Dhaleshwari River
and its effect on aquatic organism. Bangladesh Journal of Environmental Science, 23: 131-138.
Islam, M.S., Rehnuma, M., Tithi, S.S., Kabir, M.H. and Sarkar, L. (2015c). Investigation of water quality
parameters from Ramna, Crescent and Hatirjheel Lakes in Dhaka city. Journal of Environmental
Science and Natural Resources, 8(1): 1-5. DOI: https://doi.org/10.3329/jesnr.v8i1.24620
Grassroots Journal of Natural Resources, Vol.4, No.3 (September 2021), p.164-184 | ISSN 2581-6853 | CODEN GJNRA9
Doi: https://doi.org/10.33002/nr2581.6853.040313
181 Md. Sirajul Islam, Yousuf Ali, M. Humayun Kabir, Rofi M. Zubaer, Nowara Tamanna Meghla, Mausumi Rehnuma, Mir M. Mozammal Hoque
Islam, M.S., Shil, S.C., Kabir, M.H. and Hoq, M.E. (2017). Investigation of heavy metal contamination in
fishes from Passur River near the Sundarbans mangroves of Bangladesh. Journal of Environmental
Science and Natural Resources, 10(1): 21-24. DOI: https://doi.org/10.3329/jesnr.v10i1.34689.
Islam, M.S., Suravi and Meghla, N.T. (2010). Investigation on water quality in the Ashulia Beel, Dhaka.
Bangladesh Journal of Fisheries Research, 14(1-2): 55-64. Available online: http://
aquaticcommons.org/18971/1/BJFR14_055.pdf [Accessed on 11 June 2021]
Johan, F.B., Jafri, M.Z.B.M., San, L.H., Omar, W.M.W. and Ho, T.C. (2018). Chlorophyll a concentration
of freshwater phytoplankton analysed by algorithmic based spectroscopy. Journal of Physics (Conf.
Series), 1083: 012015. DOI: https://doi.org/10.1088/1742-6596/1083/1/012015
Kabir, A.N. and Naser, M.N. (2011). Physicochemical aspects of Chandbill Oxbow Lake of Meherpur,
Bangladesh. Dhaka University Journal of Biological Sciences, 20(1): 31-39.
Kabir, M.H., Tusher, T.R., Hossain, M.S., Islam, M.S., Shammi, R.S., Kormoker, T., Proshad, R. and Islam,
M. (2020). Evaluation of spatio-temporal variations in water quality and suitability of an
ecologically critical urban river employing water quality index and multivariate statistical
approaches: A study on Shitalakhya River, Bangladesh. Human and Ecological Risk Assessment:
An International Journal, 27(5): 1388-1415. DOI: https://doi.org/10.1080/10807039.2020.1848415
Karmakar, S., Haque, S.S., Hossain, M.M. and Shafiq, M. (2011). Water quality of Kaptai Reservoir in
Chittagong hill tracts of Bangladesh. Journal of Forestry Research, 22(1): 87-92.
Khan, M.A.G., and Chowdhury, S.H. (1994). Physical and chemical limnology of Kaptai Lake, Bangladesh.
Tropical Ecology, 35(1): 35-51.
Khan, M.A.G., Chowdhury, S.H. and Paul, J.C. (1996). Community structure and ecology of microbenthic
invertebrate fauna of Lake Kaptai, Bangladesh. Tropical Ecology, 37(2): 229-245.
Khondker, M., Alfasane, M.A., Islam, M.S., Bhuiyan, M.A.H. and Gani, M.A. (2010). Limnology of Lake
Bogakain, Bandarban, Bangladesh. Bangladesh Journal of Botany, 39(2): 153-159.
Li, X., Sha, J. and Wang, Z.L. (2017). Chlorophyll a prediction of Lakes with different water quality patterns
in China based on hybrid neural networks. Water, 9: 524. DOI: https://doi.org/10.3390/w9070524
Meghla, N.T., Islam, M.S., Ali, M.A., Suravi and Sultana, N.T. (2013). Investigation of physicochemical
properties of water from the Turag River in Dhaka city, Bangladesh. International Journal of
Current Microbiology and Applied Science, 2(5):110-167.
Nion, M.S.H., Islam, M.S., Hoq, M.E., Kabir, M.H. and Hoque, M.M.M. (2020). Seasonal and tidal
dynamics of nutrients and Chlorophyll a concentration in water at the Sundarbans mangrove
ecosystems of Bangladesh. Grassroots Journal of Natural Resources, 3(1): 50-67. DOI:
https://doi.org/10.33002/nr2581.6853.03015
Pal, M., Samal, N.R., Roy, P.K. and Roy, M.B. (2015). Electrical conductivity of Lake water as
environmental monitoring- a case study of Rudrasagar Lake. IOSR Journal of Environmental
Science, Toxicology and Food Technology, 9: 66-71.
Patra, R.W.R. and Azadi, M.A. (1985). Limnology of the Halda River. Journal of Noami, 2(2): 31-38.
Pavluk, T. and Bij De Vaate, A. (2017). Trophic index and efficiency. Reference module in Earth Systems
and Environmental Sciences, Elsevier. DOI: https://doi.org/10.1016/B978-0-12-409548-9.00608-
4.
Rahaman, S.M.B., Rahaman, M.S., Ghosh, A.K., Gain, D., Biswas, S.K., Sarder, L., Islam, S.S. and Sayeed.
A.B. (2015). A spatial and seasonal pattern of water quality in the Sundarbans River systems of
Bangladesh. Journal of Coastal Research, 31(2): 390-397.
Rahaman, S.M.B., Sarder, L., Rahaman, M.S., Ghosh, A.K., Biswas, S.K., Siraj, S.M.S., Huq, K.A.,
Hasanuzzaman, A.F.M. and Islam, S.S. (2013). Nutrient dynamics in the Sundarbans mangrove
estuarine system of Bangladesh under different weather and tidal cycles. Ecological Processes,
2(29): 1-13. DOI: https://doi.org/10.1186/2192-1709-2-29.
Rahman, A.K.M.L., Islam, M., Hossain, M.Z. and Ahsan, M.A. (2012). Study of the seasonal variations in
Turag River water quality parameters. African Journal of Pure and Applied Chemistry, 6(10): 144-
148.
Grassroots Journal of Natural Resources, Vol.4, No.3 (September 2021), p.164-184 | ISSN 2581-6853 | CODEN GJNRA9
Doi: https://doi.org/10.33002/nr2581.6853.040313
182 Md. Sirajul Islam, Yousuf Ali, M. Humayun Kabir, Rofi M. Zubaer, Nowara Tamanna Meghla, Mausumi Rehnuma, Mir M. Mozammal Hoque
Rahman, M.M., Bashar, M.A., Farhana, Z. and Hossain, M.Y. (2014). Temporal variation of
physicochemical parameters in Kaptai Lake, Bangladesh. World Journal of Fish and Marine
Sciences, 6(5): 475-478.
Rahman, M.S. (1992). Water quality management in aquaculture. Bangladesh: BRAC Prokashana, pp. 84.
Rao, Q.Z. (1956). Basic knowledge for lake investigation. Beijing: Science Press.
Rubel, M., Chowdhury, D.A., Ahmed, M.J.U. and Helal, M. (2019). Physicochemical characterization of
Kaptai Lake and Foy’s Lake water quality parameters in Chittagong, Bangladesh. American Journal
of Pure and Applied Biosciences, 1(6): 49-58.
Senthilkumar, B., Purvaja, R. and Ramesh, R. (2008). Seasonal and tidal dynamics of nutrients and
Chlorophyll a in tropical mangrove estuary, southeast coast of India. Indian Journal of Marine
Sciences, 37(2): 132-140.
Shrivastava, S. and Kanungo, V.K. (2013). Physicochemical analysis of pond water of Surguja District,
Chhattisgarh, India. International Journal of Herbal Medicine, 1(4): 35-43.
Shukla, P., Preeti and Singh, A. (2013). A seasonal variation of plankton population of Maheshara Lake in
Gorakhpur, India. World Journal of Zoology, 8(1): 9-16.
Stauffer, B.A., Bowers, H.A., Buckley, E., Davis, T.W., Johengen, T.H., Kudela, R., McManus, M.A.,
Purcell, H., Smith, G.J., Vander, W.A. and Tamburri, M.N. (2019). Considerations in harmful algal
bloom research and monitoring: Perspectives from a consensus-building workshop and technology
testing. Frontiers in Marine Science, 6: 399. DOI: https://doi.org/10.3389/fmars.2019.00399
Suravi, Islam, M.S., Ali, M.A., Meghla, N.T. and Sultana, N. (2013). Seasonal variations of water quality
parameters from the Pungli River in Tangail region. International Journal of Current Microbiology
and Applied Sciences, 2(5): 155-167.
Suzuki, J.Y., Bollivar, D.W. and Bauer, C.E. (1997). Genetic analysis of Chlorophyll a biosynthesis. Annual
Review of Genetics, 31(1): 61-89. Doi: https://doi.org/10.1146/annurev.genet.31.1.61.
Wang, L., Cai, Q.H., Xu, Y.H., Kong, L.H., Tan, L. and Zhang, M. (2011). Weekly dynamics of
phytoplankton functional groups under high water level fluctuations in a subtropical reservoir-bay.
Aquatic Ecology, 45:197-212.
Yang, J., Yu, X., Liu, L., Zhang, W. and Guo, P. (2012). Algae community and trophic state of subtropical
reservoirs in southeast Fujian, China. Environmental Science and Pollution Research, 19(5): 1432-
1442.
Yasmeen, S., Islam, M.S., Ahsan, M.A., Rahaman, M.H. and Meghla, N.T. (2012). Assessment of water
qualities in the Buriganga River of Dhaka city corporation area. Bangladesh Journal of Environmental
Science, 23: 151-158.

Grassroots Journal of Natural Resources, Vol.4, No.3 (September 2021), p.164-184 | ISSN 2581-6853 | CODEN GJNRA9
Doi: https://doi.org/10.33002/nr2581.6853.040313
183 Md. Sirajul Islam, Yousuf Ali, M. Humayun Kabir, Rofi M. Zubaer, Nowara Tamanna Meghla, Mausumi Rehnuma, Mir M. Mozammal Hoque
Authors’ Declarations and Essential Ethical Compliances
Authors’ Contributions (in accordance with ICMJE criteria for authorship)
Contribution Author 1 Author 2 Author 3 Author 4 Author 5 Author 6 Author 7
Conceived and designed the
research or analysis
Yes Yes Yes Yes Yes Yes Yes
Collected the data Yes Yes Yes Yes No No No
Contributed to data analysis &
interpretation
Yes Yes Yes Yes Yes Yes Yes
Wrote the article/paper Yes Yes Yes Yes Yes No No
Critical revision of the
article/paper
Yes Yes Yes Yes Yes Yes Yes
Editing of the article/paper Yes No Yes No Yes Yes Yes
Supervision Yes No Yes No Yes Yes Yes
Project Administration Yes Yes No Yes Yes No No
Funding Acquisition Yes No No No Yes No No
Overall Contribution Proportion
(%)
25 15 15 15 10 10 10
Funding
A generous funding was made available for the research and for writing of this paper by the Ministry of
Science and Technology (Gr. Sl. # ES 24, 2018-19) of the People’s Republic of Bangladesh.
Research involving human bodies (Helsinki Declaration)
Has this research used human subjects for experimentation? No
Research involving animals (ARRIVE Checklist)
Has this research involved animal subjects for experimentation? No
Research involving Plants
During the research, the authors followed the principles of the Convention on Biological Diversity and
the Convention on the Trade in Endangered Species of Wild Fauna and Flora. Yes
Research on Indigenous Peoples and/or Traditional Knowledge
Has this research involved Indigenous Peoples as participants or respondents? No
(Optional) PRISMA (Preferred Reporting Items for Systematic Reviews and Meta-Analyses)
Have authors complied with PRISMA standards? Yes
Competing Interests/Conflict of Interest
Authors have no competing financial, professional, or personal interests from other parties or in publishing
this manuscript.
Rights and Permissions
Open Access. This article is licensed under a Creative Commons Attribution 4.0 International License,
which permits use, sharing, adaptation, distribution and reproduction in any medium or format, as long as
you give appropriate credit to the original author(s) and the source, provide a link to the Creative Commons
license, and indicate if changes were made. The images or other third-party material in this article are
included in the article's Creative Commons license, unless indicated otherwise in a credit line to the material.

Grassroots Journal of Natural Resources, Vol.4, No.3 (September 2021), p.164-184 | ISSN 2581-6853 | CODEN GJNRA9
Doi: https://doi.org/10.33002/nr2581.6853.040313
184 Md. Sirajul Islam, Yousuf Ali, M. Humayun Kabir, Rofi M. Zubaer, Nowara Tamanna Meghla, Mausumi Rehnuma, Mir M. Mozammal Hoque
If material is not included in the article's Creative Commons license and your intended use is not permitted
by statutory regulation or exceeds the permitted use, you will need to obtain permission directly from the
copyright holder. To view a copy of this license, visit http://creativecommons.org/licenses/by/4.0/.

Comprehensive Overview of REDD+ in India: Status, Opportunities
and Challenges
Harish Bahadur Chand*1, Sanjay Singh2, Abhishek Kumar3, Anil Kumar Kewat4, Roshan Bhatt5,
Ramesh Bohara6
1Forest Research Institute, Dehradun, India. Email: [email protected] | ORCID: 0000-0002-3098-152X 2Indian Council of Forestry Research and Education, India.
Email: [email protected] | ORCID: 0000-0003-4668-7808 3Forest Research Institute, Dehradun, India. Email: [email protected]| ORCID: 0000-0002-4666-3438 4Forest Research Institute, Dehradun, India. Email: [email protected] | ORCID: 0000-0002-6702-2111 5Institute of Forestry, Tribhuvan University, Nepal. Email: [email protected] | ORCID: 0000-0002-7426-0097 6Sahid Bishnu-Dhani Memorial Polytechnic Institute, Nepal.
Email: [email protected] | ORCID: 0000-0002-0586-2748
*Corresponding author
Abstract Climate change is a worldwide issue with detrimental effects on
ecosystems and human well-being. Reducing Emissions from
Deforestation and Forest Degradation (REDD) is a worldwide
policy tool for combating climate change by reducing emissions
from the forestry sector and has received widespread attention.
Since the program's inception, India has been a strong advocate
for REDD+ and its activities. The goal of this research is to
evaluate India's current REDD+ readiness. India is the fourth
largest CO2 emitter in the world, accounting for 7% of global
CO2 emissions. India's emission trajectory shows the country's
ever-increasing CO2 emission trend, with an annual average
increase rate of 5-6 percent. India has a large geographical area
and forest cover, and it holds 7,124.6 million tons of carbon
stock. Forests are traditionally managed through a participatory
approach, which is similar to REDD+ activities. India has made
significant progress toward REDD+ implementation by
developing a national REDD+ strategy, enacting consistent laws
and regulations, and demonstrating accountability and
monitoring of national forest carbon. However, several issues,
including forest dependency, community rights, capacity
building, policies, and finance, should be carefully addressed to
overcome hurdles in REDD+ implementation. Keywords Carbon stock; Participatory approach; Forest dependency;
Community rights
How to cite this paper: Chand, H.B., Singh, S.,
Kumar, A., Kewat, A.K., Bhatt, R. and Bohara,
R. (2021). Comprehensive Overview of REDD+
in India: Status, Opportunities and Challenges.
Grassroots Journal of Natural Resources, 4(3):
185-200. Doi:
https://doi.org/10.33002/nr2581.6853.040314
Received: 13 August 2021
Reviewed: 31 August 2021
Provisionally Accepted: 03 September 2021
Revised: 17 September 2021
Finally Accepted: 20 September 2021
Published: 30 September 2021
Copyright © 2021 by author(s)
This work is licensed under the Creative
Commons Attribution International
License (CC BY 4.0).
http://creativecommons.org/licenses/by/4.0/
Grassroots Journal of Natural Resources, Vol.4 No.3 (September 2021) ISSN 2581-6853 | CODEN: GJNRA9 | Published by The Grassroots Institute
Website: http://grassrootsjournals.org/gjnr | Main Indexing: Web of Science
M – 00251 | Review Article
ISSN 2581-6853 | 4(3) Sep 2021

Grassroots Journal of Natural Resources, Vol.4, No.3 (September 2021), p.185-200 | ISSN 2581-6853 | CODEN GJNRA9
Doi: https://doi.org/10.33002/nr2581.6853.040314
186 Harish Bahadur Chand, Sanjay Singh, Abhishek Kumar, Anil Kumar Kewat, Roshan Bhatt, Ramesh Bohara
Introduction
Climate change is a worldwide phenomenon with negative consequences for ecosystems and human well-
being. It is defined as "a change in the condition of the climate that may be recognized by changes in the
mean and/or variability of its attributes over time, generally decades or more" (IPCC, 2007). Both natural
and human processes cause climate change. Forest fires, earthquakes, volcanoes, and permafrost are
examples of natural processes (Yue and Gao, 2018), whereas human processes include activities linked to
energy generation, industrial activities, and land use, land-use change, and forestry (LULUCF) (Edenhofer
et al., 2014). The rise in greenhouse gas (GHG) concentrations in the atmosphere as a consequence of human
activity is the major cause of climate change. Carbon dioxide (CO2), methane (CH4), Nitrous Oxide (N2O),
and Chlorofluorocarbons (CFCs) are the main GHGs (UNFCCC, 2008). These GHGs have a major role in
global warming (IPCC, 1996), with CO2 accounting for nearly 60% of total global warming (Chand et al.,
2018; Sahu et al., 2015). Between 1984 and 2019, CO2 and CH4 rose by 19% and 13%, respectively (Cail
and Criqui, 2021). The continuous increases in these GHGs due to human activities will hasten global
warming and speedup disasters like erratic rainfall, flood, changing rainfall patterns, drought, and drying
water sources (IPCC, 2014). Anthropogenic activities have already caused global warming of 1.0°C over
pre-industrial levels. If the current emission rate persists, global warming is projected to surpass 1.5°C by
2050 (IPCC, 2018).
The UNFCCC (United Nations Framework Convention on Climate Change) achieved an agreement at the
COP3 (Conference of Parties) to minimize the potential effects of climate change, known as the Kyoto
Protocol. Under Kyoto Protocol, forests are regarded essential for their carbon sinks’ role because they can
capture and store CO2 from the atmosphere (Bohara et al., 2018). The Kyoto Protocol is a pact aiming to
decrease GHGs. It was signed in 1997 and ratified on 16th February 2005. The Protocol's goals are to keep
GHG levels in the atmosphere constant at a level that avoids detrimental human impact on the climate
system (UNFCCC, 2005). During the first commitment period of the Kyoto Protocol (2008-2012), the
Parties pledged to reduce their GHG emissions by an average of 5% compared to 1990 levels. An
amendment to the Kyoto Protocol was accepted at the Doha climate change conference in 2012 to bridge
the gap between the end of the first Kyoto phase in 2012 and the start of the new global agreement (the Paris
Agreement) in 2020. In this amendment, participating countries agreed to cut their GHG emissions by at
least 18% below 1990 levels during the second commitment period (2013-2020). The Kyoto Protocol has
proposed three different flexibility options for nations to meet the emission reduction goal: Joint
Implementation (JI), Clean Development Mechanism (CDM), and Emission Trading (ET). Under CDM,
the carbon services of the forests were enlisted, and records on emissions from LULUCF activities were
maintained (Sud et al., 2012). Since COP3, the term "avoided deforestation" has been used to refer to
decreasing emissions from deforestation in underdeveloped nations. During the International Conference in
Marrakesh in 2001, the concept of avoided deforestation was dropped, leaving afforestation and
reforestation as permissible CDM project activities. It was due to fear of undercutting Annex-I nation's1
efforts to reduce fossil fuel emissions and flooding the market with large carbon credits from the forestry
sector. However, during COP11 in Montreal in 2005, the Coalition of Rainforest Nations, headed by Costa
Rica and Papua New Guinea, established RED (Reducing Emission from Deforestation) to limit
deforestation (UNFCCC, 2005). RED occurred when the Kyoto Protocol was signed, which aimed to reduce
emissions from technological projects. REDD (Reducing Emissions from Deforestation and Forest
Degradation) emerged at COP13 in Bali, Indonesia, in 2007, when deforestation and forest degradation
were seen as equal threats to the Protocol's emission reduction promise. Following that, at COP14 in Poland
in 2008, the addition of "+" to REDD was agreed. The evolution of REDD+ is shown in figure 1.
1 https://unfccc.int/process/parties-non-party-stakeholders/parties-convention-and-observer-
states?field_national_communications_target_id%5B515%5D=515

Grassroots Journal of Natural Resources, Vol.4, No.3 (September 2021), p.185-200 | ISSN 2581-6853 | CODEN GJNRA9
Doi: https://doi.org/10.33002/nr2581.6853.040314
187 Harish Bahadur Chand, Sanjay Singh, Abhishek Kumar, Anil Kumar Kewat, Roshan Bhatt, Ramesh Bohara
Figure 1: Evolution of REDD+
Since its debut, REDD+ has received much attention in international forums (Seymour and Busch, 2016).
REDD+ is a global policy tool created by the UNFCCC to address climate change by decreasing emissions
from the forestry sector. The forestry sector accounts for approximately 9-11 percent of the total GHG
emissions, or about 5.8 Gt CO2 equivalents per year, mostly in poor and tropical countries (IPCC, 2014).
However, REDD+ includes biodiversity conservation and improved rural livelihoods in addition to stopping
deforestation and forest degradation (Caplow et al., 2011; Turnhout et al., 2016). The official definition of
REDD+ by the UNFCCC is "reducing emissions from deforestation and forest degradation in developing
countries, and the role of conservation, sustainable management of forests, and enhancement of forest
carbon stocks in developing countries" (Olander, 2012; UNFCCC, 2011). REDD+ is probably the most
potent means to tackle climate change globally (Stern, 2007). It has the highest potential to reduce emissions
from AFOLU (Agriculture, Forestry, and Other Land Use) (IPCC, 2014).
India's proposal to incorporate compensation for forest protection in forest-based mitigation measures was
accepted at COP12 in Nairobi, Kenya. India has been a strong proponent of REDD+ and actively participates
in high-level climate change discussions. India ranks 10th amongst the most forested nations of the world
(FAO, 2020). The total forest cover in India is 712249 sq km (21.67% of the total geographical area), and
95,027 sq km of tree cover or tree outside the forest (2.89% of total geographical area) (IFSR, 2019).
However, the National Forest Policy of 1988 envisages achieving 33 percent of forest and tree cover. An
additional land area of 29.58 million hectares needs to be brought under the tree-cover through various
programs like National Afforestation Programme, Green India Mission, National Agroforestry Policy,
National Green Highway Mission etc. to achieve the targets mentioned in National Forest Policy. Also,
more than 40 percent of forest is degraded or understocked (Aggarwal et al., 2009) and needs restoration
efforts. With the available technical and institutional capabilities for Forest Management, India is well-
positioned to benefit from REDD+ activities. In this context, the current research explores India's current
REDD+ readiness.
Global GHG Emitters
China (28%) is the world's biggest GHG emitter, followed by the United States (15%), the European Union
(9%), and India (7%). They account for nearly 60 percent of the global GHG emissions (Cail and Criqui,
2021). Between 1990 and 2019, China and India increased their global emission share, while the United
States and the European Union decreased. Figure 2 depicts the four jurisdictions' share of global emissions
from 1990 to 2019. China and India increased their global emission share from 11 to 28 percent and 3 to 7
percent, respectively. This has largely been attributed to increased global coal consumption (Olivier et al.,
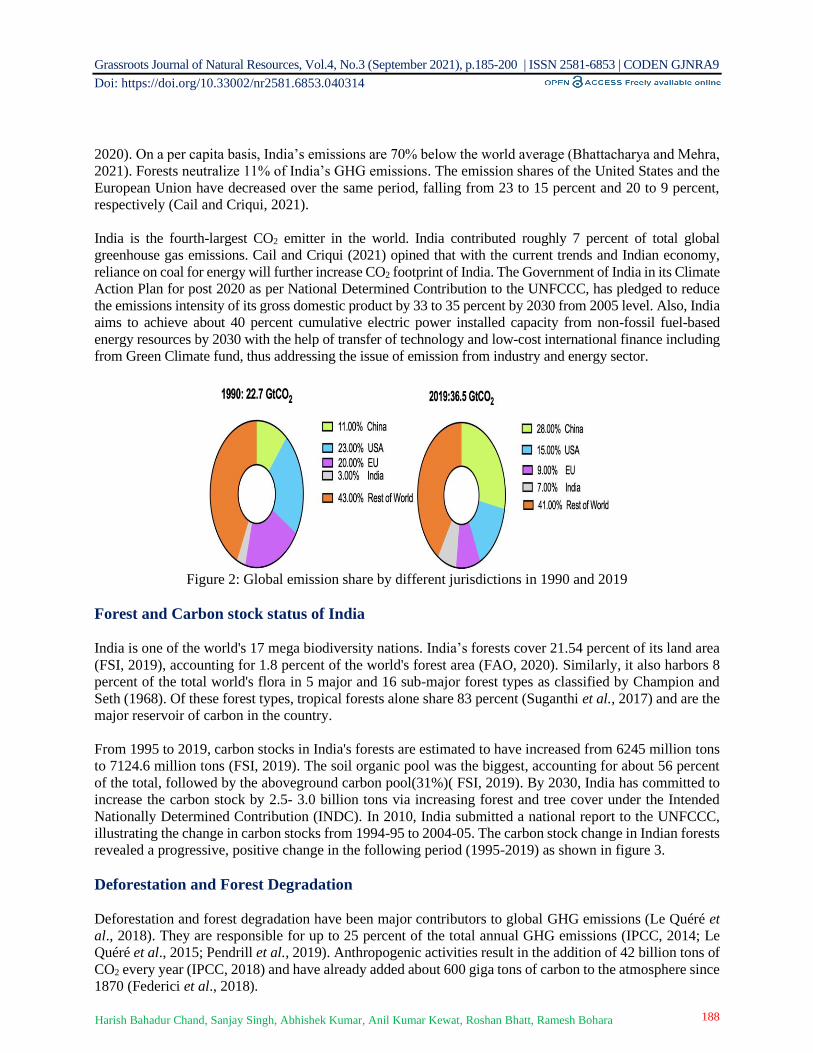
Grassroots Journal of Natural Resources, Vol.4, No.3 (September 2021), p.185-200 | ISSN 2581-6853 | CODEN GJNRA9
Doi: https://doi.org/10.33002/nr2581.6853.040314
188 Harish Bahadur Chand, Sanjay Singh, Abhishek Kumar, Anil Kumar Kewat, Roshan Bhatt, Ramesh Bohara
2020). On a per capita basis, India’s emissions are 70% below the world average (Bhattacharya and Mehra,
2021). Forests neutralize 11% of India’s GHG emissions. The emission shares of the United States and the
European Union have decreased over the same period, falling from 23 to 15 percent and 20 to 9 percent,
respectively (Cail and Criqui, 2021).
India is the fourth-largest CO2 emitter in the world. India contributed roughly 7 percent of total global
greenhouse gas emissions. Cail and Criqui (2021) opined that with the current trends and Indian economy,
reliance on coal for energy will further increase CO2 footprint of India. The Government of India in its Climate
Action Plan for post 2020 as per National Determined Contribution to the UNFCCC, has pledged to reduce
the emissions intensity of its gross domestic product by 33 to 35 percent by 2030 from 2005 level. Also, India
aims to achieve about 40 percent cumulative electric power installed capacity from non-fossil fuel-based
energy resources by 2030 with the help of transfer of technology and low-cost international finance including
from Green Climate fund, thus addressing the issue of emission from industry and energy sector.
Figure 2: Global emission share by different jurisdictions in 1990 and 2019
Forest and Carbon stock status of India
India is one of the world's 17 mega biodiversity nations. India’s forests cover 21.54 percent of its land area
(FSI, 2019), accounting for 1.8 percent of the world's forest area (FAO, 2020). Similarly, it also harbors 8
percent of the total world's flora in 5 major and 16 sub-major forest types as classified by Champion and
Seth (1968). Of these forest types, tropical forests alone share 83 percent (Suganthi et al., 2017) and are the
major reservoir of carbon in the country.
From 1995 to 2019, carbon stocks in India's forests are estimated to have increased from 6245 million tons
to 7124.6 million tons (FSI, 2019). The soil organic pool was the biggest, accounting for about 56 percent
of the total, followed by the aboveground carbon pool(31%)( FSI, 2019). By 2030, India has committed to
increase the carbon stock by 2.5- 3.0 billion tons via increasing forest and tree cover under the Intended
Nationally Determined Contribution (INDC). In 2010, India submitted a national report to the UNFCCC,
illustrating the change in carbon stocks from 1994-95 to 2004-05. The carbon stock change in Indian forests
revealed a progressive, positive change in the following period (1995-2019) as shown in figure 3.
Deforestation and Forest Degradation
Deforestation and forest degradation have been major contributors to global GHG emissions (Le Quéré et
al., 2018). They are responsible for up to 25 percent of the total annual GHG emissions (IPCC, 2014; Le
Quéré et al., 2015; Pendrill et al., 2019). Anthropogenic activities result in the addition of 42 billion tons of
CO2 every year (IPCC, 2018) and have already added about 600 giga tons of carbon to the atmosphere since
1870 (Federici et al., 2018).

Grassroots Journal of Natural Resources, Vol.4, No.3 (September 2021), p.185-200 | ISSN 2581-6853 | CODEN GJNRA9
Doi: https://doi.org/10.33002/nr2581.6853.040314
189 Harish Bahadur Chand, Sanjay Singh, Abhishek Kumar, Anil Kumar Kewat, Roshan Bhatt, Ramesh Bohara
Figure 3: Carbon stock of India (1995-2019)
Agriculture, Forestry, and Other Land Use (AFOLU) activities have contributed nearly 23 percent of total
net anthropogenic emissions from 2007-16 (IPCC, 2019). Since the Rio Summit of 1992, 250 million
hectares of tropical forests have been diverted for agriculture (Neupane, 2015). Deforestation decreased
from 12 million hectares to 10 million hectares between 2010 and 2015 (FAO, 2020). However, emissions
from forest degradation rose by one-third during the same period (FAO, 2015). In India, deforestation is not
much problem (Singh et al., 2015). According to research, forest degradation shares about 2.1 billion tons
of CO2 emissions every year in 74 developing nations (Pearson et al., 2017). It is estimated that
anthropogenic activities at this rate will increase temperature by 1°C (0.8°C to 1.2°C) (Allen et al., 2018;
IPCC, 2018), causing severe climate problems.
To develop an effective REDD+ intervention, it is essential to address the causes of deforestation and forest
degradation (Hosonuma et al., 2012; Kissinger et al., 2012; Minang et al., 2014; Moonen et al., 2016).
Understanding and linking direct and indirect drivers to policy development and implementation is critical
(Goetz et al., 2014; Tegegne et al., 2016; Yoshikura et al., 2016) to modify recent trends in forestry leading
towards better climate future.
Figure 4: Elements of REDD+ (Source: UN-REDD, 2016)
6245
6622
70447124
6000
6300
6600
6900
7200
1995 2005 2015 2019
Car
bo
n (
mil
lio
n t
on
nes
)
Year
Carbon stock of India
National strategy/Action
Plan
National Forest (Emission)
Reference Level
National Forest Monitoring
System
Safeguard Information
System

Grassroots Journal of Natural Resources, Vol.4, No.3 (September 2021), p.185-200 | ISSN 2581-6853 | CODEN GJNRA9
Doi: https://doi.org/10.33002/nr2581.6853.040314
190 Harish Bahadur Chand, Sanjay Singh, Abhishek Kumar, Anil Kumar Kewat, Roshan Bhatt, Ramesh Bohara
Elements of REDD+
For eligibility of countries to receive finance under REDD+ programme, a developing country must have
accepted documents of 4 key elements of REDD+ as given in figure 4.
REDD+ Strategy of India
One of the four major elements of REDD+ is developing a National REDD+ strategy. India has prepared
its National REDD+ strategy in 2018 and submitted to UNFCCC with technical inputs from the Indian
Council of Forestry Research and Education (ICFRE). This is required to be eligible for getting result-based
financial incentives. India's National REDD+ Strategy lays out the conducive and enabling environment for
REDD+ implementation to support multiple REDD+ accords of UNFCCC. The main goal of the REDD+
Strategy is to make it easier for the country to implement the REDD+ programme following relevant
UNFCCC decisions made at the Cancun, Warsaw, and Paris COPs.
REDD+ covers trees inside forest areas as well as trees outside forests, regardless of their legal status. FSI
defined forest as "all lands, more than one hectare in area, with a tree canopy density of more than 10 percent
irrespective of ownership, land use and legal status. These lands may or may not be part of a designated
forest area. Orchards, bamboo, and palm trees are also included." In India's REDD+ context, this definition
of the forest will be used to create a national greenhouse gas inventory. The land classifications for REDD+
operations were developed based on a thorough understanding of its various components and their
significance. According to the Cancun Agreements, REDD+ actions are specified and executed in three
stages.
o Development of National REDD+ Strategies;
o Implementation of national policies/strategies that can strengthen and support REDD+
activities; and
o Transformation into results-oriented activities that are thoroughly assessed, reported, and
validated.
REDD+ may be applied at the sub-national level to seek financial assistance for REDD+ deployment in
physiographic zones that span multiple states. However, participating States would need to create sub-
national Forest Reference Levels (FRL) with Forest Monitoring Systems with the technical assistance of
government institutions such as the Forest Survey of India (FSI) to seek REDD+ funding.
National Forest Reference Emission Level (NFREL)
REDD+ urges developing nations to establish "National Forest Reference Emission Level (NFREL) and/or
National Forest Reference Level (NFRL) or, if appropriate, as an interim measure, sub-national REL and/or
RL, following the national circumstances". FREL/FRL serves as the standard for evaluating country's
performance in the implementation of REDD+ activities.
India has laid significant emphasis to establishing a carbon stock reference level in forests. With the
technical help of the Forest Survey of India (FSI), India submitted the NFREL to the UNFCCC in 2018,
which has been technically reviewed by assessment team of the UNFCCC. The selected activity is
sustainable forest management, and all five CO2 pools were considered to formulate the country's forest
reference level. India proposed FRL of 49.70 million tons of CO2 equivalent per year, the historical average
from 2000 to 2008 (MoEFCC, 2018). This reference level will be used as a baseline for carbon stock, and
its increment will be monitored forward.
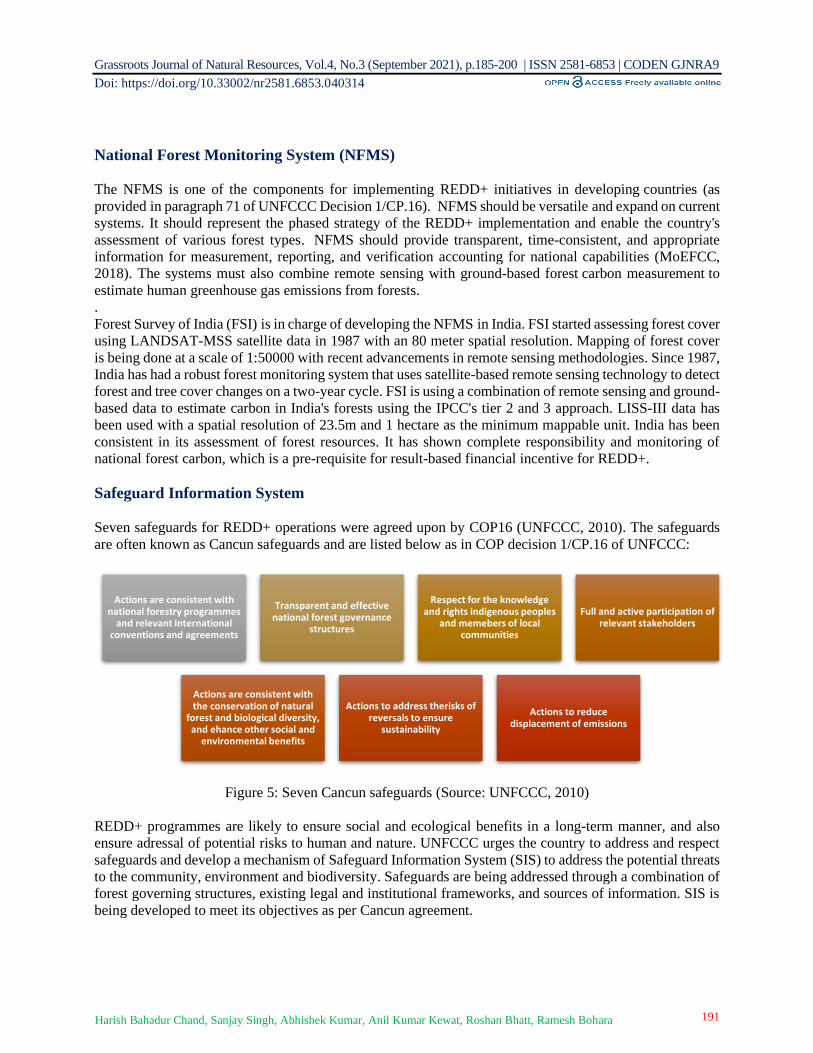
Grassroots Journal of Natural Resources, Vol.4, No.3 (September 2021), p.185-200 | ISSN 2581-6853 | CODEN GJNRA9
Doi: https://doi.org/10.33002/nr2581.6853.040314
191 Harish Bahadur Chand, Sanjay Singh, Abhishek Kumar, Anil Kumar Kewat, Roshan Bhatt, Ramesh Bohara
National Forest Monitoring System (NFMS)
The NFMS is one of the components for implementing REDD+ initiatives in developing countries (as
provided in paragraph 71 of UNFCCC Decision 1/CP.16). NFMS should be versatile and expand on current
systems. It should represent the phased strategy of the REDD+ implementation and enable the country's
assessment of various forest types. NFMS should provide transparent, time-consistent, and appropriate
information for measurement, reporting, and verification accounting for national capabilities (MoEFCC,
2018). The systems must also combine remote sensing with ground-based forest carbon measurement to
estimate human greenhouse gas emissions from forests.
.
Forest Survey of India (FSI) is in charge of developing the NFMS in India. FSI started assessing forest cover
using LANDSAT-MSS satellite data in 1987 with an 80 meter spatial resolution. Mapping of forest cover
is being done at a scale of 1:50000 with recent advancements in remote sensing methodologies. Since 1987,
India has had a robust forest monitoring system that uses satellite-based remote sensing technology to detect
forest and tree cover changes on a two-year cycle. FSI is using a combination of remote sensing and ground-
based data to estimate carbon in India's forests using the IPCC's tier 2 and 3 approach. LISS-III data has
been used with a spatial resolution of 23.5m and 1 hectare as the minimum mappable unit. India has been
consistent in its assessment of forest resources. It has shown complete responsibility and monitoring of
national forest carbon, which is a pre-requisite for result-based financial incentive for REDD+.
Safeguard Information System
Seven safeguards for REDD+ operations were agreed upon by COP16 (UNFCCC, 2010). The safeguards
are often known as Cancun safeguards and are listed below as in COP decision 1/CP.16 of UNFCCC:
Figure 5: Seven Cancun safeguards (Source: UNFCCC, 2010)
REDD+ programmes are likely to ensure social and ecological benefits in a long-term manner, and also
ensure adressal of potential risks to human and nature. UNFCCC urges the country to address and respect
safeguards and develop a mechanism of Safeguard Information System (SIS) to address the potential threats
to the community, environment and biodiversity. Safeguards are being addressed through a combination of
forest governing structures, existing legal and institutional frameworks, and sources of information. SIS is
being developed to meet its objectives as per Cancun agreement.
Actions are consistent with national forestry programmes
and relevant international conventions and agreements
Transparent and effective national forest governance
structures
Respect for the knowledge and rights indigenous peoples
and memebers of local communities
Full and active participation of relevant stakeholders
Actions are consistent with the conservation of natural
forest and biological diversity, and ehance other social and
environmental benefits
Actions to address therisks of reversals to ensure
sustainability
Actions to reduce displacement of emissions

Grassroots Journal of Natural Resources, Vol.4, No.3 (September 2021), p.185-200 | ISSN 2581-6853 | CODEN GJNRA9
Doi: https://doi.org/10.33002/nr2581.6853.040314
192 Harish Bahadur Chand, Sanjay Singh, Abhishek Kumar, Anil Kumar Kewat, Roshan Bhatt, Ramesh Bohara
Issues and Challenges for REDD+
REDD+ may enhance forest governance by spurring changes in favour of the mechanism. (Mulyani and
Jepson, 2013). However, several issues and challenges have already been uttered (Angelsen, 2008; Fletcher
et al., 2016; Phelps et al., 2010). Some of them, with relation to India, are as follows:
Dependence on forests
India bears a large population living around forests i.e., 173,000 forest fringe villages inhibit more than 300
million people (MoEFCC, 2018). These people are wholly/partly dependent on the forest for their
livelihood. Furthermore, 27.5 percent of the overall population lives in poverty and relies on forest goods
and services for a living, either directly or indirectly. The heavy reliance on the forests leads to forest
degradation. REDD+ aims to reduce forest degradation, and high forest dependence may be a hurdle for the
same. There is need to address forest dependence by creating alternate sources of income, value-addition of
the forest produce, increasing awareness, to decrease pressure on the forest resources. Similarly, demand
and supply imbalances in the market for forest products, which emerge from exploitation of forests beyond
their carrying capacity (Aggarwal et al., 2009) must be adequately addressed.
Community rights
REDD+ debates across the globe have been dominated by concerns about the infringement of human and
community rights of forest-dependent people. Fears regarding land grabbing and invasion by elite groups
can be stimulated (Larson et al., 2013). Inconsistency in land rights and carbon tenure resulting in
inequitable benefit-sharing (Vergara-Asenjo et al., 217) and exclusion of overall community rights of tribals
in decision-making have been major hurdles for REDD+ potential beneficiaries globally (Chhatre et al.,
2012; Hiraldo and Tanner, 2011; Luttrell et al., 2013; Lyster, 2011; Sikor et al., 2010).
REDD+ implementation requires the absolute participation of all relevant stakeholders. Individual and
community rights over forest areas are not new issues in India. The Forest Right Act, 20062 clearly defines
the rights of individuals and communities over the forest and forest resources. The forest policy of India
recognizes the rights of people and advocates participatory management of the forest. The concept of JFMC
(Joint Forest Management Committee) in India was initiated in 1990s to improve the quality of the forest
and the economic status of the local communities that are dependent on the forests. 22 million hectares of
forests are being managed by more than 118000 JFMC's involving about 20 million people in JFM
programme. JFMC provides a framework for benefit-sharing of REDD+ incentives and community
inclusion in REDD+ implementation while respecting the community's rights over forest resources.
Capacity building and awareness
REDD+ success, no doubt is highly dependent upon the active participation of all relevant stakeholders.
Capacity building of stakeholders towards REDD+ related issues is one of the challenges for REDD+
implementation (Rawat et al., 2020). Participatory forest management in India has been successful and well
known all over the world. However, the REDD+ approach and its process are not well known to several
stakeholders, especially forest-dependent users. Inadequate understanding of the REDD+ strategy needs a
large-scale sensitization and capacity-building effort. Similarly, the capacity building of grassroots
institutions and their engagement in REDD+ implementation must be adequately addressed. Along with
awareness and capacity building initiatives, the strong benefit-sharing mechanism needs to be expressly
specified. Along with awareness and capacity building initiatives, the robust benefit-sharing mechanism
needs to be expressly specified. Regular training and capacity building programmes are organized for
2 https://tribal.nic.in/FRA/data/FRARulesBook.pdf
Grassroots Journal of Natural Resources, Vol.4, No.3 (September 2021), p.185-200 | ISSN 2581-6853 | CODEN GJNRA9
Doi: https://doi.org/10.33002/nr2581.6853.040314
193 Harish Bahadur Chand, Sanjay Singh, Abhishek Kumar, Anil Kumar Kewat, Roshan Bhatt, Ramesh Bohara
officers and frontline forest staffs on REDD+ MRV, a programme for capacity building of State Forest
Departments for Developing State REDD+ Action Plan has also been initiated by ICFRE.
Acts and Policies
India is one of the few countries that have increased its forest and tree cover (24.56%), gradually aiming
toward fulfilling the goal of national forest policies. According to the latest Indian State of Forest Report
(IFSR) of 2019, the forest and tree cover at the national level increased by 5,188 square kilometers (0.56%)
compared to the ISFR report of 2017. However, attaining the forest cover to 33 percent of the country's land
area, according to National Forest Policy (1988)3, is a long run.
REDD+ has been extensively debated in India since the commencement of global climate change
negotiations. India supports the success of REDD+ implementation through JFM programmes and other
participatory approaches. The participatory approach has been very effective in engaging people in forest
management, and it could be a significant factor for REDD+ success in the country (MoEFCC, 2018).
However, there is speculation on tenurial security, institutional and financial viability, gender equality,
benefit-sharing, and ownership of forest products such as NTFPs in designated areas have been raised
(TERI, 2004). The National REDD+ strategy and Safeguard Information System addresses these concerns
based on existing Policies, Laws, Regulations, and Act's as per the potential policy approach based on socio-
environmental and technological perspectives and requirements of the country.
Several acts and legislations are formulated in the country, keeping the country's commitment at national
and international conferences regarding forest conservation. Policies and acts of India that supports and
uplifts REDD+ activities are Indian Forest Act (1927)4, Wildlife Protection Act (1972)5, Water (Prevention
and Control of Pollution) Act (1974)6, Forest Conservation Act (1980)7, Air (Prevention and Control of
Pollution) Act (1981)8, Environment (Protection) Act (1986)9, National Forest Policy (1988)3, Panchayat
(Extension to Scheduled Areas) Act (1996)10, Biological Diversity Act (2002)11, National Environment
Policy (2006)12, The Scheduled Tribes and Other Traditional Forest Dwellers (Recognition of Forest Rights)
Act (2006)2, National Tribunal Act (2010)13, National Agroforestry Policy (2014)14, National Working Plan
Code (2014)15 and National Action Plan on Climate Change (2008)16. The proposed National Forest Policy
(2018)17 acknowledges the need to combine climate change mitigation and adaptation measures to mitigate
the hazardous effects of climate change. The draft is no such exemption that emphasizes sustainable forest
management through the mechanism of REDD+. Although India has progressive policies and legislation to
handle REDD+ concerns, certain modifications may be necessary in the future to meet the changing
paradigm of forest management.
3 http://asbb.gov.in/Downloads/National%20Forest%20Policy.pdf 4 http://nbaindia.org/uploaded/Biodiversityindia/Legal/3.%20Indian%20forest%20act.pdf 5 https://legislative.gov.in/sites/default/files/A1972-53_0.pdf 6 https://tnpcb.gov.in/pdf_2019/WaterAct17519.pdf 7 http://nbaindia.org/uploaded/Biodiversityindia/Legal/22.%20Forest%20(Conservation)%20Act,%201980.pdf 8 https://legislative.gov.in/sites/default/files/A1981-14.pdf 9 https://www.indiacode.nic.in/bitstream/123456789/4316/1/ep_act_1986.pdf 10 https://legislative.gov.in/sites/default/files/A1996-40.pdf 11 http://nbaindia.org/uploaded/act/BDACT_ENG.pdf 12 https://ibkp.dbtindia.gov.in/DBT_Content_Test/CMS/Guidelines/20190411103521431_National%20Environment%20Policy,%202006.pdf 13 https://greentribunal.gov.in/sites/default/files/act_rules/National_Green_Tribunal_Act,_2010.pdf 14 https://agricoop.nic.in/sites/default/files/National%20Agroforestry%20Policy%202014.pdf 15 https://www.forests.tn.gov.in/tnforest/app/webroot/img/document/gov-india-publication/11.pdf 16 http://www.nicra-icar.in/nicrarevised/images/Mission%20Documents/National-Action-Plan-on-Climate-Change.pdf 17 http://www.indiaenvironmentportal.org.in/files/file/Draft%20National%20Forest%20Policy,%202018.pdf
Grassroots Journal of Natural Resources, Vol.4, No.3 (September 2021), p.185-200 | ISSN 2581-6853 | CODEN GJNRA9
Doi: https://doi.org/10.33002/nr2581.6853.040314
194 Harish Bahadur Chand, Sanjay Singh, Abhishek Kumar, Anil Kumar Kewat, Roshan Bhatt, Ramesh Bohara
Finance
Multilateral organizations have assisted nations with high deforestation rates via readiness programmes such
as the Forest Carbon Partnership Facility (FCPF) and the UN-REDD initiative. REDD+ financing can be
done through public, private, national or international support. Over $10 billion funding has been committed
for REDD+ already, almost half of it being result-oriented (Norman and Nakhooda, 2015).
The World Bank's FCPF and the bio-carbon fund have proved to be difficult for nations to participate and,
while having a variety of funding sources, obtaining funds has been difficult (Streck, 2016). The main reason
can be the inclusion of REDD+ credit for funding in markets. If REDD+ credits are utilized as an offset,
market financing may be contentious. It has been argued ideologically that paying others to enable one to
pollute is unethical. Market flooding has also been a worry, with cheap REDD+ credits could potentially
reduce the market price of carbon driving out mitigation in the energy sector (Angelsen et al., 2012). Also,
the absence of a long-term plan for meeting the monetary requirements of REDD+ nations exist. Although
short-term financing is accessible, the disbursement process is often slow and cumbersome. Also, finance
from private investors frequently went unnoticed due to modest carbon prices (Hamrick and Gallant,
2018). Most importantly, there is no complete uniformity in the criteria that nations must meet to get
financing (Pesti et al., 2017). In India, lack of national and international finance are identified as the
challenges for implementation of REDD+ activities (Rawat et al., 2020).
REDD+ funding will be raised domestically via the Green India Mission, Namami Gange Programme,
Green Highway Policy, and other initiatives in India (Bhattacharya and Mehra, 2021). Budget shortfall will
be communicated for support from UNFCCC and Green Climate Fund. The question remains the same as
other countries have and will be facing in performing REDD+ activities in the country, i.e. availability of
funds (when and where?).
Conclusion
India is the tenth most forested country on the planet. India's total forest and tree cover is estimated to be
24.56 percent of its total land area. Due to protection of forests, carbon stocks in Indian forests have been
steadily increasing since 1994. Since its inception, India has been a leader in expanding the scope of REDD+
and advocating for the conservation of different ecological services. The activities of REDD+ are similar to
the traditional management and conservation of forests through a participatory approach. REDD+ has
gained the utmost attention from policy and decision makers. This forest-based mitigation strategy to tackle
climate change issues offers a unique chance to strengthen forest conservation and sustainable management.
India has made significant progress toward REDD+ implementation by developing a national REDD+
strategy, enacting uniform laws and regulations, and demonstrating complete accountability and monitoring
of national forest carbon, all of which are required for REDD+ finance. Despite having several challenges
in REDD+ implementation, India is ready for the implementation of REDD+. Also, India already
acknowledges the significant contribution of REDD+ processes in bringing different stakeholders of the
Indian forestry sector together to protect the forests and safeguarding community rights. Overall, the
government sees REDD+ as a proper tool to fetch reward for the earlier efforts of forest conservation
through the provision of forest carbon services to the international community and an opportunity for a
better future climate.
References
Aggarwal, A., Paul, V. and Das, S. (2009). Forest Resources: Degradation, Livelihoods, and Climate
Change. In Datt, D. and Nischal, S. Eds (2009), Looking Back to Change Track. New Delhi: TERI,
219:91-108.
Grassroots Journal of Natural Resources, Vol.4, No.3 (September 2021), p.185-200 | ISSN 2581-6853 | CODEN GJNRA9
Doi: https://doi.org/10.33002/nr2581.6853.040314
195 Harish Bahadur Chand, Sanjay Singh, Abhishek Kumar, Anil Kumar Kewat, Roshan Bhatt, Ramesh Bohara
Allen, M.R., Dube, O.P., Solecki, W., Aragón-Durand, F., Cramer, W., Humphreys, S., Kainuma, M., Kala,
J., Mahowald, N., Mulugetta, Y. and Perez, R. (2018). Framing And Context. In: Global Warming
Of 1.5°C. An IPCC Special Report on the impacts of global warming of 1.5°C above pre-industrial
levels and related global greenhouse gas emission pathways, in the context of strengthening the
global response to the threat of climate change, sustainable development, and efforts to eradicate
poverty. Available online: https://www.ipcc.ch/sr15/chapter/chapter-1/ [Accessed on 21 March
2021].
Angelsen, A., Brockhaus, M., Sunderlin, W., Verchot, L. and Dokken T. (2012). Analysing REDD:
Challenges and choices. Center for International Forestry Research, Bogor, Indonesia. DOI:
https://doi.org/10.17528/cifor/003805
Angelsen, A. (2008). Moving Ahead with REDD+: Options, Issues, and Implications. Center for
International Forestry Research. Bogor, Indonesia: 172. DOI:
https://doi.org/10.17528/cifor/002601
Bhattacharya, P. and Mehra, S. (2021). REDD+ in the Indian Context: Planning and Implementation
Scenario. In: Kaushik, A., Kaushik, C.P. and Attri, S.D. (Eds) (2021), Climate Resilience and
Environmental Sustainability Approaches. Singapore: Springer Nature. DOI:
https://doi.org/10.1007/978-981-16-0902-2
Bohara, R., Chand, H.B. and Tewari, A. (2018). Biomass and Carbon Stock in Kharsu Oak (Quercus
semecarpifolia) Dominated Forest in Nainital District of Kumaun Himalaya. Journal of Energy
Research and Environmental Technology, 5(2): 45-50. Available online:
https://www.researchgate.net/publication/332292207_Biomass_and_Carbon_
Stock_in_Kharsu_Oak_Quercus_semecarpifolia_Dominated_Forest_in_Nainital_District_of_Ku
maun_Himalaya [Accessed on 28 May 2021].
Cail, S. and Criqui, P. (2021). Carbon Dioxide Emissions by the Four Largest World Emitters: Past
Performance and Future Scenarios for China, U.S.A., Europe and India. EAERE Magazine, pp. 15-
23. Available online: https://hal.archives-ouvertes.fr/hal-03160204/document [Accessed on 12 June
2021].
Caplow, S., Jagger, P., Lawlor, K. and Sills, E. (2011). Evaluating land use and livelihood impacts of early
forest carbon projects: lessons for learning about REDD+. Environment Science Policy, 14(2): 152–
167. DOI: https://doi.org/10.1016/j.envsci.2010.10.003
Champion, H.G. and Seth, S.K. (1968). A revised survey of forest types of India. Government of India,
New Delhi, India.
Chand, H.B., Singh, H. and Chhetri, R. (2018). Carbon Sequestration Potential in Sahid Smriti Community
Forest: A Case study of Terai Region of Nepal. International Conference on Agriculture and Allied
Sciences: The Productivity, Food Security and Ecology, Kolkata, India. Available online:
https://www.researchgate.net/publication/329962107_Carbon_Sequestration_Potential_in_Sahid_S
mriti_Community_Forest_A_Case_Study_of_Terai_Region_of_Nepal [Accessed on 10 May 2021].
Chhatre, A., Lakhanpal, S., Larson, A.M., Nelson, F., Ojha, H. and Rao, J. (2012). Social safeguards and
co-benefits in REDD+: a review of the adjacent possible. Current Opinion in Environmental
Sustainability, 4(6): 654-660. DOI: https://doi.org/10.1016/j.cosust.2012.08.006
Chitale, V.S., Behera, M.D. and Roy, P.S. (2014). Future of endemic flora of biodiversity hotspots in
India. PloS one, 9(12): e115264. DOI: https://doi.org/10.1371/journal.pone.0115264
FAO (2015). Assessment of forests and carbon stocks, 1990–2015. FAO, Rome, 4 pp. Available Online:
http://www.fao.org/documents/card/en/c/2e2f045a-e39b-4b11-965c-861ca6165861/ [Accessed on
12 June 2021].
FAO (2020). Global Forest Resources Assessment (key findings). FAO, Rome, 16 pp. DOI:
https://doi.org/10.4060/ca8753en
FCCC (2005). Report of the Conference of the Parties on its eleventh session, held at Montreal from 28
November to 10 December 2005. Available online:
https://unfccc.int/resource/docs/2005/cop11/eng/05a01.pdf [Accessed on 25 May 2021].
Grassroots Journal of Natural Resources, Vol.4, No.3 (September 2021), p.185-200 | ISSN 2581-6853 | CODEN GJNRA9
Doi: https://doi.org/10.33002/nr2581.6853.040314
196 Harish Bahadur Chand, Sanjay Singh, Abhishek Kumar, Anil Kumar Kewat, Roshan Bhatt, Ramesh Bohara
Federici, S., Lee, D. and Herold, M. (2018). Forest Mitigation: A Permanent Contribution to the Paris
Agreement. Working paper, Climate and Land Use Alliance, 24 pp. DOI:
https://doi.org/10.13140/RG.2.2.22022.88642
Fletcher, R., Dressler, W., Büscher, B. and Anderson, Z.R. (2016). Questioning REDD+ and the future of
market‐based conservation. Conservation Biology, 30(3): 673-675. DOI:
https://doi.org/10.1111/cobi.12680
FSI (2019). India State of Forest Report. Forest Survey of India, FSI (Ministry of Environment and Forest),
Dehradun, India. Available online: https://fsi.nic.in/forest-report-2019?pgID=forest-report-2019
[Accessed on 21 March 2021].
Goetz, S.J., Herold, M., De Sy, V., Kissinger, G., Brockhaus, M. and Skutsch, M. (2014). How countries
link REDD+ interventions to drivers in their readiness plans: implications for monitoring systems.
Environmental Research Letter, 9:074004. DOI: https://doi.org/10.1088/1748-9326/9/7/074004
Hamrick, K. and Gallant, M. (2018). Voluntary carbon markets insights: 2018 outlook and first-quarter
trends. Ecosystem Marketplace, Forest Trends, Washington, DC, USA. Available online:
https://www.forest-trends.org/publications/voluntary-carbon-markets/ [Accessed on 27 May 2021].
Hiraldo, R. and Tanner, T. (2011). Forest voices: Competing narratives over REDD+. IDS bulletin, 42(3):
42-51. DOI: https://doi.org/10.1111/j.1759-5436.2011.00221.x
Hosonuma, N., Herold, M., De Sy, V., De Fries, R.S., Brockhaus, M., Verchot, L., Angelsen, A. and Romijn,
E. (2012). An assessment of deforestation and forest degradation drivers in developing countries.
Environmental Research Letters, 7(7): 44009-12. DOI: https://doi.org/10.1088/1748-
9326/7/4/044009
IISD (2015). Earth Negotiations Bulletin No. 663. Published by the International Institute for Sustainable
Development, 12: 23-35. Available online: https://enb.iisd.org/enb/vol12/ [Accessed on 12 May
2021].
IPCC (1996). Guidelines for National Greenhouse Gas Inventories. An Assessment of the
Intergovernmental Panel on Climate Change, London. Available online:
https://www.ipcc.ch/report/revised-1996-ipcc-guidelines-for-national-greenhouse-gas-inventories/
[Accessed on 25 June 2021].
IPCC (2007). Climate Change 2007: Synthesis report. Summary for policy makers. An Assessment of the
Intergovernmental Panel on Climate Change. UK: Cambridge University Press. Available online:
https://www.ipcc.ch/site/assets/uploads/2018/02/ar4_syr_full_report.pdf [Accessed on 14 June
2021].
IPCC (2014). Climate Change 2014: Synthesis Report. Contribution of Working Groups I, II and III to the
Fifth Assessment Report of the Intergovernmental Panel on Climate Change [Core Writing Team,
R.K. Pachauri and L.A. Meyer (eds.)]. IPCC, Geneva, Switzerland, 151 pp. Available online:
https://www.ipcc.ch/report/ar5/syr/ [Accessed on 15 May 2021].
IPCC (2018). Mitigation Pathways Compatible with 1.5°C in the Context of Sustainable Development. In:
Global Warming of 1.5°C. An IPCC Special Report on the impacts of global warming of 1.5°C
above pre-industrial levels and related global greenhouse gas emission pathways, in the context of
strengthening the global response to the threat of climate change, sustainable development, and
efforts to eradicate poverty. IPCC, Geneva, Switzerland, 82 pp. Available online:
https://www.ipcc.ch/report/sr15/ [Accessed on 21 May 2021].
IPCC (2019). Climate Change and Land: an IPCC special report on climate change, desertification, land
degradation, sustainable land management, food security, and greenhouse gas fluxes in terrestrial
ecosystems. IPCC, Geneva, Switzerland, 906 pp. Available online:
https://www.ipcc.ch/site/assets/uploads/2019/11/SRCCL-Full-Report-Compiled-191128.pdf
[Accessed on 13 March 2021].
Isseren-Hamakers, I.J., Gupta, A., Herold, M., Peña-Claros, M. and Vijge, M. J. (2012). Will REDD+ work?
The need for interdisciplinary research to address key challenges. Current Opinion in
Environmental Sustainability, 4(6): 590-596. DOI: https://doi.org/10.1016/j.cosust.2012.10.006
Grassroots Journal of Natural Resources, Vol.4, No.3 (September 2021), p.185-200 | ISSN 2581-6853 | CODEN GJNRA9
Doi: https://doi.org/10.33002/nr2581.6853.040314
197 Harish Bahadur Chand, Sanjay Singh, Abhishek Kumar, Anil Kumar Kewat, Roshan Bhatt, Ramesh Bohara
Kissinger, G. M., Herold, M. and De Sy, V. (2012). Drivers of deforestation and forest degradation: A
synthesis report for REDD+ policymakers. International Forestry Research, Vancouver, Canada.
Available online:
https://www.forestcarbonpartnership.org/sites/fcp/files/DriversOfDeforestation.pdf_N_S.pdf
[Accessed on 15 June 2021].
Larson, A.M., Brockhaus, M., Sunderlin, W.D., Duchelle, A., Babon, A., Dokken, T. and Huynh, T.B.
(2013). Land tenure and REDD+: The good, the bad and the ugly. Global Environmental Change,
23(3): 678-689. DOI: https://doi.org/10.1016/j.gloenvcha.2013.02.014
Le Quéré C, Moriarty, R. and Andrew, R.M. (2015). Global Carbon Budget 2014. Earth System Science
Data, 7(1): 47–85. DOI: https://doi.org/10.5194/essd-7-47-2015
Le Quéré, C., Andrew, R.M., Friedlingstein, P., Sitch, S., Pongratz, J., Manning, A.C., Korsbakken, J.I.,
Peters, G.P., Canadell, J.G., Jackson, R.B. and Boden, T.A. (2018). Global Carbon Budget
2017. Earth System Science Data, 10(1): 405-448. DOI: https://doi.org/10.5194/essd-10-2141-
2018
Luttrell, C., Loft, L., Gebara, M.F., Kweka, D., Brockhaus, M., Angelsen, A. and Sunderlin, W.D. (2013).
Who should benefit from REDD+? Rationales and realities. Ecology and Society, 18(4). DOI:
https://doi.org/10.5751/ES-05834-180452
Lyster, R. (2011). REDD+, transparency, participation and resource rights: the role of law. Environmental
Science Policy, 14(2): 118–126. DOI: https://doi.org/10.1016/j.envsci.2010.11.008
Minang, P.A., Van Noordwijk, M., Duguma, L.A., Alemagi, D., Do, T.H., Bernard F., Agung, P., Robiglio,
V., Catacutan, D., Suyanto, S., Armas, A., Aguad, C.S., Feudjio, M., Galudra, G., Maryani, R.,
White, D., Widayati, A., Kahurani, E., Namirembe, S. and Leimona, B. (2014). REDD+ Readiness
progress across countries: time for reconsideration. Climate Policy, 14:6: 685-708. DOI:
https://doi.org/10.1080/14693062.2014.905822
MoEF (2009). State of Environment Report. New Delhi: Ministry of Environment and Forest. Government
of India.
MoEFCC (2018). National REDD+ Strategy India, Ministry of Environment, Forest and Climate Change,
Government of India. Available online:
https://redd.unfccc.int/files/india_national_redd__strategy.pdf [Accessed on 12 June 2021].
Moonen, P.C., Verbist, B., Schaepherders, J., Meyi, M.B., Van Rompaey, A., and Muys, B. (2016). Actor-
based identification of deforestation drivers paves the road to effective REDD+ in DR Congo. Land
Use Policy, 58: 123-132. DOI: https://doi.org/10.1016/j.landusepol.2016.07.019
Mulyani, M. and Jepson, P. (2013). REDD+ and forest governance in Indonesia: A multistakeholder study
of perceived challenges and opportunities. The Journal of Environment and Development, 22(3):
261-283. DOI: https://doi.org/10.1177/1070496513494203.
Neupane, P.R. (2015). Viability assessment of jurisdictional Reduced Emissions from Deforestation and
Forest Degradation (REDD+) implementation in Vietnam. Norman, M. and Nakhooda, S. (2015).
The state of REDD+ finance. Center for Global Development Working Paper, (378). Available
online: https://d-nb.info/1078408920/34 [Accessed on 15 March 2021].
Olander, L.P., Galik, C.S. and Kissinger, G.A. (2012). Operationalizing REDD+: scope of reduced
emissions from deforestation and forest degradation. Current Opinion in Environmental
Sustainability, 4(6): 661-669. DOI: https://doi.org/10.1016/j.cosust.2012.07.003
Olivier, J.G.J. and Peters, J.A.H.W. (2020). Trends in global CO2 and total greenhouse gas emissions: 2019
Report. PBL Netherlands Environmental Assessment Agency, Hague, Netherlands. Available
online: https://www.pbl.nl/sites/default/files/downloads/pbl-2020-trends-in-global-co2-and-total-
greenhouse-gas-emissions-2019-report_4068.pdf [Accessed on 23 May 2021].
Pearson, T.R., Brown, S., Murray, L., and Sidman, G. (2017). Greenhouse gas emissions from tropical forest
degradation: an underestimated source. Carbon balance and management, 12(1): 3. DOI:
https://doi.org/10.1186/s13021-017-0072-2

Grassroots Journal of Natural Resources, Vol.4, No.3 (September 2021), p.185-200 | ISSN 2581-6853 | CODEN GJNRA9
Doi: https://doi.org/10.33002/nr2581.6853.040314
198 Harish Bahadur Chand, Sanjay Singh, Abhishek Kumar, Anil Kumar Kewat, Roshan Bhatt, Ramesh Bohara
Pendrill, F., Persson, U.M., Godar, J., Kastner, T., Moran, D., Schmidt, S. and Wood, R. (2019). Agricultural
and forestry trade drives large share of tropical deforestation emissions. Global Environmental
Change, 56: 1-10. DOI: https://doi.org/10.1016/j.gloenvcha.2019.03.002
Phelps, J., Guerrero, M.C., Dalabajan, D.A., Young, B. and Webb, E.L. (2010). What makes a 'REDD'
country? Global Environmental Change, 20(2): 322-332. DOI:
https://doi.org/10.1016/j.gloenvcha.2010.01.002
Rawat, R.S., Arora, G., Shilpa, G. and Shaktan, T. (2020). Opportunities and Challenges for implementation
of REDD+ activities in India. Current Science, 119(5): 749-756. Available online:
https://www.currentscience.ac.in/Volumes/119/05/0749.pdf [Accessed on 16 June 2021].
Sahu, S.C., Kumar, M. and Ravindranath, N.H. (2015). Carbon stocks and fluxes for forests in Odisha
(India). Tropical Ecology, 56(1): 77-85. Available online:
https://www.researchgate.net/profile/Sudam-Sahu-3/publication/281927398_
Carbon_stocks_and_fluxes_for_forests_in_Odisha_India/links/59e5d647a6fdcc1b1d96f394/Carb
on-stocks-and-fluxes-for-forests-in-Odisha-India.pdf [Accessed on 21 March 2021].
Seymour, F. and Busch, J. (2016). Why Forests? Why Now? the Science, Economics, and Politics of
Tropical Forests and Climate Change, 429. Washington, DC: Center for Global Development.
Available online: https://www.cgdev.org/sites/default/files/Seymour-Busch-why-forests-why-
now-full-book.PDF [Accessed on 7 May 2021].
Sikor, T., Stahl, J., Enters, T., Ribot, J.C., Singh, N., Sunderlin, W.D. and Wollenberg, L. (2010). REDD-
plus, forest people’s rights and nested climate governance. Global Environmental Change, 20(3):
423–425. DOI: https://doi.org/10.1016/j.gloenvcha.2010.04.007
Singh, T.P., Rawat, V.R.S. and Rawat, R.S. (2015). Implementing REDD+ as a climate mitigation option
in India. Indian Forester, 141(1): 9-17. Available online:
https://www.cabdirect.org/cabdirect/abstract/20153314715 [Accessed on 14 May 2021].
Stern, N.H. (2007). The Economics of Climate Change: The Stern Review. Cambridge, UK; New York:
Cambridge University Press. DOI: https://doi.org/10.1017/CBO9780511817434
Streck, C. (2016). Mobilizing finance for REDD+ after Paris.Journal for European Environmental and
Planning Law, 13(2): 146-166. DOI: https://doi.org/10.1163/18760104-01302003
Suganthi, K., Das, K.R., Selvaraj, M., Kurinji, S., Goel, M. and Govindaraju, M. (2017). Assessment of
Altitudinal Mediated Changes of CO2 Sequestration by Trees at Pachamalai Reserve Forest, Tamil
Nadu, India. In Carbon Utilization, pp 89-99. Singapore: Springer. DOI:
https://doi.org/10.1007/978-981-10-3352-0_7
Tegegne, Y.T., Lindner, M., Fobissie, K., and Kanninen, M. (2016). Evolution of drivers of deforestation
and forest degradation in the Congo Basin forests: Exploring possible policy options to address
forest loss. Land use policy, 51: 312-324. DOI: https://doi.org/10.1016/j.landusepol.2015.11.024
Turnhout, E., Gupta, A., Weatherley-Singh, J., Vijge, M.J., de Koning, J., Visseren-Hamakers, I.J., Herold,
M. and Lederer, M. (2016). Envisioning REDD+ in a post-Paris era: between evolving expectations
and current practice. Wiley Interdisciplinary Reviews: Climate Change, 8(1): e425. DOI:
https://doi.org/10.1002/wcc.425
UNFCCC (2005). Item 6 of the Provisional Agenda. Reducing Emissions from Deforestation in Developing
Countries: Approaches to Stimulate Action. Montreal, QC, Canada: United Nations Framework
Convention on Climate Change. FCCC/CP/2005/MISC.1 GE.05-64088.
UNFCCC (2010). 1/CP. 16 the Cancun Agreement. In: United Nations Framework Convention on Climate
Change. Available online: https://unfccc.int/resource/docs/2010/cop16/eng/07a01.pdf. [Accessed
on 12 June 2021].
UNFCCC (2011). Report of the Conference of the Parties on its Sixteenth Session, Cancun, 29 November
to 10 December 2010. Addendum. Part Two: Action taken by the Conference of the Parties at its
Sixteenth Session. FCCC/CP/2010/7/Add.1.
UNFCCC (2015). Adoption of the Paris Agreement, Fccc/cp/2015/l.9/rev.1, UNFCCC, Bonn, Germany.
Available online: http://unfccc.int/resource/docs/2015/cop21/eng/l09r01.pdf. [Accessed on 12 June
2021].
Grassroots Journal of Natural Resources, Vol.4, No.3 (September 2021), p.185-200 | ISSN 2581-6853 | CODEN GJNRA9
Doi: https://doi.org/10.33002/nr2581.6853.040314
199 Harish Bahadur Chand, Sanjay Singh, Abhishek Kumar, Anil Kumar Kewat, Roshan Bhatt, Ramesh Bohara
UN-REDD (2016). Towards a Common Understanding of REDD+ Under the UNFCCC: A UN-REDD
Programme Document to Foster a Common Approach of REDD+ Implementation. Technical
Resource Series-3, International Environment House, Geneva, Switzerland. Available online:
https://www.uncclearn.org/wp-
content/uploads/library/redd_under_the_unfccc_hq.6_713128_1.pdf. [Accessed on 18 June 2021].
Vergara-Asenjo, G., Mateo-Vega, J., Alvarado, A. and Potvin, C. (2017). A participatory approach to
elucidate the consequences of land invasions on REDD+ initiatives: a case study with Indigenous
communities in Panama. PLoS One, 12(12): e0189463. DOI:
https://doi.org/10.1371/journal.pone.0189463
Yoshikura, T., Amano, M., Chikaraishi, H., Supriyanto, B. and Wardhana, D. (2016). Evaluation of
appropriate identification of deforestation agents and drivers for designing REDD+ readiness
activities through an examination of the area around Gunungpalung National Park, Indonesia. Open
Journal of Forestry, 6(2): 106-122. DOI: https://doi.org/10.4236/ojf.2016.62010.
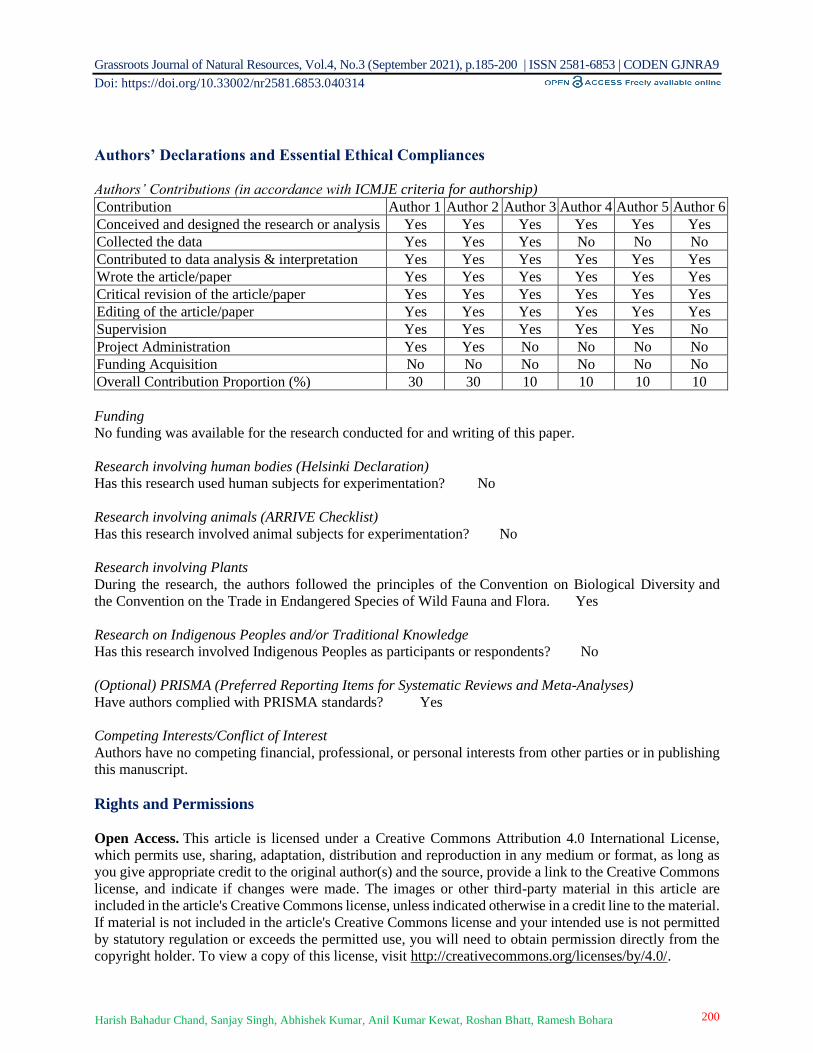
Grassroots Journal of Natural Resources, Vol.4, No.3 (September 2021), p.185-200 | ISSN 2581-6853 | CODEN GJNRA9
Doi: https://doi.org/10.33002/nr2581.6853.040314
200 Harish Bahadur Chand, Sanjay Singh, Abhishek Kumar, Anil Kumar Kewat, Roshan Bhatt, Ramesh Bohara
Authors’ Declarations and Essential Ethical Compliances
Authors’ Contributions (in accordance with ICMJE criteria for authorship)
Contribution Author 1 Author 2 Author 3 Author 4 Author 5 Author 6
Conceived and designed the research or analysis Yes Yes Yes Yes Yes Yes
Collected the data Yes Yes Yes No No No
Contributed to data analysis & interpretation Yes Yes Yes Yes Yes Yes
Wrote the article/paper Yes Yes Yes Yes Yes Yes
Critical revision of the article/paper Yes Yes Yes Yes Yes Yes
Editing of the article/paper Yes Yes Yes Yes Yes Yes
Supervision Yes Yes Yes Yes Yes No
Project Administration Yes Yes No No No No
Funding Acquisition No No No No No No
Overall Contribution Proportion (%) 30 30 10 10 10 10
Funding
No funding was available for the research conducted for and writing of this paper.
Research involving human bodies (Helsinki Declaration)
Has this research used human subjects for experimentation? No
Research involving animals (ARRIVE Checklist)
Has this research involved animal subjects for experimentation? No
Research involving Plants
During the research, the authors followed the principles of the Convention on Biological Diversity and
the Convention on the Trade in Endangered Species of Wild Fauna and Flora. Yes
Research on Indigenous Peoples and/or Traditional Knowledge
Has this research involved Indigenous Peoples as participants or respondents? No
(Optional) PRISMA (Preferred Reporting Items for Systematic Reviews and Meta-Analyses)
Have authors complied with PRISMA standards? Yes
Competing Interests/Conflict of Interest
Authors have no competing financial, professional, or personal interests from other parties or in publishing
this manuscript.
Rights and Permissions
Open Access. This article is licensed under a Creative Commons Attribution 4.0 International License,
which permits use, sharing, adaptation, distribution and reproduction in any medium or format, as long as
you give appropriate credit to the original author(s) and the source, provide a link to the Creative Commons
license, and indicate if changes were made. The images or other third-party material in this article are
included in the article's Creative Commons license, unless indicated otherwise in a credit line to the material.
If material is not included in the article's Creative Commons license and your intended use is not permitted
by statutory regulation or exceeds the permitted use, you will need to obtain permission directly from the
copyright holder. To view a copy of this license, visit http://creativecommons.org/licenses/by/4.0/.

___________________________________________________________________________________________________
___________________________________________________________________________________________________
MANUSCRIPT SUBMISSION INFORMATION
Submit your paper to Grassroots Journal of Natural Resource by email: [email protected] Further instructions for authors are available on the journal’s website: www.grassrootsjournals.org/gjnr
Related Documents