Electrical Engineering and Computer Science Department Technical Report NWU-EECS-10-09 August 20, 2010 The End User in Computer Architecture and Systems Research Alex Shye Abstract The ultimate goal of a computer design is to satisfy the end user. However, the design and optimization of computer architectures have largely left the user out of the loop. In this dissertation, I make the case that with modern computer architectures it is becoming increasingly important to take the end user into account. I then propose three specific aspects of the end user that should be explored when incorporating the end user into loop; (1) user perception, (2) user state, and (3) user ac tivity. First, I show that that computer architects should study the end user’s perception of performance relative to actual hardware performance. User studies show that for satisfaction across different users. This variation represents opportunity for optimizing computer architectures subject to individual user satisfaction. Second, I make the case for measuring user state via empathic input devices, input devices providing a computer with information about user state. I demonstrate that three example empathic input devices (eye tracking, a galvanic skin response sensor, and force sensors) can be useful for understanding changes in user satisfaction for driving power optimizations. Third, I show that computer architects should begin studying the activity of the end user as an important part of the workload. I study real user activity on Android G1 mobile phones and to show that it can be important in characterizing power consumption, and developing new power optimizations. Overall, this work points towards a new approach to computer architecture and systems research that incorporates the end user into the loop. The findings show that if we place the end user into the design and optimization process, we can significantly improve the effciency of current computer architectures and systems, while maintaining or even improving individual user satisfaction at the same time. Keywords: Human Factors, Power Management, Computer Architecture, Mobile Computing

Welcome message from author
This document is posted to help you gain knowledge. Please leave a comment to let me know what you think about it! Share it to your friends and learn new things together.
Transcript

8/7/2019 Tech Report NWU-EECS-10-09: The End User in Computer Architecture and Systems Research
http://slidepdf.com/reader/full/tech-report-nwu-eecs-10-09-the-end-user-in-computer-architecture-and-systems 1/136
Electrical Engineering and Computer Science Department
Technical ReportNWU-EECS-10-09
August 20, 2010The End User in Computer Architecture and Systems Research
Alex Shye
Abstract
The ultimate goal of a computer design is to satisfy the end user. However, the designand optimization of computer architectures have largely left the user out of the loop. Inthis dissertation, I make the case that with modern computer architectures it is becomingincreasingly important to take the end user into account. I then propose three specicaspects of the end user that should be explored when incorporating the end user into loop;(1) user perception, (2) user state, and (3) user activity.
First, I show that that computer architects should study the end user’s perception of performance relative to actual hardware performance. User studies show that for satisfaction across different users. This variation represents opportunity for optimizingcomputer architectures subject to individual user satisfaction. Second, I make the case for measuring user state via empathic input devices, input devices providing a computer withinformation about user state. I demonstrate that three example empathic input devices(eye tracking, a galvanic skin response sensor, and force sensors) can be useful for understanding changes in user satisfaction for driving power optimizations. Third, I showthat computer architects should begin studying the activity of the end user as an important
part of the workload. I study real user activity on Android G1 mobile phones and to show
that it can be important in characterizing power consumption, and developing new power optimizations.
Overall, this work points towards a new approach to computer architecture and systemsresearch that incorporates the end user into the loop. The ndings show that if we placethe end user into the design and optimization process, we can signicantly improve theeffciency of current computer architectures and systems, while maintaining or evenimproving individual user satisfaction at the same time.
Keywords: Human Factors, Power Management, Computer Architecture, Mobile Computing

8/7/2019 Tech Report NWU-EECS-10-09: The End User in Computer Architecture and Systems Research
http://slidepdf.com/reader/full/tech-report-nwu-eecs-10-09-the-end-user-in-computer-architecture-and-systems 2/136
NORTHWESTERN UNIVERSITY
The End User in Computer Architecture and Systems Research
A DISSERTATION
SUBMITTED TO THE GRADUATE SCHOOLIN PARTIAL FULFILLMENT OF THE REQUIREMENTS
for the degree
DOCTOR OF PHILOSOPHY
Field of Electrical and Computer Engineering
By
Alex Shye
EVANSTON, ILLINOIS
June 2010

8/7/2019 Tech Report NWU-EECS-10-09: The End User in Computer Architecture and Systems Research
http://slidepdf.com/reader/full/tech-report-nwu-eecs-10-09-the-end-user-in-computer-architecture-and-systems 3/136
2
c Copyright by Alex Shye 2010
All Rights Reserved

8/7/2019 Tech Report NWU-EECS-10-09: The End User in Computer Architecture and Systems Research
http://slidepdf.com/reader/full/tech-report-nwu-eecs-10-09-the-end-user-in-computer-architecture-and-systems 4/136
3
ABSTRACT
The End User in Computer Architecture and Systems Research
Alex Shye
The ultimate goal of a computer design is to satisfy the end user. However, the design
and optimization of computer architectures have largely left the user out of the loop. In
this dissertation, I make the case that with modern computer architectures it is becoming
increasingly important to take the end user into account. I then propose three specic
aspects of the end user that should be explored when incorporating the end user into loop;
(1) user perception, (2) user state, and (3) user activity.
First, I show that that computer architects should study the end user’s perception
of performance relative to actual hardware performance. User studies show that for
modern interactive and multimedia applications, there exists a signicant variation in user
satisfaction across di ff erent users. This variation represents opportunity for optimizing
computer architectures subject to individual user satisfaction. Second, I make the case
for measuring user state via empathic input devices, input devices providing a computer
with information about user state. I demonstrate that three example empathic input
devices (eye tracking, a galvanic skin response sensor, and force sensors) can be useful

8/7/2019 Tech Report NWU-EECS-10-09: The End User in Computer Architecture and Systems Research
http://slidepdf.com/reader/full/tech-report-nwu-eecs-10-09-the-end-user-in-computer-architecture-and-systems 5/136
4
for understanding changes in user satisfaction for driving power optimizations. Third,
I show that computer architects should begin studying the activity of the end user asan important part of the workload. I study real user activity on Android G1 mobile
phones and to show that it can be important in characterizing power consumption, and
developing new power optimizations.
Overall, this work points towards a new approach to computer architecture and sys-
tems research that incorporates the end user into the loop. The ndings show that if we
place the end user into the design and optimization process, we can signicantly improvethe efficiency of current computer architectures and systems, while maintaining or even
improving individual user satisfaction at the same time.
8/7/2019 Tech Report NWU-EECS-10-09: The End User in Computer Architecture and Systems Research
http://slidepdf.com/reader/full/tech-report-nwu-eecs-10-09-the-end-user-in-computer-architecture-and-systems 6/136
5
Acknowledgements
They say it takes a whole village to raise a child. It feels like it has taken several
whole villages to raise this child. I am very fortunate to have many people who have
played a signicant role in my life and career. They have o ff ered great advice (although I
sometimes don’t listen!), sweat in the lab with me (including a few too many all-nighters),
consoled me during tough times (getting a Ph.D. is no cakewalk), and challenged me to
be a better person and researcher (I’m getting there.. slowly but surely :).
First and foremost, I thank my dissertation advisor, Prof. Gokhan Memik, for his
support 1 during my time at Northwestern University. He has taught me more than I
can describe here, but I am most thankful for his constant encouragement to follow my
interests, even when it takes being courageous with research topics. I thank Prof. Peter
Dinda and Prof. Robert Dick for their great guidance and feedback. They both played
a large role in my positive experience at Northwestern, and in shaping the work in this
dissertation. In addition, I thank Prof. Seda Memik, Prof. Russ Joseph, and Prof. Nikos
Hardavellas, Prof. Bryan Pardo, Prof. Darren Gergle for their assistance, encouragement,
feedback, and advice. I thank Prof. Daniel A. Connors for giving me my rst crack at
research many years ago. I would not be where I am right now without his support and
1Of course, this includes nancial support. This work is in part supported by DOE Awards DE-FG02-05ER25691 and
DE-AC05-00OR22725 (via ORNL), NSF Awards CNS-0720691, CNS-0721978, CNS-0715612, CNS-0551639, CNS-0347941,CCF-0541337, CCF-0444405, CCF-0747201, IIS-0536994, IIS-0613568, ANI-0093221, ANI-0301108, and EIA-0224449, bySRC award 2007-HJ-1593, by Wissner-Slivka Chair funds, and by gifts from Symantec, Dell, and VMware.
8/7/2019 Tech Report NWU-EECS-10-09: The End User in Computer Architecture and Systems Research
http://slidepdf.com/reader/full/tech-report-nwu-eecs-10-09-the-end-user-in-computer-architecture-and-systems 7/136
6
guidance. I also thank Prof. Manish Vachharajani for his valuable feedback and advice
over the years.I am lucky to have several hosts and colleagues within industry that have provided me
with valuable industry research experience. I thank Evelyn Duesterwald, Calin Cascaval,
Robert Wisniewski, and Peter Sweeney for my time at IBM Research. I thank John
Pieper for mentoring me at Intel, and Brad Chen for hosting me at Google. And, I give
a big thanks to the DynOpt group (Mark Herdeg, Anton Cherno ff , Joyce Spencer, Tony
Tye, Michael Bedy, Roland Ouellette, Rick Gorton, Joe Martin, and Walter Carrell) fora wonderful 2-year co-op at AMD.
I sincerely thank all of my collaborators: Arindam Mallik, Berkin Ozisikyilmaz, Yan
Pan, J. Scott Miller, Benjamin Scholbrock, Lei Yang, Xi Chen, and Bin Lin at North-
western University; Tipp Moseley, Vijay Janapa Reddi, Matthew Iyer, Joseph Blomstedt,
Joshua Kihm, Alex Settle, Dan Fay, and Dave Hodgdon at the University of Colorado. We
worked hard, sweated it out in lab, pulled all-nighters, and, most importantly, had a greatdeal of fun in the process. All of the work would not have been possible without your con-
tributions. In addition, I would like to thank the rest of the Microarchitecture Research
Lab and the related labs at Northwestern for being a sounding board with research, and
tolerating my antics at Northwestern.
I thank Arty Plengsirivat for her companionship during the entire Ph.D. process –
celebrating with me during the good times, consoling me during the tough times, and
balancing out my life to keep me sane.

8/7/2019 Tech Report NWU-EECS-10-09: The End User in Computer Architecture and Systems Research
http://slidepdf.com/reader/full/tech-report-nwu-eecs-10-09-the-end-user-in-computer-architecture-and-systems 8/136
7
Last, but certainly not least, I thank my family; my father Ken Shye, my mother Shou
Shye, and my brother Michael Shye. Thank you for believing in me all of these years;your constant support means the world to me.

8/7/2019 Tech Report NWU-EECS-10-09: The End User in Computer Architecture and Systems Research
http://slidepdf.com/reader/full/tech-report-nwu-eecs-10-09-the-end-user-in-computer-architecture-and-systems 9/136
8
Table of Contents
ABSTRACT 3
Acknowledgements 5
List of Tables 11
List of Figures 12
Chapter 1. Introduction 16
1.1. The Forgotten End User 17
1.2. Why Care About the User Now? 20
1.3. Putting the End User into the Loop 231.4. For Reference 27
Chapter 2. User Perception: Leveraging Individual User Satisfaction 28
2.1. Hardware Performance Counters 31
2.2. User Study Setup 32
2.3. Correlation Between User Satisfaction and Hardware Counters 34
2.4. Leveraging User Variation with Predictive Power Management 38
2.5. Experimental Results 45
2.6. Summary 52
2.7. Appendix: Correlating HPC Metrics and User Satisfaction 53

8/7/2019 Tech Report NWU-EECS-10-09: The End User in Computer Architecture and Systems Research
http://slidepdf.com/reader/full/tech-report-nwu-eecs-10-09-the-end-user-in-computer-architecture-and-systems 10/136
9
Chapter 3. User Physiological Traits: Implicitly Learning User Satisfaction 55
3.1. Empathic Input Devices 583.2. User Study Setup 63
3.3. Correlating Human Physiological Traits with User Satisfaction 64
3.4. Using Physiological Traits for Dynamic Voltage and Frequency Scaling 70
3.5. Experimental Results 76
3.6. Summary 82
3.7. Raw Data from Motivational User Study 83
Chapter 4. User Activity: Studying User Behavior to Drive Optimization 85
4.1. Experimental Setup 88
4.2. Power Estimation Model 91
4.3. Studying the User for Guiding Optimization 102
4.4. User-Aware Optimization 108
4.5. Experimental Results 112
4.6. Summary 118
Chapter 5. Related Work 119
5.1. The Empathic Systems Project 119
5.2. Other User-Related Work 120
5.3. Measuring the End User 122
5.4. Power Modeling 122
5.5. Dynamic Voltage and Frequency Scaling 123
5.6. Screen Optimizations 124

8/7/2019 Tech Report NWU-EECS-10-09: The End User in Computer Architecture and Systems Research
http://slidepdf.com/reader/full/tech-report-nwu-eecs-10-09-the-end-user-in-computer-architecture-and-systems 11/136
10
Chapter 6. Conclusion 125
References 127
Vita 135

8/7/2019 Tech Report NWU-EECS-10-09: The End User in Computer Architecture and Systems Research
http://slidepdf.com/reader/full/tech-report-nwu-eecs-10-09-the-end-user-in-computer-architecture-and-systems 12/136
11
List of Tables
2.1 Hardware counters used in experiments. 32
2.2 User trend categorization, the number of users in each category for
diff erent applications. 37
2.3 Correlation of hardware counters and user satisfaction. 54
3.1 Outcomes of manually comparing t-test results and the user satisfaction
ratings. Success means that the t-test outcome matches the user rating.
False negatives occur when the t-test falsely predicts a di ff erence and
false positives occur when the t-test falsely predicts similarity with the
highest frequency. 67
4.1 Parameters used for linear regression in our power estimation model. 92

8/7/2019 Tech Report NWU-EECS-10-09: The End User in Computer Architecture and Systems Research
http://slidepdf.com/reader/full/tech-report-nwu-eecs-10-09-the-end-user-in-computer-architecture-and-systems 13/136
12
List of Figures
1.1 The (a) traditional computing stack, and the (b) computing stack
including the end user. 18
1.2 The evolution of computer architectures. Each generation throughthe years is because more “personal”, increasing the importance of
incorporating studies of the end user. 22
1.3 The end user in the computing loop. 23
2.1 Framework of the predictive user-aware power management. 38
2.2 Figure 2. Frequency traces using iDVFS and Windows power
management schemes for (a) Java Game and (b) Video. 43
2.3 Windows DVFS algorithm. 46
2.4 Reported user satisfaction for the (a) Web Browsing, (b) Game, and (c)
Video applications. 48
2.5 System power measurement setup. 52
2.6 Figure 6. Improvement in energy consumption, user satisfaction, and
energy-satisfaction product for the Shockwave application. 53

8/7/2019 Tech Report NWU-EECS-10-09: The End User in Computer Architecture and Systems Research
http://slidepdf.com/reader/full/tech-report-nwu-eecs-10-09-the-end-user-in-computer-architecture-and-systems 14/136
13
3.1 The biometric sensors used in our experiments: (a) an eye tracker,
(b) a custom-made galvanic skin response sensor, and (c) force sensorsattached to the arrow keys on the keyboard. 59
3.2 GSR traces of a user that capture (a) the long-term change in the GSR
while a user is resting, and (b) the short-term e ff ects when playing the
Need for Speed game. The existence of the long-term e ff ect motivates
the use of the delta GSR metric for measuring user arousal. 60
3.3 (a) Mean pupil movement, (b) maximum arrow force, and (c) maximum
delta GSR for the same 20 seconds of game play at a good performance
level, and at a bad performance level. Mean pupil movement and
maximum arrow force signicantly decrease. Maximum delta GSR has
more variation across users indicating di ff erent responses to a drop in
performance. 65
3.4 Averages of the three best individual sensor metrics and the user
satisfaction ratings across all 20 users. The three sensor metrics have a
very strong correlation with the reported user rating. 68
3.5 The average condence provided by the t-test between a frequency and
the highest frequency across all 20 users and all sensor metrics. A high
condence indicates a di ff erence. As frequency diff erence increases, thesensor metrics diff erentiate better, except for the lowest frequency. 69
3.6 Trace of sensor metrics and the frequency during the training phase of
the PTP algorithm. When sensor readings are compared for 1.2Ghz and

8/7/2019 Tech Report NWU-EECS-10-09: The End User in Computer Architecture and Systems Research
http://slidepdf.com/reader/full/tech-report-nwu-eecs-10-09-the-end-user-in-computer-architecture-and-systems 15/136
14
2.2Ghz, the majority of the sensors result in a high t-test, indicating
that the user’s state changes. As the algorithm adjusts to test 1.6 GHz,the physiological traits show less change. PTP chooses 1.6Ghz for the
rest of the experiment 72
3.7 Frequency that aPTP and cPTP settle on for the Need for Speed, Tetris,
and Word applications. cPTP for Word is omitted because it results in
very little change in power savings and user satisfaction. 77
3.8 User satisfaction and power consumption for the Need for Speed, Tetris,
and Word applications. The left two bars per cluster show the user
satisfaction for aPTP and the Adaptive DVFS schemes. The right bar
in each cluster shows the total system power savings. 80
3.9 User satisfaction and power consumption of cPTP for the Need for
Speed and Tetris applications. Word is not included because power
savings and user satisfaction levels are nearly identical to aPTP. The
left two bars per cluster show the user satisfaction of cPTP and the
Adaptive DVFS schemes. The right bar in each cluster shows the total
system power savings. Using cPTP, we trade-o ff a decreased power
savings with improving user satisfaction when compared to aPTP. 81
3.10 Physiological traits and user satisfaction when randomly changing to
multiple frequencies at di ff erent points in Need for Speed. 84
4.1 High-level overview of the target mobile architecture. 88
8/7/2019 Tech Report NWU-EECS-10-09: The End User in Computer Architecture and Systems Research
http://slidepdf.com/reader/full/tech-report-nwu-eecs-10-09-the-end-user-in-computer-architecture-and-systems 16/136
15
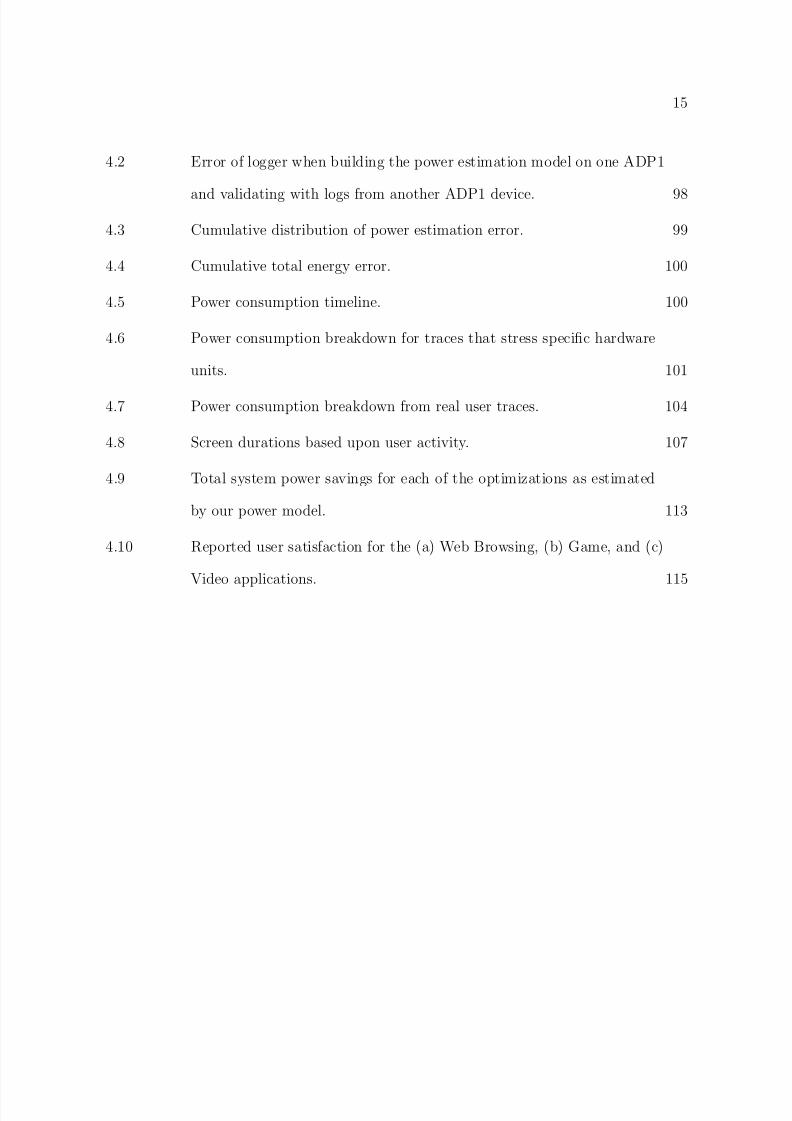
4.2 Error of logger when building the power estimation model on one ADP1
and validating with logs from another ADP1 device. 98
4.3 Cumulative distribution of power estimation error. 99
4.4 Cumulative total energy error. 100
4.5 Power consumption timeline. 100
4.6 Power consumption breakdown for traces that stress specic hardware
units. 101
4.7 Power consumption breakdown from real user traces. 104
4.8 Screen durations based upon user activity. 107
4.9 Total system power savings for each of the optimizations as estimated
by our power model. 113
4.10 Reported user satisfaction for the (a) Web Browsing, (b) Game, and (c)
Video applications. 115
8/7/2019 Tech Report NWU-EECS-10-09: The End User in Computer Architecture and Systems Research
http://slidepdf.com/reader/full/tech-report-nwu-eecs-10-09-the-end-user-in-computer-architecture-and-systems 17/136
16
CHAPTER 1
Introduction
“Focus on the user and all else will follow. ”
Google, #1 principle in Google Philosophy
The ultimate goal of a computer design is to satisfy the end user. This statement
may sound simple – perhaps even obvious – but it is a very powerful statement. It means
that after all the work we put into design and optimization, we can evaluate a computer
system by putting it into the hands of the end user. If the user is happy with it, we have
done a good job. If not, perhaps we can do better.
This statement regarding the importance of the end user is not a new idea in the
computer industry. Google understands this statement. As quoted in the beginning of
this introduction, the number one principle in their corporate philosophy is to focus on the
end user [47 ]. This focus is clear in their products, and pervades the entire user experience,
from their crisp home page, to the responsiveness and quality of their web search. Apple
understands this statement. Apple’s focus on the user for designing simple and intuitive
user interfaces has revolutionized the computer industry. Engineers and researchers in
several other computing-related elds understand this statement. For example, at the
application level, multimedia experts study the perceptual quality of a media [ 28, 29, 61,
85, 90 ], and human-computer interaction researchers develop applications for improving
the human condition [ 24, 25, 26 ].

8/7/2019 Tech Report NWU-EECS-10-09: The End User in Computer Architecture and Systems Research
http://slidepdf.com/reader/full/tech-report-nwu-eecs-10-09-the-end-user-in-computer-architecture-and-systems 18/136
17
However, despite the importance of the end user, computer architects and systems
designers have largely ignored the end user. The work in this dissertation argues thatthis should not be the case. User experience matters more than ever. Decisions at the
architecture- and systems-level impact the user experience, and must be made with end
user in mind. If we take the user into account during the architectural design process, we
can improve the efficiency and performance of computer architectures, while maintaining,
or even improving, user satisfaction.
1.1. The Forgotten End User
The design and optimization of computer architectures has typically left the end user
out of the loop. It is not difficult to understand why this is the case.
Where would the end user t with respect to computer design? Traditionally, the term
“computer” refers to a programmable machine. The Merriam-Webster Online Dictionary
denes a computer as, “a programmable, usually electronic device, that can store, retrieve,
and process data”. Other denitions do not stray too far from this general idea. Thus,
computer design has typically focused on three tasks: (1) specifying a set of instructions
for data access/manipulation, (2) designing the circuits/hardware for implementing the
instructions, and (3) developing systems software and tools to provide an environment for
running di ff erent mixes of instructions. None of these tasks involve the end user.
Where would the end user t with respect to optimizing computers? At the core,
optimization involves (1) choosing a performance metric, and (2) an iterative loop of do-
ing a baseline performance measurement, implementing/tuning an optimization, doing

8/7/2019 Tech Report NWU-EECS-10-09: The End User in Computer Architecture and Systems Research
http://slidepdf.com/reader/full/tech-report-nwu-eecs-10-09-the-end-user-in-computer-architecture-and-systems 19/136
18
Circuits
Microarchitecture
Operating SystemApplication
Software
Hardware
Architecture
(a) Traditional computing stack.
Circuits
Microarchitecture
Operating SystemApplication
End User
Software
Hardware
Architecture
Environment
(b) Computing stack with the end user.
Figure 1.1. The (a) traditional computing stack, and the (b) computingstack including the end user.
another performance measurement, and crossing your ngers for a performance improve-
ment. There are many traditional performance metrics typically used: instructions per
second, transactions per second, energy consumption, soft error rate, failures in time, av-
erage system up time, etc. However, none of the traditional performance metrics typically
involve the end user.
Of course, there is an end user involved with a computer. After all, we did invent
and create computers to do work for us. So, where does the end user t into the picture?
And, where does the end user t into computing research?
To answer these questions, it may be helpful if we observe the textbook computing
stack, as shown in Figure 1.1(a). This traditional computing stack includes (1) the cir-
cuits and microarchitecture at the hardware level, (2) the architecture for specifying the
hardware-software interface, and (3) the software layers, with the operating system (OS)
and application. Note that this computing stack only accounts for hardware and software.
Clearly, the end user is neither hardware or software. Thus, there is no room for the end
user in this picture. However, computation does not occur in a vacuum. If we expand our
scope, we can add the environment to the top of the computing stack, to account for all
8/7/2019 Tech Report NWU-EECS-10-09: The End User in Computer Architecture and Systems Research
http://slidepdf.com/reader/full/tech-report-nwu-eecs-10-09-the-end-user-in-computer-architecture-and-systems 20/136
19
of the characteristics and factors of the environment that may interact with computation.
The end user naturally ts into the environment at the top of the computing stack, asshown in Figure 1.1(b) 1.
Now that we have the end user in the computing stack, where is the end user with
respect to computing research? If we look at the interaction between layers in the comput-
ing stack, we arrive at an explanation for the state of the end user in current computing
research. The design of a computer can be very complex. To manage complexity, we use
abstraction by specifying an interface for accessing low-level details. For example, logicaloperators, such as AND and OR gates, specify the interface between circuits and the
microarchitecture. The instruction set architecture is the interface between the microar-
chitecture and software. System calls specify the interface between the operating system
and the application. Abstraction allows engineers to design to interfaces, without needing
to know the gory details under the hood. It also means that the majority of research lies
within a single layer, or spans adjacent layers in the stack that interact with each other.The layers of the computing stack show us that with respect to the end user, it is
most natural for computer researchers to study the interactions of the end user with the
application 2. There are many important questions in this area. How should end users
interact with applications? Which hardware devices are most natural and intuitive for
users? How can application interfaces designed to improve usability? These questions, and
many more, have spawned an entire eld of research, human-computer interaction (HCI).
1There may be many other factors in the environment (e.g., perhaps the energy source, room temperature,etc.). In this dissertation, the main focus is the end user, and thus, we do not discuss other potentialaspects of the environment.2Studying the end user within its own layer is most likely best left for psychologists.

8/7/2019 Tech Report NWU-EECS-10-09: The End User in Computer Architecture and Systems Research
http://slidepdf.com/reader/full/tech-report-nwu-eecs-10-09-the-end-user-in-computer-architecture-and-systems 21/136
20
The computing stack also shows us what low-level hardware and software designers
usually think of as the “end user” – the application software. We usually think of theapplication as interacting with the hardware and systems software. Thus, it becomes
our proxy for the end user. Instead of studying the user, we study the behavior of an
application. To model a “average” user, we use mixes of representative applications as
benchmarks. A look at most any modern architecture or systems research paper will show
the use of benchmarks for evaluating a proposed technique.
In summary, although a computer is ultimately designed to satisfy the end user, thereis currently a disconnect between the design of the low-level hardware/software and the
end user. Most of the user-related research occurs at the application level, or in the
interaction between the application and the end user. The levels in the computing stack
have largely ignored the end user. Instead, we have abstracted away the end user. All
that remains is a representative set of applications.
1.2. Why Care About the User Now?
This dissertation makes the case that it is time to expand the role of the end user in
computer architecture and systems research. In particular, three trends are converging
that increase the role of the end user in modern computer systems:
(1) The importance of user experience. Batch applications are not the sole
workloads for most architectures. Modern multimedia applications, video games,
web browsers, and server-side applications interact directly with the end user.
Applications on mobile devices are inherently interactive. Although traditional
8/7/2019 Tech Report NWU-EECS-10-09: The End User in Computer Architecture and Systems Research
http://slidepdf.com/reader/full/tech-report-nwu-eecs-10-09-the-end-user-in-computer-architecture-and-systems 22/136
21
metrics (i.e., instructions per second) may be important in evaluating these ma-
chines and applications, the most important thing is whether is user is satised ornot. To ensure a good user experience, we must move beyond traditional metrics,
and develop user-related performance evaluation techniques for understanding
the impact of architectural and optimization decisions on user satisfaction.
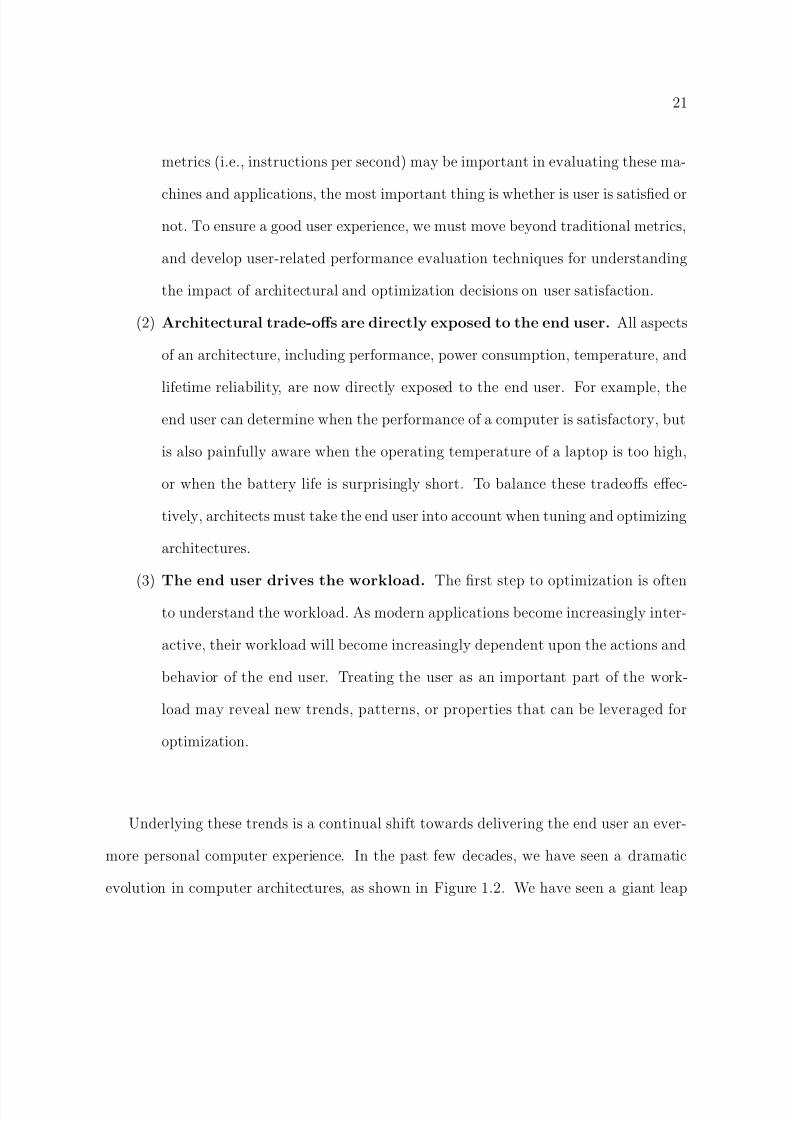
(2) Architectural trade-o ff s are directly exposed to the end user. All aspects
of an architecture, including performance, power consumption, temperature, and
lifetime reliability, are now directly exposed to the end user. For example, theend user can determine when the performance of a computer is satisfactory, but
is also painfully aware when the operating temperature of a laptop is too high,
or when the battery life is surprisingly short. To balance these tradeo ff s eff ec-
tively, architects must take the end user into account when tuning and optimizing
architectures.
(3) The end user drives the workload. The rst step to optimization is oftento understand the workload. As modern applications become increasingly inter-
active, their workload will become increasingly dependent upon the actions and
behavior of the end user. Treating the user as an important part of the work-
load may reveal new trends, patterns, or properties that can be leveraged for
optimization.
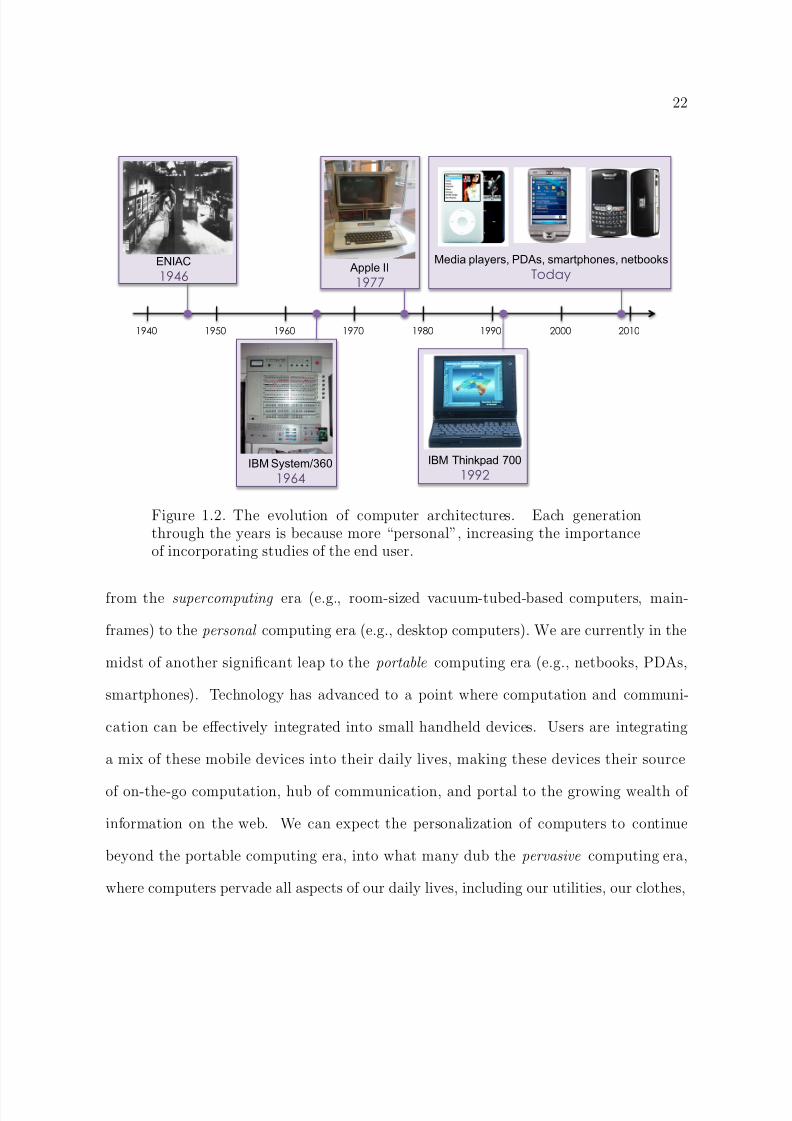
Underlying these trends is a continual shift towards delivering the end user an ever-
more personal computer experience. In the past few decades, we have seen a dramatic
evolution in computer architectures, as shown in Figure 1.2. We have seen a giant leap
8/7/2019 Tech Report NWU-EECS-10-09: The End User in Computer Architecture and Systems Research
http://slidepdf.com/reader/full/tech-report-nwu-eecs-10-09-the-end-user-in-computer-architecture-and-systems 23/136
22
ENIAC1946
IBM System/3601964
Apple II1977
IBM Thinkpad 7001992
1950 1960 1970 19901940 2000 20101980
Media players, PDAs, smartphones, netbooksToday
Figure 1.2. The evolution of computer architectures. Each generationthrough the years is because more “personal”, increasing the importanceof incorporating studies of the end user.
from the supercomputing era (e.g., room-sized vacuum-tubed-based computers, main-
frames) to the personal computing era (e.g., desktop computers). We are currently in the
midst of another signicant leap to the portable computing era (e.g., netbooks, PDAs,
smartphones). Technology has advanced to a point where computation and communi-
cation can be eff ectively integrated into small handheld devices. Users are integrating
a mix of these mobile devices into their daily lives, making these devices their source
of on-the-go computation, hub of communication, and portal to the growing wealth of
information on the web. We can expect the personalization of computers to continue
beyond the portable computing era, into what many dub the pervasive computing era,
where computers pervade all aspects of our daily lives, including our utilities, our clothes,

8/7/2019 Tech Report NWU-EECS-10-09: The End User in Computer Architecture and Systems Research
http://slidepdf.com/reader/full/tech-report-nwu-eecs-10-09-the-end-user-in-computer-architecture-and-systems 24/136
23
Computer Input
Computer Output
User Action
User Perception
User State Computer State
Figure 1.3. The end user in the computing loop.
and even our brains. As we progress further into the portable computer era, and reach
into the pervasive computing era, the three previously mentioned trends will to continue,
and grow in importance.
1.3. Putting the End User into the Loop
We begin incorporating the end user by taking a high-level view of the traditional
interaction between the end user and the computer (shown in Figure 1.3).
The interaction from the side of the computer is familiar. The computer receives
input, e.g., a keystroke or mouse movement. It then executes instructions based upon
the input and alters computer state, e.g., the contents of memory and disk. Finally, any
computer state of interest to the end user may be output, e.g., through the display or
speakers.
This dissertation focuses on the other side of this interaction. It focuses on the human
side of the human-computer interaction, and what it means to the decisions that should
be made at the architecture- and system-level. By observing the interaction from the
perspective of the end user, we nd three key points of interest in the computer design
process: (1) user perception, (2) user state, and (3) user activity. These three points are
8/7/2019 Tech Report NWU-EECS-10-09: The End User in Computer Architecture and Systems Research
http://slidepdf.com/reader/full/tech-report-nwu-eecs-10-09-the-end-user-in-computer-architecture-and-systems 25/136
24
the main focus of this dissertation. They are described briey below, and in detail in each
of the following chapters.
1.3.1. User Perception
The rst point of interest is the end user’s perception of computer behavior/performance.
Note that it is not the actual input we are interested in. We distinguish the actual
stimulus from the perception of the stimulus. This is an important distinction. Whenfocusing on the experience of the user, it is really the perception of the stimulus that is
most important, not necessarily the stimulus itself.
Chapter 2 studies user perception of computer performance relative to raw hardware
performance. We perform real user studies to study user satisfaction (a verbal user rating
of perceived computer performance) relative to raw hardware performance. We present
three main contributions.
(1) First, I show that the relationship between user satisfaction and hardware perfor-
mance is often a complex non-linear relationship that is application dependent,
and more importantly, user dependent. Our results show that there is no average
user . Instead, there exists a variation in perceived performance across individual
users. We refer to this variation as user variation .
(2) Second, I unveil a relationship between hardware performance counters on mod-
ern microprocessors. We show that we can learn this relationship by mapping
hardware counter values to user satisfaction, and then use this mapping as a
proxy for predicting user satisfaction.

8/7/2019 Tech Report NWU-EECS-10-09: The End User in Computer Architecture and Systems Research
http://slidepdf.com/reader/full/tech-report-nwu-eecs-10-09-the-end-user-in-computer-architecture-and-systems 26/136
25
(3) Third, I show that these hardware-satisfaction models can be leveraged to op-
timize subject to user variation. I demonstrate Individualized Dynamic Voltageand Freqency Scaling ( iDVFS) a system that uses a per-user model to drive dy-
namic voltage and frequency scaling (DVFS) on CPUs based upon the preferences
of the individual user.
1.3.2. User State
The second point in the human-computer interaction we are interested in is user state. We
use the term ‘user state’ broadly to account for all user-related factors that may represent
the state of the user, including bodily position, emotions, intentions, physiological traits,
etc. With respect to user state, we are particularly interested in any user state that may
indicate whether the user is satised with decisions at the architecture- or systems-level.
Chapter 3 presents a study of leveraging user state for optimizing computer architec-
tures. We make three main contributions in this chapter.
(1) I propose new empathic input devices to measure human physiological traits and
provide the computer with information on user state. Specically, I propose
using eye trackers, a galvanic skin response sensor, and force sensors as potential
empathic input devices.
(2) I present two user studies to show evidence that these empathic input devices
can be used to reason about changes in user satisfaction.
(3) I augment an existing DVFS scheme to make decisions based upon human phys-
iological traits, and demonstrate success at improving energy e fficiency for inter-
active applications.
8/7/2019 Tech Report NWU-EECS-10-09: The End User in Computer Architecture and Systems Research
http://slidepdf.com/reader/full/tech-report-nwu-eecs-10-09-the-end-user-in-computer-architecture-and-systems 27/136
26
1.3.3. User Activity
The third point in current human-computer interaction we are interested in is essentially
user output. I treat user output as the activity of the end user, e.g., keystrokes, mouse
events, turning the computer on, etc. As computers become increasingly personal, and
pervade our society, the activity of individual users, as well as users in general, will become
an increasingly important characteristic of the computer workload. Thus, studying trends,
patterns, and properties of user activity may be useful in characterizing the workload, as
well as driving future optimizations.
Chapter 4 studies user activity for perhaps the most personal of current computer
architectures, mobile smartphones. I show that studying user activity on a specic smart-
phone, the Android G1 phone, can be instrumental in understanding the power consump-
tion of smartphones in the wild, and in unveiling new user-activity-related properties for
developing power optimizations. I make the following contributions:
(1) I present a logger application for collecting data from remote smartphones, and a
validated power model driven to traces from the logger applications for estimating
the power consumption of remote smartphones.
(2) I demonstrate that user activity plays a signicant role in the activity, and power
consumption breakdown, of mobile smartphones. Along the way, I show that the
CPU and screen consume signicant power in mobile smartphones and are good
candidates for power optimization.
(3) I observe that screen on time is dominated by a small number of long screen
durations and propose an optimization for long screen intervals that leverage
change blindness, a phenomenon where humans are often unable to perceive

8/7/2019 Tech Report NWU-EECS-10-09: The End User in Computer Architecture and Systems Research
http://slidepdf.com/reader/full/tech-report-nwu-eecs-10-09-the-end-user-in-computer-architecture-and-systems 28/136
8/7/2019 Tech Report NWU-EECS-10-09: The End User in Computer Architecture and Systems Research
http://slidepdf.com/reader/full/tech-report-nwu-eecs-10-09-the-end-user-in-computer-architecture-and-systems 29/136
28
CHAPTER 2
User Perception: Leveraging Individual User Satisfaction
Any architectural optimization (performance, power, reliability, security, etc.) ulti-
mately aims at satisfying the end-user. However, understanding the happiness of the user
during the run of an application is complicated. Although it may be possible to query the
user frequently, such explicit interaction will annoy most users. Therefore, it would be
benecial to estimate user satisfaction using implicit metrics. Traditionally, computer ar-
chitects have used implicit metrics such as instructions retired per second (IPS), processor
frequency, or the instructions per cycle (IPC) as optimization objectives. The assumption
behind these metrics is that they relate in a simple way to the satisfaction of the user.
When two systems are compared, it is assumed, for example, that the system providing
a higher IPS will result in higher user satisfaction. For some application domains, this
assumption is generally correct. For example, the execution time of a long running batch
application is largely determined by the IPS of the processor. Hence, increasing IPS will
result in an increase in user satisfaction. However, in this chapter we show that the re-
lationship between hardware performance and user satisfaction is complex for interactive
applications and an increase in a metric like IPS does not necessarily result in an increase
in user satisfaction. More importantly, we show that the relationship between hardware
performance and user satisfaction is highly user-dependent. Hence, we explore the feasi-
bility of estimating individual user satisfaction from hardware metrics, develop accurate
nonlinear models to do so, and use these models for run-time power management.
8/7/2019 Tech Report NWU-EECS-10-09: The End User in Computer Architecture and Systems Research
http://slidepdf.com/reader/full/tech-report-nwu-eecs-10-09-the-end-user-in-computer-architecture-and-systems 30/136
29
Driving architectural decisions from estimates of user satisfaction has several advan-
tages. First, user satisfaction is highly user-dependent. This observation is not surprising.For example, an expert gamer will likely demand considerably more computational power
than a novice user. In addition, each user has a certain “taste”; for example, some users
prefer to prolong battery life, while others prefer higher performance. If we know the
individual users satisfaction with minimal perturbation of program execution, we will be
able to provide a better experience for the user. Second, when a system optimizes for
user satisfaction, it will automatically customize for each application. Specically, a sys-tem that knows the users satisfaction with a given application will provide the necessary
performance to the user. For interactive applications, this may result in signicant advan-
tages such as power savings or increased lifetime reliability. For example, one of our target
applications exhibits no observable change in performance when the frequency of the pro-
cessor is set to its lowest level. In this case, our system drastically reduces the power
consumption compared to traditional approaches without sacricing user satisfaction.Ultimately, our goal is to map microarchitectural information to user satisfaction.
Such a map can then be used to understand how changes in microarchitectural metrics
aff ect user satisfaction. Modern microprocessors contain integrated hardware performance
counters (HPCs) that count architectural events (e.g., cache misses) as well as a variety
of events related to memory and operating system behavior [ 4, 54, 55 ]. In this work,
we aim at nding a mapping from the HPC readings to user satisfaction. We rst show
that there is a strong correlation between the HPCs and user satisfaction. However, the
relationship between the two is often non-linear and user-dependent.

8/7/2019 Tech Report NWU-EECS-10-09: The End User in Computer Architecture and Systems Research
http://slidepdf.com/reader/full/tech-report-nwu-eecs-10-09-the-end-user-in-computer-architecture-and-systems 31/136
30
A good estimate of user satisfaction derived from microarchitectural metrics can be
used to minimize power consumption while keeping users satised. Although utilizinguser satisfaction in making architectural decisions can be employed in many scenarios, in
this work, we focus on dynamic voltage and frequency scaling (DVFS) [19 ], which is one of
the most commonly used power reduction techniques in modern processors. DVFS make
decisions online to change microprocessor frequency and voltage according to processing
needs. Existing DVFS techniques in high-performance processors select an operating
point (CPU frequency and voltage) based on the utilization of the processor. Like manyother architectural optimizations, DVFS is pessimistic about user satisfaction and assumes
that the maximum processor frequency is necessary for every process that has a high CPU
utilization. We show that incorporating user satisfaction into the decision making process
can improve the power reduction yielded by DVFS. Specically, our contributions in this
work follow:
• We unveil a strong relationship between HPCs and user satisfaction for interactive
applications;
• We show that this relationship is often non-linear, complex, and highly user-
dependent;
• We show that individual user satisfaction can be accurately predicted using neural
network models;
• We design Individualized Dynamic Voltage and Frequency Scaling (iDVFS),
which employs user satisfaction prediction in making decisions about the fre-
quency of the processor; and

8/7/2019 Tech Report NWU-EECS-10-09: The End User in Computer Architecture and Systems Research
http://slidepdf.com/reader/full/tech-report-nwu-eecs-10-09-the-end-user-in-computer-architecture-and-systems 32/136
31
• We implement and evaluate iDVFS on Windows with user studies that show it
reduces power consumption compared to Window DVFS.
The chapter is organized as follows. In Section 2.1, we give an introduction to hardware
counters. Section 2.2 describes our user study process. Section 2.3 presents results showing
the relationship between user satisfaction and hardware counters. The predictive user-
aware power management scheme is described in Section 2.4. Section 2.5 presents the
results obtained from user studies. Section 2.6 summarizes our contributions.
2.1. Hardware Performance Counters
Modern microprocessors include integrated hardware performance counters (HPC) for
non-intrusive monitoring of a variety of processor and memory system events [ 4, 54, 55 ].
HPCs provide low-overhead access to a wealth of detailed performance information related
to CPU’s functional units, caches, main memory, etc. Even though this information is
generally statistical in nature, it does provide a window into certain behaviors that are
otherwise impractical to observe. For instance, these events include various counts of
instructions, cache activity, branch mispredictions, memory coherence operations, and
functional unit usage. Several tools and microprocessors have extended this functionality
beyond simple event counting. For example, Intel’s Itanium processors [ 55 ] have features
that allow monitoring specic events based on an instruction or data address range, a
specic instruction opcode, or execution at specic privilege levels.
Current microprocessors support a limited number of HPCs. For example, the IA-64
architectures only support counting four events at a time [ 55 ]. In our experiments, we
use the Pentium M processor which only supports two counters at a time. As a result,

8/7/2019 Tech Report NWU-EECS-10-09: The End User in Computer Architecture and Systems Research
http://slidepdf.com/reader/full/tech-report-nwu-eecs-10-09-the-end-user-in-computer-architecture-and-systems 33/136
32
PAPI counter DescriptionPAPI TOT INS Instructions issuedPAPI RES STL Cycles stalled on any resourcePAPI TOT CYC Total cyclesPAPI L2 TCM Level 2 cache missesPAPI BTAC M Branch target address cache missesPAPI BR MSP Conditional branch instructions mispredictedPAPI HW INT Hardware interruptsPAPI L1 DCA Level 1 data cache accessesPAPI L1 ICA Level 1 instruction cache accesses
Table 2.1. Hardware counters used in experiments.
it is not possible to collect all hardware information simultaneously. One workaround is
to time multiplex sets of counters and then scale the values appropriately. Azimi, Stum,
and Wisniewski [11 ] show that time multiplexing up to 10 sets of counters provides
statistically signicant counter values. Despite this limitation, the low-overhead access to
low-level architectural information provided by HPCs is very useful and is often leveraged
in run-time proling and optimization systems [ 7, 69 ].
We use WinPAPI, the Windows variant of PAPI [ 21 ], to access the HPCs present in
the processor. In our study we concentrate on the nine specic performance metrics listed
in Table refperception:tab:hpcs. These counters are manually selected as a representative
set of the HPCs available on the Pentium M. The choice of using only nine counters
is due to a WinPAPI limitation. We collect counter values every 100 ms. WinPAPI
automatically time multiplexes and scales the nine event counters.
2.2. User Study Setup
To explore the relationships between di ff erent microarchitectural parameters and user
satisfaction, we conduct two sets of studies with 20 users. Our experiments are done

8/7/2019 Tech Report NWU-EECS-10-09: The End User in Computer Architecture and Systems Research
http://slidepdf.com/reader/full/tech-report-nwu-eecs-10-09-the-end-user-in-computer-architecture-and-systems 34/136
33
using an IBM Thinkpad T43p with a 2.13 GHz Pentium M-770 CPU and 1 GB memory
running Microsoft Windows XP Professional SP2. The laptop is tethered to the poweroutlet during all experiments. Although eight di ff erent frequency levels can be set on
the Pentium M-770 processor, only six can be used due to limitations in the SpeedStep
technology. For both user studies, we experiment with three types of applications: a 3D
Shockwave animation, a Java game, and high-quality video playback. The details of these
applications follow:
• Shockwave : Watching a 3D Shockwave animation using the Microsoft Internet
Explorer web browser. The user watches the animation and is encouraged to
press the number keys to change the cameras viewpoint. The animation is stored
locally. Shockwave options are congured so that rendering is done entirely in
software on the CPU.
• Java Game : Playing a Java based First Person Shooter (FPS). The users have
to move a tank and destroy di ff erent targets to complete a mission. The game is
CPU-intensive.
• Video : Watching a DVD quality video using Windows Media Player. The video
uses high bandwidth MPEG-4 encoding.
Since we target the CPU in this paper, we picked three applications with varying
CPU requirements: the Shockwave animation is very CPU-intensive, the Video places a
relatively low load on the CPU, and the Java game falls between these extremes.
Our user studies are double-blind, randomized, and intervention-based. We developed
a user pool by advertising our studies within Northwestern University. While many of

8/7/2019 Tech Report NWU-EECS-10-09: The End User in Computer Architecture and Systems Research
http://slidepdf.com/reader/full/tech-report-nwu-eecs-10-09-the-end-user-in-computer-architecture-and-systems 35/136
34
the participants were CS, CE, or EE graduate students, our users included inexperienced
computer users as well.
2.3. Correlation Between User Satisfaction and Hardware Counters
The primary objective of our rst user study is to explore the correlation between
HPCs and user satisfaction. The monitored hardware counters are listed in Table 2.1. In
this rst set of experiments, the users are asked to carry out the three application tasks as
described in Section 2.2. During execution, we randomly change the frequency and ask the
users to verbally rank their experience on a scale of 1 (discomfort) to 10 (very comfortable).
Users typically provided a satisfaction rating within 5–10 seconds. These satisfaction levels
are then recorded along with the HPC readings and analyzed as described in the next
section. Then we compute the maximum, minimum, average, range, and the standard
deviation of the counter values for up to 5 seconds within the given interval. The end
result is a vector of 45 metrics for each satisfaction level reported by the user. Note
that since we have performed the user studies with 20 users and three applications, we
collected 360 user satisfaction levels.
We then nd the correlation of the 45 metrics to the user satisfaction rating by using
the formula:
(2.1) r x,y =N xy − ( x)( y)
[N x2 − ( x)2][N y2 − ( y)2]
Pearsons Product Moment Correlation Coe ffi cien (r ) is commonly used to nd cor-
relation among two data series (x and y) and results in a value between 1 and 1. If the

8/7/2019 Tech Report NWU-EECS-10-09: The End User in Computer Architecture and Systems Research
http://slidepdf.com/reader/full/tech-report-nwu-eecs-10-09-the-end-user-in-computer-architecture-and-systems 36/136
35
correlation is negative, the series have negative relationship; if it’s positive, the relation-
ship is positive. The closer the coefficient is to either 1 or 1, the stronger the correlationbetween the variables. Thus, the magnitude of these correlations allows us to compare the
relative value of each independent variable in the predicting the dependent variable. The
correlation factors for each of the 45 parameters and the user rating are presented in Sec-
tion 2.7. In summary, we observe a strong correlation between the hardware metrics and
user satisfaction rating: there are 21 parameters that correlate with the user satisfaction
rating by a factor above 0 .7 (all these 21 parameters have a factor ranging between 0.7and 0.8) and there are 35 parameters with factors exceeding 0 .5. On one hand, this result
is intuitive; it is easy to believe that metrics representing processor performance relate
to user satisfaction. On the other hand, observing the link between such a high-level
quantity as measured user satisfaction and such low-level metrics as level 2 cache misses
is intriguing.
We classify the metrics (and their correlations with user satisfaction) based on theirstatistical nature (mean, maximum, minimum, standard deviation, and range). The mean
and standard deviation of the hardware counter values have the highest correlation with
user satisfaction rating. A t-test analysis shows with over 85% condence that mean and
standard deviation both have higher r values when compared to the minimum, maximum,
and range of the HPC values.
We analyze the correlations between the satisfaction results and user. Note that the r
value cannot be used for this purpose, as the user numbers are not independent. Instead,
we repeatedly t neural networks to the data collected for each application, attempting
to learn the overall mapping from HPCs to user satisfaction. As the inputs to the neural
8/7/2019 Tech Report NWU-EECS-10-09: The End User in Computer Architecture and Systems Research
http://slidepdf.com/reader/full/tech-report-nwu-eecs-10-09-the-end-user-in-computer-architecture-and-systems 37/136
36
network, we use the HPC statistics along with a user identication for each set of statistics.
The output is the self-reported user satisfaction rating. In each tting, we begin with athree-layer neural network model using 50 neurons in the hidden layer (neural networks
are described in more detail in Section 2.4.2). After each model is trained, we perform
a sensitivity analysis to nd the e ff ect of each input on the output. Sensitivity analysis
consists of making changes at each of the inputs of the neural network and observing the
corresponding eff ect on the output. The sensitivity to an input parameter is measured on
a 0 to 1 scale, called the relative importance factor , with higher values indicating highersensitivity. By performing sensitivity analysis, we can nd the input parameters that are
most important in determining an output parameter, i.e., user satisfaction. During this
process, we consistently nd that the user number input has by far the highest relative
importance factor . Averaging across all of our application tasks, the relative importance
factor of the user number is 0.56 (more than twice as high as the second factor). This
strongly demonstrates that the user is the most important factor in determining the rating.Finally, to understand the nature of the relationship between the HPCs and the user
satisfaction, we analyze the trends for di ff erent functions for user satisfaction as provided
by the user at each of the processor frequencies.
Figure 2.2 summarizes the trends observed among di ff erent users for our three ap-
plications. The rst row shows the trend curves when we plot user satisfaction against
the diff erent frequencies (along x-axis). Most of the trends can be placed in four major
categories:
• Constant : User satisfaction remains unchanged with frequency. As a result, it
is not aff ected by frequency setting.
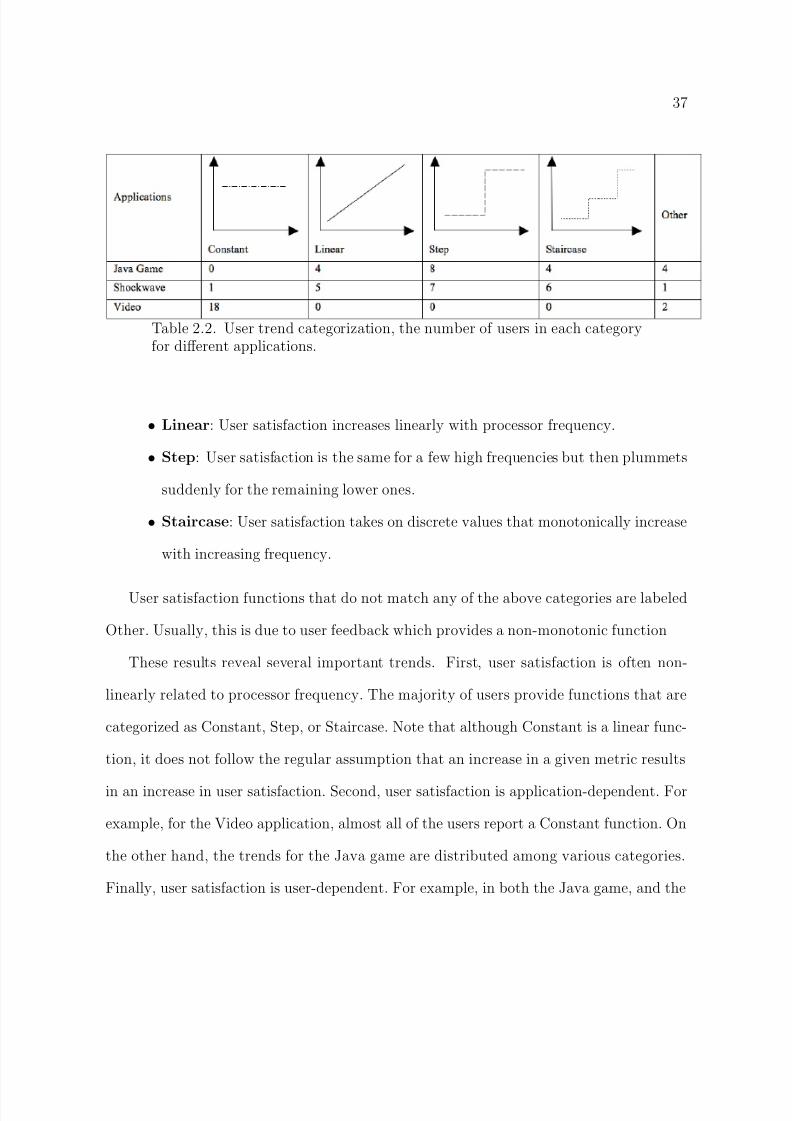
8/7/2019 Tech Report NWU-EECS-10-09: The End User in Computer Architecture and Systems Research
http://slidepdf.com/reader/full/tech-report-nwu-eecs-10-09-the-end-user-in-computer-architecture-and-systems 38/136

8/7/2019 Tech Report NWU-EECS-10-09: The End User in Computer Architecture and Systems Research
http://slidepdf.com/reader/full/tech-report-nwu-eecs-10-09-the-end-user-in-computer-architecture-and-systems 39/136
38
Figure 2.1. Framework of the predictive user-aware power management.
Shockwave animation, users specify utility functions that span multiple categories. This
shows that di ff erent users have signicantly di ff erent expectations for the system.
As we will discuss in the next section, these observations have an important e ff ect on
the modeling technique we use for learning and predicting user satisfaction. Overall, this
motivational study indicates that
• Hardware counter have a strong correlation with user satisfaction;
• The individual user is the most important factor in determining user satisfaction;
• The relation between hardware performance and user satisfaction is often non-
linear; and
• User satisfaction is both application dependent and user dependent.
Based on these observations, we design, implement, and evaluate a DVFS scheme that
is based on individual user preferences.
2.4. Leveraging User Variation with Predictive Power Management
Based on the initial user study results presented in Section 2.3, we develop a power
management scheme that sets the frequency of the processor based on estimates of user

8/7/2019 Tech Report NWU-EECS-10-09: The End User in Computer Architecture and Systems Research
http://slidepdf.com/reader/full/tech-report-nwu-eecs-10-09-the-end-user-in-computer-architecture-and-systems 40/136
39
satisfaction. This section presents this predictive user-aware power management scheme,
called Individualized Dynamic Frequency and Voltage Scaling (iDVFS). To implementiDVFS, we have built a system that is capable of predicting a users satisfaction based
on interaction with the system. The framework can be divided into two main stages as
depicted in Figure 2.1:
• Learning Stage : The system is initially trained based on reported user satis-
faction levels and HPC statistics as described in Section 2.3. Machine learning
models, specically articial neural networks, are trained o ffl ine to learn the
function from HPC values to user satisfaction.
• Runtime Power Management : Before execution, the learned model is loaded
by the system. During run time, the HPC values are sampled, entered into the
predictive model, and then the predicted user satisfaction is used to dynamically
set the processor frequency.
2.4.1. Learning Stage
In its learning stage, our algorithm builds a predictive model based on individual user
preferences. The model estimates user satisfaction from the HPCs. In this stage, the
user is asked to give feedback (user satisfaction level) while the processor is set to run at
diff erent frequency levels. The nature of this training stage is similar to the user study
described in Section 2.2 and Section 2.3. Note that the user study and its survey are
repeated for each application. While a user study runs, the nine performance counters
are collected and the 45 statistical metrics computed from them are extracted. The
8/7/2019 Tech Report NWU-EECS-10-09: The End User in Computer Architecture and Systems Research
http://slidepdf.com/reader/full/tech-report-nwu-eecs-10-09-the-end-user-in-computer-architecture-and-systems 41/136
40
combination of these values and the user feedback are used to build the model that will
later be used online.
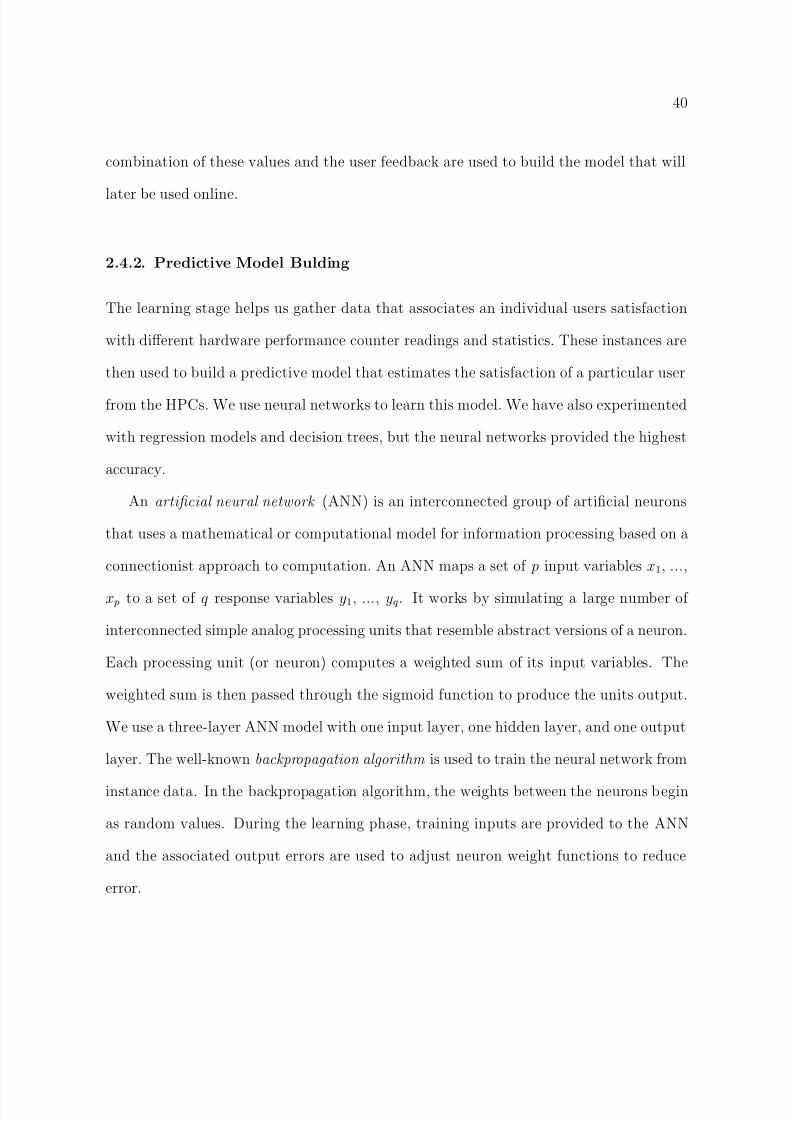
2.4.2. Predictive Model Bulding
The learning stage helps us gather data that associates an individual users satisfaction
with diff erent hardware performance counter readings and statistics. These instances are
then used to build a predictive model that estimates the satisfaction of a particular user
from the HPCs. We use neural networks to learn this model. We have also experimented
with regression models and decision trees, but the neural networks provided the highest
accuracy.
An articial neural network (ANN) is an interconnected group of articial neurons
that uses a mathematical or computational model for information processing based on a
connectionist approach to computation. An ANN maps a set of p input variables x1, ...,
x p to a set of q response variables y1, ..., yq. It works by simulating a large number of
interconnected simple analog processing units that resemble abstract versions of a neuron.
Each processing unit (or neuron) computes a weighted sum of its input variables. The
weighted sum is then passed through the sigmoid function to produce the units output.
We use a three-layer ANN model with one input layer, one hidden layer, and one output
layer. The well-known backpropagation algorithm is used to train the neural network from
instance data. In the backpropagation algorithm, the weights between the neurons begin
as random values. During the learning phase, training inputs are provided to the ANN
and the associated output errors are used to adjust neuron weight functions to reduce
error.
8/7/2019 Tech Report NWU-EECS-10-09: The End User in Computer Architecture and Systems Research
http://slidepdf.com/reader/full/tech-report-nwu-eecs-10-09-the-end-user-in-computer-architecture-and-systems 42/136
41
Our experiments represent an interesting case for machine learning. Typically, ma-
chine learning algorithms are extensively trained using very large data sets (e.g., thousandsof labeled training inputs). We would like to use ANNs for their ability to learn complex
non-linear functions, but do not have a very large data set. For each application-user
pair, we only have six training inputs; one for each processor frequency. A training input
consists of a set of HPC statistics and a user-provided satisfaction label. When we rst
began building ANN models with all 45 inputs (9 HPC counters with 5 statistics each),
we noticed that our models were overly conservative, only predicting satisfaction ratingswithin a narrow band of values. We used two training enhancements to permit the con-
struction of accurate ANN models. First, we simplied the ANN by limiting the number
of inputs. Large ANNs require large amounts of training data to su fficiently learn the
weights between neurons. To simplify the ANN, we used the two counters that had the
highest correlation, specically PAPI BTAC M-avg and PAPI TOT CYC-avg (as shown
in Section 2.7). Second, we repeatedly created and trained multiple ANNs, each beginningwith diff erent random weights. After 30 seconds of repeated trainings, we used the most
accurate ANN model. These two design decisions were important in allowing us to build
accurate ANN models.
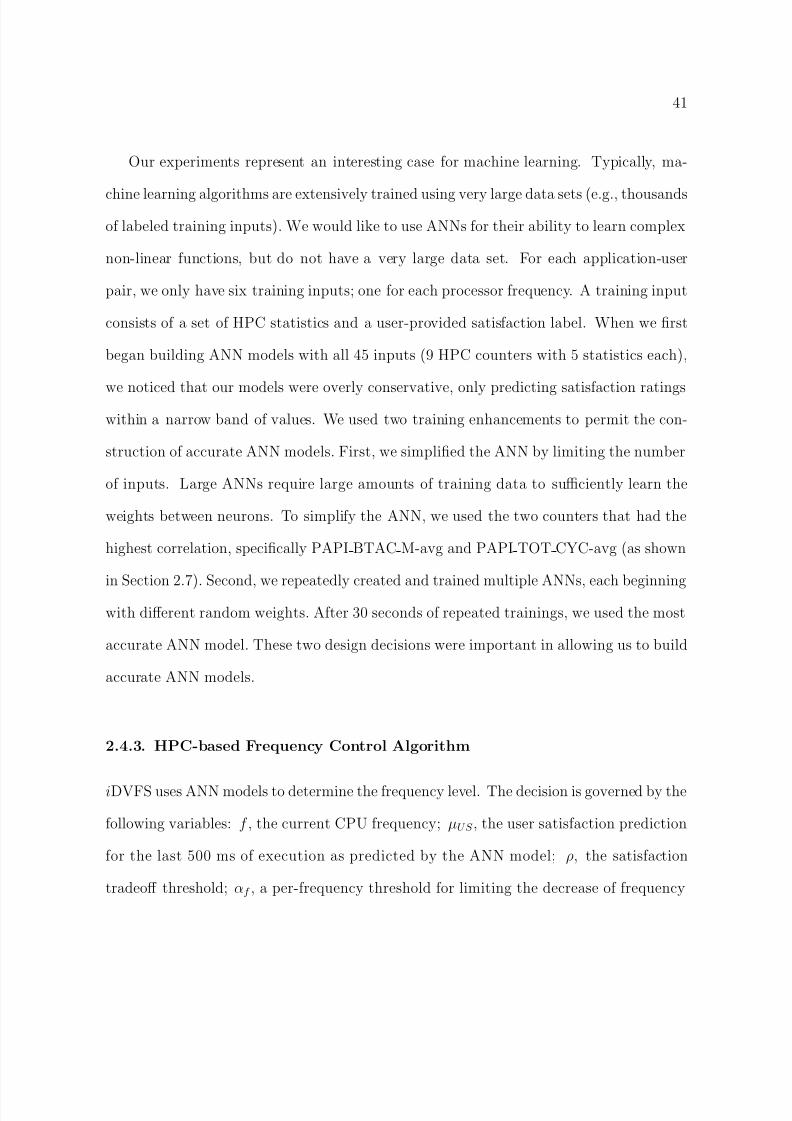
2.4.3. HPC-based Frequency Control Algorithm
iDVFS uses ANN models to determine the frequency level. The decision is governed by the
following variables: f , the current CPU frequency; µUS , the user satisfaction prediction
for the last 500 ms of execution as predicted by the ANN model; ρ, the satisfaction
tradeo ff threshold; α f , a per-frequency threshold for limiting the decrease of frequency

8/7/2019 Tech Report NWU-EECS-10-09: The End User in Computer Architecture and Systems Research
http://slidepdf.com/reader/full/tech-report-nwu-eecs-10-09-the-end-user-in-computer-architecture-and-systems 43/136
42
from the current f ; M , the maximum user comfort level; and T i , the time period for
re-initialization.iDVFS employs a greedy approach to determine the of M , iDVFS predicts that the
frequency is in a satisfactory state. If µUS − 1, the previously predicted user comfort, is also
of M , the system determines that it may be good to decrease the processor frequency; if
not, then the system of M , then the system determines that the current performance is
not satisfactory and increases the operating frequency. iDVFS uses the α f thresholds as a
hysteresis mechanism to eliminate the ping-pong eff
ect between two states. If the proces-sor rapidly switches between two states N times in a short time interval, the appropriate
α f threshold is decreased to make it harder to decrease to the lower frequency level. This
feature of the algorithm ensures that iDVFS can adjust to a set of operating conditions
very diff erent from those present at initialization but at a rate that is maximally bounded
by T i . The constant parameters ( ρ = .15, N = 3, T i = 20 seconds) were set based on the
experience of the authors using the system. α f thresholds are initialized to 1 for each of the frequency level and is decremented by 0 .1 at each frequency boost
Ideally, we would like to empirically evaluate the sensitivity of iDVFS performance
to the selected parameters. However, it is important to note that any such study would
require having real users in the loop, and thus would be slow. Testing four values of
four parameters on 20 users would require 256 days (based on 20 users/day and 25 min-
utes/user). For this reason, we decided to choose the parameters based on qualitative
evaluation by the authors and then “close the loop” by evaluating the whole system with
the choices.

8/7/2019 Tech Report NWU-EECS-10-09: The End User in Computer Architecture and Systems Research
http://slidepdf.com/reader/full/tech-report-nwu-eecs-10-09-the-end-user-in-computer-architecture-and-systems 44/136
43
Figure 2.2. Figure 2. Frequency traces using iDVFS and Windows powermanagement schemes for (a) Java Game and (b) Video.
Figure 2.2 illustrates the performance of the iDVFS algorithm for two of the three ap-
plications in our study. Each graph shows, as a function of time, the CPU frequency for a
randomly-selected user when playing the Java Game and watching the Video. First, note
that the frequency transitions in the two example traces di ff er greatly from the decisions
that Windows XP DVFS makes. The reason is that Windows XP DVFS alters frequency
based upon CPU utilization while iDVFS alters frequency based upon predicted user sat-
isfaction. iDVFS reduces the frequency signicantly in the Video application. In this
case, the user has indicated high satisfaction with all levels of performance. As shown
in Figure 2.2, the Video has the least variation in user satisfaction values at lower fre-
quencies. As a result the iDVFS algorithm can reduce CPU frequency without a ff ecting
user satisfaction. In both cases, the frequency level follows the satisfaction levels reported
by the user and minimizes power consumption with little impact on satisfaction. These
traces show that iDVFS can successfully adjust the clock frequency throttle according
to the user satisfaction derived from the HPCs. For a highly compute-intensive appli-
cation (such as the Java Game), the reduction in the frequency is minimal because any
change in frequency causes a signicant reduction in userperceived performance. For other

8/7/2019 Tech Report NWU-EECS-10-09: The End User in Computer Architecture and Systems Research
http://slidepdf.com/reader/full/tech-report-nwu-eecs-10-09-the-end-user-in-computer-architecture-and-systems 45/136
44
applications (such as the Video), frequency can be drastically reduced without a ff ecting
user satisfaction.
2.4.4. Implementation, Integration, and Limitations
Currently, we have not integrated iDVFS with the operating system (OS). Instead, we
have implemented client software that runs as a Windows toolbar task, and manually
activate iDVFS for our user studies. The client is implemented in a manner that is similar
to prole-directed optimization. An initial calibration stage is used for building a model
that is used to predict user satisfaction during run time. The current implementation
requires direct user feedback in a calibration stage for each user and each application.
While this may be cumbersome, there are two points we would like to make. First, we
believe that the current system is practical for some users (e.g., heavy gamers will not
mind a few minutes of calibration). Second, we argue that explicit user feedback is a viable
option. Future work in limiting the feedback and learning e ff ectively from explicit/implicit
mechanisms will allow such schemes to be deployed widely.
iDVFS has a few limitations that will be eliminated once it is integrated into the
OS. First, we provide the client software with per-user, per-application neural network
models tailored to the application we are about to invoke. Second, iDVFS is currently
only intended for interactive applications. The OS has knowledge of users, as well as
active applications, and could automatically load the appropriate prediction models for
interactive applications during context switches.
WinPAPI only supports system-wide HPC sampling; this includes other programs,
background processes, and kernel execution. For our work, we run a single workload on the

8/7/2019 Tech Report NWU-EECS-10-09: The End User in Computer Architecture and Systems Research
http://slidepdf.com/reader/full/tech-report-nwu-eecs-10-09-the-end-user-in-computer-architecture-and-systems 46/136
45
machine at a time; hence HPC samples correlate to the workload directly. Ideally, the HPC
interface would include thread-specic information as well as distinguish between user leveland kernel level applications. Other HPC interfaces (i.e., perfmon2 for Linux [ 53 ]) also
include this support.
The performance of iDVFS is largely dependent upon good user input. While this
may be a limitation for a current user and application, the user is free to provide new
ratings and recalibrate iDVFS if the resulting control mechanism causes dissatisfaction.
2.5. Experimental Results
In this section, we evaluate the predictive user-aware power management scheme with
a user study, as described in Section 2.4. We compare iDVFS with the native Windows XP
DVFS scheme and report reductions in CPU dynamic power, as well as changes in mea-
sured user satisfaction. This is followed by a trade-o ff analysis between user satisfaction
and system power reduction. We report the e ff ect of iDVFS on the power consumption
and user satisfaction.
We compare iDVFS to Windows Adaptive DVFS, which determines the frequency
largely based on CPU usage level. A burst of computation due to, for example, a mouse
or keyboard event brings utilization quickly up to 100% and drives frequency, voltage,
power consumption, and temperature up along with it. CPU-intensive applications cause
an almost instant increase in operating frequency and voltage regardless of whether this
change will impact user satisfaction. Windows XP DVFS uses six of the frequency states
in the Enhanced Intel Speedstep technology, as mentioned in Section 3. Performance

8/7/2019 Tech Report NWU-EECS-10-09: The End User in Computer Architecture and Systems Research
http://slidepdf.com/reader/full/tech-report-nwu-eecs-10-09-the-end-user-in-computer-architecture-and-systems 47/136
46
Figure 2.3. Windows DVFS algorithm.
requirements are determined using heuristics based on metrics “such as processor utiliza-
tion, current battery level, use of processor idle states, and inrush current events” [ 76 ].
In the Windows native adaptive DVFS scheme, decisions are made according to the algo-
rithm described in Figure 2.3. We note that this is our best interpretation of the DVFS
algorithm described in [ 76 ].
2.5.1. Analysis of User Satisfaction and Power Measurements
To analyze the e ff ect of iDVFS on system power consumption, we perform a second set of
user studies in which the users are asked to carry out the tasks described in Section 2.2.
This time, the durations of the applications are increased: the Java Game is executed for
2.5 minutes; Shockwave and Video are executed for 1.5 minutes each. The user is asked
to execute the application twice, once for Windows XP DVFS and once for iDVFS, which
loads the individual ANN model for the user/application before the start of the execution.
Once the execution completes, the users are asked to rate their satisfaction with each of
the systems on a scale of 1 (very dissatised) to 5 (very satised).

8/7/2019 Tech Report NWU-EECS-10-09: The End User in Computer Architecture and Systems Research
http://slidepdf.com/reader/full/tech-report-nwu-eecs-10-09-the-end-user-in-computer-architecture-and-systems 48/136
47
During these experiments, we log the frequency over time. We use these frequency
logs to derive CPU power savings for iDVFS compared to the default Windows XP DVFSstrategy. We have also measured the online power consumption of the entire system, and
provide a detailed discussion and analysis of trade-o ff s between power consumption and
user satisfaction.
2.5.1.1. Dynamic Power Consumption and User Satisfaction. The dynamic power
consumption of a processor is directly related to frequency and supply voltage and can be
expressed using the formula P = V 2
CF , which states that power is equal to the productof voltage squared, capacitance, and frequency. By using the frequency traces and the
nominal voltage levels on our target processor [ 45 ], we calculated the relative dynamic
power consumption of the processor. Figure 2.4 presents the CPU dynamic power reduc-
tion achieved by the iDVFS algorithm compared to the Windows XP DVFS algorithm
for the individual users for each application. It also presents their reported satisfaction
levels. To understand the gure, consider a group of three bars for a particular user.The rst two bars represent the satisfaction levels for the users for the iDVFS (gray) and
Windows (white) schemes, respectively. The third bar (black) shows the power saved by
iDVFS for that application compared to the Windows XP DVFS scheme (for which the
scale is on the right of the gure).
On average, our scheme reduces the power consumption by 8.0% (Java Game), 27.9% (Shock-
wave), and 45.4% (Video) compared to the Windows XP DVFS scheme. A one-sample
t-test of the iDVFS power savings shows that for Shockwave and Video, iDVFS decreases
dynamic power with over 95% condence. For the Java game, there are no statistically-
signicant power savings. Correspondingly, the average user satisfaction level is reduced
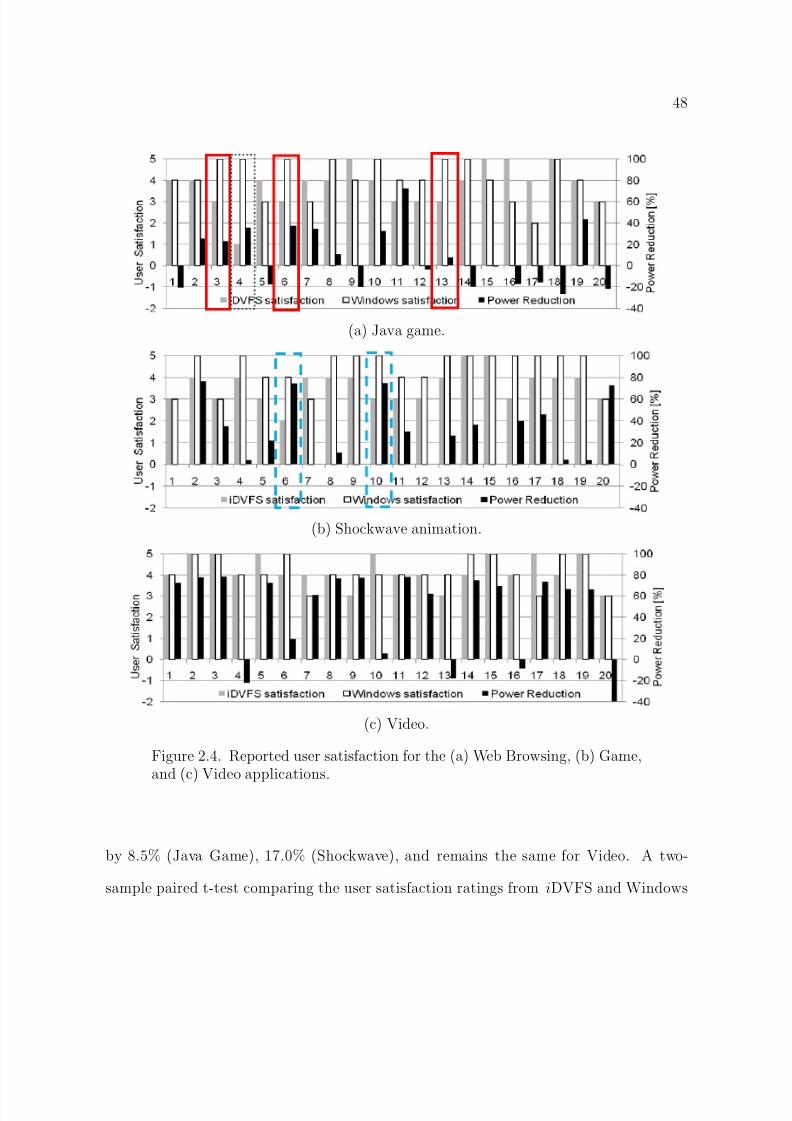
8/7/2019 Tech Report NWU-EECS-10-09: The End User in Computer Architecture and Systems Research
http://slidepdf.com/reader/full/tech-report-nwu-eecs-10-09-the-end-user-in-computer-architecture-and-systems 49/136
48
(a) Java game.
(b) Shockwave animation.
(c) Video.
Figure 2.4. Reported user satisfaction for the (a) Web Browsing, (b) Game,and (c) Video applications.
by 8.5% (Java Game), 17.0% (Shockwave), and remains the same for Video. A two-
sample paired t-test comparing the user satisfaction ratings from iDVFS and Windows
8/7/2019 Tech Report NWU-EECS-10-09: The End User in Computer Architecture and Systems Research
http://slidepdf.com/reader/full/tech-report-nwu-eecs-10-09-the-end-user-in-computer-architecture-and-systems 50/136
49
XP DVFS indicates that for Java and Video, there is no statistical di ff erence in user sat-
isfaction when using iDVFS. For Shockwave, we reduce user satisfaction with over 95%condence
The combined results show that for Java, iDVFS is no diff erent than Windows XP
DVFS, for Shockwave, iDVFS trades o ff a decrease in user satisfaction for a decrease in
power consumption, and for the Video, iDVFS signicantly decreases power consumption
while maintaining user satisfaction.
An analysis of the results quickly reveals that the average satisfaction levels arestrongly inuenced by a few exceptional cases. We have analyzed the cases where there
is a diff erence of more than 1 step between the user ratings. Among these, we found six
cases that require special attention. For the Java Game, the training inputs of Users 3, 6,
and 13 (solid rectangles in Figure 4) signicantly mismatched the performance levels of
the processor. Specically, these users have given their highest ratings to one of the lowest
frequency levels. As a result, iDVFS performs as the user asks and reduces the frequency,causing dissatisfaction to the user. The cause of dissatisfaction for User 4 (dotted rectan-
gle in Figure 2.4) was diff erent. The ANN for that user did not match the training ratings
and thus the user was dissatised. Similarly, for the Shockwave application, Users 6 and
10 (dashed rectangle in Figure 2.4) provided a roughly constant user satisfaction across
the various frequencies. During the user study, however, these Shockwave users high-
lighted their dissatisfaction when they were able to compare the performance of iDVFS
to the Windows scheme, which keeps the processor at the highest frequency at all times
It is important to note that such exceptional cases are rare; only 10% of the cases (6
out of 60) fall into this category. Such exceptional cases can be easily captured during a

8/7/2019 Tech Report NWU-EECS-10-09: The End User in Computer Architecture and Systems Research
http://slidepdf.com/reader/full/tech-report-nwu-eecs-10-09-the-end-user-in-computer-architecture-and-systems 51/136

8/7/2019 Tech Report NWU-EECS-10-09: The End User in Computer Architecture and Systems Research
http://slidepdf.com/reader/full/tech-report-nwu-eecs-10-09-the-end-user-in-computer-architecture-and-systems 52/136
51
2.5.1.2. Total System Power and Energy-Satisfaction Trade-O ff . In the previous
section, we have presented experimental results indicating the user satisfaction and thepower consumption for three applications. For two applications (Video and the Java
Game), we concluded that the iDVFS users are at least as satised as Windows XP DVFS
users. However, for the Shockwave application, we observed that although the power
consumption is reduced, this is achieved at the cost of a statistically signicant reduction
in average user satisfaction. Therefore, a designer needs to be able to evaluate the success
of the overall system. To analyze this trade-off
, we developed a new metric called theenergysatisfaction product (ESP) that works in a similar fashion to popular metrics such
as energy-delay product. Specically, for any system, the ESP per user/application can
be found by multiplying the energy consumption with the reported satisfaction level of
the user.
Clearly, to make a fair comparison using the ESP metric, we have to collect the total
system energy consumption during the run of the application. To extract these values, wereplay the traces from the user studies of the previous section. The laptop is connected
to a National Instruments 6034E data acquisition board attached to the PCI bus of a
host workstation running Windows (and the target applications), which permits us to
measure the power consumption of the entire laptop (including other power consuming
components such as memory, screen, hard disk, etc.). The sampling rate is set to 10Hz.
Figure 2.5 illustrates the experimental setup used to measure the system power.
Once the system energy measurements are collected (for both Windows XP DVFS
and iDVFS), we nd the ESP for each user by multiplying their reported satisfaction
levels and the total system energy consumption. The results of this analysis are presented
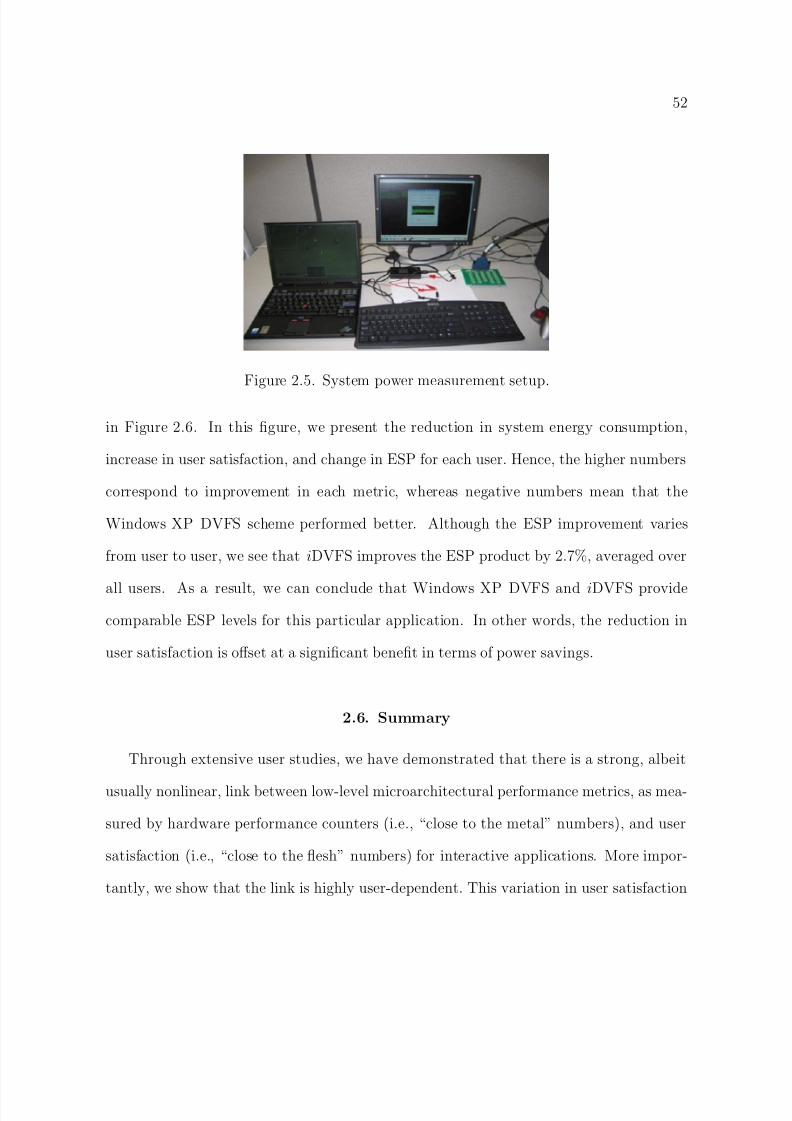
8/7/2019 Tech Report NWU-EECS-10-09: The End User in Computer Architecture and Systems Research
http://slidepdf.com/reader/full/tech-report-nwu-eecs-10-09-the-end-user-in-computer-architecture-and-systems 53/136

8/7/2019 Tech Report NWU-EECS-10-09: The End User in Computer Architecture and Systems Research
http://slidepdf.com/reader/full/tech-report-nwu-eecs-10-09-the-end-user-in-computer-architecture-and-systems 54/136

8/7/2019 Tech Report NWU-EECS-10-09: The End User in Computer Architecture and Systems Research
http://slidepdf.com/reader/full/tech-report-nwu-eecs-10-09-the-end-user-in-computer-architecture-and-systems 55/136
8/7/2019 Tech Report NWU-EECS-10-09: The End User in Computer Architecture and Systems Research
http://slidepdf.com/reader/full/tech-report-nwu-eecs-10-09-the-end-user-in-computer-architecture-and-systems 56/136
55
CHAPTER 3
User Physiological Traits: Implicitly Learning User Satisfaction
Knowing that user variation exists is not enough. We need a method for understanding
user satisfaction during computer use. Although iDVFS (described in Section 2.4) uses a
model from hardware performance counters to user satisfaction as a proxy for predicting
user satisfaction, we still need to explictly ask the end user for their satisfaction at some
point. This explicit input may be annoying to the end user, and begs the question: is it
possible to implicitly understand user satisfaction? If we could understand the end user
without explicit feedback, we could drive user-aware optimizations, such as iDVFS, to
tune performance to an individual user without any explicit feedback.
Developing an implicit feedback mechanism for modern computers is di fficult. We
assert that the design of modern architectures makes it di fficult (if not impossible) to
implicitly infer and reason about the end user. One only needs to observe the current
computer usage model to understand this claim. First, the user directs the computer
explicitly via input devices (e.g., keyboard or mouse). According to user direction, the
computer executes instructions to manipulate machine state. Afterwards, the user obtains
information via output devices (e.g., display or speakers). Note that during this human-
computer interaction, there is a considerable asymmetry between the information available
to the user and information available to the computer . Although the user can direct the
computer to change/view the system state at any time, the computer executes with little
any information about the user state.

8/7/2019 Tech Report NWU-EECS-10-09: The End User in Computer Architecture and Systems Research
http://slidepdf.com/reader/full/tech-report-nwu-eecs-10-09-the-end-user-in-computer-architecture-and-systems 57/136

8/7/2019 Tech Report NWU-EECS-10-09: The End User in Computer Architecture and Systems Research
http://slidepdf.com/reader/full/tech-report-nwu-eecs-10-09-the-end-user-in-computer-architecture-and-systems 58/136
57
Based upon these observations, we then construct a Physiological Traits-based Power-
management (PTP) system to demonstrate an application of these biometric input de-vices. PTP may augment any existing dynamic voltage and frequency scaling (DVFS)
scheme to make user-aware decisions. In its current implementation, PTP adjusts the
maximum frequency by incorporating human physiological readings. DVFS is a com-
mon power saving technique available on modern microprocessors that scales the fre-
quency (and voltage) of a microprocessor to reduce power consumption. By adding PTP
to a typical CPU-utilization-based DVFS scheme, we signicantly decrease power con-sumption with little to no impact on user satisfaction.
It is intuitive to imagine that the computer performance will impact the physiological
responses of users. There have been studies showing the relationships between physiolog-
ical sensor readings and reported user emotions in response to interaction with computer
programs [75, 52 ]. However, to the best of our knowledge, this is the rst study in mea-
suring the impact of computer performance on human physiological traits. Specically,we make the following contributions:
• We make a case for using biometric input devices (such as eye trackers, galvanic
skin response sensors, and force sensors) in making architecture-level decisions;
• We show through two user studies that our selected biometric input devices are
able to detect changes in human physiological traits as the performance is altered
during the run of an application; and
• We demonstrate a user-aware system for augmenting DVFS and evaluate the
system with another user study.

8/7/2019 Tech Report NWU-EECS-10-09: The End User in Computer Architecture and Systems Research
http://slidepdf.com/reader/full/tech-report-nwu-eecs-10-09-the-end-user-in-computer-architecture-and-systems 59/136

8/7/2019 Tech Report NWU-EECS-10-09: The End User in Computer Architecture and Systems Research
http://slidepdf.com/reader/full/tech-report-nwu-eecs-10-09-the-end-user-in-computer-architecture-and-systems 60/136

8/7/2019 Tech Report NWU-EECS-10-09: The End User in Computer Architecture and Systems Research
http://slidepdf.com/reader/full/tech-report-nwu-eecs-10-09-the-end-user-in-computer-architecture-and-systems 61/136
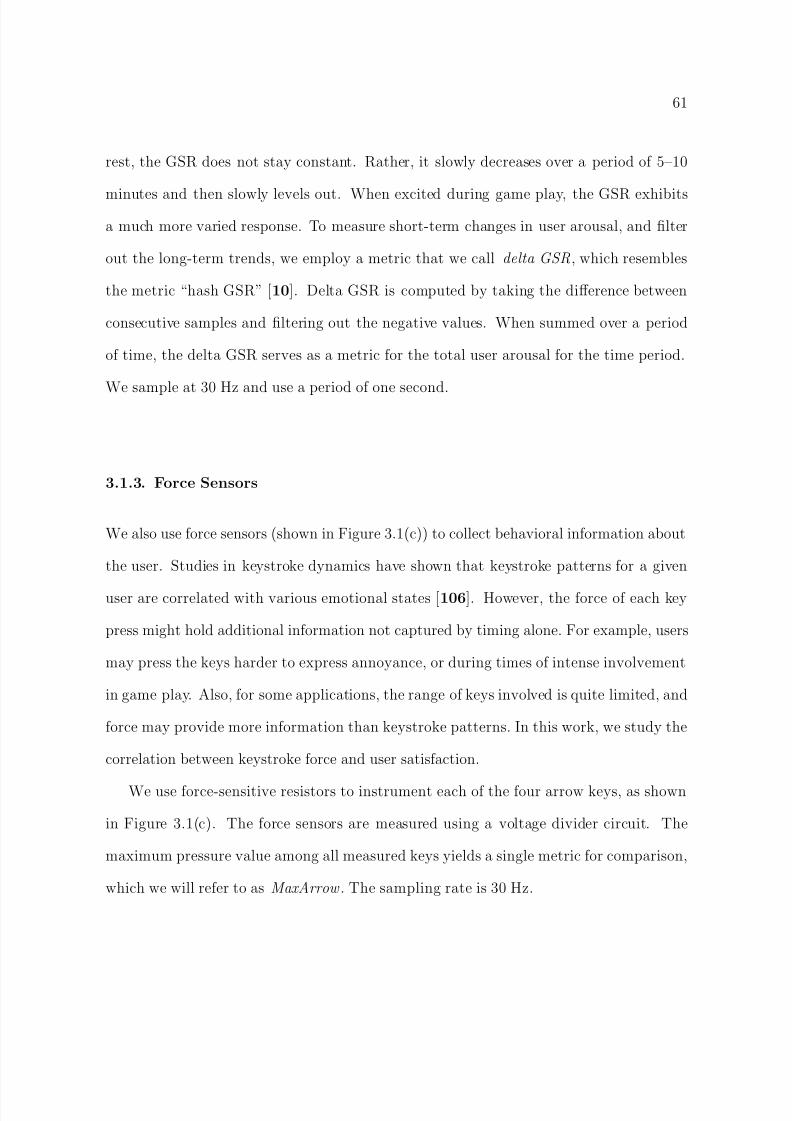
8/7/2019 Tech Report NWU-EECS-10-09: The End User in Computer Architecture and Systems Research
http://slidepdf.com/reader/full/tech-report-nwu-eecs-10-09-the-end-user-in-computer-architecture-and-systems 62/136
61
rest, the GSR does not stay constant. Rather, it slowly decreases over a period of 5–10
minutes and then slowly levels out. When excited during game play, the GSR exhibitsa much more varied response. To measure short-term changes in user arousal, and lter
out the long-term trends, we employ a metric that we call delta GSR , which resembles
the metric “hash GSR” [ 10 ]. Delta GSR is computed by taking the di ff erence between
consecutive samples and ltering out the negative values. When summed over a period
of time, the delta GSR serves as a metric for the total user arousal for the time period.
We sample at 30 Hz and use a period of one second.
3.1.3. Force Sensors
We also use force sensors (shown in Figure 3.1(c)) to collect behavioral information about
the user. Studies in keystroke dynamics have shown that keystroke patterns for a given
user are correlated with various emotional states [ 106 ]. However, the force of each key
press might hold additional information not captured by timing alone. For example, users
may press the keys harder to express annoyance, or during times of intense involvement
in game play. Also, for some applications, the range of keys involved is quite limited, and
force may provide more information than keystroke patterns. In this work, we study the
correlation between keystroke force and user satisfaction.
We use force-sensitive resistors to instrument each of the four arrow keys, as shown
in Figure 3.1(c). The force sensors are measured using a voltage divider circuit. The
maximum pressure value among all measured keys yields a single metric for comparison,
which we will refer to as MaxArrow . The sampling rate is 30 Hz.
8/7/2019 Tech Report NWU-EECS-10-09: The End User in Computer Architecture and Systems Research
http://slidepdf.com/reader/full/tech-report-nwu-eecs-10-09-the-end-user-in-computer-architecture-and-systems 63/136
62
3.1.4. Sensor Metrics
We measure four readings from the biometric input devices: pupil dilation, pupil move-
ment, delta GSR, and arrow-key force. As we gather these readings, we summarize them
using various statistics. For each reading, we consider the maximum, arithmetic mean,
and the variance of the readings every second. We dene the term sensor metric to be
a specic combination of a statistic and a biometric reading. We format sensor met-
rics as follows: <statistic> <sensor> . For example, the arithmetic mean of the pupil
movement is denoted by Mean PupilMovement .
3.1.5. Sensor Extensibility, Applicability, and Cost
The intrusiveness of sensors is a major consideration for using them as biometric input
devices. Ideally, biometric input devices will (1) not impede the use of the computer in
any way, (2) require little e ff ort by the user, and (3) not incur signicant nancial cost. We
select our sensors based on these principles. Consumer “remote eye tracking” products are
available which detect eye focus and pupil radius without a head-mounted system. Further
research into this area is likely to lower the cost of these systems [ 17 ]. Modern laptops
contain built-in cameras and image recognition software exists for detecting pupils [ 79 ].
The electrical components required to measure GSR are inexpensive. While the velcro-
strip contacts may be considered too cumbersome, these contacts have also successfully
been integrated into a computer mouse in a way that requires no explicit action by the
user [112 ]. Integrating force sensors into a computer keyboard would do little change to
the existing structure and piezoresistive force sensors are inexpensive; the force sensors
used for this work are currently available for under $15 per sensor[ 104 ].
8/7/2019 Tech Report NWU-EECS-10-09: The End User in Computer Architecture and Systems Research
http://slidepdf.com/reader/full/tech-report-nwu-eecs-10-09-the-end-user-in-computer-architecture-and-systems 64/136
63
3.2. User Study Setup
Our experiments are done using an IBM Thinkpad T61 with a 2.2 GHz Intel Core
2 Duo T7500 processor and 2 GB DDR2 SDRAM running Microsoft Windows XP. The
laptop is tethered to power for experiments. The processor supports seven frequency
levels using Intel Enhanced SpeedStep Technology (2.2 GHz, 1.6 GHz, 1.2 GHz, 800 MHz,
600 MHz, 400 MHz, and 200 MHz). In our experiments, we use the top ve frequencies
ranging from 2.2 GHz to 600 MHz.
Data from the GSR and force sensors is collected using a National Instruments 603E
data acquisition card connected to the PCI bus of a separate workstation. The workstation
then sends the sensor information through a TCP socket to the laptop over a private LAN
connection.
In our user studies, we use the following applications:
• Need for Speed Pro Street [3 ]: A 3D driving game against the computer.
The game is very CPU-intensive.
• Tetris Arena [2 ]: A 3-D version of the classic puzzle game. The game consumes
100% of the CPU. However it exhibits little performance degradation as the
frequency is decreased.
• Microsoft Word 2000 Version 9.0 [1 ]: The user is given a document to
reproduce in Microsoft Word. In general, Microsoft Word is not CPU intensive.
However, we include some high-quality images into the document. Moving the
images occasionally causes short bursts of high CPU utilization.

8/7/2019 Tech Report NWU-EECS-10-09: The End User in Computer Architecture and Systems Research
http://slidepdf.com/reader/full/tech-report-nwu-eecs-10-09-the-end-user-in-computer-architecture-and-systems 65/136
64
We developed a user pool by advertising our studies within Northwestern University.
The participants come from a variety of backgrounds and include males and females,engineers and non-engineers, as well as inexperienced computer users.
3.3. Correlating Human Physiological Traits with User Satisfaction
The ultimate goal of this paper is show how human physiological traits can be used
as an implicit measure for inferring user satisfaction. In this section, we present two user
studies exploring the link between human physiological readings and user satisfaction.
3.3.1. Motivating the Use of Physiological Sensors
The rst user study explores whether there are changes in human physiological traits
when the performance of the processor is changed. One of our major concerns was that
the measurement noise during game play may mask any changes in physiological traits.
It is not difficult to imagine possible sources of noise. For example, in a driving game, a
difficult section of tight turns may produce di ff erent measurements than another section
with a long straightaway. Due to this concern, we rst conduct a controlled initial user
study with 14 users. During the study, we ask the users to play the Need for Speed game
twice. Each time, at a predetermined position on the racetrack, we either maintain the
highest frequency, or drop the frequency to 600 MHz for 20 seconds. At 600 MHz, the
game greatly slows down. During the 20 seconds, we measure statistics from each of the
physiological sensors.
Figure 3.3 shows the data from three of the sensor metrics that display signicant
changes in the initial user study. Mean eye movement (shown in Figure 3.3(a)) decreases

8/7/2019 Tech Report NWU-EECS-10-09: The End User in Computer Architecture and Systems Research
http://slidepdf.com/reader/full/tech-report-nwu-eecs-10-09-the-end-user-in-computer-architecture-and-systems 66/136

8/7/2019 Tech Report NWU-EECS-10-09: The End User in Computer Architecture and Systems Research
http://slidepdf.com/reader/full/tech-report-nwu-eecs-10-09-the-end-user-in-computer-architecture-and-systems 67/136
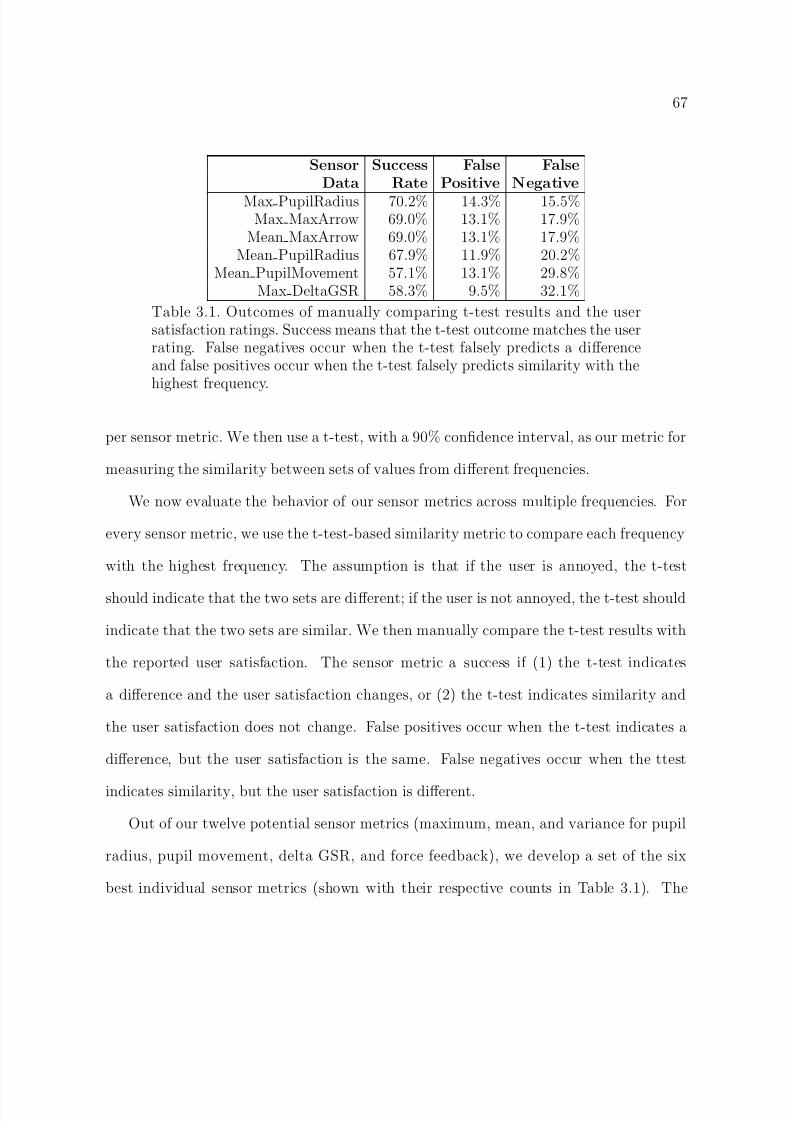
8/7/2019 Tech Report NWU-EECS-10-09: The End User in Computer Architecture and Systems Research
http://slidepdf.com/reader/full/tech-report-nwu-eecs-10-09-the-end-user-in-computer-architecture-and-systems 68/136
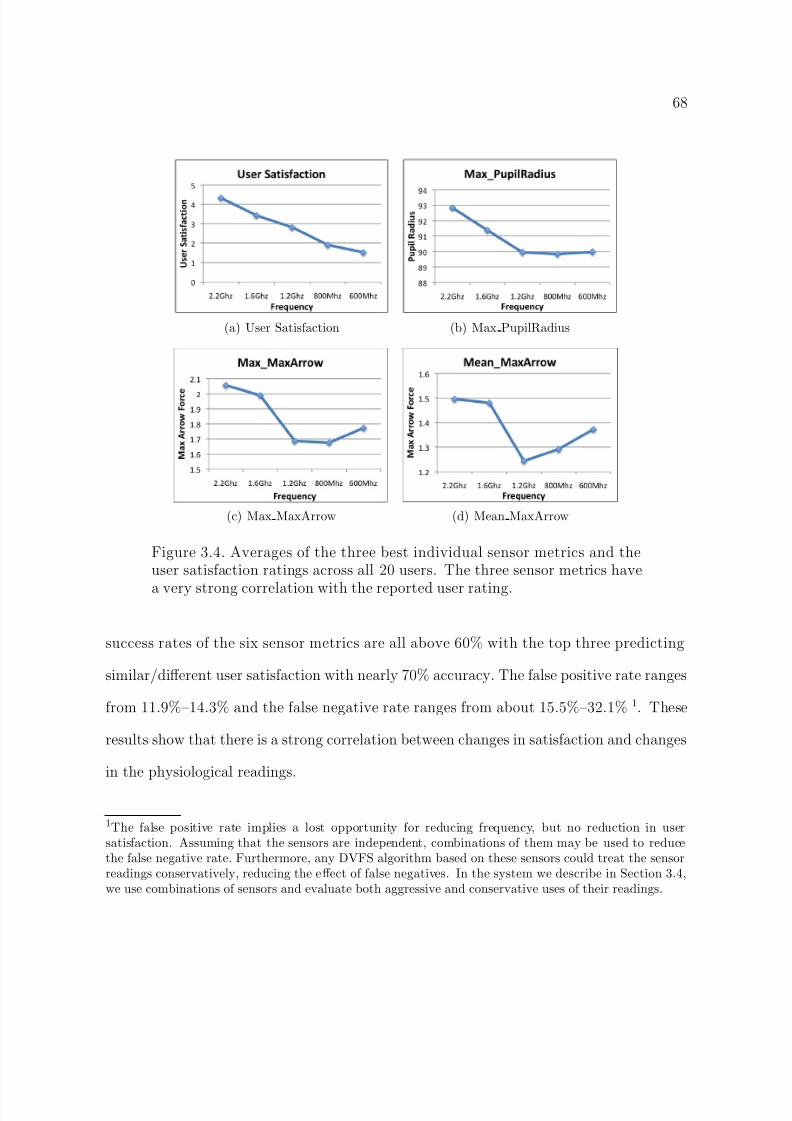
8/7/2019 Tech Report NWU-EECS-10-09: The End User in Computer Architecture and Systems Research
http://slidepdf.com/reader/full/tech-report-nwu-eecs-10-09-the-end-user-in-computer-architecture-and-systems 69/136
68
(a) User Satisfaction (b) Max PupilRadius
(c) Max MaxArrow (d) Mean MaxArrow
Figure 3.4. Averages of the three best individual sensor metrics and theuser satisfaction ratings across all 20 users. The three sensor metrics havea very strong correlation with the reported user rating.
success rates of the six sensor metrics are all above 60% with the top three predicting
similar/di ff erent user satisfaction with nearly 70% accuracy. The false positive rate ranges
from 11.9%–14.3% and the false negative rate ranges from about 15.5%–32.1% 1. These
results show that there is a strong correlation between changes in satisfaction and changes
in the physiological readings.
1The false positive rate implies a lost opportunity for reducing frequency, but no reduction in usersatisfaction. Assuming that the sensors are independent, combinations of them may be used to reducethe false negative rate. Furthermore, any DVFS algorithm based on these sensors could treat the sensorreadings conservatively, reducing the e ff ect of false negatives. In the system we describe in Section 3.4,we use combinations of sensors and evaluate both aggressive and conservative uses of their readings.
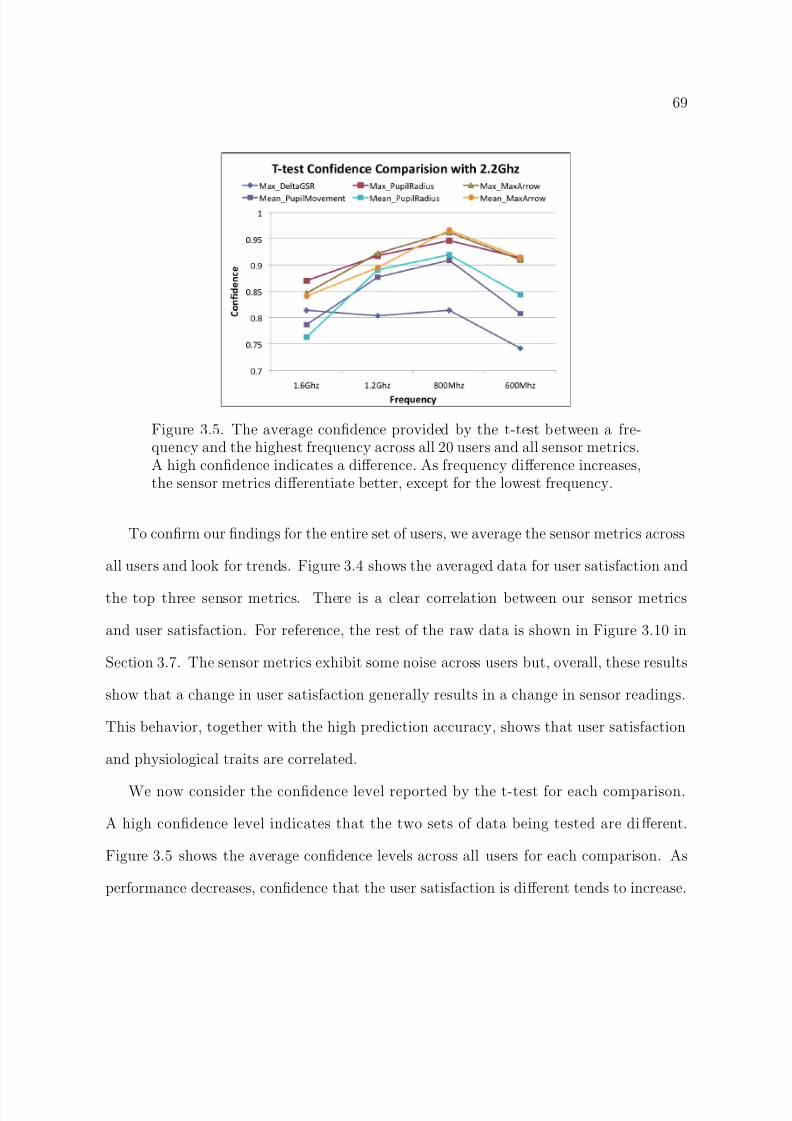
8/7/2019 Tech Report NWU-EECS-10-09: The End User in Computer Architecture and Systems Research
http://slidepdf.com/reader/full/tech-report-nwu-eecs-10-09-the-end-user-in-computer-architecture-and-systems 70/136

8/7/2019 Tech Report NWU-EECS-10-09: The End User in Computer Architecture and Systems Research
http://slidepdf.com/reader/full/tech-report-nwu-eecs-10-09-the-end-user-in-computer-architecture-and-systems 71/136

8/7/2019 Tech Report NWU-EECS-10-09: The End User in Computer Architecture and Systems Research
http://slidepdf.com/reader/full/tech-report-nwu-eecs-10-09-the-end-user-in-computer-architecture-and-systems 72/136
71
Algorithm 1 : PTP training algorithm.procedure Find-Settled-Freq ()1
Frequency: f ← MAX FREQ− 12
while f is in frequency range do3
if Test-Same (MAX FREQ, f ) then4
f ← f − 15
else if Majority vote of 3 calls to TestSame( MAX FREQ,f ) is true then6
f ← f + 17
else8
while f is in frequency range and Majority vote of 3 calls to9
TestSame( MAX FREQ,f ) is false dof ← f + 110
return f 11
12
13
14
procedure Test-Same (f 1, f 2)15
Collect sensor metrics at f 1 for 20 seconds16
Collect sensor metrics at f 2 for 20 seconds17
t-test each sensor metric at f 1 and f 2 with condence level of 85%18
if more than 50% of sensor di ff er then19
return false20
return true21
22
The goal of PTP is to determine the minimum operating frequency that maintains user
satisfaction. Specically, PTP rst runs a training phase with the target application (the
algorithm for the training phase is detailed in Algorithm 1). PTP begins by comparing
sensor readings at the second-highest frequency and the readings at the highest frequency.
Each comparison (detailed in the Test-Same procedure within Algorithm 1) consists
of (1) running for 20 seconds at the highest frequency, (2) running for 20 seconds at
the testing frequency, and (3) a t-test between each of the sensor metrics. Initially, the
algorithm aims at quickly reducing the frequency, if possible. The algorithm consecutively
tests the frequencies for noise in the sensors. If two out of three tests report that the sensor

8/7/2019 Tech Report NWU-EECS-10-09: The End User in Computer Architecture and Systems Research
http://slidepdf.com/reader/full/tech-report-nwu-eecs-10-09-the-end-user-in-computer-architecture-and-systems 73/136
8/7/2019 Tech Report NWU-EECS-10-09: The End User in Computer Architecture and Systems Research
http://slidepdf.com/reader/full/tech-report-nwu-eecs-10-09-the-end-user-in-computer-architecture-and-systems 74/136
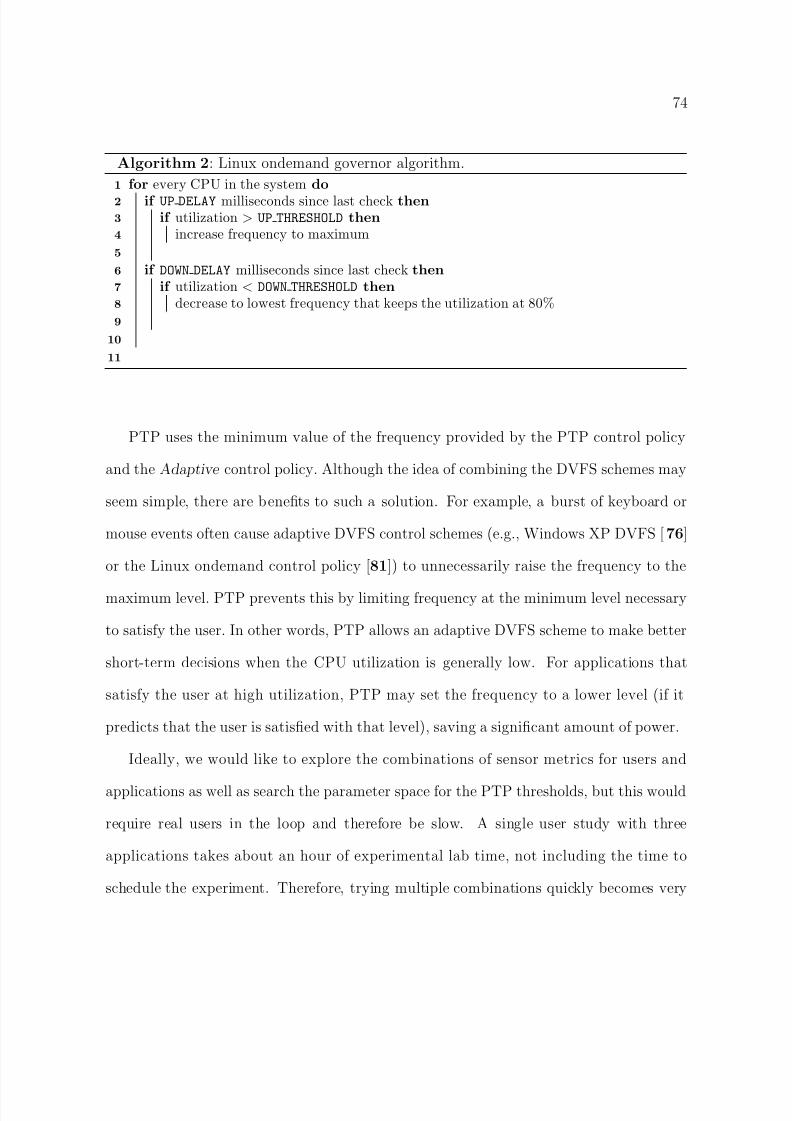
8/7/2019 Tech Report NWU-EECS-10-09: The End User in Computer Architecture and Systems Research
http://slidepdf.com/reader/full/tech-report-nwu-eecs-10-09-the-end-user-in-computer-architecture-and-systems 75/136
74
Algorithm 2 : Linux ondemand governor algorithm.for every CPU in the system do1
if UP DELAYmilliseconds since last check then2
if utilization > UP THRESHOLDthen3
increase frequency to maximum4
5
if DOWN DELAYmilliseconds since last check then6
if utilization < DOWN THRESHOLDthen7
decrease to lowest frequency that keeps the utilization at 80%8
9
10
11
PTP uses the minimum value of the frequency provided by the PTP control policy
and the Adaptive control policy. Although the idea of combining the DVFS schemes may
seem simple, there are benets to such a solution. For example, a burst of keyboard or
mouse events often cause adaptive DVFS control schemes (e.g., Windows XP DVFS [ 76 ]
or the Linux ondemand control policy [ 81 ]) to unnecessarily raise the frequency to the
maximum level. PTP prevents this by limiting frequency at the minimum level necessary
to satisfy the user. In other words, PTP allows an adaptive DVFS scheme to make better
short-term decisions when the CPU utilization is generally low. For applications that
satisfy the user at high utilization, PTP may set the frequency to a lower level (if it
predicts that the user is satised with that level), saving a signicant amount of power.
Ideally, we would like to explore the combinations of sensor metrics for users and
applications as well as search the parameter space for the PTP thresholds, but this would
require real users in the loop and therefore be slow. A single user study with three
applications takes about an hour of experimental lab time, not including the time to
schedule the experiment. Therefore, trying multiple combinations quickly becomes very
8/7/2019 Tech Report NWU-EECS-10-09: The End User in Computer Architecture and Systems Research
http://slidepdf.com/reader/full/tech-report-nwu-eecs-10-09-the-end-user-in-computer-architecture-and-systems 76/136
8/7/2019 Tech Report NWU-EECS-10-09: The End User in Computer Architecture and Systems Research
http://slidepdf.com/reader/full/tech-report-nwu-eecs-10-09-the-end-user-in-computer-architecture-and-systems 77/136
76
In a real-world implementation, the power consumption of the biometric devices would
need to be outweighed by the power savings due to the PTP. The sensors chosen forthis work all conform to this requirement. Piezoresistive force sensors may be measured
with very little additional energy using a voltage-divider circuit and an analog-todigital
converter, which are both common, low-power circuits. GSR is also a simple resistive
measurement, and requires only a voltage divider and an analog-to-digital converter.
An eye tracker requires an infrared camera, infrared LEDs, and the capacity for image
processing. Collectively, the eye tracker sensor could operate on well below a Watt [ 117,62 ]. Although some of these sensors may be expensive today, the technology for producing
sensors capable of operating within desirable power constraints and at a low cost has
already been developed. Additionally, the processing needs to interpret the sensors could
also be assigned to a core of a chip multiprocessor, reducing the additional hardware
required.
3.5. Experimental Results
In this section, we evaluate the aPTP and cPTP systems. We compare both PTP vari-
ants with the Adaptive scheme described in Section 5. We use the Need for Speed (NFS),
Tetris, and Word applications and 20 users. In each run of an application, we begin with
the training phase described in Section 3.4. The training phase varies based upon the
number of majority vote tests performed by the PTP strategy. Afterwards, the user con-
tinues to use the Adaptive scheme and the aPTP scheme for 2.5 minutes each. The order
of the aPTP and the Adaptive scheme is randomized between experiments. The last 10

8/7/2019 Tech Report NWU-EECS-10-09: The End User in Computer Architecture and Systems Research
http://slidepdf.com/reader/full/tech-report-nwu-eecs-10-09-the-end-user-in-computer-architecture-and-systems 78/136

8/7/2019 Tech Report NWU-EECS-10-09: The End User in Computer Architecture and Systems Research
http://slidepdf.com/reader/full/tech-report-nwu-eecs-10-09-the-end-user-in-computer-architecture-and-systems 79/136
78
NFS is a CPU-intensive application for which observable performance is sensitive to
CPU frequency. aPTP picked either 1.6 GHz or 2.2 GHz for 18 out of the 20 users. Thisis drastically di ff erent from Tetris, where the observable performance is less sensitive to
CPU frequency. The average frequency chosen by aPTP for Tetris is 1.08 GHz. Similarly,
for Word, the average frequency chosen is 1.2 GHz. This clearly demonstrates aPTP s
ability to intelligently detect the cases where CPU frequency can be lowered. Since for the
Tetris and Word application, the lower frequencies and higher frequencies result in similar
physiological responses, aPTP lowers the frequency. As indicated by user satisfactionlevels, this achieves signicantly higher e fficiency without causing any dissatisfaction.
Note that a user-specic customization is achieved purely based on the physiological
readings from the users, without explicit input or knowledge of program phase.
There are some cases in Tetris and Word (14 out of 40 cases altogether), where a
higher frequency of 1.6 GHz or 2.2 GHz is picked by aPTP. We checked the logs of
physiological readings and found that the eye tracking data was missing in 4 of these 14cases. This occurs when the user shifts in a manner such that pupil is not captured by the
eye tracker camera. This introduces signicant noise to the decision making system and
results in a higher frequency being chosen. Another 3 cases correspond to self-admittedly
inexperienced users. These users show erratic behavior. Thus, the sensor readings are
noisy and our system conservatively sets the frequency at a high level. We must note that,
although this looks like a lost opportunity for power saving, it is an interesting feature
of the overall scheme: if for one reason or another, the sensor readings become noisy,
our system conservatively sets the maximum allowed frequency to a high one, thereby
avoiding false negatives (i.e., cases where the user is dissatised and our system predicts

8/7/2019 Tech Report NWU-EECS-10-09: The End User in Computer Architecture and Systems Research
http://slidepdf.com/reader/full/tech-report-nwu-eecs-10-09-the-end-user-in-computer-architecture-and-systems 80/136
79
them to be otherwise). For Word, we are limited to utilizing only 4 metrics, compared
to the 6 used in NFS and Tetris, because Max MaxArrow and Mean MaxArrow cannotbe used (the user does not press the arrow keys often). Nevertheless, with Word, aPTP
succeeds in picking low CPU frequencies (1.2 GHz and below) for 13 out of the 18 users
with valid sensor readings. Similarly, for Tetris, aPTP picks a low frequency for 13 out
of 15 users with valid sensor readings.
The reported user satisfaction ratings and power savings for each of the applications
comparing aPTP and the Adaptive scheme are presented in Figure 3.8. The gure showsclustered bars for each user. The left two bars in each cluster represent the user satisfac-
tion with aPTP and with the Adaptive scheme and correspond to the leftmost vertical
axis. The right bar in each cluster represents the total power savings corresponding to
the vertical axis on the right. For our two CPU-intensive applications, aPTP saves a
considerable amount of total power. On average, for NFS (presented in Figure 3.8(a)),
aPTP reduces power consumption by 19.2%, and for Tetris (presented in Figure 3.8(b)),aPTP reduces total power consumption by 33.3%. Word (presented in Figure 3.8(c)) is
only CPU-intensive in short bursts and aPTP only saves 1.7% system power. For both
Tetris and Word, aPTP also does not impact user satisfaction. However for NFS, aPTP
trades o ff a small amount of user satisfaction for power savings. For this application,
aPTP is too aggressive for some users. Averaged across three applications, aPTP saves
18.4% system power when compared to the Adaptive scheme.
To explore a more conservative PTP scheme, we evaluate cPTP with 10 users. Fig-
ure 3.9 presents the results of this study. The graph is in the same format as Figure 3.8.
By using cPTP, we trade o ff improved user satisfaction with power savings. cPTP tends

8/7/2019 Tech Report NWU-EECS-10-09: The End User in Computer Architecture and Systems Research
http://slidepdf.com/reader/full/tech-report-nwu-eecs-10-09-the-end-user-in-computer-architecture-and-systems 81/136
80
(a) Need for Speed
(b) Tetris.
(c) Microsoft Word.
Figure 3.8. User satisfaction and power consumption for the Need for Speed,Tetris, and Word applications. The left two bars per cluster show the usersatisfaction for aPTP and the Adaptive DVFS schemes. The right bar ineach cluster shows the total system power savings.
to maintain the highest frequency for NFS and saves 5.9% system power, while maintain-
ing the same satisfaction level as the Adaptive scheme. cPTP trades o ff the decreased
power savings with an improved average user satisfaction rating compared to aPTP. cPTP
also maintains a high user satisfaction for Tetris, and the power savings drop from 33.3%

8/7/2019 Tech Report NWU-EECS-10-09: The End User in Computer Architecture and Systems Research
http://slidepdf.com/reader/full/tech-report-nwu-eecs-10-09-the-end-user-in-computer-architecture-and-systems 82/136
81
(a) Need for Speed
(b) Tetris.
Figure 3.9. User satisfaction and power consumption of cPTP for the Needfor Speed and Tetris applications. Word is not included because powersavings and user satisfaction levels are nearly identical to aPTP. The lefttwo bars per cluster show the user satisfaction of cPTP and the Adaptive
DVFS schemes. The right bar in each cluster shows the total system powersavings. Using cPTP, we trade-o ff a decreased power savings with improvinguser satisfaction when compared to aPTP.
to 25.6%. Averaged across three applications, cPTP saves 11.4% system power while
maintaining the user satisfaction.
Overall, our results are very encouraging: they show that PTP can successfully sense
physiological traits, predict user satisfaction, and drive a DVFS scheme that saves con-
siderable power while maintaining user satisfaction.
8/7/2019 Tech Report NWU-EECS-10-09: The End User in Computer Architecture and Systems Research
http://slidepdf.com/reader/full/tech-report-nwu-eecs-10-09-the-end-user-in-computer-architecture-and-systems 83/136

8/7/2019 Tech Report NWU-EECS-10-09: The End User in Computer Architecture and Systems Research
http://slidepdf.com/reader/full/tech-report-nwu-eecs-10-09-the-end-user-in-computer-architecture-and-systems 84/136
83
3.7. Raw Data from Motivational User Study
This section expands upon discussion in Section 3.3.2. Figure 3.10 presents the raw
data for six of the sensor metrics. The results for each user is presented in a row in the
table of graphs and each column corresponds to a di ff erent sensor metric (the rst column
presents the reported user satisfaction level). In each of the graphs, the x-axis represents
the frequency with 1 being the highest (2.2 Ghz) and 5 being the lowest frequency (600
Mhz). The y-axis represents the user satisfaction rating for the rst column and the meanof the sensor readings for the remaining columns. The raw data shows that the sensor
metrics are can be noisy. However, in general, a change in the user satisfaction is reected
by a change in sensor metrics. If we consider the average behavior (presented in the last
row), we see that most sensors show a strong relation to the user satisfaction levels.
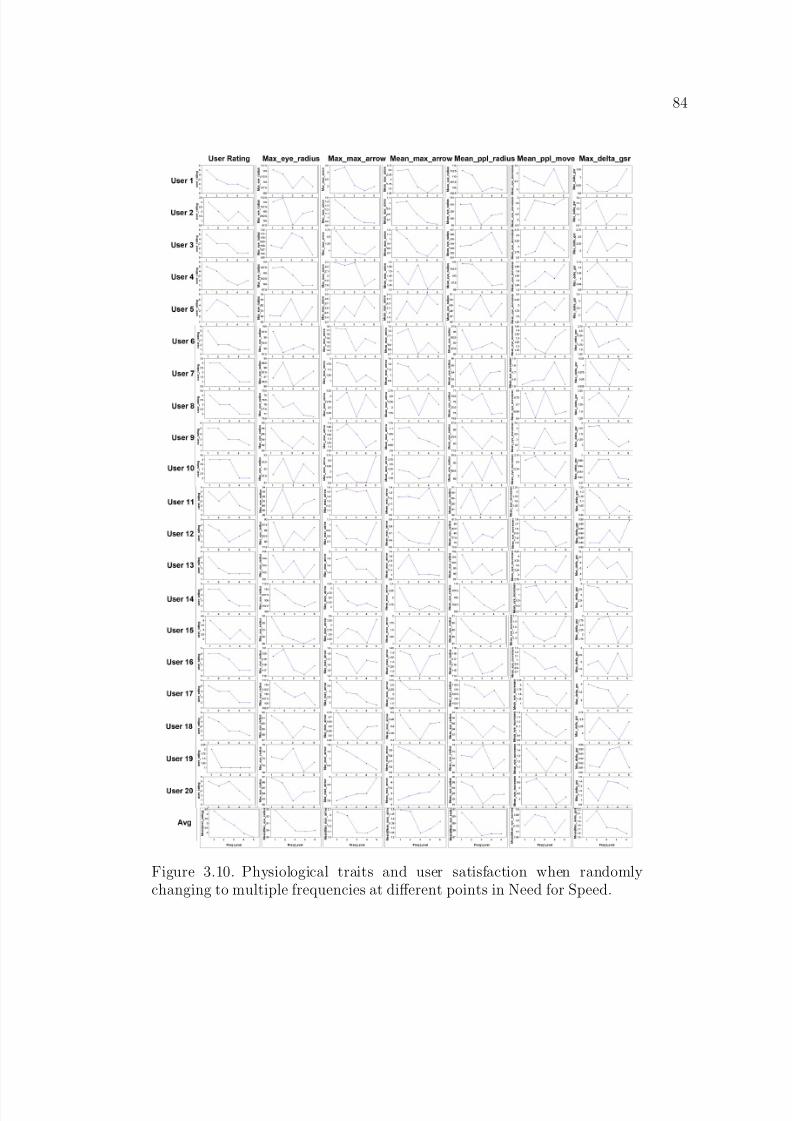
8/7/2019 Tech Report NWU-EECS-10-09: The End User in Computer Architecture and Systems Research
http://slidepdf.com/reader/full/tech-report-nwu-eecs-10-09-the-end-user-in-computer-architecture-and-systems 85/136
84
Figure 3.10. Physiological traits and user satisfaction when randomlychanging to multiple frequencies at di ff erent points in Need for Speed.
8/7/2019 Tech Report NWU-EECS-10-09: The End User in Computer Architecture and Systems Research
http://slidepdf.com/reader/full/tech-report-nwu-eecs-10-09-the-end-user-in-computer-architecture-and-systems 86/136
8/7/2019 Tech Report NWU-EECS-10-09: The End User in Computer Architecture and Systems Research
http://slidepdf.com/reader/full/tech-report-nwu-eecs-10-09-the-end-user-in-computer-architecture-and-systems 87/136
8/7/2019 Tech Report NWU-EECS-10-09: The End User in Computer Architecture and Systems Research
http://slidepdf.com/reader/full/tech-report-nwu-eecs-10-09-the-end-user-in-computer-architecture-and-systems 88/136
87
Finally, we demonstrate an example of studying user activity patterns to guide the
development of novel power optimizations. We study active screen behavior and observethat the majority of active screen time is dominated by a relatively small number of long
active screen intervals. Thus, optimizing for long screen intervals would be protable for
reducing power consumption. Targeting these long intervals enables us to develop a novel
scheme that utilizes change blindness . Change blindness refers to the inability of humans
to notice large changes in their environments, especially if the changes occur in small
increments. We implement optimizations that slowly decrease CPU frequency and screenbrightness during long active screen intervals. We conduct a user study testing these
schemes and show that users are more satised with a system that slowly reduces the
screen brightness rather than abruptly doing so, even though the two schemes reach the
same brightness level. Overall, our schemes save 10 .6% of the phone energy consumption
on average with minimal impact on user satisfaction.
Overall, we make the following contributions:
• We develop an accurate linear-regression-based power estimation model which
leverages easily-accessible measurements to accurately predict the system-wide
power consumption of a mobile architecture;
• We use our power estimation model to characterize the power consumption of an
Android G1 mobile architecture with respect to user activity patterns;
• We demonstrate an example of developing optimizations for CPU frequency scal-
ing and screen brightness based upon user activity patterns; and
• We utilize change blindness for power optimization during active use.
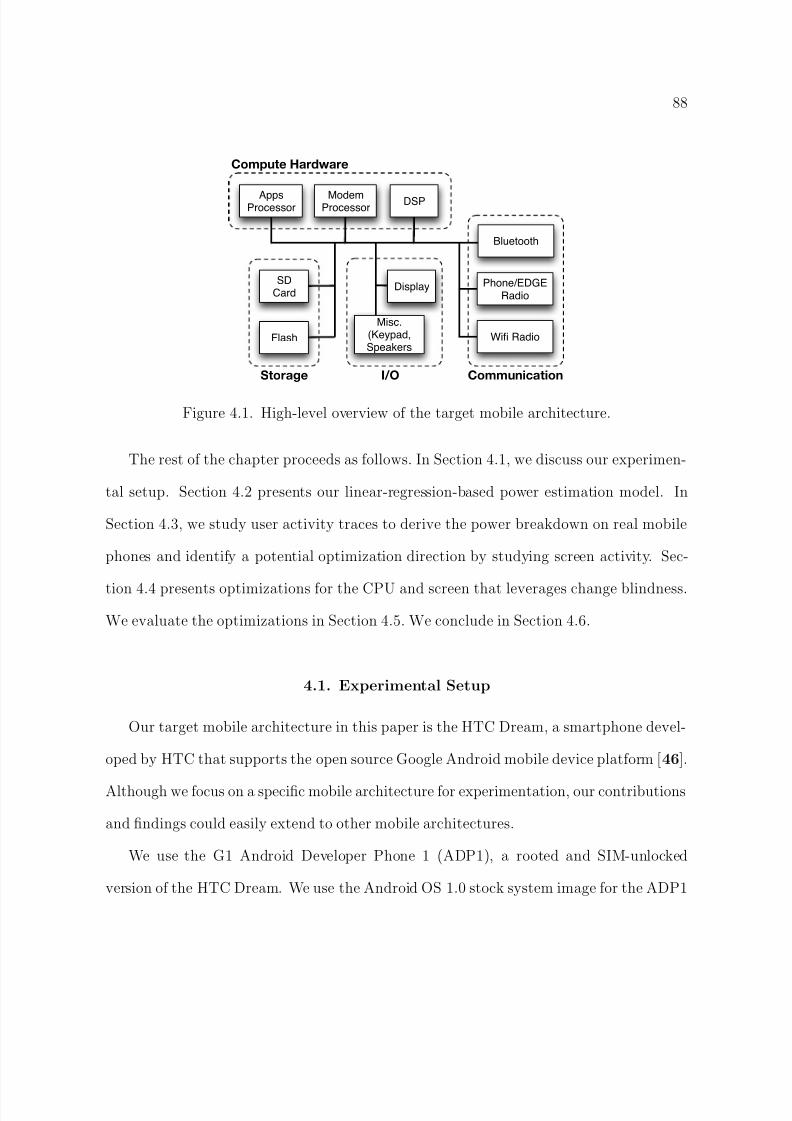
8/7/2019 Tech Report NWU-EECS-10-09: The End User in Computer Architecture and Systems Research
http://slidepdf.com/reader/full/tech-report-nwu-eecs-10-09-the-end-user-in-computer-architecture-and-systems 89/136
8/7/2019 Tech Report NWU-EECS-10-09: The End User in Computer Architecture and Systems Research
http://slidepdf.com/reader/full/tech-report-nwu-eecs-10-09-the-end-user-in-computer-architecture-and-systems 90/136
8/7/2019 Tech Report NWU-EECS-10-09: The End User in Computer Architecture and Systems Research
http://slidepdf.com/reader/full/tech-report-nwu-eecs-10-09-the-end-user-in-computer-architecture-and-systems 91/136
90
battery voltage. The linear regression model is created using the R Statistical Computing
Environment [ 86 ].We develop a logger application that logs system performance metrics and user activ-
ity. The logger runs as a Dalvik executable. It does not require any special hardware or
OS support, and runs on consumer HTC Dream devices, such as the T-Mobile G1 phone.
The logger periodically looks for a network connection and sends the logs back to our
server. All data is anonymous by the time it reaches our server.
To obtain users for our study, we publicized our project for a month on multipleuniversity campuses, as well as to the general public. Users install the logger through the
Android Market. To minimize potential bias in our data, all volunteers remain anonymous.
Volunteers are notied that we do not collect any data that could be used to identify
them. We also provide a complete list of collected data to maintain transparency with
the users. To avoid any change in user behavior, the logger application is designed to
be as unintrusive as possible. It automatically starts upon installation or after the bootprocess, and consumes minimal system resources.
For the data in this paper, we use the logs from the 20 users who have the largest
logged activity. The cumulative log data represents approximately 250 days of real user
activity. To explore usage patterns when the mobile device is battery-constrained, we
focus on time intervals when the battery is not charging. From all of the logs, we extract
860 time intervals where the battery is not charging, which add up to a total of 145 days
of user activity.

8/7/2019 Tech Report NWU-EECS-10-09: The End User in Computer Architecture and Systems Research
http://slidepdf.com/reader/full/tech-report-nwu-eecs-10-09-the-end-user-in-computer-architecture-and-systems 92/136
91
4.2. Power Estimation Model
We now discuss our approach to system-level power estimation for mobile architec-
tures. We model the architecture having two distinct power states:
Active: : The apps processor is operational. This occurs during active usage when
the screen is on, or if a system wake lock is held to ensure that the apps processor
remains on while the screen is off .
Idle: : The device is in a low-power sleep mode. The apps processor is not opera-
tional but the modem processor is still active (also called ”Standby” mode).
The power consumed in the Idle state is signicantly lower than the Active state, and
is relatively invariant under typical circumstances (measured to be around 70 mW). In
contrast, power consumed in the Active state is considerably higher (300 ∼2000+ mW),
and varies signicantly by workload. Our power estimation model focuses primarily on
modeling Active state power consumption.
We build our power estimation model based on high-level measurements collected for
a set of the hardware units. We choose a linear regression method to build the model.
Linear regression ts an output variable to a set of independent input parameters by
corresponding linear coefficients.
4.2.1. Choosing Parameters
Table 4.1 lists the parameters selected for the power estimation model, including the
nal coefficients used in our power estimation model. We model most of the hardware
components on the ADP1, including the CPU, screen, calls, EDGE/Wi- network, SD
card, and the DSP processor.

8/7/2019 Tech Report NWU-EECS-10-09: The End User in Computer Architecture and Systems Research
http://slidepdf.com/reader/full/tech-report-nwu-eecs-10-09-the-end-user-in-computer-architecture-and-systems 93/136
92
HW Unit Parameter Description Range Coe ffi cient(of β i,j ) (cj ) units
CPU hi CPU util Average CPU utilization while operating at 384 MHz 0–100 3.97 mW /% med CPU util Average CPU utilization while operating at 246 MHz 0–100 2.79 mW / %
Screen screen on Fraction of the t ime interval wi th the screen on 0–1 150.31 mW brightness Screen brightness 0–255 2.07 mW / ( step )
Call call ringing Fraction of the time interval where the phone is ringing 0–1 761.70 mW call off hook Fraction of time interval during a phone call 0–1 389.97 mW
EDGE edge has traffic Fraction of time inverval where there is EDGE tra ffi c 0–1 522.67 mW edge traffic Number of bytes transferred with the EDGE network dur-
ing time interval≥ 0 3.47 mW / byte
Wi wifi on Fraction of time interval Wi connection is on 0–1 1.77 mW wifi has traffic Fraction of time inverval where there is Wi tra ffi c 0–1 658.93 mW wifi traffic Count of bytes transferred with Wi during interval ≥ 0 0.518 mW / byte
SD Card sdcard traffic Number of sectors transferred to/from Micro SD card ≥ 0 0.0324 mW / sector
DSP music on Fraction of time interval music is on 0–1 275.65 mW System system on Fraction of time interval phone is not idle 0–1 169.08 mW
Table 4.1. Parameters used for linear regression in our power estimation model.
CPU: : The CPU refers to the apps processor and supports DFS between three
frequencies, as described in Section 4.1. The lowest frequency is never used on
consumer versions of the phone, and is too slow to perform basic tasks. Thus,
only the high (384 MHz) and medium (246 MHz) frequencies are considered in
our model.
Screen: : The screen parameters include a constant o ff set indicating whether the
screen is on and a second parameter to model the e ff ect of the screen brightness.
Call: : We model the power during phone calls by measuring the time spent ringing
and the duration of the phone calls.
EDGE: : The EDGE network power consumption parameters consider whether
there is any tra ffic and the number of bytes of tra ffic during a particular time
interval.
Wi-: : The Wi- power consumption is modeled similar to the EDGE network
but also includes a parameter for whether Wi- connectivity exists.

8/7/2019 Tech Report NWU-EECS-10-09: The End User in Computer Architecture and Systems Research
http://slidepdf.com/reader/full/tech-report-nwu-eecs-10-09-the-end-user-in-computer-architecture-and-systems 94/136

8/7/2019 Tech Report NWU-EECS-10-09: The End User in Computer Architecture and Systems Research
http://slidepdf.com/reader/full/tech-report-nwu-eecs-10-09-the-end-user-in-computer-architecture-and-systems 95/136
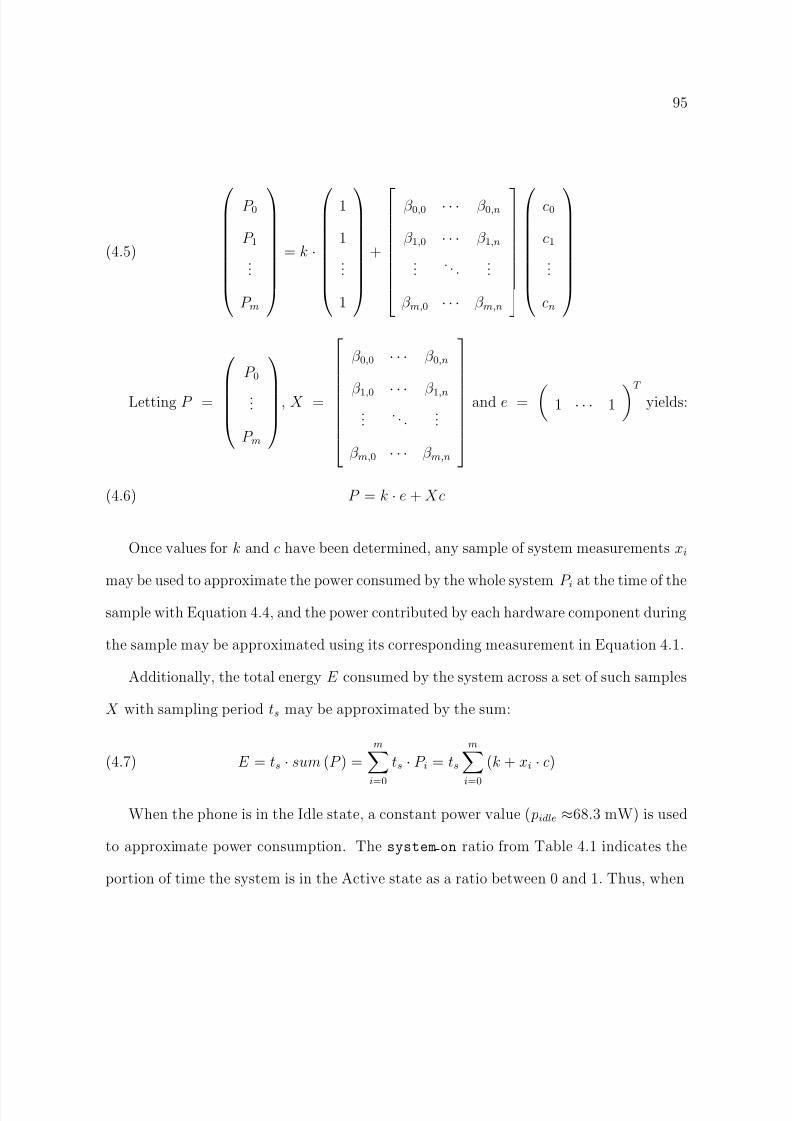
8/7/2019 Tech Report NWU-EECS-10-09: The End User in Computer Architecture and Systems Research
http://slidepdf.com/reader/full/tech-report-nwu-eecs-10-09-the-end-user-in-computer-architecture-and-systems 96/136

8/7/2019 Tech Report NWU-EECS-10-09: The End User in Computer Architecture and Systems Research
http://slidepdf.com/reader/full/tech-report-nwu-eecs-10-09-the-end-user-in-computer-architecture-and-systems 97/136
96
a log contains both the Active and Idle states, power consumption for a single sample i
is modeled as:
(4.8) Power i = system on · (P i) + (1 − system on ) · ( pidle )
When the system is in Active state, the power is approximated by the linear regression
model P i ; in Idle state, pidle is used as the approximation. In the linear regression model
for Active power, k represents the coe fficient for system on .
4.2.3. Validating the Power Model
We approximate the values of o ff set k and the coefficient vector c using a set of sampled
system measurements X with experimentally measured power consumption P . Samples
are taken from varying workloads to cover the spectrum of possible use scenarios. From
Equation 4.6 in Section 4.2.2, this produces the linear equation P = k · e+ Xc , solving for
an approximation of k and c. The approximations are shown in Table 4.1 ( k is represented
by the coefficient for system on ; other values in the column jointly form the vector c).
To demonstrate the accuracy of the model, we collect additional logs of system mea-
surements and power consumption. In addition, we collect this set of logs on a separate
ADP1 device to ensure that our power estimation model generalizes beyond the device
used for training the model. We collect two types of logs. The rst type targets spe-
cic hardware components of the phone. We name these logs Run i Unit . For example,
Run1 CPU corresponds to a log with varying CPU utilization. These logs are used for train-
ing our power model. The second type of log corresponds to a scenario, or a mix of usage
behavior, that stresses multiple hardware components. We name these logs Scenario i .
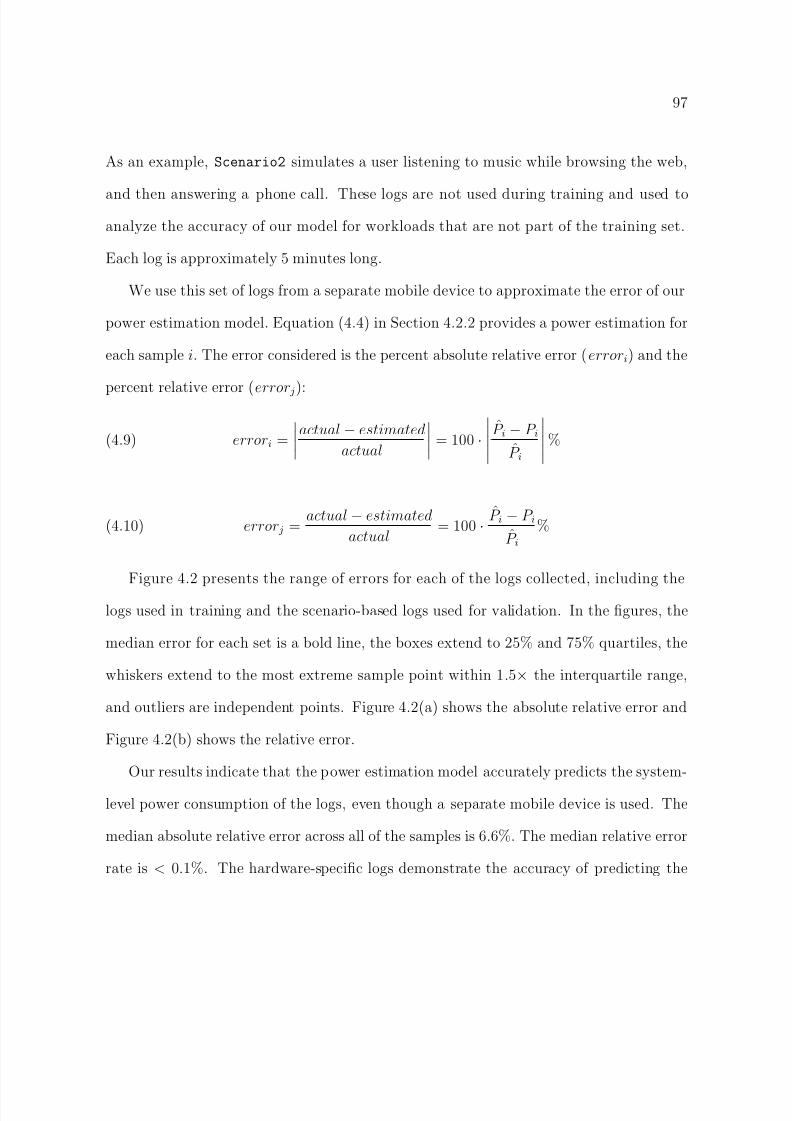
8/7/2019 Tech Report NWU-EECS-10-09: The End User in Computer Architecture and Systems Research
http://slidepdf.com/reader/full/tech-report-nwu-eecs-10-09-the-end-user-in-computer-architecture-and-systems 98/136
97
As an example, Scenario2 simulates a user listening to music while browsing the web,
and then answering a phone call. These logs are not used during training and used toanalyze the accuracy of our model for workloads that are not part of the training set.
Each log is approximately 5 minutes long.
We use this set of logs from a separate mobile device to approximate the error of our
power estimation model. Equation (4.4) in Section 4.2.2 provides a power estimation for
each sample i . The error considered is the percent absolute relative error ( error i) and the
percent relative error ( error j ):
(4.9) error i =actual − estimated
actual= 100 ·
P i − P iP i
%
(4.10) error j =actual − estimated
actual= 100 ·
P i − P iP i
%
Figure 4.2 presents the range of errors for each of the logs collected, including the
logs used in training and the scenario-based logs used for validation. In the gures, the
median error for each set is a bold line, the boxes extend to 25% and 75% quartiles, the
whiskers extend to the most extreme sample point within 1 .5× the interquartile range,
and outliers are independent points. Figure 4.2(a) shows the absolute relative error and
Figure 4.2(b) shows the relative error.
Our results indicate that the power estimation model accurately predicts the system-
level power consumption of the logs, even though a separate mobile device is used. The
median absolute relative error across all of the samples is 6 .6%. The median relative error
rate is < 0.1%. The hardware-specic logs demonstrate the accuracy of predicting the
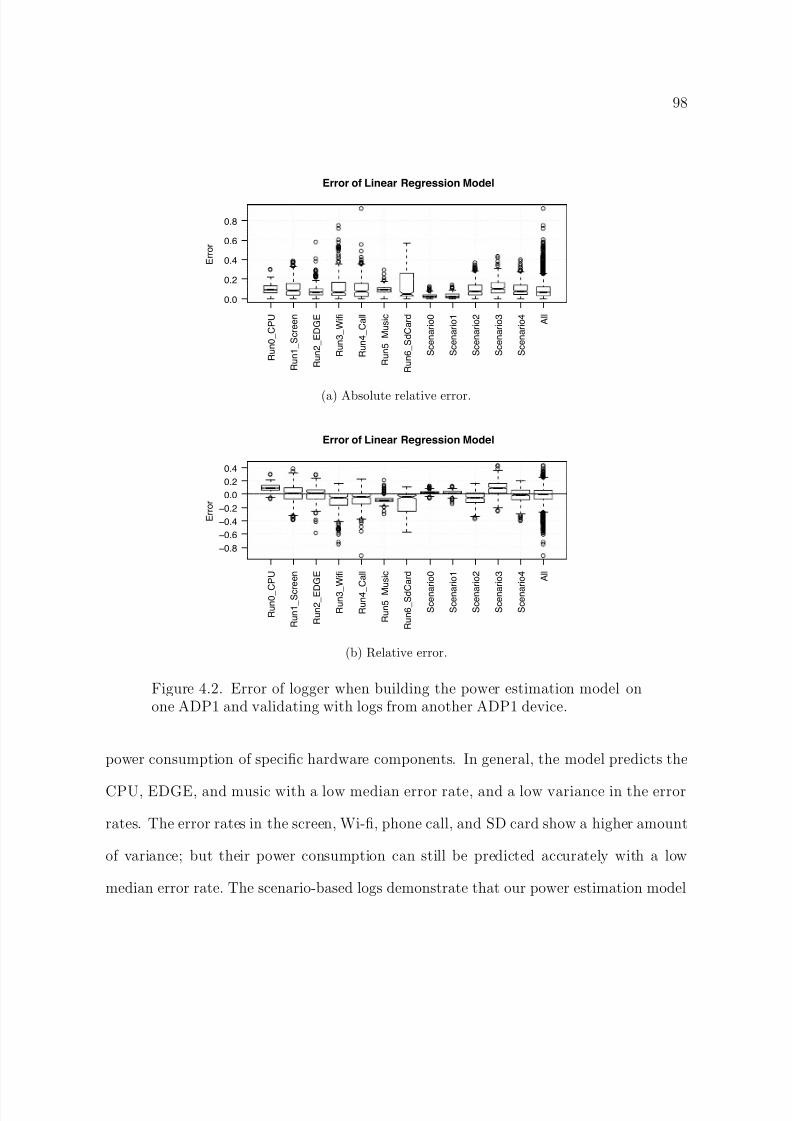
8/7/2019 Tech Report NWU-EECS-10-09: The End User in Computer Architecture and Systems Research
http://slidepdf.com/reader/full/tech-report-nwu-eecs-10-09-the-end-user-in-computer-architecture-and-systems 99/136
98
●●●
●●
●
●●
●
●●●
●
●
●●
●
●
●
●
●●●
●●
●●●
●
●
●
●
●
●
●●
●●
●
●
●●●●●
●●
●●●●●
●●●●
●
●
●
●
●
●●● ●
●●
●●●●●●●●●
●
●
●
●
●
●
●
●
●
●●
●
●
●
●
●●●
●
●●
●●
●●●
●
●
●
●
●
●
●
●
●●●●●●●●●●●
●●●●●●
●
●
●
●●●
●●●●●
●●●
●
●●
●●●●●
●●
●
●
●
●
●●●●
●●
●
●●
●●●●●●●●●●●
●
●●
●●
●●●●
●
●
●
●●
●●●
R u n 0_ C P U
R u n 1_ S c r e e n
R u n 2_ E D G E
R u n 3_ W i f i
R u n 4_ C a l l
R u n 5_ M u s i c
R u n 6_ S d C a r d
S c e n a r i o 0
S c e n a r i o 1
S c e n a r i o 2
S c e n a r i o 3
S c e n a r i o 4 A
l l0.0
0.2
0.4
0.6
0.8
Error of Linear Regression Model
E r r o r
(a) Absolute relative error.
●
●
●
●●●
●
●●
●
●
●
●
●
●
●●●●
●●
●
●
●
●
●●●●●●
●●
●●●
●
●
● ●
●
●●
●
●
●●●●
●
●
●●
●
●●
●●●
●●●●●
●
●●
●
●
●
●
●
●
●
●
●●
●●●
●●●
●●
●●
●●
●
●
●
●●●●●●●●●●●●
●
●
●
●●●●●
●●●●●●●●
●●●
●●
●
●●
●●
●●
●●
●●●●●●●●●
●●●●
●●
●●●
●●●
●
●●●
R u n 0_ C P U
R u n 1_ S c r e e n
R u n 2_ E D G E
R u n 3_ W i f i
R u n 4_ C a l l
R u n 5_ M u s i c
R u n 6_ S d C a r d
S c e n a r i o 0
S c e n a r i o 1
S c e n a r i o 2
S c e n a r i o 3
S c e n a r i o 4 A
l l
−0.8
−0.6
−0.4
−0.2
0.0
0.2
0.4
Error of Linear Regression Model
E r r o r
(b) Relative error.
Figure 4.2. Error of logger when building the power estimation model onone ADP1 and validating with logs from another ADP1 device.
power consumption of specic hardware components. In general, the model predicts the
CPU, EDGE, and music with a low median error rate, and a low variance in the error
rates. The error rates in the screen, Wi-, phone call, and SD card show a higher amount
of variance; but their power consumption can still be predicted accurately with a low
median error rate. The scenario-based logs demonstrate that our power estimation model

8/7/2019 Tech Report NWU-EECS-10-09: The End User in Computer Architecture and Systems Research
http://slidepdf.com/reader/full/tech-report-nwu-eecs-10-09-the-end-user-in-computer-architecture-and-systems 100/136
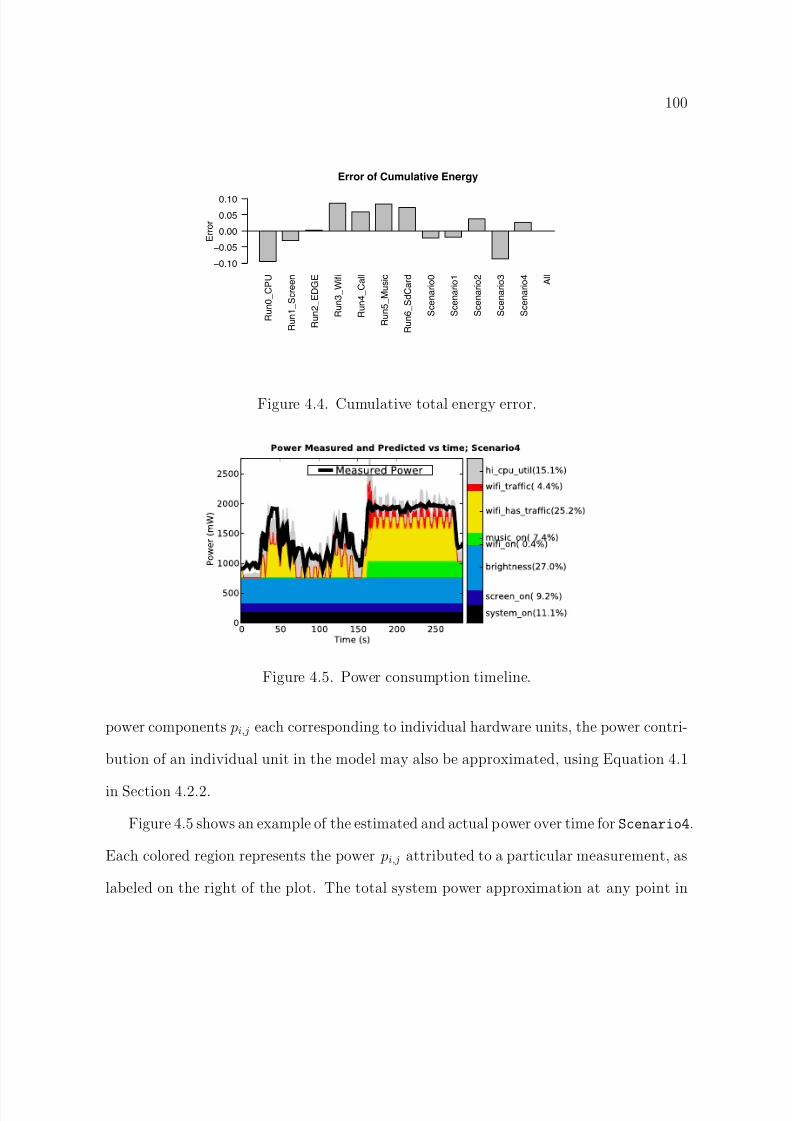
8/7/2019 Tech Report NWU-EECS-10-09: The End User in Computer Architecture and Systems Research
http://slidepdf.com/reader/full/tech-report-nwu-eecs-10-09-the-end-user-in-computer-architecture-and-systems 101/136
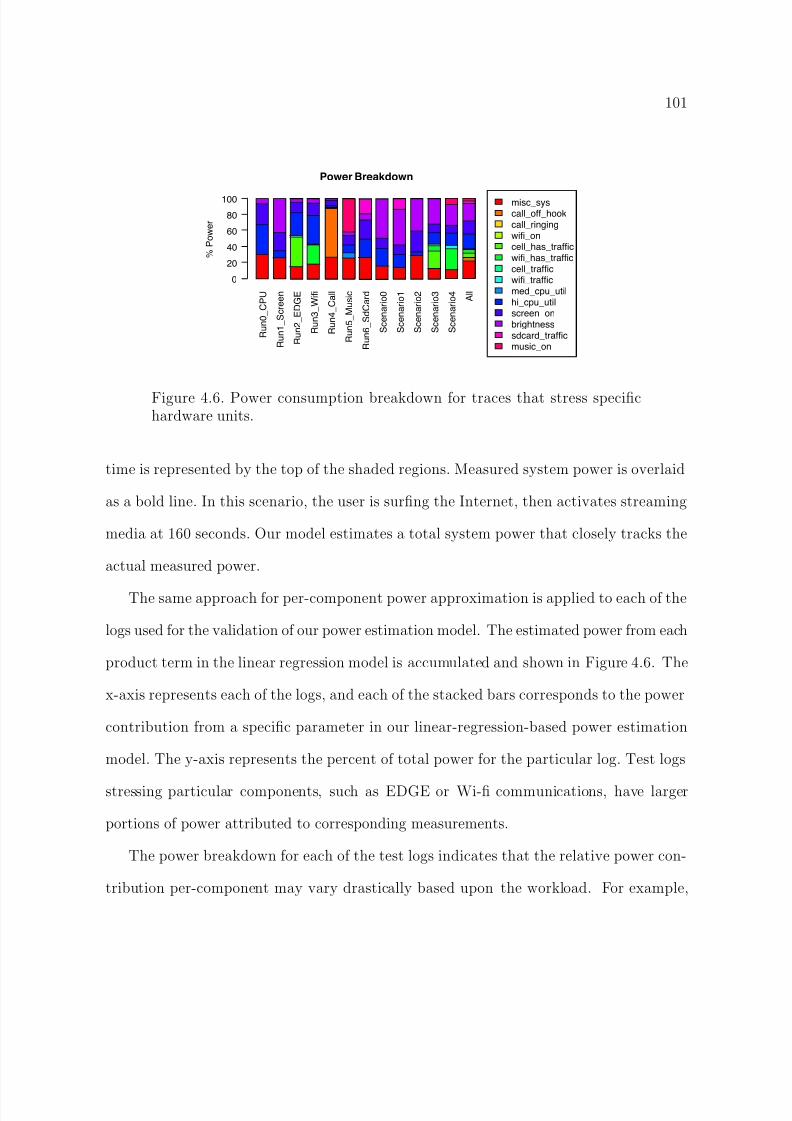
8/7/2019 Tech Report NWU-EECS-10-09: The End User in Computer Architecture and Systems Research
http://slidepdf.com/reader/full/tech-report-nwu-eecs-10-09-the-end-user-in-computer-architecture-and-systems 102/136
101
R u n 0_
C P U
R u n 1_
S c r e e n
R u n 2_
E D G E
R u n 3_
W i f i
R u n 4_
C a l l
R u n 5_
M u s i c
R u n 6_
S d C a r d
S c e n a r i o 0
S c e n a r i o 1
S c e n a r i o 2
S c e n a r i o 3
S c e n a r i o 4 A
l l
Power Breakdown
% P o w e r
0
20
40
60
80
100 misc_syscall_off_hookcall_ringingwifi_oncell_has_trafficwifi_has_trafficcell_trafficwifi_trafficmed_cpu_utilhi_cpu_utilscreen_onbrightnesssdcard_trafficmusic_on
Figure 4.6. Power consumption breakdown for traces that stress specichardware units.
time is represented by the top of the shaded regions. Measured system power is overlaid
as a bold line. In this scenario, the user is surng the Internet, then activates streaming
media at 160 seconds. Our model estimates a total system power that closely tracks the
actual measured power.
The same approach for per-component power approximation is applied to each of the
logs used for the validation of our power estimation model. The estimated power from each
product term in the linear regression model is accumulated and shown in Figure 4.6. The
x-axis represents each of the logs, and each of the stacked bars corresponds to the power
contribution from a specic parameter in our linear-regression-based power estimation
model. The y-axis represents the percent of total power for the particular log. Test logs
stressing particular components, such as EDGE or Wi- communications, have larger
portions of power attributed to corresponding measurements.
The power breakdown for each of the test logs indicates that the relative power con-
tribution per-component may vary drastically based upon the workload. For example,
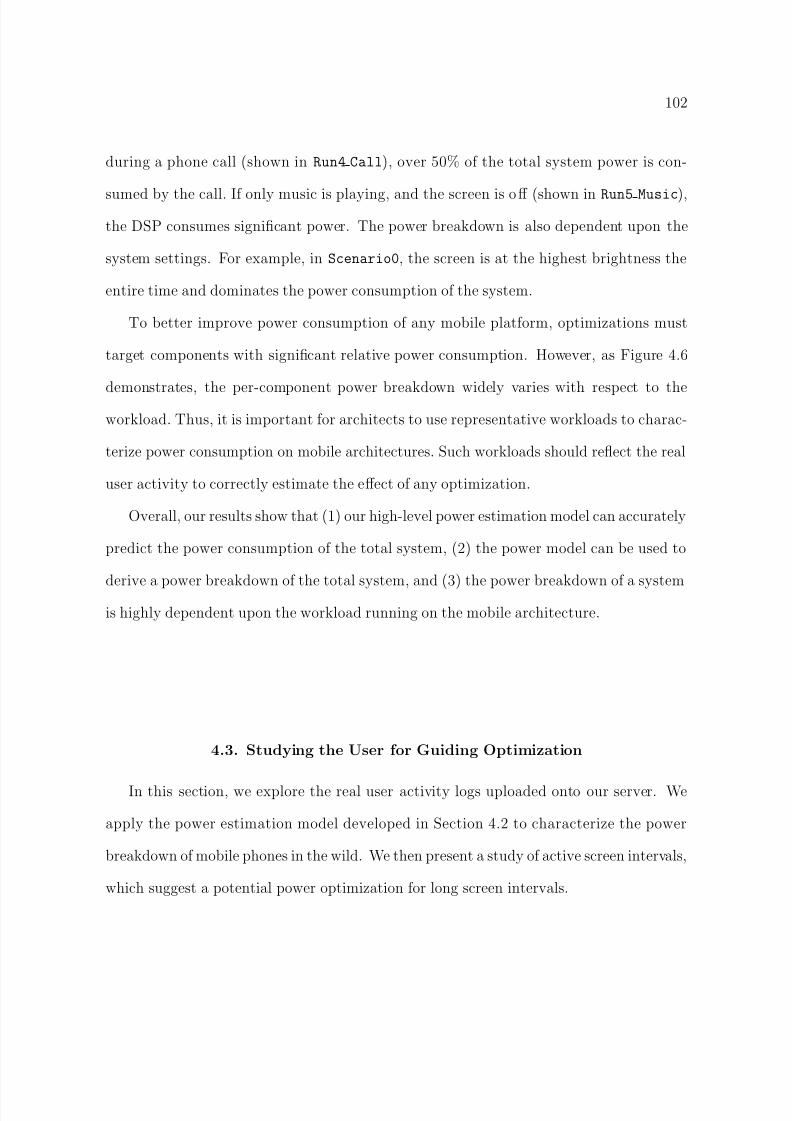
8/7/2019 Tech Report NWU-EECS-10-09: The End User in Computer Architecture and Systems Research
http://slidepdf.com/reader/full/tech-report-nwu-eecs-10-09-the-end-user-in-computer-architecture-and-systems 103/136
102
during a phone call (shown in Run4 Call ), over 50% of the total system power is con-
sumed by the call. If only music is playing, and the screen is o ff (shown in Run5 Music ),the DSP consumes signicant power. The power breakdown is also dependent upon the
system settings. For example, in Scenario0 , the screen is at the highest brightness the
entire time and dominates the power consumption of the system.
To better improve power consumption of any mobile platform, optimizations must
target components with signicant relative power consumption. However, as Figure 4.6
demonstrates, the per-component power breakdown widely varies with respect to theworkload. Thus, it is important for architects to use representative workloads to charac-
terize power consumption on mobile architectures. Such workloads should reect the real
user activity to correctly estimate the e ff ect of any optimization.
Overall, our results show that (1) our high-level power estimation model can accurately
predict the power consumption of the total system, (2) the power model can be used to
derive a power breakdown of the total system, and (3) the power breakdown of a systemis highly dependent upon the workload running on the mobile architecture.
4.3. Studying the User for Guiding Optimization
In this section, we explore the real user activity logs uploaded onto our server. We
apply the power estimation model developed in Section 4.2 to characterize the power
breakdown of mobile phones in the wild. We then present a study of active screen intervals,
which suggest a potential power optimization for long screen intervals.

8/7/2019 Tech Report NWU-EECS-10-09: The End User in Computer Architecture and Systems Research
http://slidepdf.com/reader/full/tech-report-nwu-eecs-10-09-the-end-user-in-computer-architecture-and-systems 104/136
103
4.3.1. Characterizing Real User Workloads
As described in Section 4.2.4 (and shown in Figure 4.6), the workload of a mobile ar-
chitecture has a large e ff ect on its power consumption; the hardware components that
dominate power consumption vary drastically depending upon the workload. Since the
user determines the workload for a mobile architecture, we must study real user behavior
to understand the actual power consumption of mobile architectures in real environments.
To this end, we have collected logs from users who have downloaded our logging appli-
cation from Android Market, as described in Section 4.1. The logs contain the activity
of 20 users, each for a duration exceeding a week, and accounting for approximately 250
days of user activity.
The power breakdown from each of the user logs is shown in Figure 4.7. Figure 4.7(a)
shows the power breakdown including the estimated power contribution of the Idle state.
To provide a clear breakdown of the power in the Active state, Figure 4.7(b) shows the
same power breakdown excluding the samples from the Idle state. The x-axis represents
each of the users. The product terms for each of the hardware components are com-
bined for readability. The only exception is the screen, which is still shown separately
as screen on and brightness . We show both because the screen contributes heavily to
the power breakdown of the system, and also because one of our optimizations (described
later in Section 4.4) specically targets reducing the screen brightness.
When examining the power consumption of the Idle state in Figure 4.7(a), two points
are apparent. First, the power consumed during the Idle state can contribute to a signif-
icant fraction of the total system power consumption. The power consumed in the Idle
state accounts for 49.3% of the total system power when averaging across all of the users.

8/7/2019 Tech Report NWU-EECS-10-09: The End User in Computer Architecture and Systems Research
http://slidepdf.com/reader/full/tech-report-nwu-eecs-10-09-the-end-user-in-computer-architecture-and-systems 105/136

8/7/2019 Tech Report NWU-EECS-10-09: The End User in Computer Architecture and Systems Research
http://slidepdf.com/reader/full/tech-report-nwu-eecs-10-09-the-end-user-in-computer-architecture-and-systems 106/136
105
When isolating the power consumption during the Active state (shown in Figure 4.7(b)),
we again notice a large variation in the activity among all 20 users. For example, the powerbreakdown for User 4 and User 12 is dominated by the phone calls. User 6 and User 19
have their screen brightness set high, and thus, the brightness dominates their power
breakdown. In addition, there is varying activity with regard to EDGE network usage
versus Wi- network usage.
Overall, during Active usage time, two hardware components dominate the power
consumption when averaging across all users: the screen and the CPU. The screen largelydominates the Active power breakdown and consumes 35 .5% of the Active power; 19.2%
due to the screen brightness and 16 .3% due to the screen being on. The CPU accounts
for 12.7% of the total Active power.
Although the Idle state may sometimes dominate the total system power, in this
paper, we primarily focus on the power during the Active state. There are three reason to
be concerned with the Active state. First, the power consumed during the Idle state ( ≈68 mW) is signicantly lower than the power that can be consumed in the Active state (up
to 2000 mW when listening to music and using Wi- as shown in Figure 4.5). Second, the
Active state contributes highly to the user experience since the user is actively engaged
during the Active state. Any application that requires the apps processor would require
the device to wake up and exit Idle mode. Finally, the Active state still accounts for large
fraction of the power consumed, accounting for 50.7% of the total system power.

8/7/2019 Tech Report NWU-EECS-10-09: The End User in Computer Architecture and Systems Research
http://slidepdf.com/reader/full/tech-report-nwu-eecs-10-09-the-end-user-in-computer-architecture-and-systems 107/136
106
4.3.2. Screen Usage of Real Users
Because the screen is the primary output device for interacting with the end user, the
screen is a good indicator of user activity patterns. In addition, as we have shown in the
previous section, it is the highest power consuming component on the device. We parse all
of the user activity logs to extract screen intervals . A screen interval is a continuous block
of time where the screen is on. The duration of a screen interval refers to the length of
time that corresponds to the screen interval. The total duration time refers to the sum of
durations for all screen intervals. From these intervals, we extract 9678 screen durations
from our database, which accounts for 8 .8 days worth of cumulative active “screen on”
time.
Figure 4.8(a) shows the cumulative fraction of the total duration for screen intervals
up to 500 seconds. We see that screen intervals of 100 seconds or more constitute roughly
70% of the total screen duration (equivalently, as shown in Figure 4.8(a), 30% of the
total screen duration is contributed by intervals shorter than 100 seconds). Figure 4.8(b)
shows the cumulative distribution function (CDF) relating the total duration time to
percentage of screen intervals. In other words, it shows the percentage of total duration
time (shown on the y-axis) accounted for by the fraction of screen intervals with the
shortest durations (x-axis). Figure 4.8(c) shows the ratio of total duration time accounted
for by intervals shorter than a specic screen duration time, up to 150 seconds. This means
that it shows the fraction of total duration if the rst X seconds of each screen interval
is considered.
Studying the screen intervals indicates that the total duration time is dominated by a
relatively small percentage of long screen intervals. If we observe the 40 second mark on
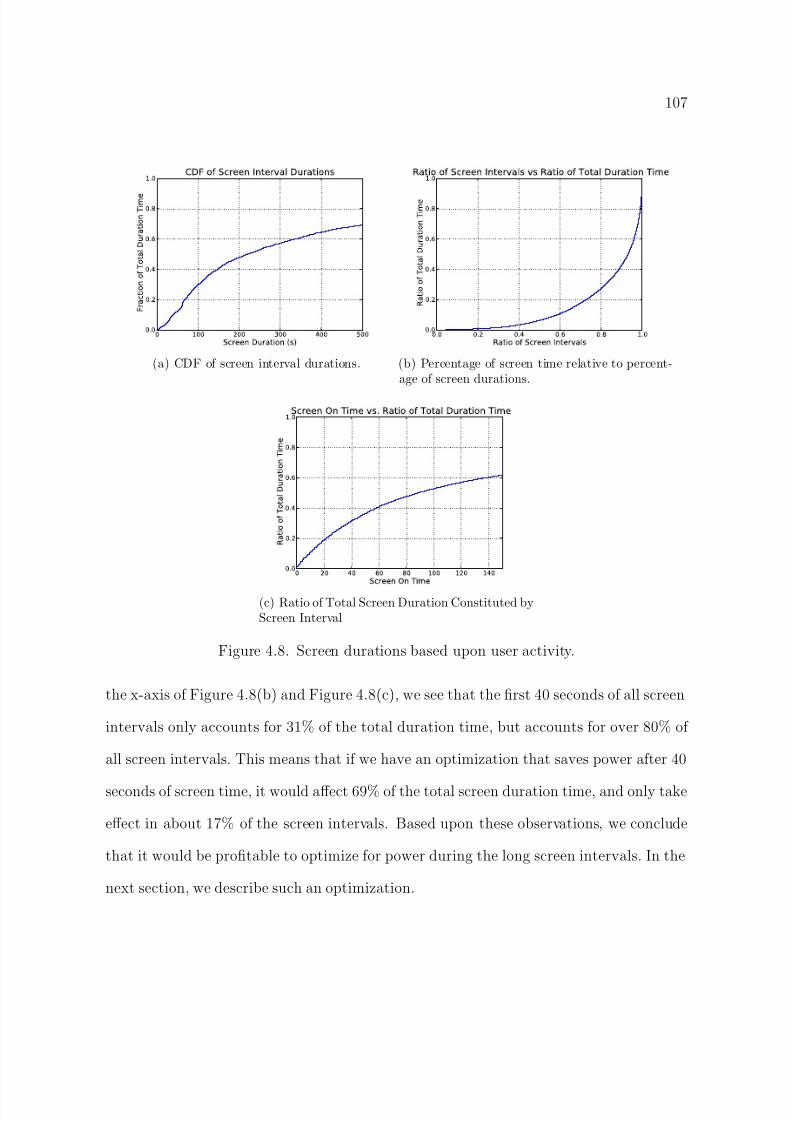
8/7/2019 Tech Report NWU-EECS-10-09: The End User in Computer Architecture and Systems Research
http://slidepdf.com/reader/full/tech-report-nwu-eecs-10-09-the-end-user-in-computer-architecture-and-systems 108/136
107
(a) CDF of screen interval durations. (b) Percentage of screen time relative to percent-age of screen durations.
(c) Ratio of Total Screen Duration Constituted byScreen Interval
Figure 4.8. Screen durations based upon user activity.
the x-axis of Figure 4.8(b) and Figure 4.8(c), we see that the rst 40 seconds of all screen
intervals only accounts for 31% of the total duration time, but accounts for over 80% of
all screen intervals. This means that if we have an optimization that saves power after 40
seconds of screen time, it would aff ect 69% of the total screen duration time, and only take
eff ect in about 17% of the screen intervals. Based upon these observations, we conclude
that it would be protable to optimize for power during the long screen intervals. In the
next section, we describe such an optimization.
8/7/2019 Tech Report NWU-EECS-10-09: The End User in Computer Architecture and Systems Research
http://slidepdf.com/reader/full/tech-report-nwu-eecs-10-09-the-end-user-in-computer-architecture-and-systems 109/136
108
4.4. User-Aware Optimization
As described in the Section 4.3, surprisingly, a few long screen intervals dominate the
overall screen duration time. In addition, the power consumption during Active time is
dominated by the screen and the CPU. To reduce the power consumption during these
long intervals, we devise a scheme that reduces the brightness. Instead of simply dropping
the brightness abruptly, we utilize change blindness , which is described in the next section.
We also devise a similar scheme to control the CPU frequency.
4.4.1. Change Blindness
Researchers in human psychology and perception have revealed an inability for humans
to detect large changes in their surrounding environment. One commonly-known study
involves a video that prompts the viewer to count the number of times a basketball is
passed. Halfway through the video, a man in a gorilla suit walks into the middle of
the group of basketball players, thumps its chest, and then walks away. Surprisingly,
the majority of viewers do not remember seeing a man in a gorilla suit, even though
the concept is absurd and is in clear view in the middle of the video [ 96 ]. Change
blindness refers to this inability for humans to detect large changes in their environment.
The gorilla-suit study refers to change blindness of dynamic events, and occurs because
although a human will view the entire video, their attention dictates the visual data
that is processed. There have also been studies exploring change blindness in the case of
gradual changes. Change blindness in the presence of gradual changes is more surprising
as humans will miss signicant changes without being distracted or disrupted. One study
demonstrates change blindness as objects within images are removed from a picture, or

8/7/2019 Tech Report NWU-EECS-10-09: The End User in Computer Architecture and Systems Research
http://slidepdf.com/reader/full/tech-report-nwu-eecs-10-09-the-end-user-in-computer-architecture-and-systems 110/136
109
as the color of objects are slowly changed [97 ]. Another demonstrates change blindness
as facial expressions are slowly changed in a picture.We aim to utilize change blindness to reduce the power consumption of the device
without causing any dissatisfaction to the users. Specically, we devise schemes that
reduce the screen brightness and CPU frequency slowly to save power. We compare
these schemes to alternatives where the brightness and frequency are abruptly reduced
and show that change blindness can indeed be utilized to save power consumption while
minimizing the user dissatisfaction. We describe these schemes in the following section.To the best of our knowledge, this is the rst study analyzing change blindness in the
context of computer performance.
4.4.2. CPU Optimization
Existing DFS. The default system image used on the HTC Dream platform supports
dynamic frequency scaling (DFS) on the ARM 11 apps processor, but uses a naıve DFSalgorithm based upon the screen 1. If the apps processor is active and the screen is on,
the processor is set to the highest frequency (384 MHz). If the apps processor is active
and the screen is off , the processor is set to the middle frequency (246 MHz).
ondemand governor. A commonly used DFS scheme on desktop/server environments
is the Linux ondemand DFS governor. The general algorithm is shown in Algorithm 3.
At a high-level, the ondemand makes decisions based upon the CPU utilization. If theutilization is above a UP THRESHOLD, it raises the CPU to the highest frequency. If the
utilization is below a DOWN THRESHOLD, it calculates the frequency that would maintain the
1We have not found a conrmed description of this DFS scheme in any documentation on the HTCDream, but have discovered this DFS behavior through our own experience with the device.
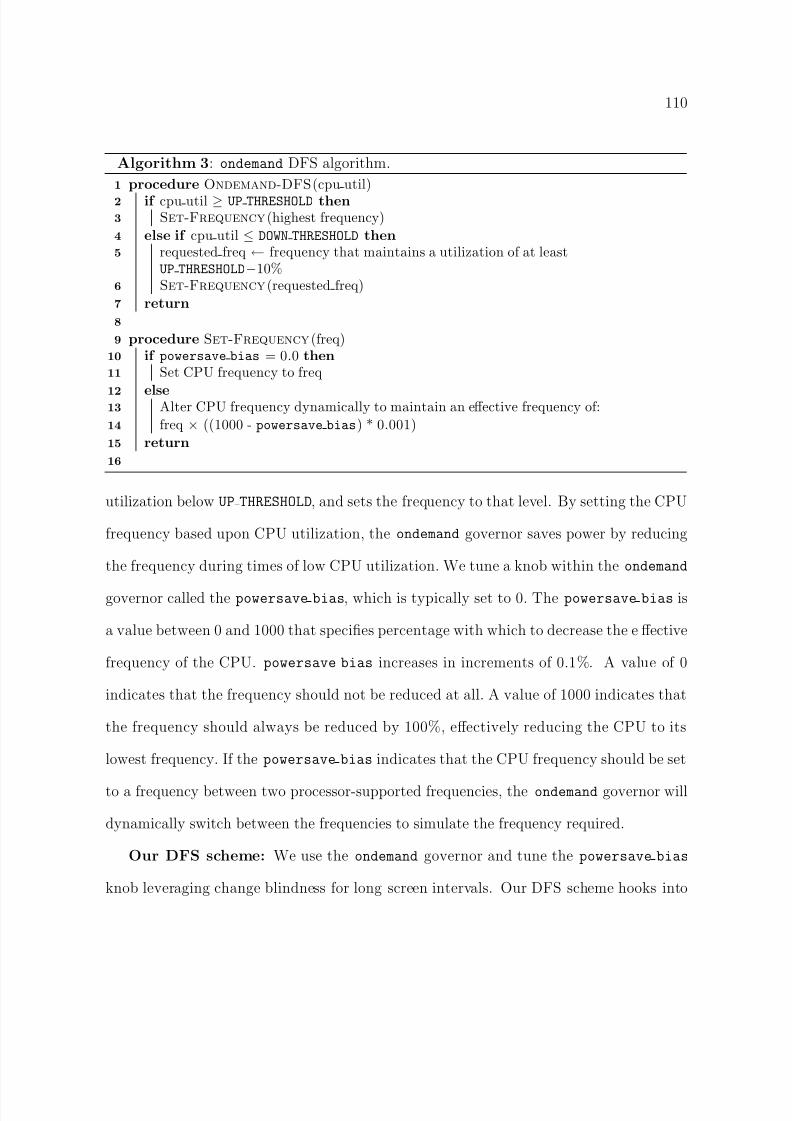
8/7/2019 Tech Report NWU-EECS-10-09: The End User in Computer Architecture and Systems Research
http://slidepdf.com/reader/full/tech-report-nwu-eecs-10-09-the-end-user-in-computer-architecture-and-systems 111/136
110
Algorithm 3 : ondemand DFS algorithm.procedure Ondemand-DFS (cpu util)1
if cpu util ≥ UP THRESHOLDthen2
Set-Frequency (highest frequency)3
else if cpu util ≤ DOWN THRESHOLDthen4
requested freq ← frequency that maintains a utilization of at least5
UP THRESHOLD− 10%Set-Frequency (requested freq)6
return7
8
procedure Set-Frequency (freq)9
if powersave bias = 0.0 then10
Set CPU frequency to freq11
else12
Alter CPU frequency dynamically to maintain an e ff ective frequency of:13
freq × ((1000 - powersave bias ) * 0.001)14
return15
16
utilization below UP THRESHOLD, and sets the frequency to that level. By setting the CPU
frequency based upon CPU utilization, the ondemand governor saves power by reducing
the frequency during times of low CPU utilization. We tune a knob within the ondemand
governor called the powersave bias , which is typically set to 0. The powersave bias is
a value between 0 and 1000 that species percentage with which to decrease the e ff ective
frequency of the CPU. powersave bias increases in increments of 0 .1%. A value of 0
indicates that the frequency should not be reduced at all. A value of 1000 indicates that
the frequency should always be reduced by 100%, e ff ectively reducing the CPU to its
lowest frequency. If the powersave bias indicates that the CPU frequency should be set
to a frequency between two processor-supported frequencies, the ondemand governor will
dynamically switch between the frequencies to simulate the frequency required.
Our DFS scheme: We use the ondemand governor and tune the powersave bias
knob leveraging change blindness for long screen intervals. Our DFS scheme hooks into
8/7/2019 Tech Report NWU-EECS-10-09: The End User in Computer Architecture and Systems Research
http://slidepdf.com/reader/full/tech-report-nwu-eecs-10-09-the-end-user-in-computer-architecture-and-systems 112/136
111
the screen events. Every four seconds, we increase the powersave bias in increments of
30 (decrease eff ective frequency by 3%), until a maximum limit of 300 is reached. If thescreen is turned o ff , the powersave bias is reset back to 0. Thus, it reaches 70% of the
frequency requested by ondemand within 40 seconds.
4.4.3. Screen Optimization
We implement a screen optimization to leverage change blindness that is similar to our
CPU optimization. Again, we hook into the screen on and o ff events. We keep track of
the user-set screen brightness. When the screen turns on, we set a timer for 3 seconds.
Every 3 seconds, we decrease the brightness of the screen by 7 units (out of a maximum
brightness of 255). We continue until the brightness reaches 60% of the user-set screen
brightness and then stop. When the screen is turned o ff , we set the brightness back to
the regular user-set screen brightness.
The idea in this scheme is to utilize two previous observations. First, since we slowly
reduce the screen brightness, we will not reduce the power consumption on small screen in-
tervals. However, as we have shown in the previous section, long screen intervals dominate
the total screen duration, hence our optimization should still be able to save considerable
fraction of the overall screen power consumption. Second, since our scheme reduces the
screen brightness slowly, we expect that the users will be less likely to distinguish the
change when compared to a sudden decrease in the screen brightness. Our experiments,
described in Section 4.5, conrm that both of these goals are achieved.
8/7/2019 Tech Report NWU-EECS-10-09: The End User in Computer Architecture and Systems Research
http://slidepdf.com/reader/full/tech-report-nwu-eecs-10-09-the-end-user-in-computer-architecture-and-systems 113/136
112
4.5. Experimental Results
We now evaluate our optimizations described in Section 4.4. We refer to the two
optimizations as Screen Ramp and CPU Ramp , for the screen and CPU optimizations,
respectively. To test the change blindness hypothesis, we also introduce two more control
schemes: Screen Drop and CPU Drop . Both of the Drop schemes wait 30 seconds before
dropping to the respective minimum threshold levels of each of the change-blindness-
inspired optimizations. In other words, the Drop and Ramp schemes eventually settle at
the same brightness/frequency. However, the Ramp schemes slowly reach this destination,
whereas the Drop schemes wait at the high brightness/frequency for the initial 30 seconds,
before adjusting sharply to the nal level.
We rst evaluate the potential power savings of the optimization schemes by emulating
the optimizations on the user logs. We then conduct a user study to assess user acceptance
of our optimization schemes and to test our hypothesis on whether change blindness can
be leveraged to optimize long screen intervals.
4.5.1. Power Savings
We approximate the power savings for each of our schemes by emulating the optimizations
on user activity logs. To estimate the power savings of the screen optimizations, we
adjust the brightness measurements in the logs to reect the Screen Drop and Screen
Ramp optimizations. Then, these new values are fed into the power model to generate
the power consumption of the alternatives. To estimate the power savings of the CPU
optimization, we rst perform an estimation of the ondemand governor. If the CPU
utilization is below 20%, we assume that ondemand would set the frequency to the lower
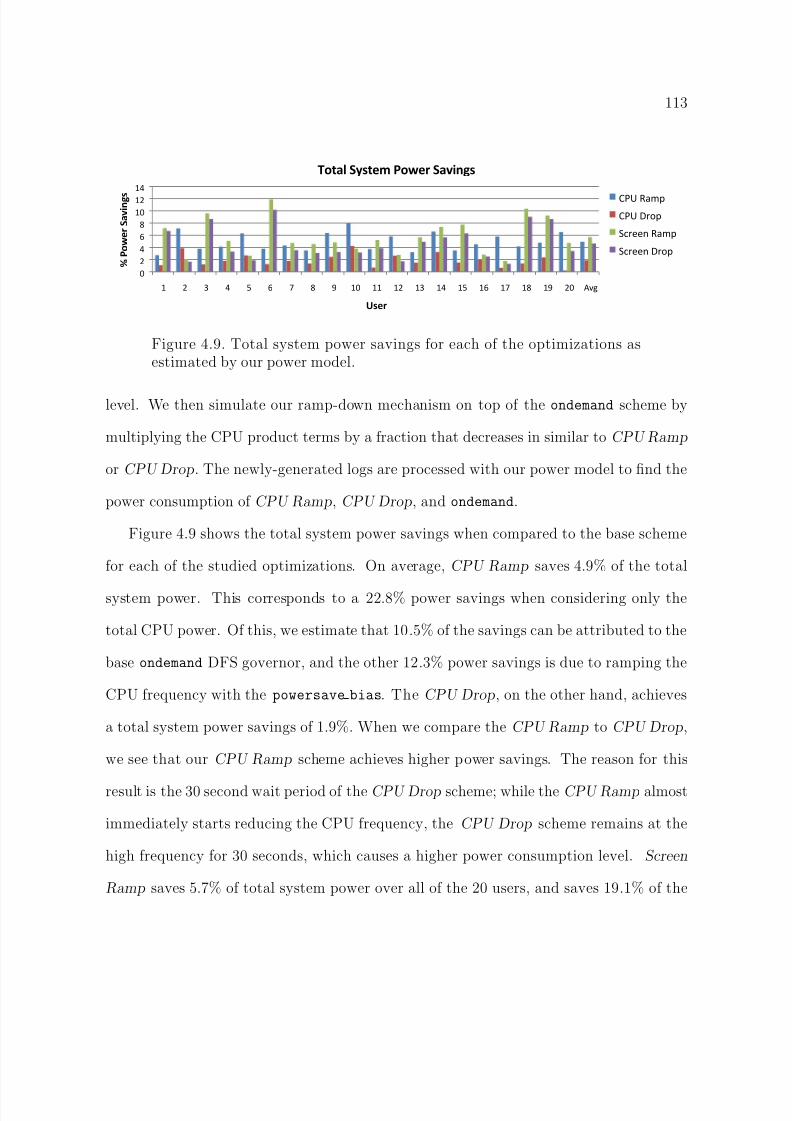
8/7/2019 Tech Report NWU-EECS-10-09: The End User in Computer Architecture and Systems Research
http://slidepdf.com/reader/full/tech-report-nwu-eecs-10-09-the-end-user-in-computer-architecture-and-systems 114/136

8/7/2019 Tech Report NWU-EECS-10-09: The End User in Computer Architecture and Systems Research
http://slidepdf.com/reader/full/tech-report-nwu-eecs-10-09-the-end-user-in-computer-architecture-and-systems 115/136
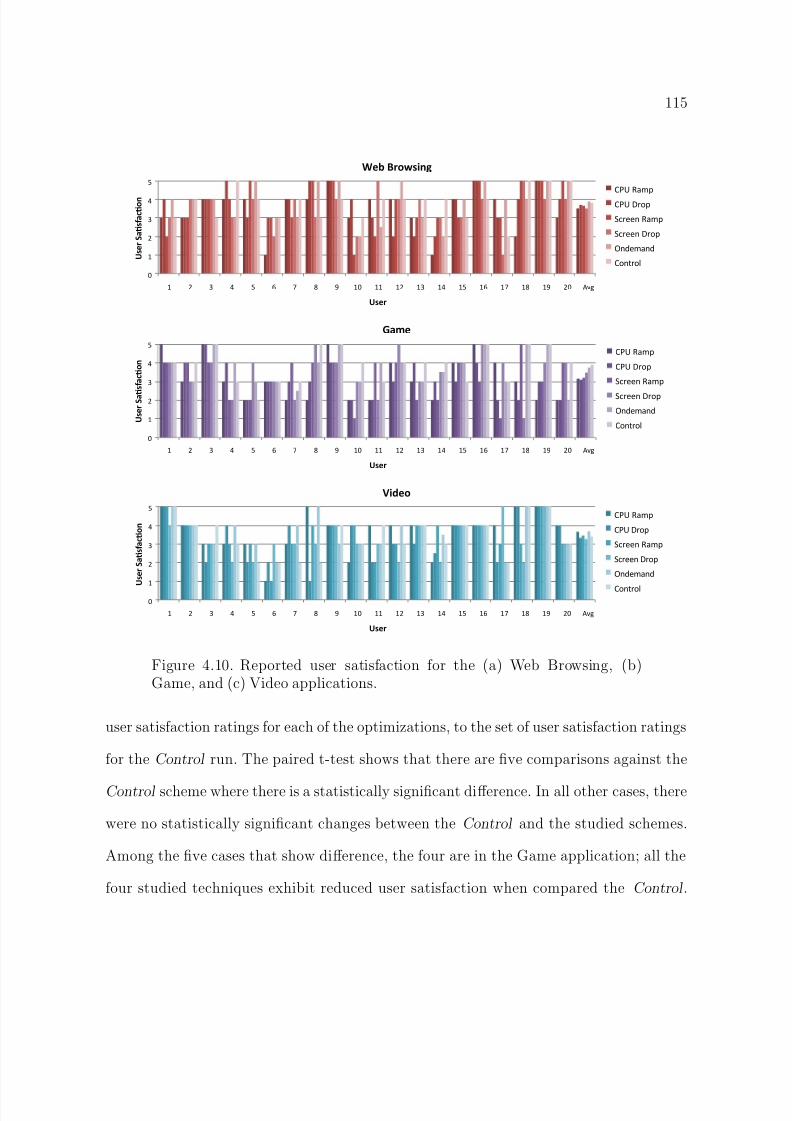
8/7/2019 Tech Report NWU-EECS-10-09: The End User in Computer Architecture and Systems Research
http://slidepdf.com/reader/full/tech-report-nwu-eecs-10-09-the-end-user-in-computer-architecture-and-systems 116/136
115
!"
#"
$"
%"
&"
'"
#" $" %" &" '" (" )" *" +" #!" ##" #$" #%" #&" #'" #(" #)" #*" #+" $!" ,-."
! " # $ & ' ( " ) ' * ( + ,
!"#$%
-#.%/$+0"1,2%
/01"2345"
/01"6785"
9:7;;<"2345"
9:7;;<"6785"
=<>;43<>"
/8<?78@"
!"
#"
$"
%"
&"
'"
#" $" %" &" '" (" )" *" +" #!" ##" #$" #%" #&" #'" #(" #)" #*" #+" $!" ,-."
! " # $ & ' ( " ) ' * ( + ,
!"#$%
-'.#%
/01"2345"
/01"6785"
9:7;;<"2345"
9:7;;<"6785"
=<>;43<>"
/8<?78@"
!"
#"
$"
%"
&"
'"
#" $" %" &" '" (" )" *" +" #!" ##" #$" #%" #&" #'" #(" #)" #*" #+" $!" ,-."
! " # $ & ' ( " ) ' * ( + ,
!"#$%
-./#+%
/01"2345"
/01"6785"
9:7;;<"2345"
9:7;;<"6785"
=<>;43<>"
/8<?78@"
Figure 4.10. Reported user satisfaction for the (a) Web Browsing, (b)Game, and (c) Video applications.
user satisfaction ratings for each of the optimizations, to the set of user satisfaction ratings
for the Control run. The paired t-test shows that there are ve comparisons against the
Control scheme where there is a statistically signicant di ff erence. In all other cases, there
were no statistically signicant changes between the Control and the studied schemes.
Among the ve cases that show di ff erence, the four are in the Game application; all the
four studied techniques exhibit reduced user satisfaction when compared the Control .

8/7/2019 Tech Report NWU-EECS-10-09: The End User in Computer Architecture and Systems Research
http://slidepdf.com/reader/full/tech-report-nwu-eecs-10-09-the-end-user-in-computer-architecture-and-systems 117/136
116
The fth comparison that di ff ers is the Screen Drop for Web Browsing. Overall, when
comparing the di ff erent schemes, Screen Drop was statistically di ff erent from the Control
run for the Game and Web applications, and the other schemes (barring the Ondemand
scheme) diff ered from the Control run only on the Game application.
4.5.3. User Feedback and Acceptance
At the end the study, we debriefed each user by informing them of the purpose of the
experiment. We discussed the power characterization study, that the CPU and screen
tended to dominate the power consumption, and introduced our di ff erent power saving
schemes to them. Afterwards, we questioned each user about their opinions on our various
power saving schemes for the screen and CPU.
When compiling notes on the discussions with the users, we recognized two general
trends:
• Most users determine their user satisfaction based upon how smoothly the com-
puter responds to their input. 9 of the 20 users let us know they rated runs poorly
when there were pauses, or the screen became jumpy/jittery. Our schemes per-
formed the worst on the Game because any glitch would a ff ect the smoothness
of the bouncing ball and would be immediately noticeable. A result of this is
that the rate of change for the CPU frequency does not matter – once the appli-
cation becomes jittery, user satisfaction decreases. This trend is another reason
why we did not observe a diff erence between the CPU Ramp and CPU Drop
schemes; both of these schemes cause jitters after a certain CPU level is reached
and regardless of how slowly we reduce the frequency, the glitches are noticeable.

8/7/2019 Tech Report NWU-EECS-10-09: The End User in Computer Architecture and Systems Research
http://slidepdf.com/reader/full/tech-report-nwu-eecs-10-09-the-end-user-in-computer-architecture-and-systems 118/136
8/7/2019 Tech Report NWU-EECS-10-09: The End User in Computer Architecture and Systems Research
http://slidepdf.com/reader/full/tech-report-nwu-eecs-10-09-the-end-user-in-computer-architecture-and-systems 119/136

8/7/2019 Tech Report NWU-EECS-10-09: The End User in Computer Architecture and Systems Research
http://slidepdf.com/reader/full/tech-report-nwu-eecs-10-09-the-end-user-in-computer-architecture-and-systems 120/136
8/7/2019 Tech Report NWU-EECS-10-09: The End User in Computer Architecture and Systems Research
http://slidepdf.com/reader/full/tech-report-nwu-eecs-10-09-the-end-user-in-computer-architecture-and-systems 121/136
8/7/2019 Tech Report NWU-EECS-10-09: The End User in Computer Architecture and Systems Research
http://slidepdf.com/reader/full/tech-report-nwu-eecs-10-09-the-end-user-in-computer-architecture-and-systems 122/136
121
Zilles proposes increasing interactivity by predicting user actions [ 118 ]. Davison also
studies the predictability of user actions [ 30 ].Bi proposes IADVS [14 ], a DVFS scheme based upon predicting the CPU utilization
following user input events. Vertigo [ 43 ] monitors application messages and can be used
to perform the optimizations implemented in our study (although to the best of our
knowledge this has not been studied). However, compared to Vertigo, our approach
provides a metric/framework that is much easier to use.
Anand, Nightingale, and Flinn [ 6 ] discuss the concept of a control parameter thatcould be used by the user. However, they focus on the wireless networking domain, not
the CPU. Second, they do not propose or evaluate a user interface.
Falaki studies real smartphone usage and nd a wide variability in smartphone us-
age [41 ]. Phillips studies user activity for predicting when to sleep for wireless mobile
devices [83 ]. MyExperience [44 ] gathers traces from user phones in the wild, similar
to our work, but uses the traces to study high-level user actions. We study user activitypatterns to understand system performance and for saving power on mobile architectures.
Outside of computer architecture and systems, the end user has been studied in a
number of contexts. Some examples include incorporating the end user for improving
internet security with CAPTCHAs [ 109 ], solving difficult AI problems via computer
games [110, 108 ], modeling the user for improving video streaming [ 70 ], studying the
perceptual quality of a media [ 28, 29, 61, 85, 90 ], and human-computer interaction
researchers develop applications for improving the human condition [ 24, 25, 26 ].

8/7/2019 Tech Report NWU-EECS-10-09: The End User in Computer Architecture and Systems Research
http://slidepdf.com/reader/full/tech-report-nwu-eecs-10-09-the-end-user-in-computer-architecture-and-systems 123/136

8/7/2019 Tech Report NWU-EECS-10-09: The End User in Computer Architecture and Systems Research
http://slidepdf.com/reader/full/tech-report-nwu-eecs-10-09-the-end-user-in-computer-architecture-and-systems 124/136
8/7/2019 Tech Report NWU-EECS-10-09: The End User in Computer Architecture and Systems Research
http://slidepdf.com/reader/full/tech-report-nwu-eecs-10-09-the-end-user-in-computer-architecture-and-systems 125/136
124
select Intel Itanium 2 processors to adjust core frequency during operation to boost appli-
cation performance. To the best of our knowledge, none of the previous DVFS techniquesconsider the user satisfaction prediction.
Sasaki et al. [88 ] propose a novel DVFS method based on statistical analysis of per-
formance counters. However, their technique needs compiler support to insert code for
performance prediction. Furthermore, their technique does not consider user satisfaction
while setting the frequency. The primary contribution of our work is to establish the
correlation between hardware counters and user satisfaction and utilize this correlationto develop a user-aware DVFS technique.
Other DVFS algorithms use task information, such as measured response times in
interactive applications [ 68, 116 ] as a proxy for the user.
Xu, Ross, and Melhem propose novel schemes [115 ] minimizing energy consumption
in real-time embedded systems that execute variable workloads. However, they try to
adapt to the variability of the workload rather than to the users.
5.6. Screen Optimizations
Researchers have studied screen optimizations that would be enabled with OLED
display technology. They explore altering the user interface to dim certain parts of screen
to save considerable power, and do a user acceptance study [ 16, 51 ]. Our work operates
on existing screen technology and leverages change blindness with gradual changes to save
power.
8/7/2019 Tech Report NWU-EECS-10-09: The End User in Computer Architecture and Systems Research
http://slidepdf.com/reader/full/tech-report-nwu-eecs-10-09-the-end-user-in-computer-architecture-and-systems 126/136

8/7/2019 Tech Report NWU-EECS-10-09: The End User in Computer Architecture and Systems Research
http://slidepdf.com/reader/full/tech-report-nwu-eecs-10-09-the-end-user-in-computer-architecture-and-systems 127/136
8/7/2019 Tech Report NWU-EECS-10-09: The End User in Computer Architecture and Systems Research
http://slidepdf.com/reader/full/tech-report-nwu-eecs-10-09-the-end-user-in-computer-architecture-and-systems 128/136
8/7/2019 Tech Report NWU-EECS-10-09: The End User in Computer Architecture and Systems Research
http://slidepdf.com/reader/full/tech-report-nwu-eecs-10-09-the-end-user-in-computer-architecture-and-systems 129/136

8/7/2019 Tech Report NWU-EECS-10-09: The End User in Computer Architecture and Systems Research
http://slidepdf.com/reader/full/tech-report-nwu-eecs-10-09-the-end-user-in-computer-architecture-and-systems 130/136
8/7/2019 Tech Report NWU-EECS-10-09: The End User in Computer Architecture and Systems Research
http://slidepdf.com/reader/full/tech-report-nwu-eecs-10-09-the-end-user-in-computer-architecture-and-systems 131/136
130
[50] S. Gurun and C. Krintz. A run-time feedback-based energy estimation model for embeddeddevices. In Proceedings of the Intl. Conference on Hardware/Software Codesign and System
Synthesis , pages 28–33, October 2006.[51] T. Harter, S. Vroegindeweij, E. Geelhoed, M. Manahan, and P. Ranganathan. Energy-
aware user interfaces: An evaluation of user acceptance. In Proceedings of the Conferenceon Human Factors in Computing Systems , pages 199–206, April 2004.
[52] R. L. Hazlett and J. Benedek. Measuring emotional valence to understad the user’s expe-rience of software. International Journal of Human-Computer Studies , 65:306–314, 2007.
[53] Hewlett-Packard Development Company. perfmon projecthttp://www.hpl.hp.com/research/linux/perfmon/.
[54] Intel Corporation. Intel 64 and IA-32 Architecture Software Developer’s Manual Volume3A: System Programming Guide . Santa Clara, CA, 2002.
[55] Intel Corporation. Intel Itanium 2 processor reference manual: For software developmentand optimization. May 2004.
[56] S. T. Iqbal, P. D. Adamczyk, Z. S. Zheng, and B. P. Bailey. Towards an index of oppor-tunity: Understanding changes in mental worklad during task execution. In Proceedingsof the Conference on Human Factors in Computing Systems (CHI) , pages 311–320, April2005.
[57] Joao P. Sousa and Rajesh K. Balan and Vahe Poladian and David Garlan and MahadevSatyanarayanan. Giving users the steering wheel for guiding resource-adaptive systems.Technical Report CMU-CS-05-198, Carnegie Mellon University, School of Computer Sci-ence, Dec 2005.
[58] R. Joseph and M. Martonosi. Run-time power estimation in high performance micropro-cessors. In Proceedings of the Intl. Symposium on Low Power Electronics and Design ,August 2001.
[59] I. Kadayif, T. Chinoda, M. T. Kandemir, N. Vijaykrishnan, M. J. Irwin, and A. Siva-subramaniam. vec: virtual energy counters. In Proceedings of the Workshop on Program Analysis For Software Tools and Engineering , June 2001.
[60] A. Kapoor, W. Burleson, and R. W. Picard. Automatic prediction of frustration. Intl.Journal of Human-Computer Studies , pages 724–736, August 2007.
[61] J.-G. Kim, Y. Wang, and S.-F. Chang. Content-adaptive utility-based video adaptation.In Proceedings of the International Conference on Multimedia and Expo , pages 281–284,2003.
[62] J.-O. Klein, J.-O. Klein, L. Lacassagne, H. Mathias, S. Moutault, and A. Dupret. Lowpower image processing: Analog versus digital comparison. In CAMP ’05: Proceedings of the Seventh International Workshop on Computer Architecture for Machine Perception ,pages 111–115, Washington, DC, USA, 2005. IEEE Computer Society.
[63] J. Lange, P. A. Dinda, and S. Rossoff
. Experiences with client-based speculative remotedisplay. In Proceedings of the USENIX Annual Technical Conference , June 2008.[64] T. Li and L. K. John. Run-time modeling and estimation of operating system power
consumption. In SIGMETRICS , 2003.[65] B. Lin and P. A. Dinda. Putting the user in direct control of cpu scheduling. In Proceedings
of the International Symposium on High Performance Distributed Computing , June 2006.

8/7/2019 Tech Report NWU-EECS-10-09: The End User in Computer Architecture and Systems Research
http://slidepdf.com/reader/full/tech-report-nwu-eecs-10-09-the-end-user-in-computer-architecture-and-systems 132/136

8/7/2019 Tech Report NWU-EECS-10-09: The End User in Computer Architecture and Systems Research
http://slidepdf.com/reader/full/tech-report-nwu-eecs-10-09-the-end-user-in-computer-architecture-and-systems 133/136
8/7/2019 Tech Report NWU-EECS-10-09: The End User in Computer Architecture and Systems Research
http://slidepdf.com/reader/full/tech-report-nwu-eecs-10-09-the-end-user-in-computer-architecture-and-systems 134/136

8/7/2019 Tech Report NWU-EECS-10-09: The End User in Computer Architecture and Systems Research
http://slidepdf.com/reader/full/tech-report-nwu-eecs-10-09-the-end-user-in-computer-architecture-and-systems 135/136

8/7/2019 Tech Report NWU-EECS-10-09: The End User in Computer Architecture and Systems Research
http://slidepdf.com/reader/full/tech-report-nwu-eecs-10-09-the-end-user-in-computer-architecture-and-systems 136/136
Related Documents