Abstract— Total Electron Content (TEC) of the ionosphere over the Southeast Asian region has been derived from measurements obtained at GPS ground stations of the International GPS Service (IGS) and three GPS ground stations of Vietnam in 2010. This paper presents the results of the study of the TEC variations during four magnetic storms on 4-10 April, 1-9 May, 1-8 August and 10-15 October, 2010. It was found that the structure of the daytime equatorial ionization anomaly (EIA), which consists of two peaks in the vicinity of 10 0 -15 0 magnetic latitude. Results are also shown that both peaks are fully developed at around afternoon. The TEC values of peaks on 4-10 April and 10-15 October are higher than on 1-9 May and 1-8 August. During the early stage of the magnetic storms, the EIA expanded poleward with large increases of TEC, which provides evidence of a penetration of the eastward electric field and a strong plasma fountain effect associated with the upward plasma drifts. In the recovery phase, the EIA is significantly reduced; the TEC value decreases and the peaks move equatorward. Keywords: Ionosphere, Magnetic storm, TEC, EIA and GPS I. INTRODUCTION The Global Positioning System (GPS) currently consists of 29 satellites which are flying at an altitude of about 20,200 kilometers in the six orbital planes. The orbital planes have an inclination 55 degrees. Each satellite transmits dual-frequency beacons of 1575.42 MHz and 1227.60 MHz [1]. The GPS has not only been a useful method for the precise navigation positioning but also provides a new technique to measure the total electron content (TEC) of the ionosphere [2]. The signals received at the ground station depend on many factors, e.g., the distance between the receiver and the satellite, the effect of the ionosphere, the deviation between the clock on the receiver and the clock on the satellite. By measuring the differential group delay and differential carrier phase between the dual-frequency beacons, along with the signal intensity, one can provide the ability to estimate the TEC. Measurements TEC are useful for the study of the ionospheric dynamics, structure and characteristics [3]. When solar flares occurred in a very short period, the tremendous energy is released and expressed in the form of light radiation, the particle acceleration flux and the disturbances in the solar atmosphere. Solar flares and the Coronal Mass Ejection (CME) often occur simultaneously, but the presence of the CME is often more complicated. The CME flux contains billions of tons of charged particles ejected from the corona at speeds of the thousands kilometers per second towards the Earth. It creates the shock wave which compresses the field lines of Earth's magnetic field, impacts on the magnetosphere and creates fluctuations in the magnetic field. This event is called the magnetic storm. After the two or three days of the solar flares occurred, the CME reached to the Earth. The geomagnetic activity is characterized by the K p and D st indices. The K p index is only performed quantitative relationship between solar wind and the geomagnetic field disturbances. The magnitude of K p is calculated from 0 to 9. The greater value is the stronger turbulence. D st is an index to provide information of the disturbance which associated geophysical parameters and the Sun, and it is derived low- latitude magnetograms [4]. The magnetic storm causes the TEC variation in the equatorial ionspheric anomaly (EIA) region. There are many studies which are the response of the ionosphere during the magnetic storm and the seasonal dependence of the EIA peaks. Using IONEX (Ionosphere Map Exchange) data, A.B.V. Walter and F. Oliveira researched the global behavior of the EIA. By using the 3D global VTEC (vertical TEC) maps, these authors found that at 08:00 (UT) on 29 October 2003, the VTEC peaks were at ± 20 0 geomagnetic latitude and occurred at around 2 pm (local time) with the high K p index (K p = 9). On 29 October 2003, in the California, they found that at 20:00 UT, the VTEC peaks extended to +40 0 geomagnetic latitude with K p index achieved 8 (high magnetic activity). Two hours later, the K p index fell drastically (Kp = 4). Like those days with low K p index, the VTEC peaks returned ± 20 0 . These authors assumed that K p , an important index, provides a great correlation with the EIA behavior during solar storms [5]. The TEC observations in Rajkot, India (14.29N, 70.74E), during the magnetic storm on 24 August 2005, M. S. Bagiya and his colleagues found that the TEC peaks was higher than on 25 August, 2005. The TEC enhancement is due to the penetration of the electric field which raises plasma to higher altitude through the fountain effect which diffuses along the magnetic field lines to higher latitudes. A day later, the TEC decreases are due to Faculty of natural science and technology, Tay Nguyen University Buon Ma Thuot City, Viet Nam. Ho Chi Minh City Institute of Physics, Viet Nam Academy of Science and Technology Ho Chi Minh City, Viet Nam Le Minh Tan, Hoang Van Hue, Phung Viet Hai, Dao Ngoc Hanh Tam TEC variations in the Southeast Asian Equatorial Anomaly region during the magnetic Storms using Signal from GPS Satellite Proceeding of the 2011 IEEE International Conference on Space Science and Communication (IconSpace) 12-13 July 2011, Penang, Malaysia 978-1-4577-0564-9/11/$26.00 ©2011 IEEE 34

Welcome message from author
This document is posted to help you gain knowledge. Please leave a comment to let me know what you think about it! Share it to your friends and learn new things together.
Transcript
Abstract— Total Electron Content (TEC) of the ionosphere over the Southeast Asian region has been derived from measurements obtained at GPS ground stations of the International GPS Service (IGS) and three GPS ground stations of Vietnam in 2010. This paper presents the results of the study of the TEC variations during four magnetic storms on 4-10 April, 1-9 May, 1-8 August and 10-15 October, 2010. It was found that the structure of the daytime equatorial ionization anomaly (EIA), which consists of two peaks in the vicinity of 100-150 magnetic latitude. Results are also shown that both peaks are fully developed at around afternoon. The TEC values of peaks on 4-10 April and 10-15 October are higher than on 1-9 May and 1-8 August. During the early stage of the magnetic storms, the EIA expanded poleward with large increases of TEC, which provides evidence of a penetration of the eastward electric field and a strong plasma fountain effect associated with the upward plasma drifts. In the recovery phase, the EIA is significantly reduced; the TEC value decreases and the peaks move equatorward.
Keywords: Ionosphere, Magnetic storm, TEC, EIA and GPS
I. INTRODUCTION The Global Positioning System (GPS) currently consists of
29 satellites which are flying at an altitude of about 20,200 kilometers in the six orbital planes. The orbital planes have an inclination 55 degrees. Each satellite transmits dual-frequency beacons of 1575.42 MHz and 1227.60 MHz [1]. The GPS has not only been a useful method for the precise navigation positioning but also provides a new technique to measure the total electron content (TEC) of the ionosphere [2]. The signals received at the ground station depend on many factors, e.g., the distance between the receiver and the satellite, the effect of the ionosphere, the deviation between the clock on the receiver and the clock on the satellite. By measuring the differential group delay and differential carrier phase between the dual-frequency beacons, along with the signal intensity, one can provide the ability to estimate the TEC. Measurements TEC are useful for the study of the ionospheric dynamics, structure and characteristics [3].
When solar flares occurred in a very short period, the tremendous energy is released and expressed in the form of light radiation, the particle acceleration flux and the disturbances in the solar atmosphere. Solar flares and the
Coronal Mass Ejection (CME) often occur simultaneously, but the presence of the CME is often more complicated. The CME flux contains billions of tons of charged particles ejected from the corona at speeds of the thousands kilometers per second towards the Earth. It creates the shock wave which compresses the field lines of Earth's magnetic field, impacts on the magnetosphere and creates fluctuations in the magnetic field. This event is called the magnetic storm. After the two or three days of the solar flares occurred, the CME reached to the Earth. The geomagnetic activity is characterized by the K p and Dst indices. The Kp index is only performed quantitative relationship between solar wind and the geomagnetic field disturbances. The magnitude of K p is calculated from 0 to 9. The greater value is the stronger turbulence. D st is an index to provide information of the disturbance which associated geophysical parameters and the Sun, and it is derived low-latitude magnetograms [4]. The magnetic storm causes the TEC variation in the equatorial ionspheric anomaly (EIA) region.
There are many studies which are the response of the ionosphere during the magnetic storm and the seasonal dependence of the EIA peaks. Using IONEX (Ionosphere Map Exchange) data, A.B.V. Walter and F. Oliveira researched the global behavior of the EIA. By using the 3D global VTEC (vertical TEC) maps, these authors found that at 08:00 (UT) on 29 October 2003, the VTEC peaks were at ± 20 0 geomagnetic latitude and occurred at around 2 pm (local time) with the high K p index (Kp = 9). On 29 October 2003, in the California, they found that at 20:00 UT, the VTEC peaks extended to +400 geomagnetic latitude with K p index achieved 8 (high magnetic activity). Two hours later, the K p index fell drastically (Kp = 4). Like those days with low K p index, the VTEC peaks returned ± 200. These authors assumed that K p, an important index, provides a great correlation with the EIA behavior during solar storms [5]. The TEC observations in Rajkot, India (14.29N, 70.74E), during the magnetic storm on 24 August 2005, M. S. Bagiya and his colleagues found that the TEC peaks was higher than on 25 August, 2005. The TEC enhancement is due to the penetration of the electric field which raises plasma to higher altitude through the fountain effect which diffuses along the magnetic field lines to higher latitudes. A day later, the TEC decreases are due to
Faculty of natural science and technology, Tay Nguyen University Buon Ma Thuot City, Viet Nam.
Ho Chi Minh City Institute of Physics, Viet Nam Academy of Science and Technology Ho Chi Minh City, Viet Nam
Le Minh Tan, Hoang Van Hue, Phung Viet Hai , Dao Ngoc Hanh Tam
TEC variations in the Southeast Asian Equatorial Anomaly region during the magnetic
Storms using Signal from GPS Satellite
Proceeding of the 2011 IEEE International Conference on Space Science and Communication (IconSpace) 12-13 July 2011, Penang, Malaysia
978-1-4577-0564-9/11/$26.00 ©2011 IEEE 34
thermospheric neutral composition changes caused by Junle heating at auroral latitudes. The TEC decreases on 25 August 2005 are due to the decrease of [O/N2] ratio which is observed by GUVI (Global Ultraviolet Imager) on the satellite TIMED. The results of their study also indicate that low latitude TEC value and daily peak time depends on the equatorial electrojet conditions [6]. In addition, by studying seasonal dependence of TEC variations in Asian equatorial anomaly region, H. F. Tsai (2001) and his colleagues concluded that the two peaks are move significantly equatorward in winter but slightly poleward in summer and autumn [7]. B. Zhao, et al., (2009) also found that the latitude and local time of the EIA peaks in the Asian-Australian region have a seasonal variation but show a north – south asymmetry [8].
There are many magnetic storms occurring in 2010. However, this paper analyzes the TEC variations at around 1030 longitude of the equatorial anomaly region in the Southeast Asia during four magnetic storms occurred in this year.
II. DATA SOURCES AND ANALYSIS METHOD The GPS data were collected from seven stations in
Southeast Asia that include three GPS stations which located in Hanoi (21.050 N, 105.800 E), Hue (16.460 N, 107.590 E), Hoc Mon (10.850 N, 106.560 E) in Vietnam and the four GPS stations of the International GPS Service System (IGS). The stations of the IGS are Kunm (25.030 N, 102.800 E), Cusv (13.740 N, 100.530 E), Ntus (01.350 N, 103.680 E) and Bako (06.490 S, 106.850 E). We took the Kp and Dst values of World Data Center Geomagnetism (http://www.tesis.lebedev.ru/en/) and the global O/N2 ratio maps of NASA Data (http://guvi.jhuapl.edu/guvi-dataproducts.shtml) for our purposes.
The slant total electron content (STEC) is the number of
free electrons in a column of 1 m2 cross section along the path of the electromagnetic waves from the satellites to the receivers. The number of free electrons is proportional to the differential delay between L1 and L2 signals [1, 9].
1
1 22 22 1
1 1 1 ( )40.3 CALSTEC P P TEC
L L
−⎛ ⎞
= − − +⎜ ⎟⎝ ⎠
(1)
P1 = Pseudo range at L1; P2 = Pseudo range at L2. TECCAL represents the bias error correction and is different for different satellite-receiver pairs.
TECU is units of TEC and denoted by 1016 electron/m2. We measured STEC by the receiver at every 30 seconds.
The bias of the satellites was reported daily by the Center International GPS Service. In principle, the bias of the receiver supplied by the GPS manufacturer, but the most of this bias in the studies is determined during the processing data of the actual observations by the algorithm [10].
The TEC varies with time, over the space and it depends on the solar activity, user location and the elevation angle. This measurement made in relation to the local vertical is called
VTEC [11]. The relationship between the STEC and the VTEC is represented by the formula:
ax
R oscos arcsin e
e m
cVTEC STECR h
α⎡ ⎤⎛ ⎞= ⎢ ⎥⎜ ⎟+⎝ ⎠⎣ ⎦
(2)
where Re is the radius of the Earth, hmax is the height of the maximum electron density (hmax = 400km), α is the elevation angle at the ground station.
The signal transmitted from GPS satellites to the receiver is affected by many phenomena, e.g., the multipath effects due to the wave reflected many times in the ionosphere before it is going to the receiver, the phase jump phenomenon. Meanwhile, the TEC calculated by (2) will not correct. Therefore, we will remove the TEC values calculated with the elevation angle less than 300.
III. RESULTS AND DISCUSSION Fig 1.a shows the contour chat of TEC during the
magnetic storm on 4-10 April 2010. On 3 April, the CME was emitted from the Sun, seen by telescopes SOHO, carried to the Earth with speeds around 700 km/s. This material impacted on the Earth's magnetic field and caused the Storm Sudden Commencement (SSC) at 8:00 UT on 5 April. This is a storm with the intensive disturbance (Kp = 8). The Dst index reached to 2 nT at SSC and the initial phase lasted until 12:00 UT. The main phase of the storm started at 12:00 UT on 5 April and continued up to 14:00 UT on 6 April and Dst value fell down -73 nT. The recovery phase lasted four days later and the storm completely finished at 01:00 UT on 10 April.
In the contour chats, the Magnetic Equator (ME) is at about 80N geographic latitude derived from the International Standard Model IGRF2005 and the contour line spacing value is 5 TECU. The TEC values are smoothed by 20 points.
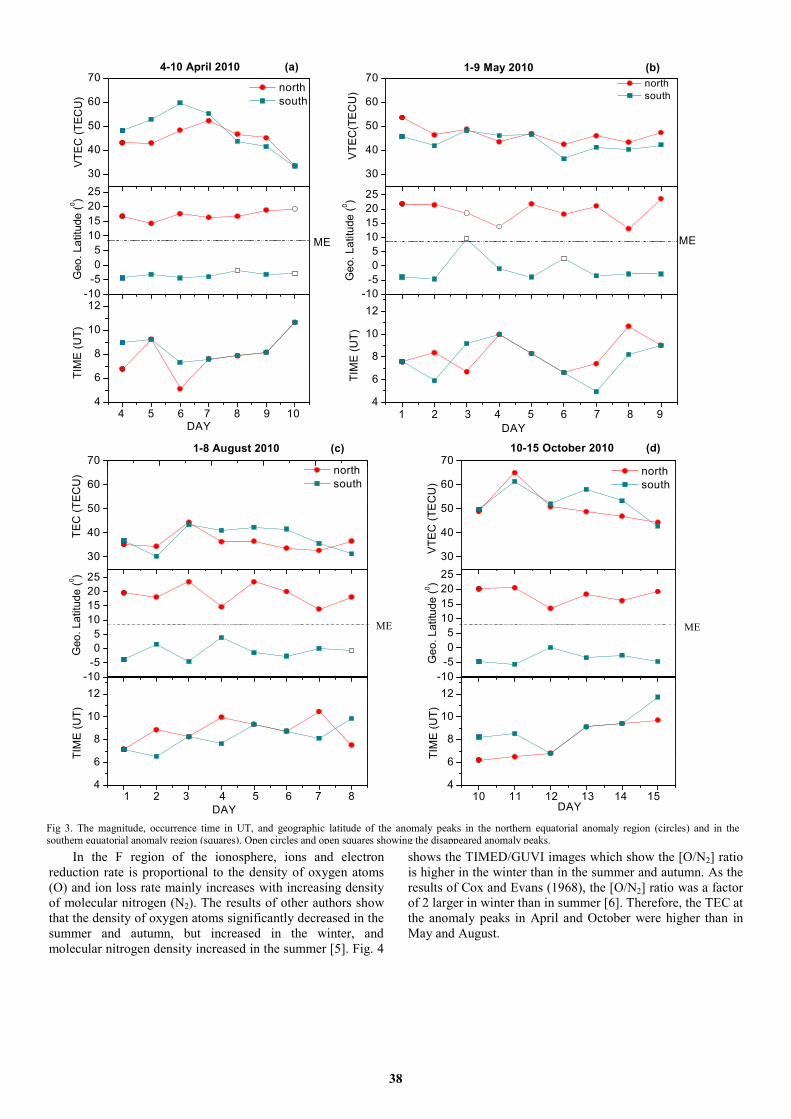
Fig 3.a shows that the TEC maximum of the southern peak was ∼ 59 TECU on 6 April and the TEC maximum of the northern peak was ∼ 52 TECU on 7 April. The anomaly peaks shifted toward the poles on 6 April. On 8 April, the anomaly peak shifted toward the equator, at the same time, the TEC values of the northern peak and the southern peak went down to ∼ 46 TECU, ∼43 TECU, respectively. On 9-10 April, the anomaly peak extended the poles at nearly the end of recovery phase. On 4 –7 April, we also found that the TEC values of the anomaly peak in the southern hemisphere were higher than in the northern hemisphere. However, on 09-10 April, the TEC values of the anomaly peak in the northern hemisphere were higher than in the southern hemisphere. On 4 – 6 April, the time of the northern peaks appeared ∼ 2 hours earlier than that of the southern peaks. After the storm completely ended, the TEC values were still lower on 10 April than on 4 April (a quiet day), and they were so low that the anomaly peaks seem to disappear.
The contour chat of TEC during the magnetic storm on 1-9 April 2010 is shown in Fig 1.b. This is a storm with the moderate disturbance (Kp = 6). At 8:00 UT on 2 May, Dst
35
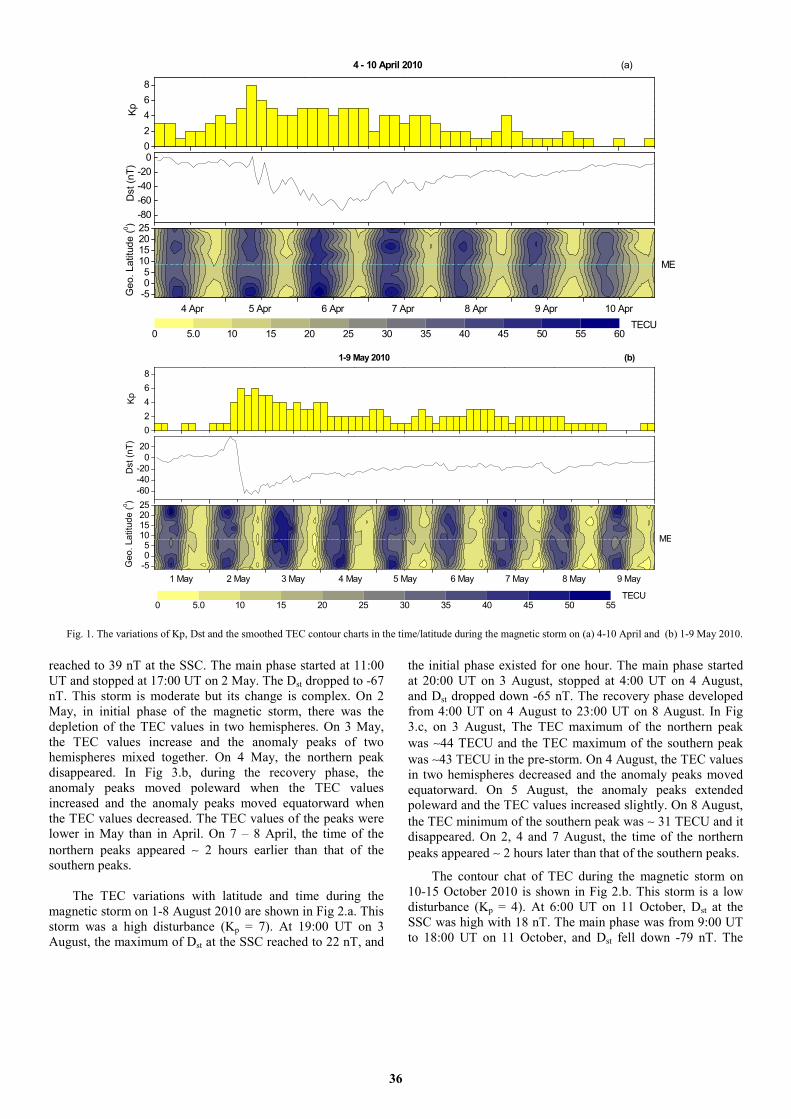
reached to 39 nT at the SSC. The main phase started at 11:00 UT and stopped at 17:00 UT on 2 May. The Dst dropped to -67 nT. This storm is moderate but its change is complex. On 2 May, in initial phase of the magnetic storm, there was the depletion of the TEC values in two hemispheres. On 3 May, the TEC values increase and the anomaly peaks of two hemispheres mixed together. On 4 May, the northern peak disappeared. In Fig 3.b, during the recovery phase, the anomaly peaks moved poleward when the TEC values increased and the anomaly peaks moved equatorward when the TEC values decreased. The TEC values of the peaks were lower in May than in April. On 7 – 8 April, the time of the northern peaks appeared ∼ 2 hours earlier than that of the southern peaks.
The TEC variations with latitude and time during the
magnetic storm on 1-8 August 2010 are shown in Fig 2.a. This storm was a high disturbance (Kp = 7). At 19:00 UT on 3 August, the maximum of Dst at the SSC reached to 22 nT, and
the initial phase existed for one hour. The main phase started at 20:00 UT on 3 August, stopped at 4:00 UT on 4 August, and Dst dropped down -65 nT. The recovery phase developed from 4:00 UT on 4 August to 23:00 UT on 8 August. In Fig 3.c, on 3 August, The TEC maximum of the northern peak was ∼44 TECU and the TEC maximum of the southern peak was ∼43 TECU in the pre-storm. On 4 August, the TEC values in two hemispheres decreased and the anomaly peaks moved equatorward. On 5 August, the anomaly peaks extended poleward and the TEC values increased slightly. On 8 August, the TEC minimum of the southern peak was ∼ 31 TECU and it disappeared. On 2, 4 and 7 August, the time of the northern peaks appeared ∼ 2 hours later than that of the southern peaks.
The contour chat of TEC during the magnetic storm on 10-15 October 2010 is shown in Fig 2.b. This storm is a low disturbance (Kp = 4). At 6:00 UT on 11 October, Dst at the SSC was high with 18 nT. The main phase was from 9:00 UT to 18:00 UT on 11 October, and Dst fell down -79 nT. The
-80-60-40-20
002468
Kp
4 - 10 April 2010 (a)
Dst
(nT)
-505
10152025
Geo
. Lat
itude
(0 )
0 5.0 10 15 20 25 30 35 40 45 50 55 60
4 Apr 5 Apr 6 Apr 7 Apr 8 Apr 9 Apr 10 AprTECU
ME
-60-40-20
020
02468
Kp
1-9 May 2010 (b)
Dst
(nT)
-505
10152025
Geo
. Lat
itude
(0 )
0 5.0 10 15 20 25 30 35 40 45 50 55
1 May 2 May 3 May 4 May 5 May 6 May 7 May 8 May 9 May
TECU
ME
Fig. 1. The variations of Kp, Dst and the smoothed TEC contour charts in the time/latitude during the magnetic storm on (a) 4-10 April and (b) 1-9 May 2010.
36
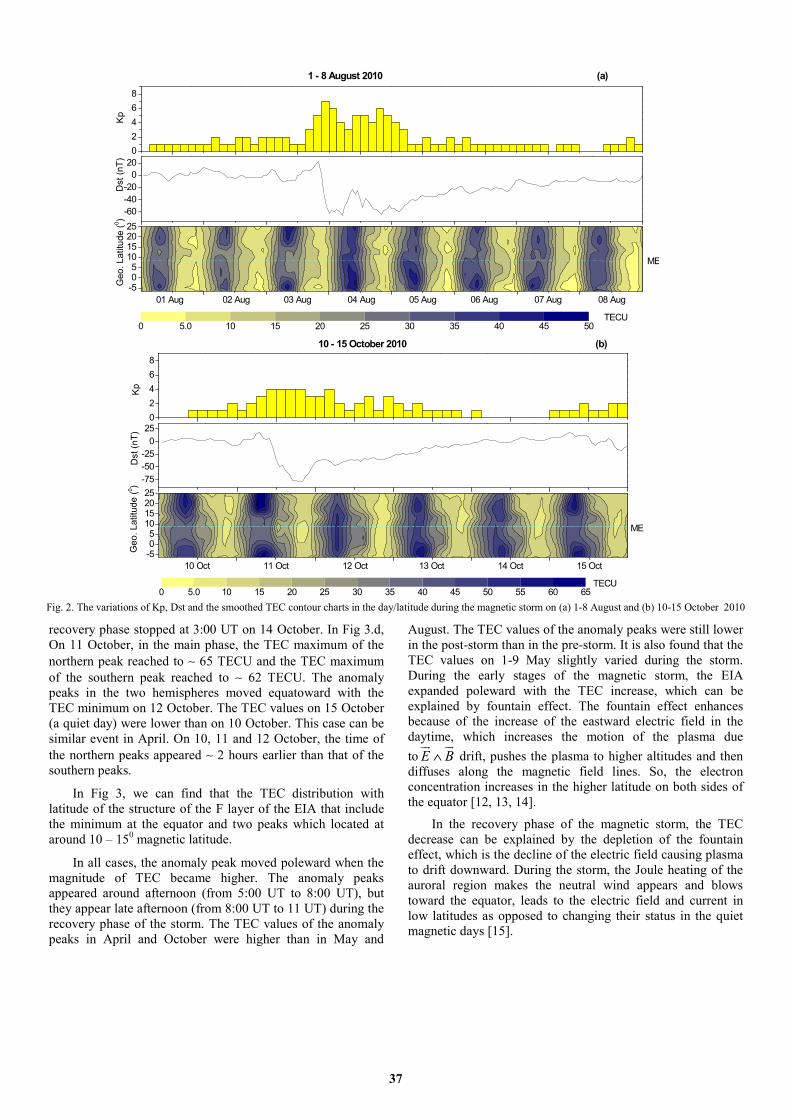
recovery phase stopped at 3:00 UT on 14 October. In Fig 3.d, On 11 October, in the main phase, the TEC maximum of the northern peak reached to ∼ 65 TECU and the TEC maximum of the southern peak reached to ∼ 62 TECU. The anomaly peaks in the two hemispheres moved equatoward with the TEC minimum on 12 October. The TEC values on 15 October (a quiet day) were lower than on 10 October. This case can be similar event in April. On 10, 11 and 12 October, the time of the northern peaks appeared ∼ 2 hours earlier than that of the southern peaks.
In Fig 3, we can find that the TEC distribution with latitude of the structure of the F layer of the EIA that include the minimum at the equator and two peaks which located at around 10 – 150 magnetic latitude.
In all cases, the anomaly peak moved poleward when the magnitude of TEC became higher. The anomaly peaks appeared around afternoon (from 5:00 UT to 8:00 UT), but they appear late afternoon (from 8:00 UT to 11 UT) during the recovery phase of the storm. The TEC values of the anomaly peaks in April and October were higher than in May and
August. The TEC values of the anomaly peaks were still lower in the post-storm than in the pre-storm. It is also found that the TEC values on 1-9 May slightly varied during the storm. During the early stages of the magnetic storm, the EIA expanded poleward with the TEC increase, which can be explained by fountain effect. The fountain effect enhances because of the increase of the eastward electric field in the daytime, which increases the motion of the plasma due to E B∧ drift, pushes the plasma to higher altitudes and then diffuses along the magnetic field lines. So, the electron concentration increases in the higher latitude on both sides of the equator [12, 13, 14].
In the recovery phase of the magnetic storm, the TEC decrease can be explained by the depletion of the fountain effect, which is the decline of the electric field causing plasma to drift downward. During the storm, the Joule heating of the auroral region makes the neutral wind appears and blows toward the equator, leads to the electric field and current in low latitudes as opposed to changing their status in the quiet magnetic days [15].
-60-40-20
02002468
Kp
Dst
(nT)
TECU
-505
10152025
Geo
. Lat
itude
(0 )
0 5.0 10 15 20 25 30 35 40 45 50
01 Aug 02 Aug 03 Aug 04 Aug 05 Aug 06 Aug 07 Aug 08 Aug
1 - 8 August 2010 (a)
ME
-75-50-25
02502468
Kp
10 - 15 October 2010 (b)
Dst
(nT)
-505
10152025
Geo
. Lat
itude
(0 )
0 5.0 10 15 20 25 30 35 40 45 50 55 60 65
10 Oct 11 Oct 12 Oct 13 Oct 14 Oct 15 Oct
ME
TECU
Fig. 2. The variations of Kp, Dst and the smoothed TEC contour charts in the day/latitude during the magnetic storm on (a) 1-8 August and (b) 10-15 October 2010
37
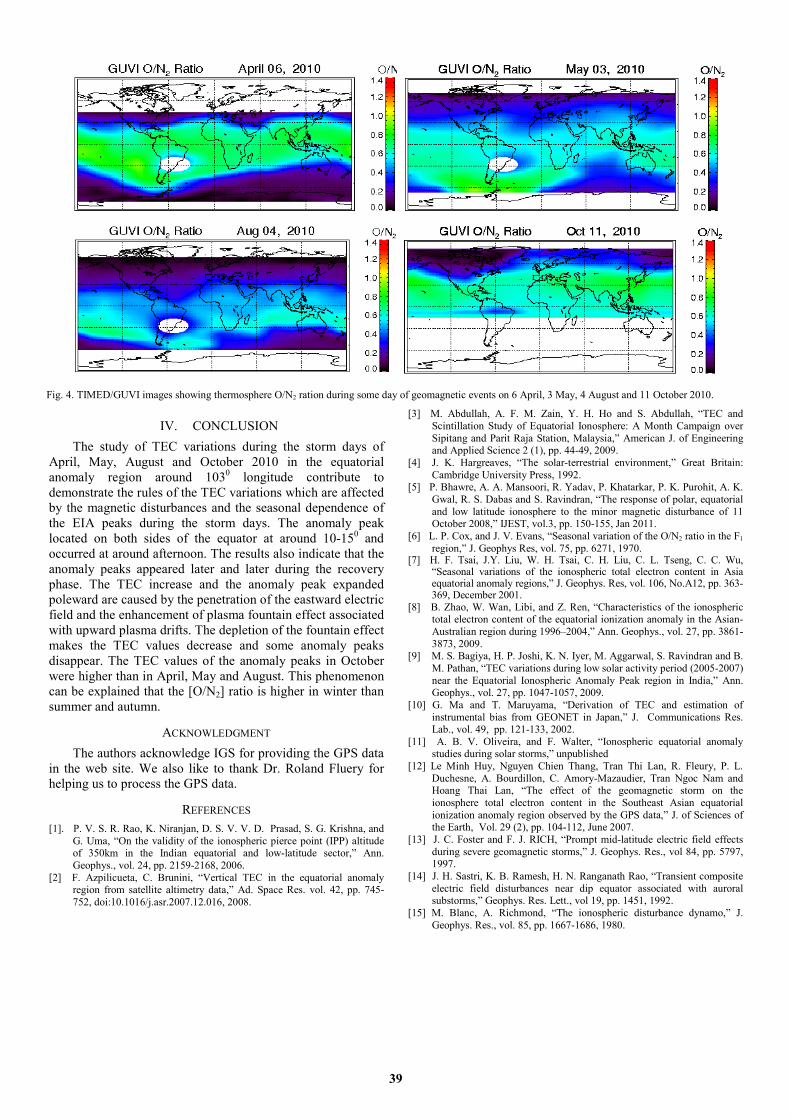
In the F region of the ionosphere, ions and electron reduction rate is proportional to the density of oxygen atoms (O) and ion loss rate mainly increases with increasing density of molecular nitrogen (N2). The results of other authors show that the density of oxygen atoms significantly decreased in the summer and autumn, but increased in the winter, and molecular nitrogen density increased in the summer [5]. Fig. 4
shows the TIMED/GUVI images which show the [O/N2] ratio is higher in the winter than in the summer and autumn. As the results of Cox and Evans (1968), the [O/N2] ratio was a factor of 2 larger in winter than in summer [6]. Therefore, the TEC at the anomaly peaks in April and October were higher than in May and August.
30
40
50
60
70
-10-505
10152025
4
6
8
10
12
north south
VTEC
(TEC
U)
4-10 April 2010 (a)
Geo
. Lat
itude
(0 )
ME
TIM
E (U
T)
DAY4 5 6 7 8 9 10
30
40
50
60
70
-10-505
10152025
4
6
8
10
12
north south
VTE
C(T
ECU
)
1-9 May 2010 (b)
1 2 3 4 5 6 7 8 9DAY
Geo
. Lat
itude
(0 )
ME
TIM
E (U
T)
30
40
50
60
70
-10-505
10152025
4
6
8
10
12
north south
TEC
(TEC
U)
1-8 August 2010 (c)
Geo
. Lat
itude
(0 )
TIM
E (U
T)
1 2 3 4 5 6 7 8
DAY
30
40
50
60
70
-10-505
10152025
4
6
8
10
12
north south
VTE
C (T
EC
U)
10-15 October 2010 (d) G
eo. L
atitu
de (0 )
TIM
E (U
T)
DAY10 11 12 13 14 15
Fig 3. The magnitude, occurrence time in UT, and geographic latitude of the anomaly peaks in the northern equatorial anomaly region (circles) and in the southern equatorial anomaly region (squares). Open circles and open squares showing the disappeared anomaly peaks.
ME ME
38
IV. CONCLUSION The study of TEC variations during the storm days of
April, May, August and October 2010 in the equatorial anomaly region around 1030 longitude contribute to demonstrate the rules of the TEC variations which are affected by the magnetic disturbances and the seasonal dependence of the EIA peaks during the storm days. The anomaly peak located on both sides of the equator at around 10-150 and occurred at around afternoon. The results also indicate that the anomaly peaks appeared later and later during the recovery phase. The TEC increase and the anomaly peak expanded poleward are caused by the penetration of the eastward electric field and the enhancement of plasma fountain effect associated with upward plasma drifts. The depletion of the fountain effect makes the TEC values decrease and some anomaly peaks disappear. The TEC values of the anomaly peaks in October were higher than in April, May and August. This phenomenon can be explained that the [O/N2] ratio is higher in winter than summer and autumn.
ACKNOWLEDGMENT The authors acknowledge IGS for providing the GPS data
in the web site. We also like to thank Dr. Roland Fluery for helping us to process the GPS data.
REFERENCES [1]. P. V. S. R. Rao, K. Niranjan, D. S. V. V. D. Prasad, S. G. Krishna, and
G. Uma, “On the validity of the ionospheric pierce point (IPP) altitude of 350km in the Indian equatorial and low-latitude sector,” Ann. Geophys., vol. 24, pp. 2159-2168, 2006.
[2] F. Azpilicueta, C. Brunini, “Vertical TEC in the equatorial anomaly region from satellite altimetry data,” Ad. Space Res. vol. 42, pp. 745-752, doi:10.1016/j.asr.2007.12.016, 2008.
[3] M. Abdullah, A. F. M. Zain, Y. H. Ho and S. Abdullah, “TEC and Scintillation Study of Equatorial Ionosphere: A Month Campaign over Sipitang and Parit Raja Station, Malaysia,” American J. of Engineering and Applied Science 2 (1), pp. 44-49, 2009.
[4] J. K. Hargreaves, “The solar-terrestrial environment,” Great Britain: Cambridge University Press, 1992.
[5] P. Bhawre, A. A. Mansoori, R. Yadav, P. Khatarkar, P. K. Purohit, A. K. Gwal, R. S. Dabas and S. Ravindran, “The response of polar, equatorial and low latitude ionosphere to the minor magnetic disturbance of 11 October 2008,” IJEST, vol.3, pp. 150-155, Jan 2011.
[6] L. P. Cox, and J. V. Evans, “Seasonal variation of the O/N2 ratio in the F1 region,” J. Geophys Res, vol. 75, pp. 6271, 1970.
[7] H. F. Tsai, J.Y. Liu, W. H. Tsai, C. H. Liu, C. L. Tseng, C. C. Wu, “Seasonal variations of the ionospheric total electron content in Asia equatorial anomaly regions,” J. Geophys. Res, vol. 106, No.A12, pp. 363-369, December 2001.
[8] B. Zhao, W. Wan, Libi, and Z. Ren, “Characteristics of the ionospheric total electron content of the equatorial ionization anomaly in the Asian-Australian region during 1996–2004,” Ann. Geophys., vol. 27, pp. 3861-3873, 2009.
[9] M. S. Bagiya, H. P. Joshi, K. N. Iyer, M. Aggarwal, S. Ravindran and B. M. Pathan, “TEC variations during low solar activity period (2005-2007) near the Equatorial Ionospheric Anomaly Peak region in India,” Ann. Geophys., vol. 27, pp. 1047-1057, 2009.
[10] G. Ma and T. Maruyama, “Derivation of TEC and estimation of instrumental bias from GEONET in Japan,” J. Communications Res. Lab., vol. 49, pp. 121-133, 2002.
[11] A. B. V. Oliveira, and F. Walter, “Ionospheric equatorial anomaly studies during solar storms,” unpublished
[12] Le Minh Huy, Nguyen Chien Thang, Tran Thi Lan, R. Fleury, P. L. Duchesne, A. Bourdillon, C. Amory-Mazaudier, Tran Ngoc Nam and Hoang Thai Lan, “The effect of the geomagnetic storm on the ionosphere total electron content in the Southeast Asian equatorial ionization anomaly region observed by the GPS data,” J. of Sciences of the Earth, Vol. 29 (2), pp. 104-112, June 2007.
[13] J. C. Foster and F. J. RICH, “Prompt mid-latitude electric field effects during severe geomagnetic storms,” J. Geophys. Res., vol 84, pp. 5797, 1997.
[14] J. H. Sastri, K. B. Ramesh, H. N. Ranganath Rao, “Transient composite electric field disturbances near dip equator associated with auroral substorms,” Geophys. Res. Lett., vol 19, pp. 1451, 1992.
[15] M. Blanc, A. Richmond, “The ionospheric disturbance dynamo,” J. Geophys. Res., vol. 85, pp. 1667-1686, 1980.
Fig. 4. TIMED/GUVI images showing thermosphere O/N2 ration during some day of geomagnetic events on 6 April, 3 May, 4 August and 11 October 2010.
39
Related Documents