CrystEngComm PAPER Cite this: CrystEngComm, 2014, 16, 8471 Received 24th April 2014, Accepted 8th July 2014 DOI: 10.1039/c4ce00878b www.rsc.org/crystengcomm Implication of microstructure on the mechanical behaviour of an aspirin–paracetamol eutectic mixture Hemant Jain, Kailas S. Khomane and Arvind K. Bansal * The present work investigates the mechanical behaviour of an aspirin–paracetamol (ASP–PCM) eutectic mixture (EM). A EM of ASP–PCM was prepared using a solvent evaporation method. Differential scanning calorimetry (DSC) and powder X-ray diffraction (PXRD) confirmed the eutectic formation with a composi- tion of 53: 47% w/w (ASP : PCM). The compaction behaviour of the EM and a physical mixture (PM) of ASP and PCM was compared using a fully instrumented rotary tablet press equipped with a Portable Press Analyzer™ (PPA). The obtained data were compared using compressibility, tabletability and compactibility profiles and Heckel analysis. The EM exhibited higher compressibility, tabletability and plastic deformation compared to the PM. Heckel analysis showed that the mean yield pressure, P y , was lower for the EM (46.9 MPa) than the PM (222.8 MPa), thus confirming the better plastic deformation of the EM. The better deformation behaviour of the EM was attributed to its layered microstructure. The sliding of adjacent layers over each other under an applied compaction pressure offered higher plastic deformation and thus provided a greater interparticulate bonding area in the EM compared to the PM. However, there was no significant difference in the compactibility profiles indicating a similar interparticulate bonding strength of the two powders. Thus, the EM showed better tabletability compared to the PM by virtue of its greater compressibility and plastic deformation. Introduction Compaction is the most commonly used unit process in the pharmaceutical industry. The initial stage of compaction involves particle rearrangement which is followed by further volume reduction by virtue of elastic deformation. After a critical point, called the ‘yield point’, the material starts to deform plastically. 1 Elastic deformation is reversible upon release of the compaction load while plastic deformation is an irreversible process. Some materials undergo extensive fragmentation under an applied compaction pressure, known as brittle fracture. The fragmented particles undergo further elastic or plastic deformation. A model based on the bonding area–bonding strength (BABS) has been proposed to explain compaction. 2 According to this model the tablet tensile strength or tabletability is governed by the interparticulate bonding area (BA) and the bonding strength (BS). 2 Mechanical properties like elastic deformation, plastic deformation or brittle fracture influence the interparticulate bonding area. Crystallographic features like slip planes contribute to the interparticulate bonding area. Slip planes in the crystal lattice allow easier slip, enabling greater plasticity, and hence produce stronger tablets. The interparticulate bonding strength is governed by inter- particulate molecular forces like van der Waals forces. Thus, the factors that contribute to the BABS govern the tabletability. A eutectic mixture (EM) is a mixture of two components that are completely miscible in the liquid state but immisci- ble in the solid state. Thermodynamically, such systems can be considered as intimately blended physical mixtures (PM). 3,4 The melting point of the EM is lower than the melt- ing point of either component. 5,6 The increased surface area of the components is mainly responsible for the increased dissolution rate of a sparingly water soluble drug. 5 These components crystallize simultaneously to a particulate size and are held together by means of non bonding interactions (NBIs). The present work investigates the mechanical behaviour of pharmaceutical eutectic systems. Eutectic systems that consist of lamellar microstructures crystallize as side by side planes and are expected to behave like slip planes in a crystal lattice. 7 Hence, it was hypothesized that the microstructure of a eutectic system may contribute to greater plastic defor- mation under an applied compaction pressure, thus affecting the tabletability. The aspirin–paracetamol eutectic system CrystEngComm, 2014, 16, 8471–8478 | 8471 This journal is © The Royal Society of Chemistry 2014 Department of Pharmaceutics, National Institute of Pharmaceutical Education and Research (NIPER), S.A.S. Nagar, Punjab-160 062, India. E-mail: [email protected] Published on 08 July 2014. Downloaded by UNIVERSIDAD SAO PAULO on 02/09/2014 15:17:22. View Article Online View Journal | View Issue

Welcome message from author
This document is posted to help you gain knowledge. Please leave a comment to let me know what you think about it! Share it to your friends and learn new things together.
Transcript
CrystEngComm
Publ
ishe
d on
08
July
201
4. D
ownl
oade
d by
UN
IVE
RSI
DA
D S
AO
PA
UL
O o
n 02
/09/
2014
15:
17:2
2.
PAPER View Article OnlineView Journal | View Issue
CrystEngCommThis journal is © The Royal Society of Chemistry 2014
Department of Pharmaceutics, National Institute of Pharmaceutical Education
and Research (NIPER), S.A.S. Nagar, Punjab-160 062, India.
E-mail: [email protected]
Cite this: CrystEngComm, 2014, 16,
8471
Received 24th April 2014,Accepted 8th July 2014
DOI: 10.1039/c4ce00878b
www.rsc.org/crystengcomm
Implication of microstructure on the mechanicalbehaviour of an aspirin–paracetamol eutecticmixture
Hemant Jain, Kailas S. Khomane and Arvind K. Bansal*
The present work investigates the mechanical behaviour of an aspirin–paracetamol (ASP–PCM) eutectic
mixture (EM). A EM of ASP–PCM was prepared using a solvent evaporation method. Differential scanning
calorimetry (DSC) and powder X-ray diffraction (PXRD) confirmed the eutectic formation with a composi-
tion of 53 : 47% w/w (ASP : PCM). The compaction behaviour of the EM and a physical mixture (PM) of ASP
and PCM was compared using a fully instrumented rotary tablet press equipped with a Portable Press
Analyzer™ (PPA). The obtained data were compared using compressibility, tabletability and compactibility
profiles and Heckel analysis. The EM exhibited higher compressibility, tabletability and plastic deformation
compared to the PM. Heckel analysis showed that the mean yield pressure, Py, was lower for the EM
(46.9 MPa) than the PM (222.8 MPa), thus confirming the better plastic deformation of the EM. The better
deformation behaviour of the EM was attributed to its layered microstructure. The sliding of adjacent layers
over each other under an applied compaction pressure offered higher plastic deformation and thus
provided a greater interparticulate bonding area in the EM compared to the PM. However, there was no
significant difference in the compactibility profiles indicating a similar interparticulate bonding strength of
the two powders. Thus, the EM showed better tabletability compared to the PM by virtue of its greater
compressibility and plastic deformation.
Introduction
Compaction is the most commonly used unit process in thepharmaceutical industry. The initial stage of compactioninvolves particle rearrangement which is followed by furthervolume reduction by virtue of elastic deformation. After acritical point, called the ‘yield point’, the material starts todeform plastically.1 Elastic deformation is reversible uponrelease of the compaction load while plastic deformation isan irreversible process. Some materials undergo extensivefragmentation under an applied compaction pressure, knownas brittle fracture. The fragmented particles undergo furtherelastic or plastic deformation.
A model based on the bonding area–bonding strength(BABS) has been proposed to explain compaction.2 Accordingto this model the tablet tensile strength or tabletability isgoverned by the interparticulate bonding area (BA) and thebonding strength (BS).2 Mechanical properties like elasticdeformation, plastic deformation or brittle fracture influencethe interparticulate bonding area. Crystallographic featureslike slip planes contribute to the interparticulate bondingarea.
Slip planes in the crystal lattice allow easier slip, enablinggreater plasticity, and hence produce stronger tablets. Theinterparticulate bonding strength is governed by inter-particulate molecular forces like van der Waals forces. Thus,the factors that contribute to the BABS govern thetabletability.
A eutectic mixture (EM) is a mixture of two componentsthat are completely miscible in the liquid state but immisci-ble in the solid state. Thermodynamically, such systems canbe considered as intimately blended physical mixtures(PM).3,4 The melting point of the EM is lower than the melt-ing point of either component.5,6 The increased surface areaof the components is mainly responsible for the increaseddissolution rate of a sparingly water soluble drug.5 Thesecomponents crystallize simultaneously to a particulate sizeand are held together by means of non bonding interactions(NBIs).
The present work investigates the mechanical behaviourof pharmaceutical eutectic systems. Eutectic systems thatconsist of lamellar microstructures crystallize as side by sideplanes and are expected to behave like slip planes in a crystallattice.7 Hence, it was hypothesized that the microstructureof a eutectic system may contribute to greater plastic defor-mation under an applied compaction pressure, thus affectingthe tabletability. The aspirin–paracetamol eutectic system
, 2014, 16, 8471–8478 | 8471
CrystEngCommPaper
Publ
ishe
d on
08
July
201
4. D
ownl
oade
d by
UN
IVE
RSI
DA
D S
AO
PA
UL
O o
n 02
/09/
2014
15:
17:2
2.
View Article Online
offers these crystallographic features and was hence selectedas a model material. Compaction studies were performedusing a fully instrumented rotary tablet press and datawere compared using compressibility, tabletability andcompactibility profiles and Heckel analysis. The microstruc-ture was characterized using various thermal and spectro-scopic techniques and was correlated to its mechanicalbehaviour. The EM of aspirin–paracetamol (ASP–PCM) wascompared to its PM using compressibility, compactibility,tabletability and Heckel analysis.
Materials and methodsMaterials
Aspirin was purchased from Allwell Pharmaceuticals Co.,Chandigarh. Paracetamol was gifted by Arbro Pharmaceuti-cals Ltd., New Delhi.
Generation of the EM
The EM was generated by a solvent evaporation method. Adifferent proportion of aspirin and paracetamol wasdissolved in a methanol : dichloromethane (DCM) (3 : 1) solu-tion. From this solution, the solvent was evaporated using aBuchi Rotavapor® at 50 °C, 130–150 rpm and under a vac-uum <10 mbar. The PM was prepared by taking an appropri-ate concentration of both ASP and PCM.
Powder X-ray diffraction (PXRD)
PXRD patterns of the samples were recorded at room temper-ature on a Bruker D8 Advance diffractometer (Bruker AXS,Karlsruhe, West Germany) with Cu Kα radiation (1.54 Å), at40 kV and 40 mA, passing through a nickel filter. Analysiswas performed in a continuous mode with a step size of0.01° and a step time of 1 s over a 2θ angular range of 3–40°.The obtained diffractograms were analysed with DIFFRACplus EVA, version 9.0 (Bruker AXS, Karlsruhe, West Germany),diffraction software.
Differential scanning calorimetry (DSC)
The melting temperature and heat of fusion were determinedusing a differential scanning calorimeter, model Q2000 (TAInstruments, New Castle, DE). Prior to analysis, the instru-ment was calibrated using a high purity standard of indiumfor temperature (156.58 °C) and heat flow (28.71 J g−1)measurements. Accurately weighed samples of about 3.5 to4.5 mg were analysed using Tzero aluminium pans, in the tem-perature range 25 to 200 °C at a heating rate of 10 °C min−1. Adry nitrogen purge was maintained at 50 mL min−1.
Optical and polarized microscopy
Samples were mounted on glass slides and observed underoptical as well as polarized light. Birefringence was observedunder polarized light using a Leica DMLP polarized lightmicroscope (Leica Microsystems, Wetzlar, GmbH, Germany),equipped with a Linkam LTS 350 hot stage. Photomicrographs
8472 | CrystEngComm, 2014, 16, 8471–8478
were acquired using a JVS color video camera and analyzedusing Linksys32 software.
Moisture content
The moisture content was determined by Karl Fischer (KF)titration (Metrohm 794 Basic Titrino, Switzerland). Thetitrator was calibrated with disodium tartrate dihydrate foraccuracy of moisture determination. A sample size of approxi-mately 300 mg was utilized for determination of the moisturecontent (n = 3).
True density and flow properties
The true density of both mixtures was determined in tripli-cate by helium pycnometry (Pycno 30, Smart Instruments,Mumbai, India) at 25 ± 2 °C/40 ± 5% relative humidity (RH).The bulk density and tapped density (n = 3) of the sampleswere determined using bulk density apparatus (ETD 1020,Electrolab, Mumbai, India) using USP method I. The flowproperties of the materials were determined by calculatingthe Hausner ratio and Carr's index.
Specific surface area measurement
The specific surface area of both mixtures was determinedusing nitrogen gas sorption (SMART SORB 91 surface areaanalyzer; Smart Instruments, Mumbai, India). The instru-ment used was calibrated by injecting a known quantity ofnitrogen. The measured parameters were then used to cal-culate the surface area of the samples by employingBrunauer–Emmett–Teller (BET) adsorption theory. An accu-rately weighed amount of sample was placed into the glassloop of the instrument and then submerged in liquidnitrogen. The quantity of adsorbed gas was measuredusing a thermal conductivity detector and then integratedusing an electronic circuit.
Particle size distribution
Similar particle size fractions of ASP, PCM, the PM and theEM were obtained by sieving (60–120 μm). D50 and D90 ofeach fraction were determined by optical microscopy by mea-suring the diameter along the longest axis for at least 150particles (DMLP microscope, Leica Microsystems, Wetzlar,Germany).
Scanning electron microscopy (SEM)
The particle morphology of both forms was studied using ascanning electron microscope (S-3400, Hitachi Ltd., Tokyo,Japan) operated at an excitation voltage of 15 kV. The pow-ders were mounted onto a steel stage using double sidedadhesive tape and coated with gold using an ion sputter(E-1010, Hitachi Ltd., Japan).
This journal is © The Royal Society of Chemistry 2014

Fig. 1 DSC overlays for screening the eutectic composition. Key: ratioof aspirin : paracetamol (%, w/w) is (a) 100 : 0, (b) 95 : 5, (c) 90 : 10,(d) 63 : 37, (e) 53 : 47, (f) 45 : 55, (g) 37 : 63, (h) 25 : 75, (i) 10 : 90, (j) 5 : 95and (k) 0 : 100.
CrystEngComm Paper
Publ
ishe
d on
08
July
201
4. D
ownl
oade
d by
UN
IVE
RSI
DA
D S
AO
PA
UL
O o
n 02
/09/
2014
15:
17:2
2.
View Article Online
Confocal laser scanning microscopy (CLSM)
The microstructure of the EM was visualised using CLSM(Olympus FV 1000, USA). The sample was mounted on theslide and observed under the microscope.
Tableting and data acquisition
A rotary tablet press (Mini II, Rimek, Ahmedabad, India) wasequipped at one of the 8 stations with 8 mm D-tooling with aflat punch tip. A feed frame was used for uniform die fillingand blind dies were used at all of the other positions.Precompression rollers were set out of function. Tablets ofeach material were compressed at a constant volume.The humidity (40 ± 2% RH) and temperature (25 ± 2 °C) con-ditions were monitored throughout the study. The tabletweight was kept at 200 ± 5 mg and the applied force waslevelled by moving the pressure roller with a hand wheel.Each powder was compacted at different compaction pres-sures on an instrumented rotary tablet press ranging fromaround 25 to 300 MPa. The tableting speed was kept constantat 14.0 rpm.
Data were acquired using a Portable Press Analyzer™(PPA), version 1.2, revision D (Data Acquisition and AnalyzingSystem, PuuMan Oy, Kuopio, Finland), through an infraredtelemetric device with a 16-bit analog-to-digital converter(6 kHZ). The force was measured by strain gauges at upperand lower punches (350×, full Wheatstone bridge; I. HollandTableting Science, Nottingham, U.K.), which were coupledwith displacement transducers (linear potentiometer, 1000×).Upper and lower punch data were recorded and trans-mitted on separate channels by individual amplifiers(“Boomerangs”). The amplifiers truncated the raw datafrom 16 bit to 12 bit after measuring to check the IRtransmission (data transmission rate, 50 kBd; internaldata buffer, 1024 measurement points). Analysis of thecompaction data was carried out by PPA software (version1.2, revision D). The accuracy of the force and displacementtransducers was 1% and 0.02%, respectively. The suitabilityof the data acquisition system has been reported in theliterature.8–10
Calculation of the tablet tensile strength and porosity
The breaking force of the tablets was measured using atablet hardness tester (Erweka, USA). The tablet dimen-sions were measured using a digital caliper (DigimaticMitutoyo Corporation, Japan). The tensile strength wascalculated using eqn (1) to eliminate the undesirableeffect of variable tablet thickness on the measured breakingforce.
σ = 2F/πdt (1)
Where σ is the tensile strength (MPa), F is the observedbreaking force (N), d is the diameter (mm), and t is the thick-ness of the compact (mm).
The porosity, ε of the tablets was calculated by eqn (2):
This journal is © The Royal Society of Chemistry 2014
ε = 1 − ρc/ρt (2)
where ρc is the density of the tablet calculated from theweight and volume of the resulting tablet and ρt is the truedensity of the powder.
Statistical analysis
The statistical significance of the values of various compac-tion parameters was determined using a two-tailed pairedt-test (SigmaStat version 3.5, San Jose, CA, USA), and the testwas considered to be statistically significant if P < 0.05.
ResultsScreening the eutectic composition
Fig. 1 shows DSC overlays of the generated mixtures with dif-ferent proportions of ASP–PCM.
All mixtures of ASP and PCM containing 5–37% w/w PCMshowed two endothermic events (Fig. 1a–d). A single endo-thermic event was observed at 120.73 °C (Fig. 1e), when thePCM concentration reached 47% w/w. Above 47% w/w PCM(Fig. 1f–j), two endothermic events were again observed.From Fig. 1, it can be concluded that the eutectic system wasformed at a concentration ratio of 53 : 47% w/w of ASP andPCM, respectively. This correlated well the with previousreports.11,12
A binary phase diagram was constructed from meltingvalues obtained during a heating cycle of the generated mix-tures (Fig. 2). The binary phase diagram suggests the forma-tion of the EM with a molar ratio of 0.49 : 0.51 of ASP : PCM.Thus, the eutectic system consists of ASP and PCM in a 1 : 1molar ratio. This system gave a eutectic temperature of120.73 °C which is consistent with earlier reports.11
CrystEngComm, 2014, 16, 8471–8478 | 8473

Fig. 2 Phase diagram of the EM of ASP–PCM.
Fig. 3 DSC overlays of ASP, PCM, the PM and EM.
Fig. 4 XRD patterns of PCM, ASP, the PM and EM.
CrystEngCommPaper
Publ
ishe
d on
08
July
201
4. D
ownl
oade
d by
UN
IVE
RSI
DA
D S
AO
PA
UL
O o
n 02
/09/
2014
15:
17:2
2.
View Article Online
Solid state characterization
Screening of the eutectic composition confirmed eutectic for-mation at a concentration ratio of 53 : 47% w/w of ASP andPCM, respectively. This system gave one sharp endothermic peakat 120.73 °C. The PM was prepared by taking 53 : 47% w/wof ASP and PCM and it was characterized using DSC. Fig. 3shows DSC overlays of ASP, PCM, the PM and the EM.
The DSC trace of ASP showed a single melting endothermwith a peak at 144.09 °C. PCM showed a sharp melting endo-therm at 171.63 °C. Both values are in close agreement withearlier reports.13,14 The PM showed melting endotherms ofboth ASP and PCM. In contrast, the trace of the EM showedonly a single melting endothermic peak at 120.73 °C.
Generation of the EM at 53 : 47% w/w was furthersupported by PXRD. Fig. 4 shows PXRD overlays of ASP,
8474 | CrystEngComm, 2014, 16, 8471–8478
Table 1 Melting point, heat of fusion, true density and moisture content of AS
Sample Melting point (°C) Heat of fusion (J g−1)
ASP 144.09 93.19PCM 171.63 105.3PM 144.09, 171.63 49.19, 49.49EM 120.73 138.2
a Standard deviations in parentheses.
PCM, the PM and the EM. The diffraction patterns and themain diffraction angles of ASP and PCM agreed with the dataof ASP form I15 and PCM form I14 from a previous study,respectively. The PXRD pattern of the EM essentiallyremained the same as the PM. This was expected because ofthe additive properties of the eutectic components in PXRD(Fig. 4).
Table 1 summarizes the melting point, heat of fusion, truedensity, and moisture content data for ASP, PCM, the PMand EM.
Physical characterization of the mixtures
Good flow properties are a prerequisite for the assessment ofthe compaction behaviour using a fully instrumented rotarytablet press. Both powders showed good flow properties, asindicated by the Carr's index and the Hausner ratio (Table 2).The effects of the particle properties were reduced by keepingthe particle shape and particle size distribution similar forASP, PCM, the PM and the EM. Table 2 shows a similar spe-cific surface area for the PM and EM, while Table 3 shows asimilar particle size distribution. SEM photographs show thesimilar particle shapes of the two mixtures (Fig. 5).
Microstructure characterization
The EM crystallized out as a thin layer on a glass slide andwas visualized using SEM and CLSM. Both techniquessuggested the formation of a lamellar microstructure
This journal is © The Royal Society of Chemistry 2014
P, PCM, the PM and EM
True densitya (g cm−3) Moisture content (%)
1.43 (0.02) 0.081.32 (0.03) 0.19
1.380 (0.03) 0.131.371 (0.02) 0.17

Table 2 Physical properties of the EM and PM
Sample Specific surface area (m2 g−1) Bulk density (g cm−3) Tapped density (g cm−3) Hausner ratio Carr's index Flowabilitya
PM 0.465 0.65 0.75 1.15 13.043 GoodEM 0.468 0.67 0.80 1.20 16.67 Fair
a As per US Pharmacopeia general chapter 1174.
Table 3 Particle size distribution for ASP, PCM, the PM and EM
Particle size distribution ASP PCM PM EM
D50 (μm) 76 69 71 76D90 (μm) 99 105 103 101
CrystEngComm Paper
Publ
ishe
d on
08
July
201
4. D
ownl
oade
d by
UN
IVE
RSI
DA
D S
AO
PA
UL
O o
n 02
/09/
2014
15:
17:2
2.
View Article Online
(Fig. 6a and b). The SEM photograph of a cross-section of aEM particle further confirmed the presence of the lamellarmicro-structure (Fig. 6c).
Compaction behaviour of the physical mixture andeutectic mixture
Preliminary experiments were carried out at a very high com-paction pressure (900 MPa) to rule out the possibility of poly-morphic transformation during the compaction study. Bothmixtures were found to be stable and no polymorphic trans-formation was observed.
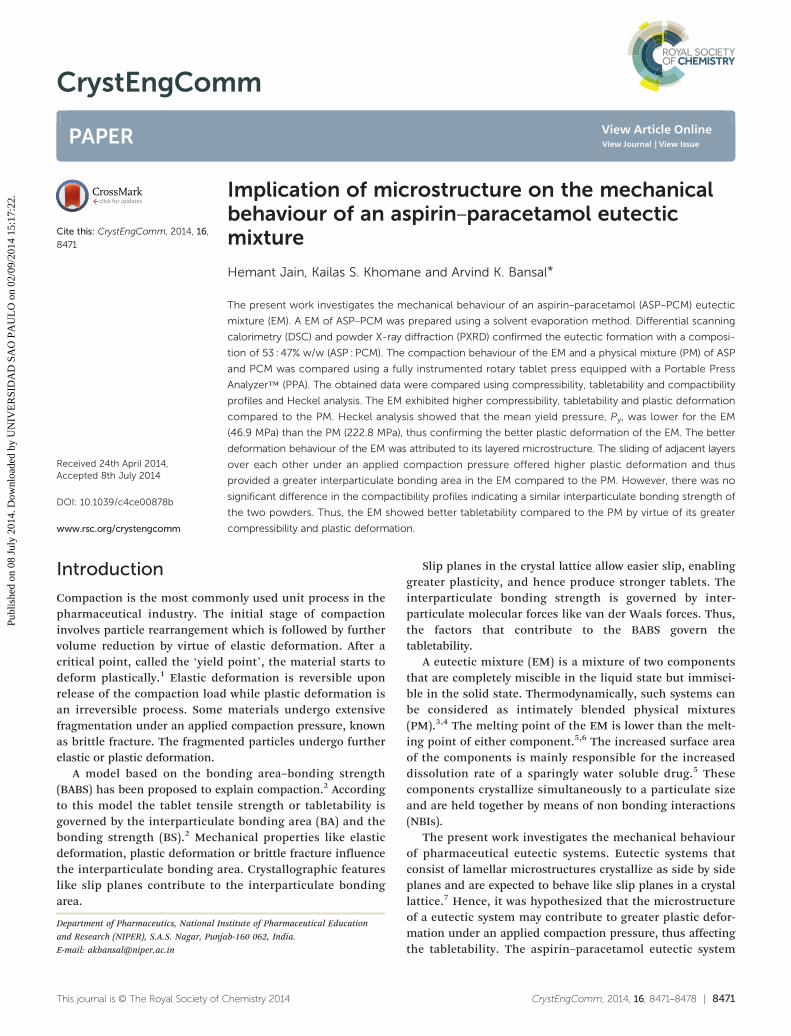
Compressibility, tabletability and compactibility (CTC)profiles. Tabletability is defined as the capacity of a powdermaterial to be transformed into a tablet of specified strengthunder the effect of compaction pressure.2 Fig. 7 shows atabletability plot for the EM and PM. The tensile strength ofboth mixtures increased with the compaction pressure.However, the EM showed a higher tensile strength over thePM at all compaction pressures. Thus, the EM showed
This journal is © The Royal Society of Chemistry 2014
Fig. 5 SEM images of (a) the PM and (b) EM.
increased tabletability compared to the PM. The tabletabilityplot of the EM and PM shows that the tensile strengthdifference between the EM and the PM widens as the pressureis increased. At 50 MPa and 200 MPa pressure, the tensilestrength of the EM and the PM was found to be 0.99 MPa,4.10 MPa and 0.60 MPa, 2.45 MPa, respectively.
The compressibility of a material is its ability to bereduced in volume as a result of an applied pressure and isrepresented by a plot of tablet porosity against pressure.2 Acompressibility plot has been reported to represent the inter-particulate bonding area. The EM exhibited a greater com-pressibility compared to the PM at a given compaction
CrystEngComm, 2014, 16, 8471–8478 | 8475
Fig. 6 The lamellar microstructure as visualized using (a) SEM,(b) CLSM and (c) SEM photographs of a cross-sectioned EM particle.
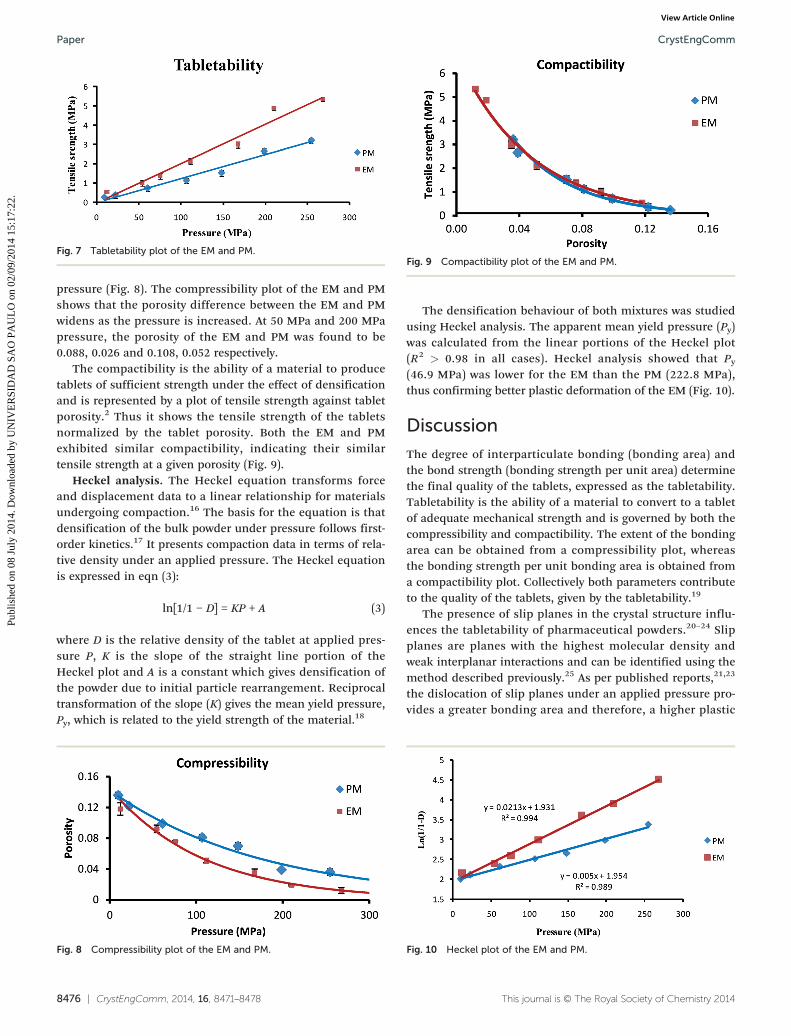
Fig. 7 Tabletability plot of the EM and PM.Fig. 9 Compactibility plot of the EM and PM.
CrystEngCommPaper
Publ
ishe
d on
08
July
201
4. D
ownl
oade
d by
UN
IVE
RSI
DA
D S
AO
PA
UL
O o
n 02
/09/
2014
15:
17:2
2.
View Article Online
pressure (Fig. 8). The compressibility plot of the EM and PMshows that the porosity difference between the EM and PMwidens as the pressure is increased. At 50 MPa and 200 MPapressure, the porosity of the EM and PM was found to be0.088, 0.026 and 0.108, 0.052 respectively.
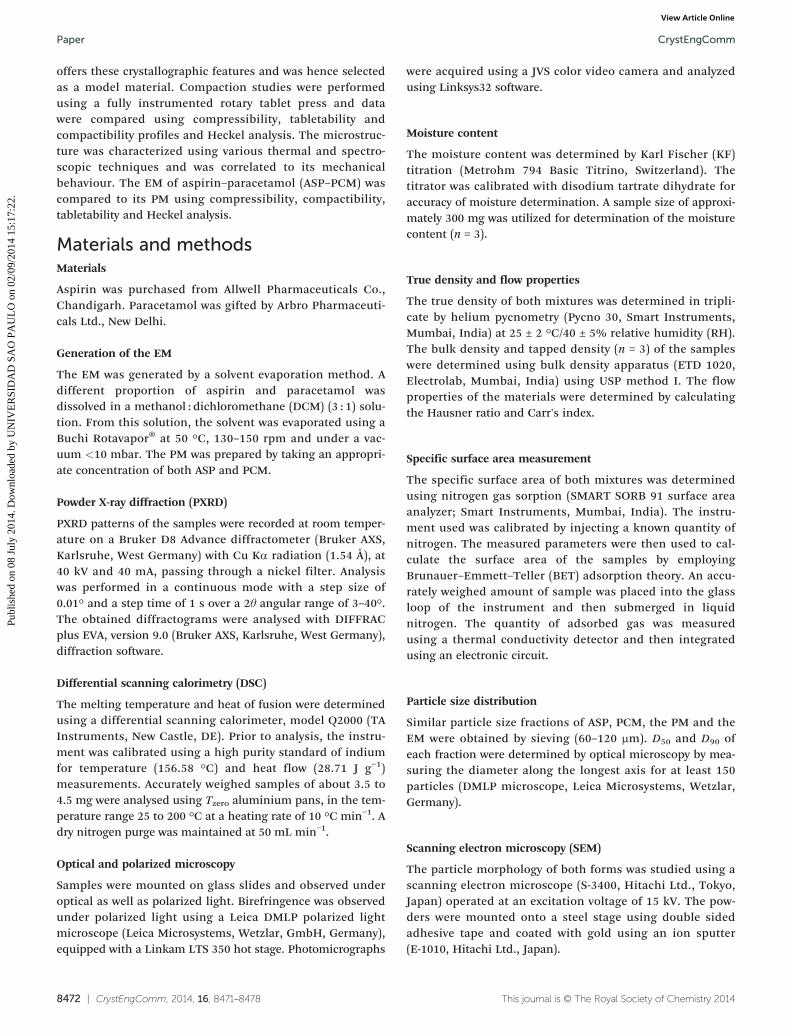
The compactibility is the ability of a material to producetablets of sufficient strength under the effect of densificationand is represented by a plot of tensile strength against tabletporosity.2 Thus it shows the tensile strength of the tabletsnormalized by the tablet porosity. Both the EM and PMexhibited similar compactibility, indicating their similartensile strength at a given porosity (Fig. 9).
Heckel analysis. The Heckel equation transforms forceand displacement data to a linear relationship for materialsundergoing compaction.16 The basis for the equation is thatdensification of the bulk powder under pressure follows first-order kinetics.17 It presents compaction data in terms of rela-tive density under an applied pressure. The Heckel equationis expressed in eqn (3):
ln[1/1 − D] = KP + A (3)
where D is the relative density of the tablet at applied pres-sure P, K is the slope of the straight line portion of theHeckel plot and A is a constant which gives densification ofthe powder due to initial particle rearrangement. Reciprocaltransformation of the slope (K) gives the mean yield pressure,Py, which is related to the yield strength of the material.18
8476 | CrystEngComm, 2014, 16, 8471–8478
Fig. 8 Compressibility plot of the EM and PM.
The densification behaviour of both mixtures was studiedusing Heckel analysis. The apparent mean yield pressure (Py)was calculated from the linear portions of the Heckel plot(R2 > 0.98 in all cases). Heckel analysis showed that Py
(46.9 MPa) was lower for the EM than the PM (222.8 MPa),thus confirming better plastic deformation of the EM (Fig. 10).
Discussion
The degree of interparticulate bonding (bonding area) andthe bond strength (bonding strength per unit area) determinethe final quality of the tablets, expressed as the tabletability.Tabletability is the ability of a material to convert to a tabletof adequate mechanical strength and is governed by both thecompressibility and compactibility. The extent of the bondingarea can be obtained from a compressibility plot, whereasthe bonding strength per unit bonding area is obtained froma compactibility plot. Collectively both parameters contributeto the quality of the tablets, given by the tabletability.19
The presence of slip planes in the crystal structure influ-ences the tabletability of pharmaceutical powders.20–24 Slipplanes are planes with the highest molecular density andweak interplanar interactions and can be identified using themethod described previously.25 As per published reports,21,23
the dislocation of slip planes under an applied pressure pro-vides a greater bonding area and therefore, a higher plastic
This journal is © The Royal Society of Chemistry 2014
Fig. 10 Heckel plot of the EM and PM.

Fig. 11 A schematic diagram showing lamellar growth of a binaryeutectic mixture. (The EM consists of ASP : PCM in a 1 : 1 molar ratio).
CrystEngComm Paper
Publ
ishe
d on
08
July
201
4. D
ownl
oade
d by
UN
IVE
RSI
DA
D S
AO
PA
UL
O o
n 02
/09/
2014
15:
17:2
2.
View Article Online
deformation can be achieved. The EM possesses a slip plane-like system called a microstructure that mimics the slipplanes of a single crystal.
As depicted in Fig. 11, the lamellar microstructure of theeutectic system crystallizes as side by side planes, by meansof a coupled growth mechanism.7 These planes are expectedto possess the highest intraplanar density and greatest inter-planar spacing, similar to slip planes in a crystal lattice.Hence, it was assumed that the interphase boundary hasmechanical implications comparable to slip planes in singlecrystals. The greater compressibility and plastic deformationof the EM over the PM supported this hypothesis. However, amechanistic understanding of this requires a detailed exami-nation of the eutectic microstructure.
Eutectics possess a microstructure-level periodicity that isdifferent to that of either pure crystalline phase. Without thismicrostructural element, the system cannot be accuratelyclassified as a eutectic solid.7 The effective entropy changeand the volume fraction of the eutectic phase during solidifi-cation are interrelated and this relationship may be used tocharacterize the microstructure.26 The difference in theentropy of fusion (ΔSf) between the individual componentscontrols the resulting eutectic microstructure.27 When twomaterials possess equivalent or very similar ΔSf values, bothphases grow simultaneously behind a planar solid–liquidinterface, resulting in a normal eutectic microstructure(Fig. 11) that appears as alternating lamellae or rods of onephase embedded in the other. In contrast, large differencesin ΔSf result in faceted growth producing an anomalousstructure, which may manifest as one of many internal struc-tures (structural variants).7
Another report classified the EM on the basis of theentropy of fusion of the components, as reported inTable 4.28
This journal is © The Royal Society of Chemistry 2014
Table 4 Classification of the EM based on the entropy of fusion
Entropy of fusion
Both components have low entropies of fusion (<2 J gK−1)One component has a low entropy of fusion (<2 J gK−1)Both components have high entropies of fusion (>2 J gK−1)
In the present investigation, both of the components, i.e.ASP (0.65 J gK−1) and PCM (0.61 J gK−1), showed similarentropies of fusion, with both values being less than 2 J gK−1.Hence, as discussed above, a lamellar microstructure wasexpected. This was further confirmed by SEM and CLSM. Thecharacteristic pattern of crystallization of the lamellar micro-structure has been reported in the literature.7 Microphoto-graphs of the ASP–PCM eutectic system showed a similarcrystallization pattern, thus confirming the formation of alamellar microstructure (Fig. 6). The microstructure, charac-teristic of the eutectic system, was not seen in the case of theindividual components.
The lamellar microstructure of the EM resulted in incoher-ent interphase boundaries (the lines between A and B inFig. 11). These provide thermodynamically stable interfaces,compared to the normal coherent interactions that comprisethe individual crystalline phases of ASP and PCM. Theseboundaries possess higher free energy because their struc-tural makeup consists of non bonding interactions (NBIs)between different molecules, i.e. ASP and PCM.
These interactions are typically not energetically equiva-lent to those between like molecules. Furthermore, the num-ber of unfulfilled bonds at the interphase boundary is greaterrelative to either pure component phase, and the NBIsformed between unlike molecules (ASP and PCM) are not asstable relative to those involved in maintaining the pure com-ponent crystal lattices, resulting in an increase in the internalenergy. These bonds are, therefore, energetically easier toovercome.7
Thus, the lamellar microstructure of the ASP–PCM eutecticsystem can be considered as a layered microstructure havingweaker interactions between two adjacent layers. The slidingof adjacent planes over each other under an applied compac-tion pressure offered higher plastic deformation and hencea greater interparticulate bonding area. Heckel analysiswas consistent with this and showed a lower mean yield pres-sure (46.9 MPa) for the eutectic system compared to the PM(222.8 MPa), thus confirming the better plastic deformationof the EM. According to the standard suggested by Rowe andRoberts for the mechanical classification of pharmaceuticalpowders,29 the EM can be classified as a plastically deformingmaterial whereas the PM as a brittle material. This may helpto improve the processability and tableting behaviour ofactive pharmaceutical ingredients during formulationdevelopment.
The CTC profiles also revealed that the compactibility ofboth the EM and PM was not significantly different (Fig. 9).As both powders showed a similar particle size distribution
CrystEngComm, 2014, 16, 8471–8478 | 8477
Eutectic mixture
Lamellar or rod shape, coupled growthIrregular or regular complex structureIrregular structure, no coupled growth, grow near each other

CrystEngCommPaper
Publ
ishe
d on
08
July
201
4. D
ownl
oade
d by
UN
IVE
RSI
DA
D S
AO
PA
UL
O o
n 02
/09/
2014
15:
17:2
2.
View Article Online
and specific surface area, the compactibility plot of the twopowders represents their relative interparticulate bondingstrength. Both the EM and PM exhibited a similar tablet ten-sile strength at a given porosity, thus indicating the similarinterparticulate bonding strength of the two materials.However, this was unexpected as the interphase boundary ofthe eutectic microstructure exhibits weaker intermolecularinteractions.
Sun et al. also correlated the melting temperature withthe interparticulate bonding strength of L-lysine salts.30 Here,the EM showed a lower melting temperature than thePM and hence a lower interparticulate bonding strength canbe expected. Nevertheless, this counterintuitive behaviourof the eutectic system is consistent with our recent observa-tions that the true density, rather than thermodynamicproperties like heat of fusion or melting temperature, governthe interparticulate bonding strength of pharmaceuticalmaterials.24,31–34 Authors have studied the compaction behav-iour of various pharmaceutical polymorphic systems, namelyclopidogrel bisulphate forms I and II, indomethacin formsα and γ, ranitidine hydrochloride forms I and II andclarithromycin forms I and II. In all of the systems, the poly-morph with the higher true density showed greater inter-particulate bonding strength. In the present study, both theEM (1.371 g cm−3) and PM (1.38 g cm−3) showed similar truedensity values and exhibited no difference in bondingstrength, thus supporting our previous findings.24,31–34 How-ever, studies on diverse materials need to be performed toestablish the correlation between true density and inter-particulate bonding strength.
Conclusion
The greater compressibility of the EM was attributed to thelayered microstructure. The sliding of adjacent layers overeach other under an applied compaction pressure offeredhigher plastic deformation and hence a greater inter-particulate bonding area over the PM. Thus, as hypothesized,the lamellar microstructure of the eutectic system hasmechanical implications that are comparable to a layeredcrystal structure (slip plane system). The similar inter-particulate bonding strength of both mixtures, despite thelower melting temperature of the EM, was consistent withour previous reports that correlated the bonding strength ofthe materials to their true density rather than their thermody-namic properties.
References
1 Y. Feng and D. J. Grant, Pharm. Res., 2006, 23, 1608–1616.
2 C. C. Sun, J. Adhes. Sci. Technol., 2011, 25, 483–499. 3 K. Chow, H. H. Tong, S. Lum and A. H. Chow, J. Pharm. Sci.,2008, 97, 2855–2877.4 R. Rastogi and V. Rastogi, J. Cryst. Growth, 1969, 5, 345–353.
8478 | CrystEngComm, 2014, 16, 8471–8478
5 S. Janssens and G. Van den Mooter, J. Pharm. Pharmacol.,
2009, 61, 1571–1586.6 C. Leuner and J. Dressman, Eur. J. Pharm. Biopharm.,
2000, 50, 47–60.7 M. D. Moore and P. L. Wildfong, J. Pharm. Innov., 2009,
4, 36–49.8 C. Matz, A. Bauer-Brandl, T. Rigassi, R. Schubert and
D. Becker, Drug Dev. Ind. Pharm., 1999, 25, 117–130.9 K. S. Khomane and A. K. Bansal, Int. J. Pharm., 2013, 455,
1–4.10 P. K. More, K. S. Khomane and A. K. Bansal, Int. J. Pharm.,
2012, 441, 527–534.11 K. Florey, H. G. Brittain, D. J. Mazzo, T. J. Wozniak,
G. S. Brenner, G. A. Forcier and A. A. Al-Badr, Analyticalprofiles of drug substances and excipients, Academic press,1992.12 S. Keizo and M. Soichi, Japan Pat., 18,232/66, 1966.
13 P. Mroso, W. Po, A. Li and W. Irwin, J. Pharm. Sci., 1982, 71,1096–1101.14 G. Nichols and C. S. Frampton, J. Pharm. Sci., 1998, 87,
684–693.15 A. D. Bond, R. Boese and G. R. Desiraju, Angew. Chem., Int.
Ed., 2007, 46, 618–622.16 R. Heckel, 1001–1008, Trans. Metall. Soc. AIME, 1961, 221.
17 S. Patel, A. M. Kaushal and A. K. Bansal, Pharm. Res., 2007,24, 111–124.18 R. Heckel, Trans. Metall. Soc. AIME, 1961, 221, 671–675.
19 S. Patel, A. M. Kaushal and A. K. Bansal, Crit. Rev. Ther. DrugCarrier Syst., 2006, 23, 1–65.20 Y. Feng, D. J. Grant and C. C. Sun, J. Pharm. Sci., 2007, 96,
3324–3333.21 C. Sun and D. J. Grant, Pharm. Res., 2001, 18, 274–280.
22 C. C. Sun and D. J. Grant, Pharm. Res., 2004, 21, 382–386. 23 C. C. Sun and H. Hou, Cryst. Growth Des., 2008, 8,1575–1579.24 P. Upadhyay, K. S. Khomane, L. Kumar and A. K. Bansal,
CrystEngComm, 2013, 15, 3959–3964.25 C. C. Sun and Y. H. Kiang, J. Pharm. Sci., 2008, 97,
3456–3461.26 G. Meng, X. Lin and W. Huang, Mater. Lett., 2008, 62,
984–987.27 J. Hunt and K. Jackson, Trans. Metall. Soc. AIME, 1966, 236,
843–852.28 M. Taylor, R. Fidler and R. Smith, Metall. Trans., 1971, 2,
1793–1798.29 R. Roberts and R. Rowe, Chem. Eng. Sci., 1987, 42, 903–911.
30 C. Sun and D. J. W. Grant, Pharm. Res., 2001, 18, 281–286. 31 K. S. Khomane and A. K. Bansal, AAPS PharmSciTech, 2013,14, 1169–1177.32 K. S. Khomane and A. K. Bansal, J. Pharm. Sci., 2013, 102,
4242–4245.33 K. S. Khomane, P. K. More and A. K. Bansal, J. Pharm. Sci.,
2012, 101, 2408–2416.34 K. S. Khomane, P. K. More, G. Raghavendra and
A. K. Bansal, Mol. Pharmaceutics, 2013, 10, 631–639.
This journal is © The Royal Society of Chemistry 2014
Related Documents


