TEAPOT NEVADA TEST SITE February - May 1955 WT-1179 AEC Category: HEALTH AND SAFETY Military Categories: 5-21, 5-30, 5-50, and 5-70 Reproduced From Best Available Copy Project 33.1 - BIOLOGICAL EFFECTS OF PRESSURE PHENOMENA OCCURRING INSIDE PROTECTIVE SHELTERS FOLLOWING A NUCLEAR DETONATION Issuance Date: October 28, 1957 DISTRIBUTION STATEMENT A Approved for Public Release Distribution Unlimited 20011105 084 CIVIL EFFECTS TEST GROUP £». j3<5Tu;

Welcome message from author
This document is posted to help you gain knowledge. Please leave a comment to let me know what you think about it! Share it to your friends and learn new things together.
Transcript
TEAPOT NEVADA TEST SITE
February - May 1955
WT-1179
AEC Category: HEALTH AND SAFETY Military Categories: 5-21, 5-30, 5-50,
and 5-70
Reproduced From Best Available Copy
Project 33.1 -
BIOLOGICAL EFFECTS OF PRESSURE PHENOMENA OCCURRING INSIDE PROTECTIVE SHELTERS FOLLOWING A NUCLEAR DETONATION
Issuance Date: October 28, 1957
DISTRIBUTION STATEMENT A Approved for Public Release
Distribution Unlimited
20011105 084 CIVIL EFFECTS TEST GROUP
£». j3<5Tu;
NOTICE
This report is published in the interest of providing information which may prove of value to the reader in his study of effects data derived principally from nuclear weapons tests.
This document is based on information available at the time of preparation which may have subsequently been expanded and re-evaluated. Also, in preparing this report for publication, some classified material may have been removed. Users are cautioned to avoid interpretations and conclusions based on unknown or incomplete data.
Price $5.50. Available from the Office of Technical Services, Department of Commerce,
Washington 25, O. C.
AEC Technical Infornutlon Service Extension Oik Ridge, Tenneaee
Report to the Test Director
BIOLOGICAL EFFECTS OF PRESSURE PHENOMENA OCCURRING INSIDE PROTECTIVE SHELTERS FOLLOWING A NUCLEAR DETONATION
By
C. S. White, T. L. Chiffelle, D. R. Richmond, W. H. Lockyear, I. G. Bowen, V. C. Goldizen, H. W. Merideth, D. E. Kilgore, B. B. Longwell, J. T. Parker, F. Sherping, and M. E. Cribb
Approved by: C. S. WHITE Approved by: ROBERT L. CORSBIE Director Director Program 33 Civil Effects Test Group
Lovelace Foundation for Medical Education and Research Albuquerque, New Mexico October 1956
1-2
ABSTRACT
In two series of experiments 277 experimental animals, including 66 dogs, 52 rabbits, 52 guinea pigs, 63 rats, and 44 mice, were exposed under selected conditions in six different general types of instrumented above- and below-ground shelters to blast produced by nuclear explosions. The distance of the several structures from Ground Zero ranged from 1050 to 5500 ft. The most severe alterations in the pressure environment occurring inside the structures followed the detonation of a nuclear device with a yield approximately 50 per cent greater than nominal. The highest overpressure to which animals were exposed was 85.8 psi, the rise time of which was 4 msec. The overpressure endured for about 570 msec. Over- pressures ranged from this maximum downward in 15 other exposure situations to a minimum of 1.3 psi enduring for nearly 1346 msec but rising to a maximum in about 420 msec. The latter pressure occurred inside a reinforced concrete bathroom shelter, which was the only surviving part of a house otherwise totally destroyed, at 4700 ft where the outside incident pressure was about 5 psi. Following the nuclear explosions, all animals were recovered, examined, sacrificed, and subjected to gross and microscopic pathological study. All lesions were tabulated and described. The results of pressure-time data, documenting the variations on the pressure environment, are presented and analyzed, and an exploratory attempt is made to relate the alterations in the pressure environment to the associated pathology observed. A critical review of selected material from the blast and related literature is presented. All data are discussed, and the several problems related to the design and construction of pro- tective shelters are noted and briefly, but analytically, assessed. The most outstanding con- tribution of the field experiments and the related study of the literature was the unequivocal demonstration that the provision of adequate protective structures can indeed be an effective means of sharply reducing casualties which would otherwise be associated with the detonation of modern large-scale explosive devices.
3-4
ACKNOWLEDGMENTS
The authors are deeply indebted to the following individuals for advice, cooperation, and active participation in planning and, in many instances, in actual execution of the project:
R. L. Corsbie, Atomic Energy Commission; Director, Civil Effects Test Group Hal Goodwin, Federal Civil Defense Administration J. C. Green, Federal Civil Defense Administration E. F. Cox, Sandia Corporation L. J. Vortman, Sandia Corporation G. W. Rollosson, Sandia Corporation J. D. Shreve, Sandia Corporation Dr. F. G. Hirsch, Sandia Corporation Dr. W. R. Lovelace II, Director, Lovelace Foundation
Appreciation is expressed also to M. A. Palmer and R. S. Harper, Lovelace Foundation, for photographic work in the field and to R. A. Smith, R. A. MacMahon, G. S. Bevil, and A. W. Dennis, Lovelace Foundation, who also assisted with the preparation of illustrative material; to H. H. Sander, Sandia Corporation, for help with the electrocardiography; to R. S. Millican, Sandia Corporation, for excellent technical support covering all the instrumentation; to J. Clark, Lovelace Foundation, for the design of benches and camera and light housings; to Major R. Crawford, USAF, who with Mr. Clark conducted the air-flow studies; to Dr. J. W. Grossman, Lovelace Foundation, for aid in radiography; to Dr. A. F. Strehler, Dr. J. W. Bailey, and Dr. W. E. Clapper, Lovelace Foundation, for their general support; to Dr. R. E. MacQuigg and Dr. W. R. Lovelace II, Lovelace Clinic and Foundation, for participation in the post- mortem examination of the animals; to Dr. Richard B. Streeper for help in interpreting the electrocardiographic records; to R. B. Thurman and J. W. Wallace, Lovelace Foundation, for help with the animal restraints and training; and to Mrs. Isabell Benton, Mrs. Roberta Schlies, Mrs. Virginia Gilmore, and Mrs. Janelle Dyer for editorial and secretarial aid.
5-6
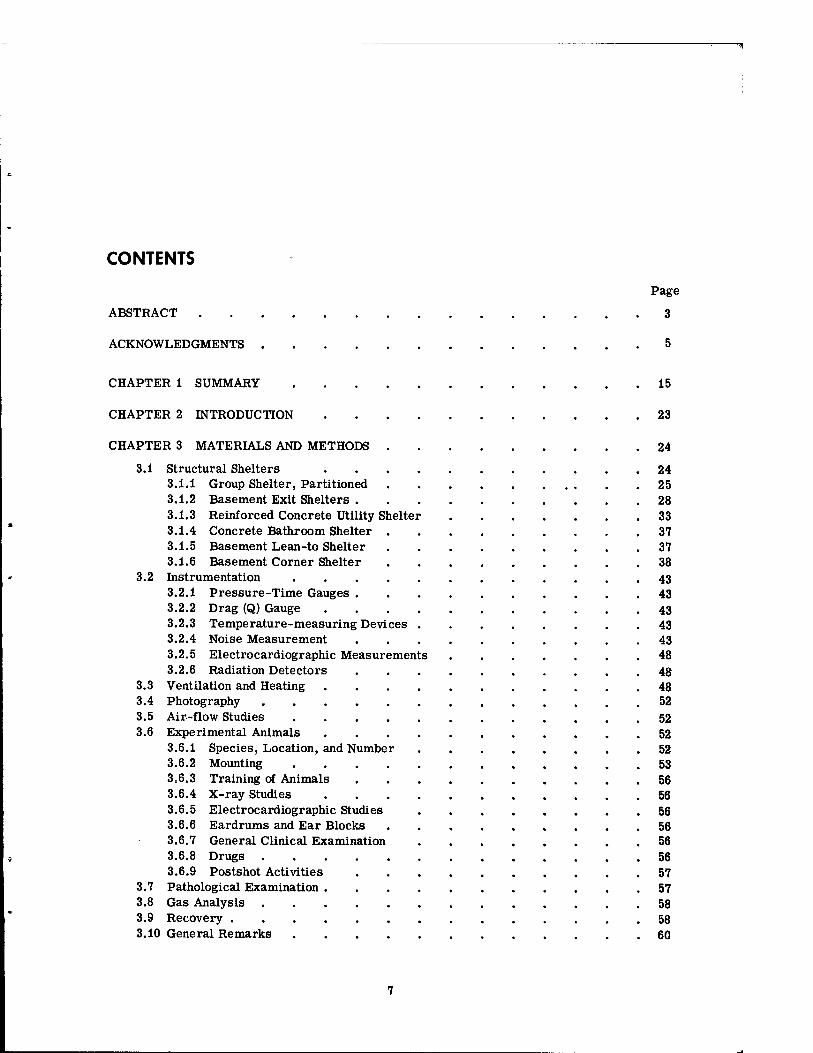
CONTENTS
ABSTRACT
ACKNOWLEDGMENTS
Page
3
CHAPTER 1 SUMMARY
CHAPTER 2 INTRODUCTION
CHAPTER 3 MATERIALS AND METHODS
3.1 Structural Shelters 3.1.1 Group Shelter, Partitioned 3.1.2 Basement Exit Shelters . 3.1.3 Reinforced Concrete Utility Shelter 3.1.4 Concrete Bathroom Shelter . 3.1.5 Basement Lean-to Shelter 3.1.6 Basement Corner Shelter
3.2 Instrumentation .... 3.2.1 Pressure-Time Gauges . 3.2.2 Drag (Q) Gauge 3.2.3 Temperature-measuring Devices 3.2.4 Noise Measurement 3.2.5 Electrocardiographic Measurements 3.2.6 Radiation Detectors
3.3 Ventilation and Heating 3.4 Photography 3.5 Air-flow Studies .... 3.6 Experimental Animals
3.6.1 Species, Location, and Number 3.6.2 Mounting .... 3.6.3 Training of Animals 3.6.4 X-ray Studies 3.6.5 Electrocardiographic Studies 3.6.6 Eardrums and Ear Blocks 3.6.7 General Clinical Examination 3.6.8 Drugs . 3.6.9 Postshot Activities
3.7 Pathological Examination . 3.8 Gas Analysis . 3.9 Recovery .... 3.10 General Remarks
15
23
24
24 25 28 33 37 37 38
43 43 43 43 43 48 48 48 52
52 52 52 53 56 56 56 56 56 56 57 57 58 58 60
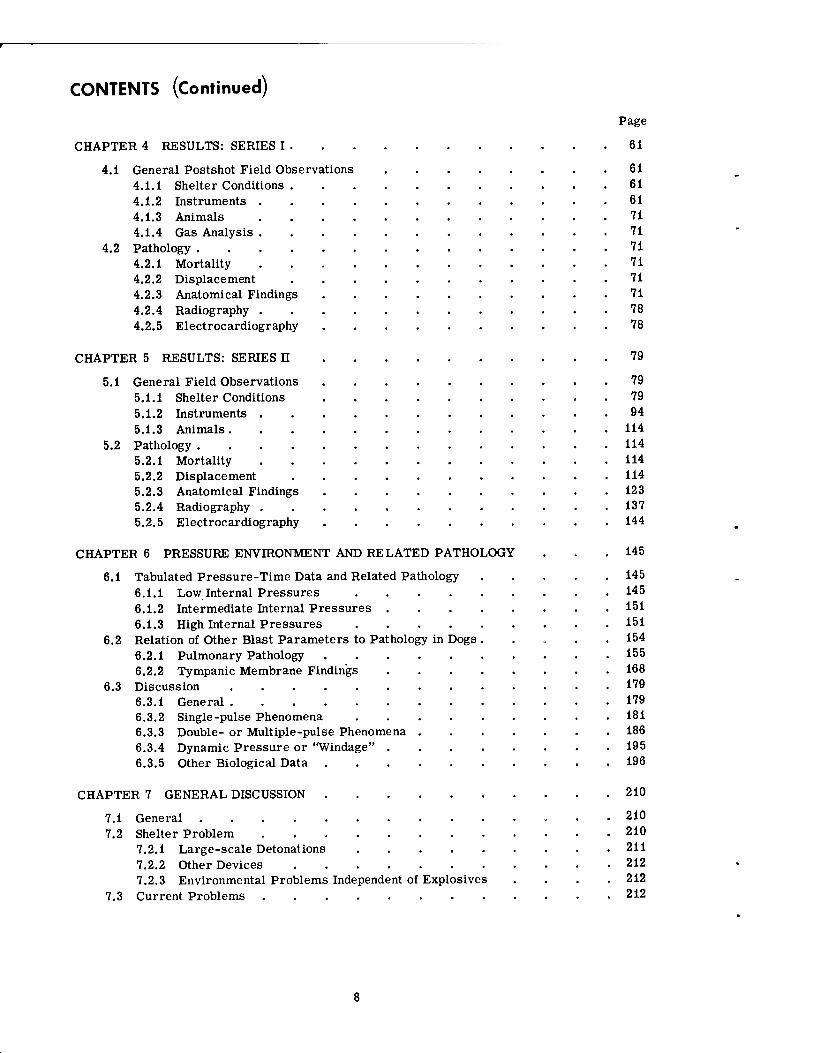
CONTENTS (Continued)
CHAPTER 4 RESULTS: SERIES I .
4.1 General Postshot Field Observations 4.1.1 Shelter Conditions 4.1.2 Instruments . 4.1.3 Animals 4.1.4 Gas Analysis .
4.2 Pathology . 4.2.1 Mortality 4.2.2 Displacement 4.2.3 Anatomical Findings 4.2.4 Radiography . 4.2.5 Electrocardiography
CHAPTER 5 RESULTS: SERIES H
5.1 General Field Observations 5.1.1 Shelter Conditions 5.1.2 Instruments . 5.1.3 Animals.
5.2 Pathology . 5.2.1 Mortality 5.2.2 Displacement 5.2.3 Anatomical Findings 5.2.4 Radiography . 5.2.5 Electrocardiography
CHAPTER 6 PRESSURE ENVIRONMENT AND RELATED PATHOLOGY
6.1 Tabulated Pressure-Time Data and Related Pathology 6.1.1 Low Internal Pressures 6.1.2 Intermediate Internal Pressures . 6.1.3 High Internal Pressures
6.2 Relation of Other Blast Parameters to Pathology in Dogs 6.2.1 Pulmonary Pathology .... 6.2.2 Tympanic Membrane Findings
6.3 Discussion ....... 6.3.1 General 6.3.2 Single-pulse Phenomena 6.3.3 Double- or Multiple-pulse Phenomena . 6.3.4 Dynamic Pressure or "Windage" . 6.3.5 Other Biological Data ....
CHAPTER 7 GENERAL DISCUSSION ....
7.1 7.2
7.3
General ........ Shelter Problem 7.2.1 Large-scale Detonations 7.2.2 Other Devices 7.2.3 Environmental Problems Independent of Explosives Current Problems
Page
61
61 61 61 71 71 71 71 71 71 78 78
79
79 79 94 114 114 114 114 123 137 144
145
145 145 151 151 154 155 168 179 179 181 186 195 196
210
210 210 211 212 212 212
ILLUSTRATIONS
CHAPTER 3 MATERIALS AND METHODS
Page
28
3.1 Diagram of the Partitioned Underground Group Shelter 25 3.2 Entry Stairs of the Underground Group Shelter 26 3.3 Fast-fill Compartment of the Group Shelter Viewed from the Entryway . . 27 3.4 Slow-fill Compartment of the Group Shelter Viewed from the Partition
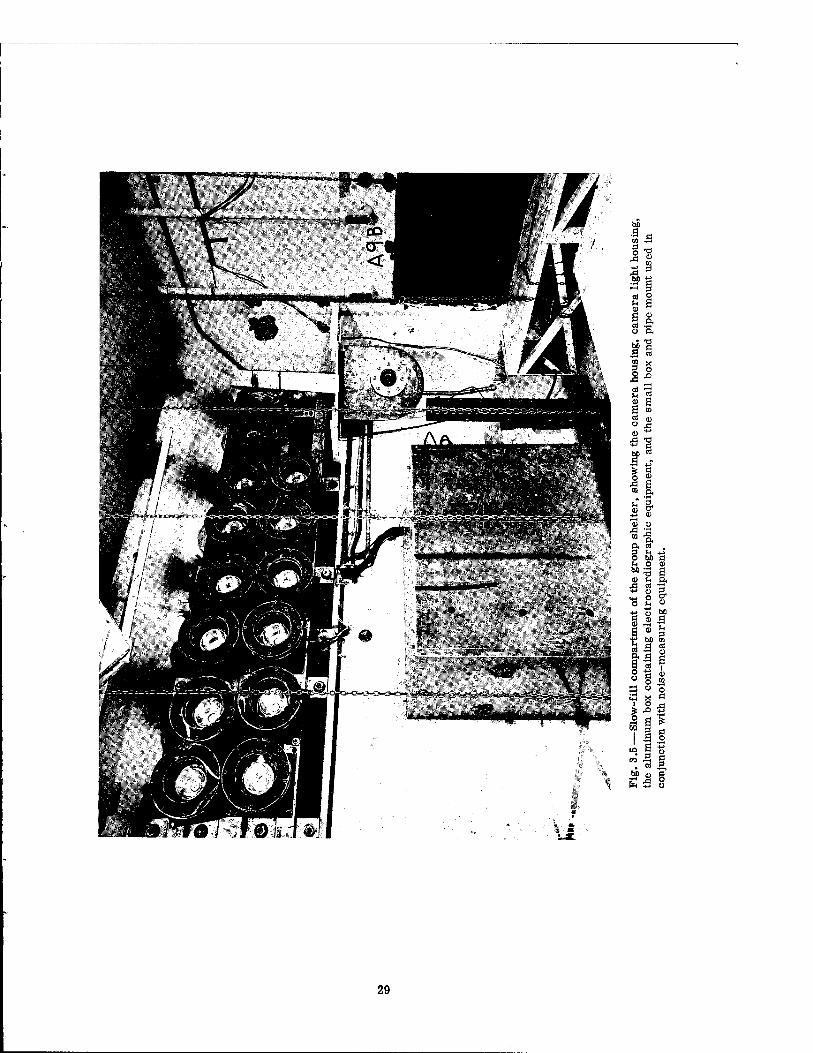
Door 3.5 Slow-fill Compartment of the Group Shelter, Showing the Camera Housing,
Camera Light Housing, the Aluminum Box Containing Electrocardiographic Equipment, and the Small Box and Pipe Mount Used in Conjunction with Noise-measuring Equipment 29
3.6 Corner View of Slow-fill Compartment, Illustrating Camera Protective Housing in Upper Right, Cylinder-mounted Microphone and Attendant Electronic Apparatus in Central Position, and (at the Left) Part of the Electrocardiographic Amplifier Housing 30
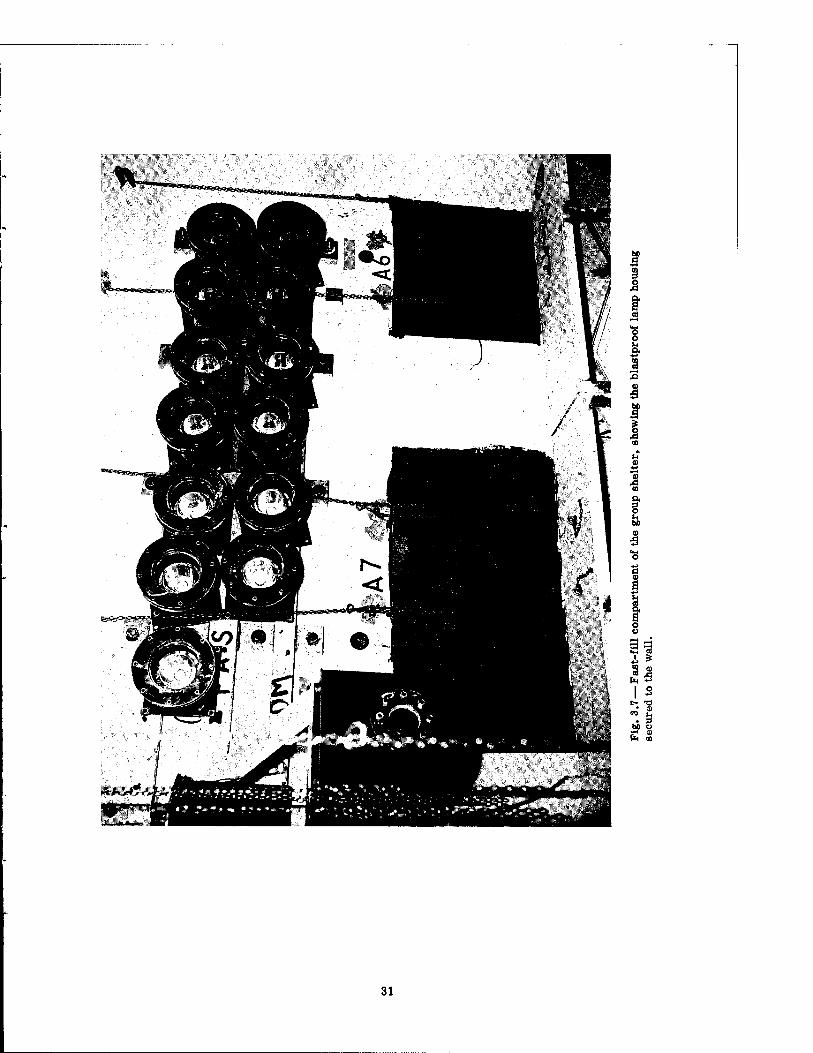
3.7 Fast-fill Compartment of the Group Shelter, Showing the Blastproof Lamp Housing Secured to the Wall 31
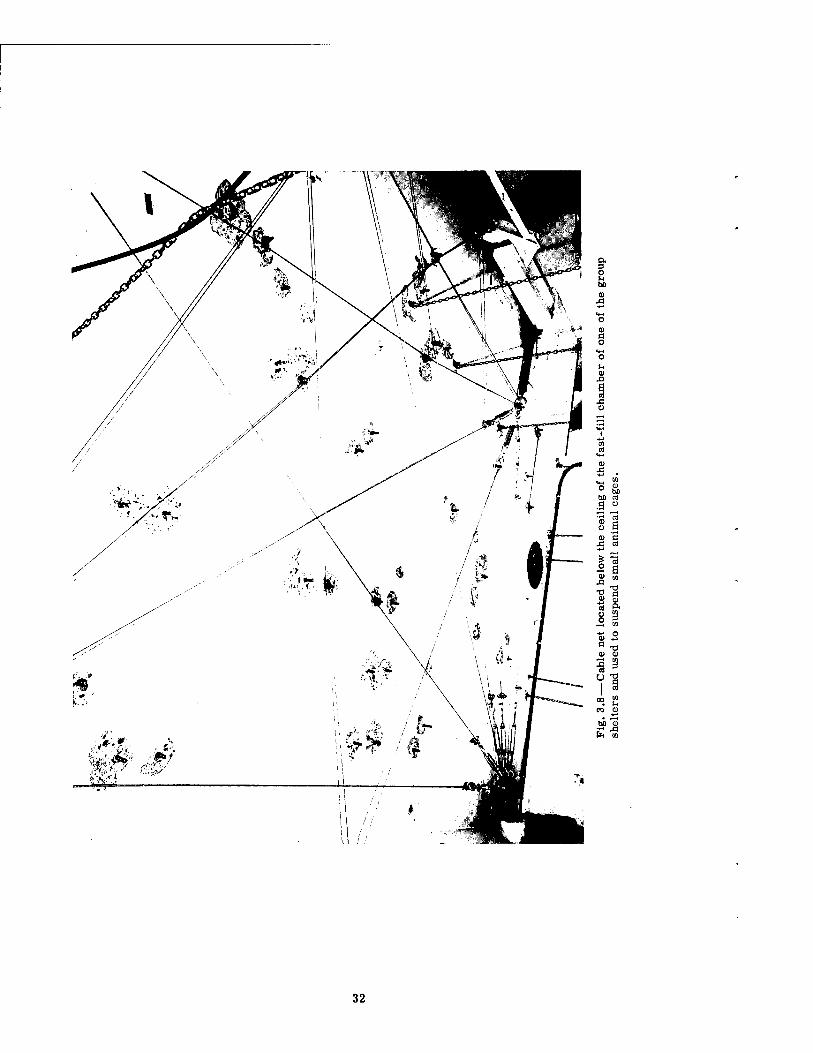
3.8 Cable Net Located Below the Ceiling of the Fast-fill Chamber of One of the Group Shelters and Used To Suspend Small Animal Cages .... 32
3.9 Small Animal Cages Suspended from the Cable Net in the Fast-fill Compartment of One of the Group Shelters 33
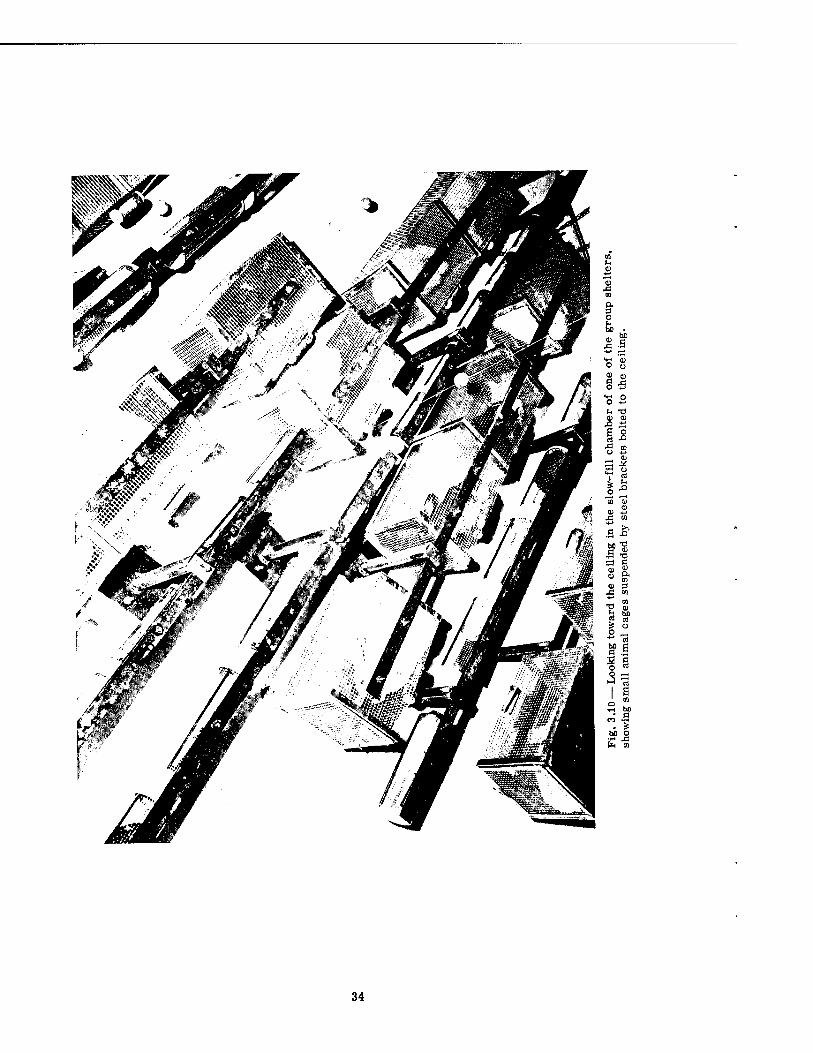
3.10 Looking Toward the Ceiling in the Slow-fill Chamber of One of the Group Shelters, Showing Small Animal Cages Suspended by Steel Brackets'Bolted to the Ceiling 34
3.11 Small Animal Cages Located on the Table in the Slow-fill Compartment of One of the Group Shelters 35
3.12 Basement Exit Shelter 36 3.13 Entryway to One of the Basement Exit Shelters 36 3.14 Entryway of Basement Exit Shelter Tested Closed 37 3.15 Entryway of Basement Exit Shelter Tested Fully Open 38 3.16 Entryway of Basement Exit Shelter Tested Half-open 39 3.17 Reinforced Concrete Utility Shelter 40 3.18 Reinforced Concrete Utility Shelter 40 3.19 Concrete Bathroom Shelter 40 3.20 Blast Door of the Concrete Bathroom Shelter Viewed in the Closed
Position from Inside the Shelter 40 3.21 Basement Lean-to Shelter 41 3.22 Basement Lean-to Shelter 41 3.23 Basement Corner Room Shelter 42 3.24 Basement Corner Room Shelter 42 3.25 Face of the Flush-mounted Wiancko Pressure Gauge 44 3.26 Partitioned Group Shelter 45 3.27 Sandia Corporation Dynamic Pressure (Drag) Gauge Located in the
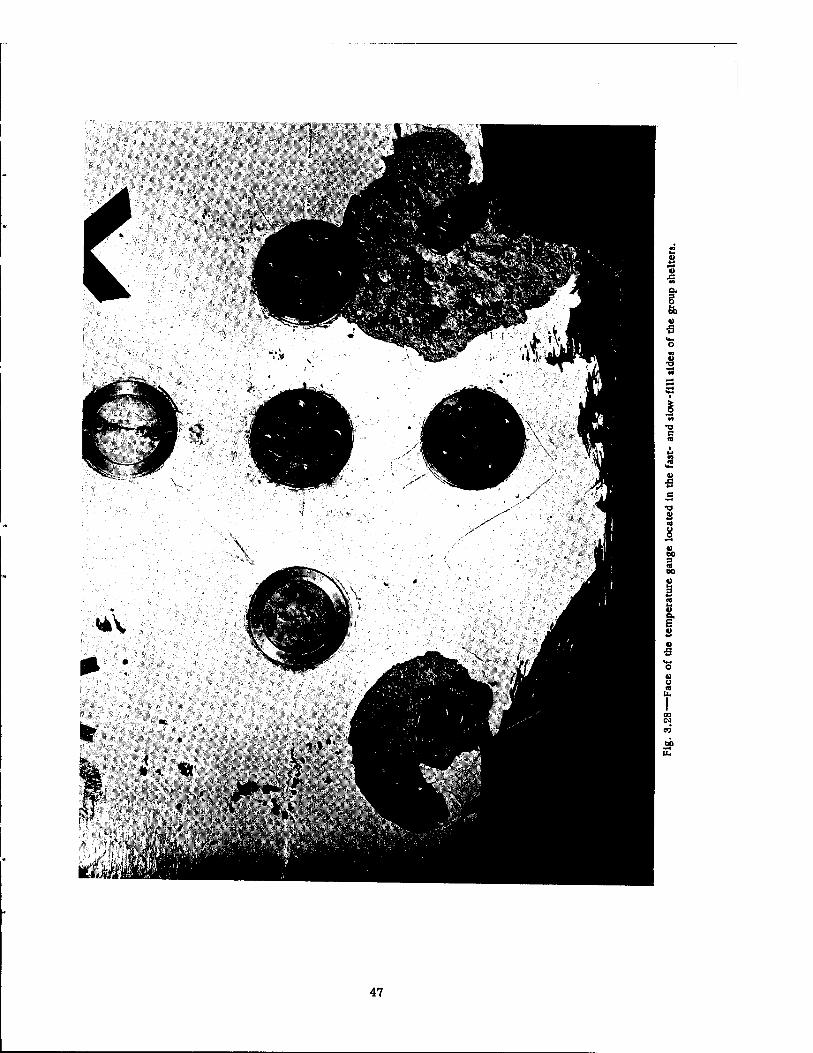
Fast-fill Sides of the Group Shelters 46 3.28 Face of the Temperature Gauge Located in the Fast- and Slow-fill
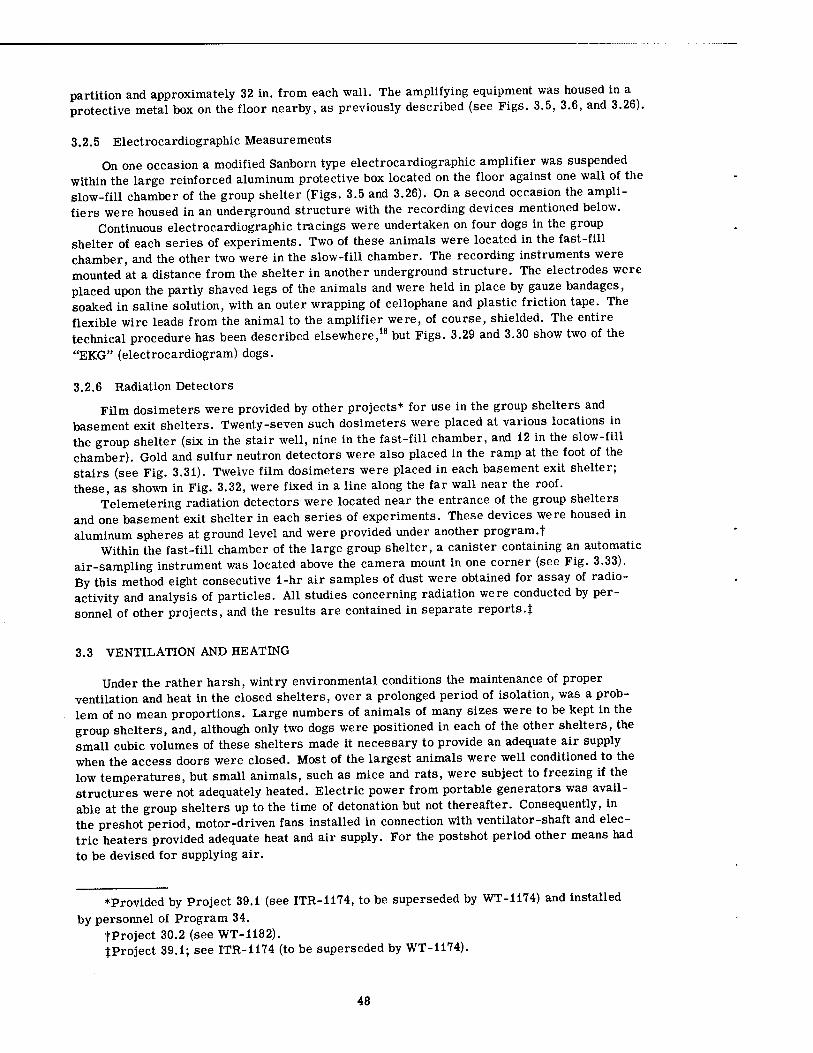
Sides of the Group Shelters . 47 3.29 Harnessed Dog in the Group Shelter with Electrocardiographic Leads in
Place 49 3.30 Harnessed Dog in the Group Shelter, Showing the Miniature Preamplifier
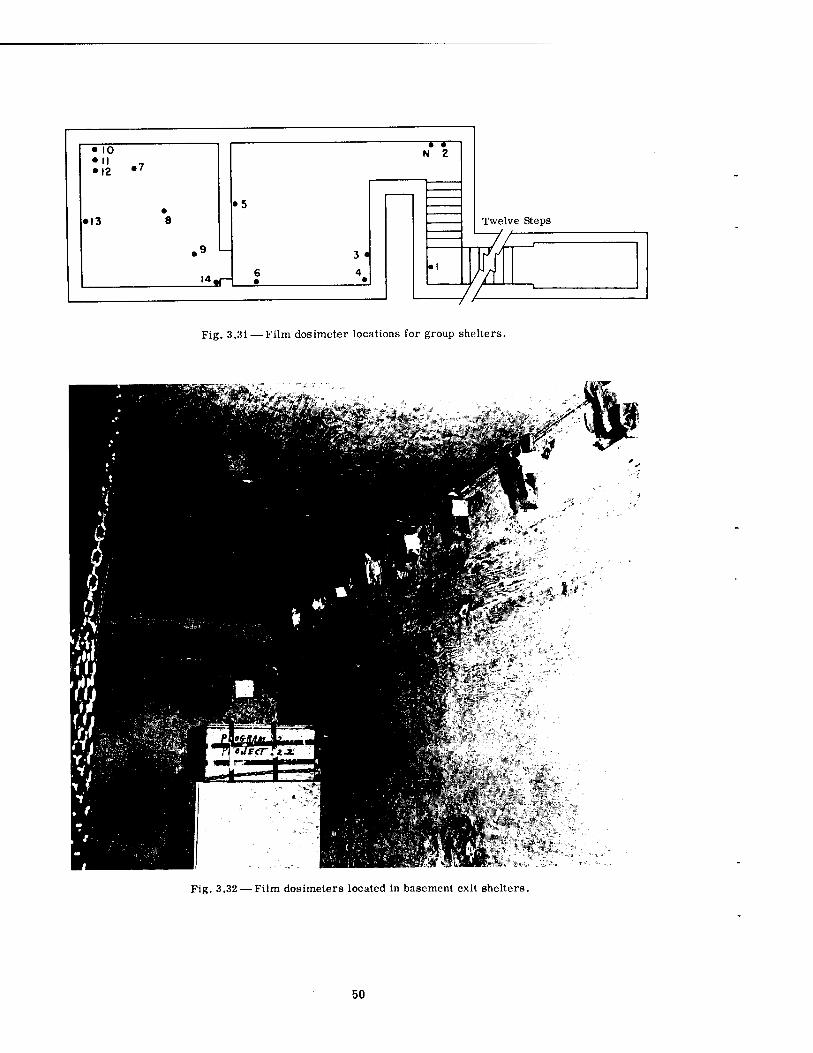
Used on Four Animals Attached to the Harness 49 3.31 Film Dosimeter Locations for Group Shelters 50
ILLUSTRATIONS (Continued)
Page
3.32 Film Dosimeters Located in Basement Exit Shelters 3.33 Air Sampler Used in the Fast-fill Side of the Group Shelter 3.34 Location of Small Animal Cages Suspended Near the Ceiling of the
Slow-fill Sides of the Group Shelters 3.35 Location of Small Animal Cages Placed on the Table in the Slow-fill
Sides of the Group Shelter and, for One Series of Experiments, Those Placed Beneath the Benches in the Fast-fill Side of One Shelter
3.36 One of Two DUKW's Used as Recovery Vehicles ....
50 5i
54
55 59
CHAPTER 4 RESULTS: SERIES I
4.1 Fast-fill Side of Series I Group Shelter, Preshot 4.2 Fast-fill Side of Series I Group Shelter, Postshot 4.3 Slow-fill Side of Series I Group Shelter, Preshot 4.4 Slow-fill Side of Series I Group Shelter, Postshot 4.5 Closed Basement Exit Shelter, Postshot . 4.6 Half-open Basement Exit Shelter, Postshot 4.7 Open Basement Exit Shelter, Postshot 4.8 Closed Basement Exit Shelter, Preshot . 4.9 Closed Basement Exit Shelter, Postshot . 4.10 Animal A-l in Preshot Position on the Bench Facing
Fast-fill Side of the Series I Group Shelter 4.11 Postshot View of Animal A-l . 4.12 Photomicrograph of Lung of Animal A-ll-A 4.13 A-P Postshot Radiograph of Animal A-l .
the Entry way to the
62 63 64 65 66 67 68 69 70
72 73 74 77
CHAPTER 5
5.1
RESULTS: SERIES II
Postshot View, Looking Up from the Bottom of the Stairway of the Series Ü Group Shelter
5.2 Postshot View of the Fast-fill Compartment of the Series H Group Shelter Taken from Just Inside the Entrance
5.3 Postshot View of Floor of Fast-fill Compartment of Series II Group Shelter, Showing Animal Z-l
5.4 Partition Wall of the Fast-fill Side of the Series n Group Shelter, Preshot
5.5 Partition Wall of the Fast-fill Side of the Series n Group Shelter, Postshot
5.6 Tower Wall and Camera Corner of the Fast-fill Chamber of the Series n Group Shelter, Preshot
5.7 Tower Wall and Camera Corner of the Fast-fill Chamber of the Series II Group Shelter, Postshot
5.8 Preshot Condition of Animal Z-6 and the Heating Duct, Fan, and Electrical Heater Located Beneath the Bench of the Fast-fill Chamber of the Series H Group Shelter
5.9 Postshot View of Animal Z-6 and the Ventilating Equipment Located Under the Bench in the Fast-fill Chamber of the Series n Group Shelter .
5.10 Reinforced Partition Door, Preshot ........ 5.11 Slow-fill Compartment of the Series n Group Shelter, Postshot 5.12 Slow-fill Compartment of the Series n Group Shelter, Postshot 5.13 Close-up View of Slow-fill Side of the Series II Group Shelter, Postshot
80
81
82
83
84
85
86
87
88 89 90 91 92
10
ILLUSTRATIONS (Continued)
Page
5.14 Slow-fill Side of the Series II Group Shelter, Showing the Postshot Condition of a Metal Box Used To House Electronic Equipment 93
5.15 Forward Open Basement Exit Shelter, Postshot 95 5.16 Roof Damage to the Forward Open Basement Exit Shelter . . . .96 5.17 Forward Closed Basement Exit Shelter, Postshot 97 5.18 After Open Basement Exit Shelter, Postshot 98 5.19 After Closed Basement Exit Shelter, Postshot 99 5.20 Entryway of the After Closed Basement Exit Shelter, Postshot . . .100 5.21 Forward Reinforced Concrete Utility Shelter, Postshot . . . . . 101 5.22 Rear of the House Containing the Bathroom Shelter 102 5.23 Bathroom Shelter House from the Front, Postshot 103 5.24 Bathroom Shelter House Viewed Postshot from the Side, Looking Along the
Rear Wall 104 5.25 Postshot View of the Blast Shutter of the Bathroom Shelter . . . .105 5.26 Preshot Rear View of the Brick House in the Basement of Which Was
Located the Lean-to Shelter 106 5.27 Basement Lean-to Shelter House, Postshot 107 5.28 House in Fig. 5.27 Several Hours Later 108 5.29 Entry to Basement Containing the Lean-to Shelter, Postshot .... 109 5.30 Basement of the House Containing the Lean-to Shelter, Postshot . . . 110 5.31 Lean-to Shelter, Postshot HI 5.32 Styrofoam Spheres from the Fast-fill Compartment of the Group Shelter
After the Shot 112 5.33 Styrofoam Spheres from the Slow-fill Compartment of the Group Shelter,
Postshot . 113 5.34 Preshot View of Animal Z-l Immediately Facing the Entrance of the Fast-
fill Compartment of the Series II Group Shelter 115 5.35 Imprint Due to Impact of Animal Against Wall and Ceiling; Fast-fill
Compartment of the Series n Group Shelter, Postshot 116 5.36 Postshot Position of Animal Z-8-B 117 5.37 Preshot View of Animal Z-% 118 5.38 Z-l Harness, Postshot 119 5.39 Close-up Showing Shear Failure of Z-l. Harness Snap 120 5.40 Z-8-B Harness, Postshot .121 5.41 View Illustrating Tension Failure of Z-8-B Harness Snaps . . . .122 5.42 Reproduction of Color Photograph of Lungs of Dog D-2-0, Posterior View . 126 5.43 Reproduction of Color Photograph of Lungs of Dog D-2-0, Anterior View . .127 5.44 Reproduction of Color Photograph of Lungs of Dog C-2, Posterior View . . 128 5.45 Reproduction of Color Photograph of Lungs of Dog C-2-0, Anterior View . . 129 5.46 Photomicrograph of Lung of Animal D-2-0 130 5.47 Reproduction of Color Photograph of Opened Urinary Bladder of Dog C-2 . 132 5.48 Trachea of Animal Z-6 133 5.49 A-P Postshot Radiograph of Animal Z-7 139 5.50 A-P Postshot Radiograph of Animal D-2-0 140 5.51 A-P Postshot Radiograph of Animal U-22-B 141 5.52 Electrocardiograms of Dog Z-5, Located in the Fast-fill Chamber of the
Group Shelter 142 5.53 Electrocardiograms of Dog Z-ll-B, Located in the Slow-fill Chamber of
the Group Shelter 143
11
ILLUSTRATIONS (Continued)
Page
CHAPTER 6 PRESSURE ENVIRONMENT AND RELATED PATHOLOGY
6.1 Association of Lung Hemorrhage in Dogs with the Pressure Ratio (AP/Pj) as a Function of Time of Occurrence of Peak Pressure 159
6.2 Pressure-Time Curves at 4700 Ft for the Series Ü Experiments . . . 161 6.3 Pressure-Time Curves at 3750 Ft 162 6.4 Pressure-Time Curves for Selected Basement Exit Shelters .... 163 6.5 Pressure-Time Curves for the Fast-fill and Slow-fill Sides of the Group
Shelter 164 6.6 Sample of Fractional or Incremental Analysis of a Pressure-Time Curve . 166 6.7 Fractional Analysis of Pressure-Time Curves for Group and Basement Exit
Shelters, Showing the Incremental Pressure Ratios as Functions of the Respective Times of Incremental Pressure Rise 167
6.8 Percentage Tympanic Membrane Failure as Associated with Maximal Overpressure 170
6.9 Percentage Tympanic Membrane Failure as a Log Function of the Maximal Overpressure 171
6.10 Percentage Tympanic Membrane Failure for Dogs as a Function of the Average Fractional Pressure Differential 174
6.11 Percentage Tympanic Membrane Failure for Dogs as a Function of the Average Pressure Ratio 175
6.12 Percentage Tympanic Membrane Failure for Dogs as a Function of the Rate of Pressure Rise 176
6.13 Percentage Tympanic Membrane Failure for Dogs as Associated with the Average Pressure Ratio and the Average Times to Reach Maximal Pressures 177
6.14 Percentage Tympanic Membrane Failure for Dogs as Associated with the Average Fractional Pressure Differential and the Average Times to Reach Maximal Pressures 178
6.15 Summary of Tympanic Membrane Data for Individual Dogs, Showing the Association with the Fractional Pressure Differential and the Time of Pressure Rise ............. 180
6.16 Fatal Overpressure-Time Conditions for Dogs Exposed to High Explosives 182
6.17 Characteristic Lines of Destruction for Dogs, Guinea Pigs, Surface of an Aircraft, and a Windowpane in a Charge-Distance Diagram .... 184
6.18 Shock Wave from a Detonating Charge of TNT 187 6.19 Shock Wave at Different Distances from a Charge of TNT . . . .188 6.20 Underwater Shock Wave at 45 ft from a lV4-lb TNT Demolition Charge . . 189 6.21 Effect of Geometry on Pressure-Time Phenomena in Underwater
Explosions 189 6.22 Underwater Shock and Successive Bubble Waves at 5 Ft from Center of a
1-lb HE 190 6.23 Shock Wave in a Detonation Chamber 190 6.24 Tracings from Pressure-Time Records Obtained with Wall Gauges Inside
Underground Structures (50 Ft Long, of Circular Cross Section, and 7 Ft in Diameter 191
6.25 Time-displacement Analysis of Nonpenetrating Missile 199
12
TABLES
CHAPTER 3 MATERIALS AND METHODS
3.1 Shelters in Which Experimental Animals Were Exposed 3.2 Species of Animals Used in Series I and H 3.3 Location of Animals 3.4 Gas Analysis Data, Partitioned Group Shelter .
Page
24 53 53 58
CHAPTER 4 RESULTS: SERIES I
4.1 Internal Parenchyma! Lesions in Dogs, Series I 4.2 Nonparenchymal Lesions in Dogs, Series I
75 76
CHAPTER 5 RESULTS: SERIES H
5.1 Nonparenchymal Lesions in Dogs, Series II 5.2 Internal Parenchymal Lesions in Dogs, Series H 5.3 Summary Pathological Findings: Rabbits, Series n . 5.4 Summary Pathological Findings: Guinea Pigs, Series II 5.5 Summary Pathological Findings: Rats, Series II 5.6 Summary Pathological Findings: Mice, Series n 5.7 Positive X-ray Findings
124 125 134 135 136 138 138
CHAPTER 6 PRESSURE ENVIRONMENT AND RELATED PATHOLOGY
6.1 Summary of Pressure Environment and Related Pathology 6.2 Summary of Pressure Environment and Related Pathology in Dogs . 6.3 Summary of Lung Lesions in Dogs as Related to Maximal Internal
Overpressure 6.4 Summary of Lung Lesions in Dogs as Related to Average Rate of Pressure
Rise . . • 6.5 Summary of Lung Lesions in Dogs as Related to Fractional Pressure
Differential 6.6 Summary of Lung Lesions in Dogs as Related to Average Rate of Rise of
Fractional Pressure Differential 6.7 Summary of Pulmonary Pathology in Dogs as Associated with Incremental
Analysis of Pressure-Time Curves Recorded Inside Group and Basement Exit Shelters
6.8 Summary Tympanic Membrane Data for Dogs, Compiled from Tables 6.1 and 6.2 Using Average Data Where Possible
6.9 Pressure-Time Data for Mice 6.10 Lung Hemorrhage Data for Dogs in Underground Shelters 6.11 Lung Hemorrhage Data for Dogs in Underground Shelters 6.12 Example of Hydrostatic Compression in a Pearl Diver 6.13 Aeromedical Decompression Data for Humans 6.14 Pressures Applied to External Auditory Meatus Required to Rupture
Tympanic Membranes of Fresh Cadavers .... 6.15 Arterial Emboli in Animals as a Result of Blast
141 152
155
156
157
158
169
172 183 192 192 192 201
202 205
13-14
CHAPTER 1
SUMMARY
In two series of experiments a total of 277 experimental animals, including 66 dogs, 52 rabbits, 52 guinea pigs, 63 rats, and 44 mice, located inside 15 separate, instrumented struc- tures comprising six different types of above- and below-ground construction, were exposed to the environmental variations associated with nuclear-produced blast.
The distance of the several structures from Ground Zero ranged from 1050 to 5500 ft, and the most severe alterations in the pressure environment inside the structures followed the detonation of a nuclear device with a yield approximately 50 per cent greater than nominal (a nominal atomic bomb has an energy release equivalent to 20 kilotons of TNT).
The small animals were housed in individual cages constructed of large-mesh wire screen. The dogs were kept in position using harnesses fabricated from cotton webbing and custom-fitted to each animal.
Recovery of all animals was accomplished within about 10 hr after the detonation in each of the two series of experiments.
Variations in the overpressure-time phenomena metered inside the structures with wall- mounted pressure gauges ranged from maximal pressures of 1.3 psi enduring for 1346 msec to 85.8 psi lasting for 570 msec. The times of pressure rise (time to Pmax) ranged from 4.0 tc 420 msec. The underpressure figures were not considered very reliable, and varied from none (no crossover) to a maximal underpressure of -6.4 psi. The total range of pressure fall varied from 2.1 to 89.1 psi with times of total pressure fall from 1919 and 1127 msec, respectively. The shortest time of total pressure fall recorded was 303 msec for a 29.1-psi drop in pressure. However, the shortest time of pressure fall from Pmax to ambient was 260 msec for a 36.9-psi drop in pressure (see Tables 6.1 and 6.2).
Dynamic pressure-time measurements were taken on two occasions. The curves were very complex and variable, and the peak readings showed pressures of 12.3 and 12.7 psi.
The geometry and design of the several structures markedly influenced the magnitude and character of the internal, compared with the external, pressure-time phenomena. For example, in some instances, the internal Pmax was near one-fourth of the external Pmax; in others the internal Pmax was more than double the external peak overpressure.
Overpressure-time curves representing environmental variations inside the structures varied considerably in contour from relatively "slow"-rising and -falling tracings for the "closed" structures located at greater ranges, to quite complex curves for the "open," "half- open," and "closed" structures located at the nearer ranges. In case of the latter, multiple saw-tooth and stepwise variations in pressure occurred which, for the most part, were due to multiple pressure reflections from the walls, ceilings, and floors and to the turbulence of high and variable winds.
In spite of the rather marked environmental pressure variations in the yield-distance relation, which in the most severe case involved local static ground pressures in the order
15
of two- to threefold those estimated to exist near the epicenters of the nominal yield ex- plosions at Hiroshima and Nagasaki, the shelters functioned reasonably well, but far from perfectly, as blast-protective structures.
Among the 66 large animals (dogs), there was no immediate mortality attributable to primary blast effects. Six animals were displaced from their preshot positions. Two animals immediately expired; one of these died as the consequence of violent displacement caused by the high-velocity winds, and the other died as a result of events secondary to a 270° rotation of one of the aboveground utility shelters. One other animal, among nine on which the autop- sies were deliberately delayed, succumbed on the 14th postshot day as a result of radiation injury. The others were then sacrificed.
Among the 211 small animals, blast-produced mortality was limited to mice (17 of 20 and one of four located inside structures, the wall gauges of which averaged a Pmax of 22 and 67 psi, respectively) and guinea pigs (one of 22 placed in a structure, the wall gauges of which averaged 22 psi).
Lung damage in the dogs consisted of one pneumothorax and spotty areas of lung hemor- rhage in 11 animals which were judged minor, moderate, or severe in seven, two, and two animals, respectively. In four of the animals the findings were complicated by the occur- rence of displacement, which in two instances at least no doubt contributed to the cause of pulmonary pathology. Other thoracic findings involved one instance each of pericardial petechiae and petechiae of the pericardial fat, four instances of subendocardial petechiae, and one animal each with tracheitis, bronchitis, and tracheobronchitis, apparently associated with inhalation of dust.
Abdominal pathology noted among the large animals included nine hemorrhagic spleens, seven mucosal tears of the urinary bladder, and two instances of omental or mesenteric petechiae.
Other signs of traumatic internal and external injury in surviving large animals included one fracture (femur), one mediastinal hemorrhage, one bracheal plexis injury with limb paralysis, one extradural hemorrhage, seven animals with hemorrhagic frontal sinuses, and rupture of 45 of 119 usable tympanic membranes among 60 of 66 animals in which examina- tions were adequate.
Of the 52 rabbits exposed, five and one exhibited minor and severe intrapulmonary hemorrhages, respectively. In the case of 52 guinea pigs, lung hemorrhages were judged minor in nine animals, moderate in five animals, and severe in one animal. Only six of 63 rats showed any lung lesions, and these were all minor. Mice exhibited the most lung pathology, consisting of one case of congestion and 6, 10, and 5 instances of minor, moderate, and severe lung hemorrhages, respectively. Other blast-related findings were minimal ex- cept for tympanic membrane rupture in rabbits, guinea pigs, and rats, totaling 34 of 74, 49 of 67, and nine of 16 usable eardrums, respectively; a subcapsular hemorrhage of the liver in one mouse; and periorbital hemorrhage, bilaterally, in another mouse. Two rabbits were not immediately sacrificed; these died on the 9th and 11th postshot days of radiation injury. Likewise, two of three guinea pigs and three rabbits (one of which died in 5 days) not examined immediately, but subsequently sacrificed, showed signs of radiation damage.
The eyeballs of all animals were fixed, sectioned, and examined microscopically. In spite of the high range of the overpressures existing in the several structures, the findings were entirely negative except for superficial injury associated with flying dust and particulate material, i.e., eight dogs, one rabbit, and two guinea pigs showed corneal pitting and abrasions, hyperemic conjunctivitis, and, in one instance, superficial focal hemorrhage beneath the conjunctival epithelium.
Rather surprisingly, thermal effects were noted in the large and small animals located in eight of the nine forward shelters even though the animals were shielded from direct ther- mal radiation by virtue of their underground locations. In 39 of 54 dogs the fur and vibrissae were singed to a varying degree, and 23 of 39 singed animals also exhibited associated burns of the skin. One rabbit was slightly singed, as were nine guinea pigs (one moderately severe) and 36 rats. Unusual necrotic lesions of the front feet were observed in 21 rats, and these were limited to animals housed in close-fitting cylindrical rather than square cages. No
16
cause for the lesions was found, but it seemed likely that the animals gnawed their own feet and that thermal injury may have been an initiating factor.
The cause for the thermal effects was not understood, but because the animals most severely affected were those located in positions most exposed to the wind, it seemed likely that hot gases and hot dust carried into the structures during the period of shelter pres- surization were important factors.
The association of the observed pathology with the variations in the environmental pres- sure-time phenomena was tabulated, and an attempt was made to relate the meager biological data with a variety of blast parameters.
In the case of pulmonary pathology, since the findings were minimal, it was only possible to search for an analytical procedure which might tentatively define environmental conditions associated with threshold damage. The work was limited to data referable to the dogs.
There seemed to be no reliable association between canine pulmonary findings and peak overpressure alone, although there was a tendency for damage to be associated with the higher overpressures. A similar statement can be made regarding the fractional pressure differential (Pf - Pi)/Pf (the final pressure minus the initial pressure divided by the final pressure in absolute units) and the pressure ratio (Pf - Pt)/Pi. However, the over-all rate of pressure rise alone and the average rate of rise of the fractional pressure differential alone both showed a somewhat better relation with threshold conditions for pulmonary damage than did the overpressure by itself. There appeared to be no correlation with the total area under the pressure-time curve (/ P dt), the first differential of the pressure-time curve (dp/dt), the total range of pressure fall, and the average rate of pressure fall. Combination of the peak overpressure with the time to Pmax for damaged and undamaged animals was likewise of little help.
The most promising analytical approach which has been explored to date concerned incremental analysis of the individual pressure-time curves, a procedure which regarded each increment of the rising portion of each curve as a separate phenomenon "loading" the animal. Each segmental pressure rise was treated individually, provided that (1) there was a 5 or more msec pause between the stepwise rises in pressure and (2) a rising pressure occurred after a pressure fall that was one-third or more of the previous pressure rise. The pres- sure ratios for each increment of the curves were calculated (AP/P4, AP'/Pf, ..., APn/P?) and plotted against the rise time in msec for each segment of the curve (t, t', ..., tn). When such a plot was made on log-log paper for conditions existing in the nine forward shelters, it was possible to draw a sloping line which denoted the region in which pulmonary damage occurred in dogs; i.e., for 10 cases of damage 90 per cent of the pressure-time curves had at least one of the incremental points above the line, and for 44 cases showing no pathology 82 per cent of the appropriate pressure-time curves had no points above the line. Thus the analytical approach was 90 per cent accurate and 10 per cent inaccurate in predicting pathology, and 82 per cent accurate and 18 per cent inaccurate in predicting no pathology.
The equation of the sloping line was
AP x t = C x Pj
where AP = the incremental pressure differential t = the time for incremental pressure rise
C = a constant (10 in the case at hand) Pi = the initial pressure in absolute units which existed for each incremental rise in
pressure
Since the expression AP x t, or force per unit area times time, expresses incremental momentum, the equation suggests that incremental momentum is proportional to the initial pressure Pj and that pulmonary blast damage may be associated with a critical magnitude of the product Pj x C, a somewhat meaningful physical concept.
The analysis also suggested that there was a relation between the incremental pressure ratio and the related time of pressure rise such that, as the incremental rise time increased,
17
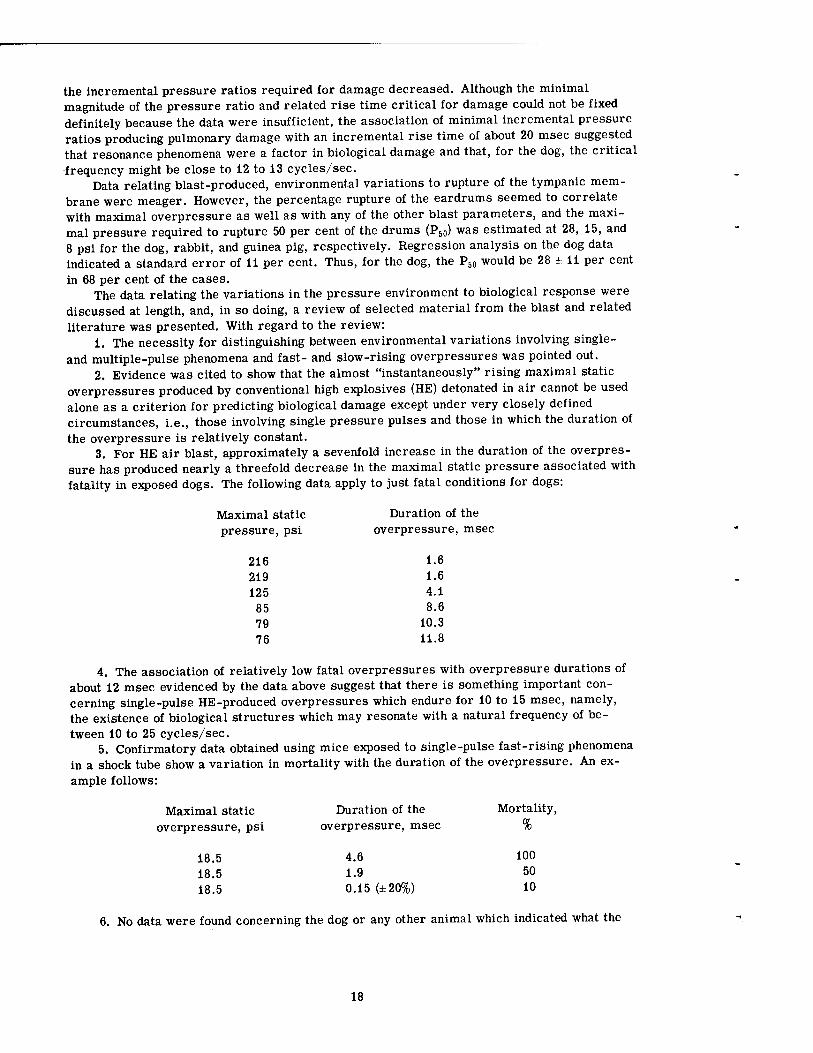
the incremental pressure ratios required for damage decreased. Although the minimal magnitude of the pressure ratio and related rise time critical for damage could not be fixed definitely because the data were insufficient, the association of minimal incremental pressure ratios producing pulmonary damage with an incremental rise time of about 20 msec suggested that resonance phenomena were a factor in biological damage and that, for the dog, the critical frequency might be close to 12 to 13 cycles/sec.
Data relating blast-produced, environmental variations to rupture of the tympanic mem- brane were meager. However, the percentage rupture of the eardrums seemed to correlate with maximal overpressure as well as with any of the other blast parameters, and the maxi- mal pressure required to rupture 50 per cent of the drums (P50) was estimated at 28, 15, and 8 psi for the dog, rabbit, and guinea pig, respectively. Regression analysis on the dog data indicated a standard error of 11 per cent. Thus, for the dog, the P50 would be 28 ± 11 per cent in 68 per cent of the cases.
The data relating the variations in the pressure environment to biological response were discussed at length, and, in so doing, a review of selected material from the blast and related literature was presented. With regard to the review:
1. The necessity for distinguishing between environmental variations involving single- and multiple-pulse phenomena and fast- and slow-rising overpressures was pointed out.
2. Evidence was cited to show that the almost "instantaneously" rising maximal static overpressures produced by conventional high explosives (HE) detonated in air cannot be used alone as a criterion for predicting biological damage except under very closely defined circumstances, i.e., those involving single pressure pulses and those in which the duration of the overpressure is relatively constant.
3. For HE air blast, approximately a sevenfold increase in the duration of the overpres- sure has produced nearly a threefold decrease in the maximal static pressure associated with fatality in exposed dogs. The following data apply to just fatal conditions for dogs:
Maximal static Duration of the pressure, psi overpressure, msec
216 1.6 219 1.6 125 4.1
85 8.6 79 10.3 76 11.8
4. The association of relatively low fatal overpressures with overpressure durations of about 12 msec evidenced by the data above suggest that there is something important con- cerning single-pulse HE-produced overpressures which endure for 10 to 15 msec, namely, the existence of biological structures which may resonate with a natural frequency of be- tween 10 to 25 cycles/sec.
5. Confirmatory data obtained using mice exposed to single-pulse fast-rising phenomena in a shock tube show a variation in mortality with the duration of the overpressure. An ex- ample follows:
Maximal static overpressure, psi
18.5 18.5 18.5
6. No data were found concerning the dog or any other animal which indicated what the
18
Duration of the Mortali overpressure, msec %
4.6 100 1.9 50 0.15 (±20%) 10
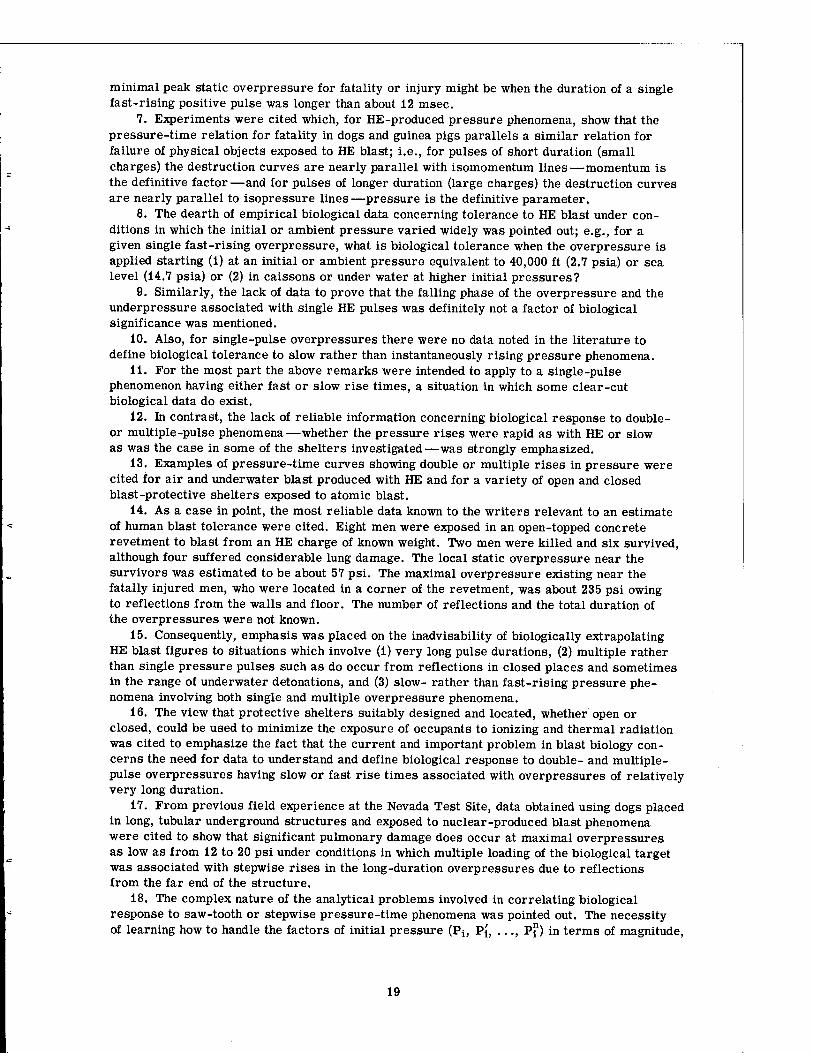
minimal peak static overpressure for fatality or injury might be when the duration of a single fast-rising positive pulse was longer than about 12 msec.
7. Experiments were cited which, for HE-produced pressure phenomena, show that the pressure-time relation for fatality in dogs and guinea pigs parallels a similar relation for failure of physical objects exposed to HE blast; i.e., for pulses of short duration (small charges) the destruction curves are nearly parallel with isomomentum lines—momentum is the definitive factor—and for pulses of longer duration (large charges) the destruction curves are nearly parallel to isopressure lines—pressure is the definitive parameter.
8. The dearth of empirical biological data concerning tolerance to HE blast under con- ditions in which the initial or ambient pressure varied widely was pointed out; e.g., for a given single fast-rising overpressure, what is biological tolerance when the overpressure is applied starting (1) at an initial or ambient pressure equivalent to 40,000 ft (2.7 psia) or sea level (14.7 psia) or (2) in caissons or under water at higher initial pressures?
9. Similarly, the lack of data to prove that the falling phase of the overpressure and the underpressure associated with single HE pulses was definitely not a factor of biological significance was mentioned.
10. Also, for single-pulse overpressures there were no data noted in the literature to define biological tolerance to slow rather than instantaneously rising pressure phenomena.
11. For the most part the above remarks were intended to apply to a single-pulse phenomenon having either fast or slow rise times, a situation in which some clear-cut biological data do exist.
12. In contrast, the lack of reliable information concerning biological response to double- or multiple-pulse phenomena—whether the pressure rises were rapid as with HE or slow as was the case in some of the shelters investigated—was strongly emphasized.
13. Examples of pressure-time curves showing double or multiple rises in pressure were cited for air and underwater blast produced with HE and for a variety of open and closed blast-protective shelters exposed to atomic blast.
14. As a case in point, the most reliable data known to the writers relevant to an estimate of human blast tolerance were cited. Eight men were exposed in an open-topped concrete revetment to blast from an HE charge of known weight. Two men were killed and six survived, although four suffered considerable lung damage. The local static overpressure near the survivors was estimated to be about 57 psi. The maximal overpressure existing near the fatally injured men, who were located in a corner of the revetment, was about 235 psi owing to reflections from the walls and floor. The number of reflections and the total duration of the overpressures were not known.
15. Consequently, emphasis was placed on the inadvisability of biologically extrapolating HE blast figures to situations which involve (1) very long pulse durations, (2) multiple rather than single pressure pulses such as do occur from reflections in closed places and sometimes in the range of underwater detonations, and (3) slow- rather than fast-rising pressure phe- nomena involving both single and multiple overpressure phenomena.
16. The view that protective shelters suitably designed and located, whether open or closed, could be used to minimize the exposure of occupants to ionizing and thermal radiation was cited to emphasize the fact that the current and important problem in blast biology con- cerns the need for data to understand and define biological response to double- and multiple- pulse overpressures having slow or fast rise times associated with overpressures of relatively very long duration.
17. From previous field experience at the Nevada Test Site, data obtained using dogs placed in long, tubular underground structures and exposed to nuclear-produced blast phenomena were cited to show that significant pulmonary damage does occur at maximal overpressures as low as from 12 to 20 psi under conditions in which multiple loading of the biological target was associated with stepwise rises in the long-duration overpressures due to reflections from the far end of the structure.
18. The complex nature of the analytical problems involved in correlating biological response to saw-tooth or stepwise pressure-time phenomena was pointed out. The necessity of learning how to handle the factors of initial pressure (Pi; P'u ..., P?) in terms of magnitude,
19
rise time, and time between incremental pressure rises, along with the duration of overpres- sure, the character and time of the falling pressure, including the underpressure, was emphasized.
19. An increased importance for the falling phase of pressure pulses was predicted for those overpressures which existed long enough to allow the lungs of the target to "fill," i.e., to come into equilibrium with the overpressure existing outside the animal. It seems clear that "decompressionlike" pathology will be encountered—if it has not already and has not been recognized —depending on the magnitude and time of pressure fall.
20. Information relevant to biological tolerance to a variety of pressure phenomena was cited from the basic literature to aid in understanding the etiology of biological blast damage.
21. Statically raising the intratracheal pressures in a variety of animals, from the mouse to the steer, has produced lung rupture, hemorrhage, and arterial air emboli at pressures of about 50, 80, and 160 mm Hg (0.98, 1.6, and 3.1 psi) for the open, closed, and bandaged chest, respectively.
22. The lowest increase in intratracheal pressure associated with emphysema in an anesthetized human was reported to be 60 mm Hg (1.2 psi).
23. Pressure differentials associated with human fatality were stated to be 6.5 and 6.4 psi for circumstances involving submarine escape training and indoctrination in explosive de- compression, respectively.
24. Ballistic data referable to penetrating missiles were cited to show that damage to the air-containing organs can occur at considerable distance from the track of the missile. In this regard the significance of the negative pressure pulse associated with cavitation was pointed out.
25. The occurrence of bilateral lung damage following unilateral trauma to the chest was mentioned, and the similarity to blast-produced pathology was noted.
26. The desirability of knowing the pressure-time phenomena which occur inside an animal in relation to the loading factors, whether blast or more localized trauma, was emphasized.
27. The dearth of reliable data relevant to the tolerance of the tympanic membranes of animals and man to dynamic pressure variations was mentioned.
28. However, for somewhat static conditions the literature contained data showing that the human eardrum (of cadavers) on the average would rupture at 23.4 psi with a range from 5.4 to 44.1 psi. For 10 dogs the average pressure for drum failure was 14.9 psi, although the range was stated to be from 9.1 to 22.8 psi.
29. For humans, suddenly applied underpressures of 1.9 to 3.8 psi have been associated with failure of the eardrum.
30. From the blast literature, information was cited which showed that rapidly fatal ex- posure to HE blast (air or water) was frequently due to the consequences of arterial air emboli in the vessels of the heart and central nervous system (brain).
31. The causes of primary blast death were considered to be due to (1) heart failure (commotio cordis and/or air emboli), (2) suffocation (lung hemorrhage and edema), and (3) central nervous system damage from arterial air emboli and possibly from trauma (com- motio cerebri).
32. It was pointed out that biological damage from exposure to blast, except for the "distant" effects of air emboli, was characteristically localized in those areas where the greatest contrast in tissue density exists, i.e., the air-containing organs, the union of bones or cartilaginous tissue with soft tissues, and the areas of union between soft tissues and adjacent air-containing tissues, such as the lung tissue overlying the heart.
33. Experimental ballistic and blast data were described which supported the conclusion that the exposure of the trunk of the animal to the static and dynamic pressure pulses of a blast wave was critical for biological damage. This seems clear for the rapid phenomena produced by HE at least but may or may not apply for slower rising, multiple-pulse pres- sure variations of "long" duration.
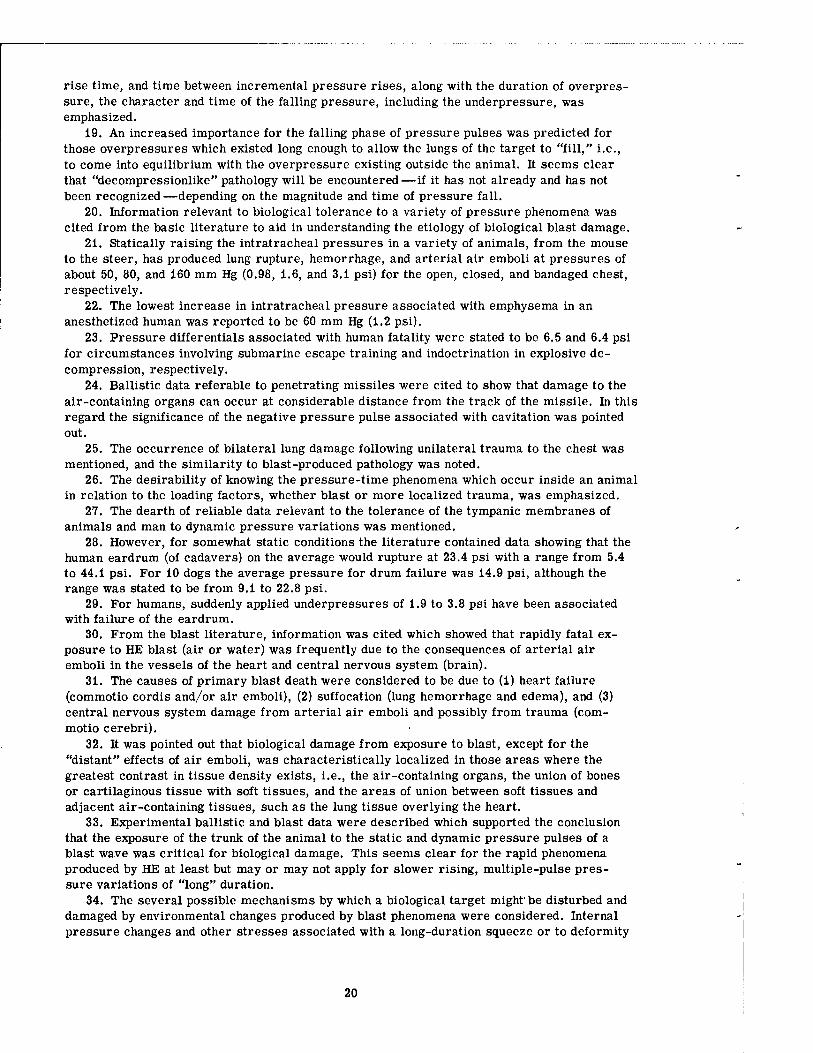
34. The several possible mechanisms by which a biological target might'be disturbed and damaged by environmental changes produced by blast phenomena were considered. Internal pressure changes and other stresses associated with a long-duration squeeze or to deformity
20
of the body, the transfer of momentum to tissues of different masses resulting in differential movement of tissues of different density and natural frequencies of oscillation (inertia ef- fects), implosion phenomena, and the spalling effect were all thought to be important.
35. As a tentative hypothesis fast-, intermediate-, and slow-acting mechanisms were suggested. The first could well be associated with implosion and spalling effects contingent upon a sufficiently dynamic environmental variation to assure the transmission of shock waves from the fluid into the air-containing organs of the body. The second or intermediate- acting mode of damage could be associated more with momentum and inertia effects, and the third or slow mechanism might involve the transmission of blood and fluid into the chest and hence into the air-containing portions of the lung, a possibility which is somewhat analogous to the "squeeze" syndrome described in divers.
The results and implications of the present study in relation to the potential value of protective shelters were discussed.
Although the structures utilized, with a few exceptions, served to prevent immediate mortality in the largest experimental animals, the conclusion that any of the shelters under the conditions tested would be adequate for human occupancy must not be drawn. There was violent displacement of constrained animals, and there were serious immediate thermal effects and delayed radiation effects which were later fatal to some animals. Also, con- siderable dust existed, a factor known to be fatal for humans in some bomb shelters during World War H.
These facts supported the suggestions that the design of a structure to serve as protection against modern large-scale explosions is not a simple task, that a sound perspective relevant to the total problem needs to be developed and maintained, and that an approach to design must be functional as well as structural in order that environmental variations will be optimized.
21-22
CHAPTER 2
INTRODUCTION
In the past, considerable effort has been expended in investigating the pathophysiological effects of blast from HE detonated in air.1-17 In contrast, biological blast damage produced by atomic explosions has not been studied intensively primarily because data were not available to appreciate fully and realistically the interrelation between blast effects and those associated with ionizing and thermal radiation. When it was realized that under appropriate circumstances the employment of relatively simple and inexpensive shelters might very well minimize or eliminate irradiation and thermal damage, it became obvious that the influence of blast phe- nomena on the internal environment of the structure must be determined and assessed biologi- cally. With regard to the latter it was desirable to expose experimental animals to metered variations in pressures produced by a nuclear explosion.
Two series of such experiments were carried out at the Nevada Test Site in the spring of 1955. The purpose of this report is to give data obtained using five species of animals which were placed in a variety of instrumented above- and below-ground structures and which were subjected to environmental pressure variations created by the tower detonations of two nuclear devices. Further objectives are to review selected material from the blast literature, along with applicable data from related disciplines, and to present the problem of assessing biologi- cal response to variations in environmental static and dynamic pressures, particularly as the latter are related to biological effects in blast-protective shelters.
The work was made possible through the common interests of the Atomic Energy Commis- sion and the Federal Civil Defense Administration, who cooperatively arranged the mutual participation of people trained in both physics and biology to prosecute a program that could not have been accomplished by personnel trained in either discipline alone.
23
CHAPTER 3
MATERIALS AND METHODS
3.1 STRUCTURAL SHELTERS
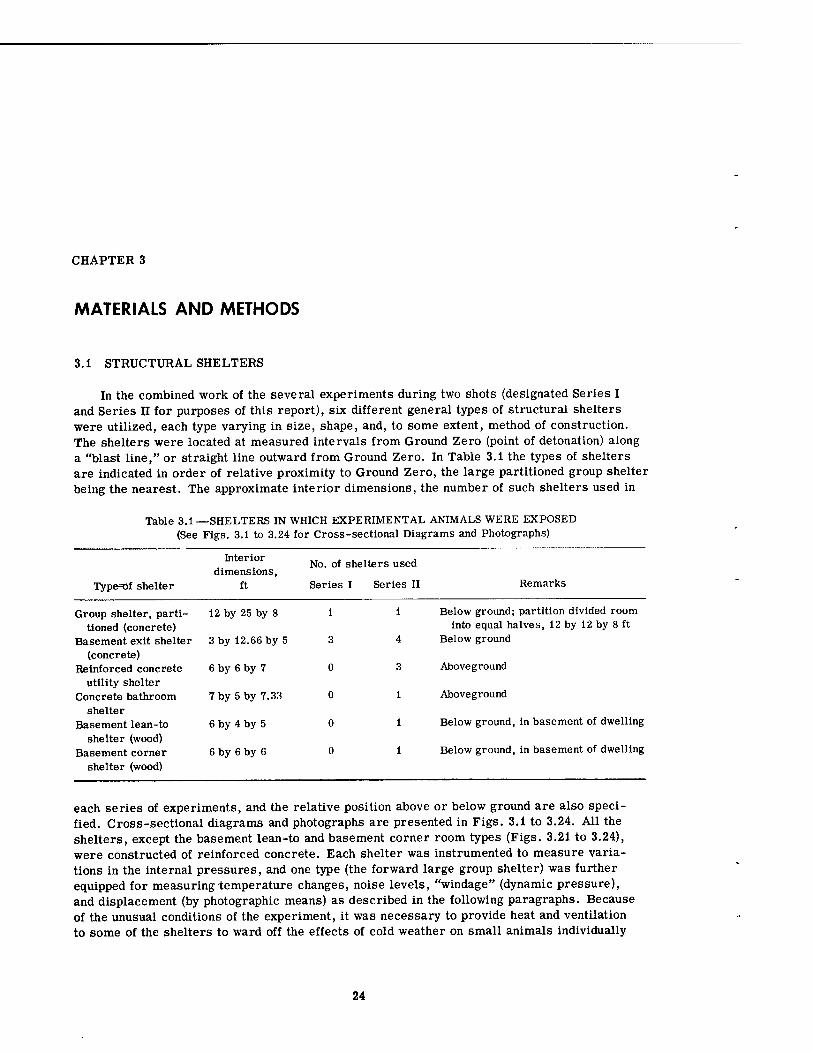
In the combined work of the several experiments during two shots (designated Series I and Series n for purposes of this report), six different general types of structural shelters were utilized, each type varying in size, shape, and, to some extent, method of construction. The shelters were located at measured intervals from Ground Zero (point of detonation) along a "blast line," or straight line outward from Ground Zero. In Table 3.1 the types of shelters are indicated in order of relative proximity to Ground Zero, the large partitioned group shelter being the nearest. The approximate interior dimensions, the number of such shelters used in
Table 3.1—SHELTERS IN WHICH EXPERIMENTAL ANIMALS WERE EXPOSED (See Figs. 3.1 to 3.24 for Cross-sectional Diagrams and Photographs)
Interior dimensions,
No . of shelters used
Type=of shelter ft Series I Series II Remarks
Group shelter, parti- tioned (concrete)
Basement exit shelter
12 by 25 by 8
3 by 12.66 by 5
1
3
1
4
Below ground; partition divided room into equal halves, 12 by 12 by 8 ft
Below ground (concrete)
Reinforced concrete 6 by 6 by 7 0 3 Aboveground utility shelter
Concrete bathroom 7 by 5 by 7.33 0 1 Aboveground shelter
Basement lean-to 6 by 4 by 5 0 1 Below ground, in basement of dwelling
shelter (wood) Basement corner 6 by 6 by 6 0 1 Below ground, in basement of dwelling
shelter (wood)
each series of experiments, and the relative position above or below ground are also speci- fied. Cross-sectional diagrams and photographs are presented in Figs. 3.1 to 3.24. All the shelters, except the basement lean-to and basement corner room types (Figs. 3.21 to 3.24), were constructed of reinforced concrete. Each shelter was instrumented to measure varia- tions in the internal pressures, and one type (the forward large group shelter) was further equipped for measuring temperature changes, noise levels, "windage" (dynamic pressure), and displacement (by photographic means) as described in the following paragraphs. Because of the unusual conditions of the experiment, it was necessary to provide heat and ventilation to some of the shelters to ward off the effects of cold weather on small animals individually
24
isolated in cages. The following paragraphs describe the shelters briefly in relation to con- struction and to point of detonation.
3.1.1 Group Shelter, Partitioned
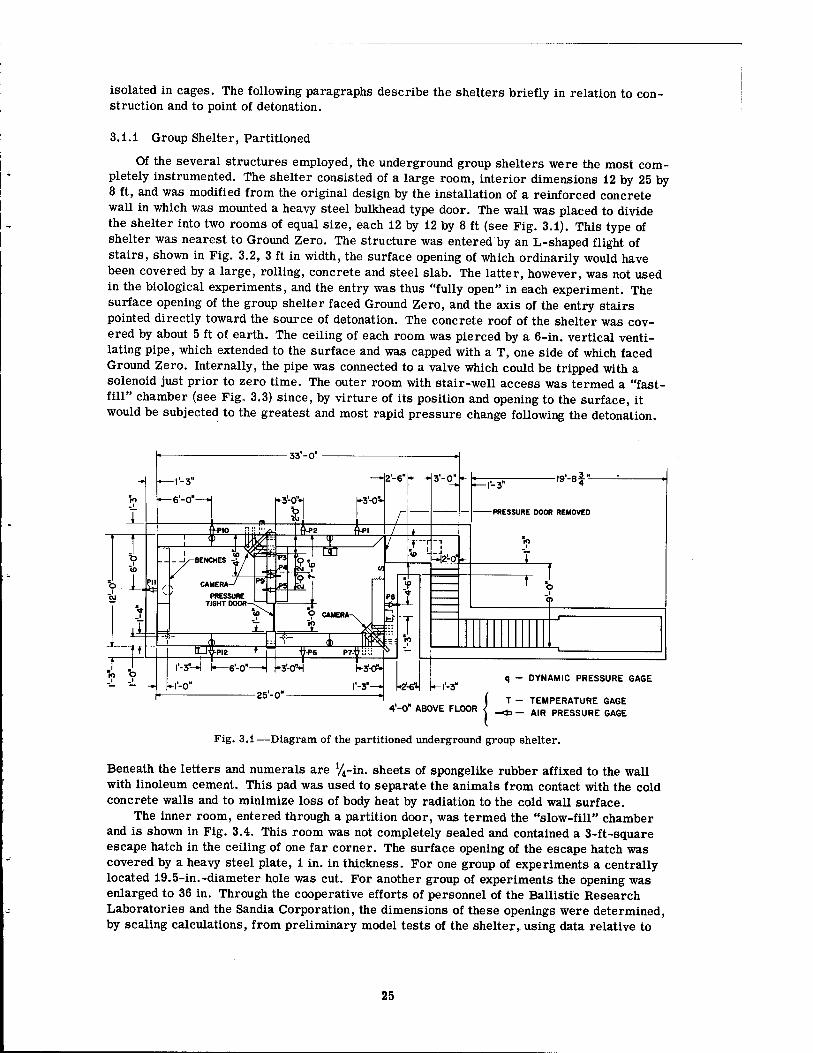
Of the several structures employed, the underground group shelters were the most com- pletely instrumented. The shelter consisted of a large room, interior dimensions 12 by 25 by 8 ft, and was modified from the original design by the installation of a reinforced concrete wall in which was mounted a heavy steel bulkhead type door. The wall was placed to divide the shelter into two rooms of equal size, each 12 by 12 by 8 ft (see Fig. 3.1). This type of shelter was nearest to Ground Zero. The structure was entered by an L-shaped flight of stairs, shown in Fig. 3.2, 3 ft in width, the surface opening of which ordinarily would have been covered by a large, rolling, concrete and steel slab. The latter, however, was not used in the biological experiments, and the entry was thus "fully open" in each experiment. The surface opening of the group shelter faced Ground Zero, and the axis of the entry stairs pointed directly toward the source of detonation. The concrete roof of the shelter was cov- ered by about 5 ft of earth. The ceiling of each room was pierced by a 6-in. vertical venti- lating pipe, which extended to the surface and was capped with a T, one side of which faced Ground Zero. Internally, the pipe was connected to a valve which could be tripped with a solenoid just prior to zero time. The outer room with stair-well access was termed a "fast- fill" chamber (see Fig. 3.3) since, by virture of its position and opening to the surface, it would be subjected to the greatest and most rapid pressure change following the detonation.
q - DYNAMIC PRESSURE GAGE
{*- - TEMPERATURE GAGE
AIR PRESSURE GAGE 4-0 ABOVE FLOOR
Fig. 3.1—Diagram of the partitioned underground group shelter.
Beneath the letters and numerals are V4-in. sheets of spongelike rubber affixed to the wall with linoleum cement. This pad was used to separate the animals from contact with the cold concrete walls and to minimize loss of body heat by radiation to the cold wall surface.
The inner room, entered through a partition door, was termed the "slow-fill" chamber and is shown in Fig. 3.4. This room was not completely sealed and contained a 3-ft-square escape hatch in the ceiling of one far corner. The surface opening of the escape hatch was covered by a heavy steel plate, 1 in. in thickness. For one group of experiments a centrally located 19.5-in.-diameter hole was cut. For another group of experiments the opening was enlarged to 36 in. Through the cooperative efforts of personnel of the Ballistic Research Laboratories and the Sandia Corporation, the dimensions of these openings were determined, by scaling calculations, from preliminary model tests of the shelter^ using data relative to
25
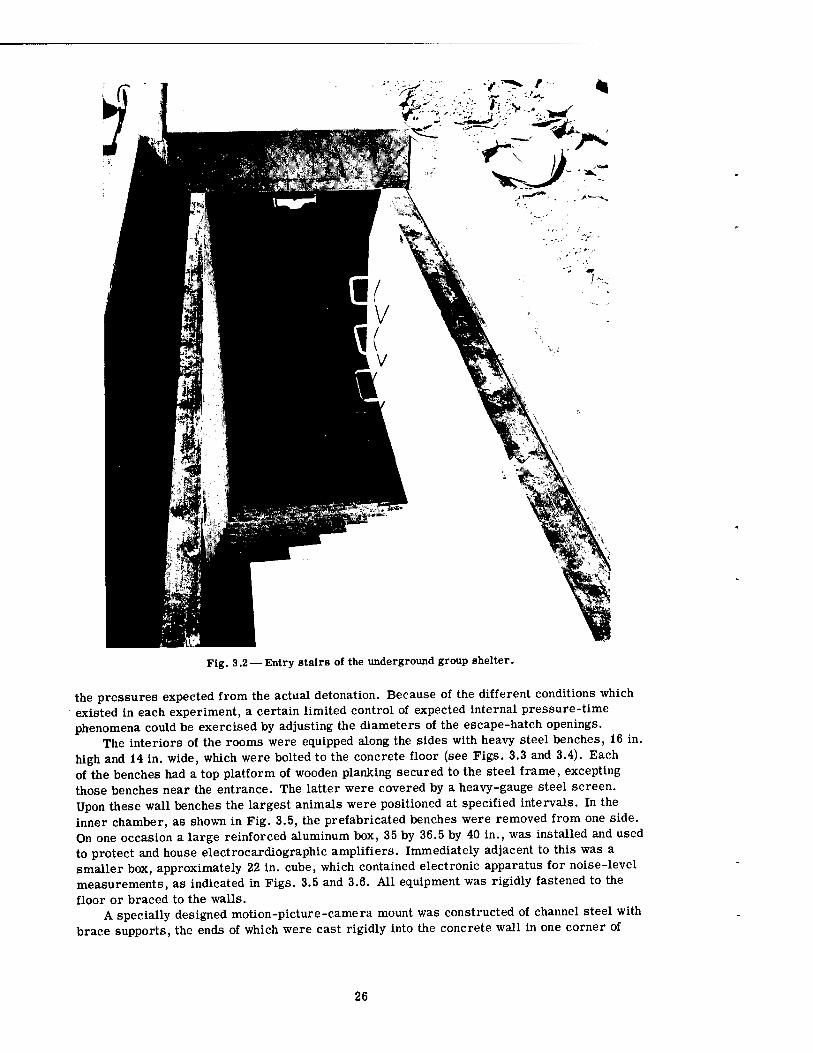
Fig. 3.2— Entry stairs of the underground group shelter.
the pressures expected from the actual detonation. Because of the different conditions which existed in each experiment, a certain limited control of expected internal pressure-time phenomena could be exercised by adjusting the diameters of the escape-hatch openings.
The interiors of the rooms were equipped along the sides with heavy steel benches, 16 in. high and 14 in. wide, which were bolted to the concrete floor (see Figs. 3.3 and 3.4). Each of the benches had a top platform of wooden planking secured to the steel frame, excepting those benches near the entrance. The latter were covered by a heavy-gauge steel screen. Upon these wall benches the largest animals were positioned at specified intervals. In the inner chamber, as shown in Fig. 3.5, the prefabricated benches were removed from one side. On one occasion a large reinforced aluminum box, 35 by 36.5 by 40 in., was installed and used to protect and house electrocardiographic amplifiers. Immediately adjacent to this was a smaller box, approximately 22 in. cube, which contained electronic apparatus for noise-level measurements, as indicated in Figs. 3.5 and 3.6. All equipment was rigidly fastened to the floor or braced to the walls.
A specially designed motion-picture-camera mount was constructed of channel steel with brace supports, the ends of which were cast rigidly into the concrete wall in one corner of
26
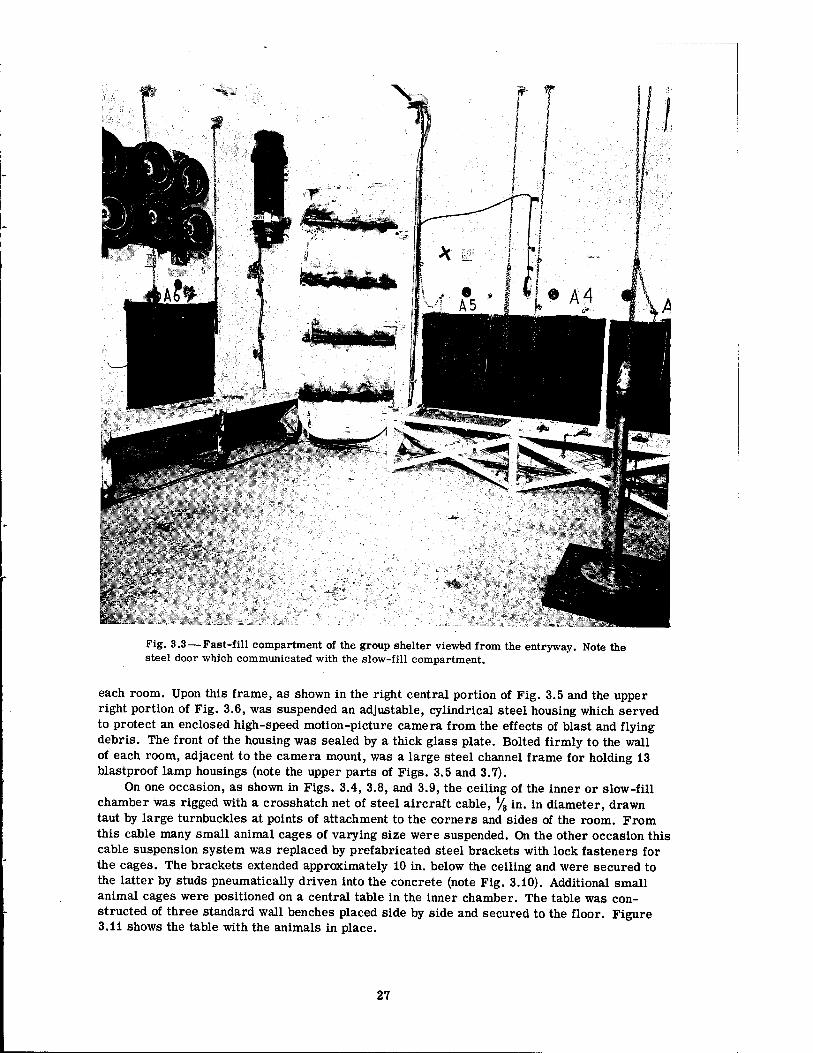
Fig. 3.3—Fast-fill compartment of the group shelter viewed from the entryway. Note the steel door which communicated with the slow-fill compartment.
each room. Upon this frame, as shown in the right central portion of Fig. 3.5 and the upper right portion of Fig. 3.6, was suspended an adjustable, cylindrical steel housing which served to protect an enclosed high-speed motion-picture camera from the effects of blast and flying debris. The front of the housing was sealed by a thick glass plate. Bolted firmly to the wall of each room, adjacent to the camera mount, was a large steel channel frame for holding 13 blastproof lamp housings (note the upper parts of Figs. 3.5 and 3.7).
On one occasion, as shown in Figs. 3.4, 3.8, and 3.9, the ceiling of the inner or slow-fill chamber was rigged with a Crosshatch net of steel aircraft cable, % in. in diameter, drawn taut by large turnbuckles at points of attachment to the corners and sides of the room. From this cable many small animal cages of varying size were suspended. On the other occasion this cable suspension system was replaced by prefabricated steel brackets with lock fasteners for the cages. The brackets extended approximately 10 in. below the ceiling and were secured to the latter by studs pneumatically driven into the concrete (note Fig. 3.10). Additional small animal cages were positioned on a central table in the inner chamber. The table was con- structed of three standard wall benches placed side by side and secured to the floor. Figure 3.11 shows the table with the animals in place.
27
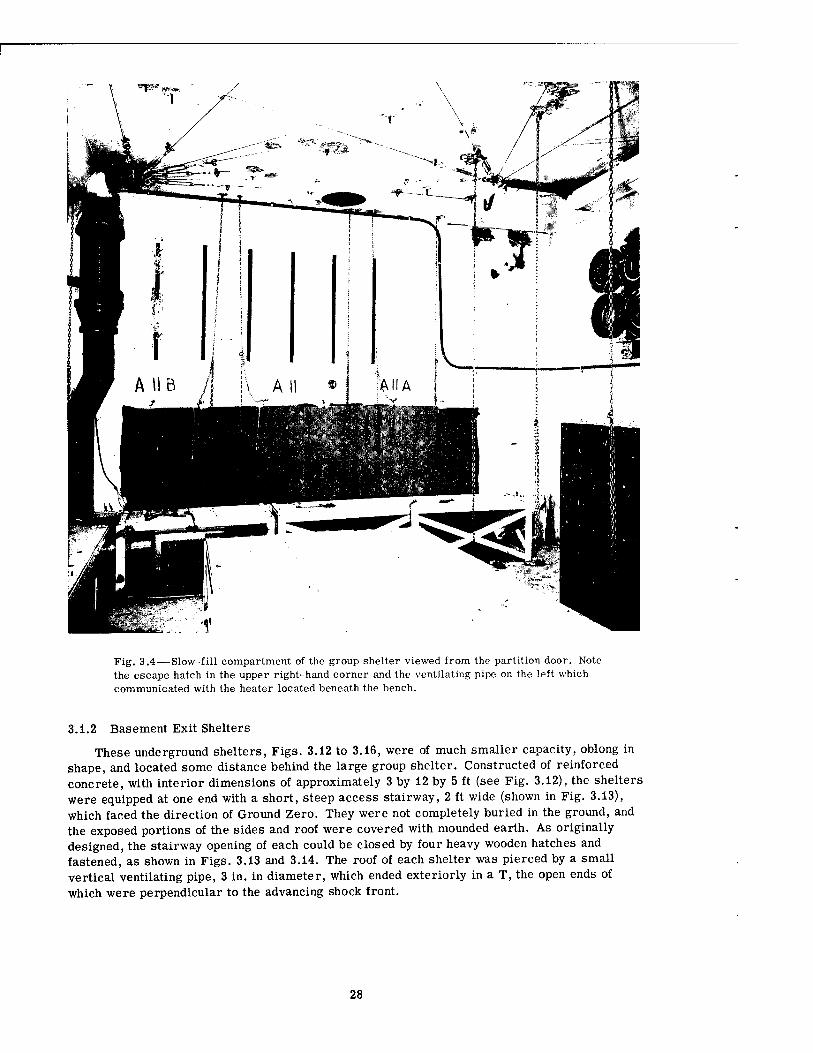
Fig. 3.4 — Slow-fill compartment of the group shelter viewed from the partition door. Note the escape hatch in the upper right-hand corner and the ventilating pipe on the left which communicated with the heater located beneath the bench.
3.1.2 Basement Exit Shelters
These underground shelters, Figs. 3.12 to 3.16, were of much smaller capacity, oblong in shape, and located some distance behind the large group shelter. Constructed of reinforced concrete, with interior dimensions of approximately 3 by 12 by 5 ft (see Fig. 3.12), the shelters were equipped at one end with a short, steep access stairway, 2 ft wide (shown in Fig. 3.13), which faced the direction of Ground Zero. They were not completely buried in the ground, and the exposed portions of the sides and roof were covered with mounded earth. As originally designed, the stairway opening of each could be closed by four heavy wooden hatches and fastened, as shown in Figs. 3.13 and 3.14. The roof of each shelter was pierced by a small vertical ventilating pipe, 3 in. in diameter, which ended exteriorly in a T, the open ends of which were perpendicular to the advancing shock front.
28
■iJL.
fcC
.3 g to .3
bo
1 s 8 JO
0) J3
■B •
s. I
J3 10
&r CD
+J
ja n o, g u bo (V
0)
o
1. bo a
a •iH
& 0
T3 U
a o
■g bp
bo to (3 rt
•s a « s o 2
a ° a "5 I § |S It a) 8
+3 o
29
.' Z, 'sf ;.«'■• «i3Ä*t".V
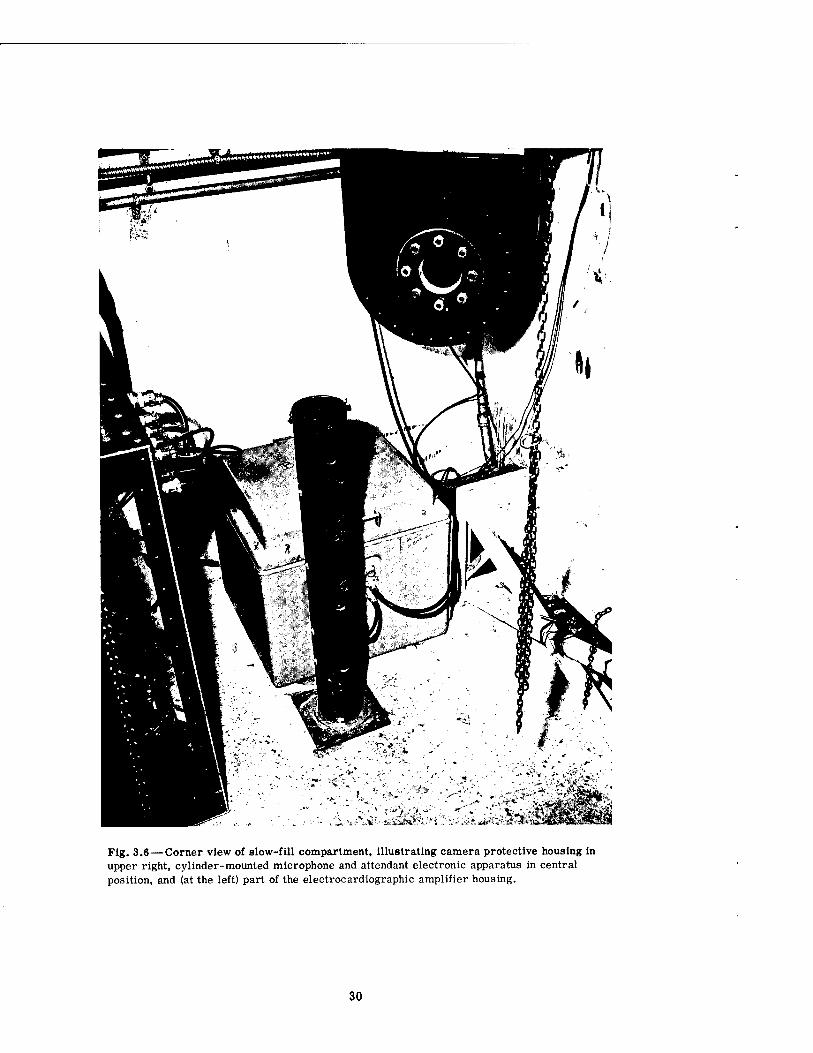
Fig. 3.6—Corner view of slow-fill compartment, illustrating camera protective housing in upper right, cylinder-mounted microphone and attendant electronic apparatus in central position, and (at the left) part of the electrocardiographic amplifier housing.
30
be a
2
1
I 0)
CO
I I
t o u
8 Jj
I 2 CO Li
. 3 bo o
31
ay«;:«»'" ■',&*/
ft 3 O (-.
0)
a o »♦-< o
CD
° 8> bO et!
'S 0 .0
13 ■a
IV
tS ft X 3
■*-» 0 (U a ■0 m di
XI 0! 3
U 'S 1 rt co CD
In 0)
hfl (II •H ,13 1* co
32
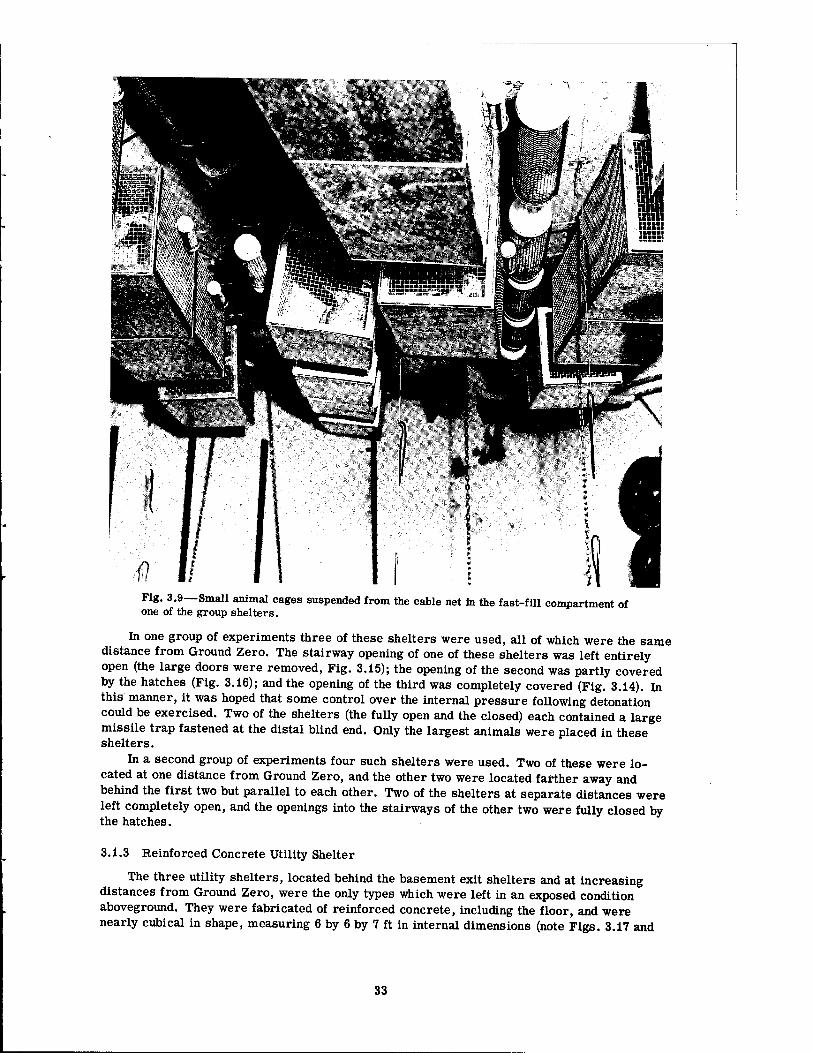
Fig. 3. one of
9—Small the group
animal cages suspended from the cable net in the fast-fill compartment of shelters.
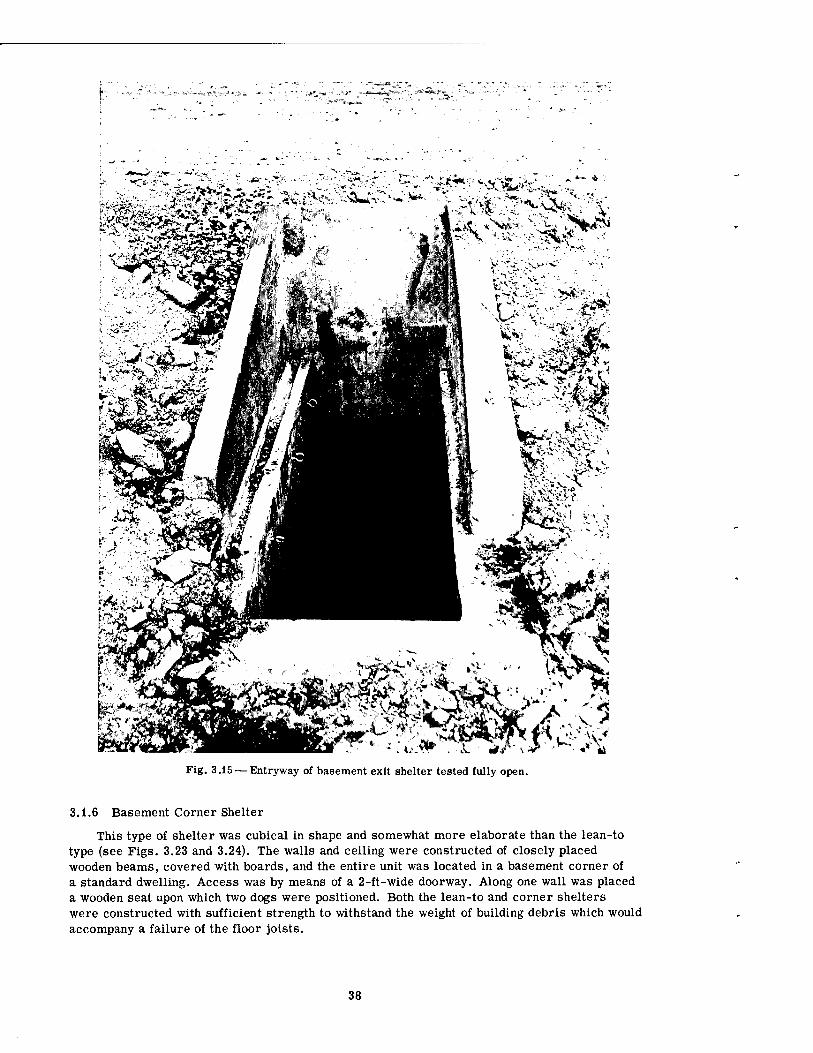
In one group of experiments three of these shelters were used, all of which were the same distance from Ground Zero. The stairway opening of one of these shelters was left entirely open (the large doors were removed, Fig. 3.15); the opening of the second was partly covered by the hatches (Fig. 3.16); and the opening of the third was completely covered (Fig. 3.14). In this manner, it was hoped that some control over the internal pressure following detonation could be exercised. Two of the shelters (the fully open and the closed) each contained a large missile trap fastened at the distal blind end. Only the largest animals were placed in these shelters.
In a second group of experiments four such shelters were used. Two of these were lo- cated at one distance from Ground Zero, and the other two were located farther away and behind the first two but parallel to each other. Two of the shelters at separate distances were left completely open, and the openings into the stairways of the other two were fully closed by the hatches.
3.1.3 Reinforced Concrete Utility Shelter
The three utility shelters, located behind the basement exit shelters and at increasing distances from Ground Zero, were the only types which were left in an exposed condition aboveground. They were fabricated of reinforced concrete, including the floor, and were nearly cubical in shape, measuring 6 by 6 by 7 ft in internal dimensions (note Figs. 3.17 and
33
34
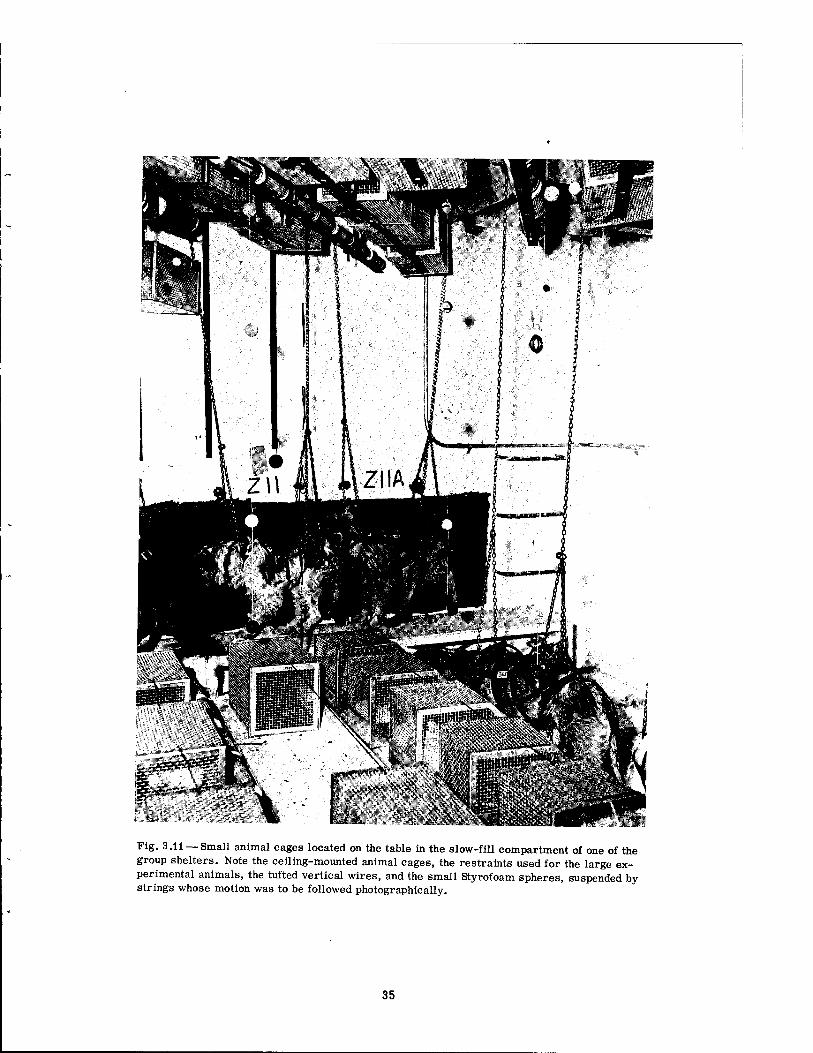
Fig. 3.11 — Small animal cages located on the table in the slow-fill compartment of one of the group shelters. Note the ceiling-mounted animal cages, the restraints used for the large ex- perimental animals, the tufted vertical wires, and the small Styrofoam spheres, suspended by strings whose motion was to be followed photographically.
35
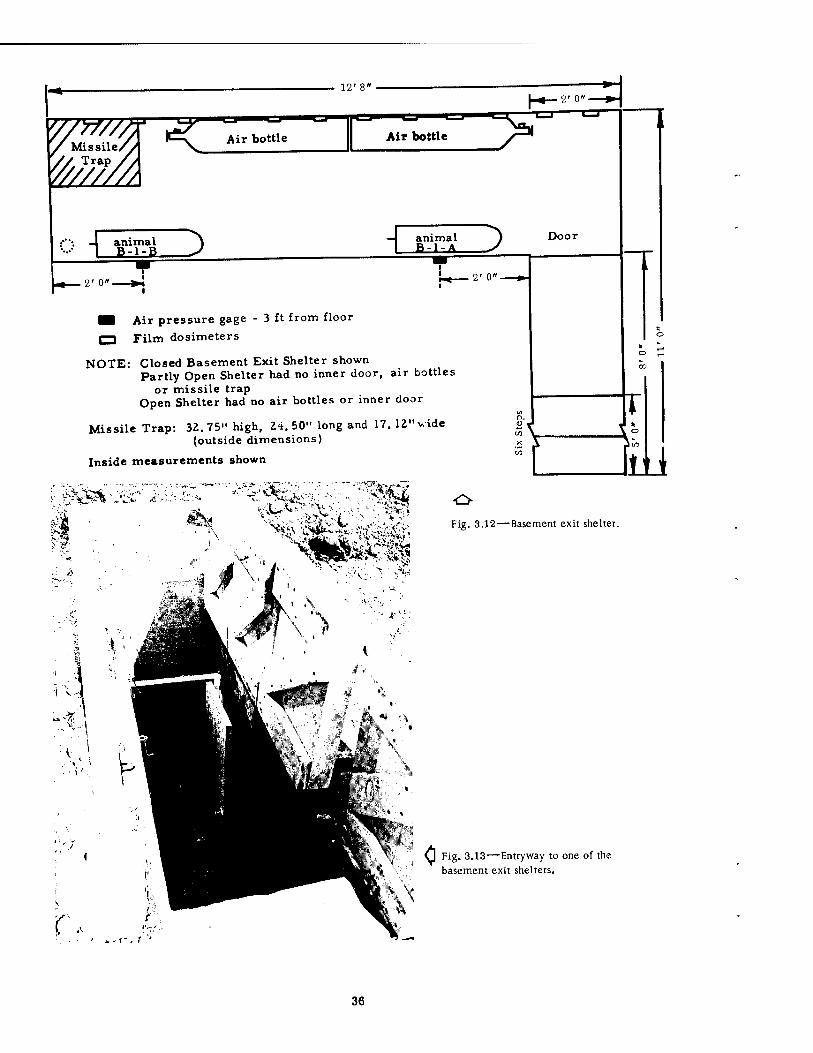
■I Air pressure gage - 3 ft from floor
r~l Film dosimeters
NOTE: Closed Basement Exit Shelter shown Partly Open Shelter had no inner door, air bottles
or missile trap Open Shelter had no air bottles or inner door
Missile Trap: 32.75" high, 24. 50" long and 17. 12" vide (outside dimensions)
Inside measurements shown
Fig. 3.12 — Basement exit shelter.
0 Fig- 3-13—Entryway to one of the basement exit shelters.
J..-T-. r
36
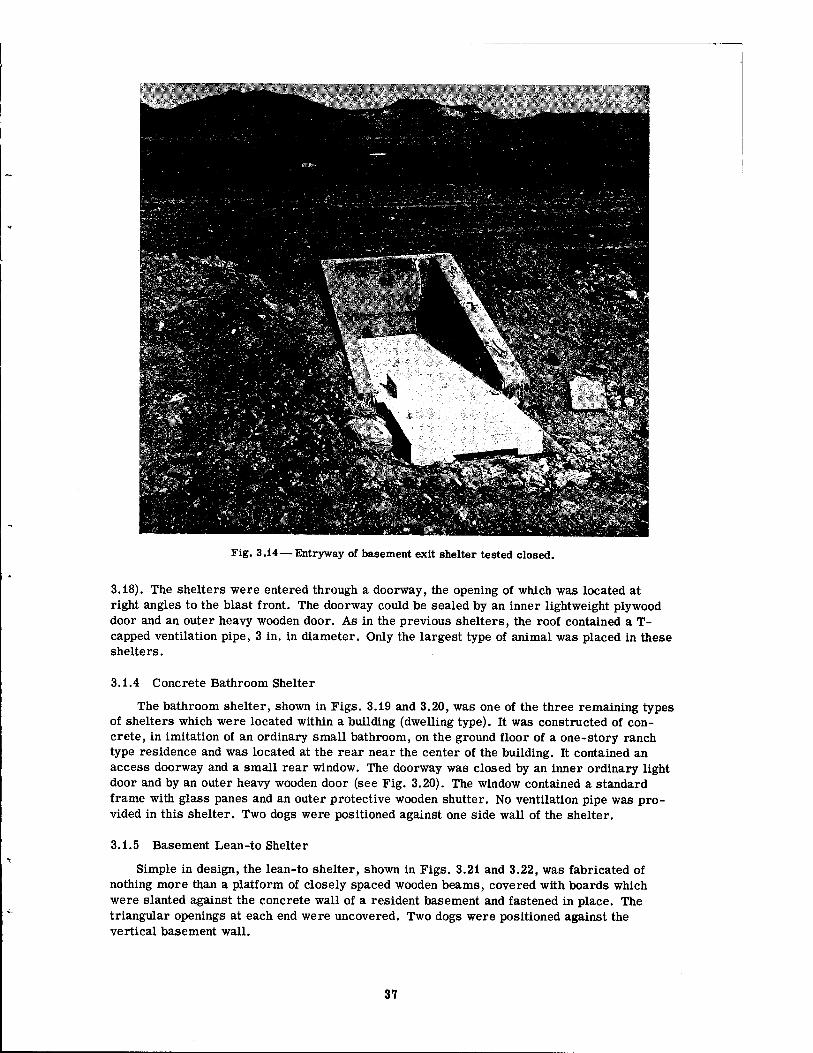
Fig. 3.14—Entryway of basement exit shelter tested closed.
3.18). The shelters were entered through a doorway, the opening of which was located at right angles to the blast front. The doorway could be sealed by an inner lightweight plywood door and an outer heavy wooden door. As in the previous shelters, the roof contained a T- capped ventilation pipe, 3 in. in diameter. Only the largest type of animal was placed in these shelters.
3.1.4 Concrete Bathroom Shelter
The bathroom shelter, shown in Figs. 3.19 and 3.20, was one of the three remaining types of shelters which were located within a building (dwelling type). It was constructed of con- crete, in imitation of an ordinary small bathroom, on the ground floor of a one-story ranch type residence and was located at the rear near the center of the building. It contained an access doorway and a small rear window. The doorway was closed by an inner ordinary light door and by an outer heavy wooden door (see Fig. 3.20). The window contained a standard frame with glass panes and an outer protective wooden shutter. No ventilation pipe was pro- vided in this shelter. Two dogs were positioned against one side wall of the shelter.
3.1.5 Basement Lean-to Shelter
Simple in design, the lean-to shelter, shown in Figs. 3.21 and 3.22, was fabricated of nothing more than a platform of closely spaced wooden beams, covered with boards which were slanted against the concrete wall of a resident basement and fastened in place. The triangular openings at each end were uncovered. Two dogs were positioned against the vertical basement wall.
37
: A„ '». -^«^j ^" * £-;-* • !*"•-« .«VJr
-A. ' tit/'* \'&
Fig. 3.15 — Entryway of basement exit shelter tested fully open.
«r tu
3.1.6 Basement Corner Shelter
This type of shelter was cubical in shape and somewhat more elaborate than the lean-to type (see Figs. 3.23 and 3.24). The walls and ceiling were constructed of closely placed wooden beams, covered with boards, and the entire unit was located in a basement corner of a standard dwelling. Access was by means of a 2-ft-wide doorway. Along one wall was placed a wooden seat upon which two dogs were positioned. Both the lean-to and corner shelters were constructed with sufficient strength to withstand the weight of building debris which would accompany a failure of the floor joists.
38
Fig. 3.16 — Entryway of basement exit shelter tested half open.
39
Air pressure gage
> Animal (Dog)
Fig. 3.17 — Reinforced concrete utility shelter. Internal dimensions are shown.
Air pressure gage 30 in. above floor
j— Animal (Dog)
Window Blast door and shutter
Fig. 3.19—Concrete bathroom shelter (inside measurements are shown).
-.-"*% ,;'"'<i'v,-','»-.ljll,,**v'"-" •
Fig. 3.18 — Reinforced concrete utility shelter.
Fig. 3.20—Blast door of the concrete bathroom shelter viewed in the closed position from inside the shelter.
40
Air pressure gage ~ Animal (Dog)
Fig. 3.21—Basement lean-to shelter (inside measurements are shown).
Fig. 3.22 — Basement lean-to shelter.
41
H 31
Air pressure gage 18" above bench
vO
H Cor -A ) ( C:>r-ß h
C Animal (Dog)
Bench 16" high
Fig. 3.23 — Basement corner room shelter (inside measurements are shown).
Fig. 3.24 — Basement corner room shelter.
42
3.2 INSTRUMENTATION
The problems of proper instrumentation of the shelters, including the installation and supervision of detecting devices, amplifiers, and recording instruments, were worked out by personnel of the Sandia Corporation. The details and results of this work are the subject of separate reports.* Only summary data which pertain to the results of this investigation are included here. Most of the recording equipment was located in a special underground instru- ment vault at considerable distance from the shelters. The following paragraphs will serve as a brief description of the instruments, their related use, and their approximate location within the shelters.
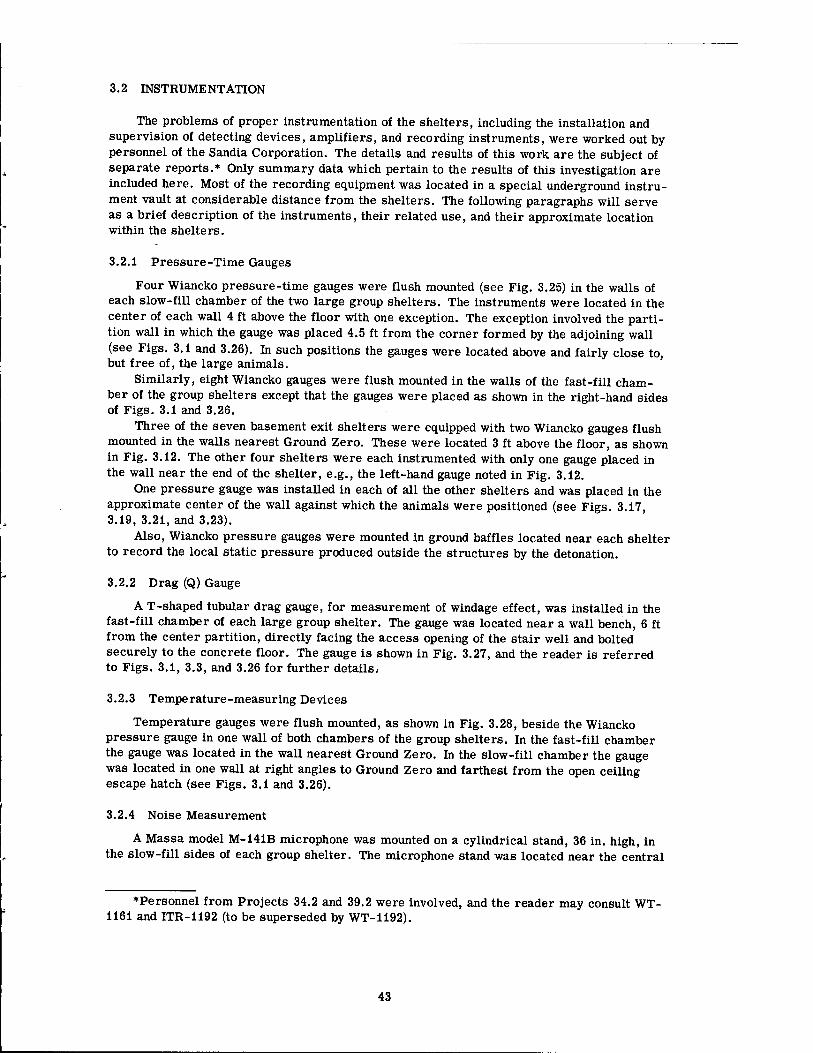
3.2.1 Pressure-Time Gauges
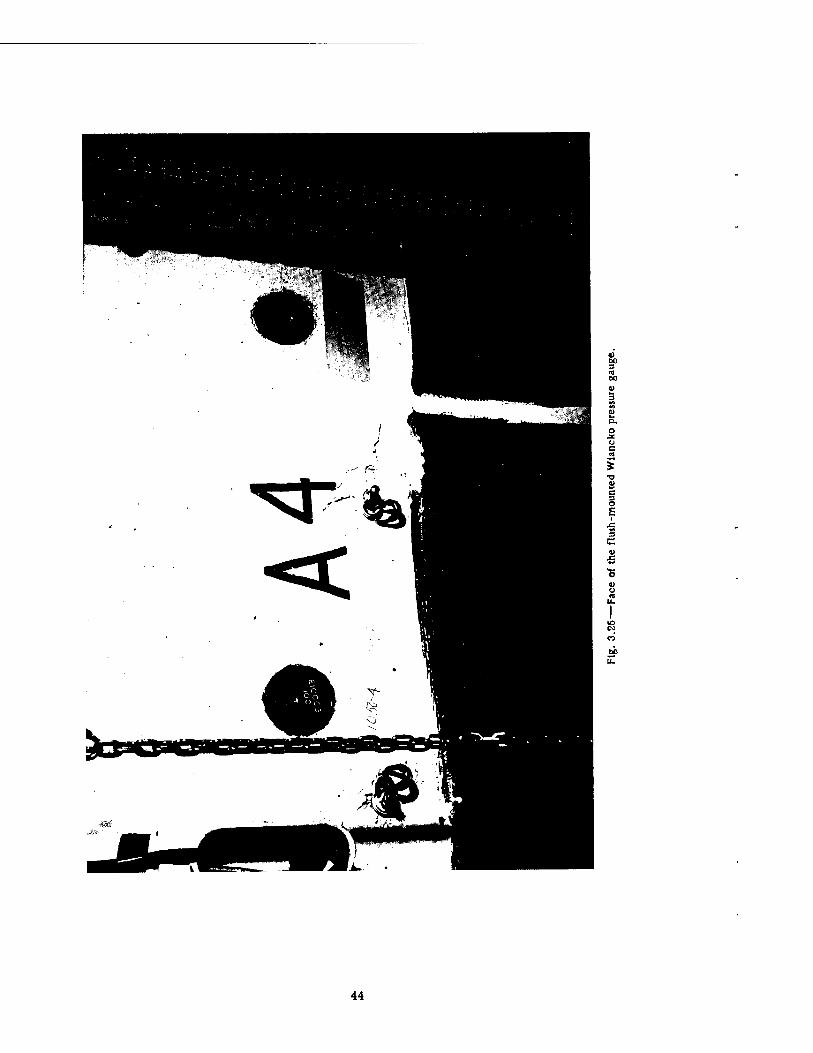
Four Wiancko pressure-time gauges were flush mounted (see Fig. 3.25) in the walls of each slow-fill chamber of the two large group shelters. The instruments were located in the center of each wall 4 ft above the floor with one exception. The exception involved the parti- tion wall in which the gauge was placed 4.5 ft from the corner formed by the adjoining wall (see Figs. 3.1 and 3.26). In such positions the gauges were located above and fairly close to, but free of, the large animals.
Similarly, eight Wiancko gauges were flush mounted in the walls of the fast-fill cham- ber of the group shelters except that the gauges were placed as shown in the right-hand sides of Figs. 3.1 and 3.26.
Three of the seven basement exit shelters were equipped with two Wiancko gauges flush mounted in the walls nearest Ground Zero. These were located 3 ft above the floor, as shown in Fig. 3.12. The other four shelters were each instrumented with only one gauge placed in the wall near the end of the shelter, e.g., the left-hand gauge noted in Fig. 3.12.
One pressure gauge was installed in each of all the other shelters and was placed in the approximate center of the wall against which the animals were positioned (see Figs. 3.17, 3.19, 3.21, and 3.23).
Also, Wiancko pressure gauges were mounted in ground baffles located near each shelter to record the local static pressure produced outside the structures by the detonation.
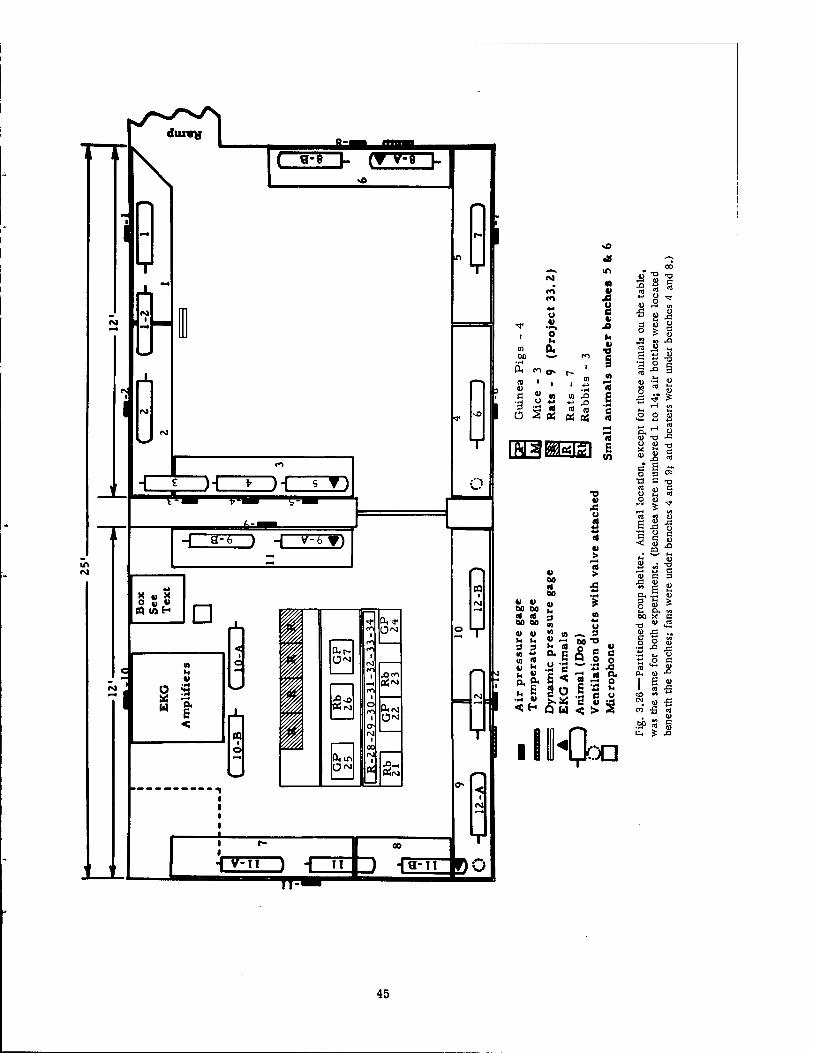
3.2.2 Drag (Q) Gauge
A T-shaped tubular drag gauge, for measurement of windage effect, was installed in the fast-fill chamber of each large group shelter. The gauge was located near a wall bench, 6 ft from the center partition, directly facing the access opening of the stair well and bolted securely to the concrete floor. The gauge is shown in Fig. 3.27, and the reader is referred to Figs. 3.1, 3.3, and 3.26 for further details,
3.2.3 Temperature-measuring Devices
Temperature gauges were flush mounted, as shown in Fig. 3.28, beside the Wiancko pressure gauge in one wall of both chambers of the group shelters. In the fast-fill chamber the gauge was located in the wall nearest Ground Zero. In the slow-fill chamber the gauge was located in one wall at right angles to Ground Zero and farthest from the open ceiling escape hatch (see Figs. 3.1 and 3.26).
3.2.4 Noise Measurement
A Massa model M-141B microphone was mounted on a cylindrical stand, 36 in. high, in the slow-fill sides of each group shelter. The microphone stand was located near the central
♦Personnel from Projects 34.2 and 39.2 were involved, and the reader may consult WT- 1161 and ITR-1192 (to be superseded by WT-1192).
43
00 3
o je <j c
8 c 3 o E
•s
60
44
CO en 4-1 O
■^ «1
. 0 tl
0) 0, bfl
■H
UH <*> fj*
n ■ | V C
M "
•3 Ü UZ
o •8 IT)
■
4 H tl
•a %
1- in 0)
1« in ,Q e t: -° 10 B n
Bä « <d
osijEra 1 •o •I
u 5
tl j>
>
v ti u £ 60 60 H <d I« 3 «
«1 »> ; «-.3
3 3 l< II O « «
«2 o -5 S .2 2 a, (x c *s g « o
Iflc )D
3 2 g
z °: c 3 u 0 £ g « ,2 K 5 s
•o W rt 2 .. 8
O O <U
ID T> J3
U 0) T3 x 5? e » U « c E - •a e -a « 9) c u al 0
■*
« M a) G X!
J3
c < O C
co
C
XI
T3 c (i> R 3 X! n) U •0 F a, 9) 3 a £
0. VI
Ml X C ■O u >2 «> X! a
ID XI J= O n
u a, I»
1 F u 1 Xi CO «0 *-* IN
CO 0) X!
U W3 « s u. ? XI
45
"%''*
Fig. 3.27—Sandia Corporation dynamic pressure (drag) gauge located in the
fast-fill sides of the group shelters.
46
47
partition and approximately 32 in. from each wall. The amplifying equipment was housed in a protective metal box on the floor nearby, as previously described (see Figs. 3.5, 3.6, and 3.26).
3.2.5 Electrocardiographic Measurements
On one occasion a modified Sanborn type electrocardiographic amplifier was suspended within the large reinforced aluminum protective box located on the floor against one wall of the slow-fill chamber of the group shelter (Figs. 3.5 and 3.26). On a second occasion the ampli- fiers were housed in an underground structure with the recording devices mentioned below.
Continuous electrocardiographic tracings were undertaken on four dogs in the group shelter of each series of experiments. Two of these animals were located in the fast-fill chamber, and the other two were in the slow-fill chamber. The recording instruments were mounted at a distance from the shelter in another underground structure. The electrodes were placed upon the partly shaved legs of the animals and were held in place by gauze bandages, soaked in saline solution, with an outer wrapping of cellophane and plastic friction tape. The flexible wire leads from the animal to the amplifier were, of course, shielded. The entire technical procedure has been described elsewhere,18 but Figs. 3.29 and 3.30 show two of the "EKG" (electrocardiogram) dogs.
3.2.6 Radiation Detectors
Film dosimeters were provided by other projects* for use in the group shelters and basement exit shelters. Twenty-seven such dosimeters were placed at various locations in the group shelter (six in the stair well, nine in the fast-fill chamber, and 12 in the slow-fill chamber). Gold and sulfur neutron detectors were also placed in the ramp at the foot of the stairs (see Fig. 3.31). Twelve film dosimeters were placed in each basement exit shelter; these, as shown in Fig. 3.32, were fixed in a line along the far wall near the roof.
Telemetering radiation detectors were located near the entrance of the group shelters and one basement exit shelter in each series of experiments. These devices were housed in aluminum spheres at ground level and were provided under another program.!
Within the fast-fill chamber of the large group shelter, a canister containing an automatic air-sampling instrument was located above the camera mount in one corner (see Fig. 3.33). By this method eight consecutive 1-hr air samples of dust were obtained for assay of radio- activity and analysis of particles. All studies concerning radiation were conducted by per- sonnel of other projects, and the results are contained in separate reports.t
3.3 VENTILATION AND HEATING
Under the rather harsh, wintry environmental conditions the maintenance of proper ventilation and heat in the closed shelters, over a prolonged period of isolation, was a prob- lem of no mean proportions. Large numbers of animals of many sizes were to be kept in the group shelters, and, although only two dogs were positioned in each of the other shelters, the small cubic volumes of these shelters made it necessary to provide an adequate air supply when the access doors were closed. Most of the largest animals were well conditioned to the low temperatures, but small animals, such as mice and rats, were subject to freezing if the structures were not adequately heated. Electric power from portable generators was avail- able at the group shelters up to the time of detonation but not thereafter. Consequently, in the preshot period, motor-driven fans installed in connection with ventilator-shaft and elec- tric heaters provided adequate heat and air supply. For the postshot period other means had to be devised for supplying air.
»Provided by Project 39.1 (see ITR-1174, to be superseded by WT-1174) and installed
by personnel of Program 34. tProject 30.2 (see WT-1182). JProject 39.1; see ITR-1174 (to be superseded by WT-1174).
48
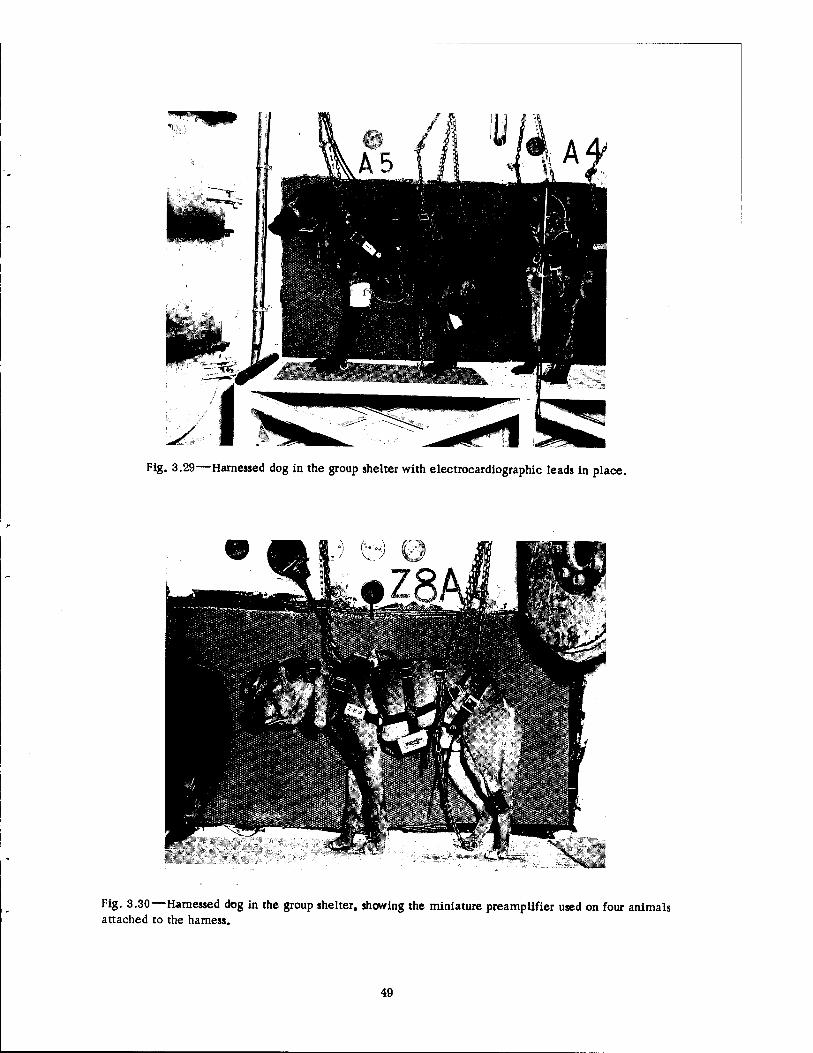
Fig. 3.29—Harnessed dog in the group shelter with electrocardiographic leads in place.
Fig. 3.30 Harnessed dog in the group shelter, showing the miniature preamplifier used on four animals attached to the harness.
49
• 10 • II •12 • 7
• 13 • 8
.9
Twelve Steps
A3=
Fig. 3.31 — Film dosimeter locations for group shelters.
Fig. 3.32 — Film dosimeters located in basement exit shelters.
50
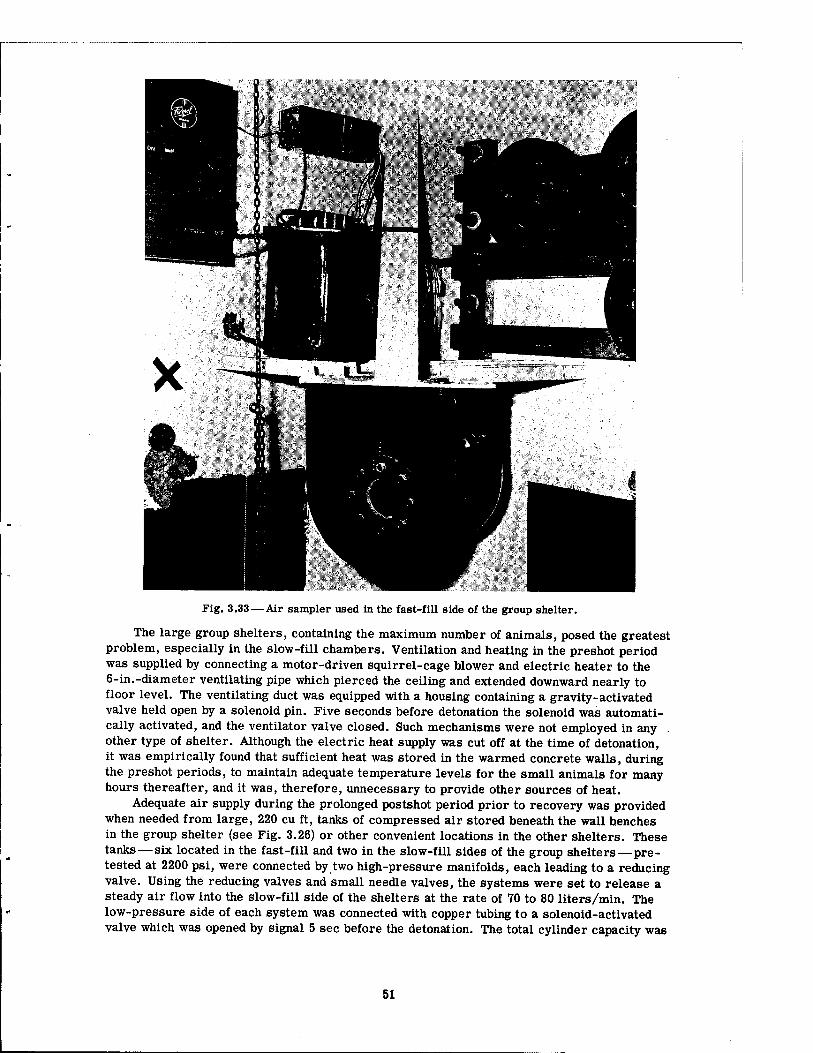
Fig. 3.33 — Air sampler used in the fast-fill side of the group shelter.
The large group shelters, containing the maximum number of animals, posed the greatest problem, especially in the slow-fill chambers. Ventilation and heating in the preshot period was supplied by connecting a motor-driven squirrel-cage blower and electric heater to the 6-in.-diameter ventilating pipe which pierced the ceiling and extended downward nearly to floor level. The ventilating duct was equipped with a housing containing a gravity-activated valve held open by a solenoid pin. Five seconds before detonation the solenoid was automati- cally activated, and the ventilator valve closed. Such mechanisms were not employed in any . other type of shelter. Although the electric heat supply was cut off at the time of detonation, it was empirically found that sufficient heat was stored in the warmed concrete walls, during the preshot periods, to maintain adequate temperature levels for the small animals for many hours thereafter, and it was, therefore, unnecessary to provide other sources of heat.
Adequate air supply during the prolonged postshot period prior to recovery was provided when needed from large, 220 cu ft, tanks of compressed air stored beneath the wall benches in the group shelter (see Fig. 3.26) or other convenient locations in the other shelters. These tanks — six located in the fast-fill and two in the slow-fill sides of the group shelters—pre- tested at 2200 psi, were connected by two high-pressure manifolds, each leading to a reducing valve. Using the reducing valves and small needle valves, the systems were set to release a steady air flow into the slow-fill side of the shelters at the rate of 70 to 80 liters/min. The low-pressure side of each system was connected with copper tubing to a solenoid-activated valve which was opened by signal 5 sec before the detonation. The total cylinder capacity was
51
calculated to give adequate air supply to the animals for a period of 10 hr or more. No forced preshot or postshot air flow was provided for the fast-fill chamber since the influx or diffu- sion of air from the open stair well was judged sufficient for the room. Analysis of gas in both preshot and postshot periods proved this assumption to be correct.
Two compressed-air tanks (220-cu ft size) were installed on the floor of the closed base- ment exit shelters (see Fig. 3.12) and were connected by a manifold to a reducing valve set to deliver air at approximately 10 liters/min. These tanks were not equipped with a solenoid- activated valve but were manually turned on prior to leaving the test site a few hours before detonation and allowed to run continuously until turned off. A similar arrangement was pro- vided for the concrete bathroom shelter. All tanks were secured to the floor and walls by chains to prevent their displacement.
The three aboveground utility shelters were provided with two sandbag-covered com- pressed-air tanks which were buried in the ground outside the shelter. The tanks, mounting appropriately set reducing and needle valves, were connected by V4-in. pressure tubing to the interior of the closed shelters by passing the tubing through a small conduit in the wall near the floor. The conduit was sealed with plaster of Paris impregnated gauze.
3.4 PHOTOGRAPHY
In both chambers of the large group shelter, Bell & Howell high-speed cinematic cameras, operating with a shutter speed of 200 frames/sec, were installed. The cameras were mounted and sealed in blastproof steel housings, as shown in Fig. 3.6. By electrical means the cam- eras were started 5 sec before detonation, and they continued running for 20 sec thereafter.
Documentary still photographs were taken of all installations and animal positions before detonation and as soon afterward as possible to permanently record the physical alterations resulting from the blast. Such means were also used to document the subsequent clinical and pathological studies. All photographic studies were conducted by personnel of a separate project, and their operations have been reported separately.*
3.5 AIR-FLOW STUDIES
An attempt was made to study the pattern of air flow and turbulence within the rooms of the large group shelter by photographic means (cinematic). Five wires, to which wool tufts (see Fig. 3.9) were attached at intervals, were stretched at predetermined intervals in each chamber from the floor to the ceiling and tightened by small turnbuckles. In addition, small colored and striped Styrofoam spheres, 1% in. in diameter, were fastened, as shown in Fig. 3.11, at intervals along a black cotton thread hanging from the ceiling. In the fast-fill cham- ber six strings holding five spheres were used, and in the slow-fill chamber three strings holding five spheres were used. It was thought that the movement of the woolen tufts and dis- placement of the marked spheres in the camera field would provide a possible index of the pattern of wind flow within the confines of the room.
3.6 EXPERIMENTAL ANIMALS
3.6.1 Species, Location, and Number
One hundred and twenty experimental animals were placed in the large group shelter and the basement exit shelters for one series of experiments. In a second group of experiments 157 animals were placed in the shelters. In Table 3.2 the species of animal, the average weight range, and the number of each used in each series are indicated. In Table 3.3 the numbers and types of animals utilized in each shelter are indicated. The relative positions of the dogs
♦Project 39.4b; see WT-1197.
52
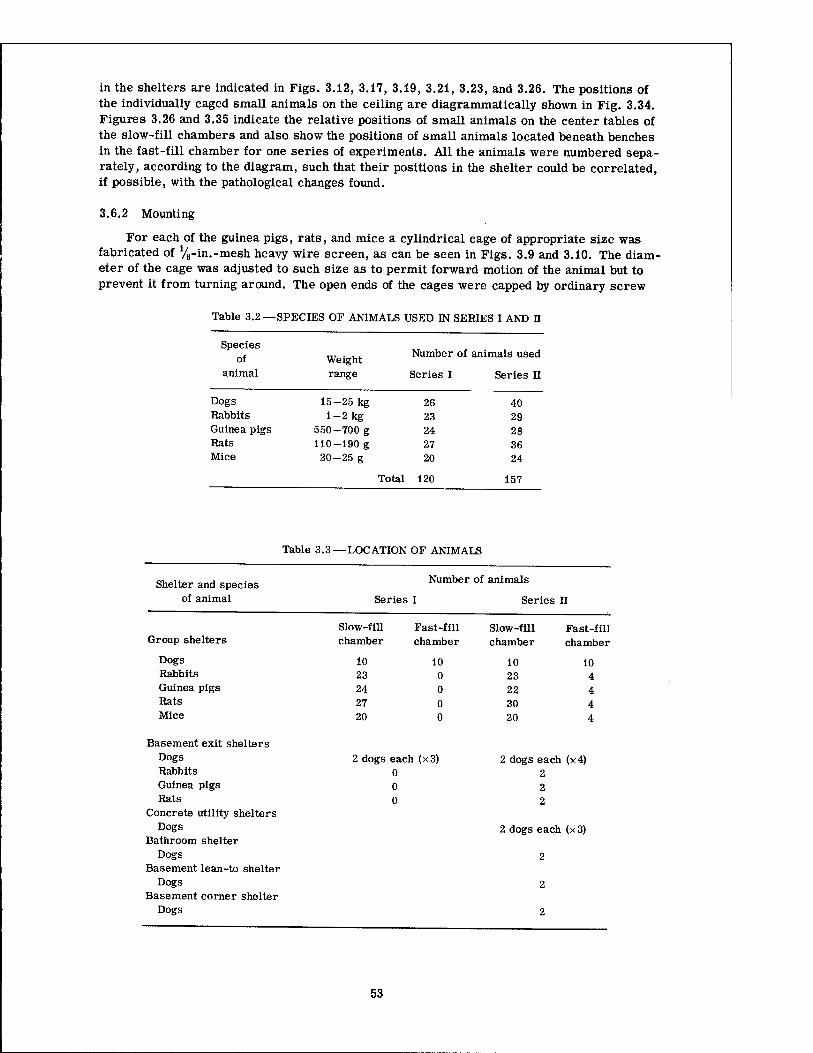
in the shelters are indicated in Figs. 3.12, 3.17, 3.19, 3.21, 3.23, and 3.26. The positions of the individually caged small animals on the ceiling are diagrammatically shown in Fig. 3.34. Figures 3.26 and 3.35 indicate the relative positions of small animals on the center tables of the slow-fill chambers and also show the positions of small animals located beneath benches in the fast-fill chamber for one series of experiments. All the animals were numbered sepa- rately, according to the diagram, such that their positions in the shelter could be correlated, if possible, with the pathological changes found.
3.6.2 Mounting
For each of the guinea pigs, rats, and mice a cylindrical cage of appropriate size was fabricated of V8-in.-mesh heavy wire screen, as can be seen in Figs. 3.9 and 3.10. The diam- eter of the cage was adjusted to such size as to permit forward motion of the animal but to prevent it from turning around. The open ends of the cages were capped by ordinary screw
Table 3.2 — -SPECIES OF ANIMALS USED IN SERIES I AND H
Species of Weight Number of animals used
animal range Series I Series n
Dogs 15-25 kg 26 40 Rabbits 1-2 kg 23 29 Guinea pigs 550-700 g 24 28 Rats 110-190 g 27 36 Mice 20-25 g 20 24
Total 120 157
Table 3.3—LOCATION OF ANIMALS
Shelter and species Number of animals
of animal Se ries I Series II
Slow-fill Fast-fill Slow-fill Fast-fill Group shelters chamber chamber chamber chamber
Dogs 10 10 10 10 Rabbits 23 0 23 4 Guinea pigs 24 0 22 4 Rats 27 0 30 4 Mice 20 0 20 4
Basement exit shelters Dogs Rabbits
2 dogs each (x3) 0
2 dogs each (x4) 2
Guinea pigs 0 2 Rats 0 2
Concrete utility shelters Dogs
Bathroom shelter 2 dogs each (x 3)
Dogs 2 Basement lean-to shelter
Dogs 2 Basement corner shelter
Dogs 2
53
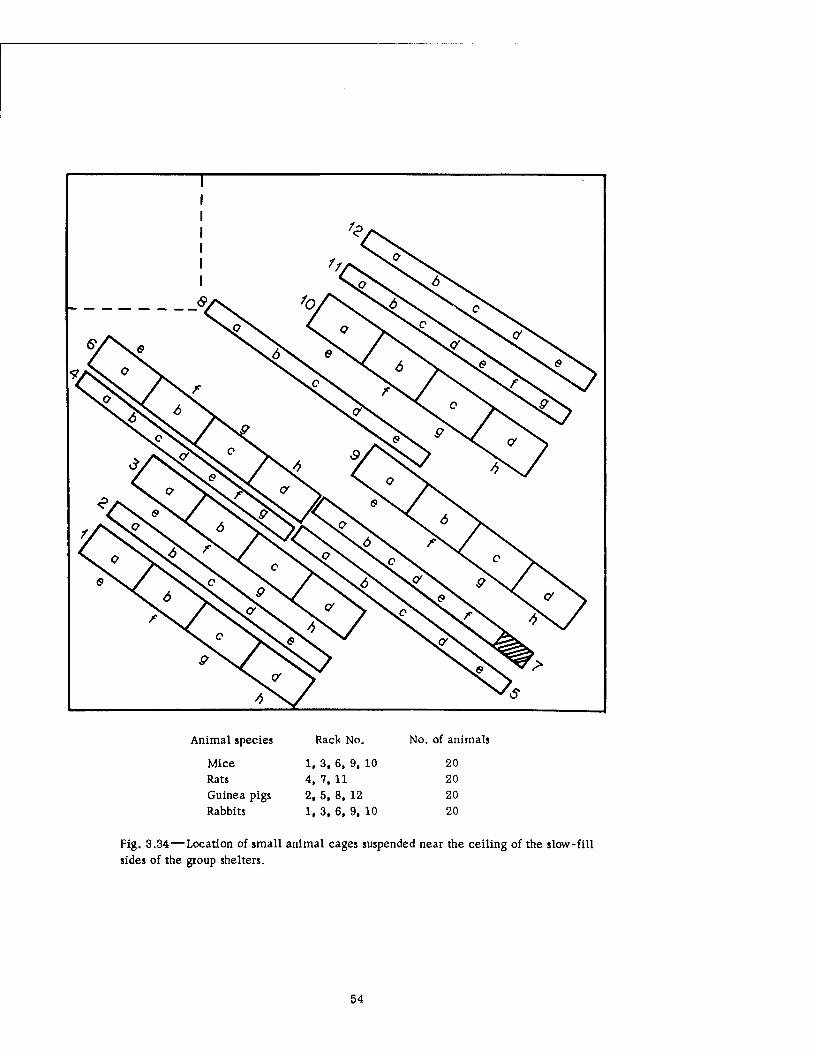
Animal species Rack No. No. of animals
Mice 1, 3, 6, 9, 10 20 Rats 4, 7, 11 20 Guinea pigs 2, 5, 8, 12 20
Rabbits 1, 3, 6, 9, 10 20
Fig. 3.34—Location of small animal cages suspended near the ceiling of the slow-fill sides of the group shelters.
54
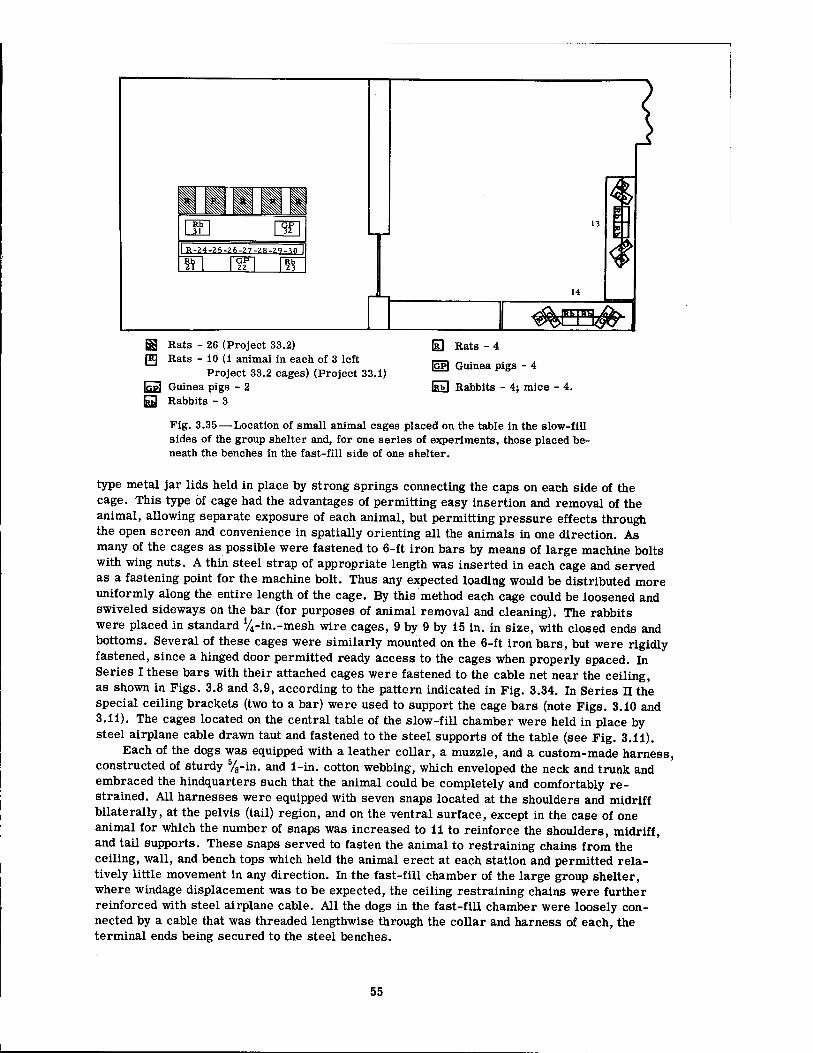
^CT^
B3 Rats - 26 (Project 33.2) [K] Rats - 10 (i animal in each of 3 left
Project 33.2 cages) (Project 33.1) Itvpl Guinea pigs - 2 52 Rabbits - 3
0 Rats - 4
|GP| Guinea pigs - 4
IÜ] Rabbits - 4; mice - 4.
Fig. 3.35—Location of small animal cages placed on the table in the slow-fill sides of the group shelter and, for one series of experiments, those placed be- neath the benches in the fast-fill side of one shelter.
type metal jar lids held in place by strong springs connecting the caps on each side of the cage. This type of cage had the advantages of permitting easy insertion and removal of the animal, allowing separate exposure of each animal, but permitting pressure effects through the open screen and convenience in spatially orienting all the animals in one direction. As many of the cages as possible were fastened to 6-ft iron bars by means of large machine bolts with wing nuts. A thin steel strap of appropriate length was inserted in each cage and served as a fastening point for the machine bolt. Thus any expected loading would be distributed more uniformly along the entire length of the cage. By this method each cage could be loosened and swiveled sideways on the bar (for purposes of animal removal and cleaning). The rabbits were placed in standard V4-in.-mesh wire cages, 9 by 9 by 15 in. in size, with closed ends and bottoms. Several of these cages were similarly mounted on the 6-ft iron bars, but were rigidly fastened, since a hinged door permitted ready access to the cages when properly spaced. In Series I these bars with their attached cages were fastened to the cable net near the ceiling, as shown in Figs. 3.8 and 3.9, according to the pattern indicated in Fig. 3.34. In Series II the special ceiling brackets (two to a bar) were used to support the cage bars (note Figs. 3.10 and 3.11). The cages located on the central table of the slow-fill chamber were held in place by steel airplane cable drawn taut and fastened to the steel supports of the table (see Fig. 3.11).
Each of the dogs was equipped with a leather collar, a muzzle, and a custom-made harness, constructed of sturdy %-in. and 1-in. cotton webbing, which enveloped the neck and trunk and embraced the hindquarters such that the animal could be completely and comfortably re- strained. All harnesses were equipped with seven snaps located at the shoulders and midriff bilaterally, at the pelvis (tail) region, and on the ventral surface, except in the case of one animal for which the number of snaps was increased to 11 to reinforce the shoulders, midriff, and tail supports. These snaps served to fasten the animal to restraining chains from the ceiling, wall, and bench tops which held the animal erect at each station and permitted rela- tively little movement in any direction. In the fast-fill chamber of the large group shelter, where windage displacement was to be expected, the ceiling restraining chains were further reinforced with steel airplane cable. All the dogs in the fast-fill chamber were loosely con- nected by a cable that was threaded lengthwise through the collar and harness of each, the terminal ends being secured to the steel benches.
55
3.6.3 Training of Animals
Several weeks before each series of experiments, all the dogs were harnessed and muzzled daily for considerable periods of time, during which they were restrained as though in the actual shelters. By this means they were gradually accustomed to the procedure. This was supplemented by numerous dry runs, during which the animals were herded into heated trucks, transported to the test site, and abandoned for several hours in the shelter positions before being transported back to the laboratory and kennels. In like manner the smaller ani- mals were periodically placed in their cages and left for varying intervals of time, in addi- tion to participating in some of the dry runs.
3.6.4 X-ray Studies
Two control X-ray films of the thorax were made on each animal prior to the series of experiments. This procedure was most easily performed by holding the animal upside down on a V-shaped plastic trough beneath which a large film cassette was placed.
3.6.5 Electrocardiographic Studies
Control electrocardiographic tracings were made on each dog prior to the experimental series for comparison with those made in the postshot examinations. Several methods of attaching leads were tried, but the most reliable and dependable tracings were obtained when the animal's feet were placed in a metal container filled with salt solution and the leads were fastened directly to the metal container.
3.6.6 Eardrums and Ear Blocks
The eardrums and auditory canal of each of the animals, excepting the mice, were exam- ined with an otoscope to record the condition of the drum and associated tissues. The right auditory canal of each was packed with cotton and sealed with liquid rubber latex which rapidly hardened and provided a firm but temporary plug for the canal. However, this was a time-consuming procedure, and occasional checks were necessary to renew the plugs that became loosened with time. Unfortunately, because of the many unexpected delays in detona- tion, many of the plugs were loosened, and insufficient time prevented their renewal. Since the eardrum does not tolerate large sudden overpressures, the procedure was introduced to determine whether such a simple plug would protect the auditory membrane from rupture.
3.6.7 General Clinical Examination
The general health of each animal was thoroughly checked before use. Such examinations included stethoscopic examination of heart and lungs, opthalmoscopic examination, and neurological assessment of reflexes, reactions, gait, and habits.
3.6.8 Drugs
Five drugs were available for general use on the animals: Serpasil,* Nembutal, ether, chloroform, and probanthine. During a laboratory trial, Serpasil was found to have a quieting effect on the excitable dogs with only a slight diarrhea as a side effect, which was controlled somewhat by the administration of probanthine. Its use was limited to those few animals which appeared unusually disturbed in the dry runs. However, the animals became so ac- customed to the procedure that ultimately these drugs were rarely employed. Chloroform was kept for the induction of rapid anesthesia in the field, if conditions of animal injury so warranted its use. Intravenous Nembutal was used for anesthesia prior to pathological exami- nation on dogs and rabbits. Ether was used to anesthetize all other small animals.
*Furnished through the courtesy of Dr. Alfred E. Earl of the Ciba Pharmaceutical Corporation, Summit, N. J.
56
3.6.9 Postshot Activities
Four to 5 hr elapsed between final installation of the animals in the shelters and the actual detonation. Several more hours passed before admittance into the blast zone was per- mitted. Recovery of the animals was effected by teams of men with trucks and radiation survey meters, and the animals were returned to the laboratory and kennels as soon as possible. There they were subjected to a clinical appraisal of injury, including examination of eyes, ears, skin, heart, lungs, and the neurological system. X-rays of the thorax and electrocardiographic tracings were taken on all living dogs. Beginning with those which were most severely damaged, the animals were anesthetized and autopsied as soon after the clinical appraisal as possible. In the first series of experiments, only one of the dogs in the slow-fill chamber was autopsied immediately, since the resulting pressures were too low to result in blast damage. In this same room all the mice, but only a sampling of five each of the other animals, were examined. The remaining animals were sacrificed 10 to 14 days later. In the second experimental series, where much higher pressure values were obtained, all the ani- mals were sacrificed and examined as soon as possible after exposure.
Prior to removal of the animals from their respective positions, documentary still photo- graphs were taken of the shelters and of each dog in position. This served as a valuable aid in assessing over-all damage, which could not properly be appraised during the rapid recovery process.
3.7 PATHOLOGICAL EXAMINATION
Each animal was thoroughly examined for evidence of blast damage, using conventional autopsy techniques. The dogs and rabbits were anesthetized by sufficient intravenous doses of Nembutal solution (60 mg/cc). The femoral artery was then cannulated, and the animal was exsanguinated. To avoid the entry of air into the venous circulation, the examination was not started until cardiac arrest had been achieved. The body and its contained organs were then systematically examined, and a protocol of findings was compiled for each animal. Sample sections were taken for histological study, and color photographs were made of all lesions seen. The autopsy included examination of the brain and meninges, ears, eyes, nasal sinuses, pharynx, neck organs, soft tissues, skeletal system, thoracic and abdominal cavities, and contained viscera and genitals. Before the thorax was opened, the trachea was clamped at the base of the neck. The lungs were then removed, together with the heart, in an inflated state and examined superficially. The tracheal clamp was removed, and each lung was dissected from the attached tissue. They were then reinflated to approximately normal size by gentle perfusion with fixative solution, and the bronchi were clamped off. Sometime later the fixed lungs were sectioned and examined internally.
Tissue samples were generally fixed in both Helly's solution and buffered 10 per cent formalin solution. The lungs, brains, and internal ears, however, were fixed only in buffered formalin. The eyes were fixed in toto in Helly's solution; penetration of the fixative solution was effected by slicing off a thin portion of the globe on either side with a razor. This pro- cedure did not appreciably disturb the retina, and later the globe was properly trimmed and blocked for processing.
The internal auditory apparatus was removed in toto by sawing a block of bone from the mastoid region in such a way as to include the attached external auditory canal. The internal roof of the tympanic cavity was removed, exposing the ossicles and the rear of the tympanic membrane. By gently introducing water with a pipette into the external auditory canal and watching for the appearance of water on the opposite side of the tympanic membrane, pres- ence or absence of membrane defects could be ascertained. The entire block was then fixed in buffered formalin and preserved for later examination with a dissection microscope.
Fixed tissue specimens were later processed according to customary histological tech- niques, and slides were examined with hematoxylin-eosin and Masson trichrome stains.
57

3.8 GAS ANALYSIS
19
Air samples obtained from the slow-fill chamber of the group shelter and from the closed basement exit shelters were analyzed with a standard Pauling oximeter using an absorber for water vapor and carbon dioxide after the technique of Behrmann and Hartman and Lundgren, White, and Boothby.20 In the first experimental series such analyses were conducted during the dry-run period and during recovery of animals following detonation. The air sampling was performed by the first man of the recovery team to enter the shelters in order to minimize disturbance of the atmospheric conditions. The results of one of these analyses are given in Table 3.4.
Table 3.4 —GAS ANALYSIS DATA, PARTITIONED GROUP SHELTER (Barometer from Air Weather Service, 26.248 in. Hg = 666.7 mm;
666.7 x 0.209 = 139.34 mm 02 pp)
Total CO,
Room air Quonset hut
143 143
Slow- -fill chamber
143 142
Pauling meter reading, 143 mm 02 pp C02 not calculable
Collected at about 2:30 p.m. Analyzed 9:00 a.m. next day Pauling reading, 143 mm Oj pp C02 not calculable
Fast-fill chamber
143 143 Collected at about 12:30 p.m. Analyzed 9:15 a.m. next day Pauling reading, 143 mm 02 pp C02 not calculable
Alveolar air
108 114 105.2 mm 02 pp
108 114 C02 content, 5.3
108 114
3.9 RECOVERY
The recovery of animals from the radiation-contaminated areas was accomplished by trained teams of men transported in military type amphibious trucks (DUKW's — see Fig. 3.36) containing sandbags in the bilges. Entry into the contaminated area was not permitted until radiation readings, determined by monitors, had fallen below an agreed-upon figure. Usually, one team in a single DUKW entered the contaminated zone for recovery of animals, and a second team and DUKW remained on stand-by call at the perimeter of the zone. Radio communication was maintained between teams. The use of the DUKW provided the team members with a certain degree of radiation protection by virtue of the high metal sides and sandbags in the bilges. Thus the accumulated exposure to radiation could be kept at minimal levels. The team members were thoroughly trained by time and motion studies in many practice trials in order that the entire recovery operation could be effected with the neces- sary speed and a minimum of confusion.
The degree of expected protection by the shielded vehicles (DUKW's) was previously determined by probing contaminated areas of varying radiation strengths and comparing by
58
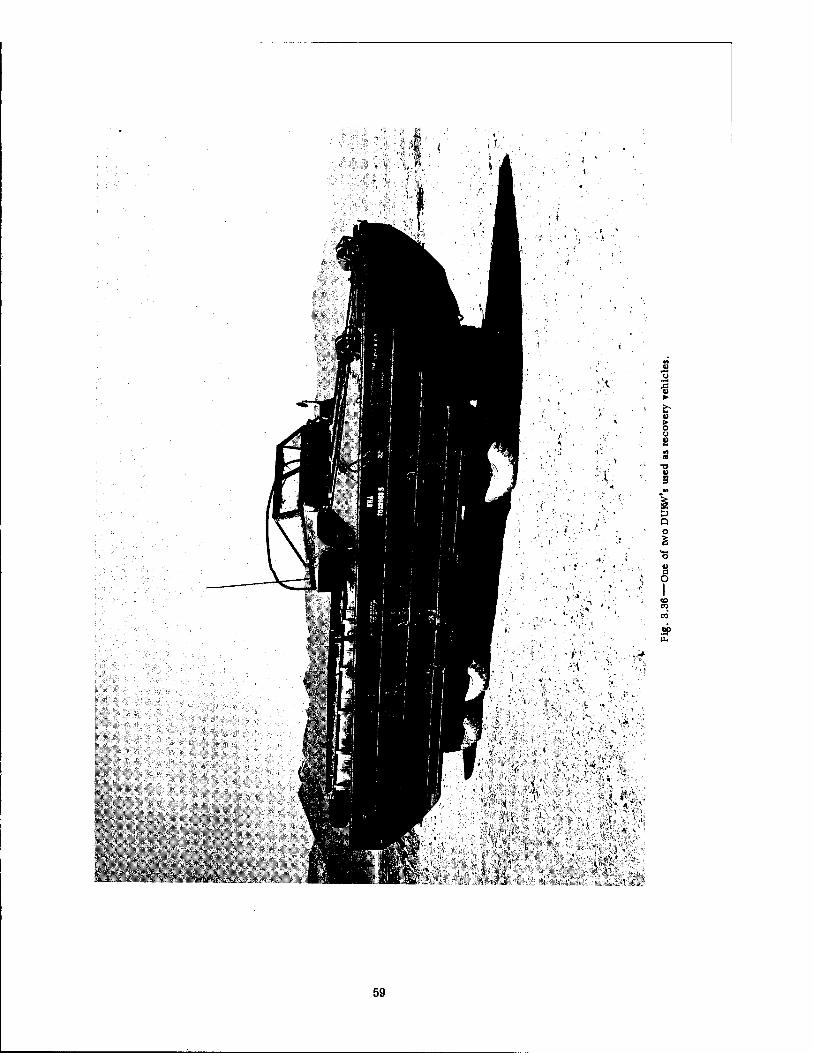
°, 1, •' ■( . •
III. . i h. ■
• '■ '/'. V-
■1 - ^^Hi ' < ' * ' '
fcL!* 1 1 .•' '. .. '
■s
u g Ü
o o i
59
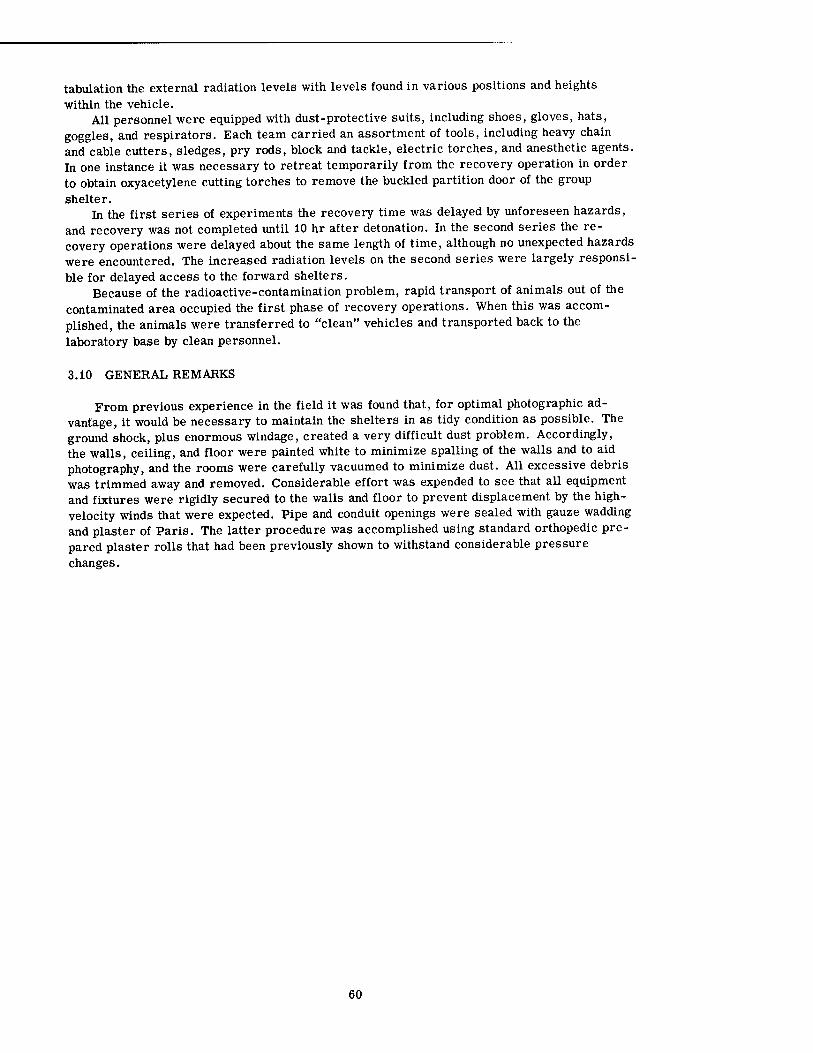
tabulation the external radiation levels with levels found in various positions and heights within the vehicle.
All personnel were equipped with dust-protective suits, including shoes, gloves, hats, goggles, and respirators. Each team carried an assortment of tools, including heavy chain and cable cutters, sledges, pry rods, block and tackle, electric torches, and anesthetic agents. In one instance it was necessary to retreat temporarily from the recovery operation in order to obtain oxyacetylene cutting torches to remove the buckled partition door of the group shelter.
In the first series of experiments the recovery time was delayed by unforeseen hazards, and recovery was not completed until 10 hr after detonation. In the second series the re- covery operations were delayed about the same length of time, although no unexpected hazards were encountered. The increased radiation levels on the second series were largely responsi- ble for delayed access to the forward shelters.
Because of the radioactive-contamination problem, rapid transport of animals out of the contaminated area occupied the first phase of recovery operations. When this was accom- plished, the animals were transferred to "clean" vehicles and transported back to the laboratory base by clean personnel.
3.10 GENERAL REMARKS
From previous experience in the field it was found that, for optimal photographic ad- vantage, it would be necessary to maintain the shelters in as tidy condition as possible. The ground shock, plus enormous windage, created a very difficult dust problem. Accordingly, the walls, ceiling, and floor were painted white to minimize spalling of the walls and to aid photography, and the rooms were carefully vacuumed to minimize dust. All excessive debris was trimmed away and removed. Considerable effort was expended to see that all equipment and fixtures were rigidly secured to the walls and floor to prevent displacement by the high- velocity winds that were expected. Pipe and conduit openings were sealed with gauze wadding and plaster of Paris. The latter procedure was accomplished using standard orthopedic pre- pared plaster rolls that had been previously shown to withstand considerable pressure changes.
60
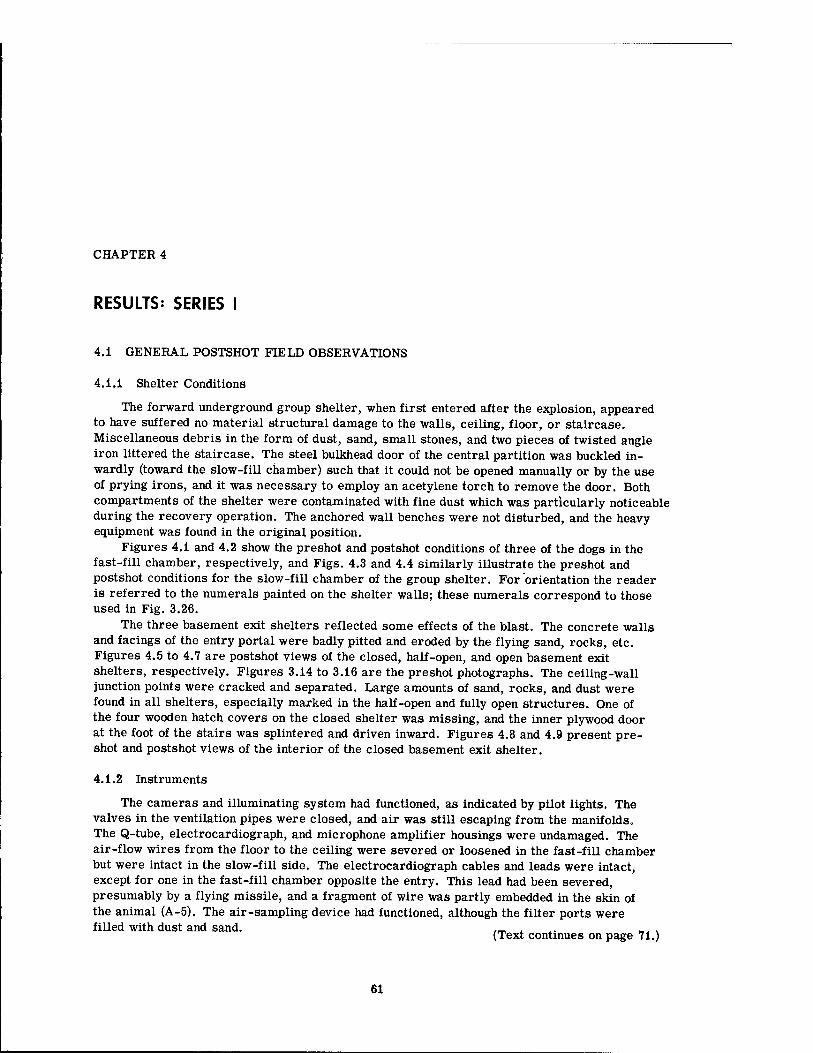
CHAPTER 4
RESULTS: SERIES I
4.1 GENERAL POSTSHOT FIELD OBSERVATIONS
4.1.1 Shelter Conditions
The forward underground group shelter, when first entered after the explosion, appeared to have suffered no material structural damage to the walls, ceiling, floor, or staircase. Miscellaneous debris in the form of dust, sand, small stones, and two pieces of twisted angle iron littered the staircase. The steel bulkhead door of the central partition was buckled in- wardly (toward the slow-fill chamber) such that it could not be opened manually or by the use of prying irons, and it was necessary to employ an acetylene torch to remove the door. Both compartments of the shelter were contaminated with fine dust which was particularly noticeable during the recovery operation. The anchored wall benches were not disturbed, and the heavy equipment was found in the original position.
Figures 4.1 and 4.2 show the preshot and postshot conditions of three of the dogs in the fast-fill chamber, respectively, and Figs. 4.3 and 4.4 similarly illustrate the preshot and postshot conditions for the slow-fill chamber of the group shelter. For orientation the reader is referred to the numerals painted on the shelter walls; these numerals correspond to those used in Fig. 3.26.
The three basement exit shelters reflected some effects of the blast. The concrete walls and facings of the entry portal were badly pitted and eroded by the flying sand, rocks, etc. Figures 4.5 to 4.7 are postshot views of the closed, half-open, and open basement exit shelters, respectively. Figures 3.14 to 3.16 are the preshot photographs. The ceiling-wall junction points were cracked and separated. Large amounts of sand, rocks, and dust were found in all shelters, especially marked in the half-open and fully open structures. One of the four wooden hatch covers on the closed shelter was missing, and the inner plywood door at the foot of the stairs was splintered and driven inward. Figures 4.8 and 4.9 present pre- shot and postshot views of the interior of the closed basement exit shelter.
4.1.2 Instruments
The cameras and illuminating system had functioned, as indicated by pilot lights. The valves in the ventilation pipes were closed, and air was still escaping from the manifolds. The Q-tube, electrocardiograph, and microphone amplifier housings were undamaged. The air-flow wires from the floor to the ceiling were severed or loosened in the fast-fill chamber but were intact in the slow-fill side. The electrocardiograph cables and leads were intact, except for one in the fast-fill chamber opposite the entry. This lead had been severed, presumably by a flying missile, and a fragment of wire was partly embedded in the skin of the animal (A-5). The air-sampling device had functioned, although the filter ports were filled with dust and sand. ,_ , ,.
(Text continues on page 71.)
61
tu*"
62
63
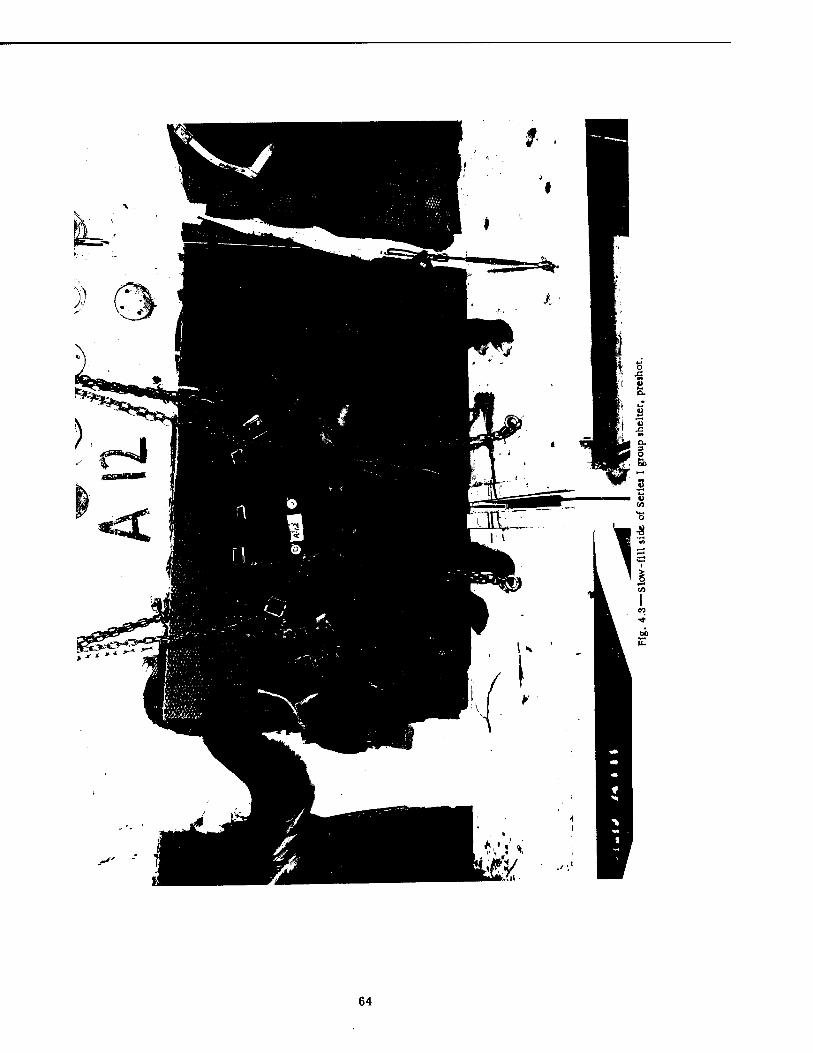
64
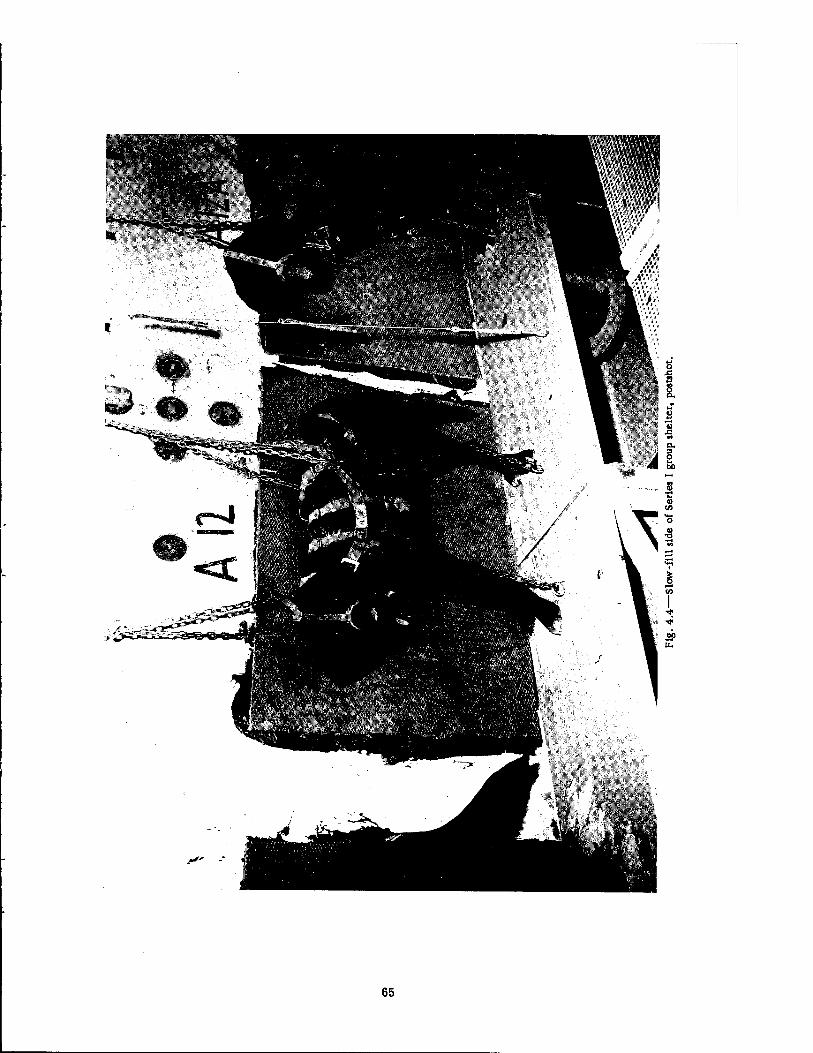
65
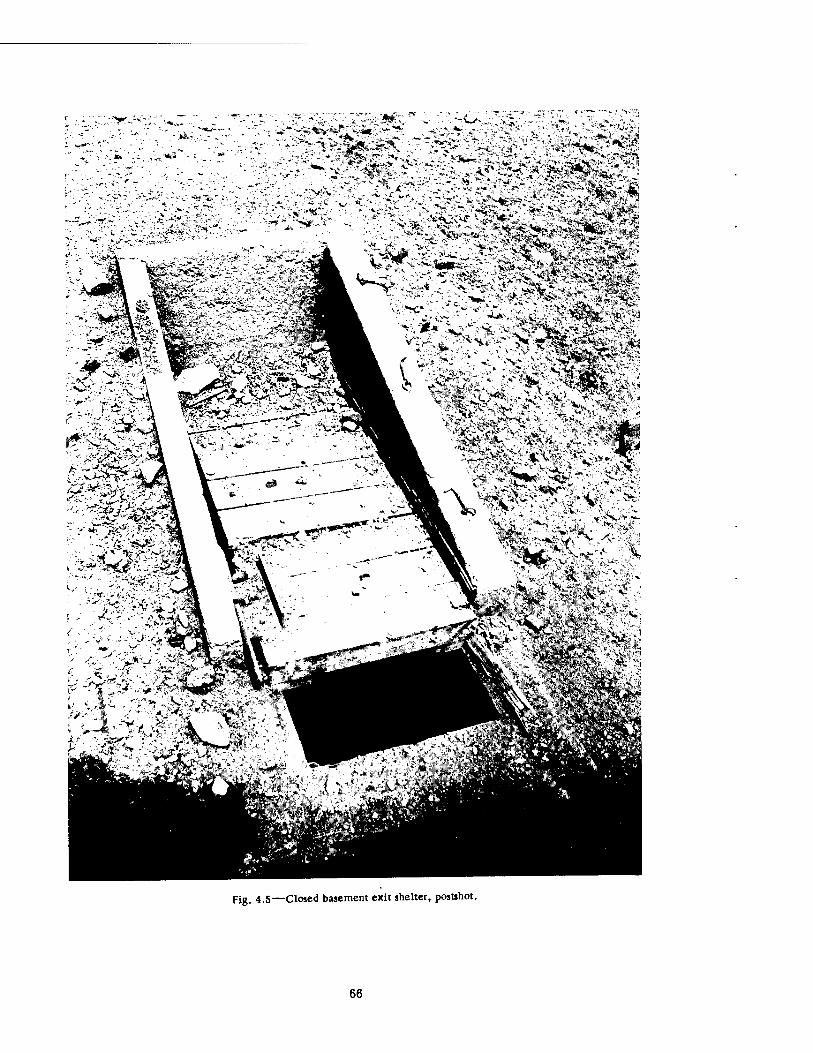
Fig. 4.5—Closed basement exit shelter, postshot.
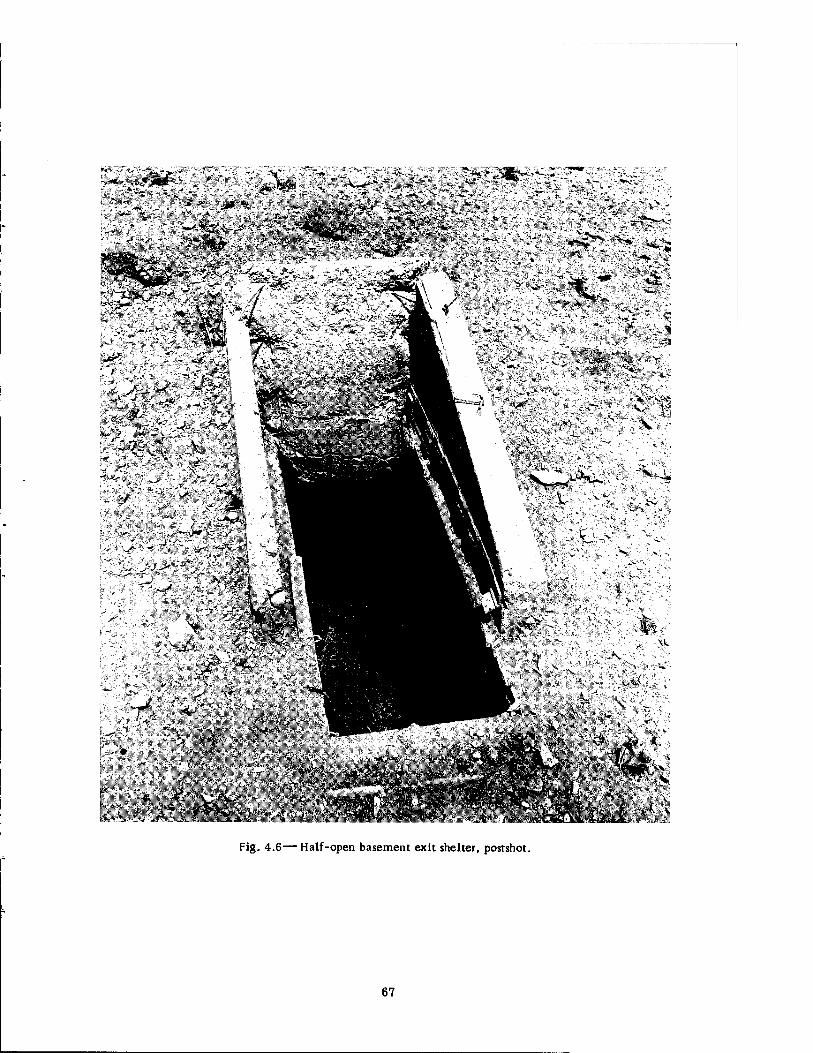
■^y -»/" f ■
*"•" t*v V..^.-*-'* ,-*'_«^ • •"•5** t/?','
■ *.-.' ' 7 ' ' ' " - ■- "
.V-V 'T- ? **3i
'. * ;:» ■ ?i . ., , , «sw? w" .•"""V" ' • - * •f" ^v "-
'^\ '"►i^T:^: -i V--": ^ti=«l^'"^"-'--:'■ *„ •■ ■■ *ir -" v
^S»-",-■«■- is>v.,yr ■*- ^-.- - - v; - . 'ir • -. *. >
J** • " " '
.. .,-«$»-A~^ .U ' "^ x .'-
-<.^
* >' «£*<* *■ v^. ;i.
v^"" s^.";** : c C-"-'-'".:" v. ~tt -ly?:'1'"- 4l§# \- ."•':.*>*- --\'
V
-,J«V..<j>
"1 'SiiBH! t-. '^'•>. ; -< 'at-
. «## * ■— ■ASs. j. «t?
f VJ
Fig. 4.6—Half-open basement exit shelter, postshot.
67
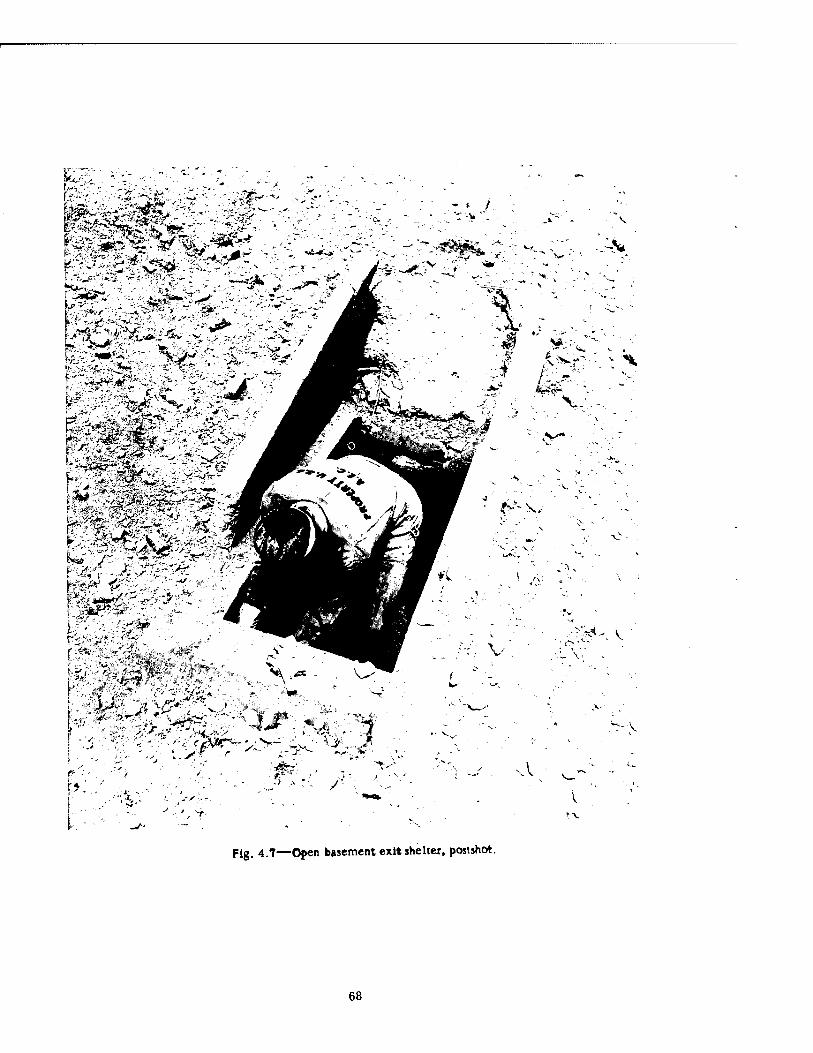
IV-v"'"' ''££&*>—*' **•.%■'
fi&v. \>Ä'*Är*&-•■'■>" ""' Js-1
!• "'<*#,*. ^ '■ . " • ~ .,?■* '':,;;'• •' '-•
It-;'.. ••-i-1-V'T ■■■
us,
-Jjf **s*>.-^ %* '
/'
\
V
Fig. 4.7—Open basement exit shelter, postshot.
68
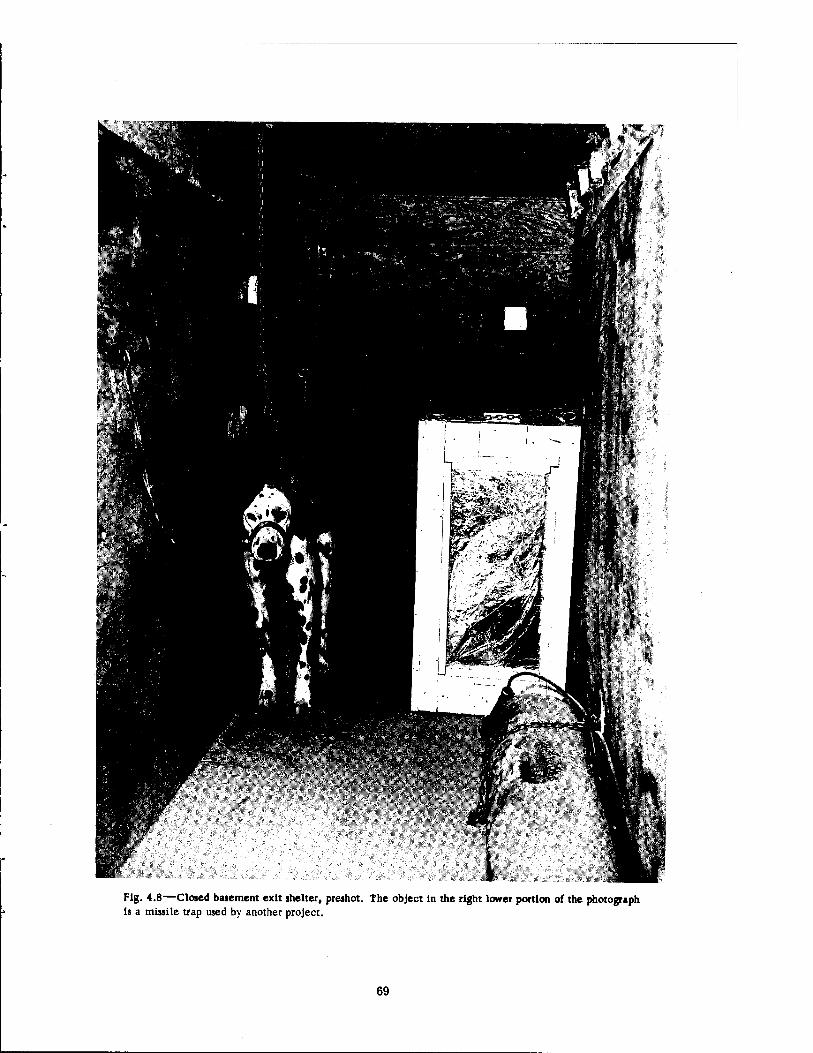
Fig. 4.8—Closed basement exit shelter, preshot. The object in the right lower portion of the photograph is a missile trap used by another project.
69
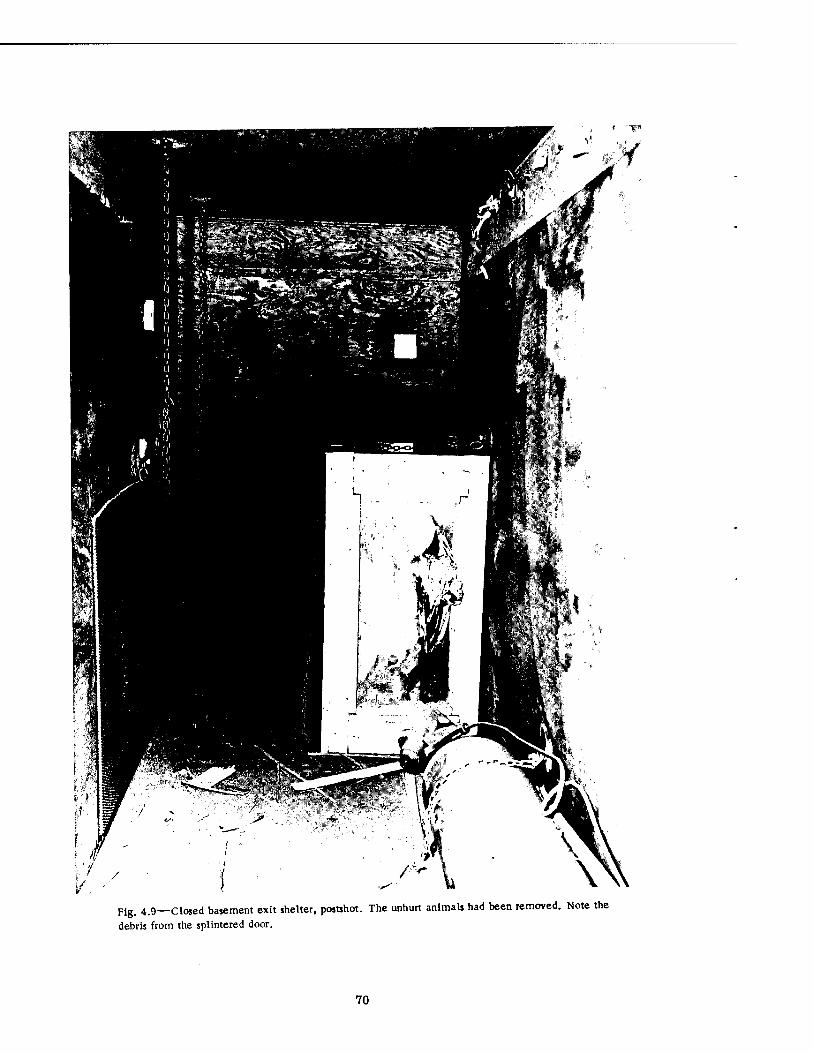
Fig. 4.9—Closed basement exit shelter, postshot. The unhurt animals had been removed. Note the
debris from the splintered door.
70
4.1.3 Animals
Figure 4.10 is a preshot view of dog A-l, which was positioned immediately facing the stair-well entrance of the group shelter. The animal, shown postshot in Fig. 4.11, was found alive on the floor in the corner just downstream of the drag gauge. The web harness in part had been torn away, and the ventral and forward snaps used to hook the harness to the re- straining chains had failed. It was immediately noted that the left forelimb was completely paralyzed, although no fractures could be palpated. All the other dogs and smaller animals were in the original placement positions and were alive and in good condition, although covered with considerable dust. The dogs were quiet, although not lethargic, and were easily led from the shelters.
4.1.4 Gas Analysis
From the analysis of air samples collected postshot in the two compartments of the group shelter and in the closed basement exit shelter, it was apparent that the oxygen content was normal and that no excess carbon dioxide had accumulated. Table 3.4 shows examples of the data obtained.
4.2 PATHOLOGY
4.2.1 Mortality
There was no immediate mortality among any of the animals. Following clinical ap- praisal, X-ray examination of the chest, and electrocardiographic procedures, all dogs in the basement exit shelters in the fast-fill chamber of the group shelter, and one dog in the slow- fill chamber, were sacrificed. The remaining nine dogs were kept for study of possible ra- diation effects. One of these (A-ll-A), which had been located nearest the ceiling escape hatch in the slow-fill chamber, became sick and expired on the 14th day after exposure as a result of radiation injury. See the photomicrograph shown in Fig. 4.12. The remaining eight animals were then sacrificed and examined. One other dog (A-10-B), also located near the escape hatch, showed gross evidence of radiation injury. Rare fresh petechiae on the serous membranes of four dogs (A-9-A, A-10-A, A-12, and A-12-A) were noted, but no other changes were seen. None of these latter animals showed effects attributable to primary blast injury.
4.2.2 Displacement
As described above, the first dog (A-l) nearest the entrance of the fast-fill chamber of the group shelter was displaced to the rear of the room. All other animals were restrained in their original positions.
4.2.3 Anatomical Findings
(a) Dogs. There was exceptionally meager evidence of internal injury due to primary blast in any of the animals. The animal (A-l) facing the main entrance of the group shelter sustained considerable injury due to violent displacement. The paralyzed left forelimb was devoid of sensation, apparently due to brachial plexus injury. There was extensive soft-tissue hemorrhage over the left side, at the base of the neck, and in the superior mediastinum, in- cluding the periesophageal and paravertebral spaces. The mediastinal hemorrhage was'in the form of a large hematoma. There was a small peribronchial hemorrhage in the hilar region of the left lung. No other intrapulmonary lesions were observed.
Small subcapsular hemorrhages in the spleen were seen in three instances, two of which occurred in animals (A-l and A-3) in the fast-fill chamber of the group shelter and one (B-2-A) in the half-open basement exit shelter. No evidence of interstitial emphysema (lungs and mediastinum), pneumothorax, or air emboli in coronary or cerebral circulation was seen, nor were there signs of myocardial or cerebral injury, either grossly or on microscopic examination of tissues. A summary of parenchymal and nonparenchymal lesions is presented in Tables 4.1 and 4.2.
71
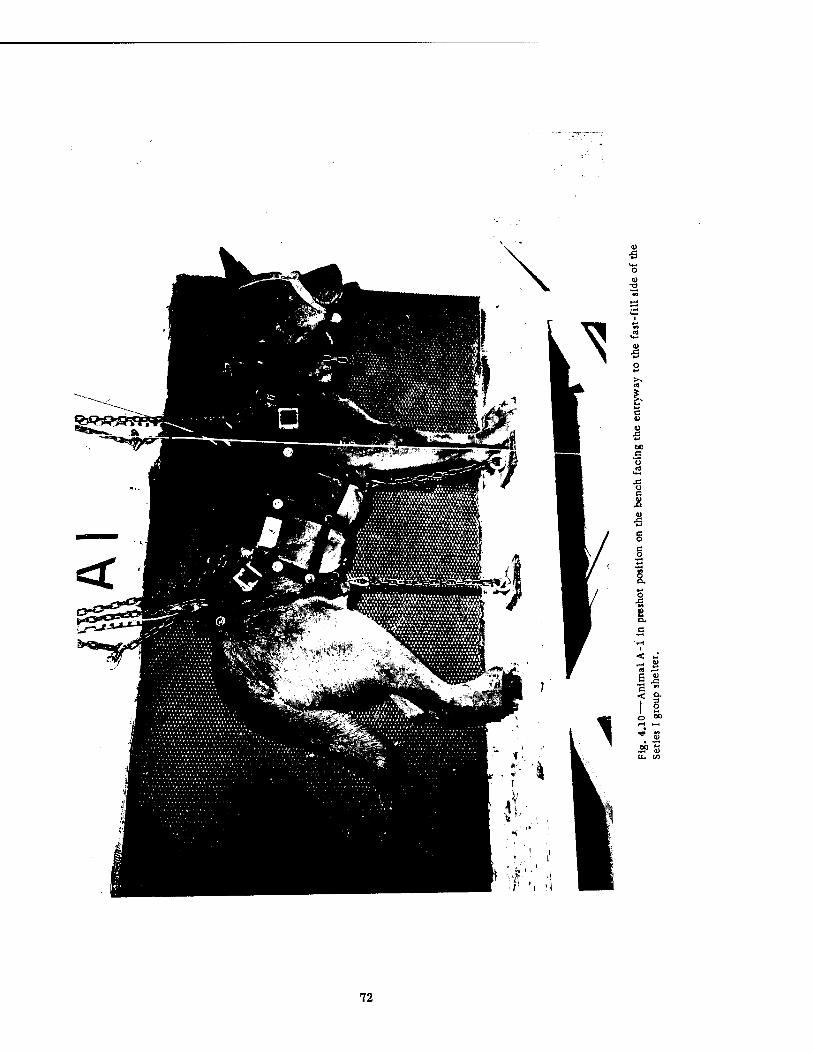
•5
X
I
I-8
< s-
72
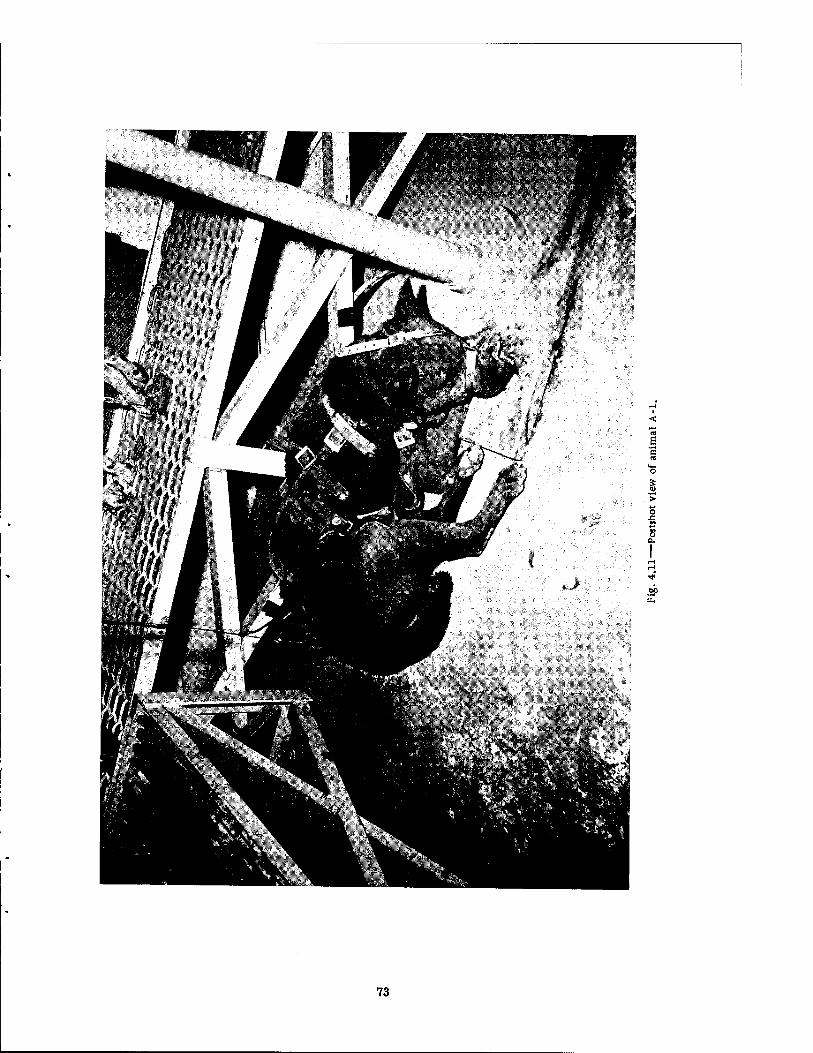
60
73
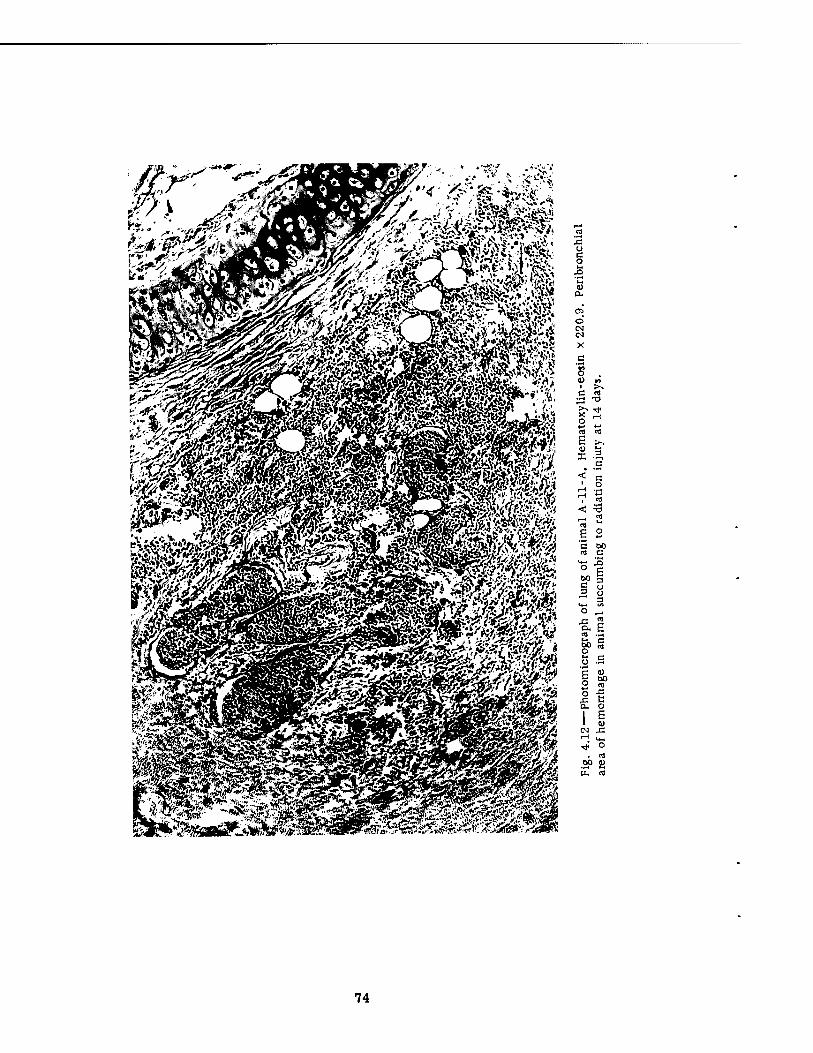
xs o a o
<u Qu
©
s . c: «
* i-i
E
V «
_ "1
nt 00 C
° 1 S <J
3 O -
nl .5
5 .s
<N
■*
«
o E <o
(4-1 O
. m .SP a
74
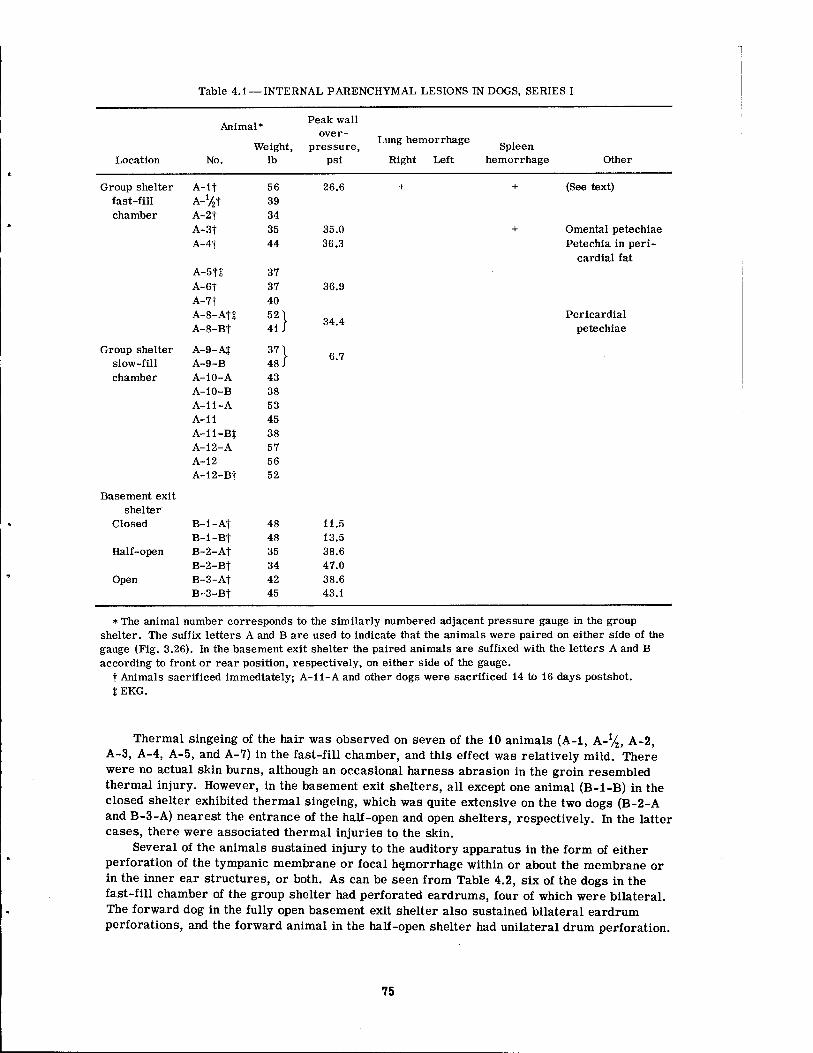
Table 4.1—INTERNAL PARENCHYMAL LESIONS IN DOGS, SERIES I
Animal* Peak wall
over- Weight, pressure,
Location No. lb psi
Group shelter A-if 56 26.6 fast-fill A-V2t 39 chamber A-2t 34
A-31 35 35.0 A-4t 44 36.3
A-5tt 37 A-6T 37 36.9
A-71 40 A-8-Att A-8-Bt
521 41/
34.4
Group shelter A-9-AJ 371 48 J
6.7 slow-fill A-9-B chamber A-10-A 43
A-iO-B 38 A-ll-A 53 A-ll 45 A-il-Bt 38 A-12-A 57 A-12 56 A-12-Bt 52
Basement exit shelter
Closed B-i-At 48 11.5 B-1-Bt 48 13.5
Half-open B-2-At 35 38.6
B-2-Bt 34 47.0 Open B-3-At 42 38.6
B-3-Bt 45 43.1
Lung hemorrhage
Right Left Spleen
hemorrhage Other
(See text)
Omental petechiae Petechia in peri-
cardial fat
Pericardial petechiae
* The animal number corresponds to the similarly numbered adjacent pressure gauge in the group shelter. The suffix letters A and B are used to indicate that the animals were paired on either side of the gauge (Fig. 3.26). In the basement exit shelter the paired animals are suffixed with the letters A and B according to front or rear position, respectively, on either side of the gauge.
t Animals sacrificed immediately; A-il-A and other dogs were sacrificed 14 to 16 days postshot. JEKG.
Thermal singeing of the hair was observed on seven of the 10 animals (A-i, A-%, A-2, A-3, A-4, A-5, and A-7) in the fast-fill chamber, and this effect was relatively mild. There were no actual skin burns, although an occasional harness abrasion in the groin resembled thermal injury. However, in the basement exit shelters, all except one animal (B-l-B) in the closed shelter exhibited thermal singeing, which was quite extensive on the two dogs (B-2-A and B-3-A) nearest the entrance of the half-open and open shelters, respectively. In the latter cases, there were associated thermal injuries to the skin.
Several of the animals sustained injury to the auditory apparatus in the form of either perforation of the tympanic membrane or focal hemorrhage within or about the membrane or in the inner ear structures, or both. As can be seen from Table 4.2, six of the dogs in the fast-fill chamber of the group shelter had perforated eardrums, four of which were bilateral. The forward dog in the fully open basement exit shelter also sustained bilateral eardrum perforations, and the forward animal in the half-open shelter had unilateral drum perforation.
75
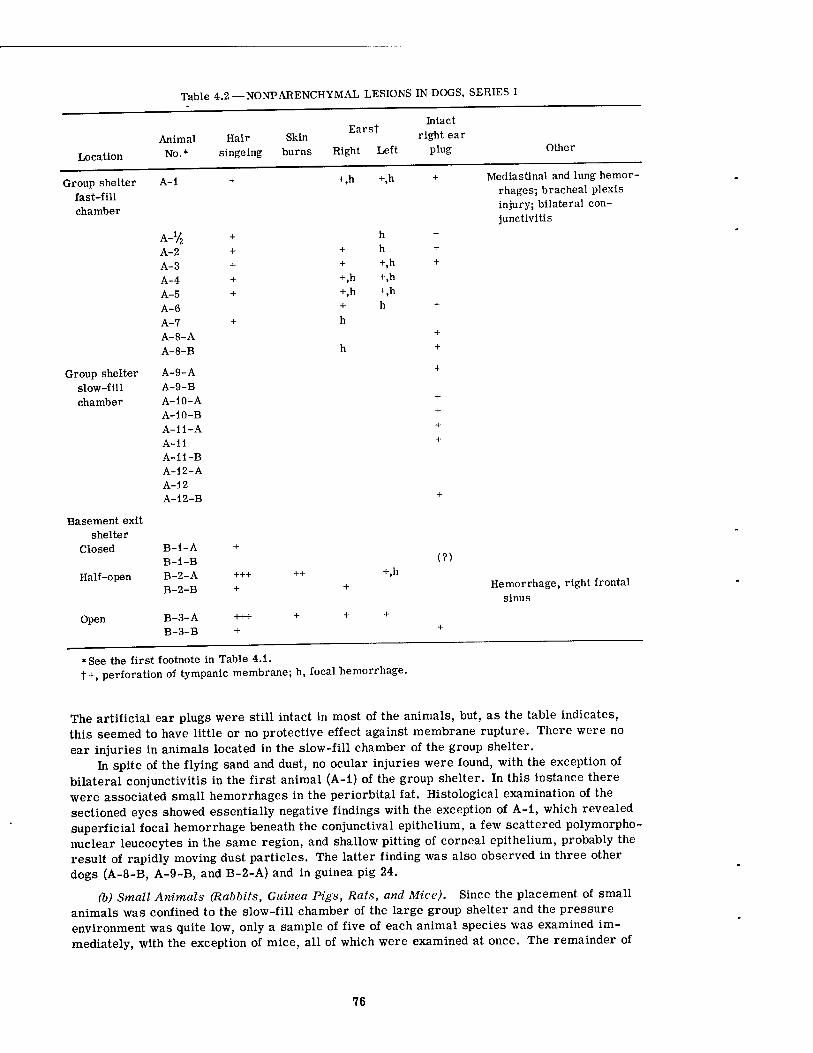
Table 4.2— NONPARENCHYMAL LESIONS IN DOGS, SERIES I
Intact
Animal Hair Skin Earst right ear
Location No.* singeing burns Right Left plug Other
Group shelter fast-fill
A-l + +,h +,h + Mediastlnal and lung hemor- rhages-, bracheal plexis injury; bilateral con-
chamber junctivitis
A-Vi + h +
A-2 + + h +
A-3 + + +,h +
A-4 + +,h +,h
A-5 + +,h +,h
A-6 + h +
A-7 + h
A-8-A +
A-8-B h +
Group shelter A-9-A +
slow-fill A-9-B
chamber A-IO-A A-IO-B A-ll-A A-11 A-ll-B A-12-A A-12 A-12-B
+ + + +
+
Basement exit shelter
Closed B-l-A B-l-B
+ (?)
Half-open B-2-A B-2-B
+++ +
++ +
+,h Hemorrhage, right frontal
sinus
Open B-3-A B-3-B
+++ +
+ + + +
»See the first footnote in Table 4.1. t+, perforation of tympanic membrane; h, focal Tiemorrhage.
The artificial ear plugs were still intact in most of the animals, but, as the table indicates, this seemed to have little or no protective effect against membrane rupture. There were no ear injuries in animals located in the slow-fill chamber of the group shelter.
In spite of the flying sand and dust, no ocular injuries were found, with the exception of bilateral conjunctivitis in the first animal (A-i) of the group shelter. In this instance there were associated small hemorrhages in the periorbital fat. Histological examination of the sectioned eyes showed essentially negative findings with the exception of A-i, which revealed superficial focal hemorrhage beneath the conjunctival epithelium, a few scattered polymorpho- nuclear leucocytes in the same region, and shallow pitting of corneal epithelium, probably the result of rapidly moving dust particles. The latter finding was also observed in three other dogs (A-8-B, A-9-B, and B-2-A) and in guinea pig 24.
(b) Small Animals (Rabbits, Guinea Pigs, Rats, and Mice). Since the placement of small animals was confined to the slow-fill chamber of the large group shelter and the pressure environment was quite low, only a sample of five of each animal species was examined im- mediately, with the exception of mice, all of which were examined at once. The remainder of
76
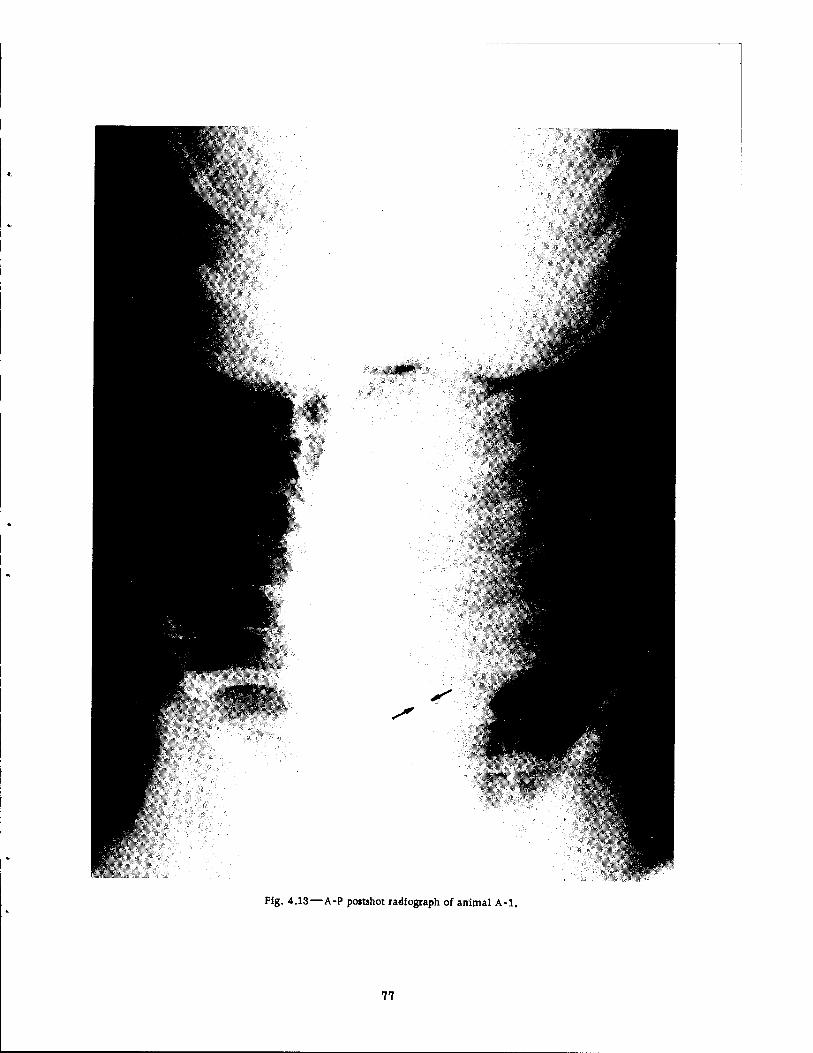
Fig. 4.13—A-P postshot radiograph of animal A-l.
77
the animals were examined during the interval of 7 to 10 days following the test. Blast in- juries to the small animals were limited to the finding of occasional petechiae in soft tissues and the lungs (rabbit 26; guinea pig 10; rat 4-c; and mice 1-f, i-g, and 3-e). Guinea pig 24 showed a superficial corneal abrasion. Of the animals examined in the 7- to 10-day period, a few fresh petechiae were observed (1-a, 9-b, and 6-b), but no significant effects of blast in- jury were noted. Thermal injury was not observed in these animals.
Tympanic membrane rupture or focal hemorrhage, or both, was frequently found in this group. Of the 23 rabbits, there were 11 instances of eardrum perforation, including one bilateral case, and 12 instances of focal hemorrhage in the auditory apparatus. Seven of the latter were associated with hemorrhage. Thirteen eardrums of guinea pigs were perforated (one case was bilateral), but there were only six records of hemorrhage, four of which were associated with eardrum injury. Data regarding auditory injury in rats were confused by the high incidence of otitis media. As a result, only eight ears were readable; three ears showed perforation, two exhibited focal hemorrhage, and three appeared normal.
4.2.4 Radiography
Abnormalities were noted in postshot radiographs of only one dog (A-l). As shown in Fig. 4.13, narrowing of the trachea was seen (see arrows). This was an accidental finding in that it would not have been visualized except for a fortuitous rotation of the animal during the postshot X-ray procedure. The presence of a large, firm hematoma, noted during the post- mortem examination, no doubt accounted for the tracheal compression documented in the radiograph.
4.2.5 Electrocardiography*
Electrocardiographic procedures were carried out on all dogs preshot and postshot in the laboratory at base camp. Tracings were attempted on four dogs that were exposed in the underground group shelter. See Fig. 3.26 for location of the animals. Recordings were tried on these animals at "button-up" of the shelters the night before the shot and for 1 hr con- tinuously, beginning 5 min before the explosion.
Only one (A-8-A) of the four recordings attempted postshot in the group shelter was successful. The other three records were lost—one (A-5) because one of the electrical leads was severed by flying debris, another due to blowout of a power transformer caused by the zero-time transient, and the third involved a blown fuse.
The postshot electrocardiogram of dog A-8-A was within normal limits, and for further information concerning the immediate preshot and postshot tracings the reader is referred to the section on EKG's appearing later in the report describing the results of the Series II experiments.
* The technical details relevant to the rather difficult task of obtaining electrocardio- graphic data under field conditions have been reported by Sander and Birdsong in a Sandia Corporation Technical Memorandum.18 The authors are indebted to Dr. F. G. Hirsch, Sandia Corporation, for his supervision of all the electrocardiographic work and to Dr. Richard B. Streeper, Lovelace Clinic, who lent his experience as a cardiologist in interpreting the tracings obtained.
78
CHAPTER 5
RESULTS: SERIES II
5.1 GENERAL FIELD OBSERVATIONS
5.1.1 Shelter Conditions
As in the previous series of experiments, the stairway of the group shelter was littered with stones and dust (see Fig. 5.1). The rooms were contaminated with dirt and debris. Fig- ure 5.2 is a postshot view of the fast-fill chamber taken from near the entryway. Note that two animals were not at their preshot stations on the right-hand bench, and note the animal's nose protruding from under the bench. Figure 5.3, a view of the floor to the left of that de- picted in Fig. 5.2, shows the dead animal, Z-l, as it was found.
Figures 5.4 and 5.5, respectively, show preshot and postshot views of those animals positioned against the partition wall, and Figs. 5.6 and 5.7 similarly show preshot and post- shot positions, respectively, of the small animals under the benches and the large animals stationed against the wall opposite the partition side of the shelter. It can be seen that animal Z-8-B was missing from its station.
The wall benches and the camera and light housing were intact, as was the air supply system. The front grill of the heater, seen preshot under the bench in Fig. 5.8, was displaced to the postshot position shown in Fig. 5.3. Figure 5.9 depicts the condition of the ventilating equipment after the detonation.
The partition door, which, based on previous experience, had been heavily reinforced as shown in Fig. 5.10, sustained no damage and was opened during recovery procedures without difficulty.
Inside the slow-fill chamber major damage was minimal, but the effects of the winds caused by the explosion can be illustrated by comparing the preshot view in Fig. 3.11 with that shown in Fig. 5.11. The small animal cages were displaced, and some were turned over; two of the large animals, positioned preshot just to the right of the table, were displaced owing to failure of their ventral restraints.
The small animal cages mounted on the ceiling and previously shown preshot in Figs. 3.10 and 3.11 are shown postshot for comparison in Fig. 5.12. The latter shows that two of the large cages were somewhat twisted on their mounts and that the spring-supported lids of two intermediate-sized cylindrical cages were displaced. Note the close-up view in Fig. 5.13. The overstretched springs can be seen by a careful inspection of Fig. 5.11. The reader will note that one spring is entangled in the restraints of the animal farthest to the right (Z- 10-B). This animal no doubt gyrated wildly about like a pendulum, and in this process the restraints became entangled with the springs of one of the small animal cages.
The overpressure that existed in the slow-fill chamber was sufficient to damage one of the metal boxes housing electronic equipment (see Fig. 5.14).
(Text continues on page 94.)
79
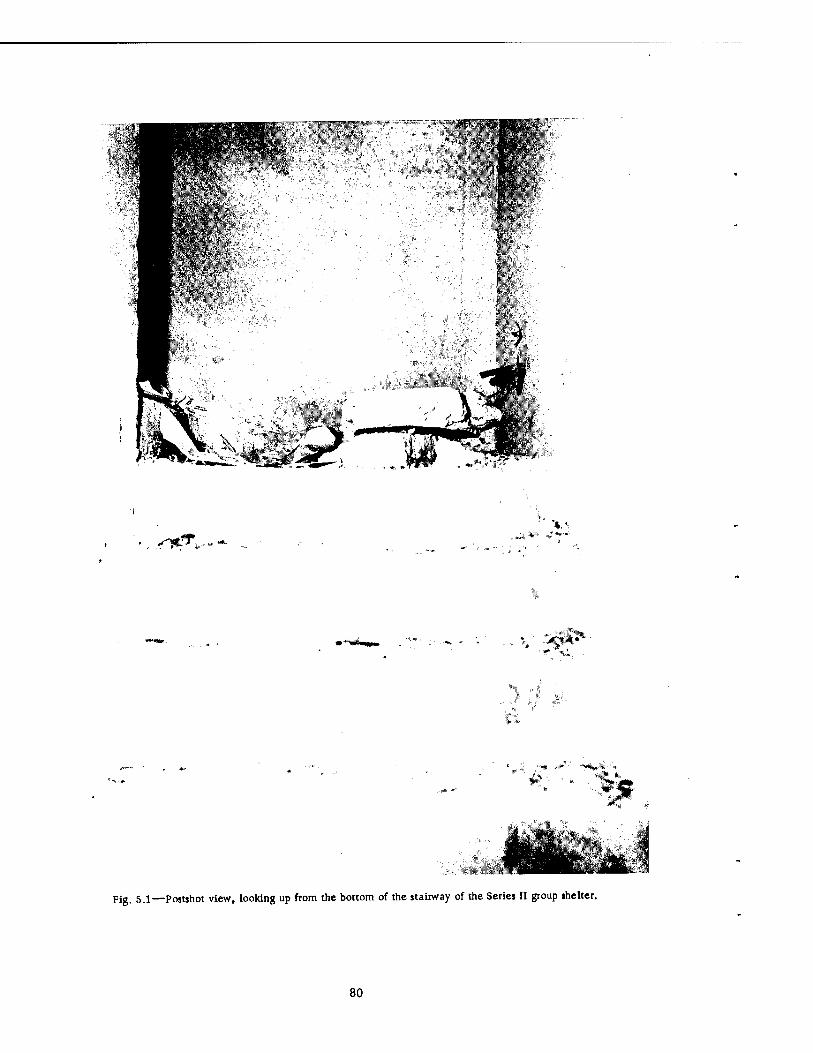
'..<^TM^^
> ., Ci» *M
, -^> r "%',
> ? -
C*1SHS
Fig. 5.1—Postshot view, looking up from the bottom of the stairway of the Series II group shelter.
80
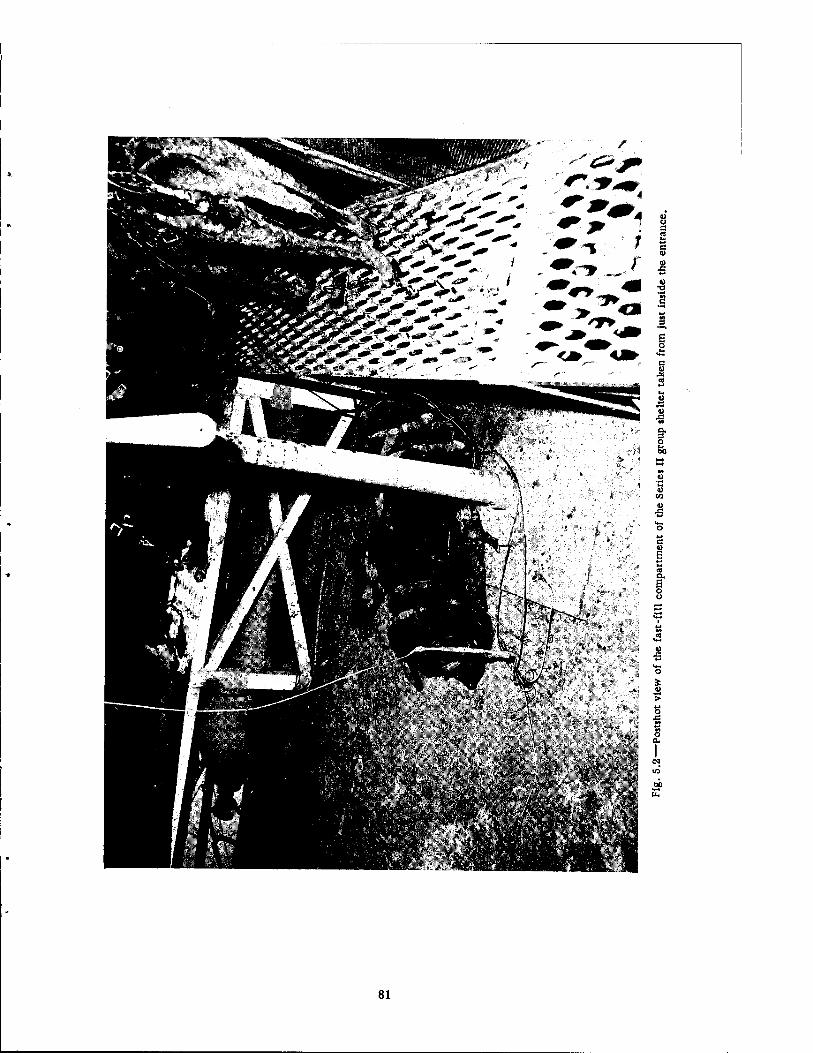
&*f»_
c u ja
a
B U E « a, E o u
I o
O a.
oo
81
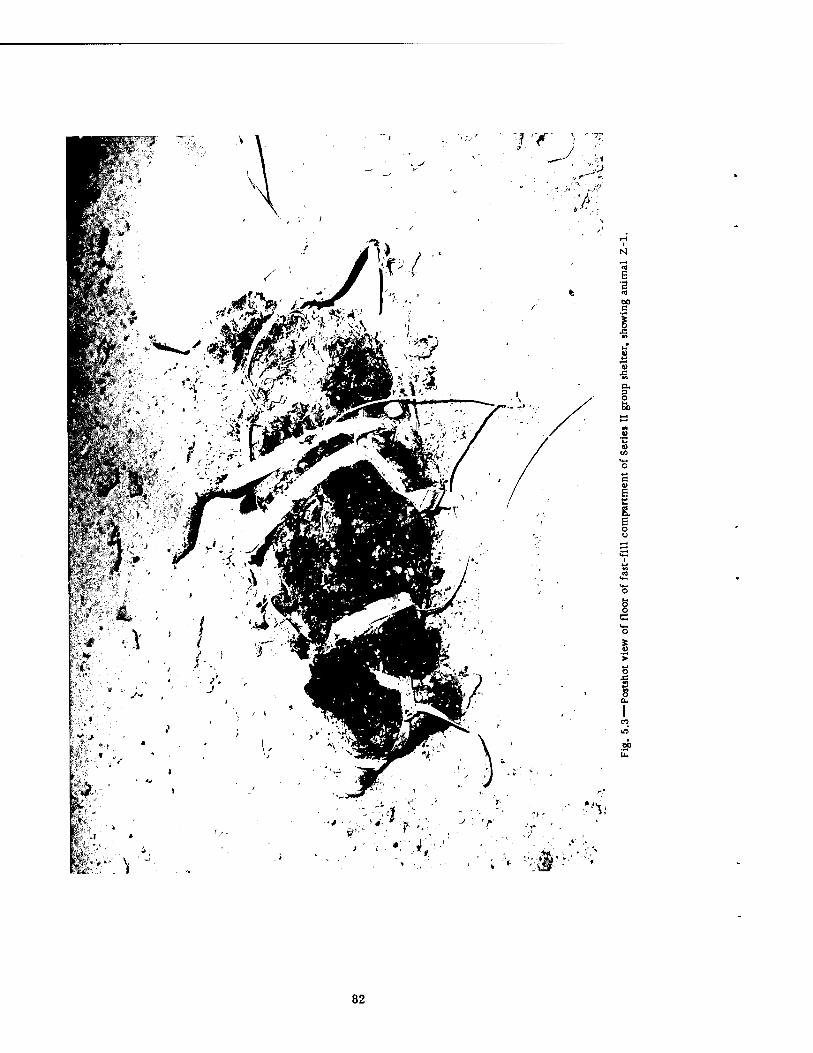
l'-f
f-J
00 a
3 O 6b
C o
o a
82
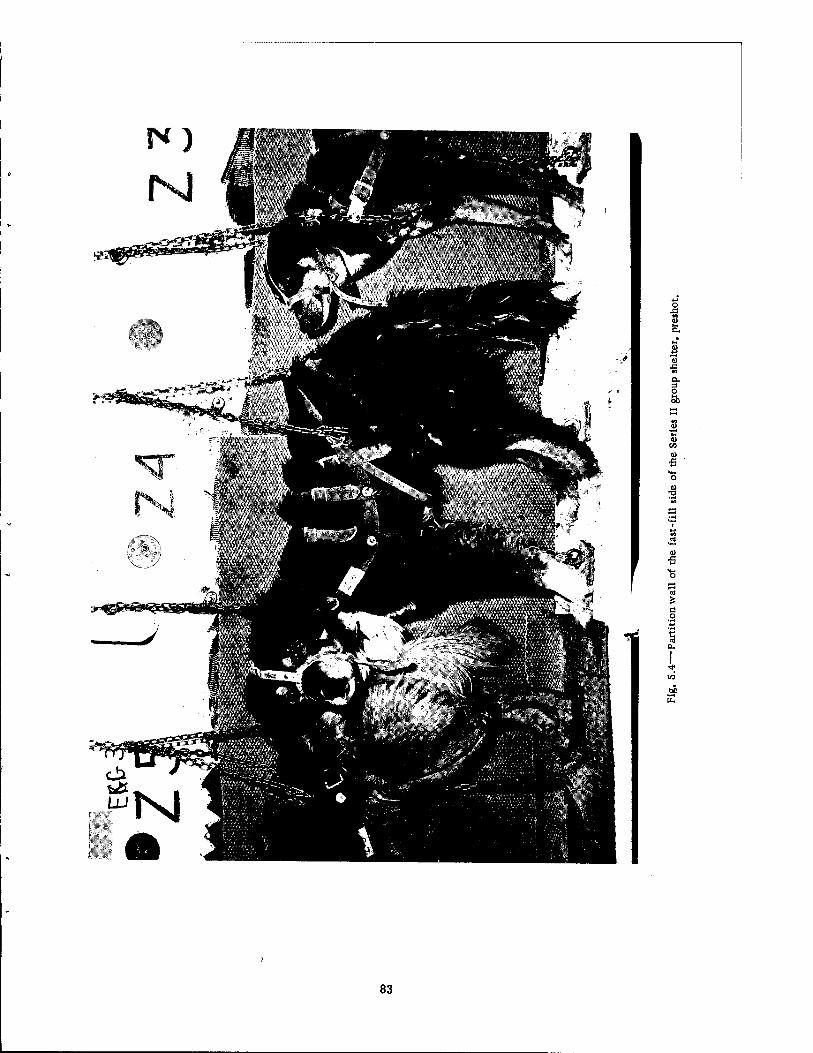
D. 3 O
•S
op
83
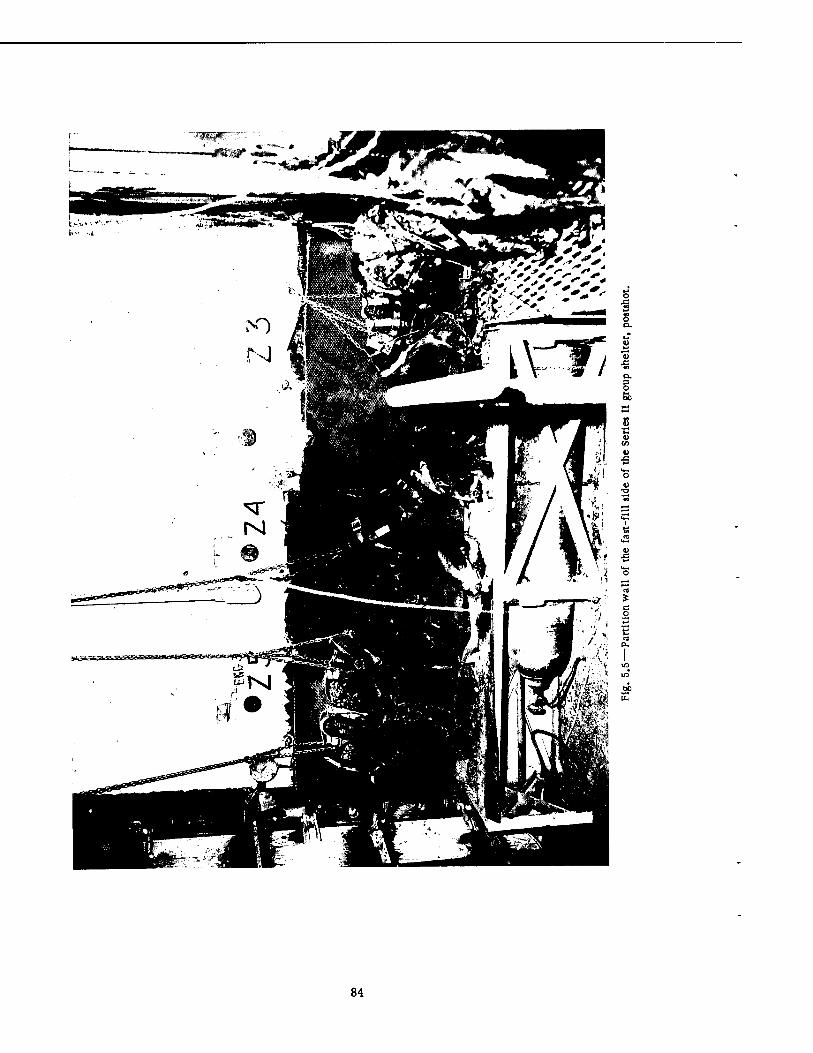
o s S a.
a. 3 O &
o,
I
84
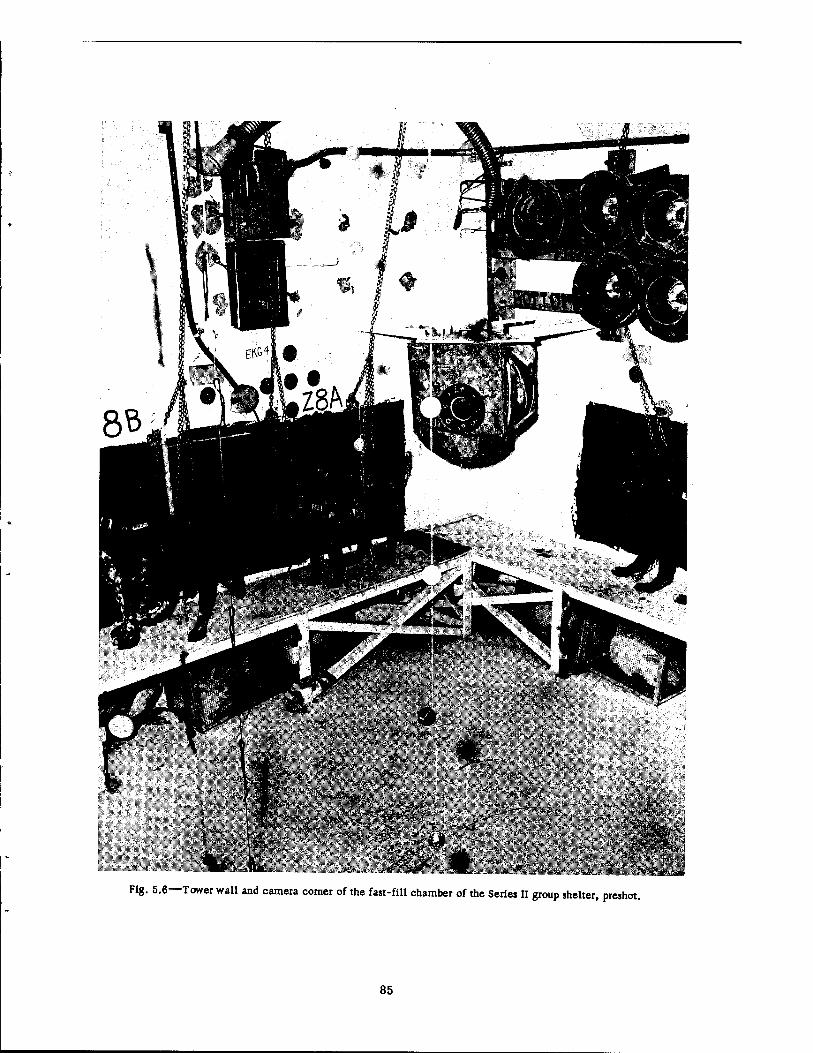
'« *k\ - \';^ ft Fig. 5.6—Tower wall and camera corner of the fast-fill chamber of the Seriei II group shelter, preshot.
^BMäü
85
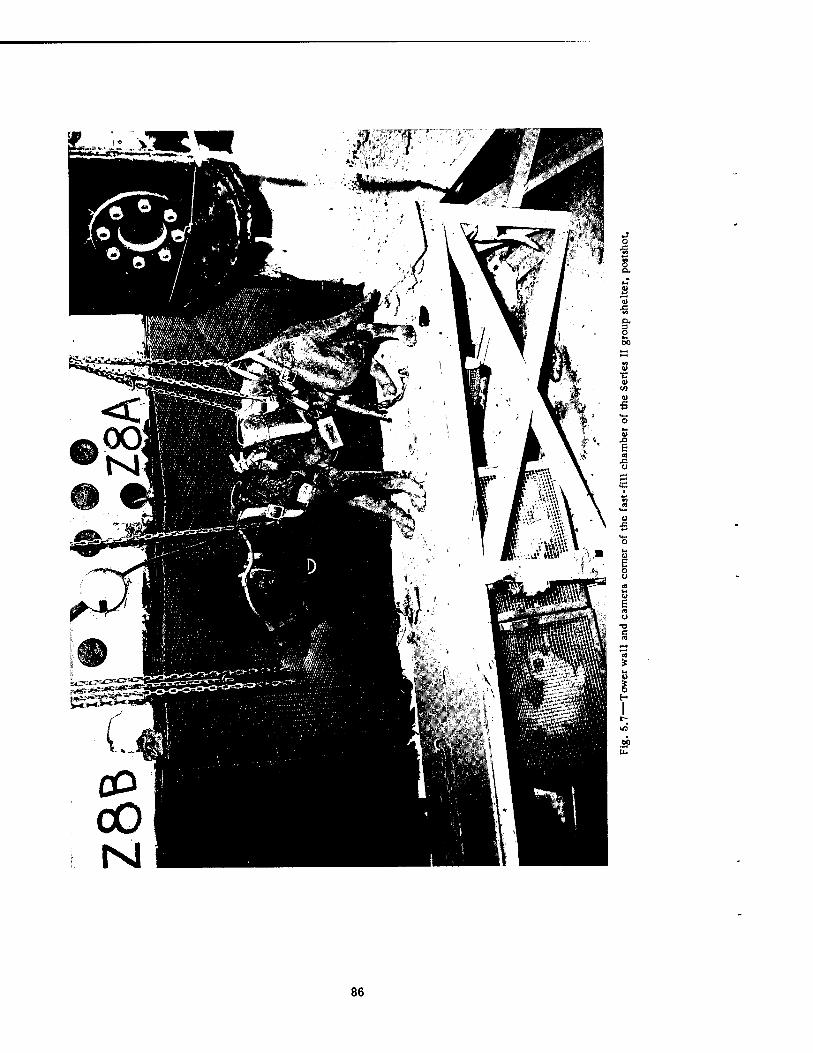
o .a
a. 3 O
s ■c in u 6
J3
•o c M
I
op
86
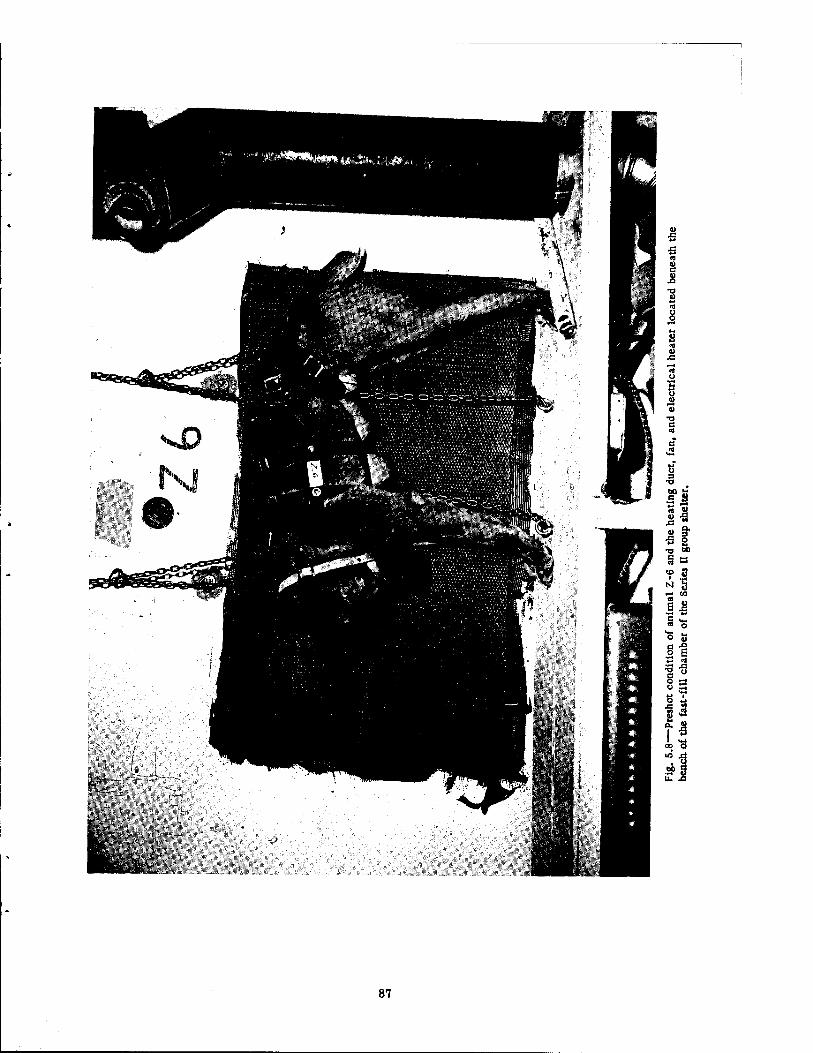
^^^mm-mt^M^M
87
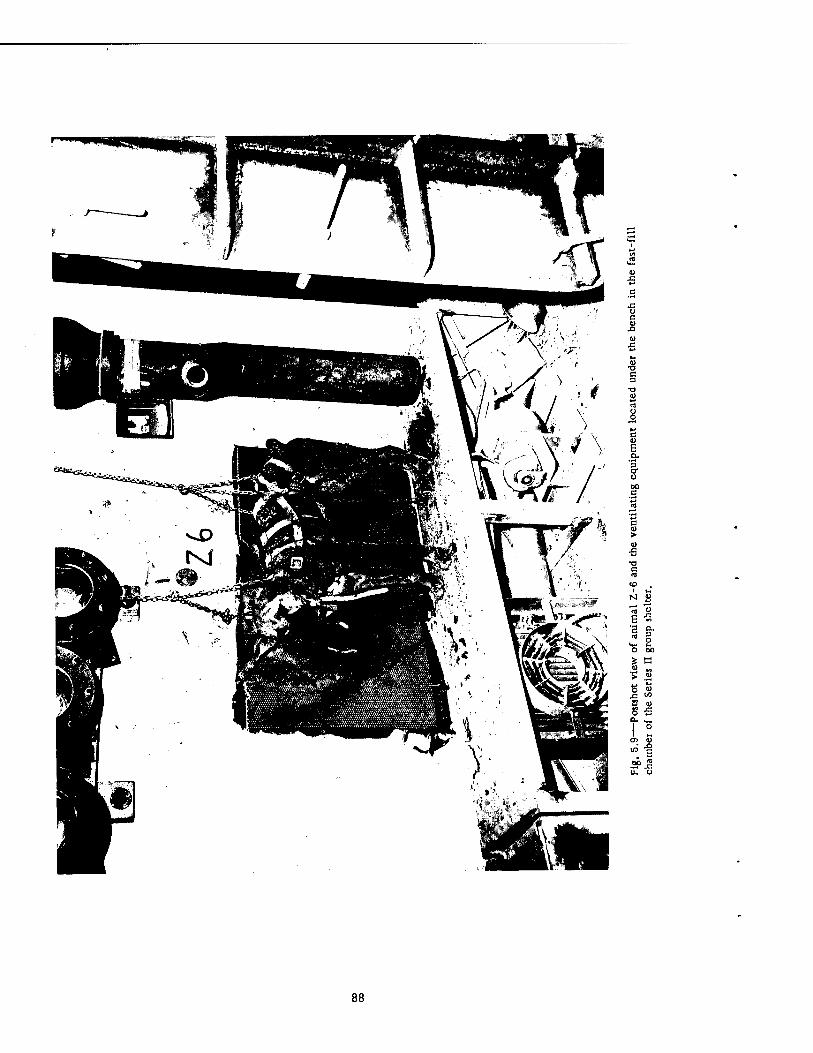
ü d ü
c u B '3 cr a
c > u
■5
« S E -S
J! ° 0 BO
S O •S •» ► .2 «-» n 5 u S V S $
1 ° CD <U
.00 _g u, u
88
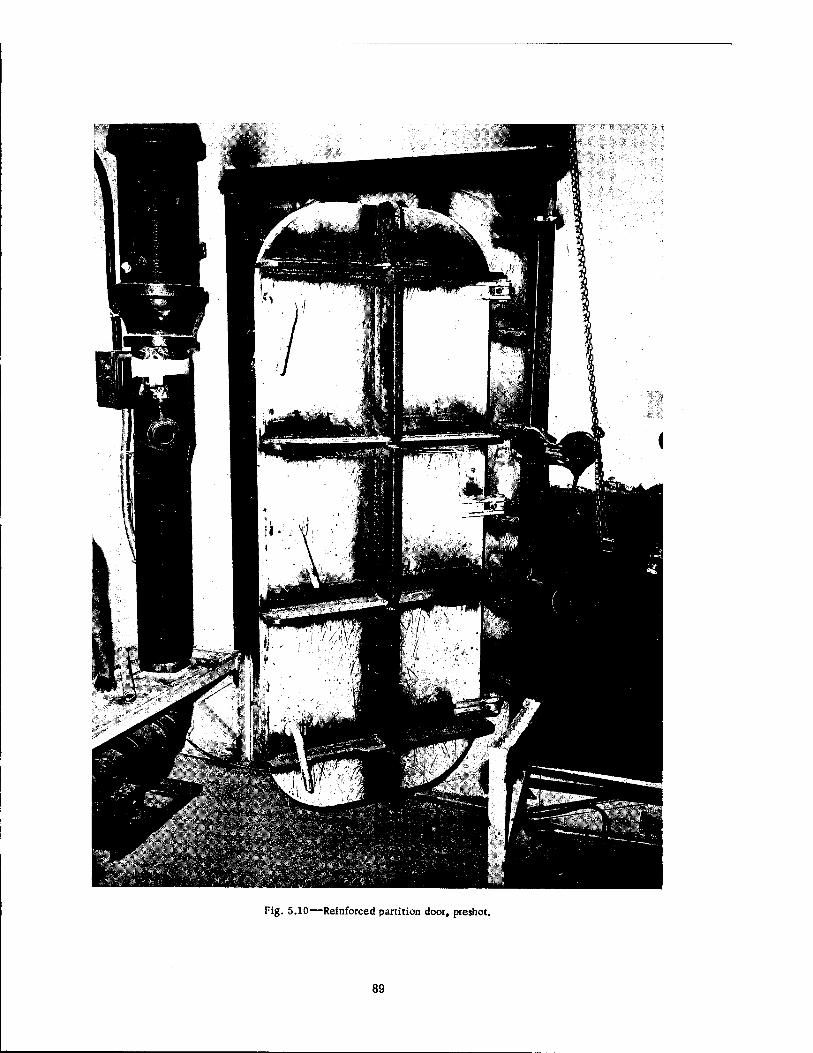
Fig. 5.10—Reinforced partition door, preshot.
89
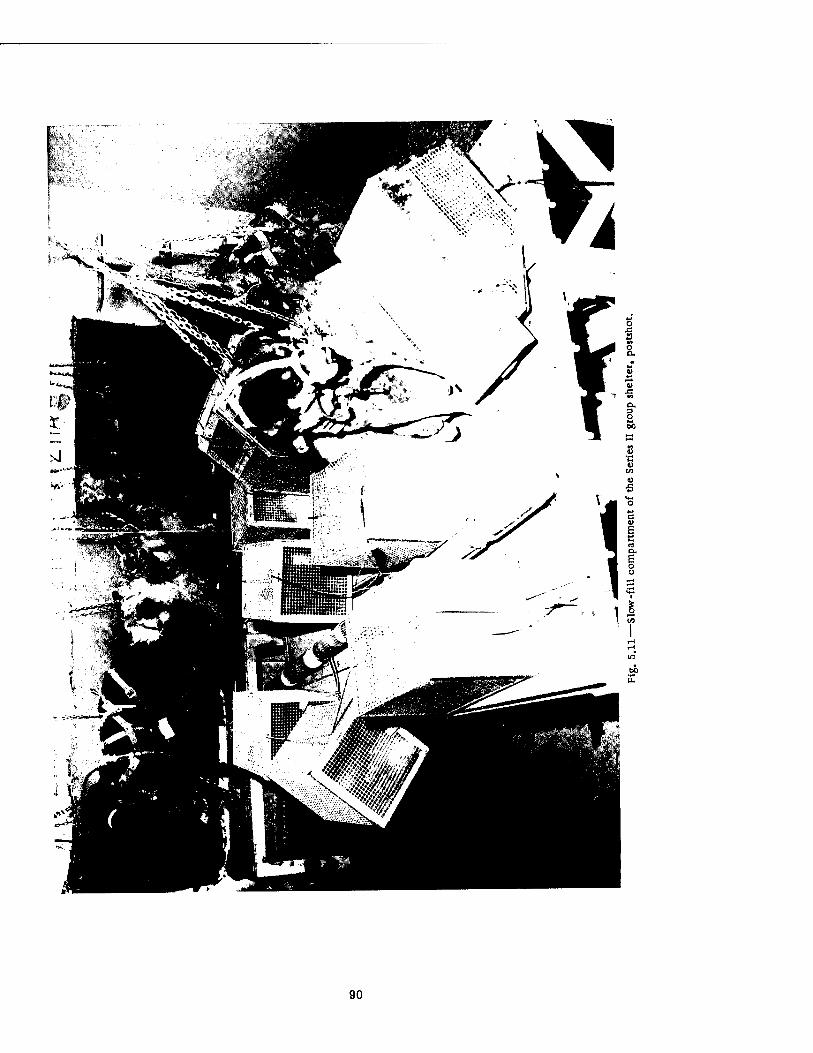
90
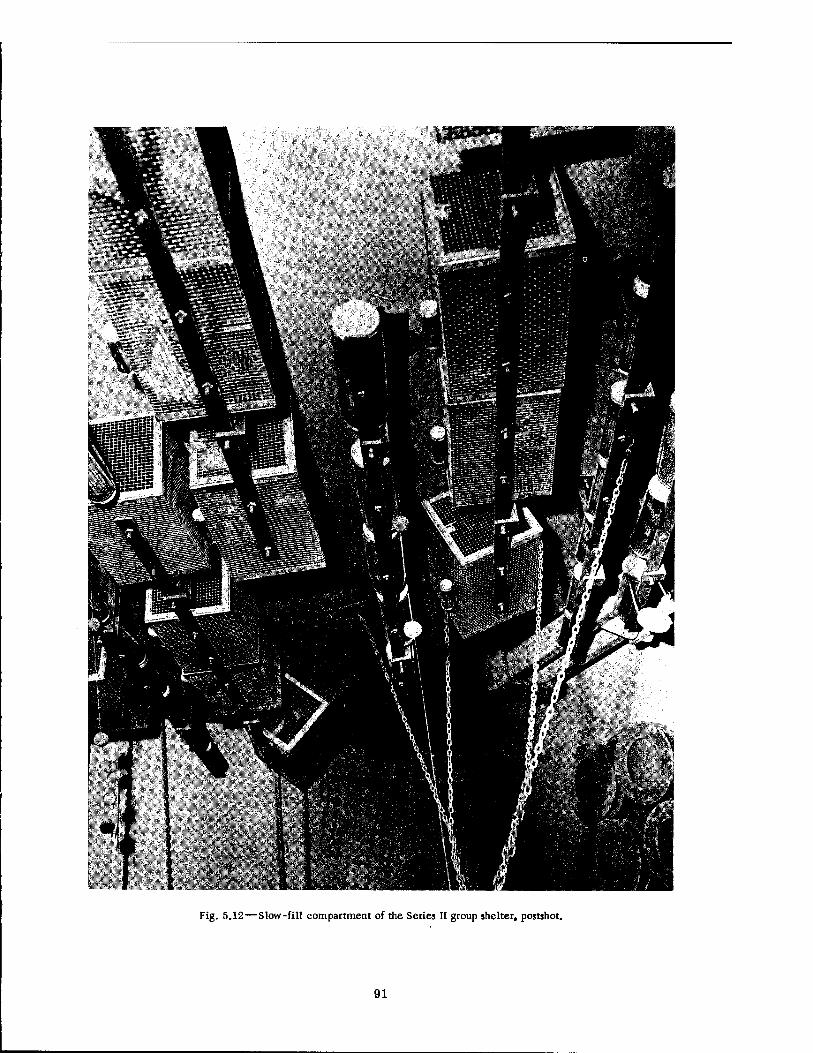
Fig. 5.12—Slow-fill compartment of the Series II group shelter, postshot.
91
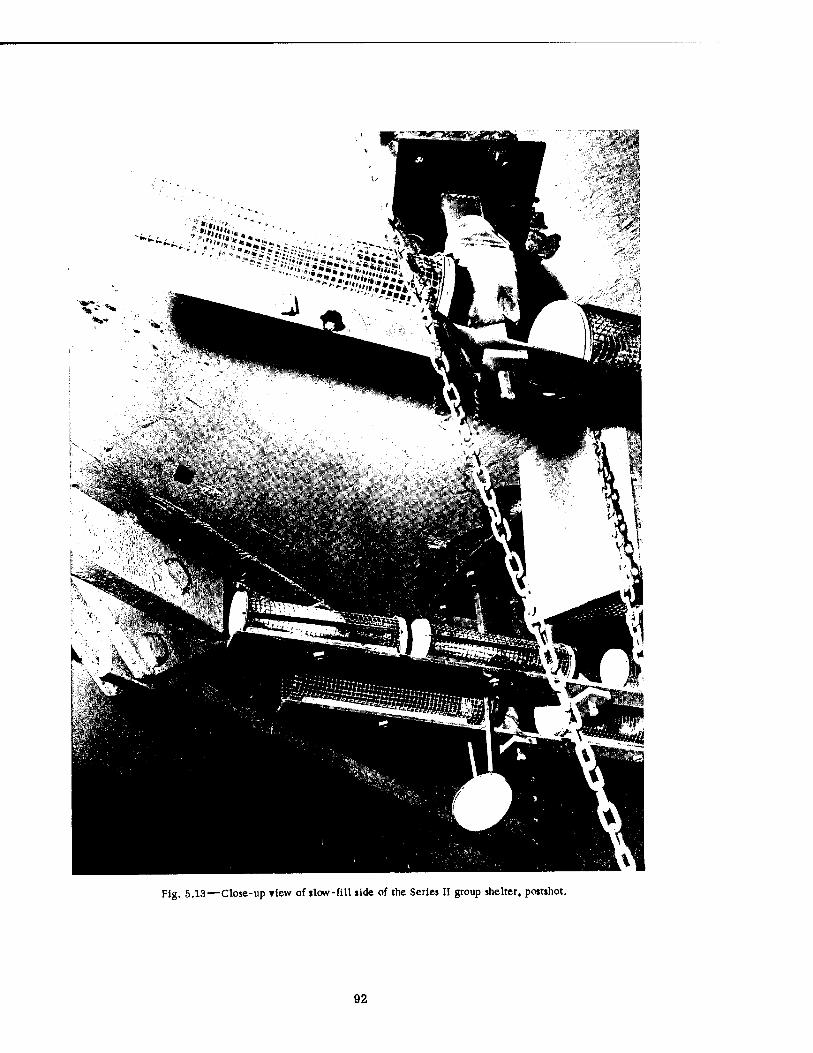
Fig. 5.13—Close-up riew of »low-fill side of the Series II group shelter, postshot.
92
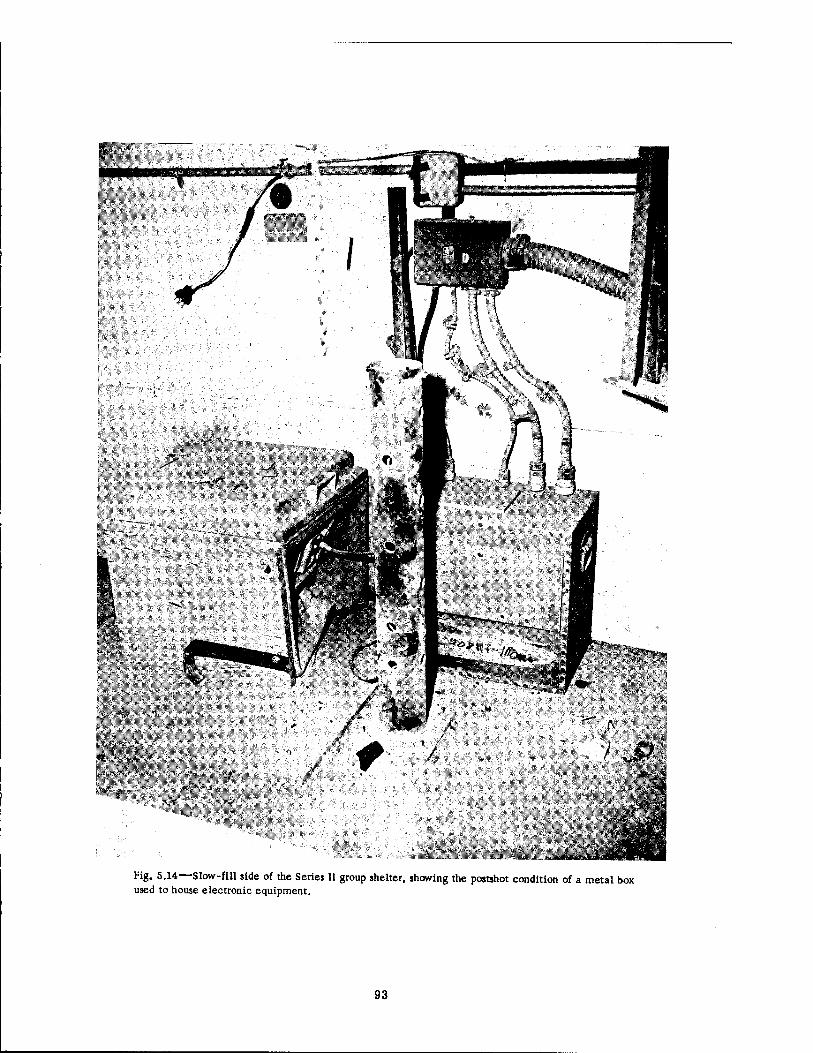
i^^^^^^M^B Fig. 5.14—Slow-fill side of the Series II group shelter, showing the postshot condition of a metal box used to house electronic equipment.
93
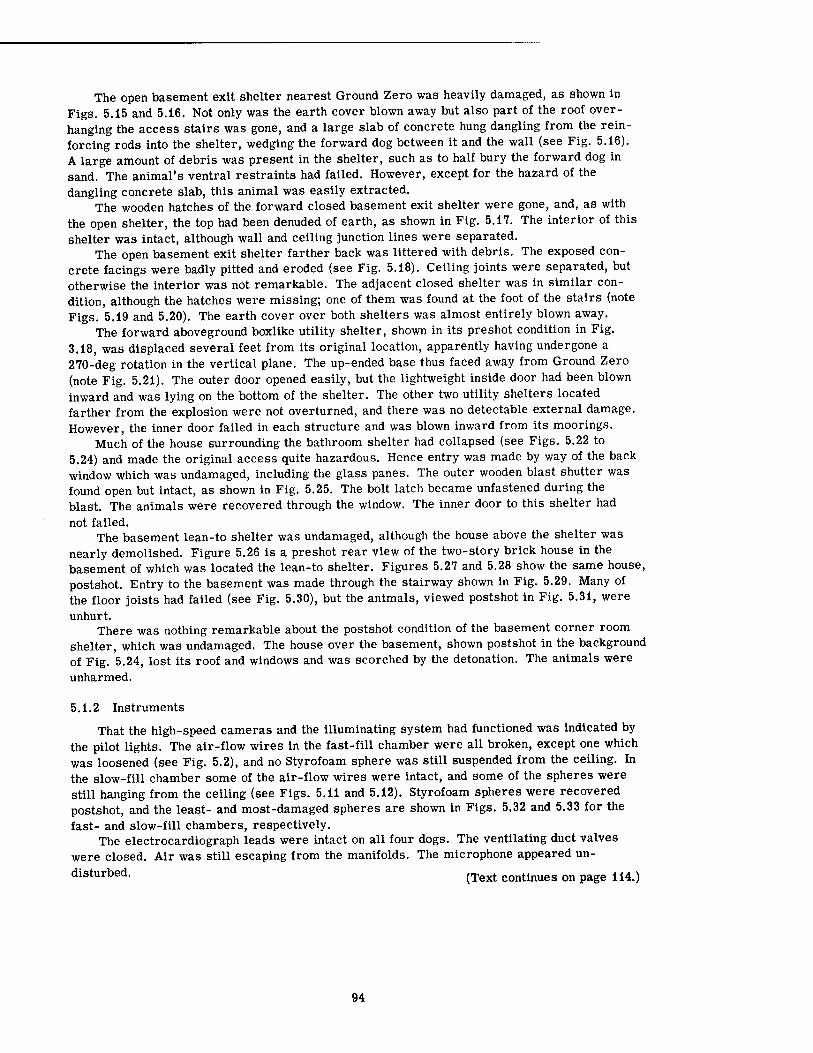
The open basement exit shelter nearest Ground Zero was heavily damaged, as shown in Figs. 5.15 and 5.16. Not only was the earth cover blown away but also part of the roof over- hanging the access stairs was gone, and a large slab of concrete hung dangling from the rein- forcing rods into the shelter, wedging the forward dog between it and the wall (see Fig. 5.16). A large amount of debris was present in the shelter, such as to half bury the forward dog in sand. The animal's ventral restraints had failed. However, except for the hazard of the dangling concrete slab, this animal was easily extracted.
The wooden hatches of the forward closed basement exit shelter were gone, and, as with the open shelter, the top had been denuded of earth, as shown in Fig. 5.17. The interior of this shelter was intact, although wall and ceiling junction lines were separated.
The open basement exit shelter farther back was littered with debris. The exposed con- crete facings were badly pitted and eroded (see Fig. 5.18). Ceiling joints were separated, but otherwise the interior was not remarkable. The adjacent closed shelter was in similar con- dition, although the hatches were missing; one of them was found at the foot of the stairs (note Figs. 5.19 and 5.20). The earth cover over both shelters was almost entirely blown away.
The forward aboveground boxlike utility shelter, shown in its preshot condition in Fig. 3.18, was displaced several feet from its original location, apparently having undergone a 270-deg rotation in the vertical plane. The up-ended base thus faced away from Ground Zero (note Fig. 5.21). The outer door opened easily, but the lightweight inside door had been blown inward and was lying on the bottom of the shelter. The other two utility shelters located farther from the explosion were not overturned, and there was no detectable external damage. However, the inner door failed in each structure and was blown inward from its moorings.
Much of the house surrounding the bathroom shelter had collapsed (see Figs. 5.22 to 5.24) and made the original access quite hazardous. Hence entry was made by way of the back window which was undamaged, including the glass panes. The outer wooden blast shutter was found open but intact, as shown in Fig. 5.25. The bolt latch became unfastened during the blast. The animals were recovered through the window. The inner door to this shelter had not failed.
The basement lean-to shelter was undamaged, although the house above the shelter was nearly demolished. Figure 5.26 is a preshot rear view of the two-story brick house in the basement of which was located the lean-to shelter. Figures 5.27 and 5.28 show the same house, postshot. Entry to the basement was made through the stairway shown in Fig. 5.29. Many of the floor joists had failed (see Fig. 5.30), but the animals, viewed postshot in Fig. 5.31, were unhurt.
There was nothing remarkable about the postshot condition of the basement corner room shelter, which was undamaged. The house over the basement, shown postshot in the background of Fig. 5.24, lost its roof and windows and was scorched by the detonation. The animals were unharmed.
5.1.2 Instruments
That the high-speed cameras and the illuminating system had functioned was indicated by the pilot lights. The air-flow wires in the fast-fill chamber were all broken, except one which was loosened (see Fig. 5.2), and no Styrofoam sphere was still suspended from the ceiling. In the slow-fill chamber some of the air-flow wires were intact, and some of the spheres were still hanging from the ceiling (see Figs. 5.11 and 5.12). Styrofoam spheres were recovered postshot, and the leas> and most-damaged spheres are shown in Figs. 5.32 and 5.33 for the fast- and slow-fill chambers, respectively.
The electrocardiograph leads were intact on all four dogs. The ventilating duct valves were closed. Air was still escaping from the manifolds. The microphone appeared un-
disturbed. (Text continues on page 114.)
94
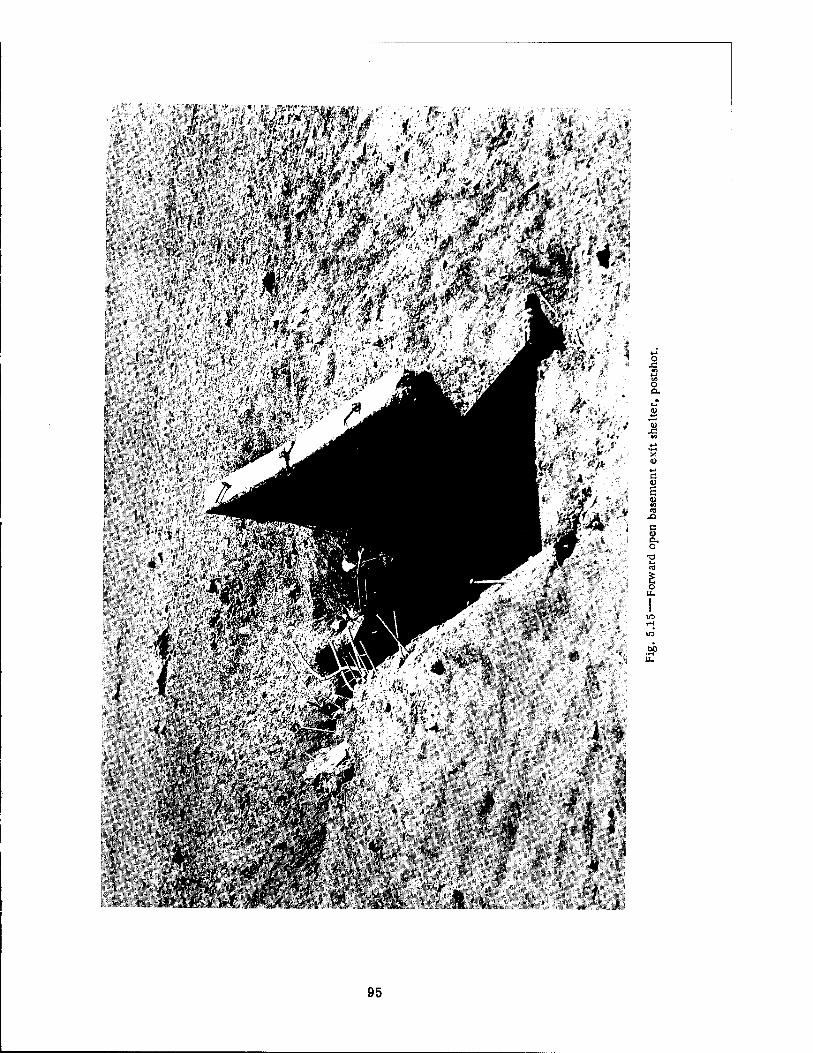
«s**-".
, ^p&*$m>i± ■ J •*:-.'•. "/'.' ■ ' ', -? * ■'# •
1
,'4
' ;-f
o
O o,
<3
C (U
o
o
iß i-H
Iß
tL,
95
.AjfiSäsite-
Fig_ 5 16_Roof damage to the forward open basement exit shelter. Note the animal between the wall
and the dangling concrete slab.
96
#.;;/■.,'»
m
t:
d
* •< \ 'si' • 1' •,,"..-:. -I ':■'/
■>;¥
« i
: '■'.-. näß''-'. '■•■*■> ;- v,'r«' ' ..*Tf.--'jt\ A. . .'
<%>
.-f..i
f
.',. */ 4
i-<'
j^
>
o o
10 43
X
3 ja
U
•O
o
c-
a,
-.»-■
i*lr
(''••,;•;
'«••:< •;,. " "1
I
■I-.,-, k
/V>
t. ' u .
97
PPllfc*" •/•• ?'fö^ ■''¥£./*:,/.* / ■
'I •1 "■'•
:•*•'. .V...''Vi..V: *4f'|te-i • •.•'■•^iir^Vi^- t i.i)
«'*»■■* • •,'• ■ /.,'■ '"•"'\/'""."' - *■"' .•'4 | -• ^ «*J; ^'%Mf:;* WWi- i-:i\ ■' •'„'^■^.;.K>.
> = .v':^!.^' '.'■;■:; V':V 4" -"'V f'-y ■'
vM-y> ..,i> ■
v'>* '•,"'';:■;:•.• v:^«/-'
, >
• ■ * \ ■ •. • f
. ••■■ Sä'
o
o (X
x *-* a <o E u V)
J3
8,
<
op in
, ..,..,»'.-?".Nri
Jt»MHVi£ßV;t* ";•' i'V*/ «»•.- ■. •• ■ 1'»: i ft. ~
... * k
98
# • ■■■.. -v':•■• -,.,•'■■ *■. ,v;... .1... , .-(,•: ', :• = ^#>y.:.w/ 'I* - .... ,*•'
. • . ; ■• . •• .> ■. <■« - •'. ,%*£ ■ , \ ',<• /,' * . - *l
VA'--; •'* ■• '■'■■ '>.< ^',- k • .
V>* t. I **
," Jf;.
.1'
J* • ■#!
,«*
i^»iV.
- f-i-'J.'-rJ'.«•/"».; .. • ;.v *• ."»* V «
£*:•?.-.• :V •--
w '< # '-'■
. " - / . *.f--"> .
. J- #i . *
-;: '4-/ ., *' *' i
ft -, - ;•- ,, '<■.*■, ,
\<f'.--t '
ij*'4"#«" '■It (- : -•. 1
o Ä*: - <«■ YX '
■"/•* £1 M o .4-
%, 1 r'.r
■ *•*
M
'S •a " » 4-»
v >■;■ X .. " * '* - WM . t 0)
, , ** s ' * l) ft"'. g
;'* = •" ;jt a J&% i r" . t*; rt
'.•'V
.;•,**«:£?'«•':':■:' ■''■■'.. ■,:• -:;•■".■■■'.■ ä •-
ab II,
99
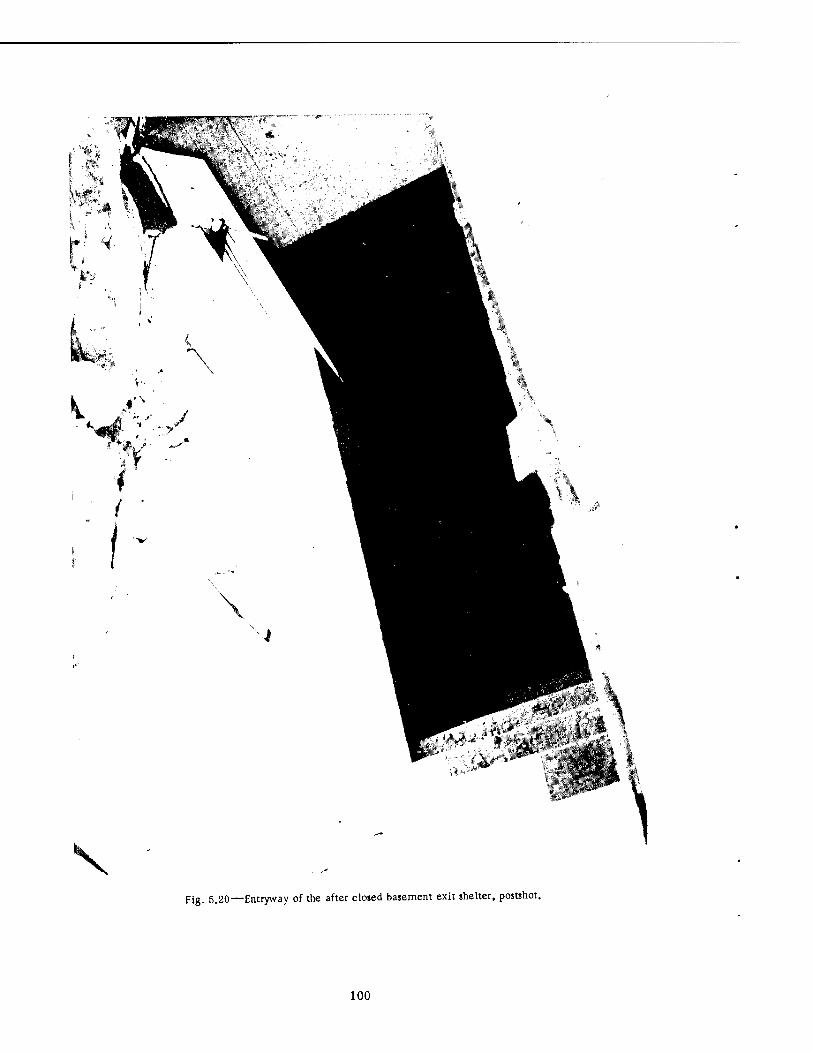
V Fig. 5.20—Entryway of the after closed basement exit shelter, postshot.
100
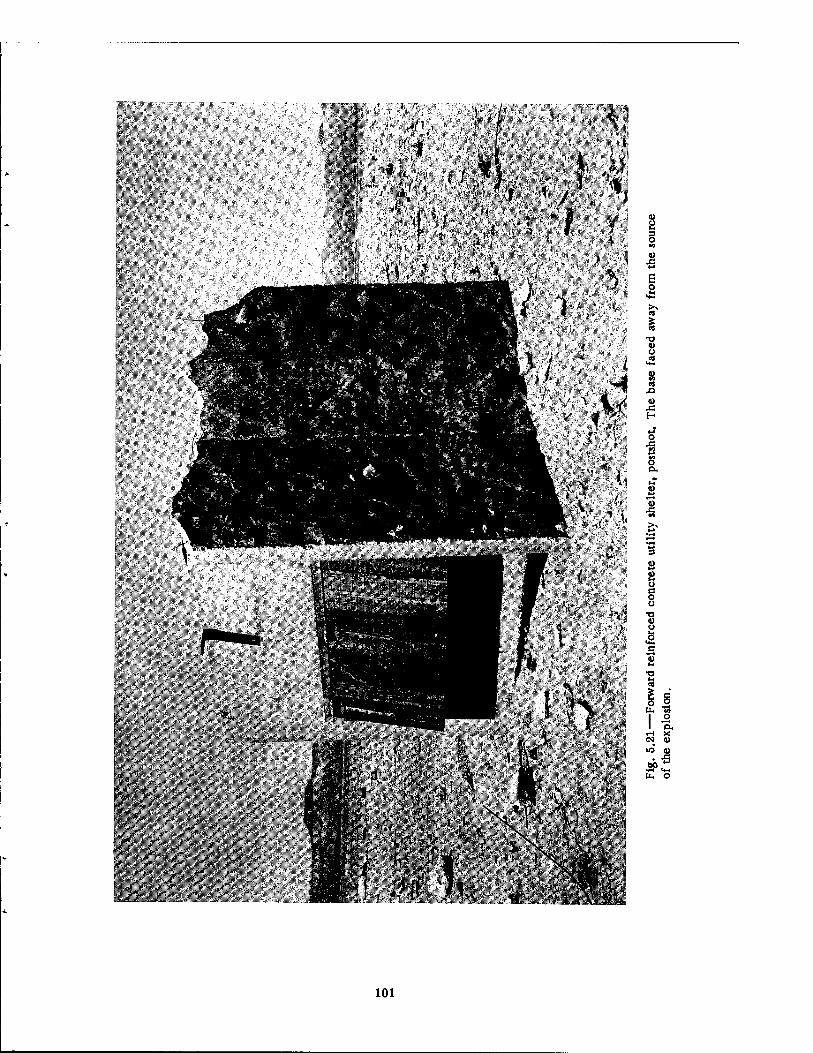
fy ¥: ■:& V.
■1 'm^.:% mm
A •r
*>» v; >/;,,• vl' v:
l*W
» * ■ ■ . . ^1 ■ ..^i*_vsÄii
9) o M 3 O M
«
I O 01
O ja
o a.
s 8 <u o c o Ü
TJ a u & a
<U
•a t-i a
I -2 U- «A
I ° ■ a. T-l X <M a) US 4)
101
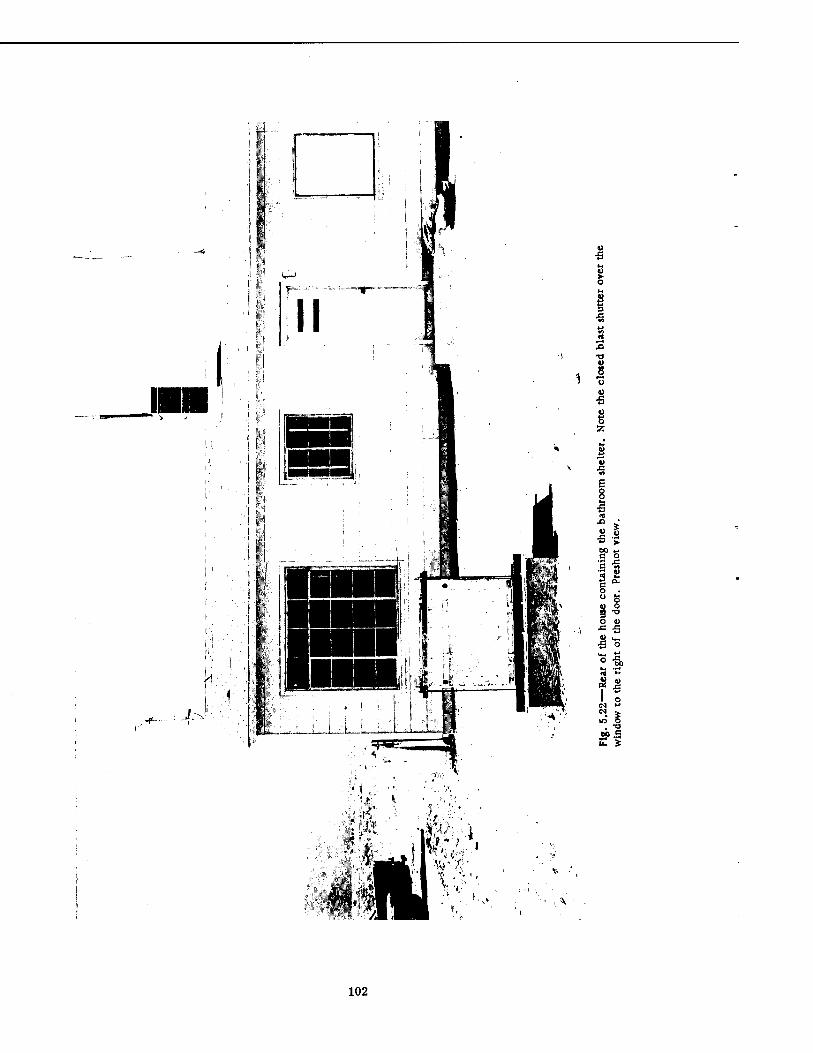
•s u >■ o
I i—<
T3 U 8
pa Ü u •5 u s z
<1 J3
00 u c o
o .
o u
■S o
° -a cd **
ä s
»I
102
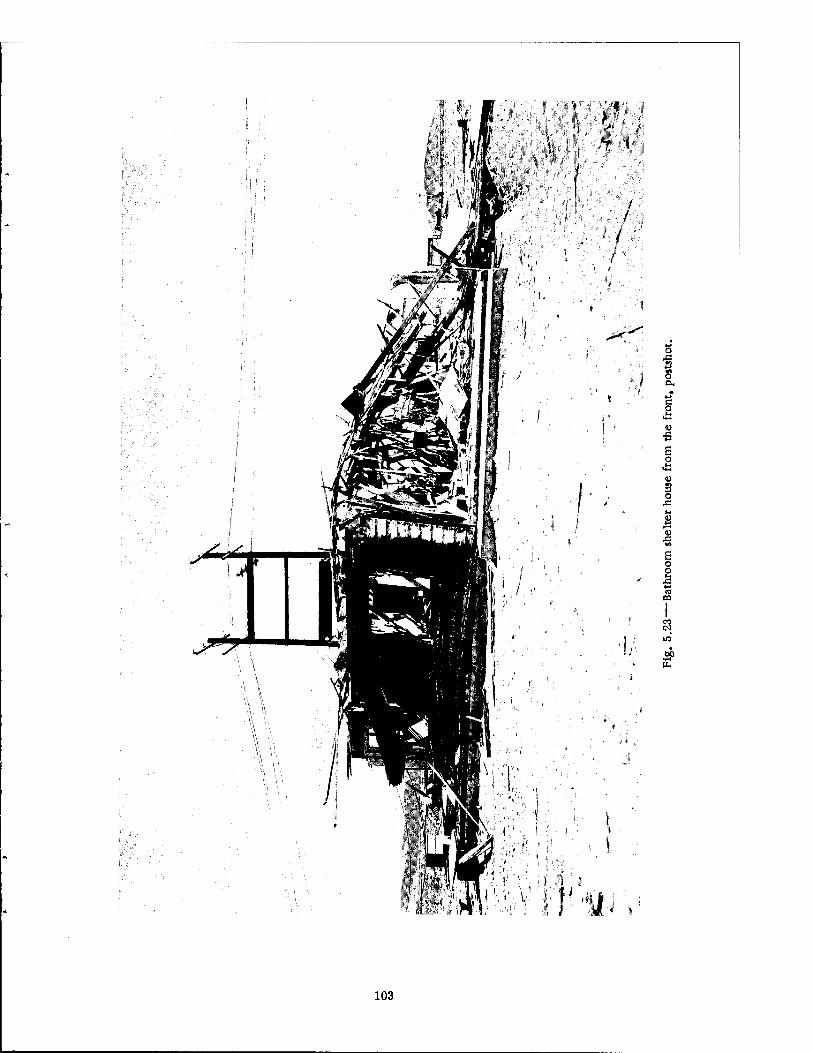
*-' b xi M
• - "i
o
• * 4-* a o
i * 1 ;
4)
E o
<a (U
3 o
t xs
x: M
G o o
V
J3 4-* «1 m
1 in
•i-4 V u.
H'-iii.
103
104
r-rrfv** •'■■'.';*«
Fig. 5.25—Postshot view of the blast shutter of the bathroom shelter.
105
C nl
-o <o #-» tu ü O
XI
43
3 o
43
o
43
I nl 9>
:\ o x:
(N
.2P
106
Fig. 5.27—Basement lean-to shelter house, postshot.
107
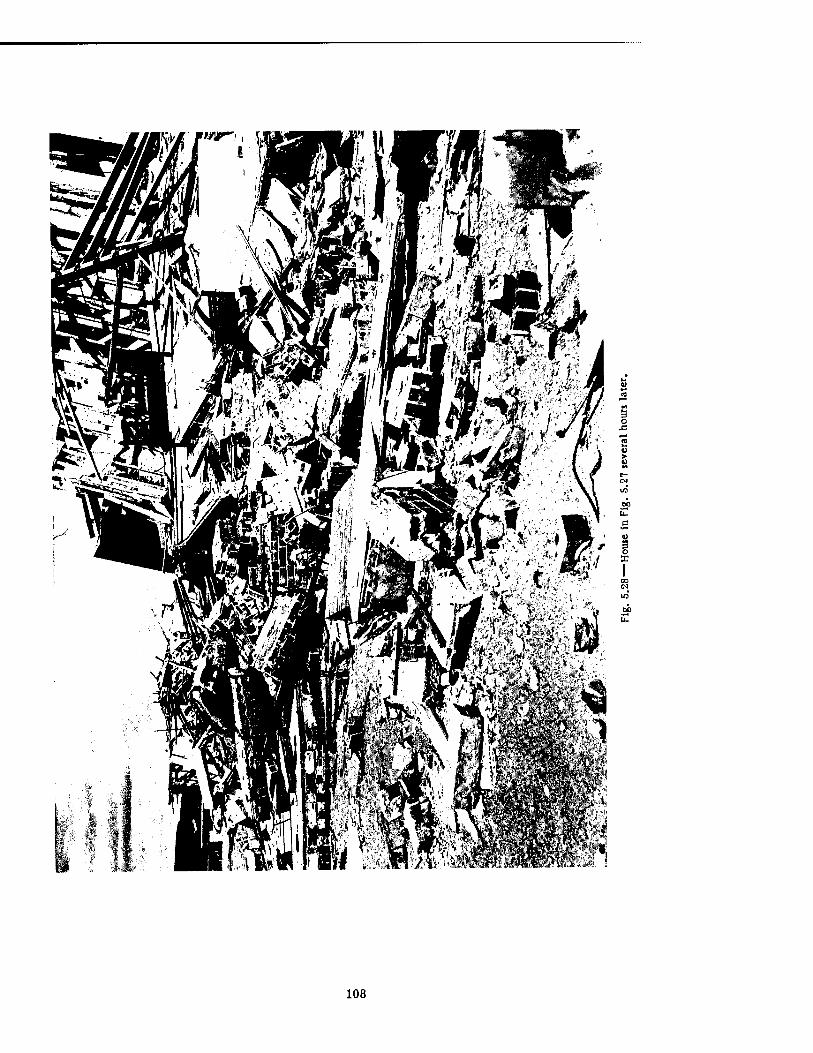
o
o X
10
60
108
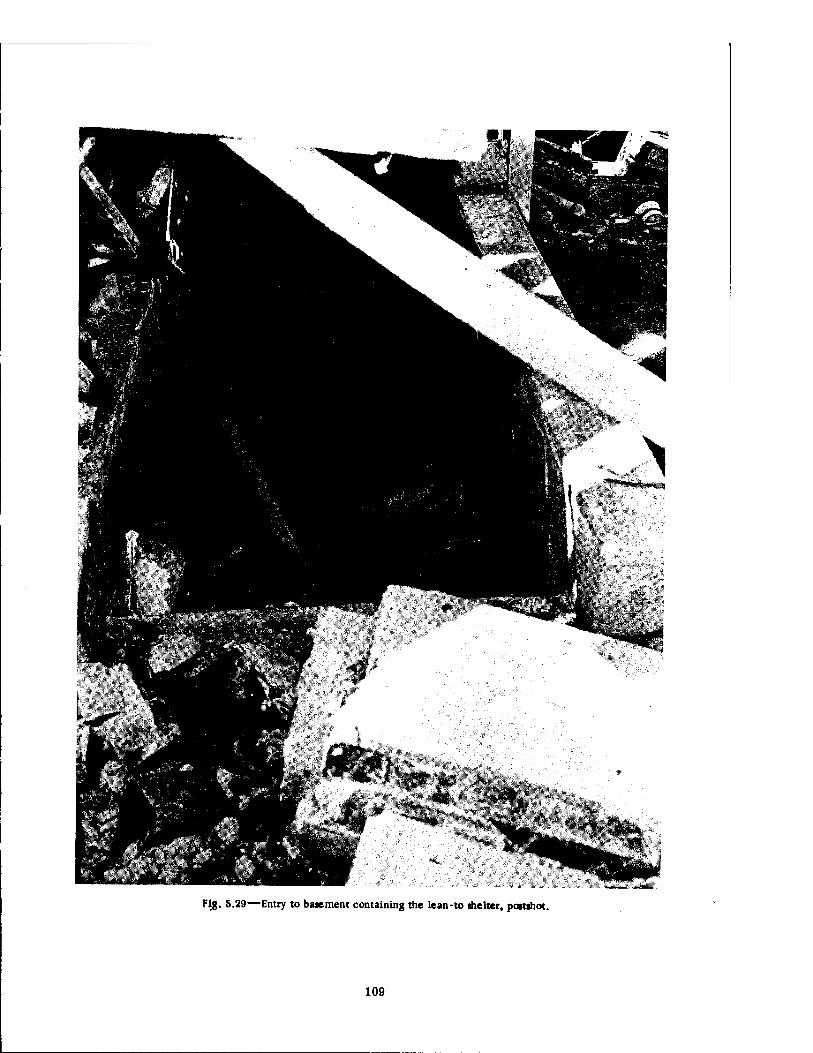
Fig. 5.29—Entry to basement containing the lean-to shelter, posuhot.
109
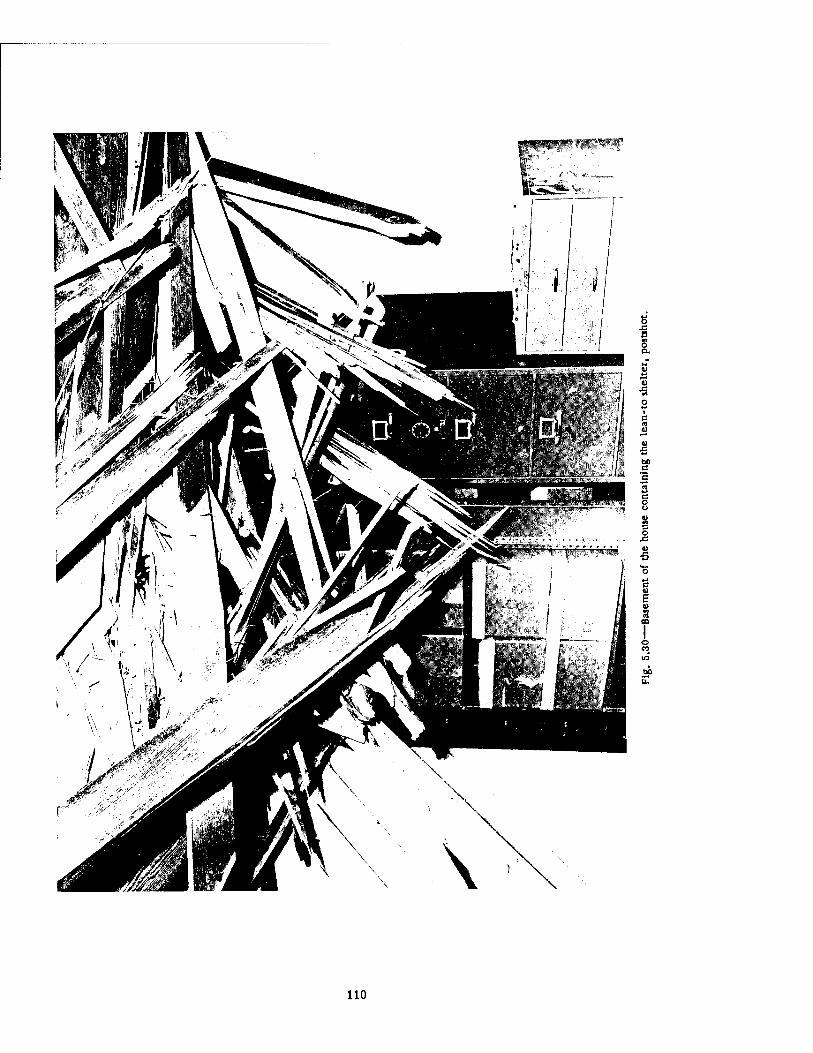
«w^g1
o 0 M o
.c
00 a
110
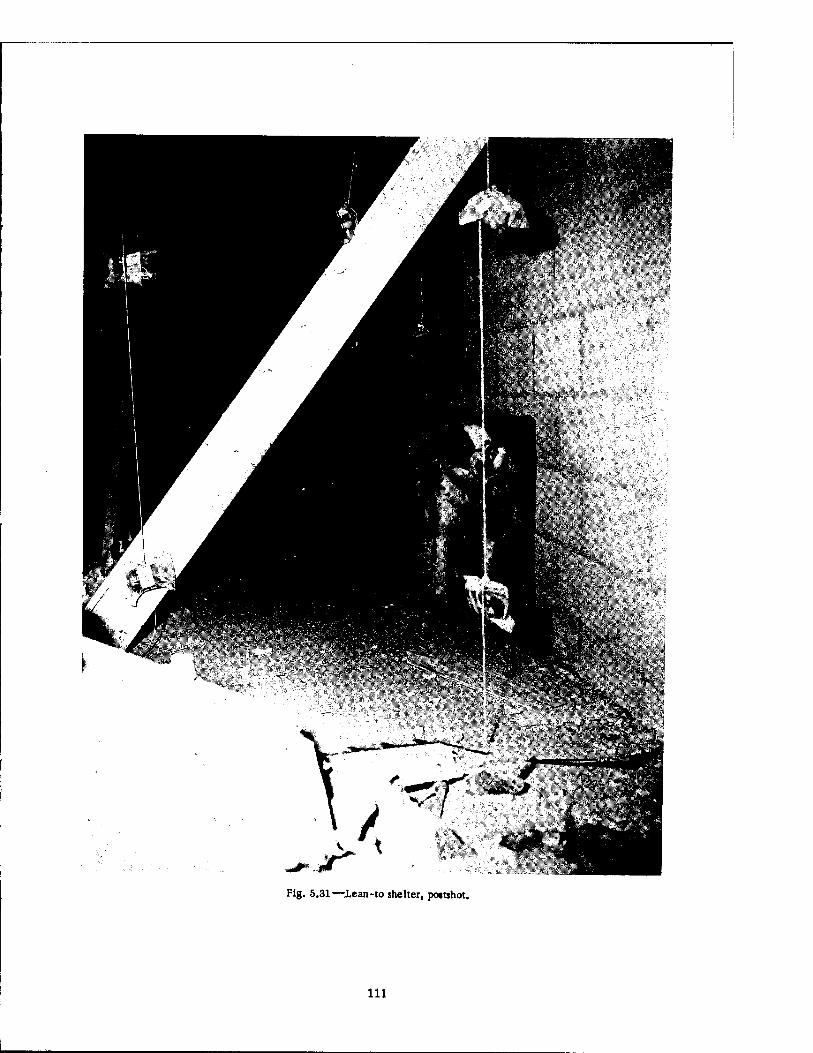
> i
,-'>A-^-':
\
Fig. 5.31—-.Lean-to shelter, pottshot.
Ill
toe&saa*
•7
■•*
JO
""£ To
"CJ
"O
"CD
"00
>-
ID
TO
To
~C\J
LE o
o x: «i
(U
•S M V
<3
V XI
tx 3 O & XI
c
e m o. E o o
u x: *-* E o
0)
a.
CD O
C3 CO
00
112
in o ■a
"<fr i.
ro 3
PfciWtöto
•x , - 4W^8*^-^ «*^*™T;'ir'
C\J
"O
"(X)
"K
lo
"V
"ro
LE
•s o, § M BO
V ■s
a i) E e « E o ü
I
XI
8- E
o
"CM I
BO
113
5.1.3 Animals
All animals were alive except two dogs, one guinea pig, and 18 mice. One of the dogs (Z-l) (see the preshot view in Fig. 5.34) presumably died almost instantly in the fast-fill chamber of the group shelter as a result of having been violently wrenched from the harness and restraining cables and hurled against the opposite wall near the ceiling. The impact was of sufficient magnitude to have left an imprint of the body on the wall. Note the upper portion of Fig. 5.35.
The second dog (U-22-B) was found dangling in its harness in the overturned utility shelter and had apparently strangled. A preliminary survey party had found the animal alive some- time prior to recovery.
Two other dogs in the fast-fill chamber of the group shelter were torn from their re- straints. One (Z-8-B), located just to the left of the entryway (see Fig. 5.6), was found alive beneath the bench (see Fig. 5.36), although the left femur was fractured. The second dog (Z- V2) was still tethered by cable but was lying down on the floor beside the bench. Preshot and postshot views are shown in Figs. 5.37 and 5.2 (note the animal lying on the floor), respectively. All the animals were quite dusty. In the group shelter and the basement exit shelters most of the animals were singed to varying degrees.
Some appreciation of the forces applied by the winds that existed inside the shelter can be gained from a study of Figs. 5.36 and 5.38, which show the postshot remains of some of the restraining harnesses. As shown in Figs. 5.38 to 5.41, failure was due to breakage and bend- ing of harness snaps, tearing of the harness, and, at least in the case of the Z-l harness shown in Figs. 5.38 and 5.39, thermal damage caused by the high-temperature air that entered the shelter during the filling phase.
Four of the small animals (two guinea pigs and two rats) in the group shelter escaped from their cylindrical wire cages, which were opened during the blast when the spring-held metal lids were displaced (see Figs. 5.7, 5.12, and 5.13). In the open basement exit shelter the small animals were in their cages except for two rats. The ground shock had apparently loosened the ceiling hangers, and the cages were found on top of the debris on the floor.
5.2 PATHOLOGY
5.2.1 Mortality
The immediate mortality rate among all animals was relatively low. Two dogs were dead: one, in the large group shelter, died as a result of violent displacement against a wall; the second dog died of strangulation in its harness in the overturned aboveground utility shelter. The companion animal in this same shelter was uninjured.
Seventeen of a total of 20 mice and one of four mice exposed in the slow- and fast-fill compartments, respectively, were dead upon recovery, as was one of 22 guinea pigs located in the slow-fill chamber of the shelter.
5.2.2 Displacement
The three dogs that were significantly displaced in the fast-fill chamber of the group shelter have already been mentioned. Of the small animals in the fast-fill chamber located beneath the benches, two rats and two guinea pigs had escaped when the metal lids of the cylindrical cages had blown off. These, however, were retrieved alive.
Displacement in the slow-fill chamber of the group shelter has already been described. This involved two dogs (Z-10-A and Z-10-B) as shown in Fig. 5.11, disturbance of table and ceiling animal cages (Figs. 5.11 to 5.13), and the escape of one rat and two guinea pigs which were retrieved alive.
In the basement exit shelters, in spite of the near disintegration of one, the dogs were all found in their original positions, although some of the restraints had failed.
There was no animal displacement in any of the other shelters except for those in the overturned forward utility shelter already mentioned, one of which died as a secondary result
of displacement. (Text continues on page 123.)
114
e a id
I u
9) J3
J2
n E e « j
o «
§ -S
U I-. L4 l-H
°o " u- o
115
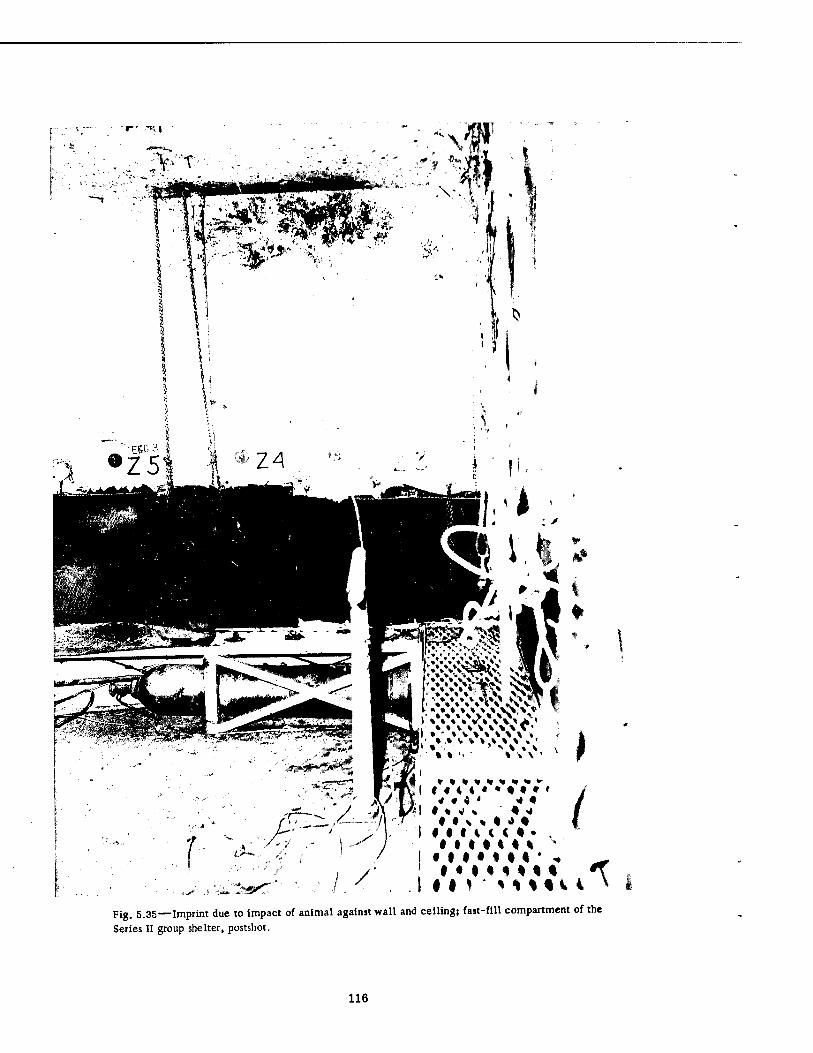
* » '. » *> % * \ •»%'.' % » V
I «♦*««•«•*< 1 0 i * 4 «
• » V s * % *
• • • • 4 * % - • t • « t « I * „ MMMM
111 MMi
/
Fig. 5.35—Imprint due to impact of animal against wall and ceiling; fast-fill compartment
Series II group shelter, postshot.
of the
116
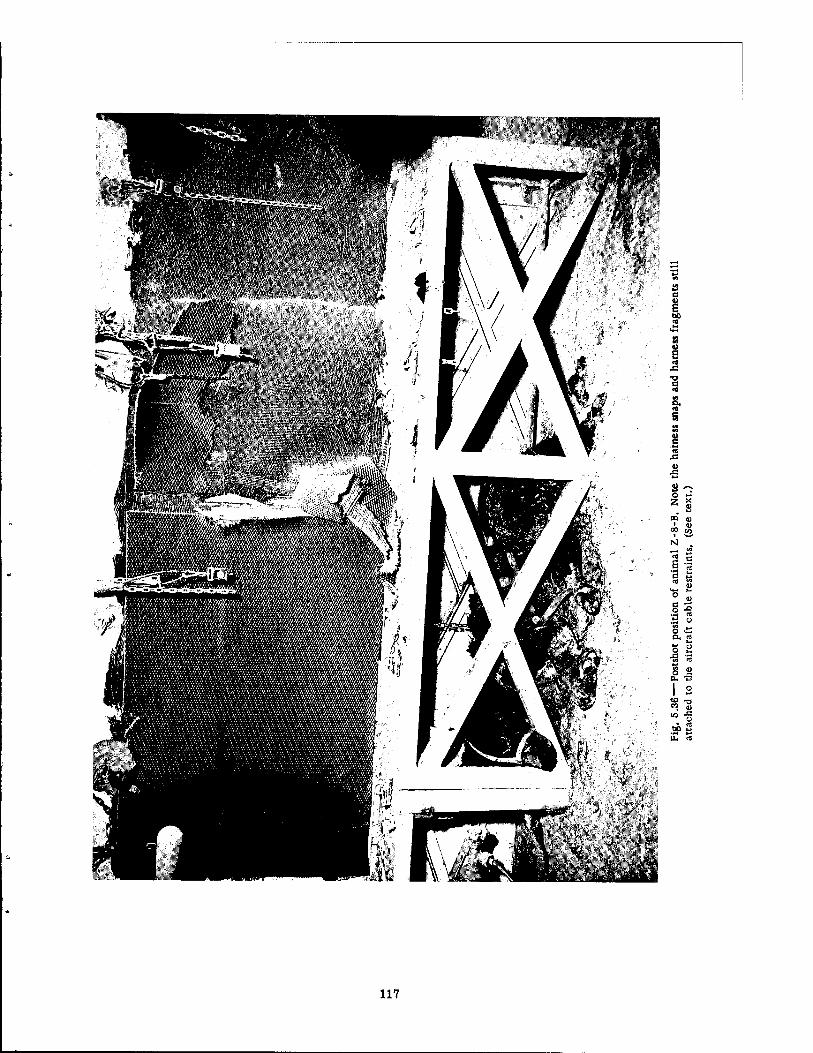
S3 a I oo
■o a
o Si
z s ■ *~"
00 o)
00 tO
1 -s a a « 3
4)
o 43
CO Q)
.SP s
117
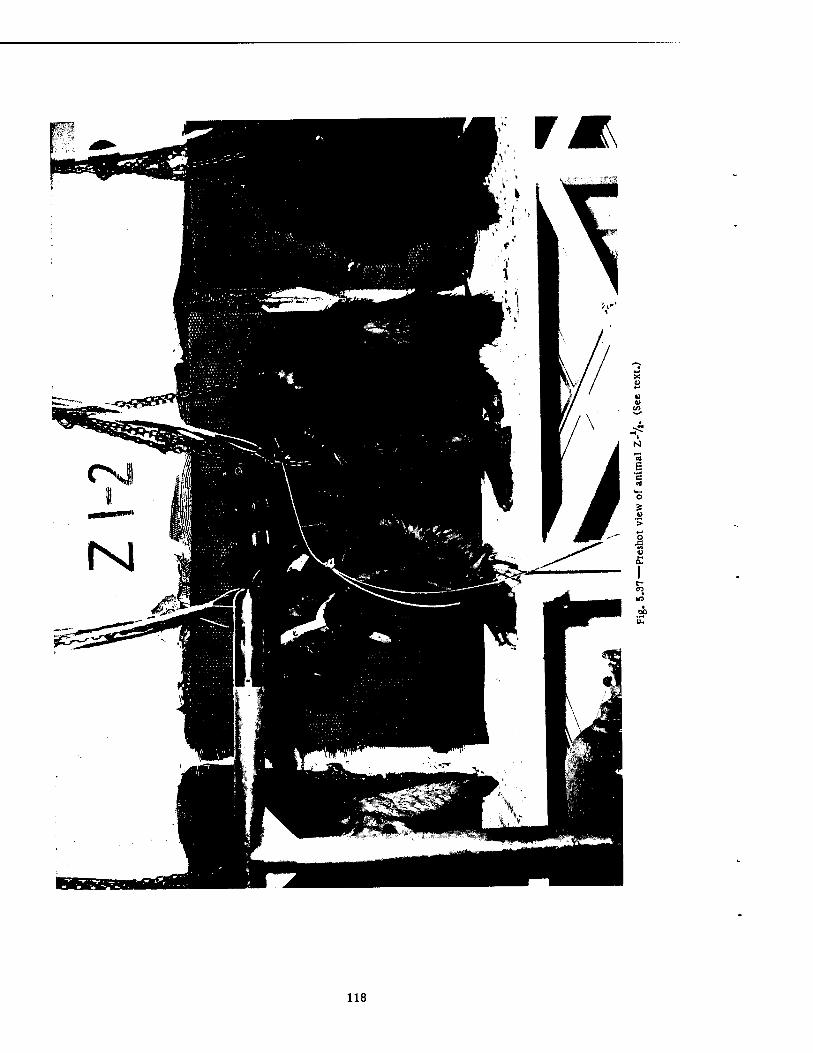
01
00
118
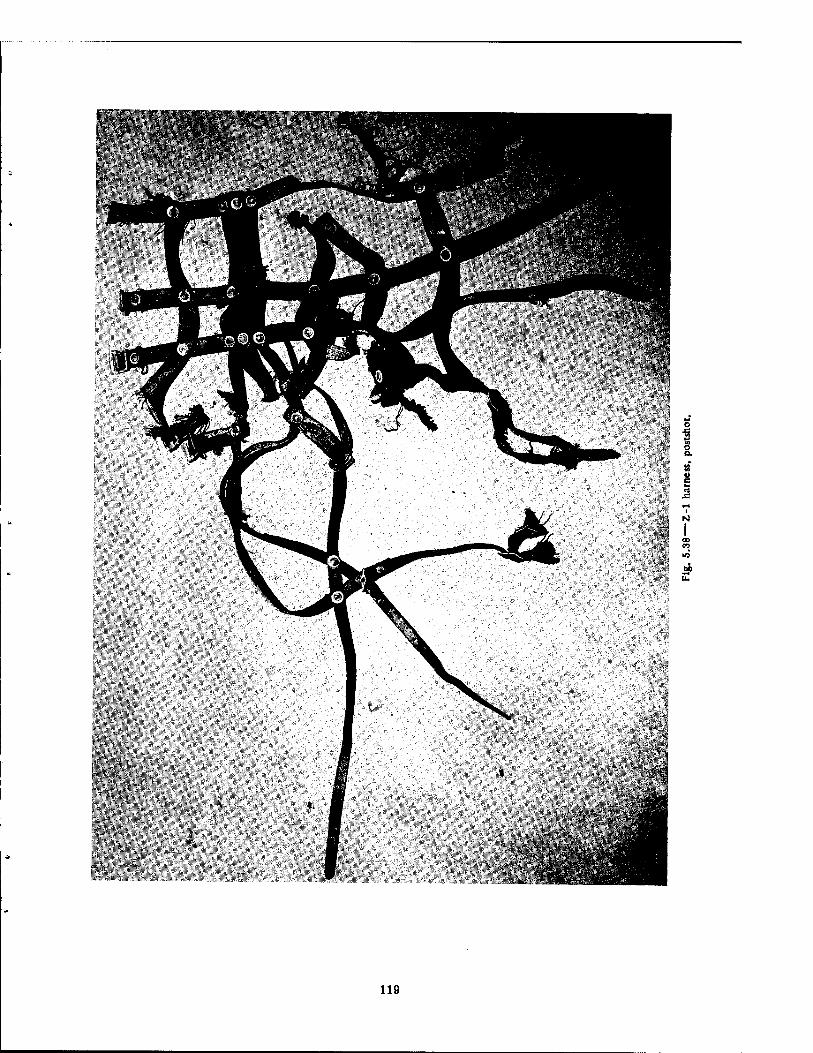
o ■a in O o. 8 8
N
CO
119
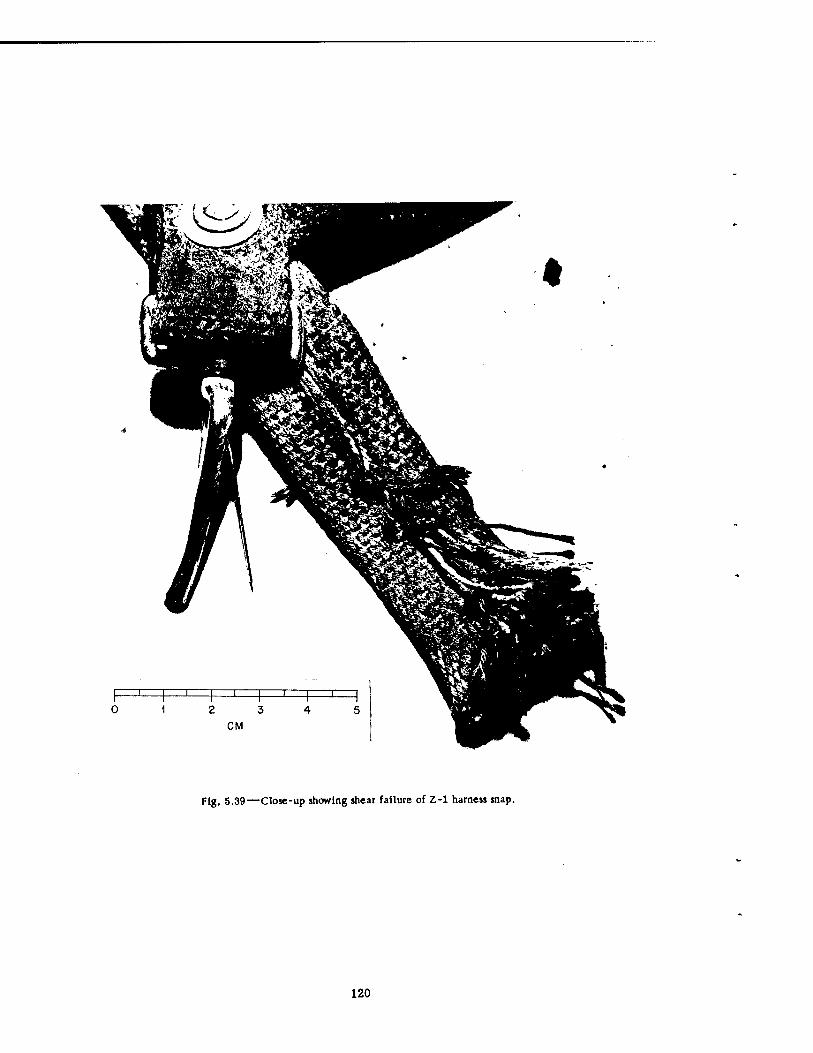
0 12 3 4 5 CM
Fig. 5.39—Close-up showing shear failure of Z-l harness snap.
120
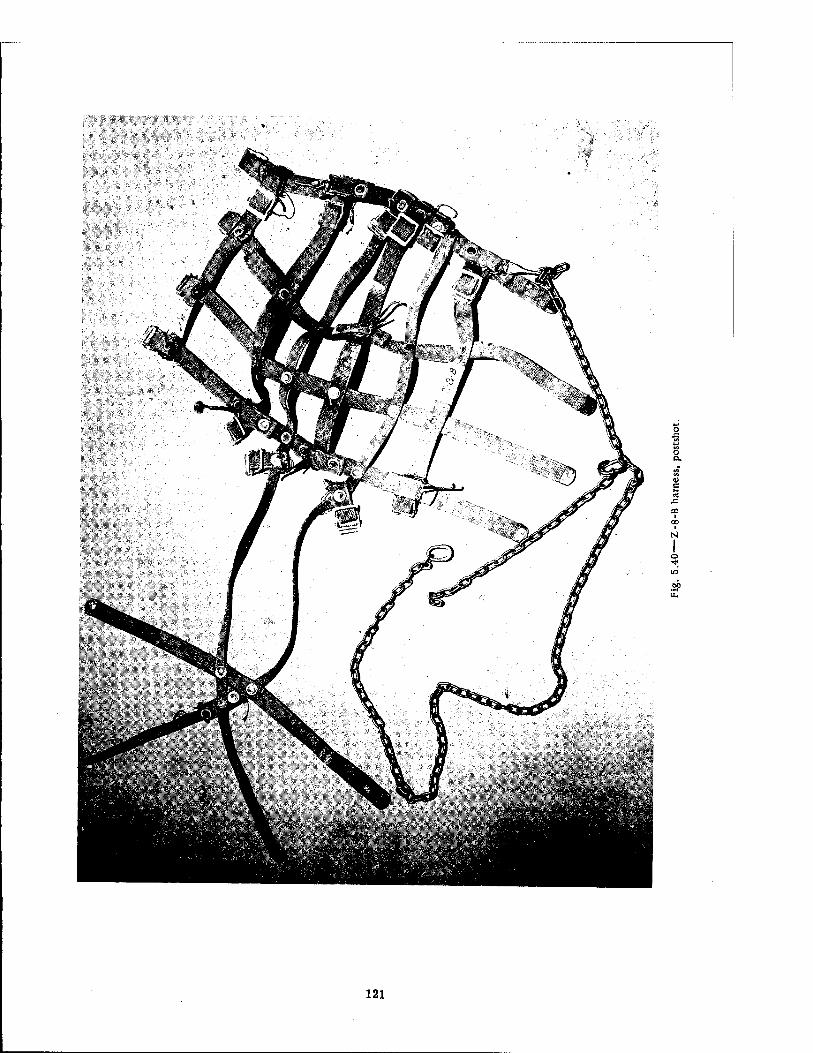
X!
03
Op
121
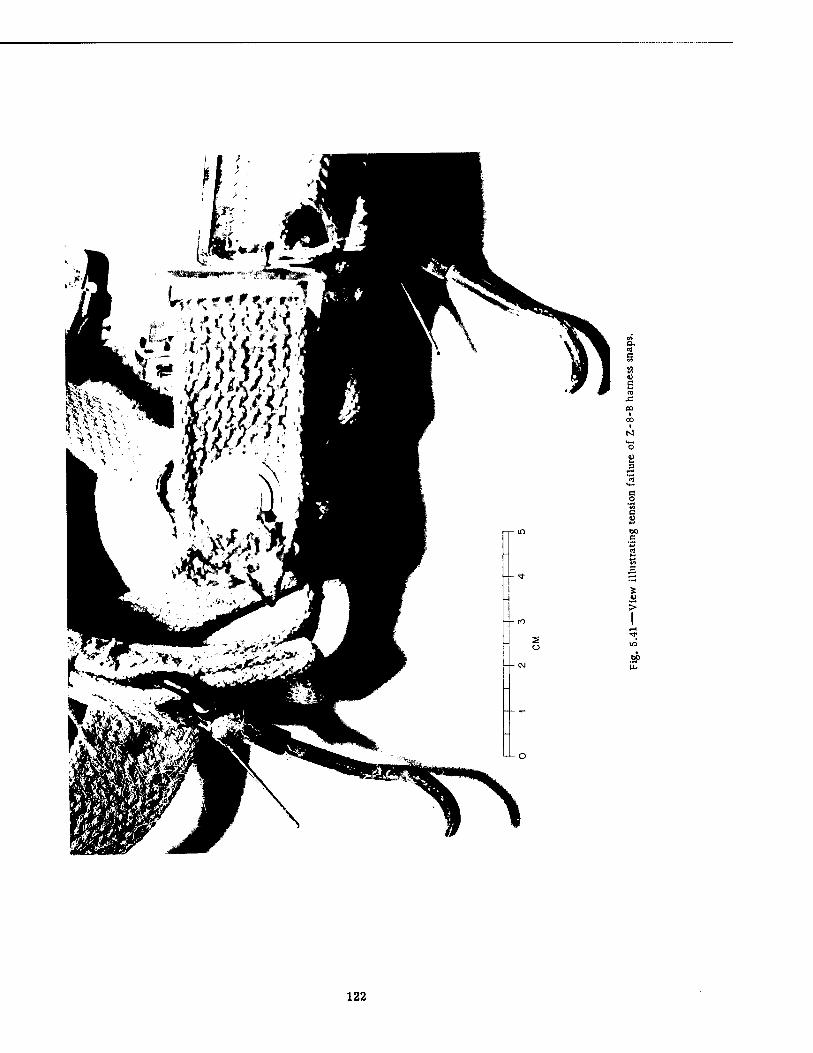
■a u e s
DO c
122
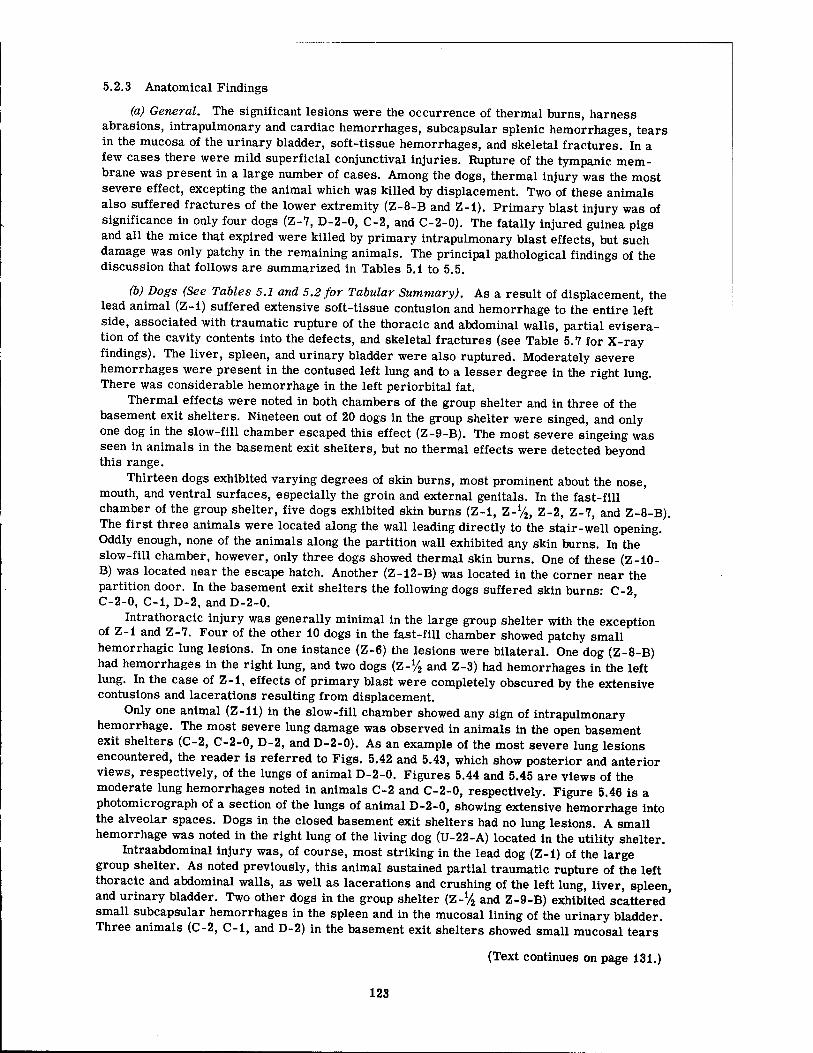
5.2.3 Anatomical Findings
(a) General. The significant lesions were the occurrence of thermal burns, harness abrasions, intrapulmonary and cardiac hemorrhages, subcapsular splenic hemorrhages, tears in the mucosa of the urinary bladder, soft-tissue hemorrhages, and skeletal fractures. In a few cases there were mild superficial conjunctival injuries. Rupture of the tympanic mem- brane was present in a large number of cases. Among the dogs, thermal injury was the most severe effect, excepting the animal which was killed by displacement. Two of these animals also suffered fractures of the lower extremity (Z-8-B and Z-i). Primary blast injury was of significance in only four dogs (Z-7, D-2-0, C-2, and C-2-0). The fatally injured guinea pigs and all the mice that expired were killed by primary intrapulmonary blast effects, but such damage was only patchy in the remaining animals. The principal pathological findings of the discussion that follows are summarized in Tables 5.1 to 5.5.
(b) Dogs (See Tables 5.1 and 5.2 for Tabular Summary). As a result of displacement, the lead animal (Z-l) suffered extensive soft-tissue contusion and hemorrhage to the entire left side, associated with traumatic rupture of the thoracic and abdominal walls, partial evisera- tion of the cavity contents into the defects, and skeletal fractures (see Table 5.7 for X-ray findings). The liver, spleen, and urinary bladder were also ruptured. Moderately severe hemorrhages were present in the contused left lung and to a lesser degree in the right lung. There was considerable hemorrhage in the left periorbital fat.
Thermal effects were noted in both chambers of the group shelter and in three of the basement exit shelters. Nineteen out of 20 dogs in the group shelter were singed, and only one dog in the slow-fill chamber escaped this effect (Z-9-B). The most severe singeing was seen in animals in the basement exit shelters, but no thermal effects were detected beyond this range.
Thirteen dogs exhibited varying degrees of skin burns, most prominent about the nose, mouth, and ventral surfaces, especially the groin and external genitals. In the fast-fill chamber of the group shelter, five dogs exhibited skin burns (Z-i, Z-% Z-2, Z-7, and Z-8-B). The first three animals were located along the wall leading directly to the stair-well opening. Oddly enough, none of the animals along the partition wall exhibited any skin burns. In the slow-fill chamber, however, only three dogs showed thermal skin burns. One of these (Z-iO- B) was located near the escape hatch. Another (Z-12-B) was located in the corner near the partition door. In the basement exit shelters the following dogs suffered skin burns: C-2 C-2-0, C-i, D-2, and D-2-0. '
Intrathoracic injury was generally minimal in the large group shelter with the exception of Z-i and Z-7. Four of the other 10 dogs in the fast-fill chamber showed patchy small hemorrhagic lung lesions. In one instance (Z-6) the lesions were bilateral. One dog (Z-8-B) had hemorrhages in the right lung, and two dogs (Z-V2 and Z-3) had hemorrhages in the left lung. In the case of Z-i, effects of primary blast were completely obscured by the extensive contusions and lacerations resulting from displacement.
Only one animal (Z-il) in the slow-fill chamber showed any sign of intrapulmonary hemorrhage. The most severe lung damage was observed in animals in the open basement exit shelters (C-2, C-2-0, D-2, and D-2-0). As an example of the most severe lung lesions encountered, the reader is referred to Figs. 5.42 and 5.43, which show posterior and anterior views, respectively, of the lungs of animal D-2-0. Figures 5.44 and 5.45 are views of the moderate lung hemorrhages noted in animals C-2 and C-2-0, respectively. Figure 5.46 is a photomicrograph of a section of the lungs of animal D-2-0, showing extensive hemorrhage into the alveolar spaces. Dogs in the closed basement exit shelters had no lung lesions. A small hemorrhage was noted in the right lung of the living dog (U-22-A) located in the utility shelter.
Intraabdominal injury was, of course, most striking in the lead dog (Z-l) of the large group shelter. As noted previously, this animal sustained partial traumatic rupture of the left thoracic and abdominal walls, as well as lacerations and crushing of the left lung, liver, spleen, and urinary bladder. Two other dogs in the group shelter (Z-% and Z-9-B) exhibited scattered' small subcapsular hemorrhages in the spleen and in the mucosal lining of the urinary bladder. Three animals (C-2, C-i, and D-2) in the basement exit shelters showed small mucosal tears
(Text continues on page 131.)
123
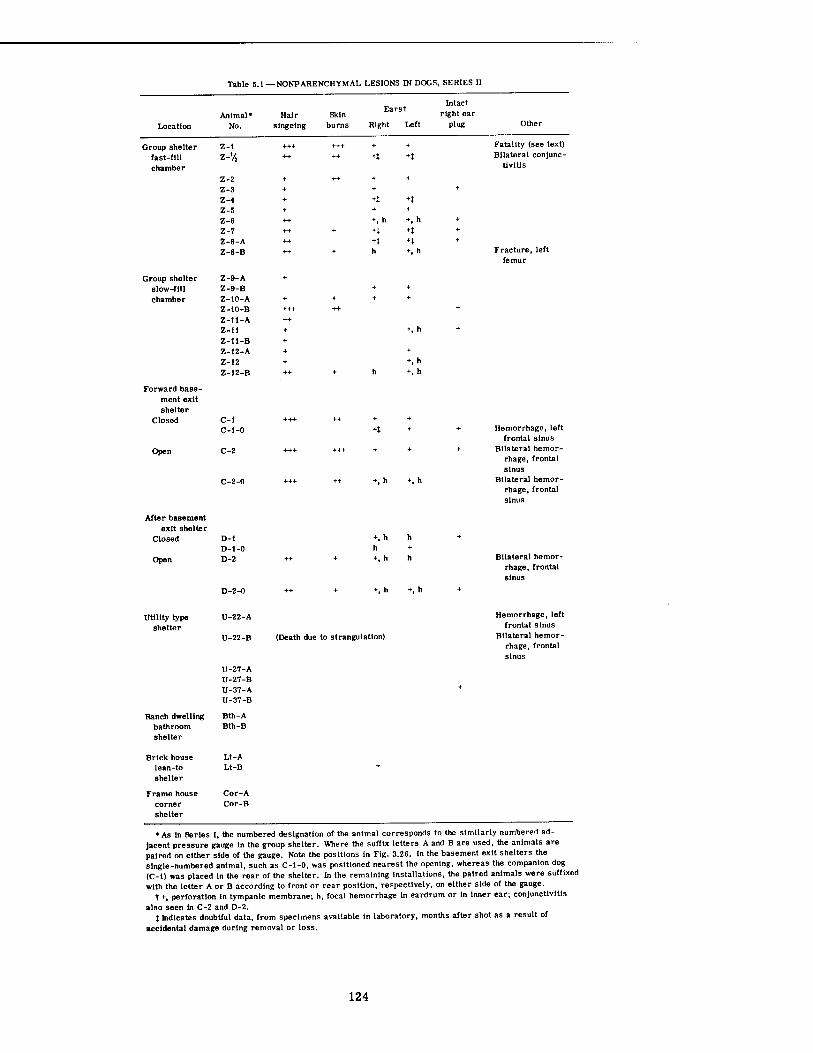
Table 5.1— NONPARENCHYMAL LESIONS IN DOGS, SERIES II
Location
Group shelter slow-fill chamber
Forward base- ment exit shelter
Closed
Open
After basement exit shelter
Closed
Open
Animal* No.
Group shelter fast-fill chamber
Z-l Z-V:
Z-2 Z-3 Z-4 Z-5 Z-6 Z-7 Z-8-A Z-8-B
Z-9-A Z-9-B Z-10-A Z-10-B Z-ll-A Z-il Z-ll-B Z-12-A Z-12 Z-12-B
C-l C-1-0
C-2
C-2-0
D-l D-1-0 D-2
Hair Skin singeing burns Right Left
Intact right ear
plug
+t +J
+t
+. h
*. h h +■ h
n +, h +, h H +1 *t +t h +, h
Other
Fatality (see text) Bilateral conjunc-
tivitis
Fracture, left femur
Hemorrhage, left frontal sinus
Bilateral hemor- rhage, frontal sinus
Bilateral hemor- rhage, frontal sinus
Bilateral hemor- rhage, frontal sinus
Utility type shelter
U-22-A
U-22-B
U-27-A U-27-B U-37-A U-37-B
Ranch dwelling Bth-A bathroom Bth-B shelter
Brick house Lt-A lean-to Lt-B shelter
Frame house Cor-A corner Cor-B shelter
(Death due to strangulation)
Hemorrhage, left frontal sinus
Bilateral hemor- rhage, frontal sinus
•As in Series I, the numbered designation of the animal corresponds to the similarly numbered ad- jacent pressure gauge in the group shelter. Where the suffix letters A and B are used, the animals are paired on either side of the gauge. Note the positions In Fig. 3.26. In the basement exit shelters the single-numbered animal, such as C-1-0, was positioned nearest the opening, whereas the companion dog (C-l) was placed in the rear of the shelter. In the remaining installations, the paired animals were suffixed with the letter A or B according to front or rear position, respectively, on either side of the gauge.
t +, perforation in tympanic membrane; h, focal hemorrhage In eardrum or In Inner ear; conjunctivitis
also seen In C-2 and D-2. } Indicates doubtful data, from specimens available in laboratory, months after shot as a result of
accidental damage during removal or loss.
124
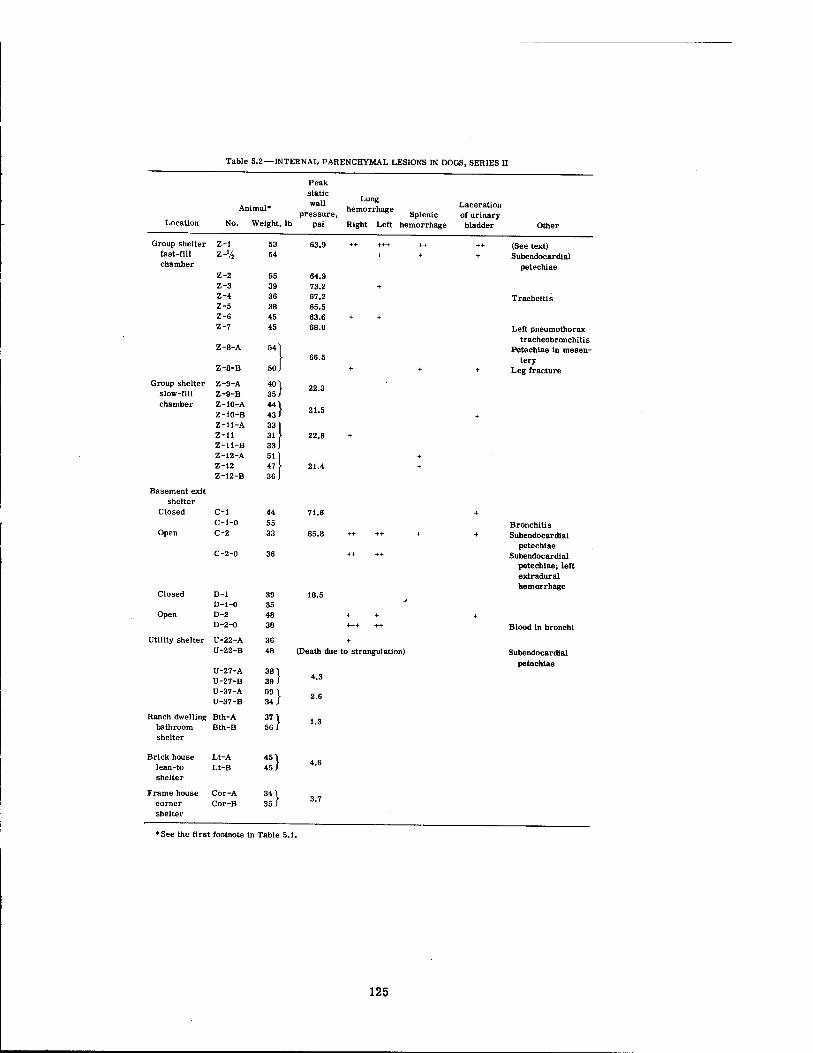
Table 5.2—INTERNAL PARENCHYMAL LESIONS DJ DOGS, SERIES I
Peak
Animal* wall Lung
Laceration pressure, Splenic of urinary
Location No. Weight, lb psi Right Left hemorrhage bladder Other
Group shelter Z-l 53 63.9 ++ +++ ++ ++ (See text) fast-fill z-»/2 54 + + + Subendocardial chamber
Z-2 Z-3 Z-4 Z-5
55 39 36 38
64.9 73.2 67.2 65.5
+
petechiae
Tracheitis
Z-6 45 63.6 + +
Z-7 45 68.0 Left Pneumothorax tracheobronchiti s
Z-8-A 54] 66.5
Petechiae in mesen- tery
Z-8-B 50 J + + + Leg fracture
Group shelter slow-fill chamber
Z-9-A Z-9-B Z-10-A Z-10-B Z-ll-A Z-ll Z-ii-B Z-12-A Z-12 Z-12-B
Basement exit shelter
Closed
Open
C-l C-1-0 C-2
C-2-0
401 35/ 441 43 J 331 31 33 51 47 36
44 55 33
22.3
21.5
22.8
71.6
85.8
Closed D-i 39 D-1-0 35
Open D-2 48 D-2-0 38
Utility shelter U-22-A 36 U-22-B 48
U-27-A 381 39/ U-27-B
U-37-A 59 1 34 J U-37-B
Ranch dwelling Bth-A 37 1 56/ bathroom Bth-B
shelter
Brick house Lt-A 451 45/ lean-to Lt-B
shelter
Frame house Cor-A 341 35/ corner Cor-B
shelter
(Death due to strangulation)
4.3
2.6
Bronchitis Subendocardial
petechiae Subendocardial
petechiae; left extradural hemorrhage
Blood in bronchi
Subendocardial petechiae
♦See the first footnote in Table 5.1.
125
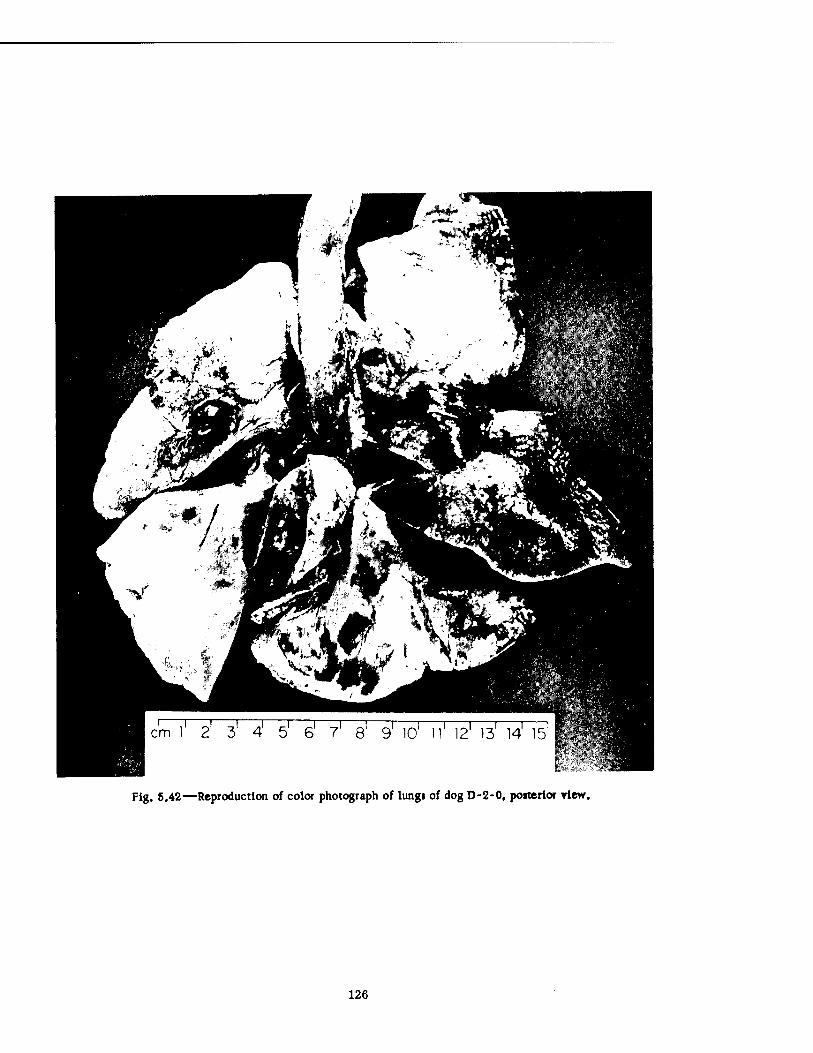
Fig. 5.42—Reproduction of color photograph of lung« of dog D-2-0, posterior view.
126
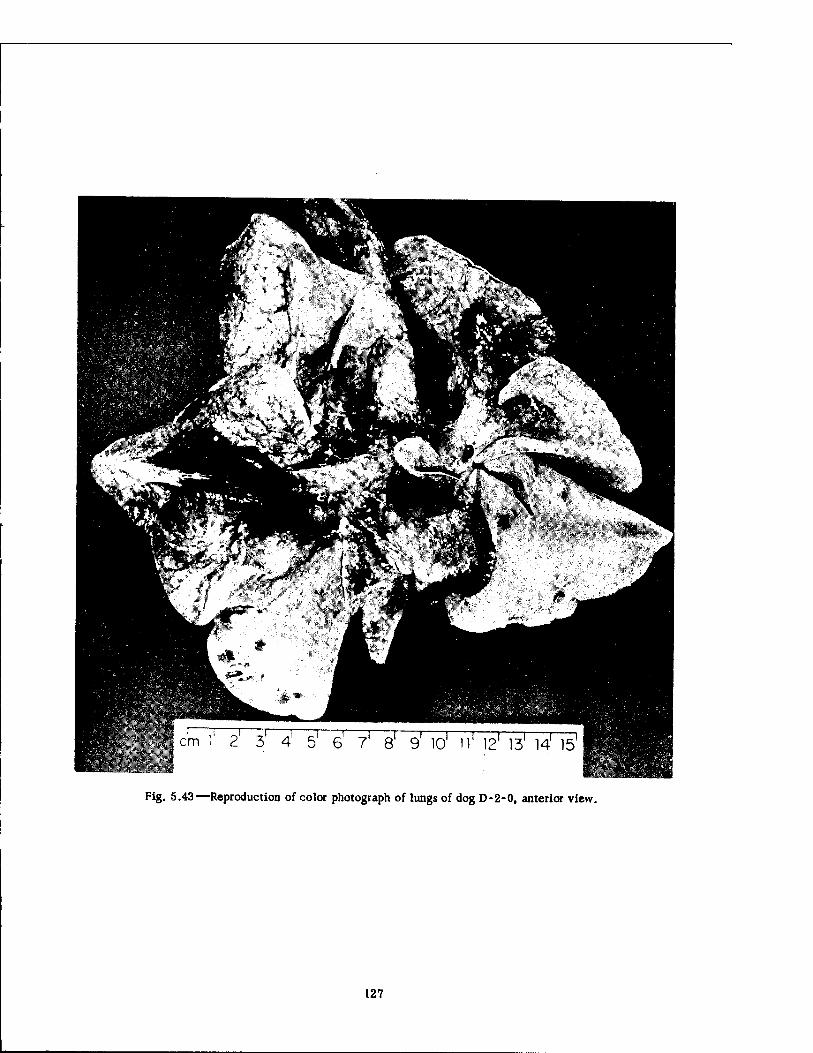
Fig. 5.43—Reproduction of color photograph of lungs of dog D-2-0, anterior view.
127
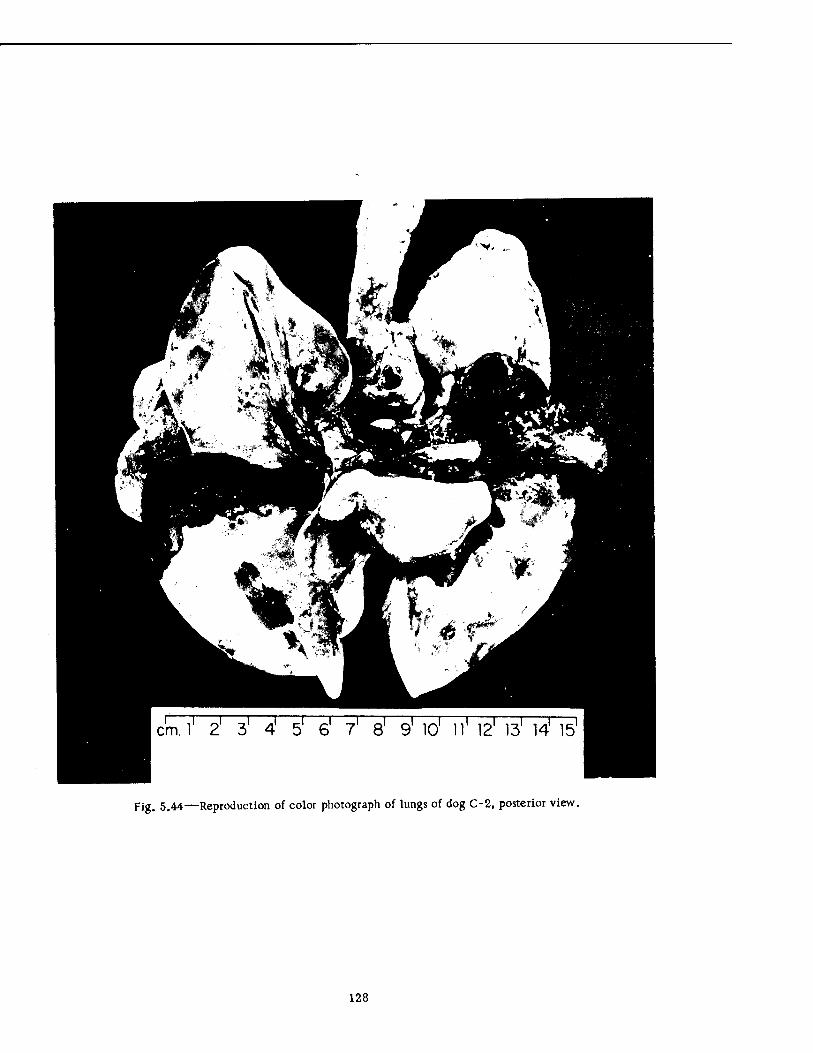
Fig. 5.44—Reproduction of color photograph of lungs of dog C-2, posterior view.
128
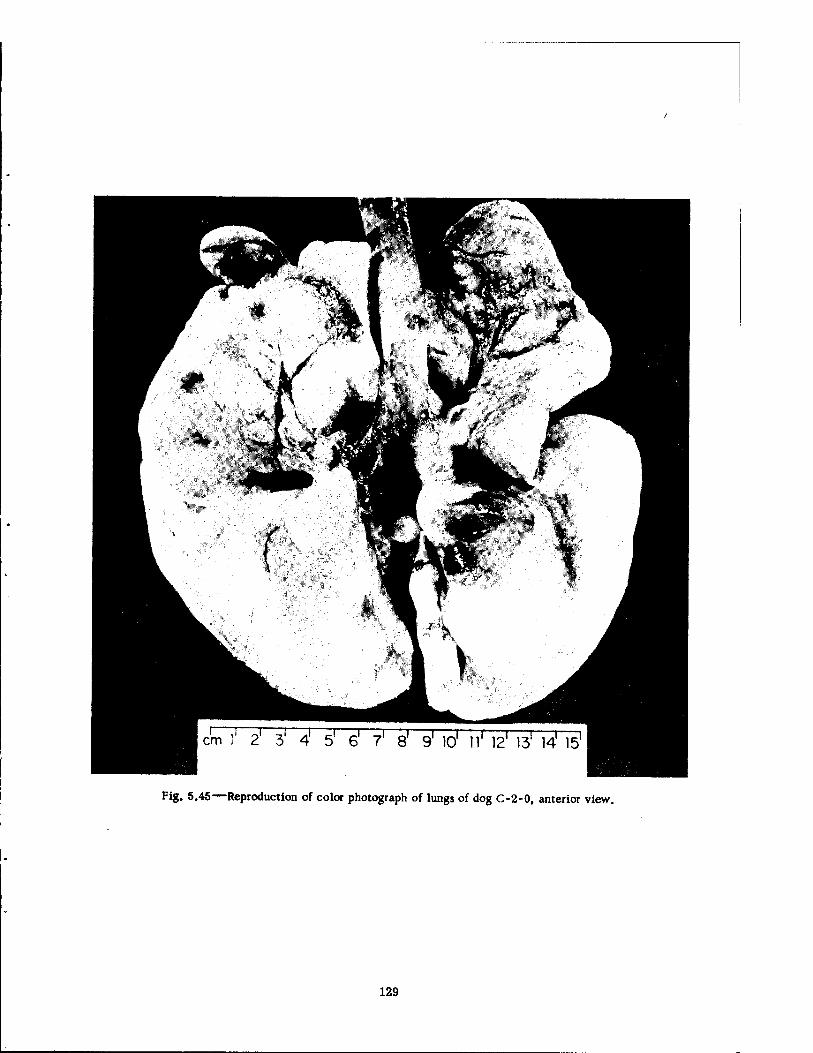
Fig. 5.45—Reproduction of color photograph of lungs of dog C-2-0, anterior view.
129
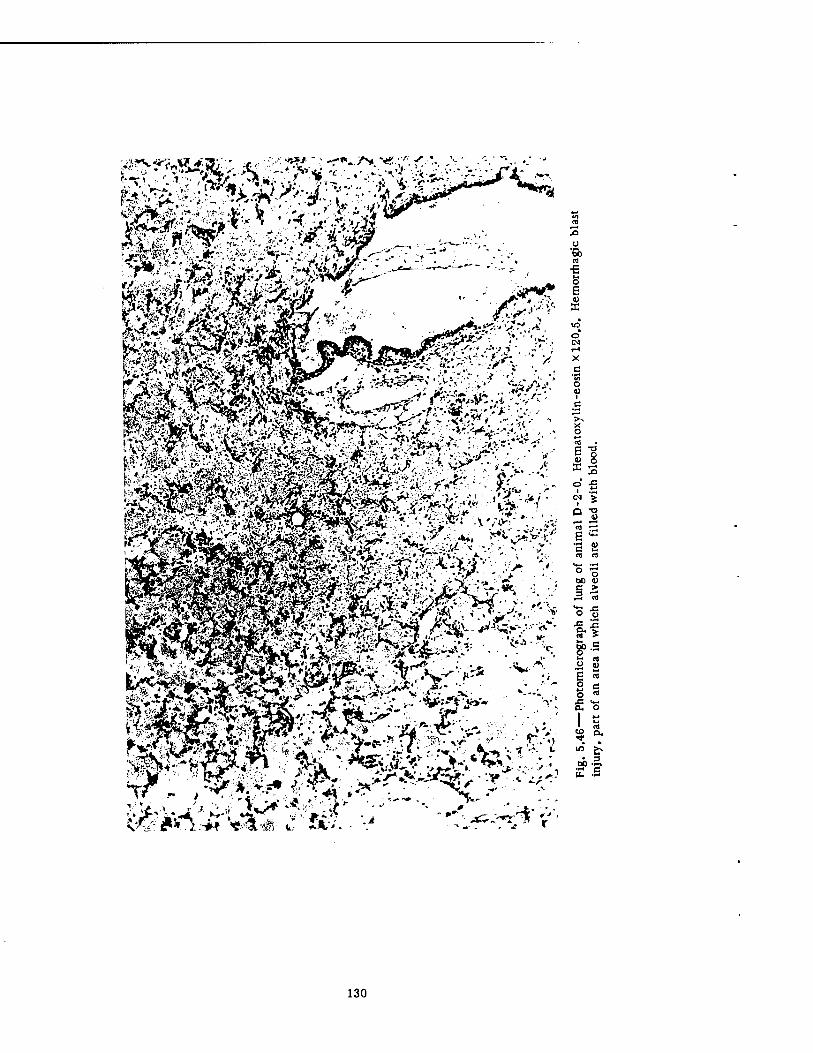
130
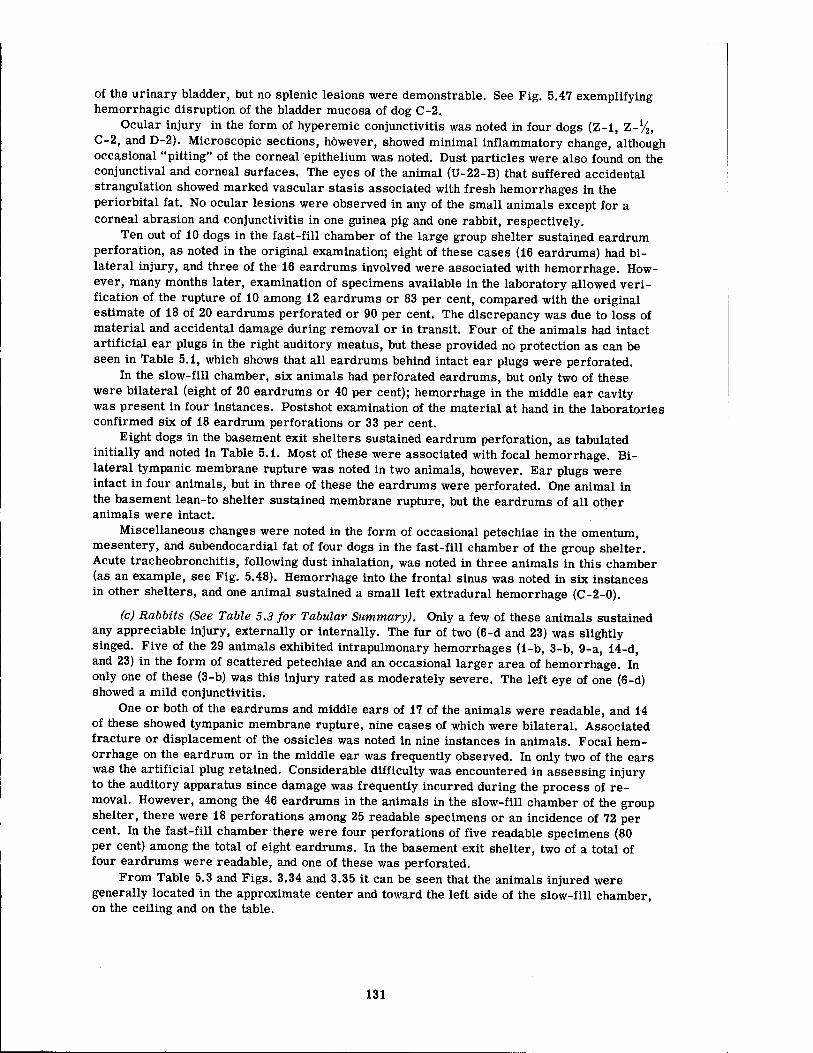
of the urinary bladder, but no splenic lesions were demonstrable. See Fig. 5.47 exemplifying hemorrhagic disruption of the bladder mucosa of dog C-2.
Ocular injury in the form of hyperemic conjunctivitis was noted in four dogs (Z-l, Z-%, C-2, and D-2). Microscopic sections, however, showed minimal inflammatory change, although occasional "pitting" of the corneal epithelium was noted. Dust particles were also found on the conjunctival and corneal surfaces. The eyes of the animal (U-22-B) that suffered accidental strangulation showed marked vascular stasis associated with fresh hemorrhages in the periorbital fat. No ocular lesions were observed in any of the small animals except for a corneal abrasion and conjunctivitis in one guinea pig and one rabbit, respectively.
Ten out of 10 dogs in the fast-fill chamber of the large group shelter sustained eardrum perforation, as noted in the original examination; eight of these cases (16 eardrums) had bi- lateral injury, and three of the 16 eardrums involved were associated with hemorrhage. How- ever, many months later, examination of specimens available in the laboratory allowed veri- fication of the rupture of 10 among 12 eardrums or 83 per cent, compared with the original estimate of 18 of 20 eardrums perforated or 90 per cent. The discrepancy was due to loss of material and accidental damage during removal or in transit. Four of the animals had intact artificial ear plugs in the right auditory meatus, but these provided no protection as can be seen in Table 5.1, which shows that all eardrums behind intact ear plugs were perforated.
In the slow-fill chamber, six animals had perforated eardrums, but only two of these were bilateral (eight of 20 eardrums or 40 per cent); hemorrhage in the middle ear cavity was present in four instances. Postshot examination of the material at hand in the laboratories confirmed six of 18 eardrum perforations or 33 per cent.
Eight dogs in the basement exit shelters sustained eardrum perforation, as tabulated initially and noted in Table 5.1. Most of these were associated with focal hemorrhage. Bi- lateral tympanic membrane rupture was noted in two animals, however. Ear plugs were intact in four animals, but in three of these the eardrums were perforated. One animal in the basement lean-to shelter sustained membrane rupture, but the eardrums of all other animals were intact.
Miscellaneous changes were noted in the form of occasional petechiae in the omentum, mesentery, and subendocardial fat of four dogs in the fast-fill chamber of the group shelter. Acute tracheobronchitis, following dust inhalation, was noted in three animals in this chamber (as an example, see Fig. 5.48). Hemorrhage into the frontal sinus was noted in six instances in other shelters, and one animal sustained a small left extradural hemorrhage (C-2-0).
(c) Rabbits (See Table 5.3 for Tabular Summary). Only a few of these animals sustained any appreciable injury, externally or internally. The fur of two (6-d and 23) was slightly singed. Five of the 29 animals exhibited intrapulmonary hemorrhages (1-b, 3-b, 9-a, 14-d, and 23) in the form of scattered petechiae and an occasional larger area of hemorrhage. In only one of these (3-b) was this injury rated as moderately severe. The left eye of one (6-d) showed a mild conjunctivitis.
One or both of the eardrums and middle ears of 17 of the animals were readable, and 14 of these showed tympanic membrane rupture, nine cases of which were bilateral. Associated fracture or displacement of the ossicles was noted in nine instances in animals. Focal hem- orrhage on the eardrum or in the middle ear was frequently observed. In only two of the ears was the artificial plug retained. Considerable difficulty was encountered in assessing injury to the auditory apparatus since damage was frequently incurred during the process of re- moval. However, among the 46 eardrums in the animals in the slow-fill chamber of the group shelter, there were 18 perforations among 25 readable specimens or an incidence of 72 per cent. In the fast-fill chamber there were four perforations of five readable specimens (80 per cent) among the total of eight eardrums. In the basement exit shelter, two of a total of four eardrums were readable, and one of these was perforated.
From Table 5.3 and Figs. 3.34 and 3.35 it can be seen that the animals injured were generally located in the approximate center and toward the left side of the slow-fill chamber, on the ceiling and on the table.
131
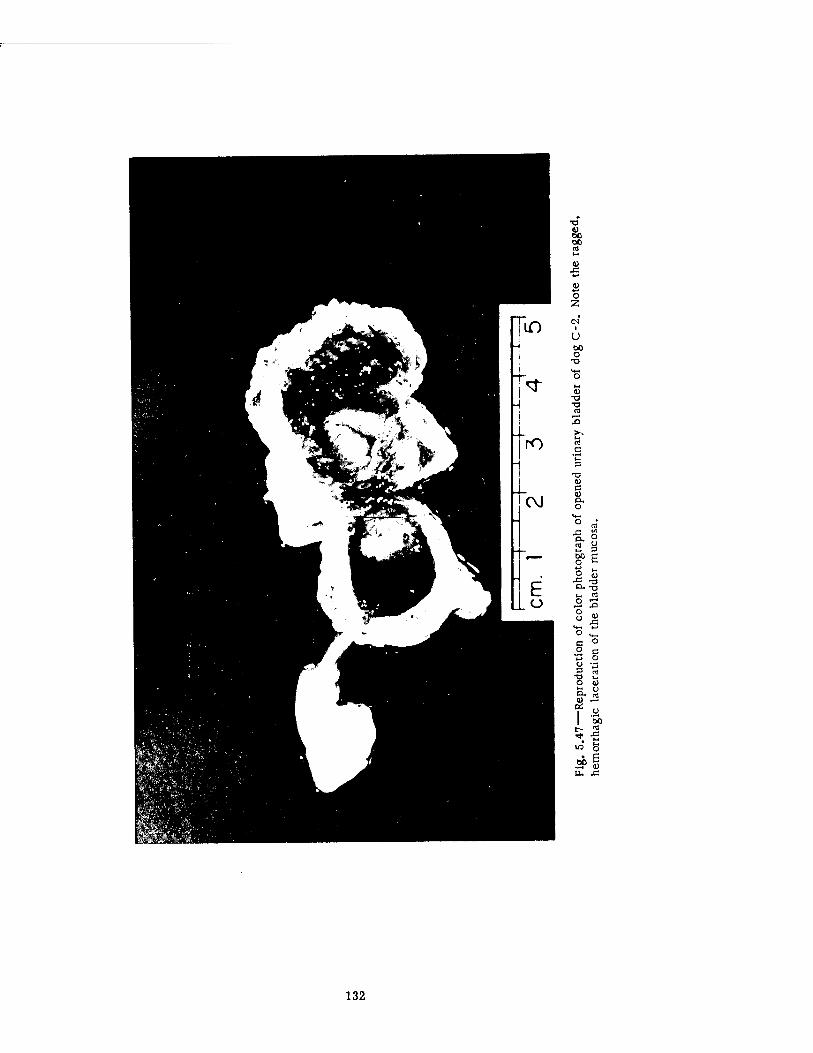
■o <u 00 00 ca 1-4
4> JZ
s o z
u oo o
•o
4)
-O
•a (U c <u a. o
UM
O « J= t/)
a. o rt u M 3 00 o E o
J3 b4
D. T3 i_, rt o »—»
.0 "o Ü
U-t 4-J
O 14—
c ■O o c
o o •a 3 rt
■o t-i
O <U 1-4
a) os O 1 1 'So c- to
"*. 1/3
l-i o op E
0) £ JC
132
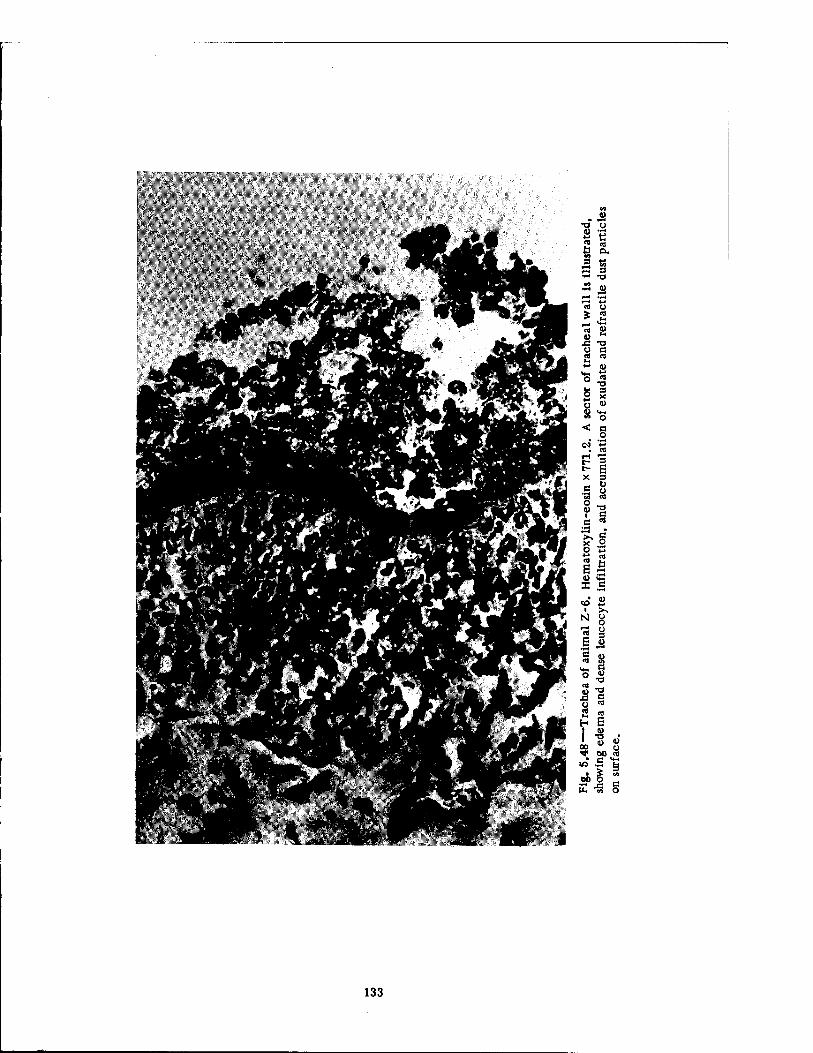
» I—i •o o
2 "
,= ,22 <—i -*H l—• *-» M O
I) M
J3 -a
at ■a 3 X
t-
X
a «
x .2
M CD a
1 s^ M o
2 3 E <3
<y a « _. ° £ 3 -a •"= s 0 « 2 2 H E
1 a) i» " ^ 00 01
• ß *** "5| 3 00 c o
133
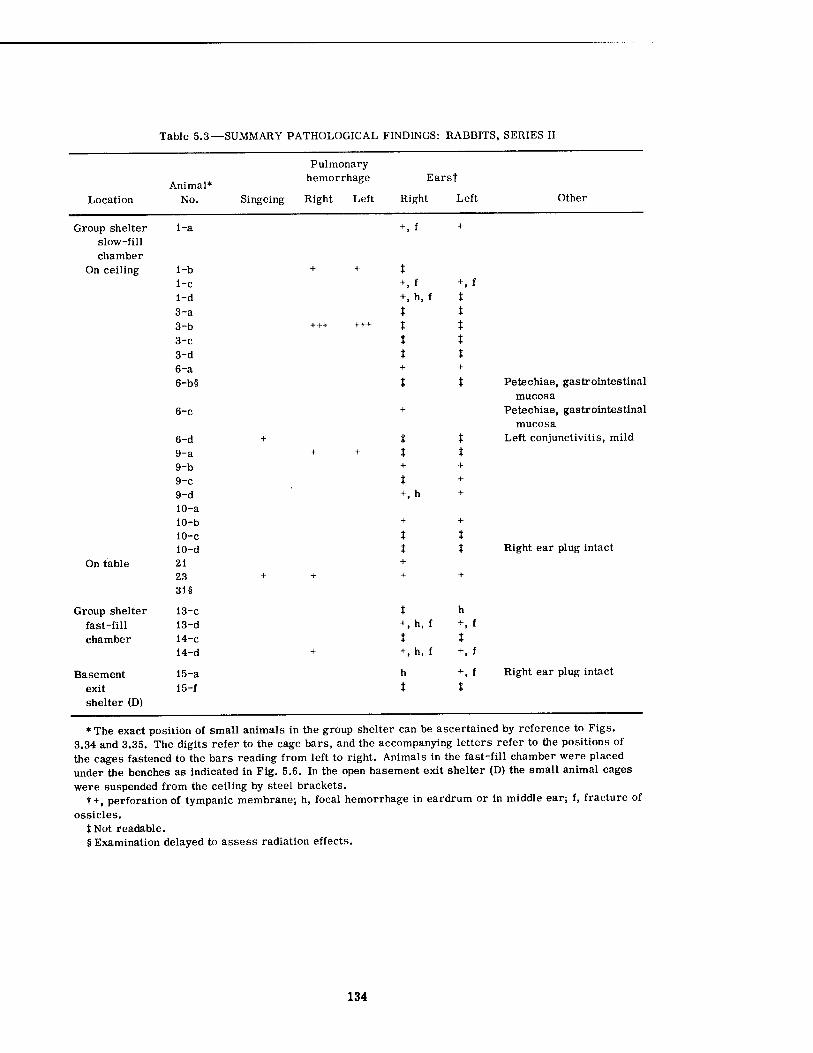
Table 5.3—SUMMARY PATHOLOGICAL FINDINGS: RABBITS, SERIES II
Location Animal*
No.
Pulmonary hemorrhage
Singeing Right Left
Earst
Right Left Other
Group shelter slow-fill chamber
On ceiling
1-a
1-b i-c i-d 3-a 3-b 3-c 3-d 6-a 6-b§
6-c
+ , f
6-d 9-a 9-b 9-c 9-d 10-a 10-b 10-c 10-d
On table 21 23 31§
Group shelter 13-c fast-fill 13-d chamber 14-c
14-d
Basement 15-a exit 15-f shelter (D)
t \t + , f +,h, f t t t t t t t t t + +
t t Petechiae, gastrointestinal mucosa
+ Petechiae, gastrointestinal mucosa
t t Left conjunctivitis, mild t t + +
t +
+, h +
+ +
t t t t + + +
t h
+ . h, f + ,t t t +, h, f + . f
h + , f t t
Right ear plug intact
Right ear plug intact
* The exact position of small animals in the group shelter can be ascertained by reference to Figs. 3.34 and 3.35. The digits refer to the cage bars, and the accompanying letters refer to the positions of the cages fastened to the bars reading from left to right. Animals in the fast-fill chamber were placed under the benches as indicated in Fig. 5.6. In the open basement exit shelter (D) the small animal cages were suspended from the ceiling by steel brackets.
t + , perforation of tympanic membrane; h, focal hemorrhage in eardrum or in middle ear; f, fracture of ossicles.
JNot readable. § Examination delayed to assess radiation effects.
134
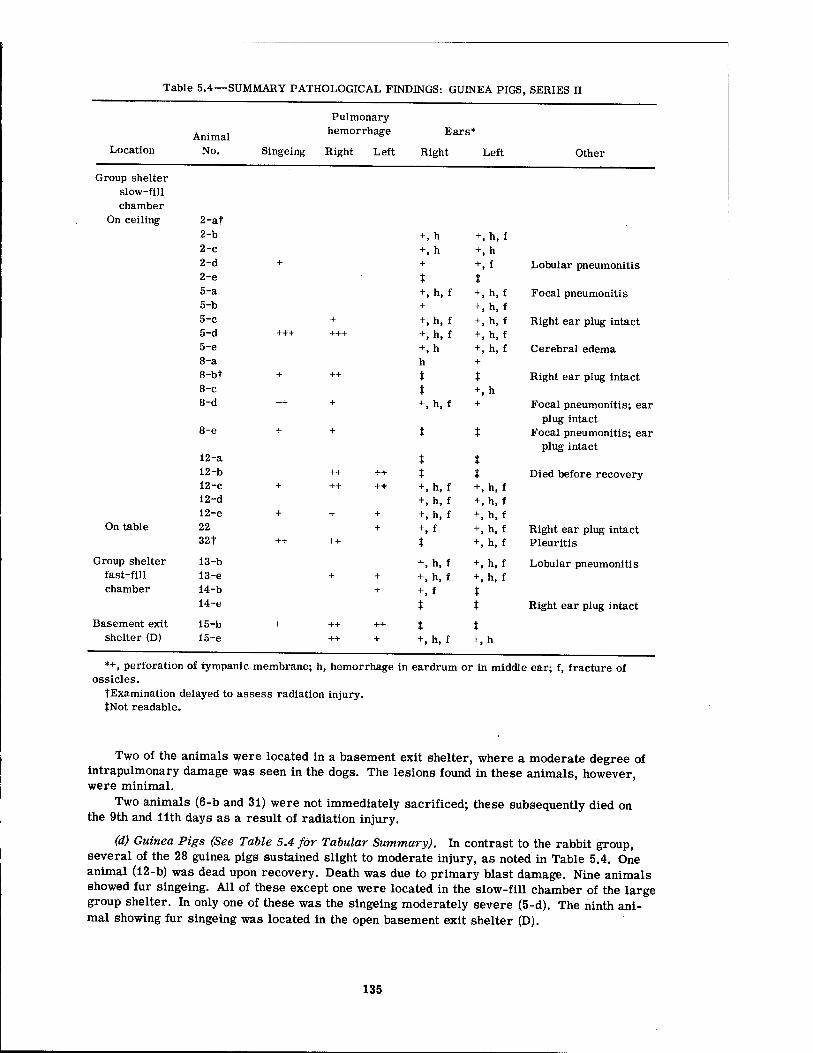
Table 5.4—SUMMARY PATHOLOGICAL FINDINGS: GUINEA PIGS, SERIES II
Location
Group shelter slow-fill chamber
On ceiling
Animal No.
Pulmonary hemorrhage
Singeing Right Left
Ears*
Right Left Other
2-at 2-b 2-c 2-d 2-e 5-a 5-b 5-c 5-d 5-e 8-a 8-bt 8-c 8-d
8-e
12-a 12-b 12-c 12-d 12-e
On table 22 32t
Group shelter 13-b fast-fill 13-e chamber 14-b
14-e
Basement exit 15-b shelter (D) 15-e
+, h +.h,f +, h +>h +
X +, f X
Lobular pneumonitis
+,h, f +
+,h,f + , h,f
Focal pneumonitis
+ +++
+,h, f +, h, f
+,h, f + ,h, f
Right ear plug intact
+, h +, h, f Cerebral edema h +
++ X X
t + . h
Right ear plug intact
+
+
+, h, f
t
X
+
*
X
Focal pneumonitis; ear plug intact
Focal pneumonitis; ear plug intact
++ ++
++ ++
X +, h, f +,h, f
X +, h, f +, h,f
Died before recovery
+ + +, h,f +,h,£
++ +
X +,h,£ +, h,f
Right ear plug intact Pleuritis
+ + +,h, f +, h, f
+ ,h, f + ,h,f
Lobular pneumonitis
+ +■ f X X X Right ear plug intact
++ ++ X X ++ + +,h,f +, h
*+, perforation of tympanic membrane; h, hemorrhage in eardrum or in middle ear; f, fracture of ossicles.
tExamination delayed to assess radiation injury. tNot readable.
Two of the animals were located in a basement exit shelter, where a moderate degree of intrapulmonary damage was seen in the dogs. The lesions found in these animals, however, were minimal.
Two animals (6-b and 31) were not immediately sacrificed; these subsequently died on the 9th and ilth days as a result of radiation injury.
(d) Guinea Pigs (See Table 5.4 for Tabular Summary). In contrast to the rabbit group, several of the 28 guinea pigs sustained slight to moderate injury, as noted in Table 5.4. One animal (12-b) was dead upon recovery. Death was due to primary blast damage. Nine animals showed fur singeing. All of these except one were located in the slow-fill chamber of the large group shelter. In only one of these was the singeing moderately severe (5-d). The ninth ani- mal showing fur singeing was located in the open basement exit shelter (D).
135
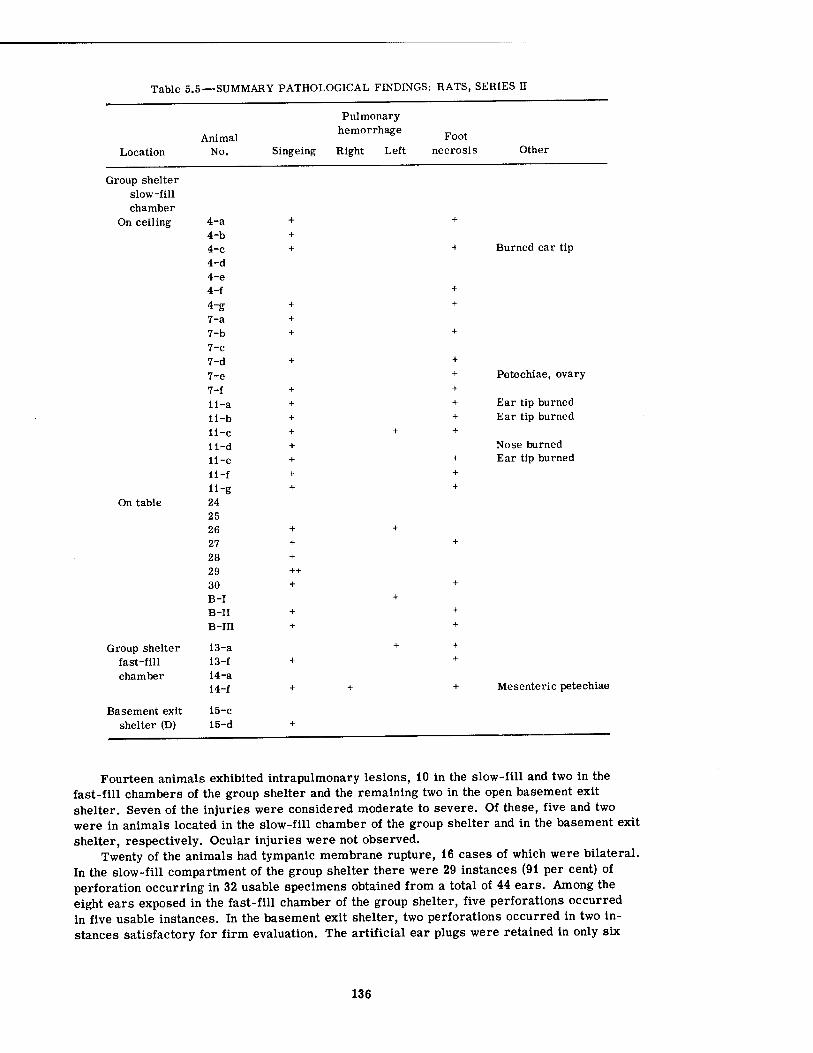
Table 5.5—SUMMARY PATHOLOGICAL FINDINGS: RATS, SERIES II
Location
Group shelter slow-fill chamber
On ceiling
On table
Group shelter fast-fill chamber
Basement exit shelter (D)
Animal No.
4-a 4-b 4-c 4-d 4-e 4-f 4-g 7-a 7-b 7-c 7-d 7-e 7-f il-a ii-b 11-c ii-d ii-e li-f 11-g 24 25 26 27 28 29 30 B-I B-II B-III
13-a 13-f 14-a 14-f
15- 15-
Pulmonary hemorrhage
Singeing Right Left Foot
necrosis Other
+ + + ++ +
Burned ear tip
Petechiae, ovary
Ear tip burned Ear tip burned
Nose burned Ear tip burned
Mesenteric petechiae
Fourteen animals exhibited intrapulmonary lesions, 10 in the slow-fill and two in the fast-fill chambers of the group shelter and the remaining two in the open basement exit shelter. Seven of the injuries were considered moderate to severe. Of these, five and two were in animals located in the slow-fill chamber of the group shelter and in the basement exit shelter, respectively. Ocular injuries were not observed.
Twenty of the animals had tympanic membrane rupture, 16 cases of which were bilateral. In the slow-fill compartment of the group shelter there were 29 instances (91 per cent) of perforation occurring in 32 usable specimens obtained from a total of 44 ears. Among the eight ears exposed in the fast-fill chamber of the group shelter, five perforations occurred in five usable instances. In the basement exit shelter, two perforations occurred in two in- stances satisfactory for firm evaluation. The artificial ear plugs were retained in only six
136
of the animals, but this device did not seem to preserve the integrity of the eardrum. Three of the group (two of which were located near the open escape hatch) were not immediately sacrificed. Subsequently two of them (8-b and 32) showed evidence of radiation injury.
(e) Rats (See Table 5.5 for Tabular Summary). There was some degree of fur singeing in nearly all the 36 rats. In some instances the tips of the ears and nose were also burned. All but three of the animals were sacrificed immediately. Only five animals showed minimal intrapulmonary lesions characterized by occurrence of scattered petechiae, three and two animals in the fast- and slow-fill chambers of the group shelter, respectively. One of the three animals not sacrificed immediately expired 5 days after the test. This animal, along with the other two that were then examined, showed signs of acute radiation injury.
Otitis media was prevalent in many of these animals, an occurrence that all but obscured studies of tympanic membrane integrity. No artificial ear plugs remained in the group. Only eight specimens of the auditory apparatus were readable, and six of these showed membrane rupture; the ossicles were fractured in one case.
A singular and rather interesting lesion was the frequency of apparent ischemic necrosis of the front paws. In some instances this effect was only partial, but in others there was com- plete amputation at the wrist, leaving the raw stumps of the radius and ulna protruding. This phenomenon was noted only in those animals kept in cylindrical wire cages, where activity was markedly restricted. The lesion was not observed in any of the animals in Series I or in any of the numerous preliminary dry runs. The phenomenon was not seen in any other group of animals. Histological studies of the tissues failed to reveal any significant vascular disease. Although no firm cause for the finding can be stated, it seems likely that the animals gnawed their own feet for reasons not clearly known, although thermal injury or noise presumably could have been the initiating agent.
(f) Mice (See Table 5.6 for Tabular Summary). With the exception of six animals (i-h, 9-g, 9-h, 13-g, 14-g, and 14-h), all of 24 mice were dead upon recovery from the test region, and examination of these showed severe, moderate, and minor pulmonary hemorrhage in 5, 10, and 2 animals, respectively. Also, one showed only pulmonary congestion, bilaterally. No thermal burns of the skin were seen. Multiple small petechiae were found in the meninges of one mouse (10-g), and another showed periorbital hemorrhage bilaterally (13-h). Of the six surviving animals, three were located on the ceiling of the slow-fill chamber of the group shelter, and three were located under the wall benches in the fast-fill chamber, where the fourth animal so exposed was fatally injured. Examination showed no evidence of internal in- jury in any of the survivors except 13-g, in which there was minor lung hemorrhage.
5.2.4 Radiography*
Chest radiographs were obtained in the A-P view in duplicate for all dogs before and after the detonation, using equipment set up at base camp. Results were of good quality, although many of the postshot films showed small dark densities up to 4 mm in greatest length. These were attributed to radioactive dust particles carried into the X-ray laboratory on the fur of animals recovered from hot areas.
The positive X-ray findings were minimal. Those of significance, along with figure num- bers, are listed in Table 5.7.
The left pneumothorax in dog Z-7 (Fig. 5.49) was of the simple, nontension type, and, since no puncture wound of the chest wall was found, the lesion probably resulted from trau- matic rupture of the lung and subsequent sealing off of the "air leak" initially involved in filling the left pleural -space.
♦The authors are indebted to Dr. Jack W. Grossman, who not only read the radiographs but also worked out a satisfactory technique, to be reported elsewhere, for obtaining tech- nically excellent films of the dogs. Too, we wish to thank the X-ray technicians of the Love- lace Clinic who promptly processed all films in Albuquerque in order that results could be available in Nevada with minimal delay.
137
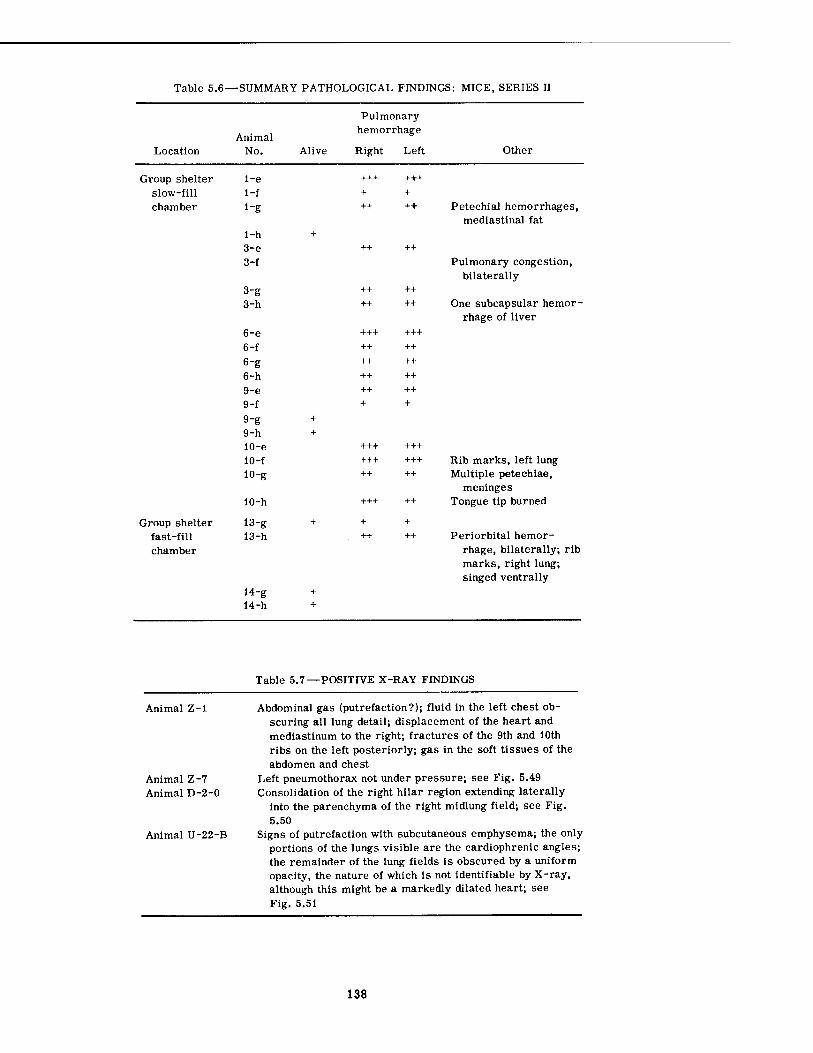
Table 5.6—SUMMARY PATHOLOGICAL FINDINGS: MICE, SERIES II
Location Animal
No. Alive
Pulmonary hemorrhage
Right Left Other
Group shelter slow-fill chamber
Group shelter fast-fill chamber
i-e i-f
1-g
1-h 3-e 3-f
3-g 3-h
6-e 6-f 6-g 6-h 9-e 9-f 9-g 9-h 10-e 10-f 10-g
10-h
13-g 13-h
14-g 14-h
+++ + ++
+++ + ++
++ ++
++ ++
+++ +++
++ ++
++ ++
++ ++
++ ++
+ +
+++ +++
+++ +++ ++ ++
+++ ++
+ +
++ ++
Petechial hemorrhages, mediastinal fat
Pulmonary congestion, bilaterally
One subcapsular hemor- rhage of liver
Rib marks, left lung Multiple petechiae,
meninges Tongue tip burned
Periorbital hemor- rhage, bilaterally; rib marks, right lung; singed ventrally
Table 5.7—POSITIVE X-RAY FINDINGS
Animal Z-l
Animal Z-7 Animal D-2-0
Animal U-22-B
Abdominal gas (putrefaction?); fluid in the left chest ob- scuring all lung detail; displacement of the heart and mediastinum to the right; fractures of the 9th and 10th ribs on the left posteriorly; gas in the soft tissues of the abdomen and chest
Left pneumothorax not under pressure; see Fig. 5.49 Consolidation of the right hilar region extending laterally
into the parenchyma of the right midlung field; see Fig. 5.50
Signs of putrefaction with subcutaneous emphysema; the only portions of the lungs visible are the cardiophrenic angles; the remainder of the lung fields is obscured by a uniform opacity, the nature of which is not identifiable by X-ray, although this might be a markedly dilated heart; see Fig. 5.51
138
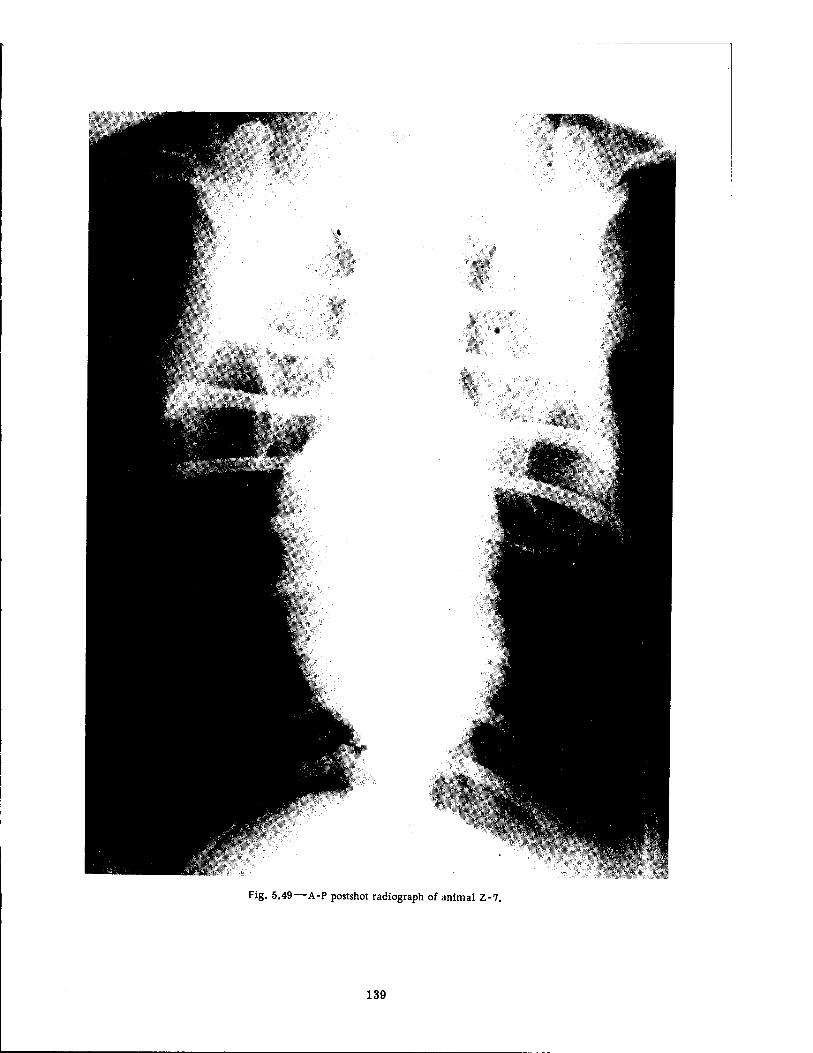
Fig. 5.49—A-P postshot radiograph of animal Z-7.
139
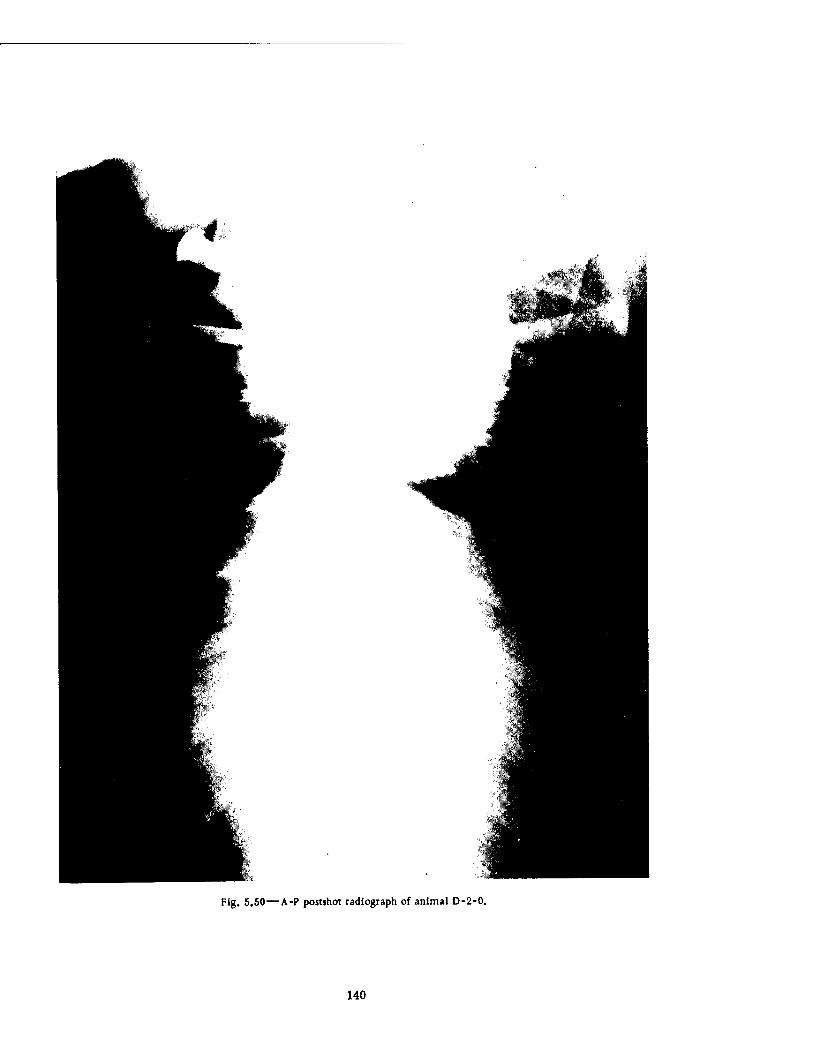
Fig. 5.50—A-P postshot radiograph of animal D-2-0.
140
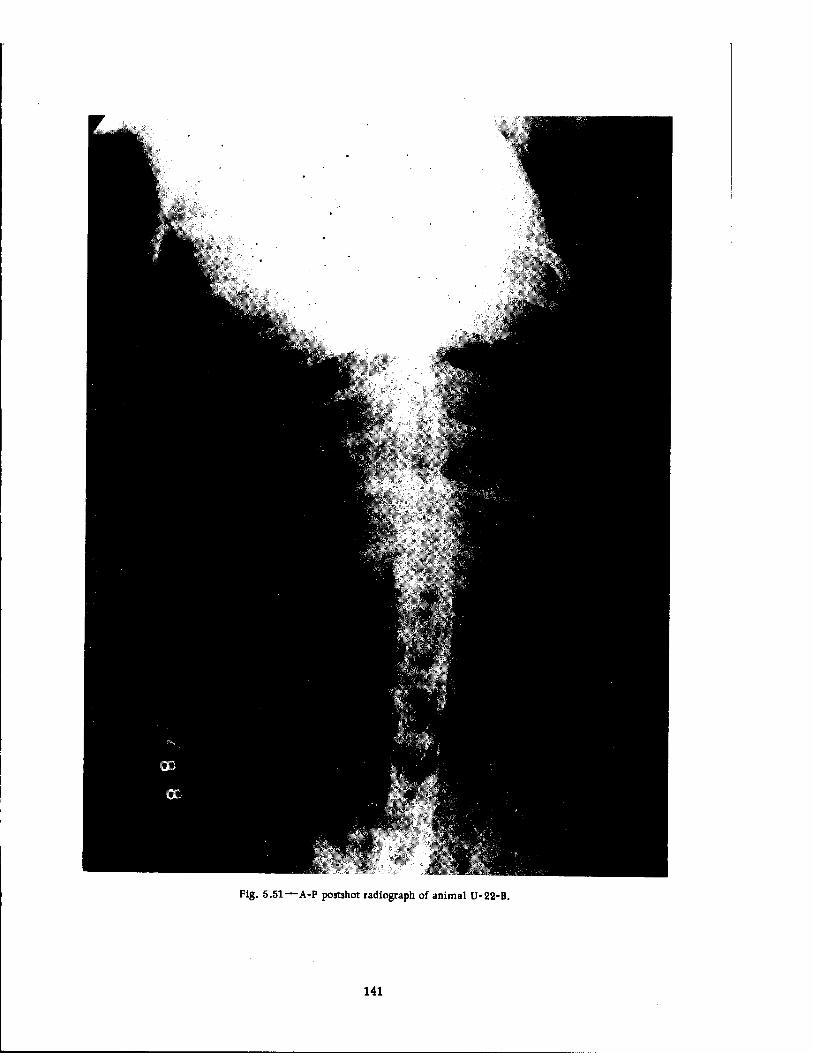
Fig. 5.51—A-P postshot radiograph of animal U-22-B.
141
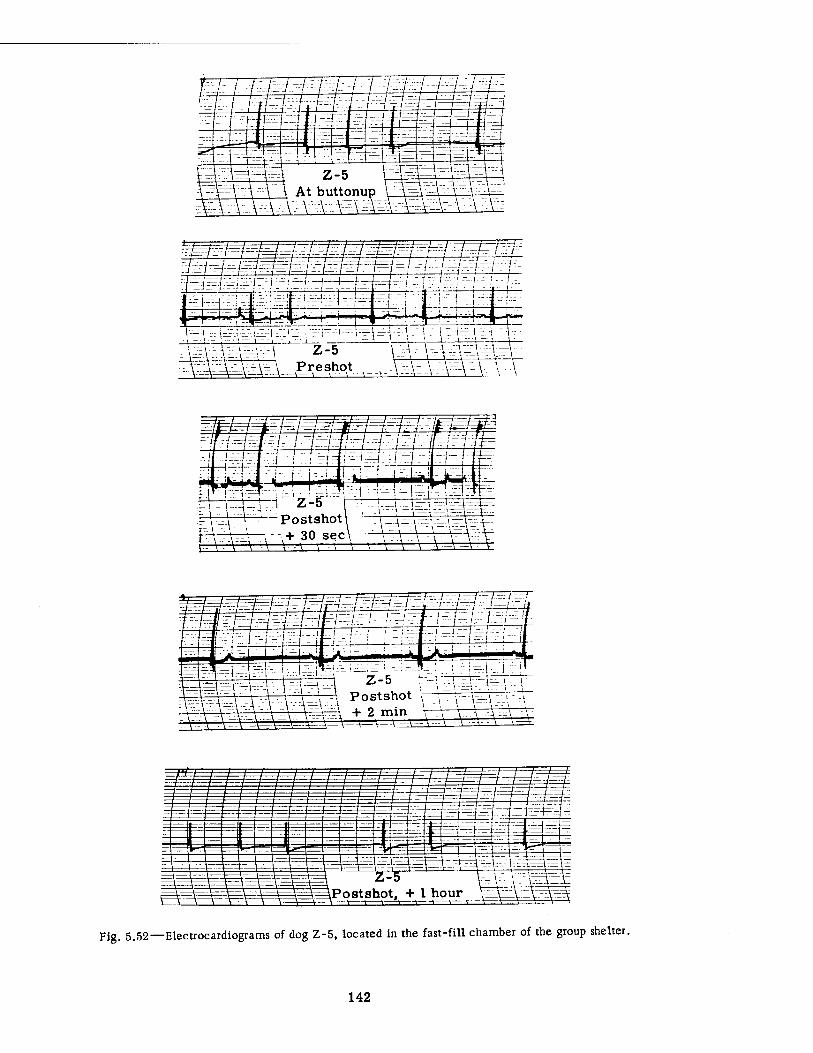
mm Z-5
At buttonup ^■^mmmm
^t^(^^=}^m^^wm
gf^\gB_Preshot ^.\i\--\:^-XV
mmämmmmm a-^_tj 7\mmm-^\i
Z-5
Vf^4 + 2 min r \ \-;-\ .-4,-^:,
Fig. 5.52—Electrocardiograms of dog Z-5. located in the fast-fill chamber of the group shelter.
142
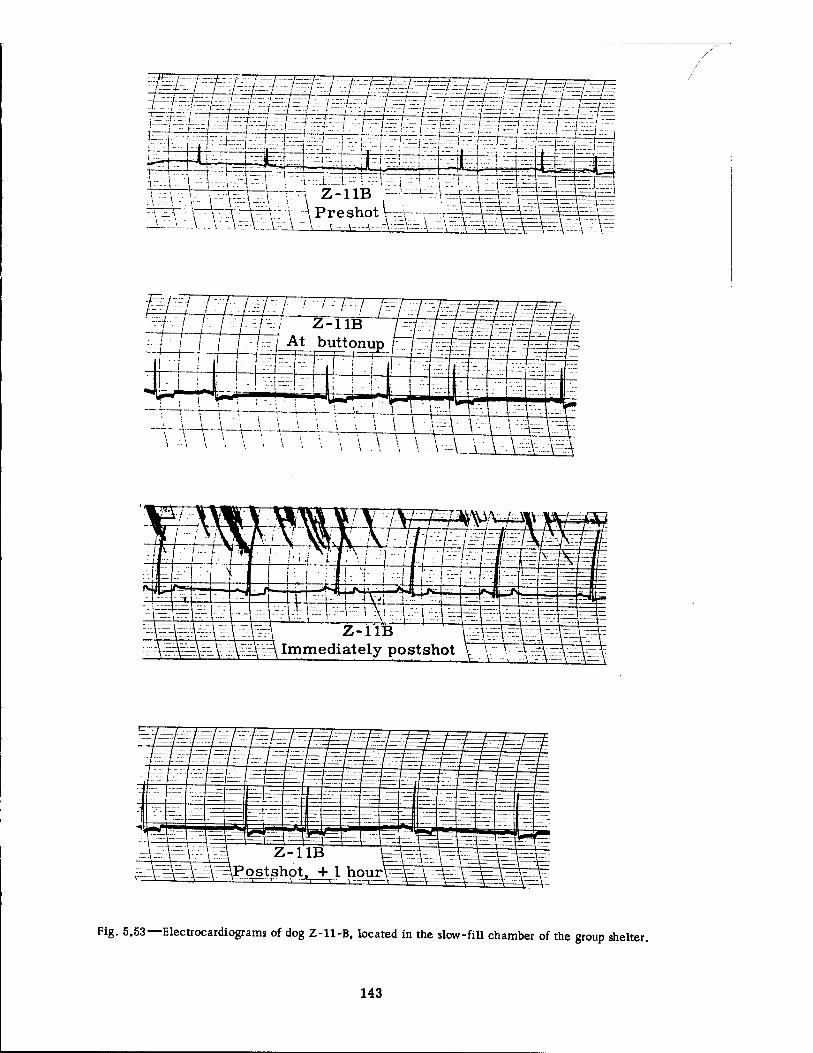
!■=■£ f^ ••-"-/- W^smmm^
m
t=? i--iz-t
Äste ".. JL' l". 1 ■
m ffi
Efz±
:4:::::nt.
IffiHi^^ r~-l--■•-1 i- ::■.!_■.
±=£ S -~- Z-11B
iPreshol ^ V^^T^i-T'APreshott^.- _ ^p^
I PP
=ö
7$=?.
:-v-:
\ \ \ \ > \ \ \ \ \ ■■'... \ \ ..-.:V_-7 1 \ '■ \ \ \ \ \ \ \ ■ \ rTr^rrt
Fig. 5.53—Electrocardiograms of dog Z-ll-B, located in the slow-fill chamber of the group shelter.
143
The findings in animal D-2-0, shown in Fig. 5.50, of consolidation in the right hilar region and radiodensity in the right midlung field were interesting in that the D-2-0 X-rays were the only positive ones among the three animals (D-2-0, C-2, and C-2-0) in the basement exit shelters showing significant lung hemorrhage by post-mortem examination. Figures 5.42 and 5.43 show posterior and anterior views of the damaged lungs in dog D-2-0, and Figs. 5.44 and 5.45 present the necropsy findings for animals C-2 and C-2-0, respectively. Apparently the lesions in the latter two cases were of such a nature or location as to escape detection by the radiographic approach used.
The thoracic radiodensity shown in Fig. 5.51, the postshot radiograph of animal U-22-B, was found at necropsy to be due to cardiac dilatation.
5.2.5 Electrocardiography*
Electrocardiographic procedures were accomplished on all living dogs preshot and post- shot in the laboratory at base camp. Tracings were attempted on four dogs who were exposed in the underground group shelter. See Fig. 3.26 for location of the animals. As in the Series I experiments, recordings were made on these four animals at button-up of the shelters the night before the shot and for 1 hr continuously, beginning 5 min before the explosion. However, fur- ther arrangements were made to take postshot recordings over an additional period of 6 hr. Automatic equipment was set to record in a continuous sequence of i min out of each 6 min. Thus tracings were obtained over a total of 7 hr postshot, continuously the first hour and in- termittently the last 6 hr.
Satisfactory postshot tracings of good technical quality were obtained on all four animals (Z-5, Z-8-A, Z-9-A, and Z-il-B). The first two of these dogs were located in the fast-fill, and the last two in the slow-fill, chamber of the Series II group shelter.
The preshot and postshot electrocardiographic tracings obtained in the laboratory at base camp on all living animals, along with the button-up and preshot records recorded in the group shelters, allowed a fairly good assessment of the normal variations that occurred among the group of animals as well as in a single animal.
Using all the data available, it is possible to say that the preshot sinus arrhythmia that was usual in the group of animals studied was minimal or absent for a time in the postshot tracings (note the 2-min postshot record on animal Z-5 in Fig. 5.52 and also the immediate postshot record of animal Z-ll-B in Fig. 5.53), but the rhythm gradually returned to the preshot condition.
A careful comparison of the preshot and postshot records revealed no differences that could be interpreted as clear-cut evidence of myocardial anoxia or ischemia. The record ob- tained at i hr after the detonation on animal Z-5 (Fig. 5.52) is suggestive, but so would have been the i-hr postshot record for Z-li-B (Fig. 5.53) were it not for the almost identical rec- ord noted on the same animal at button-up.
♦The technical details relevant to the rather difficult task of obtaining electrocardio- graphic data under field conditions have been reported by Sander and Birdsong in a Sandia Corporation Technical Memorandum.18 The authors are indebted to Dr. F. G. Hirsch, Sandia Corporation, for his supervision of all the electrocardiographic work and to Dr. Richard B. Streeper, Lovelace Clinic, who lent his experience as a cardiologist in interpreting the tracings obtained.
144
CHAPTER 6
PRESSURE ENVIRONMENT AND RELATED PATHOLOGY
The purposes of this chapter are (1) to summarize the variations in the pressure environ- ment which were recorded inside the several above- and below-ground shelters in relation to the pathological findings noted for the exposed experimental animals, and (2) to mention some of the more important physical factors that govern the pressure-time patterns inside shelters and that are of some aid in understanding the biological problems involved.
6.1 TABULATED PRESSURE-TIME DATA* AND RELATED PATHOLOGY
Using data obtained from the pressure-time gauges mounted inside the shelters, along with analytical work performed and furnished by the Sandia Corporation, Table 6.1 was pre- pared. Both Series I and II results were utilized, and the table was arranged from top to bottom in the order of increasing maximal overpressures that were metered inside the dif- ferent structures as set forth in column 5. The first four columns give the experimental series, the names of the structures utilized, the designations of the pressure-time gauges, and the distance of each structure from Ground Zero for the more important Series II experi- ments. Columns 6 and 7 state the times to peak pressures and the durations of the overpres- sures, and columns 8 and 9 show the maximal underpressures and the times of their occur- rence, respectively. In the last three columns are noted the number and species of animals employed, the animal designation, and the gross pathological findings.
The reader will note that the variations in the internal environment ranged from a maxi- mal pressure of 1.3 psi enduring for 1346.4 msec for the closed bathroom shelter to a maxi- mal pressure of 85.8 psi lasting 569.5 msec for the Series II open basement exit shelter lo- cated nearest to Ground Zero (1270 ft). In spite of this rather wide change in the pressures to which the animals were exposed, pathological findings were rather meager. These will now be discussed.
6.1.1 Low Internal Pressures
In terms of increasing maximal internal pressures the first positive pathological finding noted was the rupture of one of four eardrums of dogs exposed to a Pmax of 4.6 psi, which occurred inside the basement lean-to shelter of the destroyed house located at 4700 ft from Ground Zero in one of the Series n experiments.
The pressure-time data were made available through the courtesy and cooperation of personnel of CETG Programs 39 and 34, and the authors gratefully acknowledge the willing and untiring help of the Sandia Corporation staff before, during, and after the field phase of the program.
145
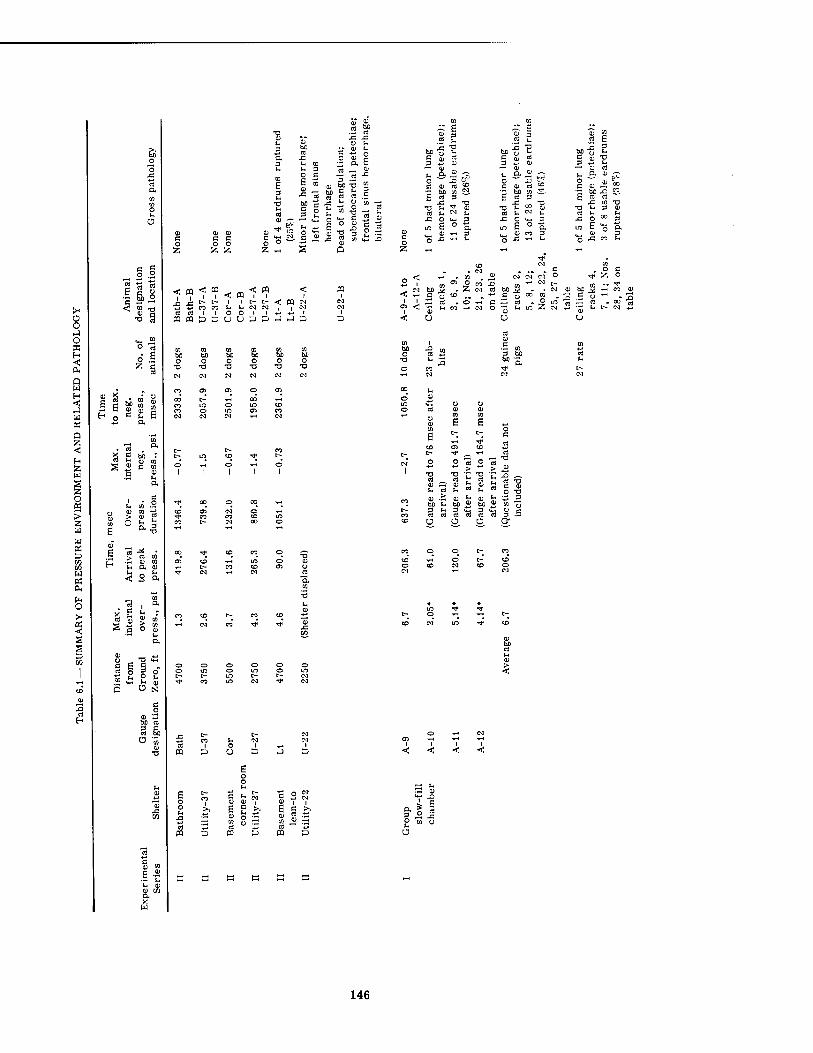
>- Ü o o X H < a w H < w « Q Z < H Z W S z o e > z w w « to t» w K a. tu o >< « < s s D
&
_ .2 -2
1.6 2
o z
0)
s i s 5? <°
H e 2. a
s cd w
< ° o.
si a o a)
c g cd o
O N
ho cd g p.
R t-l * a
f i •~ Q.
o o
c c -— e 3
£ CD j= 13
CD bC
Ei
13 c rt 3
o O ^ IH ,, p
H-< £i o c CD CD
cd
c » « <" c 'S
-2 o -
z - S
t-
b£ JZ u
c rt 3 QJ
t- a B? u
G a u r/l fa rt
JZ 3
*a u CD cd u t-
J= o 3 s O a 3
o J= ■r-i t-
z ^
a cd
x: o 3 ü bo
; e¥ yj n — bß co ^ cd 3
■E « "8 O — 3 e ° tt ÜJ CO 3
3 * t- — 0) cd
§ « ü » •~ M .C £3. S co cd
.C CO T3 ■O L 3 ffl
cd t. u
ö •" «
< m < , * * E; Ex *J *J CO cc cd cd
M . _ < n < i < n i i i t- C- < (H M
.. .. CM CM , , <M O O 1 I +-• ■*-• I
CM CM CM O
bo ^
C S ° T,
. O u, 'S - cd
MMPBUUPDJJD
bo o
TH 00 -r*
B|
.2 rt
— tu *-*
^ ^s -• *a
(30 -^
O iH bb ^> SÄ « 3 <y 3 i*j cd cd rt cd Ü Ü o*
IN -rt
TH -r* t-
5
-rH CM
I " ja ^
0) <D
B E o 3
'S o N r, -^ ^ 2 i i g c >, cu ^ .S 5 »- cd *J
m 3 9 co ü
146
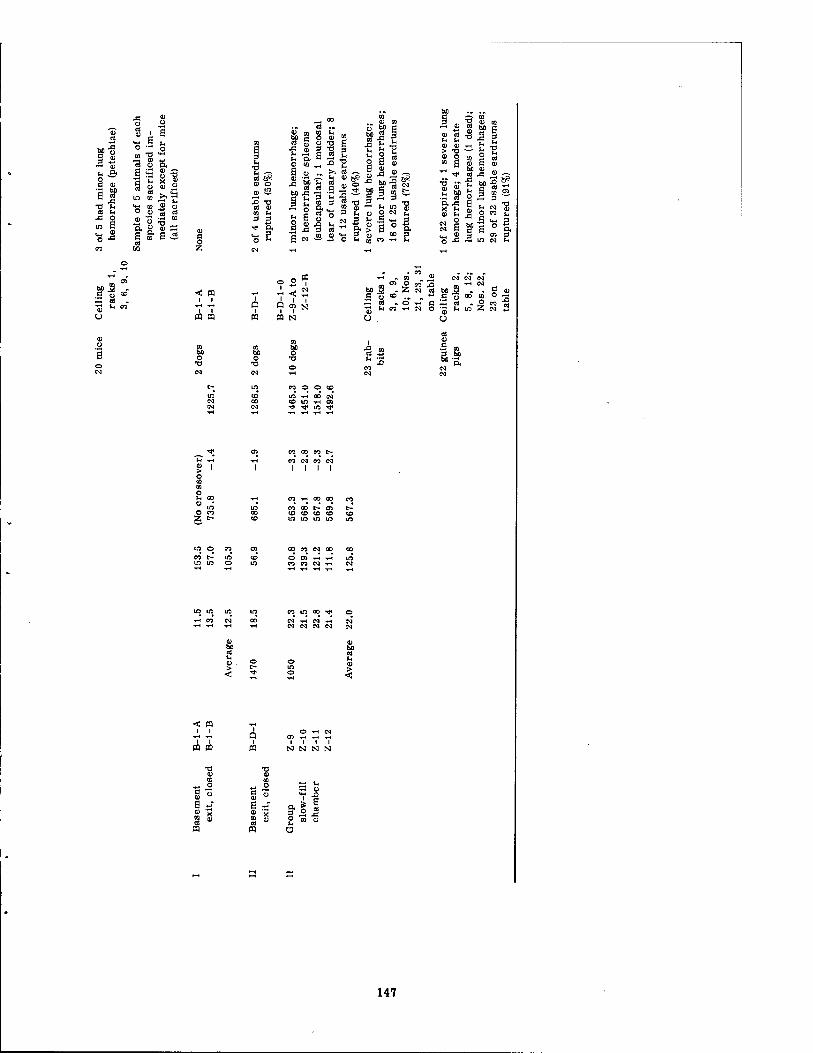
—. °° ID 1 p « B
be C
o O
09 T3 o In
3 ■a <J 'S, U o B
S
3
43
s 3 in
S CO
0) o 0)
■8 O
3 Tl U a u 03 at
J5 o a
en Iß B o> •O s O 43 S CO S ^rt
o o to
Ü
a o
< pq
P3 P3
V en (H
Ul o 0) m CO ü Tl
tf 3
<u I ■a ■o
o to ^ >i
at f*i V O J3 rt rt c aj b» M
.O T) tj
O m 3
3
tu
3 U & "o
3
XI
<*H c J3 3
CO Ctj
u u CD 0) > T3 0) O M S
•3 at P. J3
=3 CO
a; bo B •a 3
•a CO o
S CO (XI
J3
U o s o
J3
bo
bo
§ ■8
CO 0
■»-I
O c
CN) CO
0
■g
3 3
bo O
I
m © co
T-t CO
I ? N
CO © © <D
ifl »H ÜO N v ic w a -^ ^ m ^
co co co c- n N PJ N
I I I I
PJ iH 0O 00
CO CO t- Oi
CO CO CN 00
co in co -^
. CO ., - .» . **■* - °Q „ JÜ CM W CN
bojg . £ CM* t>a 3 . . S » go10 .» .♦'EU»« ° *£ ^rt . © ,-. c £ rt . O n -a •Jj« ^ CO -TH CM O 'J hW Z N ™
u , Ü
■3 6|
•* 2
CM -rt CM -*H CM CM CM CM CN
0) hn rt
O 03 > 2 <
< n
PQ A
a) o o - 2
S " fl +T B - V X aj *3
O -rH <M Oi -rH -rH -rH
3* P
147
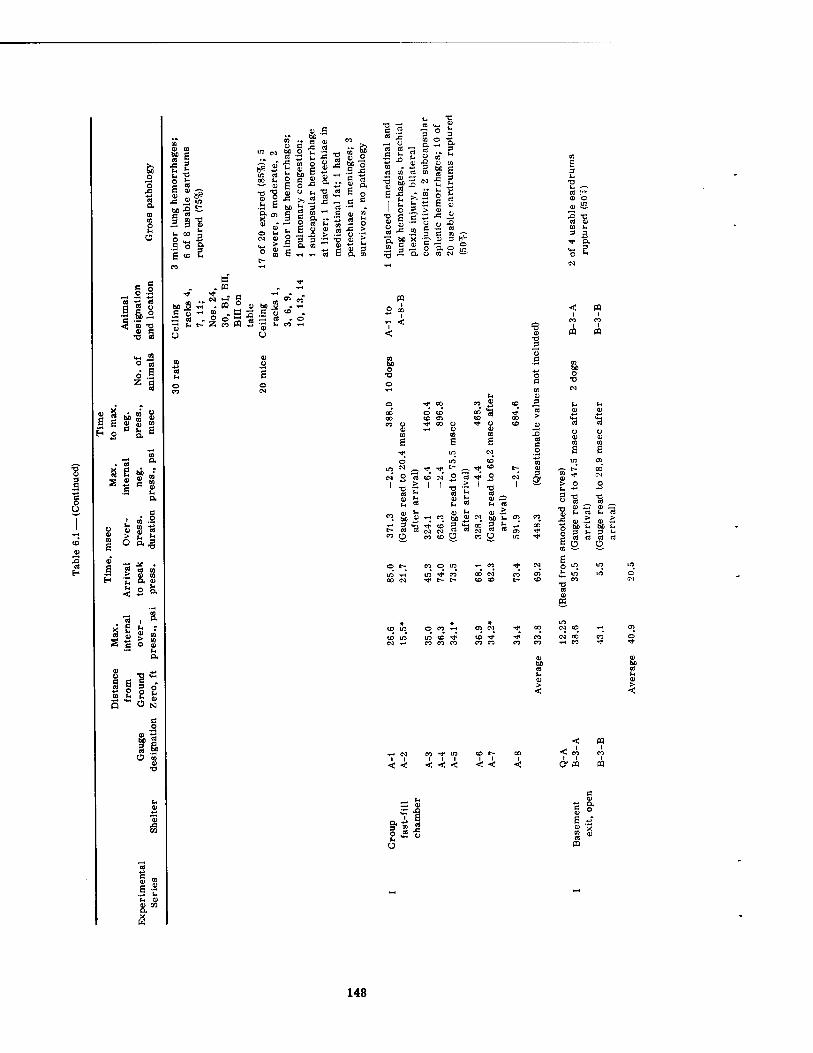
8 I ■2 6°
•o 3
■8 3 a S »
K 0)
c o
1 i „•1 1 o CD > 0) rt
CO e Ü »-S a 13 > CtJ n
CD CO
§ 1 biS 8 B E o> v "
P £ C a6
S G 5?
< 2 ö.
O CO
— M . CU
si»
U CD
CD CO
«| f 2
j3 » in M-S &
3 3 "S U 00 g
.Sog. P » 2
CO
in N b£ o
gut" 11 It ^ u
fa s
«X *■
F o .c ,y CO u u a "3 it-
M 3 ed C m c 3 o
p a a o 0)
to
O a XI
3 3 T3 a en
B ,H as £
CO f* bo o
i'» o,
S -0 g -a CO - -S 3 cs co rt to
■*■* a> T; 'S a> S N
E *
OJ CO
S| ■E 2
CO
.■a S
«PS,
p . n
CM *-* 5 «
.5 o - S - 5 3 -S 2
U U
.= >
.5 § " o
O oo ** I
'S CD CM ° c« & SH t. 0) £5
*-. u t- a t-> u
w. bo *-t W) Wl u
"a -* CO § "a 00 3 «1 eo O CO CD O CO o
to w o n »H Ol <M
CD in in to ^ CO ^ CO CO
co >
< < < < < < <
£2 CD
*n M to
T) t- rt ^V 0) O
X! ■o cd 0) en u 3 a
Tt- u 3
b« O
a -g
.^, •t*
o o B
W) IH hn t- 3 (H 3 t- a «1 cl rt O CT
P o in
OJ CO ■<-<
O* pq
•+-< o, CÜ
o
B +J*
tu
rt OJ
W
148
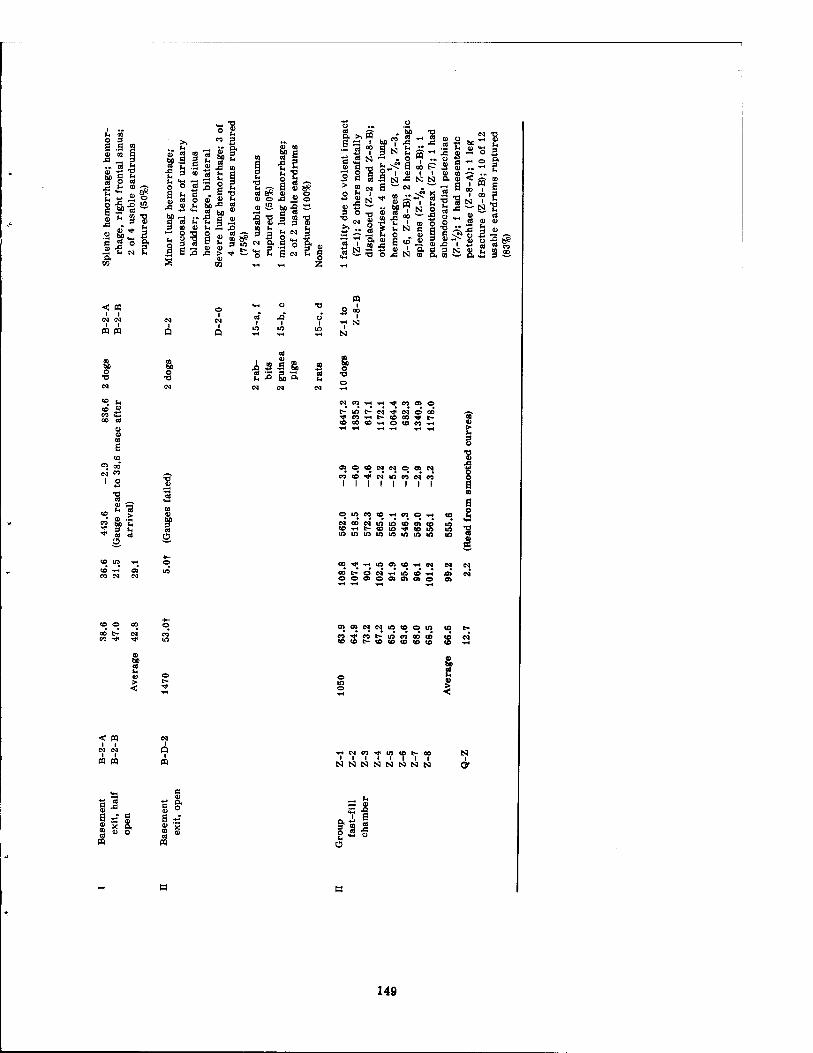
O 3 655 0) m a
■O _ 3 A) *J "D
rt o cd I £ ™S
I si® f, P •* 3
c 3 o & o.
GO
a >, PQ a« i bo •2 «<? §
5 e S a > g M B o ** I S » N ' a) 43 ^
13 IM S .s
a -H 5 £ •a T1 a u
» ' CO J3
1 £ . O
js a 1 s
00 « I u
N O s-' .£3 .3 °° "5 ti ' w o u N e a o . » S S » Ü g £ N s* a
" a .. -1
go—..
o .2 g ■° — 5 S3 g ^ o 3 • 2 i 5 §■
•< m
m m
bfi o ■Ö
CM
to U CO co
QJ
00 (4
O 0> on B to
en 00 <N eo
1 o
o ■o
iiS I bl o
■a
N n ^ TH ^ n « o t-lOt-N-^NOOO
to CO 00 to
to o
00 to CO ■H
BO 4)
t 3 o
en o «O 09 CM o en M
IS J3
1 s CO
CO 1
to 1 1 1
Ui CO
1 CM
1 eo
1
s © in CO to _
CO o T* CO H ctaocMinmcocnco
A to in ^
CD N O Cq T4 U) ID J oocnocncncno
en en CN CM m co ■* eo t> in to to t- to to
3 I
< PQ
« m • ■•■■■it NNNNNNNN
*M c
S a 2 5
e S a" 3 * «
o ,2 n
p ,
149
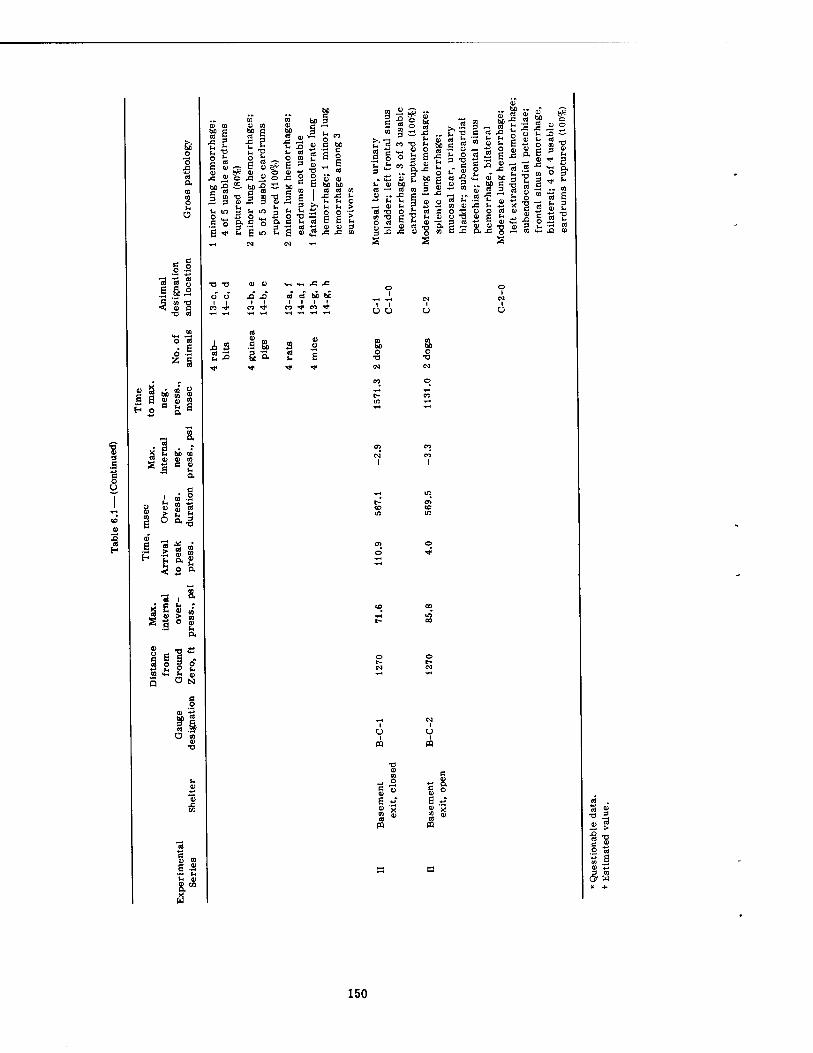
&
'S a
a 5 CO XJ 9) C
o 55
■8 3 5 t: o u
.9 B 2 » 2 H a •' a
2 o, H
S S tS > c h O 0.2
» — s a
< 2
s e s n
CD
a e o 3 ß P C
O N
bo rt
« .SJ> O co
•a Q) CD
J3 P
«•a
SCO
C Co
6?
.= 3 0) S
B •# *
"83 S 2 t- ti £ O T3 ach
~ o CO CD c hfl
Ö 1 01 •o rt 0 fi
CD CD Mi hfl cd cd | J3 a
*J u o
u o
CO S e
IH in X £
cd cd bo bc
CO ^ CO ^
i 3 22
.s a a 's.
o u
tat O •o
CO *J o e S CD "
a
'S & g ° 6 s CD £
a ^ 3 » B m
3 •a
CD -M
150
Except for the animals exposed in the displaced Utility-22 shelter (U-22) for which pres- sure-time data were unavailable, the next highest pressure which was associated with damage was a Pmax of 6.7 psi, which was metered inside the slow-fill side of the Series I group shelter. Ten dogs escaped injury, but petechial lung hemorrhages appeared in a few of the rabbits, guinea pigs, rats, and mice (see Table 6.1). Eardrum failure at this pressure was noted in 26, 46, and 38 per cent of the rabbits, guinea pigs, and rats, respectively.
Two dogs exposed in the Series I closed basement exit shelter escaped damage at a P averaging 12.5 psi, and the only pathology at a Pmax of 18.5 psi (Series II closed basement*** exit shelter) was rupture of two of four eardrums (50 per cent) in the two exposed dogs.
6.1.2 Intermediate Internal Pressures
The lowest maximal internal pressures with which thoracic and abdominal injuries to dogs were associated averaged 22.0 psi in the slow-fill chamber of the Series II group shelter; the injuries included one minor lung hemorrhage in dog Z-ll, one tear in the urinary bladder mucosa of one animal, and two instances of subcapsular hemorrhage of the spleen. Eardrum rupture in the dogs averaged 40 per cent.
In the same structure lung damage occurred in four rabbits, 10 guinea pigs, three rats, and 17 mice. Mortality was absent in the dogs, rabbits, and rats, but one of 22 (4.5 per cent) of the guinea pigs and 17 of 20 (85 per cent) of the mice died of primary blast injury. Ear- drum ruptures totaled 72, 91, and 75 per cent for the rabbits, guinea pigs, and rats, respec- tively.
In view of the findings in dogs at 22 psi it was somewhat surprising to note the results in the fast-fill side of the Series I group shelter, a compartment in which the Pmax averaged 33.8 psi. Except for the displaced animal A-l—exposed to a maximal dynamic pressure in excess of 12 psi (Q-A gauge) — the only positive findings among 10 dogs involved two instances of subcapsular splenic hemorrhage and rupture of 50 per cent of the eardrums. .Likewise, dogs exposed to average peak internal overpressures of 40.9 and 42.8 psi in the Series I open and half-open basement exit shelters suffered no lung damage but did show frontal sinus and splenic hemorrhages and rupture of 50 per cent of the eardrums. The apparently bothersome fact is that threshold lung damage in dogs occurred at peak pressures of 22 psi, whereas no lung pathology occurred in other animals of the same species at almost double these maximal overpressures. These facts suggest either that the findings are due to individual variation among the large animals or perhaps that the maximal overpressure alone is not an adequate criterion to use in predicting primary blast pathology, and this point will be discussed more fully later.
It is unfortunate that owing to gauge failure no recorded pressure-time data are available for the open Series II basement exit shelter located farthest from Ground Zero (1470 ft), in which minor and rather severe lung hemorrhages were noted in the two exposed dogs. Table 6.1 shows a value of 53.0 psi for the estimated peak internal overpressure. Although this value is probably not far in error, it cannot be regarded as reliable. Even so, it is again surprising that two rats and two rabbits exposed in the same shelter escaped pulmonary dam- age and only one of two guinea pigs suffered minor lung hemorrhages. Along with the authors, the reader will, of course, wonder why the dogs suffered quite significant pulmonary injuries' whereas the smaller animals exposed in the same structure were for all practical purposes unharmed.
6.1.3 High Internal Pressures
It remains to mention the findings in animals exposed to maximal pressures averaging 66.6, 71.6, and 85.8 psi, which occurred in the fast-fill side of the Series II group shelter and the closed and open basement exit shelters located closest to Ground Zero (1270 ft). See the data associated with the last three structures mentioned in Table 6.1.
The directional or wind load on the fatally displaced animal (Z-l) was in excess of 12.7 psi as evidenced by the reading obtained from the dynamic pressure gauge (Q-Z) located about 2 ft aft of the animal, which no doubt succumbed to injuries resulting from violent impact with
151
& SS
•a M
e cd
o c 4)
< P-
6 S
r V) s - „ 8 Q S5
>> 2
8 o s CU
B. SlSTs
< « ^ m < CD I l < W 7 7 t- t- i • * jö « " Sl
■< n t- t- < N CM >
S *3 i i o O i i *j *-
.2 &
■•-> » « J . w d to $ s A a
< "s « 2 ° 9.
« 3 w
g. S o. S 2 «• > ** ai
« » a - -
2 £ 5 8 S 1 > O- «I M «I -> 5 IM "H O, «0
IB s s S H i 3 3. fi
SS .8
■^ N
II ii' i < PQ o i i t i < PP i t . O --H -« T* M N CM I I INNMOOI | ^ -^ -M
lllllllllllflllllllll :<<<<<<<mCQQONNNNNNNNNN
t- •* PS <* N TH CC 00 »4 t- t- o» o» © <* *c O -^ -«H TH
w in ' © ©
■A iH v4
3 .¥
^ .2 <i>
8. 3 c
f i*
in in to TH t- n cg o> O CM PS *-«
X ^
t- ^ !r, 5 »s Hü 1
B g £• « o — S S 3 ° -8
5 3 ° 3 PO E> P3 O
< n -
CQ PQ PQ
o "o a "u
3 » 3 » £ » u
» « o
152
■»H > N0000CO**incOC-eO C4 IN M «S -^ ^O IflQOU^t-n'H'HMM J 1 I I I I I I I I I I I I I I QQNNNNNNNNNNÜUUU
to ^ t- ■* CD eo oo in in t- r* © go c- n to a M ■* t- w O) c- n a o oo © © TH-^M co co eo CD
mm m m iA in IA ia in
■^ in t- oo o CO W CO CO *# oo oo ao co ab
N CO CO O ^ * w in ao ao co ao © © © ©
2 3 I CJ ■* i t- to
o © o o
N t« t-
-*H 00* •* eo
m in ii
oo CO -H
^ A co m
i-( t- in ■»H to in
7t < <
n N N e (O t- co in ■* ■* ^ ■*
to co C4 tn in © -<-i ■*< to t- ao to
tc- eo U I I I
NNNCO
3 1 O £ '
o
g S3 a sj a a ss s a g a a- a i
on n PQ mo
- 5 - 8, a o a s*
I tf I rf 0) M 0) M
3*3» « pq
3 .
es ta Is W Z
153
the partition wall. Except for the injuries recorded in this animal, other findings in the 10 dogs exposed involved four minor lung hemorrhages, one pneumothorax, one instance of sub- endocardial petechiae, one mesenteric and two splenic injuries, one leg fracture, and rupture of 83 per cent of the eardrums. As for the small animals, only one fatality occurred in four mice. Pulmonary injuries were of a minor nature, being seen in one of four rabbits, two of four guinea pigs, two of four rats, and one of three surviving mice. Again it is necessary to mention the bothersome fact that, in spite of the high peak overpressures, there appears to be an inconsistency between the results seen in large and small animals, even though the num- bers exposed were small.
Finally, the peak pressures recorded inside the closed and open Series II basement exit shelters located closest to Ground Zero (1270 ft) were 71.6 and 85.8 psi, respectively. Two dogs exposed to the Pmax of 71.6 psi suffered no pulmonary damage. One showed a mucosal tear of the urinary bladder, and the other showed a left frontal sinus hemorrhage. In contrast, the animals surviving a Pmax of 85.8 psi both suffered moderate pulmonary hemorrhage, sub- endocardial petechiae, and frontal sinus hemorrhage. In addition, the one (C-2-0) nearest the door exhibited a left extradural hemorrhage, whereas the other (C-2), placed near the end of the shelter, was found to have a region of splenic hemorrhage and a mucosal tear of the urinary bladder. Here a situation existed in which the peak overpressures differed by about 14 psi. In one case two dogs escaped, and in the other case two dogs both suffered significant pulmonary blast lesions, although eardrum rupture was 100 per cent in both cases. Thus it would appear useful to summarize the pathology in terms of peak overpressure alone as well as for other blast parameters, in an attempt to coordinate the environmental variations with
biological effects.
6.2 RELATION OF OTHER BLAST PARAMETERS TO PATHOLOGY IN DOGS
Table 6.1 presents a summary of pathology in large and small animals as associated with peak overpressure, time to peak pressure (rise time), duration of overpressure, maximal negative pressure, and time from arrival to maximal negative pressure. The results of fur- ther analytical work are shown in Table 6.2, in which the pathological observations for indi- vidual dogs (except those in the forward displaced U-22 shelter) are set forth as associated with average rate of pressure rise, time from maximal to zero pressure, average rate of pressure fall from maximal to zero pressure, total range of pressure fall, time from maxi- mal overpressure to maximal underpressure, average rate of pressure fall from peak over- pressure to maximal negative pressure, the fractional pressure differential, and the pressure ratio. A word about the last two parameters is indicated.
The fractional pressure differential was obtained using the following expression:
Fractional pressure differential = (Pf - Pi)/Pf
where Pf = maximal or final internal overpressure, psia Pi = initial or ambient pressure, psia
Thus the expression Pf - Pi represents the pressure differential AP to which animals were exposed, and the fractional pressure differential expresses the environmental pressure variation to which the animal was subjected as a percentage of the final absolute pressure.
On the other hand, the pressure ratio was calculated as follows:
Pressure ratio = (Pf - Pi)/Pi
Thus the pressure ratio defines the environmental pressure change as a percentage of the initial or ambient absolute pressure. The reader will appreciate that the pressure ratio is also similar to Pf (absolute)/Pi (absolute) except that the latter expression is 100 per cent more than the former, i.e.,
[(Pf-Pi)/Pi] + 100 = Pf/Pi
154
Table 6.3 —SUMMARY OF LUNG LESIONS IN DOGS AS RELATED TO MAXIMAL INTERNAL OVERPRESSURE
Max. internal
pressure, Animal
designation Lung pathology*
psi or No. Wall side Room side Remarks
1.3-22.3 31 22.8 Z-ll-A
Z-11 Z-il-B
+
26.6 A-l
A-Vi A-2
+ Displaced, dynamic pressure > 12 psi
34.4 - 47 11 53.0t D-2 + +
D-2-0 +++ ++ 63.6 Z-6 + + 63.9 Z-l +++ ++ Fatally displaced, dynamic
pressure >12 psi z-y2 + Displaced, dynamic pressure
64.9 Z-2 >12 psi
65.5 Z-5 66.5 Z-8-A
Z-8-B + Displaced, dynamic pressure
67.2 Z-4 unknown
68.0 71.6
Z-7 C-1 C-1-0
Pneumothorax
73.2 Z-3 + 85.8 C-2 ++ ++
C-2-0 ++ ++
Total 64 8 9 U-22 A and B not included
*+, mild; ++, moderate; +++, severe. t Estimated value.
6.2.1 Pulmonary Pathology
Study of Tables 6.1 and 6.2 makes it apparent that pressure changes encountered inside the several shelters were not of the magnitude or character to produce severe pulmonary damage in dogs. It is only possible to summarize the meager positive findings in relation to the several parameters of the blast which are noted in the tables, with the hope that minimal damaging conditions for dogs might be defined and that useful suggestions for future laboratory and field work will be forthcoming.
(a) Peak Overpressures. Data in Table 6.2 for individual dogs, showing maximal internal wall pressures in relation to pulmonary lesions noted, are summarized in Table 6.3. Of 64 animals, hemorrhagic lung lesions were seen in 11, and a pneumothorax was seen in one. Four of these animals were displaced—one fatally—and it is not possible to assign a single cause for the damage noted, i.e., whether due to pressure per se, dynamic pressure or wind- age, accelerative or decelerative trauma associated with displacement, or some combination of these factors.
The reader will appreciate that there is no consistent relation between peak overpressure and pulmonary lesions, although there is a tendency for damage to be associated with the higher environmental pressures.
155
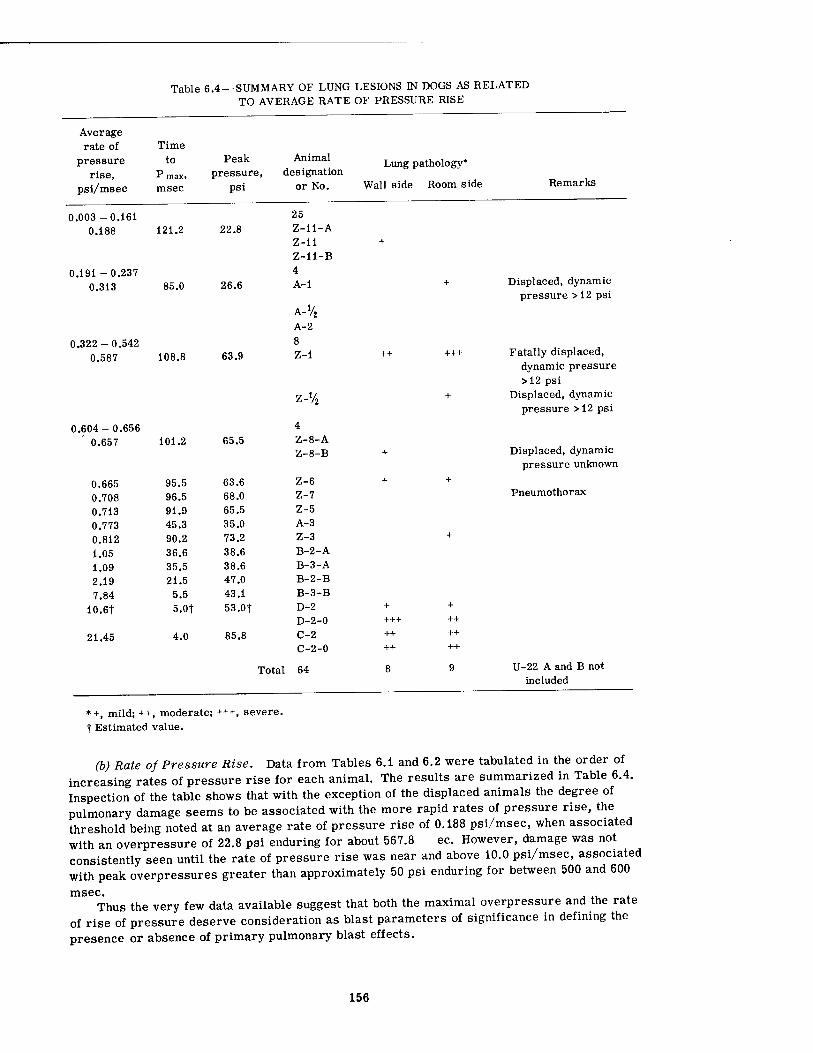
Table 6.4 —SUMMARY OF LUNG LESIONS IN DOGS AS RELATED
TO AVERAGE RATE OF PRESSURE RISE
Average rate of Time
pressure to Peak Animal Lung pathology* rise, P maxt pressure, designation
psi/msec msec psi or No. Wall side Room side Remarks
0.003 -0.161 25
0.188 121.2 22.8 Z-U-A Z-11 Z-ll-B
+
0.191 -0.237 4
0.313 85.0 26.6 A-l
A-V, A-2
+ Displaced, dynamic pressure >12 psi
0.322-0.542 8
0.587 108.8 63.9 Z-l ++ +++ Fatally displaced, dynamic pressure >12 psi
z-y, + Displaced, dynamic pressure >12 psi
0.604-0.656 4
0.657 101.2 65.5 Z-8-A Z-8-B + Displaced, dynamic
pressure unknown
0.665 95.5 63.6 Z-6 + +
0.708 96.5 68.0 Z-7 Pneumothorax
0.713 91.9 65.5 Z-5
0.773 45.3 35.0 A-3
0.812 90.2 73.2 Z-3 +
1.05 36.6 38.6 B-2-A
1.09 35.5 38.6 B-3-A
2.19 21.5 47.0 B-2-B
7.84 5.5 43.1 B-3-B
10.6t 5.0t 53.0t D-2 D-2-0
+ +
+++ ++
21.45 4.0 85.8 C-2 C-2-0
++ ++
++ ++
Total 64 8 9 U-22 A and B not included
*+, mild; ++, moderate; +++, severe. t Estimated value.
(b) Rate of Pressure Rise. Data from Tables 6.1 and 6.2 were tabulated in the order of increasing rates of pressure rise for each animal. The results are summarized in Table 6.4. Inspection of the table shows that with the exception of the displaced animals the degree of pulmonary damage seems to be associated with the more rapid rates of pressure rise, the threshold being noted at an average rate of pressure rise of 0.188 psi/msec, when associated with an overpressure of 22.8 psi enduring for about 567.8 ec. However, damage was not consistently seen until the rate of pressure rise was near and above 10.0 psi/msec, associated with peak overpressures greater than approximately 50 psi enduring for between 500 and 600 mopp
Thus the very few data available suggest that both the maximal overpressure and the rate of rise of pressure deserve consideration as blast parameters of significance in defining the presence or absence of primary pulmonary blast effects.
156
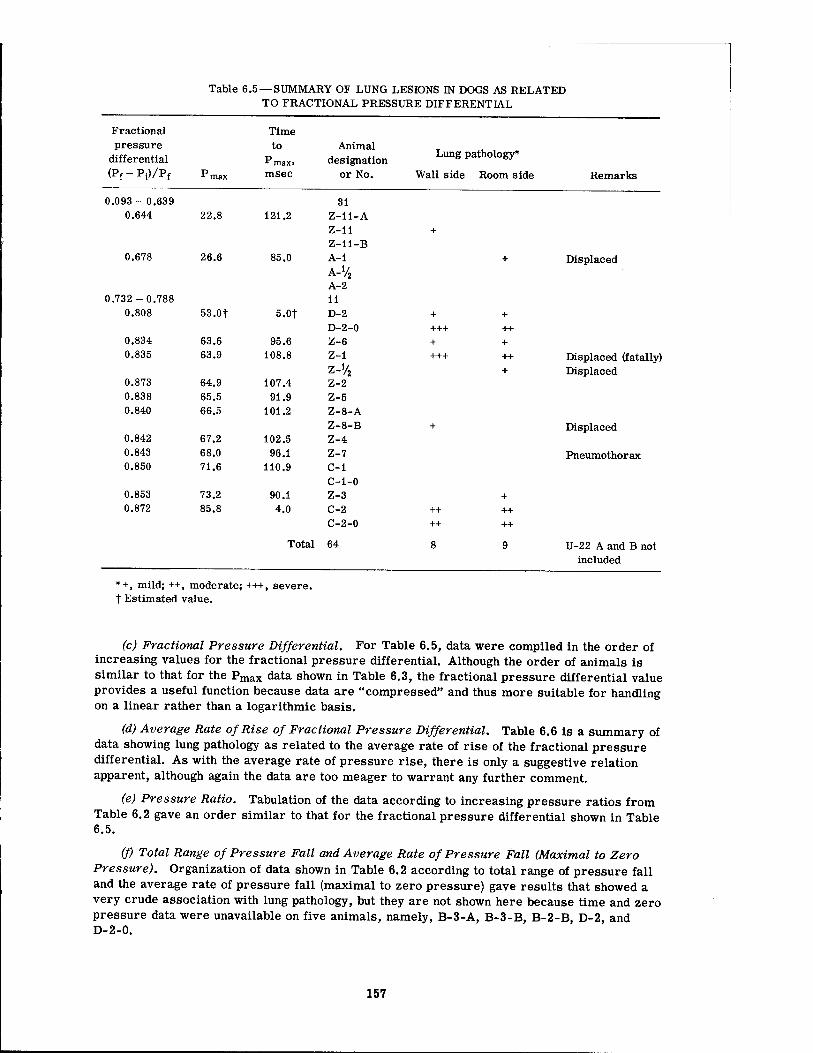
Table 6.5—SUMMARY OF LUNG LESIONS IN DOGS AS RELATED TO FRACTIONAL PRESSURE DIFFERENTIAL
Fractional Time pressure
differential to
"maxi
Animal designation
Lung pathology*
(Pf-Pi)/Pf "max msec or No. Wall side Room side Remarks
0.093 -0.639 31 0.644 22.8 121.2 Z-ll-A
Z-11 Z-ll-B
+
0.678 26.6 85.0 A-l
A-V2 A-2
+ Displaced
0.732-0.788 11 0.808 53.0t 5.0t D-2
D-2-0 + + +++ ++
0.834 63.6 95.6 Z-6 + + 0.835 63.9 108.8 Z-i +++ ++ Displaced (fatally)
0.873 64.9 107.4 z-V2 Z-2
+ Displaced
0.838 65.5 91.9 Z-5 0.840 66.5 101.2 Z-8-A
0.842 67.2 102.5 Z-8-B Z-4
+ Displaced
0.843 0.850
68.0 71.6
96.1 110.9
Z-7 C-1 C-1-0
Pneumothorax
0.853 73.2 90.1 Z-3 + 0.872 85.8 4.0 C-2
C-2-0 ++ ++ ++ ++
Total 64 8 9 U-22 A and B not included
*+, mild; ++, moderate; +++, severe. t Estimated value.
(c) Fractional Pressure Differential. For Table 6.5, data were compiled in the order of increasing values for the fractional pressure differential. Although the order of animals is similar to that for the Pmax data shown in Table 6.3, the fractional pressure differential value provides a useful function because data are "compressed" and thus more suitable for handling on a linear rather than a logarithmic basis.
(d) Average Rate of Rise of Fractional Pressure Differential. Table 6.6 is a summary of data showing lung pathology as related to the average rate of rise of the fractional pressure differential. As with the average rate of pressure rise, there is only a suggestive relation apparent, although again the data are too meager to warrant any further comment.
(e) Pressure Ratio. Tabulation of the data according to increasing pressure ratios from Table 6.2 gave an order similar to that for the fractional pressure differential shown in Table 6.5.
(f) Total Range of Pressure Fall and Average Rate of Pressure Fall (Maximal to Zero Pressure). Organization of data shown in Table 6.2 according to total range of pressure fall and the average rate of pressure fall (maximal to zero pressure) gave results that showed a very crude association with lung pathology, but they are not shown here because time and zero pressure data were unavailable on five animals, namely, B-3-A, B-3-B, B-2-B, D-2, and D-2-0.
157
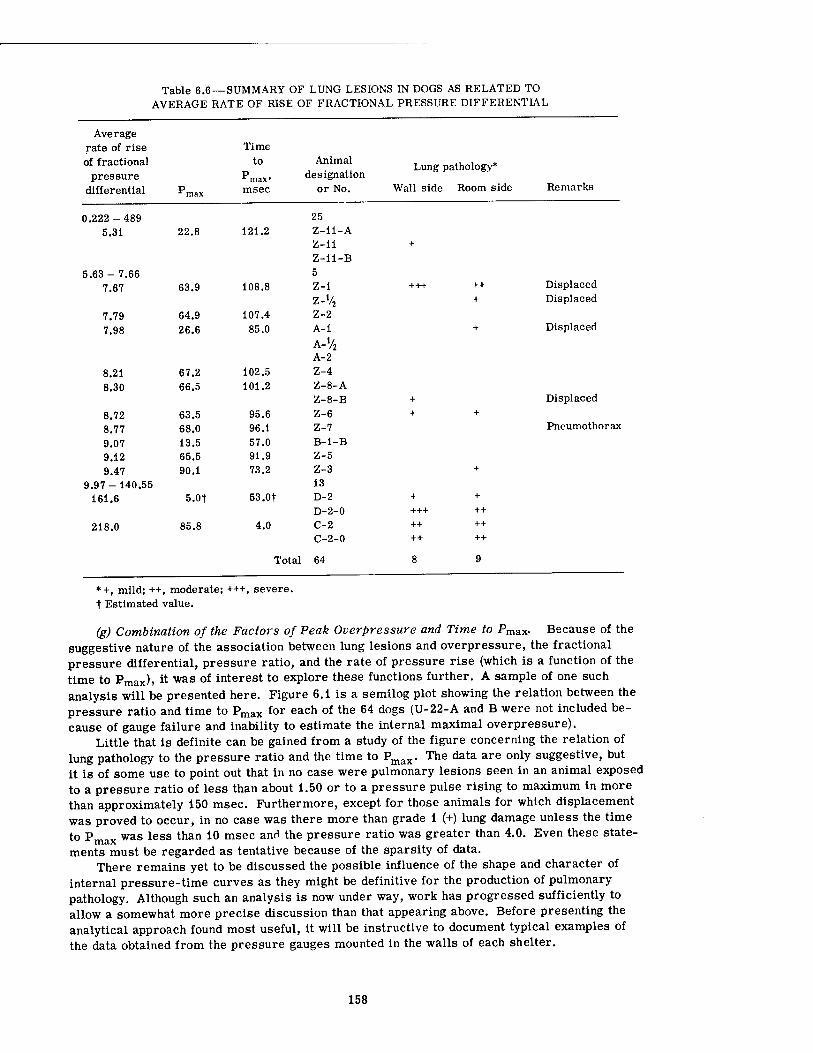
Table 6.6—SUMMARY OF LUNG LESIONS IN DOGS AS RELATED TO AVERAGE RATE OF RISE OF FRACTIONAL PRESSURE DIFFERENTIAL
Average rate of rise of fractional
pressure differential
Time to
1 max' msec
Animal designation
or No.
Lung pathology*
Wall side Room side Remarks
0.222-489 5.31
5.63 - 7.66 7.67
7.79 7.98
8.21 8.30
8.72 8.77 9.07 9.12 9.47
9.97- 140.55 161.6
218.0
22.8
63.9
64.9 26.6
67.2 66.5
63.5 68.0 13.5 65.5 90.1
5.0f
85.8
121.2
108.8
107.4 85.0
102.5 101.2
95.6 96.1 57.0 91.9 73.2
53.0t
4.0
25 Z-li-A Z-li Z-li-B 5 Z-l Z-V, Z-2 A-l A-V, A-2 Z-4 Z-8-A Z-8-B Z-6 Z-7 B-l-B Z-5 Z-3 13 D-2 D-2-0 C-2 C-2-0
++ +
Displaced Displaced
Displaced
Displaced
Pneumothorax
+ +++ ++ ++
++ ++ ++
Total 64
*+, mild; ++, moderate; +++, severe, t Estimated value.
(g) Combination of the Factors of Peak Overpressure and Time to PmSLX. Because of the suggestive nature of the association between lung lesions and overpressure, the fractional pressure differential, pressure ratio, and the rate of pressure rise (which is a function of the time to Pmax), it was of interest to explore these functions further. A sample of one such analysis will be presented here. Figure 6.1 is a semilog plot showing the relation between the pressure ratio and time to Pmax for each of the 64 dogs (U-22-A and B were not included be- cause of gauge failure and inability to estimate the internal maximal overpressure).
Little that is definite can be gained from a study of the figure concerning the relation of lung pathology to the pressure ratio and the time to Pmax- The data are only suggestive, but it is of some use to point out that in no case were pulmonary lesions seen in an animal exposed to a pressure ratio of less than about 1.50 or to a pressure pulse rising to maximum in more than approximately 150 msec. Furthermore, except for those animals for which displacement was proved to occur, in no case was there more than grade 1 (+) lung damage unless the time to P was less than 10 msec and the pressure ratio was greater than 4.0. Even these state- ments must be regarded as tentative because of the sparsity of data.
There remains yet to be discussed the possible influence of the shape and character of internal pressure-time curves as they might be definitive for the production of pulmonary pathology. Although such an analysis is now under way, work has progressed sufficiently to allow a somewhat more precise discussion than that appearing above. Before presenting the analytical approach found most useful, it will be instructive to document typical examples of the data obtained from the pressure gauges mounted in the walls of each shelter.
158
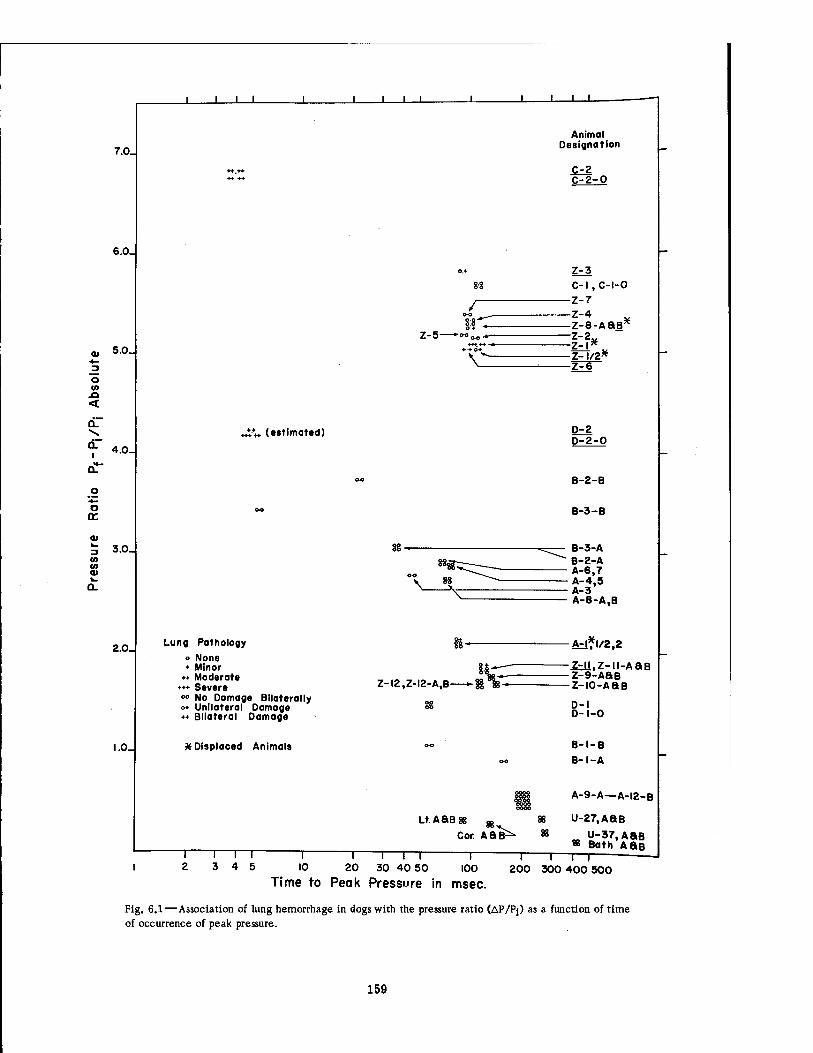
7.0-
6.0_
5.0.
o
<
QT I
o or
01
4.0-
3.0_
2.0-
l.0_
J I L
88
Z-5- 8:8' o +
V
t*«. (estimated)
Lung Pathology o None ♦ Minor ♦♦ Moderate
♦♦♦ Severe oo NO Damage Bilaterally o* Unilateral Damage ♦♦ Bilateral Damage
X Displaced Animals
Z-I2,Z-I2-A,B-
Animal Designation
C-2-0
Lt. ASB88 m
Cor. A 8^
86
Z-3 C-l ,C-l-0
-Z-7 -Z-4 -Z-S-ABB* ~z_2* -Z-l/2* -Z^~
D-2 D-2-0
B-2-B
B-3-B
-AH^I/2,2
-Z=M,Z-ll-AaB -Z-9-ASB -Z-IO-ABB
D-l D-l-O
B-l-B B-l-A
A-9-A—A-I2-B
U-27.A8B
U-37,A8B » Bath A8B
TH I i r~i i 1 1—i—i 1 1— I 2 3 4 5 10 20 30 40 50 100 200 300 400 500
Time to Peak Pressure in msec.
Fig. 6.1—Association of lung hemorrhage in dogs with the pressure ratio (AP/Pj) as a function of time of occurrence of peak pressure.
159
(h) Pressure-Time Curves. (1) Bathroom, Basement Lean-to, and Basement Corner Room Shelters. Figure 6.2 shows reproductions of the pressure-time tracings obtained inside the Series II bathroom, basement corner room, and basement lean-to shelters, along with the record of the incident pressure obtained from a ground baffle gauge located at the same dis- tance from Ground Zero (4700 ft). Attention is called to the contrast between the pressure- . time curve obtained inside the bathroom shelter and the curves for the two basement shelters. In the latter case the curves were similar to the incident pressure record (bottom of Fig. 6.2). In the former instance, however, not only was the rising portion of the curve modified but the peak pressure was sharply decreased, being only i.3 psi inside the bathroom and 5.1 psi out- side the house at ground level —almost a fourfold attenuation in maximal pressure.
These facts illustrate the point that pressures inside a structure can be either equal to or much less than those existing outside, depending upon design.
(2) Utility Shelters. In Fig. 6.3 are reproduced the pressure-time curves recorded inside and outside the utility shelter at the 3750-ft range. Here again the reader will note the rela- tively slow rate of rise of the inside, compared with the outside, tracing along with over a two- fold attenuation of the Pmax inside compared to outside, i.e., a decrease from 7.8 to 2.6 psi.
(3) Basement Exit Shelters. Pressure-time phenomena inside the several basement exit shelters were complicated by at least three factors: (i) the behavior of the outside doors, which failed at unknown times but apparently during the existence of appreciable outside over- pressures and winds; (2) the aerodynamic behavior of the openings into the shelters as they functioned as "metering" orifices; and (3) reflections of pressure (sometimes multiple) off the side walls and ends of the structures which primarily were functions of geometry of the struc- tures and the magnitude of the pressure pulse entering at any given time.
These factors combined tended to depress or magnify internal maximal pressures com- pared with those existing outside, as can be appreciated by noting data in Table 6.1. For ex- ample, peak pressures in the closed, half-open, and open shelters located at the same dis- tance from Ground Zero were 11.5, 38.6, and 38.6 psi for the gauges located near the entrance, but 13.5, 47.0, and 43.1 psi for the gauges placed near the end wall, respectively. The hatches produced about a three- to fourfold decrease in the peak overpressures. Also, for the open and closed basement shelters closest to Ground Zero, the maximal inside pressures were 85.8 and 71.6 psi, respectively, the doors serving to attenuate the pressures somewhat. These over- pressures were greater than those existing outside but were less than twice the latter.
Figure 6.4 shows examples of the internal pressure-time data recorded inside four base- ment shelters. Tracings B-l-A, B-l-B, and B-D-l represent the least severe conditions ex- perienced by animals exposed in the closed basement shelters, whereas tracing B-C-2, a drawing of one of the open basement shelter traces after analyses from a film recorder, ex- emplifies the most severe environmental pressure-time phenomena to which animals were exposed.
(4) Group Shelters. The most outstanding fact relevant to the pressure phenomena that occurred inside the divided group shelters concerned the differences in maximal overpres- sures recorded inside the slow- and fast-fill sides of the structures. For example, the Series II fast-fill Pmax was 73.2 psi, and the slow-fill Pmax was 22.8 psi (see Table 6.1). These overpressures were in both instances less than those occurring outside, and they reflect the marked attenuation in pressure which may be achieved by using the entrance into an open shelter as a metering orifice to choke the air flow into the structure.
Examples of the contour and character of the pressure-time phenomena are presented in Fig. 6.5, which shows typical tracings for the slow-fill (top) and fast-fill (middle) pressure gauges, along with data obtained from the dynamic pressure gauge Z-Q (bottom).
(i) Fractional or Incremental Analysis of the Pressure-Time Data. It was thought worth while to further analyze the pressure-time curves, and a variety of approaches were explored. Basic data in the form of expanded plots were made available through the cooperation of Sandia Corporation personnel, as were analyses of selected curves, to show the area beneath the pressure-time plots (/ P dt) and the rate of pressure change as a function of time (dp/dt). Neither of these procedures seemed promising, although at a time in the future when additional
160
2-|
I-
0-
0.0 0.5 1.0
BATHROOM
*MlM*"M*MNMMmifl%MtotfaM(rtA
2.0 —r— 2.5
5-1 4- 3- 2- I- 0-
Q.
ÜJ Dt 3
(f> 4-1 W 3 Q: a
0. 2- I - 0-
0.0
0.0
0.5 1.0
0.5
»^«■^V,
i.o
LEAN-TO
~i— 1.5 2.0
CORNER ROOM
1.5 2.0 ~i— 2.5
2.5
3.0
6-. 5- 4- 3- 2- I- 0-
0.0 0.5 l 1.0
INCIDENT
1.5 2.0
TIME (sec)
Fig. 6.2—Pressure-time curves at 4700 ft for the Series II experiments.
2.5
161
o "cvi
O "to
1^
Q_ >- I- >- I-
in I- Z LÜ Q
o
"c\i
CJ o in
in ö
o ö
I I ! IO CM — O o to
T" O
m
m "d
o "d
o S CD =»
1 s e UJ v ^ 8
»-
(isd) 'Bdnssadd
BO
162
CO ü C o c o
CD
Q UJ CO O _l Ü
X UJ
I-
CM
en "d
oo ~d
1^ "d
<o "d
c
m
GO
Q UJ co o _j o
X UJ
UJ
UJ CO < CD
^
in T" m
T" o
- * T3 C a> *—*
o — a
' m Oi o Q
UJ OO CO d o
_i ü
N- i- o X
UJ <0 1- d 2
UJ
m 2 Ul d CO < CD t
o
to o
CM ( o <
o o
CM
f ^
i i i i r o m o io o CM — —
_0> d
oo "d
"d
"d
m "d
d
ro d
CM
d
o o
CD
Ul
d
d
d J3
to d
o cu CO
Ul
CM
d a 3 CO en 01 a.
I •* to
M>
O d
i—i—i—i—r O ID O m O O N IT) CM
(!Sd) '3<dnSS3Ud
163
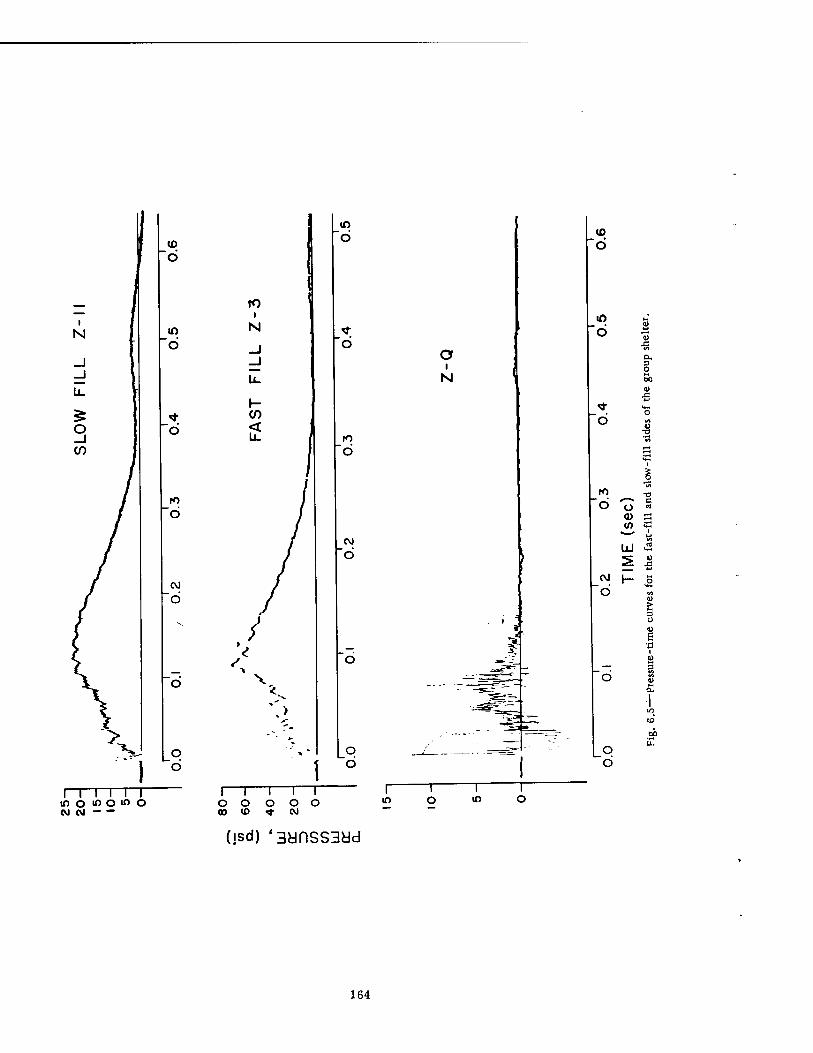
(O
>
to I
N
I-
<
/
X
in 6
6
Ö
X
CO
b
Lq O
O i
N
J
b
m M* <u o i—•
je
a. 3 O 00 u
X!
*r «+-. o o V)
to ■o c
U Ü «1
CD ?! to C*H
*— tt LÜ 2 a>
J3 _ *-J
CJ J- £ Ü (A
u
U u E •d
1
__ 3
o b
i i i i i i to o n> O m o CM CM
I—I—I—I—I o o o o o 00 ID ^ W
(isd) '3dnSS3dd
r in m
l o
164
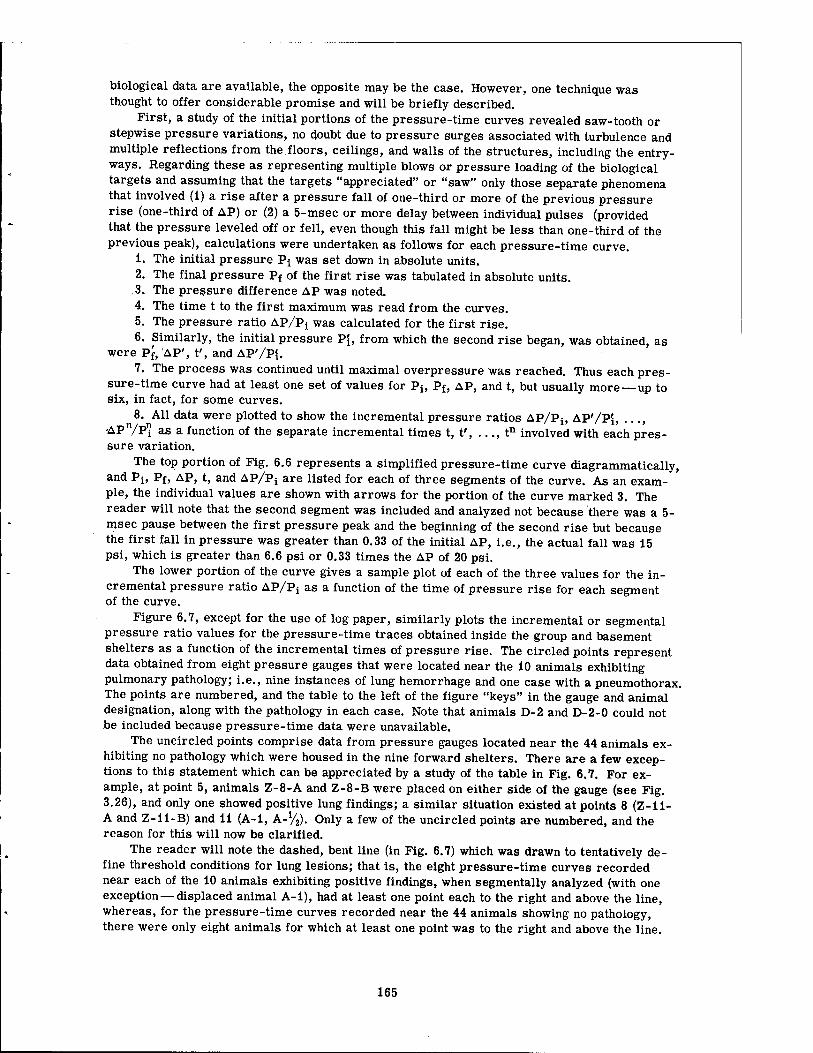
biological data are available, the opposite may be the case. However, one technique was thought to offer considerable promise and will be briefly described.
First, a study of the initial portions of the pressure-time curves revealed saw-tooth or stepwise pressure variations, no doubt due to pressure surges associated with turbulence and multiple reflections from the.floors, ceilings, and walls of the structures, including the entry- ways. Regarding these as representing multiple blows or pressure loading of the biological targets and assuming that the targets "appreciated" or "saw" only those separate phenomena that involved (1) a rise after a pressure fall of one-third or more of the previous pressure rise (one-third of AP) or (2) a 5-msec or more delay between individual pulses (provided that the pressure leveled off or fell, even though this fall might be less than one-third of the previous peak), calculations were undertaken as follows for each pressure-time curve.
1. The initial pressure P4 was set down in absolute units. 2. The final pressure Pf of the first rise was tabulated in absolute units. 3. The pressure difference AP was noted. 4. The time t to the first maximum was read from the curves. 5. The pressure ratio AP/Pj was calculated for the first rise. 6. Similarly, the initial pressure PJ, from which the second rise began, was obtained, as
were Pf, AP', t', and AP'/P«. 7. The process was continued until maximal overpressure was reached. Thus each pres-
sure-time curve had at least one set of values for Pt, Pf, AP, and t, but usually more—up to six, in fact, for some curves.
8. All data were plotted to show the incremental pressure ratios AP/Pj, AP'/P£, ..., ,Apypn ag a function of the separate incremental times t, t', ..., tn involved with each pres- sure variation.
The top portion of Fig. 6.6 represents a simplified pressure-time curve diagrammatically, and Pj, Pf, AP, t, and AP/Pi are listed for each of three segments of the curve. As an exam- ple, the individual values are shown with arrows for the portion of the curve marked 3. The reader will note that the second segment was included and analyzed not because there was a 5- msec pause between the first pressure peak and the beginning of the second rise but because the first fall in pressure was greater than 0.33 of the initial AP, i.e., the actual fall was 15 psi, which is greater than 6.6 psi or 0.33 times the AP of 20 psi.
The lower portion of the curve gives a sample plot of each of the three values for the in- cremental pressure ratio AP/Pj as a function of the time of pressure rise for each segment of the curve.
Figure 6.7, except for the use of log paper, similarly plots the incremental or segmental pressure ratio values for the pressure-time traces obtained inside the group and basement shelters as a function of the incremental times of pressure rise. The circled points represent data obtained from eight pressure gauges that were located near the 10 animals exhibiting pulmonary pathology; i.e., nine instances of lung hemorrhage and one case with a pneumothorax. The points are numbered, and the table to the left of the figure "keys" in the gauge and animal designation, along with the pathology in each case. Note that animals D-2 and D-2-0 could not be included because pressure-time data were unavailable.
The uncircled points comprise data from pressure gauges located near the 44 animals ex- hibiting no pathology which were housed in the nine forward shelters. There are a few excep- tions to this statement which can be appreciated by a study of the table in Fig. 6.7. For ex- ample, at point 5, animals Z-8-A and Z-8-B were placed on either side of the gauge (see Fig. 3.26), and only one showed positive lung findings; a similar situation existed at points 8 (Z-li- A and Z-ll-B) and 11 (A-l, A-V2). Only a few of the uncircled points are numbered, and the reason for this will now be clarified.
The reader will note the dashed, bent line (in Fig. 6.7) which was drawn to tentatively de- fine threshold conditions for lung lesions; that is, the eight pressure-time curves recorded near each of the 10 animals exhibiting positive findings, when segmentally analyzed (with one exception — displaced animal A-l), had at least one point each to the right and above the line, whereas, for the pressure-time curves recorded near the 44 animals showing no pathology, there were only eight animals for which at least one point was to the right and above the line.
165
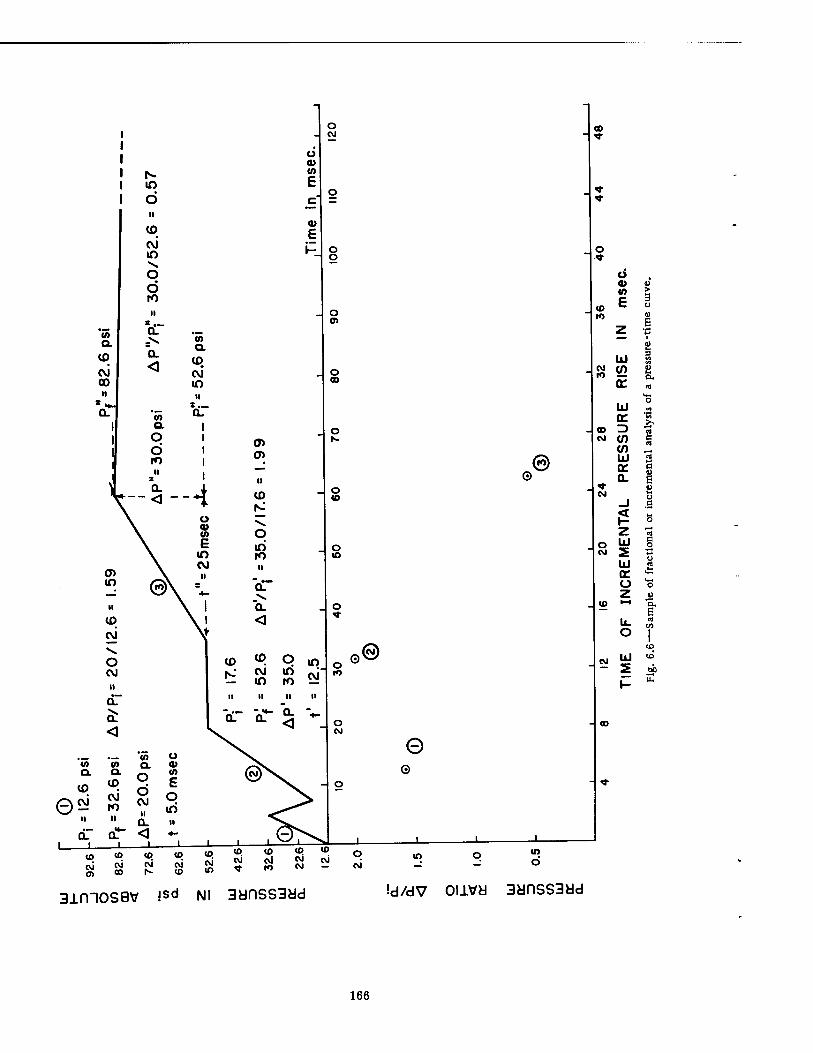
I N i m 1 d
n
(0 OJ m V. O O to ii
s ,__ (A Q.
0. ,_ ."V CO
Q.
c\i 0. < to
CJ* 00 in II ii
*H- 2 t ..
1 1 I
CL O d
a.
ro n
0_ -i u 0) (0 E m CM
0> II
a.
0Sy
in
II
to CM
o CM II
(0 Q.
<X> CM ro II
©\ V
to a. O O CM II
<
o a> CO
E O in II
CM 0)
CM CO
CO CM r»
cvi to
3±mossv !Sd Nl 3anSS3dd !d/dv ouvu 3dnss3yd
166
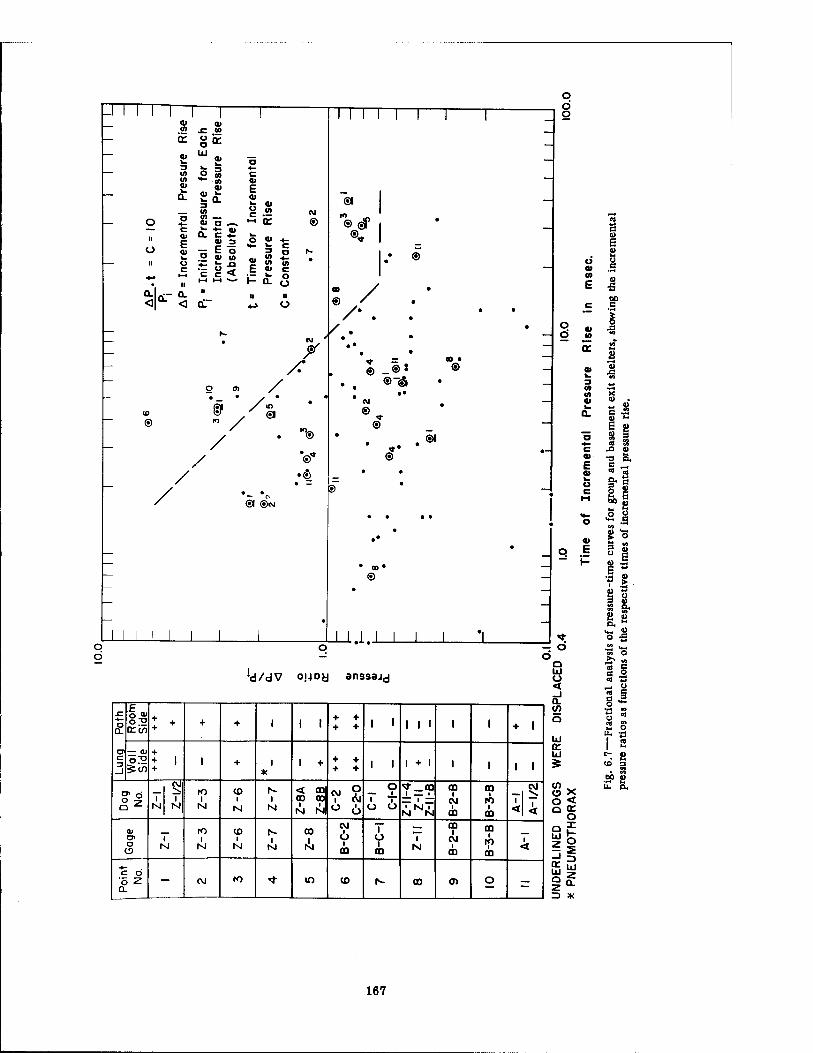
O £ II
o
o- L—
0) 01 u> -C in
OC u a: 01 kl
UJ 01 a
3 w 4- U) o c in at k. 0.
"5
01 w 3 <0 in 0)
01 k. 0.
"5
E at k. u c
t—1
01 in
be CM
® c +-
U. c k.
F 01 E
3 O w c 0) — O 3 r- k. 01 in 01
E in 9
u c "c
k. O c
.a < 01
k.
in c
II t-t HH ^" i- a. Ü
0. it ii ii
< a." *J O
ID
®
/
/: o 0> /
• - * / *
? /* ' / y . ®
/
/.
•- V ®! ®tM
O d o
®1
®
®
/•. .
® _®J CO • ®
®-& • • •
<M
® •
<* ®
, « *• ®
s>
o d
u at in E
01 «0
in in at
®
O d
LLL.I.I_L
'd/dV o|4Dy anssajj
F sz
s. 0>
o o»
0Cc/) : - + + 1 1 1 + + + + 1 1 1 1 1 1 ' + 1
— a> + c 3
_J o2 5c/>
+ i + 1 + *
1 + + + + + l 1 1 + 1 1 1 1 1
o> 0 ° z M 1
M
i-O
M
(0 1
N 1
M Z-8
A
Z-8
B
C-2
C-2
-0
C-l
C-l
-0
Z-l
l-4
Z
-ll
Z-l
l-B
m ■
CM i
CO
m ■
■ CO <
CM
1 < CD IO (0 r>- CD
CM 1 — m i m
O 1
M I
N I N
i N tsl i
m o CD
i N
CM 1
GO ■P 00
1 < 4- c o
"6 Z — co 1*5 "t m CO N- CO 0> o — 0-
— o o a
UJ o < _i a. c/> a
OC UJ
Sx ° %
Z3 *
e
u •S eo c
V .
S .3
s i a) 3 J3 (0
V T3 o. l- S - 01 « « k. u
8 I B0 <o
c
J S o •~ .s a* ► o
E 3§ 1- E t ■5 tu V > Ü « a o 3 <u S S" s a o. *• •- 2 o * " 'S co O
a 3 <9 4-1 ^- o (0 S o **
o « u O u. -g
bo u
167
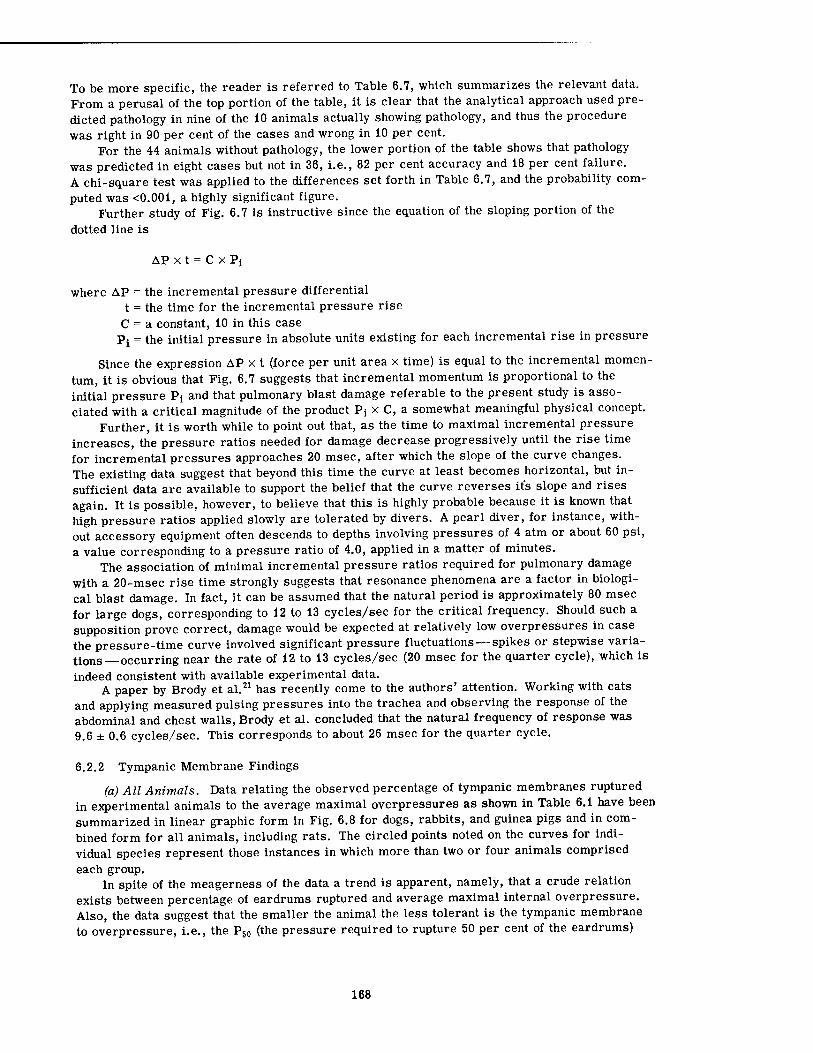
To be more specific, the reader is referred to Table 6.7, which summarizes the relevant data. From a perusal of the top portion of the table, it is clear that the analytical approach used pre- dicted pathology in nine of the 10 animals actually showing pathology, and thus the procedure was right in 90 per cent of the cases and wrong in 10 per cent.
For the 44 animals without pathology, the lower portion of the table shows that pathology was predicted in eight cases but not in 36, i.e., 82 per cent accuracy and 18 per cent failure. A chi-square test was applied to the differences set forth in Table 6.7, and the probability com- puted was <0.001, a highly significant figure.
Further study of Fig. 6.7 is instructive since the equation of the sloping portion of the dotted line is
AP X t = C X P)
where AP = the incremental pressure differential t = the time for the incremental pressure rise
C = a constant, 10 in this case Pt = the initial pressure in absolute units existing for each incremental rise in pressure
Since the expression AP x t (force per unit area x time) is equal to the incremental momen- tum, it is obvious that Fig. 6.7 suggests that incremental momentum is proportional to the initial pressure Pi and that pulmonary blast damage referable to the present study is asso- ciated with a critical magnitude of the product Pi x C, a somewhat meaningful physical concept.
Further, it is worth while to point out that, as the time to maximal incremental pressure increases, the pressure ratios needed for damage decrease progressively until the rise time for incremental pressures approaches 20 msec, after which the slope of the curve changes. The existing data suggest that beyond this time the curve at least becomes horizontal, but in- sufficient data are available to support the belief that the curve reverses it's slope and rises again. It is possible, however, to believe that this is highly probable because it is known that high pressure ratios applied slowly are tolerated by divers. A pearl diver, for instance, with- out accessory equipment often descends to depths involving pressures of 4 atm or about 60 psi, a value corresponding to a pressure ratio of 4.0, applied in a matter of minutes.
The association of minimal incremental pressure ratios required for pulmonary damage with a 20-msec rise time strongly suggests that resonance phenomena are a factor in biologi- cal blast damage. In fact, it can be assumed that the natural period is approximately 80 msec for large dogs, corresponding to 12 to 13 cycles/sec for the critical frequency. Should such a supposition prove correct, damage would be expected at relatively low overpressures in case the pressure-time curve involved significant pressure fluctuations — spikes or stepwise varia- tions—occurring near the rate of 12 to 13 cycles/sec (20 msec for the quarter cycle), which is indeed consistent with available experimental data.
A paper by Brody et al.21 has recently come to the authors' attention. Working with cats and applying measured pulsing pressures into the trachea and observing the response of the abdominal and chest walls, Brody et al. concluded that the natural frequency of response was 9.6 ± 0.6 cycles/sec. This corresponds to about 26 msec for the quarter cycle.
6.2.2 Tympanic Membrane Findings
(a) All Animals. Data relating the observed percentage of tympanic membranes ruptured in experimental animals to the average maximal overpressures as shown in Table 6.1 have been summarized in linear graphic form in Fig. 6.8 for dogs, rabbits, and guinea pigs and in com- bined form for all animals, including rats. The circled points noted on the curves for indi- vidual species represent those instances in which more than two or four animals comprised each group.
In spite of the meagerness of the data a trend is apparent, namely, that a crude relation exists between percentage of eardrums ruptured and average maximal internal overpressure. Also, the data suggest that the smaller the animal the less tolerant is the tympanic membrane to overpressure, i.e., the P50 (the pressure required to rupture 50 per cent of the eardrums)
168
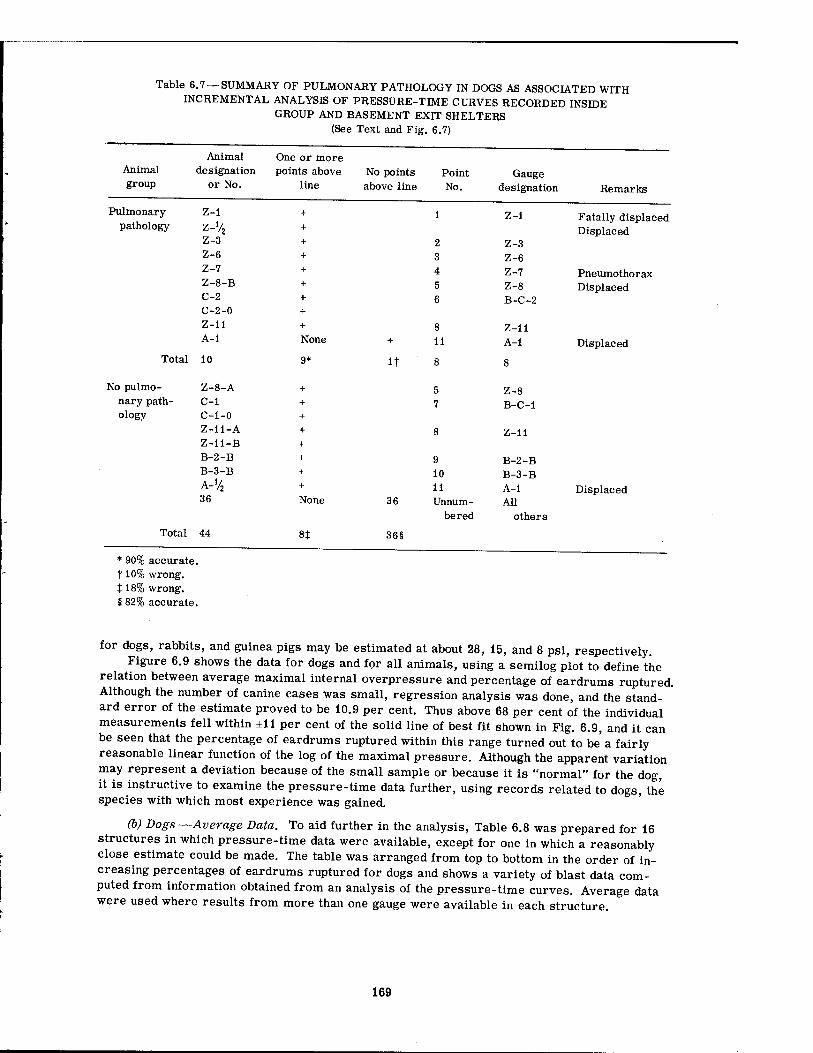
Table 6.7 —SUMMARY OF PULMONARY PATHOLOGY IN DOGS AS ASSOCIATED WITH INCREMENTAL ANALYSIS OF PRESSURE-TIME CURVES RECORDED INSIDE
GROUP AND BASEMENT EXIT SHELTERS (See Text and Fig. 6.7)
Animal One or more Animal designation points above No points Point Gauge group or No. line above line No. designation Remarks
Pulmonary Z-l + 1 Z-l Fatally displaced pathology z-1/, + Displaced
Z-3 + 2 Z-3 Z-6 + 3 Z-6 Z-7 + 4 Z-7 Pneumothorax Z-8-B + 5 Z-8 Displaced C-2 4- 6 B-C-2 C-2-0 +
Z-ll + 8 Z-ll A-l None + 11 A-l Displaced
Total 10 9* It 8 8
No pulmo- Z-8-A + 5 Z-8 nary path- C-i + 7 B-C-l ology C-i-0 +
Z-il-A + 8 Z-ll Z-li-B +
B-2-B + 9 B-2-B B-3-B + 10 B-3-B A-V2 + 11 A-l Displaced 36
Total 44
None
8t
36
36§
Unnum-
bered All
others
* 90% accurate. 110% wrong. 118% wrong. § 82% accurate.
for dogs, rabbits, and guinea pigs may be estimated at about 28, 15, and 8 psi, respectively. Figure 6.9 shows the data for dogs and for all animals, using a semilog plot to define the
relation between average maximal internal overpressure and percentage of eardrums ruptured. Although the number of canine cases was small, regression analysis was done, and the stand- ard error of the estimate proved to be 10.9 per cent. Thus above 68 per cent of the individual measurements fell within ±11 per cent of the solid line of best fit shown in Fig. 6.9, and it can be seen that the percentage of eardrums ruptured within this range turned out to be a fairly reasonable linear function of the log of the maximal pressure. Although the apparent variation may represent a deviation because of the small sample or because it is "normal" for the dog, it is instructive to examine the pressure-time data further, using records related to dogs, the species with which most experience was gained.
(b) Dogs—Average Data. To aid further in the analysis, Table 6.8 was prepared for 16 structures in which pressure-time data were available, except for one in which a reasonably close estimate could be made. The table was arranged from top to bottom in the order of in- creasing percentages of eardrums ruptured for dogs and shows a variety of blast data com- puted from information obtained from an analysis of the pressure-time curves. Average data were used where results from more than one gauge were available in each structure.
169
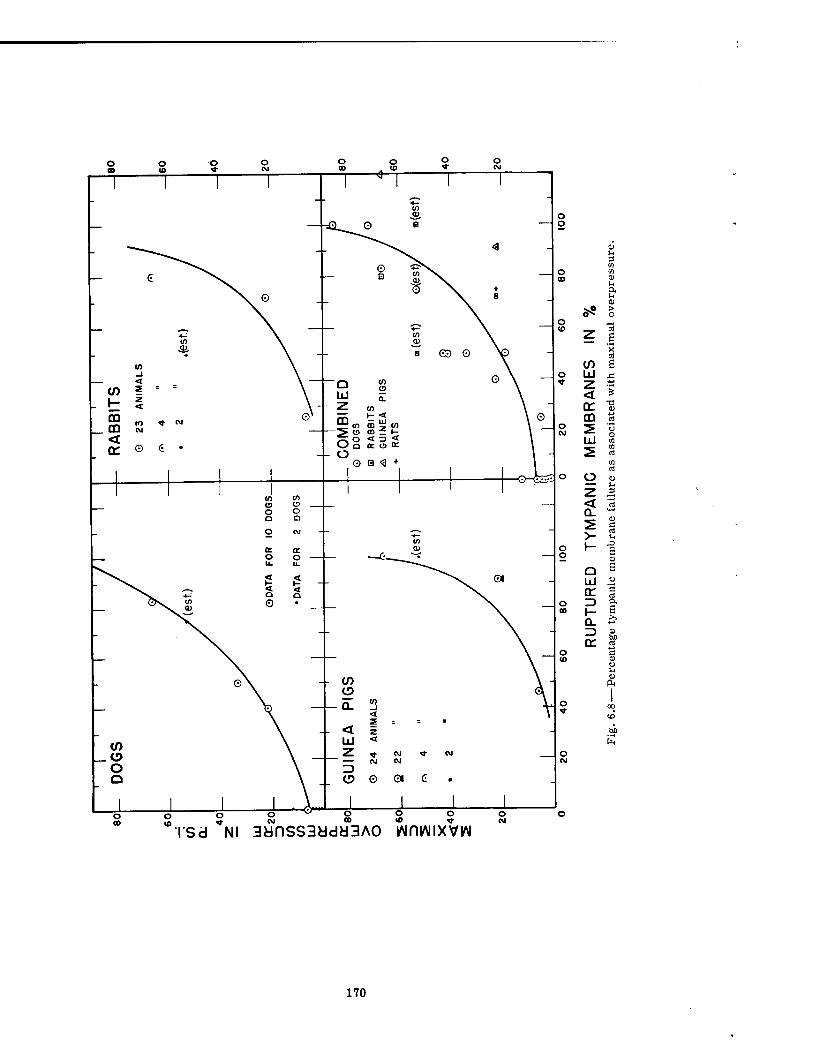
o CD
o •o o 00
o to
o
o o D Q
O CM
O O O
if) O Q.
< UJ Z
O
li- es
e»
o CO
o 10
o o o
"rsa *NI 3ynss3ddd3A0 iflnv\iixvi/\i o CM
< Q_
i- Q.
a; a
> o
s
c CTJ a S >>
Sf
to
170
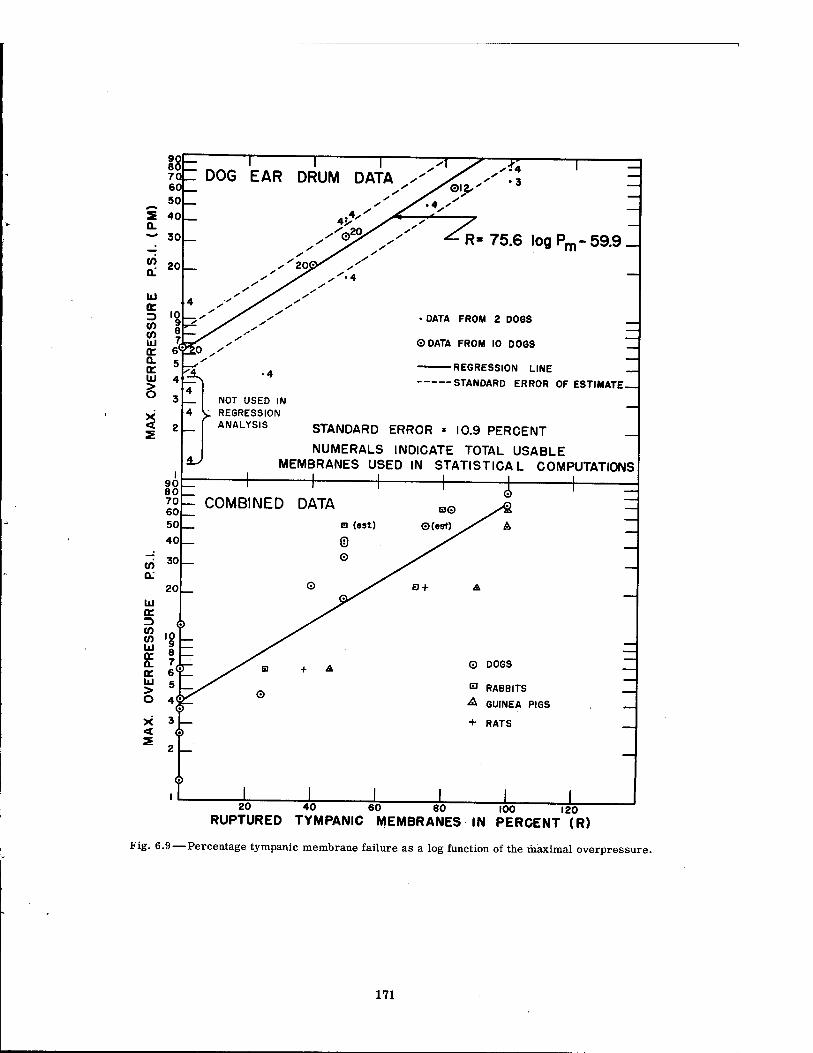
I8E \ I I ^T DOG EAR DRUM DATA ,'
S'&S/ ^R. 75. 6 log Pm-59.9 _
• DATA FROM 2 DOGS
©DATA FROM 10 DOGS
I 90 80 70 60 50
-REGRESSION LINE
-STANDARD ERROR OF ESTIMATE-
NOT USED IN K. REGRESSION
ANALYSIS STANDARD ERROR * 10.9 PERCENT _
NUMERALS INDICATE TOTAL USABLE MEMBRANES USED IN STATISTICAL COMPUTATIONS
i 1 1 1 i 1 = - COMBINED DATA
,t I 1
© DOGS
13 RABBITS
•A GUINEA PIGS
+ RATS
I 20 40 60 80 100 120
RUPTURED TYMPANIC MEMBRANES IN PERCENT (R)
Fig. 6.9—Percentage tympanic membrane failure as a log function of the maximal overpressure.
171
w
w ■J m <: H S o <s c*. Q w
S a o u
o o p « o
< < o u 55 < CO
S w a
^3 si^ 5 ° a" 8.
< E
'S oo P c to 2 S - .a s
• o. "3 -0 ■> 5 <*- ^ £ m ""• o ma
> ¥ « « 2 •? £ ^ *< S
C -5 ?. *
5 ? (ST to
w ,: w
0) cd e .a s0 2 u go) . S n, 5
< o °
s. t e a JS
s £ is >, c iJ a H £
b0 • 3 O ea ;z Ü
c3 B
-r-t CM -»-I
t- in ID
O w O I I I
w © I I
TH CO
•n co
tD Ol N o fc- m -r* co CO CO m
P3 t- N OO CO
P7 n to ^ o © en VH CM CM
-H CM ""* CO CO m
en co en co
I O © o © © © © •^ CM
CO in t- Tf t-
© © ©
co CM co co m co
co co co CM* CM* CM
CO CO 00
CO CO -r-t TH C- CO ■<** CM T4
CO CO c-
TH' CM CO*
CO CO
co en
CO CO
CM* CM
1-" CO*
CO CO
CM CM
cn
© ^ -rH O
CO CO
in to
m p o P <
< co
co co J I
Q i
co
CM ^. c- •< CO < CO ... I I I I
-* co to co 7 7 7 < B CO CO CO
Q I
CO
in co
(M ^T fj" -rH
V co" to" U
CO N
o CO
|S b B 2 i
o *-.
OS | -2 u 3 £ » s S
c 5 s • s
ai ca
cd CO
~ cj -S —
o j S
3 .2 J3 p u u
£ S a £ *. 3
S oj *i a. •£ "3 c * g o e JS S e I - § -
o is O
■■ S » S » CO CO
o!»
JÜ B E s"
- a ° o £ s
172
(1) Fractional Pressure Differential. Using average data from Table 6.8, Fig. 6.10 was plotted showing the percentage of tympanic membranes ruptured as a function of the average fractional pressure differential. The straight line fits the points for 10 dogs, but the curved line more closely approximates a fit for all the data.
(2) Pressure Ratio. Figure 6.11 presents data taken from Table 6.8 and sets forth the relation between average pressure ratio and percentage eardrum failure. Since the plot is linear, the variation from the curve is not very great, but in this instance, as in those from Figs. 6.8 to 6.10, deviations are apparent, and it is useful to examine the circumstances of greatest deviation more closely. A study of Table 6.1 shows a number of interesting facts. First, the animals deviating most from the mean curves were in the basement exit or the lean- to shelters. Second, the time of pressure rise was comparatively short in the basement shelters. Third, overpressures and rates of pressure rise tended to be higher near the closed end compared with the stairway end of the basement shelters, and thus the use of average data might be misleading.
These facts suggest that attention should be paid to the two parameters: rate of pressure rise and time to peak pressure. Also, it is obvious that the data on each dog should not be ignored, nor should segmental analysis of the individual pressure-time curves be neglected.
(3) Rate of Pressure Rise. Accordingly, Fig. 6.12 was prepared to show percentage fail- ure of canine eardrums as related to rate of pressure rise. The spread about the line is suffi- ciently discouraging to prompt further examination of possible relation between eardrum fail- ure, peak overpressure, and time to maximal pressure.
(4) Time of Pressure Rise Combined with Pressure Data. Using the average data from Table 6.8, relations between tympanic membrane failure, the time to reach peak pressure and maximal overpressure, the fractional pressure differential, and the pressure ratio were ex- plored. The results were somewhat surprising and difficult to interpret, and two examples will be mentioned here.
Figure 6.13 shows the average data from Table 6.8 plotted to show the association of per- centage of eardrums ruptured (the figures beside each point indicate membrane failure in per cent) and two blast parameters, the average pressure ratio and the average times to reach maximal pressures. Figure 6.14 is similar except that the fractional pressure differential in- stead of the pressure ratio was utilized.
A study of both Figs. 6.13 and 6.14 suggests that (1) on the average the dog's eardrum is sensitive to the rate of application of the pressure, (2) when the time to peak pressure is be- tween 90 to 100 msec, minimal overpressures will cause failure, and (3) higher pressures will be associated with rupture if the time to peak pressure is longer or shorter than the time stated above. Although the data are far from definitive, it is well to point out here that the problem is far from simple.
For instance, it is not known whether the eardrum was moving inward or outward when rupture occurred. If rupture occurred in the former case, there can be little doubt that the drum would be "time sensitive," i.e., short-duration pulses associated with failure would of necessity have to be relatively high-pressure phenomena to overcome the inertia of the ear- drum and ossicles. Slower developing pressure loads may well simply stretch a young, normally elastic eardrum until it bulges inward to reach the inner wall of the middle ear with- out rupture, a circumstance known to happen in many humans exposed to slowly increasing pressures in low-pressure chambers.
If rupture occurred when the eardrum was moving outward, it is necessary to consider (1) a membrane weakened by inward stretching, (2) the gas volume of the middle ear plus that of the communicating mastoid air cells, (3) the possibility of Eustachian tube ventilation of the middle-ear cavity, and (4) the time and magnitude of the falling pressure, including the nega- tive component associated with blast phenomena. In the human case Armstrong22 has stated that a relative pressure inside the ear of 100 to 200 mm Hg (1.9 to 3.8 psi) is usually suffi- cient to rupture the tympanic membrane, whereas Frenzel23 placed the figure at 160 mm Hg (3.1 psi). In this regard the authors are unaware of any data applicable to the dog.
173
en 01 CD o o o Q Q
o CM
a. n- o o u. u.
< < H \- 4 < O a ©
ÜJ
CM
d CM
6
to
o.
a o
o a CD
1- 4-* 01 z bo ni
LÜ Ü >
O (T a)
LU J3 QL
O
Ü CD Z o
o
ÜJ **-<
O a: CO I-- => rt
i- CO
u. O T3
< C8
o CO a a)
2 UJ fcj
o 2 P t
O
o o
z i 5 >
be
H ü ~n <D Ti
PH O I "> u
J. «> o <*-<
CO T3 • <U
ho >H
Ft CO
3innosav *d/ld-*d ~iviiN3d3ddia 3dnss3dd ~ivi\iouovud
174
UJ ü
UJ Q.
UJ z < CO
Ul
0) f-l =< at 01 0)
Q. (D be
o T3
o
O ta
7» a> o < 0
n tn s P > a>
o t- d * o
Q 9 Ul f*
o £E 3 f- bo 0. +-»
3 <l)
o or u (4
CNJ ft
bo
3imOS8V !d/ld - *d 0I1VU 3UnSS3Ud
175
100
0.01
DATA FROM 2 DOGS
© DATA FROM 10 DOGS
1 _L 20 40 60 80 100
TYMPANIC MEMBRANE RUPTURE IN PERCENT
Fig. 6.12 — Percentage tympanic membrane failure for dogs as a function of the rate of pressure rise.
176
ÜJ
O co m <
Q_
ÖL "N 5 _
< CC
ÜJ er CO CO ÜJ o:
1 1 1 1
/ 100 %
1 1 1 1
FAILURE / /
/ / / .100 /
/ / v /
X / /
X / — X /
X x /I00
"V ©83
~ / 50 % FAILURE / / / © DATA FROM 10 DOGS
.75 (est) / / / . DATA FROM 2 DOGS
/ / / THE FIGURES BESIDE EACH
N. ,5° / POINT REPRESENT EAR v-<50 / DRUM FAILURE IN PERCENT
- \ v / V50 / /25% FAILURE
Vx' / / /
/ _ ©40 /
• 50 / / ^ /
/ — ^ X 1 —.
0 / V /
1 1 ° 1 1 1 o 1 1 1 -o 1 50 100 150 200 250 300 350 400
TIME - ARRIVAL TO PEAK PRESSURE IN MSEC.
Fig. 6.13 — Percentage tympanic membrane failure for dogs as associated with the average pressure ratio and the average times to reach maximal pressures.
177
<n en es © o o □ a
UJ a: Z3
X 3
O
o
a
o IE
< D
UJ I
» S \
o o
m <NJ
o
©o
0 o m ©
° /
o
o ' in »- o I r>-, 'O 1 uL 1
cd C O
a crt IH
<+*
O <u Hi V)
bo a! IH
o o in
2 a)
5 z CD
J3
ÜJ a: 5 -> T3 V) CD CO (0 cd HI
UJ o o o * a.
o CO CO
CO CO
(T cd u UJ CO p.
> •3 o hi) a
O T3 3
_i U a C)
< z
O
(T t« cd o Ul 3 CD
o to H
Z '3
i-i 1) ci CI)
< UJ CD
a CD
0- s O <1)
O o > Ü H & rt
a. cu
_l I J3
< > cu hi)
s <r cd •a ac c < CJ c
>H h CU CD
- O UJ Un ^-i
2 1 •O
1- Tt* CU t-t
■3 CO on w cu •^ ti
In O.
3irnosev (*d/!d-*d) iviiNaaaddia aynssBdd -IVNOIIOVMJ
178
Whatever the true meaning and interpretation of Figs. 6.13 and 6.14 may be, it will be well, first, to look at the underpressure data in the present studies as associated with eardrum rup- ture and, second, to analyze the pressure-time information in terms of individual animals rather than for the average case.
(5) Underpressure and Rate of Fall of Pressure. Using the average data from Table 6.8, along with information from Tables 6.1 and 6.2, plots were made relating the percentage fail- ure of the eardrums to the maximal underpressure, total range of pressure fall, and average rate of pressure fall from Pmax to both ambient and maximal underpressure. The curves are not presented here, but it can be said that data are insufficient to confirm or deny the possible significance of these parameters, with the possible exception of the maximal underpressure. However, here the reliability of the pressure gauges to measure negative pressure under field conditions is most questionable, and even though the association of tympanic membrane failure with the metered underpressure seemed completely spurious, it is not possible to make a firm statement either way.
(c) Dogs—Individual Data. Time of Pressure Rise Combined with Pressure Data. Atten- tion will now be directed to exploratory analyses relevant to the individual animals and blast parameters.
Study of Table 6.2 indicated that, of the 66 large animals used in the study, usable and con- firmed eardrum data were available on 60 animals. There were 119 usable eardrums, of which 45 were ruptured and 74 were intact. Plots were made relating the time of pressure rise for the gauge nearest each animal to the maximal overpressure, the fractional pressure differen- tial, and the pressure ratio. The results were qualitatively similar, and only one figure in which the fractional pressure differential was used is shown as a sample (see Fig. 6.15).
The reader should feel free to interpret the figure as he chooses. The authors simply wish to point out that the bizarre dotted curve is entirely arbitrary. Empirically, however, 42 unruptured eardrums lie below the curve, and 45 ruptured and 32 intact membranes lie above it.
6.3 DISCUSSION
6.3.1 General
In assessing biological blast damage it is useful to recognize that observed pathology may be caused by or associated with one or more of the following categories:
1. Primary effects, those associated with variations in the pressure environment which are due to overpressure per se, to dynamic pressure or "windage," or to a combination of these.
2. Secondary effects, those involving damage due to penetrating or nonpenetrating mis- siles that are produced secondarily by the blast.
3. Tertiary effects, those associated with spatial displacement of the biological target. For the most part, the first two categories may be regarded as accelerative experiences,
whereas the last one encompasses the entire time-history of displacement and may therefore involve significant accelerative as well as abrupt decelerative components.
In general, the present field study has made available data that are applicable mostly to primary effects, although the tertiary problem of displacement was a significant factor in some animals. Missile, or secondary, effects were minimal with the exception (1) of damage to the eyes of an occasional animal by rapidly moving particulate material and (2) the indirect effects that very hot dust might have contributed to the thermal damage previously described.
In attempting to assess the biologic meaning of the data at hand, it is worth while to re- view a few facts from the literature which are essential to the formulation of a sound perspec- tive, and attention will now be focused in this direction.
179
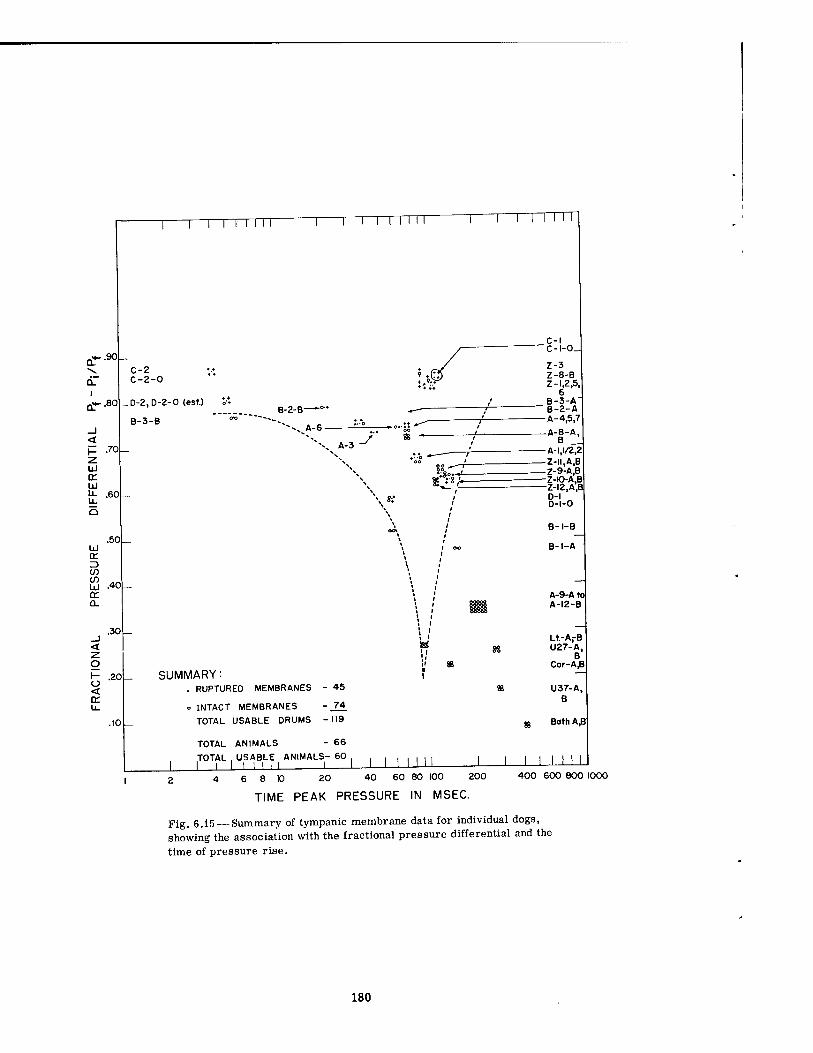
1—I—I I I I III 1—I—I I II 111 1—I Mill"
^.90
d. C-2 C-2-0
or-80 _D-Z,D-2-0 (est.) ¥<■
B-3-B °">
I*
B-2-B-
P -70 Z UJ a: UJ U- .60
.50 ÜJ or
13 .40
.30
< Z o H O <
.20
.10
vx A-6-
\ A-3 y
SUMMARY: ♦ RUPTURED MEMBRANES
o INTACT MEMBRANES
TOTAL USABLE DRUMS
TOTAL ANIMALS
J L TOTAL , USABLE, ANIMALS-
i I I I I I I L
- 45
- 74 -119
- 66 60
I I I I I Ml I
c-i "C-l-O.
~- ,'
si""' i
88 " /
>'/s ~ / ?°n t
«. ♦u r
■3 -8-B 1,2,5, 6
-3-A -2-A -4,5,7
■8-A, B _ 1,1/2,2 ll.A.B 9-A.B I0-A,B I2,A,B •I -1-0
l-B
l-A
A-9-A to A-I2-B
Lt.-ArB U27-A,
B Cor-AJ3
U37-A, B
s Bath AJ3
I I I I I I I 6 8 10 20 40 60 80 100 200
TIME PEAK PRESSURE IN MSEC.
400 600 800 1000
Fig. 6.15 — Summary of tympanic membrane data for individual dogs, showing the association with the fractional pressure differential and the time of pressure rise.
180
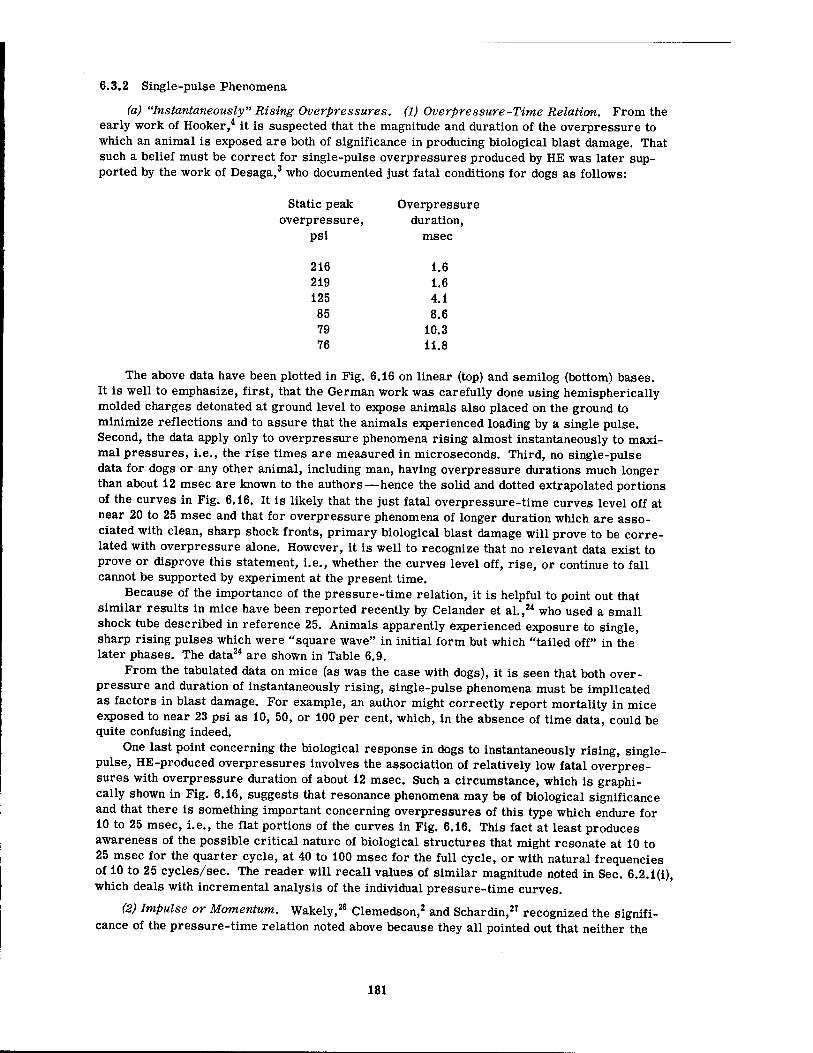
6.3.2 Single-pulse Phenomena
(a) "Instantaneously" Rising Overpressures. (1) Overpressure-Time Relation. From the early work of Hooker,4 it is suspected that the magnitude and duration of the overpressure to which an animal is exposed are both of significance in producing biological blast damage. That such a belief must be correct for single-pulse overpressures produced by HE was later sup- ported by the work of Desaga,3 who documented just fatal conditions for dogs as follows:
Static peak Overpressure overpressure, duration,
psi msec
216 1.6 219 1.6 125 4.1 85 8.6 79 10.3 76 11.8
The above data have been plotted in Fig. 6.16 on linear (top) and semilog (bottom) bases. It is well to emphasize, first, that the German work was carefully done using hemispherically molded charges detonated at ground level to expose animals also placed on the ground to minimize reflections and to assure that the animals experienced loading by a single pulse. Second, the data apply only to overpressure phenomena rising almost instantaneously to maxi- mal pressures, i.e., the rise times are measured in microseconds. Third, no single-pulse data for dogs or any other animal, including man, having overpressure durations much longer than about 12 msec are known to the authors—hence the solid and dotted extrapolated portions of the curves in Fig. 6.16. It is likely that the just fatal overpressure-time curves level off at near 20 to 25 msec and that for overpressure phenomena of longer duration which are asso- ciated with clean, sharp shock fronts, primary biological blast damage will prove to be corre- lated with overpressure alone. However, it is well to recognize that no relevant data exist to prove or disprove this statement, i.e., whether the curves level off, rise, or continue to fall cannot be supported by experiment at the present time.
Because of the importance of the pressure-time relation, it is helpful to point out that similar results in mice have been reported recently by Celander et al.,24 who used a small shock tube described in reference 25, Animals apparently experienced exposure to single, sharp rising pulses which were "square wave" in initial form but which "tailed off" in the later phases. The data24 are shown in Table 6.9.
From the tabulated data on mice (as was the case with dogs), it is seen that both over- pressure and duration of instantaneously rising, single-pulse phenomena must be implicated as factors in blast damage. For example, an author might correctly report mortality in mice exposed to near 23 psi as 10, 50, or 100 per cent, which, in the absence of time data, could be quite confusing indeed.
One last point concerning the biological response in dogs to instantaneously rising, single- pulse, HE-produced overpressures involves the association of relatively low fatal overpres- sures with overpressure duration of about 12 msec. Such a circumstance, which is graphi- cally shown in Fig. 6.16, suggests that resonance phenomena may be of biological significance and that there is something important concerning overpressures of this type which endure for 10 to 25 msec, i.e., the flat portions of the curves in Fig. 6.16. This fact at least produces awareness of the possible critical nature of biological structures that might resonate at 10 to 25 msec for the quarter cycle, at 40 to 100 msec for the full cycle, or with natural frequencies of 10 to 25 cycles/sec. The reader will recall values of similar magnitude noted in Sec. 6.2.l(i), which deals with incremental analysis of the individual pressure-time curves.
(2) Impulse or Momentum. Wakely,28 Clemedson,2 and Schardin," recognized the signifi- cance of the pressure-time relation noted above because they all pointed out that neither the
181
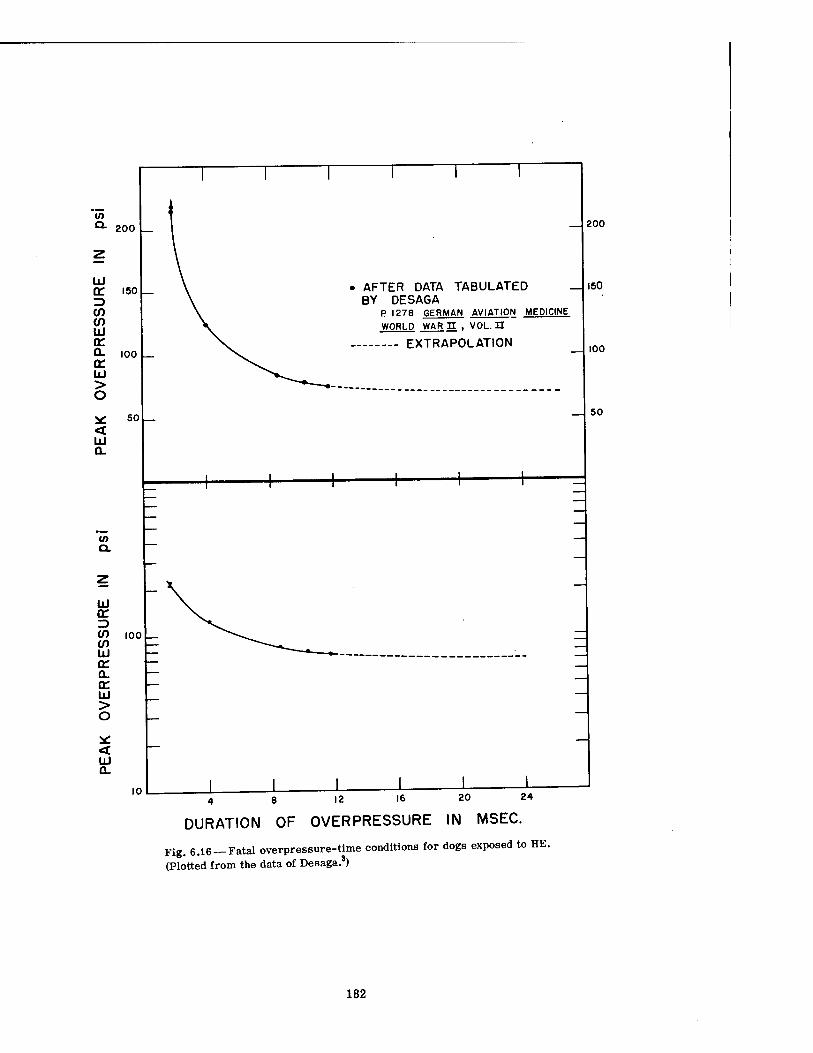
Q. 200 200
ÜJ er 3 CO CO UJ cc Q. (T UJ > o
< UJ a.
ISO
100
• AFTER DATA TABULATED BY DESAGA
P 1278 GERMAN AVIATION MEDICINE
WORLD WAR H , VOL.H
EXTRAPOLATION
150
100
_ 50
V) a.
Ul or 3 CO CO UJ a: a. or ui > o
< UJ a.
100 _
DURATION OF OVERPRESSURE IN MSEC.
Fig. 6.16 —Fatal overpressure-time conditions for dogs exposed to HE. (Plotted from the data of Desaga.8)
182
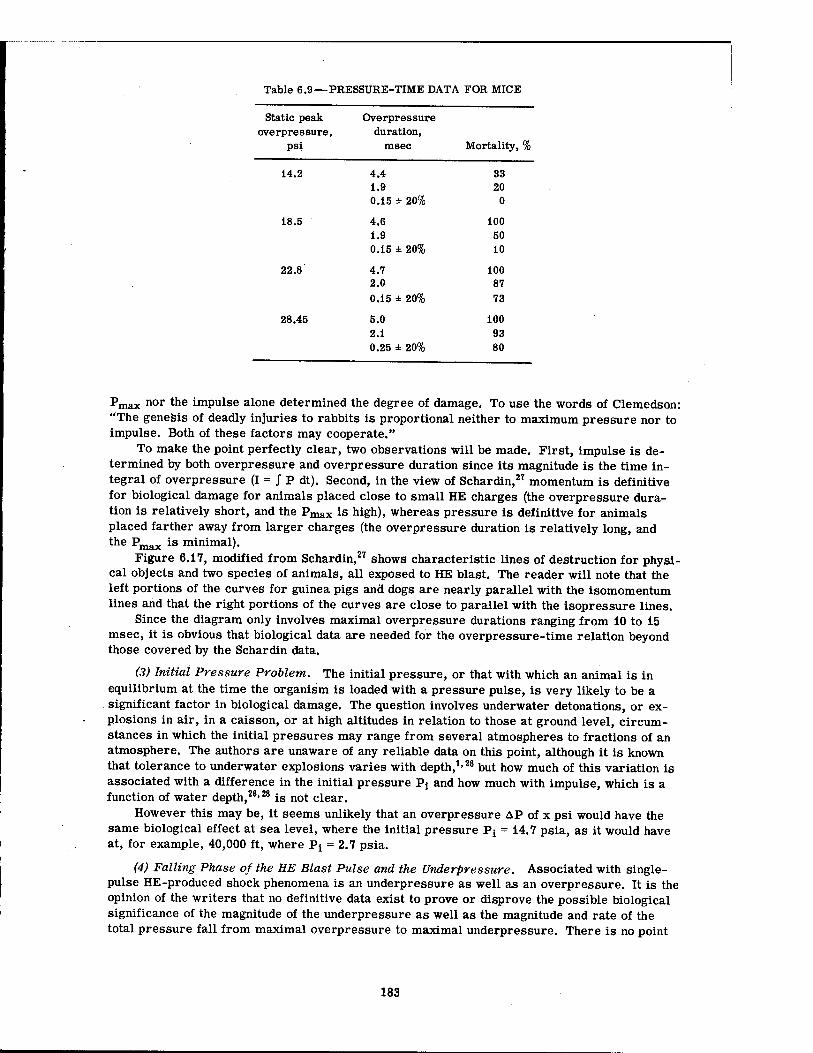
Table 6.9—PRESSURE-TIME DATA FOR MICE
Static peak Overpressure overpressure, duration,
psi msec Mortality, %
14.2 4.4 33 1.9 20 0.15 ± 20% 0
18.5 4.6 100 1.9 50 0.15 ± 20% 10
22.8 4.7 100 2.0 87 0.15 ± 20% 73
28.45 5.0 100 2.1 93 0.25 ± 20% 80
pmax nor tne impulse alone determined the degree of damage. To use the words of Clemedson: "The genesis of deadly injuries to rabbits is proportional neither to maximum pressure nor to impulse. Both of these factors may cooperate."
To make the point perfectly clear, two observations will be made. First, impulse is de- termined by both overpressure and overpressure duration since its magnitude is the time in- tegral of overpressure (I = / P dt). Second, in the view of Schardin,27 momentum is definitive for biological damage for animals placed close to small HE charges (the overpressure dura- tion is relatively short, and the Pmax is high), whereas pressure is definitive for animals placed farther away from larger charges (the overpressure duration is relatively long, and the Pmax is minimal).
Figure 6.17, modified from Schardin,27 shows characteristic lines of destruction for physi- cal objects and two species of animals, all exposed to HE blast. The reader will note that the left portions of the curves for guinea pigs and dogs are nearly parallel with the isomomentum lines and that the right portions of the curves are close to parallel with the isopressure lines.
Since the diagram only involves maximal overpressure durations ranging from 10 to 15 msec, it is obvious that biological data are needed for the overpressure-time relation beyond those covered by the Schardin data.
(3) Initial Pressure Problem. The initial pressure, or that with which an animal is in equilibrium at the time the organism is loaded with a pressure pulse, is very likely to be a significant factor in biological damage. The question involves underwater detonations, or ex- plosions in air, in a caisson, or at high altitudes in relation to those at ground level, circum- stances in which the initial pressures may range from several atmospheres to fractions of an atmosphere. The authors are unaware of any reliable data on this point, although it is known that tolerance to underwater explosions varies with depth,1,28 but how much of this variation is associated with a difference in the initial pressure Pj and how much with impulse, which is a function of water depth,26,28 is not clear.
However this may be, it seems unlikely that an overpressure AP of x psi would have the same biological effect at sea level, where the initial pressure Pj = 14.7 psia, as it would have at, for example, 40,000 ft, where Pt = 2.7 psia.
(4) Falling Phase of the HE Blast Pulse and the Underpressure. Associated with single- pulse HE-produced shock phenomena is an underpressure as well as an overpressure. It is the opinion of the writers that no definitive data exist to prove or disprove the possible biological significance of the magnitude of the underpressure as well as the magnitude and rate of the total pressure fall from maximal overpressure to maximal underpressure. There is no point
183
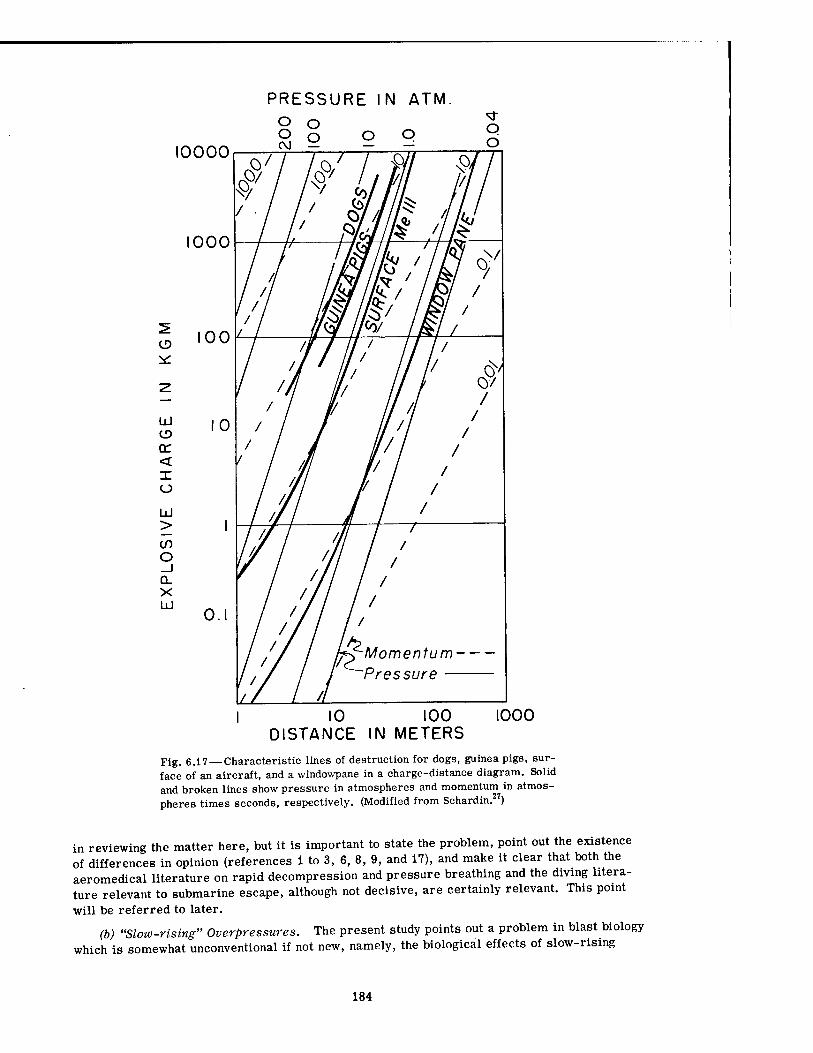
PRESSURE o
IN ATM
10000 o d
1000
<s> •XL
LÜ CD
tr < x o LÜ > CO o _l Q_ X LÜ
I 10 100 1000 DISTANCE IN METERS
Fig. 6.17 — Characteristic lines of destruction for dogs, guinea pigs, sur- face of an aircraft, and a windowpane in a charge-distance diagram. Solid and broken lines show pressure in atmospheres and momentum in atmos- pheres times seconds, respectively. (Modified from Schardin. )
in reviewing the matter here, but it is important to state the problem, point out the existence of differences in opinion (references 1 to 3, 6, 8, 9, and 17), and make it clear that both the aeromedical literature on rapid decompression and pressure breathing and the diving litera- ture relevant to submarine escape, although not decisive, are certainly relevant. This point
will be referred to later.
(b) "Slow-rising" Overpressures. The present study points out a problem in blast biology which is somewhat unconventional if not new, namely, the biological effects of slow-rising
184
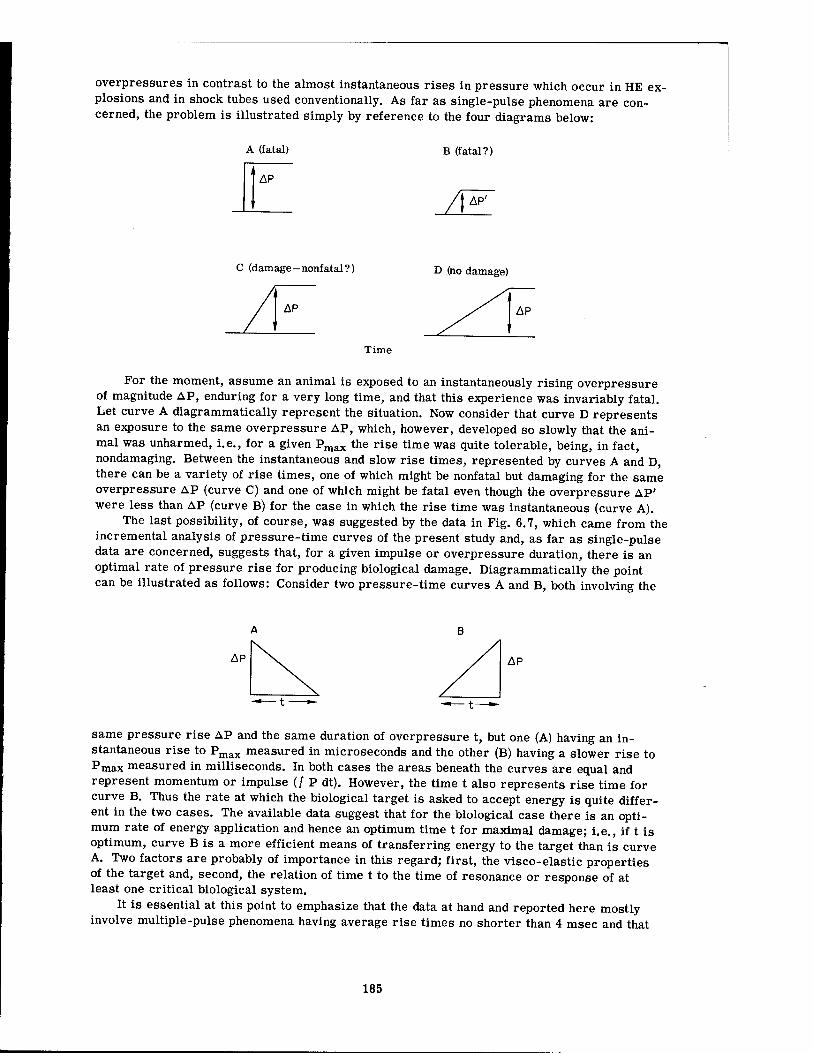
overpressures in contrast to the almost instantaneous rises in pressure which occur in HE ex- plosions and in shock tubes used conventionally. As far as single-pulse phenomena are con- cerned, the problem is illustrated simply by reference to the four diagrams below:
A (fatal) B (fatal?)
AP
AP'
C (damage-nonfatal?) D (no damage)
Time
For the moment, assume an animal is exposed to an instantaneously rising overpressure of magnitude AP, enduring for a very long time, and that this experience was invariably fatal. Let curve A diagrammatically represent the situation. Now consider that curve D represents an exposure to the same overpressure AP, which, however, developed so slowly that the ani- mal was unharmed, i.e., for a given Pmax the rise time was quite tolerable, being, in fact, nondamaging. Between the instantaneous and slow rise times, represented by curves A and D, there can be a variety of rise times, one of which might be nonfatal but damaging for the same overpressure AP (curve C) and one of which might be fatal even though the overpressure AP' were less than AP (curve B) for the case in which the rise time was instantaneous (curve A).
The last possibility, of course, was suggested by the data in Fig. 6.7, which came from the incremental analysis of pressure-time curves of the present study and, as far as single-pulse data are concerned, suggests that, for a given impulse or overpressure duration, there is an optimal rate of pressure rise for producing biological damage. Diagrammatically the point can be illustrated as follows: Consider two pressure-time curves A and B, both involving the
same pressure rise AP and the same duration of overpressure t, but one (A) having an in- stantaneous rise to Pmax measured in microseconds and the other (B) having a slower rise to pmax measured in milliseconds. In both cases the areas beneath the curves are equal and represent momentum or impulse (/ P dt). However, the time t also represents rise time for curve B. Thus the rate at which the biological target is asked to accept energy is quite differ- ent in the two cases. The available data suggest that for the biological case there is an opti- mum rate of energy application and hence an optimum time t for maximal damage; i.e., if t is optimum, curve B is a more efficient means of transferring energy to the target than is curve A. Two factors are probably of importance in this regard; first, the visco-elastic properties of the target and, second, the relation of time t to the time of resonance or response of at least one critical biological system.
It is essential at this point to emphasize that the data at hand and reported here mostly involve multiple-pulse phenomena having average rise times no shorter than 4 msec and that
185
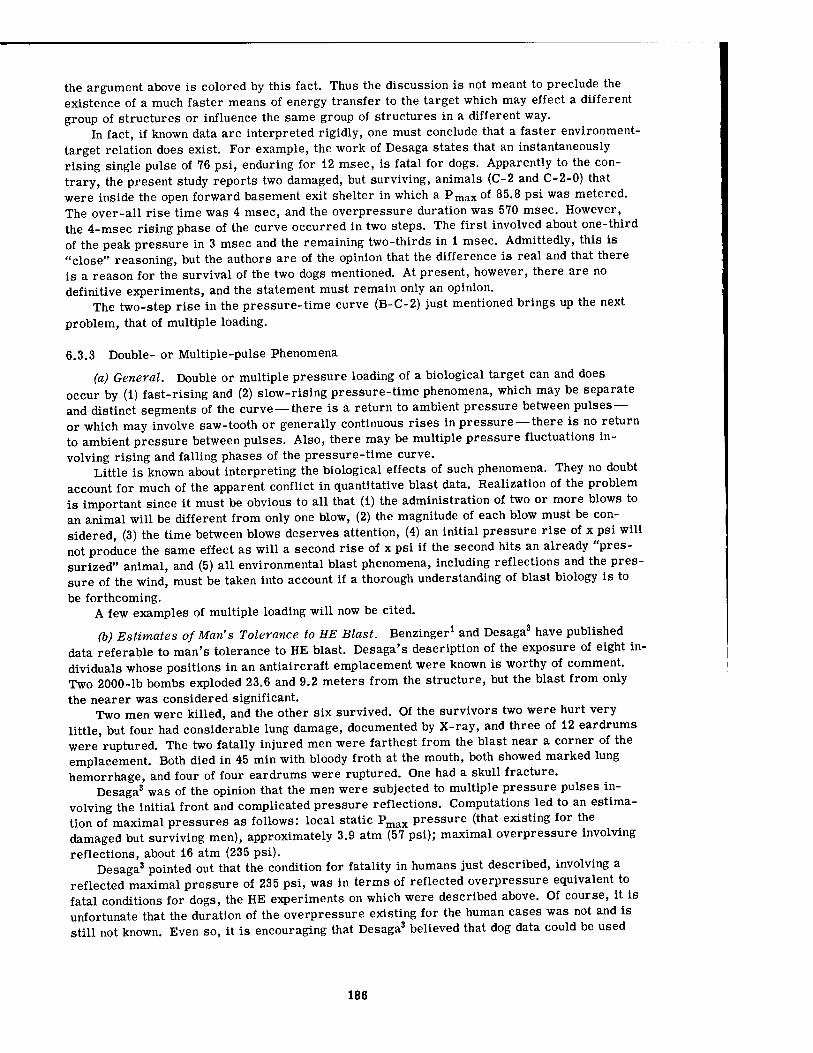
the argument above is colored by this fact. Thus the discussion is not meant to preclude the existence of a much faster means of energy transfer to the target which may effect a different group of structures or influence the same group of structures in a different way.
In fact, if known data are interpreted rigidly, one must conclude that a faster environment- target relation does exist. For example, the work of Desaga states that an instantaneously rising single pulse of 76 psi, enduring for 12 msec, is fatal for dogs. Apparently to the con- trary, the present study reports two damaged, but surviving, animals (C-2 and C-2-0) that were inside the open forward basement exit shelter in which a Pmax °f 85-8 psi was metered. The over-all rise time was 4 msec, and the overpressure duration was 570 msec. However, the 4-msec rising phase of the curve occurred in two steps. The first involved about one-third of the peak pressure in 3 msec and the remaining two-thirds in 1 msec. Admittedly, this is "close" reasoning, but the authors are of the opinion that the difference is real and that there is a reason for the survival of the two dogs mentioned. At present, however, there are no definitive experiments, and the statement must remain only an opinion.
The two-step rise in the pressure-time curve (B-C-2) just mentioned brings up the next problem, that of multiple loading.
6.3.3 Double- or Multiple-pulse Phenomena
(a) General. Double or multiple pressure loading of a biological target can and does occur by (1) fast-rising and (2) slow-rising pressure-time phenomena, which may be separate and distinct segments of the curve —there is a return to ambient pressure between pulses — or which may involve saw-tooth or generally continuous rises in pressure —there is no return to ambient pressure between pulses. Also, there may be multiple pressure fluctuations in- volving rising and falling phases of the pressure-time curve.
Little is known about interpreting the biological effects of such phenomena. They no doubt account for much of the apparent conflict in quantitative blast data. Realization of the problem is important since it must be obvious to all that (i) the administration of two or more blows to an animal will be different from only one blow, (2) the magnitude of each blow must be con- sidered, (3) the time between blows deserves attention, (4) an initial pressure rise of x psi will not produce the same effect as will a second rise of x psi if the second hits an already "pres- surized" animal, and (5) all environmental blast phenomena, including reflections and the pres- sure of the wind, must be taken into account if a thorough understanding of blast biology is to be forthcoming.
A few examples of multiple loading will now be cited.
(b) Estimates of Man's Tolerance to HE Blast. Benzinger1 and Desaga3 have published data referable to man's tolerance to HE blast. Desaga's description of the exposure of eight in- dividuals whose positions in an antiaircraft emplacement were known is worthy of comment. Two 2000-lb bombs exploded 23.6 and 9.2 meters from the structure, but the blast from only the nearer was considered significant.
Two men were killed, and the other six survived. Of the survivors two were hurt very little, but four had considerable lung damage, documented by X-ray, and three of 12 eardrums were'ruptured. The two fatally injured men were farthest from the blast near a corner of the emplacement. Both died in 45 min with bloody froth at the mouth, both showed marked lung hemorrhage, and four of four eardrums were ruptured. One had a skull fracture.
Desaga3 was of the opinion that the men were subjected to multiple pressure pulses in- volving the initial front and complicated pressure reflections. Computations led to an estima- tion of maximal pressures as follows: local static Pmax pressure (that existing for the damaged but surviving men), approximately 3.9 atm (57 psi); maximal overpressure involving reflections, about 16 atm (235 psi).
Desaga3 pointed out that the condition for fatality in humans just described, involving a reflected maximal pressure of 235 psi, was in terms of reflected overpressure equivalent to fatal conditions for dogs, the HE experiments on which were described above. Of course, it is unfortunate that the duration of the overpressure existing for the human cases was not and is still not known. Even so, it is encouraging that Desaga3 believed that dog data could be used
186
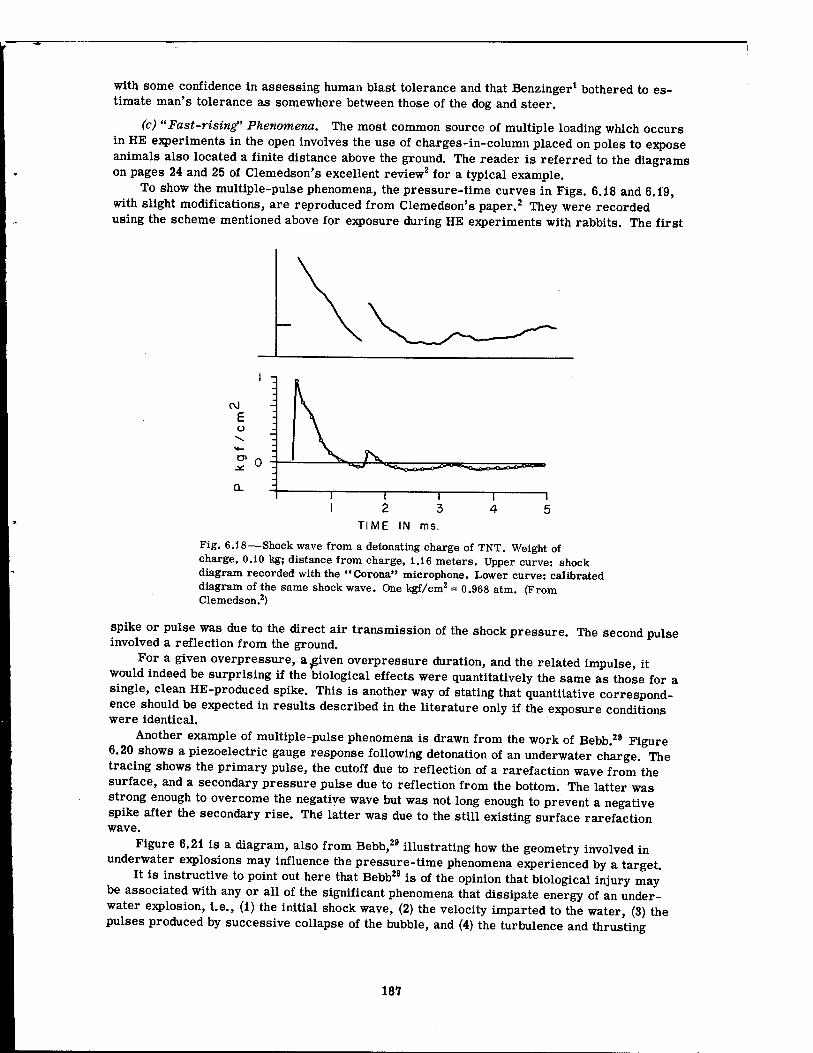
with some confidence in assessing human blast tolerance and that Benzinger1 bothered to es- timate man's tolerance as somewhere between those of the dog and steer.
(c) "Fast-rising' Phenomena. The most common source of multiple loading which occurs in HE experiments in the open involves the use of charges-in-column placed on poles to expose animals also located a finite distance above the ground. The reader is referred to the diagrams on pages 24 and 25 of Clemedson's excellent review2 for a typical example.
To show the multiple-pulse phenomena, the pressure-time curves in Figs. 6.18 and 6.19, with slight modifications, are reproduced from Clemedson's paper.2 They were recorded using the scheme mentioned above for exposure during HE experiments with rabbits. The first
C\J
E ü
I 2
TIME IN ms. 3
Fig. 6.18—Shock wave from a detonating charge of TNT. Weight of charge, O.iO kg; distance from charge, 1.16 meters. Upper curve: shock diagram recorded with the "Corona" microphone. Lower curve: calibrated diagram of the same shock wave. One kgf/cm2 = 0.968 atm. (From Clemedson.2)
spike or pulse was due to the direct air transmission of the shock pressure. The second pulse involved a reflection from the ground.
For a given overpressure, a^iven overpressure duration, and the related impulse, it would indeed be surprising if the biological effects were quantitatively the same as those for a single, clean HE-produced spike. This is another way of stating that quantitative correspond- ence should be expected in results described in the literature only if the exposure conditions were identical.
Another example of multiple-pulse phenomena is drawn from the work of Bebb.29 Figure 6.20 shows a piezoelectric gauge response following detonation of an underwater charge. The tracing shows the primary pulse, the cutoff due to reflection of a rarefaction wave from'the surface, and a secondary pressure pulse due to reflection from the bottom. The latter was strong enough to overcome the negative wave but was not long enough to prevent a negative spike after the secondary rise. The latter was due to the still existing surface rarefaction wave.
Figure 6.21 is a diagram, also from Bebb,29 illustrating how the geometry involved in underwater explosions may influence the pressure-time phenomena experienced by a target.
It is instructive to point out here that Bebb29 is of the opinion that biological injury may be associated with any or all of the significant phenomena that dissipate energy of an under- water explosion, i.e., (1) the initial shock wave, (2) the velocity imparted to the water, (3) the pulses produced by successive collapse of the bubble, and (4) the turbulence and thrusting
187
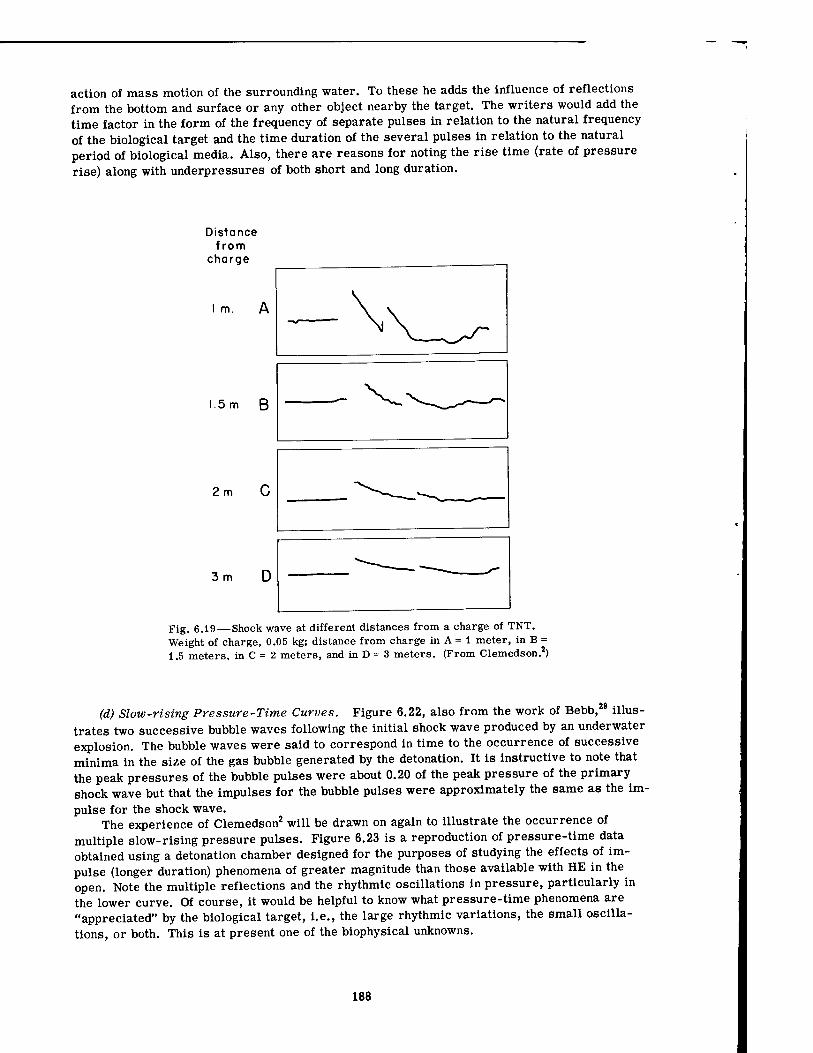
action of mass motion of the surrounding water. To these he adds the influence of reflections from the bottom and surface or any other object nearby the target. The writers would add the time factor in the form of the frequency of separate pulses in relation to the natural frequency of the biological target and the time duration of the several pulses in relation to the natural period of biological media. Also, there are reasons for noting the rise time (rate of pressure rise) along with underpressures of both short and long duration.
Distance from
charge
m.
1.5m B
2m
3 m D
Fig. 6.19 — Shock wave at different distances from a charge of TNT. Weight of charge, 0.05 kg; distance from charge in A = i meter, in B = 1.5 meters, in C = 2 meters, and in D = 3 meters. (From Clemedson.2)
(d) Slow-rising Pressure-Time Curves. Figure 6.22, also from the work of Bebb,29 illus- trates two successive bubble waves following the initial shock wave produced by an underwater explosion. The bubble waves were said to correspond in time to the occurrence of successive minima in the size of the gas bubble generated by the detonation. It is instructive to note that the peak pressures of the bubble pulses were about 0.20 of the peak pressure of the primary shock wave but that the impulses for the bubble pulses were approximately the same as the im- pulse for the shock wave.
The experience of Clemedson2 will be drawn on again to illustrate the occurrence of multiple slow-rising pressure pulses. Figure 6.23 is a reproduction of pressure-time data obtained using a detonation chamber designed for the purposes of studying the effects of im- pulse (longer duration) phenomena of greater magnitude than those available with HE in the open. Note the multiple reflections and the rhythmic oscillations in pressure, particularly in the lower curve. Of course, it would be helpful to know what pressure-time phenomena are "appreciated" by the biological target, i.e., the large rhythmic variations, the small oscilla- tions, or both. This is at present one of the biophysical unknowns.
188
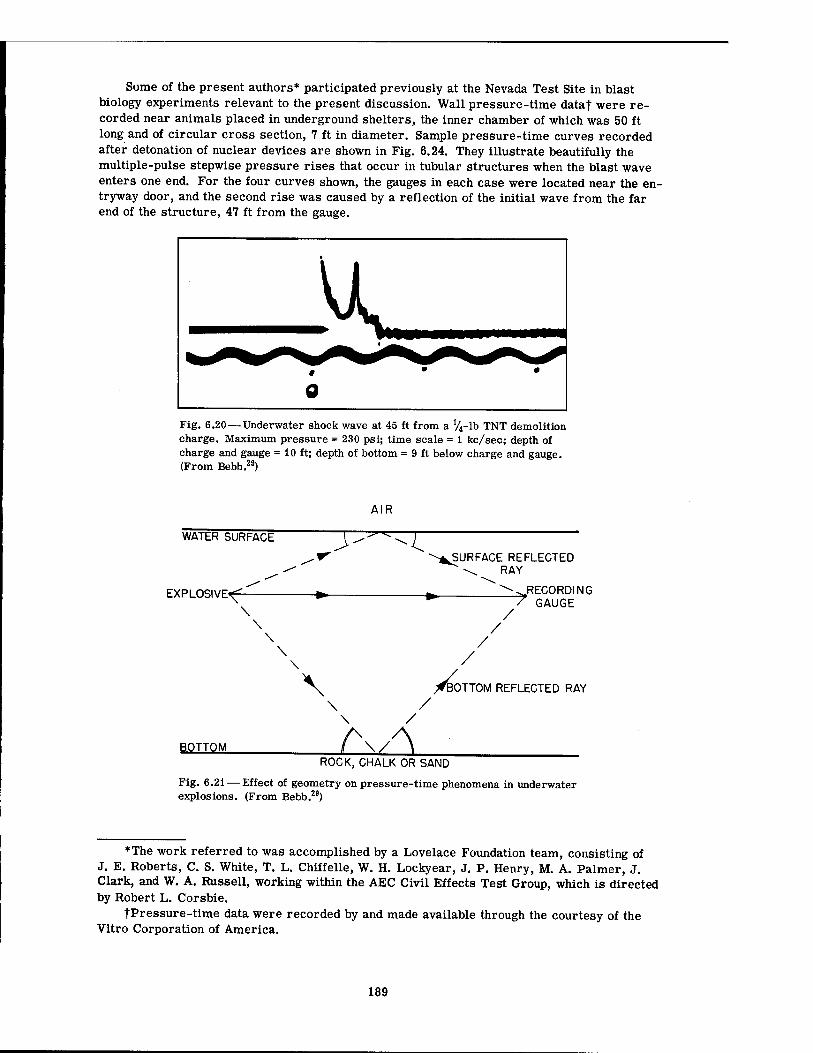
Some of the present authors* participated previously at the Nevada Test Site in blast biology experiments relevant to the present discussion. Wall pressure-time datat were re- corded near animals placed in underground shelters, the inner chamber of which was 50 ft long and of circular cross section, 7 ft in diameter. Sample pressure-time curves recorded after detonation of nuclear devices are shown in Fig. 6.24. They illustrate beautifully the multiple-pulse stepwise pressure rises that occur in tubular structures when the blast wave enters one end. For the four curves shown, the gauges in each case were located near the en- tryway door, and the second rise was caused by a reflection of the initial wave from the far end of the structure, 47 ft from the gauge.
Fig. 6.20 — Underwater shock wave at 45 ft from a V4-lb TNT demolition charge. Maximum pressure = 230 psij time scale = i kc/sec; depth of charge and gauge = 10 ft; depth of bottom = 9 ft below charge and gauge. (From Bebb.29)
WATER SURFACE
EXPLOSIVE^
\ \ \ \
y AIR
r .SURFACE REFLECTED \ RAY
/ /
-^RECORDING / GAUGE
\
BOTTOM
/ /
\^ /^BOTTOM REFLECTED RAY
\ /
KÄ ROCK,CHALK OR SAND
Fig. 6.21 — Effect of geometry on pressure-time phenomena in underwater explosions. (From Bebb.29)
♦The work referred to was accomplished by a Lovelace Foundation team, consisting of J. E. Roberts, C. S. White, T. L. Chiffelle, W. H. Lockyear, J. P. Henry, M. A. Palmer, J. Clark, and W. A. Russell, working within the AEC Civil Effects Test Group, which is directed by Robert L. Corsbie.
tPressure-time data were recorded by and made available through the courtesy of the Vitro Corporation of America.
189
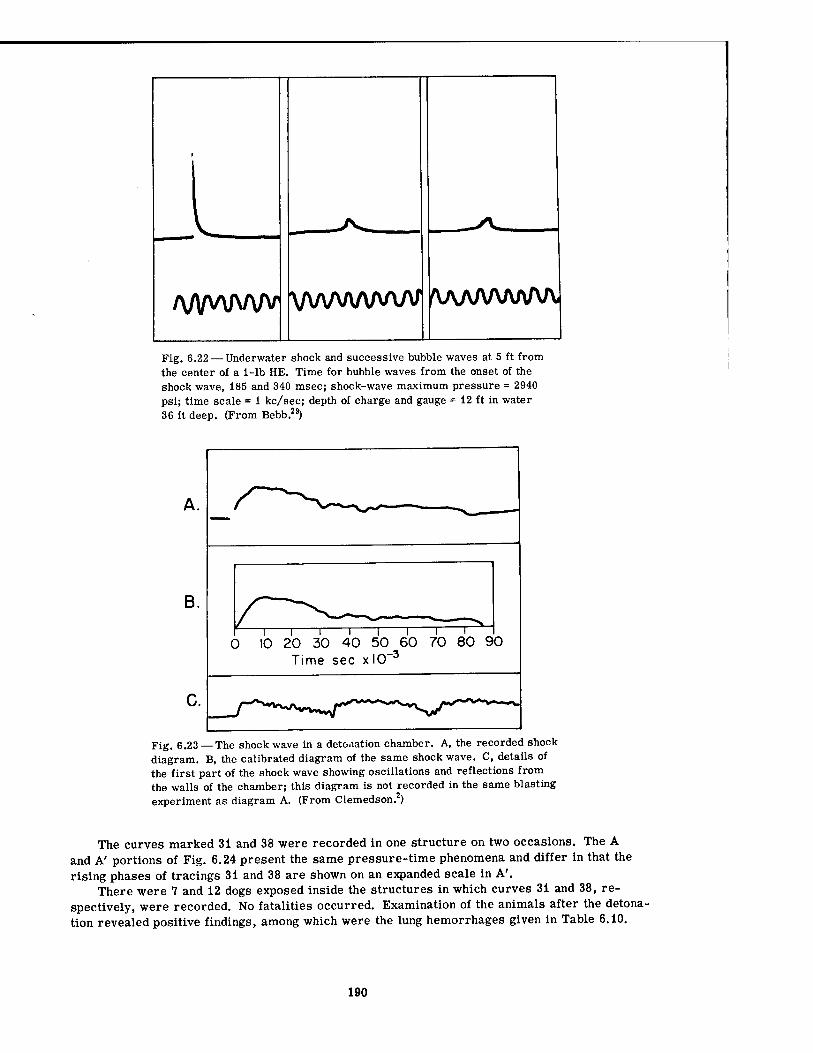
/WWWV VWW\AA/V AAAAAAAM
Fig. 6.22 — Underwater shock and successive bubble waves at 5 ft from the center of a i-lb HE. Time for bubble waves from the onset of the shock wave, 185 and 340 msec; shock-wave maximum pressure = 2940 psi; time scale = 1 kc/sec; depth of charge and gauge = 12 ft in water 36 ft deep. (From Bebb.29)
A.
B.
0 10 20 30 40 50 60 70 80 90 Time sec xlO-3
Fig. 6.23 — The Shockwave in a defoliation chamber. A, the recorded shock diagram. B, the calibrated diagram of the same shock wave. C, details of the first part of the shock wave showing oscillations and reflections from the walls of the chamber; this diagram is not recorded in the same blasting experiment as diagram A. (From Clemedson. )
The curves marked 3i and 38 were recorded in one structure on two occasions. The A and A' portions of Fig. 6.24 present the same pressure-time phenomena and differ in that the rising phases of tracings 31 and 38 are shown on an expanded scale in A'.
There were 7 and 12 dogs exposed inside the structures in which curves 31 and 38, re- spectively, were recorded. No fatalities occurred. Examination of the animals after the detona- tion revealed positive findings, among which were the lung hemorrhages given in Table 6.10.
190
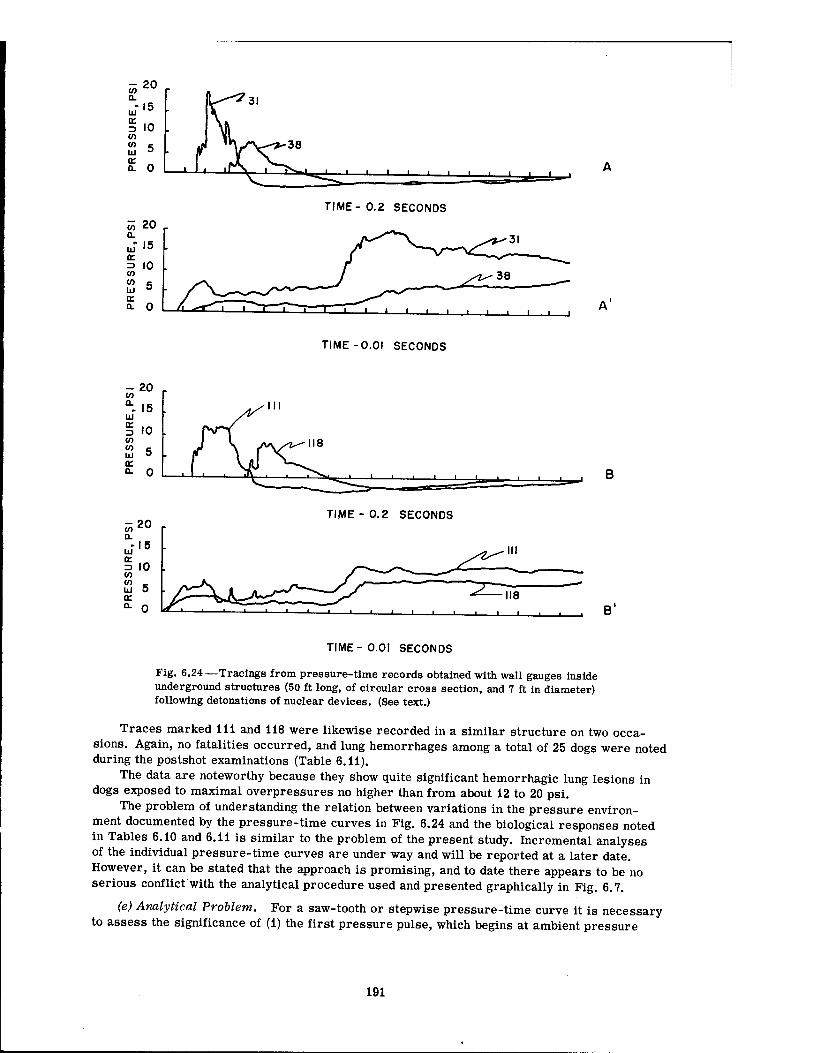
TIME- 0.2 SECONDS
TIME-0.01 SECONDS
TIME-0.2 SECONDS
TIME- 0.01 SECONDS
Fig. 6.24—Tracings from pressure-time records obtained with wall gauges inside underground structures (50 ft long, of circular cross section, and 7 ft in diameter) following detonations of nuclear devices. (See text.)
Traces marked ill and 118 were likewise recorded in a similar structure on two occa- sions. Again, no fatalities occurred, and lung hemorrhages among a total of 25 dogs were noted during the postshot examinations (Table 6.11).
The data are noteworthy because they show quite significant hemorrhagic lung lesions in dogs exposed to maximal overpressures no higher than from about 12 to 20 psi.
The problem of understanding the relation between variations in the pressure environ- ment documented by the pressure-time curves in Fig. 6.24 and the biological responses noted in Tables 6.10 and 6.11 is similar to the problem of the present study. Incremental analyses of the individual pressure-time curves are under way and will be reported at a later date. However, it can be stated that the approach is promising, and to date there appears to be no serious conflict with the analytical procedure used and presented graphically in Fig. 6.7.
(e) Analytical Problem. For a saw-tooth or stepwise pressure-time curve it is necessary to assess the significance of (1) the first pressure pulse, which begins at ambient pressure
191
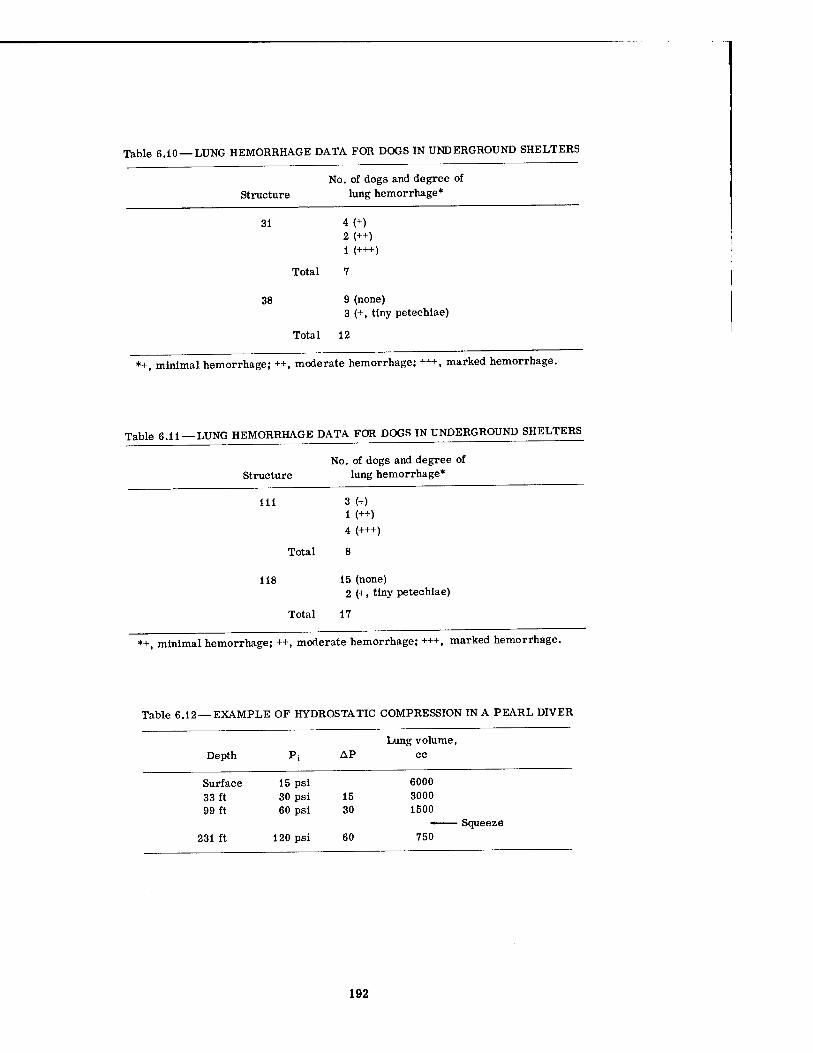
Table 6.10 — LUNG HEMORRHAGE DATA FOR DOGS IN UNDERGROUND SHELTERS
No. of dogs and degree of Structure lung hemorrhage*
31 4(+) 2(++) 1 (+++)
Total 7
38 9 (none) 3 (+, tiny petechlae)
Total 12
*+, minimal hemorrhage; ++, moderate hemorrhage; +++, marked hemorrhage.
Table 6.11 —LUNG HEMORRHAGE DATA FOR DOGS IN UNDERGROUND SHELTERS
No. of dogs and degree of Structure lung hemorrhage*
111 3 (+) 1 (++) 4 (+++)
Total 8
118 15 (none) 2 (+, tiny petechlae)
Total 17
*+, minimal hemorrhage; ++, moderate hemorrhage; +++, marked hemorrhage.
Table 6.12 —EXAMPLE OF HYDROSTATIC COMPRESSION IN A PEARL DIVER
Lung volume,
Depth Pi AP cc
Surface 15 psl 6000 33 ft 30 psl 15 3000 99 ft 60 psl 30 1500
■ Squeeze 231 ft 120 psi 60 750
192
(Pj = ambient); (2) the second pulse, which starts at a P{, not ambient, but the pressure existing at me time of the second rise; and so on for tertiary, quaternary, and additional pressure rises if any. For the rising portions of the pressure pulse there are at least five potentially significant factors: the magnitude of each pressure rise, the rise time and duration of each segmental rise, the initial pressures (Pj, P[, Pf, ..., Pf) existing when each pulse occurs, and the time between the occurrence of successive rises in pressure. In addition, the duration of the total overpressure and the falling phase of the pulse must be considered.
(1) Initial Pressure, Pi% The literature contained two hints concerning an analytical approach to the problem of multiple or stepwise loading. The first involved a paper by Luft and Bancroft,30 who pointed out the biological utility of the fractional pressure differential, a ratio which Haber and Clamann31 found helpful in analyzing the physics of rapid decompres- sion. The second involved brief remarks by Behnke32 relevant to hydrostatic compression of pearl divers and the relevant syndrome known as the "squeeze," the effect of which is "to force blood and tissue fluid into the respiratory passages where the residual pulmonary air is under less pressure than the pulmonary membranes due to the limitation caused by the ribs and contracted diaphragm."
To make the quotation from Behnke more understandable, let the reader visualize a native pearl diver having 6000 cc of gas in his chest before entering the water, at which time the initial pressure would be about 15.0 psia. At 33 ft the man would be at a pressure of 2 atm or 30.0 psi, and the gas in his chest would be roughly one-half that at the surface or 3000 cc be- cause the chest wall would have been pushed inward and the diaphragm would have risen into the chest cavity. The AP involved during the first portion of the descent would have been i atm or about 15.0 psi. The diver must descend to a pressure of 4 atm to again approximately halve the volume of gas in his chest (3000 to 1500 cc). Here the absolute pressure would be 60 psi, but the differential involved would be 30 psi, double the previous figure. Similarly, to again halve the residual air volume, the diver would have to descend to the dangerous pres- sure of 120 psi (an associated differential of 60 psi, double the previous figure), and the air volume in the chest would have become 750 cc if the chest wall and diaphragm moved suffi- ciently far into the thoracic cavity to compensate for the pressure change. Usually compensa- tion by this mechanism almost ceases when the pulmonary volume approximates that of the residual air (about 1500 cc) and the squeeze is under way. Chest pain occurs and pulmonary edema and hemorrhage ensue because the fluids of the body still seek the remaining compres- sible portions of the body, which are the air-containing organs, the most critical of which is the lung. A similar syndrome is seen in divers using pressurized helmets in case the helmet pressure fails, which circumstance deprives the individual of the intrapulmonary counter pressure essential to allow respiration and to prevent the migration of blood and other fluids into the air-containing spaces of the lung.
In summary, Table 6.12 contains data referable to the pearl diver mentioned above. The reader will be aware of the fact that, as far as lung volume is concerned, the same
fractional change would be produced by a pressure differential AP of 15, 30, or 60 psi. A crude way of making the point is to say that a AP of 15 psi applied "on top" of an initial pres- sure Pj of 15 psi is from one point of view "physiologically equivalent" to a AP of 30 or 60 psi applied on top of a P[ of 30 or a P'{ of 60 psi, respectively, i.e., the response of the chest and diaphragm and later the fluid components of the body is proportional to what in this pres- ent study has been called the pressure ratio AP/Pj.
(2) Time Factors. If now the implications of the squeeze syndrome are considered for blast biology where the loading agent is air pressure rather than hydrostatic pressure, the time factor is immediately met. For example, if the diver used diving equipment and inhaled air at ambient pressures during descent, there would have been no significant pressure differ- ential across the chest. In the case of blast overpressure, such would be the situation after the lungs have had time to fill, which circumstance is, of course, concerned with (1) the mag- nitude of the pressure differential applied, (2) the duration of the rise time and overpressure in relation to the fill time of the pulmonary tree, (3) the air density as it influences flow in small tubes, (4) the pressure-compensating effects of inward movement of the chest wall and
193
diaphragm in decreasing the volume of air in the chest, and (5) the possible deformity of the chest and diaphragm structures which might obstruct some of the major or minor airways, in which case it is necessary to consider the segmental fill time of the alveoli themselves. This last point is a very real possibility because Cassen33 and Clemedson2 have photographically documented marked deformity of animals exposed to blast, and Clemedson16 has shown in rabbits that air is often expelled from the chest presumably because of the inward thrust im- parted to the chest wall and the abdominodiaphragm system.
The writers know of no data either in humans or animals which document the fill time of the lungs under blast conditions, but, in pneumotachographic work in humans during normal breathing, it is common to note recordings for the inspiratory phase which are in the range of i to 1.5 sec in duration, although, under "forcing" conditions existing from blast overpressures, the times may be much shorter.
It is here, of course, that the reader may well wonder, along with the authors, whether or not the criteria adopted in the present study for use in the incremental analysis of the pressure- time curves were adequate, particularly the requirement for at least a 5-msec pause between segmental pressure rises. It seems clear that any decision on this point must be entirely arbitrary at the present time. For example, two pressure pulses, 5 msec apart, have been treated as two separate loadings, whereas, if the pause had been 4.9 msec, the pressure pulses would have been handled as a single pressure rise. It is nonsense, of course, to believe that the response of the animal might be so fortuitous. All that can be said at present is that the procedure of segmental analysis was exploratory but appeared to fit the available data fairly well. No doubt the future will require changes, modifications, and refinements of the criteria adopted as a guide to analysis. This statement is certainly justified if Fig. 6.7 is studied, since four of the eight dogs for which the analytical procedure was in error in pre- dicting no pathology were animals exposed in basement exit shelters. We have no explanation for this and must believe either that, by chance, biological variation accounts for the facts or that we do not yet understand the real relation between pressure-time phenomena and biologi- cal response, a very likely circumstance indeed.
Be this as it may, it must be noted here that the time between periodic variations in pres- sure could very well be most important for biological damage should any biological structure exhibit critical resonance phenomena, a possibility which has been mentioned previously. Un- fortunately, the literature relevant to resonance in the response of humans and animals to pulsing pressures is very meager indeed. However, three papers are worth mentioning.
Carlton et al.34 demonstrated air embolism and lung damage in dogs with single "blasts" of intratracheal air enduring for 2 to 3 sec at from 70 to 240 mm Hg (1.4 to 4.6 psi). However, repeated inflations at pressures of 35 to 40 mm Hg (0.68 to 0.77 psi) at the rate of 28 cycles/ min for 0.5 sec'to 15 min also produced lung damage. The shortest enduring pressure, applied at 28 cycles/min and reported to produce pneumothorax, emphysema, hemorrhage, and coronary air emboli, was for 15 sec. Thus there is evidence that the factors of peak pressure, time of exposure, and repetitive nature of the exposure are all important in the production of lung damage and arterial air emboli by application of intratracheal or intrabronchial pres- sures.
DuBois et al.35 has stated that mouth pressure is in phase with chest movement when sinusoidal pulses of air are applied to a mask fitted to the face of anesthetized human subjects at a rate of between 7 to 11 cycles/sec (period, 143 to 91 msec).
Attention is called to a recent paper by Brody et al.21 which notes that the natural fre- quency of the abdominal and thoracic walls of cats is 9.6 ± 0.6 cycles/sec and that the airways above the trachea are not factors in the results. The stimuli used in the study to energize the body walls were pulsing air pressures applied to the trachea.
In contrast to the value 9.6 cycles/sec just quoted, Clemedson and Pettersson have noted oscillations in the intrathoracic pressures in rabbits following exposure to blast which occur at a frequency of 250 cycles/sec (period, 4 msec). Thus it would appear that, as far as the respiratory system is concerned, (1) there is more than one structure or component of the system which is "energized" by pressure loading and (2) the components respond at differ- ent frequencies.
194
Stapp37 has observed rhythmic variations in the chest accelerometer records obtained on human volunteers participating in deceleration experiments. During and after the deceleration, oscillations at the rate of 30 to 35 cycles/sec (period, 33 to 29 msec) have been seen repeatedly. These are presumed to reflect periodic deformation of the subject as he is restrained by the shoulder straps and the seat belt.
It is obvious that any expression of the natural frequency of the human or animal chest will be a variable affair. Muscle tone; resiliency of the spine, ribs, and costal cartilages; variations in the gas content of the abdomen and chest; and differences in the diaphragm, lung, and size of the larynx and large airways all will enter as variable factors. Whatever the time values prove to be eventually, to date it is only possible to say that periodic environmental pressure loads occurring within the ranges of 6 to 60 and 10 to 25 cycles/sec for the human and dog, respectively, should be most carefully assessed by those dealing with biological blast phenomena.
(3) Falling Phase of Pressure and underpressure. It must be pointed out here that if a significant overpressure endures long enough for equilibrium between the alveoli and the am- bient atmosphere to take place, then a problem similar to rapid decompression may occur, depending on the time and total range of pressure fall, including the underpressure. This is not a questionable matter, as may be the case with short-duration HE-produced pulses, but will be a problem with certainty if the rates and magnitudes of pressure fall are within the pathology-producing range.
In this regard there is very useful literature which will not be reviewed here, but suffice it to say that one of the most informative recent studies is that of Luft and Bancroft30 who re- corded transthoracic pressures in humans during rapid decompression. From their work it is possible to say that the "emptying" times of the human lung following decreases in the en- vironmental pressures occurring in 0.2 sec were in the order of 0.4 to 0.6 sec, depending on the pressure differential involved.
Also, it is possible to assess somewhat the human hazard to rapid decompression by noting (1) the fastest, most severe conditions for experimental human decompression without damage known to the writers, namely, from 6375 to 33,000 ft, a pressure differential of 7.8 psi occurring in 0.2 sec (reference 38), and (2) a human fatality in decompression indoctrination in altitude chambers which occurred in a human compressed over 1.25 sec from about 8000 to 30,000 ft, a pressure differential of 6.35 psi. Theoretically, pressure differentials much lower than this (1 to 3 psi) might well be fatal if the airway were closed during decompression.
Dr. Ulrich Luft has called the attention of the writers to recent experiments by Dr. H. Kolder in Vienna. Using small animals, rapid decompressions have been carried out over the range 1.4 to 12.8 psi in from 1 to 15 msec. When the decompression was from 760 to 380 mm Hg (a differential of 7.4 psi), lethality was noted for decompression between 1 and 10 msec.39
6.3.4 Dynamic Pressure or "Windage"
Associated with high-overpressure blast phenomena, of course, are high positive winds whose rates of development and durations bear a relation to the rate of pressure rise and the duration of the overpressure. Winds associated with underpressure—negative winds — are always much less in magnitude and consequently of less relative significance. Biologically speaking, the blast winds are of importance for at least two, perhaps three, reasons: they con- tribute to pressure loading, they can cause displacement, and, through the creation of turbu- lence, they may add to the problems associated with pulsing or multiple pressure loading.
(a) Pressure Reflections. A fast-moving column of air suddenly brought partly or com- pletely to rest dissipates some of its kinetic energy through a local rise in pressure. Ad- vancing shock fronts behave similarly, and it is common knowledge that the magnitude of the peak reflected pressure bears a relation to the Pmax of the advancing front. Desaga3 has graphed this fact, and from his data it can be seen that in reflections the peak pressures may increase up to more than fivefold those in the advancing shock front. The authors are not qualified to discuss the physics of this fact or the relative contributions made by the static and dynamic pressures to pressure loading. Neither are we in a position to discuss a question of
195
equal importance, namely, what are the net alterations produced in the internal environment of a biological target by the loading due to static and dynamic pressures? However, it is ob- vious that the higher the pressure in the advancing shock front the higher will be the Pmax re- flected from, and hence experienced by, the animal. Thus the dynamic pressure may very well be a more important physical index to certain biological effects than is the local static pres- sure. The approach to this problem being taken locally involves the empirical measurement of internal pressure-time phenomena in animals exposed to various patterns of overpressure, and the reader will appreciate the potential of this approach, if indeed it can be successfully achieved, when the literature relevant to lung damage and thoracic pressure differentials is briefly reviewed below.
(b) Displacement. The experience described in the fast-fill side of the Series II blast biology shelter, in which one death due to violent displacement was noted among 10 restrained dogs, suggests that blast winds may be more important than blast overpressure per se in pre- dicting, in closed regions rather than open areas at least, the occurrence of biological damage. Since blast pathology in the other 10 animals was absent or minimal, it might well be sus- pected that, had the wind been acceptable to unrestrained animals, the associated pressure changes certainly would have been tolerable. This problem is far from settled, and plans are under way to study the relative importance of primary and tertiary blast effects.
Analytically the displacement problem encompasses a physical aerodynamic problem which concerns the complete definition of the time-displacement history of a biological target of given weight and cross-sectional area exposed to a given wind pattern. The magnitude of the wind as a function of time and the appropriate drag coefficients must be known or deter- mined.
The main biological problems concern tolerance to (i) the accelerative phase of displace- ment and (2) the decelerative phase. As one approaches limiting conditions by exposing ani- mals to winds of increasing magnitude and arranges conditions to bring about abrupt decelera- tion (as was the case with dog Z-i), it is likely that, when lethal impact velocities are reached, the associated accelerative phase of displacement will be relatively gentle and of no consequence in blast damage. Likewise, it may be that the primary effects, those due to variations in pressure per se, will be of no significance. Experimental evidence does not exist to prove this, but the data at hand do not contradict the above statements.
For many years it has been known that trauma to the chest wall of animals was associated with unilateral and bilateral damage to the lung which often involved circular, well-defined spots of hemorrhage similar to those noted in animals exposed to blast of threshold severity. Intermediate and severe blast conditions may show minimal lung hemorrhage or marked bleeding, the former perhaps because the animal dies before hemorrhage can occur and the latter because severe hemorrhage continues from the damaged vessels. So far as the authors are aware, Külbs40 in 1909, working with dogs, was the first to describe bilateral lung hemorrhage following a blow to the lateral thoracic wall administered with a wooden hammer. Of course, it is the occurrence of bilateral rather than unilateral pathology that is etiologically puzzling, and one is stimulated to look into experimental data concerning the production of
lung hemorrhage.
6.3.5 Other Biological Data
Some relevant information is available in the literature basic to diving, aviation medicine, and ballistics, and a few of the more important quantitative facts will now be reviewed.
(a) Static Intratracheal Pressures. As early as 1883 Ewald and Robert" reported that a pressure of 35 mm Hg (0.68 psi) applied statically to the trachea of removed lungs was suffi- cient to cause the escape of air from the alveoli into the pulmonary capillaries. These authors stated that, in living animals, 50 to 90 mm Hg (0.97 to 1.7 psi) was required for
damage. Polak and Adams42 noted three fatalities among 10 accidents experienced by naval per-
sonnel using the Monsen lung in submarine escape training. One of the fatalities involved as- cent from a depth of 30 ft, a pressure change equivalent to 0.886 atm (13.0 psi), and another
196
from a depth of 15 ft, equivalent to 0.443 atm (6.5 psi). These cases at autopsy showed lung damage. Expanding gas in the lungs was suspected as the cause of the sudden collapse due to air bubbles being pushed into the tributaries of the pulmonary vein, from which they migrated to the circulation of the heart and brain. Polak and Adams42 reported research done at the Harvard School of Public Health in an attempt to clarify the problem.
Employing heavily morphinized dogs, these authors definitely proved that 80 mm Hg (1.55 psi) applied statically to the trachea of the living animal would cause lung hemorrhage, emphysema, and rupture of the lung. These findings were accompanied by the appearance of gas in a carotid-artery air trap after the intratracheal pressure was released. Binding the chest and abdomen prevented this. Therefore the authors concluded that pressure and dis- tention were the critical factors for producing lung damage and air emboli. They further showed, as have other authors, that the route taken by arterial air was influenced by gravity (body position), that gas in the arteries of the brain or heart could be rapidly fatal, and that recompression to near 3 atm (45 psi) was often successful in saving animals.
It is well here to point out that gaseous emboli have been cited as at least one prominent cause of death in animals exposed to HE blast (references 1, 3, 6, and 13) and that compres- sion after exposure has been successful in saving animals otherwise fatally injured.1'18
The work of Polak and Adams supported the findings of previous workers, one of which was Lilienthal,43 who reported the production of emphysema in a patient under anesthesia by inflation using 60 mm Hg (1.2 psi), the figure usually regarded as critical for humans without an extrathoracic support.
With regard to support of the pressurized chest, Henry44 has cited experiments and refer- ences which gave rupture pressures for the lungs of various mammals (mouse to steer) of about 50, 80, and 160 mm Hg (0.97, 1.55, and 3.1 psi) for the open, closed, and bandaged chest, respectively. Thus measures that minimize distention of the lung about double the tolerance to a static rise in intratracheal pressure.
Joannides45 and Joannides and Tsoulos46 placed the intrabronchial pressure at from 60 to \ 100 mm Hg (1.2 to 1.9 psi) for the production of arterial air embolism and lung damage in dogs. Furthermore, these workers stated that they-demonstrated that air could pass the alveolar-capillary barrier without detectable damage, gross or microscopic, to the alveolar wall. This implication that air can pass into the blood without detectable local damage, in- cluding hemorrhage, is an interesting and important observation in view of the deaths noted in / some blasted animals in which significant lung findings are minimal or absent. /
(b) Dynamic Transthoracic Pressures. A number of interesting experiments involving the association of nonstatic transthoracic pressures with pathophysiological damage are of interest. These will now be briefly noted.
(1) Ballistics Studies. A few measurements of internal pressure variations during and after the impact of high-velocity penetrating missiles have been made by Harvey47 and Harvey et al.48 during studies of the mechanism of wounding by such missiles. Apparently, tissue damage outside the path of the ballistic body can be quite marked and widespread. The pathology is associated with the great radial velocity imparted to body fluids and tissues and with the appearance of often large cavities that may pulsate and create sharp variations in pressure. These variations in pressure may be transmitted to gas-containing organs of the body and thus cause damage far removed from the track of the missile.
Harvey et al.,49 using high-speed photography and tourmaline crystals to measure pres- sure, showed that air-containing balloons placed in a cylinder of water oscillated in size with variations in hydrostatic pressure during and after the passage of a high-velocity missile through the cylinder of water. Crystals placed in the stomach of a cat showed similar, but damped, oscillations in pressure when the animal was shot through the lower abdomen. A spike on one of the records was noted as the shock wave passed. This was in excess of 65 psi. The overpressure was followed by a negative pressure of near 20 psi enduring for about 2 to 3 msec. The negative pressure corresponded in time to the expansion of the temporary cavity. After the negative pressure phase, a positive spike occurred 3.5 msec after the initial shock front had arrived. The second spike revealed a pressure of 45.9 psi but showed a total pres- sure change of about 65 psi (from -20 to + 45 psi). The rise time of the second spike was be-
197
tween 1 and 2 msec. After the second spike, pressure oscillated for 5 to 10 msec about the ambient. These oscillations were thought to be due to pulsation of gas pockets in the intestines.
Harvey et al.50 later mounted frog hearts and loops of intestines in a cylinder of water through which high-velocity missiles were passed. The workers established that:
1. The tissues studied were not damaged by shock waves of hundreds of atmospheres of pressure.
2. Damage to tissues from the particle velocity of the water was marked but did not occur if organs were mounted at a distance from the cavity.
3. Air-containing tissues (intestinal loops and frog hearts in which air was introduced with a needle) could be markedly damaged by stretching due to the subatmospheric pressure associated with cavitation, i.e., damage was due to the relatively low, long-lasting negative pressure causing expansion of tissue gas pockets (measured in milliseconds) rather than to the relatively short high pressure of the shock wave (measured in microseconds).
Thus the ballistics work of the Princeton group has pointed out one mechanism whereby damage can occur to the air-containing tissues of the body when the latter are located at a distance from the original trauma. These facts deserve serious consideration by those who would understand the etiology of blast damage, a situation that also involves marked damage to air-containing tissue.
Other data in point are those of Daniel,51 who showed that bilateral lung hemorrhage could be caused by a high-velocity missile wound of the soft tissue of the dog's shoulder, conditions being such that the missile did not enter the chest cavity or tear the pleura. Also, the work of Klubs40 and of Henry et al.52 showed that bilateral hemorrhagic lung damage could be caused by local unilateral trauma to the chest wall.
Whether or not a blast wave and high-velocity winds can dynamically load an animal to the extent that cavitation will occur (separation of the parietal and visceral pleurae, for instance) is an open question. However, that some mechanism may be of etiological importance is a possibility worth investigating intensively.
A recent excellent study by Clemedson36 is most applicable. Using a barium titanate transducer, pressure-time phenomena that occurred inside the body of a rabbit exposed to blast were recorded. Curves for the brain, abdomen, thorax, and muscle were shown. The most noteworthy finding was the proof that intrathoracic pressures are composed of both positive and negative components. The data do not allow a statement as to whether it is the positive or the negative waves that damage the lungs, but the existence of the negative wave certainly opens up the possibility of damage by a cavitation-like mechanism similar to that described by Harvey in his ballistic studies.
Whatever the mechanism is, it is well to refer the reader to the very informative recent paper of Armstrong et al.53 in which the pathology produced by blast, rapid decompression, and impact deceleration was briefly reviewed. One of the very interesting statements to be found in the paper (also mentioned by Clemedson28) concerns figures attributed to Penney and Bickley,51 who, after analyzing unpublished blast data provided by Zuckerman, proposed that the lungs of a man or animal would be severely damaged if the "chest walls were flung in- ward with such acceleration that they acquire a velocity of 20 meters/sec (65.6 ft/sec) in half a millisecond or less."
We have found the 20 meter/sec figure intriguing because of unpublished experience with nonpenetrating missiles impacted against the thoracic walls of anesthetized dogs. Figure 6.25 shows an analysis of photographic data on one such experiment. A 33.5-lb anesthetized dog was struck on the right mid-lateral chest with a 0.433-lb cylindrical missile 2.75 in. in diameter. Impact velocity was about 155 ft/sec, and 0.5 msec after impact the missile, and presumably the chest wall, was moving at a velocity near 88 ft/sec (25.9 meters/sec). The lungs of the animal were severely damaged bilaterally when sacrificed 0.5 hr after injury.
Thus it would appear obvious that sooner or later someone will succeed in quantatively "marrying" data describing blast impact with values defining other forms of trauma whether these involve nonpenetrating missiles or decelerative contact with the ground or a water sur- face.
Data of some relevance in animals were noted by Stewart, Spells, and Armstrong, who
198
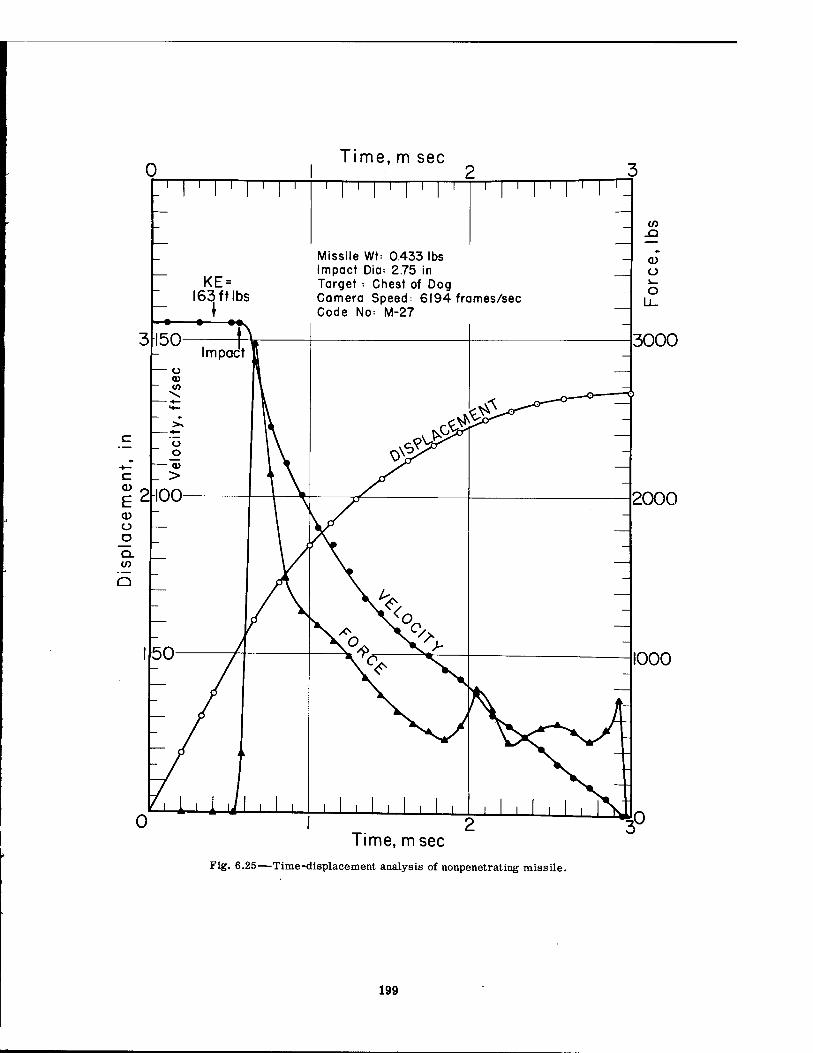
0
KE = 163 ft lbs
t
Time, m sec
Missile Wt< 0.433 lbs Impact Dia; 2.75 in Target ■■ Chest of Dog Camera Speech 6194 frames/sec Code No: M-27
Time, msec Fig. 6.25—Time-displacement analysis of nonpenetrating missile.
CO Ü
3000
2000
1000
199
reported that guinea pigs impacted at 75 ft/sec against a water surface were killed, the lungs showing localized hemorrhagic lesions. Whether or not this is the minimal velocity for lethality was not stated, but some of us* have participated in experiments to determine the height of drop and impact velocities necessary to fatally injure guinea pigs (within i hr after impact) when the animal is allowed to fall, ventral surface down, onto a concrete surface. The velocities for 50 and 100 per cent fatality were near 32 and 35 ft/sec, respectively.
(2) Resuscitation Studies. Goddard56 and Goddard et al.57 have reported the use of man- ually operated, mask-equipped resuscitators in clinical and laboratory studies involving new- born infants, both full-term and premature. The resuscitator delivered a nearly square-wave pressure pulse (rise time, about O.i sec; time at peak pressure, 0.1 to 0.2 sec) enduring for from 0.3 to 0.4 sec. Pressures (measured at the mask) at a maximum of 22 to 44 mm Hg (0.43 to 0.85 psi) have been employed clinically in resuscitation without damaging the lungs. How- ever, at pressures above 59 mm Hg (1.14 psi), applied in fresh infant cadavers, interstitial emphysema was noted, and rupture of the lungs occurred at pressures above about 70 mm Hg (1.35 psi). The work of the Albuquerque group is one of the few instances in which quantita- tive pressure-time data have been reported for conditions involving repeated pulsing pres- sures applied through the trachea of human infants, although Day et al.58 have published ex- periments with human as well as animal lungs.
(3) Aeromedical Data. Some aeromedical publications, in addition to those of Luft,38 Luft and Bancroft,30 and Stapp37 previously alluded to, are worth brief comment.
The first concerns a report by Stumm69 which describes the exposure of a chimpanzee to wind blast on the rocket sled at Edwards Air Force Base. Mach 1 velocity was reached. Ram pressures calculated as stagnation pressures (NACA Standard Atmosphere) amounted to 13.0 psi (compressible adiabatic). The animal survived, but suffered traumatic emphysema as evidenced by postrun chest signs and the presence of palpable crepitation in the neck above the clavicle.
Recently Hegenwald and Blockleyt60 discussed a near fatal accident involving supersonic ejection (Mach 1.05 at between 5000 and 7000 ft). Ram pressures survived by the test pilot were in the order of 9 psi incompressible or 11 psi compressible adiabatic. Although most of the pathology noted was attributed to g loading, the study does indicate the survival of a human exposed to fairly high pressures, the durations and oscillations of which unfortunately are not known.
Stapp's61 work on decleration of humans is of value because the data establish the biologi- cal importance of rate of loading. The force withstood by volunteers riding a rocket sled was that of decleration when the body was supported with shoulder harness and lap belts. Between 35 and 40 maximal g was tolerated. However, the occurrence of no difficulty, mild shock, and definite shock (with syncope) was associated with rates of application of force of 281, 1170, and 1370 g/sec, respectively. Near 50 g applied at the rate of 331 g/sec, on the other hand, produced conjunctival and retinal hemorrhage and mild signs of concussion.
Similar experiments in animals have documented the presence of lung lesions that in all probability are related to a rise in pressure inside the lung due to the flattening and deforma- tion of the chest produced by the shoulder straps. Since a deformity due to overpressure and windage may occur in blast exposure, one can expect similarities to develop between the en- vironmental load factors in blast and in local trauma as research develops. What is needed among other things is the measurement of intrathoracic or transthoracic pressures in ani- mals subjected to thoracic trauma from impact with solid objects and from air-borne blast phenomena.
The utility of experiments involving transthoracic pressures associated with rapid de- compression has been alluded to previously. Because the falling phase and the underpressure
♦Donald R. Richmond, I. Gerald Bowen, Clayton S. White, and Faith Sherping. tThe authors are indebted to W. V. Blockley for kindly supplying a preprint of the paper
presented at the annual meeting of the Aero Medical Association on 17 April 1956.
200
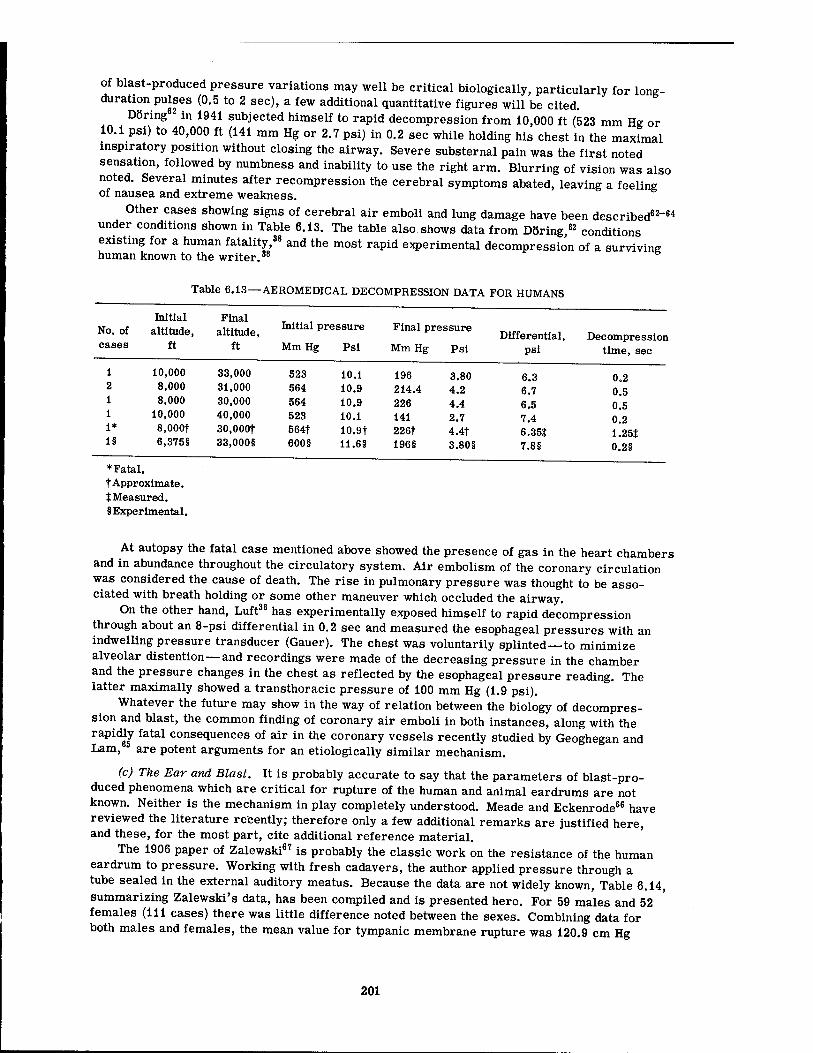
of blast-produced pressure variations may well be critical biologically, particularly for long- duration pulses (0.5 to 2 sec), a few additional quantitative figures will be cited.
Döring in 1941 subjected himself to rapid decompression from 10,000 ft (523 mm Hg or 10.1 psi) to 40,000 ft (141 mm Hg or 2.7 psi) in 0.2 sec while holding his chest in the maximal inspiratory position without closing the airway. Severe substernal pain was the first noted sensation, followed by numbness and inability to use the right arm. Blurring of vision was also noted. Several minutes after recompression the cerebral symptoms abated, leaving a feeling of nausea and extreme weakness.
Other cases showing signs of cerebral air emboli and lung damage have been described62-64
under conditions shown in Table 6.13. The table also shows data from Döring,62 conditions existing for a human fatality,38 and the most rapid experimental decompression of a surviving human known to the writer.38
Table 6.13—AEROMEDICAL DECOMPRESSION DATA FOR HUMANS
Initial Final No. of altitude, altitude, initial pressure Final pressure
Differential, Decompression cases ft ft Mm Hg Psi Mm Hg Psi psi time, sec
1 10,000 33,000 523 10.1 196 3.80 6.3 0.2 2 8,000 31,000 564 10.9 214.4 4.2 6.7 0.5 1 8,000 30,000 564 10.9 226 4.4 6.5 0.5 1 10,000 40,000 523 10.1 141 2.7 7.4 0.2 i* 8,000t 30,000t 564t 10.9t 226f 4.4f 6.35J 1.25$ 1§ 6,3751 33,000§ 600 § 11.65 196§ 3.80§ 7.8§ 0.28
* Fatal. t Approximate. t Measured. § Experimental.
At autopsy the fatal case mentioned above showed the presence of gas in the heart chambers and in abundance throughout the circulatory system. Air embolism of the coronary circulation was considered the cause of death. The rise in pulmonary pressure was thought to be asso- ciated with breath holding or some other maneuver which occluded the airway.
On the other hand, Luft38 has experimentally exposed himself to rapid decompression through about an 8-psi differential in 0.2 sec and measured the esophageal pressures with an indwelling pressure transducer (Gauer). The chest was voluntarily splinted—to minimize alveolar distention—and recordings were made of the decreasing pressure in the chamber and the pressure changes in the chest as reflected by the esophageal pressure reading. The latter maximally showed a transthoracic pressure of 100 mm Hg (1.9 psi).
Whatever the future may show in the way of relation between the biology of decompres- sion and blast, the common finding of coronary air emboli in both instances, along with the rapidly fatal consequences of air in the coronary vessels recently studied by Geoghegan and Lam, are potent arguments for an etiologically similar mechanism.
(c) The Ear and Blast. It is probably accurate to say that the parameters of blast-pro- duced phenomena which are critical for rupture of the human and animal eardrums are not known. Neither is the mechanism in play completely understood. Meade and Eckenrode66 have reviewed the literature recently; therefore only a few additional remarks are justified here, and these, for the most part, cite additional reference material.
The 1906 paper of Zalewski67 is probably the classic work on the resistance of the human eardrum to pressure. Working with fresh cadavers, the author applied pressure through a tube sealed in the external auditory meatus. Because the data are not widely known, Table 6.14, summarizing Zalewski's data, has been compiled and is presented here. For 59 males and 52 females (111 cases) there was little difference noted between the sexes. Combining data for both males and females, the mean value for tympanic membrane rupture was 120.9 cm Hg
201
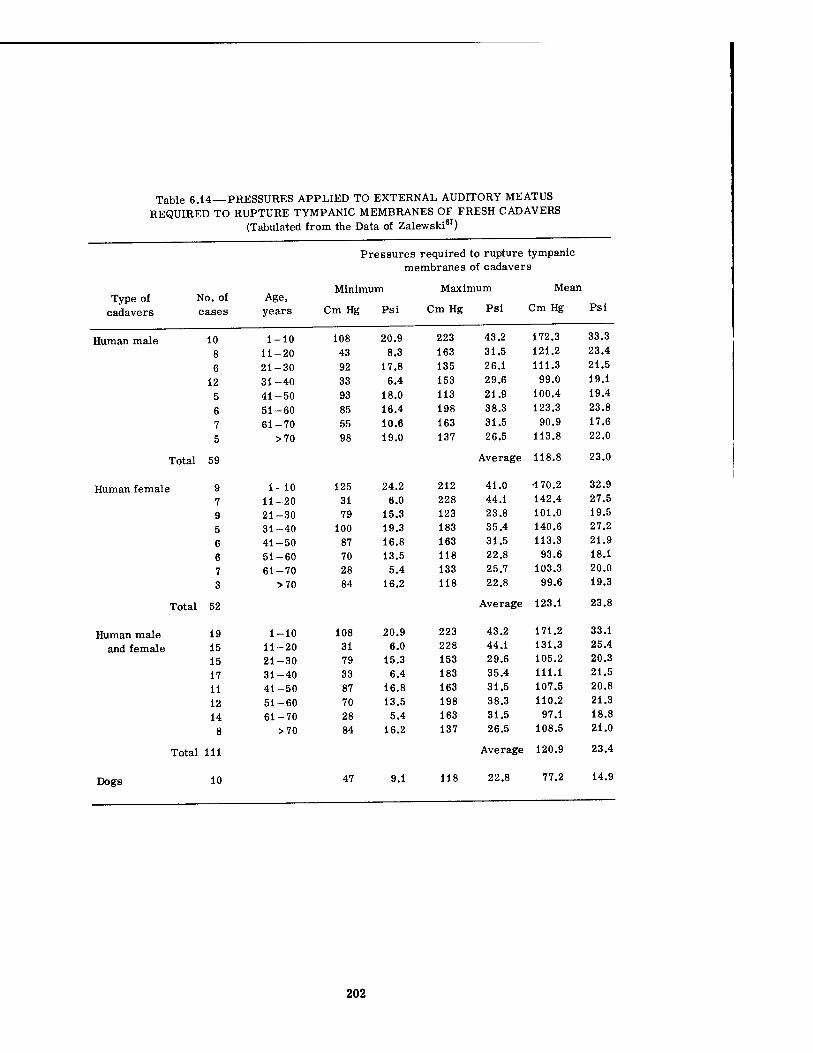
Table 6.14—PRESSURES APPLIED TO EXTERNAL AUDITORY MEATUS REQUIRED TO RUPTURE TYMPANIC MEMBRANES OF FRESH CADAVERS
(Tabulated from the Data of Zalewski67)
Pressures required to rupture tympanic membranes of cadavers
Type of cadavers
No. of cases
Age, years
Minimum
Cm Hg Psi
Maximum
Cm Hg Psi
Mean
Cm Hg Psi
Human male 10 8
1-10 11-20
108 43
20.9 8.3
223 163
43.2 31.5
172.3 121.2
33.3 23.4
6 21-30 92 17.8 135 26.1 111.3 21.5
12 31-40 33 6.4 153 29.6 99.0 19.1
5 41-50 93 18.0 113 21.9 100.4 19.4
6 51-60 85 16.4 198 38.3 123.3 23.8
7 61-70 55 10.6 163 31.5 90.9 17.6
5 >70 98 19.0 137 26.5 113.8 22.0
Total 59 Average 118.8 23.0
Human female 9 7
1-10 11-20
125 31
24.2 6.0
212 228
41.0 44.1
•170.2 142.4
32.9 27.5
9 21-30 79 15.3 123 23.8 101.0 19.5
5 31-40 100 19.3 183 35.4 140.6 27.2
6 41-50 87 16.8 163 31.5 113.3 21.9
6 51-60 70 13.5 118 22.8 93.6 18.1
7 61-70 28 5.4 133 25.7 103.3 20.0
3 >70 84 16.2 118 22.8 99.6 19.3
Total 52 Average 123.1 23.8
Human male and female
19 15 15
1-10 11-20 21-30
108 31 79
20.9 6.0
15.3
223 228 153
43.2 44.1 29.6
171.2 131.3 105.2
33.1 25.4 20.3
17 31-40 33 6.4 183 35.4 111.1 21.5
11 41-50 87 16.8 163 31.5 107.5 20.8
12 51-60 70 13.5 198 38.3 110.2 21.3
14 61-70 28 5.4 163 31.5 97.1 18.8
8 >70 84 16.2 137 26.5 108.5 21.0
Total 111 Average 120.9 23.4
Dogs 10 47 9.1 118 22.8 77.2 14.9
202
(23.4 psi) with a range from 28 to 228 cm Hg (5.4 to 44.1 psi). There was, however, evidence that aging was a factor in eardrum failure suggested by the fact that the average pressures for failure for the age groups 1 to 10, 11 to 20, 21 to 50, and 51 to 75 years were 171.2, 131.3, 112.8, and 104.4 cm Hg (33.1, 25.4, 21.8, and 20.2 psi), respectively.
Perlman68 in an interesting study states that human eardrum failure can be expected be- tween 200 and 400 mm Hg (3.9 to 7.7 psi), but Dziemian et al.69 cites 10 to 22 psi as the pres- sure required for failure, although Corey70 suggests that pressures in excess of 7 psi are re- quired. On the other hand, Schubert,71 using normal membranes of cadavers, found rupture be- tween 532 and 1292 mm Hg (10.3 to 25.0 psi). Membranes with atrophic scars ruptured be- tween 304 and 380 mm Hg (5.9 to 7.4 psi), and Schubert placed 160 mm Hg (3.1 psi) as the safe pressure.
Zalewski also cited data obtained on 10 dogs using the same method employed for the cadaver investigation. The mean pressure for eardrum rupture was 77.2 cm Hg (14.9 psi) with a range from 47 to 118 cm Hg (9.1 to 22.8 psi). These values are lower than those found in the present study, which perhaps is not surprising since the latter were blast-produced pressures and those of Zalewski were applied relatively statically.
For a recent review of work dealing with the tolerance of eardrums to pressure and de- compression, the reader is referred to the excellent work of Hoff and Greenbaum.72
(d) Blast Pathology and Environmental Factors as Related to the Etiology of Blast Injury. Although blast pathology has been well reviewed by Clemedson,2'28 Desaga,3 Benzinger,1
Rössle,6 Schardin,27 Armstrong, et al.,53 Meade and Eckenrode,88 Fulton,73 and Draeger et al.74
and in a paper by the National Research Council,5 it is well here to summarize a few facts that are of considerable aid in formulating a "feel" for the etiology of blast pathology. Initially, it is well to state that the causes of death from blast are varied and that the etiological mech- anisms in play are not well understood, particularly in those instances in which the mammal succumbs quickly with little in the way of positive pathological findings to clarify the situation. The critical reader will appreciate the difficulties as the discussion proceeds.
(1) Pathology. For many years it has been known that animals and humans exposed to blast may die within a few minutes and show no sign of external damage except, perhaps, a blood-stained frothy fluid at the nose and mouth. Others will live several minutes to hours with signs of increasing respiratory distress. Still others may succumb after hours or days during which signs of focal damage to the nervous system exist (references 1 to 6, 8 to 10, 17, 27, 28, 53, 70, and 73). Post-mortem examination of the animals dying from exposure to blast have revealed that for a general rule the tissues most susceptible are those containing air, the lungs and gut in particular, and those areas in which there is a sharp difference in tissue density, such as muscle and bone, the heart, and the overlying lung. In more detail, attention is directed to the following major findings:
1. Contused hearts of severe enough nature to have caused heart failure in some cases — the commotio cordis of Schlomka (quoted by Benzinger,1 Desaga,3 and Rössle.8
2. Arterial air embolism involving at least the coronary and cerebral arteries of a high percentage of animals exposed to lethal HE blast both in air and in water —Benzinger,1 Desaga 3
Rössle, Schafer (quoted by Benzinger1), and Clemedson.13.28 In four human blast fatalities air ' emboli were found as follows: (1) coronary and meningeal arteries in one case and the heart of another —Benzinger1; (2) cerebral vessels in one case and of the coronary and renal arter- ies in another—Kloos quoted by Benzinger.5
3. Fat embolism—Hooker4 and Robb-Smith.75
4. Various degrees of laryngeal, tracheal, and pulmonary hemorrhages, which in the last instance vary from small focal areas to lobes and entire lungs with major bronchi full of fluid and clotted blood (references 1 to 6, 8, 9, 17, 28, and others).
5. Varying degrees of pulmonary edema (references 1 to 6, 8, 9, 17, 28, 73, 76, 77, and others).
6. Rupture of the lungs involving emphysematous lesions, subpleural blebs, and produc- tion of pneumothorax (references 1, 2, 5, 6, 8, 9, and 17).
7. Perforation and rupture of laceration of abdominal organs, particularly those con- taining air (references 1, 2, 5, and 6).
203
8. Sinus and middle-ear erythema and hemorrhages.1,27
9. Ruptured eardrums and disruption of the ossicles of the middle ear. 10. Inconsistent reports of hemorrhage and softening of the intracranial nervous tissue as
well as hemorrhages and contusion of the spinal meninges and spinal nerve roots (references 1, 2, 5, 6, and 55).
(2) Causes of Death. Primary causes of blast death, other than total disintegration of the body, thus far described have included heart failure, suffocation, and failure of nervous func- tion. Secondary causes, which will not be considered further here, have involved posttraumatic contusion pneumonia, perforation peritonitis, trauma from missiles, and injury subsequent to displacement.
Heart Failure. The primary factors mentioned above deserve further discussion. Practically all experimentalists working with blast biology have reported a fall in blood pres- sure often associated with slowing of the heart, which has been distinguished from the terminal fall of blood pressure associated with circulatory or respiratory failure. As far as blast is concerned, there can be at least four possible causes of a fall in arterial pressure:
1. Commotio cordis, which may reduce cardiac activity or cause frank arrest (references
i, 3, 6, and 28). 2. Coronary air embolism, which may give the picture of right or left heart failure and
may be temporary in nature or produce rapid failure (references 1, 3, 6, 13, and 28). 3. Blast reflex of the vagus, which frequently causes reduced coronary activity secondary
to hypotension, and bradycardia, which can be minimized by bilateral vagotomy1'2,8 and avoided by also anesthetizing the carotid sinus region.12 The effector organ of this reflex is the heart, but the sensing level of the reflex is obscure. It could arise centrally because of damage to the vagal center from concussion or air emboli, from the heart itself due to anoxia from what- ever cause, from a rise in the pressure of the pulmonary artery, or from pressure receptors in the lungs and pleurae. Schaefer in 1944, quoted by Benzinger,1 measured the right heart pressures in blast and found inconsistent rises and did not think that heart failure could be associated with this factor. For further details the reader is referred to the recent review of Clemedson.28
4. Mechanical blocking of the pulmonary circulation from hemorrhage and edema. Many investigators have documented electrocardiographic evidence of coronary anoxia,
heart block, and fibrillation in blasted animals and humans. No doubt some animals die of direct trauma to the heart, commotio cordis. These die almost immediately and perhaps be- fore coronary air embolism has time to develop.1 EKG evidence and failure to find air emboli in some animals (although this does not prove the nonexistence of the latter) help support this conclusion.1 Benzinger,1 however, believes commotio cordis as a cause of death is relatively rare in blast—five of 35 fatalities in one series of animal experiments.
It is known that a careful search done fairly soon after blast with a suitable technique must be made if arterial emboli are to be visualized. If they do exist in the coronary circulation as a significant cause of death and heart failure, a large percentage of positive post-mortem find- ings would be expected. Indeed, the literature contains such evidence as shown in Table 6.15, compiled from Benzinger,1 Rassle,6 and Desaga.3
Animals that die quickly have a higher incidence of coronary embolism than is shown in Table 6.15, which includes all animals dying. Rössle,6 for instance, quotes the data of Benzinger1 to show air emboli in 11 of 12 animals dying quickly in underwater blast in one series and five of five animals expiring rapidly in another series.
Animals given experimental coronary air embolism have been saved by subsequently pressurizing the animals.1-42 If coronary air embolism were a significant cause of death, postdetonation pressurization could be expected to avoid fatality in animals exposed to other- wise lethal blast. Benzinger1 saved a dog exposed to fatal underwater blast by such a proce- dure. He also demonstrated the appearance of anoxic EKG findings which disappeared with pressure as the animals recovered. Clemedson,13 using rabbits subjected to fatal air blast, has recently confirmed the findings of the German workers by demonstrating the therapeutic effectiveness of pressurization to 4 atm and by visualizing air emboli during post-mortem examinations.
204
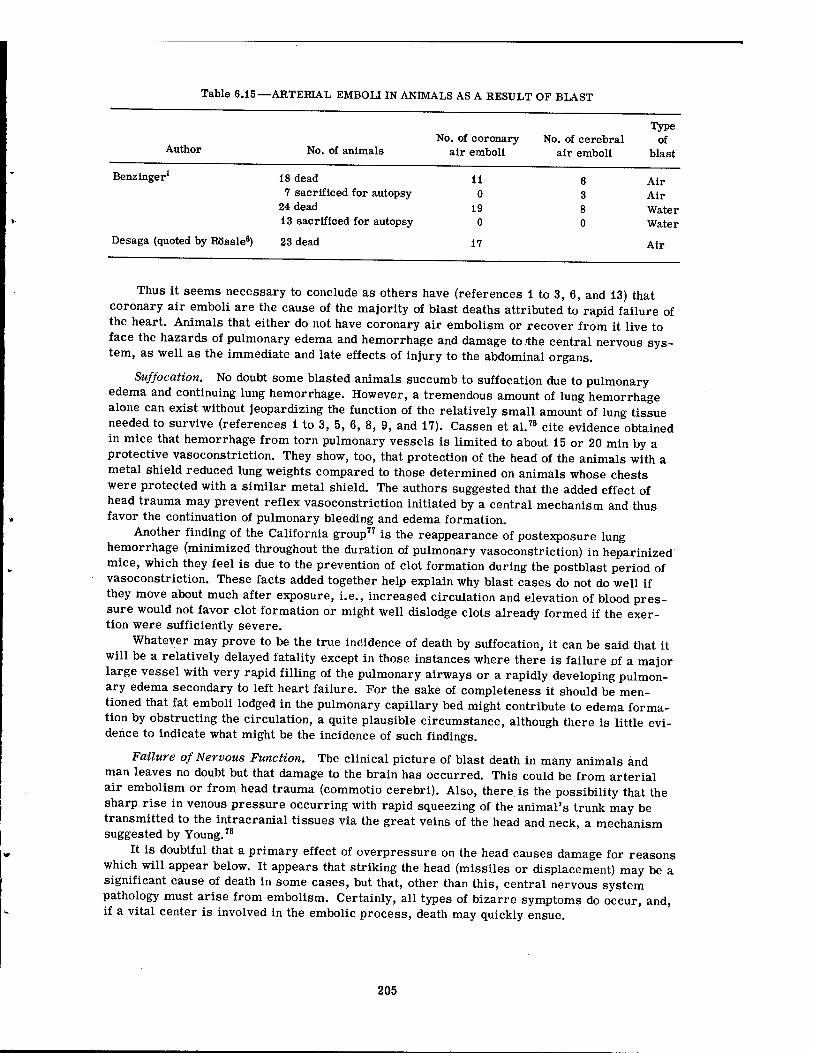
Table 6.15—ARTEBIAL EMBOLI IN ANIMALS AS A RESULT OF BLAST
Author
Benzinger
Desaga (quoted by Rössle6)
No. of animals No. of coronary
air emboli
18 dead 11 7 sacrificed for autopsy 0
24 dead 19 13 sacrificed for autopsy 0
23 dead 17
No. of cerebral air emboli
Type of
blast
6 Air 3 Air 8 Water 0 Water
Air
Thus it seems necessary to conclude as others have (references 1 to 3, 6, and 13) that coronary air emboli are the cause of the majority of blast deaths attributed to rapid failure of the heart. Animals that either do not have coronary air embolism or recover from it live to face the hazards of pulmonary edema and hemorrhage and damage to /the central nervous sys- tem, as well as the immediate and late effects of injury to the abdominal organs.
Suffocation. No doubt some blasted animals succumb to suffocation due to pulmonary edema and continuing lung hemorrhage. However, a tremendous amount of lung hemorrhage alone can exist without jeopardizing the function of the relatively small amount of lung tissue needed to survive (references i to 3, 5, 6, 8, 9, and 17). Cassen et al.78 cite evidence obtained in mice that hemorrhage from torn pulmonary vessels is limited to about 15 or 20 min by a protective vasoconstriction. They show, too, that protection of the head of the animals with a metal shield reduced lung weights compared to those determined on animals whose chests were protected with a similar metal shield. The authors suggested that the added effect of head trauma may prevent reflex vasoconstriction initiated by a central mechanism and thus favor the continuation of pulmonary bleeding and edema formation.
Another finding of the California group" is the reappearance of postexposure lung hemorrhage (minimized throughout the duration of pulmonary vasoconstriction) in heparinized mice, which they feel is due to the prevention of clot formation during the postblast period of vasoconstriction. These facts added together help explain why blast cases do not do well if they move about much after exposure, i.e., increased circulation and elevation of blood pres- sure would not favor clot formation or might well dislodge clots already formed if the exer- tion were sufficiently severe.
Whatever may prove to be the true incidence of death by suffocation, it can be said that it will be a relatively delayed fatality except in those instances where there is failure of a major large vessel with very rapid filling of the pulmonary airways or a rapidly developing pulmon- ary edema secondary to left heart failure. For the sake of completeness it should be men- tioned that fat emboli lodged in the pulmonary capillary bed might contribute to edema forma- tion by obstructing the circulation, a quite plausible circumstance, although there is little evi- dence to indicate what might be the incidence of such findings.
Failure of Nervous Function. The clinical picture of blast death in many animals and man leaves no doubt but that damage to the brain has occurred. This could be from arterial air embolism or from head trauma (commotio cerebri). Also, there is the possibility that the sharp rise in venous pressure occurring with rapid squeezing of the animal's trunk may be transmitted to the intracranial tissues via the great veins of the head and neck, a mechanism suggested by Young.78
It is doubtful that a primary effect of overpressure on the head causes damage for reasons which will appear below. It appears that striking the head (missiles or displacement) may be a significant cause of death in some cases, but that, other than this, central nervous system pathology must arise from embolism. Certainly, all types of bizarre symptoms do occur, and, if a vital center is involved in the embolic process, death may quickly ensue.
205
(3) Significance of Variation in the Experimental Environment. One older theory con- cerning the cause of blast death assumed that a wave of overpressure passed down the trachea and hence overdistended the lungs. To test this and gain additional useful information, the German and English workers performed a number of illuminating experiments. These, along with findings of American scientists, are presented below.
Animals placed inside steel boxes, except for their heads, survived an otherwise fatal detonation (references 1, 8, 9, and 17). Head and neck injury did not occur if the neck was padded and thus prevented from being banged against the end of the steel box (references 8, 9,
and 17). j J . .. Animals placed inside steel boxes but with a tracheotomy tube protruding and pointing
directly toward the origin of a close-by detonation were not damaged significantly. Also, animals exposed under fatal conditions with a tracheotomy tube containing a filter to damp the blast wave were killed as readily as those with no such tracheal obstruction.1
Animals immersed head down in water to cover only the chest and then exposed to an underwater explosion showed damage only to the chest but did exhibit signs of central nervous system origin. Those immersed tail down with the head and chest out of the water revealed only abdominal pathology.1
Animals bound with thin plaster of Paris bandages to prevent any gross overdistention of the chest and abdominal walls were still fatally injured.1 However, if the cover of the body were rigid enough or suitably constructed, some protection was definitely obtained (references 1, 3, 8, 9, and 17).
Central nervous focal signs appeared in animals blasted when the head was not exposed, e.g., an animal immersed to the neck near an underwater detonation.
Pneumothorax (Desaga, quoted by Benzinger1) gave considerable protection to the lungs. A metal disk taped to the side of the thoracic wall of an animal exposed to blast in a shock
tube resulted in a hemorrhagic image of the disk on the lungs.79
Animals exposed close to small charges of HE showed more damage to the lung on the side closest to the explosion. At greater distances damage was independent of orientation of the animal, i.e., windage effects were seen only close to HE charges (references 8, 9, and 17).
The lethal distance for an animal from a 100-kg charge was decreased from 7 to 4.5 meters (23 to 14.8 ft) by shielding the animal from the wind of the explosion by an earthwork.1
The distance from a charge, detonated in air, which marked a lethal region for dogs in which all the dogs died was reported to be a very closely defined area.3 Just outside the lethal region was a circular ring no wider than 0.5 meter (1.6 ft); this ring delineated a "critical zone" in which about 50 per cent of the animals died. Yet outside of this zone a circular re- gion about 3 to 4 meters (9.8 to 13.1 ft) wide marked an "injury zone" in which animals seemed normal in appearance and behavior but, when sacrificed and examined, often had rather severe internal injuries.3
Biological damage can occur in relatively closed places when overpressures and under- pressures are not associated with the presence of a demonstrable shock front preceding or associated with the variations in pressure (field experience of the authors).
In closed places very low overpressures may be damaging to animals; for the rabbit, small punctiform lesions of the lungs have been noted with HE in the open when the peak over- pressure was about 7 psi but have occurred at one-tenth this pressure in confined places.
A tunnel effect noted in subways that were used as blast shelters during World War II apparently was associated with the lethal transmission of blast waves at relatively great dis- tances from explosions, i.e., the blast wave was confined and able to propagate its energy in only one direction and therefore was dissipated more slowly with distance.3
Evidence is available which suggests that the rate and magnitude of pressure rise and the occurrence of stepwise rises in pressure or progressively oscillating pressures (multiple pressure pulses) may all be critical (reference 29; also, the present study and the previous field experience of the authors).
From the above information it can be concluded, as did Hooker4 (in 1919) and others (references 1 to 3, 8, 9, and 17), that exposure of the trunk of the animal is critical to primary blast damage and that for HE blast (air or water) it is the impact of the pressure wave against
206
the chest and abdomen that is essential to internal damage. In addition, it can be said that the particle velocity (wind) associated with a blast wave can add a great deal to the load on the animal. Also, it is obvious that a careful analysis of variations of the several physical param- eters of blast phenomena in relation to biological events is indicated. This is especially true for (i) relatively slow-rising pressure fronts, particularly when multiple-pulse and oscilla- ting pressure variations are involved, and (2) long-duration pressure phenomena for which the falling phase of the pressure, including the underpressure, is likely to be of biological sig- nificance.
(4) Physical Factors. Enough has been said in previous sections about blast phenomena in relation to biological damage to justify a few concise statements in the way of a summary It is clear that:
i. The duration of a single HE pulse can markedly influence the magnitude of the maxi- mal static overpressure associated with fatality.
2. The peak HE-produced local static overpressure needed for biological damage de- creases as the duration of the single pulse increases up to about 12 msec. No data of precise quantitative nature are available beyond this duration.
3. Peak pressure, momentum, and impulse, associated with the primary pulses of air and underwater blast waves, cannot now be regarded as reliable indications of expected pathology if multiple pressure loading occurs and if the overpressure duration is relatively long.
4. Wind loading is of considerable importance. 5; The occurrence of stepwise pressure rises, associated with repetitive or oscillating
pulses, may be responsible for biological damage under circumstances in which the pressure, momentum, and energy of the primary or initial pressure load appear to be of minor im- portance.
6. Very little is known about the biological effects of relatively slow-rising pressure phenomena, particularly those associated with multiple increases in pressure associated with overpressures measured in hundreds of milliseconds or seconds rather than in a few milli- seconds.
7. Such pressure-time phenomena are the rule in reasonably well-designed but open blast- protective shelters.
8. Experience to date indicates that the rate at which the pressure load develops is of biological significance.
9. The time characteristics and magnitude of primary and secondary pulses in relation to the natural period of critical biological systems may be quite decisive and deserves further study.
10. The internal geometry of a blast-protective shelter is critical, e.g., in long tubular geometry, significant lung damage in dogs has been associated with maximal wall static overpressures as low as 12.5 psi, whereas, in "square" geometry, maximal wall overpressures over fivefold have been tolerated by dogs showing little or no lung pathology.
11. A method for correlating environmental variations produced by large-scale explosions with biological effects is not available even for the animal target, not to mention the human case.
Such facts are quite puzzling, at least to the authors, and any attempt to understand the problem requires close scrutiny of data dealing with the physical characteristics of shock phenomena. In the light of the preceding material a publication by Schardin" has considerable meaning, and some of his thinking has been referred to earlier in discussions of pressure and momentum as they apply to "destruction" curves for physical and biological targets.
At this point the writers wish again to draw upon the knowledge of Schardin" and point out in the discussion below the effects of inertia, spalling, and implosion phenomena as they may influence the interpretation of biological blast effects.
Effects of Inertia. If two interconnected masses of different density lying side by side are struck by a shock front and by the following overpressure and wind, each mass impelled by a force related to the magnitude of the reflected pressure begins to move. The lighter mass will gain velocity faster than the heavier, and shearing forces will develop which may tear or rup-
207
ture the union between the masses. An example is the often seen hemorrhages along the line of the union of the ribs and the intercostal muscles of an experimental animal exposed to blast. Static loading to pressures much greater than those associated with blast waves does not pro- duce this effect. Thus a static load is not inertia sensitive. Dynamic blast loading is, and much of the internal damage can be attributed to this kinetic factor.
Spätling Effect. Schardin27 has written of another effect of the "discontinuous front of the shock wave," namely, the spalling effect. Apparently, if a shock wave is transmitted from one medium to another, the densities of which vary, a reflection wave that travels back into the first medium occurs at the interface. This wave is a suction or negative wave and will cause considerable internal stresses if the shock front travels from a more dense to a less dense medium, as pointed out also by McMillen and Harvey.80 Schardin" cites the example of pro- ducing a shock wave in the center of a glass plate with a small explosive charge. At detona- tion a shock wave moves toward the rim of glass faster than the fragmentation cracks propa- gate outward from the detonation. As the shock wave reaches the rim and attempts to move from the glass to air, a negative or tension wave is reflected back into the glass, and the en- tire rim is shattered.
A similar phenomenon is seen in the reflection of underwater shock waves from the sur- face as tension waves. Also, dust often spalls with considerable velocity from the interior of unpainted concrete bunkers following a bomb explosion.
Implosion Phenomena. Schardin" has, with spark cinematography, visualized events when a shock wave traveling into a fluid meets bubbles of air allowed to trickle through the fluid from a hose. Each bubble becomes a source of a new detonation wave with intense shock waves emanating from each. It is said that the bubbles are imploded (a bursting inward in contrast to exploded) and internal pressures as high as 100,000 atm can occur." Apparently, since the air bubble is more compressible than the water, there results a marked acceleration of the fluid near the surface of the bubble, and water particles spall or are thrown into the gas. The bubble undergoes a sharp decrease in volume and is therefore highly compressed, and pres- sures ensue which are far in excess of those of the initial shock front traveling through the
liquid. Schardin" suggests that the implosion effect may be quite damaging to the air-containing
lung tissues and may be a factor in the production of hemorrhage and air emboli. Benzinger attributes the production of pulmonary damage by blast to "the local effects of inertia, spalling, and perhaps to implosion which tear the delicate tissues," and "produce breaks in the inter- face between the air spaces and the pulmonary veins." He further states that, after the lung tissue is damaged, any cause of positive pressure in the lung will suffice to push air into the blood stream, e.g., "even the pressure of one laborious expiration is sufficient."
The consequences of implosion and spalling cannot be ignored for (1) an animal after all is composed of a fluid medium in which gas and tissues of differing densities are suspended, and (2) Clemedson36'81 has demonstrated the occurrence of pressure waves inside intact ani- mals and in muscle tissue following exposure to shock waves produced by explosives. Thus it is known that the impact of instantaneously rising pressure pulses with the surface of a biologi- cal target causes internal pressure phenomena and that the transmission of these pressure waves into air-containing tissues is likely to be quite damaging indeed. An example from the authors' own experience can be cited. Animals exposed to blast phenomena in shelters often show spotty, but multiple, bruising of the heart muscle which is apparent on gross inspection. The surface involved is limited to those areas in contact with the overlying lung.
These facts, along with those of Harvey's ballistic studies mentioned earlier, suggest that one means of biological blast damage involves a very fast mechanism associated with the kind of an external pressure load which will cause significant pressure pulses to be formed in and transmitted through the organism. The most sensitive regions will be those containing air, and damage will occur through spalling and implosion phenomena.
Less dynamic pressure loading, those phenomena in which the rise in pressure is meas- ured in milliseconds rather than microseconds, may damage predominantly by a mechanism which is intermediate in speed and which involves inertia effects and body-wall deformation
208
in the absence of significant pressure-pulse transmission through the organism. A yet slower mechanism may be visualized as involving the pooling of blood and other
fluids in the air-containing regions. Such a slow mechanism could well be associated with fairly slow but steadily rising pressures of considerable magnitude and duration which might well drive fluid into the chest in a manner somewhat analogous to that involved in the squeeze syndrome described in pearl divers.
The writers wish to make it very clear that the previous three paragraphs represent speculation only. There is no intent to imply that fast, intermediate, and slow mechanisms are either sharply delineated or mutually exclusive. Rather, the intent is to present a hypothesis to guide future local research and to stimulate the thinking of others investigating biological blast effects.
209
CHAPTER 7
GENERAL DISCUSSION
7.1 GENERAL
The most dramatic and perhaps the most important finding of the field program described in the preceding chapters concerns the fact that the blast phenomena produced by nuclear deto- nations need not be a serious cause of immediate casualties even at relatively close range.
The recovery of living animals from the ground floor and basements of totally destroyed houses demonstrates the utility of simple, inexpensive structures as a means of protection against primary, secondary, and tertiary blast effects. Yet at the same time it is necessary to point out that this investigation made no study of the possible radiation effects on animals located in the houses.
More meaningful was the recovery of living animals from open shelters at much closer range, as close, in fact, as 1050 ft from a tower-detonated nuclear device with a yield approxi- mately 50 per cent greater than nominal. The significance of this, in relation to the nominal yields employed at Hiroshima and Nagasaki, cannot be overemphasized since the overpres- sures at ground level near the forward shelters in the present study were in the order of two- to threefold those existing near the epicenters of the two devices detonated over Japan. Thus the provision of blast-protective shelters and arrangements to assure their occupancy by a maximum number of people in case of an impending explosion (minimal warning time and drill) will serve to sharply curtail casualties resulting from blast. What this could mean to the health and safety of citizens of a city, county, and state needs no further scientific em- phasis, although emphasis for other reasons is no doubt desperately needed. A question in point, of course, is: How many adequate blast-protective shelters exist in populated areas of the world? .
Among other things, this question implies that shelters should be adequate. Broad inter- pretation of this thought concerns problems outside the present study which, strictly speaking, involved the biological effects of blast-produced variations in the environment. However, it is useful and essential to develop and maintain a sound perspective for the total problem, and environmental factors in general will be briefly discussed below. Also, some observations made in the field which bear on radiation and thermal effects will be mentioned briefly again.
7.2 SHELTER PROBLEM
Any structure to be used for protection against the effects of high-yield explosions should be structurally and functionally adequate, keeping in mind the necessity of providing a total environment that is safe and acceptable for human occupancy. In this regard it is helpful to consider the possible environmental variations and problems in the light of at least the following:
210
1. Environmental variations dependent upon the source of the explosion. a. Large-scale detonations,
(i) Immediate effects. (2) Delayed effects.
b. Other devices. 2. Environmental problems independent of explosives.
7.2.1 Large-scale Detonations
(a) Immediate Effects. Immediately following a large-scale explosion environmental variations of considerable magnitude ensue. These may encompass radiation, thermal and blast effects, electromagnetic radiation, dust production, ground shock, and destruction of commonly used utilities for providing power, light, water, sewage disposal, etc.
It is obvious that appropriate specifications for use in shelter design, defining allowable environmental limits for humans, need to be set forth. Certainly this requires the cooperation of knowledgeable individuals and information far beyond the competence of the writers. Even so, we wish to point out a few relevant facts from the present study.
First, animals suffered thermal injury in the forward shelters even though they were not in the line of sight of the explosion, and, therefore, conventional thermal radiation cannot be regarded as the cause of injuries. Frankly, we do not know why the animals were burned any more than we know the magnitude and time variation of the temperatures that existed at the surface of each animal. It is clear, however, that those which were singed the most were in positions where they were most exposed to high winds. This suggests that hot gases and per- haps hot dust, carried along with the entering gases during the fill phase of shelter pressuri- zation, were the phenomena responsible for the immediate thermal damage. If this proves to be the true explanation, a shelter design to delay the fill time and minimize the internal P and wind flow inside the shelter will all tend to minimize the observed thermal effect.
Second, some animals definitely exhibited radiation damage in the forward shelters. Although this could possibly in part have been associated with radiation exposure accumulated during the 8- to 10-hr recovery delay, it seems highly probable that the significant exposure occurred as a consequence of prompt gamma and neutron radiation. We do not propose to answer this question—indeed we are not qualified to—but we certainly wish to give con- siderable emphasis to one point, namely, that the prompt radiation levels which may have occurred inside the shelters were a consequence of scatter into openings, the "diffusion" of thermalized neutrons through openings, and the amount and character of the material between the animals and the exploding device (roof and earth cover calculated on a line-of-sight basis) as they attenuated and altered the gamma and neutron spectra. It perhaps is not possible to say that radiation effects need not have occurred, but it is certainly possible to believe that they could have been sharply curtailed had the shelters been placed deep enough underground to provide a more adequate cover and hence more attenuation of the prompt radiation.
Third, the present study demonstrated that (1) the geometry and design of a shelter may intensify or minimize internal pressure-time phenomena compared with those occurring out- side a structure and (2) for large restrained animals in the geometry employed, tertiary rather than primary blast effects produced the only casualty observed. Thus it will be necessary in the future to investigate the relative importance of the consequences of displacement compared with pressure effects, particularly in structures involving long tubular geometry mentioned in the review presented in Chap. 6. It is important that large animals exposed inside such shelters have exhibited significant lung damage at the lowest overpressures yet noted in full-scale shelter work.
A fourth consequence of the field investigations in blast biology to date concerns the nature of the pressure-time curves that occur inside blast-protective shelters and the bio- logical response to such phenomena. Thus the problem is not just the biological effects of single or multiple overpressure-time phenomena which involve almost instantaneous, HE-like pressure pulses, but rather the biological implications of slower rising, multiple-pulse over- pressures of relatively long duration. Unfortunately, the literature is of little help in assessing the latter. Animal tolerance is not known, and therefore there are few data on which to base
211
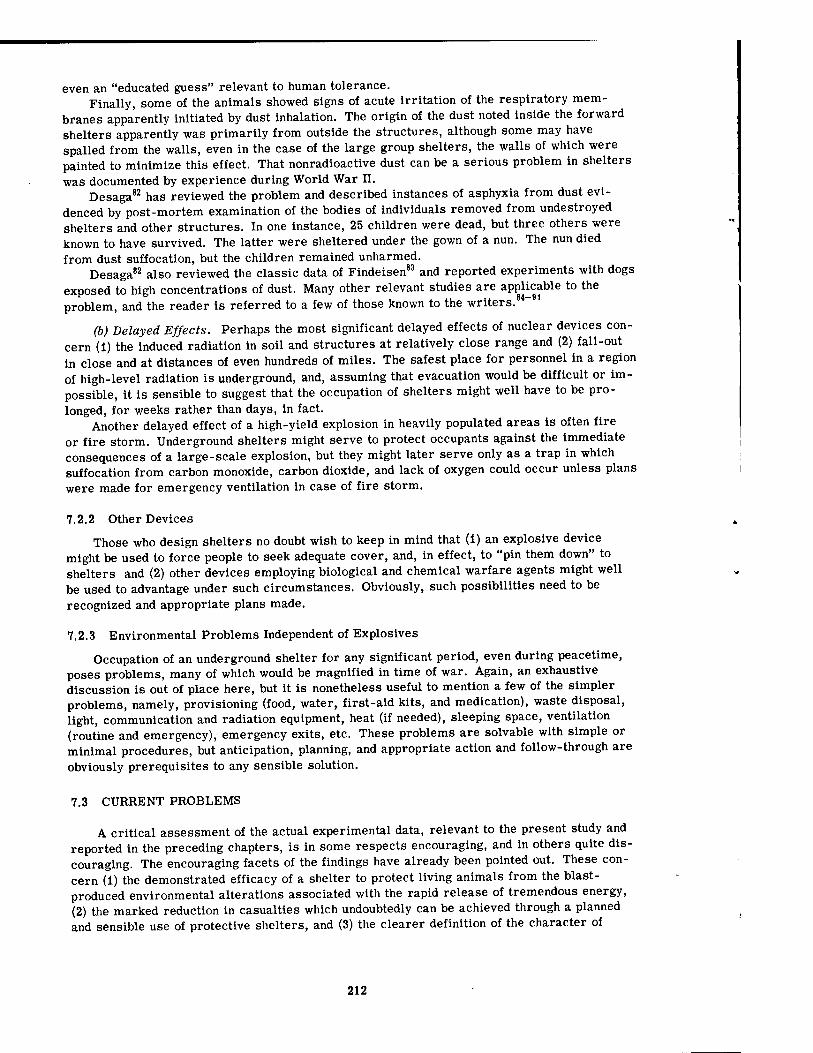
even an "educated guess" relevant to human tolerance. Finally, some of the animals showed signs of acute irritation of the respiratory mem-
branes apparently initiated by dust inhalation. The origin of the dust noted inside the forward shelters apparently was primarily from outside the structures, although some may have spalled from the walls, even in the case of the large group shelters, the walls of which were painted to minimize this effect. That nonradioactive dust can be a serious problem in shelters was documented by experience during World War II.
Desaga82 has reviewed the problem and described instances of asphyxia from dust evi- denced by post-mortem examination of the bodies of individuals removed from undestroyed shelters and other structures. In one instance, 25 children were dead, but three others were known to have survived. The latter were sheltered under the gown of a nun. The nun died from dust suffocation, but the children remained unharmed.
Desaga82 also reviewed the classic data of Findeisen83 and reported experiments with dogs exposed to high concentrations of dust. Many other relevant studies are applicable to the problem, and the reader is referred to a few of those known to the writers.
(b) Delayed Effects. Perhaps the most significant delayed effects of nuclear devices con- cern (1) the induced radiation in soil and structures at relatively close range and (2) fall-out in close and at distances of even hundreds of miles. The safest place for personnel in a region of high-level radiation is underground, and, assuming that evacuation would be difficult or im- possible, it is sensible to suggest that the occupation of shelters might well have to be pro- longed, for weeks rather than days, in fact.
Another delayed effect of a high-yield explosion in heavily populated areas is often fire or fire storm. Underground shelters might serve to protect occupants against the immediate consequences of a large-scale explosion, but they might later serve only as a trap in which suffocation from carbon monoxide, carbon dioxide, and lack of oxygen could occur unless plans were made for emergency ventilation in case of fire storm.
7.2.2 Other Devices
Those who design shelters no doubt wish to keep in mind that (1) an explosive device might be used to force people to seek adequate cover, and, in effect, to "pin them down" to shelters and (2) other devices employing biological and chemical warfare agents might well be used to advantage under such circumstances. Obviously, such possibilities need to be recognized and appropriate plans made.
7.2.3 Environmental Problems Independent of Explosives
Occupation of an underground shelter for any significant period, even during peacetime, poses problems, many of which would be magnified in time of war. Again, an exhaustive discussion is out of place here, but it is nonetheless useful to mention a few of the simpler problems, namely, provisioning (food, water, first-aid kits, and medication), waste disposal, light, communication and radiation equipment, heat (if needed), sleeping space, ventilation (routine and emergency), emergency exits, etc. These problems are solvable with simple or minimal procedures, but anticipation, planning, and appropriate action and follow-through are obviously prerequisites to any sensible solution.
7.3 CURRENT PROBLEMS
A critical assessment of the actual experimental data, relevant to the present study and reported in the preceding chapters, is in some respects encouraging, and in others quite dis- couraging. The encouraging facets of the findings have already been pointed out. These con- cern (1) the demonstrated efficacy of a shelter to protect living animals from the blast- produced environmental alterations associated with the rapid release of tremendous energy, (2) the marked reduction in casualties which undoubtedly can be achieved through a planned and sensible use of protective shelters, and (3) the clearer definition of the character of
212
pressure-time phenomena occurring inside protective shelters and the importance of under- standing the relative biological significance of similar dynamic patterns of overpressure.
The discouraging aspects of the data are several. Two important ones will be mentioned. First, the reader will appreciate that positive pathological findings were minimal; the findings for the most part concerned threshold conditions for biological blast damage, and the empiri- cal findings were, therefore, weak when the attempt was made to use them for the purpose of developing analytical procedures to be applied to the general situation. The writers recog- nized this, but, because no other data were available, it seemed necessary to explore the possibilities fully. This has been done in part. The work is continuing, and what has been presented here must be regarded as tentative only.
Second, the findings point out the necessity of knowing many facts not now understood and not now in the literature. For instance, speaking biologically, what is the limiting rate of a single, steadily rising pressure pulse? What is the consequence of multiple-pulse, rela- tively long-duration overpressure and underpressure phenomena in terms of rate and magni- tude of segmental pressure rise and fall, the number of pulses, and the time between each? What is the true mechanism involved in damage to the air-containing organs? What are the differences in stimulus and response when very fast, intermediate, and relatively slow pres- sure loads are applied to the animal ?
There is no point in following this thought further. A little reflection on the part of the reader will demonstrate that the problems are not one- or two-parameter problems but rather that some involve four, six, or eight parameters. Also, it must be obvious to all that even a reasonable understanding of just the important mechanisms responsible for the more serious aspects of biological blast damage will not come quickly.
213-214
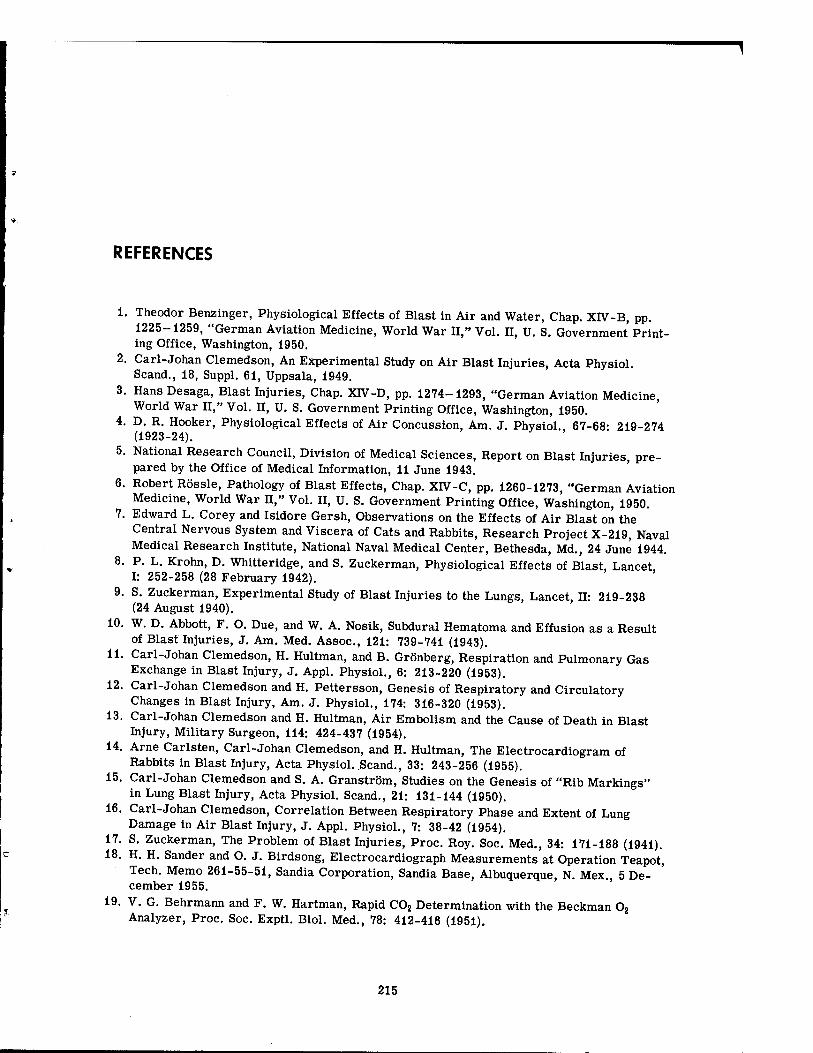
REFERENCES
i. Theodor Benzinger, Physiological Effects of Blast in Air and Water, Chap. XIV-B, pp. 1225-1259, "German Aviation Medicine, World War II," Vol. II, U. S. Government Print- ing Office, Washington, 1950.
2. Carl-Johan Clemedson, An Experimental Study on Air Blast Injuries, Acta Physiol. Scand., 18, Suppl. 61, Uppsala, 1949.
3. Hans Desaga, Blast Injuries, Chap. XIV-D, pp. 1274-1293, "German Aviation Medicine, World War II," Vol. II, U. S. Government Printing Office, Washington, 1950.
4. D. R. Hooker, Physiological Effects of Air Concussion, Am. J. Phvsiol.. 67-68- 219-274 (1923-24).
5. National Research Council, Division of Medical Sciences, Report on Blast Injuries, pre- pared by the Office of Medical Information, 11 June 1943.
6. Robert Rössle, Pathology of Blast Effects, Chap. XIV-C, pp. 1260-1273, "German Aviation Medicine, World War II," Vol. II, U. S. Government Printing Office, Washington, 1950.
7. Edward L. Corey and Isidore Gersh, Observations on the Effects of Air Blast on the Central Nervous System and Viscera of Cats and Rabbits, Research Project X-219, Naval Medical Research Institute, National Naval Medical Center, Bethesda, Md., 24 June 1944.
8. P. L. Krohn, D. Whitteridge, and S. Zuckerman, Physiological Effects of Blast, Lancet, I: 252-258 (28 February 1942).
9. S. Zuckerman, Experimental Study of Blast Injuries to the Lungs, Lancet, II: 219-238 (24 August 1940).
10. W. D. Abbott, F. O. Due, and W. A. Nosik, Subdural Hematoma and Effusion as a Result of Blast Injuries, J. Am. Med. Assoc, 121: 739-741 (1943).
11. Carl-Johan Clemedson, H. Hultman, and B. Grönberg, Respiration and Pulmonary Gas Exchange in Blast Injury, J. Appl. Physiol., 6: 213-220 (1953).
12. Carl-Johan Clemedson and H. Pettersson, Genesis of Respiratory and Circulatory Changes in Blast Injury, Am. J. Physiol., 174: 316-320 (1953).
13. Carl-Johan Clemedson and H. Hultman, Air Embolism and the Cause of Death in Blast Injury, Military Surgeon, 114: 424-437 (1954).
14. Arne Carlsten, Carl-Johan Clemedson, and H. Hultman, The Electrocardiogram of Rabbits in Blast Injury, Acta Physiol. Scand., 33: 243-256 (1955).
15. Carl-Johan Clemedson and S. A. Granström, Studies on the Genesis of "Rib Markings" in Lung Blast Injury, Acta Physiol. Scand., 21: 131-144 (1950).
16. Carl-Johan Clemedson, Correlation Between Respiratory Phase and Extent of Lung Damage in Air Blast Injury, J. Appl. Physiol., 7: 38-42 (1954).
17. S. Zuckerman, The Problem of Blast Injuries, Proc. Roy. Soc. Med., 34: 171-188 (1941). 18. H. H. Sander and O. J. Birdsong, Electrocardiograph Measurements at Operation Teapot,
Tech. Memo 261-55-51, Sandia Corporation, Sandia Base, Albuquerque, N. Mex., 5 De- cember 1955.
19. V. G. Behrmann and F. W. Hartman, Rapid C02 Determination with the Beckman 02
Analyzer, Proc. Soc. Exptl. Biol. Med., 78: 412-416 (1951).
215
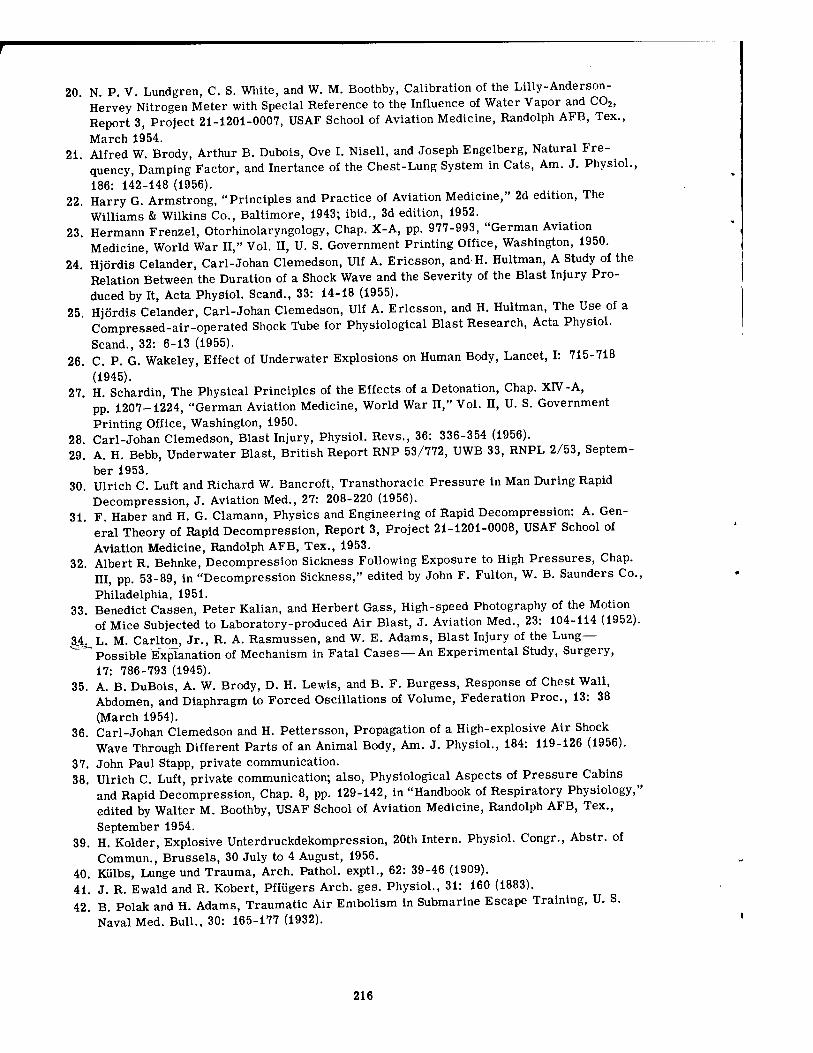
20. N. P. V. Lundgren, C. S. White, and W. M. Boothby, Calibration of the Lilly-Anderson - Hervey Nitrogen Meter with Special Reference to the Influence of Water Vapor and C02, Report 3, Project 21-1201-0007, USAF School of Aviation Medicine, Randolph AFB, Tex.,
March 1954. 21. Alfred W. Brody, Arthur B. Dubois, Ove I. Nisell, and Joseph Engelberg, Natural Fre-
quency, Damping Factor, and Inertance of the Chest-Lung System in Cats, Am. J. Physiol., 186: 142-148 (1956).
22. Harry G. Armstrong, "Principles and Practice of Aviation Medicine," 2d edition, The Williams & Wilkins Co., Baltimore, 1943; ibid., 3d edition, 1952.
23. Hermann Frenzel, Otorhinolaryngology, Chap. X-A, pp. 977-993, "German Aviation Medicine, World War II," Vol. II, U. S. Government Printing Office, Washington, 1950.
24. Hjördis Celander, Carl-Johan Clemedson, Ulf A. Ericsson, and H. Hultman, A Study of the Relation Between the Duration of a Shock Wave and the Severity of the Blast Injury Pro- duced by It, Acta Physiol. Scand., 33: 14-18 (1955).
25 Hjördis Celander, Carl-Johan Clemedson, Ulf A. Ericsson, and H. Hultman, The Use of a Compressed-air-operated Shock Tube for Physiological Blast Research, Acta Physiol.
Scand., 32: 6-13 (1955). 26. C. P. G. Wakeley, Effect of Underwater Explosions on Human Body, Lancet, I: 715-718
(1945). 27. H. Schardin, The Physical Principles of the Effects of a Detonation, Chap. XIV-A,
' pp. 1207-1224, "German Aviation Medicine, World War II," Vol. n, U. S. Government Printing Office, Washington, 1950.
28. Carl-Johan Clemedson, Blast Injury, Physiol. Revs., 36: 336-354 (1956). 29. A. H. Bebb, Underwater Blast, British Report RNP 53/772, UWB 33, RNPL 2/53, Septem-
ber 1953. 30. Ulrich C. Luft and Richard W. Bancroft, Transthoracic Pressure in Man During Rapid
Decompression, J. Aviation Med., 27: 208-220 (1956). 31. F. Haber and H. G. Clamann, Physics and Engineering of Rapid Decompression: A. Gen-
eral Theory of Rapid Decompression, Report 3, Project 21-1201-0008, USAF School of Aviation Medicine, Randolph AFB, Tex., 1953.
32. Albert R. Behnke, Decompression Sickness Following Exposure to High Pressures, Chap, m, pp. 53-89, in "Decompression Sickness," edited by John F. Fulton, W. B. Saunders Co., Philadelphia, 1951.
33. Benedict Cassen, Peter Kalian, and Herbert Gass, High-speed Photography of the Motion of Mice Subjected to Laboratory-produced Air Blast, J. Aviation Med., 23: 104-114 (1952).
34. L. M. Carlton, Jr., R. A. Rasmussen, and W. E. Adams, Blast Injury of the Lung— ^""Possible Explanation of Mechanism in Fatal Cases—An Experimental Study, Surgery,
17: 786-793 (1945). 35. A. B. DuBois, A. W. Brody, D. H. Lewis, and B. F. Burgess, Response of Chest Wall,
Abdomen, and Diaphragm to Forced Oscillations of Volume, Federation Proc, 13: 38 (March 1954).
36. Carl-Johan Clemedson and H. Pettersson, Propagation of a High-explosive Air Shock Wave Through Different Parts of an Animal Body, Am. J. Physiol., 184: 119-126 (1956).
37. John Paul Stapp, private communication. 38. Ulrich C. Luft, private communication; also, Physiological Aspects of Pressure Cabins
and Rapid Decompression, Chap. 8, pp. 129-142, in "Handbook of Respiratory Physiology,' edited by Walter M. Boothby, USAF School of Aviation Medicine, Randolph AFB, Tex., September 1954.
39. H. Kolder, Explosive Unterdruckdekompression, 20th Intern. Physiol. Congr., Abstr. of Commun., Brussels, 30 July to 4 August, 1956.
40. Kiilbs, Lunge und Trauma, Arch. Pathol. exptl., 62: 39-46 (1909). 41. J. R. Ewald and R. Robert, Pflügers Arch. ges. Physiol., 31: 160 (1883). 42. B. Polak and H. Adams, Traumatic Air Embolism in Submarine Escape Training, U. S.
Naval Med. Bull., 30: 165-177 (1932).
216
43. Howard Lilienthal, "Thoracic Surgery," Vol. I, p. 250, W. B. Saunders Co., Philadelphia, 1926.
44. James P. Henry, Problems of Escape During Flight Above 50,000 Ft, pp. 516-532 in "Physics and Medicine of the Upper Atmosphere," edited by C. S. White and O. O. Benson, Jr., University of New Mexico Press, Albuquerque, N. Mex., 1952.
45- M^oannldes, Insufflation of Compressed Air in the Treatment of Pneumonia, Arch. Internal Med., 47: 196-201 (1931).
46. M^jfoarmides and G. D. Tsoulos, The Etiology of Interstitial and Mediastinal Emphysema- Experimental Production of Air Embolism, Acute Pneumothorax, Acute Pneumoperitoneum, Interstitial, Mediastinal, and Retroperitoneal Emphysema, Arch. Surg., 21: 333-339 (1930).
47. E. Newton Harvey, The Mechanism of Wounding by High-velocity Missiles, Proc. Am. Phil. Soc, 92: 294-304 (1948).
48. E. Newton Harvey, E. G. Butler, J. H. McMillen, and W. O. Puckett, Mechanism of Wound- ing, War Med., 8: 91-104 (1945).
49. E. Newton Harvey, Arthur H. Whiteley, J. Grundfest, and J. H. McMillen, Piezoelectric Crystal Measurements of Pressure Changes in the Abdomen of Deeply Anesthetized Animals During Passage of a High-velocity Missile, Military Surgeon, 98: 509-528 (1946).
50. E. Newton Harvey, I. M. Korr, G. Oster, and J. H. McMillen, Secondary Damage in Wounding Due to Pressure Changes Accompanying the Passage of High-velocity Missiles Surgery, 21: 218-239 (1947).
51. R. A. Daniel, Jr., Bullet Wounds of Lungs; Experimental Study, Surgery, 15: 774-782 (1944).
52. J. P. Henry, C. S. White, I. G. Bowen, T. L. Chiffelle, and W. H. Lockyear, unpublished data, 1953-54.
53. J. A. Armstrong, D. I. Fryer, W. K. Stewart, and H. E. Whittingham, Interpretation of Injuries in the Comet Aircraft Disasters—An Experimental Approach, Lancet, I: 1135- 1143 (1955).
54. W. G. Penney and W. G. Bickley, Ministry of Home Security Report, R.C. 376, 1943 (unpublished).
55. W. K. Stewart, K. E. Spells, and J. A. Armstrong, Lung Injury by Impact with a Water Surface, Nature, 175: 504-505 (1955).
56. Roy F. Goddard, The Role of an Infant Resuscitation Team in Investigative Studies of Respiratory Onset at Birth, Current Researches Anesthesia & Analgesia, 34: 1-25 (1955).
57. Roy F. Goddard, James Clark, and V. Ray Bennett, Newer Concepts of Infant Resuscita- tion and Positive-pressure Therapy in Pediatrics, Am. J. Diseases Children, 89: 70-97 (1955).
58. Richard Day, Alice M. Goodfellow, Virginia Apgar, and Gustav J. Beck, Pressure-Time Relations in Safe Correction of Atelectasis in Animal Lungs, Pediatrics, 10: 593-602 (1952).
59. P. W. Stumm, private communication; letter report on Project "Windblast" from AF Flight Test Center, Edwards AFB, Edwards, Calif., to Commanding General, WADC, Wright-Patterson AFB, Dayton, Ohio, dated 8 May 1953.
60. J. F. Hegenwald, Jr., and W. V. Blockley, Survivable Supersonic Ejection—A Case Study To Correlate Analytical, Experimental, and Medical Data by Reconstruction of an Incident, an Interim Report, J. Aviation Med. (in press).
61. John Paul Stapp, Human Exposures to Linear Deceleration, n. The Forward-facing Position and Development of a Crash Harness, Technical Report 5915, Part 2, USAF, Wright-Patterson AFB, Dayton, Ohio, December 1951.
62. H. Döring, cited by T. Benzinger, Explosive Decompression, Chap. IV-M, pp. 404-405, "German Aviation Medicine, World War II," Vol. I., U.S. Government Printing Office, Washington, 1950.
63. D. M. Clark, Mediastinal Emphysema Following Explosive Decompression of Humans, Memo Report TSEAL-3-695-29-1, Aeromedical Laboratory, AAF Materiel Command, Wright Field, 1945.
64. H. M. Sweeney, unpublished records.
217
65. T. Geoghegan and C. R. Lam, The Mechanism of Death from Intracardiac Air and Its Reversibility, Ann. Surg., 138: 351-359 (1953).
66. R. D. Meade and R. T. Eckenrode, Psychological and Physiological Effects of Gun Blast with Special Reference to Recoilless Rifles—A Preliminary Literature Survey, Human Engineering Report 7, Report R-1283 on Project TS4-4018, Pitman-Dun Laboratories, Frankford Arsenal, Philadelphia, September 1955.
67. Teofil Zalewski, Experimentelle Untersuchungen über die Resistenzfähigkeit des Trommelfells, Z. Ohrenheilk, 52: 109-128 (1906).
68. H. B. Perlman, Reaction of Human Conduction Mechanism to Blast, Laryngoscope, 55: 427-443 (1945).
69. A. J. Dziemian, F. W. Light, Jr., J. V. Michalski, and C. M. Herget, Recoilless Rifle Backblast Danger Areas, Chemical Corps Medical Laboratory Report 72, Army Chemical Center, Md., July 1951.
70. E. L. Corey, Medical Aspects of Blast, U. S. Naval Med. Bull., 46: 623-652 (1946). 71. H. Schubert, Ueber die Widerstandsfähigkeit des Trommelfells gegen Ueberdruck der
Aussenluft, Z. Hals-, Nasen- u. Ohrenheilk., 1: 357-358; Excerpta Med., 1949, See. II, 3: 945 (1950).
72. Ebbe Curtis Hoff and Leon Jack Greenbaum, Jr., A Bibliographical Sourcebook of Com- pressed Air, Diving, and Submarine Medicine, Vol. II, Office of Naval Research and Bureau of Medicine and Surgery, Department of the Navy, November 1954.
73. John F. Fulton, Blast and Concussion in Present War, New Engl. J. Med., 226: 1-8 (1942). 74. R. Harold Draeger, Joseph S. Barr, and W. W. Sager, Blast Injury, J. Am. Med. Assoc,
132: 762-767 (1946). 75. A. H. T. Robb-Smith, Pulmonary Fat Embolism, Lancet, I: 135-141 (1941). 76. Benedict Cassen, Katherine Kistler, and Wanda Mankiewicz, Some Effects of Air Blast on
Mechanically Constrained Mice, J. Aviation Med., 23: 120-129 (1952). 77. Benedict Cassen, Katherine Kistler, and Wanda Mankiewicz, Lung Hemorrhage Produced
in Heparinized Mice by Air Blast, J. Aviation Med., 23: 115-119 (1952). 78. Wharton M. Young, Mechanics of Blast Injury, War Med., 8: 73-81 (1945). 79. Arturo Frisoli and Benedict Cassen, A Study of Hemorrhagic Rib Markings Produced in
Rats by Air Blast, J. Aviation Med., 21: 510-513 (1950). 80. J. H. McMillen and E. Newton Harvey, A Spark Shadowgraphic Study of Body Waves in
Water, J. Appl. Phys., 17: 541-555 (1946). 81. Carl-Johan Clemedson, L. Deffet, R. Rucquoi Fornaeus, and P. Van de Wouwer, High-
speed Radiographic Visualization of a High-explosive Shock Wave in Muscular Tissue, J. Appl. Physiol., 7: 604-608 (May 1955).
82. Hans Desaga, Experimental Investigations of the Action of Dust, Chap. Xni-B, pp. 1188- 1203, "German Aviation Medicine, World War II," Vol. II, U. S. Government Printing Office, Washington, 1950.
83. W. Findeisen, Ueber das Absetzen kleiner, in der Luft suspendierter Teilchen in der menschlichen Lunge bei der Atmung, Pflügers Arch. ges. Physiol., 236: 367-379 (1935).
84. Harold A. Abramson, Respiratory System: Aerosol Therapy, pp. 823-835 in "Medical Physics," Vol. 2, edited by Otto Glasser, Year Book Publishers, Inc., Chicago, 1950.
85. Arnold E. Reif, Helen S. Baker, Clayton S. White, T. L. Chiffelle, and Ulrich C. Luft, A Study of the Mechanism of Absorption of Particulates in the Respiratory Tree, MLCR 47, Army Chemical Center, Md., 1954.
86. Arnold E. Reif, Margot P. Holcomb, Helen S. Baker, and Clayton S. White, A Study of the Mechanism of Absorption of Particulates in the Respiratory Tree — 4th Quarterly Report, 1954, and A Summary of Reports Issued Since 1 December 1953, MLCR 51, Army Chemi- cal Center, Md., 1955.
87. Arnold E. Reif, T. L. Chiffelle, Ulrich C. Luft, James Clark, Clayton S. White, Mary C. Elliott, Helen S. Baker, A Study of the Mechanism of Absorption of Particulates in the Respiratory Tree—Part I, 1st Quarterly Report; Part II, Second Quarterly Report, MLCR 53, Army Chemical Center, Md., 1955.
218
88. Arnold E. Reif, The Mechanism of Aerosol Absorption in the Respiratory Tree—A Pre- liminary Classification of the Literature, Appendix to 3d Quarterly Report on Contract DA-18-108-Cml-5050, submitted by the Lovelace Foundation to the Army Chemical Center,
i Md-> 1954- (Unpublished, but may be obtained in mimeograph form from the Medical Laboratories of the Chemical Corps.) K. G. Scott, D. Axelrod, J. Crowley, and J. G. Hamilton, Deposition and Fate of Pluto- nium, Uranium, and Their Fission Products Inhaled as Aerosols by Rats and Man Arch Pathol., 48: 31-54 (1949).
89.
90. J. H. Brown, K. M. Cook, F. G. Ney, and T. Hatch, Influence of Particle Size upon the Retention of Particulate Matter in Human Lung, Am. J. Public Health, 40: 450-458 480 (1950).
91. Paul E. Palm, James M. McNerney, and T. Hatch, Respiratory Dust Retention in Small Animals—A Comparison with Man, Arch. Ind. Health, 13: 355-365 (April 1956).
219
Related Documents