BX21_FREDE2015_SED_v5-1_19Feb16 SED Student Experiment Documentation Document ID: BX21_FREDE2015_SED_v5-1_19Feb16.pdf Mission: BEXUS 21 Team Name: FREDE 2015 Experiment Title: CFC Decay Experiment Team Name University Student Team Leader: Mikołaj Podgórski Wrocław University of Technology (WUT) Team Members: Dorota Budzyń Andrzej Dziedzic Szymon Dzwończyk Jędrzej Górski Krzysztof Grunt Ewa Just Daniel Karczmit Joanna Kuźma Julia Marek Adrianna Niemiec WUT WUT WUT WUT WUT WUT University of Wrocław (UWr)/WUT WUT WUT UWr Version: Issue Date: Document Type: Valid from: 5.1 19.02.2016 Final report 19.02.2016 Issued by: Mikołaj Podgórski, Andrzej Dziedzic Approved by: Ph.D. Romuald Redzicki

Welcome message from author
This document is posted to help you gain knowledge. Please leave a comment to let me know what you think about it! Share it to your friends and learn new things together.
Transcript
BX21_FREDE2015_SED_v5-1_19Feb16
SED Student Experiment Documentation Document ID: BX21_FREDE2015_SED_v5-1_19Feb16.pdf Mission: BEXUS 21
Team Name: FREDE 2015 Experiment Title: CFC Decay Experiment
Team Name University Student Team Leader: Mikołaj Podgórski Wrocław University
of Technology (WUT) Team Members: Dorota Budzyń
Andrzej Dziedzic Szymon Dzwończyk Jędrzej Górski Krzysztof Grunt Ewa Just Daniel Karczmit Joanna Kuźma Julia Marek Adrianna Niemiec
WUT WUT WUT WUT WUT WUT University of Wrocław (UWr)/WUT WUT WUT UWr
Version: Issue Date: Document Type: Valid from: 5.1 19.02.2016 Final report 19.02.2016 Issued by: Mikołaj Podgórski, Andrzej Dziedzic Approved by: Ph.D. Romuald Redzicki
- 2 -
BX21_FREDE2015_SED_v5-1_19Feb16 Page 2
CHANGE RECORD
Version Date Changed chapters Remarks
0 2015-01-20 New Version Blank Book 2015 1
2015-01-25 All
PDR
2 2015-04-27 All CDR 2.1 2.2 3.0 3.1
2015-05-06 2015-06-14 2015-07-05 2015-08-08
2.1; 2.2; 2.4; 4.2; 5.1; 5.2; 7.1; 1; 1.1; 1.4; 1.5; 2.1; 2.3; 2.4; 2.5; 3; 4.3; 4.4; 4.5.4; ; 4.6; 4.7; 4.8; 5; 6; 8.1; A; B; C; D; E 2.5; 3.5; 4.4; 5; 6; C 2.5; 3.1; 3.2; 3.4; 4; 5; 6; A; B; C; D; E
Post-CDR IPR Post-IPR
4 4.1 4.2
2015-08-24 2015-09-14 2015-09-25
3; 4.4.4; 5; E; G 6 3; 4; 5; B; C; D; E
EAR, Pre-Campaign Pre-Campaign Pre-Campaign
5 5.1
2016-01-13 2016-02-11
3; 4; 5; 7; B; G 7.3
Final report Final report
Abstract:
This SED contains information about FREDE 2015 Experiment which aims at studying the disintegration phenomenon of CFC compounds (commonly known as Freons) in the lower parts of Earth’s atmosphere.
Keywords:
BEXUS, CFC – chlorofluorocarbons, FREDE – CFC Decay Experiment, SED – Student Experiment Documentation, Freon
- 3 -
BX21_FREDE2015_SED_v5-1_19Feb16 Page 3
CONTENTS CHANGE RECORD ................................................................................................ 2
CONTENTS ............................................................................................................ 3
PREFACE ............................................................................................................... 6
ABSTRACT ............................................................................................................. 7
1 INTRODUCTION ............................................................................................ 8
1.1 Scientific/Technical Background ............................................................. 9
1.1.1 Ozone and its role in the stratosphere ....................................... 9
1.1.1 Destruction of CFC-s in the stratosphere ................................... 9
1.1.2 Selection of CFC compounds .................................................. 11
1.2 Mission Statement ................................................................................ 15
1.3 Experiment Objectives.......................................................................... 15
1.3.1 Primary Objectives ................................................................... 15
1.3.2 Secondary Objectives .............................................................. 15
1.4 Experiment Concept ............................................................................. 16
1.5 Team Details ........................................................................................ 19
1.5.1 Contact Point ........................................................................... 19
1.5.2 Team Members ........................................................................ 20
2 EXPERIMENT REQUIREMENTS AND CONSTRAINTS.............................. 25
2.1 Functional Requirements ...................................................................... 25
2.2 Performance Requirements .................................................................. 26
2.3 Design Requirements ........................................................................... 27
2.4 Operational Requirements .................................................................... 29
2.5 Constraints ........................................................................................... 30
3 PROJECT PLANNING .................................................................................. 31
3.1 Work Breakdown Structure (WBS) ....................................................... 31
3.2 Schedule .............................................................................................. 33
3.3 Resources ............................................................................................ 37
3.3.1 Manpower ................................................................................ 37
3.3.2 Budget ..................................................................................... 39
3.3.3 External Support ...................................................................... 42
3.4 Outreach Approach .............................................................................. 43
3.4.1 Online channels ....................................................................... 43
3.4.2 Media about FREDE project .................................................... 43
3.4.3 Collaborations .......................................................................... 44
3.5 Risk Register ........................................................................................ 45
4 EXPERIMENT DESCRIPTION ..................................................................... 48
4.1 Experiment Setup ................................................................................. 48
- 4 -
BX21_FREDE2015_SED_v5-1_19Feb16 Page 4
4.2 Experiment Interfaces .......................................................................... 50
4.2.1 Mechanical .............................................................................. 50
4.2.2 Electrical .................................................................................. 59
4.3 Experiment Components ...................................................................... 60
4.4 Mechanical Design ............................................................................... 66
4.4.1 Main Electronics Box (MEB) .................................................... 66
4.4.2 Gas Container Boom (GCB) .................................................... 78
4.4.3 Vibration .................................................................................. 89
4.4.4 Pneumatic System ................................................................... 89
4.4.5 Camera mounting .................................................................... 96
4.5 Electronics Design ................................................................................ 99
4.5.1 Flight Control Unit .................................................................. 100
4.5.2 Sensor Board ......................................................................... 100
4.5.3 Pneumatic Board ................................................................... 101
4.5.4 Power Module ........................................................................ 101
4.5.5 Camera subsystem ................................................................ 102
4.6 Thermal Design .................................................................................. 104
4.6.1 Overview ................................................................................ 104
4.6.2 Thermal requirements ............................................................ 105
4.6.3 General framework ................................................................ 105
4.6.4 Thermal solutions .................................................................. 107
4.6.5 Numerical analysis ................................................................. 108
4.6.6 Conclusions ........................................................................... 110
4.7 Power System .................................................................................... 111
4.8 Software Design ................................................................................. 113
4.8.1 FCU Software ........................................................................ 113
4.8.2 Pneumatics Board algorithm .................................................. 119
4.8.3 Sensor Board algorithm ......................................................... 121
4.8.4 Data bandwidth budget .......................................................... 121
4.9 Ground Support Equipment ................................................................ 122
5 EXPERIMENT VERIFICATION AND TESTING ......................................... 124
5.1 Verification Matrix ............................................................................... 124
5.1.1 Functional Requirements ....................................................... 124
5.1.2 Performance Requirements ................................................... 126
5.1.3 Design Requirements ............................................................ 127
5.1.4 Operational Requirements ..................................................... 130
5.2 Test Plan ............................................................................................ 132
5.3 Test Results ....................................................................................... 138
6 LAUNCH CAMPAIGN PREPARATION ...................................................... 140
6.1 Input for the Campaign / Flight Requirement Plans ............................ 140
6.1.1 Dimensions and Mass ........................................................... 140
- 5 -
BX21_FREDE2015_SED_v5-1_19Feb16 Page 5
6.1.2 Safety Risks ........................................................................... 140
6.1.3 Electrical Interfaces ............................................................... 141
6.1.4 Launch Site Requirements .................................................... 141
6.1.5 Flight Requirements ............................................................... 142
6.1.6 Accommodation Requirements .............................................. 142
6.2 Preparation and Test Activities at Esrange......................................... 143
6.3 Timeline for Countdown and Flight ..................................................... 145
6.4 Post Flight Activities ........................................................................... 146
6.5 System success ................................................................................. 147
7 DATA ANALYSIS PLAN ............................................................................. 148
7.1 Data Analysis Plan ............................................................................. 148
7.1.1 FREDE Ground Experiment .................................................. 149
7.1.2 Zeolites .................................................................................. 150
7.2 Launch Campaign .............................................................................. 153
7.2.1 Flight preparation ................................................................... 153
7.2.2 Flight performance ................................................................. 153
7.2.3 Recovery ............................................................................... 154
7.2.4 Post flight activities ................................................................ 154
7.3 Results ............................................................................................... 154
7.3.1 Pressure measurement ......................................................... 154
7.3.2 Temperature measurements.................................................. 155
7.3.3 Cameras ................................................................................ 156
7.3.4 UV radiation ........................................................................... 157
7.3.5 Chemical analysis .................................................................. 159
7.4 Discussion and Conclusions ............................................................... 164
7.5 Lessons Learned ................................................................................ 164
8 ABBREVIATIONS AND REFERENCES ..................................................... 166
8.1 Abbreviations ...................................................................................... 166
8.2 References ......................................................................................... 167
Appendix A – Experiment Reviews ..................................................................... 169
Appendix B – Outreach and Media Coverage ..................................................... 193
Appendix C – Additional Technical Information ................................................... 213
Appendix D – ADDITIONAL CALCULATIONS .................................................... 269
Appendix E – Test results ................................................................................... 276
Appendix F –Request for Waivers ....................................................................... 293
Appendix G – Photos of completed experiment .................................................. 294
FREDE 2015 Student Experiment Documentation
BX21_FREDE2015_SED_v5-1_19Feb16 Page 6
PREFACE Project FREDE 2015 is a result of an interdisciplinary collaboration between students from several major faculties at the Wroclaw University of Technology and one faculty at the University of Wroclaw. Goal of the project is to bring a fresh perspective in the area of ozone depletion process, climate change, as well as stratospheric in-situ measurements. The following documentation provides all important information related to the project development process.
FREDE 2015 Student Experiment Documentation
BX21_FREDE2015_SED_v5-1_19Feb16 Page 7
ABSTRACT
The main goal of the experiment is to study the disintegration phenomenon of chlorofluorocarbons (CFCs) – a group of refrigerants commonly known as Freons (name reserved by DuPont). Being radiatively active gasses present in the troposphere and the stratosphere, they influence the depletion of the Earth’s ozone layer (O3) and the increase in the greenhouse effect.
The core of the experiment is a test sample reservoir, which would be exposed to both low and high altitude (<25 km) conditions. Thanks to a dedicated on-board chemical measurement chamber, it will collect information about CFCs’ decay processes, their kinetics and chemical products.
A carefully designed system of sensors, as well as the chosen measurement methodology, ensures that the data collected for different levels of selected CFCs’ concentrations constitutes a reliable source of information about the disintegration process.
FREDE 2015 Student Experiment Documentation
BX21_FREDE2015_SED_v5-1_19Feb16 Page 8
1 INTRODUCTION
Balloon flight campaigns provide a unique opportunity to study the lower parts of the Earth’s atmosphere (the troposphere and the stratosphere), where most of the anthropological air contamination is located.
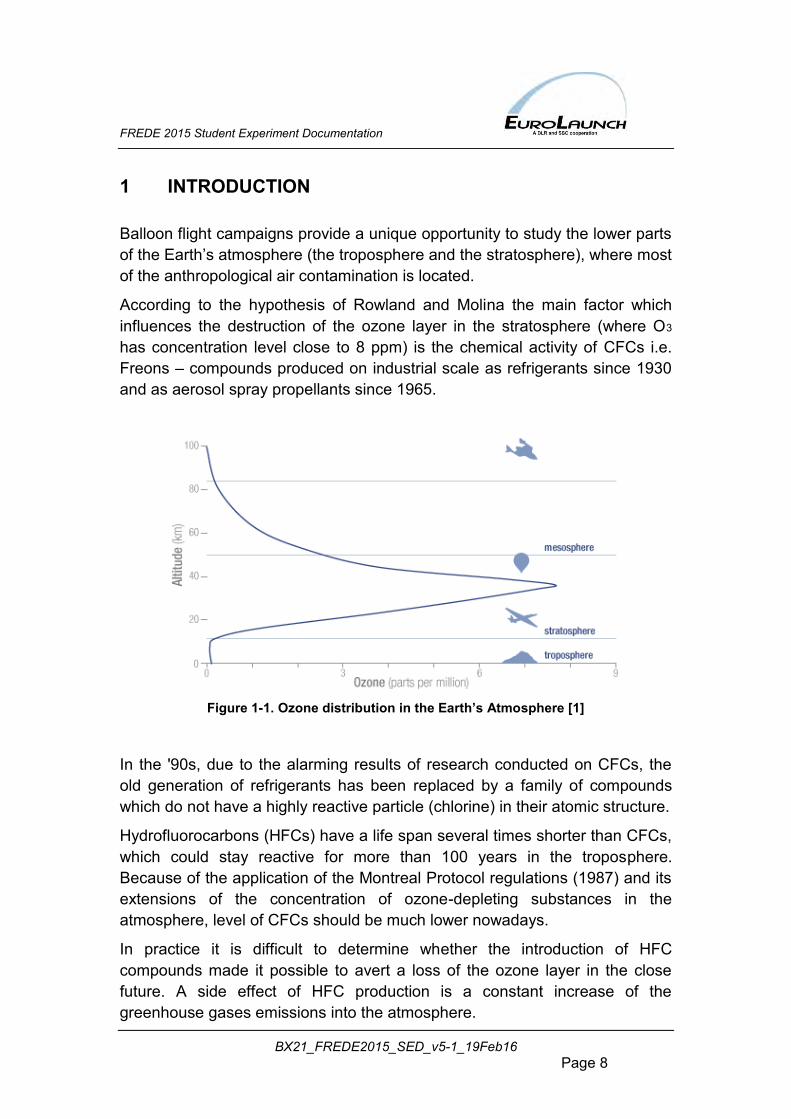
According to the hypothesis of Rowland and Molina the main factor which influences the destruction of the ozone layer in the stratosphere (where O3
has concentration level close to 8 ppm) is the chemical activity of CFCs i.e. Freons – compounds produced on industrial scale as refrigerants since 1930 and as aerosol spray propellants since 1965.
Figure 1-1. Ozone distribution in the Earth’s Atmosphere [1]
In the '90s, due to the alarming results of research conducted on CFCs, the old generation of refrigerants has been replaced by a family of compounds which do not have a highly reactive particle (chlorine) in their atomic structure.
Hydrofluorocarbons (HFCs) have a life span several times shorter than CFCs, which could stay reactive for more than 100 years in the troposphere. Because of the application of the Montreal Protocol regulations (1987) and its extensions of the concentration of ozone-depleting substances in the atmosphere, level of CFCs should be much lower nowadays.
In practice it is difficult to determine whether the introduction of HFC compounds made it possible to avert a loss of the ozone layer in the close future. A side effect of HFC production is a constant increase of the greenhouse gases emissions into the atmosphere.
FREDE 2015 Student Experiment Documentation
BX21_FREDE2015_SED_v5-1_19Feb16 Page 9
1.1 Scientific/Technical Background
1.1.1 Ozone and its role in the stratosphere
Ozone (O3) takes on an important role in the stratosphere, especially in the ozonosphere – a layer which protects Earth against ultraviolet radiation [2].
Ozone concentration in the atmosphere influences on the amount of UV radiation reaching Earth.
Ozone from the ozonosphere behaves as a filter for UV-B radiation with wave lengths λ = 243 - 315 nm, and as a consequence of this filtration process an activated form of oxygen is obtained. However, if the radiation has a higher wave length, the activated form of oxygen will not occur.
O2 + hν (243 nm<λ< 315 nm) → O + O·
O2 + hν (315 nm<λ< 1200 nm) → O+ O
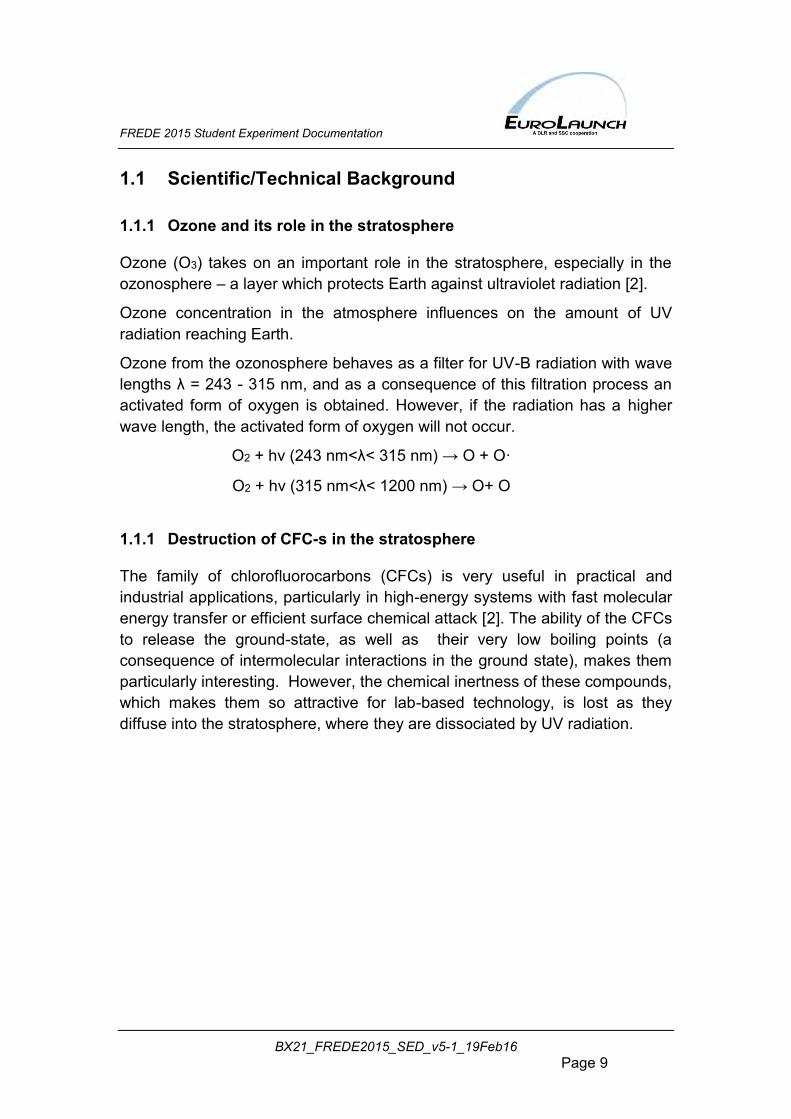
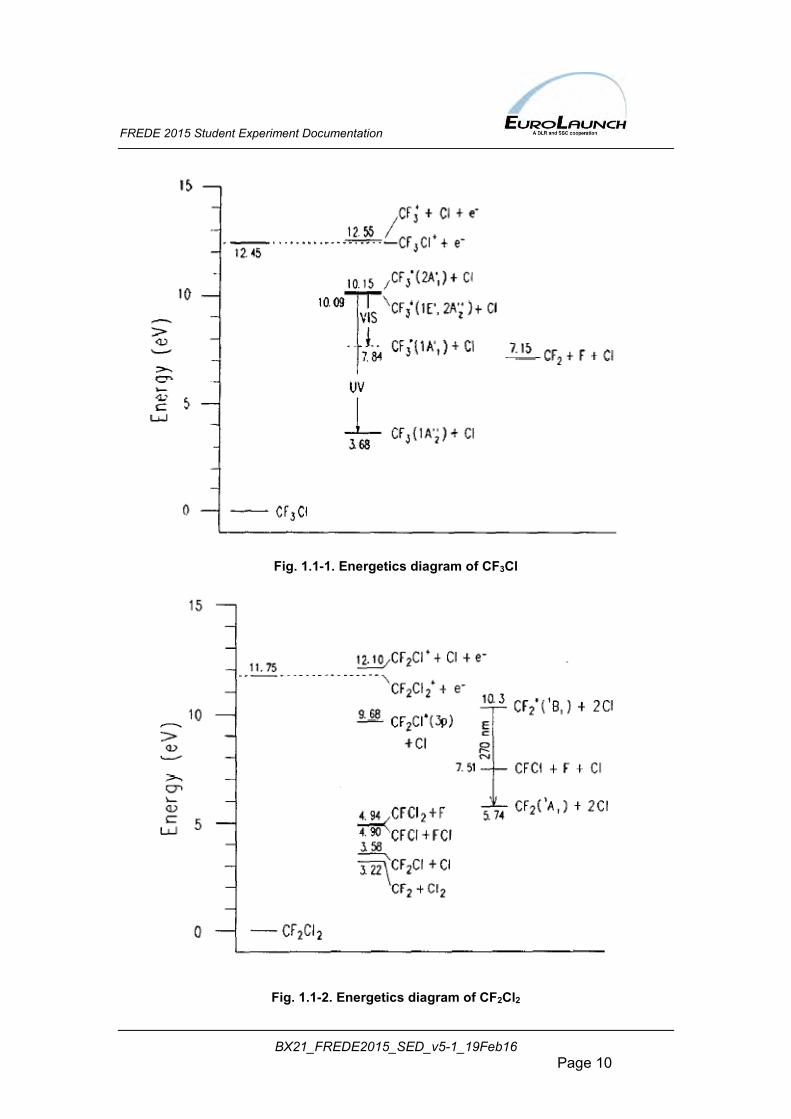
1.1.1 Destruction of CFC-s in the stratosphere
The family of chlorofluorocarbons (CFCs) is very useful in practical and industrial applications, particularly in high-energy systems with fast molecular energy transfer or efficient surface chemical attack [2]. The ability of the CFCs to release the ground-state, as well as their very low boiling points (a consequence of intermolecular interactions in the ground state), makes them particularly interesting. However, the chemical inertness of these compounds, which makes them so attractive for lab-based technology, is lost as they diffuse into the stratosphere, where they are dissociated by UV radiation.
FREDE 2015 Student Experiment Documentation
BX21_FREDE2015_SED_v5-1_19Feb16 Page 10
Fig. 1.1-1. Energetics diagram of CF3Cl
Fig. 1.1-2. Energetics diagram of CF2Cl2
FREDE 2015 Student Experiment Documentation
BX21_FREDE2015_SED_v5-1_19Feb16 Page 11
Chlorine atoms released from photodissociation subsequently engage in catalytic chain reactions involving the formation of ClO, which result in net consumption of the ozone in the stratosphere [3]. This process could have an influence on global bio-geo-chemical cycles, because more of the solar UV radiation reaches Earth surface.
Cl· + O3 → ClO· +O2 O + ClO→ Cl· + O2
An understanding of the UV photochemistry of the CFCs can provide useful information regarding the hazards caused by these compounds.
1.1.2 Selection of CFC compounds
Two chemical compounds have been selected: Dichlorodifluoromethane (R-12) and Chlorotrifluoromethane (R-13), characterized by different ozone depletion potential (ODP).
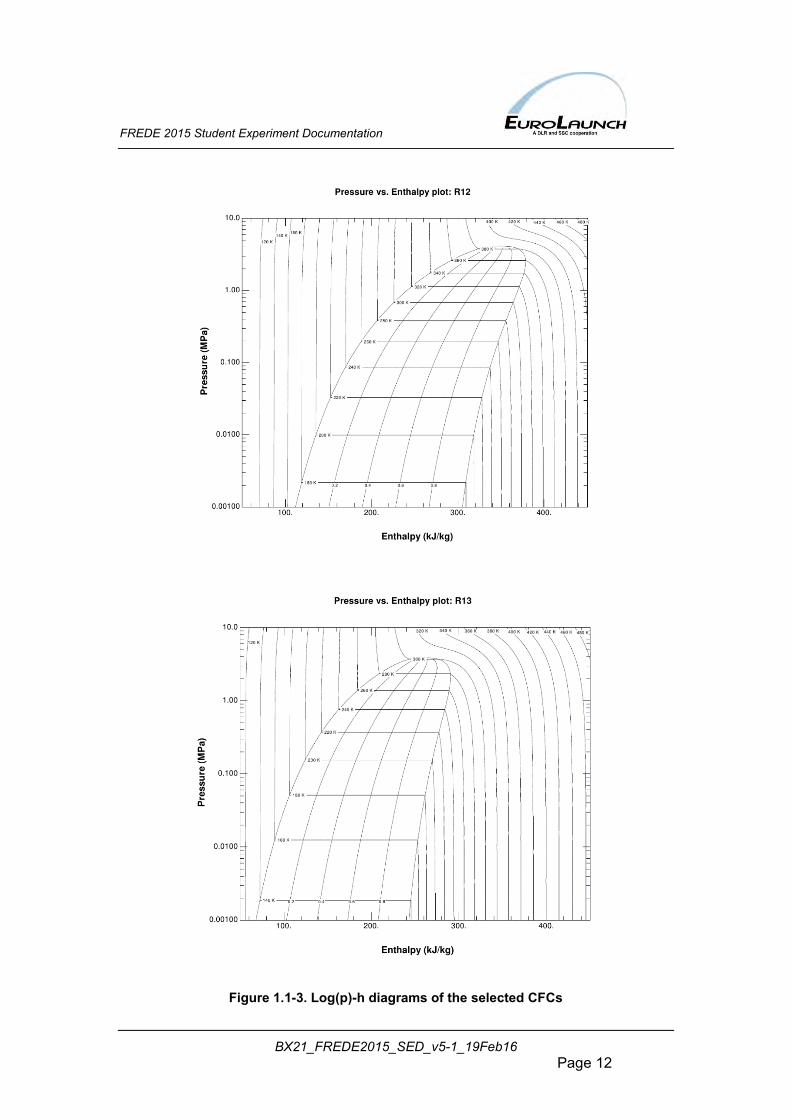
Ozone depletion potential is the relative amount of degradation to the ozone layer a compound can cause, with dichlorodifluoromethane being fixed at an ODP of 1.0. Chlorotrifluoromethane has an ODP of 0.1. For each of the gas compounds there are some specific conditions under which condensation occurs. During our measurements we are going to deal with them in a gaseous form. Saturation curves of the selected CFCs are presented in Figure 1.1-3.
Similarly to different gas compounds, under stratospheric pressure and temperature conditions there is a risk of condensation. To check the phase state of CFCs during the flight campaign few calculations regarding CFCs physical properties had to be made. In order to determine which CFCs are suitable for FREDE experiment, there was a need to analyze flight temperature and pressure profile to correlate them with boiling points of the preselected compounds.
All of the calculations were performed using REFPROP software.
FREDE 2015 Student Experiment Documentation
BX21_FREDE2015_SED_v5-1_19Feb16 Page 12
Figure 1.1-3. Log(p)-h diagrams of the selected CFCs
FREDE 2015 Student Experiment Documentation
BX21_FREDE2015_SED_v5-1_19Feb16 Page 13
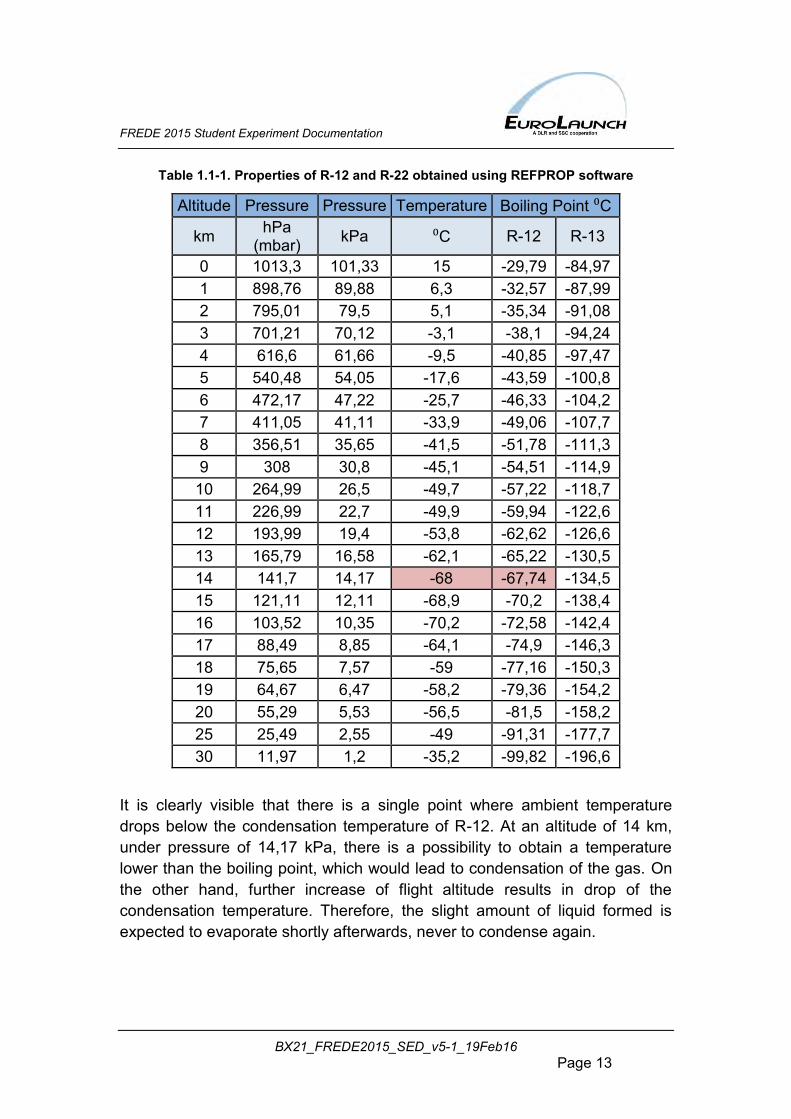
Table 1.1-1. Properties of R-12 and R-22 obtained using REFPROP software
Altitude Pressure Pressure Temperature Boiling Point ⁰C
km hPa (mbar) kPa ⁰C R-12 R-13
0 1013,3 101,33 15 -29,79 -84,97 1 898,76 89,88 6,3 -32,57 -87,99 2 795,01 79,5 5,1 -35,34 -91,08 3 701,21 70,12 -3,1 -38,1 -94,24 4 616,6 61,66 -9,5 -40,85 -97,47 5 540,48 54,05 -17,6 -43,59 -100,8 6 472,17 47,22 -25,7 -46,33 -104,2 7 411,05 41,11 -33,9 -49,06 -107,7 8 356,51 35,65 -41,5 -51,78 -111,3 9 308 30,8 -45,1 -54,51 -114,9
10 264,99 26,5 -49,7 -57,22 -118,7 11 226,99 22,7 -49,9 -59,94 -122,6 12 193,99 19,4 -53,8 -62,62 -126,6 13 165,79 16,58 -62,1 -65,22 -130,5 14 141,7 14,17 -68 -67,74 -134,5 15 121,11 12,11 -68,9 -70,2 -138,4 16 103,52 10,35 -70,2 -72,58 -142,4 17 88,49 8,85 -64,1 -74,9 -146,3 18 75,65 7,57 -59 -77,16 -150,3 19 64,67 6,47 -58,2 -79,36 -154,2 20 55,29 5,53 -56,5 -81,5 -158,2 25 25,49 2,55 -49 -91,31 -177,7 30 11,97 1,2 -35,2 -99,82 -196,6
It is clearly visible that there is a single point where ambient temperature drops below the condensation temperature of R-12. At an altitude of 14 km, under pressure of 14,17 kPa, there is a possibility to obtain a temperature lower than the boiling point, which would lead to condensation of the gas. On the other hand, further increase of flight altitude results in drop of the condensation temperature. Therefore, the slight amount of liquid formed is expected to evaporate shortly afterwards, never to condense again.
FREDE 2015 Student Experiment Documentation
BX21_FREDE2015_SED_v5-1_19Feb16 Page 14
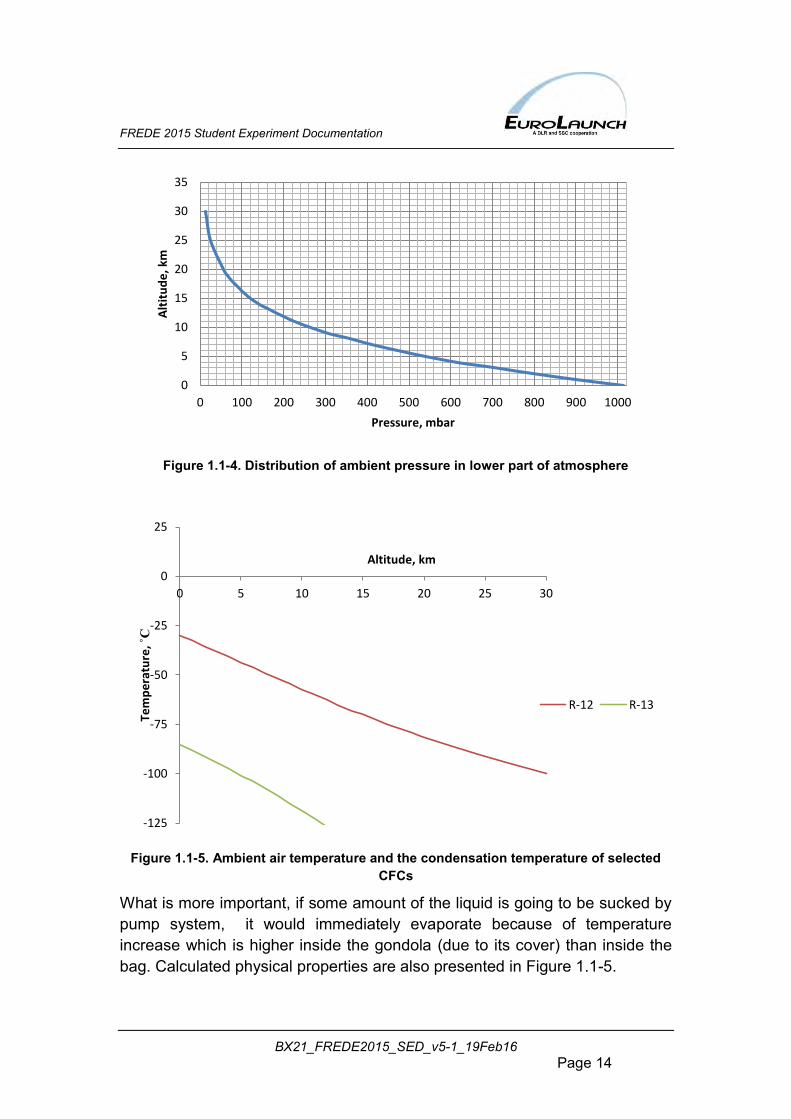
Figure 1.1-4. Distribution of ambient pressure in lower part of atmosphere
Figure 1.1-5. Ambient air temperature and the condensation temperature of selected
CFCs
What is more important, if some amount of the liquid is going to be sucked by pump system, it would immediately evaporate because of temperature increase which is higher inside the gondola (due to its cover) than inside the bag. Calculated physical properties are also presented in Figure 1.1-5.
0
5
10
15
20
25
30
35
0 100 200 300 400 500 600 700 800 900 1000
Alt
itu
de
, km
Pressure, mbar
-125
-100
-75
-50
-25
0
25
0 5 10 15 20 25 30
Tem
pe
ratu
re, ˚C
Altitude, km
R-12 R-13
FREDE 2015 Student Experiment Documentation
BX21_FREDE2015_SED_v5-1_19Feb16 Page 15
1.2 Mission Statement
"Because we take care of our planet... we want to conduct CFC Decay Experiment in the stratosphere where the Earth's ozone layer suffers most“
FREDE 2015 experiment aims at providing a better understanding of how CFC compounds disintegrate in contact with UV radiation present in Earth’s atmosphere under high and low altitude conditions, especially with the test compound brought to altitudes that range up to 30 km above Polar Circle. The obtained results should lead to conclusions, which might bring to light new scientific facts on Volatile Organic Compounds’ (especially CFC gases) possible influence on the ozone layer.
1.3 Experiment Objectives
1.3.1 Primary Objectives
To study CFC’s decay process and its products in the low levels of Earth’s atmosphere, basing on experimental data obtained during a stratospheric balloon flight and to perform a comparative analysis involving laboratory measurements.
1.3.2 Secondary Objectives
1. To build a mobile installation designed for airborne experiments related to air quality research and measurements. 2. To train young scientists and engineers and give them a possibility to earn a space-related experience. 3. To increase the awareness of the educational and scientific potential of space-related projects within the Wroclaw University of Technology and beyond.
FREDE 2015 Student Experiment Documentation
BX21_FREDE2015_SED_v5-1_19Feb16 Page 16
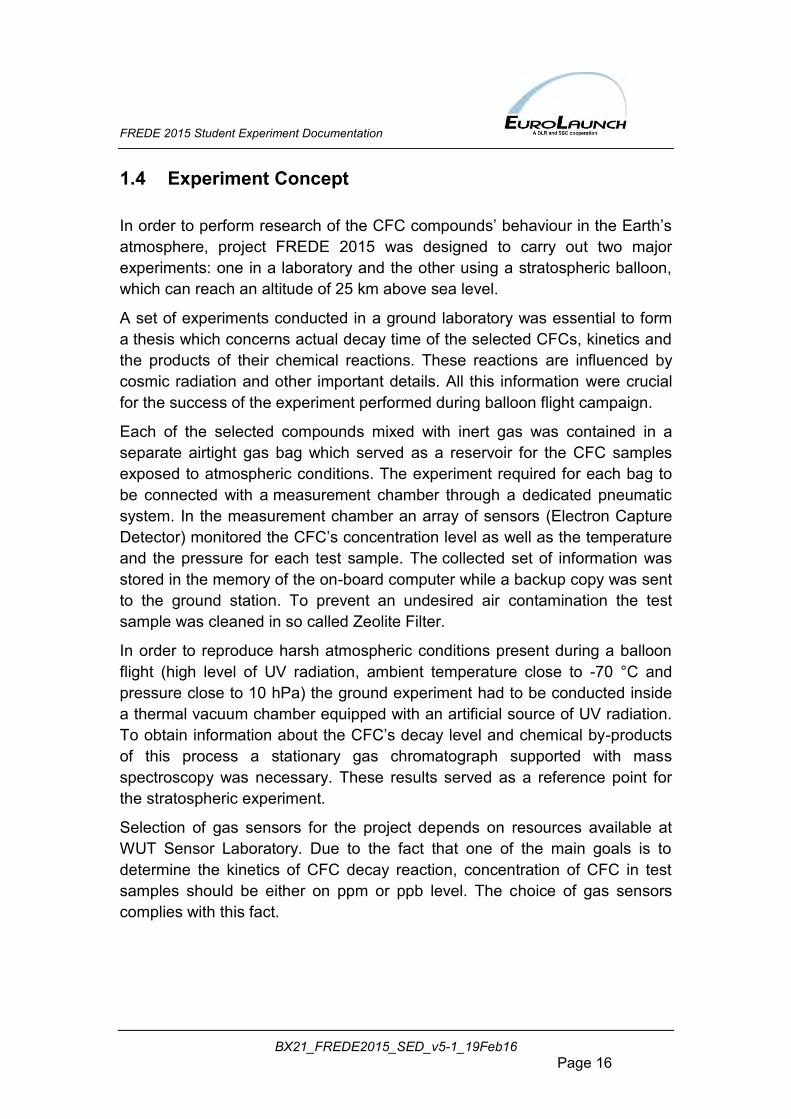
1.4 Experiment Concept
In order to perform research of the CFC compounds’ behaviour in the Earth’s atmosphere, project FREDE 2015 was designed to carry out two major experiments: one in a laboratory and the other using a stratospheric balloon, which can reach an altitude of 25 km above sea level.
A set of experiments conducted in a ground laboratory was essential to form a thesis which concerns actual decay time of the selected CFCs, kinetics and the products of their chemical reactions. These reactions are influenced by cosmic radiation and other important details. All this information were crucial for the success of the experiment performed during balloon flight campaign.
Each of the selected compounds mixed with inert gas was contained in a separate airtight gas bag which served as a reservoir for the CFC samples exposed to atmospheric conditions. The experiment required for each bag to be connected with a measurement chamber through a dedicated pneumatic system. In the measurement chamber an array of sensors (Electron Capture Detector) monitored the CFC’s concentration level as well as the temperature and the pressure for each test sample. The collected set of information was stored in the memory of the on-board computer while a backup copy was sent to the ground station. To prevent an undesired air contamination the test sample was cleaned in so called Zeolite Filter.
In order to reproduce harsh atmospheric conditions present during a balloon flight (high level of UV radiation, ambient temperature close to -70 °C and pressure close to 10 hPa) the ground experiment had to be conducted inside a thermal vacuum chamber equipped with an artificial source of UV radiation. To obtain information about the CFC’s decay level and chemical by-products of this process a stationary gas chromatograph supported with mass spectroscopy was necessary. These results served as a reference point for the stratospheric experiment.
Selection of gas sensors for the project depends on resources available at WUT Sensor Laboratory. Due to the fact that one of the main goals is to determine the kinetics of CFC decay reaction, concentration of CFC in test samples should be either on ppm or ppb level. The choice of gas sensors complies with this fact.
FREDE 2015 Student Experiment Documentation
BX21_FREDE2015_SED_v5-1_19Feb16 Page 17
Figure 1.4-1.System architecture of FREDE Experiment
FREDE 2015 Student Experiment Documentation
BX21_FREDE2015_SED_v5-1_19Feb16 Page 18
In addition to the study of CFC’s decay process, project FREDE 2015 includes registration of the ambient temperature and the intensity of UV radiation as well as changes in ambient pressure.
For the airborne experiment there was a necessity to build an equivalent of gas chromatograph.Firstly, focus was maintained on selecting the chromatographic columns and determining the conditions of the experiment (column temperature, gas flow rate etc.). Secondly, the working conditions of the ECD were determined.
There is a number of differences between the ground and the airborne experiment. First of all, in the airborne experiment there is no need to emulate the environmental conditions. Moreover, in this case factors such as ionizing radiation will be taken into account. On the other hand, there is no access to a stationary chromatograph or mass spectroscope. Due to the fact, that on the ground there is no access to an appropriate source of radiation, radiation influence on CFC’s decay process on the ground (during laboratory tests) cannot be determined. The obtained results are essential for implementation of CFC’s decay model and post flight data interpretation.
FREDE 2015 Student Experiment Documentation
BX21_FREDE2015_SED_v5-1_19Feb16 Page 19
1.5 Team Details
1.5.1 Contact Point
Endorsing professor:
Romuald Redzicki, Ph.D. Faculty of Mechanical and Power Engineering (W-9) Wroclaw University of Technology (WUT) Wyb. Wyspiańskiego 27, 50-370 Wrocław, POLAND Phone:(+48) 71 320 3939 E-mail: [email protected]
Team coordinator:
Mikołaj Podgórski Faculty of Mechanical and Power Engineering (W-9) Wroclaw University of Technology (WUT) Wyb. Wyspiańskiego 27, 50-370 Wrocław, POLAND Powstańców 29/3, 47-220 Kędzierzyn-Koźle, POLAND Phone: (+48) 504 217 324 E-mail:[email protected]
FREDE 2015 Student Experiment Documentation
BX21_FREDE2015_SED_v5-1_19Feb16 Page 20
1.5.2 Team Members Mikołaj Podgórski
Responsibilities:
Design of pneumatic gas flow system Team coordinator and project manager (technical, documentation)
Educational background
B.Eng. Power Engineering Mechanical Engineering and Machine Building (2nd year of M.Eng.)
Workload: 30-40 hours/week.
Andrzej Dziedzic
Responsibilities:
PCB architecture Hardware design (electronics) On-board software development
Educational background:
B.Eng. Automatics and Robotics Automatics and Robotics (2nd year of M. Eng.)
Workload: 30-40 hours/week.
Krzysztof Grunt
Responsibilities:
Thermal design
Educational background:
B.Eng. Mechanical Engineering and Machine Building M.Eng. Power Engineering Power Engineering (1st year of Ph.D.)
Workload: 15-20 hours/week.
FREDE 2015 Student Experiment Documentation
BX21_FREDE2015_SED_v5-1_19Feb16 Page 21
Daniel Karczmit
Responsibilities:
Chemical and physical models for data analysis Photochemical analysis of CFC decomposition (literature studies) Gas chromatography
Educational background:
B.Sc. Chemical Informatics at Wroclaw University ChemicalTechnology(3rd year of B.Sc.) at WUT Instrumental Analytics (2nd year of M.Sc.) at Wroclaw University
Workload: 10-15 hours/week.
Adrianna Niemiec
Responsibilities:
Chemical and physical models for data analysis Photochemical analysis of CFC decomposition (literature studies) Gas chromatography
Educational background:
B.Sc. Biological Chemistry at Wroclaw University Instrumental Analytics (2nd year of M.Sc.) at Wroclaw University
Workload: 5-10 hours/week.
FREDE 2015 Student Experiment Documentation
BX21_FREDE2015_SED_v5-1_19Feb16 Page 22
Joanna Kuźma
Responsibilities:
Chemical and physical models for data analysis Photochemical analysis of CFC decomposition (literature studies) Chemical installation design and laboratory measurements Design and modelling of Zeolite Filter
Educational background:
Chemical and Process Engineering (3rd year of B.Eng.)
Workload: 15-20 hours/week.
Szymon Dzwończyk
Responsibilities:
Mechanical design (lead) Documentation
Educational background:
Mechanical Engineering (3rd year of B.Eng.)
Workload: 15-20 hours/week.
Dorota Budzyń
Responsibilities:
Mechanical design (support)
Educational background:
B.Eng. Automatics and Robotics Mechanical Engineering (1st year of M.Eng.)
Workload: 20-25 hours/week.
FREDE 2015 Student Experiment Documentation
BX21_FREDE2015_SED_v5-1_19Feb16 Page 23
Julia Marek
Responsibilities:
Outreach Webpage and photography
Educational background:
Optics (2nd year of B.Eng.)
Workload: 10-15 hours/week.
Ewa Just
Responsibilities:
Outreach (support) Public relations (support)
Educational background:
B.Eng. Transport Management and Production Engineering (1st year of M. Eng.)
Workload: 10-15 hours/week.
Jędrzej Górski
Responsibilities:
Finances Outreach policy
Educational background:
M.Eng. Computer Science Power Engineering (3rd year of Ph.D.)
Workload: 30-40 hours/week.
FREDE 2015 Student Experiment Documentation
BX21_FREDE2015_SED_v5-1_19Feb16 Page 24
Additional help is provided by previous team members:
Jędrzej Kowalewski
Responsibilities:
Mechanical design (support) Vision system design
Educational background:
B.Eng. in Automatics and Robotics M.Eng. Automatics and Robotics
Aleksander Łubniewski
Responsibilities:
PCB architecture Hardware design (electronics) On-board software development
Educational background:
Electronics and Telecommunication (3rd year of B.Eng.)
FREDE 2015 Student Experiment Documentation
BX21_FREDE2015_SED_v5-1_19Feb16 Page 25
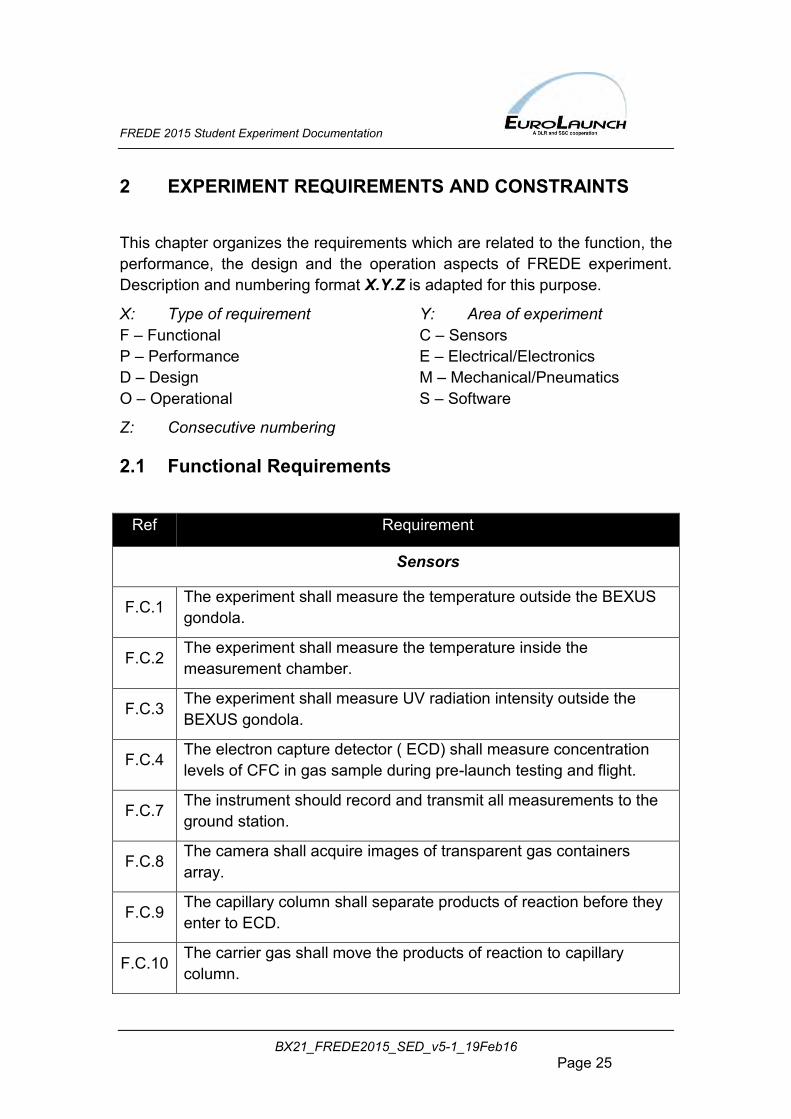
2 EXPERIMENT REQUIREMENTS AND CONSTRAINTS
This chapter organizes the requirements which are related to the function, the performance, the design and the operation aspects of FREDE experiment. Description and numbering format X.Y.Z is adapted for this purpose.
X: Type of requirement F – Functional P – Performance D – Design O – Operational
Y: Area of experiment C – Sensors E – Electrical/Electronics M – Mechanical/Pneumatics S – Software
Z: Consecutive numbering
2.1 Functional Requirements
Ref Requirement
Sensors
F.C.1 The experiment shall measure the temperature outside the BEXUS gondola.
F.C.2 The experiment shall measure the temperature inside the measurement chamber.
F.C.3 The experiment shall measure UV radiation intensity outside the BEXUS gondola.
F.C.4 The electron capture detector ( ECD) shall measure concentration levels of CFC in gas sample during pre-launch testing and flight.
F.C.7 The instrument should record and transmit all measurements to the ground station.
F.C.8 The camera shall acquire images of transparent gas containers array.
F.C.9 The capillary column shall separate products of reaction before they enter to ECD.
F.C.10 The carrier gas shall move the products of reaction to capillary column.
FREDE 2015 Student Experiment Documentation
BX21_FREDE2015_SED_v5-1_19Feb16 Page 26
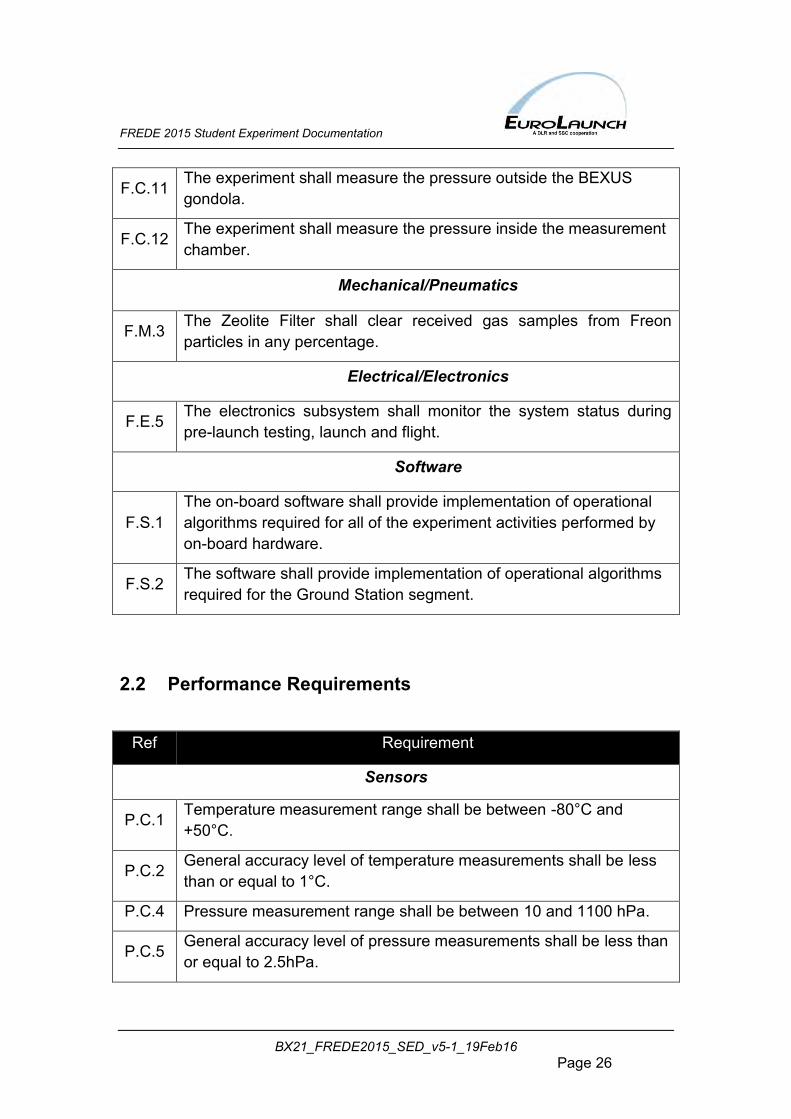
F.C.11 The experiment shall measure the pressure outside the BEXUS gondola.
F.C.12 The experiment shall measure the pressure inside the measurement chamber.
Mechanical/Pneumatics
F.M.3 The Zeolite Filter shall clear received gas samples from Freon particles in any percentage.
Electrical/Electronics
F.E.5 The electronics subsystem shall monitor the system status during pre-launch testing, launch and flight.
Software
F.S.1 The on-board software shall provide implementation of operational algorithms required for all of the experiment activities performed by on-board hardware.
F.S.2 The software shall provide implementation of operational algorithms required for the Ground Station segment.
2.2 Performance Requirements
Ref Requirement
Sensors
P.C.1 Temperature measurement range shall be between -80°C and +50°C.
P.C.2 General accuracy level of temperature measurements shall be less than or equal to 1°C.
P.C.4 Pressure measurement range shall be between 10 and 1100 hPa.
P.C.5 General accuracy level of pressure measurements shall be less than or equal to 2.5hPa.
FREDE 2015 Student Experiment Documentation
BX21_FREDE2015_SED_v5-1_19Feb16 Page 27
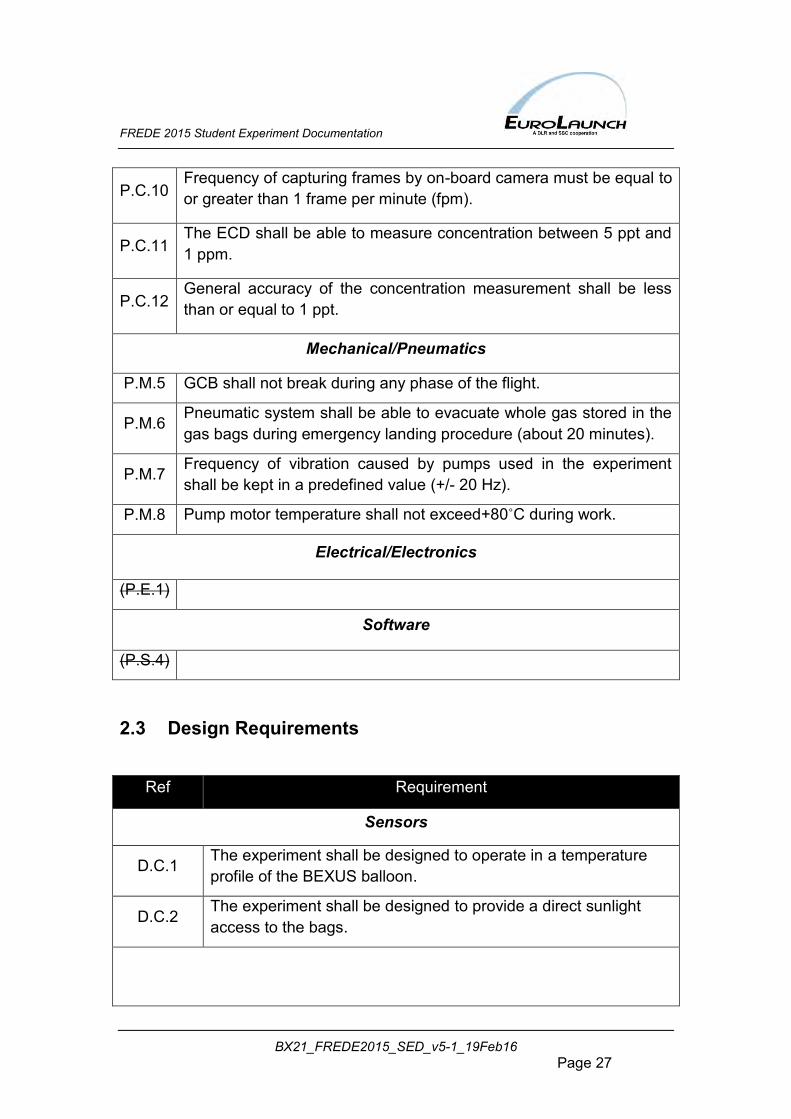
P.C.10 Frequency of capturing frames by on-board camera must be equal to or greater than 1 frame per minute (fpm).
P.C.11 The ECD shall be able to measure concentration between 5 ppt and 1 ppm.
P.C.12 General accuracy of the concentration measurement shall be less than or equal to 1 ppt.
Mechanical/Pneumatics
P.M.5 GCB shall not break during any phase of the flight.
P.M.6 Pneumatic system shall be able to evacuate whole gas stored in the gas bags during emergency landing procedure (about 20 minutes).
P.M.7 Frequency of vibration caused by pumps used in the experiment shall be kept in a predefined value (+/- 20 Hz).
P.M.8 Pump motor temperature shall not exceed+80˚C during work.
Electrical/Electronics
(P.E.1)
Software
(P.S.4)
2.3 Design Requirements
Ref Requirement
Sensors
D.C.1 The experiment shall be designed to operate in a temperature profile of the BEXUS balloon.
D.C.2 The experiment shall be designed to provide a direct sunlight access to the bags.
FREDE 2015 Student Experiment Documentation
BX21_FREDE2015_SED_v5-1_19Feb16 Page 28
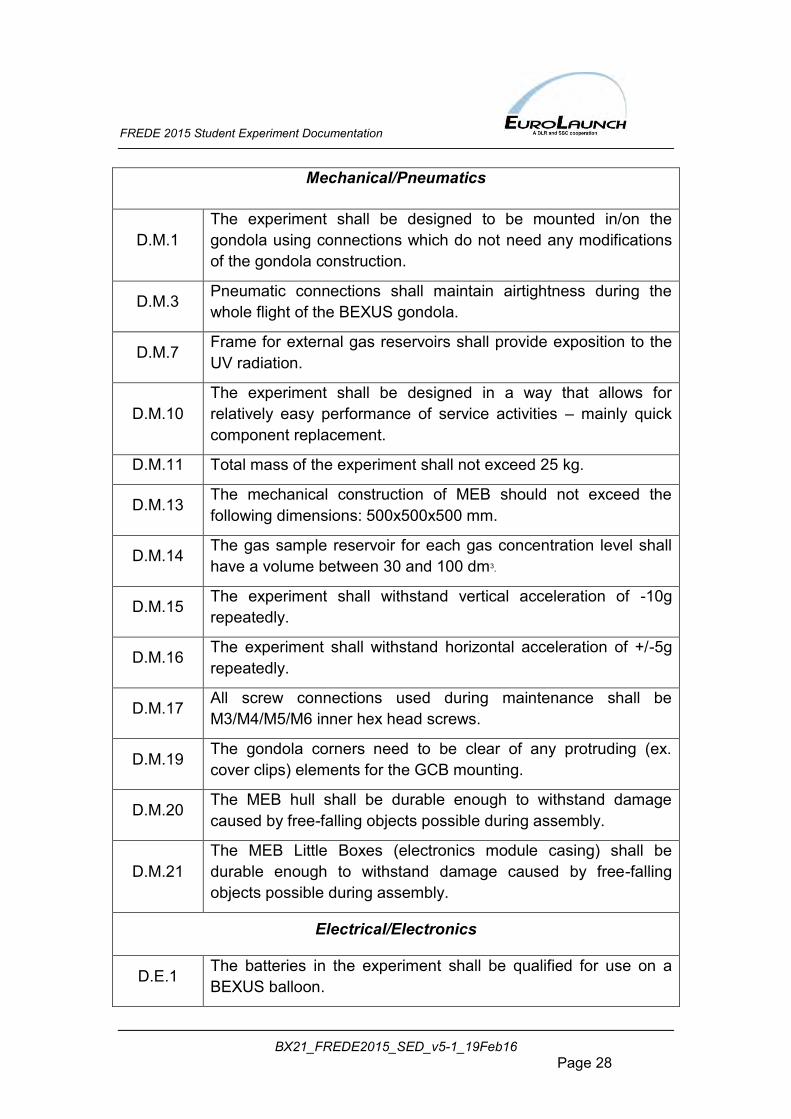
Mechanical/Pneumatics
D.M.1 The experiment shall be designed to be mounted in/on the gondola using connections which do not need any modifications of the gondola construction.
D.M.3 Pneumatic connections shall maintain airtightness during the whole flight of the BEXUS gondola.
D.M.7 Frame for external gas reservoirs shall provide exposition to the UV radiation.
D.M.10 The experiment shall be designed in a way that allows for relatively easy performance of service activities – mainly quick component replacement.
D.M.11 Total mass of the experiment shall not exceed 25 kg.
D.M.13 The mechanical construction of MEB should not exceed the following dimensions: 500x500x500 mm.
D.M.14 The gas sample reservoir for each gas concentration level shall have a volume between 30 and 100 dm3.
D.M.15 The experiment shall withstand vertical acceleration of -10g repeatedly.
D.M.16 The experiment shall withstand horizontal acceleration of +/-5g repeatedly.
D.M.17 All screw connections used during maintenance shall be M3/M4/M5/M6 inner hex head screws.
D.M.19 The gondola corners need to be clear of any protruding (ex. cover clips) elements for the GCB mounting.
D.M.20 The MEB hull shall be durable enough to withstand damage caused by free-falling objects possible during assembly.
D.M.21 The MEB Little Boxes (electronics module casing) shall be durable enough to withstand damage caused by free-falling objects possible during assembly.
Electrical/Electronics
D.E.1 The batteries in the experiment shall be qualified for use on a BEXUS balloon.
FREDE 2015 Student Experiment Documentation
BX21_FREDE2015_SED_v5-1_19Feb16 Page 29
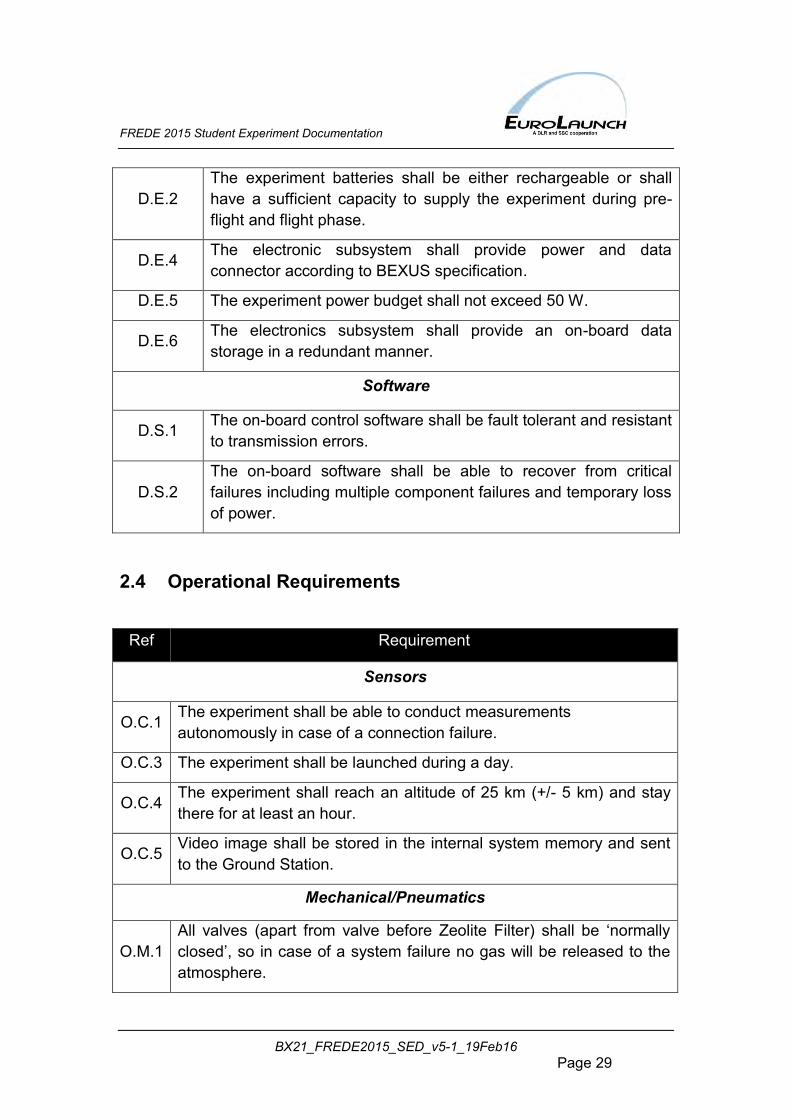
D.E.2 The experiment batteries shall be either rechargeable or shall have a sufficient capacity to supply the experiment during pre-flight and flight phase.
D.E.4 The electronic subsystem shall provide power and data connector according to BEXUS specification.
D.E.5 The experiment power budget shall not exceed 50 W.
D.E.6 The electronics subsystem shall provide an on-board data storage in a redundant manner.
Software
D.S.1 The on-board control software shall be fault tolerant and resistant to transmission errors.
D.S.2 The on-board software shall be able to recover from critical failures including multiple component failures and temporary loss of power.
2.4 Operational Requirements
Ref Requirement
Sensors
O.C.1 The experiment shall be able to conduct measurements autonomously in case of a connection failure.
O.C.3 The experiment shall be launched during a day.
O.C.4 The experiment shall reach an altitude of 25 km (+/- 5 km) and stay there for at least an hour.
O.C.5 Video image shall be stored in the internal system memory and sent to the Ground Station.
Mechanical/Pneumatics
O.M.1 All valves (apart from valve before Zeolite Filter) shall be ‘normally closed’, so in case of a system failure no gas will be released to the atmosphere.
FREDE 2015 Student Experiment Documentation
BX21_FREDE2015_SED_v5-1_19Feb16 Page 30
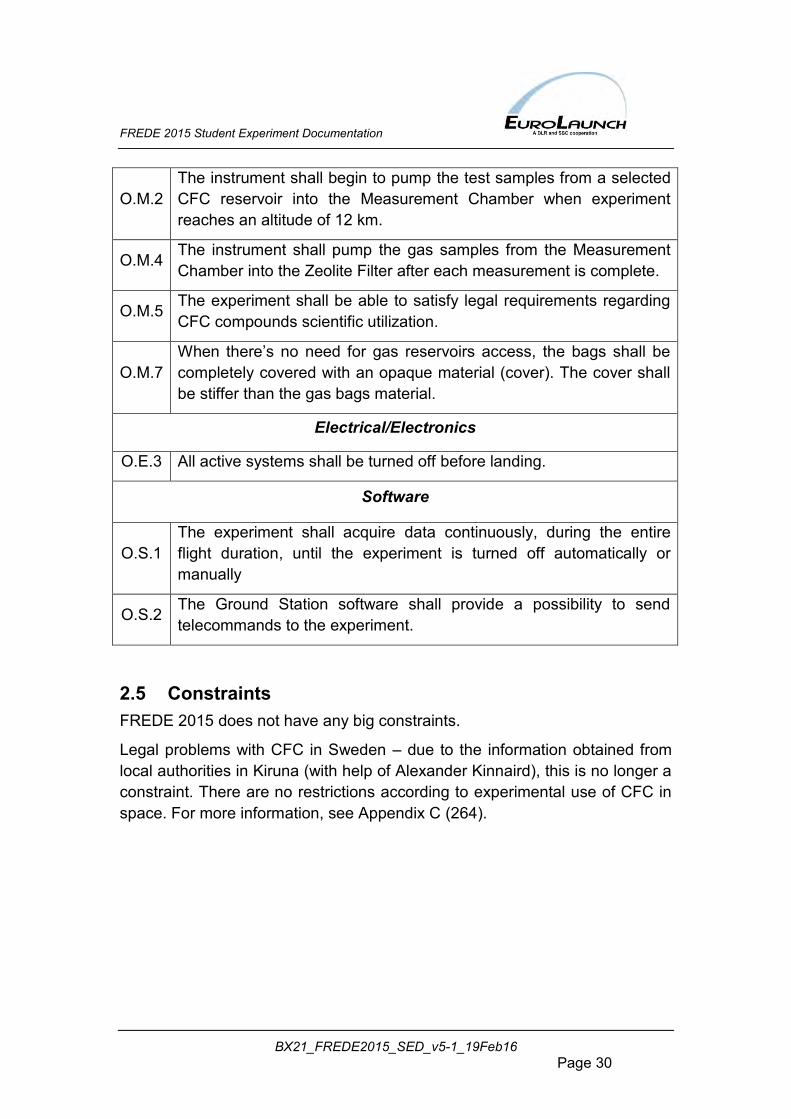
O.M.2 The instrument shall begin to pump the test samples from a selected CFC reservoir into the Measurement Chamber when experiment reaches an altitude of 12 km.
O.M.4 The instrument shall pump the gas samples from the Measurement Chamber into the Zeolite Filter after each measurement is complete.
O.M.5 The experiment shall be able to satisfy legal requirements regarding CFC compounds scientific utilization.
O.M.7 When there’s no need for gas reservoirs access, the bags shall be completely covered with an opaque material (cover). The cover shall be stiffer than the gas bags material.
Electrical/Electronics
O.E.3 All active systems shall be turned off before landing.
Software
O.S.1 The experiment shall acquire data continuously, during the entire flight duration, until the experiment is turned off automatically or manually
O.S.2 The Ground Station software shall provide a possibility to send telecommands to the experiment.
2.5 Constraints FREDE 2015 does not have any big constraints.
Legal problems with CFC in Sweden – due to the information obtained from local authorities in Kiruna (with help of Alexander Kinnaird), this is no longer a constraint. There are no restrictions according to experimental use of CFC in space. For more information, see Appendix C (264).
FREDE 2015 Student Experiment Documentation
BX21_FREDE2015_SED_v5-1_19Feb16 Page 31
3 PROJECT PLANNING
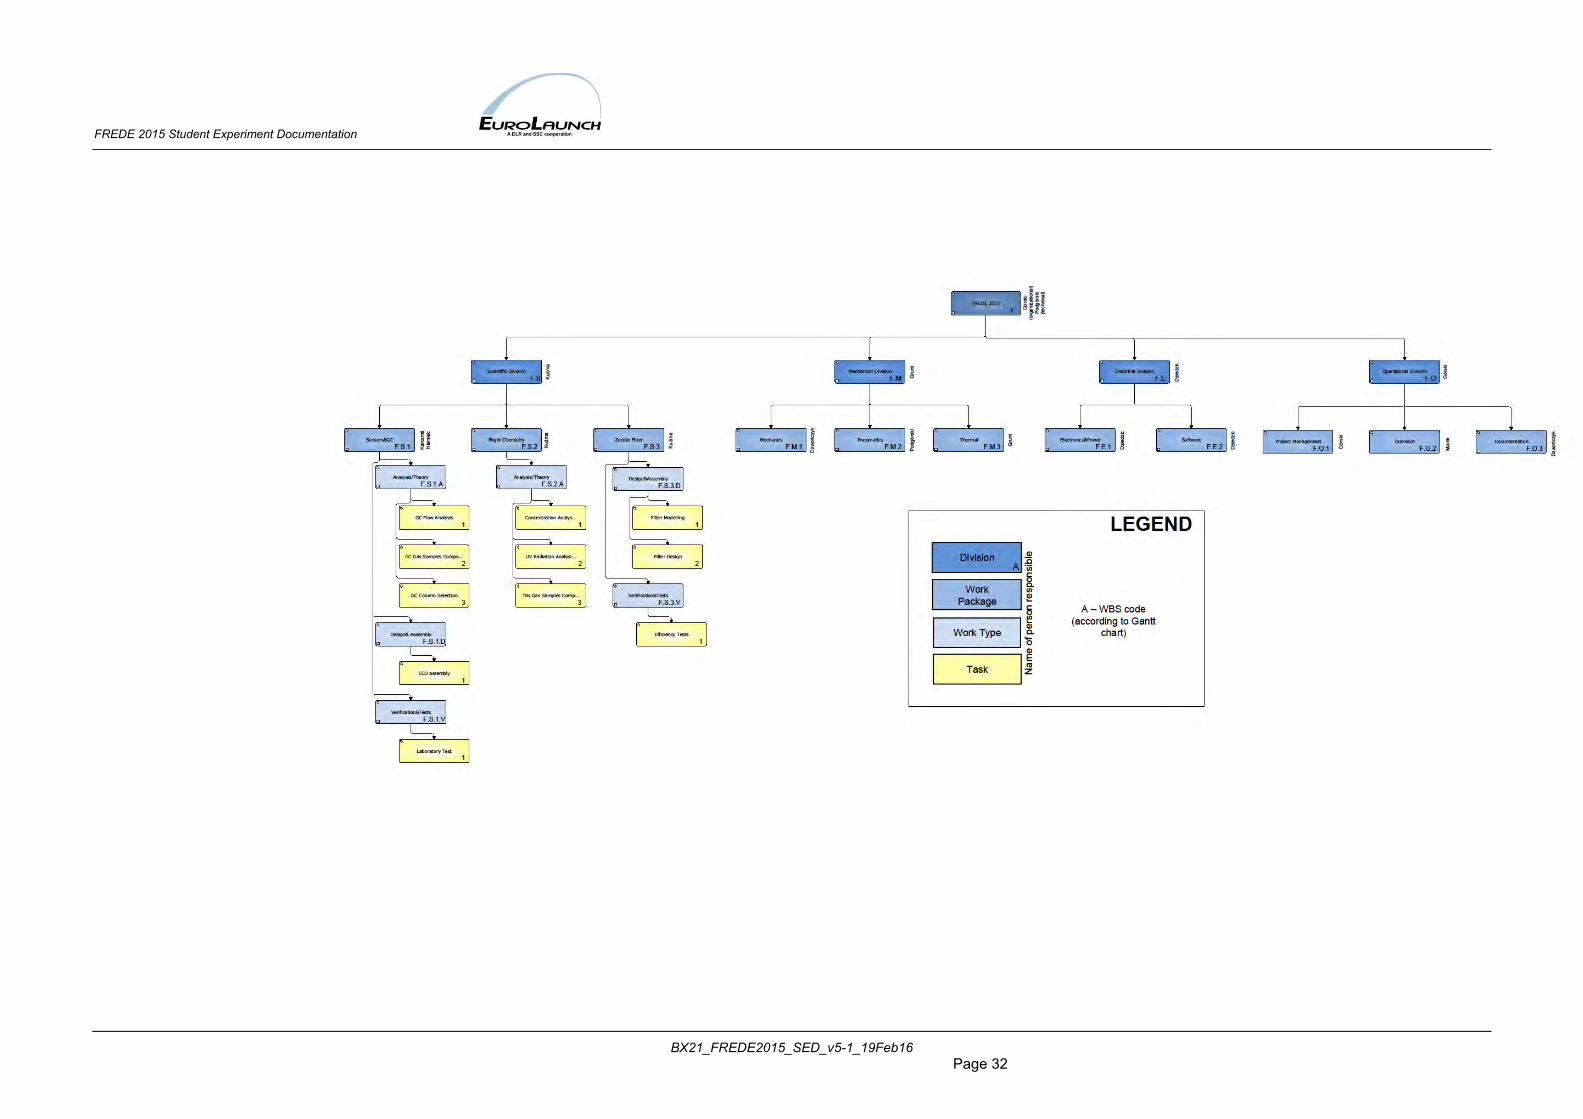
3.1 Work Breakdown Structure (WBS) The work packages for all the divisions (Scientific, Mechanical, Electrical and Operational) in FREDE 2015 are presented in the following figure. Please note that this WBS solely serves the purpose of presentation and only Scientific Division has been described in detail. The Work Breakdown Structure in its full form can be found in Appendix C (219).
FREDE 2015 Student Experiment Documentation
BX21_FREDE2015_SED_v5-1_19Feb16 Page 32
FREDE 2015 Student Experiment Documentation
BX21_FREDE2015_SED_v5-1_19Feb16 Page 33
3.2 Schedule
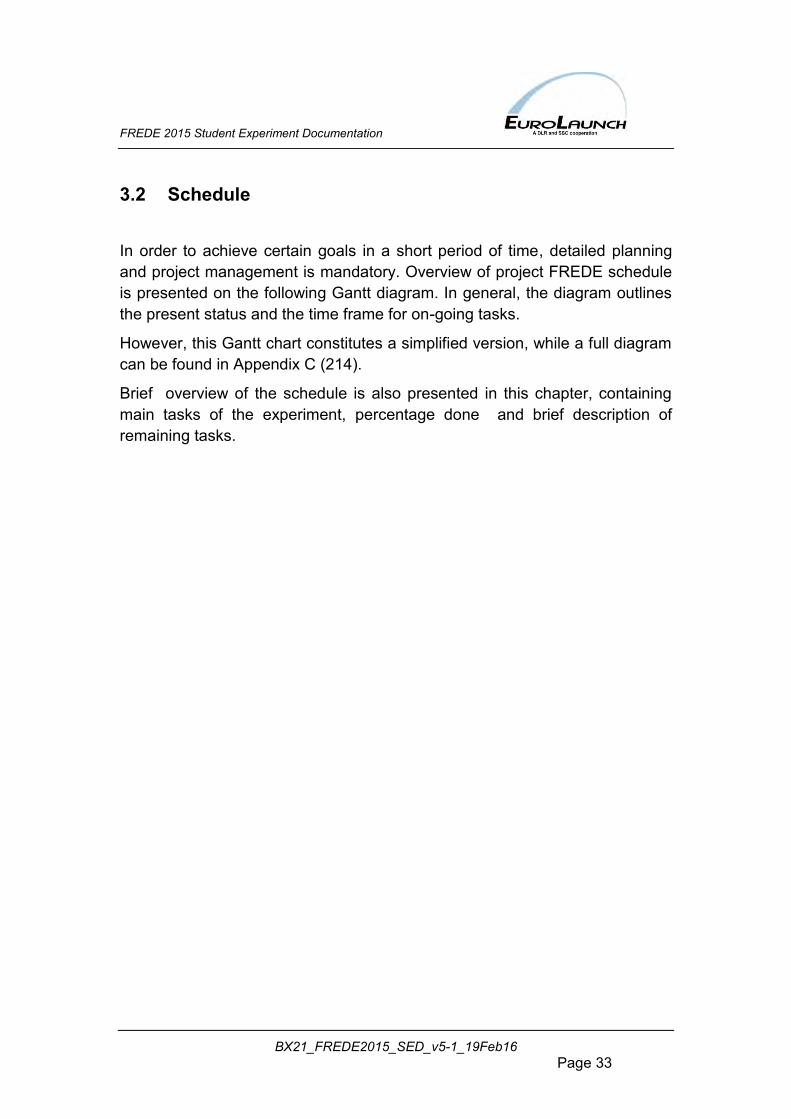
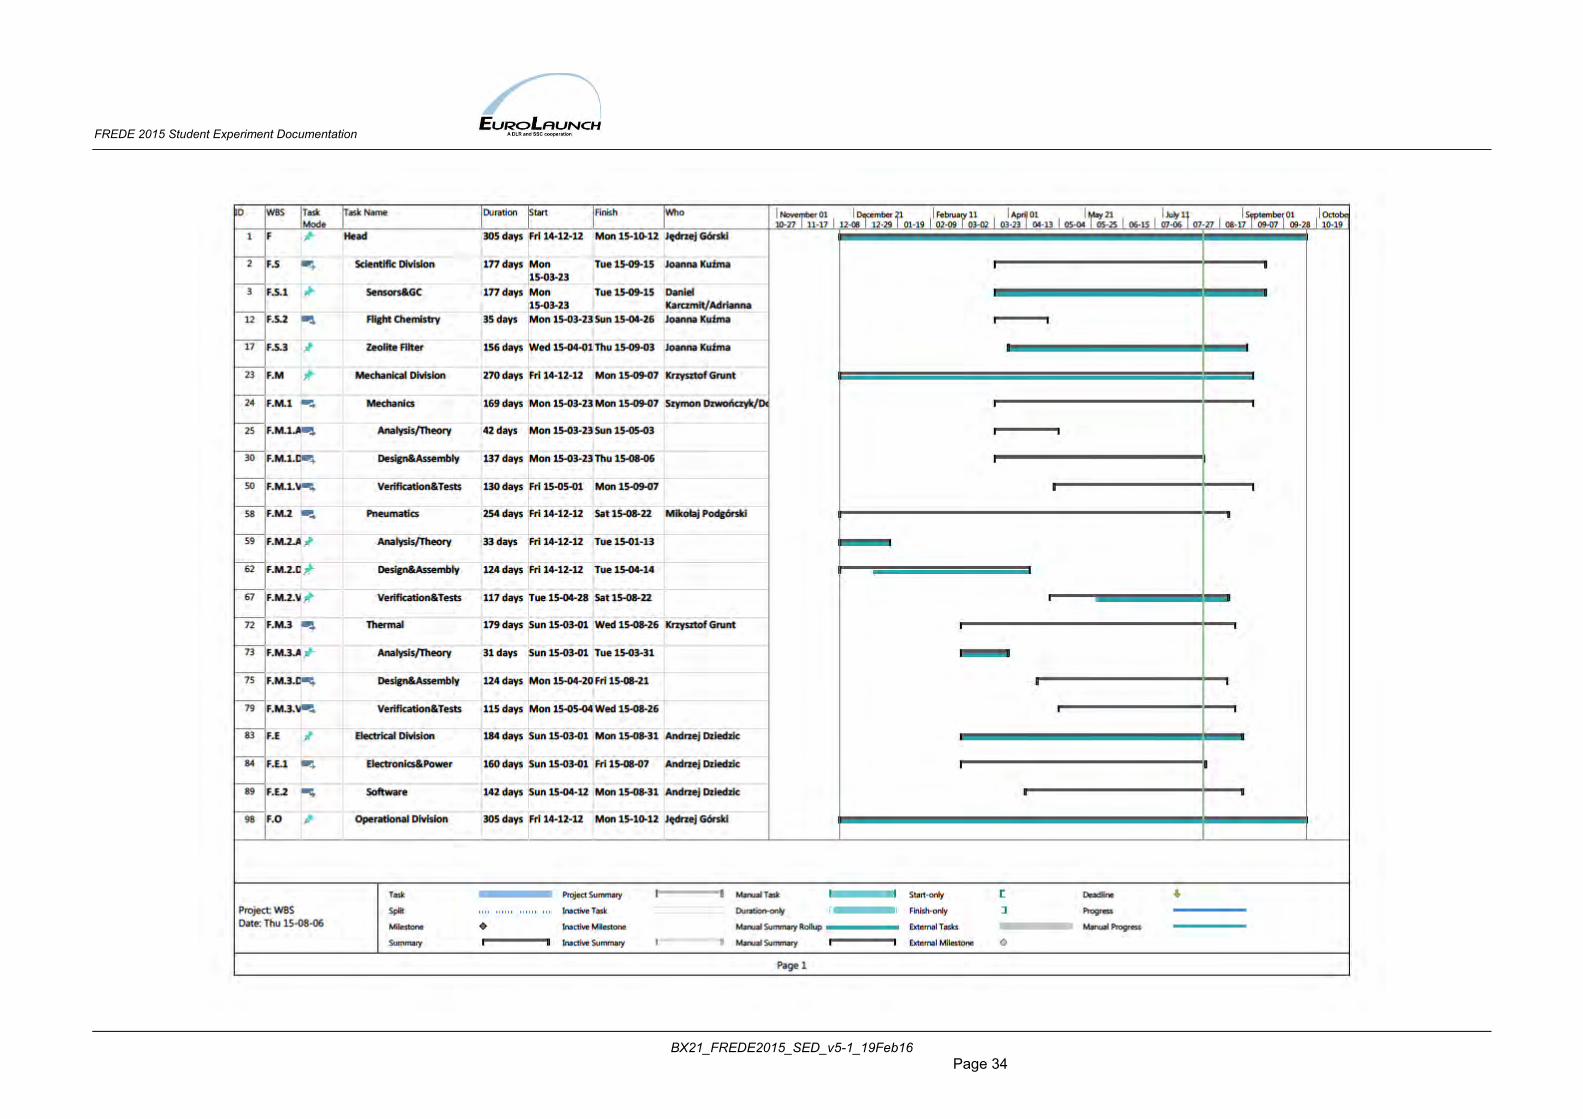
In order to achieve certain goals in a short period of time, detailed planning and project management is mandatory. Overview of project FREDE schedule is presented on the following Gantt diagram. In general, the diagram outlines the present status and the time frame for on-going tasks.
However, this Gantt chart constitutes a simplified version, while a full diagram can be found in Appendix C (214).
Brief overview of the schedule is also presented in this chapter, containing main tasks of the experiment, percentage done and brief description of remaining tasks.
FREDE 2015 Student Experiment Documentation
BX21_FREDE2015_SED_v5-1_19Feb16 Page 34
FREDE 2015 Student Experiment Documentation
BX21_FREDE2015_SED_v5-1_19Feb16 Page 35
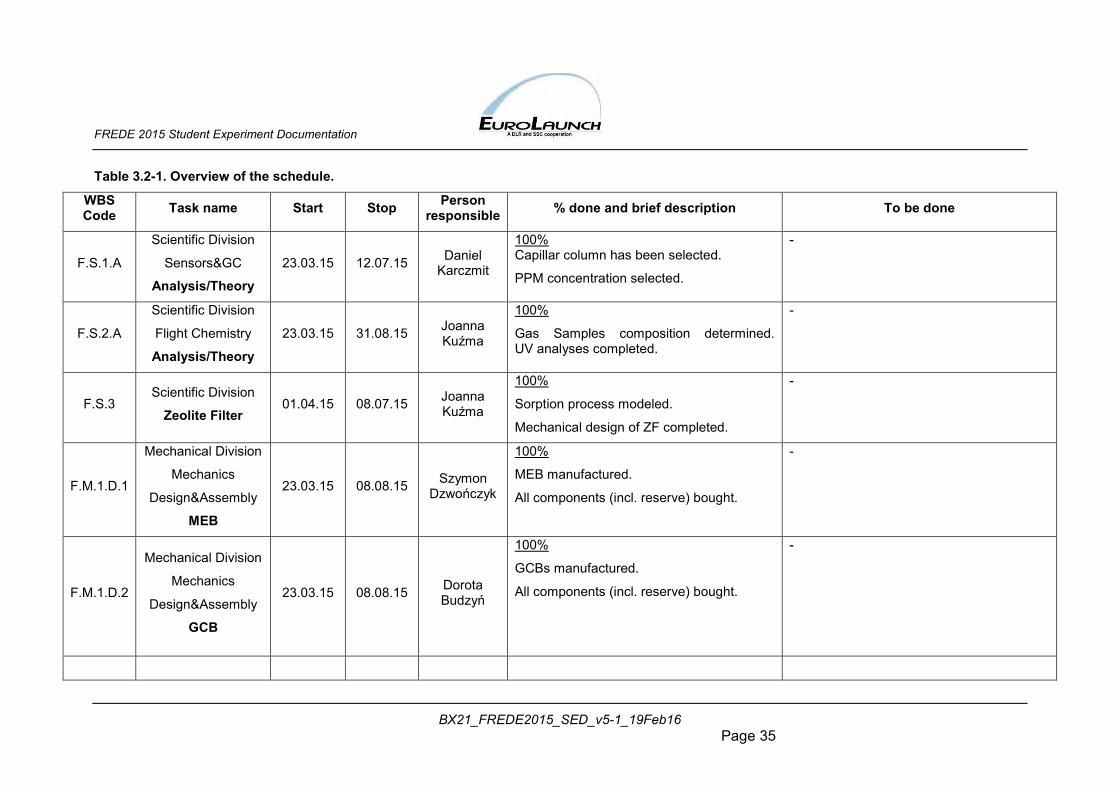
Table 3.2-1. Overview of the schedule.
WBS Code Task name Start Stop Person
responsible % done and brief description To be done
F.S.1.A
Scientific Division
Sensors&GC
Analysis/Theory 23.03.15 12.07.15 Daniel
Karczmit
100% Capillar column has been selected.
PPM concentration selected.
-
F.S.2.A
Scientific Division
Flight Chemistry
Analysis/Theory
23.03.15 31.08.15 Joanna Kuźma
100%
Gas Samples composition determined. UV analyses completed.
-
F.S.3 Scientific Division
Zeolite Filter 01.04.15 08.07.15 Joanna
Kuźma
100%
Sorption process modeled.
Mechanical design of ZF completed.
-
F.M.1.D.1
Mechanical Division
Mechanics
Design&Assembly
MEB
23.03.15 08.08.15 Szymon Dzwończyk
100%
MEB manufactured.
All components (incl. reserve) bought.
-
F.M.1.D.2
Mechanical Division
Mechanics
Design&Assembly
GCB
23.03.15 08.08.15 Dorota Budzyń
100%
GCBs manufactured.
All components (incl. reserve) bought.
-
FREDE 2015 Student Experiment Documentation
BX21_FREDE2015_SED_v5-1_19Feb16 Page 36
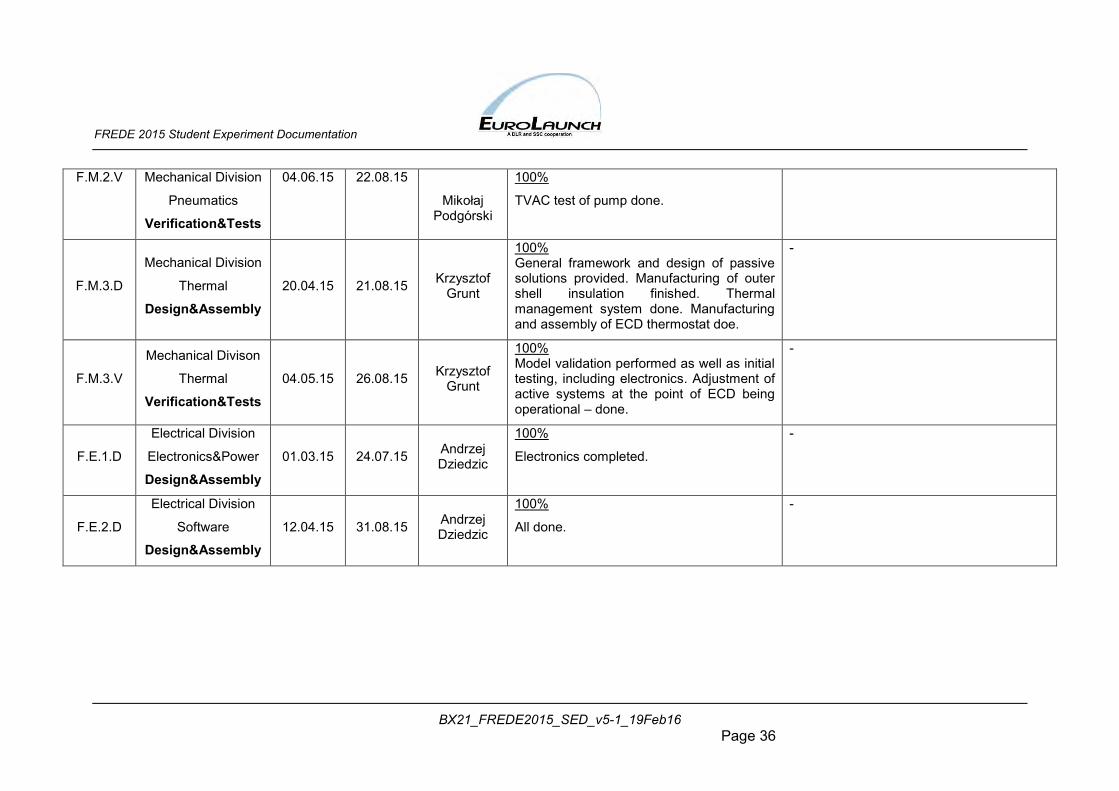
F.M.2.V Mechanical Division
Pneumatics
Verification&Tests
04.06.15 22.08.15
Mikołaj Podgórski
100%
TVAC test of pump done.
F.M.3.D
Mechanical Division
Thermal
Design&Assembly
20.04.15 21.08.15 Krzysztof Grunt
100% General framework and design of passive solutions provided. Manufacturing of outer shell insulation finished. Thermal management system done. Manufacturing and assembly of ECD thermostat doe.
-
F.M.3.V
Mechanical Divison
Thermal
Verification&Tests
04.05.15 26.08.15 Krzysztof Grunt
100% Model validation performed as well as initial testing, including electronics. Adjustment of active systems at the point of ECD being operational – done.
-
F.E.1.D
Electrical Division
Electronics&Power
Design&Assembly
01.03.15 24.07.15 Andrzej Dziedzic
100%
Electronics completed.
-
F.E.2.D
Electrical Division
Software
Design&Assembly 12.04.15 31.08.15 Andrzej
Dziedzic
100%
All done.
-
FREDE 2015 Student Experiment Documentation
BX21_FREDE2015_SED_v5-1_19Feb16 Page 37
3.3 Resources
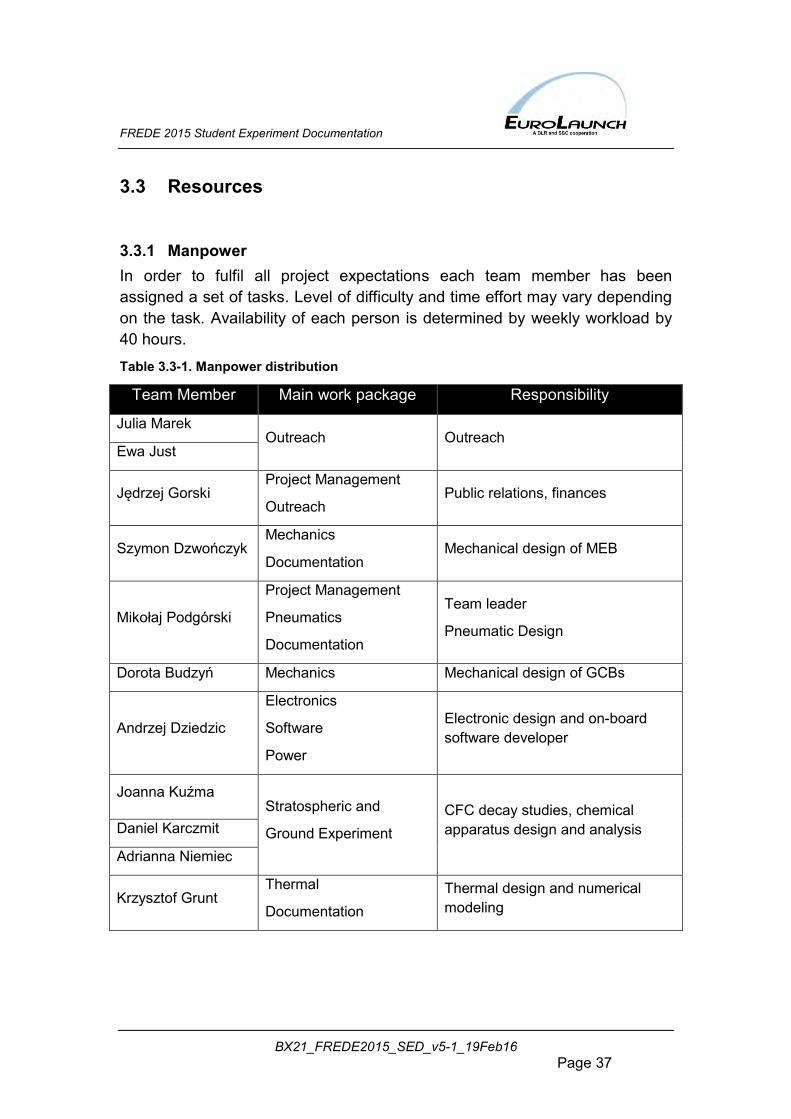
3.3.1 Manpower In order to fulfil all project expectations each team member has been assigned a set of tasks. Level of difficulty and time effort may vary depending on the task. Availability of each person is determined by weekly workload by 40 hours. Table 3.3-1. Manpower distribution
Team Member Main work package Responsibility
Julia Marek Outreach Outreach
Ewa Just
Jędrzej Gorski Project Management
Outreach Public relations, finances
Szymon Dzwończyk Mechanics
Documentation Mechanical design of MEB
Mikołaj Podgórski
Project Management
Pneumatics
Documentation
Team leader
Pneumatic Design
Dorota Budzyń Mechanics Mechanical design of GCBs
Andrzej Dziedzic
Electronics
Software
Power
Electronic design and on-board software developer
Joanna Kuźma Stratospheric and
Ground Experiment CFC decay studies, chemical apparatus design and analysis Daniel Karczmit
Adrianna Niemiec
Krzysztof Grunt Thermal
Documentation Thermal design and numerical modeling
FREDE 2015 Student Experiment Documentation
BX21_FREDE2015_SED_v5-1_19Feb16 Page 38
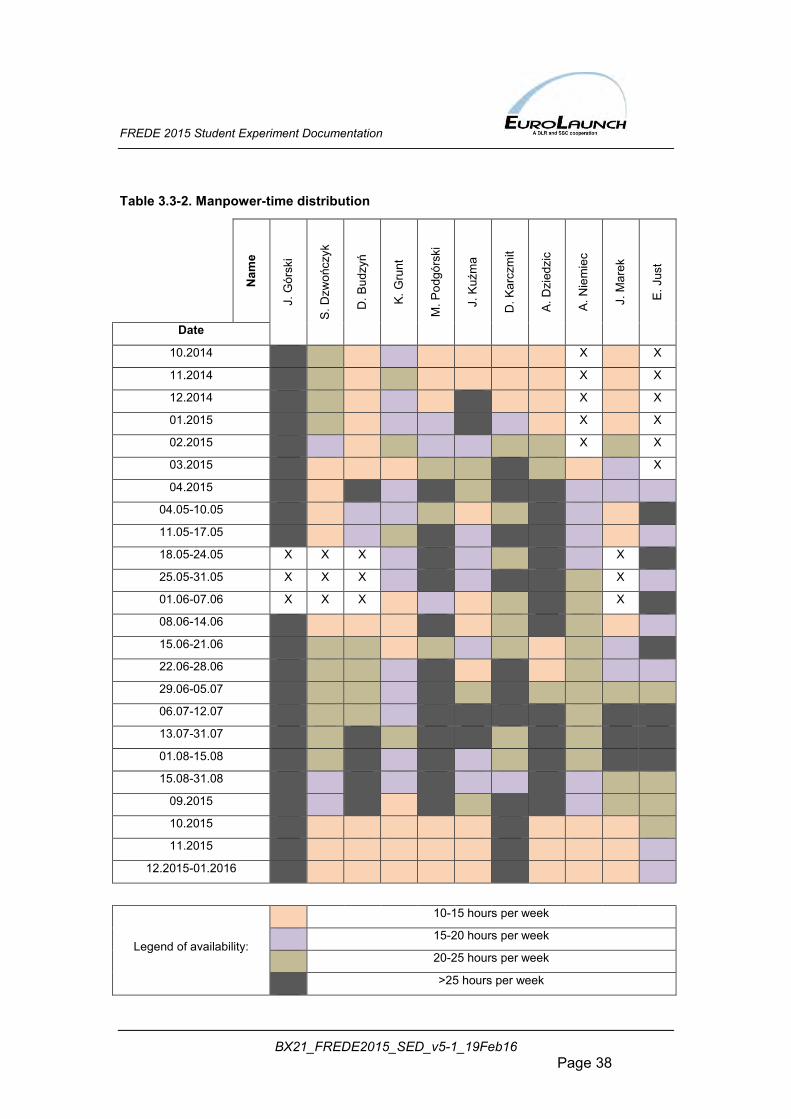
Table 3.3-2. Manpower-time distribution
N
ame
J. G
órsk
i
S. D
zwoń
czyk
D. B
udzy
ń
K. G
runt
M. P
odgó
rski
J. K
uźm
a
D. K
arcz
mit
A. D
zied
zic
A. N
iem
iec
J. M
arek
E. J
ust
Date
10.2014 X X
11.2014 X X
12.2014 X X
01.2015 X X
02.2015 X X
03.2015 X
04.2015
04.05-10.05
11.05-17.05
18.05-24.05 X X X X
25.05-31.05 X X X X
01.06-07.06 X X X X
08.06-14.06
15.06-21.06
22.06-28.06
29.06-05.07
06.07-12.07
13.07-31.07
01.08-15.08
15.08-31.08
09.2015
10.2015
11.2015
12.2015-01.2016
Legend of availability:
10-15 hours per week
15-20 hours per week
20-25 hours per week
>25 hours per week
FREDE 2015 Student Experiment Documentation
BX21_FREDE2015_SED_v5-1_19Feb16 Page 39
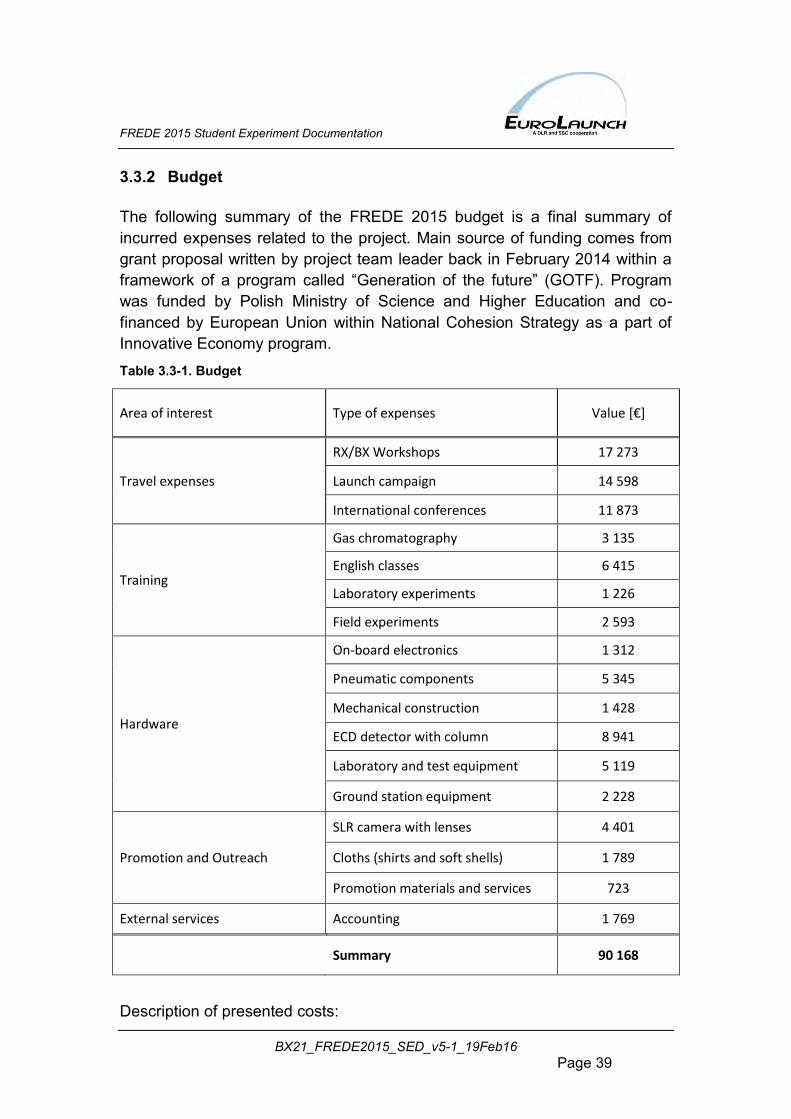
3.3.2 Budget
The following summary of the FREDE 2015 budget is a final summary of incurred expenses related to the project. Main source of funding comes from grant proposal written by project team leader back in February 2014 within a framework of a program called “Generation of the future” (GOTF). Program was funded by Polish Ministry of Science and Higher Education and co-financed by European Union within National Cohesion Strategy as a part of Innovative Economy program. Table 3.3-1. Budget
Area of interest Type of expenses Value [€]
Travel expenses
RX/BX Workshops 17 273
Launch campaign 14 598
International conferences 11 873
Training
Gas chromatography 3 135
English classes 6 415
Laboratory experiments 1 226
Field experiments 2 593
Hardware
On-board electronics 1 312
Pneumatic components 5 345
Mechanical construction 1 428
ECD detector with column 8 941
Laboratory and test equipment 5 119
Ground station equipment 2 228
Promotion and Outreach
SLR camera with lenses 4 401
Cloths (shirts and soft shells) 1 789
Promotion materials and services 723
External services Accounting 1 769
Summary 90 168
Description of presented costs:
FREDE 2015 Student Experiment Documentation
BX21_FREDE2015_SED_v5-1_19Feb16 Page 40
Travel expenses
Expenses related to transportation (airplane, train, bus, car), as well as costs of accommodation. This budget position covers all type of travel expenses related to workshop and launch campaign costs (including experiment transportation). It covers also daily subsistence allowance for each team member, and similar travel expenses related to outreach activities (ex. 65th International Astronautical Congress in Toronto in October 2014).
Training
Expenses related to additional training as a part of project development process. Main area of training is organised outside of Wroclaw University of Technology like Wroclaw Science and Technology Centre where team members gained practical and theoretical experience in area of gas chromatography, and other important experimental methods required for scientific part of the project. Another area of self-development is focus on language skills (improvement of reading, writing and speaking in English) which most of the team is still part of (8 out of 12).
Laboratory experiments
This budget position covers expenses related to indoor test at Wroclaw University of Technology and other laboratories available for team FREDE. Most of these expenses were limited to nitrogen orders (in liquid and gas form) as well as necessary equipment required for measurements in available test chamber.
Field experiments
This part of budget covers expenses related to tests performed outside of WUT laboratories. Team performed three tests with on-board electronics in the stratosphere (on altitude from 20 to 29 km). It was a part of the JADE mission, which goal was to share flight opportunity with students and scientist from three Polish Universities (West Pomeranian University of Technology, Jagiellonian University, and Wroclaw University of Technology). The mission was possible thanks to cooperation with balloon and radio amateur community called Copernicus Project and Polish Rocketry Association.
Hardware
On-board electronics
This section of the budget covers all expenses related to on-board electronics which was designed and manufactured by FREDE team members. It covers
FREDE 2015 Student Experiment Documentation
BX21_FREDE2015_SED_v5-1_19Feb16 Page 41
electronic components, PCB manufacturing and costs of additional hardware (electronics) required for FREDE manufacturing process.
Pneumatic subsystem
This section covers expenses related to all components required for development of project on-board pneumatic subsystem, responsible for delivery and utilisation of gas test sample acquired during FREDE flight. It consists of gas bags, pumps, valves, pipes, connectors, zeolite filter, etc.
Mechanical construction
Expenses which are related to building a case for FREDE experiment, the booms for Gas Bags, and mounting for a camera which monitors mentioned Gas Bags and produces outreach material.
Main detector (ECD) and column
This section of the budget corresponds to the main detector (Electron Capture Detector) as well as gas chromatography columns, which are the key parts of FREDE measurement unit.
Ground station equipment
This section of the budget is related to funds required to build a ground station for the FREDE mission and other future projects which would provide computing power for simulations and other types of calculations.
Promotion and Outreach
This part of project budget covers expenses related to promotional materials (flyers, posters, banners), as well as server provider for the web page. Biggest part of this budget concerns SLR camera with a set of lenses (for high quality of photo and video documentation), as well as unified branded cloths (t-shirts, shirts and soft shells) for all team members.
External services
Funding acquired from Polish Ministry of Science and Higher Education requires professional accounting services paid by the project with certain limitations (up to 5% of overall financial support).
FREDE 2015 Student Experiment Documentation
BX21_FREDE2015_SED_v5-1_19Feb16 Page 42
3.3.3 External Support
D.Sc. Ireneusz Śliwka - Environmental Lab in Institute of Atomic Physics (IFJ Polish Academy of Science) has significant expertise in area of CFC monitoring and experimentation techniques.
Ph.D. Wojciech Mazurek - Institute of Air Conditioning and District Heating at WUT, support available in area of thermal and vacuum testing.
Ph.D. Krzysztof Janus - Faculty of Chemistry at WUT, support available in area of CFC decay related chemical reactions theory.
D.Sc. Slawomir Pietrowicz - Department of Thermodynamics, Theory of Machines and Thermal Systems – Faculty of Mechanical and Power Engineering at WUT.
Ph.D. Jerzy Greblicki - the Institute of Computer Science, Automation and Robotics – Faculty of Electronics at WUT.
Ph.D. Krzysztof Urbański - Faculty of Photonics and Microsystems at WUT.
Ph.D. Stanisław Reszewski - Faculty of Mechanical and Power Engineering.
FREDE 2015 Student Experiment Documentation
BX21_FREDE2015_SED_v5-1_19Feb16 Page 43
3.4 Outreach Approach
3.4.1 Online channels FREDE’s basic outreach program consists of the following elements:
● Project website and blog - the most important channel: www.frede.pwr.edu.pl/home-pl
● Project Facebook fanpage - the most popular channel to share last minute news: http://www.facebook.com/ProjectFrede
● Project Instagram account:
https://instagram.com/projectfrede
3.4.2 Media about FREDE project The most popular polish science and space services writing about FREDE:
www.kosmonauta.net http://www.kosmonauta.net/2014/12/wroclawianie-na-bexus-ie-
2021/#prettyPhoto Polish Press Agency http://www.naukawpolsce.pap.pl/aktualnosci/news,403398,wroclawscy-
studenci-zbadaja-szkodliwosc-freonow.html
Focus magazine https://www.facebook.com/ProjectFrede/posts/942422312486968 Pryzmat (newspaper of Wroclaw University of Technology) Article about Preliminary Design Review in MORABA
http://www.pryzmat.pwr.edu.pl/sprawy-studenckie/755
Article about FREDE 2015 and Selection Workshop in ESTEC
http://www.pryzmat.pwr.edu.pl/sprawy-studenckie/723
Article about JADE-1 mission, the stratospheric test for FREDE electronics
http://www.pryzmat.pwr.edu.pl/sprawy-studenckie/891
Article about Critical Design Review in ESTEC
http://www.pryzmat.pwr.edu.pl/sprawy-studenckie/936
FREDE 2015 Student Experiment Documentation
BX21_FREDE2015_SED_v5-1_19Feb16 Page 44
Article about Critical Design Review in ESTEC (in English)
http://www.pryzmat.pwr.edu.pl/english/220
Article about Integration Progress Review in Wroclaw
http://www.pryzmat.pwr.edu.pl/sprawy-studenckie/980
Article about Experiment Acceptance Review in Wroclaw
http://www.pryzmat.pwr.edu.pl/sprawy-studenckie/1002
Article about preparations to Launch Campaign in Esrange
http://www.pryzmat.pwr.edu.pl/sprawy-studenckie/1013
Article about launch of FREDE and BEXUS 21 in Esrange
http://www.pryzmat.pwr.edu.pl/sprawy-studenckie/1018
Aside from the basic activities, several additional actions are in the team’s scope:
● Radio and TV interviews (mainly local stations) ● Popular Science presentation about FREDE project during 10th edition
of Avangarda convent in Warsaw (8.08.2015) ● Lectures at main Polish space-related conferences and events. For
more details - see Appendix B. ● Episode about FREDE in the newest Canal+ Discovery series (about
polish inventions). Release date - February 2016;
3.4.3 Collaborations We are glad to inform that we collaborated with Alfa Romeo during our trip to Kiruna. For more details - see Appendix B.
FREDE 2015 Student Experiment Documentation
BX21_FREDE2015_SED_v5-1_19Feb16 Page 45
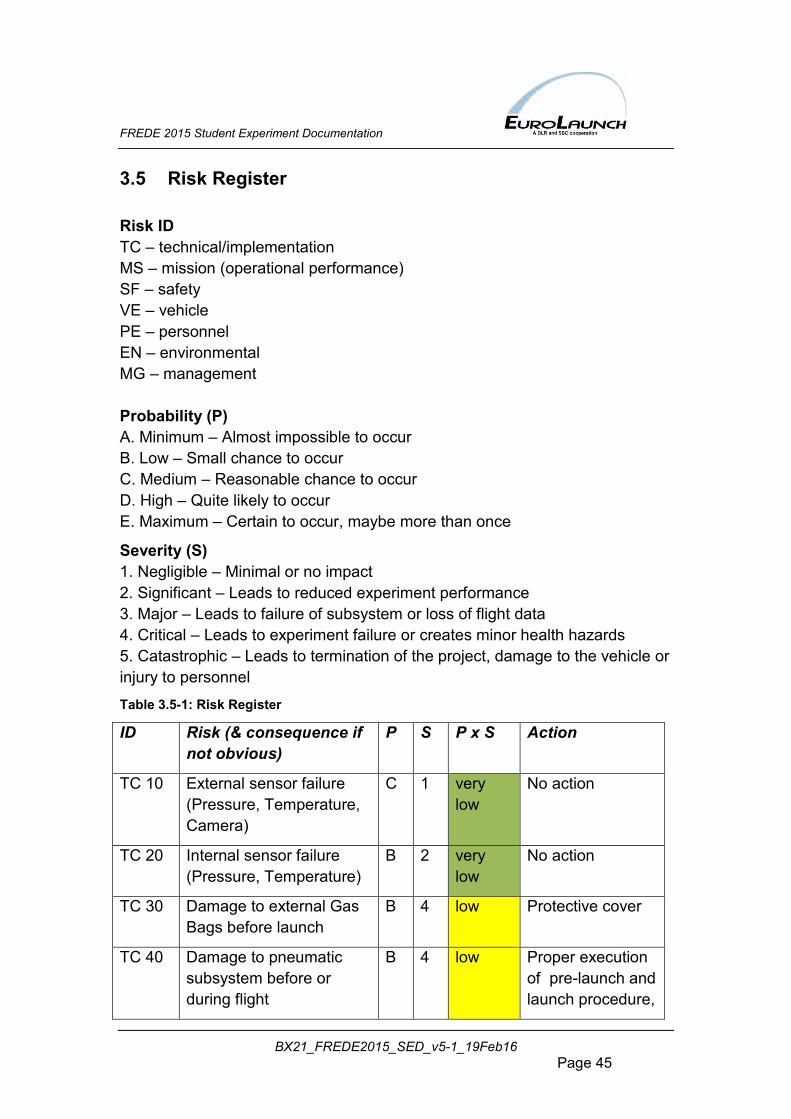
3.5 Risk Register Risk ID TC – technical/implementation MS – mission (operational performance) SF – safety VE – vehicle PE – personnel EN – environmental MG – management Probability (P) A. Minimum – Almost impossible to occur B. Low – Small chance to occur C. Medium – Reasonable chance to occur D. High – Quite likely to occur E. Maximum – Certain to occur, maybe more than once Severity (S) 1. Negligible – Minimal or no impact 2. Significant – Leads to reduced experiment performance 3. Major – Leads to failure of subsystem or loss of flight data 4. Critical – Leads to experiment failure or creates minor health hazards 5. Catastrophic – Leads to termination of the project, damage to the vehicle or injury to personnel
Table 3.5-1: Risk Register
ID Risk (& consequence if not obvious)
P S P x S Action
TC 10 External sensor failure (Pressure, Temperature, Camera)
C 1 very low
No action
TC 20 Internal sensor failure (Pressure, Temperature)
B 2 very low
No action
TC 30 Damage to external Gas Bags before launch
B 4 low Protective cover
TC 40 Damage to pneumatic subsystem before or during flight
B 4 low Proper execution of pre-launch and launch procedure,
FREDE 2015 Student Experiment Documentation
BX21_FREDE2015_SED_v5-1_19Feb16 Page 46
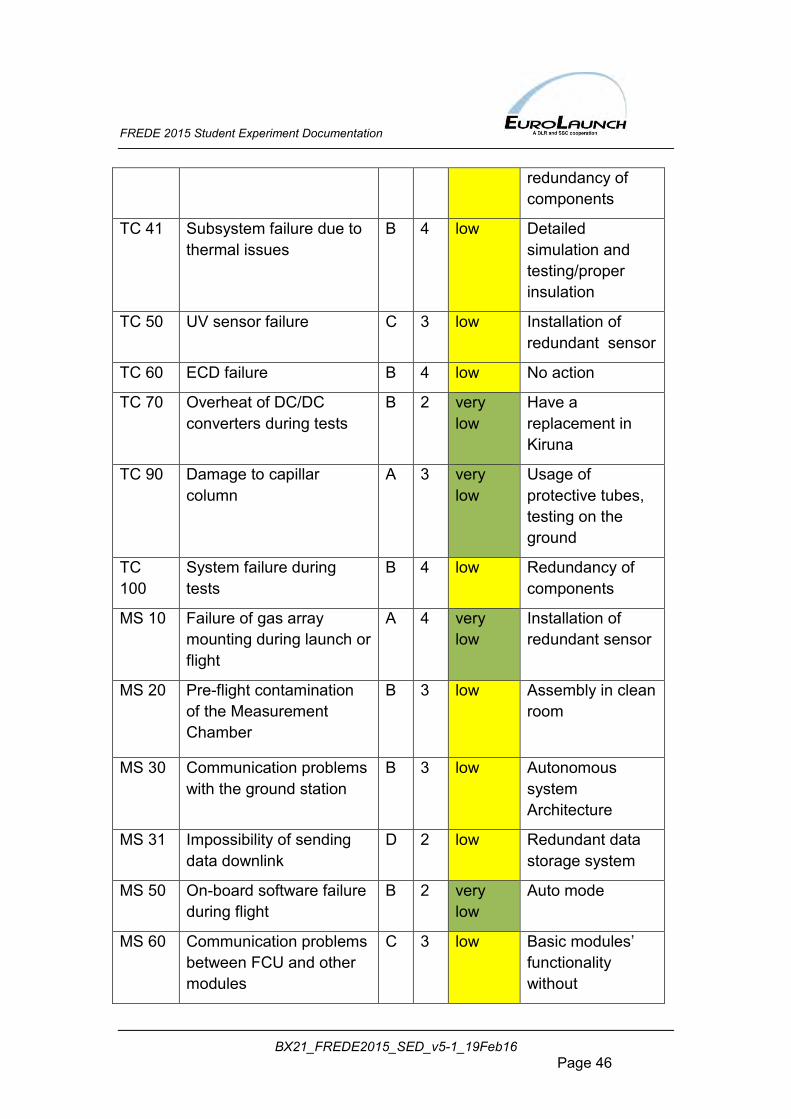
redundancy of components
TC 41 Subsystem failure due to thermal issues
B 4 low Detailed simulation and testing/proper insulation
TC 50 UV sensor failure C 3 low Installation of redundant sensor
TC 60 ECD failure B 4 low No action
TC 70 Overheat of DC/DC converters during tests
B 2 very low
Have a replacement in Kiruna
TC 90 Damage to capillar column
A 3 very low
Usage of protective tubes, testing on the ground
TC 100
System failure during tests
B 4 low Redundancy of components
MS 10 Failure of gas array mounting during launch or flight
A 4 very low
Installation of redundant sensor
MS 20 Pre-flight contamination of the Measurement Chamber
B 3 low Assembly in clean room
MS 30 Communication problems with the ground station
B 3 low Autonomous system Architecture
MS 31 Impossibility of sending data downlink
D 2 low Redundant data storage system
MS 50 On-board software failure during flight
B 2 very low
Auto mode
MS 60 Communication problems between FCU and other modules
C 3 low Basic modules’ functionality without
FREDE 2015 Student Experiment Documentation
BX21_FREDE2015_SED_v5-1_19Feb16 Page 47
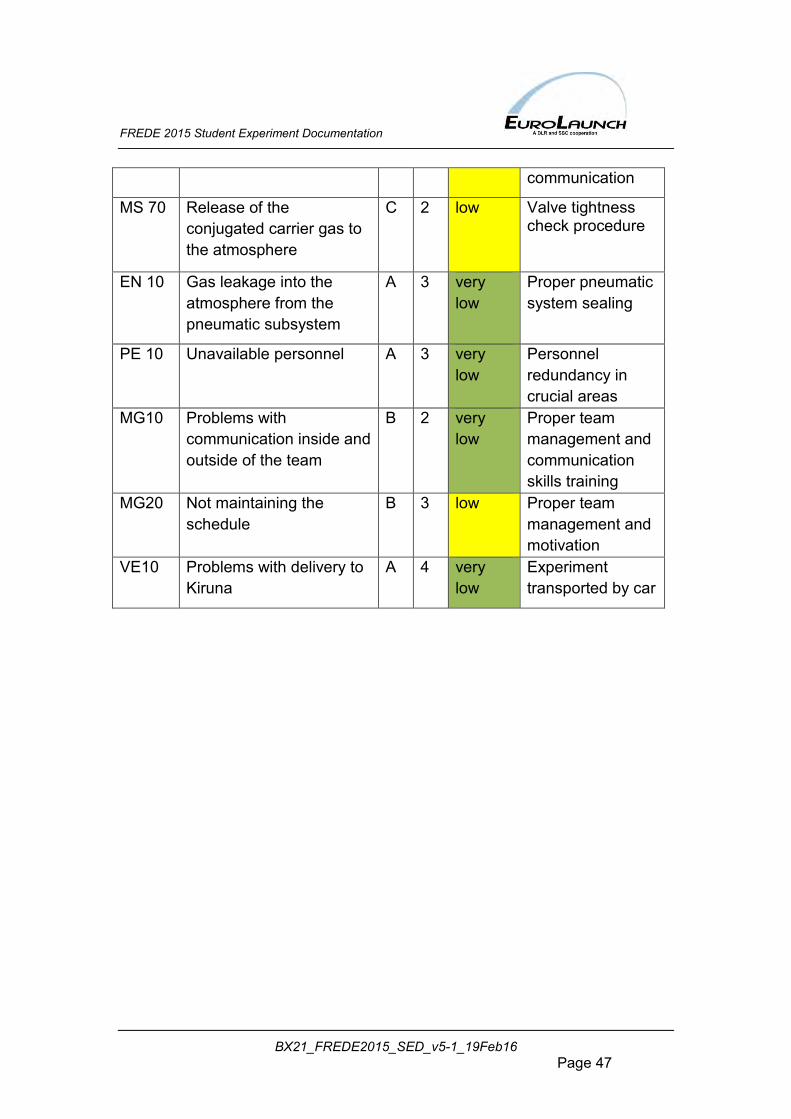
communication
MS 70 Release of the conjugated carrier gas to the atmosphere
C 2 low Valve tightness check procedure
EN 10 Gas leakage into the atmosphere from the pneumatic subsystem
A 3 very low
Proper pneumatic system sealing
PE 10 Unavailable personnel A 3 very low
Personnel redundancy in crucial areas
MG10 Problems with communication inside and outside of the team
B 2 very low
Proper team management and communication skills training
MG20 Not maintaining the schedule
B 3 low Proper team management and motivation
VE10 Problems with delivery to Kiruna
A 4 very low
Experiment transported by car
FREDE 2015 Student Experiment Documentation
BX21_FREDE2015_SED_v5-1_19Feb16 Page 48
4 EXPERIMENT DESCRIPTION
4.1 Experiment Setup The fully functional prototype has four main subsystems (Figure 1.4-1): Measurement Unit (sensors, detectors and experiment installation) Data Acquisition Unit (recording and storing measurement data) Communication Unit (on-board data transmission subsystem) Ground Station Unit (ground segment for data transmission) Due to the nature of the experiment, part of the measuring apparatus (including transparent Gas Bags and pipes as reservoir of CFC samples) was placed on a side of the balloon’s gondola. This solution provided the experiment with a direct exposure of the selected CFCs’ molecules to almost all possible atmospheric factors (except natural atmospheric air mixing and convection). Depending on the CFC concentration in each of the Gas Bags, CFC’s decay characteristics were based on stationary gas chromatography. A dedicated Measurement Chamber equipped with an ECD sensor allowed detection of varying concentrations of CFC compounds (from ppt to ppm) and some of the products of their decay.
Principles for instrumentation
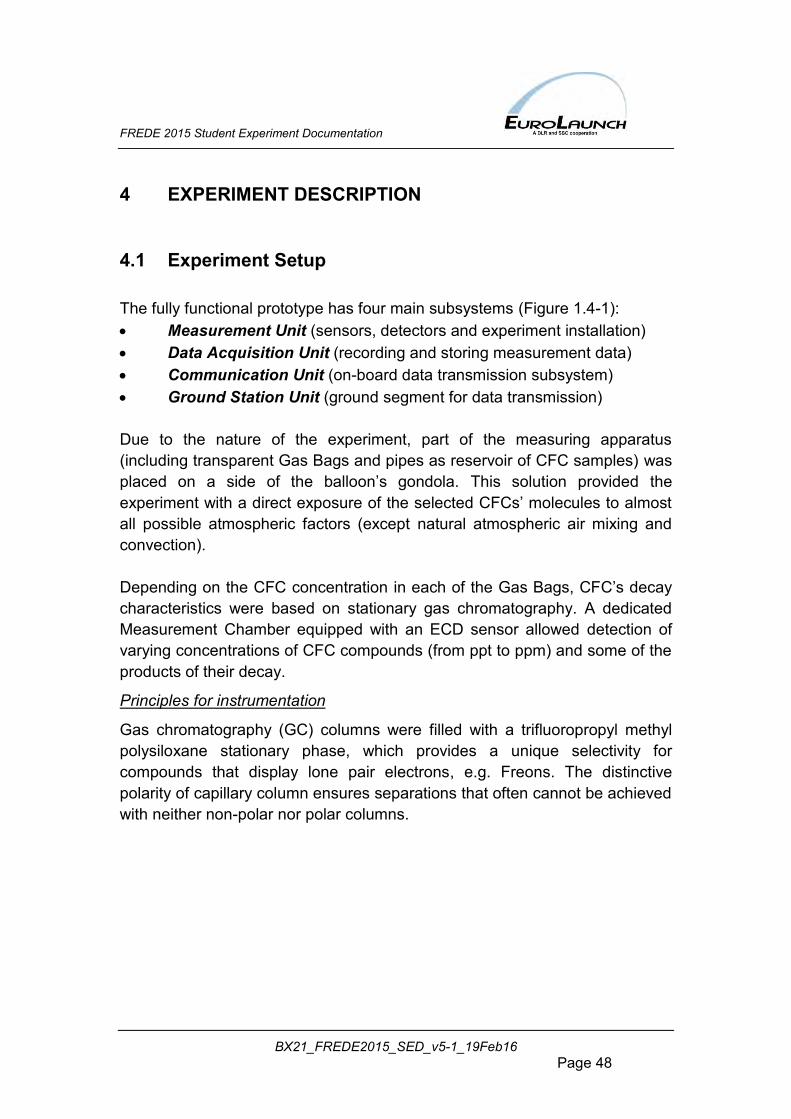
Gas chromatography (GC) columns were filled with a trifluoropropyl methyl polysiloxane stationary phase, which provides a unique selectivity for compounds that display lone pair electrons, e.g. Freons. The distinctive polarity of capillary column ensures separations that often cannot be achieved with neither non-polar nor polar columns.
FREDE 2015 Student Experiment Documentation
BX21_FREDE2015_SED_v5-1_19Feb16 Page 49
Figure 4.1-1. Capillary column [19, 20]
Electron Capture Detector (ECD) consists of an anode and a cathode. Between them the phenomenon of negative ions formation occurs. Molecule introduced into the detector (for example chlorine or CFC) reacts with the electrons. The detector is very sensitive considering the pace of electrons’ movement.
FREDE 2015 Student Experiment Documentation
BX21_FREDE2015_SED_v5-1_19Feb16 Page 50
4.2 Experiment Interfaces
This section of FREDE documentation describes interfaces.
4.2.1 Mechanical
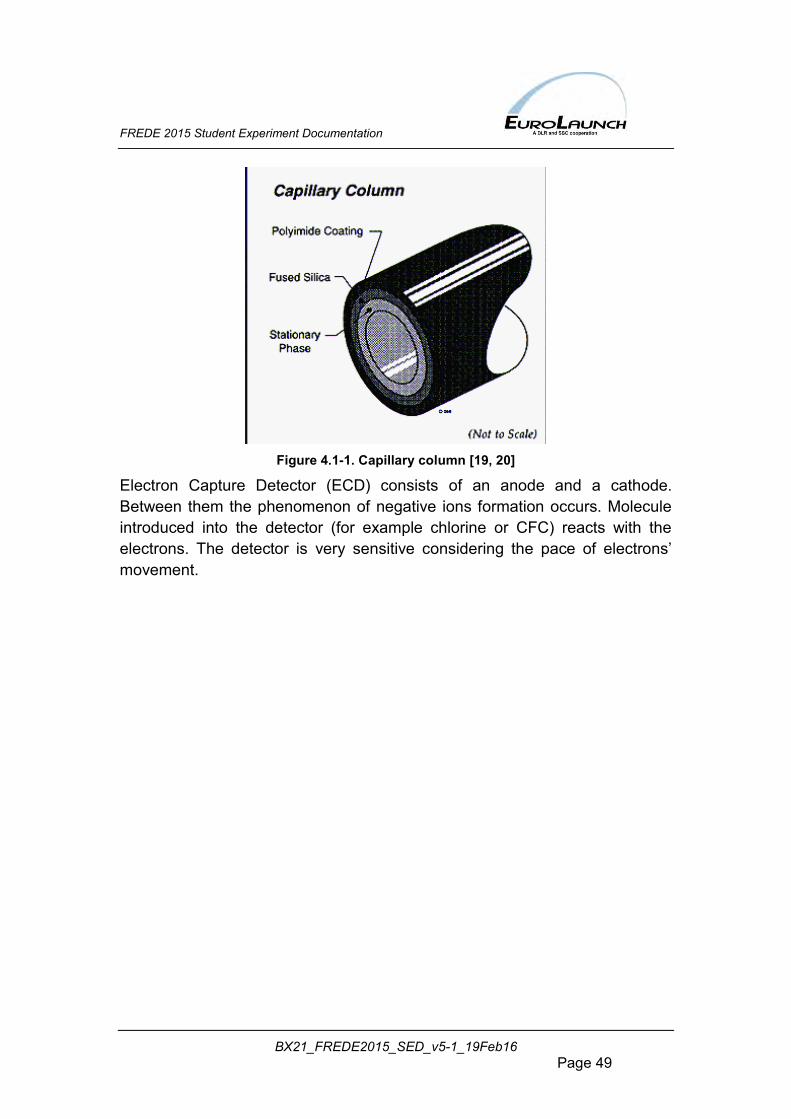
FREDE experiment set-up consists of three structures: Main Experiment Box (MEB), two Gas Container Booms (GCB) and Video Cameras Box. Each structure was mounted to the gondola frame. The experiment visualisation is shown in figure 4.2-1.
Figure 4.2-1. FREDE 2015 overview
FREDE 2015 Student Experiment Documentation
BX21_FREDE2015_SED_v5-1_19Feb16 Page 51
Main Experiment Box (MEB)
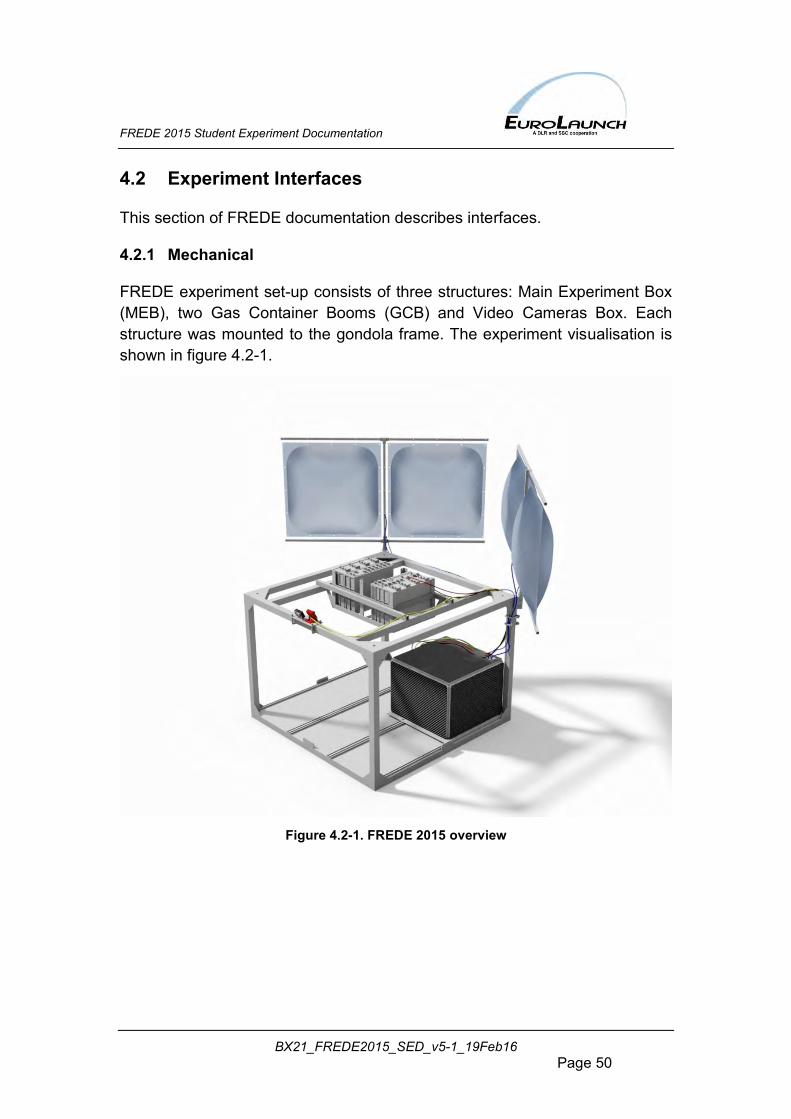
The MEB frame was designed to be mounted with M8 screws and self-locking nuts on a dedicated distance plate (3mm aluminium) in four points located in MEB corners. The plate is fixed to the EGON gondola rails in four mounting points using standard T-shaped M8 bolts secured with self-locking nuts. The mounting design is shown in figure 4.2-2. T-shaped bolts were used for mounting/dismounting the experiment to the gondola.
Figure 4.2-2. Main Experiment Box mounting design
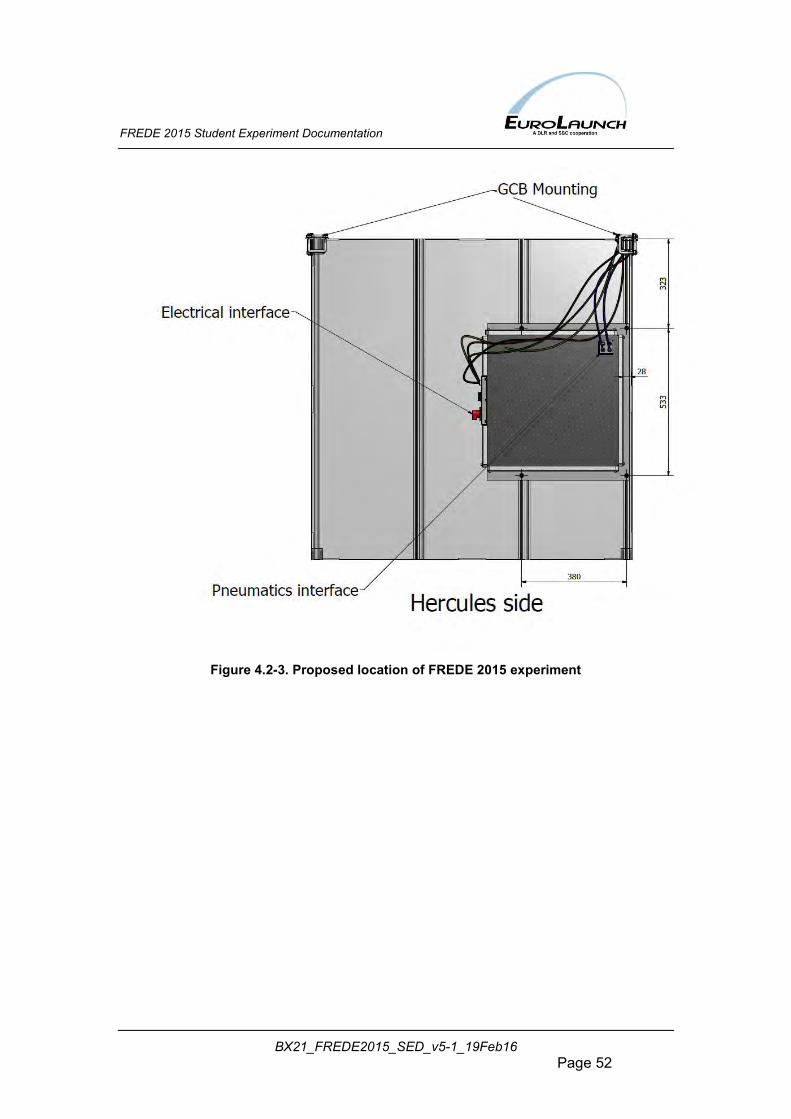
To maintain proper gondola CoG FREDE MEB position had to be changed. MEB was located in the middle of the right side of the gondola (looking form Hercules). There was at least 25 mm clearance between the box side and the side of the gondola. The pneumatics interface plate was located pointing the gondola corner for tube routing.
Main Experiment Box location with clearances is shown in figure 4.2-3.
FREDE 2015 Student Experiment Documentation
BX21_FREDE2015_SED_v5-1_19Feb16 Page 52
Figure 4.2-3. Proposed location of FREDE 2015 experiment
FREDE 2015 Student Experiment Documentation
BX21_FREDE2015_SED_v5-1_19Feb16 Page 53
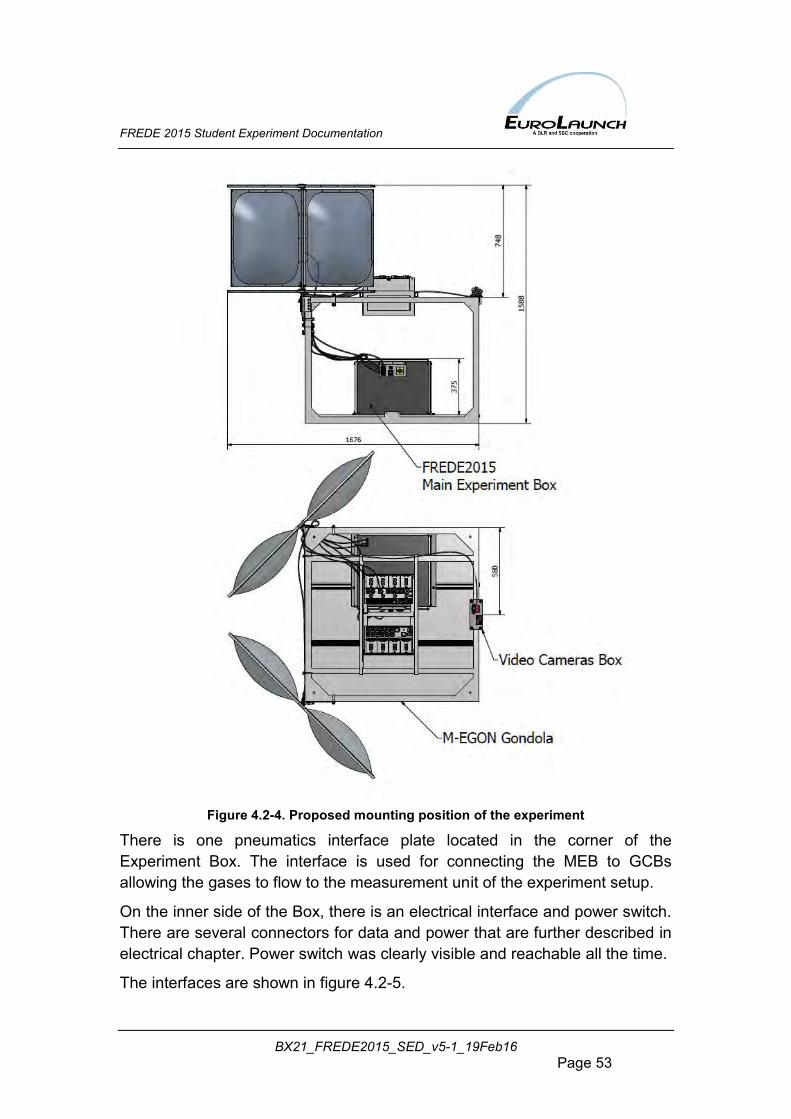
Figure 4.2-4. Proposed mounting position of the experiment
There is one pneumatics interface plate located in the corner of the Experiment Box. The interface is used for connecting the MEB to GCBs allowing the gases to flow to the measurement unit of the experiment setup.
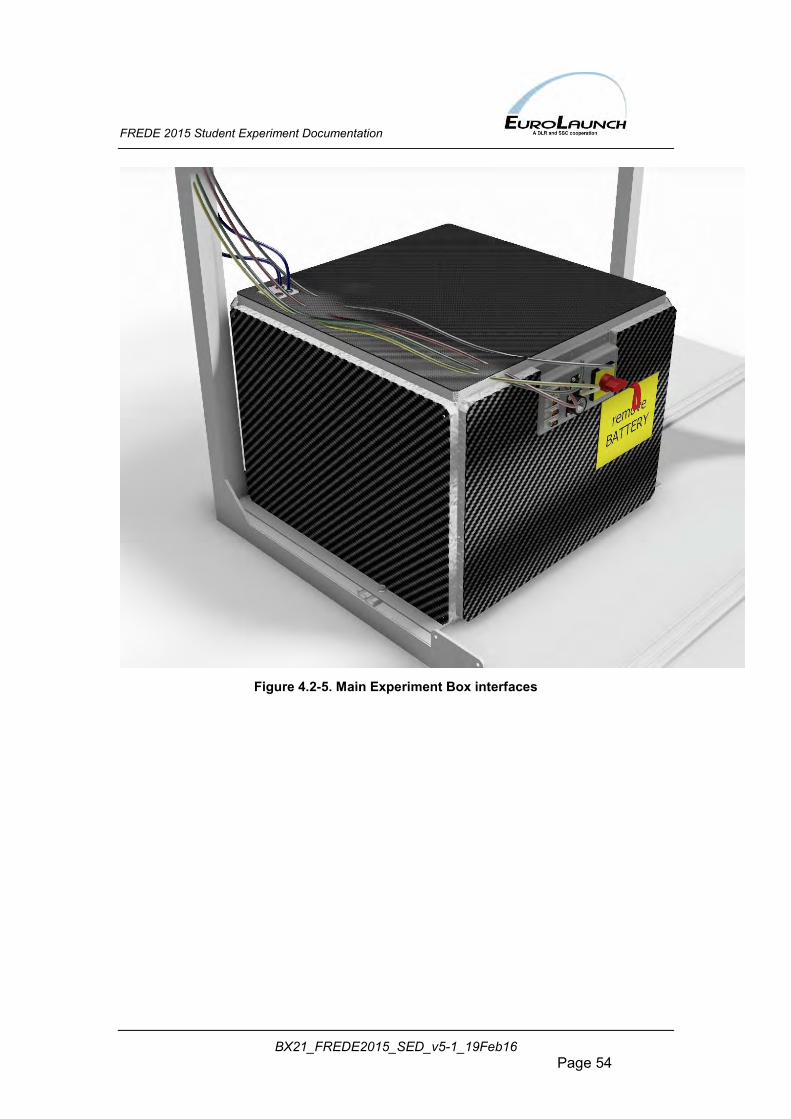
On the inner side of the Box, there is an electrical interface and power switch. There are several connectors for data and power that are further described in electrical chapter. Power switch was clearly visible and reachable all the time.
The interfaces are shown in figure 4.2-5.
FREDE 2015 Student Experiment Documentation
BX21_FREDE2015_SED_v5-1_19Feb16 Page 54
Figure 4.2-5. Main Experiment Box interfaces
FREDE 2015 Student Experiment Documentation
BX21_FREDE2015_SED_v5-1_19Feb16 Page 55
Gas Container Booms (GCB)
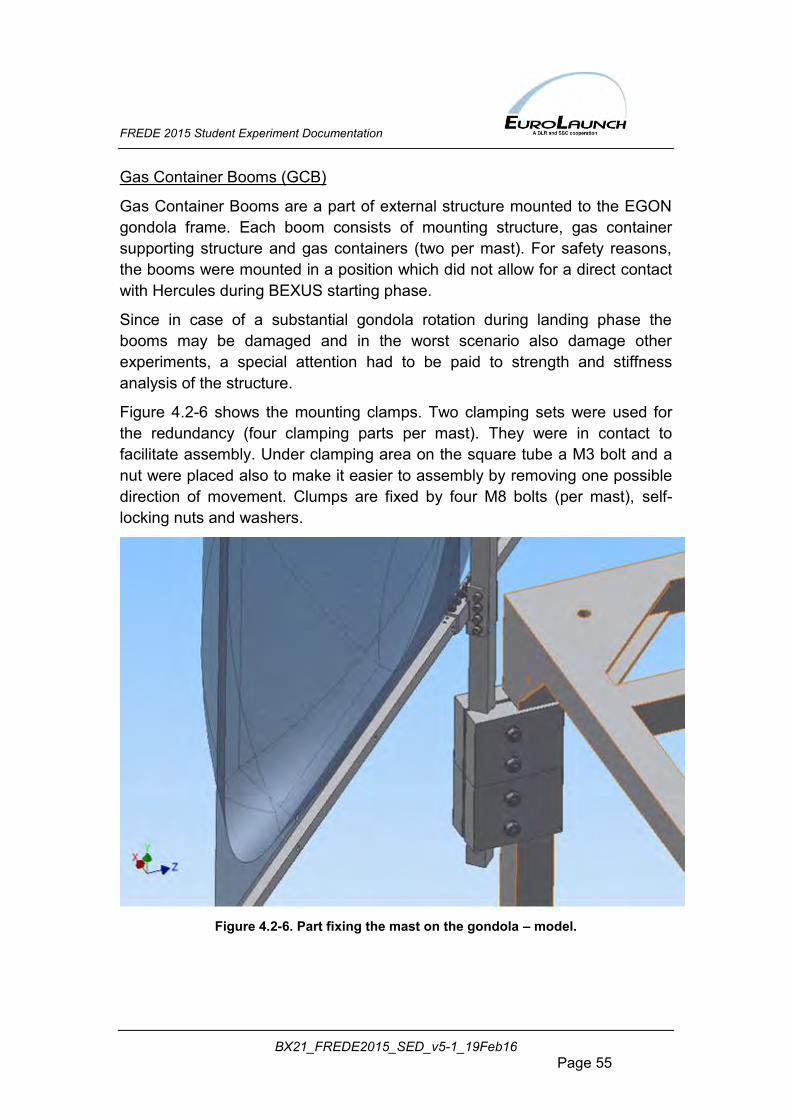
Gas Container Booms are a part of external structure mounted to the EGON gondola frame. Each boom consists of mounting structure, gas container supporting structure and gas containers (two per mast). For safety reasons, the booms were mounted in a position which did not allow for a direct contact with Hercules during BEXUS starting phase.
Since in case of a substantial gondola rotation during landing phase the booms may be damaged and in the worst scenario also damage other experiments, a special attention had to be paid to strength and stiffness analysis of the structure.
Figure 4.2-6 shows the mounting clamps. Two clamping sets were used for the redundancy (four clamping parts per mast). They were in contact to facilitate assembly. Under clamping area on the square tube a M3 bolt and a nut were placed also to make it easier to assembly by removing one possible direction of movement. Clumps are fixed by four M8 bolts (per mast), self-locking nuts and washers.
Figure 4.2-6. Part fixing the mast on the gondola – model.
FREDE 2015 Student Experiment Documentation
BX21_FREDE2015_SED_v5-1_19Feb16 Page 56
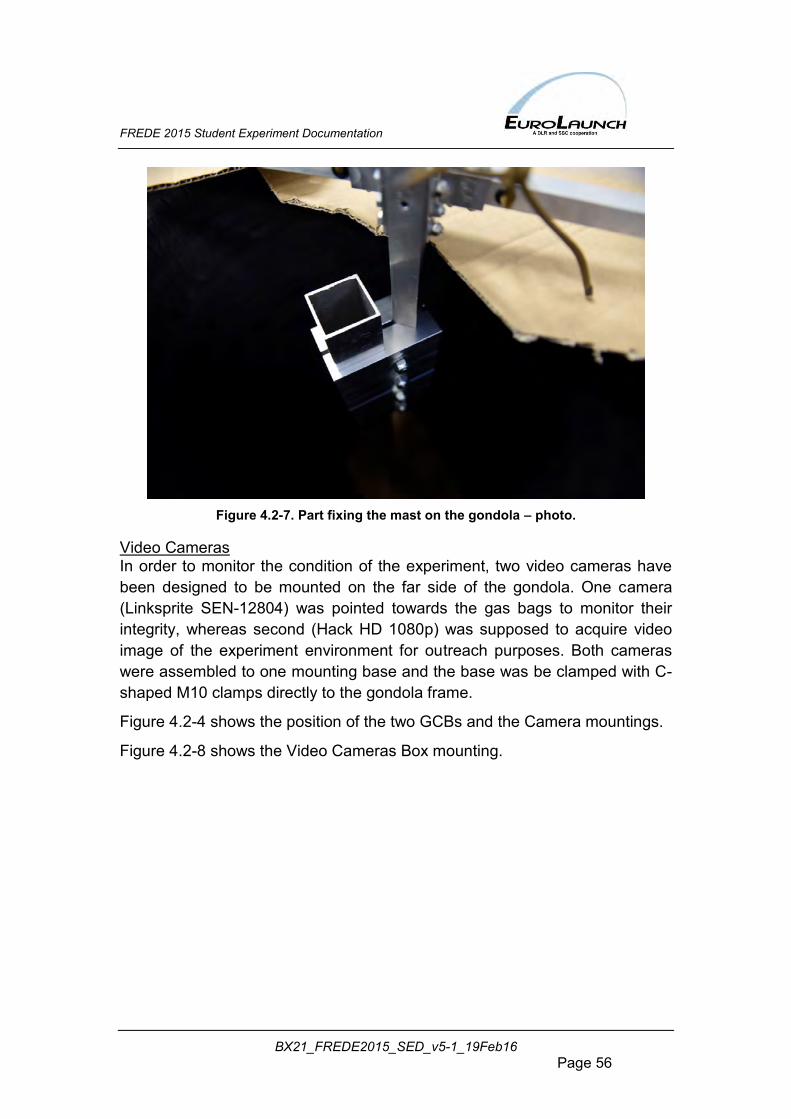
Figure 4.2-7. Part fixing the mast on the gondola – photo.
Video Cameras In order to monitor the condition of the experiment, two video cameras have been designed to be mounted on the far side of the gondola. One camera (Linksprite SEN-12804) was pointed towards the gas bags to monitor their integrity, whereas second (Hack HD 1080p) was supposed to acquire video image of the experiment environment for outreach purposes. Both cameras were assembled to one mounting base and the base was be clamped with C-shaped M10 clamps directly to the gondola frame.
Figure 4.2-4 shows the position of the two GCBs and the Camera mountings.
Figure 4.2-8 shows the Video Cameras Box mounting.
FREDE 2015 Student Experiment Documentation
BX21_FREDE2015_SED_v5-1_19Feb16 Page 57
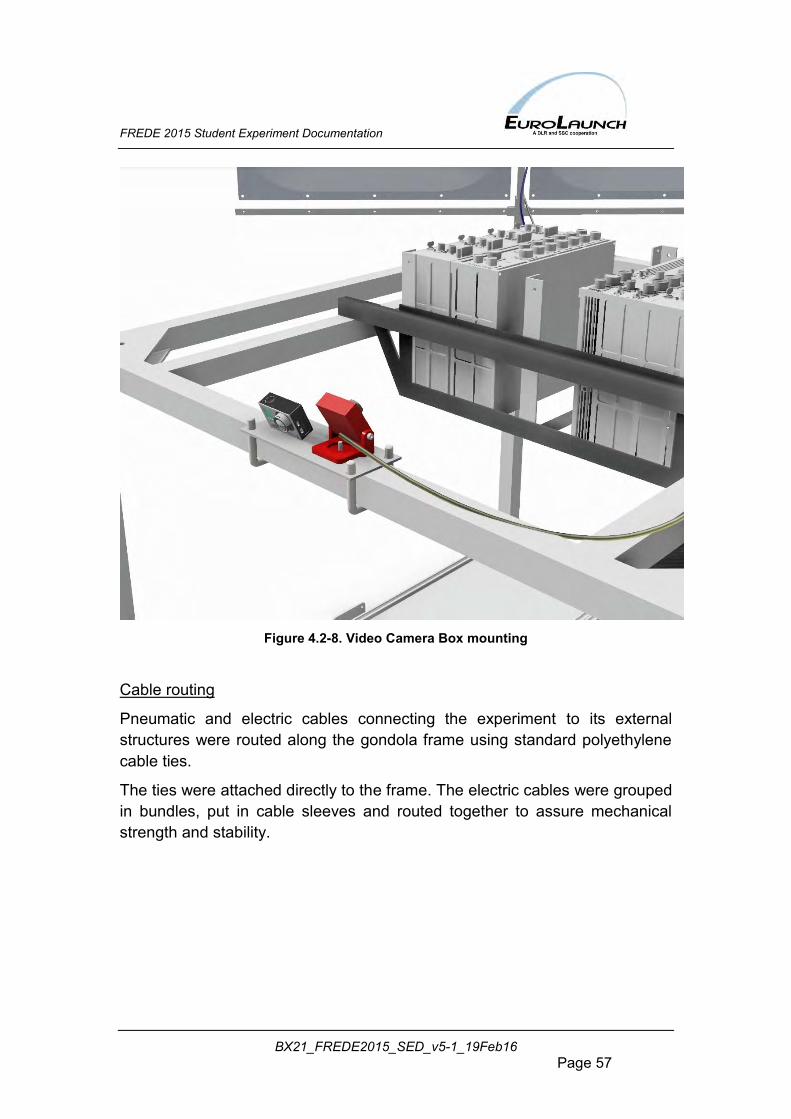
Figure 4.2-8. Video Camera Box mounting
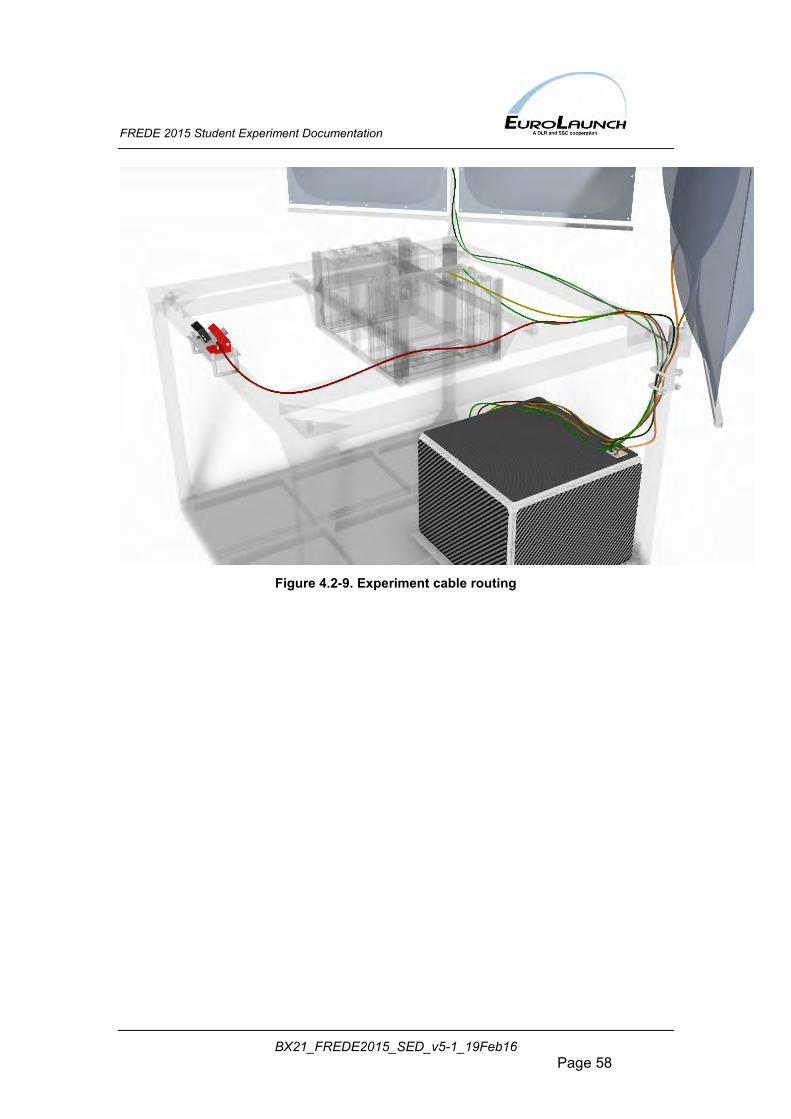
Cable routing
Pneumatic and electric cables connecting the experiment to its external structures were routed along the gondola frame using standard polyethylene cable ties.
The ties were attached directly to the frame. The electric cables were grouped in bundles, put in cable sleeves and routed together to assure mechanical strength and stability.
FREDE 2015 Student Experiment Documentation
BX21_FREDE2015_SED_v5-1_19Feb16 Page 58
Figure 4.2-9. Experiment cable routing
FREDE 2015 Student Experiment Documentation
BX21_FREDE2015_SED_v5-1_19Feb16 Page 59
4.2.2 Electrical FREDE Experiment used 3 external electrical interfaces:
Ethernet interface to communicate with the Ground Station through the E-Link connection provided by EuroLaunch (connector RJF21B). Estimated uplink was 1kB/s and downlink was 24kB/s.
Main power supply from the Gondola (from 2 battery packs – both connected through the same MS3112E8-4P connector). Average power consumption was on level of 45 W.
DE-9 connectors for external sensors and cameras.
FREDE 2015 Student Experiment Documentation
BX21_FREDE2015_SED_v5-1_19Feb16 Page 60
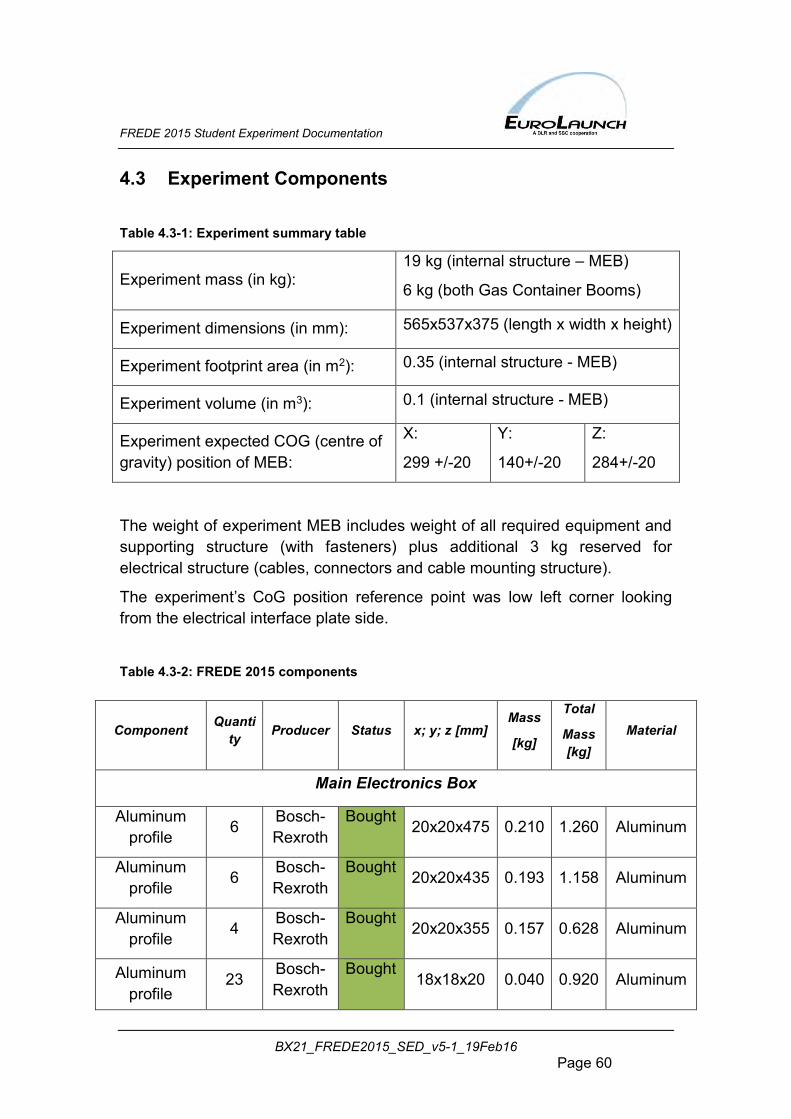
4.3 Experiment Components Table 4.3-1: Experiment summary table
Experiment mass (in kg): 19 kg (internal structure – MEB)
6 kg (both Gas Container Booms)
Experiment dimensions (in mm): 565x537x375 (length x width x height)
Experiment footprint area (in m2): 0.35 (internal structure - MEB)
Experiment volume (in m3): 0.1 (internal structure - MEB)
Experiment expected COG (centre of gravity) position of MEB:
X:
299 +/-20
Y:
140+/-20
Z:
284+/-20
The weight of experiment MEB includes weight of all required equipment and supporting structure (with fasteners) plus additional 3 kg reserved for electrical structure (cables, connectors and cable mounting structure).
The experiment’s CoG position reference point was low left corner looking from the electrical interface plate side.
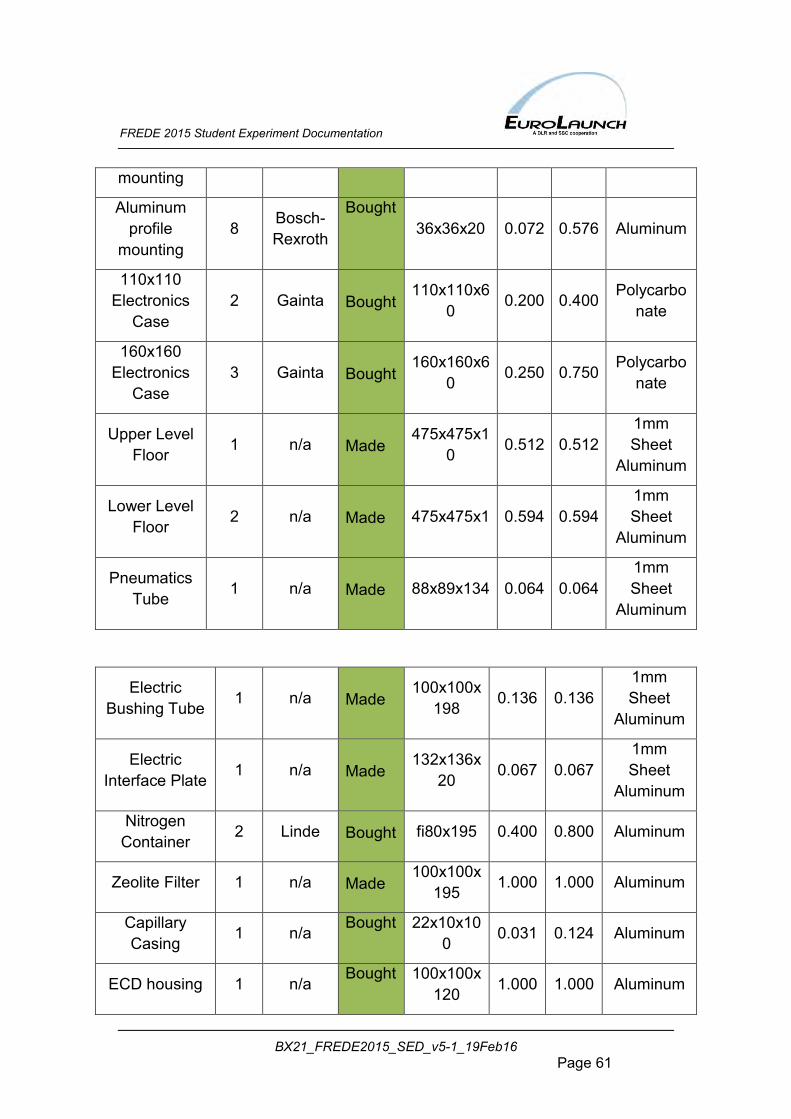
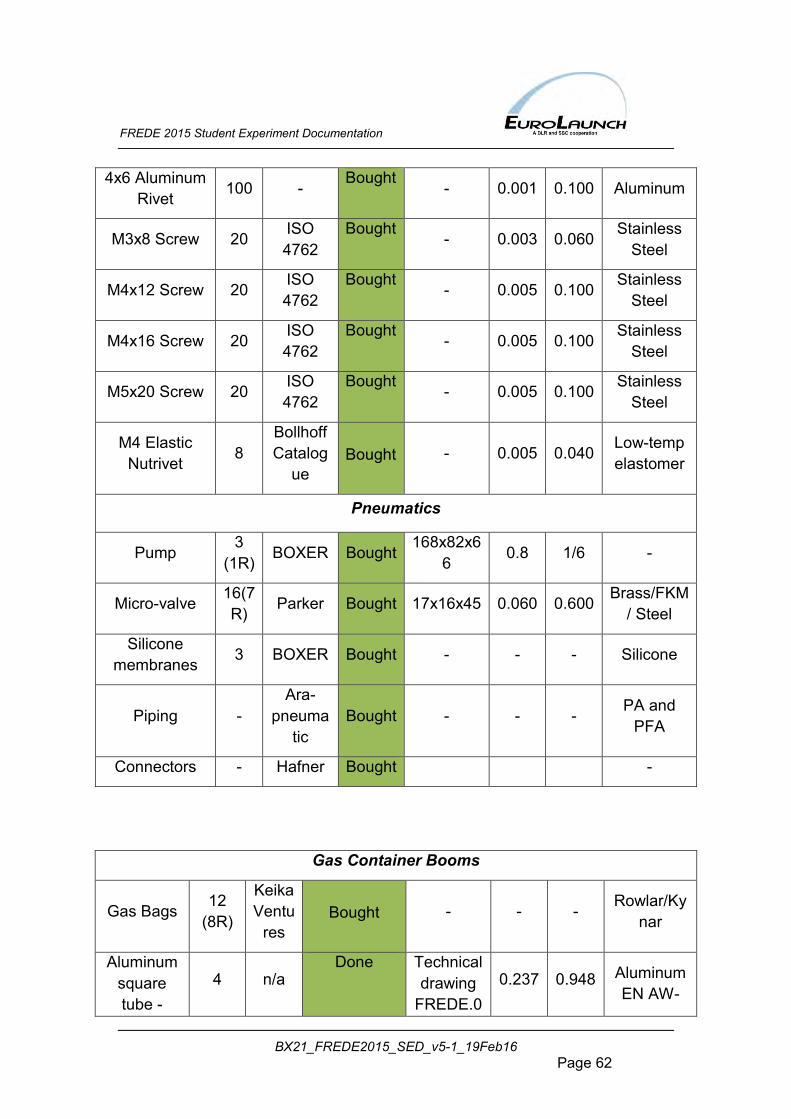
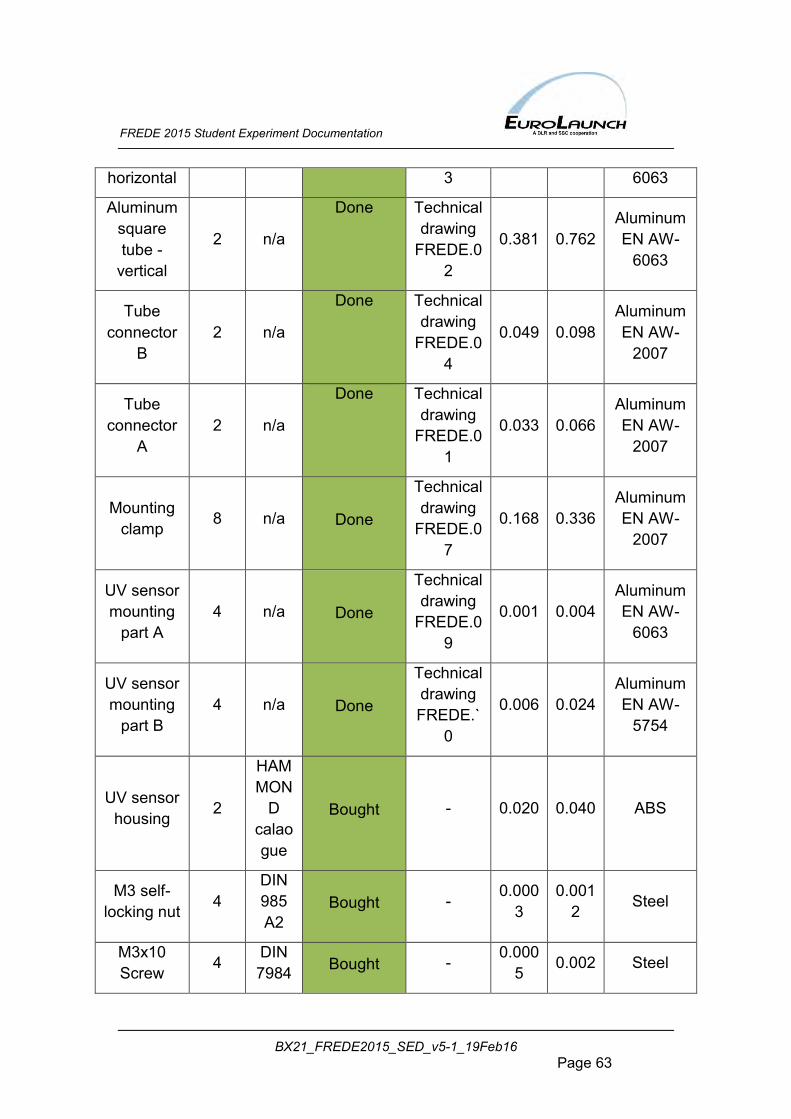
Table 4.3-2: FREDE 2015 components
Component Quantity Producer Status x; y; z [mm]
Mass
[kg]
Total
Mass [kg]
Material
Main Electronics Box
Aluminum profile 6 Bosch-
Rexroth Bought
20x20x475 0.210 1.260 Aluminum
Aluminum profile 6 Bosch-
Rexroth Bought
20x20x435 0.193 1.158 Aluminum
Aluminum profile 4 Bosch-
Rexroth Bought
20x20x355 0.157 0.628 Aluminum
Aluminum profile
23 Bosch-Rexroth
Bought 18x18x20 0.040 0.920 Aluminum
FREDE 2015 Student Experiment Documentation
BX21_FREDE2015_SED_v5-1_19Feb16 Page 61
mounting
Aluminum profile
mounting 8 Bosch-
Rexroth
Bought 36x36x20 0.072 0.576 Aluminum
110x110 Electronics
Case 2 Gainta Bought
110x110x60 0.200 0.400 Polycarbo
nate
160x160 Electronics
Case 3 Gainta Bought
160x160x60 0.250 0.750 Polycarbo
nate
Upper Level Floor 1 n/a Made
475x475x10 0.512 0.512
1mm Sheet
Aluminum
Lower Level Floor 2 n/a Made 475x475x1 0.594 0.594
1mm Sheet
Aluminum
Pneumatics Tube 1 n/a Made 88x89x134 0.064 0.064
1mm Sheet
Aluminum
Electric Bushing Tube 1 n/a Made
100x100x198 0.136 0.136
1mm Sheet
Aluminum
Electric Interface Plate 1 n/a Made
132x136x20 0.067 0.067
1mm Sheet
Aluminum
Nitrogen Container 2 Linde Bought fi80x195 0.400 0.800 Aluminum
Zeolite Filter 1 n/a Made 100x100x
195 1.000 1.000 Aluminum
Capillary Casing 1 n/a
Bought 22x10x100 0.031 0.124 Aluminum
ECD housing 1 n/a Bought 100x100x
120 1.000 1.000 Aluminum
FREDE 2015 Student Experiment Documentation
BX21_FREDE2015_SED_v5-1_19Feb16 Page 62
4x6 Aluminum Rivet 100 -
Bought - 0.001 0.100 Aluminum
M3x8 Screw 20 ISO 4762
Bought - 0.003 0.060 Stainless
Steel
M4x12 Screw 20 ISO 4762
Bought - 0.005 0.100 Stainless
Steel
M4x16 Screw 20 ISO 4762
Bought - 0.005 0.100 Stainless
Steel
M5x20 Screw 20 ISO 4762
Bought - 0.005 0.100 Stainless
Steel
M4 Elastic Nutrivet 8
Bollhoff Catalog
ue Bought - 0.005 0.040 Low-temp
elastomer
Pneumatics
Pump 3
(1R) BOXER Bought 168x82x6
6 0.8 1/6 -
Micro-valve 16(7R) Parker Bought 17x16x45 0.060 0.600 Brass/FKM
/ Steel
Silicone membranes 3 BOXER Bought - - - Silicone
Piping - Ara-
pneumatic
Bought - - - PA and PFA
Connectors - Hafner Bought -
Gas Container Booms
Gas Bags 12 (8R)
KeikaVentu
res Bought - - - Rowlar/Ky
nar
Aluminum square tube -
4 n/a Done Technical
drawing FREDE.0
0.237 0.948 Aluminum EN AW-
FREDE 2015 Student Experiment Documentation
BX21_FREDE2015_SED_v5-1_19Feb16 Page 63
horizontal 3 6063
Aluminum square tube -
vertical
2 n/a
Done Technical drawing
FREDE.02
0.381 0.762 Aluminum EN AW-
6063
Tube connector
B 2 n/a
Done Technical drawing
FREDE.04
0.049 0.098 Aluminum EN AW-
2007
Tube connector
A 2 n/a
Done Technical drawing
FREDE.01
0.033 0.066 Aluminum EN AW-
2007
Mounting clamp 8 n/a Done
Technical drawing
FREDE.07
0.168 0.336 Aluminum EN AW-
2007
UV sensor mounting
part A 4 n/a Done
Technical drawing
FREDE.09
0.001 0.004 Aluminum EN AW-
6063
UV sensor mounting
part B 4 n/a Done
Technical drawing FREDE.`
0
0.006 0.024 Aluminum EN AW-
5754
UV sensor housing 2
HAMMON
D calaogue
Bought - 0.020 0.040 ABS
M3 self-locking nut 4
DIN 985 A2
Bought - 0.0003
0.0012 Steel
M3x10 Screw 4 DIN
7984 Bought - 0.0005 0.002 Steel
FREDE 2015 Student Experiment Documentation
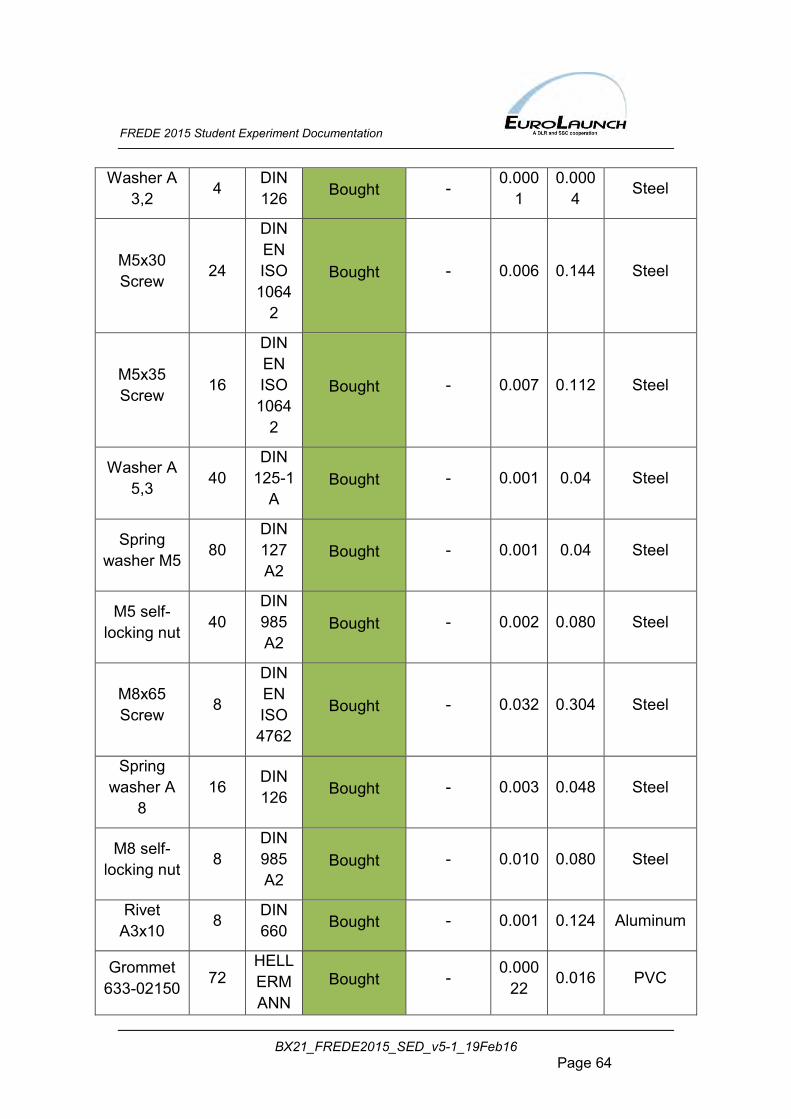
BX21_FREDE2015_SED_v5-1_19Feb16 Page 64
Washer A 3,2 4 DIN
126 Bought - 0.0001
0.0004 Steel
M5x30 Screw 24
DIN EN ISO 1064
2
Bought - 0.006 0.144 Steel
M5x35 Screw 16
DIN EN ISO 1064
2
Bought - 0.007 0.112 Steel
Washer A 5,3 40
DIN 125-1
A Bought - 0.001 0.04 Steel
Spring washer M5 80
DIN 127 A2
Bought - 0.001 0.04 Steel
M5 self-locking nut 40
DIN 985 A2
Bought - 0.002 0.080 Steel
M8x65 Screw 8
DIN EN ISO 4762
Bought - 0.032 0.304 Steel
Spring washer A
8 16 DIN
126 Bought - 0.003 0.048 Steel
M8 self-locking nut 8
DIN 985 A2
Bought - 0.010 0.080 Steel
Rivet A3x10 8 DIN
660 Bought - 0.001 0.124 Aluminum
Grommet 633-02150
72 HELLERMANN
Bought - 0.00022
0.016 PVC
FREDE 2015 Student Experiment Documentation
BX21_FREDE2015_SED_v5-1_19Feb16 Page 65
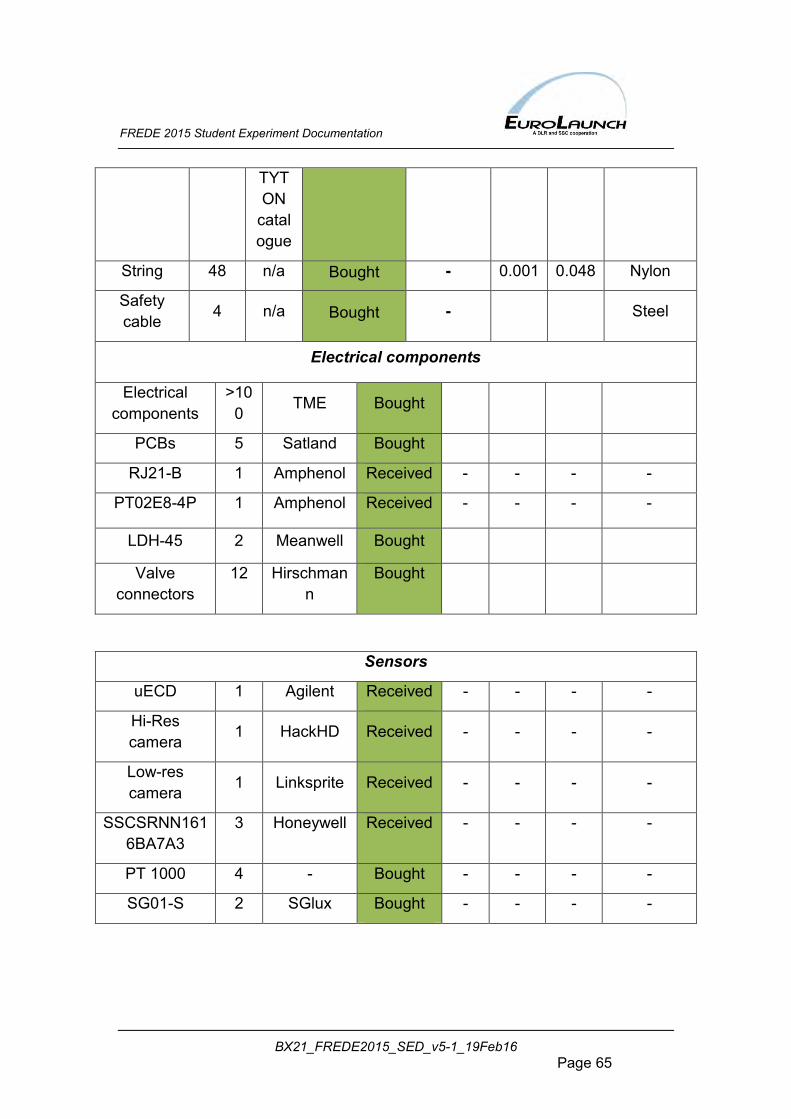
TYTON
catalogue
String 48 n/a Bought - 0.001 0.048 Nylon
Safety cable 4 n/a Bought -
Steel
Electrical components
Electrical components
>100 TME Bought
PCBs 5 Satland Bought
RJ21-B 1 Amphenol Received - - - -
PT02E8-4P 1 Amphenol Received - - - -
LDH-45 2 Meanwell Bought
Valve connectors
12 Hirschmann
Bought
Sensors
uECD 1 Agilent Received - - - -
Hi-Res camera 1 HackHD Received - - - -
Low-res camera 1 Linksprite Received - - - -
SSCSRNN1616BA7A3
3 Honeywell Received - - - -
PT 1000 4 - Bought - - - -
SG01-S 2 SGlux Bought - - - -
FREDE 2015 Student Experiment Documentation
BX21_FREDE2015_SED_v5-1_19Feb16 Page 66
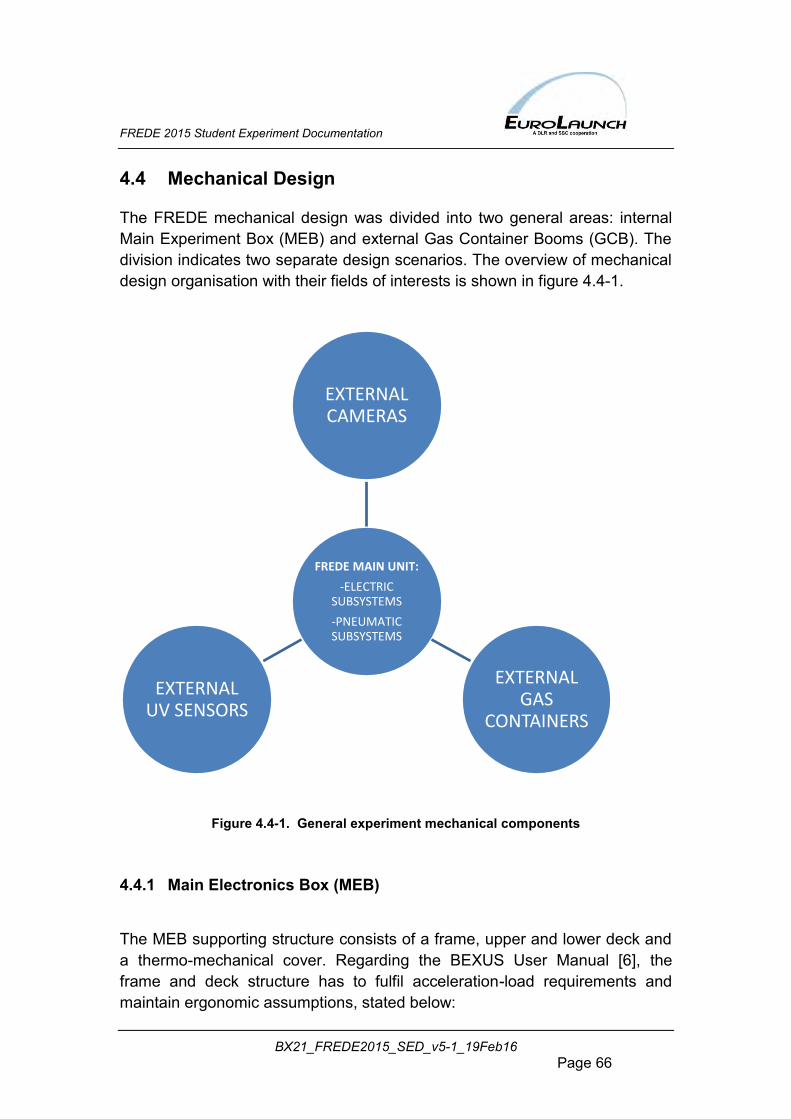
4.4 Mechanical Design
The FREDE mechanical design was divided into two general areas: internal Main Experiment Box (MEB) and external Gas Container Booms (GCB). The division indicates two separate design scenarios. The overview of mechanical design organisation with their fields of interests is shown in figure 4.4-1.
Figure 4.4-1. General experiment mechanical components
4.4.1 Main Electronics Box (MEB)
The MEB supporting structure consists of a frame, upper and lower deck and a thermo-mechanical cover. Regarding the BEXUS User Manual [6], the frame and deck structure has to fulfil acceleration-load requirements and maintain ergonomic assumptions, stated below:
FREDE MAIN UNIT:
-ELECTRIC SUBSYSTEMS
-PNEUMATIC SUBSYSTEMS
EXTERNAL CAMERAS
EXTERNAL GAS
CONTAINERS
EXTERNAL UV SENSORS
FREDE 2015 Student Experiment Documentation
BX21_FREDE2015_SED_v5-1_19Feb16 Page 67
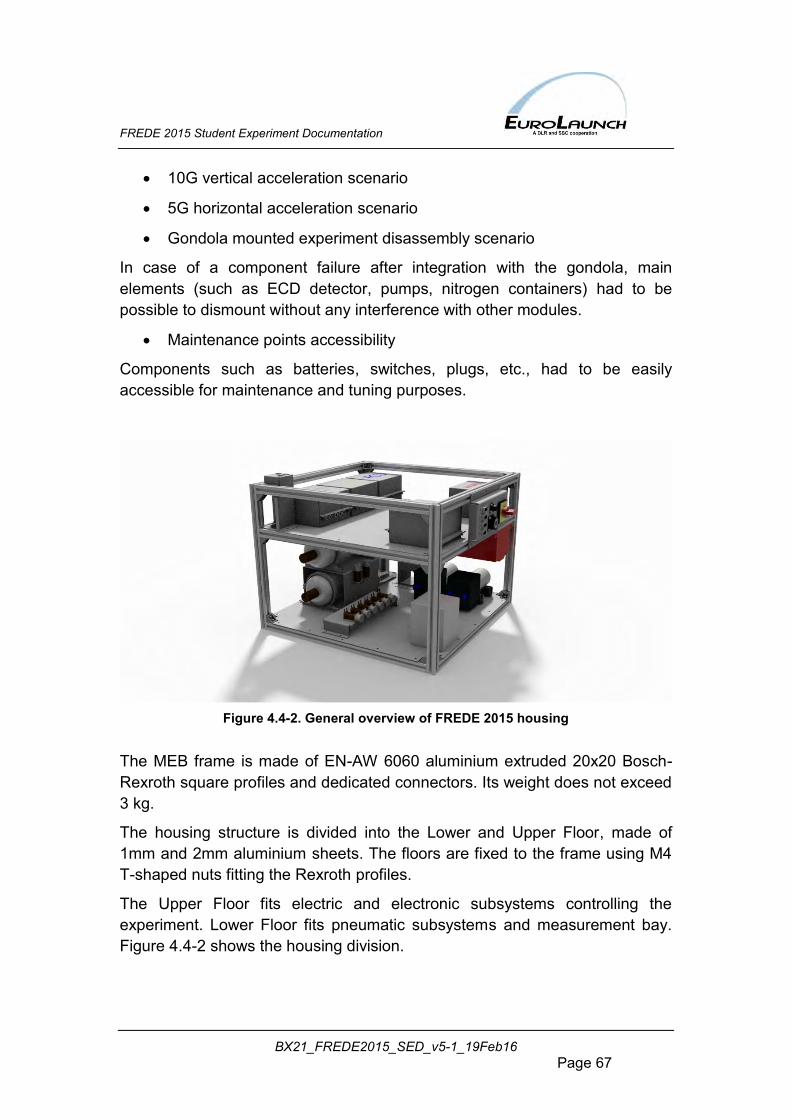
10G vertical acceleration scenario
5G horizontal acceleration scenario
Gondola mounted experiment disassembly scenario
In case of a component failure after integration with the gondola, main elements (such as ECD detector, pumps, nitrogen containers) had to be possible to dismount without any interference with other modules.
Maintenance points accessibility
Components such as batteries, switches, plugs, etc., had to be easily accessible for maintenance and tuning purposes.
The MEB frame is made of EN-AW 6060 aluminium extruded 20x20 Bosch-Rexroth square profiles and dedicated connectors. Its weight does not exceed 3 kg.
The housing structure is divided into the Lower and Upper Floor, made of 1mm and 2mm aluminium sheets. The floors are fixed to the frame using M4 T-shaped nuts fitting the Rexroth profiles.
The Upper Floor fits electric and electronic subsystems controlling the experiment. Lower Floor fits pneumatic subsystems and measurement bay. Figure 4.4-2 shows the housing division.
Figure 4.4-2. General overview of FREDE 2015 housing
FREDE 2015 Student Experiment Documentation
BX21_FREDE2015_SED_v5-1_19Feb16 Page 68
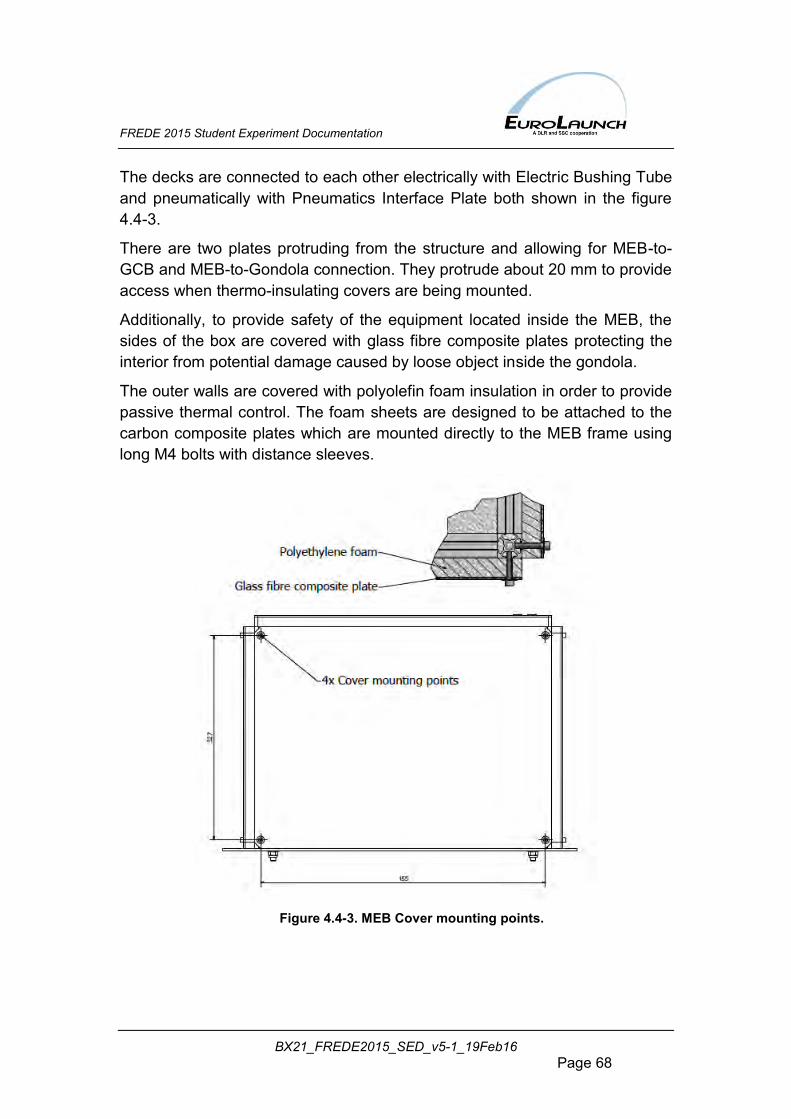
The decks are connected to each other electrically with Electric Bushing Tube and pneumatically with Pneumatics Interface Plate both shown in the figure 4.4-3.
There are two plates protruding from the structure and allowing for MEB-to-GCB and MEB-to-Gondola connection. They protrude about 20 mm to provide access when thermo-insulating covers are being mounted.
Additionally, to provide safety of the equipment located inside the MEB, the sides of the box are covered with glass fibre composite plates protecting the interior from potential damage caused by loose object inside the gondola.
The outer walls are covered with polyolefin foam insulation in order to provide passive thermal control. The foam sheets are designed to be attached to the carbon composite plates which are mounted directly to the MEB frame using long M4 bolts with distance sleeves.
Figure 4.4-3. MEB Cover mounting points.
FREDE 2015 Student Experiment Documentation
BX21_FREDE2015_SED_v5-1_19Feb16 Page 69
The equipment inside the FREDE 2015 experiment is divided into separate modules responsible for different tasks.
Flight Control Unit Power Module Sensor Boards Module ECD Boards Module Pneumatic Boards Module Pneumatic System Nitrogen Supply Subsystem Waste Filter ECD Detector
Upper Floor
The equipment inside the FREDE experiment is divided into separate and mechanically independent modules called Little Boxes (LBs). They are based on off-the-shelf products of two sizes (110x110 and 160x160), made of polycarbonate. LBs photo is shown in figure 4.4-3, their specification is given in Appendix C (222).
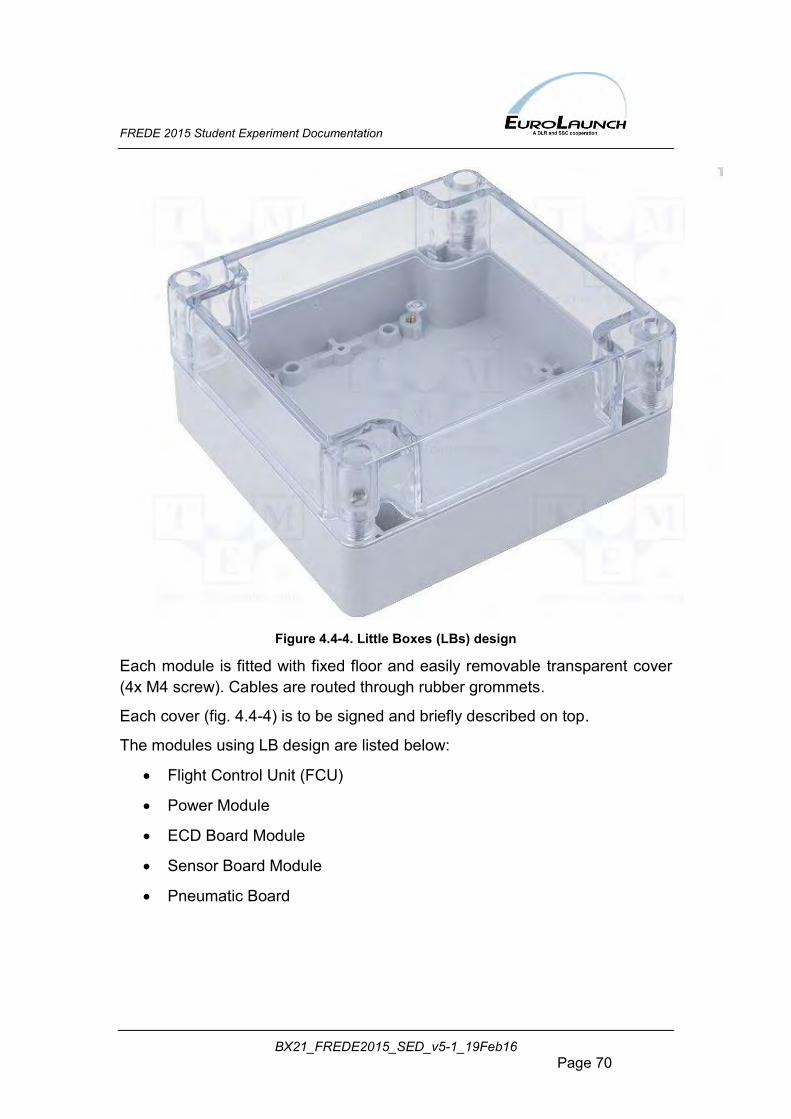
FREDE 2015 Student Experiment Documentation
BX21_FREDE2015_SED_v5-1_19Feb16 Page 70
Figure 4.4-4. Little Boxes (LBs) design
Each module is fitted with fixed floor and easily removable transparent cover (4x M4 screw). Cables are routed through rubber grommets.
Each cover (fig. 4.4-4) is to be signed and briefly described on top.
The modules using LB design are listed below:
Flight Control Unit (FCU)
Power Module
ECD Board Module
Sensor Board Module
Pneumatic Board
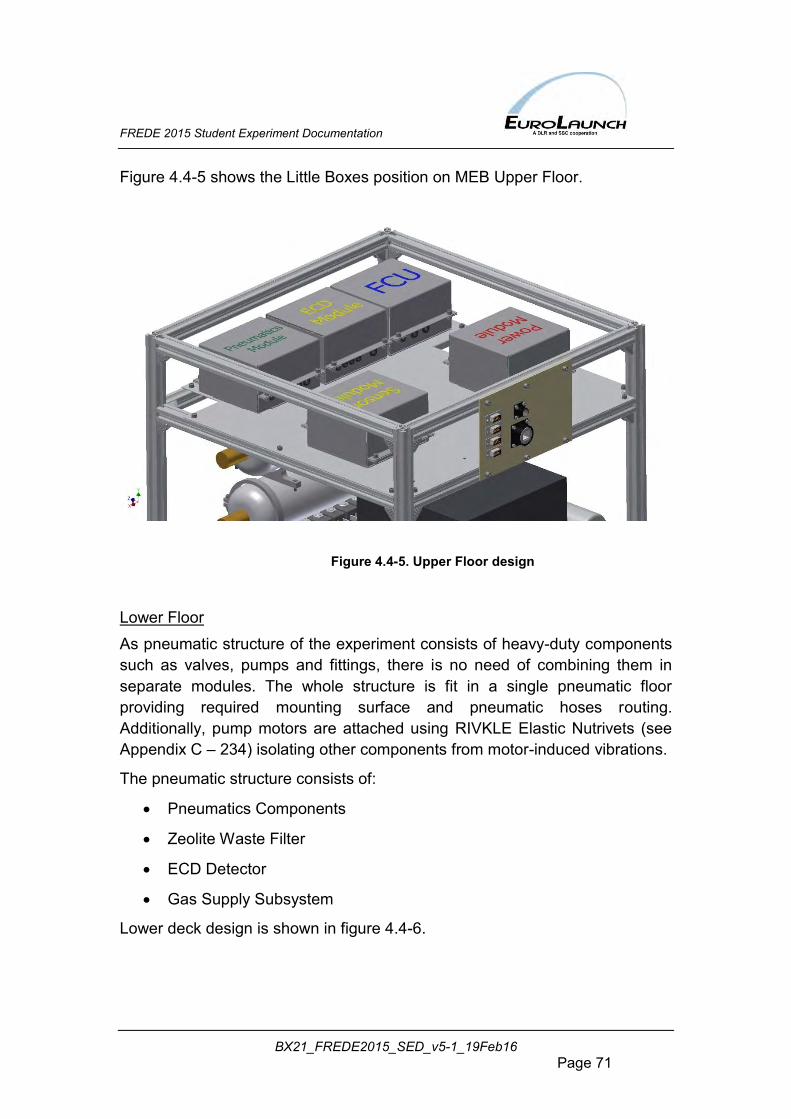
FREDE 2015 Student Experiment Documentation
BX21_FREDE2015_SED_v5-1_19Feb16 Page 71
Figure 4.4-5 shows the Little Boxes position on MEB Upper Floor.
Lower Floor As pneumatic structure of the experiment consists of heavy-duty components such as valves, pumps and fittings, there is no need of combining them in separate modules. The whole structure is fit in a single pneumatic floor providing required mounting surface and pneumatic hoses routing. Additionally, pump motors are attached using RIVKLE Elastic Nutrivets (see Appendix C – 234) isolating other components from motor-induced vibrations.
The pneumatic structure consists of:
Pneumatics Components
Zeolite Waste Filter
ECD Detector
Gas Supply Subsystem
Lower deck design is shown in figure 4.4-6.
Figure 4.4-5. Upper Floor design
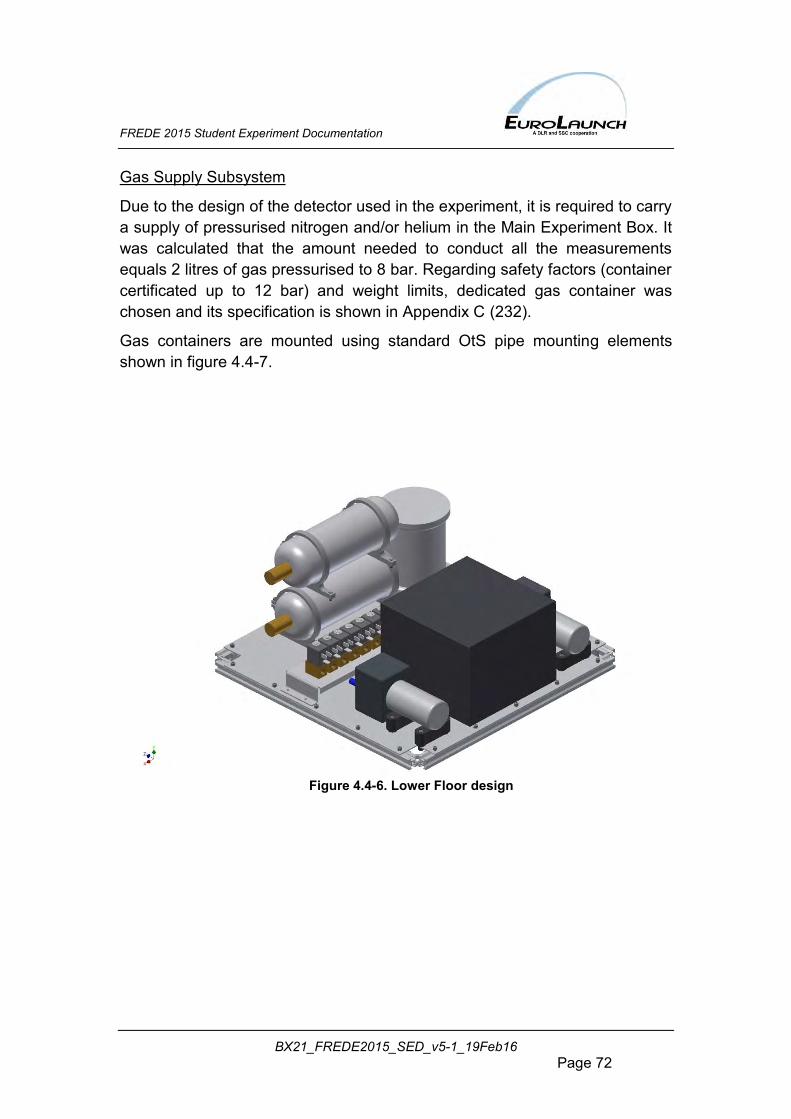
FREDE 2015 Student Experiment Documentation
BX21_FREDE2015_SED_v5-1_19Feb16 Page 72
Gas Supply Subsystem
Due to the design of the detector used in the experiment, it is required to carry a supply of pressurised nitrogen and/or helium in the Main Experiment Box. It was calculated that the amount needed to conduct all the measurements equals 2 litres of gas pressurised to 8 bar. Regarding safety factors (container certificated up to 12 bar) and weight limits, dedicated gas container was chosen and its specification is shown in Appendix C (232).
Gas containers are mounted using standard OtS pipe mounting elements shown in figure 4.4-7.
Figure 4.4-6. Lower Floor design
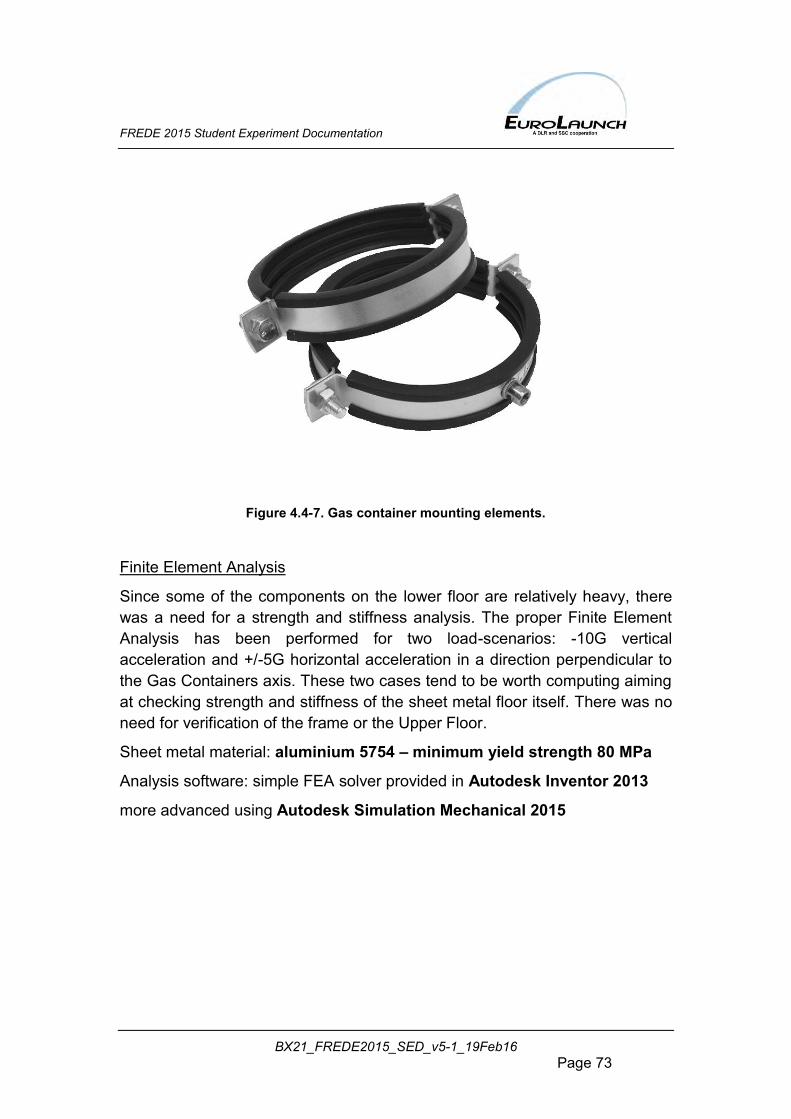
FREDE 2015 Student Experiment Documentation
BX21_FREDE2015_SED_v5-1_19Feb16 Page 73
Finite Element Analysis
Since some of the components on the lower floor are relatively heavy, there was a need for a strength and stiffness analysis. The proper Finite Element Analysis has been performed for two load-scenarios: -10G vertical acceleration and +/-5G horizontal acceleration in a direction perpendicular to the Gas Containers axis. These two cases tend to be worth computing aiming at checking strength and stiffness of the sheet metal floor itself. There was no need for verification of the frame or the Upper Floor.
Sheet metal material: aluminium 5754 – minimum yield strength 80 MPa
Analysis software: simple FEA solver provided in Autodesk Inventor 2013
more advanced using Autodesk Simulation Mechanical 2015
Figure 4.4-7. Gas container mounting elements.
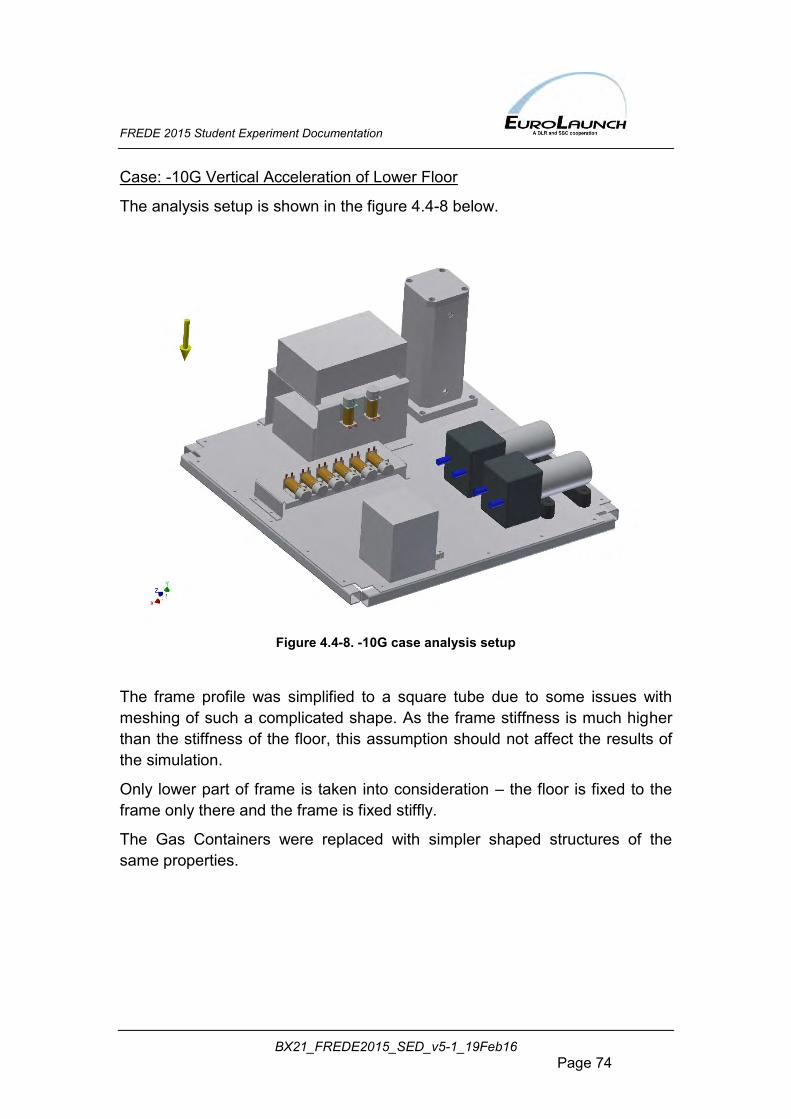
FREDE 2015 Student Experiment Documentation
BX21_FREDE2015_SED_v5-1_19Feb16 Page 74
Case: -10G Vertical Acceleration of Lower Floor
The analysis setup is shown in the figure 4.4-8 below.
Figure 4.4-8. -10G case analysis setup
The frame profile was simplified to a square tube due to some issues with meshing of such a complicated shape. As the frame stiffness is much higher than the stiffness of the floor, this assumption should not affect the results of the simulation.
Only lower part of frame is taken into consideration – the floor is fixed to the frame only there and the frame is fixed stiffly.
The Gas Containers were replaced with simpler shaped structures of the same properties.
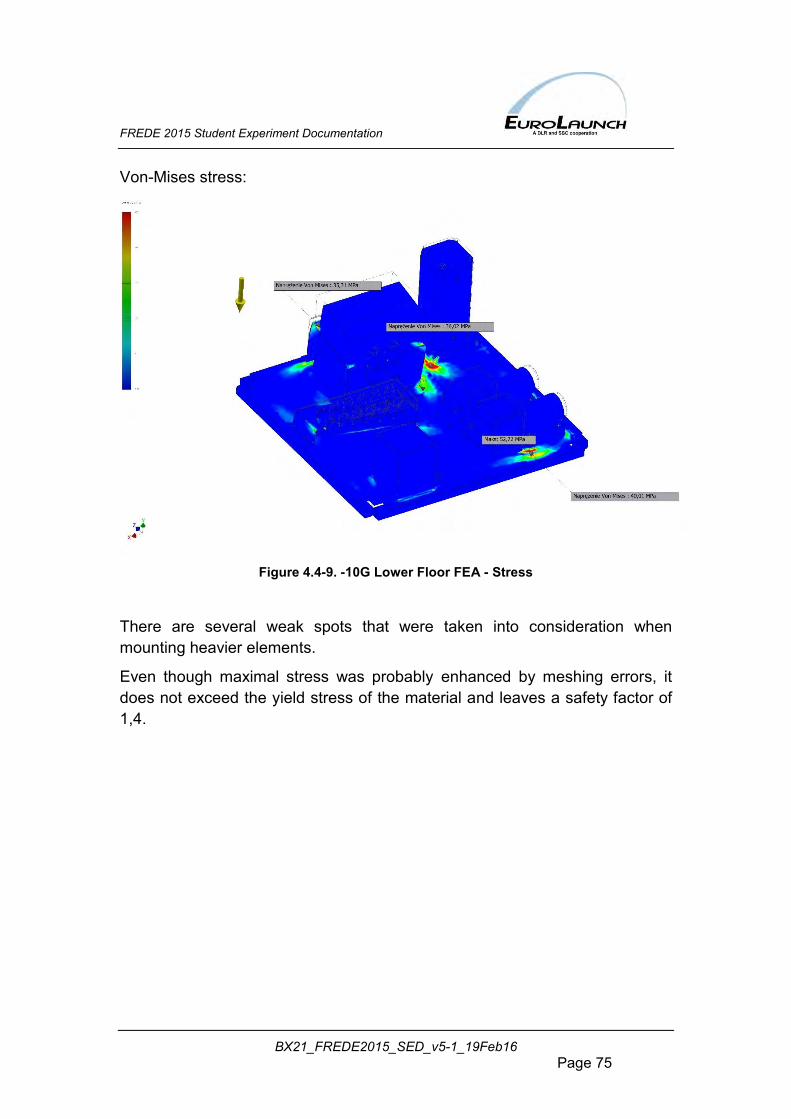
FREDE 2015 Student Experiment Documentation
BX21_FREDE2015_SED_v5-1_19Feb16 Page 75
Von-Mises stress:
Figure 4.4-9. -10G Lower Floor FEA - Stress
There are several weak spots that were taken into consideration when mounting heavier elements.
Even though maximal stress was probably enhanced by meshing errors, it does not exceed the yield stress of the material and leaves a safety factor of 1,4.
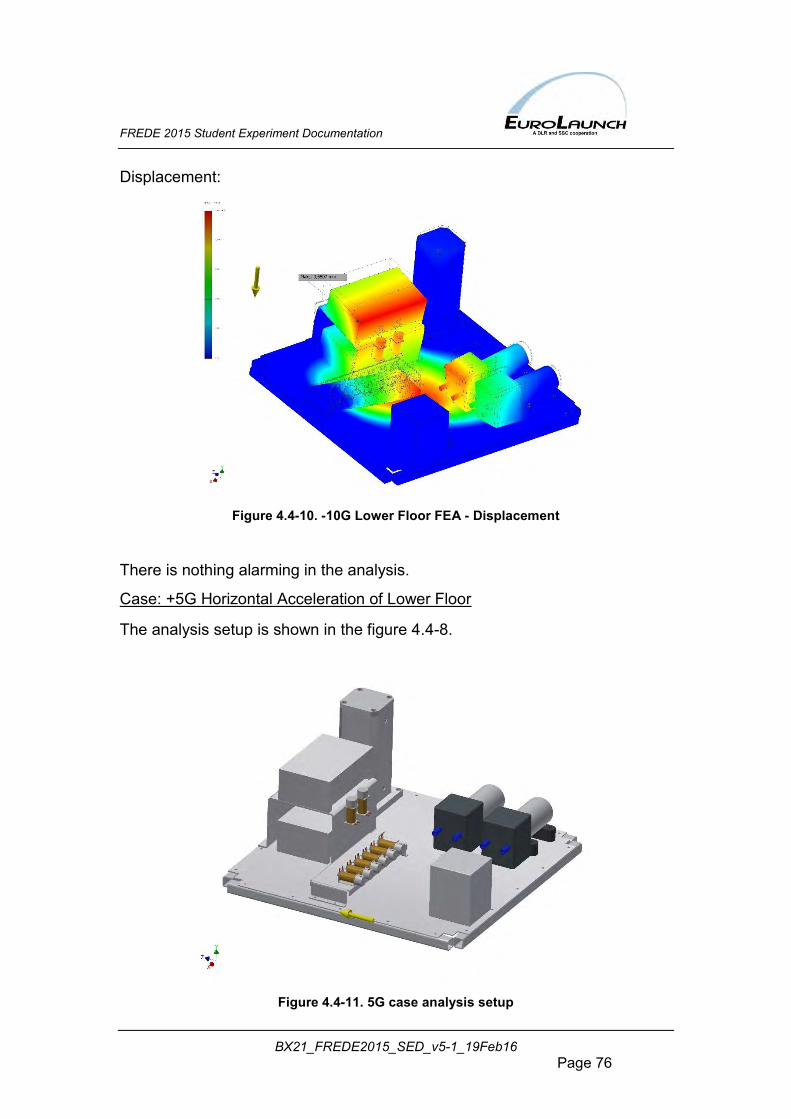
FREDE 2015 Student Experiment Documentation
BX21_FREDE2015_SED_v5-1_19Feb16 Page 76
Displacement:
Figure 4.4-10. -10G Lower Floor FEA - Displacement
There is nothing alarming in the analysis.
Case: +5G Horizontal Acceleration of Lower Floor
The analysis setup is shown in the figure 4.4-8.
Figure 4.4-11. 5G case analysis setup
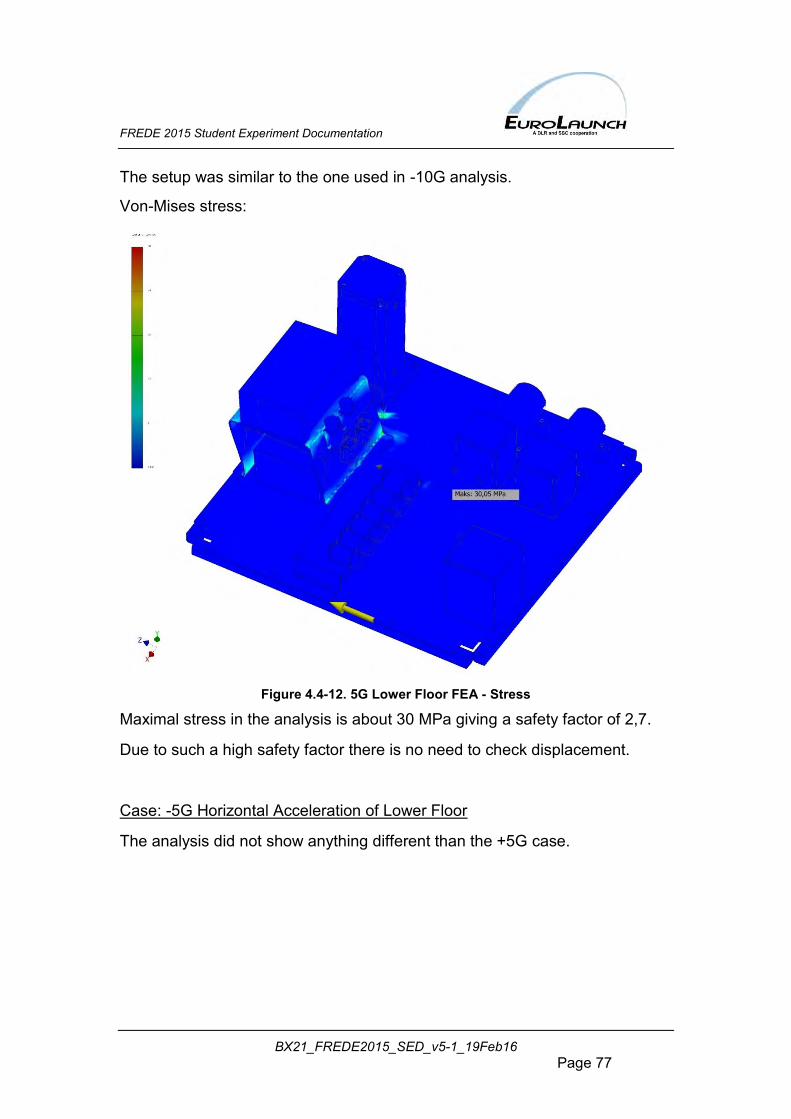
FREDE 2015 Student Experiment Documentation
BX21_FREDE2015_SED_v5-1_19Feb16 Page 77
The setup was similar to the one used in -10G analysis.
Von-Mises stress:
Figure 4.4-12. 5G Lower Floor FEA - Stress
Maximal stress in the analysis is about 30 MPa giving a safety factor of 2,7.
Due to such a high safety factor there is no need to check displacement.
Case: -5G Horizontal Acceleration of Lower Floor
The analysis did not show anything different than the +5G case.
FREDE 2015 Student Experiment Documentation
BX21_FREDE2015_SED_v5-1_19Feb16 Page 78
4.4.2 Gas Container Boom (GCB) The two Gas Container Booms consist of several parts: mounting structure, supporting structure and gas containing bags. Additionally, supporting structure surface is used to mount UV sensors, which provide information about the gas bags insolation.
As GCBs are designed to be externally mounted, a special consideration needed to be taken into. There were several aspects needed to be assured and thus special assumptions were stated:
GCB had to withstand (cannot yield) wind pressure during starting phase.
GCB modal frequency cannot cover aerodynamic-driven frequencies causing fatal resonance.
GCB had to withstand (cannot break) 10G acceleration at the beginning of the descent phase.
GCB cannot break during landing phase.
Gas Containing Bags
Each bag contains 40 litres of an air-CFC solution. As the experiment involves sampling of two types of gas and each sampling procedure requires 80 litres, there are four bags included in the design (providing a sum of 160 litres of the air-CFC solution).
Gas bags material had to withstand environmental requirements of BEXUS flight as well as provide UV transiency and fulfill no-leak requirements for a CFC gas.
All of the requirements were met by Kynar® material covered with a Rowlar film.
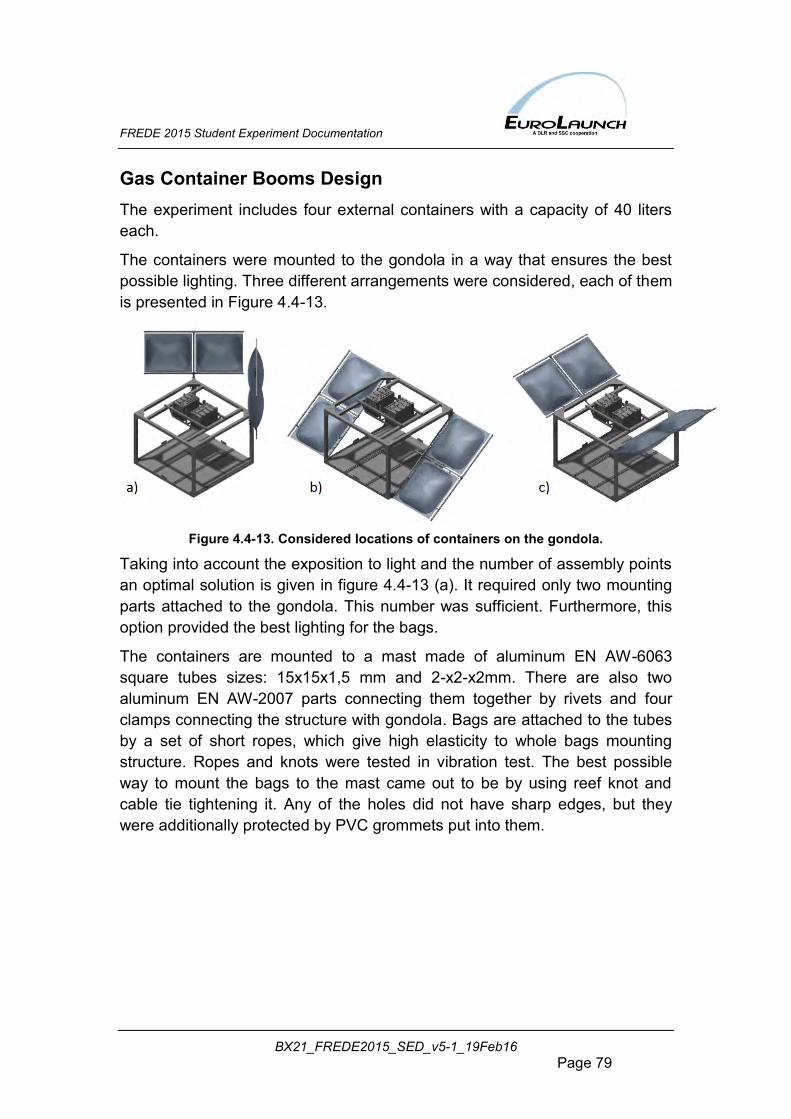
FREDE 2015 Student Experiment Documentation
BX21_FREDE2015_SED_v5-1_19Feb16 Page 79
Gas Container Booms Design The experiment includes four external containers with a capacity of 40 liters each.
The containers were mounted to the gondola in a way that ensures the best possible lighting. Three different arrangements were considered, each of them is presented in Figure 4.4-13.
Figure 4.4-13. Considered locations of containers on the gondola.
Taking into account the exposition to light and the number of assembly points an optimal solution is given in figure 4.4-13 (a). It required only two mounting parts attached to the gondola. This number was sufficient. Furthermore, this option provided the best lighting for the bags.
The containers are mounted to a mast made of aluminum EN AW-6063 square tubes sizes: 15x15x1,5 mm and 2-x2-x2mm. There are also two aluminum EN AW-2007 parts connecting them together by rivets and four clamps connecting the structure with gondola. Bags are attached to the tubes by a set of short ropes, which give high elasticity to whole bags mounting structure. Ropes and knots were tested in vibration test. The best possible way to mount the bags to the mast came out to be by using reef knot and cable tie tightening it. Any of the holes did not have sharp edges, but they were additionally protected by PVC grommets put into them.
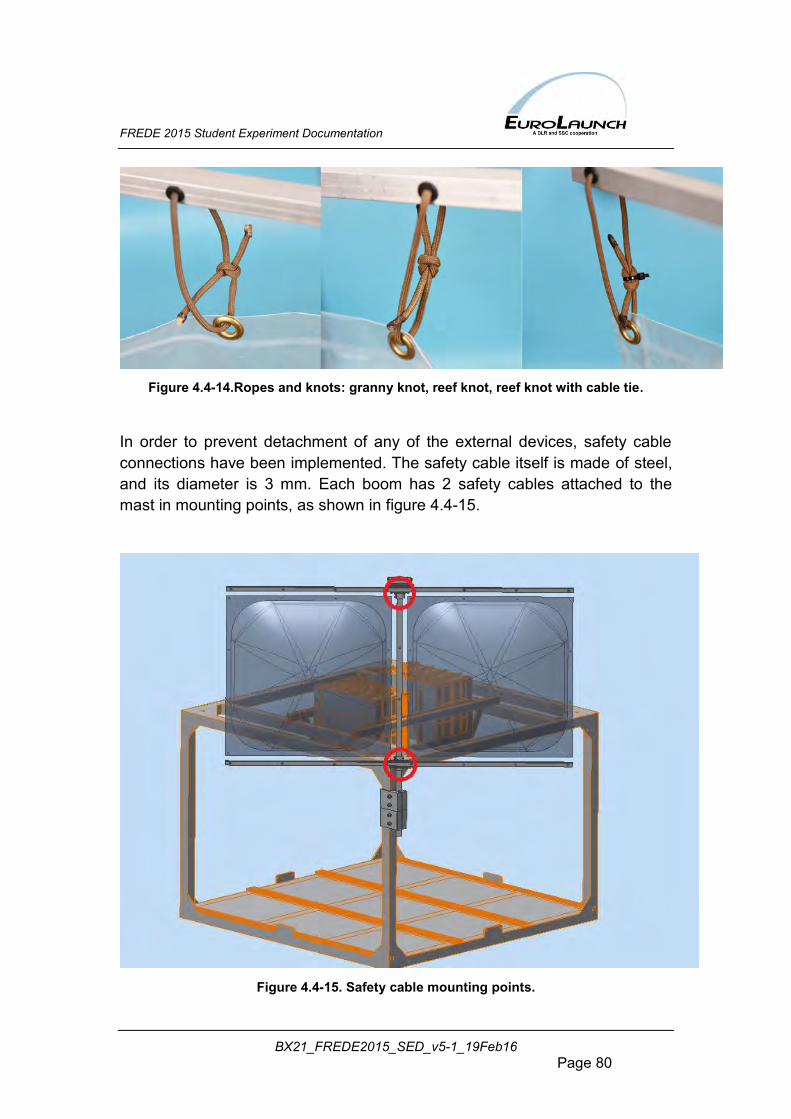
FREDE 2015 Student Experiment Documentation
BX21_FREDE2015_SED_v5-1_19Feb16 Page 80
Figure 4.4-14.Ropes and knots: granny knot, reef knot, reef knot with cable tie.
In order to prevent detachment of any of the external devices, safety cable connections have been implemented. The safety cable itself is made of steel, and its diameter is 3 mm. Each boom has 2 safety cables attached to the mast in mounting points, as shown in figure 4.4-15.
Figure 4.4-15. Safety cable mounting points.
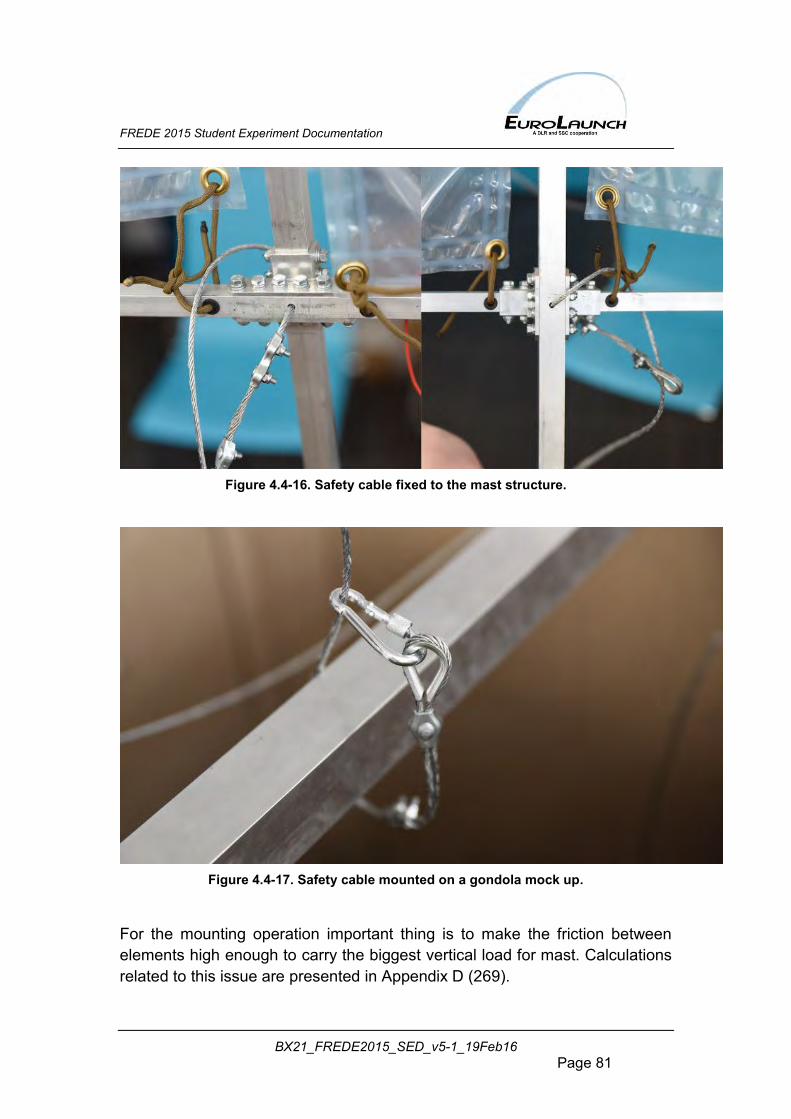
FREDE 2015 Student Experiment Documentation
BX21_FREDE2015_SED_v5-1_19Feb16 Page 81
Figure 4.4-16. Safety cable fixed to the mast structure.
Figure 4.4-17. Safety cable mounted on a gondola mock up.
For the mounting operation important thing is to make the friction between elements high enough to carry the biggest vertical load for mast. Calculations related to this issue are presented in Appendix D (269).
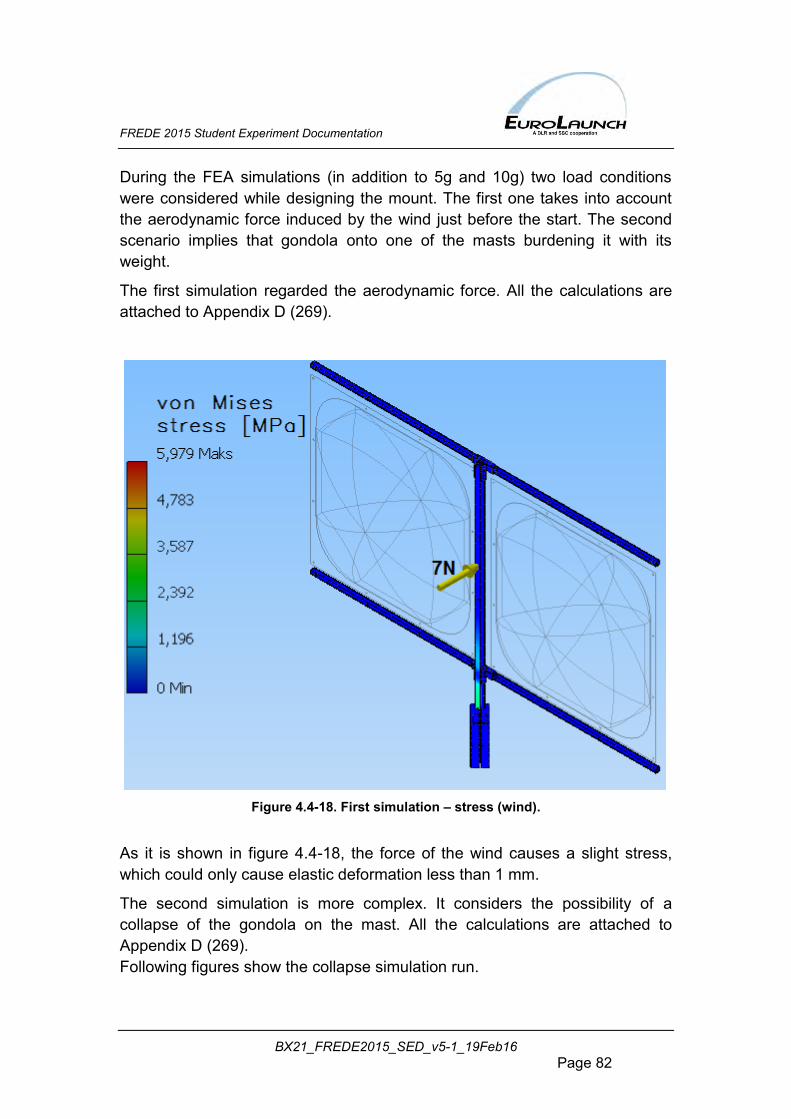
FREDE 2015 Student Experiment Documentation
BX21_FREDE2015_SED_v5-1_19Feb16 Page 82
During the FEA simulations (in addition to 5g and 10g) two load conditions were considered while designing the mount. The first one takes into account the aerodynamic force induced by the wind just before the start. The second scenario implies that gondola onto one of the masts burdening it with its weight.
The first simulation regarded the aerodynamic force. All the calculations are attached to Appendix D (269).
Figure 4.4-18. First simulation – stress (wind).
As it is shown in figure 4.4-18, the force of the wind causes a slight stress, which could only cause elastic deformation less than 1 mm.
The second simulation is more complex. It considers the possibility of a collapse of the gondola on the mast. All the calculations are attached to Appendix D (269). Following figures show the collapse simulation run.
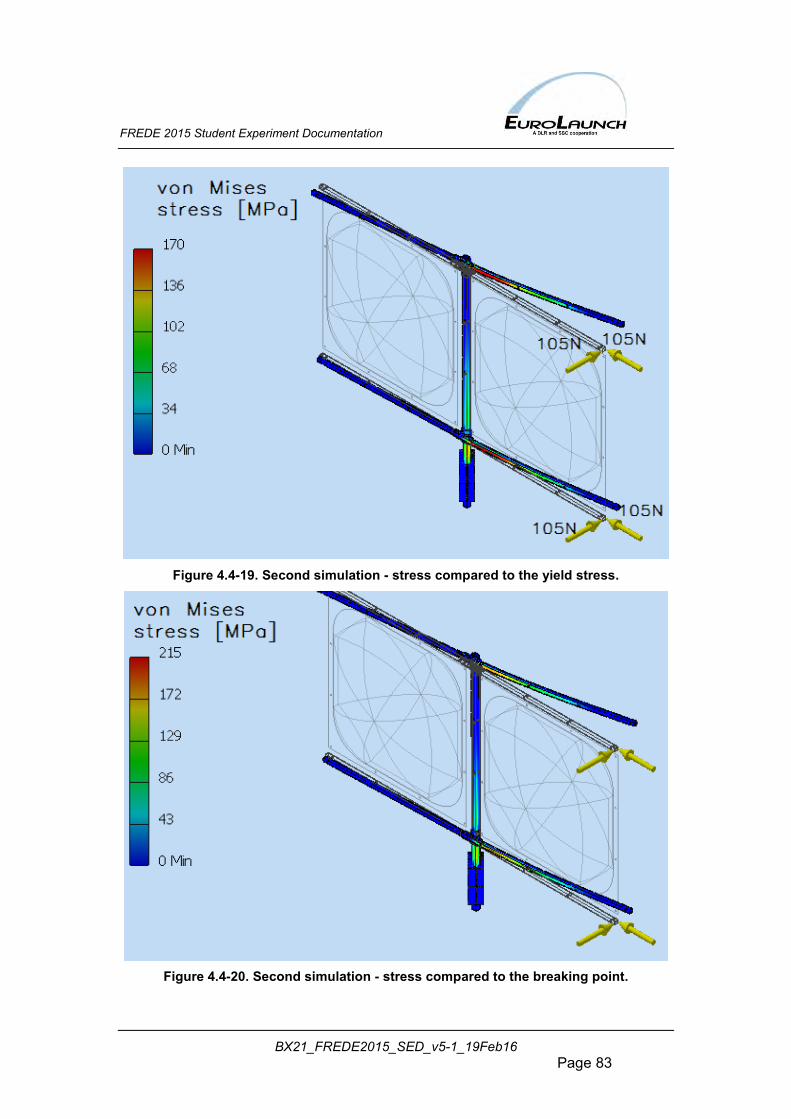
FREDE 2015 Student Experiment Documentation
BX21_FREDE2015_SED_v5-1_19Feb16 Page 83
Figure 4.4-19. Second simulation - stress compared to the yield stress.
Figure 4.4-20. Second simulation - stress compared to the breaking point.
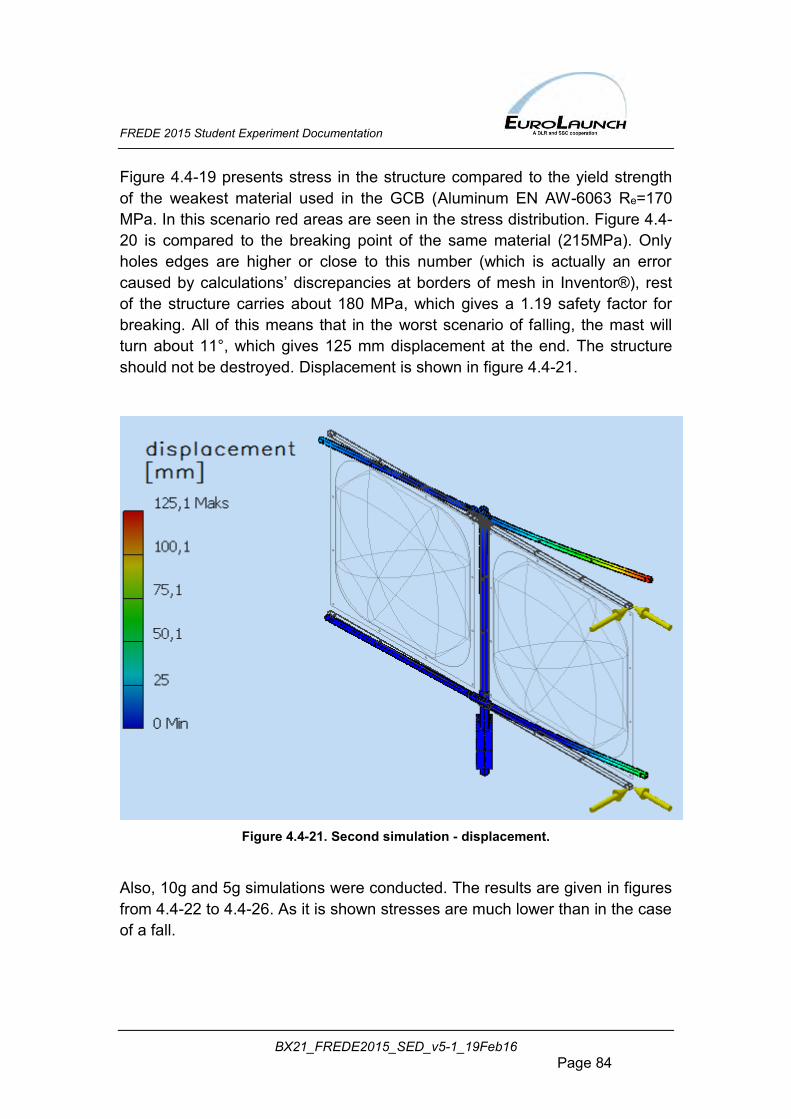
FREDE 2015 Student Experiment Documentation
BX21_FREDE2015_SED_v5-1_19Feb16 Page 84
Figure 4.4-19 presents stress in the structure compared to the yield strength of the weakest material used in the GCB (Aluminum EN AW-6063 Re=170 MPa. In this scenario red areas are seen in the stress distribution. Figure 4.4-20 is compared to the breaking point of the same material (215MPa). Only holes edges are higher or close to this number (which is actually an error caused by calculations’ discrepancies at borders of mesh in Inventor®), rest of the structure carries about 180 MPa, which gives a 1.19 safety factor for breaking. All of this means that in the worst scenario of falling, the mast will turn about 11°, which gives 125 mm displacement at the end. The structure should not be destroyed. Displacement is shown in figure 4.4-21.
Figure 4.4-21. Second simulation - displacement.
Also, 10g and 5g simulations were conducted. The results are given in figures from 4.4-22 to 4.4-26. As it is shown stresses are much lower than in the case of a fall.
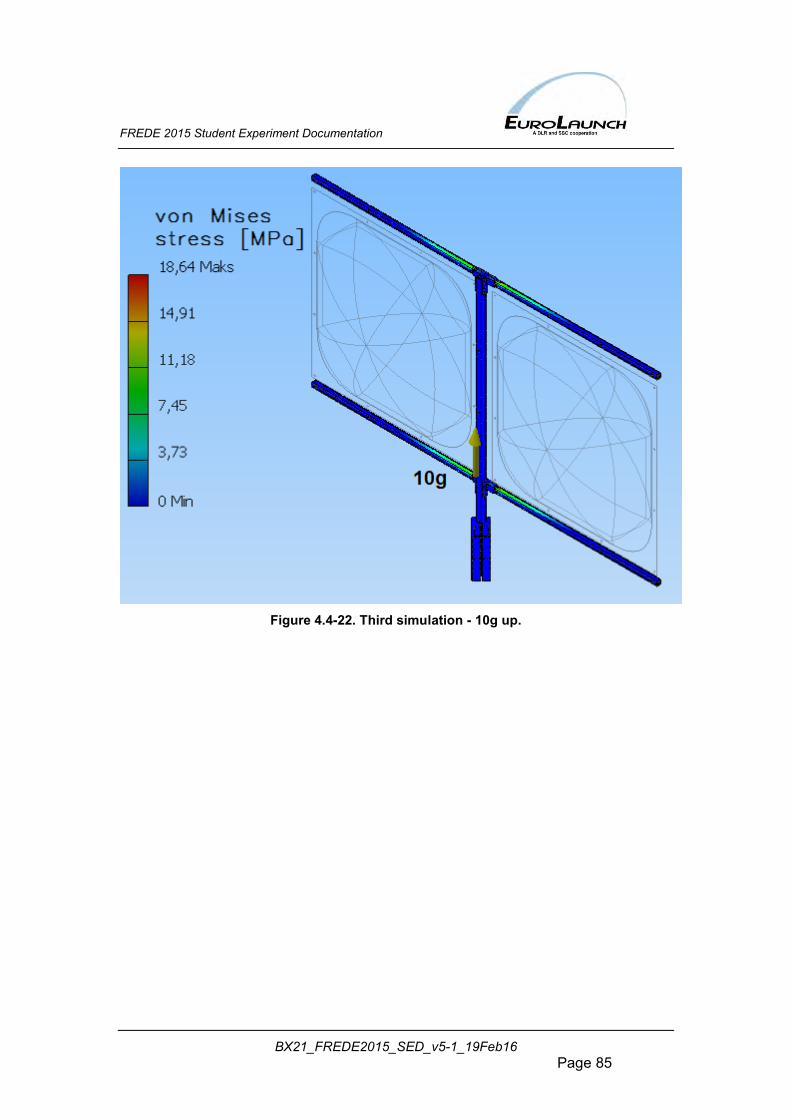
FREDE 2015 Student Experiment Documentation
BX21_FREDE2015_SED_v5-1_19Feb16 Page 85
Figure 4.4-22. Third simulation - 10g up.
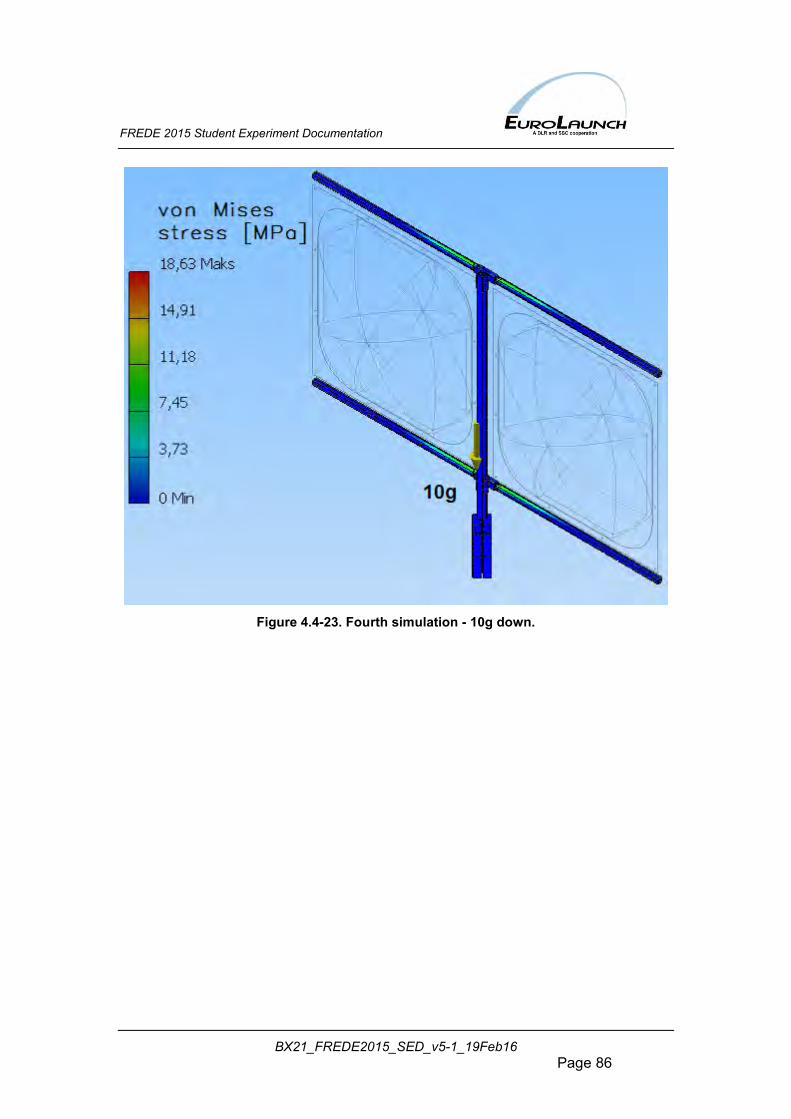
FREDE 2015 Student Experiment Documentation
BX21_FREDE2015_SED_v5-1_19Feb16 Page 86
Figure 4.4-23. Fourth simulation - 10g down.
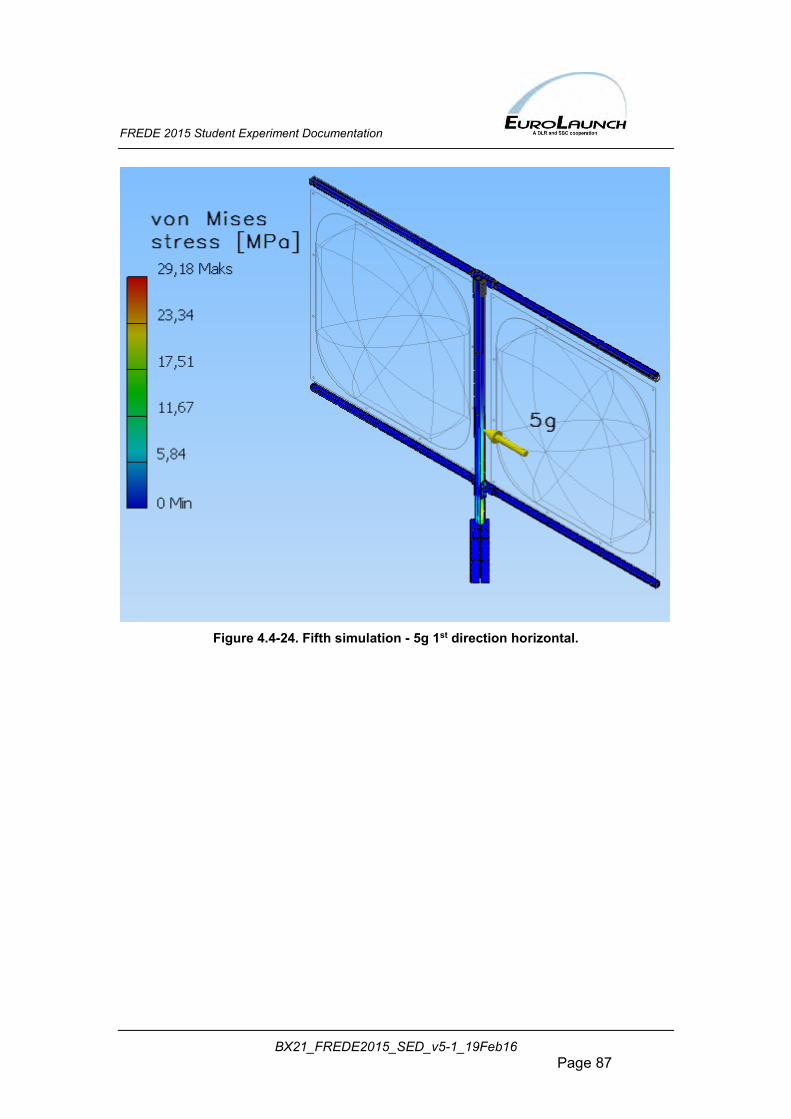
FREDE 2015 Student Experiment Documentation
BX21_FREDE2015_SED_v5-1_19Feb16 Page 87
Figure 4.4-24. Fifth simulation - 5g 1st direction horizontal.
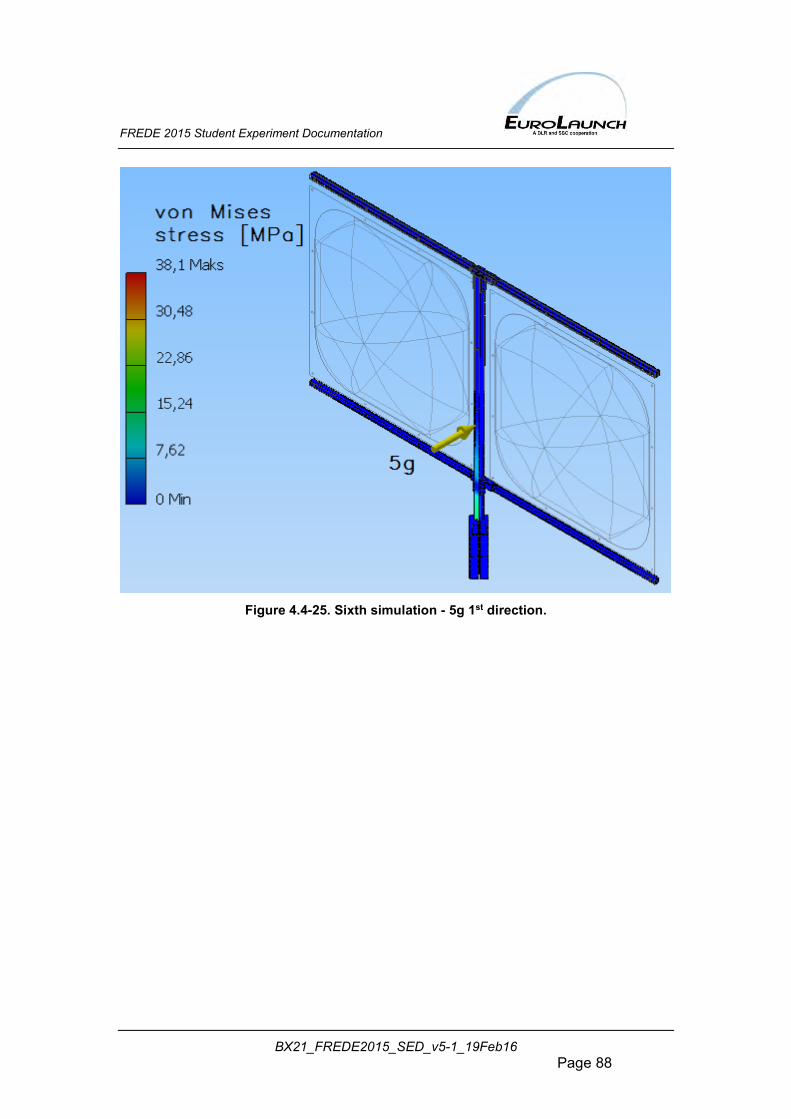
FREDE 2015 Student Experiment Documentation
BX21_FREDE2015_SED_v5-1_19Feb16 Page 88
Figure 4.4-25. Sixth simulation - 5g 1st direction.
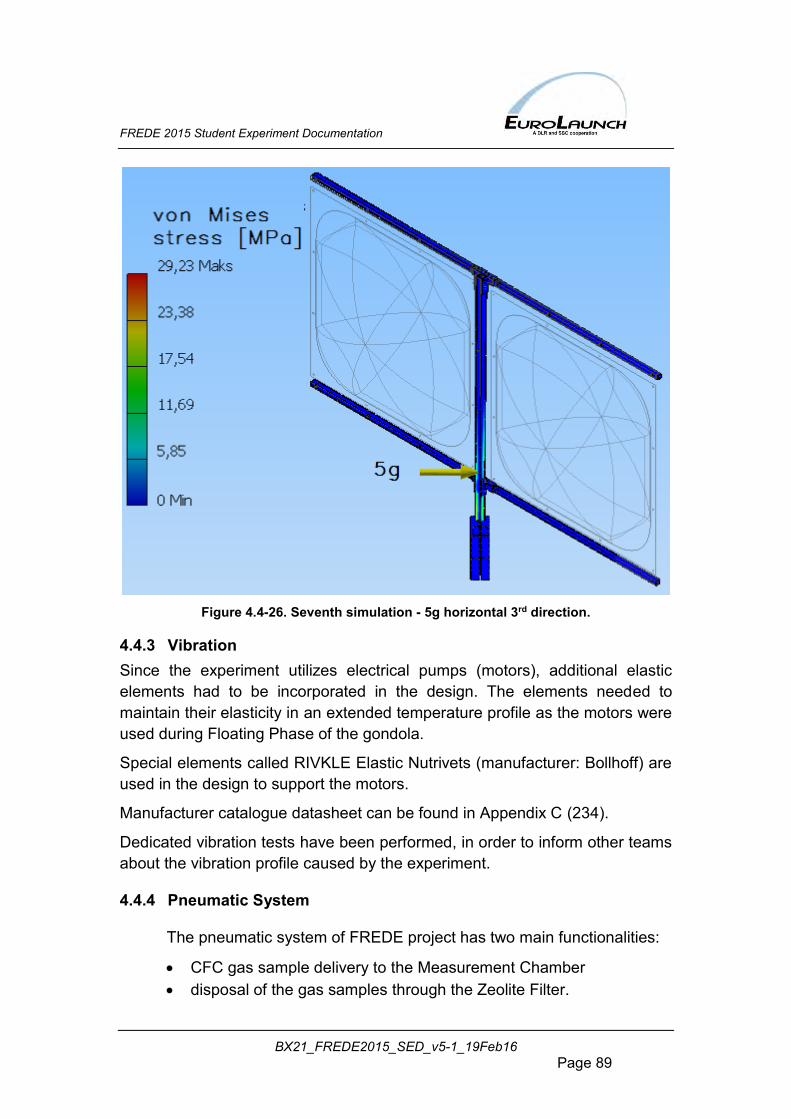
FREDE 2015 Student Experiment Documentation
BX21_FREDE2015_SED_v5-1_19Feb16 Page 89
Figure 4.4-26. Seventh simulation - 5g horizontal 3rd direction.
4.4.3 Vibration Since the experiment utilizes electrical pumps (motors), additional elastic elements had to be incorporated in the design. The elements needed to maintain their elasticity in an extended temperature profile as the motors were used during Floating Phase of the gondola.
Special elements called RIVKLE Elastic Nutrivets (manufacturer: Bollhoff) are used in the design to support the motors.
Manufacturer catalogue datasheet can be found in Appendix C (234).
Dedicated vibration tests have been performed, in order to inform other teams about the vibration profile caused by the experiment.
4.4.4 Pneumatic System
The pneumatic system of FREDE project has two main functionalities:
CFC gas sample delivery to the Measurement Chamber disposal of the gas samples through the Zeolite Filter.
FREDE 2015 Student Experiment Documentation
BX21_FREDE2015_SED_v5-1_19Feb16 Page 90
Since FREDE experiment is investigating 2 selected gases, it is clear that pneumatic system must consist of 2 independent lines, one for each type of gas. This fact had a strong influence on design of the transfer subsystem, in which there were 2 pumps needed, each for 1 line, transferring gas samples from the Gas Bags to the Measurement Chamber.
In order not to mix gas samples of different concentrations, a two-state electro valve is mounted on each line. This also allows for a direct selection of an appropriate gas bag to transport the CFC from.
To maintain a proper usage of the ECD and the CC, there are two gas tanks additionally installed in the system:
a) Helium tank (pressurized to 8 bar, volume equal to 1 dm3 with pressure reduction to 1 bar),
b) Nitrogen tank (parameters as in the helium tank). To be sure that the CC works properly, there has to be a constant flow of helium through the CC from the moment of start of the measurements. ECD, when performing measurements, requires a constant flow of nitrogen.
Chemical part of system, which is the CC with the ECD sensor, has series of three-way valves installed on the inlet to ensure a constant flow of helium.
Since the ECD is not mounted in the sealed chamber where measurements take place with flow equal to zero, there is no need for a third pump installed right after this chemical sensor.
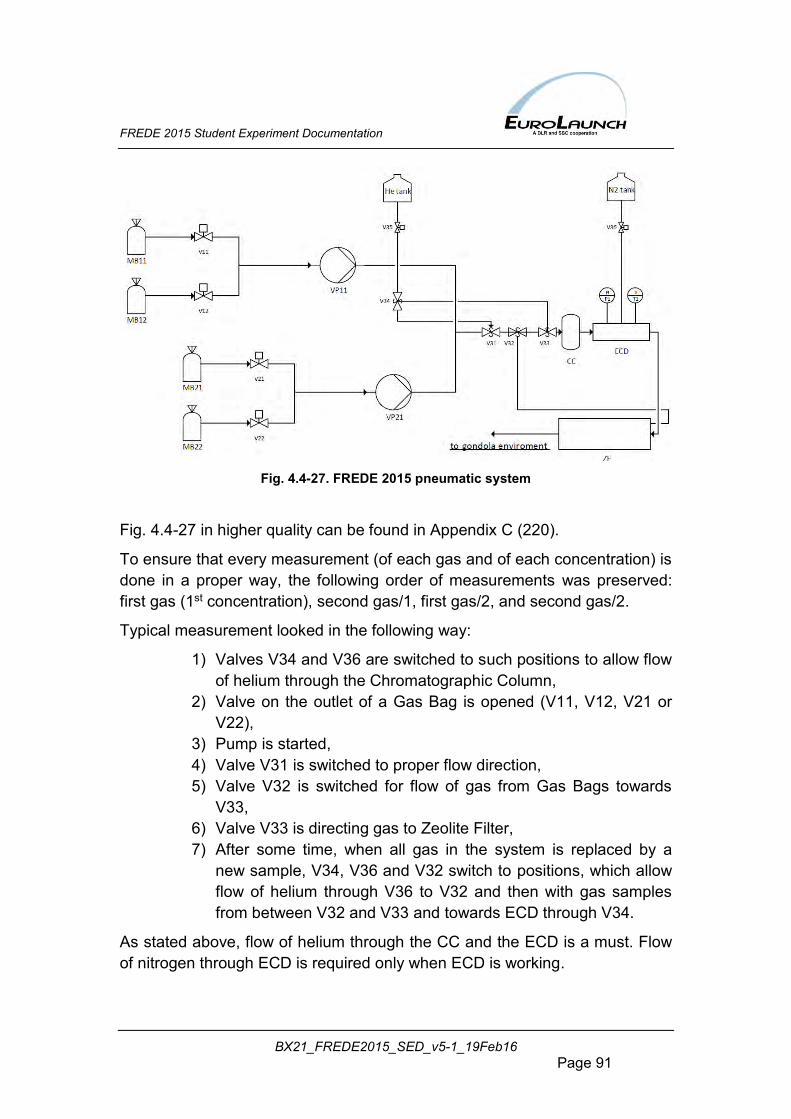
FREDE 2015 Student Experiment Documentation
BX21_FREDE2015_SED_v5-1_19Feb16 Page 91
Fig. 4.4-27. FREDE 2015 pneumatic system
Fig. 4.4-27 in higher quality can be found in Appendix C (220).
To ensure that every measurement (of each gas and of each concentration) is done in a proper way, the following order of measurements was preserved: first gas (1st concentration), second gas/1, first gas/2, and second gas/2.
Typical measurement looked in the following way:
1) Valves V34 and V36 are switched to such positions to allow flow of helium through the Chromatographic Column,
2) Valve on the outlet of a Gas Bag is opened (V11, V12, V21 or V22),
3) Pump is started, 4) Valve V31 is switched to proper flow direction, 5) Valve V32 is switched for flow of gas from Gas Bags towards
V33, 6) Valve V33 is directing gas to Zeolite Filter, 7) After some time, when all gas in the system is replaced by a
new sample, V34, V36 and V32 switch to positions, which allow flow of helium through V36 to V32 and then with gas samples from between V32 and V33 and towards ECD through V34.
As stated above, flow of helium through the CC and the ECD is a must. Flow of nitrogen through ECD is required only when ECD is working.
FREDE 2015 Student Experiment Documentation
BX21_FREDE2015_SED_v5-1_19Feb16 Page 92
1 dm3 of helium gas, under 8 bar of pressure, with density equal to 𝜌𝐻𝑒8 = 1.309 kg/m3 weighs about 𝑚𝐻𝑒8 = 0.001309 kg.
With required flow of 25 ml/min and required time equal 300 min, there is a need for 7500 ml of gas, which (when under 1 bar of pressure) with density equal to 𝜌𝐻𝑒1 = 0.1641 kg/m3 weighs about 𝑚𝐻𝑒1 = 0.00073845 kg.
𝑚𝐻𝑒8
𝑚𝐻𝑒1=
0.001309
0.00073845= 1.77
It means that with 1 dm3 of helium under 8 bar of pressure in tank, there is reserve equal to 77% of needed gas.
1 dm3 of gas, under 8 bar of pressure, with density equal to 𝜌𝑁28 = 9.211 kg/m3 weighs about 𝑚𝑁28 = 0.009211 kg.
With required flow of 40 ml/min and required time equal 180 min, there is a need for 7200 ml of gas, which (when under 1 bar of pressure) with density equal to 𝜌𝑁21 = 1.15 kg/m3 weighs about 𝑚𝑁21 = 0.00828 kg.
𝑚𝑁28
𝑚𝑁21=
0.009211
0.00828= 1,12
It means that with 1 dm3 of nitrogen under 8 bar of pressure in tank, there is reserve equal to 12% of needed gas.
Minor losses, assuming that each 3-way valve (there is 4 of them on the way from GB to ZF) has minor loss coefficient equal to 𝜉3𝑤 = 1.5 and 𝜉𝐺𝐵 = 2 for Gas Bag outlet Roberts valve (1 in system) and 𝜉𝑇 = 1 for line connector – tee (1 in system) were calculated using the following equation
∆𝑝𝑚 = 𝜉 ∙ 𝜌𝑁2 ∙𝑤2
2= 9 ∙ 0.007225 ∙
0.252
2≈ 0 Pa
with assumption of velocity 𝑤 = 0.25 m/s.
Since test T6-2 showed that pump will achieve a high enough flow under low pressure in a complicated (in terms of pneumatic losses) system, linear losses were not taken into account.
Previous BEXUS flights (e.g. CASS-E project) reported a substantial problem with flow measurements. Since altitude changes influence on the volume of gas in the Gas Bags, we needed to ensure that in each measurement the same exact amount of gas had been used. In other words, volume of ECD chamber must always contain same number of moles of the sampled gas.
Even if volume flow measurement was not be problematic under the stratospheric conditions, it would still be an inaccurate way to determine the number of moles of the sampled gas. Volume flow would have to be
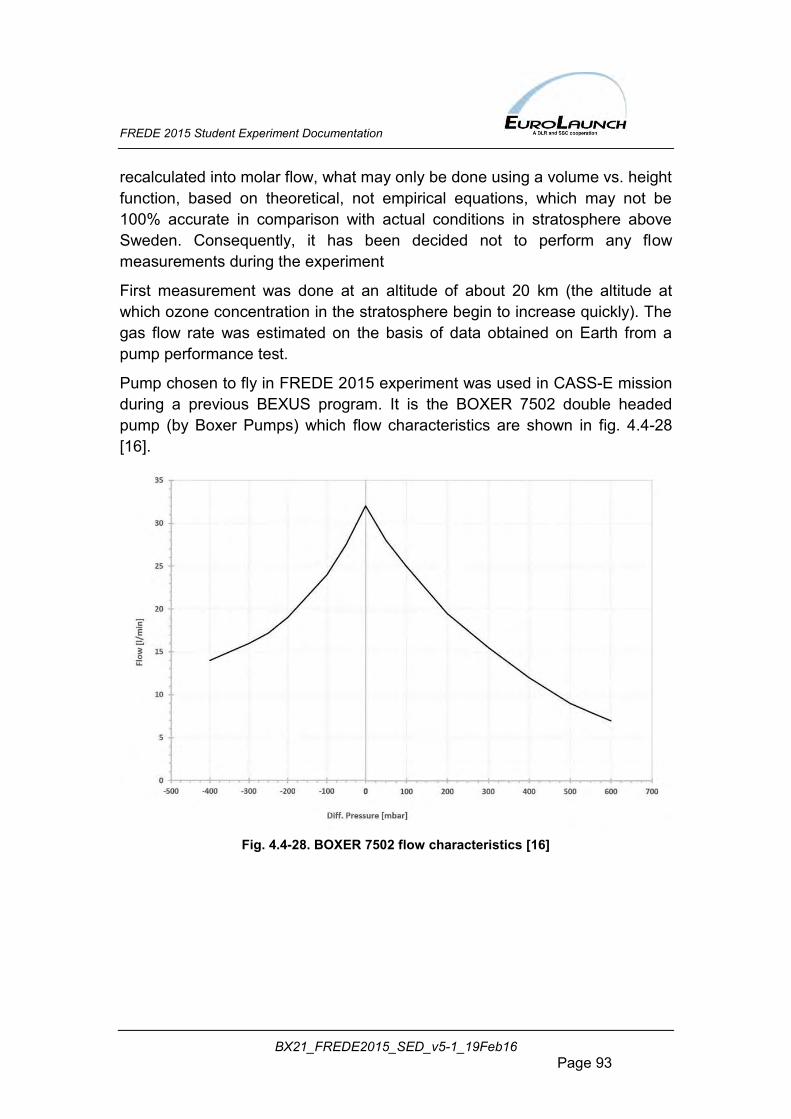
FREDE 2015 Student Experiment Documentation
BX21_FREDE2015_SED_v5-1_19Feb16 Page 93
recalculated into molar flow, what may only be done using a volume vs. height function, based on theoretical, not empirical equations, which may not be 100% accurate in comparison with actual conditions in stratosphere above Sweden. Consequently, it has been decided not to perform any flow measurements during the experiment
First measurement was done at an altitude of about 20 km (the altitude at which ozone concentration in the stratosphere begin to increase quickly). The gas flow rate was estimated on the basis of data obtained on Earth from a pump performance test.
Pump chosen to fly in FREDE 2015 experiment was used in CASS-E mission during a previous BEXUS program. It is the BOXER 7502 double headed pump (by Boxer Pumps) which flow characteristics are shown in fig. 4.4-28 [16].
Fig. 4.4-28. BOXER 7502 flow characteristics [16]
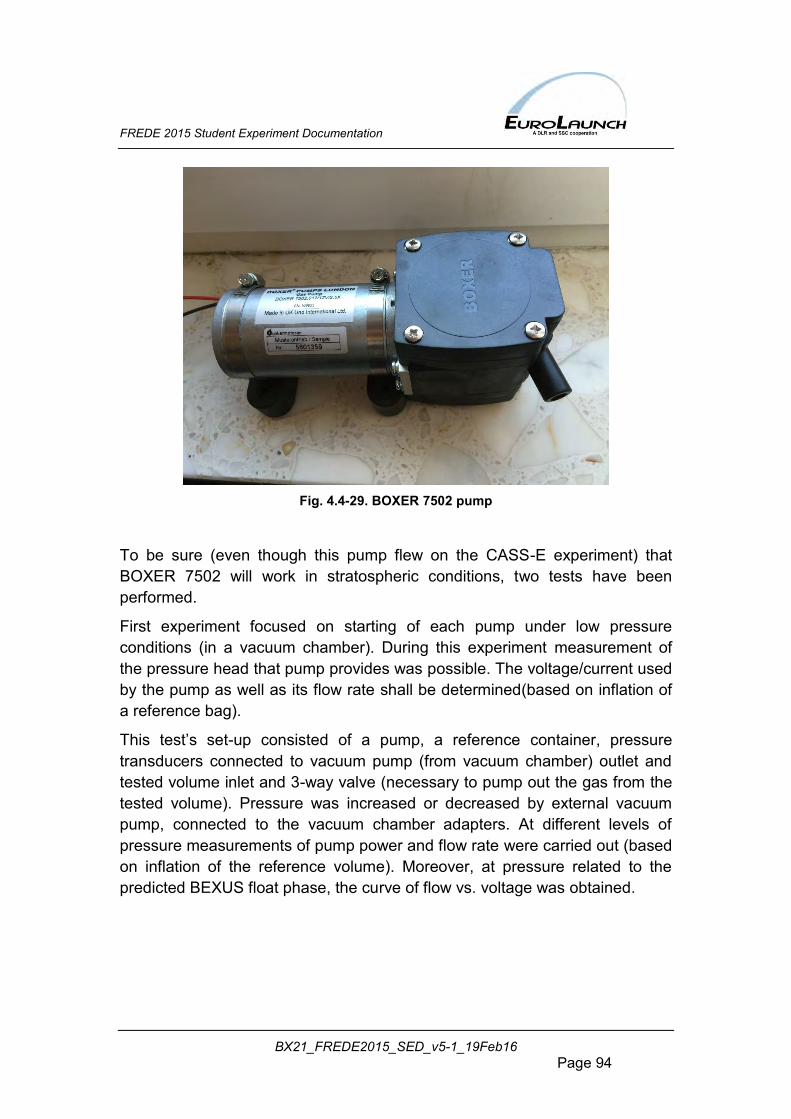
FREDE 2015 Student Experiment Documentation
BX21_FREDE2015_SED_v5-1_19Feb16 Page 94
Fig. 4.4-29. BOXER 7502 pump
To be sure (even though this pump flew on the CASS-E experiment) that BOXER 7502 will work in stratospheric conditions, two tests have been performed.
First experiment focused on starting of each pump under low pressure conditions (in a vacuum chamber). During this experiment measurement of the pressure head that pump provides was possible. The voltage/current used by the pump as well as its flow rate shall be determined(based on inflation of a reference bag).
This test’s set-up consisted of a pump, a reference container, pressure transducers connected to vacuum pump (from vacuum chamber) outlet and tested volume inlet and 3-way valve (necessary to pump out the gas from the tested volume). Pressure was increased or decreased by external vacuum pump, connected to the vacuum chamber adapters. At different levels of pressure measurements of pump power and flow rate were carried out (based on inflation of the reference volume). Moreover, at pressure related to the predicted BEXUS float phase, the curve of flow vs. voltage was obtained.
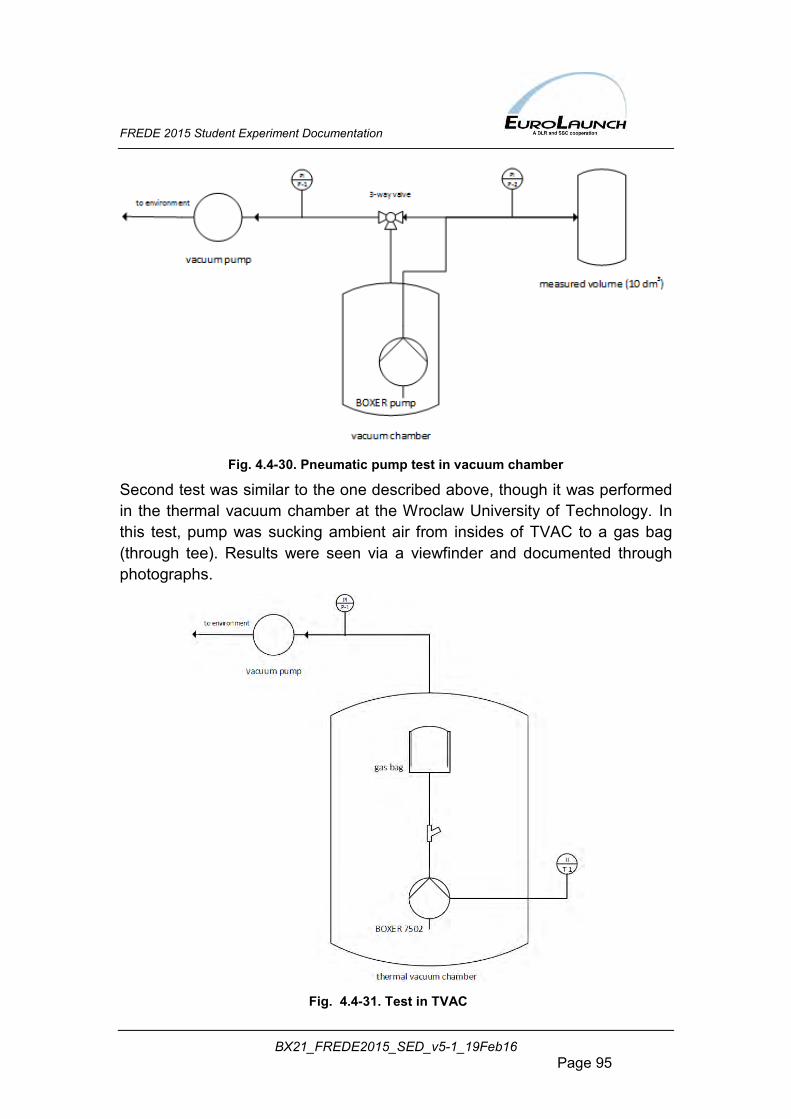
FREDE 2015 Student Experiment Documentation
BX21_FREDE2015_SED_v5-1_19Feb16 Page 95
Fig. 4.4-30. Pneumatic pump test in vacuum chamber
Second test was similar to the one described above, though it was performed in the thermal vacuum chamber at the Wroclaw University of Technology. In this test, pump was sucking ambient air from insides of TVAC to a gas bag (through tee). Results were seen via a viewfinder and documented through photographs.
Fig. 4.4-31. Test in TVAC
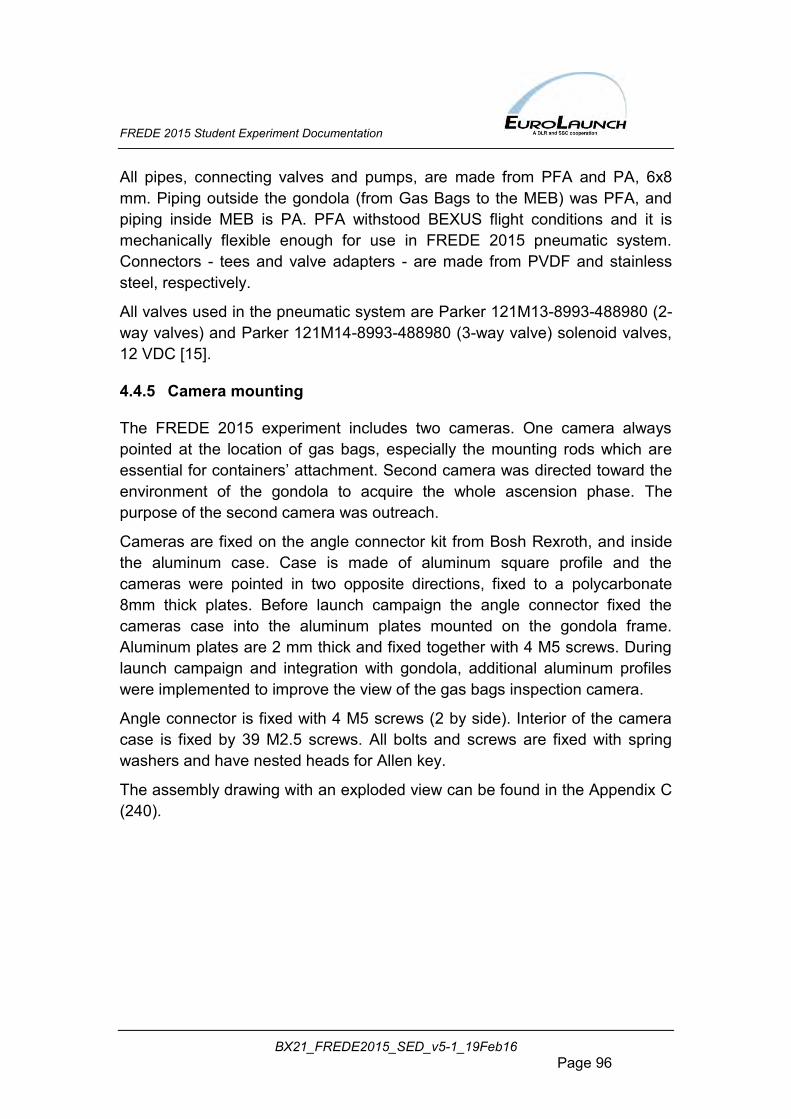
FREDE 2015 Student Experiment Documentation
BX21_FREDE2015_SED_v5-1_19Feb16 Page 96
All pipes, connecting valves and pumps, are made from PFA and PA, 6x8 mm. Piping outside the gondola (from Gas Bags to the MEB) was PFA, and piping inside MEB is PA. PFA withstood BEXUS flight conditions and it is mechanically flexible enough for use in FREDE 2015 pneumatic system. Connectors - tees and valve adapters - are made from PVDF and stainless steel, respectively.
All valves used in the pneumatic system are Parker 121M13-8993-488980 (2-way valves) and Parker 121M14-8993-488980 (3-way valve) solenoid valves, 12 VDC [15].
4.4.5 Camera mounting
The FREDE 2015 experiment includes two cameras. One camera always pointed at the location of gas bags, especially the mounting rods which are essential for containers’ attachment. Second camera was directed toward the environment of the gondola to acquire the whole ascension phase. The purpose of the second camera was outreach.
Cameras are fixed on the angle connector kit from Bosh Rexroth, and inside the aluminum case. Case is made of aluminum square profile and the cameras were pointed in two opposite directions, fixed to a polycarbonate 8mm thick plates. Before launch campaign the angle connector fixed the cameras case into the aluminum plates mounted on the gondola frame. Aluminum plates are 2 mm thick and fixed together with 4 M5 screws. During launch campaign and integration with gondola, additional aluminum profiles were implemented to improve the view of the gas bags inspection camera.
Angle connector is fixed with 4 M5 screws (2 by side). Interior of the camera case is fixed by 39 M2.5 screws. All bolts and screws are fixed with spring washers and have nested heads for Allen key.
The assembly drawing with an exploded view can be found in the Appendix C (240).
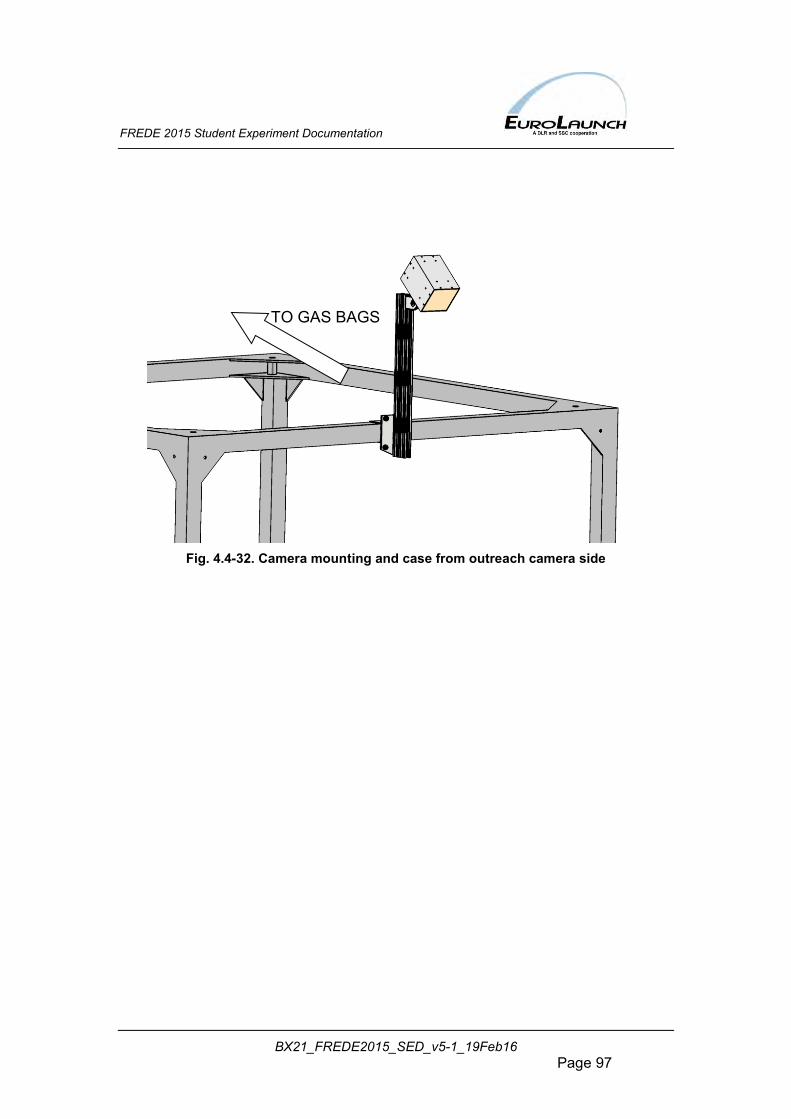
FREDE 2015 Student Experiment Documentation
BX21_FREDE2015_SED_v5-1_19Feb16 Page 97
Fig. 4.4-32. Camera mounting and case from outreach camera side
TO GAS BAGS
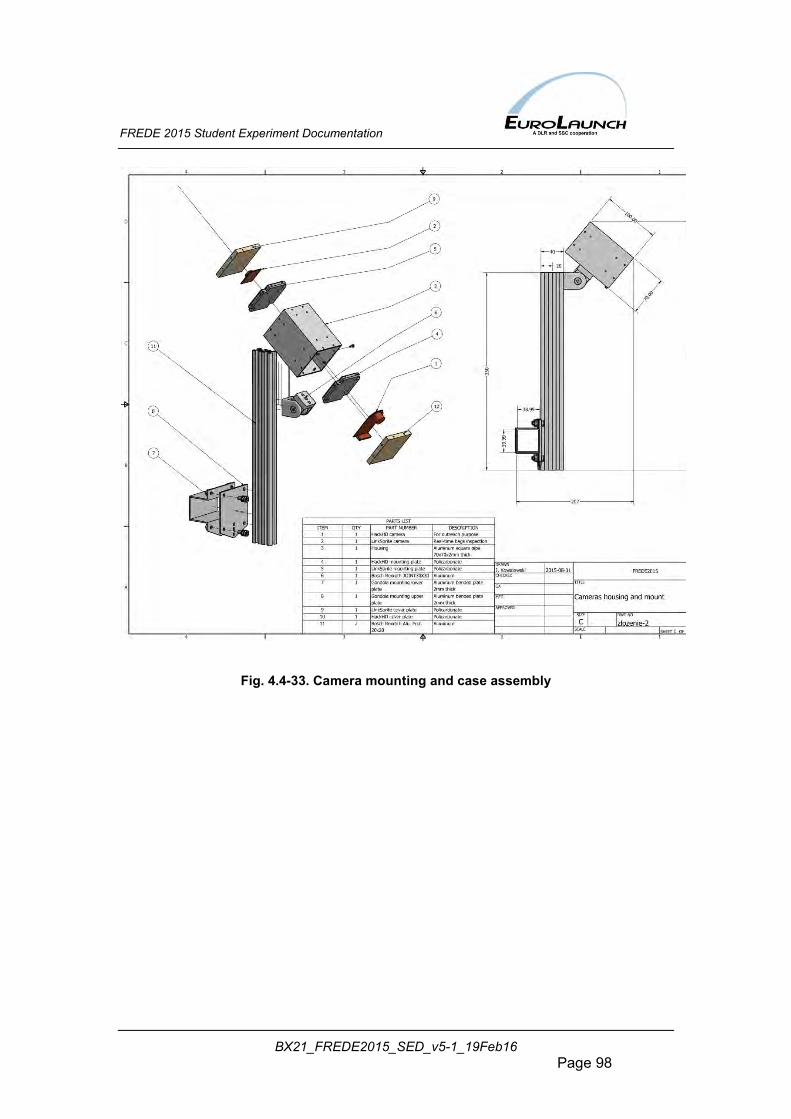
FREDE 2015 Student Experiment Documentation
BX21_FREDE2015_SED_v5-1_19Feb16 Page 98
Fig. 4.4-33. Camera mounting and case assembly
FREDE 2015 Student Experiment Documentation
BX21_FREDE2015_SED_v5-1_19Feb16 Page 99
4.5 Electronics Design
On-board architecture of FREDE project includes five boards:
Flight Control Unit (Intel Galileo): o communication with boards and cameras o data aggregation, storage and communication with Ground
Station via BEXUS E-Link Sensor Board :
o measurements from pressure and temperature sensors o measurements from UV modules
Pneumatic Board : o controlling pumps and valves o measurements from pressure and temperature sensors
ECD Board : o communication with uECD Interface Card
Power Module: o power distribution
Hardware architecture is presented in figure 4.5-1. Detailed schematics are attached in Appendix C (249).
Figure 4.5-1. Hardware architecture of FREDE on-board electronics

FREDE 2015 Student Experiment Documentation
BX21_FREDE2015_SED_v5-1_19Feb16 Page 100
4.5.1 Flight Control Unit
The FCU aggregates and stores data and communicates with the Ground Station. It allows maintaining control over all modules from the ground. It also communicates with the Gas Bags inspection camera.
The utilized FCU was Intel Galileo with an adapter board. Intel Galileo is based on Intel Quark SoC X1000, which is a 32-bit Pentium processor. It contains an Ethernet Port, an USART port, a microSD slot, and GPIOs. The adapter board was designed to supply power for Intel Galileo and connect it to RS485 bus.
Power supply
The adapter board has a switching voltage regulator with output voltage 5 V at amperage up to 3 A, which powers Intel Galileo and cameras. Intel Galileo consumes approximately 500 mA and cameras consume 100 mA.
Unregulated power from the main supply is used for heating the camera (if required).
Communication and data storage
The FCU uses two communication interfaces: RS485 bus and Ethernet.
RS485 is used to communicate with other FREDE modules (Sensor Boards, Pneumatic Board and Power Module) using MODBUS protocol. Measurement data received from boards are stored on a microSD card. The FCU has a real time clock which provides timestamps for recorded data.
Ethernet via E-Link was used to communicate with the Ground Station using UDP protocol. Commands received via E-link were processed and passed to the rest of the experiment using RS485 bus. Commands allowed for switching valves, pumps, changing parameters and switching off the experiment.
The FCU communicates with cameras via a TTL interface.
4.5.2 Sensor Board
Power supply
On-board electronics work either on 5 V or 3,3 V. Linear regulators lower the 12 V voltage from Power Module to 5 V and then to 3,3 V.

FREDE 2015 Student Experiment Documentation
BX21_FREDE2015_SED_v5-1_19Feb16 Page 101
Measurements
The Sensor Board is controlled by an ATMega168. It aggregates data from ADC converter using I2C. Data are stored on microSD card.
There are four ADC channels: PT1000, UV1, UV2 and ECD. PT1000 is placed on a small board, together with pressure sensor, which use a I2C interface.
Two UV modules equipped with photodiodes were placed outside the gondola. Small photo-currents from photodiodes were amplified and converted to voltage using precise op-amp, OPA129. Then the voltage was converted to digital values using precise, 18-bit differential ADCs.
Main sensor which measures concentration of CFCs is the ECD, which does not have a direct analog output. Therefore an adapter was designed, also responsible for heating the ECD detector.
4.5.3 Pneumatic Board
Power Supply
On-board electronics work either on 5 V or 3,3 V. A DC/DC converter lowers voltage 12 V from Power Module to 5 V and then linear regulator lowers it to 3,3 V. Pumps and valves are powered directly using 12 V. A DC/DC converter and a choke coil are used to separate them from electronics.
Control of Pneumatics System
The Pneumatic Board is responsible for control of the pneumatic subsystem. This module is based on an AVR Atmega168 microcontroller. Each element of the pneumatic subsystem has its own MOSFET as a switch. Pumps are controlled with PWM outputs to control their power and gas mass flow. They are soft-started to limit vibrations and voltage spikes. Valves are also controlled with a PWM output, which allows using “spike and hold” technique, leading to reduction of power consumption.
4.5.4 Power Module
Each module in the FREDE Experiment is connected to the Power Module. This approach creates a star topology system that helps in reducing grounding problems and noise. The Power Module is responsible for regulating and distributing power. Another function of this module is to
FREDE 2015 Student Experiment Documentation
BX21_FREDE2015_SED_v5-1_19Feb16 Page 102
measure voltage of power source, voltage on main power output, and overall current consumption. This data is later supported to FCU (on demand) via RS485 internal data bus.
Every output is protected with a fast fuse. In case of a short circuit, a module is cut off to prevent failure of the whole experiment.
The experiment can be switched on and off remotely using specific a command or manually by a mechanical switch placed outside the MEB. The mechanical switch has a priority over the electronic one so when they are without power the whole experiment is shut down.
Electronic switches (MOSFETs) were disabled after all closing procedures (such as enabling memory protections, closing E-Link connections, etc.) during post-flight mode (gondola descend).
4.5.5 Camera subsystem
Low resolution camera was supposed to provide information about conditions of the CFC gas reservoir during the flight. Additionally, a second camera with HD recording capabilities was mounted next to the first camera, although facing the other direction. Its purpose was to provide high resolution footage of the gondola during the whole flight.
Mounting requirements:
First camera (the low resolution one) had to be in position which provides a clear view of Gas bags array placed outside the EGON gondola. Also, it was placed on an extension arm outside the gondola. Second camera (HD one) had to have clear view on Earth and a part of the gondola (for scale comparison).
LinkSprite JPEG Color Camera was selected as the low resolution camera. It has on-board JPEG compression capabilities and a simple UART interface, making it possible to obtain JPEG images without any excessive FCU processing.
The high resolution camera is the HackHD 1080p camera module. It was selected because it is a simple module, which can be easily integrated into a custom case. Other advantages of this camera are its small form factor and simple controls. Recording can be switched on and off.
The low-res camera does not have any on-board memory. It transferred captured pictures to the FCU via the UART, where they were stored and
FREDE 2015 Student Experiment Documentation
BX21_FREDE2015_SED_v5-1_19Feb16 Page 103
transferred to the ground through the E-Link. The HD camera was saving video footage on the integrated micro SD card.
FREDE 2015 Student Experiment Documentation
BX21_FREDE2015_SED_v5-1_19Feb16 Page 104
4.6 Thermal Design
4.6.1 Overview
The main objective of the presented thermal design was to ensure a desired thermal behaviour of the FREDE 2015 experiment’s components during a BEXUS balloon flight. The impact of the harsh environmental conditions encountered in the stratosphere has to be mitigated in order to maintain specified operating conditions of the individual subsystems.
The thermal design encompasses both passive and active thermal systems. Even though a polyolefin foam thermal insulation in combination with alteration of the outer shell’s optical properties is expected to provide a sufficient protection for most subsystems, an active system utilizing heaters and a controller may prove necessary in case of the ECD detector.
A general framework has been developed in order to conduct a preliminary thermal analysis. The approach is to divide the domain into interior of the experiment and its surroundings, with the surface of the outer shell constituting an interface between the two. A thermal balance is applied at the interface in order to obtain an approximate temperature distribution.
A more detailed analysis performed numerically focused on the conditions inside the experiment. A series of simulations has been conducted utilizing the ANSYS CFX 13.0 CFD package in order to address the design of the active thermal system. In particular, the conditions at the upper plate were investigated, with attention brought to the secondary power source.
Given the unusual nature of tackled problems, there is a necessity to validate the models utilized in the analysis. A simple experiment has been designed for that purpose. It was conducted in the first half of May 2015 using a thermal-vacuum chamber located at the Wroclaw University of Technology.
The analyses are being supplied by appropriate testing, ranging from the for-mentioned stationary experiment to an actual stratospheric flight. A thermal imaging camera is going to be utilized in order to verify the performance of electronics, while separate tests are being commenced, regarding behaviour of the pumps.
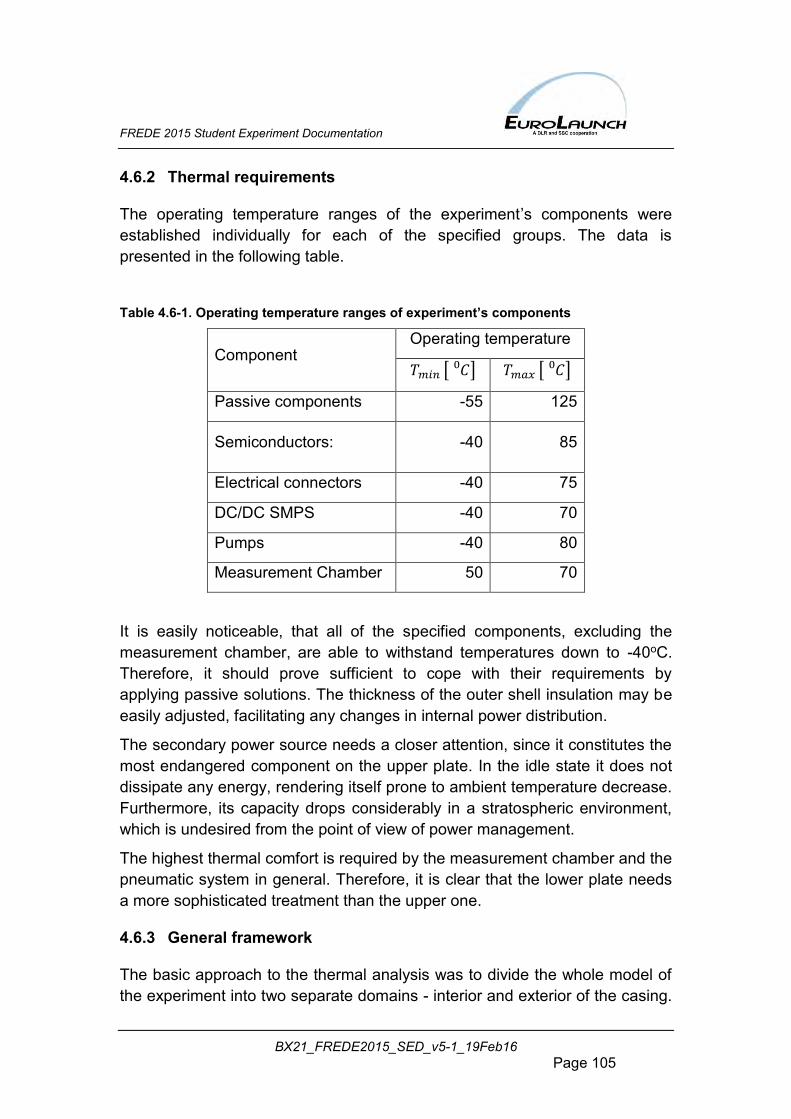
FREDE 2015 Student Experiment Documentation
BX21_FREDE2015_SED_v5-1_19Feb16 Page 105
4.6.2 Thermal requirements
The operating temperature ranges of the experiment’s components were established individually for each of the specified groups. The data is presented in the following table.
Table 4.6-1. Operating temperature ranges of experiment’s components
Component Operating temperature
𝑇𝑚𝑖𝑛 [ 𝐶0 ] 𝑇𝑚𝑎𝑥 [ 𝐶0 ]
Passive components -55 125
Semiconductors: -40 85
Electrical connectors -40 75
DC/DC SMPS -40 70
Pumps -40 80
Measurement Chamber 50 70
It is easily noticeable, that all of the specified components, excluding the measurement chamber, are able to withstand temperatures down to -40oC. Therefore, it should prove sufficient to cope with their requirements by applying passive solutions. The thickness of the outer shell insulation may be easily adjusted, facilitating any changes in internal power distribution.
The secondary power source needs a closer attention, since it constitutes the most endangered component on the upper plate. In the idle state it does not dissipate any energy, rendering itself prone to ambient temperature decrease. Furthermore, its capacity drops considerably in a stratospheric environment, which is undesired from the point of view of power management.
The highest thermal comfort is required by the measurement chamber and the pneumatic system in general. Therefore, it is clear that the lower plate needs a more sophisticated treatment than the upper one.
4.6.3 General framework
The basic approach to the thermal analysis was to divide the whole model of the experiment into two separate domains - interior and exterior of the casing.
FREDE 2015 Student Experiment Documentation
BX21_FREDE2015_SED_v5-1_19Feb16 Page 106
This division does not take into account the outer shell itself, which is thought of as the interface between the mentioned regions. An assumption of zero optical transmissivity of the interface was made. Since a quasi-stationary character of the process has been assumed as well, simple conduction through the polyolefin foam layer is considered to be the exclusive mechanism of heat exchange between respective domains.
It should be kept in mind though, that the casing itself may not be sealed well enough to prevent a leakage from the interior, hence the enthalpy may pass the interface and leave the interior on this basis as well. On the other hand the time scale of this process seems large enough to neglect it.
Initial calculations were performed under an assumption that the outer shell of the experiment is isothermal. A higher accuracy is possible to obtain through discretization of the shell into individual nodes and inclusion of conductive heat transfer between. Regardless, the following form of an energy balance equation may be applied either to the whole shell or its separate areas:
𝑄𝑜𝑢𝑡 = 𝑄𝑑𝑖𝑟 + 𝑄𝑟𝑒𝑓 + 𝑄𝑒𝑎𝑟 + 𝑄𝑐𝑜𝑛 + 𝑆
The above equation is composed mainly of radiation terms, reflecting the nature of heat exchange phenomena in the stratosphere. The source term 𝑆 corresponds to the energy dissipated inside the experiment. The convective term 𝑄𝑐𝑜𝑛 may be eschewed or replaced by a correction coefficient for the outgoing radiation flux 𝑄𝑜𝑢𝑡. The radiation terms are elaborated as follows:
𝑄1,2 = 𝐴1𝜑1,2𝐶𝐶(𝑇14 − 𝑇2
4)
Two cases were chosen for analysis – the so called hot case and cold case, resembling the two extremities the experiment may encounter. On the basis of a review of previous BEXUS flights’ thermal profiles, it was found that the cold case corresponds to the steady-state obtained at the highest altitude, where the ambient air temperature reaches values as low as -80oC. The hot case would take place during the ascent of the balloon, shortly after leaving the troposphere. This is expected due to a relatively rapid change in radiation intensity and a simultaneous decrease in density of air.
Flight during a night has not been taken into consideration, due to the requirements of the experiment itself, specifically the exposure of the gas samples to the UV radiation.
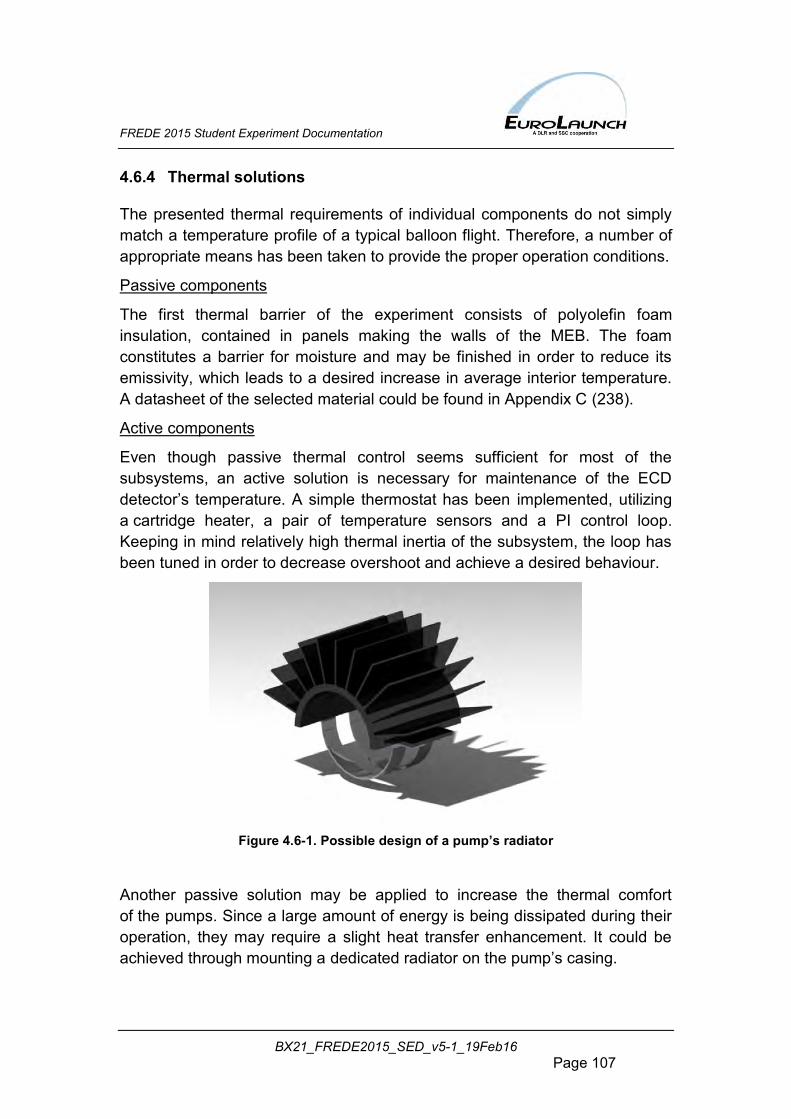
FREDE 2015 Student Experiment Documentation
BX21_FREDE2015_SED_v5-1_19Feb16 Page 107
4.6.4 Thermal solutions
The presented thermal requirements of individual components do not simply match a temperature profile of a typical balloon flight. Therefore, a number of appropriate means has been taken to provide the proper operation conditions.
Passive components
The first thermal barrier of the experiment consists of polyolefin foam insulation, contained in panels making the walls of the MEB. The foam constitutes a barrier for moisture and may be finished in order to reduce its emissivity, which leads to a desired increase in average interior temperature. A datasheet of the selected material could be found in Appendix C (238).
Active components
Even though passive thermal control seems sufficient for most of the subsystems, an active solution is necessary for maintenance of the ECD detector’s temperature. A simple thermostat has been implemented, utilizing a cartridge heater, a pair of temperature sensors and a PI control loop. Keeping in mind relatively high thermal inertia of the subsystem, the loop has been tuned in order to decrease overshoot and achieve a desired behaviour.
Figure 4.6-1. Possible design of a pump’s radiator
Another passive solution may be applied to increase the thermal comfort of the pumps. Since a large amount of energy is being dissipated during their operation, they may require a slight heat transfer enhancement. It could be achieved through mounting a dedicated radiator on the pump’s casing.
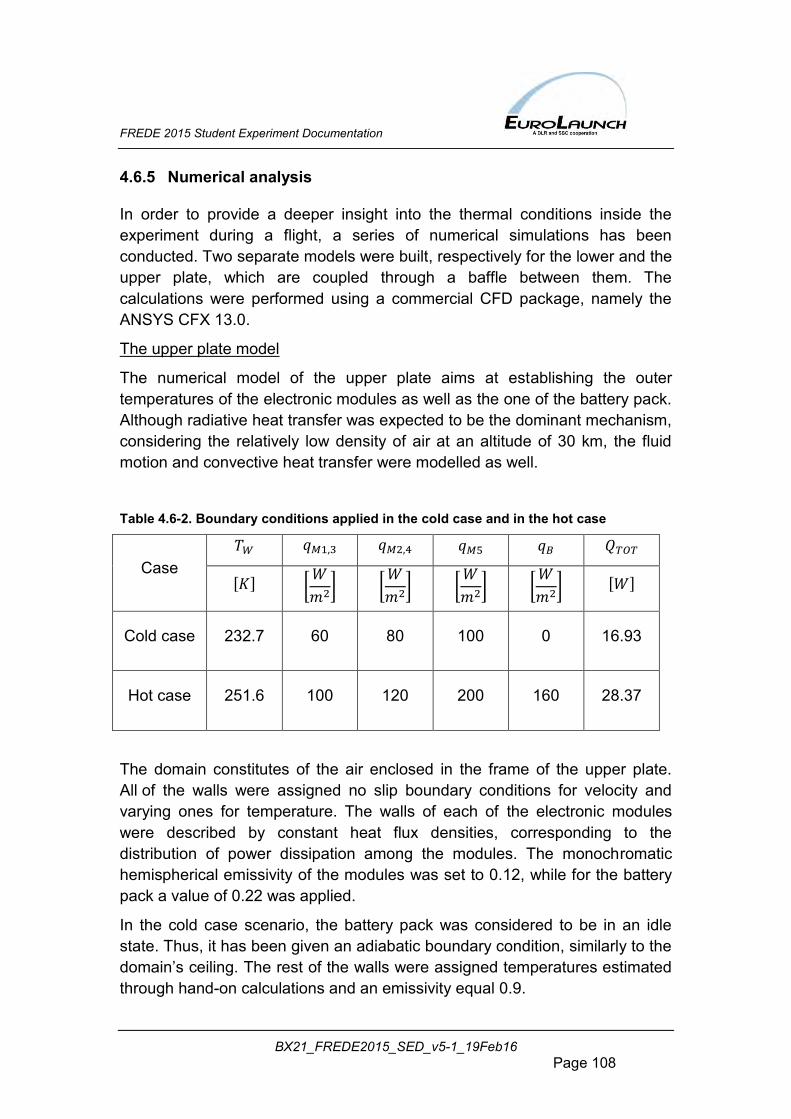
FREDE 2015 Student Experiment Documentation
BX21_FREDE2015_SED_v5-1_19Feb16 Page 108
4.6.5 Numerical analysis
In order to provide a deeper insight into the thermal conditions inside the experiment during a flight, a series of numerical simulations has been conducted. Two separate models were built, respectively for the lower and the upper plate, which are coupled through a baffle between them. The calculations were performed using a commercial CFD package, namely the ANSYS CFX 13.0.
The upper plate model
The numerical model of the upper plate aims at establishing the outer temperatures of the electronic modules as well as the one of the battery pack. Although radiative heat transfer was expected to be the dominant mechanism, considering the relatively low density of air at an altitude of 30 km, the fluid motion and convective heat transfer were modelled as well.
Table 4.6-2. Boundary conditions applied in the cold case and in the hot case
Case 𝑇𝑊 𝑞𝑀1,3 𝑞𝑀2,4 𝑞𝑀5 𝑞𝐵 𝑄𝑇𝑂𝑇
[𝐾] [𝑊
𝑚2] [
𝑊
𝑚2] [
𝑊
𝑚2] [
𝑊
𝑚2] [𝑊]
Cold case 232.7 60 80 100 0 16.93
Hot case 251.6 100 120 200 160 28.37
The domain constitutes of the air enclosed in the frame of the upper plate. All of the walls were assigned no slip boundary conditions for velocity and varying ones for temperature. The walls of each of the electronic modules were described by constant heat flux densities, corresponding to the distribution of power dissipation among the modules. The monochromatic hemispherical emissivity of the modules was set to 0.12, while for the battery pack a value of 0.22 was applied.
In the cold case scenario, the battery pack was considered to be in an idle state. Thus, it has been given an adiabatic boundary condition, similarly to the domain’s ceiling. The rest of the walls were assigned temperatures estimated through hand-on calculations and an emissivity equal 0.9.
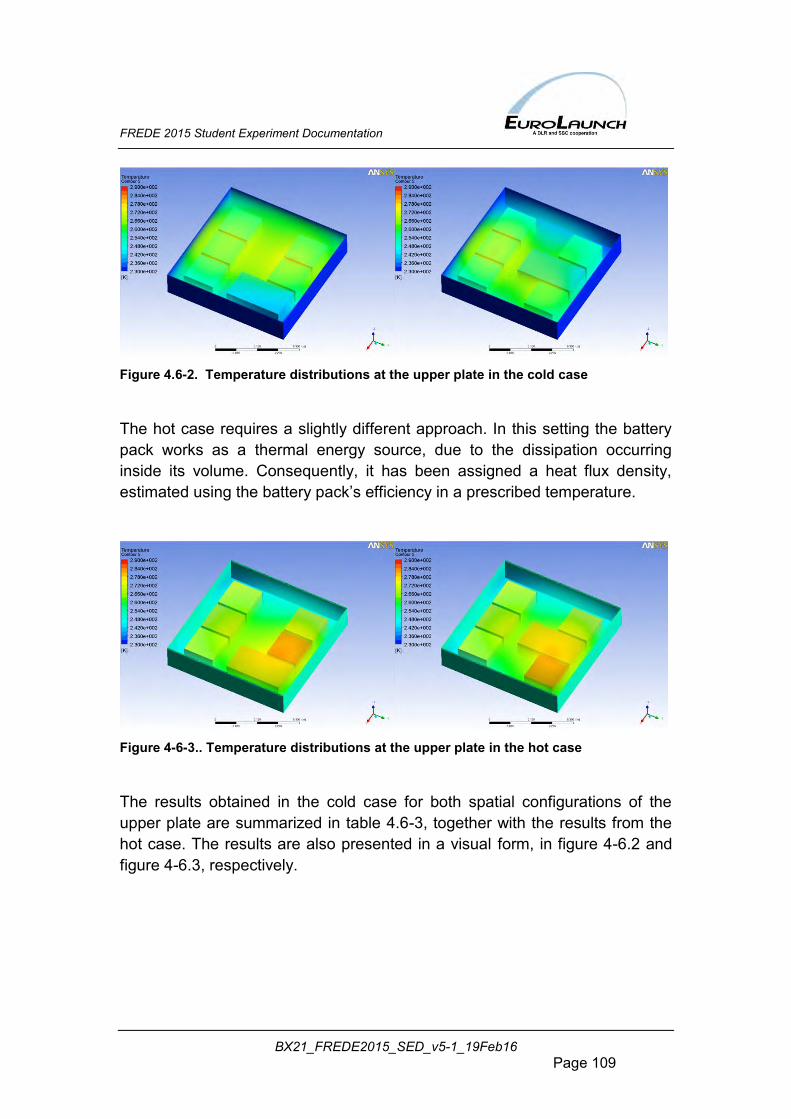
FREDE 2015 Student Experiment Documentation
BX21_FREDE2015_SED_v5-1_19Feb16 Page 109
Figure 4.6-2. Temperature distributions at the upper plate in the cold case
The hot case requires a slightly different approach. In this setting the battery pack works as a thermal energy source, due to the dissipation occurring inside its volume. Consequently, it has been assigned a heat flux density, estimated using the battery pack’s efficiency in a prescribed temperature.
Figure 4-6-3.. Temperature distributions at the upper plate in the hot case
The results obtained in the cold case for both spatial configurations of the upper plate are summarized in table 4.6-3, together with the results from the hot case. The results are also presented in a visual form, in figure 4-6.2 and figure 4-6.3, respectively.
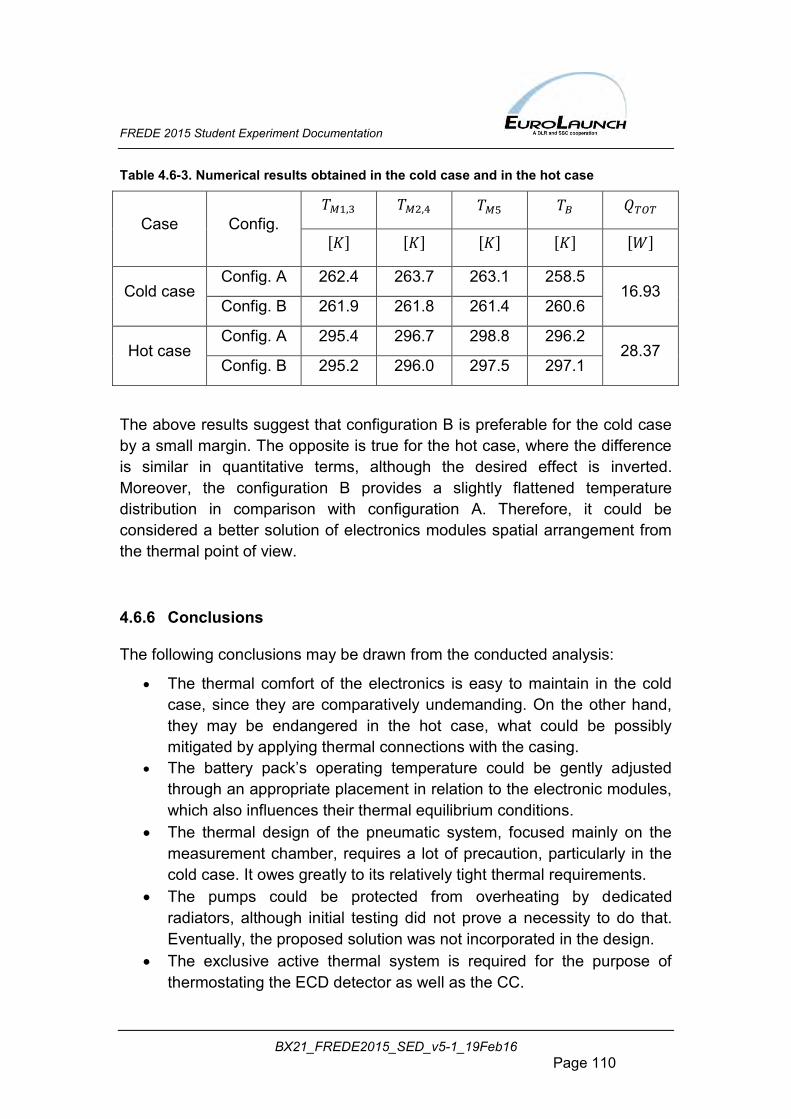
FREDE 2015 Student Experiment Documentation
BX21_FREDE2015_SED_v5-1_19Feb16 Page 110
Table 4.6-3. Numerical results obtained in the cold case and in the hot case
Case Config. 𝑇𝑀1,3 𝑇𝑀2,4 𝑇𝑀5 𝑇𝐵 𝑄𝑇𝑂𝑇
[𝐾] [𝐾] [𝐾] [𝐾] [𝑊]
Cold case Config. A 262.4 263.7 263.1 258.5
16.93 Config. B 261.9 261.8 261.4 260.6
Hot case Config. A 295.4 296.7 298.8 296.2
28.37 Config. B 295.2 296.0 297.5 297.1
The above results suggest that configuration B is preferable for the cold case by a small margin. The opposite is true for the hot case, where the difference is similar in quantitative terms, although the desired effect is inverted. Moreover, the configuration B provides a slightly flattened temperature distribution in comparison with configuration A. Therefore, it could be considered a better solution of electronics modules spatial arrangement from the thermal point of view.
4.6.6 Conclusions
The following conclusions may be drawn from the conducted analysis:
The thermal comfort of the electronics is easy to maintain in the cold case, since they are comparatively undemanding. On the other hand, they may be endangered in the hot case, what could be possibly mitigated by applying thermal connections with the casing.
The battery pack’s operating temperature could be gently adjusted through an appropriate placement in relation to the electronic modules, which also influences their thermal equilibrium conditions.
The thermal design of the pneumatic system, focused mainly on the measurement chamber, requires a lot of precaution, particularly in the cold case. It owes greatly to its relatively tight thermal requirements.
The pumps could be protected from overheating by dedicated radiators, although initial testing did not prove a necessity to do that. Eventually, the proposed solution was not incorporated in the design.
The exclusive active thermal system is required for the purpose of thermostating the ECD detector as well as the CC.

FREDE 2015 Student Experiment Documentation
BX21_FREDE2015_SED_v5-1_19Feb16 Page 111
4.7 Power System FREDE Experiment used two battery packs provided by EGON Gondola. In pre-flight and ascent phases only measurement, communication and heating systems were active. The ECD could be heated up in high power mode (20 W) during ascent or even before flight using an external power supply. In the float phase ECD heating was switched to low power mode. Low power mode is possible due to the DC/DC converter which has constant current output. Value of dissipated power can be controlled through PWM.
Pneumatics system was turned on above altitude of 20 km. Pumps did not work continuously – they were switched on periodically. Power schedule for the most power consuming subsystems is presented in figure 4.7-1.
Figure 4.7-1 Power schedule
Table 4.7-1 Power consumption
Component Voltage
[V]
Current
[A]
Power
[W]
Time(4)
[h]
Energy
[Wh]
FCU 5 0.5 2.5 3.5 8.75
Low-res camera 5 0.1 0.5 0.5 0.25
Hi-res camera 5 0.6 3 0.5 1.5
Boards 5 0.2 1 3.5 3.5
Power loss on DC/DC converters - - 3 3.5 10.5
Pumps 8 1.7 14 1(2) 14
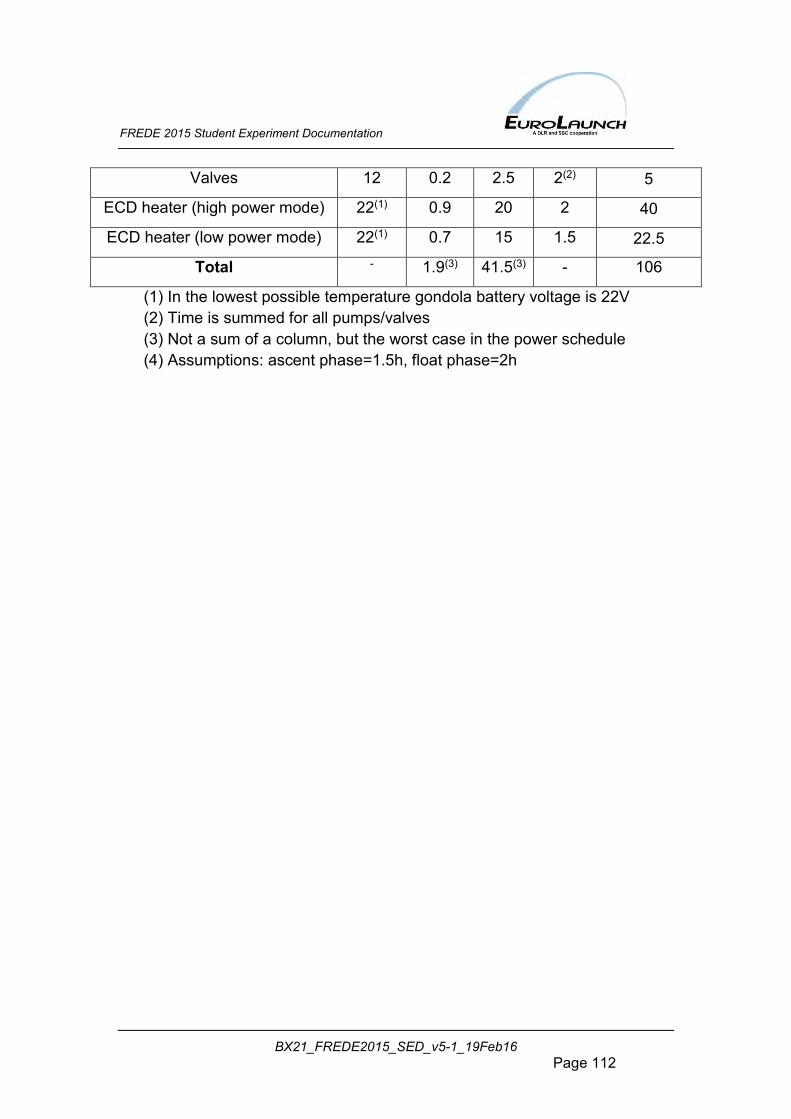
FREDE 2015 Student Experiment Documentation
BX21_FREDE2015_SED_v5-1_19Feb16 Page 112
Valves 12 0.2 2.5 2(2) 5
ECD heater (high power mode) 22(1) 0.9 20 2 40
ECD heater (low power mode) 22(1) 0.7 15 1.5 22.5
Total - 1.9(3) 41.5(3) - 106
(1) In the lowest possible temperature gondola battery voltage is 22V (2) Time is summed for all pumps/valves (3) Not a sum of a column, but the worst case in the power schedule (4) Assumptions: ascent phase=1.5h, float phase=2h
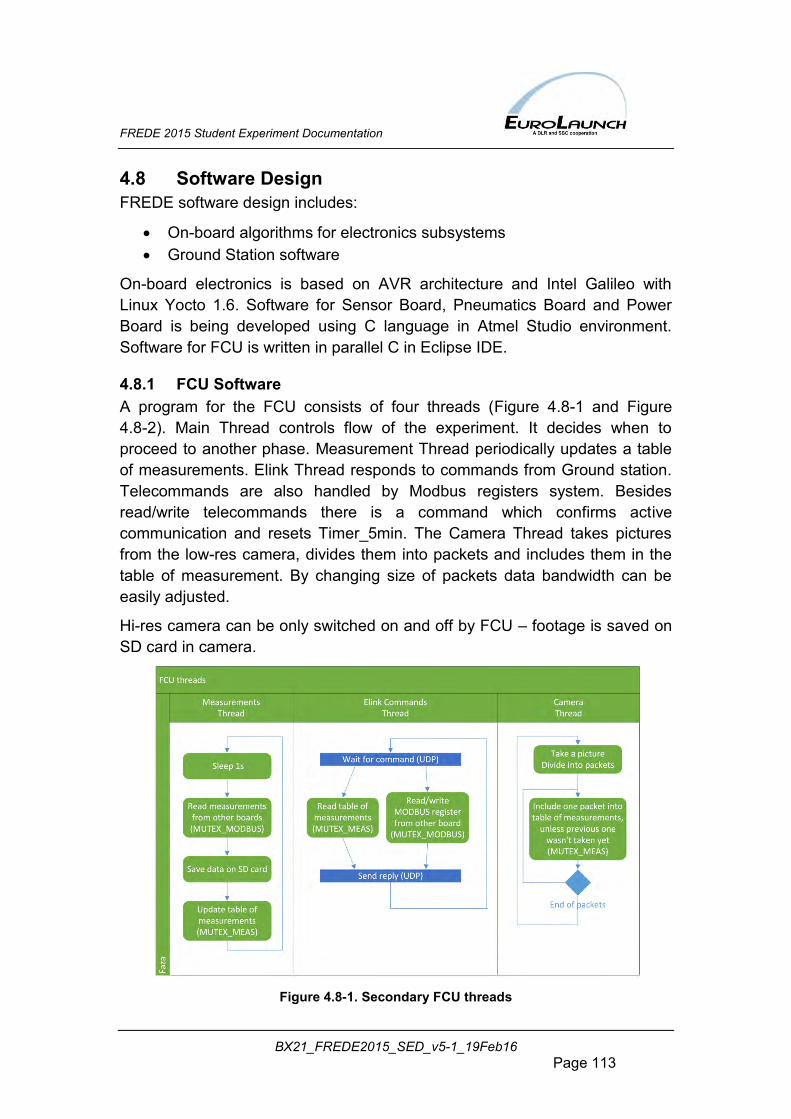
FREDE 2015 Student Experiment Documentation
BX21_FREDE2015_SED_v5-1_19Feb16 Page 113
4.8 Software Design FREDE software design includes:
On-board algorithms for electronics subsystems Ground Station software
On-board electronics is based on AVR architecture and Intel Galileo with Linux Yocto 1.6. Software for Sensor Board, Pneumatics Board and Power Board is being developed using C language in Atmel Studio environment. Software for FCU is written in parallel C in Eclipse IDE.
4.8.1 FCU Software A program for the FCU consists of four threads (Figure 4.8-1 and Figure 4.8-2). Main Thread controls flow of the experiment. It decides when to proceed to another phase. Measurement Thread periodically updates a table of measurements. Elink Thread responds to commands from Ground station. Telecommands are also handled by Modbus registers system. Besides read/write telecommands there is a command which confirms active communication and resets Timer_5min. The Camera Thread takes pictures from the low-res camera, divides them into packets and includes them in the table of measurement. By changing size of packets data bandwidth can be easily adjusted.
Hi-res camera can be only switched on and off by FCU – footage is saved on SD card in camera.
Figure 4.8-1. Secondary FCU threads
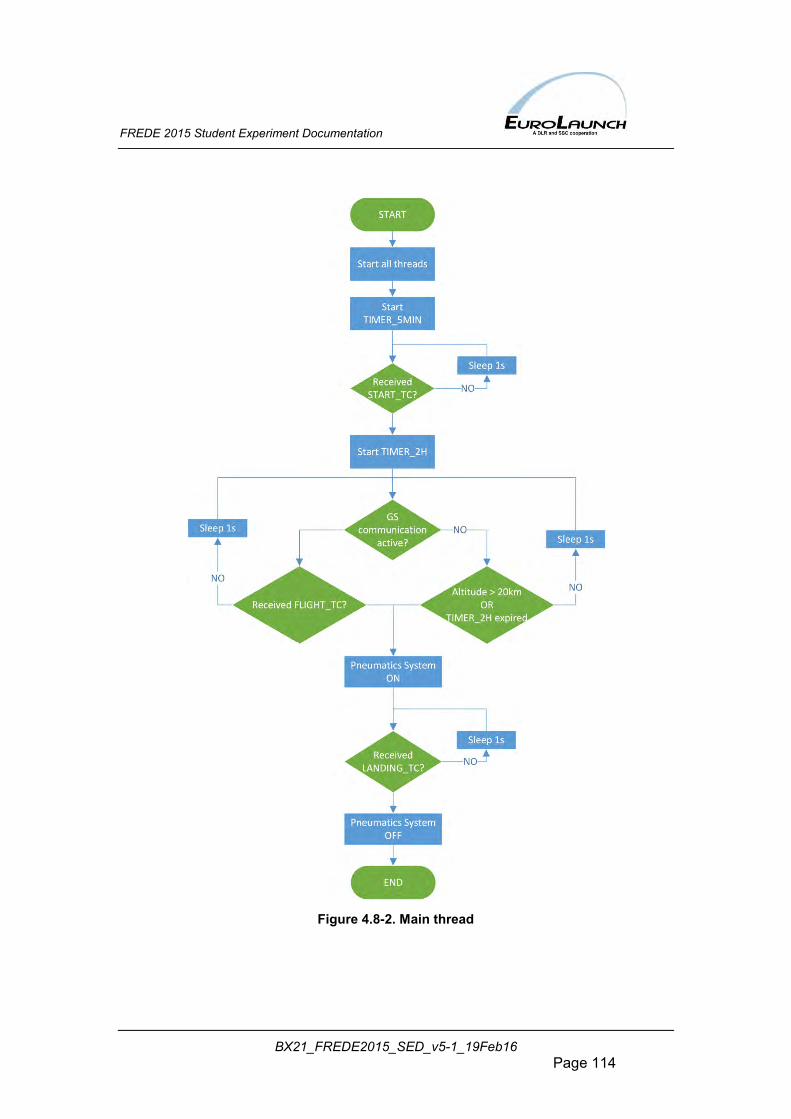
FREDE 2015 Student Experiment Documentation
BX21_FREDE2015_SED_v5-1_19Feb16 Page 114
Figure 4.8-2. Main thread
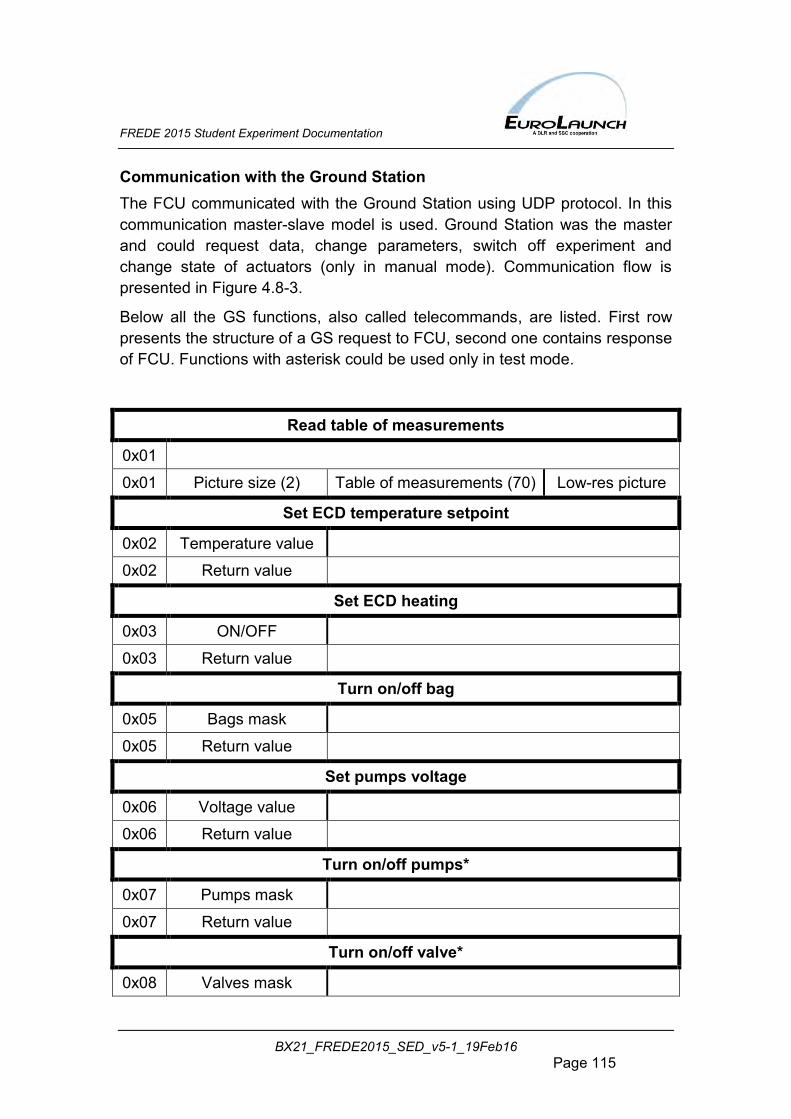
FREDE 2015 Student Experiment Documentation
BX21_FREDE2015_SED_v5-1_19Feb16 Page 115
Communication with the Ground Station The FCU communicated with the Ground Station using UDP protocol. In this communication master-slave model is used. Ground Station was the master and could request data, change parameters, switch off experiment and change state of actuators (only in manual mode). Communication flow is presented in Figure 4.8-3.
Below all the GS functions, also called telecommands, are listed. First row presents the structure of a GS request to FCU, second one contains response of FCU. Functions with asterisk could be used only in test mode.
Read table of measurements
0x01
0x01 Picture size (2) Table of measurements (70) Low-res picture
Set ECD temperature setpoint
0x02 Temperature value
0x02 Return value
Set ECD heating
0x03 ON/OFF
0x03 Return value
Turn on/off bag
0x05 Bags mask
0x05 Return value
Set pumps voltage
0x06 Voltage value
0x06 Return value
Turn on/off pumps*
0x07 Pumps mask
0x07 Return value
Turn on/off valve*
0x08 Valves mask
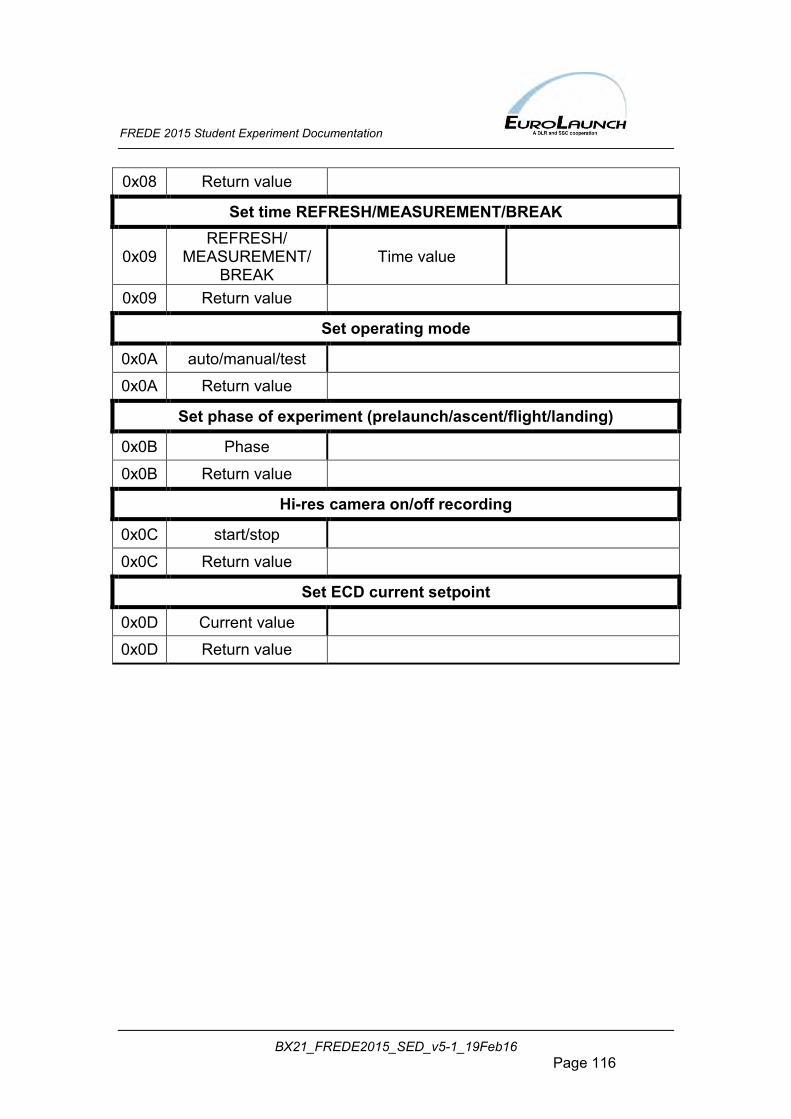
FREDE 2015 Student Experiment Documentation
BX21_FREDE2015_SED_v5-1_19Feb16 Page 116
0x08 Return value
Set time REFRESH/MEASUREMENT/BREAK
0x09 REFRESH/
MEASUREMENT/ BREAK
Time value
0x09 Return value
Set operating mode
0x0A auto/manual/test
0x0A Return value
Set phase of experiment (prelaunch/ascent/flight/landing)
0x0B Phase
0x0B Return value
Hi-res camera on/off recording
0x0C start/stop
0x0C Return value
Set ECD current setpoint
0x0D Current value
0x0D Return value
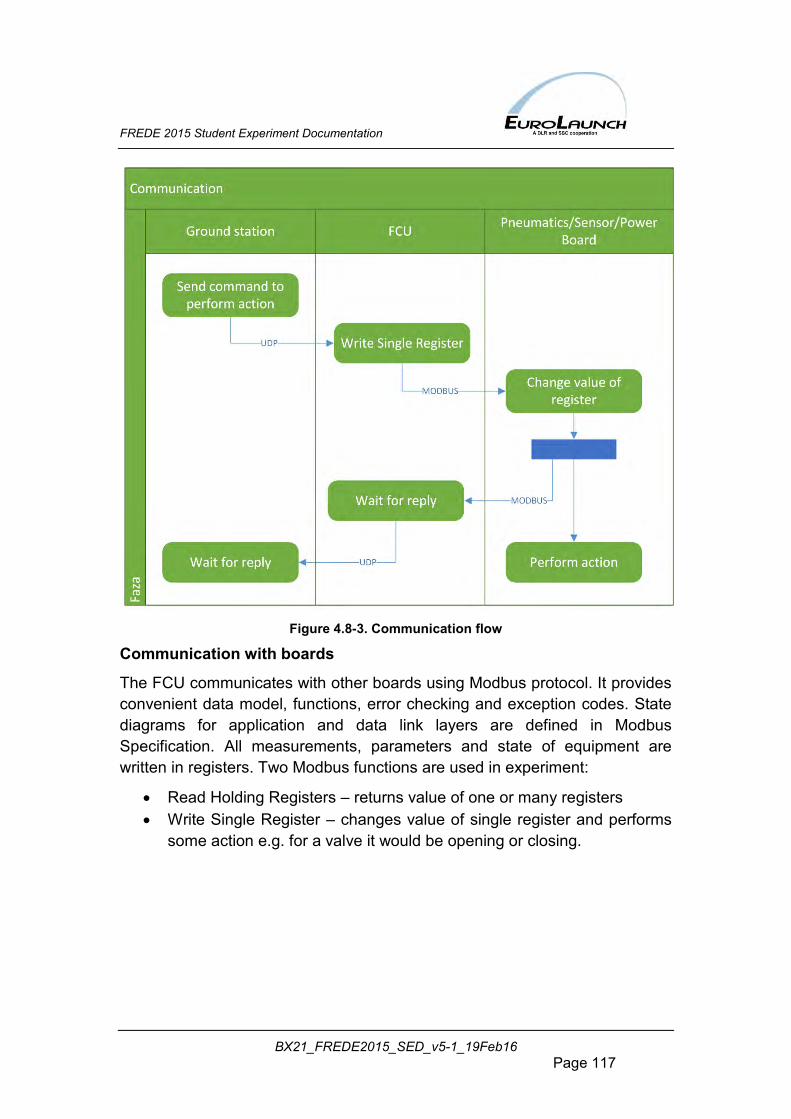
FREDE 2015 Student Experiment Documentation
BX21_FREDE2015_SED_v5-1_19Feb16 Page 117
Figure 4.8-3. Communication flow
Communication with boards
The FCU communicates with other boards using Modbus protocol. It provides convenient data model, functions, error checking and exception codes. State diagrams for application and data link layers are defined in Modbus Specification. All measurements, parameters and state of equipment are written in registers. Two Modbus functions are used in experiment:
Read Holding Registers – returns value of one or many registers Write Single Register – changes value of single register and performs
some action e.g. for a valve it would be opening or closing.
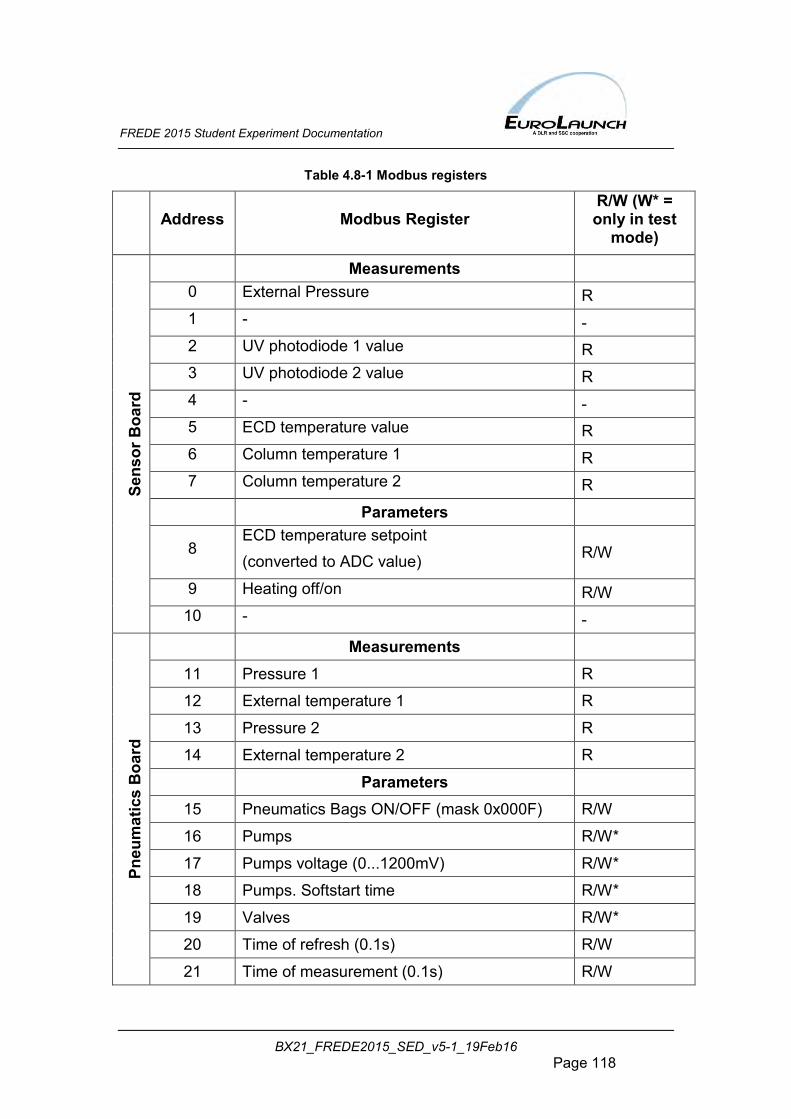
FREDE 2015 Student Experiment Documentation
BX21_FREDE2015_SED_v5-1_19Feb16 Page 118
Table 4.8-1 Modbus registers
Address Modbus Register R/W (W* = only in test
mode)
Sens
or B
oard
Measurements 0 External Pressure R 1 - - 2 UV photodiode 1 value R 3 UV photodiode 2 value R 4 - - 5 ECD temperature value R 6 Column temperature 1 R 7 Column temperature 2 R
Parameters
8 ECD temperature setpoint (converted to ADC value) R/W
9 Heating off/on R/W 10 - -
Pneu
mat
ics
Boa
rd
Measurements 11 Pressure 1 R
12 External temperature 1 R
13 Pressure 2 R
14 External temperature 2 R
Parameters 15 Pneumatics Bags ON/OFF (mask 0x000F) R/W
16 Pumps R/W*
17 Pumps voltage (0...1200mV) R/W*
18 Pumps. Softstart time R/W*
19 Valves R/W*
20 Time of refresh (0.1s) R/W
21 Time of measurement (0.1s) R/W
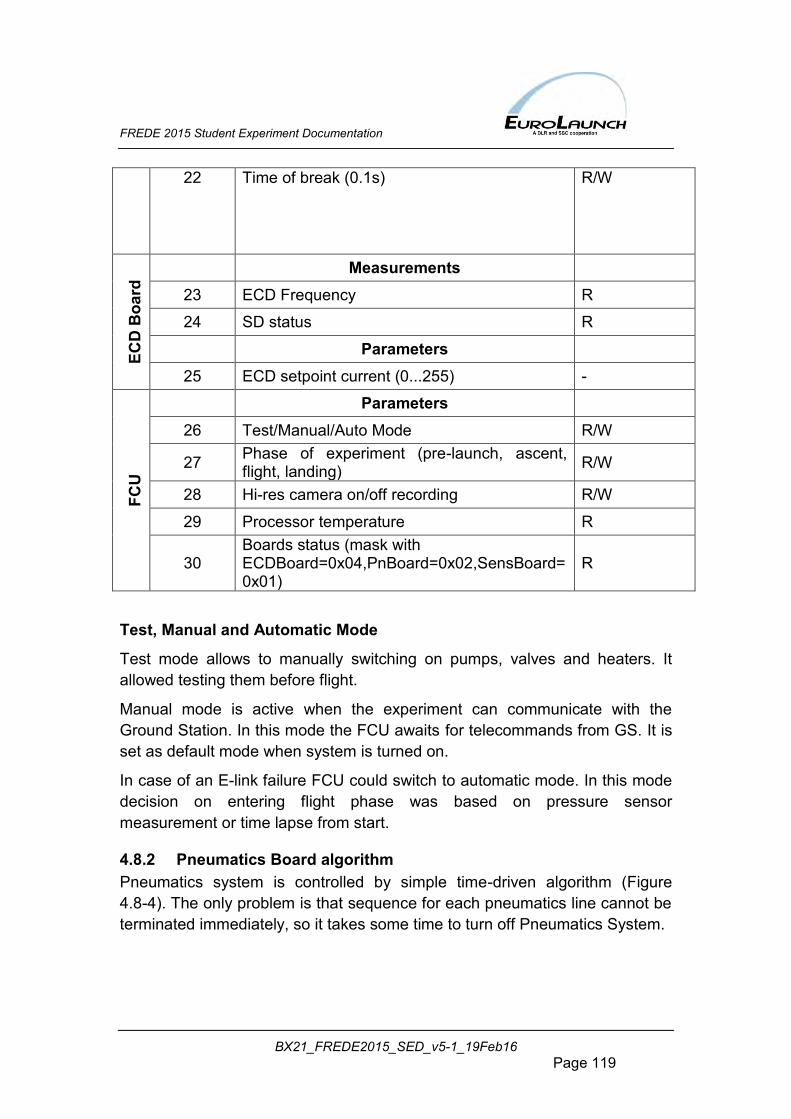
FREDE 2015 Student Experiment Documentation
BX21_FREDE2015_SED_v5-1_19Feb16 Page 119
22 Time of break (0.1s) R/W
ECD
Boa
rd Measurements
23 ECD Frequency R
24 SD status R
Parameters 25 ECD setpoint current (0...255) -
FCU
Parameters 26 Test/Manual/Auto Mode R/W
27 Phase of experiment (pre-launch, ascent, flight, landing) R/W
28 Hi-res camera on/off recording R/W
29 Processor temperature R
30 Boards status (mask with ECDBoard=0x04,PnBoard=0x02,SensBoard=0x01)
R
Test, Manual and Automatic Mode
Test mode allows to manually switching on pumps, valves and heaters. It allowed testing them before flight.
Manual mode is active when the experiment can communicate with the Ground Station. In this mode the FCU awaits for telecommands from GS. It is set as default mode when system is turned on.
In case of an E-link failure FCU could switch to automatic mode. In this mode decision on entering flight phase was based on pressure sensor measurement or time lapse from start.
4.8.2 Pneumatics Board algorithm Pneumatics system is controlled by simple time-driven algorithm (Figure 4.8-4). The only problem is that sequence for each pneumatics line cannot be terminated immediately, so it takes some time to turn off Pneumatics System.
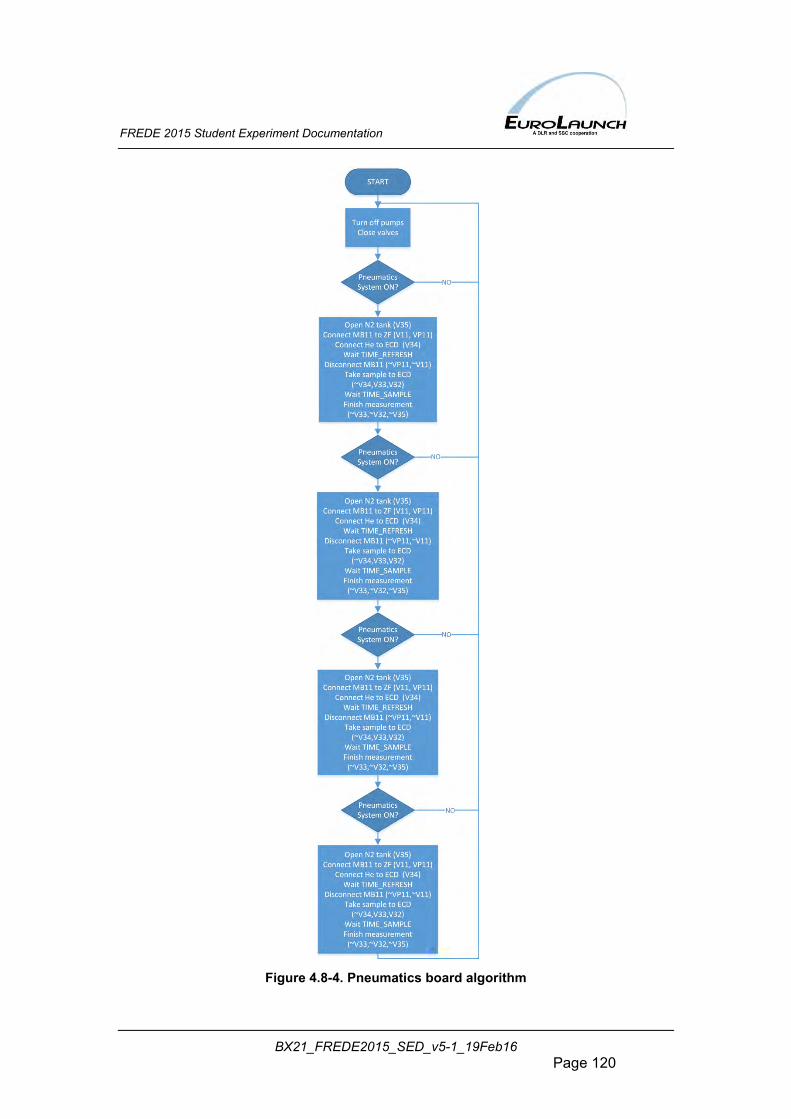
FREDE 2015 Student Experiment Documentation
BX21_FREDE2015_SED_v5-1_19Feb16 Page 120
Figure 4.8-4. Pneumatics board algorithm
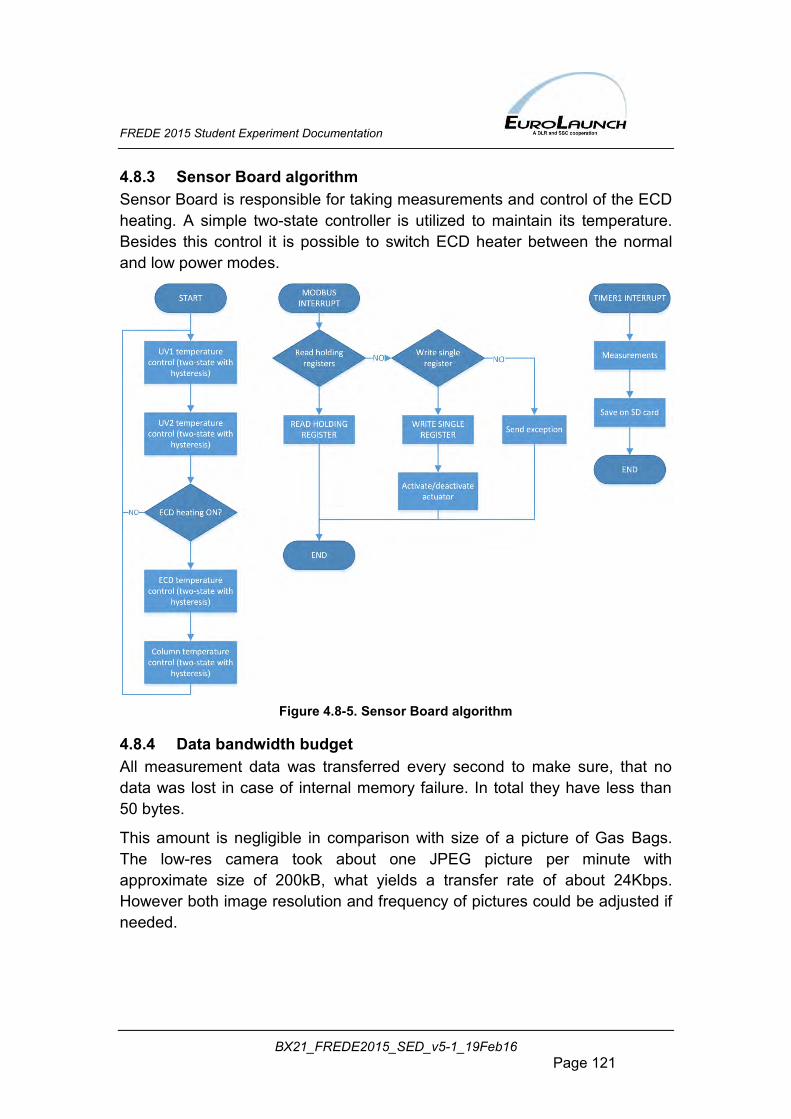
FREDE 2015 Student Experiment Documentation
BX21_FREDE2015_SED_v5-1_19Feb16 Page 121
4.8.3 Sensor Board algorithm Sensor Board is responsible for taking measurements and control of the ECD heating. A simple two-state controller is utilized to maintain its temperature. Besides this control it is possible to switch ECD heater between the normal and low power modes.
Figure 4.8-5. Sensor Board algorithm
4.8.4 Data bandwidth budget All measurement data was transferred every second to make sure, that no data was lost in case of internal memory failure. In total they have less than 50 bytes.
This amount is negligible in comparison with size of a picture of Gas Bags. The low-res camera took about one JPEG picture per minute with approximate size of 200kB, what yields a transfer rate of about 24Kbps. However both image resolution and frequency of pictures could be adjusted if needed.
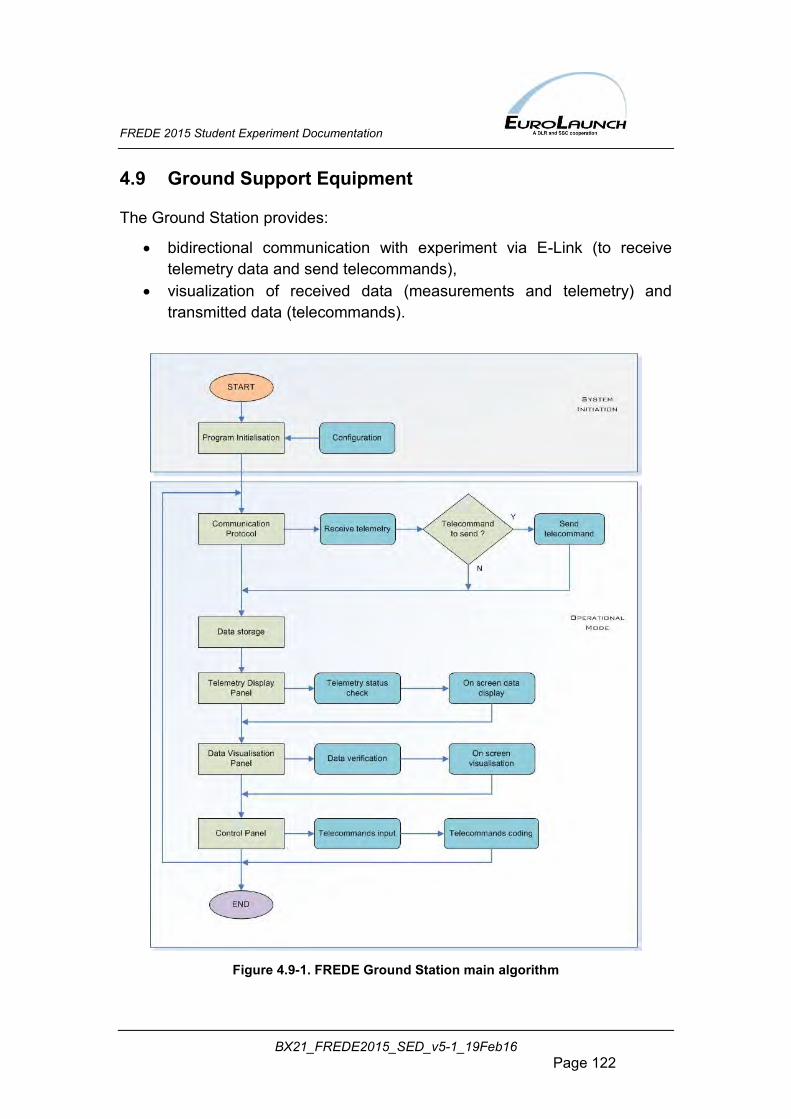
FREDE 2015 Student Experiment Documentation
BX21_FREDE2015_SED_v5-1_19Feb16 Page 122
4.9 Ground Support Equipment
The Ground Station provides:
bidirectional communication with experiment via E-Link (to receive telemetry data and send telecommands),
visualization of received data (measurements and telemetry) and transmitted data (telecommands).
Figure 4.9-1. FREDE Ground Station main algorithm
FREDE 2015 Student Experiment Documentation
BX21_FREDE2015_SED_v5-1_19Feb16 Page 123
Presented basic algorithm of FREDE Ground Station (Figure 4.9-1) describes the overall functionality of this application. The software was created using .NET4.5 using C# and WPF.
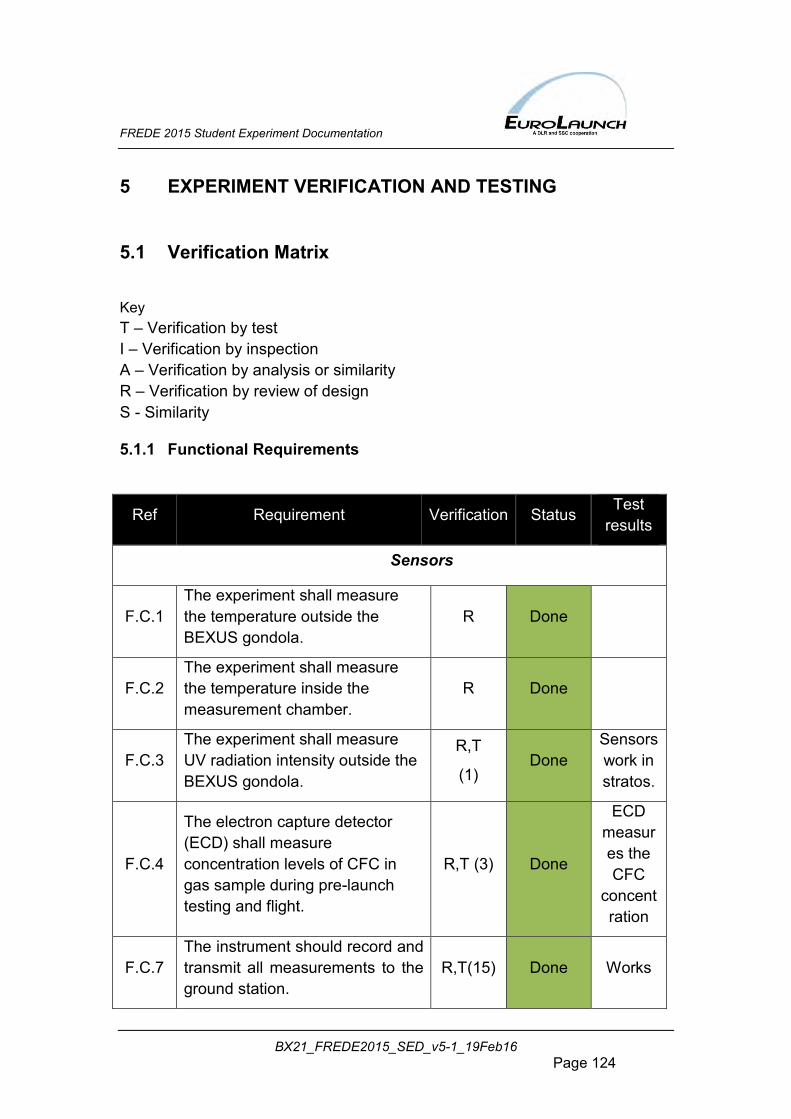
FREDE 2015 Student Experiment Documentation
BX21_FREDE2015_SED_v5-1_19Feb16 Page 124
5 EXPERIMENT VERIFICATION AND TESTING
5.1 Verification Matrix
Key T – Verification by test I – Verification by inspection A – Verification by analysis or similarity R – Verification by review of design S - Similarity
5.1.1 Functional Requirements
Ref Requirement Verification Status Test results
Sensors
F.C.1 The experiment shall measure the temperature outside the BEXUS gondola.
R Done
F.C.2 The experiment shall measure the temperature inside the measurement chamber.
R Done
F.C.3 The experiment shall measure UV radiation intensity outside the BEXUS gondola.
R,T
(1) Done
Sensors work in stratos.
F.C.4
The electron capture detector (ECD) shall measure concentration levels of CFC in gas sample during pre-launch testing and flight.
R,T (3) Done
ECD measures the CFC
concentration
F.C.7 The instrument should record and transmit all measurements to the ground station.
R,T(15) Done Works
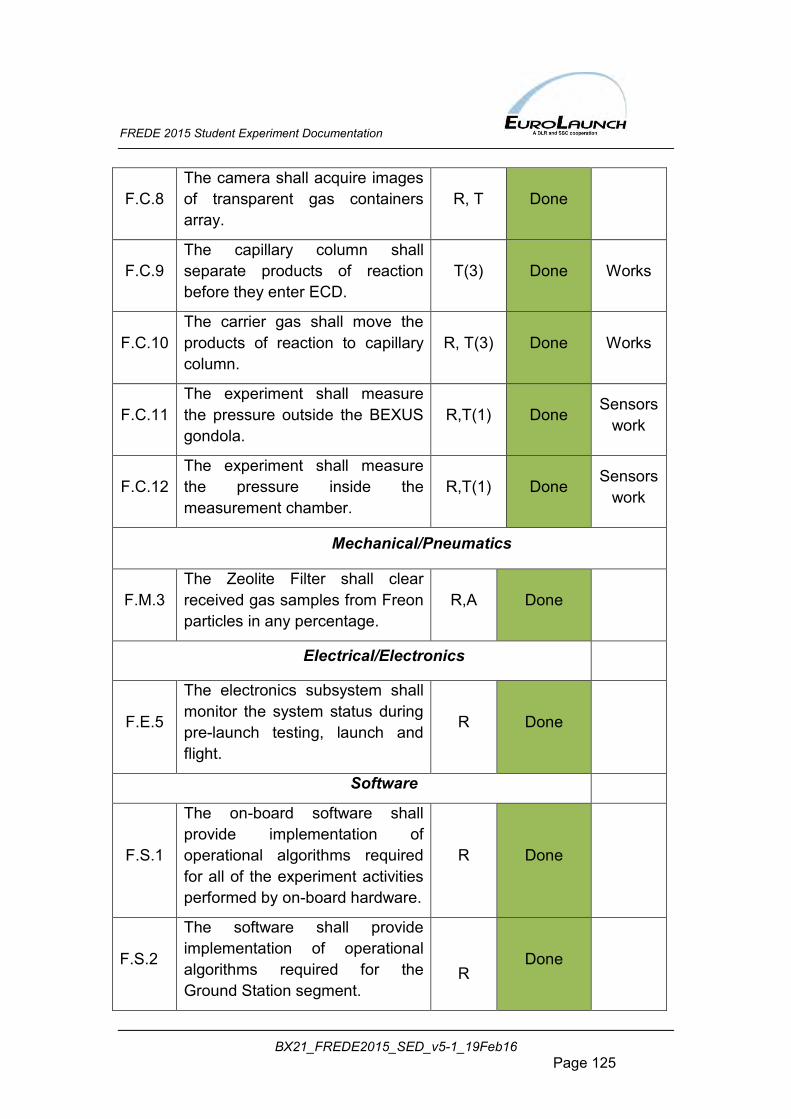
FREDE 2015 Student Experiment Documentation
BX21_FREDE2015_SED_v5-1_19Feb16 Page 125
F.C.8 The camera shall acquire images of transparent gas containers array.
R, T Done
F.C.9 The capillary column shall separate products of reaction before they enter ECD.
T(3) Done Works
F.C.10 The carrier gas shall move the products of reaction to capillary column.
R, T(3) Done Works
F.C.11 The experiment shall measure the pressure outside the BEXUS gondola.
R,T(1) Done Sensors
work
F.C.12 The experiment shall measure the pressure inside the measurement chamber.
R,T(1) Done Sensors work
Mechanical/Pneumatics
F.M.3 The Zeolite Filter shall clear received gas samples from Freon particles in any percentage.
R,A Done
Electrical/Electronics
F.E.5
The electronics subsystem shall monitor the system status during pre-launch testing, launch and flight.
R Done
Software
F.S.1
The on-board software shall provide implementation of operational algorithms required for all of the experiment activities performed by on-board hardware.
R Done
F.S.2
The software shall provide implementation of operational algorithms required for the Ground Station segment.
R Done
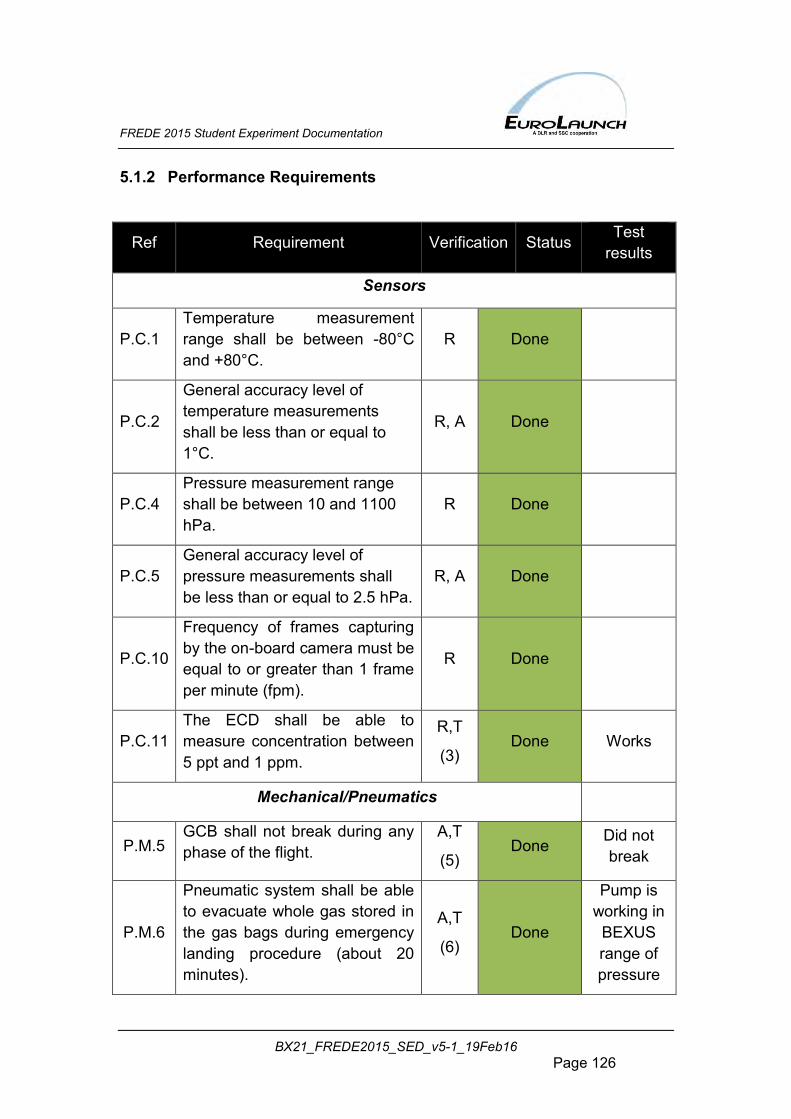
FREDE 2015 Student Experiment Documentation
BX21_FREDE2015_SED_v5-1_19Feb16 Page 126
5.1.2 Performance Requirements
Ref Requirement Verification Status Test results
Sensors
P.C.1 Temperature measurement range shall be between -80°C and +80°C.
R Done
P.C.2
General accuracy level of temperature measurements shall be less than or equal to 1°C.
R, A Done
P.C.4 Pressure measurement range shall be between 10 and 1100 hPa.
R Done
P.C.5 General accuracy level of pressure measurements shall be less than or equal to 2.5 hPa.
R, A Done
P.C.10
Frequency of frames capturing by the on-board camera must be equal to or greater than 1 frame per minute (fpm).
R Done
P.C.11 The ECD shall be able to measure concentration between 5 ppt and 1 ppm.
R,T
(3) Done Works
Mechanical/Pneumatics
P.M.5 GCB shall not break during any phase of the flight.
A,T
(5) Done Did not
break
P.M.6
Pneumatic system shall be able to evacuate whole gas stored in the gas bags during emergency landing procedure (about 20 minutes).
A,T
(6) Done
Pump is working in
BEXUS range of pressure
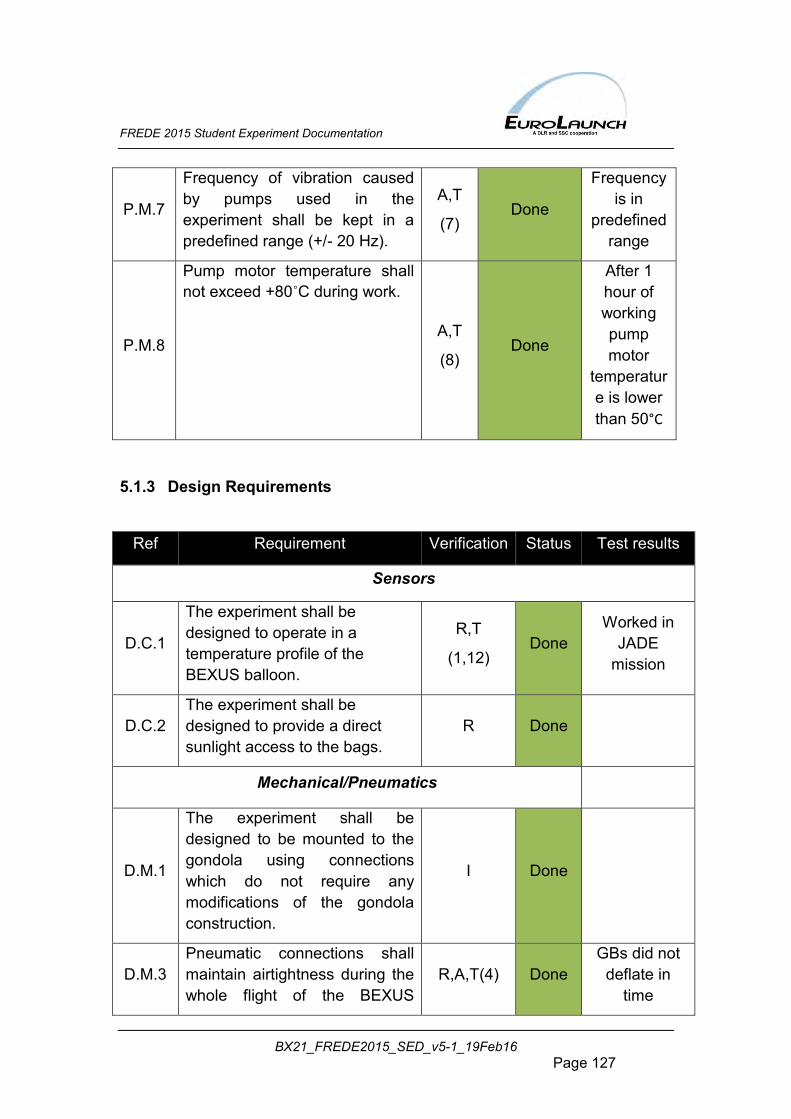
FREDE 2015 Student Experiment Documentation
BX21_FREDE2015_SED_v5-1_19Feb16 Page 127
P.M.7
Frequency of vibration caused by pumps used in the experiment shall be kept in a predefined range (+/- 20 Hz).
A,T
(7) Done
Frequency is in
predefined range
P.M.8
Pump motor temperature shall not exceed +80˚C during work.
A,T
(8) Done
After 1 hour of working pump motor
temperature is lower than 50°C
5.1.3 Design Requirements
Ref Requirement Verification Status Test results
Sensors
D.C.1
The experiment shall be designed to operate in a temperature profile of the BEXUS balloon.
R,T
(1,12) Done
Worked in JADE
mission
D.C.2 The experiment shall be designed to provide a direct sunlight access to the bags.
R Done
Mechanical/Pneumatics
D.M.1
The experiment shall be designed to be mounted to the gondola using connections which do not require any modifications of the gondola construction.
I Done
D.M.3 Pneumatic connections shall maintain airtightness during the whole flight of the BEXUS
R,A,T(4) Done GBs did not
deflate in time
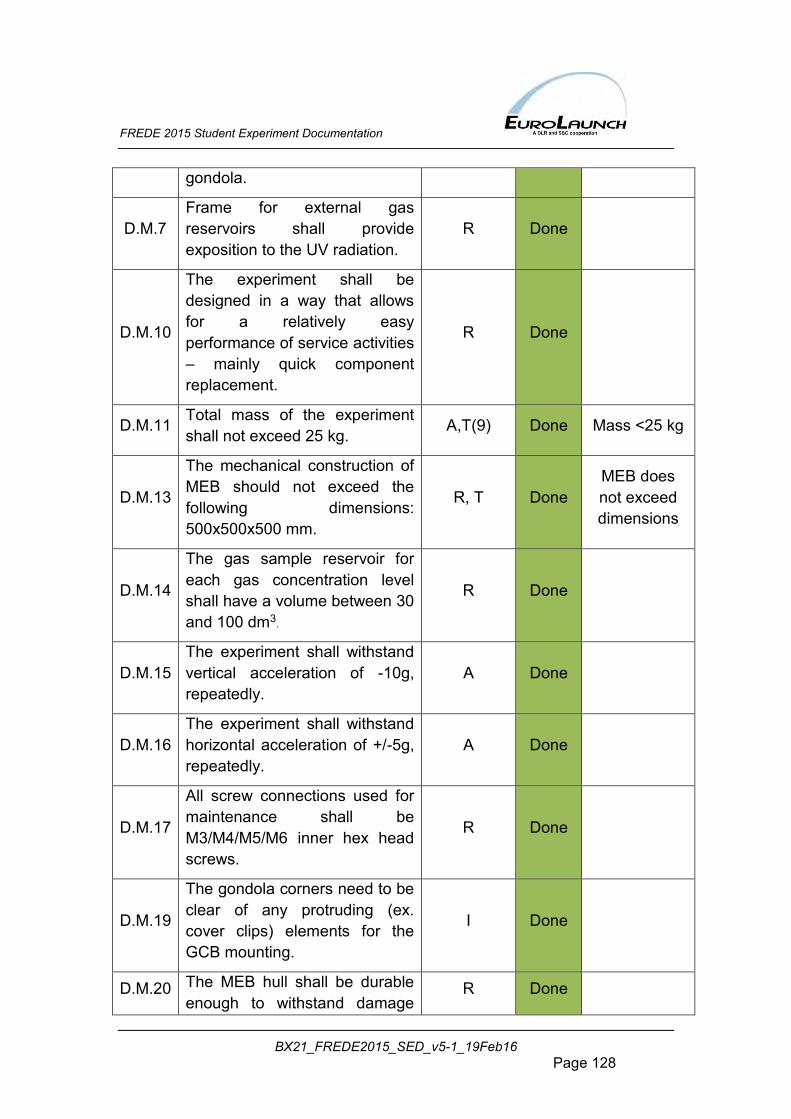
FREDE 2015 Student Experiment Documentation
BX21_FREDE2015_SED_v5-1_19Feb16 Page 128
gondola.
D.M.7 Frame for external gas reservoirs shall provide exposition to the UV radiation.
R Done
D.M.10
The experiment shall be designed in a way that allows for a relatively easy performance of service activities – mainly quick component replacement.
R Done
D.M.11 Total mass of the experiment shall not exceed 25 kg. A,T(9) Done Mass <25 kg
D.M.13
The mechanical construction of MEB should not exceed the following dimensions: 500x500x500 mm.
R, T Done MEB does not exceed dimensions
D.M.14
The gas sample reservoir for each gas concentration level shall have a volume between 30 and 100 dm3.
R Done
D.M.15 The experiment shall withstand vertical acceleration of -10g, repeatedly.
A Done
D.M.16 The experiment shall withstand horizontal acceleration of +/-5g, repeatedly.
A Done
D.M.17
All screw connections used for maintenance shall be M3/M4/M5/M6 inner hex head screws.
R Done
D.M.19
The gondola corners need to be clear of any protruding (ex. cover clips) elements for the GCB mounting.
I Done
D.M.20 The MEB hull shall be durable enough to withstand damage
R Done
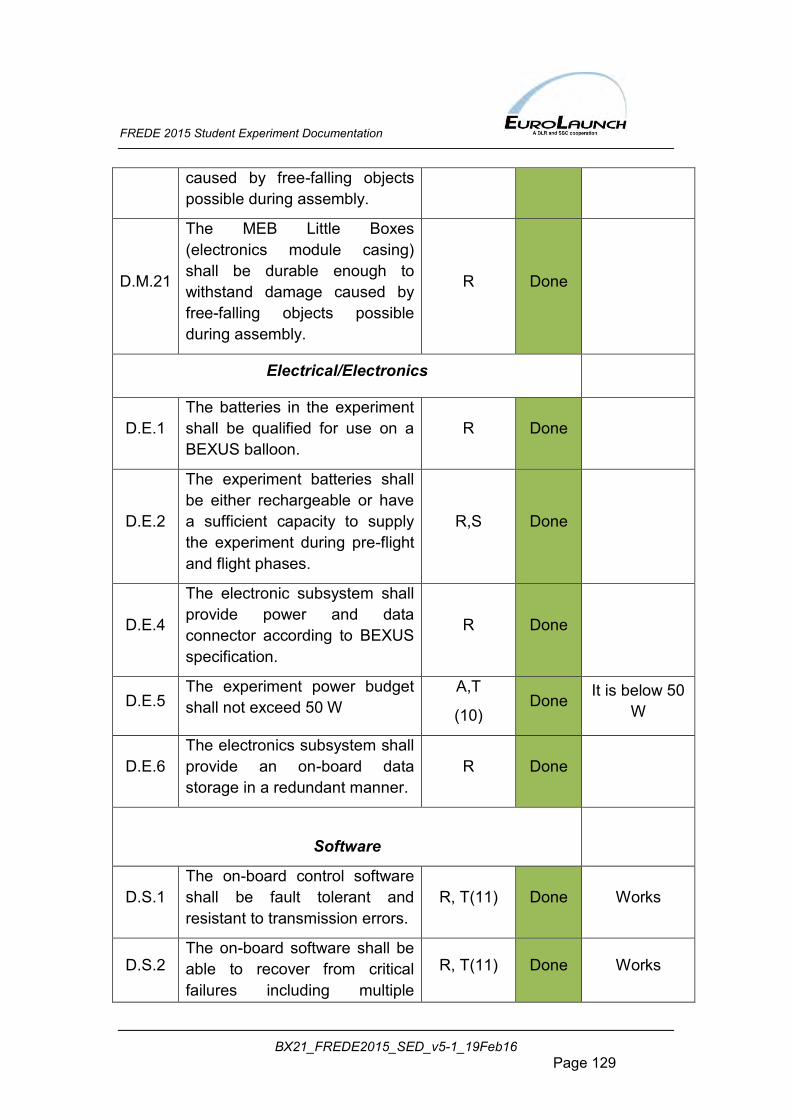
FREDE 2015 Student Experiment Documentation
BX21_FREDE2015_SED_v5-1_19Feb16 Page 129
caused by free-falling objects possible during assembly.
D.M.21
The MEB Little Boxes (electronics module casing) shall be durable enough to withstand damage caused by free-falling objects possible during assembly.
R Done
Electrical/Electronics
D.E.1 The batteries in the experiment shall be qualified for use on a BEXUS balloon.
R Done
D.E.2
The experiment batteries shall be either rechargeable or have a sufficient capacity to supply the experiment during pre-flight and flight phases.
R,S Done
D.E.4
The electronic subsystem shall provide power and data connector according to BEXUS specification.
R Done
D.E.5 The experiment power budget shall not exceed 50 W
A,T
(10) Done It is below 50
W
D.E.6 The electronics subsystem shall provide an on-board data storage in a redundant manner.
R Done
Software
D.S.1 The on-board control software shall be fault tolerant and resistant to transmission errors.
R, T(11) Done Works
D.S.2 The on-board software shall be able to recover from critical failures including multiple
R, T(11) Done Works
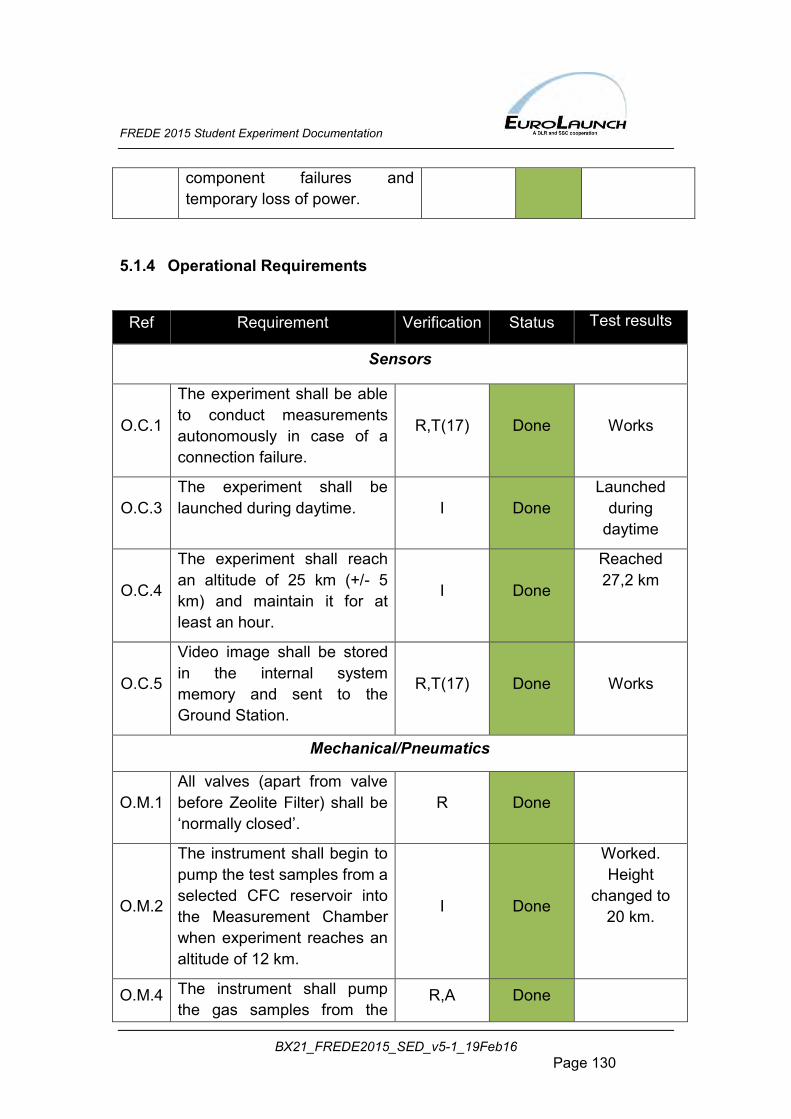
FREDE 2015 Student Experiment Documentation
BX21_FREDE2015_SED_v5-1_19Feb16 Page 130
component failures and temporary loss of power.
5.1.4 Operational Requirements
Ref Requirement Verification Status Test results
Sensors
O.C.1
The experiment shall be able to conduct measurements autonomously in case of a connection failure.
R,T(17) Done Works
O.C.3 The experiment shall be launched during daytime. I Done
Launched during
daytime
O.C.4
The experiment shall reach an altitude of 25 km (+/- 5 km) and maintain it for at least an hour.
I Done
Reached 27,2 km
O.C.5
Video image shall be stored in the internal system memory and sent to the Ground Station.
R,T(17) Done Works
Mechanical/Pneumatics
O.M.1 All valves (apart from valve before Zeolite Filter) shall be ‘normally closed’.
R Done
O.M.2
The instrument shall begin to pump the test samples from a selected CFC reservoir into the Measurement Chamber when experiment reaches an altitude of 12 km.
I Done
Worked. Height
changed to 20 km.
O.M.4 The instrument shall pump the gas samples from the
R,A Done
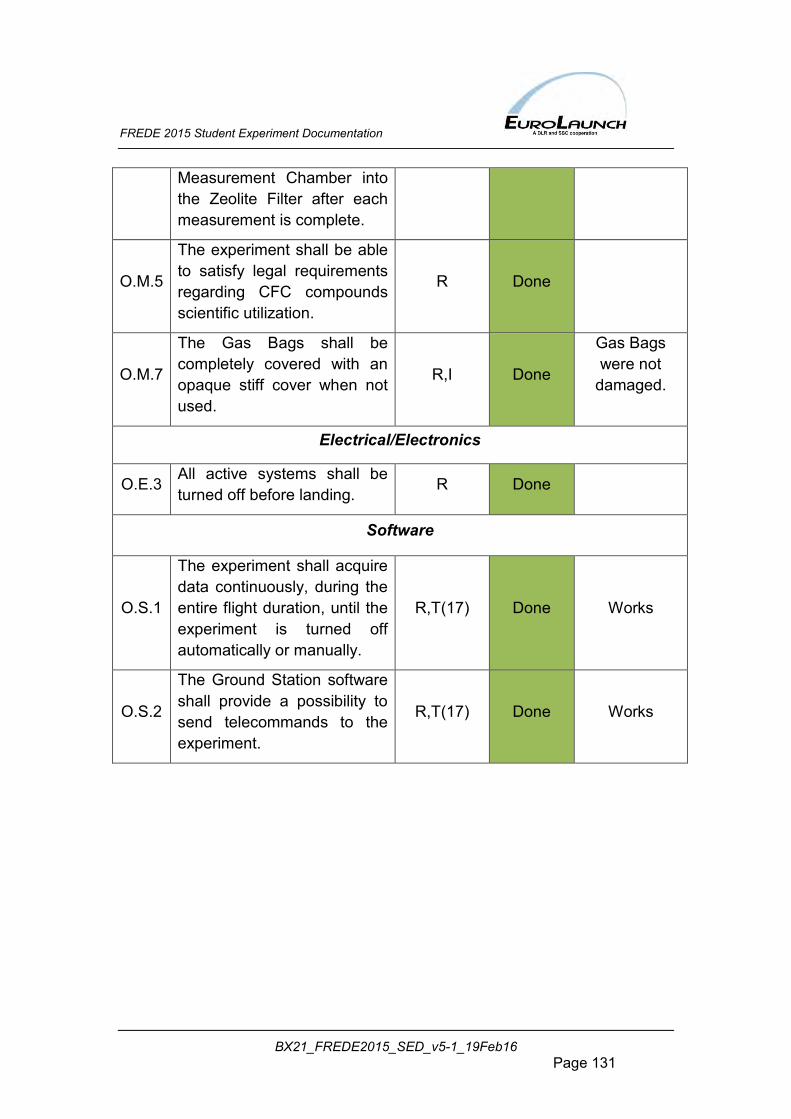
FREDE 2015 Student Experiment Documentation
BX21_FREDE2015_SED_v5-1_19Feb16 Page 131
Measurement Chamber into the Zeolite Filter after each measurement is complete.
O.M.5
The experiment shall be able to satisfy legal requirements regarding CFC compounds scientific utilization.
R Done
O.M.7
The Gas Bags shall be completely covered with an opaque stiff cover when not used.
R,I Done
Gas Bags were not
damaged.
Electrical/Electronics
O.E.3 All active systems shall be turned off before landing. R Done
Software
O.S.1
The experiment shall acquire data continuously, during the entire flight duration, until the experiment is turned off automatically or manually.
R,T(17) Done Works
O.S.2
The Ground Station software shall provide a possibility to send telecommands to the experiment.
R,T(17) Done Works
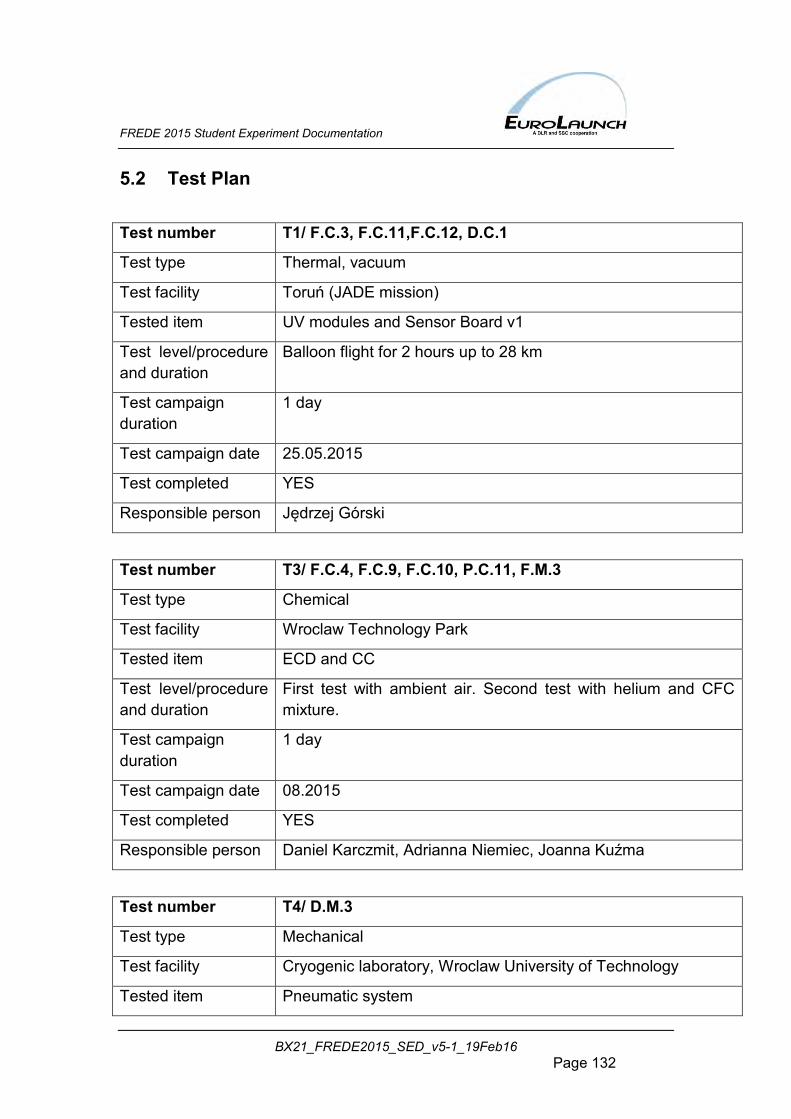
FREDE 2015 Student Experiment Documentation
BX21_FREDE2015_SED_v5-1_19Feb16 Page 132
5.2 Test Plan
Test number T1/ F.C.3, F.C.11,F.C.12, D.C.1
Test type Thermal, vacuum
Test facility Toruń (JADE mission)
Tested item UV modules and Sensor Board v1
Test level/procedure and duration
Balloon flight for 2 hours up to 28 km
Test campaign duration
1 day
Test campaign date 25.05.2015
Test completed YES
Responsible person Jędrzej Górski
Test number T3/ F.C.4, F.C.9, F.C.10, P.C.11, F.M.3
Test type Chemical
Test facility Wroclaw Technology Park
Tested item ECD and CC
Test level/procedure and duration
First test with ambient air. Second test with helium and CFC mixture.
Test campaign duration
1 day
Test campaign date 08.2015
Test completed YES
Responsible person Daniel Karczmit, Adrianna Niemiec, Joanna Kuźma
Test number T4/ D.M.3
Test type Mechanical
Test facility Cryogenic laboratory, Wroclaw University of Technology
Tested item Pneumatic system
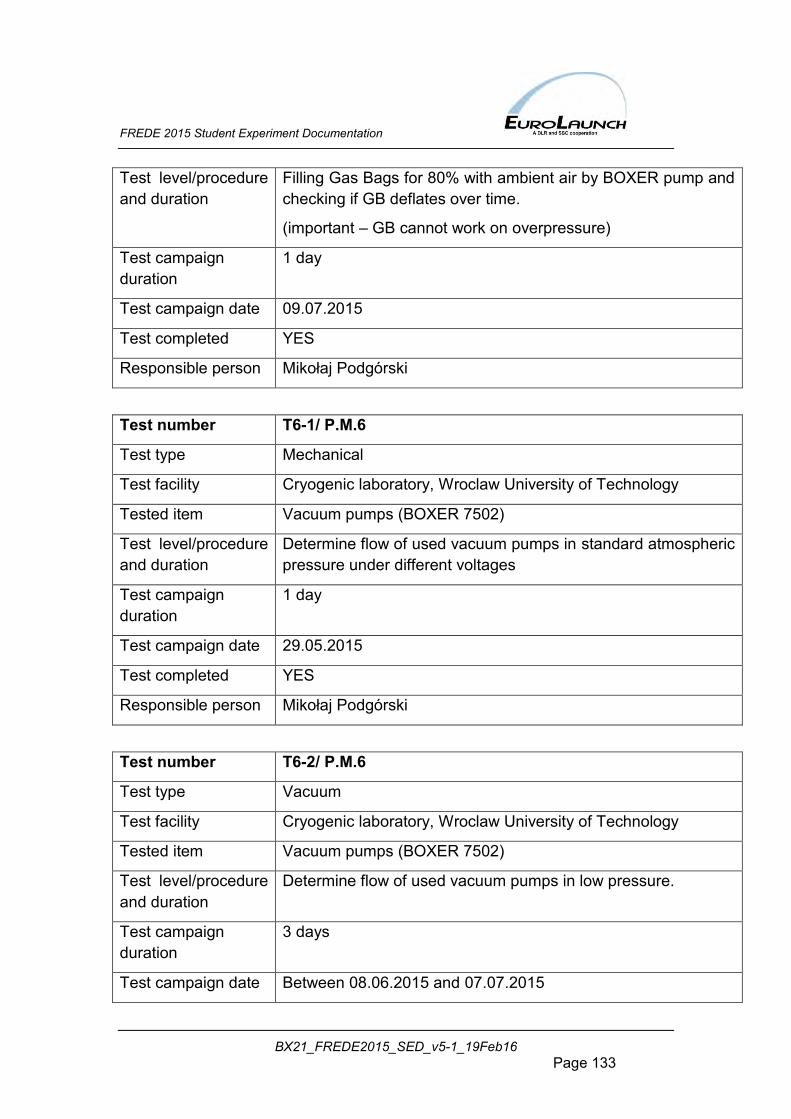
FREDE 2015 Student Experiment Documentation
BX21_FREDE2015_SED_v5-1_19Feb16 Page 133
Test level/procedure and duration
Filling Gas Bags for 80% with ambient air by BOXER pump and checking if GB deflates over time.
(important – GB cannot work on overpressure)
Test campaign duration
1 day
Test campaign date 09.07.2015
Test completed YES
Responsible person Mikołaj Podgórski
Test number T6-1/ P.M.6
Test type Mechanical
Test facility Cryogenic laboratory, Wroclaw University of Technology
Tested item Vacuum pumps (BOXER 7502)
Test level/procedure and duration
Determine flow of used vacuum pumps in standard atmospheric pressure under different voltages
Test campaign duration
1 day
Test campaign date 29.05.2015
Test completed YES
Responsible person Mikołaj Podgórski
Test number T6-2/ P.M.6
Test type Vacuum
Test facility Cryogenic laboratory, Wroclaw University of Technology
Tested item Vacuum pumps (BOXER 7502)
Test level/procedure and duration
Determine flow of used vacuum pumps in low pressure.
Test campaign duration
3 days
Test campaign date Between 08.06.2015 and 07.07.2015
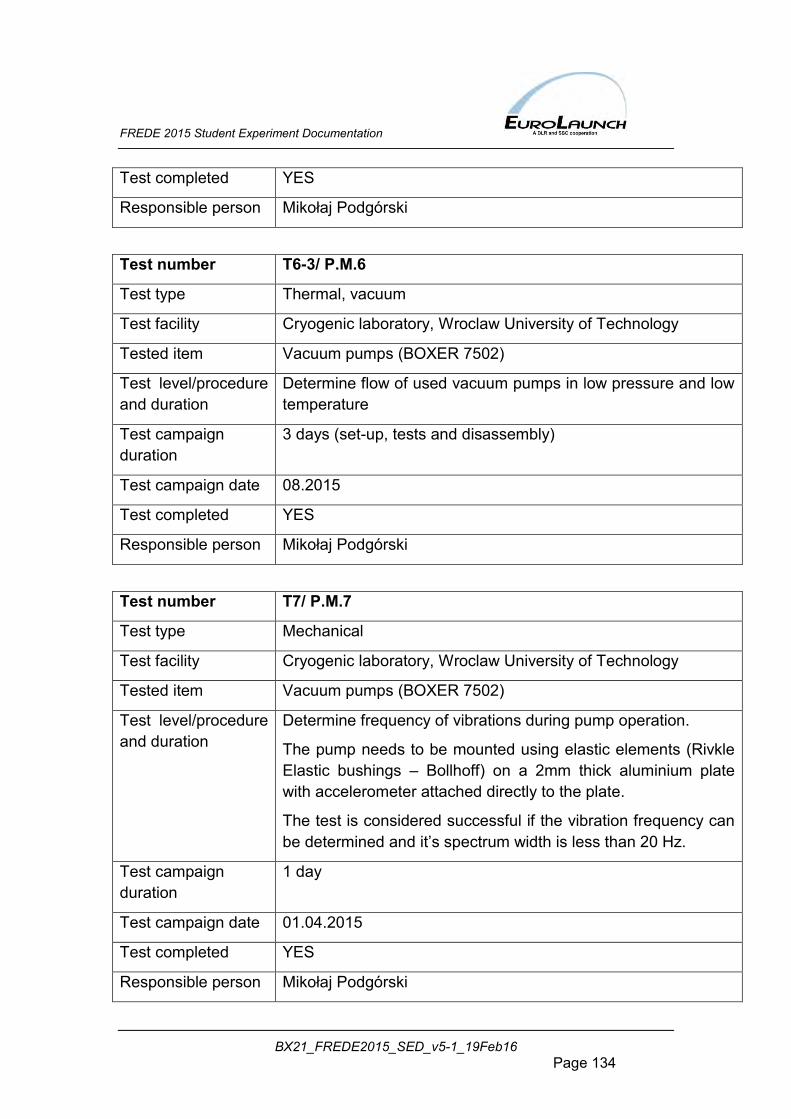
FREDE 2015 Student Experiment Documentation
BX21_FREDE2015_SED_v5-1_19Feb16 Page 134
Test completed YES
Responsible person Mikołaj Podgórski
Test number T6-3/ P.M.6
Test type Thermal, vacuum
Test facility Cryogenic laboratory, Wroclaw University of Technology
Tested item Vacuum pumps (BOXER 7502)
Test level/procedure and duration
Determine flow of used vacuum pumps in low pressure and low temperature
Test campaign duration
3 days (set-up, tests and disassembly)
Test campaign date 08.2015
Test completed YES
Responsible person Mikołaj Podgórski
Test number T7/ P.M.7
Test type Mechanical
Test facility Cryogenic laboratory, Wroclaw University of Technology
Tested item Vacuum pumps (BOXER 7502)
Test level/procedure and duration
Determine frequency of vibrations during pump operation.
The pump needs to be mounted using elastic elements (Rivkle Elastic bushings – Bollhoff) on a 2mm thick aluminium plate with accelerometer attached directly to the plate.
The test is considered successful if the vibration frequency can be determined and it’s spectrum width is less than 20 Hz.
Test campaign duration
1 day
Test campaign date 01.04.2015
Test completed YES
Responsible person Mikołaj Podgórski
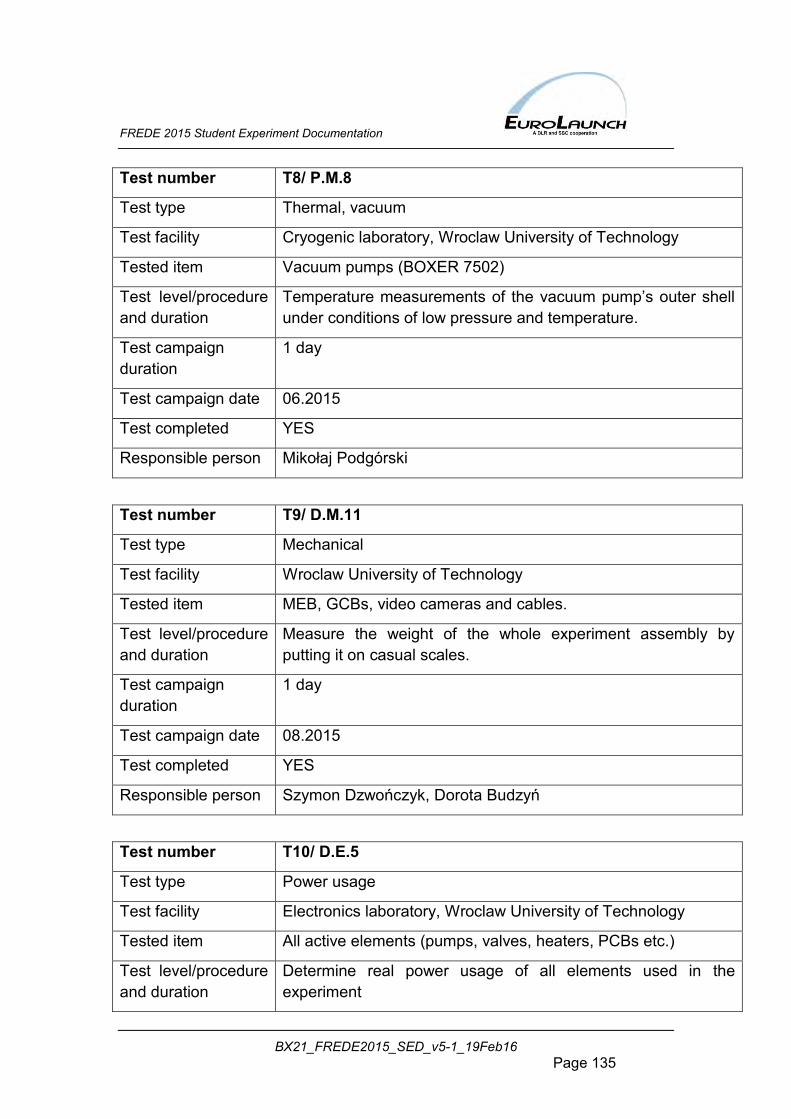
FREDE 2015 Student Experiment Documentation
BX21_FREDE2015_SED_v5-1_19Feb16 Page 135
Test number T8/ P.M.8
Test type Thermal, vacuum
Test facility Cryogenic laboratory, Wroclaw University of Technology
Tested item Vacuum pumps (BOXER 7502)
Test level/procedure and duration
Temperature measurements of the vacuum pump’s outer shell under conditions of low pressure and temperature.
Test campaign duration
1 day
Test campaign date 06.2015
Test completed YES
Responsible person Mikołaj Podgórski
Test number T9/ D.M.11
Test type Mechanical
Test facility Wroclaw University of Technology
Tested item MEB, GCBs, video cameras and cables.
Test level/procedure and duration
Measure the weight of the whole experiment assembly by putting it on casual scales.
Test campaign duration
1 day
Test campaign date 08.2015
Test completed YES
Responsible person Szymon Dzwończyk, Dorota Budzyń
Test number T10/ D.E.5
Test type Power usage
Test facility Electronics laboratory, Wroclaw University of Technology
Tested item All active elements (pumps, valves, heaters, PCBs etc.)
Test level/procedure and duration
Determine real power usage of all elements used in the experiment
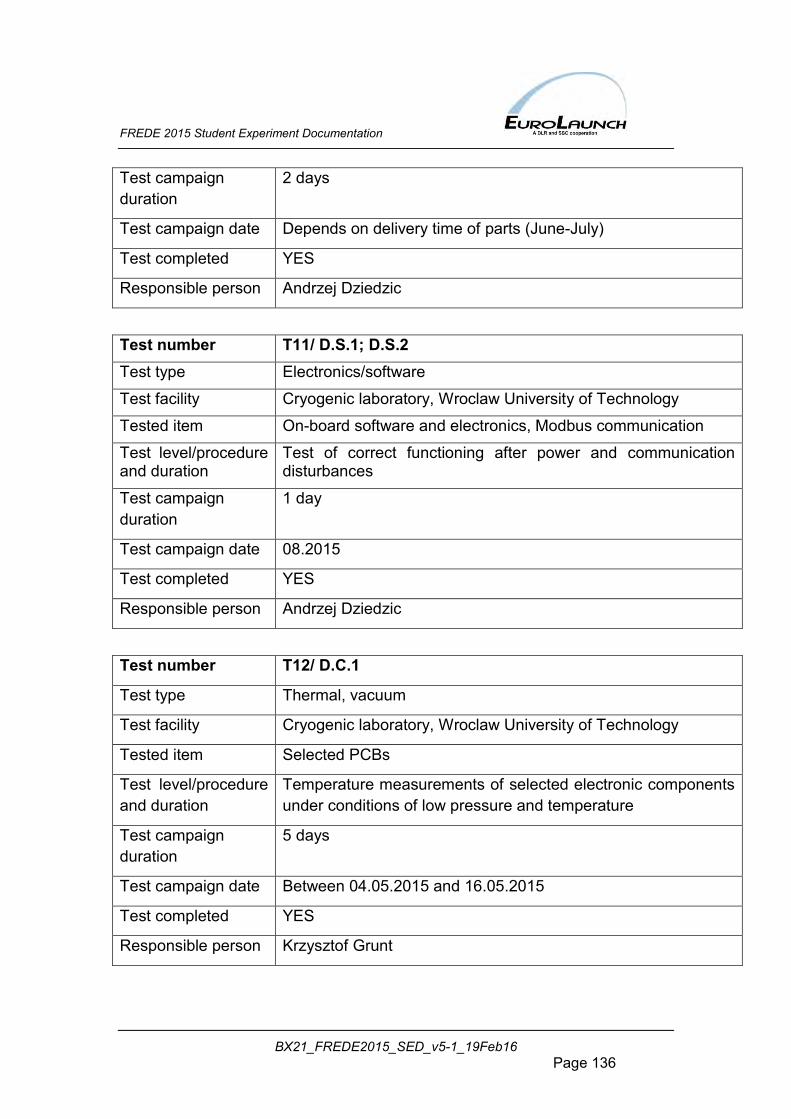
FREDE 2015 Student Experiment Documentation
BX21_FREDE2015_SED_v5-1_19Feb16 Page 136
Test campaign duration
2 days
Test campaign date Depends on delivery time of parts (June-July)
Test completed YES
Responsible person Andrzej Dziedzic
Test number T11/ D.S.1; D.S.2 Test type Electronics/software
Test facility Cryogenic laboratory, Wroclaw University of Technology
Tested item On-board software and electronics, Modbus communication
Test level/procedure and duration
Test of correct functioning after power and communication disturbances
Test campaign duration
1 day
Test campaign date 08.2015
Test completed YES
Responsible person Andrzej Dziedzic
Test number T12/ D.C.1
Test type Thermal, vacuum
Test facility Cryogenic laboratory, Wroclaw University of Technology
Tested item Selected PCBs
Test level/procedure and duration
Temperature measurements of selected electronic components under conditions of low pressure and temperature
Test campaign duration
5 days
Test campaign date Between 04.05.2015 and 16.05.2015
Test completed YES
Responsible person Krzysztof Grunt
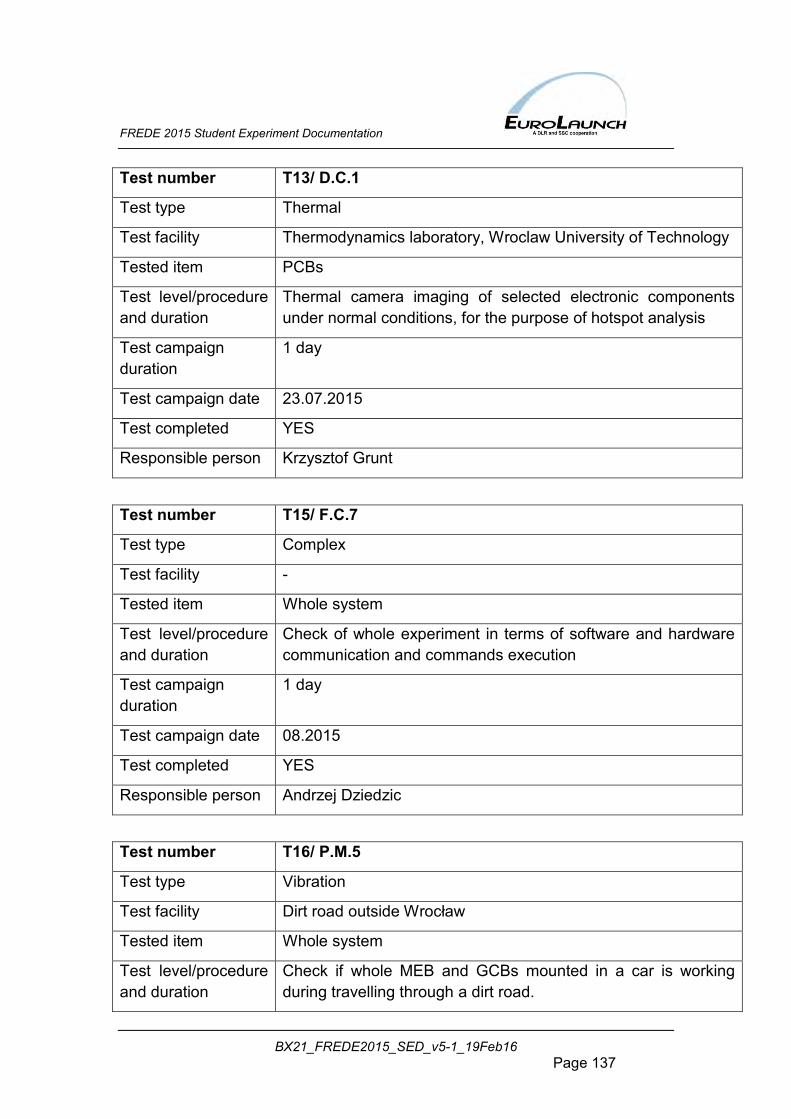
FREDE 2015 Student Experiment Documentation
BX21_FREDE2015_SED_v5-1_19Feb16 Page 137
Test number T13/ D.C.1
Test type Thermal
Test facility Thermodynamics laboratory, Wroclaw University of Technology
Tested item PCBs
Test level/procedure and duration
Thermal camera imaging of selected electronic components under normal conditions, for the purpose of hotspot analysis
Test campaign duration
1 day
Test campaign date 23.07.2015
Test completed YES
Responsible person Krzysztof Grunt
Test number T15/ F.C.7
Test type Complex
Test facility -
Tested item Whole system
Test level/procedure and duration
Check of whole experiment in terms of software and hardware communication and commands execution
Test campaign duration
1 day
Test campaign date 08.2015
Test completed YES
Responsible person Andrzej Dziedzic
Test number T16/ P.M.5
Test type Vibration
Test facility Dirt road outside Wrocław
Tested item Whole system
Test level/procedure and duration
Check if whole MEB and GCBs mounted in a car is working during travelling through a dirt road.
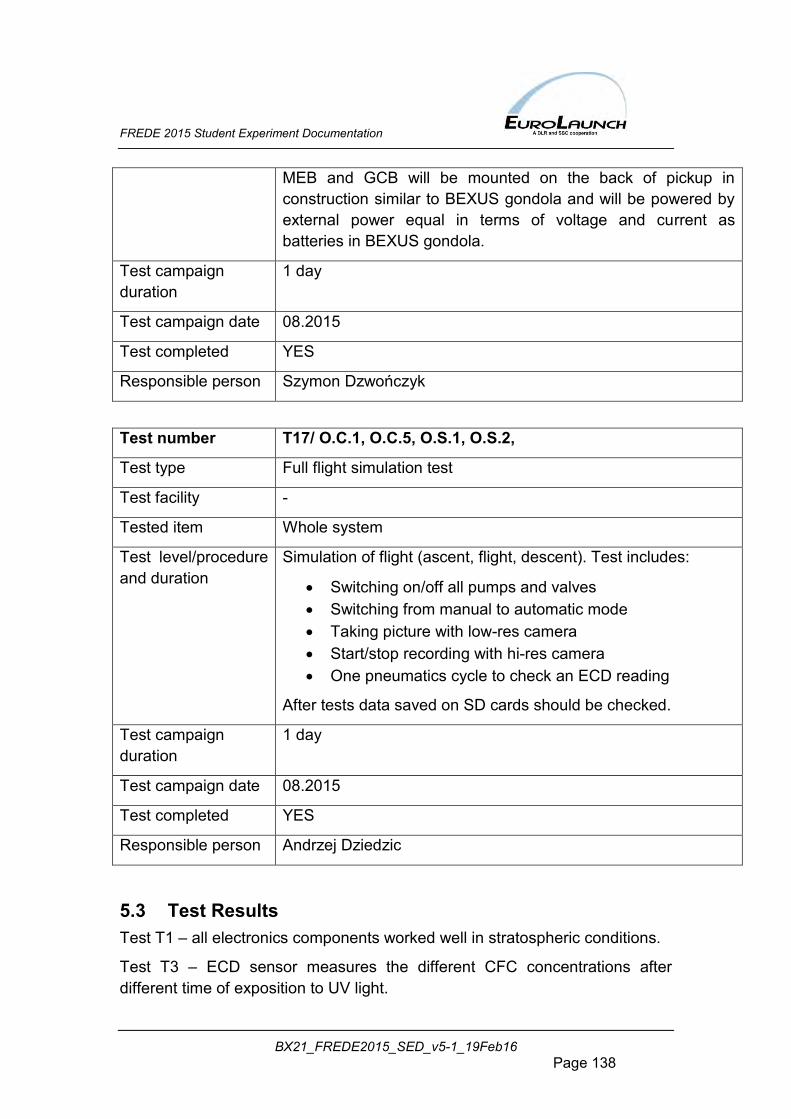
FREDE 2015 Student Experiment Documentation
BX21_FREDE2015_SED_v5-1_19Feb16 Page 138
MEB and GCB will be mounted on the back of pickup in construction similar to BEXUS gondola and will be powered by external power equal in terms of voltage and current as batteries in BEXUS gondola.
Test campaign duration
1 day
Test campaign date 08.2015
Test completed YES
Responsible person Szymon Dzwończyk
Test number T17/ O.C.1, O.C.5, O.S.1, O.S.2,
Test type Full flight simulation test
Test facility -
Tested item Whole system
Test level/procedure and duration
Simulation of flight (ascent, flight, descent). Test includes:
Switching on/off all pumps and valves Switching from manual to automatic mode Taking picture with low-res camera Start/stop recording with hi-res camera One pneumatics cycle to check an ECD reading
After tests data saved on SD cards should be checked.
Test campaign duration
1 day
Test campaign date 08.2015
Test completed YES
Responsible person Andrzej Dziedzic
5.3 Test Results Test T1 – all electronics components worked well in stratospheric conditions.
Test T3 – ECD sensor measures the different CFC concentrations after different time of exposition to UV light.
FREDE 2015 Student Experiment Documentation
BX21_FREDE2015_SED_v5-1_19Feb16 Page 139
Test T4 – GB did not deflate during and after test time.
Test T6-1 – current vs. flow curve has been successfully determined.
Test T6-2 – pump achieved flow equal to approx. 1 dm3/min at 5 hPa.
Test T6-3 – pump works with visible results up to 1 500 Pa.
Test T7 – pump most dangerous vibration frequency is 60 Hz for X axis and 65 Hz for Y axis.
Test T8 – pump outer shell temperature measured in TVAC. After 40 minutes of staying in -40˚C pump temperature got down to approx. 10˚C.
Test T9 – MEB weight is equal to 19 kg, GCBs weight is equal to 6kg.
Test T10 – all active elements have real power usage as it was calculated theoretically in table 4.7-1.
Test T11 – Modbus communication was checked in 9600 b/s and 38400 b/s. Switching on valves and pumps does not cause errors in communication. Boards were disconnected and connected again while system was working and communication was regained instantly.
Test T12 – a series of thermal vacuum tests has been conducted, confirming most of the modelling assumptions in a setting representative for electronics.
Test T13 – thermal imaging of fabricated PCBs has been performed, resulting in an analysis pointing out the most thermally endangered elements.
Test T15 – communication between GS and experiment works in UDP protocol. FCU always returns telecommand with result. Sometimes there is error in communication initialization – GS has to be restarted then.
Test T16 – GCB and then MEB, GCB and camera mounting was tested on the dirt road outside the Wroclaw. No major problems because of the vibrations have been found.
Test T17 – all functions are correct.
Detailed test results for majority of tests can be found in Appendix E (276).
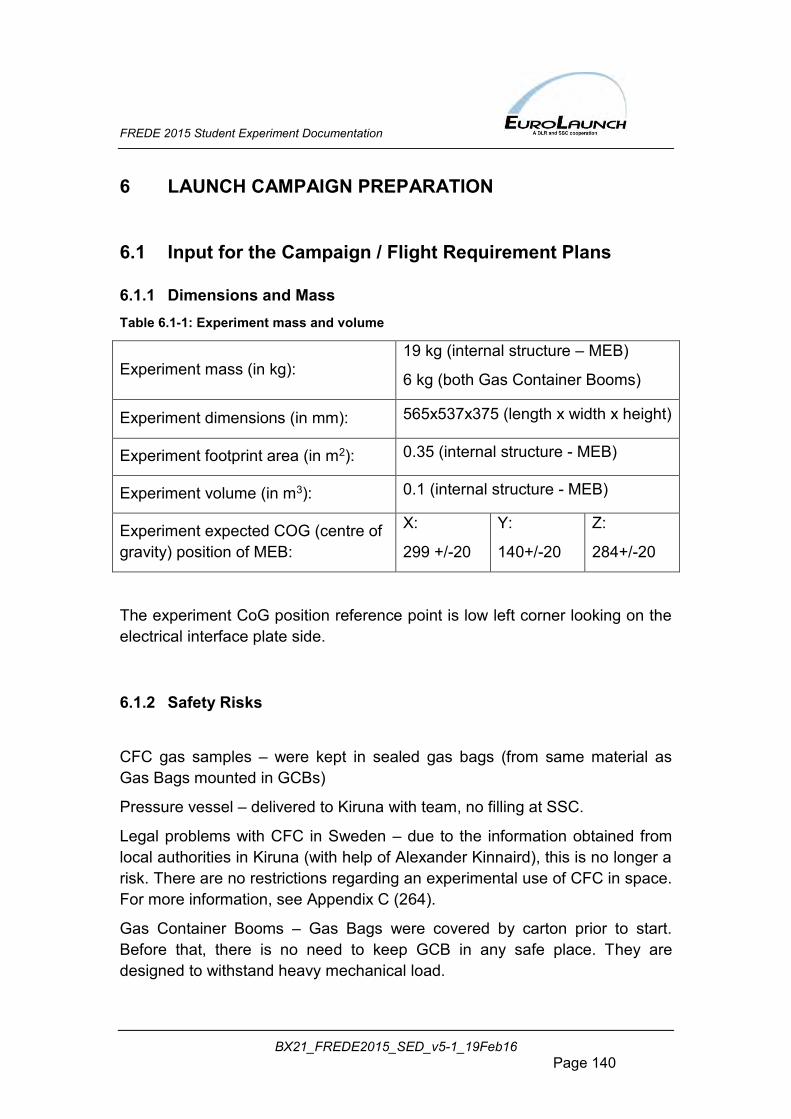
FREDE 2015 Student Experiment Documentation
BX21_FREDE2015_SED_v5-1_19Feb16 Page 140
6 LAUNCH CAMPAIGN PREPARATION
6.1 Input for the Campaign / Flight Requirement Plans
6.1.1 Dimensions and Mass Table 6.1-1: Experiment mass and volume
Experiment mass (in kg): 19 kg (internal structure – MEB)
6 kg (both Gas Container Booms)
Experiment dimensions (in mm): 565x537x375 (length x width x height)
Experiment footprint area (in m2): 0.35 (internal structure - MEB)
Experiment volume (in m3): 0.1 (internal structure - MEB)
Experiment expected COG (centre of gravity) position of MEB:
X:
299 +/-20
Y:
140+/-20
Z:
284+/-20
The experiment CoG position reference point is low left corner looking on the electrical interface plate side.
6.1.2 Safety Risks
CFC gas samples – were kept in sealed gas bags (from same material as Gas Bags mounted in GCBs)
Pressure vessel – delivered to Kiruna with team, no filling at SSC.
Legal problems with CFC in Sweden – due to the information obtained from local authorities in Kiruna (with help of Alexander Kinnaird), this is no longer a risk. There are no restrictions regarding an experimental use of CFC in space. For more information, see Appendix C (264).
Gas Container Booms – Gas Bags were covered by carton prior to start. Before that, there is no need to keep GCB in any safe place. They are designed to withstand heavy mechanical load.
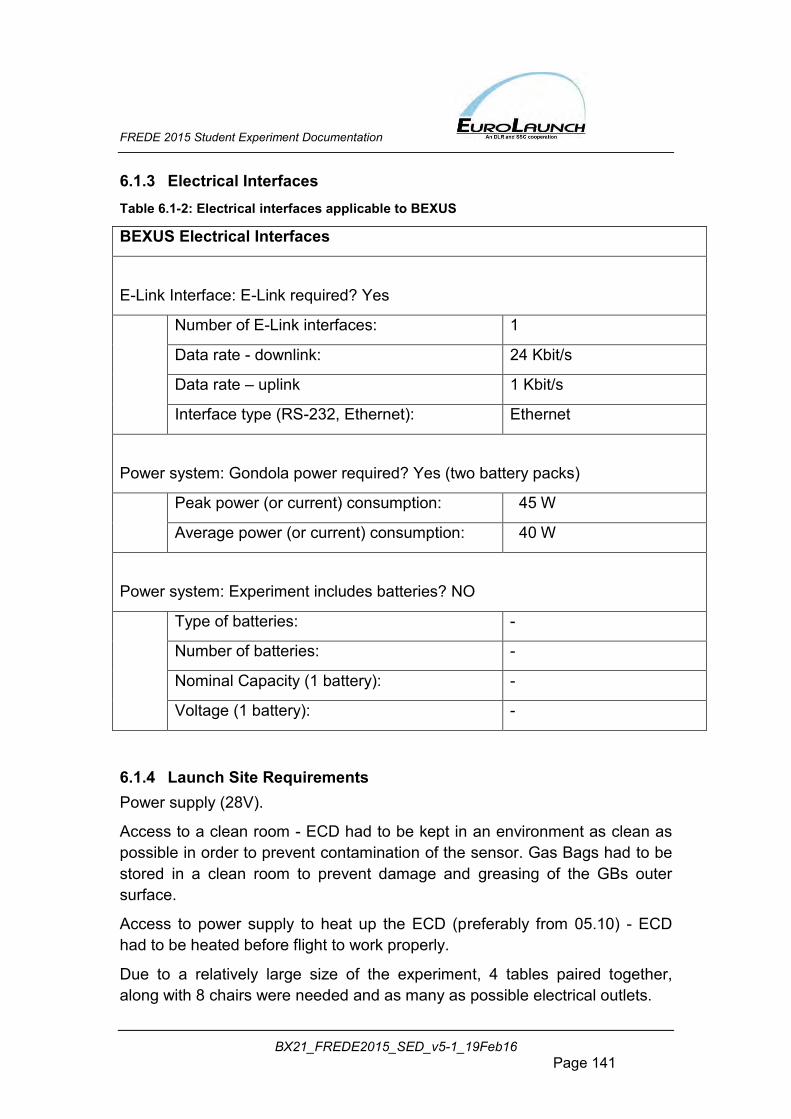
FREDE 2015 Student Experiment Documentation
BX21_FREDE2015_SED_v5-1_19Feb16 Page 141
6.1.3 Electrical Interfaces Table 6.1-2: Electrical interfaces applicable to BEXUS
BEXUS Electrical Interfaces
E-Link Interface: E-Link required? Yes
Number of E-Link interfaces: 1
Data rate - downlink: 24 Kbit/s
Data rate – uplink 1 Kbit/s
Interface type (RS-232, Ethernet): Ethernet
Power system: Gondola power required? Yes (two battery packs)
Peak power (or current) consumption: 45 W
Average power (or current) consumption: 40 W
Power system: Experiment includes batteries? NO
Type of batteries: -
Number of batteries: -
Nominal Capacity (1 battery): -
Voltage (1 battery): -
6.1.4 Launch Site Requirements Power supply (28V).
Access to a clean room - ECD had to be kept in an environment as clean as possible in order to prevent contamination of the sensor. Gas Bags had to be stored in a clean room to prevent damage and greasing of the GBs outer surface.
Access to power supply to heat up the ECD (preferably from 05.10) - ECD had to be heated before flight to work properly.
Due to a relatively large size of the experiment, 4 tables paired together, along with 8 chairs were needed and as many as possible electrical outlets.
FREDE 2015 Student Experiment Documentation
BX21_FREDE2015_SED_v5-1_19Feb16 Page 142
6.1.5 Flight Requirements
There were some essential requirements, which ensure the success of the experiment:
The launch and whole flight duration had to be performed in daylight.
The minimal altitude reached by the balloon had to exceed about 25 km and the balloon should stay there for at least an hour.
Note from the pilot after reaching 12 km is required.
Cut-off signal “5 minutes before” is required.
6.1.6 Accommodation Requirements
Covering the gondola would improve the thermal comfort of the experiment, however it was not a must for FREDE 2015.
No requirement for being close/far from other experiments.
MEB must be placed as close as possible to the corner of the gondola where GCBs are mounted.
Low-res camera must be able to acquire images of gas bags – there could be no obstacles within line of sight.
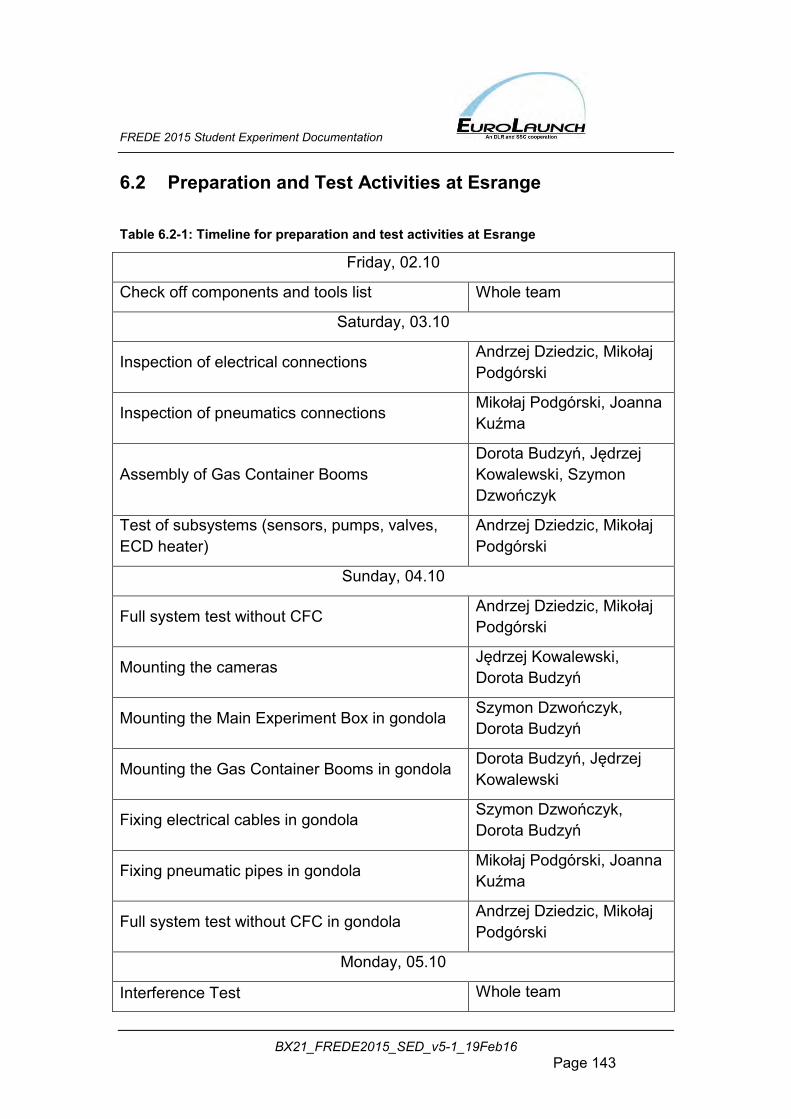
FREDE 2015 Student Experiment Documentation
BX21_FREDE2015_SED_v5-1_19Feb16 Page 143
6.2 Preparation and Test Activities at Esrange Table 6.2-1: Timeline for preparation and test activities at Esrange
Friday, 02.10
Check off components and tools list Whole team
Saturday, 03.10
Inspection of electrical connections Andrzej Dziedzic, Mikołaj Podgórski
Inspection of pneumatics connections Mikołaj Podgórski, Joanna Kuźma
Assembly of Gas Container Booms Dorota Budzyń, Jędrzej Kowalewski, Szymon Dzwończyk
Test of subsystems (sensors, pumps, valves, ECD heater)
Andrzej Dziedzic, Mikołaj Podgórski
Sunday, 04.10
Full system test without CFC Andrzej Dziedzic, Mikołaj Podgórski
Mounting the cameras Jędrzej Kowalewski, Dorota Budzyń
Mounting the Main Experiment Box in gondola Szymon Dzwończyk, Dorota Budzyń
Mounting the Gas Container Booms in gondola Dorota Budzyń, Jędrzej Kowalewski
Fixing electrical cables in gondola Szymon Dzwończyk, Dorota Budzyń
Fixing pneumatic pipes in gondola Mikołaj Podgórski, Joanna Kuźma
Full system test without CFC in gondola Andrzej Dziedzic, Mikołaj Podgórski
Monday, 05.10
Interference Test Whole team
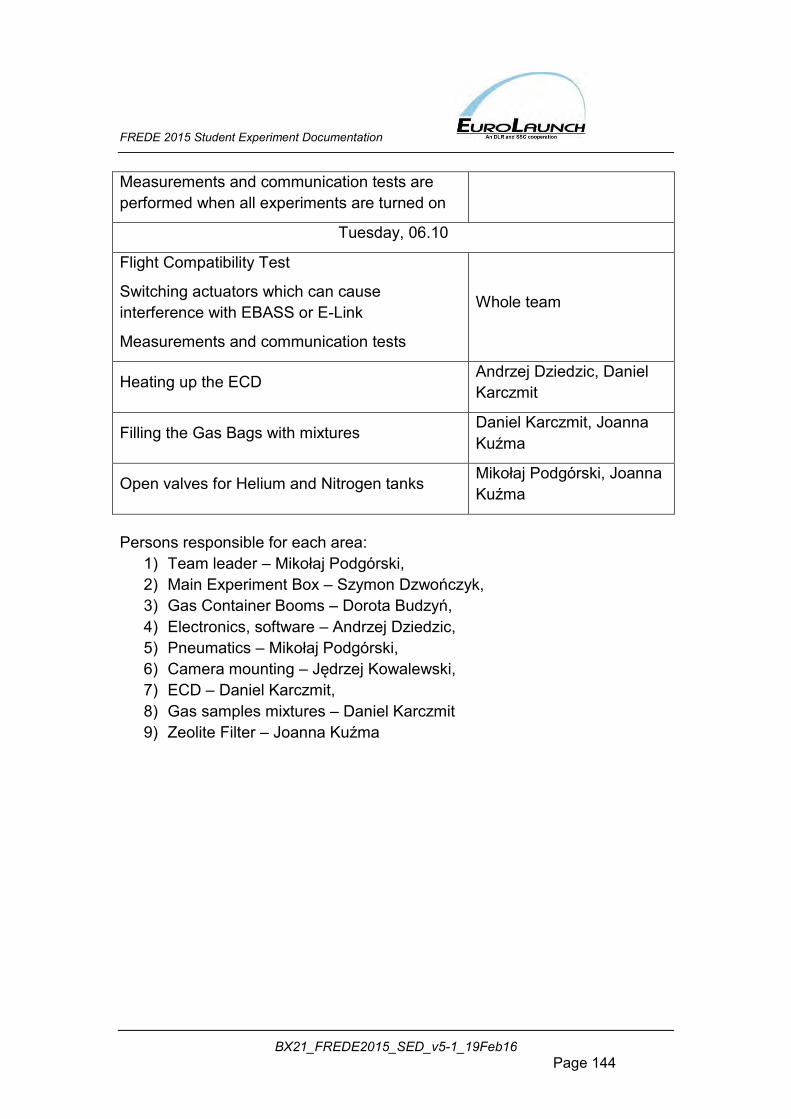
FREDE 2015 Student Experiment Documentation
BX21_FREDE2015_SED_v5-1_19Feb16 Page 144
Measurements and communication tests are performed when all experiments are turned on
Tuesday, 06.10
Flight Compatibility Test
Switching actuators which can cause interference with EBASS or E-Link
Measurements and communication tests
Whole team
Heating up the ECD Andrzej Dziedzic, Daniel Karczmit
Filling the Gas Bags with mixtures Daniel Karczmit, Joanna Kuźma
Open valves for Helium and Nitrogen tanks Mikołaj Podgórski, Joanna Kuźma
Persons responsible for each area:
1) Team leader – Mikołaj Podgórski, 2) Main Experiment Box – Szymon Dzwończyk, 3) Gas Container Booms – Dorota Budzyń, 4) Electronics, software – Andrzej Dziedzic, 5) Pneumatics – Mikołaj Podgórski, 6) Camera mounting – Jędrzej Kowalewski, 7) ECD – Daniel Karczmit, 8) Gas samples mixtures – Daniel Karczmit 9) Zeolite Filter – Joanna Kuźma
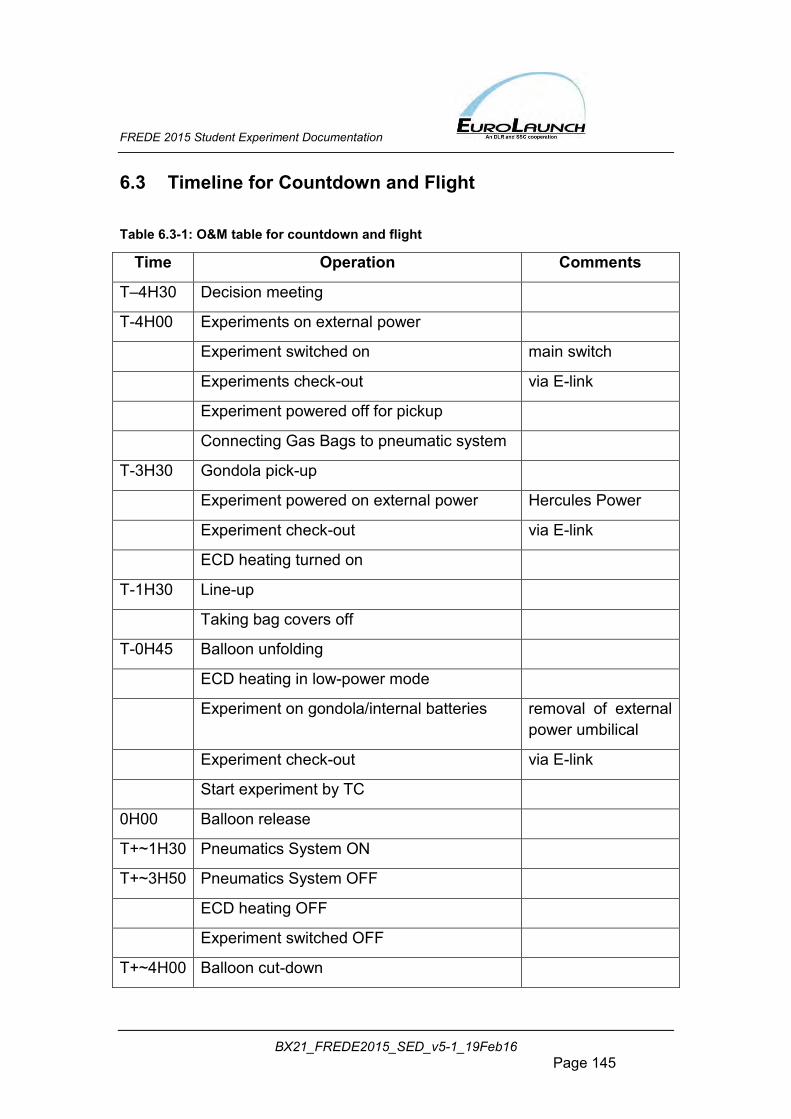
FREDE 2015 Student Experiment Documentation
BX21_FREDE2015_SED_v5-1_19Feb16 Page 145
6.3 Timeline for Countdown and Flight Table 6.3-1: O&M table for countdown and flight
Time Operation Comments
T–4H30 Decision meeting
T-4H00 Experiments on external power
Experiment switched on main switch
Experiments check-out via E-link
Experiment powered off for pickup
Connecting Gas Bags to pneumatic system
T-3H30 Gondola pick-up
Experiment powered on external power Hercules Power
Experiment check-out via E-link
ECD heating turned on
T-1H30 Line-up
Taking bag covers off
T-0H45 Balloon unfolding
ECD heating in low-power mode
Experiment on gondola/internal batteries removal of external power umbilical
Experiment check-out via E-link
Start experiment by TC
0H00 Balloon release
T+~1H30 Pneumatics System ON
T+~3H50 Pneumatics System OFF
ECD heating OFF
Experiment switched OFF
T+~4H00 Balloon cut-down
FREDE 2015 Student Experiment Documentation
BX21_FREDE2015_SED_v5-1_19Feb16 Page 146
6.4 Post Flight Activities Post flight activities were done by the whole team.
1) Dismounted external covers, 2) Checked on electronics for possible damage, 3) Dismounted covers for Little Boxes, 4) Secured data from both SD cards (two copies maintained) 5) Dismounted cameras, 6) Secured data from Hi-res (two copies maintained), 7) Mounted covers for Little Boxes and external covers, 8) Prepared all parts for transport by cars.
Recovery sheet included the instruction on how to cut down the Gas Bags from the masts and how to empty the tanks with helium and nitrogen.
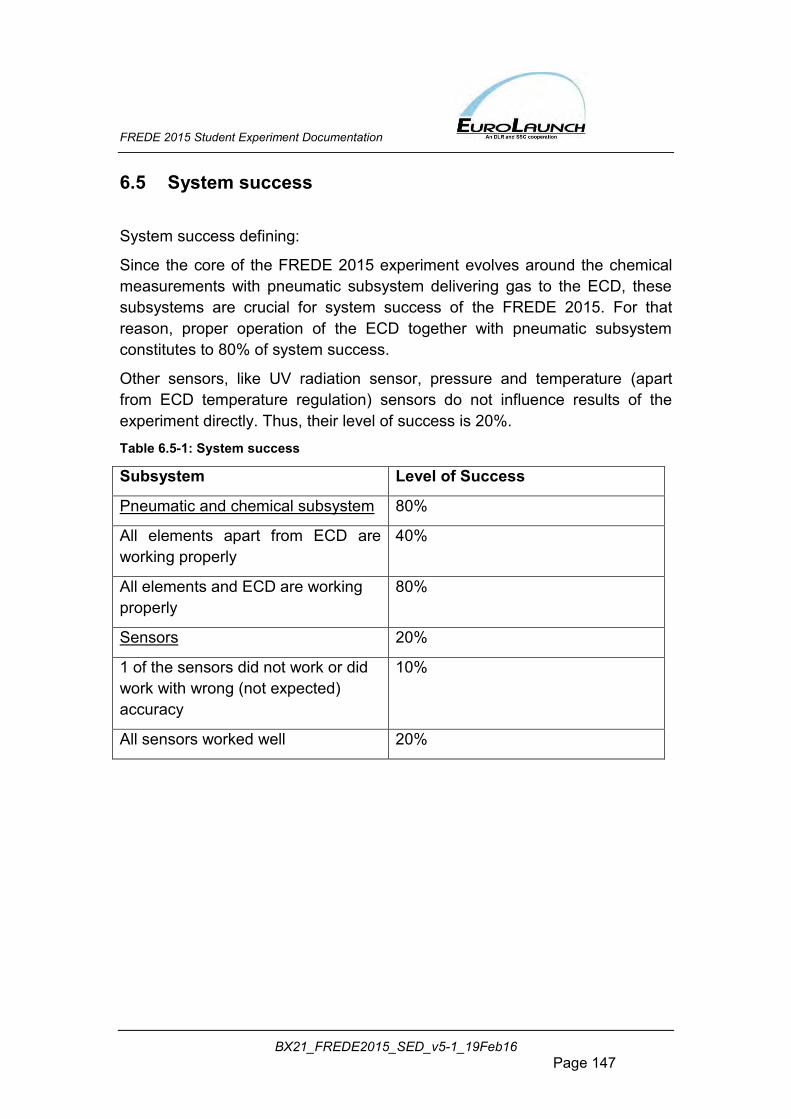
FREDE 2015 Student Experiment Documentation
BX21_FREDE2015_SED_v5-1_19Feb16 Page 147
6.5 System success System success defining:
Since the core of the FREDE 2015 experiment evolves around the chemical measurements with pneumatic subsystem delivering gas to the ECD, these subsystems are crucial for system success of the FREDE 2015. For that reason, proper operation of the ECD together with pneumatic subsystem constitutes to 80% of system success.
Other sensors, like UV radiation sensor, pressure and temperature (apart from ECD temperature regulation) sensors do not influence results of the experiment directly. Thus, their level of success is 20%. Table 6.5-1: System success
Subsystem Level of Success
Pneumatic and chemical subsystem 80%
All elements apart from ECD are working properly
40%
All elements and ECD are working properly
80%
Sensors 20%
1 of the sensors did not work or did work with wrong (not expected) accuracy
10%
All sensors worked well 20%
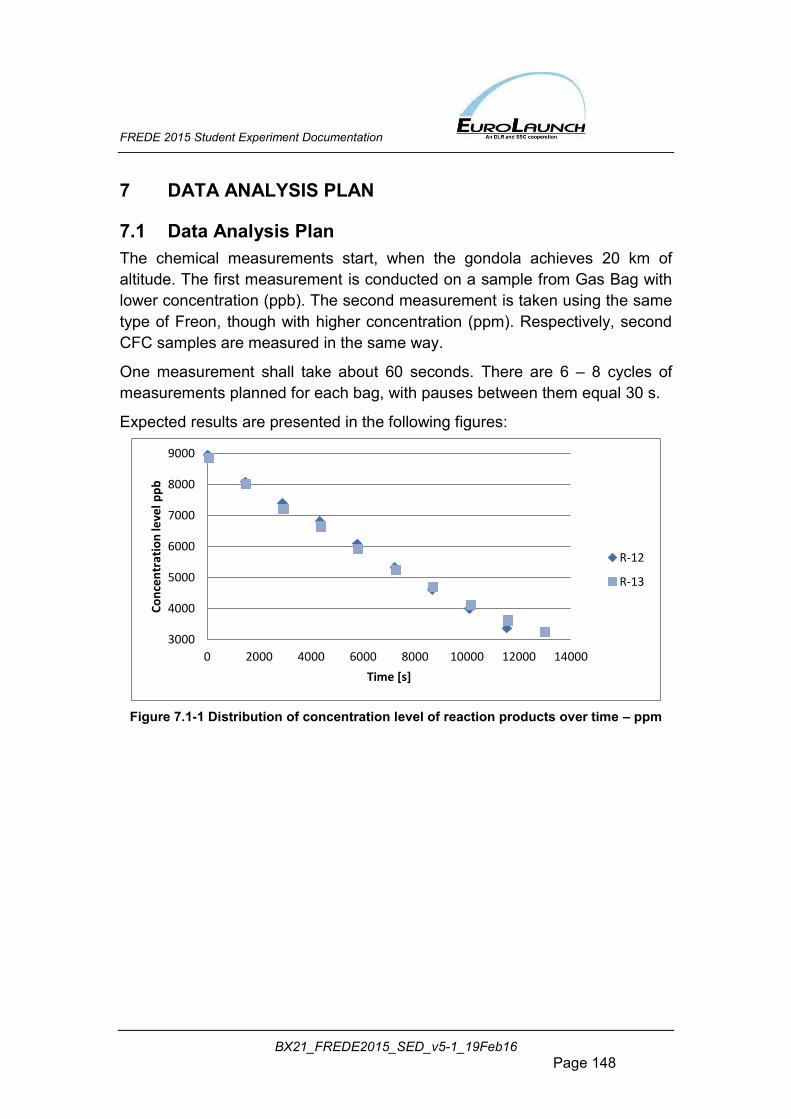
FREDE 2015 Student Experiment Documentation
BX21_FREDE2015_SED_v5-1_19Feb16 Page 148
7 DATA ANALYSIS PLAN
7.1 Data Analysis Plan The chemical measurements start, when the gondola achieves 20 km of altitude. The first measurement is conducted on a sample from Gas Bag with lower concentration (ppb). The second measurement is taken using the same type of Freon, though with higher concentration (ppm). Respectively, second CFC samples are measured in the same way.
One measurement shall take about 60 seconds. There are 6 – 8 cycles of measurements planned for each bag, with pauses between them equal 30 s.
Expected results are presented in the following figures:
Figure 7.1-1 Distribution of concentration level of reaction products over time – ppm
3000
4000
5000
6000
7000
8000
9000
0 2000 4000 6000 8000 10000 12000 14000
Co
nce
ntr
atio
n le
vel p
pb
Time [s]
R-12
R-13
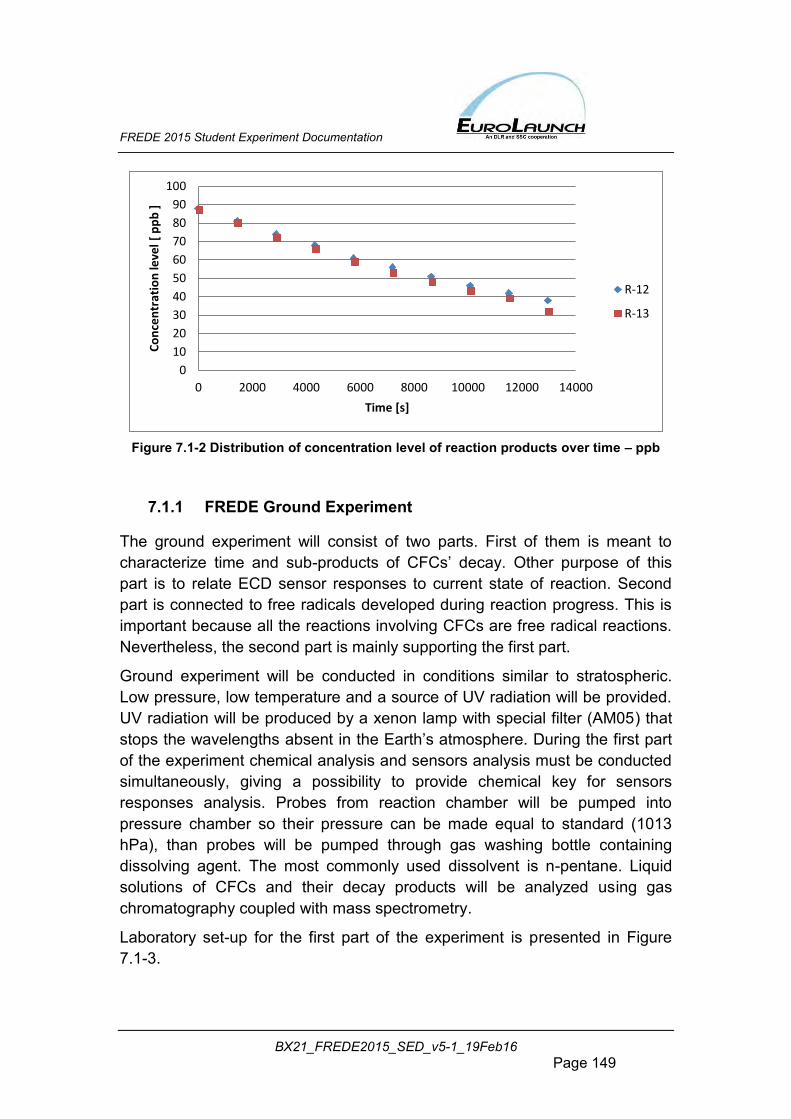
FREDE 2015 Student Experiment Documentation
BX21_FREDE2015_SED_v5-1_19Feb16 Page 149
Figure 7.1-2 Distribution of concentration level of reaction products over time – ppb
7.1.1 FREDE Ground Experiment
The ground experiment will consist of two parts. First of them is meant to characterize time and sub-products of CFCs’ decay. Other purpose of this part is to relate ECD sensor responses to current state of reaction. Second part is connected to free radicals developed during reaction progress. This is important because all the reactions involving CFCs are free radical reactions. Nevertheless, the second part is mainly supporting the first part.
Ground experiment will be conducted in conditions similar to stratospheric. Low pressure, low temperature and a source of UV radiation will be provided. UV radiation will be produced by a xenon lamp with special filter (AM05) that stops the wavelengths absent in the Earth’s atmosphere. During the first part of the experiment chemical analysis and sensors analysis must be conducted simultaneously, giving a possibility to provide chemical key for sensors responses analysis. Probes from reaction chamber will be pumped into pressure chamber so their pressure can be made equal to standard (1013 hPa), than probes will be pumped through gas washing bottle containing dissolving agent. The most commonly used dissolvent is n-pentane. Liquid solutions of CFCs and their decay products will be analyzed using gas chromatography coupled with mass spectrometry.
Laboratory set-up for the first part of the experiment is presented in Figure 7.1-3.
0
10
20
30
40
50
60
70
80
90
100
0 2000 4000 6000 8000 10000 12000 14000
Co
nce
ntr
atio
n le
vel [
pp
b ]
Time [s]
R-12
R-13
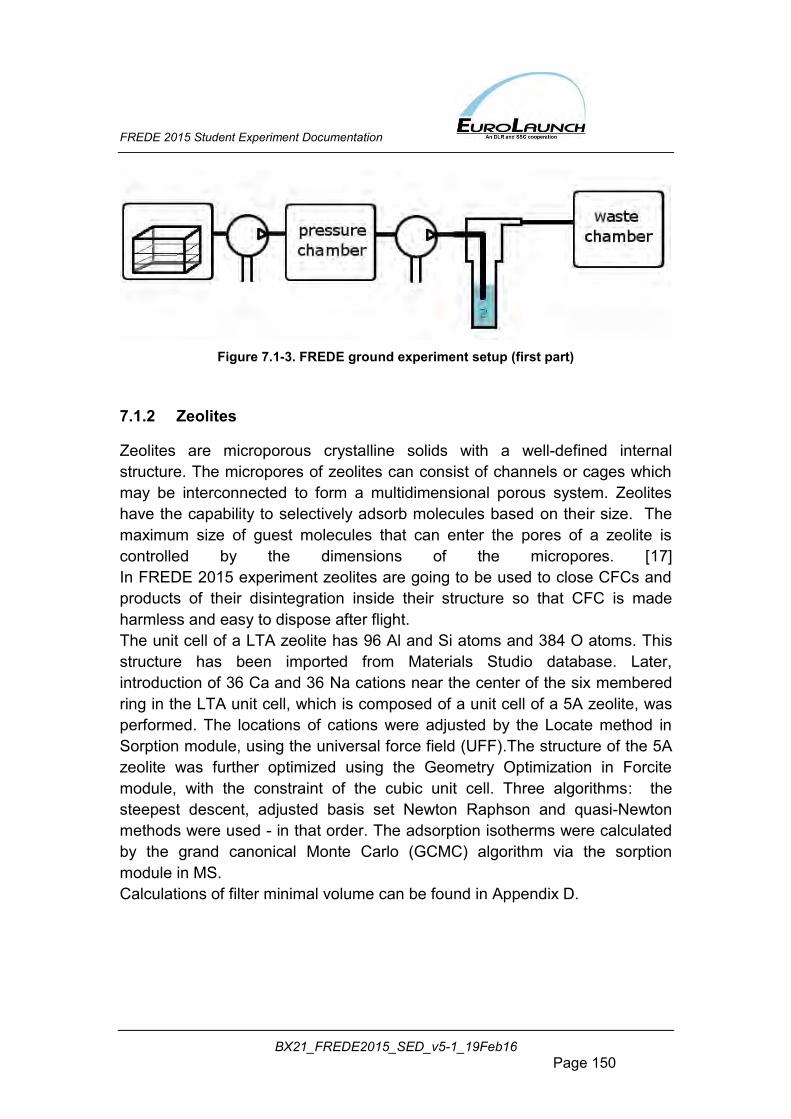
FREDE 2015 Student Experiment Documentation
BX21_FREDE2015_SED_v5-1_19Feb16 Page 150
Figure 7.1-3. FREDE ground experiment setup (first part)
7.1.2 Zeolites
Zeolites are microporous crystalline solids with a well-defined internal structure. The micropores of zeolites can consist of channels or cages which may be interconnected to form a multidimensional porous system. Zeolites have the capability to selectively adsorb molecules based on their size. The maximum size of guest molecules that can enter the pores of a zeolite is controlled by the dimensions of the micropores. [17] In FREDE 2015 experiment zeolites are going to be used to close CFCs and products of their disintegration inside their structure so that CFC is made harmless and easy to dispose after flight. The unit cell of a LTA zeolite has 96 Al and Si atoms and 384 O atoms. This structure has been imported from Materials Studio database. Later, introduction of 36 Ca and 36 Na cations near the center of the six membered ring in the LTA unit cell, which is composed of a unit cell of a 5A zeolite, was performed. The locations of cations were adjusted by the Locate method in Sorption module, using the universal force field (UFF).The structure of the 5A zeolite was further optimized using the Geometry Optimization in Forcite module, with the constraint of the cubic unit cell. Three algorithms: the steepest descent, adjusted basis set Newton Raphson and quasi-Newton methods were used - in that order. The adsorption isotherms were calculated by the grand canonical Monte Carlo (GCMC) algorithm via the sorption module in MS. Calculations of filter minimal volume can be found in Appendix D.
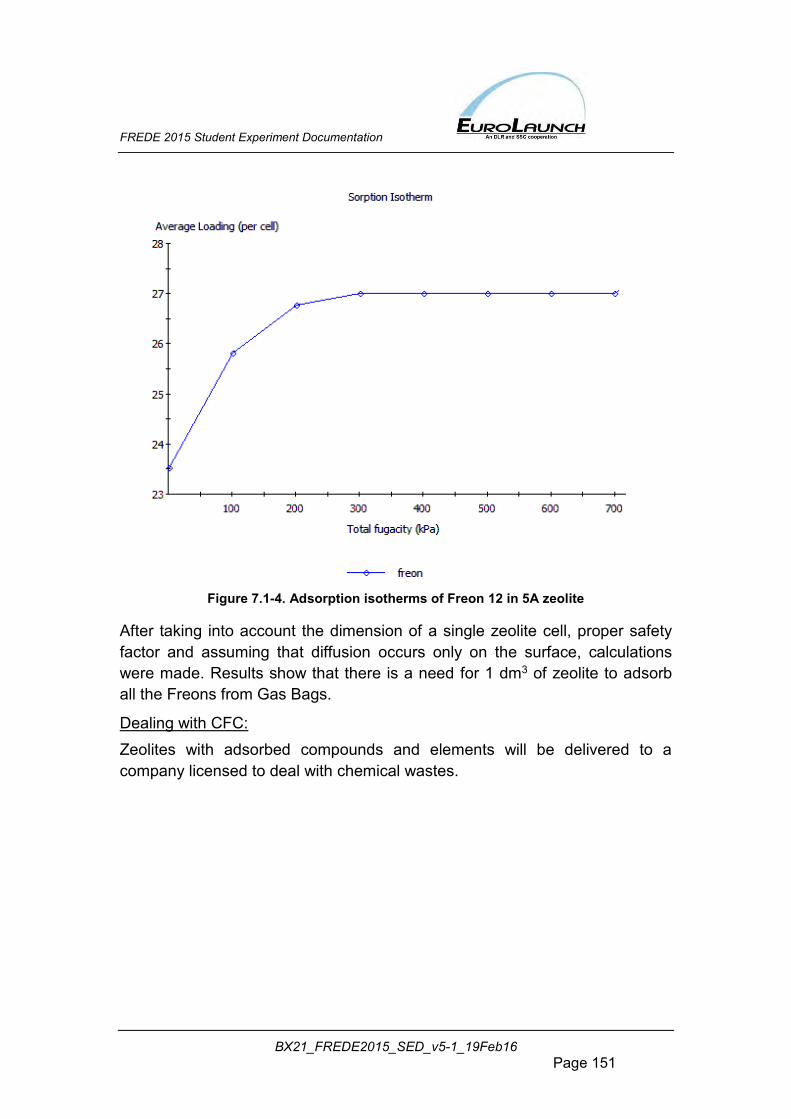
FREDE 2015 Student Experiment Documentation
BX21_FREDE2015_SED_v5-1_19Feb16 Page 151
Figure 7.1-4. Adsorption isotherms of Freon 12 in 5A zeolite
After taking into account the dimension of a single zeolite cell, proper safety factor and assuming that diffusion occurs only on the surface, calculations were made. Results show that there is a need for 1 dm3 of zeolite to adsorb all the Freons from Gas Bags.
Dealing with CFC: Zeolites with adsorbed compounds and elements will be delivered to a company licensed to deal with chemical wastes.
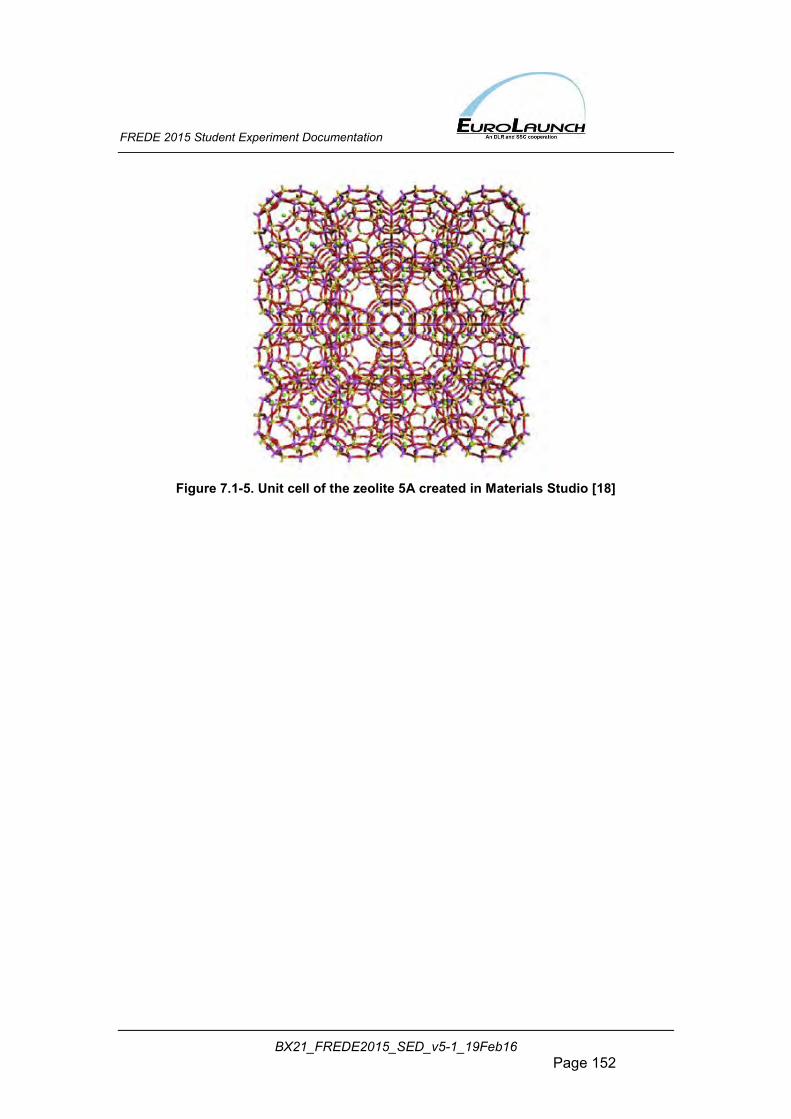
FREDE 2015 Student Experiment Documentation
BX21_FREDE2015_SED_v5-1_19Feb16 Page 152
Figure 7.1-5. Unit cell of the zeolite 5A created in Materials Studio [18]
FREDE 2015 Student Experiment Documentation
BX21_FREDE2015_SED_v5-1_19Feb16 Page 153
7.2 Launch Campaign
7.2.1 Flight preparation The FREDE team arrived to Esrange late evening on October 2nd. The
balloon was launched on October 7th. There were four days to accomplish a number of activities. Some of them had to be done as close to start as possible, so they were scheduled for the flight campaign. Others had not been finished before campaign because of delays.
First of all, CFC samples were prepared and stored in a clean room. The Zeolite Filter was assembled, filled with zeolites and fixed into the experiment box.
The holes in the experiment for mounting in the gondola had to be drilled again, because of inaccuracies in the BEXUS documentation.
The ECD mounting was improved to protect the most susceptible parts from damage.
A case for cameras was improved to get a clear picture and the required field of view from both the low-res camera and hi-res camera. Moreover it was found that EBASS cover, which was put on top of the gondola, was blocking view of low-res camera. The case was lifted by attaching a metal profile to the gondola.
Pressure and temperature sensors were fixed inside the experiment and on the gondola structure.
Finally, after all changes inside the MEB had been finished, wires and pneumatic pipes were harnessed.
The Gas Bags were fixed to GCBs on the day of flight. To prevent them from damage the cardboard covers were put on the bags.
7.2.2 Flight performance The BEXUS 21 balloon was launched on October 7 at 9:30 UTC.
During ascent phase only ECD heating and cameras were turned on.
The balloon reached altitude 27000 m after 1.5 hour. Then the FREDE experiment was activated and the first measurement had started. However it was noticed that opening of the pressurised helium bottle did not result in an expected increase in a pressure sensor reading. One reason could be a leak in pneumatics system, but after recovery all connections were confirmed airtight. Another explanation could be a malfunction of the pressure sensor,
FREDE 2015 Student Experiment Documentation
BX21_FREDE2015_SED_v5-1_19Feb16 Page 154
though it was consistent with reading from second sensor and with EBASS data.
There was also a problem with calibration of the ECD current, which was responsible for signal amplification. The systems’ behaviour was strongly nonlinear and it was difficult to adjust the ECD current to get a clear response from the ECD. There were not enough tests executed before, because of an insufficient amount of nitrogen taken to Esrange, resulting in only partial system behaviour recognition.
Despite these problems, seven chromatograms were taken during flight. The experiment was turned off at 12:24 UTC. The flight was terminated by cut-down command at 12:36 UTC.
7.2.3 Recovery Since FREDE 2015 flew in first balloon of the BEXUS 21/22 campaign, the whole team had to wait for recovery until BEXUS 22 had been launched. During the recovery, done 3 days after the start of the FREDE 2015, Gas Container Booms were damaged (during removal from gondola and transportation on the truck). One of the vertical masts of GCB was not recovered.
7.2.4 Post flight activities Post flight activities were described in section 6.4.
7.3 Results
7.3.1 Pressure measurement Two pressure sensors were used in the experiment. The first one
measured pressure behind pumps, another ahead of the CC. They had the following measurement range 0-1600 mbar. Total inaccuracy of each sensor equals 16 mbar.
It could be better to use sensors with a smaller measurement range (consequently smaller error), since all important measurements were taken below 100 mbar. Another possibility would be to measure pressure difference across a pump or the column.
In the first chart (Figure 7.3-1) there are two readings that seem identical. However, a close-up in the second chart (Figure 7.3-2) shows systematic error of 8 mbar between two sensors. Spikes on the lower chart indicate moments when a pump was running.
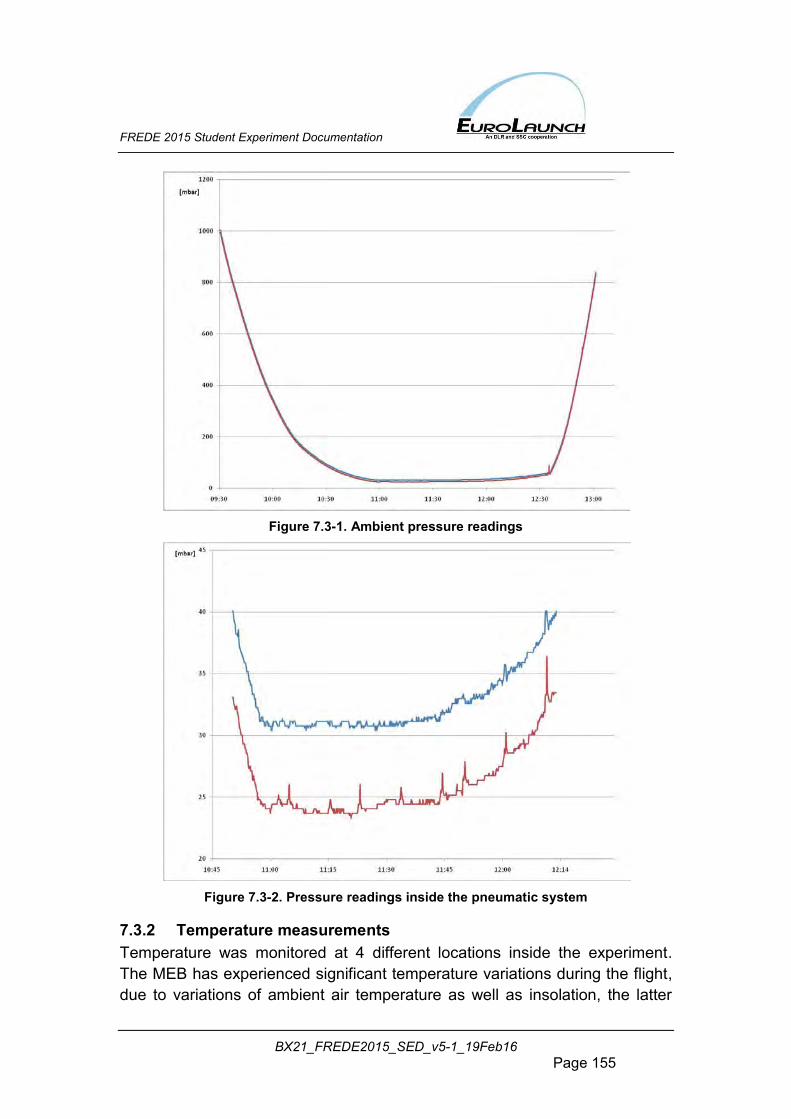
FREDE 2015 Student Experiment Documentation
BX21_FREDE2015_SED_v5-1_19Feb16 Page 155
Figure 7.3-1. Ambient pressure readings
Figure 7.3-2. Pressure readings inside the pneumatic system
7.3.2 Temperature measurements Temperature was monitored at 4 different locations inside the experiment. The MEB has experienced significant temperature variations during the flight, due to variations of ambient air temperature as well as insolation, the latter
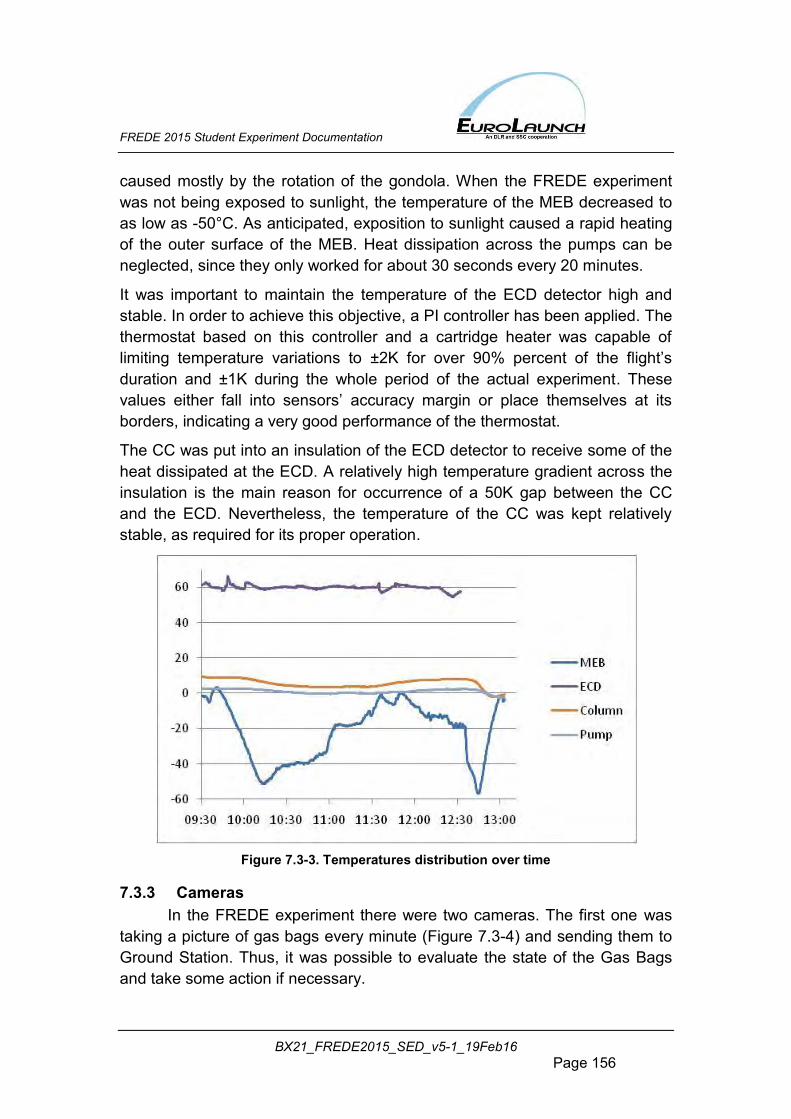
FREDE 2015 Student Experiment Documentation
BX21_FREDE2015_SED_v5-1_19Feb16 Page 156
caused mostly by the rotation of the gondola. When the FREDE experiment was not being exposed to sunlight, the temperature of the MEB decreased to as low as -50°C. As anticipated, exposition to sunlight caused a rapid heating of the outer surface of the MEB. Heat dissipation across the pumps can be neglected, since they only worked for about 30 seconds every 20 minutes.
It was important to maintain the temperature of the ECD detector high and stable. In order to achieve this objective, a PI controller has been applied. The thermostat based on this controller and a cartridge heater was capable of limiting temperature variations to ±2K for over 90% percent of the flight’s duration and ±1K during the whole period of the actual experiment. These values either fall into sensors’ accuracy margin or place themselves at its borders, indicating a very good performance of the thermostat.
The CC was put into an insulation of the ECD detector to receive some of the heat dissipated at the ECD. A relatively high temperature gradient across the insulation is the main reason for occurrence of a 50K gap between the CC and the ECD. Nevertheless, the temperature of the CC was kept relatively stable, as required for its proper operation.
Figure 7.3-3. Temperatures distribution over time
7.3.3 Cameras In the FREDE experiment there were two cameras. The first one was
taking a picture of gas bags every minute (Figure 7.3-4) and sending them to Ground Station. Thus, it was possible to evaluate the state of the Gas Bags and take some action if necessary.
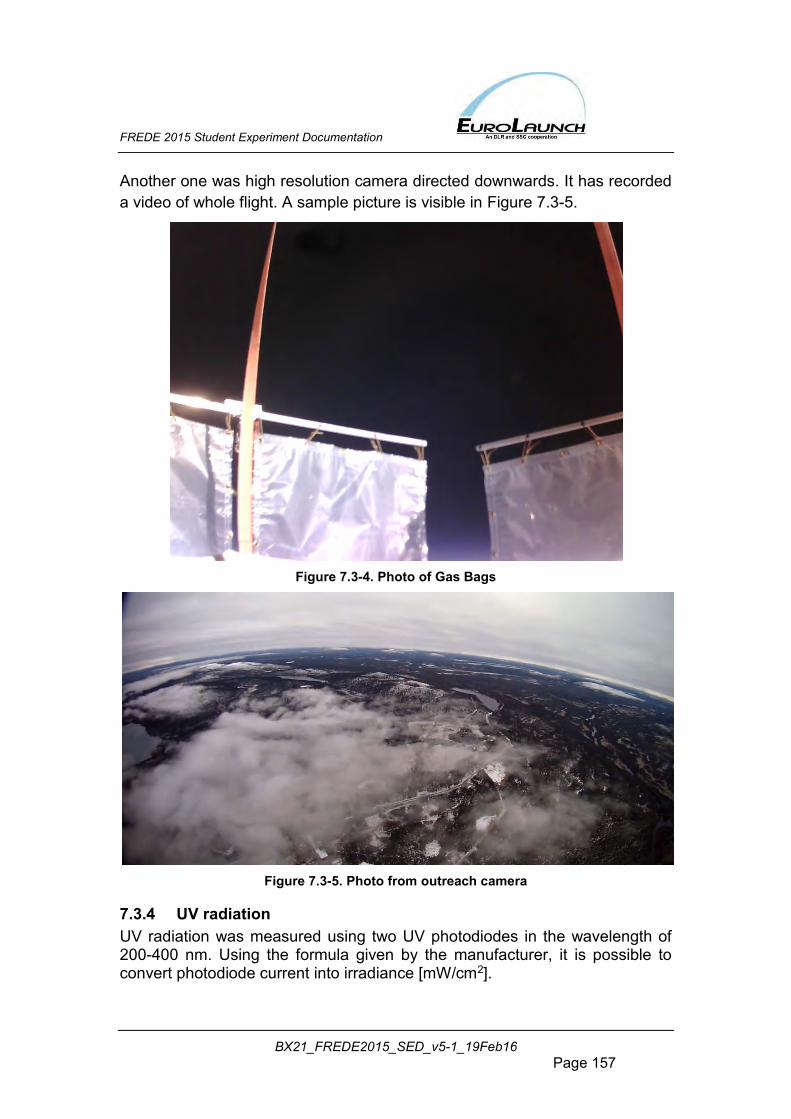
FREDE 2015 Student Experiment Documentation
BX21_FREDE2015_SED_v5-1_19Feb16 Page 157
Another one was high resolution camera directed downwards. It has recorded a video of whole flight. A sample picture is visible in Figure 7.3-5.
Figure 7.3-4. Photo of Gas Bags
Figure 7.3-5. Photo from outreach camera
7.3.4 UV radiation UV radiation was measured using two UV photodiodes in the wavelength of 200-400 nm. Using the formula given by the manufacturer, it is possible to convert photodiode current into irradiance [mW/cm2].
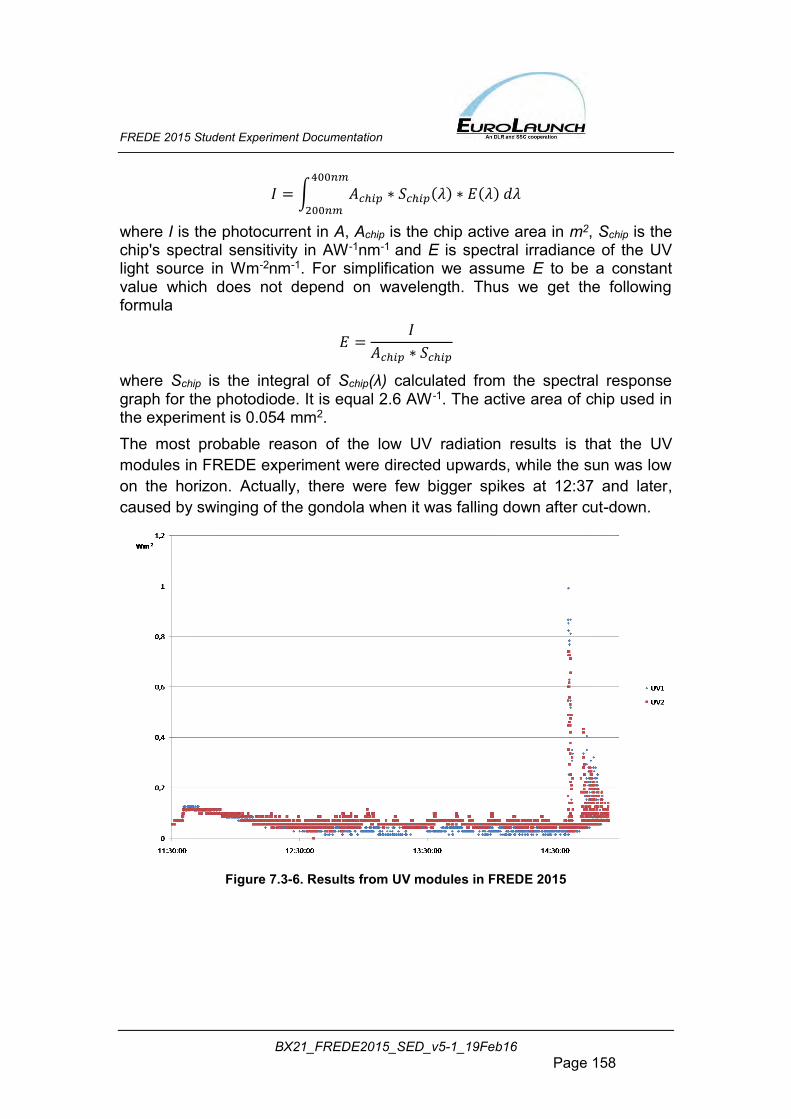
FREDE 2015 Student Experiment Documentation
BX21_FREDE2015_SED_v5-1_19Feb16 Page 158
𝐼 = ∫ 𝐴𝑐ℎ𝑖𝑝 ∗ 𝑆𝑐ℎ𝑖𝑝(𝜆) ∗ 𝐸(𝜆) 𝑑𝜆400𝑛𝑚
200𝑛𝑚
where I is the photocurrent in A, Achip is the chip active area in m2, Schip is the chip's spectral sensitivity in AW-1nm-1 and E is spectral irradiance of the UV light source in Wm-2nm-1. For simplification we assume E to be a constant value which does not depend on wavelength. Thus we get the following formula
𝐸 =𝐼
𝐴𝑐ℎ𝑖𝑝 ∗ 𝑆𝑐ℎ𝑖𝑝
where Schip is the integral of Schip(λ) calculated from the spectral response graph for the photodiode. It is equal 2.6 AW-1. The active area of chip used in the experiment is 0.054 mm2. The most probable reason of the low UV radiation results is that the UV modules in FREDE experiment were directed upwards, while the sun was low on the horizon. Actually, there were few bigger spikes at 12:37 and later, caused by swinging of the gondola when it was falling down after cut-down.
Figure 7.3-6. Results from UV modules in FREDE 2015
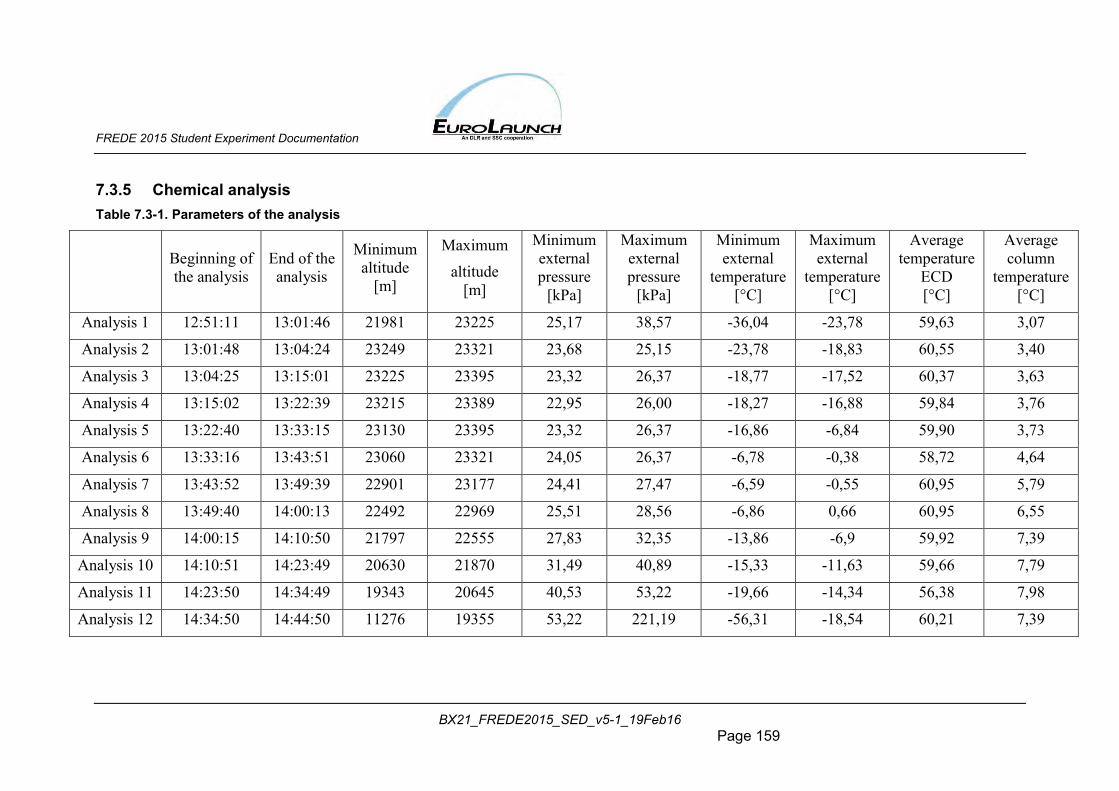
FREDE 2015 Student Experiment Documentation
BX21_FREDE2015_SED_v5-1_19Feb16 Page 159
7.3.5 Chemical analysis Table 7.3-1. Parameters of the analysis
Beginning of the analysis
End of the analysis
Minimum altitude
[m]
Maximum
altitude [m]
Minimum external pressure
[kPa]
Maximum external pressure
[kPa]
Minimum external
temperature [°C]
Maximum external
temperature [°C]
Average temperature
ECD [°C]
Average column
temperature [°C]
Analysis 1 12:51:11 13:01:46 21981 23225 25,17 38,57 -36,04 -23,78 59,63 3,07
Analysis 2 13:01:48 13:04:24 23249 23321 23,68 25,15 -23,78 -18,83 60,55 3,40
Analysis 3 13:04:25 13:15:01 23225 23395 23,32 26,37 -18,77 -17,52 60,37 3,63
Analysis 4 13:15:02 13:22:39 23215 23389 22,95 26,00 -18,27 -16,88 59,84 3,76
Analysis 5 13:22:40 13:33:15 23130 23395 23,32 26,37 -16,86 -6,84 59,90 3,73
Analysis 6 13:33:16 13:43:51 23060 23321 24,05 26,37 -6,78 -0,38 58,72 4,64
Analysis 7 13:43:52 13:49:39 22901 23177 24,41 27,47 -6,59 -0,55 60,95 5,79
Analysis 8 13:49:40 14:00:13 22492 22969 25,51 28,56 -6,86 0,66 60,95 6,55
Analysis 9 14:00:15 14:10:50 21797 22555 27,83 32,35 -13,86 -6,9 59,92 7,39
Analysis 10 14:10:51 14:23:49 20630 21870 31,49 40,89 -15,33 -11,63 59,66 7,79
Analysis 11 14:23:50 14:34:49 19343 20645 40,53 53,22 -19,66 -14,34 56,38 7,98
Analysis 12 14:34:50 14:44:50 11276 19355 53,22 221,19 -56,31 -18,54 60,21 7,39
FREDE 2015 Student Experiment Documentation
BX21_FREDE2015_SED_v5-1_19Feb16 Page 160
The composition of the samples in Gas Bags was as follows: 1 ppm and 100 ppb (each one per 2 bags). From total of four bags, only two were used. Other two were thought to be a CFC-12 reservoirs for ground analysis after flight. First analysis started at 12:51:11, at a height of 21 981 m, where ambient pressure was equal to 38.57 hPa and ambient temperature was -35.29˚C. As stated before, FREDE 2015 team encountered a problem of pressure sensors, which did not show any pressure change after opening of pressurized helium bottle. Nevertheless, without observing the pressure gain in the system, helium was transporting chemical compounds to the ECD, because there were signals on the detector. Another problem was zero change in ECD frequency after the opening of the nitrogen bottle. Despite these problems, some of the analysis show interesting results – in particular analysis 6 and 9. The average CC temperature of analysis number 6 was 4.64˚C. In this temperature, CFC-12 had a time of travel through CC equal to 7 minutes 21 seconds. Freon peak can be found in the fig. 7.3-8 as peak number 6. In the analysis number 9, where CC temperature was 7.39˚C, CFC-12 had a time of travel through CC equal to 5 minutes 32 seconds, which resulted in lower peak in the fig. 7.3-9 (number 9). Post flight data analyses were done with the gas from all four bags, despite the fact that only 2 of them were thought to be gas reservoirs for such actions. From the after-reaction mixture from bags with 100 ppb concentration nothing has been detected due to the too low Freon concentration. However, 1 ppm bags showed, that there were some mixture of different Freons in the Gas Bags:
- CFC-12 - CFC-13 - CFC-21 - CFC-22
They could have been already in the Freon used for the creating the flight mixture, however, what is more likely, they are the products of the depletion process of the CFC-12 due to the exposition to UV radiation. All post flight data analyses were done with D.Sc. Ireneusz Śliwka from Environmental Lab in Institute of Atomic Physics (IFJ Polish Academy of Science) in Kraków, Poland. With such results, it is hard to determine how many chlorine molecules were created from CFC-12 samples after the exposition to the UV radiation. We suspect, that on chromatograms one can see the signals (1-5 and then 7-9 in fig. 7.3-8; 1-8 and then 10 in fig. 7.3-9) from Gas Bags which were degrading over time and exposition to the UV, pneumatic pipes connecting every elements, lubricant from inside the pumps, nitrile pumps membranes and other gases, which might have been in the system. There is a
FREDE 2015 Student Experiment Documentation
BX21_FREDE2015_SED_v5-1_19Feb16 Page 161
significant problem with identifying their retention time, because the analysis on the ground must have had same conditions as FREDE 2015, which is quite impossible and was the main reason for the experiment to be done in the stratosphere.
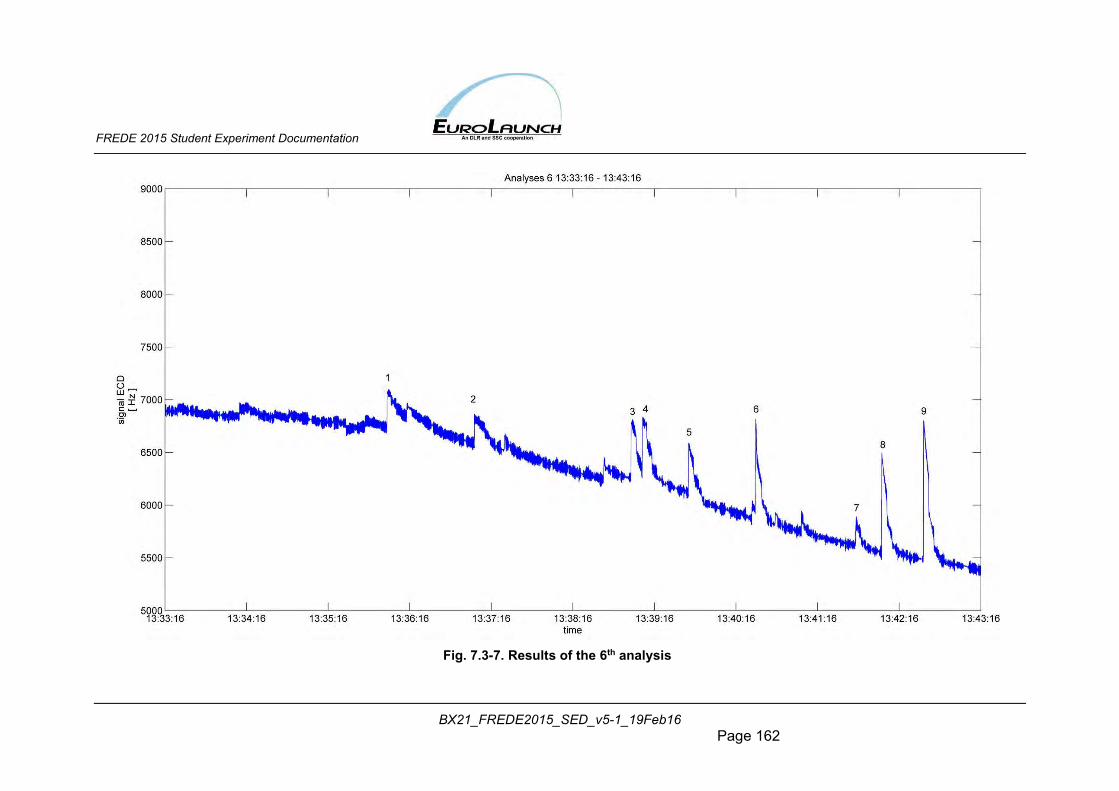
FREDE 2015 Student Experiment Documentation
BX21_FREDE2015_SED_v5-1_19Feb16 Page 162
Fig. 7.3-7. Results of the 6th analysis
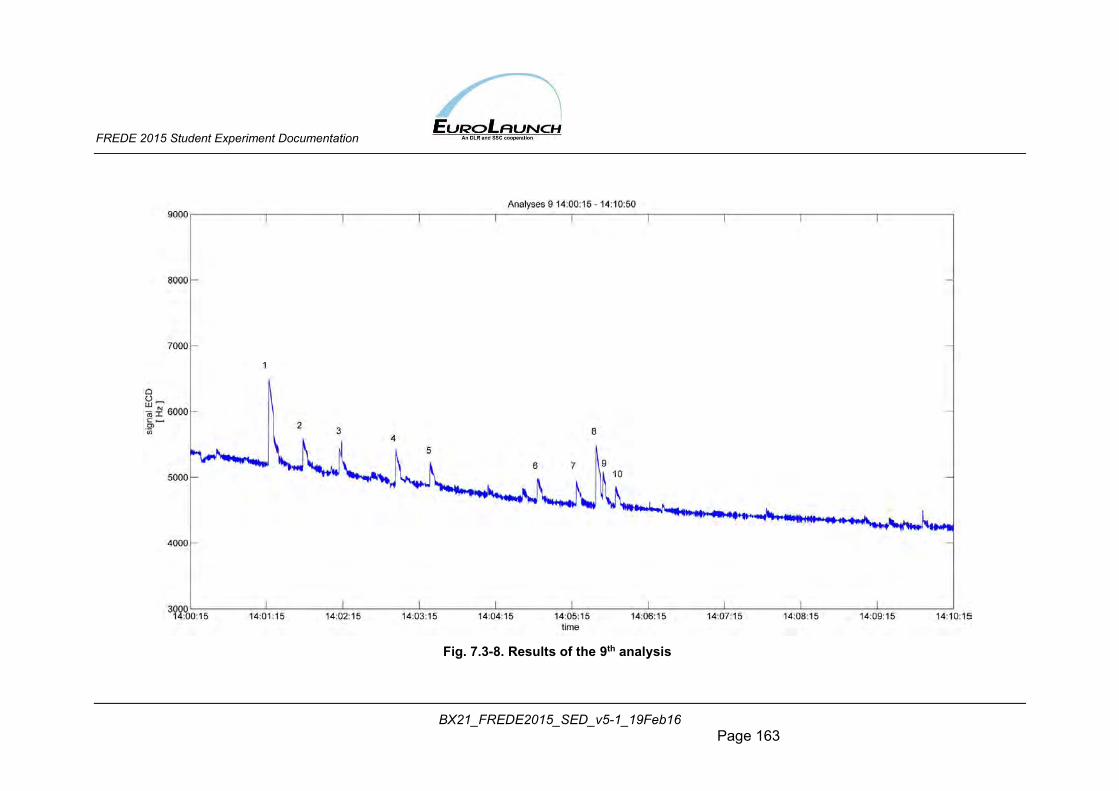
FREDE 2015 Student Experiment Documentation
BX21_FREDE2015_SED_v5-1_19Feb16 Page 163
Fig. 7.3-8. Results of the 9th analysis
FREDE 2015 Student Experiment Documentation
BX21_FREDE2015_SED_v5-1_19Feb16 Page 164
7.4 Discussion and Conclusions As stated in previous chapters, FREDE 2015 gained a lot of information about CFC decay in the stratosphere, however the team was unable to clearly state how many chlorine molecules had been created in that process during the flight time. Chemical analysis confirmed that this chlorine is present in the samples after the exposition.
Nevertheless, during the flight the experiment encountered a problem with the UV sensor, which results in lower system success of the project. Because the ECD and pneumatic subsystem worked in a proper way (apart from the possible problems with helium and nitrogen), overall system success of the project has been calculated to the level of 90% by team coordinator.
7.5 Lessons Learned
Between Selection Workshop and PDR:
1) Maintain proper documentation and share it throughout the group so that team leader is not responsible for everything,
2) Prepare tests (in terms of acquiring access to facilities) way earlier – preparations always take much more time than predicted due to random unavailability of external support,
3) WBS and Gantt are extremely helpful, especially at the beginning,
Between PDR and CDR:
1) Internal communication within the team is crucial for efficient team work,
2) Start working with deadlines (in terms of documentation) way earlier than expected, because random events can and will slow down the progress of SED integration,
3) Crucial basic design and operation assumptions and requirements should be clear for everybody from the beginning of the project,
4) Tests preparation usually take twice the anticipated time,
Between CDR and IPR:
1) Do not put too much on anybody, it slows a person down in terms of teamwork and motivation,
2) There are holidays on university too – take this into account when planning for tests,
FREDE 2015 Student Experiment Documentation
BX21_FREDE2015_SED_v5-1_19Feb16 Page 165
3) Component delivery takes more time than predicted due to some formalities on university.
Somewhere near IPR:
1) Things never go as planned, 2) Do not trust external companies – and if you must, call them and email
them as many times as necessary, 3) Motivation is the key to success, 4) Proper team leadership is extremely helpful.
From IPR to Flight Campaign:
1) Working under pressure goes really well when properly motivated, 2) There will be delays – always.
FREDE 2015 Student Experiment Documentation
BX21_FREDE2015_SED_v5-1_19Feb16 Page 166
8 ABBREVIATIONS AND REFERENCES
8.1 Abbreviations This section contains a list of all abbreviations used in the document.
CDR Critical Design Review CFC Chlorofluorocarbon COG Centre of gravity DLR Deutsches Zentrum für Luft und Raumfahrt EAR Experiment Acceptance Review ESA European Space Agency ESTEC European Space Research and Technology Centre, ESA (NL) GB Gas Bag GCB Gas Container Boom IPR Interim Progress Review LB Little Box Kbps Kilobits per second Mbps Megabits per second MEB Main Electronics Box MORABA Mobile Raketen Basis (DLR, EuroLaunch) O&M Operations and Maintenance PCB Printed Circuit Board (electronic card) PDR Preliminary Design Review SED Student Experiment Documentation T Time before and after launch noted with + or - VUV Vacuum Ultraviolet WBS Work Breakdown Structure
FREDE 2015 Student Experiment Documentation
BX21_FREDE2015_SED_v5-1_19Feb16 Page 167
8.2 References (Books, Papers, Proceedings, Internet sources)
[1] EARTH SYSTEM RESEARCH LABORATORY, http://www.esrl.noaa.gov [2] A.M. Velasco, E. Mayor, I. Martin, Intensity calculations of the VUV and UV
photoabsorption and photoionisation of CF3Cl, Departamento de QuımicaFısica, Facultad de Ciencias, Universidad de Valladolid, E47005 Valladolid, Spain
[3] Mei-wen Yen and Philip M. Johnson,The vacuum ultraviolet photodissociation
of the chlorofluorocarbons. Photolysis of CF&I, CF2C12, and CFC13 at 187, 125, and 118 nm, Department of Chemistry, State University of New York, Stony Brook, New York
[4] U.S. Environmental Protection Agency, Ozone Hole Watch, NASA
[5] ELŻBIETA ŚWIERGOSZ-BYLICA; Dziura ozonowa – dbajmy o środowisko, Warszawa 2010
[6] ELMAR UHEREK; Stratospheric ozone: the story of the discovery, processcreation and absorption of radiation, Max Planck Institute for Chemistry, Germany
[7] JAMES W. ELKINS, Chlorofluorocarbons CFC, The Chapman & HallEncyclopaedia of Environmental Science, Kluwer Academic, Boston, MA,1999.
[8] EuroLaunch: BEXUS User Manual (2014),
[9] European Cooperation for Space Standardization ECSS:Space Project Management, Project Planning and Implementation, ECSS-M-ST-10C Rev.1, 6 March 2009
[10] SSC Esrange: Esrange Safety Manual, REA00-E60 , 23June 2010
[11] European Cooperation for Space Standardization ECSS: Space Engineering, Technical Requirements Specification, ECSS-E-ST-10-06C, 6 March 2009
[12] European Cooperation for Space Standardization ECSS,Space Project Management, Risk Management, ECSS-M-ST-80C, 31 July 2008
[13] European Cooperation for Space Standardization ECSS: Space Engineering, Verification, ECSS-E-ST-10-02C, 6 March 2009
[14] Project Management Institute, Practice Standard for Work Breakdown Structures – second Edition, Project Management Institute, Pennsylvania, USA, 2006
[15] http://www.parker.com/Literature/Automation%20Division%20-
%20China/FCDE%20General%20Catalog-0110UK.pdf
FREDE 2015 Student Experiment Documentation
BX21_FREDE2015_SED_v5-1_19Feb16 Page 168
[16] http://www.boxerpumps.com/index_files/Page680.htm
[17] Shuai Ban, Computer Simulation of Zeolites: Adsorption, Diffusion and Dealumination
[18] Jianhai Zhou, Huiling Zhao, Jinxia Li, Yujun Zhu, Jun Hu*, Honglai Liu, Ying
Hu,CO2 capture on micro/mesoporous composites of (zeolite A)/(MCM-41) with Ca2ţ located: Computer simulation and experimental studies
[19] https://www.chromspec.com/pdf/e/rk91.pdf
[20] https://www.chem.agilent.com/cag/cabu/capgccols.html
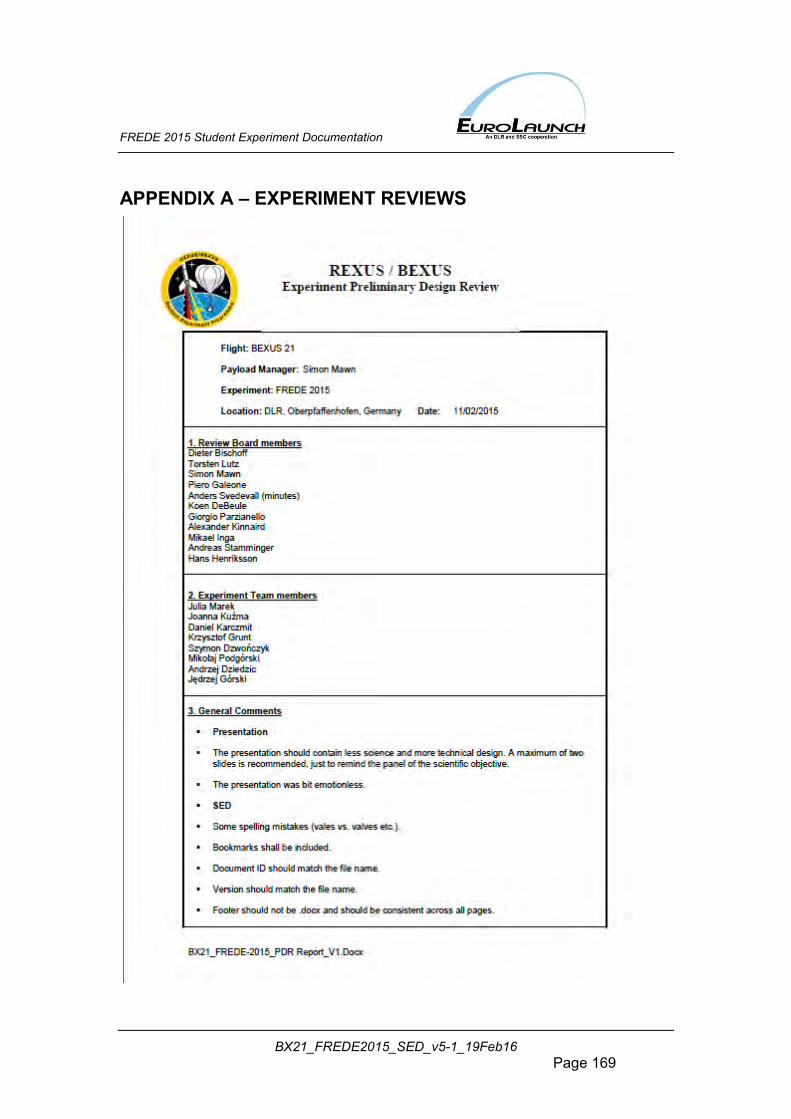
FREDE 2015 Student Experiment Documentation
BX21_FREDE2015_SED_v5-1_19Feb16 Page 169
APPENDIX A – EXPERIMENT REVIEWS
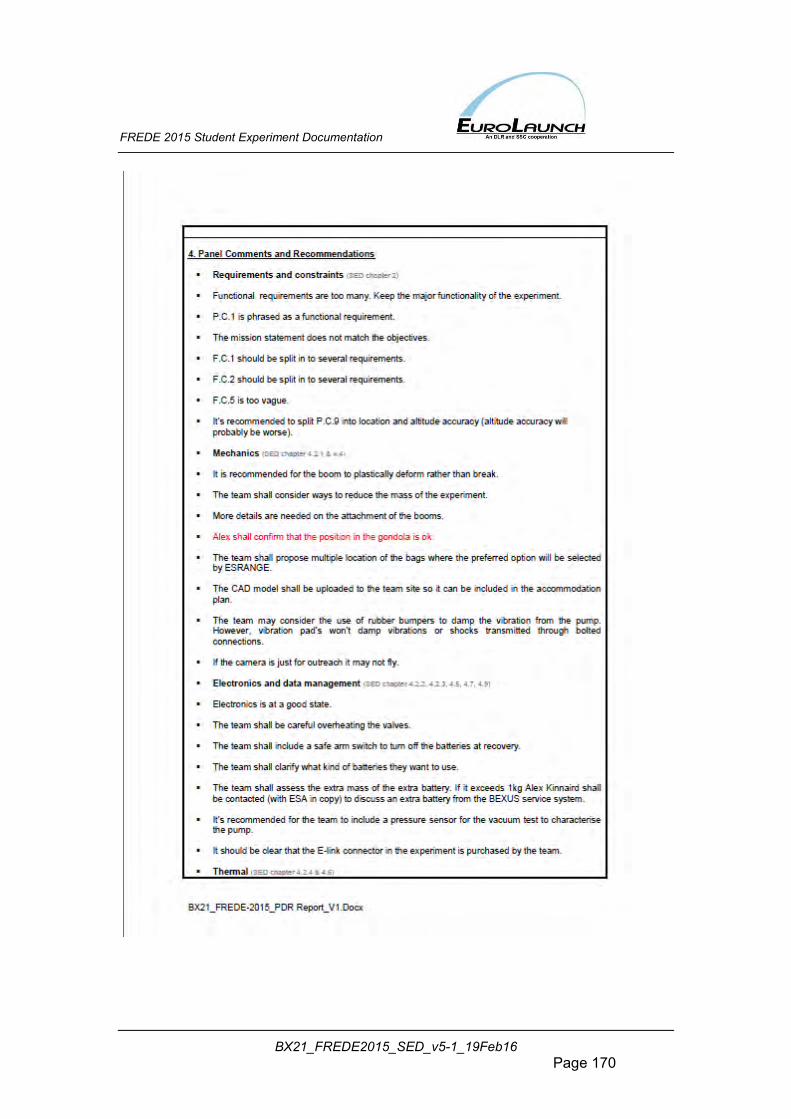
FREDE 2015 Student Experiment Documentation
BX21_FREDE2015_SED_v5-1_19Feb16 Page 170
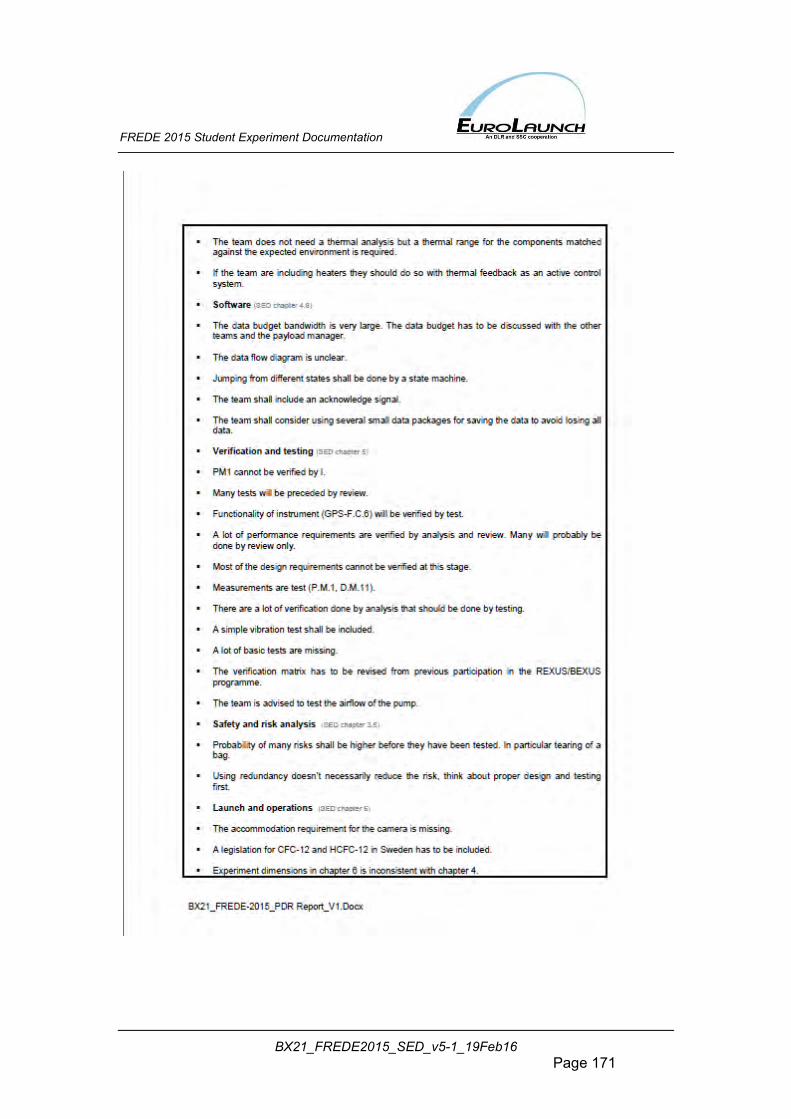
FREDE 2015 Student Experiment Documentation
BX21_FREDE2015_SED_v5-1_19Feb16 Page 171
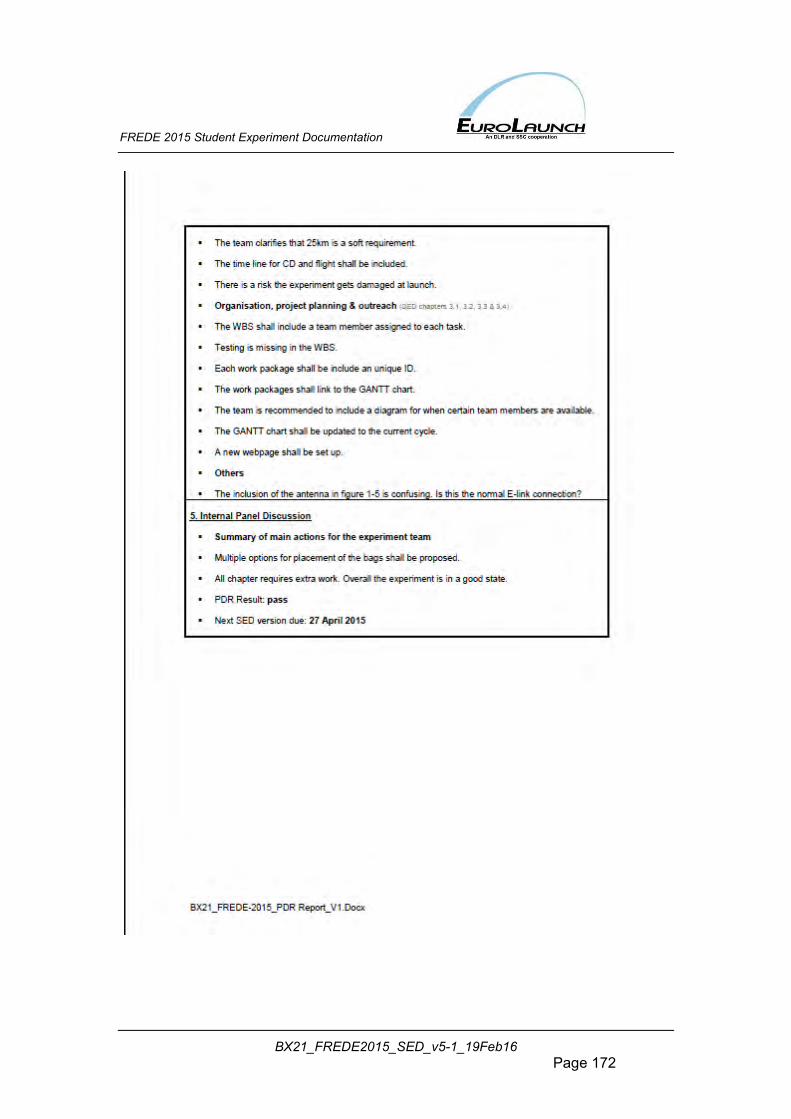
FREDE 2015 Student Experiment Documentation
BX21_FREDE2015_SED_v5-1_19Feb16 Page 172
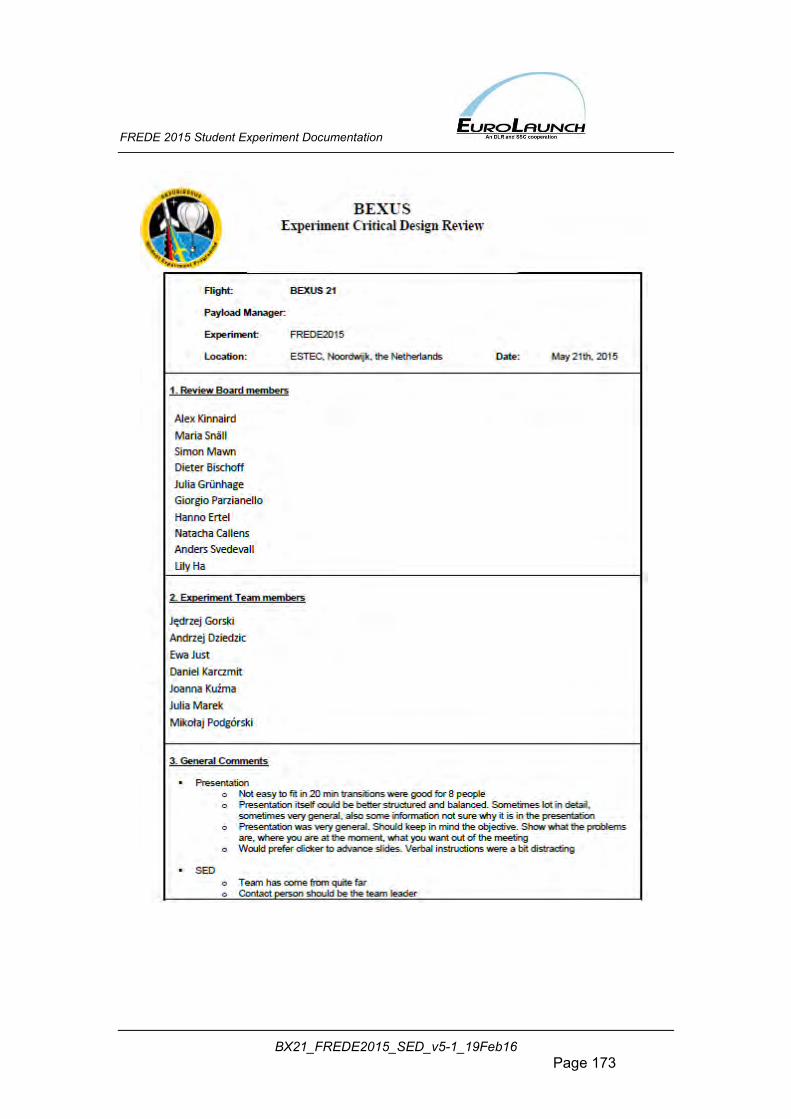
FREDE 2015 Student Experiment Documentation
BX21_FREDE2015_SED_v5-1_19Feb16 Page 173
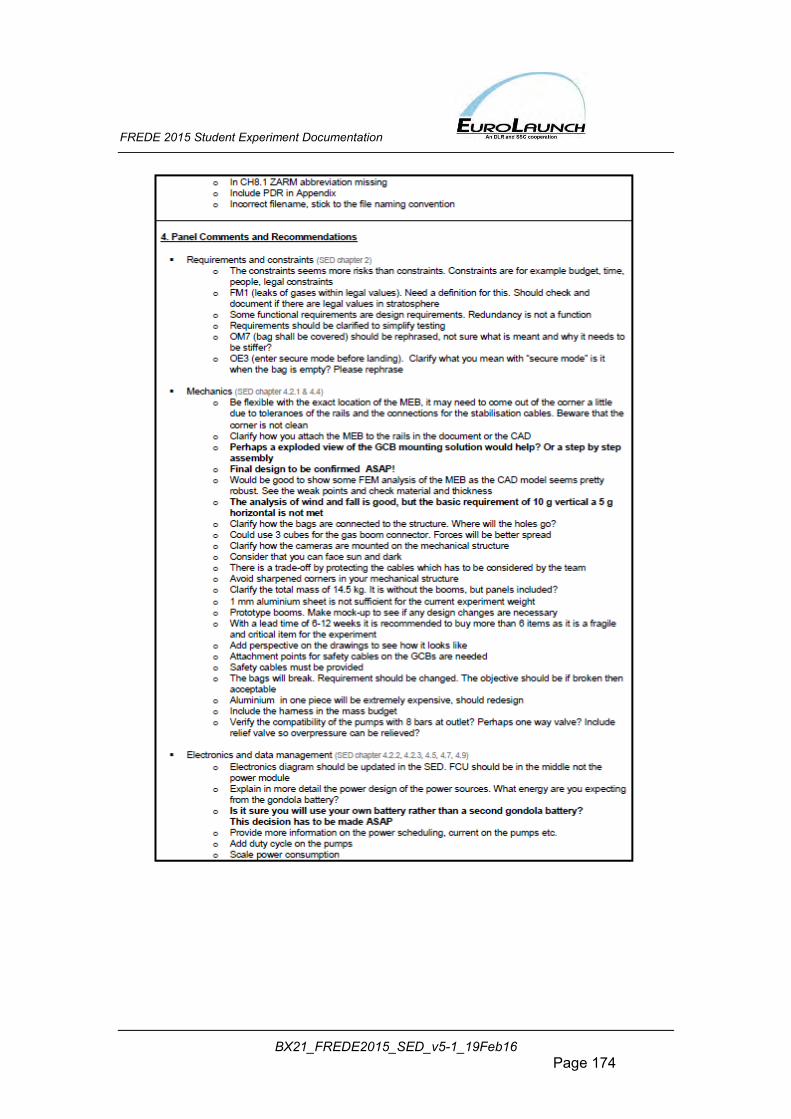
FREDE 2015 Student Experiment Documentation
BX21_FREDE2015_SED_v5-1_19Feb16 Page 174
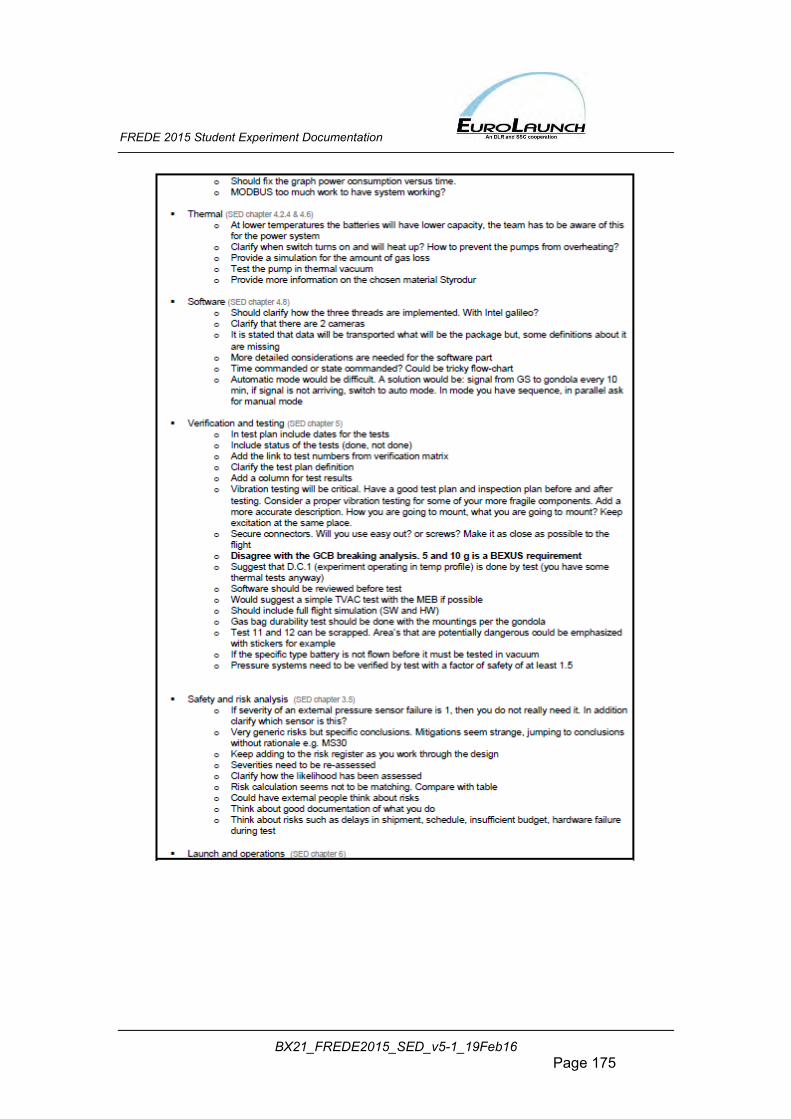
FREDE 2015 Student Experiment Documentation
BX21_FREDE2015_SED_v5-1_19Feb16 Page 175
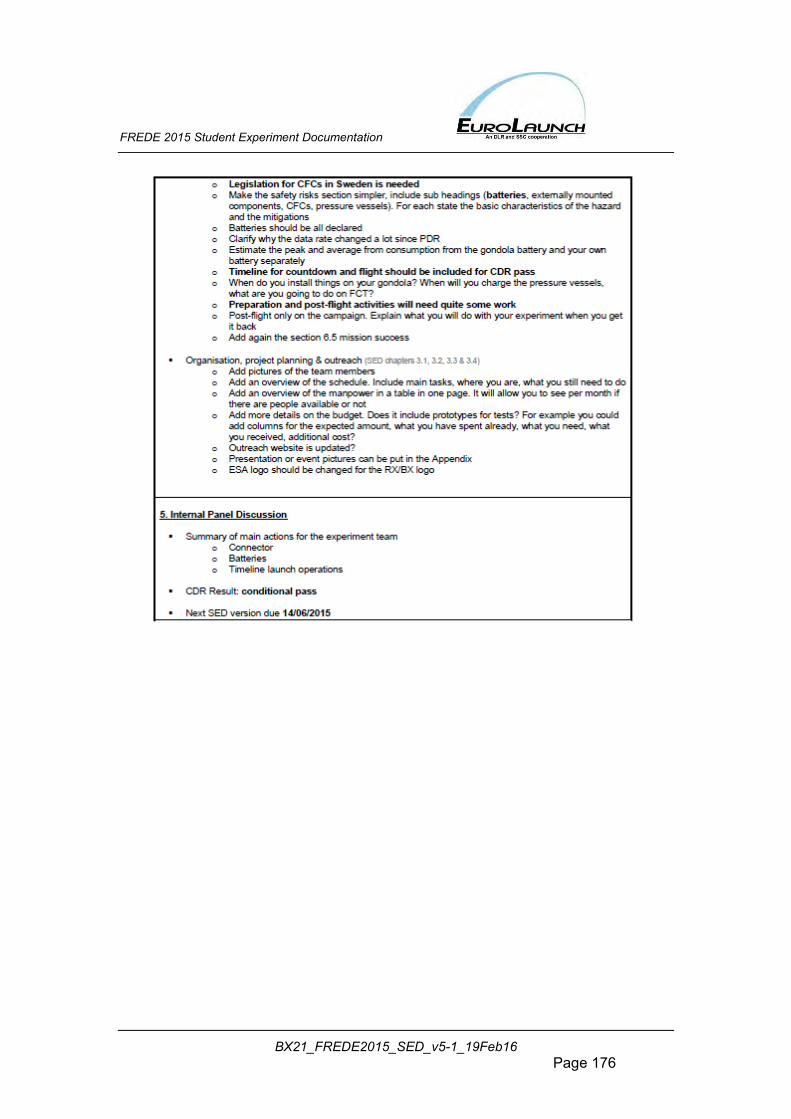
FREDE 2015 Student Experiment Documentation
BX21_FREDE2015_SED_v5-1_19Feb16 Page 176
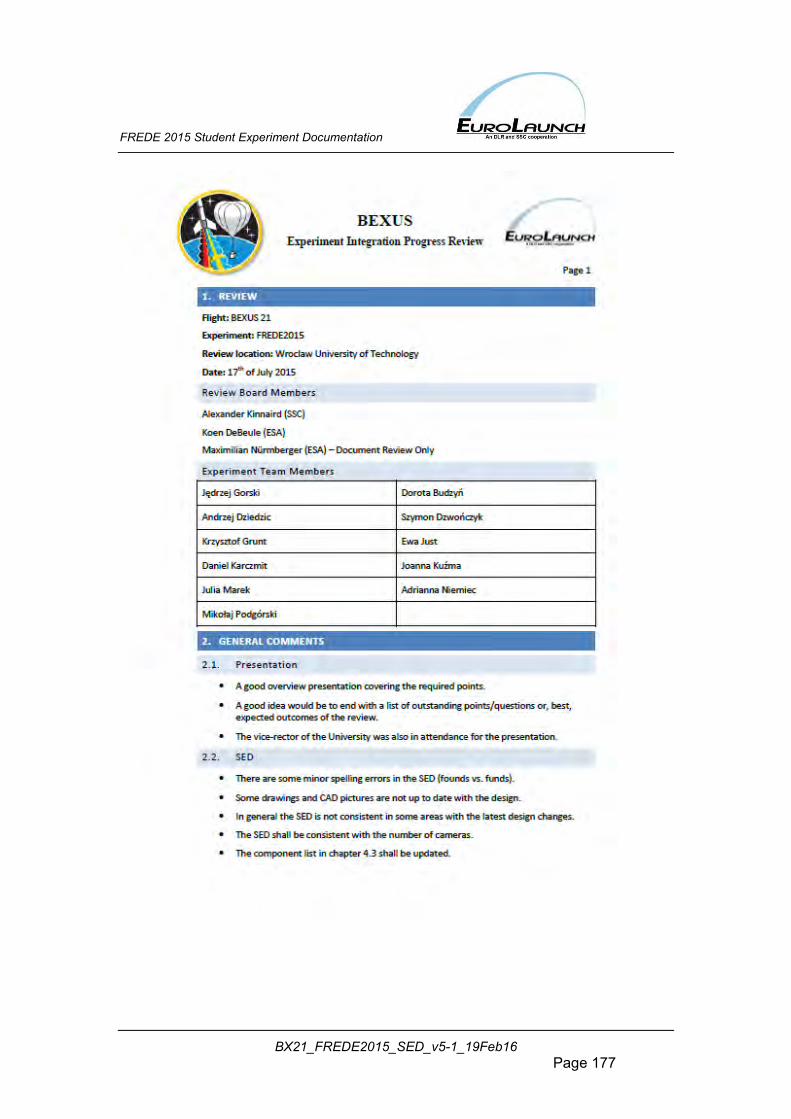
FREDE 2015 Student Experiment Documentation
BX21_FREDE2015_SED_v5-1_19Feb16 Page 177
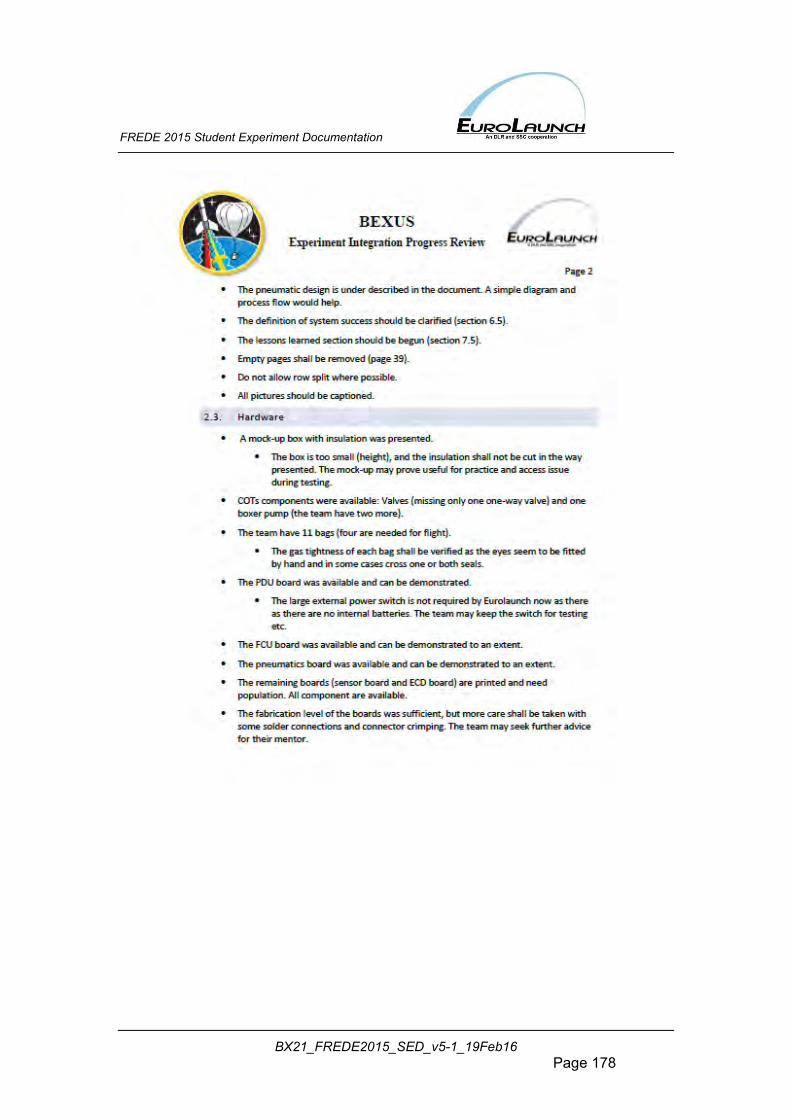
FREDE 2015 Student Experiment Documentation
BX21_FREDE2015_SED_v5-1_19Feb16 Page 178
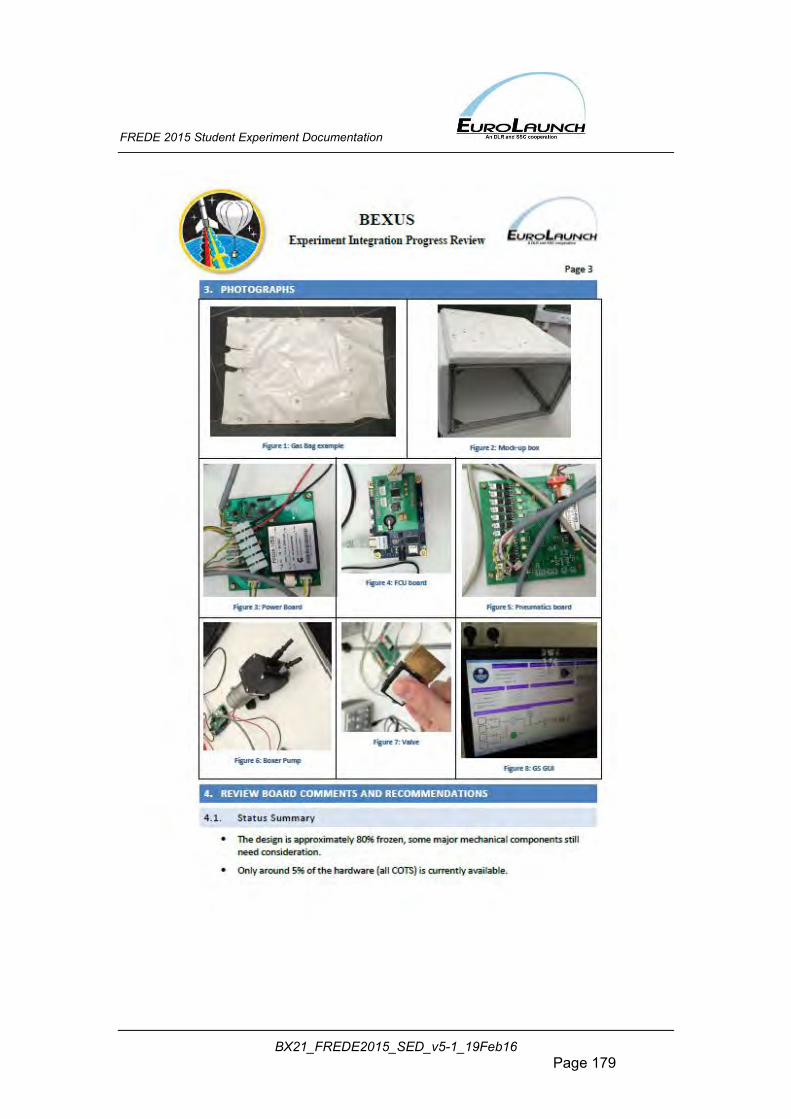
FREDE 2015 Student Experiment Documentation
BX21_FREDE2015_SED_v5-1_19Feb16 Page 179
FREDE 2015 Student Experiment Documentation
BX21_FREDE2015_SED_v5-1_19Feb16 Page 180
FREDE 2015 Student Experiment Documentation
BX21_FREDE2015_SED_v5-1_19Feb16 Page 181
FREDE 2015 Student Experiment Documentation
BX21_FREDE2015_SED_v5-1_19Feb16 Page 182
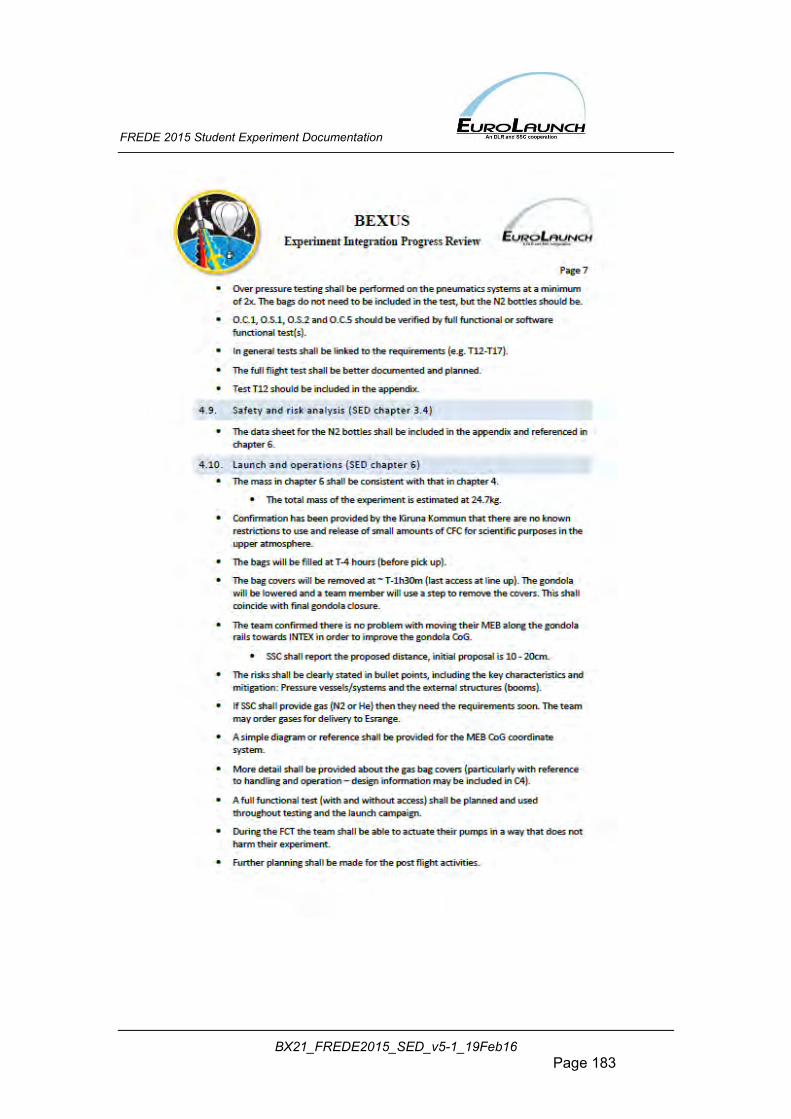
FREDE 2015 Student Experiment Documentation
BX21_FREDE2015_SED_v5-1_19Feb16 Page 183
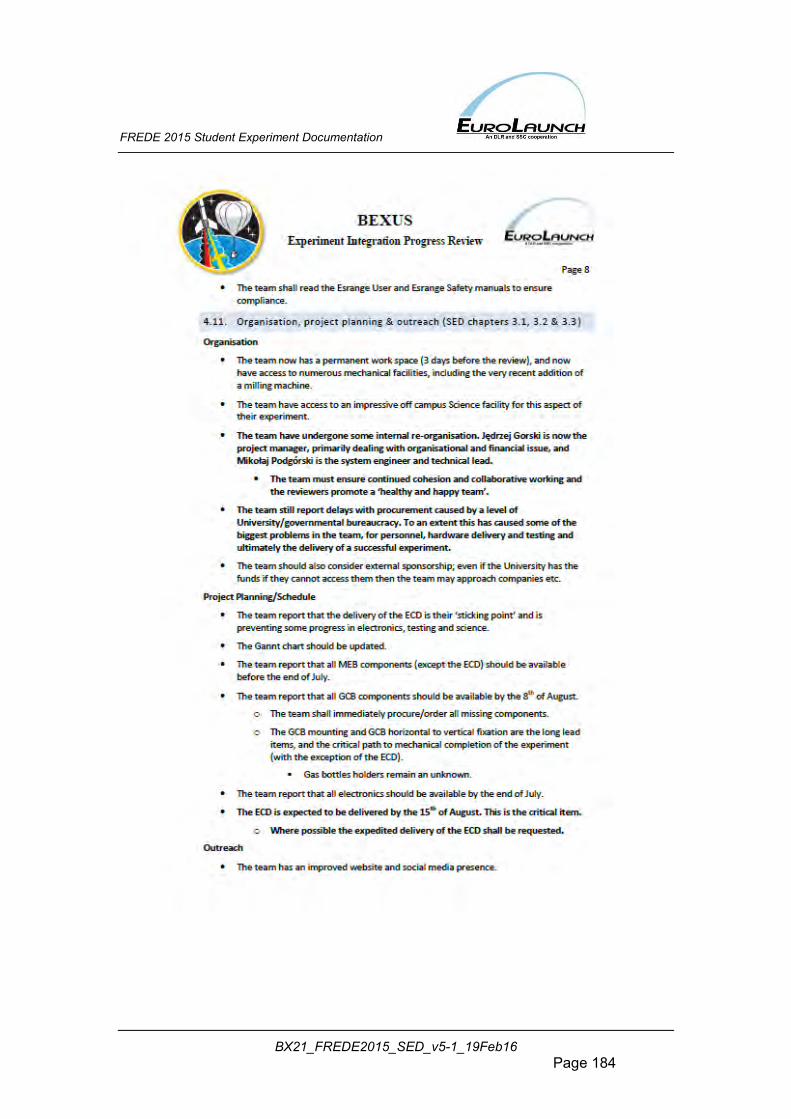
FREDE 2015 Student Experiment Documentation
BX21_FREDE2015_SED_v5-1_19Feb16 Page 184
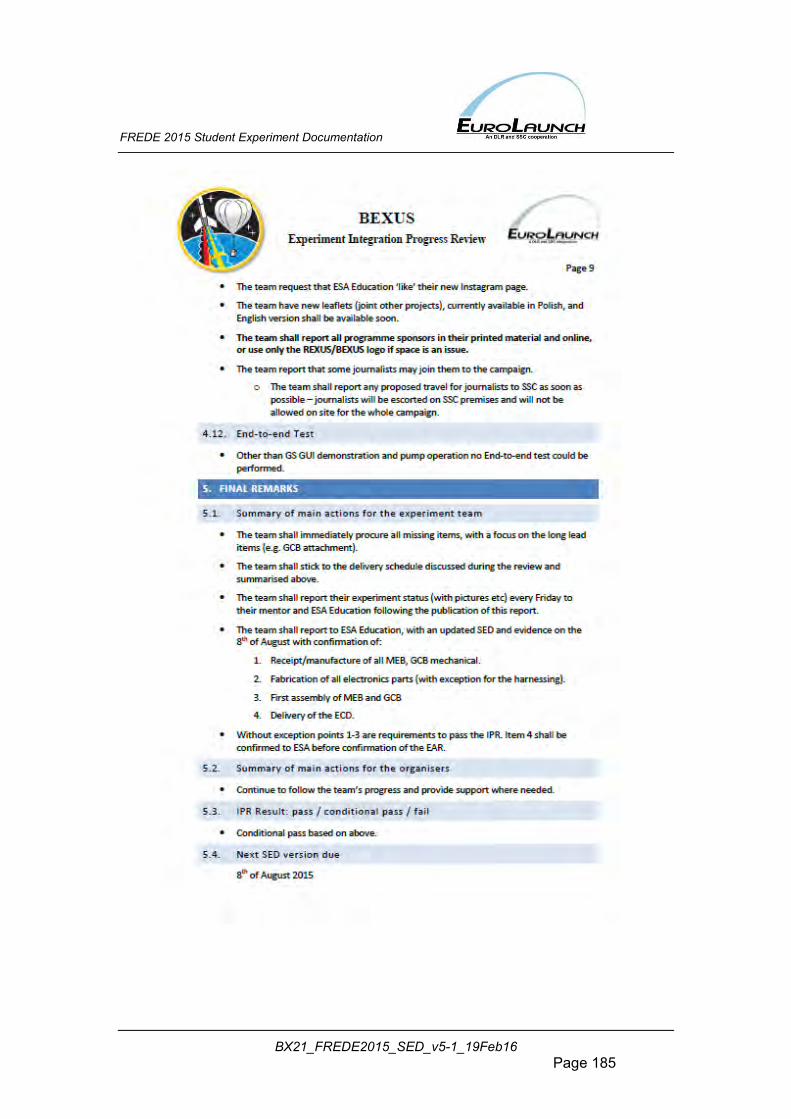
FREDE 2015 Student Experiment Documentation
BX21_FREDE2015_SED_v5-1_19Feb16 Page 185
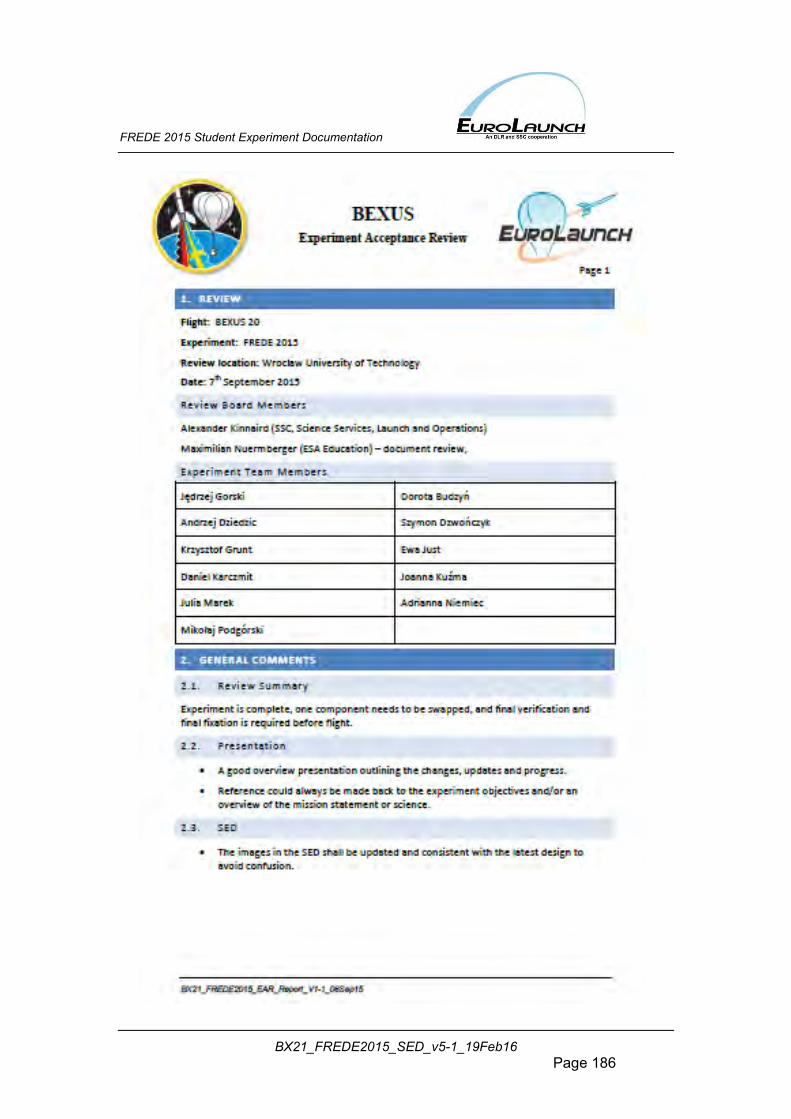
FREDE 2015 Student Experiment Documentation
BX21_FREDE2015_SED_v5-1_19Feb16 Page 186
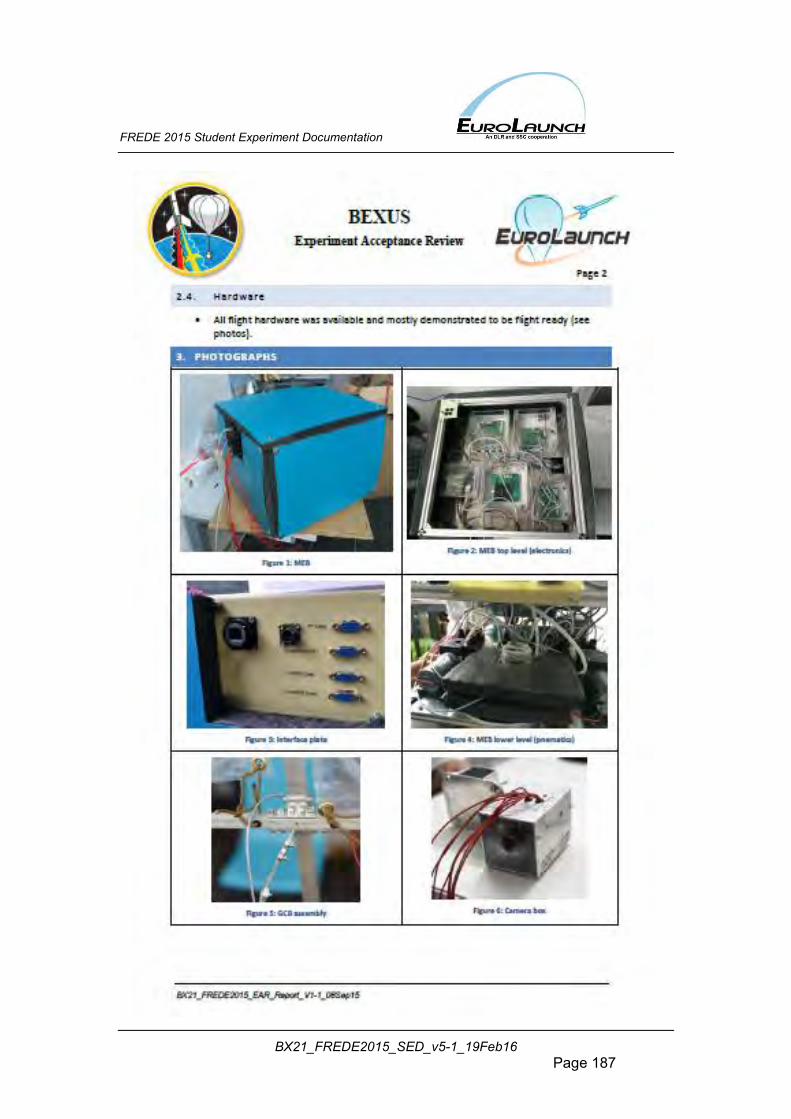
FREDE 2015 Student Experiment Documentation
BX21_FREDE2015_SED_v5-1_19Feb16 Page 187
FREDE 2015 Student Experiment Documentation
BX21_FREDE2015_SED_v5-1_19Feb16 Page 188
FREDE 2015 Student Experiment Documentation
BX21_FREDE2015_SED_v5-1_19Feb16 Page 189
FREDE 2015 Student Experiment Documentation
BX21_FREDE2015_SED_v5-1_19Feb16 Page 190
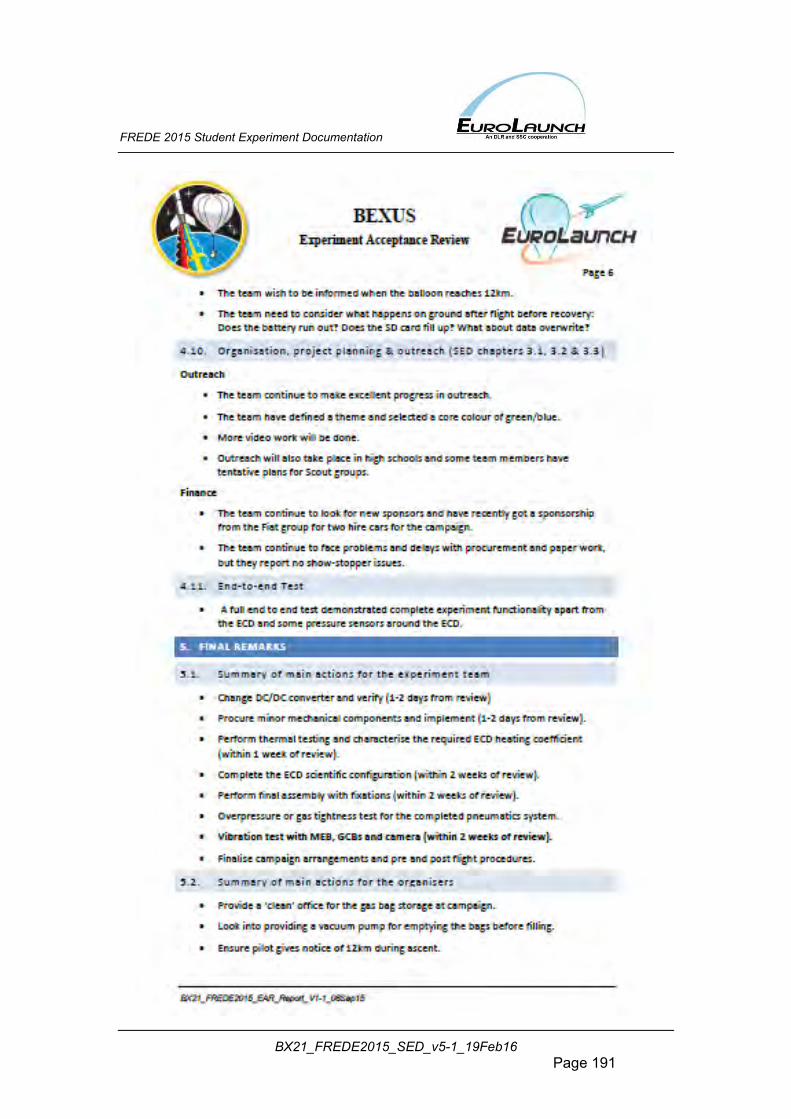
FREDE 2015 Student Experiment Documentation
BX21_FREDE2015_SED_v5-1_19Feb16 Page 191
FREDE 2015 Student Experiment Documentation
BX21_FREDE2015_SED_v5-1_19Feb16 Page 192
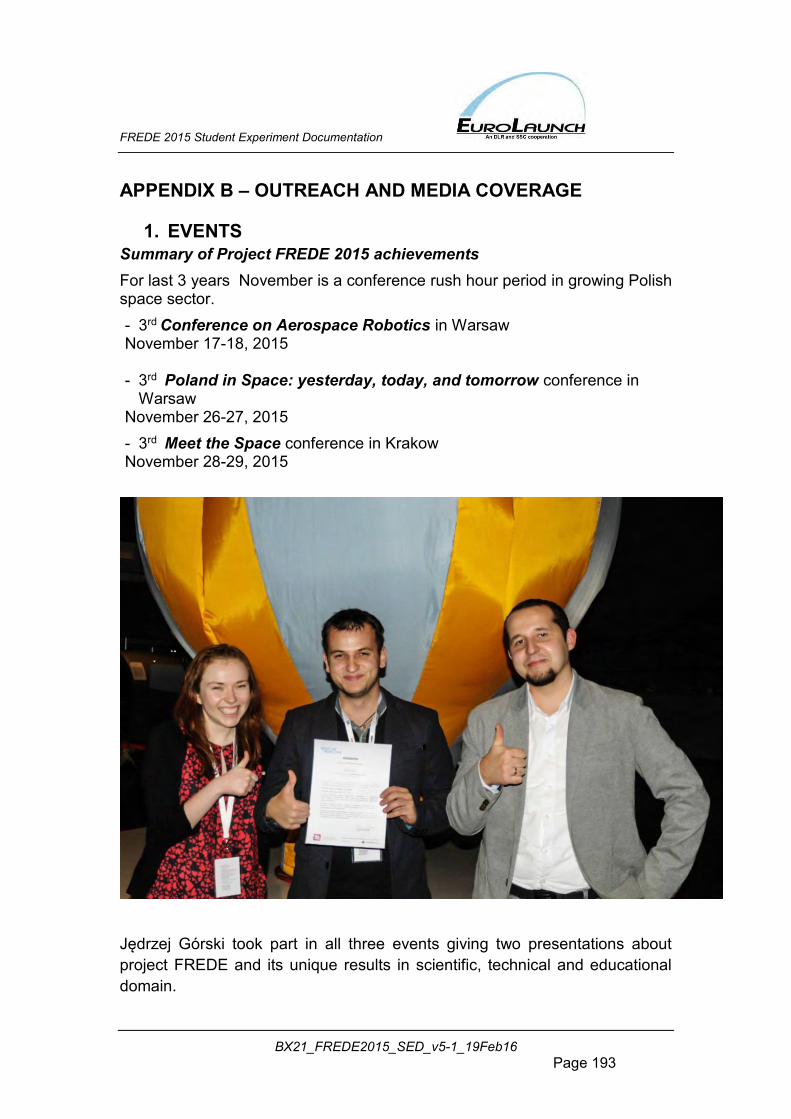
FREDE 2015 Student Experiment Documentation
BX21_FREDE2015_SED_v5-1_19Feb16 Page 193
APPENDIX B – OUTREACH AND MEDIA COVERAGE
1. EVENTS Summary of Project FREDE 2015 achievements For last 3 years November is a conference rush hour period in growing Polish space sector. - 3rd Conference on Aerospace Robotics in Warsaw November 17-18, 2015 - 3rd Poland in Space: yesterday, today, and tomorrow conference in
Warsaw November 26-27, 2015 - 3rd Meet the Space conference in Krakow November 28-29, 2015
Jędrzej Górski took part in all three events giving two presentations about project FREDE and its unique results in scientific, technical and educational domain.
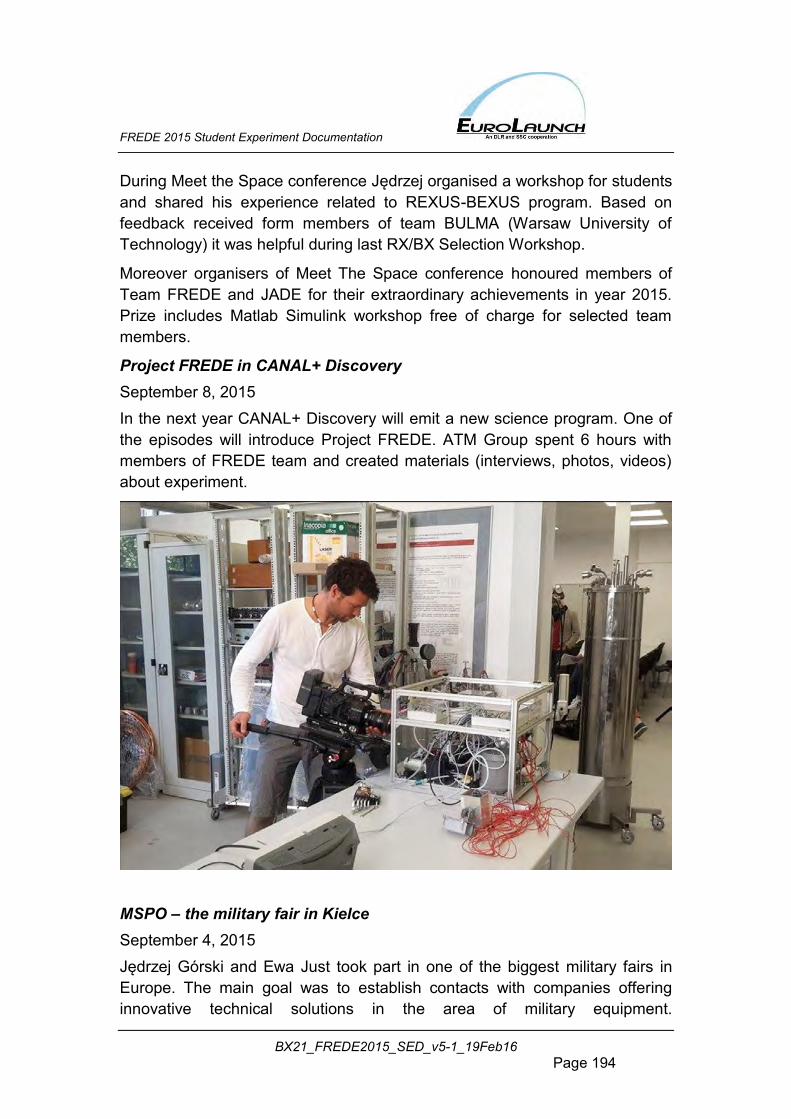
FREDE 2015 Student Experiment Documentation
BX21_FREDE2015_SED_v5-1_19Feb16 Page 194
During Meet the Space conference Jędrzej organised a workshop for students and shared his experience related to REXUS-BEXUS program. Based on feedback received form members of team BULMA (Warsaw University of Technology) it was helpful during last RX/BX Selection Workshop.
Moreover organisers of Meet The Space conference honoured members of Team FREDE and JADE for their extraordinary achievements in year 2015. Prize includes Matlab Simulink workshop free of charge for selected team members.
Project FREDE in CANAL+ Discovery September 8, 2015 In the next year CANAL+ Discovery will emit a new science program. One of the episodes will introduce Project FREDE. ATM Group spent 6 hours with members of FREDE team and created materials (interviews, photos, videos) about experiment.
MSPO – the military fair in Kielce September 4, 2015 Jędrzej Górski and Ewa Just took part in one of the biggest military fairs in Europe. The main goal was to establish contacts with companies offering innovative technical solutions in the area of military equipment.
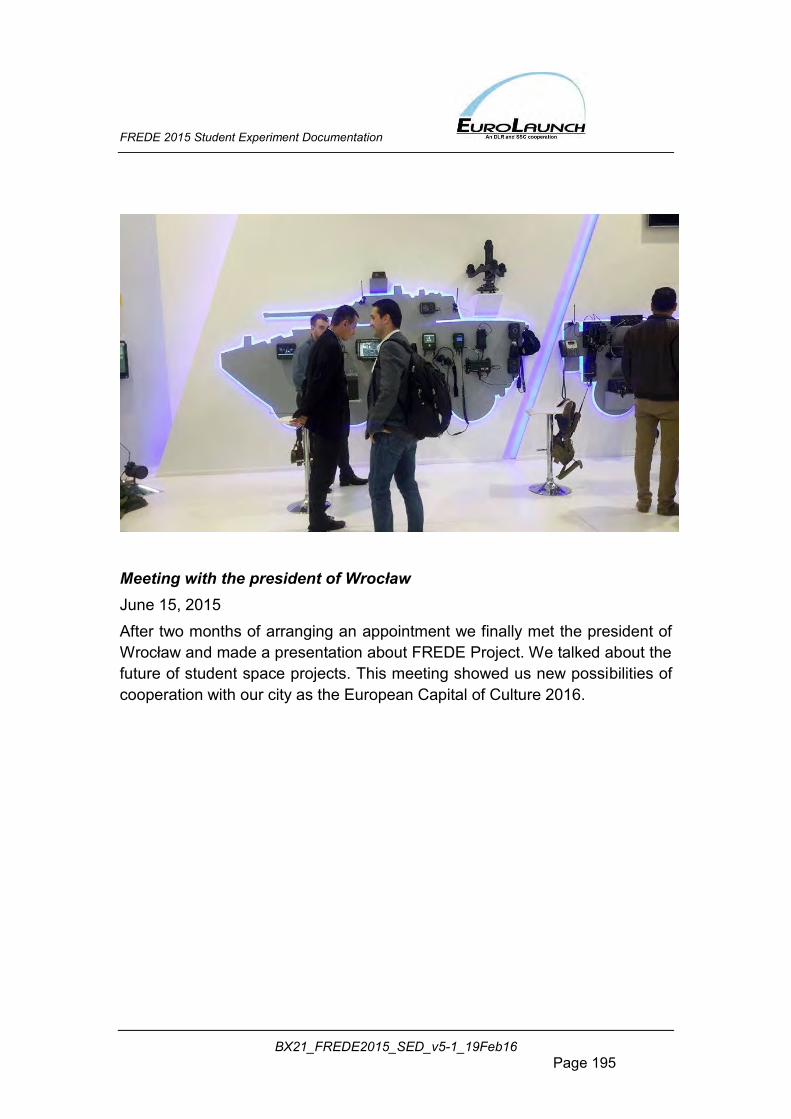
FREDE 2015 Student Experiment Documentation
BX21_FREDE2015_SED_v5-1_19Feb16 Page 195
Meeting with the president of Wrocław June 15, 2015 After two months of arranging an appointment we finally met the president of Wrocław and made a presentation about FREDE Project. We talked about the future of student space projects. This meeting showed us new possibilities of cooperation with our city as the European Capital of Culture 2016.
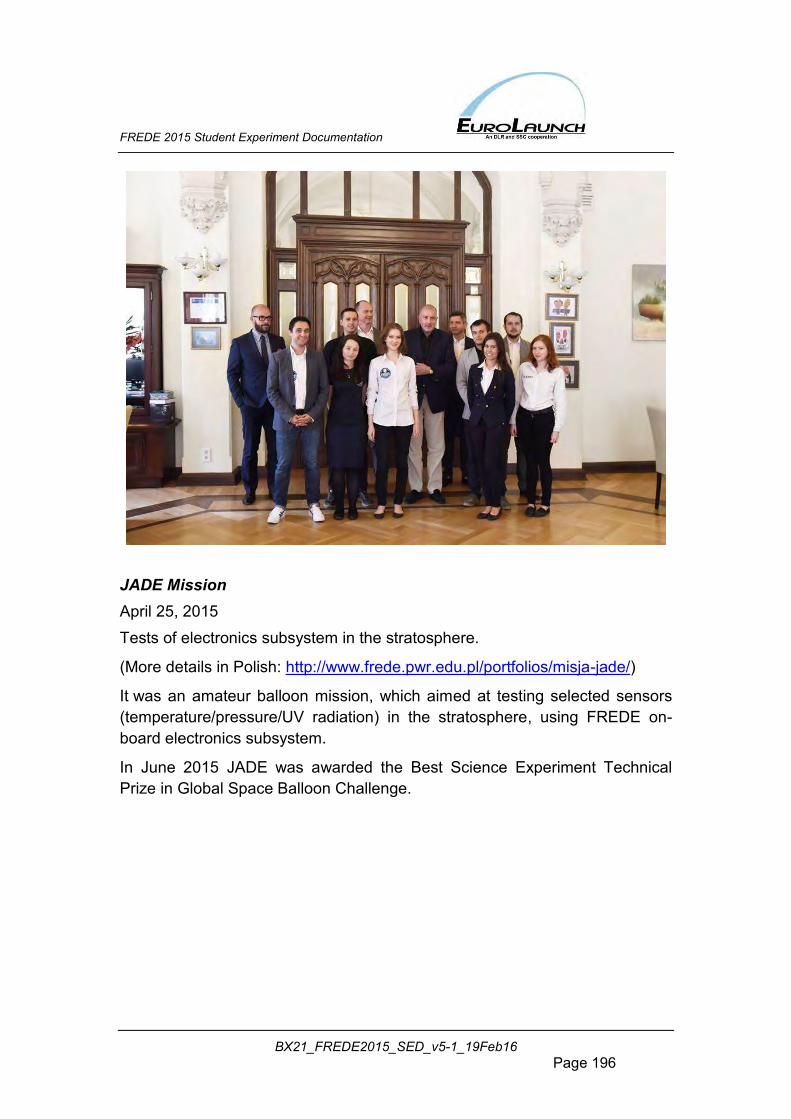
FREDE 2015 Student Experiment Documentation
BX21_FREDE2015_SED_v5-1_19Feb16 Page 196
JADE Mission April 25, 2015 Tests of electronics subsystem in the stratosphere.
(More details in Polish: http://www.frede.pwr.edu.pl/portfolios/misja-jade/)
It was an amateur balloon mission, which aimed at testing selected sensors (temperature/pressure/UV radiation) in the stratosphere, using FREDE on-board electronics subsystem.
In June 2015 JADE was awarded the Best Science Experiment Technical Prize in Global Space Balloon Challenge.
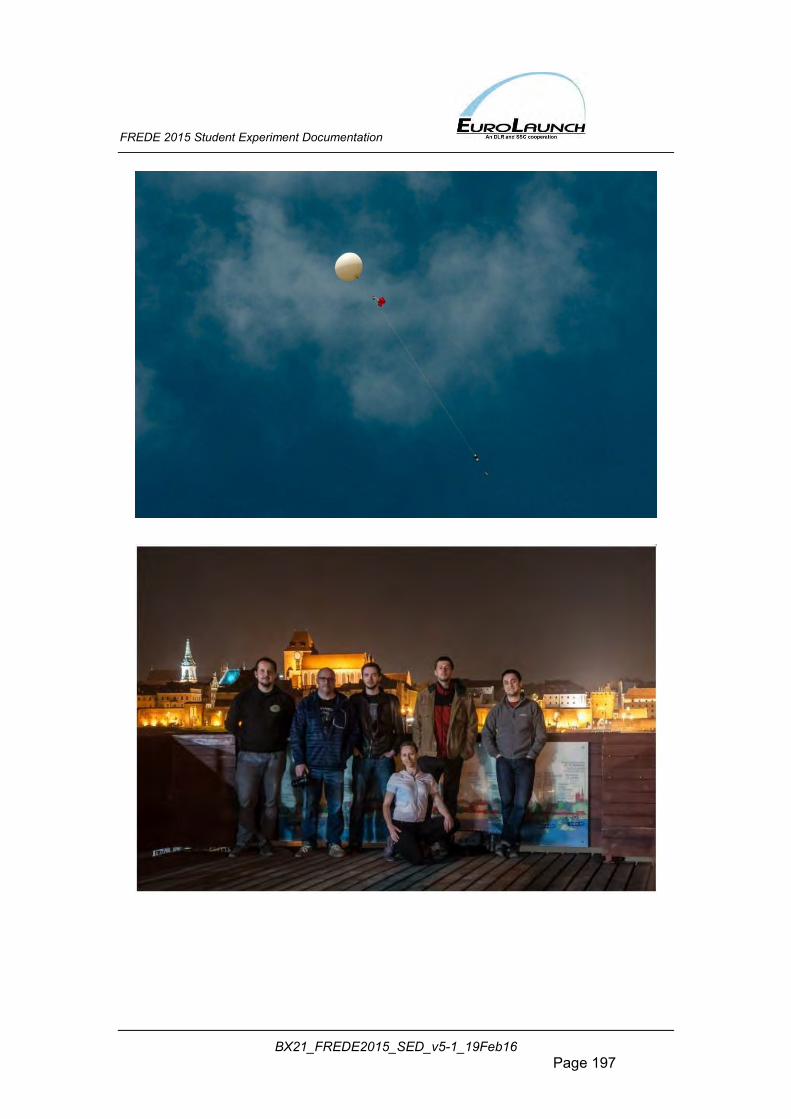
FREDE 2015 Student Experiment Documentation
BX21_FREDE2015_SED_v5-1_19Feb16 Page 197
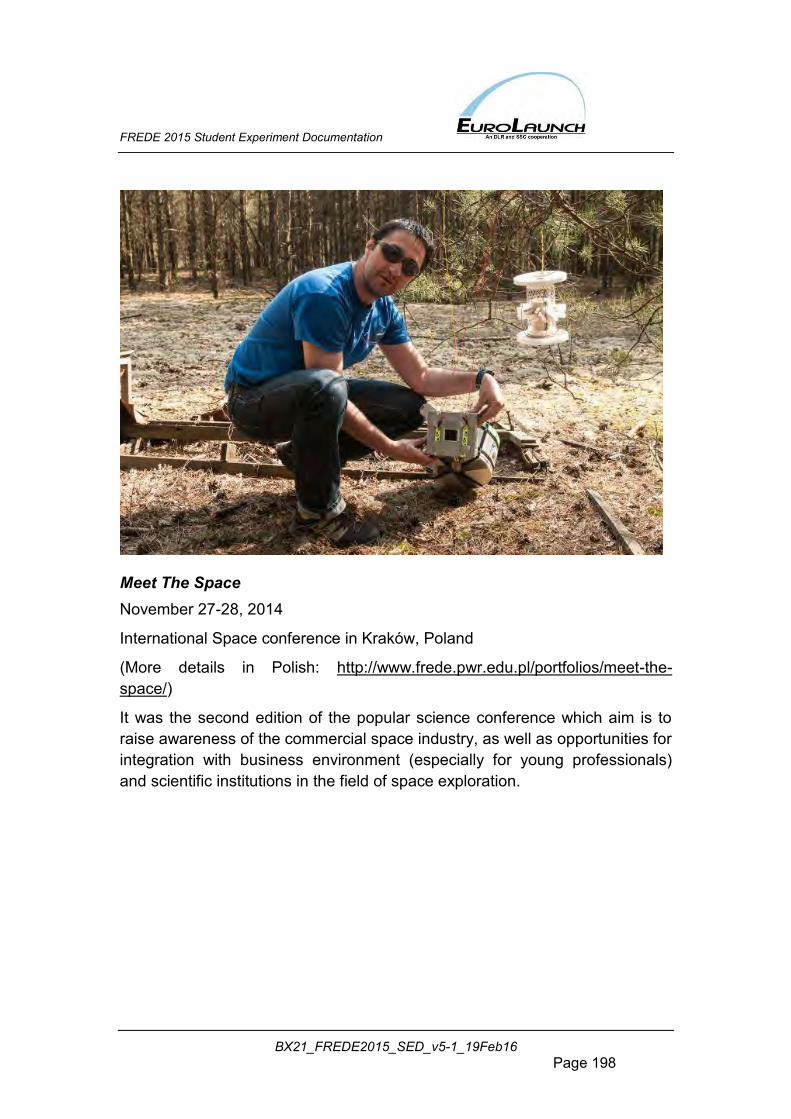
FREDE 2015 Student Experiment Documentation
BX21_FREDE2015_SED_v5-1_19Feb16 Page 198
Meet The Space November 27-28, 2014
International Space conference in Kraków, Poland
(More details in Polish: http://www.frede.pwr.edu.pl/portfolios/meet-the-space/)
It was the second edition of the popular science conference which aim is to raise awareness of the commercial space industry, as well as opportunities for integration with business environment (especially for young professionals) and scientific institutions in the field of space exploration.
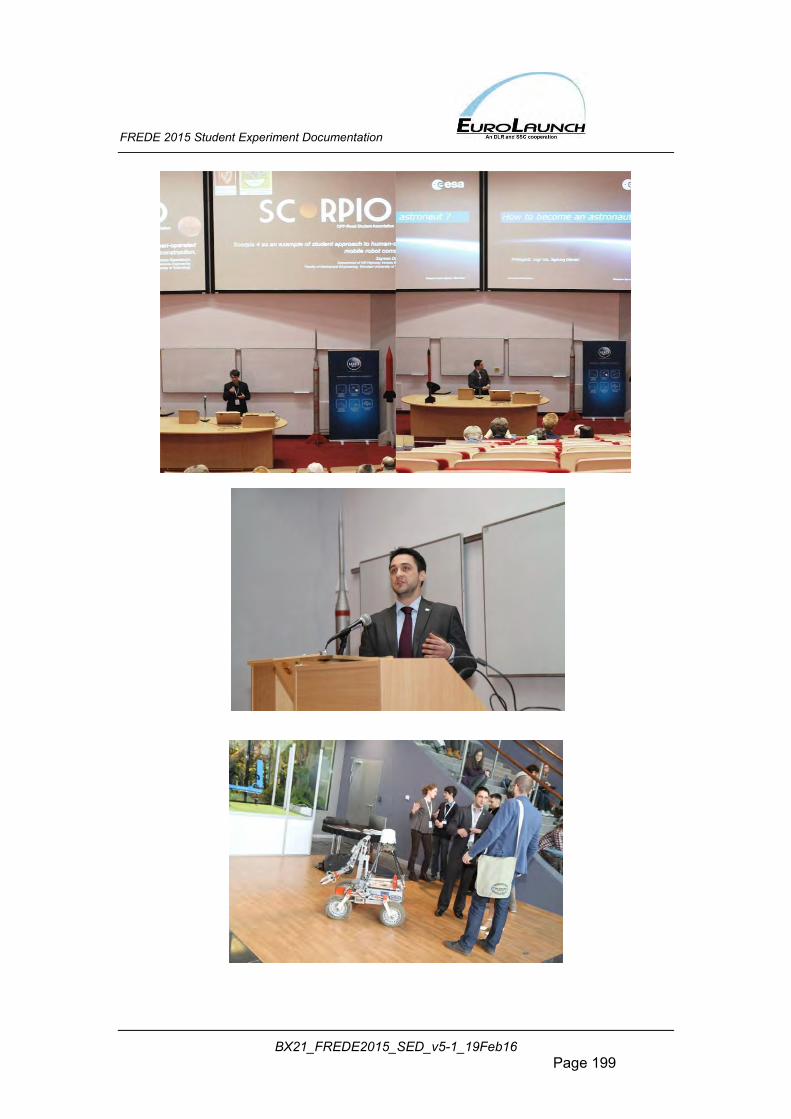
FREDE 2015 Student Experiment Documentation
BX21_FREDE2015_SED_v5-1_19Feb16 Page 199
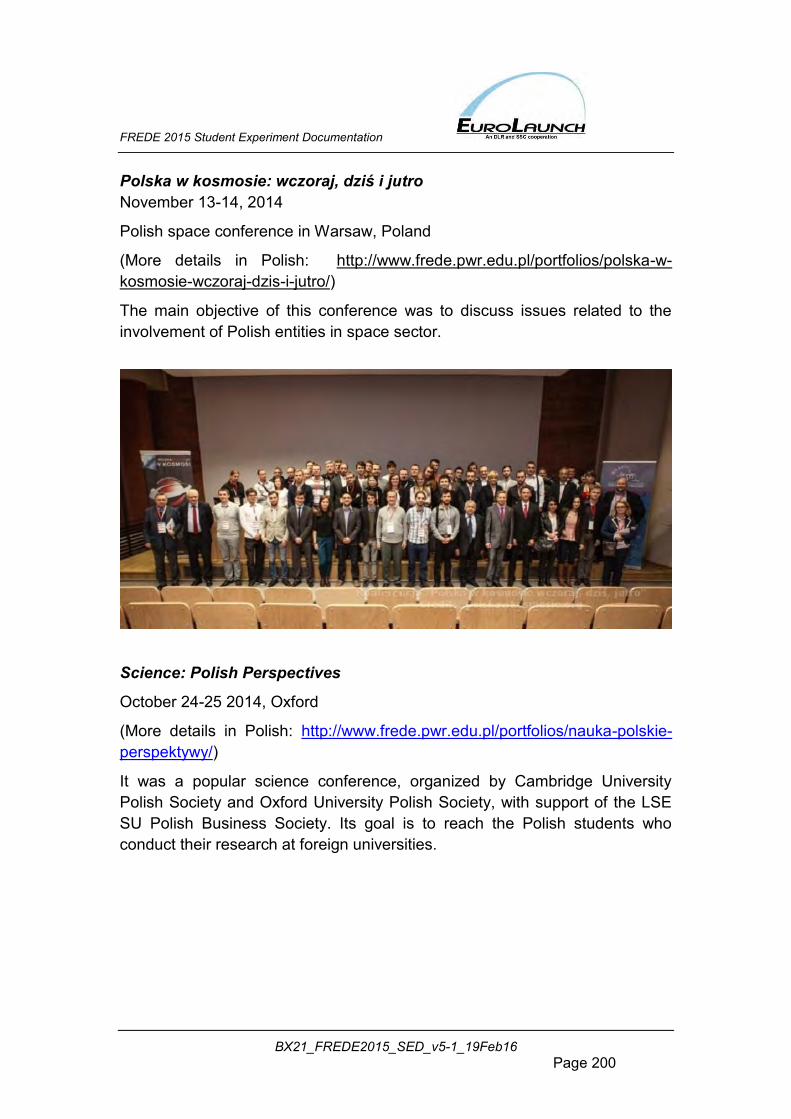
FREDE 2015 Student Experiment Documentation
BX21_FREDE2015_SED_v5-1_19Feb16 Page 200
Polska w kosmosie: wczoraj, dziś i jutro November 13-14, 2014
Polish space conference in Warsaw, Poland
(More details in Polish: http://www.frede.pwr.edu.pl/portfolios/polska-w-kosmosie-wczoraj-dzis-i-jutro/)
The main objective of this conference was to discuss issues related to the involvement of Polish entities in space sector.
Science: Polish Perspectives
October 24-25 2014, Oxford
(More details in Polish: http://www.frede.pwr.edu.pl/portfolios/nauka-polskie-perspektywy/)
It was a popular science conference, organized by Cambridge University Polish Society and Oxford University Polish Society, with support of the LSE SU Polish Business Society. Its goal is to reach the Polish students who conduct their research at foreign universities.
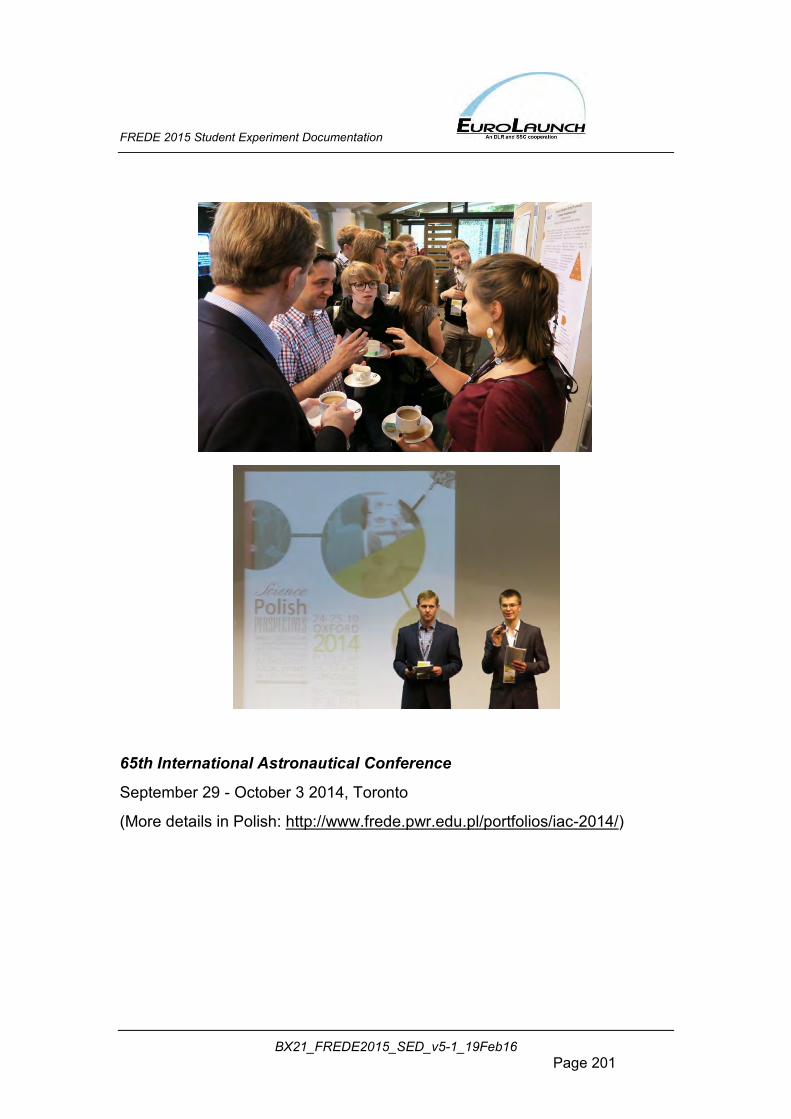
FREDE 2015 Student Experiment Documentation
BX21_FREDE2015_SED_v5-1_19Feb16 Page 201
65th International Astronautical Conference
September 29 - October 3 2014, Toronto
(More details in Polish: http://www.frede.pwr.edu.pl/portfolios/iac-2014/)
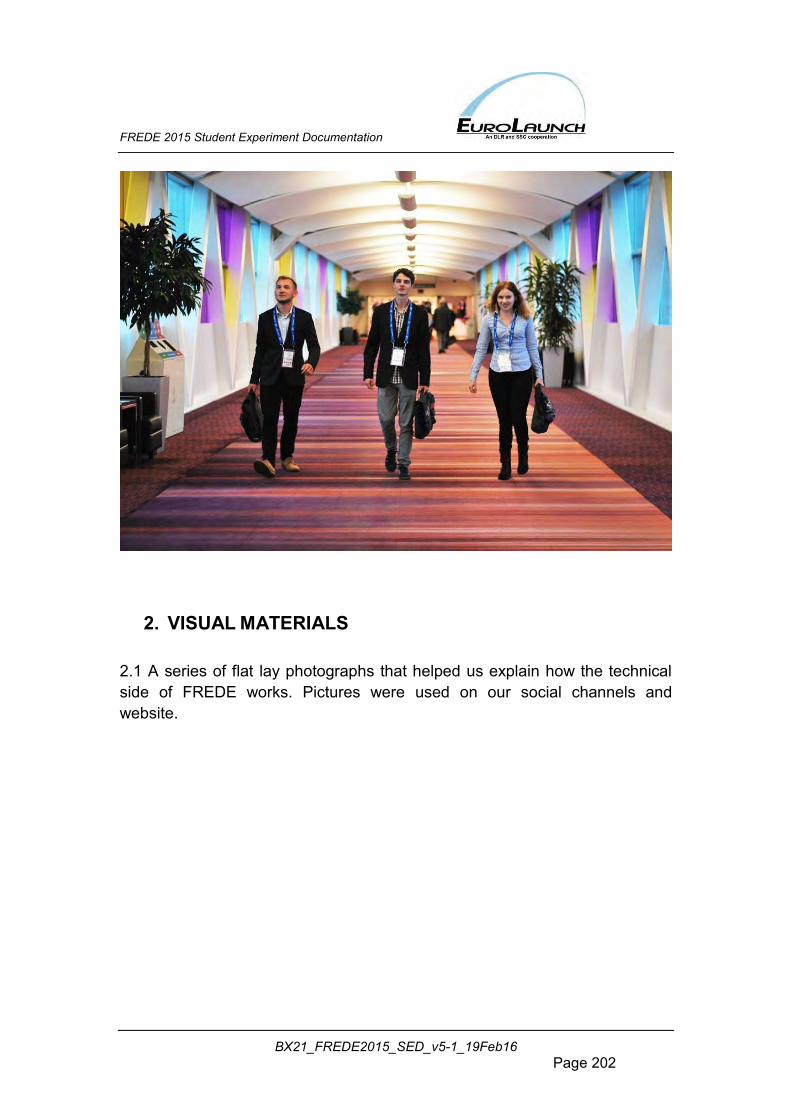
FREDE 2015 Student Experiment Documentation
BX21_FREDE2015_SED_v5-1_19Feb16 Page 202
2. VISUAL MATERIALS
2.1 A series of flat lay photographs that helped us explain how the technical side of FREDE works. Pictures were used on our social channels and website.
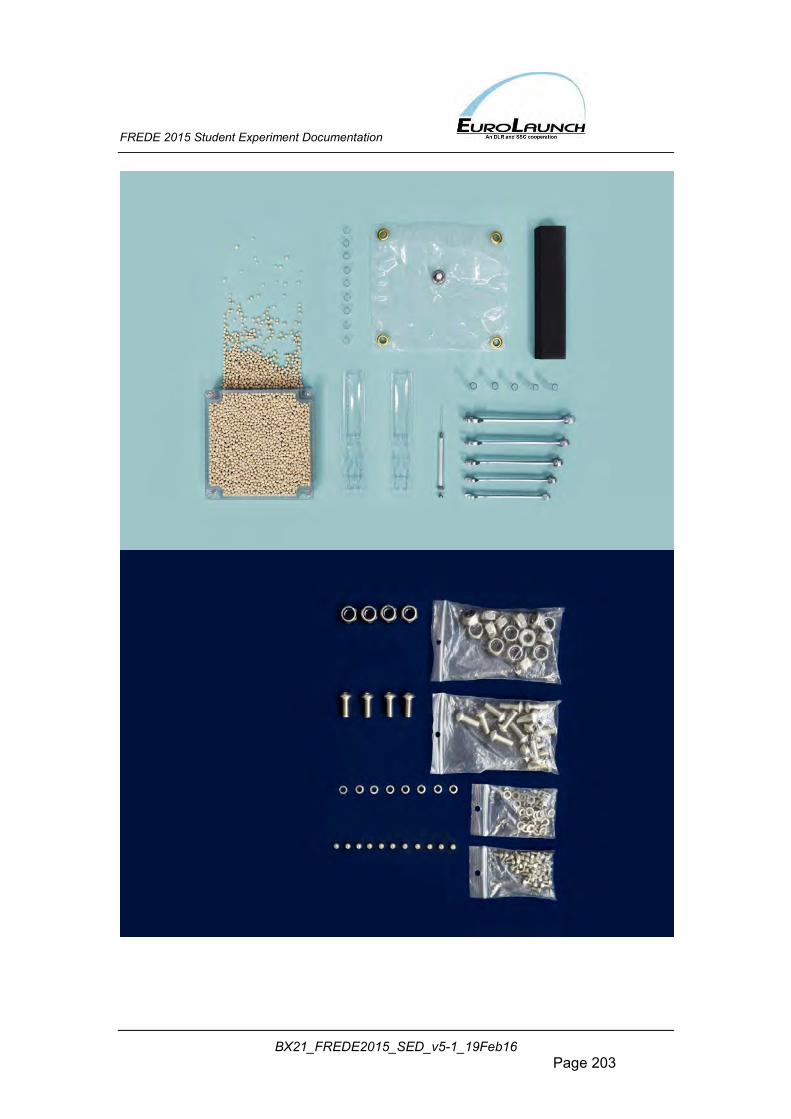
FREDE 2015 Student Experiment Documentation
BX21_FREDE2015_SED_v5-1_19Feb16 Page 203
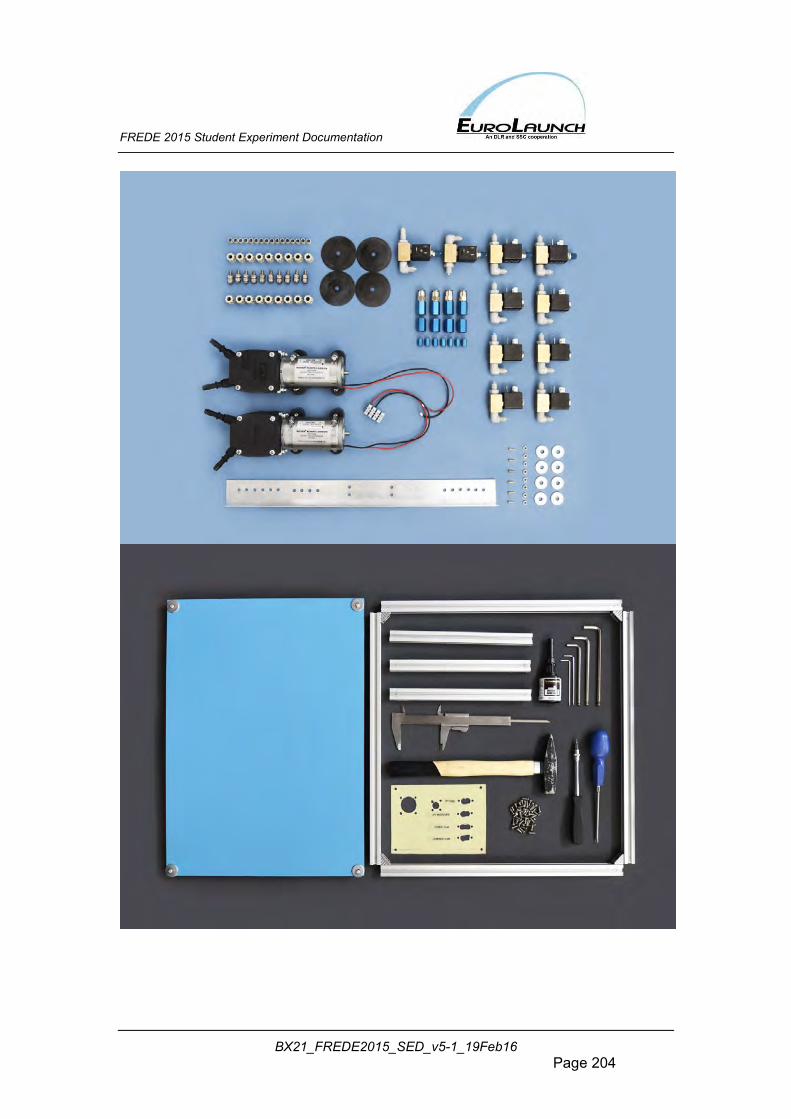
FREDE 2015 Student Experiment Documentation
BX21_FREDE2015_SED_v5-1_19Feb16 Page 204
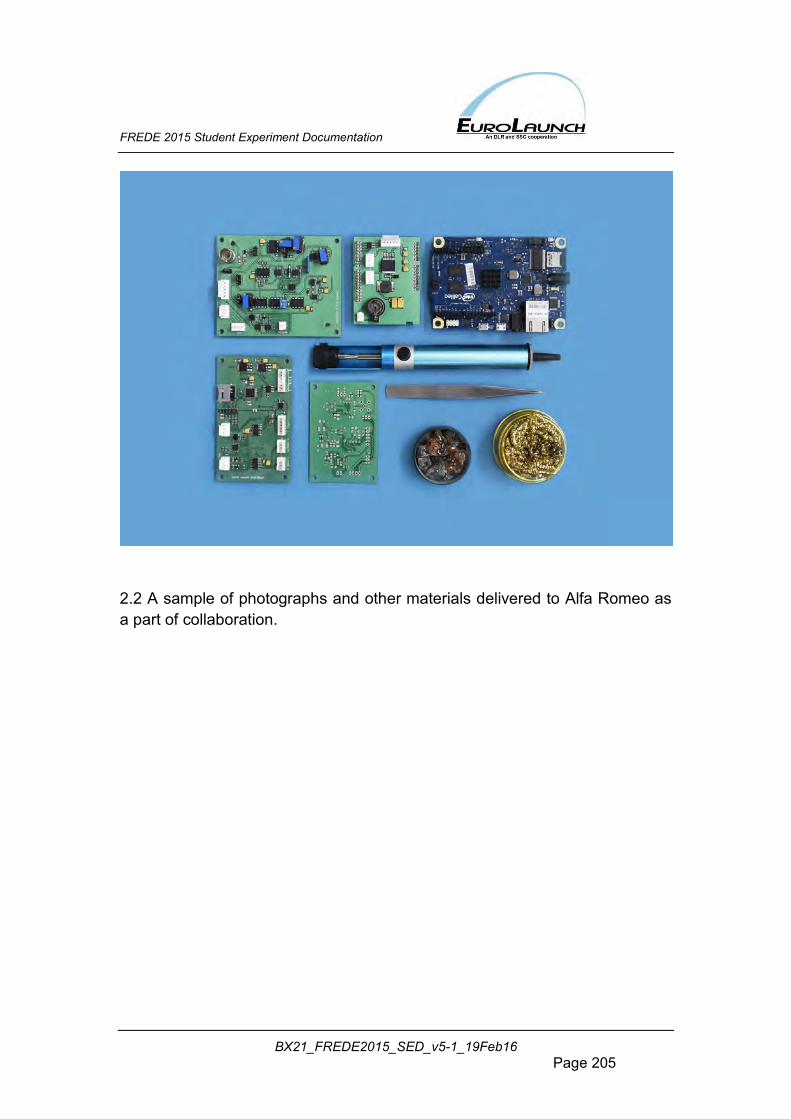
FREDE 2015 Student Experiment Documentation
BX21_FREDE2015_SED_v5-1_19Feb16 Page 205
2.2 A sample of photographs and other materials delivered to Alfa Romeo as a part of collaboration.
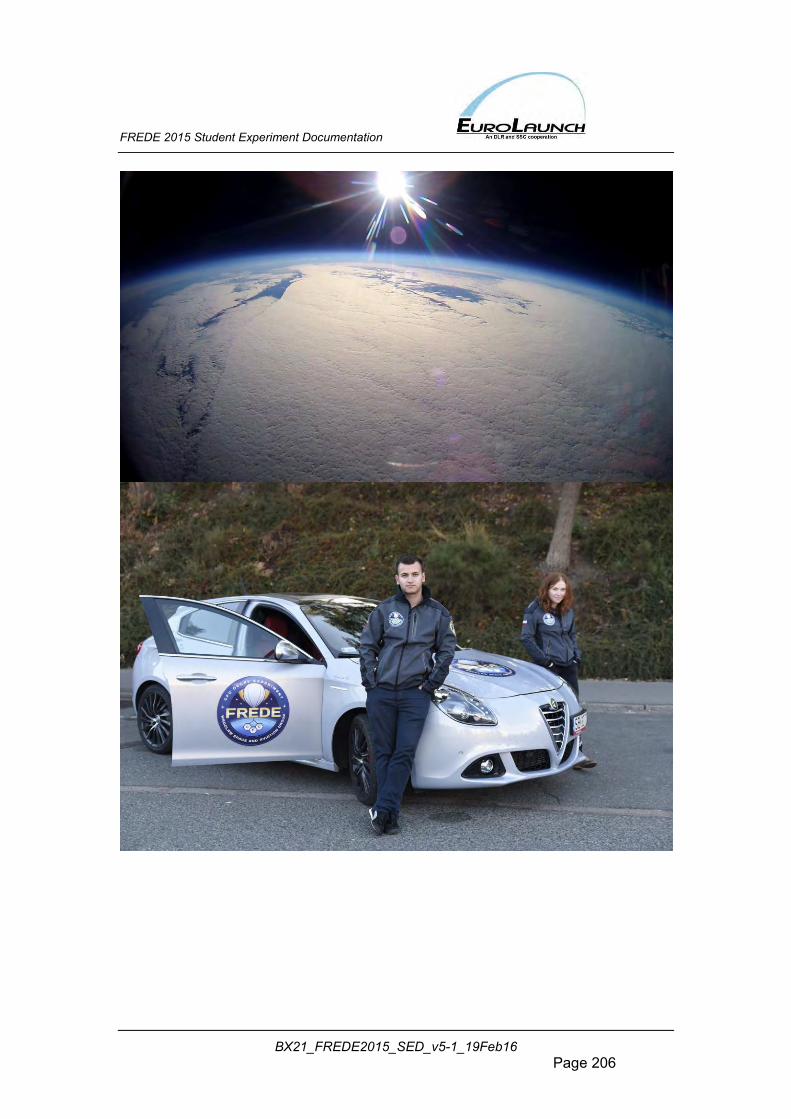
FREDE 2015 Student Experiment Documentation
BX21_FREDE2015_SED_v5-1_19Feb16 Page 206
FREDE 2015 Student Experiment Documentation
BX21_FREDE2015_SED_v5-1_19Feb16 Page 207
FREDE 2015 Student Experiment Documentation
BX21_FREDE2015_SED_v5-1_19Feb16 Page 208
FREDE 2015 Student Experiment Documentation
BX21_FREDE2015_SED_v5-1_19Feb16 Page 209
FREDE 2015 Student Experiment Documentation
BX21_FREDE2015_SED_v5-1_19Feb16 Page 210
FREDE 2015 Student Experiment Documentation
BX21_FREDE2015_SED_v5-1_19Feb16 Page 211
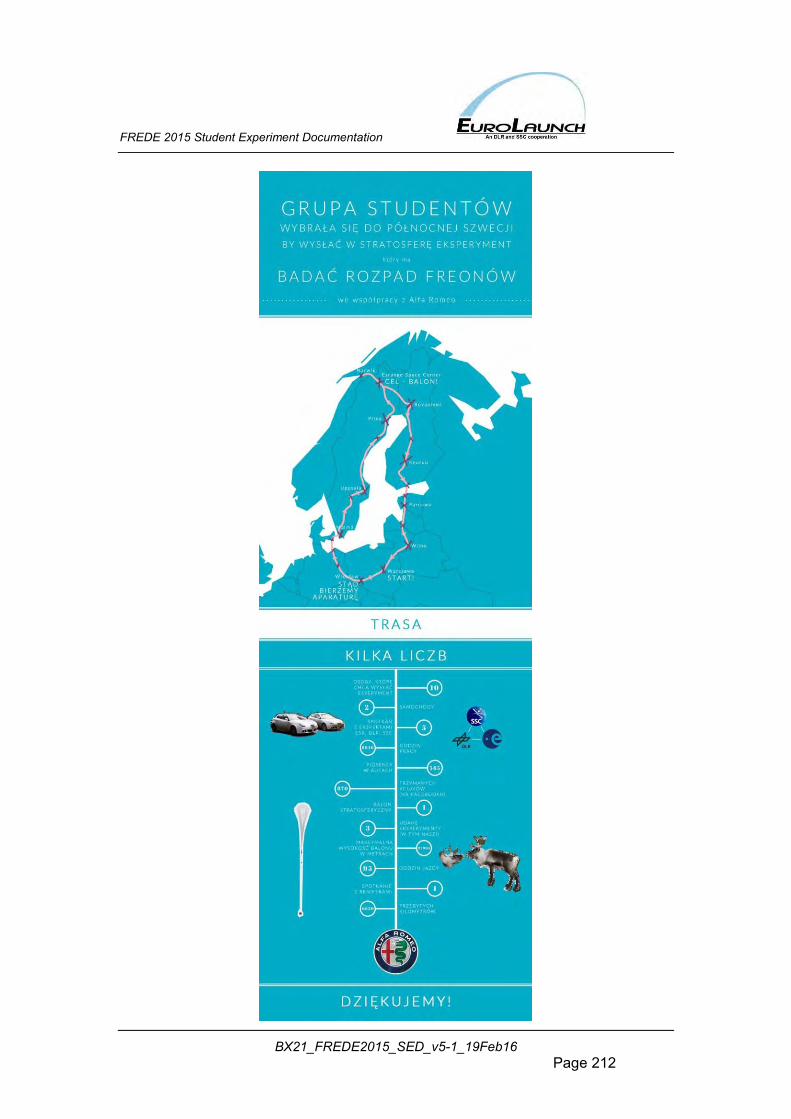
FREDE 2015 Student Experiment Documentation
BX21_FREDE2015_SED_v5-1_19Feb16 Page 212
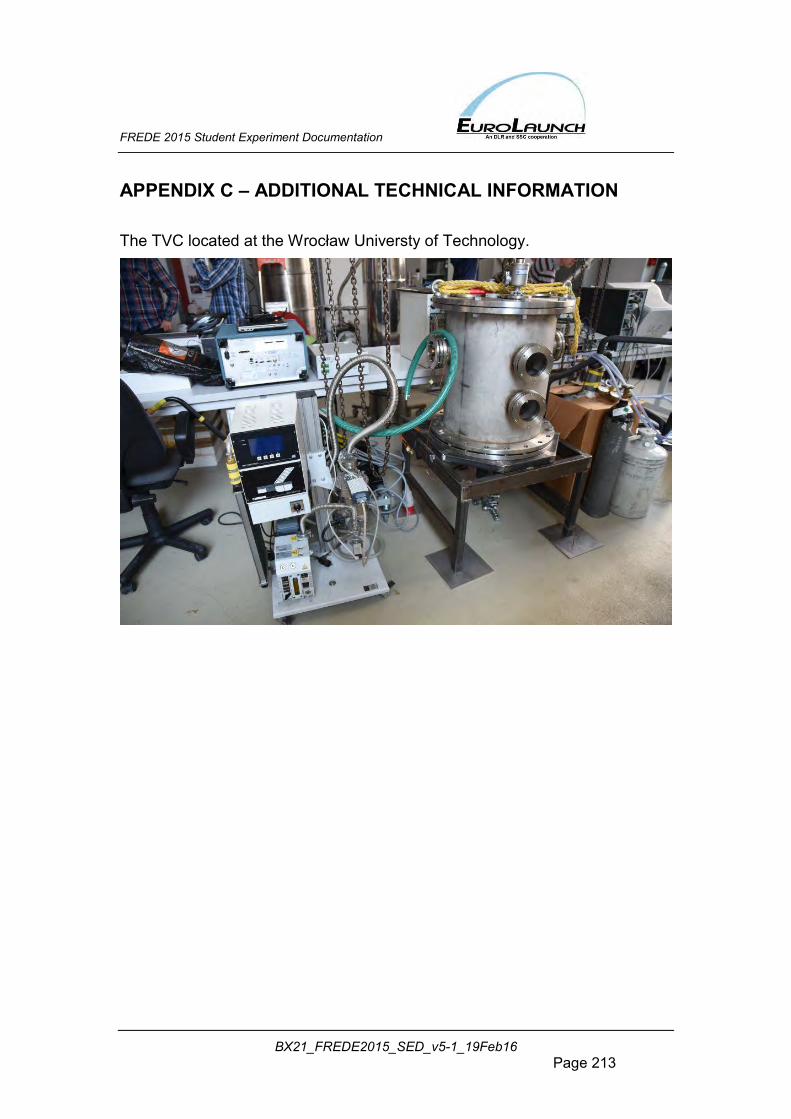
FREDE 2015 Student Experiment Documentation
BX21_FREDE2015_SED_v5-1_19Feb16 Page 213
APPENDIX C – ADDITIONAL TECHNICAL INFORMATION The TVC located at the Wrocław Universty of Technology.
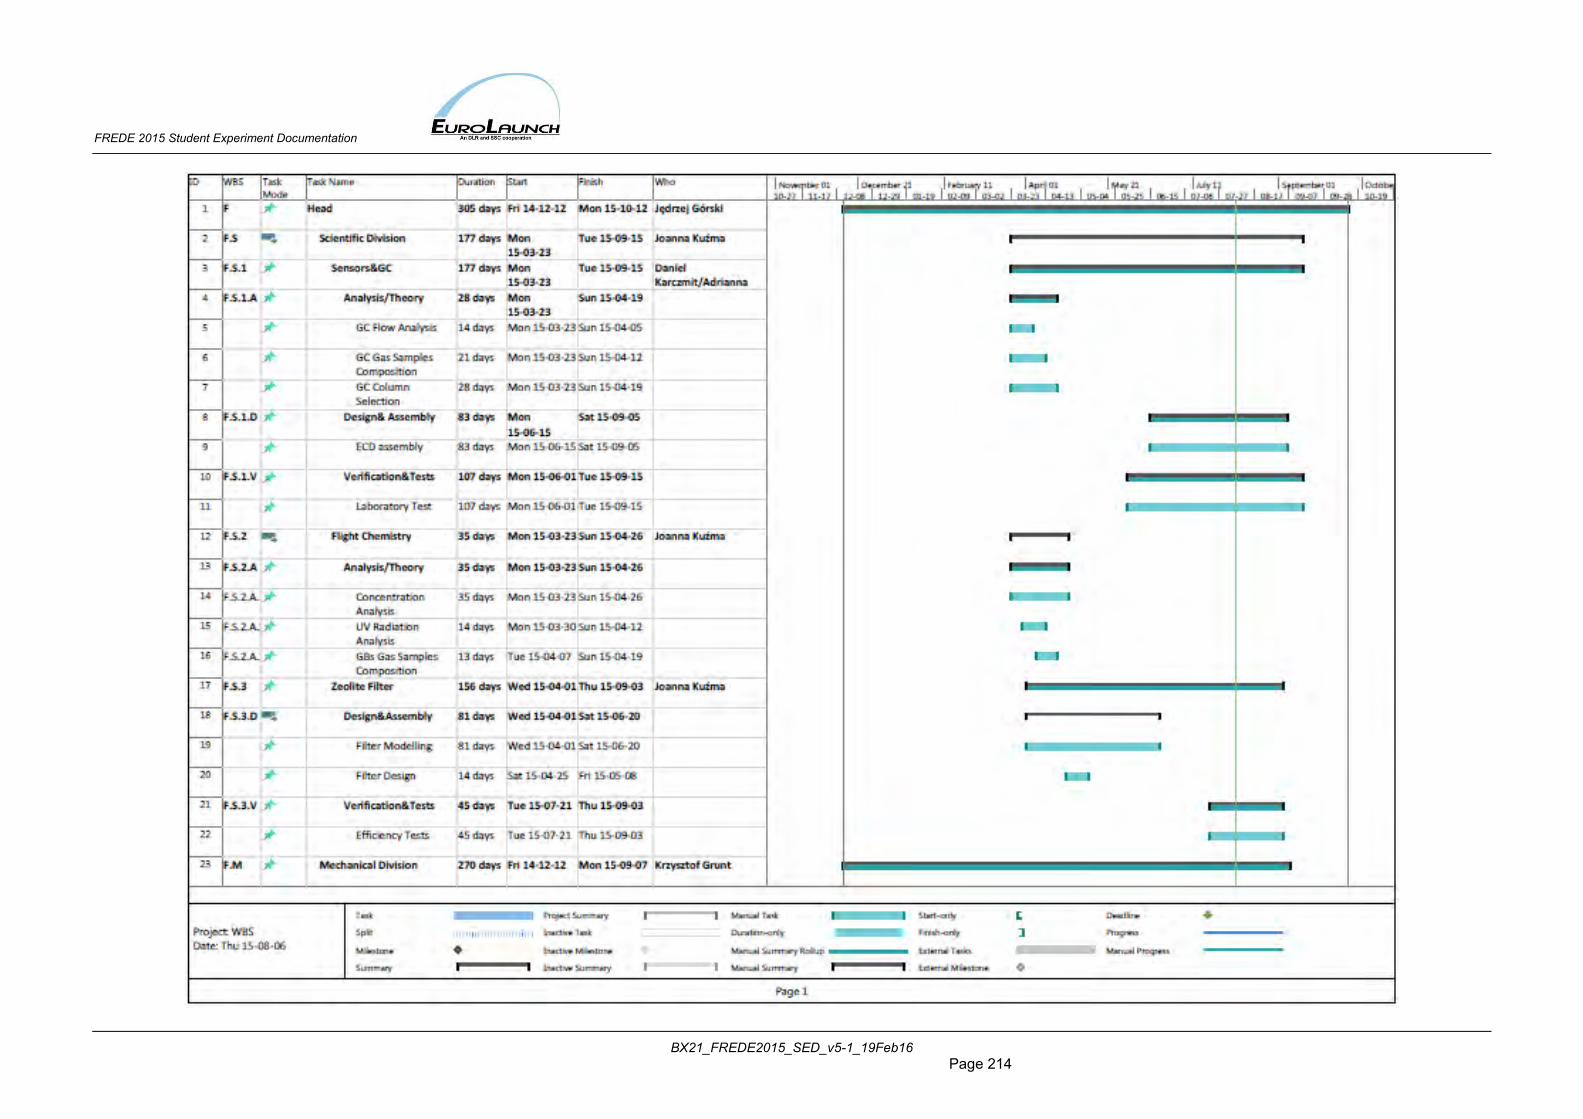
FREDE 2015 Student Experiment Documentation
BX21_FREDE2015_SED_v5-1_19Feb16 Page 214
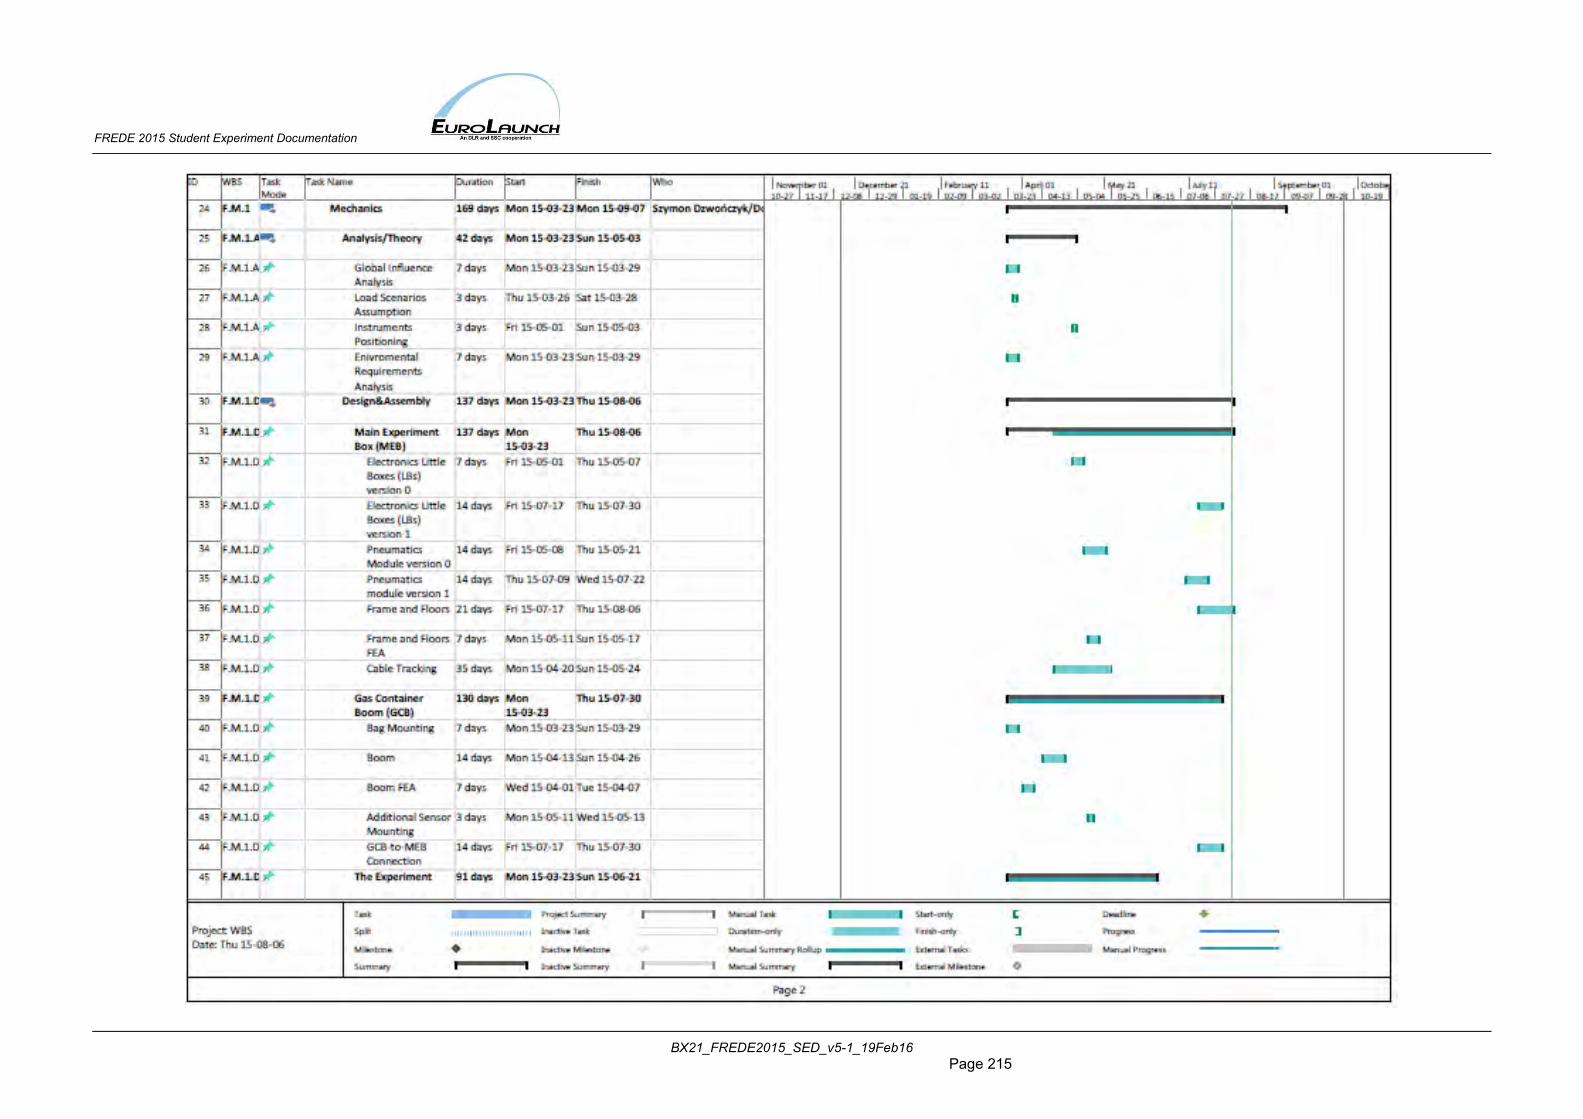
FREDE 2015 Student Experiment Documentation
BX21_FREDE2015_SED_v5-1_19Feb16 Page 215
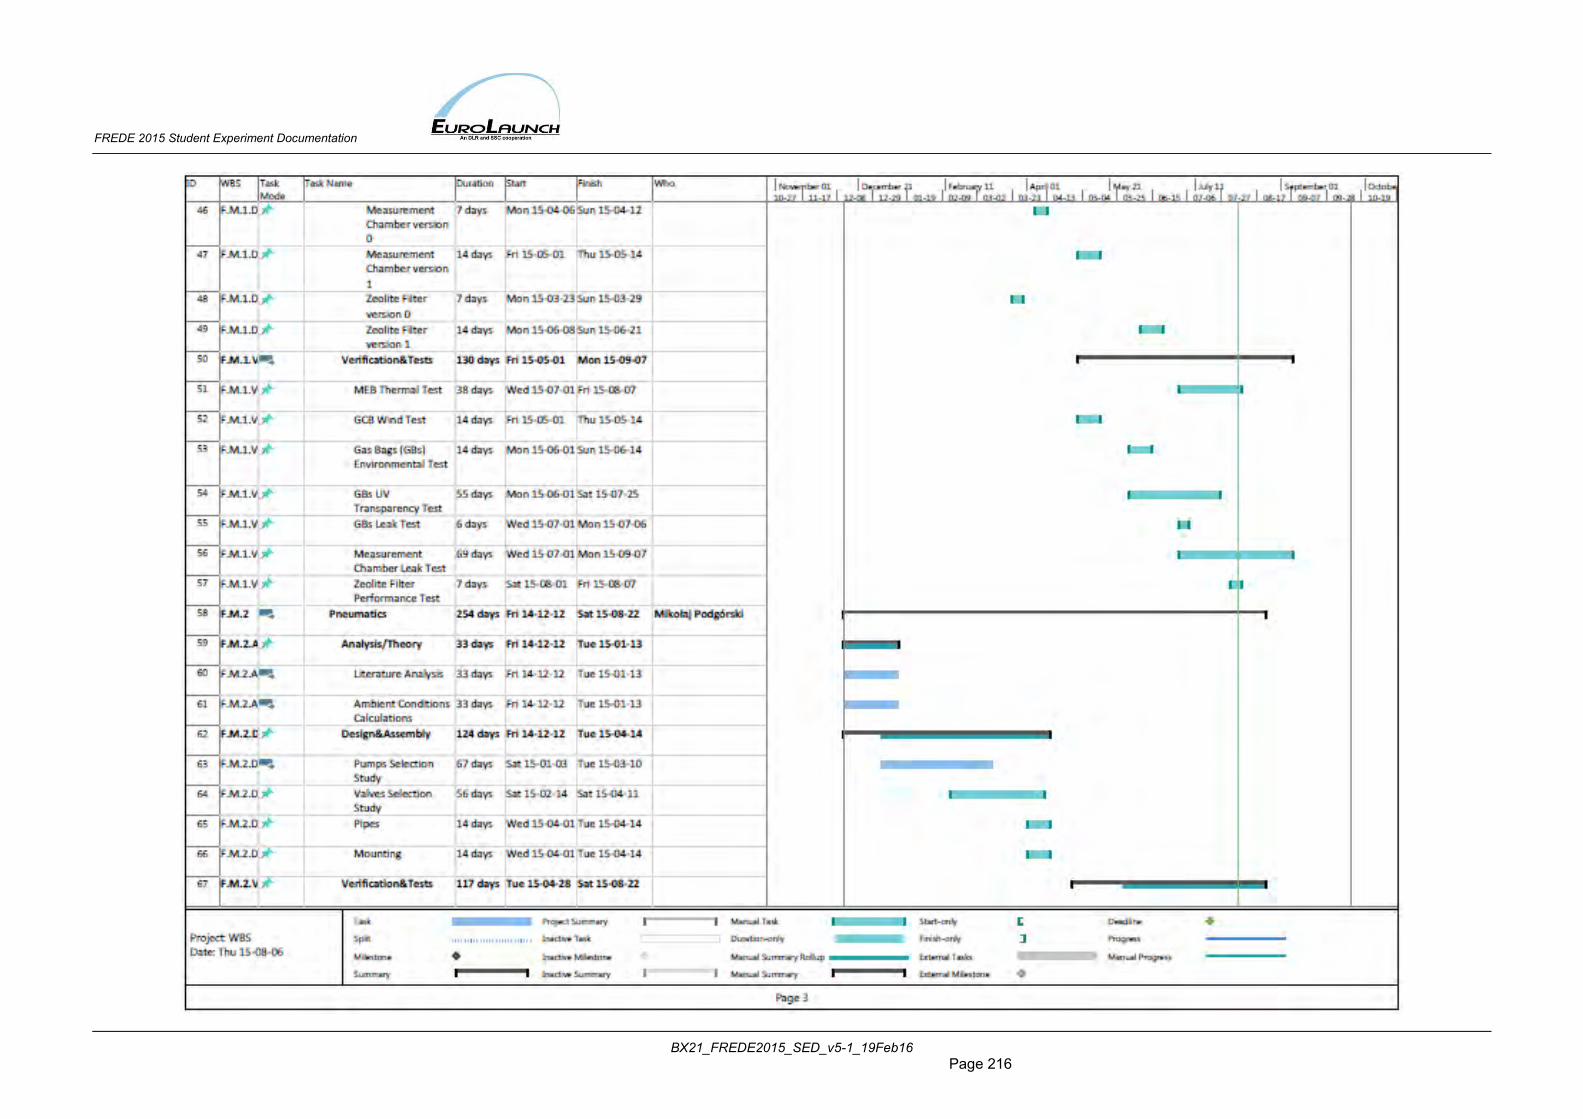
FREDE 2015 Student Experiment Documentation
BX21_FREDE2015_SED_v5-1_19Feb16 Page 216
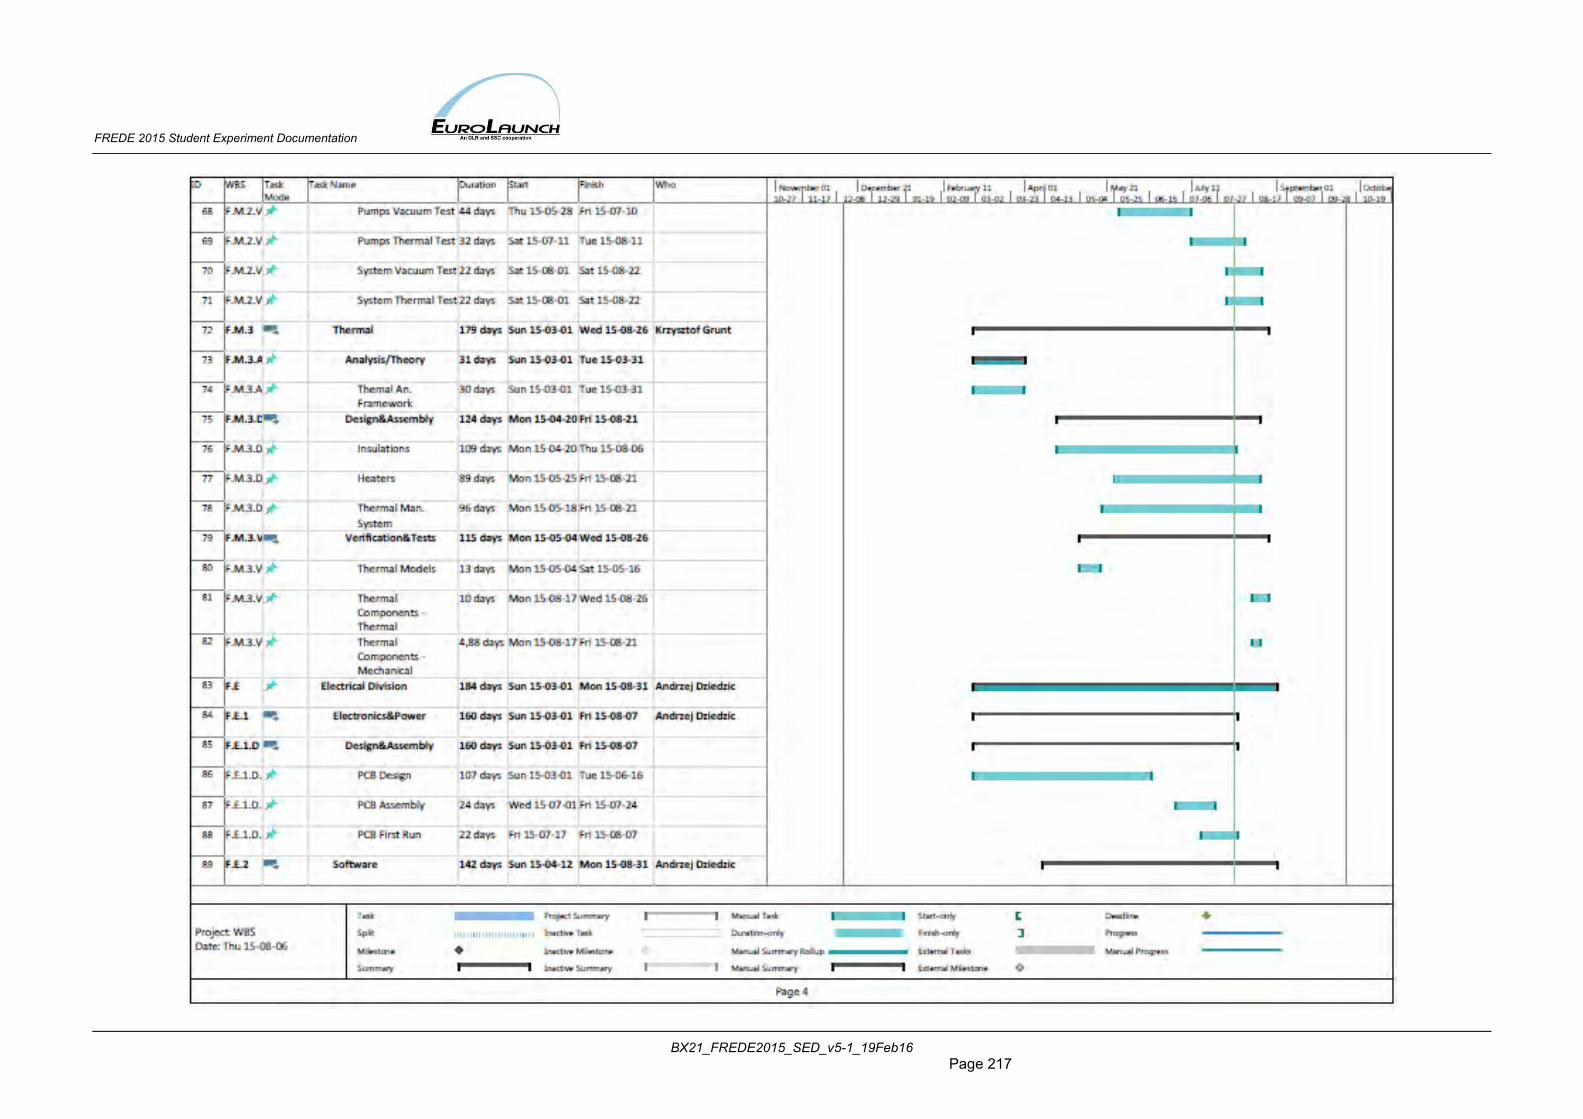
FREDE 2015 Student Experiment Documentation
BX21_FREDE2015_SED_v5-1_19Feb16 Page 217
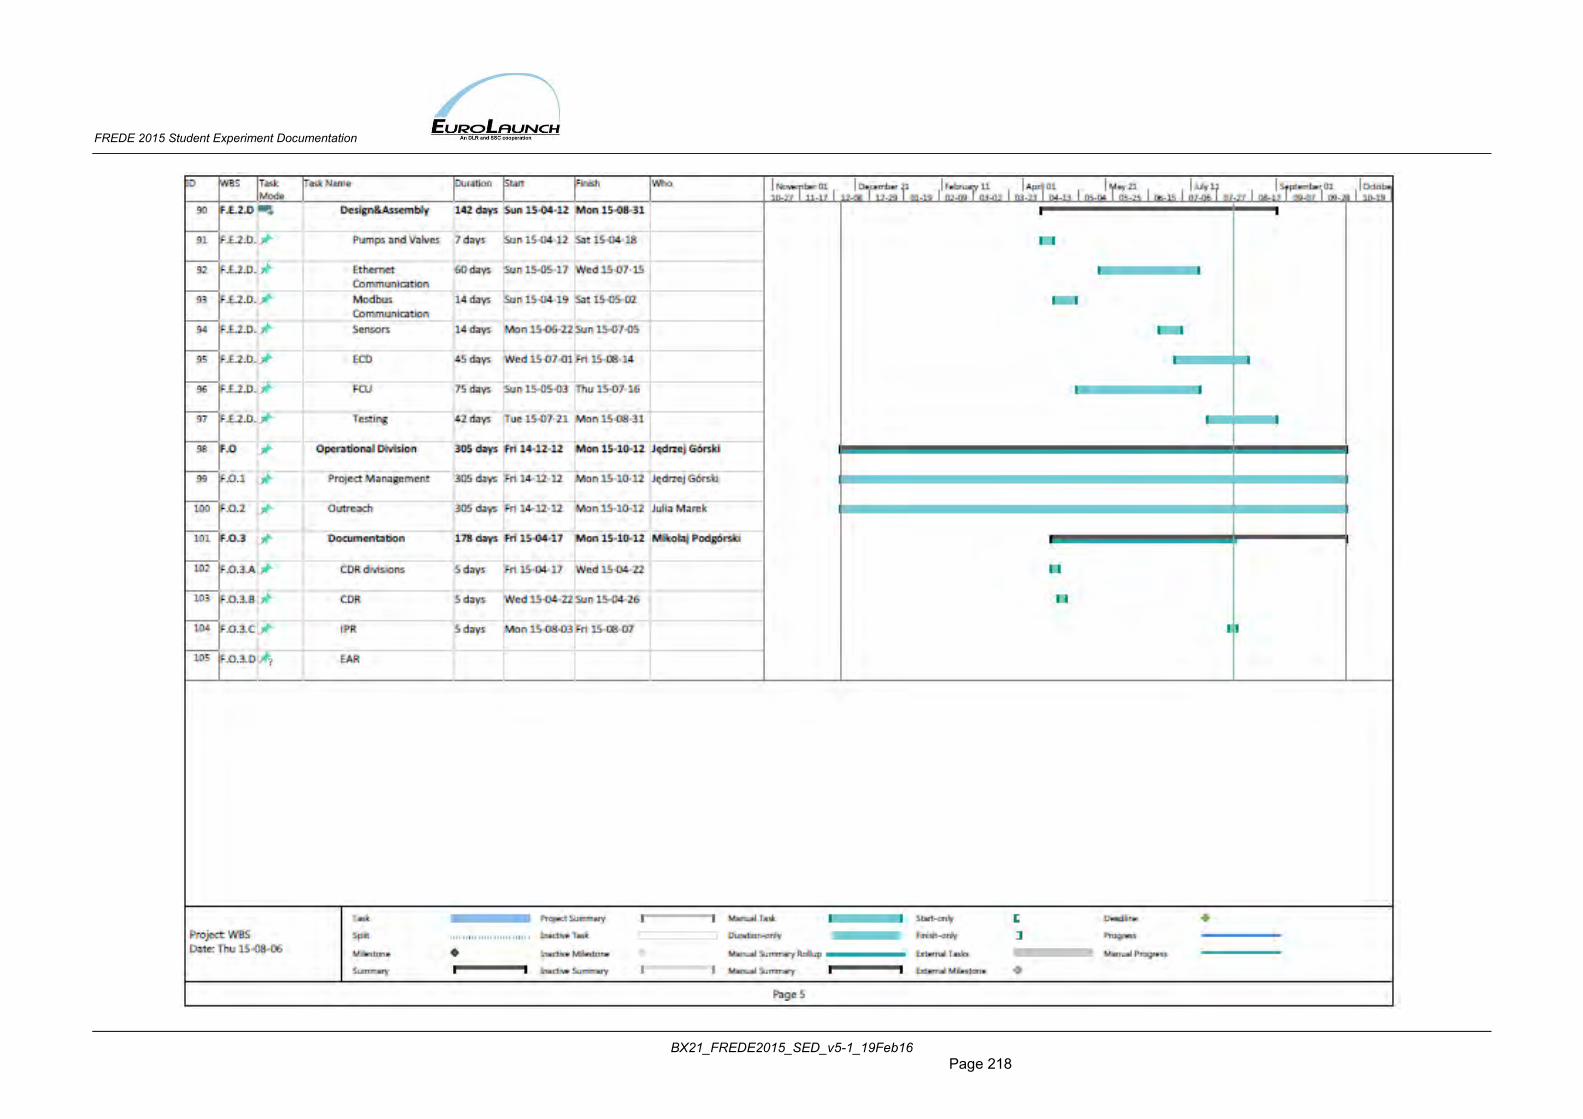
FREDE 2015 Student Experiment Documentation
BX21_FREDE2015_SED_v5-1_19Feb16 Page 218
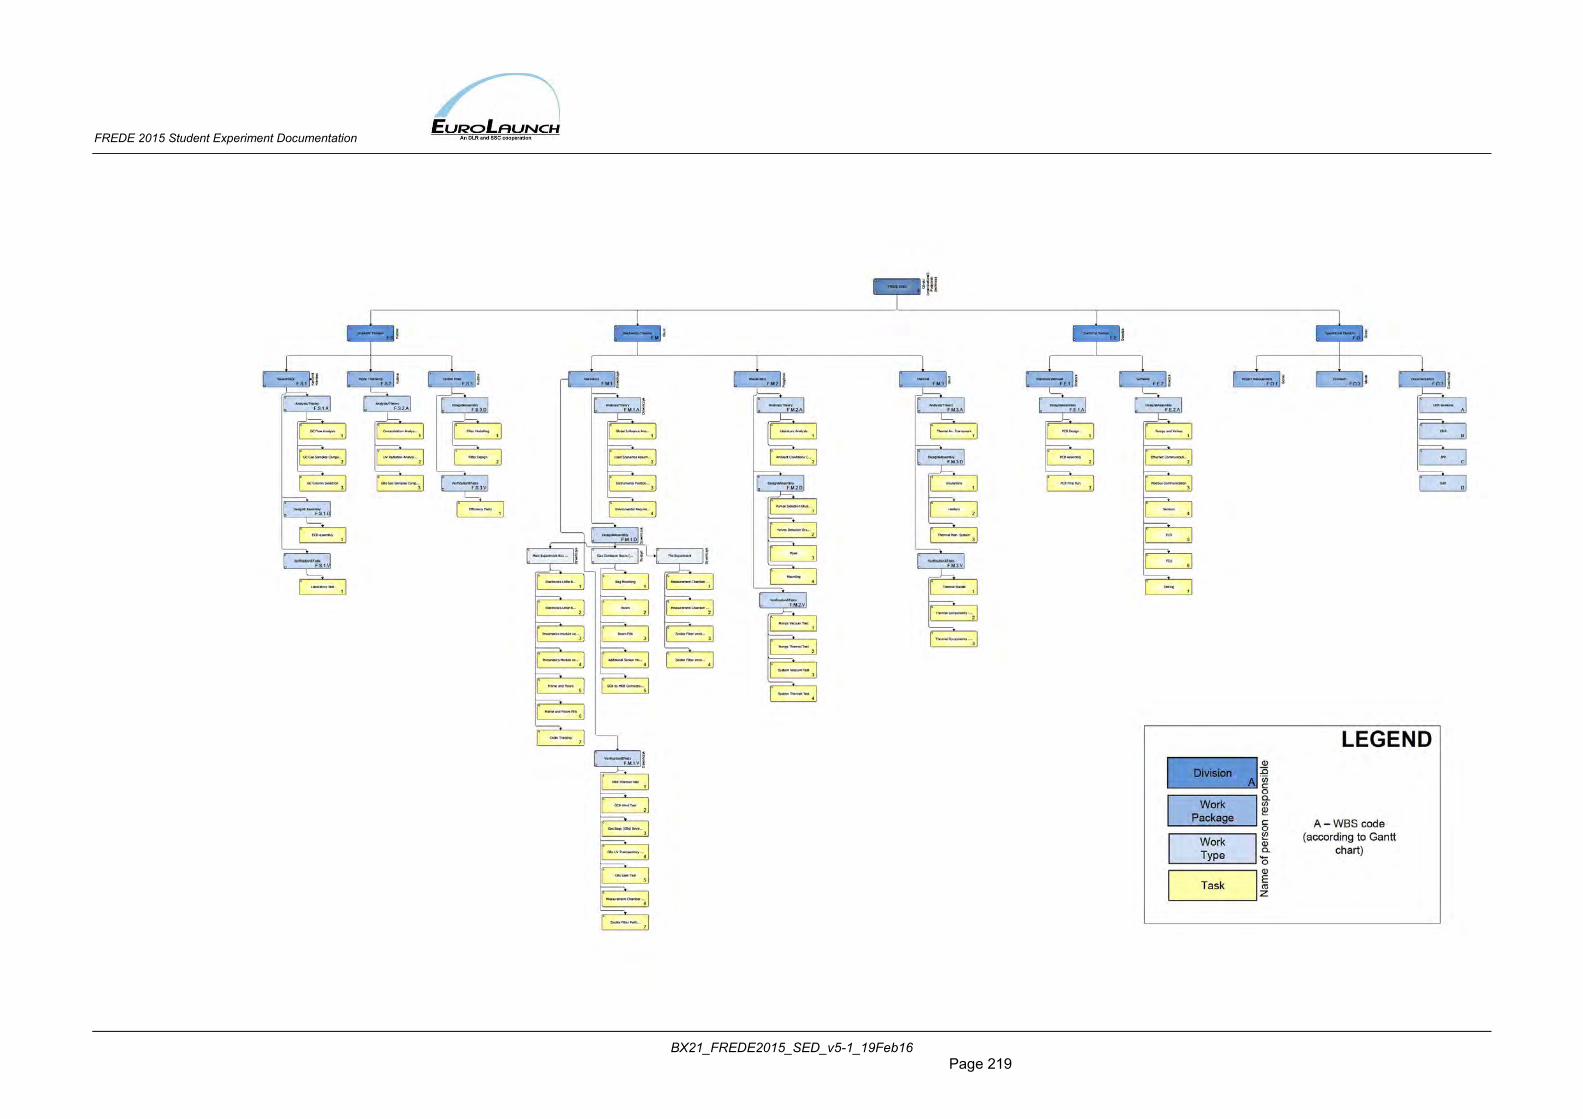
FREDE 2015 Student Experiment Documentation
BX21_FREDE2015_SED_v5-1_19Feb16 Page 219
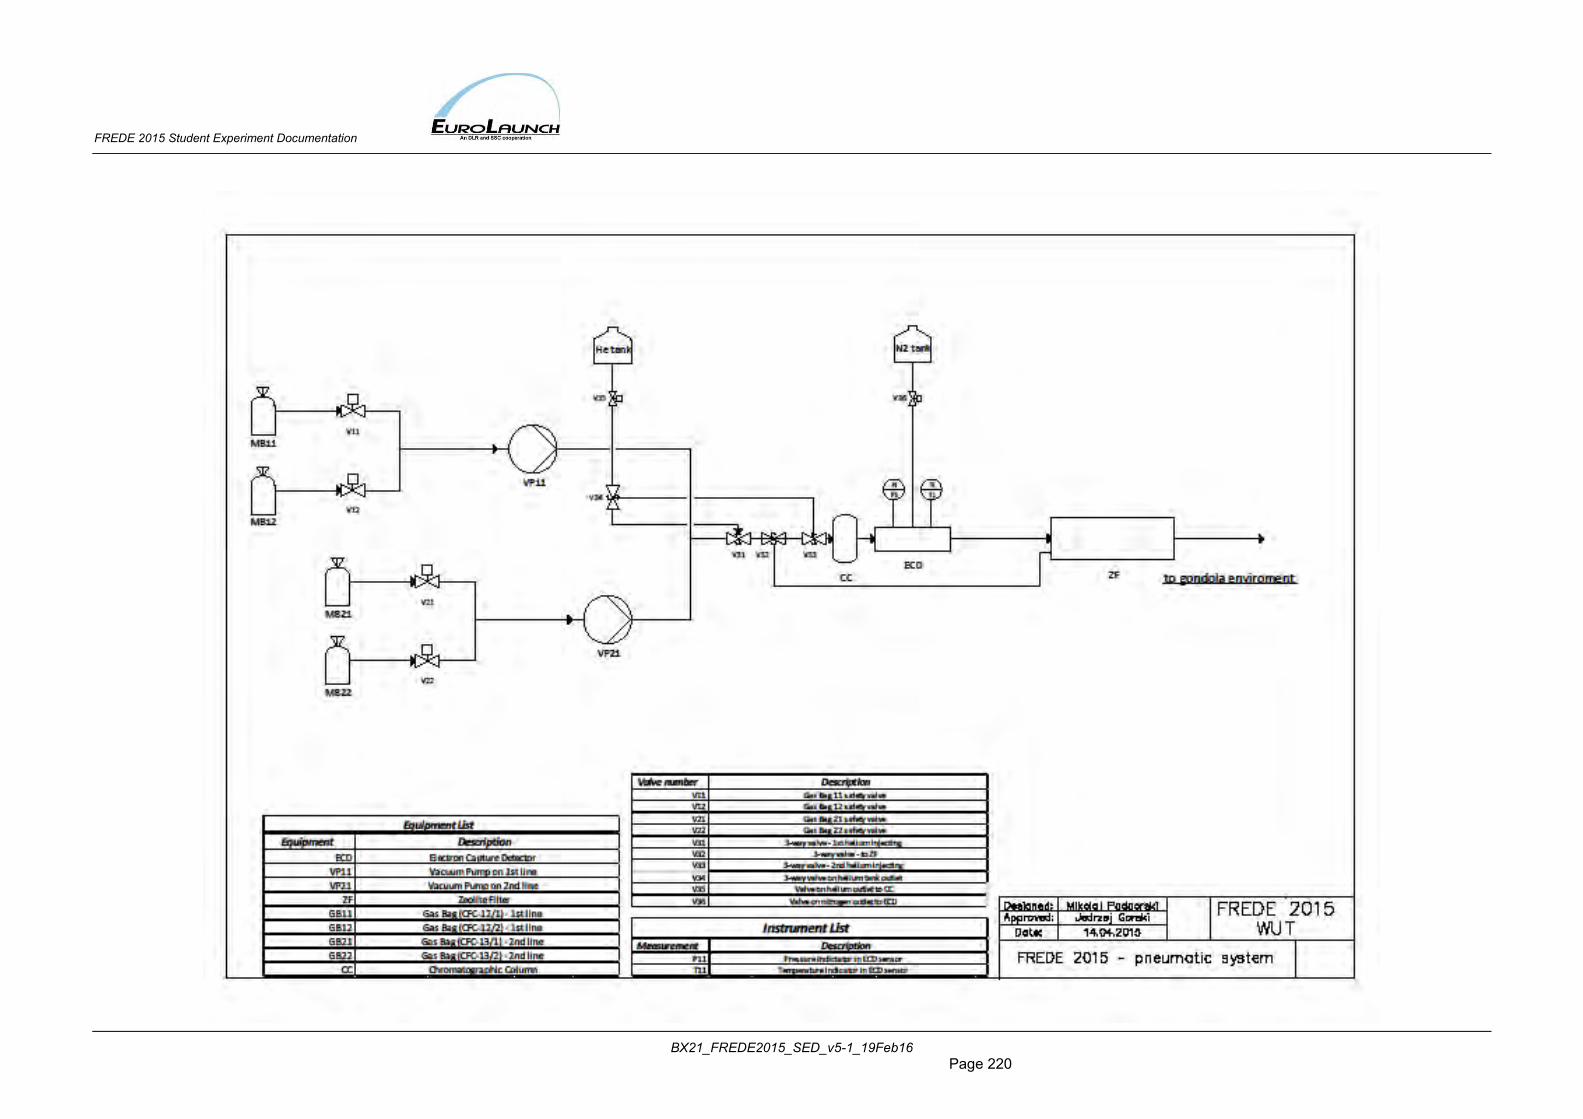
FREDE 2015 Student Experiment Documentation
BX21_FREDE2015_SED_v5-1_19Feb16 Page 220
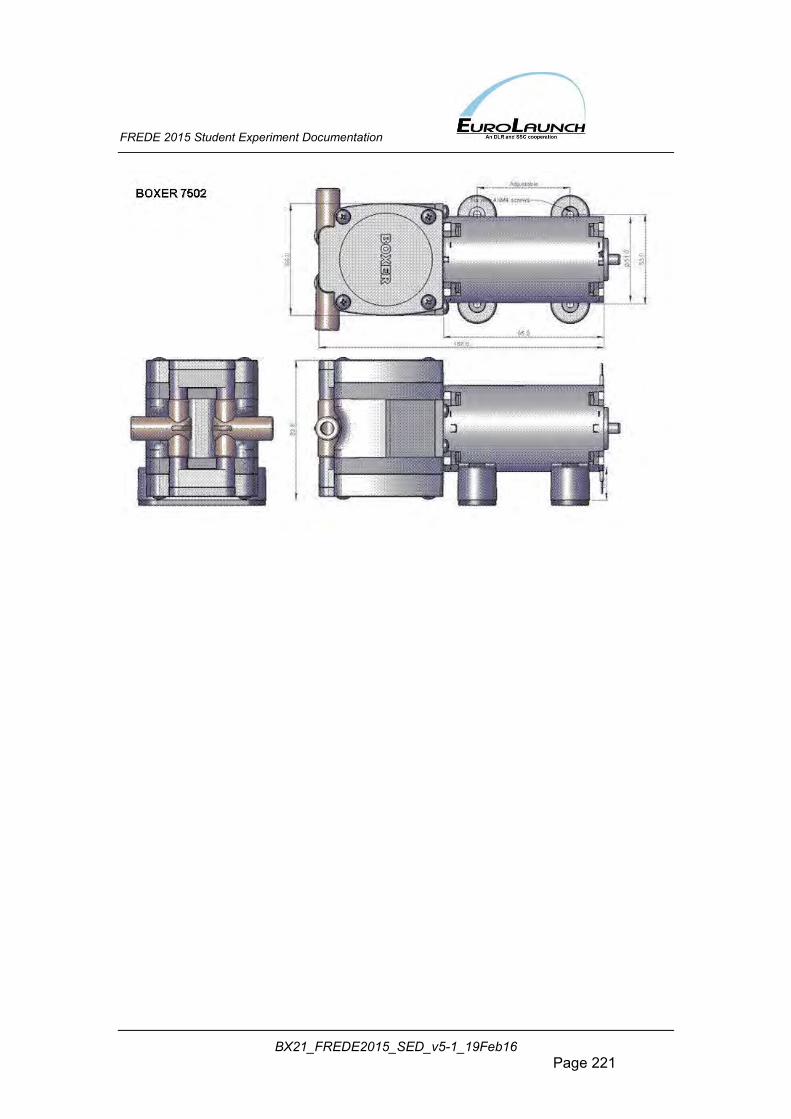
FREDE 2015 Student Experiment Documentation
BX21_FREDE2015_SED_v5-1_19Feb16 Page 221
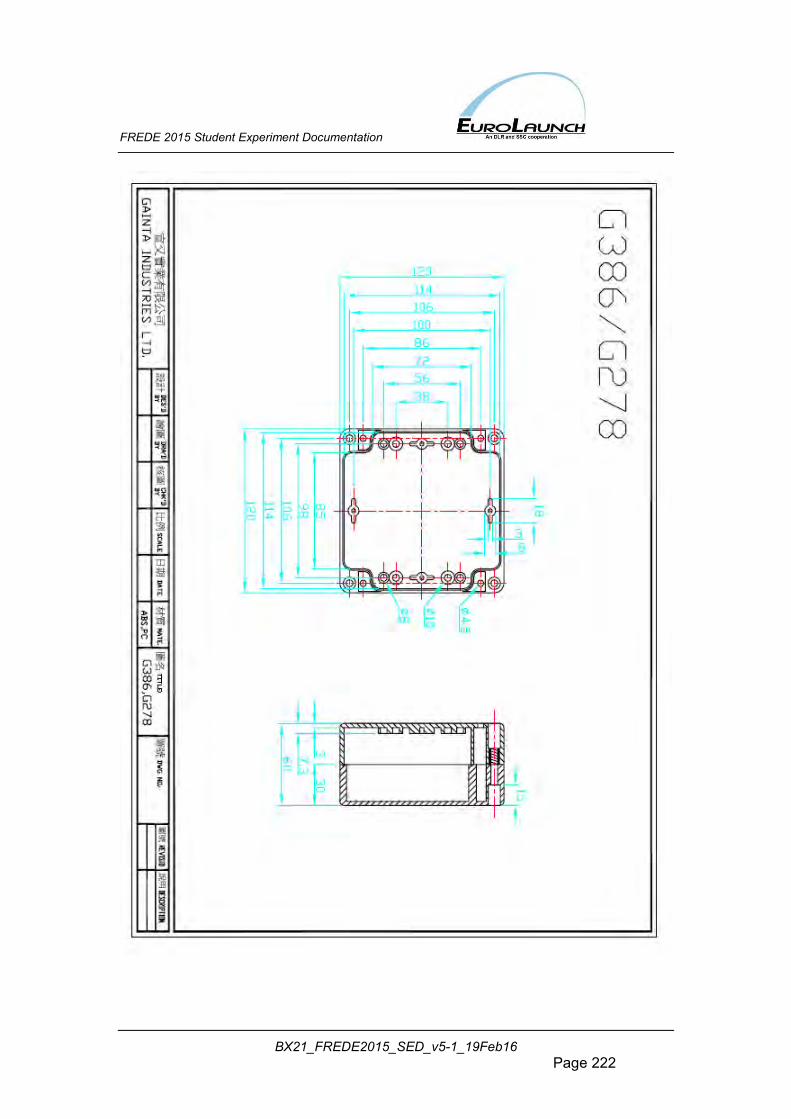
FREDE 2015 Student Experiment Documentation
BX21_FREDE2015_SED_v5-1_19Feb16 Page 222
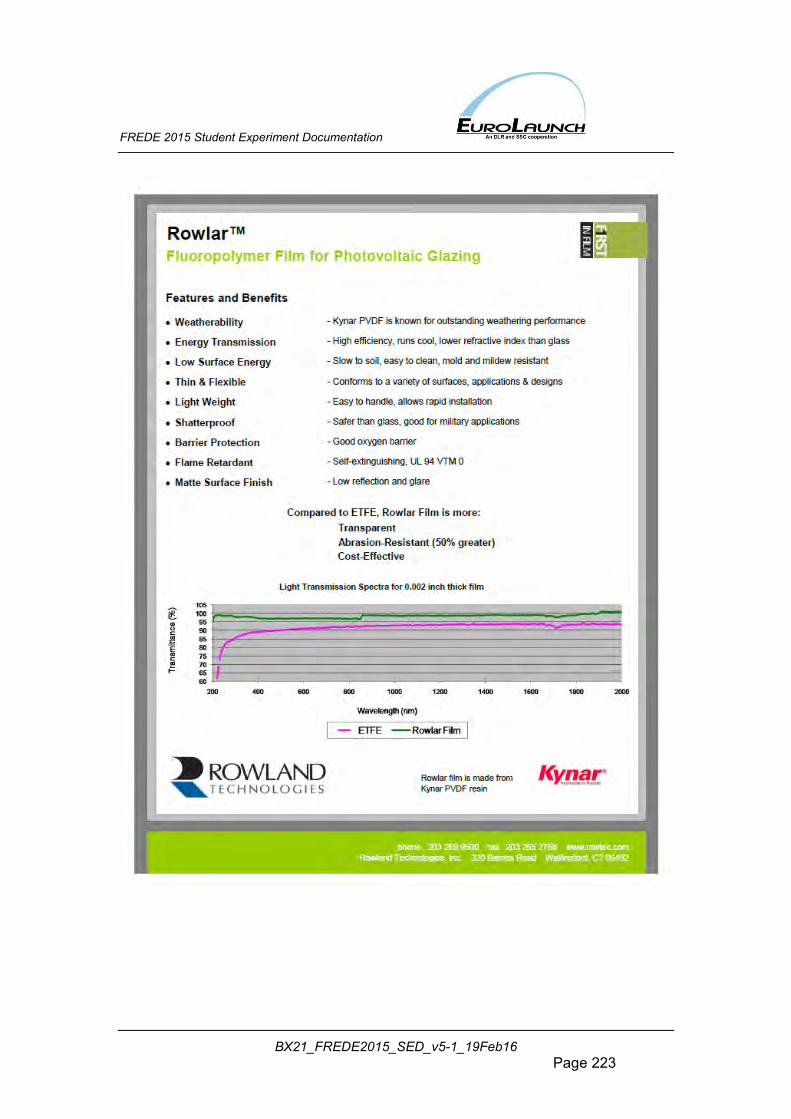
FREDE 2015 Student Experiment Documentation
BX21_FREDE2015_SED_v5-1_19Feb16 Page 223
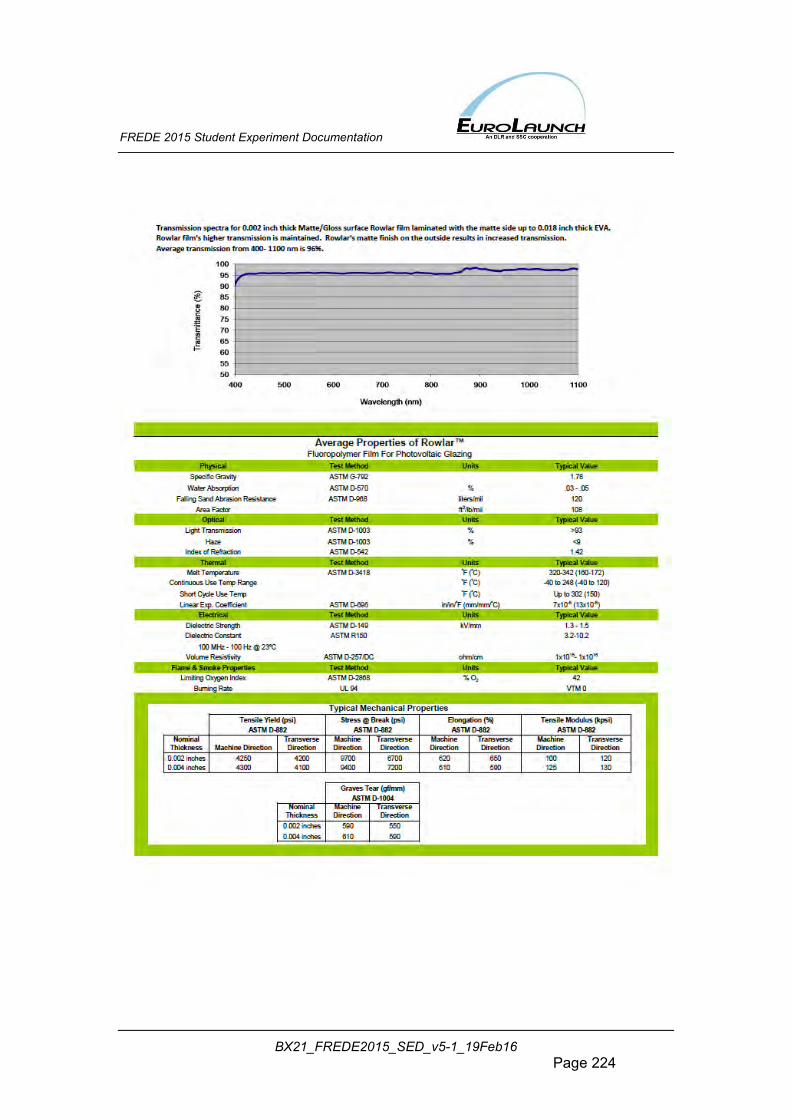
FREDE 2015 Student Experiment Documentation
BX21_FREDE2015_SED_v5-1_19Feb16 Page 224
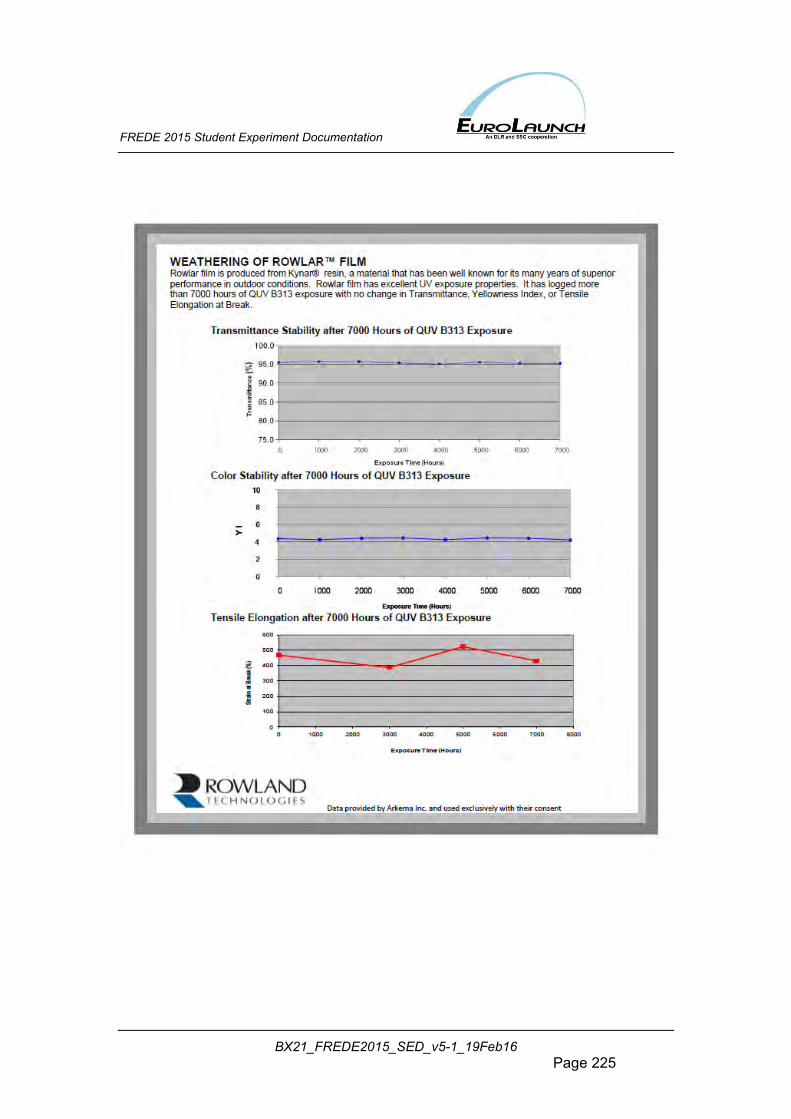
FREDE 2015 Student Experiment Documentation
BX21_FREDE2015_SED_v5-1_19Feb16 Page 225
FREDE 2015 Student Experiment Documentation
BX21_FREDE2015_SED_v5-1_19Feb16 Page 226
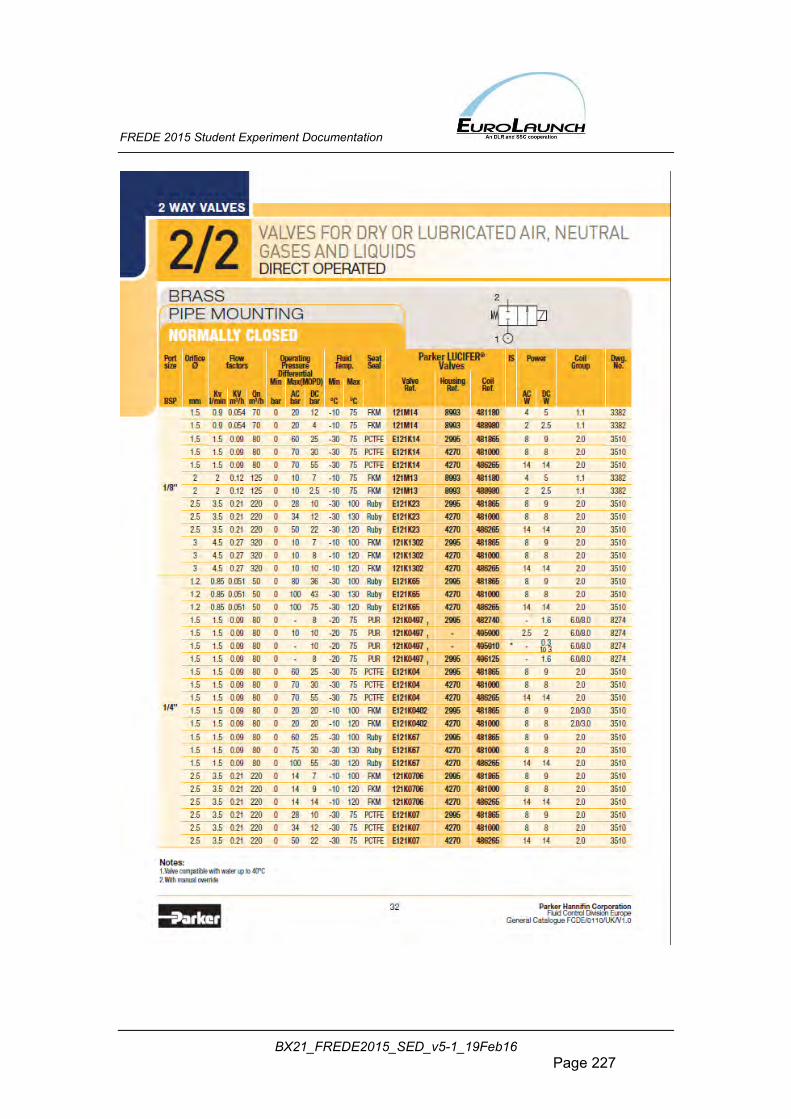
FREDE 2015 Student Experiment Documentation
BX21_FREDE2015_SED_v5-1_19Feb16 Page 227
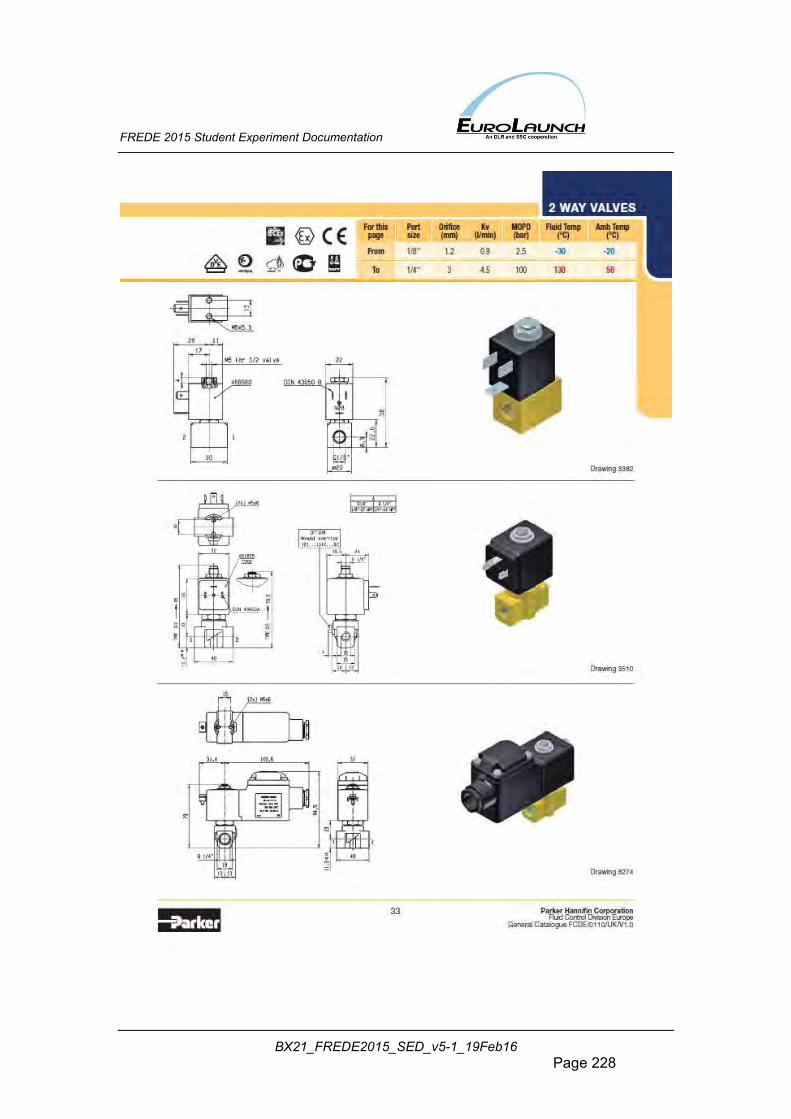
FREDE 2015 Student Experiment Documentation
BX21_FREDE2015_SED_v5-1_19Feb16 Page 228
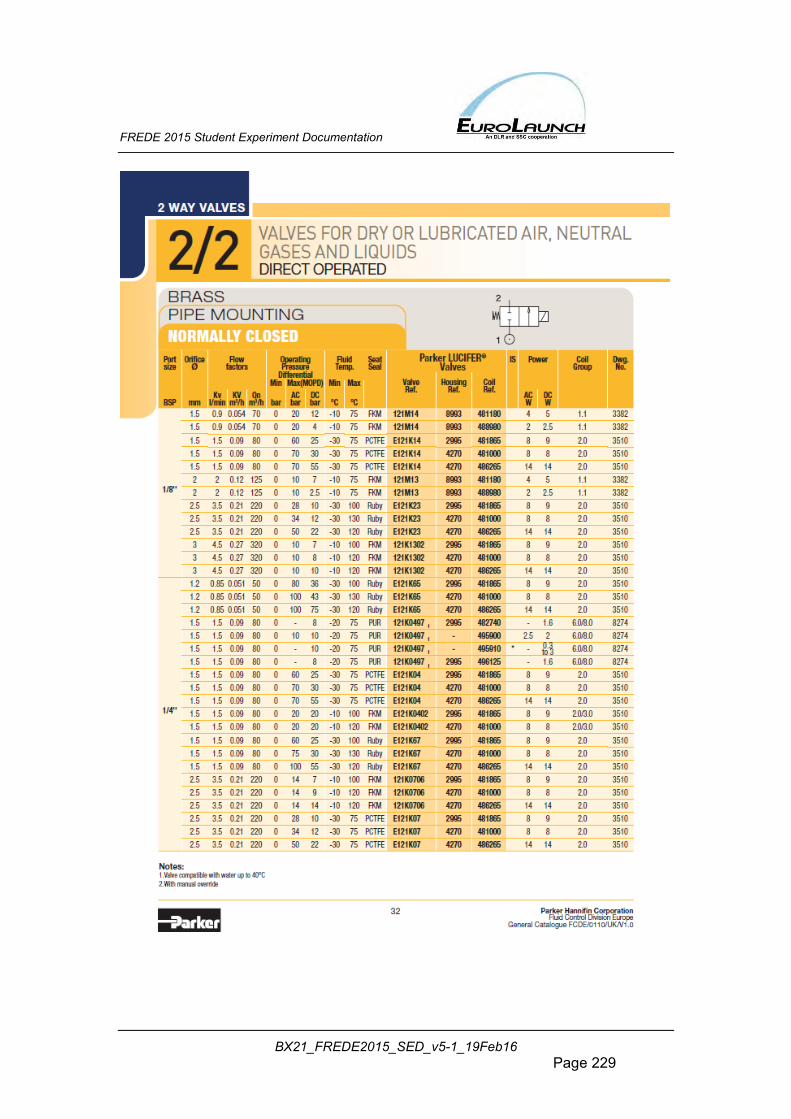
FREDE 2015 Student Experiment Documentation
BX21_FREDE2015_SED_v5-1_19Feb16 Page 229
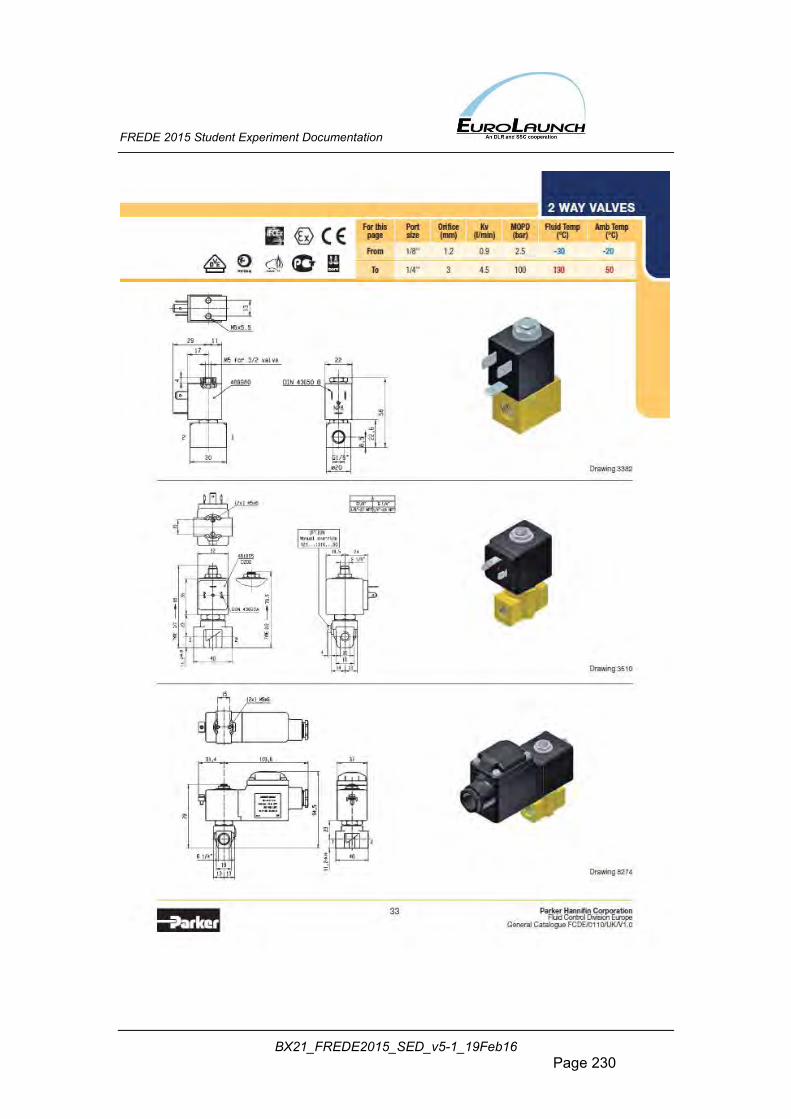
FREDE 2015 Student Experiment Documentation
BX21_FREDE2015_SED_v5-1_19Feb16 Page 230
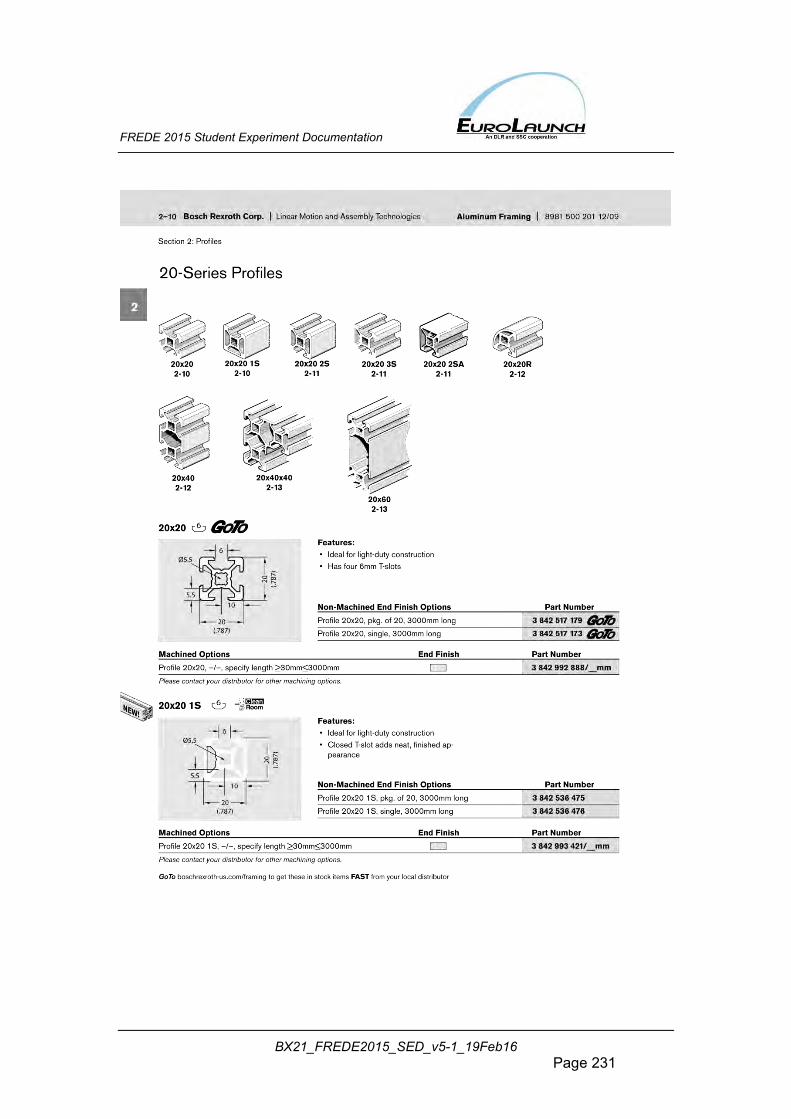
FREDE 2015 Student Experiment Documentation
BX21_FREDE2015_SED_v5-1_19Feb16 Page 231
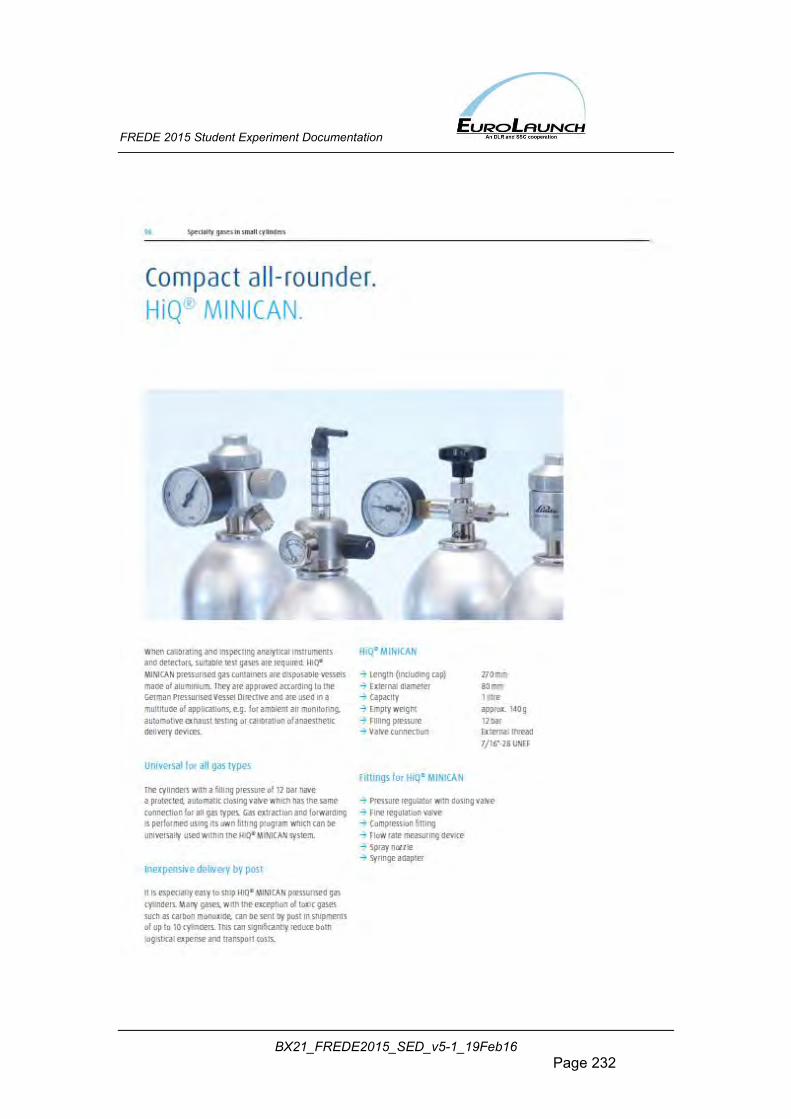
FREDE 2015 Student Experiment Documentation
BX21_FREDE2015_SED_v5-1_19Feb16 Page 232
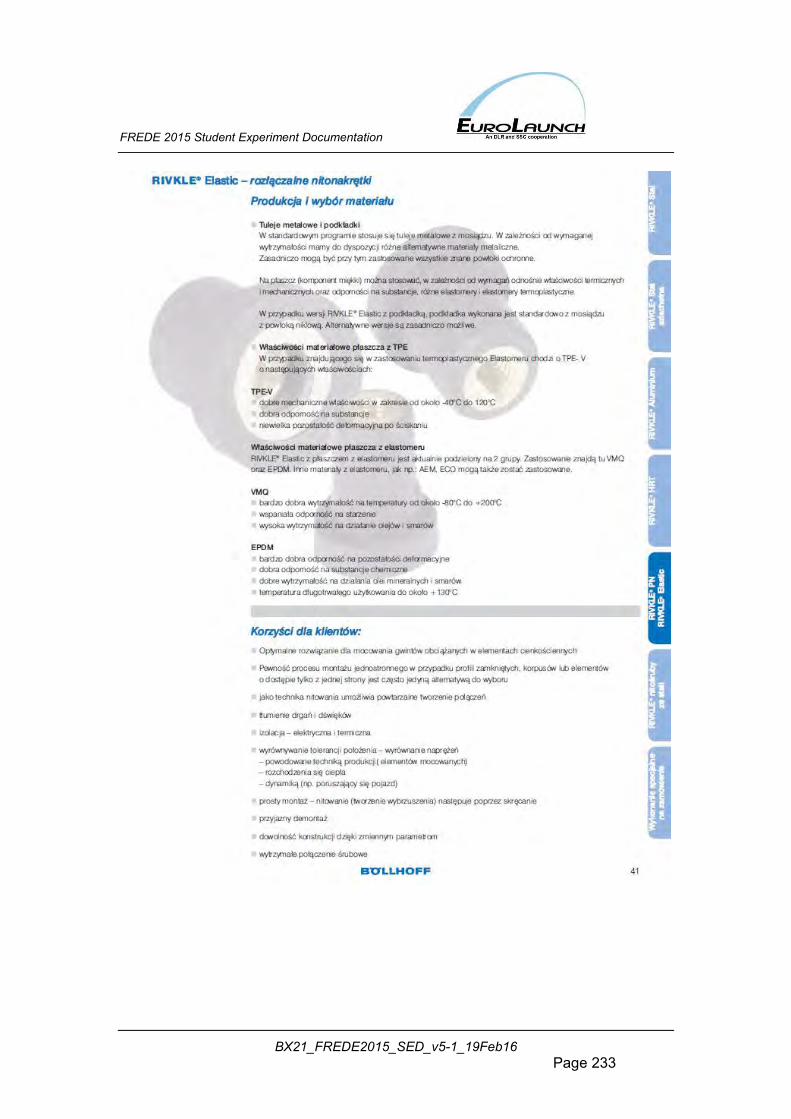
FREDE 2015 Student Experiment Documentation
BX21_FREDE2015_SED_v5-1_19Feb16 Page 233
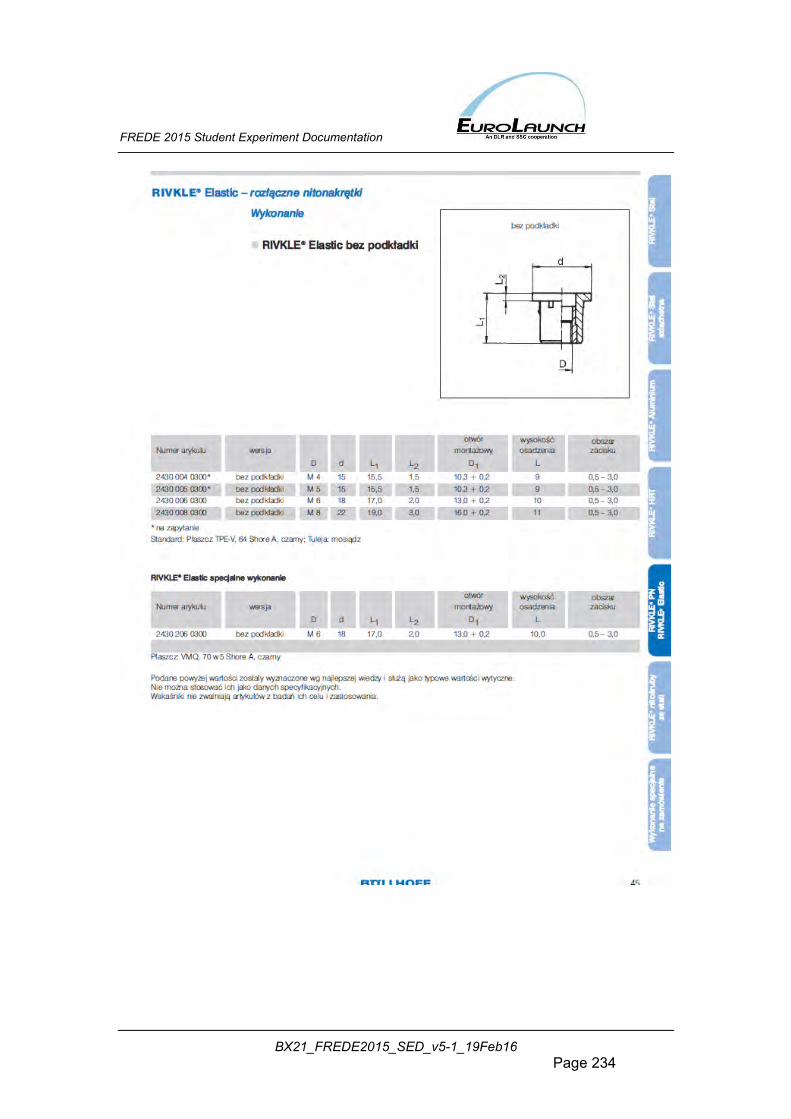
FREDE 2015 Student Experiment Documentation
BX21_FREDE2015_SED_v5-1_19Feb16 Page 234
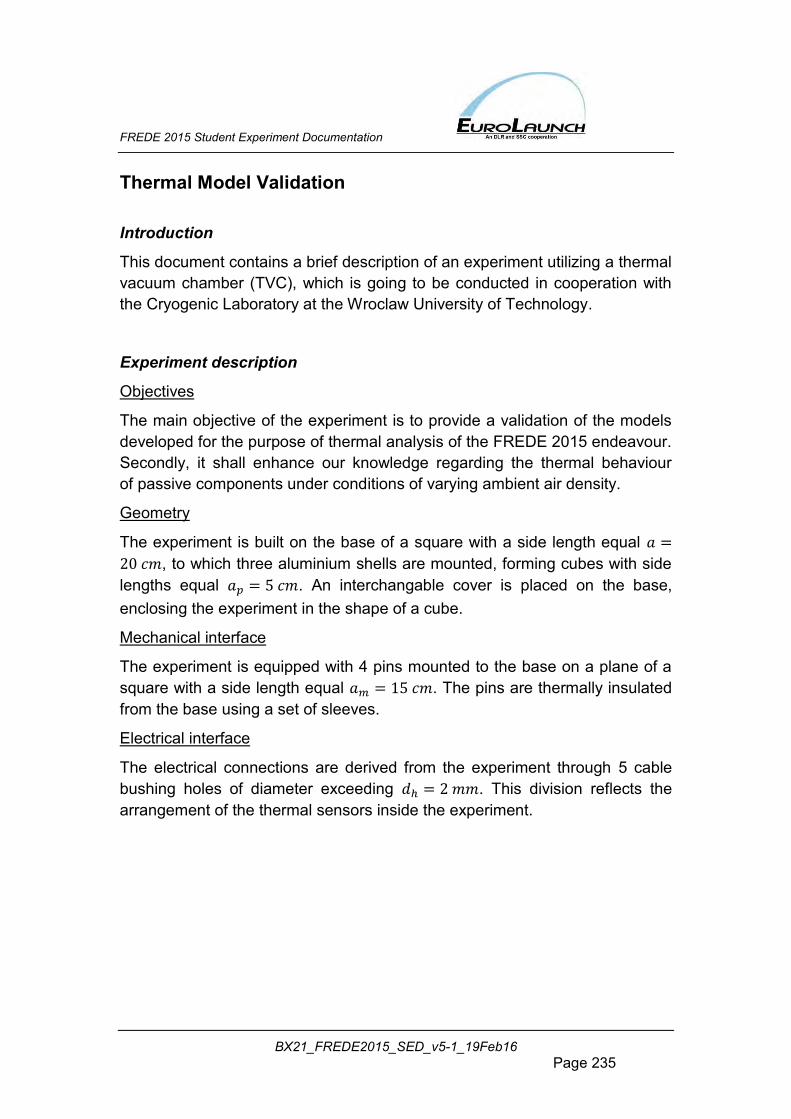
FREDE 2015 Student Experiment Documentation
BX21_FREDE2015_SED_v5-1_19Feb16 Page 235
Thermal Model Validation Introduction
This document contains a brief description of an experiment utilizing a thermal vacuum chamber (TVC), which is going to be conducted in cooperation with the Cryogenic Laboratory at the Wroclaw University of Technology.
Experiment description
Objectives
The main objective of the experiment is to provide a validation of the models developed for the purpose of thermal analysis of the FREDE 2015 endeavour. Secondly, it shall enhance our knowledge regarding the thermal behaviour of passive components under conditions of varying ambient air density.
Geometry
The experiment is built on the base of a square with a side length equal 𝑎 =
20 𝑐𝑚, to which three aluminium shells are mounted, forming cubes with side lengths equal 𝑎𝑝 = 5 𝑐𝑚. An interchangable cover is placed on the base, enclosing the experiment in the shape of a cube.
Mechanical interface
The experiment is equipped with 4 pins mounted to the base on a plane of a square with a side length equal 𝑎𝑚 = 15 𝑐𝑚. The pins are thermally insulated from the base using a set of sleeves.
Electrical interface
The electrical connections are derived from the experiment through 5 cable bushing holes of diameter exceeding 𝑑ℎ = 2 𝑚𝑚. This division reflects the arrangement of the thermal sensors inside the experiment.
FREDE 2015 Student Experiment Documentation
BX21_FREDE2015_SED_v5-1_19Feb16 Page 236
Environmental requirements
Temperature
In order to resemble the thermal profile of a stratospheric balloon flight, the temperature shall be maintained between 𝑇𝑚𝑖𝑛 = −600𝐶 and 𝑇𝑚𝑎𝑥 = 100𝐶.
Pressure
The pressure should vary from 𝑝𝑚𝑎𝑥 = 1000 ℎ𝑃𝑎 down to 𝑝𝑚𝑖𝑛 = 10 ℎ𝑃𝑎.
Radiation
The experiment shall be equipped with a source of radiation having a spectral composition similar to the one encountered at an altitude of 30 km.
Performance requirements Power supply The electrical power shall be provided from a stable DC power supply, able to reach 𝑃𝑠 = 20 𝑊. Temperature measurements The experiment should provide point measurements of temperature in the following locations:
5 sensors in the middles of each of the cover’s walls, on their internal side
3 sensors on the tops of each of the internal cubes 3 sensors on the dissipative elements inside the internal cubes 1 sensor on the base of the experiment
Power measurements In order to verify the thermal balance, the experiment shall measure the total electrical power delivered to the dissipative elements.
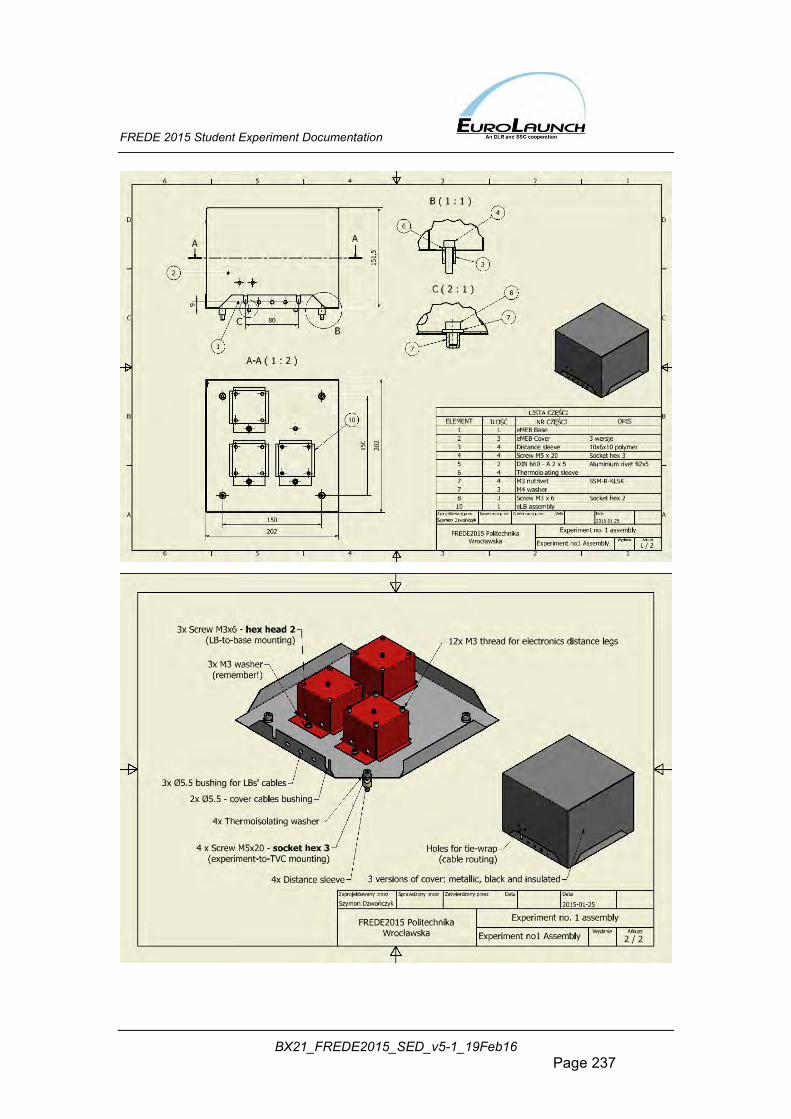
FREDE 2015 Student Experiment Documentation
BX21_FREDE2015_SED_v5-1_19Feb16 Page 237
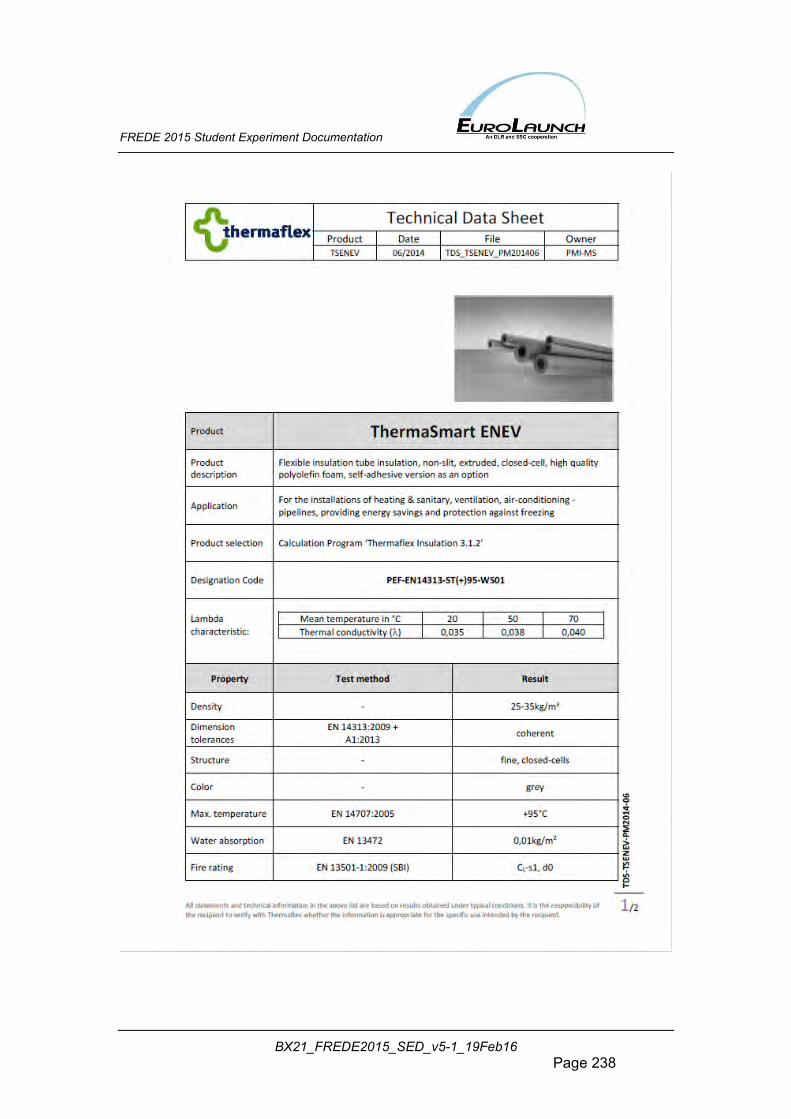
FREDE 2015 Student Experiment Documentation
BX21_FREDE2015_SED_v5-1_19Feb16 Page 238
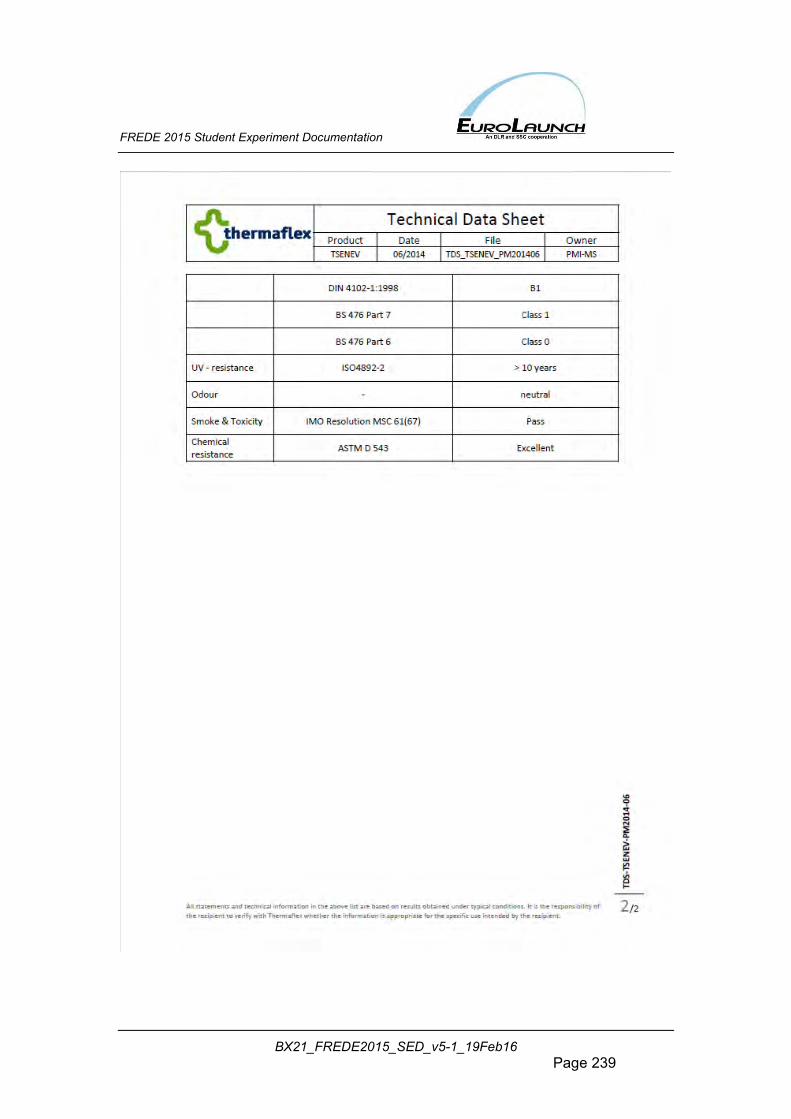
FREDE 2015 Student Experiment Documentation
BX21_FREDE2015_SED_v5-1_19Feb16 Page 239
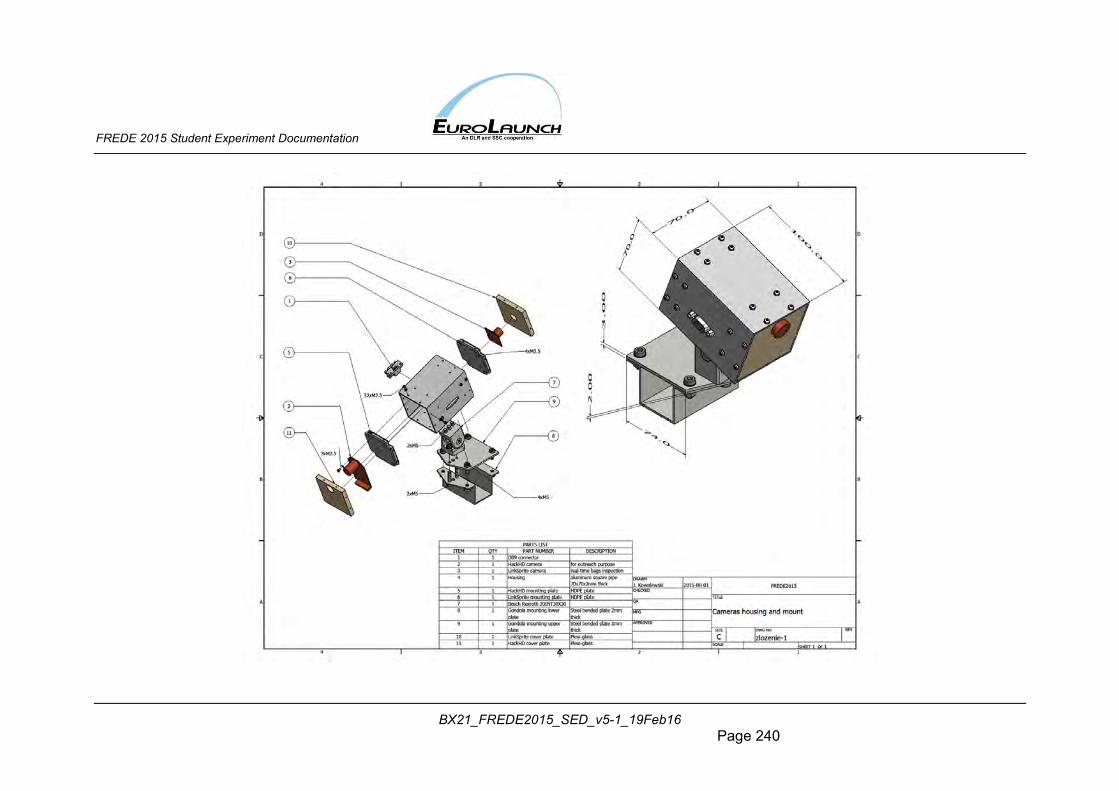
FREDE 2015 Student Experiment Documentation
BX21_FREDE2015_SED_v5-1_19Feb16 Page 240
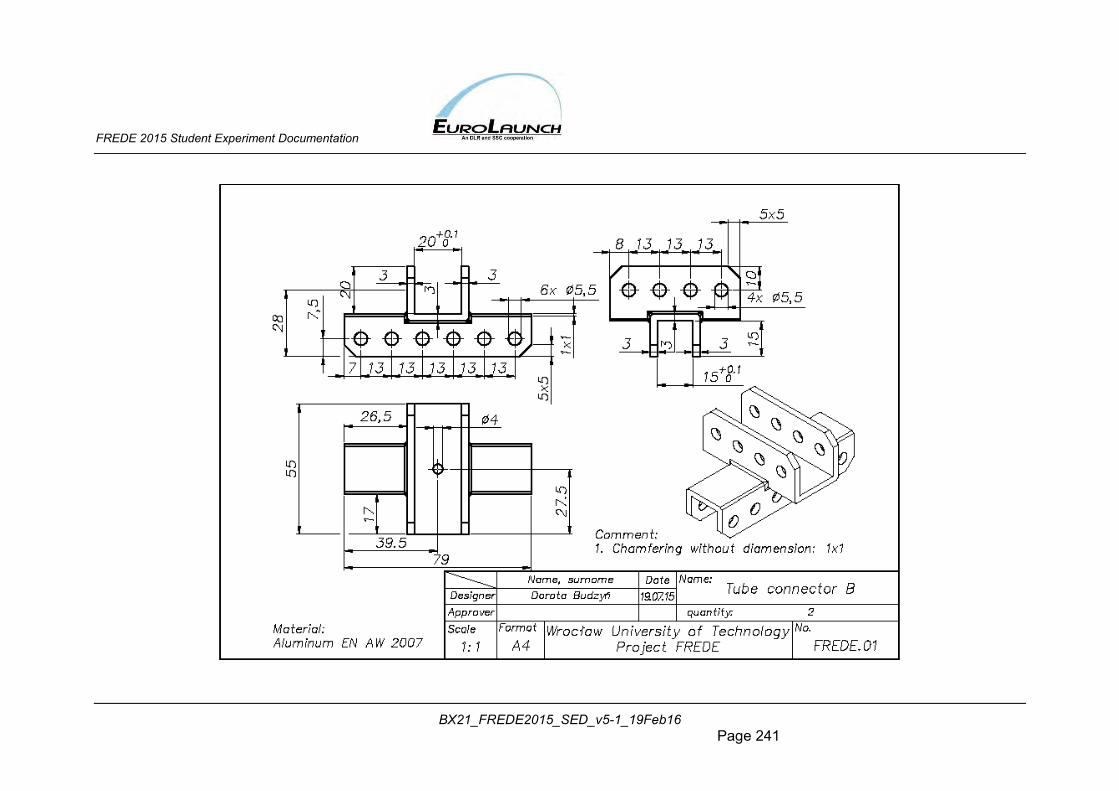
FREDE 2015 Student Experiment Documentation
BX21_FREDE2015_SED_v5-1_19Feb16 Page 241
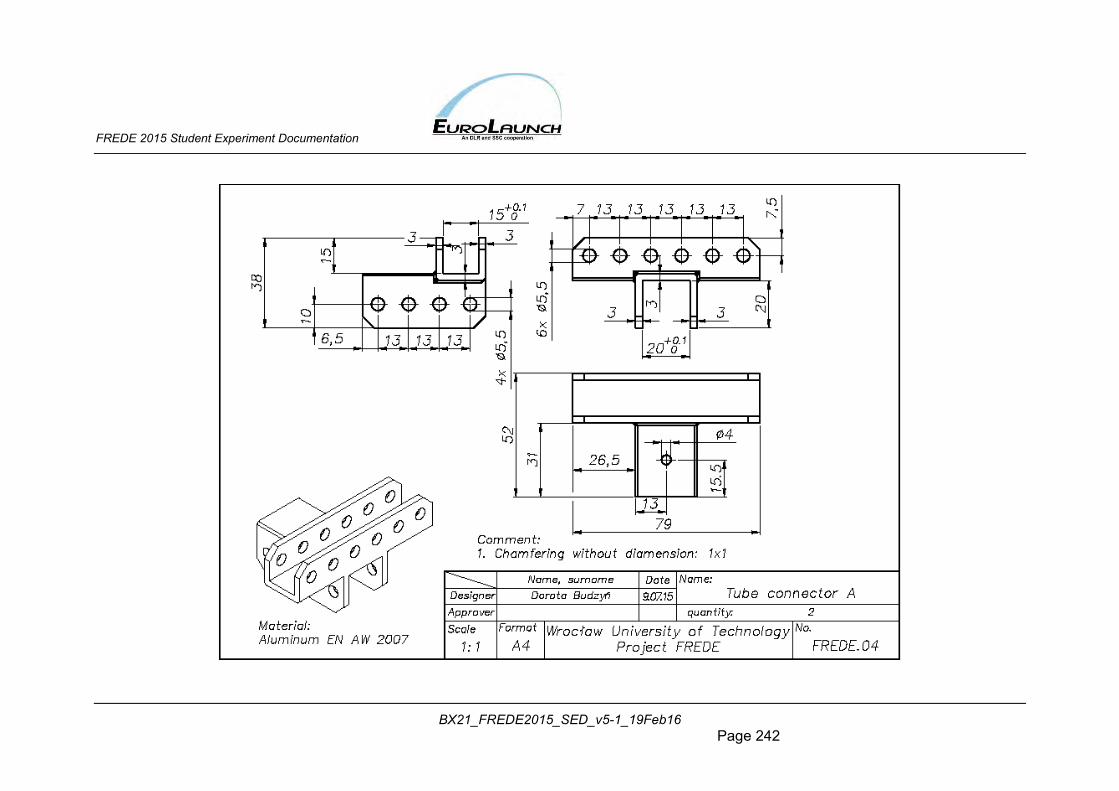
FREDE 2015 Student Experiment Documentation
BX21_FREDE2015_SED_v5-1_19Feb16 Page 242
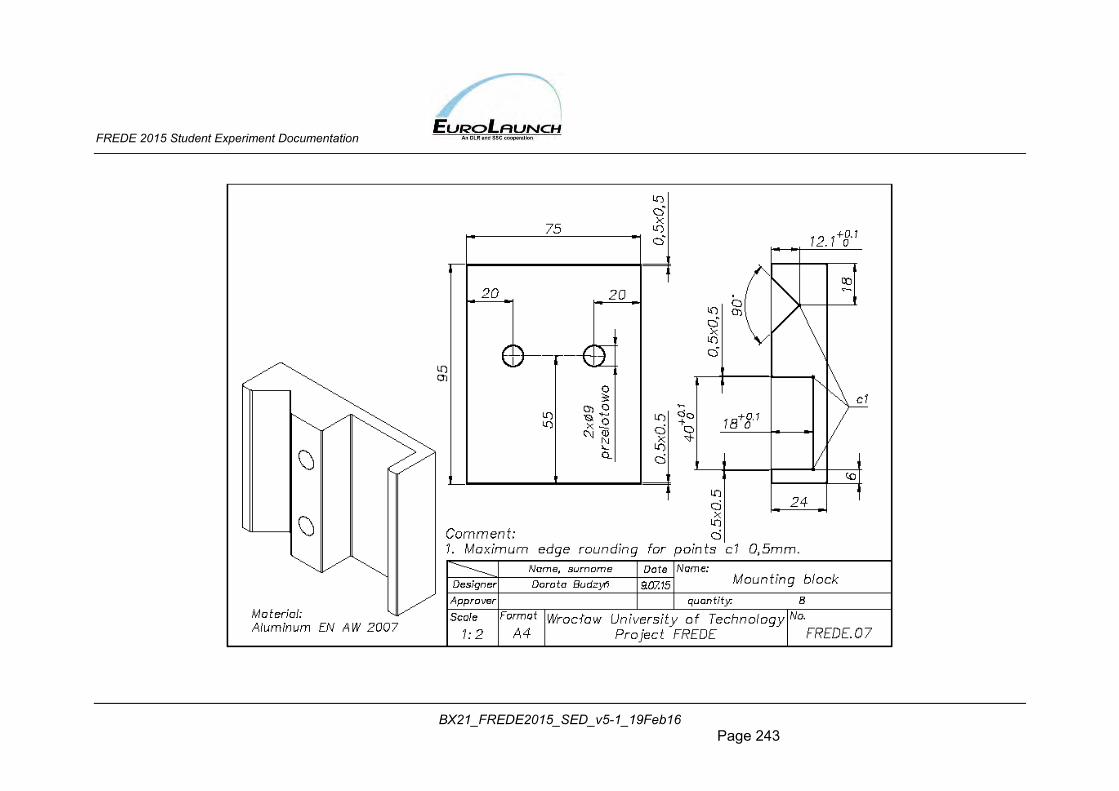
FREDE 2015 Student Experiment Documentation
BX21_FREDE2015_SED_v5-1_19Feb16 Page 243
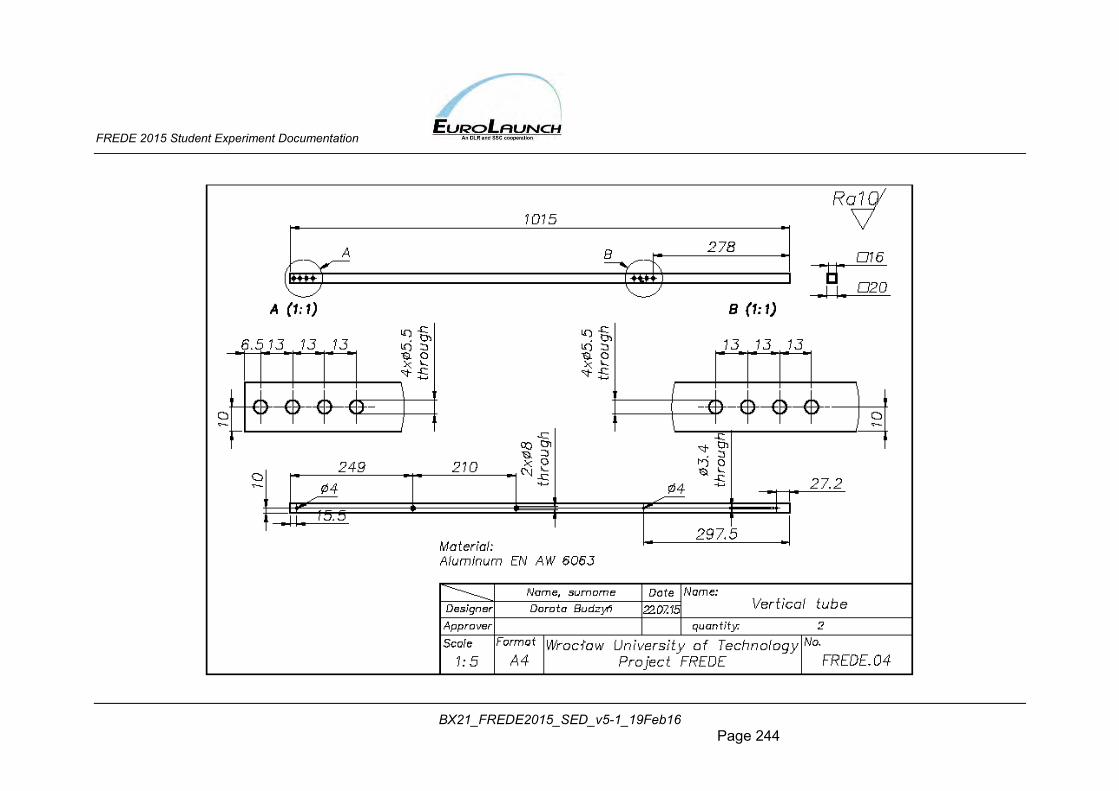
FREDE 2015 Student Experiment Documentation
BX21_FREDE2015_SED_v5-1_19Feb16 Page 244
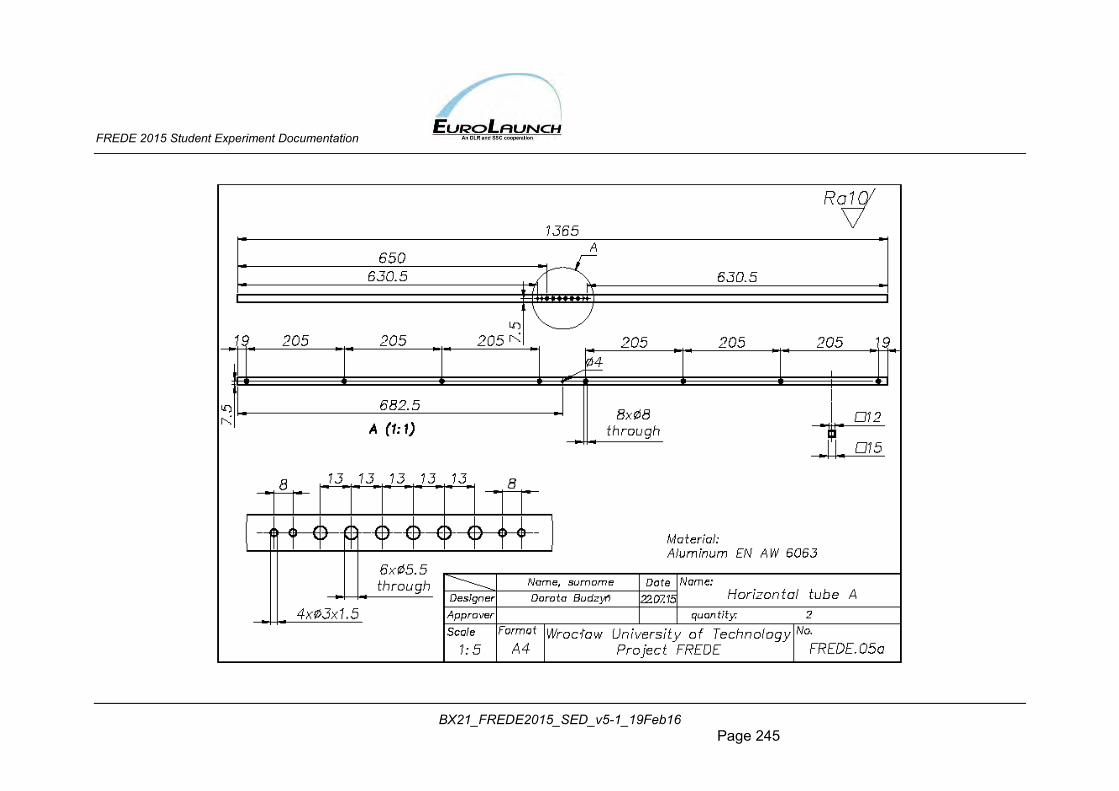
FREDE 2015 Student Experiment Documentation
BX21_FREDE2015_SED_v5-1_19Feb16 Page 245
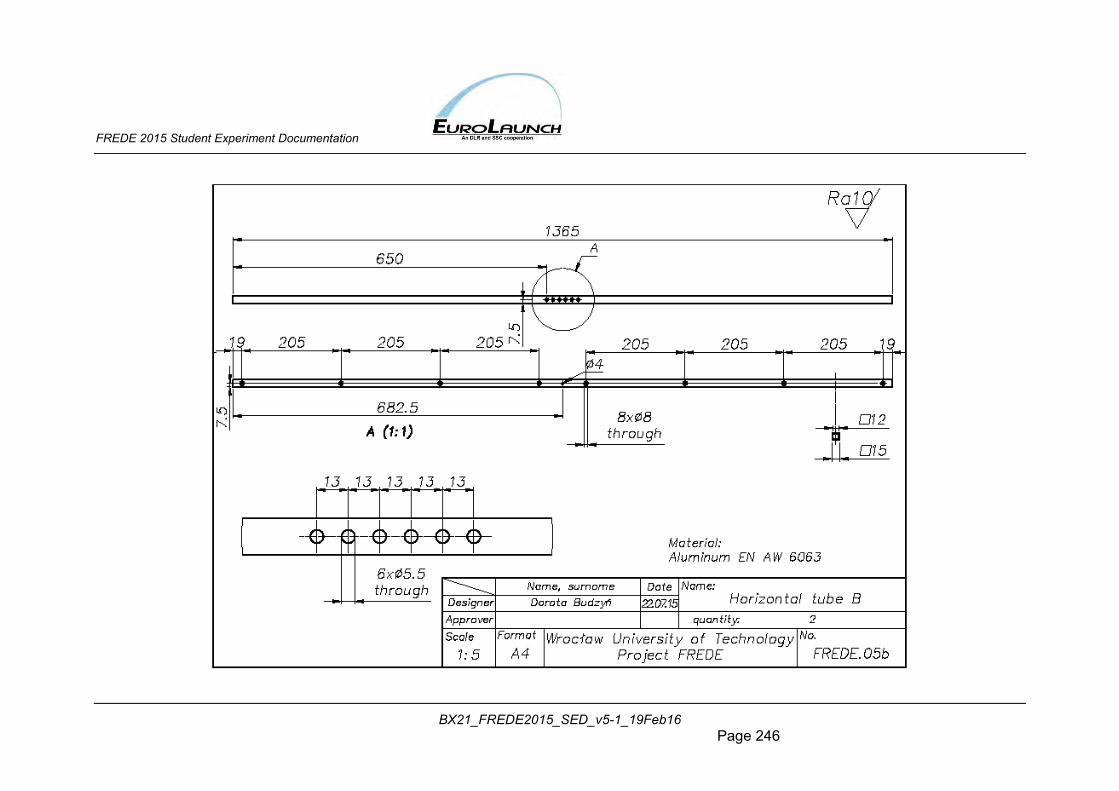
FREDE 2015 Student Experiment Documentation
BX21_FREDE2015_SED_v5-1_19Feb16 Page 246
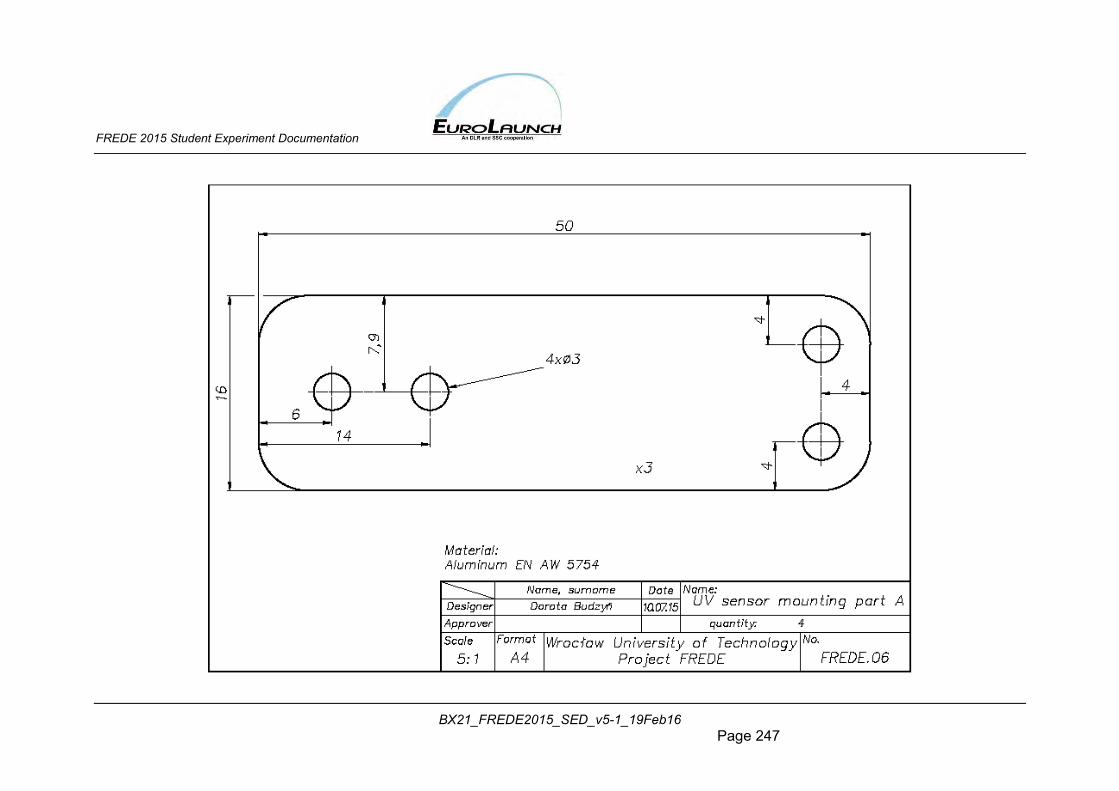
FREDE 2015 Student Experiment Documentation
BX21_FREDE2015_SED_v5-1_19Feb16 Page 247
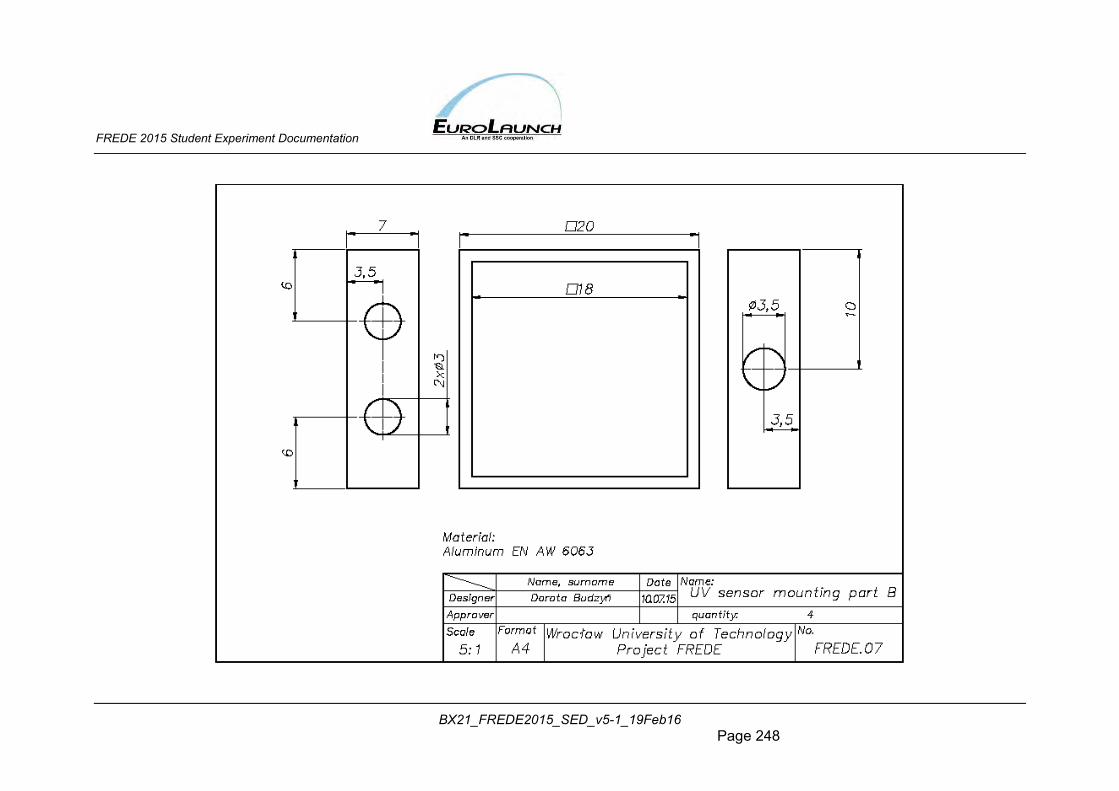
FREDE 2015 Student Experiment Documentation
BX21_FREDE2015_SED_v5-1_19Feb16 Page 248
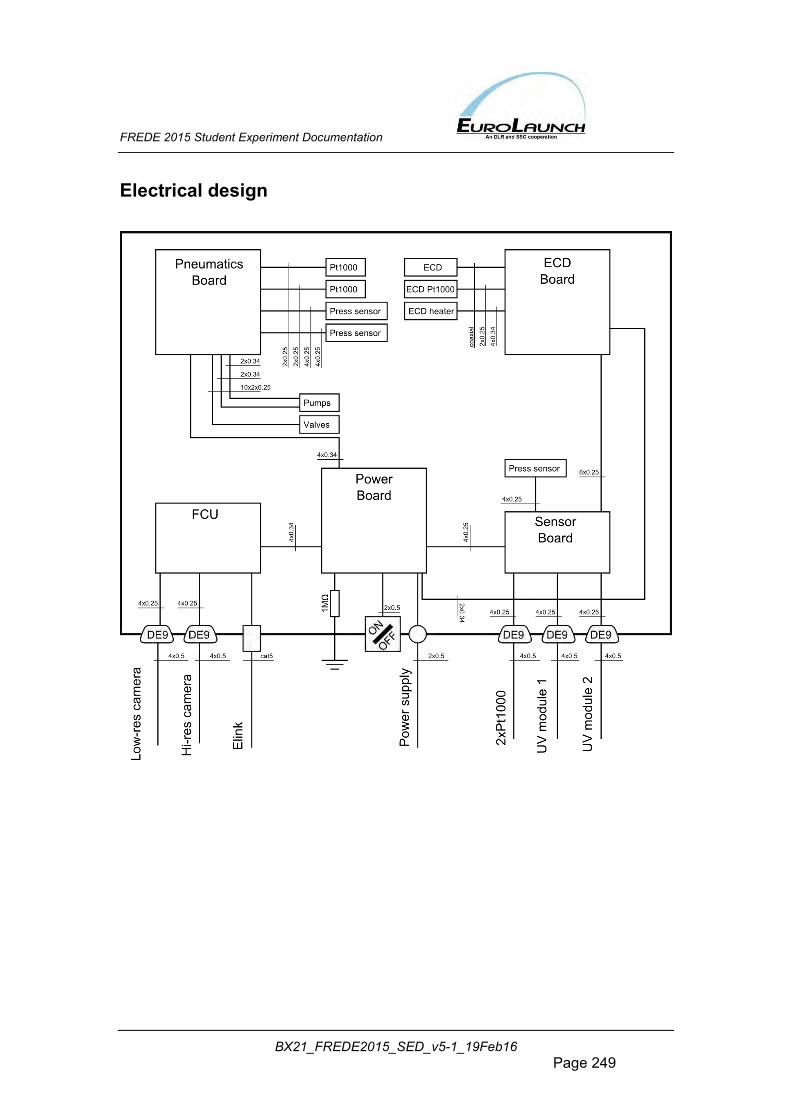
FREDE 2015 Student Experiment Documentation
BX21_FREDE2015_SED_v5-1_19Feb16 Page 249
Electrical design
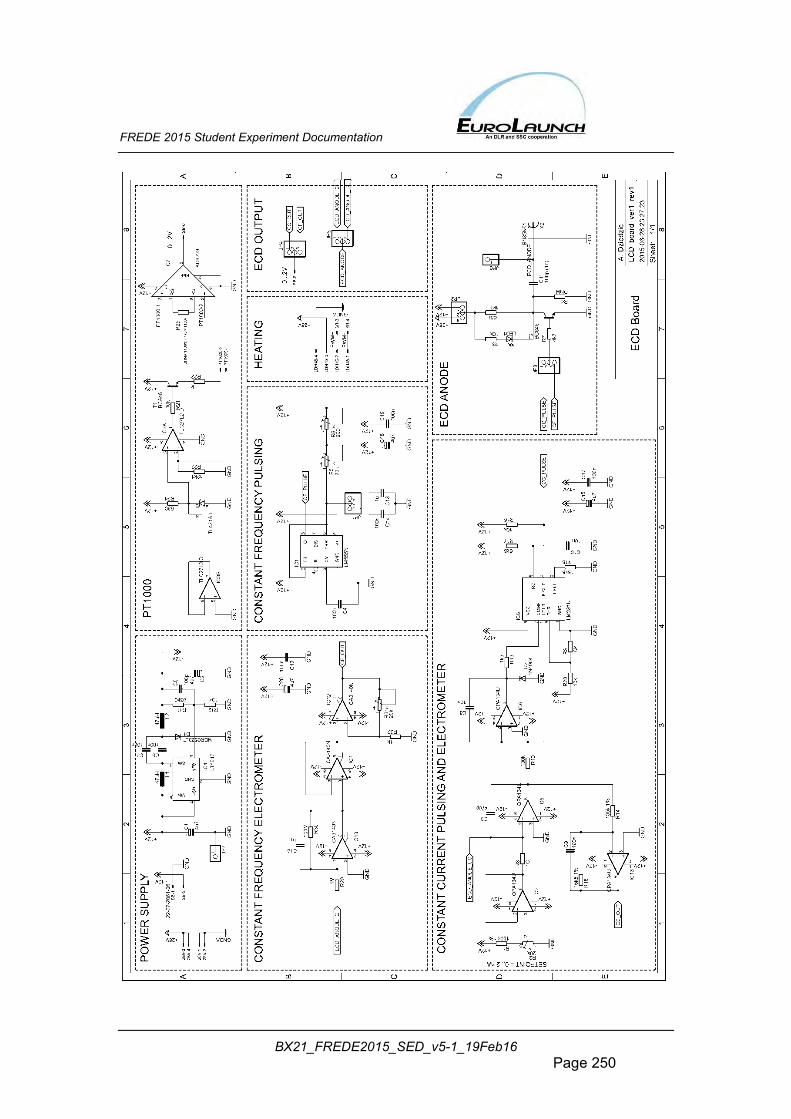
FREDE 2015 Student Experiment Documentation
BX21_FREDE2015_SED_v5-1_19Feb16 Page 250
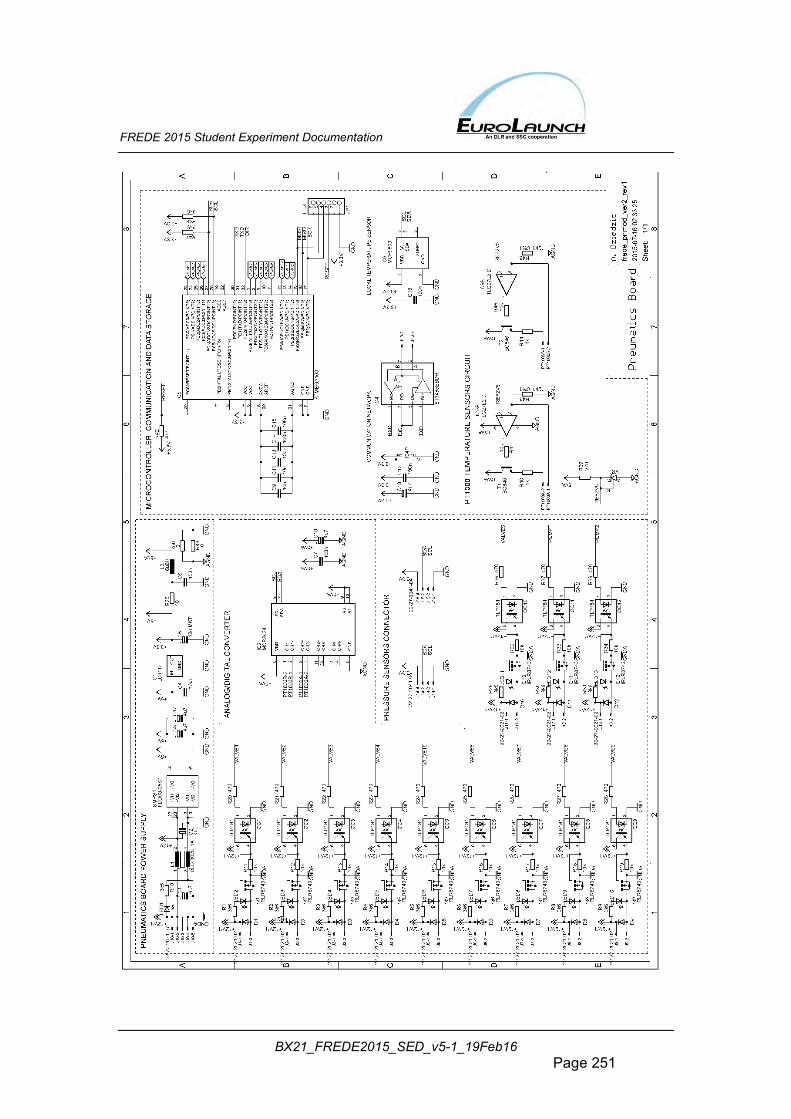
FREDE 2015 Student Experiment Documentation
BX21_FREDE2015_SED_v5-1_19Feb16 Page 251
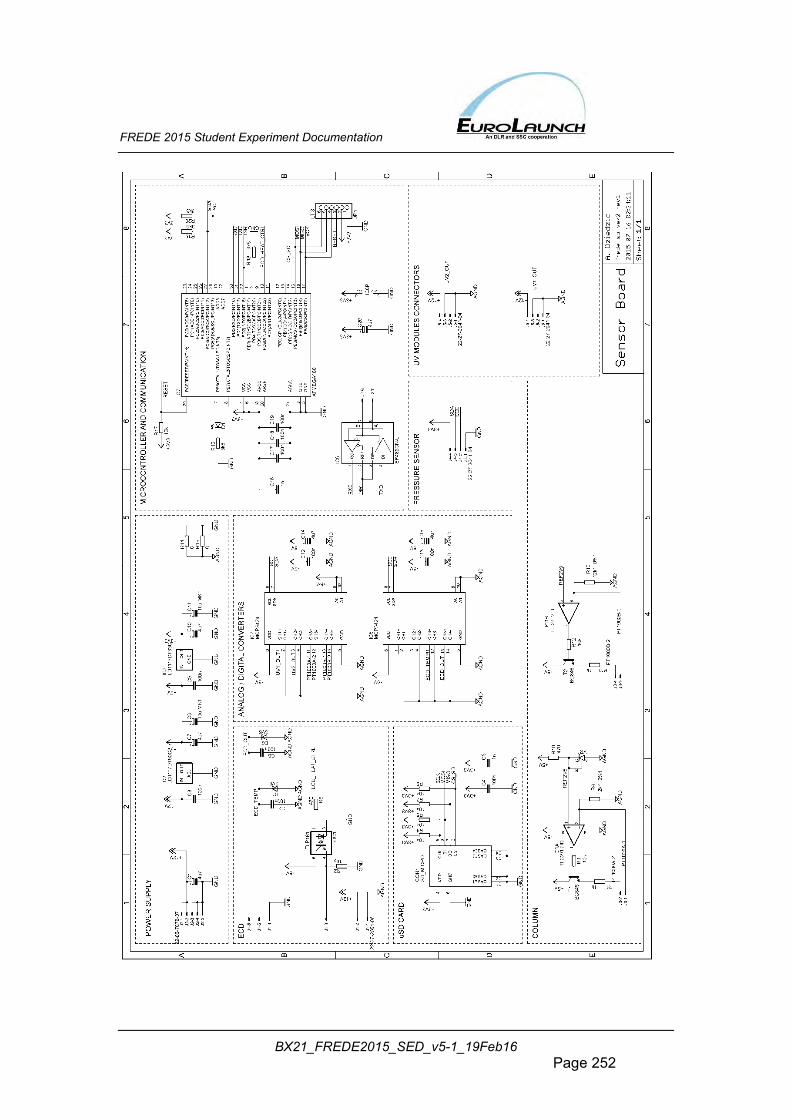
FREDE 2015 Student Experiment Documentation
BX21_FREDE2015_SED_v5-1_19Feb16 Page 252
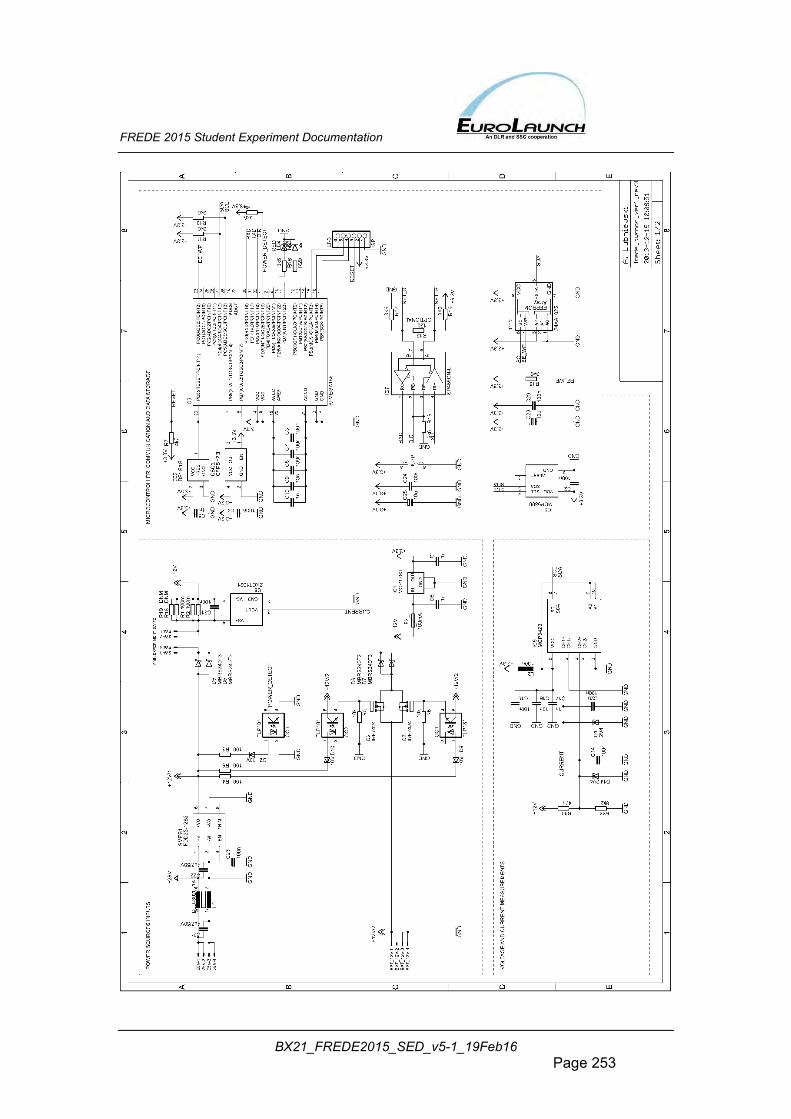
FREDE 2015 Student Experiment Documentation
BX21_FREDE2015_SED_v5-1_19Feb16 Page 253
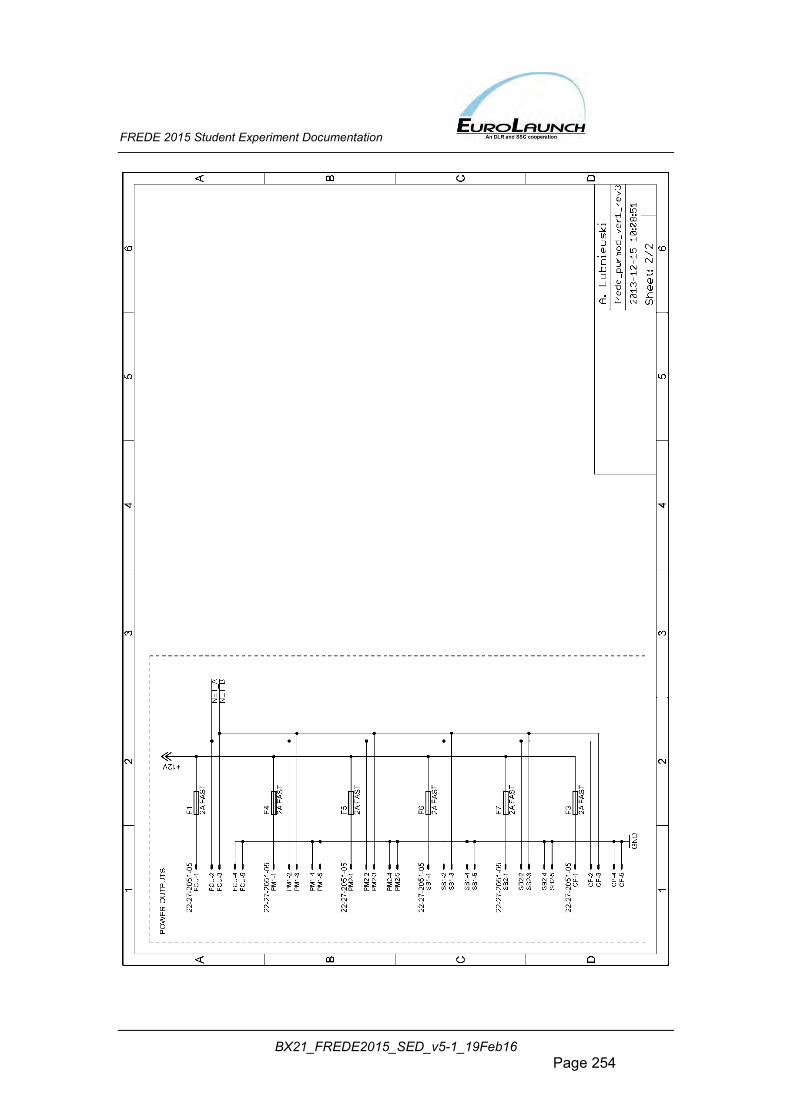
FREDE 2015 Student Experiment Documentation
BX21_FREDE2015_SED_v5-1_19Feb16 Page 254
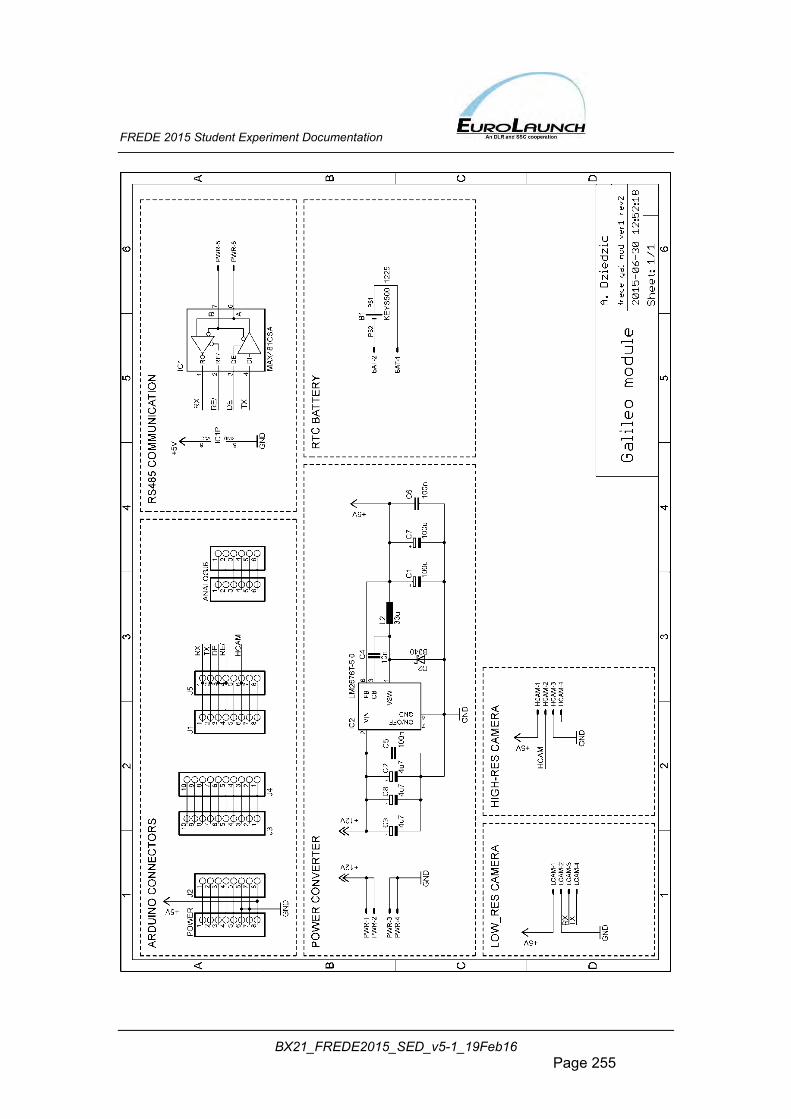
FREDE 2015 Student Experiment Documentation
BX21_FREDE2015_SED_v5-1_19Feb16 Page 255
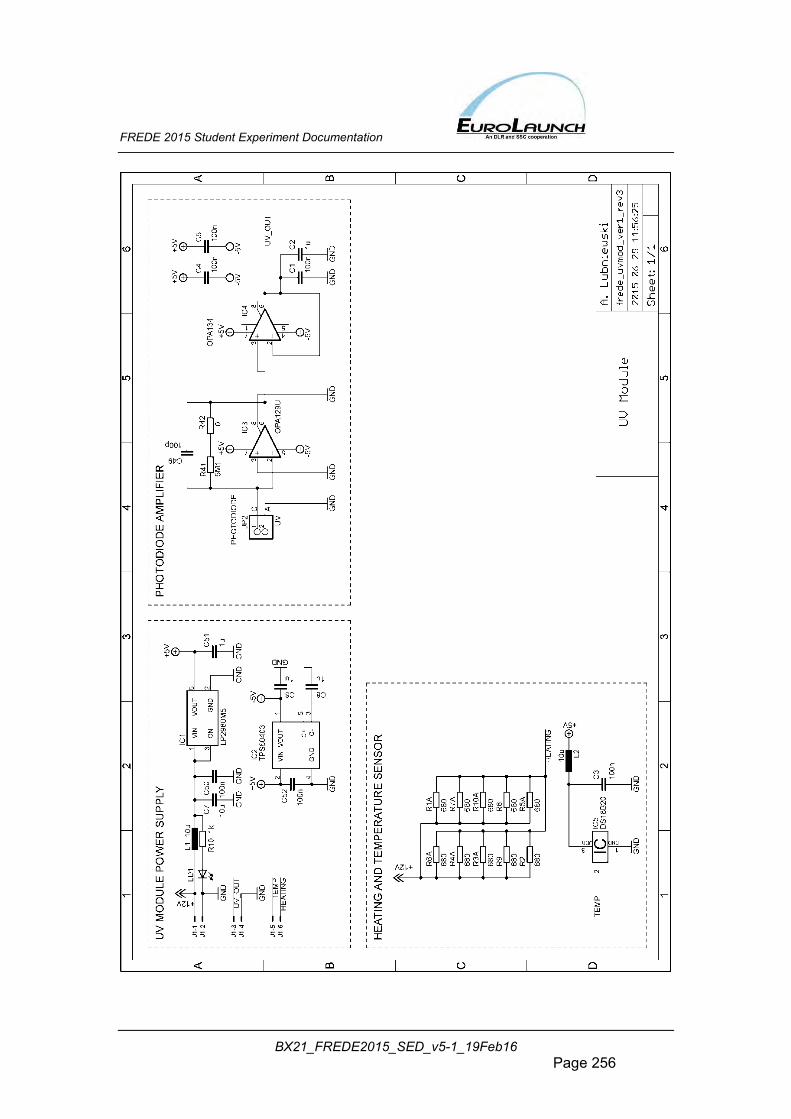
FREDE 2015 Student Experiment Documentation
BX21_FREDE2015_SED_v5-1_19Feb16 Page 256
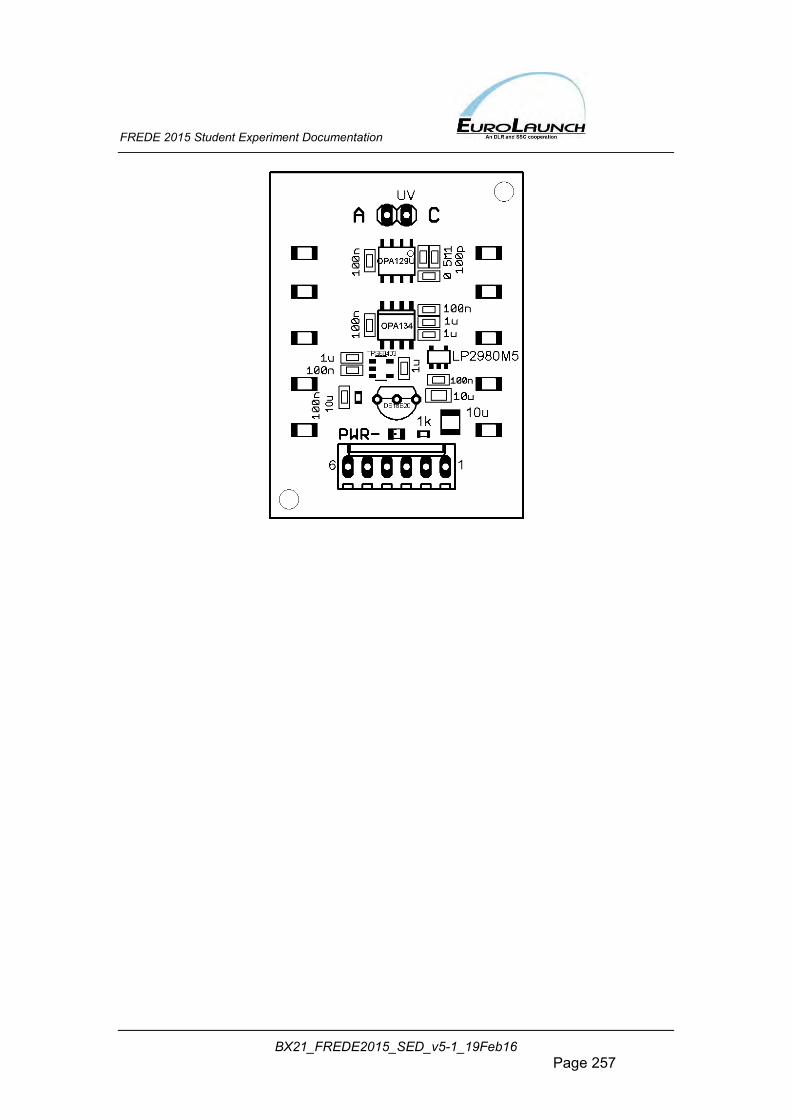
FREDE 2015 Student Experiment Documentation
BX21_FREDE2015_SED_v5-1_19Feb16 Page 257
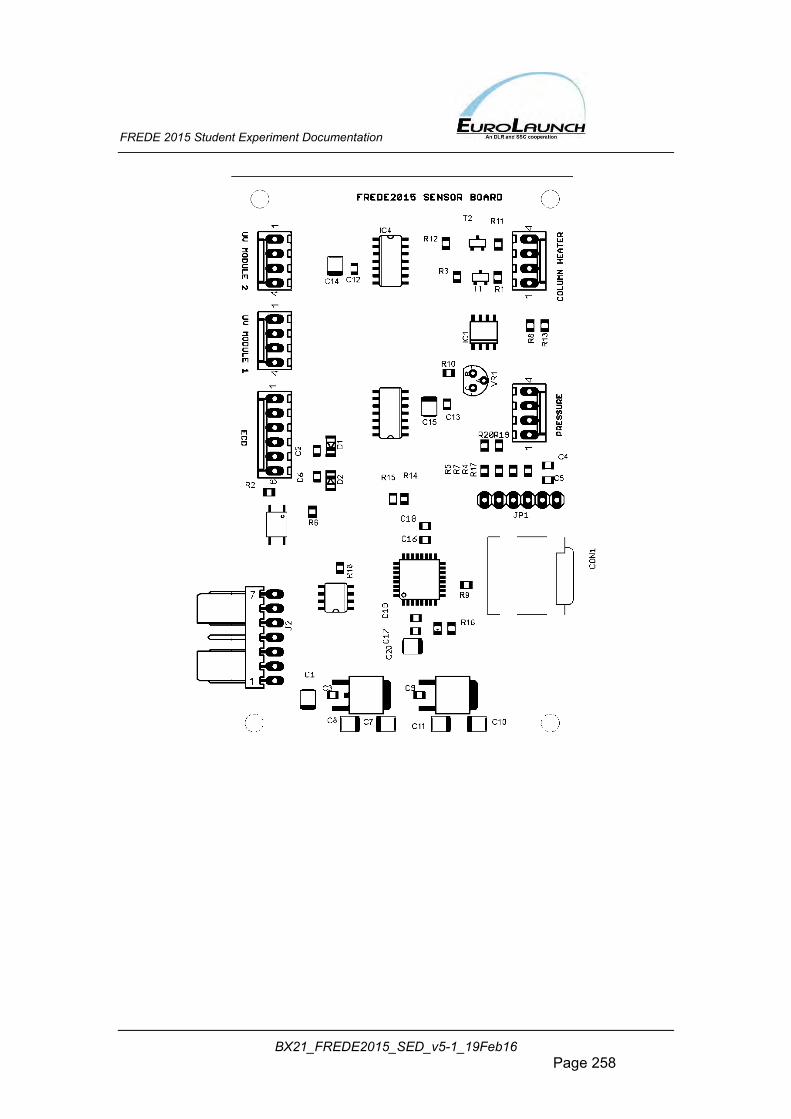
FREDE 2015 Student Experiment Documentation
BX21_FREDE2015_SED_v5-1_19Feb16 Page 258
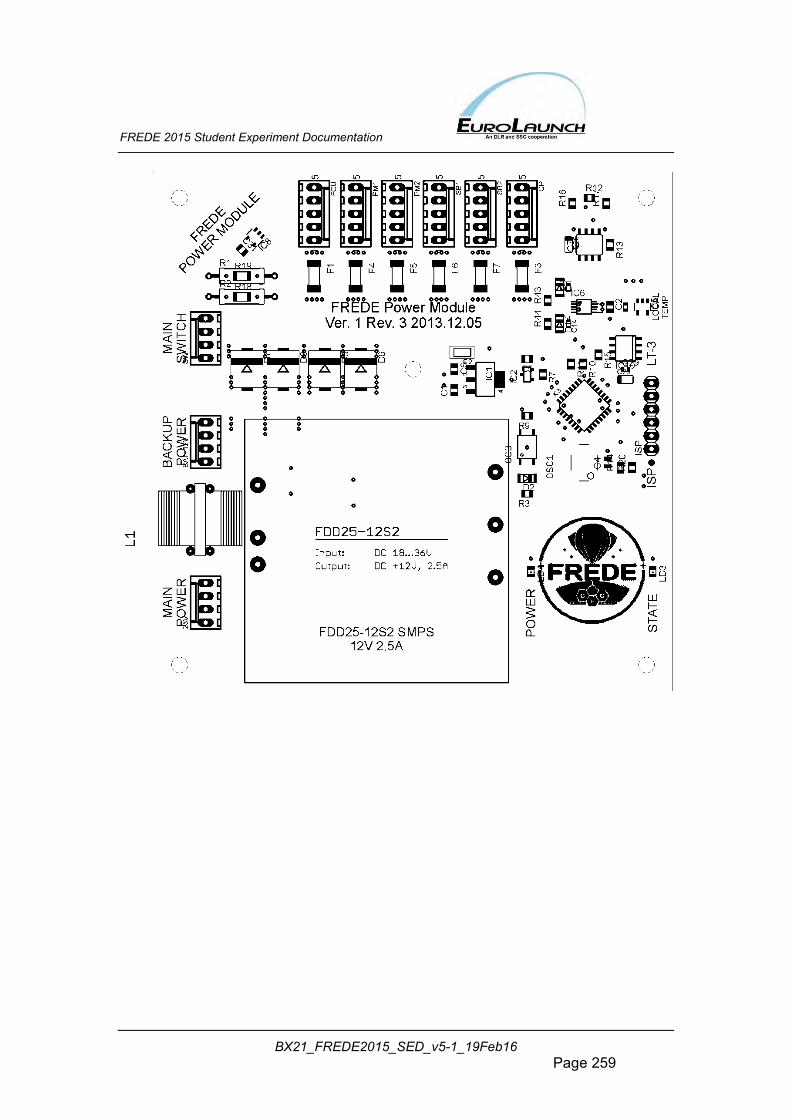
FREDE 2015 Student Experiment Documentation
BX21_FREDE2015_SED_v5-1_19Feb16 Page 259
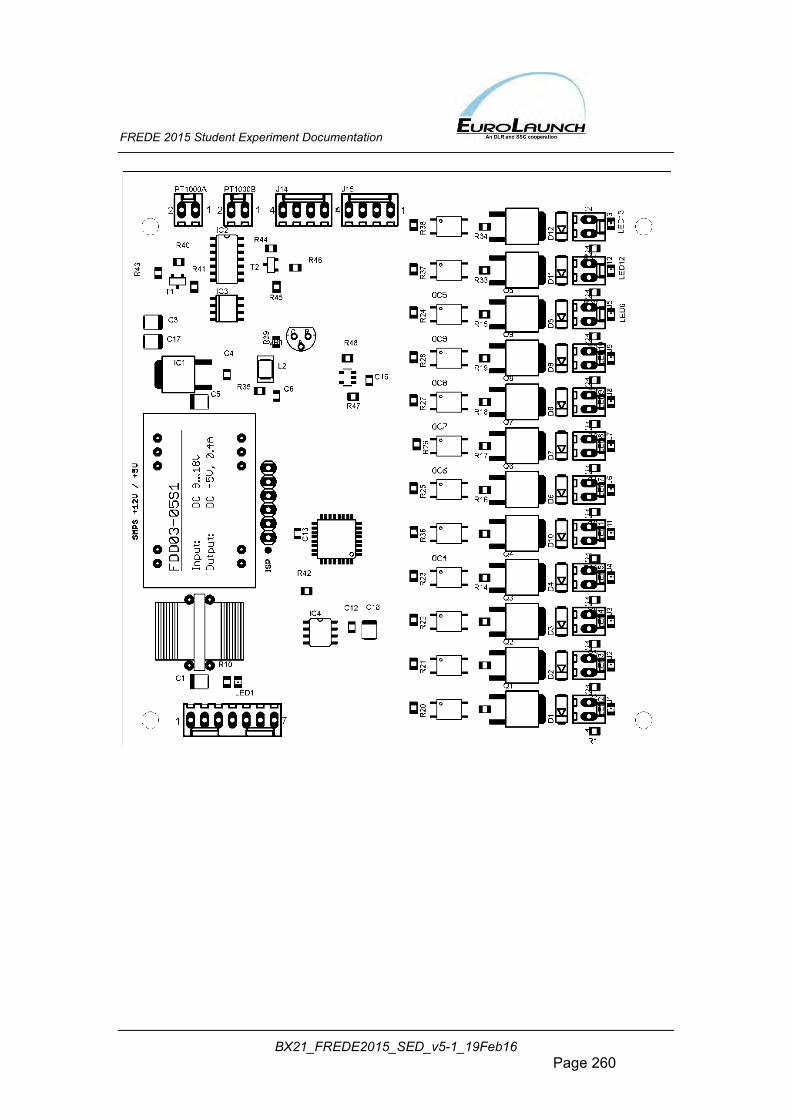
FREDE 2015 Student Experiment Documentation
BX21_FREDE2015_SED_v5-1_19Feb16 Page 260
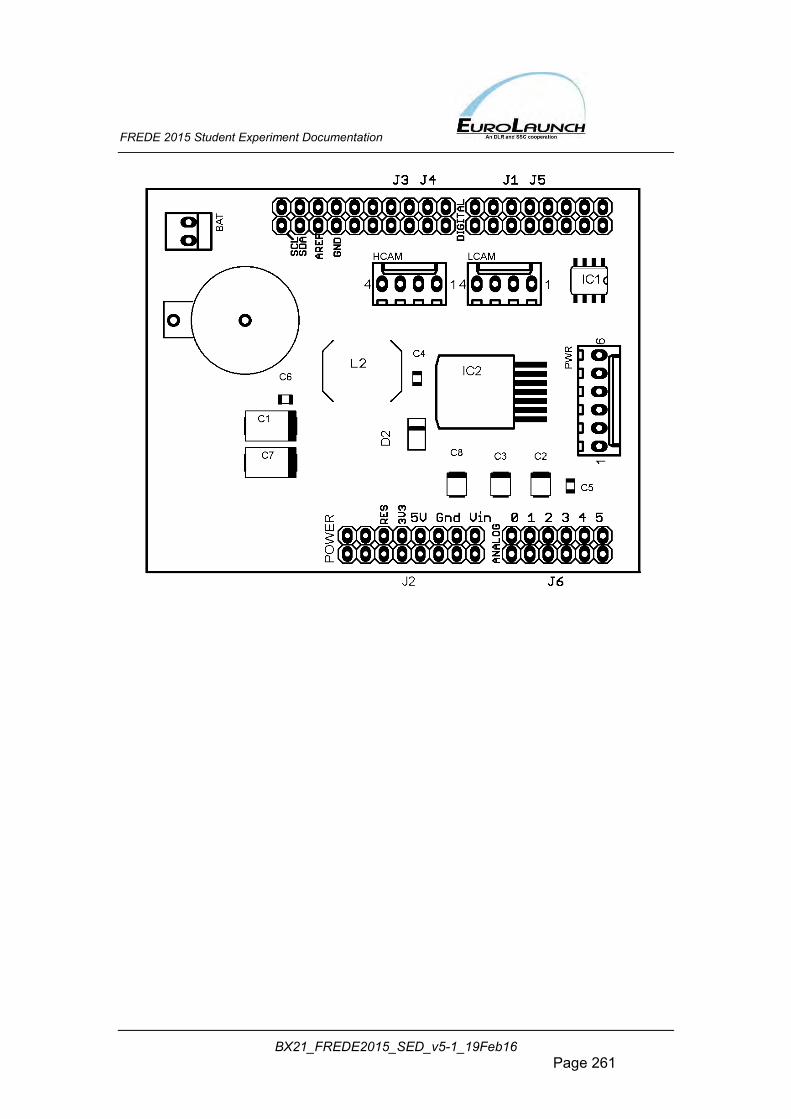
FREDE 2015 Student Experiment Documentation
BX21_FREDE2015_SED_v5-1_19Feb16 Page 261
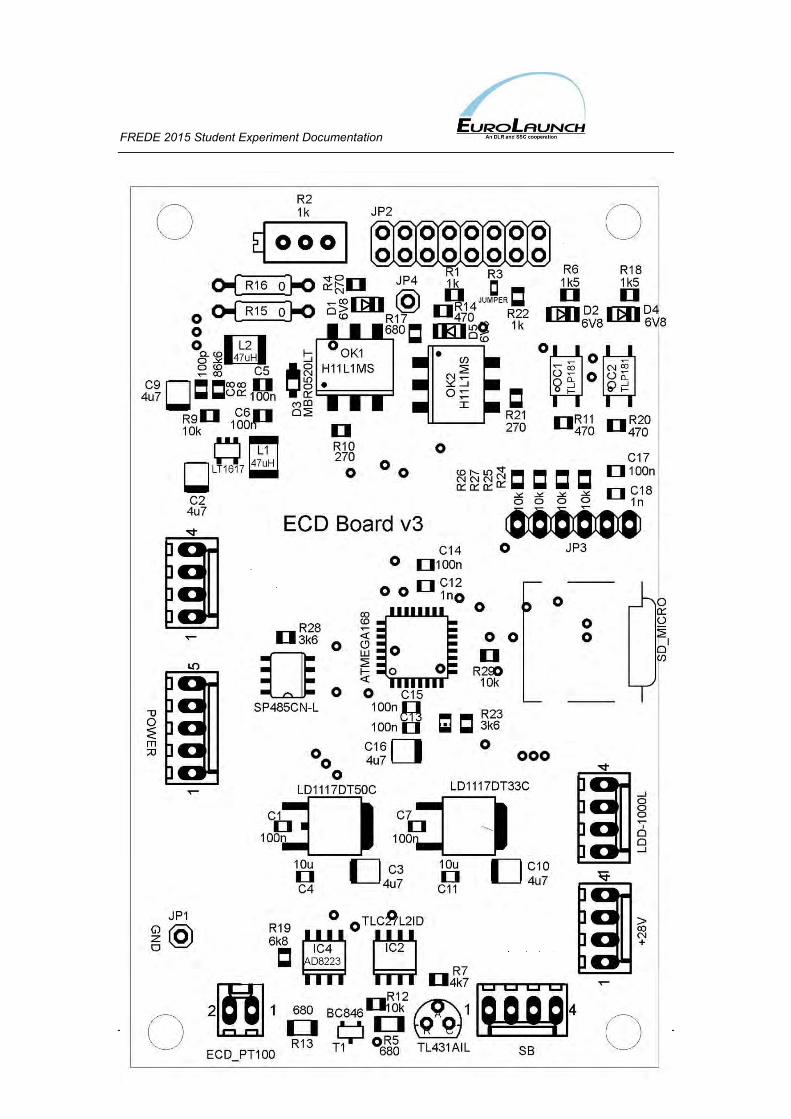
FREDE 2015 Student Experiment Documentation
BX21_FREDE2015_SED_v5-1_19Feb16 Page 262
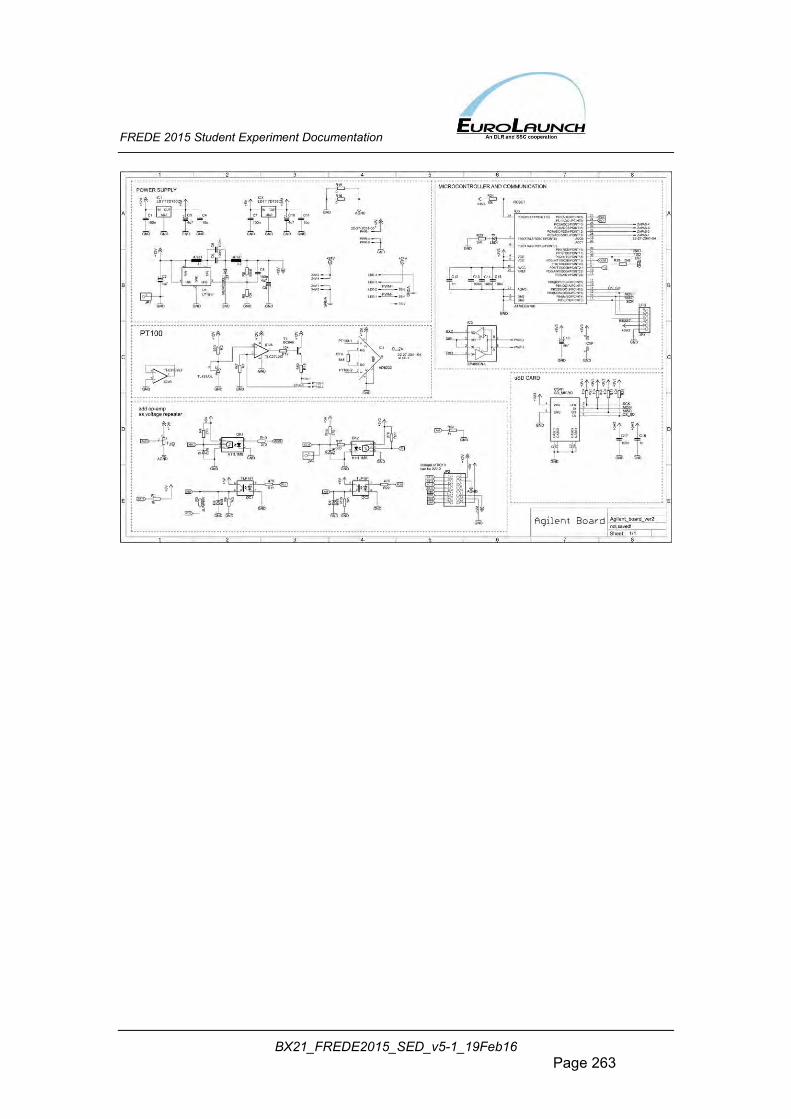
FREDE 2015 Student Experiment Documentation
BX21_FREDE2015_SED_v5-1_19Feb16 Page 263
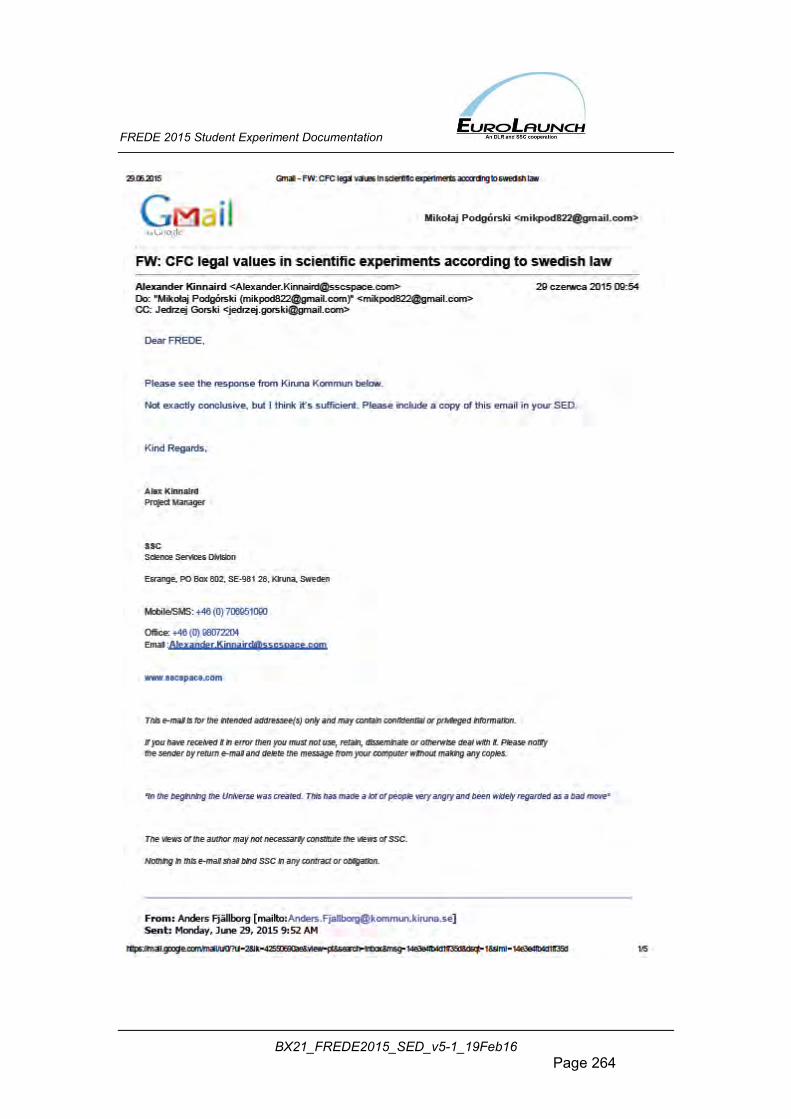
FREDE 2015 Student Experiment Documentation
BX21_FREDE2015_SED_v5-1_19Feb16 Page 264
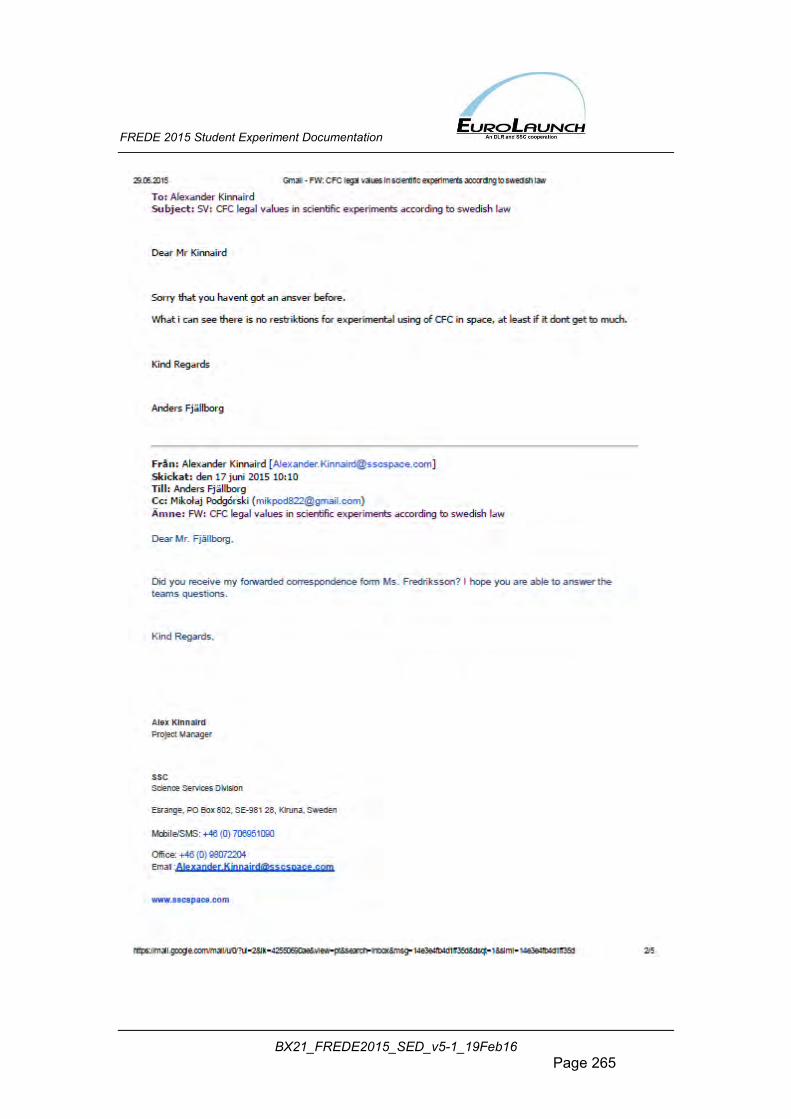
FREDE 2015 Student Experiment Documentation
BX21_FREDE2015_SED_v5-1_19Feb16 Page 265
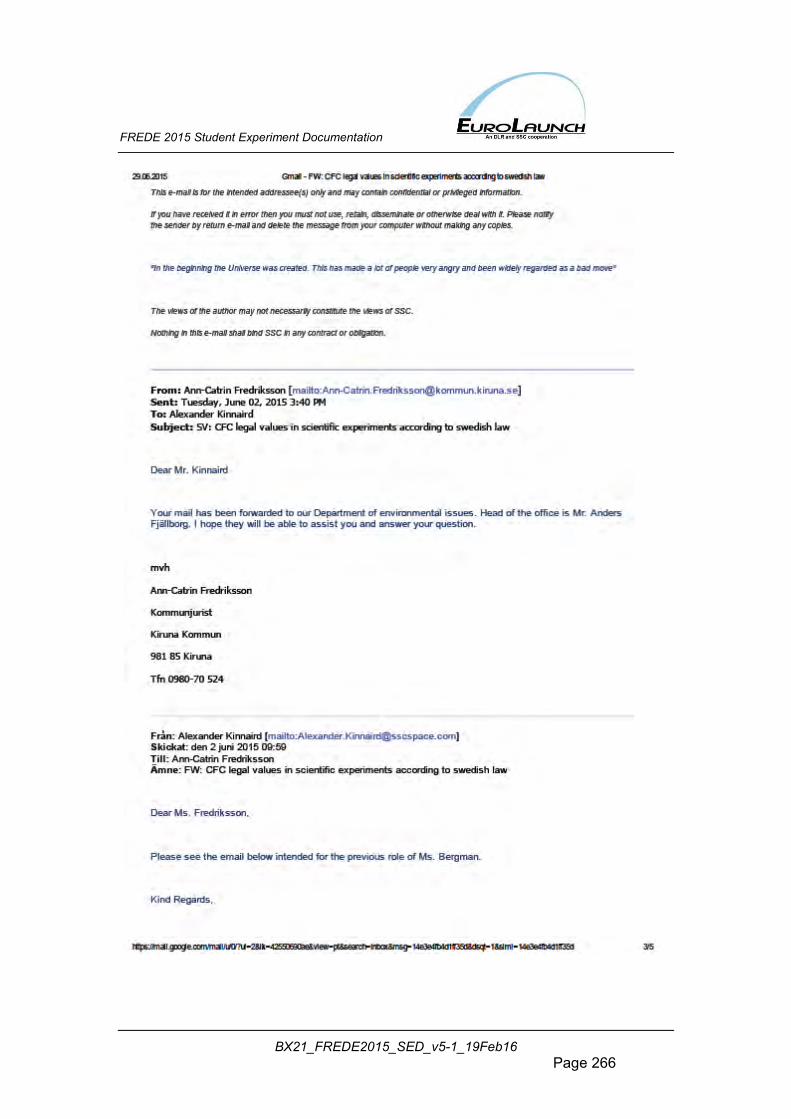
FREDE 2015 Student Experiment Documentation
BX21_FREDE2015_SED_v5-1_19Feb16 Page 266
FREDE 2015 Student Experiment Documentation
BX21_FREDE2015_SED_v5-1_19Feb16 Page 267
FREDE 2015 Student Experiment Documentation
BX21_FREDE2015_SED_v5-1_19Feb16 Page 268

FREDE 2015 Student Experiment Documentation
BX21_FREDE2015_SED_v5-1_19Feb16 Page 269
APPENDIX D – ADDITIONAL CALCULATIONS GCB calculations - aerodynamic force
The following formula was used to calculate aerodynamic force on GCB:
𝐹𝑎𝑒 = 𝐶𝑥
𝜌𝑣2
2𝐴
𝐶𝑥 − 𝑑𝑟𝑎𝑔 𝑐𝑜𝑒𝑓𝑓𝑖𝑐𝑖𝑒𝑛𝑡
𝜌 − 𝑑𝑒𝑛𝑠𝑖𝑡𝑦 𝑜𝑓 𝑡ℎ𝑒 𝑚𝑒𝑑𝑖𝑢𝑚
𝑣 − 𝑣𝑒𝑙𝑜𝑐𝑖𝑡𝑦 𝑜𝑓 𝑡ℎ𝑒 𝑚𝑒𝑑𝑖𝑢𝑚
𝐴 − 𝑓𝑟𝑜𝑛𝑡𝑎𝑙 𝑐𝑟𝑜𝑠𝑠 − 𝑠𝑒𝑐𝑡𝑖𝑜𝑛𝑎𝑙 𝑎𝑟𝑒𝑎
The utilized drag coefficient was taken from a previous experiment. During an analysis of the shape of the elements needed for the calculations and coefficients given in literature for a group of basic shapes, some approximations were made. The following data has been used for that purpose:
Figure D-1. Drag coefficients for different shapes.
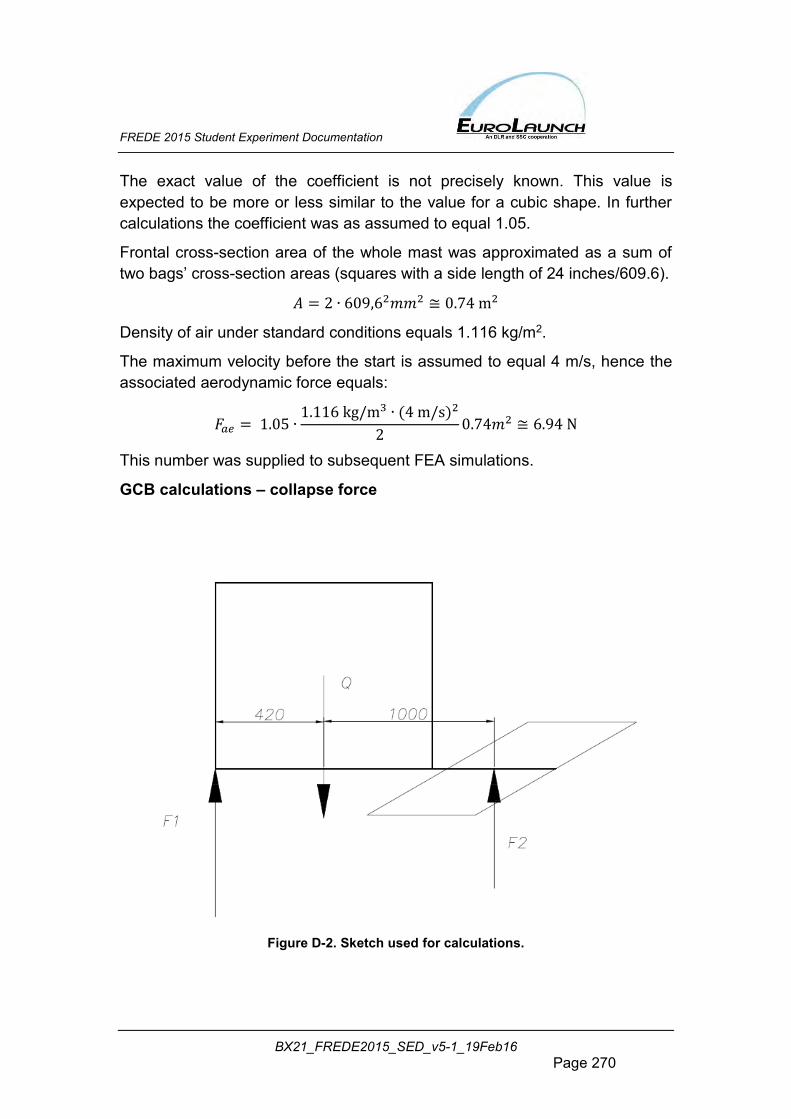
FREDE 2015 Student Experiment Documentation
BX21_FREDE2015_SED_v5-1_19Feb16 Page 270
The exact value of the coefficient is not precisely known. This value is expected to be more or less similar to the value for a cubic shape. In further calculations the coefficient was as assumed to equal 1.05.
Frontal cross-section area of the whole mast was approximated as a sum of two bags’ cross-section areas (squares with a side length of 24 inches/609.6).
𝐴 = 2 ∙ 609,62𝑚𝑚2 ≅ 0.74 m2
Density of air under standard conditions equals 1.116 kg/m2.
The maximum velocity before the start is assumed to equal 4 m/s, hence the associated aerodynamic force equals:
𝐹𝑎𝑒 = 1.05 ∙1.116 kg/m3 ∙ (4 m/s)2
20.74𝑚2 ≅ 6.94 N
This number was supplied to subsequent FEA simulations.
GCB calculations – collapse force
Figure D-2. Sketch used for calculations.
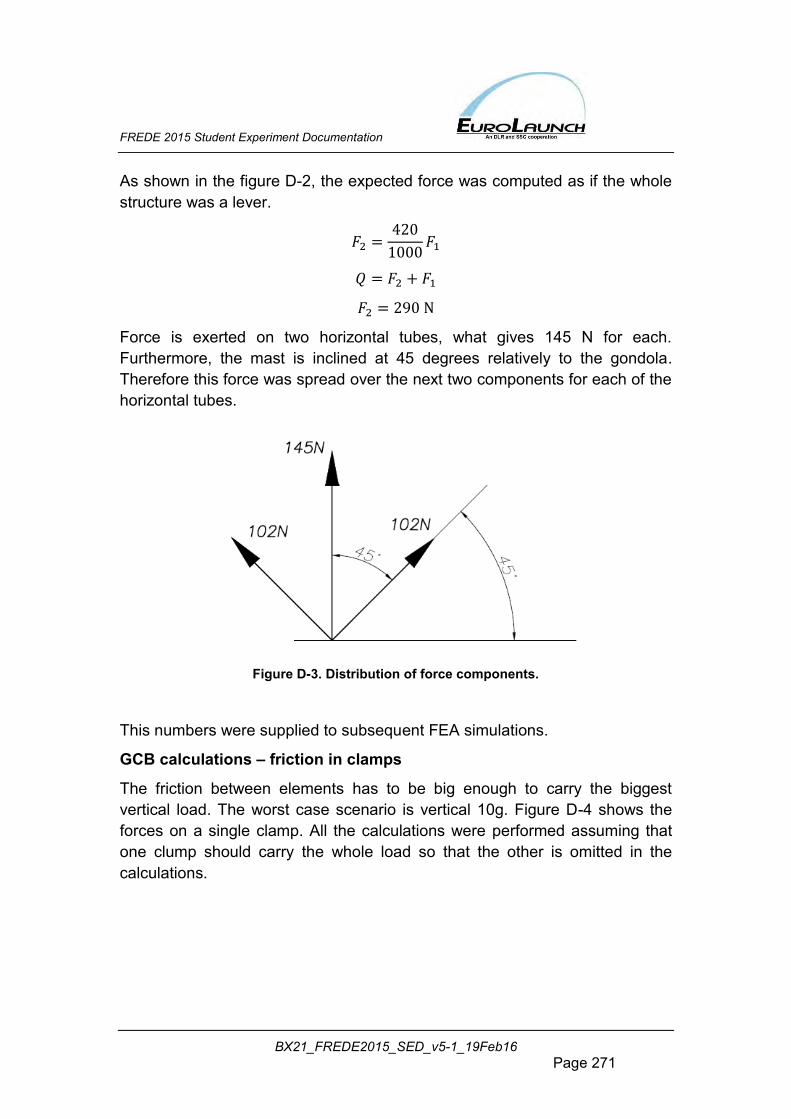
FREDE 2015 Student Experiment Documentation
BX21_FREDE2015_SED_v5-1_19Feb16 Page 271
As shown in the figure D-2, the expected force was computed as if the whole structure was a lever.
𝐹2 =420
1000𝐹1
𝑄 = 𝐹2 + 𝐹1
𝐹2 = 290 N
Force is exerted on two horizontal tubes, what gives 145 N for each. Furthermore, the mast is inclined at 45 degrees relatively to the gondola. Therefore this force was spread over the next two components for each of the horizontal tubes.
Figure D-3. Distribution of force components.
This numbers were supplied to subsequent FEA simulations.
GCB calculations – friction in clamps
The friction between elements has to be big enough to carry the biggest vertical load. The worst case scenario is vertical 10g. Figure D-4 shows the forces on a single clamp. All the calculations were performed assuming that one clump should carry the whole load so that the other is omitted in the calculations.
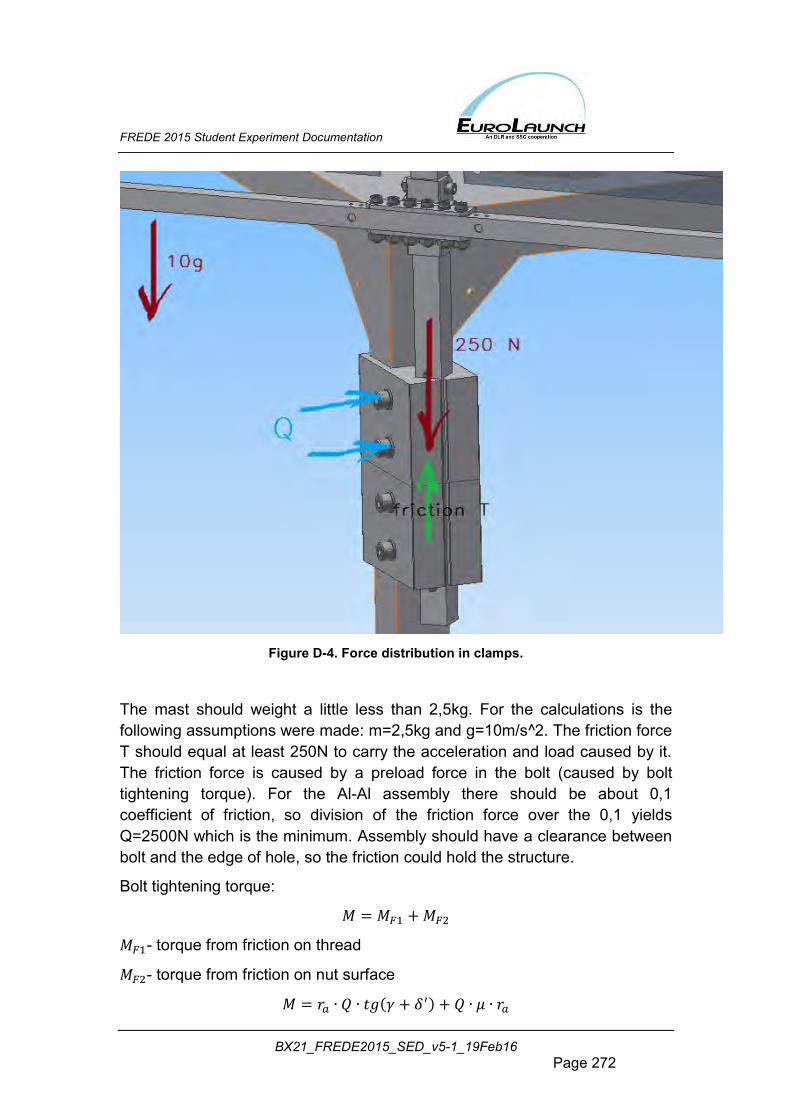
FREDE 2015 Student Experiment Documentation
BX21_FREDE2015_SED_v5-1_19Feb16 Page 272
Figure D-4. Force distribution in clamps.
The mast should weight a little less than 2,5kg. For the calculations is the following assumptions were made: m=2,5kg and g=10m/s^2. The friction force T should equal at least 250N to carry the acceleration and load caused by it. The friction force is caused by a preload force in the bolt (caused by bolt tightening torque). For the Al-Al assembly there should be about 0,1 coefficient of friction, so division of the friction force over the 0,1 yields Q=2500N which is the minimum. Assembly should have a clearance between bolt and the edge of hole, so the friction could hold the structure.
Bolt tightening torque:
𝑀 = 𝑀𝐹1 + 𝑀𝐹2
𝑀𝐹1- torque from friction on thread
𝑀𝐹2- torque from friction on nut surface
𝑀 = 𝑟𝑎 ∙ 𝑄 ∙ 𝑡𝑔(𝛾 + 𝛿′) + 𝑄 ∙ 𝜇 ∙ 𝑟𝑎
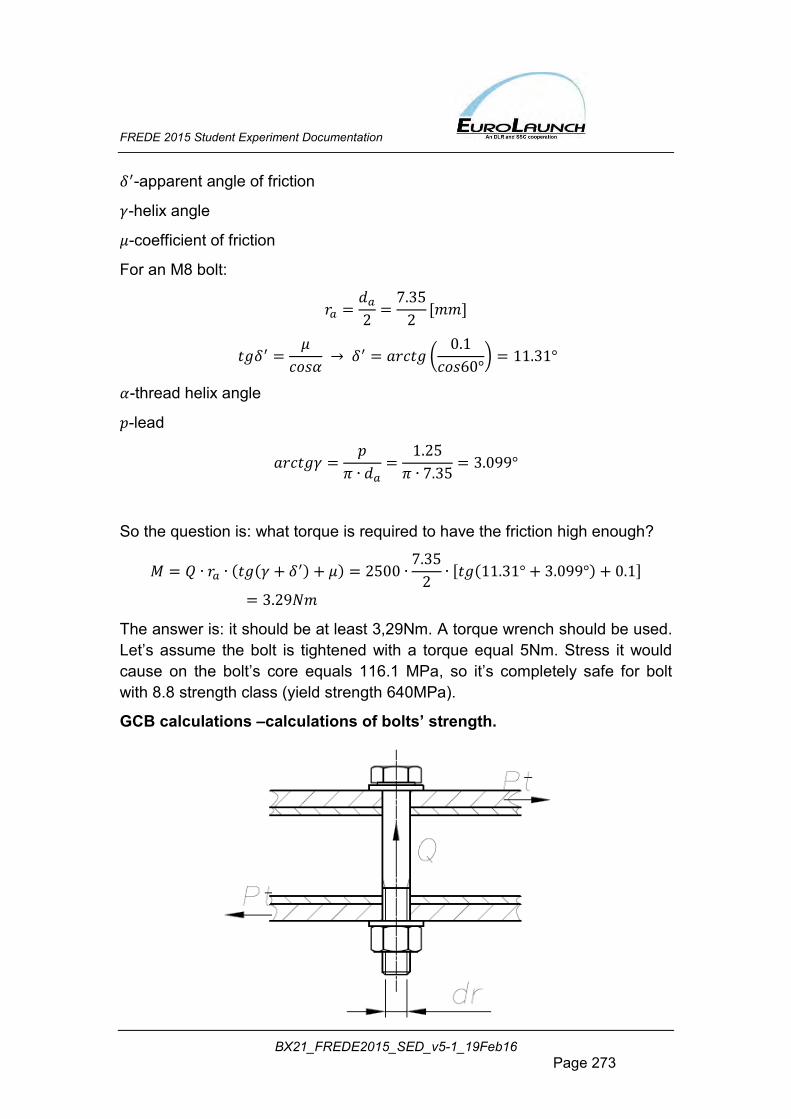
FREDE 2015 Student Experiment Documentation
BX21_FREDE2015_SED_v5-1_19Feb16 Page 273
𝛿′-apparent angle of friction
𝛾-helix angle
𝜇-coefficient of friction
For an M8 bolt:
𝑟𝑎 =𝑑𝑎
2=
7.35
2[𝑚𝑚]
𝑡𝑔𝛿′ =𝜇
𝑐𝑜𝑠𝛼 → 𝛿′ = 𝑎𝑟𝑐𝑡𝑔 (
0.1
𝑐𝑜𝑠60°) = 11.31°
𝛼-thread helix angle
𝑝-lead
𝑎𝑟𝑐𝑡𝑔𝛾 =𝑝
𝜋 ∙ 𝑑𝑎=
1.25
𝜋 ∙ 7.35= 3.099°
So the question is: what torque is required to have the friction high enough?
𝑀 = 𝑄 ∙ 𝑟𝑎 ∙ (𝑡𝑔(𝛾 + 𝛿′) + 𝜇) = 2500 ∙7.35
2∙ [𝑡𝑔(11.31° + 3.099°) + 0.1]
= 3.29𝑁𝑚
The answer is: it should be at least 3,29Nm. A torque wrench should be used. Let’s assume the bolt is tightened with a torque equal 5Nm. Stress it would cause on the bolt’s core equals 116.1 MPa, so it’s completely safe for bolt with 8.8 strength class (yield strength 640MPa).
GCB calculations –calculations of bolts’ strength.
FREDE 2015 Student Experiment Documentation
BX21_FREDE2015_SED_v5-1_19Feb16 Page 274
𝑃𝑡 ≤ 𝑇
Friction:
𝑇 = 𝑄 ∙ 𝑖 ∙ 𝜇
Stress from stretching:
𝜎 =𝑄
𝜋∙𝑑𝑟
4
≤𝑅𝑒
𝑋= 𝑘𝑟
X-safety factor
𝑃𝑤 ≤𝑘𝑟 ∙ 𝜋 ∙ 𝑑𝑟
2
4
Where for bolt strength class 5.8:
𝑅𝑒 = 300 𝑀𝑃𝑎
𝑘𝑟 =300
1.5= 200 𝑀𝑃𝑎
𝑃𝑡 ≤𝑘𝑟 ∙ 𝜋 ∙ 𝑑𝑟
2
4∙ 𝜇 ∙ 𝑖
𝑃𝑡 max 𝑀5 =200𝜋 ∙ 4.0192
4∙ 0.1 ∙ 2 = 507 𝑁(𝑓𝑜𝑟 𝑒𝑎𝑐ℎ 𝑏𝑜𝑙𝑡)
Each bolt can be loaded with more than 50 kg and every assembly point should have at least 4 bolts, resulting in over 200 kg for each mounting.
Zeolite filter calculations
Single zeolite diameter is equal to 33105 md and single zeolite cell has a cross-section of 𝑎 = 24 A. Single zeolite surface area is:
𝑃𝑘 = 𝜋𝑑2
and the area of an unit cell is:
𝐴𝑢𝐶 = 𝑎2
With the Avogadro number equal to 𝑁𝐴𝑉 = 6.023 ∙ 1023 and concentration of 𝑐 = 10ppm the number of Freon atoms is given by:
𝑛𝑎𝑡 = 𝑁𝐴𝑉 ∙ 𝑐
FREDE 2015 Student Experiment Documentation
BX21_FREDE2015_SED_v5-1_19Feb16 Page 275
Surface covered by Freon particles equals:
𝑃𝑐 =𝐴𝑢𝐶 ∙ 𝑛𝑎𝑡
𝑧
Surface covered by Freon divided by surface covered by zeolites can be obtained from following equation:
𝑛𝑘 =𝑃𝑐
𝑃𝑘
Volume of each zeolite is:
𝑉𝑘 =𝜋𝑑3
6
With the density of zeolite equal to 𝜌 = 2.2 g
ml the mass of one zeolite is equal
to:
𝑚𝑘 = 𝑉𝑘𝜌
With the bulk density of zeolite equal to 𝜌𝑛 = 0.67g
ml, volume needed to
adsorb all Freon at assumed concentration is equal to:
𝑉 =𝑚𝑘 ∙ 𝑛𝑘
𝜌𝑛=
𝑑 ∙ 𝜌 ∙ 𝑎2 ∙ 𝑁𝐴𝑉 ∙ 𝑐
6 ∙ 𝑧 ∙ 𝜌𝑛= 15.7 cm3
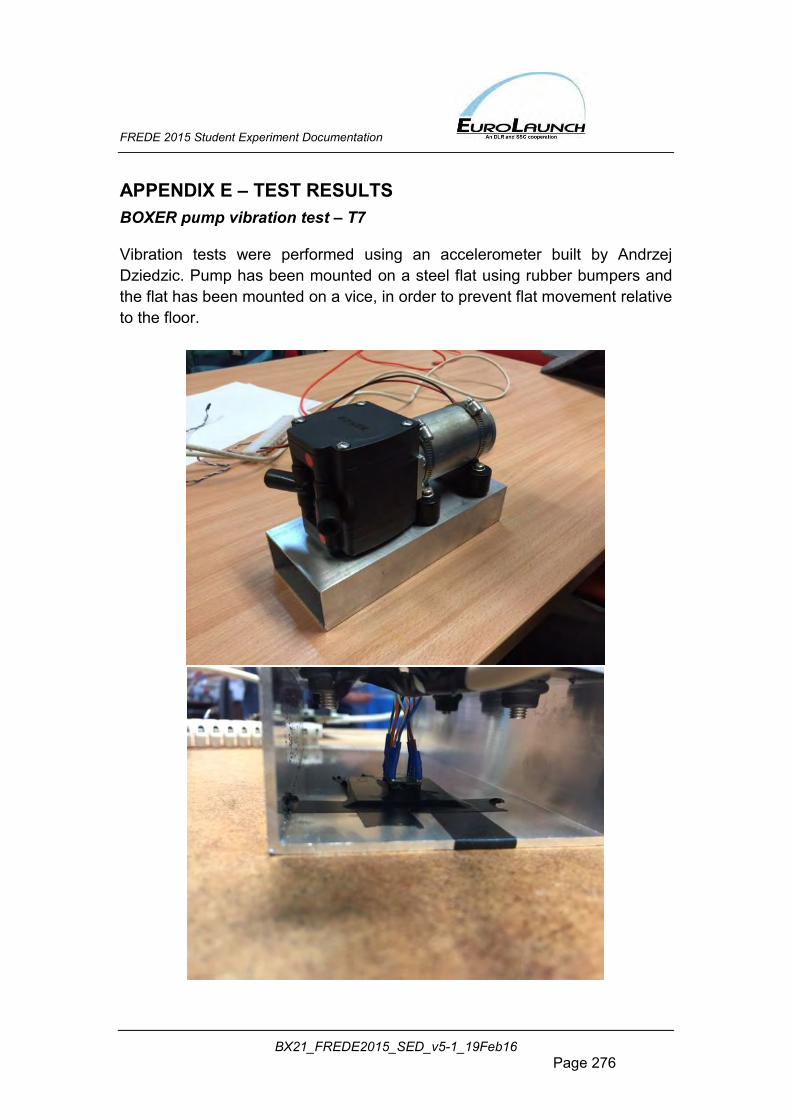
FREDE 2015 Student Experiment Documentation
BX21_FREDE2015_SED_v5-1_19Feb16 Page 276
APPENDIX E – TEST RESULTS BOXER pump vibration test – T7 Vibration tests were performed using an accelerometer built by Andrzej Dziedzic. Pump has been mounted on a steel flat using rubber bumpers and the flat has been mounted on a vice, in order to prevent flat movement relative to the floor.
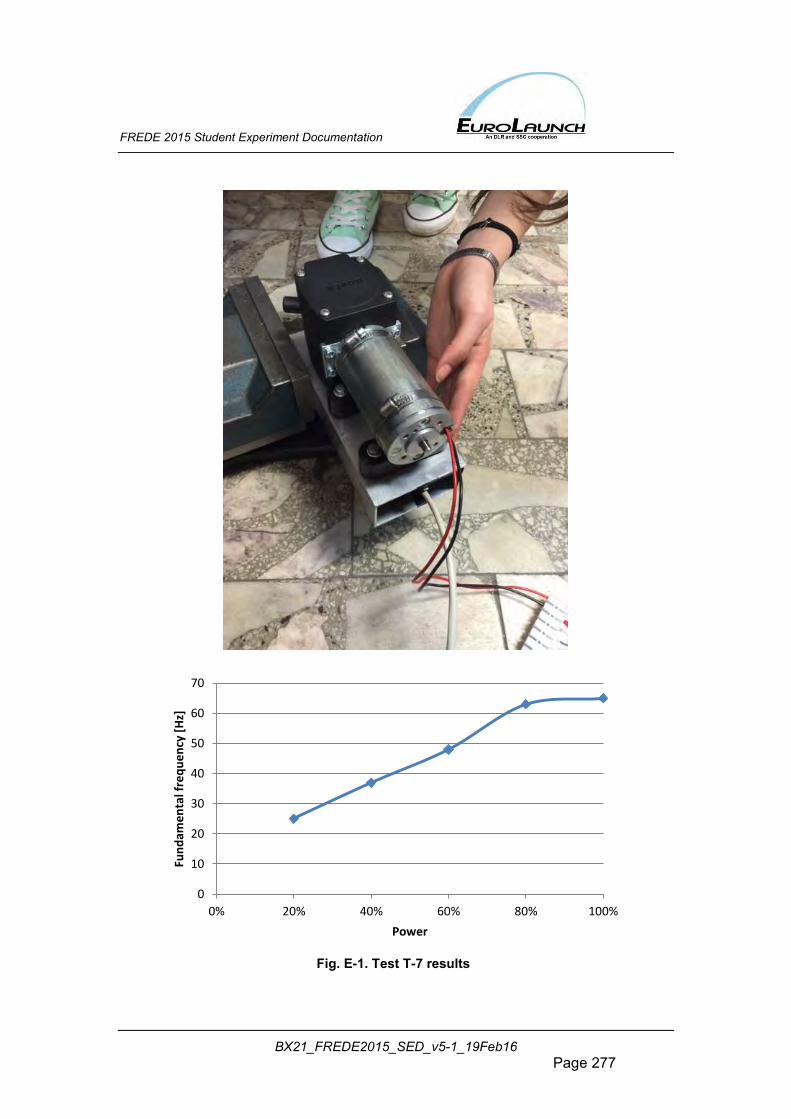
FREDE 2015 Student Experiment Documentation
BX21_FREDE2015_SED_v5-1_19Feb16 Page 277
Fig. E-1. Test T-7 results
0
10
20
30
40
50
60
70
0% 20% 40% 60% 80% 100%
Fun
dam
en
tal f
req
ue
ncy
[H
z]
Power
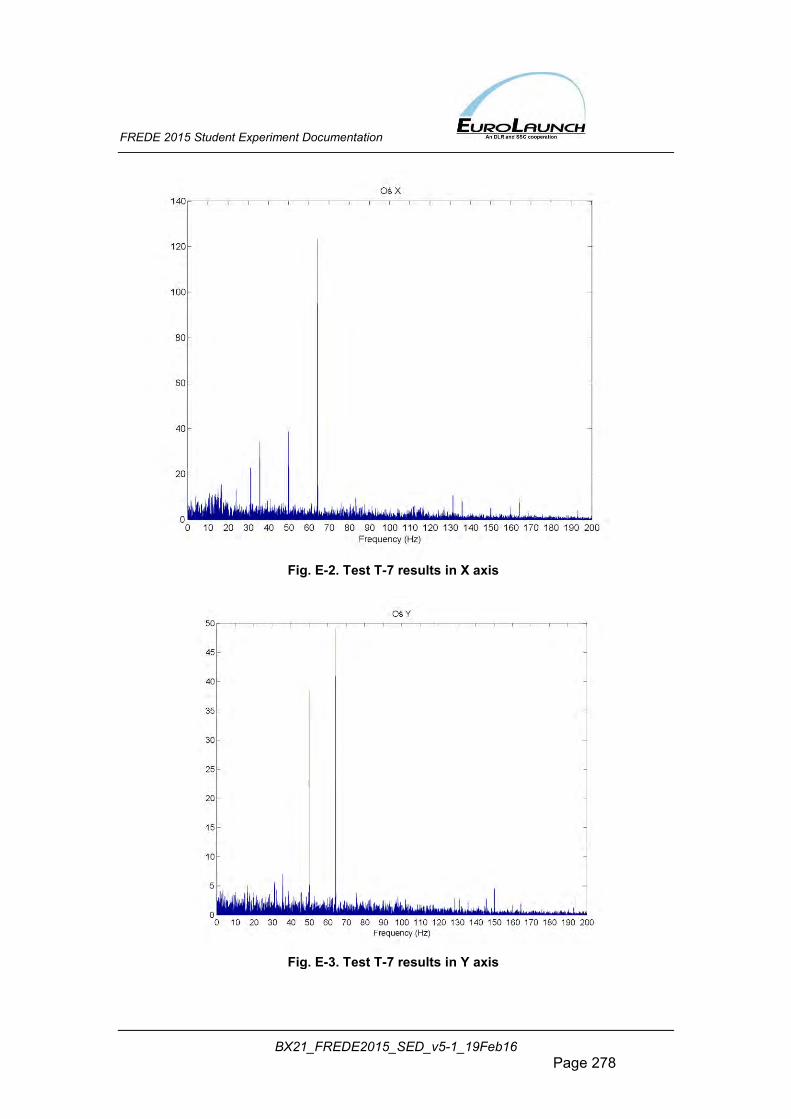
FREDE 2015 Student Experiment Documentation
BX21_FREDE2015_SED_v5-1_19Feb16 Page 278
Fig. E-2. Test T-7 results in X axis
Fig. E-3. Test T-7 results in Y axis
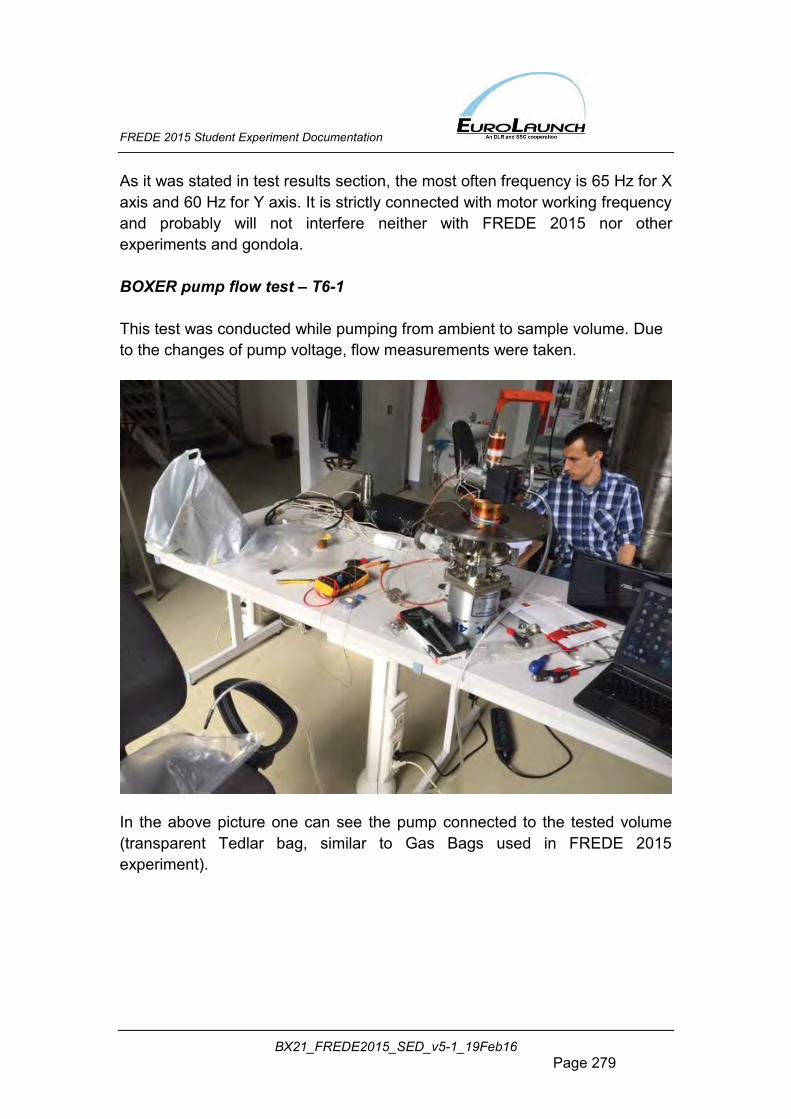
FREDE 2015 Student Experiment Documentation
BX21_FREDE2015_SED_v5-1_19Feb16 Page 279
As it was stated in test results section, the most often frequency is 65 Hz for X axis and 60 Hz for Y axis. It is strictly connected with motor working frequency and probably will not interfere neither with FREDE 2015 nor other experiments and gondola. BOXER pump flow test – T6-1 This test was conducted while pumping from ambient to sample volume. Due to the changes of pump voltage, flow measurements were taken.
In the above picture one can see the pump connected to the tested volume (transparent Tedlar bag, similar to Gas Bags used in FREDE 2015 experiment).
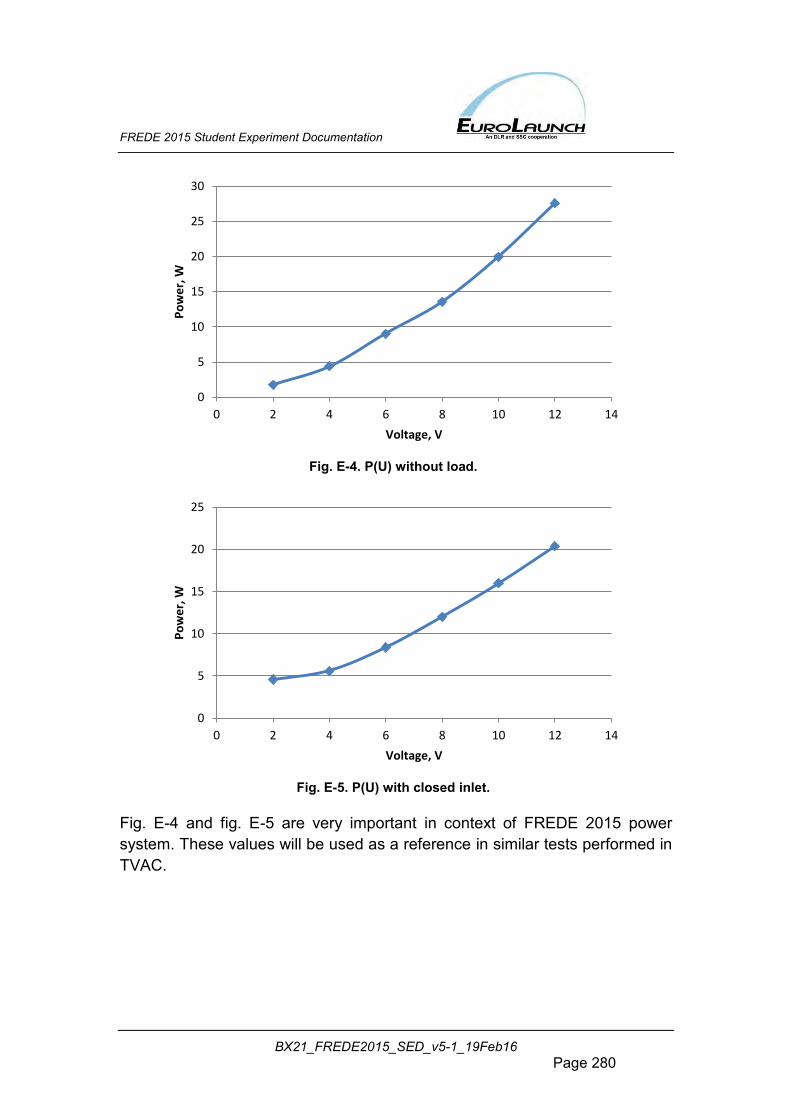
FREDE 2015 Student Experiment Documentation
BX21_FREDE2015_SED_v5-1_19Feb16 Page 280
Fig. E-4. P(U) without load.
Fig. E-5. P(U) with closed inlet.
Fig. E-4 and fig. E-5 are very important in context of FREDE 2015 power system. These values will be used as a reference in similar tests performed in TVAC.
0
5
10
15
20
25
30
0 2 4 6 8 10 12 14
Po
we
r, W
Voltage, V
0
5
10
15
20
25
0 2 4 6 8 10 12 14
Po
we
r, W
Voltage, V
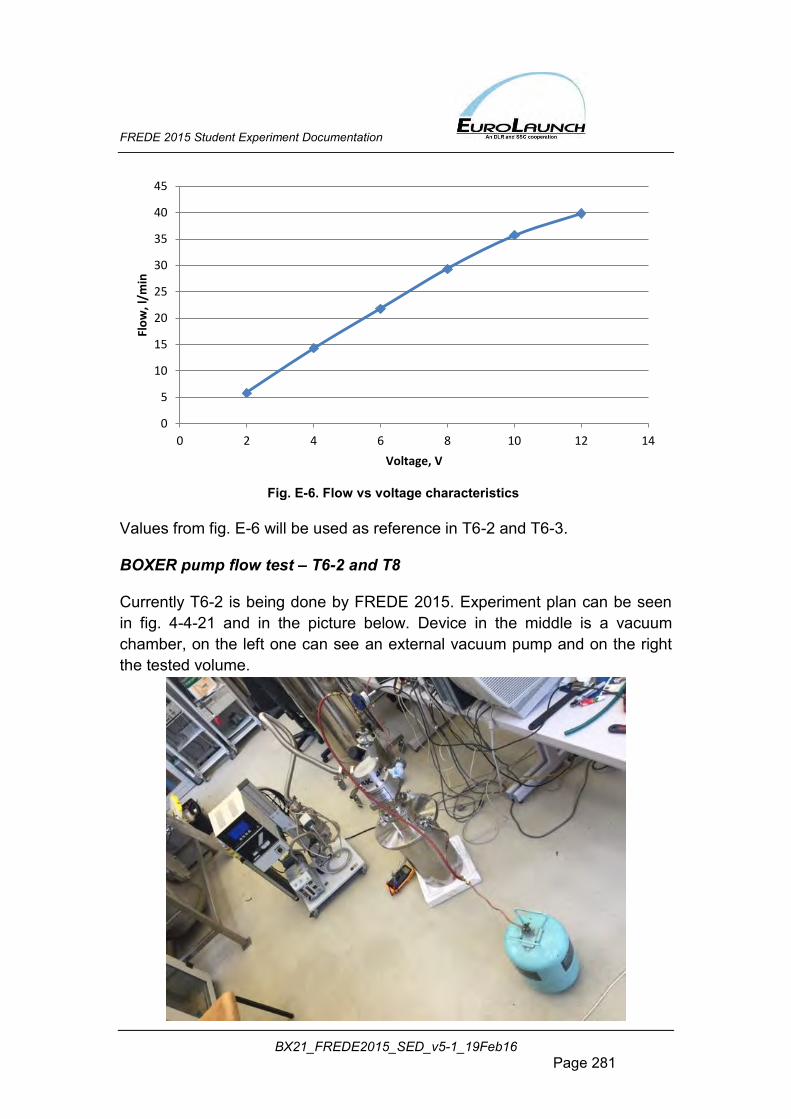
FREDE 2015 Student Experiment Documentation
BX21_FREDE2015_SED_v5-1_19Feb16 Page 281
Fig. E-6. Flow vs voltage characteristics
Values from fig. E-6 will be used as reference in T6-2 and T6-3. BOXER pump flow test – T6-2 and T8 Currently T6-2 is being done by FREDE 2015. Experiment plan can be seen in fig. 4-4-21 and in the picture below. Device in the middle is a vacuum chamber, on the left one can see an external vacuum pump and on the right the tested volume.
0
5
10
15
20
25
30
35
40
45
0 2 4 6 8 10 12 14
Flo
w, l
/min
Voltage, V
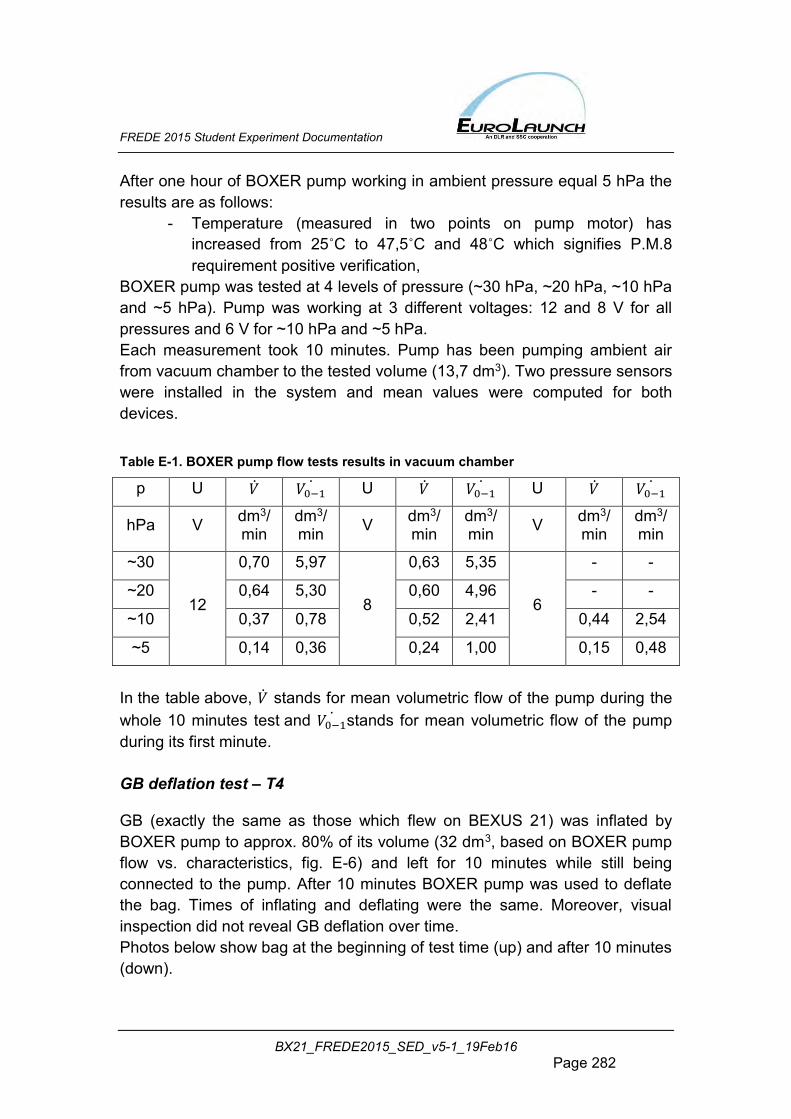
FREDE 2015 Student Experiment Documentation
BX21_FREDE2015_SED_v5-1_19Feb16 Page 282
After one hour of BOXER pump working in ambient pressure equal 5 hPa the results are as follows:
- Temperature (measured in two points on pump motor) has increased from 25˚C to 47,5˚C and 48˚C which signifies P.M.8 requirement positive verification,
BOXER pump was tested at 4 levels of pressure (~30 hPa, ~20 hPa, ~10 hPa and ~5 hPa). Pump was working at 3 different voltages: 12 and 8 V for all pressures and 6 V for ~10 hPa and ~5 hPa. Each measurement took 10 minutes. Pump has been pumping ambient air from vacuum chamber to the tested volume (13,7 dm3). Two pressure sensors were installed in the system and mean values were computed for both devices. Table E-1. BOXER pump flow tests results in vacuum chamber
p U �� 𝑉0−1 U �� 𝑉0−1
U �� 𝑉0−1
hPa V dm3/min
dm3/min V dm3/
min dm3/min V dm3/
min dm3/min
~30
12
0,70 5,97
8
0,63 5,35
6
- -
~20 0,64 5,30 0,60 4,96 - -
~10 0,37 0,78 0,52 2,41 0,44 2,54
~5 0,14 0,36 0,24 1,00 0,15 0,48
In the table above, �� stands for mean volumetric flow of the pump during the whole 10 minutes test and 𝑉0−1
stands for mean volumetric flow of the pump during its first minute. GB deflation test – T4 GB (exactly the same as those which flew on BEXUS 21) was inflated by BOXER pump to approx. 80% of its volume (32 dm3, based on BOXER pump flow vs. characteristics, fig. E-6) and left for 10 minutes while still being connected to the pump. After 10 minutes BOXER pump was used to deflate the bag. Times of inflating and deflating were the same. Moreover, visual inspection did not reveal GB deflation over time. Photos below show bag at the beginning of test time (up) and after 10 minutes (down).
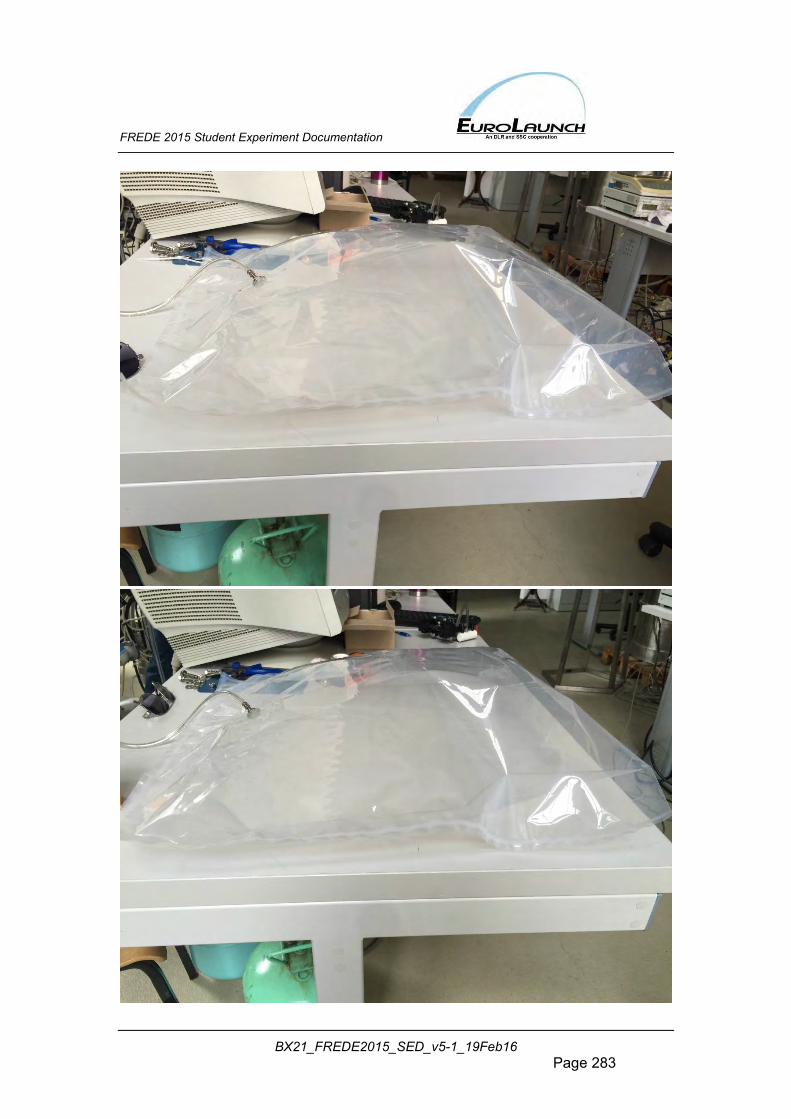
FREDE 2015 Student Experiment Documentation
BX21_FREDE2015_SED_v5-1_19Feb16 Page 283
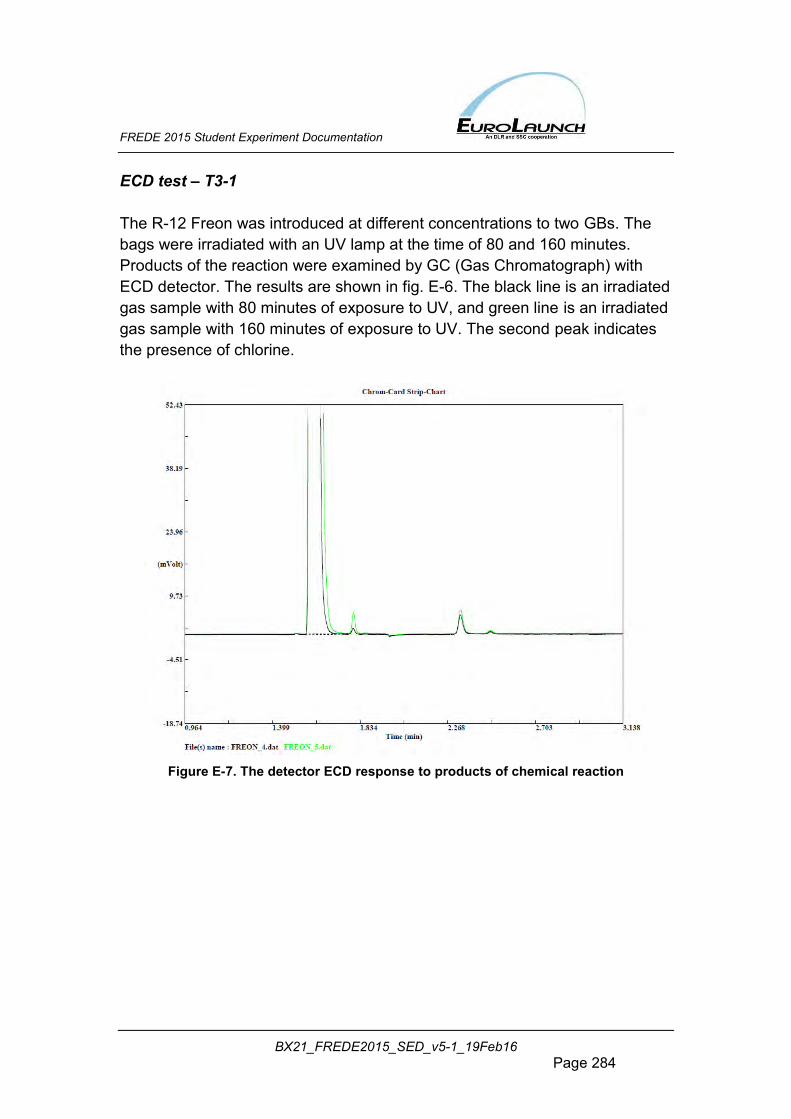
FREDE 2015 Student Experiment Documentation
BX21_FREDE2015_SED_v5-1_19Feb16 Page 284
ECD test – T3-1 The R-12 Freon was introduced at different concentrations to two GBs. The bags were irradiated with an UV lamp at the time of 80 and 160 minutes. Products of the reaction were examined by GC (Gas Chromatograph) with ECD detector. The results are shown in fig. E-6. The black line is an irradiated gas sample with 80 minutes of exposure to UV, and green line is an irradiated gas sample with 160 minutes of exposure to UV. The second peak indicates the presence of chlorine.
Figure E-7. The detector ECD response to products of chemical reaction
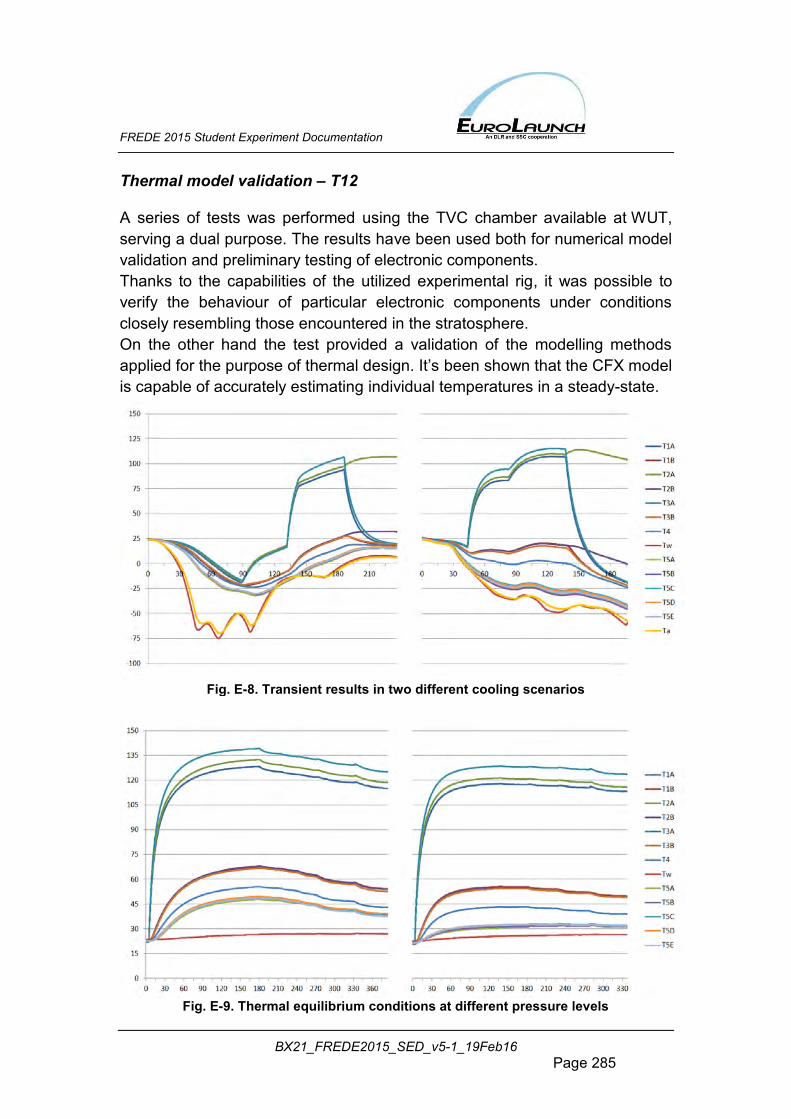
FREDE 2015 Student Experiment Documentation
BX21_FREDE2015_SED_v5-1_19Feb16 Page 285
Thermal model validation – T12 A series of tests was performed using the TVC chamber available at WUT, serving a dual purpose. The results have been used both for numerical model validation and preliminary testing of electronic components. Thanks to the capabilities of the utilized experimental rig, it was possible to verify the behaviour of particular electronic components under conditions closely resembling those encountered in the stratosphere. On the other hand the test provided a validation of the modelling methods applied for the purpose of thermal design. It’s been shown that the CFX model is capable of accurately estimating individual temperatures in a steady-state.
Fig. E-8. Transient results in two different cooling scenarios
Fig. E-9. Thermal equilibrium conditions at different pressure levels
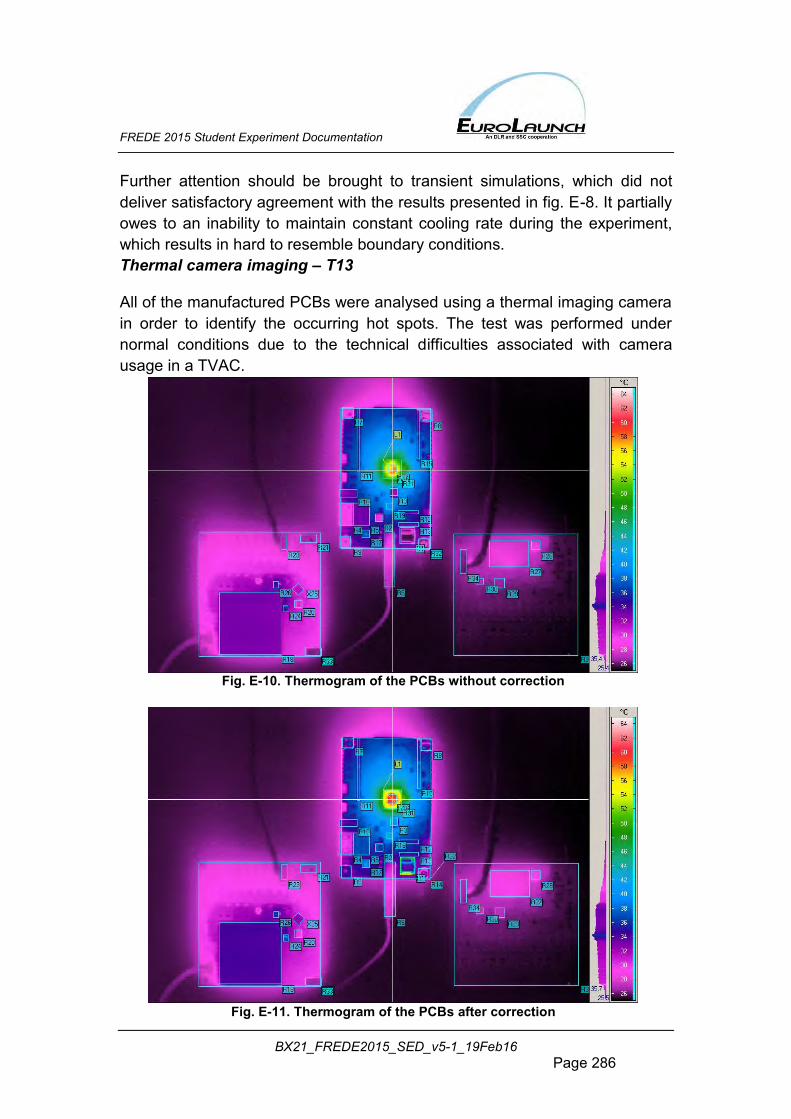
FREDE 2015 Student Experiment Documentation
BX21_FREDE2015_SED_v5-1_19Feb16 Page 286
Further attention should be brought to transient simulations, which did not deliver satisfactory agreement with the results presented in fig. E-8. It partially owes to an inability to maintain constant cooling rate during the experiment, which results in hard to resemble boundary conditions. Thermal camera imaging – T13 All of the manufactured PCBs were analysed using a thermal imaging camera in order to identify the occurring hot spots. The test was performed under normal conditions due to the technical difficulties associated with camera usage in a TVAC.
Fig. E-10. Thermogram of the PCBs without correction
Fig. E-11. Thermogram of the PCBs after correction
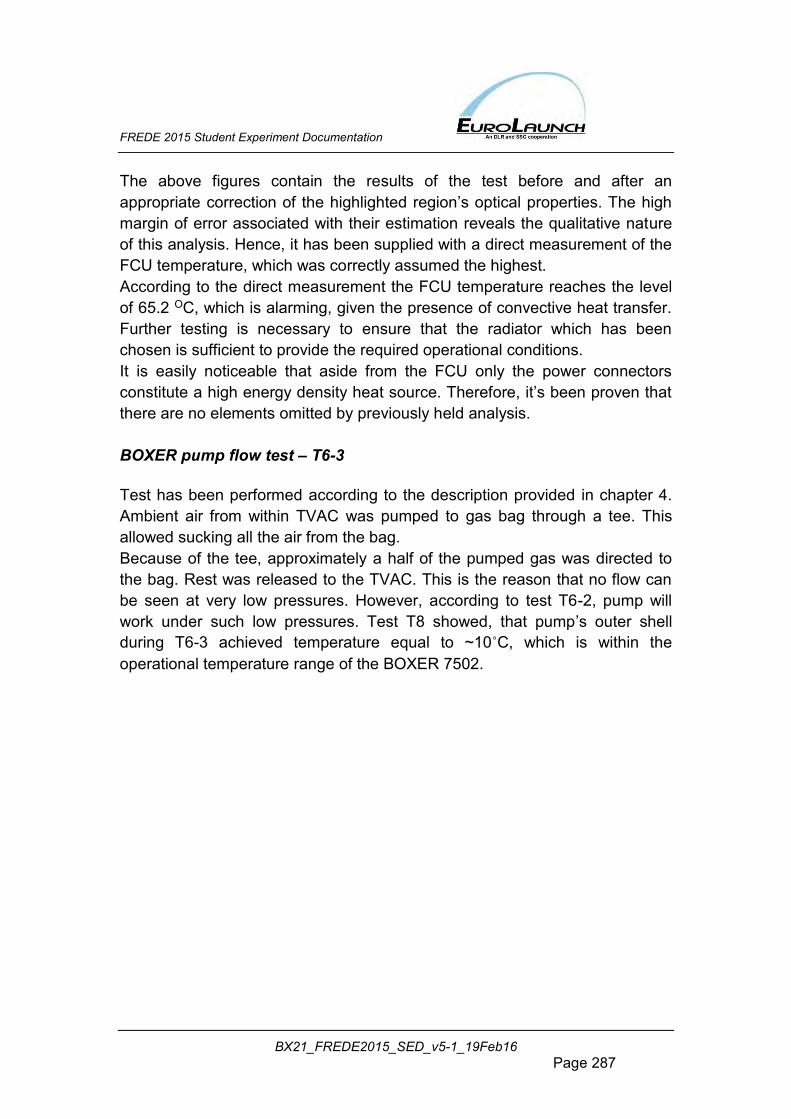
FREDE 2015 Student Experiment Documentation
BX21_FREDE2015_SED_v5-1_19Feb16 Page 287
The above figures contain the results of the test before and after an appropriate correction of the highlighted region’s optical properties. The high margin of error associated with their estimation reveals the qualitative nature of this analysis. Hence, it has been supplied with a direct measurement of the FCU temperature, which was correctly assumed the highest. According to the direct measurement the FCU temperature reaches the level of 65.2 OC, which is alarming, given the presence of convective heat transfer. Further testing is necessary to ensure that the radiator which has been chosen is sufficient to provide the required operational conditions. It is easily noticeable that aside from the FCU only the power connectors constitute a high energy density heat source. Therefore, it’s been proven that there are no elements omitted by previously held analysis. BOXER pump flow test – T6-3 Test has been performed according to the description provided in chapter 4. Ambient air from within TVAC was pumped to gas bag through a tee. This allowed sucking all the air from the bag. Because of the tee, approximately a half of the pumped gas was directed to the bag. Rest was released to the TVAC. This is the reason that no flow can be seen at very low pressures. However, according to test T6-2, pump will work under such low pressures. Test T8 showed, that pump’s outer shell during T6-3 achieved temperature equal to ~10˚C, which is within the operational temperature range of the BOXER 7502.
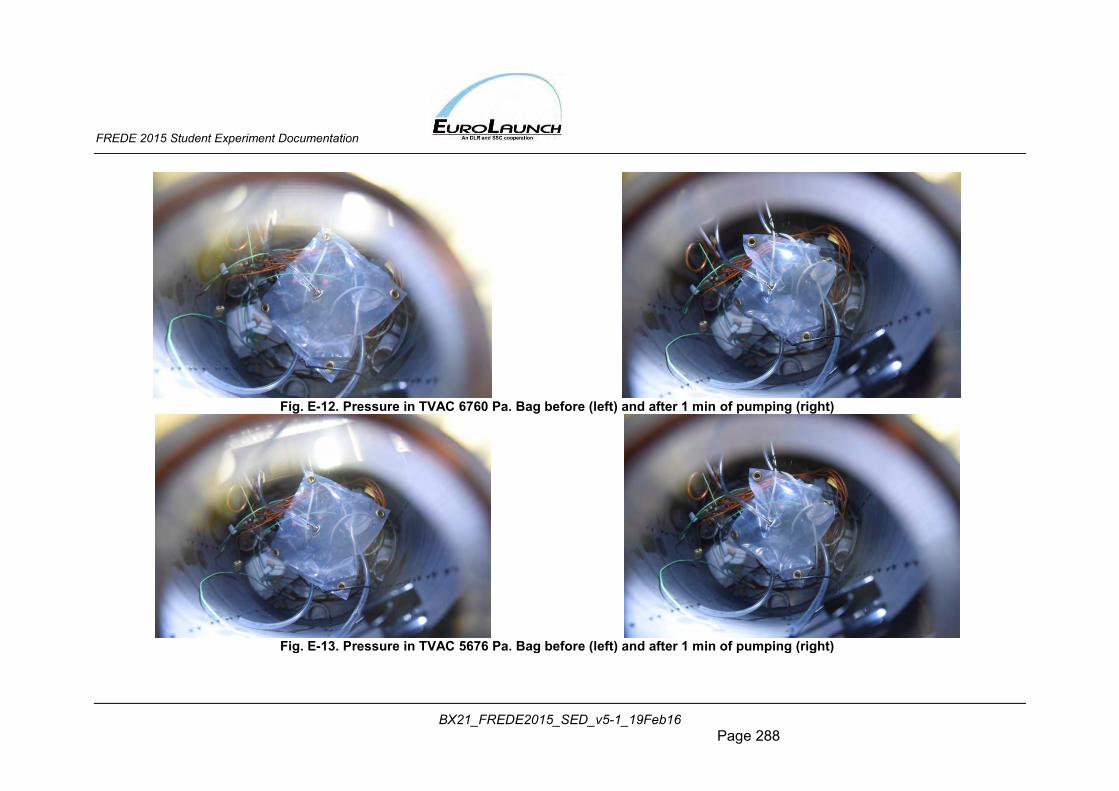
FREDE 2015 Student Experiment Documentation
BX21_FREDE2015_SED_v5-1_19Feb16 Page 288
Fig. E-12. Pressure in TVAC 6760 Pa. Bag before (left) and after 1 min of pumping (right)
Fig. E-13. Pressure in TVAC 5676 Pa. Bag before (left) and after 1 min of pumping (right)
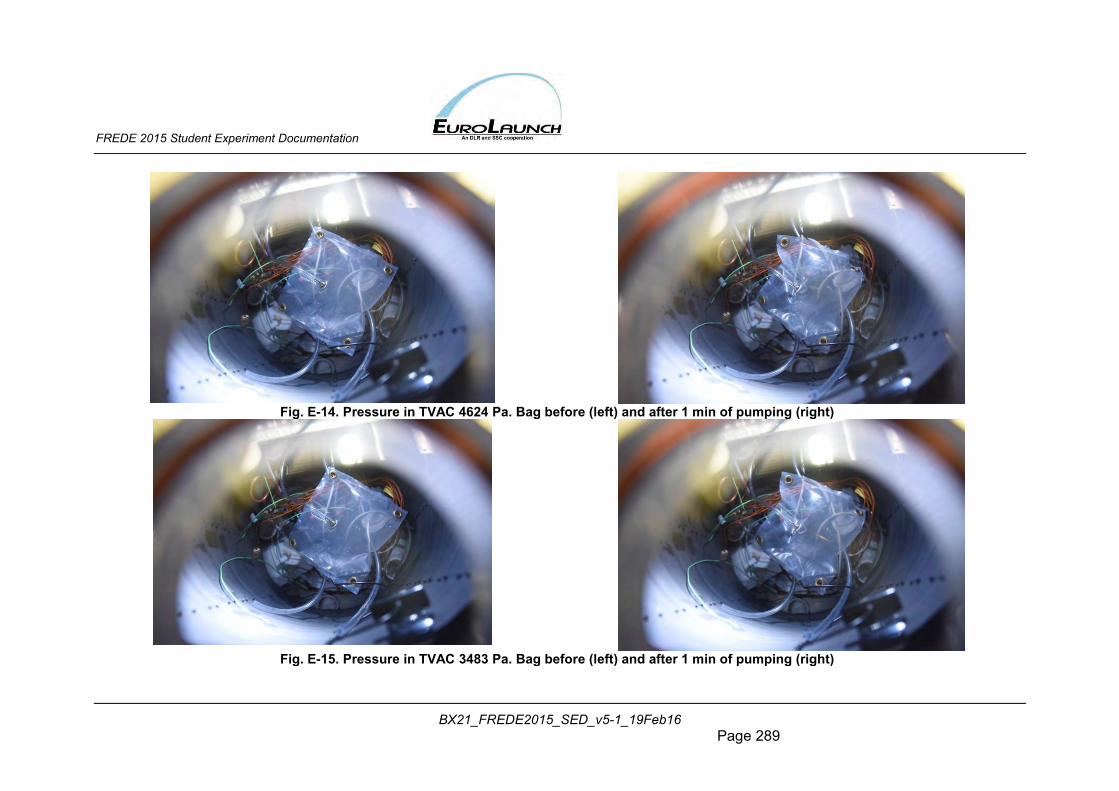
FREDE 2015 Student Experiment Documentation
BX21_FREDE2015_SED_v5-1_19Feb16 Page 289
Fig. E-14. Pressure in TVAC 4624 Pa. Bag before (left) and after 1 min of pumping (right)
Fig. E-15. Pressure in TVAC 3483 Pa. Bag before (left) and after 1 min of pumping (right)
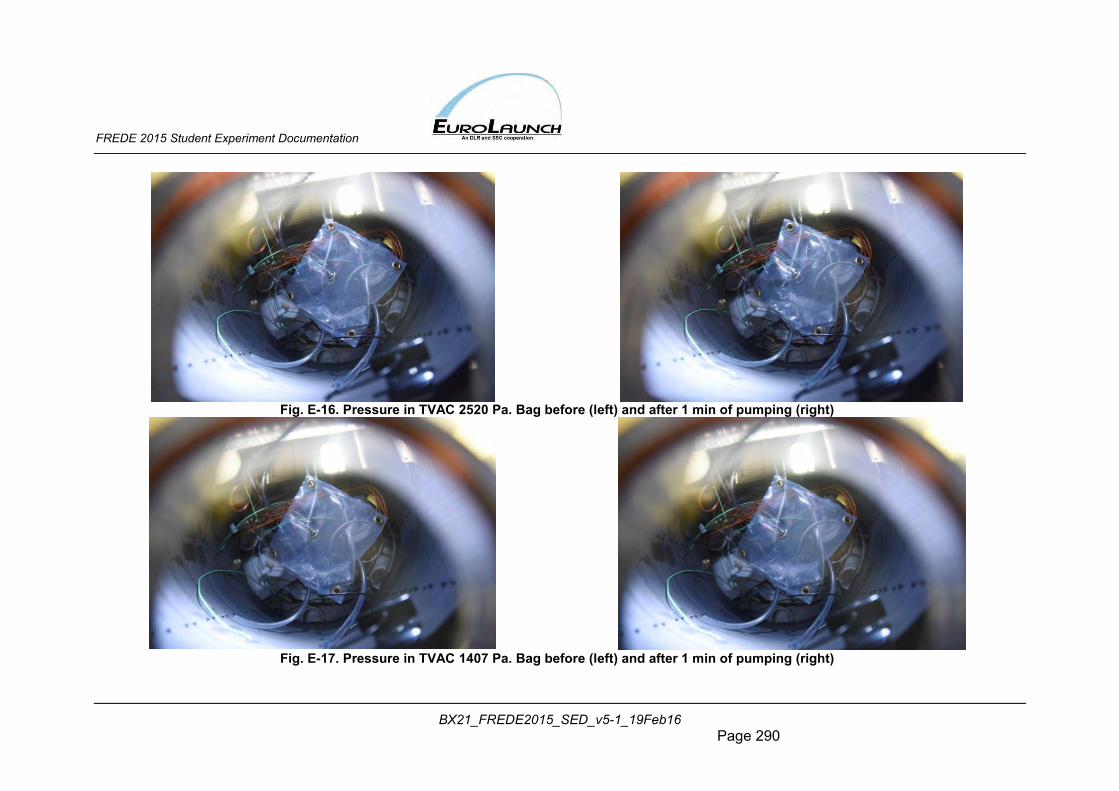
FREDE 2015 Student Experiment Documentation
BX21_FREDE2015_SED_v5-1_19Feb16 Page 290
Fig. E-16. Pressure in TVAC 2520 Pa. Bag before (left) and after 1 min of pumping (right)
Fig. E-17. Pressure in TVAC 1407 Pa. Bag before (left) and after 1 min of pumping (right)
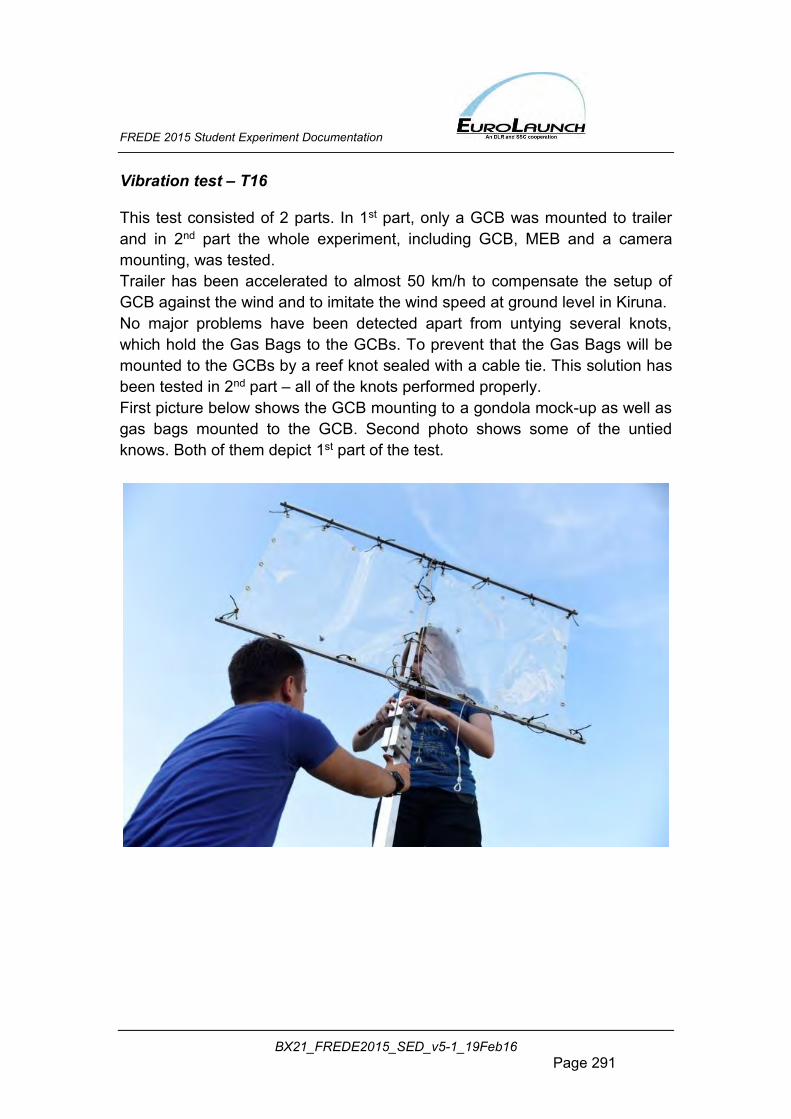
FREDE 2015 Student Experiment Documentation
BX21_FREDE2015_SED_v5-1_19Feb16 Page 291
Vibration test – T16 This test consisted of 2 parts. In 1st part, only a GCB was mounted to trailer and in 2nd part the whole experiment, including GCB, MEB and a camera mounting, was tested. Trailer has been accelerated to almost 50 km/h to compensate the setup of GCB against the wind and to imitate the wind speed at ground level in Kiruna. No major problems have been detected apart from untying several knots, which hold the Gas Bags to the GCBs. To prevent that the Gas Bags will be mounted to the GCBs by a reef knot sealed with a cable tie. This solution has been tested in 2nd part – all of the knots performed properly. First picture below shows the GCB mounting to a gondola mock-up as well as gas bags mounted to the GCB. Second photo shows some of the untied knows. Both of them depict 1st part of the test.
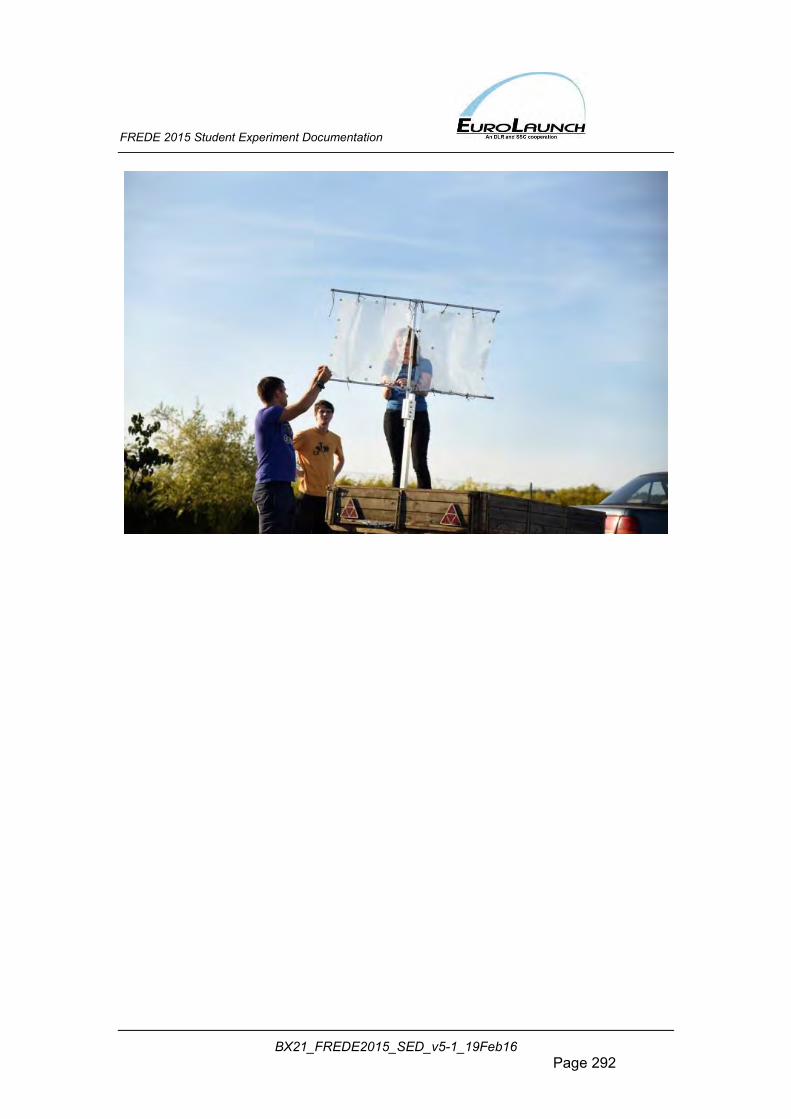
FREDE 2015 Student Experiment Documentation
BX21_FREDE2015_SED_v5-1_19Feb16 Page 292

FREDE 2015 Student Experiment Documentation
BX21_FREDE2015_SED_v5-1_19Feb16 Page 293
APPENDIX F –REQUEST FOR WAIVERS
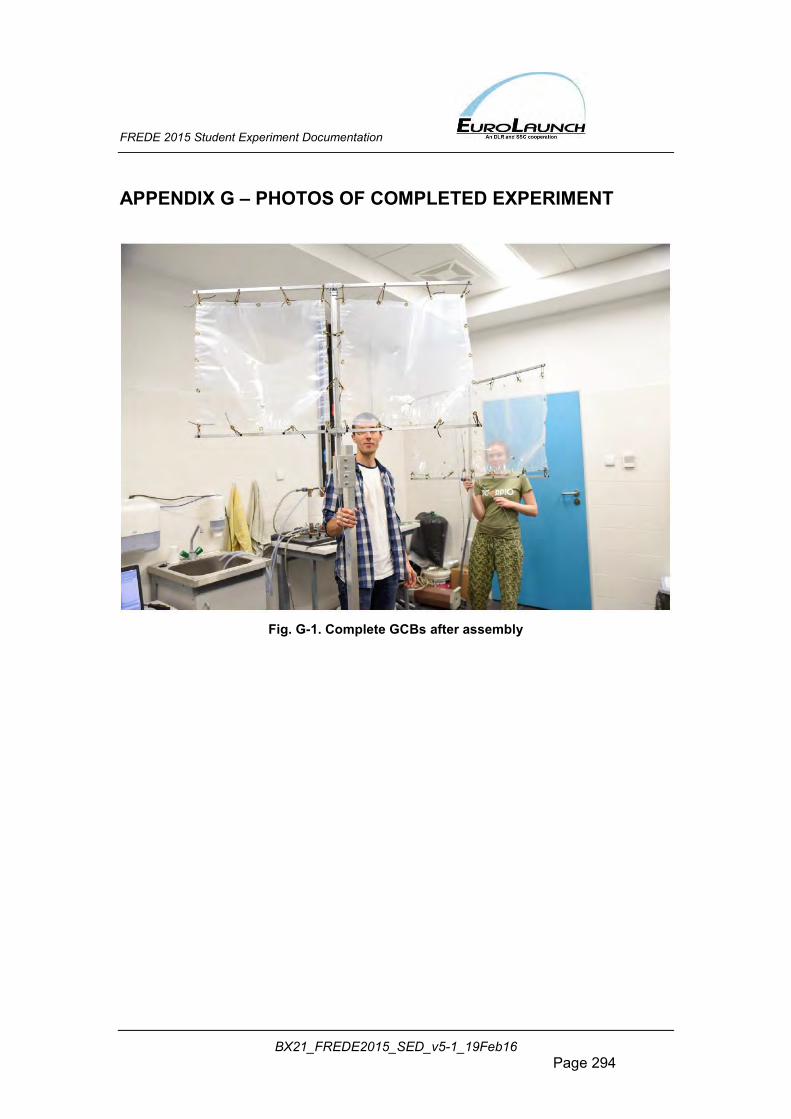
FREDE 2015 Student Experiment Documentation
BX21_FREDE2015_SED_v5-1_19Feb16 Page 294
APPENDIX G – PHOTOS OF COMPLETED EXPERIMENT
Fig. G-1. Complete GCBs after assembly
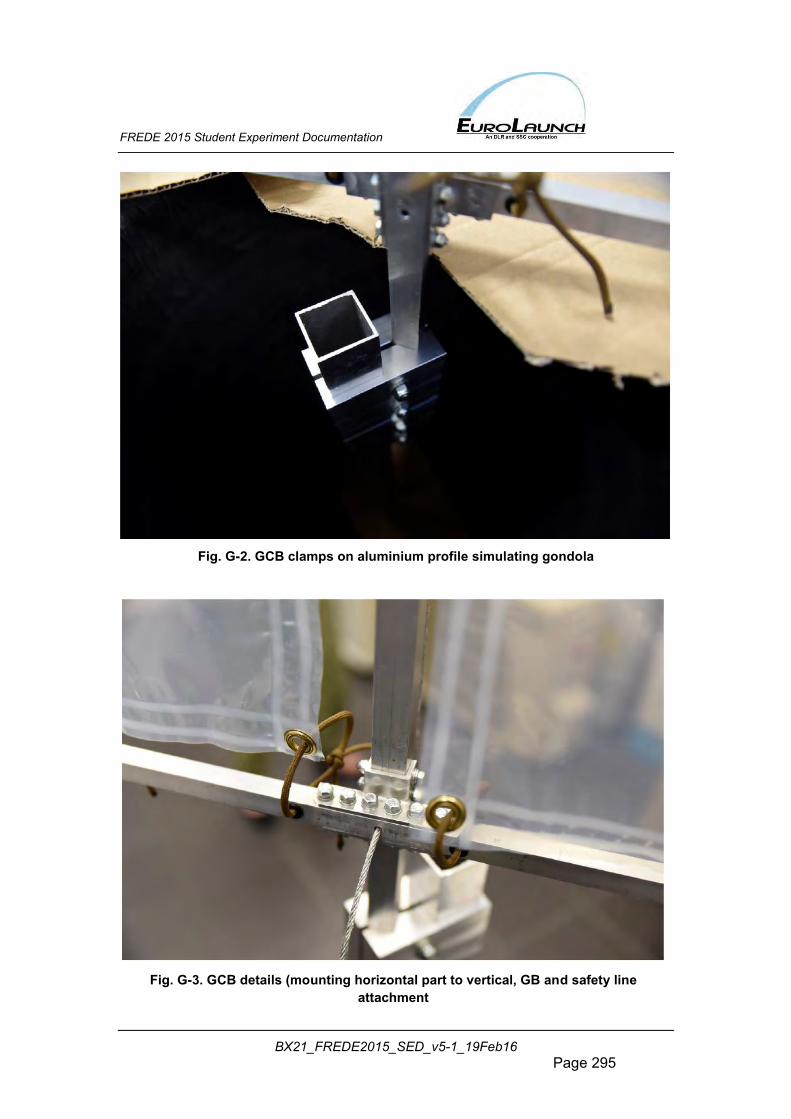
FREDE 2015 Student Experiment Documentation
BX21_FREDE2015_SED_v5-1_19Feb16 Page 295
Fig. G-2. GCB clamps on aluminium profile simulating gondola
Fig. G-3. GCB details (mounting horizontal part to vertical, GB and safety line
attachment
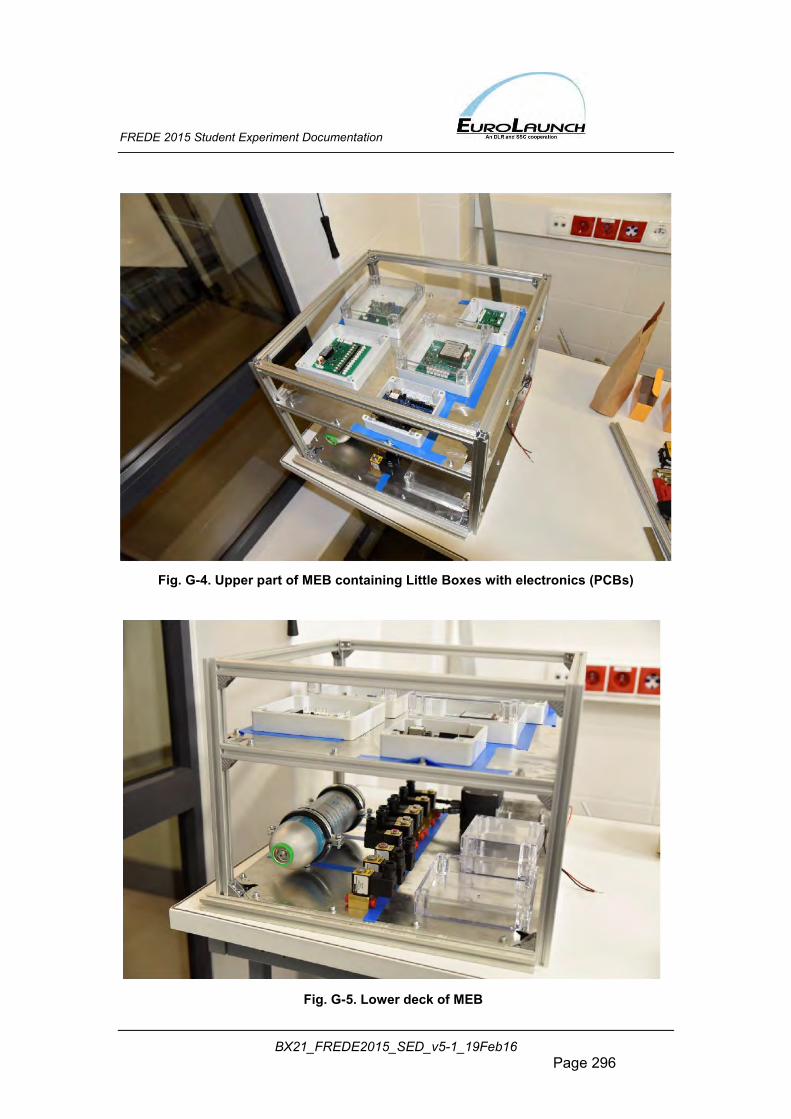
FREDE 2015 Student Experiment Documentation
BX21_FREDE2015_SED_v5-1_19Feb16 Page 296
Fig. G-4. Upper part of MEB containing Little Boxes with electronics (PCBs)
Fig. G-5. Lower deck of MEB
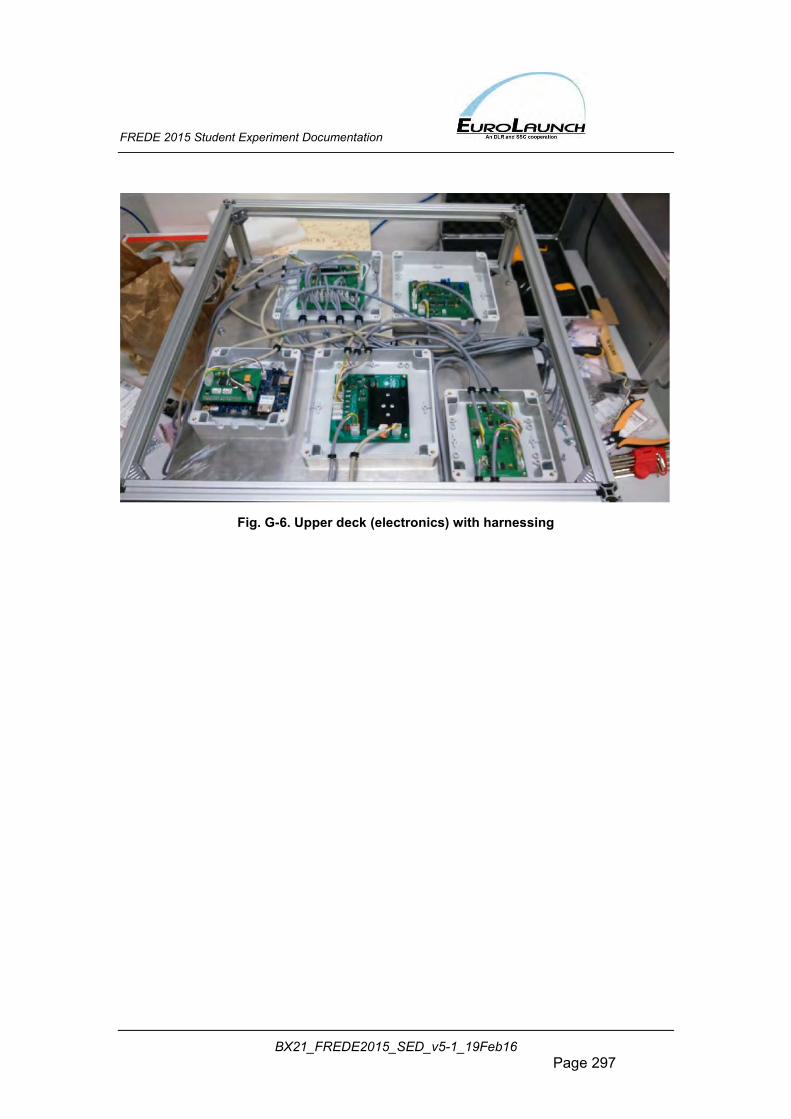
FREDE 2015 Student Experiment Documentation
BX21_FREDE2015_SED_v5-1_19Feb16 Page 297
Fig. G-6. Upper deck (electronics) with harnessing
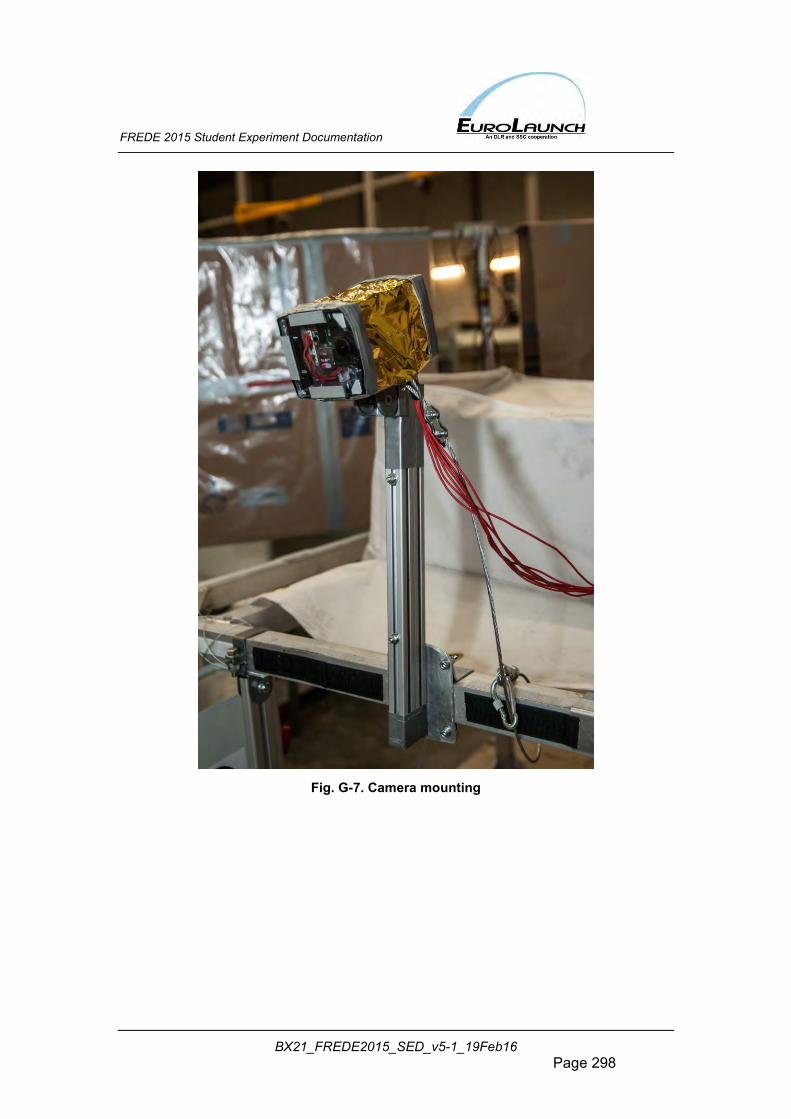
FREDE 2015 Student Experiment Documentation
BX21_FREDE2015_SED_v5-1_19Feb16 Page 298
Fig. G-7. Camera mounting
Related Documents