Present by Yaoping (Michelle) Tan MSA Siyi (Lucy) Lu MSGF Jiefei (Faye) Zheng MSSD Miaolai (Mila) Zhou MSA TTT corporation

Welcome message from author
This document is posted to help you gain knowledge. Please leave a comment to let me know what you think about it! Share it to your friends and learn new things together.
Transcript

Present byYaoping (Michelle) Tan MSASiyi (Lucy) Lu MSGFJiefei (Faye) Zheng MSSDMiaolai (Mila) Zhou MSA
TTT corporation

Recommendation
BUY
Target Price: Upside:
$35 62%
0
10
20
30
40
HTZ
62%
Dollar and ThriftyBrand Expansion
Consistent growth of travel industry
Expected spin-off ofEquipment Rental
Company Profile52 Week Range ($) 18.50- 31.61
LTM Return 45%
Average Volume (Day) 11.3M
Dividend Yield 0.0%
Shares Outstanding 447.68 M
Market Cap ($) 9.9 B
Highlights IndustryOverview
Company Overview
FinancialAnalysis
Valuation InvestmentRisk
Appendix
Source: Stock price quote, yahoo finance
Source: Morningstar

Dollar Thrifty Synergy
5%
Enterprise Hertz Avis Dollar Thrifty
Fox Advantage Others
Hertz: 24.50%Hertz: 18.65%
5.85% mkt share 21.05%48.81%19.79%
7.02%
5.11%
0.0
2,000.0
4,000.0
6,000.0
8,000.0
10,000.0
12,000.0
14,000.0
16,000.0
car rental revenue projection (2014-2018)
$ in million CAGR: 8%Growth rate: 48.9%
CAGR: 3.82%
2011 Car rental market share 2014
49.19%
3.67%
Highlights IndustryOverview
Company Overview
FinancialAnalysis
Valuation InvestmentRisk
Appendix
Source: Auto Rental News Source: HTZ 10-k, Team estimate

Recommendation
BUY
Target Price: Upside:
$35 62%
0
10
20
30
40
HTZ
62%
Dollar and ThriftyBrand Expansion
Consistent growth of travel industry
Expected spin-off ofEquipment Rental
Company Profile52 Week Range ($) 18.50- 31.61
LTM Return 45%
Average Volume (Day) 11.3M
Dividend Yield 0.0%
Shares Outstanding 447.68 M
Market Cap ($) 9.9 B
Highlights IndustryOverview
Company Overview
FinancialAnalysis
Valuation InvestmentRisk
Appendix
Source: Stock price quote, yahoo finance
Source: Morningstar
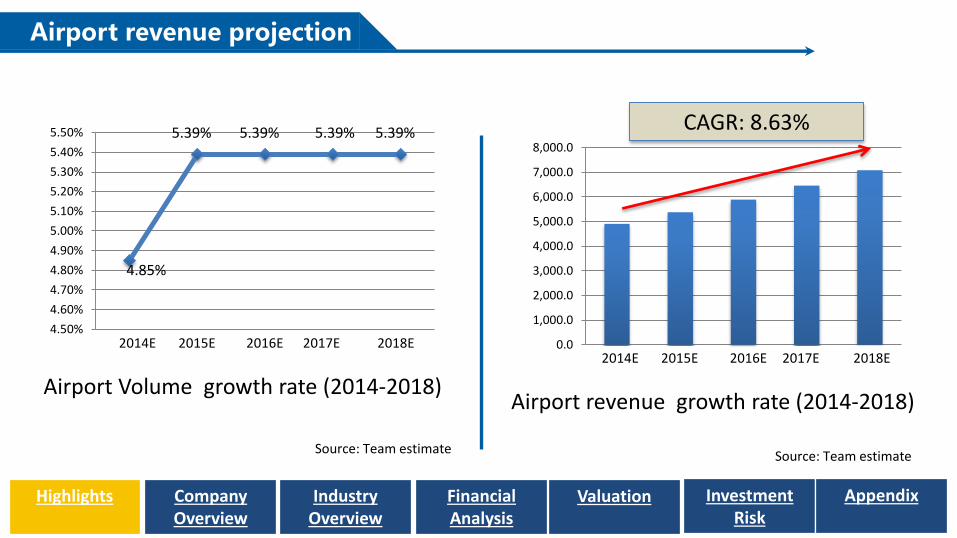
Airport revenue projection
2016E2014E 2017E 2018E2015E
Airport revenue growth rate (2014-2018)
CAGR: 8.63%
4.50%
4.60%
4.70%
4.80%
4.90%
5.00%
5.10%
5.20%
5.30%
5.40%
5.50%
4.85%
5.39% 5.39% 5.39% 5.39%
2014E 2017E 2018E2015E 2016E
Airport Volume growth rate (2014-2018)
0.0
1,000.0
2,000.0
3,000.0
4,000.0
5,000.0
6,000.0
7,000.0
8,000.0
Highlights IndustryOverview
Company Overview
FinancialAnalysis
Valuation InvestmentRisk
Appendix
Source: Team estimateSource: Team estimate

Recommendation
BUY
Target Price: Upside:
$35 62%
0
10
20
30
40
HTZ
62%
Dollar and ThriftyBrand Expansion
Consistent growth of travel industry
Expected spin-off ofEquipment Rental
Company Profile52 Week Range ($) 18.50- 31.61
LTM Return 45%
Average Volume (Day) 11.3M
Dividend Yield 0.0%
Shares Outstanding 447.68 M
Market Cap ($) 9.9 B
Highlights IndustryOverview
Company Overview
FinancialAnalysis
Valuation InvestmentRisk
Appendix
Source: Stock price quote, yahoo finance
Source: Morningstar

Equipment spin-off synergy
Debt-to-equity ratio
Highlights IndustryOverview
Company Overview
FinancialAnalysis
Valuation InvestmentRisk
Appendix
5.9x5.4x
4.8x
5.9x
4.2x
3.3x
0.0x
1.0x
2.0x
3.0x
4.0x
5.0x
6.0x
7.0x
Debt to Equity Ratio
2013 2014E 2015E 2016E 2017E 2018E
4.8-3.3=1.5Year
Hertz SG&A margin
Equipment SG&A margin
2011 6.8% 13.0%
2012 8.9% 14.0%
2013 7.7% 16.0%
2014 7.7% 16.0%
2015 7.7% 16.0%
2016 5.5% 0.0%
2017 5.5% 0.0%
2018 5.5% 0.0%
SG&A margin
1.5%
Source: Team estimate Source: Team estimate
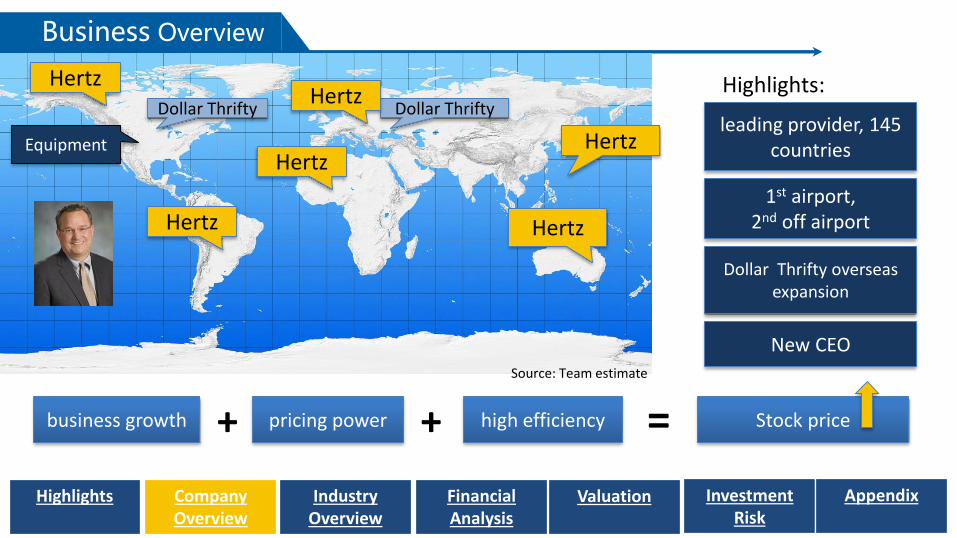
Business Overview
Dollar Thrifty Dollar Thrifty
Hertz
Hertz
HertzHertz
Hertz
Hertz
Highlights:
Equipmentleading provider, 145
countries
1st airport,2nd off airport
business growth pricing power high efficiency+ +
Dollar Thrifty overseasexpansion
=
New CEO
Stock price
Highlights IndustryOverview
Company Overview
FinancialAnalysis
Valuation InvestmentRisk
Appendix
Source: Team estimate

Market Leader in Airport Market
39.10%36.10%
2014 2018E
• US airport market is $12.96 bil in size• Dollar Thrifty provides Hertz established
brands in fast growing U.S. airport segment
Industry3.32%
Hertz8.63%
5.31% higherrevenue growth
Hertz Airport Revenue Forecast ($mil)
0.0
1,000.0
2,000.0
3,000.0
4,000.0
5,000.0
6,000.0
7,000.0
2011 2012 2013 2014E 2015E 2016E 2017E 2018ESource: HTZ 10-k, Team estimate
Highlights IndustryOverview
Company Overview
FinancialAnalysis
Valuation InvestmentRisk
Appendix

Tremendous Opportunities in Off-Airport Rental Market
Source: Auto Rental News
Labor Cost
SG&A
Utilization
Off-Airport On-Airport
$4.09 $4.47
$1.63 $3.12
84.3% 82.1%
Comparison
8% lower
48% lower
2.2% higher
Utilization Growth2%
Joint Venture20%
25% Car-sharing Industry
Source: Auto Rental News
Hertz US Off-Airport Rental Growth11.85%
Source: Auto Rental News
0.00%
20.00%
40.00%
60.00%
80.00%
2009 2010 2011 2012 2013 2014E 2015E 2016E 2017E
US Off-airport Rental Locations Growth Rate
Hertz Industry
Highlights IndustryOverview
Company Overview
FinancialAnalysis
Valuation InvestmentRisk
Appendix
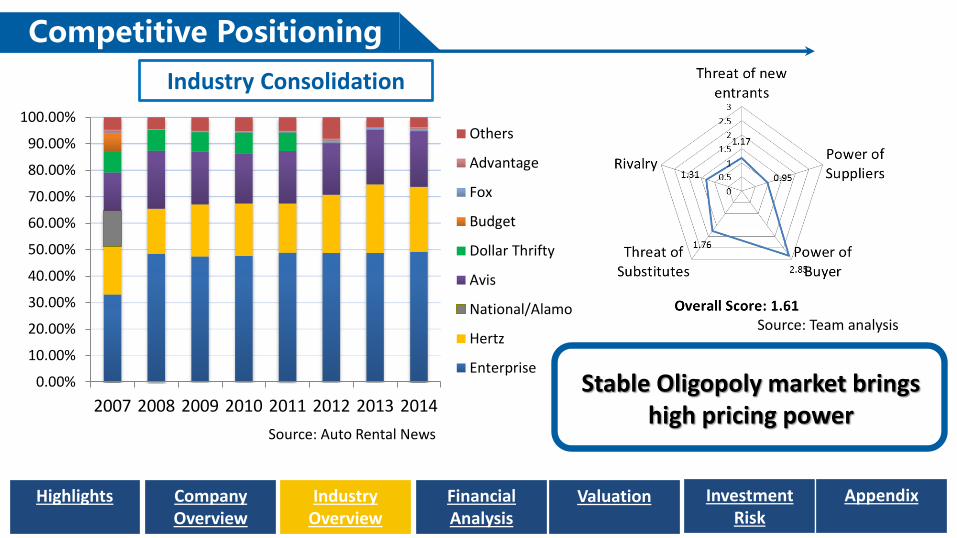
Competitive Positioning
0.00%
10.00%
20.00%
30.00%
40.00%
50.00%
60.00%
70.00%
80.00%
90.00%
100.00%
2007 2008 2009 2010 2011 2012 2013 2014
Others
Advantage
Fox
Budget
Dollar Thrifty
Avis
National/Alamo
Hertz
Enterprise
Industry Consolidation
Stable Oligopoly market brings high pricing power
Source: Auto Rental News
Source: Team analysis
Highlights IndustryOverview
Company Overview
FinancialAnalysis
Valuation InvestmentRisk
Appendix

Revenue Expansion
2013-2015:7.43%2016-2018:9.97%
Rising CAGRUnlock substantial value toconcentrate on car rental
Divesture
Car rental revenue expansionDivest HERC in 2015
0
5000
10000
15000
All otheroperationsEquipment rental
car rental
Source: 10-K; Team estimate
Highlights IndustryOverview
Company Overview
FinancialAnalysis
Valuation InvestmentRisk
Appendix
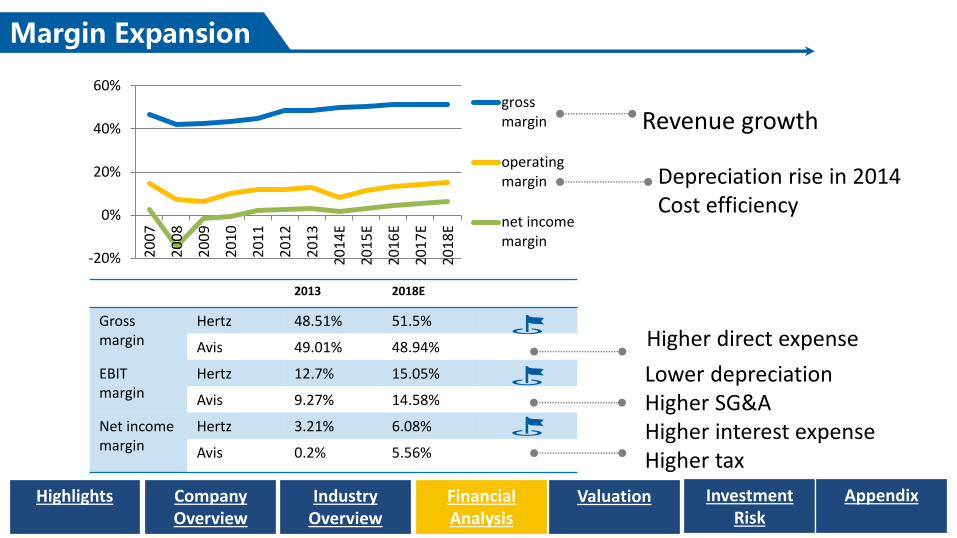
Margin Expansion
2013 2018E
Grossmargin
Hertz 48.51% 51.5%
Avis 49.01% 48.94%
EBITmargin
Hertz 12.7% 15.05%
Avis 9.27% 14.58%
Net incomemargin
Hertz 3.21% 6.08%
Avis 0.2% 5.56%
-20%
0%
20%
40%
60%
20
07
20
08
20
09
20
10
20
11
20
12
20
13
20
14
E
20
15
E
20
16
E
20
17
E
20
18
E
grossmargin
operatingmargin
net incomemargin
Revenue growth
Depreciation rise in 2014Cost efficiency
Higher direct expense
Lower depreciationHigher SG&AHigher interest expenseHigher tax
Highlights IndustryOverview
Company Overview
FinancialAnalysis
Valuation InvestmentRisk
Appendix
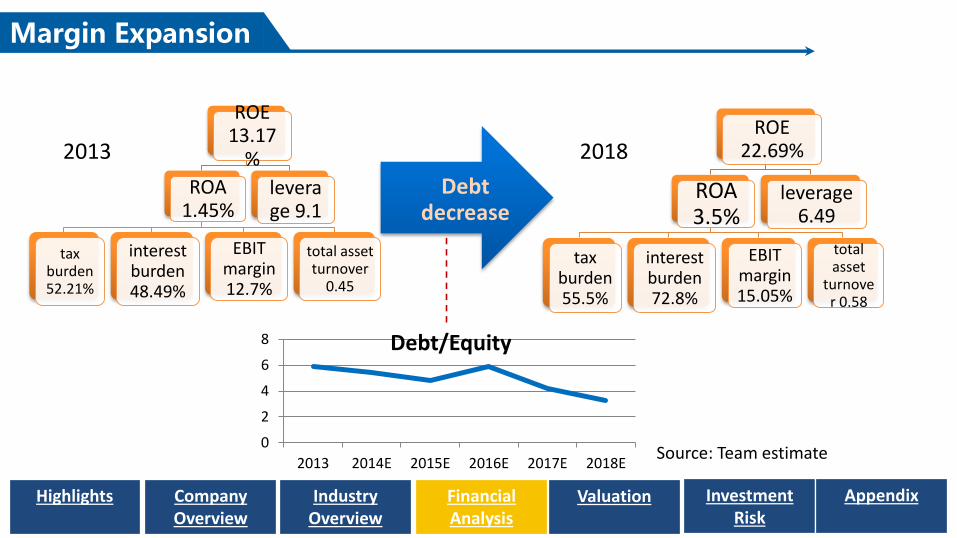
Margin Expansion
ROE 13.17
%
ROA 1.45%
tax burden 52.21%
interest burden 48.49%
EBIT margin 12.7%
total asset turnover
0.45
leverage 9.1
ROE 22.69%
ROA 3.5%
tax burden 55.5%
interest burden 72.8%
EBIT margin 15.05%
total asset
turnover 0.58
leverage 6.49
2013 2018
Debt decrease
0
2
4
6
8
2013 2014E 2015E 2016E 2017E 2018E
Debt/Equity
Source: Team estimate
Highlights IndustryOverview
Company Overview
FinancialAnalysis
Valuation InvestmentRisk
Appendix
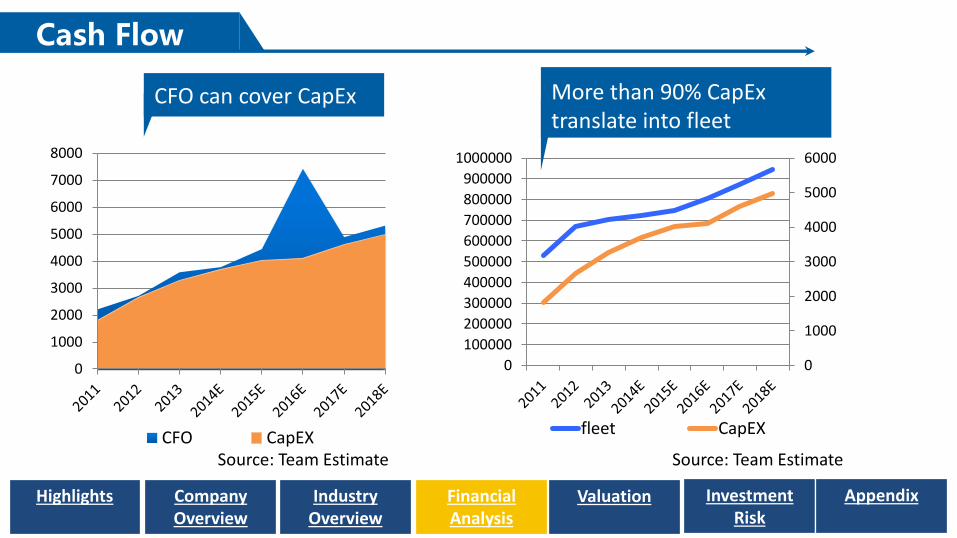
Cash Flow
2013-2018 CAGR:CFO: 8.18%NI:
0
1000
2000
3000
4000
5000
6000
7000
8000
CFO CapEX
0
1000
2000
3000
4000
5000
6000
0
100000
200000
300000
400000
500000
600000
700000
800000
900000
1000000
fleet CapEX
CFO can cover CapEx More than 90% CapExtranslate into fleet
Source: Team Estimate Source: Team Estimate
Highlights IndustryOverview
Company Overview
FinancialAnalysis
Valuation InvestmentRisk
Appendix

Revenue and Cost per Share EPS Growth
Revenue Growth + Cost Efficiencies + Repurchases = $1.28 Increase in EPS between 2013 and 2018
Repurchases: $0.17
Rev. growth: $0.45
Efficiencies: $0.66
Earning Growth
0
0.3
0.6
0.9
1.2
1.5
1.8
2.1
2.4
2013 2018E
22
24
26
28
30
32
34
36
2014 2015 2016 2017 2018
Costs per share Revenue per share
Target Price: $35
2014E 2015E 2016E 2017E 2018ETeam Estimates 0.36 0.87 1.30 1.69 2.04
Concensus 0.69 1.32 1.54 2.03 2.14
Highlights IndustryOverview
Company Overview
FinancialAnalysis
Valuation InvestmentRisk
Appendix
Source: Team Estimate
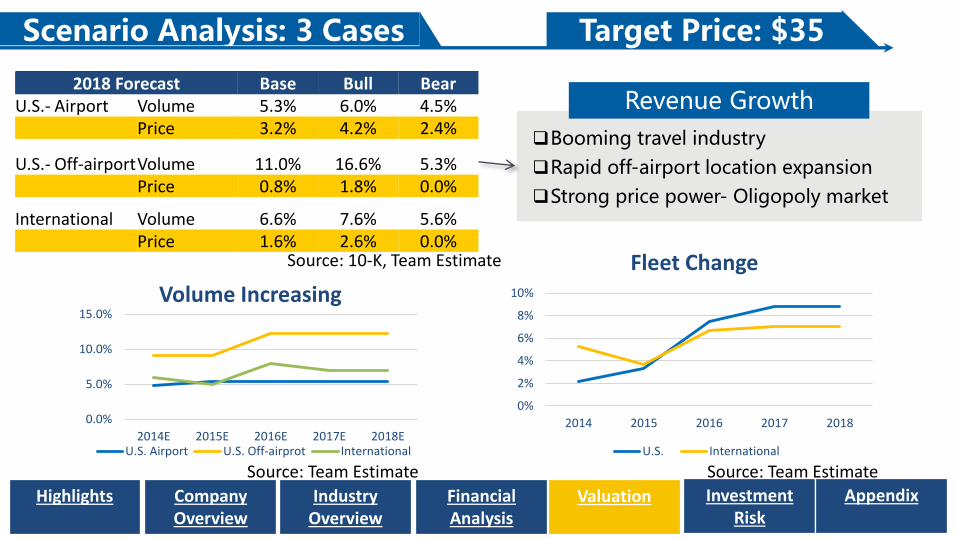
Revenue Growth
Booming travel industry
Rapid off-airport location expansion
Strong price power- Oligopoly market
Scenario Analysis: 3 Cases
2018 Forecast Base Bull BearU.S.- Airport Volume 5.3% 6.0% 4.5%
Price 3.2% 4.2% 2.4%
U.S.- Off-airportVolume 11.0% 16.6% 5.3%Price 0.8% 1.8% 0.0%
International Volume 6.6% 7.6% 5.6%Price 1.6% 2.6% 0.0%
0.0%
5.0%
10.0%
15.0%
2014E 2015E 2016E 2017E 2018E
Volume Increasing
U.S. Airport U.S. Off-airprot International
0%
2%
4%
6%
8%
10%
2014 2015 2016 2017 2018
Fleet Change
U.S. International
Target Price: $35
Source: 10-K, Team Estimate
Highlights IndustryOverview
Company Overview
FinancialAnalysis
Valuation InvestmentRisk
Appendix
Source: Team EstimateSource: Team Estimate

Cost Efficiency
Improving fleet utilization
Higher profit margin after the spin-off
Scenario Analysis: 3 Cases
2018 Forecast Base Bull BearDirect operating exp. % of sales 48.5% 48.0% 49.0%SG&A % of sales 5.5% 5.4% 5.6%Depreciation % of sales 28.6% 26.7% 30.5%Utilization U.S. 82.0% 85.0% 79.0%
International 79.0% 83.0% 75.0%
3%
4%
5%
6%
7%
8%
25%
30%
35%
40%
45%
50%
55%
2014 2015 2016 2017 2018
Cost Margin
COGS Depreciation SG&A % sales
260
270
280
290
300
310
70%72%74%76%78%80%82%84%
2013 2014 2015 2016 2017 2018
Utilization
Utilization Transactions per fleet
Target Price: $35
Source: 10-K, Team Estimate
Highlights IndustryOverview
Company Overview
FinancialAnalysis
Valuation InvestmentRisk
Appendix
Source: Team EstimateSource: Team Estimate

DCF Analysis
Higher interest rate
Lower debt to equity ratio
WACC= 8.2%7.7%
7.8% 7.8%
8.2%8.3%
7.5%
7.7%
7.9%
8.1%
8.3%
8.5%
2014E 2015E 2016E 2017E 2018E
Target Price: $35
Equity ValuePerpetuity Growth MethodWACC 8.2%Net present value of FCF $6,111.2Terminal growth rate 2.0%Terminal value $35,551.8PV of terminal value 25,938.9Less: LT debt (15,637.6)Add: Cash 998.1Equity Value 16,412.6Diluted shares 468.0Stock Price $35.1
0
5
10
15
20
25
30
35
40
Cash: 6.1%
Term Value: 56.7%
NPV of FCF: 37.2%
Highlights IndustryOverview
Company Overview
FinancialAnalysis
Valuation InvestmentRisk
Appendix
Source: Team Estimate

Scenario and Sensitivity Analysis
Terminal Growth Rate
1.5% 2.0% 2.5%
WACC 7.2% 42.21 48.54 56.21
7.7% 35.98 41.21 47.45
8.2% 30.68 35.07 40.23
8.7% 26.12 29.85 34.18
9.2% 22.16 25.35 29.03
Target Price: $35
13200
13700
14200
14700
2015 2016 2017 2018
Base Bull Bear
Terminal Value SensitivityScenario Analysis- Revenue Per Fleet
Stronger car rental pricing and higher utilization Increase in WACC to 9.2% still leaves valuation OVER current market price
Highlights IndustryOverview
Company Overview
FinancialAnalysis
Valuation InvestmentRisk
Appendix
2/4/2015 stock price: $21.46Source: Team Estimate Source: Team Estimate
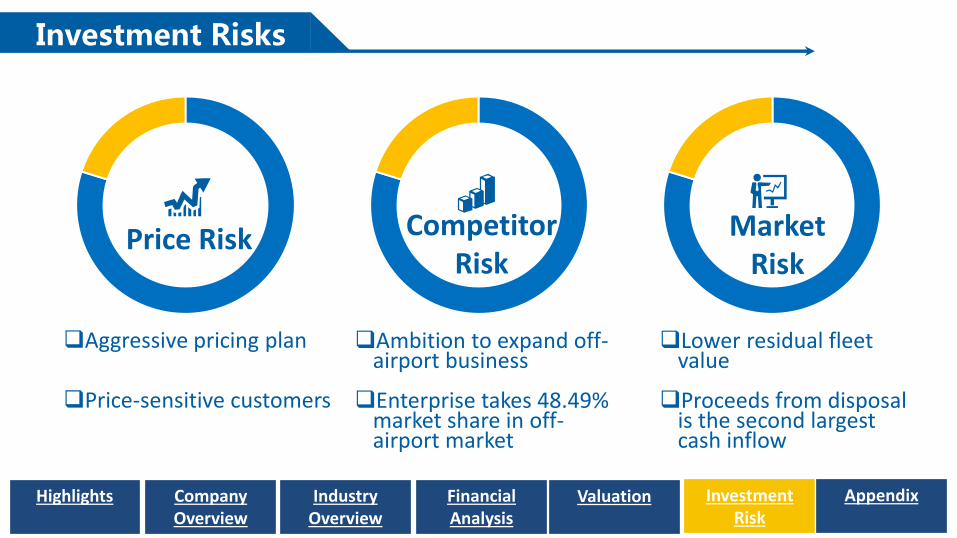
Investment Risks
Price Risk Competitor Risk
Market Risk
Aggressive pricing plan
Price-sensitive customers
Ambition to expand off-airport business
Enterprise takes 48.49% market share in off-airport market
Lower residual fleet value
Proceeds from disposal is the second largest cash inflow
Highlights IndustryOverview
Company Overview
FinancialAnalysis
Valuation InvestmentRisk
Appendix


• Hertz On-airport Revenue
• Global Car Rental Market
• US Car Rental Market
• - On-Airport
• - Off-Airport
• Global Equipment Market
• Gross Margin
• Major Suppliers
• Business/Leisure
• Joint Venture
• Auto Manufactuer
• Car-sharing Market
• Hertz 24/7
• Porter’s Five Force
• Fleet Utilization
Appendix
• Spin-off of HERC• Debt and Debt Cost• Cost Efficiency• International Revenue• Long-term growth rate inflation• Revenue Breakdown• Stock Price• Revenue Per Fleet• Transaction Days• Interest Rate• D/E• DCF Analysis• WACC
• P/E Multiples & EV/EBITDA Multiples
• Price Sensitivity• Revenue Assumption• Equipment Segment
• Forecast Cost Margin
• Shares Repurchase

On-Airport revenue
Airport revenue($ in millions) 2014E 2015E 2016E 2017E 2018E
market share growth rate
bear 1.50% 1.50% 1.50% 1.50% 1.50%
base 2.00% 2.00% 2.00% 2.00% 2.00%
bull 2.50% 2.50% 2.50% 2.50% 2.50%
market size growth rate
bear 2.79% 3.01% 3.01% 3.01% 3.01%
base 2.79% 3.32% 3.32% 3.32% 3.32%
bull 2.79% 3.63% 3.63% 3.63% 3.63%
price growth rate
bear 0.00% 3.00% 3.00% 3.00% 3.00%
base 0.00% 4.00% 4.00% 4.00% 4.00%
bull 0.00% 5.00% 5.00% 5.00% 5.00%
revenue
bear 4882.83 5258.41 5662.88 6098.46 6567.54
base 4906.89 5378.04 5894.43 6460.41 7080.73
bull 4930.94 5499.57 6133.77 6841.10 7630.00
On-Airport Revenue
Highlights IndustryOverview
Company Overview
FinancialAnalysis
Valuation InvestmentRisk
Appendix

Global Car Rental Market
US On-
Airport
31%
US Off-
Airport
29%
EU On-
Airport
13%
EU Off-
Airport
20%
Asia On-
Airport
6%
Asia Off-
Airport
1%
Global Car Rental Market (by segments)
Source: Company filings, Gabelli & Company est.
Enterpr
ise
29%
Hertz
19%Avis
14%
Others
38%
Global Car Rental Market (by companies)
Source: IBISWORLD.com
The global rental car market is approximately $49 billion in size and is segmented between on-airport and off-airport markets.
Highlights IndustryOverview
Company Overview
FinancialAnalysis
Valuation InvestmentRisk
AppendixHighlights IndustryOverview
Company Overview
FinancialAnalysis
Valuation InvestmentRisk
Appendix

US Car Rental Market
14.90% 15.94% 17.54% 19.29%21.22%
36.10% 36.82% 37.56% 38.31% 39.08%
0.00%
5.00%
10.00%
15.00%
20.00%
25.00%
30.00%
35.00%
40.00%
45.00%
2014E 2015E 2016E 2017E 2018E
Hertz US Car Rental Market Share Forecast
Off-airport
On-Airport
Source: Annual Report, Team estimates
0.00%
5.00%
10.00%
15.00%
20.00%
25.00%
30.00%
35.00%
40.00%
2011 2012 2013 2014E 2015E 2016E 2017E
On-Airport
Off-Airport
Source: Annual Report, Team estimates
Hertz US Car Rental Market Revenue
Highlights IndustryOverview
Company Overview
FinancialAnalysis
Valuation InvestmentRisk
AppendixHighlights IndustryOverview
Company Overview
FinancialAnalysis
Valuation InvestmentRisk
Appendix
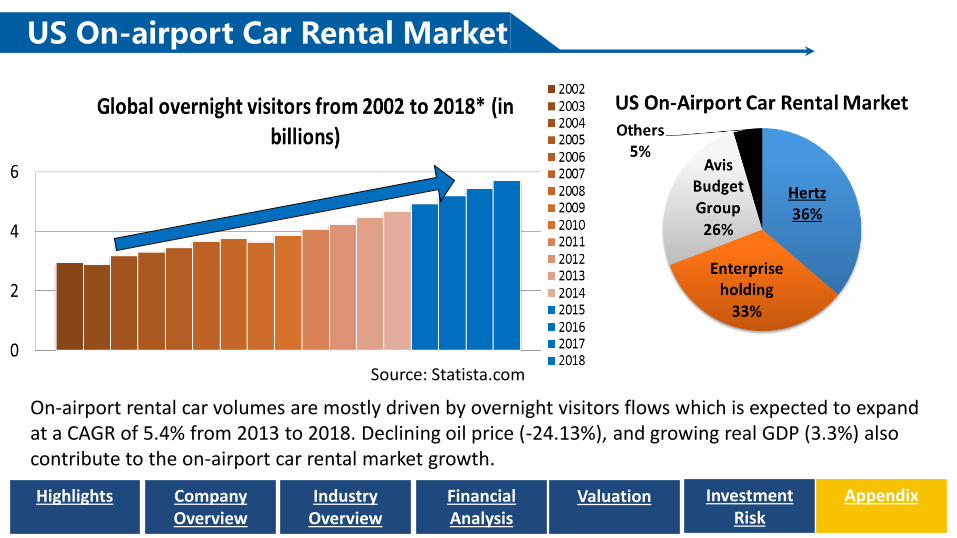
US On-airport Car Rental Market
On-airport rental car volumes are mostly driven by overnight visitors flows which is expected to expand at a CAGR of 5.4% from 2013 to 2018. Declining oil price (-24.13%), and growing real GDP (3.3%) also contribute to the on-airport car rental market growth.
Source: Statista.com
Highlights IndustryOverview
Company Overview
FinancialAnalysis
Valuation InvestmentRisk
Appendix

US Off-Airport Car Rental Market
0
5000
10000
15000
20000
25000
2004 2005 2006 2007 2008 2009 2010 2011 2012 2013 2014 2015 2016 2017 2018
US Car Rental Locations
Source: Auto Rental News
Highlights IndustryOverview
Company Overview
FinancialAnalysis
Valuation InvestmentRisk
Appendix

Global Equipment Market
77%
10%
9%
3% 1%
Global Equipment Rental Size in 2014
US
China
France
Spain
Saudi Arabia-2.5%
4%4.5%
4.5% 5%5.5%
6% 6%
7.5%
Estimated construction industry growth rates in selected regions in 2013
Source: KHL GroupSource: Bloomberg
Highlights IndustryOverview
Company Overview
FinancialAnalysis
Valuation InvestmentRisk
Appendix
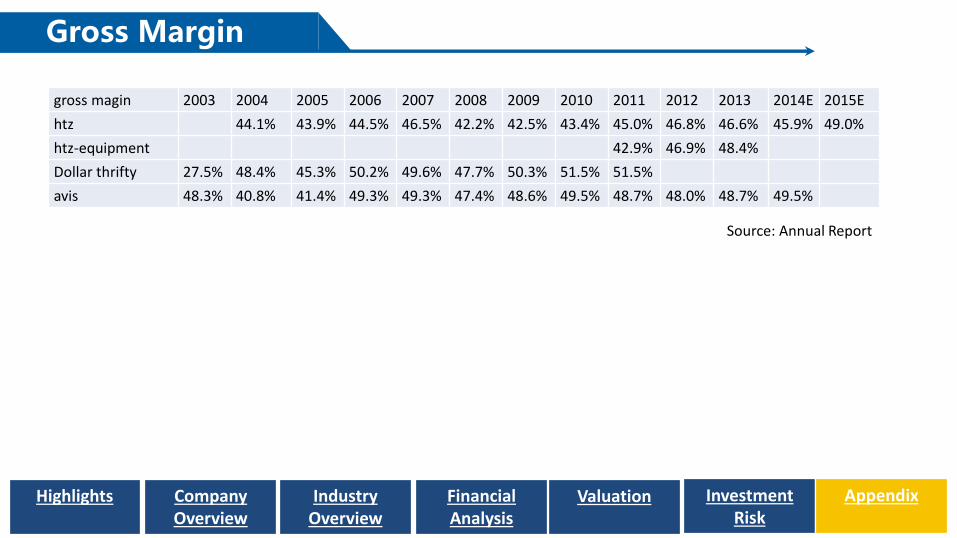
Gross Margin
gross magin 2003 2004 2005 2006 2007 2008 2009 2010 2011 2012 2013 2014E 2015E
htz 44.1% 43.9% 44.5% 46.5% 42.2% 42.5% 43.4% 45.0% 46.8% 46.6% 45.9% 49.0%
htz-equipment 42.9% 46.9% 48.4%
Dollar thrifty 27.5% 48.4% 45.3% 50.2% 49.6% 47.7% 50.3% 51.5% 51.5%
avis 48.3% 40.8% 41.4% 49.3% 49.3% 47.4% 48.6% 49.5% 48.7% 48.0% 48.7% 49.5%
Source: Annual Report
Highlights IndustryOverview
Company Overview
FinancialAnalysis
Valuation InvestmentRisk
Appendix

Major Suppliers of Hertz
Source: Bloomberg
Suppliers CAPEX of HertzGeneral Motors Co. 24.88%Ford Motor Co. 15.42%Nissan Motor Co. Ltd 12.34%Toyota Motor Cord 10.57%Fiat Chrysler Automobiles 6.15%
YTD 2013 Q2 YTD 2014 Q2 Change
USA 2,284,001 2,163,319 -5.3%
Main Suppliers and their CAPEX of Hertz
Source: OICA.net
US Production Statics
Highlights IndustryOverview
Company Overview
FinancialAnalysis
Valuation InvestmentRisk
Appendix

Business/Leisure
Hertz Revenue by Customers
In 2013, Dollar has approximately 1,400 locations in key leisure destinations across 75 countries.
2011 2012 2013
US International US International US International
Business 43% 54% 41% 55% 35% 46%
Leisure 57% 46% 58% 45% 65% 54%
Source: Hertz Annual Report
Highlights IndustryOverview
Company Overview
FinancialAnalysis
Valuation InvestmentRisk
Appendix

Joint Venture with CAR
• China car rental market will grow at 15% annually.
• In 2014, CAR operated in 70 major cities, at 52 airports across China with over 717 service locations, serving more than 1 million individual customers and nearly 10,000 corporate clients.
• Hertz now have 300 Chinese locations co-branded as “CAR Powered By Hertz.”
Source: CAR official website
Highlights IndustryOverview
Company Overview
FinancialAnalysis
Valuation InvestmentRisk
Appendix

Hertz Fleet Utilization
1) Synergies from Dollar Thrifty – opposite demand schedules means that Hertz's excess supply of weekend cars get used at Dollar Thrifty2) Technological Changes – kiosks, Hertz On Demand, and mobile apps, reduce the need for staffed locations and expand hours to 24/73) Major restructurings of GM, Chrysler, and Ford,auto manufacturers have become much morerational with their production This has significantlymitigated over-fleeting in the car rental market andincreased utilization
68.0%
70.0%
72.0%
74.0%
76.0%
78.0%
80.0%
82.0%
84.0%
86.0%
DollarThrifty
Hertz(including DTR)
Highlights IndustryOverview
Company Overview
FinancialAnalysis
Valuation InvestmentRisk
Appendix
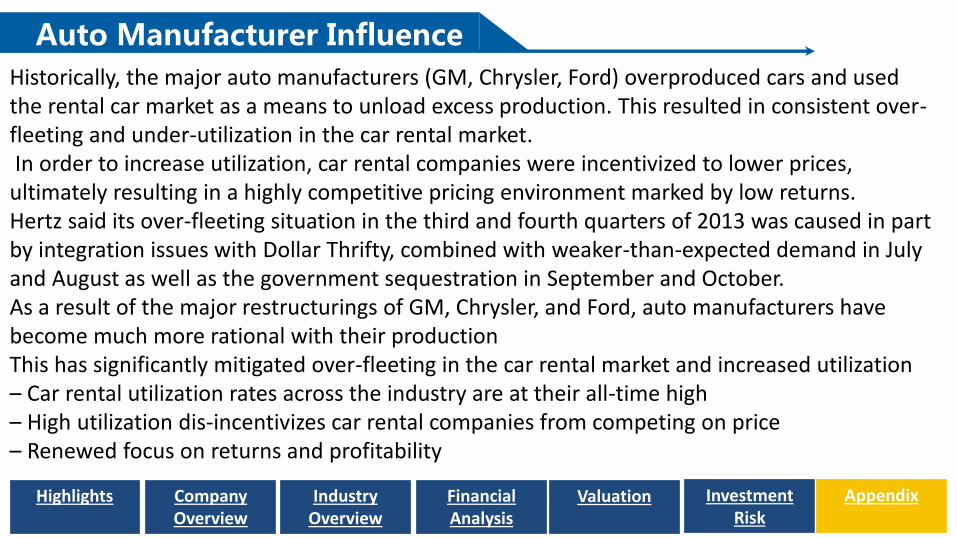
Auto Manufacturer Influence
Historically, the major auto manufacturers (GM, Chrysler, Ford) overproduced cars and used the rental car market as a means to unload excess production. This resulted in consistent over-fleeting and under-utilization in the car rental market.In order to increase utilization, car rental companies were incentivized to lower prices,
ultimately resulting in a highly competitive pricing environment marked by low returns.Hertz said its over-fleeting situation in the third and fourth quarters of 2013 was caused in part by integration issues with Dollar Thrifty, combined with weaker-than-expected demand in July and August as well as the government sequestration in September and October.As a result of the major restructurings of GM, Chrysler, and Ford, auto manufacturers have become much more rational with their productionThis has significantly mitigated over-fleeting in the car rental market and increased utilization– Car rental utilization rates across the industry are at their all-time high– High utilization dis-incentivizes car rental companies from competing on price– Renewed focus on returns and profitability
Highlights IndustryOverview
Company Overview
FinancialAnalysis
Valuation InvestmentRisk
Appendix
Car-sharing Market
Car-sharing market is a emerging market where people rent cars for short periods of time, often by the hour. There were an estimated 1.7 million car-sharing members in 27 countries and there were over 800,000 members in US, the US car-sharing market in estimated to grow at a CAGR of 24.66% which is much higher than traditional car-rental market. The main factors driving the growth of car-sharing are the rising levels of traffic congestion and the increasing costs of personal vehicle ownership. As of November 2014, the world's largest car-sharing networks across North America and Europe are Zipcar with 767,000 members and 11,000 vehicles, and Car2Go with over 900,000 members and 12,000 cars.
Highlights IndustryOverview
Company Overview
FinancialAnalysis
Valuation InvestmentRisk
Appendix

Hertz 24/7
Hertz operated a car-sharing decision since 2008 and later improved and renamed it “Hertz 24/7” in 2013. The car-sharing market is founded by Zipcar, which is later acquired by Avis Budget Group. This is a new way for Hertz to gain market share in car rental market in the role of fast follower because Hertz has a hands-free audio kit system that Zipcar does not have, which is a competitive advantage over Zipcar. The stock price of Hertz jumped 6.8% to $23.41 on the day of announcing Hertz 24/7, which is the highest price in more than five years.
Highlights IndustryOverview
Company Overview
FinancialAnalysis
Valuation InvestmentRisk
Appendix

Porter’s Five Force Model
1.17
0.95
2.85
1.76
1.31
0
0.5
1
1.5
2
2.5
3
Threat ofnew
entrants
Power ofSuppliers
Power ofBuyer
Threat ofSubstitut
es
Rivalry
Service %of Revenue (FY2013)
Threat of new entrants
Power of Suppliers
Power of Buyer
Threat of Substitutes
Rivalry
On-ariport
59%0.59 0.59 1.77 1.18 0.59
Off-airport
22%0.44 0.22 0.66 0.44 0.44
Equipment
14%0.14 0.14 0.42 0.14 0.28
Total1.17 0.95 2.85 1.76 1.31
The Scale of Competitive Interaction1:Low 2: Moderate Low 3:Moderate 4:Moderate High 5:High
Over Score: 1.61
Highlights IndustryOverview
Company Overview
FinancialAnalysis
Valuation InvestmentRisk
Appendix
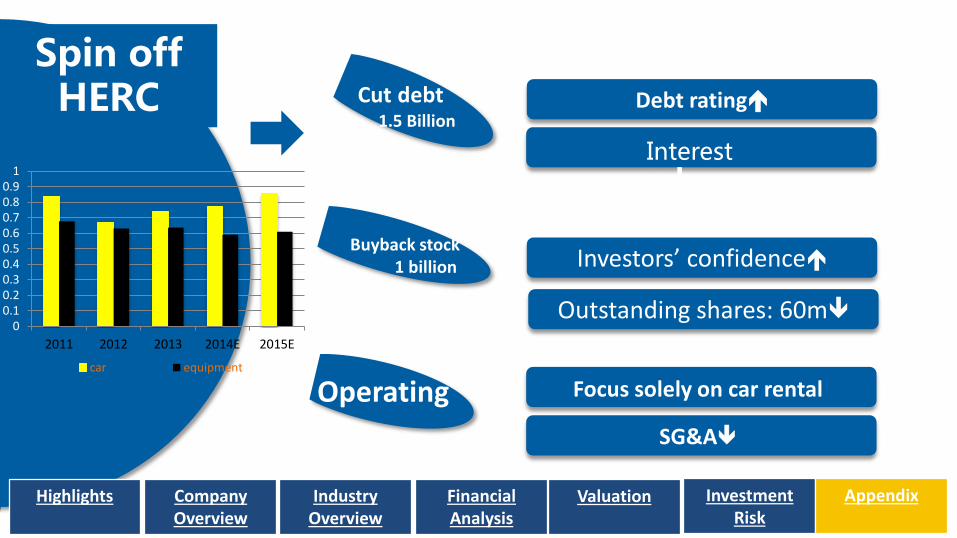
Spin off HERC Cut debt
1.5 Billion
Operating
Debt rating
Interest expense
Focus solely on car rental
Investors’ confidenceBuyback stock
1 billion
Outstanding shares: 60m
SG&A
00.10.20.30.40.50.60.70.80.9
1
2011 2012 2013 2014E 2015E
car equipment
Highlights IndustryOverview
Company Overview
FinancialAnalysis
Valuation InvestmentRisk
Appendix

Debt and debt cost
2013-2018 CAGR:CFO: 8.18%NI:
Debt will be pay down significantly in 2016, 2017Debt/EBITDA decreases constantly
Interest expense decrease even though interest rate growth slightly
-5000
-4000
-3000
-2000
-1000
0
1000
2000
00.5
11.5
22.5
33.5
44.5
5
2011 2012 2013 2014E2015E2016E2017E2018E
Debt/ EBITDA Debt paydown
3.5
3.6
3.7
3.8
3.9
4
4.1
4.2
0.0
100.0
200.0
300.0
400.0
500.0
600.0
700.0
800.0
2013 2014E 2015E 2016E 2017E 2018E
Interest expenses Interest rate
Highlights IndustryOverview
Company Overview
FinancialAnalysis
Valuation InvestmentRisk
Appendix

Cost efficiency
Acquisition of Dollar Trifty
+
Cost synergy
−
Direct operating
SG&ASelf-serve kiosks:increases fleer utilization
Cut personal-related expense
Highlights IndustryOverview
Company Overview
FinancialAnalysis
Valuation InvestmentRisk
Appendix
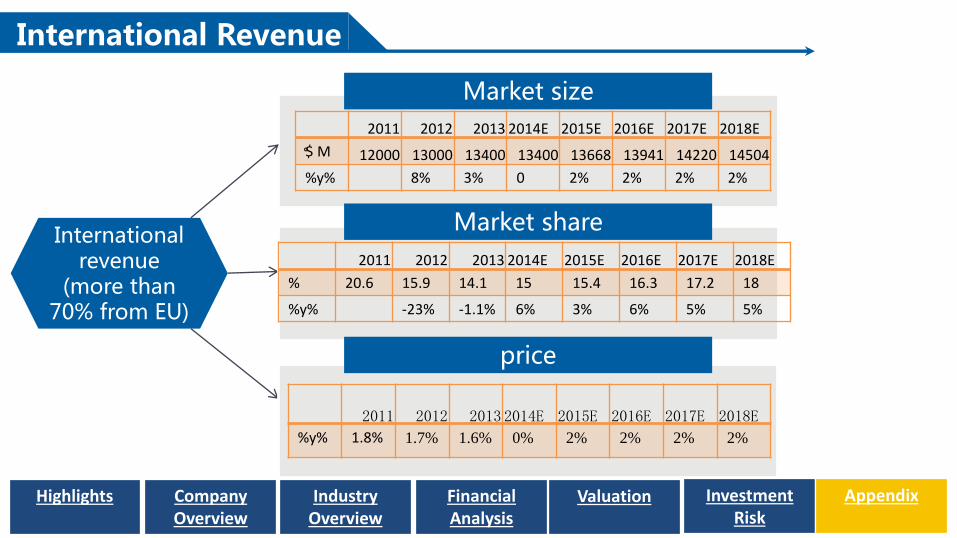
International Revenue
Market size
Internationalrevenue
(more than 70% from EU)
。
Market share
price
2011 2012 2013 2014E 2015E 2016E 2017E 2018E
$ M 12000 13000 13400 13400 13668 13941 14220 14504
%y% 8% 3% 0 2% 2% 2% 2%
2011 2012 2013 2014E 2015E 2016E 2017E 2018E
% 20.6 15.9 14.1 15 15.4 16.3 17.2 18
%y% -23% -1.1% 6% 3% 6% 5% 5%
2011 2012 2013 2014E 2015E 2016E 2017E 2018E
%y% 1.8% 1.7% 1.6% 0% 2% 2% 2% 2%
Highlights IndustryOverview
Company Overview
FinancialAnalysis
Valuation InvestmentRisk
Appendix

Long-term growth rate inflation
U.S. inflation rate
Europe inflation rate
Others ~ China inflation rate
U.S international total
Europe others
% 70% 21% 9% 100%
Long-term
2.15% 1.8% 1.5% 2.0%
Source: inflationdata.com
Source: European Central Bank
Source : IMF
Highlights IndustryOverview
Company Overview
FinancialAnalysis
Valuation InvestmentRisk
Appendix

Appendix: Revenue Breakdown
Source: Team Estimates
19.4% 19.7% 20.2% 20.7% 21.3%
27.4% 26.9% 26.8% 26.5% 26.3%
0.0%
10.0%
20.0%
30.0%
40.0%
50.0%
60.0%
70.0%
80.0%
90.0%
100.0%
2014E 2015E 2016E 2017E 2018E
Segement Revenue Contribution
U.S. Airport U.S. Off-airprot International
Highlights IndustryOverview
Company Overview
FinancialAnalysis
Valuation InvestmentRisk
Appendix

Appendix: stock price quotes
0
5
10
15
20
25
30
35
11
/16
/06
2/1
6/0
7
5/1
6/0
7
8/1
6/0
7
11
/16
/07
2/1
6/0
8
5/1
6/0
8
8/1
6/0
8
11
/16
/08
2/1
6/0
9
5/1
6/0
9
8/1
6/0
9
11
/16
/09
2/1
6/1
0
5/1
6/1
0
8/1
6/1
0
11
/16
/10
2/1
6/1
1
5/1
6/1
1
8/1
6/1
1
11
/16
/11
2/1
6/1
2
5/1
6/1
2
8/1
6/1
2
11
/16
/12
2/1
6/1
3
5/1
6/1
3
8/1
6/1
3
11
/16
/13
2/1
6/1
4
5/1
6/1
4
8/1
6/1
4
11
/16
/14
HTZ
July 11, 2014,acquisition of DollarThrifty
Jun 6,2014, disclosedaccounting problems to
Aug 20, 2014, “well-below” forecastperformance in 2014
Dec 16,2008,launched car
sharing program
2007-2008,financial
crisis
Highlights IndustryOverview
Company Overview
FinancialAnalysis
Valuation InvestmentRisk
Appendix

Appendix: Revenue Per Fleet
Source: 10-K; Team Estimates
70%
72%
74%
76%
78%
80%
82%
84%
86%
2007 2008 2009 2010 2011 2012 2013 2014 2015 2016 2017 2018
Utilization
Hertz Dollar Thrifty
Highlights IndustryOverview
Company Overview
FinancialAnalysis
Valuation InvestmentRisk
Appendix

Appendix: Revenue Per Fleet
Source: Team Estimates
10000
11000
12000
13000
14000
15000
16000
2014 2015 2016 2017 2018
Revenue Per Fleet
U.S. International
Highlights IndustryOverview
Company Overview
FinancialAnalysis
Valuation InvestmentRisk
Appendix
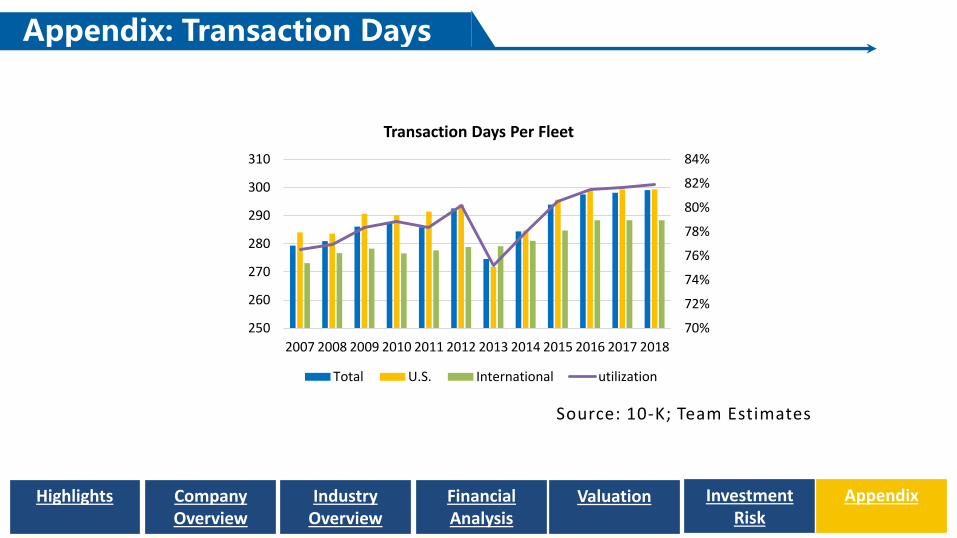
Appendix: Transaction Days
Source: 10-K; Team Estimates
70%
72%
74%
76%
78%
80%
82%
84%
250
260
270
280
290
300
310
2007 2008 2009 2010 2011 2012 2013 2014 2015 2016 2017 2018
Transaction Days Per Fleet
Total U.S. International utilization
Highlights IndustryOverview
Company Overview
FinancialAnalysis
Valuation InvestmentRisk
Appendix
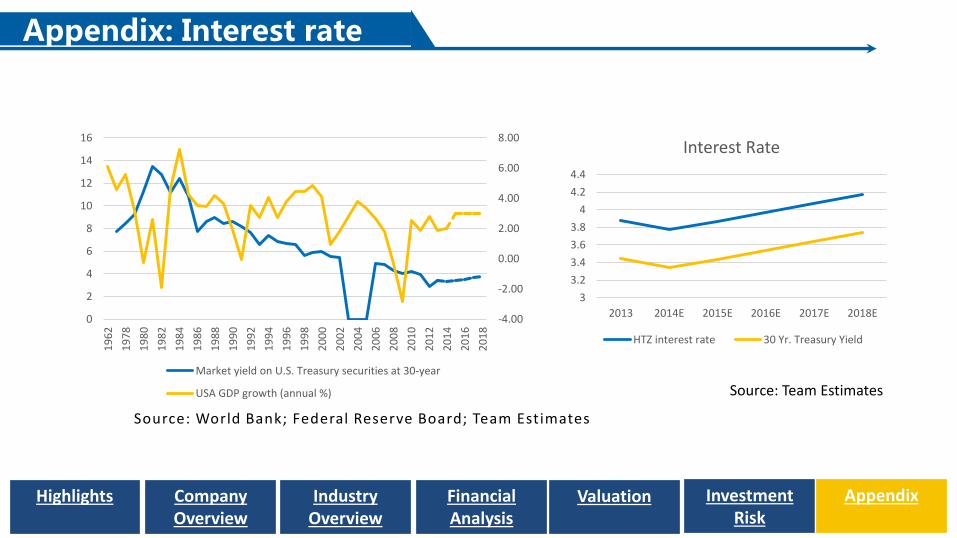
Appendix: Interest rate
-4.00
-2.00
0.00
2.00
4.00
6.00
8.00
0
2
4
6
8
10
12
14
16
19
62
19
78
19
80
19
82
19
84
19
86
19
88
19
90
19
92
19
94
19
96
19
98
20
00
20
02
20
04
20
06
20
08
20
10
20
12
20
14
20
16
20
18
Market yield on U.S. Treasury securities at 30-year
USA GDP growth (annual %)
Source: World Bank; Federal Reserve Board; Team Estimates
3
3.2
3.4
3.6
3.8
4
4.2
4.4
2013 2014E 2015E 2016E 2017E 2018E
Interest Rate
HTZ interest rate 30 Yr. Treasury Yield
Source: Team Estimates
Highlights IndustryOverview
Company Overview
FinancialAnalysis
Valuation InvestmentRisk
Appendix
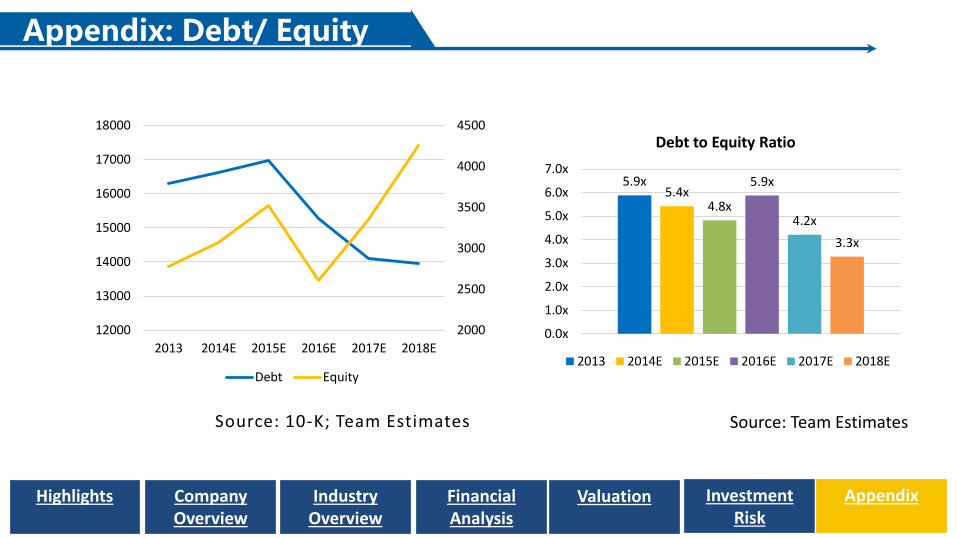
Appendix: Debt/ Equity
Source: 10-K; Team Estimates
2000
2500
3000
3500
4000
4500
12000
13000
14000
15000
16000
17000
18000
2013 2014E 2015E 2016E 2017E 2018E
Debt Equity
Source: Team Estimates
5.9x5.4x
4.8x
5.9x
4.2x
3.3x
0.0x
1.0x
2.0x
3.0x
4.0x
5.0x
6.0x
7.0x
Debt to Equity Ratio
2013 2014E 2015E 2016E 2017E 2018E
Highlights IndustryOverview
Company Overview
FinancialAnalysis
Valuation InvestmentRisk
Appendix

Appendix: DCF Analysis
CAGR 8.0%
Equity ValuePerpetuity Growth MethodWACC 8.2%Net present value of FCF $6,111.2Terminal growth rate 2.0%Terminal value $35,551.8PV of terminal value 25,938.9Less: LT debt (15,637.6)Add: Cash 998.1Equity Value 16,412.6Diluted shares 468.0Stock Price $35.1 0
5
10
15
20
25
30
35
40
Cash: 6.1%
Term Value: 56.7%
NPV of FCF: 37.2%
2014 2015 2016 2017 2018Net Income 170.6 412.5 541.3 708.1 863.5EBIT 934.6 1,399.7 1,582.3 1,850.3 2,137.1Depreciation & Amortization 3,661.1 3,784.0 3,644.5 3,896.5 4,183.3Proceeds from disposal 7,337.1 8,369.0 7,276.0 7,646.9 8,227.1Capital Expenditures (11,040.2) (12,385.9) (11,389.2) (12,255.8) (13,197.6)FCF 1,275.8 1,737.6 1,762.6 1,802.6 2,161.0
Highlights IndustryOverview
Company Overview
FinancialAnalysis
Valuation InvestmentRisk
Appendix

Appendix: WACC
Source: Bloomberg; Team Estimates
Hertz Global Holdings Inc. Standalone WACC in 2018Cost of Debt:
Historical weighted average cost of debt 4.17%
Marginal tax rate 44.50%
After-tax cost of debt: 4.17% x (1 - 44.50%) = 2.31%
Cost of Equity:
Yield on the 30-year U.S. Government Bond 3.74%
Levered beta based on target company 1.51
Market risk premium 7.74%
Size premium 0.76%
Cost of equity = 3.74% + (1.51 x 7.74%) + 0.76% = 16.19%
Percentage of Capital
Total debt $16,635.7 56.9%
Market value of equity $11,417.8 43.1%
Total capital $28,053.5 100.0%
Weighted Average Cost of Capital:
WACC = (2.31% x 56.9%) + (16.19% x 43.1%) = 8.30%
Highlights IndustryOverview
Company Overview
FinancialAnalysis
Valuation InvestmentRisk
Appendix
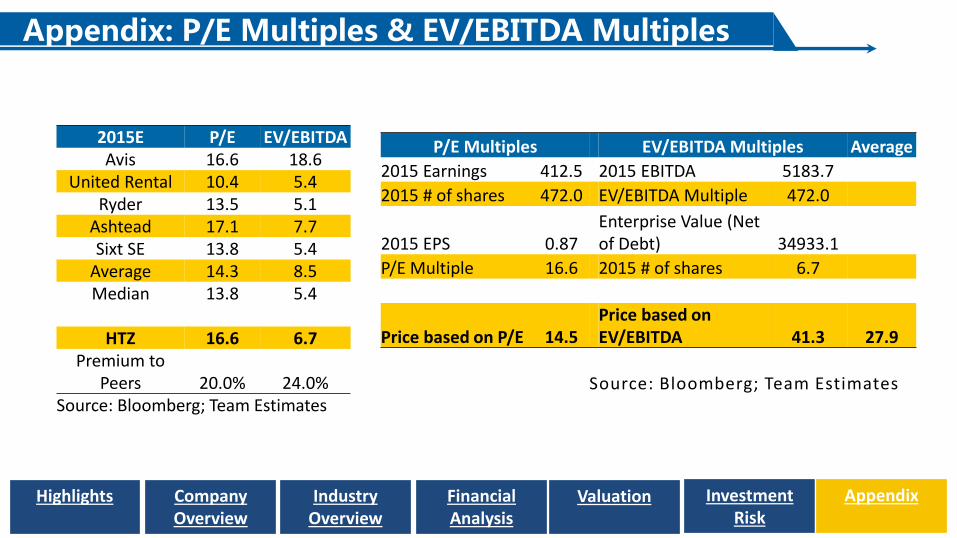
Appendix: P/E Multiples & EV/EBITDA Multiples
Source: Bloomberg; Team Estimates
2015E P/E EV/EBITDAAvis 16.6 18.6
United Rental 10.4 5.4Ryder 13.5 5.1
Ashtead 17.1 7.7Sixt SE 13.8 5.4
Average 14.3 8.5Median 13.8 5.4
HTZ 16.6 6.7Premium to
Peers 20.0% 24.0%Source: Bloomberg; Team Estimates
P/E Multiples EV/EBITDA Multiples Average
2015 Earnings 412.5 2015 EBITDA 5183.7
2015 # of shares 472.0 EV/EBITDA Multiple 472.0
2015 EPS 0.87Enterprise Value (Net of Debt) 34933.1
P/E Multiple 16.6 2015 # of shares 6.7
Price based on P/E 14.5Price based on EV/EBITDA 41.3 27.9
Highlights IndustryOverview
Company Overview
FinancialAnalysis
Valuation InvestmentRisk
Appendix
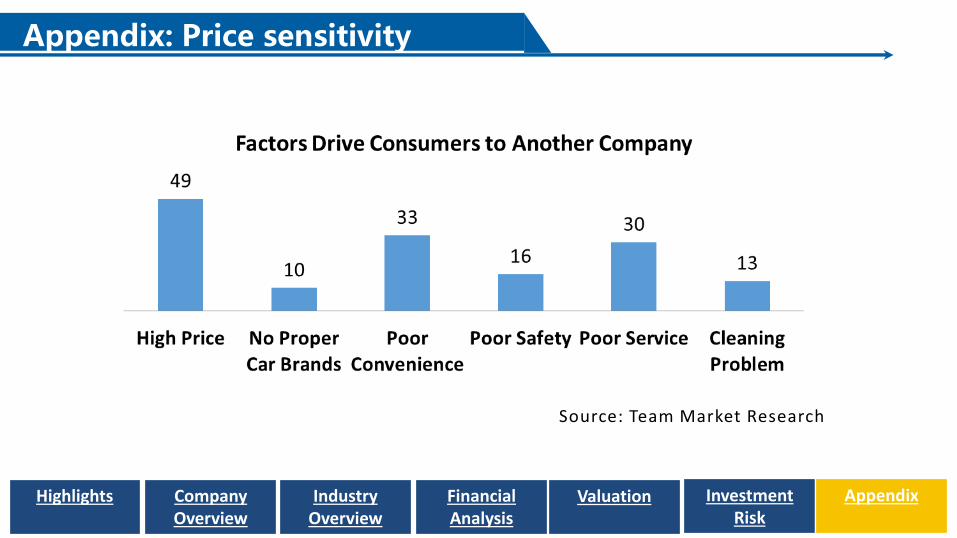
Appendix: Price sensitivity
Source: Team Market Research
Highlights IndustryOverview
Company Overview
FinancialAnalysis
Valuation InvestmentRisk
Appendix
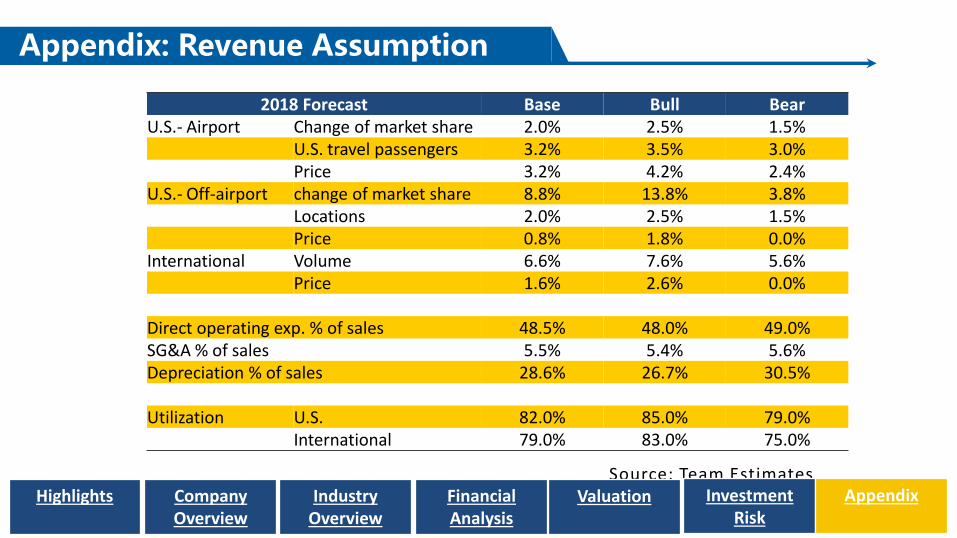
2018 Forecast Base Bull BearU.S.- Airport Change of market share 2.0% 2.5% 1.5%
U.S. travel passengers 3.2% 3.5% 3.0%Price 3.2% 4.2% 2.4%
U.S.- Off-airport change of market share 8.8% 13.8% 3.8%Locations 2.0% 2.5% 1.5%Price 0.8% 1.8% 0.0%
International Volume 6.6% 7.6% 5.6%Price 1.6% 2.6% 0.0%
Direct operating exp. % of sales 48.5% 48.0% 49.0%SG&A % of sales 5.5% 5.4% 5.6%Depreciation % of sales 28.6% 26.7% 30.5%
Utilization U.S. 82.0% 85.0% 79.0%International 79.0% 83.0% 75.0%
Appendix: Revenue Assumption
Source: Team EstimatesHighlights Industry
OverviewCompany Overview
FinancialAnalysis
Valuation InvestmentRisk
Appendix

Appendix: Equipment Segment
2011 2012 2013 2014E 2015ECost Margin COGS as % of sales 57.1% 53.1% 51.6% 51.6% 51.6%SG&A as % of sales 13.0% 14.0% 16.0% 16.0% 16.0%Depreciation as % of sales 23.8% 22.1% 21.6% 21.2% 18.8%
Diluted EPS( in dollars per share) -0.01 0.07 0.08 0.10 0.17
Source: Team Estimates
Highlights IndustryOverview
Company Overview
FinancialAnalysis
Valuation InvestmentRisk
Appendix
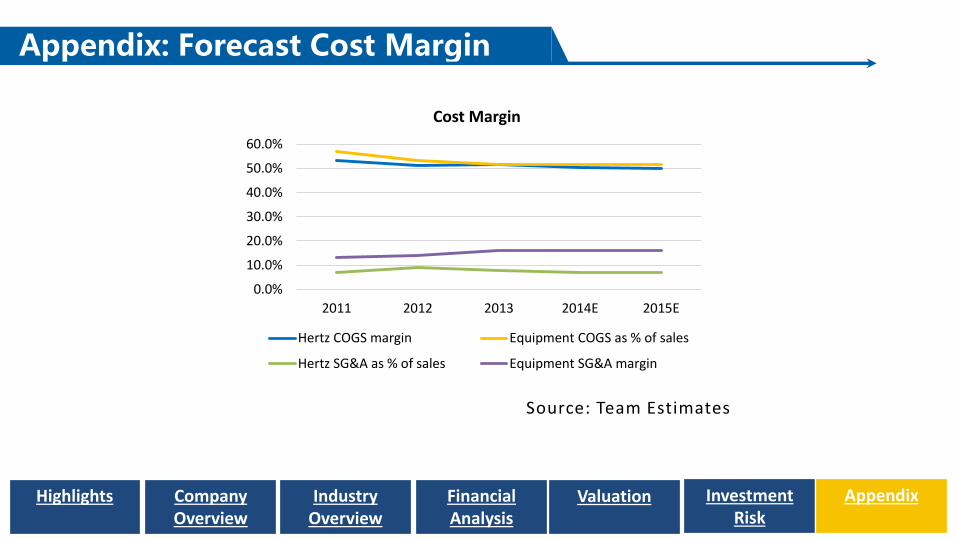
Appendix: Forecast Cost Margin
Source: Team Estimates
Highlights IndustryOverview
Company Overview
FinancialAnalysis
Valuation InvestmentRisk
Appendix
0.0%
10.0%
20.0%
30.0%
40.0%
50.0%
60.0%
2011 2012 2013 2014E 2015E
Cost Margin
Hertz COGS margin Equipment COGS as % of sales
Hertz SG&A as % of sales Equipment SG&A margin

Appendix: Share Repurchase
Source: Team Estimates
Highlights IndustryOverview
Company Overview
FinancialAnalysis
Valuation InvestmentRisk
Appendix
0
100
200
300
400
500
2015 2016
Share Repurchase
Diluted shares outstanding Shares repurchased
0.87
0.17
0.00
0.20
0.40
0.60
0.80
1.00
1.20
1.40
2015 2016
EPS from share repurchase
Related Documents
![TTT TTTT TTTD TTTTT TTTT TTT - datrix.it · '$75,; tttt ttt tttt tttd ttttt tttt ttt ttttt ttdt tttt ttt 'dwd˛ ˘ 3dj ˛ 6l]h˛ t $9(˛ t 7ludwxud˛ 'liixvlrqh˛ ˇˇ ˝ /hwwrul˛](https://static.cupdf.com/doc/110x72/5f41f4077d7bcc38d64069a0/ttt-tttt-tttd-ttttt-tttt-ttt-75-tttt-ttt-tttt-tttd-ttttt-tttt-ttt-ttttt-ttdt.jpg)