Teaching Evidence Based Medicine

Welcome message from author
This document is posted to help you gain knowledge. Please leave a comment to let me know what you think about it! Share it to your friends and learn new things together.
Transcript

Teaching Evidence Based Medicine

What’s
Ahead?
• Practicing EBM in the
Trenches
– Staying up to date
– Answering questions
• Teaching EBM to
beginners
• Teaching EBM to
advanced learners
– Tough topics
• Making EBM practical

But Evidence-Based Practice
Seems Pretty Far Away,…
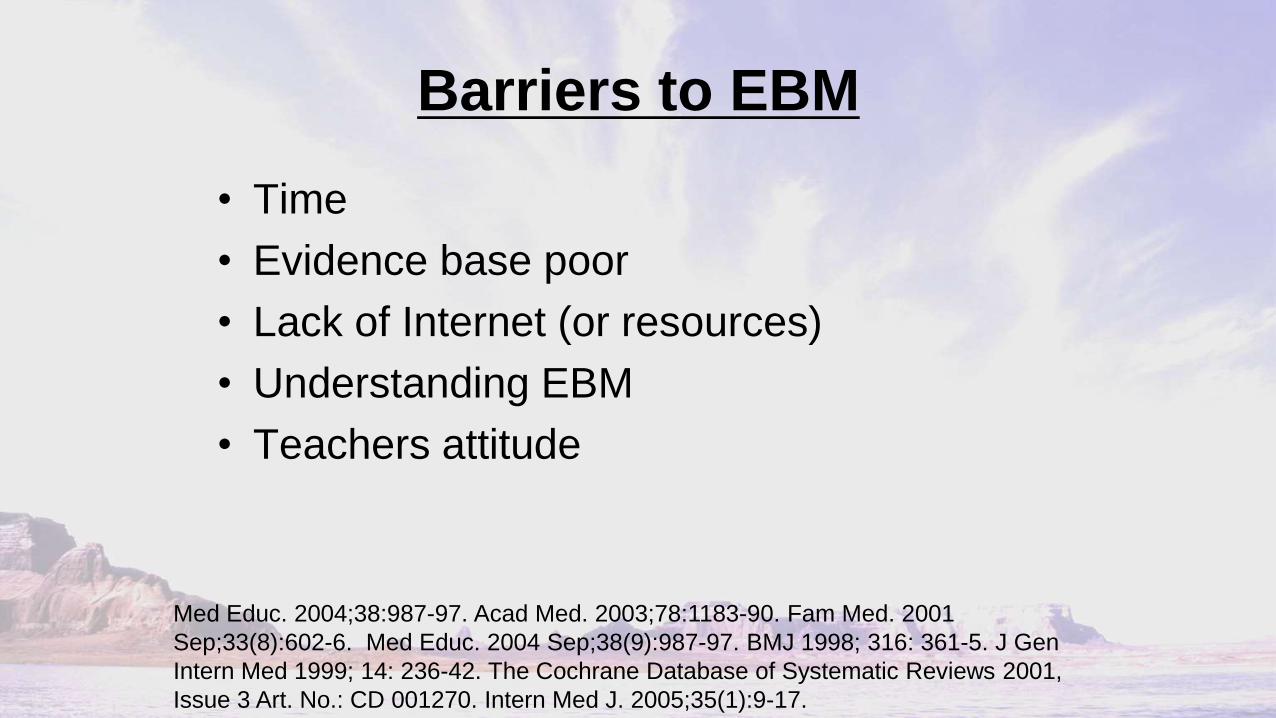
Barriers to EBM
• Time
• Evidence base poor
• Lack of Internet (or resources)
• Understanding EBM
• Teachers attitude
Med Educ. 2004;38:987-97. Acad Med. 2003;78:1183-90. Fam Med. 2001
Sep;33(8):602-6. Med Educ. 2004 Sep;38(9):987-97. BMJ 1998; 316: 361-5. J Gen
Intern Med 1999; 14: 236-42. The Cochrane Database of Systematic Reviews 2001,
Issue 3 Art. No.: CD 001270. Intern Med J. 2005;35(1):9-17.
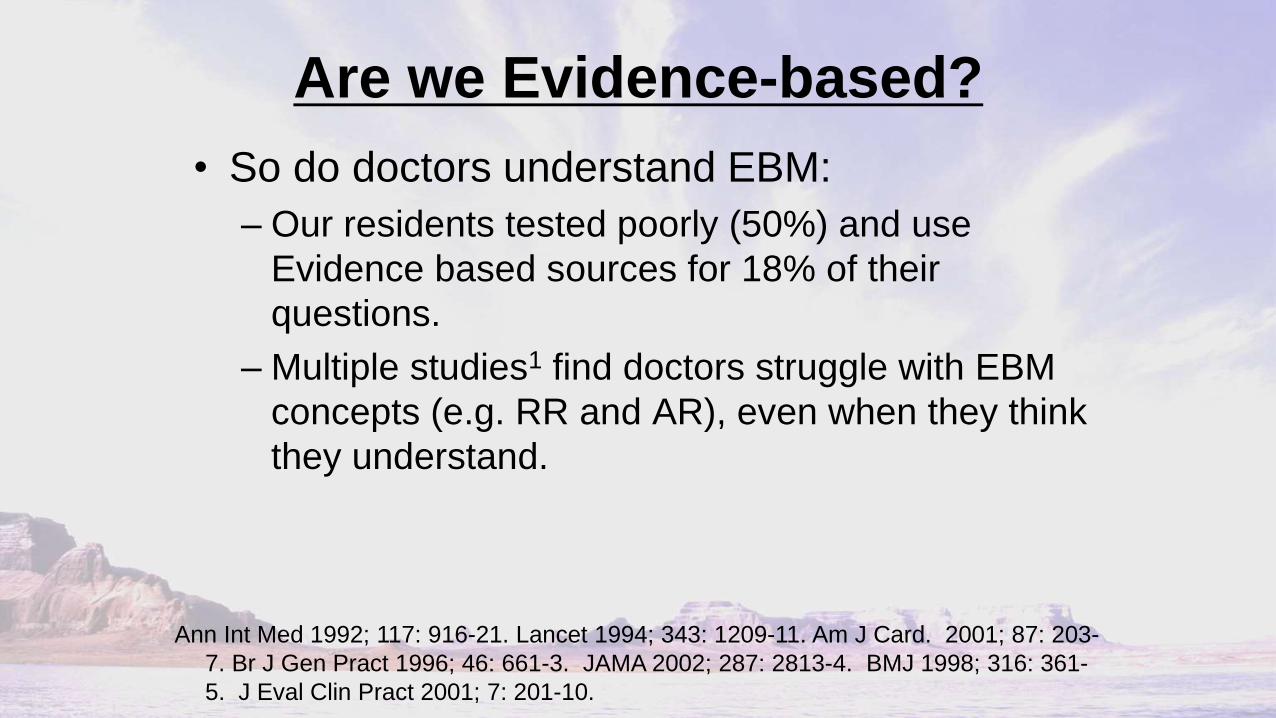
Are we Evidence-based?
• So do doctors understand EBM:
– Our residents tested poorly (50%) and use
Evidence based sources for 18% of their
questions.
– Multiple studies1 find doctors struggle with EBM
concepts (e.g. RR and AR), even when they think
they understand.
Ann Int Med 1992; 117: 916-21. Lancet 1994; 343: 1209-11. Am J Card. 2001; 87: 203-
7. Br J Gen Pract 1996; 46: 661-3. JAMA 2002; 287: 2813-4. BMJ 1998; 316: 361-
5. J Eval Clin Pract 2001; 7: 201-10.

Staying Up-To-Date: Is it Possible?
• Reading all relevant journals to General
Practice?
• There are 341 journals, 90,000 articles/yr
• Even if narrowed down to the top 85, still
would review 16,000 articles/yr.
• If trained in epidemiology, still would take us
627.5 hours/month, or 21 hours a day
Alper et al. J Med Libr Assoc 2004;902(4):429-37.
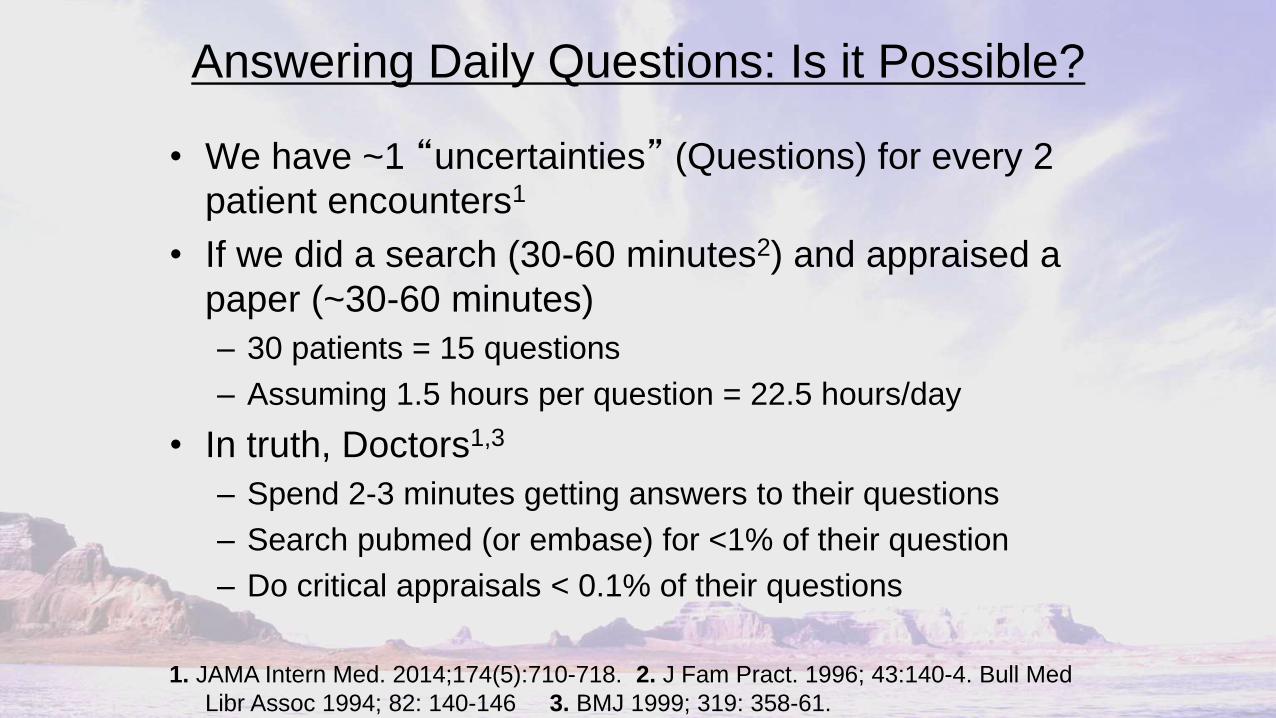
Answering Daily Questions: Is it Possible?
• We have ~1 “uncertainties” (Questions) for every 2
patient encounters1
• If we did a search (30-60 minutes2) and appraised a
paper (~30-60 minutes)
– 30 patients = 15 questions
– Assuming 1.5 hours per question = 22.5 hours/day
• In truth, Doctors1,3
– Spend 2-3 minutes getting answers to their questions
– Search pubmed (or embase) for <1% of their question
– Do critical appraisals < 0.1% of their questions
1. JAMA Intern Med. 2014;174(5):710-718. 2. J Fam Pract. 1996; 43:140-4. Bull Med
Libr Assoc 1994; 82: 140-146 3. BMJ 1999; 319: 358-61.
So, Should We Quit Now?
• There are many barriers to EBM
• Most clinicians struggle understanding EBM
• Staying up-to-date is overwhelming
• Answer questions in practice by critical
appraisal is impossible.
• We NEED to Rethink EBM education and
Practice

A New Approach to EBM
• Teaching:
– For >90%: Understand Basics and Terms.
• Needed for Practice.
– For <10%: Advanced understanding.
• Needed for people presenting or writing on Evidence
• Staying up-to-date requires
– Pre-Filtered & Pre-Appraised:
• Answering Clinical Questions requires
– Quick Search, Thorough and Unbiased

How To Stay Up-To-Date
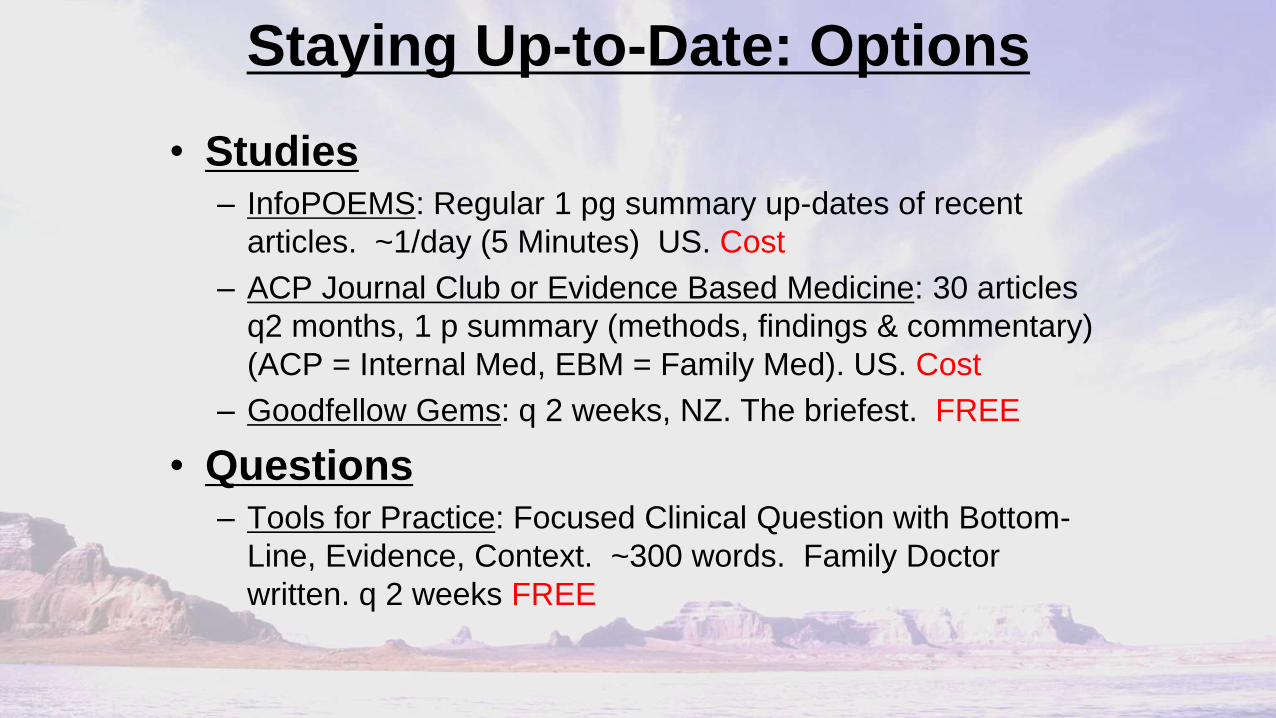
Staying Up-to-Date: Options
• Studies – InfoPOEMS: Regular 1 pg summary up-dates of recent
articles. ~1/day (5 Minutes) US. Cost
– ACP Journal Club or Evidence Based Medicine: 30 articles
q2 months, 1 p summary (methods, findings & commentary)
(ACP = Internal Med, EBM = Family Med). US. Cost
– Goodfellow Gems: q 2 weeks, NZ. The briefest. FREE
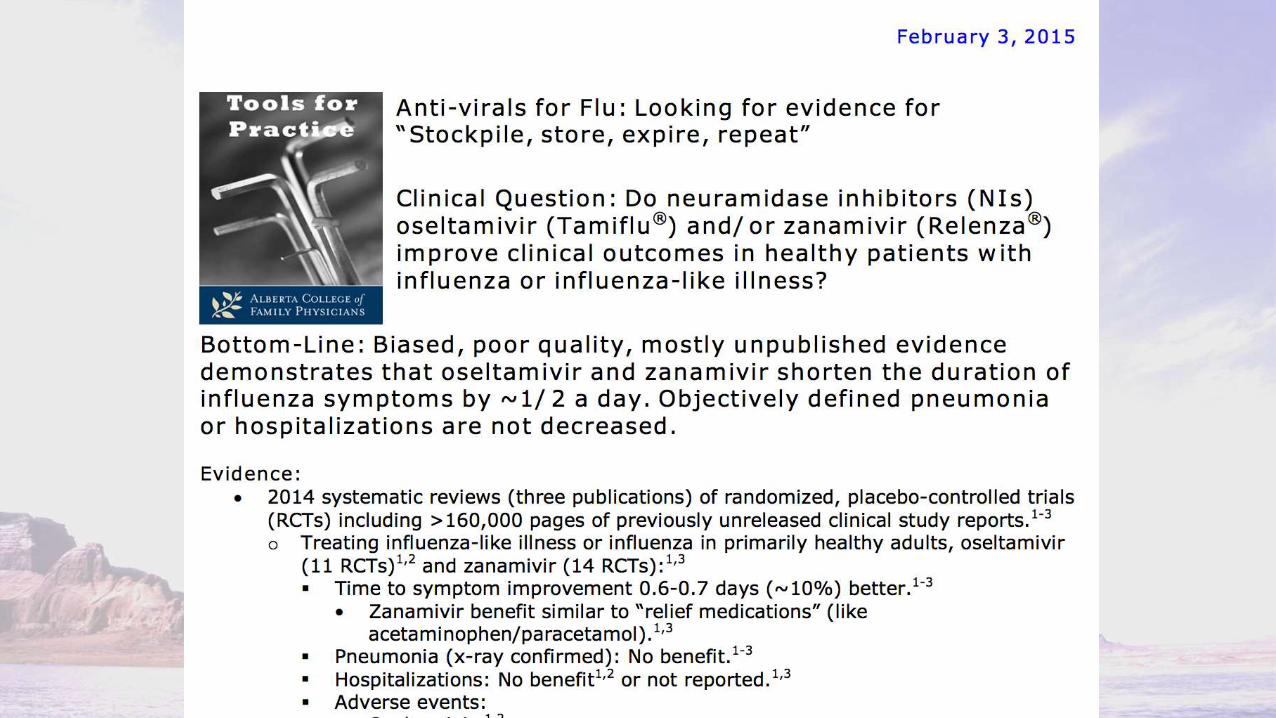
• Questions – Tools for Practice: Focused Clinical Question with Bottom-
Line, Evidence, Context. ~300 words. Family Doctor
written. q 2 weeks FREE
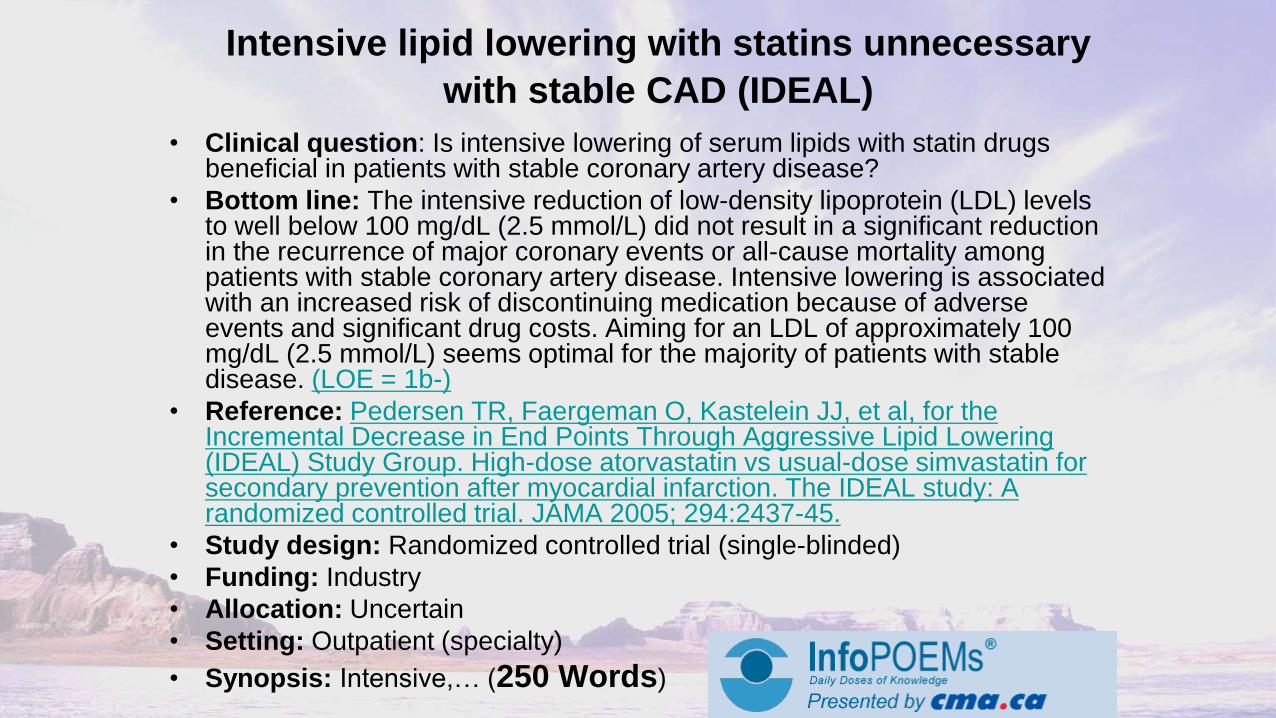
Intensive lipid lowering with statins unnecessary
with stable CAD (IDEAL) • Clinical question: Is intensive lowering of serum lipids with statin drugs
beneficial in patients with stable coronary artery disease?
• Bottom line: The intensive reduction of low-density lipoprotein (LDL) levels to well below 100 mg/dL (2.5 mmol/L) did not result in a significant reduction in the recurrence of major coronary events or all-cause mortality among patients with stable coronary artery disease. Intensive lowering is associated with an increased risk of discontinuing medication because of adverse events and significant drug costs. Aiming for an LDL of approximately 100 mg/dL (2.5 mmol/L) seems optimal for the majority of patients with stable disease. (LOE = 1b-)
• Reference: Pedersen TR, Faergeman O, Kastelein JJ, et al, for the Incremental Decrease in End Points Through Aggressive Lipid Lowering (IDEAL) Study Group. High-dose atorvastatin vs usual-dose simvastatin for secondary prevention after myocardial infarction. The IDEAL study: A randomized controlled trial. JAMA 2005; 294:2437-45.
• Study design: Randomized controlled trial (single-blinded)
• Funding: Industry
• Allocation: Uncertain
• Setting: Outpatient (specialty)
• Synopsis: Intensive,… (250 Words)

ACP Sample
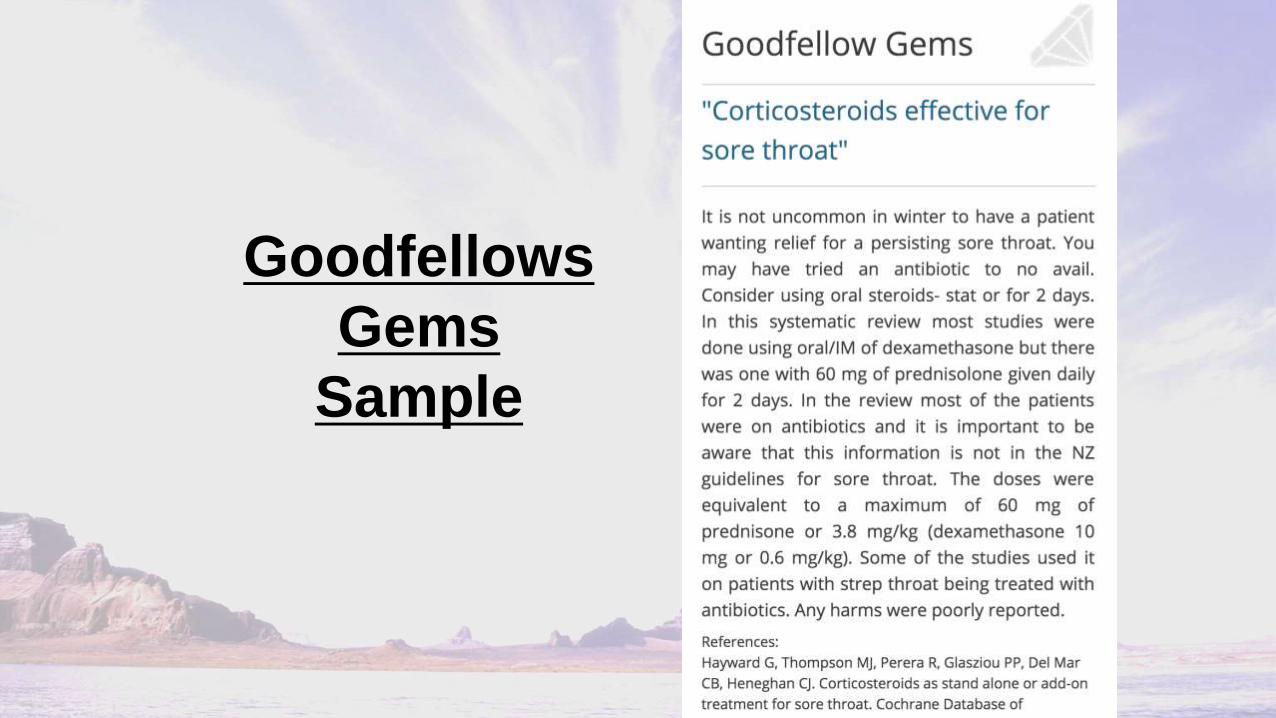
Goodfellows
Gems
Sample
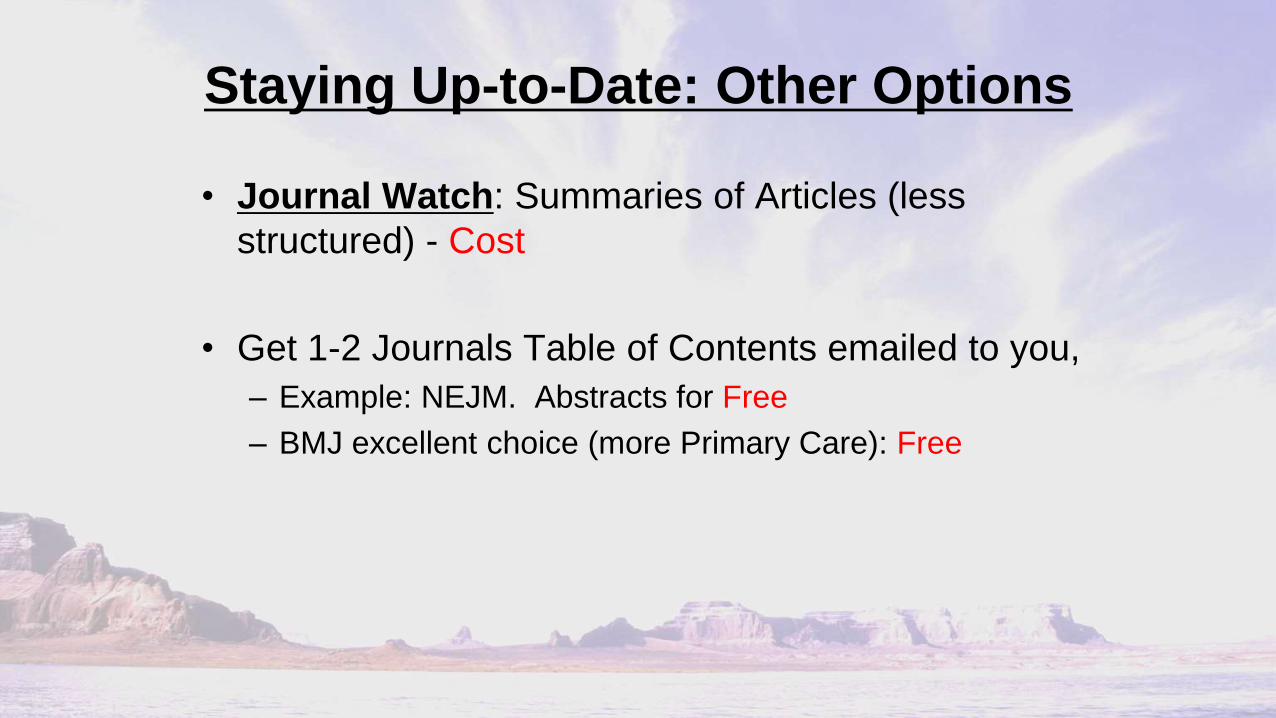
Staying Up-to-Date: Other Options
• Journal Watch: Summaries of Articles (less
structured) - Cost
• Get 1-2 Journals Table of Contents emailed to you,
– Example: NEJM. Abstracts for Free
– BMJ excellent choice (more Primary Care): Free

P
r
e
v
i
o
u
s
N
e
x
t
P
r
e
v
i
o
u
s
N
e
x
t
Example:
NEJM
Abstract

Where to Get Answers?
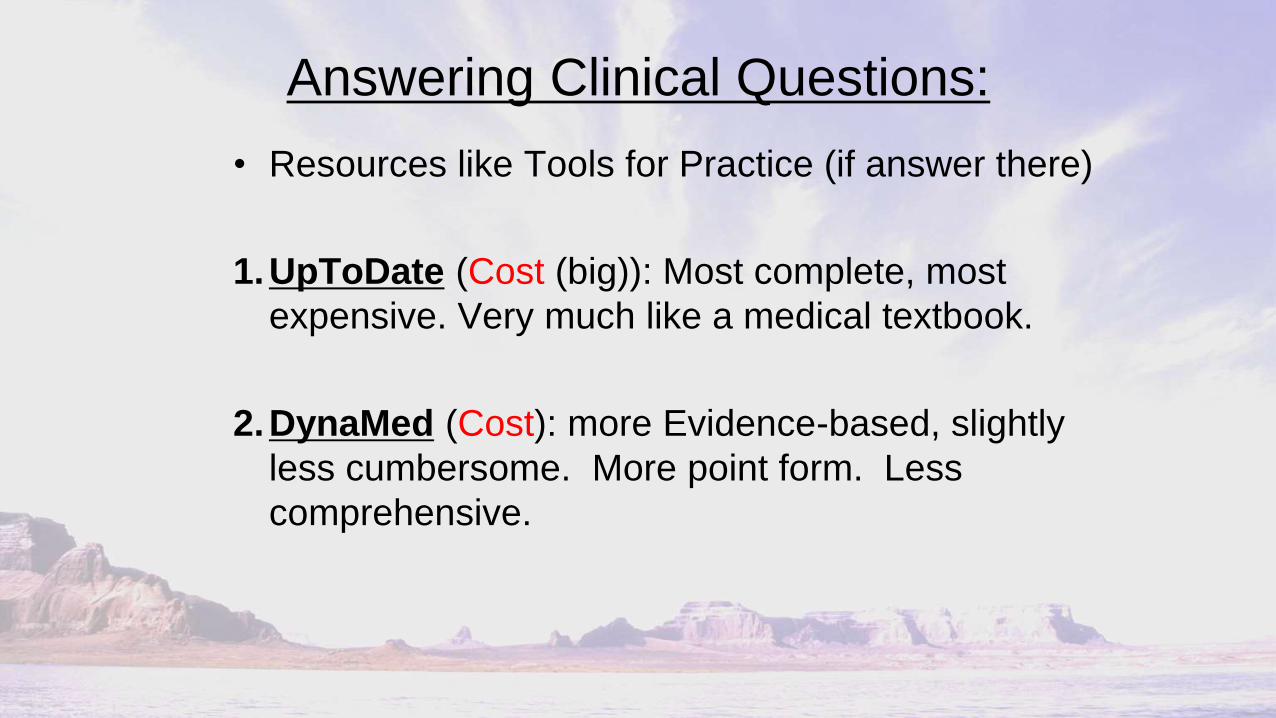
Answering Clinical Questions:
• Resources like Tools for Practice (if answer there)
1.UpToDate (Cost (big)): Most complete, most
expensive. Very much like a medical textbook.
2.DynaMed (Cost): more Evidence-based, slightly
less cumbersome. More point form. Less
comprehensive.
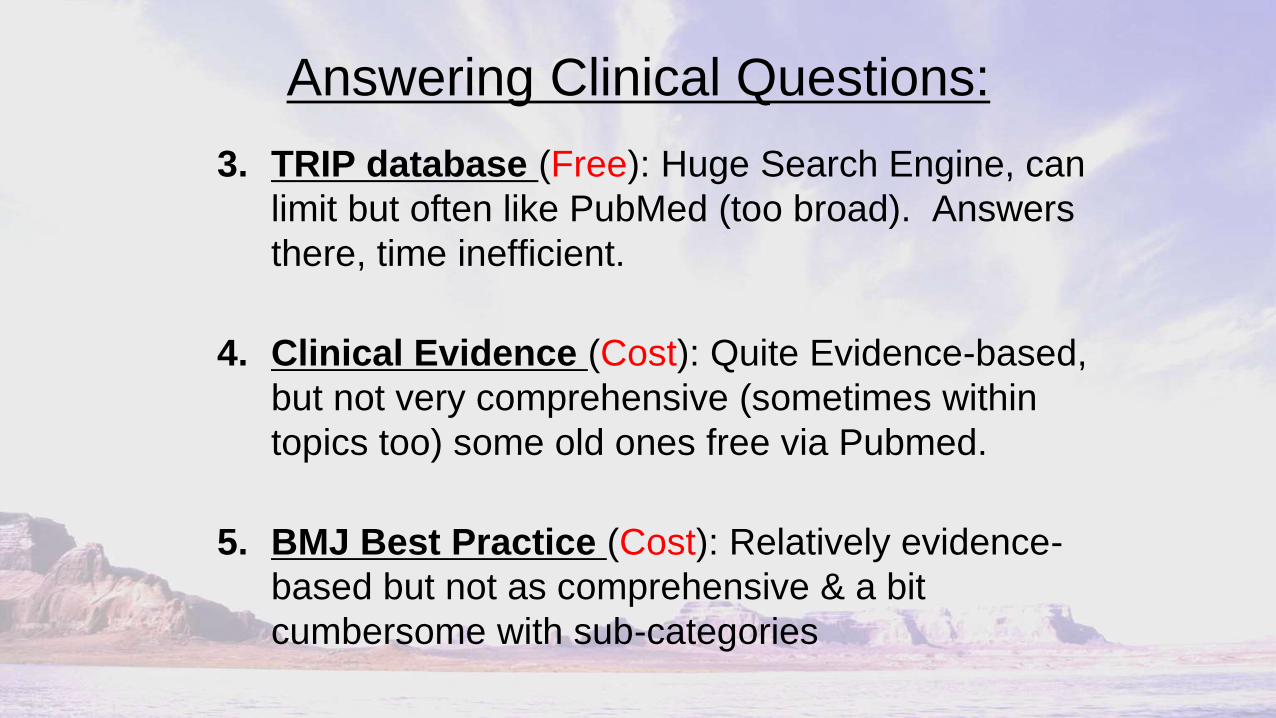
Answering Clinical Questions:
3. TRIP database (Free): Huge Search Engine, can
limit but often like PubMed (too broad). Answers
there, time inefficient.
4. Clinical Evidence (Cost): Quite Evidence-based,
but not very comprehensive (sometimes within
topics too) some old ones free via Pubmed.
5. BMJ Best Practice (Cost): Relatively evidence-
based but not as comprehensive & a bit
cumbersome with sub-categories
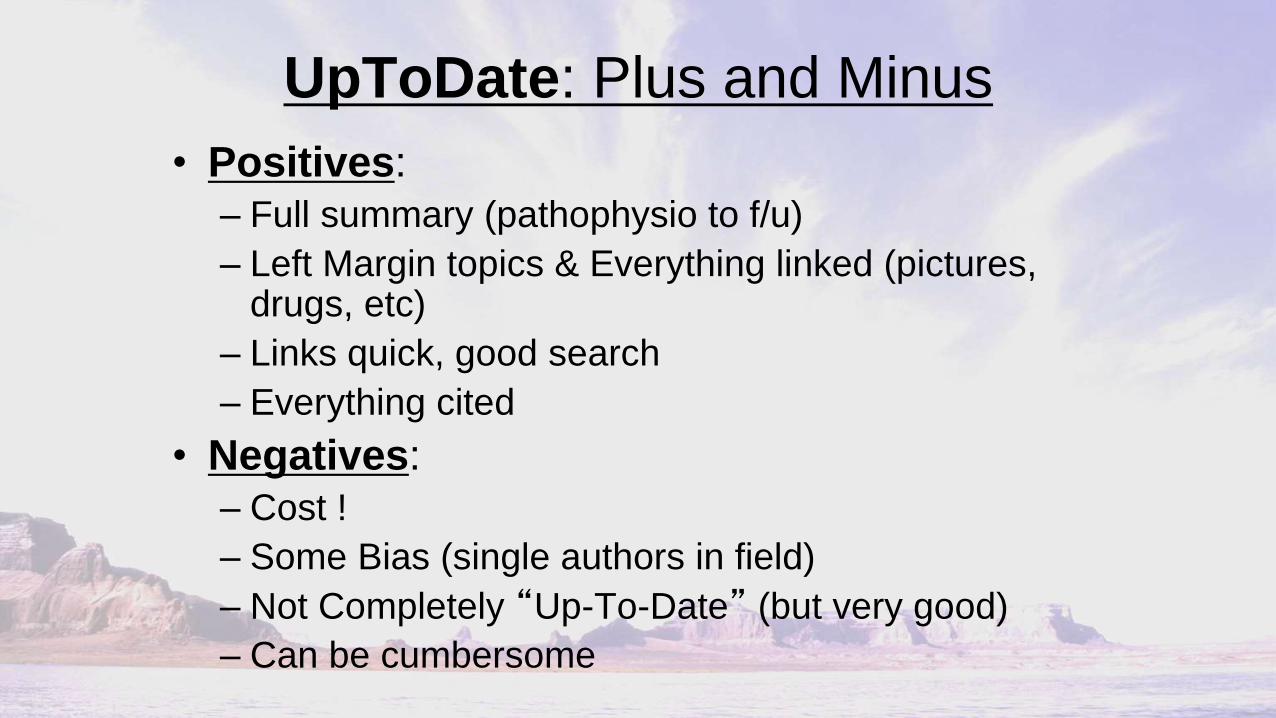
UpToDate: Plus and Minus
• Positives:
– Full summary (pathophysio to f/u)
– Left Margin topics & Everything linked (pictures, drugs, etc)
– Links quick, good search
– Everything cited
• Negatives:
– Cost !
– Some Bias (single authors in field)
– Not Completely “Up-To-Date” (but very good)
– Can be cumbersome
Teaching EBM:
The Basics?
For Learners like Medical
Students and Residents

Primary Goals
• To help residents become competent self-
directed life-long learners with the skills to
effectively and efficiently keep up-to-date.
• To learn how to use Evidence Based Medicine
(EBM) to rapidly (as possible) solve problems
encountered in daily practice.
Secondary Goals
• Review EBM components within the family medicine residency
curriculum, maximizing educational opportunities,
– Eliminating or modifying components with poor evaluation or performance.
– Enhancing other areas to promote EBM.
– Adding education time only to achieve the core features of life-long learning
skills.
• Promote the development of the skills in Residents needed to
critique educational opportunities.
• Promote and encourage residents seeking additional skills, training
or experience in EBM, knowledge transfer and/or research.
Learning Objectives:
Knowledge Component
• To understand the rationale and benefits of EBM
• Provide a strong foundation in the basic principles of
EBM including
– Recognizing and formulating clinical questions
– Finding and Accessing information
– Interpreting information
– Applying information
• Provide and identify online resources, educational tools
and web-links

Learning Objectives:
Skill Components
• Learn to identify problems/questions encountered in
practice and seek solutions based upon the best evidence.
(Via EBM “assignment” to promote rapidly answering
clinical questions).
• Build skills and comfort in knowledge transfer (primarily
through oral presentation skills).

Learning Objectives:
Attitude Components
• To facilitate appreciation and enthusiasm for
– the judicious use of current evidence to optimize
patient care
– maintenance of skills and knowledge through life long
self-directed learning
Some Background Research • Critical Appraisal based curriculum are often less
successful.1
• Workshops (3 day) have been shown to improve knowledge.2
• Classroom EBM teaching alone only improve knowledge while Integration improves skills, attitudes and behavior.3
• Web-based Clinical Questions & Answers helpful getting resident participation in EBM.4
1. Acad Med. 1999;74(6):686-94. & CMAJ 1998;158(2):177-81. 2. BMJ. 2002
7;325(7376):1338-41. & Acad Med. 2000;75(12):1212-4. 3. Acad Med. 2002;77(7):
741-2. & BMJ. 2004;329(7473):1017. 4. Acad Med. 2003 Mar;78(3):270-4.

EBM Curriculum Components
• Family Medicine Evidence Based Medicine Workshop
– 2 day mixed lecture & small group work + computer lab
• Informatics/Evidence based resources
– UpToDate, DynaMed, Clinical Evidence, others
• Brief Evidence-based Assessment of Research (BEARs)
– 1 page assignment, ≥4 during Family block (1st yr)
• Resident Journal Club
– Selected by EBM faculty, rapid review summary articles in teams, shared presentations, focus on clinical application.
• Other components
– q 2 monthly Lit review lecture
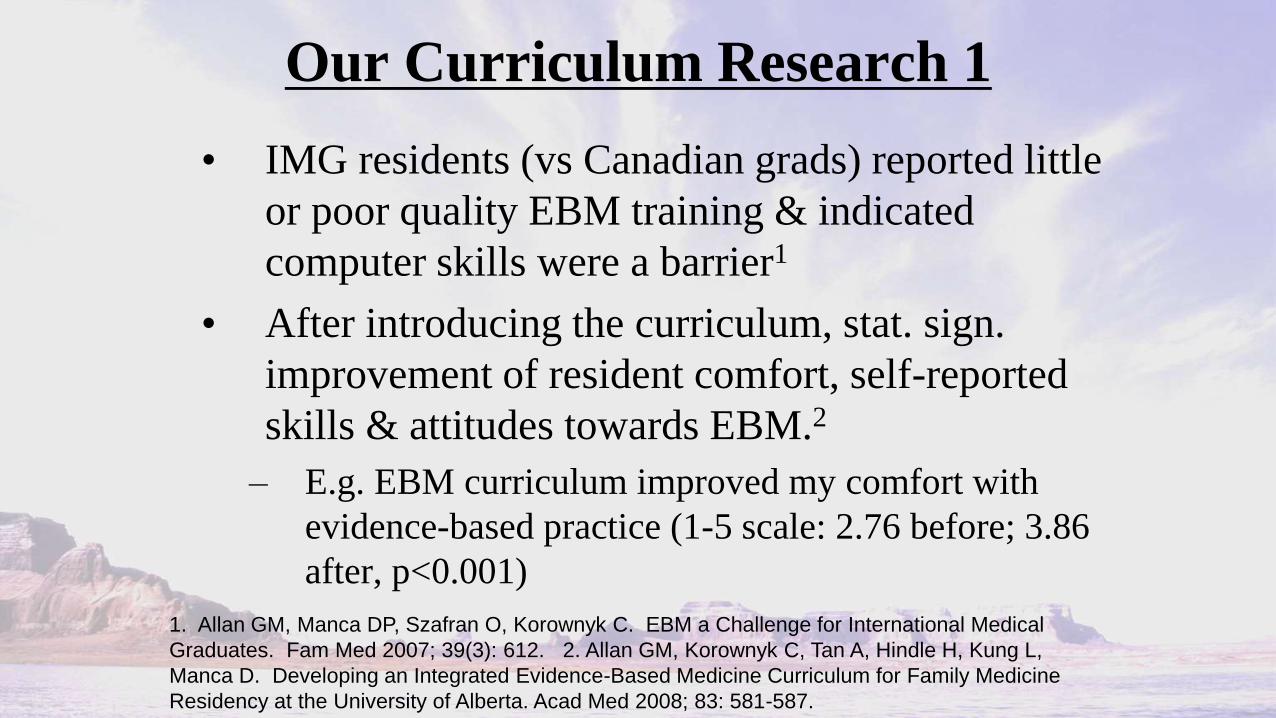
Our Curriculum Research 1
• IMG residents (vs Canadian grads) reported little
or poor quality EBM training & indicated
computer skills were a barrier1
• After introducing the curriculum, stat. sign.
improvement of resident comfort, self-reported
skills & attitudes towards EBM.2
– E.g. EBM curriculum improved my comfort with
evidence-based practice (1-5 scale: 2.76 before; 3.86
after, p<0.001)
1. Allan GM, Manca DP, Szafran O, Korownyk C. EBM a Challenge for International Medical
Graduates. Fam Med 2007; 39(3): 612. 2. Allan GM, Korownyk C, Tan A, Hindle H, Kung L,
Manca D. Developing an Integrated Evidence-Based Medicine Curriculum for Family Medicine
Residency at the University of Alberta. Acad Med 2008; 83: 581-587.

Our Curriculum Research 2
• How do residents address questions in clinics
– 38 residents: 325 questions x114 clinical ½ days (420 pts)
– 0.8 questions/pts, 83% answered with one resource (1-6)
– Attempts: colleagues 65.5% (94% were preceptor), electronic resources 20.7% and paper resources 13.8%.
– Colleagues least likely need second resource (ss).
– Utility of answers: Colleagues (ss) superior to electronic
– EBM workshop training did not influence electronic resource use but semi-independence did: 17% to 51% (ss).
• Studied practicing graduates and presently analyzing
Can Fam Physician. 2012 Jun;58(6):e344-51.
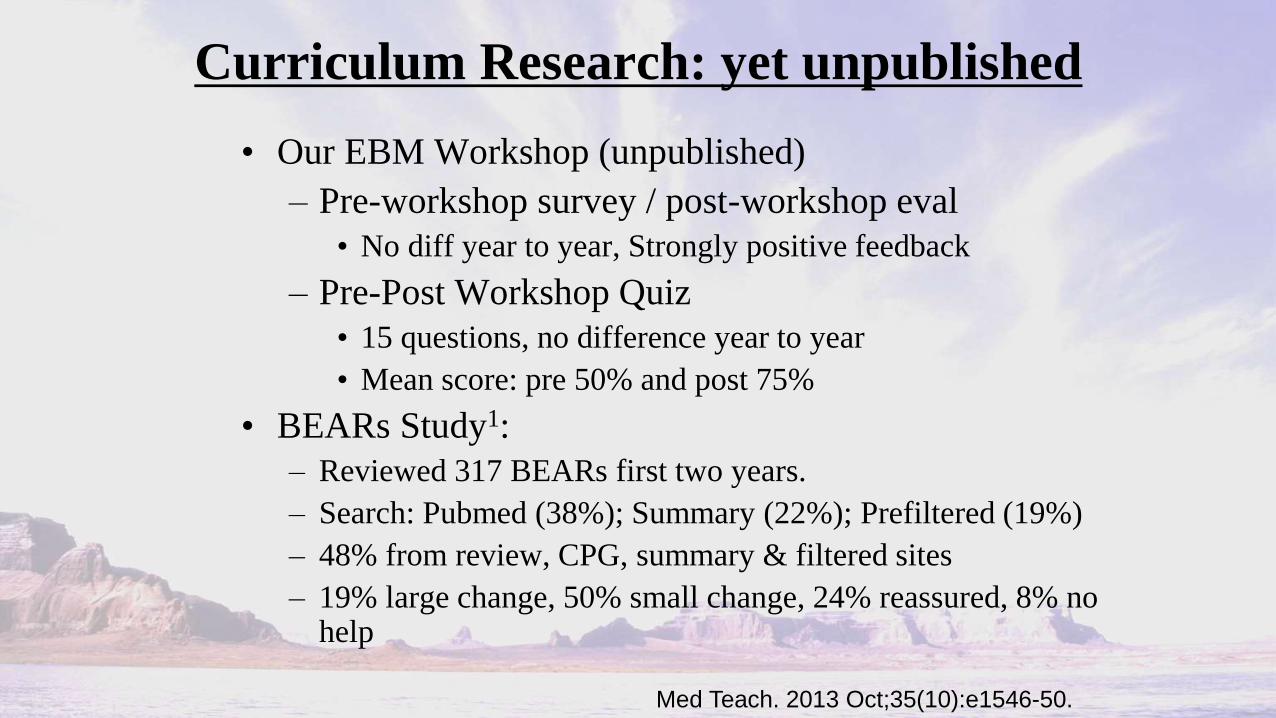
Curriculum Research: yet unpublished
• Our EBM Workshop (unpublished)
– Pre-workshop survey / post-workshop eval
• No diff year to year, Strongly positive feedback
– Pre-Post Workshop Quiz
• 15 questions, no difference year to year
• Mean score: pre 50% and post 75%
• BEARs Study1:
– Reviewed 317 BEARs first two years.
– Search: Pubmed (38%); Summary (22%); Prefiltered (19%)
– 48% from review, CPG, summary & filtered sites
– 19% large change, 50% small change, 24% reassured, 8% no help
Med Teach. 2013 Oct;35(10):e1546-50.

Summary
• Curriculum involves training physicians to be
good evidence
• While successful on many levels, not perfect.
– Still need additional factors (e.g. independence)
• When you make an education program,
– Evaluate it (Study it).

Teaching Teachers: Advanced EBM

Advanced Education Components
• Tough topics
– Allocation Concealment
– Intention to Treat
– Numbers
– Funding
– P-values (hypothesis testing)
• Advanced Workshop

Extra information for workshop

What is in the DM trials?
Number Mean Age Duration of
DM
Past CVD Weight in
2nd Meta
UKPDS 33
(1998)
3,867
(4209*) 53.2 New 2%
23.9 UKPDS 34
(1998)
753
(4209*) 53.2 New 2%
ACCORD
(2008) 10,251 62.2 8.3 35% 21.5
ADVANCE
(2008) 11,140 66 7.5 32% 28.2
VADT (2009) 1791 60.4 11.5 40% 11.9
UGDP
(1978) 414 52.7 New 6% 11.8
* The n used in the BMJ meta for UKPDS combined
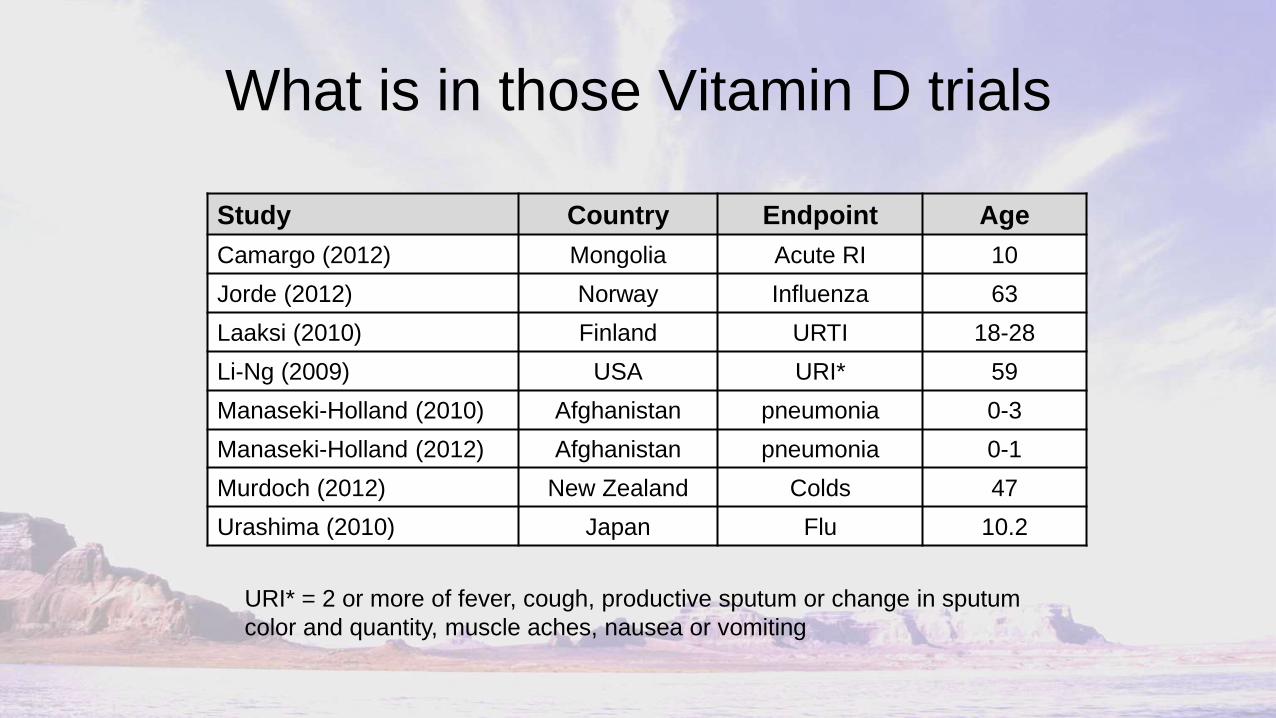
What is in those Vitamin D trials
Study Country Endpoint Age
Camargo (2012) Mongolia Acute RI 10
Jorde (2012) Norway Influenza 63
Laaksi (2010) Finland URTI 18-28
Li-Ng (2009) USA URI* 59
Manaseki-Holland (2010) Afghanistan pneumonia 0-3
Manaseki-Holland (2012) Afghanistan pneumonia 0-1
Murdoch (2012) New Zealand Colds 47
Urashima (2010) Japan Flu 10.2
URI* = 2 or more of fever, cough, productive sputum or change in sputum
color and quantity, muscle aches, nausea or vomiting

What is in those Vitamin D trials
• Let’s look specifically at Urashima (Am J
Clin Nutr 2010;91:1255-60)
Vitamin D Placebo Relative Risk*
n (167) % n (167) %
Influenza A 18 11% 31 19% 0.58 (0.34-0.996)
Influenza B 39 23% 28 17% 1.39 (0.90-2.15)
Influenza Like
Illness 8 5% 9 5% -
Total 65 38.9% 68 40.7% 0.96 (0.73-1.24)
* Using http://www.hutchon.net/ConfidRR.htm for RR (& CI) estimation

Randomization, Blinding &
Allocation Concealment
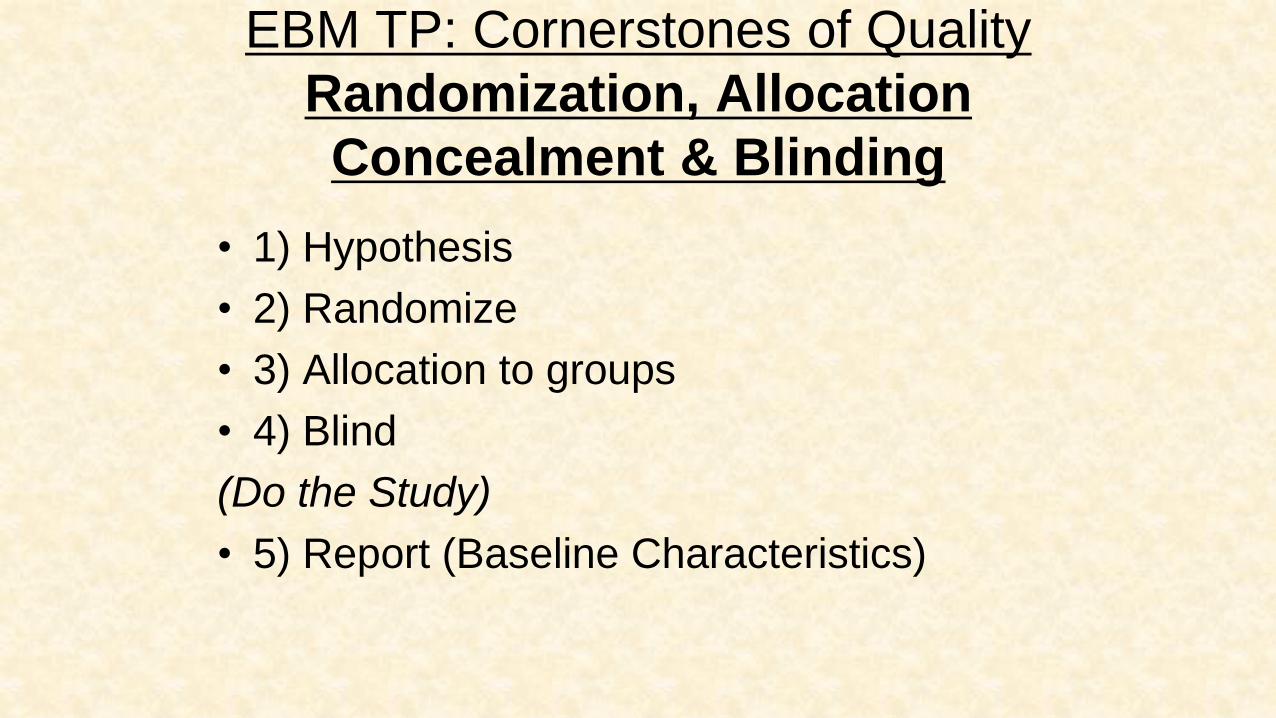
EBM TP: Cornerstones of Quality
Randomization, Allocation
Concealment & Blinding
• 1) Hypothesis
• 2) Randomize
• 3) Allocation to groups
• 4) Blind
(Do the Study)
• 5) Report (Baseline Characteristics)
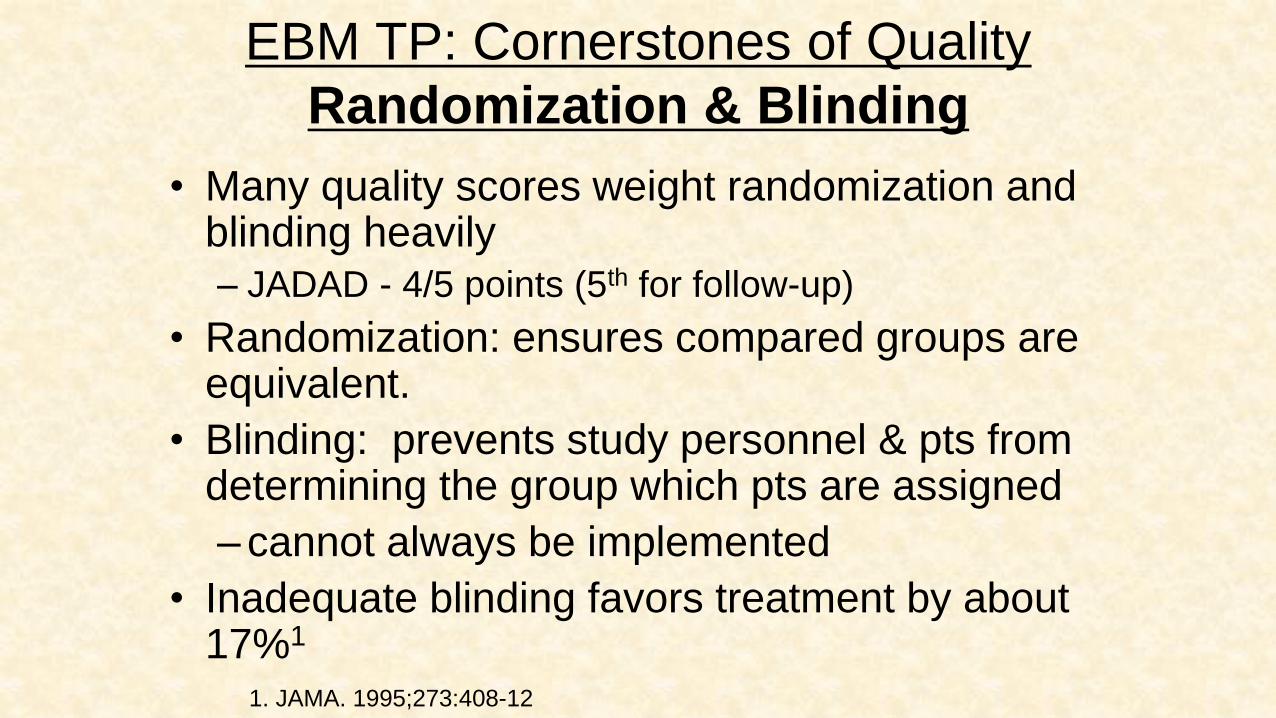
EBM TP: Cornerstones of Quality
Randomization & Blinding
• Many quality scores weight randomization and blinding heavily
– JADAD - 4/5 points (5th for follow-up)
• Randomization: ensures compared groups are equivalent.
• Blinding: prevents study personnel & pts from determining the group which pts are assigned
– cannot always be implemented
• Inadequate blinding favors treatment by about 17%1
1. JAMA. 1995;273:408-12
EBM TP: Cornerstones of Quality
• BUT Randomization & Blinding mean little
without their forgotten cousin,…

EBM TP: Cornerstones of Quality
Allocation concealment
• Allocation concealment prevents clinicians from
circumventing the randomization process
– AC can always be implemented
– Reporting AC poor (only 7% - 55%)1
• Poor Allocation concealment gives bias,2
– If Unclear AC = 33%
– If Inadequate AC = 41%
– Overall (unclear/inadequate) AC = 37%
1. BMJ 2004 3;328:22-4. ACP J Club. 2000 Mar-Apr;132:A11 .
2. JAMA 1995; 273: 408-412. Lancet. 1998;352:609-13.

EBM TP: Cornerstones of Quality
Allocation concealment Examples
• If a trial sets it’s treatment effect at 25-50%,
– Doesn’t Conceal allocation,
– Any effect or prove of benefit may be entirely the
fault of poor AC (41%)
Reporting Baseline Characteristics:
The Final Check
• Authors must report (usually Table 1) the
characteristics of the pts in each group (so we
can compare them)
• Ex Post-MI trial.
– ex if one group is older & has 10% higher risk
of MI, analysis must account for known > risk
Analysis:
Intention to Treat

EBM TP: “What is Intention to Treat”
• “Analysis was by intention to treat”
• Simply: Subjects were analyzed by what group they were
randomized to, not by what happened to them.
• The Analysis is by how the investigator intended to treat
them.

Intention to Treat: Who Cares?
• The alternatives are: Per Protocol Analysis,
Explanatory Analysis, Analysis by Treatment
Administered, Efficacy Analysis
• Using these, you can hide outcomes or
select the best patients
• Example 1: Quiters (also known as drop-
outs)

Intention to Treat: Example
Imagine a Stroke Study
Assume 10% have strokes a year
Assume it takes 6 months to get to surgery
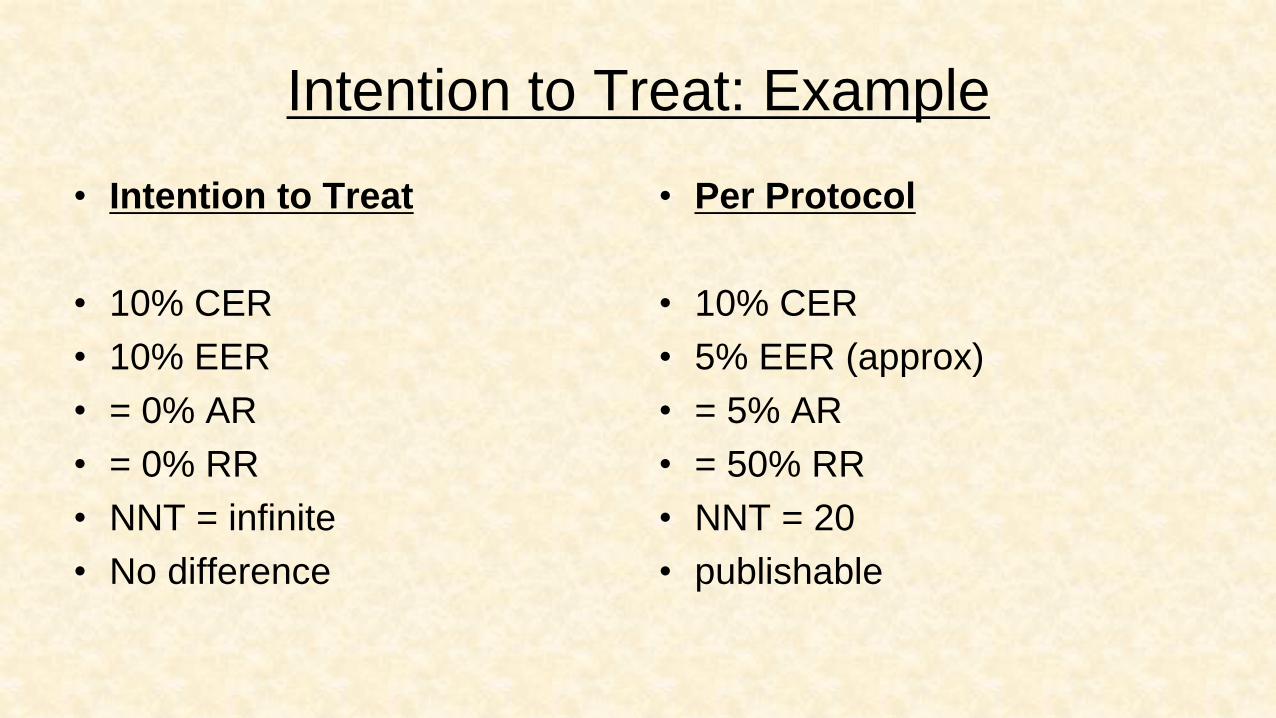
Intention to Treat: Example
• Intention to Treat
• 10% CER
• 10% EER
• = 0% AR
• = 0% RR
• NNT = infinite
• No difference
• Per Protocol
• 10% CER
• 5% EER (approx)
• = 5% AR
• = 50% RR
• NNT = 20
• publishable
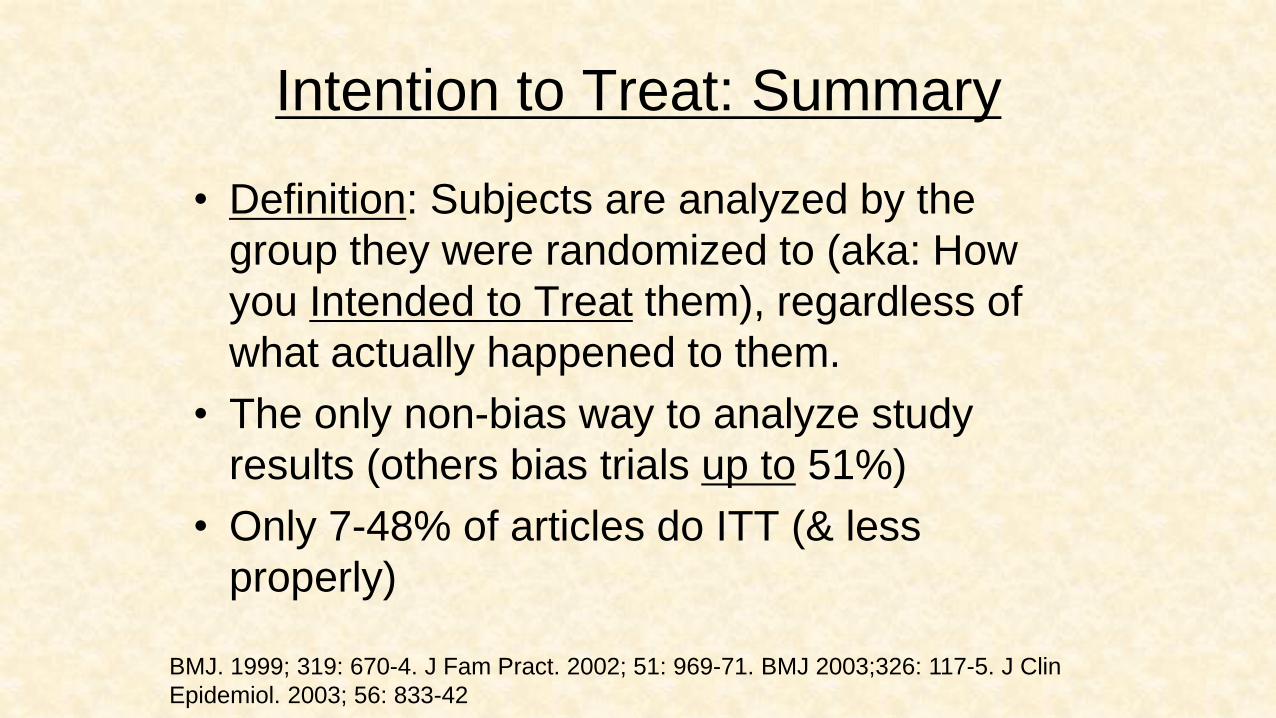
Intention to Treat: Summary
• Definition: Subjects are analyzed by the
group they were randomized to (aka: How
you Intended to Treat them), regardless of
what actually happened to them.
• The only non-bias way to analyze study
results (others bias trials up to 51%)
• Only 7-48% of articles do ITT (& less
properly)
BMJ. 1999; 319: 670-4. J Fam Pract. 2002; 51: 969-71. BMJ 2003;326: 117-5. J Clin
Epidemiol. 2003; 56: 833-42

Therapy Stats
EBM TP: (Liars, Damn Liars &) Stats
• RR vs AR
• RR when event unlikely
• The Media

RR, AR and NNT
e.g. Treating Hypertension for MI Risk (Framingham data)
• AR = CER – EER
• RR= EER / CER
• NNT = 1 / AR
AR= 20% - 10% = 10%
RR= 10% / 20% = 50%
NNT= 1 / 0.1 = 10
CER: 60 y.o. M, HDL 1.0, BP>160 = 20%
EER: 60 y.o. M, HDL 1.0, BP<130 = 10%

RR when event unlikely &
RR vs AR (NNT)
Common Diseases
• RR = 50%
• CER = 20%
• EER = 10%
• AR = 10%
• NNT = 10
Uncommon Diseases
• RR = 50%
• CER = 1%
• EER = 0.5%
• AR = 0.5%
• NNT = 200

The Media: Women’s Health Initiative
• TV Evening News
(September 24, 2003)
• 41% increase in stroke
• 29% increase in MI
• Double rate of VTE
• 26% in Breast Ca
• No benefits mentioned
• Actual Risk per 10,000
(JAMA 288(3):321-33)
• 8 strokes in 10,000 p. y.
• 7 MI’s in 10,000 p. y.
• 18 VTE in 10,000 p. y.
• 8 Breast Ca in 10,000
• 6 Colorectal Ca & 5 Hip
Fractures Less/10,000
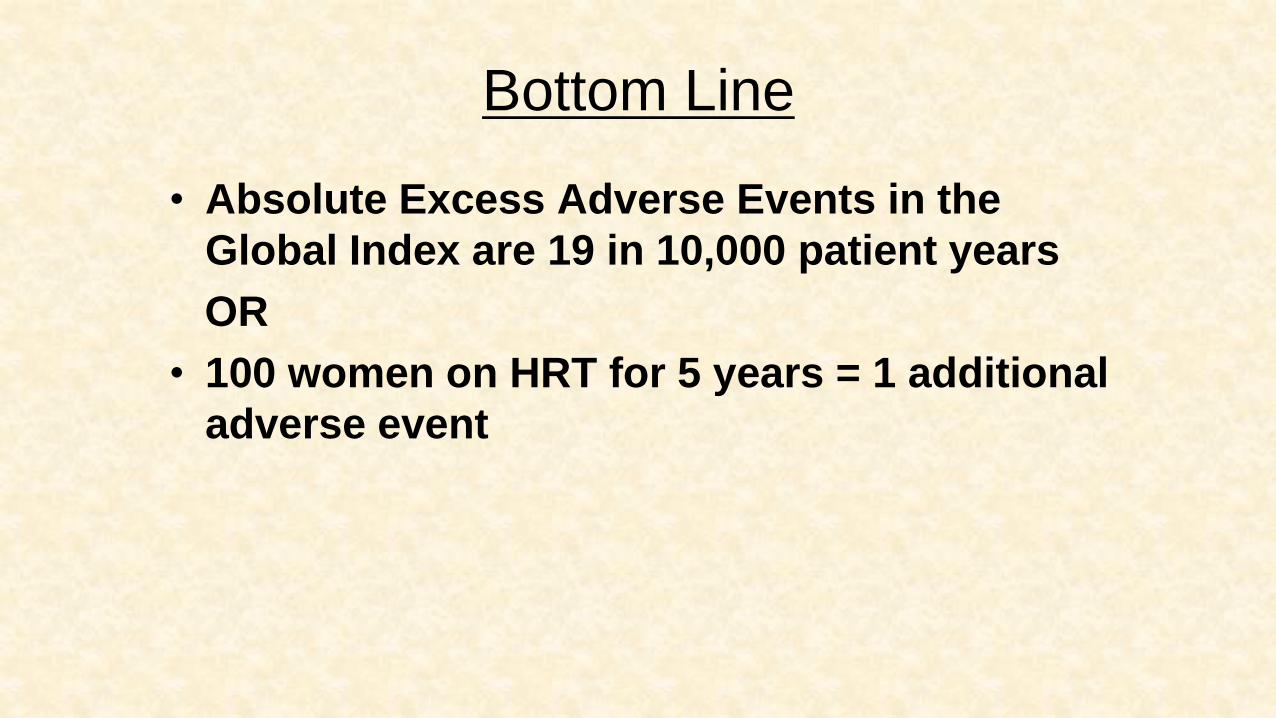
Bottom Line
• Absolute Excess Adverse Events in the
Global Index are 19 in 10,000 patient years
OR
• 100 women on HRT for 5 years = 1 additional
adverse event
Funding Bias

EBM TP: Funding Bias
“He who pays, Calls the Tune”
Some Facts (& Myths)
• Is industry research more likely to be published
• No
• Is industry research comparatively poor quality
• No (?)
• Does Funding Influence Outcomes &
Recommendations
• Yes
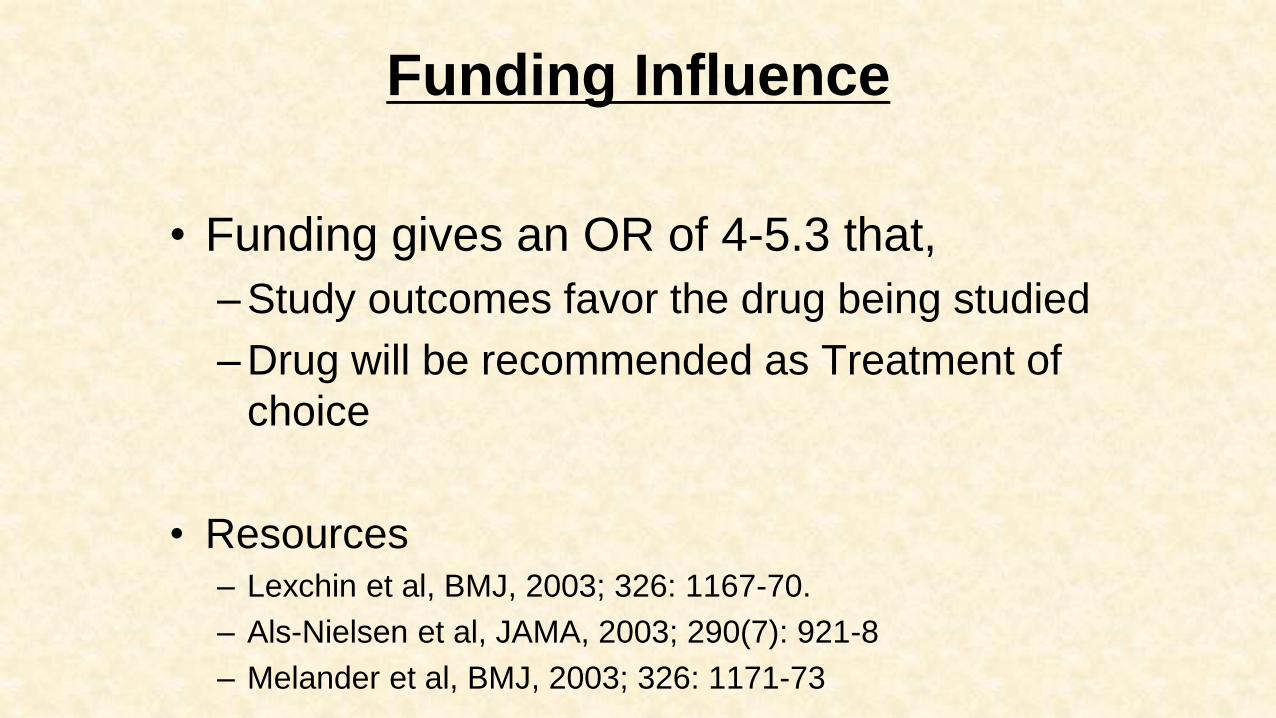
Funding Influence
• Funding gives an OR of 4-5.3 that,
– Study outcomes favor the drug being studied
– Drug will be recommended as Treatment of
choice
• Resources – Lexchin et al, BMJ, 2003; 326: 1167-70.
– Als-Nielsen et al, JAMA, 2003; 290(7): 921-8
– Melander et al, BMJ, 2003; 326: 1171-73
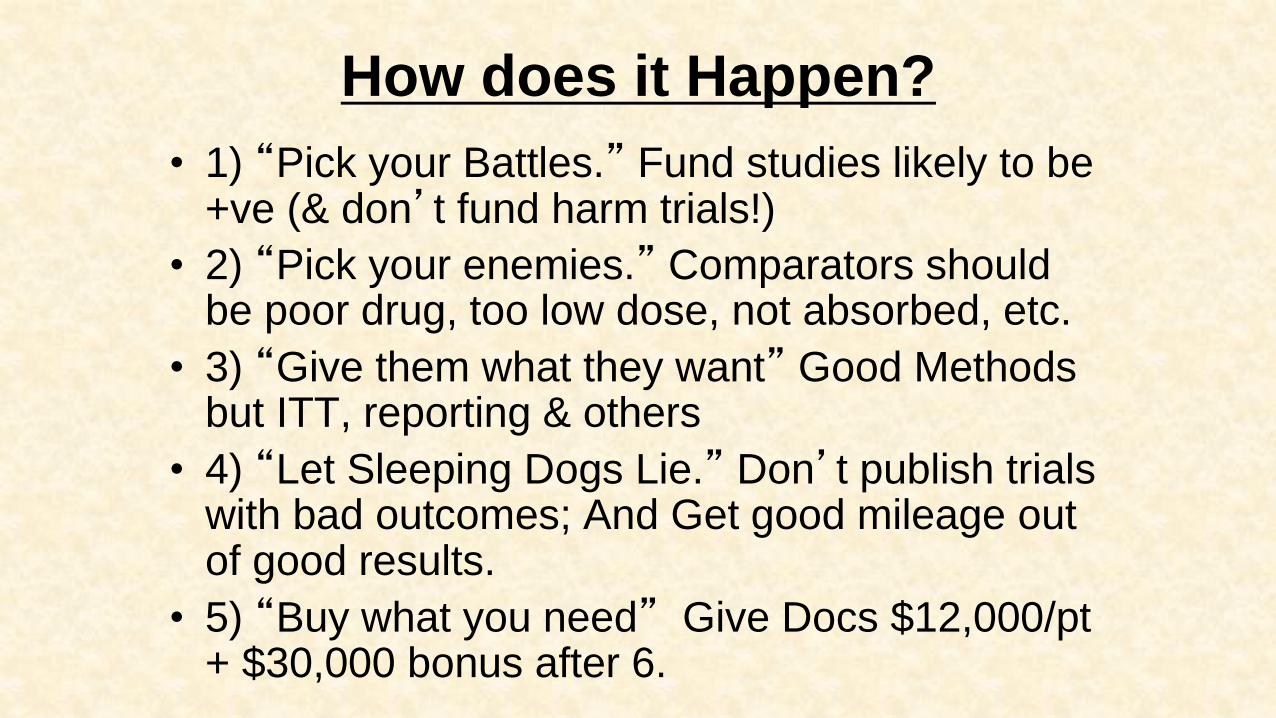
How does it Happen?
• 1) “Pick your Battles.” Fund studies likely to be +ve (& don’t fund harm trials!)
• 2) “Pick your enemies.” Comparators should be poor drug, too low dose, not absorbed, etc.
• 3) “Give them what they want” Good Methods but ITT, reporting & others
• 4) “Let Sleeping Dogs Lie.” Don’t publish trials with bad outcomes; And Get good mileage out of good results.
• 5) “Buy what you need” Give Docs $12,000/pt + $30,000 bonus after 6.

Selective Publication and Reporting - Circles: trials done by industry (red = favorable
outcome, blue = no better than placebo)
- Green Diamonds: publications off one trial.
-Yellow Boxes: publications off more than one trial
-Three Trials find their way into 15 publications (5 each)

Selective Publication and Reporting
Rare cross referencing
Changing authors &
Definitions
Publications from
Single Trails:
- if trial +ve = 90%
- if trial –ve = 29%

Bottom Line
• Don’t Blame Industry Entirely
– The authors of those papers are Doctors!
• Be Skeptical (Don’t “buy” in to advertising)
• Always “Cheque” Funding Source
• Then, Check Methods, Including ITT
• Then, Check that Recommendation Matches
Outcome & Treatment Effect

P-Value meaning
EBM TP: Alpha Errors, P-Values
and Confusion Intervals
• Can an X-ray have the appearance of a
fracture even when there isn’t one?
• Any investigation, whether a test or study,
can suggest something falsely.
• In research, they change false positive
to,…

EBM TP:
Alpha error
• Alpha error (also Type I error): The null hypothesis is considered false when it is actually true (probability of error = p)
• In English: The study shows there is difference but,… it is a fluke and there really is no difference.
• This leads to,…
P-value
• P-value 0.05 = There is 5% we will falsely reject the null hypothesis.
• English: If a study is showing there is a difference,… there is a 5% chance that it’s wrong (and there is no difference).
• When the p-value gets smaller (0.01 or 0.001, etc), so does the chance of making the mistake (i.e. assuming there is a difference when there is not).
Shortfalls of P-Values
• Using P-value alone to examine a study turns the results
into a yes or no answer
• It also doesn’t give you an idea of the range of
possibilities (ie the effect could be is high or low as this)
• Therefore we need,…
Confidence Intervals
• The range of values reflecting the statistical
precision of the estimate.
Hypothetical Example:
Beer Damaged Neurons
• Imagine a university with 1000 students
• If I randomly selected 5 and used them to estimate the
mean # of damaged neurons, how confident should I be
that the next person will have a similar #.
• If I randomly selected 250, how confident would I be.
CI: What does it tell us?
• Is the intervention helpful
• Is it statistically and clinically significant
• What is the degree of “precision”

Comparing 2 trials

Summary
• Alpha Error is when a study shows there is
difference but,… it is a fluke and there really is
no difference
• The probability of that error is the P-value
• A 0.05 P-Value means that if the study shows
a difference there is a 5% chance that it’s just
luck (and there is no difference).
• Confidence Intervals show the range of values
reflecting the precision of the estimate

Questions?

When Epidemiology Speaks,
No One Understands
Related Documents


![3URJUDPWHUYH] LQIRUPDWLNXV %6F &RPSXWHU 6FLHQFH …](https://static.cupdf.com/doc/110x72/61d569a1c177bc3a4f59cff6/3urjudpwhuyh-lqirupdwlnxv-6f-amprpsxwhu-6flhqfh-.jpg)