Volume 13, Number 3 ISSN 1099-839X Teachers' Perceptions of the Influence of No Child Left Behind On Classroom Practices Craig A. Mertler University of West Georgia Citation Mertler, C. (2011). Teachers' Perceptions of the Influence of No Child Left Behind On Classroom Practices. Current Issues in Education, 13(3). Retrieved from http://cie.asu.edu/ Abstract Due to the magnitude of NCLB, the pressure on teachers has increased to perhaps immeasurable proportions. One could argue that NCLB has ramifications for nearly all aspects of the teaching– learning process, including classroom-based assessment. The purpose of this study was to describe the extent to which K–12 teachers perceive that NCLB has influenced their instructional and assessment practices. Differences based on several demographic variables were also examined. An original instrument was administered to teachers and 1,534 responses were received. Salient findings revealed that teachers believe NCLB is having negative impacts on instructional and curricular practices, including higher levels of stress related to improving student performance. Teachers reported several changes in how they assess students. Significant group differences were found, particularly on the resultant components of Student Test Preparation and Instructional Changes. Keywords: Teacher perceptions, No Child Left Behind, classroom practices, assessment practices

Welcome message from author
This document is posted to help you gain knowledge. Please leave a comment to let me know what you think about it! Share it to your friends and learn new things together.
Transcript
Volume 13, Number 3 ISSN 1099-839X
Teachers' Perceptions of the Influence of
No Child Left Behind On Classroom Practices
Craig A. Mertler University of West Georgia
Citation
Mertler, C. (2011). Teachers' Perceptions of the Influence of No Child Left Behind On Classroom Practices. Current Issues in Education, 13(3). Retrieved from http://cie.asu.edu/
Abstract
Due to the magnitude of NCLB, the pressure on teachers has increased to perhaps immeasurable
proportions. One could argue that NCLB has ramifications for nearly all aspects of the teaching–
learning process, including classroom-based assessment. The purpose of this study was to
describe the extent to which K–12 teachers perceive that NCLB has influenced their instructional
and assessment practices. Differences based on several demographic variables were also
examined. An original instrument was administered to teachers and 1,534 responses were
received. Salient findings revealed that teachers believe NCLB is having negative impacts on
instructional and curricular practices, including higher levels of stress related to improving
student performance. Teachers reported several changes in how they assess students. Significant
group differences were found, particularly on the resultant components of Student Test
Preparation and Instructional Changes.
Keywords: Teacher perceptions, No Child Left Behind, classroom practices, assessment practices
Current Issues in Education Vol. 14 No. 1 2 About the Author(s)
Author: Craig A. Mertler Affiliation: University of West Georgia
Address: 102 Education Center, Carrollton, GA. Email: [email protected] or [email protected]
Biographical information: Craig A. Mertler is currently a Professor of Assessment and
Research Methodologies and Director of the Doctoral Program in School Improvement in the
College of Education at the University of West Georgia. He teaches doctoral courses focused on
the application of action research to promote school improvement and reform, and also teaches
quantitative research methods, introductory statistical analyses, multivariate statistical analyses,
and educational assessment methods. He is the author of five books, four invited book chapters,
16 refereed journal articles, and numerous nonrefereed articles and manuscripts. He has also
presented numerous research papers at professional meetings around the country, as well as
internationally. He conducts workshops for in-service educational professionals on classroom-
based action research and on the broad topic of classroom assessment. His primary research
interests include classroom-based action research, professional learning communities, and
assessment practices of classroom teachers.
Teachers’ Perceptions of NCLB 3
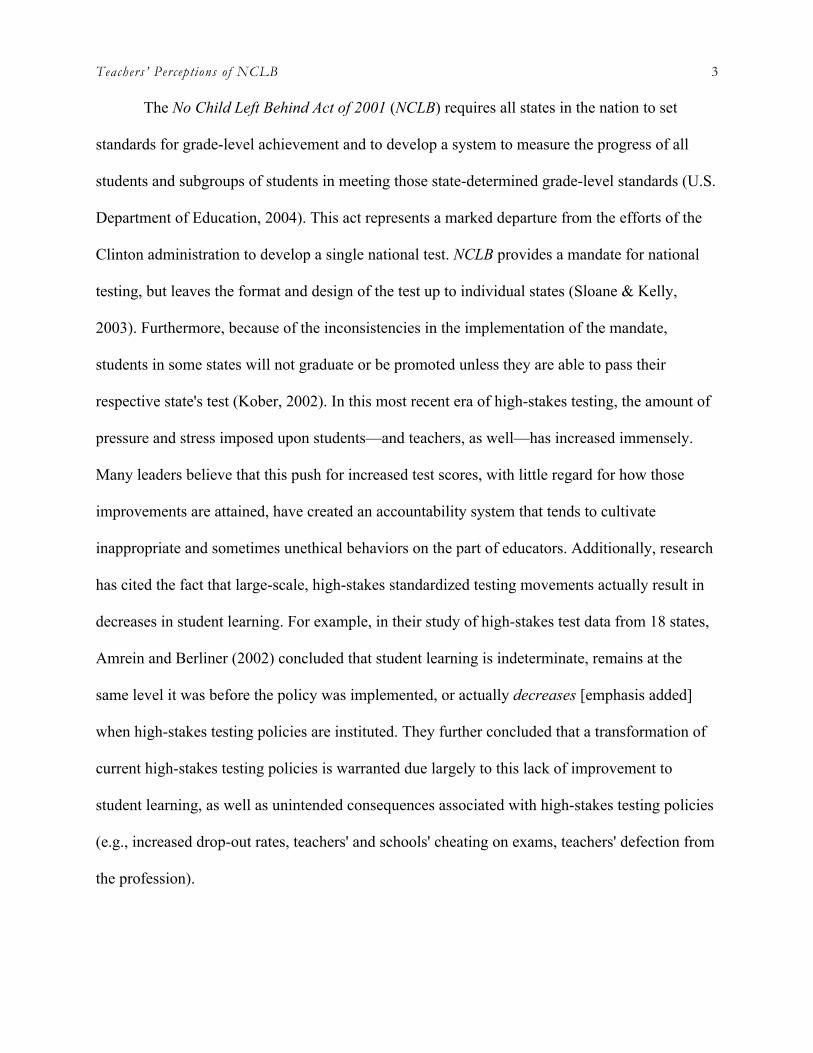
The No Child Left Behind Act of 2001 (NCLB) requires all states in the nation to set
standards for grade-level achievement and to develop a system to measure the progress of all
students and subgroups of students in meeting those state-determined grade-level standards (U.S.
Department of Education, 2004). This act represents a marked departure from the efforts of the
Clinton administration to develop a single national test. NCLB provides a mandate for national
testing, but leaves the format and design of the test up to individual states (Sloane & Kelly,
2003). Furthermore, because of the inconsistencies in the implementation of the mandate,
students in some states will not graduate or be promoted unless they are able to pass their
respective state's test (Kober, 2002). In this most recent era of high-stakes testing, the amount of
pressure and stress imposed upon students—and teachers, as well—has increased immensely.
Many leaders believe that this push for increased test scores, with little regard for how those
improvements are attained, have created an accountability system that tends to cultivate
inappropriate and sometimes unethical behaviors on the part of educators. Additionally, research
has cited the fact that large-scale, high-stakes standardized testing movements actually result in
decreases in student learning. For example, in their study of high-stakes test data from 18 states,
Amrein and Berliner (2002) concluded that student learning is indeterminate, remains at the
same level it was before the policy was implemented, or actually decreases [emphasis added]
when high-stakes testing policies are instituted. They further concluded that a transformation of
current high-stakes testing policies is warranted due largely to this lack of improvement to
student learning, as well as unintended consequences associated with high-stakes testing policies
(e.g., increased drop-out rates, teachers' and schools' cheating on exams, teachers' defection from
the profession).
Current Issues in Education Vol. 14 No. 1 4
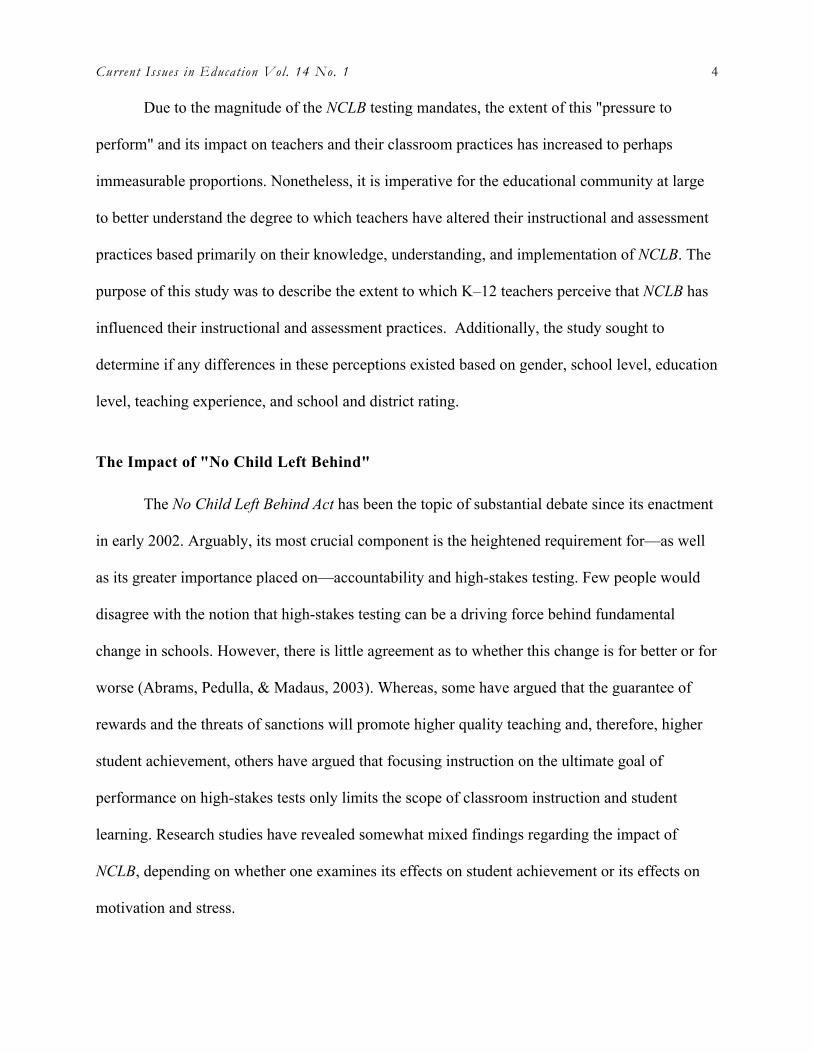
Due to the magnitude of the NCLB testing mandates, the extent of this "pressure to
perform" and its impact on teachers and their classroom practices has increased to perhaps
immeasurable proportions. Nonetheless, it is imperative for the educational community at large
to better understand the degree to which teachers have altered their instructional and assessment
practices based primarily on their knowledge, understanding, and implementation of NCLB. The
purpose of this study was to describe the extent to which K–12 teachers perceive that NCLB has
influenced their instructional and assessment practices. Additionally, the study sought to
determine if any differences in these perceptions existed based on gender, school level, education
level, teaching experience, and school and district rating.
The Impact of "No Child Left Behind"
The No Child Left Behind Act has been the topic of substantial debate since its enactment
in early 2002. Arguably, its most crucial component is the heightened requirement for—as well
as its greater importance placed on—accountability and high-stakes testing. Few people would
disagree with the notion that high-stakes testing can be a driving force behind fundamental
change in schools. However, there is little agreement as to whether this change is for better or for
worse (Abrams, Pedulla, & Madaus, 2003). Whereas, some have argued that the guarantee of
rewards and the threats of sanctions will promote higher quality teaching and, therefore, higher
student achievement, others have argued that focusing instruction on the ultimate goal of
performance on high-stakes tests only limits the scope of classroom instruction and student
learning. Research studies have revealed somewhat mixed findings regarding the impact of
NCLB, depending on whether one examines its effects on student achievement or its effects on
motivation and stress.
Teachers’ Perceptions of NCLB 5
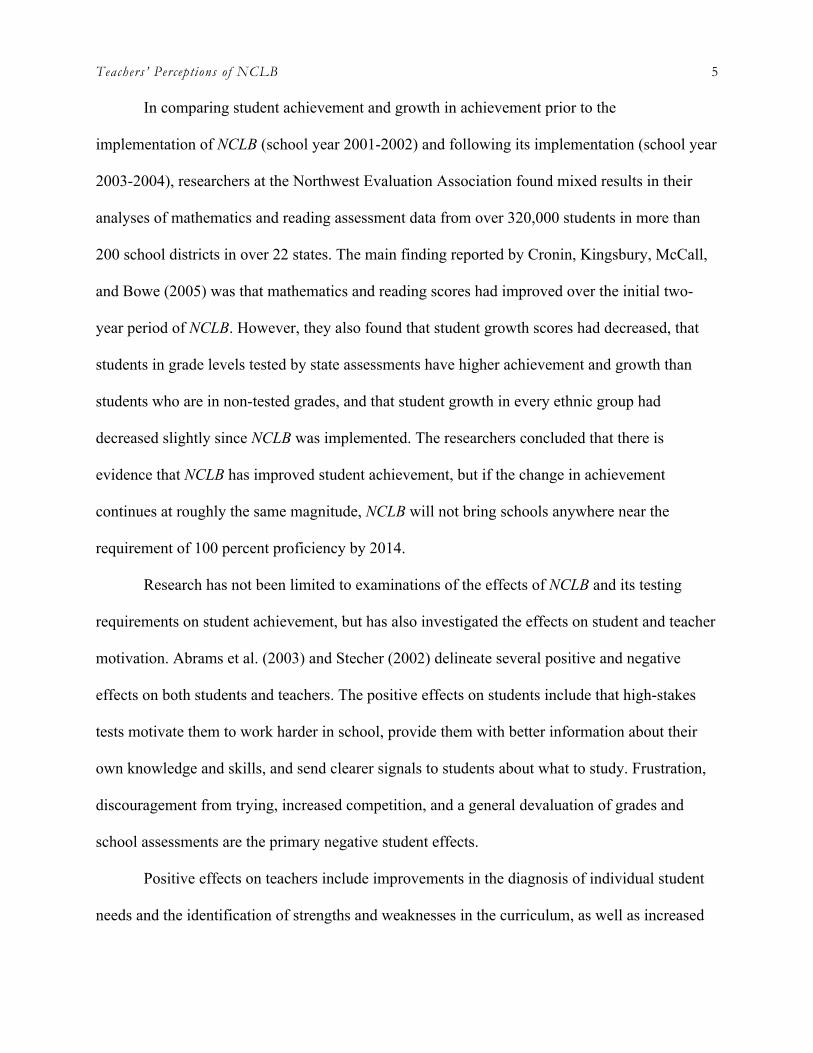
In comparing student achievement and growth in achievement prior to the
implementation of NCLB (school year 2001-2002) and following its implementation (school year
2003-2004), researchers at the Northwest Evaluation Association found mixed results in their
analyses of mathematics and reading assessment data from over 320,000 students in more than
200 school districts in over 22 states. The main finding reported by Cronin, Kingsbury, McCall,
and Bowe (2005) was that mathematics and reading scores had improved over the initial two-
year period of NCLB. However, they also found that student growth scores had decreased, that
students in grade levels tested by state assessments have higher achievement and growth than
students who are in non-tested grades, and that student growth in every ethnic group had
decreased slightly since NCLB was implemented. The researchers concluded that there is
evidence that NCLB has improved student achievement, but if the change in achievement
continues at roughly the same magnitude, NCLB will not bring schools anywhere near the
requirement of 100 percent proficiency by 2014.
Research has not been limited to examinations of the effects of NCLB and its testing
requirements on student achievement, but has also investigated the effects on student and teacher
motivation. Abrams et al. (2003) and Stecher (2002) delineate several positive and negative
effects on both students and teachers. The positive effects on students include that high-stakes
tests motivate them to work harder in school, provide them with better information about their
own knowledge and skills, and send clearer signals to students about what to study. Frustration,
discouragement from trying, increased competition, and a general devaluation of grades and
school assessments are the primary negative student effects.
Positive effects on teachers include improvements in the diagnosis of individual student
needs and the identification of strengths and weaknesses in the curriculum, as well as increased
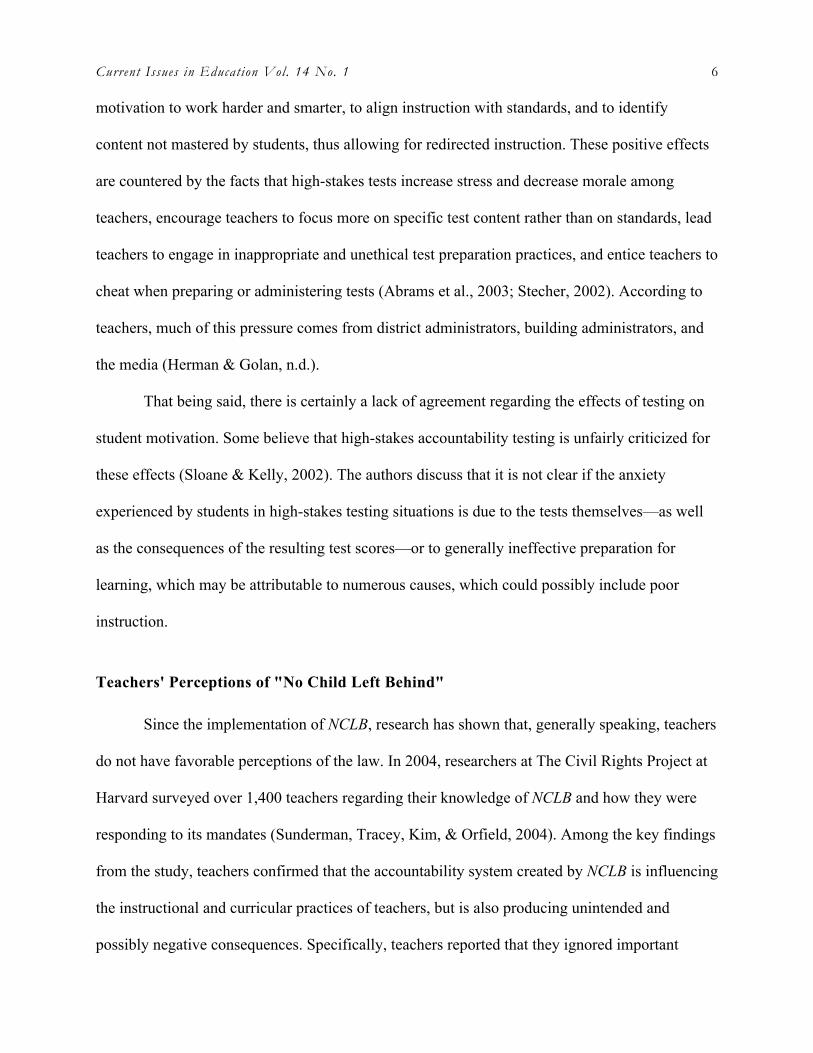
Current Issues in Education Vol. 14 No. 1 6 motivation to work harder and smarter, to align instruction with standards, and to identify
content not mastered by students, thus allowing for redirected instruction. These positive effects
are countered by the facts that high-stakes tests increase stress and decrease morale among
teachers, encourage teachers to focus more on specific test content rather than on standards, lead
teachers to engage in inappropriate and unethical test preparation practices, and entice teachers to
cheat when preparing or administering tests (Abrams et al., 2003; Stecher, 2002). According to
teachers, much of this pressure comes from district administrators, building administrators, and
the media (Herman & Golan, n.d.).
That being said, there is certainly a lack of agreement regarding the effects of testing on
student motivation. Some believe that high-stakes accountability testing is unfairly criticized for
these effects (Sloane & Kelly, 2002). The authors discuss that it is not clear if the anxiety
experienced by students in high-stakes testing situations is due to the tests themselves—as well
as the consequences of the resulting test scores—or to generally ineffective preparation for
learning, which may be attributable to numerous causes, which could possibly include poor
instruction.
Teachers' Perceptions of "No Child Left Behind"
Since the implementation of NCLB, research has shown that, generally speaking, teachers
do not have favorable perceptions of the law. In 2004, researchers at The Civil Rights Project at
Harvard surveyed over 1,400 teachers regarding their knowledge of NCLB and how they were
responding to its mandates (Sunderman, Tracey, Kim, & Orfield, 2004). Among the key findings
from the study, teachers confirmed that the accountability system created by NCLB is influencing
the instructional and curricular practices of teachers, but is also producing unintended and
possibly negative consequences. Specifically, teachers reported that they ignored important
Teachers’ Perceptions of NCLB 7 aspects of the curriculum, de-emphasized or completely neglected untested topics, and tended to
focus their instruction on tested subjects, sometimes excessively. Additionally, these teachers
rejected the idea that NCLB's testing requirements would ultimately focus teachers' instruction
and/or improve the curriculum. Finally, teachers who were teaching in schools that had been
identified as needing improvement reported that they did not plan to be teaching in those same
schools five years in the future. Generally, teachers believed that NCLB sanctions would cause
teachers to transfer out of schools not making adequate progress (Sunderman et al., 2004).
In a survey conducted by the NCLB Task Force of the National Staff Development
Council, nearly half of the 2,000 educators responding to the survey believed that the impact of
NCLB on professional development has had "no discernable effect." These teachers reported that
professional development activities were more of an obligation, as opposed to being meaningful,
useful professional learning opportunities. Only a small percentage (14%) believed the NCLB-
funded professional development is "improving the quality of teaching" (National Staff
Development Council [NSDC], 2004).
Furthermore, and perhaps more pertinent to this study, the results of the NSDC survey
revealed that nearly 60% of teachers believed that the law is having a negative impact on their
work settings. Forty percent reported that they experience NCLB implementation pressures that
negatively impact teacher morale and performance (NSDC, 2004). One-tenth reported that one
effect of the law is that teachers are being forced to divert their attention away from more
important educational issues that could improve teaching and learning. Approximately the same
proportion believed that educators are carrying on their work much as they did prior to the
implementation of NCLB. In contrast, over one-fourth of responding teachers indicated that the
law is having a more positive effect, as evidenced by the fact that many educators were
Current Issues in Education Vol. 14 No. 1 8 beginning to think, talk, and act in new ways that could ultimately result in higher levels of
student performance (NSDC, 2004).
"No Child Left Behind" and Classroom Assessment
Since NCLB places such high-stakes consequences on its mandated standardized testing,
teachers must do a more thorough job of teaching to their respective curricular standards. They
must also engage in meaningful and valid classroom assessment in order to accurately determine
the knowledge and skills that have been mastered by their students, as well as those content areas
that may require redirected instruction to entire classes or individualized student reinforcement.
One could make the argument that NCLB has far-reaching ramifications for nearly all aspects of
the teaching–learning process, of which classroom-based student assessment is a part.
Unfortunately, at this point in time, very little research exists regarding the relationship between
NCLB and teachers' classroom assessment practices.
In a statewide survey conducted with teachers in Virginia, McMillan, Myran, and
Workman (1999) found that more than three-fourths of elementary teachers and one-third of
secondary teachers believed that their statewide testing program had a "somewhat" or
"extensive" impact on their teaching and assessment. Specifically, teachers reported that they did
not cover untested areas of the curriculum nearly as much as those areas that were tested, and
that they tended to emphasize breadth rather than depth of content coverage. Teachers also
reported greater use of multiple-choice formats on their self-developed classroom tests. Many
teachers identified accountability and increased pressures as the driving forces behind these
changes in assessment and instruction (McMillan et al., 1999). These results have been supported
by a more recent, nationwide survey of more than 4,000 teachers (Abrams et al., 2003).
Teachers’ Perceptions of NCLB 9
With respect to a smaller, yet important, aspect of this relationship, there is research that
has examined the arena of test preparation practices. Researchers have identified five types of
legitimate test preparation practices that help students demonstrate more completely their
knowledge and skills. These strategies include teaching the entire content domain, using a
variety of assessment and test item formats, teaching time management skills, fostering student
motivation, and reducing test anxiety (Gulek, 2003; Miyasaka, 2000). These practices are
considered by the measurement community to be ethical strategies for helping students prepare
to take high-stakes tests, largely because they produce student learning that is robust; that is to
say, the learning is generalizable to contexts beyond student performance on the test (Gulek,
2003).
However, inappropriate test preparation practices also abound. The basic problem with
these practices is that they focus only on raising scores on a given test without also increasing
students' knowledge and skills in the broader subject being tested (Kober, 2002; Gulek, 2003).
These practices include such teacher behaviors as limiting content instruction to a particular item
format, teaching of those objectives from the domain that are sampled on the test, using
instructional guides that review actual items from a recent issue of a test, and limiting instruction
to actual test items (Gulek, 2003; Mehrens, 1991). Abrams, Pedulla, and Madaus (2003)
summarized research in which teachers reported giving greater attention, with regard to
instruction and assessment, to content areas they knew would appear on a state test. Some
teachers reported de-emphasizing or completely neglecting untested subjects or content. These
types of practices are arguably a result of the stress and pressure experienced by teachers to raise
test scores (Stecher, 2002; Mehrens, 1991).
Current Issues in Education Vol. 14 No. 1 10 Purpose of the Study
The purpose of this study was to describe the extent to which K–12 teachers perceive that
NCLB has influenced their instructional and assessment practices. Additionally, the study sought
to determine if any differences in these perceptions existed based on gender, school level,
education level, teaching experience, and school and district rating. The specific research
questions addressed in this study were:
1. What are K–12 teachers' perceptions of NCLB?
2. In what ways do teachers believe that NCLB has influenced their instruction and
assessment practices?
3. What differences in the perceptions of NCLB's influence on assessment practices exist
between groups as determined by gender, school level, education level, teaching
experience, and school rating?
Methods
Participants
The population for this study included all K–12 teachers in the state of Ohio during the
2005–2006 school year. Participation was sought through initial contact with superintendents
from 156 school districts (roughly 25% of the total 614 school districts in the state). This initial
list was randomly selected from the Ohio Department of Education's online database of school
districts (http://www.ode.state.oh.us/data/extract_oed_addgrades.asp). Email communications
with the superintendents provided them with an explanation of the study and asked for their
agreement to allow their teachers to participate. By using this procedure, the researcher was not
required to have access to individual teachers' email addresses. Once a superintendent agreed to
Teachers’ Perceptions of NCLB 11 allow the district’s teachers to participate, he or she was asked to simply forward an email "cover
letter" to respective teachers via email. Thirty-eight of the 156 districts (24%) agreed to
participate. The researcher sought an additional random sample of 105 districts. From the second
random sample, 15 districts agreed to participate. Completed surveys were submitted from 1,534
teachers representing 53 school districts (more than 20% of those districts randomly sampled)
across the state.
Instrumentation
An original Web-based survey instrument, titled the NCLB * CAP (Classroom
Assessment Practices) Survey, consisting of 22 items, was developed for purposes of data
collection. Teacher respondents were instructed to respond to each statement on a four-point
Likert scale, ranging from "strongly disagree" to "strongly agree." For purposes of addressing
Research Question #3, six additional demographic questions were asked of respondents. They
were asked to indicate their gender, teaching level, education level, years of teaching experience,
and school district and school building rating, as determined by the Ohio Department of
Education (ODE).
With respect to these last two questions, some explanation of this rating system is in order.
Each year, ODE provides local report cards for each school district and building in the state of
Ohio. Both districts and individual buildings are provided with a rating based on multiple
measures, including the results from statewide assessments, graduation rates, and attendance as
the input variables (Ohio Department of Education [ODE], 2004). Specifically, the three
measures are:
§ the school's or district's Adequate Yearly Progress (AYP) for students in 10 student
groups;
Current Issues in Education Vol. 14 No. 1 12
§ a series of state indicators, defined as a minimum percentage of students at or above the
proficient level on grade-level achievement tests (at grades 3, 4, 5, 6, 7. and 8) and on the
Ohio Graduation Test; and
§ a performance index score, ranging from 0 to 120, and defined as the average of
performance level scores (i.e., below basic, basic, proficient, and advanced) received by
students on each of five subjects tested in grades 4 and 6 (ODE, 2004).
School district ratings and their descriptions are as follows:
§ Excellent—district meets 22 or 23 (of 23) indicators, or has a score of 100 or more on the
Performance Index (PI);
§ Effective—meets 17 to 21 indicators, or has a score of 90 to 99.9 on the PI;
§ Continuous Improvement—meets 11 to 16 indicators, or has a score of 80 to 89.9 on the
PI, or meets AYP (the lowest a district can be rated is they meet AYP is Continuous
Improvement);
§ Academic Watch—meets 8 to 10 indicators, or has a score of 70 to 79.9 on the PI and has
missed AYP; and
§ Academic Emergency—meets 7 or fewer indicators, has a score less than 70 on the PI and
missed AYP (ODE, 2004).
The rating for an individual school is based, in part, on the percentage of indicators that
apply directly to that school (rather than out of a total of 23 for the entire district). These
school-level ratings are as follows:
§ Excellent—school meets 94% or more of applicable indicators, or has a score of 100 or
more on the Performance Index (PI);
Teachers’ Perceptions of NCLB 13
§ Effective—meets 75% to 93.9% of applicable indicators, or has a score of 90 to 99.9 on
the PI;
§ Continuous Improvement—meets 50% to 74.9% of applicable indicators, or has a score
of 80 to 89.9 on the PI, or meets AYP (the lowest a district can be rated is they meet AYP
is Continuous Improvement);
§ Academic Watch—meets 31% to 49.9% of applicable indicators, or has a score of 70 to
79.9 on the PI and missed AYP; and
§ Academic Emergency—meets 30.9% or fewer indicators, has a score less than 70 on the
PI and missed AYP (ODE, 2004).
The initial set of content-based items were adapted from a handful of existing instruments
(i.e., Abrams et al., 2003; NSDC, 2004; Sunderman et al., 2004). The NCLB * CAP Survey
underwent pilot-testing (with data collected from a randomly-selected sample from the
population previously described) and revision prior to its implementation. Content-evidence of
validity was also collected during the pilot-testing phase, based on reviews from survey research
experts, as well as from classroom teachers. An alpha coefficient value equal to .76 was obtained
for instrument's overall reliability.
Procedures
School district participation was sought through email communications with the
superintendents from the randomly selected districts during late summer. Once a superintendent,
or an appropriate designee, agreed to permit the survey to be accessed by the district's teachers,
the researcher sent the email "cover letter" to the superintendent and asked that the message be
forwarded to the entire teaching staff of that district. Teachers were informed that the survey
would require only about 10 minutes to complete, that their responses would remain confidential,
Current Issues in Education Vol. 14 No. 1 14 and that only aggregate results would be reported. This email message contained an embedded
link which provided direct access for respondents to the NCLB * CAP Survey. The survey was
administered during a three-week period extending from mid-September through early-October.
All data were collected and stored electronically.
Data Analyses
All data analyses were conducted using the Statistical Package for the Social Sciences
(SPSS, v. 15). Initial data analyses included frequencies, percentages, means, and standard
deviations to summarize the overall results. An exploratory factor analysis was conducted as a
data reduction technique in order to reduce the number of items for purposes of group
comparisons. Analyses of variance were then used to compare group responses based on gender,
teaching level, education level, years of teaching experience, district rating, and school rating.
All ANOVA results were evaluated at an alpha level equal to .05.
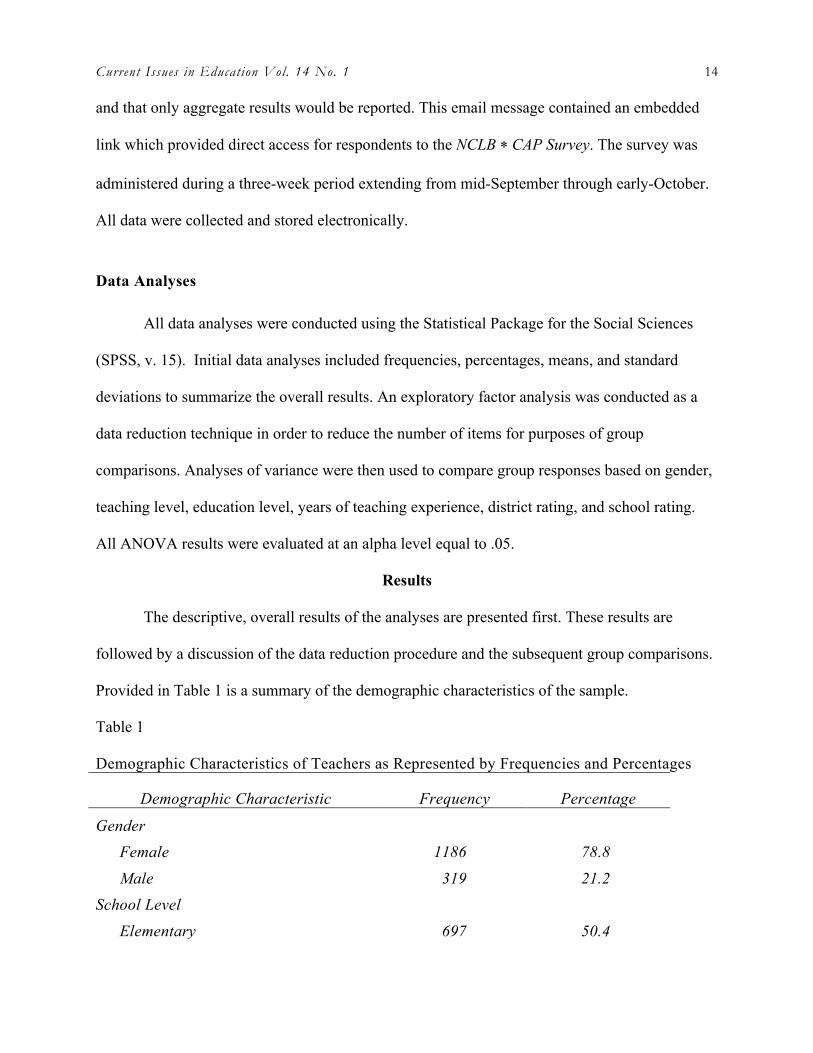
Results
The descriptive, overall results of the analyses are presented first. These results are
followed by a discussion of the data reduction procedure and the subsequent group comparisons.
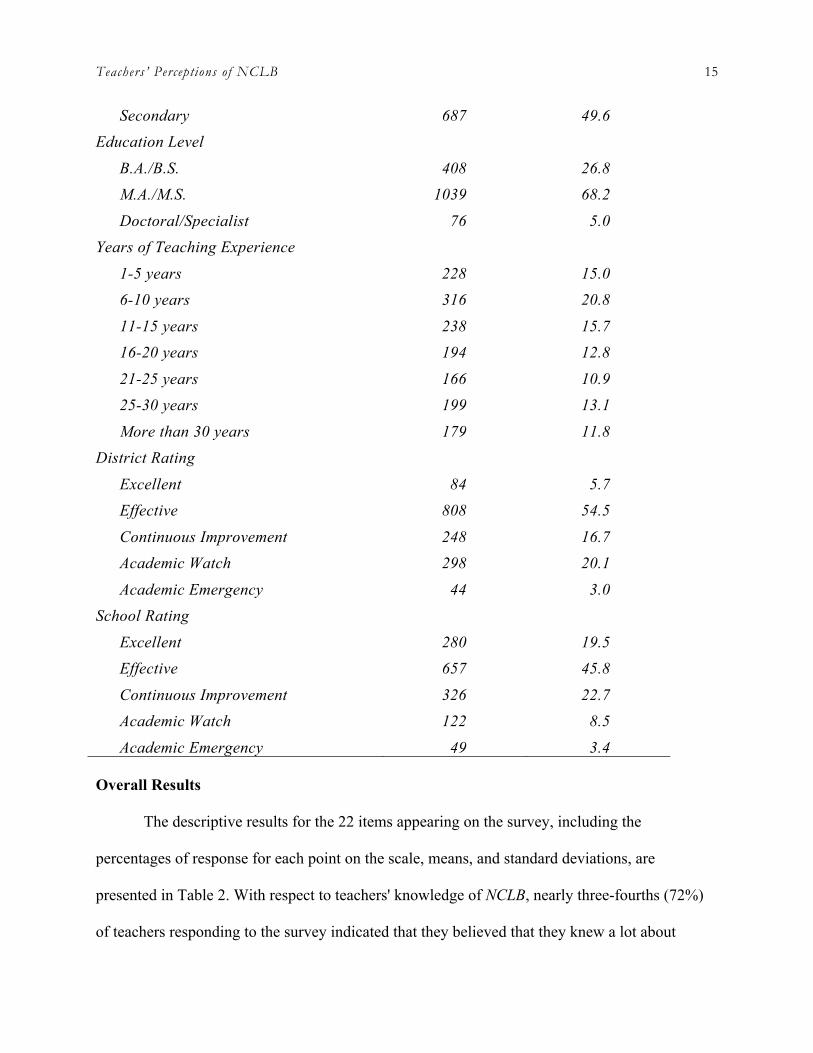
Provided in Table 1 is a summary of the demographic characteristics of the sample.
Table 1
Demographic Characteristics of Teachers as Represented by Frequencies and Percentages
Demographic Characteristic Frequency Percentage
Gender Female Male
1186
319
78.8 21.2
School Level Elementary
697
50.4
Teachers’ Perceptions of NCLB 15
Secondary 687 49.6 Education Level B.A./B.S. M.A./M.S. Doctoral/Specialist
408
1039 76
26.8 68.2
5.0 Years of Teaching Experience 1-5 years 6-10 years 11-15 years 16-20 years 21-25 years 25-30 years More than 30 years
228 316 238 194 166 199 179
15.0 20.8 15.7 12.8 10.9 13.1 11.8
District Rating Excellent Effective Continuous Improvement Academic Watch Academic Emergency
84
808 248 298
44
5.7
54.5 16.7 20.1
3.0 School Rating Excellent Effective Continuous Improvement Academic Watch Academic Emergency
280 657 326 122
49
19.5 45.8 22.7
8.5 3.4
Overall Results
The descriptive results for the 22 items appearing on the survey, including the
percentages of response for each point on the scale, means, and standard deviations, are
presented in Table 2. With respect to teachers' knowledge of NCLB, nearly three-fourths (72%)
of teachers responding to the survey indicated that they believed that they knew a lot about
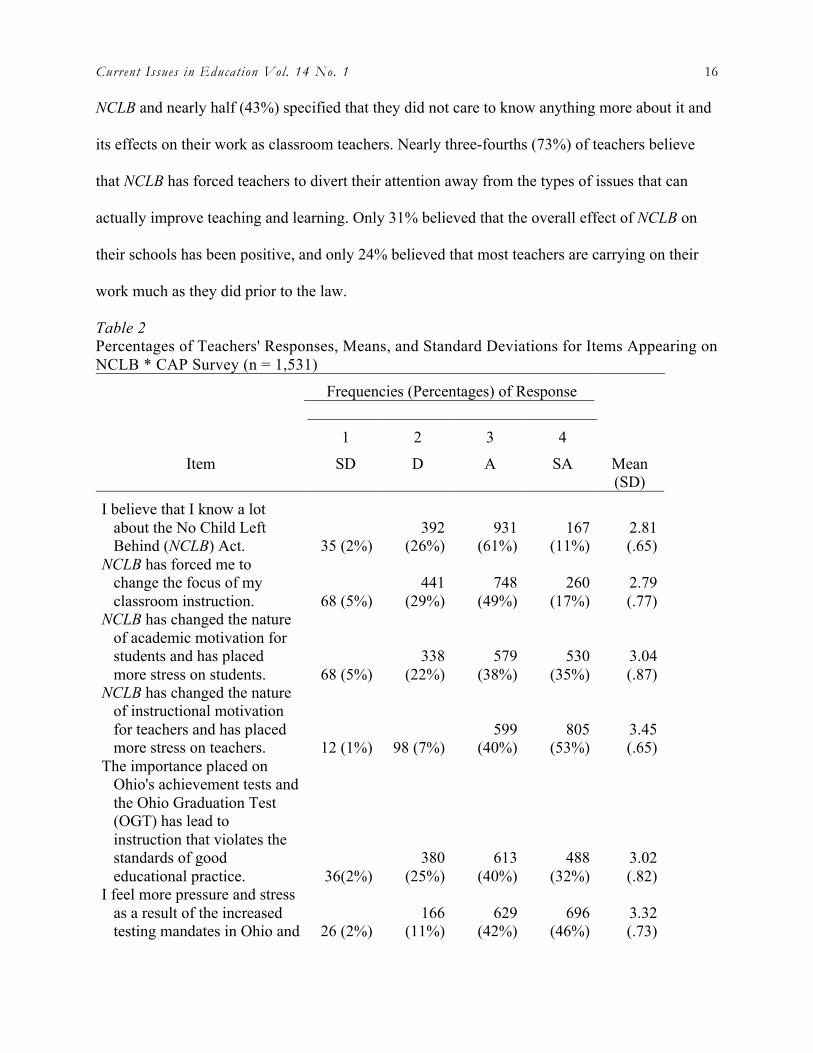
Current Issues in Education Vol. 14 No. 1 16 NCLB and nearly half (43%) specified that they did not care to know anything more about it and
its effects on their work as classroom teachers. Nearly three-fourths (73%) of teachers believe
that NCLB has forced teachers to divert their attention away from the types of issues that can
actually improve teaching and learning. Only 31% believed that the overall effect of NCLB on
their schools has been positive, and only 24% believed that most teachers are carrying on their
work much as they did prior to the law.
Table 2 Percentages of Teachers' Responses, Means, and Standard Deviations for Items Appearing on NCLB * CAP Survey (n = 1,531)
Frequencies (Percentages) of Response
Item
1
SD
2
D
3
A
4
SA
Mean (SD)
I believe that I know a lot about the No Child Left Behind (NCLB) Act. 35 (2%)
392 (26%)
931 (61%)
167 (11%)
2.81 (.65)
NCLB has forced me to change the focus of my classroom instruction. 68 (5%)
441 (29%)
748 (49%)
260 (17%)
2.79 (.77)
NCLB has changed the nature of academic motivation for students and has placed more stress on students. 68 (5%)
338 (22%)
579 (38%)
530 (35%)
3.04 (.87)
NCLB has changed the nature of instructional motivation for teachers and has placed more stress on teachers. 12 (1%) 98 (7%)
599 (40%)
805 (53%)
3.45 (.65)
The importance placed on Ohio's achievement tests and the Ohio Graduation Test (OGT) has lead to instruction that violates the standards of good educational practice. 36(2%)
380 (25%)
613 (40%)
488 (32%)
3.02 (.82)
I feel more pressure and stress as a result of the increased testing mandates in Ohio and 26 (2%)
166 (11%)
629 (42%)
696 (46%)
3.32 (.73)
Teachers’ Perceptions of NCLB 17
the related need to improve student performance.
My students feel more stress as a result of the increased testing mandates in Ohio. 16 (1%)
201 (13%)
642 (42%)
655 (43%)
3.28 (.73)
NCLB has forced me to change the ways in which I assess my students' academic performance. 21 (1%)
356 (24%)
806 (53%)
325 (22%)
2.95 (.71)
As a result of NCLB, I create a greater number of my classroom tests such that they mirror the same format and types of questions on the state's achievements tests and/or the OGT. 37 (3%)
284 (19%)
743 (49%)
439 (29%)
3.05 (.76)
I use multiple-choice classroom tests more frequently than I have in the past.
139 (9%)
837 (56%)
398 (27%)
119 (8%)
2.33 (.75)
I have substantially DECREASED the amount of time spent on instruction of content NOT tested on the state-mandated tests. 49 (3%)
345 (23%)
635 (42%)
476 (32%)
3.02 (.82)
I have NOT let NCLB or the state-mandated testing program in Ohio influence what or how I provide instruction to my students.
424 (28%)
842 (56%)
213 (14%) 33 (2%)
1.90 (.71)
I have substantially INCREASED the amount of time spent on instruction of content that I know is covered on the state-mandated tests. 28 (2%)
240 (16%)
742 (49%)
491 (33%)
3.13 (.74)
I have NOT let NCLB affect how I assess the academic achievement and progress of my students.
283 (19%)
849 (57%)
322 (22%) 42 (3%)
2.08 (.71)
I spend much more time throughout the year preparing my students for the state-mandated tests. 28 (2%)
272 (18%)
721 (48%)
472 (32%)
3.10 (.75)
As a result of NCLB, I now spend more time teaching 28 (2%)
291 (20%)
817 (55%)
358 (24%)
3.01 (.71)
Current Issues in Education Vol. 14 No. 1 18
test-taking skills to my students.
I have used sample test items from the state tests, approved by the Ohio Department of Education, to help prepare my students to take the tests. 49 (3%)
268 (18%)
699 (47%)
477 (32%)
3.07 (.79)
As a result of NCLB, I use standardized test data to help guide and improve my instruction. 46 (3%)
394 (26%)
835 (56%)
219 (15%)
2.82 (.71)
In my school, I believe that most teachers are carrying on their work much as they did before NCLB.
311 (21%)
831 (55%)
315 (21%) 46 (3%)
2.06 (.73)
In my school, I believe that NCLB has forced teachers to divert their attention away from more important issues that can better improve teaching and learning. 38 (3%)
375 (25%)
674 (45%)
418 (28%)
2.98 (.79)
I do not care to know any more about NCLB and its effect on my work as a classroom teacher than I do right now.
148 (10%)
704 (47%)
495 (33%)
153 (10%)
2.44 (.81)
I believe that the overall effect of NCLB on my school has been positive.
331 (22%)
698 (47%)
436 (29%) 34 (2%)
2.12 (.77)
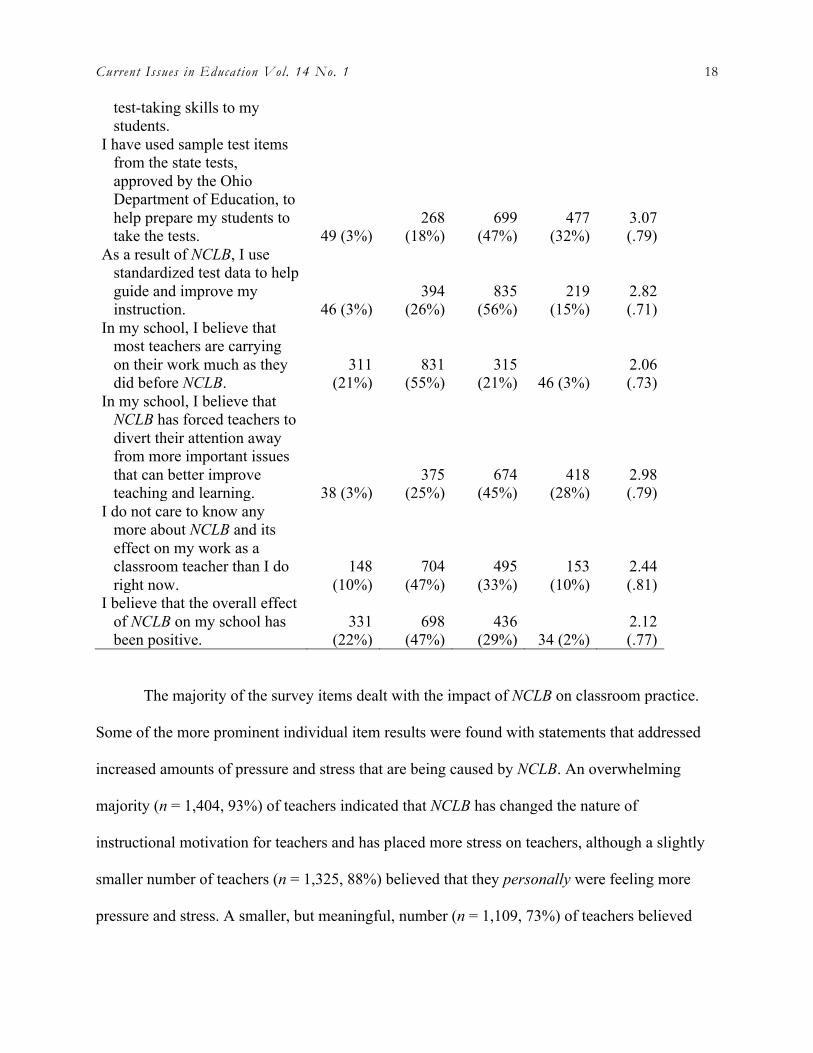
The majority of the survey items dealt with the impact of NCLB on classroom practice.
Some of the more prominent individual item results were found with statements that addressed
increased amounts of pressure and stress that are being caused by NCLB. An overwhelming
majority (n = 1,404, 93%) of teachers indicated that NCLB has changed the nature of
instructional motivation for teachers and has placed more stress on teachers, although a slightly
smaller number of teachers (n = 1,325, 88%) believed that they personally were feeling more
pressure and stress. A smaller, but meaningful, number (n = 1,109, 73%) of teachers believed
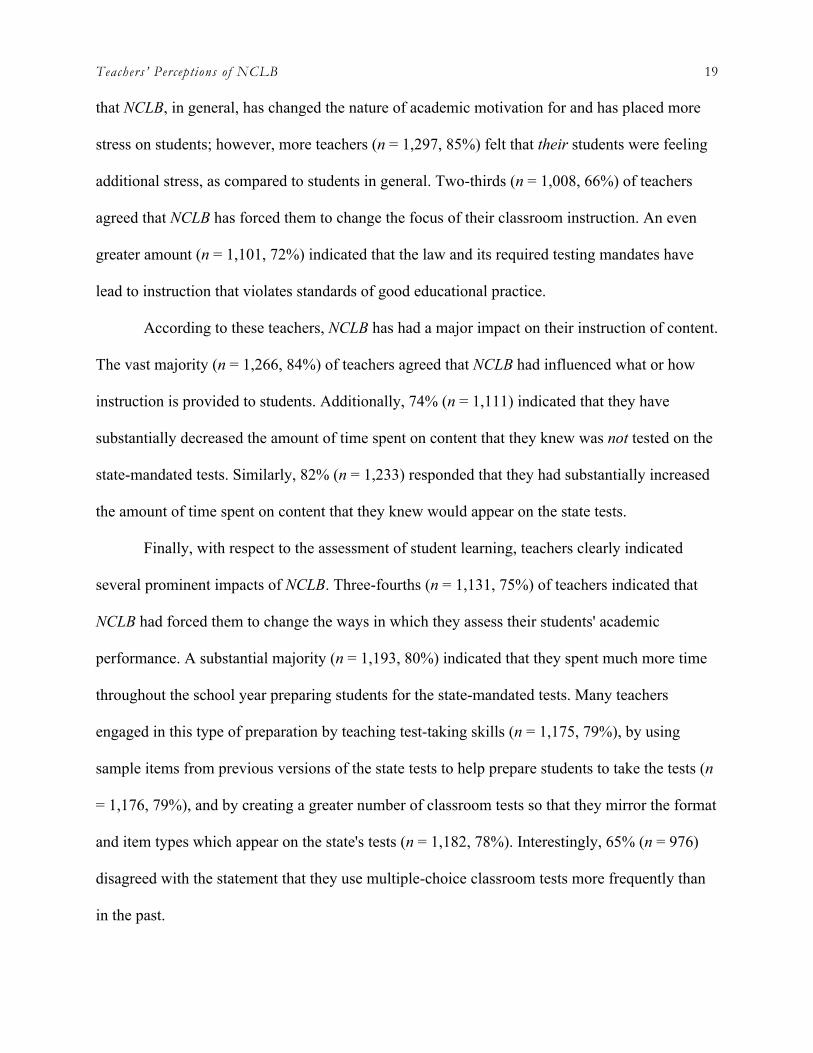
Teachers’ Perceptions of NCLB 19 that NCLB, in general, has changed the nature of academic motivation for and has placed more
stress on students; however, more teachers (n = 1,297, 85%) felt that their students were feeling
additional stress, as compared to students in general. Two-thirds (n = 1,008, 66%) of teachers
agreed that NCLB has forced them to change the focus of their classroom instruction. An even
greater amount (n = 1,101, 72%) indicated that the law and its required testing mandates have
lead to instruction that violates standards of good educational practice.
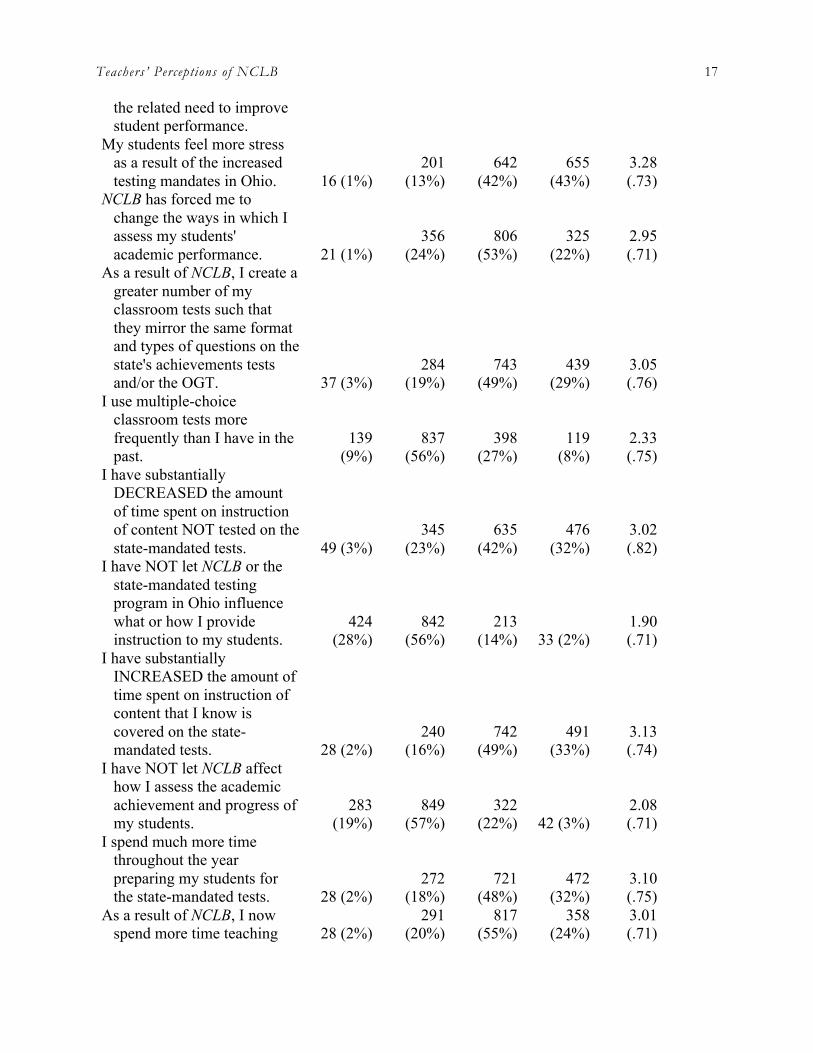
According to these teachers, NCLB has had a major impact on their instruction of content.
The vast majority (n = 1,266, 84%) of teachers agreed that NCLB had influenced what or how
instruction is provided to students. Additionally, 74% (n = 1,111) indicated that they have
substantially decreased the amount of time spent on content that they knew was not tested on the
state-mandated tests. Similarly, 82% (n = 1,233) responded that they had substantially increased
the amount of time spent on content that they knew would appear on the state tests.
Finally, with respect to the assessment of student learning, teachers clearly indicated
several prominent impacts of NCLB. Three-fourths (n = 1,131, 75%) of teachers indicated that
NCLB had forced them to change the ways in which they assess their students' academic
performance. A substantial majority (n = 1,193, 80%) indicated that they spent much more time
throughout the school year preparing students for the state-mandated tests. Many teachers
engaged in this type of preparation by teaching test-taking skills (n = 1,175, 79%), by using
sample items from previous versions of the state tests to help prepare students to take the tests (n
= 1,176, 79%), and by creating a greater number of classroom tests so that they mirror the format
and item types which appear on the state's tests (n = 1,182, 78%). Interestingly, 65% (n = 976)
disagreed with the statement that they use multiple-choice classroom tests more frequently than
in the past.
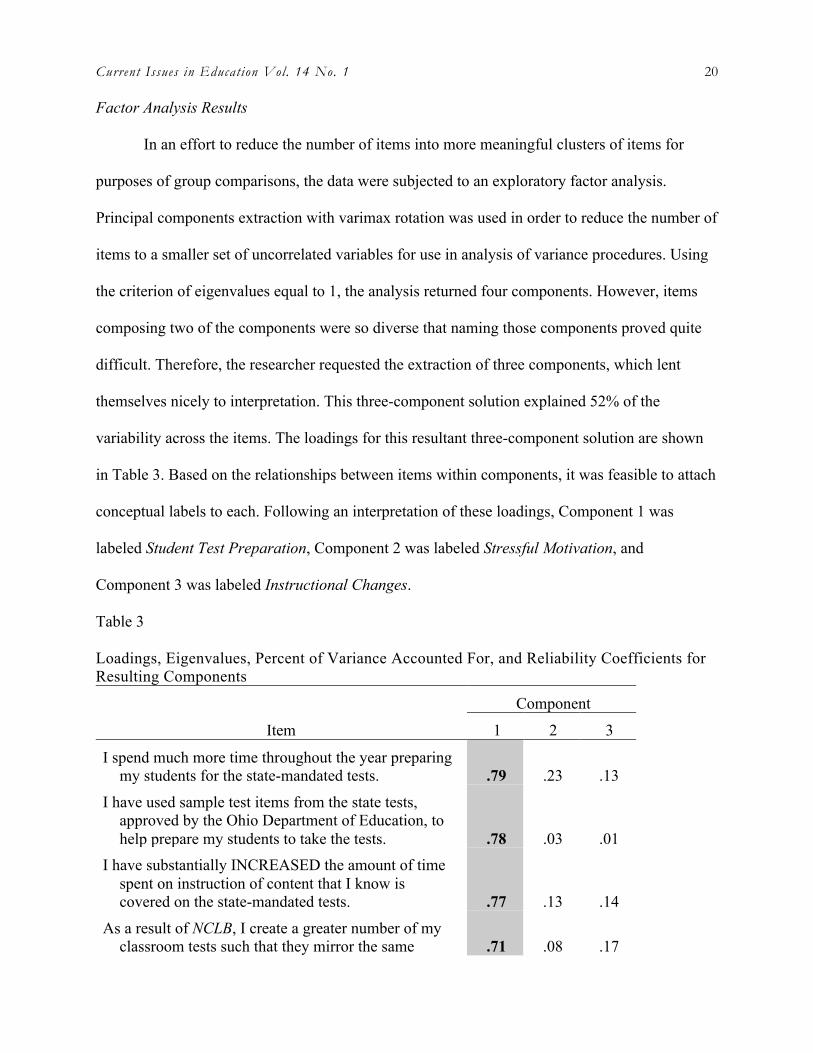
Current Issues in Education Vol. 14 No. 1 20 Factor Analysis Results
In an effort to reduce the number of items into more meaningful clusters of items for
purposes of group comparisons, the data were subjected to an exploratory factor analysis.
Principal components extraction with varimax rotation was used in order to reduce the number of
items to a smaller set of uncorrelated variables for use in analysis of variance procedures. Using
the criterion of eigenvalues equal to 1, the analysis returned four components. However, items
composing two of the components were so diverse that naming those components proved quite
difficult. Therefore, the researcher requested the extraction of three components, which lent
themselves nicely to interpretation. This three-component solution explained 52% of the
variability across the items. The loadings for this resultant three-component solution are shown
in Table 3. Based on the relationships between items within components, it was feasible to attach
conceptual labels to each. Following an interpretation of these loadings, Component 1 was
labeled Student Test Preparation, Component 2 was labeled Stressful Motivation, and
Component 3 was labeled Instructional Changes.
Table 3
Loadings, Eigenvalues, Percent of Variance Accounted For, and Reliability Coefficients for Resulting Components
Component
Item 1 2 3
I spend much more time throughout the year preparing my students for the state-mandated tests. .79 .23 .13
I have used sample test items from the state tests, approved by the Ohio Department of Education, to help prepare my students to take the tests. .78 .03 .01
I have substantially INCREASED the amount of time spent on instruction of content that I know is covered on the state-mandated tests. .77 .13 .14
As a result of NCLB, I create a greater number of my classroom tests such that they mirror the same .71 .08 .17
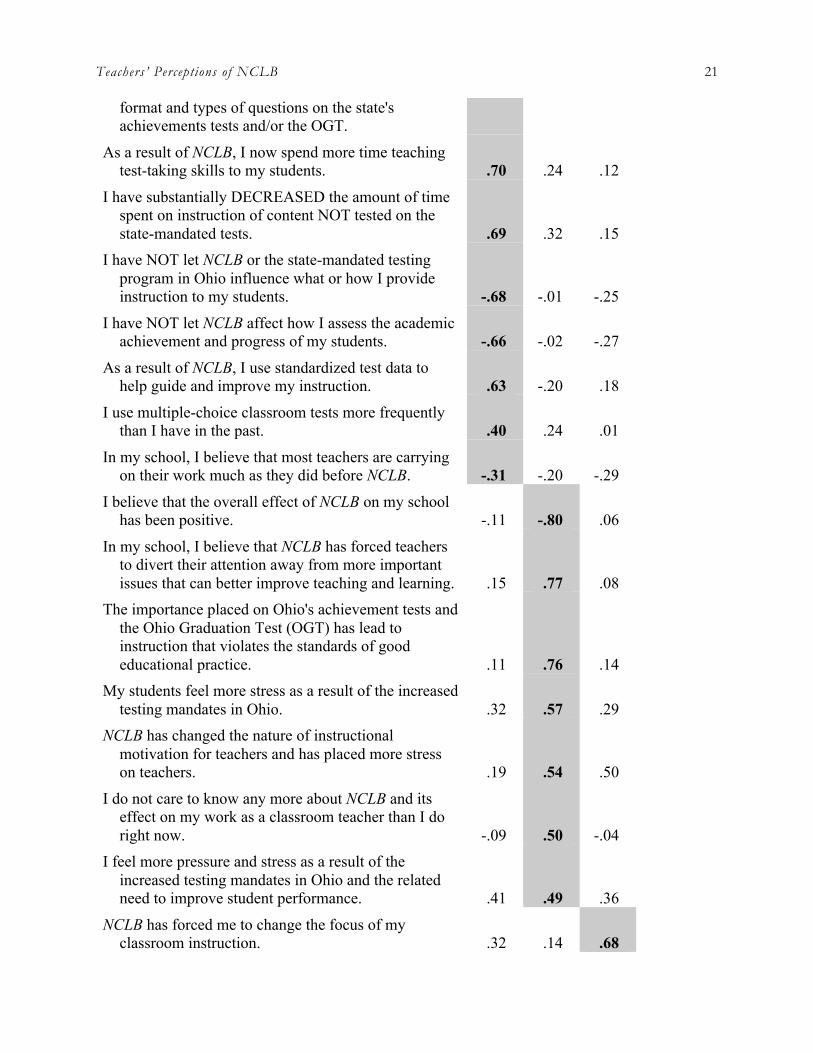
Teachers’ Perceptions of NCLB 21
format and types of questions on the state's achievements tests and/or the OGT.
As a result of NCLB, I now spend more time teaching test-taking skills to my students. .70 .24 .12
I have substantially DECREASED the amount of time spent on instruction of content NOT tested on the state-mandated tests. .69 .32 .15
I have NOT let NCLB or the state-mandated testing program in Ohio influence what or how I provide instruction to my students. -.68 -.01 -.25
I have NOT let NCLB affect how I assess the academic achievement and progress of my students. -.66 -.02 -.27
As a result of NCLB, I use standardized test data to help guide and improve my instruction. .63 -.20 .18
I use multiple-choice classroom tests more frequently than I have in the past. .40 .24 .01
In my school, I believe that most teachers are carrying on their work much as they did before NCLB. -.31 -.20 -.29
I believe that the overall effect of NCLB on my school has been positive. -.11 -.80 .06
In my school, I believe that NCLB has forced teachers to divert their attention away from more important issues that can better improve teaching and learning. .15 .77 .08
The importance placed on Ohio's achievement tests and the Ohio Graduation Test (OGT) has lead to instruction that violates the standards of good educational practice. .11 .76 .14
My students feel more stress as a result of the increased testing mandates in Ohio. .32 .57 .29
NCLB has changed the nature of instructional motivation for teachers and has placed more stress on teachers. .19 .54 .50
I do not care to know any more about NCLB and its effect on my work as a classroom teacher than I do right now. -.09 .50 -.04
I feel more pressure and stress as a result of the increased testing mandates in Ohio and the related need to improve student performance. .41 .49 .36
NCLB has forced me to change the focus of my classroom instruction. .32 .14 .68
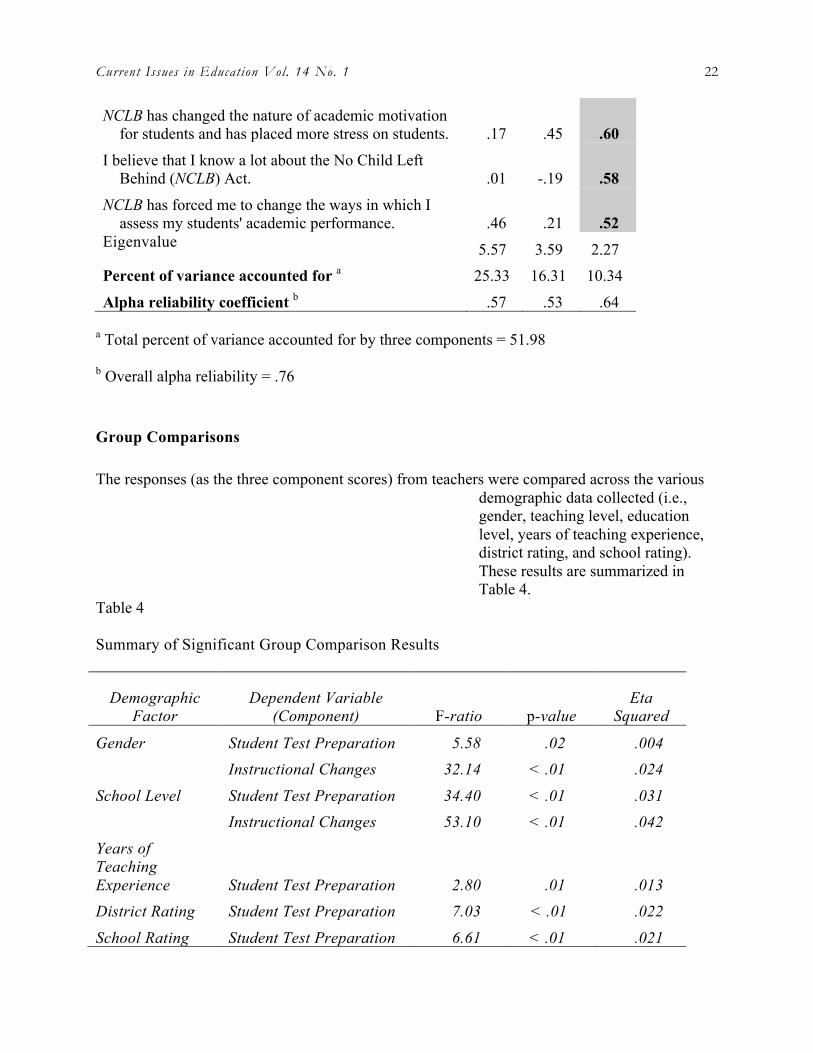
Current Issues in Education Vol. 14 No. 1 22
NCLB has changed the nature of academic motivation for students and has placed more stress on students. .17 .45 .60
I believe that I know a lot about the No Child Left Behind (NCLB) Act. .01 -.19 .58
NCLB has forced me to change the ways in which I assess my students' academic performance. .46 .21 .52
Eigenvalue 5.57 3.59 2.27 Percent of variance accounted for a 25.33 16.31 10.34
Alpha reliability coefficient b .57 .53 .64
a Total percent of variance accounted for by three components = 51.98
b Overall alpha reliability = .76
Group Comparisons
The responses (as the three component scores) from teachers were compared across the various demographic data collected (i.e., gender, teaching level, education level, years of teaching experience, district rating, and school rating). These results are summarized in Table 4.
Table 4
Summary of Significant Group Comparison Results
Demographic Factor
Dependent Variable (Component) F-ratio p-value
Eta Squared
Gender Student Test Preparation 5.58 .02 .004 Instructional Changes 32.14 < .01 .024 School Level Student Test Preparation 34.40 < .01 .031 Instructional Changes 53.10 < .01 .042 Years of Teaching Experience Student Test Preparation 2.80 .01 .013 District Rating Student Test Preparation 7.03 < .01 .022 School Rating Student Test Preparation 6.61 < .01 .021
Teachers’ Perceptions of NCLB 23
Females scored higher (i.e., they had a higher level of agreement) on each of the three
component scores than their male counterparts. However, the differences between females and
males were significant only for Student Test Preparation, F(1, 1298) = 5.58, p = .02, η2 = .004,
and for Instructional Changes, F(1, 1298) = 32.14, p < .01, η2 = .024. The difference for
Stressful Motivation was not significant, F(1, 1298) = 1.54, p = .216, η2 = .001. These results
indicate that female teachers are doing more to prepare students to take the state-mandated tests
and that they are making more NCLB-induced instructional changes than are male teachers.
However, it is important to note that the discrepancy in sample sizes between females (n = 1,186)
and males (n = 319) certainly could have impacted these statistical results.
A similar pattern of differences was apparent for the comparisons between elementary
and secondary teachers in the sample. Elementary teachers scored higher on all three components
than did secondary teachers. However, only two of these differences were significant. The
difference for Student Test Preparation was significant, F(1, 1198) = 34.40, p < .01, η2 = .031,
as was the difference for Instructional Changes, F(1, 1198) = 53.10, p < .01, η2 = .042. The
difference for Stressful Motivation was not significant, F(1, 1198) = .57, p = .45, η2 = .000.
These results indicate that elementary teachers are doing more to prepare students to take the
state tests and that they are making more instructional changes than are secondary teachers.
Although none of the education level comparisons were significant, teachers with masters
degrees scored higher than both those with bachelors or doctoral/specialist degrees on Student
Test Preparation, F(2, 1313) = 1.11, p = .33, η2 = .002. Those teachers with bachelors degrees
scored higher than the other two groups on Stressful Motivation, F(2, 1313) = 3.03, p = .05, η2 =
Current Issues in Education Vol. 14 No. 1 24 .005. Finally, those with doctoral/specialist degrees scored highest on Instructional Changes,
F(2, 1313) = .458, p = 63, η2 = .001.
Those with 6-10 years of teaching experience scored highest on Student Test
Preparation, where there was a significant difference, F(6, 1309) = 2.80, p = .01, η2 = .013.
Scheffé post hoc tests revealed the only significant difference to be between those with 6-10
years of experience and those with more than 30 years of experience. There were no significant
differences based on years of teaching experience for Stressful Motivation, F(6, 1309) = .77, p =
.59, η2 = .004, or for Instructional Changes, F(6, 1309) = .74, p = .62, η2 = .003.
With respect to the current school district rating, a significant difference was found for
the Student Test Preparation component, F(4, 1279) = 7.03, p < .01, η2 = .022. Teachers from
districts rated as "Academic Emergency" scored significantly higher (indicating that they were
engaged in more of these practices) than those rated "Excellent" or "Effective." Additionally,
"Academic Emergency" and "Academic Watch" were both significantly different from those
rated "Continuous Improvement." Although there were no significant differences for Stressful
Motivation, F(4, 1279) = .70, p = .59, η2 = .002, those from "Academic Watch" districts scored
highest. Similarly, there were no significant differences for Instructional Changes, F(4, 1279) =
1.18, p = .32, η2 = .004, those from "Effective" and from "Academic Watch" districts scored
highest.
Finally, with regard to the current school building rating, a similar pattern of results was
found. There was again a significant difference for Student Test Preparation, F(4, 1241) = 6.61,
p < .01, η2 = .021, with teachers from "Academic Emergency" and "Academic Watch" schools
scoring significantly higher than those from "Excellent" and "Effective" schools. Again, although
there were no significant differences for Stressful Motivation, F(4, 1241) = 1.55, p = .19, η2 =
Teachers’ Perceptions of NCLB 25 .005, those from "Academic Emergency" schools scored highest. Similarly, there were no
significant differences for Instructional Changes, F(4, 1241) = 1.96, p = .10, η2 = .006, those
from "Academic Emergency" schools scored highest.
Discussion
The results of this study support those of the limited studies previously conducted on the
topic of the impact of NCLB on teachers' classroom practices. Consistent with recent studies
(Abrams et al., 2003; McMillan et al., 1999; NSDC, 2004; Sunderman et al., 2004), this study
found that teachers do not have favorable perceptions of NCLB. Specifically, teachers believe
that NCLB is having negative impacts on both instructional and curricular practices of teachers.
The vast majority of teachers in the large sample employed in this study also reported that they
have substantially reduced the amount of time spent teaching content that they know is not tested
on the state-mandated tests and substantially increased time spent on tested content. Previously,
60% of teachers surveyed indicated that NCLB was having a negative impact on their work
settings (NSDC, 2004); in the present study, 69% of teachers believed that its impact on their
work, as well as on their school setting, was negative. Teachers in this study also reported
experiencing much greater levels of pressure and stress related to the need to improve student
performance as a result of NCLB and its associated testing mandates. This stress has also
"trickled down" to the students of these teachers. This study has provided empirical evidence of
assertions made by Abrams et al. (2003) and Stecher (2002).
Specifically, with respect to classroom assessment practices, the results of this study have
strongly supported previous research (Abrams et al., 2003; McMillan et al., 1999). A substantial
majority of teachers in this study reported that they had changed the ways in which they assess
students, spent more time teaching test-taking skills, used sample items from previous tests, and
Current Issues in Education Vol. 14 No. 1 26 created a greater number of classroom tests that paralleled the format of state tests. The lone
finding from this study that seems to contradict previous research (e.g., McMillan et al., 1999) is
that well over half of the teachers reported that they did not use multiple-choice classroom tests
more frequently than in the past.
This study found that teachers have experienced a substantial increase in stress and
pressure as a result of its testing mandates, as well as the push to improve student performance
on those tests. Teachers in this study have reported altering numerous aspects of their instruction,
including content coverage and methods of assessing student performance. Teachers believe that
these types of changes have forced them to take time away from more important aspects of the
teaching–learning process. These results seem to support an assertion made by Abrams et al.
(2003) that these state tests are the more powerful influence on teaching practices, as opposed to
the content standards themselves.
While it is important to remember that the ultimate purpose of any test is to improve
teaching and learning (Kober, 2002), this study strongly supports previous research (e.g.,
Abrams et al., 2003) that NCLB, with its emphasis on and pressure to improve student
performance as measured by standardized assessments, has quite possibly led to an increased
level of teacher-led student test preparation in our schools. While this appears to be an ethical
and admirable effort on the part of teachers, Abrams et al. (2003) are quick to point out that these
"highly consequential tests encourage teachers to employ test preparation strategies that may
result in improved test scores...but may not represent an actual improvement in achievement" (p.
25).
The group comparisons from this study revealed some interesting findings. The fact that
there were no significant differences between any subgroups on the Stressful Motivation
Teachers’ Perceptions of NCLB 27 component suggests that all teachers—regardless of gender, school setting, education level, years
of teaching experience, or effectiveness ratings—are feeling the stress of this increased
accountability and the need to improve student performance. Although the effect sizes were not
large, the two largest group differences were obtained for comparisons between elementary and
secondary teachers on the Student Test Preparation and Instructional Changes components.
Elementary teachers indicated significantly more time spent on test preparation and that they had
made more instructional changes than secondary teachers. This is not surprising when one takes
into consideration the nature of state-mandated testing in Ohio. There is substantially more
testing that occurs during the elementary years of school. In addition to diagnostic testing in
grades 1 and 2, students in elementary grades are required to take achievement tests in the
following grade levels and subjects:
§ Grade 3—mathematics and reading
§ Grade 4—mathematics, reading, and writing
§ Grade 5—mathematics and reading (science and social studies will be added in 2006-
2007)
§ Grade 6—mathematics and reading (ODE, 2005).
At the secondary level, students are tested in mathematics and reading in grades 7 and
8. Additionally, students begin taking the Ohio Graduation Test (OGT) in grade 10.
Arguably, there is more pressure at the elementary level for students to demonstrate
academic achievement on these tests since they are being tested every year in grades 1
through 6. However, at the secondary level, students are tested only three times between
grades 7 and 12. Elementary teachers in Ohio may feel it necessary to spend more time
Current Issues in Education Vol. 14 No. 1 28 preparing students to take the state tests and may engage more frequently in making changes
to their instruction.
Similarly, more pressure to demonstrate improvements in student achievement may be
felt by those districts or individual schools that are currently rated low (i.e., "Academic Watch"
and "Academic Emergency") on the state's effectiveness scale. These districts and schools are on
a much shorter timeline, so to speak, to show improvements and to demonstrate adequate yearly
progress than those that are rated as being more effective. Teachers, as well as administrators, in
these districts and buildings undoubtedly feel that they must do more, and do it sooner rather
than later, to improve student performance. However, this fact raises an interesting set of
questions. In light of greater pressure to perform, are these teachers preparing students for these
tests by using only those practices that are generally agreed-upon as being acceptable by the
greater measurement community? If not, they may be engaging in practices that are truly, and
only, artificially inflating test scores (Urdan & Paris, 1994). Examples of these unacceptable test
preparation practices include:
§ acquiring actual test questions from a current test form and teaching students the answers;
§ giving students actual test questions for drill, review, or homework; and
§ copying, distributing, or keeping past versions of a test that have not been officially
released as practice exams (Kober, 2002).
A second question relates to teachers' knowledge of these practices. If teachers are using
any of these practices, are they aware of their ethical “violations?” We might assume and take
for granted that teachers would know what is and is not appropriate practice in this arena. For
example, however, it is possible that a given teacher may not be aware that the state may reuse
some of the same test questions, or the same entire test version, from year to year (Kober, 2002).
Teachers’ Perceptions of NCLB 29 A final question of interest is that if these teachers are engaged in unethical test preparation
practices, have they taken this initiative on their own, or are they feeling increased pressure to do
so from district or school-level administrators? Again, it is possible that this is happening
without realizing that certain practices are considered unacceptable.
It is important to note a couple of limitations of the results of this study. Although the
findings are limited by geographic location (all teachers currently work in school districts in
Ohio, a state which includes a series of state-mandated achievement tests), external validity of
the findings of this study is suggested through the large and broad nature of the sample. The
study sought to describe teachers' beliefs with respect to specific classroom-based instructional
and assessment practices. Of course, the findings are based purely on self-reported data, and no
efforts were made within the scope of this study to validate the extent to which these beliefs are
consistent with actual classroom practice. Worthy of reiteration is the fact that this was a study of
teachers’ perceptions of the impact of NCLB, and not one of scientifically studying the extent to
which actual classroom practices have changed as a direct result of NCLB.
In light of the findings from this study of teacher perceptions, it is imperative for various
groups to be aware of any unintended effects of NCLB. For example, policymakers need to be
aware of how the law is affecting teachers. The increased pressure that has been placed on
teachers to raise levels of student academic achievement has made their daily work much more
stressful. Furthermore, teachers have been forced to change the ways that they provide
instruction to students and assess their resultant academic performance. They have substantially
altered the amount of time spent on specific content, which sometimes conflicts with their
respective academic content standards and violates sound educational practice. Additionally,
teachers have resorted to spending much more time teaching students how to take standardized
Current Issues in Education Vol. 14 No. 1 30 achievement tests, perhaps turning to unethical practices in order to achieve higher test scores.
Similarly, administrators need to be mindful of these issues as well. They should be aware of
these unintended consequences of NCLB and should look for ways to address increased stress
levels, perhaps through professional development activities. They should definitely be cognizant
of the potential for their teachers to utilize unethical test preparation practices. Closely
examining how teachers are instructing students in the skills of test-taking may be a critical first
step.
In light of the earlier discussion of unacceptable test preparation practices, it is
recommended that teachers gain a better understanding of not only these unacceptable practices,
but also activities whose practice would be more acceptable. Some students do not perform to the
best of their abilities because they lack skills in test taking (Hogan, 2007; Linn & Miller, 2005).
Specifically, students can be taught “testwiseness” skills (i.e., test-taking strategies) in order to
prevent this type of inadequacy from lowering their test scores. These skills can be mastered by
most students, but they need practice in order to develop them (Linn & Miller, 2005).
Testwiseness skills that students should be taught, and given the opportunity to practice, include:
§ listening to and/or reading test directions carefully (including following proper
procedures for marking responses on the answer sheet);
§ listening to and/or reading test items carefully;
§ establishing a pace that will permit completion of the test or subtest;
§ skipping difficult items (instead of wasting valuable testing time) and returning to them
later;
§ making informed guesses, as opposed to just omitting items that appear too difficult;
Teachers’ Perceptions of NCLB 31
§ eliminating possible options (in the case of multiple-choice items), by identifying options
that are clearly incorrect based on knowledge of content, prior to making informed
guesses;
§ checking to be sure that an answer number matches the item number when marking an
answer; and
§ checking answers, as well as the accuracy of marking those answers, if time permits
(Linn & Miller, 2005).
The importance of engaging in these types of practices with students in advance of the
administration of standardized tests is not only that they are seen as acceptable and ethical, but
that they likely will result in test scores that demonstrate real student learning (Mertler, 2007).
Since there were so many group differences on the Student Test Preparation component,
it is imperative that we shed light on the phenomenon. In order to understand this potential
"problem" more completely, it is recommended that researchers look more closely at how
teachers engage in student test preparation, focusing perhaps on particular test preparation
strategies used by teachers. We need to better understand what specific techniques are used, why
those techniques are used (i.e., what teachers are hoping to accomplish by using them), and the
nature of their overall effectiveness. If they fail to improve actual student learning, their use
should be strongly discouraged.
Current Issues in Education Vol. 14 No. 1 32
References
Abrams, L. M., Pedulla, J. J., & Madaus, G. F. (2003). Views from the classroom: Teachers' opinions of statewide testing programs. Theory Into Practice, 42(1), 18-29
American Psychological Association. (2001). Publication Manual of the American Psychological Association (5th ed.). Washington, DC: Author
Amrein, A. L. & Berliner, D. C. (2002, March 28). High-stakes testing, uncertainty, and student learning Education Policy Analysis Archives, 10(18). Retrieved February 19, 2010 from http://epaa.asu.edu/epaa/v10n18/.
Cronin, J., Kingsbury, G. G., McCall, M. S., & Bowe, B. (2005, April). The impact of the No
Child Left Behind Act on student achievement and growth: 2005 edition. Retrieved February 14, 2006, from the Northwest Evaluation Association Web site: http://www.nwea.org/research/NCLBstudy.asp
Gulek, C. (2003). Preparing for high-stakes testing. Theory Into Practice, 42(1), 42-50. Herman, J. L., & Golan, S. (n.d.). Effects of standardized testing on teachers and learning:
Another look. (CSE Technical Report 334). Los Angeles, CA: University of California, National Center for Research on Evaluation, Standards, and Student Testing.
Hogan, T. P. (2007). Educational assessment: A practical approach. Hoboken, NJ: John Wiley
& Sons. Kober, N. (2002). Teaching to the test: The good, the bad, and who's responsible (TestTalk for
Leaders, Issue No. 1). Washington, D.C.: Center on Education Policy. Linn, R. L., & Miller, M. D. (2005). Measurement and assessment in teaching (9th ed.). Upper
Saddle River, NJ: Merrill/Prentice Hall. McMillan, J. H., Myran, S., & Workman, D. (1999). The impact of mandated statewide testing
on teachers' classroom assessment and instructional practices. Paper presented at the annual meeting of the American Educational Research Association, Montreal, Canada.
Mehrens, W. A. (1991, April). Defensible/indefensible instructional preparation for high stakes
achievement tests: An exploratory trialogue. Paper presented at the annual meeting of the American Educational Research Association, Chicago, IL.
Mertler, C. A. (2007). Interpreting standardized test scores: Strategies for data-driven
instructional decision making. Thousand Oaks, CA: Sage.
Teachers’ Perceptions of NCLB 33 Miyasaka, J. R. (2000, April). A framework for evaluating the validity of test preparation
practices. Paper presented at the annual meeting of the American Educational Research Association, New Orleans, LA.
National Staff Development Council. (2004). NCLB: Survey finds many educators experience
little positive NCLB impact on professional development. Retrieved May 20, 2005, from http://www.nsdc.org/library/policy/NCLBsurvey2_04.cfm
Ohio Department of Education. (2004). 2004-05 Ohio school district rating definitions.
Retrieved July 15, 2005, from http://www.ode.state.oh.us/reportcard/definitions/rating.asp
Ohio Department of Education. (2005). Implementation schedule of Ohio statewide assessments.
Retrieved March 2, 2006, from http://www.ode.state.oh.us/proficiency/PDF/IMPLEMENTATION_SCHEDULE_OHIO_STATEWIDE_ASSESSMENTS083005.pdf
Sloane, F. C., & Kelly, A. E. (2003). Issues in high-stakes testing programs. Theory Into
Practice, 42(1), 12-17. Stecher, B. (2002). Consequences of large-scale, high-stakes testing on school and classroom
practice. In L. S. Hamilton, B. M. Stecher, & S. P. Klein (Eds.), Making sense of test-based accountability in education. (pp. 79-100). Santa Monica, CA: RAND.
Sunderman, G. L., Tracey, C. A., Kim, J., & Orfield, G. (2004). Listening to teachers:
Classroom realities and No Child Left Behind. Cambridge, MA: The Civil Rights Project at Harvard University.
Urdan, T. C., & Paris, S. G. (1994). Teachers' perceptions of standardized achievement tests.
Educational Policy, 8(2), 137-156. U.S. Department of Education. (2004). A guide to education and "No Child Left Behind."
Retrieved September 10, 2005, from http://www.ed.gov/NCLB/overview/intro/guide/guide.pdf
Current Issues in Education Vol. 14 No. 1 34
Current Issues in Education http://cie.asu.edu
Volume 14, Number 1 ISSN 1099-839X
Authors hold the copyright to articles published in Current Issues in Education. Requests to reprint CIE articles in other journals should be addressed to the author. Reprints should credit CIE as the original
publisher and include the URL of the CIE publication. Permission is hereby granted to copy any article, provided CIE is credited and copies are not sold.
Teachers’ Perceptions of NCLB 35
Editorial Team
Executive Editors Lori Ellingford Andrew Darian
Section Editors
Krista Adams Hillary Andrelchik
Meg Burke Douglas Deiss
Miriam Emran Tracy Geiger Sarah Heaslip Melinda Hollis Afzal Hossain
Jeffery Johnson Seong Hee Kim
Younsu Kim Alaya Kuntz
Angeles Maldonado Carol Masser John Michael
William Mitchell Elizabeth Reyes
Lindsay Richerson Rory Schmitt
Tapati Sen Jennifer Shea
Kara Sujansky Melissa Tarango Andrew Tesoro
Jill Wendt Jennifer Wojtulewicz
Copy Editor Lucinda Watson
Faculty Advisers
Gustavo E. Fischman Jeanne M. Powers
Debby Zambo
Related Documents