Tea and herbal infusions: Their antioxidant activity and phenolic profile Ali K. Atoui a , Abdelhak Mansouri a , George Boskou b,1 , Panagiotis Kefalas a, * a Laboratory of Chemistry of Natural Products, Mediterranean Agronomic Institute of Chania (MAICh), P.O. Box 85, 73100 Chania, Greece b Department of Nutrition–Dietetics, Harokopio University, El Venizelou 70, Kallithea 17671, Athens, Greece Received 24 November 2003; received in revised form 28 January 2004; accepted 28 January 2004 Abstract Tea and herbal infusions have been studied for their polyphenolic content, antioxidant activity and phenolic profile. The total phenolics recovered by ethyl acetate from the water extract, were determined by the Folin–Ciocalteu procedure and ranged from 88.1 ± 0.42 (Greek mountain tea) to 1216 ± 32.0 mg (Chinese green tea) GAE (Gallic acid equivalents)/cup. The antioxidant activity was evaluated by two methods, DPPH and chemiluminescence assays, using Trolox and quercetin as standards. The EC 50 of herbal extracts ranged from 0.151 ± 0.002 mg extract/mg DPPH (0.38 quercetin equivalents and 0.57 Trolox equivalents), for Chinese green tea, to 0.77 ± 0.012 mg extract/mg DPPH (0.08 quercetin equivalents and 0.13 Trolox equivalents), for Greek mountain tea. Chemiluminescence assay results showed that the IC 50 ranged from 0.17 ± 3.4 · 10 3 lg extract/ml of the final solution in the measuring cell (1.89 quercetin and 5.89 Trolox equivalents) for Chinese green tea, to 1.10 ± 1.86 · 10 2 g extract/ml of the final solution in the measuring cell (0.29 quercetin and 0.90 Trolox equivalents) for Greek mountain tea. The phenolic profile in the herbal infusions was investigated by LC-DAD-MS in the positive electrospray ionization (ESI þ ) mode. About 60 different flavo- noids, phenolic acids and their derivatives have been identified. Ó 2004 Elsevier Ltd. All rights reserved. Keywords: Antioxidant activity; Flavonoids; Phenolic acids; LC–MS; Herbal infusion; Tea 1. Introduction An antioxidant can be defined as any substance that when present at low concentrations compared to that of an oxidizable substrate, significantly delays or inhibits the oxidation of that substrate (Percival, 1998; Young & Woodside, 2001). The physiological role of free radical- and hydroxyl free radical-scavengers, as this definition suggests, is to prevent damage to cellular components arising as a consequence of chemical reactions involving free radicals. In recent years, a substantial body of evi- dence has indicated a key role for free radicals as major contributors to aging and to degenerative diseases of aging, such as cancer, cardiovascular disease, cataracts, immune system decline, and brain dysfunction (Ames, Shigenaga, & Hagen, 1990; Percival, 1998; Young & Woodside, 2001). Fortunately, free radical formation is controlled naturally by various beneficial compounds known as antioxidants (Percival, 1998). When the availability of antioxidants is limited, this damage can become cumulative and debilitating oxidative stress re- sults (Swanson, 1998). Antioxidants are capable of sta- bilizing, or deactivating free radicals before the latter attack cells and biological targets. They are therefore critical for maintaining optimal cellular and systemic health and well-being (Percival, 1998) (see Figs. 1 and 2). Many research groups are examining the chemical nature and activity of natural antioxidants in fruits, vegetables, grains, herbs and other foods (Larson, 1988; Shahidi, 2000). Most antioxidants isolated from higher plants are polyphenols, which show biological activity as * Corresponding author. Tel.: +30-28210-35056; fax: +30-28210- 35001. E-mail address: [email protected] (P. Kefalas). 1 Present address: Department of Nutrition–Dietetics, Harokopio University, El Venizelou 70, Kallithea 17671, Athens, Greece. 0308-8146/$ - see front matter Ó 2004 Elsevier Ltd. All rights reserved. doi:10.1016/j.foodchem.2004.01.075 Food Chemistry 89 (2005) 27–36 www.elsevier.com/locate/foodchem Food Chemistry

Welcome message from author
This document is posted to help you gain knowledge. Please leave a comment to let me know what you think about it! Share it to your friends and learn new things together.
Transcript
Food
Food Chemistry 89 (2005) 27–36
www.elsevier.com/locate/foodchem
Chemistry
Tea and herbal infusions: Their antioxidant activity andphenolic profile
Ali K. Atoui a, Abdelhak Mansouri a, George Boskou b,1, Panagiotis Kefalas a,*
a Laboratory of Chemistry of Natural Products, Mediterranean Agronomic Institute of Chania (MAICh), P.O. Box 85, 73100 Chania, Greeceb Department of Nutrition–Dietetics, Harokopio University, El Venizelou 70, Kallithea 17671, Athens, Greece
Received 24 November 2003; received in revised form 28 January 2004; accepted 28 January 2004
Abstract
Tea and herbal infusions have been studied for their polyphenolic content, antioxidant activity and phenolic profile. The total
phenolics recovered by ethyl acetate from the water extract, were determined by the Folin–Ciocalteu procedure and ranged from
88.1± 0.42 (Greek mountain tea) to 1216± 32.0 mg (Chinese green tea) GAE (Gallic acid equivalents)/cup. The antioxidant activity
was evaluated by two methods, DPPH and chemiluminescence assays, using Trolox and quercetin as standards. The EC50 of herbal
extracts ranged from 0.151± 0.002 mg extract/mg DPPH (0.38 quercetin equivalents and 0.57 Trolox equivalents), for Chinese green
tea, to 0.77± 0.012 mg extract/mg DPPH (0.08 quercetin equivalents and 0.13 Trolox equivalents), for Greek mountain tea.
Chemiluminescence assay results showed that the IC50 ranged from 0.17± 3.4 · 10�3 lg extract/ml of the final solution in the
measuring cell (1.89 quercetin and 5.89 Trolox equivalents) for Chinese green tea, to 1.10 ± 1.86 · 10�2 g extract/ml of the final
solution in the measuring cell (0.29 quercetin and 0.90 Trolox equivalents) for Greek mountain tea. The phenolic profile in the
herbal infusions was investigated by LC-DAD-MS in the positive electrospray ionization (ESIþ) mode. About 60 different flavo-
noids, phenolic acids and their derivatives have been identified.
� 2004 Elsevier Ltd. All rights reserved.
Keywords: Antioxidant activity; Flavonoids; Phenolic acids; LC–MS; Herbal infusion; Tea
1. Introduction
An antioxidant can be defined as any substance that
when present at low concentrations compared to that of
an oxidizable substrate, significantly delays or inhibits
the oxidation of that substrate (Percival, 1998; Young &
Woodside, 2001). The physiological role of free radical-
and hydroxyl free radical-scavengers, as this definitionsuggests, is to prevent damage to cellular components
arising as a consequence of chemical reactions involving
free radicals. In recent years, a substantial body of evi-
dence has indicated a key role for free radicals as major
* Corresponding author. Tel.: +30-28210-35056; fax: +30-28210-
35001.
E-mail address: [email protected] (P. Kefalas).1 Present address: Department of Nutrition–Dietetics, Harokopio
University, El Venizelou 70, Kallithea 17671, Athens, Greece.
0308-8146/$ - see front matter � 2004 Elsevier Ltd. All rights reserved.
doi:10.1016/j.foodchem.2004.01.075
contributors to aging and to degenerative diseases of
aging, such as cancer, cardiovascular disease, cataracts,
immune system decline, and brain dysfunction (Ames,
Shigenaga, & Hagen, 1990; Percival, 1998; Young &
Woodside, 2001). Fortunately, free radical formation is
controlled naturally by various beneficial compounds
known as antioxidants (Percival, 1998). When the
availability of antioxidants is limited, this damage canbecome cumulative and debilitating oxidative stress re-
sults (Swanson, 1998). Antioxidants are capable of sta-
bilizing, or deactivating free radicals before the latter
attack cells and biological targets. They are therefore
critical for maintaining optimal cellular and systemic
health and well-being (Percival, 1998) (see Figs. 1 and 2).
Many research groups are examining the chemical
nature and activity of natural antioxidants in fruits,vegetables, grains, herbs and other foods (Larson, 1988;
Shahidi, 2000). Most antioxidants isolated from higher
plants are polyphenols, which show biological activity as
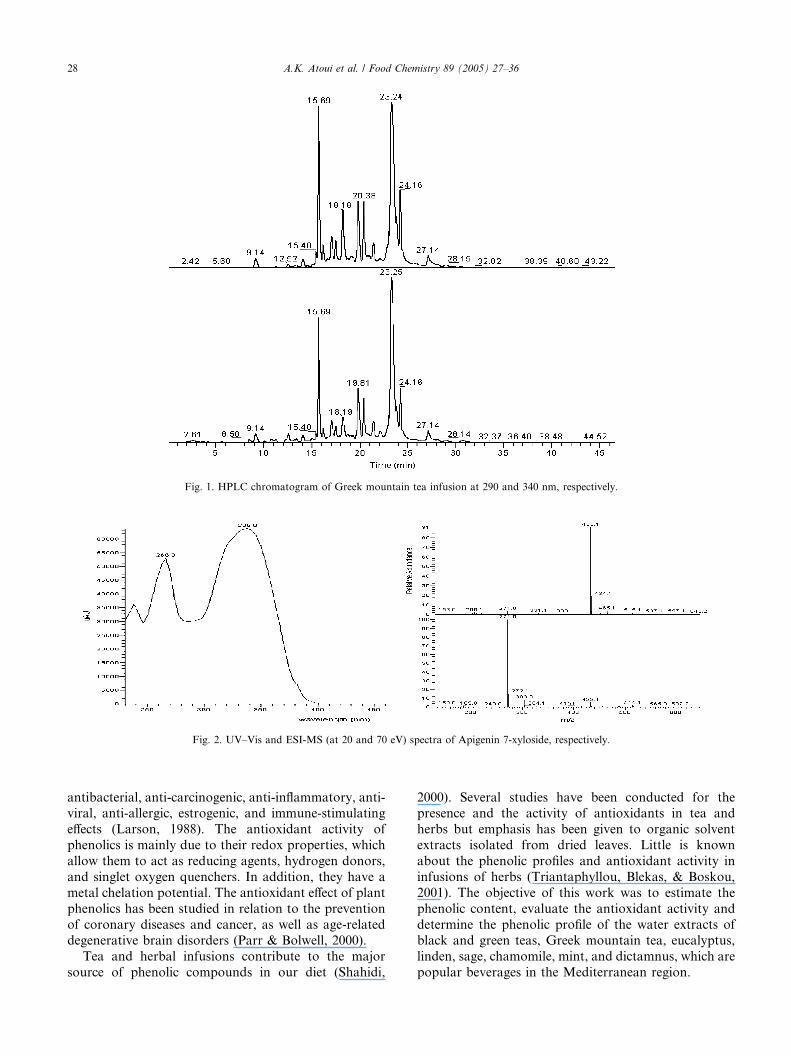
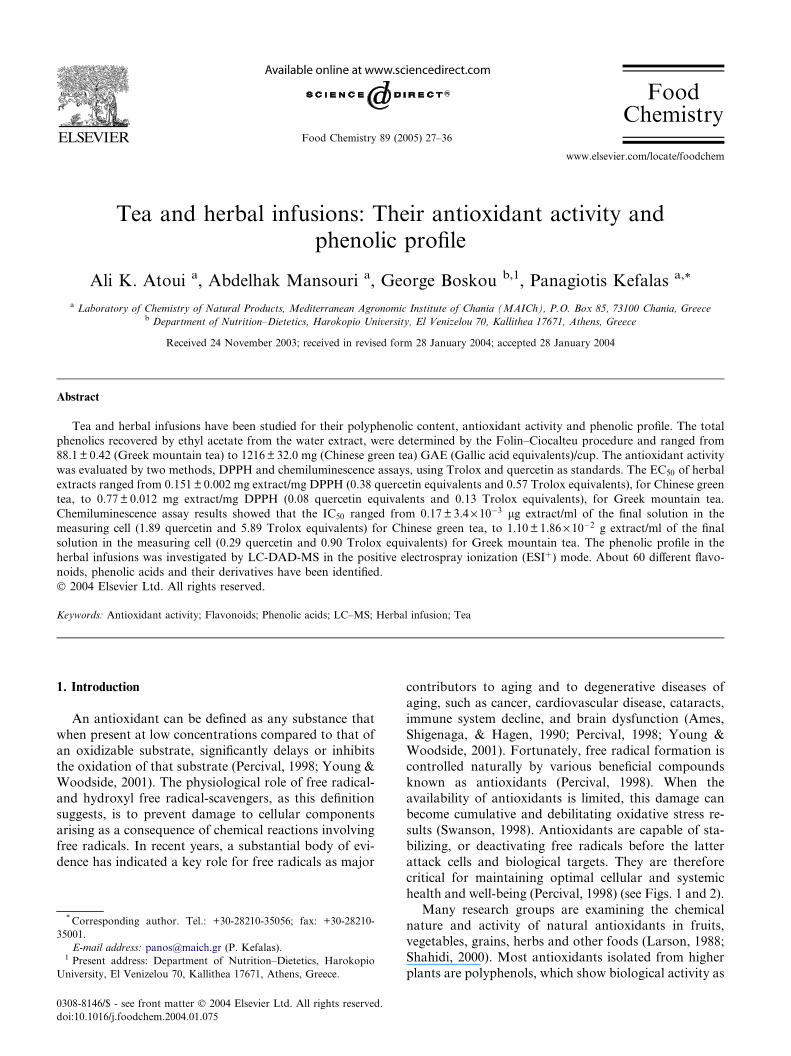
Fig. 1. HPLC chromatogram of Greek mountain tea infusion at 290 and 340 nm, respectively.
Fig. 2. UV–Vis and ESI-MS (at 20 and 70 eV) spectra of Apigenin 7-xyloside, respectively.
28 A.K. Atoui et al. / Food Chemistry 89 (2005) 27–36
antibacterial, anti-carcinogenic, anti-inflammatory, anti-viral, anti-allergic, estrogenic, and immune-stimulating
effects (Larson, 1988). The antioxidant activity of
phenolics is mainly due to their redox properties, which
allow them to act as reducing agents, hydrogen donors,
and singlet oxygen quenchers. In addition, they have a
metal chelation potential. The antioxidant effect of plant
phenolics has been studied in relation to the prevention
of coronary diseases and cancer, as well as age-relateddegenerative brain disorders (Parr & Bolwell, 2000).
Tea and herbal infusions contribute to the major
source of phenolic compounds in our diet (Shahidi,
2000). Several studies have been conducted for thepresence and the activity of antioxidants in tea and
herbs but emphasis has been given to organic solvent
extracts isolated from dried leaves. Little is known
about the phenolic profiles and antioxidant activity in
infusions of herbs (Triantaphyllou, Blekas, & Boskou,
2001). The objective of this work was to estimate the
phenolic content, evaluate the antioxidant activity and
determine the phenolic profile of the water extracts ofblack and green teas, Greek mountain tea, eucalyptus,
linden, sage, chamomile, mint, and dictamnus, which are
popular beverages in the Mediterranean region.
A.K. Atoui et al. / Food Chemistry 89 (2005) 27–36 29
2. Materials and methods
2.1. Plant material
The nine different commercial, pre-packaged, dryherbs were purchased from a supermarket in Chania,
Crete, Greece.
3. Chemicals and standards
DPPH (2,2-diphenyl-1-picryhydrazyl radicals),
EDTA, luminol (3-aminophthalhydrazide), boric acidand Trolox were purchased from Sigma Chemical Co.
(Germany). Cobalt (II)[CoCl2 � 6H2O], Folin–Ciocal-
teu’s reagent, sodium carbonate, ethyl acetate, acetic
acid and perhydrol stabilized 30% H2O2 were from E
Merck (Germany). The methanol used was from Readel
de Ha€en (Germany). Gallic acid and quercetin were
from Sigma (USA).
3.1. Preparation of the herbal infusion
Fifteen grams of each herb were infused into 1200 ml
of boiling water (equivalent to five teacups) for 3 min,
filtered through Whatman No. 4 paper and then con-
centrated under vacuum to a final volume of 50 ml. Po-
lyphenols from the concentrated samples were extracted
twice using ethyl acetate (100 ml · 2). The combined ex-tracts were dried over sodium sulphate, concentrated
under vacuum to dryness and the residue obtained was
redissolved in 5 ml of methanol for further analyses.
3.2. Determination of total phenolic compounds in the
extracts
The amount of total phenolics (TPH) was determinedusing the Folin–Ciocalteu method (Zheng & Wang,
2001). A calibration curve of gallic acid was prepared,
and the results were expressed as mg GAE (gallic acid
equivalents)/cup. In this method 5 ml of distilled water
were added into a 10 ml volumetric flask. A suitable
volume of the herbal extract was transferred into the
volumetric flask to obtain absorbance in the range of the
prepared calibration curve. About 0.2 ml of Folin–Ci-ocalteu reagent was added and mixed well. After 3 min,
0.4 ml saturated Na2CO3 solution was added, mixed
well and made up to volume with distilled water. After a
1 h reaction in the dark, the absorbance was measured at
725 nm using a Hewlett–Packard 8452A diode-array
spectrophotometer.
3.3. Evaluation of antioxidant activity of the extracts
In the present study, the antioxidant activity was
evaluated in terms of hydrogen donating or radical-
scavenging ability of tea and herbal extracts using
Co(II)/EDTA-induced luminol chemiluminescence and
the 2,2-diphenyl-1-picrylhydrazyl (DPPH) free radical
assay (Parejo, Codina, Petrakis, & Kefalas, 2000).
3.3.1. DPPH radical method
A methanolic solution (50 ll) of the herbal extract atfive different concentrations was added to 1.95 ml of
DPPH� solution (6 · 10�5 M in methanol). The decrease
in the absorbance at 515 nm was determined using a HP
8452A diode-array spectrophotometer until the reaction
reached the steady state in the dark (Siddhuraju &
Becker, 2003).The remaining DPPH� concentration in the reaction
medium was calculated from the calibration curve.
The percentage of remaining DPPH� was calculated
as follows:
% DPPH� remaining ¼ ½DPPH��T=½DPPH��T¼0;
where [DPPH�]T was the concentration of DPPH� at the
time of steady state and [DPPH�]T¼0 was the concen-
tration of DPPH� at zero time (Siddhuraju & Becker,
2003).These values were plotted against mg of herbal ex-
tract/mg DPPH� to show the amount of antioxidant
necessary to decrease the initial DPPH� concentration by
50% (EC50) using the exponential curve.
½% DPPH�rem� ¼ b½moles antioxidant=mole DPPH�� þ a:
Antiradical efficiency (AE) was also calculated
(AE¼ 1/EC50). Results were expressed as standard
equivalents using quercetin and Trolox on the basis ofthe EC50 value.
3.3.2. Luminol chemiluminescence method
Chemiluminescence analysis was carried out on a
Jenway (Essex, UK) 6200 Fluorimeter, keeping the lamp
off and using only the photomultiplier of the apparatus
(Parejo et al., 2000). In this method 1 ml of buffer so-
lution (boric acid 0.05 M, pH 9), containing cobalt(II)[CoCl2 � 6H2O] (2 mg/ml) and EDTA (10 mg/ml),
was mixed well with 100 ml of the luminol (100 lg/ml,
5.6 · 10�4 M), buffer solution (boric acid 0.05 M, pH 9)
in a test tube. Then 25 ll of H2O2 aqueous solution
(5 · 10�5 M) was deposited on the bottom of another
test tube and mixed well with 25 ll of the sample. The
luminol buffer mixture was added rapidly to the cuvette
with a Pasteur pipette and thoroughly mixed for 15 s inorder to initiate the chemiluminescence reaction in situ.
The CL intensity (I) was measured when it reached the
plateau. The ratio I0=I was calculated. I0=I vs. lg ex-
tract/ml was plotted for three prepared dilutions of each
herbal extract and a linear regression was established in
order to calculate the IC50, which is the amount of
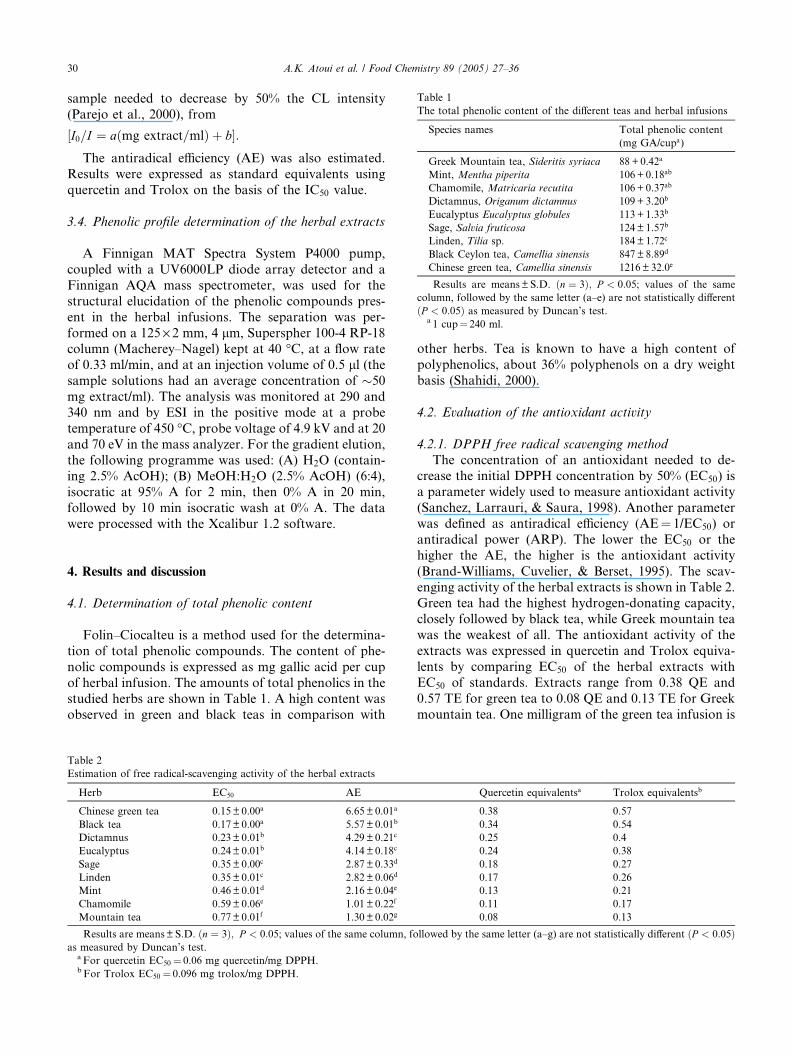
Table 1
The total phenolic content of the different teas and herbal infusions
Species names Total phenolic content
(mg GA/cupa)
Greek Mountain tea, Sideritis syriaca 88+0.42a
Mint, Mentha piperita 106+ 0.18ab
Chamomile, Matricaria recutita 106+ 0.37ab
Dictamnus, Origanum dictamnus 109+ 3.20b
Eucalyptus Eucalyptus globules 113+ 1.33b
Sage, Salvia fruticosa 124± 1.57b
Linden, Tilia sp. 184± 1.72c
Black Ceylon tea, Camellia sinensis 847± 8.89d
Chinese green tea, Camellia sinensis 1216± 32.0e
Results are means±S.D. ðn ¼ 3Þ; P < 0:05; values of the same
column, followed by the same letter (a–e) are not statistically different
ðP < 0:05Þ as measured by Duncan’s test.a 1 cup¼ 240 ml.
30 A.K. Atoui et al. / Food Chemistry 89 (2005) 27–36
sample needed to decrease by 50% the CL intensity
(Parejo et al., 2000), from
½I0=I ¼ aðmg extract=mlÞ þ b�:The antiradical efficiency (AE) was also estimated.
Results were expressed as standard equivalents using
quercetin and Trolox on the basis of the IC50 value.
3.4. Phenolic profile determination of the herbal extracts
A Finnigan MAT Spectra System P4000 pump,
coupled with a UV6000LP diode array detector and a
Finnigan AQA mass spectrometer, was used for the
structural elucidation of the phenolic compounds pres-
ent in the herbal infusions. The separation was per-
formed on a 125 · 2 mm, 4 lm, Superspher 100-4 RP-18column (Macherey–Nagel) kept at 40 �C, at a flow rate
of 0.33 ml/min, and at an injection volume of 0.5 ll (thesample solutions had an average concentration of �50
mg extract/ml). The analysis was monitored at 290 and
340 nm and by ESI in the positive mode at a probe
temperature of 450 �C, probe voltage of 4.9 kV and at 20
and 70 eV in the mass analyzer. For the gradient elution,
the following programme was used: (A) H2O (contain-ing 2.5% AcOH); (B) MeOH:H2O (2.5% AcOH) (6:4),
isocratic at 95% A for 2 min, then 0% A in 20 min,
followed by 10 min isocratic wash at 0% A. The data
were processed with the Xcalibur 1.2 software.
4. Results and discussion
4.1. Determination of total phenolic content
Folin–Ciocalteu is a method used for the determina-
tion of total phenolic compounds. The content of phe-
nolic compounds is expressed as mg gallic acid per cup
of herbal infusion. The amounts of total phenolics in the
studied herbs are shown in Table 1. A high content was
observed in green and black teas in comparison with
Table 2
Estimation of free radical-scavenging activity of the herbal extracts
Herb EC50 AE
Chinese green tea 0.15± 0.00a 6.65±0.01a
Black tea 0.17± 0.00a 5.57±0.01b
Dictamnus 0.23± 0.01b 4.29±0.21c
Eucalyptus 0.24± 0.01b 4.14±0.18c
Sage 0.35± 0.00c 2.87±0.33d
Linden 0.35± 0.01c 2.82±0.06d
Mint 0.46± 0.01d 2.16±0.04e
Chamomile 0.59± 0.06e 1.01±0.22f
Mountain tea 0.77± 0.01f 1.30±0.02g
Results are means±S.D. ðn ¼ 3Þ; P < 0:05; values of the same column, fo
as measured by Duncan’s test.a For quercetin EC50 ¼ 0.06 mg quercetin/mg DPPH.b For Trolox EC50 ¼ 0.096 mg trolox/mg DPPH.
other herbs. Tea is known to have a high content of
polyphenolics, about 36% polyphenols on a dry weight
basis (Shahidi, 2000).
4.2. Evaluation of the antioxidant activity
4.2.1. DPPH free radical scavenging method
The concentration of an antioxidant needed to de-crease the initial DPPH concentration by 50% (EC50) is
a parameter widely used to measure antioxidant activity
(Sanchez, Larrauri, & Saura, 1998). Another parameter
was defined as antiradical efficiency (AE¼ 1/EC50) or
antiradical power (ARP). The lower the EC50 or the
higher the AE, the higher is the antioxidant activity
(Brand-Williams, Cuvelier, & Berset, 1995). The scav-
enging activity of the herbal extracts is shown in Table 2.Green tea had the highest hydrogen-donating capacity,
closely followed by black tea, while Greek mountain tea
was the weakest of all. The antioxidant activity of the
extracts was expressed in quercetin and Trolox equiva-
lents by comparing EC50 of the herbal extracts with
EC50 of standards. Extracts range from 0.38 QE and
0.57 TE for green tea to 0.08 QE and 0.13 TE for Greek
mountain tea. One milligram of the green tea infusion is
Quercetin equivalentsa Trolox equivalentsb
0.38 0.57
0.34 0.54
0.25 0.4
0.24 0.38
0.18 0.27
0.17 0.26
0.13 0.21
0.11 0.17
0.08 0.13
llowed by the same letter (a–g) are not statistically different ðP < 0:05Þ
A.K. Atoui et al. / Food Chemistry 89 (2005) 27–36 31
equivalent to 0.38 mg of pure quercetin in terms of
DPPH radical-scavenging capacity.
4.2.2. Co(II)/EDTA-induced luminol chemiluminescence
assay
The concentration of an antioxidant needed to de-
crease the initial chemiluminescence intensity (I0) by
50% (IC50) is a parameter used to measure antioxidant
activity. For all extracts, the IC50 and AE were esti-
mated in order to measure their relative hydroxyl radi-
cal-scavenging activities. The lower the IC50 or the
higher the AE value, the higher is the antioxidant ac-
tivity (Parejo et al., 2000). The highest antioxidant ac-tivity, according to the CL method, was shown by the
green tea extract, closely followed by black tea while the
poorest was shown by the Greek mountain tea (Table 3).
The antioxidant activity of the extracts was expressed in
quercetin and Trolox equivalents by comparing IC50of
the herbal extracts with IC50of standards. Extracts range
from 1.89 QE and 5.89 TE for the Chinese green tea to
0.29 QE and 0.90 TE for the Greek mountain tea.
4.2.3. Correlation of CL, DPPH and FC tests
In order to correlate these methods a regression
model was used. The correlation between TPH and the
antioxidant activity of the herbal extracts (R2 ¼ 0.58 for
TPH/DPPH; R2 ¼ 0:53 for TPH/CL) was not highly
significant. It is known that the antioxidant properties of
single compounds within a group can vary remarkablyso that the same levels of phenolics do not necessarily
correspond to the same antioxidant responses (Zheng &
Wang, 2001; Parejo et al., 2002). Moreover, the response
of phenolics in the Folin–Ciocalteu assay also depends
on their chemical structure, and the radical-scavenging
capacity of an extract cannot be predicted on the basis
of its TPH content (Parejo et al., 2000). On the other
hand, a highly significant correlation coefficient (R2 ¼0.97) was observed between the DPPH and CL methods,
Table 3
Efficient concentrations, antiradical efficiencies and standard equivalents of
chemiluminescence assay
Herb IC50 AE
Chinese green tea 0.17± 3.40· 10�3a 5.94± 0.12a
Black tea 0.18± 4.40· 10�3a 5.59± 0.14b
Dictamnus 0.25± 1.07· 10�2b 4.00± 0.17c
Sage 0.28± 5.78· 10�2b 3.54± 0.09d
Eucalyptus 0.35± 1.54· 10�2c 2.84± 0.12e
Linden 0.50± 1.66· 10�2d 2.00± 0.06f
Mint 0.59± 4.31· 10�2e 1.71± 0.12g
Chamomile 0.77± 2.59· 10�2f 1.31± 0.05h
Mountain tea 1.10± 1.86· 10�2g 0.91± 0.01i
Results are means±S.D. ðn ¼ 3Þ, P < 0:05; values of the same column, fol
measured by Duncan’s test.a For quercetin IC50 ¼ 0.32 lg/ml.b For Trolox IC50 ¼ 1 lg/ml.
which might be explained by the mechanism by which
phenols scavenge the stable DPPH radical and the hy-
droxyl radical in these assays.
4.3. Phenolic profile of tea and herbal infusions
4.3.1. General profile
In this study the combination of diode array detec-
tion (DAD) and positive electrospray ionization mass
spectrometry (ESI+), coupled to the HPLC using re-
verse-phase silica provided an accurate method for the
structure elucidation of individual phenolics. Under the
conditions used, all the compounds analyzed had anintense signal corresponding to the pseudo-molecular
ion [M+H]þ. To a lesser extent, water adducts
[M+18]þ� and sodium adducts [M+23]þ were also
demonstrated by Kiehne and Engelhardt (1996).
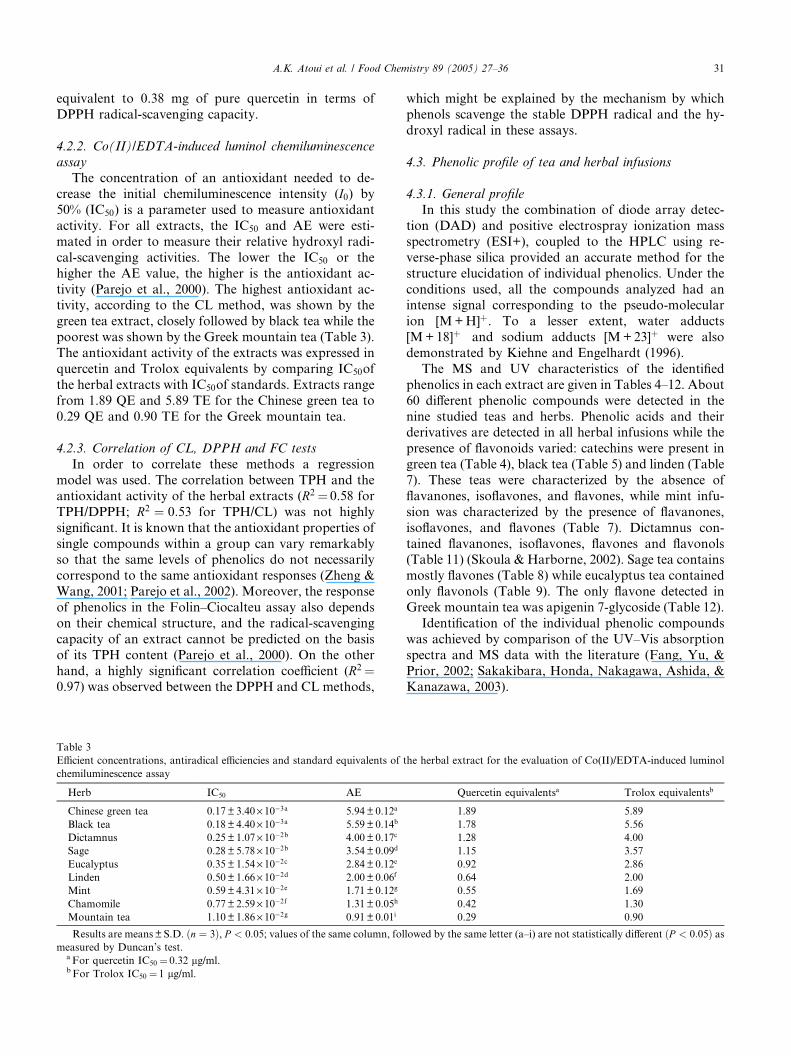
The MS and UV characteristics of the identified
phenolics in each extract are given in Tables 4–12. About
60 different phenolic compounds were detected in the
nine studied teas and herbs. Phenolic acids and theirderivatives are detected in all herbal infusions while the
presence of flavonoids varied: catechins were present in
green tea (Table 4), black tea (Table 5) and linden (Table
7). These teas were characterized by the absence of
flavanones, isoflavones, and flavones, while mint infu-
sion was characterized by the presence of flavanones,
isoflavones, and flavones (Table 7). Dictamnus con-
tained flavanones, isoflavones, flavones and flavonols(Table 11) (Skoula & Harborne, 2002). Sage tea contains
mostly flavones (Table 8) while eucalyptus tea contained
only flavonols (Table 9). The only flavone detected in
Greek mountain tea was apigenin 7-glycoside (Table 12).
Identification of the individual phenolic compounds
was achieved by comparison of the UV–Vis absorption
spectra and MS data with the literature (Fang, Yu, &
Prior, 2002; Sakakibara, Honda, Nakagawa, Ashida, &Kanazawa, 2003).
the herbal extract for the evaluation of Co(II)/EDTA-induced luminol
Quercetin equivalentsa Trolox equivalentsb
1.89 5.89
1.78 5.56
1.28 4.00
1.15 3.57
0.92 2.86
0.64 2.00
0.55 1.69
0.42 1.30
0.29 0.90
lowed by the same letter (a–i) are not statistically different ðP < 0:05Þ as
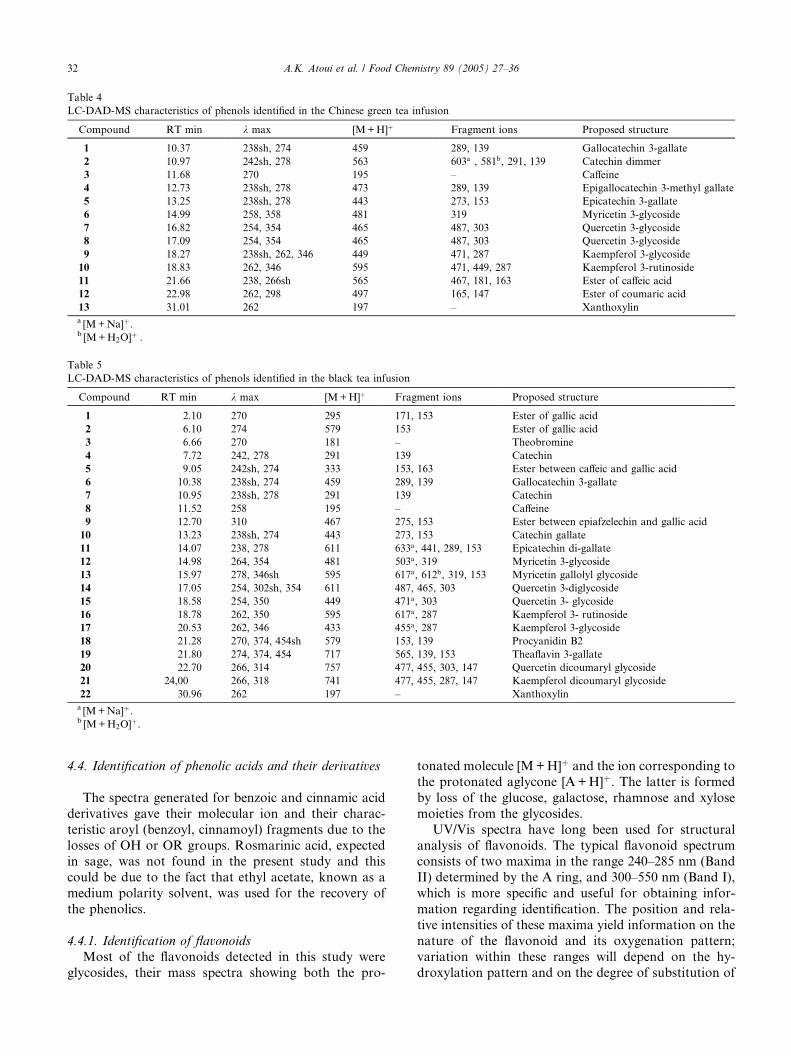
Table 4
LC-DAD-MS characteristics of phenols identified in the Chinese green tea infusion
Compound RT min k max [M+H]þ Fragment ions Proposed structure
1 10.37 238sh, 274 459 289, 139 Gallocatechin 3-gallate
2 10.97 242sh, 278 563 603a , 581b, 291, 139 Catechin dimmer
3 11.68 270 195 – Caffeine
4 12.73 238sh, 278 473 289, 139 Epigallocatechin 3-methyl gallate
5 13.25 238sh, 278 443 273, 153 Epicatechin 3-gallate
6 14.99 258, 358 481 319 Myricetin 3-glycoside
7 16.82 254, 354 465 487, 303 Quercetin 3-glycoside
8 17.09 254, 354 465 487, 303 Quercetin 3-glycoside
9 18.27 238sh, 262, 346 449 471, 287 Kaempferol 3-glycoside
10 18.83 262, 346 595 471, 449, 287 Kaempferol 3-rutinoside
11 21.66 238, 266sh 565 467, 181, 163 Ester of caffeic acid
12 22.98 262, 298 497 165, 147 Ester of coumaric acid
13 31.01 262 197 – Xanthoxylina [M+Na]þ.b [M+H2O]þ�.
Table 5
LC-DAD-MS characteristics of phenols identified in the black tea infusion
Compound RT min k max [M+H]þ Fragment ions Proposed structure
1 2.10 270 295 171, 153 Ester of gallic acid
2 6.10 274 579 153 Ester of gallic acid
3 6.66 270 181 – Theobromine
4 7.72 242, 278 291 139 Catechin
5 9.05 242sh, 274 333 153, 163 Ester between caffeic and gallic acid
6 10.38 238sh, 274 459 289, 139 Gallocatechin 3-gallate
7 10.95 238sh, 278 291 139 Catechin
8 11.52 258 195 – Caffeine
9 12.70 310 467 275, 153 Ester between epiafzelechin and gallic acid
10 13.23 238sh, 274 443 273, 153 Catechin gallate
11 14.07 238, 278 611 633a, 441, 289, 153 Epicatechin di-gallate
12 14.98 264, 354 481 503a, 319 Myricetin 3-glycoside
13 15.97 278, 346sh 595 617a, 612b, 319, 153 Myricetin gallolyl glycoside
14 17.05 254, 302sh, 354 611 487, 465, 303 Quercetin 3-diglycoside
15 18.58 254, 350 449 471a, 303 Quercetin 3- glycoside
16 18.78 262, 350 595 617a, 287 Kaempferol 3- rutinoside
17 20.53 262, 346 433 455a, 287 Kaempferol 3-glycoside
18 21.28 270, 374, 454sh 579 153, 139 Procyanidin B2
19 21.80 274, 374, 454 717 565, 139, 153 Theaflavin 3-gallate
20 22.70 266, 314 757 477, 455, 303, 147 Quercetin dicoumaryl glycoside
21 24,00 266, 318 741 477, 455, 287, 147 Kaempferol dicoumaryl glycoside
22 30.96 262 197 – Xanthoxylina [M+Na]þ.b [M+H2O]þ.
32 A.K. Atoui et al. / Food Chemistry 89 (2005) 27–36
4.4. Identification of phenolic acids and their derivatives
The spectra generated for benzoic and cinnamic acid
derivatives gave their molecular ion and their charac-
teristic aroyl (benzoyl, cinnamoyl) fragments due to the
losses of OH or OR groups. Rosmarinic acid, expectedin sage, was not found in the present study and this
could be due to the fact that ethyl acetate, known as a
medium polarity solvent, was used for the recovery of
the phenolics.
4.4.1. Identification of flavonoids
Most of the flavonoids detected in this study were
glycosides, their mass spectra showing both the pro-
tonated molecule [M+H]þ and the ion corresponding to
the protonated aglycone [A+H]þ. The latter is formed
by loss of the glucose, galactose, rhamnose and xylose
moieties from the glycosides.
UV/Vis spectra have long been used for structural
analysis of flavonoids. The typical flavonoid spectrumconsists of two maxima in the range 240–285 nm (Band
II) determined by the A ring, and 300–550 nm (Band I),
which is more specific and useful for obtaining infor-
mation regarding identification. The position and rela-
tive intensities of these maxima yield information on the
nature of the flavonoid and its oxygenation pattern;
variation within these ranges will depend on the hy-
droxylation pattern and on the degree of substitution of
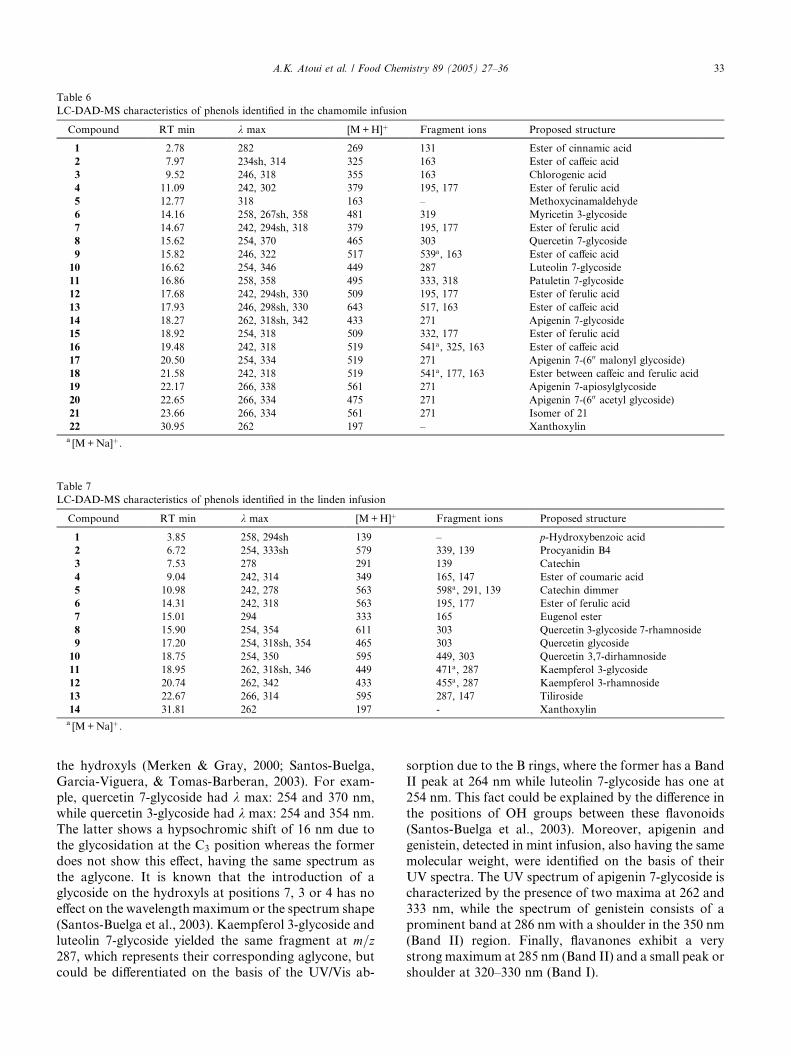
Table 6
LC-DAD-MS characteristics of phenols identified in the chamomile infusion
Compound RT min k max [M+H]þ Fragment ions Proposed structure
1 2.78 282 269 131 Ester of cinnamic acid
2 7.97 234sh, 314 325 163 Ester of caffeic acid
3 9.52 246, 318 355 163 Chlorogenic acid
4 11.09 242, 302 379 195, 177 Ester of ferulic acid
5 12.77 318 163 – Methoxycinamaldehyde
6 14.16 258, 267sh, 358 481 319 Myricetin 3-glycoside
7 14.67 242, 294sh, 318 379 195, 177 Ester of ferulic acid
8 15.62 254, 370 465 303 Quercetin 7-glycoside
9 15.82 246, 322 517 539a, 163 Ester of caffeic acid
10 16.62 254, 346 449 287 Luteolin 7-glycoside
11 16.86 258, 358 495 333, 318 Patuletin 7-glycoside
12 17.68 242, 294sh, 330 509 195, 177 Ester of ferulic acid
13 17.93 246, 298sh, 330 643 517, 163 Ester of caffeic acid
14 18.27 262, 318sh, 342 433 271 Apigenin 7-glycoside
15 18.92 254, 318 509 332, 177 Ester of ferulic acid
16 19.48 242, 318 519 541a, 325, 163 Ester of caffeic acid
17 20.50 254, 334 519 271 Apigenin 7-(600 malonyl glycoside)
18 21.58 242, 318 519 541a, 177, 163 Ester between caffeic and ferulic acid
19 22.17 266, 338 561 271 Apigenin 7-apiosylglycoside
20 22.65 266, 334 475 271 Apigenin 7-(600 acetyl glycoside)
21 23.66 266, 334 561 271 Isomer of 21
22 30.95 262 197 – Xanthoxylina [M+Na]þ.
Table 7
LC-DAD-MS characteristics of phenols identified in the linden infusion
Compound RT min k max [M+H]þ Fragment ions Proposed structure
1 3.85 258, 294sh 139 – p-Hydroxybenzoic acid
2 6.72 254, 333sh 579 339, 139 Procyanidin B4
3 7.53 278 291 139 Catechin
4 9.04 242, 314 349 165, 147 Ester of coumaric acid
5 10.98 242, 278 563 598a, 291, 139 Catechin dimmer
6 14.31 242, 318 563 195, 177 Ester of ferulic acid
7 15.01 294 333 165 Eugenol ester
8 15.90 254, 354 611 303 Quercetin 3-glycoside 7-rhamnoside
9 17.20 254, 318sh, 354 465 303 Quercetin glycoside
10 18.75 254, 350 595 449, 303 Quercetin 3,7-dirhamnoside
11 18.95 262, 318sh, 346 449 471a, 287 Kaempferol 3-glycoside
12 20.74 262, 342 433 455a, 287 Kaempferol 3-rhamnoside
13 22.67 266, 314 595 287, 147 Tiliroside
14 31.81 262 197 - Xanthoxylina [M+Na]þ.
A.K. Atoui et al. / Food Chemistry 89 (2005) 27–36 33
the hydroxyls (Merken & Gray, 2000; Santos-Buelga,
Garcia-Viguera, & Tomas-Barberan, 2003). For exam-
ple, quercetin 7-glycoside had k max: 254 and 370 nm,
while quercetin 3-glycoside had k max: 254 and 354 nm.
The latter shows a hypsochromic shift of 16 nm due to
the glycosidation at the C3 position whereas the former
does not show this effect, having the same spectrum as
the aglycone. It is known that the introduction of aglycoside on the hydroxyls at positions 7, 3 or 4 has no
effect on the wavelength maximum or the spectrum shape
(Santos-Buelga et al., 2003). Kaempferol 3-glycoside and
luteolin 7-glycoside yielded the same fragment at m=z287, which represents their corresponding aglycone, but
could be differentiated on the basis of the UV/Vis ab-
sorption due to the B rings, where the former has a Band
II peak at 264 nm while luteolin 7-glycoside has one at
254 nm. This fact could be explained by the difference in
the positions of OH groups between these flavonoids
(Santos-Buelga et al., 2003). Moreover, apigenin and
genistein, detected in mint infusion, also having the same
molecular weight, were identified on the basis of their
UV spectra. The UV spectrum of apigenin 7-glycoside ischaracterized by the presence of two maxima at 262 and
333 nm, while the spectrum of genistein consists of a
prominent band at 286 nm with a shoulder in the 350 nm
(Band II) region. Finally, flavanones exhibit a very
strong maximum at 285 nm (Band II) and a small peak or
shoulder at 320–330 nm (Band I).
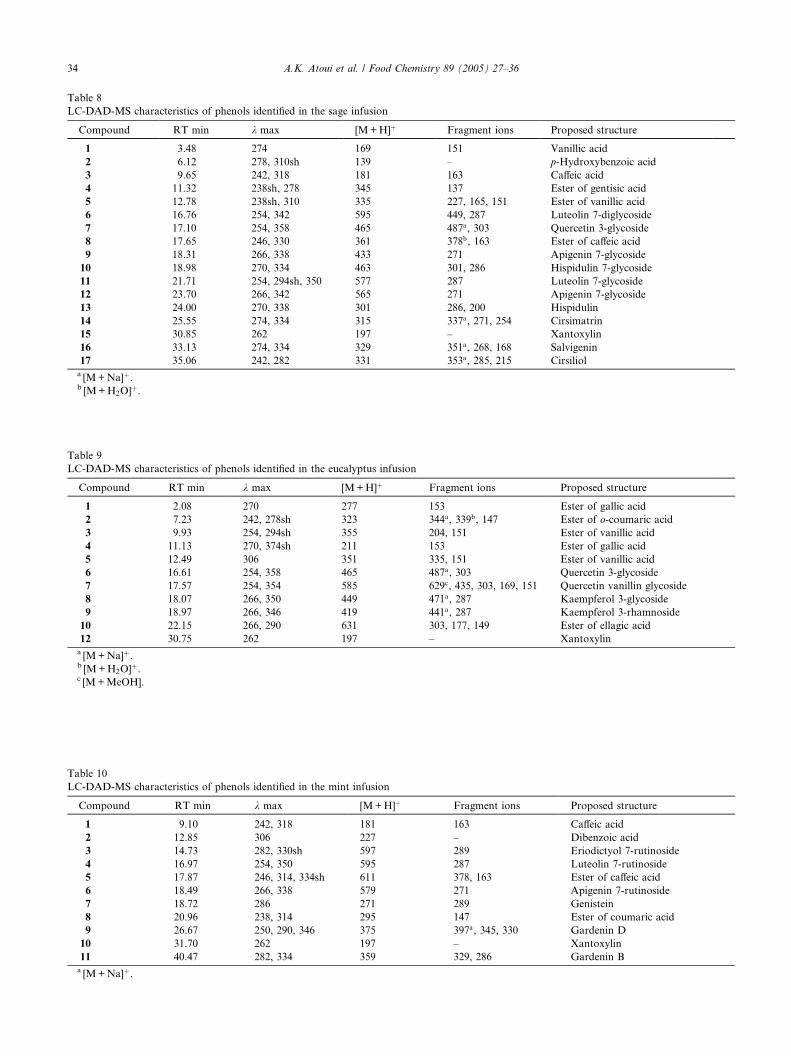
Table 8
LC-DAD-MS characteristics of phenols identified in the sage infusion
Compound RT min k max [M+H]þ Fragment ions Proposed structure
1 3.48 274 169 151 Vanillic acid
2 6.12 278, 310sh 139 – p-Hydroxybenzoic acid
3 9.65 242, 318 181 163 Caffeic acid
4 11.32 238sh, 278 345 137 Ester of gentisic acid
5 12.78 238sh, 310 335 227, 165, 151 Ester of vanillic acid
6 16.76 254, 342 595 449, 287 Luteolin 7-diglycoside
7 17.10 254, 358 465 487a, 303 Quercetin 3-glycoside
8 17.65 246, 330 361 378b, 163 Ester of caffeic acid
9 18.31 266, 338 433 271 Apigenin 7-glycoside
10 18.98 270, 334 463 301, 286 Hispidulin 7-glycoside
11 21.71 254, 294sh, 350 577 287 Luteolin 7-glycoside
12 23.70 266, 342 565 271 Apigenin 7-glycoside
13 24.00 270, 338 301 286, 200 Hispidulin
14 25.55 274, 334 315 337a, 271, 254 Cirsimatrin
15 30.85 262 197 – Xantoxylin
16 33.13 274, 334 329 351a, 268, 168 Salvigenin
17 35.06 242, 282 331 353a, 285, 215 Cirsiliola [M+Na]þ.b [M+H2O]þ.
Table 9
LC-DAD-MS characteristics of phenols identified in the eucalyptus infusion
Compound RT min k max [M+H]þ Fragment ions Proposed structure
1 2.08 270 277 153 Ester of gallic acid
2 7.23 242, 278sh 323 344a, 339b, 147 Ester of o-coumaric acid
3 9.93 254, 294sh 355 204, 151 Ester of vanillic acid
4 11.13 270, 374sh 211 153 Ester of gallic acid
5 12.49 306 351 335, 151 Ester of vanillic acid
6 16.61 254, 358 465 487a, 303 Quercetin 3-glycoside
7 17.57 254, 354 585 629c, 435, 303, 169, 151 Quercetin vanillin glycoside
8 18.07 266, 350 449 471a, 287 Kaempferol 3-glycoside
9 18.97 266, 346 419 441a, 287 Kaempferol 3-rhamnoside
10 22.15 266, 290 631 303, 177, 149 Ester of ellagic acid
12 30.75 262 197 – Xantoxylina [M+Na]þ.b [M+H2O]þ.c [M+MeOH].
Table 10
LC-DAD-MS characteristics of phenols identified in the mint infusion
Compound RT min k max [M+H]þ Fragment ions Proposed structure
1 9.10 242, 318 181 163 Caffeic acid
2 12.85 306 227 – Dibenzoic acid
3 14.73 282, 330sh 597 289 Eriodictyol 7-rutinoside
4 16.97 254, 350 595 287 Luteolin 7-rutinoside
5 17.87 246, 314, 334sh 611 378, 163 Ester of caffeic acid
6 18.49 266, 338 579 271 Apigenin 7-rutinoside
7 18.72 286 271 289 Genistein
8 20.96 238, 314 295 147 Ester of coumaric acid
9 26.67 250, 290, 346 375 397a, 345, 330 Gardenin D
10 31.70 262 197 – Xantoxylin
11 40.47 282, 334 359 329, 286 Gardenin Ba [M+Na]þ.
34 A.K. Atoui et al. / Food Chemistry 89 (2005) 27–36
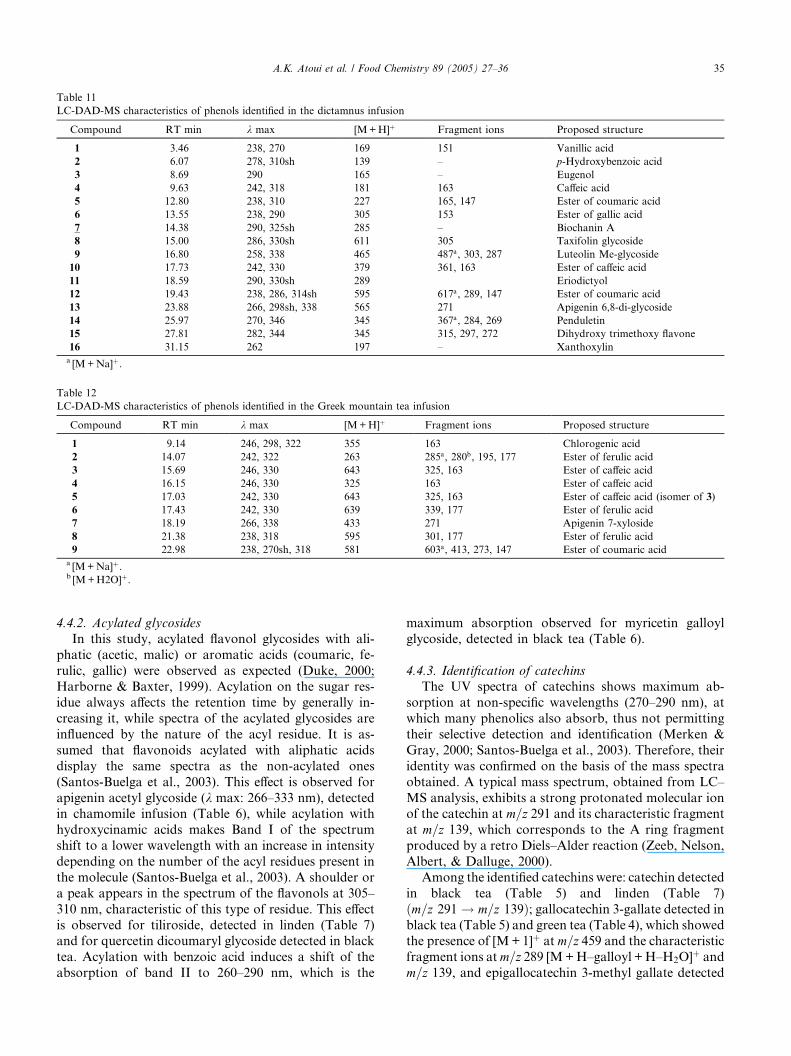
Table 11
LC-DAD-MS characteristics of phenols identified in the dictamnus infusion
Compound RT min k max [M+H]þ Fragment ions Proposed structure
1 3.46 238, 270 169 151 Vanillic acid
2 6.07 278, 310sh 139 – p-Hydroxybenzoic acid
3 8.69 290 165 – Eugenol
4 9.63 242, 318 181 163 Caffeic acid
5 12.80 238, 310 227 165, 147 Ester of coumaric acid
6 13.55 238, 290 305 153 Ester of gallic acid
7 14.38 290, 325sh 285 – Biochanin A
8 15.00 286, 330sh 611 305 Taxifolin glycoside
9 16.80 258, 338 465 487a, 303, 287 Luteolin Me-glycoside
10 17.73 242, 330 379 361, 163 Ester of caffeic acid
11 18.59 290, 330sh 289 Eriodictyol
12 19.43 238, 286, 314sh 595 617a, 289, 147 Ester of coumaric acid
13 23.88 266, 298sh, 338 565 271 Apigenin 6,8-di-glycoside
14 25.97 270, 346 345 367a, 284, 269 Penduletin
15 27.81 282, 344 345 315, 297, 272 Dihydroxy trimethoxy flavone
16 31.15 262 197 – Xanthoxylina [M+Na]þ.
Table 12
LC-DAD-MS characteristics of phenols identified in the Greek mountain tea infusion
Compound RT min k max [M+H]þ Fragment ions Proposed structure
1 9.14 246, 298, 322 355 163 Chlorogenic acid
2 14.07 242, 322 263 285a, 280b, 195, 177 Ester of ferulic acid
3 15.69 246, 330 643 325, 163 Ester of caffeic acid
4 16.15 246, 330 325 163 Ester of caffeic acid
5 17.03 242, 330 643 325, 163 Ester of caffeic acid (isomer of 3)
6 17.43 242, 330 639 339, 177 Ester of ferulic acid
7 18.19 266, 338 433 271 Apigenin 7-xyloside
8 21.38 238, 318 595 301, 177 Ester of ferulic acid
9 22.98 238, 270sh, 318 581 603a, 413, 273, 147 Ester of coumaric acida [M+Na]þ.b [M+H2O]þ.
A.K. Atoui et al. / Food Chemistry 89 (2005) 27–36 35
4.4.2. Acylated glycosides
In this study, acylated flavonol glycosides with ali-
phatic (acetic, malic) or aromatic acids (coumaric, fe-
rulic, gallic) were observed as expected (Duke, 2000;Harborne & Baxter, 1999). Acylation on the sugar res-
idue always affects the retention time by generally in-
creasing it, while spectra of the acylated glycosides are
influenced by the nature of the acyl residue. It is as-
sumed that flavonoids acylated with aliphatic acids
display the same spectra as the non-acylated ones
(Santos-Buelga et al., 2003). This effect is observed for
apigenin acetyl glycoside (k max: 266–333 nm), detectedin chamomile infusion (Table 6), while acylation with
hydroxycinamic acids makes Band I of the spectrum
shift to a lower wavelength with an increase in intensity
depending on the number of the acyl residues present in
the molecule (Santos-Buelga et al., 2003). A shoulder or
a peak appears in the spectrum of the flavonols at 305–
310 nm, characteristic of this type of residue. This effect
is observed for tiliroside, detected in linden (Table 7)and for quercetin dicoumaryl glycoside detected in black
tea. Acylation with benzoic acid induces a shift of the
absorption of band II to 260–290 nm, which is the
maximum absorption observed for myricetin galloyl
glycoside, detected in black tea (Table 6).
4.4.3. Identification of catechins
The UV spectra of catechins shows maximum ab-
sorption at non-specific wavelengths (270–290 nm), at
which many phenolics also absorb, thus not permitting
their selective detection and identification (Merken &
Gray, 2000; Santos-Buelga et al., 2003). Therefore, their
identity was confirmed on the basis of the mass spectra
obtained. A typical mass spectrum, obtained from LC–
MS analysis, exhibits a strong protonated molecular ionof the catechin at m=z 291 and its characteristic fragment
at m=z 139, which corresponds to the A ring fragment
produced by a retro Diels–Alder reaction (Zeeb, Nelson,
Albert, & Dalluge, 2000).
Among the identified catechins were: catechin detected
in black tea (Table 5) and linden (Table 7)
ðm=z 291 ! m=z 139Þ; gallocatechin 3-gallate detected in
black tea (Table 5) and green tea (Table 4), which showedthe presence of [M+1]þ at m=z 459 and the characteristic
fragment ions atm=z 289 [M+H–galloyl +H–H2O]þ and
m=z 139, and epigallocatechin 3-methyl gallate detected
36 A.K. Atoui et al. / Food Chemistry 89 (2005) 27–36
in green tea (Table 4). The observation that the latter had
a mass shift of 14 amu relative to gallocatechin 3-gallate
led to the tentative assignment of this compound (Zeeb
et al., 2000). This assignment is supported by the presence
of m=z 139, suggesting that the compound is structurallyrelated to a catechin and the presence of m=z 289, sug-gesting the relationship of this compound to epigalloca-
techin gallate and indicating that the A and B rings are
both unmodified, leaving the possibility only of a
methylated gallic acid moiety (Zeeb et al., 2000). Other
identified catechins were: epicatechin 3-gallate detected
in green tea: (m=z 443 ! m=z 273 [M+H–galloyl +H–
H2O]þ andm=z at 153, corresponding to a galloyl moiety,Table 4) (Zeeb et al., 2000), epicatechin digallate detected
in black tea (m=z 611 ! m=z 289 [M+H–2 galloyl +H–
H2O]þ and m=z 153, Table 5) and a catechin dimer de-
tected in green tea (Table 5) and linden (Table 7), which is
characterized by the molecular ion at m=z 563 and the
fragments atm=z 291 (catechin ion) andm=z 139 (catechincharacteristic fragment).
An ester between epiafzelchin and gallic acid, de-tected in black tea (Table 5), yielded a molecular ion at
m=z 467 and showed the fragmentation pattern m=z 275(M+1 of epiafzelchin) and m=z 153 (galloyl moiety).
The presence of epiafzelchin in tea has previously been
reported (Zeeb et al., 2000).
Black tea catechins are subjected topolymerizationdue
to themanufacturingprocess (Wang,Provan,&Helliwell,
2001). Among the catechin polymers, procyanidin B2(m=z 579 ! m=z 139Þ and m=z 153 (galloyl moiety) and
theaflavin 3-gallate [m=z 717 ! m=z 565 (M+H–galloyl)
! m=z 139 and m=z 153 (galloyl moiety)] were detected.
4.4.4. Caffeine
Caffeine was detected in tea as expected. The UV and
mass spectra of caffeine, detected in green tea and black
tea (Tables 4 and 5) and theobromine, detected in black
tea (Table 5), was consistent with literature values.
Regarding the important place that tea and herbal
infusions have as a popular beverages in the Mediter-ranean region and the increased interest in recent years
for food and beverages enriched in beneficial health
constituents, it may be suggested that tea and herbal
infusions can be major sources of polyphenols that ex-
hibit important antioxidant behavior.
References
Ames, B. N., Shigenaga, M. K., & Hagen, T. M. (1990). Oxidants,
antioxidants, and the degenerative diseases of aging. Proceedings of
the National Academy of Sciences, 90, 7915–7922.
Brand-Williams, W., Cuvelier, M. E., & Berset, C. (1995). Use of a free
radical method to evaluate antioxidant activity. Lebensmittel-
Wissenschaft und-Technologie, 28, 25–30.
Duke, J. A. (2000). Handbook of Medicinal Herbs. Boca Raton, FL:
CRC Press.
Fang, N., Yu, S, & Prior, R. (2002). LC/MS/MS characterization of
phenolic constituents in dried plums. Journal of Agricultural and
Food Chemistry, 50, 3579–3585.
Harborne, J. B., & Baxter, H. (1999). The Handbook of Natural
Flavonoids. Chichester, UK: Wiley.
Kiehne, A., & Engelhardt, U. H. (1996). TSP-LC-MS analysis of
various groups of polyphenols in tea. Part 1: Catechins, flavonol O-
glycosides and flavone C-glycosides. Zeitschrift fur Lebensmittel-
Untersuchung und-Forschung, 202, 48–54.
Larson, R. A. (1988). The antioxidants of higher plants. Phytochem-
istry, 27, 969–978.
Merken, H., & Gray, B. (2000). Measurement of food flavonoids by
high-performance liquid chromatography: A review. Journal of
Agricultural and Food Chemistry, 48, 577–599.
Parejo, I., Codina, C., Petrakis, C., & Kefalas, P. (2000). Evaluation of
scavenging activity assessed by Co(II)/EDTA-induced luminol
chemiluminescence and DPPH� free radical assay. Journal of
Pharmacological & Toxicological Methods, 44, 507–512.
Parejo, I., Viladomat, F., Bastida, J., Rosas-Romero, A., Flerlage, N.,
Burillo, J., & Codina, C. (2002). Comparison between the radical
scavenging activity and antioxidant activity of six distilled and
nondistilled Mediterranean herbs and aromatic plants. Journal of
Agricultural and Food Chemistry, 50, 6882–6890.
Parr, A., & Bolwell, G. P. (2000). Phenols in the plant and in man: The
potential for possible nutritional enhancement of the diet by
modifying the phenols content or profile. Journal of the Science of
Food and Agriculture, 80, 985–1012.
Percival, M. (1998). Antioxidants. Clinical Nutrition Insight, 31, 1–4.
Sanchez, M. C., Larrauri, J. A., & Saura, C. F. (1998). A procedure to
measure the antiradical efficiency of polyphenols. Journal of the
Science of Food and Agriculture, 76, 270–276.
Sakakibara, H., Honda, Y., Nakagawa, S., Ashida, H., & Kanazawa, K.
(2003). Simultaneous determination of all polyphenols in vegetables,
fruitsand teas.JournalofAgriculturalandFoodChemistry, 51, 571–581.
Santos-Buelga, G., Garcia-Viguera, C., & Tomas-Barberan, A. (2003).
On-line identification of flavonoids by HPLC coupled to diode
array detection. In Methods in Polyphenol Analysis (pp. 92–128).
Cambridge: Royal Society of Canada.
Shahidi, F. (2000). Antioxidants in food and food antioxidants.
Nahrung, 44, 158–163.
Siddhuraju, P., & Becker, K. (2003). Antioxidant properties of various
solvent extracts of total phenolic constituents from three different
agroclimatic origins of drumstick tree (Moringa oleifera Lam.)
leaves. Journal of Agricultural and Food Chemistry, 51, 2144–2155.
Skoula, M., & Harborne, J. B. (2002). The taxonomy and chemistry of
Origanum. In Oregano, The genera Origanum and Lippia (pp. 65–
108). London: Taylor & Francis.
Swanson, C. (1998). Vegetables, Fruits, and Cancer Risk: The Role of
Phytochemicals. In W. R. Bidlack, S. T. Omaye, M. S. Meskin, &
D. Jahmer (Eds.), Phytochemicals: A New Paradigm (pp. 1–12).
Lancaster, PA: Technomic Publishing.
Triantaphyllou, K., Blekas, G., & Boskou, D. (2001). Antioxidative
properties of water extracts obtained from herbs of the species of
Lamiaceae. International Journal of Food Science and Nutrition, 52,
313–317.
Wang, H., Provan, G., & Helliwell, K. (2001). Tea flavonoids: Their
functions, utilization and analysis. Trends in Food Science &
Technology, 5, 152–160.
Young, I. S., & Woodside, J. V. (2001). Antioxidants in health and
disease. Journal of Clinical Patholology, 54, 176–186.
Zeeb, D. J., Nelson, B. C., Albert, K., & Dalluge, J. J. (2000).
Separation and identification of twelve catechins in tea using liquid
chromatography/atmospheric pressure chemical ionization-mass
spectrometry. Analytical Chemistry, 72, 5020–5026.
Zheng, W., & Wang, S. Y. (2001). Antioxidant activity and phenolic
compounds in selected herbs. Journal of Agricultural and Food
Chemistry, 49, 5165–5170.
Related Documents