TDP and RTTT: Beginning the Journey to College and Career Ready Graduates

TDP and RTTT: Beginning the Journey to College and Career Ready Graduates.
Dec 21, 2015
Welcome message from author
This document is posted to help you gain knowledge. Please leave a comment to let me know what you think about it! Share it to your friends and learn new things together.
Transcript

TDP and RTTT:Beginning the Journey to
College and Career Ready Graduates

or
“Toto, I don’t think we’re in Kansas anymore!”

In the new economy…
…workers must expect change in the pursuit of careers that require more and more learning beyond
high school.

What’s the outlook for
the new ecomomy’s
fastest growing and best paying
jobs?


How are we doing in
preparing our students for the new economy?

Are Tennessee Students Proficient?
• Spring 2007… National Chamber of Commerce comparison report card of key education factors in all states:
• Tennessee made an “F” in the category of Truth in Advertising…comparing Tennessee proficiency (our state assessments) to National proficiency (NAEP)

8th Grade Achievement on State Assessment v. NAEP (2005)
87%87%
26% 21%
0%
25%
50%
75%
100%
Reading Proficient Math Proficient
Tennessee
NAEP
Is there a gap between achievement on state assessments and NAEP?

Performance MeasuresToday Beginning 2009-10
Advanced
Proficient
Below Proficient
Advanced
Proficient
Basic
Below
Basic
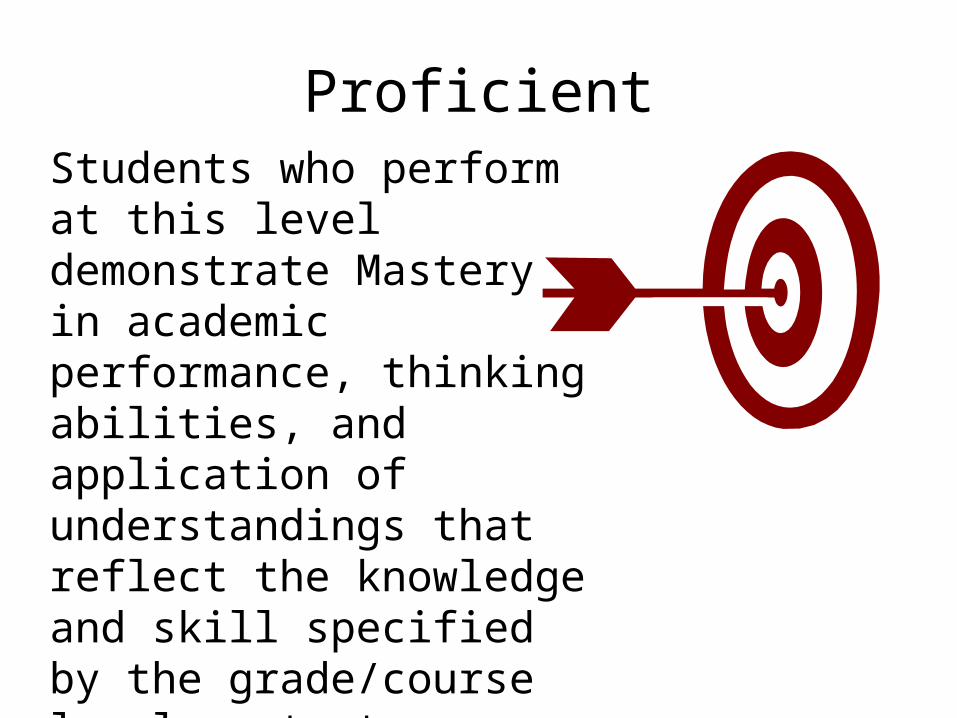
ProficientStudents who perform at this level demonstrate Mastery in academic performance, thinking abilities, and application of understandings that reflect the knowledge and skill specified by the grade/course level content standards and are prepared for the next level of study.

Proficient
• Students graduate, or are on track to graduate, ready for the next step.– University– Community College– Technology Center– Employer Training

Workforce Readiness Benchmarks
•ACT’s research has found that the skills required to be ready for college are about the SAME SKILLS required to succeed and advance in the career and technical workforce.http://www.act.org/path/policy/pdf/ReadinessBrief.pdf

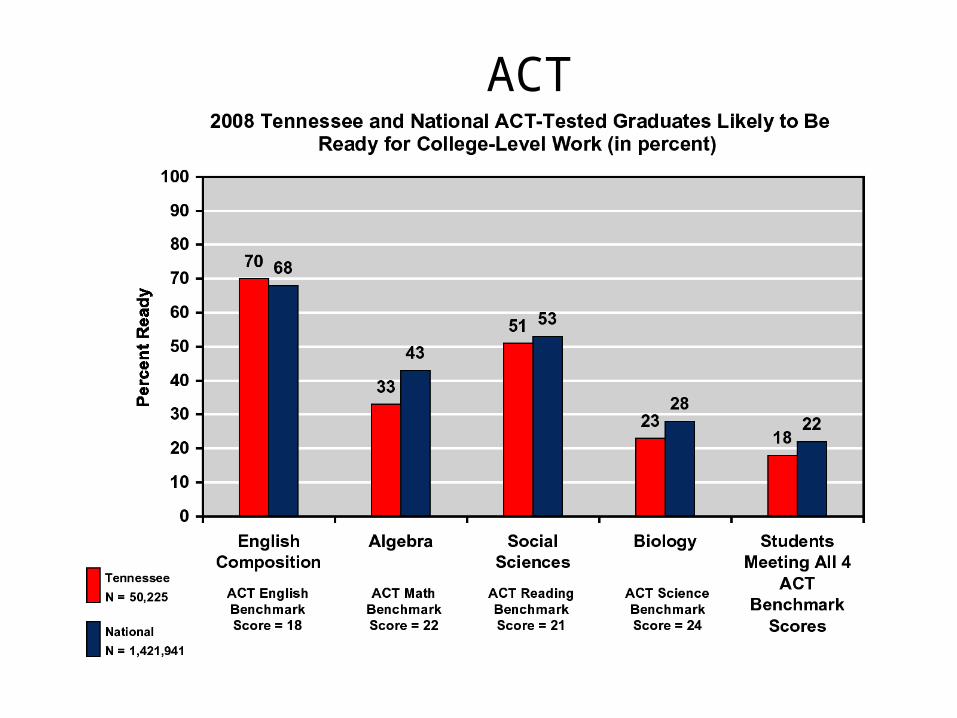
ACT Readiness Benchmarks
ACT
SUBJECT ACT(Grade 11-12)
PLAN(Grade 10)
EXPLORE(Grade 8-9)
English 18 15 13Algebra 22 19 17Social
Science 21 17 15
Biology 24 21 20
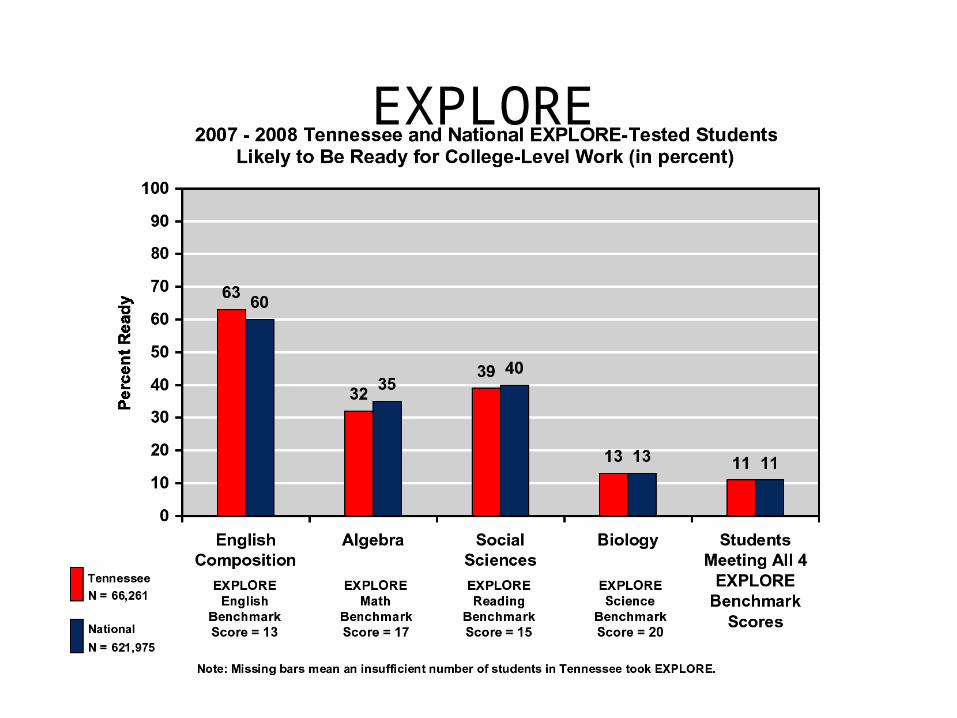
EXPLORE
ACT
College- and Career-Readiness Goals August 2009
Tennessee aspires to see dramatic improvement in the preparation of its high school graduates for college, work, and better lives.
2017-18
GOALS
INDICATORS
TARGETS
TRAJECTORIES

College- and Career-Readiness Goals August 2009
GOAL 1: Increase the high school graduation rate
•The percentage of first-time 9th grade students who graduate on-time with a regular diploma (longitudinal cohort method).

College- and Career-Readiness Goals August 2009
GOAL 2: Improve rates of college and career readiness
4th and 8th grade students on track to college and career readiness
•The percentage of 4th and 8th grade students (spring) who score at or above proficient on the TCAP reading/language arts and mathematics end-of-grade assessments and the corresponding gaps with Tennessee NAEP results.
•The percentage of 8th grade students (fall) who meet all college-readiness benchmarks of the ACT EXPLORE assessment in English, reading, mathematics, and science.
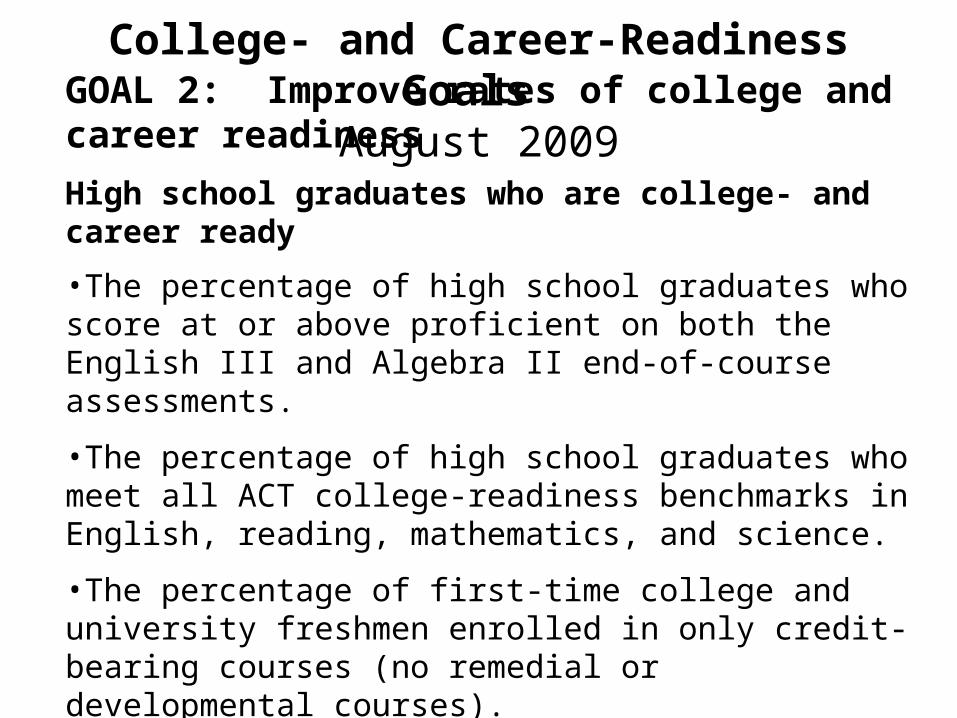
College- and Career-Readiness Goals August 2009
GOAL 2: Improve rates of college and career readiness
High school graduates who are college- and career ready
•The percentage of high school graduates who score at or above proficient on both the English III and Algebra II end-of-course assessments.
•The percentage of high school graduates who meet all ACT college-readiness benchmarks in English, reading, mathematics, and science.
•The percentage of first-time college and university freshmen enrolled in only credit-bearing courses (no remedial or developmental courses).

College- and Career-Readiness Goals August 2009
GOAL 2: Improve rates of college and career readiness
High school graduates accelerated to college and careers•The percentage of high school graduates who have attained or are eligible for postsecondary credit through dual enrollment, dual credit, Advanced Placement exams and International Baccalaureate exams, or have attained industry certification.

College- and Career-Readiness Goals August 2009
GOAL 3: Increase rates of postsecondary enrollment and completion
•The percentage of recent public high school graduates enrolled in postsecondary education.
• The percentage of first time postsecondary students completing degrees within 150% of normal degree program time (e.g., three years for associates degree and six years for bachelor’s degree)

College Readinesss Dashboard9th Grade Projected to ACT Math (22)
Probability Nr of Students Percentage
Advanced: Greater than or equal to 70%
9 2%
Accelerate II: Between 50% and 70%
21 5%
Accelerate I-B: Between 25% and 50%
19 5%
Accelerate I-A: Less than or equal to 25%
346 86%
Students who lack sufficient data
7 2%
9th Grade Projected to ACT Sci (24)
Nr of Students Percentage
5 1%
4 1%
24 6%
362 90%
7 2%

College Readinesss Dashboard9th Grade Projected to ACT Math (22)
Probability Nr of Students Percentage
Advanced: Greater than or equal to 70%
6 3%
Accelerate II: Between 50% and 70%
7 3%
Accelerate I-B: Between 25% and 50%
12 6%
Accelerate I-A: Less than or equal to 25%
181 87%
Students who lack sufficient data
3 1%
9th Grade Projected to ACT Sci (24)
Nr of Students Percentage
3 1%
4 2%
7 3%
192 92%
3 1%

College Readinesss Dashboard
9th Grade Projected to ACT Math (22)
ProbabilityNr of
StudentsPercentage
Advanced: Greater than or equal to 70%
90 18%
Accelerate II: Between 50% and 70%
46 9%
Accelerate I-B: Between 25% and 50%
57 11%
Accelerate I-A: Less than or equal to 25%
302 60%
Students who lack sufficient data
7 1%
9th Grade Projected to ACT Sci (24)
Nr of Students Percentage
44 9%
39 8%
74 15%
338 67%
7 1%

College Readinesss Dashboard
9th Grade Projected to ACT Math (22)
Probability Nr of Students Percentage
Advanced: Greater than or equal to 70%
21 6%
Accelerate II: Between 50% and 70%
14 4%
Accelerate I-B: Between 25% and 50%
32 9%
Accelerate I-A: Less than or equal to 25%
270 79%
Students who lack sufficient data
5 1%
9th Grade Projected to ACT Sci (24)
Nr of Students Percentage
10 3%
12 4%
28 8%
287 84%
5 1%

American Diploma ProjectRequired Actions
1. Align standards and assessments with the knowledge and skills required beyond high school
2. Require all high school students to take challenging courses that actually prepare them for life after high school
3. Build college and work-ready measures into statewide accountability systems
4. Hold schools accountable for graduating students who are college and/or workforce ready, and hold postsecondary accountable for students’ success once enrolled

Race to the Top
• R2tT requirements:– Standards and Assessments– Data Systems– Teachers and Leaders– Low-Performing Schools
• Bonus points: – STEM
College- and Career-Readiness Goals August 2009College- and Career-Readiness Goals August 2009

Race to the Top
• Standards and Assessments:– Common Core Standards (CCS) to be adopted by
SBE by August 1, 2010.– Professional Development on CCS by TDOE.– TDOE to develop item bank for formative, interim,
benchmark, and summative assessments: • to be administered online and on paper • electronic scoring• results automatically imported into the new State Longitudinal
Data System

Race to the Top
• Data Systems:– P-20 State Longitudinal Data System:
• TDOE, SAS, THEC, and CEBER partner to create the data system.
• Combines existing data from TDOE, THEC, TennCare, and the Departments of Children’s Services, Health, Human Services, and Corrections databases to provide a 360-degree view of the child.
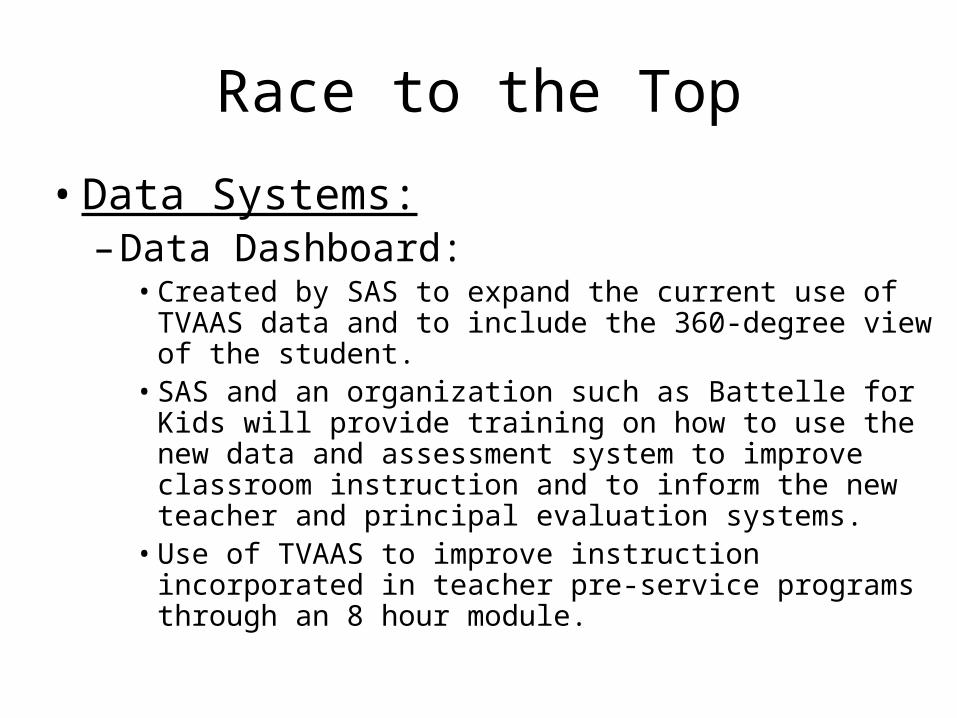
Race to the Top
• Data Systems:– Data Dashboard:
• Created by SAS to expand the current use of TVAAS data and to include the 360-degree view of the student.
• SAS and an organization such as Battelle for Kids will provide training on how to use the new data and assessment system to improve classroom instruction and to inform the new teacher and principal evaluation systems.
• Use of TVAAS to improve instruction incorporated in teacher pre-service programs through an 8 hour module.

Race to the Top
• Teachers and Leaders:– TDOE to fund the expansion of traditional and
alternative teacher training programs focused on increasing the supply of teachers in hard-to-staff subjects:
• Replicate the UTeach program in Chattanooga and Memphis.
• Expand both the Teach For America and the New Teacher Project.
• $8,000,000 in competitive grants to expand principal and teacher residency programs.

Race to the Top
• Teachers and Leaders– Teacher Evaluation Advisory Committee Data
Systems:• 15 members• Develop and recommend evaluation system based
on multiple measures;– 50% on student achievement data with at least 35% on
TVAAS for those who have it.– Annual evaluations– 4 or 5 performance categories

Race to the Top
• Teachers and Leaders– $12,000,000 competitive fund to assist
districts in designing and/or implementing alternative salary schedules.
– Other:• Small district innovation fund• Teacher working condition survey• Redesign teacher preparation report cards• School leader supply and demand study• Leadership action tank

Race to the Top
• Low-Performing Schools:– School Improvement I and II schools will be know as
Focus Schools:• Continue with current interventions. • $6,000 per school to fund additional supports.
– Corrective Action and Restructuring I schools will be known as Renewal Schools:
• Required to partner with a private provider, higher education organization, or a collaboration of non-profits to design and implement a school turnaround strategy.
• $300,000 per year per renewal school to fund the supports.

Race to the Top
• Low-Performing Schools:– Achievement School District (ASD):
• Commissioner has authority to place schools in restructuring II and beyond or “persistently lowest-achieving schools” in the newly created ASD.
• Commissioner has wide leeway to act:– From providing additional funding to implement turnaround
strategies to turning them over to a charter management organization.
– Could partner with several national non-profit organizations to turn these school around.
• Schools will remain in the ASC for at least five years.

Race to the Top
• Low-Performing Schools:– College Access Network:
• THEC will establish a statewide set of resources to help students to apply to and receive financial aid for college.
Race to the Top
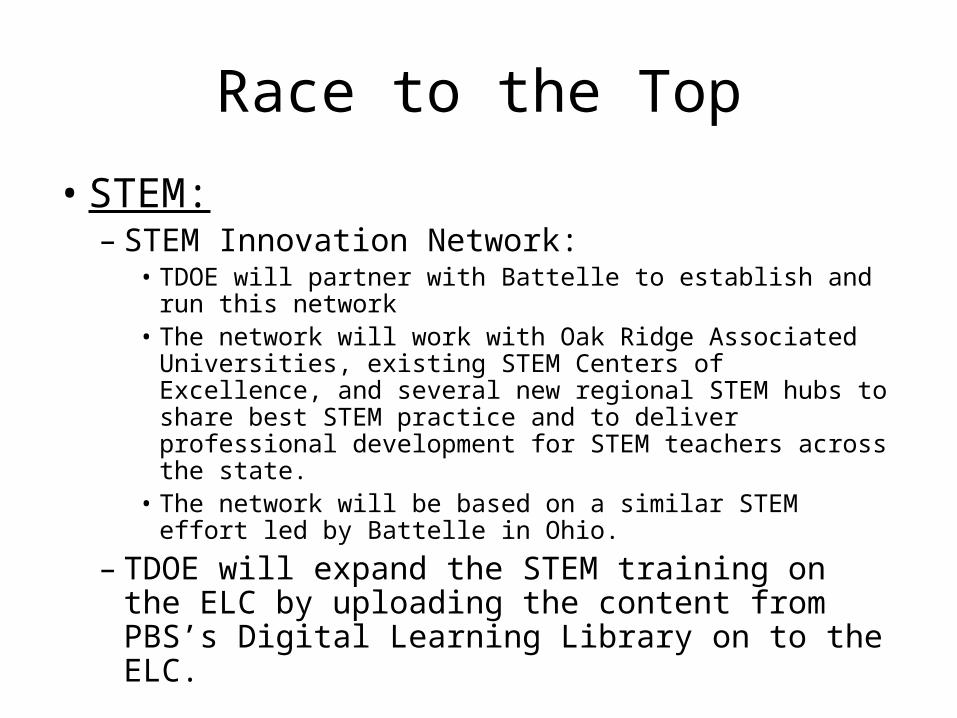
• STEM:– STEM Innovation Network:
• TDOE will partner with Battelle to establish and run this network
• The network will work with Oak Ridge Associated Universities, existing STEM Centers of Excellence, and several new regional STEM hubs to share best STEM practice and to deliver professional development for STEM teachers across the state.
• The network will be based on a similar STEM effort led by Battelle in Ohio.
– TDOE will expand the STEM training on the ELC by uploading the content from PBS’s Digital Learning Library on to the ELC.

Race to the Top
• Budget:– Total Grant request:
• $501,792,892
– 50% must flow to participating LEAs:• $250,896,446
“Life’s not about waiting for the storm to pass…
A Parting Thought:
It’s about learning to dance in the rain!
Vivian Greene
Related Documents