TOPOLOGICAL DATA ANALYSIS HJ van Veen· Data Science· Nubank Brasil

Welcome message from author
This document is posted to help you gain knowledge. Please leave a comment to let me know what you think about it! Share it to your friends and learn new things together.
Transcript
TOPOLOGICAL DATA ANALYSIS
HJ van Veen· Data Science· Nubank Brasil

TOPOLOGY I
• "When a truth is necessary, the reason for it can be found by analysis, that is, by resolving it into simpler ideas and truths until the primary ones are reached." - Leibniz

TOPOLOGY II
• Topology is the mathematical study of topological spaces.
• Topology is interested in shapes,
• More specifically: the concept of 'connectedness'

TOPOLOGY III• A topologist is someone who does not see the
difference between a coffee mug and a donut.

HISTORY I
• “Nothing at all takes place in the universe in which some rule of maximum or minimum does not appear.” - Euler
• Seven Bridges of Koningsbrucke: devise a walk through the city that would cross each bridge once and only once.

HISTORY II

HISTORY III• Euler's big insights:
• Doesn’t matter where you start walking, only matters which bridges you cross.
• A similar solution should be found, regardless where you start your walk.
• only the connectedness of bridges matter,
• a solution should also apply to all other bridges that are connected in a similar fashion, no matter the distances between them.

HISTORY IV
• We now call these graph walks ‘Eulerian walks’ in Euler’s honor.
• Euler's first proven graph theory theorem:
• 'Euler walks' are possible if exactly zero or two nodes have an odd number of edges.

TDA I• TDA marries 300-year old maths with
modern data analysis.
• Captures the shape of data
• Is invariant
• Compresses large datasets
• Functions well in the presence of noise / missing variables

TDA II• Capturing the shape of data
•Traditional techniques like clustering or dimensionality reduction have trouble capturing this shape.

TDA III• Invariance.
• Euler showed that only connectedness matters. The size, position, or pose of an object doesn't change that object.

TDA IV• Compression.
• Compressed representations use the order in data.
• Only order can be compressed.
• Random noise or slight variations are ignored.
• Lossy compression retains the mostimportant features.
• "Now where there are no parts, there neither extension, nor shape, nor divisibility is possible. And these monads are the true atoms of nature and, in a word, the elements of things." - Leibniz
MAPPER I
• Mapper was created by Ayasdi Co-founder Gurjeet Singh during his PhD under Gunnar Carlsson.
• Based on the idea of partial clustering of the data guided by a set of functions defined on the data.

MAPPER II• Mapper was inspired by the Reeb Graph.

MAPPER III• Map the data with overlapping intervals.
• Cluster the points inside the intervals
• When clusters share data points draw an edge
• Color nodes by function

MAPPER IV

MAPPER VDistance_to_median(row) x y z
1.5 1.5 1.5 1.5
1.5 -0.5 -0.5 -0.5
0 1 1 1
0 1 0.9 1.1
3 2 2 2
3 2.1 1.9 2
Y

MAPPER VI• In conclusion:

FUNCTIONS• Raw features or point-cloud axis / coordinates
• Statistics: Mean, Max, Skewness, etc.
• Mathematics: L2-norm, Fourier Transform, etc.
• Machine Learning: t-SNE, PCA, out-of-fold preds
• Deep Learning: Layer activations, embeddings

CLUSTER ALGO’S• DBSCAN / HDBSCAN:
• Handles noise well.
• No need to set number of clusters.
• K-Means:
• Creates visually nice simplicial complexes/graphs

SOME GENERAL USE CASES
• Computer Vision
• Model and feature inspection
• Computational Biology / Healthcare
• Persistent Homology
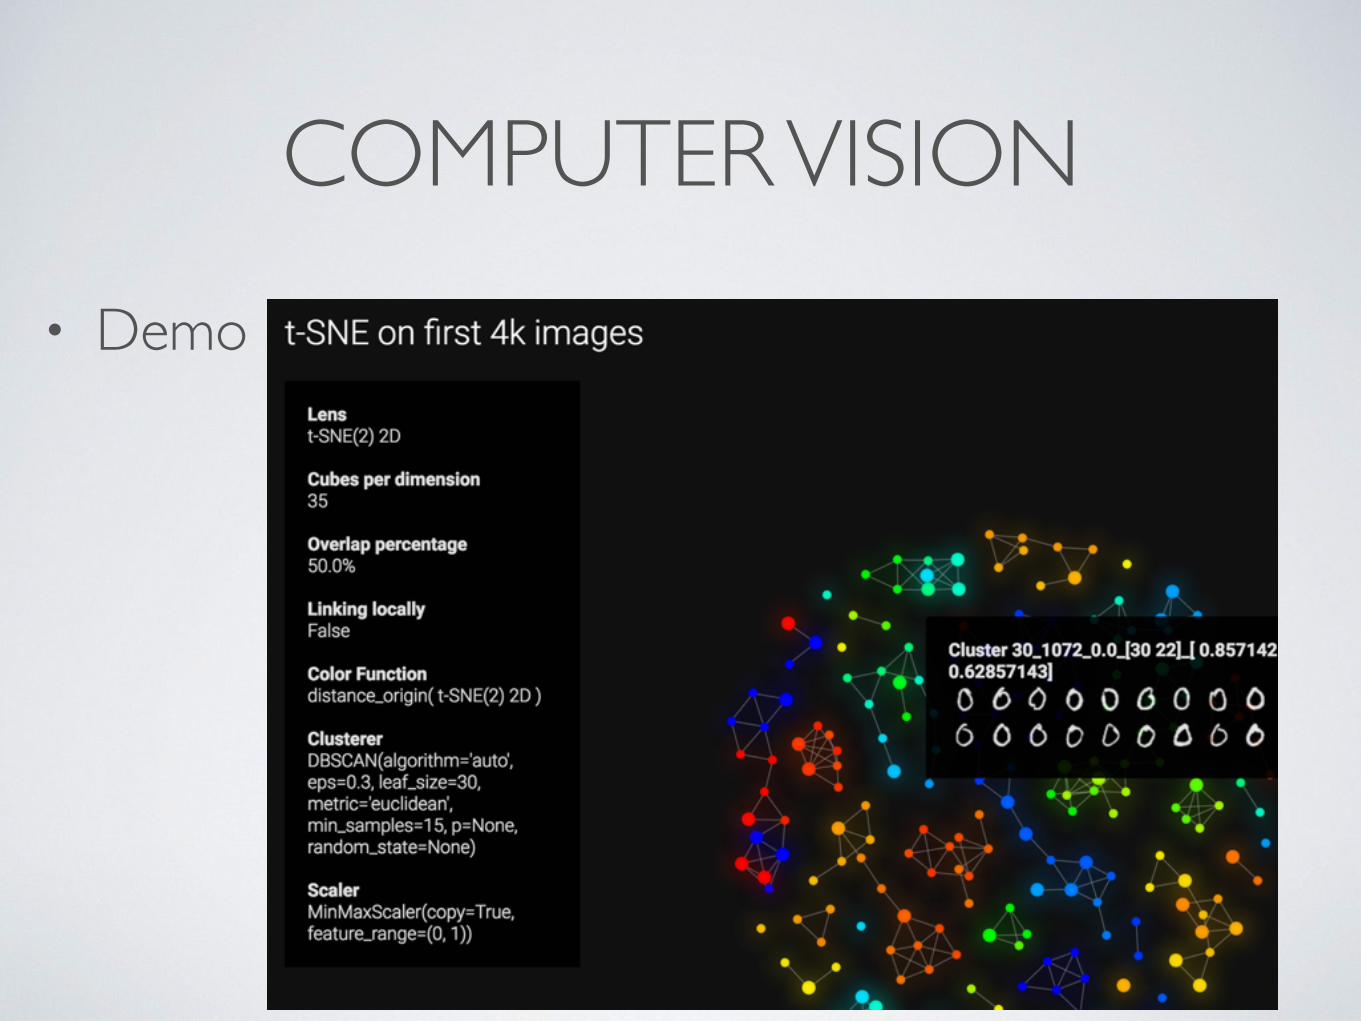
COMPUTER VISION• Demo

MODEL AND FEATURE INSPECTION
• Demo

COMPUTATIONAL BIOLOGY• Example
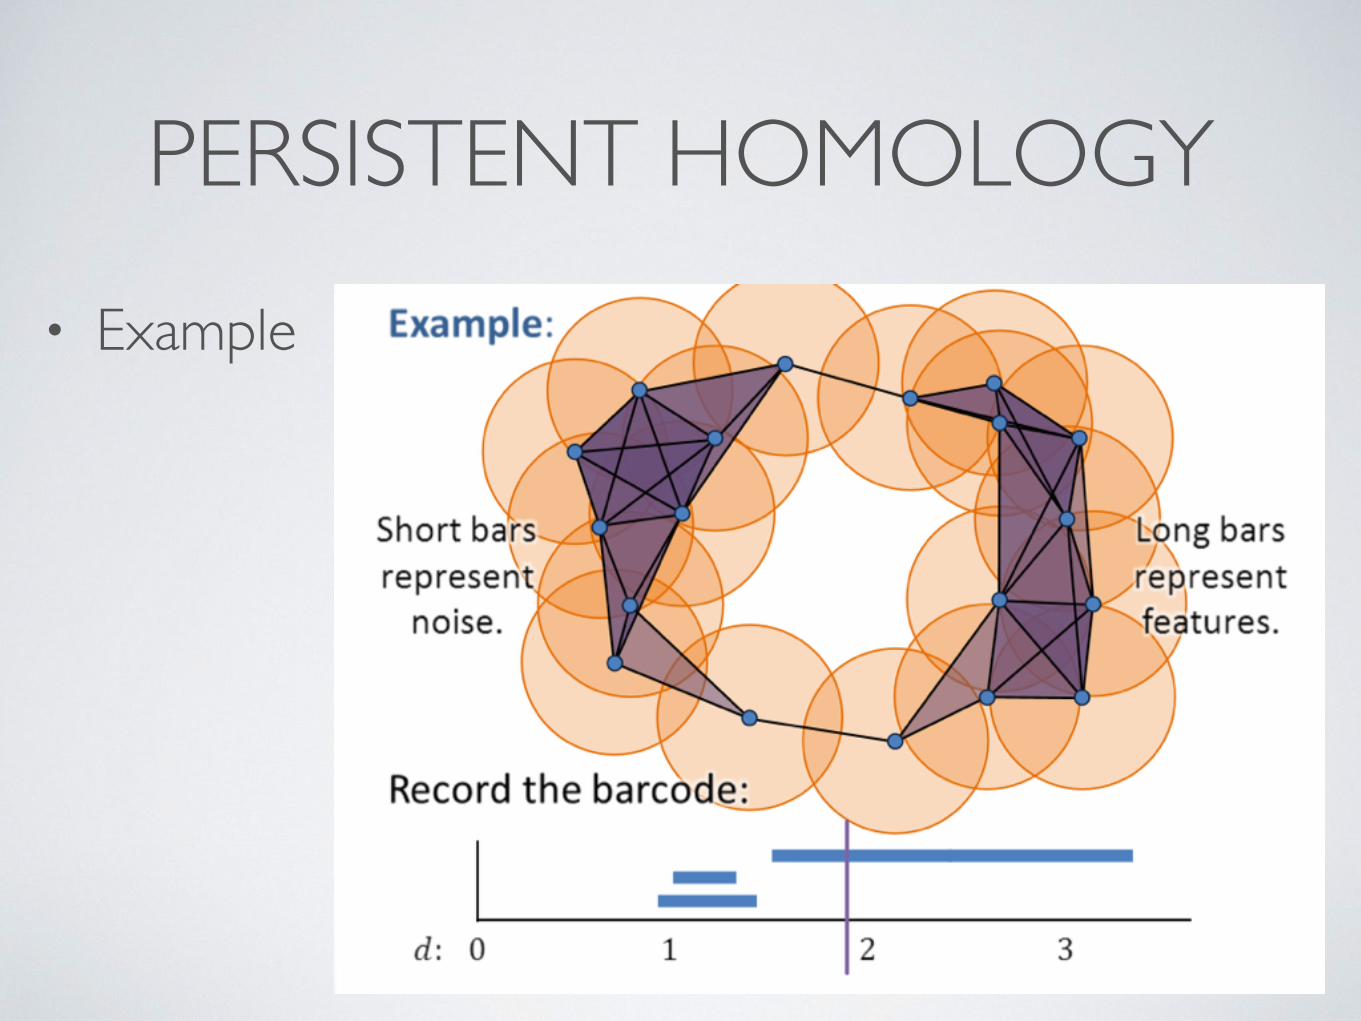
PERSISTENT HOMOLOGY• Example

SOME FINANCE USE CASES
• Customer Segmentation
• Transactional Fraud
• Accurate Interpretable Models
• Exploration / Analysis

CUSTOMER SEGMENTATION• Demo

TRANSACTIONAL FRAUD• Example of spousal fraud

ACCURATE INTERPRETABLE MODELS
• Create: global linear model
• Function: L2-norm
• Color: Heatmap by ground truth and animate to out-of-fold model predictions
• Identify: Low accuracy sub graphs
• Select: Features that are most important for sub graphs
• Create: Local linear models on sub graphs
• Stack: Decision Tree
• Compare: Divide-and-Conquer and LIME
• DEMO

EXPLORATION / ANALYSIS• Demo
QUESTIONS?

FURTHER READING• Google terms:
• Ayasdi, Topological Data Analysis, Robert Ghrist, Gurjeet Singh, Gunnar Carlsson, Anthony Bak, Allison Gilmore, Simplicial Complex, Python Mapper.
• Videos:
• https://www.youtube.com/watch?v=4RNpuZydlKY
• https://www.youtube.com/watch?v=x3Hl85OBuc0
• https://www.youtube.com/watch?v=cJ8W0ASsnp0
• https://www.youtube.com/watch?v=kctyag2Xi8o
Related Documents