1 Report of the regional Workshop on TB Surveillance and Programme Monitoring and Evaluation National Tuberculosis Institute, Bangalore India, 20-24 July 2009

Welcome message from author
This document is posted to help you gain knowledge. Please leave a comment to let me know what you think about it! Share it to your friends and learn new things together.
Transcript

1
Report of the regional Workshop on
TB Surveillance and Programme
Monitoring and Evaluation
National Tuberculosis Institute, Bangalore India, 20-24 July 2009

2
Contents Acknowledgments .........................................................................................................3 Abbreviations ................................................................................................................8 Executive summary .......................................................................................................9 Section 1: Method .........................................................................................................10 Section 2: Country-specific review...............................................................................12
1. Bangladesh ...........................................................................................................13 2. Bhutan .................................................................................................................20 3. Indonesia ..............................................................................................................27 4. Maldives ...............................................................................................................34 5. Myanmar .............................................................................................................41 6. Nepal ...................................................................................................................48 7. Sri Lanka ..............................................................................................................55 8. Thailand ...............................................................................................................62 9. Timor-Leste ..........................................................................................................70
Section 3: Conclusions and recommendations ............................................................77 Annex 1 .........................................................................................................................79 Annex 2 ........................................................................................................................85

3
Acknowledgments We would like to thank the workshop participants for their active participations and constructive discussion which will hopefully lead to improvement of TB monitoring and evaluation in the South-East Asian Region.
Country participants
Bangladesh
1. Dr Md Nazrul Islam Programme manager (TB) National Tuberculosis Control Programme DGHS Dhaka Bangaldesh
2. Mr Md Asadul Haque Sr Health Education Officer Civil Surgeon Office Dinajpur Bangladesh
3. Md Abdul Ghani Medical Officer TB Clinic Natore Bangladesh
Bhutan
4. Ms Pema Yudon Assistant Laboratory Technician Public Health Laboratory Department of Public Health Thimphu Bhutan
5. Ms Choki Seldon Health Assistant Chamgang BHU Thimphu Bhutan
6. Dr Lungten Zangmo Wangchuk Head Research and Epidemiology Unit Ministry of Health Bhutan
Indonesia
7. Dr Eka Yusuf Singka M.Sc. National TB Programme

4
Ministry of Health Republic of Indonesia Jakarta Indonesia
8. Dr Endang Lukitosari National TB Programme Ministry of Health Republic of Indonesia Jakarta Indonesia
9. Mr Sulistyo SKM, M. Epid National TB Programme Ministry of Health Republic of Indonesia Jakarta Indonesia
Maldives
10. Ms Fatimath Reeza Programme Officer Centre for Community Health and Disease Control Ministry of Health and Family Male Maldives
Myanmar
11. Dr Aye Thein (Mr) Divisional TB Officer Sagaing Divisional TB Centre Monywa Myanmar
12. Dr Hnin Wai Lwin (Ms) Medical Officer Divisional TB Centre Yangon Myanmar
13. Dr Thandar Lwin (Ms) Assistant Director National TB Control Programme Department of Health Nyapitaw Myanmar
Nepal
14. Mr Mukunda Raj Gautam Sr Public Health Administrator Ministry of Health and Population Kathmandu Nepal
15. Mr Sandip Chitrakar Medical Record Officer National Tuberculosis Centre

5
Kathmandu Nepal
Sri Lanka
16. Dr D.S.D. Samaraweera Consultant Community Physician National Programme for TB Control and Chest Diseases Colombo 5 Sri Lanka
17. Prof. A.J. Perera Faculty of Medicine University of Colombo Colombo Sri Lanka
Thailand
18. Dr Sompong Jaroongjittanusonti Provincial Chief Medical Officer Buriram Provincial Health Office Office of the Permanent Secretary Ministry of Public Health Tivanond Road, Nonthaburi 11000 Thailand
19. Dr Sriprapa Nateniyom Deputy Director, Bureau of Tuberculosis Department of Disease Control Ministry of Public Health Tivanond Road, Nonthaburi 11000 Thailand
20. Ms Sumalee Amarinsangpen Registered Nurse Office if Disease Prevention and Control 10 Department of Disease Control Ministry of Public Health Chiang Mai Province. Thailand
Timor-Leste
21. Mr Constantino Lopes NTP Manager Ministry of Health Dili Timor-Leste
22. Mr Domingos Pereira Regional Supervisor Ministry of Health Dili Timor-Leste

6
Temporary advisers 23. Dr Prahlad Kumar
Director National Tuberculosis Institute (NTI) AVALON No. 8, Bellary Road. Bangalore-560003
24. Dr V. Kumaraswamy Ag. Director, Tuberculosis Research Centre Mayor V R Ramanathan Road Spurtank Road, Chetput Chennai, Tamil Nadu 600 031 India
25. Dr Vineet K. Chadha Sr Epidemiologist, National TB Institute No 8, Bellary Road Bangalore-560 092
26. Dr Thelma Narayan Coordinator and Public Health Consultant, Centre for Public Health and Equity, SOCHARA No.27, 1st Floor, 6th Cross, 1st Main, 1st Block, Koramangala, Bangalore - 560 034, Karnataka
27. Dr V.S. Salhotra Deputy Director, SAARC TB Centre Thimi, Bhaktapur, P.O. Box 9517 Kathmandu Nepal
28. Dr Aime De Muynck 37 Hof Ter Schrieklaan B2600 Berchem Belgium
Other agencies / observers
29.
Dr Vishnuvardhan Kamineni Technical Consultant UNION C-6 Qutub Institutional Area New Delhi 110 016
30. Dr K. Zaman Scientist ICDDR,B 68 Shaheed Tajuddin Ahmed Sharani Mohakhali, Dhaka 1212 Bangladesh

7
Who country offices
31. Dr D.F. Wares Medical Officer –TB WHO India
WHO HQ
32. Dr Philippe Glaziou STB/TME WHO/HQ
33. Dr Ana Bierrenbach STB/TME WHO/HQ
34. Dr Mehran Hosseini WHO/HQ
WHO SEARO
35. Dr Md Khurshid Alam Hyder MO-TB, WHO/SEARO
8
Abbreviations ARI annual risk of infection CDR case detection rate DOTS the basic package that underpins the Stop TB Strategy HIV human immunodeficiency virus MDR multidrug resistance (resistance to, at least, isoniazid and rifampicin) NTP national tuberculosis programme SEA South-East Asia Ss+ smear-positive

9
Executive summary Representatives from nine of the eleven countries in the WHO South-East Asian region (except for India and DPR Korea) participated in this workshop. The main objective of the workshop was to make use of the data that are collected through TB routine surveillance system to improve the estimate of TB burden and trend. The main expected outcome of the workshop was for the participants to understand the current WHO methods for estimation of TB, and their application to their own country and to identify how the estimates could be improved with available data or with data that could be compiled in the future. A workbook with specific questions and a set of analysis/graphs generated from the collected data using workshop template were used to identify the fraction of TB cases missing from the surveillance system, to assess the data quality and trend in TB incidence and to plan for improvement of TB monitoring and evaluation system at the national and sub-national level. WHO method and assumptions for TB estimation were carefully reviewed by the participants and some revisions were proposed. Most countries were able to provide the national data for years 1995-2007, however, the data on case finding efforts including infrastructure, laboratories and staff were very incomplete and only available for the recent years in most countries. Only two countries (Indonesia and Sri Lanka) were able to provide the sub-national data that were requested in the workshop template. An attempt to assess the quality of data collected through routine surveillance system was made using the quantitative methods such as variation in case notifications and proportion of various TB cases out of overall notifications by time and space. By and large, most of the variations could be explained by changes in case finding efforts and/or recording and reporting practices. However, there is a need for further investigation to explain some unusual patterns in some countries. The estimate of case detection rate from the onion model for year 2007 was applied to the notification of the same year to generate the estimate of incidence for 2007. In the absence of sufficient data to estimate the trend in TB incidence, and where the notification data was not a proxy of trend in TB incidence, it was assumed that the incidence remained constant over time. This was the case for all countries except for Bhutan and Maldives where the estimates of case detection rate for years 1997, 2003 and 2007 used to derive the estimate of incidence for the respective years. The estimates for the years in between were made using cubic spline projection method. The countries are asked to provide some supporting evidences for the their estimate of case detection rate for various layers of the onion. In some countries further investigations or data collection were recommended.

10
Section 1: Method The main objectives and expected outcomes of the workshop were as follows: Objectives
1. To review existing estimates of TB incidence, prevalence and mortality and the methods used to produce them, on a country-by-country basis
2. To assess the reliability and completeness of notification data (component 1
of the WHO framework) 3. To assess what percentage of incident TB cases are included in TB
notifications (component 3 of the WHO framework) 4. To assess whether trends in TB notifications reflect trends in TB incidence
(component 2 of the WHO framework) Expected Outcomes
1. All participants understand the current methods and how they have been applied for their own country and have identified how the estimates could be improved with available data or with data that could be compiled in the future
2. Agreement on TB estimates and definition of next steps to improve
estimates
Methods Using standard Excel templates, the country representatives from the national TB programmes (NTPs) of the eleven countries in the South-East Asian Region were asked to provide the national and sub-nation data on TB case notifications and case finding efforts for years 1995-2007. The collected data were automatically compiled into a single data file using STATA software. Then the country-specific analysis/graphs were generated using R software. In order to explore the possibility of using the notification data to estimate or improve the estimation of TB incidence and its trend for each of the 9 participating countries, a workbook with a list of specific questions with structured answers was shared with the participants and was completed during the facilitated group works. The workbook contains the following four sections: Assessment of the fraction of cases being missed by routine TB notification data, based on the "Onion" model Are data reliable and complete?
1. Do changes in notifications over time reflect changes in TB incidence?
2. Planning The graphs and analysis produced using the submitted data were used to answer the questions of the workbook.

11
A country-specific document explaining the current WHO methods and assumptions to estimate TB was shared with the participants. The participants were asked to carefully review the document and provide their specific suggestions on methods and assumptions. Using the completed workbooks, the countries were asked to summarize and present their main findings and conclusion in the plenary sessions. Preparation of the report for the workshop The completed workbooks from nine participating counties were carefully reviewed and the data were used to suggest a new set of estimates for TB incidence. In section 2, the country-specific revisions of TB incidence are summarized. These estimates are still provisional. The final estimates will be shared with countries after incorporating the country feedbacks on this report and before publication of the next global TB report. The WHO task force on TB impact measurement is reviewing the main methods and assumptions used to estimate TB incidence, prevalence and mortality. And there is a possibility of major simplification of the estimation methods/assumptions used to estimate TB prevalence and mortality. Therefore, the current report do not present any revision on TB prevalence and mortality until the final results from the work of task force become available. However, the revisions that the country representatives suggested on assumptions of duration of disease and case fatality rate (Annex A) will be shared with the task force. The countries are asked to review this document and provide WHO with their comments and/or approval of the revised set of estimates of TB incidence.
12
Section 2: Country-specific review
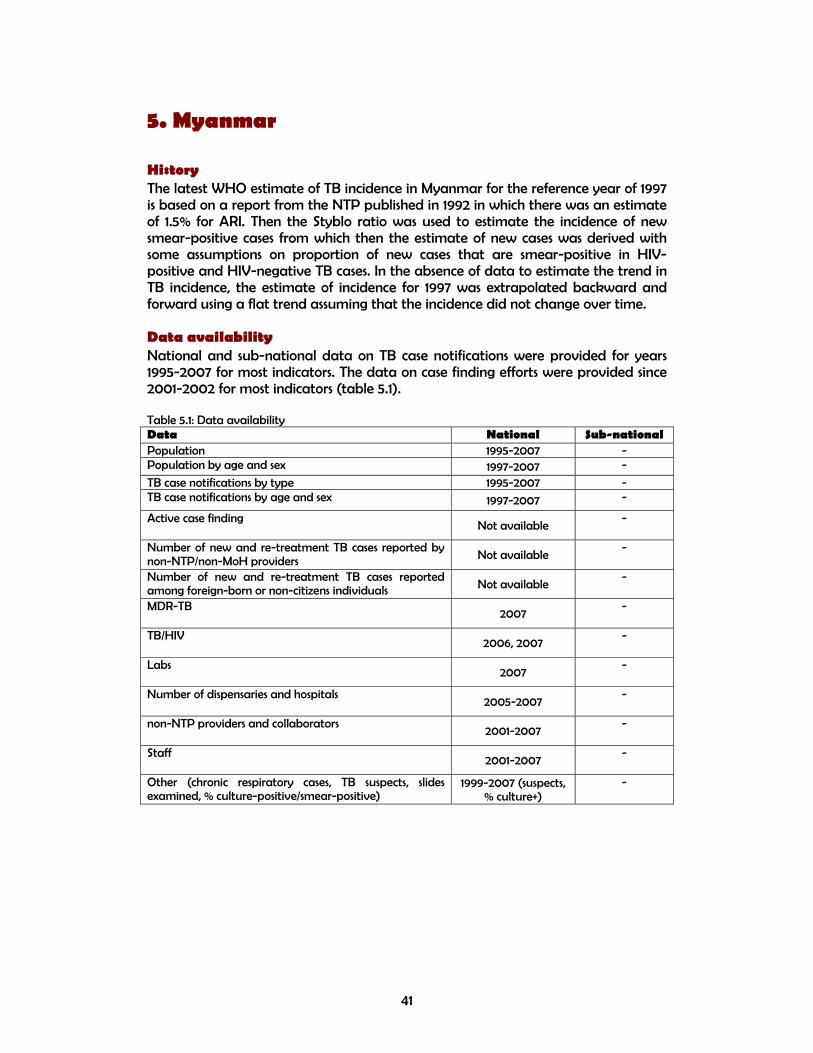
This section summarizes the information provided by countries during the workshop in order to explore the possibility of revision and improvement of the country estimates. This summary is presented under the following headings: History: a brief description of the data source and methods that WHO is currently using to estimate TB incidence and trend; Data availability: a brief summary of missing information from the workshop template at national and sub-national levels; Data quality: an assessment of the actual data (not the recording and reporting system), exploring fluctuations in case notifications, contributions of each case type to overall notification, and consistency of trends across time and space against expected values; Estimate of TB incidence for the reference year: a reassessment of the proportion of TB cases that are missing from the notification system using the onion model to estimate TB incidence; Estimate of trend in TB incidence over time: a reassessment of the trend in TB incidence over time using the notification data adjusted for case finding efforts; Revised estimates of incidence: a comparison of the current and revised estimates of incidence and case detection rates; Recommended follow-up actions for countries: a list of investigations and activities that can help to improve the estimates.

13
1. Bangladesh History The latest WHO estimate of TB incidence in Bangladesh for the reference year of 1997 is based on extrapolation of the 1966 prevalence survey using the trend in annual risk of infection from ARI surveys and some assumptions of duration of disease. Data availability National data on TB case notifications were provided for years 1995-2007. The data on case finding efforts were limited to the last 2-3 years. No sub-national data were provided (table 1.1). The was a significant difference between the data submitted to the workshop and what was reported to WHO in the previous years with lower number of cases reported in the template (see further down). The data were taken from the WHO database until the discrepancy is resolved. Table 1.1: Data availability Data National Sub-national Population 2001-2007 - Population by age and sex 2005-2007 -
TB case notifications by type 1995-2007 - TB case notifications by age and sex 2005-2007 -
Active case finding 1995-2007
-
Number of new and re-treatment TB cases reported by non-NTP/non-MoH providers -
-
Number of new and re-treatment TB cases reported among foreign-born individuals or non-citizens -
-
MDR-TB -
-
TB/HIV -
-
Labs 2005-2006
-
Number of dispensaries and hospitals 2004-2007
-
non-NTP providers and collaborators 2005-2006
-
Staff -
-
Other (chronic respiratory cases, TB suspects, slides examined, % culture-positive/smear-positive) 2005-2007 (slide)
-
WHO database Workshop template
Number of new TB cases per 100 000 population
Comparing data reported to the workshop with what was reported to WHO in the previous years
14
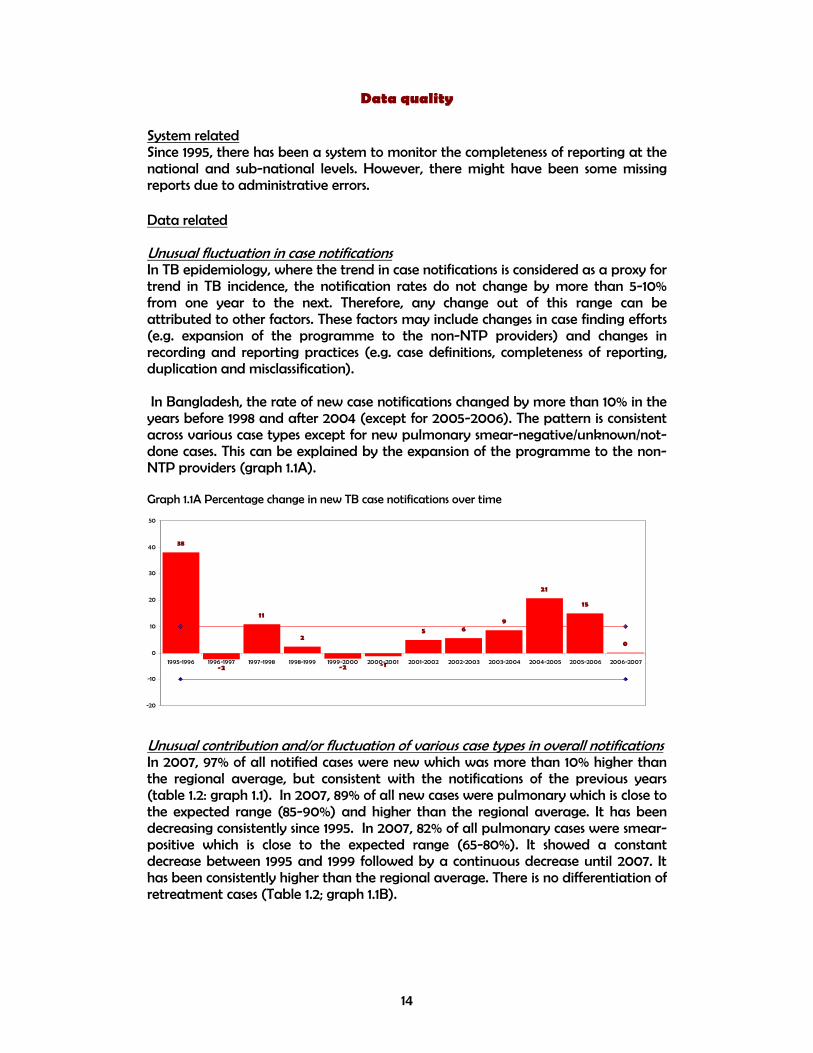
Data quality System related Since 1995, there has been a system to monitor the completeness of reporting at the national and sub-national levels. However, there might have been some missing reports due to administrative errors. Data related Unusual fluctuation in case notifications In TB epidemiology, where the trend in case notifications is considered as a proxy for trend in TB incidence, the notification rates do not change by more than 5-10% from one year to the next. Therefore, any change out of this range can be attributed to other factors. These factors may include changes in case finding efforts (e.g. expansion of the programme to the non-NTP providers) and changes in recording and reporting practices (e.g. case definitions, completeness of reporting, duplication and misclassification). In Bangladesh, the rate of new case notifications changed by more than 10% in the years before 1998 and after 2004 (except for 2005-2006). The pattern is consistent across various case types except for new pulmonary smear-negative/unknown/not-done cases. This can be explained by the expansion of the programme to the non-NTP providers (graph 1.1A). Graph 1.1A Percentage change in new TB case notifications over time
Unusual contribution and/or fluctuation of various case types in overall notifications In 2007, 97% of all notified cases were new which was more than 10% higher than the regional average, but consistent with the notifications of the previous years (table 1.2: graph 1.1). In 2007, 89% of all new cases were pulmonary which is close to the expected range (85-90%) and higher than the regional average. It has been decreasing consistently since 1995. In 2007, 82% of all pulmonary cases were smear-positive which is close to the expected range (65-80%). It showed a constant decrease between 1995 and 1999 followed by a continuous decrease until 2007. It has been consistently higher than the regional average. There is no differentiation of retreatment cases (Table 1.2; graph 1.1B).
38
-2
11
2
-2 -1
5 69
21
15
0
-20
-10
0
10
20
30
40
50
1995-1996 1996-1997 1997-1998 1998-1999 1999-2000 2000-2001 2001-2002 2002-2003 2003-2004 2004-2005 2005-2006 2006-2007

15
Table 1.2: Contribution of different types of TB in notifications
1995 2000 2007 Percentage Bangladesh SEA Bangladesh SEA Bangladesh SEA
New / all TB 98 100 98 93 97 86 New pulmonary / new TB 95 94 92 91 89 84 New smear-positive / new pulmonary TB 52 28 57 41 82 61 Relapse / all retreatment 100 100 100 25 100 37 Failure / all retreatment - - - 19 - 7 Default / all retreatment - - - 18 - 26 Other retreat / all retreatment - - - 37 - 29
Graph 1.1B Contribution of different types of TB in notifications
The contribution of various TB case types in overall notifications and their trend follows a consistent pattern which might be an indication of acceptable data quality. Estimate of TB incidence for the reference year Using the onion framework, the country representatives in the workshop estimated that in 2007, 42% of all new cases were detected by the TB programme; 8% of cases were diagnosed but not reported to the NTP; 25% of cases were detected by the non-NTP public or private providers, but not reported to the NTP, 15% of cases presented themselves to the health services, but not diagnosed, 10% had access to health services, but did not seek care and 0% of cases were estimated to have no access to health services (Table A1). It was also estimated by the country representatives that the case finding efforts improved from 1997 to 2007 which is reflected in their estimate of case detection rate for the new cases from 20% in 1997 to 30% in 2003 and 42% in 2007 (Table 1.3). Table 1.3: Case detection rate of new TB cases (%)
Year Latest WHO estimates from the 2009 global TB report
Country estimates from the workshop Point estimate (lower-upper bound)
1997 19 20 (15-25) 2003 25 30 (25-35) 2007 41 42 (28-58)
The estimate of case detection rate of new TB cases for year 2007 (42%) is used to generate the best estimate of incidence for the reference year of 2007. However, as it is shown by the uncertainty bounds around this estimate (28-58%), there is a need to provide some supporting evidence to support the estimate of missing cases in various layers of onion.
84
86
88
90
92
94
96
98
100
102
1990 1995 2000 2005 2010
% n
ew/a
ll
Bangladesh SEA
82
84
86
88
90
92
94
96
1994 1996 1998 2000 2002 2004 2006 2008
% p
ulm
/new
Bangladesh SEA
10
20
30
40
50
60
70
80
90
1994 1996 1998 2000 2002 2004 2006 2008
% s
s+/p
ulm
Bangladesh SEA

16
Estimate of trend in TB incidence over time The first step to estimate the trend in TB incidence is to decide whether the trend in TB notifications is a proxy for trend in TB incidence. That will be the case in the countries where there were not considerable changes in case finding efforts, i.e. case detection rate remains constant over time and/or recording and reporting practices leading to change in case notifications during the same period. In Bangladesh, the trend in notification rate of new TB cases can be divided into three periods. 1995-1998 shows a sharp increase (39% per year on average; from 11 to 30 cases per 100 000 population). 1999-2003 shows a slow increase (5% per year; from 36 to 43) . 2004-2007 shows a sharp increase again (14% per year; reaching to 91) (graph 1.2). A similar pattern is seen in pulmonary and extrapulmonary cases. It seems that the increase in notifications of new TB cases is mainly due to the DOTS expansion and increase in case finding efforts including expansion of the programme to the urban and hard reach areas as well as the non-NTP public and/or private sectors (e.g. medical colleges, prisons). In the absence of evidences of change in TB determinants which could have led to the increase in TB incidence, the observed increase in TB notifications seems to be reflecting the increase in case finding efforts rather TB incidence (table 1.4). In order to estimate the trend in TB incidence, the TB notifications rate needs to be adjusted for case finding efforts which is measured as an independent estimate of case detection rate using the onion model. The case detection rates of new cases that were estimated by country representatives at the workshop for years 1997, 2003 and 2007 (i.e. 20, 30 and 42% respectively) result in a decline of 3.37% per year between 1997 and 2003 followed by an increase of 2.72% per year between 2004 and 2007 in estimated TB incidence. This is difficult to explain considering the TB epidemiology. Finally, the analysis of trend in TB incidence from the notifications data proves to be difficult due to the considerable change in case finding efforts. Therefore, the trend in TB incidence is assumed to be flat (zero change per year) until more data become available (table 1.5). Table 1.4: Changes in notifications, case finding efforts and TB determinants Question Country's assessment in the workshop Have TB notifications been increasing, decreasing or stable over time?
Increased (1995-1997, 2004-2007), stable (1998-2003)
Were there any changes in case-finding effort that might have affected notifications over time? Yes
Were there any changes in recording and reporting that might have affected notifications over time? No
How have factors that may influence TB incidence changed over time, and have they had an impact on underlying TB incidence?
No

17
Table 1.5 Method to estimate TB incidence and trend
Assumptions Current method Revised method
Estimate of incidence for reference year
• Data source ss+ prevalence in 1997
42% Case detection in 2007
• Value (per 100 000 population) 223 215 (=90/0.42) Trend in TB incidence
• Data source ARI Flat trend • Type and slope Exponential,
1% decline per year
0
Revised estimates of incidence The TB incidence for years 1995-2007 is estimated by applying the flat trend on the revised estimate of 2007 which also results in the revision of case detection rate of new and smear-positive cases for the respective years (table 1.6). The estimate of new smear-positive cases derived from all cases assuming 45% of all HIV-negative and 35% of HIV-positive TB cases are smear-positive. The estimate of HIV-positive TB cases were derive indirectly from the estimate of HIV in general population and an estimate of incidence rate ratio (see Method section of 2009 global TB report for details) (table 3.6 and 3.7; graph 3.1-3.3). Table 1.6 Current versus revised estimate of incidence and case detection rate
Estimate of new TB cases Estimate of new ss+ TB cases Case detection rate,
new Case detection rate, new ss+
Year Current Revised Current Revised Current Revised Current Revised
1995 251 215 113 97 13 15 14 17
1996 248 215 112 97 20 23 21 24
1997 246 215 111 97 19 22 23 26
1998 244 215 110 97 22 25 26 29
1999 241 215 108 97 22 25 25 29
2000 239 215 107 97 22 25 26 28
2001 236 215 106 97 22 24 27 30
2002 234 215 105 97 23 25 31 33
2003 232 215 104 97 25 27 35 38
2004 229 215 103 97 28 29 40 43
2005 227 215 102 97 34 36 54 57
2006 225 215 101 97 40 42 65 68
2007 223 215 100 97 41 42 66 68

18
Table 1.7 Revised estimate of new TB cases with the confidence limits
Year
Estimate of
incidence lower bound
Upper bound
1995 215 156 323
1996 215 156 323
1997 215 156 323
1998 215 156 323
1999 215 156 323
2000 215 156 323
2001 215 156 323
2002 215 156 323
2003 215 156 323
2004 215 156 323
2005 215 156 323
2006 215 156 323
2007 215 156 323
Graph 1.2 Notifications versus estimates, new cases, before and after revision

19
Graph 1.3 Notifications versus estimates, new smear-positive cases, before and after revision
Graph 1.4 Case detection rates before and after revision
Recommended follow-up actions for countries The national notification data should be disaggregated by NTP and non-NTP providers as well as the time cohort of implementation of DOTS across different geographical areas. The country notifications data should be explored by looking at the trend in the regions where the case finding efforts have been constant through time which might be useful to assess the trend in TB incidence. Data on case finding efforts should be complied for a longer time period, i.e. 1995-2007. Supporting evidences/data for the proposed revisions on the assumptions of the TB estimates should be provided to WHO. Check the data template against the WHO database to resolve the discrepancies and provide the final numbers to WHO.
0
50
100
150
200
250
300
350
1995
1996
1997
1998
1999
200
0
200
1
200
2
200
3
200
4
200
5
200
6
200
7
Incidence_published in 09 report
Incidence_upper bound
Incidence_revised
Incidence_low er bound
Notif ications_new
0
20
40
60
80
100
120
1995
1996
1997
1998
1999
200
0
200
1
200
2
200
3
200
4
200
5
200
6
200
7
Incidence_published in 09 report
Incidence_revised
Notif ications_ss+
Case detection rate of new cases
0
20
40
60
80
100
1994 1996 1998 2000 2002 2004 2006 2008
Published in 2009 report Revised
Case detection rate of new smear-positive cases
0
20
40
60
80
100
1994 1996 1998 2000 2002 2004 2006 2008
Published in 2009 report Revised

20
2. Bhutan History The latest WHO estimate of TB incidence in Bhutan for the reference year of 1997 is based on extrapolation of 1991 ARI survey (1.5%) assuming a 2% annual decline which resulted in an ARI of 1.3% in 1997. Then the Styblo ratio was used to estimate the incidence of new smear-positive cases from which the estimate of new cases was derived with some assumptions on proportion of new cases that are smear-positive in HIV-positive and HIV-negative TB cases. The estimate of incidence for 1997 was extrapolated backward and forward using the trend in TB case notifications as proxy of trend in TB incidence. Data availability National data on TB case notifications and case finding efforts were provided for years 2001-2007 for most indicators. No sub-national data were provided (table 2.1). The missing national notification data were taken from the WHO database which were reported by country in the previous years. Table 2.1: Data availability Data National Sub-national Population 2005-2007 - Population by age and sex 2005-2007 -
TB case notifications by type 2001-2007 - TB case notifications by age and sex 2001-2007 -
Active case finding Not applicable
-
Number of new and re-treatment TB cases reported by non-NTP/non-MoH providers Not applicable
-
Number of new and re-treatment TB cases reported among foreign-born or non-citizens individuals Not applicable
-
MDR-TB 2004-2007
-
TB/HIV -
-
Labs 2001-2007
-
Number of dispensaries and hospitals 2001-2007
-
non-NTP providers and collaborators Not applicable
-
Staff -
-
Other (chronic respiratory cases, TB suspects, slides examined, % culture-positive/smear-positive) 2001-2007 (slides)
-

21
Data quality System related Since 1995, there has been a system to monitor the completeness of reporting at the national and sub-national levels. However, sometimes, there might have been some missing reports. Data related Unusual fluctuation in case notifications In TB epidemiology, where the trend in case notifications is considered as a proxy for trend in TB incidence, the notification rates do not change by more than 5-10% from one year to the next. Therefore, any change out of this range can be attributed to other factors. These factors may include changes in case finding efforts (e.g. expansion of the programme to the non-NTP providers) and changes in recording and reporting practices (e.g. case definitions, completeness of reporting, duplication and misclassification). In Bhutan, the rate of new case notifications did not show unexpected change for most years. However, in years before 2001, the changes fall out of the expected range in various case types particularly in new extrapulmonary cases. This might be due to the change in case definition, improvement of diagnosis of pulmonary cases or inconsistent classification or misclassification of cases and need further investigation (graph 2.1A). Graph 2.1A Percentage change in new TB case notifications over time
Unusual contribution and/or fluctuation of various case types in overall notifications In 2007, 95% of all notified cases were new which was around 10% higher than the regional average, but consistent with the notifications of the previous years with a decreasing trend (table 2.2; graph 2.2). In 2007, 61% of all new cases were pulmonary which is below the expected range (85-90%) and the regional average with a decreasing trend since 1995. In 2007, 56% of all pulmonary cases were smear-positive which is below the expected range (65-80%), but it has been increasing since 1995 (Table 2.2; graph 2.1B).
-3-5
3
-12
-4
-1
-23
1
-6
-1
-12
7
-25
-20
-15
-10
-5
0
5
10
15
1995-1996 1996-1997 1997-1998 1998-1999 1999-2000 2000-2001 2001-2002 2002-2003 2003-2004 2004-2005 2005-2006 2006-2007
22
Table 2.2: Contribution of different types of TB in notifications 1995 2000 2007 Percentage Bhutan SEA Bhutan SEA Bhutan SEA
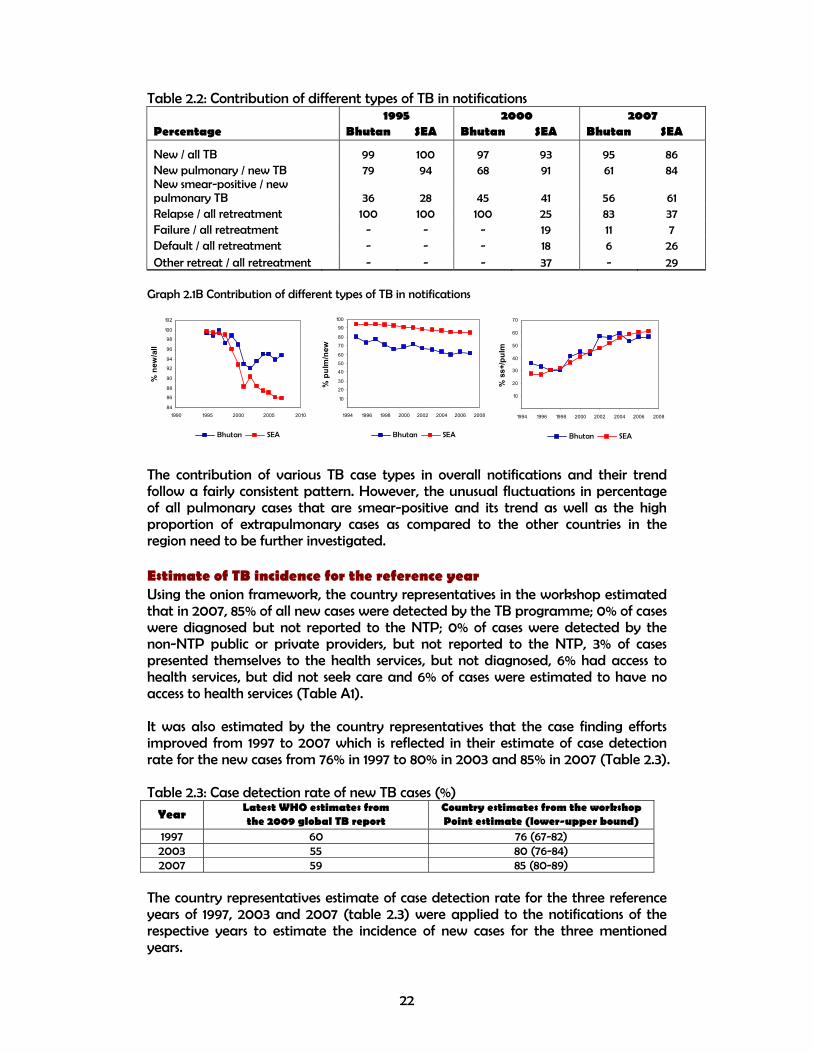
New / all TB 99 100 97 93 95 86 New pulmonary / new TB 79 94 68 91 61 84 New smear-positive / new pulmonary TB 36 28 45 41 56 61 Relapse / all retreatment 100 100 100 25 83 37 Failure / all retreatment - - - 19 11 7 Default / all retreatment - - - 18 6 26 Other retreat / all retreatment - - - 37 - 29
Graph 2.1B Contribution of different types of TB in notifications
The contribution of various TB case types in overall notifications and their trend follow a fairly consistent pattern. However, the unusual fluctuations in percentage of all pulmonary cases that are smear-positive and its trend as well as the high proportion of extrapulmonary cases as compared to the other countries in the region need to be further investigated. Estimate of TB incidence for the reference year Using the onion framework, the country representatives in the workshop estimated that in 2007, 85% of all new cases were detected by the TB programme; 0% of cases were diagnosed but not reported to the NTP; 0% of cases were detected by the non-NTP public or private providers, but not reported to the NTP, 3% of cases presented themselves to the health services, but not diagnosed, 6% had access to health services, but did not seek care and 6% of cases were estimated to have no access to health services (Table A1). It was also estimated by the country representatives that the case finding efforts improved from 1997 to 2007 which is reflected in their estimate of case detection rate for the new cases from 76% in 1997 to 80% in 2003 and 85% in 2007 (Table 2.3). Table 2.3: Case detection rate of new TB cases (%)
Year Latest WHO estimates from the 2009 global TB report
Country estimates from the workshop Point estimate (lower-upper bound)
1997 60 76 (67-82) 2003 55 80 (76-84) 2007 59 85 (80-89)
The country representatives estimate of case detection rate for the three reference years of 1997, 2003 and 2007 (table 2.3) were applied to the notifications of the respective years to estimate the incidence of new cases for the three mentioned years.
84
86
88
90
92
94
96
98
100
102
1990 1995 2000 2005 2010
% n
ew/a
ll
Bhutan SEA
10
20
30
40
50
60
70
80
90
100
1994 1996 1998 2000 2002 2004 2006 2008
% p
ulm
/new
Bhutan SEA
10
20
30
40
50
60
70
1994 1996 1998 2000 2002 2004 2006 2008
% s
s+/p
ulm
Bhutan SEA

23
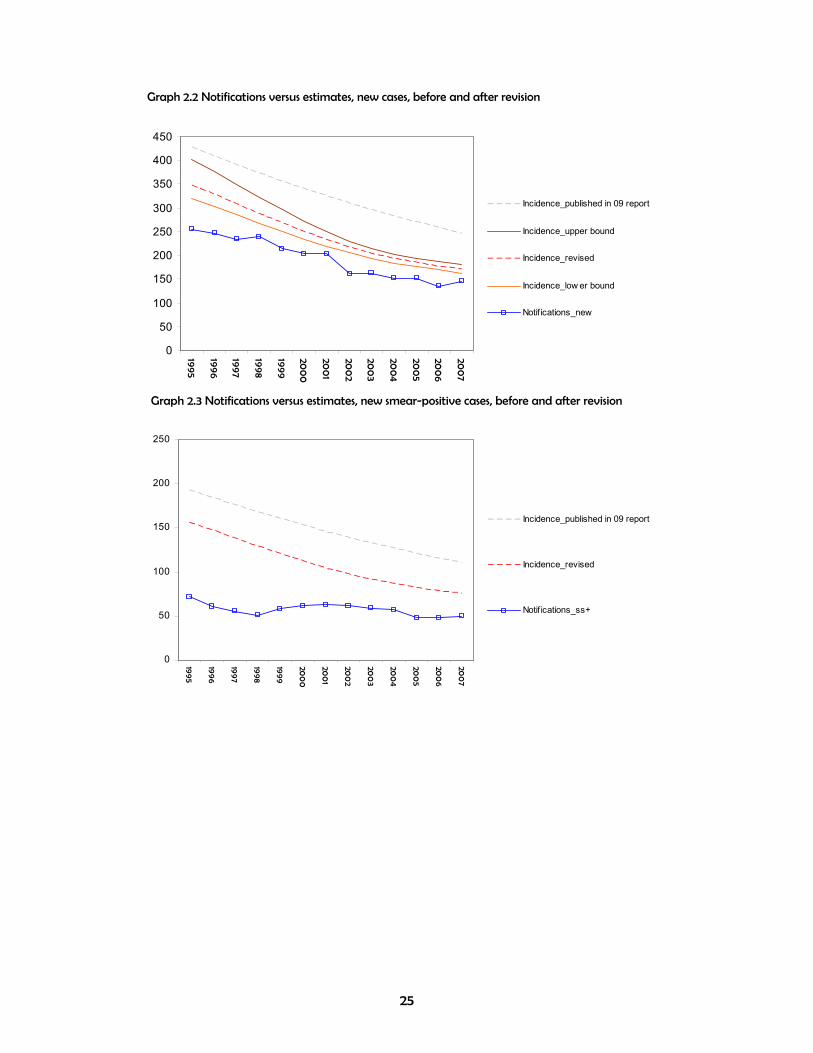
Estimate of trend in TB incidence over time The first step to estimate the trend in TB incidence is to decide whether the trend in TB notifications is a proxy for trend in TB incidence. That will be the case in the countries where there were not considerable changes in case finding efforts, i.e. case detection rate remains constant over time and/or recording and reporting practices leading to change in case notifications during the same period. The notification rate of new TB cases has been decreasing from about 250 cases per 100 000 population in 1995 to about 150 in 2007. Most of the decease is driven by new smear-negative cases (i.e. from 120 in 1995 to 40 in 2007) which can be attributed to the improvement of diagnosis through smear microscopy. The decline in TB notifications despite of improvement of programme performance seems to be mainly reflecting the decline in TB incidence, therefore, the notification rates of the reference years were adjusted for the case finding efforts and using a cubic spline fit the TB incidence for the other years were estimated (tables 2.6 and 2.7). Table 2.4: Comparison of changes in notifications with case finding efforts and TB determinants Assessment Country's assessment Have TB notifications been increasing, decreasing or stable over time? Decrease (1995-2007)
Were there any changes in case-finding effort that might have affected notifications over time?
Yes (improvement of diagnosis and health facility network)
Were there any changes in recording and reporting that might have affected notifications over time? No
How have factors that may influence TB incidence changed over time, and have they had an impact on underlying TB incidence?
Yes (improvement in socio-economic status)
Table 2.5 Method to estimate TB incidence and trend
Assumptions Current method
Revised method
Estimate of incidence for reference year
• Data source ARI 76%, 80% and 85% Case detection rates in 1997, 2003 and 2007
• Value (per 100 000 population) 67 (new ss+) 170 for 1997 (=234/0.76), 203 for 2003 (163/0.8), 308 for 2007 (145/0.85), all cases
Trend in TB incidence
• Data source Notifications Estimates of new TB cases • Type and slope Exponential
trend 1994-2007 (4.6% decline )
Cubic spline fitted on three estimates of the reference years (see table 2.3 and 2.6)

24
Revised estimates of incidence The TB incidence for years 1995-2007 is estimated by fitting a cubic spline on the estimates of new cases for years 1997, 2003 and 2007 which were calculated from the estimate of case detection rate for the respective years by the country representatives (table 2.6). The estimate of new smear-positive cases derived from new cases assuming 45% of all HIV-negative and 35% of HIV-positive TB cases are smear-positive. The estimate of HIV-positive TB cases derived indirectly from the estimate of HIV in general population and an estimate of incidence rate ratio (see Method section of 2009 global TB report for details) (table 2.6 and 2.7; graph 2.2-2.4). Table 2.6 Current versus revised estimate of incidence and case detection rate
Estimate of new TB cases Estimate of new ss+ TB cases Case detection rate,
new Case detection rate, new ss+
Year Current Revised Current Revised Current Revised Current Revised
1995 428 347 193 156 59 73 38 46
1996 409 328 184 147 60 75 33 41
1997 391 308 176 138 60 76 31 40
1998 373 288 168 129 64 83 30 39
1999 356 268 160 121 60 80 36 48
2000 340 249 153 112 60 82 41 55
2001 325 232 146 104 63 88 43 60
2002 310 216 139 97 52 75 44 63
2003 296 203 133 91 55 80 45 65
2004 283 193 127 86 54 79 45 66
2005 270 184 121 82 56 82 40 59
2006 258 177 116 79 52 76 42 61
2007 246 170 110 75 59 85 45 66
Table 2.7 Revised estimate of new TB cases with the confidence limits
Year
Estimate of
incidence lower bound
Upper bound
1995 347 320 402
1996 328 303 376
1997 308 285 349
1998 288 268 322
1999 268 251 296
2000 249 234 272
2001 232 219 249
2002 216 205 230
2003 203 194 214
2004 193 184 202
2005 184 176 193
2006 177 169 187
2007 170 163 181
25
Graph 2.2 Notifications versus estimates, new cases, before and after revision
Graph 2.3 Notifications versus estimates, new smear-positive cases, before and after revision
0
50
100
150
200
250
300
350
400
450
1995
1996
1997
1998
1999
200
0
200
1
200
2
200
3
200
4
200
5
200
6
200
7
Incidence_published in 09 report
Incidence_upper bound
Incidence_revised
Incidence_low er bound
Notif ications_new
0
50
100
150
200
250
1995
1996
1997
1998
1999
200
0
200
1
200
2
200
3
200
4
200
5
200
6
200
7
Incidence_published in 09 report
Incidence_revised
Notif ications_ss+

26
Graph 2.4 Case detection rates before and after revision
Recommended follow-up actions for countries The notification data for years before 2001 should be compiled from the NTP database and explore the possibility of excluding false diagnosis from the notifications which can lead to a better estimate of incidence and its trend for years before 2001.
0
50
100
150
200
250
1995
1996
1997
1998
1999
200
0
200
1
200
2
200
3
200
4
200
5
200
6
200
7
Incidence_published in 09 report
Incidence_revised
Notif ications_ss+

27
3. Indonesia History The latest WHO estimate of TB incidence in Indonesia for the reference year of 2004 is based on 2004 TB prevalence survey (ss+ 119 per 100 000 population) and an estimate of trend of 2.4% annual decline based on the trend in prevalence between 1979 and 2004 surveys. Data availability National and sub-national data on TB case notifications were provided for years 1995-2007 for most indicators. The data on case finding efforts were provided since 2001-2002 for most indicators (table 3.1). Table 3.1: Data availability Data National Sub-national Population 1995-2007 2000-2007 Population by age and sex 1995-2007 2000-2007
TB case notifications by type 1995-2007 1995-2007 TB case notifications by age and sex 1995-2007 1995-2007
Active case finding Not available
Not available
Number of new and re-treatment TB cases reported by non-NTP/non-MoH providers Not available
Not available
Number of new and re-treatment TB cases reported among foreign-born or non-citizens individuals Not available
Not available
MDR-TB Not available
Not available
TB/HIV 2007
2007
Labs 2002-2007
2002-2007
Number of dispensaries and hospitals 2002-2007
2002-2007
non-NTP providers and collaborators -
-
Staff 2001-2007
2002-2007
Other (chronic respiratory cases, TB suspects, slides examined, % culture-positive/smear-positive) 1995-2007 (suspects)
1995-2007 (suspects).

28
Data quality System related Since 1995, there has been a system to monitor the completeness of reporting at the national and sub-national levels. However, there might be some missing reports from the private practitioners. Data related Unusual fluctuation in case notifications In TB epidemiology, where the trend in case notifications is considered as a proxy for trend in TB incidence, the notification rates do not change by more than 5-10% from one year to the next. Therefore, any change out of this range can be attributed to other factors. These factors may include changes in case finding efforts (e.g. expansion of the programme to the non-NTP providers) and changes in recording and reporting practices (e.g. case definitions, completeness of reporting, duplication and misclassification). In Indonesia, the rate of new case notifications did not show unexpected change for most years. However, in a few years (e.g. 2001-2002), there are considerable increase across all case types which is beyond the expected value. These have mainly to due with the expansion of the programme and engagement of NGOs and other non-NTP public and/or private providers (graph 3.1A). Graph 3.1A Percentage change in new TB case notifications over time
Unusual contribution and/or fluctuation of various case types in overall notifications In 2007, 99% of all notified cases were new which was more than 10% higher than the regional average and slightly higher than previous years with an increasing trend (table 3.2; graph 3.2). In 2007, 97% of all new cases were pulmonary which is above the expected range (85-90%) and the regional average with a decreasing trend since 1995. In 2007, 61% of all pulmonary cases were smear-positive which is below the expected range (65-80%). In 1995, 90% of new pulmonary cases were smear-positive, but it showed a continuous decline reaching to 51% in 2002 when it started to increase reaching 61% in 2007 (Table 3.2; graph 3.1B).
263
150
95
61
6 11
54
12 18 168
-2
-50
0
50
100
150
200
250
300
1995-1996 1996-1997 1997-1998 1998-1999 1999-2000 2000-2001 2001-2002 2002-2003 2003-2004 2004-2005 2005-2006 2006-2007

29
Table 3.2: Contribution of different types of TB in notifications 1995 2000 2007
Percentage Indonesia SEA Indonesia SEA Indonesia SEA
New / all TB 97 100 97 93 99 86
New pulmonary / new TB 100 94 99 91 97 84
New smear-positive / new pulmonary TB 90 28 66 41 61 61
Relapse / all retreatment 100 100 100 25 100 37
Failure / all retreatment - - - 19 - 7
Default / all retreatment - - - 18 - 26
Other retreat / all retreatment - - - 37 - 29
Graph 3.1B Contribution of different types of TB in notifications
The contribution of various TB case types in overall notifications and their trend follow a fairly consistent pattern. However, the low percentage of all pulmonary cases that are smear-positive and its unusual pattern over time need to be further investigated. The observed pattern in proportion of pulmonary cases that are smear-positive might reflect the expansion of the programme to the hospitals where higher proportion of pulmonary cases are diagnosed with bacteriological confirmation. Estimate of TB incidence for the reference year Using the onion framework, the country representatives in the workshop estimated that in 2007, 69% of all new cases were detected by the TB programme; 10% of cases were diagnosed but not reported to the NTP; 10% of cases were detected by the non-NTP public or private providers, but not reported to the NTP, 8% of cases presented themselves to the health services, but not diagnosed, 10% had access to health services, but did not seek care and 10% of cases were estimated to have no access to health services (Table A1). It was also estimated by the country representatives that the case finding efforts improved from 1997 to 2007 which is reflected in their estimate of case detection rate for the new cases from 7% in 1997 to 40% in 2003 and 69% in 2007 (Table 2.3). Table 3.3: Case detection rate of new TB cases (%)
Year Latest WHO estimates from the 2009 global TB report
Country estimates from the workshop Point estimate (lower-upper bound)
1997 2 7 (2-9) 2003 31 40 (20-50) 2007 51 69 (51-80)
The estimate of case detection rate of new TB cases for year 2007 (69%) is used to generate the best estimate of incidence for the reference year of 2007. However, as it is shown by the uncertainty bounds around this estimate (51-80%), there is a need
84
86
88
90
92
94
96
98
100
102
1990 1995 2000 2005 2010
% n
ew/a
ll
Indonesia SEA
82
84
86
88
90
92
94
96
98
100
102
1994 1996 1998 2000 2002 2004 2006 2008
% p
ulm
/new
Indonesia SEA
10
20
30
40
50
60
70
80
90
100
1994 1996 1998 2000 2002 2004 2006 2008
% s
s+/p
ulm
Indonesia SEA

30
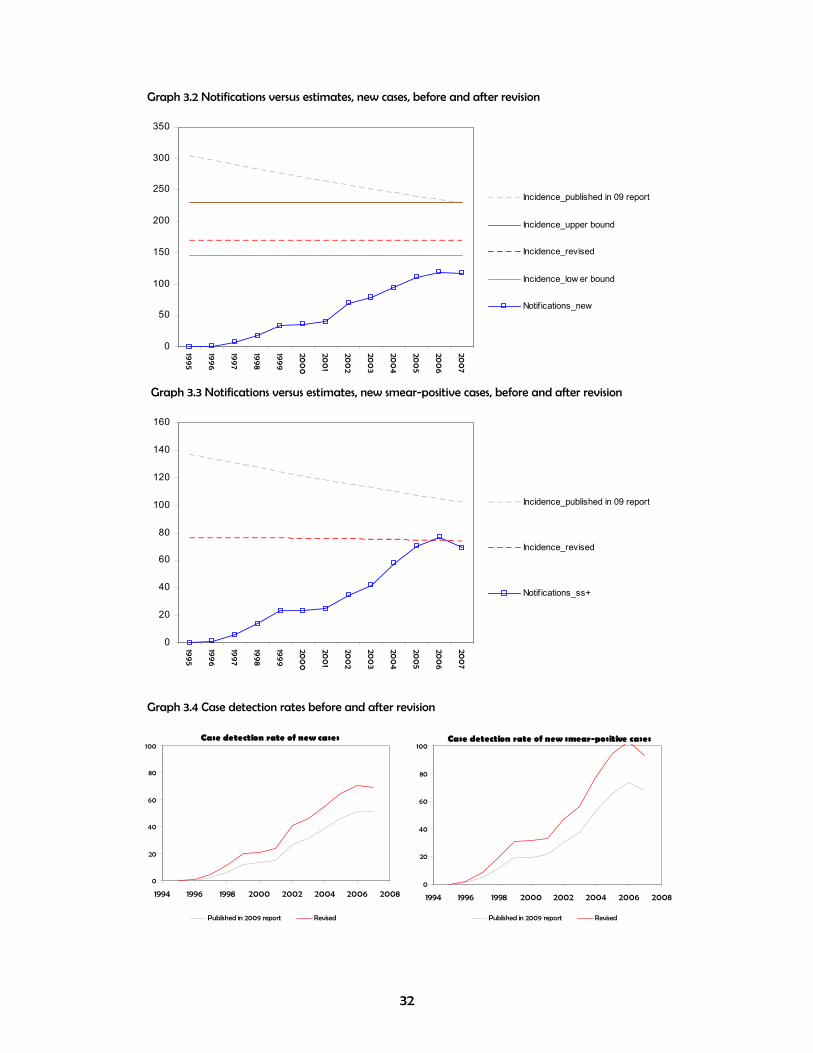
to provide some supporting evidence to support the estimate of missing cases in various layers of onion. Estimate of trend in TB incidence over time The first step to estimate the trend in TB incidence is to decide whether the trend in TB notifications is a proxy for trend in TB incidence. That will be the case in the countries where there were not considerable changes in case finding efforts, i.e. case detection rate remains constant over time and/or recording and reporting practices leading to change in case notifications during the same period. The notification rate of new TB cases has been increasing from 2 cases per 100 000 population in 1996 to about 117 in 2007. The increase is consistent across all case types, and it is mainly driven by new pulmonary cases. It seems that the increase in notifications of new TB cases is mainly due to the DOTS expansion and increase in case finding efforts (e.g. increase in suspect rate). Although HIV prevalence in general population has been increasing between 1995 and 2007, but due to its low level (about 0.12% in 2007), it cannot explain the increase in TB notifications. In the absence of evidences of change in TB determinants which could have led to the increase in TB incidence, the observed increase in TB notifications seems to be reflecting the increase in case finding efforts rather TB incidence (table 3.4). Table 3.4: Comparison of changes in notifications with case finding efforts and TB determinants Assessment Country's assessment Have TB notifications been increasing, decreasing or stable over time? Increase (1995-2007)
Were there any changes in case-finding effort that might have affected notifications over time?
Yes (improvement of diagnosis and coverage of services)
Were there any changes in recording and reporting that might have affected notifications over time? Yes
How have factors that may influence TB incidence changed over time, and have they had an impact on underlying TB incidence?
Yes (improvement in socio-economic status, declining trend in prevalence from 1979 and 2004 surveys)
Table 3.5 Method to estimate TB incidence and trend
Assumptions Current method
Revised method
Estimate of incidence for reference year
• Data source Ss+ prevalence survey
69% Case detection in 2007
• Value (per 100 000 population) 119 (new ss+) 170 (=117/0.69), new cases Trend in TB incidence
• Data source Notifications Flat trend • Type and slope Exponential
trend 1994-2007 (4.6% decline )
0

31
Revised estimates of incidence The TB incidence for years 1995-2007 is estimated by applying the flat trend on revised estimate of 2007 which also results in the revision of case detection rate of new and smear-positive cases for the respective years (table 3.6). The estimate of new smear-positive cases derived from all cases assuming 45% of all HIV-negative and 35% of HIV-positive TB cases are smear-positive. The estimate of HIV-positive TB cases were derive indirectly from the estimate of HIV in general population and an estimate of incidence rate ratio (see Method section of 2009 global TB report for details). The estimate of case detection rate for new smear-positive cases goes beyond 100% in year 2006 which needs careful review of the assumptions used to derive smear-positive from new cases (table 3.6 and 3.7; graph 3.2-3.4) Table 3.6 Current versus revised estimate of incidence and case detection rate
Estimate of new TB cases Estimate of new ss+ TB cases Case detection rate,
new Case detection rate, new ss+
Year Current Revised Current Revised Current Revised Current Revised
1995 304 170 137 76 0 0 0 0
1996 297 170 134 76 1 1 1 2
1997 290 170 130 76 2 4 5 8
1998 283 170 127 76 7 11 11 19
1999 276 170 124 76 12 20 19 31
2000 270 170 121 76 13 21 19 31
2001 263 170 118 76 15 24 21 33
2002 257 170 115 75 27 41 30 47
2003 251 170 113 75 31 46 37 56
2004 245 170 110 75 38 55 53 77
2005 239 170 107 75 46 65 66 94
2006 234 170 104 74 51 70 73 103
2007 228 170 102 74 51 69 68 94
Table 3.7 Revised estimate of new TB cases with the confidence limits
Year
Estimate of
incidence lower bound
Upper bound
1995 170 146 230 1996 170 146 230
1997 170 146 230
1998 170 146 230 1999 170 146 230 2000 170 146 230 2001 170 146 230 2002 170 146 230 2003 170 146 230 2004 170 146 230
2005 170 146 230 2006 170 146 230 2007 170 146 230
32
Graph 3.2 Notifications versus estimates, new cases, before and after revision
0
50
100
150
200
250
300
350
1995
1996
1997
1998
1999
200
0
200
1
200
2
200
3
200
4
200
5
200
6
200
7
Incidence_published in 09 report
Incidence_upper bound
Incidence_revised
Incidence_low er bound
Notif ications_new
Graph 3.3 Notifications versus estimates, new smear-positive cases, before and after revision
Graph 3.4 Case detection rates before and after revision
0
20
40
60
80
100
120
140
160
1995
1996
1997
1998
1999
200
0
200
1
200
2
200
3
200
4
200
5
200
6
200
7
Incidence_published in 09 report
Incidence_revised
Notif ications_ss+
Case detection rate of new cases
0
20
40
60
80
100
1994 1996 1998 2000 2002 2004 2006 2008
Published in 2009 report Revised
Case detection rate of new smear-positive cases
0
20
40
60
80
100
1994 1996 1998 2000 2002 2004 2006 2008
Published in 2009 report Revised

33
Recommended follow-up actions for countries The trend in proportion of pulmonary cases that are smear-positive needs to be investigated to see the reason for the sharp decline between 1995 and 2002 and subsequent increase afterwards. The assumptions used to derive estimate of smear-positive cases from new cases such as proportion of HIV-positive and HIV-negative TB cases that are smear-positive need to be reviewed in order to adjust the estimate of smear-positive cases to avoid a case detection rate of more than 100%.

34
4. Maldives History The latest WHO estimate of TB incidence in Maldives for the reference year of 1997 is based on an expert assumption of 95% case detection rate for new smear-positive cases in 1997. The estimate of new TB cases derived from smear-positive cases assuming 45% of HIV-negative and 35% of HIV-positive cases are smear-positive. The estimate of new cases for 1997 was extrapolated backward and forward using a 5.9% annual decline derived from the trend in TB case notifications which was considered as proxy for trend in TB incidence. Data availability Only sub-national data on TB case notifications were provided for year 2007. No national data and data on case finding efforts were provided (table 4.1). The missing national notification data were taken from the WHO database which were reported by country in the previous years. Table 4.1: Data availability Data National Sub-national Population - - Population by age and sex - -
TB case notifications by type - 2007 TB case notifications by age and sex - -
Active case finding -
-
Number of new and re-treatment TB cases reported by non-NTP/non-MoH providers
- -
Number of new and re-treatment TB cases reported among foreign-born or non-citizens individuals
- -
MDR-TB - 2007
TB/HIV - -
Labs - -
Number of dispensaries and hospitals - -
non-NTP providers and collaborators - -
Staff - -
Other (chronic respiratory cases, TB suspects, slides examined, % culture-positive/smear-positive)
- -

35
Data quality System related Since 1995, there has been a system to monitor the completeness and quality of reporting at the TB programme. Data related Unusual fluctuation in case notifications In TB epidemiology, where the trend in case notifications is considered as a proxy for trend in TB incidence, the notification rates do not change by more than 5-10% from one year to the next. Therefore, any change out of this range can be attributed to other factors. These factors may include changes in case finding efforts (e.g. expansion of the programme to the non-NTP providers) and changes in recording and reporting practices (e.g. case definitions, completeness of reporting, duplication and misclassification). In Maldives, the rate of new case notifications did not show unexpected change over time. Due to small number of cases, occasional fluctuations out of the expected range due to random error is acceptable. Graph 4.1A Percentage change in new TB case notifications over time
Unusual contribution and/or fluctuation of various case types in overall notifications In 2007, 98% of all notified cases were new which was more 10% higher than the regional average, but consistent with the notifications of the previous years with a increasing trend (table 4.2; graph 4.2). In 2007, 76% of all new cases were pulmonary which is below the expected range (85-90%) and the regional average with varying trend since 1995 due to random error. In 2007, 61% of all pulmonary cases were smear-positive which is slightly below the expected range (65-80%), but it has been within the expected range in most of the years since 1995 (Table 4.2; graph 4.1B).
-9
-22
1
-15-19
3
-11
8
-18
2
-23
27
-30
-20
-10
0
10
20
30
1995-1996 1996-1997 1997-1998 1998-1999 1999-2000 2000-2001 2001-2002 2002-2003 2003-2004 2004-2005 2005-2006 2006-2007

36
Table 4.2: Contribution of different types of TB in notifications 1995 2000 2007
Percentage Maldives SEA Maldives SEA Maldives SEA
New / all TB 96 100 97 93 98 86
New pulmonary / new TB 92 94 75 91 76 84
New smear-positive / new pulmonary TB 56 28 68 41 61 61
Relapse / all retreatment 100 100 100 25 33 37
Failure / all retreatment - - - 19 - 7
Default / all retreatment - - - 18 - 26
Other retreat / all retreatment - - - 37 67 29
Graph 4.1B Contribution of different types of TB in notifications
The contribution of various TB case types in overall notifications and their trend follow a fairly consistent pattern. The unusual fluctuations can mainly be explained by the random error to variation of small numbers. Estimate of TB incidence for the reference year Using the onion framework, the country representatives in the workshop estimated that in 2007, 94% of all new cases were detected by the TB programme; 1% of cases were diagnosed but not reported to the NTP; 2% of cases were detected by the non-NTP public or private providers, but not reported to the NTP, 0% of cases presented themselves to the health services, but not diagnosed, 2% had access to health services, but did not seek care and 1% of cases were estimated to have no access to health services (Table A1). It was also estimated by the country representatives that the case finding efforts improved from 1997 to 2007 which is reflected in their estimate of case detection rate for the new cases from 72% in 1997 to 74% in 2003 and 95% in 2007 (Table 2.3). Table 4.3: Case detection rate of new TB cases (%)
Year Latest WHO estimates from the 2009 global TB report
Country estimates from the workshop Point estimate (lower-upper bound)
1997 77 72 (70-74) 2003 79 75 (72-78) 2007 88 94 (90.5-98)
The country representatives estimate of case detection rate for the three reference years of 1997, 2003 and 2007 (table 4.3) were applied to the notifications of the respective years to estimate the incidence of new cases for the three mentioned years.
84
86
88
90
92
94
96
98
100
102
1990 1995 2000 2005 2010
% n
ew/a
ll
Maldives SEA
10
20
30
40
50
60
70
80
90
100
1994 1996 1998 2000 2002 2004 2006 2008
% p
ulm
/new
Maldives SEA
10
20
30
40
50
60
70
80
90
1994 1996 1998 2000 2002 2004 2006 2008
% s
s+/p
ulm
Maldives SEA

37
Estimate of trend in TB incidence over time The first step to estimate the trend in TB incidence is to decide whether the trend in TB notifications is a proxy for trend in TB incidence. That will be the case in the countries where there were not considerable changes in case finding efforts, i.e. case detection rate remains constant over time and/or recording and reporting practices leading to change in case notifications during the same period. The notification rate of new TB cases has been decreasing from about 89 cases per 100 000 population in 1995 to about 41 in 2007. Most of the decease is driven by new smear-negative cases (i.e. from around 30 in 1995 to around 5 in 2007). The decline in TB notifications despite of improvement of programme performance seems to be mainly reflecting the decline in TB incidence, therefore, the notification rates of the reference years were adjusted for the case finding efforts and using a cubic spline fit the TB incidence for the other years were estimated (tables 4.6 and 4.7). Table 4.4: Comparison of changes in notifications with case finding efforts and TB determinants Assessment Country's assessment Have TB notifications been increasing, decreasing or stable over time? Decrease (1995-2007)
Were there any changes in case-finding effort that might have affected notifications over time?
Yes (staff training, expanding of DOTS centres)
Were there any changes in recording and reporting that might have affected notifications over time? No
How have factors that may influence TB incidence changed over time, and have they had an impact on underlying TB incidence?
Yes (improvement in socio-economic status)
Table 4.5 Method to estimate TB incidence and trend
Assumptions Current method Revised method
Estimate of incidence for reference year
• Data source 95% case detection rate of ss+ cases in 1997
72%, 75% and 94% Case detection rates in 1997, 2003 and 2007
• Value (per 100 000 population) 39 (new ss+) 92 for 1997 (=65/0.72), 61 for 2003 (47/0.75), 44 for 2007 (41/0.94), all cases
Trend in TB incidence
• Data source Notifications Estimates of new TB cases • Type and slope Exponential
trend 1997-2007 (5.9% decline )
Cubic spline fitted on three estimates of the reference years (see table 4.3 and 4.6)

38
Revised estimates of incidence The TB incidence for years 1995-2007 is estimated by fitting a cubic spline on the estimates of new cases for years 1997, 2003 and 2007 which were calculated from the estimate of case detection rate for the respective years by the country representatives (table 4.6). The estimate of new smear-positive cases derived from new cases assuming 45% of all HIV-negative and 35% of HIV-positive TB cases are smear-positive. The estimate of HIV-positive TB cases derived indirectly from the estimate of HIV in general population and an estimate of incidence rate ratio (see Method section of 2009 global TB report for details). The estimate of case detection rate for new smear-positive cases goes beyond 100% in year 2006 which needs careful review of the assumptions used to derive smear-positive from new cases (table 4.6 and 4.7; graph 4.2-4.4) Table 4.6 Current versus revised estimate of incidence and case detection rate
Estimate of new TB cases Estimate of new ss+ TB cases Case detection rate,
new Case detection rate, new ss+
Year Current Revised Current Revised Current Revised Current Revised
1995 96 100 43 45 93 89 107 102
1996 90 95 41 43 91 86 103 97
1997 85 91 38 41 77 72 96 90
1998 80 86 36 39 82 77 93 86
1999 75 81 34 36 75 70 97 90
2000 71 77 32 34 66 61 75 69
2001 67 72 30 32 72 67 71 66
2002 63 67 28 30 69 64 75 71
2003 59 62 27 28 79 75 89 85
2004 56 58 25 26 70 68 90 88
2005 53 53 24 24 76 75 94 94
2006 50 48 22 22 64 65 79 81
2007 47 44 21 20 88 94 92 99
Table 4.7 Revised estimate of new TB cases with the confidence limits
Year
Estimate of
incidence lower bound
Upper bound
1995 100 98 103 1996 95 93 98
1997 91 88 93
1998 86 84 89 1999 81 79 84 2000 77 74 79 2001 72 69 75 2002 67 65 70 2003 62 60 65 2004 58 55 60
2005 53 51 55 2006 48 47 50 2007 44 42 46

39
Graph 4.2 Notifications versus estimates, new cases, before and after revision
Graph 4.3 Notifications versus estimates, new smear-positive cases, before and after revision
Graph 4.4 Case detection rates before and after revision
0
20
40
60
80
100
120
1995
1996
1997
1998
1999
200
0
200
1
200
2
200
3
200
4
200
5
200
6
200
7
Incidence_published in 09 report
Incidence_upper bound
Incidence_revised
Incidence_low er bound
Notif ications_new
0
5
10
15
20
25
30
35
40
45
50
1995
1996
1997
1998
1999
200
0
200
1
200
2
200
3
200
4
200
5
200
6
200
7
Incidence_published in 09 report
Incidence_revised
Notif ications_ss+
Case detection rate of new cases
0
20
40
60
80
100
1994 1996 1998 2000 2002 2004 2006 2008
Published in 2009 report Revised
Case detection rate of new smear-positive cases
0
20
40
60
80
100
1994 1996 1998 2000 2002 2004 2006 2008
Published in 2009 report Revised
40
Recommended follow-up actions for countries The notification data for years before 2001 should be compiled from the NTP database and explore the possibility of excluding false diagnosis from the notifications which can lead to a better estimate of incidence and its trend for years before 2001. The assumptions used to derive estimate of smear-positive cases from new cases such as proportion of HIV-positive and HIV-negative TB cases that are smear-positive need to be reviewed in order to adjust the estimate of smear-positive cases to avoid a case detection rate of more than 100%.
41
5. Myanmar History The latest WHO estimate of TB incidence in Myanmar for the reference year of 1997 is based on a report from the NTP published in 1992 in which there was an estimate of 1.5% for ARI. Then the Styblo ratio was used to estimate the incidence of new smear-positive cases from which then the estimate of new cases was derived with some assumptions on proportion of new cases that are smear-positive in HIV-positive and HIV-negative TB cases. In the absence of data to estimate the trend in TB incidence, the estimate of incidence for 1997 was extrapolated backward and forward using a flat trend assuming that the incidence did not change over time. Data availability National and sub-national data on TB case notifications were provided for years 1995-2007 for most indicators. The data on case finding efforts were provided since 2001-2002 for most indicators (table 5.1). Table 5.1: Data availability Data National Sub-national Population 1995-2007 - Population by age and sex 1997-2007 -
TB case notifications by type 1995-2007 - TB case notifications by age and sex 1997-2007 -
Active case finding Not available
-
Number of new and re-treatment TB cases reported by non-NTP/non-MoH providers Not available
-
Number of new and re-treatment TB cases reported among foreign-born or non-citizens individuals Not available
-
MDR-TB 2007
-
TB/HIV 2006, 2007
-
Labs 2007
-
Number of dispensaries and hospitals 2005-2007
-
non-NTP providers and collaborators 2001-2007
-
Staff 2001-2007
-
Other (chronic respiratory cases, TB suspects, slides examined, % culture-positive/smear-positive)
1999-2007 (suspects, % culture+)
-
42
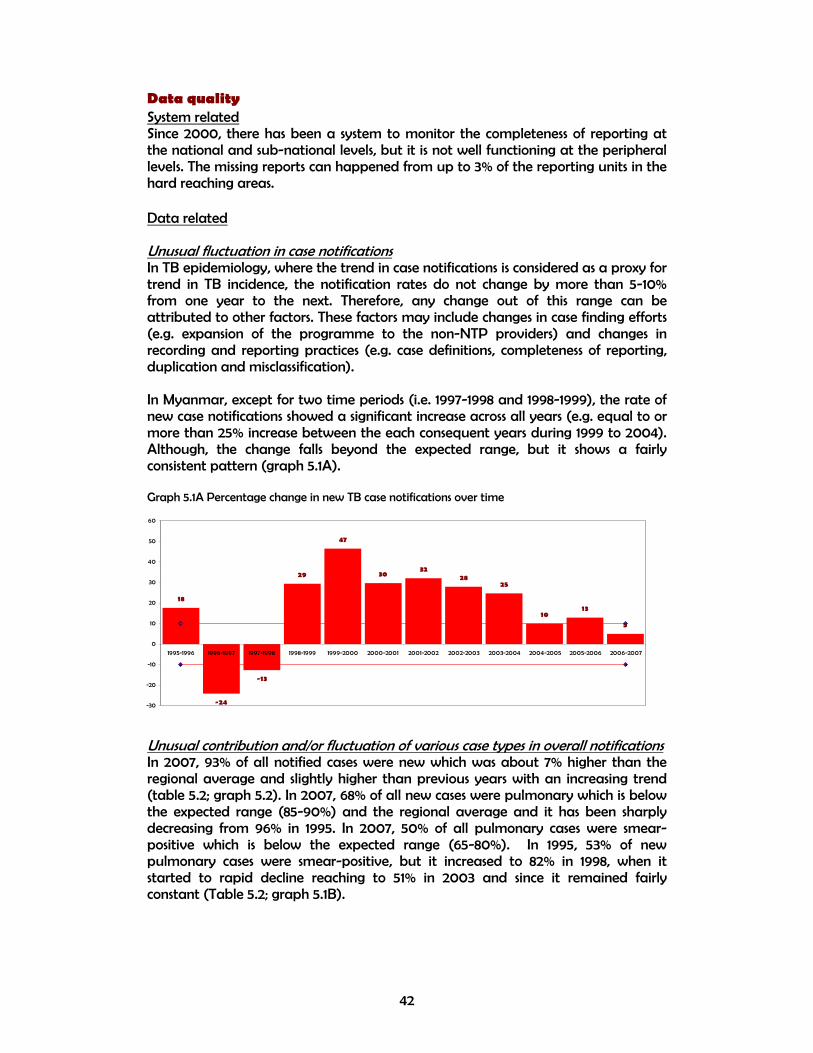
Data quality System related Since 2000, there has been a system to monitor the completeness of reporting at the national and sub-national levels, but it is not well functioning at the peripheral levels. The missing reports can happened from up to 3% of the reporting units in the hard reaching areas. Data related Unusual fluctuation in case notifications In TB epidemiology, where the trend in case notifications is considered as a proxy for trend in TB incidence, the notification rates do not change by more than 5-10% from one year to the next. Therefore, any change out of this range can be attributed to other factors. These factors may include changes in case finding efforts (e.g. expansion of the programme to the non-NTP providers) and changes in recording and reporting practices (e.g. case definitions, completeness of reporting, duplication and misclassification). In Myanmar, except for two time periods (i.e. 1997-1998 and 1998-1999), the rate of new case notifications showed a significant increase across all years (e.g. equal to or more than 25% increase between the each consequent years during 1999 to 2004). Although, the change falls beyond the expected range, but it shows a fairly consistent pattern (graph 5.1A). Graph 5.1A Percentage change in new TB case notifications over time
Unusual contribution and/or fluctuation of various case types in overall notifications In 2007, 93% of all notified cases were new which was about 7% higher than the regional average and slightly higher than previous years with an increasing trend (table 5.2; graph 5.2). In 2007, 68% of all new cases were pulmonary which is below the expected range (85-90%) and the regional average and it has been sharply decreasing from 96% in 1995. In 2007, 50% of all pulmonary cases were smear-positive which is below the expected range (65-80%). In 1995, 53% of new pulmonary cases were smear-positive, but it increased to 82% in 1998, when it started to rapid decline reaching to 51% in 2003 and since it remained fairly constant (Table 5.2; graph 5.1B).
18
-24
-13
29
47
3032
2825
1013
5
-30
-20
-10
0
10
20
30
40
50
60
1995-1996 1996-1997 1997-1998 1998-1999 1999-2000 2000-2001 2001-2002 2002-2003 2003-2004 2004-2005 2005-2006 2006-2007

43
Table 5.2: Contribution of different types of TB in notifications 1995 2000 2007
Percentage Myanmar SEA Myanmar SEA Myanmar SEA
New / all TB 89 100 89 93 93 86
New pulmonary / new TB 96 94 92 91 68 84
New smear-positive / new pulmonary TB 53 28 67 41 50 61
Relapse / all retreatment 100 100 75 25 50 37
Failure / all retreatment - - - 19 13 7
Default / all retreatment - - 25 18 11 26
Other retreat / all retreatment - - - 37 26 29
Graph 5.1B Contribution of different types of TB in notifications
The proportion of new pulmonary cases that are smear-positive do not follow a consistent pattern and is different from the regional average in terms of value and trend over time. This needs further investigation to find and address the data quality issues as the potential source of problem. Estimate of TB incidence for the reference year Using the onion framework, the country representatives in the workshop estimated that in 2007, 62% of all new cases were detected by the TB programme; 3% of cases were diagnosed but not reported to the NTP; 12% of cases were detected by the non-NTP public or private providers, but not reported to the NTP, 2% of cases presented themselves to the health services, but not diagnosed, 19% had access to health services, but did not seek care and 12% of cases were estimated to have no access to health services (Table A1). It was also estimated by the country representatives that the case finding efforts improved from 1997 to 2007 which is reflected in their estimate of case detection rate for the new cases from 35% in 1997 to 50% in 2003 and 62% in 2007 (Table 5.3). Table 5.3: Case detection rate of new TB cases (%)
Year Latest WHO estimates from the 2009 global TB report
Country estimates from the workshop Point estimate (lower-upper bound)
1997 19 35 (30-37) 2003 88 50 (45-55) 2007 149 62 (49-75)
The estimate of case detection rate of new TB cases for year 2007 (62%) is used to generate the best estimate of incidence for the reference year of 2007. However, as it is shown by the uncertainty bounds around this estimate (49-75%), there is a need
84
86
88
90
92
94
96
98
100
102
1990 1995 2000 2005 2010
% n
ew/a
ll
Myanmar SEA
20
40
60
80
100
120
1994 1996 1998 2000 2002 2004 2006 2008
% p
ulm
/new
Myanmar SEA
10
20
30
40
50
60
70
80
90
1994 1996 1998 2000 2002 2004 2006 2008
% s
s+/p
ulm
Myanmar SEA

44
to provide some supporting evidence to support the estimate of missing cases in various layers of onion. Estimate of trend in TB incidence over time The first step to estimate the trend in TB incidence is to decide whether the trend in TB notifications is a proxy for trend in TB incidence. That will be the case in the countries where there were not considerable changes in case finding efforts, i.e. case detection rate remains constant over time and/or recording and reporting practices leading to change in case notifications during the same period. The notification rate of new TB cases has been increasing from 35 cases per 100 000 population in 1995 to about 255 in 2007. The increase is consistent across all case types, and it is mainly driven by pulmonary cases, although the extrapulmonary cases has shown a significant increase (from less than 10 to more than 80 cases per 100 000 population). It seems that the increase in notifications of new TB cases is mainly due to the DOTS expansion and increase in case finding efforts (e.g. decentralizing the diagnostic facilities to the township level, policy to start treatment and notification of smear-negative and extrapulmonary cases, implementing PPM project including notification from general hospitals, increase in suspect rate). Although HIV prevalence in general population has been increasing between 1995 and 2000 with subsequent decline since then, but due to its low level (about 0.4-0.6%), it cannot explain the increase in TB notifications. In the absence of evidences of change in TB determinants which could have led to the increase in TB incidence, the observed increase in TB notifications seems to be reflecting the increase in case finding efforts rather TB incidence (table 5.4). Table 5.4: Comparison of changes in notifications with case finding efforts and TB determinants Assessment Country's assessment Have TB notifications been increasing, decreasing or stable over time? Increase (1995-2007)
Were there any changes in case-finding effort that might have affected notifications over time? Yes
Were there any changes in recording and reporting that might have affected notifications over time? Yes
How have factors that may influence TB incidence changed over time, and have they had an impact on underlying TB incidence? No
Table 5.5 Method to estimate TB incidence and trend
Assumptions Current method
Revised method
Estimate of incidence for reference year
• Data source ARI survey in 1997
62% Case detection in 2007
• Value (per 100 000 population) 75 (new ss+) 411 (=255/0.62), new cases Trend in TB incidence
• Data source Notifications Flat trend • Type and slope Flat trend 0

45
Revised estimates of incidence The TB incidence for years 1995-2007 is estimated by applying the flat trend on revised estimate of 2007 which also results in the revision of case detection rate of new and smear-positive cases for the respective years (table 5.6). The estimate of new smear-positive cases derived from all cases assuming 45% of all HIV-negative and 35% of HIV-positive TB cases are smear-positive. The estimate of HIV-positive TB cases derived directly from the percentage of HIV in TB cases (see Method section of 2009 global TB report for details) (table 5.6 and 5.7; graph 5.2-5.4). Table 5.6 Current versus revised estimate of incidence and case detection rate
Estimate of new TB cases Estimate of new ss+ TB cases Case detection rate,
new Case detection rate, new ss+
Year Current Revised Current Revised Current Revised Current Revised
1995 171 411 75 164 20 8 23 11
1996 171 411 75 162 24 10 27 12
1997 171 411 75 161 19 8 27 13
1998 171 411 75 160 17 7 30 14
1999 171 411 75 160 23 9 34 16
2000 171 411 75 160 36 15 50 24
2001 171 411 75 160 48 20 60 28
2002 171 411 75 160 67 28 69 32
2003 171 411 75 161 88 37 78 36
2004 171 411 75 162 113 47 88 41
2005 171 411 75 163 125 52 102 47
2006 171 411 75 164 142 59 111 51
2007 171 411 75 165 149 62 116 53
Table 5.7 Revised estimate of new TB cases with the confidence limits
Year Estimate ofincidence
lower bound
Upper bound
1995 411 340 520 1996 411 340 520
1997 411 340 520
1998 411 340 520 1999 411 340 520 2000 411 340 520 2001 411 340 520 2002 411 340 520 2003 411 340 520 2004 411 340 520
2005 411 340 520 2006 411 340 520 2007 411 340 520

46
Graph 5.2 Notifications versus estimates, new cases, before and after revision
Graph 5.3 Notifications versus estimates, new smear-positive cases, before and after revision
Graph 5.4 Case detection rates before and after revision
0
100
200
300
400
500
600
1995
1996
1997
1998
1999
200
0
200
1
200
2
200
3
200
4
200
5
200
6
200
7
Incidence_published in 09 report
Incidence_upper bound
Incidence_revised
Incidence_low er bound
Notif ications_new
0
20
40
60
80
100
120
140
160
180
1995
1996
1997
1998
1999
200
0
200
1
200
2
200
3
200
4
200
5
200
6
200
7
Incidence_published in 09 report
Incidence_revised
Notif ications_ss+
Case detection rate of new cases
0
20
40
60
80
100
1994 1996 1998 2000 2002 2004 2006 2008
Published in 2009 report Revised
Case detection rate of new smear-positive cases
0
20
40
60
80
100
1994 1996 1998 2000 2002 2004 2006 2008
Published in 2009 report Revised

47
Recommended follow-up actions for countries The trend in proportion of pulmonary cases that are smear-positive needs to be investigated to see the reason for unusual change over time. A sub-national trend analysis of TB case notifications in areas where case finding efforts have been fairly constant through time would help to see if there are evidences of change in TB incidence at the small scales and potentially useful to revise the current flat assumption of trend in TB incidence.

48
6. Nepal History The latest WHO estimate of TB incidence in Nepal for the reference year of 1997 is based on extrapolation of a single-district disease prevalence survey done in 1977/1978 resulted in an estimate of smear-positive cases (199 per 100 000 population for year 1999). The estimate of new cases was derived with some assumptions on proportion of new cases that are smear-positive in HIV-positive and HIV-negative TB cases. In the absence of data to estimate the trend in TB incidence, the estimate of incidence for 1997 was extrapolated backward and forward assuming 2% decline per year based on the trend in ARI from the consequent tuberculin surveys. Data availability National data on TB case notifications were provided for years 1995-2007 (except for year 2000 which are taken from the WHO database). The data on case finding efforts were limited to 2007 except for the number of laboratories which was reported for 1996-2007. No sub-national data were provided (table 6.1). Table 6.1: Data availability Data National Sub-national Population 1995-2007 - Population by age and sex 1995-2007 -
TB case notifications by type 1996-2007 - TB case notifications by age and sex 2001-2007 -
Active case finding Not available
-
Number of new and re-treatment TB cases reported by non-NTP/non-MoH providers Not available
-
Number of new and re-treatment TB cases reported among foreign-born or non-citizens individuals Not available
-
MDR-TB 2005-2007
-
TB/HIV 1998-1999, 2001, 2002
-
Labs 1996-2007
-
Number of dispensaries and hospitals 2007
-
non-NTP providers and collaborators 2007
-
Staff 2007
-
Other (chronic respiratory cases, TB suspects, slides examined, % culture-positive/smear-positive) -
-

49
Data quality System related Since 1996, there has been a system to monitor the completeness of reporting at the national and sub-national levels. No missing reports is expected. Data related Unusual fluctuation in case notifications In TB epidemiology, where the trend in case notifications is considered as a proxy for trend in TB incidence, the notification rates do not change by more than 5-10% from one year to the next. Therefore, any change out of this range can be attributed to other factors. These factors may include changes in case finding efforts (e.g. expansion of the programme to the non-NTP providers) and changes in recording and reporting practices (e.g. case definitions, completeness of reporting, duplication and misclassification). In Nepal, the rate of new case notifications changed within or close to the range of 5-10% per year in all years except for 1998-1999 with 32% drop which was compensated in 1999-2000. The drop was consistent across all case types and the reason was not explained by country representatives in the workshop (graph 6.1A). Graph 6.1A Percentage change in new TB case notifications over time
Unusual contribution and/or fluctuation of various case types in overall notifications In 2007, 91% of all notified cases were new which was about 5% higher than the regional average, but remained fairly constant around 90% since 1995 (table 6.2; graph 6.2). In 2007, 79% of all new cases were pulmonary which is below the expected range (85-90%) and the regional average and it has been decreasing from 87% in 1995. In 2007, 61% of all pulmonary cases were smear-positive which is below the expected range (65-80%), but it has been consistently around 60% since 2000. (Table 6.2; graph 6.1B).
12
1 3
-32
41
-2
1
-1
2 2
-5-1
-40
-30
-20
-10
0
10
20
30
40
50
1995-1996 1996-1997 1997-1998 1998-1999 1999-2000 2000-2001 2001-2002 2002-2003 2003-2004 2004-2005 2005-2006 2006-2007

50
Table 6.2: Contribution of different types of TB in notifications 1995 2000 2007 Percentage Nepal SEA Nepal SEA Nepal SEA
New / all TB 96 100 94 93 91 86
New pulmonary / new TB 87 94 82 91 79 84
New smear-positive / new pulmonary TB 52 28 60 41 61 61
Relapse / all retreatment 100 100 100 25 83 37
Failure / all retreatment - - - 19 9 7
Default / all retreatment - - - 18 8 26
Other retreat / all retreatment - - - 37 - 29
Graph 6.1B Contribution of different types of TB in notifications
The shares of various case types of overall notifications show a fairly consistent pattern over time. However, the fluctuation in proportion of all cases that are new between years 1995-1996 and 1999-2000 merit further investigation for the possibility of misclassification of cases. Moreover, the increase in proportion of pulmonary cases that are smear-positive between 1995 and 1999 followed by a constant trend needs further investigation. Estimate of TB incidence for the reference year Using the onion framework, the country representatives in the workshop estimated that in 2007, 70% of all new cases were detected by the TB programme; 5% of cases were diagnosed but not reported to the NTP; 7% of cases were detected by the non-NTP public or private providers, but not reported to the NTP, 5% of cases presented themselves to the health services, but not diagnosed, 10% had access to health services, but did not seek care and 3% of cases were estimated to have no access to health services (Table A1). It was also estimated by the country representatives that the case finding efforts improved from 1997 to 2007 which is reflected in their estimate of case detection rate for the new cases from 40% in 1997 to 65% in 2003 and 70% in 2007 (table 6.3). Table 6.3: Case detection rate of new TB cases (%)
Year Latest WHO estimates from the 2009 global TB report
Country estimates from the workshop Point estimate (lower-upper bound)
1997 50 40 (30-50) 2003 55 65 (45-70) 2007 52 70 (50-83)
The estimate of case detection rate of new TB cases for year 2007 (70%) is used to generate the best estimate of incidence for the reference year of 2007. However, as it is shown by the uncertainty bounds around this estimate (50-83%), there is a need
84
86
88
90
92
94
96
98
100
102
1990 1995 2000 2005 2010
% n
ew/a
ll
Nepal SEA
10
20
30
40
50
60
70
80
90
100
1994 1996 1998 2000 2002 2004 2006 2008
% p
ulm
/new
Nepal SEA
10
20
30
40
50
60
70
1994 1996 1998 2000 2002 2004 2006 2008
% s
s+/p
ulm
Nepal SEA

51
to provide some supporting evidence to support the estimate of missing cases in various layers of onion. Estimate of trend in TB incidence over time The first step to estimate the trend in TB incidence is to decide whether the trend in TB notifications is a proxy for trend in TB incidence. That will be the case in the countries where there were not considerable changes in case finding efforts, i.e. case detection rate remains constant over time and/or recording and reporting practices leading to change in case notifications during the same period. The notification rate of new TB cases has been increasing from 88 cases per 100 000 population in 1995 to 108 in 2007. The increase is mainly driven by extrapulmonary cases due to involvement of medical colleges and hospitals where extrapulmonary cases are diagnosed as well as improvement of reporting of the paediatric TB. Although HIV prevalence in general population has been increasing between 1995 and 2007, but due to its low level (about 0.1-0.3%), it cannot explain the increase in extrapulmonary cases. Despite of increase in the number of laboratories performing smear microscopy and the number of laboratories with quality assurance system in place, the notification rate of smear-positive cases remained fairly constant between 50-55 cases per 100 000 population during 1997-2007. In the absence of evidences of change in TB determinants which could have led to a significant change in TB incidence, and due to the fairly constant trend in notifications of pulmonary cases, and the fact the current increase in notification of new cases seems to be reflecting the increase in reporting of the extrapulmonary cases by linkage to the medical colleges and hospitals, there is no convincing evidence of decrease in TB incidence, therefore, we assume a flat trend in TB incidence (table 6.4). Table 6.4: Comparison of changes in notifications with case finding efforts and TB determinants Assessment Country's assessment Have TB notifications been increasing, decreasing or stable over time? Increase (1995-2007)
Were there any changes in case-finding effort that might have affected notifications over time?
Yes
Were there any changes in recording and reporting that might have affected notifications over time? Yes
How have factors that may influence TB incidence changed over time, and have they had an impact on underlying TB incidence? No
Table 6.5 Method to estimate TB incidence and trend
Assumptions Current method Revised method
Estimate of incidence for reference year
• Data source 1976-1977 ss+ prevalence survey
70% Case detection in 2007
• Value (per 100 000 population) 199 (new ss+) in 1997
154 (=108/0.70), new cases
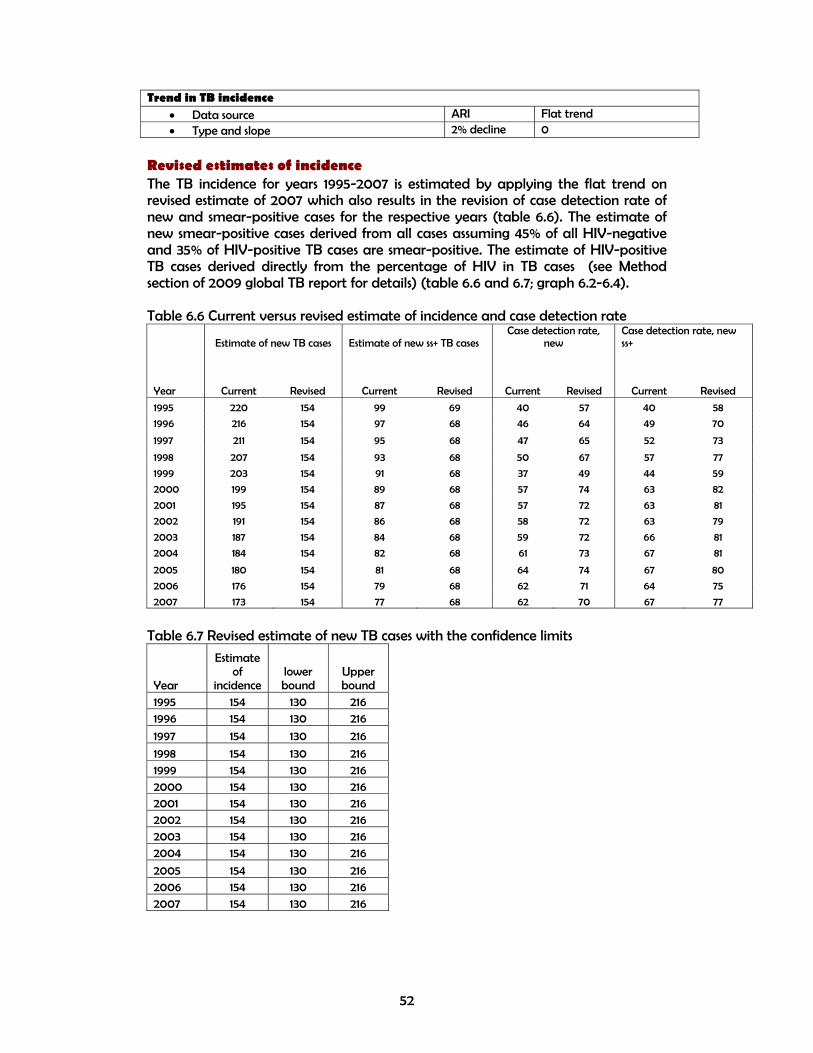
52
Trend in TB incidence
• Data source ARI Flat trend • Type and slope 2% decline 0
Revised estimates of incidence The TB incidence for years 1995-2007 is estimated by applying the flat trend on revised estimate of 2007 which also results in the revision of case detection rate of new and smear-positive cases for the respective years (table 6.6). The estimate of new smear-positive cases derived from all cases assuming 45% of all HIV-negative and 35% of HIV-positive TB cases are smear-positive. The estimate of HIV-positive TB cases derived directly from the percentage of HIV in TB cases (see Method section of 2009 global TB report for details) (table 6.6 and 6.7; graph 6.2-6.4). Table 6.6 Current versus revised estimate of incidence and case detection rate
Estimate of new TB cases Estimate of new ss+ TB cases Case detection rate,
new Case detection rate, new ss+
Year Current Revised Current Revised Current Revised Current Revised
1995 220 154 99 69 40 57 40 58
1996 216 154 97 68 46 64 49 70
1997 211 154 95 68 47 65 52 73
1998 207 154 93 68 50 67 57 77
1999 203 154 91 68 37 49 44 59
2000 199 154 89 68 57 74 63 82
2001 195 154 87 68 57 72 63 81
2002 191 154 86 68 58 72 63 79
2003 187 154 84 68 59 72 66 81
2004 184 154 82 68 61 73 67 81
2005 180 154 81 68 64 74 67 80
2006 176 154 79 68 62 71 64 75
2007 173 154 77 68 62 70 67 77
Table 6.7 Revised estimate of new TB cases with the confidence limits
Year
Estimate of
incidence lower bound
Upper bound
1995 154 130 216 1996 154 130 216
1997 154 130 216
1998 154 130 216 1999 154 130 216 2000 154 130 216 2001 154 130 216 2002 154 130 216 2003 154 130 216 2004 154 130 216
2005 154 130 216 2006 154 130 216 2007 154 130 216

53
Graph 6.2 Notifications versus estimates, new cases, before and after revision
Graph 6.3 Notifications versus estimates, new smear-positive cases, before and after revision
Graph 6.4 Case detection rates before and after revision
0
50
100
150
200
250
1995
1996
1997
1998
1999
200
0
200
1
200
2
200
3
200
4
200
5
200
6
200
7
Incidence_published in 09 report
Incidence_upper bound
Incidence_revised
Incidence_low er bound
Notif ications_new
0
20
40
60
80
100
120
1995
1996
1997
1998
1999
200
0
200
1
200
2
200
3
200
4
200
5
200
6
200
7
Incidence_published in 09 report
Incidence_revised
Notif ications_ss+
Case detection rate of new cases
0
20
40
60
80
100
1994 1996 1998 2000 2002 2004 2006 2008
Published in 2009 report Revised
Case detection rate of new smear-positive cases
0
20
40
60
80
100
1994 1996 1998 2000 2002 2004 2006 2008
Published in 2009 report Revised

54
Recommended follow-up actions for countries The drop in case notifications between 1998 and 1999 should be explored and fixed by looking at the national database. The missing data for year 2000 to be provided to WHO, if different from what have been reported previously. A careful analysis and comparison of the recent ARI survey with the previous ones to be done in order to explore the possibility of estimation of the trend in TB incidence.

55
7. Sri Lanka History The latest WHO estimate of TB incidence in Sri Lanka for the reference year of 1997 is based on an estimate of case detection rate for smear-positive cases (71%) for 1997 based on expert assessment in the joint programme review in 1997. The estimate of new cases was derived with some assumptions on proportion of new cases that are smear-positive in HIV-positive and HIV-negative TB cases. In the absence of data to estimate the trend in TB incidence, the estimate of incidence for 1997 was extrapolated backward and forward assuming a flat trend. Data availability National and sub-national data on TB case notifications were provided for years 2001-2007. The data on case finding efforts were limited to the number of labs (2004-2007) and number of staff (2007). The missing notification data were taken from the WHO database (table 7.1). Table 7.1: Data availability Data National Sub-national Population 2001-2007 2001-2007 Population by age and sex 2003-2007 2001-2007
TB case notifications by type 2001-2007 2001-2007 TB case notifications by age and sex 2001-2007 2001-2007
Active case finding Not available
Not available
Number of new and re-treatment TB cases reported by non-NTP/non-MoH providers Not available
Not available
Number of new and re-treatment TB cases reported among foreign-born or non-citizens individuals Not available
Not available
MDR-TB 2004-2007
Not available
TB/HIV 2004-2007
-
Labs 2005-2007
2007
Number of dispensaries and hospitals -
-
non-NTP providers and collaborators -
-
Staff 2007
2007
Other (chronic respiratory cases, TB suspects, slides examined, % culture-positive/smear-positive) -
-

56
Data quality System related There is no system to monitor the completeness of reporting at the national and sub-national levels. So, the assessment of the missing reports is not possible at the moment. Data related Unusual fluctuation in case notifications In TB epidemiology, where the trend in case notifications is considered as a proxy for trend in TB incidence, the notification rates do not change by more than 5-10% from one year to the next. Therefore, any change out of this range can be attributed to other factors. These factors may include changes in case finding efforts (e.g. expansion of the programme to the non-NTP providers) and changes in recording and reporting practices (e.g. case definitions, completeness of reporting, duplication and misclassification). In Sri Lanka, the rate of new case notifications changed within or close to the expected range of 5-10% per year in all years between 1995-2007 (graph 7.1A). Graph 7.1A Percentage change in new TB case notifications over time
Unusual contribution and/or fluctuation of various case types in overall notifications In 2007, 93% of all notified cases were new which was about 7% higher than the regional average, but remained fairly constant since 1999 (table 7.2; graph 7.2). In 2007, 77% of all new cases were pulmonary which is below the expected range (85-90%) and the regional average and it has been slowly decreasing from 83% in 1995. In 2007, 70% of all pulmonary cases were smear-positive which is within the expected range (65-80%) and it has been changing between 60-70% since 1995. (Table 7.2; graph 7.1B).
-11
17
9
4
13
1
4
1
-5
7
-9
2
-15
-10
-5
0
5
10
15
20
1995-1996 1996-1997 1997-1998 1998-1999 1999-2000 2000-2001 2001-2002 2002-2003 2003-2004 2004-2005 2005-2006 2006-2007

57
Table 7.2: Contribution of different types of TB in notifications 1995 2000 2007
Percentage Sri Lanka SEA Sri Lanka SEA Sri Lanka SEA
New / all TB 96 100 93 93 93 86
New pulmonary / new TB 83 94 81 91 77 84
New smear-positive / new pulmonary TB 65 28 66 41 70 61
Relapse / all retreatment 100 100 43 25 50 37
Failure / all retreatment - - 4 19 17 7
Default / all retreatment - - 24 18 32 26
Other retreat / all retreatment - - 29 37 - 29
Graph 7.1B Contribution of different types of TB in notifications
The shares of various case types of overall notifications show a fairly consistent pattern over time. The sub-national variations of various case types were fairly consistent over time except for proportion of pulmonary cases that are smear-positive which varied from 46% in the North & East region to Sabaragamuwa which might be a reflection of different capacity in performing smear microscopy across provinces (graph 7.1C). Graph 7.1C Proportion of all pulmonary cases that are smear-positive across provinces
84
86
88
90
92
94
96
98
100
102
1990 1995 2000 2005 2010
% n
ew/a
ll
Sri Lanka SEA
10
20
30
40
50
60
70
80
90
100
1994 1996 1998 2000 2002 2004 2006 2008
% p
ulm
/new
Sri Lanka SEA
10
20
30
40
50
60
70
80
1994 1996 1998 2000 2002 2004 2006 2008
% s
s+/p
ulm
Sri Lanka SEA

58
Estimate of TB incidence for the reference year Using the onion framework, the country representatives in the workshop estimated that in 2007, 70% of all new cases were detected by the TB programme; 0% of cases were diagnosed but not reported to the NTP; 25% of cases were detected by the non-NTP public or private providers, but not reported to the NTP, 2% of cases presented themselves to the health services, but not diagnosed, 1% had access to health services, but did not seek care and 2% of cases were estimated to have no access to health services (Table A1). It was also estimated by the country representatives that the case finding efforts remained constantly at 70% during 1995 to 2007 (Table 7.3). Table 7.3: Case detection rate of new TB cases (%)
Year Latest WHO estimates from the 2009 global TB report
Country estimates from the workshop Point estimate (lower-upper bound)
1997 56 70 (60.5-75.5) 2003 77 70 (60.5-75.5) 2007 73 70 (60.5-75.5)
The estimate of case detection rate of new TB cases for year 2007 (70%) is used to generate the best estimate of incidence for the reference year of 2007. However, as it is shown by the uncertainty bounds around this estimate (60.5-75.5%), there is a need to provide some supporting evidence to support the estimate of missing cases in various layers of onion. Estimate of trend in TB incidence over time The first step to estimate the trend in TB incidence is to decide whether the trend in TB notifications is a proxy for trend in TB incidence. That will be the case in the countries where there were not considerable changes in case finding efforts, i.e. case detection rate remains constant over time and/or recording and reporting practices leading to change in case notifications during the same period. The notification rate of new TB cases has been increasing from 32 cases per 100 000 population in 1995 to 43 in 2000 at which it remained fairly constant till 2007. The observed trend is consistent across various case types. Although HIV prevalence in general population has been increasing between 1995 and 2007, but due to its low level (about 0.015-0.02%), it cannot explain the observed pattern in TB case notifications. Implementation of DOTS in a phased manner between 1997 and 2005 and improvement of smear diagnosis through establishment of new labs and recruitment and training of the staff might partly explain the slow increase in case notifications. In the absence of evidences of change in TB determinants which could have led to a significant change in TB incidence, and due to the fairly constant trend in notifications, it is assumed that TB incidence has been following a flat trend over time (table 7.4).

59
Table 7.4: Comparison of changes in notifications with case finding efforts and TB determinants Assessment Country's assessment Have TB notifications been increasing, decreasing or stable over time?
Increase (1996-2000), stable (2001-2007)
Were there any changes in case-finding effort that might have affected notifications over time? Yes
Were there any changes in recording and reporting that might have affected notifications over time? No
How have factors that may influence TB incidence changed over time, and have they had an impact on underlying TB incidence? No
Table 7.5 Method to estimate TB incidence and trend
Assumptions Current method
Revised method
Estimate of incidence for reference year
• Data source 71% case detection rate of ss+ cases in 1997
70% Case detection in 2007
• Value (per 100 000 population) 19 (new ss+) in 1997
63 (=44/0.70), new cases
Trend in TB incidence
• Data source Flat trend Flat trend • Type and slope 0 0
Revised estimates of incidence The TB incidence for years 1995-2007 is estimated by applying the flat trend on revised estimate of 2007 which also results in the revision of case detection rate of new and smear-positive cases for the respective years (table 7.6). The estimate of new smear-positive cases derived from all cases assuming 45% of all HIV-negative and 35% of HIV-positive TB cases are smear-positive. The estimate of HIV-positive TB cases derived directly from the percentage of HIV in TB cases (see Method section of 2009 global TB report for details) (table 7.6 and 7.7; graph 7.2-7.4). Table 7.6 Current versus revised estimate of incidence and case detection rate
Estimate of new TB cases Estimate of new ss+ TB cases Case detection rate,
new Case detection rate, new ss+
Year Current Revised Current Revised Current Revised Current Revised
1995 60 63 27 28 52 50 62 60
1996 60 63 27 28 47 45 60 57
1997 60 63 27 28 56 54 70 67
1998 60 63 27 28 61 58 75 72
1999 60 63 27 28 63 61 77 74
2000 60 63 27 28 72 69 85 81
2001 60 63 27 28 73 70 84 81
2002 60 63 27 28 76 73 84 80
2003 60 63 27 28 77 74 84 81
2004 60 63 27 28 72 70 83 80
2005 60 63 27 28 78 75 94 90
2006 60 63 27 28 71 69 85 82
2007 60 63 27 28 73 70 86 83

60
Table 7.7 Revised estimate of new TB cases with the confidence limits
Year
Estimate of
incidence lower bound
Upper bound
1995 63 58 73 1996 63 58 73
1997 63 58 73
1998 63 58 73 1999 63 58 73 2000 63 58 73 2001 63 58 73 2002 63 58 73 2003 63 58 73 2004 63 58 73
2005 63 58 73 2006 63 58 73 2007 63 58 73
Graph 7.1 Notifications versus estimates, new cases, before and after revision
0
10
20
30
40
50
60
70
80
1995
1996
1997
1998
1999
200
0
200
1
200
2
200
3
200
4
200
5
200
6
200
7
Incidence_published in 09 report
Incidence_upper bound
Incidence_revised
Incidence_low er bound
Notif ications_new
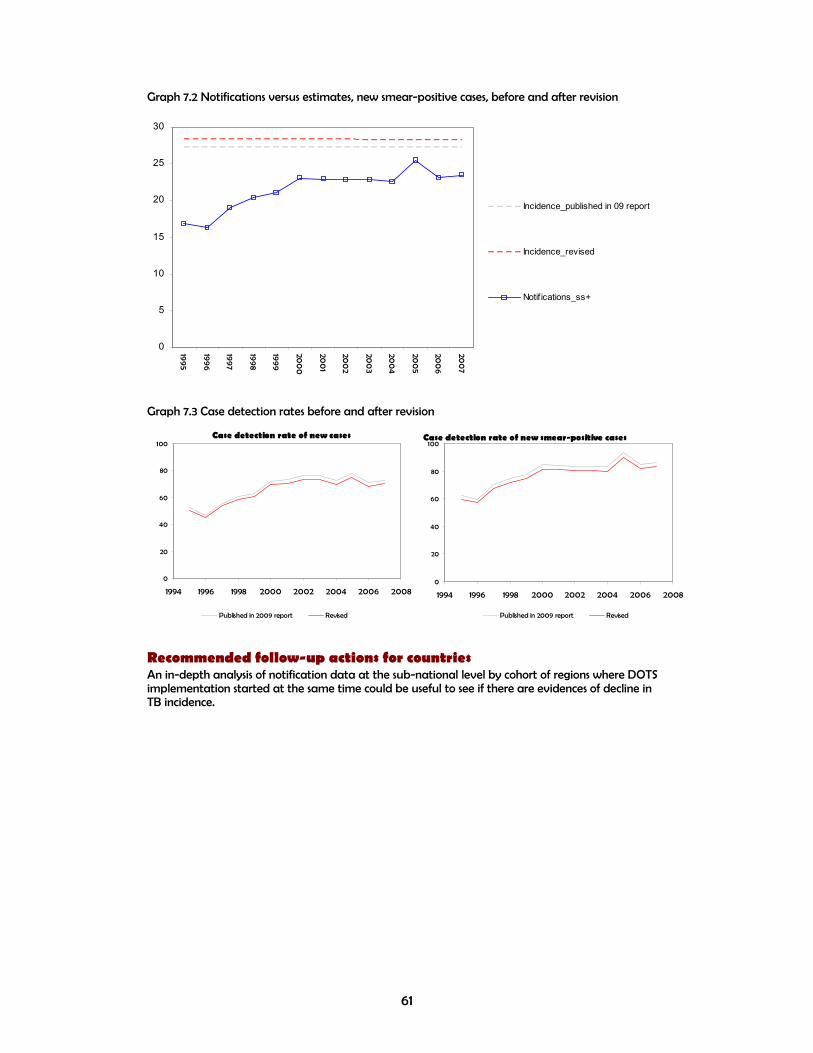
61
Graph 7.2 Notifications versus estimates, new smear-positive cases, before and after revision
Graph 7.3 Case detection rates before and after revision
Recommended follow-up actions for countries An in-depth analysis of notification data at the sub-national level by cohort of regions where DOTS implementation started at the same time could be useful to see if there are evidences of decline in TB incidence.
0
5
10
15
20
25
30
1995
1996
1997
1998
1999
200
0
200
1
200
2
200
3
200
4
200
5
200
6
200
7
Incidence_published in 09 report
Incidence_revised
Notif ications_ss+
Case detection rate of new cases
0
20
40
60
80
100
1994 1996 1998 2000 2002 2004 2006 2008
Published in 2009 report Revised
Case detection rate of new smear-positive cases
0
20
40
60
80
100
1994 1996 1998 2000 2002 2004 2006 2008
Published in 2009 report Revised
62
8. Thailand History The latest WHO estimate of TB incidence in Thailand is based on adjustment of the result of the 1991/1992 prevalence survey from 170 to 143 cases per 100 000 population for 1997. With an assumption of 2.4 years average duration of disease, it was estimated that in 1997, there was 61 incident cases per 100 000 population. In the absence of data to estimate the trend in TB incidence, the estimate of incidence for 1997 was extrapolated backward and forward assuming a flat trend. Data availability National data on TB case notifications were provided for years 1995-2007. The data on case finding efforts were provided mainly for the recent years. No sub-national data were provided (table 8.1). Table 8.1: Data availability Data National Sub-national Population 1995-2007 - Population by age and sex 1995-2007 -
TB case notifications by type 1995-2007 - TB case notifications by age and sex 1995-2007 -
Active case finding 2005-2007
-
Number of new and re-treatment TB cases reported by non-NTP/non-MoH providers 2000-2007
-
Number of new and re-treatment TB cases reported among foreign-born or non-citizens individuals 2006-2007
-
MDR-TB Not available
-
TB/HIV 2005-2007
-
Labs 2000-2007
-
Number of dispensaries and hospitals Not available
-
non-NTP providers and collaborators 2006-2007
-
Staff 2007
-
Other (chronic respiratory cases, TB suspects, slides examined, % culture-positive/smear-positive) 1995-2007
-

63
Data quality System related Since 1995, there is no system to monitor the completeness of reporting at the national and sub-national levels. However, the missing reports are sometimes expected. Data related Unusual fluctuation in case notifications In TB epidemiology, where the trend in case notifications is considered as a proxy for trend in TB incidence, the notification rates do not change by more than 5-10% from one year to the next. Therefore, any change out of this range can be attributed to other factors. These factors may include changes in case finding efforts (e.g. expansion of the programme to the non-NTP providers) and changes in recording and reporting practices (e.g. case definitions, completeness of reporting, duplication and misclassification). In Thailand, the rate of new case notifications showed unusual fluctuations in the years before 2002 which are mainly reflecting the change in the recording and reporting system (graph 8.1A). Graph 8.1A Percentage change in new TB case notifications over time
-13 -16
-31
77
21
30
17
-1
0
-2 -2 -4
-40
-20
0
20
40
60
80
100
1995-1996 1996-1997 1997-1998 1998-1999 1999-2000 2000-2001 2001-2002 2002-2003 2003-2004 2004-2005 2005-2006 2006-2007

64
Unusual contribution and/or fluctuation of various case types in overall notifications In 2007, 93% of all notified cases were new which was about 7% higher than the regional average, but a drop from the constant proportion of 97% between 1995-2005 (table 8.2; graph 8.2). In 2007, 86% of all new cases were pulmonary which is within the expected range (85-90%) and close to the regional average and it has been slowly decreasing from 100% in 1995 which is due to introduction of reporting of the extrapulmonary cases since 1999. In 2007, 62% of all pulmonary cases were smear-positive which is close the expected range (65-80%) and the regional average and remained fairly constant since 1999 where the reporting of smear-negative cases started. (Table 8.2; graph 8.1B). Table 8.2: Contribution of different types of TB in notifications
1995 2000 2007 Percentage Thailand SEA Thailand SEA Thailand SEA
New / all TB 97 100 97 93 93 86 New pulmonary / new TB 100 94 91 91 86 84 New smear-positive / new pulmonary TB 100 28 59 41 62 61 Relapse / all retreatment 100 100 100 25 41 37 Failure / all retreatment - - - 19 16 7 Default / all retreatment - - - 18 19 26 Other retreat / all retreatment - - - 37 25 29
Graph 8.1B Contribution of different types of TB in notifications
The shares of various case types of overall notifications show a fairly consistent pattern over time and can be explained by the changes in the recording and reporting system (graph 8.1B). Estimate of TB incidence for the reference year Using the onion framework, the country representatives in the workshop estimated that in 2007, 60% of all new cases were detected by the TB programme; 5% of cases were diagnosed but not reported to the NTP; 20% of cases were detected by the non-NTP public or private providers, but not reported to the NTP, 5% of cases presented themselves to the health services, but not diagnosed, 5% had access to health services, but did not seek care and 5% of cases were estimated to have no access to health services (Table A1).
84
86
88
90
92
94
96
98
100
102
1990 1995 2000 2005 2010
% n
ew/a
ll
Thailand SEA
20
40
60
80
100
120
1994 1996 1998 2000 2002 2004 2006 2008
% p
ulm
/new
Thailand SEA
20
40
60
80
100
120
1994 1996 1998 2000 2002 2004 2006 2008
% s
s+/p
ulm
Thailand SEA

65
It was also estimated by the country representatives that the case finding efforts improved from 1997 to 2007 which is reflected in their estimate of case detection rate for the new cases from 30% in 1997 to 55% in 2003 and 60% in 2007 (table 8.3). Table 8.3: Case detection rate of new TB cases (%)
Year Latest WHO estimates from the 2009 global TB report
Country estimates from the workshop Point estimate (lower-upper bound)
1997 21 30 (25-40) 2003 65 55 (50-60) 2007 60 60 (42-74)
Using the case detection rates as estimated by the country representatives in the workshop (table 8.3) and applying them on the country notifications to estimate the TB incidence will result in an increasing trend up to 2003 followed by a rapid decline since then (graph 8.1C). Graph 8.1C Estimates of new cases using country representatives estimate of case detection
As we don't have enough epidemiological evidence to support this pattern, the estimate of case detection rate of new TB cases for year 2007 (60%) is used to generate the best estimate of incidence for the reference year of 2007 with an assumption of flat trend over time which is explained further down. However, as it is shown by the uncertainty bounds around this estimate (42-74%), there is a need to provide some supporting evidence to support the estimate of missing cases in various layers of onion. Estimate of trend in TB incidence over time The first step to estimate the trend in TB incidence is to decide whether the trend in TB notifications is a proxy for trend in TB incidence. That will be the case in the countries where there were not considerable changes in case finding efforts, i.e. case detection rate remains constant over time and/or recording and reporting practices leading to change in case notifications during the same period. The notification rate of new TB cases showed a rapid decline from 40 to 22 cases per 100 000 population between 1995 and 1998, followed by a rapid increase to 93 in 2002 at which it remained fairly constant till 2007. The observed trend is consistent across various case types.
0
50
100
150
200
250
1995
1996
1997
1998
1999
200
0
200
1
200
2
200
3
200
4
200
5
200
6
200
7
Incidence_published in 09 report
Incidence_upper bound
Incidence_revised
Incidence_low er bound
Notif ications_new

66
Although HIV prevalence in general population has been decreasing between 1995 and 2007 (from 1.3% in 1995 to 1% in 2001 and to 0.9% in 2007). It is hard to see its effect on TB case notifications given other changes in TB control programme including changes in the recording and reporting system and case finding efforts. Similarly, the role of other factors that might impact TB notifications and/or incidence including GDP, smoking and diabetes is heard to measure and disentangle in this context. Improving the case finding efforts such as improvement of the quality of smear laboratories and intensified case finding among HIV-positives as well as coverage and quality of recording and reporting system have also some impact in TB case notification, but hard to measure and quantify. With the available data in change of TB determinants as well as the observed pattern in case notifications, it is very hard to come up with a fairly accurate measure of change in TB incidence, therefore, it is assumed that TB incidence has been following a flat trend over time until more convincing evidence become available (table 8.4). Table 8.4: Comparison of changes in notifications with case finding efforts and TB determinants Assessment Country's assessment Have TB notifications been increasing, decreasing or stable over time?
Decrease (1995-1998), Increase (1999-2001), stable (2002-2007)
Were there any changes in case-finding effort that might have affected notifications over time?
Yes
Were there any changes in recording and reporting that might have affected notifications over time? Yes
How have factors that may influence TB incidence changed over time, and have they had an impact on underlying TB incidence? Yes
Table 8.5 Method to estimate TB incidence and trend
Assumptions Current method Revised method
Estimate of incidence for reference year
• Data source 1991/1992 disease prevalence survey
60% Case detection in 2007
• Value (per 100 000 population) 143 (new ss+) in 1997
142 (=85/0.60), new cases
Trend in TB incidence
• Data source Flat trend Flat trend • Type and slope 0 0
Revised estimates of incidence The TB incidence for years 1995-2007 is estimated by applying the flat trend on revised estimate of 2007 which also results in the revision of case detection rate of new and smear-positive cases for the respective years (table 8.6). The estimate of new smear-positive cases derived from all cases assuming 45% of all HIV-negative and 35% of HIV-positive TB cases are smear-positive. The estimate of HIV-positive TB cases derived directly from the percentage of HIV in TB cases (see Method section of 2009 global TB report for details) (table 8.6 and 8.7; graph 8.2-8.4).

67
Table 8.6 Current versus revised estimate of incidence and case detection rate
Estimate of new TB cases Estimate of new ss+ TB cases Case detection rate,
new Case detection rate, new ss+
Year Current Revised Current Revised Current Revised Current Revised
1995 142 142 61 50 28 28 65 80
1996 142 142 61 50 24 25 57 70
1997 142 142 61 50 21 21 49 60
1998 142 142 61 50 15 15 36 44
1999 142 142 61 51 33 33 42 50
2000 142 142 61 51 41 41 51 61
2001 142 142 61 52 55 55 69 82
2002 142 142 61 52 65 65 81 95
2003 142 142 61 53 65 65 80 94
2004 142 142 62 53 65 65 79 92
2005 142 142 62 53 63 63 77 90
2006 142 142 62 53 62 62 77 89
2007 142 142 62 53 60 60 74 86
Table 8.7 Revised estimate of new TB cases with the confidence limits
Year Estimate ofincidence
lower bound
Upper bound
1995 142 115 203 1996 142 115 203
1997 142 115 203
1998 142 115 203 1999 142 115 203 2000 142 115 203 2001 142 115 203 2002 142 115 203 2003 142 115 203 2004 142 115 203
2005 142 115 203 2006 142 115 203 2007 142 115 203

68
Graph 8.2 Notifications versus estimates, new cases, before and after revision
Graph 8.3 Notifications versus estimates, new smear-positive cases, before and after revision
0
50
100
150
200
250
1995
1996
1997
1998
1999
200
0
200
1
200
2
200
3
200
4
200
5
200
6
200
7
Incidence_published in 09 report
Incidence_upper bound
Incidence_revised
Incidence_low er bound
Notif ications_new
0
10
20
30
40
50
60
70
1995
1996
1997
1998
1999
200
0
200
1
200
2
200
3
200
4
200
5
200
6
200
7
Incidence_published in 09 report
Incidence_revised
Notif ications_ss+
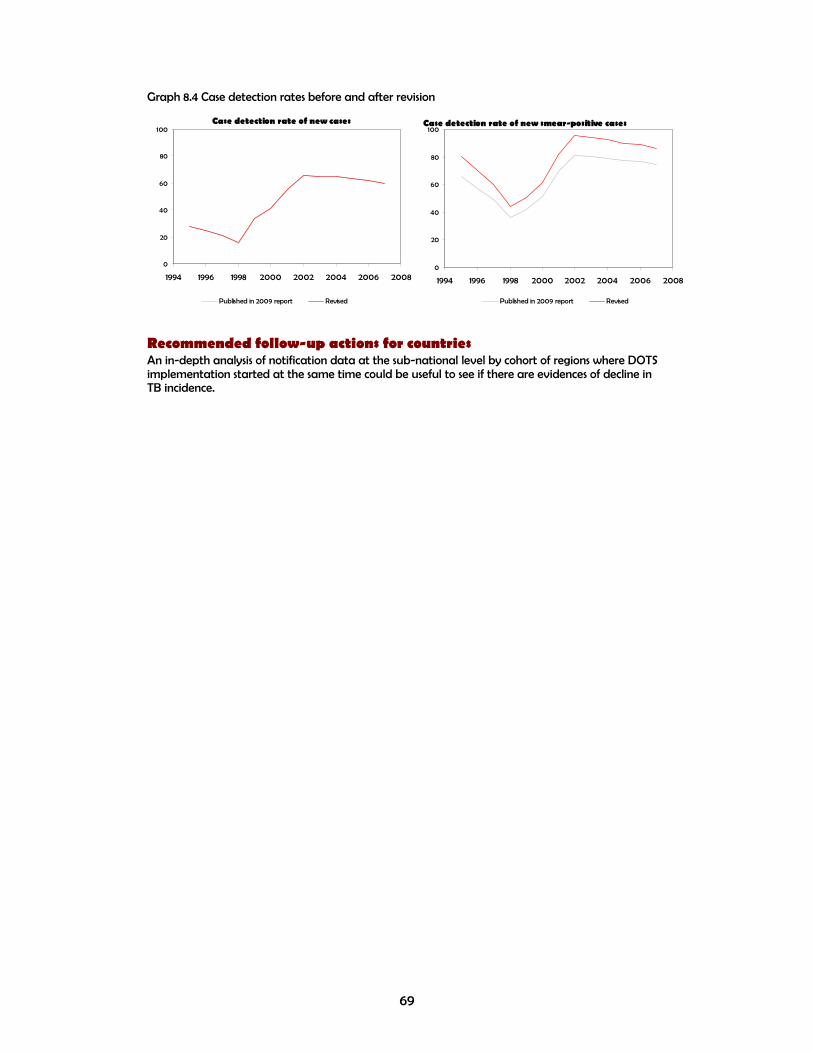
69
Graph 8.4 Case detection rates before and after revision
Recommended follow-up actions for countries An in-depth analysis of notification data at the sub-national level by cohort of regions where DOTS implementation started at the same time could be useful to see if there are evidences of decline in TB incidence.
Case detection rate of new cases
0
20
40
60
80
100
1994 1996 1998 2000 2002 2004 2006 2008
Published in 2009 report Revised
Case detection rate of new smear-positive cases
0
20
40
60
80
100
1994 1996 1998 2000 2002 2004 2006 2008
Published in 2009 report Revised
70
9. Timor-Leste History The latest WHO estimate of TB incidence in Timor-Leste is based on expert assumption of 60% smear-positive case detection rate for the reference year of 2007 which resulted in an estimate if 145 per 100 000 population for smear-positive cases. The estimate of new cases then was derived from the estimate of smear-positive cases assuming 45% of new cases are smear-positive. In the absence of data to estimate the trend in TB incidence, the estimate of incidence for year 2007was extrapolated backward assuming a flat trend. Data availability National data on TB case notifications and most of case finding efforts indicators were provided for years 2000-2007 which is the period of existence of this country as an independent nation. No sub-national data except for 2007 population were provided (table 9.1). Table 9.1: Data availability Data National Sub-national Population 2000-2007 2007 Population by age and sex 2000-2007 2007
TB case notifications by type 2000-2007 - TB case notifications by age and sex 2000-2007 -
Active case finding Not available
-
Number of new and re-treatment TB cases reported by non-NTP/non-MoH providers Not available
-
Number of new and re-treatment TB cases reported among foreign-born or non-citizens individuals Not available
-
MDR-TB 2000-2007
-
TB/HIV 2000-2007
-
Labs 2000-2007
-
Number of dispensaries and hospitals 2000-2007
-
non-NTP providers and collaborators 2000-2007
-
Staff 2000-2007
-
Other (chronic respiratory cases, TB suspects, slides examined, % culture-positive/smear-positive) 2000-2007
-

71
Data quality System related Since 2000, there has been a system to monitor the completeness of reporting at the national and sub-national levels. So, no missing reports are expected, although there are some delays. Data related Unusual fluctuation in case notifications In TB epidemiology, where the trend in case notifications is considered as a proxy for trend in TB incidence, the notification rates do not change by more than 5-10% from one year to the next. Therefore, any change out of this range can be attributed to other factors. These factors may include changes in case finding efforts (e.g. expansion of the programme to the non-NTP providers) and changes in recording and reporting practices (e.g. case definitions, completeness of reporting, duplication and misclassification). In Timor-Leste, the rate of new case notifications changed within the range of 5-10% in most years except for the first two years (2000-2002) which seem to be political instability leading to flux of refugees in 2000 and migration of population to the peripheral areas where the health system was weak at 2001 (graph 8.1A). Graph 9.1A Percentage change in new TB case notifications over time
-19
-34
10 8
-4
-9
-13
00000
-40
-30
-20
-10
0
10
20
30
1995-1996 1996-1997 1997-1998 1998-1999 1999-2000 2000-2001 2001-2002 2002-2003 2003-2004 2004-2005 2005-2006 2006-2007

72
Unusual contribution and/or fluctuation of various case types in overall notifications In 2007, 99% of all notified cases were new which was about 14% higher than the regional average, but consistent with previous years (table 9.2; graph 9.2). In 2007, 87% of all new cases were pulmonary which is within the expected range (85-90%) and close to the regional average and fairly consistent with previous years. In 2007, 37% of all pulmonary cases were smear-positive which is much lower than the expected range (65-80%) and the regional average and remained fairly constant since 2000. (Table 9.2; graph 9.1B). Table 9.2: Contribution of different types of TB in notifications
1995 2000 2007
Percentage Timor-Leste SEA
Timor-Leste SEA
Timor-Leste SEA
New / all TB - 100 97 93 99 86 New pulmonary / new TB - 94 86 91 87 84 New smear-positive / new pulmonary TB - 28 38 41 37 61 Relapse / all retreatment - 100 38 25 66 37 Failure / all retreatment - - 15 19 23 7 Default / all retreatment - - 47 18 11 26 Other retreat / all retreatment - - - 37 - 29
Graph 9.1B Contribution of different types of TB in notifications
The shares of various case types of overall notifications show a fairly consistent trend over time, but low percentage of smear-positive cases out of all pulmonary cases indicates the need for strengthening of smear diagnosis (graph 9.1B). Estimate of TB incidence for the reference year Using the onion framework, the country representatives in the workshop estimated that in 2007, 60% of all new cases were detected by the TB programme; 1% of cases were diagnosed but not reported to the NTP; 0% of cases were detected by the non-NTP public or private providers, but not reported to the NTP, 3% of cases presented themselves to the health services, but not diagnosed, 26% had access to health services, but did not seek care and 10% of cases were estimated to have no access to health services (Table A1).
84
86
88
90
92
94
96
98
100
102
1990 1995 2000 2005 2010
% n
ew/a
ll
Timor-Leste SEA
78
80
82
84
86
88
90
92
94
96
1994 1996 1998 2000 2002 2004 2006 2008
% p
ulm
/new
Timor-Leste SEA
10
20
30
40
50
60
70
1994 1996 1998 2000 2002 2004 2006 2008
% s
s+/p
ulm
Timor-Leste SEA

73
It was also estimated by the country representatives that the case finding efforts slightly improved from 2003 to 2007 which is reflected in their estimate of case detection rate for the new cases from 55% in 2003 to 60% in 2007 (table 9.3). Table 9.3: Case detection rate of new TB cases (%)
Year Latest WHO estimates from the 2009 global TB report
Country estimates from the workshop Point estimate (lower-upper bound)
2000 158 - 2003 103 55 (45-60) 2007 57 60 (55-65)
The estimate of case detection rate of new TB cases for year 2007 (60%) is used to generate the best estimate of incidence for the reference year of 2007. However, as it is shown by the uncertainty bounds around this estimate (55-65%), there is a need to provide some supporting evidence to support the estimate of missing cases in various layers of onion. Estimate of trend in TB incidence over time The first step to estimate the trend in TB incidence is to decide whether the trend in TB notifications is a proxy for trend in TB incidence. That will be the case in the countries where there were not considerable changes in case finding efforts, i.e. case detection rate remains constant over time and/or recording and reporting practices leading to change in case notifications during the same period. The notification rate of new TB cases showed a rapid decline from 508 cases per 100 000 population in 2000 to 301 in 2002 and continued to decline in a slower rate to 279 in 2007. The observed trend is fairly consistent across various case types, but it is mainly driven by the smear-negative/unknown/not-done cases. Despite of reported increase in the number of hospitals, health facilities providing TB services, microscopy centres and TB doctors and staff, it is difficult and perhaps too soon to find the impact in case notifications as it has been fairly constant and even decreasing in the recent years following a sharp decline in the first two years of programme implementation (i.e. 2000 and 2001) In the absence of data to make an assessment of trend in TB incidence, it is assumed that the TB incidence followed a flat trend between 2000 and 2007. Table 9.4: Comparison of changes in notifications with case finding efforts and TB determinants Assessment Country's assessment Have TB notifications been increasing, decreasing or stable over time? Decrease (2000-2007)
Were there any changes in case-finding effort that might have affected notifications over time? Yes
Were there any changes in recording and reporting that might have affected notifications over time? Yes
How have factors that may influence TB incidence changed over time, and have they had an impact on underlying TB incidence? Possible

74
Table 9.5 Method to estimate TB incidence and trend
Assumptions Current method Revised method
Estimate of incidence for reference year
• Data source 60% case detection rate of ss+ cases in 2007
60% case detection of new cases in 2007
• Value (per 100 000 population) 145 (new ss+) in 2007
466 (=279/0.60), new cases
Trend in TB incidence
• Data source Flat trend Flat trend • Type and slope 0 0
Revised estimates of incidence The TB incidence for years 1995-2007 is estimated by applying the flat trend on revised estimate of 2007 which also results in the revision of case detection rate of new and smear-positive cases for the respective years (table 9.6). The estimate of new smear-positive cases derived from all cases assuming 45% of all HIV-negative and 35% of HIV-positive TB cases are smear-positive. The estimate of HIV-positive TB cases derived directly from the percentage of HIV in TB cases (see Method section of 2009 global TB report for details) (table 9.6 and 9.7; graph 9.2-9.4). Table 9.6 Current versus revised estimate of incidence and case detection rate
Estimate of new TB
cases Estimate of new ss+ TB cases
Case detection rate, new
Case detection rate, new ss+
Year Current Revised Current Revised Current Revised Current Revised
1995 - - - - - - - -
1996 - - - - - - - -
1997 - - - - - - - -
1998 - - - - - - - -
1999 - - - - - - - -
2000 322 466 145 210 158 109 114 79
2001 322 466 145 210 131 91 105 72
2002 322 466 145 210 93 65 84 58
2003 322 466 145 210 103 71 74 51
2004 322 466 145 210 112 78 68 47
2005 322 466 145 210 108 75 67 46
2006 322 466 145 210 99 68 56 39
2007 322 466 145 210 87 60 61 42

75
Table 9.7 Revised estimate of new TB cases with the confidence limits
Year
Estimate of
incidence lower bound
Upper bound
1995 - - - 1996 - - - 1997 - - - 1998 - - - 1999 - - - 2000 466 430 508 2001 466 430 508 2002 466 430 508 2003 466 430 508 2004 466 430 508 2005 466 430 508 2006 466 430 508 2007 466 430 508
Graph 9.2 Notifications versus estimates, new cases, before and after revision
0
100
200
300
400
500
600
1995
1996
1997
1998
1999
200
0
200
1
200
2
200
3
200
4
200
5
200
6
200
7
Incidence_published in 09 report
Incidence_upper bound
Incidence_revised
Incidence_low er bound
Notif ications_new
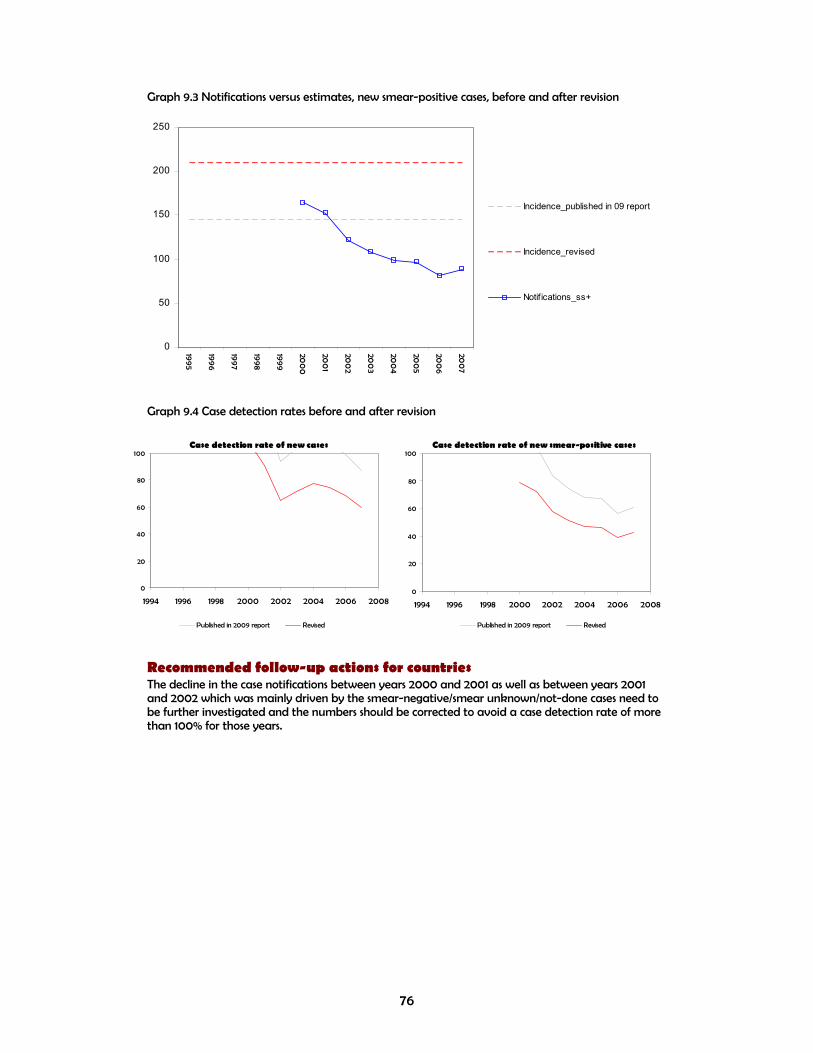
76
Graph 9.3 Notifications versus estimates, new smear-positive cases, before and after revision
Graph 9.4 Case detection rates before and after revision
Recommended follow-up actions for countries The decline in the case notifications between years 2000 and 2001 as well as between years 2001 and 2002 which was mainly driven by the smear-negative/smear unknown/not-done cases need to be further investigated and the numbers should be corrected to avoid a case detection rate of more than 100% for those years.
0
50
100
150
200
250
1995
1996
1997
1998
1999
200
0
200
1
200
2
200
3
200
4
200
5
200
6
200
7
Incidence_published in 09 report
Incidence_revised
Notif ications_ss+
Case detection rate of new cases
0
20
40
60
80
100
1994 1996 1998 2000 2002 2004 2006 2008
Published in 2009 report Revised
Case detection rate of new smear-positive cases
0
20
40
60
80
100
1994 1996 1998 2000 2002 2004 2006 2008
Published in 2009 report Revised
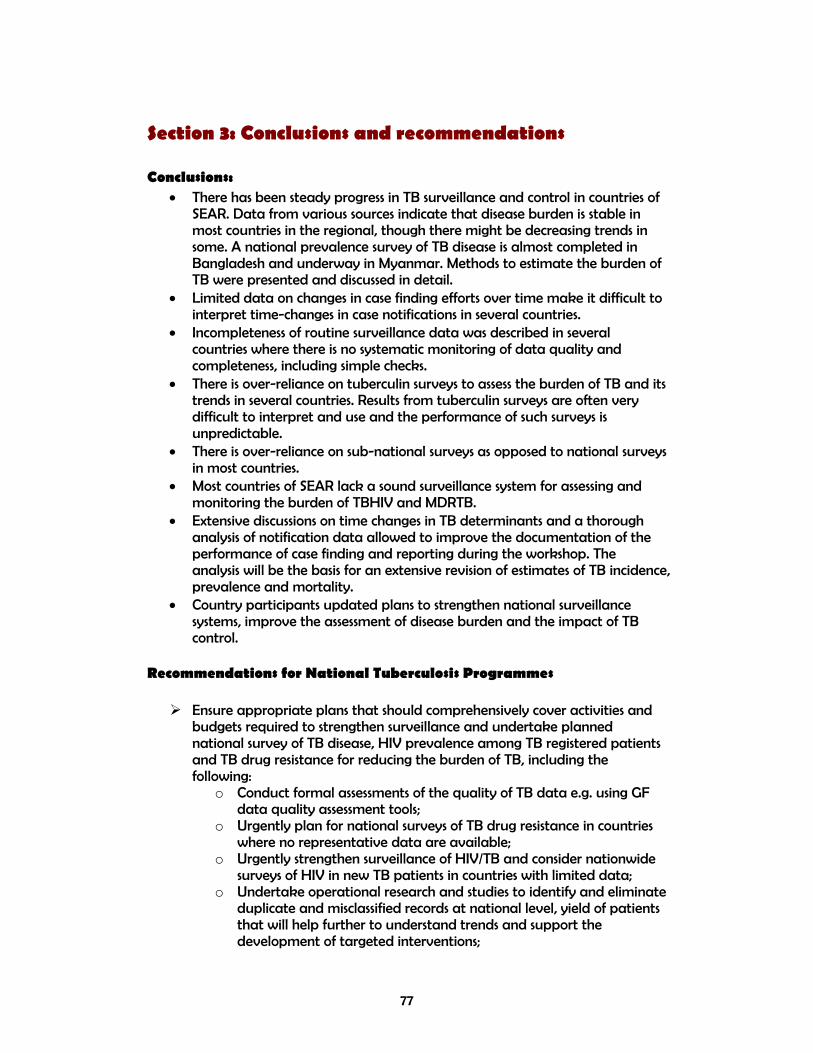
77
Section 3: Conclusions and recommendations Conclusions:
• There has been steady progress in TB surveillance and control in countries of SEAR. Data from various sources indicate that disease burden is stable in most countries in the regional, though there might be decreasing trends in some. A national prevalence survey of TB disease is almost completed in Bangladesh and underway in Myanmar. Methods to estimate the burden of TB were presented and discussed in detail.
• Limited data on changes in case finding efforts over time make it difficult to interpret time-changes in case notifications in several countries.
• Incompleteness of routine surveillance data was described in several countries where there is no systematic monitoring of data quality and completeness, including simple checks.
• There is over-reliance on tuberculin surveys to assess the burden of TB and its trends in several countries. Results from tuberculin surveys are often very difficult to interpret and use and the performance of such surveys is unpredictable.
• There is over-reliance on sub-national surveys as opposed to national surveys in most countries.
• Most countries of SEAR lack a sound surveillance system for assessing and monitoring the burden of TBHIV and MDRTB.
• Extensive discussions on time changes in TB determinants and a thorough analysis of notification data allowed to improve the documentation of the performance of case finding and reporting during the workshop. The analysis will be the basis for an extensive revision of estimates of TB incidence, prevalence and mortality.
• Country participants updated plans to strengthen national surveillance systems, improve the assessment of disease burden and the impact of TB control.
Recommendations for National Tuberculosis Programmes
Ensure appropriate plans that should comprehensively cover activities and budgets required to strengthen surveillance and undertake planned national survey of TB disease, HIV prevalence among TB registered patients and TB drug resistance for reducing the burden of TB, including the following:
o Conduct formal assessments of the quality of TB data e.g. using GF data quality assessment tools;
o Urgently plan for national surveys of TB drug resistance in countries where no representative data are available;
o Urgently strengthen surveillance of HIV/TB and consider nationwide surveys of HIV in new TB patients in countries with limited data;
o Undertake operational research and studies to identify and eliminate duplicate and misclassified records at national level, yield of patients that will help further to understand trends and support the development of targeted interventions;

78
o Strengthen capacity to improve recording and reporting system, analyze TB notification and other supporting data at national and sub national levels and improve feedback of data analysis and interpretation to TB staff and other health care working in the peripheral level;
o Systems should be developed on capturing data on cases diagnosed in hospitals under other public sector units. Non-NTP health facilities like private health facilities and NGOs should also be made part of routine surveillance. It should however be ensured that the case definitions are followed accurately. Data from various sources can be linked to eliminate double counting by use of common identifiers and appropriate software;
o Appropriate action need to be taken for accurate diagnosis of TB among children and capturing the same under routine surveillance data;
Co-ordinate with WHO in finalizing the report of the workshop, and improve estimates of TB disease burden.
Recommendations for WHO and partners
A report of the analysis conducted during the workshop to be shared with countries for feedback and corrections prior to updating estimates of TB disease burden at WHO/HQ;
WHO and partners to provide technical assistance for developing and strengthening the monitoring and evaluation components of GF applications;
Continue to develop standard protocols and guidelines to assist Member States to undertake population based representative surveys/studies, to establish sound baselines and measure trends in TB case detection, treatment success, incidence, prevalence and mortality;
Continue in developing guidelines and assist in building capacity through training and maintaining a roster of consultants to provide technical assistance to Member States and build national capacity in order to systematically analyze routinely collected programme data, to better understand emerging trends and to develop targeted programme interventions;
Assist Member States on operational research priorities related to TB surveillance and monitoring and assist in promoting and implementing operational research activities, particularly those related to better analyzing and using data from routine surveillance.

79
Annex 1
Table A1: Percentage of undetected TB cases, 2007
Country No access Have access, but don't go
Go, but not diagnosed by health facility
Diagnosed by NTP but not notified
Diagnosed by non-NTP, but not notified
Total
Bangladesh 0 (0-0) 10 (6-14) 15 (12-18) 25 (20-30) 8 (4-10) 58 (42-72) Bhutan 6 (5-8) 6 (4-8) 3 (2-4) 0 (0-0) 0 (0-0) 15 (11-20) Indonesia 5 (3-10) 5 (4-10) 8 (5-12) 8 (5-10) 5 (1-7) 31 (18-49) Maldives 1 (0-1.5) 2 (1-3) 0 (0-0) 2 (1-3) 1 (0-2) 6 (2-9.5) Myanmar 12 (8-16) 9 (6-12) 2 (1-3) 12 (8-16) 3 (2-4) 38 (25-51) Nepal 3 (1-5) 10 (5-15) 5 (3-10) 7 (5-10) 5 (3-10) 30 (17-50) Sri Lanka 2 (1-5) 1 (0.5-1.5) 2 (1-3) 25 (20-30) 0 (0-0) 30 (22.5-39.5) Thailand 5 (3-8) 5 (3-10) 5 (2-7) 20 (15-25) 5 (3-8) 40 (26-58) Timor-Leste 10 (8-12) 26 (24-28) 3 (2-4) 0 (0-0) 1 (1-1) 40 (35-45)
Table A2: Case detection rate, 1997, 2003 and 2007
Country 1997 2003 2007 Bangladesh 20 (15-25) 30 (25-35) 42 (28-58) Bhutan 76 (67-82) 80 (76-84) 85 (80-89) Indonesia 7 (2-9) 40 (20-50) 69 (51-80) Maldives 72 (70-74) 75 (72-78) 94 (90.5-98) Myanmar 35 (30-37) 50 (45-55) 62 (49-75) Nepal 40 (30-50) 65 (45-70) 70 (50-83) Sri Lanka 70 (60.5-75.5) 70 (60.5-75.5) 70 (60.5-75.5) Thailand 30 (25-40) 55 (50-60) 60 (42-74) Timor-Leste Not applicable 55 (45-60) 60 (55-65)
Table A3: Data sources that can be used to assess undetected cases
Country Mortality (vital registration)
Laboratory registries
Separate NTP list
Hospital registries
HIV notification data with information on TB diagnoses
Pharmacy registries
Health insurance registries
Other
Bangladesh x x x x Bhutan x x x x Indonesia x x x x x TB in prison and workspace Maldives x x x Myanmar x x x Registers of INGOs and PPs Nepal x Sri Lanka x x Thailand x x TB epidemiology registration (from
bureau of epidemiology) Timor-Leste x x TB suspect registers

80
Table A4: Types of studies relevant to help assess the number of TB case missing Country Invento
ry studies using existing sources of data
Inventory studies using newly collected sources of data
Studies of diagnostic procedures performed to TB suspects
Yield of patients found as a result of ACSM
Yield of patients found following training staff on PAL
Yield of patients found while screening high risk populations
Yield of patients found while contact tracing
Yield of patients found because of improvements in diagnostic quality or tools
Sub-national TB disease prevalence studies
Capture recapture studies
Other
Bangladesh x x x Bhutan X X X X x Indonesia X X X X X X x Maldives x Myanmar x x X x Nepal X x Sri Lanka X X X X x Yield of
patients found by PPM activities
Thailand X X X X x Timor-Leste X X X x x
Table A5: Data completeness and reliability
Country Are there any missing reports? Are the TB cases classified correctly? Bangladesh Sometimes due to admin error Yes Bhutan Sometimes Yes, but ss- cases might not be true Indonesia No Almost always Maldives No Yes Myanmar Yes (3% of reporting units in hard reaching areas) Yes (except for occasional misclassification of retreatment
cases as new due to weak history taking) Nepal No Yes (minimal misclassifications) Sri Lanka No system to monitor (a system will be in place soon) Yes Thailand Sometimes Sometimes (e.g. smear unknown classified as others) Timor-Leste No (delayed sometimes) Sometimes (occasional misclassification of retreatment cases)
Table A6: System to monitor TB/HIV and MDR-TB
Country TB/HIV MDR-TB Bangladesh No No Bhutan No No? Indonesia Yes Yes Maldives Yes Yes Myanmar Yes No Nepal Yes Yes Sri Lanka No No Thailand Yes Yes Timor-Leste No No
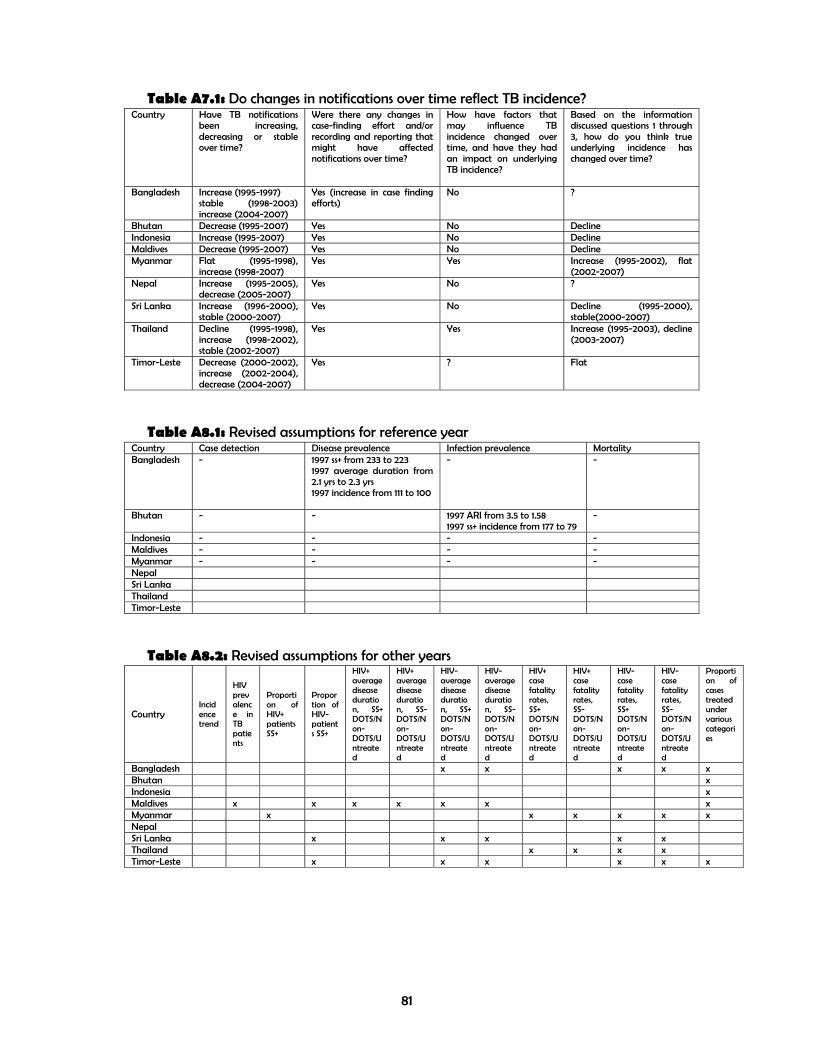
81
Table A7.1: Do changes in notifications over time reflect TB incidence? Country Have TB notifications
been increasing, decreasing or stable over time?
Were there any changes in case-finding effort and/or recording and reporting that might have affected notifications over time?
How have factors that may influence TB incidence changed over time, and have they had an impact on underlying TB incidence?
Based on the information discussed questions 1 through 3, how do you think true underlying incidence has changed over time?
Bangladesh Increase (1995-1997) stable (1998-2003) increase (2004-2007)
Yes (increase in case finding efforts)
No ?
Bhutan Decrease (1995-2007) Yes No Decline Indonesia Increase (1995-2007) Yes No Decline Maldives Decrease (1995-2007) Yes No Decline Myanmar Flat (1995-1998),
increase (1998-2007) Yes Yes Increase (1995-2002), flat
(2002-2007) Nepal Increase (1995-2005),
decrease (2005-2007) Yes No ?
Sri Lanka Increase (1996-2000), stable (2000-2007)
Yes No Decline (1995-2000), stable(2000-2007)
Thailand Decline (1995-1998), increase (1998-2002), stable (2002-2007)
Yes Yes Increase (1995-2003), decline (2003-2007)
Timor-Leste Decrease (2000-2002), increase (2002-2004), decrease (2004-2007)
Yes ? Flat
Table A8.1: Revised assumptions for reference year
Country Case detection Disease prevalence Infection prevalence Mortality Bangladesh - 1997 ss+ from 233 to 223
1997 average duration from 2.1 yrs to 2.3 yrs 1997 incidence from 111 to 100
- -
Bhutan - - 1997 ARI from 3.5 to 1.58 1997 ss+ incidence from 177 to 79
-
Indonesia - - - - Maldives - - - - Myanmar - - - - Nepal Sri Lanka Thailand Timor-Leste
Table A8.2: Revised assumptions for other years
Country Incidence trend
HIV prevalence in TB patients
Proportion of HIV+ patients SS+
Proportion of HIV- patients SS+
HIV+ average disease duration, SS+ DOTS/Non-DOTS/Untreated
HIV+ average disease duration, SS- DOTS/Non-DOTS/Untreated
HIV- average disease duration, SS+ DOTS/Non-DOTS/Untreated
HIV- average disease duration, SS- DOTS/Non-DOTS/Untreated
HIV+ case fatality rates, SS+ DOTS/Non-DOTS/Untreated
HIV+ case fatality rates, SS- DOTS/Non-DOTS/Untreated
HIV- case fatality rates, SS+ DOTS/Non-DOTS/Untreated
HIV- case fatality rates, SS- DOTS/Non-DOTS/Untreated
Proportion of cases treated under various categories
Bangladesh x x x x x Bhutan x Indonesia x Maldives x x x x x x x Myanmar x x x x x x Nepal Sri Lanka x x x x x Thailand x x x x Timor-Leste x x x x x x

82
Table A8.3: Revised assumptions for other years Country Revisions: Bangladesh % maximum untreated for ss+ cases from 25% to 20%
weighted average of duration to 2.3 ss+ hiv- CFR from 10/30/70 to 2/8/20 ss- hiv- CFR from 5/15/20 to 2/8/20
Bhutan % maximum untreated for ss+ cases from 25% to 10% Indonesia % maximum untreated for ss+ and ss- cases from 15% to 10%
% ss- cases treated under non-DOTS (46%) seems to be high Maldives HIV prevalence in TB from 0 to 0.001%
% ss+ and ss- untreated cases from 8 and 10 to 0% Myanmar % HIV+ ss+ from 35% to 20%
Case fatality rate: HIV+ SS+ DOTS/Non-DOTS/Untreated from 10/38/83% to 26/40/50% HIV+ SS- DOTS/Non-DOTS/Untreated from 10/50/74% to 24/50/55% HIV- SS+ DOTS/Non-DOTS/Untreated from 10/30/70% to 5/20/30% HIV- SS- DOTS/Non-DOTS/Untreated from 5/15/20% to 5/25/35%
Nepal ? Sri Lanka Proportion of HIV- patients SS+ from 45% to 50%
HIV- average disease duration: SS+ DOTS/Non-DOTS/Untreated from 1.0/2.5/2.0 years to 0.75/1/2 years SS- DOTS/Non-DOTS/Untreated from 1.0/2.5/2.0 years to 0.75/1/2 years HIV- case fatality rates: SS+ DOTS/Non-DOTS/Untreated from 10/30/70% to 10/ 20/ 70% SS- DOTS/Non-DOTS/Untreated from 5/15/20% to 5/ 10/ 20%
Thailand HIV+ case fatality rates: SS+ DOTS/Non-DOTS/Untreated from 10/25/83% to 12/25/83 SS- DOTS/Non-DOTS/Untreated from 10/33/74% to 12/33/74 HIV- case fatality rates: SS+ DOTS/Non-DOTS/Untreated from 10/20/70% to 7/15//50 SS- DOTS/Non-DOTS/Untreated from 5/10/20% to 5/10/20
Timor-Leste Proportion of HIV- patients SS+ from 45% to 32% HIV- average disease duration: SS+ DOTS/Non-DOTS/Untreated from 1.0/2.0/2.0 years to 1.0/0/1.0 year SS- DOTS/Non-DOTS/Untreated from 1.0/2.0/2.0 years to 1.0/2.0/1.5 years HIV- case fatality rates: SS+ DOTS/Non-DOTS/Untreated from 10/20/70% to 5/0/70 % SS- DOTS/Non-DOTS/Untreated from 5/10/20% to 5/0/20 %

83
Table A9: Plan List of activities Bangladesh Bhutan Indonesia Maldives Myanmar Nepal ? Sri Lanka
Thailand Timor-Leste
1. Improve recording and reporting capacity:
i. - Improve coverage of R&R
2009-2010
2010 2009-2010
ii. - Improve supervision of R&R activities, from data collection to data validation and transmission
2009-2010
2009-2010
2010-2011 2009-2011 2009-2010
iii. - Progress from a paper-based to an electronic-based system
2009-2010
2009-2010 (for MDR)
2010-2011
iv. - Progress to web-based system 2010
v. - Other, please specify
2. Improve capacity to analyse TB notification and other supporting data at national level
2010 2009-2010
2009-2010
2010-2011 2010 2010
3. Improve capacity to analyse TB notification and other supporting data at sub-national level
2009-2010
2010-2011 2012 2010 2010
4. Improve feedback of data analysis and interpretation to TB staff and other health care working in the peripheral level
2009-2010
2010-2011 2010
5. Perform study to identify and eliminate duplicate and misclassified records at national level
2010
6. Perform data quality assessment (e.g. using data quality assessment tool)
2010 2010
7. Improve feedback of data analysis and interpretation to TB staff and other health care working in the peripheral level
8. Perform, in a sample of health care facilities, studies of the yield of patients:
i. - by comparing number of TB cases with number of suspects examined and/or number of suspects examined with number of chronic respiratory cases attending the health care facilities
2010
2010 2010
ii. - diagnosed through active case finding
iii. - diagnosed through contact investigation
2009 2010-2011 2010
iv. - diagnosed through PPM 2010-2011 2010-2011 2010
v. - Other, please specify
9. Perform cross-validation of TB notification data with other pre-existing sources of TB data

84
10. Perform cross-validation of TB notification data with other newly collected TB data (for example, introduce new registries to be completed by non-NTP providers)
11. Capture-recapture studies
12. Perform a national survey of TB drug resistance 2010
2009-2010
2010-2011 2010-2011 2011-2012 2011
13. Perform a national survey of HIV prevalence among TB registered patients
2010 2010-2011
2011 2011-2012
14. Perform a national survey of TB disease 2010-2011 2010-2011 2010-2011 2012
15. Screening for TB in high risk populations 2011
2010
(prisoners)
16. Perform studies to quantify the effect of risk factors for TB and their population attributable fraction in your country (HIV, diabetes, smoking, …)
17. ARTI survey
2009-2010
18. Implement and intensify PAL programme
2009-2010
19. Strengthen PPM (HDL, TB in prison, TB in workplace)
2009-2010
20. Perform inventory studies at province level 2010-2011
21. Include TB/HIV data into routine TB register
2009-2010
2009
22. Adaptation of WHO guidelines for MDR-TB surveillance and treatment
2010
HIV sentinel surveillance continuation and expansion of sites (5 sites/year) 2010-2011
Diabetes prevalence among new TB patients 2010-2011
Analysis of source of referral to NTP 2010
Verbal autopsy to validate vital registration data 2011-2012
Perform a study of situation analysis of MDR-TB 2010
Perform a study of situation analysis of TB in children 2010
Capacity building on supervision for national and districts staff 2010

85
Annex 2 Bangladesh
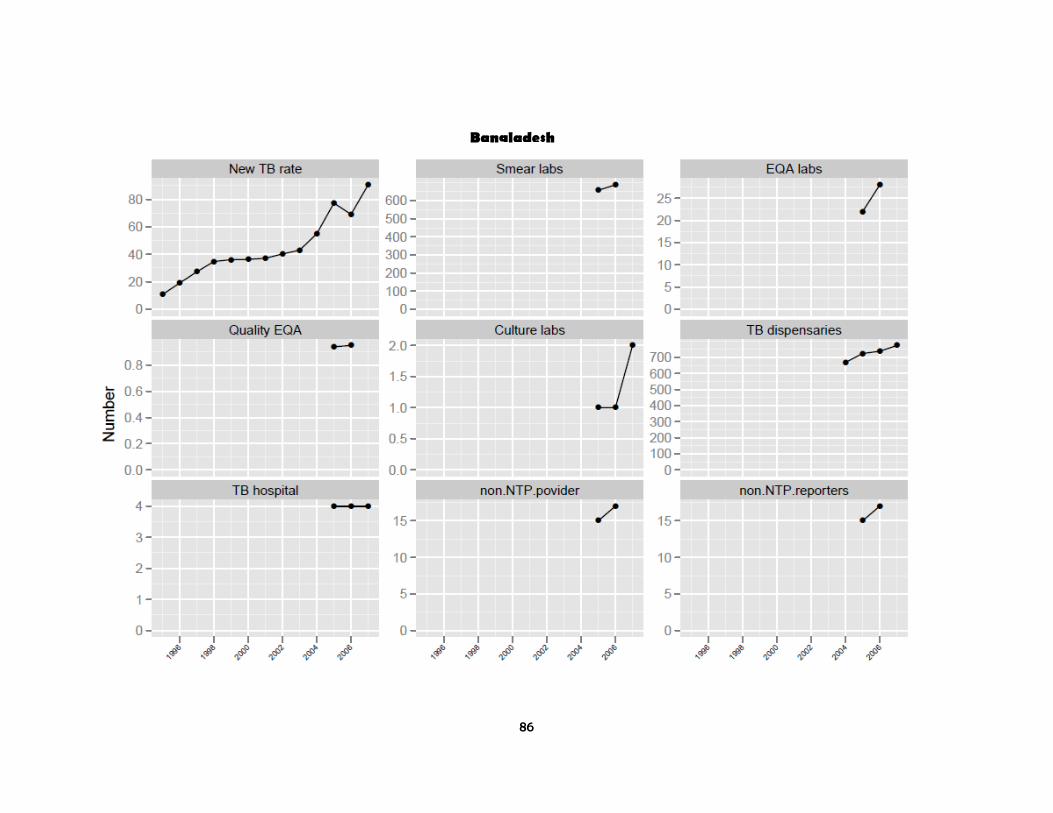
86
Bangladesh

87
Bangladesh
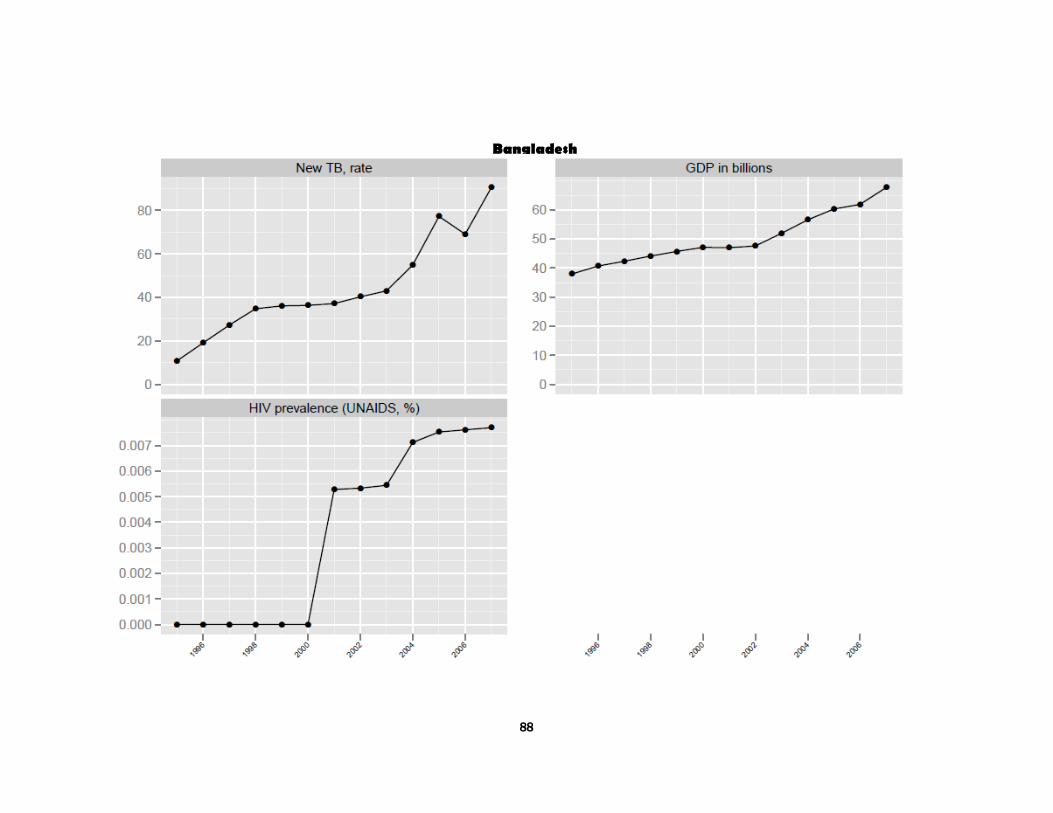
88
Bangladesh
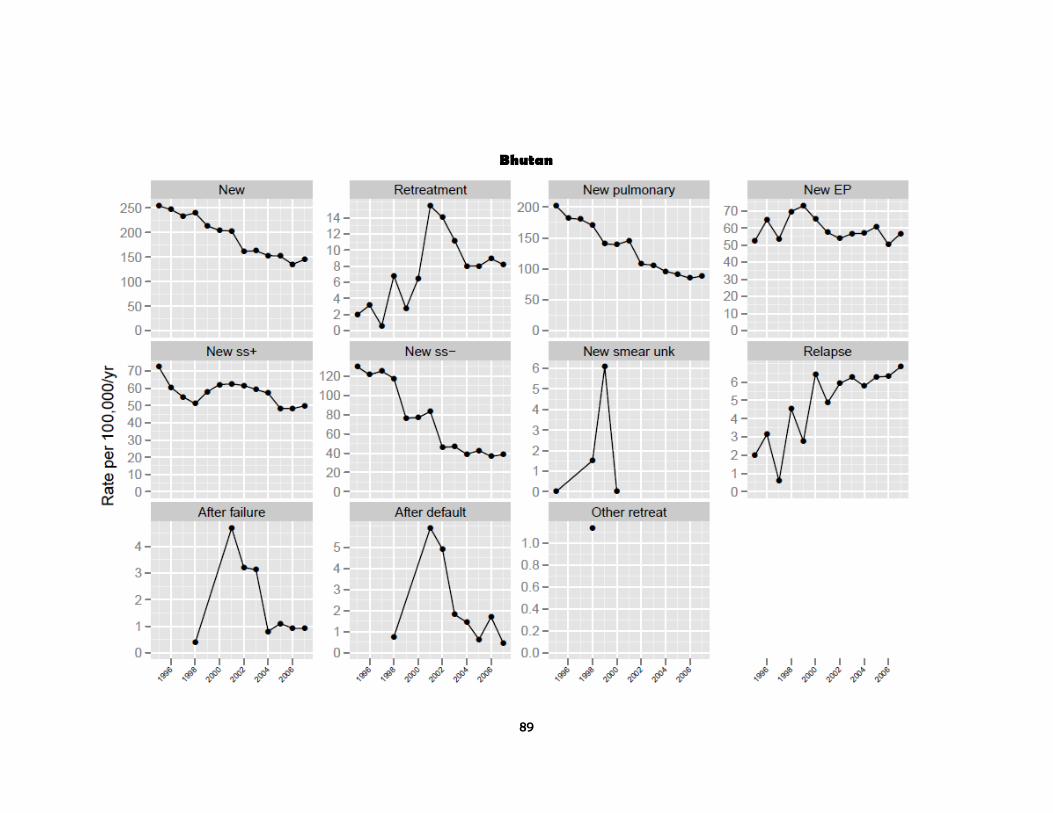
89
Bhutan
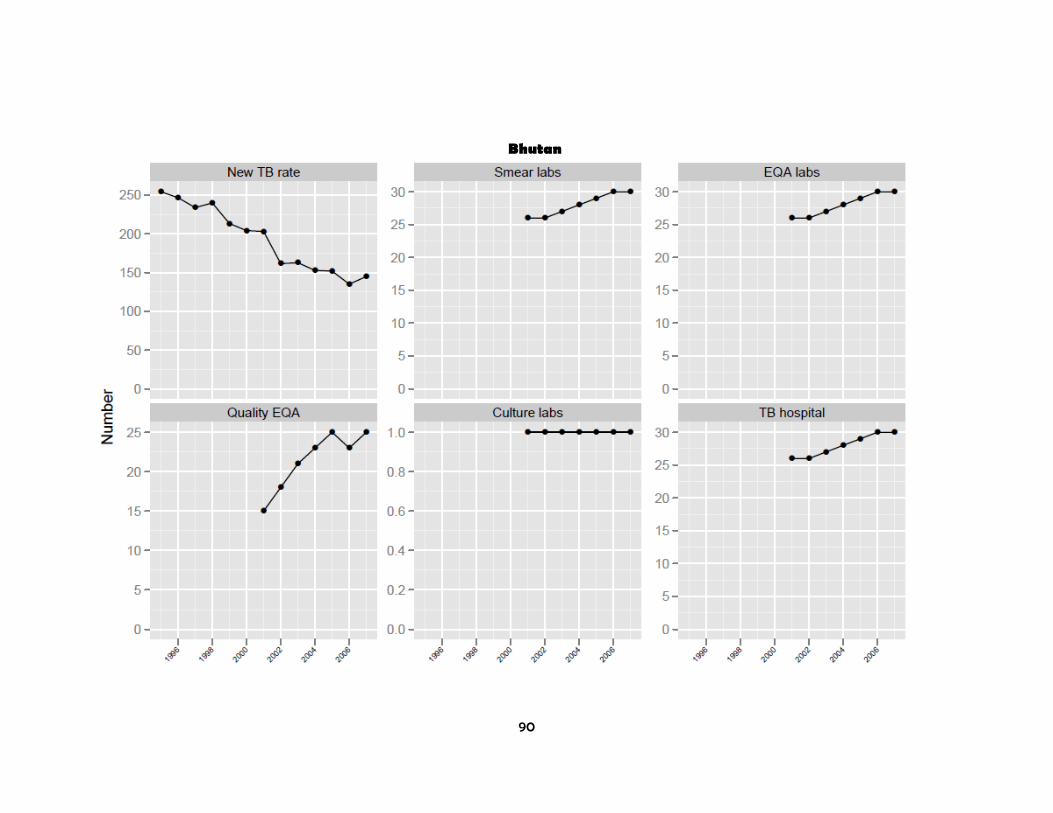
90
Bhutan
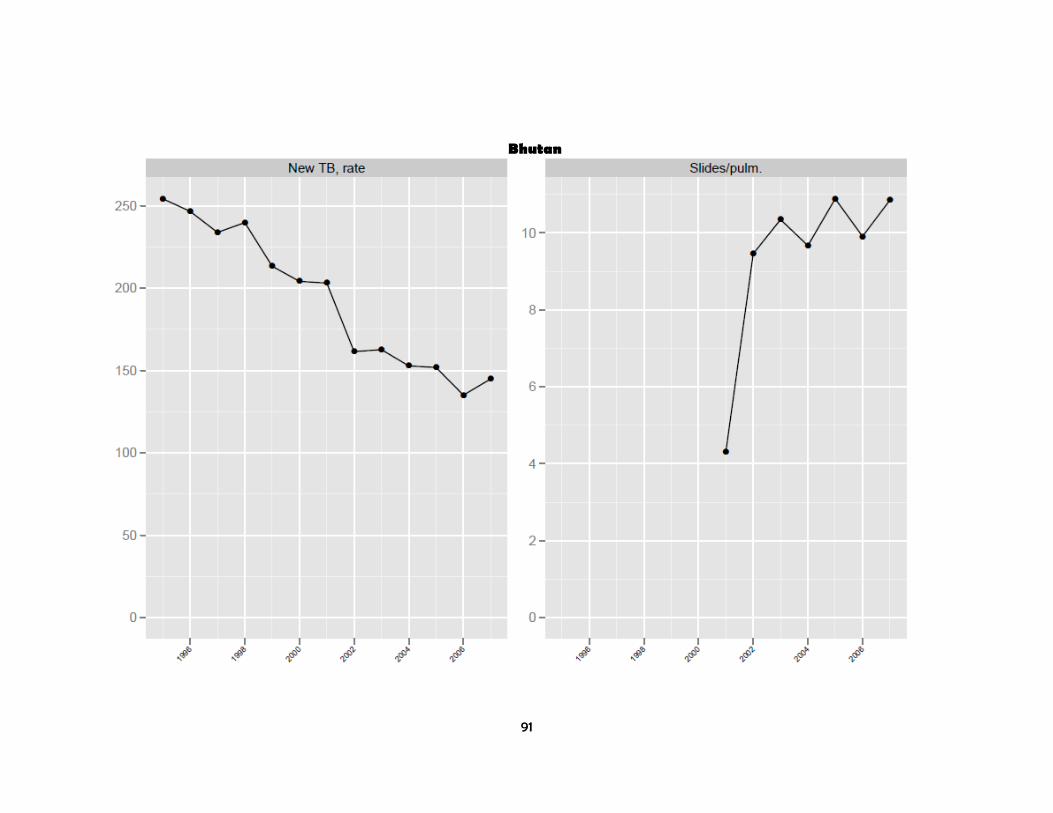
91
Bhutan

92
Bhutan

93
Indoensia

94
Indoensia
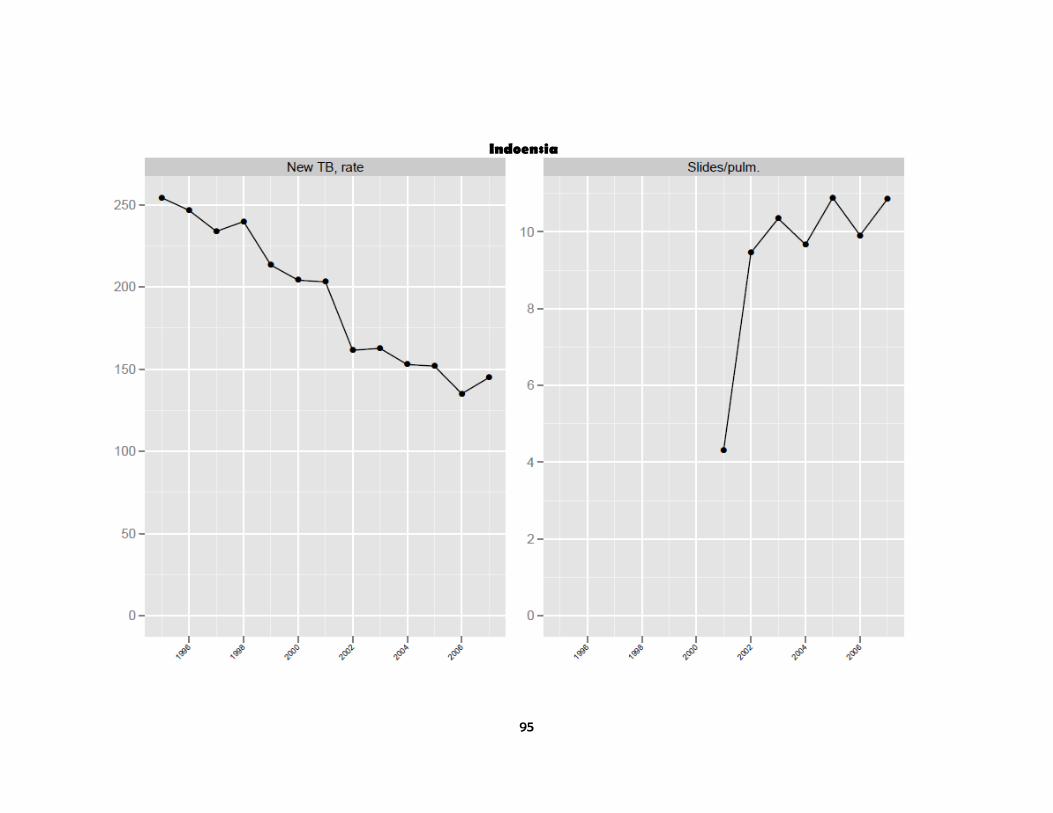
95
Indoensia

96
Indoensia

97
Maldives

98
Maldives

99
Maldives

100
Myanmar

101
Myanmar

102
Myanmar

103
Myanmar

104
Nepal

105
Nepal

106
Nepal

107
Sri Lanka
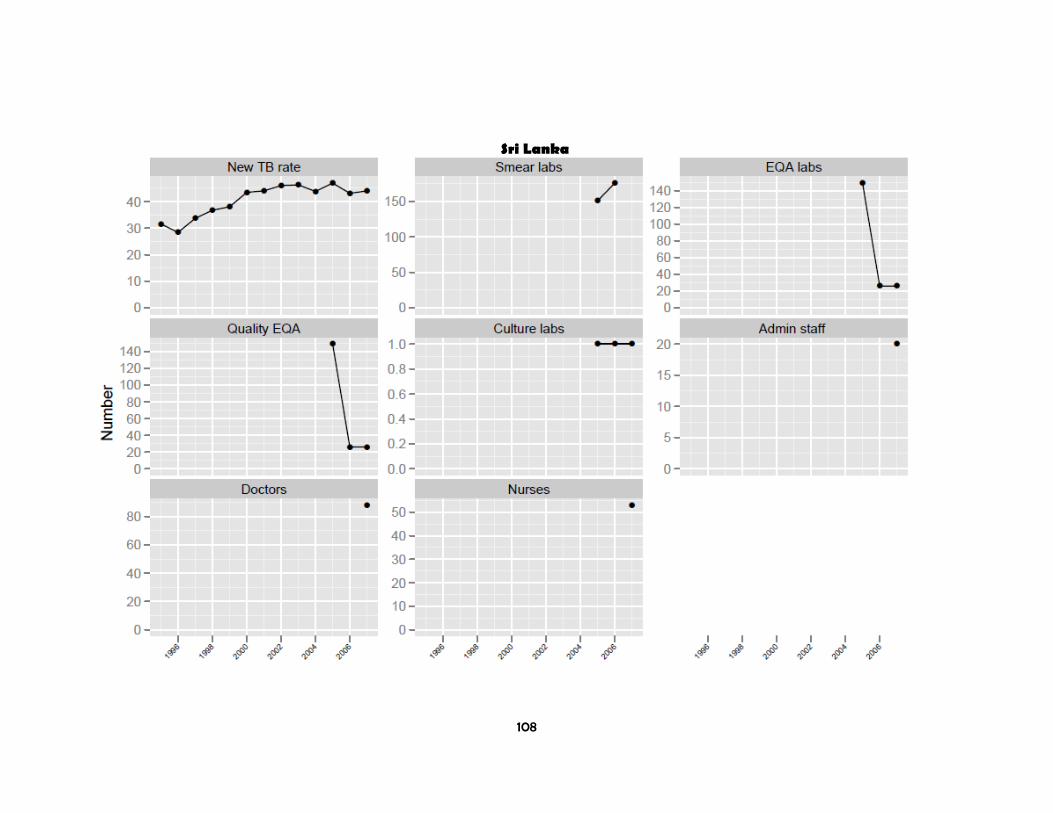
108
Sri Lanka
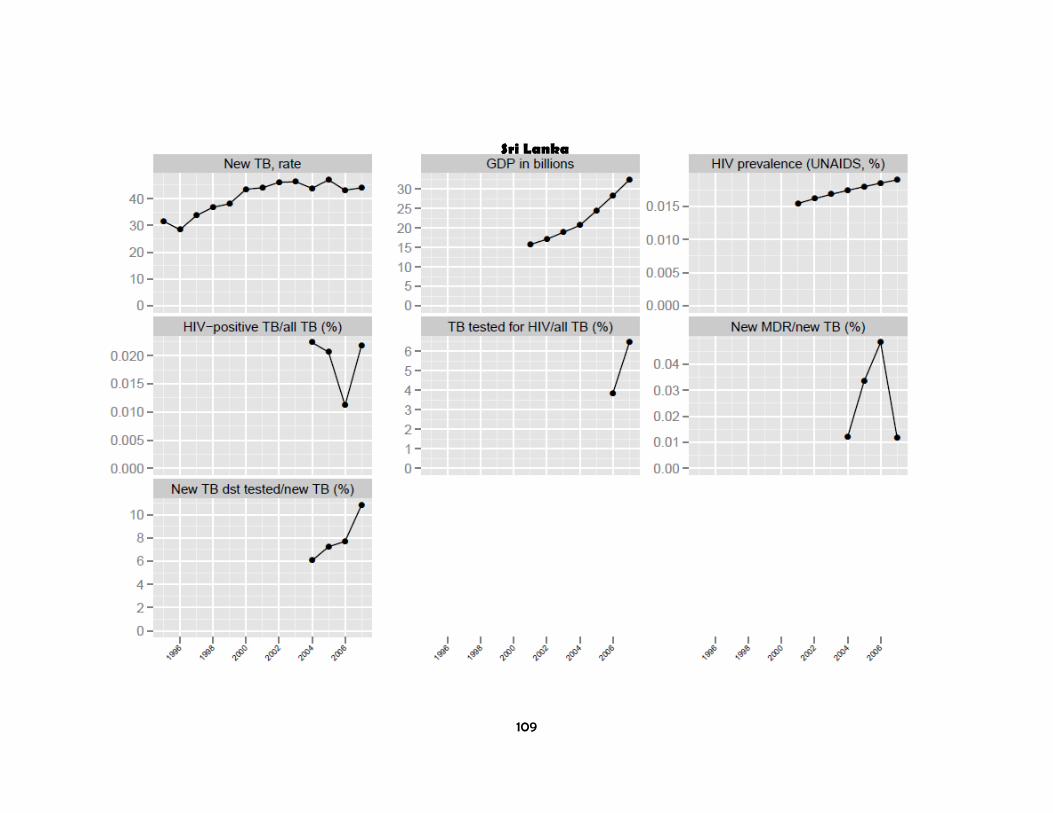
109
Sri Lanka

110
Thailand

111
Thailand
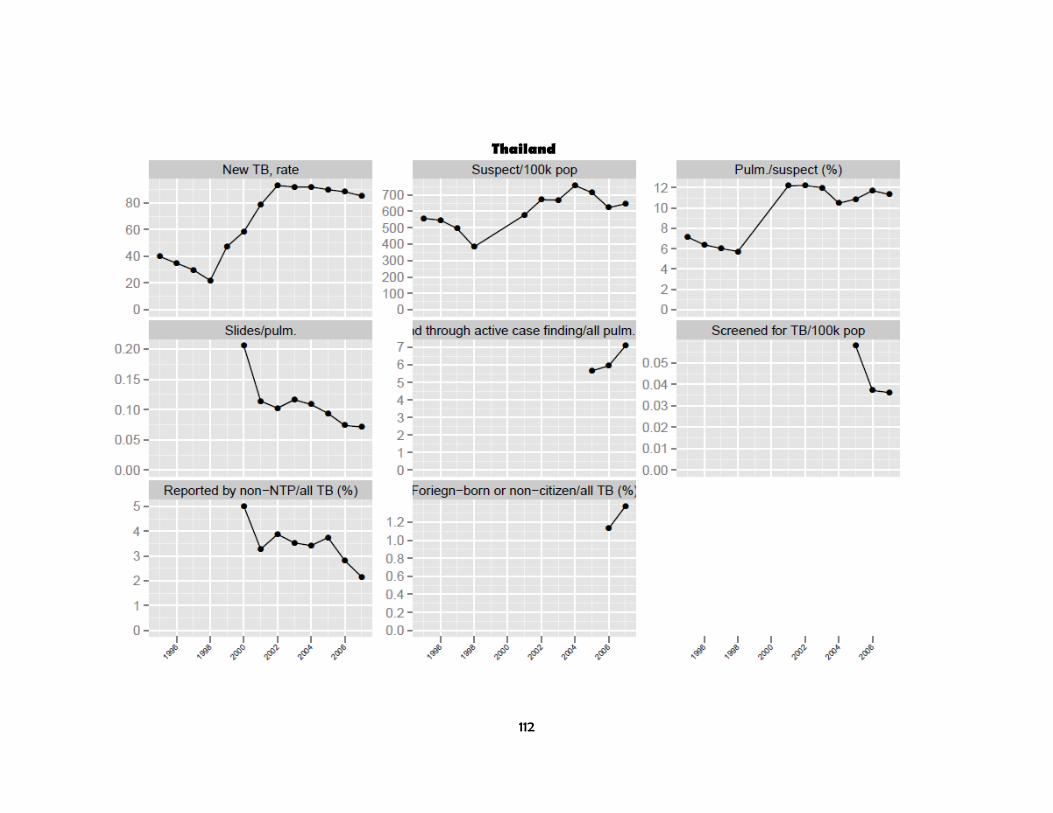
112
Thailand

113
Thailand

114
Timor Leste

115
Timor Leste
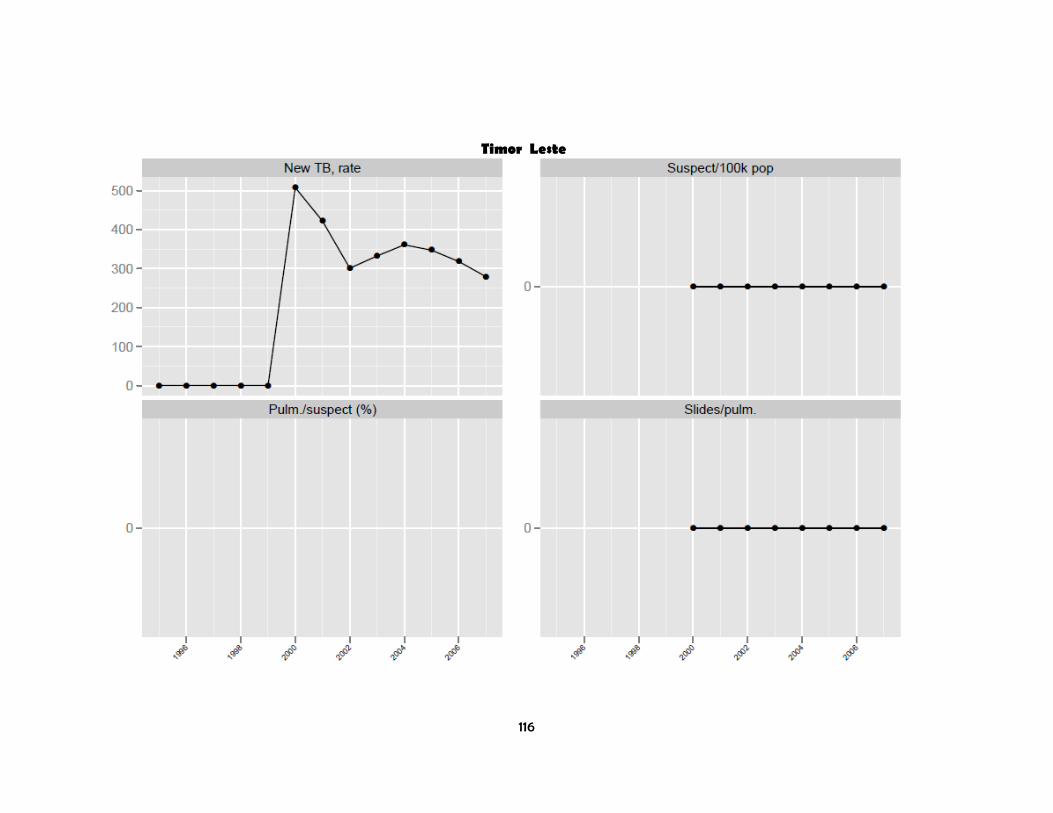
116
Timor Leste
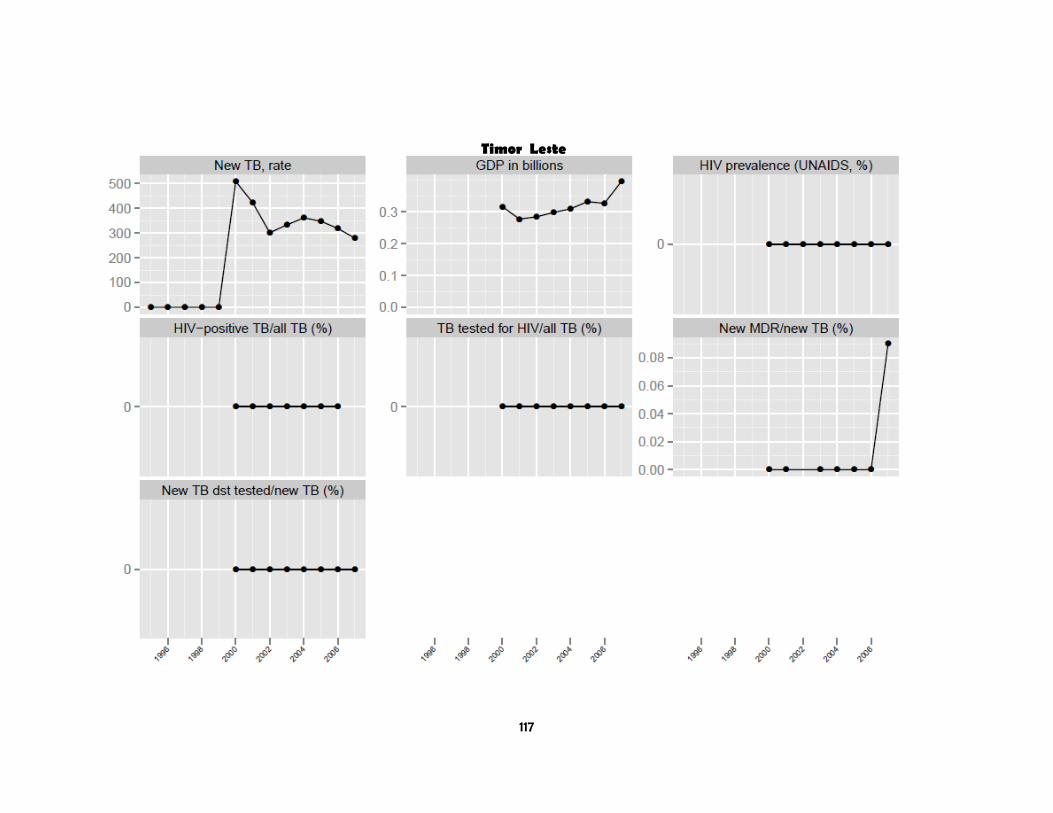
117
Timor Leste
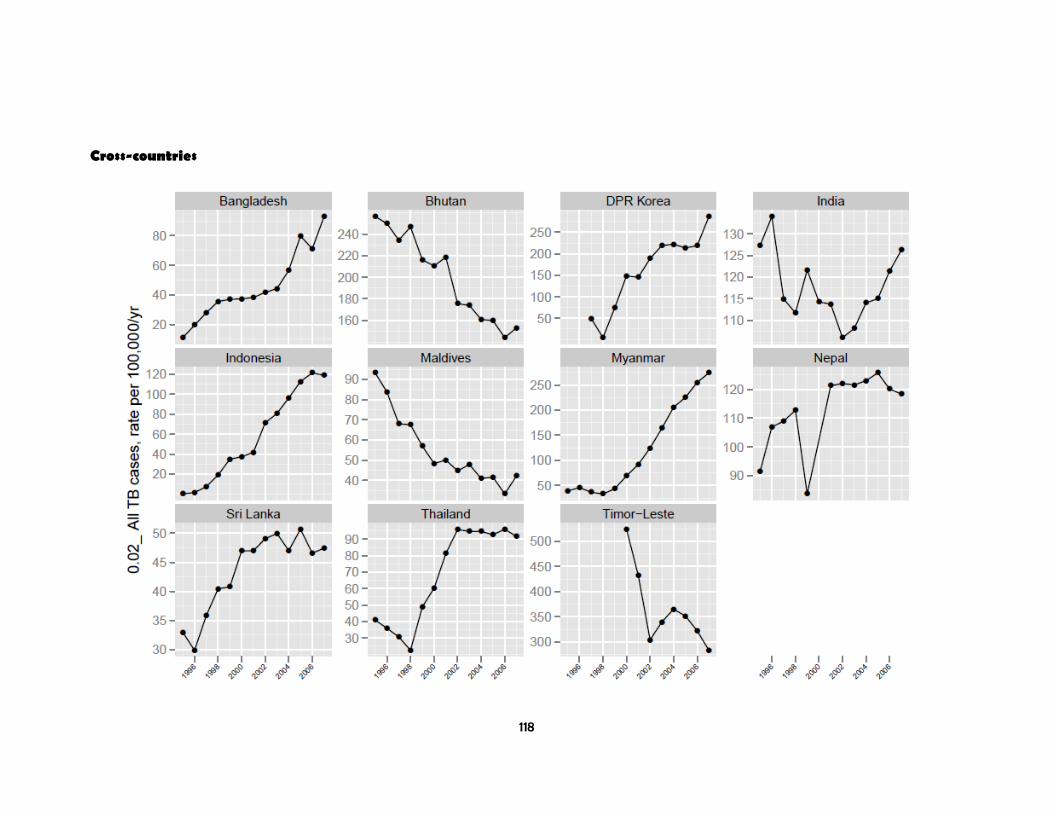
118
Cross-countries

119
Cross-countries
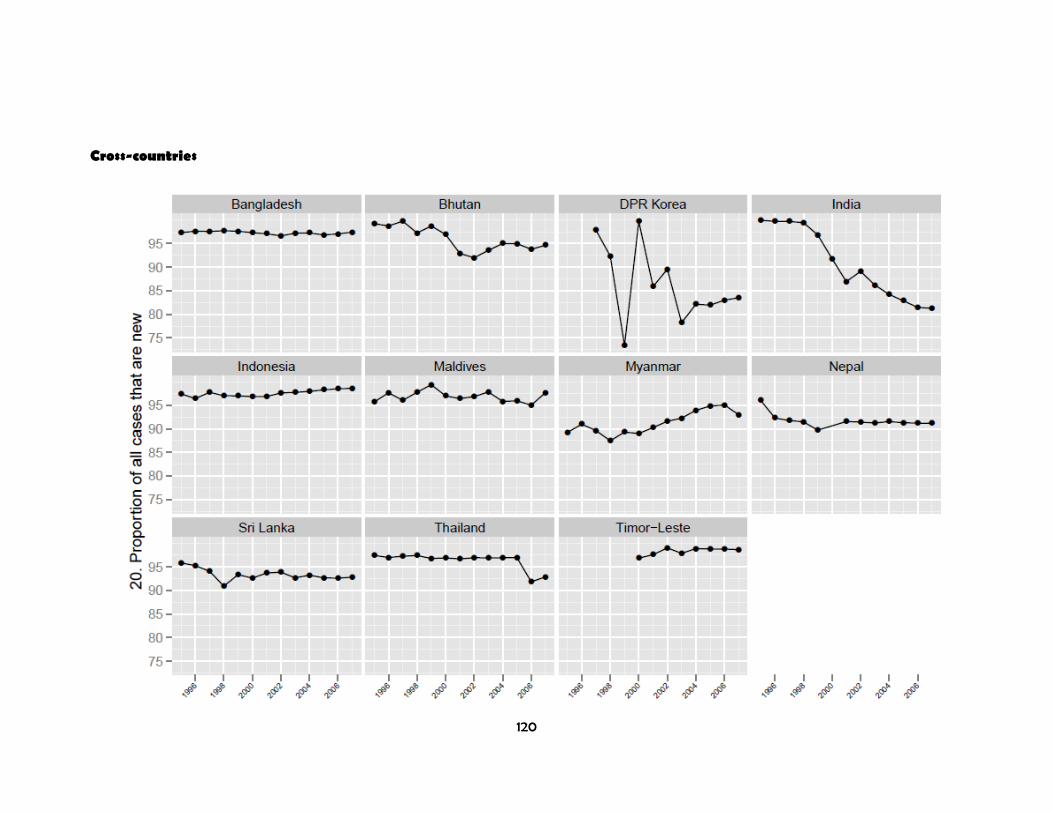
120
Cross-countries

121
Cross-countries

122
Cross-countries

123
Cross-countries
Related Documents