MONTHLY FACTSHEET all data as at 31 October 2021 unless otherwise indicated TB EVENLODE GLOBAL INCOME MANAGER COMMENTARY October was another strong month for equity markets with the benchmark MSCI World index up 3.9% (source: FE Analytics, Total Return Terms, GBP). As has been the case for some time now, the main driver for the market was the information technology sector, responsible for about a third of the market’s return (source: FactSet). It was joined by the consumer discretionary sector where about a quarter of the market’s return was created by Tesla’s continued rise. The fund was in marginally positive territory in the month (+0.3%, Total Return Terms, GBP), with a contribution from the IT sector in line with the market’s offset by the underperformance of the consumer goods sector. Many companies released their third quarter results during the month, and input cost inflation is a consistent theme across many different industries. Consumer packaged goods firms have felt the effects most markedly, as all of their key input costs of raw materials, packaging and transportation have seen price rises, well into the double digits in some cases. Some such as Clorox and Reckitt have also seen demand for their hygiene products reduce from the high levels seen at the height of the pandemic in 2020. Something we like about this sector is its ability to price its products to keep up with inflation through time, and many have already started on this journey. PepsiCo for example grew its revenues by 9% in the third quarter compared to the same period in 2020, of which 4 percentage points was from selling more products, and 5 from pricing them higher. Nonetheless, the process of passing prices on to consumers takes time, and these companies are seeing short-term impact on their margins. The resulting uncertainty is creating a valuation opportunity in our view, hence the fund’s increased exposure to consumer goods companies this year. Past performance is not a reliable indicator of future results. All performance data used on this factsheet is total return, bid-to-bid, and sourced from Financial Express and MSCI. 1. From launch date: 20 November 2017. 2. TB Evenlode Global Income B Acc GBP shares. 3. Comparator Benchmark is MSCI World (with net dividends reinvested) in GBP. 4. The historic yield reflects distributions over the past 12 months as a percentage of the price of the B Inc GBP share class as at the date shown. It does not include any initial charge and investors may be subject to tax on their distributions. 5. Active share is calculated against the fund’s Comparator Benchmark, the MSCI World. FUND ATTRIBUTES Emphasis on sustainable real dividend growth Focus on companies with high returns on capital and strong free cash-flow Aims to provide income and capital growth over rolling periods of 5 years Focused portfolio of 30-50 high quality dividend paying global equities Low portfolio turnover with long-term holding periods Invests across the world in companies with diverse multi-national revenue streams KEY DETAILS Sector IA Global Equity Income Comparator Benchmark MSCI World Launch date 20 November 2017 Fund size £1,387 million No. of Holdings 37 Historic yield 4 2.0% Active share 5 90.4% Valuation point 12 noon daily Div ex dates 1 Mar, Jun, Sep, Dec Div pay dates end Apr, Jul, Oct, Jan Currency availability GBP, EUR, USD CUMULATIVE PERFORMANCE 1 Mths 3 Mths 6 Mths 1 Yr 3 Yrs Launch 1 Fund (%) 2 0.3 1.3 6.3 25.0 43.4 51.8 Benchmark (%) 3 3.9 5.3 9.9 32.5 54.0 61.5 IA Sector (%) 1.2 2.4 5.0 27.2 32.5 32.9 Rank in sector 42/53 40/53 17/53 34/52 12/47 8/46 Quartile 4 3 2 3 1 1 CALENDAR YEAR PERFORMANCE (%) YTD 2020 2019 2018 2017 2016 Fund 2 14.6 3.5 24.3 1.8 - - Benchmark 3 19.1 12.3 22.7 -3.0 - - IA Sector 13.2 3.3 18.6 -5.8 - - Oct 18 Oct 19 Oct 20 Oct 21 -20 -10 0 10 20 30 40 50 60 70 PERFORMANCE SINCE LAUNCH (%)

Welcome message from author
This document is posted to help you gain knowledge. Please leave a comment to let me know what you think about it! Share it to your friends and learn new things together.
Transcript
MONTHLY FACTSHEET all data as at 31 October 2021 unless otherwise indicated
TB EVENLODE GLOBAL INCOME
MANAGER COMMENTARYOctober was another strong month for equity markets with the benchmark MSCI World index up 3.9% (source: FE Analytics, Total Return Terms, GBP). As has been the case for some time now, the main driver for the market was the information technology sector, responsible for about a third of the market’s return (source: FactSet). It was joined by the consumer discretionary sector where about a quarter of the market’s return was created by Tesla’s continued rise. The fund was in marginally positive territory in the month (+0.3%, Total Return Terms, GBP), with a contribution from the IT sector in line with the market’s offset by the underperformance of the consumer goods sector.Many companies released their third quarter results during the month, and input cost inflation is a consistent theme across many different industries. Consumer packaged goods firms have felt the effects most markedly, as all of their key input costs of raw materials, packaging and transportation have seen price rises, well into the double digits in some cases. Some such as Clorox and Reckitt have also seen demand for their hygiene products reduce from the high levels seen at the height of the pandemic in 2020. Something we like about this sector is its ability to price its products to keep up with inflation through time, and many have already started on this journey. PepsiCo for example grew its revenues by 9% in the third quarter compared to the same period in 2020, of which 4 percentage points was from selling more products, and 5 from pricing them higher. Nonetheless, the process of passing prices on to consumers takes time, and these companies are seeing short-term impact on their margins. The resulting uncertainty is creating a valuation opportunity in our view, hence the fund’s increased exposure to consumer goods companies this year.
Past performance is not a reliable indicator of future results. All performance data used on this factsheet is total return, bid-to-bid, and sourced from Financial Express and MSCI.1. From launch date: 20 November 2017. 2. TB Evenlode Global Income B Acc GBP shares. 3. Comparator Benchmark is MSCI World (with net dividends reinvested) in GBP. 4. The historic yield reflects distributions over the past 12 months as a percentage of the price of the B Inc GBP share class as at the date shown. It does not include any initial charge and investors may be subject to tax on their distributions.5. Active share is calculated against the fund’s Comparator Benchmark, the MSCI World.
FUND ATTRIBUTESEmphasis on sustainable real dividend growth
Focus on companies with high returns on capital and strong free cash-flow
Aims to provide income and capital growth over rolling periods of 5 years
Focused portfolio of 30-50 high quality dividend paying global equities
Low portfolio turnover with long-term holding periods
Invests across the world in companies with diverse multi-national revenue streams
KEY DETAILS
Sector IA Global Equity Income
Comparator Benchmark MSCI World
Launch date 20 November 2017
Fund size £1,387 million
No. of Holdings 37
Historic yield4 2.0%
Active share5 90.4%
Valuation point 12 noon daily
Div ex dates 1 Mar, Jun, Sep, Dec
Div pay dates end Apr, Jul, Oct, Jan
Currency availability
GBP, EUR, USD
CUMULATIVE PERFORMANCE
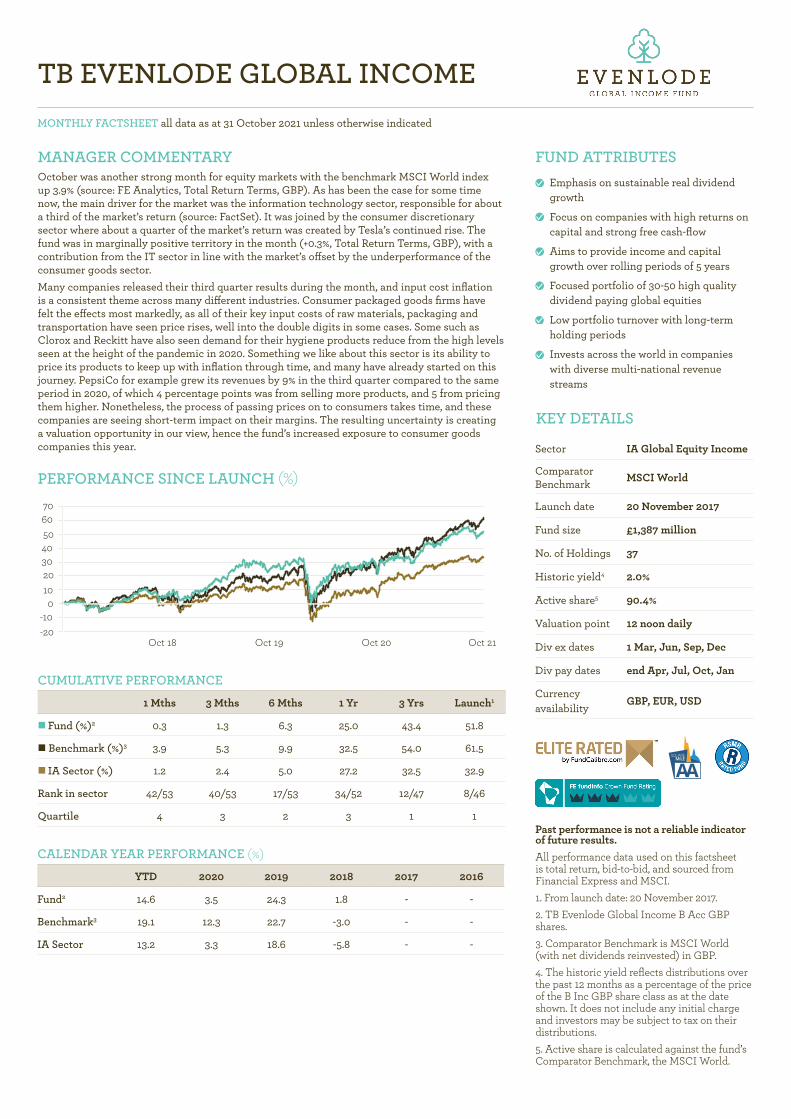
1 Mths 3 Mths 6 Mths 1 Yr 3 Yrs Launch1
Fund (%)2 0.3 1.3 6.3 25.0 43.4 51.8
Benchmark (%)3 3.9 5.3 9.9 32.5 54.0 61.5
IA Sector (%) 1.2 2.4 5.0 27.2 32.5 32.9
Rank in sector 42/53 40/53 17/53 34/52 12/47 8/46
Quartile 4 3 2 3 1 1
CALENDAR YEAR PERFORMANCE (%)
YTD 2020 2019 2018 2017 2016
Fund2 14.6 3.5 24.3 1.8 - -
Benchmark3 19.1 12.3 22.7 -3.0 - -
IA Sector 13.2 3.3 18.6 -5.8 - -
Oct 18 Oct 19 Oct 20 Oct 21-20-10
010203040506070
PERFORMANCE SINCE LAUNCH (%)
PAGE 2
TB Evenlode Global Income
MONTHLY FACTSHEET all data as at 31 October 2021 unless otherwise indicated
PORTFOLIO
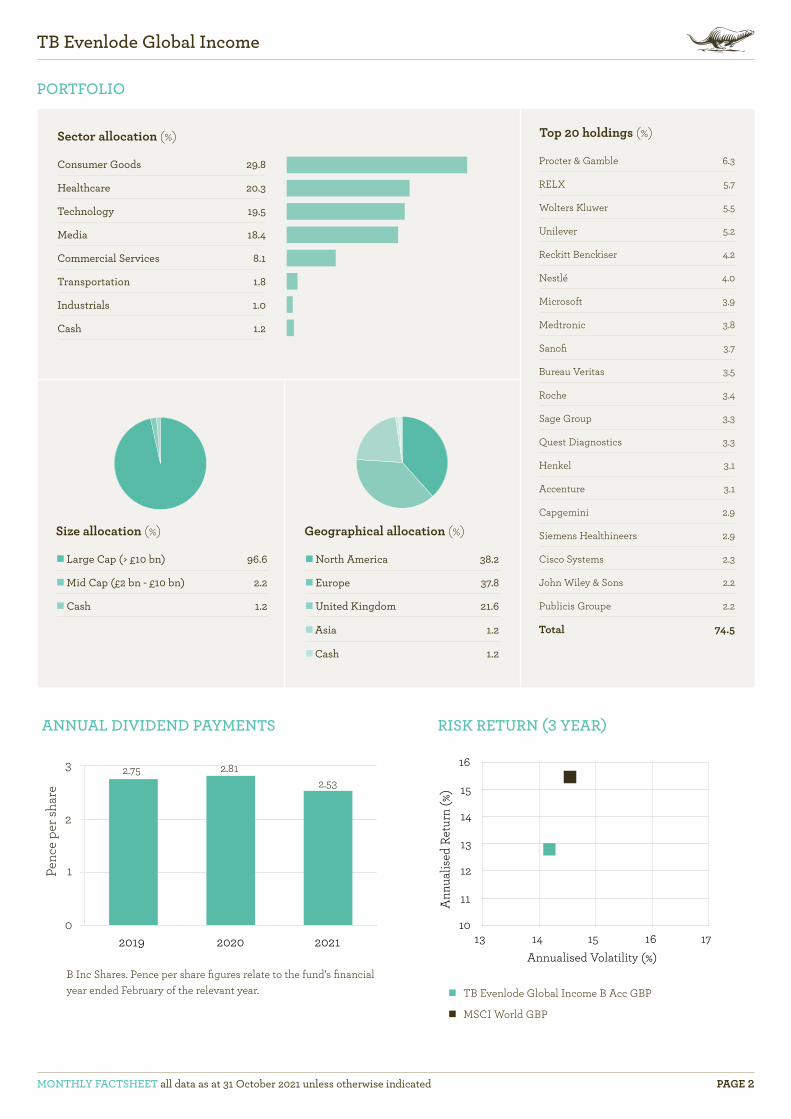
Top 20 holdings (%)
Procter & Gamble 6.3
RELX 5.7
Wolters Kluwer 5.5
Unilever 5.2
Reckitt Benckiser 4.2
Nestlé 4.0
Microsoft 3.9
Medtronic 3.8
Sanofi 3.7
Bureau Veritas 3.5
Roche 3.4
Sage Group 3.3
Quest Diagnostics 3.3
Henkel 3.1
Accenture 3.1
Capgemini 2.9
Siemens Healthineers 2.9
Cisco Systems 2.3
John Wiley & Sons 2.2
Publicis Groupe 2.2
Total 74.5
Sector allocation (%)
Consumer Goods 29.8
Healthcare 20.3
Technology 19.5
Media 18.4
Commercial Services 8.1
Transportation 1.8
Industrials 1.0
Cash 1.2
Size allocation (%)
Large Cap (> £10 bn) 96.6
Mid Cap (£2 bn - £10 bn) 2.2
Cash 1.2
Geographical allocation (%)
North America 38.2
Europe 37.8
United Kingdom 21.6
Asia 1.2
Cash 1.2
B
10
11
12
13
14
15
16
13 14 15 16 17
Ann
ualis
ed R
etur
n (%
)
Annualised Volatility (%)
TB Evenlode Global Income B Acc GBP
MSCI World GBP
RISK RETURN (3 YEAR)ANNUAL DIVIDEND PAYMENTS
2019 2020 20210
1
2
3
Penc
e pe
r sha
re
2.75 2.812.53
B Inc Shares. Pence per share figures relate to the fund’s financial year ended February of the relevant year.
TB Evenlode Global Income
MONTHLY FACTSHEET all data as at 31 October 2021 unless otherwise indicated PAGE 3
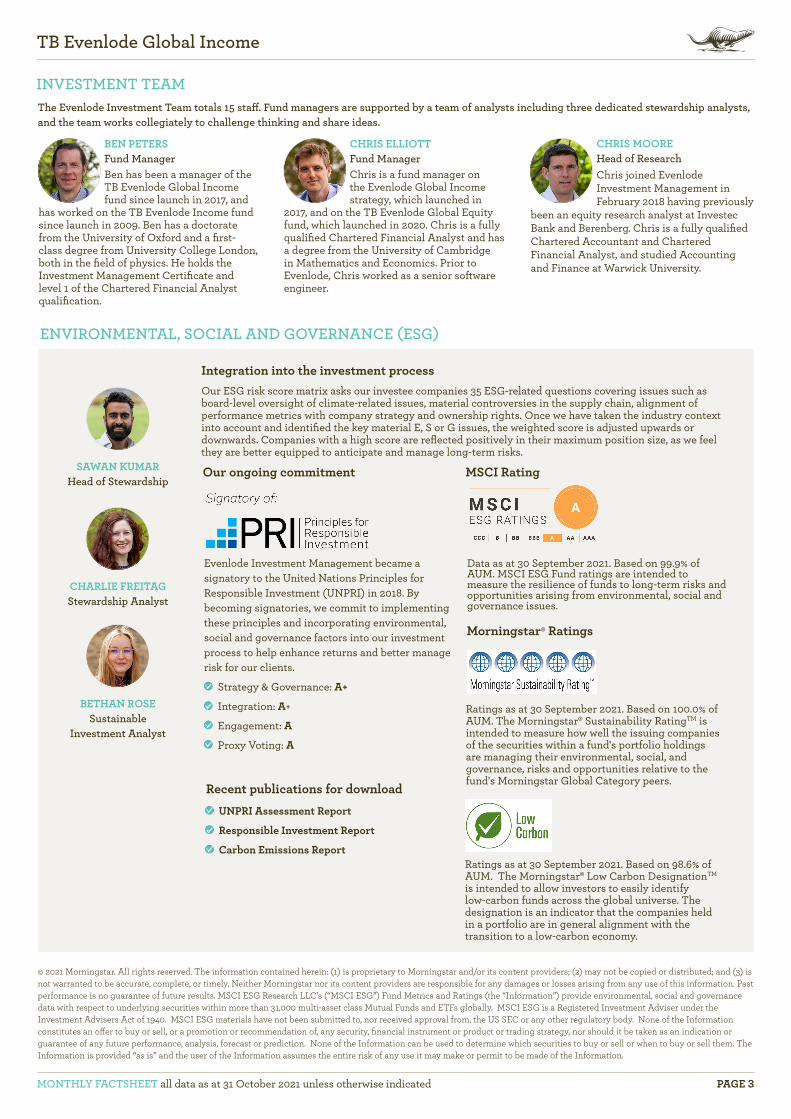
INVESTMENT TEAMThe Evenlode Investment Team totals 15 staff. Fund managers are supported by a team of analysts including three dedicated stewardship analysts, and the team works collegiately to challenge thinking and share ideas.
CHRIS ELLIOTTFund ManagerChris is a fund manager on the Evenlode Global Income strategy, which launched in
2017, and on the TB Evenlode Global Equity fund, which launched in 2020. Chris is a fully qualified Chartered Financial Analyst and has a degree from the University of Cambridge in Mathematics and Economics. Prior to Evenlode, Chris worked as a senior software engineer.
CHRIS MOOREHead of ResearchChris joined Evenlode Investment Management in February 2018 having previously
been an equity research analyst at Investec Bank and Berenberg. Chris is a fully qualified Chartered Accountant and Chartered Financial Analyst, and studied Accounting and Finance at Warwick University.
BEN PETERSFund ManagerBen has been a manager of the TB Evenlode Global Income fund since launch in 2017, and
has worked on the TB Evenlode Income fund since launch in 2009. Ben has a doctorate from the University of Oxford and a first-class degree from University College London, both in the field of physics. He holds the Investment Management Certificate and level 1 of the Chartered Financial Analyst qualification.
© 2021 Morningstar. All rights reserved. The information contained herein: (1) is proprietary to Morningstar and/or its content providers; (2) may not be copied or distributed; and (3) is not warranted to be accurate, complete, or timely. Neither Morningstar nor its content providers are responsible for any damages or losses arising from any use of this information. Past performance is no guarantee of future results. MSCI ESG Research LLC’s (“MSCI ESG”) Fund Metrics and Ratings (the “Information”) provide environmental, social and governance data with respect to underlying securities within more than 31,000 multi-asset class Mutual Funds and ETFs globally. MSCI ESG is a Registered Investment Adviser under the Investment Advisers Act of 1940. MSCI ESG materials have not been submitted to, nor received approval from, the US SEC or any other regulatory body. None of the Information constitutes an offer to buy or sell, or a promotion or recommendation of, any security, financial instrument or product or trading strategy, nor should it be taken as an indication or guarantee of any future performance, analysis, forecast or prediction. None of the Information can be used to determine which securities to buy or sell or when to buy or sell them. The Information is provided “as is” and the user of the Information assumes the entire risk of any use it may make or permit to be made of the Information.
ENVIRONMENTAL, SOCIAL AND GOVERNANCE (ESG)
Our ongoing commitment
Evenlode Investment Management became a signatory to the United Nations Principles for Responsible Investment (UNPRI) in 2018. By becoming signatories, we commit to implementing these principles and incorporating environmental, social and governance factors into our investment process to help enhance returns and better manage risk for our clients.
Strategy & Governance: A+
Integration: A+
Engagement: A
Proxy Voting: A
Data as at 30 September 2021. Based on 99.9% of AUM. MSCI ESG Fund ratings are intended to measure the resilience of funds to long-term risks and opportunities arising from environmental, social and governance issues.
MSCI Rating
Recent publications for download UNPRI Assessment Report
Responsible Investment Report
Carbon Emissions ReportRatings as at 30 September 2021. Based on 98.6% of AUM. The Morningstar® Low Carbon DesignationTM
is intended to allow investors to easily identify low-carbon funds across the global universe. The designation is an indicator that the companies held in a portfolio are in general alignment with the transition to a low-carbon economy.
Ratings as at 30 September 2021. Based on 100.0% of AUM. The Morningstar® Sustainability RatingTM is intended to measure how well the issuing companies of the securities within a fund's portfolio holdings are managing their environmental, social, and governance, risks and opportunities relative to the fund's Morningstar Global Category peers.
Morningstar® Ratings
Integration into the investment processOur ESG risk score matrix asks our investee companies 35 ESG-related questions covering issues such as board-level oversight of climate-related issues, material controversies in the supply chain, alignment of performance metrics with company strategy and ownership rights. Once we have taken the industry context into account and identified the key material E, S or G issues, the weighted score is adjusted upwards or downwards. Companies with a high score are reflected positively in their maximum position size, as we feel they are better equipped to anticipate and manage long-term risks.
SAWAN KUMARHead of Stewardship
CHARLIE FREITAGStewardship Analyst
BETHAN ROSESustainable
Investment Analyst
TB Evenlode Global Income
MONTHLY FACTSHEET all data as at 31 October 2021 unless otherwise indicated PAGE 4
This Factsheet has been produced by Evenlode Investment Management Limited. TB Evenlode Global Income is a sub-fund of the TB Evenlode Investment Funds ICVC. Full details of the TB Evenlode Investment Funds, including risk warnings, are published in the TB Evenlode Investment Funds Prospectus, the TB Evenlode Investment Funds Supplementary Information Document (SID) and the TB Evenlode Investment Funds Key Investor Information Documents (KIIDs) which are available on request and at www.evenlodeinvestment.com. The TB Evenlode Investment Funds are subject to normal stock market fluctuations and other risks inherent in such investments. The value of your investment and the income derived from it can go down as well as up, and you may not get back the money you invested, you should therefore regard your investment as long term. As a focused portfolio of typically less than 40 investments, TB Evenlode Global Income carries more risk than a fund spread over a large number of stocks. The fund has the ability to invest in derivatives for the purposes of EPM, which may restrict gains in a rising market. Investments in overseas equities may be affected by changes in exchange rates, which could cause the value of your investment to increase or diminish. Every effort is taken to ensure the accuracy of the data used in this document but no warranties are given. Evenlode Investment Management Limited is authorised and regulated by the Financial Conduct Authority, No. 767844. T. Bailey Fund Services Limited is authorised and regulated by the Financial Conduct Authority, No. 190293.The MSCI information may only be used for your internal use, may not be reproduced or redisseminated in any form and may not be used as a basis for or a component of any financial instruments or products or indices. None of the MSCI information is intended to constitute investment advice or a recommendation to make (or refrain from making) any kind of investment decision and may not be relied on as such. Historical data and analysis should not be taken as an indication or guarantee of any future performance analysis, forecast or prediction. The MSCI information is provided on an “as is” basis and the user of this information assumes the entire risk of any use made of this information. MSCI, each of its affiliates and each other person involved in or related to compiling, computing or creating any MSCI information (collectively, the “MSCI Parties”) expressly disclaims all warranties (including, without limitation, any warranties of originality, accuracy, completeness, timeliness, non-infringement, merchantability and fitness for a particular purpose) with respect to this information. Without limiting any of the foregoing, in no event shall any MSCI Party have any liability for any direct, indirect, special, incidental, punitive, consequential (including, without limitation, lost profits) or any other damages. (www.msci.com).
IMPORTANT INFORMATION
How to Invest
TB Evenlode Global Income is available as an OEIC and is also suitable to include in stocks and shares ISAs and SIPPs.
You can buy shares in the fund by visiting:www.tbaileyfs.co.uk/funds/ tb-evenlodeinvestment-funds
Or by telephoning the TB Evenlode Investor Dealing Line:
0115 988 8287(open business days between 9am and 5pm)
Or through various third parties including Aegon/Cofunds, Transact, Ascentric, Hargreaves Lansdown, Axa Winterthur, Axa Elevate and Standard Life.
Contact Evenlode
The Long BarnChalford Park BarnsOxford RoadChipping NortonOxfordshireOX7 5QRUnited Kingdom
01608 695200www.evenlodeinvestment.com
Authorised Corporate Director & Administrator:
T. Bailey Fund Services Ltd(www.tbaileyfs.co.uk/funds/tb-evenlode-investment-funds)
Please contact Spring Capital Partners, in the first instance. 020 3195 0076 [email protected]
SHARE CLASS DETAILSGBP shares EUR shares USD shares
Share class B ACC B INC C ACC C INC B ACC B INC C INC B ACC B INC
SEDOL codes BF1QMV6 BF1QNC4 BF1QNG8 BF1QNK2 BF1QN91 BF1QND5 BF1QNL3 BF1QNB3 BF1QNF7
Share price 151.75p 139.07p 152.15p 139.71p €1.59 €1.47 €1.45 $1.58 $1.38
Minimum lump sum £1,000 £1,000 £10 million £10 million €1,000 €1,000 €10 million $1,000 $1,000
Minimum regular savings £50 pm £50 pm N/A N/A N/A N/A N/A N/A N/A
Periodic charge (%)1 0.85 0.85 0.75 0.75 0.85 0.85 0.75 0.85 0.85
Ex ante transaction cost (%) 0.07 0.07 0.07 0.07 0.07 0.07 0.07 0.07 0.07
Latest distribution2 0.76 0.70 0.76 0.70 0.51 0.73 0.72 0.79 0.67
1. Equivalent to OCF. For full information on the periodic charge please refer to section 7.1 of the full Prospectus.2. Pence/share for GBP shares and cents/share for EUR/USD shares. XD date 1 September 2021. Latest distribution rate may be estimated.
WHAT ARE THE RISKS?As a focused equity portfolio of typically less than 40 investments, the fund can involve higher risk and higher volatility. The value of an investment and the income from it can fall as well as rise as a result of market and currency movement; you may not get back the amount originally invested. You should therefore regard your investment as long term. Details on the risk factors are included in the fund’s prospectus, available on our website.
INVESTOR PROFILEThe Fund may appeal to investors who:
Would like the prospect of sustainable real income growth combined with some capital growth over the long term
Accept the risk associated with the volatile nature of equity investments
Plan to hold their investment for at least 5 years
Related Documents


![Revsine FinancialReportingandAnalysis 7 Chap002 TB · Chap002 Accrual Accounting and Net income determination True/False [QUESTION] 1. Accrual accounting decouples measured earnings](https://static.cupdf.com/doc/110x72/5f08a5a27e708231d42309de/revsine-financialreportingandanalysis-7-chap002-tb-chap002-accrual-accounting-and.jpg)
