TB Elimination in California Can We Get There? Navigating the Landmines CTCA April 28, 2011 Jennifer Flood MD MPH Chief, Tuberculosis Control Branch California Department of Public Health [email protected]

TB Elimination in California Can We Get There? Navigating the Landmines CTCA April 28, 2011 Jennifer Flood MD MPH Chief, Tuberculosis Control Branch California.
Dec 24, 2015
Welcome message from author
This document is posted to help you gain knowledge. Please leave a comment to let me know what you think about it! Share it to your friends and learn new things together.
Transcript
TB Elimination in California
Can We Get There?Navigating the Landmines
CTCAApril 28, 2011
Jennifer Flood MD MPHChief, Tuberculosis Control Branch
California Department of Public [email protected]
2
Outline
• Is TB controlled?
• Who is involved in TB control?
• Where are the landmines?
• Way forward?
TB Case Trends
3
4
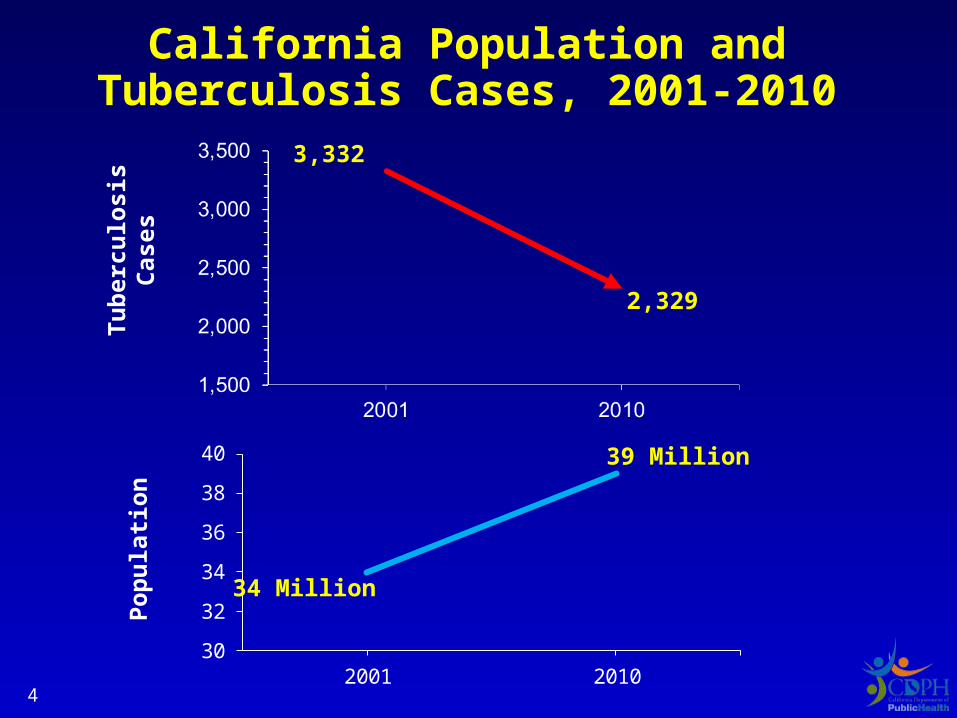
California Population andTuberculosis Cases, 2001-2010
Tu
ber
culo
sis
Cas
es
30
32
34
36
38
40
2001 2010
Po
pu
lati
on
3,332
2,329
34 Million
39 Million
5
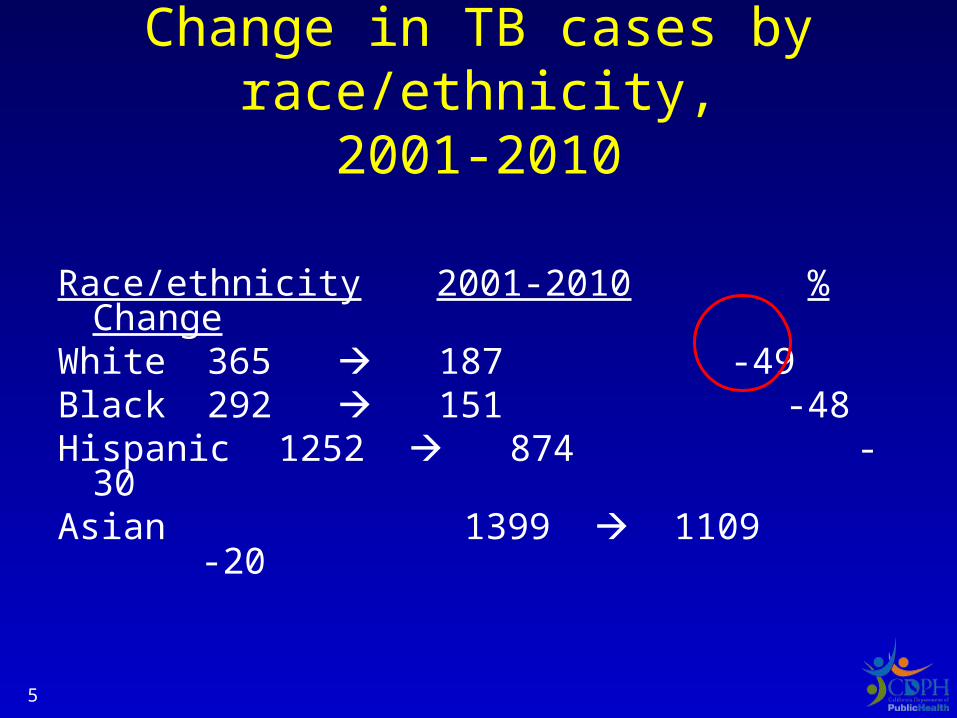
Change in TB cases by race/ethnicity,2001-2010
Race/ethnicity 2001-2010 % ChangeWhite 365 187 -49Black 292 151 -48Hispanic 1252 874 -30Asian 1399 1109 -20
6
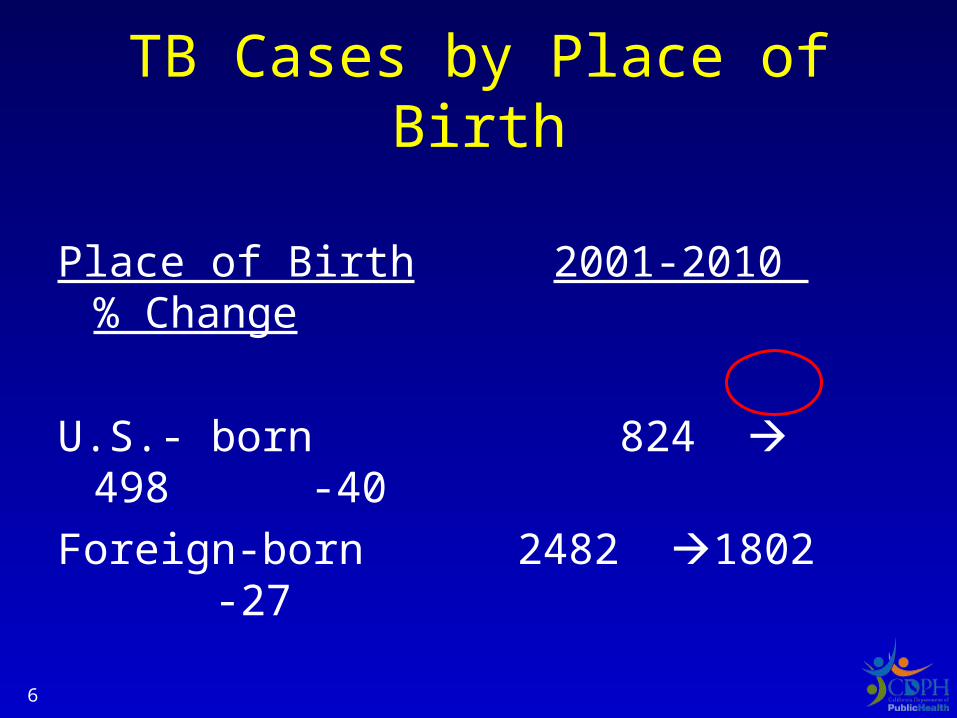
TB Cases by Place of Birth
Place of Birth 2001-2010 % Change
U.S.- born 824 498 -40
Foreign-born 2482 1802 -27
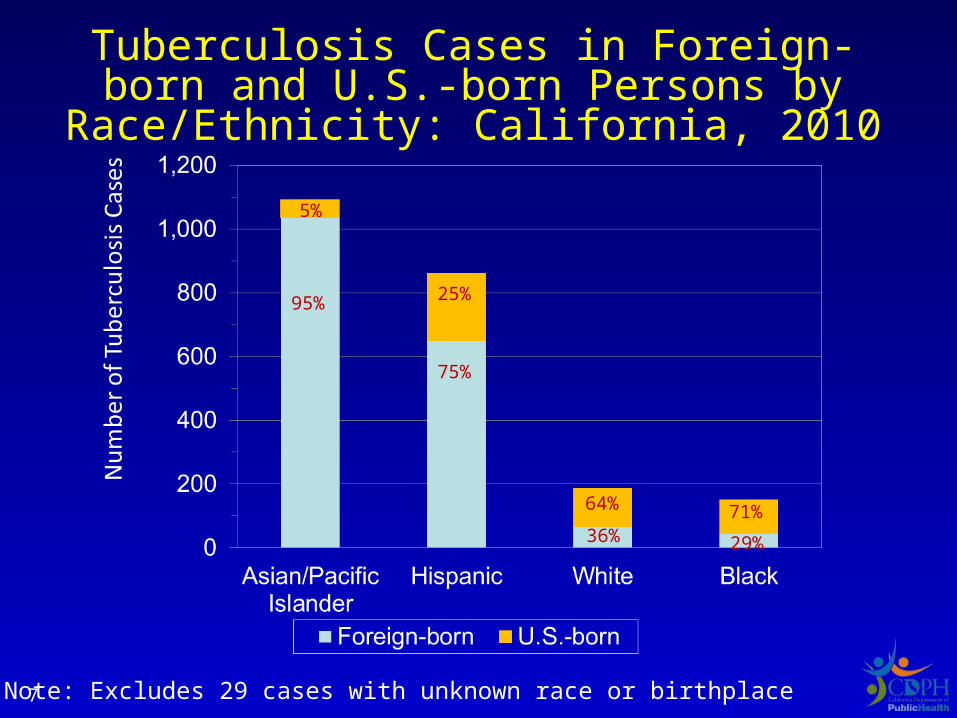
Tuberculosis Cases in Foreign-born and U.S.-born Persons by Race/Ethnicity:
California, 2010
Note: Excludes 29 cases with unknown race or birthplace
95%
5%
25%
75%
36%
64%
29%
71%
7
8
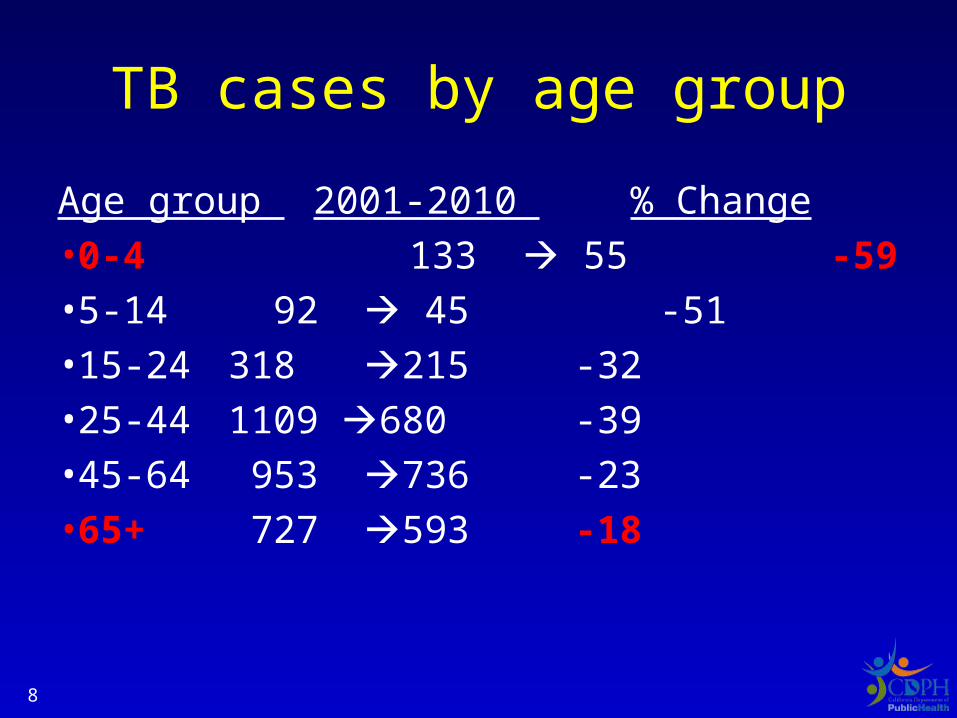
TB cases by age group
Age group 2001-2010 % Change
•0-4 133 55 -59
•5-14 92 45 -51
•15-24 318 215 -32
•25-44 1109 680 -39
•45-64 953 736 -23
•65+ 727 593 -18
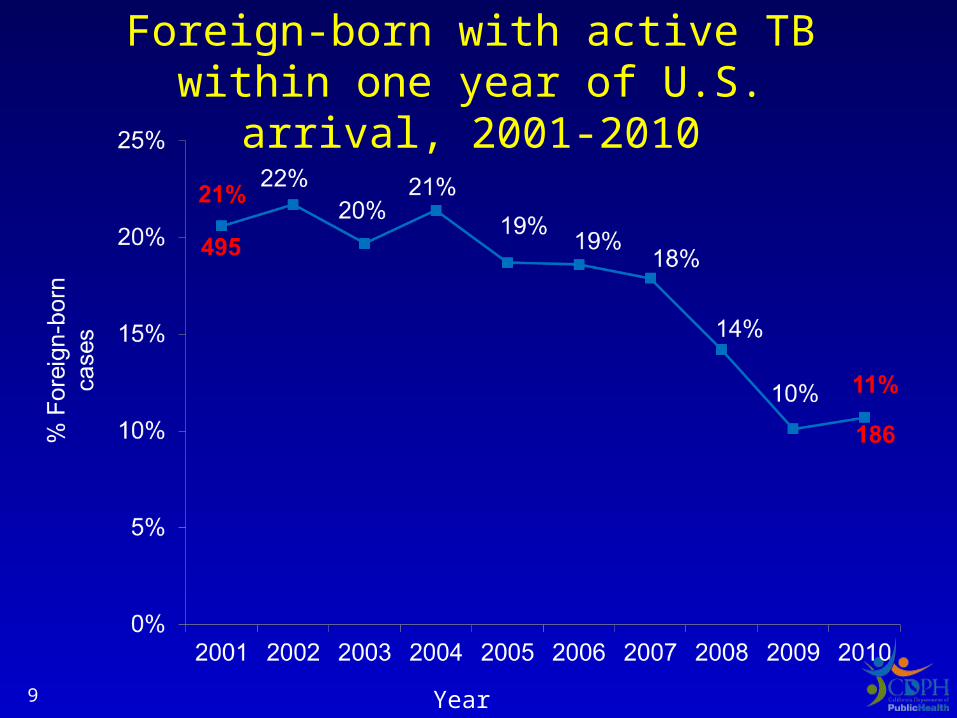
Foreign-born with active TB within one year of U.S. arrival, 2001-2010
Year9
Is TB controlled?
• Lowest case count in California history
• Success in – interrupting TB transmission and – TB disease importation
suggested by decline in:• pediatric cases • US born cases • new arrivers
10
TB Case Characteristics
11
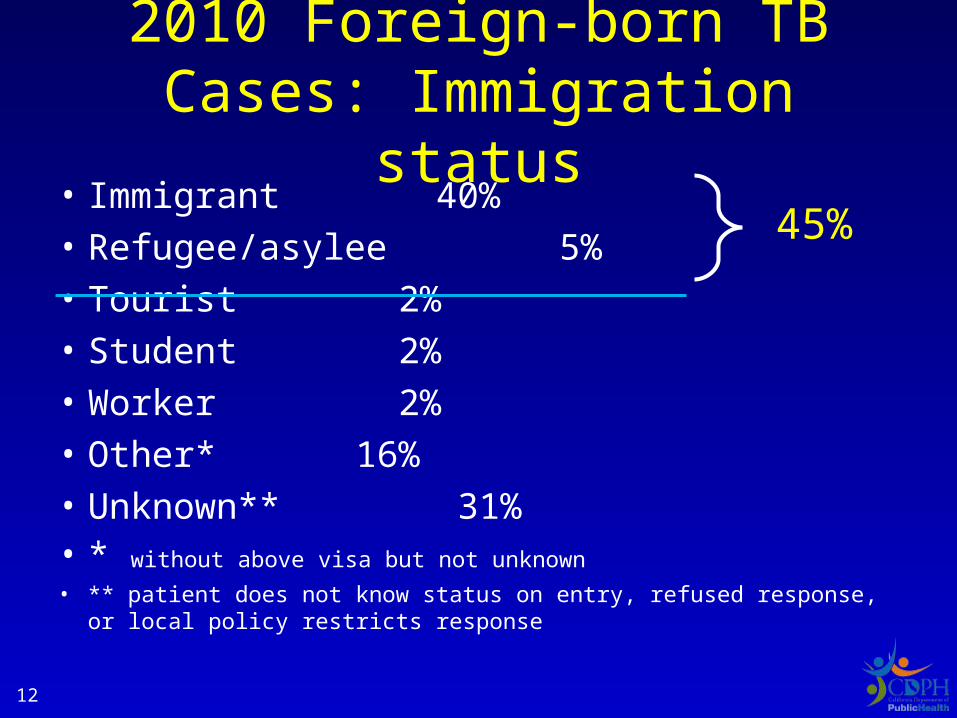
2010 Foreign-born TB Cases: Immigration status
• Immigrant 40%• Refugee/asylee 5%• Tourist 2%• Student 2%• Worker 2%• Other* 16%• Unknown** 31%• * without above visa but not unknown
• ** patient does not know status on entry, refused response, or local policy restricts response
12
45%
1313
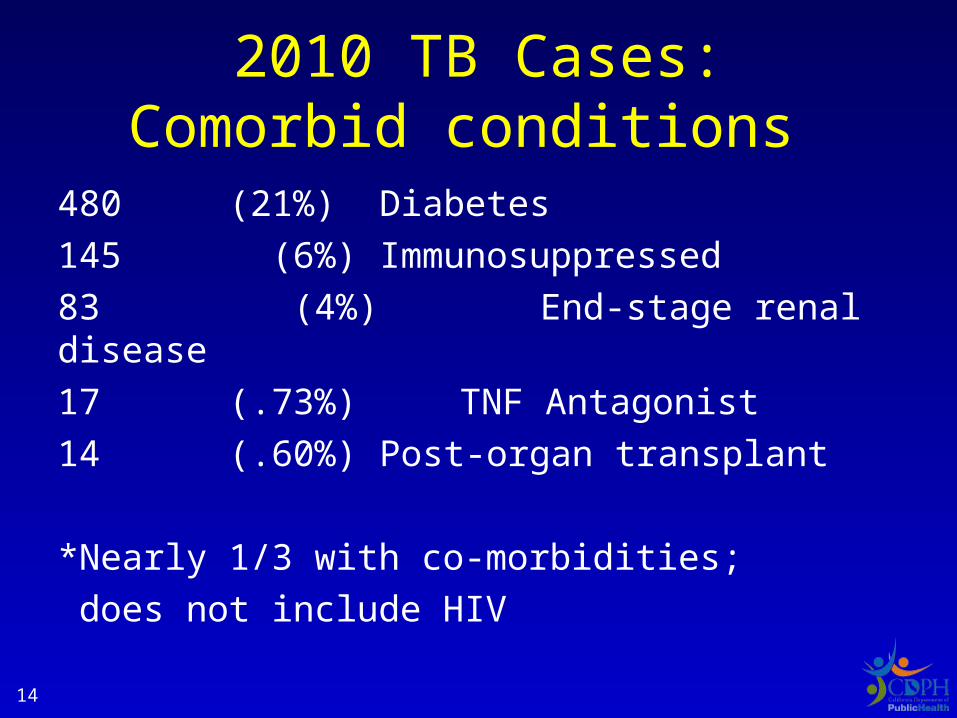
2010 TB Cases:Comorbid conditions
480 (21%) Diabetes
145 (6%) Immunosuppressed
83 (4%) End-stage renal disease
17 (.73%) TNF Antagonist
14 (.60%) Post-organ transplant
*Nearly 1/3 with co-morbidities;
does not include HIV 14
TB Diagnosis and Treatment
15
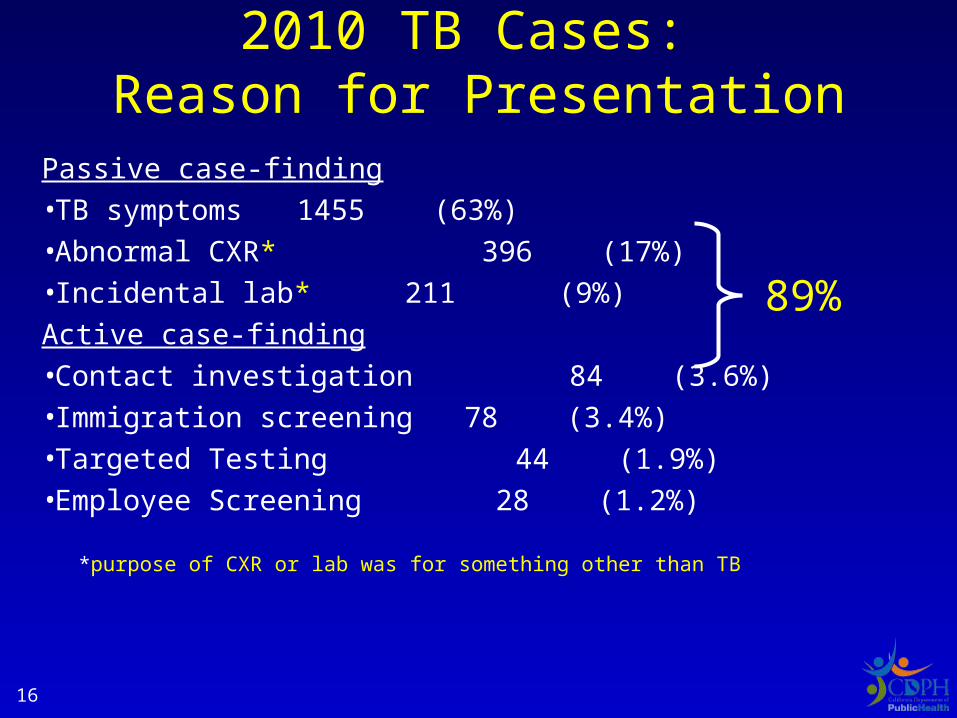
Passive case-finding•TB symptoms 1455 (63%)•Abnormal CXR* 396 (17%)•Incidental lab* 211 (9%)
Active case-finding•Contact investigation 84 (3.6%)•Immigration screening 78 (3.4%)•Targeted Testing 44 (1.9%)•Employee Screening 28 (1.2%)
*purpose of CXR or lab was for something other than TB
2010 TB Cases: Reason for Presentation
16
89%
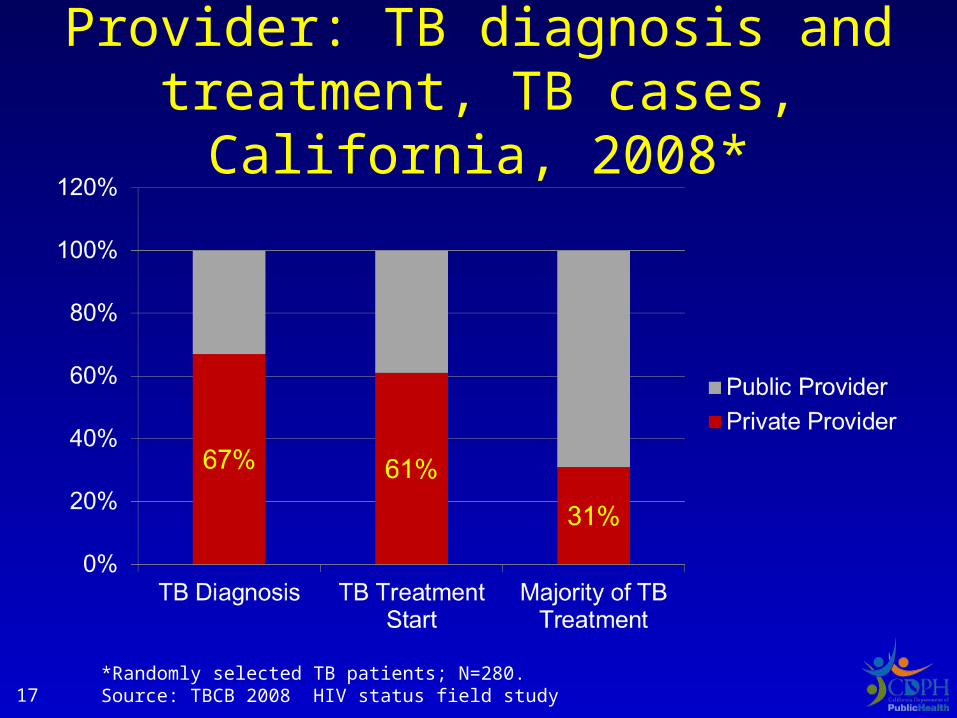
Provider: TB diagnosis and treatment, TB cases, California, 2008*
17*Randomly selected TB patients; N=280. Source: TBCB 2008 HIV status field study
What interventions are high impact?
Diagnosis
•Rapid MTB and drug resistance tests
•HIV test of TB patients
Treatment
•Effective TB treatment
•HAART
18
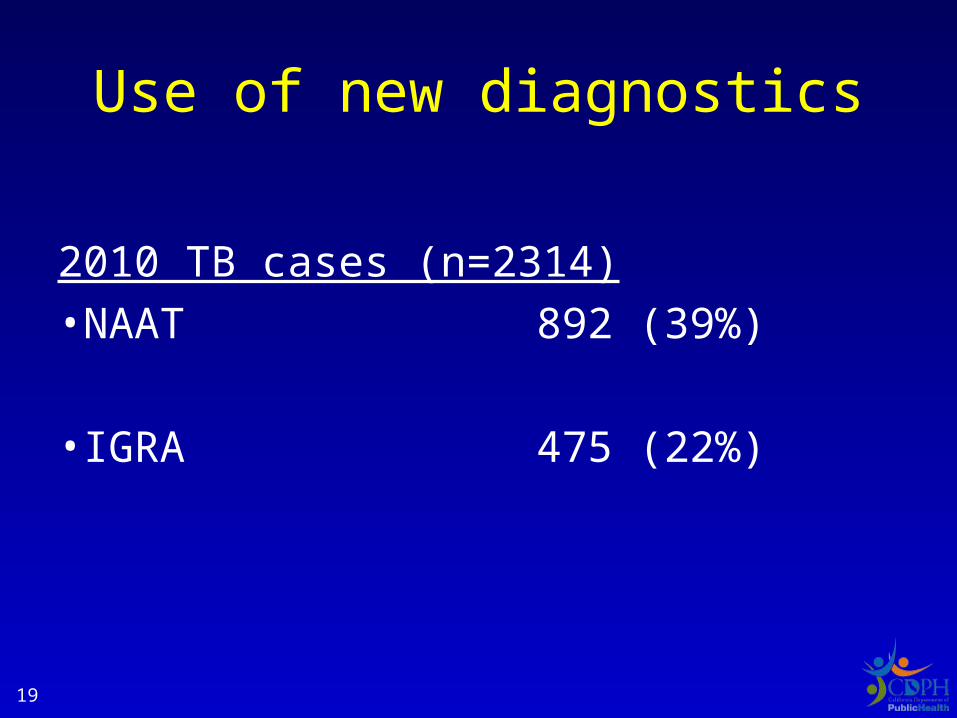
Use of new diagnostics
2010 TB cases (n=2314)
•NAAT 892 (39%)
•IGRA 475 (22%)
19
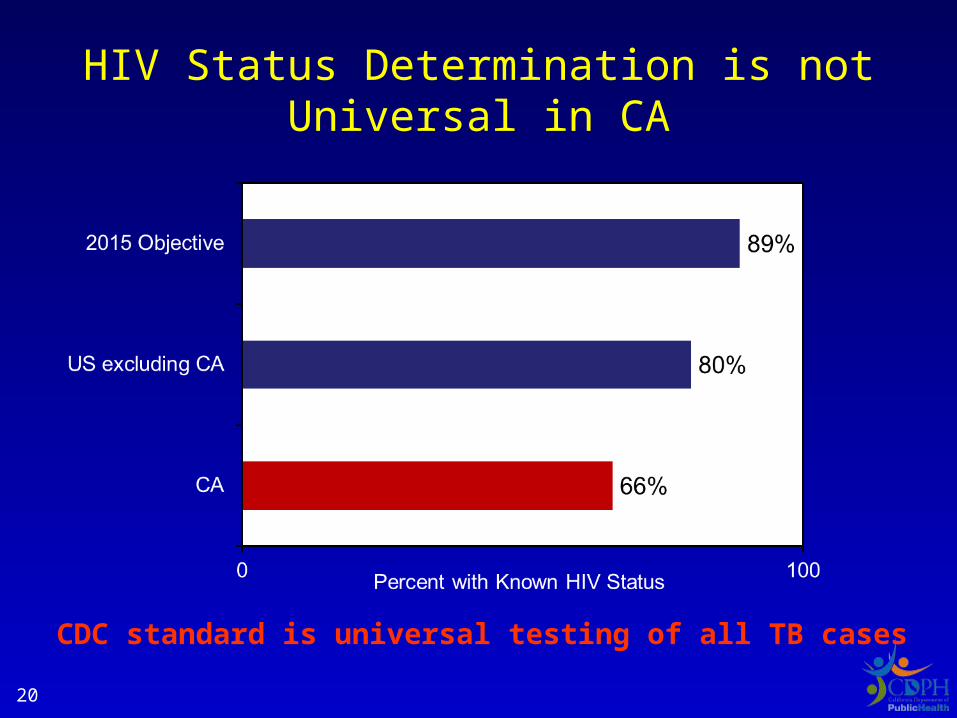
HIV Status Determination is not Universal in CA
CDC standard is universal testing of all TB cases20
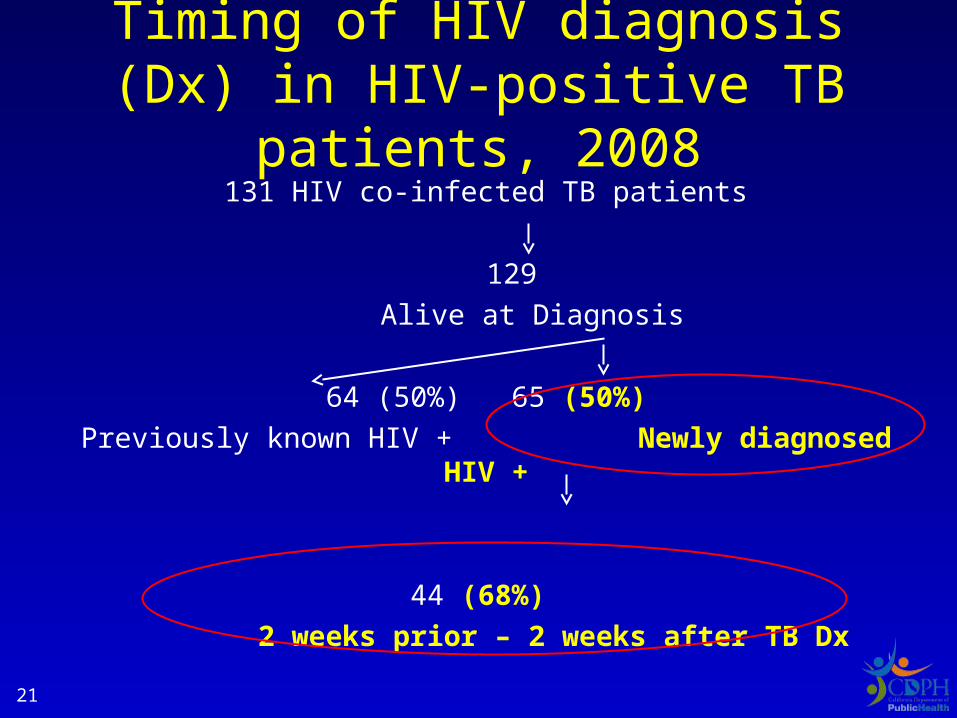
Timing of HIV diagnosis (Dx) in HIV-positive TB patients, 2008
131 HIV co-infected TB patients
129
Alive at Diagnosis
64 (50%) 65 (50%)
Previously known HIV + Newly diagnosed HIV +
44 (68%)
2 weeks prior – 2 weeks after TB Dx
21
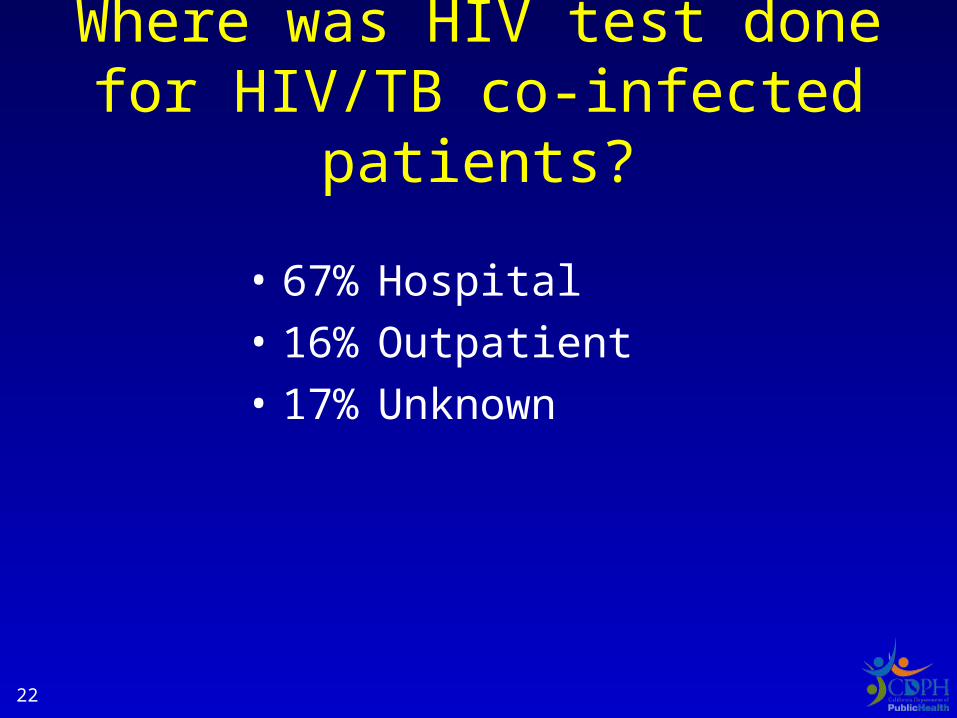
Where was HIV test done for HIV/TB co-infected patients?
• 67% Hospital
• 16% Outpatient
• 17% Unknown
22
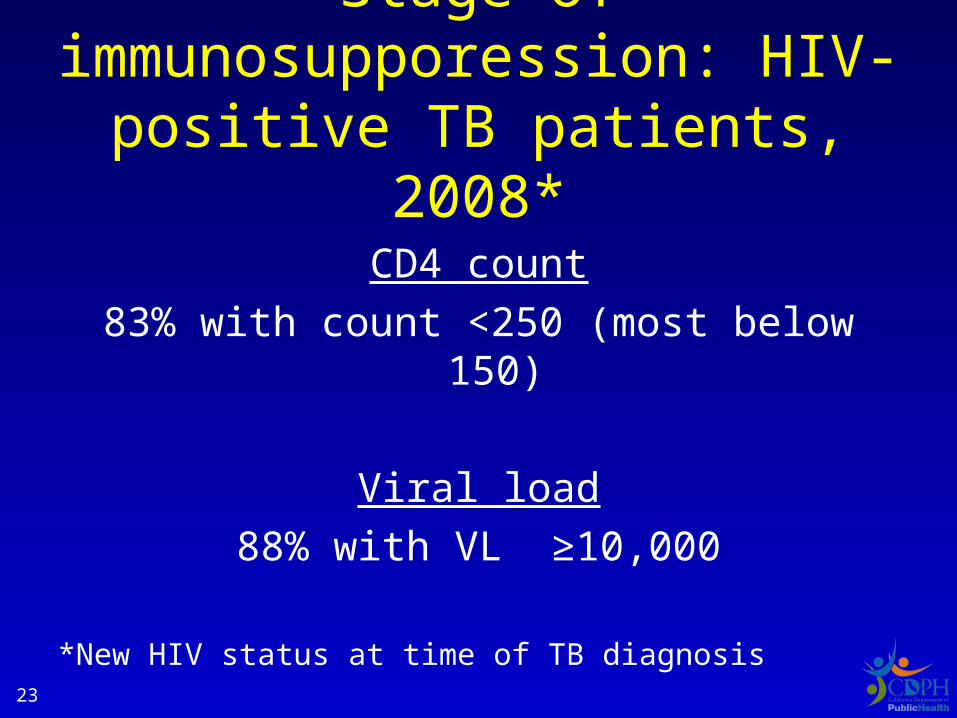
Stage of immunosupporession: HIV-positive TB patients, 2008*
CD4 count
83% with count <250 (most below 150)
Viral load
88% with VL ≥10,000
*New HIV status at time of TB diagnosis
23
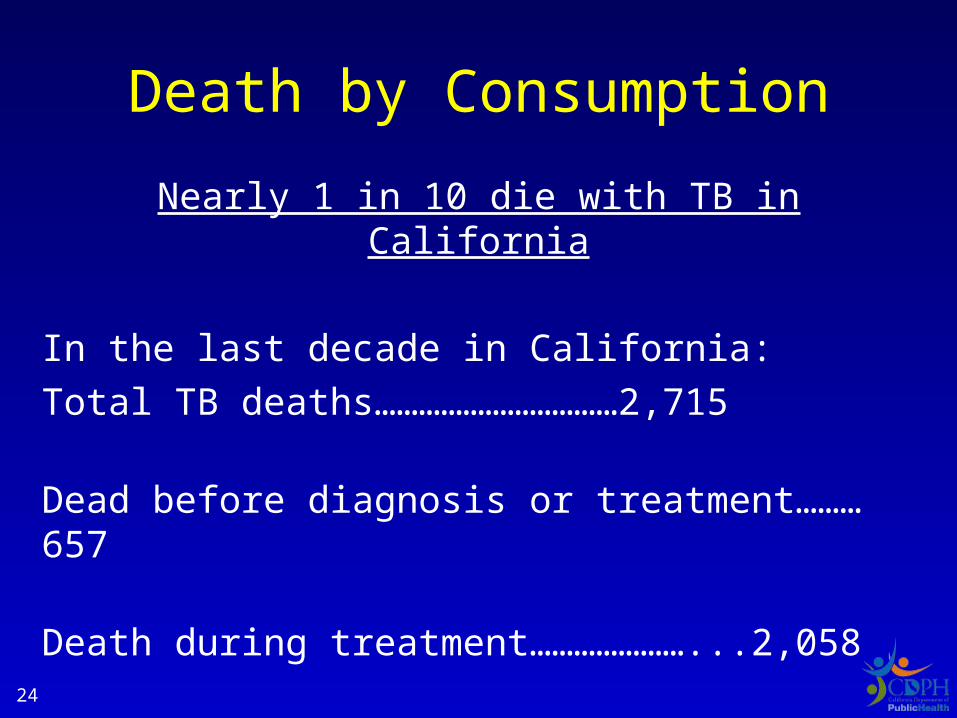
Death by Consumption
Nearly 1 in 10 die with TB in California
In the last decade in California:
Total TB deaths……………………………2,715
Dead before diagnosis or treatment………657
Death during treatment…………………...2,058
24
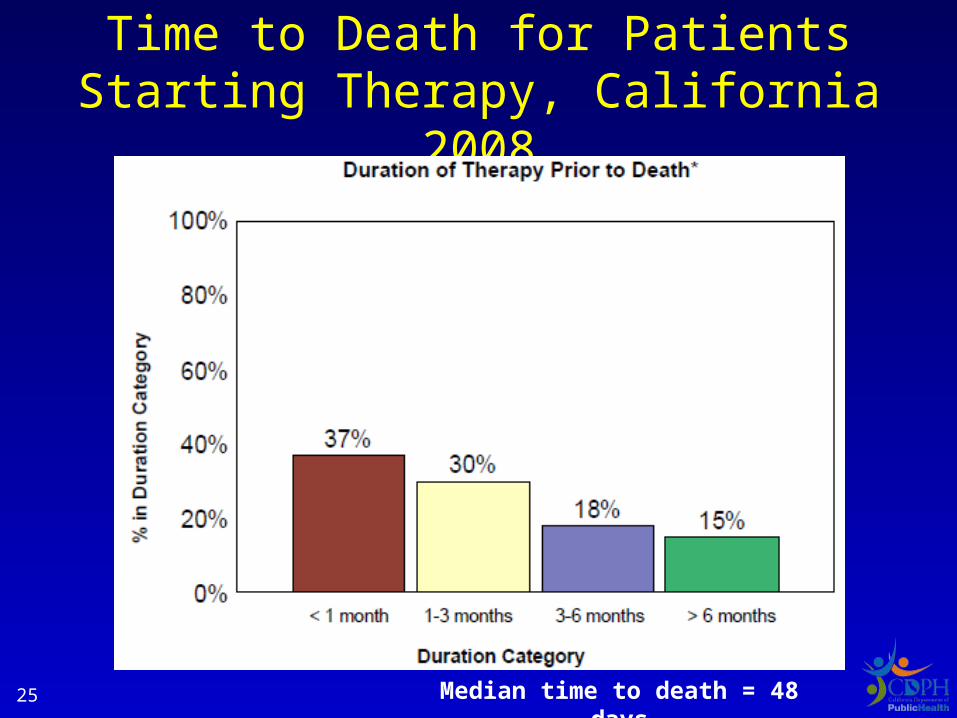
Time to Death for Patients Starting Therapy, California 2008
Median time to death = 48 days25
26
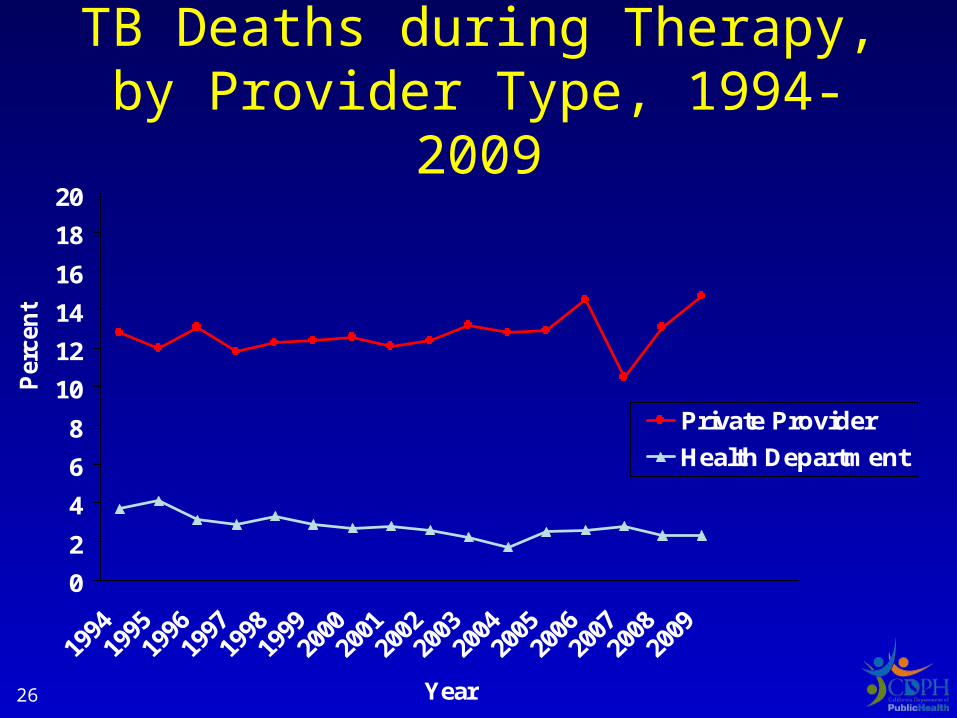
TB Deaths during Therapy, by Provider Type, 1994-2009
0
2
4
6
8
10
12
14
16
18
20
Year
Per
cen
t
Private Provider
Health Department
Why are TB deaths occurring?
27
Is TB a contributor to Death?
Preliminary Results: Mortality Study TBESC
•In 75%, TB contributed to death !
28
Who is diagnosing and treating TB in California?
• Private providers are most likely to diagnose TB and start TB treatment
• TB diagnosis often occurs in a hospital or emergency room
• Public providers provide the majority of care during treatment
29
Who are our cases?
• 40% of foreign-born underwent pre-departure screening
• A sizeable fraction with comorbid conditions
• Opportunity to prevent TB and
detect disease earlier
• TB deaths = compelling reason to intervene
30
Navigating Landmines
31
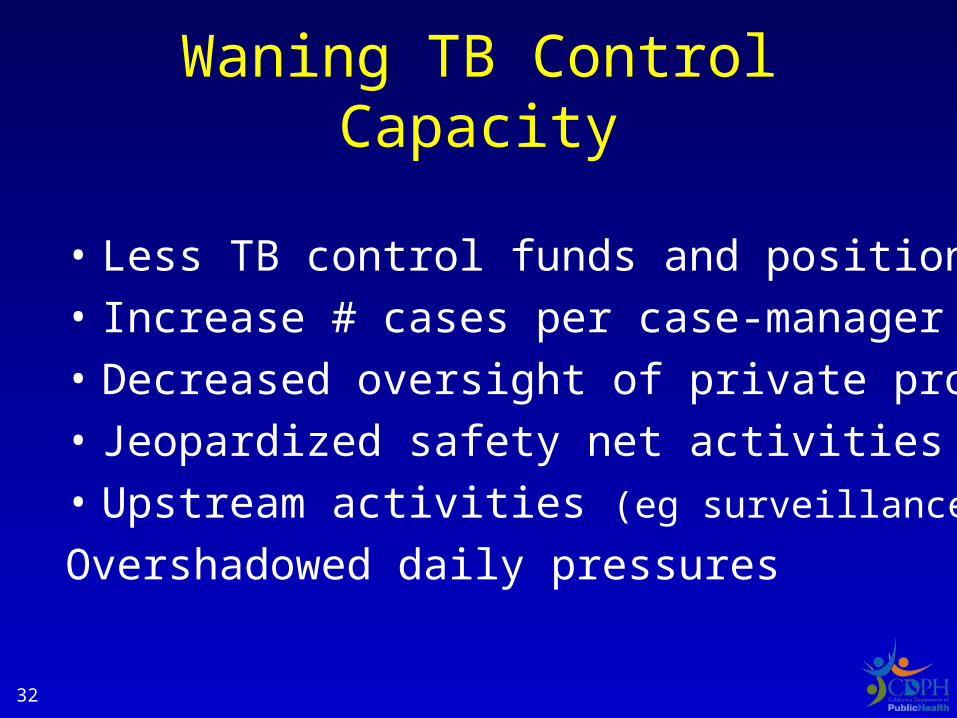
Waning TB Control Capacity
• Less TB control funds and positions
• Increase # cases per case-manager
• Decreased oversight of private providers
• Jeopardized safety net activities
• Upstream activities (eg surveillance, evaluation)
Overshadowed daily pressures
32
Too busy killing alligators to drain the swamp?
33
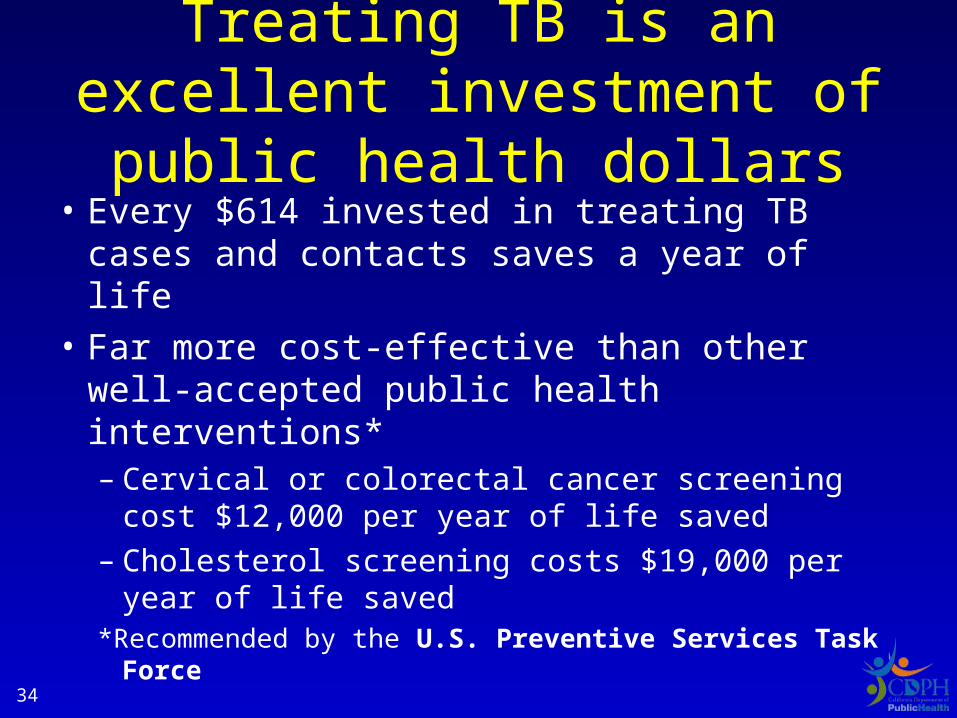
Treating TB is an excellent investment of public health dollars
• Every $614 invested in treating TB cases and contacts saves a year of life
• Far more cost-effective than other well-accepted public health interventions*– Cervical or colorectal cancer screening cost
$12,000 per year of life saved– Cholesterol screening costs $19,000 per year
of life saved*Recommended by the U.S. Preventive Services Task
Force34
Prevention:
Can we afford it?Can we afford not to do it?
35
36
Horsburgh CR Jr, Rubin EJ. Clinical Practice: Latent Tuberculosis Infection in the United States. NEJM 2011;364 (15):1441-8.
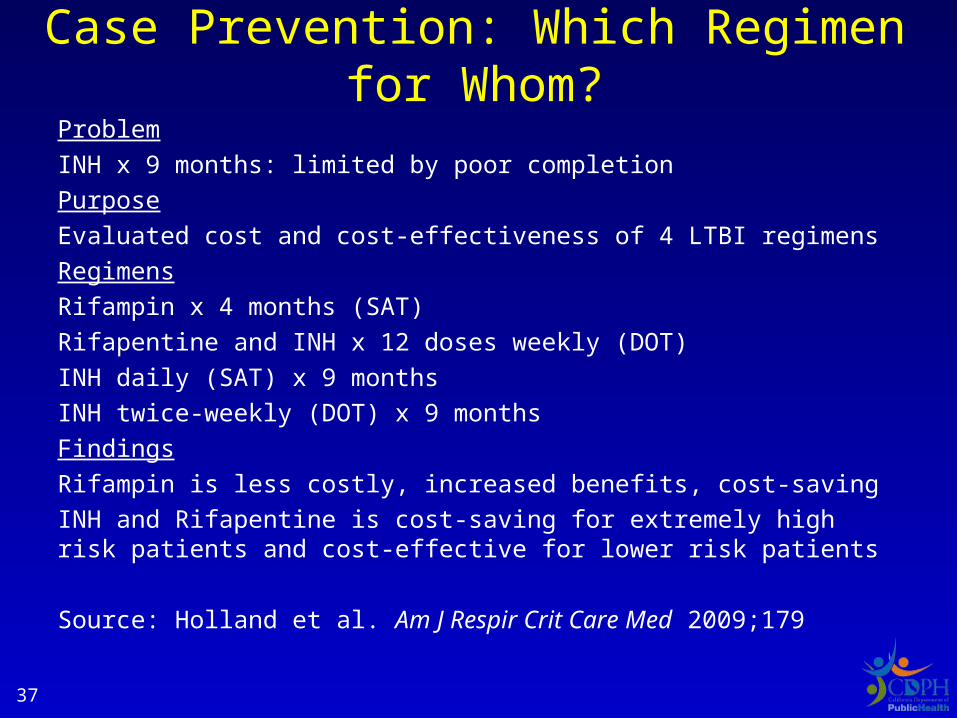
Case Prevention: Which Regimen for Whom?
Problem
INH x 9 months: limited by poor completion
Purpose
Evaluated cost and cost-effectiveness of 4 LTBI regimens
Regimens
Rifampin x 4 months (SAT)
Rifapentine and INH x 12 doses weekly (DOT)
INH daily (SAT) x 9 months
INH twice-weekly (DOT) x 9 months
Findings
Rifampin is less costly, increased benefits, cost-saving
INH and Rifapentine is cost-saving for extremely high risk patients and cost-effective for lower risk patients
Source: Holland et al. Am J Respir Crit Care Med 2009;17937
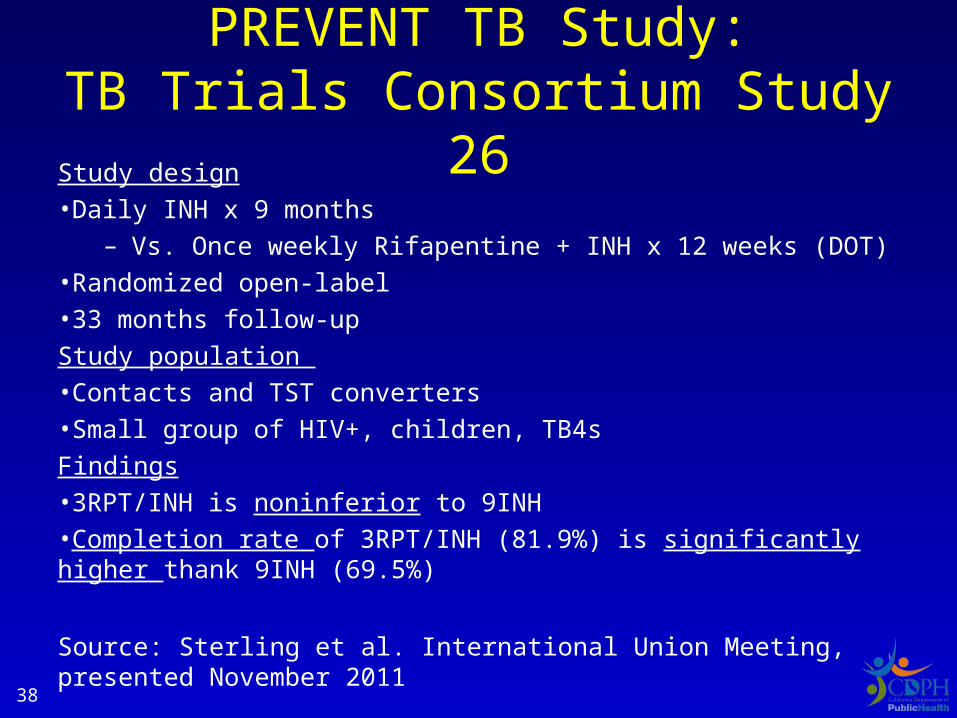
PREVENT TB Study:TB Trials Consortium Study 26
Study design•Daily INH x 9 months
– Vs. Once weekly Rifapentine + INH x 12 weeks (DOT)•Randomized open-label•33 months follow-up
Study population •Contacts and TST converters•Small group of HIV+, children, TB4s
Findings•3RPT/INH is noninferior to 9INH•Completion rate of 3RPT/INH (81.9%) is significantly higher thank 9INH (69.5%)
Source: Sterling et al. International Union Meeting, presented November 201138
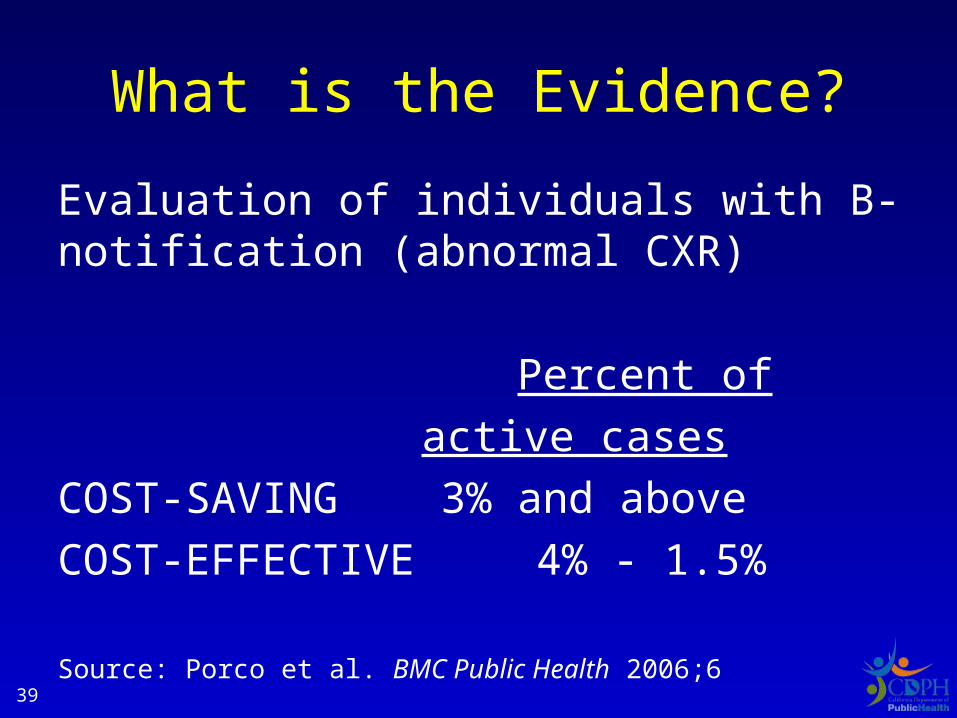
What is the Evidence?
Evaluation of individuals with B-notification (abnormal CXR)
Percent of
active cases
COST-SAVING 3% and above
COST-EFFECTIVE 4% - 1.5%
Source: Porco et al. BMC Public Health 2006;639
Case Prevention
Should we prioritize LTBI treatment for arrivers with B-notification of TB2 and TB4?
40
The Way Forward?
• Prioritize the most effective activities
• Engage partners
• BOTH upstream and more direct TB control activities needed
• TB funds are a required ingredient
• Examining outcomes is paramount
41
What Strategic Direction is Under Consideration?
• Adopt cost-effective diagnostic and treatment approaches
• Abandon ineffective unproven approaches
• Tackle case prevention as cases decline
42
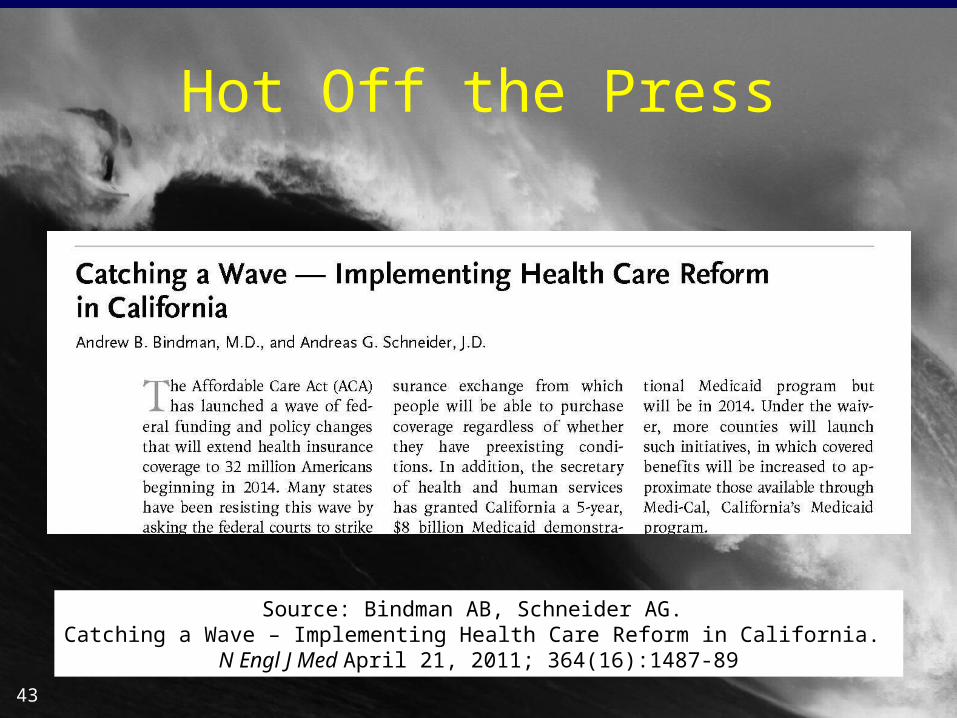
Source: Bindman AB, Schneider AG. Catching a Wave – Implementing Health Care Reform in California.
N Engl J Med April 21, 2011; 364(16):1487-89
Hot Off the Press
43
Related Documents