TAXATION, INFORMATION AND WITHHOLDING: EVIDENCE FROM COSTA RICA * Anne Brockmeyer, Marco Hernandez The World Bank November 21, 2019 100-Word Abstract Withholding of taxes by employers or firms’ trading partners is common around the world, but absent in public finance theory. We demonstrate the surprising power of withholding as a compliance instrument, studying a scheme in Costa Rica where credit-card companies withhold tax from retail firms. Doubling the withholding rate increases sales tax remittance among treated firms by 29% and aggregate revenue by 8%, although the statutory tax rate and third-party reporting requirements remain unchanged. We identify the mechanisms driv- ing this effect, show that such withholding schemes are common in developing countries, and replicate our results in multiple contexts. Long Abstract In standard tax compliance models, tax withholding at source is irrelevant. In these models, tax compliance is determined by a combination of enforcement (via audits and penalties), social motives, and third-party re- porting, which deters evasion by enabling the tax authority to verify self-reported liability. The fact that third parties may also withhold taxes at source – and the impact of withholding on compliance – has largely been ignored. Yet tax withholding is common around the world: withholding of the personal income tax by em- ployers is almost universal, and withholding is also applied to firms, especially in lower-income countries. We provide a simple framework to rationalize the use of tax withholding as a compliance mechanism and test its predictions using administrative data from Costa Rica. We find that doubling the tax withholding rate applied by credit-card companies increases sales tax remittance among treated firms by 29% and aggregate sales tax revenue by 8%, even though the statutory tax rate and third-party reporting requirements remain unchanged. The mechanisms are a default payment effect and a change in enforcement perceptions. We replicate our main findings using withholding-rate reforms in multiple contexts. JEL codes: H25, H26, H32, O23. * Corresponding author: Anne Brockmeyer, [email protected]. We are exceedingly grateful to the Costa Rican Ministry of Finance and General Directorate for Taxation for their outstanding collaboration. We would also like to thank the anonymous referees, Pierre Bachas, Oriana Bandiera, Abigail Barr, Youssef Benzarti, Michael Best, Robin Burgess, Lorenzo Casaburi, Esther Duflo, Lucie Gadenne, François Gerard, Beata Javorcik, Henrik Kleven, Aart Kraay, Benjamin Lockwood, Brigitte Madrian, David McKenzie, Joana Naritomi, Oyebola Okunogbe, Steven Pennings, Imran Rasul, Joel Slemrod, Juan Carlos Suárez Serrato, Eleanor Wilking and the seminar and conference participants at Oxford, Cambridge, Nottingham, the World Bank, the IMF, George Washington University, University of Michigan, LSE STICERD, Zurich PF Conference, NTA, PEUK, PacDev, ABCDE, IIPF, Oxford CBT, Oxford CSAE, AEA, IFS and CEPR for their helpful comments. Francisco Ilabaca, Juliana Londoño Vélez, Magaly Saenz Somarriba, Spencer Smith, Corinne Stephenson, and Gabriel Tourek provided excellent research assistance. The work was funded by the World Bank. The findings, interpretations, and conclusions expressed in this paper do not necessarily reflect the views of the Goverment of Costa Rica or of the World Bank, its Executive Directors, or the governments they represent. All errors are our own. 1

Welcome message from author
This document is posted to help you gain knowledge. Please leave a comment to let me know what you think about it! Share it to your friends and learn new things together.
Transcript
TAXATION, INFORMATION AND WITHHOLDING:EVIDENCE FROM COSTA RICA∗
Anne Brockmeyer, Marco HernandezThe World Bank
November 21, 2019
100-Word Abstract
Withholding of taxes by employers or firms’ trading partners is common around the world, but absent in publicfinance theory. We demonstrate the surprising power of withholding as a compliance instrument, studying ascheme in Costa Rica where credit-card companies withhold tax from retail firms. Doubling the withholdingrate increases sales tax remittance among treated firms by 29% and aggregate revenue by 8%, although thestatutory tax rate and third-party reporting requirements remain unchanged. We identify the mechanisms driv-ing this effect, show that such withholding schemes are common in developing countries, and replicate ourresults in multiple contexts.
Long Abstract
In standard tax compliance models, tax withholding at source is irrelevant. In these models, tax complianceis determined by a combination of enforcement (via audits and penalties), social motives, and third-party re-porting, which deters evasion by enabling the tax authority to verify self-reported liability. The fact that thirdparties may also withhold taxes at source – and the impact of withholding on compliance – has largely beenignored. Yet tax withholding is common around the world: withholding of the personal income tax by em-ployers is almost universal, and withholding is also applied to firms, especially in lower-income countries. Weprovide a simple framework to rationalize the use of tax withholding as a compliance mechanism and test itspredictions using administrative data from Costa Rica. We find that doubling the tax withholding rate appliedby credit-card companies increases sales tax remittance among treated firms by 29% and aggregate sales taxrevenue by 8%, even though the statutory tax rate and third-party reporting requirements remain unchanged.The mechanisms are a default payment effect and a change in enforcement perceptions. We replicate our mainfindings using withholding-rate reforms in multiple contexts.
JEL codes: H25, H26, H32, O23.
∗Corresponding author: Anne Brockmeyer, [email protected]. We are exceedingly grateful tothe Costa Rican Ministry of Finance and General Directorate for Taxation for their outstanding collaboration.We would also like to thank the anonymous referees, Pierre Bachas, Oriana Bandiera, Abigail Barr, YoussefBenzarti, Michael Best, Robin Burgess, Lorenzo Casaburi, Esther Duflo, Lucie Gadenne, François Gerard,Beata Javorcik, Henrik Kleven, Aart Kraay, Benjamin Lockwood, Brigitte Madrian, David McKenzie, JoanaNaritomi, Oyebola Okunogbe, Steven Pennings, Imran Rasul, Joel Slemrod, Juan Carlos Suárez Serrato, EleanorWilking and the seminar and conference participants at Oxford, Cambridge, Nottingham, the World Bank, theIMF, George Washington University, University of Michigan, LSE STICERD, Zurich PF Conference, NTA,PEUK, PacDev, ABCDE, IIPF, Oxford CBT, Oxford CSAE, AEA, IFS and CEPR for their helpful comments.Francisco Ilabaca, Juliana Londoño Vélez, Magaly Saenz Somarriba, Spencer Smith, Corinne Stephenson, andGabriel Tourek provided excellent research assistance. The work was funded by the World Bank. The findings,interpretations, and conclusions expressed in this paper do not necessarily reflect the views of the Govermentof Costa Rica or of the World Bank, its Executive Directors, or the governments they represent. All errors areour own.
1
1 Introduction
Tax withholding schemes are widely used around the world, but absent in public finance theory.1
Withholding of the personal income tax by employers is almost universal. Withholding is also
commonly applied to firms’ transactions, to ensure compliance with corporate income and
consumption taxes. In this case, the payer in a transaction withholds tax from the payee,
sending the tax withheld to the tax authority as an advance tax remittance2 by the payee.3
Large firms and financial institutions are common withholding agents. We identified over 60
countries which use such withholding schemes for firms. Figure 1 shows that the use of these
schemes is particularly prevalent in lower-income countries, and that lower-income countries
have a broader application of the withholding scheme across firm types, and higher withholding
rates. This suggests that withholding may be a desirable policy tool in a context with low tax
compliance. In standard public finance theory, however, tax compliance is modeled primarily
as a function of enforcement (audits and penalties) and third-party reported information about
the taxpayer’s income.4 The fact that the third party may also withhold tax at source has been
largely ignored.
This paper studies the surprising power of withholding and its mechanisms. In our main
application in Costa Rica, credit- and debit-card companies5 report retailers’ card-machine
sales, withhold a fraction of the transaction amount, and remit this to the tax authority as
an advance on the retailers’ sales tax. As withholding applies to transactions that are also
third-party reported to the tax authority, and as the withheld tax is fully creditable against
a taxpayer’s final tax liability, standard models suggest that withholding should be irrelevant
to tax compliance. However, our empirical evidence rejects these models. We exploit variation
in firm-specific withholding rates in a difference-in-difference design to show that a doubling
of the withholding rate increases sales tax remittance among treated firms by 29%, although
third-party reporting requirements and statutory tax rates do not change. The mechanisms are
1Slemrod (2008) and Slemrod and Boning (2018) discuss the importance of withholding qualitatively, withoutspecifically modeling it.
2We use the term “remittance” rather than “payment” to refer to transfers from taxpayers or other economicagents to the tax authority. The purpose of this term is to distinguish these transfers from transactions betweeneconomic agents and to avoid confusion between the transfer of money to the tax authority and bearing theburden of the tax (Slemrod 2008).
3In some countries, the payee also withholds from the payer, adding the withheld tax to the invoice. Moregenerally, the term “withholding” can refer to any circumstance in which the agent responsible for remitting thetax is different from the statutory bearer of the tax.
4Formal employment contracts (Kleven et al. 2011, Jensen 2019), modern accounting systems (Kleven etal. 2016), financial transactions (Gordon and Li 2009), electronic receipts (Naritomi 2019) and firm-to-firmtransaction records (Pomeranz 2015) all generate third-party information, which allow the tax authority toverify a taxpayer’s self-reported income and deter evasion.
5Henceforth referred to as credit-card companies for simplicity.
2

a default payment effect and a change in enforcement perceptions. This rationalizes the use of
withholding as a compliance instrument.6
To examine the potential effect of withholding conceptually, we extend a simple tax evasion
model with third-party information reporting based on Allingham and Sandmo (1972). We
allow the third party to both report a taxpayer’s sale and withhold a share of the transaction
amount as an advance tax remittance for the taxpayer. If audits are targeted at taxpayers that
misreport sales compared to third-party reports, and if taxpayers correctly perceive the audit
function, third-party reporting puts a lower bound on the reported tax liability. Withholding is
then irrelevant to taxpayers’ compliance decisions, if the tax withheld can be fully and costlessly
reclaimed and if withholding does not affect taxpayers’ perceptions of enforcement. When we
relax these two assumptions, however, withholding can increase tax remittance through two
channels: incomplete reclaiming of the tax withheld and a reduction in misreporting.7
To evaluate the effect of third-party reporting and withholding empirically, we use a ten-
year panel of administrative tax records from Costa Rica. Our data contains the universe
of income tax and sales tax declarations, registration and deregistration records, and over 20
million third-party information and withholding reports.
Our analysis is divided into three parts. As withholding is always accompanied by third-
party reporting, we start by providing novel evidence on the impact of third-party information
reporting on firm compliance. We conduct an event study exploiting within-firm changes over
time in the coverage by third-party reporting. We find that a firm’s reported tax liability
increases by up to 40% after the first third-party report by another firm, by 23% after the
first report by a credit-card company, and by 21% after the first report by a state institution.
These effects emerge sharply at the time of the event after otherwise parallel trends between
the event and control groups, and thus cannot be explained by a pure growth effect. The event
study results are corroborated by the heterogeneity of bunching at kinks and notches, a proxy
for misreporting, across subsamples of firms with different degrees of information reporting
coverage.
In the second part of our analysis, we show that, despite the presence of third-party informa-
tion and its targeted use in tax enforcement in Costa Rica, compliance gaps remain widespread
and sizable on all margins. About 50% of tax-liable firms fail to file their income tax declara-
6Withholding in this context does not reduce transaction costs for the taxpayer, as withholding is incompleteand most taxpayers still have an outstanding tax liability to remit. Withholding reduces administrative costsfor the tax authority, which may be a reason for the attractiveness of withholding schemes, but this cannotexplain why withholding increases compliance, as we show in this paper.
7We also discuss how withholding would impact compliance if firms are liquidity constrained, but find noempirical evidence for this mechanism.
3
tions, 22% of income tax liability among third-party-reported firms remains undeclared, and a
non-negligible fraction of firms remit their taxes after a significant delay.
These findings suggest a role for tax withholding at source as an alternative compliance
instrument, which we evaluate in the third part of the analysis. We exploit a reform to the
withholding-rate schedule applied by credit-card companies. Firm-specific withholding rates
are determined each semester based on each firm’s sales tax declarations from two semesters
prior, which means there is no scope for firms to manipulate withholding rates ex-post. Prior
to the reform, withholding rates were increasing in reported value-added; after the reform they
were increasing in the share of domestic sales. As a result, the reform triggered an increase
in the withholding rate for firms with a low value-added rate and a high share of domestic
sales. Firms in an intermediate range of value-added and intermediate share of domestic sales,
and firms that did not use a credit-card machine were unaffected by the reform. These firms
serve as the control group for a difference-in-difference estimation. Their pre-reform trend
in key outcome variables is identical to the treatment-group trend, even in terms of seasonal
fluctuations. Importantly, the reform allows us to isolate the impact of withholding from other
determinants of compliance, as the statutory tax rate did not change, and the information
reporting environment was unaffected. Specifically, credit-card companies were required to
report all card transactions both before and after the reform, and card machine usage hardly
responded to the reform.
We find that doubling the withholding rate leads to a 29% increase in total sales tax re-
mittances from taxpayers subject to the rate change. In the aggregate, the withholding-rate
reform increased sales tax revenue by 8%.8 Using detailed information from all line items on
the sales tax return, we decompose the main treatment effect into its mechanisms. We find that
the impact is driven in equal proportions by (i) a default remittance effect caused by firms that
do not reclaim the tax withheld, and (ii) an increase in reported tax liability among firms that
do reclaim the tax withheld. This reporting response is not driven by a change in enforcement
parameters, or by the bunching of reported tax liabilities at the amount of tax withheld (which
could arise in a model with liquidity constraints or rule-of-thumb reporting behavior). We ar-
gue instead that withholding changes enforcement perceptions and provide evidence consistent
with this.
As with any study exploiting a specific reform, questions of external validity may arise.
To allay such concerns, we replicate our results using event studies and difference-in-difference
8While the withholding rate change affected firms’ tax compliance, we find little evidence for an effect onreal firm growth, as proxied by the wage bill and number of employees.
4

estimations of withholding rate changes which apply to different taxes and different types
of taxpayers in Costa Rica. In addition, we demonstrate that Costa Rica’s tax enforcement
and audit capacity is in line with the capacity observed in other countries at a similar level
of development.9 Withholding in Costa Rica applies to relatively larger firms, but among
the firms subject to withholding, the tax remittance response to withholding is larger among
smaller firms. Withholding might thus generate even larger effects in lower-income countries
with smaller firms.
Our paper contributes to several strands of the literature. First, we contribute to a large
body of work on tax compliance surveyed in Slemrod (2018) and Slemrod and Yitzhaki (2002).10
We present withholding as an empirically important compliance mechanism which has been
missing in the literature.11 Withholding is not only less costly to implement than audits or
other forms of enforcement, but it is also conceptually distinct from standard enforcement, as
it abandons the idea of incentivizing taxpayers to correctly report their income, and instead
establishes a default tax remittance, based on a proxy of the tax liability (sales in our context).
As withholding agents are usually firms, our work also connects to Kopczuk and Slemrod (2006),
who have emphasized the important role of firms in tax enforcement, and Slemrod (2008), who
emphasized firms’ role as withholding agents in particular. Related empirical evidence from a
study of diesel taxation (Kopczuk et al. 2016) shows that the identity of the remitting agent
matters for tax incidence. Our study is the first to estimate the impact of withholding on
compliance and identify the mechanisms through which it works.
Since withholding is always accompanied by third-party information reporting (but not vice-
versa), our study also relates to the empirical literature on third-party reporting (Pomeranz
2015, Jensen 2019, Naritomi 2019; the latter being methodology most closely related to our
study). While these papers show that information trails increase compliance, it remains unclear
whether there are remaining compliance gaps, and how large they are. There are also studies
highlighting the limits of third-party reporting if firms can adjust less easily verifiable margins
(Carrillo et al. 2017, Slemrod et al. 2017). We can reconcile these findings with empirical
9We have also conducted a difference-in-difference estimation around a withholding-rate increase in anotherdeveloping country, which yields similar results as the study in Costa Rica (results available upon request).
10Previous studies have identified the key drivers of tax compliance as (i) audits and other enforcementmechanisms (Allingham and Sandmo 1972), (ii) third-party reporting and information trails more generally(Kleven et al. 2011, Kleven et al. 2016), and (iii) social motives, such as the desire to conform to social norms(Singhal and Luttmer 2014, Slemrod et al. 2019).
11A few policy reports (Samanamud 2013, OECD 2009) and legal studies (Soos 1990) anecdotally describethe relationship between withholding and tax compliance among small firms, and an empirical study by Carrilloet al. (2018) examines bunching at a withholding-rate kink. Another literature has analyzed personal incometax withholding with a special focus on the United States, examining why individuals voluntarily over-withhold(Barr and Dokko 2008, Gandhi and Kuehlwein 2014, White et al. 1993, Highfill et al. 1998).
5

evidence from a novel setting by examining firms’ responses not to intensive-margin increases
in information reporting or to the use of preexisting reports (as in previous studies), but to
extensive-margin changes in being reported, which is arguably where the largest compliance
response should be expected. We find large increases in reported tax liability in response to
information reporting, despite some offsetting adjustments on the cost margin. We then show
that, even in a context where third-party information is routinely used for enforcement, a non-
negligible share of taxpayers remain non-compliant with these reports, suggesting a need for
an alternative compliance mechanism: withholding.
Third, our study relates to the literature on state capacity and development, and the optimal
mix of tax instruments in a low-capacity setting (Besley and Persson 2013, Gordon and Li
2009, Keen 2008). Similar to the minimum tax studied in Best et al. (2015), withholding
on firms is a tax instrument that is predominantly used in lower-income countries and low-
compliance settings. We provide evidence that rationalizes its use in these contexts. Lastly, by
identifying the default mechanism as one of the two channels through which withholding raises
compliance, our study complements the behavioral economics literature on defaults (Chetty et
al. 2014, Thaler and Benartzi 2004, Madrian and Shea 2001). Our setting differs from other
default studies in that the agents we study (firms) are likely rational, and that the cost that
discourages agents from abandoning the default may be a monetary rather than a psychological
cost.
The remainder of the paper is organized as follows. We start by presenting our conceptual
framework in Section 2. Section 3 describes the context and data. Sections 4, 5 and 6 evaluate
the impact of information reporting, the anatomy of compliance and the impact of withholding.
While the main innovative contribution of the paper is the effect of tax withholding examined
in section 6, we consider it important to first study the effect of information reporting, as
withholding is always associated with information reporting, and our objective is to separately
estimate the effect of the former and the latter. Section 7 provides evidence for the external
validity of our findings, and section 8 concludes.
2 Conceptual Framework
This section presents a simple framework for analyzing behavioral responses to third-party
reporting and withholding. This is based on the canonical tax-evasion model by Allingham
and Sandmo (1972), extended by Kleven et al. (2011) and Carrillo et al. (2017) to include
third-party reporting for individuals and firms, respectively. We begin by describing the basic
6
setup of the model with third-party reporting, then introduce withholding, and finally discuss
the mechanisms through which withholding can impact compliance.
2.1 A Tax-Evasion Model with Third-Party Reporting
The basic setup of our model follows Carrillo et al. (2017). Firms have revenue R = RT +RS,
where revenue can be either third-party-reported or self-reported, indexed by T and S, and firms
declare R. Firms have costs C = CT + CS and choose to report C. The government levies tax
at rate τ on declared profits π = R− C. The tax liability is T = τ π. With probability p, firms
are audited, in which case any evasion is certain to be detected, and evaders pay a fine θ, which
is proportional to the evaded liability. Firms maximize expected utility over after-tax income
in the audited and non-audited states YA and YN .12 To account for the tax authority’s use of
risk scores and third-party information to target audits, we assume that the audit probability
is decreasing in the reported profit rate, p = p((π + ε)/R) with p′ < 0.13 Misreporting against
third-party information is automatically flagged and triggers the maximum audit probability:
p = p = max(p) if R < RT .14
We allow perceptions of the enforcement environment to vary across firms without imposing
any structure on how these perceptions are formed. Consider first firms whose perceptions of
the enforcement environment correspond to the truth, that is p = p() and RT = RT . As ε→ 0,
a firm with RT = 0 sets R? = π? to satisfy the first order condition, and set C? = 0. The firm
thus underreports revenue and does not even claim costs reported by a third party. When the
information environment changes to RT > π? > 0, for instance because a client starts reporting
the firm’s sales to the tax authority, the firm adjusts to R? = RT and sets C∗ ≷ C to satisfy
the first-order condition. If the audit function is sufficiently steep, or the firm is sufficiently risk
averse, the increase in C is smaller than the increase in R, and the firm increases its reported
tax liability π. We test this prediction in our event study of firm behavior after receipt of the
first third-party report.
Now, consider firms that misperceive the enforcement environment, so that p() ≷ p() and
RT ≷ RT . This is reasonable for many firms, as audits are rare and the audit function is not
public knowledge. Third-party reporting mechanisms usually require third parties to report
12Modeling firms in a middle-income country as risk-averse is reasonable, since more than half of the firms inour sample are unincorporated, and most firm owners are vulnerable to income volatility.
13The inclusion of ε, a small positive number, ensures that firms declaring zero profits on a large revenue baseincur a higher audit probability than firms declaring zero profits on a small revenue base, thus differentiatingthe two corner cases where π = 0.
14As is standard in the literature, we ensure that the second-order condition on the firm’s maximizationproblem is met and avoid non-concavities by imposing p′′ ≥ 0.
7

transactions to the tax authority, but not directly to the taxpayer, so taxpayers may be unaware
of the exact value of RT . In this context, we predict that firms with RT < RT underreport
sales compared to third-party reports: R? ≤ RT < RT . We test this prediction in our anatomy
of compliance, comparing firms’ self-reports to third-party reports of sales and costs.
2.2 Modeling Withholding
We introduce withholding into the model by assuming that tax is withheld at a rate µ on third-
party reported revenue RT . The information reporting agent thus also acts as withholding
agent. As revenue RT is already reported to the tax authority, the introduction of withholding
leaves the government’s information set unchanged. We assume that the tax withheld can be
fully reclaimed upon filing. This means that firms’ net tax liability is P = T − µRT , where the
tax withheld is deducted from the gross tax liability. We further assume that firms always pay
their tax in full, meaning that the actual tax payment P= P . There are no restrictions on the
sign of P, P ≷ 0, so that firms can request a refund if the reported tax liability is smaller than
the tax withheld. In this model, firms’ after-tax income in the audited and non-audited state
of the world are identical to after-tax income in the model without withholding:
YN = π − µRT − [τ π − µRT ] = YN ,
YA = π − µRT − [τπ − µRT ]− θ[(τπ − µRT )− (τ π − µRT )] = YA.
Withholding should thus be irrelevant to firms’ evasion decisions. This naive prediction, at
odds with our empirical results, relies on assumptions which we relax in the next section.
2.3 Withholding Impact Mechanisms
This section examines firm behavior when relaxing some of the assumptions in the naive model
to bring it closer to reality. In this case, withholding can impact compliance.
Default Mechanism. The naive model assumes that taxpayers subject to withholding can
fully and costlessly reclaim the tax withheld. In reality, firms may incur administrative or
monetary costs to credit the tax withheld against their liability. A simple way to model this is
to consider that firms incur a firm-specific fixed cost fi, distributed according to a cumulative
distribution function H(f), to deduct the tax withheld µRT from the gross tax liability T . This
could represent the administrative or mental cost of tracking how much tax has been withheld
during each transaction and then adding up those amounts when preparing the tax return. The
presence of the fixed cost generates a cutoff f = µRT such that firms with fi < f reclaim the
tax withheld, and firms with fi ≥ f do not reclaim. This yields the testable predictions that (i)
8
reclaiming of the tax withheld is incomplete if reclaiming costs are sufficiently high, H(f) < 1;
and (ii) firms with larger amounts of withheld tax (either due to higher RT or higher µ) are
more likely to reclaim, ∂H(f)/∂RT > 0 and ∂H(f)/∂µ > 0.15
Enforcement-Perceptions Mechanism. Our baseline model implicitly assumes that taxpayer
perceptions of enforcement, RT and p(), are not affected by withholding. Yet withholding agents
must inform the taxpayer of the amount of tax withheld to enable the taxpayer to reclaim it.
For instance, credit-card companies provide client firms with a monthly statement listing the
volume of transactions processed, the commission due, and the tax withheld, if any.16 Such
a statement can prompt taxpayers to update their enforcement perceptions either because it
provides new information or because it makes known information more salient (Chetty et al.
2009, Finkelstein 2009). Specifically, the statement conveys that an amount µRT of tax was
withheld and remitted to the tax authority, hence the value of RT was communicated to the tax
authority, and the tax authority employs credit-card companies for tax compliance purposes.
Even though the true RT and p() do not change, withholding can thus lead taxpayers to update
RT and p(), and increase reported sales RT and tax liability π accordingly.
For example, for taxpayers that are initially unaware of third-party reporting, the introduc-
tion of withholding raises RT from 0 to RT and moves reported profits from π∗(0) to π∗(RT ),
where π∗(RT ) > π∗(0) if p′ 6= 0. As another example, taxpayers may have a perceived audit
probability of p, which is an increasing function of the number of times they have witnessed tax
enforcement in practice. When confronted with tax withholding, these taxpayers may revise p
upwards and hence increase π.
Updating of RT and p is more likely among the following grous of firms: firms that have
previously misreported their taxable income compared to third-party reports RT (and hence
must misperceive p() or RT ), firms that are subject to withholding for the first time (and hence
experiencing tax remittance through a credit-card company for the first time), and firms that
reclaim the tax remitted (and hence must have taken note of the information on the credit-
card statement). We thus test the predictions that (i) an increase in the withholding rate
prompts firms to increase their reported tax liability, and (ii) that this effect is larger among
the aforementioned subsamples.
Alternative Mechanisms. In our empirical analysis, we consider and refute two potential
alternative mechanisms. In a dynamic model with liquidity constraints, withholding could
influence tax compliance behavior if taxpayers suffer unexpected shocks between the time of
15A cap on reclaims or an increase in the audit probability for reclaimers would similarly generate incompletereclaim, but these features are empirically not relevant, as we discuss below.
16See Figure A.11 and section 3.2 for more details on reporting requirements.
9

income receipt and the time of tax remittance, or if they myopically consume income before
taxes are due. Such taxpayers earn taxable income, but find themselves without liquidity
to remit tax at the end of the period. In this case, they would report π = 0 ≤ π.17 The
introduction of withholding could then increase compliance. It would allow taxpayers to report
a positive tax liability, even if they have no liquidity to remit the tax, as (part of) the tax
has already been withheld. In this case, the reported tax liability would equal the amount of
tax withheld: π · τ = µRT , still ensuring P = 0. This mechanism thus predicts bunching of
reported tax liabilities at the amount of tax withheld.18 Another model of firm behavior which
could generate such bunching is one in which firms interpret the amount of tax withheld as a
signal about the appropriate tax liability to declare (e.g. rule-of-thumb reporting behavior).
In either model, an increase in withholding would increase tax compliance, because it would
mechanically move firms to report higher tax liabilities. We will thus examine the presence of
bunching in reported tax liabilities, and any changes in bunching with the withholding rate.
We also test whether firms with low profit margins, for whom liquidity constraints are more
likely to bind, exhibit a larger response to the withholding rate.
3 Context and Data
We test the predictions of our conceptual framework using policy variation and administrative
tax records from Costa Rica, where tax revenue is predominantly derived from income taxes on
firms and a VAT-style sales tax. This section describes these taxes, the compliance mechanisms
used to enforce them, and the data we use.
3.1 Income Tax, Sales Tax and Simplified Regime
Firms are liable for income tax on taxable profits. Tax declarations are filed annually by
December 15, with three quarterly advance remittances due in March, June, and September.19
17Note, however, that the nature of shocks or myopia that would generate this result needs to be very specific,affecting only disposable but not taxable income. An example could be an owner-manager using business incometo pay for a family emergency. A shock to taxable income would affect also true tax liabilities, and would thusnot necessarily generate non-compliance. Also note that, for taxpayers who find themselves without liquidityto remit tax, and whose sales are partially covered by third-party reporting, non-payment or non-filing wouldnot be optimal in our model, unless the taxpayers mis-perceive the enforcement parameters p() and RT .
18In a more complicated model where only part of firms’ taxable income is lost between the receipt of incomeand tax remittance, the distribution of (reported tax liability-tax withheld)/(reported tax liability) would exhibitexcess mass just above 0, and an increase in the withholding rate would lead to an increase in bunching at 0.
19Fiscal year t in Costa Rica starts on October 1 in year t− 1 and ends on September 30 in year t. Taxpayerscan request to remit taxes according to a different fiscal schedule, which we account for in our analysis. Eachquarterly advance remittance is a quarter of either the previous year’s tax liability or of the average liabilityover the last three years, whichever is higher.
10
While all firms use the same tax declaration, the tax-rate schedule differs between corporations
and self-employed individuals (i.e., unincorporated firms). Self-employed filers face a standard
kinked tax schedule on profits with five tax brackets. As Table 1 shows, the location of all the
kinks is adjusted annually to reflect the expected inflation rate. The marginal tax rates that
apply to incomes in the five brackets are 0%, 10%, 15%, 20%, and 25%, respectively. These
rates did not change over the 2006-2015 period.
Corporations face a notched tax schedule on revenue with three tax brackets and no exempt
amount. A firm’s revenue determines its average tax rate, which is then applied to profits.
As above, notch locations are adjusted annually for inflation, and the average tax rates of
10%, 20%, and 30% were unchanged during the 2006-2015 period.20 The annual adjustment
of kink and notch locations generates 60 different thresholds over the period – all but three at
non-round numbers – facilitating the identification of bunching driven by tax-rate changes.
Costa Rica levies a monthly sales tax, which is effectively a VAT with an invoice-credit
system, i.e. deductability of tax paid on inputs, but with a narrow base. The tax base includes
most goods and some retail services (e.g. hotels and tailors), but it excludes professional services
(e.g. lawyers and doctors). Only firms remitting tax on their sales can deduct tax paid on their
inputs. The sales tax rate was constant at 13% for the entire period of our study, with reduced
rates of 10% and 5% levied on wood and residential electricity, respectively.
Retailers in certain sectors and below certain size thresholds21 can opt into a simplified
regime that unifies income and sales taxes. This regime levies taxes on inputs at sector-specific
rates that vary from 3% to 9.8%. Firms file and remit tax quarterly and are not subject to tax
withholding by credit-card companies.
3.2 Compliance Mechanisms
The Costa Rican tax authority uses third-party information reporting and withholding to en-
hance tax compliance among firms. Under this system, a third-party informant submits one
“informative declaration” for each transaction partner specifying the tax identification numbers
of both the informant and the taxpayer, the transaction amount, the tax withheld if applicable,
and the income or transaction type. The relevant informative declarations are listed in Table 3.
All information reporting and withholding mechanisms apply in the same way to self-employed
20Wage earners are taxed according to another tax schedule, which features three tax brackets with marginalrates of 0%, 10%, and 15%, respectively.
21These include having annual purchases equal to less than 150 base salaries, owning fixed assets equal to lessthan 350 base salaries, and employing fewer than six workers. The base salary is a national accounting unitequivalent to CRC 446,200 (US$764) in calendar year 2019.
11

individuals and corporations. The tax authority uses informative declarations, as well as cus-
toms declarations on imports and exports, to automatically cross-check taxpayers’ self-reported
tax declarations. Taxpayers with large discrepancies between third-party information and self-
reported information are selected for intensive margin controls or audits. The exact selection
algorithm is not public and changes from year to year.
A firm must report firm-to-firm purchases and sales if its cumulative annual transactions
with a single partner reach 2.5 million Costa Rican colones (CRC), equivalent to US$4,365.22
The payment of rent, commissions, professional-service fees, or interests must be reported if
annual transactions with a single transaction partner reach CRC 50,000 (US$87). These reports
are purely for information purposes and are not linked to tax withholding.23
State institutions and credit-card companies act as both third-party informants and with-
holding agents. State institutions report all purchases from the private sector and withhold 2%
of the transaction amount, which is remitted to the tax authority and creditable against the
taxpayer’s income tax liability.24 Credit-card companies report all sales processed through card
machines and withhold taxes at a firm-specific rate, which varies from 0 to 6%. The withheld
tax is creditable against the firm’s sales tax liability. Withholding agents remit the withheld
tax to the tax authority the day after the transaction takes place and thus receive almost no
liquidity benefit. Compliance with withholding obligations in high, as discussed in section 6.1.
The sales tax withholding system generates the key variation used in this paper. Table 2
shows the withholding-rate schedule for the sales tax. Prior to August 2011, the withholding
rate was increasing in the reported value-added rate. Value added is defined as tax-liable sales
net of tax-liable purchases and imports, where tax-liable refers to the sales tax. Under this
schedule, 40.3% of firms subject to credit-card transaction reporting faced a withholding rate
of 0%, and only 21.8% faced the maximum rate of 6%. In August 2011, in an effort to better
align withholding rates with sales tax liability, the authorities consolidated the withholding-rate
schedule to three rates of 0%, 3%, and 6% and changed the rate-determination methodology.
As exports are exempt from the sales tax, the rates are now increasing in the share of domestic
sales in total sales, with notches at 0% and 50%. Since then, over 60% of firms subject to
credit-card reporting have faced a withholding rate of 6%.
22As of October 5, 2017, US$1 was equal to CRC 573.23Firms provide these reports only to the tax authority and not to each other, but each firm should be aware
of whether it is being reported, as transactions above the reporting threshold must be reported by both thesupplier and the client.
24A small number of companies also withhold taxes on the purchase of certain specified services (e.g., trans-portation, communications) from foreign firms. However, this type of withholding applies to just 2% of corpo-rations and 0.8% of self-employed individuals and is thus not considered in our study.
12

Importantly, firms were not able to manipulate the withholding rates assigned to them at
the time of the reform. This is because withholding rates for semester t are always based
on domestic sales reported in firms’ tax declarations in semester t − 2.25 Each semester, the
tax authority calculates the firm-specific withholding rates and communicates them to the
withholding agents. Only in special circumstances (e.g. consecutive annual losses) are firms
able to request a reduction in their withholding rate before the end of the semester. In this
case, the realized withholding rate may differ from the rate predicted by value added or share
of domestic sales reported in semester t− 2.
Withholding agents are required to provide firms with a receipt confirming the amount of tax
withheld, as illustrated in Appendix Figure A.11. This receipt lists the volume of transactions
processed, the commission charged, and the tax withheld. Taxpayers should this know whether
or not they are subject to withholding, and a change in the withholding rate from 0% to any
positive rate should be very salient.
Taxpayers can deduct (henceforth “reclaim”) the amount of tax withheld from their gross
tax liability by simply filling in one additional box on their tax return. Taxpayers only need
to keep track of the amount of tax withheld. If the taxpayer has reported zero tax liability for
three consecutive months, and therefore has no liability from which to deduct withheld taxes,
the taxpayer can submit a “refund request” form. Such a request requires detailed information
on the withholding agent, including the amount of tax withheld and the timing of withholding,
and may take serveral months to be processed. While taxpayers reclaiming the tax withheld
are not subject to higher audit rates than other taxpayers, taxpayers requesting a refund are
often subjected to a desk audit. Refund requests are, however, very rare, as the amount of tax
withheld is smaller than the tax liability for most taxpayers in our context. We will show below
that the difficulty of obtaining refunds is not the key driver of our results.
3.3 Sanctions for Non-Compliance
Non-compliant taxpayers face monetary sanctions, temporary firm closure or prison sentences.
Relatively minor non-compliance such as non-filing, non-payment, non-filing of third-party
reports, or non-emission of receipts is subject to monetary sanctions of up to three base salaries
(one base salary was CRC 446,200, i.e. USD 764, in calendar year 2019). For repeated non-filing
or non-payment, the tax authority can close a business for five days. Misreporting is sanctioned
with a 25% or 75% penalty on the unreported tax liability, with the higher sanction applying
25The two semesters extend from January to June and from July to December.
13
in cases where misreporting with the intention to evade taxes can be proven and unintentional
errors ruled out. The sanction for misreporting also applies to incorrect reclaims of tax withheld
and to refund requests. Taxpayers who evade tax of an amount higher than 200 base salaries
(USD 152,800) can be imprisioned for up to ten years.26
3.4 Data
Our analysis combines electronically-filed tax returns, third-party information and withholding
reports from the Government of Costa Rica. The tax-return data include the universe of
income tax declarations for 2006-2015 and sales tax declarations for 2008-2015, as well as
the corresponding remittance (payment) receipts. These data have all tax-return line items,
including firm type and sector, income sources, cost items, deductions, gross and net liability,
and tax remittance. The final dataset contains 112,000 to 260,000 self-employed individuals per
year, as well as 90,000 to 150,000 corporations and 58,000 to 70,000 sales tax filers per month.
We merge the tax records with all third-party reports for the period 2006-2015. Table 3
provides an overview of the number of records and their coverage. Firm-to-firm transaction
reports have both the largest number of observations and the widest coverage, as they are
available for approximately half of all firms. This coverage rate is similar for both self-employed
individuals and corporations. The filing of informative declarations is more concentrated than
the coverage, meaning that a smaller share of firms act as informants.
The coverage of withholding by state institutions and credit-card companies is lower than the
coverage of firm-to-firm information reporting, especially for self-employed individuals. With-
holding reports by state institutions and card companies are available for only 5.0% and 5.8%
of self-employed tax filers and 8.4% and 11.5% of corporate filers, respectively.27 A significant
share of third-party reports cannot be matched to income tax records, suggesting that a large
number of firms covered by reporting or withholding are non-filers.
In addition to tax returns and third-party reports, we use the registration and deregistration
records for 2006-2014 to reconstruct the tax register for each fiscal period.
26Prison sentences are applied in rare cases of extraordinary levels of fraud, and the judicial proceed-ings can take many years: https://www.nacion.com/sucesos/judiciales/empresario-ira-15-anos-a-prision-por-fraude/4TVYNLZZ2BDMDKDDTZKU57EQBU/story/. As of September 2016, 24 judicial proceedings wereongoing. There are usually several hundred firm closures per year, as Brockmeyer et al. (2019) documents.
27As indicated by the percentages in squared brackets in Table 3, the coverage of credit-card reports amongsales tax-liable firms is higher, since they constitute only a small subsample of income taxpayers.
14

3.5 Summary Statistics for Samples of Analysis
Table A.1 presents summary statistics of the samples used in the analysis, for the years 2010 and
2013, before and after the withholding rate reform. Firms in the sample used in the event study
of third-party reporting are bigger than the average income taxpayer, and firms in the bunching
sample are on average smaller, largely due to differences in the tails of the distribution. Thus,
if both samples yield evidence consistent with the idea that third-party information enhances
compliance, the result might well generalize to the overall population of firms.
Sales tax filers, which are relevant for the withholding analysis, have higher turnover than
income tax filers all along the distribution, and are also bigger than the event study sample
and more likely to be corporations. This is consistent with the fact that the sales tax is levied
mostly on the sale of manufactured goods. To the extent that we find large effects of withholding
among sales tax filers, and larger effects among the relatively smaller firms, we might expect
even larger effects if withholding was applied to the full population of firms.
Finally, the summary statistics show that regular filers, which we focus on in our main
analysis, have higher turnover than irregular filers (defined as filing at least once during the
three-year period around the withholding reform), but the latter still constitute a significant
proportion of the tax liability. We therefore confirm the robustness of our results to using various
types of unbalanced panels (Section 6.4), and show that there is no evidence for extensive margin
responses to withholding (Figure A.9).
4 The Impact of Information Reporting
This section presents estimates of the impact of third-party information on self-reported taxable
income. We begin by analyzing the heterogeneity of bunching–a proxy for misreporting–across
subsamples of firms with different degrees of third-party information coverage. We then conduct
an event study of firms’ responses to the first third-party report.
4.1 Heterogeneity in Bunching
Numerous studies have used bunching at kinks or notches in the tax schedule to estimate
tax base responses to the tax rate. Bunching is usually shown to be driven by tax evasion
or avoidance rather than a real response (e.g. Bachas and Soto 2019, Almunia and Lopez-
Rodriguez 2018, Seim 2017). In Costa Rica, we observe large and sharp bunching at the first
kink for self-employed individuals and at the first notch for corporations. Bunching moves every
15
single year with the location of the kink, as shown in Figure A.1 for self-employed individuals.28
This speedy adjustment supports the interpretation of bunching as a reporting response rather
than a real production change.29 We thus use bunching as a proxy for misreporting.
To examine the heterogeneity of bunching with the coverage of third-party information, we
pool the data for 2006 to 2015 and display the distribution as a percentage difference from
the year-specific threshold location in 1% bins. To estimate the size of bunching, we fit a
flexible polynomial to the observed distribution, excluding a range around the thresholds, as is
standard in the bunching literature (Chetty et al. 2011, Kleven and Waseem 2013). Given the
asymmetric nature of bunching, we estimate bunching to the left of the kink and the missing
mass to the right of the kink. As the missing mass does not seem to be the same size as the
excess mass, at least for self-employed filers, we apply the estimation strategy suggested by
Best and Kleven (2018) rather than the convergence method.30
Figure A.2 displays the observed distribution (dotted blue line), the estimated counterfac-
tual (solid red line), and excess-mass estimates for different sub-samples of the self-employed
individuals (row A) and corporations (row B). Among both firm types, the largest excess mass
is found in the sample of firms not subject to third-party reporting (panels A1 and B1). The
subsample of firms subject to third-party reporting (panels A2 and B2) still exhibits a large
excess mass around both the kink and the notch, but in both cases the excess-mass estimate
is significantly smaller than the estimate for firms not subject to third-party reporting. The
excess mass drops from 4.5 to 2.08 for self-employed individuals and from 4.49 to 3.17 for corpo-
rations, and those changes are statistically significant at the 1% level.31 The fact that bunching
is smaller but still highly significant, among firms subject to third-party reporting is consistent
with the fact that the information trail is incomplete, and that firms could still bunch through
legal tax avoidance.
28We focus on the first threshold as it is the most salient one, and also the largest in terms of the tax ratechange for the self-employed.
29Strikingly, the excess mass is always concentrated to the left of the kink, and in some years the distributionexhibits a missing mass to the right of the kink. Such asymmetric bunching at kinks is at odds with the predictionof standard utility theory and might instead reflect reference-point dependence (Kleven 2016). While cautionshould be exercised when using bunching to estimate the elasticity of taxable income, this does not prevent usfrom interpreting bunching as a measure of misreporting that generates a revenue loss for the government.
30We choose the lower bound of the excluded range as the point where bunching starts and the upper boundas the point where the derivative of the observed distribution shifts from positive to negative. The convergencemethod would require the missing mass and the excess mass to be of the same size and assumes that there areno extensive-margin responses, which is unlikely in our context due to the large share of non-filers.
31Note that the change in the missing-mass estimate is driven by a change in the counterfactual density thatscales the excess mass, rather than by a change in the absolute size of the excess mass. The missing massdrops for corporations, but increases for self-employed individuals. In fact, the missing mass for the latter isclearly visible only in panels A2 to B3. This suggests that some self-employed individuals in subsample mayerroneously perceive the threshold to be a kink not covered by third-party reporting.
16
Third-party reporting by state institutions and credit-card companies, which also act as
withholding agents, is associated with a further reduction in misreporting (panels A3 to B4).
For self-employed filers, the excess mass among firms subject to state reporting is similar to the
excess mass among firms subject only to third-party reporting by other firms, but the excess
mass drops to 0.52 for firms subject to reporting by credit-card companies. For corporations,
the excess mass drops to 1.44 and 1.35, respectively, for firms subject to reporting by state
institutions and credit-card companies. Once again, these changes are highly statistically sig-
nificant. While the heterogeneity of bunching across subsamples captures a correlation rather
than a causal relationship, it is consistent with a compliance impact of third-party information
reporting and an even stronger impact of withholding.32
4.2 Event Study
To move towards estimating a causal effect of information reporting, we exploit within-firm
variation across time in the coverage of information reporting. Each year, over a thousand
Costa Rican firms become subject to third-party reporting for the first time. Our conceptual
framework predicts that, among firms which correctly perceive the enforcement parameters,
third-party reporting of sales RT imposes a lower bound on reported taxable sales R, and an
increase in RT weakly increases reported sales and profits.
We thus conduct an event study of firm behavior around the time of its first third-party
report, distinguishing reports by the different informing agents, which may be other firms, state
institutions, or credit-card companies. As we seek to identify a reporting rather than a real
response to the information reports, we are mindful of two identification challenges. First,
the receipt of a first information report may coincide with a real growth acceleration the firm
is experiencing. Second, the event leading to the first information report may itsself cause a
growth acceleration. This is most relevant for the receipt of a first information report by a
state institution and card company, which are generated by the award of a public procurement
contract and the adoption of a credit card machine respectively.33 We argue below that our
estimates capture a reporting rather than a real response, because of the sharpness and large
size of the response, the fact that almost the entire response is realized immediately in the
event period after otherwise parallel trends between event-group firms and control-group firms,
32Our results are also consistent with estimates from the United States, where the Internal Revenue Servicereports tax evasion rates of 63%, 7% and 1%, respectively, on income covered by little third-party reporting,income covered by substantial third-party reporting, and income subject to withholding (IRS 2016).
33Incomplete compliance by firms with third-party reporting obligations is not a concern for our analysis,which seeks to identify the impact of actual (observed) third-party reports rather than that of reporting obli-gations, as the former is the policy-relevant effect.
17
and the absence of a trend-break in the wage bill, a real outcome unlikely to be misreported
Our main specification considers the event group E of firms that become subject to third-
party reporting for the first time at event time k = 0 and a control group C of firms that
have not become subject to third-party reporting by k = 0. As a precaution, but without
substantively modifying the estimates, we follow Hilger (2016) and Naritomi (2019) in re-
weighting the control group to match the treatment group. We estimate each firms’ propensity
score of being reported by a third party for the first time in k = 0, and then re-weight the
control group by quintile bins of the propensity score to match the propensity-score distribution
of the event group, following DiNardo et al. (1996).34 We consider a balanced sample of firms we
can observe for at least four periods before and three periods after the event. This means that
we use events in event periods p = {2010, 2011, 2012, 2013}(for the income tax) and between
February 2009 and August 2014 (for the sales tax).
Table A.2 illustrates why estimates from a balanced panel are most meaningful. The defi-
nition of the event requires that a firm is economically active, which is correlated with filing a
tax declaration. A substantial fraction of firms only start filing at or after the event, and a few
firms file prior to the event but not afterwards. Moving from a balanced to an unbalanced panel
thus increases the sample size but adds little useful variation. Moving from a panel in which a
firm appears at least once before and after the event to a fully balanced panel around the event
has little effect on the number of observations. We thus focus on the balanced panel in our
main results. The appendix shows robustness of our results to numerous other specifications.35
Our main results are shown in Figure 2. Each panel displays the trend in reported taxable
income for the event group (orange dots) and the control group (blue crosses), scaled by the
pre-event average, along with the difference-in-difference coefficient obtained from estimating
yipk = γk + αip + β · I{k ≥ 0, g = E}+ uipk. (1)
The unit of observation in this estimation is a firm i in event period p at event time k. We
34The weight is thus constant within a firm over time. The propensity score is estimated separately for eachof the four different third-party reports, using firm-type and tax-administration dummies and the two lags of athird-order polynomial of total income and taxable income. See Yagan (2015) for a detailed description of there-weighting procedure.
35First, we show that the results hardly change when dropping the propensity score reweighting (Figure A.3),when considering shorter pre- and post-event periods which means considering a larger number of events overmore event periods (Figure A.4), and when considering a semi-balanced panel (in which case there is also nopropensity score reweighting, Figure A.5). To further explore the robustness of the results to unbalanced orsemi-balanced samples, Table A.3 reports the difference-in-difference estimates from all event studies, for fivedifferent samples, adopting the preferred specification presented in this section, but without propensity scorereweighting. Table A.4 does the same for the specifications with shorter pre- and post-periods (as in FigureA.4). These tables show that the effects are robust to all sample definitions, and that our preferred estimatesfrom the balanced sample are in fact on the lower end.
18

estimate the firm’s reported taxable income as a function of event-time dummies γk, firm-event-
period fixed effects αip , and the post-event and treatment group dummy I{k ≥ 0, i ∈ E}.36 A
challenge for all estimations in this paper is that our preferred outcome variables (tax base, tax
liability or tax remittance) take the value zero for a large fraction of observations, which means
that estimates from a log or inverse hyperbolic sine transformation are difficult to interpret. To
obtain an estimate that is equivalent to a percentage effect, we use the Poisson Pseudo Maximum
Likelihood (PPML) estimator pioneered by Santos Silva and Tenreyro (2006) throughout the
paper. Appendix A discusses this choice and the properties of this estimator.37
For most firms, the first transaction partner that reports to the tax authority is a supplier
providing a report about the firm’s purchase. As panels A1 and B1 in Figure 2 show, this
first third-party report is associated with a 20% increase in reported taxable income for self-
employed individuals and a 40% increase for corporations. This large effect emerges precisely
at event time, after otherwise similar trends in the event and control groups. Almost the entire
treatment effect materializes in the event period, after which the event and control group return
to parallel trends. This is perfectly consistent with a reporting response but difficult to reconcile
with a real growth effect, which would emerge less suddenly and prove more persistent.
Over time, firms gradually become subject to more third-party reports, including reports
from their clients. This event, which happens on average one year after the first supplier
report, is considered in panels A2 and B2. The first client report is still associated with an
increase in reported taxable income but the deviation is now less sharp. This is likely because
firms receiving the first client report have already become more compliant when receiving the
first supplier report, so that the new report does not provide much additional information.
A sharp deviation at event time emerges again when firms receive the first report by a state
institutions, or by a card company, which raises reported taxable income by 20%-23% (panels
A3-B4). Although most firms that become subject to reporting by a state institution or a
credit-card company are already subject to reporting by other firms, these new reports expand
the coverage of third-party reporting to transactions that were previously not reported, and
36A firm could, for example, be in the control group for events happening in 2010 and 2011, but in thetreatment group for events in 2012. Each firm-year observation for this firm would appear in the event datasetthree times, for event years 2010, 2011, and 2012. Firm-event-period fixed effects and clustering of standarderrors at the firm level account for the potentially repeated appearance of firm-year/firm-month observations.
37Our estimates are qualitatively robust to running an OLS estimation on log or IHS-transformed data,and are quantitatively very similar when running an OLS estimation on untransformed data, and scaling thecoefficient by the pre-event mean to obtain a proportional effect (see Figure A.6).
19

should therefore have an additional effect on the self-reported tax base.38
In all figures, the event and control group follow almost identical trends in the pre-event
period, and then diverge precisely at event time k = 039, until the difference between the two
groups stabilizes at approximately k = 1. It is particularly striking that the sharp deviation at
event time can be observed even in the sales tax data with monthly frequency (panels A4 and
B4). In further robustness tests (available upon request), we find that the of pattern results – a
sharp deviation at event time and a large increase in the reported tax base/liability in the event
group – is still present after controlling for the wage bill or the number of employees. Neither
of these two proxies of firm size changes discontinuously at event time. We thus conclude that
the size and timing of the effect is hard to reconcile with a pure growth effect, and must be
largely driven by a compliance response to information reporting.
5 The Anatomy of Compliance
Having shown that third-party reporting substantially increases reported tax liability, we now
study whether it moves taxpayers close to full compliance. Our conceptual framework suggests
that this should be the case if taxpayers correctly perceive the enforcement parameters RT
and p(), but not if taxpayers misperceive those parameters. Following Fisman and Wei (2004),
we examine compliance by comparing two data reports on the same tax base. We consider
successively the extensive, intensive and remittance margin of compliance.
5.1 The Extensive Margin
To examine compliance on the extensive margin, we construct the set of tax-liable firms based
on all tax declarations, third-party reports, and registration reports, and compare it to self-
reported income tax and sales tax declarations. The algorithm to identify tax-liable firms is
38Figure A.6 shows that, consistent with the fact that firms under-report both sales and costs, the taxable-income response to all events is driven by a similarly-sized percent increase in reported sales and reported costs.The increase in reported taxable income is also associated with an increase in the reported profit rate. Forreporting by credit-card companies (last two panels), we use the reported tax liability (rather than reportedtaxable income) as the main outcome, and use sales tax collected and input tax credits deducted (rather thansales and costs) for the decomposition, as sales and costs are not available on monthly sales tax declarations.
39The only exception to this pattern are corporations receiving a first client report from other firms (fourthpanel), whose trend diverges from the control group at k = −1 rather than k = 0.
20

described in detail in the appendix.40 Table 4 reports the share of non-filers for different taxes
and subsamples. The overall share of non-filers for the income tax is substantial in all years and
rose from 38% of tax-liable firms in 2010 to 55% in 2013 (panel A, column 1). Non-filing for
the sales tax seems less prevalent at about 20% of tax-liable firms, which is consistent with the
self-enforcing nature of Costa Rica’s VAT-like sales tax. However, identifying non-filers is more
difficult for sales tax than for income tax, as third-party reports provide no information on
which firms are liable for sales tax. The majority of the sales tax non-filers that we identify are
registered firms that file only intermittently. By contrast, the majority of income tax non-filers
are identified through third-party reports (column 2). This suggests that although third-party
information helps identify taxable activities, it does not necessarily induce reported firms to
comply with their tax-filing obligations.
An analysis of filing behavior across firm types shows that non-filing rates are generally
lower for registered firms (panel B, column 1). Among registered firms, non-filing rates are
lower for corporations than for self-employed individuals (columns 2 and 4).41 The coverage of
third-party reporting is also correlated with tax filing among registered firms, as theory would
predict (columns 3 and 5), and this correlation is stronger for corporations. Non-filing rates
are significantly lower among firms reported by state institutions or credit-card companies than
among firms reported only by their suppliers or clients (panel C). This suggests that reporting
mechanisms have a stronger compliance impact when accompanied by withholding.
To proxy the loss of tax revenue due to non-filing, we estimate that the share of undeclared
sales represents 16-23% of declared sales and that the estimated share of unreported income tax
liabilities represents 7-10% of reported liabilities (panel A, columns 4-5). The estimates rely
on non-filers’ third-party-reported sales or their most recent available tax return. It is assumed
that the distribution of profit rates by firm size is similar for non-filers and filers and that the
tax schedule is applied according to Costa Rican law (see the notes to Table 4 for details).
As our data does not capture firms that are fully informal and do not transact with any
third-party reporting agents, our estimates provide a weak lower bound for extensive-margin
compliance gaps. However, they should still capture the policy-relevant subsample of extensive-
margin non-compliers. Indeed, while several studies find that formalizing fully informal firms
40Note that our algorithm is more conservative than the tax authority’s own algorithm, which considers firmsto be tax-liable if they have filed in the past three years and have not deregistered since. Appendix Table A.5reports estimates using a more lenient algorithm, which goes back three years for income tax and 12 months forsales tax. The estimates are marginally higher for the income tax and about one-third higher for the sales tax.The three-year window reflects the tax authority’s practice of deregistering a firm de oficio if it has not filed atax declaration for three years.
41Note that column 1 in panel B is not the average of columns 2 and 4, as column 1 also includes firms forwhich the firm-type indicator, which identifies self-employed individuals and corporations, is missing.
21
is difficult and costly (de Mel et al. 2013, Bruhn and McKenzie 2014), Brockmeyer et al. (2019)
show that low-cost deterrence messages can significantly increase filing rates among firms known
to the tax authority, especially those covered by third-party reporting.
5.2 The Intensive Margin
To examine compliance on the intensive margin, we compare taxpayers’ self-reports and third-
party reports, for sales and costs respectively. We construct a taxpayer’s third-party reported
sales as the sum of sales reported by other firms (the taxpayer’s clients), state institutions, and
credit-card companies, as well as sales recorded in export data from the customs service. A
taxpayer’s third-party-reported costs (purchases) are the sum of sales reported by the taxpayer’s
suppliers as well as purchases recorded in import data. Firms reporting an amount at least
0.25% smaller that the relevant comparison amount are defined as “under-reporters,” while firms
reporting an amount at least 0.25% larger than the relevant comparison amount are defined as
“over-reporters.”
Table 5 shows estimated under-reporting for tax year 2012, distinguishing sales reports and
cost reports and self-employed individuals from corporations. Panel A focuses on income tax
under-reporting, panel B on estimating under-reported income tax liability, and panel C on the
internal consistency between the income tax and sales tax.42
While 16% of self-employed individuals and 13% of corporations under-report sales com-
pared to third-party reports, the share of firms under-reporting their costs is even higher, at
51% for self-employed individuals and 35% for corporations (row 1). This indicates that firms
not only under-report sales, they also under-report the scale, which is consistent with the find-
ings of Carrillo et al. (2017). The presence of an exempt tax bracket in the self-employed
tax schedule explains the larger share of cost under-reporters among self-employed individu-
als. While under-reporters leave 41-46% of their third-party-reported sales and 36-40% of their
third-party-reported costs unreported (row 5), these amounts represent about 20% of total
third-party reports (row 6). The share of unreported sales in total third-party-reported sales is
slightly larger than the share of sales under-reporters, at least among corporations, suggesting
that under-reporters are not disproportionately likely to be small firms (rows 1 vs 6, column
2). The share of under-reported costs in total third-party-reported costs is significantly smaller
than the share of cost under-reporters (rows 1 vs 6, columns 3 and 4). This suggests that
although cost under-utilization is widespread, it is modest in scale.
42Estimating under-reporting for sales tax is more challenging, due to its narrow base and the fact thatthird-party reports do not distinguish between sales that are liable for sales tax and those that are not.
22

With a few assumptions, we estimate that if all third-party-reported sales were declared,
reported tax liability would increase by 19% for corporations and by 48% for self-employed
individuals (row 9).43 The especially large increase among self-employed individuals is driven
by their high initial reported profit rates, given the exempt tax bracket. However, self-employed
individuals report tax liabilities that are, on average, much smaller than those reported by
corporations. If all third-party reported sales were declared and taxed, overall income tax
revenue from firms would increase by about 22%.
Combining estimates from the extensive and intensive margin indicates that fully enforcing
compliance with third-party reports could boost income tax revenue by up to 30%. However,
enforcement is costly, and the limited impact of desk audits (phone calls to misreporting tax-
payers requesting that they file an amended tax declaration) suggests that it is unlikely to
substantially increase compliance rates. Figure A.7 displays the results of desk audits for the
income tax (panel A) and the sales tax (panel B). Comparing a firm’s initial tax return to the
post-audit amended return, the figure plots the change in reported costs against the change
in reported revenue (the change in reported input tax credit against the change in sales tax
collected in panel B). The figures focus on the small share of desk-audited firms that actually
amend their declarations in response to the desk audit: 19% of firms for income tax and 16%
for sales tax. Firms that amend their declarations clearly offset increases in reported revenue
by increasing reported costs. Such changes offset each other by almost 100% for income tax
and by about two-thirds for sales tax. On average, firms that file an amended declaration more
than double their reported tax liability, as their initial reported liability is extremely low, but
the number of such firms and their aggregate liability are so small that amended declarations
increase total revenue by less than 0.5%.44
5.3 The Tax Remittance Margin
Finally, to examine taxpayers’ compliance with the obligation to remit their net tax liability,
we match income and sales tax returns with remittance records (payment receipts). Impor-
tantly, Costa Rican remittance records display the remittance date, the tax period, and the
43We assume that under-reporters declare all third-party-reported sales, apply the initially reported profitrate to their initially unreported sales, and then apply the tax schedule. This means we allow under-reportersto offset additional reported sales with additional reported costs in proportion to their initial declared profitrate. This assumption is supported by evidence from Carrillo et al. (2017) and Slemrod et al. (2017), and it isconsistent with firms’ response to desk audits discussed below.
44Whether it is optimal for the tax authority to invest in desk audits rather than full audits or follow-upcommunications with non-filers or late payers depends on the relative revenue elasticities of these differentenforcement methods. See, e.g., Keen and Slemrod (2017).
23

taxpayer to which each remittance corresponds, allowing us to exactly match remittances with
liabilities. To our knowledge, this is the first attempt to estimate remittance compliance for the
income and sales tax and to test the previously implicit assumption that declared tax liabilities
automatically translate into tax remittances.45 The relevant liability is the taxpayer’s final tax
liability and is to be remitted per the final (amended) tax declaration, after deductions, ad-
vance remittances, and withheld taxes have been subtracted. We compare this liability to each
taxpayer’s final tax remittance, excluding remittances made by withholding agents and advance
remittances made by the taxpayer.46 We then take the share of remittance over liability for
each taxpayer, and average this share across all taxpayers in each fiscal period.
The results are displayed in Figure A.8, where panel A corresponds to the income tax
and panel B correspond to the sales tax, and the thick blue and thin red lines correspond to
corporations and self-employed individuals, respectively. In both panels, the average remittance
share is below 100% in all fiscal periods and decreases in more recent periods, dropping to 85%
for the sales tax and 70% for the income tax in the most recent period considered (solid lines).
This patterns is clear despite the fact that we consider remittances made until April 2015, the
remittance deadline for fiscal year 2014. There are two potential explanations for this downward
sloping profile of the average remittance rate: delayed remittance and diminished compliance.
If taxpayers remit tax only after a substantial delay, then more recent periods will mechanically
display lower remittance rates than earlier periods, for which a longer data series is available.
It is also possible that a rising number of firms is failing to remit tax entirely, and these two
explanations are not mutually exclusive.
To distinguish these two explanations, we add two more remittance profiles, considering
only remittances made until April 2013 and April 2011, respectively (dashed and dotted lines).
These remittance profiles are similarly downward sloping and shifted to the left, suggesting
that remittance delays do indeed play a role in the observed decline in average remittance rate.
For instance, while the income tax remittance share for 2010 is about 88% when measured
in April 2011, it is above 95% when measured in April 2015–indicating that a small share of
taxpayers remit their tax after a substantial delay. This finding is consistent with anecdotal
evidence that cash-constrained firms remit tax when they have adequate liquidity rather than
when the remittance is due, as fines and interest fees for late remittance are small. Meanwhile,
45The estimates of property tax compliance in Peru by Del Carpio (2014) are conceptually different from ourestimates, as property taxes are assessed by the government and thus have no misreporting margin.
46Note that we use the net liability derived from the firm’s tax return, and take into account only the amountof advance tax remittances and withheld taxes that the taxpayer chose to reclaim on the tax declaration.Including remittances that are enforced retroactively by the tax authority through administrative or judicialprocedures does not significantly affect the results.
24

remittance compliance is relatively high, especially in the aggregate. As firms that do not remit
tax or remit after a significant delay are disproportionately small, the aggregate remittance rate
(i.e., the sum of remittances divided by the sum of final liabilities) approaches 100% shortly
after the remittance deadline and remains stable over time.
To summarize, despite the tax authority’s systematic use of third-party information, com-
pliance gaps remain widespread. About 50% of firms fail to file their taxes, another 13-16%
under-report their sales, 35-50% under-utilize their deductible costs, and 15-25% remit out-
standing liabilities after a several-month delay. Perfect enforcement could increase income tax
revenue by over 30%. Yet, the observed effect of desk audits is orders of magnitude smaller than
would be necessary to achieve full compliance. The persistence of large compliance gaps despite
third-party reporting is consistent with taxpayers misperceiving tax enforcement parameters
RT and p(). This suggests that there is scope for withholding to improve tax compliance.
6 The Impact of Withholding
In this section, we use the August 2011 reform of the sales tax withholding-rate schedule
to estimate the compliance impact of withholding, keeping the tax authority’s information set
constant. We start by describing the policy change and the empirical strategy. We then present
the main results on the tax-remittance response to the withholding-rate increase. Lastly, we
decompose this response into its mechanisms.
6.1 Policy Change
As discussed in section 3.2, the government revised the withholding-rate schedule for the sales
tax in August 2011. Panel A in Figure 3 shows that the reform roughly doubled the average
withholding rate applied to sales taxpayers. The graph also displays small jumps every semester,
when the withholding rates are revised by the tax authority and the new rates are communicated
to the withholding agents. This suggests that withholding agents (card companies) tend to
comply with the government-assigned withholding rates.
To better understand the relationship between the assigned and realized withholding rates,
we predict each firm’s withholding rate based on its past tax returns and the withholding-rate
schedule (Table 2). As panel B in Figure 3 shows, the predicted rate tracks the realized rate
very closely among firms for which we can observe both rates. The realized withholding rate is
slightly higher, though only prior to the reform. This is consistent with the fact that firms can
25

request a lower withholding rate from the tax authority if, for instance, they experience losses
for several consecutive months.47
Panels C and D investigate whether the reform reduced firms’ propensity to file their sales
tax declarations or to use their credit-card machines. The effect of withholding on filing propen-
sity is theoretially ambiguous. Panel C shows that the number of sales tax filers increases
steadily and smoothly around the reform. This is true both in the full sample, and in the retail
sector, which has the highest share of treated firms (over a third). Figure A.9 confirms this
zero-effect on tax filing, using a difference-in-difference analysis on an unbalanced sample.
Panel D in Figure 3 shows that also the number of credit card reports and the share of
sales tax filers with a credit-card machine displays no discontinuity at the time of the reform.
Similarly, there is little change in card machine usage. As panels E and F show, among firms
whose transactions are reported by at least one credit-card company, neither the share of card
sales in total sales nor the average of the firm-specific share of card sales changes drastically
with the reform. While both series display a small drop at the time of the reform, this drop is
statistically significant only for the average share of card sales, suggesting it is driven by firms
with a relatively small volume of total sales. Moreover, the size of the drop is economically very
small even in this sample, accounting for one percentage point of an average share of 50%.48
This suggests that most firms lack the market power to refuse card transactions to avoid the
withholding-rate increase or reduce its impact. We can thus regard the third-party reporting
environment as unaffected by the reform and use the reform to isolate the effect of withholding.49
6.2 Empirical Strategy
To estimate the impact of the withholding-rate increase on total tax remittances, and on inter-
mediate outcomes such as reporting behavior, we conduct a difference-in-difference estimation
on a panel of firms observed during a three-year window around the reform (January 2010
to December 2012). Treatment is defined at the firm-level and requires that firms are in the
sample at least once per semester for two semesters prior to the reform, as withholding rates
47There is only a weak behavioral response to the withholding-rate notches in reported value added and theshare of domestic sales, suggesting that few firms manipulate the withholding rate by misreporting the relevantline items on their sales tax declaration.
48This is consistent with the regression results presented below. While the PPML and OLS estimations donot detect a significant effect on the volume of card transactions, the estimation with an inverse hyperbolic sinetransformation, which put more weight on small observations, finds a small negative effect.
49Any reduction in credit-card usage would cause a downward bias in the difference-in-difference estimatespresented below. If the small number of firms that reduced their card usage after the withholding-rate reformwere the firms with the largest potential evasion rents, our estimates would constitute a lower bound on thetrue compliance impact of withholding.
26
for semester t are determined based on firms’ sales tax declarations from semester t − 2. The
least balanced panel we can use is thus a semesterly-balanced panel, in which firms file at least
once per semester during the period we study. In practice, most filers file regularly, so that the
semesterly-balanced panel is similar to a fully balanced panel, our preferred choice.50
Firms that used a credit-card machine at least once during January to July 2011, and for
which we calculate an increase in the predicted withholding rate between July and August 2011
are considered treated. The control group consists of firms for which we predict no change in
their withholding rate or that were not subject to withholding at the time of the reform.51
The treatment assignment is based on the predicted rather than the realized increase in the
withholding rate, as the latter may be affected by a firm-specific request or a connection to the
tax authority that allowed the firm to obtain a lower withholding rate.52 The predicted rate
change depends on a firm’s value added and share of domestic sales in total sales in the second
semester of 2010, well before July 2011 when the reform decree was drafted. Consequently,
firms could not have gamed the system to avoid an increase in the predicted withholding rate.
We estimate the effect of the rate increase using the specification
yit = αi + γt + µi · t+ β · Treati · Postt + εit, (2)
where yit is the outcome reported by firm i in month t; αi and γt are firm and month fixed
effects; µi is a firm-specific linear time trend; Treati and Postt are dummies indicating the
treatment group and the post-reform period; and εit is the error term. As several outcome
variables take a value of zero for a large share of observations, we use the PPML estimator as
our preferred specification, a choice we explain in Appendix A. We discuss below the robustness
of our results to numerous alternative specifications.
6.3 Tax Remittance Response to Withholding
To visualize the identifying assumption and treatment effect on total tax remittance, Figure 4,
panel A, plots total tax remittance for the treatment and control groups over time, scaled by
50As filing rates are not affected by the reform (cf previous section) using a semesterly-balanced panel is nota strong restriction. The results are robust to using a longer or shorter semesterly-balanced panel, or balancingthe panel only pre-reform and allowing firms to exit at any time after the reform (Table A.9).
51The results are similar but more noisy when the control group consists solely of firms that were subject towithholding but experienced no withholding-rate change. We always exclude firms that experienced a reductionin their withholding rate, as the small size of this sample does not allow us to separately estimate the impactof a rate reduction, which is not necessarily symmetric to the impact of a rate increase. We instead estimatethe effect of a rate reduction in an event study, shown in Figure A.10.
52Collusion between the withholding agent and the firm is unlikely, given the small number of withholdingagents and the intense monitoring to which they are subject.
27

the pre-reform mean, together with the DiD estimate from Equation 2. Total tax remittance is
the sum of the tax withheld and the taxpayer’s remittance. The treatment and control groups
exhibit parallel pre-reform trends, including the same seasonal fluctuations, with peaks during
the December shopping season. At the time of the reform, tax remittances in the treatment
group increase sharply by almost 30% and remain at this elevated level for the next 16 months.
In addition to this revenue effect from tax filers, the withholding-rate increase mechanically
increased tax remittance by non-filers. Prior to the reform, non-filers represent about 15%
of firms for which taxes are withheld and account for 5-7% of the amount of withheld taxes.
The amount of tax withheld from non-filers doubled at the time of the reform, while the filing
propensity did not change, as discussed above.53
In aggregate, the withholding-rate reform increased sales tax revenue by 8.1%. Panel B in
Figure 4 illustrates this result by using a simple regression discontinuity in time on demeaned
semester-wise revenue data. Importantly, the revenue data is from official government statistics
and net of any tax refunds granted to taxpayers. We also show in panel C that revenue from
the simplified tax regime, which is paid quarterly and not subject to withholding, evolves
completely smoothly at the time of the withholding-rate reform, allaying concerns that the
increase in sales tax revenue may be driven by fluctuations in the business cycle.54
6.4 Robustness
Table 6 reports the treatment effect on total tax remittance and other tax return line items for
various specifications. We report the treatment effect (semi-elasticity) for the fully balanced
and the semesterly-balanced panel.55 For each panel, we report three different specifications,
trimming the data at the 99.9th, 99th, and 95th percentile, respectively, of the distribution of
total sales. We trim rather than winsorize the data to preserve internal consistency of a firm’s
tax return, for the decomposition of the treatment effect. Our preferred specification is to trim
at the 99th percentile, as it achieves the highest internal consistency between variables.
The treatment effect on total sales tax remittance is highly significant and large in all
specifications. The point estimate is larger in the more trimmed samples, showing that with-
holding has a larger effect on smaller firms. The effect is also sligthly larger in the semesterly
53The reform also advanced part of the tax remittance among delayed remitters, but this has little impact onthe total treatment effect, even under the assumption of large discount rates. Delayed remitters comprise 5%of taxpayers, they have small liabilities on average, and most remit within a few months of the deadline.
54To investigate potential real effects of withholding, we use data on the wage bill and number of employees,and a similar difference-in-difference estimation as in our main analysis of sales tax withholding. We do notfind a significant effect of withholding on these proxies of real firm size (results available upon request).
55In the appendix tables, we also report results for a quarterly balanced panel.
28

balanced sample, suggesting that irregular filers (though few in number) are relatively more
responsive than regular filers. Appendix Tables A.6 to A.8 show that the estimates from our
main specification are quantitively very similar to OLS estimates, and also similar to estimates
from data transformed with the inverse hyperbolic sine transformation or from collapsed data
(Bertrand et al. 2004), though the latter two specifications suggest much larger point estimates
(due to how these specifications process the presence of zeros). The estimates are also robust
to adding treatment-group-specific Christmas fixed effects to account for the larger share of
retailers among the treated firms, sector-month fixed effects, clustering of errors at the sector
level, and longer or shorter pre- and post-reform periods (Table A.9).
The effect on total tax remittance is driven by the combination of a 16% increase in the share
of firms that remitted any sales tax (either by direct remittance or via withholding), and a 0.7
log-point increase in the remittance amount among firms that already remitted regularly before
the reform. A similar combination of intensive and extensive margin reporting changes holds
for other tax return items. This is evidenced in an OLS estimation with a binary dependent
variable (Tables A.10 and A.11) and an IHS estimation on the sample of firms with mostly
non-zero outcomes pre-reform (Tables A.12 and A.13).
Table A.14 shows that the treatment effect is not overturned by refund requests, increases in
compensation requests on the income tax declaration (possibly due to net credits from sales tax
withholding), or a reduction in income tax remittance. The main treatment effect is statistically
indistinguishable when the outcome is defined as total sales tax remittances net of any refund
requests and income tax compensation.56 When the outcome is the sum of total income and
sales tax remittances minus refunds, we estimate that the reform increased tax remittances by
22% in our preferred specification (column 2). Given that annual sales tax remittances among
these firms are on average twice as high as income tax remittances, this is consistent with the
demonstrated increase in sales tax remittances by 29% and even with a slight increase in income
tax remittances. Indeed, to the extent that taxpayers are internally consistent (reporting the
same tax base on their income and sales tax declarations), an increase in reported sales tax
liability should spill over to the income tax.
56The number of the refund requests increased slightly at the time of the reform, but we observe less than150 refund requests by sales tax filers per month, for 6000 treated firms in our balanced panel. This is becausethe amount of tax withheld is smaller than the gross tax liability for most firms, so a refund is rarely necessary.
29
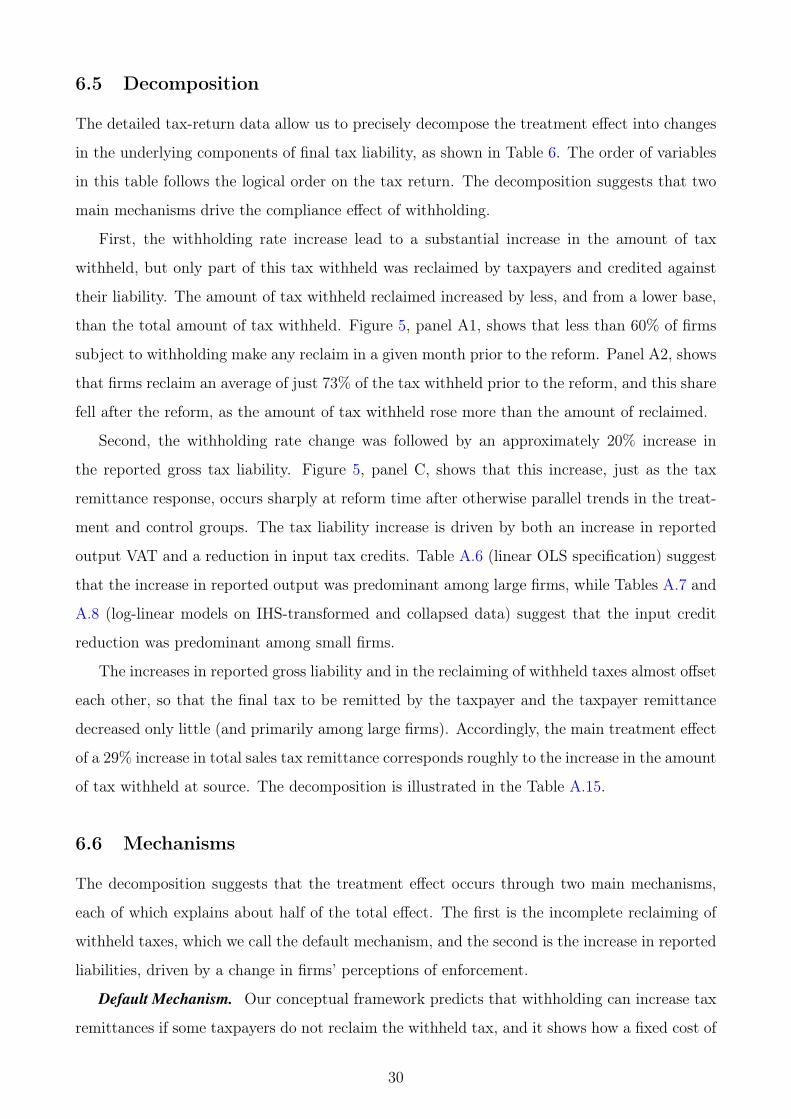
6.5 Decomposition
The detailed tax-return data allow us to precisely decompose the treatment effect into changes
in the underlying components of final tax liability, as shown in Table 6. The order of variables
in this table follows the logical order on the tax return. The decomposition suggests that two
main mechanisms drive the compliance effect of withholding.
First, the withholding rate increase lead to a substantial increase in the amount of tax
withheld, but only part of this tax withheld was reclaimed by taxpayers and credited against
their liability. The amount of tax withheld reclaimed increased by less, and from a lower base,
than the total amount of tax withheld. Figure 5, panel A1, shows that less than 60% of firms
subject to withholding make any reclaim in a given month prior to the reform. Panel A2, shows
that firms reclaim an average of just 73% of the tax withheld prior to the reform, and this share
fell after the reform, as the amount of tax withheld rose more than the amount of reclaimed.
Second, the withholding rate change was followed by an approximately 20% increase in
the reported gross tax liability. Figure 5, panel C, shows that this increase, just as the tax
remittance response, occurs sharply at reform time after otherwise parallel trends in the treat-
ment and control groups. The tax liability increase is driven by both an increase in reported
output VAT and a reduction in input tax credits. Table A.6 (linear OLS specification) suggest
that the increase in reported output was predominant among large firms, while Tables A.7 and
A.8 (log-linear models on IHS-transformed and collapsed data) suggest that the input credit
reduction was predominant among small firms.
The increases in reported gross liability and in the reclaiming of withheld taxes almost offset
each other, so that the final tax to be remitted by the taxpayer and the taxpayer remittance
decreased only little (and primarily among large firms). Accordingly, the main treatment effect
of a 29% increase in total sales tax remittance corresponds roughly to the increase in the amount
of tax withheld at source. The decomposition is illustrated in the Table A.15.
6.6 Mechanisms
The decomposition suggests that the treatment effect occurs through two main mechanisms,
each of which explains about half of the total effect. The first is the incomplete reclaiming of
withheld taxes, which we call the default mechanism, and the second is the increase in reported
liabilities, driven by a change in firms’ perceptions of enforcement.
Default Mechanism. Our conceptual framework predicts that withholding can increase tax
remittances if some taxpayers do not reclaim the withheld tax, and it shows how a fixed cost of
30
reclaiming would shape reclaiming behavior. Panels A1 and A2 of Figure 5 show that reclaiming
behavior is indeed consistent with this framework. First, panel A1 shows that reclaiming is
incomplete: fewer than 50% of all firms with withheld taxes and fewer than 60% of those with a
non-zero gross liability reclaim any amount of withheld tax in a given month prior to the reform.
Second, panel A1 also shows that the withholding-rate increase lead to an increase in taxpayers’
likelihood of making any reclaim, with the share of reclaimers eventually surpassing the pre-
reform level by approximately 10 percentage points (but never approaching full reclaim).57
Third, the comparison of panels A1 and A2 shows that firms with larger amounts of withheld
tax are more likely to reclaim. Indeed, the share of withheld tax reclaimed reaches almost
73% prior to the reform and continues to exceed 60% after the reform (panel A2), significantly
higher than the share of reclaiming firms.58 These three empirical facts support our argument
that a fixed cost prevents some firms from reclaiming their withheld taxes, thereby establishing
a compliance default.
Enforcement Perceptions Mechanism. For firms that reclaim the withheld taxes, the treat-
ment effect is driven by a large (approximately 20%) increase in reported tax liability. Table 7
studies the heterogeneity of this effect, to substantiate our claim that it is driven by a change
in enforcement perceptions. As discussed in section 2, firms which had previously misreported
their tax liability, firms which are subject to withholding for the first time, and those that
reclaim their reported tax liability are more likely to update their perceived enforcement prob-
ability with the withholding reform, and should thus exhibit larger increases in their reported
tax liability. This is indeed the pattern we observe. The interactions between the treatment
indicator and the stated characteristics are all highly statistically significant, and remain so
when we use them all at once and additionally control for an interaction with firm size. Firms
which are neither misreporters, nor first-time withholdees nor reclaimers do not exhibit any
increase in their reported tax liablity.59 This heterogeneity in the treatment effect is consistent
with an increase in the perceived probability of enforcement.
Alternative Mechanisms. We now refute potential alternative mechanisms. First, the with-
holding reform does not seem to coincide with or lead to an increase in enforcement probabilities.
57Graphs with a longer post-reform window show that the reclaiming rate eventually approaches a steadylevel at below 60%. At the time of the reform, the reclaiming rate temporarily fell because the reform increasedthe number of taxpayers subject to withholding, many of whom were initially unfamiliar with the reclaimingprocedure. As these firms gradually begin reclaiming withheld taxes, the share of reclaiming firms rose.
58Panel A2 also suggests that while the reform pushes more small firms to reclaim the tax withheld, italso pushes some firms to the point where their amount of withheld tax exceeds their declared gross liability,constraining their ability to reclaim. As a result, the overall share of withheld taxes reclaimed decreases.
59Table A.16 shows the response is larger for larger withholding rate changes (4-5 percentage points, asopposed to 1-3 percentage points), particularly among previous withholdees. Among first-time withholdees,even small changes in the withholding rate seem salient enough to generate a large change in reported liabilities.
31

Panel C1 in Figure 5 shows that audit rates are constant over time.60 Second, the reader may
be concerned that taxpayers bunch their reported tax liabilities at or around the amount of tax
withheld, in which case an increase in withholding would mechanically generate an increase in
reported tax liabilities. As discussed in section 2, bunching behavior could arise if taxpayers are
liquidity constrained and declare a liability equal to the amount of tax withheld to avoid having
to remit any tax, or if taxpayers consider the tax withheld as a signal for an “appropriate" tax
liability to declare. Panel C2 in Figure 5 plots the distribution of the difference between the
reported tax liability and the amount of tax withheld. It shows that only a small fraction of
firms exhibit bunching of reported liabilities, and the vast majority of firms report liabilities
much larger than the amount of tax withheld.61 Importantly, though the withholding reform
shifts the distribution left-wards, the degree of bunching does not increase disproportionately.
Columns 6, 7 and 9 of Table 7 show that firms with below-median profitability, which are
more likely to be liquidity constrained, or bunchers do not exhibit a stronger response to the
withholding rate increase than other firms.62 This evidence runs counter the idea that liquidity
constraints mediate the effect of withholding, or that withholding increases tax compliance
mechanically. Instead, the evidence is consistent with our interpretation of the reported tax
liability change as a conscious behavioral response by firms.
We conclude that two mechanisms drive the impact of withholding on compliance: a default
mechanism, whereby some firms fail to reclaim withheld taxes, which mechanically translates
into higher tax remittances; and a reporting mechanism, whereby the withholding-rate increase
alters firms’ perceptions of the enforcement environment, increasing reported tax liability.
7 External Validity
As with any policy evaluation that relies on a specific source of variation in a specific context,
concerns about the external validity of our study may arise. In addition to recalling that
withholding for firms is widely used around the world (Figure 1) which is prima facie evidence
for its attractive properties, this section provides causally identified evidence on the impact of
60There is no evidence that the withholding reform was accompanied by a public statement on enforcementactivities, or that enforcement activities other than audits changed discontinuously with the reform (such achange would also have to be targeted only at firms subject to withholding to generate our results).
61The fact that tax filing and remittance is monthly for the sales tax, and at a minimum quarterly (for theincome tax) also limits the potential impact of shocks and myopia among liquidity-constrained firms. It alsomeans that the damage which withholding can do to firms’ liquidity is limited, as withholding advances thetiming of tax remittance only marginally.
62We do not use seasonality or variability of income as a marker of liquidity constraints, as the frequency atwhich we observe outcomes (monthly) is the same at which firms have to remit tax.
32

withholding from multiple reforms.
First, for readers concerned that the withholding reform in August 2011 increased compli-
ance only due to fortunate timing or a particular targeting, we can show that other reforms
in Costa Rica which generated an increase in the withholding rate have a similar impact on
compliance. Panel A1 in Figure 6 shows that firms which become subject to sales tax with-
holding at different points in time, independently of the withholding-rate reform, exhibit a
sudden increase in their reported tax liability. The figure presents an event study of firms
that are already subject to third-party reporting by a credit-card company, but not subject
to withholding, and that experience a change in their withholding rate due to the biannual
withholding-rate updates.63 Panel A2 shows that firms exhibit an increase in their reported
tax liability also in 2015, after the introduction of tax withholding by credit-card companies
for the purpose of income tax compliance. Similar to the 2011 reform, this reform did not
affect the government’s information set (as all card transactions were already reported) nor the
statutory tax rates. Consistent with the enforcement perceptions mechanism, the response to
the introduction of withholding is larger among treated firms that had previously misreported
their tax liability.64
In addition to concerns about the particular reform we study, one may be concerned that
the Costa Rican context exhibits features which would lend withholding an outsized impact.
For instance, in a context where audit rates are low, third-party information reporting may
have little bite, as taxpayers would assume that audits based on cross-checks between third-
party reports and self-reports are unlikely. A similar result may hold true if audits are not
based on risk assessment or cross-checks, regardless of the audit rate. However, as Figure 6,
panel B shows, audit rates in Costa Rica are in line with the average for countries at a similar
level of per capita income. Section II.C. in Brockmeyer et al. 2019 shows that the Costa Rican
tax authority conducts a variety of enforcement interventions, from phone calls to taxpayers
with discrepancies between self-reports and third-party reports to comprehensive audits, most
of which are targeted using cross-checks and risk criteria.65
63As the update of the withholding rate between June and July in year t depends on a firm’s reported valuedadded and share of domestic sales in the second semester of year t− 1, any change in the reported tax liabilityin t is likely driven by the withholding-rate change itself, rather than by the underlying fundamentals drivingthe withholding rate. Accordingly, the reported tax liability in the event and control groups evolve in parallelbetween March and June. Upon treatment in July, the event group diverges and continues reporting a 5-6%higher tax liability for the following six months.
64Figure A.10 displays event studies for a reduction in the withholding rate, showing that a (larger) reductionin the rate leads to a (larger) reduction in reported tax liability.
65To provide direct evidence that withholding also increases compliance in other countries, we have conducteda difference-in-difference estimation around a withholding-rate increase in another developing country, andconfirmed that this reform also lead to an increase in the reported tax liability (results available upon request).
33
These results support the external validity of our study, not only in terms of its main finding
– that withholding increases tax compliance – but also in terms of a key mechanism to which we
ascribe the positive impact of tax withholding – the fact that withholding leads to an increase
in reported tax liabilities.
8 Conclusion
This paper has studied the compliance impact of tax withholding, exploiting variation generated
by withholding on firms’ sales. We show that third-party reporting increases tax compliance
among firms, but that large compliance gaps remain, which tax withholding can partially close.
Doubling the withholding rate applied by credit-card companies increases sales tax remittances
by 29% among treated firms and by 8% overall, although the government’s information set
and the statutory tax rates remain constant. The treatment effect is driven by the incomplete
reclaiming of withheld taxes and by an increase in reported tax liability. We interpret our results
on the impact channels of withholding as evidence that withholding is a distinct compliance
mechanism, which, unlike traditional enforcement and third-party reporting mechanisms, does
not attempt to elicit taxpayers’ true income, but instead establishes a default tax remittance
at source. This explains why withholding schemes for firms are a key feature of tax systems in
lower-income countries and in low-compliance sectors.
However, even if withholding increases tax compliance, its welfare impact remains ambigu-
ous. Withholding shifts administrative costs from the tax authority to the withholding agent
and the taxpayer. It also transfers liquidity from the taxpayer to the government and increases
effective tax rates, particularly for small and liquidity-constrained firms. Studying the optimal
level of withholding rates and examining the distributional effects of withholding could yield
important insights into the welfare implications of this policy. Analyzing the spillover effects
of withholding on firms along the supply chain and on competitor firms in the same sector or
location is also worthwhile. This would allow decomposing the aggregate revenue impact of
withholding into the direct effect on treated firms and the potential indirect effects.
Finally, investigating the choice of withholding agents would also be relevant. In addition
to state institutions and credit-card companies, governments may consider using other financial
institutions and large firms as withholding agents. In doing so, they face a trade-off between
improving compliance and increasing administrative costs for both the government and the
withholding agents. These costs are likely to be smallest for firms that are already subject
to increased government monitoring and have sophisticated accounting departments. It would
34

also be interesting to study under which conditions governments should provide monetary or
non-monetary incentives to withholding agents.
35
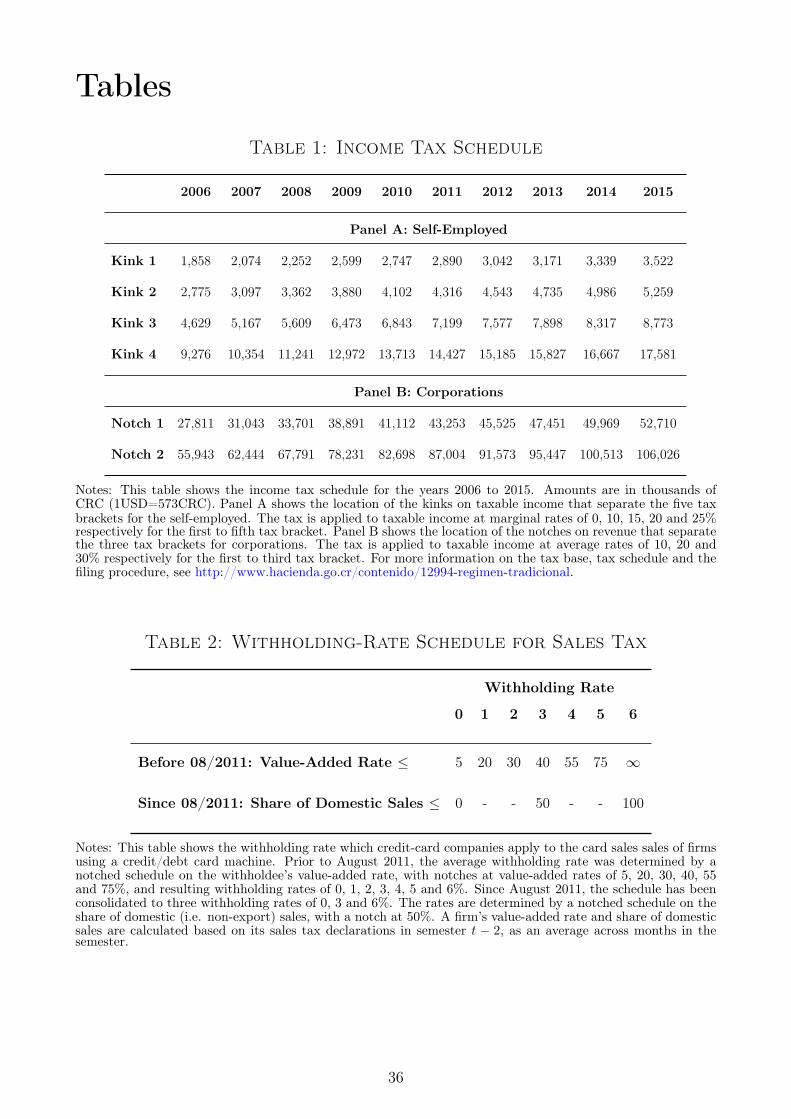
Tables
Table 1: Income Tax Schedule
2006 2007 2008 2009 2010 2011 2012 2013 2014 2015
Panel A: Self-Employed
Kink 1 1,858 2,074 2,252 2,599 2,747 2,890 3,042 3,171 3,339 3,522
Kink 2 2,775 3,097 3,362 3,880 4,102 4,316 4,543 4,735 4,986 5,259
Kink 3 4,629 5,167 5,609 6,473 6,843 7,199 7,577 7,898 8,317 8,773
Kink 4 9,276 10,354 11,241 12,972 13,713 14,427 15,185 15,827 16,667 17,581
Panel B: Corporations
Notch 1 27,811 31,043 33,701 38,891 41,112 43,253 45,525 47,451 49,969 52,710
Notch 2 55,943 62,444 67,791 78,231 82,698 87,004 91,573 95,447 100,513 106,026
Notes: This table shows the income tax schedule for the years 2006 to 2015. Amounts are in thousands ofCRC (1USD=573CRC). Panel A shows the location of the kinks on taxable income that separate the five taxbrackets for the self-employed. The tax is applied to taxable income at marginal rates of 0, 10, 15, 20 and 25%respectively for the first to fifth tax bracket. Panel B shows the location of the notches on revenue that separatethe three tax brackets for corporations. The tax is applied to taxable income at average rates of 10, 20 and30% respectively for the first to third tax bracket. For more information on the tax base, tax schedule and thefiling procedure, see http://www.hacienda.go.cr/contenido/12994-regimen-tradicional.
Table 2: Withholding-Rate Schedule for Sales Tax
Withholding Rate
0 1 2 3 4 5 6
Before 08/2011: Value-Added Rate ≤ 5 20 30 40 55 75 ∞
Since 08/2011: Share of Domestic Sales ≤ 0 - - 50 - - 100
Notes: This table shows the withholding rate which credit-card companies apply to the card sales sales of firmsusing a credit/debt card machine. Prior to August 2011, the average withholding rate was determined by anotched schedule on the withholdee’s value-added rate, with notches at value-added rates of 5, 20, 30, 40, 55and 75%, and resulting withholding rates of 0, 1, 2, 3, 4, 5 and 6%. Since August 2011, the schedule has beenconsolidated to three withholding rates of 0, 3 and 6%. The rates are determined by a notched schedule on theshare of domestic (i.e. non-export) sales, with a notch at 50%. A firm’s value-added rate and share of domesticsales are calculated based on its sales tax declarations in semester t − 2, as an average across months in thesemester.
36

Tabl
e3:
Info
rm
ativ
eD
ecla
rat
ions
to
the
Tax
Authorit
y
(1)
(2)
(3)
(4)
(5)
(6)
Form
Purpose
RecordTyp
eCoverageof
Coverageof
%Matched
With
Corporations
Self-Employed
IncomeTax
Records
D15
1Rep
orting
offirm-firm
tran
sactions
Sales
46.4
38.9
36.8
N=17,251,681
(53.4%
sales)
Purchases
49.2
53.9
65.1
D15
0Rep
orting
ofan
dwithh
olding
onSa
lesto
stateinstitutions
8.4
5.0
78.2
salesto
specificclients
Salesto
specificfirms
0.22
0.08
40.2
forpu
rposeof
incometaxcompliance
N=864,695(98.7%
statepu
rcha
se)
D15
3Rep
orting
ofan
dwithh
olding
onSa
les
11.5
[29.4]
5.8[20.7]
67.8
[48.7]
credit/d
ebit-cardsalesforsalestax
forpu
rposeof
salestaxcompliance
N=3,928,545
Notes:Thistableprovides
inform
ationab
outthena
ture
andcoverage
ofthird-pa
rtyinform
ativede
clarations
used
bythetaxau
thorityin
Costa
Rica,
for2006-2015.
Colum
ns4an
d5displaytheshareof
incometaxfilerscoveredby
thediffe
rent
third-pa
rtydeclarations,distingu
ishing
corporations
andtheself-em
ployed.Colum
n6displays
theshareof
inform
ativedeclarations
which
arematched
withan
incometaxdeclaration.
Inthelast
row,theshares
inbrackets
referto
thematch
rate
with
themon
thly
salestaxdeclarations
for2008-2014.
The
shares
arecalculated
onthepo
oled
data
forallyears/mon
ths.
All
declarations
identify
therepo
rter
andtaxp
ayer
bytheirad
ministration-internal
anon
ymou
staxID
,an
dprovideinform
ationon
thetran
sactionam
ount,an
d(w
here
applicab
le)theam
ount
ofthetax
withh
eld.
Amou
ntsareaccrued.
SinceJa
nuary2012,a
lldeclarations
mustbe
prepared
usingtheDECLA
R@7software.
Alldeclarations
arean
nual,e
xceptD153,
which
ismon
thly.D151requ
ires
repo
rtingof
tran
sactions
>2.5millionCRC
annu
ally
withatran
sactionpa
rtner,
andtran
sactions
of>50,000
CRC
annu
ally
for
rent,c
ommission
s,profession
alservices
orinterests.
ForD15
0,thewithh
olding
rate
is2%
and3%
respectively
forstatean
dprivatepu
rcha
ses.
ForD15
3,thewithh
olding
rate
isfirm
specific,
follo
wingtheschedu
lein
Table2.
Formoreinform
ationon
thefilingof
inform
ativedeclarations,
seehttp://w
ww.haciend
a.go
.cr/contenido/
1299
7-declaraciones-inform
ativas
37

Table 4: Non-Filing
Panel A: Non-filing among all tax-liable firms
(1) (2) (3) (4) (5)
% Non-filers
Of which
registered
non-filers
Non-filers’
TPR sales as
% of declared
TPR sales
Undeclared
sales as % of
declared sales
Unreported
liability as %
of declared
liability
Income Tax 2010 0.384 0.185 0.155 0.211 0.071
Income Tax 2011 0.485 0.125 0.195 0.230 0.069
Income Tax 2012 0.528 0.116 0.115 0.168 0.071
Income Tax 2013 0.556 0.121 0.114 0.181 0.099
Sales Tax 2011 0.196 0.894 . . .
Sales Tax 2012 0.185 0.884 . . .
Sales Tax 2013 0.198 0.891 . . .
Panel B: Non-filing among registered firms
AllSelf-
Employed
Self-
Employed
with TPR
CorporationsCorporations
with TPR
Income Tax 2010 0.104 0.095 0.082 0.081 0.045
Income Tax 2011 0.105 0.090 0.078 0.061 0.033
Income Tax 2012 0.115 0.080 0.070 0.065 0.028
Income Tax 2013 0.131 0.128 0.094 0.137 0.043
Sales Tax 2011 0.180 0.263 0.122 0.094 0.060
Sales Tax 2012 0.168 0.247 0.103 0.085 0.045
Sales Tax 2013 0.181 0.269 0.079 0.085 0.034
Panel C: Non-filing among firms covered by information reporting
AllReported by
firms
Reported by
state
Reported by
card
companies
Income Tax 2010 0.574 0.579 0.235 0.293 .
Income Tax 2011 0.653 0.659 0.202 0.297 .
Income Tax 2012 0.673 0.679 0.186 0.308 .
Income Tax 2013 0.677 0.682 0.177 0.319 .
Notes: These panels show the share of non-filers (tax liable firms that do not file) for the income tax (rows1-4) and the sales tax (rows 5-7). The algorithm used to construct the share of non-filers is explained in theappendix. Panel A shows the share of non-filers among all tax liable firms (column 1), the share of non-filersthat are registered (2), non-filers’ third-party reported sales as share of filers’ reported sales (3), non-filers’estimated sales as share of declared sales (4), and non-filers’ estimated tax liability as share of declared liability(5). TPR stands for third-party reports, and TPR sales is the sum of all third-party reports except cost reports.A non-filing firm’s estimated sales in period t is max(third-party reported sales in t ; self-reported sales in themost recent prior reporting period). A non-filer’s tax liability is estimated using its estimated sales, applyingthe average profit rate of filers in the corresponding decile of the sales distribution of filers, and then applyingthe tax schedule. Panel B reports the share of non-filers among all registered firms (1), and among subsamplesof registered firms as indicated by the column headings (2-5). Panel C reports the share of non-filers amongall firms covered by information reporting (1), and among subsamples of firms reported by different informingagents, as indicated by the column headings (2-4).
38
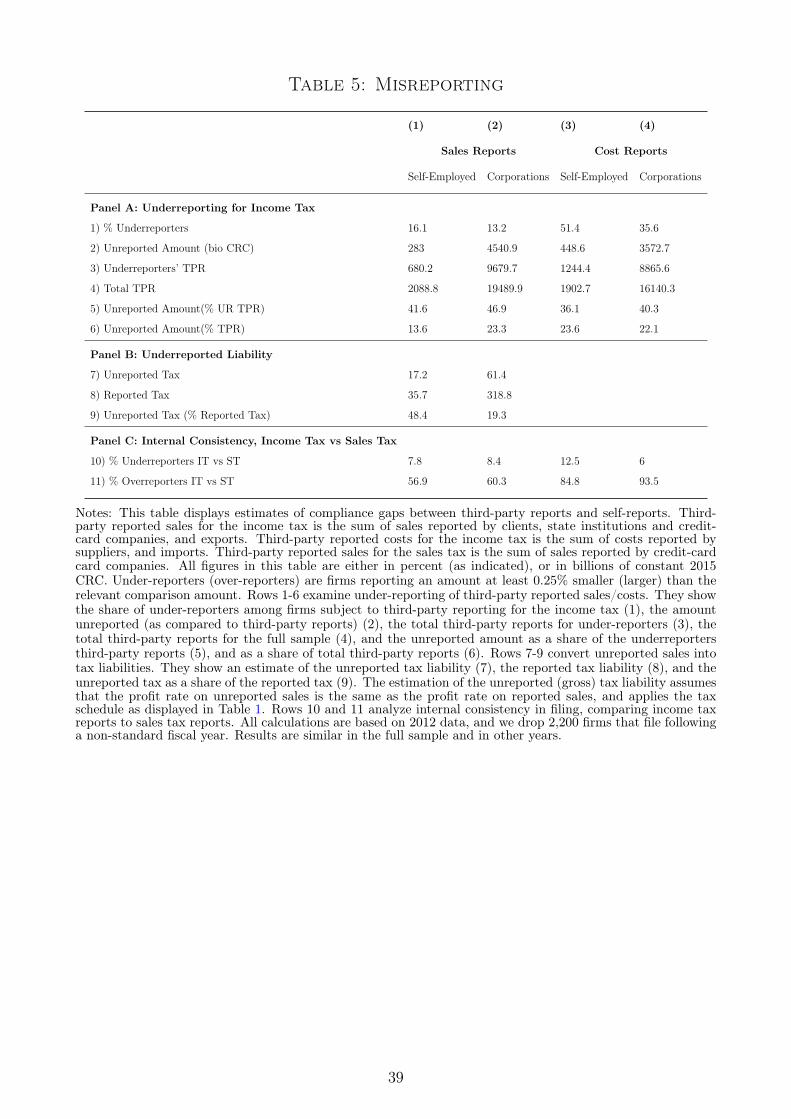
Table 5: Misreporting
(1) (2) (3) (4)
Sales Reports Cost Reports
Self-Employed Corporations Self-Employed Corporations
Panel A: Underreporting for Income Tax
1) % Underreporters 16.1 13.2 51.4 35.6
2) Unreported Amount (bio CRC) 283 4540.9 448.6 3572.7
3) Underreporters’ TPR 680.2 9679.7 1244.4 8865.6
4) Total TPR 2088.8 19489.9 1902.7 16140.3
5) Unreported Amount(% UR TPR) 41.6 46.9 36.1 40.3
6) Unreported Amount(% TPR) 13.6 23.3 23.6 22.1
Panel B: Underreported Liability
7) Unreported Tax 17.2 61.4
8) Reported Tax 35.7 318.8
9) Unreported Tax (% Reported Tax) 48.4 19.3
Panel C: Internal Consistency, Income Tax vs Sales Tax
10) % Underreporters IT vs ST 7.8 8.4 12.5 6
11) % Overreporters IT vs ST 56.9 60.3 84.8 93.5
Notes: This table displays estimates of compliance gaps between third-party reports and self-reports. Third-party reported sales for the income tax is the sum of sales reported by clients, state institutions and credit-card companies, and exports. Third-party reported costs for the income tax is the sum of costs reported bysuppliers, and imports. Third-party reported sales for the sales tax is the sum of sales reported by credit-cardcard companies. All figures in this table are either in percent (as indicated), or in billions of constant 2015CRC. Under-reporters (over-reporters) are firms reporting an amount at least 0.25% smaller (larger) than therelevant comparison amount. Rows 1-6 examine under-reporting of third-party reported sales/costs. They showthe share of under-reporters among firms subject to third-party reporting for the income tax (1), the amountunreported (as compared to third-party reports) (2), the total third-party reports for under-reporters (3), thetotal third-party reports for the full sample (4), and the unreported amount as a share of the underreportersthird-party reports (5), and as a share of total third-party reports (6). Rows 7-9 convert unreported sales intotax liabilities. They show an estimate of the unreported tax liability (7), the reported tax liability (8), and theunreported tax as a share of the reported tax (9). The estimation of the unreported (gross) tax liability assumesthat the profit rate on unreported sales is the same as the profit rate on reported sales, and applies the taxschedule as displayed in Table 1. Rows 10 and 11 analyze internal consistency in filing, comparing income taxreports to sales tax reports. All calculations are based on 2012 data, and we drop 2,200 firms that file followinga non-standard fiscal year. Results are similar in the full sample and in other years.
39

Table 6: Impact of Withholding-Rate Increase
Fully-Balanced Panel Semesterly-Balanced Panel
(1) (2) (3) (4) (5) (6)Trimmed
99.9th
pctile
Trimmed
99th
pctile
Trimmed
95th
pctile
Trimmed
99.9th
pctile
Trimmed
99th
pctile
Trimmed
95th
pctile
Total Sales Reported 0.0314* 0.0130 0.0252*** 0.0372** 0.0171* 0.0290***
(0.0162) (0.00912) (0.00765) (0.0147) (0.00885) (0.00714)
Sales Tax Collected 0.0493 0.0758** 0.124* 0.0599** 0.0771** 0.0639**
(0.0304) (0.0371) (0.0681) (0.0266) (0.0355) (0.0295)
Input Tax Credits -0.0225 -0.0512** -0.0717* -0.0129 -0.0500** -0.0692*
(0.0315) (0.0223) (0.0422) (0.0278) (0.0217) (0.0413)
- Import Credits -0.0462 -0.0292 0.0113 -0.0124 -0.0310 -0.00871
(0.0526) (0.0273) (0.0326) (0.0355) (0.0264) (0.0331)
- Local Purchase Credits -0.00910 -0.0402 -0.0585 -0.0106 -0.0370 -0.0529
(0.0343) (0.0360) (0.0599) (0.0324) (0.0350) (0.0586)
Gross Tax Liability 0.215** 0.199*** 0.262*** 0.236*** 0.221*** 0.277***
(0.0865) (0.0259) (0.0248) (0.0845) (0.0237) (0.0229)
Withholding Base -0.0142 -0.0160 0.0238 -0.00775 -0.00662 0.0303**
(0.0259) (0.0187) (0.0160) (0.0238) (0.0175) (0.0142)
Withheld Tax 0.793*** 0.867*** 0.938*** 0.806*** 0.881*** 0.912***
(0.0666) (0.0423) (0.0340) (0.0605) (0.0345) (0.0285)
Withheld Tax Reclaims 0.691*** 0.773*** 0.861*** 0.709*** 0.803*** 0.847***
(0.0712) (0.0425) (0.0377) (0.0659) (0.0359) (0.0326)
Compensation Requests 0.244* 0.304** 0.0823 0.265** 0.355*** 0.199**
(0.138) (0.134) (0.105) (0.130) (0.118) (0.0995)
Final Tax To Remit -0.00999 -0.0758*** 0.00807 0.00802 -0.0540** 0.0170
(0.0990) (0.0258) (0.0214) (0.0977) (0.0240) (0.0201)
Taxpayer Sales Tax Remittance -0.0843** -0.0419* 0.0194 -0.0728** -0.0256 0.0189
(0.0352) (0.0238) (0.0213) (0.0332) (0.0221) (0.0201)
Total Sales Tax Remittance 0.255*** 0.293*** 0.395*** 0.277*** 0.318*** 0.407***
(0.0303) (0.0216) (0.0191) (0.0285) (0.0193) (0.0172)
Month FE Yes Yes Yes Yes Yes Yes
Firm FE Yes Yes Yes Yes Yes Yes
Time Trend Yes Yes Yes Yes Yes Yes
Observations 962,424 944,352 871,308 1,046,304 1,026,540 946,368
Notes: This table displays DiD estimates of the impact of the (predicted) withholding-rate increase, as perequation 2. Each cell represents the point estimate (semi-elasticity) on the treatment dummy, indicating firmswith a predicted rate increase at reform time. The rows reflect different outcome variables corresponding to themain line items on the sales tax return. Taxpayer remittance is the remittance made by the taxpayer at theend of each month. Total remittance is the sum of taxpayer remittance and any tax withheld. The estimatesare based on the Poisson Pseudo Maximum Likelihood Estimator (PPML, see Appendix A). All estimationsallow for sector-specific time-trends, firm and month fixed effects, and standard errors are clustered at the firmlevel. Columns 1-3 and 4-6 correspond to estimations on a fully balanced panel (firms filing every month during2010-2012), and on a semesterly balanced panel (firms filing at least once per semester during 2010-2012),respectively. To reduce the effect of outliers while maintaining the internal consistency of the tax declaration,we trim rather than topcode outliers, at the 99.9th, 99th or 95th percentile in the distribution of reported sales(as indicated in the column headings).
40
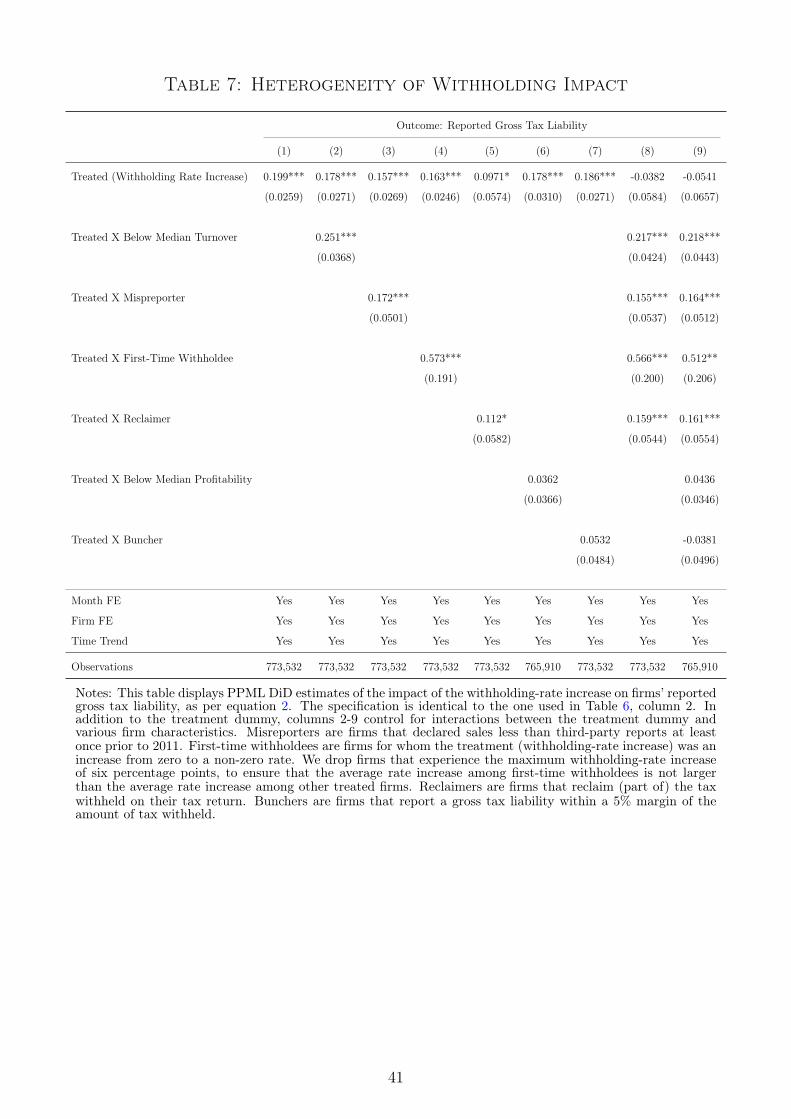
Table 7: Heterogeneity of Withholding Impact
Outcome: Reported Gross Tax Liability
(1) (2) (3) (4) (5) (6) (7) (8) (9)
Treated (Withholding Rate Increase) 0.199*** 0.178*** 0.157*** 0.163*** 0.0971* 0.178*** 0.186*** -0.0382 -0.0541
(0.0259) (0.0271) (0.0269) (0.0246) (0.0574) (0.0310) (0.0271) (0.0584) (0.0657)
Treated X Below Median Turnover 0.251*** 0.217*** 0.218***
(0.0368) (0.0424) (0.0443)
Treated X Mispreporter 0.172*** 0.155*** 0.164***
(0.0501) (0.0537) (0.0512)
Treated X First-Time Withholdee 0.573*** 0.566*** 0.512**
(0.191) (0.200) (0.206)
Treated X Reclaimer 0.112* 0.159*** 0.161***
(0.0582) (0.0544) (0.0554)
Treated X Below Median Profitability 0.0362 0.0436
(0.0366) (0.0346)
Treated X Buncher 0.0532 -0.0381
(0.0484) (0.0496)
Month FE Yes Yes Yes Yes Yes Yes Yes Yes Yes
Firm FE Yes Yes Yes Yes Yes Yes Yes Yes Yes
Time Trend Yes Yes Yes Yes Yes Yes Yes Yes Yes
Observations 773,532 773,532 773,532 773,532 773,532 765,910 773,532 773,532 765,910
Notes: This table displays PPML DiD estimates of the impact of the withholding-rate increase on firms’ reportedgross tax liability, as per equation 2. The specification is identical to the one used in Table 6, column 2. Inaddition to the treatment dummy, columns 2-9 control for interactions between the treatment dummy andvarious firm characteristics. Misreporters are firms that declared sales less than third-party reports at leastonce prior to 2011. First-time withholdees are firms for whom the treatment (withholding-rate increase) was anincrease from zero to a non-zero rate. We drop firms that experience the maximum withholding-rate increaseof six percentage points, to ensure that the average rate increase among first-time withholdees is not largerthan the average rate increase among other treated firms. Reclaimers are firms that reclaim (part of) the taxwithheld on their tax return. Bunchers are firms that report a gross tax liability within a 5% margin of theamount of tax withheld.
41

Figures
Figure 1: Withholding Systems and Development
A: Withholding Bases
** ***
**
N= N= N= N= N= N= N= N= 0
1020
3040
GD
P pe
r cap
ita
VAT WH
No VAT W
HIT W
H
No IT W
H
VAT WH Broa
d
VAT WH Targ
eted
IT WH Broa
d
IT WH Targ
eted
Mean GDP pc Median GDP pc 95% CI
B: Withholding Rates
AGO
ARG
BDI
BLZ
CHL
COL
DZAECU
EGY
GEO
GHA IDNKEN KOR
KWT
LCA
LVA
MEX
MNE
MOZ
MUS
MYS
NAM
NGA OMN
PER
PHL
PRY
QAT
RWA
SAU SGPSLV SRB
SVN
SWZ
TUR
UGA
URY
ZMB
010
2030
With
hold
ing
Rat
e
5 7.5 10 12.5Log GDP per capita
Coefficient: -.07 (.025), N=40
Technical Service Fees
AFG
BDI
KEN
LSOMNE
MOZ
MUS
NGAPAK
SLE
SWZ
010
2030
With
hold
ing
Rat
e
5 7.5 10 12.5Log GDP per capita
Coefficient: -.08 (.033), N=11
Contractor Fees
Notes: This figure shows that tax withholding on firms is widespread, and that the use of withholding, thebreadth of withholding bases and the level of withholding rates are all negatively correlated with GDP percapita. Panel A displays the mean/median GDP per capita (in thousands of 2013 USD, WDI) for differentsubsamples of countries. The number below each bar displays the sample size. The stars reflect the significancelevels of the mean difference between two adjacent bars: countries that use and do not use withholding on theVAT/sales tax; countries that use and do not use withholding on income taxes for firms; countries that usea broad withholding regime (that applies across sectors), and those that use a targeted withholding regime,applicable only to certain sectors (e.g. construction, fishing). The analysis is based on a sample of 118 countriesfor which data was available from the PKF International Worldwide Tax Guide 2015, recent EY InternationalTax Alerts, PWC Tax Summaries, or the secondary sources referenced in the introduction. Panel B displaysthe correlation between log GDP per capita and the withholding rate, for withholding on technical services feesand on contractor fees, collected from the PKF International Worldwide Tax Guide 2015.
42

Fig
ure
2:Even
tst
udy
of
Fir
stIn
form
atio
nR
eport
A:Self-Employed
A1:
Rep
ortby
Supp
lier
A2:
Rep
ortby
Client
A3:
Rep
ortby
State
A4:
Rep
ortby
Credit/Debit
Card
DD
=0.1
95 (0
.009
)
.811.21.41.6Taxable Income (Scaled by Pre-Event Mean)
-4-3
-2-1
01
23
Even
t Yea
r
Con
trol G
roup
Even
t Gro
upN
eve
nt g
roup
=881
0, N
con
trol g
roup
=215
65 in
eve
nt y
ear.
DD
=0.0
97 (0
.005
)
.911.11.21.3Taxable Income (Scaled by Pre-Event Mean)
-4-3
-2-1
01
23
Even
t Yea
r
Con
trol G
roup
Even
t Gro
upN
eve
nt g
roup
=274
60, N
con
trol g
roup
=373
47 in
eve
nt y
ear.
DD
=0.2
09 (0
.009
)
.811.21.41.6Taxable Income (Scaled by Pre-Event Mean)
-4-3
-2-1
01
23
Even
t Yea
r
Con
trol G
roup
Even
t Gro
upN
eve
nt g
roup
=440
8, N
con
trol g
roup
=116
919
in e
vent
yea
r.
DD
=0.2
16 (0
.016
)
.911.11.21.31.4Net Tax Liability (Scaled)
-4-3
-2-1
01
23
Even
t Mon
th
Con
trol G
roup
Even
t Gro
upN
eve
nt g
roup
=521
5, N
con
trol g
roup
=529
890
in e
vent
yea
r.
B:Corporations
B1:
Rep
ortby
Supp
lier
B2:
Rep
ortby
Client
B3:
Rep
ortby
State
B4:
Rep
ortby
Credit/Debit
Card
DD
=0.3
97 (0
.030
)
.811.21.41.61.8Taxable Income (Scaled by Pre-Event Mean)
-4-3
-2-1
01
23
Even
t Yea
r
Con
trol G
roup
Even
t Gro
upN
eve
nt g
roup
=582
7, N
con
trol g
roup
=201
45 in
eve
nt y
ear.
DD
=0.2
49 (0
.019
)
.811.21.41.6Taxable Income (Scaled by Pre-Event Mean)
-4-3
-2-1
01
23
Even
t Yea
r
Con
trol G
roup
Even
t Gro
upN
eve
nt g
roup
=944
7, N
con
trol g
roup
=220
83 in
eve
nt y
ear.
DD
=0.2
13 (0
.024
)
.811.21.41.6Taxable Income (Scaled by Pre-Event Mean)
-4-3
-2-1
01
23
Even
t Yea
r
Con
trol G
roup
Even
t Gro
upN
eve
nt g
roup
=300
3, N
con
trol g
roup
=834
76 in
eve
nt y
ear.
DD
=0.2
30 (0
.023
)
.911.11.21.31.4Net Tax Liability (Scaled)
-4-3
-2-1
01
23
Even
t Mon
th
Con
trol G
roup
Even
t Gro
upN
eve
nt g
roup
=516
0, N
con
trol g
roup
=532
355
in e
vent
yea
r.
Notes:Thisfig
uredisplays
eventstud
iesof
firms’be
havior
afterbe
ingrepo
rted
forthefirst
timeby
diffe
rent
repo
rtingagents.Eachpa
neld
isplay
stherepo
rted
taxa
ble
income(tax
liability,
inpa
nels
A4an
dB4)
arou
ndtheyear
(mon
th)of
theevent,
scaled
bythepre-eventmean,
foran
eventgrou
p(orang
edo
tedlin
e)an
dan
event
controlgrou
p(bluecrossedlin
e).The
blacksolid
linemarks
eventtime0,
whenfirmsin
theeventgrou
parerepo
rted
tothetaxau
thorityforthefirst
timeby
the
repo
rtingagentindicatedin
thepa
neltitle.The
data
istop-codedat
the98th
percentile
byevent-grou
p-mon
th.The
controlg
roup
isre-w
eigh
tedby
itsprop
ensity
score
ofexpe
rien
cing
theevent(cf.
section4.2an
dfootno
te34
forde
tails).
Eachgrou
pconsists
ofaba
lanced
panelof
firmsthat
canbe
observed
forthepe
riod
displayed
(fou
ryears/mon
thsbe
fore
andthreeyears/mon
thsaftertheevent).Pan
elsA1-A3an
dB1-B3consider
events
happ
eningin
2010-2013.
Pan
elsA4an
dB4consider
events
happ
eningin
02/2009-08/2014.
The
text
displays
thediffe
rence-in-difference
coeffi
cientfrom
estimatingequa
tion
1.Stan
dard
errors
areclusteredat
thefirm-le
vel.
Figures
A.3,A
.4,A
.5an
dA.6,a
ndTab
lesA.4
andA.3
show
robu
stne
ssof
theresultsto
alternativespecification
s.
43
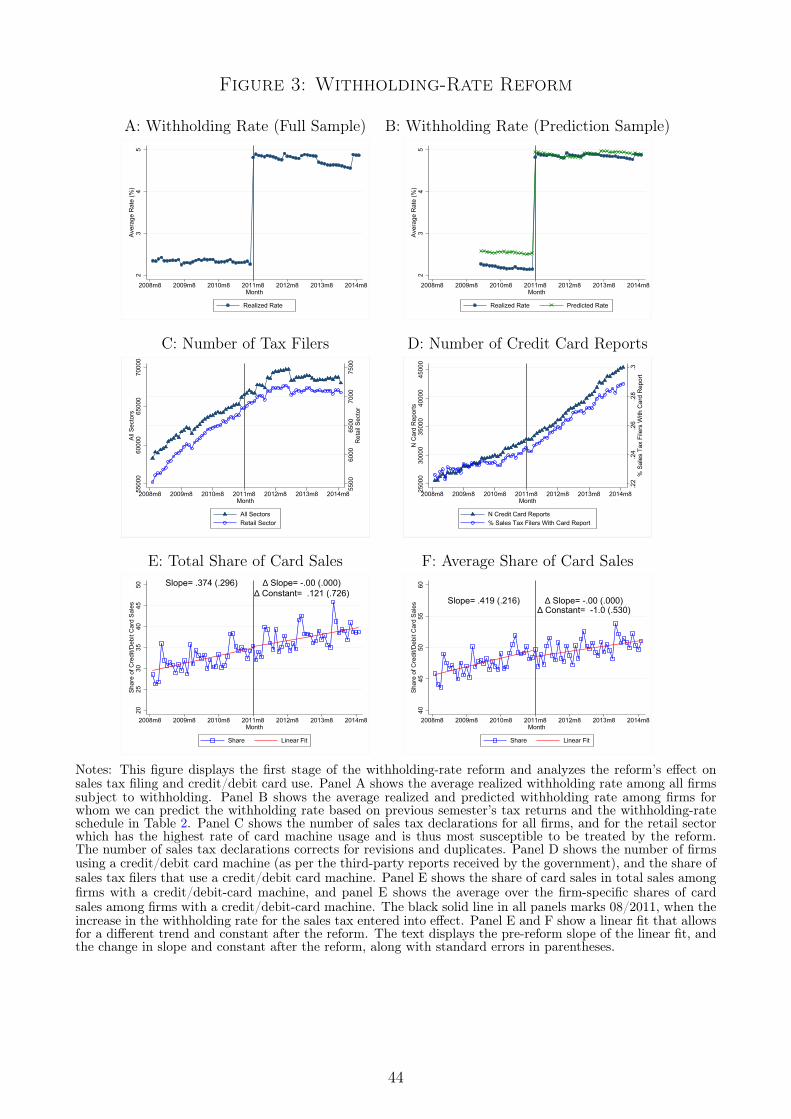
Figure 3: Withholding-Rate Reform
A: Withholding Rate (Full Sample) B: Withholding Rate (Prediction Sample)2
34
5Av
erag
e R
ate
(%)
2008m8 2009m8 2010m8 2011m8 2012m8 2013m8 2014m8Month
Realized Rate
23
45
Aver
age
Rat
e (%
)
2008m8 2009m8 2010m8 2011m8 2012m8 2013m8 2014m8Month
Realized Rate Predicted Rate
C: Number of Tax Filers D: Number of Credit Card Reports55
0060
0065
0070
0075
00R
etai
l Sec
tor
5500
060
000
6500
070
000
All S
ecto
rs
2008m8 2009m8 2010m8 2011m8 2012m8 2013m8 2014m8Month
All SectorsRetail Sector
.22
.24
.26
.28
.3%
Sal
es T
ax F
ilers
With
Car
d R
epor
t
2500
030
000
3500
040
000
4500
0N
Car
d R
epor
ts
2008m8 2009m8 2010m8 2011m8 2012m8 2013m8 2014m8Month
N Credit Card Reports% Sales Tax Filers With Card Report
E: Total Share of Card Sales F: Average Share of Card SalesSlope= .374 (.296) ∆ Slope= -.00 (.000)
∆ Constant= .121 (.726)
2025
3035
4045
50Sh
are
of C
redi
t/Deb
it C
ard
Sale
s
2008m8 2009m8 2010m8 2011m8 2012m8 2013m8 2014m8Month
Share Linear Fit
Slope= .419 (.216) ∆ Slope= -.00 (.000)∆ Constant= -1.0 (.530)
4045
5055
60Sh
are
of C
redi
t/Deb
it C
ard
Sale
s
2008m8 2009m8 2010m8 2011m8 2012m8 2013m8 2014m8Month
Share Linear Fit
Notes: This figure displays the first stage of the withholding-rate reform and analyzes the reform’s effect onsales tax filing and credit/debit card use. Panel A shows the average realized withholding rate among all firmssubject to withholding. Panel B shows the average realized and predicted withholding rate among firms forwhom we can predict the withholding rate based on previous semester’s tax returns and the withholding-rateschedule in Table 2. Panel C shows the number of sales tax declarations for all firms, and for the retail sectorwhich has the highest rate of card machine usage and is thus most susceptible to be treated by the reform.The number of sales tax declarations corrects for revisions and duplicates. Panel D shows the number of firmsusing a credit/debit card machine (as per the third-party reports received by the government), and the share ofsales tax filers that use a credit/debit card machine. Panel E shows the share of card sales in total sales amongfirms with a credit/debit-card machine, and panel E shows the average over the firm-specific shares of cardsales among firms with a credit/debit-card machine. The black solid line in all panels marks 08/2011, when theincrease in the withholding rate for the sales tax entered into effect. Panel E and F show a linear fit that allowsfor a different trend and constant after the reform. The text displays the pre-reform slope of the linear fit, andthe change in slope and constant after the reform, along with standard errors in parentheses.
44
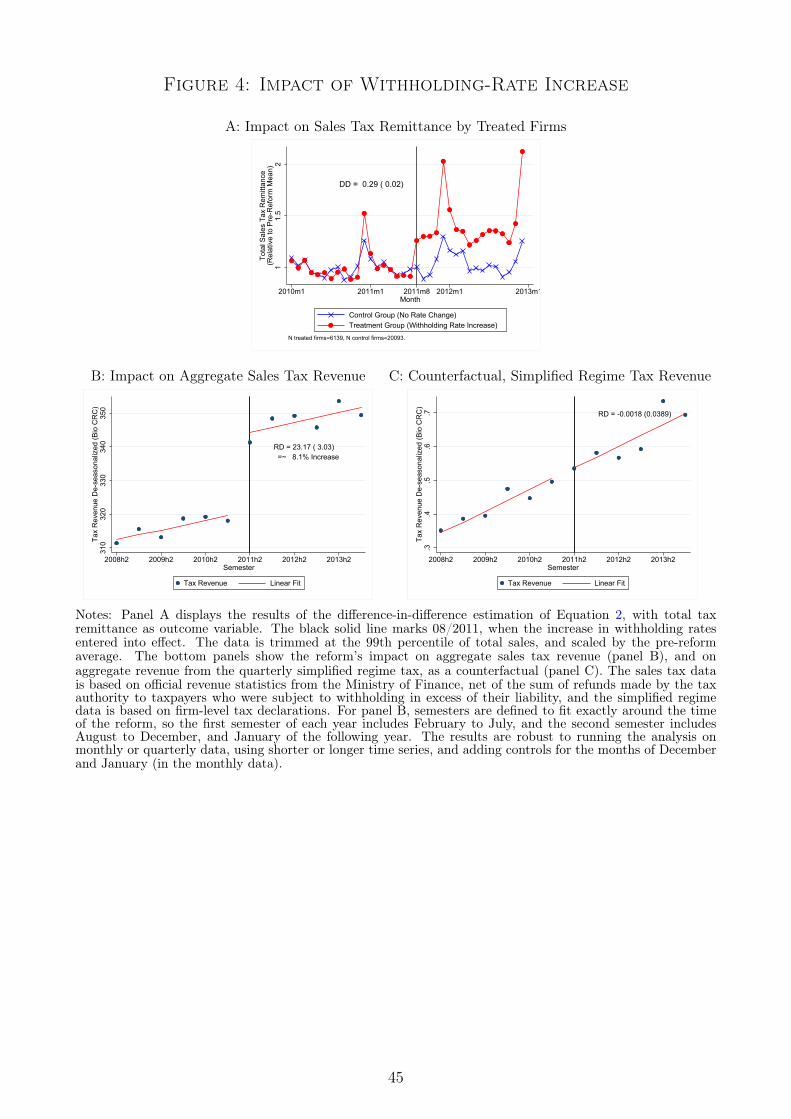
Figure 4: Impact of Withholding-Rate Increase
A: Impact on Sales Tax Remittance by Treated Firms
DD = 0.29 ( 0.02)
11.
52
Tota
l Sal
es T
ax R
emitt
ance
(Rel
ativ
e to
Pre
-Ref
orm
Mea
n)
2010m1 2011m1 2011m8 2012m1 2013m1Month
Control Group (No Rate Change)Treatment Group (Withholding Rate Increase)
N treated firms=6139, N control firms=20093.
B: Impact on Aggregate Sales Tax Revenue C: Counterfactual, Simplified Regime Tax Revenue
RD = 23.17 ( 3.03) =~ 8.1% Increase
310
320
330
340
350
Tax
Rev
enue
De-
seas
onal
ized
(Bio
CR
C)
2008h2 2009h2 2010h2 2011h2 2012h2 2013h2Semester
Tax Revenue Linear Fit
RD = -0.0018 (0.0389).3
.4.5
.6.7
Tax
Rev
enue
De-
seas
onal
ized
(Bio
CR
C)
2008h2 2009h2 2010h2 2011h2 2012h2 2013h2Semester
Tax Revenue Linear Fit
Notes: Panel A displays the results of the difference-in-difference estimation of Equation 2, with total taxremittance as outcome variable. The black solid line marks 08/2011, when the increase in withholding ratesentered into effect. The data is trimmed at the 99th percentile of total sales, and scaled by the pre-reformaverage. The bottom panels show the reform’s impact on aggregate sales tax revenue (panel B), and onaggregate revenue from the quarterly simplified regime tax, as a counterfactual (panel C). The sales tax datais based on official revenue statistics from the Ministry of Finance, net of the sum of refunds made by the taxauthority to taxpayers who were subject to withholding in excess of their liability, and the simplified regimedata is based on firm-level tax declarations. For panel B, semesters are defined to fit exactly around the timeof the reform, so the first semester of each year includes February to July, and the second semester includesAugust to December, and January of the following year. The results are robust to running the analysis onmonthly or quarterly data, using shorter or longer time series, and adding controls for the months of Decemberand January (in the monthly data).
45

Figure 5: Mechanisms of Withholding Impact
A: Default Mechanism - Incomplete Reclaim of Withheld Tax
A1: Share of Reclaimers A2: Share of Withheld Tax Reclaimed
.2.4
.6.8
Shar
e of
recl
aim
ers
amon
g w
ithho
ldee
s
2010m1 2011m1 2011m8 2012m1 2013m1Month
All Withholdees Withholdees with Gross Liability>0
.2.4
.6.8
Shar
e of
tax
with
held
recl
aim
ed
2010m1 2011m1 2011m8 2012m1 2013m1Month
All Withholdees
B: Enforcement-Perceptions Mechanism: Increase in Reported Tax Liability
DD = 0.20 ( 0.03)
11.
52
Gro
ss T
ax L
iabi
lity
(Rel
ativ
e to
Pre
-Ref
orm
Mea
n)
2010m1 2011m1 2011m8 2012m1 2013m1Month
Control Group (No Rate Change)Treatment Group (Withholding Rate Increase)
N treated firms=6139, N control firms=20093.
C: Ruling out Alternative Explanations
C1: No Change in Audit Rates C2: Little Bunching in Gross Tax Liability
400
600
800
1000
1200
Num
ber o
f Aud
its
20092009 2010 2011 2012 2013 2014Year
N planned audits N planned (non-LTU firms)
01
23
4D
ensi
ty
0 .5 1(Gross Liability - Tax Withheld)/Gross Liability
Pre-Reform Post-Reform
Notes: This figure illustrates the mechanisms for the withholding-rate impact. In all panels, the black solid linemarks 08/2011, when the increase in withholding rates entered into effect. Panels A and B display, for all firmssubject to withholding in a given month, the share of firms making a reclaim, and the average share of withheldtax reclaimed respectively. Panel B shows results of the difference-in-difference estimation of Equation 2, ongross liability. The Panel is constructed as Panel A in Figure 4. Panel C1 shows the evolution over time of thenumber of planned audits for all taxpayers and for taxpayers who are part of the large taxpayer unit, as per theannual work programs of the audit department. Panel C2 shows the distribution of the deviation of reportedgross liability from the amount of tax withheld, before and after the reform, for the balanced panel underlyingall difference-in-difference estimation. 46
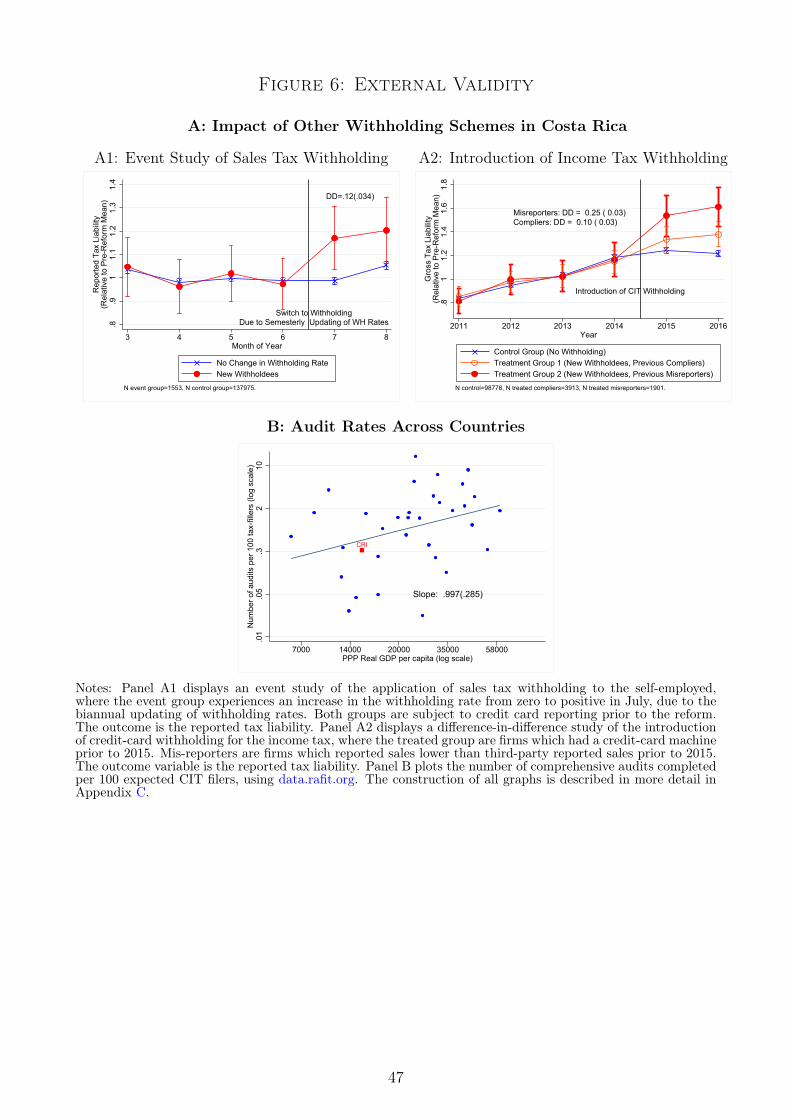
Figure 6: External Validity
A: Impact of Other Withholding Schemes in Costa Rica
A1: Event Study of Sales Tax Withholding A2: Introduction of Income Tax Withholding
Switch to WithholdingDue to Semesterly Updating of WH Rates
DD=.12(.034)
.8.9
11.
11.
21.
31.
4
Rep
orte
d Ta
x Li
abilit
y(R
elat
ive
to P
re-R
efor
m M
ean)
3 4 5 6 7 8Month of Year
No Change in Withholding RateNew Withholdees
N event group=1553, N control group=137975.
Introduction of CIT Withholding
Misreporters: DD = 0.25 ( 0.03)Compliers: DD = 0.10 ( 0.03)
.81
1.2
1.4
1.6
1.8
Gro
ss T
ax L
iabi
lity
(Rel
ativ
e to
Pre
-Ref
orm
Mea
n)
2011 2012 2013 2014 2015 2016Year
Control Group (No Withholding)Treatment Group 1 (New Withholdees, Previous Compliers)Treatment Group 2 (New Withholdees, Previous Misreporters)
N control=98778, N treated compliers=3913, N treated misreporters=1901.
B: Audit Rates Across Countries
CRI
Slope: .997(.285)
.01
.05
.32
10N
umbe
r of a
udits
per
100
tax-
fille
rs (l
og s
cale
)
7000 14000 20000 35000 58000PPP Real GDP per capita (log scale)
Notes: Panel A1 displays an event study of the application of sales tax withholding to the self-employed,where the event group experiences an increase in the withholding rate from zero to positive in July, due to thebiannual updating of withholding rates. Both groups are subject to credit card reporting prior to the reform.The outcome is the reported tax liability. Panel A2 displays a difference-in-difference study of the introductionof credit-card withholding for the income tax, where the treated group are firms which had a credit-card machineprior to 2015. Mis-reporters are firms which reported sales lower than third-party reported sales prior to 2015.The outcome variable is the reported tax liability. Panel B plots the number of comprehensive audits completedper 100 expected CIT filers, using data.rafit.org. The construction of all graphs is described in more detail inAppendix C.
47
ReferencesAllingham, Michael G. and Agnar Sandmo, “Income Tax Evasion: A Theoretical Analysis,” Journal of
Public Economics, 1972, 1, 323–338.
Almunia, Miguel and David Lopez-Rodriguez, “Under the Radar: The Effects of Monitoring Firms onTax Compliance,” American Economic Journal: Applied Economics, 2018, 10 (1), 1–38.
Bachas, Pierre and Mauricio Soto, “Not(ch) Your Average Tax System: Corporate Taxation Under WeakEnforcement,” 2019. Working Paper.
Barr, Michael S. and Jane K. Dokko, “Paying to Save: Tax Withholding and Asset Allocation Among Low-and Moderate-Income Taxpayers,” Finance and Economics Discussion Series 2008-11, Board of Governors ofthe Federal Reserve System (U.S.) 2008.
Bertrand, Marianne, Esther Duflo, and Sendhil Mullanaithan, “How Much Should We TrustDifferences-In-Differences Estimates,” Quarterly Journal of Economics, 2004, 119 (1), 249–275.
Besley, Timothy and Torsten Persson, “Taxation and Development,” in Alan J Auerbach, Raj Chetty,Martin Feldstein, and Emmanuel Saez, eds., Handbook of Public Economics, Vol. 5 2013.
Best, Michael and Henrik Jacobsen Kleven, “Housing Market Responses to Transaction Taxes: Evidencefrom Notches and Stimulus in the UK,” Review of Economic Studies, 2018, 81 (1), 157–193.
, Anne Brockmeyer, Henrik Kleven, Johannes Spinnewijn, and Mazhar Waseem, “Productionvs Revenue Efficiency with Low Tax Compliance: Theory and Evidence from Pakistan,” Journal of PoliticalEconomy, 2015, 123 (6), 1311–1355.
Brockmeyer, Anne, Spencer Smith, Marco Hernandez, and Stewart Kettle, “Casting a Wider TaxNet: Experimental Evidence from Costa Rica,” American Economic Journal: Economic Policy, 2019, 11 (3),55–87.
Bruhn, Miriam and David McKenzie, “Entry Regulation and the Formalization of Microenterprises inDeveloping Countries,” World Bank Research Observer, 2014, 29 (2), 186–201.
Carpio, Lucia Del, “Are the Neighbors Cheating? Evidence from a Social Norm Experiment on PropertyTaxes in Peru,” 2014. Mimeo.
Carrillo, Paul, Dina Pomeranz, and Monica Singhal, “Dodging the Taxman: Firm Misreporting andLimits to Tax Enforcement,” American Economic Journal: Applied Economics, 2017, 9 (2), 144–164.
, Shahe Emran, and Anita Rivadeneira, “Loss Aversion, Transaction Costs or Audit Trigger? LearningAbout Corporate Tax Compliance from a Policy Experiment With Withholding Regime,” 2018. WorkingPaper.
Chetty, Raj, Adam Looney, and Kory Kroft, “Salience and Taxation: Theory and Evidence,” AmericanEconomic Review, 09 2009, 99 (4), 1145–1177.
, John Friedman, Tore Olsen, and Luigi Pistaferri, “Adjustment Costs, Firm Responses, and Microvs. Macro Labor Supply Elasticities: Evidence from Danish Tax Records,” Quarterly Journal of Economics,2011, 126, 749–804.
, John N. Friedman, Soren Leth-Petersen, Torben Heien Nielsen, and Tore Olsen, “Active vs.Passive Decisions and Crowd-Out in Retirement Savings Accounts: Evidence from Denmark,” QuarterlyJournal of Economics, 2014, 129 (3), 1141–1219.
de Mel, Suresh, David McKenzie, and Christopher Woodruff, “The Demand for, and Consequences of,Formalization among Informal Firms in Sri Lanka,” American Economic Journal: Applied Economics, 2013,5 (2), 122–50.
DiNardo, John, Nicole M. Fortin, and Thomas Lemieux, “Labor Market Institutions and the Distribu-toin of Wages, 1973-1992: A Semiparametric Approach,” Econometrica, 09 1996, 64 (5), 1001–1044.
48

Finkelstein, Amy, “E-ztax: Tax Salience and Tax Rates,” Quarterly Journal of Economics, 2009, 124 (3),969–1010.
Fisman, Raymond and Shang-Jin Wei, “Tax Rates and Tax Evasion: Evidence from Missing Imports inChina,” Journal of Political Economy, April 2004, 112 (2), 471–500.
Gandhi, Ashvin and Michael Kuehlwein, “Reexamining Income Tax Overwithholding as a Response toUncertainty,” Public Finance Review, 2014, 44 (2), 3531–3563.
Gordon, Roger and Wei Li, “Tax Structures in Developing Countries: Many Puzzles and a Possible Expla-nation,” Journal of Public Economics, August 2009, 93 (7-8), 855–866.
Highfill, Jannett, Douglas Thorson, and William V. Weber, “Tax Overwithholding as a Response ToUncertainty,” Public Finance Review, 1998, 26 (4), 376–391.
Hilger, Nathaniel G., “Parental Job Loss and Children’s Long-Term Outcomes: Evidence from 7 MillionFathers’ Layoffs,” American Economics Journal: Applied Economics, 2016, 8 (3), 247–283. Mimeo.
IRS, “Tax Year 2008-2010 Tax Gap Estimates,” Technical Report, Internal Revenue Service 2016. FS-2016-4.
Jensen, Anders, “Employment Structure and the Rise of the Modern Tax System,” 2019. Working Paper.
Keen, Michael, “VAT, Tariffs, and Withholding: Border Taxes and Informality in Developing Countries,”Journal of Public Economics, October 2008, 92 (10-11), 1892–1906.
and Joel Slemrod, “Optimal Tax Administration,” Journal of Public Economics, July 2017, 152, 133–142.
Kleven, Henrik, “Bunching,” Annual Review of Economics, 2016, 8, 435–464.
Kleven, Henrik J. and Mazhar Waseem, “Using Notches to Uncover Optimization Frictions and StructuralElasticities: Theory and Evidence from Pakistan,” Quarterly Journal of Economics, 2013, 128, 669–723.
Kleven, Henrik Jacobsen, Claus Thustrup Kreiner, and Emmanuel Saez, “Why Can Modern Gov-ernments Tax So Much? An Agency Model of Firms as Fiscal Intermediaries,” Economica, 2016, 83 (330),219–246.
, Martin B. Knudsen, Claus Thustrup Kreiner, Søren Pedersen, and Emmanuel Saez, “Unwillingor Unable to Cheat? Evidence From a Tax Audit Experiment in Denmark,” Econometrica, 05 2011, 79 (3),651–692.
Kopczuk, Wojciech and Joel Slemrod, “Putting Firms into Optimal Tax Theory,” American EconomicReview Papers and Proceedings, May 2006, 96 (2), 130–134.
, Justin Marion, Erich Muehlegger, and Joel Slemrod, “Does Tax-Collection Invariance Hold? Evasionand the Pass-Through of State Diesel Taxes,” American Economic Journal: Economic Policy, May 2016, 8(2), 251–86.
Madrian, Brigitte C. and Dennis F. Shea, “The Power of Suggestion: Inertia in 401(k) Participation andSavings Behavior,” Quarterly Journal of Economics, 2001, 116 (4), 1149–1187.
Naritomi, Joana, “Consumers as Tax Auditors,” American Economic Review, 2019, 109 (9), 3031–72.
OECD, “Withholding and Information Reporting Regimes for Small or Medium-Sized Businesses and Self-Employed Taxpayers, Information Note,” Technical Report, OECD 2009.
Pomeranz, Dina, “No Taxation without Information: Deterrence and Self-Enforcement in the Value AddedTax,” American Economic Review, 2015, 105 (8), 2539–2569.
Samanamud, Enrique, “Estudio comparado de los regimenes de retenciones y percepciones del IVA e impuestoa la renta en America Latina y el Caribe,” Technical Report, Inter-American Centre of Tax Administrations2013.
Seim, David, “Behavioral Responses to an Annual Wealth Tax: Evidence from Sweden,” American EconomicJournal: Economic Policy, 2017, 9 (4), 395–421. Mimeo.
49

Silva, João Santos and Silvana Tenreyro, “The Log of Gravity,” The Review of Economics and Statistics,2006, 88 (4), 641–658.
Singhal, Monica and Erzo Luttmer, “Tax Morale,” Journal of Economic Perspectives, 2014, 28 (4), 149–168.
Slemrod, Joel, “Does It Matter Who Writes the Check to the Government? The Economics of Tax Remit-tance,” National Tax Journal, 2008, 61 (2), 251–75.
, “Tax Compliance and Enforcement,” NBER Working Paper 24799, 2018.
and Shlomo Yitzhaki, “Tax Avoidance, Evasion, and Administration,” in A. J. Auerbach and M. Feldstein,eds., Handbook of Public Economics, Vol. 3 of Handbook of Public Economics, Elsevier, 2002, chapter 22,pp. 1423–1470.
and William C. Boning, “Real Firms in Tax Systems,” FinanzArchiv: Public Finance Analysis, March2018, 74 (1), 131–143.
, Brett Collins, Jeffrey L. Hoopes, Daniel H. Reck, and Michael Sebastiani, “Does Credit-CardInformation Reporting Improve Small-Business Tax Compliance?,” Journal of Public Economics, 2017, 149,1–19.
, Obeid Ur Rehman, and Mazhar Waseem, “Pecuniary and Non-Pecuniary Motivations for Tax Com-pliance: Evidence from Pakistan,” NBER Working Paper 25623, 2019.
Soos, Pirosko, “Self-Employed Evasion and Tax Withholding: A Comparative Study and Analysis of theIssues,” UC Davis Law Review, 1990, 24 (107), 107–193.
Thaler, Richard and Shlomo Benartzi, “Save More Tomorrow: Using Behavioral Economics to IncreaseEmployee Saving,” Journal of Political Economy, 2004, 112 (1), 164–187.
White, Richard A., Paul D. Harrison, and Adrian Harrell, “The Impact of Income Tax Withholdingon Taxpayer Compliance: Further Empirical Evidence,” Journal of the American Taxation Association, May1993, pp. 63–78.
Yagan, Danny, “Capital Tax Reform and the Real Economy: The Effects of the 2003 Dividend Tax Cut,”American Economic Review, 2015, 105 (12), 3531–3563.
50
Related Documents