Journal of Applied Economics and Business 59 TAX DEBT AS AN INDICATOR OF COMPANIES’ DEFAULT: THE CASE OF SLOVAKIA Jana Kubicová 1 , Slavomír Faltus 1* University of Economics, Bratislava, Slovak Republic *[email protected] Abstract Scientific literature has proposed a number of indicators that are successful in predicted future of company’s default. Our study is focused to enrich of the literature by presenting data on the potential tax liability as a warning sign of future company’s default. Using the Receiver Operating Characteristic of curves and the values of Area Under Curve we measure and compare the resolution of the twelve ratio indicators that have in numerator the accounting data on income tax. From the twelve indicators, we have used three with the best-resolution as independent variables in the hazard multi-period logit model of prediction of company’s default. The research was done on the data of failed and healthy companies that are included in the financial statements from 82,572 companies in the Slovak Republic for the period 2003-2012. We found that although the best ratio indicators with income tax were ranked in terms of their distinctive capabilities in the first half of selected 49 benchmark indicators, they does not include the best under this criterion. However in terms of accuracy of prediction model, fiscal indicators came through better than indicators with the best resolution. Therefore, it is not possible to say that which model is better. It depends on what criterion is evaluated. The possibility of using tax indicators is thus a matter of the required characteristics of the model. Key words: Bankruptcy prediction; Tax accounting variables; Ability of resolution; ROC curves; Hazard multi-period logit model INTRODUCTION For internal and external clients of a company, the important objective information on the financial health of the company are important in the current period. Furthermore, information is important about the likely development of the financial health of the company in the future, as well as information on the likelihood of company’s default in the future. It was due to the failure of business partners during the crisis that the phenomenon of secondary insolvency has led to increased demand for qualified information and methods of prediction company’s default. Efforts to correct

Welcome message from author
This document is posted to help you gain knowledge. Please leave a comment to let me know what you think about it! Share it to your friends and learn new things together.
Transcript
Journal of Applied Economics and Business
59
TAX DEBT AS AN INDICATOR OF
COMPANIES’ DEFAULT: THE CASE
OF SLOVAKIA
Jana Kubicová1, Slavomír Faltus1*
University of Economics, Bratislava, Slovak Republic
Abstract
Scientific literature has proposed a number of indicators that are successful in predicted future of
company’s default. Our study is focused to enrich of the literature by presenting data on the potential
tax liability as a warning sign of future company’s default. Using the Receiver Operating Characteristic
of curves and the values of Area Under Curve we measure and compare the resolution of the twelve
ratio indicators that have in numerator the accounting data on income tax. From the twelve indicators,
we have used three with the best-resolution as independent variables in the hazard multi-period logit
model of prediction of company’s default. The research was done on the data of failed and healthy
companies that are included in the financial statements from 82,572 companies in the Slovak Republic
for the period 2003-2012. We found that although the best ratio indicators with income tax were ranked
in terms of their distinctive capabilities in the first half of selected 49 benchmark indicators, they does
not include the best under this criterion. However in terms of accuracy of prediction model, fiscal
indicators came through better than indicators with the best resolution. Therefore, it is not possible to
say that which model is better. It depends on what criterion is evaluated. The possibility of using tax
indicators is thus a matter of the required characteristics of the model.
Key words:
Bankruptcy prediction; Tax accounting variables; Ability of resolution; ROC curves; Hazard multi-period logit
model
INTRODUCTION
For internal and external clients of a company, the important objective information on
the financial health of the company are important in the current period. Furthermore,
information is important about the likely development of the financial health of the
company in the future, as well as information on the likelihood of company’s default
in the future. It was due to the failure of business partners during the crisis that the
phenomenon of secondary insolvency has led to increased demand for qualified
information and methods of prediction company’s default. Efforts to correct
Jana Kubicová, Slavomír Faltus
Tax Debt as an Indicator of Companies’ Default: the Case of Slovakia
60 JOURNAL OF APPLIED ECONOMICS AND BUSINESS, VOL.2, ISSUE 4 – DECEMBER , 2014, PP. 59-74
prediction of company’s default led also in the past to the fact that the researchers on
the basis of empirical research of financially healthy and failed companies constructed
indicators, methods and ways of evaluation of the financial health of the company as
well as the methods and models of company’s default prediction. Let us brief
overview of currently known indicators and models of business default prediction.
In the beginnings of examination of methods and ways prediction of company’s
default was most frequently applied method of the one-dimensional discriminant
analysis that was represented by Beaver (1966) and Zmijewski (1983) models. The
largest expansion of modeling of the financial health of firms and prediction of
company’s default occurred using multidimensional discriminant analysis. It is
carried out for example by Altman Z-Score (Altman, 1968 and 1993) and Altman et
al, (1995), Springate model (Sands et al, 1983), Fulmer model (Fulmer, 1984),
Beermann test (Beerman, 1976), CH index (Chrastinová, 1998), Taffler model (Taffler
& Tisshaw, 1997; Taffler, 1983), Credit Index (Kralicek, 1993), indicator IN 95
(Neumaier & Neumaierová, 1995; Kotulič et al, 2010), IN 99 (Kotulič et al, 2010), IN 01
(Kotulič et al, 2010), IN 05 (Kotulič et al, 2010), Analysis by Doucha I and II (Doucha,
1995). A similar method is represented by Tamari scoring model (1978), Quick test (27
Kralicek, 1993), and by A score (Argenti, 1976). In a further development of modeling
of the probability of company’s default were applied logit and probit models. This
approach is represented for example by O score (Ohlson, 1980) and through
Zmijewski model (Zmijewski, 1984). Shumway (1999) represents the method by its
model of business failure prediction through hazard models. Separate category of
models of failure prediction is represented by a nonlinear model Moody's RiskCalc,
which is intended for private companies (Falkenstein & Boral, 2000). Since models
based solely on market indicators are not the subject of this paper, in the literature
review we do not present the models.
Models of the failure prediction of the companies work with various independent
variables. The first group of the variables represent accounting variables which
include independent variables of Altman model - working capital to total assets
(WC/TA), retained earnings to TA (RE/TA), earnings before interest and taxes to TA
(EBIT/TA), market equity to total liabilities (ME/TA), and sales to TA (S/TA) (Altman,
1993), and also the ratio indicators of the Zmijewski model – ratio of net income to
total assets (NI/TA), the ratio of total liabilities to TA (TL/TA), and the ratio of current
assets to current liabilities (CA/CL) (Shumway, 1999; Zmijewski, 1984). The second
group of independent variables in the models of prediction of company’s failures is
market-driven variables and they include market size, past stock returns, or the
idiosyncratic standard deviation of stock returns. Shumway later showed that the
estimates of the parameters of independent variables, which were different
accounting variables reveal that half of these variables has no statistical correlation
with the probability of bankruptcy of companies (Shumway, 1999: 23).
Journal of Applied Economics and Business
61
However, in the literature no research exists that could to examine the ability of
resolution and predictive capability of models with independent variables
represented by ratio indicators that could be based on accounting data on income tax
(tax derived indicators). Therefore, in this paper, we aim to empirical data obtained
from the financial statements of companies in the Slovak Republic to testing the ability
of resolution of the ratio indicators based on income tax and also to determine the
predictive accuracy of the model of prediction of failures of companies which act as
independent variables selected ratio indicators based on tax income, which
demonstrate in our research the best ability of the resolution. Our aim is testing
whether and how accurate it is possible to predict the failure of companies in the
Slovak Republic on the basis of accounting data on the amount of income tax of
companies in one of the five years that preceding the failure of the company. The
ambition is to contribute to filling gap in the empirical literature, which is concerned
with the subject of the ways and methods of predicting of failure of companies and
enrich the empirical literature on knowledge, whether the financial information on
income tax are such independent variables, which are statistically significantly related
to the probability of failure of the company in the future.
The motivation for our research is that data on corporate income taxes are available to
external business clients and in particular for tax authorities. If the amount of income
tax was sufficiently precise indicator of the failure of the company could be the
following information useful for public authorities, in particular for the financial
authority for the prediction of failure of companies, but also as a means to distinguish
the real, the expected failure from an intentionally caused failure of the company.
The remainder of the paper is organized as follows: In the second part we briefly
explain the background of hypothesis, intuition for this hypothesis in the particular
reasons for which we consider to be appropriate to consider a resolution of the ratio
indicators containing income tax. In the third section, we describe empirical
methodology, explaining the process, methodology and data. In the fourth part, we
present the results of testing the ability of resolution of ratio indicators containing
income tax and testing of the predictive ability of the model prediction of bankruptcy
as independent variables contains just such indicators. Conclusion follows, and it
summarizes the results of our research.
HYPOTHESIS DEVELOPMENT
Income tax is in terms of double-entry bookkeeping for contractors a part of the cost
of an entity. In case of income tax is separately charged current tax and deferred tax
(Ministry of Finance of the Slovak Republic, 2002). Current income tax is charged from
the tax base, which is in the meaning of the Income Tax Act determined by the trading
Jana Kubicová, Slavomír Faltus
Tax Debt as an Indicator of Companies’ Default: the Case of Slovakia
62 JOURNAL OF APPLIED ECONOMICS AND BUSINESS, VOL.2, ISSUE 4 – DECEMBER , 2014, PP. 59-74
income of increasing or decreasing about certain amounts that fall or not fall into the
income tax base. Deferred tax is charged in:
a) Temporary differences between the accounting value of assets and liabilities
showed in the balance sheet and their tax base;
b) For the possibility to carry forward tax loss into the future;
c) Possibility to transfer the unused tax deductions into the future periods (Ministry
of Finance of the Slovak Republic, 2002).
Deferred tax is an accounting category, which displays the increasing or decreasing
the tax base in future periods and will be due in the next financial periods (Gašpárová,
2004a and 2014b). Profit after income tax is one of the important own resources and
thus a prerequisite for increasing its performance in future periods that may restrict
the company’s default in future. Profit after income tax is also one of the key
performance indicators of the company.
May be mentioned the extensive review of the literature that presents research results
of the relationship of income tax and corporate finances. The question of whether there
is an optimal capital structure that would be a subject to the way of taxation of
interests and dividends as is peculiar to so-called classical bilayer system of taxation,
belongs to the most famous themes in the relationship between income tax and
corporate finances. It examines whether the tax advantages in financing through debt
affects the value of the company. Empirical research was undertaken and presented
by Miller and Modigliani (1958 and 1963) and Miller (1977) and Miller and Schloes
(1978). Following this, it examines whether the non-debt tax shields, for, example
based on depreciation, are in the negative relationship to debt financing arrangement
because they substitute the interests as a tax-deductible expenditure (Bradley et al,
1984). Under examination is also the fact whether the income tax has an impact on the
option of organizational form and motivation to reorganization of the companies
(Alford & Berger, 1998), on the dividend policy and on the form of the payment of
revenues from investments into company (Allen & Michaely, 2001).
In this research, we want to verify the hypothetical assumption whether it is possible
to predict the company's default through ratio indicators that are based on income tax.
To clarify the intuition behind this assumption in this section, we want to show the
channels through which income tax affects the return of investment of enterprise.
Income tax, in this the profit tax on dividends also from the interests affects rate of
return on shareholders' investments into the equity of the company, therefore, the
return on equity (ROE below). ROE is ratio indicator, which is one of the most
important indicators, which are used in fundamental financial analysis of a company.
We assume that the return on investments and overall financial situation of the
company affects the company's default in the future. If income tax through several
channels affects return of investments measured by ROE indicator and financial

Journal of Applied Economics and Business
63
situation, then we conclude that the income tax also affects the failure of the company
in the future.
For explanation of the main channels through which income tax affects ROE, and
implicitly also the financial situation of the company, we use DuPont system of
decomposition of ROE, which has been for a long time applied for fundamental
financial analysis of a company. ROE is affected by profitability, which is measured
by profit margin (PM), operating efficiency, which is measured by asset turnover (AT),
and financial leverage, which is measured by the equity multiplier (EqM). Then ROE
is calculated using the formula (Groppelli & Nikbakht, 2000):
EqMATPMROE ** (1)
The aim of fundamental financial analysis is to identify the sources of success or
company’s default that is measured by ROE. For it is used DuPont system of ROE
decomposition by that
E
A
A
S
S
NPROE ** (2)
where NP is net profit; S is sales; A is assets; E is equity. Expression (2) after adjustment
has the form
E
NPROE (3)
The ROE indicator can be further by decomposition also decomposed as this (Zane,
2004: 458):
E
A
A
S
S
EBIT
EBIT
EBT
EBT
NIROE **** (4)
where NI is net income, i.e. income after income tax; EBT is pretax profit; EBIT states
for earnings before interest and taxes.
From DuPont decomposition of ROE, formula is clear that the return on equity has a
direct impact to the tax burden. We measure it through the ratio NI/EBT, therefore, as
a share of income after taxation (net income, NI) to the income of company before
taxation (EBT). The higher of the income tax, the lower the net income (NI) and the
lower the share of net income to income of company before taxation.
Income of the company after taxation is allocated at the decision of the General
Assembly into the reserve fund and statutory fund, for the redemption of shares for
shareholders, the remuneration of members of statutory bodies, to an increasing of the
basic capital or to account of undivided profit (Hudecová, 2013: 100). The channel, that
has an effect of income tax on the financial situation and performance of the company
is an income after taxation by income tax (net income); it is one of the important own
Jana Kubicová, Slavomír Faltus
Tax Debt as an Indicator of Companies’ Default: the Case of Slovakia
64 JOURNAL OF APPLIED ECONOMICS AND BUSINESS, VOL.2, ISSUE 4 – DECEMBER , 2014, PP. 59-74
source of financing when it is not distributed among the partners, because it serves
for increasing of the basic capital and equity. The higher income tax and the tax
burden, the smaller is the net income which remains in the company for financing of
its needs from its own resources and from undivided earnings from former periods.
Net income as its own source of financing of the needs of the company has an indirect
effect on the increasing of assets, which has in accordance with DuPont decomposition
also affect the level of ROE.
Withholding tax levied from interests on their payments to creditors increases the cost
of foreign capital and has an impact on another compositional element in calculating
of ROE - the interest burden of the company, which is in decomposition of ROE
(Altman, 1968) expressed by the ratio of EBT/EBIT.
Another channel by that an income tax impacts to the financial situation in the
company to financing from its own resources, which is also retained profit, is the
income tax levied at taxation of profit shares that are paid to the partners or
shareholders. It is an effect of taxation of dividends. In the case that paid and received
dividends are not burdened by the income tax, the company has a higher motivation
to the distribution of profit after taxation and less motivation to detention of the profit
after taxation as its own source of financing.
Assessment of income tax in terms of its impact on the financial situation of the
company may also be expressed as follows:
1. Higher tax due means that it had been assessed from a higher tax base. As the
tax base is assessed by modifications of profit, deductible and non-deductible
items, it can be concluded that the higher the tax due, the higher profit and
therefore also performance of the company was higher. It can be in terms of a
company's health assessed positively as a sign that the company does not send
signals of probable bankruptcy.
2. The higher the tax due from income, the lower is the income of the company
after taxation (net income), which is own source of financing of needs of the
company and its assets. From this point of view, the higher tax due generates,
the higher risk that the company will not have sufficient own financing sources,
solvency, liquidity or financing of equity investments. It means that the
company probably will use other means – the outside sources of financing,
although during period of crisis they have the reduced availability.
EMPIRICAL METHODOLOGY
Procedure
When assessing the distinctive ability of the ratio indicators that include income tax
and during testing of the predictive ability of the bankruptcy model with the
independent variables based on income tax we proceeded in two stages. The first stage
Journal of Applied Economics and Business
65
of the research that preceded our analysis described in this paper was done by Faltus
in his earlier research (2014). He for the failed (defaulted) company indicated such
company, which in the relevant year showed lower total assets than total liabilities.
Faltus chosen 49 ratio indicators of the financial analysis, as they were indicated for
example by Groppelli and Nikbakht (2000: 444-445) and he identified their distinctive
ability, default detection and zero prediction horizon. These 49 indicators is a set of
indicators, by which in the second stage of matching a resolution of ratio indicators
based on income tax - therefore we indicate them hereinafter as the benchmark
indicators.
To the results of the first stage (Faltus, 2014) are followed by a second stage of research,
the results of which we present in this paper, and we divided the second stage into
two phases. In the first phase we verify resolution of the twelve ratio indicators that
include income tax. The aims are two: firstly, to test the resolution of these distinctive
indicators, and compare it with the resolution of three benchmark indicators with the
absolute best resolution, and secondly, to choose three ratio indicators based on
income tax that have the best resolution and use them in the second phase as
independent variables in the hazard model of prediction of company’s default in the
Slovak Republic. Twelve ratio indicators based on income tax we construct the
following: in the numerator of the indicator is income tax in any of its accounting
manifestations:
1) Total income tax;
2) Tax due from income;
3) Deferred income tax; or
4) Deferred tax claim and deferred tax obligation.
Into the denominator, we insert one of the three of accounting indicators, namely own
capital (equity), revenue from sales or total assets.
Ability of ratio indicators based on income tax to distinguish between firms that failed
in the prediction horizon and firms that stay healthy and survived, we measure by the
size of the area under curves Receiver Operating Characteristic – we indicate as AUC
ROC (12). We proceed by calculating of the AUC ROC for prediction horizons of 1-5
years, 1-5 unfailing years and detection of first year of default (zero prediction
horizon). We compare these values with values of the AUC ROC that have reached
benchmark indicators in the first stage of research (Faltus, 2014).
The results of the first phase we will use in the second phase of research. Its aim is to
estimate the parameters of independent variables of hazard model of prediction
company’s default and identify its prediction accuracy. In hazard model of prediction
company’s default as independent variables, we use three ratio indicators based on
income tax, which show the best ability of resolution.

Jana Kubicová, Slavomír Faltus
Tax Debt as an Indicator of Companies’ Default: the Case of Slovakia
66 JOURNAL OF APPLIED ECONOMICS AND BUSINESS, VOL.2, ISSUE 4 – DECEMBER , 2014, PP. 59-74
Methodology
In the first phase we for determination of the predictive ability of indicators based on
income tax used the method Receiver Operating Characteristic curves (ROC). It is a
method that is used for evaluation of the resolution of the various tests in the analysis
of survival (survival analysis) and to compare them not only in financial science, but
also in medicine, astrology and other research areas (Gonen, 2007). Details on the
method of ROC curves, are presented for example in Metz (1978), Pepe (2004) and
Zhou et al, (2011).
For each of the twelve indicators based on income tax, we constructed an ROC curve.
It is a set of points whose coordinates on the x-axis is 1 - specificity and on the axis y
is the value of the indicator of sensitivity. ROC curve shows the cumulative number
of correctly determined values for the prediction of company’s' default and the
cumulative number of incorrectly determined values for different values so-called cut-
off values (Wilson, 2013). The values can be either 0 or 1 whereas they may be positive
or negative. When we have values of the resolution of each of the twelve ratio
indicators and their representation through individual ROC curves, we can compare
each of their resolution. Comparison we do through comparison method of values
that represent the size of area under individual ROC curves, it is comparison of the
values of the Area Under Curve (below AUC). The size of the area under the ROC
curve we calculate by using the formula for calculating the Gini coefficient. We will
use these formulas:
𝐴𝑈𝐶 = 1
2(𝐺 + 1) (5)
𝐺 = 𝐵
𝐴+𝐵 (6)
where AUC is area under ROC curve; G is Gini coefficient. The larger area under the ROC
curve, the better specific ratio indicator distinguishes between companies that have failed
in the prediction horizon and of the healthy companies. Figure 1 illustratively depicts the
ROC curve (panel A) and the area bounded by the curve (panel B).
Panel A Panel B
FIGURE 1. RECEIVER OPERATING CURVE (ROC) AND AREA UNDER CURVE (AUC)
Source: Panel A: own processing; Panel B: (Wilson, 2013: 44)
Journal of Applied Economics and Business
67
In the second phase, we estimated the parameters of the independent variables in the
model of prediction of company’s default and its predictive ability. Historically the
several approaches were developed to modeling of prediction of company’s default.
The first group consists of models based on discriminant analysis and static logit
model. Their representative is the Altman model (Altman, 1968). Using of the logit
models for prediction of default are subject of criticism because they have a static
character. The advantage of hazard models is that in contrast of the logit models they
take into account the time before the company’s' default. According to the Shumway,
hazard models take into account that the risk of bankruptcy of the company is
changed over time and its financial health is a function of its most recent financial data
and age of the firm. Shumway also states three reasons for favoring of hazard models
of prediction of default:
1) Static models are failing for make provision of individual periods in which the
company faces to the risk of default;
2) Hazard models include covariates that varies with time;
3) Hazard models have better prediction capability because they use a lot more
data (Shumway, 1999: 2).
Therefore the second group of prediction models is represented by the hazard models.
Method hazard multi-period logit model we use for estimation of parameters of three
independent variables and through likelihood ratios we estimate predictive ability of
the whole model. For this model, on the base of the criterion AUC ROC (an average
of all the prediction horizons) we selected three variables, X1, X2, X3, which are
represented by those indicators based on income tax that we selected in the first phase
from the original twelve indicators. Due to variable choice based on maximum AUC
ROC, the model is also referred to as the compromise model (Faltus, 2014; Shumway,
1999). Further we tested the accuracy of the model for prediction horizons 0 up to 5.
Data
The estimation of the predictive ability of indicators based on income tax we
performed on the example of enterprises in the Slovak Republic for the period 2003-
2012. We started from the accounting information contained in the financial
statements of enterprises in the Slovak Republic. The data source is a commercial
database called Albertina, and the producer is a company Bisnode, edition from
August 2013. Our research uses data from the accounts of 82,572 companies. In the
relevant years, there are also missing data. Quotient of available accounting
statements for each of the years is: in year 2003 is available 0.5 % of financial
statements, in year 2004 it is 3.1 %, in year 2005 it is 8.1 %, in year 2006 it is 11.5 %, in
year 2007 it is 13.6 %, in year 2008 it is 14.4 %, in year 2009 it is 17.6 %, in year 2010 it
is 18.1 %, in year 2011 it is 11.3 % and in year 2012 it is 1.8 %.
Jana Kubicová, Slavomír Faltus
Tax Debt as an Indicator of Companies’ Default: the Case of Slovakia
68 JOURNAL OF APPLIED ECONOMICS AND BUSINESS, VOL.2, ISSUE 4 – DECEMBER , 2014, PP. 59-74
EMPIRICAL RESULTS
TAX/SALES (Own Capital/Sales).365
PAYABLE TAX/SALES Total Liabilities/Total Assets
TAX/TOTAL ASSETS Working Capital/Total Assets
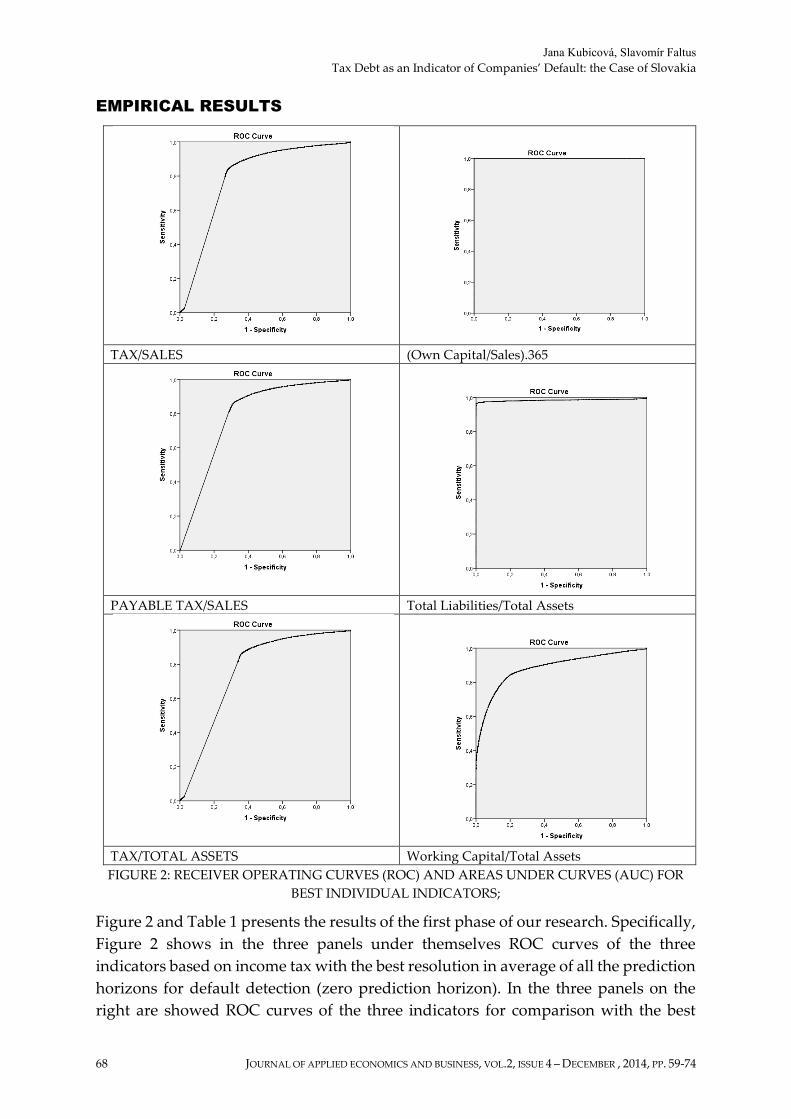
FIGURE 2: RECEIVER OPERATING CURVES (ROC) AND AREAS UNDER CURVES (AUC) FOR
BEST INDIVIDUAL INDICATORS;
Figure 2 and Table 1 presents the results of the first phase of our research. Specifically,
Figure 2 shows in the three panels under themselves ROC curves of the three
indicators based on income tax with the best resolution in average of all the prediction
horizons for default detection (zero prediction horizon). In the three panels on the
right are showed ROC curves of the three indicators for comparison with the best
Journal of Applied Economics and Business
69
resolution of all for default detection (zero prediction horizon), so as they were found
in previous research by Faltus (2014). The best indicator is own capital/sales.
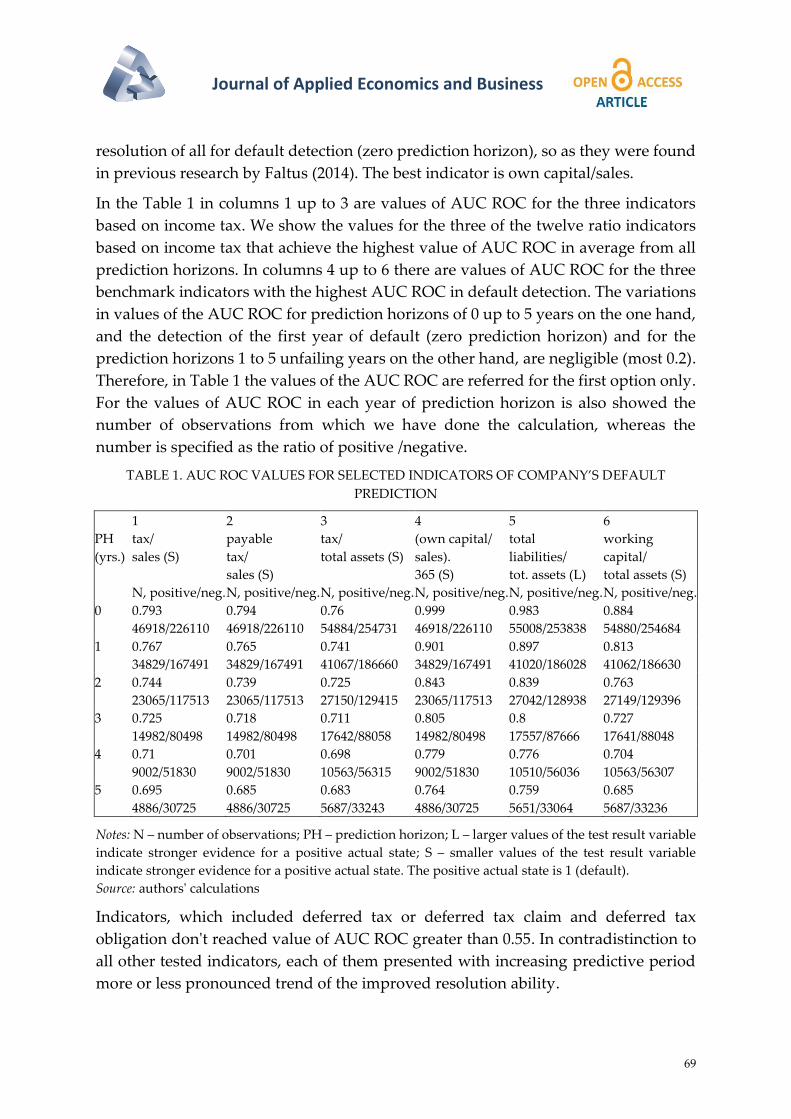
In the Table 1 in columns 1 up to 3 are values of AUC ROC for the three indicators
based on income tax. We show the values for the three of the twelve ratio indicators
based on income tax that achieve the highest value of AUC ROC in average from all
prediction horizons. In columns 4 up to 6 there are values of AUC ROC for the three
benchmark indicators with the highest AUC ROC in default detection. The variations
in values of the AUC ROC for prediction horizons of 0 up to 5 years on the one hand,
and the detection of the first year of default (zero prediction horizon) and for the
prediction horizons 1 to 5 unfailing years on the other hand, are negligible (most 0.2).
Therefore, in Table 1 the values of the AUC ROC are referred for the first option only.
For the values of AUC ROC in each year of prediction horizon is also showed the
number of observations from which we have done the calculation, whereas the
number is specified as the ratio of positive /negative.
TABLE 1. AUC ROC VALUES FOR SELECTED INDICATORS OF COMPANY’S DEFAULT
PREDICTION
1 2 3 4 5 6
PH
(yrs.)
tax/
sales (S)
N, positive/neg.
payable
tax/
sales (S)
N, positive/neg.
tax/
total assets (S)
N, positive/neg.
(own capital/
sales).
365 (S)
N, positive/neg.
total
liabilities/
tot. assets (L)
N, positive/neg.
working
capital/
total assets (S)
N, positive/neg.
0 0.793
46918/226110
0.794
46918/226110
0.76
54884/254731
0.999
46918/226110
0.983
55008/253838
0.884
54880/254684
1 0.767
34829/167491
0.765
34829/167491
0.741
41067/186660
0.901
34829/167491
0.897
41020/186028
0.813
41062/186630
2 0.744
23065/117513
0.739
23065/117513
0.725
27150/129415
0.843
23065/117513
0.839
27042/128938
0.763
27149/129396
3 0.725
14982/80498
0.718
14982/80498
0.711
17642/88058
0.805
14982/80498
0.8
17557/87666
0.727
17641/88048
4 0.71
9002/51830
0.701
9002/51830
0.698
10563/56315
0.779
9002/51830
0.776
10510/56036
0.704
10563/56307
5 0.695
4886/30725
0.685
4886/30725
0.683
5687/33243
0.764
4886/30725
0.759
5651/33064
0.685
5687/33236
Notes: N – number of observations; PH – prediction horizon; L – larger values of the test result variable
indicate stronger evidence for a positive actual state; S – smaller values of the test result variable
indicate stronger evidence for a positive actual state. The positive actual state is 1 (default).
Source: authors' calculations
Indicators, which included deferred tax or deferred tax claim and deferred tax
obligation don't reached value of AUC ROC greater than 0.55. In contradistinction to
all other tested indicators, each of them presented with increasing predictive period
more or less pronounced trend of the improved resolution ability.

Jana Kubicová, Slavomír Faltus
Tax Debt as an Indicator of Companies’ Default: the Case of Slovakia
70 JOURNAL OF APPLIED ECONOMICS AND BUSINESS, VOL.2, ISSUE 4 – DECEMBER , 2014, PP. 59-74
In the second phase, we estimated the bankruptcy model by hazard method multi-
period logit model with using three indicators based on income tax that we identified
in the first phase. Whereas that between the indicators tax/sales and payable tax/sales
is the high measure of collinearity, the variable payable tax/sales for purpose of
estimation of the model we replaced by the indicator with the fourth best-resolution
ability, specifically by indicator of payable tax/own capital. The number of
observations included into the regression is 270,815, including 46,757 defaults. The
estimated model including the coefficients that we estimated by logistic regression has
this form and parameter values:
eXXX
y).45.86.689.3.004.0812.0( 3211
1
(7)
where: X1 = tax/sales; X2 = tax/total assets; X3 = payable tax/own capital. The positive sign
of the coefficient indicates the relationship, which shows that the higher the value of
the variable, the higher probability of default, and vice versa. The model's accuracy is
measured by the likelihood ratio (LR). LR value for the estimated model is 65 572.888.
Resolution ability of the model for prediction horizons of 0 up to 5 years is shown in
Table 3.
TABLE 2. VARIANCE INFLATION FACTORS
Indicator Variance Inflation Factor
(VIF)
tax/sales 1.000
tax/total assets 1.008
payable tax/own capital 1.008
TABLE 3. AUC ROC OF THE MODEL FOR PREDICTION HORIZONS
Prediction
horizon
(years)
AUC ROC Number of observations
(positive/negative)
0 0.871 46757/224058
1 0.791 34552/166019
2 0.745 22813/116419
3 0.713 14804/79687
4 0.689 8880/51259
5 0.672 4812/30372
CONCLUSION
Prediction of company’s default through scientific methods has gained a well-
deserved interest of external clients in undertaking, financial managers, bankers and
public administration institutions in the time of financial crisis, but also in subsequent
periods. The subject of our research was testing of the resolution ability of the financial
indicators with incorporated elements of income tax and testing of the predictive
ability of the prediction model of bankruptcy on data of Slovak companies for the time
period 2003-2012. In our research, we proceeded in two phases.
Journal of Applied Economics and Business
71
In the first phase we through ROC curves and the areas under these curves tested the
resolution ability of the ratio indicators based on accounting data, namely on the
income tax and its accounting variants. In the empirical literature, results are about
the resolution ability of the accounting variables there lacking empirical analysis of
the resolution ability of the accounting variables containing income tax. Therefore, we
decided in this research at least partially fill this gap by an empirical research of data
about default (failed) and healthy companies in the Slovak Republic. We had
constructed twelve ratio indicators that have in the numerator the total income tax,
the payable tax, deferred tax or deferred tax claim and deferred tax obligation, and in
the denominator they have either sales, total assets or own capital. We found that the
ratio indicators including deferred tax and deferred tax claim and deferred tax
obligation in combination with sales, total assets or own capital have very little ability
to distinguish between default and unfailing companies. While comparing of the
ability of the indicators containing the income tax to distinguish between default
(failed) and healthy companies, we found that the best ratio indicators that containing
in the numerator the income tax are placed between all 49 benchmark indicators on
the eighteenth, nineteenth and twenty-second place (default detection, zero prediction
horizon). On this basis, we concluded that the ratio indicators that containing
accounting data about the income tax are not suitable indicators for prediction of
company’s default in the Slovak Republic.
In the second stage, we estimated the hazard multi-period logit model for prediction
of Slovak company’s default. In our model, we had chosen three financial variables as
independent variables that showed the best resolution ability in the first phase of the
research. We had selected the three best indicators based on income tax detected by
the AUC ROC method in average from the all prediction periods, but from the
econometric reasons, we had exchanged variable payable tax/sales for variable
payable tax/own capital. The resolution ability of the hazard multi-period logit model
with the three independent variables we were measured by means of AUC ROC,
while this statistics reached in the prediction horizon of the year zero the value 0.871
only. For comparison with the results of our previous research, the model constructed
by the same method from overall the three best benchmark indicators, it has the value
of this statistics 0.996, while the fact of collinearity problem we solved so that the third
best overall benchmark indicator we replaced by the fourth in the order (Faltus, 2014).
The accuracy of prediction of company’s default through hazard multi-period logit
model, we measured through statistics likelihood ratio. We found that in the accuracy
of the prediction, the model of prediction of default reaches better results with the
accounting variables that contain in the numerator the data about the income tax. This
model has likelihood ratio 65,572. Conversely, model of company’s default, which
estimates the probability of default of companies with three independent variables
Jana Kubicová, Slavomír Faltus
Tax Debt as an Indicator of Companies’ Default: the Case of Slovakia
72 JOURNAL OF APPLIED ECONOMICS AND BUSINESS, VOL.2, ISSUE 4 – DECEMBER , 2014, PP. 59-74
that have the best overall resolution ability, has accuracy of prediction measured
through likelihood ratio equal to only 15,434 (Faltus, 2014). From a comparison of both
models we can deduce conclusion that the resolution ability and accuracy of
prediction of hazard multi-period logit model may not be proportionally dependent.
Therefore, it is not possible to say that which model is better. It depends on what
criterion is evaluated. The possibility of using tax indicators is thus a matter of the
required characteristics of the model.
As a whole we can evaluate that our empirical research has confirmed the results of
previous empirical research according to which the estimates through hazard models
with accounting variables, for example, that have been made with Altman (1968) and
Zmijewski (1984) variables, reveal that half of these variables has no statistical
correlation with the probability of company’s bankruptcy (Shumway: 23).
ACKNOWLEDGEMENT
The paper has been prepared in a framework of VEGA scientific research project no.
1/0238/13 Taxes and effectiveness of financial re-engineering tools to improve the
performance of companies in the time of the crisis.
REFERENCES
Alford, A. & Berger, P. (1998). The Role of Taxes, Financial Reporting, and Other
Market Imperfections in Structuring Divisive Reorganizations, University of
Pennsylvania Working Papers.
Allen, F. & Michaely, R. (2001). Payout Policy, Cornell University Working paper.
Altman, E. I. (1968). Financial Ratios, Discriminant Analysis and the Prediction of
Corporate Bankruptcy, Journal of Finance, 23(4), 589-609.
Altman, E. I. (1993). Corporate Financial Distress and Bankruptcy: A Complete Guide
to Predicting and Avoiding Distress and Profiting from Bankruptcy, New York: John
Wiley and Sons Inc.
Altman, E. I., Hartzell, J. & Peck, M. (1995). Emerging Markets Corporate Bonds: A
Scoring System, Salomon Brothers Working Paper.
Argenti, J. (1976). Corporate Collapse: the Causes and Symptoms, New York: John
Wiley and Sons.
Beaver, W. H. (1966). Financial Ratios as Predictors of Failure, Journal of Accounting
Research, Empirical research in accounting: selected studies, 4, 71-111.
Beerman, K. (1976). Possible Ways to Predict Capital Losses with Annual Financial
Statements, University of Düsseldorf Working Paper.
Bisnode, Albertina, s.l. (2013). Bisnode, 08.
Journal of Applied Economics and Business
73
Bradley, M. G., Jarrel, G. & Kim, E. H. (1984). On the Existence of an Optimal Capital
Structure: Theory and Evidence, Journal of Finance, 39, 857-878.
Chrastinová, Z. (1998). Methods of evaluation of economic value and prediction of
financial situation of farms (original: Metódy hodnotenia ekonomickej bonity a
predikcie finančnej situácie poľnohospodárskych podnikov), VÚEPP Working Paper.
Doucha, R. (1995). Balance analysis (original : Bilanční analýza), Prague: Grada
Publishing.
Falkenstein, E., Boral, A. & Carty, L. V. (2000). RiskCalcTM for Private Companies:
Moody´s Default Model, Moody´s Investors Service, Working Paper.
Faltus, S. (2014). Firm Default Prediction Model for Slovak Companies, The European
Financial Systems 2014 Conference Proceedings, Lednice, 12-13 June, 2014.
Fulmer, J. G. (1984). A Bankruptcy Classification Model for Small Firms, The Journal
of commercial bank lending, 66(11), 25-37.
Gašpárová, E. (2014a). Deferred Income Tax (original: Odložená daň z príjmov), Dane
a účtovníctvo, XIX, 7-8.
Gašpárová, E. (2014b). Accounting and reporting of deferred income tax (original:
Účtovanie a vykazovanie odloženej dane z príjmov), Dane a účtovníctvo, Mesačník s
bezkonkurenčným počtom aktualít, XI, 7.
Gonen, M. (2007). Analyzing Receiver Operating Characteristic Curves Using SAS,
Cary, NC: SAS Press.
Groppelli, A. A. & Nikbakht, E. (2000). Finance, 4th ed. Barron´s Educational Series,
Inc.
Hudecová, H. (2013). Approval and distribution of profit - Accounting view (original:
Schválenie a rozdelenie výsledku hospodárenia - účtovný pohľad), Dane a
účtovníctvo, Vzory a prípady, 2.
Kotulič, R., Király, P. & Rajčániová, M. (2010). Financial Analysis of Company
(original: Finančná analýza podniku), Bratislava: Iura Edition.
Kralicek, P. (1993). Fundamentals of financial management (original: Základy
finančního hospodaření), Prague: Linde.
Metz, C. E. (1978). Basic Principles of ROC Analysis, Seminars in Nuclear Medicine, 8,
283-298.
Miller, M. H. & Schloes, M. (1978). Dividends and Taxes, Journal of Financial
Economics, 6, 333-364.
Miller, M. H. (1977). Debt and Taxes, Journal of Finance, 32, 261-275.

Jana Kubicová, Slavomír Faltus
Tax Debt as an Indicator of Companies’ Default: the Case of Slovakia
74 JOURNAL OF APPLIED ECONOMICS AND BUSINESS, VOL.2, ISSUE 4 – DECEMBER , 2014, PP. 59-74
Ministry of Finance of the Slovak Republic. (2002). Details of Accounting Procedures
and Framework Chart of Accounts for Entrepreneurs Using Double Entry
Bookkeeping (original: Provision of MF SR, Podrobnosti o postupoch účtovania a
rámcovej účtovej osnove pre podnikateľov účtujúcich v sústave podvojného
účtovníctva), Bratislava, No. 23054/2002-92.
Modigliani, F. & Miller, M. H. (1963). Corporate Income Taxes and Cost of Capital: a
Correction (in Communications), American Economic Review, 53, 433-443.
Modigliani, F. & Miller, M. H. (1958). The Cost of Capital, Corporation Finance and
the Theory of Investment, American Economic Review, 48, 261-297.
Neumaier, I. & Neumaierová, I. (1995). Try to calculate your INDEX IN 95 (original:
Zkuste spočítat svůj INDEX IN 95), Terno, 5, 7-10.
Ohlson, J. A. (1980). Financial Ratios and Probabilistic Prediction of Bankruptcy,
Journal of Accounting Research, 18, 109-131.
Pepe, M. S. (2004). The Statistical Evaluation of Medical Tests for Classification and
Prediction, Oxford: Oxford University Press.
Sands, E. G., Springate, G. L. & Peck, M. (1983). Predicting Business Failures, CGA
Magazine, 17, 24-27.
Shumway, T. (1999). Forecasting Bankruptcy More Accurately: A Simple Hazard
Model, [Date: 1st August, 2014. http://www-personal.umich.edu/-shumway].
Taffler, R. J. & Tisshaw, H. (1997). Going, Going, Gone - Four Factors which Predict,
Accountancy, 88, 50-54.
Taffler, R. J. (1983). The Assessment of Company Solvency and Performance Using a
Statistical Model, Accounting and Business Research, 15(52), 295-308.
Tamari, M. (1978). Financial Ratios: Analysis and Prediction, London: P. Elek.
Wilson, N. (2013). Multivariate Regression and Limited Dependent Variables:
research report, Leeds: Credit Management Research Center.
Zane, B., Alex, K. & Marcus, A. J. (2004). Essentials of Investments, 5th ed. McGraw-
Hill Irwin.
Zhou, X., Obuchowski, N. & McClish, D. K. (2011). Statistical Methods in Diagnostic
Medicine, John Wiley and Sons, Inc.
Zmijewski, M. E. (1983). Essays on Corporate Bankruptcy, State University of New
York Dissertation.
Zmijewski, M. E. (1984). Methodological Issues Related to the Estimation of Financial
Distress Prediction Models, Journal of Accounting Research, 252, 59-82.
Related Documents