NBER WORKING PAPER SERIES TAX AUDITS AS SCARECROWS: EVIDENCE FROM A LARGE-SCALE FIELD EXPERIMENT Marcelo L. Bérgolo Rodrigo Ceni Guillermo Cruces Matias Giaccobasso Ricardo Perez-Truglia Working Paper 23631 http://www.nber.org/papers/w23631 NATIONAL BUREAU OF ECONOMIC RESEARCH 1050 Massachusetts Avenue Cambridge, MA 02138 July 2017 We thank the Tax Registry of Uruguay for their collaboration. We thank Gustavo Gonzalez for his support, without which this research would not have been possible. We thank Joel Slemrod for his valuable feedback, as well as that of seminar participants at the 2017 RIDGE Public Economics Conference and the 2017 Zurich Center for Economic Development Conference. This project benefited from funding by CEF, CEDLAS-UNLP and IDRC. The views expressed herein are those of the authors and do not necessarily reflect the views of the National Bureau of Economic Research. NBER working papers are circulated for discussion and comment purposes. They have not been peer-reviewed or been subject to the review by the NBER Board of Directors that accompanies official NBER publications. © 2017 by Marcelo L. Bérgolo, Rodrigo Ceni, Guillermo Cruces, Matias Giaccobasso, and Ricardo Perez-Truglia. All rights reserved. Short sections of text, not to exceed two paragraphs, may be quoted without explicit permission provided that full credit, including © notice, is given to the source.

Welcome message from author
This document is posted to help you gain knowledge. Please leave a comment to let me know what you think about it! Share it to your friends and learn new things together.
Transcript

NBER WORKING PAPER SERIES
TAX AUDITS AS SCARECROWS:EVIDENCE FROM A LARGE-SCALE FIELD EXPERIMENT
Marcelo L. BérgoloRodrigo Ceni
Guillermo CrucesMatias Giaccobasso
Ricardo Perez-Truglia
Working Paper 23631http://www.nber.org/papers/w23631
NATIONAL BUREAU OF ECONOMIC RESEARCH1050 Massachusetts Avenue
Cambridge, MA 02138July 2017
We thank the Tax Registry of Uruguay for their collaboration. We thank Gustavo Gonzalez for his support, without which this research would not have been possible. We thank Joel Slemrod for his valuable feedback, as well as that of seminar participants at the 2017 RIDGE Public Economics Conference and the 2017 Zurich Center for Economic Development Conference. This project benefited from funding by CEF, CEDLAS-UNLP and IDRC. The views expressed herein are those of the authors and do not necessarily reflect the views of the National Bureau of Economic Research.
NBER working papers are circulated for discussion and comment purposes. They have not been peer-reviewed or been subject to the review by the NBER Board of Directors that accompanies official NBER publications.
© 2017 by Marcelo L. Bérgolo, Rodrigo Ceni, Guillermo Cruces, Matias Giaccobasso, and Ricardo Perez-Truglia. All rights reserved. Short sections of text, not to exceed two paragraphs, may be quoted without explicit permission provided that full credit, including © notice, is given to the source.

Tax Audits as Scarecrows: Evidence from a Large-Scale Field ExperimentMarcelo L. Bérgolo, Rodrigo Ceni, Guillermo Cruces, Matias Giaccobasso, and Ricardo Perez-TrugliaNBER Working Paper No. 23631July 2017JEL No. C93,H26,K42
ABSTRACT
According to the canonical model of Allingham and Sandmo (1972), firms evade taxes by making a trade-off between a lower tax burden and higher expected penalties. However, there is still no consensus about whether real-world firms operate in this rational way. We conducted a large-scale field experiment, sending letters to over 20,000 firms that collectively pay over 200 million dollars in taxes per year. In our letters, we provided firms with exogenous but nondeceptive signals about key inputs for their evasion decisions, such as audit probabilities and penalty rates. We measure the effect of these signals on their subsequent perceptions about the auditing process, based on survey data, as well as on the actual taxes paid, according to administrative data. We find that firms do increase their tax compliance in response to information about audits. However, the patterns in these responses are inconsistent with utility maximization. The evidence suggests that, much like scarecrows frighten off birds, audits can be a significant deterrent for tax evaders even though they would be perceived as harmless by a rational optimizer.
Marcelo L. BérgoloInstituto de Economia (IECON) Universidad de La Republica 1375 Joaquin Requena Montevideo, Uruguay [email protected]
Rodrigo CeniInstituto de Economia (IECON) Universidad de La Republica 1375 Joaquin Requena Montevideo, Uruguay [email protected]
Guillermo CrucesCEDLASUnivesidad Nacional de La Plata Calle 6 entre 47 y 48La Plata, [email protected]
Matias GiaccobassoInstituto de Economia (IECON) Universidad de La Republica1375 Joaquin RequenaMontevideo, Uruguay [email protected]
Ricardo Perez-TrugliaAnderson School of Management University of California, Los Angeles 110 Westwood PlazaLos Angeles, CA 90095and [email protected]

1 Introduction
Tax audits have been standard tools of most tax administrations throughout history. Besidesthe proceeds of actual inspections, the mere threat of an audit can be a powerful device toensure compliance. In fact, the probability of being audited is one of the key parameters inAllingham and Sandmo’s (1972) canonical model of tax evasion. In this framework, taxpayersare modeled as selfish and risk-averse criminals (Becker, 1968) who choose how much incometo conceal from the tax authority by comparing the costs (i.e., the penalties to be paid ifcaught) and benefits (i.e., the lower tax burden) of evading.
The importance of tax audits for tax evasion decisions, however, might vary for differentsources of income. For instance, wage income is hard to conceal in modern economies becauseemployers are usually required to report their employees’ earnings to the tax authority. As aresult, tax evasion can be detected and deterred even without conducting an audit (Klevenet al., 2011). However, this automatic third-party reporting is limited for other sources oftaxable income, such as income from self-employment and firm value-added.1 For thosesources of income, the threat of being audited is supposed to play an important role indeterring tax evasion.
Although there is a consensus that audits and penalties have some positive effects ontax compliance, there is no consensus yet on whether real-world firms react to audits inthe optimal manner predicted by Allingham and Sandmo (1972). In this paper, we presentevidence from a field experiment designed to understand how firms react to the threat ofaudits.
In collaboration with the Internal Revenue Services (IRS) from Uruguay, we conducted anexperiment with a sample of over 20,000 small- and medium-size firms. The IRS mailed lettersto the owners of each of these firms. We randomly assigned the information contained ineach of these letters to test specific hypothesis about the role of audits in tax compliance. Wemeasure the effect of this information on behavioral outcomes: the value-added tax (VAT) andother taxes paid by these firms, using the administrative records from the IRS. Additionally,we measure the effect of the information contained in the letter on subsequent perceptionsof these firms, such as the perceived probability of being audited and the perceived penaltyrate, using survey responses collected nine months after the letters were sent.
We designed several letter types and subtypes. The baseline letter type included somebrief generic information about taxes that the IRS often includes in its communicationswith firms. The audit-statistics letter type was identical to the baseline letter, except for
1While the value added tax (VAT) requires a paper trail, this might reduce but not rule out the possibilityor scope of evasion. For once, the paper trail breaks down when reaching the consumer. Moreover, there isevidence that firms can collude to avoid or tamper with the paper trail (Pomeranz, 2015; Naritomi, 2016).
2

an added message signaling the probability of being audited and the penalty rate, based ontax administration statistics. We can estimate the effect of this information about audits bycomparing the posttreatment tax payments of firms assigned to the baseline letters to thoseof recipients of audit-statistics letters. According to Allingham and Sandmo (1972), if firmsare underestimating audit probability or penalty, giving them this feedback should increasetheir tax compliance.
However, observing that firms react to unbiased feedback about the auditing processwould not imply that firms are making an optimal cost–benefit calculation as in Allinghamand Sandmo (1972). On one extreme, it is possible that firms are rationally learning from theinformation about audits and changing their behavior because they are re-optimizing underthe new beliefs. On the other extreme, firms may be reacting to the information because ittriggers an irrational feeling of fear, even if there are no changes in beliefs about the auditprobabilities and penalty rates.
To explore the causal mechanisms, we included audit-statistics subtreatments that gen-erated exogenous yet nondeceptive variation in information about audit and penalty rates.We computed the average audit probability and penalty rates included in the audit-statisticsmessage using a sample of 50 firms randomly selected from those similar to the firm of theletter recipient. The limited sample size used to compute these averages introduced substan-tial sampling variation in the information included in the letters. For instance, a firm mayreceive a signal of audit probability of 8% or 15% depending on the sample of similar firmsthat was drawn for that particular letter. As a result, firms were assigned to 950 distinctcombinations of audit probabilities and penalty rates. We exploit this exogenous variationin signals to estimate the behavioral elasticities between tax compliance and the audit andpenalty rates.
In a complementary experiment, we used a separate sample of firms that had been prese-lected by the IRS for audit consideration. We randomly divided these firms into two groups,one that would be audited with a 25% probability and the other that would be audited witha 50% probability. The audit-threat letter type included a message informing these firmsabout the probability to which they had been assigned. This exogenous variation allows foran alternative estimation of the elasticity between tax compliance and the audit probabil-ity. However, because of legal and practical considerations, randomizing the penalty rates towhich these firms would be subject was not possible.
We included two additional treatment arms of the main experiment pool. In the first one,we explored an additional aspect of the auditing process: the audit-endogeneity letter wasidentical to the baseline letter, except for an added message explaining that evading taxesincreases the probability of being audited. According to Allingham and Sandmo (1972), if
3

firms are unaware of this probability, informing them about this endogeneity should increasetax compliance. In the last treatment arm, we provided a nonpecuniary benchmark for theaudit messages. The public-goods letter was identical to the baseline letter, except for anadded message listing all the public goods that could be provided if firms reduced their taxevasion by 10%. According to the theory of the moral cost of noncompliance, adding thismessage could increase tax payments of evaders (Cowell and Gordon, 1988).2
We find that adding messages related to audits increases tax compliance. Adding a para-graph with statistics about the probability of being audited and the penalty rates increasestax compliance by about 6.3%, and adding a paragraph that indicates the endogeneity ofthe audit probability increases tax compliance by about 7.4%. These effects are not onlyhighly statistically significant, but also economically substantial. Using the estimated aver-age evasion rate of 26% from Gomez-Sabaini and Jimenez (2012), these effects would amountto a reduction in the evasion rate of 24% and 28%, respectively. Furthermore, these effectsare robust to a number of specification checks and alternative outcomes. In comparison,the message about public goods had a smaller and statistically insignificant effect on taxcompliance.
The effects of the audit-statistics subtreatments shed some light on why firms reactedto the feedback about statistics. Among firms that were sent this type of letter, thosereceiving higher signals of the audit or penalty rates by chance do not pay significantly highertaxes. Indeed, the average elasticities of tax compliance with respect to audit probabilityand penalty rate are close to zero, precisely estimated and statistically different from theelasticities predicted by various calibrations of Allingham and Sandmo (1972). The resultsare similar if we instead use firms assigned to the audit-threat letter, which provides analternative randomization of the probability of audits.
The survey data also favor the fear channel. We find that the audit-statistics letter reducedthe perceived probability of being audited. Thus, if firms were reacting to the audit-statisticsletter because of re-optimization, they should have reduced, rather than increased, their taxcompliance. Similarly, since most firms were already aware of this information, the effect ofthe audit-endogeneity message is inconsistent with the re-optimization channel.
Our survey also shows that, on average, firms perceive a probability of being auditedof almost three times the real probability, but have unbiased beliefs about penalty rates.This finding of overestimation of audit probabilities is consistent with prior survey evidence(Harris and Associates, 1988; Erard and Feinstein, 1994; Scholz and Pinney, 1995). However,
2There is a related literature on the social determinants of tax compliance. For instance, Blumenthalet al. (2001) and Fellner, Sausgruber and Traxler (2013) show that moral suasion messages do not increasecompliance, while Perez-Truglia and Troiano (2015) show that social shaming can sometimes be effective.
4

this previous evidence corresponds to wage-earners, for whom the misperception of auditprobabilities is mostly inconsequential owing to third-party reporting (Kleven et al., 2011).Our evidence suggests that these biases persist even when the financial stakes of misperceivingaudit probabilities can be substantial.
Our findings suggest that firms may comply with taxes because of the threat of beingaudited, but not in an optimal manner as in Allingham and Sandmo (1972). Our evidencesuggests two relevant sources of frictions. First, tax compliance being elastic with respectto the visibility of audit statistics but inelastic with respect to the audit probability andpenalties suggests significant optimization frictions. Second, the fact that firms have largedispersion and biases in beliefs about audits, with most of these misperceptions persistingeven after firms are provided with accurate information, suggests information frictions.
Our findings contribute to the debate about the determinants of tax compliance. Sometake the failure of the Allingham and Sandmo (1972) model to predict evasion rates as anindication that tax compliance does not largely depend on tax enforcement but on otherfactors such as tax morale (Luttmer and Singhal, 2014). Our evidence suggests that taxenforcement could still be important, just not in the fully rational way in which Allinghamand Sandmo (1972) modeled it. In other words, much like scarecrows frighten off birds,audits could be a significant deterrent for tax evaders even though they would be perceivedas harmless by a rational optimizer.
This paper belongs to various strands of literature. First, it contributes to a growingliterature that uses field experiments to study the decision of individuals to pay taxes. In aseminal contribution, Slemrod, Blumenthal, and Christian (2001) showed that, for a sampleof U.S. self-employed individuals, those who were randomly assigned to receive a letter fromthe Internal Revenue Services with an enforcement message reported higher income in theirtax returns. Similar messages about tax enforcement have been shown to have positiveeffects on compliance in a variety of contexts: wage income taxes in Denmark (Kleven et al.,2011), individual public-TV fees in Austria (Fellner, Sausgruber and Traxler, 2013), firms’VAT payments in Chile (Pomeranz, 2015), individual municipal taxes in Argentina (Castroand Scartascini, 2015), and an individual church tax in Germany (Dwenger et al., 2016). Wecontribute to this literature by disentangling the precise mechanism through which the threatof audits affects tax compliance. Our results indicate that the threat of audits matters, eventhough precise information such as the probability of audits and the penalty rates do not.3
Our analysis uses a subject pool similar to that of Pomeranz (2015). She shows that,compared to firms that received a placebo letter, firms that received a letter mentioning the
3These results are consistent with abundant evidence on the importance of salience for tax avoidance(Chetty, Looney and Kroft, 2009).
5

possibility of being audited increased their VAT payments. Pomeranz (2015) then uses thatexogenous variation in payments to measure how the higher tax payments spill over to otherfirms in the value-added chain. We instead focus on understanding the mechanisms thoughwhich letters with information about audits, such as ours or those in Pomeranz (2015), affectthe tax payments of the recipients in the first place.
From the perspective of experimental design, our work is related to Kleven et al. (2011)and Dwenger et al. (2016). In one treatment arm in their experiment, Kleven et al. (2011)show that randomizing employed individuals to a higher audit probability (100% insteadof 50%) increases their tax compliance by an amount that is statistically significant buteconomically negligible. However, their findings do not constitute evidence against Allinghamand Sandmo (1972) because they conduct these experiments with wage earners, for whomevasion is almost always automatically detected through automatic third-party reportingand without the need of audits, and who thus should not rationally care much about theprobability of audits. In another experiment, Dwenger et al. (2016) show that announcingdifferent probabilities of audits does not have a statistically significant effect on compliancewith a small local church tax in Germany; however, because of statistical power they cannotrule out economically significant effects.
This paper also belongs to a literature that tries to evaluate the fit of the Allingham andSandmo (1972) model. The evidence based on calibration exercises suggests that Allinghamand Sandmo (1972) would predict substantially lower tax compliance than that observedin the United States (e.g., Alm, McClelland, and Schulze, 1992). Other studies rely onregression analysis based on observational data. For example, Beron, Tauchen, and Witte(1988) find a weak correlation between the probability of being audited and reported income.Dhami and al-Nowaihi (2004) suggest the addition of behavioral features, such as stigma costand prospect theory, to improve the fit of the Allingham and Sandmo (1972) model. Finally,a group of studies explores these issues in laboratory settings. Most notably, Alm, Jackson,and McKee (1992) show that taxpayer reporting increases with audit and penalty rates,but the magnitudes of these reactions in the laboratory are smaller than those predicted byAllingham and Sandmo (1972).
The paper is organized as follows. Section 2 discusses the relevant hypotheses and theexperimental design used to test them. Section 3 presents the data sources and discussesthe implementation of the field experiment. Sections 4 and 5 present the results. The finalsection concludes.
6

2 Hypotheses and Experimental Design
2.1 Baseline Letter
Our experiment consisted of a mailing campaign from Uruguay’s IRS, which included anumber of treatment and subtreatment arms. Rather than comparing firms that received aletter to firms that did not, all of our analysis is based on comparisons between firms thatreceived letters, but with subtle variations in their content. We can thus net out the potentialeffects of simply receiving a letter from the tax authority, which might for instance induce areminder to pay due taxes.
These letters consisted of a single sheet of paper with the name of the recipient in theheader, the official letterhead of the IRS, and the hand signature of the General Director of theIRS. These letters were folded and placed in an envelope sealed with the official identificationof the IRS and sent by certified mail, which guarantees that the letters are delivered directlyto the recipient, who must sign upon receipt.
The first type of letter is the baseline letter, a sample of which is provided in AppendixA.1. The baseline letter contained some information that the IRS routinely includes in itscommunications with firms about the goals and responsibilities of the tax authority. The textexplained that the individual was randomly selected to receive this information, the letter wasfor information only, and there was no need to reply or to present any documentation to theIRS. The letters in other treatment arms included the same text as the baseline letter as wellas a distinct paragraph dependent on the arm. The additional paragraphs were presented ina larger type size and in boldface.
2.2 Audit-Statistics Letter
The goal of this treatment arm is to generate exogenous variation in the firms’ perceptionsabout audit probabilities and penalty rates. Because of legal constraints, we could not assigndifferent firms to different penalty rates. In Uruguay, as in most of the world, individualscannot be punished differently for the same crime. To circumvent this situation, we cre-ate exogenous variation in information that may affect perceptions about penalties, in anondeceptive way, by exploiting sampling variation in statistics about audits.
In the audit-statistics letter type, we provided firms with information about the auditand penalty rates. According to the Allingham and Sandmo (1972) model, we would expectrisk-averse firms to be interested in this information because it would help them optimizetheir evasion decisions and potentially increase their bottom line.4 Furthermore, this infor-
4We assume that firms in our sample are risk averse, which is plausible since we deal mainly with small
7

mation would seem to be particularly valuable in the context of limited information aboutaudits. For instance, it is easy to find information online about factors potentially relevantfor firms’ decision-making, such as the inflation rate or exchange rates. However, it is virtu-ally impossible to find online any information about audit probabilities and actual penaltiespaid by evading firms—tax authorities seem to prefer to conceal this information.
Uruguay’s tax law indicates that tax audits should cover the previous three years of taxreturns. As a result, the probability that this year’s tax report will be audited is equal tothe probability that the firm gets audited at least once over the next three years.
Appendix A.2 presents a sample of the audit-statistics letter type. Compared to the base-line letter, it contained an additional paragraph with information about the audit probability(p) and penalty rates (θ) for a random sample of firms similar to that of the recipient. :
“On the basis of historical information on similar businesses, there is a probabilityof [p%]that the tax returns you filed for this year will be audited in at least oneof the coming three years. If, pursuant to that auditing, it is determined that taxevasion has occurred, you will be required to pay not only the amount previouslyunpaid, but also a fee of approximately [θ%] of that amount.”
In our sample, the average value of p is 11.7%, while the average value of θ is 30.6%. Taxagencies do not publish data on the values of p and θ in their countries, which makes it difficultto compare the Uruguayan case to other contexts. In the United States, for which somecomparable data are available, these two parameters are on the same order of magnitude:self-employed individuals face p=11.42% and θ=20%.5
The addition of the audit-statistics message to the baseline letter may induce a positive ornegative effect on tax payments through two potential mechanisms. On the one hand, firmsmight change their beliefs about p and θ and rationally re-optimize their evasion decisionbased on the new beliefs. If these messages increase firms’ perception of p (or θ), they shouldincrease their tax payments. To the contrary, if this information reduces the firms’ perceivedvalues of p (or θ), then they should reduce their tax payments. On the other hand, providingfirms with the information about audit probabilities and penalty rates may scare firms introreducing their tax evasion, even if there was no cost-benefit analysis of the information.
To distinguish between these two mechanisms, we introduced exogenous variation in thevalues of p and θ shown in our treatment letters. To avoid any deception, we included a
and medium firms.5First, there is an annual probability of being audited of 2.1%, according to the ratio of returns examined
for businesses with no income tax credit and with a reported income between 25,000 and 200,000 USD (Table9a of IRS, 2014). Each audit covers the previous 3 to 6 years, which implies that the the probability thatthe current year’s tax filing will be eventually audited ranges from 5.88% to 11.42%. Second, IRS usuallyimposes a basic penalty of θ=20%, although the penalties can be higher in severe cases.
8

footnote in the letter to detail how we had estimated the values of p and θ:
“Estimates are based on data from the 2011–2013 period for a group of firms withsimilar characteristics in terms of, for instance, total revenue. The probabilityof being audited was calculated as a percentage of audited firms in a randomsub-sample of firms. The rate of the fee was estimated as an average of a randomsub-sample of audits.”
More specifically, we divided the firms into quintiles based on total sales revenues. For eachfirm we then drew a random sample of 100 other firms from the same quintile (i.e., “similarfirms”), from which we computed the averages of p and θ. This randomization strategyled us to 940 different combinations of p and θ. These estimates of p and θ were unbiasedand consistent with the explanation given in the footnote—the information provided to therecipients was thus nondeceptive.
Figure 1 shows a histogram of the values of p and θ included in these letters. The valuesof p range from 2% to 25%, with an average of about 11.7%. The values of θ range from 15%to 66%, with an average of about 30.6%. A small share of this variation in p and θ (13.6%and 0.9%, respectively) derives from the fact that firms belonged to different reference groups(i.e., different quintiles of sales revenues). The rest of the variation is the result of samplingvariation.6
The goal is to compare the tax payments among firms that were assigned different valuesof p and θ by chance. A lack of reaction to these different levels of p or θ would suggestthat fear was the main channel through which firms reacted to the audit-statistics message.If, instead, this variation in the values of p and θ in our treatment letters had an effect ontax compliance, we could infer that recipients learned from the information provided andre-optimized their behavior based on their updated posterior beliefs. We present below acomparison between the effects of our mailing campaign and the magnitude of the impactderived from a calibration of the Allingham and Sandmo (1972) model.
As a second strategy for disentangling between the fear and re-optimization mechanisms,we conducted a survey of recipients (described in detail in Section 3.5). This survey allowsus to assess whether they had incorporated the information provided to them in the letter.We captured the effects of the information contained in the audit-statistics letters on beliefsby means of the two following survey questions:
Perceived Audit Probability: “In your opinion, what is the probability that the
6To obtain the proportion of the variation corresponding to the clustering size, we regress each parameteron the quintiles of sales revenues. Regressing p over VAT sales quintiles results in R2 = 0.136, while regressingθ over the same variables results in R2 = 0.009.
9

tax returns filed by a company like yours will be audited at least in one of thenext three years (from 0% to 100%)?”
Perceived Penalty Rate: “Let us imagine that a company like yours is auditedand that tax evasion is detected. What, in your opinion, is the penalty (in %)as determined by law that the firm must pay in addition to the originally unpaidamount? For example, a fee of X% means that, for each $100 not paid, the firmwould have to pay those original $100 plus $X in penalties.”
2.3 Audit-Threat Letter
To complement the evidence from the audit-statistics subtreatments, we conducted an alter-native way of randomizing perceptions about audit probabilities. We devised a treatmentarm called audit-threat letter that randomly assigned firms to groups with different proba-bilities of being audited, with a certain probability in the following year. A sample of theaudit-threat letter is presented in A.3. The audit-threat letters were identical to the baselineletter, except for the following additional paragraph:
“We would like to inform you that the business you represent is one of a groupof firms pre-selected for auditing in 2016. A [X%] of the firms in that group willthen be randomly selected for auditing.”
We devised this treatment arm with the IRS audit department, which specified a group ofhigh-risk firms, randomly assigned them to two groups, and committed to carry out auditson 25% of the firms in one of the groups and 50% of the firms in the other group, yielding tworandomly assigned probabilities of audit in our letters ofX=25% andX=50%. If these lettersaffected the recipients’ perceptions of the audit probability rather than simply generating afear of audits, those randomly assigned to the 50% probability should report higher taxesthan those assigned to the 25% group.
This audit-threat treatment arm was applied to a different sample of high-risk firms fromthat of the rest of the experiment. These different experimental samples imply that theeffects of the audit-threat treatment arm cannot be directly compared to those of the baselineletter. We use this treatment arm as a separate auxiliary experiment.
2.4 Audit-Endogeneity Letter
Most tax agencies, including Uruguay’s, take into account firm characteristics when decidingwhich ones to audit. They assign higher audit probabilities to firms that are consideredto have a higher probability of evading. As a result, evading taxes typically increases the
10

probability of being audited. In the canonical model of tax evasion, the audit probabilityis exogenous, but several authors, such as Allingham and Sandmo (1972), Andreoni et al.(1998), Yitzhaki (1987), and Slemrod and Yitzhaki (2002), introduce variations of the modelin which the audit probabilities are determined endogenously. In the context of these models,if unsuspecting firms receive news about the endogeneity of audits, they should revise theirtax evasion decisions and reduce the amount of tax evaded.7
To explore this hypothesis, we designed the audit-endogeneity treatment arm. We askedour counterparts at the IRS to split a small sample of firms into ones suspected of evadingtaxes and ones not suspected of evading at taxes, according to the IRS’s scoring data onfirms’ evasion risk. We then computed the difference in 2011–2013 audit rates between thetwo groups and found that the rates were approximately twice as high for the latter group.We used this information to create the audit-endogeneity letter type, which adds to thebaseline letter the following paragraph (see sample in Appendix A.4):
“The IRS uses data on thousands of taxpayers to detect firms that may be evadingtaxes; most of its audits are aimed at those firms. Evading taxes, then, doublesyour chances of being audited.”
As with the other treatment arms, we estimate whether recipients of these letters paid moretaxes than those in the baseline group. As in the audit-statistics treatment arm, two mecha-nisms could be at play with this audit-endogeneity letter. On the one hand, tax compliancemay increase when firms internalize the fact that audits are endogenous to their evasionbehavior—the importance of their own actions becomes more palpable. On the other hand,firms may re-optimize their tax compliance decisions incorporating the information we pro-vided about how audits change as a function of their behavior. If, on average, recipientsrevised their beliefs about the degree of endogeneity of audits upward (downward), the lattermechanism should increase (decrease) their tax compliance.
As with the audit-statistics treatment, we included question in the survey intended tomeasure the subject’s awareness about the endogeneity of audit probabilities—this questionand its results are described in detail in Appendix C.3.
2.5 Public-Goods Letter
In line with previous studies (see e.g., Blumenthal et al., 2001; Fellner et al., 2013; Dwengeret al., 2014; Pomeranz, 2015), we devised a treatment arm that could provide a benchmark
7Konrad et al. (2016) present suggestive evidence of this mechanism in the context of a lab experiment:taxpayers facing a situation where suspicious attitudes toward tax officers increase the probability of beingaudited increase their tax compliance by 80%.
11

for the effect of nonpecuniary incentives on tax compliance. In coordination with IRS staffand authorities, we compiled the message that we believed would be the most effective atincreasing compliance. This is a message about the cost of evasion in terms of public goodprovision, in the spirit of the model of Cowell and Gordon (1988).8The public-goods letteris identical to the baseline letter, with the exception of the addition of a specific paragraph.The paragraph lists a series of services that the government could provide if tax evadersreduced their evasion by 10% (see Appendix A.5 for a sample of the letter):
“If those who currently evade their tax obligations were to evade 10% less, theadditional revenue collected would enable all of the following: to supply 42,000portable computers to school children; to build 4 high schools, 9 elementaryschools, and 2 technical schools; to acquire 80 patrol cars and to hire 500 policeofficers; to add 87,000 hours of medical attention by doctors at public hospitals;to hire 660 teachers; to build 1,000 public housing units (50m2 per unit). Therewould be resources left over to reduce the tax burden. The tax behavior of eachof us has direct effects on the lives of us all.”
We used estimates from different governmental agencies to design this message.9 As with theother treatment arms, we can test whether the public-goods letter increased tax compliancecompared to the baseline letter. A possible channel is that this message induces a moralcost of evasion and thus reduces noncompliance. An alternative channel linking this type ofmessage and evasion behavior is that firms may revise their beliefs about the social cost ofevasion. An upward revision should increase their tax compliance, and a downward revisioncould reduce it.
3 Data Sources and Implementation of the Field Ex-periment
3.1 Institutional Context
Uruguay is a South American country with an annual GDP per capita of about USD 15,000in 2015. Total tax revenues (i.e., for all levels of government) were about 19% of GDP in
8This message is also related to the laboratory experiment from Alm, McClelland, and Schulze (1992),which presents evidence that one of the reasons why people decide to pay taxes is their valuation of the publicgoods provided with the tax revenues.
9These agencies were: Administracion Nacional de Educacion Publica (ANEP), CEIBAL, Ministerio deSalud Publica (MSP), Ministerio del Interior (MI), Ministerio de Vivienda, Ordenamiento Territorial y MedioAmbiente (MVOTMA).
12

2015 and, as usual in many other countries, VAT represents the largest source of tax revenuein Uruguay, accounting for roughly 50% of the total tax collection.10 Firms are required toremit VAT payments all along the production and distribution chain.11 The standard VATrate is 22%, and a small number of specific products (a basic basket of foodstuff) have a 10%rate or are exempt. Although we study the impact of our experiment on other taxes, ourmain focus is on the VAT.
Tax morale in Uruguay—the intrinsic motivation to comply with taxation—is believed tobe among the highest in Latin America and possibly comparable to some developed nations.For instance, according to survey data from the 2010–2013 wave of the World Values Survey,77.2% of respondents from Uruguay say that evading taxes is “Never Justifiable,” while thisproportion is 68.2% among all other Latin American countries (population-weighted) and70.9% for the United States. Tax evasion is conversely relatively low in Uruguay. Accordingto estimates from Gomez-Sabaini and Jimenez (2012), evasion of VAT in Uruguay was around26% in 2008, the third lowest rate among the nine Latin American countries included in thestudy and roughly comparable to the 22% evasion rate computed for Italy in 2006 (Gomez-Sabaini and Moran, 2014).
3.2 Subject Pool and Randomization
Our experiment was conducted in collaboration with the IRS. As of May 2015, there were120,125 firms registered with the IRS of Uruguay. A subsample of 4,597 firms preselected bythe IRS was put aside for the audit-threat sample, which we call the secondary experimentalsample. Of the remaining firms, we selected a group to form the main experimental sample.
To form this main sample, we excluded some firms by request of the IRS. For instance, weexcluded firms subject to special regimes for VAT payments (very small or very large firms).We also kept in the experimental sample only firms that had made VAT payments in at leastthree different months during the previous 12-month period12 and those with a total valueadded of at least USD 1,000 – for the sake of simplicity, all amounts shown in this paper areadjusted by inflation and converted from Uruguayan pesos to U.S. dollars using the nominal
10Own calculations based on data from the Central Bank of Uruguay and from the Internal RevenueService. The other sources of tax revenues are the personal income tax, the corporate tax, and some specifictaxes to consumption, businesses and wealth.
11Firms may credit VAT paid on input costs (i.e., imports and purchases from their suppliers) against thetotal sales of goods and services to their costumers (i.e., “tax debit”). They pay VAT to the IRS only onthe excess of the total “tax debit” over the tax credit. If the tax credit exceeds the debit, the excess may becarried over for future tax years. While the VAT should have the same implications than a retail sales taxin theory, in practice they are believed to differ in some substantial aspects (Slemrod, 2008).
12The sample selection was conducted in May 2015, so this 12-month period spans from April 2014 toMarch 2015.
13

exchange rate from August 2015.To maximize the impact of our information provision experiment, we wanted the letters to
be delivered to the owners of the firms, or at least to those making the day-to-day decisions. Insome cases, owners provide the address of external accountants instead of their own addresses.Since the IRS has data on the addresses of all registered accountants, we dropped all of thesecases from the sample. We were also concerned that in very large firms the effect of theinformation may be substantially diluted since it would probably not reach the owner. Forthat reason, we excluded firms with a total value added above USD 100,000 during theprevious 12 months.
These criteria left us with 20,471 firms for the main experimental sample. All these firmswere randomly assigned to receive one the four letter types, with the following distribution:62.5% of the firms were assigned to our main treatment arm, the audit-statistics letter; theother three letter types (baseline, audit-endogeneity, and public-goods) were each assigned to12.5% of the sample.13 After removing the roughly 18.5% of the letters that were returnedby the postal agency, the final distribution of letter types was 10,272 to audit-statistics; 2,064to baseline, 2,039 to audit-endogeneity, and 2,017 to public-goods (total N = 16,392).
The 4,597 firms in the secondary sample were assigned to receive the audit-threat letter.Half of them were assigned to the 25% audit probability and the other half to the 50% auditprobability. After excluding the 12% of letters returned by the postal office, we were leftwith 2,015 firms in the 25% probability group and 2,033 firms in the 50% probability group(total N = 4,048).
Columns (1) through (4) of Table 1 compare the balance of pretreatment characteristicsbetween firms assigned to the different letter types in the main experimental sample, withcharacteristics such as VAT paid prior to the experiment, the age of the firm and the numberof employees. Additionally, for each characteristic, column (5) presents the p-value of thetest of the null hypothesis that the averages are the same across all four letter types. Asexpected, the differences across letter types are economically but not statistically significant.Columns (6) through (8) of Table 1 present a similar balance test, except for the secondarysample used for the audit-threat arm. Again, the characteristics are balanced across firmsthat received the 25% threat letter and firms that received the 50% threat letter.
Table 2 provides some descriptive statistics for the firms in our experimental sample.Column (2) of Table 2 corresponds to all firms in the main experimental sample. On average,these firms had paid USD 1,890 in VAT over the past three months (implying a value addedof about USD 8,600), they had been registered with the IRS for 15.3 years, they had 4.8
13The randomization to letter types was stratified by the quintiles of the distribution of value added overthe 12 months previous to the randomization.
14

employees, 14% of them had been audited at least once over the previous three years, and22% belonged to the retail sector.
Column (1) of Table 2 corresponds to the universe of registered firms. By design, firmsin our experimental sample are smaller, both in terms of number of employees and levelof VAT payments. Lastly, column (3) of Table 2 provides statistics about the secondaryexperimental sample (i.e., for the audit-threat treatment arm). While some statisticallysignificant differences exist between firms in the two groups, they are still broadly comparablein size. The main difference between firms in the two samples is that the audit rates were 7percentage points higher in the audit-threat sample. This difference is by design because theIRS selected firms classified as high-risk for this treatment arm, which had been targeted tobe audited more frequently in the past.
3.3 Econometric Specifications
We want to compare outcomes across treatment arms as well as across subtreatment arms.For the comparison across treatment arms, consider the sample of firms assigned to eitherbaseline letter or one of the other letter types, indexed by j: audit-statistics, audit-endogeneityor public-goods. The baseline specification is given by the following:
Yi = α + β ·Dji +Xiδ + εi (1)
The outcome variable (Yi) is the total outcome during the 12-month posttreatment period(i.e., after the delivery of the treatment letter). Dj
i is a dummy variable that takes the value0 if i was assigned to the baseline letter, and the value 1 if i was assigned to letter type j.Last, Xi is a vector of control variables.
In the second econometric model, we use data only for firms assigned to the audit-statisticsletter and estimate the following regression:
Yi = α + γp · pi + γθ · θi +Xiδ + εi (2)
Where pi ∈ (0, 1) is the audit probability included in the letter sent to individual i,and θi ∈ (0, 1) is the penalty rate included in the letter sent to individual i. The resultingcoefficients can be directly interpreted as elasticities, because the audit probabilities andpenalty rates are expressed from 0 to 1 and we use a Poisson regression model. For instance,γp = 1 would imply that a 1 percentage point increase in the audit probability increases theVAT payments by 1%.
We always include in Xi a set of four dummies corresponding to the five groups of similarfirms from which we drew the sample to calculate pi and θi — this approach ensures that we
15

are only exploiting variation in pi and θi that is exogenous (i.e., due to sampling variation).In the third econometric model, we use data only for firms assigned to the audit-statistics
letter and estimate the following regression:
Yi = α + γp · pi +Xiδ + εi (3)
Where pi ∈ {0.25, 0.50} is the audit probability included in the audit-threat letter sent toindividual i.
When outcomes are persistent over time, which applies to the case of VAT payments, theuse of pretreatment controls can help reduce the variance of the error term and thus resultsin gains in statistical power (McKenzie, 2012). Thus, our baseline specification includes theoutcomes during each of the previous 12 pretreatment months as control variables (Xi).
In our baseline specification, we use a Poisson regression model to allow for proportionaleffects and bunching at zero, and we present robustness checks with alternative regressionmodels. In the interest of transparency, for each coefficient related to posttreatment effects,we also present a falsification test based on pretreatment “effects”; that is, we re-estimatethe model, but instead of using posttreatment outcomes as the dependent variable, we usepretreatment outcomes. We should expect these pretreatment effects to be close to zero andnot statistically significant.
3.4 Outcomes of Interest
The letters were provided to the Uruguay Postal Office on August 21, 2015. The vast majorityof the letters were delivered in the month of September, and therefore we define August as thelast month of the pretreatment period and October as the first month of the posttreatmentperiod. The main outcome of interest in our study consists of the total VAT amount remittedby taxpayers in the 12 months subsequent to receiving the letter.14
Table 3 presents some descriptive statistics about the distribution of payments for firmsthat received the baseline letter type. On average, the total amount of VAT paid in the12-month pretreatment period is about USD 7,700, while the amount for the correspondingposttreatment period is approximately USD 6,500. This negative trend in VAT paymentscan be explained by this sample containing smaller firms, which have a high turnover rate.The size of posttreatment VAT payments varied substantially, ranging from a 10th percentileof USD 400 to a 90th percentile of USD 16,550.
Furthermore, we can break down firms’ VAT payments according to their timing. We canobserve the date of the transfer to the IRS as well as the month for which the payment was
14This variable includes VAT payments and also VAT withholding made by third party agents.
16

intended. Firms can transfer funds to cover their liabilities in previous periods. Since firmstypically make VAT payments on a monthly basis, they normally cover the current and theprevious month, which we call concurrent payments (73.5% of the firms in July 2015). Weclassify payments for two or more months in the past as retroactive payments (3.9% of thefirms in July 2015).
Finally, although we focus on VAT payments in our analysis, we obtained data from theIRS on the other main taxes paid by the firms, which included corporate income taxes andnet worth taxes that represent (with VAT) more than 96% of the total tax burden of firms.We use payments of these taxes as additional outcomes of interest.
3.5 Survey Implementation
The IRS, with the support of the Inter-American Center of Tax Administrations and theUnited Nations, had previously administered a survey on the costs of tax compliance forsmall and medium-sized businesses. We collaborated with the tax authority in the designand implementation of this survey. The survey included a module specific to our experiment,to capture the degree to which our information provision experiment might have affectedrecipients’ beliefs. The survey included seven additional modules designed by the IRS toassess the taxpayers’ burden of reporting in terms of time, money, and patience.
To ensure trustworthy responses, the IRS assured potential respondents that the surveywas anonymous and that replies could not be traced back to specific individuals or firms. Wepartnered with local and international universities to increase respondent confidence and tohighlight that the survey was part of a study and part of an audit or compliance campaignby the IRS. Since we were interested in the effect of our experiment on the beliefs elicitedby means of the survey, we embedded a code in the emailed survey link to identify whichtreatment arm of the experiment the recipient was assigned to (i.e., which of the four lettertypes and, within the audit-statistics treatment, which combination of p and θ). These codesdid not uniquely identify any single firm but allowed us to link treatment arms and surveyresponses while still maintaining the anonymity.
The email invitations to the online survey (see a sample in Appendix A.6) was sent byemail on May 2016, about nine months after the letters from our experiments were sent.The IRS communicates mainly by postal mail, and it thus has the mailing addresses of theowners of all registered firms. However, the tax agency only keeps records of email addressesfor a subset of firms that used their online services in the past. We sent invitations to allthe firms in the main experimental sample with a valid email address.15 The last column of
15The IRS wanted to target taxpayers and not their agents for this study. We did not include emailaddresses that in the full sample were repeated more than three times, which most likely correspond to
17

Table 2 presents the average characteristics among the 3,845 firms that were invited to thesurvey. The firms invited to the survey were very similar in characteristics to those in theentire experimental sample (shown in column 2).
Our purpose was to elicit the beliefs of firm owners. Since the IRS records could not ensurethat the registered email address corresponded to the firms’ owners, we asked the surveyrespondent to self-identify as one of the following five types: owner, internal accountant,external accountant, manager, or other employee. From the 3,845 recipients that we invitedto participate in the survey, we received 2,331 responses (response rate of 60.6%). Of these2,331, 45% self-identified as owner, 4.4% as internal accountant, 5.4% as external accountant,1.9% as manager, 4.5% as other employee, and the remaining 38.8% did not provide a responseto this question. For the baseline results, we use only respondents who self-identified as owners– the results are robust to the inclusion of all respondents (see Appendix C.4).
A noteworthy aspect of the survey was that none of the questions was mandatory byrequest of the IRS. Among respondents self-identified as owners, the missing data rate forour three key questions is between 19.5% and 23.3%, which is comparable to the averagenonresponse rate for all questions in the survey (17.8%).
4 Results: Effects of Messages about Audits
4.1 Baseline Results
Our baseline results capture the impact of our mailing campaign on our outcomes of interest(subsequent tax payments). These results are obtained by comparing the posttreatment taxpayments of firms assigned to the audit-statistics, audit-endogeneity, and public-goods letterswith the payments from recipients of the baseline letter. We interpret these as the effects ofthe corresponding messages (audit-statistics, audit-endogeneity, and public-goods).
Figure 2 summarizes these baseline results. In each of the three panels, we plot thedifference between the VAT payments of the firms assigned to the baseline letter to thepayments of firms assigned to each of the other three treatment arms for the two quarterspreceding our mailing campaign and for the four subsequent quarters.16 The effects of each ofthe treatment arms are computed by means of Poisson regressions, so that the coefficients canbe directly interpreted as semi-elasticities. These regressions are simple, with no additionalcontrol variables.
accountants.16We top-coded all outcomes of interest at 99.99% to avoid the contamination of the results by typos and
outliers.
18

Figure 2.a shows that the audit-statistics message had statistically and economically sig-nificant effects on VAT payments. For instance, the point coefficient corresponding to thethird posttreatment quarter implies that the audit-statistics message increased the VAT pay-ments by 8.7% (p = 0.012). The effects are similar in magnitude for all the posttreatmentquarters (7.8% in the first quarter, and about 5.6% in the second and fourth quarters aftertreatment), suggesting that this effect was stable and persistent. The coefficients on the pre-treatment VAT payments correspond to a falsification test for our experiment. As expectedby the random assignment of firms to different treatment arms, the pretreatment differencesin VAT payments are economically small and not statistically significant (effects of less than1% and about −1.7%, with p-values greater than 0.6 in both cases).
Figure 2.b shows that the audit-endogeneity treatment arm also induced a significantchange in VAT payments compared to the baseline letter. The effect of adding the audit-endogeneity message is positive and statistically significant in all four posttreatment quarters,and ranges between 10% and 12.4%. These effects are slightly higher than those of the audit-statistics treatment arm, but these differences are not statistically significant at standardlevels. The differences for the two pretreatment quarters are also economically small andstatistically nonsignificant for the audit-endogeneity treatment arm.
Figure 2.c, in turn, depicts the effects of the public-goods treatment arm. Adding thismessage to the baseline letter did not seem to have an effect as high and stable as that of theother two treatment arms. While there are large posttreatment differences in posttreatmentVAT payments, ranging from 5.0% to 10.1% (significant at standard levels in the secondand third quarters), inspection of the event-study reveals substantial differences in the pre-treatment period between firms assigned to the public-goods letters and those assigned to thebaseline letter. A proper assessment of the effect of the public-goods message requires us tocontrol for these differences in pretreatment outcomes, which we do in the regression analysisthat follows.
Table 4 presents the baseline regression results. These estimates are obtained by meansof Poisson regressions—the results are qualitatively and quantitatively similar to those fromalternative estimators.17 In Table 4, we control for pretreatment outcomes as describedin Section 3.3. The first column presents the results of our baseline results: the effects ofeach of the three treatments (audit-statistics in Panel A, audit-endogeneity in Panel B, andpublic-goods in Panel C) compared with the outcomes for firms that received the baselineletter. The posttreatment coefficients correspond to regressions with total VAT paid in the12 months after the delivery of the letter as the dependent variable. Additionally, we alsoinclude a series of placebo tests: the pretreatment coefficients correspond to regressions with
17These additional results are presented in Appendix C.1.
19

total VAT paid in the 12 months prior the delivery of the letter as the dependent variable.The first column from Table 4 corresponds to average effects of each treatment arm for
the entire sample. The posttreatment coefficient of audit-statistics (panel a.) indicates thatfirms receiving the audit-statistics message paid 6.3% more VAT in the 12 months after theintervention on average. This effect is not only highly statistically significant (p = 0.013),it is also economically substantial. Using the estimated average evasion rate of 26% fromGomez-Sabaini and Jimenez (2012), the effect amounts to a reduction in the evasion rateof 24% (= 6.3%
26% ). The (placebo) effect on pretreatment outcomes is close to zero (−0.8%),not statistically significant at standard levels, and even more precisely estimated than thecorresponding posttreatment effect (the standard error on the pretreatment coefficient is0.021, 16% smaller than the corresponding 0.025 for the posttreatment coefficient).
The effects of our audit-statistics treatment are not directly comparable to those of theaudit message from Pomeranz (2015) because the messages differed in content and becausethe two studies cover firms from different countries and with different characteristics. Nev-ertheless, Table 4 from Pomeranz (2015) indicates that the deterrence letter in that studyled to an increase in VAT payments of 7.6%, which is similar in magnitude and statisticallyindistinguishable from the 6.3% effect of our audit-statistics message.
Panel b. from Table 4 indicates that the audit-endogeneity message increased subsequentVAT payments by 7.4% (p = 0.021), with the placebo experiment confirming the pretreatmentbalance in the outcome of interest. This effect is similar in magnitude to the 6.3% effect of ouraudit-statistics message (difference not statistically significant). In other words, the additionof either of the two messages about audits had a similar effect on VAT payments.
Finally, there is weaker evidence that the public-goods message affected VAT payments.Panel c from Table 4 indicates that the public-goods message had an effect on subsequentVAT payments of 4.3%, which was not statistically significant at standard levels (p = 0.147);this effect is smaller than the effect for the other two treatment arms. These results controlfor pretreatment outcomes, which explains the differing pattern of statistical significance withrespect to the coefficients in Figure 2.c.
The results discussed so far correspond to the average effect of each treatment arm. Theliterature on tax evasion and the results from previous empirical studies indicate that therecould be some heterogeneity in the effect of our treatments on evasion behavior. Columns(2) to (5) of Table 4 present the analysis of heterogeneity in our treatments’ effects along twodimensions: firms above or below median size (columns 2 and 3) and firms that have andhave not been audited in the recent past (columns 4 and 5).
The results in columns (2) and (3) of Table 4 indicate that the effects of the audit-statisticsand audit-endogeneity messages were more prominent among larger firms: the coefficients
20

are larger and statistically significant for firms above median size compared with those belowmedian size—8.8% and 7.1% compared with 4.3% and 3.5% for audit-statistics and audit-endogeneity, respectively. However, we must take this difference with a grain of salt becauseit is not statistically significant at standard levels. In turn, there is no discernible differencein effect sizes for the public-goods treatment arm.
The results in columns (4) and (5) of Table 4, indicate in turn that the effects of theaudit-statistics and audit-endogeneity treatment arms were mainly driven by firms that hadnot been audited in the recent past. However, again we lack statistical power to establishthis result unequivocally. This pattern is consistent with recently audited firms being moreaware (or more frightened) of the possibility of being subject to an inspection by the IRS.
4.2 Effects by Type and Timing of Tax Payments
As previously described, firms in Uruguay can make payments for their present liabilities, butthey can also pay taxes for previous periods—either because they owe past taxes or becausethey are revising their accounts and correcting past mistakes or imputing invoices they didnot have at the time of the original payment.
When firms that engage in tax evasion have increased fear of being audited, we can expectthem to increase their tax payments (reduce their evasion) in the future, but we can alsoexpect them to retroactively revise their payments for previous time periods to reduce oreliminate their past evasion. We explore this possibility with the results presented in thefirst two columns of Table 5, which split the effects of our treatment arms on concurrent andretroactive payments. For reference, we include in column (3) the baseline results on totalVAT payments (those from column 1 in Table 4).
Consistent with increased fear of being audited, the messages about audits had an eco-nomically and statistically significant effect on retroactive payments. Indeed, because of themuch lower baseline rate, the effects on retroactive payments are larger in magnitude thanthe effects on the concurrent payments. For instance, the effect for audit-statistics messageis 38.1% (p = 0.004) for the retroactive payments and 4.4% (p = 0.087) for the concurrentpayments. The results are similar for the audit-endogeneity message (effects of 31.4% and6.1%, respectively). In contrast, the public-goods message does not have a statistically sig-nificant effect either on retroactive payments or on current payments (p = 0.146 and p =0.304, respectively).
We have so far established that firms in two of our three treatment arms increased theirVAT payments compared to recipients of the baseline letter. Our analysis focuses on VATbecause VAT liabilities represent the largest fraction of tax payments by firms in our sample
21

and because VAT is the tax that leaves more room for exploiting loopholes and the lack ofthird-party reporting. However, our mailing referred to taxes in general and did not mentionVAT or any other specific tax. In fact, the effects on VAT may not represent a net increasein tax payments; firms may increase their evasion (i.e., reduce their payments) of other taxesthey are liable for.
The results in columns (4) through (6) of Table 5 help us deal with these considerations.The columns present the effects of our treatment arms for different taxes: VAT, other taxes(mostly the corporate income tax), and total (i.e., VAT + other). The evidence suggests that,far from crowding out other tax payments, the audit-statistics and audit-endogeneity messageshad positive effect on non-VAT revenues. Indeed, the effects on payments of other taxes are aseconomically and statistically as significant as those on VAT payments. The audit-statisticshad an effect of 6.3% on VAT payments, while the effect on other tax payments was 7.7%. (p= 0.038). This difference implies that the effect of the audit-statistics message on other taxpayments was 22.2% larger compared with VAT payments. The results are similar for theaudit-endogeneity message (effects of 7.4% and 8.4%, respectively). In contrast, the effect ofthe public-goods message on other tax payments is close to zero (0.1%) and not statisticallysignificant at standard levels. The effect of the public-goods message on total tax paymentswas also small (1.8%) and statistically insignificant.
5 Results: Causal Mechanisms
5.1 Evidence from the Audit-Statistics and Audit-Threat Sub-Treatments
The results in the previous section indicate that our audit-statistics and audit-endogeneitymessages had significant and substantial effects on VAT payments. This evidence, however,does not allow us to establish the precise channels through which the information we providedin our mailings affected tax payments and evasion behavior. In this section, we present furtherevidence in an attempt to distinguish between the rational and the fear channels; that is,whether firms re-optimized their evasion decisions based on the information we provided, orif they just reacted out of some irrational fear after being exposed to information about taxaudits.
According to the Allingham and Sandmo (1972) model, the VAT payments should increasein both audit probabilities and penalty rates. We calibrated this model to obtain somequantitative predictions as a benchmark for what we could expect from our informationtreatments (see the details of this calibration and the results from alternative assumptions
22

in Appendix B). Our preferred model assumes that individuals derive a “warm glow” effectfrom paying their taxes, so that we can fit the data without relying on an extreme curvatureof the utility function. This model predicts a behavioral elasticity of tax payments withrespect to the audit probability of 4.02 and an elasticity of tax payments with respect to thepenalty rates of 1.64.
Instead of comparing the behavior of firms in different treatment arms with that of firmsin the baseline group, the results in this section are based on a comparison of the behavior offirms within the main treatment arm, audit-statistics. We measure the effect of the signalsabout audit probabilities and penalty rates on their posttreatment payments. The resultingcoefficients can be directly interpreted as elasticities. For instance, a coefficient on the auditprobability with a value of 1 would imply that a 1 percentage point increase in the auditprobability increases the VAT payments by 1%. Similarly, a coefficient on the penalty ratewith a value of 1 would imply that a 1 percentage point increase in the penalty rates wouldincrease VAT payments by 1%.
Table 6.a presents estimates of these elasticities for the firms in the audit-statistics sub-treatments.18 The estimates are close to zero and not statistically significant. The elasticitywith respect to the audit probability is 0.030 (with a standard error [se] of 0.236, p = 0.897),and the elasticity with respect to the penalty rate is −0.118 (se 0.115, p = 0.304). In otherwords, within the group of firms that received the audit-statistics message, those who receivedsignals of higher audit probabilities and penalty rates did not significantly increase their VATpayments compared with firms in the same group that received signals with lower values ofaudit probabilities and penalty rates.19 Table 6.a also presents estimates for pretreatmentoutcomes, for firms above or below median size, and for those who had and had not beenaudited in the recent past. In all cases, the estimates are not statistically significant, sug-gesting that these null results are not driven by differences in the evolution of pretreatmentoutcomes.20
Since we devoted a large fraction of our subject pool to this treatment arm, these elas-ticities are quite precisely estimated. We can reject the null hypothesis that each of theseelasticities is equal to those predicted by the calibrated model (4.02 for the audit probabilityand 1.64 for the penalty rate). Furthermore, we can rule out even smaller effects; the 90%
18Table C.2 in the Appendix presents the results from alternative specifications based on OLS, Tobit andProbit models.
19The results are robust if, instead of estimating the elasticities w.r.t. p and θ separately, we estimate theelasticity w.r.t. p ∗ θ
20For completeness, Table C.3 in the Appendix presents the results for the audit-statistics elasticities withthe same breakdown as in Table 5, i.e., for retroactive and concurrent VAT payments, and for VAT versusother taxes. The pattern of results in that table is consistent with these results: firms did not seem to reactto the different messages about probability of audits and penalty rates included in the letters.
23

confidence interval for the audit probability excludes elasticities above 0.418, and the 90%confidence interval for the penalty rate excludes elasticities above 0.071.
As complementary evidence, we can use the results from the audit-threat secondary sam-ple, which generated alternative variation in the audit probabilities by randomly assigningfirms to messages of audit probabilities of 25% and 50%. Table 6.b presents the results ofthis treatment arm. As in the audit-statistics treatment, the coefficient from the Poissonregression can be interpreted directly as the behavioral elasticity. The audit-threat messagesimplies an elasticity of 0.376 and borderline significant at the 10% level (p = 0.073).21 Theestimated elasticity for the audit-threat message is thus somewhat larger than the one foundfor the audit-statistics message (0.03). However, this elasticity of 0.376 is still economicallysmall, and it is statistically different from the elasticity of 4.02 predicted by our calibrationof Allingham and Sandmo (1972).
We can also explore whether the elasticities are larger for a particular range of {p, θ}.Figure 3.a estimates the effects of the audit-statistics and audit-threat subtreatments in a lessparametric way, by breaking down the effect of the audit-statistics message by decile of p (leftpanel) and by decile of θ (right panel). There does not seem to be a systematic relationshipbetween the effect of the audit-statistics message and the values of {p, θ} contained in themessage.
Figure 3.b provides an event-study analysis of the effect of the audit-statistics message(relative to the baseline letter), split into two groups: firms that received above- and below-median signals of p. Figure 3.c presents the equivalent analysis for firms that received above-and below-median values of θ. And Figure 3.d provides the equivalent analysis for the audit-threat arm, comparing firms assigned to the 25% and 50% conditions. Consistent with theprevious evidence, Figure 3.b-d suggest that the effects of the messages are unrelated to thelevels of p and θ.
All in all, these results indicate that firms did not seem to react to the different messagesabout probability of audits and penalty rates included in the audits-statistics letters. Ourfavorite interpretation is that the effects of the audit-statistics message was due to the fearchannel rather than due to rational re-optimization.
5.2 Evidence from the Survey Data
In this section, we distinguish between the rational and the fear channels by measuring theeffects of the audit-statistics and audit-endogeneity messages on beliefs, as captured by means
21However, the pre-treatment (falsification) coefficient (-0.342) is also borderline statistically significantat the 10% level (p-value=0.055), indicating that the post-treatment coefficient may be spurious.
24

of the survey we carried out nine months after the delivery of the letters.Figure 4.a and 4.b depict the distributions of perceptions about audit probabilities and
penalty rates, respectively, as elicited from the survey. The shaded bars show the distributionof perceptions for individuals who received the baseline letter. The red curves correspond tothe distribution of signals sent to the firms in the audit-statistics letters.
The comparison between the shaded bars and the red curve from Figure 4.a suggests thatrespondents substantially overestimated the probability of being audited on average. Whileour statistics indicate a probability of roughly 11.7%, the mean perception in the baselinegroup is 37.6% (p < 0.01 for the difference ). Conversely, the comparison between the shadedbars and the red curve from Figure 4.b suggests that respondents were about right regardingthe penalty rates on average; the average penalty is 30.7%, while the mean of the perceivedpenalty is 31.0% in the baseline group.
A potential explanation for the positive bias in the perceived audit probability is givenby the availability heuristic bias (Kahneman and Tversky 1974). According to that model,individuals judge the probability of an event by how easily they recall instances of the event.Even though audits are rare, the fact that they are visible among colleagues and even some-times salient in the media may induce firms to assign a high probability. Indeed, there isevidence that individuals overestimate the probabilities of a wide range of rare events of asimilar nature (Lichtenstein et al., 1978; Kahneman, Slovic, and Tversky, 1982).
Regarding the distribution of beliefs, the systematic bias in the perceptions of auditprobabilities and penalty rates in the baseline group presents evidence against the rationalmechanisms and in favor of the fear mechanism; that is, if the audit-statistics informationeliminated some of this systematic bias, it would lower the perceived audit probability andthus decrease rather than increase tax compliance.
To test this hypothesis more directly, the shallow bars in Figure 4 depict the distributionof perceptions for respondents from firms in the audit-statistics treatment arm comparedto different control subsamples, whereas Table 7 presents the average of these perceptionsand their differences between groups. Inspection of Figure 4.a indicates that, if anything,the audit-statistics message slightly reduced the perceived probability of being audited, froman average of 37.6% to an average of 35.4%. Although this difference is not statisticallysignificant, the difference becomes significant once we increase the statistical power by poolingsubjects from the baseline and the public-goods groups (Figure 4.c and Table 7) since bothreceived messages with no specific information about audit probabilities.
As indicated by Table 7, our information treatment seems to have reduced the perceptionof the probability of audits from an average of 40.7% for the pooled group to 35.4% forrespondents from firms in the audits-statistics treatment arm (p = 0.033 for the difference).
25

Moreover, each panel in Figure 4 reports the results from an Epps–Singleton two-sample testusing the empirical characteristic function, which is a version of the Kolmogorov–Smirnov testof equality of distributions that is valid for discrete data (Goerg and Kaiser, 2009). Accordingto this test, the audit-statistics message did not have a statistically significant effect on thedistribution of perceptions about audit probabilities (p-values of 0.25) compared with thedistribution for the baseline group only (Figures 4.a), but when we increase statistical powerby adding the public-goods respondents to the control group the difference between the twodistributions is statistically significant at the 5% level (Figure 4.c).22
Meanwhile, the two distributions of perceived penalty rates are statistically indistinguish-able with baseline only or with the additional observations in the control group (p-values of0.15 and 0.5, Figures 4.b and 4.d) The audit-statistics message had a very small effect on theperceived penalty rate, decreasing it from an average of 32.2% to an average of 29.9% for thebaseline only control group, and from 30.42% to 29.9% with the pooled control group (Table7). These differences are not statistically significant at standard levels.
To sum up, the audit-statistics treatment arm seems to have reduced the average perceivedaudit probability, and it did not affect the average perceived penalty rate. The rational mech-anism would suggest that the audit-statistics message should have reduced VAT paymentssince it reduced the perceived probability of tax audits among recipients. This prediction,however, is at odds with the observed positive effect of the audit-statistics message discussedin Section 4.1. Our favorite interpretation is that firms reacted with some form of irrationalfear from our mailing, rather than learning and re-optimizing their behavior in the rationalway predicted by the Allingham and Sandmo (1972) model.23
6 Conclusions
Economists often posit that firms incorporate the threat of being audited into their taxevasion decisions. However, no consensus exists as to whether they proceed in a rationaloptimizing way as suggested by the model of Allingham and Sandmo (1972). We conducteda large-scale field experiment with firms that collectively pay over USD 200 million dollarsin taxes per year, and we measured the effect of our information treatments on behavior(tax payments obtained from administrative data) and on beliefs (obtained from a survey of
22The public-goods letter did not include any information about audit probabilities or penalty rates, andthey can thus be considered valid controls to assess if the information in the audits-statistics letters had aneffect on recipients’ beliefs. We include them alongside the baseline letters to increase the statistical powerof the test.
23Appendix C.3 presents suggestive evidence that the effect of the audit-endogeneity message is also dueto fear, because recipients were already aware of the endogeneity of audit probabilities.
26

recipients).We show that, consistent with prior findings, providing information related to audits
increases firms’ tax payments. However, we showed that individuals did not react to thedifferent signals about audit probabilities and penalty rates included in the message. Also,the information treatments reduced the perceived probability of tax audits, which shouldhave triggered an increase in tax evasion, yet we find that our letters actually increasedtax payments. Our favorite interpretation of these findings is that the messages about auditsaffects tax evasion decisions primarily through creating a sense of fear, rather than by makingthe taxpayers revise their beliefs about audits and subsequently re-optimize their behavior.
Our findings contribute to the debate about the determinants of tax compliance. Althoughthe failure of the Allingham and Sandmo (1972) model to predict evasion rates may beinterpreted as an indication that tax compliance depends on factors such as tax morale(Luttmer and Singhal, 2014) rather than on tax enforcement, our evidence suggests that taxenforcement indeed matters, but in a context of optimization and information frictions.
Our findings provide some insights for tax collection. Holding the actual detection ratefixed, tax revenues may be higher if audits and other detection mechanisms are made moresalient to the taxpayers.24 Indeed, there is evidence that some tax agencies are already takingadvantage of this approach. For instance, Blank and Levin (2010) find a disproportionatelylarge number of tax enforcement press releases during the weeks immediately prior to TaxDay, presumably in order to influence taxpayers’ perceptions while they are preparing to filetheir annual tax returns.
24For a practical discussion on how to implement this type of policy, see for example Morse (2009).Furthermore, salience can be used to improve compliance with other laws: for instance, Dur and Vollaard(2016) show experimental evidence that the use of a salience intervention can significantly reduce illegalgarbage disposal.
27

References
[1] Allingham, M. G. and Sandmo, A. (1972). “Income Tax Evasion: A Theoretical Analysis.”Journal of Public Economics, 1: 323-338.
[2] Alm, J., McClelland, G. H. and Schulze, W. (1992). “Why do people pay taxes?” Journal ofPublic Economics, 48(1): 21-38.
[3] Alm, J., Jackson, B., and McKee, M. (1992). “Estimating the Determinants of Taxpayer Com-pliance with Experimental Data. Economic Development and Cultural Change.”, National TaxJournal 45(1): 107-114.
[4] Andreoni, J, Erard, B. and Feinstein, J. (1998) “Tax Compliance,” Journal of Economic Lit-erature, 32(2): 818–860.
[5] Becker, G.S. (1968). “Crime and Punishment: An Economic Approach,” Journal of PoliticalEconomy, 76(2): 169-217.
[6] Beron, K. J., Tauchen, H. V., and Witte, A. D. (1988). “A Structural Equation Model for TaxCompliance and Auditing”, NBER Working Paper No. 2556.
[7] Blank, J. D. and Levin, D. Z. (2010) “When Is Tax Enforcement Publicized?” Virginia TaxReview, 30; NYU Law and Economics Research Paper No. 10-12.
[8] Blumenthal, M.; C. Christian and J. Slemrod (2001), “Do Normative Appeals Affect TaxCompliance? Evidence From a Controlled Experiment in Minnesota,” National Tax Journal,54(1): 125-138.
[9] Castro, L., and Scartascini, C. (2015). “Tax Compliance and Enforcement in the PampasEvidence From a Field Experiment.” Journal of Economic Behavior & Organization, 116, 65-82.
[10] Chetty, R, Looney, A, and Kroft, K.. (2009). “Salience and Taxation: Theory and Evidence.”The American Economic Review 99 (4): 1145–77.
[11] Cowell, F. A. and Gordon, J. P. F. (1988) “Unwillingness to pay, Journal of Public Economics”,Journal of Public Economics, 36(3):305-321.
[12] Dirección General Impositiva (DGI) (2013) “Estimating VAT Evasion Through ConsumptionMethod”, Technical Report, Economic Advisory Office.
[13] Dhami S. and al-Nowaihi A. (2007), “Why Do People Pay Taxes? Prospect theory versusexpected utility theory”, Journal of Economic Behavior and Organization, 64(1),171-192
[14] Dur, R, and Vollaard, B. (2016) “Salience of Law Enforcement: A Field Experiment” TinbergenInstitute Discussion Paper 2017-007/VII.
[15] Dwenger, N.; H. Kleven; I. Rasul and J. Rincke (2016), “Extrinsic and Intrinsic Motivationsfor Tax Compliance: Evidence from a Field Experiment in Germany,” American EconomicJournal: Economic Policy 8(3), 203-232.
28

[16] Erard, B. and Feinstein J. S. (1994). “The Role of Moral Sentiment and Audit Perceptions inTax Compliance”. Public Finance 49 (Supplement), 70 – 89.
[17] Fellner, G.; Sausgruber, R. and Traxler, C. (2013), “Testing Enforcement Strategies in theField: Threat, Moral Appeal and Social Information,” Journal of the European EconomicAssociation 11 (3): 634–660.
[18] Goerg, S. and Kaiser, J. (2009). “Nonparametric testing of distributions—the Epps–Singletontwo-sample test using the empirical characteristic function,” Stata Journal, 9(3):454-465.
[19] Gomez-Sabaini, J. C. and Jimenez, J. P. (2012). “Tax structure and tax evasion in LatinAmerica.” Macroeconomics of Development Series, 118, ECLAC.
[20] Gomez-Sabaini, J.C. and Moran, D. (2014). “Tax policy in Latin America Assessment andguidelines for a second generation of reforms.” Macroeconomics of Development Series, 133,ECLAC.
[21] Harris, L. and Associates, Inc. (1988), “1987 taxpayer opinion survey,” Internal Revenue ServiceDocument 7292, Washington, DC.
[22] Internal Revenue Service Data Book, 2014 (2015), Publication 55B, Washington, DC.
[23] Kahneman, D., and Tversky, A. (1972), “Subjective Probability: A Judgment of Representa-tiveness.” In “The concept of Probability in Psychological Experiments”, edited by: Carl-AxelS. Staël Von Holstein, pp. 25-48, Springer Netherlands.
[24] Tversky, A., and Kahneman, D. (1974). “Judgment under Uncertainty: Heuristics and Biases.”Science, 185(4157), 1124-1131
[25] Kleven, H. J., Kreiner, C. and Saez, E. (2016), “Why Can Modern Governments Tax So Much?An Agency Model of Firms as Fiscal Intermediaries,” Economica 83, 219-246, 2016.
[26] Konrad, K. A., Lohse, T., and Qari, S. (2016). “Compliance With Endogenous Audit Proba-bilities.” Scandinavian Journal of Economics, forthcoming.
[27] Lichtenstein, S., Slovic, P., Fischhoff, B., Layman, M., and Combs, B. (1978). “Judged fre-quency of lethal events,” Journal of experimental psychology: Human learning and memory,4(6), 551.
[28] Luttmer, E. F. P. and Singhal, M. (2014). “Tax Morale.” Journal of Economic Perspectives,28(4):149–168.
[29] McKenzie, D. (2012) “Beyond baseline and follow-up: The case for more T in experiments”,Journal of Development Economics, 99(2): 210-221
[30] Morse, S. C., (2009) “Using Salience and Influence to Narrow the Tax Gap.” Loyola UniversityChicago Law Journal, 40:483.
[31] Naritomi, J, (2016), “Consumers as Tax Auditors,”, mimeo, London School of Economics.
[32] Perez-Truglia; R. and Troiano, U. (2015) "Shaming Tax Delinquents: Theory and Evidencefrom a Field Experiment in the United States", NBER Working Paper No. 21264
29

[33] Pomeranz, D. (2015), “No Taxation Without Information: Deterrence and Self-Enforcementin the Value Added Tax,” The American Economic Review, 105(8), 2539-2569.
[34] Scholz, J. T. and Pinney N. (1995). “Duty, Fear, and Tax Compliance: The heuristic basis ofcitizenship behavior”. American Journal of Political Science 39 (2), 490–512.
[35] Slemrod, J.; Blumenthal, M. and Christian C. (2001), “Taxpayer Response to an IncreasedProbability of Audit: Evidence from a Controlled Experiment in Minnesota,” Journal of PublicEconomics, 79 (3):455-483.
[36] Slemrod, J. and Yitzhaki, S. (2002), “Chapter 22 - Tax Avoidance, Evasion, and Administra-tion,” in “Handbook of Public Economics” edited by: Auerbach, A. J. and Feldstein, M., Vol.3:1423-1470, Elsevier.
[37] Slemrod, J. (2008). “Does It Matter WhoWrites the Check to the Government? The Economicsof Tax Remittance.” National Tax Journal 61 (2): 251–75.
[38] Yitzhaki, S. (1987), “On the Excess Burden of Tax Evasion,” Public Finance Review, 15(2):123-137.
30

Table 1: Balance of Observable Firm Characteristics across Treatment GroupsMain Sample Secondary Sample
AuditStatistics
(1)
PublicGoods(2)
AuditEndogeneity
(3)Baseline
(4)p-value test
(5)
AuditThreat (25%)
(6)
AuditThreat (50%)
(7)p-value test
(8)
% paid VAT taxes (3 months pre-mailing) 0.92 0.94 0.93 0.93 0.18 0.90 0.89 0.54(0.00) (0.01) (0.01) (0.01) (0.01) (0.01)
Amount of VAT paid (3 months pre-mailing) 1.87 1.96 1.93 1.91 0.56 1.74 1.75 0.95(0.03) (0.07) (0.07) (0.06) (0.10) (0.09)
Years registered in tax agency 15.34 14.75 15.70 15.01 0.27 19.45 19.42 0.94(0.17) (0.22) (0.54) (0.22) (0.28) (0.29)
% audited between 2011-2015 0.14 0.14 0.12 0.14 0.17 0.21 0.20 0.69(0.00) (0.01) (0.01) (0.01) (0.01) (0.01)
Number of employees 4.81 4.66 4.88 5.09 0.96 4.83 4.88 0.80(0.26) (0.54) (0.57) (0.64) (0.13) (0.12)
% retail trade sector 0.22 0.22 0.21 0.23 0.78 0.33 0.32 0.40(0.00) (0.01) (0.01) (0.01) (0.01) (0.01)
% Agricultural, forest and others 0.03 0.03 0.03 0.03 0.77 0.03 0.04 0.12(0.00) (0.00) (0.00) (0.00) (0.00) (0.00)
% construction sector 0.03 0.03 0.03 0.03 0.85 0.03 0.03 0.33(0.00) (0.00) (0.00) (0.00) (0.00) (0.00)
% other sector 0.73 0.73 0.73 0.72 0.95 0.61 0.62 0.54(0.00) (0.01) (0.01) (0.01) (0.01) (0.01)
Observations 10,272 2,017 2,039 2,064 2,015 2,033
Notes: Averages for different pre-treatment firm-level characteristics, by treatment group and type of sample. The main sample includes all firmsselected as described in section 3.2. The secondary sample includes high risk firms selected by the IRS. Standard errors in parentheses. The lastcolumn of each sample reports the p-value of a test in which the null hypothesis is that the mean is equal for all the treatment groups. Data on VATamount and firm characteristics comes from administrative tax records (including monthly ayments, annual tax returns and auditing registers)..
31

Table 2: Comparison of Firm Characteristics for All Firms, for Firms in Main Sample, for Firms in the Secondary Sample andfor Firms Invited to the Survey
Experimental Sample
All firms(1)
Main(2)
Secondary(3)
Invited tothe survey
(4)
% paid VAT taxes (3 months pre-mailing) 0.78 0.93 0.89 0.93(0.42) (0.26) (0.31) (0.26)
Amount of VAT paid (3 months pre-mailing) 3.72 1.89 1.74 1.89(11.55) (2.83) (4.25) (2.98)
Years registered in tax agency 14.21 15.26 19.44 14.46(14.85) (17.16) (12.84) (10.08)
% audited between 2011-2015 0.08 0.14 0.21 0.11(0.28) (0.34) (0.40) (0.31)
Number of employees 12.65 4.84 4.89 6.43(302.98) (26.60) (5.76) (53.77)
% retail trade sector 0.13 0.22 0.33 0.15(0.34) (0.41) (0.47) (0.36)
% Agricultural, forest and others 0.03 0.03 0.03 0.02(0.17) (0.17) (0.18) (0.15)
% construction sector 0.03 0.03 0.03 0.03(0.17) (0.17) (0.17) (0.18)
% other sector 0.84 0.73 0.61 0.80(0.37) (0.45) (0.49) (0.40)
N 120,125 16,392 4,048 3,845
Notes: Column (1) includes all firms that remitted at least one payment in 2014 or 2015. Column (2) includes the subset of firms selected for theexperimental sample according to the criteria described in section 3.2, restricted to firms between USD 1,000 and USD 100,000 of added value. Wealso exclude firms that were tagged by the IRS as accountancy firms and those that did not report receiving the letter. Column (3) represents a groupof high risk firms that were selected from a special sample defined by the IRS and received the audit-threat letter. Column (4) corresponds to firmswith valid e-mail addresses on file with the IRS, and therefore selected to participate in the on-line survey conducted after the experiment. All datais based on administrative tax records (monthly payments, annual tax returns and auditing registers)..
32

Table 3: Pre-Treatment Tax Payments: Summary StatisticsMean(1)
SD(2)
10th(3)
25th(4)
50th(5)
75th(6)
90th(7)
VAT AmountsPost-treatment 6.47 7.77 0.44 1.30 3.74 8.48 16.55Pre-Treatment 7.77 8.07 0.96 1.99 4.86 10.94 19.73
Retroactive VAT AmountsPost-treatment 0.30 1.40 0.00 0.00 0.00 0.00 0.62Pre-Treatment 0.40 1.76 0.00 0.00 0.00 0.00 0.81
Other Taxes AmountsPost-Treatment 3.30 5.43 0.00 0.95 1.81 3.52 7.42Pre-Treatment 4.07 8.57 0.04 1.43 2.14 4.37 8.72
Notes: The statistics in this table correspond to firms that received the baseline letter (N=2,064). The pre-treatmentperiod ranges from September 1, 2014 to August 31, 2015 and the post-treatment period ranges from October 1, 2015to September 30, 2016. Data on payments comes from administrative data records. VAT amounts corresponds to VATpayments and withholdings. Retroactive VAT amount corresponds to two months or more retroactive VAT payments andwithholding, e.g. VAT payments made in March 2016 corresponding to September 2015. Other taxes includes paymentsfor the corporate tax, the wealth tax and other specific taxes to bussiness activity..
33

Table 4: Average Effects of Audit-Statistics, Audit-Endogeneity and Public-Goods Messages
Above Median Size Recently AuditedAll(1)
Yes(2)
No(3)
Yes(4)
No(5)
a. Audit - Statistics vs Baseline
Post-Treatment 0.063** 0.088*** 0.043 -0.002 0.068**(0.025) (0.031) (0.036) (0.056) (0.027)
Pre-Treatment -0.008 -0.012 0.028 -0.025 -0.003(0.021) (0.023) (0.037) (0.054) (0.023)
Observations 12,336 6,211 6,125 1,371 10,965
b. Audit - Endogeneity vs Baseline
Post-Treatment 0.074** 0.071* 0.035 0.055 0.075**(0.032) (0.039) (0.042) (0.091) (0.034)
Pre-Treatment -0.006 -0.014 0.032 -0.024 -0.005(0.027) (0.031) (0.040) (0.070) (0.028)
Observations 4,103 2,052 2,051 425 3,678
c. Public - Goods vs Baseline
Post-Treatment 0.043 0.045 0.038 0.138* 0.025(0.030) (0.036) (0.043) (0.074) (0.032)
Pre-Treatment -0.004 -0.010 0.057 -0.060 0.002(0.026) (0.029) (0.041) (0.063) (0.028)
Observations 4,081 2,054 2,027 449 3,632
Notes: * significant at the 10% level, ** at the 5% level, *** at the 1% level. Robust standard errors. The results are basedon a Poisson regression, so coefficients can be interpreted directly as semi-elasticities. Panel a. compares the audit-statisticsmessage with the baseline letter, while panels b. and c. replicate the analysis for audit-endogeneity and public-goodsmessages. In the first row of each panel the dependent variable is the amount of VAT payments (in dollars) after receivingthe letter. The second row presents a falsification test in which we estimate the same regression, but using the amountcontributed before receiving the mailing (pre-treatment) as the dependent variable. All regressions are estimated with a setof monthly controls that correspond to the year before the outcome, i.e. in the post treatment outcome we include monthlyVAT payment controls from September, 2014 to August, 2015 and in pre-treatment outcome we include the same variablesfor the September, 2013 - August 2014 period. We also restrict the analysis to firms that effectively received the letteras reported by the postal service. Column (1) presents the results for the total number of firms that received each letter.Column (2) presents the effect of each letter on firms with a number of employees greater than the median. Column (3)replicates the estimates for firms with a number of employees below the median. Column (4) presents estimates for firmsthat were audited at least once between 2012 and 2014, and Column (5) presents the estimates for the group of firms thatwere not audited in the same period..
34

Table 5: Average Effects of Audit-Statistics, Audit-Endogeneity and Public-Goods Messages: VAT Pay-ment Timing and Other Taxes
VAT,By Payment Timing
VATvs. Other Taxes
Retroactive(1)
Concurrent(2)
Retroactive +Concurrent
(3)VAT(4)
Other(5)
VAT +Other(6)
a. Audit - Statitstics (N= 10,272) vs Baseline (N= 2,064)
Post-Treatment 0.381*** 0.044* 0.063** 0.063** 0.077** 0.052**(0.131) (0.026) (0.025) (0.025) (0.037) (0.026)
Pre-Treatment -0.132 -0.005 -0.008 -0.008 0.016 0.037(0.105) (0.022) (0.021) (0.021) (0.045) (0.026)
b. Audit - Endogeneity (N= 2,039) vs Baseline (N= 2,064)
Post-Treatment 0.314** 0.061* 0.074** 0.074** 0.084** 0.079***(0.139) (0.033) (0.032) (0.032) (0.041) (0.031)
Pre-Treatment 0.008 -0.003 -0.006 -0.006 0.006 0.027(0.125) (0.027) (0.027) (0.027) (0.056) (0.031)
c. Public - Goods (N= 2,017) vs Baseline (N= 2,064)
Post-Treatment 0.195 0.032 0.043 0.043 0.001 0.018(0.134) (0.031) (0.030) (0.030) (0.048) (0.029)
Pre-Treatment -0.192 0.002 -0.004 -0.004 -0.047 -0.004(0.124) (0.026) (0.026) (0.026) (0.046) (0.027)
Notes: * significant at the 10% level, ** at the 5% level, *** at the 1% level. Robust standard errors. The results arebased on a Poisson regression, so coefficients can be interpreted directly as semi-elasticities. Panel a. compares the audit-statistics message with the baseline letter while panels b. and c. replicate the analysis for audit-endogeneity and public-goodsmessages. In the first row of each panel, the dependent variable is the amount of VAT payments (in dollars) after receivingthe letter. The second row presents a falsification test in which we estimate the same regression but using the amountcontributed before receiving the mailing (pre-treatment) as the dependent variable. All regressions are estimated with a setof monthly controls that correspond to the year before the outcome, i.e. in the post treatment outcome we include monthlyVAT payment controls from September, 2014 to August, 2015 and in pre-treatment outcome we include the same variablesfor the September, 2013 - August 2014 period. We also restrict the analysis to those firms that effectively received theletter. Columns (1), (2) and (3) show the effect of treatment by type of payments. Columns (1) and (2) present separatelythe effect of treatment on current and retroactive VAT payments, while column (3) presents the overall effect. Columns(4), (5) and (6) present the results by type of tax. Column (4) presents the effect of the treatment in post experiment VATpayments, column (5) presents the effect on the rest of taxes considered, and column (6) presents the effect on the totalamount of taxes paid by the firms..
35

Table 6: Elasticities of Evasion with Respect to Audit Probability and Penalty Rate, Audit-Statistics andAudit-Threat Sub-Treatments
Above Median Size Recently AuditedAll(1)
Yes(2)
No(3)
Yes(4)
No(5)
a. Audit - Statistics Letters
Audit Probability (%)
Post-Treatment 0.030 -0.001 0.012 0.574 -0.005(0.236) (0.313) (0.298) (0.446) (0.272)
Pre-Treatment 0.025 0.118 -0.166 -0.211 -0.211(0.115) (0.140) (0.200) (0.319) (0.319)
Penalty Size (%)
Post-Treatment -0.118 0.005 -0.069 0.066 -0.128(0.115) (0.140) (0.151) (0.220) (0.123)
Pre-Treatment -0.001 -0.005 -0.006 0.160 -0.020(0.088) (0.073) (0.232) (0.170) (0.097)
Observations 10,272 5,147 5,125 1,139 9,133
b. Audit - Threat Letters
Audit Probability(%)
Post-Treatment 0.376* 0.192 0.435* -0.124 0.591**(0.210) (0.245) (0.264) (0.340) (0.233)
Pre-Treatment -0.342* -0.320 -0.372 -0.370 -0.177(0.178) (0.197) (0.275) (0.299) (0.200)
Observations 4,048 1,844 1,833 653 3,395
Notes: * significant at the 10% level, ** at the 5% level, *** at the 1% level. Robust standard error.s Panel a. presentsthe effect of providing different information regarding p and in the audit-statistics message. Panel b. compares the twoaudit-threat messages, i.e. the 50% threat of audit vs. the 25% threat of audit. Rows (1) and (3) of panel a. presentthe effect of informing an additional percentage point of p and θ respectively on the post-treatment VAT payments. Rows(2) and (4) present a falsification test in which we estimate the same regression using pre-treatment information as thedependent variable. All regressions are estimated with a set of monthly controls that correspond to the year before theoutcome, i.e. in the post-treatment outcome we include monthly VAT payment controls from September, 2014 to August,2015 and in the pre-treatment outcome we include the same variables for the September, 2013 - August 2014 period. Wealso restrict the analysis to firms that effectively received the letter as reported by the postal service. Row (1) in panel b.presents the post-treatment effect of receiving the letter of 50% threat relative to receiving the 25% threat letter. Thesecoefficients can be interpreted directly as elasticities. Row (2) of panel b. replicates the estimates for the pre-treatmentoutcomes. Column (1) presents the result for the total number of firms that received each letter. Column (2) presents theeffect of each letter on firms with a number of employees greater than the median. Column (3) replicates the estimates forfirms with a number of employees below the median. Column (4) presents estimates for firms that were audited at leastonce between 2012 and 2014 and Column (5) presents the estimates for the group of firms that were not audited in thesame period..
36

Table 7: Effects of Audit-Statistics on Survey Beliefs
Baseline(1)
AuditStatistics
(2)p-value(3)
Panel a.p - Mean 37.65 35.23 0.474
(3.39) (1.32)θ - Mean 32.13 29.90 0.560
(3.41) (1.57)Panel b.
Baseline +Public Goods
AuditStatistics p-value
p - Mean 40.73 35.23 0.033(2.30) (1.32)
θ - Mean 30.46 29.90 0.849(2.44) (1.57)
Notes: Table 7 is based on responses given by owners or respondents with missing values in the question regarding whoanswered the survey. In panel a., Column (1) (N=69) refers to respondents who received the baseline letter during theexperimental stage. Column (2): “Aud. Statistics / Endogeneity” (N=365 for Aud. Statistics and N=79 for Endogeneity)refers to respondents who received the audit-statistics letter (columns 1 and 2), and in row (3) we present results for thegroup of taxpayers that received the audit-endogeneity letter. Column (3) presents the p-value of a test that compares themean baseline and audit-statistics perceptions for questions regarding p(Q2-row (1)), θ (Q4-row (2)) and baseline, with theendogeneity perception for (Q6-row (3)) of the survey questionnaire (appendix A.7). In panel b we pool respondents fromthe baseline group with those who received the public-goods letter to improve the statistical power in the test (N=137).The public-goods letter did not include any information regarding p and θ..
37

Figure 1: Distribution of Statistics Shown in Audit-Statistics Letter Typea. Audit Probability (p) b. Penalty rate (θ)
05
1015
2025
Per
cent
0 5 10 15 20 25Probability of being audited (%)
010
2030
40P
erce
nt
0 20 40 60Average Penalty Rate (%)
Notes: The data corresponds to the distribution of the information provided in the audit-statistics letter (N=10,272). Panela. presents the distribution of the probability of being audited (p ). Panel b represents the distribution of the averagepenalty rate (θ ). p and θ arise from the following procedure: 1) divide the firms in total sales revenues quintiles, 2)randomly draw a sample of 100 similar firms (i.e. from the same quintile) and 3) compute the average p and θ from thatsample. This algorithm lead to 950 different combinations of the two parameters..
38

Figure 2: Average Effects of Audit-Statistics, Audit-Endogeneity and Public-Goods Messages: By Quartersa. Audit-Statistics vs. Baseline b. Audit-Endogeneity vs. Baseline
−0.
10.
00.
10.
2
Tre
atm
ent E
ffect
(p.
p)
−2 −1 +1 +2 +3 +4
Quarter
Point Estimate 90% CI
−0.
10.
00.
10.
2
Tre
atm
ent E
ffect
(p.
p)
−2 −1 +1 +2 +3 +4
Quarter
Point Estimate 90% CI
c. Public-Goods vs. Baseline
−0.
10.
00.
10.
2
Tre
atm
ent E
ffect
(p.
p)
−2 −1 +1 +2 +3 +4
Quarter
Point Estimate 90% CI
Notes: These figures plot the quarterly effect of each treatment arm when compared to the baseline letter . Panel a.(N=12,336) presents the effect of the audit-statistics message on total quarterly VAT payments, while panel b. (N=4,103)represents the effect of the audit-endogeneity message and panel c. (N=4,081) depicts the effect of the public-goods messageon the same outcome variable. Each point (red circle) in the plot represents the estimate of the effect of treatment onVAT payments for a specific quarter from two quarters before treatment up to four quarters after receiving the letter.Regressions do not include monthly pre-treatment controls. The estimates correspond to Poisson regressions. Confidenceintervals, represented by red lines, are computed with heteroskedastic-robust standard errors..
39

Figure 3: Effects of Audit-Statistics and Audit-Threat Sub-Treatments: By Deciles and Quartersa. Effect of audit-statistics vs. baseline, by deciles of p and θ b. Effect of audit-statistics vs. baseline, by level of p
0.0
5.1
.15
Aud
. Sta
tistic
Effe
ct (
%)
0 4 8 12 16 20Probability of being audited (%)
coef_p Fitted values
0.0
5.1
.15
Aud
. Sta
tistic
Effe
ct (
%)
15 20 25 30 35 40 45 50Average penalty rate(%)
coef_M Fitted values
−0.
10.
00.
10.
2
Tre
atm
ent E
ffect
(p.
p)
−2 −1 +1 +2 +3 +4
Quarter
≥ 12% < 12%
c. Effect of audit-statistics vs. baseline, by level of θ d. Effect of audit-threat, p = 0.50 vs. p = 0.25
−0.
10.
00.
10.
2
Tre
atm
ent E
ffect
(p.
p)
−2 −1 +1 +2 +3 +4
Quarter
≥ 31% < 31%
−1.
0−
0.5
0.0
0.5
1.0
Tre
atm
ent E
ffect
(p.
p)
−2 −1 +1 +2 +3 +4
Quarter
Point Estimate 90% CI
Notes: Panel a. plots the effects of audit-statistics letter by decile of p and θ. Panel b. (N=10,272) presents the effectof the p reported in the audit-statistics message on the total quarterly of VAT payments, while panel c. reports the sameestimations for θ. Panel d. (N=4,048) represents the effect of the audit-threat message (50% vs 25%). Each dot in panels b.c. and d. represents the estimate of the effect of treatment on VAT payments for a specific quarter from two quarters beforetreatment up to four quarters after receiving the letter. Red dots in panels b. and c. represent the effect for audit-statisticsletter recipients with a reported porθ above the median. Green dots represent the same effect but for those with reported pand θ below the median. Regressions do not include monthly pre-treatment controls. The estimates correspond to Poissonregressions. Confidence intervals, represented by red and green lines, are computed with heteroskedastic-robust standarderrors..
40

Figure 4: Survey Results: Perceived p and θ, by Treatment GroupAudit Probability - p Penalty rate - θ
a. Audit-statistics vs. Baseline b. Audit-statistics vs. Baseline
Note: ES test p−value: 0.25
010
2030
40P
erce
nt
0 20 40 60 80 100Probability of being audited (%)
Perceived − BaselinePerceived − Aud. StatisticsShown
Note: ES test p−value: 0.15
010
2030
40P
erce
nt
0 20 40 60 80 100Average Penalty Rate
Perceived − BaselinePerceived − Aud. StatisticsShown
c. Audit-statistics vs. Baseline and Public-goods d. Audit-statistics vs. Baseline and Public-goods
Note: ES test p−value: 0.04
010
2030
40P
erce
nt
0 20 40 60 80 100Probability of being audited (%)
Perceived − Plac + Pub.GPerceived − Aud. StatisticsShown
Note: ES test p−value: 0.50
010
2030
40P
erce
nt
0 20 40 60 80 100Average Penalty Rate
Perceived − Plac + Pub.GPerceived − Aud. StatisticsShown
Notes: The histograms are based on survey responses from those self-reported as owners in the post-treatment survey.Perceived - Baseline (N=69) refers to survey respondents who received the baseline letter during the experimental stage,while Perceived - Aud. Statistics (N=365) refers to respondents who received audit-statistics letters and Public-goods(N=68) refers to recipients of the public-goods letters. The answers correspond to questions Q2 and Q4 (see full surveyquestionnaire in Appendix A.7). In panel a. the x-axis represents the probability of being audited; in panel b. it representsthe average penalty rate. Perceived Baseline is the histogram for firm owners who received the baseline letter. PerceivedAud. Statistics refer to the histograms of firms that effectively received audit-statistics letters. “Shown” refers to thedistribution of the information displayed in the audit-statistics letters..
41

Online Appendix: For Online Publication Only
A Replication Material: Letters and Survey
This appendix presents samples of the five letter types: baseline letter (A.1), audit-statistics letter (A.2),audit-threat letter (A.3), audit-endogeneity letter (A.4) and public goods letter (A.5). Additionally, Ap-pendix A.6 presents a sample of the invitation email sent by the IRS to complete the online survey, andAppendix A.7 presents the module from that survey that we included with the questions that are mostrelevant for our experiment.
i

A.1 Sample Letter: Baseline Letter
Montevideo, August 20th 2015 Mr../Ms. Taxpayer: The DGI has the authority to perform inspections (see Art. 68 of the tax code) and routine audits of taxpayers on the basis of crosschecks and assessment of data compiled to detect oversights and inconsistency on tax returns as well as pending tax debts. The aim of the DGI, and the primary challenge it faces, is to ensure the collection of revenue to sustain life in society. Additionally, its task is to generate a framework of fair and transparent competition where the failure of some to meet their obligations does not have an unfavorable impact on honest taxpayers. In order to meet these goals, inspections are performed in a routine fashion. Your micro, small, or medium-sized business has been randomly selected to receive this information. It is solely for your information and its receipt does not require you to present any documentation to the DGI offices. We ask you to comply with your tax obligations for the sake of the country we all want, a more and more developed Uruguay with greater and greater social cohesion. Sincerely,
Collection and Controls Division
Internal Revenues Services
ii

A.2 Sample Letter: Audit-Statistics Letter
Montevideo, August 20th 2015 Mr../Ms. Taxpayer: The DGI has the authority to perform inspections (see Art. 68 of the tax code) and routine audits of taxpayers on the basis of crosschecks and assessment of data compiled to detect oversights and inconsistency on tax returns as well as pending tax debts.
On the basis of historical information on similar businesses, there is a probability of p% that the tax returns you filed for this year will be audited in at least one of the coming three years. If, pursuant to that auditing, it is determined that tax evasion has occurred, you will be required to pay not only the amount previously unpaid, but also a fee of
approximately M% of that amount.
The aim of the DGI, and the primary challenge it faces, is to ensure the collection of revenue to sustain life in society. Additionally, its task is to generate a framework of fair and transparent competition where the failure of some to meet their obligations does not have an unfavorable impact on honest taxpayers. In order to meet these goals, inspections are performed in a routine fashion. Your micro, small, or medium-sized business has been randomly selected to receive this information. It is solely for your information and its receipt does not require you to present any documentation to the DGI offices. We ask you to comply with your tax obligations for the sake of the country we all want, a more and more developed Uruguay with greater and greater social cohesion. Sincerely,
Collection and Controls Division
Internal Revenues Services
iii

A.3 Sample Letter: Audit-Threat Letter
Montevideo, August 20th 2015 Mr../Ms. Taxpayer: The DGI has the authority to perform inspections (see Art. 68 of the tax code) and routine audits of taxpayers on the basis of crosschecks and assessment of data compiled to detect oversights and inconsistency on tax returns as well as pending tax debts.
We would like to inform you that the business you represent is one of a group of firms pre-selected for auditing in 2016. A p% of the firms in that group will then be randomly selected for auditing. The aim of the DGI, and the primary challenge it faces, is to ensure the collection of revenue to sustain life in society. Additionally, its task is to generate a framework of fair and transparent competition where the failure of some to meet their obligations does not have an unfavorable impact on honest taxpayers. In order to meet these goals, inspections are performed in a routine fashion. Your micro, small, or medium-sized business has been randomly selected to receive this information. It is solely for your information and its receipt does not require you to present any documentation to the DGI offices. We ask you to comply with your tax obligations for the sake of the country we all want, a more and more developed Uruguay with greater and greater social cohesion. Sincerely,
Collection and Controls Division Internal Revenues Services
iv

A.4 Sample Letter: Audit-Endogeneity Letter
Montevideo, August 20th 2015 Mr../Ms. Taxpayer: The DGI has the authority to perform inspections (see Art. 68 of the tax code) and routine audits of taxpayers on the basis of crosschecks and assessment of data compiled to detect oversights and inconsistency on tax returns as well as pending tax debts.
The DGI uses data on thousands of taxpayers to detect firms that may be evading taxes; most of its audits are aimed at those firms. Evading taxes, then, doubles your chances of being audited. The aim of the DGI, and the primary challenge it faces, is to ensure the collection of revenue to sustain life in society. Additionally, its task is to generate a framework of fair and transparent competition where the failure of some to meet their obligations does not have an unfavorable impact on honest taxpayers. In order to meet these goals, inspections are performed in a routine fashion. Your micro, small, or medium-sized business has been randomly selected to receive this information. It is solely for your information and its receipt does not require you to present any documentation to the DGI offices. We ask you to comply with your tax obligations for the sake of the country we all want, a more and more developed Uruguay with greater and greater social cohesion. Sincerely,
Collection and Controls Division
Internal Revenues Services
v

A.5 Sample Letter: Public-Goods Letter
Montevideo, August 20th 2015 Mr../Ms. Taxpayer: The DGI has the authority to perform inspections (see Art. 68 of the tax code) and routine audits of taxpayers on the basis of crosschecks and assessment of data compiled to detect oversights and inconsistency on tax returns as well as pending tax debts.
If those who currently evade their tax obligations were evade 10% less, the additional revenue collected would enable all of the following: to supply 42,000 portable computers to school children; to build 4 high schools, 9 elementary schools, and 2 technical schools; to acquire 80 patrol cars and to hire 500 police officers; to add 87,000 hours of medical attention by doctors at public hospitals; to hire 660 teachers; to build 1,000 public housing units (50m2 per unit). There would be resources left over to reduce the fiscal burden. The tax behavior of each of us has direct effects on the lives of us all. The aim of the DGI, and the primary challenge it faces, is to ensure the collection of revenue to sustain life in society. Additionally, its task is to generate a framework of fair and transparent competition where the failure of some to meet their obligations does not have an unfavorable impact on honest taxpayers. In order to meet these goals, inspections are performed in a routine fashion. Your micro, small, or medium-sized business has been randomly selected to receive this information. It is solely for your information and its receipt does not require you to present any documentation to the DGI offices. We ask you to comply with your tax obligations for the sake of the country we all want, a more and more developed Uruguay with greater and greater social cohesion. Sincerely,
Collection and Controls Division
Internal Revenues Services
vi

A.6 Sample Letter: Invitation to the Online Survey
Dear Taxpayer: The DGI’s strategic objectives for this period include improving taxpayer services. In 2013, the first Survey on the Costs of Tax Compliance for Small and Medium-Sized Businesses was administered with the support of the Inter-American Center of Tax Administrations (CIAT) and the United Nations (UN). The DGI, in conjunction with a group of academics, has designed a new version of the survey (for more information, visit www.dgi.gub.uy). You can give us your answers on the website where you will find instructions on how to fill out the simple questionnaire; the entire process should take no more than fifteen minutes.
Respond to survey To address these concerns, a random sample of taxpayers will receive a survey to be answered anonymously. You are one of the randomly selected taxpayers, which is why you have received this communication. We are grateful for the time and effort you dedicate to assessing this questionnaire and to responding to it as precisely as possible. Let me assure you that the survey is completely anonymous and the selection of recipients entirely random. The success of this project lies in the precision of your responses. It is on the basis of those responses and the real information they provide that the DGI will be able to hone the design, in the present and in the future, of its strategies to reduce the costs of compliance. If you have any questions about this questionnaire, please send an e-mail to [email protected]. We would like to thank you once again for your contribution to this project, which we are sure will benefit all taxpayers. Sincerely, Joaquín Serra Director of the Income Tax Department PS: If the "Respond to survey" link doesn’t open, copy the following address in your browser:https://URL.
vii

A.7 Excerpt from the Online Survey Questionnaire
Introductory Text: We would like you to respond to a survey about the costs of paying taxes. We hope you have the ten minutes that responding to the questionnaire will require. We are interested in your opinion and hope you will be frank in your responses, which are anonymous and used only for statistical purposes. We would like to thank you for your participation. Questions Included in Main Module: Q1) Have you been subject to a DGI audit (inspection or monitoring) at any point in the last three years? Yes. No. Q2)In your opinion,what is the probability that the tax returns filed by a company like yours be audited at least once in the next three years (from 0% to 100%)?
Q3) How sure are you of your response? Not at all sure. A little sure. Somewhat sure. Very sure. Q4)Let’s imagine that a company like yours is audited and that tax evasion is detected. What, in your opinion, is the penalty (in %) as determined by law that the firm must pay in addition to the originally unpaid amount? For example, a fee of X% means that, for each $100 not paid, the firm would have to pay those original $100 plus $X in fees.
Q5) How sure are you of your response? Not at all sure. A little sure.
viii

B A Calibration of Allingham and Sandmo (1972)
Let Y be the total value-added. Let τ be the value added tax rate (in practice, it should include the VATplus all the other taxes that the individual must pay as a consequence of declaring higher value-added,like for example income tax, benefits for formal employees, etc.). Let E be the amount to be under-declared (so τ · E is the amount evaded), p be the probability of audit and θ be the penalty (as definedin audit-statistics). Finally α is a social responsability parameters, that in the Allingham and Sandmo(1972) model is fixed as 1 and decreases to 0 as social responsability increases. The optimal evasion isgiven by maximizing the expected utiltiy:
maxE
1− p1− σ (Y − ατ(Y − E))1−σ + p
1− σ (Y − ατ(Y − E)− (1 + θ)τE)1−σ (B.1)
In the traditional model (α = 1) the VAT remitances elasticities with respect to the audit parametes(p and θ) depend on the set of audit parameters, the tax level (τ), and the CRRA utility functionparameters σ
∂τ(Y − E)∂p
p
τ(Y − E) = −(1− τ)∂x∂p
(1 + θ)(θx+ 1)2
p[τ − (1− τ)
(x−11+θx
)] (B.2)
∂τ(Y − E)∂θ
θ
τ(Y − E) = −(1− τ)(1 + θ)∂x
∂θ− x(x− 1)
(θx+ 1)2θ[
τ − (1− τ)(x−11+θx
)] (B.3)
with
x =(
pθ
1− p
)− 1σ
∂x
∂p= − 1
σ
(pθ
1− p
)− σ+1σ θ
(1− p)2
∂x
∂θ= − 1
σ
(pθ
1− p
)− σ+1σ p
1− p
In the model with social responsability (α < 1), VAT remitances elasticities with respect to the auditparametes (p and θ) depend on the set of audit parameters, the tax level (τ), the CRRA utility functionparameters σ, and the weight of the social responsability alpha
∂τ(Y − E)∂p
p
τ(Y − E) = −(1− ατ)∂x1∂p
(1 + θ)(α + (1 + θ − α)p)2
p
τ − (1− ατ) x1−1α+x1(1+θ−α)
(B.4)
ix

∂τ(Y − E)∂θ
θ
τ(Y − E) = −(1− ατ)∂x1∂θ
(1 + θ)− x1(x1 − 1)(α + (1 + θ − α)p)2
θ
τ − (1− ατ) x1−1α+x1(1+θ−α)
(B.5)
We calibrate the model with two sets of parameters. In the first one, we use the actual parametersi.e. the level of audit probability (p) is 0.113 and the amount of fines (θ) is 30.3% of the amount evaded.The second set of parameters are firm owner perceptions in the survey conducted after the experiment.This parameter in the case of audit probability is three times higher than the actual one at 0.376. Inthe case of θ, the perceived penalty rate is about 31% which is similar to the actual penalty rate. Forboth parameter sets in the Allingham and Sandmo (1972) model, a rational individual would evade 100%of his tax duties for the range of risk aversion level used in the literature. Additionally, for perceivedparameters we calibrate also with a social responsability model
In Table B.1 we show the computed elasticities respect to p and θ and the evasion rate assuming aCRRA utility function with a wide range of risk aversion parameters from 1 to 40. We calibrate the modelwith no social responsability with the actual set of audit paremeters in Panel A and the perceived auditparameters in Panel B. In Panel C, we calibrate the model with social resposability and the perceivedaudit parameters.
Panel A of Table B.1 presents predicted elasticities with the mean value of actual audit characteristics.We find larger elasticities for those individuals with less risk aversion, but only for σ larger than 9.6 wefind evasion rates lower than 1. Moreover, to find the evasion rate (26%) which is estimated for LatinAmerica in Gómez-Sabaini and Jiménez (2012) we need the risk aversion coeffcient at 35. This ratemeans, tax payers are indiferent between receiving USD 102.05 for sure than participating in a lotterywith equal probabilities to receive USD 100 or USD 200.
Panel B of Table B.1 presents the predicted elasticities and aversion rate of the AS model calibratedwith the perceived set of audit parameters. Here, the risk aversion required coefficient to find a 26%of evasion rate is also high (18.3). This risk aversion means that for the same lottery, taxpayers areindifferent between the lottery and a sure payment of USD 103.9.
The calibration in the model with social responsability, we use α = 0.59 which is the parameter toobtain a evasion rate of 0.26 with CRRA parameter at 4. At this level of risk aversion, the model predictsa behavioral elasticity of tax payments with respect to the audit probability of 4.02, and a behavioralelasticity of tax payments with respect to the penalty rates of 1.64. This is our preferred calibration,because it does not rely on an extreme curvature of the utility function.
x

Table B.1: VAT Remittances Elasticities Respect to the Main Parameters. Calibrated in the Actual andPerceived Means
A. Actual B. Perceived C. Perceived + Social Responsibilityp = 0.113; θ = 0.303; α = 1 p = 0.367; θ = 0.31; α = 1 p = 0.367; θ = 0.31; α = 0.59
σ ∂lnτ(Y−E)∂lnp
∂lnτ(Y−E)∂lnθ
EY
∂lnτ(Y−E)∂lnp
∂lnτ(Y−E)∂lnθ
EY
∂lnτ(Y−E)∂lnp
∂lnτ(Y−E)∂lnθ
EY
1 1 1 12 1 1 10.61 4.62 0.523 1 1 5.83 2.43 0.354 1 1 4.02 1.64 0.265 1 1 3.07 1.24 0.2110 80.59 50.50 0.96 2.46 2.66 0.49 1.41 0.55 0.1020 2.74 1.65 0.46 0.80 0.85 0.24 0.68 0.26 0.0530 1.37 0.82 0.30 0.47 0.50 0.16 0.44 0.17 0.0340 0.91 0.54 0.23 0.34 0.36 0.12 0.33 0.13 0.03
Notes: The predicted elasticities and evasion rates are obtained from three calibrations of the model from Appendix B.All specifications use the same tax rate τ = 0.22. p denotes the probability that the tax report is eventually audited; θdenotes the penalty rate for evasion; σ denotes the Coefficient of Relative Risk Aversion; α denotes the social responsibilityparameter; Y and E denote the tax base amount and the evaded amount, respectively. In Panel A, α = 0 and the auditparameters are calibrated with the average probabilities and evasion rates from the experimental sample. Panel B is similarto Panel A, but the results in B use the perceived audit parameters from the post-treatment survey data. Panel C is similarto Panel A, but the results are derived with α = 0.59 instead of α = 0 (this parameter was calibrated so that the modelfits an estimated evasion rate of 26% when σ = 4)..
xi

C Additional Results, Specification and Robustness Checks
C.1 Robustness Checks of Baseline Specification
To assess the robustness of the baseline results in Section 4.1, Table C.1 presents alternative estimatesbased on different specifications. The first two columns present estimates of the treatment effects basedonly on the extensive margin of VAT payments: i.e. the outcome is 1 if the firm made at least onepayment in the post-treatment period, and 0 otherwise. Column (1) presents results from a linearprobability model, while column (2) presents Probit estimates. There is not much variation in theextensive margin: 96% of firms in the sample made positive payments in the post-treatment period. Thisis a direct byproduct of the selection of the subject pool: we excluded all firms who did not make atleast three payments in the 12 months before the treatment assignment. The effects of the three differentmessages on the extensive margin are close to zero and not statistically significant.
The specifications in columns (3), (4) and (5) of Table C.1 use the amount of VAT payments as thedependent variable. Column (3) corresponds to our baseline Poisson specification. In turn, column (4)presents estimates based on Tobit regressions and (5) presents OLS estimates. The Poisson model hasa main advantage in this context: it deals naturally with bunching of payments at exactly zero, whilestill allowing for the effects to be proportional. The OLS specification, instead, does not deal with thebunching at zero and does not allow for the effects on amounts to be proportional. The Tobit specificationis more appropriate than OLS since it takes into account the censored nature of the data at zero, but itdoes not allow for the effects to be proportional.
The results from columns (3), (4) and (5) of Table C.1 are identical in terms of the signs and statisticalsignificance of the coefficients, indicating that the results are robust to the three alternative specifications.If anything, the effects are statistically more significant when using the OLS and Tobit models. Eventhough the results from the Poisson, OLS and Tobit models are not directly comparable in terms ofmagnitudes, they are roughly consistent. For example, the Tobit model suggests an effect of auditstatistics of USD 480 (p-value=0.001). Since the average outcome is USD 6,465, this Tobit coefficientamounts to an effect of about 7.4%, which is in the same order of magnitude than the Poisson model,which indicates an effect of audit-statistics of 6.3% (p-value=0.013). .
xii
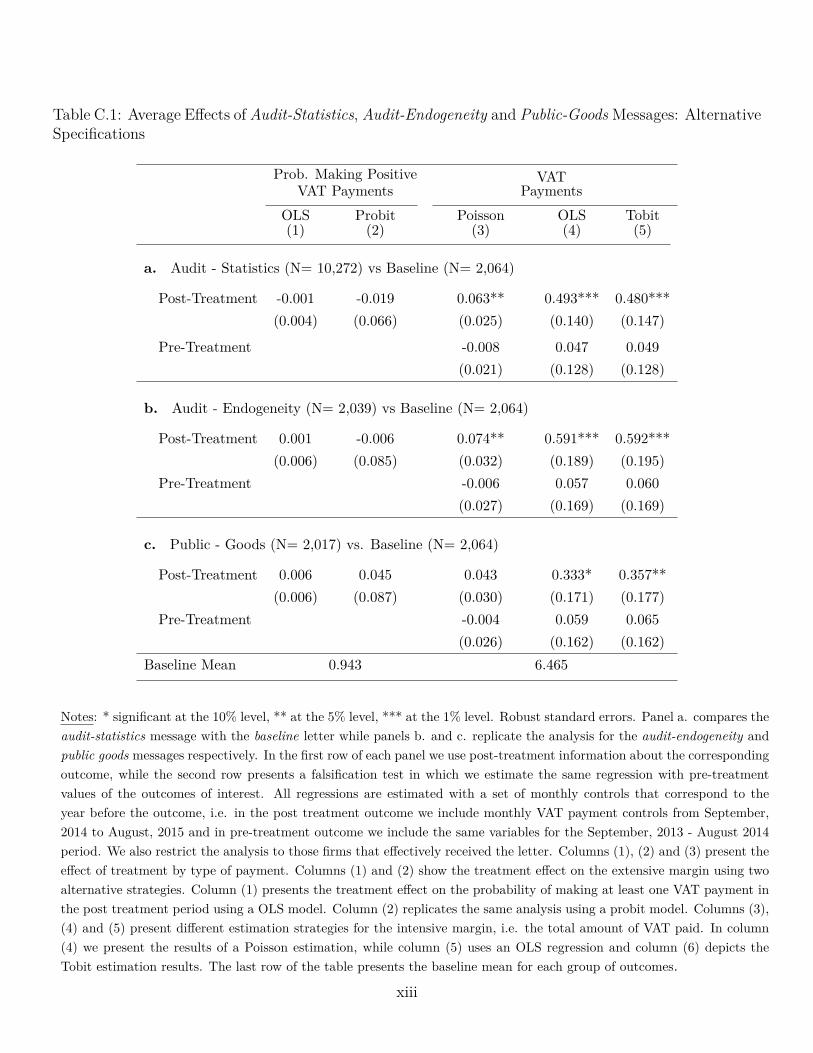
Table C.1: Average Effects of Audit-Statistics, Audit-Endogeneity and Public-Goods Messages: AlternativeSpecifications
Prob. Making PositiveVAT Payments
VATPayments
OLS(1)
Probit(2)
Poisson(3)
OLS(4)
Tobit(5)
a. Audit - Statistics (N= 10,272) vs Baseline (N= 2,064)
Post-Treatment -0.001 -0.019 0.063** 0.493*** 0.480***(0.004) (0.066) (0.025) (0.140) (0.147)
Pre-Treatment -0.008 0.047 0.049(0.021) (0.128) (0.128)
b. Audit - Endogeneity (N= 2,039) vs Baseline (N= 2,064)
Post-Treatment 0.001 -0.006 0.074** 0.591*** 0.592***(0.006) (0.085) (0.032) (0.189) (0.195)
Pre-Treatment -0.006 0.057 0.060(0.027) (0.169) (0.169)
c. Public - Goods (N= 2,017) vs. Baseline (N= 2,064)
Post-Treatment 0.006 0.045 0.043 0.333* 0.357**(0.006) (0.087) (0.030) (0.171) (0.177)
Pre-Treatment -0.004 0.059 0.065(0.026) (0.162) (0.162)
Baseline Mean 0.943 6.465
Notes: * significant at the 10% level, ** at the 5% level, *** at the 1% level. Robust standard errors. Panel a. compares theaudit-statistics message with the baseline letter while panels b. and c. replicate the analysis for the audit-endogeneity andpublic goods messages respectively. In the first row of each panel we use post-treatment information about the correspondingoutcome, while the second row presents a falsification test in which we estimate the same regression with pre-treatmentvalues of the outcomes of interest. All regressions are estimated with a set of monthly controls that correspond to theyear before the outcome, i.e. in the post treatment outcome we include monthly VAT payment controls from September,2014 to August, 2015 and in pre-treatment outcome we include the same variables for the September, 2013 - August 2014period. We also restrict the analysis to those firms that effectively received the letter. Columns (1), (2) and (3) present theeffect of treatment by type of payment. Columns (1) and (2) show the treatment effect on the extensive margin using twoalternative strategies. Column (1) presents the treatment effect on the probability of making at least one VAT payment inthe post treatment period using a OLS model. Column (2) replicates the same analysis using a probit model. Columns (3),(4) and (5) present different estimation strategies for the intensive margin, i.e. the total amount of VAT paid. In column(4) we present the results of a Poisson estimation, while column (5) uses an OLS regression and column (6) depicts theTobit estimation results. The last row of the table presents the baseline mean for each group of outcomes.. xiii

Table C.2: Effects of Audit-Statistics and Audit-Threat Sub-Treatments: Alternative Specifications
Prob. Making PositiveVAT Payments
VATPayments
OLS(1)
Probit(2)
Poisson(3)
OLS(4)
Tobit(5)
a. Audit - Statistics (N= 10,272)
Audit Probability (%)
Post-Treatment 0.007 0.376 0.030 -0.441 0.141(0.040) (0.619) (0.236) (1.617) (1.728)
Pre-Treatment 0.025 0.183 0.212(0.115) (0.943) (0.945)
Penalty Size (%)
Post-Treatment 0.002 0.079 -0.118 -0.362 -0.319(0.021) (0.316) (0.115) (0.856) (0.896)
Pre-Treatment -0.001 -0.123 -0.133(0.088) (0.785) (0.785)
b. Audit - Threat Letters (N= 4,048)
Post-Treatment 0.009 0.160 0.376* 1.325 1.253(0.026) (0.320) (0.210) (0.900) (0.940)
Pre-Treatment -0.342* -0.958 -0.954(0.178) (0.695) (0.699)
Baseline Mean 0.943 6.465
Notes: * significant at the 10% level, ** at the 5% level, *** at the 1% level. Robust standard error. Panel a. presents theeffect of providing different information regarding p and θ in the audit-statistics message. Panel b. compares the two audit-threat messages, i.e. the 50% threat of audit vs. the 25% threat of audit. Rows (1) and (3) of panel a. present the effectof informing an additional percentage point of p and θ respectively on post treatment VAT payments. Rows (2) and (4)present a falsification test in which we estimate the same regression but using pre-treatment information. All regressions areestimated with a set of monthly controls that correspond to the year before the outcome, i.e. in the post treatment outcomewe include monthly VAT payment controls from September, 2014 to August, 2015 and in the pre-treatment outcome weinclude the same variables for the September, 2013 - August 2014 period. We also restrict the analysis to firms that receivedthe letter according to the postal service. Row (1) in panel b. presents the post treatment effect of receiving the letterof 50% threat relative to receive the 25% letter. These coefficients can be interpreted as elasticities. Row (2) of panelb. replicates the estimates for the pre-treatment outcomes. Column (1) presents the treatment effect on the probabilityof making at least one VAT payment in the post treatment period using a OLS model. Column (2) replicates the sameanalysis using a probit model. Columns (3), (4) and (5) present different estimation strategies for the intensive margin, i.e.the total amount of VAT paid. In column (4) we present the results of a Poisson estimation, while column (5) uses an OLSregression and column (6) depicts the Tobit estimation results. The last row of the table presents the baseline mean foreach group of outcome..
xiv

Table C.3: Effects of Audit-Statistics and Audit-Threat Sub-Treatments: VAT Payment Timing andOther Taxes
VAT,By Payment Timing
VATvs. Other Taxes
Retroactive(1)
Concurrent(2)
Retroactive +Concurrent
(3)VAT(4)
Other(5)
VAT +Other(6)
a. Audit - Statitstics (N= 10,272)
Audit Probability(%)
Post-Treatment -1.484 0.123 0.030 0.030 0.465 0.264(1.034) (0.241) (0.236) (0.236) (0.343) (0.229)
Pre-Treatment -1.138 0.144 0.025 0.025 0.214 0.081(0.766) (0.120) (0.115) (0.115) (0.304) (0.142)
Penalty Size (%)
Post-Treatment 0.997 -0.220** -0.118 -0.118 -0.018 -0.086(0.725) (0.106) (0.115) (0.115) (0.166) (0.121)
Pre-Treatment -0.087 -0.004 -0.001 -0.001 -0.283** -0.152*(0.437) (0.092) (0.088) (0.088) (0.143) (0.081)
b. Audit - Threat Letters (N= 4,048)
Post-Treatment 0.864 -0.011 0.376* 0.376* 0.045 0.419***(0.871) (0.205) (0.210) (0.210) (0.164) (0.162)
Pre-Treatment 0.521 -0.215 -0.342* -0.342* -0.201 -0.195(0.698) (0.176) (0.178) (0.178) (0.170) (0.141)
Notes: significant at the 10% level, ** at the 5% level, *** at the 1% level. Robust standard errors. Panel a. presentsthe effect of providing different information regarding p and θ in the audit-statistics message. Panel b. compares the twoaudit-threat messages, i.e. the 50% threat of audit vs. the 25% threat of audit. Rows (1) and (3) of panel a. present theeffect of informing an additional percentage point of p and θ respectively on post treatment VAT payments. Rows (2) and(4) show a falsification test in which we estimate the same regression but using pre-treatment information. All regressionsare estimated with a set of monthly controls that correspond to the year before the outcome, i.e. in the post-treatmentoutcome we include monthly VAT payments controls from September, 2014 to August, 2015 and in pre-treatment outcomewe include the same variables for the September, 2013 - August 2014 period. We also restrict the analysis to firms thatreceived the letter according to the postal service. Row (1) in panel b. represents the post treatment effect of receivingthe letter of 50% threat relative to receive the 25% letter. These coefficients can be interpreted directly as elasticities.Row (2) of panel b. replicates the estimates for the pre-treatment outcomes. Columns (1), (2) and (3) show the effect oftreatment by type of payments. Columns (1) and (2) present separately the effect of treatment on current and retroactiveVAT payments, while column (3) presents the overall effect. Columns (4), (5) and (6) present the results by type of tax.While column (4) depicts the effect of the treatment in post experiment VAT payments, column (5) presents the effect onthe rest of taxes considered and column (6) presents the effect on the total amount of taxes paid by the firms..
xv

C.2 Alternative Specifications for Audit Probabilities and Fines
Table C.4 presents the results for an alternative specification of the elasticity estimation. Instead ofestimating the elasticities w.r.t. p and θ separately, we estimate the elasticity w.r.t. p ∗ θ.
Yi = α + γp∗θ · pi ∗ θi +Xiδ + εi (C.1)
As in the model where p and θ were included separately, the elasticity with thise alternative specifi-cation is statistically and economically insignificant too
Table C.4: Effects of Audit-Statistics Sub-Treatments: Alternative Specification of p · θ
Above Median Size Recently AuditedAll(1)
Yes(2)
No(3)
Yes(2)
No(3)
a. Audit - Statistics Letters (N= 10,272)
p*θ (%)
Post-Treatment -0.373 -0.133 -0.216 1.523 -0.537(0.530) (0.672) (0.708) (0.969) (0.605)
Pre-Treatment 0.049 0.218 -0.361 -0.040 0.030(0.316) (0.347) (0.647) (0.764) (0.346)
Observations 10,272 5,147 5,125 1,139 9,133
Notes: * significant at the 10% level, ** at the 5% level, *** at the 1% level. Robust standard error. Panel a. presents theeffect of providing different information regarding p and θ in the audit-statistics message. Row (1) of panel a. present theeffect of informing an additional percentage point of p times θ respectively on the post treatment VAT payments. Row (2)presents a falsification test in which we estimate the same regression but using pre-treatment information. All regressionsare estimated with a set of monthly controls that correspond to the year before the outcome, i.e. in the post treatmentoutcome we include monthly VAT payment controls from September, 2014 to August, 2015, and in pre-treatment outcomewe include the same variables for the September, 2013 - August 2014 period. We also restrict the analysis to firms thateffectively received the letter according to the postal service. The first column presents the results for the total number offirms that received each letter. Columns (2) and (3) present the effects for firms that sell goods and firms that sell services..
xvi

C.3 Additional Results: Beliefs About Audit Endogeneity
As in the case of the audit-statistics treatment arm, we conducted a survey of letter recipients in whichwe included a specific question to assess whether the information provided in the letter had an impacton beliefs about the endogeneity of audits:
Perceived Audit Endogeneity: “In your opinion, if a firm that evades taxes doubles the amountit is evading, what is the effect on its probability of being audited?” The possible answerswere: It would increase significantly; It would increase slightly; It would not change; It woulddiminish slightly; It would diminish significantly.
The distribution of responses to this question about the perceived endogeneity of audits is depicted inFigure C.1. The distribution of perceptions in the baseline letter suggests that firms were already awareof this endogeneity. In line with the previous results in Section 5.2, relative to the baseline group, thereis no statistically significant differences in the distribution of perceptions for the audit-endogeneity group(p-value of 0.61). In a scale from 1 to 5, where 1 is “more evasion significantly increases the probabilityof being audited”, and 5 means “more evasion significantly diminish the probability of being audited”,the average belief was 1.49 the baseline group and 1.14 for the audit-endogeneity group (Table C.5).
xvii

Figure C.1: Perception of Endogeneity of Auditsa. Audit-endogeneity vs. Baseline b. Audit-endogeneity vs. Baseline and Public-Goods
Note: Rank−sum test p−value: 0.51
020
4060
80P
erce
nt
Incr
ease
a lo
t
Incr
ease
little
No ch
ange
s
Reduc
e a
little
Reduc
e a
lot
Perceived BaselinePerceived − Aud. Endogeneity
Note: Rank−sum test p−value: 0.62
020
4060
80P
erce
ntIn
crea
se a
lot
Incr
ease
little
No ch
ange
s
Reduc
e a
little
Reduc
e a
lot
Perceived − Plac + Pub.GPerceived − Aud. Endogeneity
Notes: Histograms are based on responses to the post treatment survey by respondents self-identified as owners. Perceived- Baseline (N=69) refers to respondents who received the baseline letter during the experimental stage, while PerceivedEndogeneity (N=79) refers to respondents who received audit-endogeneity letters and Public-goods (N=68) refers to re-cipients of the public-goods letters. These answers correspond to the question Q6 of the survey questionnaire (see the fullquestionnaire in Appendix A.7). The x axis represents the different categories allowed in the relationship between evasionand probability of being audited question. Perceived Baseline refers to the histogram of the owners of firms that received thebaseline letter. Perceived Endogeneity refers to the histograms of firms that effectively received audit-endogeneity letters..
C.4 Additional Results: Robustness to the inclusion of Non-Owners
In section 5.2 and Appendix C.3we presented the results for survey respondents that self-declared asowners. In this appendix we present estimations for all respondents. The results are robusts to the onesfound for the sub-sample of owners.
xviii

Figure C.2: Distribution of Beliefs, by Treatment Group: Robustness to the Inclusion of Non-Ownersa. Audit Probability - p b. Penalty rate - θ
Note: ES test p−value: 0.35
010
2030
Per
cent
0 20 40 60 80 100Probability of being audited (%)
Perceived − BaselinePerceived − Aud. StatisticsShown
Note: ES test p−value: 0.48
010
2030
40P
erce
nt
0 20 40 60 80 100Probability of being audited (%)
Perceived − BaselinePerceived − Aud. StatisticsShown
c. Endogeneity
Note: ES test p−value: 0.83
020
4060
80P
erce
nt
Incr
ease
a lo
t
Incr
ease
little
No ch
ange
s
Reduc
e a
little
Reduc
e a
lot
Perceived BaselinePerceived − Aud. Endogeneity
Notes: The histograms are based on responses to the post-treatment survey for all respondents. Perceived - Baseline (N=89)refers to respondents who received the baseline letter during the experimental stage, while Perceived - Aud. Statistics(N=465) and Perceived Endogeneity (N=97) refers to respondents who received audit-statistics and audit-endogeneityletters respectively. These answer correspond to the questions Q2, Q4 and Q6 of the survey questionnaire (see the fullquestionnaire in Appendix A.7). In panel a. the x-axis represents the probability of being audited; in panel b. it representsthe average penalty rate while in panel c. it represents the different categories allowed in the relationship between evasionand probability of being audited question. Perceived Baseline refers to the histogram for responses of firm owners whoreceived the baseline letter. Perceived Aud. Statistics and Perceived Endogeneity refers to the histograms for firms thatreceived audit-statistics and audit-endogeneity letters. “Shown” represents the distribution of the information contained inthe audit-statistics letter..
xix

Table C.5: Effects of Audit-Statistics on Survey Beliefs
Baseline(1)
AuditEndogeneity
(2)p-value(3)
Panel a.Perceived End. 1.49 1.41 0.515
(0.09) (0.08)
Panel b.Baseline +
Public GoodsAudit
Endogeneity p-value
Perceived End. 1.45 1.41 0.673(0.06) (0.08)
Notes: The table is based on responses from firm owners or those with missing values in the question regarding who answerthe survey . In panel a. Column (1) (N=69), refers to respondents who received the baseline letter during the experimentalstage. Column (2): “Endogeneity” (N=79 for Endogeneity) refers f to respondents who received the audit-statistics letter(rows 1 and 2) while in row (3) it refers to the group of taxpayers that received the audit-endogeneity letter. Column(3) presents the p-value of a test comparing the mean endogeneity perception between firms in the baseline and in theaudit-statistics groups (Q6-row (3)) (see the survey questionnaire in Appendix A.7). The results in panel b are obtainedby pooling the baseline group and respondents who received the public-goods letter to improve the statistical power of thetest (N=137). The public-goods letter did not include any information regarding audit probabilities or their endogeneity..
xx
Related Documents


