NBER WORKING PAPER SERIES TAX AUDITS AS SCARECROWS: EVIDENCE FROM A LARGE-SCALE FIELD EXPERIMENT Marcelo L. Bérgolo Rodrigo Ceni Guillermo Cruces Matias Giaccobasso Ricardo Perez-Truglia Working Paper 23631 http://www.nber.org/papers/w23631 NATIONAL BUREAU OF ECONOMIC RESEARCH 1050 Massachusetts Avenue Cambridge, MA 02138 July 2017, Revised September 2021 We thank Uruguay’s national tax administration (Dirección General Impositiva) for their collaboration. We thank Gustavo Gonzalez for his indisensable support of this research. We thank Joel Slemrod for his valuable feedback. We thank comments from participants in seminars at the University of Berkeley, the University of Michigan, the University of California San Diego, Dartmouth University, Universidad Di Tella, Universidad de la Republica, Universidad de Santiago de Chile, Universidad Católica de Chile, UADE, Corporación Andina de Fomento (Buenos Aires), Banco Central del Uruguay, LACEA 2017, the 2017 NBER Public Economics Fall Meeting, the 2017 RIDGE Public Economics Conference, the 2017 Zurich Center for Economic Development Conference, the 2017 Advances with Field Experiments Conference, the 2018 PacDev Conference, the 2018 AEA Annual Meetings, the 2018 LAGV Conference, the 2018 IIPF Annual Congress, the 2019 LACEA BRAIN Conference, and the 2019 National Tax Association meeting. This project benefited from funding by CEF, CEDLAS-UNLP and IDRC. The AEA RCT registration number is AEARCTR-0004593. The views expressed herein are those of the authors and do not necessarily reflect the views of the National Bureau of Economic Research. NBER working papers are circulated for discussion and comment purposes. They have not been peer-reviewed or been subject to the review by the NBER Board of Directors that accompanies official NBER publications. © 2017 by Marcelo L. Bérgolo, Rodrigo Ceni, Guillermo Cruces, Matias Giaccobasso, and Ricardo Perez-Truglia. All rights reserved. Short sections of text, not to exceed two paragraphs, may be quoted without explicit permission provided that full credit, including © notice, is given to the source.

Welcome message from author
This document is posted to help you gain knowledge. Please leave a comment to let me know what you think about it! Share it to your friends and learn new things together.
Transcript

NBER WORKING PAPER SERIES
TAX AUDITS AS SCARECROWS:EVIDENCE FROM A LARGE-SCALE FIELD EXPERIMENT
Marcelo L. BérgoloRodrigo Ceni
Guillermo CrucesMatias Giaccobasso
Ricardo Perez-Truglia
Working Paper 23631http://www.nber.org/papers/w23631
NATIONAL BUREAU OF ECONOMIC RESEARCH1050 Massachusetts Avenue
Cambridge, MA 02138July 2017, Revised September 2021
We thank Uruguay’s national tax administration (Dirección General Impositiva) for their collaboration. We thank Gustavo Gonzalez for his indisensable support of this research. We thank Joel Slemrod for his valuable feedback. We thank comments from participants in seminars at the University of Berkeley, the University of Michigan, the University of California San Diego, Dartmouth University, Universidad Di Tella, Universidad de la Republica, Universidad de Santiago de Chile, Universidad Católica de Chile, UADE, Corporación Andina de Fomento (Buenos Aires), Banco Central del Uruguay, LACEA 2017, the 2017 NBER Public Economics Fall Meeting, the 2017 RIDGE Public Economics Conference, the 2017 Zurich Center for Economic Development Conference, the 2017 Advances with Field Experiments Conference, the 2018 PacDev Conference, the 2018 AEA Annual Meetings, the 2018 LAGV Conference, the 2018 IIPF Annual Congress, the 2019 LACEA BRAIN Conference, and the 2019 National Tax Association meeting. This project benefited from funding by CEF, CEDLAS-UNLP and IDRC. The AEA RCT registration number is AEARCTR-0004593. The views expressed herein are those of the authors and do not necessarily reflect the views of the National Bureau of Economic Research.
NBER working papers are circulated for discussion and comment purposes. They have not been peer-reviewed or been subject to the review by the NBER Board of Directors that accompanies official NBER publications.
© 2017 by Marcelo L. Bérgolo, Rodrigo Ceni, Guillermo Cruces, Matias Giaccobasso, and Ricardo Perez-Truglia. All rights reserved. Short sections of text, not to exceed two paragraphs, may be quoted without explicit permission provided that full credit, including © notice, is given to the source.

Tax Audits as Scarecrows: Evidence from a Large-Scale Field ExperimentMarcelo L. Bérgolo, Rodrigo Ceni, Guillermo Cruces, Matias Giaccobasso, and Ricardo Perez-Truglia NBER Working Paper No. 23631July 2017, Revised September 2021JEL No. C93,H26,K42
ABSTRACT
The canonical model of Allingham and Sandmo (1972) predicts that firms evade taxes by optimally trading off the costs and benefits of evasion. However, there is no direct evidence that firms react to audits in this way. We conducted a large-scale field experiment in collaboration with Uruguay’s tax authority to address this question. We sent letters to 20,440 small and medium-sized firms that collectively paid more than two hundred million U.S. dollars in taxes per year. Our letters provided exogenous yet nondeceptive signals on key inputs for their evasion decisions such as audit probabilities and penalty rates. Using survey data, we measured the effect of these signals on firms’ subsequent perceptions of the auditing process. Using administrative data, we measured their effect on actual taxes paid. We find that providing information on audits had a significant effect on tax compliance, but in a manner inconsistent with Allingham and Sandmo (1972). Our findings are consistent with an alternative model of risk-as-feeling, in which messages about audits generate fear and induce probability neglect. According to this model, audits may deter tax evasion in the same way scarecrows scare birds away.
Marcelo L. BérgoloInstituto de Economia (IECON) Universidad de La Republica 1926 Gonzalo Ramirez MontevideoUruguayand [email protected]
Rodrigo CeniInstituto de Economia (IECON) Universidad de La Republica 1375 Joaquin Requena Montevideo, [email protected]
Guillermo CrucesCEDLASUnivesidad Nacional de La Plata Calle 6 entre 47 y 48La Plata, [email protected]
Matias GiaccobassoAnderson School of Management - UCLA110 Westwood Plaza, C 3.10Los Angeles, CA [email protected]
Ricardo Perez-TrugliaHaas School of BusinessUniversity of California, Berkeley545 Student Services Building #1900Berkeley, CA 94720-1900and [email protected]
An online appendix available at http://www.nber.org/data-appendix/w23631

1 Introduction
Tax audits are a standard tool that most tax administrations have used throughout history.Audits increase tax revenues directly because firms caught evading must pay taxes on thehidden income as well as penalties. Except in the case of large taxpayers, however, thesedirect revenues are not enough to make audits cost-effective. Audits play a central role inthe deterrence paradigm of tax evasion: the threat of being audited in the future–of beingcaught evading and having to pay penalties–deters firms from evading taxes in the present.
Audits may be useful to fostering tax compliance, but there is no direct evidence on howfirms react to them. The Allingham and Sandmo (1972) model (hereafter referred to as A&S)is the canonical model of tax evasion in economics. It is an application of Becker (1968),in which selfish individuals choose whether to engage in criminal activities by calculatingexpected costs and benefits. In A&S, firms choose the optimal amount of income to hidefrom the tax authority so that the marginal benefits (i.e., the lower tax burden) equal themarginal costs (i.e., the penalties they will be required to pay if caught). This intuition is sodeeply ingrained in economic thought that most economists take it for granted. Be that asit may, surprisingly little causal evidence exists on whether real firms react to audits in thisprofit-maximizing fashion (Alm et al., 1992; Luttmer and Singhal, 2014; Slemrod, 2018). Inthis study, we provide direct tests of the A&S model based on a high-stakes, large-scale fieldexperiment.
We study small and medium-sized firms in Uruguay that are subject to the Value AddedTax (VAT). Though that is a context in which taxpayers should care about the threat of beingaudited, that is not always the case: tax agencies can sometimes use third-party reporting toautomatically detect and rectify tax evasion regardless of whether the taxpayer is audited,thus making the audit threat irrelevant. For instance, the U.S. Internal Revenue Serviceuses their electronic records to compare the wage amount reported by an individual to theamount reported by the individual’s employer. This algorithm automatically rectifies thediscrepancies in reporting and sends a notification to the taxpayer with the updated taxamount to be paid. Because the evasion will be caught through the third-party reportingregardless of whether the individual is audited, taxpayers should not care about the threatof being audited (Kleven et al., 2011). On the contrary, in our context of the VAT in adeveloping country, such automatic cross-checking and rectification does not exist. The VATpaper trail, which consists of non-electronic invoices, can only be scrutinized in the event ofan audit.1 Thus, tax authorities must rely heavily on the threat of audits to discourage VAT
1While the VAT requires a paper trail, which is a form of third-party reporting, that paper trail is subjectto significant limitations, chief among them the fact that there is no simple algorithm that automaticallydetects tax evasion. Moreover, the paper trail breaks down when it reaches the consumer (Naritomi, 2019).
1
evasion (Gomez-Sabaini and Jimenez, 2012; Bergman and Nevarez, 2006).We collaborated with Uruguay’s Internal Revenue Service (hereafter referred to as “IRS”)
to conduct a natural field experiment with a sample of 20,440 small and medium-sized firmssubject to the VAT. For our study, the IRS mailed four different types of letters with infor-mation on audits to the owners of each of these firms.2 Some of the information contained ineach of these letters was randomized, with the goal of testing predictions of A&S. Using IRSadministrative records, we measured the effects of the information contained in the letterson the firms’ subsequent compliance with the VAT and other tax liabilities. Additionally,we collaborated with the IRS to conduct a post-mailing survey to capture the effect of thisinformation on these firms’ subsequent perceptions of audits.
Following the seminal work by Slemrod et al. (2001), the first part of the experimentaldesign measures how informing taxpayers of tax enforcement affects compliance. Firms wererandomized into four different letter types: baseline, audit-statistics, audit-endogeneity, andpublic-goods. The baseline letter type included brief and generic tax information that theIRS often includes in its communications with firms. The audit-statistics letter type wasidentical to the baseline letter, but contained as well information on the probability of beingaudited and the penalty rate according to tax administration statistics. The hypothesis isthat adding the audit-statistics message to the baseline letter will deter tax evasion, thatis, it will increase post-treatment tax payment. We can compare the effects of this audit-statistics message with the effects of other types of messages. The audit-endogeneity lettertype provided information on a different feature of the auditing process. It was identical tothe baseline letter except for the inclusion of an additional message on how evading taxesincreases the probability of being audited. The public-goods letter type was designed as abenchmark message that might increase tax compliance without providing information ontax audits. It was identical to the baseline letter, except for the inclusion of an additionalmessage describing the social costs of evasion by detailing the set of public goods that couldbe provided if tax evasion were lower.
We show that, consistent with Slemrod et al. (2001) and the subsequent literature, in-forming firms of tax enforcement increases compliance. We find that adding the audit-statistics message to the baseline letter increases tax payments by about 7.0% in the firstpost-treatment year; the effects continue into the second post-treatment year, but are onlyhalf as large and no longer statistically significant. This effect is economically significant: theestimated average VAT evasion rate in Uruguay is 26% (Gomez-Sabaini and Jimenez, 2012).
Finally, firms can also collude to tamper with the paper trail (Pomeranz, 2015).2Throughout this paper, for simplicity’s sake, we refer to firms’ perceptions and behavior as a shorthand
for the perception and behavior of the firms’ owners or managers.
2

While the tax base is not necessarily fully comparable, this figure implies that the 7.0%increase equals a 27% reduction in VAT evasion. The effect of the audit-statistics message(increased tax payments of 7.0% in the first year) is similar in magnitude to the effect of theother message on tax audits (7.1%, for audit-endogeneity), but larger and more persistentthan the effect of the public-goods message (5.1% in the first year, but negligible in the secondyear).
The second and most important part of the experimental design tests the hypothesis thatfirms react to information about audits as predicted by A&S. We provide two tests of A&S.The first test exploits survey data on perceptions of audits. If the audit-statistics letter hada positive effect on average tax compliance, for this effect to be consistent with A&S, it mustbe true that the letter increased the average perceived probability of being audited or theperceived penalty rate. To test this hypothesis, we designed a survey, which was sent outmonths after the firms received the audit-statistics and audit-endogeneity letters, elicitingperceptions of the probability of being audited and the penalty rate.
The second test of A&S is based on heterogeneity in the signals induced by the letters.We included exogenous, nondeceptive variation in the information on audit probabilitiesand penalty rates in the audit-statistics letter. To generate this information, we computedthe average probabilities and penalty rates using a series of random samples of fifty firms.This sample size was small enough to introduce non-trivial sampling variation in the averageprobabilities and fines shown to the subjects. Specifically, a given firm could receive a lettersaying that the audit probability is 8%, 10%, or 15%, depending on the sample of similarfirms chosen for that particular letter. These random variations in probabilities and penaltiesallow us to test whether firms evade less when they face higher audit probabilities and higherpenalty rates, as predicted by A&S.
The second part of the results suggests that the effects of the audit-statistics letter are notconsistent with A&S. Based on the survey data, the results for the first test indicate that theaudit-statistics message reduced the perceived probability of being audited which, accordingto A&S, would in turn reduce compliance. We find, however, that the audit-statistics messageactually increased average compliance.
The second test shows that, contrary to the A&S prediction, signals of audit probabilityand penalty rates in the audit-statistics message had no differential effect on compliance. Theestimated elasticity of tax compliance with respect to audit probabilities and penalty ratesis close to zero and precisely estimated. Moreover, we compare our experimental estimatesto the results from calibrations of A&S. We reject the null hypothesis of A&S even underconservative assumptions about how much firms learned from the audit-statistics message.These results suggest the presence of probability neglect, i.e., that firms react similarly to
3

the threat of being audited regardless of its actual probability or the penalties involved.As a complement to the audit-statistics treatment arm, we designed a separate treatment
arm that created exogenous variation in expected audit probabilities in a more direct way.The audit-threat letter type was sent to a separate sample of firms that were pre-selected bythe IRS for auditing. We randomly divided this set of firms into two groups, one with a 25%probability of being audited and the other with a 50% probability. The audit-threat letterinformed firms of the exact audit probability that was assigned to them. Consistent with theaudit-statistics treatment arm, we find probability neglect in the audit-threat arm too.
In sum, we find that informing firms of tax audits increased their tax compliance, but thereaction to the information was inconsistent with the optimal reaction predicted by A&S. Onaverage, firms reduced, rather than increased, their perceived probability of being audited.Furthermore, reaction was not heightened when firms were faced with a higher probabilityof being audited or a higher penalty rate. These results suggest that while firms may complywith tax obligations because of the threat of audit, their response is not necessarily optimalas in A&S.
Hence, the question arises as to which alternative model best explains the firms’ reactionsto audits. Models of salience (Chetty et al., 2009) and prospect theory (Kahneman andTversky, 1979) can explain some, but not all, findings. As highlighted in recent modelsof firm evasion (Kleven et al., 2016), agency issues within firms could play a role, but theycannot explain our findings either. Our preferred interpretation is based on the model of risk-as-feelings (Loewenstein et al., 2001). The models used for choice under risk are typicallycognitive: people make decisions using some type of expectation-based calculus. The risk-as-feelings model proposes that responses to fearsome situations may differ substantiallyfrom cognitive evaluations of the same risks. When fear is involved, responses to risks arequick, automatic, and intuitive, and thus neglect the underlying probabilities (Sunstein,2003; Zeckhauser and Sunstein, 2010). The model of risk-as-feelings can reconcile all of ourkey findings. Moreover, we present anecdotal and survey evidence indicating that fear ofbeing audited does indeed play a significant role in tax compliance. We also discuss policyimplications for increasing tax capacity.
Our study relates to various strands of literature. First, it forms part of a recent butgrowing body of literature that uses field experiments in partnership with tax authorities tostudy the decisions of individuals to pay taxes. In a seminal contribution, Slemrod et al.(2001) showed that, for a sample of U.S. self-employed individuals, those who were randomlyassigned to receive a letter from the Minnesota Department of Revenue with an enforcementmessage reported higher income in their tax returns than those who received no letter. Similarmessages about tax enforcement have been shown to have positive effects on tax compliance
4
in other contexts (for recent reviews, see Pomeranz and Vila-Belda, 2018; Slemrod, 2018; Alm,2019).3 One common interpretation in this literature is that taxpayers react to informationon tax enforcement tools and, in line with A&S, reduce their evasion to re-optimize theirbehavior. There is no direct evidence in favor of or against this interpretation, however. Wehope to contribute by filling this gap in the literature.
This paper is closely related to a group of studies testing A&S predictions in a laboratorysetting. For example, Alm et al. (1992) conducted a laboratory experiment in which under-graduate students play a tax-evasion game. Subjects can hide income from the experimenter,but some subjects are randomly selected to be audited and must pay a penalty if they arecaught evading. The authors show that, in the game, tax compliance increases significantlywith audit and penalty rates, but these effects are economically small, indeed smaller thanthe effects predicted by optimizing behavior in the context of A&S. The laboratory experi-ment setting of Alm et al. (1992) and similar studies have a number of advantages, such asfull control over the rules of the game and freedom to select parameters. These laboratoryexperiments have two main limitations, however. First, the subjects are typically undergrad-uate students playing the tax game for the first time, with no real-world experience of payingtaxes. In contrast, subjects in our field experiment are experienced firm owners who havebeen registered with the tax agency, that is, paying taxes, for an average of fifteen years.Second, subjects in the laboratory games typically pay less than USD 10 in tax. In contrast,subjects in our field experiment paid USD 11,800 per year in taxes (to get a sense of thismagnitude, the Uruguay’s GDP per capita in 2015 was around USD 15,000).4 We contributeto this literature in two ways. We show that A&S does not fare substantially better in anatural context with experienced subjects and high stakes. Additionally, we show that auditthreats can still be useful to reduce evasion even if taxpayers don’t react to audits optimally.
Our findings also contribute to the more general debate about the determinants of taxcompliance. The literature wonders why, among smaller firms and self-employed individualsin particular, evasion rates are so low, given the low detection probabilities and penaltyrates (Luttmer and Singhal, 2014). One traditional explanation is tax morale: firms andindividuals do not evade taxes because they feel morally obliged to comply (Luttmer andSinghal, 2014). Our evidence suggests an alternative explanation: taxpayers overreact tothe threat of audits because their tax decisions are emotional. In other words, audits scaretaxpayers into declaring their income truthfully just like scarecrows scare birds away. Thiswould explain why, despite low audit probabilities and penalty rates, most taxpayers still
3For example, Slemrod et al. (2001); Kleven et al. (2011); Fellner et al. (2013); Pomeranz (2015); Castroand Scartascini (2015); Dwenger et al. (2016); Perez-Truglia and Troiano (2018).
4In the twelve months before our experiment, the firms in our sample paid an average of USD 7,770 inVAT and USD 4,070 in other taxes; the GDP per capita in Uruguay was about USD 15,000 in 2015.
5
report the threat of audit as a major reason why they don’t want to evade taxes (UnitedStates Internal Revenue Service, 2018).
The paper is organized as follows. Section 2 discusses the experimental design. Section 3presents the data sources and discusses the implementation of the field experiment. Section4 presents the results on the average effect of the audit-statistics message. Section 5 presentsthe two tests of A&S. Section 6 discusses the interpretation of the findings. The final sectionconcludes.
2 Experimental Design
Our experiment consisted of a mail campaign sent out by Uruguay’s IRS with multipletreatment arms and sub-treatments. Rather than comparing firms that received a letter tofirms that did not, all of our analyses are based on comparisons between firms that receivedletters with subtle variations in content. We can thus control for the potential effects oncompliance of simply receiving a letter from the tax authority, even if the letter is just areminder to report taxable income.
The letters consisted of a single sheet of official IRS letterhead with the name of therecipient in the header and the scanned signature of the IRS General Director at the bottom.These letters were folded, sealed in an official IRS envelope, and sent by certified mail toguarantee direct delivery to the recipient and signature upon receipt. Panel (a) of Figure 1shows the sample sizes for the different treatment arms detailed below.
2.1 Baseline Letter
The baseline letter contained information on the goals and responsibilities of the tax authorityroutinely included in IRS communications with firms. It explained that the individual hadbeen randomly selected to receive this information, that the letter was for informationalpurposes only, and that there was no need to reply or to provide any documentation to theIRS. Figure 2 provides a sample of the baseline letter, with the addition of a placeholder boxwith the word “MESSAGE” written inside.5 This box was empty in the baseline letter butcontained a different message (printed in larger print and boldface) in each of the other lettertypes.
5For a full-page sample of the letter without this placeholder, see Appendix A.1. For the correspondingsamples of the audit-statistics, audit-threat, audit-endogeneity, and public-goods letter types, see AppendicesA.2, A.3, A.4, and A.5, respectively.
6

2.2 Audit-Statistics Letter
According to the Allingham and Sandmo (1972) model, we expect risk-averse firms to beinterested in information on the audit process, because it helps them optimize their tax-payment decisions and potentially increase their bottom line.6 The information sent shouldbe particularly valuable in a context where information about audits is limited. It is easy tofind online data about factors potentially relevant to firms’ decision-making, such as prices,inflation, and exchange rates. Information about tax audit probabilities (and, to a lesserextent, actual penalties paid by evading firms) is much harder to come by. Tax authoritiesseem to prefer to conceal this information.
In the audit-statistics letter type, we added to the baseline letter the following paragraphon audit probabilities (p) and penalty rates (θ). This letter type was sent to a random sampleof firms:7
“On the basis of historical information on similar businesses, there is a probabilityof [p%]that the tax returns you filed for this year will be audited in at least oneof the coming three years. If, pursuant to that auditing, it is determined that taxevasion has occurred, you will be required to pay not only the amount previouslyunpaid, but also a fee of approximately [θ%] of that amount.”
We communicated the probability that firms be audited in at least one of the three followingyears because IRS experts have found that this is the probability that matters to firms asthey make decisions. Uruguayan tax law indicates that tax audits should cover the previousthree years of tax returns and, as a result, the probability that the current year’s tax filingbe audited is roughly equal to the probability that the firm be audited at least once over thefollowing three years.
In our sample, the average value of p is 11.7%, and the average value of θ is 30.6%. Taxagencies in most countries do not publish data on the values of p and θ, which makes itdifficult to compare the Uruguayan case to others. In the United States, for which somecomparable data are available, these two parameters are on the same order of magnitude:self-employed individuals face a p of 11.4% and a base θ of 20%.8
6We assume that firms in our sample are risk-averse–a safe assumption since we deal mainly with small andmedium-sized firms. However, A&S has also been generalized to settings with risk-neutral agents (Reinganumand Wilde, 1985; Srinivasan, 1973).
7To make the information on audit probability and penalty rate clear and salient, we provided all figuresas round numbers.
8First, there is a 2.1% probability of being audited in any given year, according to the ratio of returnsexamined for businesses with no income tax credit and with a reported income of between USD 25,000 and200,000 (Table 9a of IRS, 2014). Each audit covers the previous three to six years, which implies thatthe probability that the current year’s tax filing be audited at some point ranges from 5.88% to 11.42%.
7

The goal of this treatment arm was to generate exogenous variation in the firms’ per-ceptions of audit probabilities and penalty rates. Because of legal considerations and otherconstraints, we could not send different firms different sets of information about these fac-tors. We instead induced nondeceptive, exogenous variations in messages that may havean effect on perceptions by exploiting the sampling variation in statistics about audits andpenalties. What we did was divide the firms into five groups according to the five quintiles oftotal VAT payments in the fiscal year before our intervention. For each firm, we then drewa random sample of fifty other firms from the same quintile (i.e., similar firms), for whichwe computed the averages of p and θ. This randomization strategy generated nine hundredand forty different combinations of p and θ. These estimates of p and θ were unbiased andconsistent with the explanation given in a footnote included in the letter. In other words,the information provided to recipients was nondeceptive. The footnote explained how weestimated the values of p and θ:
“Estimates are based on data from the 2011–2013 period for a group of firms withsimilar characteristics, for instance, in terms of total revenue. The probabilityof being audited was calculated as a percentage of audited firms in a randomsub-sample of firms. The rate of the fee was estimated as an average of a randomsub-sample of audits.”
The values of p ranged from 2% to 25%, with an average of about 11.7%. The values ofθ ranged from 15% to 68%, with an average of about 30.6%. Figure 3 presents the audit-probability and penalty-rate distribution across five groups by firm size (one in each row)and the distribution of the generated within-group parameters. The vertical line denotes theaverage audit probability or penalty rate based on all members of the group. If we basedour estimates of p and θ included in the letter on the population of firms, every member ofthe group would have received the same signal (the vertical line). Since we computed p andθ from samples of fifty firms, different members of each group received different signals. Forexample, panel (a.1) of Figure 3 shows that in group 1 (i.e., the first quintile of firms rankedby total VAT payments), the average p for all group members is 8.2%, whereas the histogramdepicts the different signals actually sent to firms within the group. These signals clusteraround the average of 8.2%, but they range anywhere from 2.5% to 25%.9
Second, the IRS usually imposes a basic penalty of θ=20%, although penalties can be higher depending onthe situation.
9The within-group average p differs across the different groups, increasing monotonically from 8.2% in thebottom quintile to 13.4% in the top quintile. This implies that some of the variation in the values of p and θincluded in the letter was non-random. To estimate the causal effects of the signals p and θ, we must isolatethe random variation when analyzing the data. In any case, this aspect of the design is not overly importantin practice as most of the variation in signals is due to the sampling variation. For example: regressing p on
8

2.3 Audit-Threat Letter
To complement the evidence from the audit-statistics sub-treatment, we implemented analternative randomization of perceptions of audit probabilities with an audit-threat letter. Wedevised a treatment arm that randomly assigned firms to groups with different probabilitiesof being audited in the following year. The audit-threat letter was identical to the baselineletter, except for the addition of the following paragraph:
“We would like to inform you that the business you represent is one of a groupof firms pre-selected for auditing in 2016. A [X%] of the firms in that group willthen be randomly selected for auditing.”
This audit-threat treatment arm was applied to a separate experimental sample, a groupof high-risk firms selected by the IRS audit department. The recipients of the audit-threatletter cannot, then, be compared to the recipients of the baseline letter. Instead, we randomlyassigned the firms in this treatment arm to two groups, one with a 25% probability of beingaudited in the following year (X=25%) and another with a 50% probability (X=50%). Thesemessages were nondeceptive: the IRS audit department committed to conducting audits inthe following year according to these probabilities.
2.4 Audit-Endogeneity Letter
The audit-statistics and audit-threat treatment arms conveyed quantitative information aboutaudit probabilities and penalty rates, but we wanted to incorporate into our research designa message about a different aspect of the audit process as well. Most tax agencies, includingUruguay’s, consider firm characteristics when deciding which ones to audit. They assignhigher audit probabilities to firms with higher evasion risk. As a result, evading taxes typicallyincreases probability of being audited. This factor was incorporated as a special case inA&S, in which audit probabilities were determined endogenously. If unsuspecting firms learnabout the endogenous nature of their audit probabilities, they should revise their tax-evasiondecisions and reduce the amount of tax evaded.10
We used this insight from economic theory to devise the audit-endogeneity message aboutthe nature of the audit process. We asked our counterparts at the IRS to use their evasion-risk scores to divide a small sample of firms into two groups: those suspected of evading taxes
a set of dummy variables for the pre-treatment VAT quintiles results in an R2 = 0.135. Likewise, regressingθ on the same set of dummy variables results in an R2 = 0.009.
10Konrad et al. (2016) present suggestive evidence of this mechanism in the context of a laboratoryexperiment. They find that compliance increases by 80% when taxpayers face a situation where a suspiciousattitude toward a tax officer increases audit probability.
9

and those not suspected of evading taxes. We then computed the difference in audit ratesfrom 2011–2013 between the two groups. We found that the rates were approximately twiceas high for the likely-evaders group. On the basis of this information, we created the messagein the audit-endogeneity letter type, which was identical to the baseline letter except for theaddition of the following paragraph:
“The IRS uses data on thousands of taxpayers to detect firms that may be evadingtaxes; most of its audits are aimed at those firms. Evading taxes, then, doublesyour chances of being audited.”
2.5 Public-Goods Letter
We also devised a treatment arm to provide a benchmark for the effect of messages intendedto increase tax compliance without directly mentioning audits. We designed a non-pecuniarymessage based on the suggestions of IRS staff and authorities (i.e., on what information theyexpected to be most effective at increasing compliance). In the spirit of the model of Cowelland Gordon (1988), this message provided information on the cost of evasion in terms of theprovision of public goods.11 The public-goods letter is identical to the baseline letter, exceptfor the addition of the following message:12
“If those who currently evade their tax obligations were to evade 10% less, theadditional revenue collected would enable all of the following: to supply 42,000portable computers to school children; to build 4 high schools, 9 elementaryschools, and 2 technical schools; to acquire 80 patrol cars and to hire 500 policeofficers; to add 87,000 hours of medical attention by doctors at public hospitals;to hire 660 teachers; to build 1,000 public housing units (50m2 per unit). Therewould be resources left over to reduce the tax burden. The tax behavior of eachof us has direct effects on the lives of us all.”
2.6 Survey Design
We designed a survey to be conducted with a sample of firm owners from our main sub-ject pool several months after they received the letters. The IRS, with the support of the
11This message is also related to the laboratory experiment from Alm et al. (1992), which finds that oneof the reasons people decide to pay taxes is appreciation of the public goods provided by tax revenue.
12The content of the message was based on estimates from the following governmental agencies: Admin-istracion Nacional de Educacion Publica (ANEP), CEIBAL, Ministerio de Salud Publica (MSP), Ministeriodel Interior (MI), Ministerio de Vivienda, Ordenamiento Territorial y Medio Ambiente (MVOTMA).
10

Inter-American Center of Tax Administrations and the United Nations, had previously ad-ministered a survey on the costs of tax compliance to small and medium-sized firms. Wecollaborated with the tax authority on the design and implementation of a new survey,which included a module tailored to our research design. The survey also included seven ad-ditional modules, designed by the IRS, on the costs of tax compliance and other topics.13 Wepartnered with local and international universities to increase respondent confidence and tohighlight the fact that the survey was part of a scientific study, not of an audit or complianceexercise by the IRS.
To further ensure trustworthy responses, the IRS assured potential respondents that re-sponses would be anonymous and impossible to trace back to specific individuals or firms.To measure the effect of our experiment on these survey responses, we embedded a code inthe survey link to identify which treatment arm of the experiment the recipient was assignedto. While these codes did not uniquely identify any firm, they allowed us to link treatmentarms and completed questionnaires without compromising anonymity.
In our survey module, we used the following two questions to assess whether the audit-statistics message altered recipients’ perception of our letters:14
Perceived Audit Probability: “In your opinion, what is the probability that thetax returns filed by a company like yours will be audited at least in one of thenext three years (from 0% to 100%)?”
Perceived Penalty Rate: “Let us imagine that a company like yours is auditedand that tax evasion is detected. What, in your opinion, is the penalty (in %)as determined by law that the firm must pay in addition to the originally unpaidamount? For example, a fee of X% means that, for each $100 not paid, the firmwould have to pay those original $100 plus $X in penalties.”
After each question, we asked how certain the subject felt about his or her response on a 1–4scale, from “Not sure at all” (1) to “Very sure” (4).15
13The email with the invitation to participate in the online survey is reproduced in Appendix A.6.14A screenshot of our survey module is found in Appendix A.7.15We also included a question in the survey to measure the subject’s awareness of the endogeneity of audit
probabilities. You can find a screenshot of this question in Appendix A.7.
11

3 Data Sources and Implementation of the Field Ex-periment
3.1 Institutional Context
Uruguay is a middle-income country in South America (the annual GDP per capita wasabout USD 15,000 in 2015). Our main focus for the study of tax evasion is the VAT, whichrepresents the largest tax liability for firms in Uruguay and also the largest source of taxrevenue. At the time of the study, the VAT rate was 22%,16 and VAT revenues accountedfor nearly half of total tax revenues.17 Uruguay is not atypical in terms of tax evasion.According to estimates from Gomez-Sabaini and Jimenez (2012), evasion of VAT in Uruguaywas around 26% in 2008. This is the third-lowest rate in the nine Latin American countriesincluded in the study, and it is comparable to evasion rates in more developed economies. Forexample, the evasion rate for Italy in 2006 was estimated as 22% (Gomez-Sabaini and Moran,2014).18 Uruguay is not an outlier in terms of tax morale either. According to data from the2010–2013 wave of the World Values Survey, 77.2% of respondents from Uruguay stated thatevading taxes is “Never Justifiable,” whereas that proportion is, on average, 68.2% for allother Latin American countries (weighted by population) and 70.9% for the United States.
In some contexts, tax authorities do not need to rely on audits to mitigate tax evasion.For example, the U.S. Internal Revenue Service uses their electronic records to compare thewage amount reported by a taxpayer to the amount reported by his or her employer. Theiralgorithm automatically rectifies the discrepancies in reporting and sends a notification to thetaxpayer with the updated tax amount to be paid. Because evasion will be caught throughthird-party reporting regardless of whether the individual is audited, the probability of beingaudited should be irrelevant to taxpayers (Kleven et al., 2011). We focused on a context wheretax authorities still rely heavily on the threat of audits to discourage evasion. There is somethird-party reporting for the VAT, namely the paper trail of invoices for sales and purchases.19
16A small number of products considered basic necessities had either a 10% rate or were exempt from thetax altogether.
17Own calculations based on data from the Central Bank of Uruguay and from the Internal RevenueService. Other sources of tax revenues include personal income tax, corporate income tax, and some specifictaxes on consumption, businesses, and wealth.
18Gomez-Sabaini and Jimenez (2012) compute those rates by applying an “indirect” method to estimatetax evasion. This method is based on the comparison of collected VAT with aggregate consumption datafrom the System of National Accounts (SNA).
19Firms can credit VAT paid on input costs (i.e., imports and purchases from their suppliers) against thetotal sales of goods and services to their costumers (i.e., “tax debit”). They pay VAT to the IRS only on theexcess of the total “tax debit” over the tax credit. If the tax credit exceeds the debit, the difference can becarried over as a credit for future tax years. While the effects of the VAT should, in theory, be similar tothose of a retail sales tax, in practice the two types of taxes differ in some significant ways (Slemrod, 2008).
12

This type of third-party reporting is highly imperfect, however. Most importantly, there is noautomatic cross-checking and rectification of VAT payments–that because the paper trail isnon-electronic and thus can only be scrutinized by the tax agency in the event of an audit.20
The VAT paper trail has other limitations documented in the literature, such as breakdownat the consumer end (Pomeranz 2015; Naritomi 2019). The tax agency has access to otherenforcement tools, such as tax withholding, but they have limitations as well. As a result,audits are still one of the main ways the tax agency detects tax evasion in the Uruguayancontext (Gomez-Sabaini and Jimenez, 2012; Bergman and Nevarez, 2006).
3.2 Subject Pool and Randomization
Our experiment was conducted in collaboration with the IRS of Uruguay. As of May 2015,there were 120,142 firms registered in the agency’s database. A subsample of 4,597 firms, pre-selected by the IRS, was put aside for the audit-threat sample, which we call the secondaryexperimental sample. We used a series of criteria to select our main experimental sample fromthe remaining firms. First, we excluded some firms at the request of the IRS, among themvery small or very large firms that were subject to special VAT regimes. We also restrictedthe experimental sample to firms that had made VAT payments for at least three differentmonths in the previous twelve-month period and to firms with a total value of at least USD1,000.21
To maximize the impact of our information provision experiment, we did our best toensure that the letters would be delivered to the firms’ owners.22 Moreover, in very largefirms the effect of the information could be substantially diluted, as it may not reach theowner or the individuals making decisions about tax compliance. Thus, we excluded fromour subject pool firms with a total value exceeding USD 100,000 during the previous twelvemonths.
These criteria left a subject pool of 20,471 firms for the main experimental sample. Allfirms were randomly assigned to receive one of the four letter types according to the followingdistribution: 62.5% were assigned to the main treatment arm (audit-statistics letter), and12.5% were assigned to each of the three remaining letter types (baseline, audit-endogeneity,and public-goods).23 After removing the 19.9% of letters returned by the postal service, the
20The use of standardized electronic invoicing systems may facilitate and automatize the cross-checkingof the VAT trail to detect evasion. No such system is in place in Uruguay.
21The sample selection was conducted in May 2015, so the twelve-month period spans from April 2014 toMarch 2015.
22In some cases, owners provide the address of an external accountant rather than their address or theirfirm’s address. We removed from the sample firms that were registered with an accountant’s mailing address(the IRS keeps records of addresses for all registered accountants).
23The randomization of letter types was stratified by the quintiles of the distribution of VAT payments
13

final distribution of letter types was as follows: 10,272 received audit-statistics; 2,064 receivedbaseline; 2,039 received audit-endogeneity; and 2,017 received public-goods letters (total N =16,392). The 4,597 firms in the secondary sample were assigned to receive the audit-threatletter. Half were randomly assigned to the message of a 25% audit probability, and the otherhalf to the 50% audit probability. After excluding the 12% of letters returned by the postalservice, we were left with 2,015 firms in the 25% probability group and 2,033 firms in the50% probability group (total N = 4,048).
Table 1 allows us to compare the balance of pre-treatment characteristics for firms assignedto the different letter types. Columns (1) through (4) correspond to firms in the mainexperimental sample. For each characteristic, column (5) presents the p-value of the testof the null hypothesis that the averages for these characteristics are the same across allfour letter types. As expected, the differences across letter types are economically smalland statistically insignificant. Columns (6) through (8) of Table 1 present a similar balancetest for the secondary sample used for the audit-threat arm. Again, the characteristics arebalanced across the two sub-treatments in the audit-threat treatment arm.24
3.3 Outcomes of Interest
The letters were mailed by Uruguay’s postal service on August 21, 2015, and the vast ma-jority were delivered to taxpayers during the month of September. For that reason, we setSeptember as the last month of the pre-treatment period and October as the first monthof the post-treatment period. The main outcome of interest is the total amount of VATliabilities remitted by taxpayers in the twelve months after receiving the letter.25 To testfor the persistence of our treatment effects, a second period of observation, between October2016 and September 2017 (or up to two years after the intervention), was estalbished. Panel(b) of Figure 1 depicts a timeline of the experiment and the data collection.
The VAT represented 64.4% of the total tax paid by these firms in the fiscal year thatpreceded our treatment. The corporate income tax represented 25.3% of total tax paid,the wealth tax 6.5%, and the personal income tax withholding only 3.3%. In a context ofsole proprietorships, small enterprises, and micro enterprises, the VAT represents the bulk offirms’ tax liability, which is why it is our main focus. We did, however, obtain data from theIRS on the other taxes paid by the firms, which allows us to assess whether firms effectively
over the fiscal year before our intervention.24Appendix B.1 provides descriptive statistics for the firms in our subject pool. Moreover, Appendix
B.2 shows that the rate of non-delivered letters is mostly balanced across treatments, with only minor andeconomically insignificant differences in missing delivery status for the public-goods and audit-endogeneitytreatment arms with respect to audit-statistics and baseline.
25This variable includes all VAT payments, that is, direct VAT payments and indirect VAT withholdings.
14
changed their overall tax compliance or whether they simply substituted the evasion of VATfor evasion of other taxes.
Significantly, the firms in our sample are mostly small. On average, the total amount ofVAT paid by the firms that received the baseline letter was about USD 7,700 for the twelvemonth pre-treatment period; the amount for the corresponding post-treatment period wasapproximately USD 6,500. That negative trend could be explained by the high share ofsmall firms in our sample, since small firms tend to have high turnover rates. The size ofpost-treatment VAT payments varied widely, from USD 440 at the 10th percentile to USD16,550 at the 90th percentile.26
We can further break down firms’ VAT payments according to timing, observing the dateof transfer to the IRS as well as the month for which the payment was imputed. Firmscan backdate payments to cover liabilities from previous periods. As firms typically makeVAT payments on a monthly basis, they normally cover the current and previous months,which we call concurrent payments. We classified payments covering liabilities incurred twoor more months prior as retroactive payments–that is, adjustments for revisions in pastliabilities. About 99.7% of firms made one or more concurrent payment in the twelve-monthpre-treatment period, whereas only 23.11% of firms made one or more retroactive paymentfor this same period.27
3.4 Survey Implementation
Since the IRS communicates mainly via post, it has mailing addresses for all registeredfirms. It also keeps records of email addresses for a subset of firms that have used theironline services. We emailed invitations to participate in the survey to all firms in the mainexperimental sample with a valid email address (N=3,867). We wanted to roll out the surveyshortly after the reception of the letters but, for reasons beyond our control, we were not ableto do so until May 2016, nine months after the intervention.28 We find that firms invited tothe survey were similar in characteristics to the broader set of firms in the main experimentalsample.29
26See Appendix B.3 for detailed descriptive statistics on the distribution of pre- and post-treatment pay-ments for firms that received the baseline letter type.
27It should be noted that the retroactive payments do not reflect delinquency or outstanding debts to thetax authority. Overall VAT liabilities are computed on a yearly basis, and firms make monthly paymentsaccording to their provisional receipts on a pay-as-you-go basis to avoid a large bill at the end of the fiscalyear. Thus, retroactive payments reflect changes in past liabilities. For instance, a firm may have “forgotten”to declare a sale in the past and thus need to send a retroactive payment corresponding to the gap betweenthe original and the updated accounting.
28While we would have preferred a shorter interval between the experiment and the survey, its designinvolved several departments of the tax authority, creating delays.
29See Appendix B.1.
15

The main purpose of the survey was to elicit the beliefs of firm owners. We did not includeemail addresses repeated more than three times in the full sample, since they likely belongedto accounting firms representing multiple small and medium-sized firms. Even after applyingthis criterion, the IRS records could not ensure that the registered email address belonged tothe firms’ owners. We thus asked the survey respondent to self-identify as belonging to oneof the following five categories: owner, inhouse accountant, external accountant, manager,or other employee. Of the 3,867 recipients invited to participate in the survey, 948 startedto answer the survey (a response rate of 24.5%).30 Of these 948, 68.9% self-identified asan owner and 23.5% as a non-owner; the remaining 7.6% did not provide a response to thisquestion.31 Our baseline specification excludes respondents who self-identified as non-owners,though the results are similar if we include only those who identified as owners.32 As per anIRS request, respondents could skip as many questions as they wanted. We find that 6.6%and 8.6% of respondents skipped the audit probability and penalty questions respectively,which is comparable to the average rate (6.1%) at which they skipped other questions in thesurvey.33
4 Results: Average Effect of Messages
4.1 Effect of the Audit-Statistics Message
Our first set of hypotheses concern whether providing letters with information on tax enforce-ment increases tax compliance. We start by describing the effects of our main treatment,the audit-statistics message. The literature suggests that a message of this sort will have apositive effect on tax compliance.34
Figure 4 summarizes the raw data before conducting any regression analysis. Panel (a) ofFigure 4 corresponds to the effect of the audit-statistics message. More precisely, the graphshows the percentage difference in VAT paid between the individuals randomly assigned the
30For this calculation, we required that respondents had answered at least the first two questions of thesurvey.
31The non-owner responses are distributed as follows: 6.1% self-identified as an internal accountant, 8.3%as an external accountant, 2.7% as a manager, 6.3% as another type of employee.
32See Appendix B.4.2.33The skip rate is the probability of providing an answer once a question in the survey has been reached.
Appendix B.4 presents a series of robustness tests, and other tests, as well as analyses of differential responserates by treatment group.
34As long as the enforcement messages do not affect the taxpayers’ true income, the changes in the totalamount of VAT paid measure changes in tax evasion. Given the presence of real effects, however, our estimatesprovide a lower bound for the impact of tax-enforcement information on compliance. Although real effects arepossible in our setting, most of the public finance literature provides evidence that real effects are normallyzero or small relative to reporting effects (see for example Saez et al., 2012).
16
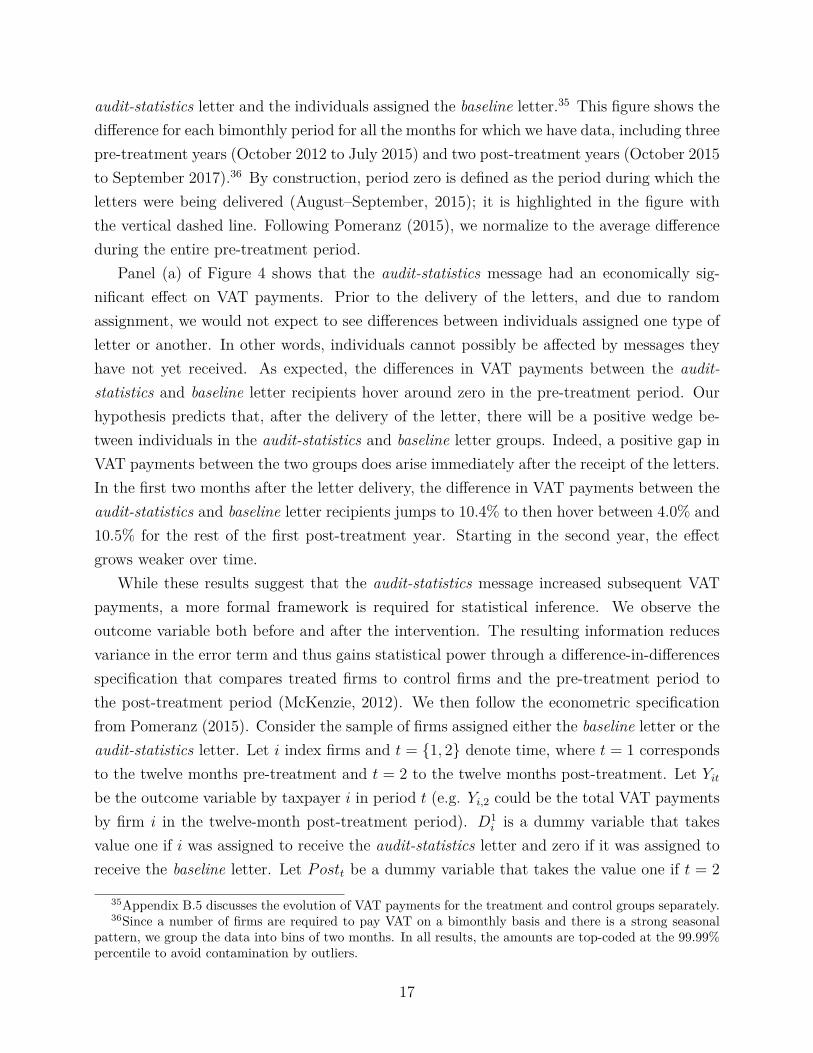
audit-statistics letter and the individuals assigned the baseline letter.35 This figure shows thedifference for each bimonthly period for all the months for which we have data, including threepre-treatment years (October 2012 to July 2015) and two post-treatment years (October 2015to September 2017).36 By construction, period zero is defined as the period during which theletters were being delivered (August–September, 2015); it is highlighted in the figure withthe vertical dashed line. Following Pomeranz (2015), we normalize to the average differenceduring the entire pre-treatment period.
Panel (a) of Figure 4 shows that the audit-statistics message had an economically sig-nificant effect on VAT payments. Prior to the delivery of the letters, and due to randomassignment, we would not expect to see differences between individuals assigned one type ofletter or another. In other words, individuals cannot possibly be affected by messages theyhave not yet received. As expected, the differences in VAT payments between the audit-statistics and baseline letter recipients hover around zero in the pre-treatment period. Ourhypothesis predicts that, after the delivery of the letter, there will be a positive wedge be-tween individuals in the audit-statistics and baseline letter groups. Indeed, a positive gap inVAT payments between the two groups does arise immediately after the receipt of the letters.In the first two months after the letter delivery, the difference in VAT payments between theaudit-statistics and baseline letter recipients jumps to 10.4% to then hover between 4.0% and10.5% for the rest of the first post-treatment year. Starting in the second year, the effectgrows weaker over time.
While these results suggest that the audit-statistics message increased subsequent VATpayments, a more formal framework is required for statistical inference. We observe theoutcome variable both before and after the intervention. The resulting information reducesvariance in the error term and thus gains statistical power through a difference-in-differencesspecification that compares treated firms to control firms and the pre-treatment period tothe post-treatment period (McKenzie, 2012). We then follow the econometric specificationfrom Pomeranz (2015). Consider the sample of firms assigned either the baseline letter or theaudit-statistics letter. Let i index firms and t = {1, 2} denote time, where t = 1 correspondsto the twelve months pre-treatment and t = 2 to the twelve months post-treatment. Let Yitbe the outcome variable by taxpayer i in period t (e.g. Yi,2 could be the total VAT paymentsby firm i in the twelve-month post-treatment period). D1
i is a dummy variable that takesvalue one if i was assigned to receive the audit-statistics letter and zero if it was assigned toreceive the baseline letter. Let Postt be a dummy variable that takes the value one if t = 2
35Appendix B.5 discusses the evolution of VAT payments for the treatment and control groups separately.36Since a number of firms are required to pay VAT on a bimonthly basis and there is a strong seasonal
pattern, we group the data into bins of two months. In all results, the amounts are top-coded at the 99.99%percentile to avoid contamination by outliers.
17

(i.e., after the letters were delivered) and zero if t = 1. The regression of interest is as follows:
Yit = α0 + γ1 ·D1i · Postt + α1 ·D1
i + α2 · Postt + εit (1)
The coefficient of interest is γ1, which measures the differential effect between the audit-statistics letter and the baseline letter. When the dependent variable is the amount of taxpaid, we estimate a log-linear model, also known as a Poisson regression, for two reasons. Firstand foremost, in the Poisson regression effects are proportional–indeed, the coefficients can bereadily interpreted as semi-elasticities.37 Second, the Poisson regression naturally accountsfor the bunching at zero of the dependent variable. Note that the Poisson regression can beused for a continuous non-negative variable; we do not have to rely on additional functionalform assumptions such as equidispersion thanks to the quasi-MLE estimator.38 In any case,we find that the results are robust to alternative regression models (OLS, Tobit, and Probit).39
Standard errors are always clustered at the firm level.Table 2 presents the baseline regression results. Panel (a) compares the audit-statistics
and baseline letters. In column (1), the dependent variable corresponds to the effect on VATpaid. The post-treatment coefficient corresponds to the effect during the twelve months afterthe delivery of the letter (October 2015 to September 2016), as measured by the coefficientγ1 from equation (1) above. The post-treatment coefficient of audit-statistics (in column(1) of panel (a)) is positive (0.070) and highly significant statistically (p-value = 0.001) andeconomically, suggesting that the audit-statistics message increased VAT payments in thetwelve months after the intervention by about 7.0%.40 To better grasp the magnitude ofthe effects, we can compare them to some basic benchmarks. The estimated average evasionrate for VAT in Uruguay is 26% (Gomez-Sabaini and Jimenez, 2012), and while the taxbase is not necessarily comparable, it does provide a benchmark: the 7% increase in VATpayments amounts to a reduction in the evasion rate of 27% (= 7.0%
26% ). The effects of ouraudit-statistics treatment are not directly comparable to the effects of the audit message fromPomeranz (2015) because the messages differed in content and each study covers firms fromdifferent countries and with different characteristics. Nevertheless, Table 4 from Pomeranz
37The Poisson model can be expressed as follows: log(YX) = α + βX + ε. The effect of a unit change inX can be re-expressed in log-units of the dependent variable, β = log(YX=x+1) − log(YX=x). Provided thiscoefficient is small enough, it can be approximated as a percent-change effect: β = log(YX=x+1)−log(YX=x) ≈YX=x+1 − YX=x
YX=x.
38For more details, see for example Chapter 19 of Wooldridge (2010).39See Appendix B.6.1 for the results from these robustness checks.40This percent-effect is based on the following approximation: β = log(YX=x+1) − log(YX=x) ≈
YX=x+1 − YX=x
YX=x. For the sake of simplicity, in the rest of the paper we interpret all of the Poisson coeffi-
cients using this same approximation. The exact percent-effect can be calculated exactly using the exponentialtransformation. For example, the 0.070 coefficient corresponds exactly to a 7.25% effect (= 100 ·
(e0.070 − 1
)).
18

(2015) indicates that the deterrence letter led to an increase in VAT payments of 7.6%, afigure similar in magnitude and statistically indistinguishable from the 7.0% effect of ouraudit-statistics message. Moreover, our results are qualitatively consistent with a broaderliterature that finds messages about enforcement to have an effect on tax compliance ina variety of contexts: self-employed income in the United States (Slemrod et al., 2001),wage income taxes in Denmark (Kleven et al., 2011), individual TV license fees in Austria(Fellner et al., 2013), individual municipal taxes in Argentina (Castro and Scartascini, 2015),an individual church tax in Germany (Dwenger et al., 2016), and tax delinquencies in theUnited States (Perez-Truglia and Troiano, 2018).
Table 2 presents a number of robustness checks discussed below. First, we present falsi-fication tests in the spirit of event-study analysis. The pre-treatment coefficients from Table2 are estimated with a specification identical to the one used for the post-treatment coeffi-cients, except for the use of a “placebo” date for the delivery of the letters: i.e., we simulatethat the letters were delivered in August and September 2014 and estimate the “effects”on the VAT paid in the subsequent twelve months (i.e., October 2014 to September 2015).Since the letters had not actually been delivered on that date, we would expect the “effect”of the audit-statistics message to be close to zero and statistically insignificant. A findingto the contrary would suggest problems with the specification or the random assignment.As expected, the pre-treatment coefficients for the audit-statistics message (column (1) inpanel (a) of Table 2) is close to zero (0.009), statistically insignificant (p-value=0.658), andas precisely estimated as the corresponding post-treatment coefficient.
Over time, individuals may forget the information conveyed in the letter, or it may becomeless salient. Beliefs and perceptions may change for other reasons, for instance new eventssuch as audits and information campaigns. To assess the persistence of the effects, column(2) in Table 2 replicates the analysis for the second year after treatment (October 2016 toSeptember 2017). As expected, the effect of the treatment is half as large as it is duringthe first year, and no longer statistically significant. These estimates are consistent with thepattern of effects by quarter depicted in panel (a) of Figure 4: the effect decreases graduallyover time and is about half as large in the second year as in the first. The timing of theeffects is also consistent with previous evidence on the effects of tax enforcement messages.The effects of the main intervention in Pomeranz (2015) were also substantially higher in thefirst twelve months after the intervention, at which point they fell substantially; by the 18thmonth, they had largely vanished.41
Table 2 presents results for complementary outcomes. Firms in Uruguay, as explained inthe previous section, make payments not only for their current liabilities, but also for previous
41See, for example, Figure 2 in Pomeranz (2015).
19

periods either because accounts are revised and past mistakes remedied or because invoicesnot available at the time of the original payment are now imputed. When firms that engagein tax evasion face a heightened threat of audit, we can expect them not only to increasetax payments (i.e., reduce their evasion) in the future, but also to revise their payments forprevious periods to reduce or eliminate past evasion. To shed light on this question, columns(3) and (4) in panel (a) of Table 2 split the effects during the first year between retroactiveand concurrent payments. The audit-statistics message had an economically and statisticallysignificant effect on both retroactive and concurrent payments: the coefficient correspondingto the audit-statistics message is 0.383 (p-value=0.006) for retroactive payments and 0.053(p-value=0.012) for concurrent payments.42
We have so far established that firms in the audit-statistics treatment arms increasedtheir VAT payments compared to those in the baseline letter group. Our analysis focuseson VAT liabilities, which represent the largest fraction of tax payments made by firms inour sample. Our letters referred to taxes in general, however, not VAT or any other tax inparticular, which means the effects we reported for VAT may not actually represent a netincrease in tax payments: firms may increase their evasion (i.e., reduce their payments) ofother tax liablities, thereby crowding out payments or substituting evasion to other taxes.On the other hand, firms may need to declare higher income in order to declare higher VAT,and thus be required to pay more, not less, in non-VAT taxes. The results in columns (5)and (6) of Table 2 shed light on these issues. Column (5) presents the effects on all othertaxes paid (mostly the corporate income tax). The effects on the payments of other taxesare as economically and statistically significant as the effects on VAT payments: the audit-statistics message had an effect of 8.6% (p-value=0.019) on other tax payments. Column(6) shows that the results are robust if we look at the effect on the sum of VAT and othertaxes: the audit-statistics message increased this outcome by a statistically significant 7.3%(p-value<0.001).43
42While the size of the effect for retroactive payments is larger than for concurrent payments, thesedifferences must be taken with a grain of salt because there are large differences in baseline levels betweenthe two outcomes. In the baseline letter group, for example, firms paid an average of USD 300 in retroactivepayments versus USD 6,160 in concurrent payments in the post-treatment period.
43Appendix B.7 presents both a finer analysis that breaks down the effects of “other taxes” into their threecomponents and a series of additional robustness checks, such as alternative estimation methods (AppendixB.6.1), alternative specifications of the dependent variable (Appendix B.6.1), and a heterogeneity analysisbased on firm characteristics such as size, age, and sector (Appendix B.8). Overall, we find that the effectsare qualitatively and quantitatively similar across the board.
20

4.2 Audit-Endogeneity Message
The first benchmark for the audit-statistics message is the audit-endogeneity message; thetwo are similar in that both provide information on tax enforcement through audits. Panel(b) of Figure 4 shows the raw evolution of VAT payments in the audit-endogeneity treatmentrelative to the baseline treatment. The results suggest that the audit-endogeneity messagealso induced a significant increase in VAT payments, and that that increase was similarin timing and magnitude to the effects induced by the audit-statistics message depictedin panel (a) of Figure 4. For a more formal statistical analysis, the regression results arepresented in panel (b) of Table 2.44 The coefficient in column (1) indicates that the audit-endogeneity message increased subsequent VAT payments by 7.1% (p-value of 0.009).45 This7.1% is similar in magnitude and statistically indistinguishable (p-value=0.950) from thecorresponding 7.0% effect of the audit-statistics message reported in panel (a).46 The samerobustness checks were performed on the effects of the audit-endogeneity message as on theeffects of the audit-statistics message: for example, the “effect” on the pre-treatment year isclose to zero (-0.005) and statistically insignificant (p-value=0.868), and the effects duringthe second post-treatment year are about half as large as during the first year.
4.3 Public-Goods Message
Panel (c) of Figure 4 shows the effects of the public-goods message on VAT payments. Thetime series data suggest that the public-goods message also had a positive effect on tax com-pliance, but that effect dissipated a lot more quickly than the effects of the audit-statisticsmessage. The corresponding regression results are presented in panel (c) of Table 2. Thepublic-goods message increased VAT payments in the first post-treatment year by 5.1%, andthe effect is statistically significant (p-value=0.043). The effects of the public-goods messagein the second post-treatment year, however, were close to zero (0.4%) and statistically in-significant (p-value=0.906). The evidence on the effects of moral messages is mixed, and theyappear to work in some contexts (Bott et al., 2020; Nathan et al., 2020; Hallsworth et al.,2017) but not others (Blumenthal et al., 2001; Fellner et al., 2013; Castro and Scartascini,2015; Dwenger et al., 2016; Meiselman, 2018; Perez-Truglia and Troiano, 2018). A closely
44The results from panels (b) and (c) in Table 2 are based on a regression specification equivalent to theone from equation (1) above, which was used to obtain the estimates in panel (a).
45The estimate of the effect of the audit-endogeneity message is somewhat less precise than the effect ofthe audit-statistics message, but that is as expected due to the difference in sample sizes.
46This is an equality test between two coefficients based on the same data but different regressions. Toallow for a nonzero covariance between these two coefficients, we estimate a system of seemingly unrelatedregressions. In the remainder of the paper, when comparing coefficients from the same data but differentregressions, we will use this method.
21
related study, Pomeranz (2015), included a message of moral suasion that had a positiveeffect on subsequent VAT payments, although that effect was statistically insignificant andnot as large as the effect of the deterrence message. Our findings on moral suasion fall closestto the findings of the experiment with Norwegian taxpayers reported in Bott et al. (2020):they find that the message of moral suasion increased tax compliance in the short term, butthe effects dissipated completely the following year.
5 Tests of A&SThe results presented in the previous section are broadly consistent with the evidence in theliterature, namely, providing information on audits significantly increases tax compliance.In this section, we present additional evidence to establish whether the effects of the audit-statistics treatment are driven by the A&S mechanism.
5.1 First Test of A&S: Effects on Perceptions
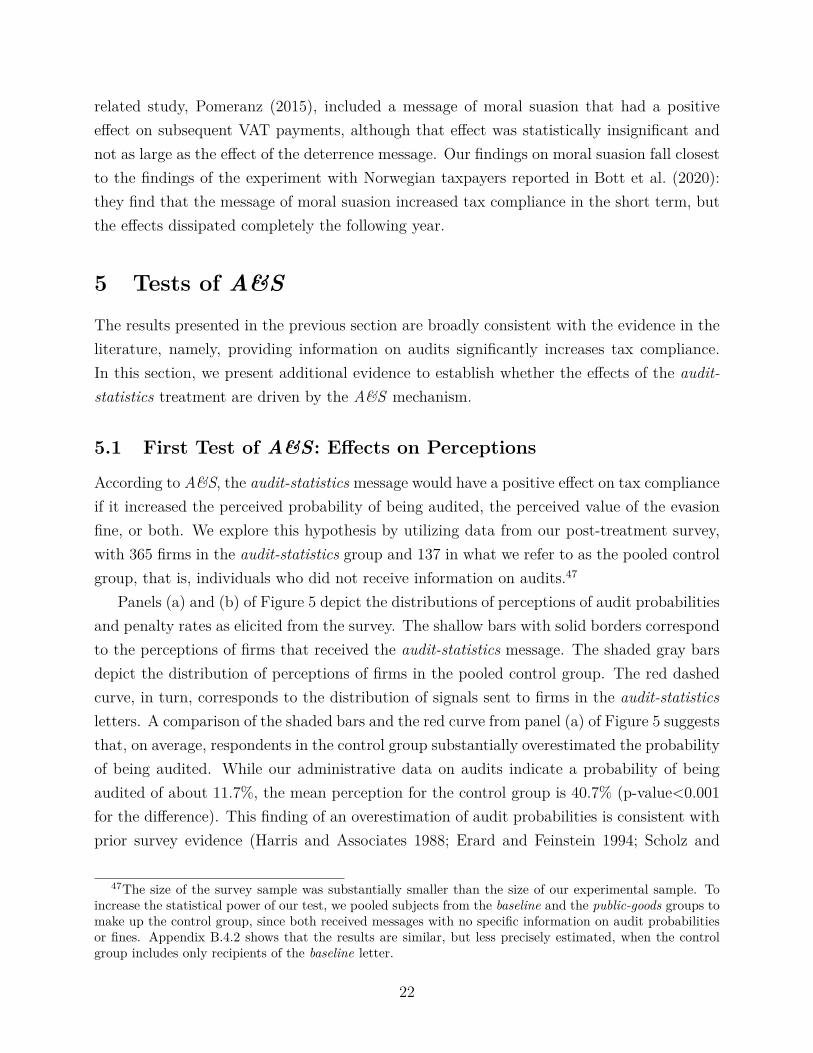
According to A&S, the audit-statistics message would have a positive effect on tax complianceif it increased the perceived probability of being audited, the perceived value of the evasionfine, or both. We explore this hypothesis by utilizing data from our post-treatment survey,with 365 firms in the audit-statistics group and 137 in what we refer to as the pooled controlgroup, that is, individuals who did not receive information on audits.47
Panels (a) and (b) of Figure 5 depict the distributions of perceptions of audit probabilitiesand penalty rates as elicited from the survey. The shallow bars with solid borders correspondto the perceptions of firms that received the audit-statistics message. The shaded gray barsdepict the distribution of perceptions of firms in the pooled control group. The red dashedcurve, in turn, corresponds to the distribution of signals sent to firms in the audit-statisticsletters. A comparison of the shaded bars and the red curve from panel (a) of Figure 5 suggeststhat, on average, respondents in the control group substantially overestimated the probabilityof being audited. While our administrative data on audits indicate a probability of beingaudited of about 11.7%, the mean perception for the control group is 40.7% (p-value<0.001for the difference). This finding of an overestimation of audit probabilities is consistent withprior survey evidence (Harris and Associates 1988; Erard and Feinstein 1994; Scholz and
47The size of the survey sample was substantially smaller than the size of our experimental sample. Toincrease the statistical power of our test, we pooled subjects from the baseline and the public-goods groups tomake up the control group, since both received messages with no specific information on audit probabilitiesor fines. Appendix B.4.2 shows that the results are similar, but less precisely estimated, when the controlgroup includes only recipients of the baseline letter.
22

Pinney 1995).48 A comparison of the shaded bars and the red curve from panel (b) of Figure5, meanwhile, suggests that the average belief about the penalty rates was unbiased: theactual average penalty computed from administrative data for the experimental sample is30.6%, while the mean perceived penalty for in the control group is 30.5%.
The positive bias in the perceived audit probability could be explained by the availabilityheuristic bias (Kahneman and Tversky, 1974), according to which individuals judge theprobability of an event on the basis of how easily they recall instances of it happening. Eventhough audits are rare, their likely salience in memory or frequent discussion by colleaguesand the media may induce firms to perceive them as more frequent than they actually are.Indeed, there is evidence that individuals overestimate the probabilities of a wide range ofrare events of a similar nature (probabilities of dying in a terrorist attack or in an airplaneaccident (Lichtenstein et al., 1978; Kahneman et al., 1982)).
The survey data indicate that the effects of the audit-statistics message are inconsistentwith the A&S predictions. According to A&S, if taxpayers overestimate the audit proba-bilities on average, the audit-statistics message would have reduced average tax compliance.The results presented in the previous section show that, on the contrary, the audit-statisticsmessage increased average compliance.49 To bolster this argument, we show that the audit-statistics letter did indeed have a negative effect on perceived audit probability.50 The shallowbars with solid borders in panel (a) of Figure 5 show the distribution of perceptions for re-spondents who received the audit-statistics letter. An inspection of panel (a) of Figure 5indicates that recipients of the audit-statistics letter reported a lower perceived probabilityof being audited, from an average of 40.7% in the pooled control group to an average of 35.2%in the audit-statistics group (p-value of the difference 0.03).51 The mechanisms behind theaudit-statistics message are relevant to the interpretation of the audit-endogeneity message:subjects may have learned that the audits are endogenous through the audit-endogeneity
48The prior survey evidence was based on responses from wage earners, however, for whom misperceptionof audit probabilities is largely inconsequential due to widespread third-party reporting (Kleven et al., 2011).On the contrary, the financial stakes of misperceiving audit probabilities can be substantial in our context.
49One caveat of the test presented in this section, and for the test presented in the section below, isthat we are estimating the effects on the average firm. The fact that the average firm does not behave asA&S predicts does not imply that none of the firms do. It is possible, for instance, that some firms alteredtheir perceived probability upward because of the information contained in the letter and increased their taxpayments as a consequence. The fact that the average effects are so far from the A&S prediction suggests,however, that the firms behaving as A&S predicted must have been a minority at most.
50One caveat here: a reduction in the self-reported probability of being audited could be caused by anincrease in tax compliance due to the endogenous nature of p with respect to tax evasion.
51Panel (b) of Figure 5 shows that the audit-statistics message had a small effect on the perceived penaltyrate, decreasing it from an average of 30.5% for the pooled control group to an average of 29.9% for theaudit-statistics group. The difference is statistically insignificant (p-value of 0.82). For more details, seeAppendix B.4.3.
23

message and re-optimized their tax evasion accordingly; or they could have had a knee-jerkreaction to any information about audits, even if they were already aware of the endogene-ity component. Consistent with the evidence on the audit-statistics message, we find thatthe effect of the audit-endogeneity message was probably not due to a change in recipients’beliefs: recipients were already aware of the endogeneity.
5.1.1 Concerns with Survey Data
This first test relies on survey data, and as such it faces some challenges common to this typeof data. In this section, we discuss and address some of those challenges.
One potential concern is that the responses on audit probabilities and penalty rates mostlyreflect measurement errors because the questions were not incentivized. There are severalpieces of evidence suggesting otherwise. First, the fact that the survey beliefs changed de-pending on the information provided in the letters suggests that these responses containedsome truthful information. Second, while there is a large positive bias in the perception ofaudit probabilities, the average perception of the penalty rate (30.5%) is extremely close tothe actual probability computed from administrative data (30.6%). The fact that belief andreality line up to such an extent suggests that individuals responded honestly and thought-fully. Furthermore, individuals were better informed about penalty rates than about auditprobabilities, which is also consistent with the fact that there is more readily available infor-mation about penalty rates: audits are relatively rare events, and their probabilities are notadvertised, whereas evasion penalties are more widely broadcast by the tax agency.
Another potential issue is that respondents were aware that they were misinformed andwould never have acted on their biased beliefs. Our survey data provide evidence to thecontrary. Even though their estimates were substantially off, survey participants reportedbeing confident of their responses. For example, only 16.2% of those in the control groupreported being “Not at all sure” about their perceived probability of audit (on a four-pointscale, ranging from “Not at all sure” to “Very sure”); a similar share (18.1%) reported being“Not sure at all” about their guess of the penalty rate. Even for the subgroup of individualsin the control group who reported being “Very sure” of the audit probability, their averagebelief was, if anything, slightly more biased: they reported a perceived audit probability of45.7%, which is still substantially higher than the actual probability of 11.7%.
Another concern is that our subjects may have been confused about the questions; perhapsthey did not understand the definition of an “audit.” Of the 137 responses from the pooledcontrol group, 10.2% of firms reported having been audited in the past three years. Thisshare (10.2%) is close to the actual share of firms that were audited (11.7%), thus suggestingthat respondents correctly understood the definition of an audit. Moreover, if firms use their
24

own audit history to form their beliefs about audit probabilities, the ones that had beenaudited recently should report a higher perceived probability. Indeed, we found that to be thecase: firms that had recently been audited reported a substantially higher average perceivedprobability of being audited in the future (63.9%) than firms that had not been auditedrecently (38.1% – p-value of the difference<0.001). Subjects could, conceivably, have cognitivelimitations when responding to questions about percentages and probabilities. That would bea minor concern in our subject pool, since it is comprised of business owners likely familiarwith fractions and probabilities. While no verifying administrative data is available, theanecdotal evidence indicates that our sample is a highly educated subgroup of the population.After all, these business owners need, at the very least, some rudimentary arithmetic skillsand understanding of percentages to compute the VAT and other tax liabilities.
Another potential concern is that respondents report a probability of 50% as a way ofexpressing uncertainty (Bruine de Bruin et al., 2002; Bruine de Bruin and Carman, 2012).Responses of exactly 50% are somewhat common in our data: among individuals in thepooled control group, 41.61% of responses about perceived audit probability and 13.5% aboutpenalty rate are equal to exactly 50%. Our data indicate, however, that most of theseresponses of exactly 50% are not a product of uncertainty: individuals who provided ananswer of 50% are somewhat, but not dramatically, less certain of their responses thanindividuals who provided answers different from 50%.52 Moreover, even if we ignored the50% responses, the main result would still be robust: individuals in the control group stillsubstantially overestimate the probability of being audited (average perception of 34.1%,compared to the actual probability of 11.7%).53
As an additional validation of the survey data, we can measure the effect of the signalson p and θ from the audit-statistics sub-treatments, though this exercise is limited due tothe small sample size (we only have 365 survey responses in the audit-statistics group). Withthat caveat in mind, the survey data suggest that a percentage point increase in the signalon audit probability in the letter increased the perceived audit probability nine months laterby 0.397 (SE 0.288) percentage points.54 While imprecisely estimated and thus statisticallyinsignificant at conventional levels, the magnitude of this belief updating is consistent withthe findings from other information-provision experiments (see Section 5.2.1 below for a moredetailed discussion). The true effects of the signals in the letter on beliefs were probably
52In the pooled control group, the average certainty of perceived audit probability is 2.03 (in the 1-4 scalefrom “Not at all sure” (1) to “Very sure” (4)) for individuals who responded with a value of exactly 50%, and2.37 for individuals who responded with a different value (p-value of difference<0.001). For responses aboutperceived penalty rate, the average certainty is 2.11 for individuals who responded with 50%, and 2.51 forthose who responded with another value (p-value of difference=0.001).
53For more details, see Appendix B.4.2.54For more details, see Appendix B.4.4.
25
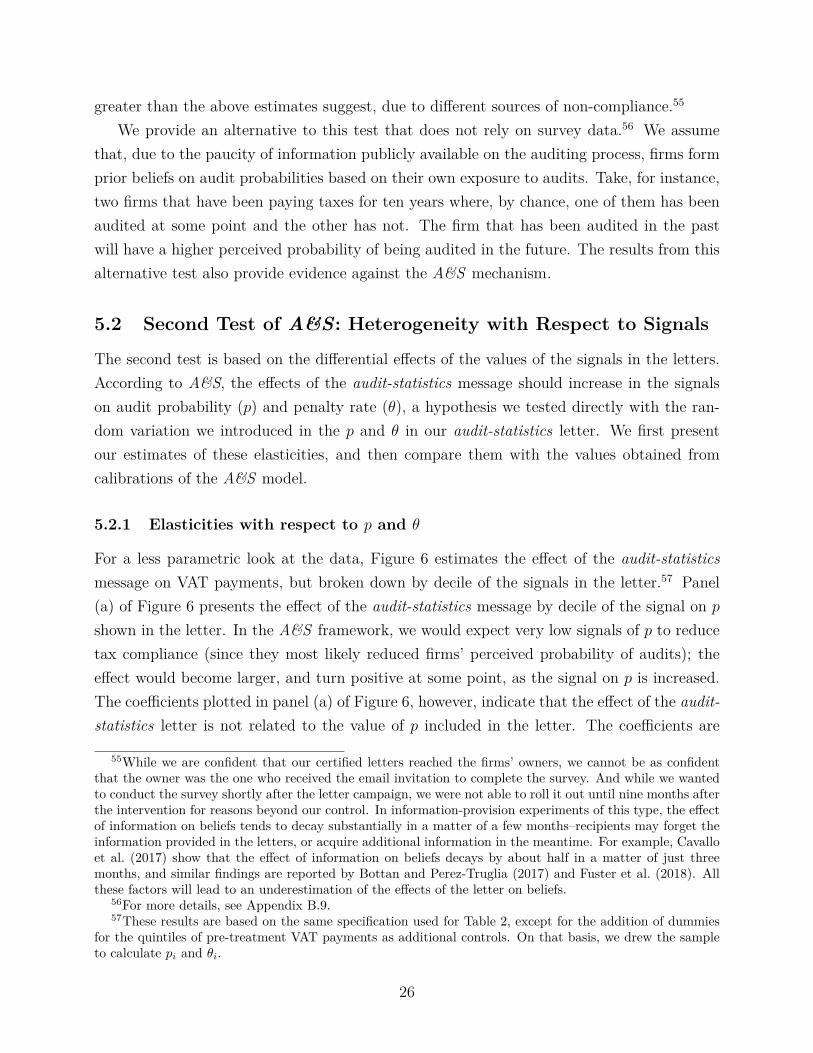
greater than the above estimates suggest, due to different sources of non-compliance.55
We provide an alternative to this test that does not rely on survey data.56 We assumethat, due to the paucity of information publicly available on the auditing process, firms formprior beliefs on audit probabilities based on their own exposure to audits. Take, for instance,two firms that have been paying taxes for ten years where, by chance, one of them has beenaudited at some point and the other has not. The firm that has been audited in the pastwill have a higher perceived probability of being audited in the future. The results from thisalternative test also provide evidence against the A&S mechanism.
5.2 Second Test of A&S: Heterogeneity with Respect to Signals
The second test is based on the differential effects of the values of the signals in the letters.According to A&S, the effects of the audit-statistics message should increase in the signalson audit probability (p) and penalty rate (θ), a hypothesis we tested directly with the ran-dom variation we introduced in the p and θ in our audit-statistics letter. We first presentour estimates of these elasticities, and then compare them with the values obtained fromcalibrations of the A&S model.
5.2.1 Elasticities with respect to p and θ
For a less parametric look at the data, Figure 6 estimates the effect of the audit-statisticsmessage on VAT payments, but broken down by decile of the signals in the letter.57 Panel(a) of Figure 6 presents the effect of the audit-statistics message by decile of the signal on pshown in the letter. In the A&S framework, we would expect very low signals of p to reducetax compliance (since they most likely reduced firms’ perceived probability of audits); theeffect would become larger, and turn positive at some point, as the signal on p is increased.The coefficients plotted in panel (a) of Figure 6, however, indicate that the effect of the audit-statistics letter is not related to the value of p included in the letter. The coefficients are
55While we are confident that our certified letters reached the firms’ owners, we cannot be as confidentthat the owner was the one who received the email invitation to complete the survey. And while we wantedto conduct the survey shortly after the letter campaign, we were not able to roll it out until nine months afterthe intervention for reasons beyond our control. In information-provision experiments of this type, the effectof information on beliefs tends to decay substantially in a matter of a few months–recipients may forget theinformation provided in the letters, or acquire additional information in the meantime. For example, Cavalloet al. (2017) show that the effect of information on beliefs decays by about half in a matter of just threemonths, and similar findings are reported by Bottan and Perez-Truglia (2017) and Fuster et al. (2018). Allthese factors will lead to an underestimation of the effects of the letter on beliefs.
56For more details, see Appendix B.9.57These results are based on the same specification used for Table 2, except for the addition of dummies
for the quintiles of pre-treatment VAT payments as additional controls. On that basis, we drew the sampleto calculate pi and θi.
26
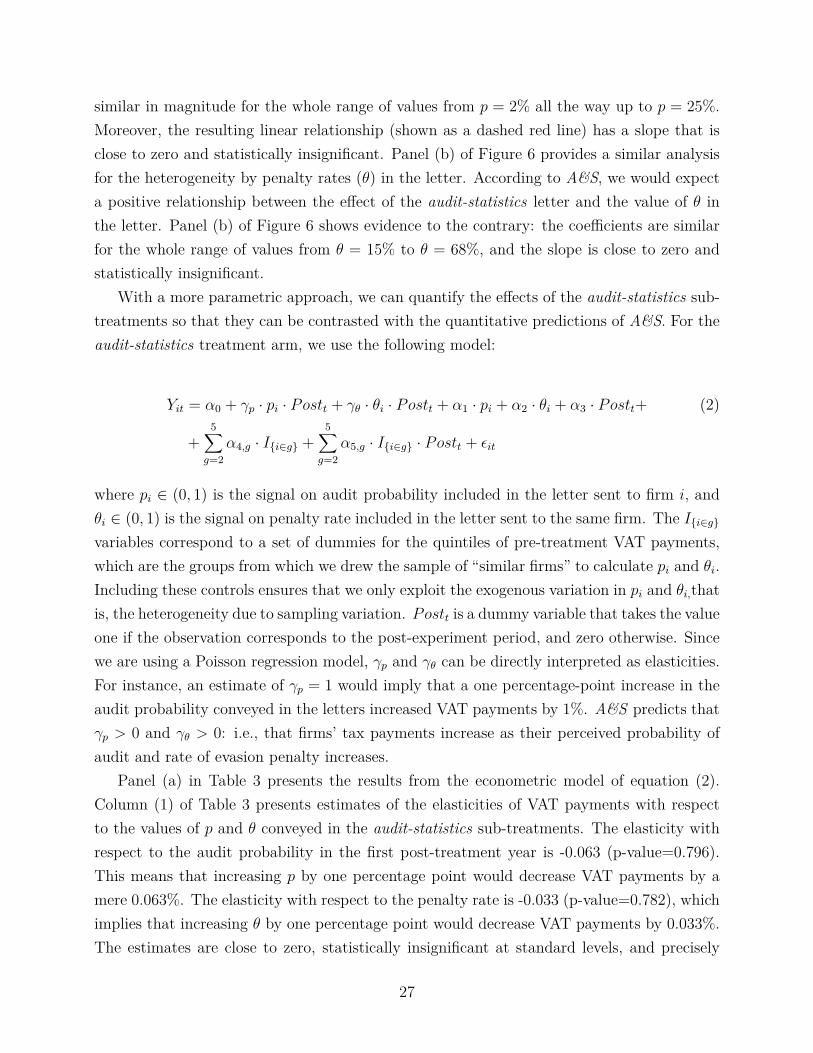
similar in magnitude for the whole range of values from p = 2% all the way up to p = 25%.Moreover, the resulting linear relationship (shown as a dashed red line) has a slope that isclose to zero and statistically insignificant. Panel (b) of Figure 6 provides a similar analysisfor the heterogeneity by penalty rates (θ) in the letter. According to A&S, we would expecta positive relationship between the effect of the audit-statistics letter and the value of θ inthe letter. Panel (b) of Figure 6 shows evidence to the contrary: the coefficients are similarfor the whole range of values from θ = 15% to θ = 68%, and the slope is close to zero andstatistically insignificant.
With a more parametric approach, we can quantify the effects of the audit-statistics sub-treatments so that they can be contrasted with the quantitative predictions of A&S. For theaudit-statistics treatment arm, we use the following model:
Yit = α0 + γp · pi · Postt + γθ · θi · Postt + α1 · pi + α2 · θi + α3 · Postt+ (2)
+5∑g=2
α4,g · I{i∈g} +5∑g=2
α5,g · I{i∈g} · Postt + εit
where pi ∈ (0, 1) is the signal on audit probability included in the letter sent to firm i, andθi ∈ (0, 1) is the signal on penalty rate included in the letter sent to the same firm. The I{i∈g}variables correspond to a set of dummies for the quintiles of pre-treatment VAT payments,which are the groups from which we drew the sample of “similar firms” to calculate pi and θi.Including these controls ensures that we only exploit the exogenous variation in pi and θi,thatis, the heterogeneity due to sampling variation. Postt is a dummy variable that takes the valueone if the observation corresponds to the post-experiment period, and zero otherwise. Sincewe are using a Poisson regression model, γp and γθ can be directly interpreted as elasticities.For instance, an estimate of γp = 1 would imply that a one percentage-point increase in theaudit probability conveyed in the letters increased VAT payments by 1%. A&S predicts thatγp > 0 and γθ > 0: i.e., that firms’ tax payments increase as their perceived probability ofaudit and rate of evasion penalty increases.
Panel (a) in Table 3 presents the results from the econometric model of equation (2).Column (1) of Table 3 presents estimates of the elasticities of VAT payments with respectto the values of p and θ conveyed in the audit-statistics sub-treatments. The elasticity withrespect to the audit probability in the first post-treatment year is -0.063 (p-value=0.796).This means that increasing p by one percentage point would decrease VAT payments by amere 0.063%. The elasticity with respect to the penalty rate is -0.033 (p-value=0.782), whichimplies that increasing θ by one percentage point would decrease VAT payments by 0.033%.The estimates are close to zero, statistically insignificant at standard levels, and precisely
27
estimated. The degree of precision means that we can rule out even moderate elasticities:the 95% confidence interval for the audit probability excludes elasticities above 0.411, andthe 95% confidence interval for the penalty rate excludes elasticities above 0.198.
Significantly, the pre-treatment falsification test does not yield any statistically significanteffects, and the results are similar for the other specifications, for examaple, for the secondpost-treatment year (column (2)), by payment timing (columns (3) and (4)), and by type oftax (columns (5) and (6)). The estimates in all cases are close to zero, precisely estimated,and statistically insignificant.
One potential confounding factor for the lack of heterogeneity in signals on p and θ isthat some subjects might have interpreted the audit-statistics message per se as a signal thattheir firms were on the IRS’s radar, above and beyond the factual information conveyed inthe message. We were careful to mitigate this concern in the design of our mailings by, forinstance, underscoring in the letter that its recipients were randomly selected. Neverthe-less, some individuals may have ignored or overlooked this cue. While recipients may havelearned–or thought they learned–something from the receipt of the audit-statistics message,there is no reason why they could not also learn from the content of the message. In otherwords, the test presented above continues to be valid, and A&S would still predict that theaudit-statistics message have a differential effect depending on the values of p and θ.
To address this concern more directly, we use the audit-threat treatment arm, where anexplicit threat from the tax agency was made to every recipient. Panel (d) of Figure 4 depictsthe difference in the evolution of VAT payments over time between the two sub-treatments inthe audit-threat arm, corresponding to audit probabilities of 50% and 25%. We find almostno systematic difference between the two groups in post-treatment VAT payments. We canperform a more parametric test based on an econometric model similar to the one in equation(2) for firms assigned to the audit-threat letter:
Yit = α + τp · pi + δ · Postt + γp (pi · Postt) + εit (3)
where pi ∈ {0.25, 0.50} is the audit probability in the audit-threat letter sent to firm i. Again,A&S predicts γp > 0. The results are presented in panel (b) of Table 3. While the estimatedcoefficient based on audit-threat messages implies an elasticity of 0.217 with respect to p inthe first year post-treatment, this estimate is economically small and statistically insignificant(p-value=0.128). Taking into account precision and power concerns, the evidence from panel(d) of Figure 4 and panel (b) of Table 3 further reinforces our result. Contrary to A&Spredictions, tax compliance does not seem to depend on the probability of being audited,even when there is a direct and credible threat of an audit, rather than simply informationon audit probabilities.
28

The evidence is robust, then, that firms did not react to the values of p and θ shown inour letters.58 Since a large portion of our subject pool was assigned this treatment arm, theseelasticities are precisely estimated. It is not clear, however, whether the estimates are smallenough, and precisely estimated enough, to rule out the values of the elasticities predictedby A&S. We address this question below.
5.2.2 A&S Calibration
For a quantitative test of A&S, we need quantitative predictions from A&S. In this section, wepresent results from different calibrations of the model and compare them to the experimentalresults in the following section.
Let Y be the total value-added amount and let τ = 0.22 be the value added tax rate.Let E be the amount to be underreported (so τ · E is the amount evaded). Each firm has autility from income given by a Constant Relative Risk Aversion (CRRA) utility function withrisk parameter σ. Let p be the probability that the tax return for a given year be auditedsometime in the future, and θ the penalty rate applied over the amount evaded when caught(both of these parameters are defined as in the audit-statistics treatment).
Given any reasonable value for the CRRA parameter, the basic A&S model predicts100% evasion. As a result, we need to use one of the extensions discussed in the literatureto accommodate the 26% evasion rate observed in practice (as estimated by Gomez-Sabainiand Jimenez, 2012). We consider the following extensions: endogenous audit probabilities(Allingham and Sandmo, 1972; Yitzhaki, 1987), third-party reporting and whistle-blowing(Acemoglu and Jackson, 2017), misperceptions of audit parameters (Alm et al., 1992), andsocial preferences (Luttmer and Singhal, 2014).
The probability of being audited can be broken down as p = p0 + p1EY.59 The parameter
p1 > 0 represents the endogeneity of the audit process, whereby firms that evade more aremore likely to be audited (in the original A&S model, the audit probability is exogenous sop1 = 0). Firms can be caught evading by some non-audit technology such as third-partyreporting or whistle-blowing. We represent this with an effective probability of being caughtof p+ ε, where the parameter epsilon represents the additional monitoring tool. To allow formisperceptions, we can calibrate p and θ to the average perceptions reported in the survey
58See Appendix B.6.2 for a series of robustness checks (alternative specifications based on OLS, Tobit andProbit models, and using an alternative data source for the dependent variable), all of which yielded similarresults. An additional robustness check, presented in the same Appendix, shows that results are robust if,instead of estimating elasticities with respect to p and θ separately, we estimate elasticity with respect top ∗ θ (i.e., the expected penalty per dollar evaded).
59We assume that, when an audit occurs, all evasion is detected. In practice, that probability may besmaller than one, which would only make the A&S result more puzzling: firms should be even less worriedabout being audited.
29

rather than the values calculated on the basis of the tax agency’s administrative records. Toallow for social preferences, we assume that individuals get some direct utility from payingtaxes, and that that utility is equal to the fraction α of the amount paid. This socialresponsibility parameter α can take values from zero to one, where a higher value denotes agreater sense of social responsibility (in the original A&S, α = 0).
The optimal evasion choice is given by maximizing the expected utility:
maxE∈[0,Y ]
1− p(EY
)− ε
1− σ(Y − ατ(Y − E)
)1−σ+p(EY
)+ ε
1− σ(Y − ατ(Y − E)− (1 + θ)τE
)1−σ(4)
Given a set of parameters, it is straightforward to find the optimal value of E that solves thismaximization problem.60 Table 4 presents the calibration results; each row corresponds toa different calibration of A&S. The first seven columns correspond to the parameter values,while the last three indicate the corresponding predictions: E
Yis the evasion rate, ∂log(τ(Y−E))
∂p
is the elasticity with respect to the audit probability, and ∂log(τ(Y−E))∂θ
is the elasticity withrespect to the penalty rate.61
All the parameters are calibrated so that the predictions always match the average evasionrate (E
Y) of 26% (Gomez-Sabaini and Jimenez, 2012). In the first row, we assume a CRRA of
4 and set the audit probability and penalty rates at the rates estimated from administrativerecords (p0 = 0.117 and θ = 0.306). To match the 26% evasion rate, we allow for a non-auditdetection rate of ε = 0.575. The resulting elasticity is 4.516 with respect to p and 3.434 withrespect to θ. This is the simplest extension to the A&S model, and given that its predictionsare in the middle range of all our calibrations, it is our preferred specification. The remainingrows present results with alternative calibrations of the model. Even though the models arequite different, the predicted elasticities are in the same order of magnitude as our preferredspecification.
In the second row, instead of accommodating the evasion rate of 26% by introducing thenon-audit detection rate, we assume a social responsibility parameter of α = 0.202. Whilethis different approach yields different predicted elasticities, they are in the same order ofmagnitude: the elasticity with respect to the audit probability is 9.116, and the elasticitywith respect to the penalty rate is 1.207. The specification in the third row is similar to theone in the second row, but it is augmented by allowing for an endogenous audit probability.We let p0 = p1 = 0.0896, which accommodates two important features of audit probabilities:the effective audit probability turns out to be equal to the observed average probability of
60For more details, see Appendix C.61These two elasticities are defined exactly as in the econometric model from equations (2) and (3) to
facilitate the comparison of the regression results and the calibrations.
30
11.7% and, consistent with the content of the audit-endogeneity message, a firm that doesnot evade taxes (E
Y= 0) would double its audit probability if it decided to evade taxes
(EY
= 1). Since this endogeneity parameter is not, on its own, enough to match the observedevasion rate, we again rely on the social responsibility parameter by setting α = 0.2296. Thisspecification shows that introducing endogeneity to the audit probabilities barely changeselasticity with respect to the audit probability (it is 3.324, similar to the 4.516 from the firstspecification), but it does substantially reduce elasticity with respect to the penalty rate (to0.589). The fourth row follows a similar specification as the second row, but is extendedby allowing individuals to have biased perceptions of the audits: p0 = 0.407 and θ = 0.305.These biases would not, on their own, be enough to match the observed evasion rate, so weset the social responsibility parameter to α = 0.643. The elasticities yielded are, once again,of the same order of magnitude as with the other specifications: the elasticity is 3.889 withrespect to audit probability and 1.763 with respect to the penalty rate. The specifications inthe second set of four rows are identical to the ones in the first set of four rows, except theassumption of a CRRA of 2 instead of 4. The results indicate that assuming a lower level ofrisk aversion leads to elasticities that are even larger in magnitude.
5.2.3 Comparison of Experimental Results and the A&S Calibration
We can test the null hypothesis that the elasticities for p and θ in the main specification ofthe audit-statistics presented in column (1) of Table 3 (γp = −0.063 and γθ = −0.033) areequal to the elasticities in our preferred A&S calibration. We can reject the null hypothesisthat the elasticity is 4.516 for the audit probability and 3.434 for the penalty rate (bothtests with p-values<0.001). In other words, the calibrated elasticities (4.516 for the auditprobability and 3.434 for the penalty rate) far exceed the 95% confidence bands for theestimated elasticities ([−0.536, 0.411] and γθ [−0.264, 0.198], respectively).
One potential concern with the above comparison is the implicit assumption that a letterconveying the message of a one percentage point higher signal of p or θ will increase therecipient’s perception of the parameter by one percentage point–and that is a lot to assume:some taxpayers may not have adjusted their prior belief all the way to the signal, and othertaxpayers may not have even read the letter in the first place. As a benchmark, we can use theestimates from related studies that measure how individuals learn about economic variablessuch as the inflation rate (Cavallo et al., 2017), cost of living (Bottan and Perez-Truglia,2017), and housing prices (Fuster et al., 2018). These studies find that for each percentage-point increase in the feedback given to subjects, the average individual alters their beliefsby about half a percentage point. If we assume this rate of learning, we should double theelasticities estimated in our regressions before comparing them to the calibrations of A&S.
31

Even under this assumption, we could still confidently reject the null hypothesis that theestimated elasticities are equal to the calibrated elasticities (p-values<0.001 for both γp andγθ).
The effect of the differential values of p and θ on the audit-statistics treatments, presentedin Section 5.1 above, can provide a direct estimate of the learning rate in our context. Thesurvey data suggest that a one percentage-point increase in the signal on audit probabilityin the letter increased the perceived audit probability nine months later by 0.397 percentagepoints (SE 0.288). Even if it is imprecisely estimated and thus statistically insignificant atconventional levels, this point estimate suggests a learning rate consistent with other studiesof learning, which is reassuring. Moreover, because of multiple sources of noncompliance,that rate is probably less than the true learning rate.62 We can, furthermore, reproduce theanalysis with an extremely conservative assumption on the magnitude of the learning rate:even if we assumed that for each percentage-point difference in the letter individuals adjustedtheir beliefs by only one tenth of a percentage point, the null hypothesis that the estimatedelasticities are equal to those in the A&S calibration (p-values of 0.033 and 0.002 for auditprobability and for penalty rate, respectively) could be rejected.
5.2.4 Comparison to Related Studies
We can also compare our estimated elasticities to those from related studies. In some research,laboratory experiments are used to study tax evasion. These experiments often randomizethe probability of being audited by experimenter and penalties involved. Consistent withour results, those laboratory studies find evidence of probability neglect. For example, Almet al. (1992) find an elasticity of 0.169 with respect to audit probability (comparable to ourestimate of -0.063), and an elasticity of 0.037 with respect to penalty rate (comparable toour estimate of -0.033). Indeed, these elasticities are statistically indistinguishable from theones obtained in our study (p-values of the differences are 0.338 and 0.555 respectively).
We also compare our findings to the results of a couple of related field experiments.Dwenger et al. (2016) conducted a field experiment in the context of a local church tax inGermany for which enforcement was extremely lax. While this experiment was not designedto test the A&S model, it did include one treatment arm where the message mentioned differ-ent audit probabilities (p = 0.1, p = 0.2, or p = 0.5). The results are qualitatively consistentwith our finding of probability neglect: the effects of all these probability messages are statis-tically indistinguishable from each other. Another related experiment, Kleven et al. (2011),included a treatment arm with two different audit probabilities. Consistent with our results,it finds rates of tax compliance between individuals assigned to different audit probabilities
62For a discussion of the sources of noncompliance, see footnote 55.
32
to be negligible in magnitude.63 The evidence from Kleven et al. (2011), however, wouldbe consistent with A&S because their subjects face automatic third-party reporting, whichour subjects do not. The authors conducted their experiment with wage earners in a coun-try where tax evasion is automatically detected through third-party reporting, regardless ofaudits. As a result, A&S predicts that, consistent with their evidence, wage earners wouldreport their earnings truthfully regardless of probability of being audited.
6 Discussion: Risk-as-Feelings
In this section, we summarize our findings and discuss their potential interpretations andimplications.
We present three main findings. First, we documented increased compliance: onaverage, the audit-statistics message had a positive effect on tax compliance. Second, we re-ported reduced subjective probability: on average, the audit-statistics message decreasedthe perceived probability of being audited. Third, we documented probability neglect: theeffect of the audit-statistics message did not depend on the audit probability conveyed in theletter or on the firm’s prior belief about that probability. Jointly, these three findings areinconsistent with the A&S predictions. But the question of what framework might providea better fit for these results remains unanswered.
One natural candidate is salience (Chetty et al., 2009): firms may behave as if the prob-ability of detection and the penalty rate were zero unless those parameters are made salientto them. This explanation could reconcile the findings of increased compliance and reducedperceived audit probability: even if firms who were sent the messages adjusted downwardtheir perceived probability of audit, they would have behaved as if that probability werezero had they not received those signals. However, the salience model fails to explain otherfeatures of our findings. First, salience effects are by definition short-lived. A reminder ofa non-salient tax should only affect the behavior of an agent at the time the informationis received, not days or months later. Effectively, salience models predict a rapid decay ofthe effect of information, which contradicts our evidence that the audit-statistics letter hadeffects that persisted months after the information was transmitted.64 The salience model is
63In one of their treatments, they send letters to individuals stating audit probabilities as high as p = 50%and p = 100%. Compared with a group that did not receive any letter, they find that the letters hada positive and significant effect on declared income and tax liability. While statistically significant, thedifferential effect between these two groups is economically negligible: an increase from 50% to 100% in thesignal on the probability of audit increases reported income by 0.025% and taxes paid by 0.05%.
64The informational treatment may increase salience and cause an instantaneous effect with lasting con-sequences if, for instance, it induces a change in the way the firm deals with evasion in transactions. Sucha change would imply a constant effect over time, however, and we find a substantial decline in evasion over
33
also inconsistent with our finding of probability neglect: according to that model, the effectof making salient a high audit probability should be greater than the effect of making salienta low audit probability.65
A second explanation would be agency issues at the firm if, say, the person who receivedthe letter was not the person who decided how much tax to evade. This type of agencyissue would generate insensitivity to the information received (or, at least, an attenuationeffect). We find, however, that firms do react to the information received, just not in thedirection predicted by A&S (i.e., information on low audit probabilities reduces, rather thanincreases, evasion). Moreover, agency and information frictions should be weaker in smallerfirms, and the firms in our experimental sample are small: over 75% of firms in our samplehave five or fewer employees.66 Moreover, the heterogeneity analysis indicates no substantialor statistically significant difference between firms below and above the median number ofemployees (one to three employees versus the rest), which further reinforces the point thatagency issues are not a decisive factor in our context.67
Our preferred interpretation is based on the model of risk-as-feelings (Loewenstein et al.,2001). The traditional economic models used for choice under uncertainty are cognitive inthat agents make decisions using some sort of expectation-based calculus. The risk-as-feelingsmodel proposes that responses to fearsome situations may differ substantially from cognitiveevaluations of the same situations (Loewenstein and Lerner, 2003).68 When fear is involved,agents tend to neglect the cost-benefit calculus and instead have quick, automatic, and intu-itive responses to risk. A key prediction of this model is that feelings about risk are largelyinsensitive to changes in probability, in what the literature calls probability neglect (Sunstein,2002; Zeckhauser and Sunstein, 2010). According to this model, the emotional response torisk makes individuals ignore the underlying likelihoods. There is evidence of probability ne-glect in a range of fearsome situations involving electric shocks, arsenic, abandoned hazardouswaste dumps, pesticides, and anthrax (Sunstein, 2003; Zeckhauser and Sunstein, 2010).
This risk-as-feelings model can reconcile our three key findings, namely increased compli-
the year following the intervention.65Another pertinent model from behavioral economics is prospect theory (Kahneman and Tversky, 1979;
see, for example, Dhami and al Nowaihi, 2007). This model, however, is unlikely to explain our findingson, for instance, probability neglect: although differences between extremely low probabilities can be ignoredunder prospect theory, the range of probabilities in our context (e.g., in the audit-threat arm, the probabilitieswere 25% versus 50%) was far higher than what is normally considered extremely low in prospect theory.
66More precisely, 29.1% of the firms have a single employee, 46.2% have between two and five employees,and 15% have between six and ten employees.
67See Appendix B.8.68A related concept, the affect heuristic, corresponds to quick, automatic, and intuitive evaluations of
risky situations based on emotions, which might be used as a shortcut for more complex evaluations of risk(Slovic et al., 2004). Borrowing Kahneman’s (2003) terminology for the dual system model of the humanmind, emotions might influence the intuitive system.
34

ance and reduced subjective probability: even if the perceived probability of audit decreasedamong the treated subjects, they may nonetheless be scared into paying more taxes becausethey did not rely on cognitive evaluations of probabilities. The risk-as-feelings model predictsprobability neglect and thus fits our third finding too.
The risk-as-feeling model suggests that taxpayers overreact to the threat of audits.69
This interpretation can explain the paradox that, despite low audit probabilities and penaltyrates, most taxpayers report the threat of audits as a major reason for reporting taxableincome truthfully. For example, a survey by the United States Internal Revenue Service(2018) indicates that 61% of U.S. taxpayers claim that a “fear of audits” exerts a significantinfluence on their tax compliance decisions.70 In comparison, audits are perceived as a stronga deterrent as third-party reporting: 66% of respondents identified “third-party reporting(e.g., wages, interest, dividends)” as an important factor for tax compliance. Moreover,there is some direct evidence that, consistent with the risk-as-feelings model, taxpayers havean emotional reaction to the thought of tax audits and the tax authority more generally.Some of the evidence comes from laboratory experiments. Coricelli et al. (2010), for instance,conducted a tax evasion game in the laboratory and measured how emotional arousal affectedtax evasion decisions. They showed that the intensity of emotional arousal predicts whetherand how much individuals evade. In a related laboratory study, Dulleck et al. (2016) showed asignificant correlation between tax compliance and physiological markers of stress in makingdecisions about tax filing. Fear of tax audits can also be found in the media. For example, aWashington Post (2016) article claims that “a lot of people are super scared of the InternalRevenue Service” and that its powers “can instill a lot of fear.” The New York Times (2009)reported cases where fear of the tax authority is strong enough to be considered a phobia.
In other areas of public policy, the risk-as-feelings heuristic can be a problem. It dis-torts facts and leads to irrational judgment, which results in suboptimal decisions from apure risk-assessment perspective. Zeckhauser and Sunstein (2010) and others discuss casesinvolving regulation of nuclear power, vaccines, and other heated emotional issues. When itcomes to tax collection, such behavioral biases might have positive implications for the taxauthority’s goals. Indeed, there is anecdotal evidence that tax authorities use fear tactics tofoster tax compliance. In the United States, for example, a disproportionately large numberof tax enforcement press releases covering criminal convictions and civil injunctions are re-
69This excessive caution has been documented in other contexts (Loewenstein et al., 2001). A fear of ter-rorist attacks, for instance, can make people choose not to take airplanes but, rather, other, more dangerous,forms of transport; and a fear of shark attacks can lead to unnecessary legislation (Sunstein, 2002, 2003;Zeckhauser and Sunstein, 2010).
70More precisely, 32% of respondents claim that a “fear of audits” exerts “a great deal of an influence,”and 29% “somewhat of an influence” on whether they honestly report and pay their taxes.
35

leased during the weeks immediately preceding Tax Day, presumably to scare taxpayers intopreparing compliant returns (Morse, 2009; Blank and Levin, 2010). Some tax experts evenclaim that the IRS “likes [targeting] celebrities because they get the most bang for their buckin terms of publicity” to “scare the public into complying” (Forbes, 2008).
The risk-as-feelings framework indicates that vivid imagery can be used to instill fear andbiased risk evaluations (Slovic et al., 2004; Zeckhauser and Sunstein, 2010). Coincidentally,tax agencies seem to resort to vivid images in some of their advertising campaigns. A TVadvertisement in the United States showed the IRS as “something like poltergeist coming outof a TV set and the world falling apart,” followed by the phrase, “Have you filed your incometax?” (United Press International, 1988) The U.K. tax agency used advertisement campaignsthat also rely on frightening imagery. One poster features a pair of eyes peeking threateninglythrough a gash in a piece of paper that reads, “If you’ve declared all your income, you havenothing to fear.”71 This anecdotal evidence suggests that some tax administrations may beleveraging fear to help in collecting taxes.72
7 Conclusions
The canonical model Allingham and Sandmo (1972) predicts that firms evade taxes by makingoptimal trade-offs on the costs and benefits of evasion. It is unclear, however, whetherreal-world firms react to audits according to that model. We designed a large-scale fieldexperiment in collaboration with Uruguay’s tax authority to assess the factors behind firms’evasion behavior and reactions to audits. Our findings indicate that firms do increase taxcompliance when informed of the audit process. We do not, however, find this reaction tobe consistent with the predictions of A&S. For example, the information on audits decreased(rather than increased) the perceived probability of being audited; moreover, the effects ofour messages about audit probabilities were independent from the signal we conveyed andfrom the firms’ prior beliefs. Models of salience are consistent with the increased complianceand reduced perceived perception of audit probabilities that we observed, but they are notconsistent with our findings on probability neglect. All three findings can, we agree, bereconciled by the risk-as-feelings model, which heeds the role of emotions in decision-makingand predicts that agents tend to exhibit probability neglect in dreaded or feared situations,
71This poster is reproduced in Appendix D.72Whether these fear tactics should be used by tax agencies is outside the scope of this paper. These tactics
may be ethically questionable to the extent to which they rely on deception. Moreover, actively promotingfear could have unintended negative effects, such as imposing negative psychological stress on taxpayers. Fora discussion of the ethical and practical issues at stake in communication efforts to increase tax compliance,see, for example, Morse (2009).
36
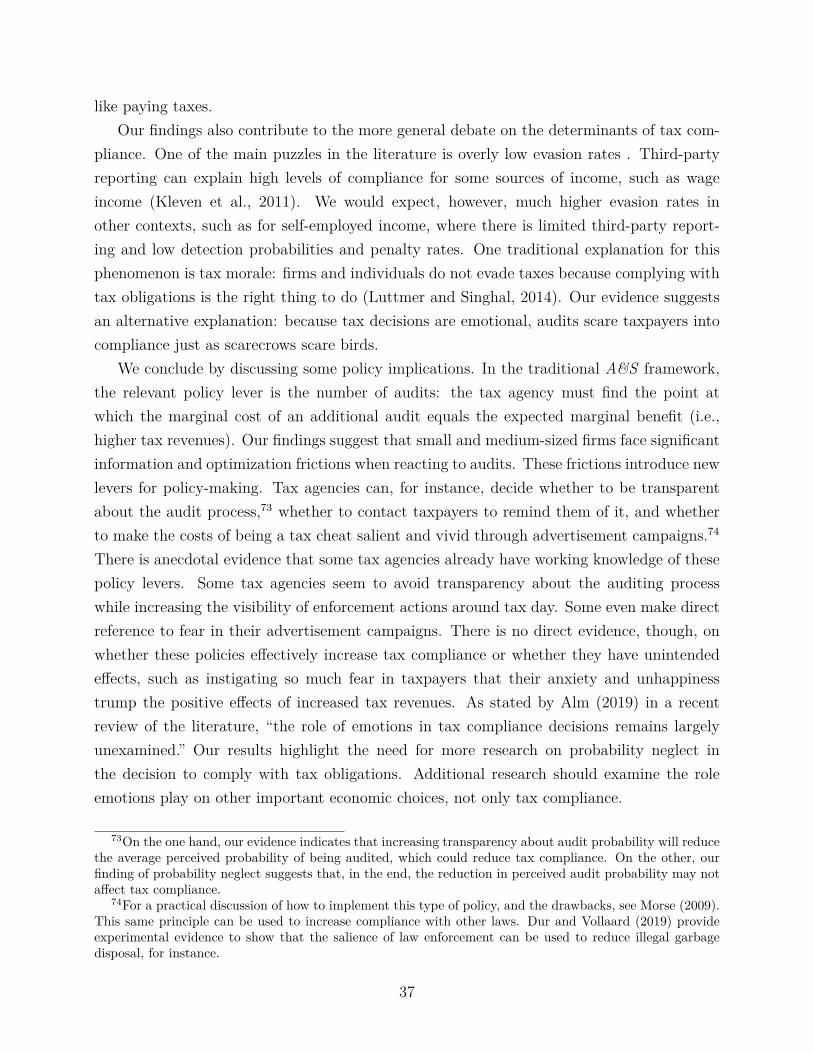
like paying taxes.Our findings also contribute to the more general debate on the determinants of tax com-
pliance. One of the main puzzles in the literature is overly low evasion rates . Third-partyreporting can explain high levels of compliance for some sources of income, such as wageincome (Kleven et al., 2011). We would expect, however, much higher evasion rates inother contexts, such as for self-employed income, where there is limited third-party report-ing and low detection probabilities and penalty rates. One traditional explanation for thisphenomenon is tax morale: firms and individuals do not evade taxes because complying withtax obligations is the right thing to do (Luttmer and Singhal, 2014). Our evidence suggestsan alternative explanation: because tax decisions are emotional, audits scare taxpayers intocompliance just as scarecrows scare birds.
We conclude by discussing some policy implications. In the traditional A&S framework,the relevant policy lever is the number of audits: the tax agency must find the point atwhich the marginal cost of an additional audit equals the expected marginal benefit (i.e.,higher tax revenues). Our findings suggest that small and medium-sized firms face significantinformation and optimization frictions when reacting to audits. These frictions introduce newlevers for policy-making. Tax agencies can, for instance, decide whether to be transparentabout the audit process,73 whether to contact taxpayers to remind them of it, and whetherto make the costs of being a tax cheat salient and vivid through advertisement campaigns.74
There is anecdotal evidence that some tax agencies already have working knowledge of thesepolicy levers. Some tax agencies seem to avoid transparency about the auditing processwhile increasing the visibility of enforcement actions around tax day. Some even make directreference to fear in their advertisement campaigns. There is no direct evidence, though, onwhether these policies effectively increase tax compliance or whether they have unintendedeffects, such as instigating so much fear in taxpayers that their anxiety and unhappinesstrump the positive effects of increased tax revenues. As stated by Alm (2019) in a recentreview of the literature, “the role of emotions in tax compliance decisions remains largelyunexamined.” Our results highlight the need for more research on probability neglect inthe decision to comply with tax obligations. Additional research should examine the roleemotions play on other important economic choices, not only tax compliance.
73On the one hand, our evidence indicates that increasing transparency about audit probability will reducethe average perceived probability of being audited, which could reduce tax compliance. On the other, ourfinding of probability neglect suggests that, in the end, the reduction in perceived audit probability may notaffect tax compliance.
74For a practical discussion of how to implement this type of policy, and the drawbacks, see Morse (2009).This same principle can be used to increase compliance with other laws. Dur and Vollaard (2019) provideexperimental evidence to show that the salience of law enforcement can be used to reduce illegal garbagedisposal, for instance.
37

ReferencesAcemoglu, D. and M. O. Jackson (2017). Social Norms and the Enforcement of Laws. Journal of
the European Economic Association 15 (2), 245–295.Allingham, M. G. and A. Sandmo (1972). Income Tax Evasion: A Theoretical Analysis. Journal
of Public Economics 1, 323–338.Alm, J. (2019). What motivates tax compliance? Journal of Economic Surveys 33 (2), 353–388.Alm, J., B. Jackson, and M. McKee (1992). Estimating the Determinants of Taxpayer Compliance
with Experimental Data. National Tax Journal 45 (1), 107–114.Alm, J., G. H. McClelland, and W. Schulze (1992). Why do people pay taxes? Journal of Public
Economics 48 (1), 21–38.Becker, G. S. (1968). Crime and Punishment: An Economic Approach. Journal of Political Econ-
omy 76 (2), 169–217.Bergman, M. and A. Nevarez (2006). Do Audits Enhance Compliance? An Empirical Assessment
of VAT Enforcement. National Tax Journal 59 (4), 817–832.Bergolo, M., R. Ceni, G. Cruces, M. Giaccobasso, and R. Perez-Truglia (2018). Misperceptions
about Tax Audits. AEA Papers and Proceedings 108, 83–87.Blank, J. D. and D. Z. Levin (2010). When Is Tax Enforcement Publicized? Virginia Tax Review 30.Blumenthal, M., C. Christian, and J. Slemrod (2001). Do Normative Appeals Affect Tax Com-
pliance? Evidence From a Controlled Experiment in Minnesota. National Tax Journal 54 (1),125–138.
Bott, K. M., A. W. Cappelen, E. Ø. Sørensen, and B. Tungodden (2020). You’ve got mail: Arandomized field experiment on tax evasion. Management Science 66 (7), 2801–2819.
Bottan, N. L. and R. Perez-Truglia (2017). Choosing Your Pond: Location Choices and RelativeIncome. NBER Working Paper (23615).
Bruine de Bruin, W. and K. G. Carman (2012). Measuring Risk Perceptions: What Does theExcessive Use of 50% Mean? Medical Decision Making 32 (2), 232–236.
Bruine de Bruin, W., P. S. Fischbeck, N. A. Stiber, and B. Fischhoff (2002). What number is"fifty-fifty"? Redistributing excess 50% responses in risk perception studies. Risk Analysis 22 (4),725–735.
Castro, L. and C. Scartascini (2015). Tax Compliance and Enforcement in the Pampas EvidenceFrom a Field Experiment. Journal of Economic Behavior & Organization 116, 65–82.
Cavallo, A., G. Cruces, and R. Perez-Truglia (2017, July). Inflation Expectations, Learning, andSupermarket Prices: Evidence from Survey Experiments. American Economic Journal: Macroe-conomics 9 (3), 1–35.
Chetty, R., A. Looney, and K. Kroft (2009). Salience and Taxation: Theory and Evidence. TheAmerican Economic Review 99 (4), 1145–77.
Coricelli, G., M. Joffily, C. Montmarquette, and M. C. Villeval (2010). Cheating, Emotions, andRationality: An Experiment on Tax Evasion. Experimental Economics 13 (2), 226–247.
Cowell, F. A. and J. P. F. Gordon (1988). Unwillingness to pay: Tax evasion and public goodprovision. Journal of Public Economics 36 (3), 305–321.
Dhami, S. and A. al Nowaihi (2007). Prospect theory versus expected utility theory: Why DoPeople Pay Taxes? Journal of Economic Behavior and Organization 64 (1), 171–192.
38

Dulleck, U., J. Fooken, C. Newton, A. Ristl, M. Schaffner, and B. Torgler (2016). Tax complianceand psychic costs: Behavioral experimental evidence using a physiological marker. Journal ofPublic Economics 134, 9 – 18.
Dur, R. and B. Vollaard (2019). Salience of law enforcement a field experiment. Journal of Envi-ronmental Economics and Management 93 (C), 208–220.
Dwenger, N., H. Kleven, I. Rasul, and J. Rincke (2016). Extrinsic and Intrinsic Motivations forTax Compliance: Evidence from a Field Experiment in Germany. American Economic Journal:Economic Policy 8 (3), 203–232.
Erard, B. and J. S. Feinstein (1994). The Role of Moral Sentiment and Audit Perceptions in TaxCompliance. Public Finance 49, 70–89.
Fellner, G., R. Sausgruber, and C. Traxler (2013). Testing Enforcement Strategies in the Field:Threat, Moral Appeal and Social Information. Journal of the European Economic Associa-tion 11 (3), 634–660.
Forbes (2008, July). Pity The Celebrity Taxpayer. Forbes.Fuster, A., R. Perez-Truglia, and B. Zafar (2018). Expectations with Endogenous Information
Acquisition: An Experimental Investigation. NBER Working Paper .Gomez-Sabaini, J. C. and J. P. Jimenez (2012). Tax structure and tax evasion in Latin America.
Macroeconomics of Development Series 118.Gomez-Sabaini, J. C. and D. Moran (2014). Tax policy in Latin America Assessment and guidelines
for a second generation of reforms. Macroeconomics of Development Series 133.Hallsworth, M., J. A. List, R. D. Metcalfe, and I. Vlaev (2017). The behavioralist as tax collector:
Using natural field experiments to enhance tax compliance. Journal of Public Economics 148,14–31.
Harris, L. and I. Associates (1988). 1987 taxpayer opinion survey. Washington, DC: InternalRevenue Service Document.
Kahneman, D. (2003). A Perspective on Judgement and Choice: Mapping Bounded Rationality.American Psychologist 58 (9), 697–720.
Kahneman, D., P. Slovic, and A. Tversky (Eds.) (1982). Judgment under uncertainty: heuristicsand biases. Cambridge ; New York: Cambridge University Press.
Kahneman, D. and A. Tversky (1974). Judgment under Uncertainty: Heuristics and Biases. Sci-ence 185 (4157), 1124–1131.
Kahneman, D. and A. Tversky (1979). Prospect Theory: An Analysis of Decision under Risk.Econometrica 47 (2), 263–291.
Kleven, H. J., M. B. Knudsen, T. Kreiner, S. Pedersen, and E. Saez (2011). Unwilling or Unable toCheat? Evidence from a Randomized Tax Audit Experiment in Denmark. Econometrica 79 (3),651–692.
Kleven, H. J., C. Kreiner, and E. Saez (2016). Why Can Modern Governments Tax So Much? AnAgency Model of Firms as Fiscal Intermediaries. Economica 83, 2016.
Konrad, K. A., T. Lohse, and S. Qari (2016). Compliance With Endogenous Audit Probabilities.Scandinavian Journal of Economics.
Lichtenstein, S., P. Slovic, B. Fischho, M. Layman, and B. Combs (1978). Judged frequency oflethal events. Journal of experimental psychology: Human learning and memory 4 (6), 551.
Loewenstein, G. and S. Lerner (2003). The role of affect in decision making. In R. Davidson,K. Scherer, and H. Goldsmith (Eds.), Handbook of Affictive Sciences. Oxford: Oxford UniversityPress.
39

Loewenstein, G. F., E. U. Weber, C. K. Hsee, and N. Welch (2001). Risk as feelings. PsychologicalBulletin 127 (2), 267–286.
Luttmer, E. F. P. and M. Singhal (2014). Tax Morale. Journal of Economic Perspectives 28 (4),149–168.
McKenzie, D. (2012). Beyond baseline and follow-up: The case for more T in experiments. Journalof Development Economics 99 (2), 210–221.
Meiselman, B. S. (2018). Ghostbusting in detroit: Evidence on nonfilers from a controlled fieldexperiment. Journal of Public Economics 158, 180 – 193.
Morse, S. C. (2009). Using Salience and Influence to Narrow the Tax Gap. Loyola UniversityChicago Law Journal 40, 483.
Naritomi, J. (2019, September). Consumers as tax auditors.Nathan, B., R. Perez-Truglia, and A. Zentner (2020). My taxes are too darn high: Tax protests as
revealed preferences for redistribution. NBER Working Paper No. 27816 .New York Times (2009, April). A Paralyzing Fear of Filing Taxes. New York Times.Perez-Truglia, R. and U. Troiano (2018). Shaming tax delinquents. Journal of Public Economics 167,
120–137.Pomeranz, D. (2015). No Taxation Without Information: Deterrence and Self-Enforcement in the
Value Added Tax. The American Economic Review 105 (8), 2539–2569.Pomeranz, D. and J. Vila-Belda (2018). Taking State-Capacity Research to the Field: Insights from
Collaborations with Tax Authorities.Reinganum, J. F. and L. L. Wilde (1985). Income tax compliance in a principal agent framework.
Journal of Public Economics 26 (1), 1–18.Saez, E., J. Slemrod, and S. Giertz (2012). The elasticity of taxable income with respect to marginal
tax rates: A critical review. Journal of Economic Literature 50 (1), 3–50.Scholz, J. T. and N. Pinney (1995). Duty, Fear, and Tax Compliance: The heuristic basis of
citizenship behavior. American Journal of Political Science 39, 2.Slemrod, J. (2008). Does It Matter Who Writes the Check to the Government? The Economics of
Tax Remittance. National Tax Journal 61.Slemrod, J. (2018). Tax Compliance and Enforcement. Journal of Eonomic Literature Forthcoming.Slemrod, J., M. Blumenthal, and C. Christian (2001). Taxpayer Response to an Increased Prob-
ability of Audit: Evidence from a Controlled Experiment in Minnesota. Journal of Public Eco-nomics 79 (3), 455–483.
Slovic, P., M. L. Finucane, E. Peters, and D. G. MacGregor (2004). Risk as analysis and risk asfeelings: some thoughts about affect, reason, risk, and rationality. Risk Analysis: An OfficialPublication of the Society for Risk Analysis 24 (2), 311–322.
Srinivasan, T. N. (1973). Tax Evasion: A Model. Journal of Public Economics 2 (4), 339–346.Sunstein, C. (2002). Probability Neglect: Emotions, Worst Cases, and Law. Yale Law Jour-
nal 112 (1), 61–107.Sunstein, C. R. (2003). Terrorism and probability neglect. Journal of Risk and Uncertainty 26 (2-3),
121–136.United Press International (1988). Psychologist takes issue with irs scare tactic. UPI-United Press
International.
40

United States Internal Revenue Service (2018). Comprehensive Taxpayer Attitude Survey (CTAS)2017 Executive Report. Publication 5296 (Rev. 3-2018) Catalog Number 71353Y, Department ofTreasury, Washington, D.C.
Washington Post (2016, August). That is NOT the IRS Calling You! The Washington Post.Wooldridge, J. M. (2010). Econometric analysis of cross section and panel data. MIT press.Yitzhaki, S. (1987). On the Excess Burden of Tax Evasion. Public Finance Review 15 (2), 123–137.Zeckhauser, R. and C. R. Sunstein (2010). Dreadful Possibilities, Neglected Probabilities. In
E. Michel-Kerjan and P. Slovic (Eds.), The Irrational Economist: Making Decisions in a Dan-gerous World, pp. 116–123. New York: Public Affairs Press.
41

Figure 1: Structure of the Field Experiment
a. Samples and Treatment Arms
b. Timeline
Notes: Panel (a) reports the key features of the experimental design. Panel (b) reports the key dates of the field experimentand the survey..
42

Figure 2: Sample Letter
Montevideo, August 20th 2015
Mr../Ms. Taxpayer:
The DGI has the authority to perform inspections (see Art. 68 of the tax code) and routine audits of taxpayers on the basis of crosschecks and assessment of data compiled to detect oversights and inconsistency on tax returns as well as pending tax debts.
The aim of the DGI, and the primary challenge it faces, is to ensure the collection of revenue to sustain life in society. Additionally, its task is to generate a framework of fair and transparent competition where the failure of some to meet their obligations does not have an unfavorable impact on honest taxpayers. In order to meet these goals, inspections are performed in a routine fashion.
Your micro, small, or medium-sized business has been randomly selected to receive this information. It is solely for your information and its receipt does not require you to present any documentation to the DGI offices.
We ask you to comply with your tax obligations for the sake of the country we all want, a more and more developed Uruguay with greater and greater social cohesion.
Sincerely,
Collection and Controls Division Internal Revenues Services
Notes: The baseline letter contains information on the goals and responsibilities of the tax authority. In the space with thetext MESSAGE, the baseline letter is empty (See A.1 for the full letter). In the audit-statistics letter, a paragraph added tothe baseline letter provides information on audit probabilities and tax evasion penalty rates (Appendix A.2). In the audit-threat letter, firms were randomly assigned to groups with different probabilities (25% and 50%) of being audited in thefollowing year (Appendix A.3). The audit-endogeneity letter included information on how evading taxes typically doublesthe probability of being audited (Appendix A.4). Finally, the public-goods letter included a message with information onthe cost of evasion in terms of the provision of public goods (Appendix A.5)..
43
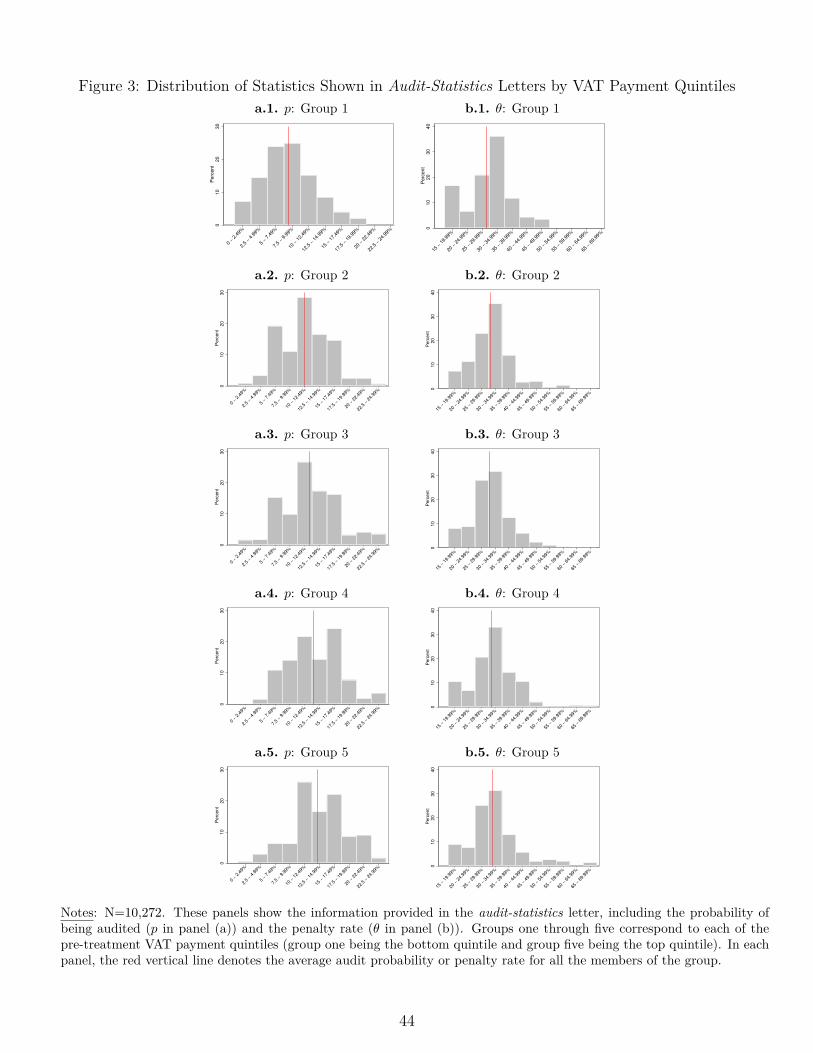
Figure 3: Distribution of Statistics Shown in Audit-Statistics Letters by VAT Payment Quintilesa.1. p: Group 1 b.1. θ: Group 1
010
20
30
Perc
en
t
0 −
2.4
9%
2.5
− 4
.99%
5 −
7.4
9%
7.5
− 9
.99%
10 −
12.4
9%
12.5
− 1
4.9
9%
15 −
17.4
9%
17.5
− 1
9.9
9%
20 −
22.4
9%
22.5
− 2
4.9
9%
010
20
30
40
Perc
en
t
15 −
19.9
9%
20 −
24.9
9%
25 −
29.9
9%
30 −
34.9
9%
35 −
39.9
9%
40 −
44.9
9%
45 −
49.9
9%
50 −
54.9
9%
55 −
59.9
9%
60 −
64.9
9%
65 −
69.9
9%
a.2. p: Group 2 b.2. θ: Group 2
010
20
30
Perc
ent
0 −
2.4
9%
2.5
− 4
.99%
5 −
7.4
9%
7.5
− 9
.99%
10 −
12.4
9%
12.5
− 1
4.9
9%
15 −
17.4
9%
17.5
− 1
9.9
9%
20 −
22.4
9%
22.5
− 2
4.9
9%
010
20
30
40
Perc
ent
15 −
19.9
9%
20 −
24.9
9%
25 −
29.9
9%
30 −
34.9
9%
35 −
39.9
9%
40 −
44.9
9%
45 −
49.9
9%
50 −
54.9
9%
55 −
59.9
9%
60 −
64.9
9%
65 −
69.9
9%
a.3. p: Group 3 b.3. θ: Group 3
010
20
30
Perc
ent
0 −
2.4
9%
2.5
− 4
.99%
5 −
7.4
9%
7.5
− 9
.99%
10 −
12.4
9%
12.5
− 1
4.9
9%
15 −
17.4
9%
17.5
− 1
9.9
9%
20 −
22.4
9%
22.5
− 2
4.9
9%
010
20
30
40
Perc
ent
15 −
19.9
9%
20 −
24.9
9%
25 −
29.9
9%
30 −
34.9
9%
35 −
39.9
9%
40 −
44.9
9%
45 −
49.9
9%
50 −
54.9
9%
55 −
59.9
9%
60 −
64.9
9%
65 −
69.9
9%
a.4. p: Group 4 b.4. θ: Group 4
010
20
30
Perc
ent
0 −
2.4
9%
2.5
− 4
.99%
5 −
7.4
9%
7.5
− 9
.99%
10 −
12.4
9%
12.5
− 1
4.9
9%
15 −
17.4
9%
17.5
− 1
9.9
9%
20 −
22.4
9%
22.5
− 2
4.9
9%
010
20
30
40
Perc
ent
15 −
19.9
9%
20 −
24.9
9%
25 −
29.9
9%
30 −
34.9
9%
35 −
39.9
9%
40 −
44.9
9%
45 −
49.9
9%
50 −
54.9
9%
55 −
59.9
9%
60 −
64.9
9%
65 −
69.9
9%
a.5. p: Group 5 b.5. θ: Group 5
010
20
30
Perc
ent
0 −
2.4
9%
2.5
− 4
.99%
5 −
7.4
9%
7.5
− 9
.99%
10 −
12.4
9%
12.5
− 1
4.9
9%
15 −
17.4
9%
17.5
− 1
9.9
9%
20 −
22.4
9%
22.5
− 2
4.9
9%
010
20
30
40
Perc
ent
15 −
19.9
9%
20 −
24.9
9%
25 −
29.9
9%
30 −
34.9
9%
35 −
39.9
9%
40 −
44.9
9%
45 −
49.9
9%
50 −
54.9
9%
55 −
59.9
9%
60 −
64.9
9%
65 −
69.9
9%
Notes: N=10,272. These panels show the information provided in the audit-statistics letter, including the probability ofbeing audited (p in panel (a)) and the penalty rate (θ in panel (b)). Groups one through five correspond to each of thepre-treatment VAT payment quintiles (group one being the bottom quintile and group five being the top quintile). In eachpanel, the red vertical line denotes the average audit probability or penalty rate for all the members of the group..
44
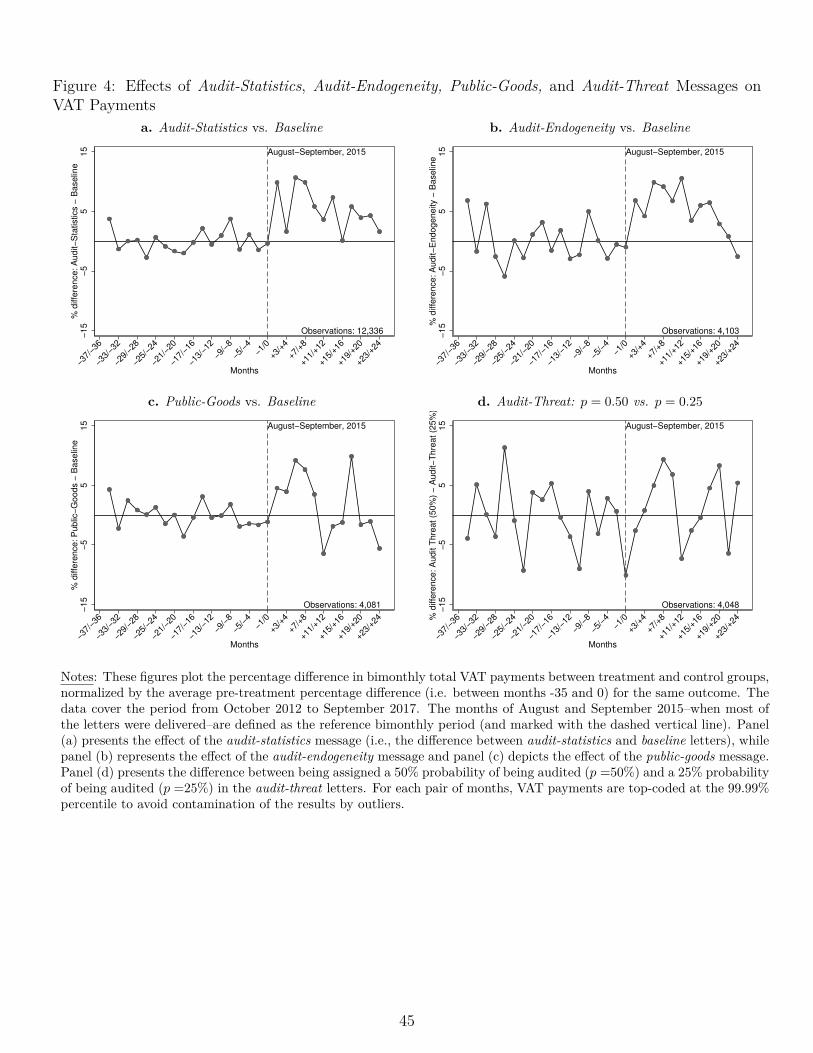
Figure 4: Effects of Audit-Statistics, Audit-Endogeneity, Public-Goods, and Audit-Threat Messages onVAT Payments
a. Audit-Statistics vs. Baseline b. Audit-Endogeneity vs. Baseline
August−September, 2015
Observations: 12,336
−15
−5
515
% d
iffe
rence: A
udit−
Sta
tistics −
Baseline
−37/−
36
−33/−
32
−29/−
28
−25/−
24
−21/−
20
−17/−
16
−13/−
12
−9/−
8
−5/−
4
−1/0
+3/+
4
+7/+
8
+11/+
12
+15/+
16
+19/+
20
+23/+
24
Months
August−September, 2015
Observations: 4,103
−15
−5
515
% d
iffe
rence: A
udit−
Endogeneity −
Baseline
−37/−
36
−33/−
32
−29/−
28
−25/−
24
−21/−
20
−17/−
16
−13/−
12
−9/−
8
−5/−
4
−1/0
+3/+
4
+7/+
8
+11/+
12
+15/+
16
+19/+
20
+23/+
24
Months
c. Public-Goods vs. Baseline d. Audit-Threat: p = 0.50 vs. p = 0.25
August−September, 2015
Observations: 4,081
−15
−5
515
% d
iffe
rence: P
ublic−
Goods −
Baseline
−37/−
36
−33/−
32
−29/−
28
−25/−
24
−21/−
20
−17/−
16
−13/−
12
−9/−
8
−5/−
4
−1/0
+3/+
4
+7/+
8
+11/+
12
+15/+
16
+19/+
20
+23/+
24
Months
August−September, 2015
Observations: 4,048
−15
−5
515
% d
iffe
rence: A
udit T
hre
at (5
0%
) −
Audit−
Thre
at (2
5%
)
−37/−
36
−33/−
32
−29/−
28
−25/−
24
−21/−
20
−17/−
16
−13/−
12
−9/−
8
−5/−
4
−1/0
+3/+
4
+7/+
8
+11/+
12
+15/+
16
+19/+
20
+23/+
24
Months
Notes: These figures plot the percentage difference in bimonthly total VAT payments between treatment and control groups,normalized by the average pre-treatment percentage difference (i.e. between months -35 and 0) for the same outcome. Thedata cover the period from October 2012 to September 2017. The months of August and September 2015–when most ofthe letters were delivered–are defined as the reference bimonthly period (and marked with the dashed vertical line). Panel(a) presents the effect of the audit-statistics message (i.e., the difference between audit-statistics and baseline letters), whilepanel (b) represents the effect of the audit-endogeneity message and panel (c) depicts the effect of the public-goods message.Panel (d) presents the difference between being assigned a 50% probability of being audited (p =50%) and a 25% probabilityof being audited (p =25%) in the audit-threat letters. For each pair of months, VAT payments are top-coded at the 99.99%percentile to avoid contamination of the results by outliers...
45

Figure 5: Survey Results: Perception of Audit Probabilities and of Tax Evasion Penalty Rates by Treat-ment Group
a. Audit Probability (p) b. Penalty Rate (θ)
Letters
010
20
30
40
50
60
Perc
ent
0 −
9.9
9%
10 −
19.9
9%
20 −
29.9
9%
30 −
39.9
9%
40 −
49.9
9%
50 −
59.9
9%
60 −
69.9
9%
70 −
79.9
9%
80 −
89.9
9%
90 −
100%
Audit Probability (%)
Perceived (pooled control group)
Mean = 40.7%
Perceived (audit−statistics)
Mean = 35.2%
Diff − p−value: 0.03
Letters
010
20
30
40
50
60
Perc
ent
0 −
9.9
9%
10 −
19.9
9%
20 −
29.9
9%
30 −
39.9
9%
40 −
49.9
9%
50 −
59.9
9%
60 −
69.9
9%
70 −
79.9
9%
80 −
89.9
9%
90%
+
Penalty Size (%)
Perceived (pooled control group)
Mean = 30.5%
Perceived (audit−statistics)
Mean = 29.9%
Diff − p−value: 0.82
Notes: The histograms are based on the survey responses of individuals who did not self-identify as non-owners. Perceived(pooled control group) (N=137) refers to survey respondents who received the baseline (N=69) or the public-goods (N=68)letters during the experimental stage (neither of those letters contained any information on audit probabilities or penaltyrates). Perceived (audit–statistics) refers to respondents who received the audit-statistics letters (N=365). In panel (a), thex-axis represents the probability of being audited; in panel (b), it represents the average penalty rate. We report the meanresponses and the p-value of the difference between the two groups. The answers correspond to Q2 and Q4 in the survey(see full survey questionnaire in Appendix A.7). The red line represents the density function of the information displayedin the audit-statistics letters, measured in the right y-axis (hidden for the sake clarity)..
46

Figure 6: Effect of Audit-Statistics vs. Baseline by Deciles of p and θa. Audit Probability (p) b. Penalty Rate (θ)
Slope = 0.0002 (s.e. = 0.002)
−0.1
0−
0.0
50.0
00.0
50.1
00.1
50.2
00.2
5
Tre
atm
ent E
ffect
0 5 10 15 20
Audit Probability (%)
Point Estimate 95% CI
Linear Fit
Slope = 0.0001 (s.e. = 0.001)
−0.1
0−
0.0
50.0
00.0
50.1
00.1
50.2
00.2
5
Tre
atm
ent E
ffect
10 20 30 40 50
Penalty Size (%)
Point Estimate 95% CI
Linear Fit
Notes: Panel (a) plots the effect of the audit-statistics letter on total VAT payments by decile of p in the first year post-treatment (October 2015–September 2016), while panel (b) reports the results from the same regressions by decile of θ(N=10,272). In both panels, each dot represents the estimated treatment effect for each decile of the parameter considered.These effects are estimated using a regression similar to the one reported in equation (1), but with two differences. First,instead of including a single treatment variable, we include ten dummy variables, one for each decile of p or θ. Thesedummies take the value of one if the signal in the letter belongs to the corresponding decile in the p or θ distribution, andzero if the signal corresponds to a different decile, or if the firm was assigned to the baseline treatment. Second, we includean additional set of dummies for quintiles of the pre-treatment VAT payments, which are the groups from which we drewthe sample of “similar firms” to calculate p and θ and the corresponding interactions with the post-treatment indicator.All effects are depicted with a 95% confidence interval. The results are based on Poisson regressions, so the coefficients canbe interpreted directly as semi-elasticities. Confidence intervals are computed with standard errors clustered at the firmlevel. The dashed line represents the linear fit that results from regressing the treatment effect on the average signal withinthe decile..
47
Table 1: Balance of Firm Characteristics across Treatment GroupsMain Sample Secondary Sample
AuditStatistics
(1)
PublicGoods(2)
AuditEndogeneity
(3)Baseline
(4)p-value test
(5)
AuditThreat (25%)
(6)
AuditThreat (50%)
(7)p-value test
(8)
Share paid VAT (3 months pre-mailing) 0.925 0.939 0.926 0.928 0.181 0.897 0.891 0.538(0.003) (0.005) (0.006) (0.006) (0.007) (0.007)
Amount of VAT paid (3 months pre-mailing) 1.872 1.963 1.926 1.906 0.557 1.739 1.748 0.950(0.027) (0.067) (0.069) (0.059) (0.097) (0.092)
Years registered with tax agency 15.338 14.746 15.704 15.009 0.268 19.453 19.425 0.944(0.170) (0.224) (0.538) (0.225) (0.285) (0.286)
Share audited between 2013-2015 0.106 0.097 0.089 0.101 0.302 0.134 0.147 0.382(0.004) (0.009) (0.009) (0.009) (0.010) (0.010)
Number of employees 4.814 4.658 4.880 5.089 0.962 4.835 4.880 0.795(0.264) (0.538) (0.566) (0.635) (0.126) (0.117)
Share filed comprehensive tax return in 2013 0.682 0.687 0.691 0.687 0.871 0.999 1.000 0.558(0.005) (0.010) (0.010) (0.010) (0.001) (0.000)
Share no retail goods sector 0.289 0.293 0.283 0.300 0.621 0.431 0.434 0.845(0.004) (0.010) (0.010) (0.010) (0.011) (0.011)
Share retail goods sector 0.218 0.219 0.214 0.227 0.775 0.334 0.322 0.398(0.004) (0.009) (0.009) (0.009) (0.011) (0.010)
Share services sector 0.493 0.488 0.504 0.473 0.232 0.235 0.244 0.482(0.005) (0.011) (0.011) (0.011) (0.009) (0.010)
N 10,272 2,017 2,039 2,064 2,015 2,033
Notes: Averages for different pre-treatment firm-level characteristics, disaggregated by treatment group and type of sample (robust standard errors are reportedin parentheses). The main sample includes all firms selected as described in section 3.2. The secondary sample includes high-risk firms selected by the IRSfor the audit-threat treatment. The last column of each sample reports the p-value of a test in which the null hypothesis is that the mean is equal for all thetreatment groups. Data on the VAT amount and firm characteristics come from administrative tax records (including monthly payments, annual tax returns,and auditing registers). The amount of VAT reported in row 2 is expressed in constant thousands of U.S. dollars as of August 2015..
48
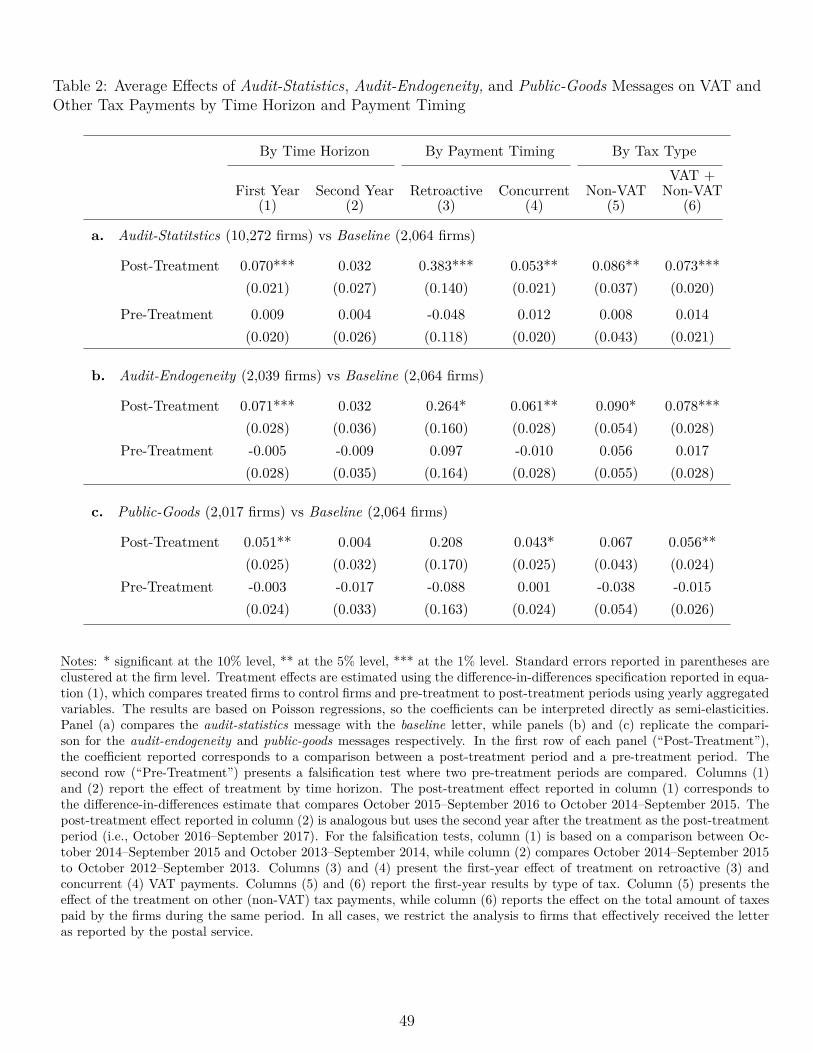
Table 2: Average Effects of Audit-Statistics, Audit-Endogeneity, and Public-Goods Messages on VAT andOther Tax Payments by Time Horizon and Payment Timing
By Time Horizon By Payment Timing By Tax Type
First Year(1)
Second Year(2)
Retroactive(3)
Concurrent(4)
Non-VAT(5)
VAT +Non-VAT
(6)
a. Audit-Statitstics (10,272 firms) vs Baseline (2,064 firms)
Post-Treatment 0.070*** 0.032 0.383*** 0.053** 0.086** 0.073***(0.021) (0.027) (0.140) (0.021) (0.037) (0.020)
Pre-Treatment 0.009 0.004 -0.048 0.012 0.008 0.014(0.020) (0.026) (0.118) (0.020) (0.043) (0.021)
b. Audit-Endogeneity (2,039 firms) vs Baseline (2,064 firms)
Post-Treatment 0.071*** 0.032 0.264* 0.061** 0.090* 0.078***(0.028) (0.036) (0.160) (0.028) (0.054) (0.028)
Pre-Treatment -0.005 -0.009 0.097 -0.010 0.056 0.017(0.028) (0.035) (0.164) (0.028) (0.055) (0.028)
c. Public-Goods (2,017 firms) vs Baseline (2,064 firms)
Post-Treatment 0.051** 0.004 0.208 0.043* 0.067 0.056**(0.025) (0.032) (0.170) (0.025) (0.043) (0.024)
Pre-Treatment -0.003 -0.017 -0.088 0.001 -0.038 -0.015(0.024) (0.033) (0.163) (0.024) (0.054) (0.026)
Notes: * significant at the 10% level, ** at the 5% level, *** at the 1% level. Standard errors reported in parentheses areclustered at the firm level. Treatment effects are estimated using the difference-in-differences specification reported in equa-tion (1), which compares treated firms to control firms and pre-treatment to post-treatment periods using yearly aggregatedvariables. The results are based on Poisson regressions, so the coefficients can be interpreted directly as semi-elasticities.Panel (a) compares the audit-statistics message with the baseline letter, while panels (b) and (c) replicate the compari-son for the audit-endogeneity and public-goods messages respectively. In the first row of each panel (“Post-Treatment”),the coefficient reported corresponds to a comparison between a post-treatment period and a pre-treatment period. Thesecond row (“Pre-Treatment”) presents a falsification test where two pre-treatment periods are compared. Columns (1)and (2) report the effect of treatment by time horizon. The post-treatment effect reported in column (1) corresponds tothe difference-in-differences estimate that compares October 2015–September 2016 to October 2014–September 2015. Thepost-treatment effect reported in column (2) is analogous but uses the second year after the treatment as the post-treatmentperiod (i.e., October 2016–September 2017). For the falsification tests, column (1) is based on a comparison between Oc-tober 2014–September 2015 and October 2013–September 2014, while column (2) compares October 2014–September 2015to October 2012–September 2013. Columns (3) and (4) present the first-year effect of treatment on retroactive (3) andconcurrent (4) VAT payments. Columns (5) and (6) report the first-year results by type of tax. Column (5) presents theeffect of the treatment on other (non-VAT) tax payments, while column (6) reports the effect on the total amount of taxespaid by the firms during the same period. In all cases, we restrict the analysis to firms that effectively received the letteras reported by the postal service..
49
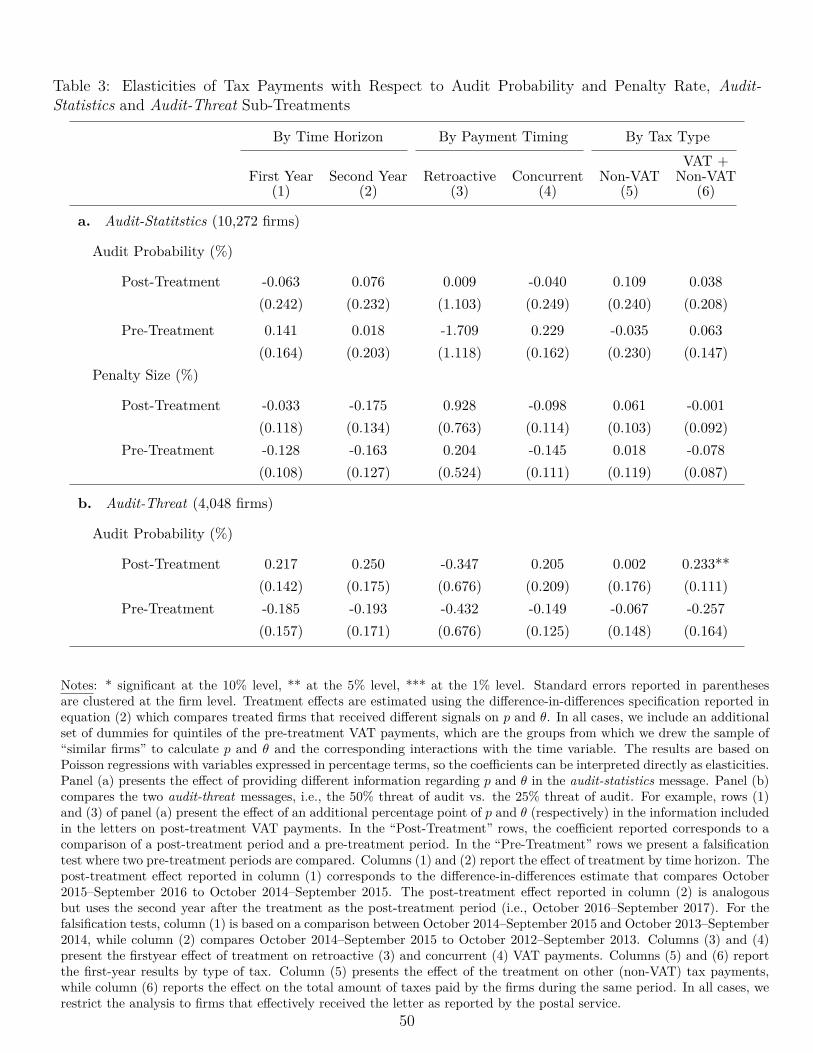
Table 3: Elasticities of Tax Payments with Respect to Audit Probability and Penalty Rate, Audit-Statistics and Audit-Threat Sub-Treatments
By Time Horizon By Payment Timing By Tax Type
First Year(1)
Second Year(2)
Retroactive(3)
Concurrent(4)
Non-VAT(5)
VAT +Non-VAT
(6)
a. Audit-Statitstics (10,272 firms)
Audit Probability (%)
Post-Treatment -0.063 0.076 0.009 -0.040 0.109 0.038(0.242) (0.232) (1.103) (0.249) (0.240) (0.208)
Pre-Treatment 0.141 0.018 -1.709 0.229 -0.035 0.063(0.164) (0.203) (1.118) (0.162) (0.230) (0.147)
Penalty Size (%)
Post-Treatment -0.033 -0.175 0.928 -0.098 0.061 -0.001(0.118) (0.134) (0.763) (0.114) (0.103) (0.092)
Pre-Treatment -0.128 -0.163 0.204 -0.145 0.018 -0.078(0.108) (0.127) (0.524) (0.111) (0.119) (0.087)
b. Audit-Threat (4,048 firms)
Audit Probability (%)
Post-Treatment 0.217 0.250 -0.347 0.205 0.002 0.233**(0.142) (0.175) (0.676) (0.209) (0.176) (0.111)
Pre-Treatment -0.185 -0.193 -0.432 -0.149 -0.067 -0.257(0.157) (0.171) (0.676) (0.125) (0.148) (0.164)
Notes: * significant at the 10% level, ** at the 5% level, *** at the 1% level. Standard errors reported in parenthesesare clustered at the firm level. Treatment effects are estimated using the difference-in-differences specification reported inequation (2) which compares treated firms that received different signals on p and θ. In all cases, we include an additionalset of dummies for quintiles of the pre-treatment VAT payments, which are the groups from which we drew the sample of“similar firms” to calculate p and θ and the corresponding interactions with the time variable. The results are based onPoisson regressions with variables expressed in percentage terms, so the coefficients can be interpreted directly as elasticities.Panel (a) presents the effect of providing different information regarding p and θ in the audit-statistics message. Panel (b)compares the two audit-threat messages, i.e., the 50% threat of audit vs. the 25% threat of audit. For example, rows (1)and (3) of panel (a) present the effect of an additional percentage point of p and θ (respectively) in the information includedin the letters on post-treatment VAT payments. In the “Post-Treatment” rows, the coefficient reported corresponds to acomparison of a post-treatment period and a pre-treatment period. In the “Pre-Treatment” rows we present a falsificationtest where two pre-treatment periods are compared. Columns (1) and (2) report the effect of treatment by time horizon. Thepost-treatment effect reported in column (1) corresponds to the difference-in-differences estimate that compares October2015–September 2016 to October 2014–September 2015. The post-treatment effect reported in column (2) is analogousbut uses the second year after the treatment as the post-treatment period (i.e., October 2016–September 2017). For thefalsification tests, column (1) is based on a comparison between October 2014–September 2015 and October 2013–September2014, while column (2) compares October 2014–September 2015 to October 2012–September 2013. Columns (3) and (4)present the firstyear effect of treatment on retroactive (3) and concurrent (4) VAT payments. Columns (5) and (6) reportthe first-year results by type of tax. Column (5) presents the effect of the treatment on other (non-VAT) tax payments,while column (6) reports the effect on the total amount of taxes paid by the firms during the same period. In all cases, werestrict the analysis to firms that effectively received the letter as reported by the postal service... 50

Table 4: Predicted Elasticities under Different A&S Calibrations
Setup Predictions
σ τ p0 p1 ε θ α EY
∂log(τ(Y−E))∂p
∂log(τ(Y−E))∂θ
4 0.22 0.117 0 0.575 0.306 1 0.26 4.516 3.4344 0.22 0.117 0 0 0.306 0.202 0.26 9.116 1.2074 0.22 0.0896 0.0896 0 0.306 0.2296 0.26 3.324 0.5894 0.22 0.407 0 0 0.305 0.643 0.26 3.889 1.7632 0.22 0.117 0 0.614 0.306 1 0.26 9.777 6.5782 0.22 0.117 0 0 0.306 0.176 0.26 18.245 2.1112 0.22 0.0896 0.0896 0 0.306 0.2022 0.26 4.215 0.6612 0.22 0.407 0 0 0.305 0.586 0.26 7.771 3.030
Notes: Each row corresponds to a different calibration of the extended A&S model presented in Section 5.2.2. The firstseven columns correspond to the parameter values. The last three columns correspond to the predictions of the modelunder those parameter values. The predicted evasion rate (EY ) is always 26% because all the specifications were calibratedto match that rate..
51
Related Documents