Arbeitskreis Quantitative Steuerlehre Quantitative Research in Taxation – Discussion Papers Andreas Dinkel, Sara Keller, Deborah Schanz Tax Attractiveness and the Location of German-Controlled Subsidiaries arqus Discussion Paper No. 142 April 2013 revised March 2014 www.arqus.info ISSN 1861-8944

Welcome message from author
This document is posted to help you gain knowledge. Please leave a comment to let me know what you think about it! Share it to your friends and learn new things together.
Transcript

Arbeitskreis Quantitative Steuerlehre
Quantitative Research in Taxation – Discussion Papers
Andreas Dinkel, Sara Keller, Deborah Schanz
Tax Attractiveness and the Location of
German-Controlled Subsidiaries
arqus Discussion Paper No. 142
April 2013
revised March 2014
www.arqus.info
ISSN 1861-8944
1
Tax Attractiveness and the Location of German-Controlled
Subsidiaries
Andreas Dinkel a, Sara Keller b, Deborah Schanz a,*
a Munich Business School, Ludwig-Maximilians-University Munich, Ludwigstraße 28/RG IV, D-80539 Munich, Germany
b WHU – Otto Beisheim School of Management, Burgplatz 2, D-56179 Vallendar, Germany
This draft: 13 March 2014
Abstract: This paper analyzes whether taxation has an influence on the location de-
cisions of multinational enterprises. As a tax measure, we employ a novel measure of tax attractiveness, the Tax Attractiveness Index. This index covers 18 different tax factors, such as the taxation of dividends and capital gains, withholding taxes, the existence of a group taxation regime, and thin capitalization rules. Our count data regression analysis is based on a novel hand-collected data set consisting of the subsidiaries of German DAX30 companies in 97 countries. Controlling for non-tax effects, we find that a country’s tax environment as measured by the Tax Attractiveness Index has a significantly positive effect on the number of German-controlled subsidiaries located there. Hence, our study implies that location de-cisions depend on a bundle of tax factors as captured by the index. In a second step, we show that the location decisions of German DAX30 companies cannot be explained by the statu-tory tax rate alone. In contrast, withholding taxes, double tax treaty networks, and special holding regimes seem to play a decisive role in location decisions. Previous studies examin-ing only the influence of statutory tax rates may thus have underestimated the effects of taxation on the activities of multinational companies and suffer from omitted variable bias. Keywords: International taxation; Tax attractiveness; Statutory tax rate; Location decision; Multinational enterprise; Composite index * Corresponding author. Tel.: +49 89 2180 3681 E-mail addresses: [email protected] (A. Dinkel), [email protected] (S. Keller), [email protected] (D. Schanz)

2
1 Introduction
In the course of globalization and ongoing economic integration, a growing number of
companies have significantly intensified their international activities. The stock of German
companies’ investment abroad has increased by more than 40% over the five years from 2004
to 2009 and has grown from approximately 30% to 40% of the size of the German GDP
(Deutsche Bundesbank, 2007, 2013). The reasons why firms establish subsidiaries in foreign
countries are manifold. First, real economic facts, such as the size of the host market, lower
factor prices, distance from the parent country, and market-access may motivate them to locate
production abroad.1 Second, the fact, that tax rules are not harmonized gives multinational com-
panies the opportunity to exploit international differences to their advantage. Recent literature
contributions reveal that taxation also has an influence on location decisions for production
(Buettner and Ruf, 2007; Devereux and Griffith, 1998). Moreover, there is evidence that mul-
tinational enterprises establish subsidiaries in off-shore tax havens (e.g., Desai et al., 2006a)
and set up intermediate group entities, such as holding or financial companies, for tax purposes
only. Anecdotal evidence demonstrates very low effective tax rates of companies such as
Google and Apple because of their tax-optimized international firm-setup. As a result, compli-
cated group structures may arise, successfully aiming at reduced tax burdens (e.g., Collins,
2011; Drucker, 2010; Mintz and Weichenrieder, 2010). However, empirical evidence in this
field is scarce. Therefore, we ask the question as to how taxation affects the location decisions
of multinational enterprises. Is it merely the corporate tax rate or a bundle of tax factors that
influence this decision? Specifically, this paper analyzes whether companies place subsidiaries
in countries that offer an attractive tax environment.
We are the first to use a large-scale composite index, the Tax Attractiveness Index (Kel-
ler and Schanz, 2013), that combines various tax criteria for the 100 most important countries.2
Most existing studies either apply the statutory tax rate or a model-based effective tax rate to
explain the influence of taxation on corporate decisions. It is well-known that, in most cases,
the statutory tax rate is an unsatisfactory proxy for the tax environment due to the fact that it
neglects tax base effects. To overcome this shortcoming at least partially, previous studies apply
effective tax rates that capture tax base determinants, such as depreciation allowances and in-
terest deductions. However, existing measures focus on very few tax rules that are important
1 Economic theory distinguishes between two main driving forces for becoming a multinational firm. Ac-
cording to the vertical model, differences in factor prices across countries lead to the emergence of multi-national companies (Helpman, 1984, 1985). According to the horizontal model, the internationalization decision is motivated by market access (Markusen, 1984, 2002).
2 Simmons (2003) constructed a composite index for seven countries for the year 1999.

3
for the location and volume of real investments. Many other important real-world domestic and
cross-border tax rules, such as group taxation regimes, thin capitalization rules or double tax
treaty networks have not been integrated yet. We argue that the location decisions of multina-
tional enterprises depend on a bundle of tax factors. Hence, the Tax Attractiveness Index that
we employ for this study covers 18 tax factors, such as the taxation of dividends and capital
gains, withholding taxes, the existence of a group taxation regime, the double tax treaty net-
work, and thin capitalization rules (Keller and Schanz, 2013). In this way, it also reflects tax
planning opportunities that multinational enterprises may take advantage of by establishing in-
termediate group units, such as holding companies, in a particular country.
To investigate the location decisions of multinational firms, we focus on the number of
subsidiaries that German parent companies operate in different host countries. To be precise,
on the basis of count data regression models, we analyze whether the tax environment, as meas-
ured by the Tax Attractiveness Index, has an influence on location decisions and, hence, on the
number of subsidiaries. Our empirical analysis is based on a novel data set consisting of the
subsidiaries3 of German DAX30 companies4 over the years 2005 to 2009. We consider Ger-
many to be a suitable reference country since dividends from foreign affiliates are exempt from
taxation.5 Therefore, domestic parent country taxation can be neglected and, hence, the corpo-
rate tax environment of the subsidiary’s host country including source taxes for cross-border
payments to the home-country, which is subject to our study, is critical. To ensure a compre-
hensive picture of German-controlled affiliates abroad, we do not rely on existing databases,
but we hand-collect our data. Our final sample includes subsidiaries of German DAX30 parent
companies that are located in 97 different host countries – including tax havens – spread across
the world.
The main finding of our study is that a host country’s tax environment, as measured by
the Tax Attractiveness Index, plays a significant role in determining the number of German-
controlled subsidiaries located there. Controlling for non-tax influences, our analysis reveals
that the tax attractiveness of a country has a positive impact on the number of subsidiaries.
Since the effect that we find is substantial, we can conclude that taxation has an influence on
the location decisions of multinational enterprises. Our results imply that the location choices
3 We include all legally independent entities held by a parent company. We use the terms “subsidiary” and
“affiliate” interchangeably. 4 DAX30 is the major German stock market index (Deutscher Aktien Index) and comprises the 30 largest
listed companies based on order book volume and market capitalization. 5 According to Section 8b of the German corporate income tax code (Körperschaftsteuergesetz), dividends
distributed by national or foreign affiliates can be received free of tax. Only 5% of dividends are taxed as non-deductible operating expenditures.

4
depend on multiple tax factors as combined in the Tax Attractiveness Index. Multinational com-
panies establish (an increased number of) affiliates in tax attractive countries, suggesting that
they implement tax-efficient corporate group structures by making use of intermediate compa-
nies in favorable holding locations and by placing subsidiaries in off-shore tax havens. We
perform several robustness checks to confirm the reliability of our results. Furthermore, we
show that the location decisions of multinational enterprises cannot be explained by the statu-
tory tax rate alone, the predominantly used measure of attractiveness so far. Although the cor-
porate tax rate has a significant effect on the number of subsidiaries in a country, location de-
cisions can be better explained by a bundle of tax factors as combined in the Tax Attractiveness
Index. Decomposing the Tax Attractiveness Index, we identify the withholding taxes that a
country imposes as well as its double tax treaty network and the existence of a special holding
regime as additional key tax drivers for foreign subsidiary location decisions. Accordingly, the
importance of taking the entire tax system, including double taxation conventions, into account,
instead of only tax rates, has recently been emphasized by the OECD (2013). Furthermore, we
show that the equal-weighting method used for constructing the index is robust. Alternative
methods result in composites that are highly correlated with the equal-weighted index and do
not change empirical results.
Our research is relevant for different groups of addressees: first, it is important for policy
makers. The Tax Attractiveness Index makes it possible to rank countries according to their tax
environment and our analysis reveals which countries succeed in attracting foreign subsidiaries.
From this, governments and politicians can compare their current tax position to other countries
and learn about firm location decisions. In addition, our study provides insight into the tax
factors that multinational enterprises consider to be the most important in their location deci-
sions. Policy makers can use this knowledge in regard to future tax reforms that may be targeted
to enhance location attractiveness. Furthermore, for German policy makers, it is valuable to be
aware of the location of German-controlled subsidiaries. Since Germany is a high-tax country,
tax authorities are exposed to the risk of relocation of economic activity with its negative effects
on tax revenues and the economy in general, such as job losses.6 The issue of international tax
base erosion caused by profit-shifting has been recently addressed by the OECD (2013). Sec-
ond, our findings are relevant for companies as well as consultants. This group can gain insight
6 However, recent articles reveal that internationalization is not necessarily associated with less tax revenue
in high-tax countries. The possibility of shifting profits into low-tax countries might even have a positive effect on the investment level in high-tax countries, such as Germany and the U.S. (Becker and Fuest, 2010; Desai et al., 2006b; Overesch, 2009).

5
into the location strategies of other multinational enterprises. Furthermore, from the Tax Attrac-
tiveness Index which is provided per country, they can identify favorable tax jurisdictions that
can be used for future tax planning purposes. Third, researchers can benefit from our analysis.
We reveal that the foreign subsidiary location decisions depend on a bundle of tax factors, most
of which have never been previously included in empirical research. We recommend interna-
tional researchers to employ the Tax Attractiveness Index as a tax measure in future studies.
Moreover, we provide an idea of which tax factors matter most for the location decisions of
multinational firms. This knowledge is valuable for forthcoming research.
The remainder of the paper is organized as follows: in the next section, we relate our
topic to existing literature providing the theoretical background for our analysis, and we develop
our hypothesis. In section 3, we present the Tax Attractiveness Index, our firm data set and the
econometric methodology that we apply. Section 4 is dedicated to the results of our empirical
analysis. In section 5, we subject our results to multiple robustness checks, we replace the Tax
Attractiveness Index with the statutory tax rate and we decompose the index to learn about the
key drivers of our results. Furthermore, we check, whether alternative weighting methods to
construct the index changes results. In the last section, we point at limitations of our study and
draw conclusions.
2 Theoretical Background and Hypothesis
Existing studies dealing with the influence of taxation on the location decisions of mul-
tinational enterprises form part of a sizeable body of empirical research that investigates the
impact of taxation on foreign direct investment (FDI). This literature confirms a significantly
negative effect of the host country’s tax level on the volume and frequency of
FDI.7 Simmons (2003) finds a positive relationship between the FDI inflows of a country and
a composite index labeled Corporate Tax Attractiveness Index (CTA). The CTA consists of 13
components, which are concerned with the total level of tax burden (e.g. corporate tax rate,
withholding taxes, double tax relief, etc.), administrative issues (e.g. compliance costs, anti-
avoidance legislation, etc.) and systemic quality (transparency, stability and predictability of
7 Hines (1997) and Devereux (2007) provide comprehensive reviews of the existing literature. Based on
previous studies De Mooij and Ederveen (2003, 2006) and Feld and Heckemeyer (2011) conduct meta-analyses. Early contributions in the field of taxation and FDI are based on aggregate FDI flows (see Hart-man (1984) for pioneering work). Other analyses use aggregated firm-level data on property, plant, and equipment to investigate real economic activity more accurately than FDI in its broad definition (Altshuler et al., 2001; Grubert and Mutti, 1991, 2000; Hines and Rice, 1994). However, due to the underlying data structure, they are not capable of disentangling the discrete location choice and the subsequent continuous choice of the investment level. With the availability of firm-level data, the number of studies examining international location decisions has increased (see the framework developed by Devereux, 2007).
6
tax judgments). Both the scores (scale one to ten) and the weights are based on the assessment
of survey respondents, comprised of executives and tax professionals from around the world.
The data is collected for seven countries (Hong Kong, China, Singapore, Australia, Canada,
United Kingdom and United States of America) and for one year (1999).
Our study goes beyond Simmons (2003) in several ways. Firstly, our dataset consists of
97 rather than just seven countries. Thus, we can analyze worldwide tax-effects rather than few
examples only. Moreover, this allows us to conduct parametric tests, rather than applying Ken-
dall’s tau b, a non-parametric statistic of correlation. Secondly, we collect data for five years
(2005-2009) allowing us to test our hypotheses over time. Thirdly, our dataset is fact based and
involves little judgment, whereas Simmons (2003) bases his research on evaluations and per-
ceptions of professionals. This also explains, why we do not include some of his dimensions
(e.g. transparency and predictability of tax judgments), for which factual data is impossible to
retrieve to the best of our knowledge. Lastly, we use disaggregated company level data (e.g.
Number of Subsidiaries), not aggregated FDI data.
In contrast to our study, tax measures used in prior literature take only very few tax rules
into consideration when analyzing the effect of taxation on location decisions. Most studies use
either the statutory tax rate or they apply model-based effective tax rates which only include
information about the depreciation of assets, financing activities, and the statutory corporate tax
rate. The underlying methodology developed by King and Fullerton (1984) and put forward by
Devereux and Griffith (1999, 2003) is to determine the effective tax burden of a hypothetical
standardized investment project. The basic approach refers to the influence of taxation on an
investment that only earns the cost of capital (effective marginal tax rate) (e.g., Devereux et al.,
2002). However, prior studies claim that location decisions depend on the effective average tax
rate, rather than on the effective marginal tax rate (Devereux and Griffith, 1998). The effective
average tax rate represents the impact of taxes, assuming a higher profitability of the underlying
investment project.8 Huizinga and Laeven (2008) use a tax measure based on the weighted av-
erage of statutory tax rate differences, that is defined with respect to all other countries a mul-
tinational is active in.
Based on the statutory tax rate or the effective tax rate as a proxy for the tax environment
of a country, one strand of literature applies binary choice estimation models to analyze tax
effects on location decisions. Devereux and Griffith (1998) analyze how taxation influences the
decisions of U.S. multinational enterprises whether to place a subsidiary in the UK, France, or
8 Devereux and Griffith (2003) argue that, for the discrete location choice, the effect of taxation on the after-
tax profit of the total investment project is decisive.

7
Germany (conditional on having chosen to produce in Europe) over the years 1980 to 1994. As
expected, they identify the host country’s effective average tax rate (but not the effective mar-
ginal tax rate) to be important for the location decision. Similar to this approach, Buettner and
Ruf (2007) examine the impact of taxation on German outbound FDI in 18 different host coun-
tries between 1996 and 2003. Their results indicate that the statutory tax rate has considerably
more predictive power for the location decision than the effective marginal tax rate. Hebous et
al. (2011) find a similar result when analyzing differences in tax sensitivity between M&A and
Greenfield investments. Consistent with Devereux and Griffith (1998), Buettner and Ruf (2007)
find no effect of the effective marginal tax rate. Barrios et al. (2012) are the first to integrate
parent country taxation into the location choice of European multinational firms over the period
1999-2003.9 Making use of a conditional logit model, their findings suggest that the corporate
taxation of both the host country and the parent country exerts a negative influence. Gumpert
et al. (2012) find that higher foreign non-haven statutory tax rates of German multinational
firms increase their likelihood of investing in a tax haven country. The described effect is sig-
nificant only for firms from the manufacturing sector, but not for service firms. The authors
explain this by the fact, that manufacturing firms have lower marginal costs of income reallo-
cation, due to their more intensive use of intangible property, which allows for easier income
shifting. Desai et al. (2004a) find that haven and non-haven activity of multinationals can be
complementary.
As an alternative method for modeling discrete foreign subsidiary location decisions,
studies applying count data estimation techniques have recently emerged (Becker et al., 2012;
Overesch and Wamser, 2009, 2010; Stöwhase, 2002).10 In contrast to binary choice models,
count data models are able to take the fact that multinational enterprises mostly operate more
than one subsidiary in one host country into consideration. Hence, a count variable contains
more information than a binary variable. Although the regression technique in recent literature
has changed from binary choice models to count data models, the tax measures applied to ex-
plain foreign subsidiary location decisions remain the same: either the statutory tax rate or
model-based effective tax rates are employed. Based on the number of German outbound FDI
positions in 30 European countries over the years 1989 to 2005, Overesch and Wamser (2009)
show that the host country’s effective average tax rate has a negative influence on the location
decision. Furthermore, they aim at investigating asymmetries in tax elasticity depending on
9 Parent country taxation occurs in case of countries that tax the income of multinational enterprises on a
worldwide basis (in contrast to Germany, where foreign dividends are exempt from taxation). 10 On a national level, previously, Papke (1991) has used count data estimation to investigate the influence of
tax rate differentials between U.S. states on the number of firm births in the manufacturing sector.

8
different FDI characteristics. Dividing FDI according to the type of business activity, their anal-
ysis reveals that financial services and R&D activities are most tax sensitive. In line with other
studies, Overesch and Wamser (2009) put forward the argument that the statutory tax rate is
decisive for the location choice of non-manufacturing group units, such as holdings and financ-
ing companies (Overesch and Wamser, 2010; Stöwhase, 2002). Remarkably, they do not find
a significant effect in the case of holding companies.11 Overesch and Wamser (2010) find a
negative impact of the effective average and the statutory tax rate on the location decisions of
German companies in ten eastern European countries.
A different type of effective tax rate is analyzed by Markle and Shackelford (2012).
They empirically investigate accounting effective tax rates based on financial statement infor-
mation. Their analysis reveals that the location of the parent company strongly affects a multi-
national’s worldwide effective tax burden, while the locations of its subsidiaries have much less
impact. Moreover, the authors show that mean values of the financial statement-based effective
tax rates per country are highly correlated with the statutory tax rates of the parents’ home
countries. Dyreng and Lindsey (2009) also investigate effective tax rates based on financial
accounting data. Their findings indicate that U.S. firms with subsidiaries in tax havens face a
lower worldwide tax liability than those who do not operate in tax havens. Overall, the account-
ing effective tax rate approach is interesting for analyzing the ex post tax burdens of multina-
tionals depending on their locations; however, this approach is not suitable for an ex ante anal-
ysis of the influence of a country’s tax environment.
Next to statutory tax rates and tax base determinants, such as depreciation, included in
model-based effective tax rates, few other tax factors have been analyzed so far. Mintz and
Weichenrieder (2010) are the first to investigate indirect group structures empirically. Exploit-
ing data on German outbound FDI, they reveal that multinational enterprises set up holdings in
a third country in order to gain access to favorable tax rules agreed on in a double tax treaty (so
called Treaty Shopping), such as reduced withholding taxes. Moreover, they find that interme-
diate entities may be used to implement tax-efficient financing structures.12 In addition, it is
shown that the existence of a group taxation regime increases the probability of setting up a
country holding.13 Blonigen et al. (2011) confirm the positive effect of double tax treaties on
11 The authors identify holding companies according to industry code. In a similar approach, Stöwhase (2002)
suggests that the effective average tax rate is a significant determinant of real investment. In the case of service, finance and R&D activities, he finds an influence of the statutory tax rate.
12 Mintz (2004) develops a corresponding model. 13 Oestreicher and Koch (2010) empirically analyze the determinants of forming a German tax group. They
reveal that the introduction of the exemption method for corporate shareholders in 2001 leads to an increase in the probability of establishing a tax group.

9
the decision to invest in the other treaty state. However, the fact, that double tax treaties often
also contain information sharing agreements, makes them less attractive for companies that
engage in profit shifting via transfer prices. This effect is especially pronounced, and in some
instances it outweighs the positive effect, for multinational groups exchanging goods internally,
for which external prices can be easily observed (e.g. exchange traded goods). They argue, that
these two opposing effects are the reason for several previous studies (e.g., Blonigen and Da-
vies, 2004) not finding a positive effect of double tax treaties on aggregate FDI. Buettner et al.
(2012) show that the introduction of thin capitalization rules significantly reduces the tax-sen-
sitivity of internal debt usage and Voget (2010) finds that countries that introduce CFC rules
are more likely to be affected by outbound headquarter relocations. Further tax planning strat-
egies involving holding companies can be found, e.g., in Eicke (2009). Bond (1981) demon-
strates that discounted tax rates that are limited in time (tax holidays) increase employment by
attracting foreign companies which establish subsidiaries. At the same time this measure in-
creases company turnover because tax favored companies drive out those whose tax holiday
has expired.
Apparently, existing tax measures focus only on few tax factors. Contributing to exist-
ing literature, we apply the Tax Attractiveness Index, which does not only include tax factors
that determine the location decisions of real investment, but also captures those that may explain
the cross-border location decisions of non-operative group units, such as holdings or similar tax
planning entities.
Mintz and Weichenrieder (2010) descriptively identify the Netherlands, Switzerland,
Luxembourg, and Ireland as favorable holding locations. This evaluation is confirmed by Desai
et al. (2003) who analyze the influence of indirect structures on FDI of U.S. multinational en-
terprises. Typical off-shore tax havens, such as Bermuda, the Bahamas, and the Cayman Islands
do not seem to play a significant role in hosting intermediate companies because they lack a
comprehensive treaty network (Mintz and Weichenrieder, 2010). Still, very low statutory tax
rates that apply in tax havens represent incentives to place subsidiaries there (e.g., as profit-
shifting entities). We aim at analyzing the importance of tax havens for the location of foreign
affiliates. The activities of U.S. multinational enterprises in tax havens have been widely stud-
ied (Desai et al., 2006a; Grubert and Slemrod, 1998; Hines, 2005; Hines and Rice, 1994). How-
ever, evidence for the operations of German multinational firms in tax havens is scarce.14 There-
14 The aforementioned Gumpert et al. (2012) are a recent exemption.

10
fore, this paper seeks to examine the role that tax havens play in the location decisions of Ger-
man multinational enterprises, which are subject to a dividend exemption rather than a credit
regime.
We put forward the theory that the location decisions of multinational enterprises can
be explained by the Tax Attractiveness Index. Hence, we examine the following hypothesis:
The host country’s tax environment as measured by the Tax Attractiveness Index has a
positive influence on the location decisions of German multinational enterprises.
We operationalize the location decisions by counting the number of subsidiaries a Ger-
man DAX30-parent company holds in a distinct host country.
3 Data Description and Empirical Methodology
3.1 Tax Attractiveness Index
As a tax measure that is relevant for the location decisions of multinational enterprises,
we apply the Tax Attractiveness Index (Keller and Schanz, 2013).15 This index intends to pro-
vide a detailed picture of a country’s tax environment. It especially aims at reflecting the tax
planning opportunities offered by a particular location. Therefore, in contrast to existing tax
measures, the Tax Attractiveness Index also captures the tax factors that may sway multinational
enterprises to establish intermediate affiliates, such as holding companies.
The Tax Attractiveness Index covers 18 different tax factors16, including the statutory
tax rate, the taxation of dividends and capital gains, withholding taxes, loss offset provisions,
the group taxation regime, the double tax treaty network, thin capitalization rules, controlled
foreign company (CFC) rules, anti-avoidance legislation, the personal statutory income tax rate
and the existence of a special holding regime. Most of the tax factors are qualitative in nature,
but have been quantified in order to be summarized in one index value per country. All tax
factors are restricted to values between zero and one. In each case, a value of one indicates the
optimum (e.g., a statutory tax rate of 0%; the possibility of cross border group relief; no thin
capitalization rules) while a value of zero signifies least favorable tax conditions (e.g., the high-
est statutory tax rate in the sample; no group relief; the existence of thin capitalization rules).
15 In other contexts, the application of indices is widely accepted. A famous example is the creditor rights
index introduced by La Porta et al. (1998) that has been applied in many subsequent articles (e.g., Djankov et al., 2007; Spamann, 2010). In the sense of Hung (2000), Jacob and Goncharov (2013) construct a tax accrual index that counts accrual norms codified in tax law.
16 The Tax Attractiveness Index described in Keller and Schanz (2013) has been slightly adjusted to reflect the perspective of German multinational companies in this study. We include the withholding taxes on dividends, interest and royalties paid to a German parent and exclude the EU dummy.

11
Adding values for all single tax factors and dividing the sum by 18 yields the country-specific
Tax Attractiveness Index. Thus, the index is constructed using an equal-weighting approach. As
a robustness check, we construct alternative indices based on factor analysis and the regression
results described in this paper (see section 5.2.3 for a detailed description). Consistent with the
single tax factors, the index varies between zero and one with high values indicating an attrac-
tive tax environment. The index is constructed for 40 European countries17, 18 countries that
are situated in Africa and the Middle East, 19 in North and South America, 16 in Asia-Pacific,
and 6 in the Caribbean. It is measured on an annual basis.
As a first element, the index includes the statutory tax rate since it determines the general
level of taxation faced by corporate entities. The statutory tax rate is defined as the corporate
income tax rate plus surcharges and local trade taxes. For the purpose of standardization, it is
put into relation to the highest statutory tax rate of the 99 sample countries. Thus, a value of
one stands for a zero tax rate, while a value of zero is assigned to the highest tax rate in the
sample. Furthermore, the taxation of dividends and capital gains is taken into account. In many
countries, a participation exemption applies which allows the collection of dividends from af-
filiated companies as well as capital gains free of tax. The Tax Attractiveness Index accounts
for the extent to which dividends and capital gains are tax exempt. Next, withholding taxes that
a country levies are measured, since it is very much in the interest of multinational companies
that withholding taxes be abolished since they are one of the major causes of double taxation.
The EU Parent-Subsidiary Directive and the Interest and Royalties Directive are in effect elim-
inating withholding taxes within the European Union. Moreover, in most double tax conven-
tions, the minimization of withholding taxes is codified. To provide a detailed picture, the Tax
Attractiveness Index includes six different withholding tax variables. On the one hand, it covers
withholding taxes on dividends, interest and royalties that are constituted in domestic law. On
the other hand, it considers withholding taxes on dividends, interest and royalties that each host
country levies in its relationship with Germany. In this way, the index accounts for the possi-
bility that either an EU provision or a double tax treaty abolishes or lowers withholding taxes.18
In addition, the Tax Attractiveness Index considers the loss offset provisions that a coun-
try offers by including a variable for loss carry back as well as for loss carry forward opportu-
17 The Tax Attractiveness Index we construct for this study is not calculated for Germany, since we look at non-German subsidiaries only. 18 In its original version, the Tax Attractiveness Index contains a dummy variable indicating whether the re-
spective country is part of the European Union and, therefore, benefits from the EU directives (Keller and Schanz, 2013). However, in this study, we replace the dummy variable with the specific withholding tax rates to Germany, making our analysis more precise for our Germany-related research question.

12
nities. Another included tax factor stands for the possibility of filing a consolidated group re-
turn. Under a group relief scheme losses incurred by one subsidiary can be used to compensate
for profits earned by another group member. As a result, the overall group tax burden is low-
ered. Next, the index includes the number of double tax treaties that a country has concluded.
A comprehensive treaty network may represent an important determinant of the location deci-
sion. By setting up a subsidiary in such countries, companies obtain access to favorable tax
rules agreed upon in a double tax convention that they could not have otherwise exploited.
Furthermore, the index incorporates thin capitalization rules, CFC rules, and a country’s general
anti-avoidance legislation to account for measures that countries put into force in order to secure
tax revenue. From the multinational firms’ perspective, the existence of such provisions is not
desirable as they hinder them from allocating their profits in the most efficient way. Addition-
ally, the Tax Attractiveness Index incorporates the personal income tax rate to allow for the
level of taxation faced by the employees of a subsidiary. As a last criterion, the index considers
whether a jurisdiction offers a special holding regime which decreases the corporate tax burden
below the standard level, for example by offering lower corporate tax rates for holding compa-
nies. Table 1 reports mean values of the Tax Attractiveness Index for 99 countries over the 2005
to 2009 period.19
[Insert Table 1 about here]
3.2 Firm Data
Our empirical analysis is based on a hand-collected data set consisting of the subsidiar-
ies of German DAX30 companies. We consider the DAX30 enterprises to be most suitable for
our purposes since they operate great numbers of subsidiaries in diverse countries all over the
world. Due to their location in Germany, a country that nearly exempts foreign sourced divi-
dends, we can disregard home country taxation. For several reasons, we refrain from using
existing databases. First, the AMADEUS database provided by Bureau van Dijk that has been
used in several previous publications (e.g., Barrios et al., 2012) offers financial data for exclu-
sively European affiliates. Nevertheless, the names and the respective locations of non-Euro-
pean subsidiaries are listed, which would yield sufficient information for our main analysis.
19 With 0.727 countries identified as tax havens by Hines and Rice (1994) have a significantly higher aver-
age index value than non-haven countries (0.481). 13 out of the most attractive 20 countries are identified as tax havens. However, there are several tax havens, such as Lebanon and Panama, which do not appear among the highest ranking peers according to the Tax Attractiveness Index. A similar result is found, if the tax haven definition by the OECD is used (see OECD, 2000, 2009).

13
However, a crosscheck reveals that the database rarely includes all subsidiaries of German
DAX30 companies. At least in some cases, several affiliates are lacking. These are supposed to
be predominantly small ones with minor operating activities. However, we consider including
virtually all subsidiaries in our sample to be important since certain intermediate group units or
small subsidiaries in tax havens might otherwise be disregarded. Next, we took the MiDi data-
base provided by the German Central Bank into consideration. Data collection is enforced by
German law20 and German companies are required to report their investment positions held
abroad if the participation is 10% or more and the balance sheet total of the investment exceeds
€ three million.21 However, small subsidiaries that fall below the threshold do not have to be
reported. Therefore, the MiDi database does not include all foreign German-controlled subsid-
iaries. Comparisons of the number of subsidiaries in our hand-collected data set with randomly
chosen MiDi-based studies reveal much higher numbers in our case. Therefore, to ensure that
the number of subsidiaries is correctly specified and to yield a comprehensive picture of the
affiliates of German DAX30 companies held abroad, we hand-collect our data. Due to the high
level of effort required for data collection, we concentrate solely on the German DAX30 com-
panies. Extending the sample, for example, to non-listed firms offers room for further research.
We source the enumeration of all subsidiaries from the full list of shareholdings which
is part of the group appendix according to German commercial law (Section 313 (2) and Section
285 No. 11 of the German Commercial Code (Handelsgesetzbuch)). The full lists of sharehold-
ings are published in the electronic German Federal Gazette (www.ebundesanzeiger.de) and
the commercial register or they are available on the firm websites. Our sample period covers
the years 2005 to 2009. To avoid survivorship bias, we include parent companies that have been
listed in the DAX30 at any time during the sample period. Furthermore, we restrict our data set
to non-financial firms since financial firms apply different accounting methods22. This leads us
to 28 parent companies. We collect all subsidiaries (legally independent entities) each parent
company holds per year. However, data does not allow differentiating between types of subsid-
iaries (e.g., operative units, holding companies). Although this differentiation seems to be de-
sirable, anecdotal evidence shows that multinationals often establish mixtures of different types,
e.g., to avoid controlled-foreign-corporation rules (CFC-rules) applicable on passive income
20 See Section 26 of the Foreign Trade and Payments Act (Aussenwirtschaftsgesetz) in connection with the
Foreign Trade and Payments Regulation (Aussenwirtschaftsverordnung). 21 For further information about MiDi, see Lipponer (2009). 22 Furthermore, we do not include Fresenius Medical Care AG & Co. KGaA (FMC), since it is owned and consolidated by Fresenius SE. An inclusion of both members of the DAX30 would lead to double- counting the subsidiaries of FMC.

14
only. Taking all five years together, we accumulate a total number of 74,396 subsidiaries lo-
cated in 189 different countries. For each subsidiary, we obtain information on its location, the
group equity share (in %), and its scope of consolidation.23 For a number of 42,572 affiliates,
information on equity is available.
We employ the number of subsidiaries that German multinational enterprises operate
per year in different host countries to analyze the determinants of location decisions. The num-
ber of affiliates represents the sum of location choices in favor of a distinct country. Therefore,
we count the subsidiaries that parent company j holds in year t in host country i. This provides
us with the dependent variable of main interest, Number Subsidiaries.24 For the purpose of more
detailed analyses and to be able to conduct robustness tests, we generate certain alternative
dependent variables. First, we count the number of consolidated subsidiaries (Number Cons.
Subsidiaries) that parent company j holds in year t in host country i. Next, we generate Number
Subsidiaries (relative), defined as the number of subsidiaries that parent company j holds in
year t in host country i divided by the total sum of foreign subsidiaries that parent company j
holds in year t. Furthermore, we sum up the equity that parent company j holds in year t in host
country i measured in mill. EUR (Equity). We also generate Equity (relative), defined as the
sum of equity that parent company j holds in year t in host country i divided by the total sum of
the equity that parent company j holds in year t in foreign countries. For an aggregated analysis,
we count the subsidiaries that all 28 parent companies together hold in year t in host country i
(Number Subsidiaries (all)).
As a next step, we merge the tax data (Tax Attractiveness Index) with our firm sample.
Complete tax data are available for 99 countries, excluding Germany. We have to drop obser-
vations for the British Virgin Islands and Jersey due to a lack of country-level control variables
presented in the next section. Thus, our analysis is based on 97 countries and our initial sample
contains 13,580 observations (28 parent companies × 5 years × 97 countries). We have to drop
observations for Belarus 2005, as we lack tax information (minus 28 observations), and for two
parent companies for which we do not have access to the list of shareholdings for 2005 (minus
2 parent companies × 96 remaining countries for 2005 = 192 observations). Our final sample
consists of 13,360 observations representing 97 different host countries.25
23 We are able to differentiate between consolidated affiliates, non-consolidated affiliates, associated compa-
nies and joint ventures. However, about 70% of the subsidiaries included in our initial sample are consoli-dated affiliates.
24 The following example illustrates our approach: if parent company 1 operates five affiliates in Spain in year 2006, then Number Subsidiaries equals five. The five Spanish subsidiaries count as one observation.
25 Thus, we finally capture 51,075 of the initial 74,396 subsidiaries.

15
The dependent variable that we apply in our main analysis is Number Subsidiaries. Fig-
ure 1 displays its distribution, revealing that our data set contains 6,595 zeros (~ 49.36%).
[Insert Figure 1 about here]
The high number of zeros can be explained by the fact that each of our 28 parent com-
panies does not operate subsidiaries in all 97 host countries in each year of the sample period.
We will address the issue of excess zeros in the next chapter. Summary statistics for all depend-
ent variables used in this study are presented in Table 2 Panel A.
[Insert Table 2 about here]
Number Subsidiaries ranges from zero to 524. The mean is 3.815, revealing that each
German DAX30 company operates on average 3.815 subsidiaries in each of the 97 host coun-
tries per year. Number subsidiaries (all) has a minimum of zero and a maximum of 2,060 affil-
iates, with a mean of about 112, i.e., the German DAX30 companies together have on average
112 subsidiaries in each of the 97 host countries per year. Comparing the mean and median of
Number Subsidiaries and of Number Subsidiaries (all) shows that variance is high in both cases.
Equity of one parent company in one host country goes up to 92 billion EUR per year.
3.3 Econometric Approach
3.3.1 General Econometric Framework
As we want to consider the fact that multinationals might operate more than one sub-
sidiary in one host country, we apply count data regression models, not binary choice models.
We employ Number Subsidiaries that reflects the number of subsidiaries that parent company
j holds in year t in host country i to analyze the effect of taxation on the location decisions of
German multinational enterprises. Thus, our main dependent variable is a count variable, mean-
ing that it has only non-negative integer outcomes. A natural starting point for the analysis of
count data is the Poisson regression model. However, the Poisson model implies that the mean
of the count variable is equal to the conditional variance (equidispersion) (e.g., Winkelmann
and Zimmermann, 1995). In applied research, this assumption is frequently violated. Table 2
Panel A reveals that this is also true in our case: the variance of Number Subsidiaries clearly
exceeds its mean, revealing that our data are overdispersed. Further formal tests to reinsure
descriptive examination likewise reject the null hypothesis of equidispersion. Number Cons.

16
Subsidiaries and Number Subsidiaries (all) that we use as alternative dependent count variables
suffer from overdispersion as well. Hence, the Poisson model is not appropriate in our applica-
tion. However, as it is widely applied, we use it as a benchmark.
Next, we take the negative binomial model into consideration since it is more flexible
than the Poisson model. In the negative binomial model, the conditional variance is specified
differently and, thus, it allows for overdispersion. Specification tests that compare different
model-fits confirm that the negative binomial model is more suitable for our data. Therefore,
we employ the negative binomial model as the preferred specification in our empirical estima-
tions. Precisely, we apply the negative binomial model of type two that allows for overdisper-
sion which increases with the conditional mean (e.g., Cameron and Trivedi, 1998).26
Furthermore, we account for the fact that zero is a frequent observation for Number
Subsidiaries. A zero-inflated negative binomial model is able to handle the large number of
zeros. Therefore, we apply it as an alternative to the negative binomial model (e.g., Cameron
and Trivedi, 2010).27
Moreover, we use OLS estimation as an alternative to count data models. In our robust-
ness checks, the dependent variable is sometimes not a count variable (such as Number Subsid-
iaries (relative), Equity and Equity (relative)). In those cases, we only use OLS estimation.
3.3.2 Regression Equation
Apart from the Tax Attractiveness Index, we include several country-level control vari-
ables to model the location decisions of multinational enterprises. Applying count data models,
we estimate the following regression (with host country i, parent company j and year t):
ijt 0 1 it 2 it 3 it
4 it 5 it 6 it
7
Number Subsidiaries α +β Tax Attractiveness Index +β GDP +β Similarity
+β Distance +β Adjacency +β Ruleof Law
+β Voic it jt ijte& Accountability +α +ε
(1)
As non-tax parameters that may affect the location decision and, hence, the number of
subsidiaries, we take account of GDP, Similarity, Distance, Adjacency, Rule of Law and Voice
& Accountability. All country-level control variables are measured on an annual basis. Moreo-
ver, we include parent-year fixed effects (αjt) to control for exogenous firm-year characteristics.
26 Becker et al. (2012) and Overesch and Wamser (2009) also opt for this version of the negative binomial
model. 27 Working with count data, there is typically no clear cut-off that determines that one model fits better than
another. In our case, specification tests suggest both the negative binomial and the zero-inflated negative binomial model.

17
However, in alternative specifications, parent and year fixed effects are incorporated separately.
The error term is denoted with εijt.
Our independent variable of interest is the Tax Attractiveness Index. The higher the
score, the more attractive the tax environment offered by a host country. Therefore, we expect
the Tax Attractiveness Index to have a positive effect on the location decisions of multinational
enterprises and, thus, we expect it to be positively associated with Number Subsidiaries. Over
our sample period of five years, the Tax Attractiveness Index shows a relatively low within-
country variation over time when compared to the cross-country variation. Hence, the identifi-
cation of the index as a regressor relies on the latter. For this reason, we pool the data over time,
providing us with a pooled cross-sectional data set. Accordingly, we refrain from using panel
data models, but we apply pooled estimation techniques. However, as a consequence, standard
errors may be correlated over time on a within-country basis. To prevent standard errors from
being biased, we take two different measures: first, we include year-fixed effects to control for
special time effects. Second, we cluster the standard errors by country.28
In accordance with the existing literature on the determinants of the location decision,
we take GDP as a first control variable (Buettner and Ruf, 2007; Overesch and Wamser, 2009,
2010). GDP captures the size of the host market and, therefore, we expect it to be positively
related to Number Subsidiaries (Haufler and Wooton, 1999). GDP is defined as the natural
logarithm of host country i’s gross domestic product measured in constant U.S. dollars, based
on the year 2000. Second, we include Similarity as a proxy for similarity in the endowment with
skills and human capital. Similarity is an index expressing the difference between Germany’s
GDP per capita and the GDP per capita of the host country (Buch et al., 2005).29 It is based on
the assumption that a higher GDP represents higher productivity. Though, recent literature sug-
gests using measures, such as school enrollment, that reflect the endowment with skilled labor
more explicitly (Carr et al., 2001; Overesch and Wamser, 2009). Barrios et al. (2012) apply the
logarithm of labor costs. However, data coverage for most of the 97 sample countries is poor.
This is why we rely on the Similarity index. Similarity ranges between zero and one, with high
values indicating that countries are more similar. Expectations regarding the sign of Similarity
are ambiguous (e.g., Barrios et al., 2012). If market access motives dominate (horizontal
model), enterprises are more likely to establish subsidiaries in countries that are similar (e.g.,
28 The clustering by country-year results in lower standard errors. To apply the most conservative specifica-
tion, we therefore cluster standard errors by country. Moreover, standard errors allow for hetero-skedastic-ity.
29 The corresponding formula can be written as: 1-(abs[GDP per capitait – GDP per capita DEUt] / max[GDP per capitait, GDP per capita DEUt]) (Buch et al., 2005). GDP per capita is measured in constant U.S. dollars based on the year 2000, respectively.
18
Markusen, 1984, 2002). This would lead to an expectation of a positive coefficient for Similar-
ity. In contrast, if production cost-saving motives dominate (vertical model), companies set up
affiliates in countries which are dissimilar in their endowment with human capital and skilled
labor (e.g., Helpman, 1984, 1985). This is an argument for a negative association between Sim-
ilarity and Number Subsidiaries.
Next, we control for the geographic distance between Germany and the respective host
country.30 Primarily, geographic distance is regarded as a proxy for transportation costs. More-
over, it may capture cultural distance and, therefore, reflect communication and information
costs incurred due to language barriers and differing business practices (Buch et al., 2005; Carr
et al., 2001; Overesch and Wamser, 2009). Thus, geographic distance should have a negative
effect on the location decisions of multinational enterprises. We apply two different measures
for geographic distance: first, we use Distance, defined as the distance between Germany’s
main agglomeration and the main agglomeration of host country i, weighted by the share of the
agglomeration in the overall country’s population, respectively, provided by the Centre
d'Etudes Prospectives et d'Informations Internationales (CEPII) (Mayer and Zignago, 2011).
Second, we include a dummy variable, obtaining a value of one if host country i shares a border
with Germany (Adjacency) (e.g. Barrios et al., 2012). While we anticipate a negative coefficient
for Distance, we expect Adjacency to have a positive sign.
Finally, we control for the perceptions of governance in respective host countries using
the World Governance Indicators developed by Kaufmann et al. (2010). The authors differen-
tiate six dimensions of governance. We opt for including Rule of Law and Voice & Accounta-
bility.31 Rule of Law reflects the level to which negotiators have confidence in, and stick to the
rules of society. It captures particularly the quality of contract enforcement, property rights, the
police, as well as the probability of crime and violence in host country i. Voice & Accountability
indicates the degree to which citizens of host country i are given the possibility to elect their
government. In addition, it represents the extent to which the freedom of expression, the free-
dom of association and a free media are established. Both governance indicators may range
between -2.5 and 2.5. The higher the score, the better is the perception of governance. Hence,
we expect both variables to be positively related with Number Subsidiaries. Appendix A pro-
vides detailed descriptions of the independent variables used in this study as well as the corre-
sponding data sources. Table 2 Panel B summarizes descriptive statistics for all country-level
30 This is in line with the gravity approach that explains international activity by a combination of mass vari-
ables (e.g., GDP and population) and distance variables (e.g., Bellak et al., 2009). 31 Since the parameters are highly correlated with each other, we are not able to include all six indicators.

19
parameters. The Tax Attractiveness Index ranges between 0.177 indicating the score for Argen-
tina in 2009, and 0.889 reflecting the score for Bermuda and the Bahamas in years 2005 to
2009. The mean and median of the index are close to 0.5. It can be seen that all variables show
sufficient variation. In the appendix, Table B.I presents a correlation matrix for all dependent
and independent variables applied in this study.
4 Results
4.1 Graphical Evaluation
As a first step, we graphically analyze the location of German-controlled subsidiaries.
Figure 2 gives an impression of where parent countries included in our sample place their affil-
iates. On the abscissa, all 97 sample countries are entered in alphabetical order. On the ordinate,
the yearly average of Number Subsidiaries (all), defined as the number of affiliates all sample
parent companies together operate in year t in host country i is plotted.
[Insert Figure 2 about here]
The United States and Great Britain host the highest numbers of subsidiaries. From Fig-
ure 2 it is not possible to deduce motives for the location decisions. However, the increased
numbers of affiliates in both countries might be explained by the close relationship and the
intense trade connections existing with Germany. The United States and Great Britain are large
economies that form important markets for German companies. With regard to the tax environ-
ment as expressed by the Tax Attractiveness Index, Great Britain has a relatively high score (on
average 0.637) while tax conditions in the United States are weak (on average 0.379). The third
highest number of German-controlled subsidiaries is located in the Netherlands. Although the
Netherlands is a neighboring country, this is a somewhat surprising result since the Dutch econ-
omy is not among the largest in Europe. The Netherlands, however, offer a very attractive tax
environment as indicated by an index value of 0.741 on average. Consistent with previous stud-
ies that have identified the Netherlands as an important holding location (Mintz and Weichen-
rieder, 2010), there is reason to assume that some German-controlled subsidiaries located there
do not serve operative purposes, but are established mainly for tax motives. Furthermore, a
considerable number of German-controlled subsidiaries are located in Austria, Switzerland and
Belgium, respectively. Since all countries provide favorable tax conditions (index values of on
average 0.661, 0.644 and 0.664, respectively), taxation might play a role in locating large num-
bers of subsidiaries in these countries.

20
Figure 3 focuses on countries hosting, on average, less than 85 German-controlled sub-
sidiaries per year. In this way, it yields a deeper look into the cloud depicted at the bottom of
Figure 2. Locations with an attractive tax environment as indicated by a high Tax Attractiveness
Index are highlighted.
[Insert Figure 3 about here]
Figure 3 reveals that German multinational enterprises operate subsidiaries in classical
off-shore tax havens. Affiliates are located in countries such as Bermuda, the Bahamas, the
Cayman Islands, and the Netherlands Antilles. Due to the fact that these economies are very
small, there is hardly any operative reason to establish subsidiaries there. The same is true for
highly tax attractive European countries, such as Luxembourg, Liechtenstein, Malta, Cyprus,
and Guernsey. Although absolute figures are low, the mere fact that German multinational en-
terprises establish subsidiaries in these countries may serve as an indication for tax planning
and the existence of tax-optimized group structures. Hence, we can conclude that tax havens
play a role in the location decisions of German multinational firms.
4.2 Regression Results
Table 3 presents results for our regression specified in equation (1). We apply pooled
cross-sectional data. Although specification tests reject the Poisson model, we use it as bench-
mark (column 3). As our preferred model, we apply the negative binomial model since it is
more suitable for our analysis (column 1). Results from employing a zero-inflated model are
reported in column (2). Moreover, we use OLS estimation as an alternative to count data models
(column 4).
[Insert Table 3 about here]
Results reveal that the Tax Attractiveness Index plays a significant role in determining
the number of German-controlled subsidiaries in a particular country. As expected, the Tax
Attractiveness Index is significantly positively associated with Number Subsidiaries in all spec-
ifications. Hence, we can confirm the hypothesis that an attractive tax environment as measured
by the Tax Attractiveness Index has a positive influence on the location decisions of multina-
tional enterprises. Regarding the economic interpretation and the magnitude of the effects ob-
served, we focus on the negative binomial model (column 1). Coefficients can be interpreted as

21
semi-elasticities. However, this direct interpretation is not useful in our setting, since a one-unit
change in the Tax Attractiveness Index cannot be defined. Thus, we make use of the exponen-
tiated coefficients that can be given a multiplicative interpretation (Cameron and Trivedi, 2010).
Hence, a one standard deviation increase in the Tax Attractiveness Index (about 0.147), which
equals approximately the difference in index values between France (0.585) and the Nether-
lands (0.741), is associated with about 37% more subsidiaries (exp0.147×2.151–1=0.372). Evalu-
ated at the mean of Number Subsidiaries (3.815), such an increase in the tax attractiveness
represents about one and a half (1.419) additional subsidiaries that a host country attracts from
each parent company per year. Therefore, we can conclude that our results are not only statis-
tically significant, but also have an economic impact. Since the Tax Attractiveness Index that
combines multiple tax factors proves to be highly significant, our findings reveal that location
decisions depend on a bundle of tax factors, implying that multinational firms carry out tax
planning activities. In line with the graphical evaluation, there is reason to assume that multi-
national enterprises make use of intermediate companies to exploit favorable tax provisions in
distinct countries, thus increasing the number of subsidiaries located there.32
With regard to the non-tax parameters that we include as country-level control variables,
the results in Table 3 show that GDP has a significant influence on the location of German-
controlled subsidiaries. In line with our expectations, the size of the host market is positively
associated with Number Subsidiaries. Economically, the coefficient for GDP can be interpreted
as follows: a one standard deviation change in GDP, which approximately represents the dif-
ference in GDP between Great Britain and Belgium, is related to about 12 additional affiliates
(evaluated at the mean of Number Subsidiaries: (exp1.854 ×0.754–1) x 3.815 = 11.614). In accord-
ance with Overesch and Wamser (2009), we find a significantly negative effect for Similarity,
which is used as a proxy for differences in the endowment with skilled labor. This allows the
conclusion that cost-saving motives realized by differences in factor prices are relevant for lo-
cation decisions as proposed by the vertical model. In magnitude, the coefficient for Similarity
is very close to the estimates presented in Overesch and Wamser (2009). Moreover, our analysis
confirms the findings of previous studies revealing that Distance has a negative impact on lo-
cation decisions (e.g., Buch et al., 2005; Hebous et al., 2011; Overesch and Wamser, 2009).
Like GDP and Similarity, Distance is also highly significant. In contrast, Adjacency, which
indicates whether the host country has a common border with Germany, does not have a signif-
icant effect; however, the coefficient has the predicted sign. As expected, Rule of Law and Voice
32 Our main results hold when the Tax Attractiveness Index in its original version (EU-dummy instead of
withholding taxes to Germany, see Keller and Schanz, 2013) is applied.

22
& Accountability, which serve as proxies for the perceptions of governance in the respective
host country, are positively associated with the number of subsidiaries. However, only Voice &
Accountability proves to be statistically significant.
Qualitatively, the results hold if a zero-inflated model is used (column 2). If alternative
model specifications (Poisson model (column 3), the (less adequate) OLS estimation (column
4) or negative binomial and zero-inflated models with separate parent fixed effects and year
fixed effects (Table B.II in the appendix)) are applied, the Tax Attractiveness Index proves to
be highly significant. In the OLS regression, however, Similarity has no significant influence
on the number of subsidiaries. Though, with respect to the magnitude of the coefficients, the
different models are not directly comparable.
5 Robustness Tests and Further Analyses
5.1 Robustness Tests
In order to check for robustness of our results, we replace our main dependent variable
of interest, Number Subsidiaries, with alternative variables. We first provide an analysis of
Number Subsidiaries (relative), which is defined as the number of subsidiaries that parent com-
pany j operates in year t in host country i divided by the total number of foreign subsidiaries
that parent company j holds in year t. Hence, the dependent variable Number Subsidiaries (rel-
ative) abstracts from absolute numbers. In this way, we address the issue that the denominator
representing the total number of affiliates that a certain parent company operates per year in
foreign countries differs heavily across our sample. Observations range from around 20 to more
than 1,000, revealing that parent companies vary widely in their degree of internationalization.
By using the share of affiliates in a certain host country instead of employing the absolute fig-
ure, cases in which Number Subsidiaries takes on small values may gain importance. Since
Number Subsidiaries (relative) is not a count variable, we apply OLS estimation. Results are
presented in column (1) of Table 4.
[Insert Table 4 about here]
Consistent with our main results, we find that the Tax Attractiveness Index has a signif-
icantly positive effect on Number Subsidiaries (relative). Thus, our results are robust to altering
the dependent variable from absolute to relative values.
Next, we apply the amount of equity that German multinational enterprises locate in
foreign countries as a dependent variable. So far we have treated large and small subsidiaries

23
equally. Equity adds a size dimension to our dataset. A large strand of literature deals with the
influence of taxation on corporate financing structures (e.g., Buettner et al., 2009; Desai et al.,
2004b; Huizinga et al., 2008; Ramb and Weichenrieder, 2005). The rationale behind these stud-
ies is that in most countries interest expenses are deductible for corporate tax purposes while
dividends have to be paid out of profits after tax. Hence, there is a general incentive to prefer
debt financing over equity financing, even for national companies.33 However, multinational
enterprises have the opportunity to allocate their debts across countries in the most efficient
way by means of internal financing strategies. The deductibility of interest expenses is per-
ceived to be most valuable in high-tax countries. From a multinational’s perspective, it is there-
fore advantageous to equip subsidiaries in low tax locations with equity.34 Hence, we expect
the Tax Attractiveness Index to be positively associated with the amount of equity in a particular
location. Though, this prediction is not straightforward, since the statutory tax rate alone seems
to be the decisive tax parameter for financing structures and some countries have high index
values while, at the same time, levying high statutory tax rates. However, there are other tax
factors that might incentivize companies to place large amounts of equity in certain countries,
such as a notional interest deduction or a preferential tax treatment of interest income.35 These
special regimes can be found in countries that offer an attractive tax environment in general as
indicated by the Tax Attractiveness Index. Hence, we expect the Tax Attractiveness Index to
have a positive effect on the amount of equity. We apply two different measures for equity:
first, we use Equity, defined as the sum of equity (in mill. EUR) that parent company j holds in
year t in host country i (weighted by the respective share in equity). Second, we employ Equity
(relative) defined as the sum of equity that parent company j holds in year t in host country i
divided by the total sum of equity that parent company j holds in year t in foreign countries.
Results from OLS estimations are reported in columns (2) and (3) of Table 4. We find that the
coefficient for the Tax Attractiveness Index is significant in both cases, revealing that a host
country’s tax environment has a positive effect on the amount of equity that German multina-
tional enterprises allocate there.
33 To prevent the extensive use of debt financing, some countries enforce thin capitalization rules. 34 Mintz (2004) suggests that financial structures involving an intermediate entity in a low-tax country are
used to achieve a double dip of interest deductions. In such cases, the parent company borrows capital and passes it to the intermediate company in the form of equity. The intermediate company, in turn, lends the capital to another subsidiary located in a high-tax country. Hence, interest can be deducted twice, once at the level of the high-tax affiliate and again at the level of the parent company. Interest is taxed at the level of the intermediate group unit. The overall group tax burden can be decreased if the local tax rate of the interposed company is comparably low or if interest income is subject to a reduced tax rate.
35 A notional interest deduction applies, for instance, in Belgium. It allows the deduction of a fictitious interest on equity.

24
Next, we use Number Subsidiaries (all) as an alternative dependent variable. It specifies
how many affiliates all parent companies together operate in year t in host country i. Since we
refrain from considering each parent country separately, this enables us to analyze the location
decisions of German multinational enterprises in aggregated form (see Figures 2 and 3). We
run count data models and OLS estimation.36 Results are presented in Table B.III in the appen-
dix; our result holds. Taking an aggregated view, the Tax Attractiveness Index still has a signif-
icant impact on the number of subsidiaries and, thus, on the location decisions of German mul-
tinational enterprises. All coefficients for the control variables show the same signs as in our
initial regression. Significance levels also correspond to those depicted in Table 3.
Furthermore, we find, that restricting our sample to fully consolidated subsidiaries only
does not change results and, that our findings hold in each year separately. Our results also hold
when outlier observations are excluded. (results not reported)
5.2 Further Analyses
5.2.1 Statutory Tax Rate and Location Decision
For further analysis, we investigate whether the statutory tax rate can explain the loca-
tion decision of multinational enterprises and, hence, the number of subsidiaries. In previous
studies, the statutory tax rate is often used to identify a country’s tax environment (e.g., Buettner
and Ruf, 2007; Devereux and Griffith, 1998). We analyze the impact of the statutory tax rate in
order to compare it to the influence of the Tax Attractiveness Index. Applying count data mod-
els, we run our regression with the statutory tax rate in replacement of the Tax Attractiveness
Index. Since we employ the statutory tax rate without modifications (i.e., not in standardized
form as it enters the Tax Attractiveness Index), we expect it to be negatively associated with
Number Subsidiaries. Regression results are presented in Table 5.
[Insert Table 5 about here]
In all specifications and in line with previous studies (e.g., Buettner and Ruf, 2007;
Overesch and Wamser, 2009, 2010), the statutory tax rate has the predicted sign. However, in
the zero-inflated model, it proves to be insignificant. In the negative binomial as well as in the
Poisson model, we find a significant effect of the statutory tax rate. However, levels of signifi-
cance are not as high as in the Tax Attractiveness Index. Also, the pseudo-log likelihood is lower
36 Zero is not a frequent observation for Number Subsidiaries (all). Therefore, we refrain from using a zero-
inflated negative binomial model.

25
in comparison with models where the Tax Attractiveness Index is applied (see Tables 3 and B.II
in the appendix). From this, we can conclude that the Tax Attractiveness Index can better ex-
plain the location decisions of multinational enterprises than can the statutory tax rate alone.
An explanation of this, perhaps surprising, result is that the index and the statutory tax rate are
not necessarily highly correlated with each other. Some countries offer an attractive tax envi-
ronment as indicated by the Tax Attractiveness Index although they impose high statutory tax
rates (e.g., the Netherlands and Belgium). Our findings reveal that the location decision depends
on a bundle of tax factors as combined in the Tax Attractiveness Index rather than solely on the
statutory tax rate. Previous studies may thus have underestimated the influence of taxation on
location decisions and potentially suffer from omitted variable bias. This leaves room for fur-
ther research.
5.2.2 Decomposing the Tax Attractiveness Index
To shed light on the question, which of the tax factors included in the Tax Attractiveness
Index mainly drive our finding of an influence on location decisions, we rerun our analysis with
the individual components. A check for multicollinearity using the Variance Inflation Factor
(VIF) reveals that this indicator is below 10, the most commonly applied threshold level to
accept the inclusion of factors, for all components. In order to be even more conservative we
eliminate the two components Withholding Taxes on Royalties paid to a German parent
(WHTRG) and Rule of Law (RoL) to have the VIFs of all components below five.37 We use a
zero-inflated, a negative binomial and a Poisson model. In analogy to the index, we expect
positive coefficients for all subcategories.
[Insert Table 6 about here]
The regression results reported in Table 6 reveal that for our preferred regression mod-
els, negative binomial (column 1) and zero-inflated negative binomial (column 2), the statutory
tax rate (STR), the taxation of dividends received (DIV), the withholding tax rate on interest
paid to a German parent (WHTIG), the withholding tax rate on dividends (WHTD), the treaty
37 After the elimination of WHTRG, six pairs of Tax Attractiveness Index components remain, that exhibit a
correlation of above 0.5 or below -0.5 (not reported): taxation of capital gains (CG) and taxation of divi-dends received (DIV), corporate statutory tax rate (STR) and personal income tax rate (PIT), loss-carry-forward (LCF) and taxation of capital gains (CG), withholding tax rate on interest paid to a German par-ent (WHTIG) and withholding tax rates on interest - no treaty (WHTI), withholding tax rates on interest - no treaty (WHTI) and withholding tax rates on royalties – no treaty (WHTR), personal income tax rate (PIT) and treaty network (DTT).

26
network (DTT) and the existence of a holding regime (HOLD) are positively associated with
Number Subsidiaries. This allows the conclusion that these components contribute to the posi-
tive effect of the Tax Attractiveness Index on location decisions. The Poisson model yields the
same results. Only WHTD loses its significance.
We can conclude that a low corporate statutory tax rate, low withholding tax rates, a
broad double tax treaty network and a favorable holding regime are the key drivers of subsidiary
location decisions.
5.2.3 Test of Alternative Weights of the Tax Attractiveness Index
The Tax Attractiveness Index is part of a growing family of composite indices from
various fields such as accounting, gender studies, or overall economic situations. One often
cited critique of these indices is, that their construction involves several subjective decisions
(Booysen, 2002) . The weighting of the individual components represents one of these deci-
sions. The Tax Attractiveness Index assigns equal weights to its 18 components. In order to
check for robustness, we derive alternative weights using factor analysis and the results from
count-data location regressions. We then compare the resulting indices to our original, equally
weighted index.
In order to find weights based on factor analysis we conduct a standard principal com-
ponent analysis. Applying the Kaiser criterium, we retain six factors that have eigenvalues of
greater than one. These six factors combined explain 73 percent of the total variance of all 18
components. In the next step we varimax-rotate these factors and weight them by their eigen-
values in order to recombine them to an index. We then rerun all the analyses presented in this
paper with the new index. The result is that the outcomes do not materially change (not re-
ported). This finding is supported by Permanyer (2011) who reports that popular composite
indices such as the Human Development Index (HDI), the Gender-related Development Index
(GDI) and the Human Poverty Index (HPI) are robust against the choice of the weighting
scheme.38 McGranahan (1995) and Slottje (1991) get the same result for their self-created in-
dices.
Furthermore, we generate index weightings based on the regression results shown in
Table 6. For each of the three models we generate an index by assigning weights to each of the
38 Permanyer (2011) also finds two indices, the Gender Empowerment Measure (GEM) and the Gender Relative Status (GRS) which are not fully robust against the choice of alternating weighting schemes.
27
included 17 components based on their exponentiated regression coefficients divided by the
sum of the exponentiated coefficients of all 17 components.
[Insert Table 7 about here]
Table 7 shows the Pearson correlations of the three “regression indices” and the “factor
index” with the original, equally weighted Tax Attractiveness Index. With correlations of
greater than 0.97 all indices are highly correlated with the original, equally weighted Tax At-
tractiveness Index. It can be concluded that the Tax Attractiveness Index is fairly stable when
subject to a change in weighting method. We therefore suggest to stick to the equal-weighting
method.
6 Conclusion and Limitations
This paper analyzes whether taxation has an influence on the location decisions of mul-
tinational enterprises. In contrast to previous studies, we are the first to employ a very broad
tax measure available across a broad variety of jurisdictions, the Tax Attractiveness Index (Kel-
ler and Schanz, 2013). Capturing 18 different tax factors, the index aims at providing a detailed
picture of a country’s tax conditions. Employing count data regression models, we find that a
country’s tax environment as measured by the Tax Attractiveness Index has a positive effect on
the number of German-controlled subsidiaries and, therefore, on the location decisions of Ger-
man multinational enterprises. Our results indicate that corporate location decisions depend on
a bundle of tax factors. Specifically, our analysis reveals that German multinational firms place
affiliates in countries that offer favorable tax conditions. Correspondingly, the graphical evalu-
ation shows that German multinational firms operate affiliates in off-shore tax havens. Moreo-
ver, they hold an increased number of subsidiaries in countries with extremely attractive tax
environments, such as the Netherlands, Belgium, Austria, and Switzerland. Hence, there is rea-
son to assume that multinational firms implement indirect group structures by means of holding
companies in third countries and by establishing profit-shifting entities in tax havens. As key
drivers for the influence of taxation on location decisions, we identify the withholding taxes
that a country imposes as well as its double tax treaty network and the existence of a holding
regime. Moreover, in line with previous studies, we reveal that the statutory tax rate is signifi-
cantly associated with the number of subsidiaries. However, we find that the Tax Attractiveness
Index can even better explain the location decisions of multinational enterprises. Prior studies
that use the statutory tax rate as a tax measure may thus have underestimated the influence of

28
taxation on location decisions and potentially suffer from omitted variable bias. We encourage
research to apply the Tax Attractiveness Index instead of the statutory tax rate or other effective
tax rates in future studies.
However, our study suffers from several limitations. Most of them are inherent in the
data set we explore. First, the sample does not yield the linkage between the subsidiaries, mak-
ing it impossible to explore corporate group structures. Therefore, we are not able to analyze
whether the affiliates located in favorable tax locations do in fact serve as intermediate entities.
Moreover, due to the fact that we do not have balance sheet data (e.g., assets, property, plant,
and equipment) or any further information (e.g., employees) about the subsidiaries, we are not
able to identify the type of the respective group unit. Hence, it is impossible to identify whether
a certain subsidiary serves predominantly operative purposes or is a pure holding or profit-
shifting entity. From the (increased number of) subsidiaries that German multinational enter-
prises locate in tax attractive countries, we can only assume that at least some of them are hold-
ing or financial companies with little operative activities. Finally, the sample period that we
have chosen does not cover an overall “event,” such as a tax reform, making it impossible to
conduct a “before and after analysis” in the form of, for example, a difference-in-difference
approach. Therefore, we are not able to verify a causal link between the Tax Attractiveness
Index and location decisions.
Nevertheless, our study has several implications. First, the finding of multinational en-
terprises taking various tax parameters into account when deciding where to locate their sub-
sidiaries is important for governments and politicians. Policy makers might take this into con-
sideration with respect to future tax reforms or the current fight against the tax avoidance of big
multinationals (OECD, 2013). Second, researchers might be interested in learning that several
tax factors besides the statutory tax rate explain location decisions. Thus, regarding the statutory
tax rate as the only important tax signal for a country’s attractiveness will not be sufficient in
the future. Applying a broad measure, such as the Tax Attractiveness Index, in future analyses
might help to reveal a more comprehensive picture of a country’s tax environment. Moreover,
our investigation reveals that German multinational enterprises place their subsidiaries in tax
havens and other tax attractive countries, which supports the assertion that tax motivations,
rather than production costs and market access alone, play a role in the location decisions of
big multinationals.

29
Acknowledgements
We thank Martin Jacob, Igor Goncharov, Martin Ruf, Maximilian André Müller, Caspar David Peter, Holger Theßeling, Robert Risse, Wolfgang Schön, Kai Konrad, and delegates from the European Accounting Association conference in Paris 2013, the German Academic Association for Business Research conference in Würzburg 2013, the Quantitative Research in Taxation conference (arqus.info) in Bochum 2013, workshop participants at WHU – Otto Beisheim School of Management, Otto-von-Guericke University Magdeburg, Ludwig-Maximilians-Uni-versity Munich, and the Max Planck Institute for Tax Law and Public Finance, Munich, for their helpful comments and suggestions.
30
References
Altshuler, R., Grubert, H., Newlon, T.S., 2001. Has U.S. investment abroad become more sensitive to tax rates?, in: Hines, J.R., Jr. (Ed.), International Taxation and Multinational Activity. The University of Chicago Press, Chicago, pp. 9-32.
Barrios, S., Huizinga, H., Laeven, L., Nicodème, G., 2012. International taxation and multina-tional firm location decisions. Journal of Public Economics 96, 946-958.
Becker, J., Fuest, C., 2010. Internationalization and business tax revenue – evidence from Germany. International Tax and Public Finance 17, 174-192.
Becker, S.O., Egger, P.H., Merlo, V., 2012. How low business tax rates attract MNE activity: municipality-level evidence from Germany. Journal of Public Economics 96, 698-711.
Bellak, C., Leibrecht, M., Damijan, J.P., 2009. Infrastructure endowment and corporate in-come taxes as determinants of foreign direct investment in Central and Eastern Euro-pean countries. World Economy 32, 267-290.
Blonigen, B.A., Davies, R.B., 2004. The effects of bilateral tax treaties on U.S. FDI activity. International Tax and Public Finance 11, 601-622.
Blonigen, B.A., Oldenski, L., Sly, N., 2011. Separating the Opposing Effects of Bilateral Tax Treaties. NBER Working Paper 17480.
Bond, E., 1981. Tax holidays and industry behavior. Review of Economics & Statistics 63, 88.
Booysen, F., 2002. An overview and evaluation of composite indices of development. Social Indicators Research 59, 115.
Buch, C.M., Kleinert, J., Lipponer, A., Toubal, F., 2005. Determinants and effects of foreign direct investment: evidence from German firm-level data. Economic Policy 20, 53-110.
Buettner, T., Overesch, M., Schreiber, U., Wamser, G., 2009. Taxation and capital structure choice – evidence from a panel of German multinationals. Economics Letters 105, 309-311.
Buettner, T., Overesch, M., Schreiber, U., Wamser, G., 2012. The impact of thin-capitaliza-tion rules on the capital structure of multinational firms. Journal of Public Economics 96, 930-938.
Buettner, T., Ruf, M., 2007. Tax incentives and the location of FDI: evidence from a panel of German multinationals. International Tax and Public Finance 14, 151-164.
Cameron, A.C., Trivedi, P.K., 1998. Regression Analysis of Count Data. Cambridge Univer-sity Press, Cambridge.
Cameron, A.C., Trivedi, P.K., 2010. Micoeconometrics Using Stata - Revised Edition. Stata Press, Texas.
Carr, D.L., Markusen, J.R., Maskus, K.E., 2001. Estimating the knowledge-capital model of the multinational enterprise. The American Economic Review 91, 693-708.
Collins, C., 2011. iHate Corporate Tax Dodgers: How Apple Avoids Paying Its Fair Share. September 22 2013. http://www.alternet.org/story/151140/ihate_corporate_tax_dodg-ers%3A_how_apple_avoids_paying_its_fair_share.
De Mooij, R.A., Ederveen, S., 2003. Taxation and foreign direct investment: a synthesis of empirical research. International Tax and Public Finance 10, 673-693.

31
De Mooij, R.A., Ederveen, S., 2006. What a difference does it make? Understanding the em-pirical literature on taxation and international capital flows, European Commission Eco-nomic Papers No. 261, Brussels.
Desai, M.A., Foley, C.F., Hines, J.R., 2004a. Economic effects of regional tax havens. Na-tional Bureau of Economic Research Working Paper Series No. 10806.
Desai, M.A., Foley, C.F., Hines Jr, J.R., 2003. Chains of ownership, regional tax competition, and foreign direct investment, in: Herrmann, H., Lipsey, R. (Eds.), Foreign Direct In-vestment in the Real and Financial Sector of Industrial Countries. Springer, Berlin, pp. 61-98.
Desai, M.A., Foley, C.F., Hines Jr, J.R., 2004b. A multinational perspective on capital struc-ture choice and internal capital markets. The Journal of Finance 59, 2451-2487.
Desai, M.A., Foley, C.F., Hines Jr, J.R., 2006a. The demand for tax haven operations. Journal of Public Economics 90, 513-531.
Desai, M.A., Foley, C.F., Hines Jr, J.R., 2006b. Do tax havens divert economic activity? Eco-nomics Letters 90, 219-224.
Deutsche Bundesbank, 2007. Foreign direct investment stock statistics. Special Statistical Publication 10.
Deutsche Bundesbank, 2013. Foreign direct investment stock statistics. Special Statistical Publication 10.
Devereux, M.P., 2007. The impact of taxation on the location of capital, firms and profit: a survey of empirical evidence, Working Paper, Oxford University Centre for Business Taxation No. 702.
Devereux, M.P., Griffith, R., 1998. Taxes and the location of production: evidence from a panel of US multinationals. Journal of Public Economics 68, 335-367.
Devereux, M.P., Griffith, R., 1999. The taxation of discrete investment choices, IFS Working Paper No. W98/16, London.
Devereux, M.P., Griffith, R., 2003. Evaluating tax policy for location decisions. International Tax and Public Finance 10, 107-126.
Devereux, M.P., Griffith, R., Klemm, A., 2002. Corporate income tax reforms and interna-tional tax competition. Economic Policy 17, 449-495.
Djankov, S., McLiesh, C., Shleifer, A., 2007. Private credit in 129 countries. Journal of Fi-nancial Economics 84, 299-329.
Drucker, J., 2010. Google 2.4% Rate Shows How $60 Billion Lost to Tax Loopholes. Bloom-berg. September 22 2013. http://www.bloomberg.com/news/2010-10-21/google-2-4-rate-shows-how-60-billion-u-s-revenue-lost-to-tax-loopholes.html.
Dyreng, S.D., Lindsey, B.P., 2009. Using financial accounting data to examine the effect of foreign operations located in tax havens and other countries on U.S. multinational firms' tax rates. Journal of Accounting Research 47, 1283-1316.
Eicke, R., 2009. Tax Planning with Holding Companies – Repatriation of US Profits from Eu-rope. Kluwer Law International, New York.
Feld, L.P., Heckemeyer, J.H., 2011. FDI and taxation: a meta-study. Journal of Economic Surveys 25, 233-272.
32
Grubert, H., Mutti, J., 1991. Taxes, tariffs and transfer pricing in multinational corporate deci-sion making. Review of Economics & Statistics 73, 285-293.
Grubert, H., Mutti, J., 2000. Do taxes influence where U.S. corporations invest? National Tax Journal 53, 825-839.
Grubert, H., Slemrod, J., 1998. The effect of taxes on investment and income shifting to Puerto Rico. Review of Economics & Statistics 80, 365-373.
Gumpert, A., Hines, J.R., Schnitzer, M., 2012. The use of tax havens in exemption regimes, CEPR Discussion Papers.
Hartman, D.G., 1984. Tax policy and foreign direct investment in the United States. National Tax Journal 37, 475-487.
Haufler, A., Wooton, I., 1999. Country size and tax competition for foreign direct investment. Journal of Public Economics 71, 121-139.
Hebous, S., Ruf, M., Weichenrieder, A.J., 2011. The effects of taxation on the location deci-sion of multinational firms: M&A versus greenfield investments. National Tax Journal 64, 817-838.
Helpman, E., 1984. A simple theory of international trade with multinational corporations. Journal of Political Economy 92, 451-471.
Helpman, E., 1985. Multinational corporations and trade structure. The Review of Economic Studies 52, 443-457.
Hines, J.R., Jr., 1997. Tax policy and the activities of multinational corporations, in: Auer-bach, A.J. (Ed.), Fiscal Policy: Lessons From Economic Research. MIT Press, Cam-bridge, pp. 401-445.
Hines, J.R., Jr., 2005. Do tax havens flourish? Tax Policy and the Economy 19, 65-99.
Hines, J.R., Jr., Rice, E.M., 1994. Fiscal paradise: foreign tax havens and American business. The Quarterly Journal of Economics 109, 149-182.
Huizinga, H., Laeven, L., Nicodeme, G., 2008. Capital structure and international debt shift-ing. Journal of Financial Economics 88, 80-118.
Hung, M., 2000. Accounting standards and value relevance of financial statements: an inter-national analysis. Journal of Accounting and Economics 30, 401-420.
Jacob, M., Goncharov, I., 2013. Why Do Countries Mandate Accrual Accounting for Tax Pur-poses? FAccT Center Working Paper No. 03/2012.
Kaufmann, D., Kraay, A., Mastruzzi, M., 2010. The Worldwide Governance Indicators: meth-odology and analytical issues, World Bank Policy Research Working Paper No. 5430.
Keller, S., Schanz, D., 2013. Measuring tax attractiveness across countries, arqus-Working Paper No. 143.
King, M.A., Fullerton, D., 1984. The Taxation of Income from Capital. University of Chicago Press, Chicago.
La Porta, R., Lopez de Silanes, F., Shleifer, A., Vishny, R.W., 1998. Law and finance. Journal of Political Economy 106, 1113-1155.
Lipponer, A., 2009. Microdatabase direct investment - MiDi. A brief guide, Bundesbank Working Paper, Frankfurt.

33
Markle, K.S., Shackelford, D.A., 2012. Cross-country comparisons of corporate income taxes. National Tax Journal 65, 493-527.
Markusen, J.R., 1984. Multinationals, multi-plant economies, and the gains from trade. Jour-nal of International Economics 16, 205-226.
Markusen, J.R., 2002. Multinational Firms and the Theory of International Trade. MIT Press, Cambridge.
Mayer, T., Zignago, S., 2011. Notes on CEPII’s distances measures: the GeoDist database, CEPII Working Paper 2011-25.
McGranahan, D., 1995. Measurement of development: research at the United Nations Re-search Institute for Social Development. International Social Science Journal 47, 39-59.
Mintz, J.M., 2004. Conduit entities: implications of indirect tax-efficient financing structures for real investment. International Tax and Public Finance 11, 419-434.
Mintz, J.M., Weichenrieder, A.J., 2010. Holding companies and ownership chains, in: Mintz, J.M., Weichenrieder, A.J. (Eds.), The Indirect Side of Direct Investment – Multinational Company Finance and Taxation. MIT Press, Cambridge, pp. 77-120.
OECD, 2000. Towards Global Tax Co-operation: Progress in Identifying and Eliminating Harmful Tax Practices. OECD, Paris.
OECD, 2009. A progress report on the jurisdictions surveyed by the OECD Global Forum in implementing the internationally agreed tax standard. OECD, Paris.
OECD, 2013. Addressing Base Erosion and Profit Shifting. OECD Publishing, Paris.
Oestreicher, A., Koch, R., 2010. The determinants of opting for the German group taxation regime with regard to taxes on corporate profits. Review of Managerial Science 4, 119-147.
Overesch, M., 2009. The effects of multinationals' profit shifting activities on real invest-ments. National Tax Journal 62, 5-23.
Overesch, M., Wamser, G., 2009. Who cares about corporate taxation? Asymmetric tax ef-fects on outbound FDI. World Economy 32, 1657-1684.
Overesch, M., Wamser, G., 2010. The effects of company taxation in EU accession countries on German FDI. Economics of Transition 18, 429-457.
Papke, L.E., 1991. Interstate business tax differentials and new firm location: evidence from panel data. Journal of Public Economics 45, 47-68.
Permanyer, I., 2011. Assessing the robustness of composite indices rankings. Review of In-come & Wealth 57, 306-326.
Ramb, F., Weichenrieder, A.J., 2005. Taxes and the financial structure of German inward FDI. Review of World Economics 141, 670-692.
Simmons, R.S., 2003. An empirical study of the impact of corporate taxation on the global al-location of foreign direct investment: a broad tax attractiveness index approach. Journal of International Accounting, Auditing & Taxation 12, 105-120.
Slottje, D.J., 1991. Measuring the quality of life across countries. Review of Economics & Statistics 73, 684.
Spamann, H., 2010. The “Antidirector Rights Index” revisited. Review of Financial Studies 23, 467-486.

34
Stöwhase, S., 2002. Profit shifting opportunities, multinationals, and the determinants of FDI, Munich Discussion Paper No. 2002-11.
Voget, J., 2010. Relocation of headquarters and international taxation. Journal of Public Eco-nomics 95, 1067-1081.
Winkelmann, R., Zimmermann, K.F., 1995. Recent developments in count data modelling: theory and application. Journal of Economic Surveys 9, 1-24.

35
Figure 1 Distribution of Number Subsidiaries
Figure 1 displays the distribution of Number Subsidiaries, defined as the number of subsidiaries that parent com-pany j operates in year t in host country i. The underlying sample is based on the subsidiaries of 28 German parent companies (DAX30) over years 2005 to 2009. The subsidiaries are situated in 97 different host countries.
02.
000
4.00
06.
000
0 1 2 3 4 5 6 7 8 9 101112131415161718192021222324252627282930
Fre
quen
cy
Number Subsidiaries
…
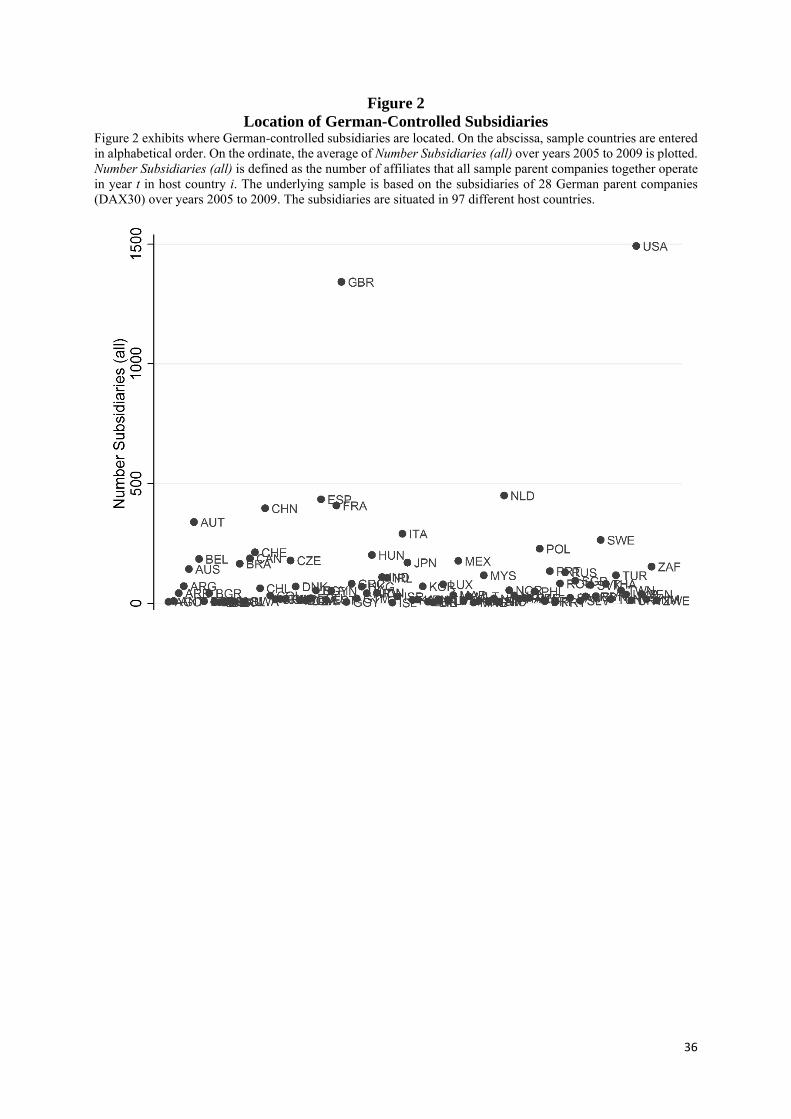
36
Figure 2 Location of German-Controlled Subsidiaries
Figure 2 exhibits where German-controlled subsidiaries are located. On the abscissa, sample countries are entered in alphabetical order. On the ordinate, the average of Number Subsidiaries (all) over years 2005 to 2009 is plotted. Number Subsidiaries (all) is defined as the number of affiliates that all sample parent companies together operate in year t in host country i. The underlying sample is based on the subsidiaries of 28 German parent companies (DAX30) over years 2005 to 2009. The subsidiaries are situated in 97 different host countries.

37
Figure 3 Location of German-Controlled Subsidiaries – Focus on Less-Frequented Countries
Figure 3 exhibits where German-controlled subsidiaries are located. On the abscissa, sample countries are entered in alphabetical order. Only countries for which Number Subsidiaries (all) is lesser than 85 are displayed. On the ordinate, the average of Number Subsidiaries (all) over years 2005 to 2009 is plotted. Number Subsidiaries (all) is defined as the number of affiliates that all sample parent companies together operate in year t in host country i. Locations with an attractive tax environment as indicated by a high Tax Attractiveness Index are highlighted. The underlying sample is based on the subsidiaries of 28 German parent companies (DAX30) over years 2005 to 2009.

38
Table 1 Tax Attractiveness Index per Country
This table reports mean values of the Tax Attractiveness Index (TAX) per sample country over years 2005 to 2009. TAX represents an equally-weighted sum of 18 tax factors. It is restricted to values between zero and one. The closer the TAX is to one, the more attractive is the tax environment that country i offers.
Country (Code) TAX Country (Code) TAX Country (Code) TAX Country (Code) TAX
Algeria (DZA) 0.400 Denmark (DNK) 0.541 Latvia (LVA) 0.543 Portugal (PRT) 0.470
Angola (AGO) 0.415 Dom. Republic (DOM) 0.413 Lebanon (LBN) 0.536 Puerto Rico (PRI) 0.348
Argentina (ARG) 0.177 Ecuador (ECU) 0.466 Liechtenstein (LIE) 0.624 Romania (ROU) 0.483
Australia (AUS) 0.412 Egypt (EGY) 0.375 Lithuania (LTU) 0.460 Russia (RUS) 0.475
Austria (AUT) 0.661 El Salvador (SLV) 0.522 Luxembourg (LUX) 0.754 Saudi Arabia (SAU) 0.533
Bahamas (BHS) 0.889 Estonia (EST) 0.656 Macedonia (MKD) 0.555 Serbia (SRB) 0.453
Bahrain (BHR) 0.838 Finland (FIN) 0.557 Malaysia (MYS) 0.685 Singapore (SGP) 0.750
Bangladesh (BGD) 0.437 France (FRA) 0.585 Malta (MLT) 0.702 Slovak Republic (SVK) 0.593
Belarus (BLR) 0.469 Great Britain (GBR) 0.638 Mauritius (MUS) 0.609 Slovenia (SVN) 0.520
Belgium (BEL) 0.664 Greece (GRC) 0.441 Mexico (MEX) 0.394 South Africa (ZAF) 0.573
Bermuda (BMU) 0.889 Guatemala (GTM) 0.526 Montenegro (MNE) 0.561 Spain (ESP) 0.546
Bolivia (BOL) 0.593 Guernsey (GGY) 0.641 Morocco (MAR) 0.527 Sweden (SWE) 0.623
Botswana (BWA) 0.419 Hong Kong (HKG) 0.614 Namibia (NAM) 0.583 Switzerland (CHE) 0.644
Brazil (BRA) 0.406 Hungary (HUN) 0.579 Netherlands (NLD) 0.741 Taiwan (TWN) 0.352
Br. Virg. Islands (VGB) 0.850 Iceland (ISL) 0.616 Neth. Antilles (ANT) 0.736 Thailand (THA) 0.443
Bulgaria (BGR) 0.503 India (IND) 0.480 New Zealand (NZL) 0.428 Tunisia (TUN) 0.479
Canada (CAN) 0.409 Indonesia (IDN) 0.317 Nicaragua (NIC) 0.522 Turkey (TUR) 0.465
Cayman Islands (CYM) 0.861 Ireland (IRL) 0.707 Nigeria (NGA) 0.509 Ukraine (UKR) 0.540
Chile (CHL) 0.306 Israel (ISR) 0.379 Norway (NOR) 0.654 Unit. Arab Emir. (ARE) 0.850
China (CHN) 0.405 Italy (ITA) 0.441 Pakistan (PAK) 0.402 United States (USA) 0.379
Colombia (COL) 0.326 Japan (JPN) 0.365 Panama (PAN) 0.497 Uruguay (URY) 0.503
Costa Rica (CRI) 0.471 Jersey (JEY) 0.805 Paraguay (PRY) 0.563 Venezuela (VEN) 0.260
Croatia (HRV) 0.485 Kazakhstan (KAZ) 0.442 Peru (PER) 0.240 Vietnam (VNM) 0.500
Cyprus (CYP) 0.742 Kenya (KEN) 0.500 Philippines (PHL) 0.300 Zimbabwe (ZWE) 0.361
Czech Republic (CZE) 0.445 Korea (South) (KOR) 0.261 Poland (POL) 0.459

39
Table 2 Descriptive Statistics
Table 2 reports descriptive statistics for all variables used in this study. Summary statistics for different dependent variables are presented in Panel A. The underlying sample is based on the subsidiaries of 28 German parent com-panies (DAX30) over years 2005 to 2009. The subsidiaries are situated in 97 different host countries. Number Subsidiaries signifies the number of subsidiaries that parent company j operates in year t in host country i. Number Subsidiaries (relative) is defined as the number of subsidiaries that parent company j operates in year t in host country i divided by the total number of foreign subsidiaries that parent company j holds in year t. Equity is the sum of equity (in current mill. EUR) that parent company j holds in year t in host country i. Equity (relative) is the sum of equity (in current mill. EUR) that parent company j holds in year t in host country i divided by the total sum of equity that parent company j holds in year t in foreign countries. Number Cons. Subsidiaries refers to the number of consolidated subsidiaries that parent company j operates in year t in host country i. Number Subsidiaries (all) is the aggregated number of subsidiaries that all 28 parent companies together operate in year t in host country i. Summary statistics for country-level criteria are reported in Panel B. The Tax Attractiveness Index is an index summarizing 18 different tax factors representing host country i’s tax attractiveness. The index is restricted to values between zero and one. High index values indicate a favorable tax environment. GDP is the natural logarithm of host country i’s GDP in constant USD for the year 2000. Similarity is an index defined as one minus the ratio of the absolute value of host country i’s GDP per capita minus Germany’s GDP per capita to the higher of both GDPs per capita (GDP per capita in constant USD for the year 2000, respectively). Distance is defined as the natural logarithm of the population-weighted distance between main agglomerations of Germany and host country i. Adjacency is a dummy variable obtaining the value of one if host country i shares a border with Germany. Rule of Law and Voice & Accountability represent governance indicators of host country i. They may range from -2.5 to 2.5. All country-level variables are measured on an annual basis. See Appendix A for information about country-level variables and data sources.
Panel A: Summary Statistics for Dependent Variables
Variable N Mean Std. Dev. Min. Median Max.
Number Subsidiaries 13,360
3.815
15.071 0.000 1.000 524.000 Number Subsidiaries (rel.) 13,360 0.007 0.020 0.000 0.001 0.457
Equity 13,360 200.660 1,977.657 -19,808.400 0.000 92,177.000
Equity (relative) 13,360 0.006 0.040 -1.866 0.000 0.933 Number Cons. Subsidia-ries 13,360
2.777
12.854 0.000 0.000 515.000
Number Subsidiaries (all) 484 111.774 246.921 0.000 36.000
2,060.000
Panel B: Summary Statistics for Country-Level Variables
Variable N Mean Std. Dev. Min. Median Max. Tax Attractiveness In-dex 13,360 0.520 0.147 0.167 0.504 0.889
GDP 13,360 24.891 1.854 20.846 24.945 30.088
Similarity 13,360 0.367 0.310 0.011 0.240 0.998
Distance 13,360 8.117 1.088 5.934 8.481 9.810
Adjacency 13,360 0.093 0.290 0.000 0.000 1.000
Rule of Law 13,360 0.383 0.995 -1.914 0.508 1.964 Voice & Accountabi-lity 13,360 0.376 0.908 -1.774 0.537 1.782

40
Table 3 Tax Attractiveness and the Location of Subsidiaries – Main Results
This table reports regression results for the location of German-controlled subsidiaries. The dependent variable is Number Subsidiaries, defined as the number of subsidiaries that parent company j operates in year t in host country i. The underlying sample is based on the subsidiaries of 28 German parent companies (DAX30) over years 2005 to 2009. The subsidiaries are situated in 97 different host countries. We apply pooled estimation techniques. In column (1) we use a negative binomial model, in column (2) we apply a zero-inflated model and in column (3) we apply a Poisson model. Column (4) provides results from OLS estimation. To measure host country i’s tax attrac-tiveness, we use the Tax Attractiveness Index. The index summarizes 18 different tax factors and is restricted to values between zero and one. High index values indicate a favorable tax environment. GDP is the natural logarithm of host country i’s GDP in constant USD for the year 2000. Similarity is an index defined as one minus the ratio of the absolute value of host country i’s GDP per capita minus Germany’s GDP per capita to the higher of both GDPs per capita (GDP per capita in constant USD for the year 2000, respectively). Distance is defined as the natural logarithm of the population-weighted great circle distance between main agglomerations of Germany and host country i. Adjacency is a dummy variable obtaining the value of one if host country i shares a border with Germany. Rule of Law and Voice & Accountability represent governance indicators of host country i. They may range from -2.5 to 2.5. All country-level variables are measured on an annual basis (2005-2009). We use parent-year fixed effects in all specifications. Standard errors (shown in parentheses) allow for heteroskedasticity and are clustered by country. ***, **, * indicate statistical significance at 1%, 5%, and 10% level, respectively.
Exp. Negative Binomial
Zero- Inflated Poisson OLS
Sign (1) (2) (3) (4) Tax Attrac-tiveneness + 2.151*** 2.035*** 2.281*** 12.796** Index (0.504) (0.474) (0.740) (5.465) GDP + 0.754*** 0.652*** 0.767*** 3.058*** (0.046) (0.044) (0.047) (0.925) Similarity +/− -1.395*** -0.905*** -1.030*** -2.631 (0.337) (0.295) (0.394) (3.380) Distance − -0.210*** -0.089* -0.361*** -0.939 (0.058) (0.053) (0.094) (0.778) Adjacency + 0.145 0.130 -0.259 -2.427 (0.194) (0.169) (0.217) (3.442) Rule of Law + 0.135 0.0240 0.1330 -0.343 (0.111) (0.104) (0.144) (1.110) Voice & Ac- + 0.378*** 0.292*** 0.206* 1.791** countability (0.109) (0.093) (0.125) (0.817) Parent FE No No No No Year FE No No No No Parent-Year FE Yes Yes Yes Yes Observations 13,360 13,360 13,360 13,360 Pseudo Log L -21,985 -21,050 -36,551 R-squared 0.160

41
Table 4 Tax Attractiveness and the Location of Subsidiaries – Alternative Dependent Variables
This table reports regression results for the location of German-controlled subsidiaries. As a dependent variable, we use Number Subsidiaries (relative) (column 1), defined as the number of subsidiaries that parent company j operates in year t in host country i divided by the total number of foreign subsidiaries that parent company j holds in year t. Moreover, Equity is used as a dependent variable (column 2), defined as the sum of equity (in current mill. EUR) that parent company j holds in year t in host country i. In column (3) the dependent variable is Equity (relative), defined as the sum of equity (in current mill. EUR) that parent company j holds in year t in host country i divided by the sum of equity that parent company j holds in year t in foreign countries. The underlying sample is based on the subsidiaries of 28 German parent companies (DAX30) over years 2005 to 2009 and their respective equity holdings. The subsidiaries are situated in 97 different host countries. We apply pooled estimation tech-niques. In all columns we run OLS regressions. To measure host country i’s tax attractiveness in year t, we use the Tax Attractiveness Index. The index summarizes 18 different tax factors and is restricted to values between zero and one. High index values indicate a favorable tax environment. Furthermore, we include control variables (re-sults not reported): GDP is the natural logarithm of host country i’s GDP in constant USD for the year 2000; Similarity is an index defined as one minus the ratio of the absolute value of host country i’s GDP per capita minus Germany’s GDP per capita to the higher of both GDPs per capita (GDP per capita in constant USD for the year 2000, respectively); Distance is defined as the natural logarithm of the population-weighted great circle distance between main agglomerations of Germany and host country i; Adjacency is a dummy variable obtaining the value of one if host country i shares a border with Germany; Rule of Law and Voice & Accountability represent govern-ance indicators of host country i. They may range from -2.5 to 2.5. All country-level variables are measured on an annual basis (2005-2009). In all columns, we use parent-year fixed effects. Standard errors (shown in parentheses) allow for heteroskedasticity and are clustered by country. ***, **, * indicate statistical significance at 1%, 5%, and 10% level, respectively.
Number Sub-sidia-
ries (relative) Equity Equity
(relative) (1) (2) (3) Tax Attractiveness Index 0.023*** 937.612** 0.028** (0.009) (401.352) (0.011) Controls Yes Yes Yes Parent FE No No No Year FE No No No Parent-Year FE Yes Yes Yes Observations 13,360 13,360 13,360 R-squared 0.235 0.048 0.068

42
Table 5 Tax Attractiveness and the Location of Subsidiaries – Statutory Tax Rate
This table reports regression results for the location of German-controlled subsidiaries. The dependent variable is Number Subsidiaries, defined as the number of subsidiaries that parent company j operates in year t in host country i. The underlying sample is based on the subsidiaries of 28 German parent companies (DAX30) over years 2005 to 2009. The subsidiaries are situated in 97 different host countries. We apply pooled estimation techniques. In columns (1) and (2), we use negative binomial models and in columns (3) and (4) we apply zero-inflated models. Column (5) provides results from estimating a Poisson model. To measure host country i’s tax attractiveness in year t, we use the statutory tax rate imposed. Furthermore, we include control variables (results not reported): GDP is the natural logarithm of host country i’s GDP in constant USD for the year 2000; Similarity is an index defined as one minus the ratio of the absolute value of host country i’s GDP per capita minus Germany’s GDP per capita to the higher of both GDPs per capita (GDP per capita in constant USD for the year 2000, respectively); Distance is defined as the natural logarithm of the population-weighted great circle distance between main agglomerations of Germany and host country i; Adjacency is a dummy variable obtaining the value of one if host country i shares a border with Germany; Rule of Law and Voice & Accountability represent governance indicators of host country i. They may range from -2.5 to 2.5. All country-level variables are measured on an annual basis (2005-2009). We use parent and year fixed effects in columns (1) and (3). In columns (2), (4) and (5), we use parent-year fixed effects. Standard errors (shown in parentheses) allow for heteroskedasticity and are clustered by country. ***, **, * indicate statistical significance at 1%, 5%, and 10% level, respectively.
Negative Binomial Zero-Inflated Poisson (1) (2) (3) (4) (5)
Statutory Tax Rate -1.393* -1.385* -0.959 -0.933 -2.243** (0.827) (0.824) (0.662) (0.654) (0.966) Controls Yes Yes Yes Yes Yes Parent FE Yes No Yes No No Year FE Yes No Yes No No Parent-Year FE No Yes No Yes Yes Observations 13,360 13,360 13,360 13,360 13,360 Pseudo Log L -22,213 -22,118 -21,343 -21,215 -37,011

43
Table 6 Tax Attractiveness and the Location of Subsidiaries – Test of Single Components
This table reports regression results for the location of German-controlled subsidiaries. The dependent variable is Number Subsidiaries, defined as the number of subsidiaries that parent company j operates in year t in host country i. The underlying sample is based on the subsidiaries of 28 German parent companies (DAX30) over years 2005 to 2009. The subsidiaries are situated in 97 different host countries. We apply pooled estimation techniques. In column (1) we use a negative binomial model, in column (2) we apply a zero-inflated model and in column (3) we apply a Poisson model. Column (4) reports the Variance Inflation Factors. To measure host country i’s tax attractiveness, we use the individual components of the Tax Attractiveness Index excluding withholding taxes on royalties paid to Ger-man parents, which was eliminated due to multicollinearity reasons. The components are restricted to values between zero and one. High index values indicate a favorable tax environment. The 17 included Tax Attractiveness Index components are: the statutory tax rate (STR), the taxation of dividends (DIV), the taxation of capital gains (CG), withholding taxes on dividends, interest and royalties (WHTD, WHTI and WHTR), the respective withholding taxes for interest and dividends in relation to Germany (WHTIG and WHTDG), loss carry forward (LCF), loss carry back (LCB), group taxation (GROUP), thin capitalization rules (THIN), controlled foreign company rules (CFC), anti-avoidance legislation (AAL), double tax treaties (DTT) and the existence of a holding regime (HOLD), personal income tax rate (PIT). We use five control variables including GDP, Similarity, Distance, Adjacency and Voice & Account-ability. Rule of Law was eliminated due to multicollinearity reasons. We use parent-year fixed effects in all specifica-tions. Standard errors allow for heteroskedasticity and are clustered by country. ***, **, * indicate statistical signifi-cance at 1%, 5%, and 10% level, respectively.
Negative Zero- Exp. Binomial Inflated Poisson VIF
Sign (1) (2) (3) (4)
STR + 0.573 * 0.709 ** 0.826 ** 2.72 DIV + 0.229 ** 0.235 ** 0.073 2.35 CG + -0.026 -0.135 -0.041 2.26 WHTD + 0.447 ** 0.443 ** 0.246 3.21 WHTDG + 0.071 -0.011 0.256 2.86 WHTI + -0.265 -0.139 0.122 3.08 WHTIG + 0.746 ** 0.775 ** 1.320 *** 3.55 WHTR + 0.081 0.068 -0.159 2.43 LCB + -0.022 0.041 -0.026 1.69 LCF + 0.204 0.152 0.196 1.84 GROUP + 0.158 0.204 0.029 1.88 THIN + -0.187 -0.136 -0.164 1.80 CFC + 0.051 -0.021 0.163 2.30 AAL + -0.133 -0.096 -0.320 1.59 DTT + 0.851 ** 0.703 ** 0.632 4.30 HOLD + 0.386 *** 0.465 *** 0.452 *** 1.59 PIT + -0.436 -0.388 -0.407 3.09
Controls Yes Yes Yes Parent Year FE Yes Yes Yes Observations 13,360 13,360 13,360 Pseudo Log -21,719 -21,622 -35,212 Likelihood

44
Table 7 Correlations of Indices with Alternative Weights
This table reports correlation coefficients for six versions of the Tax Attractiveness Index with the original equally-weighted index version (1). Version (2) is an index resulting from the six factors derived by principal component analysis. The six factors are weighted by their eigenvalues. Versions (3)-(5) are indices consisting of the original Tax Attractiveness components excluding withholding taxes on royalties paid to a German parent (WHTRG). The weights for these components are derived from the coefficients of the location regressions reported in Table 6, where the exponentiated coefficient of a component is divided by the sum of all components’ exponentiated coefficients. The index values are calculated on an annual basis (2005-2009) for each country separately.
Tax Attractiveness Index (1) Equally-weighted (original)
(1) Equally-weighted (original) 1.000 (2) Factor analysis 0.972 (3) Poisson 0.987 (4) Negative binomial 0.990 (5) Zero-inflated negative binomial 0.992

45
Appendix A: Variable Definitions
Tax Attractiveness Index Index covering 18 different tax factors. The index represents host country i’s tax attractiveness and is constrained to values between zero and one. The more the index approaches one, the more attractive the tax environment that host country i offers. The index is measured on an annual basis (2005-2009). Data sources: The Global Corporate Tax Handbook and the European Tax Handbook published by the International Bureau of Fiscal Documentation (IBFD), PricewaterhouseCoopers’ Corporate Taxes – Worldwide Summaries and Individual Taxes – World-wide Summaries, Ernst & Young’s Worldwide Corporate Tax Guide, Deloitte’s Taxation and Investment Guides, KPMG’s Corporate Tax Rate Survey and Individual Income Tax Rate Survey, and the OECD tax database.
GDP Logarithm of host country i’s gross domestic product measured
in constant U.S. dollars based on the year 2000. GDP is meas-ured on an annual basis. Data sources: World Development In-dicators of the World Bank. For Taiwan, we source data from the National Statistics of China (Taiwan) (http://eng.stat.gov.tw/) and the Directorate-General of Budget, Accounting and Statistics, Executive Yuan, R.O.C. Taiwan (http://eng.dgbas.gov.tw/). For the Netherlands Antilles, we source data from the Central Bureau of Statistics Curaçao (http://www.cbs.cw/) and Statistics Netherlands (http://www.cbs.nl/). For the Cayman Islands, we source data from the Economics and Statistics Office, Government of the Cayman Islands (http://www.eso.ky/). For Guernsey, we source data from the States of Guernsey (http://www.gov.gg/).
Similarity An index reflecting the difference between Germany’s gross do-
mestic product per capita and the gross domestic product per capita of host country i. The index is defined as one minus the ratio of the absolute value of host country i’s gross domestic product per capita minus Germany’s gross domestic product per capita to the higher of both gross domestic products per capita. Gross domestic product per capita is measured in constant U.S. dollars based on the year 2000, respectively. The index uses val-ues between one and zero; a higher score indicates that countries are more similar. Similarity is measured on an annual basis. Data source: World Development Indicators of the World Bank. For Taiwan, we source data from the National Statistics of China (Taiwan) (http://eng.stat.gov.tw/) and the Directorate-General of Budget, Accounting and Statistics, Executive Yuan, R.O.C. Taiwan (http://eng.dgbas.gov.tw/). For the Netherlands Antil-les, we source data from the Central Bureau of Statistics Cura-çao (http://www.cbs.cw/) and Statistics Netherlands (http://www.cbs.nl/). For the Cayman Islands, we source data from the Economics and Statistics Office, Government of the

46
Cayman Islands (http://www.eso.ky/). For Guernsey, we source data from the States of Guernsey (http://www.gov.gg/).
Distance The great circle distance between Germany’s main agglomera-
tion and host country i’s main agglomeration, weighted by the share of the agglomeration in the overall country’s population, respectively. Data source: Centre d'Etudes Prospectives et d'In-formations Internationales (CEPII). For Liechtenstein, we take the Swiss value (Zurich). For Montenegro, we take the Serbian value (Belgrade). For Guernsey, we take the value of Great Brit-ain (London).
Adjacency A dummy variable obtaining the value of one if host country i
shares a border with Germany. Rule of Law Reflecting the level to which negotiators have confidence in and
stick to the rules of society. It captures particularly the qualities of contract enforcement, property rights, the police, as well as the probability of crime and violence in host country i. Rule of Law may range between -2.5 and 2.5 and is measured on an an-nual basis. Data source: World Governance Indicators of the World Bank. For Guernsey, we take the value of Great Britain.
Voice & Accountability Indicating the degree to which citizens of host country i are
given the possibility to elect their government. In addition, it represents the extent to which the freedom of expression, the freedom of association, and a free media are established in host country i. Voice & Accountability may range between -2.5 and 2.5 and is measured on an annual basis. Data source: World Governance Indicators of the World Bank. For Guernsey, we take the value of Great Britain.

47
Appendix B: Additional Analysis Table B.I
Correlation between Different Dependent Variables and Country-Level Controls This table reports correlation coefficients for all variables used in this study. The underlying sample for all dependent variables used (1-6) is based on the subsidiaries of 29 German parent companies (DAX30) over years 2005 to 2009. The subsidiaries are situated in 97 different host countries. Number Subsidiaries signifies the number of subsidi-aries that parent company j operates in year t in host country i. Number Subsidiaries (relative) is defined as the number of subsidiaries that parent company j operates in year t in host country i divided by the total number of foreign subsidiaries that parent company j holds in year t. Equity is the sum of equity (in current mill. EUR) that parent company j holds in year t in host country i. Equity (relative) is the sum of equity (in current mill. EUR) that parent company j holds in year t in host country i divided by the total sum of equity that parent company j holds in year t in foreign countries. Number Cons. Subsidiaries refers to the number of consolidated subsidiaries that parent company j operates in year t in host country i. Number Subsidiaries (all) is the aggregated number of subsidiaries that all 28 parent companies together operate in year t in host country i. Tax Attractiveness Index is an index summarizing 18 different tax factors representing host country i’s tax attractiveness. The index is restricted to values between zero and one. High index values indicate a favorable tax environment. GDP is the natural logarithm of host country i’s GDP in constant USD for the year 2000. Similarity is an index defined as one minus the ratio of the absolute value of host country i’s GDP per capita minus Germany’s GDP per capita to the higher of both GDPs per capita (GDP per capita in constant USD for the year 2000, respectively). Distance is defined as the natural logarithm of the population-weighted great circle distance between main agglomerations of Germany and host country i. Adjacency is a dummy variable obtaining the value one if host country i shares a border with Germany. Rule of Law and Voice & Accountability represent governance indicators of host country i. They may range from -2.5 to 2.5. All country-level variables are measured on an annual basis. Insignificant correlations (p ≥ 0.1) are reported in italics.
(1) (2) (3) (4) (5) (6) (7) (8) (9) (10) (11) (12) (13) (1) Number Subsidiaries 1.00 (2) Number Subsidiaries (relative) 0.76 1.00 (3) Equity 0.35 0.35 1.00 (4) Equity (relative) 0.36 0.53 0.63 1.00 (5) Number Cons. Subsidiaries 0.97 0.74 0.32 0.35 1.00 (6) Number Subsidiaries (all) 0.51 0.69 0.32 0.39 0.47 1.00 (7) Tax Attractiveness Index -0.00 -0.01 0.02 0.04 -0.00 -0.02 1.00 (8) GDP 0.31 0.44 0.15 0.19 0.27 0.57 -0.36 1.00 (9) Similarity 0.18 0.24 0.10 0.15 0.16 0.32 0.36 0.35 1.00 (10) Distance -0.10 -0.11 -0.06 -0.10 -0.08 -0.15 -0.32 0.01 -0.29 1.00 (11) Adjacency 0.10 0.16 0.07 0.13 0.09 0.17 0.20 0.20 0.34 -0.55 1.00 (12) Rule of Law 0.16 0.22 0.10 0.15 0.15 0.30 0.44 0.20 0.81 -0.40 0.35 1.00 (13) Voice & Accountability 0.13 0.18 0.08 0.13 0.12 0.24 0.25 0.09 0.64 -0.39 0.35 0.79 1.00

48
Table B.II Tax Attractiveness and the Location of Subsidiaries – Alternative Specifications
This table presents regression results for the location of German-controlled subsidiaries. The dependent variable is Number Subsidiaries, defined as the number of subsidiaries that parent company j operates in year t in host country i. The underlying sample is based on the subsidiaries of 28 German parent companies (DAX30) over years 2005 to 2009. The subsidiaries are situated in 97 different host countries. We apply pooled estimation techniques. In column (1) we use a negative binomial model and in column (2) we apply a zero-inflated model. To measure host country i’s tax attractiveness we use the Tax Attractiveness Index. The index summarizes 18 different tax factors and is restricted to values between zero and one. High index values indicate a favorable tax environment. GDP is the natural logarithm of host country i’s GDP in constant USD for the year 2000. Similarity is an index defined as one minus the ratio of the absolute value of host country i’s GDP per capita minus Germany’s GDP per capita to the higher of both GDPs per capita (GDP per capita in constant USD for the year 2000, respectively). Distance is defined as the natural logarithm of the population-weighted great circle distance between main ag-glomerations of Germany and host country i. Adjacency is a dummy variable obtaining the value one if host country i shares a border with Germany. Rule of Law and Voice & Accountability represent governance indicators of host country i. They may range from -2.5 to 2.5. All country-level variables are measured on an annual basis (2005-2009). In both columns, we use parent and year fixed effects separately. Standard errors (shown in parentheses) allow for heteroskedasticity and are clustered by country. ***, **, * indicate statistical significance at 1%, 5%, and 10% level, respectively.
Exp. Negative Binomial Zero-Inflated Sign (1) (2) Tax Attractiveness Index + 2.134*** 2.040*** (0.504) (0.475) GDP + 0.753*** 0.653*** (0.046) (0.045) Similarity +/− -1.395*** -0.909*** (0.336) (0.297) Distance − -0.208*** -0.088* (0.058) (0.052) Adjacency + 0.145 0.130 (0.194) (0.169) Rule of Law + 0.139 0.024 (0.112) (0.105) Voice & Accountability + 0.377*** 0.297*** (0.109) (0.093) Parent FE Yes Yes Year FE Yes Yes Parent-Year FE No No Observations 13,360 13,360 Pseudo Log L -22,085 -21,182

49
Table B.III Tax Attractiveness and the Location of Subsidiaries – Aggregated Country Analysis
This table reports regression results for the location of German-controlled subsidiaries. The dependent variable is Number Subsidiaries (all) defined as the aggregated number of subsidiaries that all 28 parent firms together operate in year t in host country i. The underlying sample is based on the subsidiaries of 28 German parent companies (DAX30) over years 2005 to 2009. The subsidiaries are situated in 97 different host countries. We apply pooled estimation techniques. In column (1) we use a Poisson model and in column (2) we apply a negative binomial model. Column (3) provides results from OLS estimation. To measure host country i’s tax attractiveness, we use the Tax Attractiveness Index. The index summarizes 18 different tax factors and is restricted to values between zero and one. High index values indicate a favorable tax environment. GDP is the natural logarithm of host country i’s GDP in constant USD for the year 2000. Similarity is an index defined as one minus the ratio of the absolute value of host country i’s GDP per capita minus Germany’s GDP per capita to the higher of both GDPs per capita (GDP per capita in constant USD for the year 2000, respectively). Distance is defined as the natural logarithm of the population-weighted great circle distance between main agglomerations of Germany and host country i. Adja-cency is a dummy variable obtaining the value of one if host country i shares a border with Germany. Rule of Law and Voice & Accountability represent governance indicators of host country i. They may range from -2.5 to 2.5. All country-level variables are measured on an annual basis (2005-2009). We use year fixed effects in all specifi-cations. Standard errors (shown in parentheses) allow for heteroskedasticity and are clustered by country. ***, **, * indicate statistical significance at 1%, 5%, and 10% level, respectively.
Exp. Poisson Negative Binomial OLS
Sign (1) (2) (3) Tax Attractiveness In-dex + 2.061*** 1.899*** 358.822** (0.750) (0.559) (156.421) GDP + 0.786*** 0.720*** 92.453*** (0.048) (0.051) (30.472) Similarity +/− -1.124*** -1.126*** -96.043 (0.403) (0.367) (113.608) Distance − -0.354*** -0.190*** -23.989 (0.089) (0.061) (22.841) Adjacency + -0.269 0.184 -82.313 (0.201) (0.212) (98.392) Rule of Law + 0.185 0.093 -1.393 (0.148) (0.104) (37.030) Voice & Accountabi-lity + 0.209* 0.342*** 52.650** (0.118) (0.110) (24.263) Year FE Yes Yes Yes Observations 484 484 484 Pseudo Log L -7,136 -2,202 R-squared 0.401

Impressum: Arbeitskreis Quantitative Steuerlehre, arqus, e.V. Vorstand: Prof. Dr. Ralf Maiterth (Vorsitzender), Prof. Dr. Kay Blaufus, Prof. Dr. Dr. Andreas Löffler Sitz des Vereins: Berlin Herausgeber: Kay Blaufus, Jochen Hundsdoerfer, Martin Jacob, Dirk Kiesewetter, Rolf J. König, Lutz Kruschwitz, Andreas Löffler, Ralf Maiterth, Heiko Müller, Jens Müller, Rainer Niemann, Deborah Schanz, Sebastian Schanz, Caren Sureth, Corinna Treisch Kontaktadresse: Prof. Dr. Caren Sureth, Universität Paderborn, Fakultät für Wirtschaftswissenschaften, Warburger Str. 100, 33098 Paderborn, www.arqus.info, Email: [email protected]
ISSN 1861-8944
Related Documents