Tata motors Ltd. VS Mahindra and Mahindra Ltd. Page 1 AND Financial analysis Ghaziabad 2015 Submitted By: Group 5 Name Roll No. Email Phone No. Swapnil Bartaria 140301021 [email protected] +919810047743 Vaibhav Prakash 140301022 [email protected] +919971626680 Vibhu Gaur 140301023 [email protected] +919891972062 Vivek Pandey 140301024 [email protected] +919870503010 Yogesh Saini 140301025 [email protected] +919311550038 UNDER THE GUIDANCE OF Dr. Sachin Choudhry

tata motors vs mahindra and mahindra
Aug 05, 2015
Welcome message from author
This document is posted to help you gain knowledge. Please leave a comment to let me know what you think about it! Share it to your friends and learn new things together.
Transcript

Tata motors Ltd. VS Mahindra and Mahindra Ltd. Page 1
AND
Financial analysis
Ghaziabad
2015
Submitted By: Group 5
Name Roll No. Email Phone No.
Swapnil Bartaria 140301021 [email protected] +919810047743
Vaibhav Prakash 140301022 [email protected] +919971626680
Vibhu Gaur 140301023 [email protected] +919891972062
Vivek Pandey 140301024 [email protected] +919870503010
Yogesh Saini 140301025 [email protected] +919311550038
UNDER THE GUIDANCE OF
Dr. Sachin Choudhry

Tata motors Ltd. VS Mahindra and Mahindra Ltd. Page 2
COMPANY BACKGROUND
Tata Motors Limited is India’s largest automobile company, with consolidated revenues of INR 2, 32,834 crores (USD 38.9 billion) in 2013-14. It is the leader in commercial vehicles in each segment, and among the top in passenger vehicles with winning products in the compact, midsize car and utility vehicle segments. Its products include passenger cars, trucks, vans, coaches, buses, construction equipment and military vehicles.
It is the world's 17th-largest motor vehicle manufacturing company, fourth-largest truck manufacturer, and second-largest bus manufacturer by volume.
The Tata Motors Group’s over 60,000 employees are guided by the mission “to be passionate in anticipating and providing the best vehicles and experiences that excite our customers globally.''
Established in 1945, Tata Motors’ presence cuts across the length and breadth of India. Over 8 million Tata vehicles ply on Indian roads, since the first rolled out in 1954.
The foundation of the company’s growth over the last 69 years is a deep understanding of economic stimuli and customer needs, and the ability to translate them into customer-desired offerings through leading edge R&D.
Tata Motors has auto manufacturing and assembly plants in Jamshedpur, Pantnagar, Lucknow, Sanand, Dharwad, and Pune in India, as well as in Argentina, South Africa, Thailand, and the United Kingdom. It has research and development centres in Pune, Jamshedpur, Lucknow, and Dharwad, India, and in South Korea, Spain, and the United Kingdom.
Tata Motors' principal subsidiaries include the British premium car maker Jaguar Land Rover (the maker of Jaguar, Land Rover, and Range Rover cars) and the South Korean commercial vehicle manufactuer Tata Daewoo. Tata Motors has a bus-manufacturing joint venture with Marcopolo S.A.(Tata Marcopolo), a construction-equipment manufacturing joint venture with Hitachi (Tata Hitachi Construction Machinery), and a joint venture with Fiat which manufactures automotive components and Fiat and Tata branded vehicles.
The milestones achieved by the company in 2013 are:
Tata Nano becomes the first Auto Brand in India to cross 3 million fans on Facebook.
The Tata Indigo eCS enters Limca Book of Records.
Tata Motors' Jamshedpur plant rolls out its two millionth truck.
Tata Nano offered industry first phenomenon - Swipe your credit card and drive home a Nano.
Tata Motors launches the world-class range of Tata PRIMA trucks in Sri Lanka
Tata Motors is listed on the Bombay Stock Exchange, where it is a constituent of the BSE SENSEX index, the National Stock Exchange of India, and the New York Stock Exchange. Tata Motors is ranked 314th in the 2012 Fortune Global 500 ranking of the world's biggest corporations.
Tata motors Ltd. VS Mahindra and Mahindra Ltd. Page 3
COMPANY BACKGROUND
Mahindra & Mahindra Limited (M&M) is an Indian multinational automobile manufacturing corporation headquartered in Mumbai, Maharashtra, India.It is one of the largest vehicle manufacturers by production in India and the largest seller of tractors across the world. It is a part of Mahindra Group, an Indian conglomerate.
Mahindra & Mahindra was established on October 2, 1945 when K.C. Mahindra visited the United States of America as Chairman of the India Supply Mission. He met Barney Roos, inventor of the rugged 'general purpose vehicle' or Jeep and had a flash of inspiration: wouldn't a vehicle that had proved its invincibility on the battlefields of World War II be ideal for India's rugged terrain and its kutcha rural roads. Swift action followed thought. The Mahindra brothers joined hands with a distinguished gentleman called Ghulam Mohammed. And, Mahindra & Mohammed was set up as a franchise for assembling jeeps from Willys, USA. Two years later, India became an independent nation and Mahindra & Mohammed changed its name to Mahindra & Mahindra. Ghulam Mohammed migrated to Pakistan post-partition and became the first Finance Minister of Pakistan.
Mahindra & Mahindra is the only Indian company among the top three tractor manufacturers in the world. The Group has a leading presence in key sectors of the Indian economy. The Group employs over 50,000 people and has several state-of-the-art facilities in India and overseas.
Mahindra & Mahindra has comprehensive manufacturing facilities with high level of vertical integration. These manufacturing plants keep abreast with the latest technology to meet the growing market expectations.
In addition to making groundbreaking UVs like the Scorpio and Bolero, Mahindra & Mahindra offers cars, electric vehicles, pickups, and commercial vehicles that are rugged, reliable, environmentally friendly, and fuel-efficient. The acquisition of the Ssangyong Motor Company in 2011, brought a major South Korean utility manufacturer with a presence in more than 90 countries into the Mahindra fold. The global presence of Mahindra & Mahindra means that its vehicles can be found on the roads—both paved and unpaved—of Australia, Europe, Latin America, Malaysia, South Korea, and South Africa.
It produces SUVs, saloon cars, pickups, commercial vehicles, and two wheeled motorcycles and tractors. It owns assembly plants in India, Mainland China (PRC), the United Kingdom, and has three assembly plants in the United States. Mahindra maintains business relations with foreign companies like Renault SA, France.

Tata motors Ltd. VS Mahindra and Mahindra Ltd. Page 4
RATIO ANALYSIS Exhibit: 1 (Financial year 2013-14)
Sr No. Ratio
A Liquidity & Solvency Ratio
1 Current Ratio 0.43 1.19
2 Quick Ratio 0.36 0.93
3 D/E Ratio 0.76 0.22
4 Interest Coverage 0.64 7.65
B. Management Efficiency Ratio
5 Inventory Turnover Ratio 8.89 14.45
6 Debtors Turnover 22.62 17.17
7 Asset Turnover 8.89 14.45
8 Fixed Assets Turnover 1.49 4.02
9 Total Assets Turn over 1.12 1.99
C. Profitability Ratio
C.(i) Related to Sales
10 Gross Profit Margin (-8.59%) 9.52%
11 Net Profit Margin 0.87% 9.11%
C.(ii) Expenses Ratio
12 Operating Ratio 102 91
13 Operating Profit Margin -2.56 11.65
D. ROI
14 Return on Assets 59.58 272.63
15 ROCE 2.52 22.28
16 ROE 0.51 12.73
17 EPS 1.04 Rs 61.02 Rs
18 DPS 2 Rs. 14 Rs
19 P/E Ratio 382 16.02
20 Dividend Yield 0.5% 1.42%
21 Dividend Pay out 193.87 22.94
Tata motors Ltd. VS Mahindra and Mahindra Ltd. Page 5
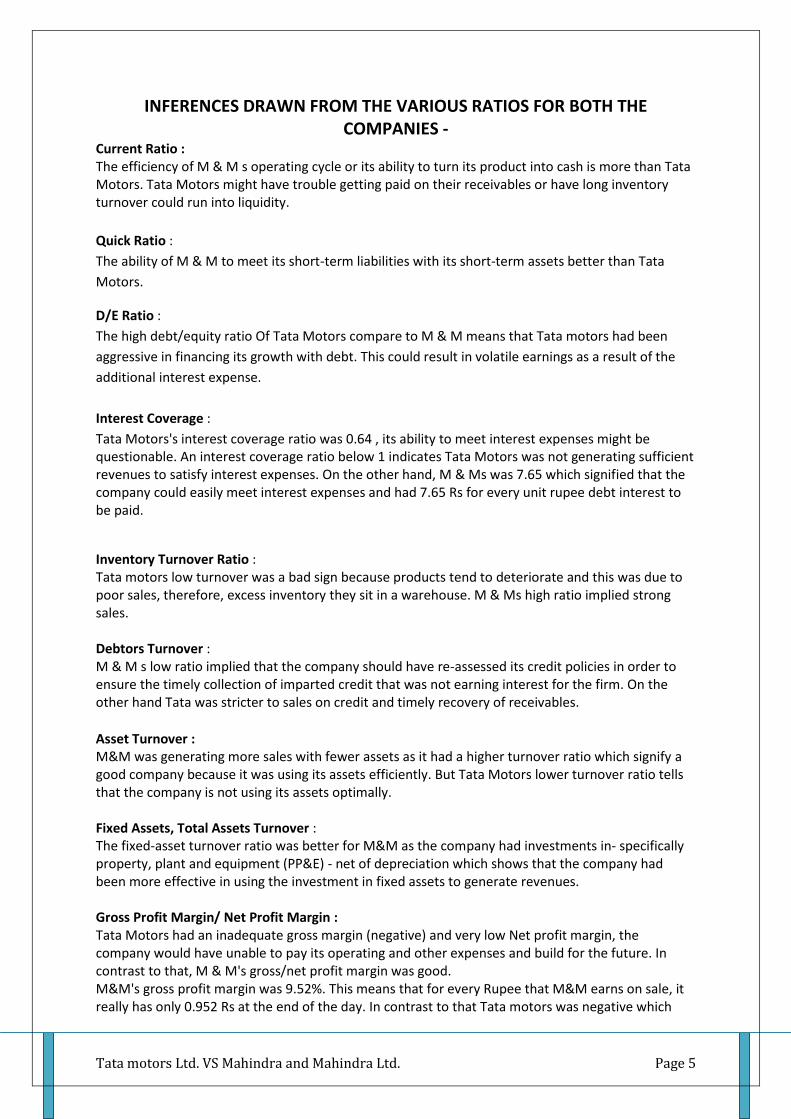
INFERENCES DRAWN FROM THE VARIOUS RATIOS FOR BOTH THE COMPANIES -
Current Ratio : The efficiency of M & M s operating cycle or its ability to turn its product into cash is more than Tata Motors. Tata Motors might have trouble getting paid on their receivables or have long inventory turnover could run into liquidity.
Quick Ratio :
The ability of M & M to meet its short-term liabilities with its short-term assets better than Tata
Motors.
D/E Ratio :
The high debt/equity ratio Of Tata Motors compare to M & M means that Tata motors had been
aggressive in financing its growth with debt. This could result in volatile earnings as a result of the
additional interest expense.
Interest Coverage :
Tata Motors's interest coverage ratio was 0.64 , its ability to meet interest expenses might be questionable. An interest coverage ratio below 1 indicates Tata Motors was not generating sufficient revenues to satisfy interest expenses. On the other hand, M & Ms was 7.65 which signified that the company could easily meet interest expenses and had 7.65 Rs for every unit rupee debt interest to be paid.
Inventory Turnover Ratio : Tata motors low turnover was a bad sign because products tend to deteriorate and this was due to poor sales, therefore, excess inventory they sit in a warehouse. M & Ms high ratio implied strong sales. Debtors Turnover : M & M s low ratio implied that the company should have re-assessed its credit policies in order to ensure the timely collection of imparted credit that was not earning interest for the firm. On the other hand Tata was stricter to sales on credit and timely recovery of receivables.
Asset Turnover : M&M was generating more sales with fewer assets as it had a higher turnover ratio which signify a good company because it was using its assets efficiently. But Tata Motors lower turnover ratio tells that the company is not using its assets optimally. Fixed Assets, Total Assets Turnover : The fixed-asset turnover ratio was better for M&M as the company had investments in- specifically property, plant and equipment (PP&E) - net of depreciation which shows that the company had been more effective in using the investment in fixed assets to generate revenues. Gross Profit Margin/ Net Profit Margin : Tata Motors had an inadequate gross margin (negative) and very low Net profit margin, the company would have unable to pay its operating and other expenses and build for the future. In contrast to that, M & M's gross/net profit margin was good. M&M's gross profit margin was 9.52%. This means that for every Rupee that M&M earns on sale, it really has only 0.952 Rs at the end of the day. In contrast to that Tata motors was negative which

Tata motors Ltd. VS Mahindra and Mahindra Ltd. Page 6
show that for every Rupee Tata Motors earns on sale, it really doesn’t have any money rather Tata infused money from outside or adjusted from taxes. Operating Ratio/ Operating Profit Margin : Operating margin ratio M & M of 91% means that a net profit of Rupees 0.91 is made on each Rupees of sales. In case of Tata motors, a higher value of operating margin ratio (102%) is favorable which indicates that more proportion of revenue is converted to operating income. An increase in operating margin ratio overtime means that the profitability is improving. Tata Motors which was more efficient is controlling its overall costs will have higher operating margin ratio. Return on Assets : The higher ROA of M & M tells us that higher earnings were generated from invested capital (assets) in compare of Tata motors which had lower ROA. The assets of M & M are comprised of both debt and equity. Both of these types of financing are used to fund the operations of the company. The Better ROA figure gives investors an idea that M & M was converting the money it had to invest into net income effectively. But in case of Tata Motors the lower the ROA number, the worsen, because the company is earning lesser money on more investment. M & M had good management practice which show that the company have managers excel at making large profits with little investment. Return on Capital Employed (ROCE) : The return on capital employed ratio shows how much profit each dollar of employed capital generates. M&M, a higher ratio gave more favorable because it means that more Rupees of profits are generated by each rupee of capital employed. In M & M, Investors are interested in the ratio to see how efficiently it uses its capital employed as well as its long-term financing strategies. The Companies' returns should always be high than the rate at which they are borrowing to fund the assets. But if Tata Motors borrowed at 10 percent and could only achieve a return of 2.52 percent, they were losing money. Just like the return on assets ratio, M & M's amount of assets could help them to achieve a high return. In other words, M & M have a small Rupees amount of assets but a large amount of profits had a higher return than Tata Motor with 60 % more assets and the one tenth profits ROCE of M & M is better than ROCE of Tata Motors which is a long-term profitability ratio because it shows that M & M assets were performing better while taking into consideration long-term financing. Return On Equity : This ratio indicates how profitable a company is by comparing its net income to its average shareholders' equity. The return on equity ratio (ROE) measures how much the shareholders earned for their investment in the company. In case of M & M higher ratio percentage had the more efficient management is in utilizing its equity base and the better return is to investors and vice versa for Tata Motors. Earnings per share (EPS) ratio : EPS figure is very important for actual and potential common stockholders because the payment of dividend and increase in the value of stock in future largely depends on the earnings of the company. There is no rule of thumb to interpret earnings per share. In M&M the higher the EPS figure, the better the sign of higher earnings, strong financial position and, therefore, a reliable company to invest money but if we compare with Tata Motors the EPS figure is very low which signified that the lower earnings, weak financial position. A consistent improvement in the EPS figure year after year should expected from TATA to regain earning power and the market sentiments.

Tata motors Ltd. VS Mahindra and Mahindra Ltd. Page 7
Dividend Per Share (DPS), Dividend Yield, Dividends are a form of profit distribution to the shareholder. Having a growing dividend per share could be a sign that the M & M's management believes that the growth could be sustained in longer term. Dividend yield of M & M,Tata Motors show that the cash flow investors are getting for each Rupee invested in an equity position - in other words, But Investors who require a minimum stream of cash flow from their investment portfolio can secure this cash flow by investing in M & M and expect good amount of ‘stocks paying relatively high, stable dividend yields’ as compare to Tata Motors where the chances are negligible.
Dividend Pay out : M &M dividend payout was better than Tata motor that show M& M was having robust earning which support the dividend payments and signify more mature company. CONCLUSION Based on the above mentioned Ratio analysis Mahindra and Mahindra ltd. is doing good as a company relatively in comparison with Tata motors ltd., Investor confidence is higher for M & M than Tata motors.

Tata motors Ltd. VS Mahindra and Mahindra Ltd. Page 8
APPENDIX 1.1
Balance Sheet of Tata Motors ------------------- in Rs. Cr. -------------------
Mar '14 Mar '13 Mar '12 Mar '11 Mar '10
12 mths 12 mths 12 mths 12 mths 12 mths
Sources Of Funds
Total Share Capital 643.78 638.07 634.75 637.71 570.60
Equity Share Capital 643.78 638.07 634.75 637.71 570.60
Share Application Money 0.00 0.00 0.00 0.00 0.00
Preference Share Capital 0.00 0.00 0.00 0.00 0.00
Reserves 18,532.87 18,496.77 18,991.26 19,375.59 14,208.55
Revaluation Reserves 0.00 0.00 0.00 0.00 24.63
Networth 19,176.65 19,134.84 19,626.01 20,013.30 14,803.78
Secured Loans 4,450.01 5,877.72 6,915.77 7,708.52 7,742.60
Unsecured Loans 10,065.52 8,390.97 4,095.86 6,929.67 8,883.31
Total Debt 14,515.53 14,268.69 11,011.63 14,638.19 16,625.91
Total Liabilities 33,692.18 33,403.53 30,637.64 34,651.49 31,429.69
Mar '14 Mar '13 Mar '12 Mar '11 Mar '10
12 mths 12 mths 12 mths 12 mths 12 mths
Application Of Funds
Gross Block 26,130.82 25,190.73 23,676.46 21,002.78 18,416.81
Less: Accum. Depreciation 10,890.25 9,734.99 8,656.94 7,585.71 7,212.92
Net Block 15,240.57 15,455.74 15,019.52 13,417.07 11,203.89
Capital Work in Progress 6,355.07 4,752.80 4,036.67 3,799.03 5,232.15
Investments 18,458.42 19,934.39 20,493.55 22,624.21 22,336.90
Inventories 3,862.53 4,455.03 4,588.23 3,891.39 2,935.59
Sundry Debtors 1,216.70 1,818.04 2,708.32 2,602.88 2,391.92
Cash and Bank Balance 226.15 462.86 1,840.96 2,428.92 612.16
Total Current Assets 5,305.38 6,735.93 9,137.51 8,923.19 5,939.67
Loans and Advances 4,374.98 5,305.91 5,832.03 5,426.95 5,248.71
Fixed Deposits 0.00 0.00 0.00 0.00 1,141.10
Total CA, Loans & Advances 9,680.36 12,041.84 14,969.54 14,350.14 12,329.48
Deffered Credit 0.00 0.00 0.00 0.00 0.00
Current Liabilities 13,334.13 16,580.47 20,280.82 16,271.85 16,909.30
Provisions 2,708.11 2,200.77 3,600.82 3,267.11 2,763.43
Total CL & Provisions 16,042.24 18,781.24 23,881.64 19,538.96 19,672.73
Net Current Assets -6,361.88 -6,739.40 -8,912.10 -5,188.82 -7,343.25
Miscellaneous Expenses 0.00 0.00 0.00 0.00 0.00
Total Assets 33,692.18 33,403.53 30,637.64 34,651.49 31,429.69
Contingent Liabilities 12,419.30 14,981.11 15,413.62 19,084.08 3,708.33
Book Value (Rs) 59.58 59.98 61.84 315.36 259.03
Source : Dion Global Solutions Limited

Tata motors Ltd. VS Mahindra and Mahindra Ltd. Page 9
APPENDIX 1.2 Consolidated Profit & Loss account of Tata Motors
------------------- in Rs. Cr. -------------------
Mar '14 Mar '13 Mar '12 Mar '11 Mar '10
12 mths 12 mths 12 mths 12 mths 12 mths
Income
Sales Turnover 232,833.66 188,817.63 165,654.49 122,127.92 94,835.38
Excise Duty 0.00 0.00 0.00 0.00 3,135.12
Net Sales 232,833.66 188,817.63 165,654.49 122,127.92 91,700.26
Other Income -156.79 208.82 -169.77 660.47 3,555.32
Stock Adjustments 2,792.25 3,031.43 2,535.72 1,836.19 817.10
Total Income 235,469.12 192,057.88 168,020.44 124,624.58 96,072.68
Expenditure
Raw Materials 148,109.33 124,746.40 113,220.54 82,033.81 63,703.05
Power & Fuel Cost 1,128.69 1,069.06 1,017.19 851.60 689.45
Employee Cost 21,556.42 16,584.05 12,298.45 9,342.67 8,751.77
Other Manufacturing Expenses 2,565.21 2,021.59 1,389.23 997.55 1,157.12
Selling and Admin Expenses 0.00 0.00 0.00 0.00 8,954.69
Miscellaneous Expenses 27,428.56 22,880.66 17,953.56 13,921.00 7,037.94
Preoperative Exp Capitalised 0.00 0.00 0.00 0.00 -4,592.50
Total Expenses 200,788.21 167,301.76 145,878.97 107,146.63 85,701.52
Mar '14 Mar '13 Mar '12 Mar '11 Mar '10
12 mths 12 mths 12 mths 12 mths 12 mths
Operating Profit 34,837.70 24,547.30 22,311.24 16,817.48 6,815.84
PBDIT 34,680.91 24,756.12 22,141.47 17,477.95 10,371.16
Interest 4,733.78 3,553.34 2,982.22 2,385.27 2,916.20
PBDT 29,947.13 21,202.78 19,159.25 15,092.68 7,454.96
Depreciation 11,078.16 7,569.30 5,625.38 4,655.51 3,887.13
Other Written Off 0.00 0.00 0.00 0.00 0.00
Profit Before Tax 18,868.97 13,633.48 13,533.87 10,437.17 3,567.83
Extra-ordinary items 0.00 0.00 0.00 0.00 0.00
PBT (Post Extra-ord Items) 18,868.97 13,633.48 13,533.87 10,437.17 3,567.83
Tax 4,764.79 3,770.99 -40.04 1,216.38 1,005.75
Reported Net Profit 14,104.18 9,862.49 13,573.91 9,220.79 2,516.89
Minority Interest 59.45 83.67 82.33 48.52 30.33
Share Of P/L Of Associates 53.71 -113.79 -24.92 -101.35 -84.50
Net P/L After Minority Interest & Share Of Associates
14,976.40 10,495.32 14,348.04 9,042.61 2,915.13
Total Value Addition 52,678.88 42,555.36 32,658.43 25,112.82 21,998.47
Preference Dividend 0.00 0.00 0.00 0.00 0.00
Equity Dividend 648.56 645.20 1,280.70 1,274.23 859.05
Corporate Dividend Tax 117.21 110.94 207.92 207.07 142.80
Per share data (annualised)
Shares in issue (lakhs) 32,186.80 31,901.16 31,735.47 6,346.14 5,705.58
Earning Per Share (Rs) 43.82 30.92 42.77 145.30 44.11
Equity Dividend (%) 0.00 0.00 0.00 0.00 0.00
Book Value (Rs) ‘ Source : Dion Global Solutions Limited
203.82 117.98 104.46 302.10 143.93

Tata motors Ltd. VS Mahindra and Mahindra Ltd. Page 10
APPENDIX 2.1
Balance Sheet of Mahindra and Mahindra ------------------- in Rs. Cr. -------------------
Mar '14 Mar '13 Mar '12 Mar '11 Mar '10
12 mths 12 mths 12 mths 12 mths 12 mths
Sources Of Funds
Total Share Capital 295.16 295.16 294.52 293.62 282.95
Equity Share Capital 295.16 295.16 294.52 293.62 282.95
Share Application Money 0.00 0.00 0.00 0.02 8.01
Preference Share Capital 0.00 0.00 0.00 0.00 0.00
Reserves 16,496.03 14,363.76 11,876.57 10,019.75 7,527.60
Revaluation Reserves 0.00 0.00 0.00 0.00 11.67
Networth 16,791.19 14,658.92 12,171.09 10,313.39 7,830.23
Secured Loans 294.10 266.67 400.18 407.23 602.45
Unsecured Loans 3,451.06 2,960.40 2,774.04 1,913.87 2,277.70
Total Debt 3,745.16 3,227.07 3,174.22 2,321.10 2,880.15
Total Liabilities 20,536.35 17,885.99 15,345.31 12,634.49 10,710.38
Mar '14 Mar '13 Mar '12 Mar '11 Mar '10
12 mths 12 mths 12 mths 12 mths 12 mths
Application Of Funds
Gross Block 10,242.58 8,602.96 7,502.36 5,858.26 4,866.18
Less: Accum. Depreciation 4,365.63 3,645.10 3,216.34 2,725.35 2,537.77
Net Block 5,876.95 4,957.86 4,286.02 3,132.91 2,328.41
Capital Work in Progress 1,228.44 863.48 794.73 773.68 1,374.31
Investments 11,379.85 11,833.46 10,310.46 8,925.63 6,398.02
Inventories 2,803.63 2,419.77 2,358.39 1,694.21 1,188.78
Sundry Debtors 2,509.84 2,208.35 1,988.36 1,260.31 1,258.08
Cash and Bank Balance 2,950.39 1,781.41 1,188.43 614.64 475.17
Total Current Assets 8,263.86 6,409.53 5,535.18 3,569.16 2,922.03
Loans and Advances 4,539.55 3,389.26 2,985.59 3,138.40 2,034.47
Fixed Deposits 0.00 0.00 0.00 0.00 1,268.06
Total CA, Loans & Advances 12,803.41 9,798.79 8,520.77 6,707.56 6,224.56
Deffered Credit 0.00 0.00 0.00 0.00 0.00
Current Liabilities 8,678.28 7,662.13 6,721.40 5,223.75 3,822.50
Provisions 2,074.02 1,905.47 1,845.27 1,681.54 1,796.54
Total CL & Provisions 10,752.30 9,567.60 8,566.67 6,905.29 5,619.04
Net Current Assets 2,051.11 231.19 -45.90 -197.73 605.52
Miscellaneous Expenses 0.00 0.00 0.00 0.00 4.12
Total Assets 20,536.35 17,885.99 15,345.31 12,634.49 10,710.38
Contingent Liabilities 6,421.09 87.20 2,307.66 1,893.85 2,307.70
Book Value (Rs) 272.63 238.75 198.23 167.99 138.02
Source : Dion Global Solutions Limited
Tata motors Ltd. VS Mahindra and Mahindra Ltd. Page 11
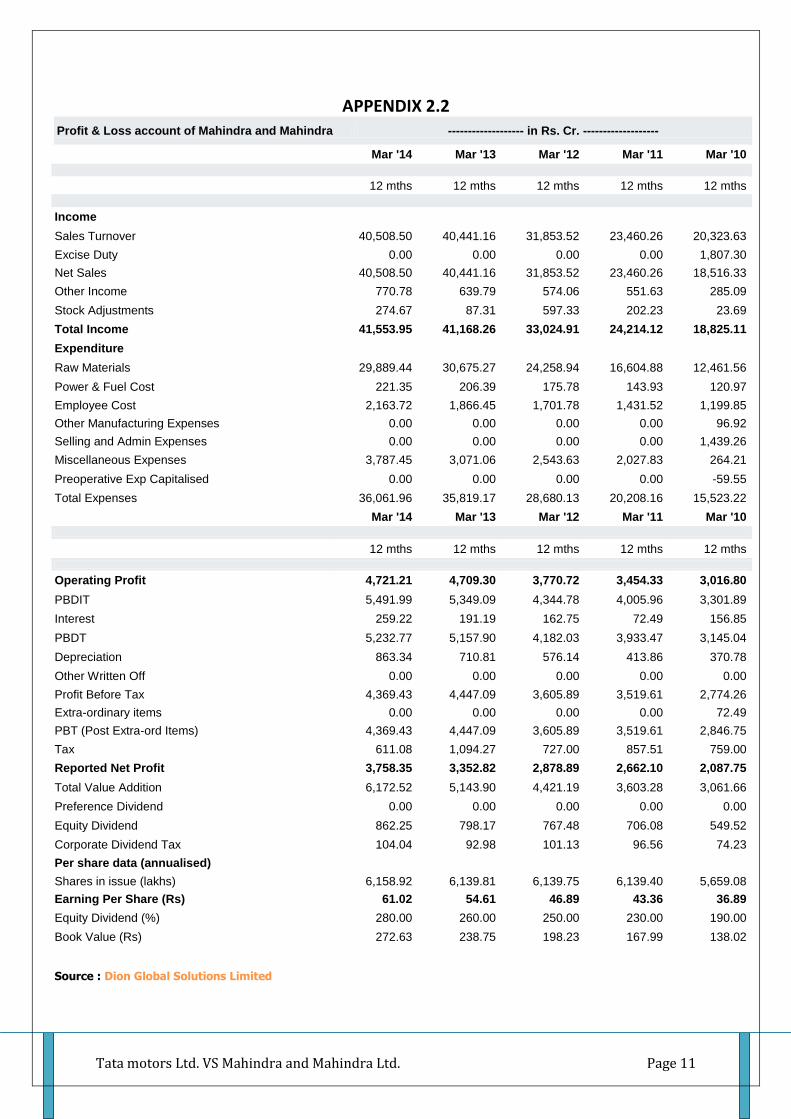
APPENDIX 2.2 Profit & Loss account of Mahindra and Mahindra ------------------- in Rs. Cr. -------------------
Mar '14 Mar '13 Mar '12 Mar '11 Mar '10
12 mths 12 mths 12 mths 12 mths 12 mths
Income
Sales Turnover 40,508.50 40,441.16 31,853.52 23,460.26 20,323.63
Excise Duty 0.00 0.00 0.00 0.00 1,807.30
Net Sales 40,508.50 40,441.16 31,853.52 23,460.26 18,516.33
Other Income 770.78 639.79 574.06 551.63 285.09
Stock Adjustments 274.67 87.31 597.33 202.23 23.69
Total Income 41,553.95 41,168.26 33,024.91 24,214.12 18,825.11
Expenditure
Raw Materials 29,889.44 30,675.27 24,258.94 16,604.88 12,461.56
Power & Fuel Cost 221.35 206.39 175.78 143.93 120.97
Employee Cost 2,163.72 1,866.45 1,701.78 1,431.52 1,199.85
Other Manufacturing Expenses 0.00 0.00 0.00 0.00 96.92
Selling and Admin Expenses 0.00 0.00 0.00 0.00 1,439.26
Miscellaneous Expenses 3,787.45 3,071.06 2,543.63 2,027.83 264.21
Preoperative Exp Capitalised 0.00 0.00 0.00 0.00 -59.55
Total Expenses 36,061.96 35,819.17 28,680.13 20,208.16 15,523.22
Mar '14 Mar '13 Mar '12 Mar '11 Mar '10
12 mths 12 mths 12 mths 12 mths 12 mths
Operating Profit 4,721.21 4,709.30 3,770.72 3,454.33 3,016.80
PBDIT 5,491.99 5,349.09 4,344.78 4,005.96 3,301.89
Interest 259.22 191.19 162.75 72.49 156.85
PBDT 5,232.77 5,157.90 4,182.03 3,933.47 3,145.04
Depreciation 863.34 710.81 576.14 413.86 370.78
Other Written Off 0.00 0.00 0.00 0.00 0.00
Profit Before Tax 4,369.43 4,447.09 3,605.89 3,519.61 2,774.26
Extra-ordinary items 0.00 0.00 0.00 0.00 72.49
PBT (Post Extra-ord Items) 4,369.43 4,447.09 3,605.89 3,519.61 2,846.75
Tax 611.08 1,094.27 727.00 857.51 759.00
Reported Net Profit 3,758.35 3,352.82 2,878.89 2,662.10 2,087.75
Total Value Addition 6,172.52 5,143.90 4,421.19 3,603.28 3,061.66
Preference Dividend 0.00 0.00 0.00 0.00 0.00
Equity Dividend 862.25 798.17 767.48 706.08 549.52
Corporate Dividend Tax 104.04 92.98 101.13 96.56 74.23
Per share data (annualised)
Shares in issue (lakhs) 6,158.92 6,139.81 6,139.75 6,139.40 5,659.08
Earning Per Share (Rs) 61.02 54.61 46.89 43.36 36.89
Equity Dividend (%) 280.00 260.00 250.00 230.00 190.00
Book Value (Rs) 272.63 238.75 198.23 167.99 138.02
Source : Dion Global Solutions Limited

Tata motors Ltd. VS Mahindra and Mahindra Ltd. Page 12
APPENDIX 3
COMPARISON OF STOCKS OF TATA MOTORS, MAHINDRA AND MAHINDRA WITH THE SENSEX
Related Documents