Task 5: Cost-Benefit Analysis VIETNAM Prof. Dr. Pham Hoang Luong Dr. Do Tien Minh Dr. Nguyen Thi Mai Anh Hanoi University of Science and Technology July 2015

Welcome message from author
This document is posted to help you gain knowledge. Please leave a comment to let me know what you think about it! Share it to your friends and learn new things together.
Transcript

Task 5: Cost-Benefit Analysis
VIETNAM
Prof. Dr. Pham Hoang Luong
Dr. Do Tien Minh
Dr. Nguyen Thi Mai Anh
Hanoi University of Science and Technology
July 2015

Effective energy efficiency policy implementation targeting
“New Modern Energy Consumer” in the Greater Mekong Subregion
Page 2
Table of contents
Table of contents ........................................................................................................................ 2
Abstract ...................................................................................................................................... 5
1 Introduction ........................................................................................................................ 6
2 Methodology ...................................................................................................................... 8
2.1 Cost-benefit analysis at household level ..................................................................... 8
2.2 Energy-economic impact of energy efficiency policy packages (national impacts) . 10
2.3 Behavioural response of the households ................................................................... 11
3 Results .............................................................................................................................. 12
3.1 Cost-benefit analysis ................................................................................................. 12
3.2 LEAP modelling ........................................................................................................ 14
3.3 Rebound Effect .......................................................................................................... 21
4 Conclusions and Recommendations ................................................................................ 28
5 References ........................................................................................................................ 30
6 Appendix A: Survey Questionnaire ................................................................................. 32
Appendix B: Data and assumptions for LEAP modelling and scenario analysis ............ 41
……Appendix C: Data and assumptions for cost-benefit analyses (CBA) ............................. 52

Effective energy efficiency policy implementation targeting
“New Modern Energy Consumer” in the Greater Mekong Subregion
Page 3
List of Tables
Table Page
Table 3.1. Life cycle cost of different appliances 12
Table 3.2 LLC of sensitivity options (equation 1) 13
Table 3.3 LLC of sensitivity options (equation 2) 14
Table 3.4 Sample profile 22
Table 3.5 Who makes decisions about electricity and other fuels 23
Table 3.6 Monthly average expenditure on different items of households 23
Table 3.7 Electricity availability and acceptability 23
Table 3.8. Equipment used in households 24
Table 3.9 Housholds owned entertainment equipment 24
Table 3.10 Percentage of households owning large appliances 25
Table 3.11 Categories of the surveyed households 25
Table 3.12 Comparison of households’ monthly income between households
in Ba Ria, Nam Dinh and Duc Tho
25
Table 3.13 Comparison of households’ monthly income between category
(b) and (c)
26
Table 3.14 Change in electricity bill and on what family spends money
saved through lower electricity bills
26
Table 3.15 Ranking in household spending if they have an extra 10 USD 27
Table B.1 Data and assumptions for LEAP modelling and scenario analysis 41
Table B.2 Assumptions for High Energy Efficiency (HEE) Scenario 43
Table B.3 Assumptions for Medium Energy Efficiency (MEE) Scenario 46
Table B.4 Energy consumption by scenarios and sectors 2014-2030 49
Table C.1 Data and assumptions for cost-benefit analyses (CBA) 52
Table C.2 CBA between Incandescent and CFL light bulbs 53
Table C.3 CBA between fluorescent and LED light bulbs 53
Table C.4 CBA between conventional and efficient rice cookers 54
Table C.5 CBA between conventional and efficient air conditioning units 54
Table C.6 CBA between conventional and efficient refrigerators 55
Table C.7 CBA between conventional and efficient electric fans 56
Table C.8 CBA between conventional and efficient electric water heater 56

Effective energy efficiency policy implementation targeting
“New Modern Energy Consumer” in the Greater Mekong Subregion
Page 4
List of Figures
Figures Page
Figure 3.1 Final energy consumption by scenario during 2014-2030 15
Figure 3.2 Energy consumptions for lighting of different scenarios during
2014-2030
16
Figure 3.3 Energy consumptions for cooking of different scenarios during
2014-2030
16
Figure 3.4 Energy consumptions for cooling of different scenarios during
2014-2030
17
Figure 3.5 Energy consumptions for heating of different scenarios during
2014-2030
18
Figure 3.6 Energy consumptions for entertainment of different scenarios
during 2014-2030
19
Figure 3.7 Energy consumptions for cleaning of different scenarios during
2014-2030
19
Figure 3.8 Energy consumptions for others of different scenarios during
2014-2030
20
Figure 3.9 Average ranking on different items 27

Effective energy efficiency policy implementation targeting
“New Modern Energy Consumer” in the Greater Mekong Subregion
Page 5
Abstract
Energy plays an important role in residential sector. New modern energy consumer
(MECON) household, defined to be energy consumers who connect to the grid and have low
incomes (USD 2-5 per day), accounts for about half of energy consumers. Promoting energy
efficiency for this group will be crucial for energy saving in residential sector. The aim of this
study is to explore energy consumption behaviour of MECON household. The study will
analyse costs and benefits of using energy efficient appliances on consumers, effect of
improving EE among MECON household to the national level, and the rebound effect of EE
improvements. LEAP model is used to project energy demand for MECON. A survey of 129
households had been conducted to explore their existing and future consumption behaviour.
It was found that cooling devices take the highest energy consumption, followed by
cooking, entertainment, lighting, heating, cleaning and other. However the results from cost-
benefit analysis point out that lighting technology has the highest potential for the energy
efficiency improvement. This solution could be implemented easily and by shifting to energy
efficient light bulbs households will be financially better off. It should be considered as first
priority for policy makers, especially on the substitution from fluorescent to LED light bulb.
The biggest energy saving in term of absolute value is in cooling appliances. However, due to
the relatively high investment cost, measures for energy efficiency in these appliances will be
long term focused.
The expenditure priority of MECON is given to basic needs like food or health care,
while cooking fuel or electrical appliances are not their priority. In order to promote energy
saving in MECON, government should have policy to improve their income first.
Effective energy efficiency policy implementation targeting
“New Modern Energy Consumer” in the Greater Mekong Subregion
Page 6
1 Introduction
Energy efficiency (EE) means the ratio of output of performance, service, goods or
energy, to input of energy. EE improvement means an increase in energy efficiency of an
appliance due to a technological change. EE improvements offer multiple benefits, such as
reduced household energy expenditure and improved productivity, thus contributing to
economic growth, enhancing energy security and facilitating cheaper and faster energy access
to populations. The 2012 World Energy Outlook highlights the importance of EE in reducing
greenhouse gas emissions (GHG) in the coming decades: EE is responsible for 75% of
emissions reductions by 2020 in a 2°C temperature increase scenario (IEA, 2012). For
developing countries, EE will be important since it curbs demand growth, thereby reducing
additional power capacity needs and facilitating cheaper and faster energy access to
populations. Improved EE will also reduce energy consumption, leading to lower fossil fuel
imports for the countries. Moreover, EE can make it easier for lower income households to
pay energy bills, freeing up funds for other needs (Sarkar and Singh, 2010). Although the
adoption of EE measures has few technical challenges, and numerous energy efficient
technologies with accountable payback times do exist, there remain important non-technical
barriers, particularly at the household level. As a result, many of the potential EE gains
remain untapped.
Implementing EE measures within households will reduce the energy needed to
produce the same quantity of energy services such lighting, heating, air conditioning, cooling,
etc. As a consequence of reduced energy use, householders may benefit from lower energy
bills. However, the overall cost and benefits to the householders depends on the cost of the
appliance, the level of efficiency improvement and the price of fuel (for example electricity
tariff) as well as any tax/subsidies applicable. Conversely, reduced bills may also lead to an
increased level of energy consumption and real energy savings may be well below the
expected level. One explanation is that improvements in EE encourage greater use of the
services (for example heat or mobility) which energy helps to provide. Behavioural responses
such as these have come to be known as the EE “rebound effect”. While rebound effects vary
widely in size, in some cases they may be sufficiently large to lead to an overall increase in
energy consumption - an outcome that has been termed ‘backfire’ (UKERC, 2007). In the
MECON project, due to the nature of the target group – those who have access to electricity
and are affordable to pay only for certain energy services at present – it is likely that they will
use part of their extra income to consume more energy in two key ways. The first by buying
more appliances and using them more for the same energy services to which they already
have access (for example, buying more bulbs or using the them more). The second is buying
a new appliance to meet an energy service which they did not have before (for example,
buying a fan which they did not previously have).
In the Greater Mekong Sub region (GMS - Cambodia, Laos, Myanmar, Thailand and
Vietnam), it will be the ‘new Modern Energy CONsumers’ (the MECON) i.e. people who

Effective energy efficiency policy implementation targeting
“New Modern Energy Consumer” in the Greater Mekong Subregion
Page 7
have access to grid electricity but who live on low incomes (USD 2-5 per day), who will be
responsible for a large share of expected increase in energy demand and thus GHG emissions.
This report is one of five country-specific reports, which present the results of cost-benefit
analysis carried on MECON project.
The aim of this study is to assess the cost-benefits at the household (new modern
energy consumers) and at the national level. The study will also analyse the rebound effect of
EE improvements.

Effective energy efficiency policy implementation targeting
“New Modern Energy Consumer” in the Greater Mekong Subregion
Page 8
2 Methodology
Task 5 has three sub-tasks:
5.1: carrying out a cost-benefit analysis of selected energy efficient technologies at the
individual household level
5.2: analysing energy-economic impact of energy efficiency policy packages at a national
level. Two energy efficiency scenarios are defined under this task.
5.3: analysing the behavioural response of the households and the impacts on a household’s
energy services demands. A questionnaire survey will be carried out under this task.
2.1 Cost-benefit analysis at household level
The cost-benefit analysis (CBA) has been in use since the 1940s. Traditionally, the
CBA has been applied to those costs and benefits to which an accepted basis of monetary
valuation is available. In addition there are environmental factors and factors such as
economic development, employment and energy use. The evaluation compares the benefits
with and without the project. CBA involves defining the project, listing the costs and
benefits, putting money values for them, and comparing the time streams of the benefits and
costs.
The Life-Cycle Cost (LCC) of an appliance accounts for all expenditures associated
with purchase and use. From the consumer perspective, the two main components of LCC are
the equipment cost (capital cost) and the operating costs which is the fuel cost and
maintenance cost. Equipment cost is the retail price paid by the consumer purchasing the
appliance. Operating cost is the cost of energy, in the form of utility bills, for using the
equipment. Life-Cycle Cost is given by:
LCC =CC +FCt +MCt
1+DR( )t
t=1
n
å Equation (1)
Where:
LCC – life cycle cost
CC – capital cost of the appliance
FCt – fuel cost in year t (Annual electricity consumption in year t X price in year t)
MCt – maintenance cost in year t

Effective energy efficiency policy implementation targeting
“New Modern Energy Consumer” in the Greater Mekong Subregion
Page 9
DR – Discount rate
N – life of the appliance
The CBA can be carried out for selected technologies by comparing the LCC of
efficient and inefficient technologies. Equation (1) shows the traditional way of calculating
CBA. The MECON project focuses on a particular consumer group whose income is
relatively low. This particular consumer group sometimes needs financial support, as they do
not have sufficient capital to buy an efficient appliance. Rather, these households may have to
borrow money from different institutions, or from friends and family members in order to
buy an energy efficient appliance. In some countries, the shop owners also allow consumers
to make payments in instalments. Irrespective of where the consumers get the financial
support, they have to pay a higher price for the appliances due to the interest rate. This could
be added to the cost of capital to the consumers. Therefore, here the capital cost of the
appliance is annualised using a different discount rate, which is defined as the hurdle rate,
which represents the interest rate and is normally higher than that of the discount rate.
Equation (1) is then modified to take into account the hurdle rate:
LCC =ACt +FCt +MCt
1+DR( )t
t=1
n
å Equation (2)
AC =CC´HR
1- 1+HR( )-l
Equation (3)
Where:
AC – annualised cost
HR – Hurdle rate (interest rate)
l – Number of years by which the loan is repaid.
If there is a government subsidy programme for energy efficient appliances, then consumers
will pay net of subsidy for the capital cost.
LCC =CC - SS +FCt +MCt
1+DR( )t
t=1
n
å Equation (4)
SS – is the amount of subsidy the consumer receives under the programme.
Analysis will compare the benefits of energy efficient over inefficient technologies.
At least five appliances (such as TV, rice cooker, fan or refrigerator) are analysed here. The

Effective energy efficiency policy implementation targeting
“New Modern Energy Consumer” in the Greater Mekong Subregion
Page 10
selection of appliances for the CBA are based on three criteria: energy consumption,
ownership and future potential for each country.
2.2 Energy-economic impact of energy efficiency policy packages (national impacts)
The calculations shown above provide an estimate of the financial impacts of an
efficient appliance for each household. Though the individual household level analysis is
crucial, a second critical aspect to evaluate in an EE policy package is the national-level
impacts. The three main national impacts calculations can be: Net Present Value; national energy
savings potential; and reduced environmental impacts, including GHG emissions reductions.
The LEAP model has been used for the CBA at the national level under different
scenarios, which have been defined through consideration of each country’s EE policy packages.
Appliance stock and national end use consumption are driven by population growth and trends in
appliance ownership rates. Unlike in developed countries, where the market for most major
appliances is saturated, in developing countries the ownership rates of even basic appliances are
dynamic, and depend critically on household income level, degree of urbanisation and
electrification; this is particularly true for the emerging middle classes and the target group of this
research, the MECON. The EE policy packages will define the diffusion of efficient technologies
among the consumer groups and its saturation levels, which can be modelled in LEAP. The
existing LEAP model, which has been developed under Task 1 of the MECON project, will be
further improved by adding costs to appliances for both efficient and less efficient technologies
under this Task.
Three scenarios have been defined in the LEAP model for each country: the Base
Case (BC) modelled under the Task 1, a High Energy Efficiency (HEE) scenario, and a
Moderate Energy Efficiency (MEE) scenario.
High Energy Efficiency (HEE) scenario: this scenario assumes 100% penetration of
efficient appliances by end of the modelling period (2030) for each energy service.
This scenario assumes that the share of efficient appliances will increase gradually
from the current level to reach 100% by 2030. This scenario aims to explore what the
potential impacts on energy, emission and costs will be when all households use
efficient appliances. Details is given in the Appendix B
Moderate Energy Efficiency (MEE) scenario: this scenario assumes a moderate
penetration of efficient appliances in 2030. The appropriate share of efficient
appliances for each energy service demand is defined by linking them to the energy
efficiency policies discussed in Task 4. The share of energy efficient appliances in
2030 will be different for different energy services, which will vary according to each
country. For example, the share of efficient refrigerators in 2030 will be different to
the share of efficient televisions in 2030. Since each country team was best placed to
make assumptions on the penetration levels of energy efficient appliances, the
assumptions vary.
Under Task 5, two activities were undertaken using the LEAP model: firstly, to model
the cost for each end-use appliances and the price for each fuel (i.e. electricity, gas,

Effective energy efficiency policy implementation targeting
“New Modern Energy Consumer” in the Greater Mekong Subregion
Page 11
kerosene, biomass,); and secondly to develop the two new scenarios - HEE and MEE.
In order to model the costs in LEAP, each country partner had to develop a
technology database which shows the cost for each appliance. This was done by
adding cost data, generated in Task 2, to the existing technology Excel-based database
developed under Task 1. Once the modelling was completed, the results generated
were used to analyse the impact of EE scenarios on the energy system. The results
are discussed in Section 3. The data course for Vietnam’s LEAP modelling and lists
of key assumptions for Vietnam’s scenario analysis is presented in Appendix B.
2.3 Behavioural response of the households
In order to understand how individual households may respond to reduced energy
consumption as a result of EE policy packages, the final sub-task involved a short
questionnaire survey. This will help us to understand how reductions in the cost of electricity
bills might be spent, whether households prioritise energy or other (non) essential items.
For this sub-task, a questionnaire was developed (Appendix A) which used many of
the same questions as the Task 3 survey. The questionnaire focused on characteristics of the
household, current energy consumption as well as how additional, future income might be
spent. Analysis of these data, also examined whether there were any differences between
those households who used electricity: a) solely for lighting, b) for lighting and small
appliances and, c) for other energy services. Grouping the consumers will help to carry out
detailed analysis and to capture the rebound effect as discussed in the introduction.
In Vietnam, 129 questionnaires were carried out in the North, Central and South of
Vietnam. Specific surveyed provinces were Baria (35 households – in the South), Nam Dinh
(37 households – in the North) and Ha Tinh province (57 households – in the Central). The
survey was carried out in both urban (Nam Dinh) and rural areas (Duc Tho and Ba Ria).
Convenience sampling was employed. Enumerators went to households in the same
commune and they ask respondents who are available and willing to give the answer. As
result, a total of 129 completed and usable questionnaires were collected. The sample profile
is given in section 3.3.

Effective energy efficiency policy implementation targeting
“New Modern Energy Consumer” in the Greater Mekong Subregion
Page 12
3 Results
3.1 Cost-benefit analysis
Six types of appliances were analysed in the cost-benefit analysis. These were
lighting, rice cooker, air conditioning, refrigerator, electric fan and electric water heater. The
selection was based on energy consumption, popularity and availability of efficient
technologies. To conduct the cost-benefit analysis, the capital and operating cost of dominant
traditional and efficient technology appliance were taken. The electricity price was assumed
to increase by 1% per year, discount rate of 5%, hurdle rate of 8% and loan repayment of one
year. All these assumptions were set on the basis of their past variation. The Table 3.1 below
presents the detailed information including capital and life cycle cost and life-time of
different appliances.
Table 3.1: Life cycle costs of different appliances
Category Appliance Capital cost
(USD)
Life cycle
cost (USD)
Equation (1)*
Life cycle
cost (USD)
Equation (2)*
Lifetime
(years)
Lighting Incandescent 0.47 6.26 6.28 2
Fluorescent (FLO) 0.95 17.20 17.22 4
CFL 1.90 10.38 8.96 6
LED 4.50 7.61 7.74 6
Difference in LCC
(lifetime of 6):
LED & FLO
27.97 27.87
Rice cooker EE 55.00 236.25 237.82 10
Conventional 38.00 263.21 264.30 10
Difference in LCC:
EE & conventional 26.96 26.48
AC EE 570.00 1,464.72 1,481.00 15
Conventional 410.00 1,602.95 1,614.67 15
Difference in LCC:
EE & conventional 138.23 133.67
Refrigerator EE 214.00 527.70 544.82 15
Conventional 180.00 544.93 559.33 15
Difference in LCC:
EE & conventional 17.23 14.51
Electric fan EE 25.00 89.19 91.19 10
Conventional 19.00 99.26 100.78 10
Difference in LCC:
EE & conventional 10.07 9.59
Electric water
heater
EE 114.00 252.09 261.21 10
Conventional 95.00 267.40 275.00 10
Difference in LCC:
EE & conventional 15.31 13.79
(*) Pls. refer to the equation 1 and 2 given in page 7 and 8

Effective energy efficiency policy implementation targeting
“New Modern Energy Consumer” in the Greater Mekong Subregion
Page 13
The analysis shows that all efficient appliances were more expensive than the
existing, conventional technology (non-efficient) in terms of the capital cost. However, they
are all lower in terms of LCC. This shows that, even though the initial costs of energy
efficient technologies are higher, consumers will make save money over the longer term. For
example, over the life cycle, using efficient air conditioning units will result in significant
cost savings (138 USD) in comparison to conventional ones. Total saving life cycle cost
when using LED in substitution for FLO reaches 27.79 USD or case of rice cooker is 26.96
USD. This illustrates that the substitution of efficient technologies are always economically
over the traditional ones.
Due to the future variation of assumed input data used in LCC analysis, therefore a
sensitivity analysis was also carried out to ensure the financial feasibility of efficient
equipment over non-efficient ones. Sensitivity was done with different possible values of
discount rates, hurdle rates, year of loan repayment, and electricity price. Table 3.2 presents
LLC under the different scenarios.
Table 3.2: LLC of sensitivity options (equation 1)
Appliance Appliance Baseline Discount rate Electricity price
increase
7% 8% 1.5% 2.5%
Lighting Incandescent
light bulb 6.26 6.10 6.03 6.28 6.31
FLO 17.20 16.47 16.12 17.31 17.55
CFL 10.38 9.85 9.61 10.48 10.68
LED 7.61 7.42 7.33 7.65 7.73
Difference in
LCC: LED &
FLO (life time -
6 years)
18.19
Rice cooker EE 236.25 219.61 212.15 240.05 247.94
Conventional 263.21 242.54 233.26 267.93 277.74
Difference in
LCC: EE &
conventional
26.96 22.93 21.11 27.88 29.8
AC EE 1,464.72 1,352.43 1,304.11 1,490.67 1,545.32
Conventional 1,602.95 1,453.24 1,388.82 1,637.55 1,710.42
Difference in
LCC: EE &
conventional
138.23 100.81 84.71 146.88 165.1
Refrigerator EE 527.70 488.33 471.39 536.79 555.96
Conventional 544.93 499.14 479.43 555.52 577.81
Difference in
LCC: EE &
conventional
17.23 10.81 8.04 18.73 21.85
Electric fan EE 89.19 83.30 80.66 90.54 93.34
Conventional 99.26 91.89 88.58 100.94 104.43
Difference in
LCC: EE &
conventional
10.07 8.59 7.92 10.4 11.09

Effective energy efficiency policy implementation targeting
“New Modern Energy Consumer” in the Greater Mekong Subregion
Page 14
Electric water
heater
EE 252.09 239.42 233.73 254.99 261.00
Conventional 267.40 251.58 244.48 271.02 278.53
Difference in
LCC: EE &
conventional
15.31 12.16 10.75 16.03 17.53
Table 3.3: LLC of sensitivity options (equation 2)
Category Appliance Baseline Discount
rate 8%
Hurdle
rate 10%
Loan
repayment
(2 years)
Electricity
price
increase
2%
Lighting Incandescent 6.28 6.278 6.287 6.28 6.31
FLO 17.22 17.22 17.24 17.24 17.46
CFL 8.96 8.96 8.97 8.97 9.16
LED 7.74 7.74 7.83 7.81 7.82
Rice cooker EE 237.82 238.60 238.87 238.60 245.52
Conventional 264.30 264.83 265.02 264.83 273.86
AC unit EE 1,481.00 1,481.00 1,491.86 1,489.06 1,538.95
Conventional 1,614.67 1,614.67 1,622.48 1,620.46 1,691.93
Refrigerator EE 544.82 553.71 549.10 553.71 565.13
Conventional 559.33 566.81 562.93 566.81 582.97
Electric fan EE 91.19 91.19 91.69 198.22 93.92
Conventional 100.78 100.78 101.16 191.85 104.18
Electric
water heater
EE 261.21 322.03 263.49 322.03 267.08
Conventional 275.00 326.61 276.90 326.61 282.32
LLC of all sensitivity scenarios is higher than baseline. This is reasonable as input in
sensitivity change negatively in comparing to those in baseline. However in all sensitivity,
the LCC in the energy efficient options were lower than the non-efficient technology. Indeed,
the more that electricity prices increase, the greater savings that the efficient appliances make
in comparison with the non-efficient appliances.
3.2 LEAP modelling
This study uses the key assumptions and energy consumption data of MECON
household in Appendix B to create an energy forecast model in the LEAP software. As
mentioned in section 2.21, two scenarios were developed, which were compared to the
business-as-usual (BAU) scenario. Details of these scenarios are described in section 2.2.1
and given in appendix B. The two alternative scenarios are medium and high energy
efficiency. The final energy consumption for MECON target group in Vietnam is shown in
Figure 6.
Total energy consumption
The final energy consumption of MECON is expected to reduce slightly in 2030
comparing to year 2014 in all three scenarios (BAU, medium and high). This energy
reduction is resulted from the decrease of MECON households as well as the replacement of
efficient equipment for the traditional ones. The energy demand of BAU falls from 724.8

Effective energy efficiency policy implementation targeting
“New Modern Energy Consumer” in the Greater Mekong Subregion
Page 15
ktoe in 2014 to 691 ktoe in 2030 or by 4.7%. This number in case of medium and high
scenarios is even more. They are 13.0% in medium and 21.3% in high scenario. Detailed
energy consumption is given in the Appendix B.
Figure 3.1: Final energy consumption by scenario during 2014-2030
Energy consumption for lighting
Figure 3.2 presents energy consumption for lighting of different scenarios during
2014-2030. Total energy for lighting will be decreased in 2030 in all three scenarios. This
reduction is resulted from the substitution from conventional technologies to more efficient
ones. The compact fluorescent lamps and light emitting diode will be used increasingly in the
future especially in MEE and HEE in comparison to BAU. Thanks to this shift, total energy
consumption for lighting in MEE and HEE scenarios will be reduced 20.3% and 26.3%
respectively in comparison to BAU. Detailed energy consumption for lighting is given in the
Appendix B.

Effective energy efficiency policy implementation targeting
“New Modern Energy Consumer” in the Greater Mekong Subregion
Page 16
Figure 3.2: Energy consumptions for lighting of different scenarios during 2014-2030
Energy consumption for cooking appliances
Cooking appliances are the second highest consumers of energy in the household.
Owing to a shift towards more efficient cooking technologies, the energy consumption in
year 2030 will decrease from 162.5 ktoe in BAU to 147.5 ktoe (9.2%) in MEE scenario and
to 131.2 ktoe in HEE scenario (19.2%). Detailed energy consumption is given in the
Appendix B.
Figure 3.3: Energy consumptions for cooking of different scenarios during 2014-2030
Effective energy efficiency policy implementation targeting
“New Modern Energy Consumer” in the Greater Mekong Subregion
Page 17
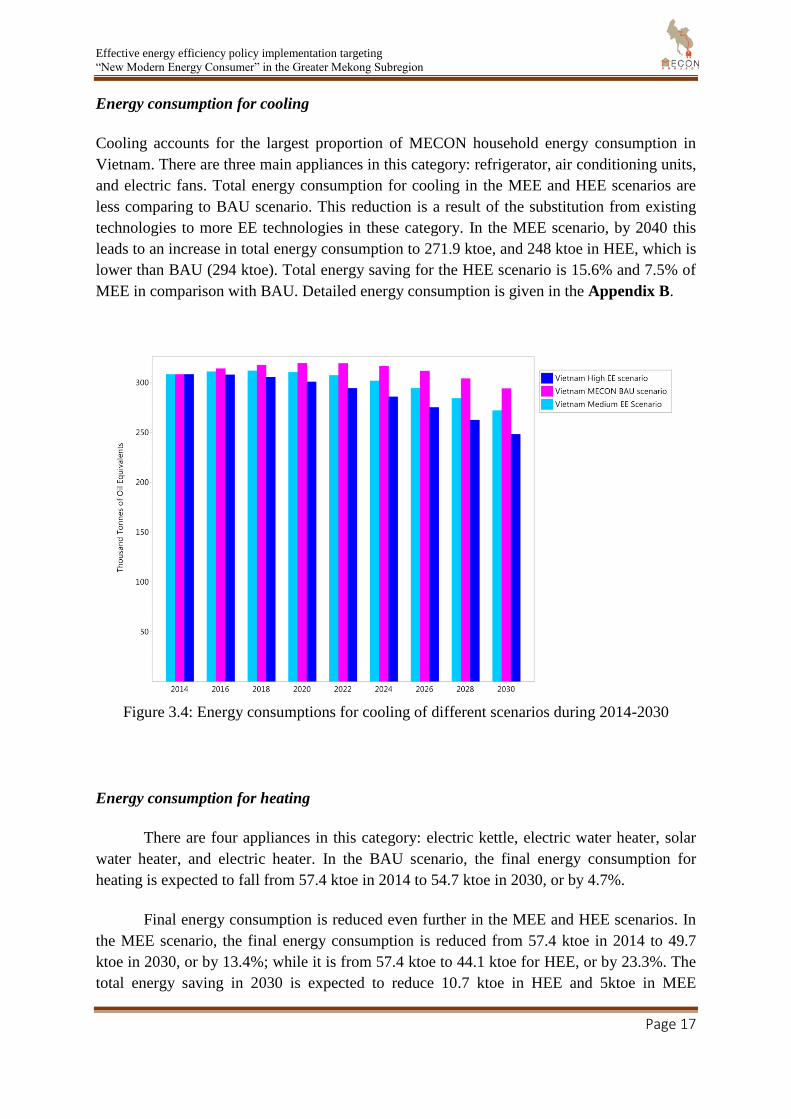
Energy consumption for cooling
Cooling accounts for the largest proportion of MECON household energy consumption in
Vietnam. There are three main appliances in this category: refrigerator, air conditioning units,
and electric fans. Total energy consumption for cooling in the MEE and HEE scenarios are
less comparing to BAU scenario. This reduction is a result of the substitution from existing
technologies to more EE technologies in these category. In the MEE scenario, by 2040 this
leads to an increase in total energy consumption to 271.9 ktoe, and 248 ktoe in HEE, which is
lower than BAU (294 ktoe). Total energy saving for the HEE scenario is 15.6% and 7.5% of
MEE in comparison with BAU. Detailed energy consumption is given in the Appendix B.
Figure 3.4: Energy consumptions for cooling of different scenarios during 2014-2030
Energy consumption for heating
There are four appliances in this category: electric kettle, electric water heater, solar
water heater, and electric heater. In the BAU scenario, the final energy consumption for
heating is expected to fall from 57.4 ktoe in 2014 to 54.7 ktoe in 2030, or by 4.7%.
Final energy consumption is reduced even further in the MEE and HEE scenarios. In
the MEE scenario, the final energy consumption is reduced from 57.4 ktoe in 2014 to 49.7
ktoe in 2030, or by 13.4%; while it is from 57.4 ktoe to 44.1 ktoe for HEE, or by 23.3%. The
total energy saving in 2030 is expected to reduce 10.7 ktoe in HEE and 5ktoe in MEE

Effective energy efficiency policy implementation targeting
“New Modern Energy Consumer” in the Greater Mekong Subregion
Page 18
comparing to BAU and shown in the figure below. Detailed energy consumption is given in
the Appendix B.
Figure 3.5: Energy consumptions for heating of different scenarios during 2014-2030
Energy consumption for entertainment
Detailed energy consumption for entertainment of different scenarios is given in
Figure 3.6. Total energy consumption for entertainment of MECON in the BAU scenarios is
104.7 ktoe in 2030, while this figure of MEE and HEE is only 98.8 ktoe or 90.1 ktoe
respectively. The faster substitution from CRT technology to LCD technology in HEE and
MEE leads to this energy reduction. Detailed energy consumption is given in the Appendix
B.

Effective energy efficiency policy implementation targeting
“New Modern Energy Consumer” in the Greater Mekong Subregion
Page 19
Figure 3.6: Energy consumptions for entertainment of different scenarios during 2014-2030
Energy consumption for cleaning
Total energy consumption for cleaning purpose of MECON in BAU, MEE and HEE
fall during the period of 2014-2030. For BAU, the energy consumed for cleaning decrease
from 8.700 toe in 2014 to 8.293 toe in 2030. This reduction is resulted from the replacement
of existing technology of washing machine and vacuum cleaners to higher energy efficiency
one. The energy consumed in HEE and MEE is less 19.1% and 9.0% comparing to BAU.
Detailed energy consumption is given in the Appendix B.
Figure 3.7: Energy consumptions for cleaning of different scenarios during 2014-2030
Energy consumption for other appliances
Two appliances are included in this category, the water pump and electric iron. In
2030, the energy consumed in this category accounts for less 12.3% in the MEE scenario and
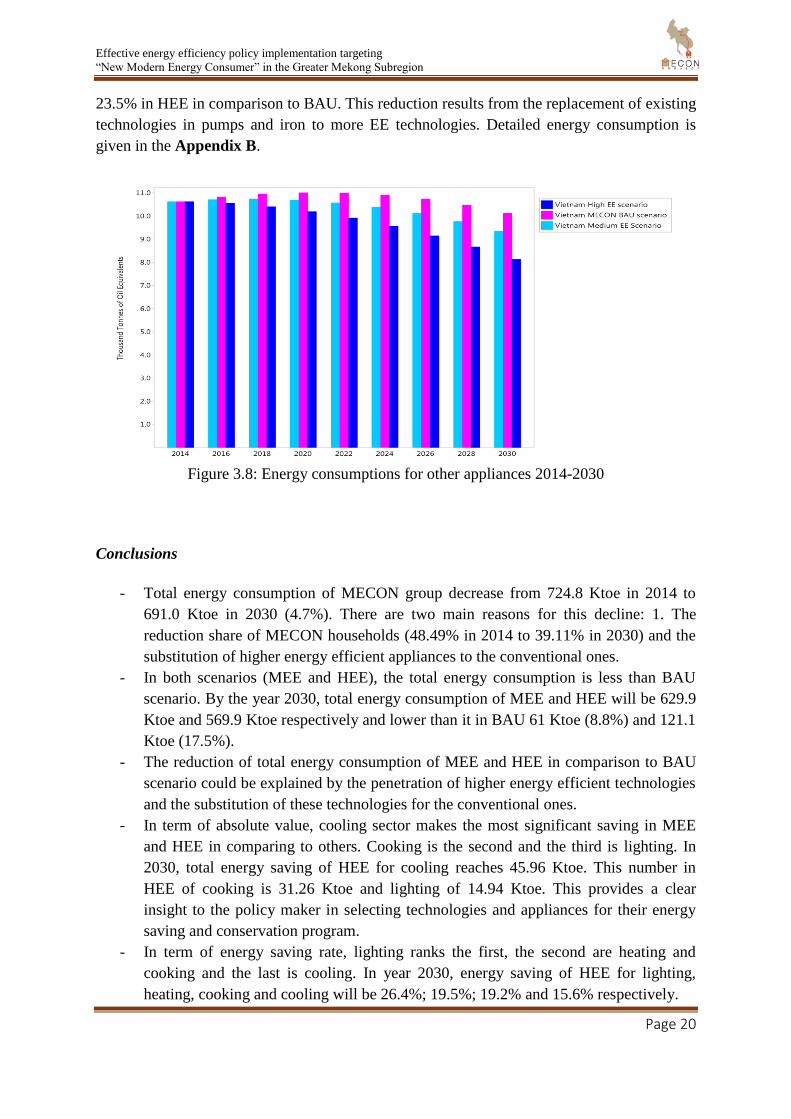
Effective energy efficiency policy implementation targeting
“New Modern Energy Consumer” in the Greater Mekong Subregion
Page 20
23.5% in HEE in comparison to BAU. This reduction results from the replacement of existing
technologies in pumps and iron to more EE technologies. Detailed energy consumption is
given in the Appendix B.
Figure 3.8: Energy consumptions for other appliances 2014-2030
Conclusions
- Total energy consumption of MECON group decrease from 724.8 Ktoe in 2014 to
691.0 Ktoe in 2030 (4.7%). There are two main reasons for this decline: 1. The
reduction share of MECON households (48.49% in 2014 to 39.11% in 2030) and the
substitution of higher energy efficient appliances to the conventional ones.
- In both scenarios (MEE and HEE), the total energy consumption is less than BAU
scenario. By the year 2030, total energy consumption of MEE and HEE will be 629.9
Ktoe and 569.9 Ktoe respectively and lower than it in BAU 61 Ktoe (8.8%) and 121.1
Ktoe (17.5%).
- The reduction of total energy consumption of MEE and HEE in comparison to BAU
scenario could be explained by the penetration of higher energy efficient technologies
and the substitution of these technologies for the conventional ones.
- In term of absolute value, cooling sector makes the most significant saving in MEE
and HEE in comparing to others. Cooking is the second and the third is lighting. In
2030, total energy saving of HEE for cooling reaches 45.96 Ktoe. This number in
HEE of cooking is 31.26 Ktoe and lighting of 14.94 Ktoe. This provides a clear
insight to the policy maker in selecting technologies and appliances for their energy
saving and conservation program.
- In term of energy saving rate, lighting ranks the first, the second are heating and
cooking and the last is cooling. In year 2030, energy saving of HEE for lighting,
heating, cooking and cooling will be 26.4%; 19.5%; 19.2% and 15.6% respectively.

Effective energy efficiency policy implementation targeting
“New Modern Energy Consumer” in the Greater Mekong Subregion
Page 21
- So in short term, Vietnamese government should focus on energy saving in lighting.
For medium or long term the focus will be on cooking, heating and cooling.
3.3 Rebound Effect
3.3.1 Characteristics of the sample
In order to analyse the rebound effect, a survey was carried out in three regions in
Vietnam. They are Nam Dinh, Ba Ria and Nghe An (Duc Tho). A convenience sampling
method was employed, and a total of 129 questionnaires collected. Details of sample profile
is given in the below table.
There were slightly more male respondents (53.5%) than female (46.5%). The
majority of respondents are quite young. Respondents with age from 30 to 39 accounted for
35.66% of the sample, while 27.13% were aged between 18-29. Majority of respondents
(23.26%) reported that they work in construction field, while 19.38% work in agriculture and
the same that share works as government, teacher or other professional. More than half of the
respondents (61.24%) had obtained a vocational degree, and about one third (29.45%)
finished only secondary or primary school. The majority of respondents (77.69%) reported
that they have 4 or less than 4 people in the family. Only 2.36% households have more than 6
people in their family.

Effective energy efficiency policy implementation targeting
“New Modern Energy Consumer” in the Greater Mekong Subregion
Page 22
Table 3.4: Sample profile
Number Percentage (%)
Gender Female 60 46.51
Male 69 53.48
Age 18-29 35 27.13
30-39 46 35.65
40-49 22 17.05
50-59 17 13.18
>60 9 6.97
Principal
occupation
Agriculture 25 19.38
Construction 30 23.26
Retail/street vendor 23 17.83
Government/teacher/other
professional 25 19.38
Self-employment 8 6.20
Unemployment 1 0.78
Retired 7 5.43
Other 10 7.75
Highest level of
schooling
completed by the
chief wage earner
Primary 9 6.97
Secondary 29 22.48
Vocational/College 79 61.24
No answer 12 9.30
Size of
households
<4 people 44 34.65
4 people 55 43.31
5-6 people 25 19.68
>6 people 3 2.36
Family with
people under 16
age
Family without people under
16 32 24.81
Family with people under 16 97 75.19
With only 1 under 16 48 49.48
With 2 under 16 45 46.39
With 3 under 16 4 4.12
Number of
people earning an
income
1 9 7.087
2 96 75.59
3 12 9.45
4 7 5.51
>5 3 2.36
75.19% of households reported that they have children under 16 years old. However,
the majority of these households have only 1 child (49.48%) or two children (46.39%). All
households responded that at least one member was earning an income, while the majority
(75.59) reported that they have two people earning an income. 7.87% reported that they have
more than four people earning an income.
The majority of decisions about electricity (62.99%) and other fuels (59.02%) are
made jointly with others. Female and male are quite balanced in role of making decision on
electricity (18.11% each). Females (21.26%) are more dominant than male (19.68%) in
making decisions about other fuels.

Effective energy efficiency policy implementation targeting
“New Modern Energy Consumer” in the Greater Mekong Subregion
Page 23
Table 3.5: Who makes decisions about electricity and other fuels
Decision about electricity Decision about other fuels
Number % Number %
Female 23 18.11 27 21.26
Male 23 18.11 25 19.68
Jointly with others 80 62.99 75 59.02
Son/ Daughter 1 0.78 0 0
More than half (53.28%) of households fall in low income (equal or less than 301-480
USD/month). Number of household with income more than 600 USD/month is only 27.87%.
While average people per household is 4. This shows that the surveyed households are
MECON group.
3.3.2 Status quo (Section B)
Monthly average expenditure on different items of household is given in the below
table. In general households spend highest money for their food (1,334.55 thousand dong per
month). Expenditure for education, saving and investment, clothing and furniture and housing
is number 2, 3, 4 and 5. These expenditure per month are 1,293 thousand dong; 1,026
thousand dong; 848 thousand dong and 814 thousand dong respectively. All households pay
electricity bill monthly.
Table 3.6: Monthly average expenditure on different items of households
Expenditure items Thousand VND
Housing 814.28
Food 1,334.55
Cooking fuels (fuel wood, charcoal, gas etc.) 202.03
Electricity bills 390.08
Transportation 649.38
Water bills 108.85
Education 1,293.63
Clothing & furniture 848.00
Healthcare 771.43
Savings & investments 1,026.67
Table 3.7: Electricity availability and acceptability
Electricity availability Always Often Sometimes
% 68.2 27.9 1.6
Electricity
acceptability
Very acceptable &
completely acceptable
Moderately acceptable Not at all acceptable
& slightly acceptable
% 37.3 34.1 28.6
Majority of respondents (68.2%) reported that they always have electricity supplied
while 27.9% said that they often get electricity. Only 1.6% reported that they have electricity
sometimes. 37.3% respondents thought that the cost of electricity is very and completely
acceptable. While 28.6% said that electricity cost is not at all or slightly acceptable.

Effective energy efficiency policy implementation targeting
“New Modern Energy Consumer” in the Greater Mekong Subregion
Page 24
Table 3.8: Equipment used in households
Equipment used for
cooking
HH used
equipment (%)
Equipment used for
lighting
HH used
equipment (%)
Traditional biomass stove 28.57 Candles 15.87
Improved biomass stove 10.32 Batteries/ torches 23.01
Electric hot plate/ stove 34.12 Kerosene lamp 8.7
Rice cooker 99.20 Incandescent light bulbs 52.38
LPG burner or stove 94.44 Fluorescent lamps 90.47
Kerosene stove 3.17 Compact fluorescent lamps 77.78
Microwave oven 33.33 Light Emitting Diode lamps 19.04
Majority of households own a rice cooker (99.2%) and an LPG burner (94.44%).
About one third households use an electric stove (34.12%) and microwave (33.33%). Very
few households use kerosene stove. The number of households using traditional biomass
stove and improved biomass stoves is few. These numbers are 28.57% for traditional biomass
stove and 10.32% for improved biomass stove.
Table 3.9: Households owned entertainment equipment
The majority of households have mobile phones (96.8%), electric fans (96.03%) and
refrigerators (88.8%). More than 80% of households use an electric iron (83.33%); washing
machine (83.33%) and computer (80.95%). Only a limited number of households have
electric winter heater (intensive energy consumed) (11.9%), while electric. However 69.84%
of households own electric water heater. TV, electric kettle, air conditioning are quite
common equipment in survey family.
The Table below shows the adoption of large equipment in surveyed households and
in different regions. Majority of households own refrigerator (88.88%) and washing machine
(83.3%). The second common appliances are electric kettle (73%); electric water heater
(69.8%) and air conditioning (65.9%). Electric winter heater is used in the two provinces
(Duc Tho and Nam Dinh) in the North where there is winter. There is significant different in
adoption of electric water heater in Ba Ria (The South) and Duc Tho and Nam Dinh (the
North). The South is hot, it is therefore number of households own electric water heater are
less than in the North.
Equipment % of HH used Equipment % of HH used
Box TV 60.48 Electric kettle 73.02
Flat screen TV 60.32 Electric iron 83.33
Mobile phone 96.8 Electric water heater 69.84
Refrigerator 88.8 Solar water heater 17.46
Radio 24.8 Washing machine 83.33
Video/ DVD player 51.58 Electric water pump 53.6
Computer 80.95 Vacuum cleaner 23.81
Electric fan 96.03 Hi Fi/ sound system 19.84
Air conditioning unit 65.87 Electric winter heater 11.90

Effective energy efficiency policy implementation targeting
“New Modern Energy Consumer” in the Greater Mekong Subregion
Page 25
Table 3.10: Percentage of households owning large appliances
All
households Ba Ria
Duc Tho Nam Dinh
Refrigerator 88.8 91.2 81.8 97.2
Air conditioning unit 65.9 42.8 60 97.2
Washing machine 83.3 74.3 97.2 83.3
Electric water heater 69.8 31.4 80 91.7
Electric winter heater 11.9 0 12.7 22.2
Water Pump 53.6 17.6 65.4 69.4
Kettle 73.0 68.6 63.6 91.6
The surveyed households were divided into three types of households who used
electricity (a) solely for lighting, (b) for lighting and small appliances, and (c) for other
energy services. For other energy services, we included households owning large appliances,
which are refrigerators, washing machines, air conditioning units, and electric water heaters.
Table 3.11: Categories of the surveyed households
Household
category
Purpose of electricity
consumption
All
households Ba Ria
Duc
Tho Nam Dinh
Category (a) Solely for lighting
0 0 0 0%
Category (b) For lighting and small
appliances 11.2% 8.8% 18.2% 2.8%
Category (c) For lighting, small appliances,
and other energy services 88.8% 91.2% 81.8% 97.2%
All survey households use electricity for not only lighting, but also other purposes.
Majority of them have lighting equipment, small appliances as well as large equipment like
refrigerator, washing machines, electric water heater or even air conditioning. The result
shows that majority of households in three surveyed provinces fall in category (c).
Table 3.12: Comparison of households’ monthly income between households in Ba Ria, Nam
Dinh and Duc Tho
Monthly income All household Ba Ria Duc Tho Nam Dinh
< 120 USD 4.07 - 8.93 -
121 -300 USD 14.63 14.71 21.43 3.03
301 - 480 USD 34.15 26.47 42.86 27.27
481-600 USD 18.70 23.53 19.64 12.12
>600 USD 28.46 35.29 7.14 57.58
Total
In terms of household monthly incomes, the surveyed households in Nam Dinh have
higher incomes in comparing to the other two. Duc Tho seems to have lowest income. In fact
Duc Tho is one commune in Ha Tinh province. People who living in this central province is
relatively poorer than those in Ba Ria and Nam Dinh province.
Effective energy efficiency policy implementation targeting
“New Modern Energy Consumer” in the Greater Mekong Subregion
Page 26
Table 3.13: Comparison of households’ monthly income between category (b) and (c)
Monthly income All household
(%) Category b
Category c
< 120 USD 4.07 3 21.43% 2 1.85%
121 -300 USD 14.63 7 50.00% 11 10.19%
301 - 480 USD 34.15 3 21.43% 39 36.11%
481-600 USD 18.70 0 - 23 21.30%
>600 USD 28.46 1 7.14% 33 30.56%
Total 14 108
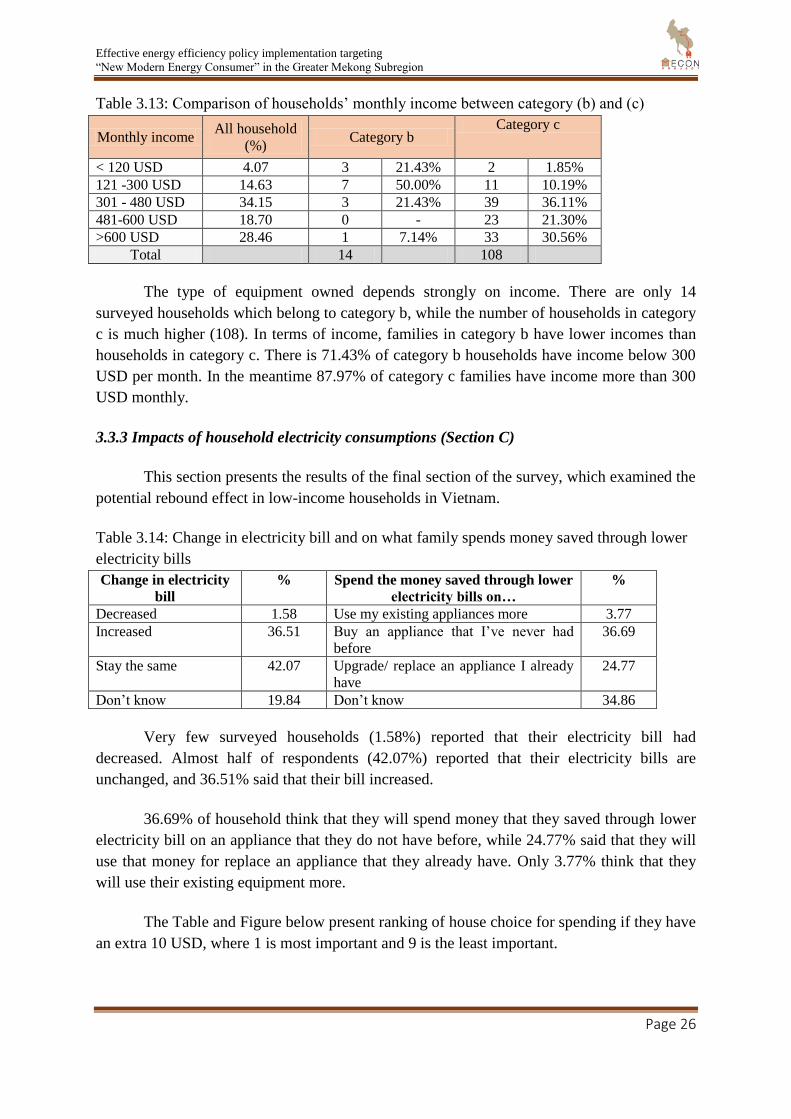
The type of equipment owned depends strongly on income. There are only 14
surveyed households which belong to category b, while the number of households in category
c is much higher (108). In terms of income, families in category b have lower incomes than
households in category c. There is 71.43% of category b households have income below 300
USD per month. In the meantime 87.97% of category c families have income more than 300
USD monthly.
3.3.3 Impacts of household electricity consumptions (Section C)
This section presents the results of the final section of the survey, which examined the
potential rebound effect in low-income households in Vietnam.
Table 3.14: Change in electricity bill and on what family spends money saved through lower
electricity bills
Change in electricity
bill
% Spend the money saved through lower
electricity bills on…
%
Decreased 1.58 Use my existing appliances more 3.77
Increased 36.51 Buy an appliance that I’ve never had
before
36.69
Stay the same 42.07 Upgrade/ replace an appliance I already
have
24.77
Don’t know 19.84 Don’t know 34.86
Very few surveyed households (1.58%) reported that their electricity bill had
decreased. Almost half of respondents (42.07%) reported that their electricity bills are
unchanged, and 36.51% said that their bill increased.
36.69% of household think that they will spend money that they saved through lower
electricity bill on an appliance that they do not have before, while 24.77% said that they will
use that money for replace an appliance that they already have. Only 3.77% think that they
will use their existing equipment more.
The Table and Figure below present ranking of house choice for spending if they have
an extra 10 USD, where 1 is most important and 9 is the least important.

Effective energy efficiency policy implementation targeting
“New Modern Energy Consumer” in the Greater Mekong Subregion
Page 27
On average, food was ranked the highest (mean = 2.08). This shows that the most
important thing for a family to spend additional income on is food. The second and third
important things are education (mean = 3.64) and healthcare (mean=3.58). The least
important things belong to “housing (mean = 6.35); cooking fuels (mean = 5.67) and savings
& investment (mean = 6,65). Electrical appliances were ranked in the middle (mean = 4.79)
Table 3.15: Household's expending ranking items if they have an extra 10 USD
Ranking 1 2 3 4 5 6 7
Housing
4.59
0.92
3.67
10.09
19.27
13.76
10.09
Food
38.52
13.93
12.30
16.39
10.66
0.82
1.64
Cooking fuels
2.41
4.82
10.84
7.23
15.66
21.69
10.84
Electrical appliances
3.88
12.62
12.62
14.56
14.56
14.56
4.85
Transportation
2.97
7.92
10.89
19.80
15.84
12.87
8.91
Education
18.18
19.83
23.14
10.74
9.92
4.13
5.79
Clothing & furniture
7.29
7.29
18.75
25.00
9.38
8.33
6.25
Health care
18.60
30.23
10.85
1.55
6.98
9.30
9.30
Saving and
investment
7.69
10.26
10.26
11.11
11.11
9.40
13.68
Figure 3.9: Average ranking on different items
6.36
2.80
5.67
4.79
5.02
3.58
4.49
3.64
5.65
- 1.00 2.00 3.00 4.00 5.00 6.00 7.00
Housing
Food
Cooking
Electrical appliances
Transportation
Education
Clothing and furniture
Health care
Saving and investment

Effective energy efficiency policy implementation targeting
“New Modern Energy Consumer” in the Greater Mekong Subregion
Page 28
4 Conclusions and Recommendations
Total energy demand for MECON is projected by using the LEAP model. The result
shows that energy demand for MECON is slightly decrease (5% in BAU scenario). The fall
in population of MECON is main reason for this reduction. This is expected as the economic
continuing improvement, poor households have higher income and become non-MECON.
Total energy demand in HEE is less than BAU scenario 121 ktoe by the year 2030
(17.5%). This shows the huge potential for energy saving in this group. It is recommended
that government should put priority to MECON and introduce appropriate and immediate
policy for this low income group.
Energy demand for cooling is ranked as the first (42.5%). The second is cooking
(23.5%) and third is entertainment (15.1%). Among energy consumed equipment, cooling
should be given the first priority, then cooking and entertainment in the policy intervention.
All efficient equipment has lower LCC in comparing to the non-efficient ones despite
their higher investment cost. It is therefore the government should promote the use of
efficient appliances instead of traditional to not only MECON households but to other target
group as well.
Among efficient technologies, lighting equipment has the highest cost saving. The
replacement of LED for incandescent can reach 56.5% saving of total LCC cost. With the
lowest investment cost, while achieving the highest saving, efficient lighting technologies
should be the first priority for government to consider in their energy conservation policy.
This should be the immediate and short term solution for energy saving for MECON and
Vietnam.
Cooling appliances have the highest energy consumption and also largest share
(42.54%) of energy consumed among energy equipment. The maximum potential for energy
saving for cooling is high and reaches 45.96 ktoe in 2030 or 15.6%. The measures to promote
energy saving for cooling are important and should be given high priority. However due to
the relatively high investment cost, this should be a medium or long run solution to save
energy for the MECON group.
Energy consumed for cooking and entertainment purpose is ranked as the second and
third and make up 38.66% of total energy consumption in MECON group. These types of
equipment are popular in MECON and majority of households has it. With relatively low
investment cost, the substitution of non-efficient technologies for the high efficient ones
should be feasible for medium term. Government should also have policy to encourage this
replacement.
All the surveyed households currently own many electricity equipment, even large
ones like refrigerators (88.8%), washing machines (83.3%), air conditioning units (65.9%),

Effective energy efficiency policy implementation targeting
“New Modern Energy Consumer” in the Greater Mekong Subregion
Page 29
and electric water heaters (69.8%). This can be explained by electricity supply and climate in
Vietnam. The surveyed areas have electricity for quite long time (years) and In Vietnam
summer is very hot so fridge and air-conditioning become important while winter is cold in
the North, that is why electric water heater is necessary. It is therefore, policy to target these
large type equipment is crucial.
Related to the spending pattern of MECON, they rank the most important is foods,
second is health care, education is ranked as the third and cooking fuel is sixth and the last is
electrical appliances. It is clear that the priorities are given to the basic needs (food, health
care). Poor families only think of others when their basic needs satisfied. So in order to
encourage MECON use efficient technologies, first thing to do is to improve their living
standards. It is suggested that the policy to improve income for poor households should
introduce first or parallel to energy saving.
The conclusions and recommendations are drawn from the analysis based on data
obtained from 129 households survey. However, 28.46% of them with income higher than
600USD/month and may not fall in MECON group. Further research could improve in
sample size in order to have better representation of MECON households.

Effective energy efficiency policy implementation targeting
“New Modern Energy Consumer” in the Greater Mekong Subregion
Page 30
5 References
Citations and References should be indicated using the Author-Date method of citation
(Last name of author, Date of publication.
For more than two authors, add “et al.” after the name of the first author, for example:
(Frits, 1976; Pandey and Shukla, 2003; Kungsuwan et al., 1996).
If the author’s name is part of the sentence, only the date is placed in parentheses: “Frits
(1976) argued that…”
References are listed fully in alphabetical order according to the last name of the first
author.
Birbili, M. 2000. Translating from one language to another. Social Research Update, Winter
2000. Available from: http://sru.soc.surrey.ac.uk/SRU31.html [Accessed November 2013].
Chapman, D.W. and Carter, J.F. 1979. Translation procedures for the cross-cultural use of
measurement instruments. Educational Evaluation and Policy Analysis 1(3): 71-76.
IEA. 2012. World Energy Outlook 2012. International Energy Agency, Paris.
Sarkar, A. and Singh, J. 2010. Financing energy efficiency in developing countries: lessons
learned and remaining challenges. Energy Policy 38(10): 5560.-5571.
Further examples of references formatting are given below.
Book:
Frits, H.C. 1976. Tree Rings and Climate. London: Academic Press.
Journal article:
Pandey, S.K. and Shukla, R.P. 2003. Plant diversity in managed sal (Shorea robusta Gaertn.
f.) forests of Gorakhpur, India: species composition, regeneration and conservation.
Biodiversity and Conservation 12(11): 2295–2319.
Chapter in a book:
Kungsuwan, A., Ittipong, B., and Chandrkrachang, S. 1996. Preservative effect of chitosan on
fish products. In: Steven, W.F., Rao, M.S. and Chandrkachang, S. (eds): Chitin and Chitosan:
Environmental and Friendly and Versatile Biomaterials (pp. 193–199). Bangkok: Asian
Institute of Technology.

Effective energy efficiency policy implementation targeting
“New Modern Energy Consumer” in the Greater Mekong Subregion
Page 31
Published conference proceedings:
Stolwijk, J.A.J. 1984. The sick building syndrome. In: Recent Advances in Health Science
and Technology, vol. 1 (pp. 22–29). Proceedings of the Third International Conference on
Indoor Air Quality and Climate. Stockholm: Swedish Council for Building Research.
Ph.D. thesis:
Shrestha, M.K. 2004. Relative ungulate abundance in a fragmented landscape: implications
for tiger conservation. Ph.D. dissertation, University of Minnesota.
Website:
United Nations Environment Programme (UNEP). 2007. Geo Indicators [Online]. Available
at: http://www.unep.org/geo/yearbook/yb2007/pdf/8_Indicators 72dpi.pdf [Accessed on 26
April 2008].

Effective energy efficiency policy implementation targeting
“New Modern Energy Consumer” in the Greater Mekong Subregion
Page 32
6 Appendix A: Survey Questionnaire
TRƯỜNG ĐẠI HỌC BACH KHOA HÀ NỘI Mã số xác định cuộc phỏng vấn::
Mã số xác định người thực hiện:
Ngày: __________/ Tháng____________ / 2015
Phường/xã:
Chào cô/bác (anh/chị), tên cháu (em) là (…………..). Cháu (em) đang thực hiện một nghiên cứu điều tra cho Trường Đại học Bách khoa Hà nội. Mục đích của nghiên cứu này là để tìm hiểu xem gia đình ta sử dụng điện như thế nào cũng như những khó khăn mà gia đình có thể gặp phải khi tiếp cận các thiết bị gia dụng mới có hiệu quả hơn. Nghiên cứu này đang được tiến hành ở 5 nước thuộc tiểu vùng sông Mê-kong bao gồm cả Việt nam ta.
Theo cháu (em), để trả lời hết các câu hỏi trong phiếu điều tra này cần khoảng 20 đến 30 phút. Tất các thông tin mà cô/bác (anh/chị) cung cấp sẽ được giữ bí mật. Sẽ không ai có thể nhận ra cô/bác (anh/chị) và gia đình ta trong bất kỳ kết quả công bố nào của nghiên cứu này. Nếu cô/bác (anh/chị) không muốn trả lời bất kỳ câu hỏi nào hoặc tất cả các câu hỏi của nghiên cứu này thì cô/bác (anh/chị) có thể bỏ qua mà không cần phải đưa ra lý do giải thích. Cuối cùng, nếu cô/bác (anh/chị) có bất kỳ câu hỏi hay nhận xét gì về nghiên cứu điều tra này xin cứ hỏi ngay bây giờ.
Xin trân trọng cám ơn cô/bác (anh/chị) đã tham gia giúp đỡ thực hiện nghiên cứu này.
PHẦN A. THÔNG TIN VỀ HỘ GIA ĐÌNH
NGƯỜI PHỎNG VẤN: Trước hết cháu (em) muốn hỏi một số thông tin về cô/bác (anh/chị)
và gia đình ta.
Xin cô/bác (anh/chị) cho biết tên của mình ạ?
A01 Giới tính □ Nam
□ Nữ
A02 Cô/bác (anh/chị) năm nay bao nhiêu tuổi? □ 18 – 29
□ 30 – 39
□ 40 – 49
□ 50 – 59
□ 60+
Effective energy efficiency policy implementation targeting
“New Modern Energy Consumer” in the Greater Mekong Subregion
Page 33
A03 Có phải cô/bác (anh/chị) là người có thu
nhập chính của gia đình không?
□ Có
□ Không
→ chuyển sang câu A05
→ A04
A04 Nếu không phải thì cô/bác (anh/chị) có
quan hệ như thế nào với người có thu
nhập chính trong gia đinh ta?
□ Chồng/ Vợ
□ Con trai/ con gái
□ Bố/ mẹ
□ Khác (Xin ghi rõ)____________________
A05 Người có thu nhập chính trong gia đình ta
làm nghề gì? □ Nông nghiệp
□ Xây dựng
□ Có cửa hàng bán lẻ
□ Cán bộ nhà nước, giáo viên hoặc các
chuyên môn khác
□ Tự mở công ty
□ Thất nghiệp
□ Về hưu
□ Nghề khác (xin ghi rõ)__________________
A06 Trình độ học vấn cao nhất của người có
thu nhập chính trong gia đình ta là gì?
□ Chưa qua hệ thống đào tạo chính thức nào
□ Tiểu học
□ Trung học cơ sở
□ Cao đẳng/ Đại học
□ Không trả lời
A07 Ai là người trong gia đình ta có quyền
quyết định về việc sử dụng điện? □ Tôi
□ Chống tôi/vợ tôi
□ Con trai/ con gái tôi
□ Mọi người cùng tham gia
□ Khác (Xin ghi rõ)______________________

Effective energy efficiency policy implementation targeting
“New Modern Energy Consumer” in the Greater Mekong Subregion
Page 34
A08 Ai là người trong gia đình ta có quyền
quyết định về việc sử dụng các nhiên liệu
khác? cho nấu nướng chẳng hạn?
□ Tôi
□ Chống tôi/vợ tôi
□ Con trai/ con gái tôi
□ Mọi người cùng tham gia
□Khác (Xin ghi rõ)______________________
A09 Gia đình cô/bác (anh/chị) có bao nhiêu người?
A10 Gia đình cô/bác (anh/chị) có bao nhiêu người dưới 16 tuổi?
A11 Gia đình cô/bác (anh/chị) có bao nhiêu người có thu nhập?
A12 Nhìn chung, thu nhập một tháng của gia
đình ta khoảng bao nhiêu? □ < 60 USD (1.260,000 đồng)
□ 61 – 120 USD (1.281.000 – 2.520.000 đồng)
□ 121 – 180 USD (2.541.000 – 3.780.000 đồng)
□ 181 – 240 USD (3.801.000 – 5.040.000 đồng)
□ 241 – 300 USD (5.061.000 – 6.300.000 đồng)
□ 301 - 360 USD (6.321.000 – 7.560.000 đồng)
□ 361 – 420 USD (7.581.000 – 8.820.000 đồng)
□ 421 – 480 USD (8.841.000 – 10.080.000 đồng)
□ 481 – 540 USD (10.101.000 – 11.340.000 đồng)
□ 541 – 600 USD (11.361.000 – 12.600.000 đồng)

Effective energy efficiency policy implementation targeting
“New Modern Energy Consumer” in the Greater Mekong Subregion
Page 35
□ > 600 USD (12.600.000 đồng)
□ Không trả lời
PHẦN B. NĂNG LƯỢNG TIÊU THỤ CỦA HỘ GIA ĐÌNH
NGƯỜI PHỎNG VẤN: Cháu (em) muốn hỏi cô/bác (anh/chị) về việc tiêu thụ năng lượng
trong gia đình ta
Hãy nghĩ về tháng trước, hộ gia đình của cô bác/anh- chị đã tiêu khoảng bao nhiêu tiền cho các mục đích sau đây trong tháng trước
B01
Nhu cầu ở Housing
B02
Đồ ăn uống Food
B03
Nhiên liệu dùng để nấu (củi, than, gas, …) Cooking fuels (fuelwood,
charcoal, gas etc.)
B04
Tiền điện Electricity bills
B05
Đi lại Transportation
B06
Hoá đơn tiền nước Water bills
B07
Giáo dục Education
B08
Quần áo và đồ gỗ Clothing & furniture
B09
Chăm sóc sức khoẻ Healthcare
B1
0
Tiết kiệm và đầu tư Savings & investments
B1
1
Mục đích khác Other
NGƯỜI PHỎNG VẤN: Hãy nghĩ về điện năng
B1
2
Ông/Bà (anh/chị) trả tiền điện theo hình thức nào? □ Trả trước
□ Trả khi nhận được hoá đơn
B1
3
Tiền điện thường được trả theo? □ Hàng tuần
□ Hàng tháng
□ Hàng quí
□ Khi nào có tiền thì trả

Effective energy efficiency policy implementation targeting
“New Modern Energy Consumer” in the Greater Mekong Subregion
Page 36
□ Không phải trả tiền
B14
Gia đình ta có được cấp điện thường xuyên không?
Không bao giờ
Ít khi có Đôi khi
có Thường
có Luôn có
□ □ □ □ □
B15
Theo cô/bác (anh/chị) thì chi tiêu cho việc sử dụng điện và các nhiên liệu khác là chấp nhận được không so với mức thu nhập của gia đình
Hoàn toàn
không thể
chấp nhận
Chấp nhận ở
mức thấp
Chấp nhận ở
mức trung bình
Chấp nhận ở
mức cao
Chấp nhận hoàn toàn
□ □ □ □ □
NGƯỜI PHỎNG VẤN: Gia đình cô/bác (anh/chị) sử dụng điện cho mục đích …
B1
6
Chiếu sáng
□ Có
□ Không
B1
7
Đun nấu
□ Có
□ Không
NGƯỜI PHỎNG VẤN: Để nun nấu, gia đình cô/bác (anh/chị) sử dụng thiết bị nào được
kể ra dưới dây..
B18 Bếp củi truyền thống □ Có
□ Không
B19 Bếp củi cải tiến □ Có
□ Không
B20 Bếp điện □ Có
□ Không B21 Nồi cơm điện □ Có
□ Không
B22 Bếp gas □ Có
□ Không
B23 Bếp dầu □ Có
□ Không

Effective energy efficiency policy implementation targeting
“New Modern Energy Consumer” in the Greater Mekong Subregion
Page 37
B24 Lò vi sóng □ Có
□ Không
NGƯỜI PHỎNG VẤN: Để chiếu sáng, gia đình cô/bác (anh/chị) dùng những thiết bị nào
dưới đây
B25 Nến □ Có
□ Không B26 Đèn pin/ắc qui □ Có
□ Không
B27 Đèn dầu □ Có
□ Không
B28 Bóng đèn dây tóc □ Có
□ Không B29 Đèn huỳnh quang (đèn ống tuýp) □ Có
□ Không
B30 Đèn compact (đèn tiết kiệm điện) □ Có
□ Không
B31 Đèn đi-ôt chiếu sáng (đèn LED) □ Có
□ Không
NGƯỜI PHỎNG VẤN: Gia đình cô bác (anh/chị) có thuê hoặc sở hữu các thiết bị dưới
đây
B32 Ti vi thường □ Có □ Không
B33 Ti vi màn hình phẳng □ Có □ Không
B34 Điện thoại di động □ Có □ Không
B35 Tủ lạnh □ Có □ Không
B36 Radio □ Có □ Không
B37 Đầu Video/DVD □ Có □ Không
B38 Máy tính □ Có □ Không
B39 Quạt điện □ Có □ Không
B40 Điều hòa nhiệt độ □ Có
Effective energy efficiency policy implementation targeting
“New Modern Energy Consumer” in the Greater Mekong Subregion
Page 38
□ Không
B41 Ấm đun nước điện □ Có □ Không
B42 Bàn là điện □ Có □ Không
B43 Bình nước nóng điện □ Có □ Không
B44 Bình nước nóng mặt trời □ Có □ Không
B45 Máy giặt □ Có □ Không
B46 Bơm điện □ Có □ Không
B47 Máy hút bụi □ Có □ Không
B48 Giàn âm thanh/Hi-Fi □ Có □ Không
B49 Lò sưởi điện □ Có □ Không
B50 Khác (Xin ghi rõ)
PHẦN C. TÁC ĐỘNG BÊN NGOÀI/REBOUND EFFECT
NGƯỜI PHỎNG VẤN: Nếu có thêm thu nhập nhờ tiết kiệm được chi tiêu cho điện
năng và các nhiên liệu khác thông qua việc sử dụng các thiết bị TKNL thì gia đình cô
bác (anh/chị) sẽ sử dụng số tiền này cho mục đích nào?
C01 Anh chị cho biết tiền điện của gia đình
mình như thế nào trong 6 tháng qua? □ Giảm xuống
□ Tăng lên
□ Giữ nguyên (ko tăng;
ko giảm)
□ Không biết
C02, C03 [NOT C04]
C04
C04
C04
C02 Tại sao tiền điện lại giảm xuống?
C03 Anh/Chị (Ông/ Bà) đã dùng tiền tiết
kiệm (nói chung) được cho mục đích
nào bên cạnh, ước tính tỉ lệ % ước tính
của tiền tiết kiệm cho những mục đích
này?
□ Nhà ở
□ Đồ ăn và uống
□ Nhiên liệu dùng cho đun nấu

Effective energy efficiency policy implementation targeting
“New Modern Energy Consumer” in the Greater Mekong Subregion
Page 39
□ Các thiết bị điện
□ Đi lại
□ Giáo dục
□ Quần áo và đồ gỗ trong nhà
□ Chăm sóc sức khoẻ
□ Tiết kiệm và đầu tư
□ Chưa biết
□ Mục đích khác (đề nghị ghi rõ)
C04 Nếu hoá đơn tiền điện giảm, Ông/Bà
muốn sử dụng tiền giảm được này cho
mục đích nào và ước tính tỉ lệ % chi cho
từng mục đích?
□ Nhà ở
□ Đồ ăn và uống
□ Nhiên liệu dùng cho đun nấu
□ Các thiết bị điện
□ Đi lại
□ Giáo dục
□ Quần áo và đồ gỗ trong nhà
□ Chăm sóc sức khoẻ
□ Tiết kiệm và đầu tư
□ Chưa biết
□ Mục đích khác (đề nghị ghi rõ)
C05
Nếu Anh/Chị (Ông/Bà) tiết kiệm được
tiền điện thì ông bà sẽ dùng điền tiết
kiệm này để làm gì nhất?
□ Dùng các thiết bị hiện có của tôi nhiều hơn
□ Mua thiết bị mới mà tôi chưa có
□ Nâng cấp/thay thế thiết bị mà tôi đã có

Effective energy efficiency policy implementation targeting
“New Modern Energy Consumer” in the Greater Mekong Subregion
Page 40
□ Không biết
□ Mục đích khác (đề nghị ghi rõ)
C06
Hãy hình dung nếu gia đình Anh/Chị (Ông/Bà) có thêm 200.000 đồng hàng tháng, Ông/Bà sẽ sử dụng số tiền này như thế nào? Hãy sắp xếp thứ tự theo mức độ quan trọng với 1 là quan trọng nhất và 9 là ít quan trọng nhất.
□ Nhà ở
□ Đồ ăn và uống
□ Nhiên liệu dùng cho đun nấu
□ Các thiết bị điện
□ Đi lại
□ Giáo dục
□ Quần áo và đồ gỗ trong nhà
□ Chăm sóc sức khoẻ
□ Tiết kiệm và đầu tư
□ Chưa biết
□ Mục đích khác (đề nghị ghi rõ)
Cuối cùng, cô/bác (anh/chị) có muốn trao đổi thêm về những điều chưa được nêu lên trong phiếu điều tra này có liên quan đến việc sử dụng điện và các nhiên liệu khác của gia đình ta không?
Cảm ơn cô/bác (anh/chị) đã giành thời gian trả lời phiếu điều tra!

Effective energy efficiency policy implementation targeting
“New Modern Energy Consumer” in the Greater Mekong Subregion
Page 41
Appendix B
Table B.1: Data and assumptions for LEAP modelling and scenario analysis
Appliance Percentage of households
owning the appliance in 2014
Final energy intensity
(kWh/household/year)
Final energy intensity
(TOE/household/year)
Lighting technologies
Incandescent light bulb 26.44 142.30 -
Fluorescent light bulb 37.97 335.72 -
Compact fluorescent light bulb 26.78 77.93 -
LED 2.71 47.46 -
Kerosene light bulb 0.68 - 0.001880
Cooking appliances
Existing electric cooking stove 11.19 6.94 -
Efficient electric cooking stove 0.00 5.55 -
Existing rice cooker 41.36 296.73 -
Efficient rice cooker 5.6 237.4 -
Existing microwave oven 6.78 86.87 -
Efficient microwave oven 0.00 69.5 -
Existing biomass stove 23.39 - 0.002059
Efficient biomass stove 0.00 - 0.001647
Existing charcoal stove 4.41 - 0.009516
Efficient charcoal stove 0.00 - 0.007613
Existing LPG stove 42.03 - 0.006692
Efficient LPG stove 0.00 - 0.005354
Kerosene Stove 0.00 - 0.002824
Cooling appliances
Existing AC unit 7.46 369.38 -
Efficient AC unit 0.54 295.5 -
Existing refrigerator 57.61 214.01 -
Efficient refrigerator 42.39 171.2 -
Existing electric fan 76.51 235.03 -
Efficient electric fan 23.49 188.0 -
Heating
Existing electric kettle 93.91 193.51 -
Efficient electric kettle 6.09 154.80 -
Existing electric water heater 18.64 18.91 -
Efficient electric water heater 0.00 15.12 -
Existing solar water heater 3.39 18.25
Efficient solar water heater 0.00 14.60
Existing electric heater 1.69 18.25

Effective energy efficiency policy implementation targeting
“New Modern Energy Consumer” in the Greater Mekong Subregion
Page 42
Appliance Percentage of households
owning the appliance in 2014
Final energy intensity
(kWh/household/year)
Final energy intensity
(TOE/household/year)
Efficient electric heater 0.00 14.60
Entertainment
Existing TV (CRT/box TV) 44.74 256.69 -
Efficient TV (LCD/flat screen TV) 8.14
-
Video/DVD player 22.71 4.61 -
Radio 8.47 9.39 -
Computer 27.8 3.65 -
Hi-fi system 5.08 0.33 -
Mobile phone 40.68 6.50 -
Cleaning
Existing washing machine 20.68 41.76 -
Efficient washing machine 0.19 33.41
Existing vacuum cleaner 0.68 22.38 -
Efficient vacuum cleaner 0.00 17.90 -
Other appliances
Water pump 27.12 2.19 -
Existing electric iron 22.71 46.99 -
Efficient electric iron 0.47 37.59 -

Effective energy efficiency policy implementation targeting
“New Modern Energy Consumer” in the Greater Mekong Subregion
Page 43
Table B.2: Assumptions for High Energy Efficiency (HEE) Scenario
Appliance Assumptions: High Energy Efficiency Scenario
Percentage of household owning the EE appliances in 2030 (%) Final energy intensity (kWh/year)
Lighting technologies
Incandescent light bulb
Assumed a complete phasing out for Incandescent, and then 100% substitution
to LED
Incandescent: Interpolation (2014, 100, 2030, 0)
LED: Remainder (100)
Incandescent to CFL: Final energy intensity reduces by 80%
Incandescent to LED: Final energy intensity reduces by 90%
Fluorescent light bulb (FLS)
Assumed a complete phasing out for FLS, and then 100% substitution to LED
FLS: Interpolation (2014, 100, 2030, 0)
LED: Remainder (100)
FLS to CFL: Final energy intensity reduces by 50%
FLS to LED: Final energy intensity reduces by 75%
Compact fluorescent light
(CFL) bulb
Assumed a complete phasing out for CFL, and then 100% substitution to LED
CFL: Interpolation (2014, 100, 2030, 0)
LED: Remainder (100)
CFL to CFL: Final energy intensity reduces by 50%
LED Assumed to penetrate the market to 30% of households
LED: Interpolation (2014, 0, 2030, 30)
Assumed constant
Kerosene light bulb No change No change
Cooking appliances
Electric cooking stove
Full substitution from existing to efficient technology
Existing technology:
Interpolation (2014, 100, 2030, 0)
Efficient technology: Remainder (100)
Efficient technology is assumed to have 20% less final energy intensity
than existing one
Rice cooker
Full substitution from existing to efficient technology
Existing technology: Interpolation (2014, 94.40, 2030, 0)
Efficient technology: Remainder (100)
Efficient technology is assumed to have 20% less final energy intensity
than existing one
Microwave oven
Full substitution from existing to efficient technology
Existing technology: Interpolation (2014, 100, 2030, 0)
Efficient technology: Remainder (100)
Efficient technology is assumed to have 20% less final energy intensity
than existing one.
Biomass Stove Full substitution from existing to efficient technology Efficient technology is assumed to have 20% less final energy intensity

Effective energy efficiency policy implementation targeting
“New Modern Energy Consumer” in the Greater Mekong Subregion
Page 44
Appliance Assumptions: High Energy Efficiency Scenario
Percentage of household owning the EE appliances in 2030 (%) Final energy intensity (kWh/year)
Improve biomass stove Existing technology: Interpolation (2014, 86, 2030, 0)
Efficient technology: Remainder (100)
than existing one.
Charcoal Stove
Full substitution from existing to efficient technology
Existing technology: Interpolation (2014, 100, 2030, 0)
Efficient technology: Remainder (100)
Efficient technology is assumed to have 20% less final energy intensity
than existing one.
LPG Stove
Full substitution from existing to efficient technology
Existing technology: Interpolation (2014, 100, 2030, 0)
Efficient technology: Remainder (100)
Efficient technology is assumed to have 20% less final energy intensity
than existing one.
Kerosene Stove No change No change
Cooling appliances
AC
Assumed to penetrate the market to 20% of households
AC: Interpolation (2014, 7.46, 2030, 20)
Full substitution from existing to efficient technology
Existing technology: Interpolation (2014, 99.66, 2030, 0)
Efficient technology: Remainder (100)
Efficient technology is assumed to have 20% less final energy intensity
than existing one.
Refrigerator
Full substitution from existing to efficient technology
Existing technology: Interpolation (2014, 57.61, 2030, 0)
Efficient technology: Remainder (100)
Efficient technology is assumed to have 20% less final energy intensity
than existing one.
Electric fan
Full substitution from existing to efficient technology
Existing technology: Interpolation (2014, 76.51, 2030, 0)
Efficient technology: Remainder (100)
Efficient technology is assumed to have 20% less final energy intensity
than existing one.
Heating
Electric kettle
Full substitution from existing to efficient technology
Existing technology: Interpolation (2014, 93.91, 2030, 0)
Efficient technology: Remainder (100)
Efficient technology is assumed to have 20% less final energy intensity
than existing one.
Electric water heater
Full substitution from existing to efficient technology
Existing technology: Interpolation (2014, 100, 2030, 0)
Efficient technology: Remainder (100)
Efficient technology is assumed to have 20% less final energy intensity
than existing one.
Solar water heater (SWH) No change No change

Effective energy efficiency policy implementation targeting
“New Modern Energy Consumer” in the Greater Mekong Subregion
Page 45
Appliance Assumptions: High Energy Efficiency Scenario
Percentage of household owning the EE appliances in 2030 (%) Final energy intensity (kWh/year)
Electric Heater No change No change
Entertainment
TV CRT (box TV) Full substitution from CRT to LCD
CRT: Interpolation (2014, 87, 2030, 0)
LCD: Remainder (100)
LCD can reduce 20% energy consumption comparing to CRT
TV LCD (flat screen TV)
Video/DVD player No change No change
Radio No change No change
Computer No change No change
Hi-fi system No change No change
Mobile phone No change No change
Cleaning
Washing machine
Full substitution from existing to efficient technology
Existing technology: Interpolation (2014, 94.44, 2030, 0)
Efficient technology: Remainder (100)
Efficient technology is assumed to have 20% less final energy intensity
than existing one.
Vacuum cleaner
Full substitution from existing to efficient technology
Existing technology: Interpolation (2014, 100, 2030, 0)
Efficient technology: Remainder (100)
Efficient technology is assumed to have 20% less final energy intensity
than existing one.
Other appliances
Water pump No change No change
Electric iron
Full substitution from existing to efficient technology
Existing technology: Interpolation (2014, 98.55, 2030, 0)
Efficient technology: Remainder (100)
Efficient technology is assumed to have 20% less final energy intensity
than existing one.
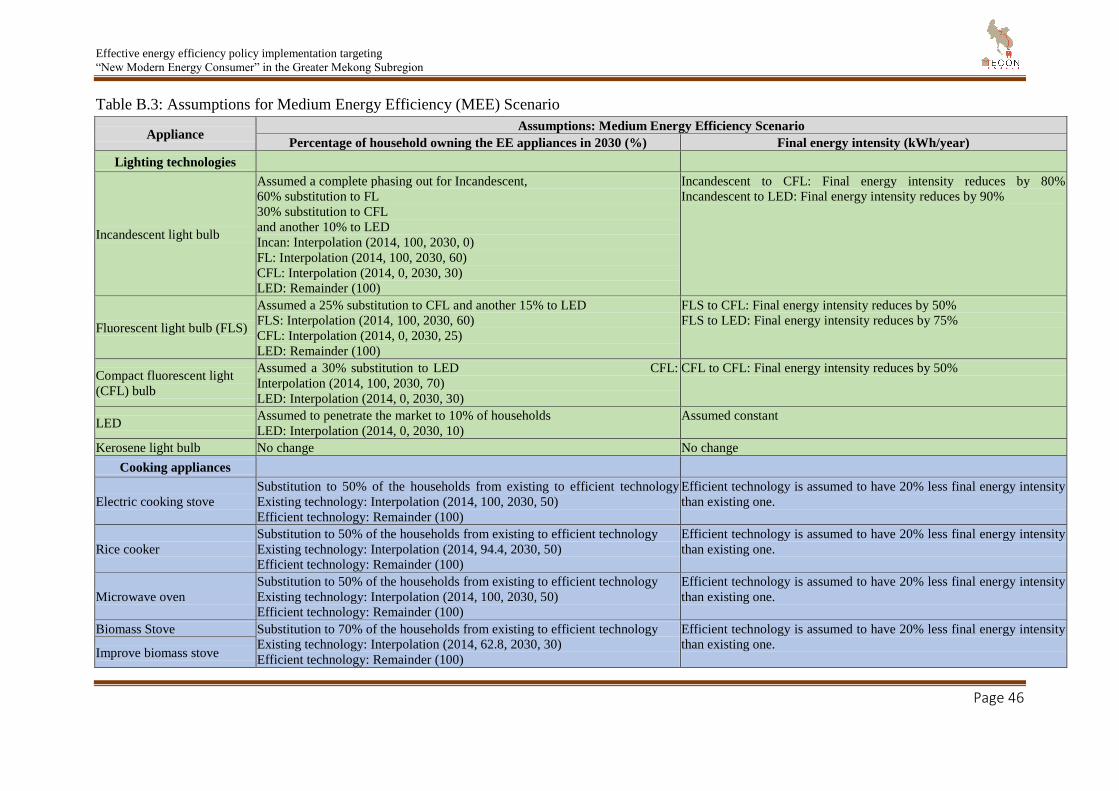
Effective energy efficiency policy implementation targeting
“New Modern Energy Consumer” in the Greater Mekong Subregion
Page 46
Table B.3: Assumptions for Medium Energy Efficiency (MEE) Scenario
Appliance Assumptions: Medium Energy Efficiency Scenario
Percentage of household owning the EE appliances in 2030 (%) Final energy intensity (kWh/year)
Lighting technologies
Incandescent light bulb
Assumed a complete phasing out for Incandescent,
60% substitution to FL
30% substitution to CFL
and another 10% to LED
Incan: Interpolation (2014, 100, 2030, 0)
FL: Interpolation (2014, 100, 2030, 60)
CFL: Interpolation (2014, 0, 2030, 30)
LED: Remainder (100)
Incandescent to CFL: Final energy intensity reduces by 80%
Incandescent to LED: Final energy intensity reduces by 90%
Fluorescent light bulb (FLS)
Assumed a 25% substitution to CFL and another 15% to LED
FLS: Interpolation (2014, 100, 2030, 60)
CFL: Interpolation (2014, 0, 2030, 25)
LED: Remainder (100)
FLS to CFL: Final energy intensity reduces by 50%
FLS to LED: Final energy intensity reduces by 75%
Compact fluorescent light
(CFL) bulb
Assumed a 30% substitution to LED CFL:
Interpolation (2014, 100, 2030, 70)
LED: Interpolation (2014, 0, 2030, 30)
CFL to CFL: Final energy intensity reduces by 50%
LED Assumed to penetrate the market to 10% of households
LED: Interpolation (2014, 0, 2030, 10)
Assumed constant
Kerosene light bulb No change No change
Cooking appliances
Electric cooking stove
Substitution to 50% of the households from existing to efficient technology
Existing technology: Interpolation (2014, 100, 2030, 50)
Efficient technology: Remainder (100)
Efficient technology is assumed to have 20% less final energy intensity
than existing one.
Rice cooker
Substitution to 50% of the households from existing to efficient technology
Existing technology: Interpolation (2014, 94.4, 2030, 50)
Efficient technology: Remainder (100)
Efficient technology is assumed to have 20% less final energy intensity
than existing one.
Microwave oven
Substitution to 50% of the households from existing to efficient technology
Existing technology: Interpolation (2014, 100, 2030, 50)
Efficient technology: Remainder (100)
Efficient technology is assumed to have 20% less final energy intensity
than existing one.
Biomass Stove Substitution to 70% of the households from existing to efficient technology
Existing technology: Interpolation (2014, 62.8, 2030, 30)
Efficient technology: Remainder (100)
Efficient technology is assumed to have 20% less final energy intensity
than existing one.
Improve biomass stove
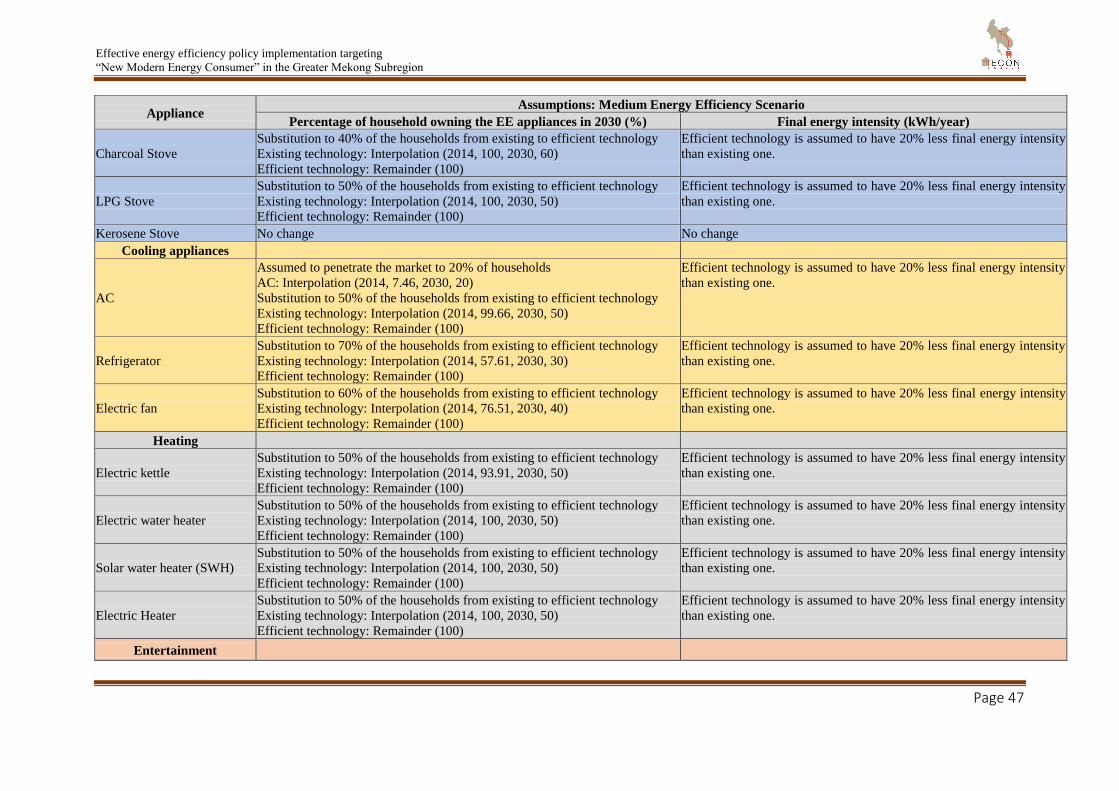
Effective energy efficiency policy implementation targeting
“New Modern Energy Consumer” in the Greater Mekong Subregion
Page 47
Appliance Assumptions: Medium Energy Efficiency Scenario
Percentage of household owning the EE appliances in 2030 (%) Final energy intensity (kWh/year)
Charcoal Stove
Substitution to 40% of the households from existing to efficient technology
Existing technology: Interpolation (2014, 100, 2030, 60)
Efficient technology: Remainder (100)
Efficient technology is assumed to have 20% less final energy intensity
than existing one.
LPG Stove
Substitution to 50% of the households from existing to efficient technology
Existing technology: Interpolation (2014, 100, 2030, 50)
Efficient technology: Remainder (100)
Efficient technology is assumed to have 20% less final energy intensity
than existing one.
Kerosene Stove No change No change
Cooling appliances
AC
Assumed to penetrate the market to 20% of households
AC: Interpolation (2014, 7.46, 2030, 20)
Substitution to 50% of the households from existing to efficient technology
Existing technology: Interpolation (2014, 99.66, 2030, 50)
Efficient technology: Remainder (100)
Efficient technology is assumed to have 20% less final energy intensity
than existing one.
Refrigerator
Substitution to 70% of the households from existing to efficient technology
Existing technology: Interpolation (2014, 57.61, 2030, 30)
Efficient technology: Remainder (100)
Efficient technology is assumed to have 20% less final energy intensity
than existing one.
Electric fan
Substitution to 60% of the households from existing to efficient technology
Existing technology: Interpolation (2014, 76.51, 2030, 40)
Efficient technology: Remainder (100)
Efficient technology is assumed to have 20% less final energy intensity
than existing one.
Heating
Electric kettle
Substitution to 50% of the households from existing to efficient technology
Existing technology: Interpolation (2014, 93.91, 2030, 50)
Efficient technology: Remainder (100)
Efficient technology is assumed to have 20% less final energy intensity
than existing one.
Electric water heater
Substitution to 50% of the households from existing to efficient technology
Existing technology: Interpolation (2014, 100, 2030, 50)
Efficient technology: Remainder (100)
Efficient technology is assumed to have 20% less final energy intensity
than existing one.
Solar water heater (SWH)
Substitution to 50% of the households from existing to efficient technology
Existing technology: Interpolation (2014, 100, 2030, 50)
Efficient technology: Remainder (100)
Efficient technology is assumed to have 20% less final energy intensity
than existing one.
Electric Heater
Substitution to 50% of the households from existing to efficient technology
Existing technology: Interpolation (2014, 100, 2030, 50)
Efficient technology: Remainder (100)
Efficient technology is assumed to have 20% less final energy intensity
than existing one.
Entertainment

Effective energy efficiency policy implementation targeting
“New Modern Energy Consumer” in the Greater Mekong Subregion
Page 48
Appliance Assumptions: Medium Energy Efficiency Scenario
Percentage of household owning the EE appliances in 2030 (%) Final energy intensity (kWh/year)
TV CRT (box TV) Substitution to 60% of the households from CRT to LCD
CRT: Interpolation (2014, 87, 2030, 40)
LCD: Remainder (100)
LCD can reduce 20% energy consumption comparing to CRT
TV LCD (flat screen TV)
Video/DVD player No change No change
Radio No change No change
Computer No change No change
Hi-fi system No change No change
Mobile phone No change No change
Cleaning
Washing machine
Substitution to 50% of the households from existing to efficient technology
Existing technology: Interpolation (2014, 94.44, 2030, 50)
Efficient technology: Remainder (100)
Efficient technology is assumed to have 20% less final energy intensity
than existing one.
Vacuum cleaner
Substitution to 50% of the households from existing to efficient technology
Existing technology: Interpolation (2014, 100, 2030, 50)
Efficient technology: Remainder (100)
Efficient technology is assumed to have 20% less final energy intensity
than existing one.
Other appliances
Water pump No change No change
Electric iron
Substitution to 40% of the households from existing to efficient technology
Existing technology: Interpolation (2014, 98.55, 2030, 60)
Efficient technology: Remainder (100)
Efficient technology is assumed to have 20% less final energy intensity
than existing one.

Effective energy efficiency policy implementation targeting
“New Modern Energy Consumer” in the Greater Mekong Subregion
Page 49
Table B.4: Energy consumption by scenarios and sectors 2014-2030
Scenarios - Total energy consumption (Ktoe) 2014 2016 2018 2020 2022 2024 2026 2028 2030
Vietnam High EE scenario
724.7
721.8
714.2
701.7
684.6
662.8
636.3
605.3
569.9
Vietnam MECON BAU scenario
724.8
738.1
747.0
751.2
750.5
744.4
732.7
714.9
691.0
Vietnam Medium EE Scenario
724.7
729.8
730.4
726.2
717.2
703.2
684.1
659.6
629.9
Total
2,174.1
2,189.8
2,191.6
2,179.1
2,152.3
2,110.4
2,053.1
1,979.8
1,890.8
Scenarios - Lighting (Ktoe) 2014 2016 2018 2020 2022 2024 2026 2028 2030
Vietnam High EE scenario
59.4
58.5
57.2
55.5
53.4
51.0
48.2
45.1
41.7
Vietnam MECON BAU scenario
59.4
60.5
61.2
61.6
61.5
61.0
60.1
58.6
56.7
Vietnam Medium EE Scenario
59.4
59.0
58.1
56.9
55.3
53.3
50.9
48.2
45.1
Total
178.3
178.0
176.6
174.0
170.2
165.3
159.2
151.9
143.5
Scenarios - Cooking (Ktoe) 2014 2016 2018 2020 2022 2024 2026 2028 2030
Vietnam High EE scenario
170.3
169.3
167.1
163.8
159.4
153.9
147.4
139.8
131.2
Vietnam MECON BAU scenario
170.4
173.6
175.7
176.6
176.5
175.1
172.3
168.1
162.5
Vietnam Medium EE Scenario
170.3
171.4
171.5
170.4
168.3
164.9
160.3
154.5
147.5
Total
511.0
514.3
514.3
510.9
504.2
493.9
480.0
462.5
441.2
Scenarios - Cooling (Ktoe) 2014 2016 2018 2020 2022 2024 2026 2028 2030

Effective energy efficiency policy implementation targeting
“New Modern Energy Consumer” in the Greater Mekong Subregion
Page 50
Vietnam High EE scenario
308.4
307.9
305.4
300.8
294.3
285.7
275.1
262.5
248.0
Vietnam MECON BAU scenario
308.4
314.0
317.8
319.6
319.3
316.7
311.7
304.1
294.0
Vietnam Medium EE Scenario
308.4
311.1
311.8
310.6
307.3
301.8
294.2
284.2
271.9
Total
925.1
933.0
935.0
931.0
920.9
904.3
881.0
850.9
813.9
Scenarios - Heating (Ktoe) 2014 2016 2018 2020 2022 2024 2026 2028 2030
Vietnam High EE scenario
57.4
57.1
56.3
55.2
53.7
51.8
49.5
47.0
44.1
Vietnam MECON BAU scenario
57.4
58.5
59.2
59.5
59.5
59.0
58.0
56.6
54.7
Vietnam Medium EE Scenario
57.4
57.8
57.8
57.5
56.7
55.6
54.0
52.1
49.7
Total
172.3
173.3
173.3
172.1
169.8
166.3
161.6
155.7
148.5
Scenarios - Entertainment (Ktoe) 2014 2016 2018 2020 2022 2024 2026 2028 2030
Vietnam High EE scenario
109.8
109.9
109.2
107.9
105.8
102.9
99.4
95.1
90.1
Vietnam MECON BAU scenario
109.8
111.9
113.2
113.8
113.7
112.8
111.0
108.3
104.7
Vietnam Medium EE Scenario
109.8
111.1
111.6
111.4
110.5
108.8
106.3
103.0
98.8
Total
329.5
332.8
334.0
333.1
330.0
324.6
316.7
306.4
293.6
Scenarios - Cleaning (toe) 2014 2016 2018 2020 2022 2024 2026 2028 2030
Vietnam High EE scenario
8,699.6
8,647.8
8,537.6
8,369.7
8,146.5
7,867.2
7,533.1
7,145.6
6,708.0

Effective energy efficiency policy implementation targeting
“New Modern Energy Consumer” in the Greater Mekong Subregion
Page 51
Vietnam MECON BAU scenario
8,700.3
8,860.2
8,966.8
9,016.6
9,008.0
8,935.2
8,794.4
8,581.3
8,293.8
Vietnam Medium EE Scenario
8,700.3
8,760.4
8,764.8
8,712.0
8,602.2
8,432.1
8,200.1
7,904.8
7,546.5
Total
26,100.2
26,268.3
26,269.2
26,098.2
25,756.6
25,234.5
24,527.6
23,631.6
22,548.3
Scenarios - Others - Ktoe) 2014 2016 2018 2020 2022 2024 2026 2028 2030
Vietnam High EE scenario
10.6
10.6
10.4
10.2
9.9
9.6
9.1
8.7
8.1
Vietnam MECON BAU scenario
10.6
10.8
10.9
11.0
11.0
10.9
10.7
10.5
10.1
Vietnam Medium EE Scenario
10.6
10.7
10.7
10.7
10.6
10.4
10.1
9.8
9.3
Total
31.9
32.1
32.1
31.9
31.5
30.9
30.0
28.9
27.6

Effective energy efficiency policy implementation targeting
“New Modern Energy Consumer” in the Greater Mekong Subregion
Page 52
Appendix C
Table C.1: Data and assumptions for cost-benefit analyses (CBA)
Wattage Hour used
(hours/day) Life span (year)
Energy
consumption
(kWh/year)
Capital cost
(USD)
Maintenance cost
(USD/year)
Incandescent light bulb 50 2.20 2 40.15 0.47 0.00
Fluorescent light bulb 35.84 4.47 4 58.47 0.95
Compact fluorescent light bulb 18.66 3.10 6 21.11 1.9
LED light bulb 5 4.25 6 7.76 4.5 0.00
Rice cooker (efficient) 470.00 1.70 10 291.64 55.00 0.00
Rice cooker (conventional) 584.00 1.70 10 362.37 38.00 0.00
Air conditioning unit (efficient) 1150.00 2.50 15 1049.38 570.00 10.00
Air conditioning unit (conventional) 1533.33 2.50 15 1399.16 410.00 10.00
Refrigerator (efficient) 72 14.00 15 367.92 214.00 0.00
Refrigerator (conventional) 83.76 14.00 15 428.01 180.00 0.00
Electric fan (efficient) 46.24 6.12 10 103.29 25.00 0.00
Electric fan (conventional) 57.81 6.12 10 129.14 19.00 0.00
Electric water heater (Efficient) 534 1.14 10 222.20 114.00 0.00
Electric water heater (conventional) 666.67 1.14 10 277.40 95.00 0.00

Effective energy efficiency policy implementation targeting
“New Modern Energy Consumer” in the Greater Mekong Subregion
Page 53
Table C.2: CBA between Incandescent and CFL light bulbs
Incandescent light bulb CFL light bulb
Year
Electricity
Price
($/kWh)
Electricity
Cons.
(kWh/year)
Capital Cost
($/appl.)
Maintenance
Cost ($/year)
Fuel Cost
($/year)
Life Cycle Cost
($)
Electricity
Cons.
(kWh/year)
Capital Cost
($/appl.)
Maintenance
Cost ($/year)
Fuel Cost
($/year)
Life Cycle Cost
($)
1 0.0772 40.15 0.47 0.00 3.10 3.44 21.11 1.90 0 1.63 2.04
2 0.0780 40.15 0.00 0.00 3.13 2.84 21.11 0.00 0 1.65 1.49
3 0.0788 40.15 0.00 0.00 3.16 0.00 21.11 0.00 0 1.66 1.44
4 0.0796 40.15 0.00 0.00 3.20 0.00 21.11 0.00 0 1.68 1.38
5 0.0804 40.15 0.00 0.00 3.23 0.00 21.11 0.00 0 1.70 1.33
6 0.0812 40.15 0.00 0.00 3.26 0.00 21.11 0.00 0 1.71 1.28
7 0.0820 40.15 0.00 0.00 3.29 0.00 21.11 0.00 0 1.73 0.00
8 0.0828 40.15 0.00 0.00 3.32 0.00 21.11 0.00 0 1.75 0.00
9 0.0836 40.15 0.00 0.00 3.36 0.00 21.11 0.00 0 1.77 0.00
10 0.0845 40.15 0.00 0.00 3.39 0.00 21.11 0.00 0 1.78 0.00
Total Life Cost:
6.28
8.96
Table C.3: CBA between fluorescent and LED light bulbs
Fluorescent light bulb LED light bulb
Year
Electricity
Price
($/kWh)
Electricity
Cons.
(kWh/year)
Capital Cost
($/appl.)
Maintenance
Cost ($/year)
Fuel Cost
($/year)
Life Cycle Cost
($)
Electricity
Cons.
(kWh/year)
Capital Cost
($/appl.)
Maintenance
Cost ($/year)
Fuel Cost
($/year)
Life Cycle Cost
($)
1 0.0772 58.47 0.95 0 4.52 5.28 7.76 4.50 0 0.60 5.20
2 0.0780 58.47 0 0 4.56 4.14 7.76 0.00 0 0.61 0.55
3 0.0788 58.47 0 0 4.61 3.98 7.76 0.00 0 0.61 0.53
4 0.0796 58.47 0 0 4.65 3.83 7.76 0.00 0 0.62 0.51
5 0.0804 58.47 0 0 4.70 0.00 7.76 0.00 0 0.62 0.49
6 0.0812 58.47 0 0 4.75 0.00 7.76 0.00 0 0.63 0.47
7 0.0820 58.47 0 0 4.79 0.00 7.76 0.00 0 0.64 0.00
8 0.0828 58.47 0 0 4.84 0.00 7.76 0.00 0 0.64 0.00
9 0.0836 58.47 0 0 4.89 0.00 7.76 0.00 0 0.65 0.00
10 0.0845 58.47 0 0 4.94 0.00 7.76 0.00 0 0.66 0.00
Total Life Cost:
17.32
7.74

Effective energy efficiency policy implementation targeting
“New Modern Energy Consumer” in the Greater Mekong Subregion
Page 54
Table C.4: CBA between conventional and efficient rice cookers
Conventional rice cooker Efficient rice cooker
Year
Electricity
Price
($/kWh)
Electricity
Cons.
(kWh/year)
Capital Cost
($/appl.)
Maintenance
Cost ($/year)
Fuel Cost
($/year)
Life Cycle Cost
($)
Electricity
Cons.
(kWh/year)
Capital Cost
($/appl.)
Maintenance
Cost ($/year)
Fuel Cost
($/year)
Life Cycle Cost
($)
1 0.0772 362.37 38.00 0 27.99 65.74 291.64 55.00 0 22.53 78.02
2 0.0780 362.37 0.00 0 28.27 25.64 291.635 0 0 22.75 20.64
3 0.0788 362.37 0.00 0 28.55 24.66 291.635 0 0 22.98 19.85
4 0.0796 362.37 0.00 0 28.84 23.72 291.635 0 0 23.21 19.09
5 0.0804 362.37 0.00 0 29.13 22.82 291.635 0 0 23.44 18.37
6 0.0812 362.37 0.00 0 29.42 21.95 291.635 0 0 23.67 17.67
7 0.0820 362.37 0.00 0 29.71 21.11 291.635 0 0 23.91 16.99
8 0.0828 362.37 0.00 0 30.01 20.31 291.635 0 0 24.15 16.35
9 0.0836 362.37 0.00 0 30.31 19.54 291.635 0 0 24.39 15.72
10 0.0845 362.37 0.00 0 30.61 18.79 291.635 0 0 24.64 15.12
Total Life Cost:
264.3
237.82
Table C.5: CBA between conventional and efficient air conditioning units
Conventional air conditioning unit Efficient air conditioning unit
Year
Electricity
Price
($/kWh)
Electricity
Cons.
(kWh/year)
Capital Cost
($/appl.)
Maintenance
Cost ($/year)
Fuel Cost
($/year)
Life Cycle Cost
($)
Electricity
Cons.
(kWh/year)
Capital Cost
($/appl.)
Maintenance
Cost ($/year)
Fuel Cost
($/year)
Life Cycle Cost
($)
1 0.0772 1,399.16 410.00 10 108.07 524.64 1,049.38 570.00 10 81.05 663.48
2 0.0780 1,399.16 0 10 109.15 99.00 1,049.38 0 10 81.86 74.25
3 0.0788 1,399.16 0 10 110.24 95.23 1,049.38 0 10 82.68 71.42
4 0.0796 1,399.16 0 10 111.34 91.60 1,049.38 0 10 83.51 68.70
5 0.0804 1,399.16 0 10 112.46 88.11 1,049.38 0 10 84.34 66.08
6 0.0812 1,399.16 0 10 113.58 84.76 1,049.38 0 10 85.19 63.57
7 0.0820 1,399.16 0 10 114.72 81.53 1,049.38 0 10 86.04 61.15
8 0.0828 1,399.16 0 10 115.86 78.42 1,049.38 0 10 86.90 58.82
9 0.0836 1,399.16 0 10 117.02 75.43 1,049.38 0 10 87.77 56.58
10 0.0845 1,399.16 0 10 118.19 72.56 1,049.38 0 10 88.65 54.42
11 0.0853 1,399.16 0 10 119.38 69.80 1,049.38 0 10 89.53 52.35
12 0.0862 1,399.16 0 10 120.57 67.14 1,049.38 0 10 90.43 50.35

Effective energy efficiency policy implementation targeting
“New Modern Energy Consumer” in the Greater Mekong Subregion
Page 55
13 0.0870 1,399.16 0 10 121.77 64.58 1,049.38 0 10 91.33 48.43
14 0.0879 1,399.16 0 10 122.99 62.12 1,049.38 0 10 92.24 46.59
15 0.0888 1,399.16 0 10 124.22 59.75 1,049.38 0 10 93.17 44.81
Total Life Cost:
1614.67
1481.0
Table C.6: CBA between conventional and efficient refrigerators
Conventional refrigerator Efficient refrigerator
Year
Electricity
Price
($/kWh)
Electricity
Cons.
(kWh/year)
Capital Cost
($/appl.)
Maintenance
Cost ($/year)
Fuel Cost
($/year)
Life Cycle Cost
($)
Electricity
Cons.
(kWh/year)
Capital Cost
($/appl.)
Maintenance
Cost ($/year)
Fuel Cost
($/year)
Life Cycle Cost
($)
1 0.0772 428.01 180.00 0 33.06 225.88 367.92 214.00 0 28.42 258.18
2 0.0780 428.01 0 0 33.39 30.29 367.92 0 0 28.70 26.03
3 0.0788 428.01 0 0 33.72 29.13 367.92 0 0 28.99 25.04
4 0.0796 428.01 0 0 34.06 28.02 367.92 0 0 29.28 24.09
5 0.0804 428.01 0 0 34.40 26.95 367.92 0 0 29.57 23.17
6 0.0812 428.01 0 0 34.75 25.93 367.92 0 0 29.87 22.29
7 0.0820 428.01 0 0 35.09 24.94 367.92 0 0 30.17 21.44
8 0.0828 428.01 0 0 35.44 23.99 367.92 0 0 30.47 20.62
9 0.0836 428.01 0 0 35.80 23.08 367.92 0 0 30.77 19.84
10 0.0845 428.01 0 0 36.16 22.20 367.92 0 0 31.08 19.08
11 0.0853 428.01 0 0 36.52 21.35 367.92 0 0 31.39 18.35
12 0.0862 428.01 0 0 36.88 20.54 367.92 0 0 31.70 17.65
13 0.0870 428.01 0 0 37.25 19.76 367.92 0 0 32.02 16.98
14 0.0879 428.01 0 0 37.62 19.00 367.92 0 0 32.34 16.33
15 0.0888 428.01 0 0 38.00 18.28 367.92 0 0 32.67 15.71
Total Life Cost:
559.33
544.82

Effective energy efficiency policy implementation targeting
“New Modern Energy Consumer” in the Greater Mekong Subregion
Page 56
Table C.7: CBA between conventional and efficient electric fans
Conventional electric fan Efficient electric fan
Year
Electricity
Price
($/kWh)
Electricity
Cons.
(kWh/year)
Capital Cost
($/appl.)
Maintenance
Cost ($/year)
Fuel Cost
($/year)
Life Cycle Cost
($)
Electricity
Cons.
(kWh/year)
Capital Cost
($/appl.)
Maintenance
Cost ($/year)
Fuel Cost
($/year)
Life Cycle Cost
($)
1 0.0772 129.14 17.50 0 9.97 30.02 103.29 25.00 0 7.98 34.60
2 0.0780 129.14 0 0 10.07 9.14 103.29 0 0 8.06 7.31
3 0.0788 129.14 0 0 10.17 8.79 103.29 0 0 8.14 7.03
4 0.0796 129.14 0 0 10.28 8.45 103.29 0 0 8.22 6.76
5 0.0804 129.14 0 0 10.38 8.13 103.29 0 0 8.30 6.50
6 0.0812 129.14 0 0 10.48 7.82 103.29 0 0 8.38 6.26
7 0.0820 129.14 0 0 10.59 7.52 103.29 0 0 8.47 6.02
8 0.0828 129.14 0 0 10.69 7.24 103.29 0 0 8.55 5.79
9 0.0836 129.14 0 0 10.80 6.96 103.29 0 0 8.64 5.57
10 0.0845 129.14 0 0 10.91 6.70 103.29 0 0 8.73 5.36
Total Life Cost:
100.78
91.19
Table C.8: CBA between conventional and efficient electric water heater
Conventional electric water heater Efficient electric water heater
Year
Electricity
Price
($/kWh)
Electricity
Cons.
(kWh/year)
Capital Cost
($/appl.)
Maintenance
Cost ($/year)
Fuel Cost
($/year)
Life Cycle Cost
($)
Electricity
Cons.
(kWh/year)
Capital Cost
($/appl.)
Maintenance
Cost ($/year)
Fuel Cost
($/year)
Life Cycle Cost
($)
1 0.0772 277.40 95.00 0 21.43 123.01 222.20 114.00 0 17.16 139.46
2 0.0780 277.40 0 0 21.64 19.63 222.20 0 0 17.33 15.72
3 0.0788 277.40 0 0 21.86 18.88 222.20 0 0 17.51 15.12
4 0.0796 277.40 0 0 22.08 18.16 222.20 0 0 17.68 14.55
5 0.0804 277.40 0 0 22.30 17.47 222.20 0 0 17.86 13.99
6 0.0812 277.40 0 0 22.52 16.80 222.20 0 0 18.04 13.46
7 0.0820 277.40 0 0 22.74 16.16 222.20 0 0 18.22 12.95
8 0.0828 277.40 0 0 22.97 15.55 222.20 0 0 18.40 12.45
9 0.0836 277.40 0 0 23.20 14.96 222.20 0 0 18.58 11.98
10 0.0845 277.40 0 0 23.43 14.39 222.20 0 0 18.77 11.52
Total Life Cost:
275.00
261.21

Effective energy efficiency policy implementation targeting
“New Modern Energy Consumer” in the Greater Mekong Subregion
Page 57
Related Documents