Florida Water Management Inventory Project Task 4: Final Project Report Version: 1.1 on 10/14/2016 Page 1 of 130 Task 4: Final Project Report Version: 1.1 Date: 10/14/2016 Document Type: Task Deliverable Author: Elke Ursin, Project Owner REVISION HISTORY Version Date Author Comments 1.0 9/30/2016 E. Ursin Initial Draft 1.1 10/14/2016 E. Ursin Drafting Document Sections This project and the preparation of this report was funded in part by a Section 319 Nonpoint Source Management Program Implementation grant from the U.S. Environmental Protection Agency through an agreement/contract with the Nonpoint Source Management Section of the Florida Department of Environmental Protection. The total cost of the project was $757,400, of which $390,800 or 52% was provided by the U.S. Environmental Protection Agency. The Centers for Disease Control provided funding in the amount of $106,500 (14%) and the remaining funds came from Florida Department of Health, Environmental Health trust funds ($260,100, 34%).

Welcome message from author
This document is posted to help you gain knowledge. Please leave a comment to let me know what you think about it! Share it to your friends and learn new things together.
Transcript

Florida Water Management Inventory Project Task 4: Final Project Report
Version: 1.1 on 10/14/2016 Page 1 of 130
Task 4: Final Project Report
Version: 1.1 Date: 10/14/2016 Document Type: Task Deliverable Author: Elke Ursin, Project Owner
REVISION HISTORY Version Date Author Comments
1.0 9/30/2016 E. Ursin Initial Draft
1.1 10/14/2016 E. Ursin Drafting Document Sections
This project and the preparation of this report was funded in part by a Section 319 Nonpoint Source Management Program Implementation grant from the U.S. Environmental Protection Agency through an agreement/contract with the Nonpoint Source Management Section of the Florida Department of
Environmental Protection. The total cost of the project was $757,400, of which $390,800 or 52% was provided by the U.S. Environmental Protection Agency. The Centers for Disease Control provided funding in the amount of $106,500 (14%) and the remaining funds came from Florida Department of Health, Environmental Health trust funds ($260,100, 34%).

Florida Water Management Inventory Project Task 4: Final Project Report
Version: 1.1 on 10/14/2016 Page 2 of 130

Florida Water Management Inventory Project Task 4: Final Project Report
Version: 1.1 on 10/14/2016 Page 3 of 130
TABLE OF CONTENTS
Section 1 - Background ............................................................................................... 5
Purpose of Report ................................................................................................... 5
History ................................................................................................................... 5
Project Need ........................................................................................................... 6
Project Benefits....................................................................................................... 6
Project Goal............................................................................................................ 8
Project Scope Statement .......................................................................................... 8
Project Team .......................................................................................................... 9
The project team for this cycle is shown in ................................................................. 9
Work Breakdown Structure ....................................................................................... 9
Section 2 - Process Development ............................................................................... 10
Project Business Processes ..................................................................................... 10
Contact Management ............................................................................................. 12
County DOH ......................................................................................................... 12
Data Gathering ..................................................................................................... 12
Data Processing .................................................................................................... 13
Geoprocessing ...................................................................................................... 14
Mapping & Reporting ............................................................................................. 15
Tracking & Status .................................................................................................. 15
Section 3 - Data Structure Development ..................................................................... 16
Develop Data Dictionary......................................................................................... 16
Develop Geodatabase Framework ........................................................................... 18
Section 4 - Quality Management and Assurance ........................................................... 19
Develop Quality Management Plan .......................................................................... 19
Perform Quality Audits ........................................................................................... 20
Update Process Documents .................................................................................... 21
Update Data Structure Elements ............................................................................. 21
Section 5 - Data Collection / Processing / Mapping ....................................................... 21
First Cycle Overview .............................................................................................. 21
Phase 1................................................................................................................ 35
Phase 2................................................................................................................ 35
Phase 3................................................................................................................ 35
Phase 4................................................................................................................ 36
Section 6 - Project Management ................................................................................. 37

Florida Water Management Inventory Project Task 4: Final Project Report
Version: 1.1 on 10/14/2016 Page 4 of 130
Conduct Team Meetings ......................................................................................... 37
Develop and Publish Project Schedule ...................................................................... 37
Develop and Maintain Project Task List .................................................................... 37
Collect Spending Data ............................................................................................ 38
Develop and Maintain Project Budget ....................................................................... 38
Prepare Project Status Reports ............................................................................... 38
Update Project Website .......................................................................................... 39
Develop and Publish Web Application ....................................................................... 40
Coordinate Outreach Efforts ................................................................................... 41
Seek New Funding ................................................................................................. 41
Section 7 - Recommendations and Conclusions ............................................................ 42
Recommendations ................................................................................................. 42
Conclusions .......................................................................................................... 42
Section 8 - Acknowledgements .................................................................................. 43
Section 9 - References .............................................................................................. 43
APPENDIX A – RESPONSE FROM FDEP PERMITTED WASTEWATER TREATMENT FACILITIES AND PUBLIC WATER
SYSTEMS ................................................................................................................... 44
APPENDIX B – SUMMARIES BY COUNTY ............................................................................... 50
APPENDIX C –WASTEWATER RESULTS BY COUNTY ................................................................ 116
APPENDIX D –DRINKING WATER RESULTS BY COUNTY ........................................................... 120
APPENDIX E –ESTIMATION METHODOLOGY ......................................................................... 124
APPENDIX F –PROJECT SUMMARY REPORT .......................................................................... 130

Florida Water Management Inventory Project Task 4: Final Project Report
Version: 1.1 on 10/14/2016 Page 5 of 130
Section 1 - BACKGROUND
Purpose of Report
The purpose of this report is to provide a comprehensive summary of the work completed for
the Florida Water Management Inventory Project under DEP Contract Number G0431. This
report covers the entire Cycle 1 of the project, which covers work started in April, 2014 and
completed in September, 2016.
Nonpoint source pollution from onsite sewage treatment and disposal systems (OSTDS) can
have significant impacts on surface water and groundwater quality. Approximately thirty
percent of Florida’s population uses an OSTDS as their method of wastewater disposal (Florida
Department of Health website). Electronic permitting data records for OSTDS, which have
been collected by the Florida Department of Health since the late 1990’s, do not include a
record for every OSTDS in the state (Hall and Clancy 2009). Systems are added to the
statewide database when there is new construction, a system is in failure and needs repair,
a system modification is required, the existing system needs approval to proceed with state
or local building requirements, or when the existing system is abandoned. Not having a
comprehensive and updateable inventory utilizing best available information has made it
difficult to assess the potential impacts from this nonpoint pollution source. As the Florida
Department of Environmental Protection (FDEP) works with stakeholders to develop Basin
Management Action Plans (BMAPs) to reduce pollutant loadings to impaired waters, there is
a need for a comprehensive inventory to help determine OSTDS impacts.
The Florida Onsite Sewage Treatment and Disposal Systems Inventory will identify and map
the location of all (OSTDS) in the state of Florida. Geographic Information System (GIS) data
and maps will provide information facilitating statistical analysis necessary for the reduction
of nonpoint source pollution. Some examples include OSTDS regional density; OSTDS
locations within known sewer service area boundaries; and OSTDS locations and density in or
near biologically or geographically sensitive areas, such as springsheds, wetlands, and other
protected water bodies or groundwater recharge areas. Another vital use of the GIS data and
maps will be to provide the location and density of OSTDS in floodplains or storm surge areas
which will aid in public health and environmental disaster preparedness and response planning
and execution.
History
The 2008-2009 Florida Legislature tasked the Florida Department of Health with providing a
statewide inventory of Onsite Wastewater systems. The project was completed in June 2009
(Hall and Clancy 2009). Some of the data were known and verified but some were estimated.
The dataset has not been updated since that time. A coordinated effort was needed between
the Department, the DEP, county governments, and utility providers to bring this inventory
up to date. The absence of a lead facilitator to direct this project led to a delay until 2014,
when the Department started a project to update and maintain this inventory.
The projects initial financial support came from the Centers of Disease Control, through Florida
Disaster Preparedness funds. Once those funds were expended, the Department of Health’s
Environmental Health trust funds were used until grant funds from the Section 319 Nonpoint
Source Management Program from the U.S. Environmental Protection Agency were secured

Florida Water Management Inventory Project Task 4: Final Project Report
Version: 1.1 on 10/14/2016 Page 6 of 130
through a contract with the Nonpoint Source Management Section of the Florida Department
of Environmental Protection.
Project Need
Information about drinking water sources and wastewater treatment methods are vital for
environmental risk assessments, disaster preparedness and response activities, and local
planning evaluations. These activities relate to environmental health and the protection of
public health by detecting and preventing disease caused by natural and manmade factors in
the environment.
Multiple state and local agencies across the state of Florida gather information about drinking
water sources and wastewater treatment methods; however, historic data gathering methods
have been fragmented. This results in the lack of readily accessible information to evaluate
impacts to Florida’s water quality and quantity.
The Florida Department of Health (Department) is developing a centralized comprehensive
mapping tool to provide Geographic Information System (GIS) data.
Project Benefits
A comprehensive drinking water and wastewater inventory of the approximate 6.5 million
developed parcels in the State of Florida will provide many benefits including:
Enhanced customer service, permitting, development review, and planning activities
for state agencies, local government, utilities, citizens, and other interested parties
through data sharing; it will also identify redundancies and information gaps for future
work
Improved disaster preparedness and response activities resulting in accurate
estimates of impacts on public health and infrastructure during disasters
Enhanced resources for homeowners, home-buyers, realtors, and other entities
interested in potable water and wastewater services
Centralized web portal of maps and data, consolidated project results, all accessible to
the public
Collaboration with stakeholders is an essential part of this inventory project. Aside from the
Department of Health state and county offices, participating stakeholders include public and
private utilities; Florida Departments of Environmental Protection, Business and Professional
Regulation, Emergency Management, and Agriculture and Consumer Services; Water
Management Districts; Public Service Commission; various county and municipal
governments; and many others (Table 1).

Florida Water Management Inventory Project Task 4: Final Project Report
Version: 1.1 on 10/14/2016 Page 7 of 130
Table 1. Cooperating Partners
Organization Participation Level
Florida Department of Environmental
Protection: Nonpoint Source Management
Section
Sponsor project in 2016, total funded:
$390,800
Centers for Disease Control and Prevention Sponsor project in 2014, total funded:
$106,500
Strategic Planning Oversight Team,
Public Health and HealthCare Preparedness
Cooperative Agreement
Sponsor project and provide funding
allocations in 2014
Florida State Emergency Response Team Receive project information and coordinate
incorporation into the Geospatial Assessment
Tool for Operations and Response (GATOR)
Florida Department of Health, Division of
Disease Control and Health Protection,
Bureau of Environmental Health
Manage and coordinate project, responsible
for deliverables, provide Water and
wastewater data extracts from the statewide
Environmental Health Database (EHD),
geodatabase design
Florida Department of Health, Division of
Disease Control and Health Protection, GIS
Section
Web mapping front end development
(through a contract), ArcGIS REST endpoint,
provide technical support for project
Florida Department of Health, Information
Technology Office
Assist with publishing information to the
FDOH website, assist with data collection and
integration
Florida Department of Health, Sixty-Seven
County Offices
Assist with data collection efforts, provide
contact information
Florida Department of Health, Research
Review and Advisory Committee
Provide technical support, review project
reports, public meeting forum for contact with
key stakeholders and public
Florida Department of Environmental
Protection: Water Resource Management
Provide technical support, provide water and
wastewater facility locations and contact
information, provide GIS data, collaborate on
contact letters, review project reports, assist
with work plan development
Florida Department of Environmental
Protection (multiple sections): Florida
Geological Survey, Environmental
Assessment and Restoration, Water
Management Districts
Provide technical support, provide water and
wastewater facility locations and contact
information, provide GIS data
Florida Department of Business and
Professional Regulation
Provide regulated facility locations
Florida Department of Agriculture and
Consumer Services
Provide regulated facility locations
Florida County or City Government Provide relevant information and indicate
interest in dissemination of project
information
Public and Private Drinking Water and
Wastewater Facilities across Florida
Provide information on drinking water source
and wastewater disposal for customers within
service areas

Florida Water Management Inventory Project Task 4: Final Project Report
Version: 1.1 on 10/14/2016 Page 8 of 130
Project Goal
The goal of the Florida Water Management Inventory project is to link each built property in
the state to information about the drinking water source type (public water or private well)
and the wastewater treatment method (central sewer or onsite sewage).
More detailed goals of the project include:
1) Document and map the Wastewater treatment method and the Drinking Water source
for the more than 6 million improved (“built”) parcels in the state
2) Collect and maintain Data Contacts (who), Data Sources (where), and Data Sets
(what) to support Geographic Information System (GIS) Mapping and Summary
Reporting for the Inventory
3) Analyze and process collected Data Sets for standardization and readiness for GIS
import
4) Collect, import, analyze, and maintain information in the GIS for all property parcels
in the state
5) Create GIS Maps & Summary Reports for all 67 Florida counties
6) Create a publically accessible web site with GIS data, maps, and other project
information
7) Conduct outreach activities for communication and education of stakeholders
regarding the Inventory needs, benefits, and results
8) Provide regular status reporting to all project stakeholders at a level that is appropriate
to their needs and/or their role in the project
9) Take all steps possible to position the FLWMI Project to continue as a recurring, annual
Statewide Inventory
Project Scope Statement
The project scope statement provides a detailed description of the project, deliverables,
constraints, exclusions, assumptions, and acceptance criteria. Additionally, the scope
statement includes what work should not be performed in order to eliminate any implied but
unnecessary work which falls outside the of the project’s scope.
This project is to design and develop a system to collect, analyze, and display drinking water
and wastewater information for every built property in the State of Florida. The deliverables
for this project are completed GIS maps showing the required information. The flexibility to
modify and update the drinking water and wastewater information will be accounted for within
the project plan, the GIS data structure, and the methodologies developed during this project.
This project is accepted once the GIS maps are completed for each of the 67 counties in
Florida. This project does not include ongoing operations and maintenance. If opportunities
for collaboration and project enhancement arise, regardless of whether they are internal or
external personnel and resources, they may be used for this project provided that such
opportunities do not expand the scope or negatively impact successful completion of the
project. Additionally, the project is funded through September 2016.

Florida Water Management Inventory Project Task 4: Final Project Report
Version: 1.1 on 10/14/2016 Page 9 of 130
Project Team
The project team for this cycle is shown in
Figure 1. Project Team for the Florida Water Management Inventory
Work Breakdown Structure
In order to effectively manage the work required to complete this project, it was subdivided
into individual work packages. This allowed the Project Manager to more effectively manage
the project’s scope as the project team works on the tasks necessary for project completion.
The project is broken down into five main components: process development, data structure
development, quality management and assurance, data collection, and project
management. Each of these components is then subdivided further down, see WBS
structure in Figure 1. The sections that follow will provide information for each of the main
components identified. This report satisfies project component 5.11 in Figure 2: Prepare Final Project Report.
Executive Sponsor
Project Owner
Project Manager & Business
Analyst
Data Processor
GIS Analyst
Project Oversight & Strategic Planning
Project Financial Oversight

Florida Water Management Inventory Project Task 4: Final Project Report
Version: 1.1 on 10/14/2016 Page 10 of 130
Florida Water Management Inventory
4Data Collection/
Processing/ Mapping
4.2Phase 2
4.3Phase 3
4.4Phase 4
4.1Pilot Phase
2Data Structure Development
2.1Develop Data
Dictionary
2.2Develop Geodatabase
Framework
1Process
Development
1.2County DOH
1.5Geoprocessing
1.7Tracking & Status
1.3Data Gathering
1.4Data Processing
1.6Mapping & Reporting
1.1Contact
Managements
5Project
Management
5.4Collect Spending Data
5.1Conduct Team
Meetings
5.9Coordinate Outreach
Efforts
5.5Develop and
Maintain Project Budget
5.3Develop and
Maintain Project Task List
5.2Develop and Publish
Project Schedule
5.8Develop and Publish
Web Application
5.11Prepare Final Project
Report
5.6Prepare Project Status Reports
5.10Seek New Funding
5.7Update Project
Website
3Quality Mgmt. &
Assurance
3.1Develop Quality
Management Plan
3.2Perform Quality
Audits
3.4Update Data
Structure Elements
3.3Update Process
Documents
Figure 2. Project Work Breakdown Structure
Section 2 - PROCESS DEVELOPMENT
Project Business Processes
Overall, there are several guiding documents that provide background and an overview of
the project as a whole. Each of these documents can be found in the Process Documents
folder on the project FTP site:
http://ww10.doh.state.fl.us/pub/bos/Inventory/ProcessDocuments/.
The guiding documents are:
1. Project Charter – Developed prior to work began on the project, when the project
was funded by Emergency Preparedness. The project charter defines the scope,
objectives, and overall approach for the work to be completed. It is a critical element
for initiating, planning, executing, controlling, and assessing the project. It should be
the single point of reference on the project for project goals and objectives, scope,

Florida Water Management Inventory Project Task 4: Final Project Report
Version: 1.1 on 10/14/2016 Page 11 of 130
organization, estimates, work plan, and budget. In addition, it serves as a contract
between the Project Team and the Project Sponsors, stating what will be delivered
according to the budget, time constraints, risks, resources, and standards agreed
upon for the project.
2. Project Management Plan – The purpose of the project management plan (PMP) is
to provide a comprehensive baseline of what has to be achieved by the project, how
it is to be achieved, who will be involved, how it will be reported and measured, and
how information will be communicated. The intended audience of the Florida Water
Management Inventory (FLWMI) PMP is all project stakeholders including the project
sponsor, senior leadership, and the project team.
3. Operational Work Plan – This plan provides the basis for the consensus objectives
and expectations of the Project Team and stakeholders related to project work for
the time period of October 2015 through September 2016.
4. Status Update – Provides a snapshot of the current status of the project as of the
date on the document.
5. General Business Rules – The Business Rules constitute ongoing documentation
related to business process and procedural steps for different stages in the Inventory
Workflow. Presently, the project’s formal Business Processes and Standard Operating
Procedures are not static and are constantly being improved for accuracy and
efficiency. Relevant Business Rules are captured, on an ongoing basis, within this
document, until finalized documentation is completed.
6. Frequently Asked Questions – Document available on the project website to help
address several frequently asked questions. This document is updated as needed to
help provide clarity for areas where it is needed.
Figure 3 shows a diagram of the workflow for the Florida Water Management Inventory.
This diagram outlines the major components of the business process documents that are
included on the pages that follow.
Workflow Diagram
CONTACTMANAGEMENT
COUNTYDOH
DATAGATHERING
DATAPROCESSING
MAPPING &REPORTING
12
34
5
TRACKING& STATUSGEOPROCESSING
· WW Contacts from DEP
· DW Contacts from DEP
· DOACS
· DBPR
· WMDs
· County DOH
· County GIS
· Other Projects and/or Studies (such as BMAP, etc.)
· Data from Delegated Counties (wells, sewer, drinking water, etc.)
· Other Contacts
· Participation
· Contacts for Utilities
· Contacts for GIS
· Data Scrubbing
· DB or Spreadsheet for Delegations
· Website
· GIS Requests
· BMAP and similar requests for data
· Data Request Emails
· Reminder Emails
· County follow-up
· Data Sheet Template
· GIS Response Tracking
· Inventory Tracking Sheet
· Inventory DB
· County Indexes
· External Sources and EHD, DOACS, DBPR
· Parcels (obtaining most recent DOR polygons and tables)
· Standardizing Data Sheets
· Determining if Geocoding is required
· Geocoding Data Sheets
· Updating County Indexes
· GIS review, standardization, and preparations for geoprocessing
· Determining Built / Not-Built
· 2009 Crosswalk
· Pre-Assignment Geoprocessing
· Assign DW & WW Values
· GIS Maps
· Data Products
· Other non-GIS Reporting
· Publishing
· Online Hosting for Map Server
· Team Weekly Status Reports
· Weekly Project Reports (leadership)
· Weekly Executive Summary
· GIS Workflow Tracking Spreadsheet
· County Indexing
· Other status, tracking, Ad Hoc requests, etc.
· Organization
· Collaboration
Figure 3. Workflow Diagram for the Florida Water Management Inventory

Florida Water Management Inventory Project Task 4: Final Project Report
Version: 1.1 on 10/14/2016 Page 12 of 130
Contact Management
Process documents relating to Contact Management are found on this webpage:
http://ww10.doh.state.fl.us/pub/bos/Inventory/ProcessDocuments/1ContactManagement/
The documents included are:
1. Identifying and Maintaining Data Contacts – this document addresses these
primary business goals: (1) How to identify data contact information, (2) How to
update data contact information, and (3) How to maintain data contact information.
2. Data Sets Sources and Contacts – A matrix of dataset tables that explain what
types of information and data will be necessary to conduct the Florida Water
Management Inventory on a cyclical, ongoing basis. For Parcels, Wastewater, and
Drinking Water, each table explains the specific Data Set (what), the Data Source
(where), and the Data Contacts (who) for obtaining the required information.
3. Workflow Analysis and Improvement for Contacts – A Strategic Planning
activity was conducted for each of the main project components, where the project
team listed the projects Strengths, Weaknesses, Opportunities, and Threats (SWOT).
This document outlines the results of the SWOT analysis for the Contacts component.
County DOH
Process documents relating to County DOH are found on this webpage:
http://ww10.doh.state.fl.us/pub/bos/Inventory/ProcessDocuments/2CountyDOH/
The documents included are:
1. Solicitation Email Example – This document is an example of the solicitation
emails that are sent to each County Health Department Director and Environmental
Health Director when initiating a county.
2. Orientation Sign Up Template – This document is a template for recording
individuals that sign up for an orientation meeting.
3. Orientation Meetings Attendees Template – This document is a template for
recording individuals that attended an orientation meeting.
4. Example Orientation Presentation – This is an example of the Phase 3 orientation
presentation.
5. Workflow Analysis and Improvement for County DOH – A Strategic Planning
activity was conducted for each of the main project components, where the project
team listed the projects Strengths, Weaknesses, Opportunities, and Threats (SWOT).
This document outlines the results of the SWOT analysis for the County DOH
component.
Data Gathering
Process documents relating to Data Gathering are found on this webpage:
http://ww10.doh.state.fl.us/pub/bos/Inventory/ProcessDocuments/3DataGathering/
The documents included are:

Florida Water Management Inventory Project Task 4: Final Project Report
Version: 1.1 on 10/14/2016 Page 13 of 130
1. Requesting and Importing Data Sets – This document addresses three primary
business goals: (1) How to request data sets from data providers, (2) How to
transmit data sets from data providers to DOH, and (3) How to store data sets on
the DOH network.
2. Data Sheet Template – This document is a template for submitting data sets.
There are two templates: one for smaller wastewater treatment plant or public water
systems which serve only one single parcel (for example, a Mobile Home or RV Park,
a small commercial or industrial building, a state or municipal park, etc.), then this
would be a single record or just a single row in the spreadsheet template. If the
facility(s) serves multiple parcels, then there would be multiple corresponding
records (or rows). If, however, the facility(s) serves many property parcels and/or
customer addresses (dozens, hundreds, or thousands), the second template for
larger data set would be used, providing a list of all the customer properties served
by the facility(s).
3. MOVEit Instructions for Inventory Team – The Department of Health (DOH)
MOVEit DMZ application is utilized for secure transmission of large files (>8MB). DOH
staff will create a “Package” within the MOVEit DMZ application and email the
“Package” to the organization’s contact person that will be transmitting files. This
document provide instructions for the inventory team on how to use this program.
4. MOVEit Instructions for External Submitters – The Department of Health (DOH)
MOVEit DMZ application is utilized for secure transmission of large files (>8MB). DOH
staff will create a “Package” within the MOVEit DMZ application and email the
“Package” to the organization’s contact person that will be transmitting files. This
document provide instructions for anyone submitting data on how to use this
program.
5. Data Request Templates – This is a folder containing templates for data requests
to multiple stakeholders in multiple scenarios such as initial contacts to county
municipal governments, DEP regulated facilities (both those that did respond to our
2009 request for data and those that did not), state agencies, and water
management districts; and follow-up messages to DEP regulated facilities that did
not respond to previous data requests.
6. Template Script for Contacting Data Providers – This process map shows an
example of how a data request might flow.
7. Data Gathering Escalation Process – This process map shows how to handle a
DEP regulated facility that does not submit data.
8. Workflow Analysis and Improvement for Data Gathering – A Strategic
Planning activity was conducted for each of the main project components, where the
project team listed the projects Strengths, Weaknesses, Opportunities, and Threats
(SWOT). This document outlines the results of the SWOT analysis for the Data
Gathering component.
Data Processing
Process documents relating to Data Processing are found on this webpage:
http://ww10.doh.state.fl.us/pub/bos/Inventory/ProcessDocuments/4DataProcessing/
The documents included are:
1. Processing Inventory Data Sets – This document addresses how to process Data
Sets received from utility providers to prepare them for import, analysis, and

Florida Water Management Inventory Project Task 4: Final Project Report
Version: 1.1 on 10/14/2016 Page 14 of 130
reporting in the Geographic Information System (GIS). This process and information
is specific to the Florida Department of Health Statewide Inventory Project.
2. Compiling Parcel Data– This procedural document is utilized for compiling parcel
data by receiving property records, importing the records into the Inventory
Database, compiling all associated parcel information, and maintaining the parcel
data.
3. Compiling Wastewater and Drinking Water Data – This procedural document is
utilized for compiling data received from all data sources for assigning wastewater
methods and drinking water sources to compiled parcel data.
4. Estimation Methodology Procedure –Some data gathered for parcels, drinking
water sources, or wastewater treatment methods will not be sufficient to make an
exact designation. In those cases, estimation methods will be utilized as defined
within this procedure. The methods documented within will be utilized to perform
the first iteration of the Statewide Inventory.
5. Creating a County Index – The purpose of a County Index is to provide a “road
map” for where the Data Sets for each Parent Organization within each County is
located. The Data Gatherer creates the County Index and the Data Processor
populates and maintains the Data Set details for each listed Parent Organization. The
GIS Database Analyst also refers to the Index when importing Data Sets into the
GIS.
6. Environmental Health Database Data Extraction – This document lists the
queries used to pull data from the Environmental Health Database for incorporation
into the Inventory.
7. Steps for Small Facility Research – This document lists the steps to go through
when researching DEP regulated WWTP and PWS that have a small flow or serve a
small population. The likelihood of these facilities only serving one parcel is greater
than for a large facility and following this process will reduce the need to contact
these facilities.
8. OSTDS Variance Database Data Extraction – This document lists the queries
used to pull data from the OSTDS Variance Database for incorporation into the
Inventory.
9. Steps to Update DEP WWTF and PWS Facilities – This document lists the steps
to take to update the contact tracking database with the latest DEP facility data.
10. Steps to Update DOACS and DBPR Data Tables – This document lists the steps
to take to pull data received from DOACS and DBPR for incorporation into the
Inventory.
11. Process to Update Environmental Health Database Datasets – This document
lists the steps to take to pull updated data from the Environmental Health Database
for incorporation into the Inventory.
12. Workflow Analysis and Improvement for Data Processing – A Strategic
Planning activity was conducted for each of the main project components, where the
project team listed the projects Strengths, Weaknesses, Opportunities, and Threats
(SWOT). This document outlines the results of the SWOT analysis for the Data
Processing component.
Geoprocessing
Process documents relating to Geoprocessing are found on this webpage:
http://ww10.doh.state.fl.us/pub/bos/Inventory/ProcessDocuments/5Geoprocessing/

Florida Water Management Inventory Project Task 4: Final Project Report
Version: 1.1 on 10/14/2016 Page 15 of 130
The documents included are:
1. GIS Source Data Processing Steps Outline – This document outlines the steps to
take for data processing in GIS for the project.
2. GIS Process for DOH Parcel and Tax Roll Data – This is the first process to
follow in conducting the inventory. These instructions only apply to bringing in
completely new parcel data. Subsequent work on the inventory should include steps
where new parcel data is ‘inserted’ into the existing feature class where the parcel
characteristics have changed over time. These changes would occur with parcel
splits, parcel combines, parcel sales, new construction, demolition, redevelopment,
and other such events.
3. GIS Process for Source Data Processing and Assignment to Parcels – Source
data for wastewater and drinking water should be processed and assigned to parcels
according to the instructions outlined in this process document.
4. Assignment of Inventory Values for Wastewater Method – This document
shows the historical background on assignment of inventory values for wastewater.
5. Geocoding with Google Earth Pro – This document outlines the steps taken to
geocode source data with Google Earth Pro.
6. Quality Control for Geocoding – This document outlines the quality control steps
to take to verify geocoding was done correctly.
7. Workflow Analysis and Improvement for Geoprocessing – A Strategic Planning
activity was conducted for each of the main project components, where the project
team listed the projects Strengths, Weaknesses, Opportunities, and Threats (SWOT).
This document outlines the results of the SWOT analysis for the Geoprocessing
component.
Mapping & Reporting
Process documents relating to Mapping & Reporting are found on this webpage:
http://ww10.doh.state.fl.us/pub/bos/Inventory/ProcessDocuments/1ContactManagement/
The documents included are:
1. Template for Single Panel Wastewater Map – This document shows the colors
and layout for the final reporting single panel wastewater map.
2. Template for Multi Panel Wastewater Map – This document shows the colors
and layout for the final reporting multi panel wastewater map.
3. Template for Single Panel Drinking Water Map – This document shows the
colors and layout for the final reporting single panel drinking water map.
4. Template for Multi Panel Drinking Water Map – This document shows the colors
and layout for the final reporting multi panel drinking water map.
5. Workflow Analysis and Improvement for Mapping and Reporting – A Strategic
Planning activity was conducted for each of the main project components, where the
project team listed the projects Strengths, Weaknesses, Opportunities, and Threats
(SWOT). This document outlines the results of the SWOT analysis for the Mapping
and Reporting component.
Tracking & Status
Process documents relating to Tracking & Status are found on this webpage:
http://ww10.doh.state.fl.us/pub/bos/Inventory/ProcessDocuments/1ContactManagement/
Florida Water Management Inventory Project Task 4: Final Project Report
Version: 1.1 on 10/14/2016 Page 16 of 130
The documents included are:
1. Weekly Status Report Sample – This document is used for team members to
report the current status of the work they performed during the week.
2. Weekly Project Status Report Template – This document is put together by the
project manager to provide a weekly update on the project to leadership.
3. Workflow Analysis and Improvement for Tracking and Status – A Strategic
Planning activity was conducted for each of the main project components, where the
project team listed the projects Strengths, Weaknesses, Opportunities, and Threats
(SWOT). This document outlines the results of the SWOT analysis for the Tracking
and Status component.
Section 3 - DATA STRUCTURE DEVELOPMENT
Develop Data Dictionary
The project data dictionary, as of November 25, 2015 can be found on this webpage:
http://ww10.doh.state.fl.us/pub/bos/Inventory/Deliverables/. The data dictionary outlines
the GIS Feature Classes and Tables for the Florida Water Management Inventory.
Specifically, the project data dictionary shows the layer names, layer descriptions, field
names, field descriptions, and format for the project geodatabases. The contents of the
final GIS dataset, the edit version hosted on the DOH website, and the primary feature
classes and tables that are used in conducting the inventory are shown in Figure 4.

Florida Water Management Inventory Project Task 4: Final Project Report
Version: 1.1 on 10/14/2016 Page 17 of 130
Florida Water Management Inventory GIS Database Diagram
Parcels_public
par11Alachua
par13Bay
fwmi_cnty_working.gdbfwmi_cnty_public.gdb
ParNoNameYYYY*
LOC_NoFYYYY*
VI_NoFYYYY*
parNoNameYYYY
PK PARCELNO
CO_NO LANDUSE BLT_STATUS BLT_UPD ALT_KEY NAL_MTCH PHY_ADD1 PHY_ADD2 PHY_CITY PHY_ZIPCD S_LEGAL OWNER_NAME GIS_ACRE INCORP PAR_CHAR WW WW_UPD WW_SRC_TYP WW_SRC_NAME WW_GEO ... wastewater ... sources ... information COMMENTS DW DW_UPD DW_SRC_TYP DW_SRC_NAME DW_GEO ... drinking water ... sources ... information ASMNT_YR PAR_UPD PAR_UPD_TYPE COUNTYFP
VI_NOFYYYY
PK PARCEL_ID
FK1 PARCELNO CO_NO ALT_KEY BLT_STATUS BLT_MTHD LANDUSE BAS_STRT DOR_UC PUBLIC_LND JV_HMSTD JV_NON_HMSTD_RESD JV_CLASS_USE NCONST_VAL PAR_SPLT LND_VAL EFF_YR_BLT ACT_YR_BLT TOT_LVG_AREA NO_BULDNG NO_RES_UNTS VI_CD1 SALE_YR1 VI_CD2 SALE_YR2 MULTI_PAR_SAL1 SAL_CHNG_CD1 MULTI_PAR_SAL2 SAL_CHNG_CD2 FC_MTCH
parNoName
PK PARCELNO
CO_NO LANDUSE BLT_STATUS ALT_KEY PHY_ADD1 PHY_CITY PHY_ZIPCD GIS_ACRE WW DW SUB_DATE SUB_BLT SUB_LU SUB_WW SUB_DW SUB_ROLE SUB_FIRST SUB_LAST SUB_EMAIL SUB_PHONE SUB_COMMENT APP_STATUS APP_ST_DT APP_COMMENT
parNoName
PK PARCELNO
CO_NO LANDUSE BLT_STATUS ALT_KEY PHY_ADD1 PHY_CITY PHY_ZIPCD GIS_ACRE WW WW_UPD WW_SRC_TYP WW_SRC_NAME WW_GEO DW DW_UPD DW_SRC_TYP DW_SRC_NAME DW_GEO ASMNT_YR COUNTYFP
Final GDB for public distribution
Editing and Inventory Development GDB
Parcels
* one FC/TBL set per county
LOC_NOFYYYY
PK PARCEL_ID
CO_NO ALT_KEY PHY_ADDR1 PHY_ADDR2 PHY_CITY PHY_ZIPCD S_LEGAL OWN_NAME LND_SQFOOT CALC_ACRE CENSUS_BK TWN RNG SEC FC_MTCHFK1 PARCELNO
DOR (staging area for importing DOR shapefiles)
Inv2009 (staging area for migrating 2009 Inventory data to current parcel feature classes)
Parcels_public FDS Parcels_web FDS
... wastewater sources
Util_WW Util_WW_SRC Util_WW_GEO EHDConst_WW EHDConst_WW_SRC EHDOp_WW EHDOp_WW_SRC EHDFac_WW EHDFac_WW_SRC EHDOth_WW EHDOth_WW_SRC CHD_WW CHD_WW_SRC CHD_WW_GEO FAC_WW FAC_WW_SRC FAC_WW_GEO Gov1_WW Gov1_WW_SRC Gov1_WW_GEO Gov2_WW Gov2_WW_SRC Gov2_WW_GEO Gov3_WW Gov3_WW_SRC Gov3_WW_GEO Other_WW Other_WW_SRC Other_WW_GEO WW_09Inv OrigWW_09Inv PRB_09Inv
... drinking water sources
Util_DW Util_DW_SRC Util_DW_GEO EHDConst_DW EHDConst_DW_SRC EHDLU_DW EHDLU_DW_SRC EHDFac_DW EHDFac_DW_SRC EHDOth_DW EHDOth_DW_SRC CHD_DW CHD_DW_SRC CHD_DW_GEO FAC_DW FAC_DW_SRC FAC_DW_GEO WMD_DW WMD_DW_SRC WMD_DW_GEO Gov1_DW Gov1_DW_SRC Gov1_DW_GEO Gov2_DW Gov2_DW_SRC Gov2_DW_GEO Gov3_DW Gov3_DW_SRC Gov3_DW_GEO Other_DW Other_DW_SRC Other_DW_GEO
FINAL GDB
DEVELOPMENT/WORKING GDBFeature Classes and Tables
parNoName
parNoName
fwmi_cnty_web.gdb
Parcels_web
Proposed GDB for web application
WEB GDB
par77Washington
. . .
. . .
. . .
par76Walton
Figure 4. GIS Database Diagram
There are three different GIS geodatabase datasets: the final one for public distribution
(fwmi_cnty_public.gdb), one that is used in the online web application
(fwmi_cnty_web.gdb), and an editing and development geodatabase
(fwmi_cnty_working.gdb). The parcel data were acquired from the Florida Department of
Revenue. Data and other information relative to the drinking water and wastewater were
obtained from various sources acquired through the data collection process.
The public geodatabase contains the feature classes of county parcels with inventoried
drinking water and domestic wastewater information. The county feature classes of parcels
are named according to the following concatenated values: “par”, DOR County number,
County Name (i.e. par11Alachua).
The web application geodatabase is hosted on the web with feature classes of county
parcels containing inventoried drinking water and domestic wastewater information. The
county feature classes of parcels are named according to the following concatenated values:
“par”, DOR County number, County Name (i.e. par11Alachua). Currently the web
application allows for a user to select parcel polygon(s) by searching on the address or
Parcel Number and export data. The feature classes allow for proposed edits to be
submitted through the web application. This edit functionality has not been built, but the
structure is there for future development. The conceptual process is that the user would be
able to enter requested edits into a web-based form that will contain both mandatory and

Florida Water Management Inventory Project Task 4: Final Project Report
Version: 1.1 on 10/14/2016 Page 18 of 130
optional fields for the Submitter’s Role, First and Last Name, email, phone, and comments.
The polygon(s) will be copied from the original feature class to the edit feature class, and
those attributes with the ‘SUB’ prefix will be populated according to what the submitter
provides. These changes will be reconciled back into the original after approval. The
submitter fields are not included in the final feature class.
The editing and development geodatabase is the working geodatabase with feature classes
and tables for county parcels with inventoried drinking water and domestic wastewater
information. The county feature classes of parcels are named according to the following
concatenated values: “par”, DOR County number, County Name (i.e. par11Alachua), Tax
Assessment Year (i.e. 2014). Note that the year suffix reflects the currency of the parcel
geometry, and not necessarily the year in which the inventory was conducted.
Table VI_NOFYYYY, in the editing and development geodatabase, includes fields to be used
to determine Built status. This table is extracted from the Florida Department of Revenue
(DOR) Real Property Name – Address – Legal (NAL) file. The majority of attributes are
populated directly from the NAL file. Specific information about the data in the NAL file can
be found in the DOR User’s Guide (http://dor.myflorida.com/dor/property/rp/dataformats/).
The BLT_STATUS, BLT_MTHD, LANDUSE attributes are populated as part of the inventory
process. ‘NO’ in the title is the DOR county number and matches the number in the feature
class.
Table LOC_NOFYYYY, in the editing and development geodatabase, includes fields related to
the location and size of the parcel. This table is extracted from the Florida Department of
Revenue (DOR) Real Property Name – Address – Legal (NAL) file. The majority of attributes
are populated directly from the NAL file. Specific information about the data in the NAL file
can be found in the DOR User’s Guide. ’NO’ in the title is the DOR county number and
matches the number in the feature class.
The wastewater sources and drinking water sources tables include information on the
sources of data used to calculate the final drinking water and wastewater determination.
These values are evaluated in the data model to help determine known, likely, somewhat
likely, unknown, conflicting, and NA values for each parcel.
Develop Geodatabase Framework
The geodatabase framework can be found on this webpage:
http://ww10.doh.state.fl.us/pub/bos/Inventory/Deliverables/. There are templates for each
of the three different GIS geodatabase datasets: the final one for public distribution
(fwmi_cnty_public.gdb), one that is used in the online web application
(fwmi_cnty_web.gdb), and an editing and development geodatabase
(fwmi_cnty_working.gdb).

Florida Water Management Inventory Project Task 4: Final Project Report
Version: 1.1 on 10/14/2016 Page 19 of 130
Section 4 - QUALITY MANAGEMENT AND ASSURANCE
Develop Quality Management Plan
The quality management plan for this project provides the basis for the consensus
objectives and expectations of the project team and sponsors as they relate to managing
data quality for the Florida Water Management Inventory Project. The plan documents the
data to assess, identifies quality objectives and metrics, and develops methods to reconcile
assessment results. The quality management plan, as of September 28, 2016 can be found
on this webpage: http://ww10.doh.state.fl.us/pub/bos/Inventory/Deliverables/.
The quality management plan for this project was initially outlined in June, 2014. As the
project commenced and process documentation was developed, the quality management
plan was adjusted. As Phase 3 of the project completed, the plan was fleshed out. Audits
were performed throughout Phase 4 and continued after completion of Phase 4 to help
develop the plan for the next project cycle. The quality management plan was updated after
Phase 4 based on audit results.
The plan includes a list of the attributes to check and manage for information items to
manage for each major project area. The plan also includes the audit schedule, which lists
the frequency, responsible staff, and procedure for each information item.

Florida Water Management Inventory Project Task 4: Final Project Report
Version: 1.1 on 10/14/2016 Page 20 of 130
Table 2. Quality Management Plan Components
Audit Group Information Item
Contact
Management
Public Water Systems Facilities & Contacts from DEP
Wastewater Treatment Facilities & Contacts from DEP
Water Management District Contacts
County DOH Contact List
Data Gathering
Parent Organization Grouping
Inventory Database Tracking Sheet
County Indexes
Data Processing Standardization of Data Sheets
Geocoded Spreadsheets (Google Earth or ArcGIS Street Mapper)
GIS
Status Map
County Parcels
Parcel Built Status
Source Datasets
Utility services encompassing multiple counties
State-level source assignment to parcels
County-level source assignment to parcels
GIS Workflow Tracking Datasheet
Environmental Health Database Queries
Final Wastewater Disposal Method
Final Drinking Water Source
County Inventory Maps
Public GIS dataset
Final GIS related products
Inventory
Database (IDB)
IDB
Last Modification to Record in IDB
Web
Internal Map Server
External Map Server
Website Content
Perform Quality Audits
Quality audits were performed throughout the project. Some processes include the audit
procedures within the process itself; other audits occur at the start or end of a project
phase or cycle; while still other audits occur on a set timeframe such as weekly, monthly, or
quarterly. These are outlined in the audit schedule within the quality management plan.
Florida Water Management Inventory Project Task 4: Final Project Report
Version: 1.1 on 10/14/2016 Page 21 of 130
Update Process Documents
The process documents developed for this project, as described in Section 2 of this report,
are evaluated and updated at the beginning of each project phase or as needed. New
process documents are created when necessary. One of the major project strengths is the
level of detail contained within the process documentation. This allows for replication of
processes, streamlining efforts, and a high quality end product.
Update Data Structure Elements
Data structure elements, such as the geodatabase framework described in Section 3 of this
report, were carefully designed during the process development stage done during the
Phase 1 (pilot phase) of the project. Once Phase 2 was complete, and a quality audit was
done on the built/not-built parcels, the data structure elements were updated to standardize
the format for all county datasets. Other data structure elements include the final project
maps, the inventory database for tracking and reporting on the data gathering effort, and
the frequency spreadsheets for each county. Elements were updated and added throughout
the project as needed. For example, the shared public data includes an Excel spreadsheet
of the attribute table in the final GIS maps. This was not one of the original data elements,
but after a suggestion from someone who did not have GIS software and wanted to analyse
the data, this element was added. Such enhancements allow for wider use of the end
products.
Section 5 - DATA COLLECTION / PROCESSING / MAPPING
First Cycle Overview
Florida was split into implementation phases to make this project more manageable and to
allow for ongoing development and improvement of business processes and standard
operating procedures and methodologies (Figure 5). The basic processes were to collect all
relevant data available, compile, analyse, and finally map these data and make them available
to the public.

Florida Water Management Inventory Project Task 4: Final Project Report
Version: 1.1 on 10/14/2016 Page 22 of 130
Figure 5. Phases of the Florida Water Management Inventory
At the beginning of the data collection effort, Department county environmental health offices
were asked for their assistance in locating local contacts (i.e. organization names, email
addresses, websites) that may have relevant information. The data collection effort was a
two-step process, with an initial attempt to acquire GIS datasets, followed by other types of
information and/or data. There were several counties that completed similar projects at the
local level. The information and local knowledge from these projects have been a tremendous
help. Additionally, many of the utilities have been able to provide GIS data representing
addresses that receive public water and sewer service. Assistance at the local level has been
invaluable.
Sources of information included organizations and state agencies such as the Department,
DEP, Department of Business and Professional Regulation (DBPR), Department of Agriculture
and Consumer Services (DACS), county governments, utilities, and water management
districts. Data from onsite wastewater treatment system permits, utility customer address
lists, and multiple other sources were compiled to link the drinking water source and
wastewater disposal method to a specific property.

Florida Water Management Inventory Project Task 4: Final Project Report
Version: 1.1 on 10/14/2016 Page 23 of 130
Figure 6. Data Sources and What Types of Data They Have
The main data sources were:
1. Parcel Information
A base parcel layer was acquired from the Florida Department of Revenue (DOR). Parcel
data are released annually by the DOR, which are a compilation of data submitted by the
property appraiser for each county. A series of queries were developed to determine which
parcels likely had a structure with the potential for using drinking water or generating
wastewater.
2. Environmental Health Database
The Environmental Health Database (EHD) is a statewide web-based database, maintained
by the Department, with information on environmental health permitting and inspections
for facilities regulated by the Department. EHD has electronic permitting and inspection
data for onsite wastewater treatment systems covering a period from the mid-1990s
onward. The database was queried based on several criteria to develop variable levels of
confidence (known, likely, or somewhat likely) related to the presence of a working onsite
wastewater system. Some of the query conditions included permits with the following
criteria:
• Construction permits for onsite wastewater systems:
• Parcel DataProperty Appraisers &
DOR
• Locations of Wastewater Treatment Facilities
• Location of Public Water SystemsDEP
• Private Well Permitting DataWater Management
Districts
• Septic Tank Permitting Data
• Private Well Permitting Data (Delegated Counties)County DOH Offices
• Environmental Health Database (EHD)DOH Central Office
• Utility Service Area BoundariesPublic Service Commission
• Limited Data on Licensed BusinessesDBPR
• Limited Data on Licensed BusinessesDACS
• Locations of Properties ServedUtilities

Florida Water Management Inventory Project Task 4: Final Project Report
Version: 1.1 on 10/14/2016 Page 24 of 130
o Known sewer – abandonment permit applied for indicating sewer is
available
o Known septic – not known sewer and has construction/final approval data
o Private domestic well or public water – as indicated on the permit
application
• Operating permits for commercial strength sewage waste, industrial or
manufacturing zoned or equivalent usage, aerobic treatment units, or
performance-based treatment systems:
o Known septic if permit is not expired, or inspection was recently completed
o Likely septic for all others
The EHD was also queried with data from other environmental health programs that
record permitting and inspection information in the database. Some programs have
information about water and wastewater infrastructure. These included: limited use
water wells, public swimming pools, private domestic water wells, public water, mobile
home parks, food hygiene facilities, group care facilities, migrant labor camps, and
foster home programs. Information from any source that did not directly permit the
drinking water source or wastewater disposal method was classified as likely or
somewhat likely.
3. Other Sources within the Department
GIS statewide inventory of onsite wastewater treatment systems that was completed by
a private contractor in 2009 (EarthSTEPS and GlobalMind, 2009) was used. Also used
were statewide Well Surveillance Program data collected by the Department’s drinking
water program.
Assistance was requested from Department offices within each county to collect well or
onsite wastewater treatment system data not in EHD. Local offices also informed us about
other professionals who might have similar data and let us know whether there were any
planned onsite wastewater treatment to sewer conversions or utility expansions. County-
level inspectors also have direct knowledge about environmental health regulated facilities
inspected by the Department at the local level. This streamlined the process and resulted
in us not having to contact several utilities and organizations. The local office provided
assistance in contacting utility service providers who did not respond to repeated requests
for data collection. Leveraging local knowledge, expertise, and relationships improved
data acquisition and quality information.
4. Utility sources
In Florida, DEP regulates larger public water systems and central sewer systems and
collects data on the wastewater treatment plants under their jurisdiction such as the
permitted capacity and sample results. They do not collect location information on sewer
laterals or which properties contribute wastewater to the facility. This information was
obtained directly from individual utilities and treatment plants.
DEP regulated facilities were compiled together in the project tracking database, and
facilities that had similar contact information were grouped to minimize the total number
of contacts needed. This process, which the team coined “Parent org grouping” was an
important step in the success of this process. Having a single point of contact for a large
utility that handles multiple drinking water and wastewater facilities, ensured that the
work was consistent across the utility and no effort was wasted.

Florida Water Management Inventory Project Task 4: Final Project Report
Version: 1.1 on 10/14/2016 Page 25 of 130
5. Other sources
In addition to collecting data at the local level, data are also collected at the state and
sub-state levels. State level data include any available Florida DEP GIS coverages for
domestic wastewater facilities and public water systems, statewide information from
Department of Business and Professional Regulation and Department of Agriculture and
Consumer Services relative to licensed establishments with food service. Sub-state data
have been provided by the water management districts and several large utilities.
When looking at the overall success of the data gathering effort, 48% of the facilities were
manually researched (Figure 7). Manual research was done for regulated facilities with a
small treatment capacity, which often only serve one or two parcels. Examples of these types
of facilities included apartment complexes, mobile home parks, bars, and convenience stores.
These facilities provide drinking water for a very small population and treat very little
wastewater (7% and <6% of the overall total) (Table 1). County property appraiser records
were investigated for the physical facility address and aerial maps were used to identify parcel
locations. Several business rules were created that prevented making unnecessary contacts
and, DEP facility data were also utilized to improve efficiency.
Figure 7. Data Receipt Summary for all FDEP Regulated Drinking Water and Wastewater Systems

Florida Water Management Inventory Project Task 4: Final Project Report
Version: 1.1 on 10/14/2016 Page 26 of 130
Table 3. Summary of FDEP Facility Data Collection Results
# of WW Facilities
# of DW Facilities
WW % DW %
Data Received 647 871 77% 74%
Manually Researched 403 3,048 6% 7%
No Response 387 899 12% 13%
Undeliverable 316 309 2% 1%
Submitting at Later Date 19 67 1% 2%
Refused 51 145 2% 4%
Subtotal 1,823 5,339
Grand Total 7,162 100%
Even though only 21% of the total number of facilities submitted data, this accounted for
77% of the treated wastewater and 74% of the population served by drinking water facilities.
Those facilities that either refused or were unable to submit data were mainly privately owned
utilities.
Table 4. Data sets available for mapping by project phase
Data Sets Available for Mapping by Project Phase
Project Phase Wastewater Permitted Capacity
(millions of gallons per day) Drinking Water
Population Served WW % DW %
Phase 1 458.0 3,860,135
YES 428.4 2,869,827 94% 74%
NO 29.7 990,308 6% 26%
Phase 2 251.9 1,774,688
YES 217.7 1,429,085 86% 81%
NO 34.2 345,603 14% 19%
Phase 3 723.7 5,921,640
YES 572.4 4,101,553 79% 69%
NO 151.3 1,820,087 21% 31%
Phase 4 1232.7 8,068,515
YES 1196.8 7,511,658 97% 93%
NO 35.9 556,857 3% 7%
Total Data Available 2666.3 19,624,978 91% 81%
Another method used for gathering county specific data was a centralized approach, where
the local Environmental Health office coordinated meetings with county, municipal, and
large utility entities. All GIS datasets were gathered and compiled by one centralized staff
member, leveraging local knowledge and relationships. Three counties used this approach:
Indian River, Duval, and Leon.
Obtaining GIS datasets is one key to efficiency in data collection and for more robust, useful
information. The project team gathered contacts for GIS resources within each county.
Larger utilities, as well as county or city level governments, were the most frequent sources

Florida Water Management Inventory Project Task 4: Final Project Report
Version: 1.1 on 10/14/2016 Page 27 of 130
for GIS data. The GIS data varied across organizations, from coarse service area
boundaries to detailed service representations directly linked to parcels.
GIS datasets for 488 facilities were collected in this first cycle of the project (Table 5).
While this represents a fairly low percentage of all facilities (7%), it represents 67% of the
total wastewater capacity (millions of gallons per day) and 61% of the population served by
public drinking water. It includes regional, county, city, municipal, and private utility
providers. Figure 7 shows the breakdown of this by phase. These statistics reinforce the
strategy to focus initial information gathering efforts on GIS data from larger facilities and
organizations.
Table 5. Summary of GIS Data Showing the Percentage of Facilities, Wastewater Capacity, and
Drinking Water Population Served for Facilities That Did and Did Not Submit GIS Data
GIS Data Sets Available?
Count of Facilities
% Facilities % Wastewater Capacity
% Drinking Water Population Served
Yes 488 7% 67% 61%
No 7,177 93% 33% 39%
Figure 8. Percent of Population Served by Drinking Water and Wastewater Permitted Capacity
Submitting GIS Data by Phase
Summary of data received by county is shown in Appendix A. Appendix B shows shows, for
each county, a summary of the final parcel counts for wastewater and drinking water, the
percent of FDEP wastewater and drinking water where we received data, and a list of the
large permitted facilities that did not submit data for incorporation into the project. Large
wastewater facilities are defined as having a permitted capacity of greater than 1 million
gallons per day. Large drinking water facilities are defined as have a permitted population
of more than 500.
Florida Water Management Inventory Project Task 4: Final Project Report
Version: 1.1 on 10/14/2016 Page 28 of 130
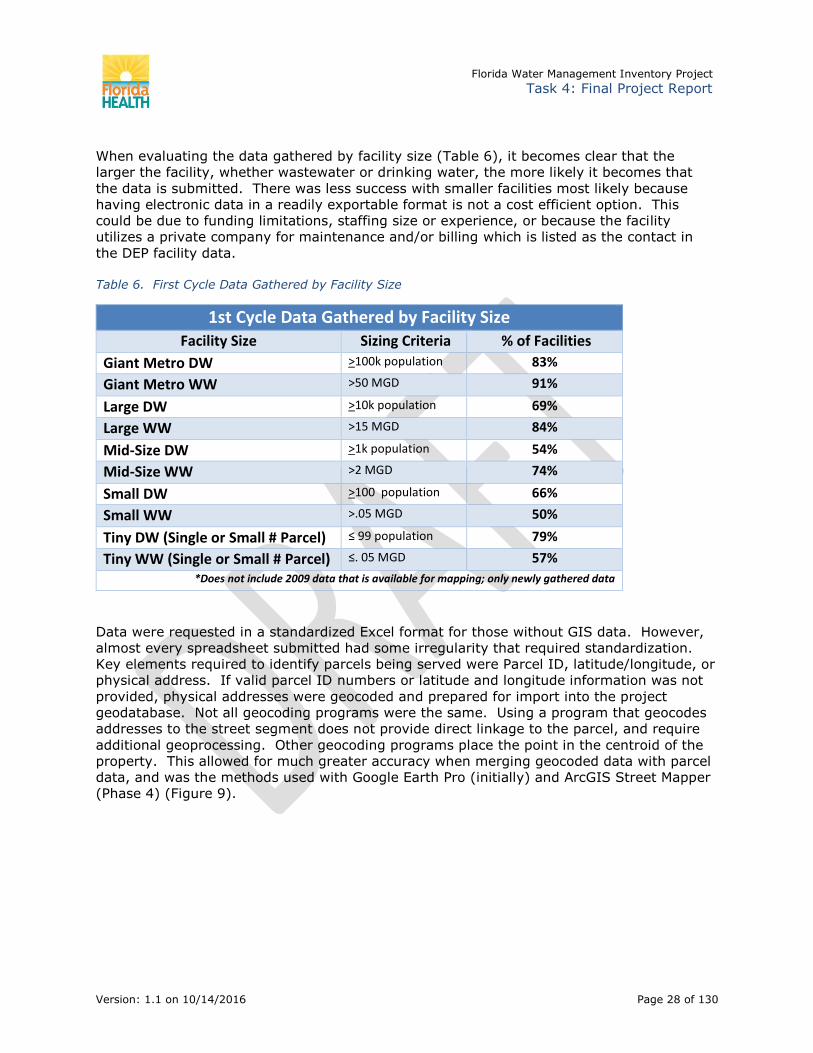
When evaluating the data gathered by facility size (Table 6), it becomes clear that the
larger the facility, whether wastewater or drinking water, the more likely it becomes that
the data is submitted. There was less success with smaller facilities most likely because
having electronic data in a readily exportable format is not a cost efficient option. This
could be due to funding limitations, staffing size or experience, or because the facility
utilizes a private company for maintenance and/or billing which is listed as the contact in
the DEP facility data.
Table 6. First Cycle Data Gathered by Facility Size
1st Cycle Data Gathered by Facility Size Facility Size Sizing Criteria % of Facilities
Giant Metro DW >100k population 83%
Giant Metro WW >50 MGD 91%
Large DW >10k population 69%
Large WW >15 MGD 84%
Mid-Size DW >1k population 54%
Mid-Size WW >2 MGD 74%
Small DW >100 population 66%
Small WW >.05 MGD 50%
Tiny DW (Single or Small # Parcel) ≤ 99 population 79%
Tiny WW (Single or Small # Parcel) ≤. 05 MGD 57%
*Does not include 2009 data that is available for mapping; only newly gathered data
Data were requested in a standardized Excel format for those without GIS data. However,
almost every spreadsheet submitted had some irregularity that required standardization.
Key elements required to identify parcels being served were Parcel ID, latitude/longitude, or
physical address. If valid parcel ID numbers or latitude and longitude information was not
provided, physical addresses were geocoded and prepared for import into the project
geodatabase. Not all geocoding programs were the same. Using a program that geocodes
addresses to the street segment does not provide direct linkage to the parcel, and require
additional geoprocessing. Other geocoding programs place the point in the centroid of the
property. This allowed for much greater accuracy when merging geocoded data with parcel
data, and was the methods used with Google Earth Pro (initially) and ArcGIS Street Mapper
(Phase 4) (Figure 9).

Florida Water Management Inventory Project Task 4: Final Project Report
Version: 1.1 on 10/14/2016 Page 29 of 130
Figure 9. Screenshot of Geocoding via Google Earth
The geodatabase (Figure 10), was started with base parcel layers provided by the
Department of Revenue. Within the geodatabase, each county is represented by one
feature class and two tables for the most recent tax assessment year. Another geodatabase
was developed for hosting the inventory results on-line. The on-line version provides a
means by which the information for a parcel may be researched, along with a mechanism to
submit corrections.

Florida Water Management Inventory Project Task 4: Final Project Report
Version: 1.1 on 10/14/2016 Page 30 of 130
FL_WaterMngInventory
fwmi
fwmi_edit
fwmi_cnty.gdbfwmi_final.gdb
parNoNameYYYY*
LOC_NOFYYYY*
VI_NOFYYYY*
fwmi
PK PARCELNO
CO_NO BLT_STATUS BLT_UPD LANDUSE GIS_ACRE DW DW_UPD DW_SRC_TYP DW_SRC_NAME DW_SRC_GEO WW WW_UPD WW_SRC_TYP WW_SRC_NAME WW_SRC_GEO ALT_KEY PHY_ADDR1 PHY_CITY PHY_ZIPCD COUNTYFP COMMENTS
fwmi_edit
PK PARCELNO
CO_NO BLT_STATUS LANDUSE DW WW ALT_KEY PHY_ADDR PHY_CITY PHY_ZIPCD SUB_DATE SUB_BLT SUB_LU SUB_DW SUB_WW SUB_ROLE SUB_FIRST SUB_LAST SUB_EMAIL SUB_PHONE SUB_COMMENT APP_STATUS APP_ST_DT APP_COMMENT
parNoNameYYYY
PK PARCELNO
CO_NO BLT_STATUS BLT_UPD LANDUSE GIS_ACRE DW DW_UPD DW_SRC_TYP DW_SRC_NAME WW WW_UPD WW_SRC_TYP WW_SRC_NAME ALT_KEY PAR_UPD NAL_MTCH COUNTYFP COMMENTS
GDB for Web Application
GDB for Editing and Inventory Development
Parcels
* one FC/TBL set per county
Florida Water Management Inventory GIS Database Diagram
Figure 10. Inventory Geodatabase Diagram
A series of queries were developed to determine which parcels likely had a structure. These
parcels have the potential for using drinking water or generating wastewater, and was the
focus of the inventory. Information from the 2009 wastewater inventory was brought into
the parcel feature classes. Drinking water and wastewater data were compiled, converted,
imported and assigned to associated parcels within the geodatabase. The qualifiers “known”,
“likely”, and “somewhat likely” were assigned, based on the relative confidence in the tabular

Florida Water Management Inventory Project Task 4: Final Project Report
Version: 1.1 on 10/14/2016 Page 31 of 130
information. For example, utility account records would receive the qualifier “known”, while
septic permits that were never inspected may receive the qualifier “likely”. A detailed
summary of the estimation criteria used in this project can be found in Appendix E.
The method by which the source was imported into the GIS and assigned to a particular
parcel is represented by the attribute values “spatial”, “geocode”, and “parcel”. “Parcel”
represented a direct table import where the source data had a parcel identifier matching the
parcel feature in the inventory feature class. These records may be assumed to have the
highest level of horizontal accuracy. A value of “geocode” was assigned to records where
the GIS feature was geocoded from address information provided by the source. “Spatial”
was assigned where GIS data were provided by the source. One or more geoprocessing
operations were performed in assigning the values for those records coded with “geocode”
and “spatial”. These records will have varying levels of horizontal accuracy.
Figure 11 shows a small selection of the different source datasets that were received for
Clay County specific to drinking water. The “EHD Construction” and “CHD Well Permits”
points were geocoded from the addresses found in the respective databases. The “Utility
Water Accounts” were directly imported into the GIS using Parcel Identifiers and/or
coordinates. Other data depicted were provided in GIS format.
Figure 11. Sources for Drinking Water Information
After all data sources for a county were compiled, the various drinking water and
wastewater values were analysed with final values assigned for each parcel (Figure 12).
Generally, data from a utility took precedence over any other data source. Values that
included the qualifier “known” had the next level of priority over any other data source with
qualifier of “likely” or “somewhat likely”. Final values of “undetermined” or “unknown” were
assigned where either two or more sources list equal opposing values, or no information
was provided for a built parcel. Any parcel that was evaluated as being “not built” and had
no source data for water or wastewater was assigned value of “not applicable”.

Florida Water Management Inventory Project Task 4: Final Project Report
Version: 1.1 on 10/14/2016 Page 32 of 130
Figure 12. Screen Shot of Final Assigned Wastewater Value, Year Determination was Made, Type of
Source, Source Name, and Method by Which the Source Coordinate was Derived
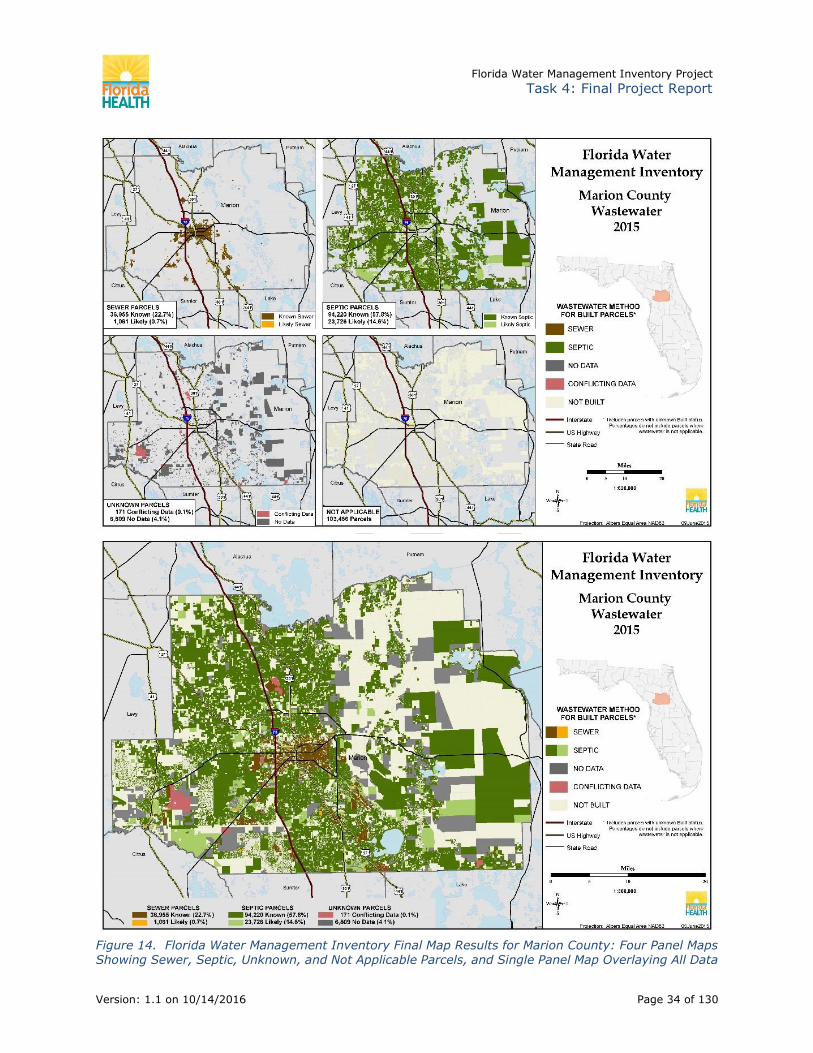
Final graphic data maps were designed to display high-level details in an easy-to-read
format. When comparing two data maps, (Palm Beach County’s inventory results (Figure
13) and Marion County (Figure 14)), Palm Beach has a high number of sewered parcels
(87% sewer) and Marion County has a high number of parcels on septic (73% septic).
Unknown data, which includes parcels with no submitted data or with conflicting data, is a
relatively small percentage of the overall map (2% for Palm Beach, 4% for Marion). Much
of the unknown data are from utilities that did not respond to the data request. These
utilities might be the focus for the next iteration of data gathering for these counties.

Florida Water Management Inventory Project Task 4: Final Project Report
Version: 1.1 on 10/14/2016 Page 33 of 130
Figure 13. Florida Water Management Inventory Final Map Results for Palm Beach County: Four Panel Map Showing Sewer, Septic, Unknown, and Not Applicable Parcels, and Single Panel Map Overlaying All Data
Florida Water Management Inventory Project Task 4: Final Project Report
Version: 1.1 on 10/14/2016 Page 34 of 130
Figure 14. Florida Water Management Inventory Final Map Results for Marion County: Four Panel Maps Showing Sewer, Septic, Unknown, and Not Applicable Parcels, and Single Panel Map Overlaying All Data

Florida Water Management Inventory Project Task 4: Final Project Report
Version: 1.1 on 10/14/2016 Page 35 of 130
Finally, GIS maps and summary reports were created, posted on a public website
(http://floridahealth.gov/FLWMI), and interested parties were notified via email. As of
September 2016, mapping and summary reporting is completed in all 67 counties in Florida,
and posted on the project website.
Phase 1
Phase 1 counties, also referred to as pilot counties, were selected based on several target
criteria shown in Table 7.
Table 7. Counties in Phase 1 and Reason for Inclusion in the Pilot Phase
County Reason for Inclusion in the Pilot Phase
Alachua Example of a mostly complete county from the 2009 inventory
Brevard Indian River Lagoon county
Charlotte County with numerous onsite wastewater treatment systems
Indian River Indian River Lagoon county
Lee County with numerous onsite wastewater treatment systems
Marion Example of a mostly incomplete county from the 2009 inventory
Martin Indian River Lagoon county
Palm Beach County had interest in participation, letter of support received for CDC funding in 2014
St. Lucie Indian River Lagoon county
Phase 2
Phase 2 counties were selected to complete the northern part of the eastern coast of
Florida. There was interest from the St. Johns River Water Management District in having a
completed inventory for these counties, and assistance was provided in gathering support
from DEP regulated facilities.
These are the counties included in Phase 2:
1. Clay
2. Duval
3. Flagler
4. Nassau
5. St. Johns
6. Volusia
Phase 3
Phase 3 counties were selected based on whether they contained areas located in a DEP
Basin Management Action Plan for springs areas. Counties on the following list with a “3A”
after the name, were completed first based on a new process that identified efficiencies with
contacting predominantly rural counties first and focusing efforts on obtaining GIS datasets
from the remaining ones through a targeted email campaign.

Florida Water Management Inventory Project Task 4: Final Project Report
Version: 1.1 on 10/14/2016 Page 36 of 130
1. Baker – 3A
2. Bay
3. Bradford
4. Citrus
5. Columbia
6. Dixie
7. Gadsden
8. Gilchrist
9. Hamilton – 3A
10. Hernando
11. Hillsborough
12. Holmes – 3A
13. Jackson
14. Jefferson – 3A
15. Lafayette – 3A
16. Lake
17. Leon
18. Levy
19. Liberty – 3A
20. Madison – 3A
21. Orange
22. Pasco
23. Polk
24. Putnam
25. Seminole
26. Sumter
27. Suwannee
28. Union – 3A
29. Wakulla – 3A
30. Walton
31. Washington
Phase 4
Phase 4 was strategically planned and executed according to the following criteria:
1. Separate Phase 4 into individual, discreet sub-phases, as was done in Phase 3,
grouping counties and facilities with similar characteristics to achieve the maximum
results given the time constraints
2. Balance the workload and gathering tasks across these sub-phases in an effort to
ensure a more continuous flow of data sets being requested and received
3. Ensure that there are data sets gathered and processed that are ready for
geoprocessing, causing no lag in mapping and summary reporting between Phases 3
and 4
COUNTY BREAKDOWN STRUCTURE
Phase 4 consisted of the following sub-phases and their corresponding counties:
PHASE 4A
Characteristics: 9 mostly-rural counties with little or no GIS and relatively low facility
counts
1. Calhoun
2. Desoto
3. Franklin
4. Glades
5. Gulf
6. Hardee
7. Hendry
8. Okeechobee
9. Taylor
PHASE 4B
Characteristics: 9 counties with a mixture of metropolitan and suburban municipalities
possessing moderate levels of GIS, with some of the counties consisting of very high facility
counts and medium to high WW capacity and DW volumes

Florida Water Management Inventory Project Task 4: Final Project Report
Version: 1.1 on 10/14/2016 Page 37 of 130
10. Collier
11. Escambia
12. Highlands
13. Manatee
14. Monroe
15. Okaloosa
16. Osceola
17. Santa Rosa
18. Sarasota PHASE 4C
Characteristics: 3 very dense, urban counties with a high likelihood of GIS data sets to be
gathered and moderate facility counts, with the exception of Miami-Dade County, which has
the second-largest number of facilities in Phase 4
19. Broward
20. Miami-Dade
21. Pinellas
Section 6 - PROJECT MANAGEMENT
Conduct Team Meetings
Team meetings were conducted on a biweekly schedule or as needed throughout the
project. The team utilized several formats for the meetings, including in-person, conference
call, and web-conference meetings.
Develop and Publish Project Schedule
The project schedule was created at the beginning of the project and maintained throughout
the project. Due to the start and stop of funding from 2014 through 2016, there were
several delays that could have been avoided had there been consistent funding. The project
team did meet the final deadline from the final funding source.
Develop and Maintain Project Task List
The project schedule launched a more detailed project task list, which was maintained
throughout the project. The task list outlined the various tasks, who they were assigned to,
when they were due, and any deviations from the original due date along with related
comments.

Florida Water Management Inventory Project Task 4: Final Project Report
Version: 1.1 on 10/14/2016 Page 38 of 130
Collect Spending Data
Spending data was collected at several key points through the project. Once the EPA
Nonpoint Source funding was allocated to the project, a separate accounting code was
created to assist with categorizing funds and simplifying reporting.
Develop and Maintain Project Budget
The project budget was maintained throughout the project.
Prepare Project Status Reports
Figure 15 shows the project status as of October 1, 2015 as an example of what the project
status maps looked like. These maps were posted to the project website and sent regularly
to key project contacts. Appendix F shows the final project summary update for the first
cycle.
Figure 15. Example of Project Status Map Posted to Project Website and Sent in Weekly Status Updates

Florida Water Management Inventory Project Task 4: Final Project Report
Version: 1.1 on 10/14/2016 Page 39 of 130
Update Project Website
The project website (http://floridahealth.gov/flwmi) was maintained throughout the project
to show the most up-to-date status and data available. The website has the following
sections:
· Purpose
· Benefits
· Status
· Requested Data Sets
· Data Fields & Formats (including a Data Sheet spreadsheet template to use for
submitting the requested data)
· Knowing What to Submit in Your Data Set
· Submitting Your Data Set to the Project Team
· FAQ
· Contact Information
· Thank You
Development is ongoing to create a clickable interface which will allow individuals to click on
the county on a statewide map and be directed to a webpage for detailed summary
information. Figure 16 shows a screenshot of the project FTP site where the GIS maps, pdf
maps, and spreadsheet data can be downloaded. Figure 17 shows an example of the
project snapshot webpage for Alachua County.
Figure 16. Screenshot of the FTP Website where County-Specific Data and Maps Can Be Downloaded

Florida Water Management Inventory Project Task 4: Final Project Report
Version: 1.1 on 10/14/2016 Page 40 of 130
Figure 17. Example of the County Snapshot Webpage for Alachua County
Develop and Publish Web Application
A web application was created and published at this site: https://gis.flhealth.gov/FLWMI/.
Figure 18 shows a screenshot of the interactive web application that was developed for this
project. This web application allows for searching by address, exporting data, and
developing personal maps.

Florida Water Management Inventory Project Task 4: Final Project Report
Version: 1.1 on 10/14/2016 Page 41 of 130
Figure 18. Screenshot of the Interactive Web Application
Coordinate Outreach Efforts
Data was shared with multiple entities throughout the project.
During Hurricane Matthew, several maps were created and used to assist with the
environmental response activities relating to flooded drinking water wells and onsite
wastewater systems that were damaged by the storm.
We have collaborated with multiple public and private entities throughout the project. A list
of these efforts is forthcoming.
Seek New Funding
Funding for part of the second cycle has been secured through the EPA Nonpoint Source
Protection program. Other efforts are ongoing to see if funds from CDC and other state
sources can be secured so we can keep this project ongoing.
Florida Water Management Inventory Project Task 4: Final Project Report
Version: 1.1 on 10/14/2016 Page 42 of 130
Section 7 - RECOMMENDATIONS AND CONCLUSIONS
Recommendations
Some planned improvements include:
• Online data accessibility
– Developing standardized webpage for each county
– Improvements to the interactive mapping tool
– Integration with needs for other state programs
• Public Health Dental Program and fluoridated drinking water systems
• Environmental Public Health Tracking to improve reporting to CDC
• Integration with the State Emergency Response Team (SERT)
Geospatial Assessment Tool for Operations and Response (GATOR)
system to improve disaster response
• Enhancements to the Environmental Health Database (EHD)
– Linking points back to EHD for better geo-spatial references
• Updating county data to fill in blanks and refine estimations
• Ground-truthing data
Conclusions
Collaboration with stakeholders was found to be an essential part of this inventory project.
Working closely with local experts allowed for a more comprehensive and accurate final
product. There is a great deal of interest in these results, but not having a dedicated
funding source is a challenge. The Department has received approval to start work on the
next cycle of data gathering through a grant with the Environmental Protection Agency’s
319 Nonpoint Source Pollution Program administered by DEP.
Having a comprehensive drinking water and wastewater inventory of the approximate 6.5
million developed parcels in Florida is extremely beneficial. It will help improve government
customer service, permitting, development review, and planning activities. It is available at
no charge to both the public and other entities. This project will improve disaster
preparedness and response activities by providing accurate estimates of public health and
infrastructure that may be impacted during disasters. The resulting data and associated
map products will be a resource that researchers can use to help evaluate connections
between various public health and environmental factors. This will also be a great resource
for homeowners, home-buyers, realtors and other entities interested in potable water and
wastewater services. All of the maps and data are available in one place through a web
portal, with the project results consolidated and accessible to the public.
Visit the project website (http://www.floridahealth.gov/FLWMI) to download data, access
the interactive web application, and for an up-to-date status of this project.

Florida Water Management Inventory Project Task 4: Final Project Report
Version: 1.1 on 10/14/2016 Page 43 of 130
Section 8 - ACKNOWLEDGEMENTS
We would like to acknowledge the U.S. Centers for Disease Control and Prevention (CDC)
and the Section 319 Nonpoint Source Management Program with the U.S. Environmental
Protection Agency for providing funding support for this project. Several sections within the
Florida Department of Environmental Protection have also provided administrative support.
We also acknowledge the Florida Department of Health’s Research Review and Advisory
Committee which ranked this project as the number one priority for onsite sewage research
efforts in Florida. This work would not have happened without the project team including
Levi Owens and Liz Sabeff with Global Information Services, Inc. who provided project
management, data analysis, and GIS administration for this project; Diane Hood and Alx
Walter who provided data processing assistance with this project; Pranathi Gannapureddy
with Brandt Information Services who developed a method to capture abandonments by
utility in the Environmental Health Database; and all the Florida Agricultural and Mechanical
Masters in Public Health students that have provided assistance with data analysis and
website content. Collaboration with stakeholders is an essential part of this inventory
project. Many professionals within the Florida Department of Health state and county offices
provided unmeasurable amounts of support for this project. This project would not be
possible without the help from participating stakeholders including public and private
utilities; Florida Departments of Environmental Protection, Business and Professional
Regulation, Emergency Management, and Agriculture and Consumer Services; Water
Management Districts; Public Service Commission; various county and municipal
governments; and many others. We have developed a webpage to thank all the public and
private drinking water and wastewater facilities that contributed data to this project:
http://www.floridahealth.gov/environmental-health/onsite-
sewage/research/FLWMI/thankyou.html.
Some of this report includes text previously published at the proceedings of the 2015
National Onsite Wastewater and Recycling Association Onsite Wastewater Mega-Conference.
Section 9 - REFERENCES
Florida Department of Health Onsite Sewage Programs Website.
http://www.floridahealth.gov/environmental-health/onsite-sewage/index.html
Florida Department of Health Florida Water Management Inventory Website.
http://www.floridahealth.gov/flwmi
Hall, Pamela and Stephen Clancy. 2009. Statewide Inventory of Onsite Sewage
Treatment and Disposal Systems in Florida. Report to the Florida Department of
Health. http://www.floridahealth.gov/environmental-health/onsite-
sewage/research/_documents/research-reports/_documents/inventory-report.pdf

Florida Water Management Inventory Project Task 4: Final Project Report
Version: 1.1 on 10/14/2016 Page 44 of 130
APPENDIX A – RESPONSE FROM FDEP PERMITTED WASTEWATER
TREATMENT FACILITIES AND PUBLIC WATER SYSTEMS
This table shows the data available by county for both wastewater and drinking water
facilities permitted by FDEP.
Column Description
County County name
WW Facilities Count of the number of permitted FDEP wastewater systems
DW Facilities Count of the number of permitted FDEP drinking water systems
% of Total WW Sum of the permitted wastewater capacity, in millions of gallons
per day converted to a percent of the total
% of Total DW Sum of the population served converted to a percent of the total
Data Available by County County WW Facilities DW Facilities % of Total WW % of Total DW
Alachua
YES 14 52 92.9% 91.5%
NO 4 11 7.1% 8.5%
Baker
YES 3 12 98.5% 39.4%
NO 1 3 1.5% 60.6%
Bay
YES 8 43 100.0% 54.1%
NO 6 0.0% 45.9%
Bradford
YES 3 22 100.0% 43.7%
NO 4 0.0% 56.3%
Brevard
YES 37 60 73.6% 71.4%
NO 18 25 26.4% 28.6%
Broward
YES 17 55 100.0% 93.0%
NO 3 0.0% 7.0%
Calhoun
YES 1 9 100.0% 84.0%
NO 2 0.0% 16.0%

Florida Water Management Inventory Project Task 4: Final Project Report
Version: 1.1 on 10/14/2016 Page 45 of 130
County WW Facilities DW Facilities % of Total WW % of Total DW
Charlotte
YES 21 19 85.6% 24.9%
NO 5 12 14.4% 75.1%
Citrus
YES 24 119 37.4% 72.9%
NO 31 52 62.6% 27.1%
Clay
YES 15 68 36.0% 13.0%
NO 5 18 64.0% 87.0%
Collier
YES 17 47 99.2% 96.6%
NO 3 4 0.8% 3.4%
Columbia
YES 17 45 53.9% 15.0%
NO 4 16 46.1% 85.0%
Desoto
YES 13 47 41.4% 63.1%
NO 4 2 58.6% 36.9%
Dixie
YES 2 19 23.5% 18.0%
NO 1 10 76.5% 82.0%
Duval
YES 14 58 99.3% 94.4%
NO 5 47 0.7% 5.6%
Escambia
YES 7 10 98.0% 93.5%
NO 1 5 2.0% 6.5%
Flagler
YES 13 21 78.0% 100.0%
NO 4 1 22.0% 0.0%
Franklin
YES 4 3 14.3% 2.0%
NO 2 6 85.7% 98.0%
Gadsden
YES 6 13 49.8% 36.8%
NO 4 12 50.2% 63.2%

Florida Water Management Inventory Project Task 4: Final Project Report
Version: 1.1 on 10/14/2016 Page 46 of 130
County WW Facilities DW Facilities % of Total WW % of Total DW
Gilchrist
YES 3 22 77.4% 98.7%
NO 2 2 22.6% 1.3%
Glades
YES 14 10 77.6% 93.8%
NO 6 5 22.4% 6.2%
Gulf
YES 5 11 100.0% 100.0%
Hamilton
YES 7 13 29.2% 36.8%
NO 1 3 70.8% 63.2%
Hardee
YES 8 32 96.4% 89.9%
NO 2 10 3.6% 10.1%
Hendry
YES 12 36 91.2% 81.2%
NO 4 7 8.8% 18.8%
Hernando
YES 21 115 98.2% 99.0%
NO 4 10 1.8% 1.0%
Highlands
YES 49 65 70.5% 77.8%
NO 7 17 29.5% 22.2%
Hillsborough
YES 64 463 98.3% 53.3%
NO 42 217 1.7% 46.7%
Holmes
YES 2 12 6.2% 26.3%
NO 2 8 93.8% 73.7%
Indian River
YES 11 22 100.0% 100.0%
Jackson
YES 6 59 23.3% 40.6%
NO 3 11 76.7% 59.4%

Florida Water Management Inventory Project Task 4: Final Project Report
Version: 1.1 on 10/14/2016 Page 47 of 130
County WW Facilities DW Facilities % of Total WW % of Total DW
Jefferson
YES 3 7 26.1% 28.1%
NO 1 7 73.9% 71.9%
Lafayette
YES 2 10 100.0% 99.1%
NO 1 0.0% 0.9%
Lake
YES 64 160 70.8% 59.5%
NO 46 121 29.2% 40.5%
Lee
YES 46 52 94.7% 85.8%
NO 18 18 5.3% 14.2%
Leon
YES 8 30 91.8% 87.6%
NO 5 12 8.2% 12.4%
Levy
YES 5 44 18.1% 33.7%
NO 8 21 81.9% 66.3%
Liberty
YES 1 7 52.8% 30.4%
NO 1 8 47.2% 69.6%
Madison
YES 3 9 85.3% 78.0%
NO 2 5 14.7% 22.0%
Manatee
YES 9 58 100.0% 98.5%
NO 2 0.0% 1.5%
Marion
YES 84 367 91.8% 73.2%
NO 32 175 8.2% 26.8%
Martin
YES 20 45 97.1% 76.2%
NO 4 16 2.9% 23.8%
Miami Dade
YES 22 103 98.8% 94.1%
NO 2 20 1.2% 5.9%

Florida Water Management Inventory Project Task 4: Final Project Report
Version: 1.1 on 10/14/2016 Page 48 of 130
County WW Facilities DW Facilities % of Total WW % of Total DW
Monroe
YES 79 1 39.9% 100.0%
NO 35 60.1% 0.0%
Nassau
YES 8 39 89.9% 63.1%
NO 7 14 10.1% 36.9%
Okaloosa
YES 13 15 74.1% 69.7%
NO 3 8 25.9% 30.3%
Okeechobee
YES 10 37 88.4% 20.6%
NO 8 4 11.6% 79.4%
Orange
YES 31 106 60.6% 98.4%
NO 13 34 39.4% 1.6%
Osceola
YES 26 73 98.4% 97.2%
NO 8 10 1.6% 2.8%
Palm Beach
YES 42 60 99.8% 71.7%
NO 5 22 0.2% 28.3%
Pasco
YES 39 188 87.0% 62.6%
NO 29 56 13.0% 37.4%
Pinellas
YES 19 13 99.8% 99.9%
NO 3 1 0.2% 0.1%
Polk
YES 80 239 84.0% 50.8%
NO 65 193 16.0% 49.2%
Putnam
YES 18 78 19.3% 29.4%
NO 9 35 80.7% 70.6%
Santa Rosa
YES 9 19 98.8% 73.5%
NO 1 2 1.2% 26.5%

Florida Water Management Inventory Project Task 4: Final Project Report
Version: 1.1 on 10/14/2016 Page 49 of 130
County WW Facilities DW Facilities % of Total WW % of Total DW
Sarasota
YES 29 104 86.2% 94.6%
NO 8 17 13.8% 5.4%
Seminole
YES 14 44 93.3% 61.1%
NO 7 25 6.7% 38.9%
St. Johns
YES 26 60 100.0% 99.9%
NO 3 0.0% 0.1%
St. Lucie
YES 21 36 92.1% 93.8%
NO 7 17 7.9% 6.2%
Sumter
YES 24 74 94.1% 78.6%
NO 6 11 5.9% 21.4%
Suwannee
YES 6 35 16.8% 9.3%
NO 2 13 83.2% 90.7%
Taylor
YES 3 14 27.8% 36.8%
NO 2 4 72.2% 63.2%
Union
YES 7 0.0% 40.8%
NO 1 4 100.0% 59.2%
Volusia
YES 64 115 82.1% 77.5%
NO 32 36 17.9% 22.5%
Wakulla
YES 4 10 98.0% 72.2%
NO 1 1 2.0% 27.8%
Walton
YES 6 21 38.4% 44.2%
NO 5 8 61.6% 55.8%
Washington
YES 4 18 86.9% 67.2%
NO 2 6 13.1% 32.8%

Florida Water Management Inventory Project Task 4: Final Project Report
Version: 1.1 on 10/14/2016 Page 50 of 130
APPENDIX B – SUMMARIES BY COUNTY
This appendix shows, for each county, a summary of the final parcel counts for wastewater
and drinking water, the percent of FDEP wastewater and drinking water where we received
data, and a list of the large permitted facilities that did not submit data for incorporation
into the project. Large wastewater facilities are defined as having a permitted capacity of
greater than 1 million gallons per day. Large drinking water facilities are defined as have a
permitted population of more than 500.
Alachua County Summary
Received responses from 92.9% of all permitted wastewater in the county, with no large
facilities missing.
Received responses from 91.5% of all permitted drinking water in the county, with the
following large facilities missing:
· Archer Water System
· City of Alachua
· City of Hawthorne
· High Springs WTP
· Kincaid Hills Water System
· Micanopy Water System

Florida Water Management Inventory Project Task 4: Final Project Report
Version: 1.1 on 10/14/2016 Page 51 of 130
Baker County Summary
Using both data collected in 2009 and during 2014-2016, responses were received from
98.5% of all permitted wastewater in the county, with the following large facilities missing
from the more recent data request:
· City of Macclenny (submitted in 2009)
Received responses from 39.4% of all permitted drinking water in the county, with the
following large facilities missing:
· City of Macclenny

Florida Water Management Inventory Project Task 4: Final Project Report
Version: 1.1 on 10/14/2016 Page 52 of 130
Bay County Summary
Using both data collected in 2009 and during 2014-2016, responses were received from
100.0% of all permitted wastewater in the county, with the following large facilities missing
from the more recent data request:
· Panama City Beach WWTP#1 (submitted in 2009)
Received responses from 54.1% of all permitted drinking water in the county, with the
following large facilities missing:
· City of Mexico Beach
· City of Panama City Beach
· City of Springfield
· Waller Elementary School

Florida Water Management Inventory Project Task 4: Final Project Report
Version: 1.1 on 10/14/2016 Page 53 of 130
Bradford County Summary
Using both data collected in 2009 and during 2014-2016, responses were received from
100.0% of all permitted wastewater in the county, with the following large facilities missing
from the more recent data request:
· Starke WWTF (submitted in 2009)
Received responses from 43.7% of all permitted drinking water in the county, with the
following large facilities missing:
· Brooker Water Department
· City of Lawtey
· City of Starke

Florida Water Management Inventory Project Task 4: Final Project Report
Version: 1.1 on 10/14/2016 Page 54 of 130
Brevard County Summary
Using both data collected in 2009 and during 2014-2016, responses were received from
73.6% of all permitted wastewater in the county, with the following large facilities missing
from the more recent data request:
· City of Melbourne (submitted in 2009)
· City of Rockledge
· Cocoa Beach WRF (submitted in 2009)
· Cocoa Beach Reclamation Facility
· West Melbourne Water
Received responses from 71.4% of all permitted drinking water in the county, with the
following large facilities missing:
· Aqua Utilities Florida Inc
· City of Melbourne
· South Brevard Water Co-Op
· South Shores Utility Association
· West Melbourne Water

Florida Water Management Inventory Project Task 4: Final Project Report
Version: 1.1 on 10/14/2016 Page 55 of 130
Broward County Summary
Using both data collected in 2009 and during 2014-2016, responses were received from
100.0% of all permitted wastewater in the county, with the following large facilities missing
from the more recent data request:
· City of Cooper City (submitted in 2009)
· Plantation Regional WWTP (submitted in 2009)
Received responses from 93.0% of all permitted drinking water in the county, with the
following large facilities missing:
· City of Cooper City
· Ft Laud Assembly Hall-Jeh Witn
· Plantation East & Central
· Royal Utility Company

Florida Water Management Inventory Project Task 4: Final Project Report
Version: 1.1 on 10/14/2016 Page 56 of 130
Calhoun County Summary
Received responses from 100.0% of all permitted wastewater in the county, with the
following large facilities missing:
Received responses from 84.0% of all permitted drinking water in the county, with no large
facilities missing.
· Town of Altha

Florida Water Management Inventory Project Task 4: Final Project Report
Version: 1.1 on 10/14/2016 Page 57 of 130
Charlotte County Summary
Using both data collected in 2009 and during 2014-2016, responses were received from
85.6% of all permitted wastewater in the county, with the following large facilities missing
from the more recent data request:
· Charlotte County Utilities (submitted in 2009)
Received responses from 24.9% of all permitted drinking water in the county, with the
following large facilities missing:
· Charlotte County Utilities
· El Jobean Water Association
· Knight Island Utilities Inc

Florida Water Management Inventory Project Task 4: Final Project Report
Version: 1.1 on 10/14/2016 Page 58 of 130
Citrus County Summary
Using both data collected in 2009 and during 2014-2016, responses were received from
37.4% of all permitted wastewater in the county, with the following large facilities missing
from the more recent data request:
· City of Crystal River (submitted in 2009)
Received responses from 72.9% of all permitted drinking water in the county, with the
following large facilities missing:
· American Land Lease
· Constate Utl/Hills of Avalon
· Falkner Groups
· Floral City Water Association
· Homosassa Special Water District
· Ozello Water Association

Florida Water Management Inventory Project Task 4: Final Project Report
Version: 1.1 on 10/14/2016 Page 59 of 130
Clay County Summary
Using both data collected in 2009 and during 2014-2016, responses were received from
36.0% of all permitted wastewater in the county, with the following large facilities missing
from the more recent data request:
· Clay County Utility Authority (submitted in 2009)
Received responses from 13.0% of all permitted drinking water in the county, with the
following large facilities missing:
· Clay County Utility Authority (submitted in 2009)

Florida Water Management Inventory Project Task 4: Final Project Report
Version: 1.1 on 10/14/2016 Page 60 of 130
Collier County Summary
Received responses from 99.2% of all permitted wastewater in the county, with no large
facilities missing.
Received responses from 96.6% of all permitted drinking water in the county, with the
following large facilities missing:
· Center Point Community Church
· City of Everglades
· Collier County School Board
· E’S Country Store
· FDOT
· Hakan Services Inc
· Orange Tree Utility Co Inc
· Port of the Islands
· US Water Corp

Florida Water Management Inventory Project Task 4: Final Project Report
Version: 1.1 on 10/14/2016 Page 61 of 130
Columbia County Summary
Using both data collected in 2009 and during 2014-2016, responses were received from
53.9% of all permitted wastewater in the county, with the following large facilities missing
from the more recent data request:
· City of Lake City (submitted in 2009)
Received responses from 15.0% of all permitted drinking water in the county, with the
following large facilities missing:
· City of Lake City

Florida Water Management Inventory Project Task 4: Final Project Report
Version: 1.1 on 10/14/2016 Page 62 of 130
Desoto County Summary
Received responses from 41.4% of all permitted wastewater in the county, with the
following large facilities missing:
· City of Arcadia
Received responses from 63.1% of all permitted drinking water in the county, with the
following large facilities missing:
· City of Arcadia
· Desoto County Utilities

Florida Water Management Inventory Project Task 4: Final Project Report
Version: 1.1 on 10/14/2016 Page 63 of 130
Dixie County Summary
Received responses from 23.5% of all permitted wastewater in the county, with no large
facilities missing.
Received responses from 18.0% of all permitted drinking water in the county, with the
following large facilities missing:
· City of Cross City
· Suwannee Water & Sewer District

Florida Water Management Inventory Project Task 4: Final Project Report
Version: 1.1 on 10/14/2016 Page 64 of 130
Duval County Summary
Using both data collected in 2009 and during 2014-2016, responses were received from
99.3% of all permitted wastewater in the county, with the following large facilities missing
from the more recent data request:
· City of Atlantic Beach
· City of Jacksonville Beach (submitted in 2009)
· Neptune Beach WWTF (submitted in 2009)
· Usn Mayport Naval Station WWTF (submitted in 2009)
· Usn Nas Jacksonville WWTF (submitted in 2009)
Received responses from 94.4% of all permitted drinking water in the county, with the
following large facilities missing:
· Atlantic Beach Water System
· Baldwin Water System
· City of Jacksonville Beach
· Jacksonville University
· Montgomery Correctional Center
· Neighborhood Utility Inc
· Neptune Beach
· Normandy Village Utility Co

Florida Water Management Inventory Project Task 4: Final Project Report
Version: 1.1 on 10/14/2016 Page 65 of 130
Escambia County Summary
Received responses from 98.0% of all permitted wastewater in the county, with no large
facilities missing.
Received responses from 93.5% of all permitted drinking water in the county, with the
following large facilities missing:
· Ascend Performance Materials (Solutia)
· Cottage Hill Water Works
· Farm Hill Utilities Inc
· Molino Utilities Inc
· Town of Century

Florida Water Management Inventory Project Task 4: Final Project Report
Version: 1.1 on 10/14/2016 Page 66 of 130
Flagler County Summary
Received responses from 78.0% of all permitted wastewater in the county, with no large
facilities missing.
Received responses from 100.0% of all permitted drinking water in the county, with no
large facilities missing.

Florida Water Management Inventory Project Task 4: Final Project Report
Version: 1.1 on 10/14/2016 Page 67 of 130
Franklin County Summary
Received responses from 14.3% of all permitted wastewater in the county, with the
following large facilities missing:
· City of Carrabelle
Received responses from 2.0% of all permitted drinking water in the county, with the
following large facilities missing:
· City of Apalachicola
· City of Carrabelle
· Eastpoint Water & Sewer District
· Water Management Services Inc

Florida Water Management Inventory Project Task 4: Final Project Report
Version: 1.1 on 10/14/2016 Page 68 of 130
Gadsden County Summary
Received responses from 49.8% of all permitted wastewater in the county, with the
following large facilities missing:
· Quincy WWTP
Received responses from 36.8% of all permitted drinking water in the county, with the
following large facilities missing:
·
· City of Gretna
· City of Quincy
· Talquin Electric Coop. Inc

Florida Water Management Inventory Project Task 4: Final Project Report
Version: 1.1 on 10/14/2016 Page 69 of 130
Gilchrist County Summary
Received responses from 77.4% of all permitted wastewater in the county, with no large
facilities missing.
Received responses from 98.7% of all permitted drinking water in the county, with no large
facilities missing.

Florida Water Management Inventory Project Task 4: Final Project Report
Version: 1.1 on 10/14/2016 Page 70 of 130
Glades County Summary
Received responses from 77.6% of all permitted wastewater in the county, with no large
facilities missing.
Received responses from 93.8% of all permitted drinking water in the county, with no large
facilities missing.

Florida Water Management Inventory Project Task 4: Final Project Report
Version: 1.1 on 10/14/2016 Page 71 of 130
Gulf County Summary
Received responses from 100.0% of all permitted wastewater in the county, with no large
facilities missing.
Received responses from 100.0% of all permitted drinking water in the county, with no
large facilities missing.

Florida Water Management Inventory Project Task 4: Final Project Report
Version: 1.1 on 10/14/2016 Page 72 of 130
Hamilton County Summary
Received responses from 29.2% of all permitted wastewater in the county, with the
following large facilities missing:
· Jasper Water Department
Received responses from 36.8% of all permitted drinking water in the county, with the
following large facilities missing:
· Jasper Water Department

Florida Water Management Inventory Project Task 4: Final Project Report
Version: 1.1 on 10/14/2016 Page 73 of 130
Hardee County Summary
Received responses from 96.4% of all permitted wastewater in the county, with no large
facilities missing.
Received responses from 89.9% of all permitted drinking water in the county, with no large
facilities missing.
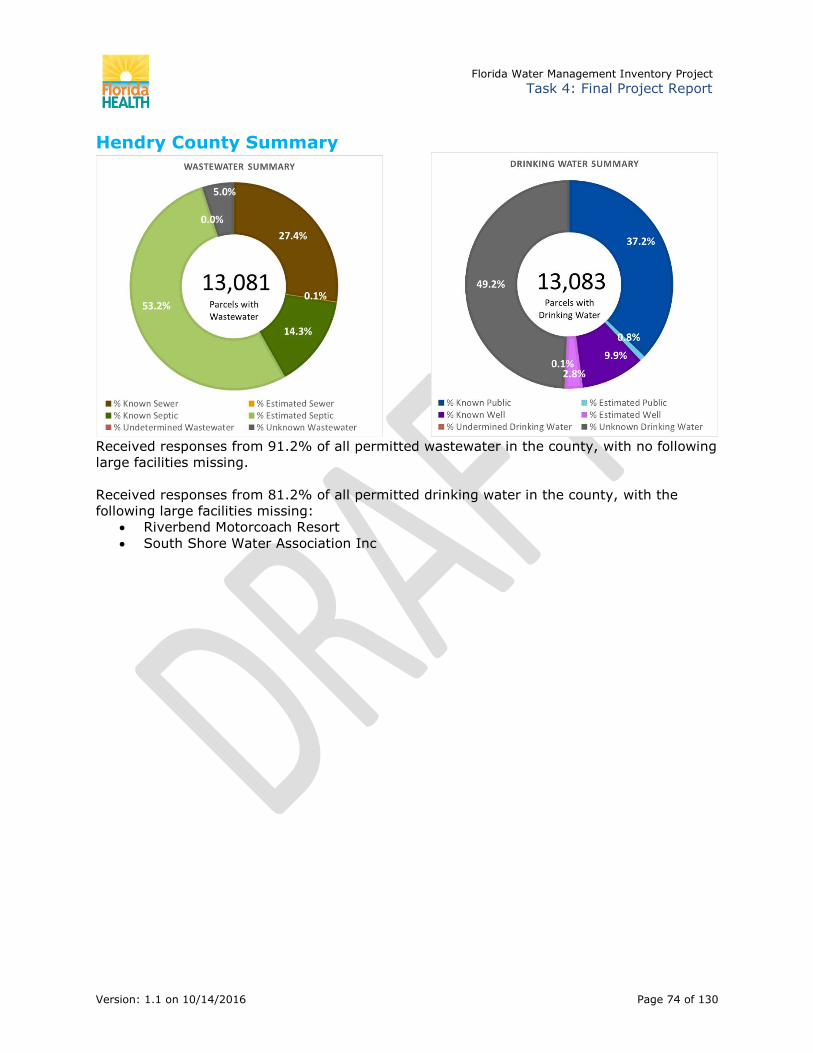
Florida Water Management Inventory Project Task 4: Final Project Report
Version: 1.1 on 10/14/2016 Page 74 of 130
Hendry County Summary
Received responses from 91.2% of all permitted wastewater in the county, with no following
large facilities missing.
Received responses from 81.2% of all permitted drinking water in the county, with the
following large facilities missing:
· Riverbend Motorcoach Resort
· South Shore Water Association Inc

Florida Water Management Inventory Project Task 4: Final Project Report
Version: 1.1 on 10/14/2016 Page 75 of 130
Hernando County Summary
Received responses from 98.2% of all permitted wastewater in the county, with no large
facilities missing.
Received responses from 99.0% of all permitted drinking water in the county, with the
following large facilities missing:
· BP Gas Station
· Division of Forestry

Florida Water Management Inventory Project Task 4: Final Project Report
Version: 1.1 on 10/14/2016 Page 76 of 130
Highlands County Summary
Received responses from 70.5% of all permitted wastewater in the county, with the
following large facilities missing:
· City of Avon Park
Received responses from 77.8% of all permitted drinking water in the county, with the
following large facilities missing:
· City of Avon Park
· Country Club Utilities
· Lake Bonnet Village
· Lake Placid Congregation of Jehovah’s Witnesses
· US Water Corp

Florida Water Management Inventory Project Task 4: Final Project Report
Version: 1.1 on 10/14/2016 Page 77 of 130
Hillsborough County Summary
Using both data collected in 2009 and during 2014-2016, responses were received from
98.3% of all permitted wastewater in the county, with the following large facilities missing
from the more recent data request:
· City of Plant City (submitted in 2009)
· Hillsborough County Public Utilities (submitted in 2009)
· Macdill Afb WWTP
Received responses from 53.3.% of all permitted drinking water in the county, with the
following large facilities missing:
· Cax Lakeshore Villas
· City of Plant City
· Davpam MHP
· Fishhawk Ridge Association Inc
· Hide-A-Way Campground
· Hillsborough County Public Utilities
· Independence Academy
· Jay Mar Villas
· Little Manatee Springs MHP
· Oaks of Thonotosassa MHP
· Paradise Village
· Plurisusa
· Riverside Golf Course Community
· Spanish Main Travel Resort
· Temple Terrace Utility

Florida Water Management Inventory Project Task 4: Final Project Report
Version: 1.1 on 10/14/2016 Page 78 of 130
Holmes County Summary
Received responses from 6.2% of all permitted wastewater in the county, with the following
large facilities missing:
· Bonifay Public Works
Received responses from 26.3% of all permitted drinking water in the county, with the
following large facilities missing:
· Bonifay Public Works
· Town of Ponce De Leon

Florida Water Management Inventory Project Task 4: Final Project Report
Version: 1.1 on 10/14/2016 Page 79 of 130
Indian River County Summary
Received responses from 100.0% of all permitted wastewater in the county, with no large
facilities missing.
Received responses from 100.0% of all permitted drinking water in the county, with no
large facilities missing.

Florida Water Management Inventory Project Task 4: Final Project Report
Version: 1.1 on 10/14/2016 Page 80 of 130
Jackson County Summary
Using both data collected in 2009 and during 2014-2016, responses were received from
23.3% of all permitted wastewater in the county, with the following large facilities missing
from the more recent data request:
· City of Graceville
· City of Marianna
· Town of Sneads (submitted in 2009)
Received responses from 40.6% of all permitted drinking water in the county, with the
following large facilities missing:
· City of Graceville
· City of Marianna
· Cottondale Water System
· Town of Sneads

Florida Water Management Inventory Project Task 4: Final Project Report
Version: 1.1 on 10/14/2016 Page 81 of 130
Jefferson County Summary
Received responses from 26.1% of all permitted wastewater in the county, with no large
facilities missing.
Received responses from 28.1% of all permitted drinking water in the county, with the
following large facilities missing:
· City of Monticello
· Jefferson and Lamont Water System
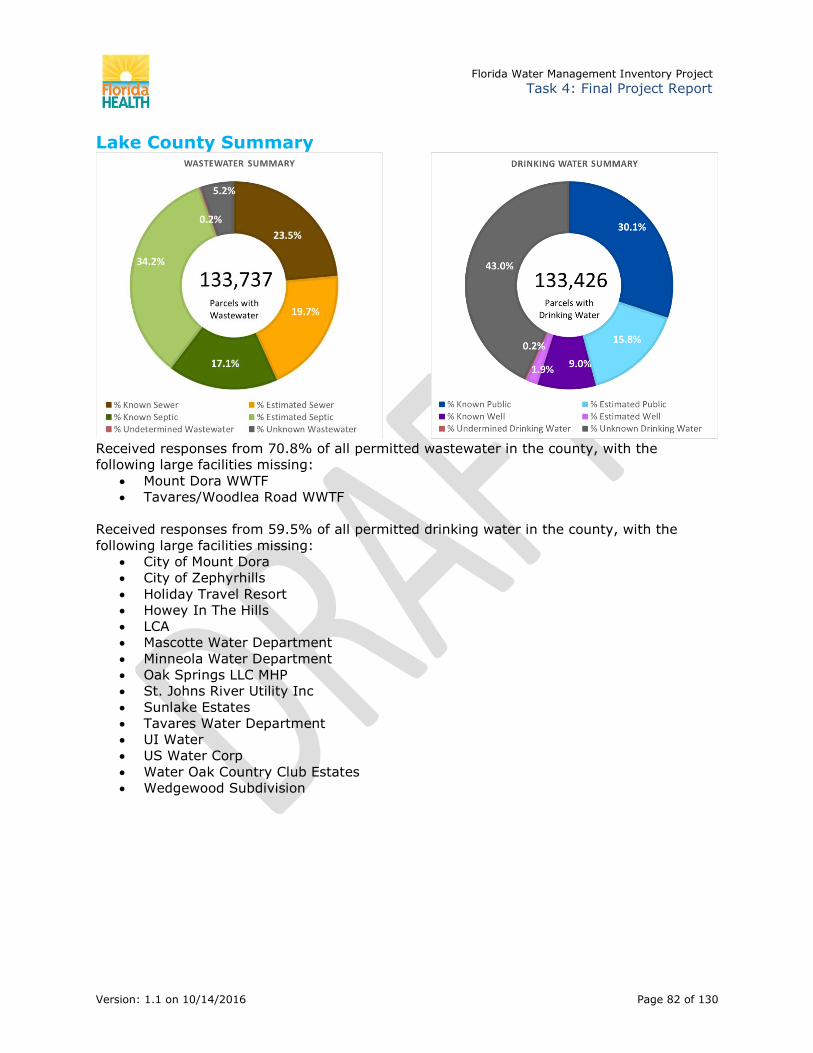
Florida Water Management Inventory Project Task 4: Final Project Report
Version: 1.1 on 10/14/2016 Page 82 of 130
Lake County Summary
Received responses from 70.8% of all permitted wastewater in the county, with the
following large facilities missing:
· Mount Dora WWTF
· Tavares/Woodlea Road WWTF
Received responses from 59.5% of all permitted drinking water in the county, with the
following large facilities missing:
· City of Mount Dora
· City of Zephyrhills
· Holiday Travel Resort
· Howey In The Hills
· LCA
· Mascotte Water Department
· Minneola Water Department
· Oak Springs LLC MHP
· St. Johns River Utility Inc
· Sunlake Estates
· Tavares Water Department
· UI Water
· US Water Corp
· Water Oak Country Club Estates
· Wedgewood Subdivision

Florida Water Management Inventory Project Task 4: Final Project Report
Version: 1.1 on 10/14/2016 Page 83 of 130
Lee County Summary
Using both data collected in 2009 and during 2014-2016, responses were received from
94.7% of all permitted wastewater in the county, with the following large facilities missing
from the more recent data request:
· Donax Water Reclamation Facility (submitted in 2009)
· US Water Corp
Received responses from 85.8% of all permitted drinking water in the county, with the
following large facilities missing:
· Citrus Park RV Resort
· Gateway Services District
· Greater Pine Island Water Association
· Island Water Association
· Old Bridge Village Mobile Home Park
· Raintree RV Resort
· Syngenta Flowers Inc
· Town of Fort Myers Beach
· US Water Corp

Florida Water Management Inventory Project Task 4: Final Project Report
Version: 1.1 on 10/14/2016 Page 84 of 130
Leon County Summary
Received responses from 91.8% of all permitted wastewater in the county, with no large
facilities missing.
Received responses from 87.6% of all permitted drinking water in the county, with the
following large facilities missing:
· Leon County Schools
· Talquin Electric Coop. Inc

Florida Water Management Inventory Project Task 4: Final Project Report
Version: 1.1 on 10/14/2016 Page 85 of 130
Levy County Summary
Received responses from 18.1% of all permitted wastewater in the county, with no large
facilities missing.
Received responses from 33.7% of all permitted drinking water in the county, with the
following large facilities missing:
· Bronson WTP
· Fanning Springs Ws
· Inglis Water Department
· Town of Chiefland
· Williston City of
· Yankeetown Water Department

Florida Water Management Inventory Project Task 4: Final Project Report
Version: 1.1 on 10/14/2016 Page 86 of 130
Liberty County Summary
Received responses from 52.8% of all permitted wastewater in the county, with no large
facilities missing.
Received responses from 30.4% of all permitted drinking water in the county, with the
following large facilities missing:
· City of Bristol
· Liberty County Water

Florida Water Management Inventory Project Task 4: Final Project Report
Version: 1.1 on 10/14/2016 Page 87 of 130
Madison County Summary
Received responses from 85.3% of all permitted wastewater in the county, with no large
facilities missing.
Received responses from 78.0% of all permitted drinking water in the county, with the
following large facilities missing:
· Cherry Lake Utilities
· Greenville WTP

Florida Water Management Inventory Project Task 4: Final Project Report
Version: 1.1 on 10/14/2016 Page 88 of 130
Manatee County Summary
Received responses from 100.0% of all permitted wastewater in the county, with no large
facilities missing.
Received responses from 98.5% of all permitted drinking water in the county, with the
following large facilities missing:
· Palmetto Pines Golf Course
· Town of Longboat Key
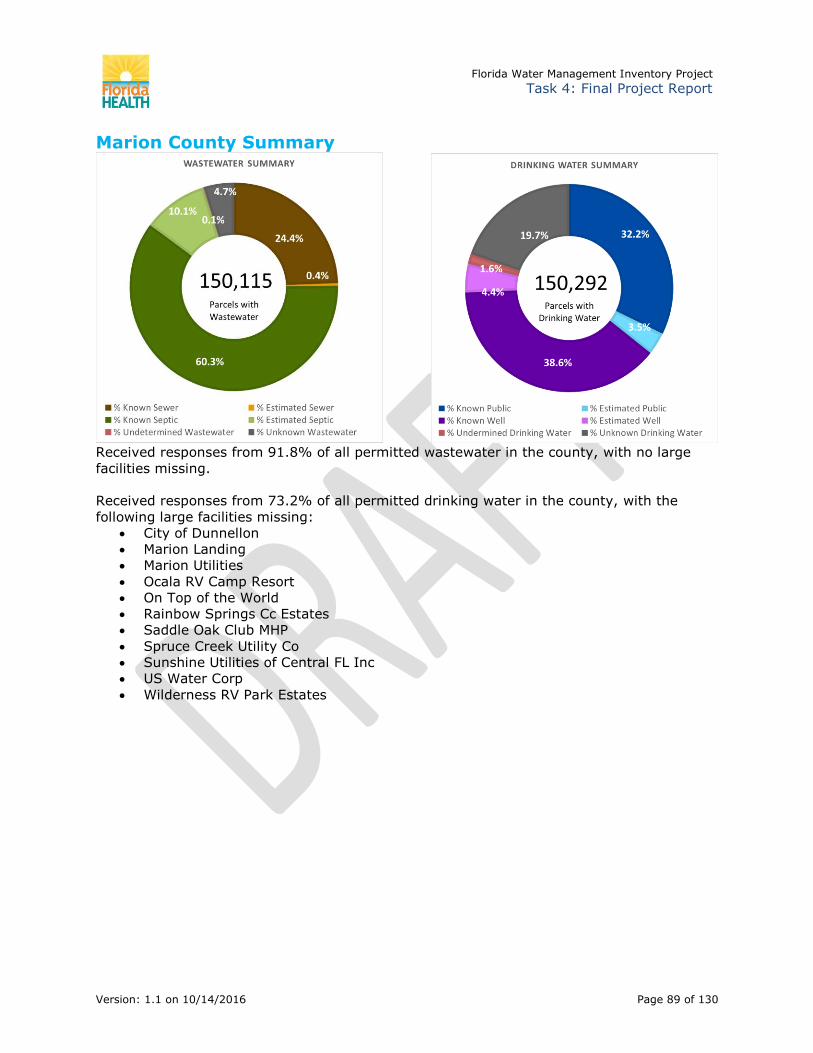
Florida Water Management Inventory Project Task 4: Final Project Report
Version: 1.1 on 10/14/2016 Page 89 of 130
Marion County Summary
Received responses from 91.8% of all permitted wastewater in the county, with no large
facilities missing.
Received responses from 73.2% of all permitted drinking water in the county, with the
following large facilities missing: · City of Dunnellon
· Marion Landing
· Marion Utilities
· Ocala RV Camp Resort
· On Top of the World
· Rainbow Springs Cc Estates
· Saddle Oak Club MHP
· Spruce Creek Utility Co
· Sunshine Utilities of Central FL Inc
· US Water Corp
· Wilderness RV Park Estates

Florida Water Management Inventory Project Task 4: Final Project Report
Version: 1.1 on 10/14/2016 Page 90 of 130
Martin County Summary
Using both data collected in 2009 and during 2014-2016, responses were received from
97.1% of all permitted wastewater in the county, with the following large facilities missing
from the more recent data request:
· South Martin Regional Utilities (submitted in 2009)
Received responses from 76.2% of all permitted drinking water in the county, with the
following large facilities missing:
· Indiantown Company Inc
· Sailfish Point
· South Martin Regional Utilities
· St. Lucie Mobile Village

Florida Water Management Inventory Project Task 4: Final Project Report
Version: 1.1 on 10/14/2016 Page 91 of 130
Miami Dade County Summary
Received responses from 98.8% of all permitted wastewater in the county, with the
following large facilities missing: · Homestead City of
Received responses from 94.1% of all permitted drinking water in the county, with the
following large facilities missing:
· American Village
· City of Miami Beach
· Homestead City of
· North Bay Village City of
· Opa Locka City of
· Surfside Town of
· Virginia Gardens Village of

Florida Water Management Inventory Project Task 4: Final Project Report
Version: 1.1 on 10/14/2016 Page 92 of 130
Monroe County Summary
Received responses from 39.9% of all permitted wastewater in the county, with the
following large facilities missing. · Richard A Heyman WWTP-Key West
Received responses from 100.0% of all permitted drinking water in the county, with no
large facilities missing.

Florida Water Management Inventory Project Task 4: Final Project Report
Version: 1.1 on 10/14/2016 Page 93 of 130
Nassau County Summary
Using both data collected in 2009 and during 2014-2016, responses were received from
89.9% of all permitted wastewater in the county, with the following large facilities missing
from the more recent data request: · JEA (submitted in 2009)
Received responses from 63.1% of all permitted drinking water in the county, with the
following large facilities missing.
· JEA
· Town of Callahan
· Town of Hilliard

Florida Water Management Inventory Project Task 4: Final Project Report
Version: 1.1 on 10/14/2016 Page 94 of 130
Okaloosa County Summary
Received responses from 74.1% of all permitted wastewater in the county, with the
following large facilities missing: · City of Crestview
· Nv Regional WWTP
Received responses from 69.7% of all permitted drinking water in the county, with the
following large facilities missing:
· Auburn Water System
· Blackman Community
· City of Crestview
· City of Laurel Hill
· City of Niceville
· FDOT
· Holt Water Works Inc
· Public Water30

Florida Water Management Inventory Project Task 4: Final Project Report
Version: 1.1 on 10/14/2016 Page 95 of 130
Okeechobee County Summary
Received responses from 88.4% of all permitted wastewater in the county, with the
following large facilities missing: · Okeechobee Utility Authority
Received responses from 20.6% of all permitted drinking water in the county, with the
following large facilities missing:
· Ancient Oaks RV Resort
· Okeechobee Utility Authority
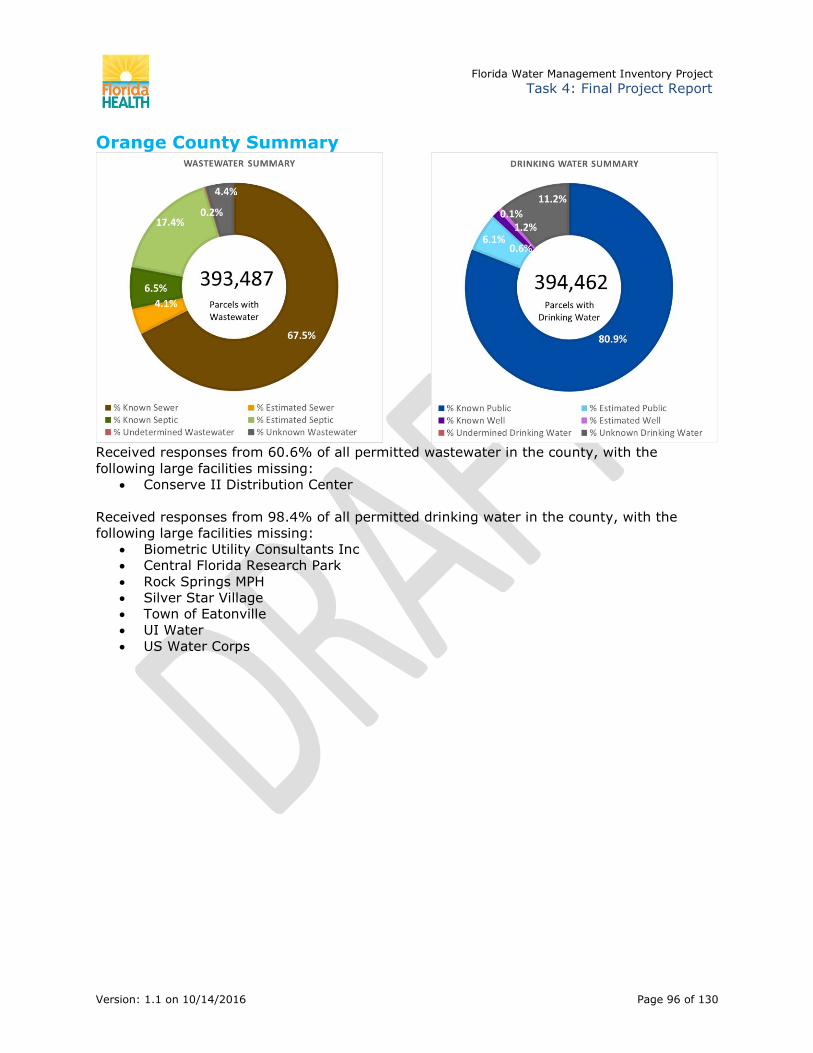
Florida Water Management Inventory Project Task 4: Final Project Report
Version: 1.1 on 10/14/2016 Page 96 of 130
Orange County Summary
Received responses from 60.6% of all permitted wastewater in the county, with the
following large facilities missing: · Conserve II Distribution Center
Received responses from 98.4% of all permitted drinking water in the county, with the
following large facilities missing:
· Biometric Utility Consultants Inc
· Central Florida Research Park
· Rock Springs MPH
· Silver Star Village
· Town of Eatonville
· UI Water
· US Water Corps
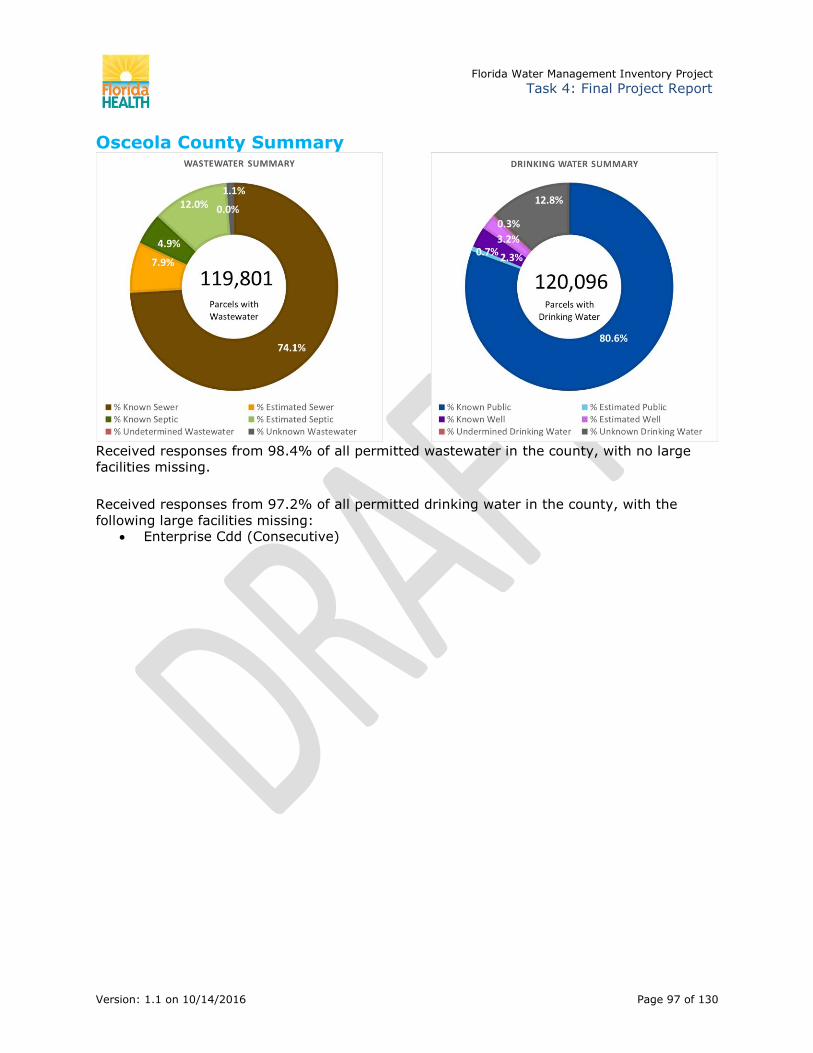
Florida Water Management Inventory Project Task 4: Final Project Report
Version: 1.1 on 10/14/2016 Page 97 of 130
Osceola County Summary
Received responses from 98.4% of all permitted wastewater in the county, with no large
facilities missing. Received responses from 97.2% of all permitted drinking water in the county, with the
following large facilities missing: · Enterprise Cdd (Consecutive)

Florida Water Management Inventory Project Task 4: Final Project Report
Version: 1.1 on 10/14/2016 Page 98 of 130
Palm Beach County Summary
Using both data collected in 2009 and during 2014-2016, responses were received from
99.8% of all permitted wastewater in the county, with the following large facilities missing
from the more recent data request:
· City of Boca Raton (submitted in 2009)
· South Central Regional WWTP (submitted in 2009)
Received responses from 71.7% of all permitted drinking water in the county, with the
following large facilities missing:
· Boynton Beach WTP
· City of Atlantis
· City of Boca Raton
· Delray Beach Water Department
· Golf Village of
· Gulfstream Town of
· Highland Beach Water Plant
· Lake Worth Utilities
· Manalapan WTP (Leroy C. Paslay)
· Mangonia Park Town of
· Palm Lake Estates
· Palm Springs Village of
· Tropical Breeze Estates
· US Water Corp

Florida Water Management Inventory Project Task 4: Final Project Report
Version: 1.1 on 10/14/2016 Page 99 of 130
Pasco County Summary
Received responses from 87.0 % of all permitted wastewater in the county, with the
following large facilities missing: · City of Zephyrhills
· US Water Corp
· Wesley Center Subregional WWTF
Received responses from 62.6% of all permitted drinking water in the county, with the
following large facilities missing:
· Aqua Utilites
· Baker Acres RV Ranch
· City of San Antonio
· City of Zephryrhills
· Country Aire Village
· Dade City Water Dept
· Gardens Utilities
· Lakewood Villas Inc
· New Port Richey Water Dept
· Settlers Rest RV Park
· UI Water
· US Water Corp

Florida Water Management Inventory Project Task 4: Final Project Report
Version: 1.1 on 10/14/2016 Page 100 of 130
Pinellas County Summary
Received responses from 99.8% of all permitted wastewater in the county, with no large
facilities missing.
Received responses from 99.9% of all permitted drinking water in the county, with the
following large facilities missing:
· UI Water

Florida Water Management Inventory Project Task 4: Final Project Report
Version: 1.1 on 10/14/2016 Page 101 of 130
Polk County Summary
Using both data collected in 2009 and during 2014-2016, responses were received from
84.0% of all permitted wastewater in the county, with the following large facilities missing
from the more recent data request:
· City of Auburndale (submitted in 2009)
· City of Haines City
· City of Lake Wales
· Polk County Utilities (submitted in 2009)
· Southwest Regional WWTP (submitted in 2009)
Received responses from 50.8% of all permitted drinking water in the county, with the
following large facilities missing:
· Camp Inn Resorts
· Carefree RV Subdivision
· City of Auburndale
· City of Davenport
· City of Eagle Lake
· City of Frostproof
· City of Haines City
· City of Lake Wales
· City of Mulberry
· Deer Creek RV Golf & Country Club
· Florida Camp Inn
· Florida’s Natural Growers
· Four Lakes Golf Club
· Gcp Plantation Landing
· Gold Coast Utility
· Lake Region Mobile Home Village
· Mosaic Fertilizer
· Mouse Mountain RV & Mobile Home
Resort
· Outdoor Resorts
· Park Water Company
· Polk County Utilities
· Rainbow RV Resort
· Saddlebag Lake Resort
· Sunrise Utilities
· Town of Dundee
· Town of Lake Hamilton
· UI Water
· US Water Corp
· Utility Message
· Wg Resorts
· Woodard Curran
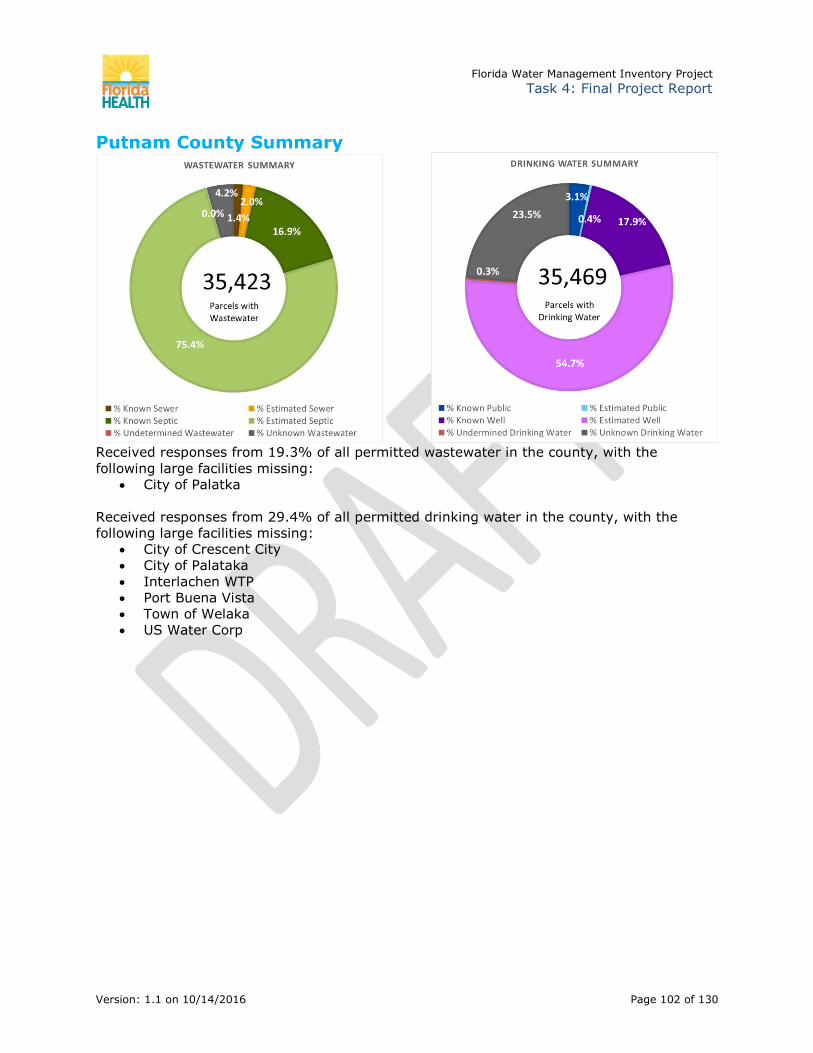
Florida Water Management Inventory Project Task 4: Final Project Report
Version: 1.1 on 10/14/2016 Page 102 of 130
Putnam County Summary
Received responses from 19.3% of all permitted wastewater in the county, with the
following large facilities missing: · City of Palatka
Received responses from 29.4% of all permitted drinking water in the county, with the
following large facilities missing:
· City of Crescent City
· City of Palataka
· Interlachen WTP
· Port Buena Vista
· Town of Welaka
· US Water Corp

Florida Water Management Inventory Project Task 4: Final Project Report
Version: 1.1 on 10/14/2016 Page 103 of 130
Santa Rosa County Summary
Using both data collected in 2009 and during 2014-2016, responses were received from
98.8% of all permitted wastewater in the county, with the following large facilities missing
from the more recent data request:
· Holley-Navarre (submitted in 2009)
Received responses from 73.5% of all permitted drinking water in the county, with the
following large facilities missing:
· Holley-Navarre

Florida Water Management Inventory Project Task 4: Final Project Report
Version: 1.1 on 10/14/2016 Page 104 of 130
Sarasota County Summary
Using both data collected in 2009 and during 2014-2016, responses were received from
86.2% of all permitted wastewater in the county, with the following large facilities missing
from the more recent data request:
· Fruitville Wastewater Treatment Facility
· Siesta Key Utilities Authority (submitted in 2009)
Received responses from 94.6% of all permitted drinking water in the county, with the
following large facilities missing:
· Kings Gate Club
· Plurisusa

Florida Water Management Inventory Project Task 4: Final Project Report
Version: 1.1 on 10/14/2016 Page 105 of 130
Seminole County Summary
Using both data collected in 2009 and during 2014-2016, responses were received from
93.3% of all permitted wastewater in the county, with the following large facilities missing
from the more recent data request:
· City of Castleberry (submitted in 2009)
· UI Water (submitted in 2009)
· Winter Springs
Received responses from 61.1% of all permitted drinking water in the county, with the
following large facilities missing:
· City of Castleberry
· City of Lake Mary
· City of Longwood
· City of Winter Springs
· Lake Harney Water Association
· Mullet Lake Water Association
· Midway Canaan Water Association
· Palm Valley MHP
· Seminole County School Board
· Seminole Woods
· UI Water
· US Water Corp

Florida Water Management Inventory Project Task 4: Final Project Report
Version: 1.1 on 10/14/2016 Page 106 of 130
St. Johns County Summary
Received responses from 100.0% of all permitted wastewater in the county, with no large
facilities missing.
Received responses from 99.9% of all permitted drinking water in the county, with no large
facilities missing.

Florida Water Management Inventory Project Task 4: Final Project Report
Version: 1.1 on 10/14/2016 Page 107 of 130
St. Lucie County Summary
Received responses from 92.1% of all permitted wastewater in the county, with the
following large facilities missing: · SLCU
Received responses from 93.8% of all permitted drinking water in the county, with the
following large facilities missing:
· Meadowood Community Association
· Pat Walsh Walsh Environmental
· Reserve Utilities
· SLCU

Florida Water Management Inventory Project Task 4: Final Project Report
Version: 1.1 on 10/14/2016 Page 108 of 130
Sumter County Summary
Using both data collected in 2009 and during 2014-2016, responses were received from
94.1% of all permitted wastewater in the county, with the following large facilities missing
from the more recent data request:
· City of Wildwood (submitted in 2009)
Received responses from 78.6% of all permitted drinking water in the county, with the
following large facilities missing:
· City of Bushnell
· City of Center Hill
· City of Webster City
· City of Wildwood
· General Utilities
· Lake Panasoffkee Water Association
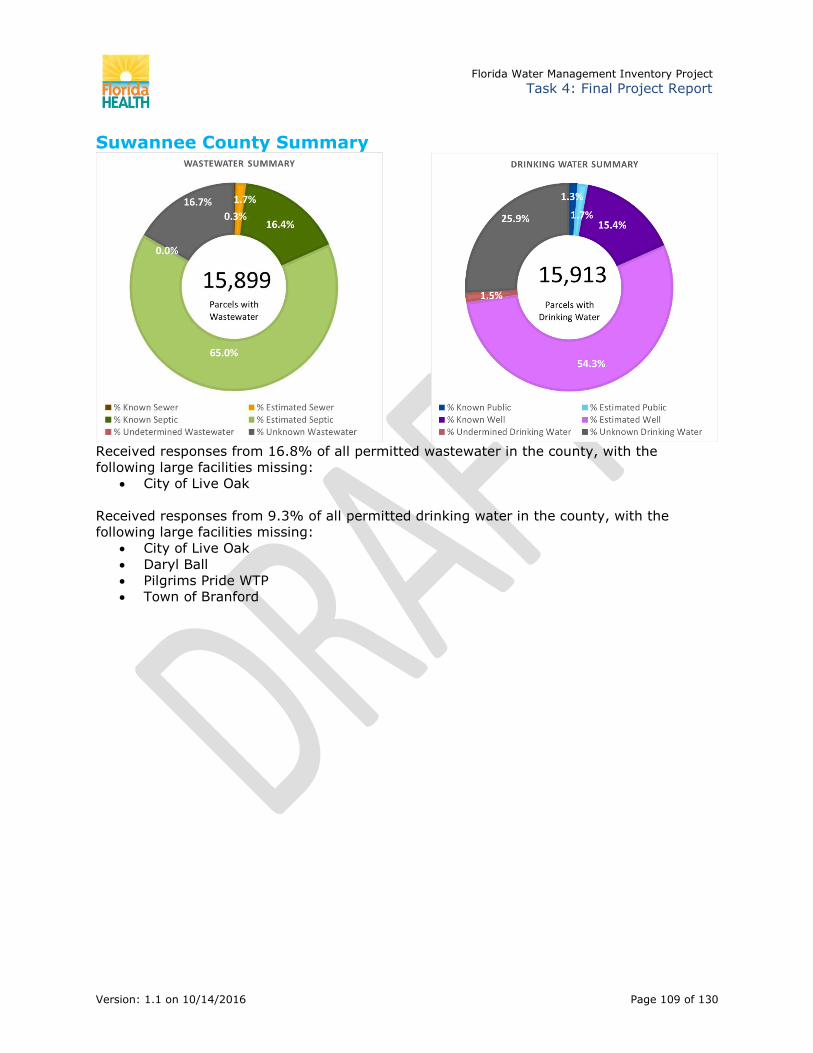
Florida Water Management Inventory Project Task 4: Final Project Report
Version: 1.1 on 10/14/2016 Page 109 of 130
Suwannee County Summary
Received responses from 16.8% of all permitted wastewater in the county, with the
following large facilities missing: · City of Live Oak
Received responses from 9.3% of all permitted drinking water in the county, with the
following large facilities missing:
· City of Live Oak
· Daryl Ball
· Pilgrims Pride WTP
· Town of Branford
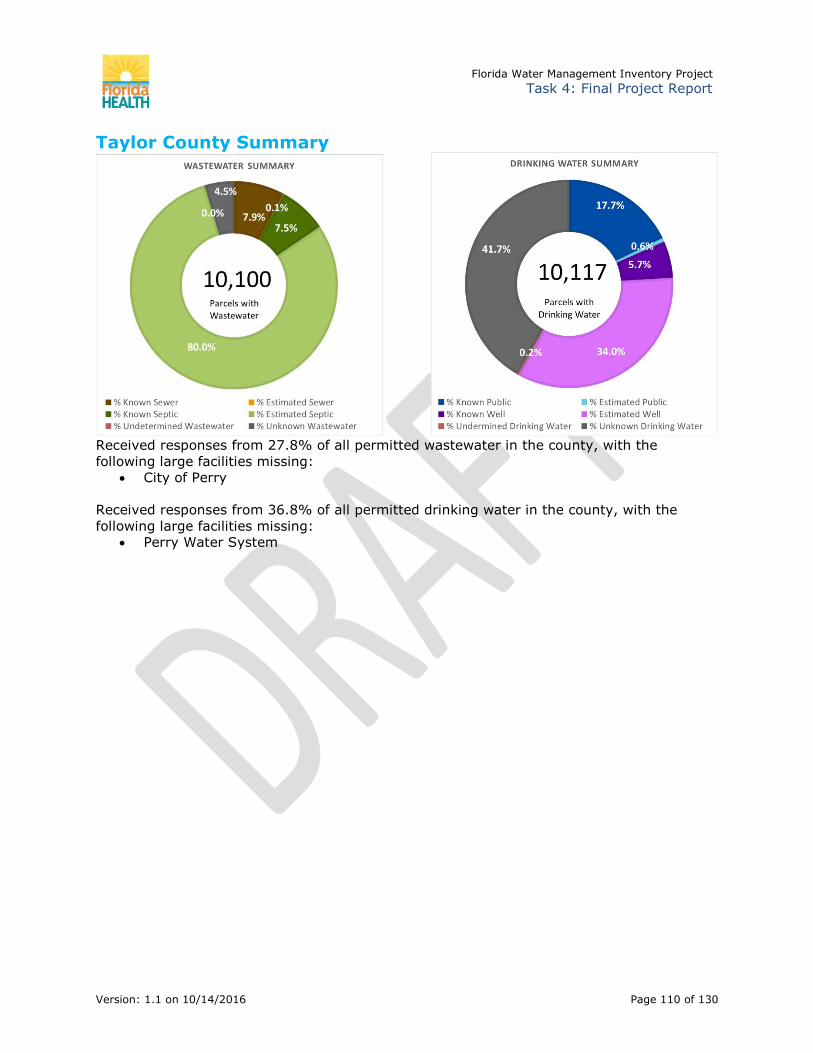
Florida Water Management Inventory Project Task 4: Final Project Report
Version: 1.1 on 10/14/2016 Page 110 of 130
Taylor County Summary
Received responses from 27.8% of all permitted wastewater in the county, with the
following large facilities missing: · City of Perry
Received responses from 36.8% of all permitted drinking water in the county, with the
following large facilities missing:
· Perry Water System

Florida Water Management Inventory Project Task 4: Final Project Report
Version: 1.1 on 10/14/2016 Page 111 of 130
Union County Summary
Received responses from 0.0% of all permitted wastewater in the county, with no large
facilities missing.
Received responses from 40.8% of all permitted drinking water in the county, with the
following large facilities missing:
· Reception and Medical Center

Florida Water Management Inventory Project Task 4: Final Project Report
Version: 1.1 on 10/14/2016 Page 112 of 130
Volusia County Summary
Received responses from 82.1% of all permitted wastewater in the county, with the
following large facilities missing: · City of Holly Hill
· Deland/ Wiley M. Nash Water Reclamation Facility
· Deltona Lakes
Received responses from 77.5% of all permitted drinking water in the county, with the
following large facilities missing:
· City of Deltona
· City of Holly Hill
· City of Lake Helen
· Hestor Park/ Malloy School
· Kove Estates
· Lake Beresford
· Orange City Utilities
· Town of Pierson
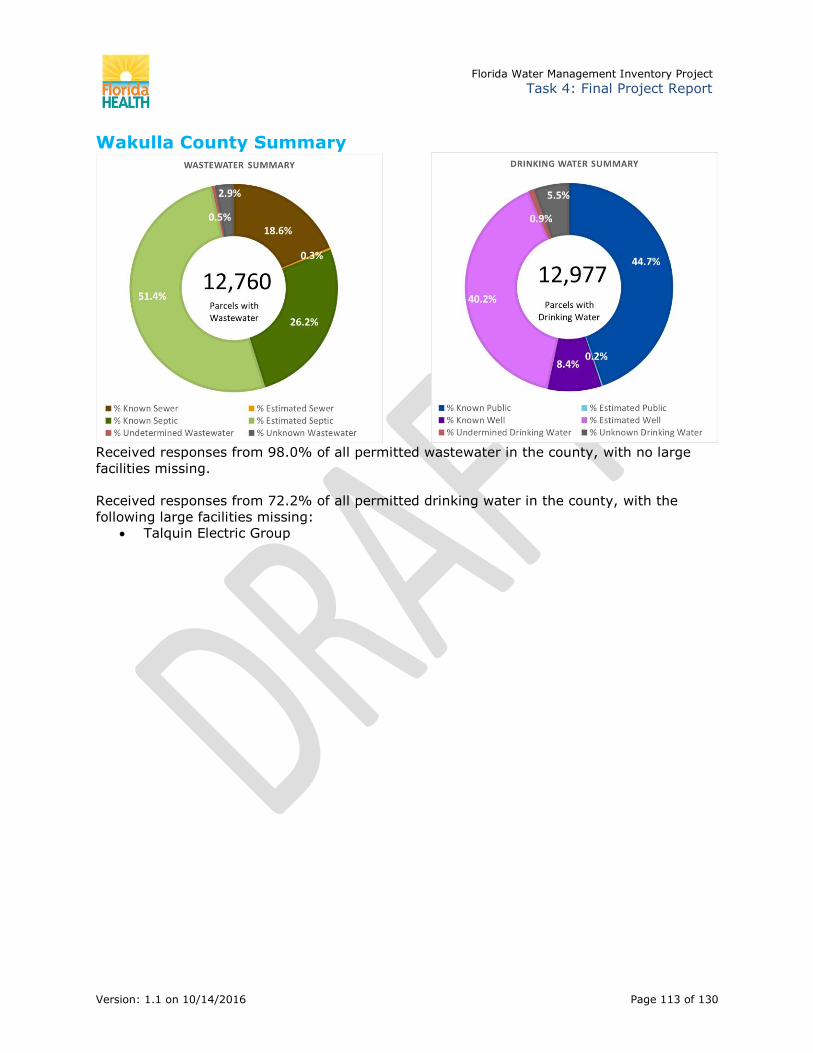
Florida Water Management Inventory Project Task 4: Final Project Report
Version: 1.1 on 10/14/2016 Page 113 of 130
Wakulla County Summary
Received responses from 98.0% of all permitted wastewater in the county, with no large
facilities missing.
Received responses from 72.2% of all permitted drinking water in the county, with the
following large facilities missing:
· Talquin Electric Group

Florida Water Management Inventory Project Task 4: Final Project Report
Version: 1.1 on 10/14/2016 Page 114 of 130
Walton County Summary
Using both data collected in 2009 and during 2014-2016, responses were received from
38.4% of all permitted wastewater in the county, with the following large facilities missing
from the more recent data request: · City of Defuniak Springs (submitted in 2009)
· Dewey Wilson
· Regional Utilities Water System
Received responses from 44.2% of all permitted drinking water in the county, with the
following large facilities missing:
· City of Freeport
· Regional Utilities Water System
· Robert Barley
· Town of Mossy Head

Florida Water Management Inventory Project Task 4: Final Project Report
Version: 1.1 on 10/14/2016 Page 115 of 130
Washington County Summary
Received responses from 86.9% of all permitted wastewater in the county, with no large
facilities missing.
Received responses from 67.2% of all permitted drinking water in the county, with the
following large facilities missing:
· City of Vernon
· Town of Wausau
· US Water Corp
· Washington County Kennel Club

Florida Water Management Inventory Project Task 4: Final Project Report
Version: 1.1 on 10/14/2016 Page 116 of 130
APPENDIX C –WASTEWATER RESULTS BY COUNTY

Florida Water Management Inventory Project Task 4: Final Project Report
Version: 1.1 on 10/14/2016 Page 117 of 130
County
Cumulative Total Onsite
Wastewater From Census Data
Total Parcels Total Parcels with
Wastewater Determination
Wastewater Not
Applicable
# Known Sewer
# Estimated Sewer
# Known Onsite
Wastewater
# Estimated Onsite
Wastewater
Wastewater Conflicting
Data
Wastewater No Data
Total Parcels Wastewater
Not Estimated
Alachua 41,434 101,050 82,976 18,074 52,092 307 6,195 21,492 945 1,945 2,890
Baker 7,844 12,145 8,726 3,419 1,538 480 1,064 5,035 4 605 609
Bay 36,482 114,279 90,587 23,692 28,608 13,881 6,539 34,302 169 7,088 7,257
Bradford 10,500 15,038 9,897 5,141 1,371 750 1,106 5,965 44 661 705
Brevard 91,641 287,810 214,094 73,716 106,919 10,878 35,687 55,993 181 4,436 4,617
Broward 107,384 750,826 719,659 31,167 431,038 49,666 8,528 42,951 390 187,086 187,476
Calhoun 5,609 10,735 5,201 5,534 943 841 860 2,159 5 393 398
Charlotte 43,243 213,318 98,672 114,646 43,239 7,946 10,639 30,308 652 5,888 6,540
Citrus 60,151 146,274 75,243 71,031 30,177 13 17,697 23,775 2,811 770 3,581
Clay 31,923 88,847 73,703 15,144 44,652 2,250 6,932 13,676 28 6,165 6,193
Collier 44,832 265,746 199,688 66,058 122,858 1,973 8,391 19,168 3 47,295 47,298
Columbia 25,125 36,307 24,331 11,976 4,695 414 3,618 14,487 4 1,113 1,117
Dade 215,793 561,672 515,594 46,078 297,346 96,424 15,440 93,411 76 12,897 12,973
DeSoto 10,594 19,437 10,939 8,498 463 26 1,706 1,559 - 7,185 7,185
Dixie 7,764 16,203 8,260 7,943 3 7 734 6,522 2 992 994
Duval 92,394 358,135 328,567 29,568 215,039 20,093 8,792 73,051 7,261 4,331 11,592
Escambia 70,012 150,972 121,170 29,802 68,559 24,268 13,001 13,175 1,349 818 2,167
Flagler 6,105 77,605 49,256 28,349 44,342 26 1,503 2,315 2 1,068 1,070
Franklin 5,431 17,701 8,598 9,103 151 729 853 4,039 - 2,826 2,826
Gadsden 17,297 27,179 17,039 10,140 2,081 311 2,985 8,420 2 3,240 3,242
Gilchrist 8,021 13,481 6,942 6,539 634 7 1,992 3,938 1 370 371
Glades 5,211 11,229 5,153 6,076 28 1 343 4,547 - 234 234
Gulf 6,919 33,880 9,349 7,591 4,559 193 1,307 2,919 53 318 371
Hamilton 4,188 12,870 4,663 8,207 554 1,205 466 2,148 1 289 290
Hardee 8,915 14,357 8,871 5,486 3,076 2 1,092 4,220 - 481 481
Hendry 10,553 35,418 13,081 22,337 3,578 19 1,876 6,959 - 649 649
Hernando 55,378 115,518 82,722 32,796 33,987 2,176 16,590 27,818 14 2,137 2,151
Highlands 36,731 226,496 47,576 65,672 10,271 391 6,547 25,499 16 4,852 4,868
Hillsborough 109,029 115,518 82,722 32,796 33,987 2,176 16,590 27,818 14 2,137 2,151

Florida Water Management Inventory Project Task 4: Final Project Report
Version: 1.1 on 10/14/2016 Page 118 of 130
County
Cumulative Total Onsite
Wastewater From Census Data
Total Parcels Total Parcels with
Wastewater Determination
Wastewater Not
Applicable
# Known Sewer
# Estimated Sewer
# Known Onsite
Wastewater
# Estimated Onsite
Wastewater
Wastewater Conflicting
Data
Wastewater No Data
Total Parcels Wastewater
Not Estimated
Holmes 9,359 13,034 6,908 6,126 72 169 973 4,977 - 717 717
Indian River 37,152 76,371 57,476 18,895 25,923 45 30,457 117 2 932 934
Jackson 17,978 38,333 17,709 20,624 667 285 2,551 11,911 3 2,292 2,295
Jefferson 5,482 11,883 5,965 5,918 4 21 723 4,786 2 429 431
Lafayette 3,377 6,820 2,915 3,905 391 6 328 1,840 1 349 350
Lake 77,701 173,576 133,737 39,839 31,422 26,376 22,902 45,785 249 7,003 7,252
Lee 131,941 442,667 271,176 171,491 158,996 4,972 33,857 63,575 596 9,180 9,776
Leon 39,608 108,249 94,000 14,249 58,008 4,107 23,159 8,726 - - -
Levy 23,041 47,265 20,510 26,755 50 910 3,418 14,914 4 1,214 1,218
Liberty 3,112 5,621 2,657 2,964 2 1 212 2,082 - 360 360
Madison 7,708 15,757 7,206 8,551 1,026 8 718 4,885 2 567 569
Manatee 36,673 133,421 119,981 13,440 65,888 1,104 2,948 42,883 3 7,155 7,158
Marion 121,950 266,408 150,115 116,293 36,695 575 90,525 15,160 162 6,998 7,160
Martin 28,687 78,434 58,859 19,575 23,895 4,306 16,172 13,674 148 664 812
Monroe 25,804 89,553 53,727 35,826 35,815 394 160 16,647 29 682 711
Nassau 21,611 43,717 31,874 11,843 14,968 30 15,548 552 97 679 776
Okaloosa 33,861 105,803 88,704 17,099 25,861 21,701 7,642 10,908 225 22,367 22,592
Okeechobee 12,640 64,564 15,721 16,595 1,847 380 2,163 10,634 104 7,742 697
Orange 107,568 439,436 393,487 45,949 265,691 16,028 25,383 68,376 744 17,265 18,009
Osceola 25,057 149,906 119,801 30,105 88,743 9,477 5,846 14,396 5 1,334 1,339
Palm Beach 81,285 429,408 400,521 28,887 314,677 36,515 14,688 27,247 3,664 3,730 7,394
Pasco 71,247 258,008 209,663 48,345 9,924 84,241 16,122 92,705 105 6,566 6,671
Pinellas 23,949 434,439 417,669 16,770 343,193 46,696 2,328 12,631 17 12,804 12,821
Polk 119,919 356,996 232,219 124,777 68,216 10,790 27,307 111,446 54 14,406 14,460
Putnam 40,635 98,900 35,423 63,477 506 716 5,974 26,724 7 1,496 1,503
Santa Rosa 45,726 95,282 68,827 26,455 29,699 3,603 10,445 21,398 43 3,639 3,682
Sarasota 81,165 274,115 217,107 57,008 134,679 27,259 4,613 34,644 159 15,753 15,912
Seminole 40,410 171,933 152,704 19,229 85,477 35,148 10,009 17,618 683 3,769 4,452
St. Johns 29,991 103,192 82,728 20,464 53,815 390 7,030 17,405 21 4,067 4,088
St. Lucie 44,259 150,529 107,587 42,942 65,089 5,560 27,052 7,312 948 1,626 2,574
Sumter 20,002 74,510 64,401 10,109 34,795 14,058 3,111 9,201 7 3,229 3,236

Florida Water Management Inventory Project Task 4: Final Project Report
Version: 1.1 on 10/14/2016 Page 119 of 130
County
Cumulative Total Onsite
Wastewater From Census Data
Total Parcels Total Parcels with
Wastewater Determination
Wastewater Not
Applicable
# Known Sewer
# Estimated Sewer
# Known Onsite
Wastewater
# Estimated Onsite
Wastewater
Wastewater Conflicting
Data
Wastewater No Data
Total Parcels Wastewater
Not Estimated
Suwannee 18,241 30,565 15,899 14,666 44 264 2,602 10,331 5 2,653 2,658
Taylor 8,968 18,322 10,100 8,222 800 8 755 8,078 1 458 459
Union 4,781 6,383 3,760 2,623 1 18 316 2,882 - 543 543
Volusia 99,710 284,266 221,844 62,422 75,332 27,081 30,888 71,943 818 15,782 16,600
Wakulla 11,206 24,692 12,760 11,932 2,379 43 3,337 6,564 61 376 437
Walton 22,655 79,276 44,076 35,200 13,601 130 3,123 18,873 1,669 6,680 8,349
Washington 10,665 43,033 9,811 33,222 1,457 11 2,450 5,395 - 498 498

Florida Water Management Inventory Project Task 4: Final Project Report
Version: 1.1 on 10/14/2016 Page 120 of 130
APPENDIX D –DRINKING WATER RESULTS BY COUNTY

Florida Water Management Inventory Project Task 4: Final Project Report
Version: 1.1 on 10/14/2016 Page 121 of 130
County Total
Parcels
Total Parcels with Drinking Water Determination
Drinking Water Not Applicable
# Known Public
# Estimated Public
# Known Private
Well
# Estimated Private Well
Drinking Water Conflicting
Data
Drinking Water No
Data
# Drinking Water Not Estimated
Alachua 101,050 82,987 18,063 51,650 1,267 424 7,393 120 22,133 22,253
Baker 12,145 8,754 3,391 153 42 1,443 4,330 27 2,759 2,786
Bay 114,279 91,054 23,225 33,559 963 4,053 3,271 35 49,173 49,208
Bradford 15,038 9,901 5,137 389 88 1,058 4,969 22 3,375 3,397
Brevard 287,810 213,277 74,533 106,065 15,571 21,664 5,482 2,328 62,167 64,495
Broward 750,826 720,259 30,567 332,343 23,207 1,293 1,758 31 361,627 361,658
Calhoun 10,735 5,166 5,569 1,134 42 622 984 14 2,370 2,384
Charlotte 213,318 99,017 114,301 30,967 1,213 5,351 455 179 60,852 61,031
Citrus 146,274 74,481 71,793 47,959 135 9,956 15,081 12 1,338 1,350
Clay 88,847 73,941 14,906 46,571 55 19,707 662 314 6,632 6,946
Collier 265,746 200,478 65,268 128,750 635 7,090 29,012 646 34,345 34,991
Columbia 36,307 24,445 11,862 7,843 28 2,986 11,895 43 1,650 1,693
Dade 561,672 516,933 44,739 400,527 2,773 1,556 517 136 111,424 111,560
DeSoto 19,437 10,947 8,490 809 71 1,594 4,482 82 3,909 3,991
Dixie 16,203 8,262 7,941 177 22 1,307 4,260 31 2,465 2,496
Duval 358,135 330,184 27,951 236,145 4,146 12,087 3,938 469 73,399 73,868
Escambia 150,972 125,821 25,151 52,131 38,657 180 218 22 34,613 34,635
Flagler 77,605 49,305 28,300 45,572 11 2,570 30 46 1,076 1,122
Franklin 17,701 8,598 9,103 1,299 95 202 291 1 6,710 6,711
Gadsden 27,179 17,057 10,122 4,292 142 1,071 6,607 241 4,704 4,945
Gilchrist 13,481 6,947 6,534 962 18 1,898 3,362 21 686 707
Glades 11,229 5,183 6,046 714 69 166 48 - 4,186 4,186
Gulf 33,880 9,350 7,590 5,461 54 460 632 3 2,740 2,743
Hamilton 12,870 4,661 8,209 641 27 445 2,365 29 1,154 1,183
Hardee 14,357 8,876 5,481 3,531 40 1,117 2,861 24 1,303 1,327
Hendry 35,418 13,083 22,335 4,862 109 1,298 362 16 6,436 6,452
Hernando 115,518 82,769 32,749 41,523 22,590 6,498 8,973 198 2,987 3,185
Highlands 226,496 50,661 62,587 24,594 3,636 4,280 8,148 113 9,890 10,003
Hillsborough 115,518 82,769 32,749 41,523 22,590 6,498 8,973 198 2,987 3,185

Florida Water Management Inventory Project Task 4: Final Project Report
Version: 1.1 on 10/14/2016 Page 122 of 130
Holmes 13,034 6,921 6,113 349 65 907 1,073 9 4,518 4,527
Indian River 76,371 57,616 18,755 48,501 44 3,658 408 92 4,913 5,005
County Total
Parcels
Total Parcels with Drinking Water Determination
Drinking Water Not Applicable
# Known Public
# Estimated Public
# Known Private
Well
# Estimated Private Well
Drinking Water Conflicting
Data
Drinking Water No
Data
# Drinking Water Not Estimated
Jackson 38,333 17,744 20,589 1,234 229 3,147 3,384 192 9,558 9,750
Jefferson 11,883 5,974 5,909 182 46 672 3,412 16 1,646 1,662
Lafayette 6,820 2,913 3,907 427 3 345 1,876 7 255 262
Lake 173,576 133,426 40,150 40,141 21,054 12,058 2,476 302 57,395 57,697
Lee 442,667 270,199 172,468 131,559 1,055 29,017 2,051 62 106,455 106,517
Leon 108,249 96,040 12,209 69,241 570 4,849 21,380 - - -
Levy 47,265 20,520 26,745 891 987 3,029 10,827 24 4,762 4,786
Liberty 5,621 2,666 2,955 152 15 121 1,796 12 570 582
Madison 15,757 7,237 8,520 1,718 25 628 3,376 26 1,464 1,490
Manatee 133,421 120,470 12,951 71,952 2,003 1,828 2,605 39 42,043 42,082
Marion 266,408 150,292 116,116 48,461 5,246 57,998 6,670 2,349 29,568 31,917
Martin 78,434 57,046 21,388 30,789 1,199 6,562 215 219 18,062 18,281
Monroe 89,553 51,972 37,581 35,497 16,294 128 5 - 48 48
Nassau 43,717 31,908 11,809 15,812 5 9,779 5,358 121 833 954
Okaloosa 105,803 89,206 16,597 56,691 2,690 695 461 14 28,655 28,669
Okeechobee 64,564 15,687 16,561 950 331 1,683 4,877 1 696 7,846
Orange 439,436 394,462 44,974 319,186 23,905 4,718 2,292 269 44,092 44,361
Osceola 149,906 120,096 29,810 96,831 885 3,837 2,811 331 15,401 15,732
Palm Beach 429,408 397,920 31,488 258,290 1,901 7,430 932 159 129,208 129,367
Pasco 258,008 209,052 48,956 18,745 99,538 9,816 15,324 2,699 62,930 65,629
Pinellas 434,439 414,778 19,661 239,430 107,064 204 1,017 138 66,925 67,063
Polk 356,996 231,679 125,317 93,262 1,907 9,979 13,973 334 112,224 112,558
Putnam 98,900 35,469 63,431 1,117 154 6,343 19,384 119 8,352 8,471
Santa Rosa 95,282 69,344 25,938 45,922 59 38 747 2 22,576 22,578
Sarasota 274,115 218,239 55,876 152,868 25,750 3,136 23,155 455 12,875 13,330
Seminole 171,933 152,594 19,339 77,913 957 6,680 3,392 219 63,433 63,652
St. Johns 103,192 82,923 20,269 64,158 187 8,453 992 325 8,808 9,133
St. Lucie 150,529 107,926 42,603 26,351 6,415 5,932 1,048 191 67,989 68,180
Sumter 74,510 64,453 10,057 35,091 13,447 1,982 4,409 37 9,487 9,524

Florida Water Management Inventory Project Task 4: Final Project Report
Version: 1.1 on 10/14/2016 Page 123 of 130
Suwannee 30,565 15,913 14,652 203 265 2,456 8,639 233 4,117 4,350
Taylor 18,322 10,117 8,205 1,794 61 578 3,442 24 4,218 4,242
County Total
Parcels
Total Parcels with Drinking Water Determination
Drinking Water Not Applicable
# Known Public
# Estimated Public
# Known Private
Well
# Estimated Private Well
Drinking Water Conflicting
Data
Drinking Water No
Data
# Drinking Water Not Estimated
Union 6,383 3,758 2,625 64 21 374 1,808 4 1,487 1,491
Volusia 284,266 222,515 61,751 129,524 13,554 24,302 982 1,057 53,096 54,153
Wakulla 24,692 12,977 11,715 5,806 26 1,090 5,223 118 714 832
Walton 79,276 44,104 35,172 16,005 337 1,562 1,784 1,694 22,722 24,416
Washington 43,033 9,855 33,178 2,226 78 2,148 1,468 17 3,918 3,935

Florida Water Management Inventory Project Task 4: Final Project Report
Version: 1.1 on 10/14/2016 Page 124 of 130
APPENDIX E –ESTIMATION METHODOLOGY
For purposes of the Florida Water Management Inventory, some data gathered for parcels,
wastewater treatment methods, or drinking water sources will not be sufficient to make an
exact designation. In those cases, estimation methods will be utilized as outlined in this
Appendix.
PARCELS The methods documented within will be utilized to perform the first iteration of the
Statewide Inventory. It is acknowledged, and planned, as part of the project lifecycle, to refine these methods after the first iteration of parcel analysis.
Built Status Values Definitions
BUILT – for inventory purposes, a built parcel is defined as a parcel that should
have drinking water and domestic wastewater, and NOT-BUILT– for inventory purposes, a parcel that is not-built is defined as a
parcel that has no requirement for drinking water and domestic wastewater
UNKNOWN – for inventory purposes, parcels where drinking water and domestic wastewater requirements cannot be determined, most often due to conflicting data
or the absence of data
Built Status Values Queries
BLT_CODE, BLT_MTHD, and Query used to select records
Notes
BLT. 2013 new construction "ACT_YR_BLT" >= 2012 OR ("ACT_YR_BLT" IS NULL AND
"EFF_YR_BLT" >= 2012)
All new construction for this assessment year. This query assumes that any 2012 or later build
date is valid; regardless of number of buildings, number of residential units,
and the DOR land use code. Certain buildings may be constructed that do not have drinking water or
wastewater (i.e. barn) – no attempt has been made to separate these
buildings out from the selected set.
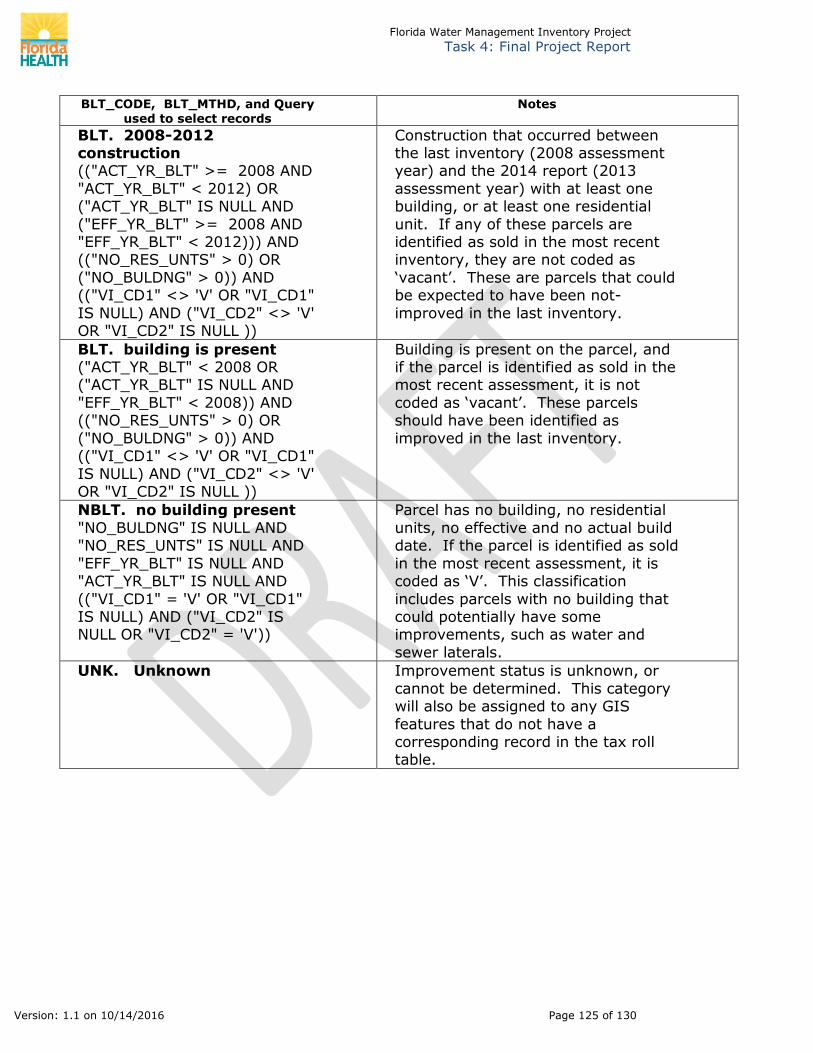
Florida Water Management Inventory Project Task 4: Final Project Report
Version: 1.1 on 10/14/2016 Page 125 of 130
BLT_CODE, BLT_MTHD, and Query
used to select records
Notes
BLT. 2008-2012 construction (("ACT_YR_BLT" >= 2008 AND
"ACT_YR_BLT" < 2012) OR ("ACT_YR_BLT" IS NULL AND
("EFF_YR_BLT" >= 2008 AND "EFF_YR_BLT" < 2012))) AND (("NO_RES_UNTS" > 0) OR
("NO_BULDNG" > 0)) AND (("VI_CD1" <> 'V' OR "VI_CD1"
IS NULL) AND ("VI_CD2" <> 'V' OR "VI_CD2" IS NULL ))
Construction that occurred between the last inventory (2008 assessment year) and the 2014 report (2013
assessment year) with at least one building, or at least one residential
unit. If any of these parcels are identified as sold in the most recent inventory, they are not coded as
‘vacant’. These are parcels that could be expected to have been not-
improved in the last inventory.
BLT. building is present ("ACT_YR_BLT" < 2008 OR ("ACT_YR_BLT" IS NULL AND
"EFF_YR_BLT" < 2008)) AND (("NO_RES_UNTS" > 0) OR
("NO_BULDNG" > 0)) AND (("VI_CD1" <> 'V' OR "VI_CD1"
IS NULL) AND ("VI_CD2" <> 'V' OR "VI_CD2" IS NULL ))
Building is present on the parcel, and if the parcel is identified as sold in the most recent assessment, it is not
coded as ‘vacant’. These parcels should have been identified as
improved in the last inventory.
NBLT. no building present
"NO_BULDNG" IS NULL AND "NO_RES_UNTS" IS NULL AND
"EFF_YR_BLT" IS NULL AND "ACT_YR_BLT" IS NULL AND
(("VI_CD1" = 'V' OR "VI_CD1" IS NULL) AND ("VI_CD2" IS NULL OR "VI_CD2" = 'V'))
Parcel has no building, no residential
units, no effective and no actual build date. If the parcel is identified as sold
in the most recent assessment, it is coded as ‘V’. This classification
includes parcels with no building that could potentially have some improvements, such as water and
sewer laterals.
UNK. Unknown Improvement status is unknown, or
cannot be determined. This category will also be assigned to any GIS
features that do not have a corresponding record in the tax roll table.

Florida Water Management Inventory Project Task 4: Final Project Report
Version: 1.1 on 10/14/2016 Page 126 of 130
WASTEWATER
The methods documented within will be utilized to perform the first iteration of the Statewide Inventory. It is acknowledged, and planned, as part of the project
lifecycle, to refine these methods after the first iteration of parcel analysis.
Where there is insufficient data to determine an exact method (Known Central Sewer or Known Onsite Septic), an estimated designation will be assigned.
1. Known Septic: a) OSTDS Final inspection done at least once AND if no conflicting sewer
information exists b) OSTDS Operating permit active, not expired AND if no conflicting sewer
information exists
c) 2009 inventory indicated the property was known septic AND if no conflicting sewer information exists
d) CHD Inventory, Carmody, etc. AND if no conflicting sewer information exists
2. Likely Onsite Septic:
a) 2009 inventory indicated the property was estimated septic (with a probability of > .8)
b) OSTDS construction Permit is not an abandonment, temporary, or holding tank, sewer not available (checked “no” or left blank on application form), construction permit issued
c) Operating permit active, expired d) Utility does not provide proof of sewer connection and it is in the utility’s service
area (where service area data is provided) e) Drinking water source is “Known Onsite Well” f) Drinking water source is a DEP regulated PWS with 1 connection and no WWTF
exists for the address g) DBPR, DOACS, or other State Agency indicate address is on a septic system
h) Other EHD program info (e.g. MHP, group care) indicates it is septic i) Other data source (e.g. local government) indicates it is septic
3. Somewhat Likely Septic:
a) OSTDS Construction permit application exists, no permit issued, and sewer not
available (checked “no” or left blank on application form) b) OSTDS Operating permit record exists, but marked as “inactive” or “closed”
c) Lot size is greater than 1 acre and Land Use Code is Residential and Built Status Value equals “Built”
d) 75% of surrounding properties are known septic
e) Not within Municipal boundaries

Florida Water Management Inventory Project Task 4: Final Project Report
Version: 1.1 on 10/14/2016 Page 127 of 130
4. Undetermined: a) Parcel does not fit any of the requirements in any of the other categories (not
enough data exists to make a determination or estimation)
5. Somewhat Likely Sewer: a) 75% of surrounding properties are known sewer b) 2009 inventory indicated the property was estimated sewer (with a probability
of > .3 < .5)
6. Likely Sewer: a) 2009 inventory indicated the property was estimated sewer(with a probability of
< .3)
b) 100% of surrounding properties are known sewer and Service Area is unknown c) Sewer line located in front of property and no other data source is available
d) DBPR, DOACS, or other State Agency indicate address is on sewer e) Other EHD program info (e.g. MHP, group care) indicates it is sewer f) Other data source (e.g. local government) indicates it is sewer
g) Specific subdivision is identified by Utility, and Shapefile provided, as having sewer service, but we do not have complete address or parcel information
7. Known Sewer:
a) Utility indicates property is on sewer b) Abandonment permit in EHD, AND sewer available c) 2009 inventory indicated the property was known sewer
d) DBPR or DOACS indicate address is on sewer e) Other EHD program info (e.g. MHP, group care) indicates it is sewer
f) Other data source (e.g. local government) indicates it is sewer

Florida Water Management Inventory Project Task 4: Final Project Report
Version: 1.1 on 10/14/2016 Page 128 of 130
DRINKING WATER
The methods documented within will be utilized to perform the first iteration of the Statewide Inventory. It is acknowledged, and planned, as part of the project
lifecycle, to refine these methods after the first iteration of parcel analysis.
Where there is insufficient data to determine an exact method (Known Central Water or Known Onsite Well), an estimated designation will be assigned.
1. Known Onsite Well: a) Non-Limited Use Well permitting info (e.g. Indian River uses “miscellaneous”
category for private well records) in EHD b) Domestic well permitting records from WMD or the delegated county AND not
coded as “denied” or “withdrawn” AND we have sufficient information to
geocode the location c) Final inspection done at least once AND if no conflicting public water
information exists d) If OSTDS Application indicates “Well” AND OSTDS Site Evaluation Form indicates
1,500 Gallons Per Day AND if no conflicting public water information exists
2. Likely Onsite Well:
a) Utility does not provide proof of central water connection and it is in the utility’s service area (where service area data is provided)
b) Utility provides water and sewer, the parcels are identified as a sewered
address, but not a watered address, and no other water provider indicated c) DBPR, DOACS, or other State Agency indicate address is an onsite well
d) Other EHD program info (e.g. MHP, group care) indicates it is onsite well e) Other data source (e.g. local government) indicates it is onsite well f) If OSTDS Application indicates “Well” OR OSTDS Site Evaluation Form does not
indicate 2,500 Gallons Per Day (or blank) AND if no conflicting public water information exists
3. Somewhat Likely Onsite Well:
a) 75% of surrounding properties are known onsite well b) Lot size is greater than 1 acre and Land Use Code is Residential and Built Status
Value equals “Built”
4. Undetermined:
a) Parcel does not fit any of the requirements in any of the other categories (not enough data exists to make a determination or estimation)
5. Somewhat Likely Central Water: a) 75% of surrounding properties are known central water

Florida Water Management Inventory Project Task 4: Final Project Report
Version: 1.1 on 10/14/2016 Page 129 of 130
6. Likely Central Water: a) Well abandonment permits AND central water is available
b) All surrounding properties are known central water and Service Area is unknown c) A Limited Use Well that has been closed in EHD
d) Sewer or drinking water line located in front of property and no other data source is available
e) Sewage treatment source is “Known Sewer”
f) DBPR, DOACS, or other State Agency indicate address is on central water g) Other EHD program info (e.g. MHP, group care) indicates it is on central water
h) Other data source (e.g. local government) indicates it is on central water i) If OSTDS Application indicates “Public Water” OR OSTDS Site Evaluation Form
does not indicate 2,500 Gallons Per Day (or blank)
7. Known Central Water:
a) Utility indicates property is on central water b) If OSTDS Application indicates “Public Water” AND OSTDS Site Evaluation Form
does not indicate 2,500 Gallons Per Day (or blank)
c) Active Limited Use Well in EHD

Florida Water Management Inventory Project Task 4: Final Project Report
Version: 1.1 on 10/14/2016 Page 130 of 130
APPENDIX F –PROJECT SUMMARY REPORT
Related Documents